Table of Contents
As filed with the Securities and Exchange Commission on June 9, 2017
Registration No. 333-217662
UNITED STATES
SECURITIES AND EXCHANGE COMMISSION
Washington, D.C. 20549
Amendment No. 1
to
FORMS-1
REGISTRATION STATEMENT UNDER THE SECURITIES ACT OF 1933
Advantage Solutions Inc.
(Exact name of registrant as specified in its charter)
| Delaware | 7389 | 38-3934401 | ||
| (State or other jurisdiction of incorporation or organization) | (Primary Standard Industrial Classification Code Number) | (I.R.S. Employer Identification Number) |
18100 Von Karman Avenue, Suite 1000
Irvine, CA 92612
(949)797-2900
(Address, including zip code, and telephone number, including area code, of registrant’s principal executive offices)
Tanya Domier
Chief Executive Officer
18100 Von Karman Avenue, Suite 1000
Irvine, CA 92612
(949)797-2900
(Name, address, including zip code, and telephone number, including area code, of agent for service)
Copies to:
Howard A. Sobel Michael A. Treska Latham & Watkins LLP 650 Town Center Drive, 20th Floor Costa Mesa, CA 92626 Telephone: (714)540-1235 Fax: (714)755-8290 | Brian Stevens Bryce Robinson 18100 Von Karman Avenue, Suite 1000 Irvine, CA 92612 Telephone: (949)797-2900 Fax: (949)797-9112 | Christopher M. Forrester Merritt S. Johnson Shearman & Sterling LLP 1460 El Camino Real, 2nd Floor Menlo Park, CA 94025 Telephone: (650)838-3600 Fax: (650)838-5173 |
Approximate date of commencement of proposed sale to the public: As soon as practicable after this Registration Statement becomes effective
If any of the securities being registered on this Form are to be offered on a delayed or continuous basis pursuant to Rule 415 under the Securities Act of 1933 check the following box: ☐
If this Form is filed to register additional securities for an offering pursuant to Rule 462(b) under the Securities Act, please check the following box and list the Securities Act registration statement number of the earlier effective registration statement for the same offering. ☐
If this Form is apost-effective amendment filed pursuant to Rule 462(c) under the Securities Act, check the following box and list the Securities Act registration statement number of the earlier effective registration statement for the same offering. ☐
If this Form is apost-effective amendment filed pursuant to Rule 462(d) under the Securities Act, check the following box and list the Securities Act registration statement number of the earlier effective registration statement for the same offering. ☐
Indicate by check mark whether the registrant is a large accelerated filer, an accelerated filer, anon-accelerated filer, a smaller reporting company or an emerging growth company. See the definitions of “large accelerated filer,” “accelerated filer,” “smaller reporting company” and “emerging growth company” in Rule12b-2 of the Exchange Act.
| Large accelerated filer ☐ | Accelerated filer ☐ | Non-accelerated filer ☒ | Smaller reporting company ☐ | |||
| Emerging growth company ☐ |
If an emerging growth company, indicate by check mark if the registrant has elected not to use the extended transition period for complying with any new or revised financial accounting standards provided pursuant to Section 7(a)(2)(B) of the Securities Act. | ☐ | |||||
CALCULATION OF REGISTRATION FEE
| ||||
Title of each class of securities to be registered | Proposed maximum aggregate offering price(1)(2) | Amount of registration fee(3) | ||
Common stock, par value $0.01 per share | $100,000,000.00 | $11,590.00 | ||
| ||||
| ||||
| (1) | Estimated solely for the purpose of calculating the registration fee pursuant to Rule 457(o) under the Securities Act of 1933, as amended. |
| (2) | Includes the offering price of shares of common stock that may be sold if the option to purchase additional shares of common stock solely to cover over-allotments granted by the Registrant to the underwriters is exercised. |
| (3) | The Registrant previously paid $11,590.00 on May 4, 2017 in connection with the initial filing of this Registration Statement. |
The Registrant hereby amends this Registration Statement on such date or dates as may be necessary to delay its effective date until the Registrant shall file a further amendment which specifically states that this Registration Statement shall thereafter become effective in accordance with Section 8(a) of the Securities Act of 1933, as amended, or until the Registration Statement shall become effective on such date as the Commission, acting pursuant to said Section 8(a), may determine.
Table of Contents
The information in this preliminary prospectus is not complete and may be changed. We may not sell these securities until the registration statement filed with the Securities and Exchange Commission is effective. This preliminary prospectus is not an offer to sell these securities, and we are not soliciting an offer to buy these securities in any state where the offer or sale is not permitted.
Subject to Completion
Preliminary Prospectus dated June 9, 2017
PROSPECTUS
Shares

Common Stock
This is an initial public offering of shares of common stock of Advantage Solutions Inc.
We are offering all of the shares to be sold in the offering.
Prior to this offering, there has been no public market for the common stock. It is currently estimated that the initial public offering price per share will be between $ and $ . We intend to list the common stock on the New York Stock Exchange under the symbol “ADV.”
Following this offering, we will be a “controlled company” within the meaning of the corporate governance rules of the New York Stock Exchange. After the completion of this offering, Karman Topco L.P. will own approximately % of our common stock (or approximately % if the underwriters exercise in full their option to purchase additional shares). The equity interests of Karman Topco L.P. are owned by equity funds affiliated with or advised by CVC Capital Partners, Leonard Green & Partners, Juggernaut Capital Partners, and Centerview Capital, as well as by certain members of our management.
See “Risk Factors” on page 21 to read about factors you should consider before buying shares of the common stock.
Neither the Securities and Exchange Commission nor any other regulatory body has approved or disapproved of these securities or passed upon the accuracy or adequacy of this prospectus. Any representation to the contrary is a criminal offense.
| Per Share | Total | |||||||
Initial public offering price | $ | $ | ||||||
Underwriting discount(1) | $ | $ | ||||||
Proceeds, before expenses, to Advantage Solutions Inc. | $ | $ | ||||||
| (1) | See “Underwriting” for a description of the compensation payable to the underwriters. |
To the extent that the underwriters sell more than shares of common stock, the underwriters have the option to purchase up to an additional shares from us at the initial price to the public less the underwriting discount.
The underwriters expect to deliver the shares against payment in New York, New York on , 2017.
| Goldman Sachs & Co. LLC | Morgan Stanley |
Prospectus dated , 2017
Table of Contents

Table of Contents
| Page | ||||
| 1 | ||||
| 21 | ||||
| 38 | ||||
| 39 | ||||
| 43 | ||||
| 43 | ||||
| 43 | ||||
| 44 | ||||
| 46 | ||||
| 47 | ||||
| 48 | ||||
| 50 | ||||
| 52 | ||||
UNAUDITED PRO FORMA CONDENSED CONSOLIDATED STATEMENT OF OPERATIONS | 55 | |||
MANAGEMENT’S DISCUSSION AND ANALYSIS OF FINANCIAL CONDITION AND RESULTS OF OPERATIONS | 58 | |||
| 91 | ||||
| 109 | ||||
| 118 | ||||
| 142 | ||||
| 145 | ||||
| 149 | ||||
| 153 | ||||
| 158 | ||||
MATERIAL U.S. FEDERAL INCOME TAX CONSEQUENCES TONON-U.S. HOLDERS | 161 | |||
| 166 | ||||
| 171 | ||||
| 171 | ||||
| 172 | ||||
| F-1 |
You should rely only on the information contained in this prospectus or in any free writing prospectus we may authorize to be delivered or made available to you. We and the underwriters have not authorized anyone to provide you with different information. We are offering to sell, and seeking offers to buy, shares of our common stock only in jurisdictions where offers and sales are permitted. The information in this prospectus is accurate only as of the date of this prospectus, regardless of the time of delivery of this prospectus or any sale of shares of our common stock.
For investors outside the United States: Neither we nor the underwriters have taken any action to permit this offering or the possession or distribution of this prospectus to occur in any jurisdiction where action for that purpose is required, other than in the United States. Persons outside the United States who come into possession of this prospectus must inform themselves about, and observe any restrictions relating to, the offering of the shares of common stock and the distribution of this prospectus outside the United States. See “Underwriting.”
i
Table of Contents
This summary highlights certain significant aspects of our business and this offering. This is a summary of information contained elsewhere in this prospectus, is not complete, and does not contain all of the information that you should consider before investing in our common stock. You should carefully read the entire prospectus, including the information presented under the sections entitled “Risk Factors” and “Special Note Regarding Forward-Looking Statements” and our consolidated financial statements and the related notes thereto included elsewhere in this prospectus, before making a decision to invest in our common stock. This summary contains forward-looking statements that involve risks and uncertainties. Our actual results may differ significantly from future results contemplated in the forward-looking statements as a result of certain factors such as those set forth in the sections entitled “Risk Factors” and “Special Note Regarding Forward-Looking Statements.”
In this prospectus, unless otherwise stated or the context otherwise requires, the “Company,” “we,” “our,” and “us” refer to Advantage Solutions Inc., a Delaware corporation, and its subsidiaries.
Our Company
We are a leading business solutions provider to consumer goods manufacturers and retailers. Our customizable suite of technology-enabled sales and marketing solutions is designed to help manufacturers and retailers across a broad range of channels drive consumer demand, increase sales, and achieve operating efficiencies. Through our sales segment, we serve as a strategic intermediary between consumer goods manufacturers and their retailer partners. Our sales associates prepare and present to retailers the business case to increase distribution of manufacturers’ products and optimize how they are displayed, priced, and promoted. We also makein-store visits to ensure such products are adequately stocked and properly displayed. Through our marketing segment, we develop marketing programs for manufacturers and retailers that are designed to influence shoppers on their paths to, and at the point of, purchase using our proprietary insights on shopper behavior, analytics, brand knowledge, and understanding of manufacturer and retailer strategies. In 2016, we provided services to over 2,000 manufacturers for products located at more than 200,000 retail locations.
Our sales services primarily include:
| • | Headquarter Relationship Management. We act as a representative of our consumer goods manufacturer clients and facilitate relationships with retailers across a range of matters, including business development and sales planning efforts. We prepare customized, data-driven business plans on behalf of our manufacturer clients and present the business case to increase distribution of their products, and optimize the shelf placement, pricing, and promotion of their products, to our extensive network of industry contacts spanning retailer buying organizations and senior executive ranks. |
| • | Analytics, Insights, and Intelligence. To support our sales efforts, we field a team of over 300 analytics professionals who practice what our industry refers to as category and space management. These professionals analyze consumer purchase and retailer data to identify opportunities to increase the sales of our clients’ products and categories. |
| • | Administration. Our associates handle key back-office functions such as receiving and processing purchase orders. We also manage trade promotion programs executed between clients and retailers. |
1
Table of Contents
| • | Retail Services. We deploy teams in retail locations to support manufacturers’in-store sales strategies. Our associates conduct both cyclical andad hoc store visits to manage product availability and positioning, implement promotions, installpoint-of-purchase displays, and perform other value-added merchandising services. |
| • | Retailer Client Partnerships andIn-Store Media Programs. We serve select retailers as their exclusive provider, and other retailers as theirnon-exclusive provider, ofin-store reset work. We also perform compliance audits andin-store product assembly work, and manage a wide variety of media, merchandising, and display platforms for retailers. |
| • | Digital Technology. We offer technology solutions that drive efficiencies for consumer goods manufacturers and retailers. For example, one of our technology solutions automates critical reporting and provides insights that allow clients to make revenue-optimizing decisions regardingin-store operations and workflows. Additionally, oure-commerce capabilities cover a comprehensive set of services, including content development, brand reputation management, and representation of consumer goods manufacturers to online retailers. |
Our marketing services primarily include:
| • | Experiential Marketing. We design and executein-person consumer engagements ranging fromin-store product sampling and demo programs to large-scale events such as grand openings, product launch events, and festivals. |
| • | Shopper and Consumer Marketing. For manufacturer clients, we analyze shopper behavior and apply our deep retailer knowledge and expertise to offer planning, execution, and measurement of insight-based, retailer-specific promotions that target a retailer’s specific shoppers to drive product sales. Manufacturers also hire us for national consumer promotions, which are designed to stimulate demand for, and awareness of, their products more broadly. |
| • | Digital Marketing. Using advanced analytics, our digital marketing teams provide a wide range of services to clients, including: digital advertising; interactive design and development across mobile, tablet, and desktop; application development; content management solutions; paid media, including search engine marketing, programmatic, and direct media; and social media development and management. |
| • | Advantage Media. We offer targeted media solutions powered by our proprietary data management platform. |
We serve leading manufacturers across a range of consumer product categories, including packaged foods, beverages, perishables, health and beauty care, and consumer electronics. We also maintain deep relationships with retailers across various channels, including traditional retail (which includes grocery, drug, mass, convenience, club, and natural/specialty), foodservice, ande-commerce.
Our clients vary in terms of size and growth profile, ranging from some of the world’s largest consumer goods manufacturers, including Mars, PepsiCo, and Smucker’s, to smaller regional players and emerging brands. While our client base has been predominantly comprised of consumer goods manufacturers, over the past ten years we have increased our offerings to retailers, particularly in the areas of designing and managingin-store events platforms, merchandising, and other labor-based services, such as data collection, product assembly,new-store setups, and remodels. More recently, we have also begun to offer our marketing services to industries beyond consumer goods manufacturing and retail, such as automotive, entertainment, and travel.
2
Table of Contents
We believe that our strategic insights, flexible, service-oriented approach, and superior execution have helped us cultivate long-standing relationships with our clients. We help our clients increase sales and reduce costs by leveraging our industry expertise, network of relationships, and scale to develop and execute strategies that fuel our clients’ growth and allow them to focus on their core competencies. Dechert-Hampe & Company, or Dechert-Hampe, an independent consulting firm, estimated in a recent study that outsourcing direct retail coverage teams to a syndicated model may save manufacturers between 45% and 50%. Moreover, that same study includes an estimate that replacing a direct sales team with headquarter representation from an outsourcing partner may save manufacturers between 35% and 50%. We work closely with our clients to identify the combinations of services that best meet their sales and marketing objectives and strive to address the related challenges they face in a customized way.
Eleven of our top 15 clients by revenues in 2016 have been clients for over ten years, with the remaining four clients being new business wins in the last ten years. Since 2009, we have had an average revenue-weighted client retention rate of approximately 99%. We define average revenue-weighted client retention rate as prior year total revenues less annual revenues from lost clients in that period, divided by prior year total revenues. We believe this high level of retention demonstrates that we are deeply embedded in our clients’ operations and that we execute mission critical sales and marketing functions on their behalf.
We maintain over 120 offices located throughout the United States and Canada. Our geographic footprint allows us to execute our strategies on a local, regional, or national level. We have in excess of 50,000 associates who provide us with the resources and scale to provide broad-reaching and cost-efficient solutions to our clients. Our offices are strategically located near our manufacturer and retailer clients, with many of our associates working directly at manufacturers’ or retailers’ offices. This presence provides us with deeper insight into client strategies, systems, and operations and gives our associates more direct access to key decision makers, allowing them to deliver our value-enhancing services in a more tailored and effective manner. While the majority of our business is currently concentrated in the United States and Canada, through our strategic international investments, we maintain a platform in select markets throughout Africa, Asia, Australia, and Europe through which we can service the global needs of multinational manufacturers.
Our business has demonstrated an ability to consistently grow revenues and Adjusted EBITDA over time and through economic cycles. In 2016, we generated $2,100.2 million in revenues, $31.2 million of net income, $128.2 million of Adjusted Net Income, and $411.3 million of Adjusted EBITDA. Our revenues and Adjusted EBITDA in 2016 reflect a compound annual growth rate, or CAGR, of 9.8% and 12.4%, respectively, since 2007. See “Summary Consolidated Financial and Other Data” for a reconciliation of each of Adjusted EBITDA and Adjusted Net Income to net income (loss).
3
Table of Contents
We believe that the consistency in the growth of our business is attributable to a variety of factors, including: the stability of the end markets we serve, as a significant portion of our revenues is tied to the sales of a broad group ofnon-discretionary consumer goods; the diversity of the services we offer across a variety of distribution channels; and the critical nature of the services we provide to our clients. Additionally, our services-based operations provide us with a capital-efficient business model that requires limited reinvestment in the form of capital expenditures and working capital. The consistency of our operating results as well as our strong cash flow profile provide us with a high degree of financial flexibility, which enables us to strategically deploy capital to increase stockholder value.
Our Historical Financial Performance ($ in millions)
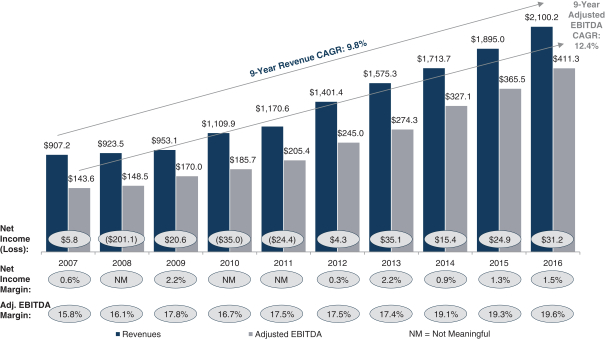
Note: Revenues, net loss, and Adjusted EBITDA for the year ended December 31, 2010 presented above represent the mathematical addition of the audited results of a successor entity for the period from December 17, 2010 to December 31, 2010, and the audited results of a predecessor entity for the period from January 1, 2010 to December 16, 2010, following an acquisition of Advantage Sales & Marketing Inc. by AGS Topco Holdings, L.P. and its private equity sponsor, Apax Partners, on December 16, 2010. We refer to this transaction as the 2010 Acquisition. Revenues, net income, and Adjusted EBITDA for Pro Forma 2014 (as defined, “Summary Consolidated Financial and Other Data”) presented above give effect to the pro forma adjustments attributable to the 2014 Topco Acquisition (as defined below) that are described in “Unaudited Pro Forma Condensed Consolidated Statement of Operations” and “Non-GAAP Financial Measures” and are based upon available information and certain assumptions that we believe are reasonable.
In the three months ended March 31, 2017, we generated $508.5 million in revenues, a net loss of $9.2 million, $16.9 million of Adjusted Net Income, and $75.7 million of Adjusted EBITDA. See “Summary Consolidated Financial and Other Data” for a reconciliation of each of Adjusted EBITDA and Adjusted Net Income to net loss.
4
Table of Contents
Our Market Opportunity
We compete in several large and growing markets for outsourced business services targeting the sales, marketing, and technology needs of consumer goods manufacturers and retailers.
Dechert-Hampe estimates that the market for the traditional outsourced sales services offered through our sales segment in the United States was approximately $7.9 billion in 2016 and has grown at a CAGR of approximately 4.8% over the last four years. Historically, the outsourced sales services industry has grown consistently, largely driven by the steady expansion of the broader U.S. consumer goods market and the growth in penetration of outsourced services with consumer goods manufacturers. Over the past two decades, the industry has experienced meaningful consolidation. Today, the U.S. industry operates with three national firms consisting of Acosta, Inc., CROSSMARK, Inc., and us. We and Acosta, Inc. have the most significant industry market share. Based on our 2016 U.S. sales services revenues and industry data provided by Dechert-Hampe, we estimate that we account for approximately 16% of the sales services market in the United States by revenues. Other than the three national firms, the industry remains fragmented, comprised of smaller independent agencies that offer services on a more regional level or are focused on a specific channel (e.g., foodservice) or specific service (e.g., merchandising projects and resets).
We have an opportunity to increase our sales commission-based revenues in the growinge-commerce consumer packaged goods, or CPG, channel. Dechert-Hampe estimates thate-commerce CPG sales in the United States were approximately $38.0 billion in 2016, up from approximately $20.0 billion in 2015, an increase of 90%. In addition, Dechert-Hampe estimates that the market for the business intelligence technology solutions offered through our sales segment in the United States was approximately $43.6 billion in 2016, up from approximately $39.1 billion in 2015, an increase of 11.5%. The market for our technology solutions has grown rapidly as manufacturers and retailers have looked for solutions that drive efficiencies in operations by helping them analyze data for more effective decision-making, and support the growing need to distribute, manage, and advertise products effectively in thee-commerce channel. We expect the market for technology solutions to continue to grow at a rapid rate as these trends continue.
Dechert-Hampe estimates that the market for the experiential, shopper, and consumer marketing services offered through our marketing segment in the United States was approximately $11.1 billion in 2015 and has grown at a CAGR of approximately 26% over the last three years. The market for these marketing services has grown with increased manufacturer and retailer awareness and understanding of the greater effectiveness of properly targeted marketing strategies. These strategies aim to influence shoppers with meaningful messages and experiences along their paths to purchase, particularly whilein-store and at thepoint-of-purchase. Dechert-Hampe estimates that overall marketing spend in these service areas will grow approximately 17% from 2016 to 2021, primarily driven by manufacturers’ and retailers’ desire to influence shoppers to purchase products with memorable content and experiences. The industry for these services remains highly fragmented and consists of a large number of specialized and diversified agencies.
Dechert-Hampe estimates that the market for the social, media, and digital technology solutions, including those offered through our marketing segment, in the United States was approximately $11.7 billion in 2015 and has grown at a CAGR of approximately 18% over the last three years. The market for these solutions has grown with the increasing influence of digital in consumers’ shopping routines, causing manufacturers and retailers to integrate digital, social, and mobile marketing techniques into their marketing plans. We expect the market for these solutions to continue to grow rapidly as manufacturers and retailers seek to create effective, integrated multi-channel marketing
5
Table of Contents
campaigns that deliver compelling content and experiences to influence shopper behavior across all mediums.
We believe that growth in the several markets in which we compete is driven by a number of prevailing industry trends:
| • | Outsourced business services are in increasing demand as manufacturers and retailers continue to seek effective and cost-efficient operational solutions. |
| • | Small andmid-sized consumer brands are rising in popularity and require a deeper level of outsourced support for key sales and marketing functions. |
| • | The proliferation of e-commerce has driven retailers to pursue strategies to differentiate theirin-store shopping experience. |
| • | The proliferation of e-commerce has driven manufacturers to seek solutions that support the growth of their business in this channel. |
Within this industry environment, we believe we are advantageously positioned because of our expertise, diverse and customizable suite of services, relationships, national footprint, and scale.
Our Competitive Strengths
We believe the following strengths differentiate us within our industry and have contributed to our sustained success:
Leading National Provider with Significant Scale and Infrastructure that Would Be Difficult to Replicate
We are a leading national provider of technology-enabled sales and marketing services, as measured by revenues, in the markets in which we operate. With over 37,000 associates regularly providing services within retail locations and 3,400 associates working on behalf of manufacturers and retailers at or near their headquarters or regional buying offices, we are one of the largest national providers of sales and marketing services. We have spent decades developing a reputation for providing high quality service and superior execution, grounded in our data-driven insights. We believe that our scale provides us with significant competitive advantages by allowing us to differentiate the value of the services we provide to our clients by:
| • | offering a broad suite of capabilities that allows us to create flexible, customizable, multi-service solutions that meet our clients’ evolving needs, from small regional businesses to large multinational corporations; |
| • | providing the expertise, experience, andin-market presence necessary to deliver flexible, centrally coordinated, local, regional, or national execution of large and complex labor-based services; |
| • | building, training, and managing the deployment of our large workforce to serve our clients’ needs more efficiently than they could with their own employees; |
| • | leveraging the significant volume of products that we market on behalf of our manufacturer clients and our proximity and connectivity to retailers to influence retailer decision makers; and |
| • | investing in technology and data that enable our talented associates to better support our clients’ businesses. |
6
Table of Contents
Our scale affords us efficiencies to deliver solutions that are more effective and cost-efficient than those provided by smaller competitors or internal manufacturer and retailer teams, allowing us to grow both our clients’top-line revenues and bottom-line profits. We believe this attractively positions us to retain existing clients and win new business, which, in turn, further increases our scale and associated competitive advantages.
Strategic Intermediary Benefiting from Self-Reinforcing Network Effects
We occupy an important industry position where we serve as a strategic intermediary between consumer goods manufacturers and retailers, creating value for both parties. Due to the breadth and depth of our manufacturer representation across key categories and departments, we are among the largest supplier partners to many retailers. Our size gives us access and influence with key retailer decision makers that smaller agencies and many manufacturers cannot secure on their own, which, in turn, helps us secure additional manufacturer representations. This self-reinforcing “network effect” has helped us grow to become an important strategic partner to both manufacturers and retailers. We have focused on strengthening the value we can provide to our network by investing in technology andin-market talent that, through our proximity to manufacturer clients and retailers, gives us direct visibility into strategies and systems and better positions us to support clients’ and retailers’ businesses.
Broad Suite of Complementary Services and Technology Solutions Tailored to Client Needs
Based on the insights we have gained as a strategic intermediary between manufacturers and retailers, we have built what we believe to be one of the industry’s broadest suites of technology-enabled sales and marketing services, allowing our associates to create coordinated, innovative, multi-service solutions designed to achieve our clients’ sales and marketing objectives.
In response to our clients’ needs, we have expanded our offering from purely sales services to include marketing services, leveraging our expertise, network of relationships, data, insights, and technology to differentiate our solutions. We began our marketing business in 2000 after we observed the challenges our clients were experiencing while using traditional marketing agencies that were not effectively connecting brand marketing strategies, sales planning efforts, and retailer strategies. More recently, we have begun building a complementary suite of sellable technology solutions designed to address several major business drivers in our industry, including the continuous push for operational efficiency, e-commerce channel expansion, and the need to optimize online andin-store execution capabilities.
Talented Associates and Performance-Based Culture
We believe that our talented associates and performance-based culture are important competitive advantages. We have a results-driven team of leaders who average more than 20 years of experience in the consumer, sales, marketing, and technology industries.
We have made significant investments in training and leadership programs to ensure we remain an attractive career choice for associates at every level. Our employee programs are complemented by our performance-based culture that we believe differentiates us from our competitors. Our culture is built on both internal and external transparency and accountability for results. We set clear objectives with our associates, analyze score-card performance, and reward associates who outperform. We strive to encourage and empower our associates to be proactive, creative, and entrepreneurial in providing solutions for our clients. We believe our encouragement and empowerment has driven the
7
Table of Contents
history of service innovation that has fueled our growth, and that our commitment to results and continuous improvement produces long-term relationships with our clients that typically increase in scale and scope over time.
Differentiated and Proprietary Technology Infrastructure
Our proprietary technology infrastructure enables our associates to provide differentiated services that help us grow manufacturers’ and retailers’ businesses by leveraging data-driven insights to develop winning sales and marketing strategies and enable more effective and more efficientin-store execution.
Our technology supports our associates across a range of functions, including a proprietary analytics software suite that helps our associates analyze and apply vast amounts of industry data in the selling process and automate reporting. Our business and category managers use this software to quickly and efficiently develop insight-based sales plans for our clients.
Furthermore, our retail services associates use tablets with proprietary software that help them optimize their workflow and store-level activities. This enables them to utilize proprietary applications to perform functions such as recommending promotional display programs to store managers and illustrating potential store-level sales impact of their recommendations.
Strong, Long-Term Relationships with Leading Manufacturers and Retailers
We maintain strategic relationships with a diversified base of over 2,000 consumer goods manufacturers and retailers, including iconic brands at manufacturers such as Mars, PepsiCo, and Smucker’s, and leading retailers such as Albertsons, Kroger, Sam’s Club, and Walmart. We maintain long-term, multi-service relationships with our largest clients, and have a tenure of over ten years with 11 of our top 15 clients. We view our relationships with our clients as long-term strategic collaborations, which provide us with a stable and consistent revenue base due to mutually aligned incentives and a partnership dynamic. This approach has led to low levels of client attrition, as evidenced by our average revenue-weighted client retention rate of 99% since 2009.
Proven Acquisition and Integration Capabilities
We have a successful track record of sourcing, executing, and integrating acquisitions that expand our service capabilities, sales channels, and geographic markets. Since 2014, we have acquired 40 businesses, which have dramatically expanded our capabilities in digital and social marketing, extended our sales services into thee-commerce channel, and expanded our footprint into Europe and other international markets such as Africa, Asia, and Australia through our strategic partnership with Smollan. We maintain a highly disciplined approach to acquisitions, and have a proven history of acquiring businesses at attractive prices, achieving meaningful synergies, and meeting or exceeding our internal performance goals for the acquired businesses.
Our Growth Strategies
Our competitive strengths and industry leadership enable us to pursue numerous growth opportunities. We intend to continue our growth through the following strategies:
Grow Our Client Relationships
Expand Existing Client Relationships
We have cultivated long-term, multi-service relationships across a diverse set of manufacturers and retailers. As we have broadened our service offerings, we have succeeded in expanding our client
8
Table of Contents
relationships. We believe significant opportunities remain to increase service penetration within our existing client base across our technology-enabled sales and marketing solutions. The long-term nature of our client relationships allows us to identify expansion opportunities and positions us to actively develop customized service arrangements to broaden the scope of those relationships.
Continue to Win New Clients and Retailer Accounts
We have a strong track record of securing business from new clients. Over the last five years we have won approximately 50 new client accounts and experiential marketing platforms with annual revenues between $500,000 and $40 million per account. In aggregate, the annualized revenues resulting from these wins are approximately $320 million. Of those accounts, approximately 20% are attributed to increased outsourcing among consumer goods manufacturers and retailers, and approximately 80% are attributed to consumer goods manufacturers and retailers switching from competitors. Moreover, as we expand the industries we serve to areas such as healthcare, financial services, and automotive, and our addressable market continues to grow, we believe that we will continue to succeed in generating new business.
Pursue Channel Expansion and New Industry Opportunities
We believe thee-commerce channel will be a growth opportunity, and that our existing competencies and capabilities position us well to succeed as the channel becomes more meaningful for our clients and the categories we represent. Many of the core competencies that allow us to add value for clients in traditional retail channels are as relevant to effective sales and marketing in thee-commerce channel as they are inbrick-and-mortar retail channels. In addition, we have added talent and capabilities dedicated to selling, marketing, and merchandising clients’ products in thee-commerce channel.
Outside of the consumer goods manufacturing industry and traditional retail channel, we believe there is an opportunity to sell our services to companies in other industries that we believe are underserved, such as automotive, education, entertainment, healthcare, specialty pet, and travel.
Continue to Enhance Our Solutions and Expand Into Logical Adjacencies
We believe that we have a significant opportunity to leverage our position as a strategic intermediary between manufacturers and retailers to develop new and innovative outsourced solutions.
We have recently developed digital technology solutions to help consumer goods manufacturers and retailers find operational efficiencies; create, produce, and distribute compelling content; and successfully market their products in an increasingly omni-channel environment. We believe there is an opportunity for further development in this area.
We also believe there is an opportunity to develop new value-added marketing services. The marketing capabilities we have added over the past five years include a paid search marketer, two digital marketing agencies, and a dedicated media solutions team specializing in targeted mobile advertising. As marketing spend migrates away from television, where traditional ad agencies have historically held competitive advantages, toward the disciplines where we have built our reputation and can differentiate our services through our understanding and connectivity to retail (i.e., promotional, shopper, and digital marketing), we believe we are well-positioned to add value for clients with new demand creation services such as brand identity, content, and packaging design.
9
Table of Contents
Furthermore, there are adjacent industries in which our ability to build, manage, and train large technology-enabled service- and process-oriented teams would give us a competitive advantage.
Pursue Additional Strategic and Financially Attractive Acquisitions
We have a track record of successfully identifying, acquiring, and integrating businesses that expand our solutions offering, sales channels, and geographic markets, while achieving synergies and outperforming our performance objectives. Using our disciplined approach for screening and evaluating potential opportunities, we intend to continue to seek strategically and financially attractive acquisition targets that provide us with new capabilities and drive long-term stockholder value.
Further Develop Our International Platform
We believe that growing our international presence will allow us to offer integrated outsourcing solutions for multinational manufacturers and to provide those clients a single strategic partner with an understanding of their global businesses. While the majority of our business is currently concentrated in the United States and Canada, we have made strategic international investments that have provided us with growth opportunities in several markets throughout Africa, Asia, Australia, and Europe. As we deepen our penetration of these existing markets and enter new geographies, we expect to focus on acquiring knowledge of local market dynamics while also leveraging our deep understanding of how to create a consolidated platform to service the outsourcing needs of large clients.
Utilize Technology and Scale to Drive Efficiencies in Operations
We believe our scale and continued investment in technology enable us to achieve operational excellence and capture productivity improvements. We consider technological innovation to be a critical component of our strategy, allowing us to provide superior execution at scale and deliver data-driven insights to grow our clients’ businesses. We believe that with our talent, entrepreneurial culture, and willingness to invest in our future, we are positioned to continue to develop new technologies that will differentiate our service offering from our competitors.
Recent Developments
On May 2, 2017, we amended our First Lien Credit Agreement (as defined in “Description of Indebtedness”) to incur an additional $225.0 million of First Lien Term Loans (as defined in “Description of Indebtedness”), and to extend the maturity date with respect to $150.0 million of our Revolving Credit Facility (as defined in “Description of Indebtedness”). See “Management’s Discussion and Analysis of Financial Condition and Results of Operations—Liquidity and Capital Resources—Description of Credit Facilities” and “Description of Indebtedness.”
Risks Related to Our Business
Investing in our common stock involves substantial risk. You should carefully consider all of the information in this prospectus prior to investing in our common stock. There are several risks related to our business that are described under “Risk Factors” elsewhere in this prospectus. Among these important risks are the following:
| • | risks relating to our associates, including changes to labor laws or wage or job classification regulations, including minimum wage, market-driven wage increases, and our ability to hire, timely train, and retain talented individuals for our workforce while maintaining our corporate culture; |
10
Table of Contents
| • | our business and results of operations are affected by developments with and policies of retailers that are out of our control; |
| • | we need to continue to generate significant operating cash flow in order to fund acquisitions and to service our debt; |
| • | consolidation in the industries we serve could put pressure on the pricing of our services; |
| • | our ability to identify attractive acquisition targets, acquire them at attractive prices, and successfully integrate the acquired businesses; |
| • | our ability to acquire new clients and retain and grow existing clients, including managing business conflicts among competing brands; |
| • | our ability to successfully develop and maintain relevant omni-channel services for our clients, protect our intellectual property, and adapt to technological change; |
| • | our three largest client relationships comprise a significant portion of our revenues; and |
| • | we are controlled by Karman Topco L.P., whose economic and other interests in our business may be different from yours. |
Basis of Presentation
References to ‘‘revenues’’ in this prospectus represent total revenues, inclusive of revenues from related and unrelated third parties.
Unless indicated otherwise, the information included in this prospectus (1) assumes no exercise by the underwriters of the option to purchase up to an additional shares of common stock and (2) reflects the restatement of our certificate of incorporation on , 2017 to effect, among other things, a -for-one stock split of our common stock and an increase in our authorized capital stock to shares of common stock. Numerical figures included in this prospectus have been subject to rounding adjustments.
Numerical figures shown as totals in various tables may not be arithmetic aggregations of the figures that precede them. In addition, we round certain percentages and amounts presented in this prospectus to the nearest whole number. As a result, figures expressed in total and as percentages in the text may not total 100% or, as applicable, when aggregated may not be the arithmetic aggregation of the amounts or percentages that precede them.
Corporate Information
We are a corporation initially formed under the laws of the State of Delaware on June 13, 2014 under the name Karman Holding Corp. solely for the purpose of the 2014 Topco Acquisition (as defined below). From June 13, 2014 to July 25, 2014, the Company had no operations or expenses. Operations commenced on July 25, 2014.
On July 25, 2014, the Company acquired Advantage Sales & Marketing Inc., or the 2014 Topco Acquisition, from AGS Topco Holdings, L.P. and its private equity sponsor, Apax Partners. As a result of the 2014 Topco Acquisition, Advantage Sales & Marketing Inc. became a wholly owned indirect subsidiary of the Company, which is a wholly owned direct subsidiary of Karman Topco L.P., or
11
Table of Contents
Karman Topco. From an accounting perspective, the 2014 Topco Acquisition represented a recapitalization of our equity interests by equity funds affiliated with or advised by CVC Capital Partners, Leonard Green & Partners, Juggernaut Capital Partners, and Centerview Capital. Accordingly, the assets and liabilities acquired were recorded at fair value for the interests acquired by our new investors and the results of our operations prior to the 2014 Topco Acquisition have been presented as our Predecessor period. The units of Karman Topco are held by such equity funds, as well as by members of the Company’s management. Through its ownership of our common stock, Karman Topco controls us, and after this offering will continue to control us. Throughout this prospectus, we refer to CVC Capital Partners, Leonard Green & Partners, Juggernaut Capital Partners, and Centerview Capital collectively as the Sponsors.
On March 16, 2016, the Company changed its name from “Karman Holding Corp.” to “Advantage Solutions Inc.”
Our corporate headquarters are located at 18100 Von Karman Avenue, Suite 1000, Irvine CA 92612. Our telephone number is (949)797-2900. Our principal website address iswww.advantagesolutions.net. The information on any of our websites is deemed not to be incorporated in this prospectus or to be part of this prospectus.
12
Table of Contents
The Offering
Issuer | Advantage Solutions Inc. |
Common stock offered | shares |
Underwriters’ option to purchase additional shares of common stock | shares |
Common stock to be outstanding after this offering | shares (or shares if the underwriters exercise their option to purchase additional shares in full). |
Use of proceeds | We estimate that the net proceeds to us from this offering, after deducting the underwriting discount and estimated offering expenses payable by us, will be approximately $ million (or approximately $ million if the underwriters exercise in full their option to purchase additional shares), assuming the shares are offered at $ per share, the midpoint of the estimated price range set forth on the cover of this prospectus. |
| We intend to use the net proceeds that we receive from this offering to repay borrowings outstanding under our Second Lien Term Loans (as defined in “Description of Indebtedness”). |
Directed share program | The underwriters have reserved for sale, at the initial public offering price, up to approximately shares of our common stock being offered for sale to our directors, director nominees, officers, and full-time associates, certain persons affiliated with Smollan, our international strategic partner, and certain other persons associated with such officers, as designated by us. We will offer these shares to the extent permitted under applicable regulations. The number of shares available for sale to the general public in this offering will be reduced to the extent these persons purchase reserved shares. Any reserved shares not purchased will be offered by the underwriters to the general public on the same terms as the other shares. |
Controlled company | Following this offering, we will be a “controlled company” within the meaning of the corporate governance rules of the New York Stock Exchange and therefore will be exempt from certain of the corporate governance listing requirements of New York Stock Exchange. See “Management—Corporate Governance.” |
13
Table of Contents
Dividend policy | We currently intend to retain all available funds and any future earnings for use in the operation of our business, and therefore we do not currently expect to pay any cash dividends on our common stock. Any future determination to pay dividends will be at the discretion of our board of directors and will depend upon our results of operations, financial condition, capital requirements, and other factors that our board of directors deems relevant. The payment of cash dividends is restricted under the terms of the agreements governing our debt and our ability to pay dividends may also be restricted by the terms of any future credit agreement or any securities we or our subsidiaries may issue. See “Dividend Policy.” |
Risk factors | Investing in shares of our common stock involves a high degree of risk. See “Risk Factors” beginning on page 21 of this prospectus for a discussion of factors you should carefully consider before investing in shares of our common stock. |
Proposed New York Stock Exchange symbol | “ADV” |
The number of shares of our common stock to be outstanding after this offering is based on shares of our common stock outstanding as of March 31, 2017 and excludes shares of common stock reserved as of the closing date of this offering for future issuance under our 2017 Incentive Award Plan and shares of common stock reserved as of the closing date of this offering for future issuance under our 2017 Employee Stock Purchase Plan, each of which we plan to adopt in connection with this offering.
Unless otherwise indicated, this prospectus reflects and assumes no exercise by the underwriters of their option to purchase additional shares of our common stock in connection with this offering.
14
Table of Contents
Summary Consolidated Financial and Other Data
The following table presents certain of our historical financial data. Advantage Sales & Marketing Inc. is the predecessor of the issuer, Advantage Solutions Inc., for financial reporting purposes. Unless otherwise stated or the context otherwise requires, any reference hereinafter to the “Successor” reflects the operations of Advantage Solutions Inc. after July 25, 2014, the date of the 2014 Topco Acquisition, and any reference to the “Predecessor” refers to the operations of Advantage Sales & Marketing Inc. on or prior to the date of the 2014 Topco Acquisition. The 2014 Topco Acquisition was accounted for using the acquisition method. Under this method, the purchase price of an acquisition is allocated to the underlying assets acquired and liabilities assumed based upon their estimated fair values at the date of acquisition.
The consolidated statements of operations of the Successor for the years ended December 31, 2016 and 2015, the period from July 26, 2014 to December 31, 2014, and the Predecessor period from January 1, 2014 to July 25, 2014 are derived from the audited consolidated financial statements included elsewhere in this prospectus. The condensed consolidated statements of operations for the three months ended March 31, 2017 and 2016 are derived from our unaudited interim financial statements included elsewhere in this prospectus. We have prepared the unaudited interim financial statements on the same basis as the audited financial statements and have included, in our opinion, all normal recurring adjustments that we consider necessary for a fair presentation of the financial information set forth in those statements. The unaudited pro forma condensed consolidated financial information is derived from the Predecessor and Successor audited historical financial statements and should be read together with those financial statements and related notes contained therein, which are included elsewhere in this prospectus. The results of operations for the periods presented below are not necessarily indicative of the results to be expected for any future period and the results for any interim period are not necessarily indicative of the results that may be expected for a full fiscal year.
The unaudited pro forma condensed consolidated statement of operations for the year ended December 31, 2014 gives effect to the 2014 Topco Acquisition as if such transaction had occurred on January 1, 2014, which presentation we refer to as Pro Forma 2014. See “Unaudited Pro Forma Condensed Consolidated Statement of Operations” for a complete description of the adjustments and assumptions underlying the unaudited pro forma condensed consolidated statement of operations.
15
Table of Contents
The following information should also be read together with “Management’s Discussion and Analysis of Financial Condition and Results of Operations,” “Selected Consolidated Financial Data” and our consolidated financial statements and related notes appearing elsewhere in this prospectus.
| Successor | Predecessor | |||||||||||||||||||||||||||
| Three Months Ended March 31, | Year Ended December 31, | Period From July 26, 2014 to December 31, 2014 | Period From January 1, 2014 to July 25, 2014 | Pro Forma 2014(1) | ||||||||||||||||||||||||
| 2017 | 2016 | 2016 | 2015 | |||||||||||||||||||||||||
| (Unaudited) | (Unaudited) | |||||||||||||||||||||||||||
(in thousands, except share and per share data) |
| |||||||||||||||||||||||||||
Revenues | $ | 508,468 | $ | 458,276 | $ | 2,100,235 | $ | 1,895,046 | $ | 808,075 | $ | 905,646 | $ | 1,713,721 | ||||||||||||||
Cost of revenues | 413,153 | 370,368 | 1,611,285 | 1,454,255 | 601,649 | 715,104 | 1,316,753 | |||||||||||||||||||||
Selling, general, and administrative | 26,668 | 23,025 | 97,542 | 72,224 | 59,540 | 141,300 | 64,903 | |||||||||||||||||||||
Depreciation and amortization | 42,894 | 42,639 | 170,260 | 164,584 | 68,683 | 75,271 | 154,315 | |||||||||||||||||||||
|
|
|
|
|
|
|
|
|
|
|
|
|
| |||||||||||||||
Total expenses | 482,715 | 436,032 | 1,879,087 | 1,691,063 | 729,872 | 931,675 | 1,535,971 | |||||||||||||||||||||
|
|
|
|
|
|
|
|
|
|
|
|
|
| |||||||||||||||
Operating income (loss) | 25,753 | 22,244 | 221,148 | 203,983 | 78,203 | (26,029 | ) | 177,750 | ||||||||||||||||||||
Interest expense, net | 41,362 | 44,066 | 167,360 | 160,895 | 84,227 | 83,896 | 156,200 | |||||||||||||||||||||
|
|
|
|
|
|
|
|
|
|
|
|
|
| |||||||||||||||
(Loss) income before income taxes | (15,609 | ) | (21,822 | ) | 53,788 | 43,088 | (6,024 | ) | (109,925 | ) | 21,550 | |||||||||||||||||
(Benefit from) provision for income taxes | (6,406 | ) | (8,821 | ) | 22,623 | 18,202 | 3,861 | (20,826 | ) | 6,159 | ||||||||||||||||||
|
|
|
|
|
|
|
|
|
|
|
|
|
| |||||||||||||||
Net (loss) income | (9,203 | ) | (13,001 | ) | 31,165 | 24,886 | (9,885 | ) | (89,099 | ) | 15,391 | |||||||||||||||||
Less: net income (loss) attributable to noncontrolling interests | 147 | (37 | ) | (984 | ) | 292 | 54 | 116 | 170 | |||||||||||||||||||
|
|
|
|
|
|
|
|
|
|
|
|
|
| |||||||||||||||
Net (loss) income attributable to stockholder of Advantage Solutions Inc. | $ | (9,350 | ) | $ | (12,964 | ) | $ | 32,149 | $ | 24,594 | $ | (9,939 | ) | $ | (89,215 | ) | $ | 15,221 | ||||||||||
|
|
|
|
|
|
|
|
|
|
|
|
|
| |||||||||||||||
Net (loss) income per share of common stock: | ||||||||||||||||||||||||||||
Basic | (93,502 | ) | (129,645 | ) | 321,486 | 245,946 | (99,385 | ) | 152,205 | |||||||||||||||||||
|
|
|
|
|
|
|
|
|
|
|
| |||||||||||||||||
Diluted | (93,502 | ) | (129,645 | ) | 321,486 | 245,946 | (99,385 | ) | 152,205 | |||||||||||||||||||
|
|
|
|
|
|
|
|
|
|
|
| |||||||||||||||||
Weighted-average number of shares of common stock: | ||||||||||||||||||||||||||||
Basic | 100 | 100 | 100 | 100 | 100 | 100 | ||||||||||||||||||||||
|
|
|
|
|
|
|
|
|
|
|
| |||||||||||||||||
Diluted | 100 | 100 | 100 | 100 | 100 | 100 | ||||||||||||||||||||||
|
|
|
|
|
|
|
|
|
|
|
| |||||||||||||||||
16
Table of Contents
| Successor | Predecessor | |||||||||||||||||||||||||||
| Three Months Ended March 31, | Year Ended December 31, | Period From July 26, 2014 to December 31, 2014 | Period From January 1, 2014 to July 25, 2014 | Pro Forma 2014(1) | ||||||||||||||||||||||||
| (in thousands) | 2017 | 2016 | 2016 | 2015 | ||||||||||||||||||||||||
| (Unaudited) | (Unaudited) | |||||||||||||||||||||||||||
Other Financial Data (unaudited): | ||||||||||||||||||||||||||||
Adjusted EBITDA(2) | $ | 75,723 | $ | 68,376 | $ | 411,250 | $ | 365,490 | $ | 175,645 | $ | 151,490 | $ | 327,135 | ||||||||||||||
M&A Adjusted EBITDA(2) | $ | 422,050 | $ | 375,782 | $ | 335,323 | ||||||||||||||||||||||
Adjusted Net Income(3) | $ | 16,889 | $ | 9,735 | $ | 128,188 | $ | 105,647 | $ | 49,056 | $ | 11,763 | $ | 89,693 | ||||||||||||||
| (1) | Presented to give pro forma effect to the adjustments attributable to the 2014 Topco Acquisition that are described in “Unaudited Pro Forma Condensed Consolidated Statement of Operations” and are based upon available information and certain assumptions that we believe are reasonable. |
| (2) | Adjusted EBITDA and M&A Adjusted EBITDA are supplemental financial measures of our operating performance that are not recognized under generally accepted accounting principles in the United States, or GAAP. Adjusted EBITDA means net income (loss) before (i) interest expense, net, (ii) (benefit from) provision for income taxes, (iii) depreciation, (iv) amortization of intangible assets, (v) our sponsors’ management fees and equity-based compensation expense, (vi) fair value adjustments of contingent consideration related to acquisitions, (vii) acquisition-related expenses, (viii) EBITDA for economic interests in investments, net, (ix) restructuring expenses, (x) litigation expenses, and (xi) other adjustments that management believes are helpful in evaluating our operating performance. |
M&A Adjusted EBITDA means Adjusted EBITDA for a given year as further adjusted to give pro forma effect to the results associated with acquisitions made during such period as if each acquisition had been completed as of the first day of the period presented. M&A Adjusted EBITDA includes information of acquired businesses prior to their acquisition by us which we believe to be accurate; however, this information has been derived from financial information that was not prepared by us. As a result, our independent registered public accounting firm have not audited, reviewed, compiled, or performed any procedures with respect to such information and, accordingly, do not express an opinion or any other form of assurance with respect thereto. Such amounts have not been prepared in accordance with the requirements ofRegulation S-X relating to the presentation of pro forma financial information, are presented for illustrative purposes only, and do not purport to be indicative of the contribution these acquired businesses would have made to our Adjusted EBITDA had they been included in our operations for the relevant period.
Generally, the companies we acquire do not have audited financial statements. In calculating M&A Adjusted EBITDA, we analyze the historical operating performance of an acquired business and may make certain adjustments to the acquired business’ unaudited financial results. These adjustments, which are intended to present such financial results similar to our calculation of Adjusted EBITDA, include additions or subtractions to the acquired business’ EBITDA to reflect the ongoing operating results of a given acquired business exclusive of any anticipated synergies (e.g., normalization of owner compensation, removal of equity distributions, management fees, or other non-recurring items). We do not intend for these adjustments to reflect cost savings that may occur as a result of the integration of the acquired businesses into our operations. While these adjustments are inherently subjective in nature, we believe that they are helpful in comparing our operating results year over year.
We supplementally present Adjusted EBITDA and M&A Adjusted EBITDA because they are key operating measures used by us and our board of directors to assess our financial performance. These measures adjust for items that we believe do not reflect the ongoing operating performance of our business, such as certain noncash items, unusual or infrequent items or items that change from period to period without any material relevance to our operating performance. We evaluate these measures in conjunction with our results according to GAAP because we believe they provide a more complete understanding of factors and trends affecting our business than GAAP measures alone. Furthermore, the agreements governing our indebtedness contain covenants and other tests based on measures substantially similar to Adjusted EBITDA. Neither Adjusted EBITDA nor M&A Adjusted EBITDA should be considered as an alternative for our most directly comparable measure presented on a GAAP basis.
17
Table of Contents
A reconciliation of net (loss) income to Adjusted EBITDA and M&A Adjusted EBITDA is provided in the following table:
| Successor | Predecessor | |||||||||||||||||||||||||||
| Three Months Ended March 31, | Year Ended December 31, | Period From July 26, | Period From January 1, 2014 to July 25, 2014 | Pro Forma 2014(a) | ||||||||||||||||||||||||
| (in thousands) | 2017 | 2016 | 2016 | 2015 | ||||||||||||||||||||||||
| (Unaudited) | (Unaudited) | |||||||||||||||||||||||||||
Net (loss) income | $ | (9,203 | ) | $ | (13,001 | ) | $ | 31,165 | $ | 24,886 | $ | (9,885 | ) | $ | (89,099 | ) | $ | 15,391 | ||||||||||
Add: | ||||||||||||||||||||||||||||
Interest expense, net | 41,362 | 44,066 | 167,360 | 160,895 | 84,227 | 83,896 | 156,200 | |||||||||||||||||||||
(Benefit from) provision for income taxes | (6,406 | ) | (8,821 | ) | 22,623 | 18,202 | 3,861 | (20,826 | ) | 6,159 | ||||||||||||||||||
Depreciation and amortization | 42,894 | 42,639 | 170,260 | 164,584 | 68,683 | 75,271 | 154,315 | |||||||||||||||||||||
Sponsors’ management fee and equity-based compensation expense(b) | 1,406 | 1,812 | 7,622 | 7,463 | 2,201 | 831 | 3,032 | |||||||||||||||||||||
Fair value adjustments related to contingent consideration related to acquisitions(c) | 2,739 | (2,228 | ) | (841 | ) | (31,305 | ) | — | (11,979 | ) | (11,979 | ) | ||||||||||||||||
Acquisition-related expenses(d) | 2,474 | 3,119 | 10,368 | 9,857 | 26,563 | 113,860 | 4,486 | |||||||||||||||||||||
EBITDA for economic interests in investments(e) | 457 | 610 | 1,778 | 1,426 | (5 | ) | (464 | ) | (469 | ) | ||||||||||||||||||
Restructuring expenses(f) | — | 180 | 1,890 | 5,498 | — | — | — | |||||||||||||||||||||
Litigation expenses(g) | — | — | (975 | ) | 3,984 | — | — | — | ||||||||||||||||||||
|
|
|
|
|
|
|
|
|
|
|
|
|
| |||||||||||||||
Adjusted EBITDA | $ | 75,723 | $ | 68,376 | 411,250 | 365,490 | $ | 175,645 | $ | 151,490 | 327,135 | |||||||||||||||||
|
|
|
|
|
|
|
|
|
|
|
|
|
| |||||||||||||||
Add: | ||||||||||||||||||||||||||||
Acquisitions(h) | 10,800 | 10,292 | 8,188 | |||||||||||||||||||||||||
|
|
|
|
|
| |||||||||||||||||||||||
M&A Adjusted EBITDA | $ | 422,050 | $ | 375,782 | $ | 335,323 | ||||||||||||||||||||||
|
|
|
|
|
| |||||||||||||||||||||||
| (a) | Presented to give pro forma effect to the adjustments attributable to the 2014 Topco Acquisition that are described in “Unaudited Pro Forma Condensed Consolidated Statement of Operations” and are based upon available information and certain assumptions that we believe are reasonable. |
| (b) | Represents the management fees and reimbursements for expenses paid to affiliates of certain of the Sponsors pursuant to a management services agreement in the three months ended March 31, 2017 and 2016, the years ended December 31, 2016 and 2015 and the period from July 26, 2014 to December 31, 2014, and the management fees and reimbursements for expenses paid to affiliates of Predecessor’s sponsor, Apax Partners, in the period from January 1, 2014 to July 25, 2014 under a prior management services agreement that was terminated in connection with the 2014 Topco Acquisition. At the completion of this offering, the management services agreement with the Sponsors will terminate, and we will be obligated to make a final payment of $4.0 million to affiliates of certain of the Sponsors. Also represents expenses related to equity-based compensation associated with grants of units of Karman Topco made to one of the Sponsors, who provides services to us. |
| (c) | Represents adjustments to the estimated fair value of our contingent consideration liabilities related to our acquisitions, excluding the present value accretion recorded in interest expense, net, for the applicable periods. See Note 7 to our consolidated financial statements for the year ended December 31, 2016 for additional information. |
| (d) | Represents fees and costs associated with changes in our and the Predecessor’s equity ownership and activities related to our acquisitions. Transaction fees related to the change in equity ownership consist of professional services fees including legal, accounting, and other consultants, equity compensation that vested upon the completion of the 2014 Topco Acquisition, bonus compensation payments related to the 2014 Topco Acquisition, and fair value lease amortization resulting from the purchase accounting related to the 2014 Topco Acquisition. Acquisition-related costs are comprised of professional fees, including due diligence and integration activities. |
| (e) | Represents additions of $1.3 million, $1.1 million, $4.4 million, $2.5 million, zero and zero to reflect our proportional share of Adjusted EBITDA related to our equity method investments and a reduction of $0.9 million, $0.5 million, $2.6 million, $1.1 million, $0.0 million and $0.5 million to remove the Adjusted EBITDA related to the minority ownership percentage of the entities that we fully consolidate in our financial statements for the three months ended March 31, 2017 and 2016, the years ended December 31, 2016 and 2015, the period from July 26, 2014 to December 31, 2014, and the period from January 1, 2014 to July 25, 2014, respectively. |
| (f) | Represents fees and costs associated with various internal reorganization activities among our consolidated entities. |
| (g) | Represents legal settlements that are unusual or infrequent costs associated with our operating activities. |
| (h) | Reflects the portion of Adjusted EBITDA generated by acquisitions completed in a given period prior to the acquisition date and therefore not captured in our consolidated financial statements for the applicable period. |
18
Table of Contents
| (3) | Adjusted Net Income is anon-GAAP financial measure. Adjusted Net Income means net income (loss) before (i) our sponsors’ management fees and equity-based compensation expense, (ii) fair value adjustments of contingent consideration related to acquisitions, (iii) acquisition-related expenses, (iv) restructuring expenses, (v) litigation expenses, (vi) amortization of intangible assets, (vii) other adjustments that management believes are helpful in evaluating our operating performance, and (viii) related tax adjustments. |
We supplementally present Adjusted Net Income because we use it as a supplemental measure to evaluate the performance of our business in a way that also considers our ability to generate profit without the impact of items that we do not believe are indicative of our operating performance or are unusual or infrequent in nature and aid in the comparability of our performance from period to period. Adjusted Net Income should not be considered as an alternative for our most directly comparable measure presented on a GAAP basis.
A reconciliation of net (loss) income to Adjusted Net Income is provided in the following table:
| Successor | Predecessor | |||||||||||||||||||||||||||
| Three Months Ended March 31, | Year Ended December 31, | Period From July 26, 2014 to December 31, 2014 | Period From January 1, 2014 to July 25, 2014 | Pro Forma 2014(a) | ||||||||||||||||||||||||
| (in thousands) | 2017 | 2016 | 2016 | 2015 | ||||||||||||||||||||||||
| (Unaudited) | (Unaudited) | |||||||||||||||||||||||||||
Net (loss) income | $ | (9,203 | ) | $ | (13,001 | ) | $ | 31,165 | $ | 24,886 | $ | (9,885 | ) | $ | (89,099 | ) | $ | 15,391 | ||||||||||
Add: | ||||||||||||||||||||||||||||
Sponsors’ management fee and equity-based compensation expense(b) | 1,406 | 1,812 | 7,622 | 7,463 | 2,201 | 831 | 3,032 | |||||||||||||||||||||
Fair value adjustments related to contingent consideration related to acquisitions(c) | 2,739 | (2,228 | ) | (841 | ) | (31,305 | ) | — | (11,979 | ) | (11,979 | ) | ||||||||||||||||
Acquisition-related expenses(d) | 2,474 | 3,119 | 10,368 | 9,857 | 26,563 | 113,860 | 4,486 | |||||||||||||||||||||
Restructuring expenses(e) | — | 180 | 1,890 | 5,498 | — | — | — | |||||||||||||||||||||
Litigation expenses(f) | — | — | (975 | ) | 3,984 | — | — | — | ||||||||||||||||||||
Amortization of intangible assets(g) | 35,522 | 34,380 | 138,502 | 134,679 | 56,220 | 59,654 | 126,235 | |||||||||||||||||||||
Tax adjustments related tonon-GAAP | (16,049 | ) | (14,527 | ) | (59,543 | ) | (49,415 | ) | (26,043 | ) | (61,504 | ) | (47,472 | ) | ||||||||||||||
|
|
|
|
|
|
|
|
|
|
|
|
|
| |||||||||||||||
Adjusted Net Income | $ | 16,889 | $ | 9,735 | $ | 128,188 | $ | 105,647 | $ | 49,056 | $ | 11,763 | $ | 89,693 | ||||||||||||||
|
|
|
|
|
|
|
|
|
|
|
|
|
| |||||||||||||||
| (a) | Presented to give pro forma effect to the adjustments attributable to the 2014 Topco Acquisition that are described in “Unaudited Pro Forma Condensed Consolidated Statement of Operations” and are based upon available information and certain assumptions that we believe are reasonable. |
| (b) | Represents the management fees and reimbursements for expenses paid to affiliates of certain of the Sponsors pursuant to a management services agreement in the three months ended March 31, 2017 and 2016, the years ended December 31, 2016 and 2015 and the period from July 26, 2014 to December 31, 2014, and the management fees and reimbursements for expenses paid to affiliates of Predecessor’s sponsor, Apax Partners, in the period from January 1, 2014 to July 25, 2014 under a prior management services agreement that was terminated in connection with the 2014 Topco Acquisition. At the completion of this offering, the management services agreement with the Sponsors will terminate, and we will be obligated to make a final payment of $4.0 million to affiliates of certain of the Sponsors. Also represents expenses related to equity-based compensation associated with grants of units of Karman Topco made to one of the Sponsors, who provides services to us. |
| (c) | Represents adjustments to the estimated fair value of our contingent consideration liabilities related to our acquisitions, excluding the present value accretion recorded in interest expense, net, for the applicable periods. See Note 7 to our consolidated financial statements for the year ended December 31, 2016 for additional information. |
| (d) | Represents fees and costs associated with changes in our and the Predecessor’s equity ownership and activities related to our acquisitions. Transaction fees related to the change in equity ownership consist of professional services fees including legal, accounting, and other consultants, equity compensation that vested upon the completion of the 2014 Topco Acquisition, bonus compensation payments related to the 2014 Topco Acquisition, and fair value lease amortization resulting from the purchase accounting related to the 2014 Topco Acquisition. Acquisition-related costs are comprised of professional fees, including due diligence and integration activities. |
| (e) | Represents fees and costs associated with various internal reorganization activities among our consolidated entities. |
| (f) | Represents legal settlements that are unusual or infrequent costs associated with our operating activities. |
| (g) | Represents the amortization of intangible assets recorded in connection with the 2014 Topco Acquisition and our other acquisitions. |
| (h) | Reflects the application of U.S. federal and state enterprise tax rates to our Adjusted Net Income adjustments of 38.9% in the three months ended March 31, 2017, 38.9% in 2016, 39.0% in 2015, 39.0% for the period from July 26, 2014 to December 31, 2014 and 39.0% for the period from January 1, 2014 to July 25, 2014 to the 2014 Topco Acquisition. |
19
Table of Contents
Reconciliation of Net Income (Loss) to Adjusted EBITDA for the Years Ended December 31, 2007 through December 31, 2013
The following table presents a reconciliation of net income (loss) of Predecessor to Adjusted EBITDA for the years ended December 31, 2007 through December 31, 2013. Except as described in the following table and the accompanying footnotes, net income (loss) and the other financial data included in the following table (other than Adjusted EBITDA) are derived from our audited financial statements for such periods that are not included or incorporated by reference in this prospectus.
For more definitions of, and information regarding Adjusted EBITDA and other considerations associated withnon-GAAP financial measures refer to “—Summary Consolidated Financial and Other Data.”
| Year ended December 31, | ||||||||||||||||||||||||||||
| (in thousands) | 2013 | 2012 | 2011 | 2010(a) (unaudited) | 2009 | 2008 | 2007 | |||||||||||||||||||||
Net income (loss) | $ | 35,072 | $ | 4,253 | $ | (24,442 | ) | $ | (34,984 | ) | $ | 20,622 | $ | (201,052 | ) | $ | 5,790 | |||||||||||
Add: | ||||||||||||||||||||||||||||
Impairment of definite lived intangibles(b) | — | — | — | — | 26,199 | 255,211 | 6,290 | |||||||||||||||||||||
Interest expense, net | 106,020 | 112,426 | 106,738 | 96,606 | 45,989 | 59,213 | 69,403 | |||||||||||||||||||||
Provision for (benefit from) income taxes | 17,922 | (8,106 | ) | (8,471 | ) | (50 | ) | 16,538 | (13,074 | ) | 10,294 | |||||||||||||||||
Depreciation and amortization | 126,648 | 144,912 | 124,644 | 57,566 | 60,234 | 53,189 | 51,110 | |||||||||||||||||||||
Sponsors’ management | 1,724 | 1,855 | 1,771 | 758 | 668 | 931 | 665 | |||||||||||||||||||||
Fair value adjustments related to contingent consideration(d) | (2,278 | ) | — | — | — | (290 | ) | (5,879 | ) | — | ||||||||||||||||||
Acquisition-related costs(e) | 2,547 | 719 | 5,115 | 65,754 | — | — | — | |||||||||||||||||||||
EBITDA for economic interests in investments(f) | (13,355 | ) | (11,107 | ) | 84 | — | — | — | — | |||||||||||||||||||
|
|
|
|
|
|
|
|
|
|
|
|
|
| |||||||||||||||
Adjusted EBITDA | $ | 274,300 | $ | 244,952 | $ | 205,439 | $ | 185,650 | $ | 169,960 | $ | 148,539 | $ | 143,552 | ||||||||||||||
|
|
|
|
|
|
|
|
|
|
|
|
|
| |||||||||||||||
| (a) | For the purpose of comparability and as a result of the 2010 Acquisition on December 16, 2010, net loss and the other financial data for the year ended December 31, 2010 presented above represents the mathematical addition of the audited results of a successor entity for the period from December 17, 2010 to December 31, 2010, and the audited results of a predecessor entity for the period from January 1, 2010 to December 16, 2010. We believe the comparison to this addition assists readers in understanding and assessing the trends and significant changes, provides a more meaningful method of comparison, and does not impact the drivers of the financial changes between the relevant periods. |
| (b) | Represents impairment charges associated with client relationships and tradenames and identifiable intangible assets impairment that were the result of management’s decision to discontinue use of certain tradenames. |
| (c) | Represents the management fees paid to affiliates of our previous sponsors in the years ended December 31, 2007 through December 31, 2013. |
| (d) | Represents adjustments to the estimated fair value of our contingent consideration liabilities related to our acquisitions, excluding the present value accretion recorded in interest expense, net, for the applicable periods. |
| (e) | Represents fees and costs associated with changes in our and the Predecessor’s equity ownership and activities related to acquisitions. Transaction fees related to the change in equity ownership consist of professional services fees including legal, accounting, and other consultants, equity compensation that vested upon the completion of the 2010 Acquisition, bonus compensation payments related to the 2010 Acquisition, and fair value lease amortization resulting from the purchase accounting related to the 2010 Acquisition. Acquisition-related costs are comprised of professional fees, including due diligence and integration activities. |
| (f) | Represents a reduction to remove the Adjusted EBITDA related to the minority ownership percentage of the entities that we fully consolidate in our financial statements. |
20
Table of Contents
You should carefully consider the risks described below, together with all of the other information included in this prospectus, before making an investment decision. Our business, financial condition, and results of operations could be materially and adversely affected by any of these risks or uncertainties. In that case, the trading price of our common stock could decline, and you may lose all or part of your investment.
Risks Related to Our Business and Indebtedness
Changes to wage or job classification regulations, including minimum wages, and market-driven wage increases could have an impact on our results of operations.
Changes in labor laws related to employee hours, wages, job classification, and benefits, including health care benefits, could have a significant impact on our results of operations. We employ over 50,000 associates and utilize a considerable number of associates paid at rates above, but near, the federal minimum wage. Many of our associates work in locations where the state minimum wage is greater than the federal minimum wage and where those associates receive compensation at least equal to the state minimum wage. Moreover, municipalities may set minimum wages above the applicable state standards.
Additionally, many of our salaried associates are paid at rates that could be impacted by changes to minimum pay levels for exempt roles. Any increases at the federal, state, or municipal level to the minimum pay rate required to remain exempt from overtime pay may adversely affect our business or results of operations.
In the event of market-driven increases in wage rates or in benefits, if we fail to increase our wages or benefits packages competitively, the quality of our workforce could decline, causing our client service to suffer. Any of these changes affecting wages for our associates could adversely affect our business or results of operations.
Our business and results of operations are affected by developments with and policies of retailers that are out of our control.
A limited number of national retailers account for a large percentage of sales for our consumer goods manufacturer clients. We expect that a significant portion of our clients’ sales will continue to be made through a relatively small number of retailers and that this percentage may increase if the growth of mass retailers and the trend of retailer consolidation continues. As a result, changes in the strategies of large retailers, including a reduction in the number of brands that these retailers carry or shelf space that they dedicate to private label products, could materially reduce the value of our services to our clients, or our clients’ use of our services, and, in turn, our revenues and profitability. Many retailers have critically analyzed the number and variety of brands they sell, and have reduced or discontinued the sale of certain of our clients’ product lines at their stores. If this continues to occur and our clients are unable to improve distribution for their products at other retailers, our results could be adversely affected.
Additionally, some retailers have implemented policies that designate certain service providers to be the exclusive or preferred provider for certainin-store services. Some of these designations apply across all of such retailers’ stores, while other designations are limited to specific regions. If we are unable to respond effectively to the expectations and demands of such retailers, they could reduce the services that we are permitted to perform for our clients at their facilities, or require our clients to purchase services from other designated services providers, which include our competitors, either of which could adversely affect our business or results of operations.
21
Table of Contents
We need to continue to generate significant operating cash flow in order to fund acquisitions and to service our debt.
Our business currently generates significant operating cash flow, which we use to fund acquisitions to grow our business and to service our substantial indebtedness. If, because of loss of revenue, pressure on pricing from customers, increases in our costs, including due to rising labor costs, or other factors, our business generates less operating cash flow, we may not have sufficient funds to grow our business or to service our indebtedness.
Consolidation in the industries we serve could put pressure on the pricing of our services, leading to decreased earnings.
Consolidation in the consumer goods and retail industries we serve could reduce aggregate demand for our services in the future and could limit the amounts we earn for our services. When companies merge, the services they previously purchased separately are often purchased by the combined entity, leading to the termination of relationships with certain service providers, demands for reduced fees and commissions, or the loss of service provider revenue. The combined company may also choose toin-source certain functions that were historically outsourced, resulting in the termination of existing relationships with third-party service providers. While we attempt to mitigate the revenue impact of any consolidation by maintaining existing or winning new service arrangements with the combined companies, there can be no assurance as to the degree to which we will be able to do so as consolidation continues in the industries we serve.
Consumer goods manufacturers and retailers may periodically review and change their sales, retail, marketing, and technology programs and relationships to our detriment.
The consumer goods manufacturers and retailers to whom we provide our business solutions operate in highly competitive and rapidly changing environments. From time to time these parties may put their sales, retail, marketing, and technology programs and relationships up for competitive review. We have occasionally lost accounts as a result of these reviews in the past, and our clients are typically able to reduce or cancel current or future spending on our services on short notice for any reason. We believe that key competitive considerations for retaining existing and winning new accounts include our ability to develop solutions that meet the needs of these manufacturers and retailers in this environment, the quality and effectiveness of our services, and our ability to operate efficiently. To the extent that we are not able to develop these solutions or to operate efficiently, we may not be able to retain key clients, and our business or results of operations may be adversely affected.
If we do not successfully develop and maintain relevant omni-channel services for our clients, our business and results of operations could be adversely impacted.
Historically, substantially all of our sales segment revenues were generated by sales and services that ultimately occurred in traditional retail stores. As consumers shift to purchase more products online ande-commerce continues to displace brick and mortar retail sales, there may be a decrease in the demand for our traditional sales services. Consumers are increasingly using computers, tablets, mobile phones, and other devices to comparison shop, determine product availability, and complete purchases online. Omni-channel retailing is rapidly evolving and we believe we will need to keep pace with the changing customer expectations and new developments by our competitors.
While we continue to seek to develop effective omni-channel solutions for our clients that support both theire-commerce and traditional retail needs, there can be no assurances that these efforts will result in revenue gains sufficient to offset potential decreases associated with a decline in traditional
22
Table of Contents
retail sales or that we will be able to maintain our position as a leader in our industry. If we are unable to provide, improve, or develop innovative digital services and solutions in a timely manner or at all, our business and results of operations could be adversely impacted.
We may be unable to adapt to significant technological change which could adversely affect our business.
We operate in businesses that require sophisticated data collection, processing, and software for analysis and insights. Some of the technologies supporting the industries we serve are changing rapidly. We will be required to adapt to changing technologies, either by developing and marketing new services or by enhancing our existing services, to meet client demand.
Moreover, the introduction of new services embodying new technologies, including automation of certain of ourin-store services, and the emergence of new industry standards could render existing services obsolete. Our continued success will depend on our ability to adapt to changing technologies, manage and process increasing amounts of data and information, and improve the performance, features, and reliability of our existing services in response to changing client and industry demands. We may experience difficulties that could delay or prevent the successful design, development, testing, introduction, or marketing of our services. New services, or enhancements to existing services, may not adequately meet the requirements of current and prospective clients or achieve market acceptance.
Our ability to maintain our competitive position depends on our ability to attract and retain talented executives.
We believe that our continued success depends to a significant extent upon the efforts, abilities, and relationships of our senior executives and the strength of our middle management team. Although we have entered into employment agreements with certain of our senior executives, each of them may terminate their employment with us at any time. The replacement of any of our senior executives likely would involve significant time and costs and may significantly delay or prevent the achievement of our business objectives and could therefore have an adverse impact on our business. In addition, we do not carry any “key person” insurance policies that could offset potential loss of service under applicable circumstances. If we are unable to attract and retain a talented team of middle management executives, it may be difficult to maintain the expertise and industry relationships that our clients find valuable, and they may terminate or reduce their relationship with us.
Client procurement strategies could put additional operational and financial pressure on our services.
Many of our clients are seeking opportunities to reduce their costs through procurement strategies that reduce fees paid to third-party service providers. As a result, certain of our clients have sought, and may continue to seek, more favorable terms from us, including with respect to pricing and payment terms. This puts operational and financial pressure on our business, which could limit the amounts we earn or delay the timing of our cash receipts. While we attempt to mitigate the revenue impact of any pricing pressure by aligning our revenue opportunity with satisfactory client outcomes, such as revenue growth for the client, and tailoring our services to the specific needs of each client, there can be no assurance as to the degree to which we will be able to do so successfully. Additionally, price concessions can lead to margin compression, which in turn could adversely affect our business or results of operations.
23
Table of Contents
We may be adversely affected if clients reduce their outsourcing of sales and marketing functions.
Our business and growth strategies depend in large part on companies continuing to elect to outsource sales and marketing functions. Our clients and potential clients will outsource if they perceive that outsourcing may provide quality services at a lower overall cost and permit them to focus on their core business activities. We cannot be certain that the industry trend to outsource will continue or not be reversed or that clients that have outsourced functions will not decide to perform these functions themselves. Unfavorable developments with respect to outsourcing could have a negative effect on our business and results of operations.
If we are unable to identify attractive acquisition targets, acquire them at attractive prices, or successfully integrate the acquired businesses, we may be unsuccessful in growing our business.
A significant portion of our growth has been as a result of our acquisition of complementary businesses that grow our service offerings, expand our geographic reach, and strengthen valuable relationships with clients. However, there can be no assurance that we will find attractive acquisition targets, that we will succeed at effectively managing the integration of acquired businesses into our existing operations, or that such acquired businesses or technologies will be received well by our clients or our investors. We could also encounter unforeseen transaction- and integration-related costs or other circumstances such as the loss of key personnel from acquired businesses or unforeseen or higher-than-expected inherited liabilities. Many of these potential circumstances are outside of our control and any of them could result in increased costs, decreased revenue, decreased synergies, higher than expectedearn-out payments, or the diversion of management time and attention. In order for us to continue to grow our business through acquisitions we will need to identify appropriate acquisition opportunities and acquire them at attractive prices.
We may choose to pay cash, incur debt, or issue equity securities to pay for any such acquisition. The incurrence of indebtedness would result in increased fixed obligations and could also include covenants or other restrictions that would impede our ability to manage our operations. The sale of equity to finance any such acquisition could result in dilution to our stockholders.
An inability to hire, timely train, and retain talented individuals for our workforce could slow our growth and adversely impact our ability to operate our business.
Our ability to meet our workforce needs, while controlling wage- and associate-related costs, is subject to numerous external factors, including the availability of talented persons in the workforce in the local markets in which we operate and competitive wage rates in such markets. We may find that there is an insufficient number of qualified individuals to fill our associate positions with the qualifications we seek. Competition in these communities for qualified staff could require us to pay higher wages and provide greater benefits, especially if there is significant improvement in regional or national economic conditions. We must also train and, in some circumstances, certify these associates under our policies and practices and any applicable legal requirements. Any inability to hire, timely train, and retain talented individuals may result in higher turnover and increased labor costs, and could compromise the quality of our service, all of which could adversely affect our business.
Our corporate culture has contributed to our success and, if we are unable to maintain it as we evolve, our business, operating results, and financial condition could be harmed.
We believe our corporate culture has been a significant factor in our success. However, as our company evolves, it may be difficult to maintain our culture, which could reduce our ability to innovate
24
Table of Contents
and operate effectively. The failure to maintain the key aspects of our culture as our organization evolves could result in decreased employee satisfaction, increased difficulty in attracting top talent, increased turnover, and could compromise the quality of our client service, all of which are important to our success and to the effective execution of our business strategy. If we are unable to maintain our corporate culture as we evolve and execute our growth strategies, our business, operating results, and financial condition could be harmed.
Acquiring new clients and retaining existing clients depends on our ability to avoid or manage business conflicts among competing brands.
Our ability to acquire new clients and to retain existing clients, whether by expansion of our own operations or by an acquired business, may in some cases be limited by the other parties’ perceptions of, or policies concerning, perceived competitive conflicts arising from our other relationships. Some of our contracts expressly restrict our ability to represent competitors of the counterparty. If we are unable to avoid or manage business conflicts among competing brands, our business and results of operations may be adversely affected.
Our substantial indebtedness could adversely affect our financial health, restrict our activities, and affect our ability to meet our obligations.
We have a significant amount of indebtedness. As of March 31, 2017, we had total indebtedness of $2,796.7 million, excluding debt issuance costs, and we would have been able to borrow an additional $80.6 million under our Revolving Credit Facility (as defined in “Description of Indebtedness”). As of March 31, 2017, we had $75.0 million in outstanding borrowings against our Revolving Credit Facility. Of our total indebtedness at March 31, 2017, $1,875.0 million matures in 2021, $760.0 million matures in 2022, and the remaining balance is payable in periodic installments of $5.0 million each quarter plus interest through 2020.
The terms of our debt facilities contain customary covenants that restrict us from taking certain actions, such as incurring additional debt, permitting liens on pledged assets, making investments, making distributions to equityholders, prepaying junior debt, engaging in mergers or restructurings, and selling assets, among other things, which may restrict our ability to successfully execute on our business plan. For a more complete description of the covenants and material terms of the First Lien Credit Agreement (as defined in “Description of Indebtedness”), the Second Lien Credit Agreement (as defined in “Description of Indebtedness”) and the Revolving Credit Facility, please see “Management’s Discussion and Analysis of Financial Condition and Results of Operations—Liquidity and Capital Resources—Description of Credit Facilities” and “Description of Indebtedness” in this prospectus.
To service our indebtedness, we will require a significant amount of cash and our ability to generate cash depends on many factors beyond our control.
Our ability to make cash payments on our indebtedness will depend on our ability to generate significant operating cash flow in the future. This, to a significant extent, is subject to general economic, financial, competitive, legislative, regulatory, and other factors that are beyond our control.
We cannot assure you that our business will generate sufficient cash flow from operations or that future borrowings will be available to us under our credit facilities in an amount sufficient to enable us to pay or refinance our indebtedness or to fund our other liquidity needs.
We expect that we will need to refinance all or a portion of our indebtedness on or before maturity. We may not be able to refinance any of our indebtedness at comparable interest rates, on commercially reasonable terms or at all. If such refinancing indebtedness is not available at interest
25
Table of Contents
rates comparable to our existing indebtedness our interest expense could materially increase, which could have a negative impact on our results of operations. If we cannot timely refinance our indebtedness, we may have to take actions such as issuing additional equity and reducing, delaying or foregoing capital expenditures, strategic acquisitions, investments, and alliances. We cannot assure you that any such actions, if necessary, could be implemented on commercially reasonable terms or at all.
If we are unable to generate sufficient cash flow or are otherwise unable to obtain funds necessary to meet required payments of principal, premium, if any, and interest on our indebtedness, or if we otherwise fail to comply with the various covenants in the agreements governing our indebtedness, we could be in default under the terms of the agreements governing such indebtedness. In the event of such default, the lenders under our credit facilities could elect to terminate their commitments thereunder, cease making further loans and institute foreclosure proceedings against our assets, and we could be forced into bankruptcy or liquidation. If our operating performance declines, we may in the future need to obtain waivers from the required lenders under our credit agreements to avoid being in default. If we or any of our subsidiaries breach the covenants under our credit agreements and seek a waiver, we may not be able to obtain a waiver from the required lenders. If this occurs, we would be in default under our credit agreements, the lenders could exercise their rights as described above, and we could be forced into bankruptcy or liquidation.
Despite current indebtedness levels, we and our subsidiaries may still be able to incur additional indebtedness, which could increase the risks associated with our indebtedness.
We and our subsidiaries may be able to incur additional indebtedness in the future because the terms of our indebtedness do not fully prohibit us or our subsidiaries from doing so. Subject to covenant compliance and certain conditions, our indebtedness permits additional borrowing, including total borrowing up to $80.6 million under our Revolving Credit Facility as of March 31, 2017. If new debt is added to our current debt levels and our subsidiaries’ current debt levels, the related risks that we and they now face could increase. On May 2, 2017, we amended our First Lien Credit Agreement to incur an additional $225.0 million of First Lien Term Loans and extend the maturity date with respect to $150.0 million of our Revolving Credit Facility. See “Management’s Discussion and Analysis of Financial Condition and Results of Operations—Liquidity and Capital Resources—Description of Credit Facilities” and “Description of Indebtedness.”
Our three largest clients comprise a significant portion of our revenues.
Our three largest clients comprised approximately 16% of our revenues in 2016 and approximately 16% of our revenues in the three months ended March 31, 2017. These clients are generally able to reduce or cancel current or future spending on our services on short notice for any reason. A significant reduction in spending on our services by our largest clients, or the loss of one or more of our largest clients, if not replaced by new clients or an increase in business from existing clients, would adversely affect our business or results of operations.
Limitations, restrictions, and business decisions involving our joint ventures and minority investments may adversely affect our growth and results of operations.
We have made substantial investments in joint ventures and minority investments, and may use these and other similar methods to expand our service offerings and geographical coverage in the future. These arrangements typically involve other business services companies as partners that may be competitors of ours in certain markets. Joint venture agreements may place limitations or restrictions on our services. For example, as part of our joint venture with and investments in Smollan, we are restricted under certain circumstances from making direct acquisitions and otherwise expanding
26
Table of Contents
our service offerings into markets outside of North America and Europe. These limitations and restrictions tied to our joint venture and minority investments limit our potential business opportunities and reduce the economic opportunity for certain prospective international investments and operations. Additionally, though we control our joint ventures, we may rely upon our equity partners or local management for operational and compliance matters associated with our joint ventures or minority investments. Moreover, our other equity partners and minority investments may have business interests, strategies, or goals that are inconsistent with ours. Business decisions, including actions or omissions, of a joint venture or other equity partner or management for a business unit may adversely affect the value of our investment, result in litigation or regulatory action against us, or adversely affect our growth and results of operations.
Our international operations expose us to risks that could impede growth in the future, and our attempts to grow our business internationally may not be successful.
We continue to explore opportunities in major international markets around the world. International operations expose us to various additional risks that could adversely affect our business, including:
| • | costs of customizing services for clients outside of the United States; |
| • | the burdens of complying with a wide variety of foreign laws; |
| • | potential difficulty in enforcing contracts; |
| • | being subject to U.S. laws and regulations governing international operations, including the U.S. Foreign Corrupt Practices Act and sanctions regimes; |
| • | being subject to foreign anti-bribery laws in the jurisdictions in which we operate, such as the UK Bribery Act; |
| • | reduced protection for intellectual property rights; |
| • | increased financial accounting and reporting complexity; |
| • | exposure to foreign currency exchange rate fluctuations; |
| • | exposure to local economic conditions; |
| • | limitations on the repatriation of funds or profits from foreign operations; |
| • | exposure to local political conditions, including adverse tax policies and civil unrest; and |
| • | the risks of an outbreak of war, the escalation of hostilities, and acts of terrorism in the jurisdictions in which we operate. |
Additionally, in many countries outside of the United States, there has not been a historical practice of using third parties to provide sales and marketing services. Accordingly, while it is part of our strategy to expand into international markets, it may be difficult for us to grow our international business units on a timely basis, or at all.
We may be subject to unionization, work stoppages, slowdowns, or increased labor costs.
Currently, none of our associates are represented by a union. However, our associates have the right under the National Labor Relations Act to form or affiliate with a union. If some or all of our workforce were to become unionized and the terms of the collective bargaining agreement were significantly different from our current compensation arrangements, it could increase our costs and adversely impact our profitability. Moreover, if our associates participate in labor unions it could put us at increased risk of labor strikes and disruption of our operations.
27
Table of Contents
If goodwill or other intangible assets in connection with our acquisitions become impaired, we could take significantnon-cash charges against earnings.
We have made acquisitions to complement and expand the services we offer and intend to continue to do so when attractive acquisition opportunities exist in the market. As a result of prior acquisitions, including the 2014 Topco Acquisition, we have goodwill and intangible assets recorded on our balance sheet of $2,092.0 million and $3,181.7 million, respectively, as of March 31, 2017, as further described in Note 4 to our consolidated financial statements for the three months ended March 31, 2017. Under current accounting guidelines, we must assess, at least annually, whether the value of goodwill and other intangible assets has been impaired. Any reduction or impairment of the value of goodwill or other intangible assets will result in charges against earnings, which could adversely affect our reported financial results in future periods.
Our systems may be subject to disruptions that could harm our business and reputation.
Our business is highly dependent on our ability to manage operations and process a large number of transactions on a daily basis. We rely heavily on our operating, payroll, financial, accounting, and other data processing systems. If any of these systems fails to operate properly or becomes disabled even for a brief period of time, we could suffer financial loss, a disruption of our businesses, liability to clients, regulatory intervention, or damage to our reputation, any of which could adversely impact our results of operation. We have disaster recovery and business continuity plans and procedures designed to protect our businesses against a multitude of events, including natural disasters, terrorist actions, power or communication failures, or similar events. However, these plans may not be successful in preventing the loss of client data, service interruptions, disruptions to our operations, or damage to our important facilities.
Our business is seasonal in nature and quarterly operating results can fluctuate.
Our services are seasonal in nature, with the fourth fiscal quarter typically generating a higher proportion of our revenues than other fiscal quarters. Adverse events, such as deteriorating economic conditions, higher unemployment, higher gas prices, public transportation disruptions, or unanticipated adverse weather, could result in lower-than-planned sales during key revenue-producing seasons. For example, frequent or unusually heavy snowfall, ice storms, rainstorms, windstorms, or other extreme weather conditions over a prolonged period could make it difficult for consumers to travel to retail stores or foodservice locations. This could lead to lower revenue, negatively impacting our financial condition and results of operations.
Our business and financial results may be affected by various litigation and regulatory proceedings.
We are subject to litigation and regulatory proceedings in the normal course of business and could become subject to additional claims in the future. These proceedings have included, and in the future may include, matters involving personnel and employment issues, workers’ compensation, personal and property injury, disputes relating to acquisitions (including contingent consideration), agency investigation, and other proceedings. Some legal proceedings have in the past, and may in the future, purport to be brought as class actions on behalf of similarly situated parties. We cannot be certain of the ultimate outcomes of any such claims, and resolution of these types of matters against us may result in significant fines, judgments, or settlements, which, if uninsured, or if the fines, judgments, and settlements exceed insured levels, could adversely affect our business or financial results.
Damage to our reputation could negatively impact our business and results of operations.
Our reputation and the quality of our brand are critical to our business and success in existing markets, and will be critical to our success as we enter new markets. We believe that we have built our
28
Table of Contents
reputation on the high quality of our sales and marketing services, our commitment to our clients, and our performance-based culture, and we must protect and grow the value of our brand in order for us to continue to be successful. Any incident that erodes client loyalty for our brand could significantly reduce its value and damage our business.
Also, there has been a marked increase in the use of social media platforms and similar devices, including weblogs (blogs), social media websites, and other forms of internet-based communications that provide individuals with access to a broad audience of consumers and other interested persons. Many social media platforms immediately publish the content their subscribers and participants post, often without filters or checks on accuracy of the content posted. Information concerning us may be posted on such platforms at any time. Information posted may be adverse to our interests or may be inaccurate, each of which may harm our performance, prospects, or business. The harm may be immediate without affording us an opportunity for redress or correction.
Security breaches of confidential manufacturer, retailer, or associate information may adversely affect our business.
Our business requires the collection, transmission, and retention of large volumes of manufacturer, retailer, and associate data in various information technology systems that we and third parties maintain. The integrity and protection of that manufacturer, retailer, and associate data is critical to us. Further, our manufacturers, retailers, and associates have a high expectation that we will adequately protect their personal information.
The information, security, and privacy requirements imposed by governmental regulation are increasingly demanding. Our systems may not be able to satisfy these changing requirements and manufacturer, retailer, and associate expectations, or may require significant additional investments or time in order to do so. Efforts to hack or breach security measures, failures of systems or software to operate as designed or intended, viruses, operator error, or inadvertent releases of data all threaten our and our service providers’ information systems and records. A breach in these information technology systems could lead to an interruption in the operation of our systems, resulting in operational inefficiencies and a loss of profits. Additionally, a significant theft, loss, or misappropriation of, or access to, proprietary data of a manufacturer or retailer or personal information of an associate or other breach of our information technology systems could result in fines, legal claims or proceedings, including regulatory investigations, actions, or liability for failure to comply with privacy and information security laws, which could disrupt our operations, damage our reputation, and expose us to claims from clients and associates.
We are subject to many federal, state, local, and international laws with which compliance is both costly and complex.
Our business is subject to various, and sometimes complex, laws and regulations. In order to conduct our operations in compliance with these laws and regulations, we must obtain and maintain numerous permits, approvals, and certificates from various federal, state, local, and international governmental authorities. We may incur substantial costs in order to maintain compliance with these existing laws and regulations. In addition, our costs of compliance may increase if existing laws and regulations are revised or reinterpreted or if new laws and regulations become applicable to our operations. These costs could have an adverse impact on our business or results of operations. Moreover, our failure to comply with these laws and regulations, as interpreted and enforced, could lead to fines, penalties, or management distraction, or otherwise harm our business.
29
Table of Contents
We rely on third parties to provide certain data and services in connection with the provision of our services.
We rely on third parties to provide certain data and services for use in connection with the provision of our services. For example, we contract with third parties to obtain the raw data on retail product sales and inventories. These suppliers of data may impose restrictions on our use of such data, fail to adhere to our quality control standards, increase the price they charge us for this data, or refuse altogether to license the data to us. If we are unable to use such third party data and services or if we are unable to contract with third parties, when necessary, our business or our potential growth could be adversely affected. In the event that such data and services are unavailable for our use or the cost of acquiring such data and services increases, our business could be adversely affected.
We may not be able to adequately protect our intellectual property, which, in turn, could harm the value of our brands and adversely affect our business.
Our ability to implement our business plan successfully depends in part on our ability to further build brand recognition using our trade names, service marks, trademarks, proprietary products, and other intellectual property, including our name and logos. We rely on U.S. and foreign trademark, copyright, and trade secret laws, as well as license agreements, nondisclosure agreements, and confidentiality and other contractual provisions to protect our intellectual property. Nevertheless, our competitors may develop similar business solutions and concepts, and adequate remedies may not be available in the event of an unauthorized use or disclosure of our trade secrets and other intellectual property.
The success of our business depends on our continued ability to use our existing trademarks and service marks to increase brand awareness and further develop our brand in both domestic and international markets. We have registered and applied to register our trade names, service marks, and trademarks in the United States and foreign jurisdictions. However, the steps we have taken to protect our intellectual property in the United States and in foreign countries may not be adequate, and third parties may misappropriate, dilute, infringe upon, or otherwise harm the value of our intellectual property. In addition, the laws of some foreign countries do not protect intellectual property to the same extent as the laws of the United States.
Third parties may also assert that we infringe, misappropriate, or otherwise violate their intellectual property and may sue us for intellectual property infringement. Even if we are successful in these proceedings, we may incur substantial costs, and the time and attention of our management and other personnel may be diverted in pursuing these proceedings. If a court finds that we infringe a third party’s intellectual property, we may be required to pay damages or be subject to an injunction. With respect to any third party intellectual property that we use or wish to use in our business (whether or not asserted against us in litigation), we may not be able to enter into licensing or other arrangements with the owner of such intellectual property at a reasonable cost or on reasonable terms.
Our insurance may not provide adequate levels of coverage against claims.
We believe that we maintain insurance customary for businesses of our size and type. However, there are types of losses we may incur that cannot be insured against or that we believe are not economically reasonable to insure. Further, insurance may not continue to be available to us on acceptable terms, if at all, and, if available, coverage may not be adequate. If we are unable to obtain insurance at an acceptable cost or on acceptable terms, we could be exposed to significant losses.
30
Table of Contents
We generate income throughout the world that is subject to exchange rate fluctuations, and our results of operations may suffer due to currency translations.
Our U.S. operations earn revenues and incur expenses primarily in U.S. dollars, while our international operations earn revenues and incur expenses primarily in Canadian dollars, British pounds, Euros, or South African rands. Because of currency exchange rate fluctuations (including possible devaluations), we are subject to currency translation exposure on the results of our operations, in addition to economic exposure. These risks could adversely impact our business or results of operations.
Fluctuations in our tax obligations and effective tax rate and realization of our deferred tax assets may result in volatility of our operating results.
We are subject to taxes by the U.S. federal, state, local, and foreign tax authorities, and our tax liabilities will be affected by the allocation of expenses to differing jurisdictions. We record tax expense based on our estimates of future payments, which may include reserves for uncertain tax positions in multiple tax jurisdictions, and valuation allowances related to certain net deferred tax assets. At any one time, many tax years may be subject to audit by various taxing jurisdictions. The results of these audits and negotiations with taxing authorities may affect the ultimate settlement of these matters. We expect that throughout the year there could be ongoing variability in our quarterly tax rates as events occur and exposures are evaluated. Our future effective tax rates could be subject to volatility or adversely affected by a number of factors, including:
| • | changes in the valuation of our deferred tax assets and liabilities; |
| • | expected timing and amount of the release of any tax valuation allowance; |
| • | tax effects of equity-based compensation; |
| • | changes in tax laws, regulations, or interpretations thereof; or |
| • | future earnings being lower than anticipated in jurisdictions where we have lower statutory tax rates and higher than anticipated earnings in jurisdictions where we have higher statutory tax rates. |
In addition, our effective tax rate in a given financial statement period may be materially impacted by a variety of factors including but not limited to changes in the mix and level of earnings, varying tax rates in the different jurisdictions in which we operate, fluctuations in the valuation allowance, deductibility of certain items, or by changes to existing accounting rules or regulations. Further, tax legislation may be enacted in the future which could negatively impact our current or future tax structure and effective tax rates. We may be subject to audits of our income, sales, and other transaction taxes by U.S. federal, state, local, and foreign taxing authorities. Outcomes from these audits could have an adverse effect on our operating results and financial condition.
Changes in tax law may have an adverse effect on our business, financial condition, and results of operations and may also affect the federal tax considerations of the purchase, ownership, and disposition of the common stock.
Potential tax reform in the United States may result in significant changes to U.S. federal income tax law, including changes to the U.S. federal income taxation of corporations (including the Company) or changes to the U.S. federal income taxation of stockholders in U.S. corporations, including investors in our common stock. Certain proposed changes to the U.S. corporate tax regime include: reduction of the maximum corporate tax rate, immediate expensing of certain business investment, and elimination of a deduction for net interest expense, as well as substantial changes to the international tax system, including border tax adjustments, a destination based cash flow tax, and moving to a territorial based
31
Table of Contents
tax system. We are currently unable to predict whether any such changes will occur and, if so, the impact of such changes, including on the U.S. federal income tax considerations relating to the purchase, ownership, and disposition of our common stock discussed below in the section titled “Material U.S. Federal Income Tax Consequences toNon-U.S. Holders.”
Risks Related to This Offering and Ownership of Our Common Stock
We are controlled by Karman Topco, whose economic and other interests in our business may be different from yours.
Upon the closing of this offering, our authorized capital stock will consist of shares of common stock and shares of preferred stock, and Karman Topco will own approximately million shares, or %, of our outstanding common stock and we will have no preferred stock issued or outstanding. The equity interests of Karman Topco are owned by the equity funds affiliated with or advised by the Sponsors, as well as by certain members of our management. We expect that Karman Topco will, for the foreseeable future, have significant influence over our corporate management and affairs, and will be able to control virtually all matters requiring stockholder approval. Karman Topco is able to, subject to applicable law, exert significant influence in the election of our directors and control actions to be taken by us and our board of directors, including amendments to our certificate of incorporation and bylaws and approval of mergers, sales of substantially all of our assets, and other significant corporate transactions. The directors so elected will have the authority, subject to the terms of our indebtedness and our rules and regulations, to issue additional stock, implement stock repurchase programs, declare dividends, and make other decisions. It is possible that the interests of Karman Topco may in some circumstances conflict with our interests and the interests of our other stockholders, including you.
We are a controlled company within the meaning of the New York Stock Exchange listing requirements and as a result, will qualify for and intend to rely on exemptions from certain corporate governance requirements. You will not have the same protections afforded to stockholders of companies that are subject to such corporate governance requirements.
Because of the voting power over our company held by Karman Topco, we are considered a controlled company for the purposes of the New York Stock Exchange listing requirements. As such, we are exempt from the corporate governance requirements that our board of directors, compensation committee, and nominating and corporate governance committee meet the standard of independence established by those corporate governance requirements. The independence standards are intended to ensure that directors who meet the independence standards are free of any conflicting interest that could influence their actions as directors.
Following this offering, we intend to utilize these exemptions afforded to a controlled company. Accordingly, you will not have the same protections afforded to stockholders of companies that are subject to all of the corporate governance requirements of the New York Stock Exchange.
If we fail to maintain proper and effective internal controls, our ability to produce accurate and timely financial statements could be impaired and investors’ views of us could be harmed.
The Sarbanes-Oxley Act requires, among other things, that we maintain effective internal control over financial reporting and disclosure controls and procedures. In particular, we must perform system and process evaluation and testing of our internal control over financial reporting to allow management and our independent registered public accounting firm to report on the effectiveness of our internal control over financial reporting, as required by Section 404 of the Sarbanes-Oxley Act, with independent registered public accountant attestation of the effectiveness of our internal controls,
32
Table of Contents
beginning with our annual report on Form10-K for the fiscal year ending December 31, 2018. If we are not able to comply with the requirements of Section 404 in a timely manner, or if we or our independent registered public accounting firm identify deficiencies in our internal control over financial reporting that are deemed to be material weaknesses, the market price of shares of our common stock could decline and we could be subject to sanctions or investigations by the Securities and Exchange Commission, or the SEC, the New York Stock Exchange, the Public Company Accounting Oversight Board, or other regulatory authorities, and we could be the subject of stockholder litigation, each of which would require additional financial and management resources.
Our ability to successfully implement our business plan and comply with Section 404 requires us to be able to prepare timely and accurate financial statements. Any delay in the implementation of, or disruption in the transition to, new or enhanced systems, procedures, or controls, may cause our operations to suffer and we may be unable to conclude that our internal control over financial reporting is effective and obtain an unqualified report on internal controls from our independent registered public accountants as required under Section 404 of the Sarbanes-Oxley Act. Moreover, we cannot be certain that these measures would ensure that we implement and maintain adequate controls over our financial processes and reporting in the future. Even if we were to conclude, and our independent registered public accountants were to concur, that our internal control over financial reporting provided reasonable assurance regarding the reliability of financial reporting and the preparation of financial statements for external purposes in accordance with GAAP, because of its inherent limitations, internal control over financial reporting may not prevent or detect fraud or misstatements. This, in turn, could have an adverse impact on trading prices for our shares of common stock, and could adversely affect our ability to access the capital markets.
There is no existing market for our common stock and an active, liquid trading market may not develop.
Prior to this offering, there has not been a public market for our common stock. We cannot predict the extent to which investor interest in our company will lead to the development of a trading market on the New York Stock Exchange or otherwise or how active and liquid that market may become. If an active and liquid trading market does not develop, you may have difficulty selling any of our common stock that you purchase. The initial public offering price for the shares of our common stock will be determined by negotiations between us and the underwriters and may not be indicative of prices that will prevail in the open market following this offering. The market price of our common stock may decline below the initial offering price, and you may not be able to sell your shares of our common stock at or above the price you paid in this offering, or at all.
The trading price of our common stock may be volatile or may decline regardless of our operating performance, and you may not be able to resell your shares at or above the initial public offering price.
After this offering, the market price for our common stock is likely to be volatile, in part because our shares have not been traded publicly. In addition, the market price of our common stock may fluctuate significantly in response to a number of factors, most of which we cannot control, including:
| • | quarterly variations in our operating results compared to market expectations; |
| • | changes in preferences of our clients; |
| • | announcements of new products or services or significant price reductions; |
| • | size of our public float; |
| • | fluctuations in stock market prices and volumes; |
33
Table of Contents
| • | default on our indebtedness; |
| • | changes in senior management or key personnel; |
| • | the granting or exercise of employee stock options; |
| • | changes in financial estimates or recommendations by securities analysts; |
| • | negative earnings or other announcements by us; |
| • | downgrades in our credit ratings; |
| • | material litigation or government investigations; |
| • | issuances of capital stock; |
| • | global economic, legal, and regulatory factors unrelated to our performance; or |
| • | the realization of any risks described in this prospectus under “Risk Factors.” |
The initial public offering price of our common stock will be determined by negotiations between us and the underwriters based upon a number of factors and may not be indicative of prices that will prevail following the closing of this offering. Volatility in the market price of our common stock may prevent investors from being able to sell their common stock at or above the initial public offering price. As a result, you may suffer a loss on your investment.
In addition, in the past, stockholders have instituted securities class action litigation against companies following periods of market volatility. If we were involved in securities litigation, we could incur substantial costs and our resources and the attention of management could be diverted from our business.
If securities analysts do not publish research or reports about our business or if they publish negative evaluations of our common stock, the price of our common stock could decline.
The trading market for our common stock will rely in part on the research and reports that industry or financial analysts publish about us or our business. We do not currently have and may never obtain research coverage by industry or financial analysts. If no or few analysts commence coverage of us, the trading price of our stock could be negatively affected. Even if we do obtain analyst coverage, if one or more of the analysts covering our business downgrade their evaluations of our stock, the price of our common stock could decline. If one or more of these analysts cease to cover our common stock, we could lose visibility in the market for our stock, which in turn could cause our common stock price to decline.
If you purchase shares of common stock sold in this offering, you will incur immediate and substantial dilution.
If you purchase shares of common stock in this offering, you will incur immediate and substantial dilution in the amount of $ per share based upon an assumed initial public offering price of $ per share (the midpoint of the estimated price range set forth on the cover of this prospectus), which is substantially higher than the pro forma net tangible book deficit per share of our outstanding common stock. In addition, you may also experience additional dilution, or potential dilution, upon future equity issuances, including those made to investors, the shareholders of future acquired businesses, or to our associates and directors under our stock option and equity incentive plans. See “Dilution.”
34
Table of Contents
Substantial future sales of our common stock, or the perception in the public markets that these sales may occur, may depress our stock price.
Sales of substantial amounts of our common stock in the public market after this offering, or the perception that these sales could occur, could adversely affect the price of our common stock and could impair our ability to raise capital through the sale of additional shares.
The shares of common stock offered in this offering will be freely tradable without restriction under the Securities Act of 1933, as amended, or the Securities Act, except for any shares of our common stock that may be held or acquired by our directors, executive officers, and other affiliates, as that term is defined in the Securities Act, which will be restricted securities under the Securities Act. Restricted securities may not be sold in the public market unless the sale is registered under the Securities Act or an exemption from registration is available. Certain Karman Topco investors have rights, subject to certain conditions, to require us to file registration statements covering Karman Topco’s shares of our common stock or to include shares in registration statements that we may file for ourselves or other stockholders. See “Certain Relationships and Related Party Transactions—Registration Rights Agreement.”
Upon the closing of this offering, Karman Topco will own shares of our outstanding common stock. However, we, our executive officers, our directors, our director nominees, and Karman Topco have agreed that, subject to certain customary exceptions, for a period of 180 days from the date of this prospectus, we and they will not, without the prior written consent of Goldman Sachs & Co. LLC and Morgan Stanley & Co. LLC, offer, sell, contract to sell, pledge, or otherwise dispose of, directly or indirectly, any shares of our common stock or any securities convertible into or exchangeable for our common stock. Goldman Sachs & Co. LLC and Morgan Stanley & Co. LLC may release any of the securities subject to theselock-up agreements at any time without notice. See “Underwriting.”
Following the expiration of the period covered by, or the waiver of, thelock-up agreements, Karman Topco will have the right to sell or distribute an aggregate of approximately shares of our common stock. Those shares may be sold in the public market subject to applicable restrictions under the federal securities laws, including the limitations under Rule 144 (particularly those applicable to our directors, officers, and affiliates, which restrict the manner and volume of shares that may be sold). Those shares may also be sold in registered offerings pursuant to the registration rights described elsewhere in this prospectus. We may issue shares of our common stock or securities convertible into our common stock from time to time in connection with financings, acquisitions, investments, or otherwise. Any such issuance could result in ownership dilution to you as a stockholder and cause the trading price of our common stock to decline. See “Shares Eligible for Future Sale” for a more detailed description of the restrictions on selling shares of our common stock after this offering.
We will incur increased costs as a result of becoming a public company.
As a public company, we will incur significant legal, accounting, insurance, and other expenses that we have not incurred as a private company, including costs associated with public company reporting requirements. We also have incurred and will incur costs associated with the Sarbanes-Oxley Act and related rules implemented by the SEC. The expenses incurred by public companies for reporting and corporate governance purposes generally have been increasing. We expect these rules and regulations to increase our legal and financial compliance costs and to make some activities more time-consuming and costly, although we are currently unable to estimate these costs with any degree of certainty. In estimating these costs, we took into account expenses related to insurance, legal, accounting, and compliance activities, as well as other expenses not currently incurred. These laws and regulations could also make it more difficult or costly for us to obtain certain types of insurance,
35
Table of Contents
including director and officer liability insurance, and we may be forced to accept reduced policy limits and coverage or incur substantially higher costs to obtain the same or similar coverage. These laws and regulations could also make it more difficult for us to attract and retain qualified persons to serve on our board of directors, on our board committees, or as our executive officers. Furthermore, if we are unable to satisfy our obligations as a public company, we could be subject to delisting of our common stock, fines, sanctions, and other regulatory action and potentially civil litigation.
Our anti-takeover provisions could prevent or delay a change in control of us, even if such change in control would be beneficial to our stockholders.
Provisions of our restated certificate of incorporation and amended and restated bylaws, as well as provisions of Delaware law, could discourage, delay, or prevent a merger, acquisition, or other change in control of us, even if such change in control would be beneficial to our stockholders. These include:
| • | authorizing the issuance of “blank check” preferred stock that could be issued by our board of directors to increase the number of outstanding shares and thwart a takeover attempt; |
| • | provision for a classified board of directors so that not all members of our board of directors are elected at one time; |
| • | the removal of directors only for cause, on and after the date on which Karman Topco and its affiliates cease to beneficially own, in the aggregate, more than % in voting power of our stock entitled to vote generally in the election of directors; |
| • | no provision for the use of cumulative voting for the election of directors; |
| • | limiting the ability of stockholders to call special meetings; |
| • | requiring all stockholder actions to be taken at a meeting of our stockholders (i.e., no provision for stockholder action by written consent), on and after the date on which Karman Topco and its affiliates cease to beneficially own, in the aggregate, more than % in voting power of our stock entitled to vote generally in the election of directors; |
| • | the required approval of the holders of at leasttwo-thirds of the shares entitled to vote at an election of directors to adopt, amend, or repeal our bylaws or repeal the provisions of our restated certificate of incorporation regarding the election and removal of directors, on and after the date on which Karman Topco and its affiliates cease to beneficially own, in the aggregate, more than % in voting power of our stock entitled to vote generally in the election of directors; and |
| • | establishing advance notice requirements for nominations for election to the board of directors or for proposing matters that can be acted upon by stockholders at stockholder meetings. |
In addition, although we have opted out of Section 203 of the Delaware General Corporation Law, or DGCL, our restated certificate of incorporation contains similar provisions providing that we may not engage in certain “business combinations” with any “interested stockholder” for a three-year period following the time that the stockholder became an interested stockholder, subject to certain exceptions. Generally, a “business combination” includes a merger, asset, or stock sale or other transaction resulting in a financial benefit to the interested stockholder. Subject to certain exceptions, an “interested stockholder” is a person who, together with that person’s affiliates and associates, owns, or within the previous three years owned, 15% or more of our outstanding voting stock.
Under certain circumstances, this provision will make it more difficult for a person who would be an “interested stockholder” to effect various business combinations with us for a three-year period. These provisions also may have the effect of preventing changes in our board of directors and may make it more difficult to accomplish transactions which stockholders may otherwise deem to be in their best interests.
36
Table of Contents
Moreover, our restated certificate of incorporation provides that Karman Topco and its affiliates do not constitute “interested stockholders” for purposes of this provision, and thus any business combination transaction between us and Karman Topco and its affiliates would not be subject to the protections otherwise provided by this provision. See “Description of Capital Stock—Business Combinations.”
Karman Topco and its affiliates are not prohibited from selling a controlling interest in us to a third party and may do so without your approval and without providing for a purchase of your shares of common stock, subject to the lock-up restrictions applicable to Karman Topco. Accordingly, your shares of common stock may be worth less than they would be if Karman Topco and its affiliates did not maintain voting control over us.
For additional information about our relationship with Karman Topco and its affiliates, please see “Certain Relationships and Related Party Transactions” elsewhere in this prospectus.
The provision of our restated certificate of incorporation requiring exclusive venue in the Court of Chancery in the State of Delaware for certain types of lawsuits may have the effect of discouraging lawsuits against our directors and officers.
Our restated certificate of incorporation will require, to the fullest extent permitted by law, that (i) any derivative action or proceeding brought on our behalf, (ii) any action asserting a claim of breach of a fiduciary duty owed by any of our directors, officers, or other employees to us or our stockholders, (iii) any action asserting a claim against us arising pursuant to any provision of the DGCL or our restated certificate of incorporation or amended and restated bylaws, or (iv) any action asserting a claim against us governed by the internal affairs doctrine will have to be brought only in the Court of Chancery in the State of Delaware. Although we believe this provision benefits us by providing increased consistency in the application of Delaware law in the types of lawsuits to which it applies, the provision may have the effect of discouraging lawsuits against our directors and officers.
37
Table of Contents
SPECIAL NOTE REGARDING FORWARD-LOOKING STATEMENTS
This prospectus contains forward-looking statements. In some cases, you can identify forward-looking statements by terminology such as “anticipates,” “believes,” “continue,” “estimates,” “expects,” “intends,” “may,” “plans,” “potential,” “predicts,” “should,” “could,” “would,” “will,” or the negative of these terms or other comparable terminology. In particular, statements regarding our plans, strategies, prospects, and expectations regarding our business are forward-looking statements. These statements relate to future events or our future financial performance and involve known and unknown risks, uncertainties, and other factors that may cause our actual results, levels of activity, performance, or achievements to differ materially from any future results, levels of activity, performance, or achievements expressed or implied by these forward-looking statements. These risks, uncertainties, and other factors include, but are not limited to:
| • | changes to labor laws or wage or job classification regulations, including minimum wage, or other market-driven wage changes; |
| • | developments and policies of retailers that are out of our control; |
| • | our ability to continue to generate significant operating cash flow; |
| • | consolidation of our clients’ industries creating pressure on the pricing of our services; |
| • | consumer goods manufacturers and retailers reviewing and changing their sales, retail, marketing, and technology programs and relationships; |
| • | our ability to successfully develop and maintain relevant omni-channel services for our clients and to otherwise adapt to significant technological change; |
| • | our ability to attract and retain talented executives; |
| • | client procurement strategies putting additional operational and financial pressure on our services; |
| • | our ability to identify attractive acquisition targets, acquire them at attractive prices, and successfully integrate the acquired businesses; |
| • | our ability to hire, timely train, and retain talented individuals for our workforce, and to maintain our corporate culture as we evolve; |
| • | our ability to avoid or manage business conflicts among competing brands; |
| • | our substantial indebtedness; |
| • | limitations, restrictions, and business decisions involving our joint ventures and minority investments; and |
| • | risks related to our international operations. |
Although we believe that the expectations reflected in the forward-looking statements are reasonable, we cannot guarantee future results, levels of activity, performance, or achievements. The forward-looking statements speak only as of the date of this prospectus and are subject to a number of risks, uncertainties, and assumptions elsewhere in this prospectus. Except as required by law, we undertake no obligation to update or revise publicly any forward-looking statements, whether as a result of new information, future events, or otherwise after the date of this prospectus. You should read this prospectus and the documents that we reference in this prospectus and have filed as exhibits to the registration statement, of which this prospectus is a part, completely and with the understanding that our actual future results may be materially different from what we expect. We qualify all of our forward-looking statements by these cautionary statements.
38
Table of Contents
LETTER FROM TANYA DOMIER, OUR CHIEF EXECUTIVE OFFICER
Dear Prospective Investors,
When I joined Advantage Solutions 27 years ago, we were a small local sales agency with 50 associates and $5 million in revenues. It has been a privilege to have played a role in our exciting journey. I hope as you read our story that you will get a sense for our business model, culture, and determination to win for all – manufacturer and retailer partners, associates, and shareholders.
Advantage was built with the simple mission of providing outsourced sales services to local consumer packaged goods manufacturers to help them grow their businesses efficiently and cost-effectively. We were founded by Sonny King after he spent three decades at Vons. During his time in retail, he interacted with various local sales agencies. While each agency provided value to the brands they represented, Sonny believed there was an opportunity to offer more professional services, become a more significant strategic partner and offer national, rather than just local representation. With that goal in mind, he founded Advantage in 1987, with only two clients and a small amount of money. By 1998, he had invested all of his retirement assets to make payroll and fund two local acquisitions while trying to grow the business. Sonny’s initial vision of building an organization with national scale was realized in 2004 when Allied Capital provided the funding to consolidate Advantage plus 15 regional sales agencies.
Fast forward three decades – Advantage has become one of the largest sales and marketing agencies in the U.S., with 50,000+ associates and over $2 billion in revenues in 2016. We represent some of the world’s most recognized brands and offer a wide range of services, such as headquarter relationship management, category and space management, in-store merchandising, experiential events, and consumer, shopper, digital and social marketing. We operate in numerous channels, including traditional retail, foodservice and e-commerce. We are expanding into new geographies such as Africa, Asia, Australia, and Europe, and we’ve added numerous services such as e-commerce representation and business intelligence technology solutions.
Our evolution from a national sales agency into an international diversified sales and marketing solutions company occurred in three distinct three-year chapters, each one involving a private equity partnership. We are proud of our evolution during these chapters as both a business and as leaders and we look forward to our next chapter as a public company. We have learned from both our successes and our failures. Learning from and institutionalizing these lessons is a big part of our culture at Advantage. Our experiences shape how we see the future and how we are charting the course for ongoing growth and success as a public company.
Chapter 1 – Increased Scale and the Expansion of Marketing Services
In 2006, Allied Capital sold Advantage to Merrill Lynch and JW Childs. With the benefit of scale, we focused on removing costs and diversifying from a pure play sales agency into a sales and marketing business. We eliminated redundant costs within 16 companies and cut tens of millions of dollars of expenses between 2004 and 2006. This focus on maintaining a lean operation remains with us today, as we conduct multiple Kaizen events each year and implement zero-based budgeting for all cost centers to ensure every activity is driving value for clients and shareholders.
39
Table of Contents
The expansion of our marketing business during this chapter was critical for us because it proved that we could leverage our position as a strategic intermediary between manufacturers and retailers to develop new and innovative outsourced solutions. We realized that our intimate knowledge of retailers, combined with our understanding of brand needs from a sales perspective, enabled us to create more effective, shopper-focused marketing promotions as compared to traditional advertising agencies. We launched our own agency that closely connected client sales and marketing strategies with retailer priorities to optimize results. While this business started out small, over the past decade it has grown into the number one promotion and experiential business in the country according toAd Age. Today, our marketing division delivers over 30% of our enterprise revenues.
Our most valuable lesson learned during this chapter was that while finding efficiencies is an important part of running a business, you can’t cut your way to growth.
Chapter 2 – Talent and Cultural Transformation and the Reinvigoration of M&A
We started this chapter by realizing that what got us here wouldn’t get us there. In 2010, we aligned with our new partner Apax on a long-term view of growth that included making strategic investments in our talent and technology platforms and reigniting M&A activity to diversify our offerings and strengthen our client relationships. We deployed a tablet-based workforce management solution to our retail services associates and developed new business intelligence software to help our category managers quickly and efficiently optimize trade promotions, assortment, and pricing. Our marketing business rolled out an enterprise platform to manage and measure our experiential marketing services.
During this phase, we also made very difficult decisions about our talent base and culture – reevaluating how to maximize value for our clients. While we had experienced rapid sales growth, we lacked external perspective and diversity and had become a culture of entitlement instead of meritocracy. Recognizing this, we recruited senior-level talent from leading consumer packaged goods companies and focused on increasing our diversity. To address the entitlement culture, we revamped every area of our compensation structure and moved from an “everyone gets a trophy” approach to a highly differentiated, pay-for-performance environment. We developed a formal training program to provide our entry-level associates with the advanced skillset and general-management mindset required of today’s sales managers. We retrained our teams to escalate risks, share bad news as fast as good news, and respect transparency over hierarchy. We also realized that we needed to focus on delivering more value to retailers and that in so doing, we could be much more effective for our manufacturer clients.
Finally, we leveraged M&A to strengthen our marketing capabilities and expand into new channels including foodservice, where we consolidated eight regional agencies to become the first national provider. The cultural transformation initiatives, expanded retailer focus, and M&A activities paid off with significant business growth taking us to $1.7 billion in annual revenues.
Our most valuable lesson learned during this chapter was that if you are willing to reinvent before you are forced to, the long-term gain is worth the short-term pain.
Chapter 3 – Technology, Diversification, and International Expansion
In 2014, we began our partnership with CVC and Leonard Green, which has been characterized by growth in clients and breadth of services. We chose these firms for their deep industry expertise, ability to make introductions for Advantage domestically and internationally, and shared viewpoint and reputation for investing for growth. This alignment has led to additional investment in talent,
40
Table of Contents
technology, and M&A directed at service and geographic expansion. In the last three years, we have won approximately 30 new client accounts in our core consumer packaged goods space – where switching is complex, costly, and hard. Equally exciting has been the expansion of our business into strategic adjacencies. Today, we compete in industries as varied as consumer electronics, travel, health care, automotive, and entertainment. With intentional focus on technology, we have developed services to help clients more efficiently develop, distribute, and market their products in an omni-channel environment. One example of this is the creation of MomentAware™, which uses real-time location data, billions of behavioral data points, and first-party data to help brands find and engage with their shoppers when they are most open to purchase influence using programmatic media. Another example is that we now facilitate our clients’ sales at over 1,000 retailers physically and digitally through proprietary e-commerce solutions. From a geographic standpoint, we have expanded internationally and are now able to serve clients in Africa, Asia, Australia, and Europe. Dissatisfaction with the status quo and continual innovation have enabled us to consistently outperform the industry. In three short years, this partnership has been everything we hoped for and more.
When we partnered with CVC and Leonard Green, we shared with them that our goal was to take the company public. We believe that after these three chapters of private equity – from consolidation to transformation to growth – the best long-term partners for us will be public shareholders for whom we are excited to create value. We are motivated to continue to create value through prudent investments in evolutionary talent and capabilities and a keen focus on growing our business while we deliver best-in-class services for our clients every day.
Our most valuable lesson learned during this chapter is that practical innovation is the most important and controllable driver of growth in a service business.
Chapter 4 – Innovation and Expansion in an Omni-channel, Global Retail Landscape
We are excited to share our next chapter with public market shareholders. A willingness to outwork and out-innovate to win runs deep in the culture and DNA of Advantage. While we believe that retail will encounter significant change in the coming years, we equally believe that there are many paths to growth that capitalize on the strengths of our platform, technology, and key position as the intermediary between brands, consumers, and both physical and digital retailers. We have a proven history of anticipating trends, using deep marketplace expertise, and applying insights gained from our experience and strong relationships to develop services in logical adjacencies. We see growth opportunity through further diversification in services, channels, and geographies as well as ample M&A opportunities. We are also bringing a much broader range of marketing and technology services to our existing clients, creating further growth opportunities in an efficient way.
Today, we have the capability to serve many aspects of the brand development value chain, from foundational services like retail merchandising all the way to higher value added services like brand marketing, media buying, and brand strategy development. We are well positioned to apply the full array of our capabilities as a brand development solutions provider – as increasingly advertising and promotion dollars migrate toward the areas where we have built capability, including shopper marketing, digital, and social. We see meaningful opportunities to grow our digital technology solutions, including by turning shoppers into buyers through next-generation marketing solutions – in traditional retail as well as online venues. Our early investments in our technology offerings like MomentAware™ have shown that brands that employ our technology-enabled solutions see substantially higher sales revenue from their in-store programming versus unsupported stores.
While we have expanded our presence internationally, we are early in our efforts and significant opportunity exists to consolidate regional players around the world and expand our service offerings.
41
Table of Contents
We believe many of the same opportunities exist for outsourcing partners in international markets that existed in the United States when the industry began consolidating in the late 1990s. We believe that through our strategic international investments we will create a consolidated international platform to service large clients and partner with the most attractive local and regional agencies.
As we continue to strengthen our core and enhance our service offerings and geographic footprint, we know that talent and culture will remain the key enabler of our success as people are our brand. Over the last 30 years, together we have built a great business. We are doubling down to continue to invest in our people, including strengthening our recruiting, training, and career development programs and focusing on diversity to ensure we have a strong pipeline of leaders for the dynamic new world we are creating together.
Our goal historically has been simple – create value for our clients and help them grow. When we do this we are able to grow our business and create value for all of our stakeholders. “Winning together” is not just a tag line at Advantage. We’ve always loved to win with our clients, associates, and shareholders. We believe the public markets will be the best place for Advantage as a business to grow and prosper and our people to flourish going forward and are excited by the opportunity to welcome new shareholders to our journey. As a public company, we will focus on creating value for our shareholders by continuing to win every day with our clients and our associates. My team and I are excited about the future and look forward to having you as part of our next chapter of growth.
Winning Together,

Tanya Domier
42
Table of Contents
This prospectus includes our trademarks, trade names, and service marks, which are protected under applicable intellectual property laws and are our property. This prospectus also contains trademarks, trade names, and service marks of other companies, which are the property of their respective owners. Solely for convenience, trademarks, trade names, and service marks referred to in this prospectus may appear without the®,TM orSM symbols, but such references are not intended to indicate, in any way, that we will not assert, to the fullest extent under applicable law, our rights or the right of the applicable licensor to these trademarks, trade names, and service marks. We do not intend our use or display of other parties’ trademarks, trade names, or service marks to imply, and such use or display should not be construed to imply, a relationship with, or endorsement or sponsorship of us by, these other parties.
Information contained in this prospectus concerning our industry and the markets in which we operate is based on information from independent industry and research organizations, other third-party sources (including industry publications, surveys, and forecasts, as well as a market study prepared for us by Dechert-Hampe), and management estimates. Management estimates are derived from publicly available information released by independent industry analysts and third-party sources, as well as data from our internal research, and are based on assumptions made by us upon reviewing such data and our knowledge of such industry and markets which we believe to be reasonable. We are responsible for all of the disclosures in this prospectus, and although we believe the data from these third-party sources is reliable, we have not independently verified any third-party information. In addition, projections, assumptions, and estimates of the future performance of the industry in which we operate and our future performance are necessarily subject to uncertainty and risk due to a variety of factors, including those described in “Risk Factors” and “Special Note Regarding Forward-Looking Statements.” These and other factors could cause results to differ materially from those expressed in the estimates made by the independent parties and by us.
Estimates of industry and market data by Dechert-Hampe referred to herein are derived from a study prepared for us by Dechert-Hampe and represent research opinions of Dechert-Hampe. The estimates of Dechert-Hampe referred to herein are based on historical data that speaks as of May 3, 2017 or earlier (and not as of the date of this prospectus).
References to ‘‘revenues’’ in this prospectus represent total revenues, inclusive of revenues from related and unrelated third parties.
Unless indicated otherwise, the information included in this prospectus (1) assumes no exercise by the underwriters of the option to purchase up to an additional shares of common stock and (2) reflects the restatement of our certificate of incorporation on to effect, among other things, a -for-one stock split of our common stock and an increase in our authorized capital stock to shares of common stock. Numerical figures included in this prospectus have been subject to rounding adjustments.
Numerical figures shown as totals in various tables may not be arithmetic aggregations of the figures that precede them. In addition, we round certain percentages and amounts presented in this prospectus to the nearest whole number. As a result, figures expressed in total and as percentages in
43
Table of Contents
the text may not total 100% or, as applicable, when aggregated may not be the arithmetic aggregation of the amounts or percentages that precede them.
Certain financial measures presented in this prospectus, such as Adjusted EBITDA, M&A Adjusted EBITDA, and Adjusted Net Income are supplemental measures of our operating performance that are not recognized under GAAP. We define these terms as follows:
| • | “Adjusted EBITDA” means net income (loss) before (i) interest expense, net, (ii) (benefit from) provision for income taxes, (iii) depreciation, (iv) amortization of intangible assets, (v) our sponsors’ management fees and equity-based compensation expense, (vi) fair value adjustments of contingent consideration related to acquisitions, (vii) acquisition-related expenses, (viii) EBITDA for economic interests in investments, net, (ix) restructuring expenses, (x) litigation expenses, and (xi) other adjustments that management believes are helpful in evaluating our operating performance. |
| • | “M&A Adjusted EBITDA” means Adjusted EBITDA for a given year as further adjusted to give pro forma effect to the results associated with acquisitions made during such period as if each acquisition had been completed as of the first day of the period presented. M&A Adjusted EBITDA includes information of acquired businesses prior to their acquisition by us which we believe to be accurate; however, this information has been derived from financial information that was not prepared by us. As a result, our independent registered public accounting firm have not audited, reviewed, compiled, or performed any procedures with respect to such information and, accordingly, do not express an opinion or any other form of assurance with respect thereto. Such amounts have not been prepared in accordance with the requirements ofRegulation S-X relating to the presentation of pro forma financial information, are presented for illustrative purposes only, and do not purport to be indicative of the contribution these acquired businesses would have made to our Adjusted EBITDA had they been included in our operations for the relevant period. |
Generally, the companies we acquire do not have audited financial statements. In calculating M&A Adjusted EBITDA, we analyze the historical operating performance of an acquired business and may make certain adjustments to the acquired business’ unaudited financial results. These adjustments, which are intended to present such financial results similar to our calculation of Adjusted EBITDA, include additions or subtractions to the acquired business’ EBITDA to reflect the ongoing operating results of a given acquired business exclusive of any anticipated synergies (e.g., normalization of owner compensation, removal of equity distributions, management fees, or other non-recurring items). We do not intend for these adjustments to reflect cost savings that may occur as a result of the integration of the acquired businesses into our operations. While these adjustments are inherently subjective in nature, we believe that they are helpful in comparing our operating results year over year.
| • | “Adjusted Net Income” means net income (loss) before (i) our sponsors’ management fees and equity-based compensation expense, (ii) fair value adjustments of contingent consideration related to acquisitions, (iii) acquisition-related expenses, (iv) restructuring expenses, (v) litigation expenses, (vi) amortization of intangible assets, (vii) other adjustments that management believes are helpful in evaluating our operating performance, and (viii) related tax adjustments. |
The foregoing are included in this prospectus because they are key operating measures used by us and our board of directors to assess our financial performance. These measures adjust for items that we believe do not reflect the ongoing operating performance of our business, such as certain
44
Table of Contents
noncash items, unusual or infrequent items or items that change from period to period without any material relevance to our operating performance. We evaluate these measures in conjunction with our results according to GAAP because we believe they provide a more complete understanding of factors and trends affecting our business than GAAP measures alone. Furthermore, the agreements governing our indebtedness contain covenants and other tests based on measures substantially similar to Adjusted EBITDA.
Adjusted EBITDA, M&A Adjusted EBITDA, and Adjusted Net Income may also be used by analysts, investors, and other interested parties to evaluate companies in our industry. Our measures of Adjusted EBITDA, M&A Adjusted EBITDA, and Adjusted Net Income are not necessarily comparable to similarly titled captions of other companies due to different methods of calculation. See “Prospectus Summary—Summary Consolidated Financial and Other Data” for a reconciliation of each of Adjusted EBITDA and Adjusted Net Income to net income (loss).
The foregoing are not GAAP measures of our financial performance and should not be considered as alternatives to net income (loss) as a measure of financial performance, or any other performance measure derived in accordance with GAAP. Adjusted EBITDA, M&A Adjusted EBITDA, and Adjusted Net Income should not be construed as an inference that our future results will be unaffected by unusual ornon-recurring items. Additionally, Adjusted EBITDA, M&A Adjusted EBITDA, and Adjusted Net Income are not intended to be measures of free cash flow for management’s discretionary use, as they do not reflect tax payments, debt service requirements, capital expenditures, and certain other cash costs that may recur in the future, including, among other things, cash requirements for working capital needs and cash costs to replace assets being depreciated and amortized. We compensate for these limitations by using thenon-GAAP financial measures noted above to supplement our most directly comparable measure presented on a GAAP basis.
45
Table of Contents
We estimate that the net proceeds to us from this offering, after deducting the underwriting discounts and commissions and estimated offering expenses payable by us, will be approximately $ million (or $ million if the underwriters exercise their option to purchase additional shares in full), assuming the shares are offered at $ per share, the midpoint of the estimated price range set forth on the cover of this prospectus.
Each $1.00 increase (decrease) in the assumed initial public offering price of $ per share, the midpoint of the estimated price range set forth on the cover of this prospectus) would increase (decrease) the net proceeds we receive from this offering by approximately $ million, after deducting the underwriting discounts and commissions and estimated offering expenses payable by us. Each increase (decrease) of 1,000,000 shares in the number of shares we are offering would increase (decrease) the net proceeds to us from this offering by approximately $ million, assuming that the assumed initial public offering price remains the same, and after deducting the underwriting discounts and commissions and estimated offering expenses payable by us.
We intend to use the net proceeds that we receive from this offering to repay borrowings outstanding under our Second Lien Term Loans.
As of March 31, 2017, we had $760.0 million of borrowings outstanding under our Second Lien Term Loans, which mature on July 25, 2022. Our Second Lien Term Loans accrue interest at the rate of the London Interbank Offered Rate, or LIBOR, plus 6.50%, subject to a LIBOR floor of 1.00%, and, as of March 31, 2017, the effective interest rate on our Second Lien Term Loans was 7.50% per annum. See “Description of Indebtedness.”
46
Table of Contents
We currently intend to retain all available funds and any future earnings for use in the operation of our business, and therefore we do not currently expect to pay any cash dividends on our common stock. Any future determination to pay dividends will be at the discretion of our board of directors and will depend upon our results of operations, financial condition, capital requirements, and other factors that our board of directors deems relevant. The payment of cash dividends is restricted under the terms of the agreements governing our debt and our ability to pay dividends may also be restricted by the terms of any future credit agreement or any securities we or our subsidiaries may issue.
47
Table of Contents
The following table sets forth our cash and cash equivalents and capitalization as of March 31, 2017 of:
| • | on an actual basis; and |
| • | on an as adjusted basis to give effect to (1) our issuance and sale of shares of common stock in this offering at an assumed initial public offering price of $ per share, which is the midpoint of the price range listed on the cover page of this prospectus, after deducting the underwriting discounts and commissions and estimated offering expenses payable by us, and (2) the application of the net proceeds from this offering, including the repayment of borrowings outstanding under our Second Lien Term Loans, as described under “Use of Proceeds,” as if such events occurred on March 31, 2017. |
For more information, please see “Use of Proceeds.” You should read this information in conjunction with our consolidated financial statements and the related notes appearing at the end of this prospectus and the “Management’s Discussion and Analysis of Financial Condition and Results of Operations” section and other financial information contained in this prospectus.
| As of March 31, 2017 | ||||||||
| (in thousands, except share data) | Actual | As Adjusted(1) | ||||||
Cash and cash equivalents(2) | $ | 67,233 | $ | |||||
|
|
|
| |||||
Debt: | ||||||||
First Lien Term Loans(2) | $ | 1,960,485 | $ | |||||
Second Lien Term Loans | 760,000 | |||||||
Revolving Credit Facility(3) | 75,000 | |||||||
Notes payable and deferred obligations | 1,169 | |||||||
Less: debt issuance costs | (51,769 | ) | ||||||
|
|
|
| |||||
Total indebtedness(2) | $ | 2,744,885 | $ | |||||
|
|
|
| |||||
Redeemable noncontrolling interest | $ | 2,496 | $ | |||||
|
|
|
| |||||
Total equity: | ||||||||
Common stock: 1,000 shares authorized, actual, and as adjusted; 100 shares issued and outstanding, actual; shares issued and outstanding, as adjusted(4) | — | |||||||
Preferred stock: shares authorized, no shares issued and outstanding, actual, and as adjusted(4) | — | |||||||
Additionalpaid-in capital | 1,668,503 | |||||||
Retained earnings | 37,454 | |||||||
Loans to Karman Topco L.P. | (224 | ) | ||||||
Accumulated other comprehensive loss | (11,615 | ) | ||||||
|
|
|
| |||||
Total stockholders’ equity attributable to Advantage Solutions Inc. | $ | 1,694,118 | $ | |||||
Nonredeemable noncontrolling interest | 34,405 | |||||||
|
|
|
| |||||
Total stockholders’ equity | 1,728,523 | |||||||
|
|
|
| |||||
Total capitalization | $ | 4,475,904 | $ | |||||
|
|
|
| |||||
| (1) | Each $1.00 increase (decrease) in the assumed initial price to the public of $ per share, which is the midpoint of the price range set forth on the cover page of this prospectus, would decrease (increase) total indebtedness and increase (decrease) additionalpaid-in capital and total stockholders’ equity by approximately $ , assuming that the number of shares offered by us, as set forth on the cover page of this prospectus, remains the same, and after deducting the underwriting discounts and commissions and estimated offering expenses payable by us. We may also increase or decrease the number of shares we are offering. Each increase (decrease) of 1,000,000 shares in the number of shares offered by us would decrease (increase) total indebtedness and increase (decrease) additionalpaid-in capital and total |
48
Table of Contents
| stockholders’ equity by approximately $ , assuming that the assumed initial price to the public remains the same, and after deducting the underwriting discounts and commissions and estimated offering expenses payable by us. The as adjusted information discussed above is illustrative only and will be adjusted based on the actual initial public offering price, number of shares offered, and other terms of this offering determined at pricing. |
| (2) | On May 2, 2017, we amended our First Lien Credit Agreement and incurred an additional $225.0 million of First Lien Term Loans. We will use the proceeds of incremental First Lien Term Loans to pay related fees and expenses, to finance additional acquisitions, to repay existing loans under the Revolving Credit Facility, and for general corporate purposes. See “Management’s Discussion and Analysis of Financial Condition and Results of Operations—Liquidity and Capital Resources—Description of Credit Facilities” and “Description of Indebtedness.” |
| (3) | As of March 31, 2017, on an actual basis, we had $80.6 million in additional availability under our Revolving Credit Facility. As of March 31, 2017, on an as adjusted basis, we had $ million in additional availability thereunder. |
| (4) | Reflects the filing of our restated certificate of incorporation to effect, among other things, a -for-one stock split with respect to our common stock and an increase in our authorized capital stock to shares of common stock and shares of preferred stock, which occurred on , 2017. |
The table and discussion above exclude shares of common stock reserved as of the closing date of this offering for future issuance under our 2017 Incentive Award Plan and shares of common stock reserved as of the closing date of the offering for future issuance under our 2017 Employee Stock Purchase Plan, each of which we plan to adopt in connection with this offering.
49
Table of Contents
If you invest in our common stock in this offering, your ownership interest will be immediately diluted to the extent of the difference between the initial public offering price per share and the pro forma net tangible book value (deficit) per share of our common stock after this offering.
Our net tangible book value (deficit) as of March 31, 2017 was $ million, or $ per share of our common stock. Net tangible book value (deficit) per share represents our total tangible assets less total liabilities divided by the number of shares of common stock outstanding as March 31, 2017, after giving effect tothe -for-one stock split that occurred on , 2017.
Our pro forma net tangible book value (deficit) as of March 31, 2017 was approximately $ million, or $ per share of common stock. Pro forma net tangible book value (deficit) per share represents our total tangible assets less total liabilities divided by the number of shares of common stock outstanding as of March 31, 2017, after giving further effect to the sale of shares of our common stock in this offering at an assumed initial public offering price of $ per share, which is the midpoint of the price range set forth on the cover page of this prospectus, and after deducting the underwriting discounts and commissions and estimated offering expenses payable by us. This represents an immediate increase in net tangible book value (deficit) of $ per share of common stock to our existing stockholder and an immediate dilution in net tangible book value (deficit) of $ per share to investors purchasing common stock in this offering.
The following table illustrates this per share dilution:
Assumed initial public offering price per share of common stock | $ | |||||||
Net tangible book value (deficit) per share of common stock as of March 31, 2017 | $ | |||||||
Increase in net tangible book value per share of common stock attributable to this offering | ||||||||
|
| |||||||
Pro forma net tangible book value (deficit) per share of common stock after this offering | $ | |||||||
|
| |||||||
Dilution per share of common stock to new investors in this offering | $ | |||||||
|
|
Each $1.00 increase (decrease) in the assumed initial public offering price of $ per share, the midpoint of the price range set forth on the cover page of this prospectus, would increase (decrease) our pro forma net tangible book value (deficit) by approximately $ million, or approximately $ per share, and the dilution per share to investors in this offering by approximately $ per share, assuming that the number of shares offered by us, as set forth on the front cover of this prospectus, remains the same and after deducting the underwriting discounts and commissions and estimated offering expenses payable by us.
We may also increase or decrease the number of shares we are offering. An increase of 1,000,000 shares in the number of shares offered by us would result in a pro forma net tangible book value (deficit) of approximately $ million, or approximately $ per share, and the dilution per share to investors in this offering would be approximately $ per share, assuming the assumed initial public offering price of $ per share remains the same and after deducting the underwriting discounts and commissions and estimated offering expenses payable by us. Conversely, a decrease of 1,000,000 shares in the number of shares offered by us would result in a pro forma net tangible book value (deficit) of approximately $ million, or approximately $ per share, and the dilution per share to investors in this offering would be approximately $ per share, assuming the assumed initial public offering price of $ per share, remains the same and after deducting the underwriting
50
Table of Contents
discounts and commissions and estimated offering expenses payable by us. The pro forma information discussed above is illustrative only and will adjust based on the actual initial public offering price and other terms of this offering.
If the underwriters exercise their option to purchase additional shares of our common stock in full in this offering, the pro forma net tangible book value (deficit) after the offering would be $ per share, the increase in net tangible book deficit per share to our existing investor would be $ and the dilution in net tangible book deficit per share to new investors would be $ per share, in each case assuming an initial public offering price of $ per share, which is the midpoint of the range listed on the cover page of this prospectus.
The following table summarizes, on the pro forma basis described above as of March 31, 2017, the total number of shares of common stock purchased from us, the total consideration paid to us and the average price per share of common stock paid to us by our existing stockholder and by new investors purchasing shares of common stock in this offering, assuming an initial offering price of $ per share, the midpoint of the price range on the cover page of this prospectus, and before deducting the underwriting discounts and commissions and estimated offering expenses payable by us:
| Shares purchased | Total consideration | Average price per share | ||||||||||||||||
| Number | Percent | Amount | Percent | |||||||||||||||
Existing investor | % | $ | % | $ | ||||||||||||||
New investors | % | $ | % | $ | ||||||||||||||
|
|
|
|
|
|
|
|
| ||||||||||
Total | 100 | % | $ | 100 | % | $ | ||||||||||||
|
|
| ||||||||||||||||
Each $1.00 increase (decrease) in the assumed initial public offering price of $ per share, the midpoint of the price range set forth on the cover page of this prospectus, would increase (decrease) the total consideration paid by new investors by approximately $ million, assuming that the number of shares offered by us, as set forth on the cover page of this prospectus, remains the same and after deducting the underwriting discounts and commissions and estimated offering expenses payable by us.
To the extent any of our outstanding options are exercised, there will be further dilution to new investors.
If the underwriters exercise their option to purchase additional shares in full:
| • | the percentage of shares of common stock held by existing investors will decrease to approximately % of the total number of shares of our common stock outstanding after this offering; and |
| • | the number of shares held by new investors will increase to , or approximately % of the total number of shares of our common stock outstanding after this offering, in each case assuming the shares are offered at $ per share, which is the midpoint of the estimated price range set forth on the cover of this prospectus. |
The table and discussion above exclude shares of common stock reserved as of the closing date of this offering for future issuance under our 2017 Incentive Award Plan and shares of common stock reserved as of the closing date of this offering for future issuance under our 2017 Employee Stock Purchase Plan, each of which we plan to adopt in connection with this offering.
51
Table of Contents
SELECTED CONSOLIDATED FINANCIAL DATA
The following table presents our historical selected consolidated financial information for the periods presented. Advantage Sales & Marketing Inc. is the predecessor of the issuer, Advantage Solutions Inc., for financial reporting purposes. Unless otherwise stated or the context otherwise requires, any reference hereinafter to the “Successor” reflects the operations of Advantage Solutions Inc. after July 25, 2014, the date of the 2014 Topco Acquisition, and any reference to the “Predecessor” refers to the operations of Advantage Sales & Marketing Inc. on or prior to the date of the 2014 Topco Acquisition. The 2014 Topco Acquisition was accounted for using the acquisition method. Under this method, the purchase price of an acquisition is allocated to the underlying assets acquired and liabilities assumed based upon their estimated fair values at the date of acquisition.
The selected consolidated statement of operations data of the Successor for the years ended December 31, 2016 and 2015 and the period from July 26, 2014 to December 31, 2014, the selected consolidated statement of operations data of the Predecessor for the period from January 1, 2014 to July 25, 2014, and the selected consolidated balance sheet data of the Successor as of December 31, 2016 and December 31, 2015 are derived from our audited consolidated financial statements included elsewhere in this prospectus. The selected condensed consolidated statements of operations data of the Successor for the three months ended March 31, 2017 and 2016 and the selected condensed consolidated balance sheet data of March 31, 2017 are derived from our unaudited consolidated financial statements contained in this prospectus. The selected consolidated balance sheet data as of December 31, 2014 has been derived from the Successor’s audited consolidated financial statements that are not included in this prospectus. The selected consolidated statements of operations of the Predecessor for the years ended December 31, 2013 and 2012 and the selected consolidated balance sheet data as of December 31, 2013 and 2012 have been derived from the Predecessor’s audited consolidated financial statements which are not included in this prospectus.
The results of operations for the periods presented below are not necessarily indicative of the results to be expected for any future period and the results for any interim period are not necessarily indicative of the results that may be expected for a full fiscal year. The information set forth below should be read together with the “Management’s Discussion and Analysis of Financial Condition and Results of Operations” section and the consolidated financial statements and the accompanying notes included elsewhere in this prospectus. Our historical results are not necessarily indicative of the results that may be expected for any future period. In the opinion of our management, the following unaudited condensed financial statements reflect all adjustments, consisting of normal recurring adjustments, necessary for a fair presentation of the financial position and results of operations for those periods.
52
Table of Contents
Consolidated Statements of Operations Data:
| Successor |
|
| Predecessor | |||||||||||||||||||||||||||||||||||||
| Three Months Ended March 31, | Year Ended December 31, | Period From July 26, 2014 to December 31, 2014(c)(d) | Period From January 1, 2014 to July 25, 2014(d)(e) | Year Ended December 31, | ||||||||||||||||||||||||||||||||||||
| 2017 | 2016 | 2016(a) | 2015(b) |
|
| 2013(f) | 2012 | |||||||||||||||||||||||||||||||||
| (in thousands, except share and per share data) | (Unaudited) | |||||||||||||||||||||||||||||||||||||||
Revenues | $ | 508,468 | $ | 458,276 | $ | 2,100,235 | $ | 1,895,046 | $ | 808,075 | $ | 905,646 | $ | 1,575,254 | $ | 1,401,406 | ||||||||||||||||||||||||
Cost of revenues | 413,153 | 370,368 | 1,611,285 | 1,454,255 | 601,649 | 715,104 | 1,205,247 | 1,072,148 | ||||||||||||||||||||||||||||||||
Selling, general, and administrative | 26,668 | 23,025 | 97,542 | 72,224 | 59,540 | 141,300 | 84,345 | 75,773 | ||||||||||||||||||||||||||||||||
Depreciation and amortization | 42,894 | 42,639 | 170,260 | 164,584 | 68,683 | 75,271 | 126,648 | 144,912 | ||||||||||||||||||||||||||||||||
|
|
|
|
|
|
|
|
|
|
|
|
|
|
|
| |||||||||||||||||||||||||
Total expenses | 482,715 | 436,032 | 1,879,087 | 1,691,063 | 729,872 | 931,675 | 1,416,240 | 1,292,833 | ||||||||||||||||||||||||||||||||
|
|
|
|
|
|
|
|
|
|
|
|
|
|
|
| |||||||||||||||||||||||||
Operating income (loss) | 25,753 | 22,244 | 221,148 | 203,983 | 78,203 | (26,029 | ) | 159,014 | 108,573 | |||||||||||||||||||||||||||||||
Interest expense, net | 41,362 | 44,066 | 167,360 | 160,895 | 84,227 | 83,896 | 106,020 | 112,426 | ||||||||||||||||||||||||||||||||
|
|
|
|
|
|
|
|
|
|
|
|
|
|
|
| |||||||||||||||||||||||||
(Loss) income before income taxes | (15,609 | ) | (21,822 | ) | 53,788 | 43,088 | (6,024 | ) | (109,925 | ) | 52,994 | (3,853 | ) | |||||||||||||||||||||||||||
Provision for (benefit from) income taxes | (6,406 | ) | (8,821 | ) | 22,623 | 18,202 | 3,861 | (20,826 | ) | 17,922 | (8,106 | ) | ||||||||||||||||||||||||||||
|
|
|
|
|
|
|
|
|
|
|
|
|
|
|
| |||||||||||||||||||||||||
Net (loss) income | (9,203 | ) | (13,001 | ) | 31,165 | 24,886 | (9,885 | ) | (89,099 | ) | 35,072 | 4,253 | ||||||||||||||||||||||||||||
Less: net income (loss) attributable to noncontrolling interests | 147 | (37 | ) | (984 | ) | 292 | 54 | 116 | 7,588 | 6,331 | ||||||||||||||||||||||||||||||
|
|
|
|
|
|
|
|
|
|
|
|
|
|
|
| |||||||||||||||||||||||||
Net (loss) income attributable to stockholder of Advantage Solutions Inc. | $ | (9,350 | ) | $ | (12,964 | ) | $ | 32,149 | $ | 24,594 | $ | (9,939 | ) | $ | (89,215 | ) | $ | 27,484 | $ | (2,078 | ) | |||||||||||||||||||
|
|
|
|
|
|
|
|
|
|
|
|
|
|
|
| |||||||||||||||||||||||||
Net (loss) income per share of common stock: | ||||||||||||||||||||||||||||||||||||||||
Basic | $ | (93,502 | ) | $ | (129,645 | ) | $ | 321,486 | $ | 245,946 | $ | (99,385 | ) | |||||||||||||||||||||||||||
Diluted | $ | (93,502 | ) | $ | (129,645 | ) | $ | 321,486 | $ | 245,946 | $ | (99,385 | ) | |||||||||||||||||||||||||||
Weighted-average number of shares of common stock: | ||||||||||||||||||||||||||||||||||||||||
Basic | 100 | 100 | 100 | 100 | 100 | |||||||||||||||||||||||||||||||||||
Diluted | 100 | 100 | 100 | 100 | 100 | |||||||||||||||||||||||||||||||||||
Consolidated Balance Sheet Data:
| Successor | Predecessor | |||||||||||||||||||||||
| (in thousands) | March 31, 2017 | December 31, 2016 | December 31, 2015 | December 31, 2014 | December 31, 2013 | December 31, 2012 | ||||||||||||||||||
| (Unaudited) | ||||||||||||||||||||||||
Cash and cash equivalents | $ | 67,233 | $ | 40,268 | $ | 70,563 | $ | 84,796 | $ | 72,926 | $ | 47,221 | ||||||||||||
Total assets(g) | 5,965,524 | 5,949,800 | 5,887,020 | 5,760,311 | 2,512,196 | 2,455,942 | ||||||||||||||||||
Long-term debt, net of current portion(h)(i) | 2,649,199 | 2,651,686 | 2,660,358 | 2,525,807 | 1,331,863 | 1,324,435 | ||||||||||||||||||
Redeemable noncontrolling interest | 2,496 | 2,457 | — | — | — | — | ||||||||||||||||||
Stockholder’s equity | 1,728,523 | 1,735,845 | 1,709,613 | 1,656,357 | 633,721 | 606,044 | ||||||||||||||||||
| (a) | In the year ended December 31, 2016, we completed 11 business acquisitions, all of which were accounted for under the acquisition method of accounting, and were reflected in our results of operations for a portion of the year. |
| (b) | In the year ended December 31, 2015, we completed 12 business acquisitions, all of which were accounted for under the acquisition method of accounting, and were reflected in our results of operations for a portion of the year. |
| (c) | For the period from July 26, 2014 to December 31, 2014, the results are reflective of the 2014 Topco Acquisition and three business acquisitions, all accounted for under the acquisition method of accounting. |
| (d) | Due to the 2014 Topco Acquisition, our consolidated financial statements for the year ended December 31, 2014 are not directly comparable to the consolidated financial statements of the Successor for the period from July 26, 2014 to December 31, 2014 and of the Predecessor for the period from January 1, 2014 to July 25, 2014. Refer to Note 3 in the notes to our consolidated financial statements for the year ended December 31, 2016 included elsewhere in this prospectus for further information. |
| (e) | For the period from January 1, 2014 to July 25, 2014 (Predecessor), we completed seven business acquisitions throughout the period, all of which were accounted for under the acquisition method of accounting. |
| (f) | For the year ended December 31, 2013, we completed nine business acquisitions, all of which were accounted for under the acquisition method of accounting, and reflected in our results of operations for a portion of the year. |
| (g) | In connection with the 2014 Topco Acquisition, we recognized a significant increase in our intangible assets, as of December 31, 2014, total assets included goodwill of $1,906.5 million and other intangible assets, net, of $3,341.6 million. |
53
Table of Contents
| (h) | In the first quarter for the fiscal year 2016, we adopted ASU2015-03,Simplifying the Presentation of Debt Issuance Costs, which changed the presentation of debt issuance costs in the balance sheet as a reduction of the related debt liability rather than an assets and ASU2015-15,Interest—Imputed Interest (Subtopic835-30): Presentation and Subsequent Measurement of Debt Issuance Costs Associated withLine-of Credit Arrangements, which clarified that ASU2015-03 does not apply to line of credit arrangements. Accordingly, the Successor has reflected the impact of these standards retrospectively. |
| (i) | In conjunction with the 2014 Topco Acquisition, we incurred additional indebtedness to finance the transaction. At December 31, 2014, total debt was $2,627.0 million consisting of $2,615.4 million of borrowings outstanding under the First Lien Credit Agreement and Second Lien Credit Agreement, net of unamortized deferred financing fees of $75.7 million. |
54
Table of Contents
UNAUDITED PRO FORMA CONDENSED CONSOLIDATED STATEMENT OF OPERATIONS
On July 26, 2014, we consummated the 2014 Topco Acquisition. The total purchase price of $4,267.7 million was financed with the issuance of equity units of $1,595.0 million (including $500.0 million in cash funded directly by Karman Topco’s unitholders), borrowings of $2,585.0 million (including $1,636.1 million which was used to pay off the Predecessor’s debt at closing), the roll-over of management’s equity in the predecessor with a fair value of $67.0 million, and cash on hand.
The following unaudited pro forma condensed consolidated statement of operations for the year ended December 31, 2014 has been derived from the historical audited consolidated financial statements of Predecessor for the period from January 1, 2014 to July 25, 2014 and of Successor for the period from July 26, 2014 to December 31, 2014, and gives effect to the 2014 Topco Acquisition as if it had occurred on January 1, 2014, which presentation we refer to as Pro Forma 2014 and was prepared in accordance with Article 11 of RegulationS-X.
The following unaudited pro forma condensed consolidated statement of operations includes pro forma adjustments to reflect the impact of the 2014 Topco Acquisition. The historical financial information has been adjusted to give effect to the events that are (i) directly attributable to the 2014 Topco Acquisition, (ii) factually supportable, and (iii) expected to have a continuing impact on the combined results of the Company. The assumptions underlying the pro forma adjustments are described in the accompanying notes, which should be read in conjunction with the unaudited pro forma condensed consolidated statement of operations. We believe the unaudited pro forma condensed consolidated statement of operations provides a meaningful comparison of operating results for the year ended December 31, 2014, adjusted for the impact of the 2014 Topco Acquisition, to those of the year ended December 31, 2015. However, the unaudited pro forma condensed consolidated statement of operations are for informational purposes only and do not purport to represent what our actual results of operations would have been if the 2014 Topco Acquisition had been completed as of January 1, 2014 or that may be achieved in the future.
The following unaudited pro forma condensed consolidated statement of operations should be read in conjunction with “Selected Consolidated Financial Data,” “Management’s Discussion and Analysis of Financial Condition and Results of Operations,” and our consolidated financial statements and the related notes thereto included elsewhere in this prospectus.
55
Table of Contents
UNAUDITED PRO FORMA CONDENSED CONSOLIDATED STATEMENT OF OPERATIONS FOR THE YEAR ENDED DECEMBER 31, 2014
| Successor | Predecessor | |||||||||||||||
| Period From July 26, 2014 to December 31, 2014 | Period From January 1, 2014 to July 25, 2014 | Pro Forma Adjustments | Pro Forma 2014 | |||||||||||||
| (in thousands, except share and per share data) | ||||||||||||||||
| (Unaudited) | ||||||||||||||||
Revenues | $ | 808,075 | $ | 905,646 | $ | — | $ | 1,713,721 | ||||||||
Cost of revenues | 601,649 | 715,104 | — | 1,316,753 | ||||||||||||
Selling, general, and administrative | 59,540 | 141,300 | (135,937) | (1) | 64,903 | |||||||||||
Depreciation and amortization | 68,683 | 75,271 | 10,361 | (2) | 154,315 | |||||||||||
|
|
|
|
|
|
|
| |||||||||
Total expenses | 729,872 | 931,675 | (125,576) | 1,535,971 | ||||||||||||
|
|
|
|
|
|
|
| |||||||||
Operating income (loss) | 78,203 | (26,029 | ) | 125,576 | 177,750 | |||||||||||
Interest expense, net | 84,227 | 83,896 | (11,923) | (3) | 156,200 | |||||||||||
|
|
|
|
|
|
|
| |||||||||
(Loss) income before income taxes | (6,024 | ) | (109,925 | ) | 137,499 | 21,550 | ||||||||||
Provision for (benefit from) income taxes | 3,861 | (20,826 | ) | 23,124 | (4) | 6,159 | ||||||||||
|
|
|
|
|
|
|
| |||||||||
Net (loss) income | (9,885 | ) | (89,099 | ) | 114,375 | 15,391 | ||||||||||
Less: net income attributable to noncontrolling interests | 54 | 116 | — | 170 | ||||||||||||
|
|
|
|
|
|
|
| |||||||||
Net (loss) income attributable to stockholder of Advantage Solutions Inc. | $ | (9,939 | ) | $ | (89,215 | ) | $ | 114,375 | $ | 15,221 | ||||||
|
|
|
|
|
|
|
| |||||||||
Net (loss) income per share: | ||||||||||||||||
Basic | $ | (99,385 | ) | $ | 152,205 | |||||||||||
|
|
|
| |||||||||||||
Diluted | $ | (99,385 | ) | $ | 152,205 | |||||||||||
|
|
|
| |||||||||||||
Weighted average shares of common stock outstanding: | ||||||||||||||||
Basic | 100 | 100 | ||||||||||||||
|
|
|
| |||||||||||||
Diluted | 100 | 100 | ||||||||||||||
|
|
|
| |||||||||||||
56
Table of Contents
UNAUDITED PRO FORMA CONDENSED CONSOLIDATED STATEMENT OF OPERATIONS
Footnotes to the Unaudited Pro Forma Condensed Consolidated Statement of Operations
| (1) | Representsnon-recurring transaction costs incurred in connection with the 2014 Topco Acquisition, consisting primarily of transaction expenses, including legal, accounting, and other advisory fees, as well as employee compensation expense due to the acceleration of stock-based compensation awards and transaction bonus payments. The adjustment to selling, general, and administrative was comprised of $60.4 million related to transaction expenses and $75.5 million related to equity compensation that vested upon the completion of the 2014 Topco Acquisition and bonus compensation payments related to the 2014 Topco Acquisition for the Pro Forma 2014 period. |
| (2) | Represents adjustments for the amortization of intangible assets associated with the 2014 Topco Acquisition. As a result of acquisition accounting, we recorded $3,340.0 million in intangible assets, $1,860.0 million of which relates to client relationships and is being amortized over a useful life of 15 years, and $1,480.0 million of which relates to tradenames which have an indefinite useful life. This pro forma adjustment assumes that the intangible assets were acquired on January 1, 2014 and the related amortization expense was recorded for the entire year ended December 31, 2014. |
| (in thousands) | Pro Forma 2014 (Unaudited) | |||
Client relationships amortization for the period of January 1, 2014 to July 25, 2014 | $ | 70,015 | ||
Less: Historical amortization for the period of January 1, 2014 to July 25, 2014 | (59,654 | ) | ||
|
| |||
Net pro forma adjustment | $ | 10,361 | ||
|
| |||
| (3) | Represents adjustments to reflect the recognition of interest expense and amortization of fees and expenses attributable to the First Lien Credit Agreement and Second Lien Credit Agreement as described elsewhere in this prospectus. In connection with the 2014 Topco Acquisition, we entered into the First Lien Credit Agreement and Second Lien Credit Agreement and borrowed an aggregate of $2,585.0 million, including $1,636.1 million used to pay off the Predecessor’s debt at closing. The borrowings made at the closing of the 2014 Topco Acquisition resulted in additional annual interest expense of approximately $69.7 million. This pro forma adjustment assumes that the additional indebtedness was entered into and replaced the previously outstanding indebtedness of Predecessor as of January 1, 2014. Additionally, we incurred fees and expenses relating to the extinguishment of the Predecessor’s debt which have been eliminated here as the amounts areone-time in nature and directly attributable to the 2014 Topco Acquisition. |
The following table summarizes the net adjustment to interest expense:
| (in thousands) | Pro Forma 2014 (Unaudited) | |||
Interest expense related to new indebtedness | $ | 58,231 | ||
Amortization of debt issuance costs related to new indebtedness | 11,462 | |||
Less: Historical interest expense | (42,664 | ) | ||
Less: Historical amortization and write-off of debt issuance costs | (38,952 | ) | ||
|
| |||
Net pro forma adjustment | $ | (11,923 | ) | |
|
| |||
A change of 1/8% (12.5 basis points) in the interest rate associated with the floating rate borrowings would result in an additional annual interest expense of approximately $2.6 million, in the case of an increase to the rate, and there would be no change in interest expense, in the case of a decrease in the rate as a result of the floor on our floating rate borrowings.
| (4) | Reflects income tax effect for the above adjustments at an estimated statutory rate of 39.0% adjusted for $78.2 million innon-deductible transaction costs incurred in connection with the 2014 Topco Acquisition. |
57
Table of Contents
MANAGEMENT’S DISCUSSION AND ANALYSIS OF FINANCIAL CONDITION AND RESULTS OF OPERATIONS
The following discussion and analysis of our financial condition and results of operations should be read in conjunction with the section titled “Selected Consolidated Financial Data,” our consolidated financial statements and related notes and other financial information included elsewhere in this prospectus.
Some of the information contained in this discussion and analysis or set forth elsewhere in this prospectus, including information with respect to our plans and strategy for our business, includes forward-looking statements that involve risks and uncertainties. You should review the “Risk Factors” and “Special Note Regarding Forward-Looking Statements” sections of this prospectus for a discussion of important factors that could cause actual results to differ materially from the results described in or implied by the forward-looking statements contained in the following discussion and analysis. Our fiscal year ends December 31 and, unless otherwise noted, references to years or fiscal years are for fiscal years ended December 31. The statements of operations for the three months ended March 31, 2017 and 2016 are derived from our unaudited interim financial statements included elsewhere in this prospectus. The statements of operations for the years ended December 31, 2016 and 2015, the period from July 26, 2014 to December 31, 2014 (Successor) and the period from January 1, 2014 to July 25, 2014 (Predecessor) are derived from the audited consolidated financial statements included elsewhere in this prospectus.References to “Pro Forma 2014” in this discussion and analysis are to our unaudited pro forma results for the year ended December 31, 2014, which have been derived from the results of the Predecessor from January 1, 2014 to July 25, 2014 and the Successor from July 26, 2014 to December 31, 2014, and gives effect to the 2014 Topco Acquisition as if it had occurred on January 1, 2014. See “Unaudited Pro Forma Condensed Consolidated Statement of Operations.” Certain totals, subtotals, and percentages contained in this discussion and analysis may not reconcile due to rounding.
Executive Overview
We are a leading business solutions provider to consumer goods manufacturers and retailers. Our customizable suite of technology-enabled sales and marketing solutions is designed to help manufacturers and retailers across a broad range of channels drive consumer demand, increase sales, and achieve operating efficiencies.
We maintain long-standing relationships with leading manufacturers across a range of consumer product categories, including packaged foods, beverages, perishables, health and beauty care, and consumer electronics. We also maintain deep relationships with retailers across various channels, including: traditional retail (which includes grocery, drug, mass, convenience, club, and natural/specialty), foodservice, ande-commerce. Our clients vary considerably in terms of size and growth profile, ranging from some of the world’s largest consumer goods manufacturers, including Mars, PepsiCo, and Smucker’s, to smaller regional players and emerging brands. We help our clients increase sales and reduce costs by leveraging our industry expertise, network of relationships, and scale to develop and execute strategies that fuel our clients’ growth and allow them to focus on their individual core competencies.
We have two reportable segments: sales and marketing. Through our sales segment, we serve as a strategic intermediary between consumer goods manufacturers and their retailer partners. Our sales associates prepare and present to retailers the business case to increase distribution of manufacturers’ products and optimize how they are displayed, priced, and promoted. We also makein-store visits to ensure such products are adequately stocked and properly displayed.
58
Table of Contents
Through our marketing segment, we develop and execute marketing programs for manufacturers and retailers that are designed to influence shoppers on their paths to, and at the point of, purchase using our expertise in shopper behavior, our proprietary analytics, our extensive brand knowledge, and our understanding of manufacturer and retailer strategies.
Highlights
Highlights from the three months ended March 31, 2017 include:
| • | Revenues increased by $50.2 million, or 11.0%, to $508.5 million for the three months ended March 31, 2017 from $458.3 million for the three months ended March 31, 2016. The increase in revenues reflects organic growth of $16.8 million or 3.7%. |
| • | Operating income increased $3.6 million, or 15.8%, to $25.8 million for the three months ended March 31, 2017 from $22.2 million for the three months ended March 31, 2016. |
| • | Net loss decreased to $9.2 million for the three months ended March 31, 2017 from $13.0 million for the three months ended March 31, 2016. |
| • | Adjusted EBITDA increased by $7.3 million, or 10.7% to $75.7 million for the three months ended March 31, 2017 from $68.4 million for the three months ended March 31, 2016. Of this increase, acquired companies accounted for $5.3 million and organic growth accounted for $2.0 million. |
Subsequent to March 31, 2017, we completed six acquisitions: three sales agencies in Europe and two sales agencies and one marketing agency in the United States. On May 2, 2017, we amended our First Lien Credit Agreement to incur an additional $225.0 million of First Lien Term Loans, and extend the maturity date with respect to $150.0 million of our Revolving Credit Facility. See “—Liquidity and Capital Resources—Description of Credit Facilities” and “Description of Indebtedness.”
Highlights from the year ended December 31, 2016 include:
| • | Revenues increased by $205.2 million, or 10.8% to $2,100.2 million for the year ended December 2016 from $1,895.0 million for the year ended December 31, 2015, with organic revenue growth representing 56.8% of the increase, and the balance associated with acquisitions. |
| • | Operating income increased by $17.1 million, or 8.4% to $221.1 million, for the year ended December 2016 from $204.0 million for the year ended December 31, 2015. |
| • | Net income increased by $6.3 million, or 25.2% to $31.2 million, for the year ended December 2016 from $24.9 million for the year ended December 31, 2015. |
| • | Adjusted EBITDA increased by $45.8 million, or 12.5% to $411.3 million for the year ended December 31, 2016 from $365.5 million for the year ended December 31, 2015. Of this increase, organic growth accounted for $20.6 million and acquired companies accounted for $25.2 million. |
| • | Cash generated by operations was $164.4 million for the year ended December 31, 2016, representing an increase of 40.6% in comparison with the year ended December 31, 2015. |
| • | We completed 11 business acquisitions, including seven sales agencies and two sales digital agencies, which have been integrated into our sales segment, and two marketing agencies, which have been integrated into our marketing segment. The aggregate purchase price of the acquisitions was $110.4 million in cash, plus $49.8 million in contingent consideration and holdbacks. |
59
Table of Contents
| • | In March 2016, Jeff Hansberry was appointed our President and Chief Commercial Officer. Mr. Hansberry brings to our business more than 25 years of sales, marketing, and general management experience. |
Factors Affecting Our Business and Financial Reporting
There are a number of factors that affect the performance of our business, and the comparability of our results from year to year and from quarter to quarter, including:
| • | Organic Growth. A large part of our strategy is focused on generating organic growth by expanding our existing client relationships, continuing to win new clients, pursuing channel expansion and new industry opportunities, enhancing our digital technology solutions, developing our international platform, and expanding into logical adjacencies. We believe that by pursuing these organic growth strategies we will be able to continue to enhance our value proposition to our clients and thereby grow our business. |
| • | Acquisitions. We have grown and expect to continue to grow our business in part by acquiring high quality businesses, both in and outside of the United States. Since 2014, we have completed 40 acquisitions, ranging in purchase price from approximately $0.6 million to $60.3 million. Many of our acquisition agreements include contingent consideration arrangements, which are described below. We have completed acquisitions at attractive purchase prices and have regularly structured our agreements to result in the generation of long-lived tax assets, which have in turn reduced our effective purchase prices when incorporating the value of the tax assets created. In the future, we intend to look for strategic andtuck-in acquisitions that can be completed at attractive purchase prices. |
| • | Contingent Consideration. Many of our acquisition agreements include contingent consideration arrangements, which are generally based on the achievement of financial performance by the operations attributable to the acquired companies. The contingent consideration arrangements are based upon our valuations of the acquired companies and reduce the risk of overpaying for such companies if the projected financial results are not achieved. The fair values of these contingent consideration arrangements are included as part of the purchase price of the acquired companies on their respective acquisition dates. For each transaction, we estimate the fair value of contingent consideration payments as part of the initial purchase price. We review and assess the estimated fair value of contingent consideration on a quarterly basis, and the updated fair value could differ materially from the initial estimates. Changes in the estimated fair value of contingent consideration liabilities related to the time component of the present value calculation are reported in “Interest expense, net.” Adjustments to the estimated fair value related to changes in all other unobservable inputs are reported in “Selling, general, and administrative expenses” in the Consolidated Statements of Comprehensive Income (Loss). |
| • | Depreciation and Amortization. Due to the fair value analysis of our intangible assets related to the 2014 Topco Acquisition and our subsequent acquisitions, the amortization recorded in our consolidated financial statements has a significant impact on our operating income (loss) and net income (loss). Our historical acquisitions have increased, and future acquisitions likely will increase, our intangible assets. We amortize these intangible assets over extended periods ranging from five to 15 years from the date of each acquisition. We do not believe the amortization expense associated with the intangibles created from our purchase accounting adjustments reflect a material economic cost to our business. Unlike depreciation expense which has an economic cost reflected by the fact that we mustre-invest in property and equipment to maintain the asset base delivering our results of operations, we do not have any capitalre-investment requirements associated with the acquired intangibles (e.g., client |
60
Table of Contents
relationships and trade names) that comprise the majority of the finite-lived intangibles that create our amortization expense. |
| • | Seasonality. Our quarterly results are seasonal in nature, with the fourth quarter typically generating a higher proportion of our revenues than other fiscal quarters, as a result of higher consumer spending, along with a small portion of our contractual arrangements that includes performance incentives that are primarily payable to us during the fourth quarter. We generally record slightly lower revenues in the first quarter of each year, as our clients begin to roll out new programs for the year, and consumer spending generally is less in the first quarter than other quarters. Timing of our clients’ marketing expenses, associated with marketing campaigns and new product launches, can also result in fluctuations from one quarter to another. |
| • | Presentation. Our consolidated financial statements will not be directly comparable to the consolidated financial statements of the Predecessor due to the effects of the 2014 Topco Acquisition in July 2014. However, for purposes of discussion of the results of operations, we compared the results for the year ended December 31, 2015 to the results of the Predecessor from January 1, 2014 to July 25, 2014 and the Successor from July 26, 2014 to December 31, 2014. Supplementally, included in the discussion below are unaudited pro forma statement of operations for the year ended December 31, 2014. The unaudited pro forma condensed consolidated statement of operations for the year ended December 31, 2014 has been derived from the historical audited consolidated financial statements of Predecessor for the period from January 1, 2014 to July 25, 2014 and of Successor for the period from July 26, 2014 to December 31, 2014, and gives effect to the 2014 Topco Acquisition as if it had occurred on January 1, 2014. The unaudited pro forma condensed consolidated statement of operations for the year ended December 31, 2014 is presented because we believe the unaudited pro forma condensed consolidated statement of operations enables a meaningful comparison of operating results for the year ended December 31, 2014, adjusted for the impact of the 2014 Topco Acquisition, to those of the year ended December 31, 2015. However, the unaudited pro forma condensed consolidated statement of operations is for informational purposes only and does not purport to represent what our actual results of operations would have been if the 2014 Topco Acquisition had been completed as of January 1, 2014 or that may be achieved in the future. |
How We Assess the Performance of Our Business
Revenues
Revenues related to the sales segment are primarily recognized in the form of commissions, fee-for-service, or on a cost-plus basis for providing headquarter relationship management, analytics, insights and intelligence services,administrative services, retail services, retailer client relationships and in-store media programs, and digital technology solutions (which include our business intelligence solutions, e-commerce services, and content services). We may be entitled to additional fees upon meeting specific performance goals or thresholds, which we refer to as bonus revenue. We recognize the bonus revenue when the specific performance goals are assured or when our clients determine performance against these goals has been achieved.
Marketing segment revenues are primarily recognized in the form of a fee-for-service (including retainer fees, fees charged to clients based on hours incurred, project-based fees, or fees for executing in-person consumer engagements or experiences, which engagements or experiences we refer to as “events”) or on a cost-plus basis for providing experiential marketing, shopper and consumer marketing services, and our digital, social, and media services.
61
Table of Contents
Given our ongoing acquisition strategy, we analyze our performance, in part, by measuring growth in revenues attributable to both organic and acquisition-related activities. We measure organic revenue growth by comparing the revenues of our businesses period over period. Our acquired businesses are considered to be generating organic revenue after an initial period of 12 months from the date they are acquired. Organic revenue growth is the amount by which revenue in the organic period (after the initial 12 months following the acquisition) has increased over the prior year same period. For example, if we completed an acquisition on July 1, 2015, we would consider the incremental difference in revenues from the acquired company during the second half of 2016, when compared to the second half of 2015, to be organic revenue growth, and we would consider any revenues generated from January 1, 2016 to June 30, 2016 from the acquired business to be acquired revenues.
Cost of Revenues
Our cost of revenues consists of both fixed and variable expenses primarily attributable to the hiring, training, compensation, and benefits provided to both full-time and part-time associates, as well as other project-related expenses. A number of costs associated with our associates are subject to external factors, including inflation, increases in market specific wages, and minimum wage rates at federal, state, and municipal levels, and minimum pay levels for exempt roles. Additionally, when we enter into certain new client relationships, we may experience an initial increase in expenses associated with hiring, training, and other items needed to launch the new relationship.
Selling, General, and Administrative Expenses
Selling, general, and administrative expenses consist primarily of salaries, payroll taxes, and benefits for corporate personnel. Other overhead costs include information technology, occupancy costs for corporate personnel, professional services fees, including accounting and legal services, and other general corporate expenses. Additionally, included in selling, general, and administrative expenses are costs associated with the changes in fair value of the contingent consideration of acquisitions and other acquisition-related costs. Acquisition-related costs are comprised of fees related to change of equity ownership, transaction costs, and professional fees, including due diligence and integration activities.
Interest Expense
Interest expense relates primarily to borrowings under our First Lien Credit Agreement (including the Revolving Credit Facility) and Second Lien Credit Agreement as described below. See “—Liquidity and Capital Resources—Description of Credit Facilities.”
Depreciation and Amortization
Amortization Expense
Included in our depreciation and amortization expense is amortization of acquired intangible assets. We have ascribed value to identifiable intangible assets other than goodwill in our purchase price allocations for companies we have acquired. These assets include, but are not limited to, client relationships and tradenames. To the extent we ascribe value to identifiable intangible assets that have finite lives, we amortize those values over the estimated useful lives of the assets. Such amortization expense, althoughnon-cash in the period expensed, directly impacts our results of operations. It is difficult to predict with any precision the amount of expense we may record relating to future acquired intangible assets.
62
Table of Contents
As a result of our 2014 Topco Acquisition, we acquired significant intangible assets, the value of which is amortized, on a straight-line basis, over 15 years from the date of the 2014 Topco Acquisition, unless determined to be indefinite-lived.
Depreciation Expense
Depreciation expense relates to the property and equipment that we own, which represented less than 1% of our total assets at March 31, 2017.
Income Taxes
Income tax (benefit) expense and our effective tax rates can be affected by many factors, including state apportionment factors, our acquisition strategy, tax incentives and credits available to us, changes in judgment regarding the ability to realize our deferred tax assets, changes in our worldwide mix ofpre-tax losses/earnings, changes in existing tax laws, and our assessment of uncertain tax positions.
Cash Flows
We have positive cash flow characteristics, as described below (see “—Liquidity and Capital Resources”), due to the limited required capital investment in the fixed assets and working capital needs to operate our business in the normal course.
Our principal sources of liquidity have been cash flows from operations, borrowings under our Revolving Credit Facility, and other debt. Our principal uses of cash are operating expenses, working capital requirements, acquisitions, and repayment of debt. We believe that our anticipated sources of liquidity including operating cash flows, existing cash and cash equivalents, borrowing capacity under our Revolving Credit Facility and our ability to issue debt or equity, if required, will be sufficient to meet our projected cash requirements for at least the next 12 months.
Adjusted EBITDA and M&A Adjusted EBITDA
Adjusted EBITDA and M&A Adjusted EBITDA arenon-GAAP financial measures. Adjusted EBITDA means net income (loss) before (i) interest expense, net, (ii) (benefit from) provision for income taxes, (iii) depreciation, (iv) amortization of intangible assets, (v) our sponsors’ management fees and equity-based compensation expense, (vi) fair value adjustments of contingent consideration related to acquisitions, (vii) acquisition-related expenses, (viii) EBITDA for economic interests in investments, net, (ix) restructuring expenses, (x) litigation expenses, and (xi) other adjustments that management believes are helpful in evaluating our core operating performance. M&A Adjusted EBITDA means Adjusted EBITDA for a given year as further adjusted to give pro forma effect to the results associated with acquisitions made during such period as if each acquisition had been completed as of the first day of the period presented.
Given our ongoing acquisition strategy, we analyze our performance, in part, by measuring Adjusted EBITDA attributable to both organic and acquisition related activities. We measure organic Adjusted EBITDA growth by comparing the Adjusted EBITDA of our businesses period over period. Our acquired businesses are considered to be generating organic Adjusted EBITDA after an initial period of 12 months from the date they are acquired. Organic Adjusted EBITDA growth is the amount by which Adjusted EBITDA in the organic period (after the initial 12 months following the acquisition) has increased over the prior year same period. For example, if we completed an acquisition on July 1, 2015, we would consider the incremental difference in Adjusted EBITDA from the acquired company during the second half of 2016, when compared to the second half of 2015, to be organic Adjusted
63
Table of Contents
EBITDA growth, and we would consider any Adjusted EBITDA generated from January 1, 2016 to June 30, 2016 from the acquired business to be acquired Adjusted EBITDA.
We supplementally present Adjusted EBITDA and M&A Adjusted EBITDA because we believe they assist investors and analysts in comparing our operating performance. These measures adjust for items that we believe do not reflect the ongoing operating performance of our business, such as certain noncash items, unusual or infrequent items or items that change from period to period without any material relevance to our operating performance. Our use of the terms Adjusted EBITDA and M&A Adjusted EBITDA may vary from that of others in our industry. We evaluate these measures in conjunction with our results according to GAAP because we believe they provide a more complete understanding of factors and trends affecting our business than GAAP measures alone. Furthermore, the agreements governing our indebtedness contain covenants and other tests based on measures substantially similar to Adjusted EBITDA. Neither Adjusted EBITDA nor M&A Adjusted EBITDA should be considered as an alternative for our most directly comparable measure presented on a GAAP basis.
The most directly comparable GAAP measure to each of Adjusted EBITDA and M&A Adjusted EBITDA is net income (loss). For a reconciliation of Adjusted EBITDA and M&A Adjusted EBITDA to net income (loss), see “Prospectus Summary—Summary Consolidated Financial and Other Data.”
Adjusted Net Income
Adjusted Net Income is anon-GAAP financial measure. Adjusted Net Income means net income (loss) before (i) our sponsors’ management fees and equity-based compensation expense, (ii) fair value adjustments of contingent consideration related to acquisitions, (iii) acquisition-related expenses, (iv) restructuring expenses, (v) litigation expenses, (vi) amortization of intangible assets, (vii) other adjustments that management believes are helpful in evaluating our operating performance, and (viii) related tax adjustments.
We supplementally present Adjusted Net Income because we use it as a supplemental measure to evaluate the performance of our business in a way that also considers our ability to generate profit without the impact of items that we do not believe are indicative of our operating performance or are unusual or infrequent in nature and aid in the comparability of our performance from period to period. Adjusted Net Income should not be considered as an alternative for our most directly comparable measure presented on a GAAP basis.
The most directly comparable GAAP measure to Adjusted Net Income is net income (loss). For a reconciliation of Adjusted Net Income to net income (loss), see “Prospectus Summary—Summary Consolidated Financial and Other Data.”
64
Table of Contents
Results of Operations for the Three Months Ended March 31, 2017 and 2016 (Unaudited)
| Three Months Ended March 31, | ||||||||||||||||
| (in thousands) | 2017 | 2016 | ||||||||||||||
Revenues | $ | 508,468 | 100.0 | % | $ | 458,276 | 100.0 | % | ||||||||
Cost of revenues | 413,153 | 81.3 | % | 370,368 | 80.8 | % | ||||||||||
Selling, general, and administrative | 26,668 | 5.2 | % | 23,025 | 5.0 | % | ||||||||||
Depreciation and amortization | 42,894 | 8.4 | % | 42,639 | 9.3 | % | ||||||||||
|
|
|
|
|
|
|
| |||||||||
Total expenses | 482,715 | 94.9 | % | 436,032 | 95.1 | % | ||||||||||
|
|
|
|
|
|
|
| |||||||||
Operating income | 25,753 | 5.1 | % | 22,244 | 4.9 | % | ||||||||||
Interest expense, net | 41,362 | 8.1 | % | 44,066 | 9.6 | % | ||||||||||
|
|
|
|
|
|
|
| |||||||||
Loss before income taxes | (15,609 | ) | (3.1 | %) | (21,822 | ) | (4.8 | %) | ||||||||
Benefit from income taxes | (6,406 | ) | (1.3 | %) | (8,821 | ) | (1.9 | %) | ||||||||
|
|
|
|
|
|
|
| |||||||||
Net loss | $ | (9,203 | ) | (1.8 | %) | $ | (13,001 | ) | (2.8 | %) | ||||||
|
|
|
|
|
|
|
| |||||||||
Other Financial Data | ||||||||||||||||
Adjusted EBITDA(1) | $ | 75,723 | 14.9 | % | $ | 68,376 | 14.9 | % | ||||||||
Adjusted Net Income(2) | $ | 16,889 | 3.3 | % | $ | 9,735 | 2.1 | % | ||||||||
| (1) | Adjusted EBITDA is a financial measure that is not calculated in accordance with GAAP. For a discussion of our presentation of Adjusted EBITDA and a reconciliation of net loss to Adjusted EBITDA, see “Prospectus Summary—Summary Consolidated Financial and Other Data.” |
| (2) | Adjusted Net Income is a financial measure that is not calculated in accordance with GAAP. For a discussion of our presentation of Adjusted Net Income and a reconciliation of net loss to Adjusted Net Income, see “Prospectus Summary—Summary Consolidated Financial and Other Data.” |
Comparison of the Three Months Ended March 31, 2017 and 2016 (Unaudited)
Revenues
| Three Months Ended March 31, | Change | |||||||||||||||
| (in thousands) | 2017 | 2016 | $ | % | ||||||||||||
Sales | $ | 343,078 | $ | 325,431 | $ | 17,647 | 5.4 | % | ||||||||
Marketing | 165,390 | 132,845 | 32,545 | 24.5 | % | |||||||||||
|
|
|
|
|
| |||||||||||
Total revenues | $ | 508,468 | $ | 458,276 | $ | 50,192 | 11.0 | % | ||||||||
|
|
|
|
|
| |||||||||||
In the sales segment, acquired companies contributed $14.1 million in revenue growth during the three months ended March 31, 2017. Organic growth in sales revenues of $3.5 million was primarily attributable to an expansion in our retail service offerings. In the marketing segment, acquired companies contributed $19.3 million in revenue growth during the three months ended March 31, 2017. Organic growth in marketing revenues of $13.3 million was primarily attributable to expansion in our experiential retailer and manufacturer programs.
Cost of Revenues
Cost of revenues as a percentage of revenues for the three months ended March 31, 2017 was 81.3%, as compared to 80.8% for the three months ended March 31, 2016. The increase as a percentage of revenues for the three months ended March 31, 2017 relates primarily to ramp up costs associated with the launch of a new experiential marketing engagement during this period.
65
Table of Contents
Selling, General, and Administrative Expense
The increase in selling, general, and administrative expense was primarily attributable to fair value adjustments, excluding the present value accretion recorded as interest expense, net, related to the change in contingent consideration in the three months ended March 31, 2017 resulting in a gain of $5.0 million, of which $3.8 million was attributable to our marketing segment and $1.2 million was attributable to our sales segment. This increase was partially offset by a reduction in rent expense.
Depreciation and Amortization Expense
The slight increase in depreciation and amortization expense was primarily attributable to the amortization of additional intangibles related to the acquisitions in the year ended December 31, 2016 and the three months ended March 31, 2017.
Operating Income (Loss)
| Three Months Ended March 31, | Change | |||||||||||||||
| (in thousands) | 2017 | 2016 | $ | % | ||||||||||||
Sales | $ | 28,702 | $ | 22,698 | $ | 6,004 | 26.5 | % | ||||||||
Marketing | (2,949 | ) | (454 | ) | (2,495 | ) | (549.6 | %) | ||||||||
|
|
|
|
|
| |||||||||||
Total operating income | $ | 25,753 | $ | 22,244 | $ | 3,509 | 15.8 | % | ||||||||
|
|
|
|
|
| |||||||||||
In the sales segment, operating income growth was primarily attributable to an expansion of retail service offerings with our existing clients and additional revenues from acquired companies. In the marketing segment, acquired companies’ contribution to operating income was more than offset by the $3.8 million change in fair value related to contingent consideration recognized during this period. Due to the seasonality within our business, as described above, operating income as a percentage of revenues is generally lower in the first quarter as a percentage of revenues compared to the other three quarters in the fiscal year.
Interest Expense
The decrease in interest expense was primarily related to the change in fair value of our interest derivative instruments.
Benefit from Income Taxes
For the three months ended March 31, 2017 and 2016, we recorded a benefit from income taxes of $6.4 million and $8.8 million, respectively, which resulted in effective tax rates of 41.0% and 40.4%, respectively. The increase in the effective tax rate is primarily attributable to a change in non-deductible items, such as transaction costs, and a decrease in the work opportunity tax credit as a percentage of annual pre-tax book income during the three months ended March 31, 2017. The quarter-over-quarter decrease in our benefit from income taxes of $2.4 million was primarily attributable to a decrease inpre-tax loss.
Net Loss, Adjusted EBITDA, and Adjusted Net Income
The decrease in net loss was primarily attributable to the sales segment operating income growth as described above. Acquired companies contributed $5.3 million in Adjusted EBITDA growth during the three months ended March 31, 2017. Adjusted EBITDA organic growth of $2.0 million was related to organic revenue growth in the sales segment, partially offset by increased costs to support new platform launches in the marketing segment. The increase in Adjusted Net Income is primarily attributable to the increase in operating income complemented by reduced interest expense.
66
Table of Contents
Adjusted EBITDA and Adjusted Net Income are financial measures that are not calculated in accordance with GAAP. For a discussion of our presentation of these non-GAAP measures and a reconciliation of net income (loss) thereto, see “Prospectus Summary—Summary Consolidated Financial and Other Data.”
Results of Operations for the Years Ended December 31, 2016 and 2015
| Year Ended December 31, | ||||||||||||||||
| (in thousands) | 2016 | 2015 | ||||||||||||||
Revenues | $ | 2,100,235 | 100.0 | % | $ | 1,895,046 | 100.0 | % | ||||||||
Cost of revenues | 1,611,285 | 76.7 | % | 1,454,255 | 76.7 | % | ||||||||||
Selling, general, and administrative | 97,542 | 4.7 | % | 72,224 | 3.8 | % | ||||||||||
Depreciation and amortization | 170,260 | 8.1 | % | 164,584 | 8.7 | % | ||||||||||
|
|
|
|
|
|
|
| |||||||||
Total expenses | 1,879,087 | 89.5 | % | 1,691,063 | 89.2 | % | ||||||||||
|
|
|
|
|
|
|
| |||||||||
Operating income | 221,148 | 10.5 | % | 203,983 | 10.8 | % | ||||||||||
Interest expense, net | 167,360 | 8.0 | % | 160,895 | 8.5 | % | ||||||||||
|
|
|
|
|
|
|
| |||||||||
Income before income taxes | 53,788 | 2.6 | % | 43,088 | 2.3 | % | ||||||||||
Provision for income taxes | 22,623 | 1.1 | % | 18,202 | 1.0 | % | ||||||||||
|
|
|
|
|
|
|
| |||||||||
Net income | 31,165 | 1.5 | % | 24,886 | 1.3 | % | ||||||||||
|
|
|
|
|
|
|
| |||||||||
Other Financial Data: | ||||||||||||||||
Adjusted EBITDA(1) | 411,250 | 19.6 | % | 365,490 | 19.3 | % | ||||||||||
M&A Adjusted EBITDA(1) | 422,050 | 375,782 | ||||||||||||||
Adjusted Net Income(2) | 128,188 | 6.1 | % | 105,647 | 5.6 | % | ||||||||||
| (1) | Adjusted EBITDA and M&A Adjusted EBITDA are financial measures that are not calculated in accordance with GAAP. For a discussion of our presentation of Adjusted EBITDA and M&A Adjusted EBITDA and a reconciliation of net income to Adjusted EBITDA and M&A Adjusted EBITDA, see “Prospectus Summary—Summary Consolidated Financial and Other Data.” |
| (2) | Adjusted Net Income is a financial measure that is not calculated in accordance with GAAP. For a discussion of our presentation of Adjusted Net Income and a reconciliation of net income to Adjusted Net Income, see “Prospectus Summary—Summary Consolidated Financial and Other Data.” |
Comparison of the Years Ended December 31, 2016 and 2015
Revenues
| Year Ended December 31, | Change | |||||||||||||||
| (in thousands) | 2016 | 2015 | $ | % | ||||||||||||
Sales | $ | 1,448,278 | $ | 1,377,452 | $ | 70,826 | 5.1 | % | ||||||||
Marketing | 651,957 | 517,594 | 134,363 | 26.0 | % | |||||||||||
|
|
|
|
|
| |||||||||||
Total revenues | $ | 2,100,235 | $ | 1,895,046 | $ | 205,189 | 10.8 | % | ||||||||
|
|
|
|
|
| |||||||||||
In the sales segment, acquired companies contributed $55.9 million in revenue growth during the year ended December 31, 2016. Organic growth in sales revenues of $21.1 million was primarily attributable to an expansion of retail service offerings, partially offset by $6.2 million due to foreign currency exchange rate fluctuations between the U.S. dollar and the British pound. In the marketing segment, acquired companies contributed $32.8 million in marketing revenue growth during the year ended December 31, 2016. Organic growth in marketing revenues of $101.6 million was primarily attributable to new business wins in our experiential marketing business that launched at the end of 2015 and during 2016.
67
Table of Contents
Cost of Revenues
As a percentage of revenues, cost of revenues was unchanged at 76.7% for the years ended December 31, 2016 and 2015. On an absolute basis, the increase was primarily attributable to our increase in revenues, including an increase in costs related to startup expenses to launch several new experiential marketing engagements, partially offset by reduced bonus compensation expense.
Selling, General, and Administrative Expense
Selling, general, and administrative expense as a percentage of revenues for the year ended December 31, 2016 was 4.7%, as compared to 3.8% for the year ended December 31, 2015. The increase was primarily attributable to the change in fair value adjustments of $30.5 million related to contingent consideration recognized as a gain in the year ended December 31, 2015.
Depreciation and Amortization Expense
The increase in depreciation and amortization expense was primarily attributable to the amortization of additional intangibles related to the acquisitions in the year ended December 31, 2016.
Operating Income
| Year Ended December 31, | Change | |||||||||||||||
| (in thousands) | 2016 | 2015 | $ | % | ||||||||||||
Sales | $ | 186,766 | $ | 163,396 | $ | 23,370 | 14.3 | % | ||||||||
Marketing | 34,382 | 40,587 | (6,205 | ) | (15.3 | %) | ||||||||||
|
|
|
|
|
| |||||||||||
Total operating income | $ | 221,148 | $ | 203,983 | $ | 17,165 | 8.4 | % | ||||||||
|
|
|
|
|
| |||||||||||
The increase in the sales segment is attributable to our organic and acquired revenue growth described above, offset by a reduction of bonus compensation expense to associates.The decrease in the marketing segment was primarily attributable to the change in fair value adjustments of $26.9 million related to contingent consideration, offset by several new business launches, which included initialstart-up expenses that will not reoccur for these new retail experiential engagements.
Interest Expense
The increase in interest expense was primarily attributable to the change in the fair value of our interest derivative instruments in the year ended December 31, 2015, in addition to increased use of the Revolving Credit Facility during the year ended December 31, 2016.
Provision for Income Taxes
For the years ended December 31, 2016 and 2015, we recorded a provision for income taxes of $22.6 million and $18.2 million, respectively, which resulted in effective tax rates of 42.1% and 42.2%, respectively. The decrease in the effective tax rate is primarily attributable to a change in our state apportionment factors. The year-over-year increase in our provision for income taxes of $4.4 million was primarily attributable to an increase inpre-tax income.
68
Table of Contents
Net Income, Adjusted EBITDA, M&A Adjusted EBITDA, and Adjusted Net Income
The increase in net income was primarily attributable to contributions from acquired companies and organic revenue growth as described above. The increase in Adjusted EBITDA was attributable to acquired companies, which accounted for $25.2 million in growth, or 6.9%, and organic growth of $20.6 million, or 5.6%. Similarly the increase in M&A Adjusted EBITDA was attributable to contributions from acquired companies and organic revenue growth as described above. The increase in Adjusted Net Income is related to the above growth in revenue, partially offset by increased provision for income taxes and interest expense.
Adjusted EBITDA, M&A Adjusted EBITDA, and Adjusted Net Income are financial measures that are not calculated in accordance with GAAP. For a discussion of our presentation of these non-GAAP measures and a reconciliation of net income (loss) thereto, see “Prospectus Summary—Summary Consolidated Financial and Other Data.”
Results of Operations for the Year Ended December 31, 2015 to the Period from July 26, 2014 to December 31, 2014 (Successor) and the Period from January 1, 2014 to July 25, 2014 (Predecessor)
| (in thousands) | Year Ended December 31, 2015 | Period From July 26, 2014 to December 31, 2014 (Successor) | Period From January 1, 2014 to July 25, 2014 (Predecessor) | |||||||||||||||||||||
Revenues | $ | 1,895,046 | 100.0 | % | $ | 808,075 | 100.0 | % | $ | 905,646 | 100.0 | % | ||||||||||||
Cost of revenues | 1,454,255 | 76.7 | % | 601,649 | 74.5 | % | 715,104 | 79.0 | % | |||||||||||||||
Selling, general, and administrative | 72,224 | 3.8 | % | 59,540 | 7.4 | % | 141,300 | 15.6 | % | |||||||||||||||
Depreciation and amortization | 164,584 | 8.7 | % | 68,683 | 8.5 | % | 75,271 | 8.3 | % | |||||||||||||||
|
|
|
|
|
|
|
|
|
|
|
| |||||||||||||
Total expenses | 1,691,063 | 89.2 | % | 729,872 | 90.3 | % | 931,675 | 102.9 | % | |||||||||||||||
|
|
|
|
|
|
|
|
|
|
|
| |||||||||||||
Operating income (loss) | 203,983 | 10.8 | % | 78,203 | 9.7 | % | (26,029 | ) | (2.9 | %) | ||||||||||||||
Interest expense, net | 160,895 | 8.5 | % | 84,227 | 10.4 | % | 83,896 | 9.3 | % | |||||||||||||||
|
|
|
|
|
|
|
|
|
|
|
| |||||||||||||
Income (loss) before income taxes | 43,088 | 2.3 | % | (6,024 | ) | (0.7 | %) | (109,925 | ) | (12.1 | %) | |||||||||||||
Provision for (benefit from) income taxes | 18,202 | 1.0 | % | 3,861 | 0.5 | % | (20,826 | ) | (2.3 | %) | ||||||||||||||
|
|
|
|
|
|
|
|
|
|
|
| |||||||||||||
Net income (loss) | $ | 24,886 | 1.3 | % | $ | (9,885 | ) | (1.2 | %) | $ | (89,099 | ) | (9.8 | %) | ||||||||||
|
|
|
|
|
|
|
|
|
|
|
| |||||||||||||
Other Financial Data: | ||||||||||||||||||||||||
Adjusted EBITDA(1) | $ | 365,490 | 19.3 | % | $ | 175,645 | 21.7 | % | $ | 151,490 | 16.7 | % | ||||||||||||
Adjusted Net Income(2) | $ | 105,647 | 5.6 | % | $ | 49,056 | 6.1 | % | $ | 11,763 | 1.3 | % | ||||||||||||
| (1) | Adjusted EBITDA is a financial measure that is not calculated in accordance with GAAP. For a discussion of our presentation of Adjusted EBITDA and a reconciliation of net income (loss) to Adjusted EBITDA, see “Prospectus Summary—Summary Consolidated Financial and Other Data.” |
| (2) | Adjusted Net Income is a financial measure that is not calculated in accordance with GAAP. For a discussion of our presentation of Adjusted Net Income and a reconciliation of net income (loss) to Adjusted Net Income, see “Prospectus Summary—Summary Consolidated Financial and Other Data.” |
69
Table of Contents
Comparison of the Year Ended December 31, 2015 to the Period from July 26, 2014 to December 31, 2014 (Successor) and the Period from January 1, 2014 to July 25, 2014 (Predecessor)
Revenues
| (in thousands) | Year Ended December 31, 2015 | Successor Period From July 26, 2014 to December 31, 2014 | Predecessor Period From January 1, 2014 to July 25, 2014 | |||||||||
Sales | $ | 1,377,452 | $ | 598,608 | $ | 660,597 | ||||||
Marketing | 517,594 | 209,467 | 245,049 | |||||||||
|
|
|
|
|
| |||||||
Total revenues | $ | 1,895,046 | $ | 808,075 | $ | 905,646 | ||||||
|
|
|
|
|
| |||||||
Due to the 2014 Topco Acquisition, our consolidated financial statements for the year ended December 31, 2015 are not directly comparable to the consolidated financial statements of the Successor for the period from July 26, 2014 to December 31, 2014 or to the Predecessor for the period from January 1, 2014 to July 25, 2014. Please refer to our supplemental Pro Forma 2014 discussion for more information.
In the sales segment, acquired companies contributed $88.1 million in sales revenues during the year ended December 31, 2015. Organic growth in sales revenue growth included new client wins and an expansion with existing clients, offset by foreign currency exchange rates between the U.S. dollar and the Canadian dollar. In the marketing segment, acquired companies contributed $68.4 million in marketing revenues during the year ended December 31, 2015.
Cost of Revenues
Cost of revenues as a percentage of revenues for the year ended December 31, 2015 was 76.7% as compared to 74.5% for the Successor period from July 26, 2014 to December 31, 2014 and 79.0% for the Predecessor period from January 1, 2014 to July 25, 2014. Due to the seasonality of our business as noted above, a direct comparison of these periods is not meaningful.
Selling, General, and Administrative Expense
Selling, general, and administrative expense as a percentage of revenues for the year ended December 31, 2015 was 3.8% as compared to 7.4% for the Successor period from July 26, 2014 to December 31, 2014. The decrease as a percentage of revenues was primarily attributable to the transaction expenses in connection with the 2014 Topco Acquisition. Excluding these transaction expenses of $23.9 million, selling, general, and administrative expenses as a percentage of revenues was 4.4%. The decrease is also attributable to the change in fair value adjustments of $19.3 million related to contingent consideration recognized as a gain in the year ended December 31, 2015, offset by an increase in sponsor management fees, transaction expenses related to international acquisitions and equity-based compensation expense in the Successor period. Selling, general, and administrative expenses as a percentage of revenues for the Predecessor period from January 1, 2014 to July 25, 2014 was 15.6%. The decrease was primarily attributable to the transaction expenses in connection with the 2014 Topco Acquisition. Excluding transaction expenses of $112.0 million, selling, general, and administrative expenses as a percentage of revenues was 3.2%. The increase was primarily attributable to an increase in Sponsors’ management fees, transaction expenses related to international acquisitions and equity-based compensation, partially offset by the change in fair value of $19.3 million related to contingent consideration recognized as a gain in the year ended December 31, 2015.
70
Table of Contents
Depreciation and Amortization Expense
Depreciation and amortization expense as a percentage of revenues for the year ended December 31, 2015 was 8.7%, as compared to 8.5% for the Successor period from July 26, 2014 to December 31, 2014. The increase was primarily attributable to the amortization of additional intangibles related primarily to the 2014 Topco Acquisition. Additionally, new acquisitions during the year ended December 31, 2015 contributed to additional depreciation and amortization expense. Depreciation and amortization expense as a percentage of revenues for the Predecessor period from January 1, 2014 to July 25, 2014 was 8.3%. The increase was primarily attributable to the amortization of additional intangibles related primarily to the 2014 Topco Acquisition. Additionally, new acquisitions during the year ended December 31, 2015 contributed to additional depreciation and amortization expense.
Operating Income (Loss)
| (in thousands) | Year Ended December 31, 2015 | As a Percentage of Revenues | Successor Period From July 26, 2014 to December 31, 2014 | As a Percentage of Revenues | Predecessor Period From January 1, 2014 to July 25, 2014 | As a Percentage of Revenues | ||||||||||||||||||
Sales | $ | 163,396 | 11.9 | % | $ | 68,299 | 11.4 | % | $ | (33,908 | ) | (5.1 | %) | |||||||||||
Marketing | 40,587 | 7.8 | % | 9,904 | 4.7 | % | 7,879 | 3.2 | % | |||||||||||||||
|
|
|
|
|
| |||||||||||||||||||
Total operating income (loss) | $ | 203,983 | 10.8 | % | $ | 78,203 | 9.7 | % | $ | (26,029 | ) | (2.9 | %) | |||||||||||
|
|
|
|
|
| |||||||||||||||||||
Our operating income (loss) was principally impacted by the period from July 26, 2014 to December 31, 2014 being shorter than the year ended December 31, 2015 and the transaction costs associated with the 2014 Topco Acquisition.The increase in operating income in the sales segment was primarily attributable to the transaction costs in connection with the 2014 Topco Acquisition during the Successor period from July 26, 2014 to December 31, 2014 and the Predecessor period from January 1, 2014 to July 25, 2014, complemented by the continued growth from acquired and organic revenues. The increase in marketing segment operating income was primarily attributable to the transaction costs associated with the 2014 Topco Acquisition during the Successor period from July 26, 2014 to December 31, 2014 and the Predecessor period from January 1, 2014 to July 25, 2014, complemented by the continued growth from acquired and organic revenues. Additionally, operating income during the year ended December 31, 2015 increased due to a gain in the change in fair value adjustments of $18.7 million related to the release of contingent consideration, partially offset by aone-time restructuring expense of $4.0 million and an increase in amortization expense of $9.1 million, each of which primarily related to an acquisition during the Successor period ending December 31, 2014.
Interest Expense
The decrease in interest expense was primarily attributable to the extinguishment of debt consisting of awrite-off of unamortized debt issuance costs of $22.9 million for the Predecessor period from January 1, 2014 to July 25, 2014, partially offset by an increase in expense associated with the higher outstanding debt balance following the 2014 Topco Acquisition.
Provision for (Benefit from) Income Taxes
For the year ended December 31, 2015 and the Successor period from July 26, 2014 to December 31, 2014, we recorded a provision for income taxes of $18.2 million and $3.9 million,
71
Table of Contents
respectively, which resulted in effective tax rates of 42.2% and a benefit of 64.1%. The differences between the effective tax rates and the U.S. federal statutory rates are primarily attributable to bonus expenses andnon-deductible items such as transaction costs.
For the year ended December 31, 2015 and the Predecessor period from January 1, 2014 to July 25, 2014, we recorded a provision for income taxes of $18.2 million and a benefit from income taxes of $20.8 million, respectively, which resulted in effective tax rates of 42.2% and 18.9%. The differences between the effective tax rates and the U.S. federal statutory rates are primarily attributable to equity-based compensation andnon-deductible items such as transaction costs.
Net Income (Loss), Adjusted EBITDA, and Adjusted Net Income
The change in net income (loss) was principally caused by the Successor period from July 26, 2014 to December 31, 2014 being shorter than the year ended December 31, 2015 and the transaction costs associated with the 2014 Topco Acquisition. The increase in net income (loss) was primarily attributable to the 2014 Topco Acquisition transaction expenses of $23.9 million and $112.0 million during the Successor period from July 26, 2014 to December 31, 2014 and the Predecessor period from January 1, 2014 to July 25, 2014, respectively. Adjusted for transaction expenses, reduction in net income was primarily attributable to the full year of increased amortization expense in the year ended December 31, 2015. The increase in Adjusted EBITDA was attributable to the increases in acquisition and organic revenues as noted above. The increases in Adjusted Net Income were attributable to the growth in Adjusted EBITDA as compared to the Successor and Predecessor periods coupled with the reduction of interest expense related to the 2014 Topco Acquisition in the year ended December 31, 2015.
Adjusted EBITDA and Adjusted Net Income are financial measures that are not calculated in accordance with GAAP. For a discussion of our presentation of these non-GAAP measures and a reconciliation of net income (loss) thereto, see “Prospectus Summary—Summary Consolidated Financial and Other Data.”
Supplemental Results of the Year Ended December 31, 2015 (Successor) to Pro Forma 2014
| Year Ended December 31, | ||||||||||||||||
| (in thousands) | 2015 | Pro Forma 2014(1) (Unaudited) | ||||||||||||||
Revenues | $ | 1,895,046 | 100.0 | % | $ | 1,713,721 | 100.0 | % | ||||||||
Cost of revenues | 1,454,255 | 76.7 | % | 1,316,753 | 76.8 | % | ||||||||||
Selling, general, and administrative | 72,224 | 3.8 | % | 64,903 | 3.8 | % | ||||||||||
Depreciation and amortization | 164,584 | 8.7 | % | 154,315 | 9.0 | % | ||||||||||
|
|
|
|
|
|
|
| |||||||||
Total expenses | 1,691,063 | 89.2 | % | 1,535,971 | 89.6 | % | ||||||||||
|
|
|
|
|
|
|
| |||||||||
Operating income | 203,983 | 10.8 | % | 177,750 | 10.4 | % | ||||||||||
Interest expense, net | 160,895 | 8.5 | % | 156,200 | 9.1 | % | ||||||||||
|
|
|
|
|
|
|
| |||||||||
Income before income taxes | 43,088 | 2.3 | % | 21,550 | 1.3 | % | ||||||||||
Provision for income taxes | 18,202 | 1.0 | % | 6,159 | 0.4 | % | ||||||||||
|
|
|
|
|
|
|
| |||||||||
Net income | $ | 24,886 | 1.3 | % | $ | 15,391 | 0.9 | % | ||||||||
|
|
|
|
|
|
|
| |||||||||
Other Financial Data: | ||||||||||||||||
Adjusted EBITDA(2) | $ | 365,490 | 19.3 | % | $ | 327,135 | 19.1 | % | ||||||||
M&A Adjusted EBITDA(2) | $ | 375,782 | $ | 335,323 | ||||||||||||
Adjusted Net Income(3) | $ | 105,647 | �� | 5.6 | % | $ | 89,693 | 5.2 | % | |||||||
72
Table of Contents
| (1) | Presented to give pro forma effect to the adjustments attributable to the 2014 Topco Acquisition that are described in “Unaudited Pro Forma Condensed Consolidated Statement of Operations.” The pro forma adjustments are described in the footnotes included in “Unaudited Pro Forma Condensed Consolidated Statement of Operations” and are based upon available information and certain assumptions that we believe are reasonable. |
| (2) | Adjusted EBITDA and M&A Adjusted EBITDA are financial measures that are not calculated in accordance with GAAP. For a discussion of our presentation of Adjusted EBITDA and M&A Adjusted EBITDA and a reconciliation of net income to Adjusted EBITDA and M&A Adjusted EBITDA, see “Prospectus Summary—Summary Consolidated Financial and Other Data.” |
| (3) | Adjusted Net Income is a financial measure that is not calculated in accordance with GAAP. For a discussion of our presentation of Adjusted Net Income and a reconciliation of net income to Adjusted Net Income, see “Prospectus Summary—Summary Consolidated Financial and Other Data.” |
Comparison of the Year Ended December 31, 2015 (Successor) to Pro Forma 2014
Revenues
| Year Ended December 31, 2015 | Pro Forma 2014(1) (Unaudited) | Change | ||||||||||||||
| (in thousands) | $ | % | ||||||||||||||
Sales | $ | 1,377,452 | $ | 1,259,205 | $ | 118,247 | 9.4 | % | ||||||||
Marketing | 517,594 | 454,516 | 63,078 | 13.9 | % | |||||||||||
|
|
|
|
|
| |||||||||||
Total revenues | $ | 1,895,046 | $ | 1,713,721 | $ | 181,325 | 10.6 | % | ||||||||
|
|
|
|
|
| |||||||||||
| (1) | Presented to give pro forma effect to the adjustments attributable to the 2014 Topco Acquisition. The pro forma adjustments are described in “Unaudited Pro Forma Condensed Consolidated Statement of Operations” and are based upon available information and certain assumptions that we believe are reasonable. |
In the sales segment, acquired companies contributed $88.1 million in sales revenue growth during the year ended December 31, 2015. Organic growth in sales revenues of $44.7 million was primarily attributable to new client wins and expansions with existing clients, offset by $14.6 million due to foreign currency exchange rate fluctuations between the U.S. dollar and the Canadian dollar. In the marketing segment, acquired companies contributed $68.4 million in revenue growth during the year ended December 31, 2015. Organic marketing revenues declined by $5.3 million, primarily attributable to the reduction in revenues associated with the loss of one contract in the marketing segment which accounted for $44.3 million year over year decline, partially offset by additional revenues from a combination of growth with existing clients and new business launched throughout the year.
Cost of Revenues
Cost of revenues as a percentage of revenues was relatively unchanged at 76.7% for the years ended December 31, 2015 and 76.8% for the Pro Forma 2014 period. On an absolute basis, the increase was primarily attributable to costs associated with our increase in revenues.
Selling, General, and Administrative Expense
Selling, general, and administrative expense as a percentage of revenues remained unchanged for the years ended December 31, 2015 and the Pro Forma 2014 period at 3.8%. Excluding adjustments noted below, selling, general, and administrative expense as a percentage of revenues for the year ended December 31, 2015 was 4.4%. During the year ended December 31, 2015, the change in fair value adjustments of contingent consideration, excluding the present value accretion recorded as interest expense, net, was a gain of $19.3 million. The change was primarily related to one of our acquisitions completed in the year ended December 31, 2014, offset by restructuring expenses of $5.3 million recorded in the year ended December 31, 2015, of which $4.0 million was related to the
73
Table of Contents
same 2014 acquisition, and $2.6 million in transaction expenses related to other acquisitions. The remaining increase as a percentage of revenues is primarily attributable to an increase of $4.4 million related to sponsor management fees and equity-based compensation expense associated with awards to one of the entities affiliated with a Sponsor that owns equity interests in Karman Topco.
Depreciation and Amortization Expense
The increase in depreciation and amortization expense was primarily attributable to new acquisitions during the year ended December 31, 2015 and the Pro Forma 2014 period.
Operating Income
| Year Ended December 31, 2015 | Pro Forma 2014(1) | Change | ||||||||||||||
| (in thousands) | $ | % | ||||||||||||||
| (Unaudited) | ||||||||||||||||
Sales | $ | 163,396 | $ | 142,720 | $ | 20,676 | 14.5 | % | ||||||||
Marketing | 40,587 | 35,030 | 5,557 | 15.9 | % | |||||||||||
|
|
|
|
|
|
|
| |||||||||
Total operating income | $ | 203,983 | $ | 177,750 | $ | 26,233 | 14.8 | % | ||||||||
|
|
|
|
|
| |||||||||||
| (1) | Presented to give pro forma effect to the adjustments attributable to the 2014 Topco Acquisition that are described in “Unaudited Pro Forma Condensed Consolidated Statement of Operations” and are based upon available information and certain assumptions that we believe are reasonable. |
The increase in operating income was primarily attributable to revenue growth from our organic operations and acquired companies, offset by increased depreciation and amortization. In the sales segment, acquired companies and organic revenue growth contributed to the increase as noted above. Expenses in the sales segment grew at a slower rate than revenue due to lower variable costs and our ability to leverage our fixed costs offset by increased transaction expenses related to our international acquisitions. Material factors impacting operating income, in the marketing segment, include a year-over-year increase in fair value adjustments of $18.7 million related to the release of contingent consideration, partially offset by aone-time restructuring expense of $4.0 million and an increase in depreciation and amortization expense of $9.1 million, each of which primarily related to a 2014 acquisition, along with a legal settlement of $2.0 million. Growth attributable to acquired companies and organic growth described above contributed to the additional operating income growth.
Interest Expense
The increase was primarily due to the present value accretion recorded as interest expense, net, related to contingent consideration for the year ended December 31, 2015.
Provision for Income Taxes
For the year ended December 31, 2015 and for the Pro Forma 2014 period, provision for income taxes was $18.2 million and $6.2 million, respectively, which resulted in effective tax rates of 42.2% and 28.6%, respectively. The increase in the effective tax rate is primarily attributable tonon-deductible items such as fair value adjustments. The year-over-year increase in our provision for income taxes of $12.0 million was primarily attributable to an increase inpre-tax income, along with the increase in the effective tax rate.
74
Table of Contents
Net Income, Adjusted EBITDA, M&A Adjusted EBITDA, and Adjusted Net Income
The increase in net income was primarily attributed to acquired and organic growth in revenues offset by increased provision for tax expense and interest expense. Acquired companies contributed $24.0 million in Adjusted EBITDA growth during the year ended December 31, 2015. Adjusted EBITDA organic growth of $14.4 million and M&A Adjusted EBITDA growth of $40.5 million were primarily attributable to new client wins in both the sales and marketing segments and additional business with existing clients. The increase in Adjusted Net Income was consistent with the growth in revenues and Adjusted EBITDA as noted above.
Adjusted EBITDA, M&A Adjusted EBITDA, and Adjusted Net Income are financial measures that are not calculated in accordance with GAAP. For a discussion of our presentation of these non-GAAP measures and a reconciliation of net income (loss) thereto, see “Prospectus Summary—Summary Consolidated Financial and Other Data.”
Backlog
We do not believe that our backlog of service arrangements is meaningful as of any particular date or indicative of future service, as our clients can change or cancel our services with little or no penalty and limited advance notice prior to services being rendered.
75
Table of Contents
Quarterly Results of Operations
The following table sets forth our historical quarterly results of operation as well as certain operating data for each of our most recent eight fiscal quarters. This unaudited quarterly information has been prepared on the same basis as our annual audited financial statements appearing elsewhere in this prospectus, and includes all adjustments, consisting only of normal recurring adjustments, that we consider necessary to present fairly the financial information for the fiscal quarters presented. The quarterly data should be read in conjunction with our audited consolidated financial statements and the related notes appearing elsewhere in this document. In our opinion, the accompanying unaudited interim consolidated financial statements contain all adjustments which are necessary for a fair presentation of the quarters presented. The operating results for any quarter are not necessarily indicative of the results of any future quarter.
| Three Months Ended (Unaudited) | ||||||||||||||||||||||||||||||||
| March 31, 2017 | December 31, 2016 | September 30, 2016 | June 30, 2016 | March 31, 2016 | December 31, 2015 | September 30, 2015 | June 30, 2015 | |||||||||||||||||||||||||
Revenues | $ | 508,468 | $ | 601,935 | $ | 533,620 | $ | 506,404 | $ | 458,276 | $ | 561,625 | $ | 482,492 | $ | 452,000 | ||||||||||||||||
Cost of revenues | 413,153 | 439,642 | 413,028 | 388,247 | 370,368 | 422,383 | 369,284 | 347,283 | ||||||||||||||||||||||||
Selling, general, and administrative | 26,668 | 27,973 | 22,527 | 24,017 | 23,025 | 39,702 | 27,642 | 12,799 | ||||||||||||||||||||||||
Depreciation and amortization | 42,894 | 42,746 | 42,003 | 42,872 | 42,639 | 41,683 | 41,273 | 41,377 | ||||||||||||||||||||||||
|
|
|
|
|
|
|
|
|
|
|
|
|
|
|
| |||||||||||||||||
Total expenses | 482,715 | 510,361 | 477,558 | 455,136 | 436,032 | 503,768 | 438,199 | 401,459 | ||||||||||||||||||||||||
|
|
|
|
|
|
|
|
|
|
|
|
|
|
|
| |||||||||||||||||
Operating income | 25,753 | 91,574 | 56,062 | 51,268 | 22,244 | 57,857 | 44,293 | 50,541 | ||||||||||||||||||||||||
Interest expense, net | 41,362 | 40,616 | 40,868 | 41,810 | 44,066 | 41,674 | 46,782 | 43,422 | ||||||||||||||||||||||||
|
|
|
|
|
|
|
|
|
|
|
|
|
|
|
| |||||||||||||||||
Loss (income) before income taxes | (15,609 | ) | 50,958 | 15,194 | 9,458 | (21,822 | ) | 16,183 | (2,489 | ) | 7,119 | |||||||||||||||||||||
Provision for (benefit from) income taxes | (6,406 | ) | 19,986 | 7,735 | 3,724 | (8,821 | ) | 6,785 | (590 | ) | 2,683 | |||||||||||||||||||||
|
|
|
|
|
|
|
|
|
|
|
|
|
|
|
| |||||||||||||||||
Net (loss) income | (9,203 | ) | 30,972 | 7,459 | 5,734 | (13,001 | ) | 9,398 | (1,899 | ) | 4,436 | |||||||||||||||||||||
Less: net income (loss) attributable to noncontrolling interests | 147 | (788 | ) | (111 | ) | (48 | ) | (37 | ) | 256 | 23 | 13 | ||||||||||||||||||||
|
|
|
|
|
|
|
|
|
|
|
|
|
|
|
| |||||||||||||||||
Net (loss) income attributable to stockholder of Advantage Solutions Inc. | $ | (9,350 | ) | $ | 31,760 | $ | 7,570 | $ | 5,782 | $ | (12,964 | ) | $ | 9,142 | $ | (1,922 | ) | $ | 4,423 | |||||||||||||
|
|
|
|
|
|
|
|
|
|
|
|
|
|
|
| |||||||||||||||||
Net (loss) income per share of common stock: | ||||||||||||||||||||||||||||||||
Basic | $ | (93,502 | ) | $ | 317,600 | $ | 75,711 | $ | 57,821 | $ | (129,645 | ) | $ | 91,419 | $ | (19,216 | ) | $ | 44,230 | |||||||||||||
|
|
|
|
|
|
|
|
|
|
|
|
|
|
|
| |||||||||||||||||
Diluted | $ | (93,502 | ) | $ | 317,600 | $ | 75,711 | $ | 57,821 | $ | (129,645 | ) | $ | 91,419 | $ | (19,216 | ) | $ | 44,230 | |||||||||||||
|
|
|
|
|
|
|
|
|
|
|
|
|
|
|
| |||||||||||||||||
Weighted-average number of shares of common stock: | ||||||||||||||||||||||||||||||||
Basic | 100 | 100 | 100 | 100 | 100 | 100 | 100 | 100 | ||||||||||||||||||||||||
|
|
|
|
|
|
|
|
|
|
|
|
|
|
|
| |||||||||||||||||
Diluted | 100 | 100 | 100 | 100 | 100 | 100 | 100 | 100 | ||||||||||||||||||||||||
|
|
|
|
|
|
|
|
|
|
|
|
|
|
|
| |||||||||||||||||
76
Table of Contents
Liquidity and Capital Resources
Cash Flows
A summary of our cash operating, investing, and financing activities are shown in the following table:
| Successor | Predecessor | |||||||||||||||||||||||
| Three Months Ended March 31, 2017 | Three Months Ended March 31, 2016 | Year Ended December 31, 2016 | Year Ended December 31, 2015 | Period From July 26, 2014 to December 31, 2014 | Period From January 1, 2014 to July 25, 2014 | |||||||||||||||||||
| (unaudited) | ||||||||||||||||||||||||
| (in thousands) | ||||||||||||||||||||||||
Net cash (used in) provided by operating activities | $ | (2,172 | ) | $ | 23,893 | $ | 164,407 | $ | 116,945 | $ | 18,045 | $ | 66,563 | |||||||||||
Net cash used in investing activities | (17,467 | ) | (43,896 | ) | (148,981 | ) | (240,969 | ) | (3,759,726 | ) | (91,893 | ) | ||||||||||||
Net cash provided by (used in) financing activities | 46,289 | 15,065 | (42,621 | ) | 112,295 | 3,619,599 | 160,220 | |||||||||||||||||
Net effect of foreign currency fluctuations on cash | 315 | 169 | (3,100 | ) | (2,504 | ) | (824 | ) | (114 | ) | ||||||||||||||
|
|
|
|
|
|
|
|
|
|
|
| |||||||||||||
Net change in cash and cash equivalents | $ | 26,965 | $ | (4,769 | ) | $ | (30,295 | ) | $ | (14,233 | ) | $ | (122,906 | ) | $ | 134,776 | ||||||||
|
|
|
|
|
|
|
|
|
|
|
| |||||||||||||
Net Cash (Used in) Provided by Operating Activities
Net cash used in operating activities during the three months ended March 31, 2017, consists of net loss of $9.2 million adjusted for certainnon-cash items, including depreciation and amortization of $42.9 million and effects of changes in working capital. The decrease in cash provided by operating activities during the three months ended March 31, 2017 relative to 2016 was primarily due to timing of cash collections related to accounts receivable.
Net cash provided by operating activities for the year ended December 31, 2016 consists of net income of $31.2 million adjusted for certainnon-cash items, including depreciation and amortization of $170.3 million and effects of changes in working capital. The increase in cash provided by operating activities in 2016 relative to 2015 was primarily due to cash generated from higher net income, excludingnon-cash items, from operations, partially offset by a $4.2 million decrease in working capital.
For the year ended December 31, 2015, net cash provided by operating activities was $116.9 million. Net income was $24.9 million andnon-cash expenses, comprised of depreciation and amortization expense, noncash interest expense, equity-based compensation expense, fair value adjustments related to contingent consideration, deferred income taxes, and equity in earnings of unconsolidated affiliates, were $112.3 million. The change innon-cash expenses was principally due to additional amortization expense resulting from the 2014 Topco Acquisition and fair value adjustments to contingent consideration, net of interest expense accretion, of $25.6 million. Additionally, changes in operating assets and liabilities represented a $20.2 million use of cash, which was primarily driven by changes in working capital including an increase in accounts payable, and collection of accounts receivables.
77
Table of Contents
For the Successor period from July 26, 2014 to December 31, 2014, net cash provided by operating activities was $18.0 million. Net loss was $9.9 million andnon-cash expenses, comprised ofnon-cash interest, depreciation and amortization expense, stock-based compensation expense, and deferred income taxes, was a $63.5 million source of cash for the Successor period from July 26, 2014 to December 31, 2014. The change innon-cash expenses was principally due to a partial period of othernon-cash expenses for the Successor period from July 26, 2014 to December 31, 2014. Changes in operating assets and liabilities represented a $35.6 million use of cash, primarily driven by changes in working capital including an increase in accounts receivables attributable to an increase in sales during the fourth quarter as a result of the seasonality trends discussed above.
For the Predecessor period from January 1, 2014 to July 25, 2014, net cash provided by operating activities was $66.6 million. Net loss was $89.1 million andnon-cash expenses, comprised of interest, depreciation and amortization expense, equity-based compensation expense, and deferred income taxes, was a $116.0 million source of cash during the Predecessor period from January 1, 2014 to July 25, 2014. The change innon-cash expenses was principally due to $51.6 million in equity-based compensation during the Predecessor period from January 1, 2014 to July 25, 2014, related to 9,720 units granted at no cost to the recipients. As a result of the 2014 Topco Acquisition, all then-outstanding profit interests vested as of July 25, 2014 and the Predecessor recognized equity-based compensation expense of $51.6 million, offset by a partial period of othernon-cash expense for the Predecessor period from January 1, 2014 to July 25, 2014. Changes in operating assets and liabilities represented a $39.7 million source of cash, primarily driven by changes in working capital including an increase in accounts payable, partially offset by a decrease in accrued compensation and benefits due to timing of ourbi-weekly payroll period as of July 25, 2014.
Our principal sources of liquidity are cash flows from operations, borrowings under our Revolving Credit Facility, and other debt. Our principal uses of cash are operating expenses, working capital requirements, acquisitions, and repayment of debt. We believe that our anticipated sources of liquidity including operating cash flows, existing cash and cash equivalents, borrowing capacity under our Revolving Credit Facility, and our ability to issue debt or equity, if required, will be sufficient to meet our projected cash requirements for at least the next 12 months. However, if we were to undertake any significant acquisitions that require financing beyond our existing borrowing capacity, it may be necessary for us to obtain additional debt or equity financing. We may not be able to obtain such financing on reasonable terms, or at all.
Net Cash Used in Investing Activities
For the three months ended March 31, 2017 and 2016, the years ended December 31, 2016 and 2015, the period from July 26, 2014 to December 31, 2014, and the period from January 1, 2014 to July 25, 2014, our net cash used in investing activities was $17.5 million, $43.9 million, $149.0 million, $241.0 million, $3,759.7 million, and $91.9 million, respectively. In each of these periods, our primary investing activities consisted of acquisitions. For the period from July 26, 2014 to December 31, 2014, purchase of businesses, net of cash acquired included the 2014 Topco Acquisition, in which Karman Topco acquired all of the voting interests in our company. The total purchase price of $4,267.7 million was financed with the sale of equity units of $1,595.0 million (including $500.0 million in cash funded directly by Karman Topco’s unitholders), borrowings of $2,585.0 million (including $1,636.1 million which was used to pay off the predecessor’s debt at closing), the roll-over of management’s equity in the predecessor with a fair value of $67.0 million, and cash on hand. Additionally, during the year ended December 31, 2015, we purchased investments in unconsolidated affiliates of $78.0 million.
Additionally, we invest cash for the purchase of property and equipment to support our increased employee headcount and overall growth in our business. We expect that we will make additional capital expenditures and investments in the future to support the future growth of our business.
78
Table of Contents
Net Cash Provided by Financing Activities
We primarily finance our growth through cash flows from operations, however, we also incur long-term debt or borrow under lines of credit when necessary to execute acquisitions. Cash flows from financing activities relate to borrowings related to these instruments and subsequent payments of principal and financing fees paid. Additionally, many of our acquisition agreements include contingent consideration arrangements, which are generally based on the achievement of future financial performance by the operations attributable to the acquired companies. Payments related to contingent consideration are reflected as cash outflows from financing activities. Cash flows related to financing activities during the three months ended March 31, 2017 were primarily the result of borrowings on our Revolving Credit Facility, net of payments, of $55.0 million, $5.8 million in principal payments on our long-term debt and $3.0 million related to payments of contingent consideration. Cash flows related to financing activities during the three months ended March 31, 2016 were primarily the result of borrowings on our Revolving Credit Facility, net of payments of $20.0 million, $6.0 million in principal payments on our long-term debt and $1.6 million related to payments of contingent consideration, net of redemption of noncontrolling interests of $2.7 million. Cash flows related to financing activities during the year ended December 31, 2016 were primarily the result of payments on our Revolving Credit Facility, net of borrowings of $20.0 million and incremental increase in financing cash outflows attributable to an additional $11.2 million in payments related to contingent consideration arrangements resulting from previous acquisitions. During the year ended December 31, 2015, we obtained an additional $150.0 million of borrowing under the First Lien Term Loan and the First Lien Credit Agreement to finance additional acquisitions, to pay related fees and expenses, to repay loans under the Revolving Credit Facility, and for general corporate purposes, offset by additional borrowings under our Revolving Credit Facility.
From January 1, 2014 through July 25, 2014, in connection with the 2014 Topco Acquisition, Karman Topco acquired all of the voting interests in the Company. The total purchase price of $4,267.7 million was financed with the issuance of equity units of $1,595.0 million (including $500.0 million in cash funded directly by Karman Topco’s unitholders), borrowings of $2,585.0 million (including $1,636.1 million which was used to pay off the Predecessor’s debt at closing), the roll-over of management’s equity in the Predecessor with a fair value of $67.0 million, and cash on hand.
Description of Credit Facilities
On July 25, 2014, certain of our subsidiaries entered into the following credit facilities with different syndicates of lenders in connection with the 2014 Topco Acquisition:
| • | the First Lien Credit Agreement, which provided for: |
| • | a $200.0 million revolving credit facility, or the Revolving Credit Facility, of which up to $75.0 million may be used for letters of credit, |
| • | a $1,800.0 million term loan facility, or the Initial First Lien Term Loans, |
| • | commitments for an additional $60.0 million of unfunded delayed draw term loans, or the Delayed Draw Commitments, and |
| • | uncommitted incremental revolving and first lien term loan facilities, subject to certain incurrence tests; and |
| • | the Second Lien Credit Agreement, which that provided for: |
| • | a $760.0 million term loan facility, or the Second Lien Term Loans, and |
| • | uncommitted incremental second lien term loan facilities, subject to certain incurrence tests. |
79
Table of Contents
Borrower, Guarantors, and Collateral
Advantage Sales & Marketing Inc., our wholly owned, indirect subsidiary, is the borrower under the credit facilities, or Borrower. Obligations under the credit facilities are guaranteed by Karman Intermediate Corp., the Borrower’s direct parent and our wholly owned, direct subsidiary, and by certain wholly owned, domestic material subsidiaries of the Borrower, or collectively the Guarantors. Obligations under the credit facilities are secured by a lien on substantially all of the property and assets of the Borrower and the Guarantors and which, in the case of the First Lien Credit Agreement, is a first-priority lien and, in the case of the Second Lien Credit Agreement, is a second-priority lien. Advantage Solutions Inc. is not a party to the credit agreements, is not a Guarantor, and has not granted any liens on any of its assets to secure the credit facilities.
Borrowings and Use of Proceeds
The Borrower incurred $1,800.0 million of Initial First Lien Term Loans and $760.0 million of Second Lien Term Loans in July 2014, and used the proceeds to finance the 2014 Topco Acquisition and to pay related fees and expenses. The Borrower incurred an aggregate of $60.0 million of additional first lien term loans under the Delayed Draw Commitments in September and November 2014, and used the proceeds to finance certain acquisitions and to pay related fees and expenses. The Borrower incurred $150.0 million of additional first lien term loans under the incremental facilities in April 2015 and used the proceeds to finance additional acquisitions, to pay related fees and expenses, to repay loans under the Revolving Credit Facility, and for general corporate purposes. From time to time the Borrower has incurred and repaid loans under the Revolving Credit Facility, and those borrowings generally are used for working capital purposes and to fund acquisitions. The Borrower also uses the Revolving Credit Facility to maintain various letters of credit.
Maturity
Except for the Series A Revolving Loan Facility (as described below), the Revolving Credit Facility matures on July 25, 2019. The Initial First Lien Term Loans, the first lien term loans funded under the Delayed Draw Commitments and the first lien term loans funded under the incremental facilities, or, collectively, the First Lien Term Loans, mature on July 23, 2021. The Second Lien Term Loans mature on July 25, 2022.
Amortization
The First Lien Term Loans amortize at a rate that approximates 1.0% per annum of the principal amount of First Lien Term Loans borrowed, and amortization payments are due quarterly on the last business day of each fiscal quarter. In the years ended December 31, 2016 and 2015, the Borrower paid $20.1 million and $19.7 million, respectively, of principal in amortization on the First Lien Term Loans. As of December 31, 2016, the amortization payments were $5.0 million per quarter. The Second Lien Term Loans do not amortize.
Prepayments
The following mandatory prepayments of First Lien Term Loans are required:
| • | Excess Cash Flow—the Borrower must prepay First Lien Term Loans with 50% of its “Excess Cash Flow” (as defined in the First Lien Credit Agreement) in excess of $20.0 million (net of certain voluntary prepayments of debt) for each fiscal year commencing with the year ended December 31, 2015. Payment is due annually at approximately the time when the Borrower is required to deliver its audited financial statements for the prior fiscal year. The percentage of Excess Cash Flow that must be applied to prepay loans declines to 25% or 0% if the Borrower achieves a first lien net leverage ratio of 4.50:1.00 or 3.75:1.00, respectively, for the applicable fiscal year. |
80
Table of Contents
| • | Asset Sales and Casualty Events—the Borrower must prepay First Lien Term Loans with 100% of the Net Cash Proceeds (as defined in the First Lien Credit Agreement) from certain types ofnon-ordinary course asset sales, insurance proceeds, or condemnation awards. However, in lieu of making the mandatory prepayment, the Borrower has the option to reinvest Net Cash Proceeds in other assets within 12 months of receipt of the proceeds or, if a commitment to reinvest such proceeds is made within such12-month period, within 180 days after such12-month period. |
| • | Other Debt—the Borrower must prepay First Lien Term Loans with the proceeds of debt that otherwise is not permitted to be incurred under the First Lien Credit Agreement. |
The Borrower also may make voluntary prepayments of First Lien Term Loans at any time without penalty or premium. In 2016, the Borrower was not required to make any Excess Cash Flow payment for the year ended December 31, 2015, and the Borrower did not make any other mandatory or voluntary prepayments of First Lien Term Loans for the years ended December 31, 2016 or 2015.
The Second Lien Credit Agreement includes comparable mandatory prepayment provisions, but they do not have effect prior to the date that the First Lien Credit Agreement is terminated. The Borrower may make voluntary prepayments of the Second Lien Term Loans at any time without penalty or premium, as the original call protection in the Second Lien Credit Agreement is no longer applicable. However, under certain circumstances, the First Lien Credit Agreement restricts the Borrower’s ability to prepay the Second Lien Term Loans. The Borrower did not make any prepayments of the Second Lien Term Loans in the three months ended March 31, 2017 and in the years ended December 31, 2016 or 2015.
Interest and Fees
Interest on the credit facilities accrues at a floating rate. For each borrowing and interest period, the Borrower has the right to choose either a base rate or eurodollar rate of interest. The base rate is, as of any date, the highest of (a) the federal funds rate plus 0.5%, (b) Bank of America’s “prime rate” and (c) the eurodollar rate for an interest period of one month plus 1.00%. The eurodollar rate is, for a specified interest period of one, two, three, six, or 12 months, the rate equal to the ICE LIBOR Rate determined two business days prior to the start of the applicable interest period, further adjusted for statutory reserves. The base rate and eurodollar rate for term loans are each subject to a “floor” of 2.00% and 1.00%, respectively. Base rate interest is payable at the end of each quarter, and eurodollar rate interest is payable at the end of the applicable interest period or, if more than three months, every three months. If a eurodollar rate loan is prepaid or converted to base rate prior to the end of the applicable interest period, the Borrower may be liable for customary “breakage” costs. Both base rate loans and eurodollar rate loans accrue interest at the applicable rate plus a margin, as follows:
| • | for the Revolving Credit Facility, there is a pricing grid based on first lien net leverage where the base rate margins range between 2.25% to 1.75% and the eurodollar rate margins range between 3.25% and 2.75%, with the margin determined based on whether the Borrower is above or below a leverage ratio of 4.50:1.00 or 4.00:1.00; |
| • | for First Lien Term Loans, the base rate margin is 2.25% and the eurodollar rate margin is 3.25%; and |
| • | for Second Lien Term Loans, the base rate margin is 5.50% and the eurodollar rate margin is 6.50%. |
The Borrower generally elects the eurodollar rate. In both 2016 and 2015, the effective total interest rate on the First Lien Term Loans was 4.25% per annum, and the effective total interest rate on the Second Lien Term Loans was 7.50% per annum.
81
Table of Contents
The Revolving Credit Facility accrues a commitment fee for unfunded commitments, calculated based on daily unused commitments and payable quarterly, at a rate of 0.5% per annum or, if the Borrower achieves a first lien net leverage ratio equal to or below 4.50:1.00 for the applicable quarter, 0.375% per annum. Outstanding letters of credit accrue a fee, calculated based on daily outstandings and payable quarterly, equal to the eurodollar rate margin applicable to the Revolving Credit Facility times the face value of outstanding undrawn letters of credit. The Borrower also pays customary “fronting fees” upon the issuance of letters of credit. As of March 31, 2017, December 31, 2016 and 2015, the Borrower had $75.0 million, $20.0 million, and $0, respectively, of loans outstanding under the Revolving Credit Facility and $44.4 million, $43.4 million, and $40.0 million, respectively, of undrawn letters of credit outstanding under the Revolving Credit Facility. The maximum and average daily borrowings outstanding under our short-term borrowing arrangements during the years ended December 31, 2016 and 2015 were $80.0 million and $41.0 million, and $25.0 million and $6.3 million, respectively.
Covenants
The Revolving Credit Facility has a “springing” financial maintenance covenant. If, at the end of any fiscal quarter, the Borrower has used more than 30% of the Revolving Credit Facility commitments (excluding letters of credit), then the Borrower must demonstrate that its first lien net leverage ratio is equal to or less than 8.25:1.00 for the12-month period ended as of such fiscal quarter. If the financial covenant is required to be tested and cannot be met, the Borrower has a customary right to “cure” the default with the proceeds of a specified capital contribution (if made available to the Borrower by us or its equityholders), which is treated as EBITDA for purposes of demonstrating compliance with the financial covenant. The Borrower was in compliance with the financial covenant as of March 31, 2017, December 31, 2016 and 2015 (regardless of whether the covenant was required to be tested).
The First Lien Credit Agreement and Second Lien Credit Agreement also contain customary affirmative and negative covenants. These covenants restrict the ability of the Borrower, the Guarantors and their subsidiaries to incur debt, permit liens on pledged assets, make investments, make distributions to equityholders, prepay junior debt, engage in mergers or restructurings, and sell assets, among other things. These covenants are subject to a number of exceptions that generally provide the Borrower and its subsidiaries with adequate flexibility to operate their business in the ordinary course. The credit agreements contain customary covenants that restrict our ability to receive distributions of cash or assets from the Borrower, the Guarantors and their Subsidiaries, which, collectively, constitute substantially all of our operating assets; however, these covenants are subject to a number of exceptions, including an exception that permits unlimited distributions if the Borrower’s senior secured net leverage ratio is equal to or less than 6.00:1.00. Although prior to this offering the Borrower does not meet such leverage ratio, we expect that after giving effect to this offering and the application of the net proceeds from this offering, the Borrower would be below the applicable leverage ratio. Therefore, after giving effect to this offering and for as long as the Borrower remains below the 6.00:1.00 leverage test thereafter, we expect to be entitled to receive unlimited distributions from the Borrower and its subsidiaries. To the extent the Borrower from time to time in the future is not able to meet this leverage test, we would still be able to receive distributions from the Borrower and its subsidiaries under other baskets to the covenant which include, among other things, distributions:
| • | in an amount of up to 6% per annum of the net proceeds of public offerings of stock; |
| • | to pay salary, bonus, and benefits to our officers and employees; |
| • | to repurchase management equity upon termination, retirement, death, or disability, subject to a cap; |
| • | to pay taxes on behalf of the Borrower and its subsidiaries; |
82
Table of Contents
| • | to pay our costs, fees, and expenses of being a public company, including compliance with regulations applicable to public reporting companies and listed companies; |
| • | to pay the costs and expenses related to our operations as a holding company of the Borrower, including administrative, legal, accounting, and similar expenses; and |
| • | to pay the costs of any unsuccessful equity or debt offering we may attempt. |
As of March 31, 2017, December 31, 2016 and 2015, the Borrower was in compliance with the negative and affirmative covenants under the credit agreements.
On May 2, 2017, pursuant to an amendment to the First Lien Credit Agreement, entered into by the Borrower and the Guarantors, the Borrower (a) incurred $225.0 million of additional First Lien Term Loans, or Incremental TermB-2 Loans, and (b) extended the termination date with respect to a $150.0 million portion of our Revolving Credit Facility held by certain lenders, or such portion, the Series A Revolving Loan Facility, and the maturity date for any and all loans made pursuant to the Series A Revolving Loan Facility from July 25, 2019 to April 25, 2021. The Borrower will use the proceeds of the Incremental TermB-2 Loans to pay related fees and expenses, to finance additional acquisitions, to repay existing loans under the Revolving Credit Facility and for general corporate purposes. From time to time, the Borrower may incur and repay loans under the Revolving Credit Facility, and these borrowings generally will be used for working capital purposes, including to fund acquisitions. The Borrower may also use the Revolving Credit Facility (including the Series A Revolving Loan Facility) to maintain various letters of credit. See “Description of Indebtedness.”
Loss on Extinguishment of Debt
As a result of the 2014 Topco Acquisition financing, we recorded a loss on the extinguishment of debt consisting of awrite-off of unamortized debt issuance costs of $22.9 million. The loss on extinguishment is included in “Interest expense” in the Consolidated Statements of Comprehensive Income (Loss) during the period from January 1, 2014 to July 25, 2014 (Predecessor).
We expect to use the proceeds from the offering to pay a portion of the Second Lien Term Loans and accrued interest thereon.
Contractual Obligations
The following table sets forth our contractual obligations as of December 31, 2016 and does not give effect to the use of proceeds of this offering:
| Long-term debt(1) | Operating leases | Total | ||||||||||
| (in thousands) | ||||||||||||
Years Ending December 31, | ||||||||||||
2017 | $ | 41,047 | $ | 30,403 | $ | 71,450 | ||||||
2018 | 20,384 | 24,913 | 45,297 | |||||||||
2019 | 20,233 | 19,310 | 39,543 | |||||||||
2020 | 20,235 | 11,827 | 32,062 | |||||||||
2021 | 1,885,116 | 7,186 | 1,892,302 | |||||||||
Thereafter | 760,389 | 3,017 | 763,406 | |||||||||
|
|
|
|
|
| |||||||
Total | $ | 2,747,404 | $ | 96,656 | $ | 2,844,060 | ||||||
|
|
|
|
|
| |||||||
| (1) | Scheduled principal payments on our long-term debt. Does not reflect the May 2, 2017 amendment to our First Lien Credit Agreement, the incurrence of an additional $225.0 million in long-term debt related thereto, or the extension of the maturity of a portion of the Revolving Credit Facility related thereto. See “—Liquidity and Capital Resources—Description of Credit Facilities” and “Description of Indebtedness.” |
83
Table of Contents
Cash and Cash Equivalents Held Outside the United States
As of December 31, 2016 and 2015, $29.2 million and $33.0 million, respectively, of our cash, cash equivalents, and marketable securities were held by foreign subsidiaries. It is not our intention to repatriate the cash back to the United States. However, if the cash were repatriated, we may be subject to additional United States income taxes and/or foreign withholding taxes.
Off-Balance Sheet Arrangements
We do not have anyoff-balance sheet financing arrangements or liabilities, guarantee contracts, retained or contingent interests in transferred assets, or any obligation arising out of a material variable interest in an unconsolidated entity. We do not have any majority-owned subsidiaries that are not included in our consolidated financial statements. Additionally, we do not have an interest in, or relationships with, any special-purpose entities.
Critical Accounting Policies and Estimates
The preparation of financial statements in accordance with GAAP requires us to make estimates and assumptions about future events that affect amounts reported in our consolidated financial statements and related notes, as well as the related disclosure of contingent assets and liabilities at the date of the financial statements. We evaluate our accounting policies, estimates, and judgments on anon-going basis. We base our estimates and judgments on historical experience and various other factors that are believed to be reasonable under the circumstances. Actual results may differ from these estimates under different assumptions and conditions.
We evaluated the development and selection of our critical accounting policies and estimates and believe that the following involve a higher degree of judgment or complexity and are most significant to reporting our results of operations and financial position, and are therefore discussed as critical. The following critical accounting policies reflect the significant estimates and judgments used in the preparation of our consolidated financial statements. With respect to critical accounting policies, even a relatively minor variance between actual and expected experience can potentially have a materially favorable or unfavorable impact on subsequent results of operations. More information on all of our significant accounting policies can be found in the footnotes to our audited consolidated financial statements included elsewhere in this prospectus.
Revenue Recognition
We recognize revenue when the following four criteria are met: (i) persuasive evidence of an arrangement exists; (ii) the sales price is fixed or determinable; (iii) delivery, performance, and acceptance are achieved in accordance with the client arrangement; and (iv) collection is reasonably assured. Contracts are individually negotiated and the amounts earned can vary significantly.
Revenues related to the sales segment are primarily recognized in the form of commissions, fee-for-service, or on a cost-plus basis for providing headquarter relationship management, analytics, insights and intelligence services,administrative services, retail services, retailer client relationships and in-store media programs, and digital technology solutions (which include our business intelligence solutions, e-commerce services, and content services).
Marketing segment revenues are primarily recognized in the form of a fee-for-service (including retainer fees, fees charged to clients based on hours incurred, project-based fees, or fees for executing in-person consumer engagements or experiences, which engagements or experiences we refer to as “events”) or on a cost-plus basis for providing experiential marketing, shopper and consumer marketing services, and our digital, social, and media services.
84
Table of Contents
Our revenue recognition policies are designed to recognize revenues at the time services are performed. Our accounting policy for revenue recognition has an impact on our reported results and relies on certain estimates that require judgments on the part of management. We record an allowance as a reduction to revenue for differences between estimated revenues and the amounts ultimately invoiced to our clients based on our historical experience and current trends. Cash collected in advance of services being performed is recorded as deferred revenues.
Commission revenues are earned and recognized upon performance of headquarter relationship management, retail, administrative, e-commerce, and analytics, insights, and intelligence services. We may be entitled to additional fees upon meeting specific performance goals or thresholds, which we refer to as bonus revenue. We recognize the bonus revenue when the specific performance goals are assured, or when our clients determine performance against these goals has been achieved. Non-refundable retainer fees are generally recognized on a straight-line basis over the term of the specific client arrangement. Fees for services are recognized upon completion of performance of the service or acceptance by the client.
We evaluate each client contract individually in accordance with the applicable accounting guidance to determine whether we act as a principal (whereby we would present revenue on a gross basis) or as an agent (whereby we would present revenue on a net basis). While we primarily act as a principal in our arrangements and report revenues on a gross basis, given the varying terms of our client contracts, we will occasionally act as an agent and in such instances present revenues on a net basis. For example, for certain advertising arrangements, our clients purchase media content in advance, and we do not take on any risk of recovering the cost to acquire the media. As a result, we determined we act as the agent in these arrangements and record revenues and their related costs on a net basis. However, in cases where media is not purchased in advance by our clients, we record such revenues and the related costs on a gross basis, as we bear the risk of recovering the costs to acquire the media.
We record revenues from sales of services and the related direct costs in accordance with the accounting guidance on reporting revenue gross as a principal versus net as an agent. In situations where we act as a principal in the transaction, we report gross revenues and cost of revenues. When we act as an agent, we report the revenues and their related costs on a net basis. Cost of revenues does not include depreciation charges for fixed assets.
In May 2014, the Financial Accounting Standards Board, or FASB, issued amended guidance on revenue recognition which requires an entity to recognize revenue when it transfers promised goods or services to customers in an amount that reflects the consideration to which the company expects to be entitled in exchange for those goods or services. In July 2015, the FASB affirmed its proposal to delay the effective date of the new standard by one year to January 1, 2018, with early adoption to be permitted as of the original effective date of January 1, 2017.
The new standard includes a number of changes compared to the current standard. We believe the most significant to us is the requirement to estimate the amount of incentive consideration, that is variable in nature, included in our contracts, that will most likely be earned and recognize that consideration over the term of the contract. This will likely result in an acceleration in revenue recognition for certain variable contract incentives. While we are still assessing the impact that adoption of the amended guidance will have on our consolidated financial statements, we expect that the primary impact of the change will be in the timing of revenue recognition within the quarters of a fiscal year. We plan to adopt the standard as of January 1, 2018, using the modified retrospective method.
85
Table of Contents
Contingent Consideration
Many of our acquisition agreements include contingent consideration arrangements, which are generally based on the achievement of future financial performance by the operations attributable to the acquired companies. The contingent consideration arrangements are based upon our valuations of the acquired companies and reduce the risk of overpaying for such companies if the projected financial results are not achieved. The fair values of these contingent consideration arrangements are included as part of the purchase price of the acquired companies on their respective acquisition dates. For each transaction, we estimate the fair value of contingent consideration payments as part of the initial purchase price.
We measure our contingent consideration liabilities at fair value on a recurring basis using significant unobservable inputs classified within Level 3 of the fair value hierarchy. We use a probability weighted income approach as a valuation technique to convert future estimated cash flows to a single present value amount. The significant unobservable inputs used in the fair value measurements are operating income projections over the contingent consideration period (generally one to three years), and the probability outcome percentages assigned to each scenario. Significant changes in either of these inputs could result in a significantly higher or lower liability, subject to the contractual maximum of the contingent obligation. As of December 31, 2016, the maximum potential payment outcomes would have been $131.9 million. Ultimately, the liability will be equivalent to the amount paid, and the difference between the fair value estimate and amount paid will be recorded in earnings.
We review and assess the estimated fair value of contingent consideration on a quarterly basis, and the updated fair value could differ materially from the initial estimates. Changes in the estimated fair value of contingent consideration liabilities related to the time component of the present value calculation are reported in “Interest expense, net.” Adjustments to the estimated fair value related to changes in all other unobservable inputs are reported in “Selling, general, and administrative expenses” in the Consolidated Statements of Comprehensive Income (Loss).
Goodwill and Intangible Assets
Goodwill represents the excess of the purchase price over the fair value of the identifiable net assets acquired in an acquisition. Goodwill and indefinite lived intangibles are tested at least annually for impairment and during interim periods when a triggering event occurs. We have the option to perform a qualitative assessment of whether it is more likely than not that the fair value of a reporting unit is less than its carrying value before applying thetwo-step goodwill impairment test. If we conclude it is not more likely than not that the fair value of a reporting unit is less that the carrying amount, then there is no need to perform thetwo-step impairment test.
The annual evaluation for impairment of indefinite lived intangible assets is atwo-step process. The first step is to perform a qualitative impairment assessment. If this qualitative assessment indicates that, more likely than not, the indefinite lived intangible assets are not impaired, then no further testing is performed. If the qualitative assessment indicates that, more likely than not, the indefinite lived intangible assets are impaired, then the fair value of the indefinite lived intangible assets must be calculated. If the carrying value exceeds the fair value, an impairment loss is recorded for that excess. Determining the fair value of a reporting unit or an indefinite-lived intangible asset is judgmental in nature and involves the use of significant estimates and assumptions. These estimates and assumptions include revenue growth rates, weighted average cost of capital, and royalty rates. We base our fair value estimates on assumptions we believe to be reasonable but which are unpredictable and inherently uncertain. Actual future results may differ from the estimates.
Our annual goodwill impairment assessment as of October 1, 2016 was performed using a qualitative approach. The qualitative assessment considered industry and market considerations for
86
Table of Contents
any deterioration in the environment in which we operate, the competitive environment, a decline (both absolute and relative to peers) in market-dependent multiples or metrics, any changes in the market for our services, and regulatory and political developments. Additionally, we assessed financial performance by reporting unit and considered cost factors, such as labor or other costs that would have a negative effect on results. The annual goodwill impairment assessments performed for fiscal year 2016 have indicated that it is more likely than not that the fair value of our reporting units is substantially in excess of carrying value and not at risk of failing step one of the quantitative goodwill impairment test. Based on our qualitative assessment and quantitative assessment, we have determined that goodwill and indefinite lived intangible assets, respectively, were not impaired. As goodwill and intangible assets associated with recently acquired businesses, including those intangibles and goodwill recorded upon the 2014 Topco Acquisition, are recorded on the acquisition date at their estimated fair values, those amounts are more susceptible to an impairment risk if business operating results or macroeconomic conditions deteriorate.
Long-lived assets to be held and used, including intangible assets, are reviewed for impairment whenever events or changes in circumstances indicate that the carrying amount of an asset may not be fully recoverable. These events or changes in circumstances may include a significant deterioration of operating results, changes in business plans, or changes in anticipated future cash flows. If an impairment indicator is present, we evaluate recoverability by a comparison of the carrying amount of the assets to future undiscounted net cash flows expected to be generated by the assets. If the assets are impaired, the impairment recognized is measured by the amount by which the carrying amount exceeds the fair value of the assets. Fair value is generally determined by estimates of discounted cash flows. The discount rate used in any estimate of discounted cash flows would be the rate required for a similar investment of like risk. No impairment related to our long-lived assets was recorded during the three months ended March 31, 2017, or the years ended December 31, 2016, 2015, and 2014.
Equity-Based Compensation
Karman Topco, the parent company of the Successor, has a long-term equity incentive plan that allows for the grant of performance-based profit interests, or Common Series C Units, in Karman Topco to certain of its and its subsidiaries’ directors and employees in exchange for services provided to us. Since we receive the benefit associated with such services the related expense is recorded within our Consolidated Statements of Comprehensive Income. Seventy-five percent of each Common Series C Unit award, or the Performance Vesting Units, are subject to certain vesting requirements, including performance requirements based either on the achievement of specific annual or cumulative thresholds substantially similar to Adjusted EBITDA or on the occurrence of a vesting exit event. For the Performance Vesting Units, a vesting exit event means the earlier to occur of (i) a sale of (a) 50% of more of the outstanding equity units of Karman Topco held by the equity funds affiliated with or advised by each of CVC Capital Partners and Leonard Green & Partners or (b) substantially all of the assets of Karman Topco and its subsidiaries, in each case that is approved by Karman Topco’s board of directors, which sale described in (a) or (b) we refer to as an Approved Partnership Sale, or (ii) a public offering that results in the sale of at least 30% of the equity securities of Karman Topco or any of its subsidiaries that are held by the equity funds affiliated with or advised by each of CVC Capital Partners and Leonard Green & Partners, which we refer to as a Qualified Public Offering, provided that, at the time of such event, the pre-tax internal rate of return to the Common Series A Limited Partners is at least 8% compounded annually with respect to the Common Series A Units held by them, based on cash proceeds received or, in respect of a sale of Karman Topco or a sale of substantially all of its assets, available to be received by them pursuant to the definitive agreement relating thereto, and after giving effect to the vesting of the Common Series C Units in accordance with the terms of any Restricted Unit Agreement and the vesting of the Common Series D Units. The remaining 25% of the awards, or the 20% IRR Vesting Units, vest upon the earlier of an Approved Partnership Sale or a Qualified Public Offering, provided that, at the time of such event, the Common
87
Table of Contents
Series A Limited Partners of Karman Topco realize a pre-tax internal rate of return of 20% compounded annually. However, each of the Common Series C Unit awards (whether Performance Vesting Units or 20% IRR Units, vested or unvested) is subject to forfeiture upon an Approved Partnership Sale or a Qualified Public Offering in which the requisite minimum pre-tax annual rate of return applicable to those units is not achieved. No expense for these awards has been recorded in the three months ended March 31, 2017, the years ended December 31, 2016 and 2015 and the period from July 26, 2014 to December 31, 2014 since a vesting exit event is not yet deemed probable of occurring. If a vesting exit event becomes probable, the Company would record a compensation charge of $50.5 million at December 31, 2016.
Karman Topco also issued time-vesting profit interests to entities affiliated with one of the Sponsors, from whom we receive services. These time-vesting profit interests vest on a monthly basis beginning on October 1, 2014 through September 1, 2019. The compensation expense associated with the issuance of such awards fornon-employees is recorded by us.
We and Karman Topco are private companies with no active market for our common stock. In determining the fair value of Karman Topco’s equity, we utilize three widely recognized valuation models:
| • | Discounted Cash Flow Analysis (Income Model)—The discounted cash flow analysis is dependent on a number of significant management assumptions regarding the expected future financial results of the Company and Karman Topco as well as upon estimates of an appropriate cost of capital; |
| • | Guideline Public Companies (Market Model)—Multiples of historical and projected EBITDA from guideline public companies are applied to estimate the fair value for the equity of Karman Topco; and |
| • | Mergers and Acquisition (Market Model)—Multiples of historical enterprise value divided by last twelve months revenues, and enterprise value by last 12 months, EBITDA for mergers and acquisitions of companies in the same industry. |
After considering the results of each of these valuation models, we then use the Backsolve Option Pricing Method, or OPM, to determine the fair value of the profit interest awards and resulting equity-based compensation expense.
Assumptions used in the OPM include the expected life, volatility, risk-free rate and dividend yield. We utilized the observable data for a group of peer companies that grant options with substantially similar terms to assist in developing our volatility assumption. The risk-free rate is based on U.S. Treasury yields in effect at the time of grant over the expected term. We assume a dividend yield of 0% as we have not historically paid distributions.
The assumptions used in estimating the fair value of equity-based payment awards represent management’s best estimates, but these estimates involve inherent uncertainties and the application of management judgment. As a result, if factors change and we use different assumptions, equity-based compensation expense could be different in the future.
Once our common stock becomes publicly traded, certain key valuation inputs to the option pricing method will be based on publicly available information. These key valuation inputs include the fair value of the common shares, and once there is a sufficient trading history, the volatility is expected to be derived from the historical trading activity of our common shares.
Refer to Note 11,Equity-Based Compensation, to our audited consolidated financial statements included elsewhere in this prospectus for details regarding Karman Topco’s and our anticipated equity-based compensation plans.
88
Table of Contents
Income Taxes
We account for income taxes using the asset and liability method, under which deferred tax assets and liabilities are recognized for the expected future tax consequences of temporary differences between the financial reporting and tax bases of assets and liabilities, and for operating losses and tax credit carry-forwards. Deferred tax assets and liabilities are measured using the currently enacted tax rates that apply to taxable income in effect for the years in which those tax assets are expected to be realized or settled. The income tax provision (benefit) is computed on thepre-tax income (loss) of the entities located within each taxing jurisdiction based on current tax law. A valuation allowance for deferred tax assets is recorded to the extent that the ultimate realization of the deferred tax assets is not considered more likely than not. We believe our deferred tax assets are more likely than not to be realized based on historical and projected future results.
Realization of our deferred tax assets is principally dependent upon our achievement of future taxable income, the estimation of which requires significant management judgment. These judgments regarding future profitability may change due to many factors, including future market conditions and our ability to successfully execute our business plans. These changes, if any, may require adjustments to deferred tax asset balances and deferred income tax expense.
Recently Issued Accounting Pronouncements
See the information set forth in Note 1,Recent Accounting Pronouncements, to our audited consolidated financial statements for the year ended December 31, 2016 included elsewhere in this prospectus.
Quantitative and Qualitative Disclosure of Market Risk
Foreign Currency Risk
Our exposure to foreign currency exchange rate fluctuations is primarily the result of foreign subsidiaries domiciled in the United Kingdom and Canada. We use financial derivative instruments to hedge foreign currency exchange rate risks associated with our Canadian subsidiary.
The assets and liabilities of our British and Canadian subsidiaries, whose functional currencies are the British pound and Canadian dollar, respectively, are translated into U.S. dollars at exchange rates in effect at the balance sheet date. Income and expense items are translated at the average exchange rates prevailing during the period. The cumulative translation effects for subsidiaries using a functional currency other than the U.S. dollar are included in accumulated other comprehensive loss as a separate component of stockholders’ equity. We estimate that had the exchange rate in each country unfavorably changed by ten percent relative to the U.S. dollar, our consolidated income before taxes would have decreased by approximately $5.6 million for the year ended December 31, 2016 and $0.2 million for the three months ended March 31, 2017.
Interest Rate Risk
Interest rate exposure relates primarily to the effect of interest rate changes on borrowings outstanding under our Revolving Credit Facility, First Lien Term Loans, and Second Lien Term Loans. We had borrowings of $75.0 million and $20.0 million outstanding at March 31, 2017 and December 31, 2016 under our revolving credit facility, which were subject to a weighted average interest rate of 4.2% and 3.9% for the three months ended March 31, 2017 and the year ended December 31, 2016, respectively. We had borrowings of $2,720.5 million and $2,725.5 million outstanding at March 31, 2017 and December 31, 2016 under our credit facilities, which were subject
89
Table of Contents
to a weighted average interest rate of 5.2% for both the three months ended March 31, 2017 and the year ended December 31, 2016, respectively. We manage our interest rate risk through the use of derivative financial instruments. Specifically, we have entered into interest rate cap agreements to manage our exposure to potential interest rate increases that may result from fluctuations in LIBOR.
We do not designate these derivatives as hedges for accounting purposes, and as a result, all changes in the fair value of derivatives, used to hedge interest rates, are recorded in “Interest expense, net” in our consolidated statements of comprehensive income (loss). As of March 31, 2017, we had three outstanding interest rate cap contracts with notional amounts of $850.0 million, $650.0 million and $200.0 million, all which mature on April 23, 2019. The aggregate fair value of our outstanding interest rate caps at March 31, 2017 represented an outstanding net liability of $8.3 million.
Holding other variables constant, an increase of 25 basis points in the weighted average interest rate on our Revolving Credit Facility, First Lien Term Loans and Second Lien Term Loans would have resulted in an increase of $1.7 million and $7.0 million in interest expense in the three months ended March 31, 2017 and the year ended December 31, 2016, respectively.
In the future, in order to manage our interest rate risk, we may refinance our existing debt, enter into additional interest rate cap agreements, or modify our existing interest rate cap agreement. However, we do not intend or expect to enter into derivative or interest rate cap transactions for speculative purposes.
90
Table of Contents
Our Company
We are a leading business solutions provider to consumer goods manufacturers and retailers. Our customizable suite of technology-enabled sales and marketing solutions is designed to help manufacturers and retailers across a broad range of channels drive consumer demand, increase sales, and achieve operating efficiencies. Through our sales segment, we serve as a strategic intermediary between consumer goods manufacturers and their retailer partners. Our sales associates prepare and present to retailers the business case to increase distribution of manufacturers’ products and optimize how they are displayed, priced, and promoted. We also makein-store visits to ensure such products are adequately stocked and properly displayed. Through our marketing segment, we develop marketing programs for manufacturers and retailers that are designed to influence shoppers on their paths to, and at the point of, purchase using our proprietary insights on shopper behavior, analytics, brand knowledge, and understanding of manufacturer and retailer strategies. Our segments are bolstered by our suite of technology offerings which enhance our sales and marketing capabilities by leveraging data and analytics solutions to support our associates in creating, executing and measuring insight-based plans to grow our clients’ business. In 2016, we provided services to over 2,000 manufacturers for products located at more than 200,000 retail locations.
We serve leading manufacturers across a range of consumer product categories, including packaged foods, beverages, perishables, health and beauty care, and consumer electronics. We also maintain deep relationships with retailers across various channels, including traditional retail (which includes grocery, drug, mass, convenience, club, and natural/specialty), foodservice, ande-commerce.
Our clients vary in terms of size and growth profile, ranging from some of the world’s largest consumer goods manufacturers, including Mars, PepsiCo, and Smucker’s, to smaller regional players and emerging brands. While our client base has been predominantly comprised of consumer goods manufacturers, over the past ten years we have increased our offerings to retailers, particularly in the areas of designing and managingin-store events platforms, merchandising, and other labor-based services, such as data collection, product assembly,new-store setups, and remodels. More recently, we have also begun to offer our marketing services to industries beyond consumer goods manufacturing and retail, such as automotive, entertainment, and travel.
We believe that our strategic insights, flexible, service-oriented approach, and superior execution have helped us cultivate long-standing relationships with our clients. We help our clients increase sales and reduce costs by leveraging our industry expertise, network of relationships, and scale to develop and execute strategies that fuel our clients’ growth and allow them to focus on their core competencies. Eleven of our top 15 clients by revenues in 2016 have been clients for over ten years, with the remaining four clients being new business wins in the last ten years. Since 2009, we have had an average revenue-weighted client retention rate of approximately 99%. We define average revenue-weighted client retention rate as prior year total revenues less annual revenues from lost clients in that period, divided by prior year total revenues. We believe this high level of retention demonstrates that we are deeply embedded in our clients’ operations and that we execute mission critical sales and marketing functions on their behalf.
We maintain over 120 offices located throughout the United States and Canada. Our geographic footprint allows us to execute our strategies on a local, regional, or national level. We have in excess of 50,000 associates who provide us with the resources and scale to provide broad-reaching and cost-efficient solutions to our clients. Our offices are strategically located near our manufacturer and retailer clients, with many of our associates working directly at manufacturers’ or retailers’ offices. This presence provides us with deeper insight into client strategies, systems, and operations and gives our associates more direct access to key decision makers, allowing them to deliver our value-enhancing services in a more tailored and effective manner. While the majority of our business is currently
91
Table of Contents
concentrated in the United States and Canada, through our strategic international investments, we maintain a platform in select markets throughout Africa, Asia, Australia, and Europe through which we can service the global needs of multinational manufacturers.
Our business has demonstrated an ability to consistently grow revenues and Adjusted EBITDA, over time and through economic cycles. In 2016, we generated $2,100.2 million in revenues, $31.2 million of net income, $128.2 million of Adjusted Net Income, and $411.3 million of Adjusted EBITDA. Our revenues and Adjusted EBITDA in 2016 reflect a CAGR of 9.8% and 12.4%, respectively, since 2007. See “Prospectus Summary—Summary Consolidated Financial and Other Data” for a reconciliation of each of Adjusted EBITDA and Adjusted Net Income to net income (loss).
We believe that the consistency in the growth of our business is attributable to a variety of factors, including: the stability of the end markets we serve, as a significant portion of our revenues is tied to the sales of a broad group ofnon-discretionary consumer goods; the diversity of the services we offer across a variety of distribution channels; and the critical nature of the services we provide to our clients. Additionally, our services-based operations provide us with a capital-efficient business model that requires limited reinvestment in the form of capital expenditures and working capital. The consistency of our operating results as well as our strong cash flow profile provide us with a high degree of financial flexibility, which enables us to strategically deploy capital to increase stockholder value.
Our Historical Financial Performance ($ in millions)
Note: Revenues, net loss, and Adjusted EBITDA for the year ended December 31, 2010 presented above represent the mathematical addition of the audited results of a successor for the period from December 17, 2010 to December 31, 2010, and the audited results of a predecessor for the period from January 1, 2010 to December 16, 2010, following the 2010 Acquisition. Revenues, net income, and Adjusted EBITDA for Pro Forma 2014 presented above give effect to the pro forma adjustments attributable to the 2014 Topco Acquisition (as defined below) that are described in “Unaudited Pro Forma Condensed Consolidated Statement of Operations” and “Non-GAAP Financial Measures” and are based upon available information and certain assumptions that we believe are reasonable.
92
Table of Contents
Our Value Proposition
We believe we offer a compelling and tangible value proposition: we provide specialized expertise and service offerings, a vast network of existing relationships, and operational scale that increase our clients’ sales while reducing their costs and allowing them to focus on their core competencies. Dechert-Hampe estimated in a recent study that outsourcing direct retail coverage teams to a syndicated model may save manufacturers between 45% and 50%. That same study includes an estimate that replacing a direct sales team with headquarter representation from an outsourcing partner may save manufacturers between 35% and 50%.
For many consumer goods manufacturers, managing relationships across a comprehensive set of retailers and channels can be prohibitively costly. For instance, our associates regularly call on over 900 retailer headquarter or buying offices in the United States and our syndicated retail teams visit over 64,000 unique stores each month. Sales and marketing functions involve a variety of specialized steps that can place a large burden on internal resources and divert attention away from core product innovation and brand building activities. On the sales front, these steps include introducing products to retailers, soliciting orders, negotiating shelf-space fees, coordinating merchandizing assortments, determining optimal space allocation, and planning and executing promotional and display programs. Once products reach stores, manufacturers must also remain vigilant to ensure products are stocked in accordance with supply contracts and agreed planograms, inventory levels are appropriately managed and replenished, andone-time events and promotions are properly executed. In addition, as consumers shift to purchase more products online, manufacturers are responding by enlisting business partners to help them make the transition toe-commerce in order to maintain brand awareness and maximize revenues in a new channel, without the need to dedicate significant internal resources.
On the marketing front, manufacturers and retailers have also been challenged to implement effective programs to drive consumer demand and differentiate shoppers’ experiences in a rapidly evolving retail environment that spans multiple channels. Effective and differentiated marketing programs require extensive market analysis to optimize dollar spend through programs that influence consumers across their entire purchase journey, whether it be in a physical store or on a computer or mobile device. As a result, manufacturers and retailers have struggled to maintain the expertise and capabilities needed to develop and execute integrated multi-channel marketing campaigns that reach consumers across all mediums, while also providing compelling content, offers, and experiences that influence purchase behavior.
We believe that we offer a compelling value proposition that is relevant to manufacturers and retailers of all sizes. Larger manufacturers and retailers, which may possess the resources and scale to bear the cost of internal sales and marketing teams, often rely on our services and ability to drive more effective outcomes. For instance, Dechert-Hampe estimated in their study that almost 90% of North American consumer goods manufacturers rely on sales and marketing agencies for at least one service. Similarly, we have found that large retailers increasingly outsource the development, management, and execution of services such as experiential marketing programs to third-party agencies in order to redirect their internal resources towards core competencies.Small-to-mid sized consumer goods manufacturers and retailers generally do not possess the resources and scale to implement and maintain internal sales and marketing teams and as a result, these companies also turn to outsourcing providers to successfully grow their businesses at a lower cost than they could support on their own.
We work closely with our clients to identify the combinations of services that best meet their sales and marketing objectives and strive to address the related challenges they face in a customized way.
93
Table of Contents
Our Solutions
Our services are provided across two segments—sales and marketing.
What We Do
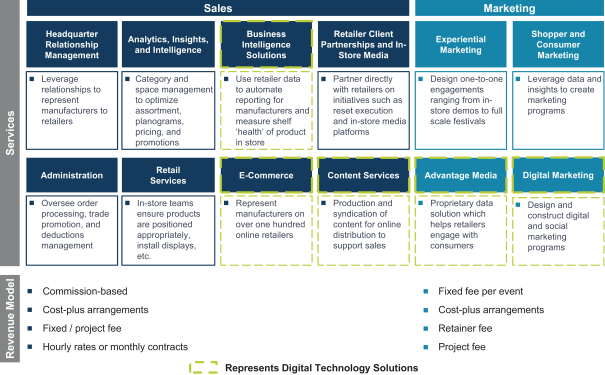
Sales Segment
Through our sales segment, we provide our clients with a full suite of outsourced solutions to enhance sales in the traditional retail, foodservice, ande-commerce channels. Our primary sales services include:
Headquarter Relationship Management
We act as a representative of our consumer goods manufacturer clients and facilitate relationships with retailers across a range of matters, including business development and sales planning efforts. We prepare customized, data-driven business plans on behalf of our manufacturer clients and present the business case to increase distribution of their products, and optimize the shelf placement, pricing, and promotion of their products, to our extensive network of industry contacts spanning retailer buying organizations and senior executive ranks. Our services are enhanced by ourin-depth understanding of both the manufacturers’ and retailers’ strategic priorities, which is supported by our close physical proximity to our clients’ offices, as well as our proactive approach in identifying business-building opportunities. Our scale allows us to offer these services on a local, regional, or national level, as well as for a client’s designated product, brand, or entire portfolio.
Analytics, Insights, and Intelligence
To support our sales efforts, we field a team of over 300 analytics professionals who practice what our industry refers to as category and space management. These professionals analyze
94
Table of Contents
consumer purchase and retailer data to identify opportunities to increase the sales of our clients’ products and categories. We perform these analyses using our proprietary business intelligence technology platform, which aggregates data to guide sales strategies to expand product distribution and optimize other factors such as assortment, planograms, pricing and trade promotions. We also use post-promotion analytical tools to evaluate promotion effectiveness and work with clients and retailers to make the adjustments necessary to meet sales and profit objectives at the product and category level. Our teams of category managers are available in every market, including some who sit onsite with retailers and assist in developing analysis to support recommendations. We also conduct advanced analytical services for clients such as retailerpoint-of-sale and shopper card analytics, and primary market and shopper research.
Administration
Our associates handle key back-office functions such as receiving and processing purchase orders. We also manage trade promotion programs executed between clients and retailers. Through our innovative technology, we can process over 75,000 purchase orders monthly with limited or no human involvement. Through our expanded “Order to Cash” service, we strive to deliver additional savings for clients by managing extra steps in the order process, including revenue reconciliation, cash application, and collection management. Finally, we leverage this infrastructure to offer additional services that include call center support and vendor-managed inventory (i.e., building orders to ensure an agreed-upon quantity of products are keptin-stock).
Retail Services
We deploy teams in retail locations to support manufacturers’in-store sales strategies. Our associates conduct both cyclical andad hoc store visits to manage product availability and positioning, implement promotions, installpoint-of-purchase displays, and perform other value-added merchandising services. Tablet technology and proprietary software are used extensively in the workflow. For example, routing software helps guide our associates from location to location in the most efficient and effective way based on factors such as store volume, sales velocity, driving efficiencies, andin-store conditions. In store, our associates use our merchandising application and scanners to efficiently and effectively execute a range of activities such as distribution tasks, validating promotional compliance, or answering survey questions.
Our software leverages dailypoint-of-sale store data, supply chain data, and advanced algorithms to target and correct potential store-level merchandising issues in real time, such as SKUs that are void, out of stock, or past expiration; we are able to leverage this intelligence to route our retail teams to stores where issues exist, or may soon exist, as well as prioritize our associates’ work to address the highest-value opportunities while conducting a store visit.
Another application provides our associates with professional digital presentation materials enabling them to make quick and impactful recommendations to store managers for assortment changes, promotional events, and display programs. We are also able to integratepoint-of-sale data into these presentations to help store managers understand the potential store-level sales impact from such recommendations.
We offer our clients a full spectrum of flexible service models for our retail services coverage. In our dedicated coverage model, our associates perform services exclusively for a particular client and have intimate knowledge of its categories and products. Our syndicated coverage model utilizes shared teams in particular channels to perform services for multiple clients while in a store. Finally, we offer hybrid coverage models whereby clients can choose to have dedicated teams covering designated channels or retailers and syndicated coverage for other channels. Our retail services teams
95
Table of Contents
focus either on manufacturers or particular retail channels, such as grocery, drug, mass, convenience, club, and natural/specialty, which allows them to develop expertise in either manufacturer products or a particular class of trade.
Retailer Client Partnerships andIn-Store Media Programs
Over the past decade we have leveraged our strategic position to consult with retailers on their needs and pain points and to provide them with solutions. For example, we serve select retailers as their exclusive provider, and other retailers as theirnon-exclusive provider, ofin-store reset work. We also perform compliance audits andin-store product assembly work so that store personnel can focus on shoppers. In addition, we manage a wide variety of media, merchandising, and display platforms for retailers including: multi-manufacturer(co-op) circular programs; anin-store display platform for perishable brands with over 4,000 cooler units in high-traffic locations; a media, coupon, and promotion network that utilizes packaging space on perishable products; and a network of advertisements on security pedestals at the entrances and exits of major retailers.
Digital Technology
We offer technology solutions to both manufacturers and retailers. Our business intelligence solutions drive efficiencies for consumer goods manufacturers in two ways: first, certain of our technology solutions automate critical reporting and provide insights that allow clients to make revenue-optimizing decisions (e.g., software applications that synthesize large amounts of commercial data into intuitive reports that allow managers to make more informed decisions with respect to sales and inventory levels); and second, when combined with our merchandising services delivered through our retail services team, our digital and technology solutions optimizein-store operations and workflows. Oure-commerce capabilities cover a comprehensive set of services, including content development, brand reputation management, and representation of consumer goods manufacturers to online retailers. Additionally, we manage a retailer syndication network that distributes rich content (e.g., digital images, videos, product specifications, etc.) to over 1,000e-commerce sites. These assets, leveraged from the manufacturer’s own brand development efforts (e.g., consumer-facing websites), help manufacturers and online retailers sell more by providing the most comprehensive and compelling product information available for a more engaging shopper experience.
Within our sales segment, we typically generate revenues on a commission, fee-for-service, or cost-plus basis.
Marketing Segment
Our marketing segment, Advantage Marketing Partners, is an award-winning agency that we believe is differentiated from our competition by our people, retail connectivity, entrepreneurial mindset, and scale. We began our marketing business in 2000 after we observed the challenges our clients were experiencing while using traditional advertising agencies to connect brand marketing strategies, sales planning efforts, and retailer strategies. Our position as an intermediary in the market gives us deep insight and understanding into manufacturers’ needs from a sales perspective, their marketing and promotion strategies, as well as retailer strategies. We believe this enables us to create more effective, shopper-focused marketing promotions by connecting client sales and marketing strategies with those of retailers. Since its founding, Advantage Marketing Partners has grown to become a national agency collective and is the agency of record for many of the most recognized brands across the retail, packaged goods, technology, apparel, automotive, travel, entertainment, education, and healthcare industries. We were ranked byAd Age as the largest U.S. promotions agency and the largest U.S. experiential and event marketing agency in 2014, 2015, 2016, and 2017 based on prior
96
Table of Contents
year revenues. Furthermore, in 2017 we ranked tenth onAd Age’s list of the largest U.S. marketing agencies from all disciplines based on prior year revenues.
Experiential Marketing
We design and executein-person consumer engagements ranging fromin-store product sampling and demo programs to large-scale events such as grand openings, product launch events, and festivals. These platforms can beretailer-led orbrand-led.
Shopper and Consumer Marketing
For manufacturer clients, we analyze shopper behavior and apply our deep retailer knowledge and expertise to offer planning, execution, and measurement of insight-based, retailer-specific promotions that target a retailer’s specific shoppers to drive product sales. We combine an understanding of how a brand’s consumers behave as shoppers in different channels, formats, and retailers (mined from data resources) with an understanding of retailer objectives, strategies, and preferred programming tactics (informed by our connectivity and resources in the field) to develop programs that successfully promote the sales of clients’ products at retail. Manufacturers also hire us for national consumer promotions, which are designed to stimulate demand for, and awareness of, their products more broadly.
Digital Marketing
Using advanced analytics, our digital marketing teams provide a wide range of services to clients, including: digital advertising; interactive design and development across mobile, tablet and desktop; application development; content management solutions; paid media, including search engine marketing, programmatic and direct media; and social media development and management.
Advantage Media
We offer targeted media solutions powered by our proprietary data management platform. For example, one of our internally developed applications uses real-time location data, billions of behavioral data points, and market data to help retailers and manufacturers find and engage with their consumers when they are most likely to make a purchase.
Within our marketing segment, we typically generate revenues on a fee-for-service or cost-plus basis.
Our Market Opportunity
We compete in several large and growing markets for outsourced business services targeting the sales, marketing, and technology needs of consumer goods manufacturers and retailers.
Dechert-Hampe estimates that the market for the traditional outsourced sales services offered through our sales segment in the United States was approximately $7.9 billion in 2016 and has grown at a CAGR of approximately 4.8% over the last four years. Historically, the outsourced sales services industry has grown consistently, largely driven by the steady expansion of the broader U.S. consumer goods market and the growth in penetration of outsourced services with consumer goods manufacturers. Over the past two decades, the industry has experienced meaningful consolidation. Today, the U.S. industry operates with three national firms, two of which, including us, have the most significant market share. Based on our 2016 U.S. sales services revenues and industry data provided
97
Table of Contents
by Dechert-Hampe, we estimate that we account for approximately 16% of the sales services market in the United States by revenues. Other than the three national firms, the industry remains fragmented, comprised of smaller independent agencies that offer services on a more regional level or are focused on a specific channel (e.g., foodservice) or specific service (e.g., merchandising projects and resets).
End markets for our solutions consist of a diversified group of large and emerging consumer goods manufacturers across mostlynon-discretionary categories, such as packaged foods, beverage, and personal care, and a diversified group of leading retailers across traditional retail, foodservice, ande-commerce channels. These end markets have experienced relatively stable growth over time and across market cycles, as demonstrated by their 3.7% annualized growth rate over the last 26 years, with only one year of decline during the same period.
We have an opportunity to increase our sales commission-based revenues in the growinge-commerce CPG channel. Dechert-Hampe estimates thate-commerce CPG sales in the United States were approximately $38.0 billion in 2016, up from approximately $20.0 billion in 2015, an increase of 90%. In addition, Dechert-Hampe estimates that the market for the business intelligence technology solutions offered through our sales segment in the United States was approximately $43.6 billion in 2016, up from approximately $39.1 billion in 2015, an increase of 11.5%. The market for our technology solutions has grown rapidly as manufacturers and retailers have looked for solutions that drive efficiencies in operations by helping them analyze data for more effective decision-making, and support the growing need to distribute, manage, and advertise products effectively in thee-commerce channel. We expect the market for technology solutions to continue to grow at a rapid rate as these trends continue.
Dechert-Hampe estimates that the market for the experiential, shopper, and consumer marketing services offered through our marketing segment in the United States was approximately $11.1 billion in 2015 and has grown at a CAGR of approximately 26% over the last three years. The market for these marketing services has grown with increased manufacturer and retailer awareness and understanding of the greater effectiveness of properly targeted marketing strategies. These strategies aim to influence shoppers with meaningful messages and experiences along their paths to purchase, particularly whilein-store and at thepoint-of-purchase. Dechert-Hampe estimates that overall marketing spend in these service areas will grow approximately 17% from 2016 to 2021, primarily driven by manufacturers’ and retailers’ desire to influence shoppers to purchase products with memorable content and experiences. The industry for these services remains highly fragmented and consists of a large number of specialized and diversified agencies.
Dechert-Hampe estimates that the market for the social, media, and digital technology solutions, including those offered through our marketing segment, in the United States was approximately $11.7 billion in 2015 and has grown at a CAGR of approximately 18% over the last three years. The market for these solutions has grown with the increasing influence of digital in consumers’ shopping routines, causing manufacturers and retailers to integrate digital, social, and mobile marketing techniques into their marketing plans. We expect the market for these solutions to continue to grow rapidly as manufacturers and retailers seek to create effective, integrated multi-channel marketing campaigns that deliver compelling content and experiences to influence shopper behavior across all mediums.
We believe that growth in the several markets in which we compete is driven by a number of prevailing industry trends:
Outsourced business services are in increasing demand as manufacturers and retailers continueto seek effective and cost-efficient operational solutions. The scale and expertise of leading outsourced service providers allow manufacturers and retailers to find efficiencies innon-core
98
Table of Contents
services. For example, outsourced sales services allow manufacturers to establish and maintain retail sales relationships without the commitment of employing a largein-house labor force. As manufacturers continue to outsource sales and marketing functions to intensify focus on their core competencies and drive cost efficiency, we believe demand for outsourcing will outpace end market growth in consumer goods.
Small andmid-sized consumer brands are rising in popularity and require a deeper level of outsourced support for key sales and marketing functions. While small andmid-sized consumer brands continue to account for a larger share of total consumer spending, they often lack the scale and resources to interface with a broad network of retailers, achieve broad distribution, and influence consumer demand. Outsourced solutions providers offer the expertise, technology, and support to fulfill these brands’ needs.
The proliferation of e-commerce has driven retailers to pursue strategies to differentiate theirin-store shopping experience. Retailers have sought to adapt to shifting consumer shopping trends by leveraging outsourced service providers to help differentiate theirin-store shopping experience in order to more effectively compete withe-commerce shopping alternatives. By delivering memorablein-store experiences, we believe retailers can increase customer loyalty and influence key purchase decision making.
The proliferation of e-commerce has driven manufacturers to seek solutions that support the growth of their business in this channel. Consumer brands have sought to adapt to the growing propensity for online shopping and to develop the expertise, infrastructure, and technology necessary to effectively distribute and advertise their products in this space. We expect consumer brands will be especially well served by outsourcing providers that can coordinate sales and marketing efforts across both physical and digital retail channels.
Within this industry environment, we believe we are advantageously positioned because of our expertise, diverse and customizable suite of services, relationships, national footprint, and scale.
Our Competitive Strengths
We believe the following strengths differentiate us within our industry and have contributed to our sustained success:
Leading National Provider with Significant Scale and Infrastructure that Would Be Difficult to Replicate
We are a leading national provider of technology-enabled sales and marketing services, as measured by revenues, in the markets in which we operate. With over 37,000 associates regularly providing services within retail locations and 3,400 associates working on behalf of manufacturers and retailers at or near their headquarters or regional buying offices, we are one of the largest national providers of sales and marketing services. We have spent decades developing a reputation for providing high quality service and superior execution, grounded in our data-driven insights. We believe that our scale provides us with significant competitive advantages by allowing us to differentiate the value of the services we provide to our clients by:
| • | offering a broad suite of capabilities that allows us to create flexible, customizable, multi-service solutions that meet our clients’ evolving needs, from small regional businesses to large multinational corporations; |
| • | providing the expertise, experience, andin-market presence necessary to deliver flexible, centrally coordinated, local, regional, or national execution of large and complex labor-based services; |
99
Table of Contents
| • | building, training, and managing the deployment of our large workforce to serve our clients’ needs more efficiently than they could with their own employees; |
| • | leveraging the significant volume of products that we market on behalf of our manufacturer clients and our proximity and connectivity to retailers to influence retailer decision makers; and |
| • | investing in technology and data that enable our talented associates to better support our clients’ businesses. |
Our scale affords us efficiencies to deliver solutions that are more effective and cost-efficient than those provided by smaller competitors or internal manufacturer and retailer teams, allowing us to grow both our clients’top-line revenues and bottom-line profits. We believe this attractively positions us to retain existing clients and win new business, which further increases our scale and associated competitive advantages. As a result, we believe it would be very difficult to replicate our scale. Despite numerous attempts since the industry began consolidating in the United States in the late 1990s, no competitor has been able to successfully build a sales and marketing platform capable of serving manufacturers and retailers on a national scale that is competitive with us or the other larger national players in terms of breadth of offering and quality of execution.
Strategic Intermediary Benefiting from Self-Reinforcing Network Effects
We occupy an important industry position where we serve as a strategic intermediary between consumer goods manufacturers and retailers, creating value for both parties. Due to the breadth and depth of our manufacturer representation across key categories and departments, we are among the largest supplier partners to many retailers. Our size gives us access and influence with key retailer decision makers that smaller agencies and many manufacturers cannot secure on their own, which, in turn, helps us secure additional manufacturer representations. This self-reinforcing “network effect” has helped us grow to become an important strategic partner to both manufacturers and retailers. We have focused on strengthening the value we can provide to our network by investing in technology andin-market talent that, through our proximity to manufacturer clients and retailers, gives us direct visibility into strategies and systems and better positions us to support clients’ and retailers’ businesses.
Self-Reinforcing Network Effects

100
Table of Contents
Broad Suite of Complementary Services and Technology Solutions Tailored to Client Needs
Based on the insights we have gained as a strategic intermediary between manufacturers and retailers, we have built what we believe to be one of the industry’s broadest suites of technology-enabled sales and marketing services, allowing our associates to create coordinated, innovative, multi-service solutions designed to achieve our clients’ sales and marketing objectives.
In response to our clients’ needs, we have expanded our offering from purely sales services to include marketing services, leveraging our expertise, network of relationships, data, insights, and technology to differentiate our solutions. We began our marketing business in 2000 after we observed the challenges our clients were experiencing while using traditional marketing agencies that were not effectively connecting brand marketing strategies, sales planning efforts, and retailer strategies. More recently, we have begun building a complementary suite of sellable technology solutions designed to address several major business drivers in our industry, including the continuous push for operational efficiency, e-commerce channel expansion, and the need to optimize online andin-store execution capabilities. For example, one of our software solutions uses store-level data to proactively identify product issues, such as SKUs that are void, out of stock, or past expiration dates, which enables our associates to focus on correcting, rather than merely identifying, shelf issues during theirin-store visits.
Talented Associates and Performance-Based Culture
We believe that our talented associates and performance-based culture are important competitive advantages. When our chief executive officer, Tanya Domier, who has been with Advantage Solutions since 1990, assumed chief operating officer responsibilities in 2010, she recognized an opportunity to differentiate Advantage Solutions from our competitors by transforming our talent and culture. Under Ms. Domier’s leadership, we have a results-driven team of leaders who average more than 20 years of experience in the consumer, sales, marketing, and technology industries.
We have made significant investments in training and leadership programs to ensure we remain an attractive career choice for associates at every level. For example, we created a leading entry-level training program, known as the Accelerated Career Experience, to attract talented associates to help the organization succeed in the future. We have also instituted a senior leadership program, known as the Executive Leadership Institute, to develop the next class of senior executive leaders at the Company.
Our employee programs are complemented by our performance-based culture that we believe differentiates us from our competitors. Our culture is built on both internal and external transparency and accountability for results. We set clear objectives with our associates, analyze score-card performance, and reward associates who outperform. We strive to encourage and empower our associates to be proactive, creative, and entrepreneurial in providing solutions for our clients. We believe our encouragement and empowerment has driven the history of service innovation that has fueled our growth, and that our commitment to results and continuous improvement produces long-term relationships with our clients that typically increase in scale and scope over time.
Differentiated and Proprietary Technology Infrastructure
Our proprietary technology infrastructure enables our associates to provide differentiated services that help us grow manufacturers’ and retailers’ businesses by leveraging data-driven insights to develop winning sales and marketing strategies and enable more effective and more efficientin-store execution.
Our technology supports our associates across a range of functions, including a proprietary analytics software suite that helps our associates analyze and apply vast amounts of industry data in
101
Table of Contents
the selling process and automate reporting. Our business and category managers use this software to quickly and efficiently develop insight-based sales plans for our clients.
For example, our business managers use astep-by-step analytic workflow tool that enables them to look across their product universe and the retailers they service to determine where the largest growth opportunities are (e.g., a product not getting its “fair share” of category sales at a certain retailer), benchmark against competitors to diagnose performance issues (e.g., inferior promotional activity), identify retailers that are losing category shoppers to other retailers or channels, and turn their findings into compelling sales presentations for retailers. Our category managers use a separate analytical tool that enables them to mine extensive data sets to optimize promotions, distribution, pricing, and assortment plans.
Furthermore, our retail services associates use tablets with proprietary software that helps them optimize their workflow and store-level activities. This enables them to utilize proprietary applications to perform functions such as recommending promotional display programs to store managers and illustrating potential store-level sales impact of their recommendations.
Strong, Long-Term Relationships with Leading Manufacturers and Retailers
We maintain strategic relationships with a diversified base of over 2,000 consumer goods manufacturers and retailers, including iconic brands at manufacturers such as Mars, PepsiCo, and Smucker’s, and leading retailers such as Albertsons, Kroger, Sam’s Club, and Walmart.
We enjoy long-term, multi-service relationships with our largest clients. We have a tenure of over ten years with 11 of our top 15 clients by revenues, with the remaining four clients being new business wins in the last ten years. Historically, we have experienced low levels of client attrition, as evidenced by our average revenue-weighted client retention rate of 99% since 2009. We and our clients view our relationships as long-term strategic collaborations, which provide us with a stable and consistent revenue base due to mutually aligned incentives and a partnership dynamic.
Proven Acquisition and Integration Capabilities
We have a successful track record of sourcing, executing, and integrating acquisitions that expand our service capabilities, sales channels, and geographic markets. Since 2014, we have acquired 40 businesses, which have dramatically expanded our capabilities in digital and social marketing, extended our sales services into thee-commerce channel, and expanded our footprint into Europe and other international markets such as Africa, Asia, and Australia through our strategic partnership with Smollan. We maintain a highly disciplined approach to acquisitions, and have a proven history of acquiring businesses at attractive prices, achieving meaningful synergies, and meeting or exceeding our internal performance goals for the acquired businesses. We intend to continue to pursue strategic, attractive acquisition opportunities in the future.
Our Growth Strategies
Our competitive strengths and industry leadership enable us to pursue numerous growth opportunities. We intend to continue our growth through the following strategies:
Grow Our Client Relationships
Expand Existing Client Relationships
We have cultivated long-term, multi-service relationships across a diverse set of manufacturers and retailers. As we have broadened our service offerings, we have succeeded in expanding our client
102
Table of Contents
relationships. For example, Smucker’s has been a client for over ten years, primarily using our sales services, but over the past five years, we have expanded our sales coverage into the foodservice channel and added digital technology, shopper marketing, and consumer marketing services to further support the growth of their business. Similarly, in the five years since Sargento first became a sales division client, we have added shopper marketing and consumer marketing to our responsibilities. We have also successfully expanded our retailer client partnerships. For example, Advantage became Kroger’s exclusive agency forin-store events in 2012 and since that time has added other services includingin-store merchandising for corporate brands andin-store resets in several markets. We believe significant opportunities remain to increase service penetration within our existing client base across our technology-enabled sales and marketing solutions. The long-term nature of our client relationships allows us to identify expansion opportunities and positions us to actively develop customized service arrangements to broaden the scope of those relationships.
Continue to Win New Clients and Retailer Accounts
We have a strong track record of securing business from new clients. Over the last five years we have won approximately 50 new client accounts and experiential marketing platforms with annual revenues between $500,000 and $40 million per account. In aggregate, the annualized revenues resulting from these wins are approximately $320 million. Of those accounts, approximately 20% are attributed to increased outsourcing among consumer goods manufacturers and retailers, and approximately 80% are attributed to consumer goods manufacturers and retailers switching from competitors. Moreover, as we expand the industries we serve to areas such as healthcare, financial services, and automotive, and our addressable market continues to grow, we believe that we will continue to succeed in generating new business.
Pursue Channel Expansion and New Industry Opportunities
We believe thee-commerce channel will be a growth opportunity. Dechert-Hampe estimates that the total United Statese-commerce market was approximately $393 billion in 2016 and is expected to reach approximately $645 billion by 2021, representing 16% annual growth, as online category penetration expands, mobile sales grow, and order values increase. While categories such as books and music are already highly penetrated in thee-commerce channel, the grocery and personal care categories, which comprise the majority of the products we represent, currently remain relatively underpenetrated at less than 5% penetration, according to the U.S. Department of Commerce. However, Dechert-Hampe estimates that growth ine-commerce sales in both the online grocery and personal care categories are projected to accelerate over the next five years to approximately 35% and 12% per annum, respectively, with online grocery reaching approximately 5% penetration, or $60 billion domestically, by 2021. We believe that our existing competencies and capabilities position us well to succeed as the channel becomes more meaningful for our clients and the categories we represent. Many of the core competencies that allow us to add value for clients in traditional retail channels are as relevant to effective sales and marketing in thee-commerce channel as they are inbrick-and-mortar retail channels. In addition, we have added talent and capabilities dedicated to selling, marketing, and merchandising clients’ products in thee-commerce channel. One of oure-commerce agency acquisitions strengthened our relationships and capabilities in the channel, adding expertise in important areas such as sales and marketing plan development, headquarter selling, specialized search engine optimization, online review management, search engine marketing, enhanced content creation, and promotion execution.
Outside of the consumer goods manufacturing industry and traditional retail channel, we believe there is an opportunity to sell our services to companies in other industries, such as automotive, education, entertainment, healthcare, specialty pet, and travel, which are currently underserved by providers of outsourced technology-enabled sales and marketing services.
103
Table of Contents
Continue to Enhance Our Solutions and Expand Into Logical Adjacencies
We believe that we have a significant opportunity to leverage our position as a strategic intermediary between manufacturers and retailers to develop new and innovative outsourced solutions. Our management team has a strong track record of using the insights gained from our strategic relationships to develop services in logical adjacencies. For example, we established our marketing business, Advantage Marketing Partners, after our leadership team observed the challenges our clients had experienced with traditional marketing agencies that lacked our deep understanding of retail and had challenges connecting brand marketing strategies to sales planning efforts and retailer strategies. Since its inception, our marketing segment has grown to become a national agency collective with over $600 million in revenues in 2016, representing approximately 30% of total revenues.
We have recently developed digital technology solutions to help consumer goods manufacturers and retailers find operational efficiencies; create, produce, and distribute compelling content; and successfully market their products in an increasingly omni-channel environment. We believe there is an opportunity for further development in this area. For example, we acquired a provider ofback-end/point-of-sale data and business intelligence to help our clients more efficiently manage their business, allowing them to monitor inventory issues such asout-of-stocks. In addition, we recently acquired a syndicator of rich digital content to help consumer goods manufacturers and retailers more effectively distribute their digital content, such as product descriptions, images, and videos, in a uniform manner to online retail websites. With multiple product platforms in place and plans to continue building upon our digital technology portfolio, we believe we can take advantage of macro trends and the evolving shift to digital to grow our technology offerings into a larger component of our business.
We also believe there is an opportunity to develop new value-added marketing services. The marketing capabilities we have added over the past five years include a paid search marketer, two digital marketing agencies, and a dedicated media solutions team specializing in targeted mobile advertising. These additions further enable us to leverage data-driven insights to help clients target and connect more effectively with their consumers. As marketing spend migrates away from television, where traditional ad agencies have historically held competitive advantages, toward the disciplines where we have built our reputation and can differentiate our services through our understanding and connectivity to retail (i.e., promotional, shopper, and digital marketing), we believe we are well-positioned to add value for clients with new demand creation services such as brand identity, content, and packaging design. Moreover, the growing relevance of small, emerging brands has created a sizeable market opportunity for us to apply the full array of our capabilities.
Furthermore, there are adjacent industries in which our ability to build, manage, and train large service- and process-oriented teams and technology would give us a competitive advantage.
Pursue Additional Strategic and Financially Attractive Acquisitions
We have a track record of successfully identifying, acquiring, and integrating businesses that expand our solutions offering, sales channels, and geographic markets, while achieving synergies and outperforming our performance objectives. Using our disciplined approach for screening and evaluating potential opportunities, we intend to continue to seek strategically and financially attractive acquisition targets that provide us with new capabilities and drive long-term stockholder value.
Further Develop Our International Platform
We believe that growing our international presence will allow us to offer integrated outsourcing solutions for multinational manufacturers and to provide those clients a single strategic partner with an understanding of their global businesses. We have made strategic minority investments in Smollan,
104
Table of Contents
and established a joint venture with Smollan in Europe. While the majority of our business is currently concentrated in the United States and Canada, these investments have provided us with growth opportunities in several markets throughout Africa, Asia, Australia, and Europe. We plan to further expand our global presence through both strategic investments and acquisitions. As we deepen our penetration of these existing markets and enter new geographies, we expect to focus on acquiring knowledge of local market dynamics while also leveraging our deep understanding of how to create a consolidated platform to service the outsourcing needs of large clients. We believe many of the same opportunities exist for outsourcing partners in international markets that existed in the United States when the industry began consolidating in the late 1990s.
Dechert-Hampe estimates that the market for addressable sales segment services and the in-store activation portion of our marketing services in the international markets where we operate was $5.9 billion in 2016 and has grown at a CAGR of 2.2% over the past four years. They project these markets will grow, in aggregate, at approximately 3% annually over the next five years, driven by gross domestic product growth and the maturation of retail business models in certain geographies.
Utilize Technology and Scale to Drive Efficiencies in Operations
We believe our scale and continued investment in technology enable us to achieve operational excellence and capture productivity improvements. We consider technological innovation to be a critical component of our strategy, allowing us to provide superior execution at scale and deliver data-driven insights to grow our clients’ businesses. We believe that with our talent, entrepreneurial culture, and willingness to invest in our future, we are positioned to continue to develop new technologies that will differentiate our service offering from our competitors.
Our Competition
In our sales segment, we compete in an industry that has experienced significant consolidation over the last two decades. Today, the U.S. industry operates with three national firms consisting of Acosta, Inc., CROSSMARK, Inc., and us. We and Acosta, Inc. have the most significant industry market share. Based on our 2016 U.S. sales services revenues and industry data provided by Dechert-Hampe, we estimate that we account for approximately 16% of the market in the United States by revenues. Other than the three national firms, the industry remains highly fragmented, comprised of smaller independent agencies that offer services on a more regional level or are focused on a specific channel (e.g., foodservice) or specific service (e.g., merchandising projects and resets).
We have made significant progress in expanding our footprint in marketing services. In our marketing segment, we currently compete for a total marketing pool of $23 billion, distributed across experimental marketing, consumer and shopper marketing, and digital/social marketing. We face different competitors in each marketing service segment, but mainly compete with pure-play marketing and advertising agencies.
We primarily compete based on service offerings, value-enhancing solutions, relationships, ability to execute, and price. We believe that our comprehensive channel coverage, geographical reach, breadth of services, focus on delivering industry expertise,best-in-class service, and technology-enabled insights make us the provider of choice in the industry. We are well-positioned to maintain our existing client base and to continue to attract new clients and customers due to our established reputation, attractive value proposition, and winning record.
105
Table of Contents
Government Regulation
In connection with the services we provide, we must comply with various laws and regulations from federal, state, local and foreign regulatory agencies. We believe that we are in material compliance with regulatory requirements applicable to our business. These regulatory requirements include, without limitation:
| • | federal, state, local and foreign laws and regulations involving minimum wage, health care, overtime, sick leave, lunch and rest breaks and other similar wage, benefits and hour requirements, and other similar laws; |
| • | Title VII of the Civil Rights Act and the Americans with Disabilities Act and regulations of the U.S. Department of Labor, the Occupational Safety & Health Administration, the U.S. Equal Employment Opportunity Commission and the equivalent state agencies, and other similar laws; |
| • | food and permitting matters (e.g., licensing under the Perishable Agricultural Commodities Act, and regulations from the U.S. Department of Agriculture), food safety matters (e.g., federal, state and local certification and training, and inspection and enforcement of standards for our associates, facilities, equipment, and the products we promote), alcohol beverage marketing regulations, custom and import matters with respect to products imported to and exported from the United States; |
| • | the U.S. Foreign Corrupt Practices Act, the UK Bribery Act and other similar anti-bribery and anti-kickback laws and regulations that generally prohibit companies and their intermediaries from making improper payments for the purpose of obtaining or retaining business; and |
| • | federal, state and foreign anticorruption, data protection, privacy, consumer protection, content regulation, and other laws and regulations. |
For more information about the impact of government regulation on our business, please see “Risk Factors—Risks Related to Our Business—Changes to wage or job classification regulations, including minimum wages, and market-driven wage increases could have an impact on our results of operations” and “—We are subject to many federal, state, local, and international laws with which compliance is both costly and complex.”
Employees
As of June 1, 2017, we had more than 50,000 associates. Approximately 16,000 of these associates are full-time, and 34,000 are part-time. We believe we generally have good relations with our associates.
Properties
Our corporate headquarters are located at 18100 Von Karman Avenue, Suite 1000, Irvine, California 92612, where we rent approximately 48,000 square feet pursuant to a lease agreement that is scheduled to expire in May 2023.
As of March 31, 2017, we maintained more than 120 offices throughout the United States and Canada. We lease all of our properties, except for one property that we own in Connecticut. Leases on these offices expire at various dates from 2017 to 2025, excluding any options for renewal. We typically seek office space in proximity to retailers’ headquarters or buying offices, to aid our associates in acting as sales representatives for our manufacturer clients.
106
Table of Contents
Intellectual Property
We own or have the rights to use certain trade names and trademarks that are registered with the U.S. Patent and Trademark Office or other foreign trademark registration offices or exist under common law in the United States and other jurisdictions. Trade names that are important in identifying and distinguishing our business include, but are not limited to, Advantage Solutions, Advantage Sales & Marketing, Integrated, Advantage Marketing Partners, and Waypoint. Our rights to some of these trade names and trademarks may be limited to select markets. We also own domain names, including “advantagesolutions.net.”
We rely on trade secrets, including unpatentedknow-how, and proprietary systems and information, to maintain and develop our technology-enabled services. We try to protect trade secrets andknow-how by taking reasonable steps to keep them confidential, including entering into nondisclosure and confidentiality agreements with our associates that contain confidentiality obligations and entering into invention assignment commitments that obligate them to assign to us any inventions developed in the course of their work for us.
Legal Proceedings
We are involved in various legal matters that arise in the ordinary course of our business. Some of these legal matters purport or may be determined to be class actions or seek substantial damages.
We are currently engaged in arbitration relating to a business acquisition that closed in 2014. A lawsuit over the dispute was filed on December 30, 2015 in the United States District Court for the District of Delaware. The parties subsequently agreed to arbitrate the dispute through CPR International Institute for Conflict Prevention & Resolution and that arbitration proceeding is currently pending. The adverse parties sold us an acquired business and consist of USG Companies, Inc., Lott Companies, Ltd., and Dalton Lott, the principal beneficial owner of those selling companies. The arbitration concerns the parties’ disagreement over the proper interpretation of certain terms in the purchase agreement that set the amount of a post-closing earn-out payment (i.e., contingent consideration) due under that agreement. The principal amount in dispute is $5.7 million. We have retained outside counsel to represent us in this matter and are vigorously defending our interests.
We are also currently engaged in litigation matters in Delaware and Kansas relating to post-closing disputes arising from a separate business acquisition that closed in 2014. The litigation matters involve issues of arbitrability and various claims primarily relating to indemnification, severance payments, lease obligations, purchase price adjustments, and a conditional earn-out amount (i.e., contingent consideration). There have been four separate lawsuits filed arising from this 2014 business acquisition. The first lawsuit was filed on March 2, 2016 in Johnson County District Court in the State of Kansas by Trevor Garberg and Justin Garberg seeking monetary relief under certain severance agreements. The second lawsuit was filed by us on October 7, 2016 in the Court of Chancery of the State of Delaware. We seek to compel compliance with certain alternative dispute mechanisms with respect to certain claims and seek monetary and declaratory relief with respect to other claims. The adverse parties to this lawsuit filed in Delaware are the parties that sold us the business assets in the 2014 business acquisition: Dennis Garberg & Associates, Inc., Tallgrass Talent Group LLC, Datahound LLC, Midwest Project Services LLC, North 51st Group Inc., and certain beneficial owners of these selling companies, including Trevor Garberg and Justin Garberg. These defendants have filed counterclaims in the Delaware case seeking monetary and declaratory relief. The third and fourth lawsuits were filed on April 11, 2017 and April 18, 2017 in Johnson County District Court in the State of Kansas by Midwest Project Services LLC and Tallgrass Talent Group LLC against us, seeking monetary relief. These lawsuits each concern subleases entered into as part of the 2014 business
107
Table of Contents
acquisition. On May 11, 2017, we removed these two lawsuits to the U.S. District Court for the District of Kansas. On May 18, 2017, we filed a motion to dismiss or stay these two sublease lawsuits in favor of the earlier filed action in Delaware. Each of these litigation matters is in early stages. We have retained outside counsel to represent us in these matters and we are vigorously defending our interests.
In connection with the above matters and other legal matters, we have accrued immaterial amounts. There can be no assurance, however, that the above matters and other legal matters will not result in us having to make payments in excess of such accruals or that the above matters or other legal matters will not materially or adversely affect our business, financial position, or results of operations.
108
Table of Contents
Below is a list of the names and ages, as of June 1, 2017, of our current executive officers and directors and the directors that will be appointed prior to the completion of this offering and a description of the business experience of each of them.
Name | Age | Position | ||||
Tanya Domier | 51 | Chief Executive Officer and Director | ||||
Brian Stevens | 44 | Chief Financial Officer, Chief Operating Officer, and Director(1) | ||||
Jeff Hansberry | 53 | President and Chief Commercial Officer | ||||
David Cortese | 46 | President of Digital Technology | ||||
Jill Griffin | 45 | President of Marketing | ||||
Michael O’Keefe | 61 | President of Sales | ||||
Melissa Oesterreich | 40 | Chief People Officer | ||||
Bryce Robinson | 43 | General Counsel and Secretary | ||||
Yul Vanek | 47 | Chief Information Officer | ||||
Cameron Breitner | 42 | Director Nominee | ||||
Robert F. End | 61 | Director Nominee | ||||
Timothy J. Flynn | 44 | Director Nominee | ||||
Sonny King | 75 | Director Nominee | ||||
Christopher J. Stadler | 52 | Director Nominee | ||||
Jack L. Stahl | 64 | Director Nominee | ||||
Jonathan D. Sokoloff | 59 | Director Nominee | ||||
| (1) | Mr. Stevens will resign from our board of directors prior to the consummation of this offering. |
Executive Officers, Directors, and Director Nominees
Tanya Domier has served on the board of directors of both Advantage Solutions Inc. and Karman Topco since July 2014. From December 2010 to July 2014, she also served on the board of directors of AGS Topco Holdings, L.P., our prior owner. Ms. Domier has served as our company’s Chief Executive Officer since January 2013, after previously serving as President and Chief Operating Officer from 2010 to 2013, and as President of Marketing from 2000 to 2010. Ms. Domier first joined our company in 1990. Earlier in her career, Ms. Domier held various roles with The J.M. Smucker Company, a food manufacturing company. She has also served on the board of Nordstrom, Inc. since 2015, where she is a member of the audit committee and the chair of the compensation committee. She also serves on the board of Enactus, an international nonprofit organization. Ms. Domier received her B.A. from California State University, Chico.
Ms. Domier was selected to serve on our board of directors due to her long-standing leadership role at the Company, her understanding of our business and her significant experience in the sales and marketing industry. The board believes that she serves as a valuable bridge between management and the board and will continue to lead our management team with her vision of strategic growth.
Brian Stevens has served as our company’s Chief Financial Officer since June 2010 and as its Chief Operating Officer since October 2015. Mr. Stevens has served on the board of directors of both Advantage Solutions Inc. and Karman Topco since July 2014, but will resign from the board of directors of Advantage Solutions Inc. prior to the consummation of this offering. Mr. Stevens first joined our company in March 2008 as the Vice President of Finance. Previously, from March 2004 to March 2008, Mr. Stevens served as Vice President of Finance at Multi-Fineline Electronix, Inc., a technology company that underwent an initial public offering in 2004. From March 1999 to March 2004,
109
Table of Contents
Mr. Stevens worked at PricewaterhouseCoopers LLP, an accounting firm, in a variety of roles. Mr. Stevens has also served on the board of directors of Big Brothers Big Sisters of Orange County, anon-profit organization, since 2012. Mr. Stevens received his B.A. in Business Administration from California State University, Fullerton, is a Certified Public Accountant and received an M.B.A. with a concentration in Finance from the University of Southern California.
Jeff Hansberry has served as our company’s President and Chief Commercial Officer since March 2016. Mr. Hansberry joined our company from Starbucks Coffee Company, where he served as President of the Evolution Fresh Business Unit from October 2014 to March 2016 and as President of the China Asia Pacific Region from May 2013 to September 2014. Mr. Hansberry previously served as President of Starbucks Channel Development and Emerging Brands Business Unit, from 2012 to 2013, President of the Channel Development and Seattle’s Best Coffee Business Units from 2011 to 2012, and President of the Global Consumer Packaged Goods and Food Service Business Units from 2010 to 2011. Prior to Starbucks, Mr. Hansberry served as a Vice President and General Manager for E&J Gallo Winery. His professional background also includes 17 years at Procter & Gamble, where he held assignments in sales, marketing, and general management, both in the United States and abroad. Mr. Hansberry currently serves on the board of directors of Junior Achievement USA, a position he has held since 2010, and previously served on the board of the organization’s Washington State chapter. Mr. Hansberry received his B.A. from the University of Pittsburgh and an M.B.A. from the Katz Graduate School of Business, University of Pittsburgh.
David Cortese has served as our company’s President of Digital Technology since January 2015. Mr. Cortese first joined our company as Chief Information Officer in July 2012, and held that position until March 2015. Previously, Mr. Cortese served as the Senior Vice President of Digital Studio Services for Rentrak, a global media measurement and research company, from January 2011 to May 2012. Mr. Cortese joined Rentrak from Media Salvation, a company he founded in 2009 that focused on tracking and managing business intelligence forpoint-of-sale, rental, mobile, and digital distribution channels. Prior to founding Media Salvation, Mr. Cortese spent more than seven years at Sony Pictures, a motion picture company. Mr. Cortese started his career with Accenture, a management consulting and professional services company, working there for more than six years. Mr. Cortese earned a B.S. in Mechanical Engineering from Worcester Polytechnic Institute.
Jill Griffin has served as our company’s President of Marketing leading the Advantage Marketing Partners line of business since January 2010, after previously serving as our company’s President of Experiential Marketing from February 2008 to January 2010. From February 2007 to February 2008, Ms. Griffin served as the President of the Interactive Publishing division of Navarre Corporation, a public distribution and publishing company. She held various leadership roles with such business from 1998 to 2007 both before and after it was acquired by Navarre Corporation in 2002. Ms. Griffin began her career with TMP Worldwide, a recruitment advertising agency, in a business development and client service role. Ms. Griffin received her B.A. from the University of Minnesota and her B.S. from the University of Minnesota, Carlson School of Management. She was recognized as one of Progressive Grocer’s “Top Women in Grocery” in 2013 and 2016. Ms. Griffin also serves on the Global Retail Marketing Association Advisory Board.
Michael O’Keefe has served as our company’s President of Sales since October 2015. Mr. O’Keefe served as our Executive Vice President of Client Services from April 2014 through September 2015, and Vice President of Client Services from December 2011 to April 2014. Mr. O’Keefe previously held various roles with our company since first joining us in 2004, including serving as Client Team Leader and Vice President of Business Development. Mr. O’Keefe started his career with the Pezrow Company, a food broker, which we acquired in 2004. Mr. O’Keefe has been a member of the Board of Directors of the National Frozen & Refrigerated Foods Association for over 15 years and served as president of the Metro New York Eastern Frosted Foods Association. Mr. O’Keefe received his B.A. from Rutgers University.
110
Table of Contents
Melissa Oesterreich has served as our company’s Chief People Officer since March 2017, after previously serving as our company’s Executive Vice President of Client Services and Operations from November 2015 to February 2017, as Senior Vice President of Client Services from April 2014 to October 2015, and as Vice President of Client Services from December 2011 to April 2014. From 2001 to 2011, Ms. Oesterreich was an executive at IN Marketing, part of our marketing division, and prior to that, she was an account executive at News America Marketing, a marketing firm. Ms. Oesterreich received her B.S. in Business Administration as well as her B.A. from Chapman University. Ms. Oesterreich was named one of Progressive Grocer’s “Top Women in Grocery” in 2013, 2014, and 2016.
Bryce Robinsonhas served as our company’s General Counsel and Secretary since October 2015, after previously serving as Senior Vice President—Corporate Counsel from August 2014 through September 2015, as Vice President—Corporate Counsel from May 2013 to August 2014, and as Senior Corporate Counsel from April 2010 through April 2013. Earlier in his career, Mr. Robinson served as General Counsel and Secretary of InSight Health Corp., a nationwide medical imaging provider, and as an associate at Latham & Watkins LLP, an international law firm. Mr. Robinson received his B.A. from the University of Washington and his J.D. from UCLA School of Law. Mr. Robinson is licensed with the California State Bar.
Yul Vanek has served as our company’s Chief Information Officer since March 2015. Prior to taking on that position, Mr. Vanek served as Information Systems and Technology-Mergers and Acquisitions Integration Lead for the Beats Electronics acquisition at Apple Inc., a technology company, from August 2014 to January 2015, as Vice President of Information Technology at Beats Electronics, an audio technology company, from July 2013 to July 2014, and as Vice President of Information Technology at Deckers Outdoor Corporation, a footwear designer and distributor, from December 2009 to July 2013. Mr. Vanek previously provided consulting services to New Balance, a footwear and sportswear company, and Luxottica Retail, a luxury eyewear company, from 2008 to 2009, served as Vice President of Information Technology at Charlotte Russe Inc., an apparel retailer, from 2007 to 2008, and served as Vice President of Information Systems atK-Swiss Inc., a sportswear and footwear company, from 2005 to 2007. He started his career at Accenture in 1992, and left in 1997 to join Oakley Inc., a sportswear and eyewear company, where he held various roles through 2005. Mr. Vanek received his B.S. from the University of California, Los Angeles. He serves on the board of Surfside Colony Ltd. and previously served on the board of the Santa Barbara Zoo from 2011 to 2013.
Cameron Breitner will be appointed as a member of the board of directors of Advantage Solutions Inc. prior to completion of this offering, and has served as a director of Karman Topco since July 2014. Mr. Breitner is currently a partner with CVC Capital Partners, a private equity firm advising funds that hold units in Karman Topco. Mr. Breitner is the head of CVC’s San Francisco office and leads CVC’s U.S. Business Services, Consumer, and Retail investing activities. Prior to joining CVC in 2007, Mr. Breitner worked at Centre Partners, a private equity firm, as a managing director. He joined Centre Partners in 1998 from Bowles Hollowell Conner & Co., an investment bank where he worked in mergers and acquisitions. Mr. Breitner currently serves on the boards of directors of the parent holding companies of Petco and BJ’s Wholesale Club. He also serves as a director for Enactus, anon-profit organization. He previously served as a director of Leslie’s prior to its sale to L Catterton in 2017. Mr. Breitner received his B.A. from Duke University.
Mr. Breitner has been selected for appointment to our board of directors because he possesses particular knowledge and experience in accounting, finance and capital structure, strategic planning and leadership of complex organizations, retail businesses, and board practices of other major corporations.
Robert F. End will be appointed as a member of the board of directors of Advantage Solutions Inc. prior to completion of this offering. Mr. End has also served as a director of USA Compression GP,
111
Table of Contents
LLC since November 2012, where he serves as chairman of the compensation committee and a member of the audit committee. Previously, Mr. End served as a director of Hertz Global Holdings, Inc. from December 2005 until August 2011, and served on the compensation committee from December 2005 to August 2011. Mr. End was a managing director of Transportation Resource Partners, a private equity firm, from 2009 through 2011. Prior to joining Transportation Resource Partners in 2009, Mr. End had been a managing director of Merrill Lynch Global Private Equity Division, the private equity arm of Merrill Lynch & Co., Inc., where he served asco-Head of the North American Region. He also served as a managing director of Merrill Lynch Global Private Equity, Inc., the Manager of ML Global Private Equity Fund, L.P., a proprietary private equity fund which he joined in 2004. Mr. End was a founding partner and director of Stonington Partners Inc., a private equity firm established in 1994. Prior to leaving Merrill Lynch in 1994, Mr. End was a managing director of Merrill Lynch Capital Partners, Merrill Lynch’s private equity group. Mr. End joined Merrill Lynch in 1986 and worked in the investment banking division before joining the private equity group in 1989. Mr. End received his A.B. from Dartmouth College and his M.B.A. from the Tuck School of Business Administration at Dartmouth College.
Mr. End has been selected for appointment to our board of directors because of his significant knowledge and expertise as a result of his service on other boards and his years of experience with private equity groups, including his previous experience within our industry.
Timothy J. Flynn will be appointed as a member of the board of directors of Advantage Solutions Inc. prior to completion of this offering and has served as a director of Karman Topco since July 2014. Mr. Flynn is currently a partner with Leonard Green & Partners, L.P., a private equity firm that holds units in Karman Topco. Prior to joining LGP in 2003, Mr. Flynn had been a director in the investment banking department of Credit Suisse First Boston (CSFB), a financial services company, which he joined in 2000 following CSFB’s acquisition of Donaldson, Lufkin & Jenrette (DLJ), an investment bank. Mr. Flynn had been with DLJ since 1996 and had previously worked in the Mergers and Acquisitions group at Paine Webber Inc., a financial services company. Mr. Flynn also serves on the boards of The Container Store, United States Infrastructure Corp., Tank Holdings Corp., Insight Global, and has served on the boards of CCC Information Services and Del Taco Holdings Inc. Mr. Flynn serves as the chair of The Container Store’s culture and compensation committee. He received his A.B. from Brown University.
Mr. Flynn has been selected for appointment to the board of directors because he possesses particular knowledge and experience in accounting, finance and capital structure, strategic planning and leadership of complex organizations, retail businesses, and board practices of other major corporations.
Sonny King is the founder of our company and will be appointed to the board of directors of Advantage Solutions Inc. prior to completion of this offering. Mr. King has served on the board of directors of Karman Topco since July 2014. From December 2010 to July 2014, he also served on the board of directors of AGS Topco Holdings, L.P., our prior owner. Mr. King served as our company’s Chief Executive Officer from our founding in 1987 to December 2012. Prior to founding our company in 1987, Mr. King served as the Vice President of Grocery and General Merchandise for Vons Grocery Company, a regional supermarket chain in Southern California. Mr. King previously served on the board of directors for Sunny Delight Beverages Co. and Tile Shop Holdings, Inc. He also previously served on the boards of the international nonprofit organizations Enactus and GS1. Mr. King completed graduate certificates in Food Marketing and Distributions from both Cornell University and the University of Southern California.
Mr. King has been selected for appointment to the board of directors due to his intimate knowledge of our company. His deep understanding of our business model and strategic objectives, derived from his leadership role since our founding, has given him unique insight into our industry.
112
Table of Contents
Christopher J. Stadlerwill be appointed as a member of the board of directors of Advantage Solutions Inc. prior to completion of this offering and has served as a director of Karman Topco L.P. since July 2014. Mr. Stadler is currently a managing partner with CVC Capital Partners, a private equity firm advising funds that hold units in Karman Topco. Prior to joining CVC in 2007, Mr. Stadler worked for Investcorp, an investment management firm, as Head of Private Equity, North America, after joining as a managing director in 1996. Mr. Stadler currently serves on the boards of the parent holding companies of Petco, BJ’s Wholesale Club and DTI. He has previously served on the boards of Leslie’s, Pilot Flying J, Univar, and AlixPartners. He also sits on the board of CVC Capital Partners advisory business. Mr. Stadler currently serves on the board of Jumpstart and on the advisory council of Global Citizen, bothnon-profit organizations. Mr. Stadler received his B.A. in Economics from Drew University and an M.B.A. in Finance from Columbia University.
Mr. Stadler has been selected for appointment to the board of directors because he possesses particular knowledge and experience in accounting, finance and capital structure, strategic planning and leadership of complex organizations, retail businesses, and board practices of other major corporations.
Jack L. Stahl will be appointed as a member of the board of directors of Advantage Solutions Inc. prior to completion of this offering and has served as a director of Karman Topco since August 2014. Mr. Stahl was previously the President and Chief Executive Officer of Revlon, Inc., a cosmetics and beauty products company, from 2002 until his retirement in 2006. Prior to joining Revlon, Mr. Stahl served as President and Chief Operating Officer of The Coca-Cola Company, a multinational beverage company, from 2000 to 2001, where he previously served in various management positions since joining the company in 1979. Mr. Stahl currently serves on the boards of Ahold Delhaize, Catalent Inc. and the U.S. Board of Advisors of CVC Capital Partners, and serves as the Chairman of the Board of Managers of New Avon LLC. Additionally, Mr. Stahl formerly served on the boards of the Delhaize Group, Coty Inc., Schering-Plough Corporation, Dr Pepper Snapple Group, Saks, Inc., and Coca-Cola Enterprises. He has served on the audit committees of Ahold Delhaize, Catalent Inc. and Saks, Inc., the compensation committee of Dr Pepper Snapple Group, and the nominating committees of Dr Pepper Snapple Group and Catalent Inc. He has previously served as the chairman of thenon-profit organizations the Boys and Girls Club of America and UNCF (The United Negro College Fund). Mr. Stahl received a B.A. in Economics from Emory University and an M.B.A. from the Wharton School of Business at the University of Pennsylvania.
Mr. Stahl has been selected for appointment to the board of directors because he possesses significant knowledge of the consumer goods industry and has a great deal of experience serving as both an executive officer and director of large, multinational companies.
Jonathan D. Sokoloffwill be appointed as a member of the board of directors of Advantage Solutions Inc. prior to completion of this offering and has served as a director of Karman Topco since July 2014. Mr. Sokoloff is currently a managing partner with Leonard Green & Partners, L.P., a private equity firm that holds units in Karman Topco. Before joining LGP in 1990, he was a managing director in Investment Banking at Drexel Burnham Lambert, an investment bank. Mr. Sokoloff also serves on the boards of the publicly traded companies Shake Shack, Signet Jewelers, The Container Store and Whole Foods Market. In addition, Mr. Sokoloff serves on the boards of the parent holding companies of the private companies BJ’s Wholesale Club, J. Crew, Jetro Cash & Carry and Jo Ann Stores and serves on the boards of the private companies The Pure Group, Top Shop/Top Man Limited and Union Square Hospitality Group LLC. Mr. Sokoloff has served on Shake Shack’s compensation committee, Signet Jewelers’ compensation and nomination committees and the compensation committee of Whole Foods. He serves on the boards of severalnon-profit organizations, including the Los Angeles County Museum of Art and the Melanoma Research Alliance. Mr. Sokoloff received his B.A. from Williams
113
Table of Contents
College, and currently is a trustee of Williams College andco-chairs its Endowment Committee for Private Equity.
Mr. Sokoloff has been selected for appointment to the board of directors because he possesses particular knowledge and experience in accounting, finance and capital structure, strategic planning and leadership of complex organizations, retail businesses and board practices of other major corporations.
Selection Arrangements
Because Karman Topco will continue to control a majority of the voting power of our common stock upon the closing of this offering, we expect that Karman Topco will control the election of our directors. The equity interests of Karman Topco are owned by equity funds affiliated with or advised by the Sponsors, as well as by certain members of our management. No person or entity has the right to appoint a majority of Karman Topco’s directors.
Corporate Governance
Composition of Our Board of Directors
We believe our board of directors should be composed of individuals with sophistication and experience in many substantive areas that impact our business. We believe experience, qualifications or skills in the following areas are most important: retail merchandising; marketing and advertising; consumer goods; sales and distribution; accounting, finance, and capital structure; strategic planning and leadership of complex organizations; legal/regulatory and government affairs; people management; communications and interpersonal skills and board practices of other major corporations. We believe that all of our current board members possess the professional and personal qualifications necessary for board service, and have highlighted particularly noteworthy attributes for each board member in the individual biographies above.
Initially, our board of directors will consist of eight directors, including our Chief Executive Officer. Our restated certificate of incorporation provides that our board of directors shall consist of such number of directors as determined from time to time by resolution adopted by a majority of the total number of authorized directors whether or not there exists any vacancies in previously authorized directorships. Any additional directorships resulting from an increase in the number of directors may only be filled by the directors then in office unless otherwise required by law or by a resolution passed by our board of directors. The term of office for each director will be until his or her successor is elected at our annual meeting or his or her death, resignation or removal, whichever is earliest to occur.
Our board of directors will be divided into three classes, with each director serving a three-year term, and one class being elected at each year’s annual meeting of stockholders. will serve as Class I directors with an initial term expiring in 2018. will serve as Class II directors with an initial term expiring in 2019. will serve as Class III directors with an initial term expiring in 2020.
With respect to the roles of Chairman of the Board and Chief Executive Officer, our Corporate Governance Guidelines, as will be in effect prior to the closing of this offering, will provide that the roles may be separated or combined, and our board of directors exercises its discretion in combining or separating these positions as it deems appropriate in light of prevailing circumstances. Our board of directors believes that the combination or separation of these positions should continue to be considered as part of our succession planning process. Currently, the roles are separated. Our Corporate Governance Guidelines will provide the flexibility for our board of directors to modify our leadership structure in the future as appropriate. We believe that we, like many U.S. companies, are well-served by this flexible leadership structure.
114
Table of Contents
Upon the closing of this offering, Karman Topco will continue to control a majority of the voting power of our outstanding common stock. As a result, we will be a “controlled company” under the New York Stock Exchange corporate governance standards. As a controlled company, exemptions under the standards will mean that we are not required to comply with certain corporate governance requirements, including the following requirements:
| • | that a majority of our board of directors consists of “independent directors,” as defined under the rules of the New York Stock Exchange; |
| • | that we have a nominating and corporate governance committee that is composed entirely of independent directors with a written charter addressing the committee’s purpose and responsibilities; |
| • | that we have a compensation committee that is composed entirely of independent directors with a written charter addressing the committee’s purpose and responsibilities; and |
| • | for an annual performance evaluation of nominating and governance committee and compensation committee. |
These exemptions do not modify the independence requirements for our audit committee, and we intend to comply with the applicable requirements of the Sarbanes-Oxley Act and rules with respect to our audit committee within the applicable time frame.
Director Independence
In connection with this offering, our board of directors undertook a review of the independence of our directors and considered whether any director has a material relationship with us that could compromise that director’s ability to exercise independent judgment in carrying out that director’s responsibilities. Our board of directors has affirmatively determined that each of is an “independent director,” as defined under the rules of the New York Stock Exchange.
Board Committees
Prior to this offering, the board of directors of Karman Topco maintained an audit committee and a compensation committee. In connection with this offering, our board of directors will establish an audit committee, a compensation committee, and a nominating and corporate governance committee. In the future, our board of directors may establish other committees, as it deems appropriate, to assist it with its responsibilities. The composition, duties and responsibilities of our committees is as set forth below.
Audit Committee
Our audit committee will be responsible for, among other matters:
| • | appointing, compensating, retaining, evaluating, terminating and overseeing our independent registered public accounting firm; |
| • | discussing with our independent registered public accounting firm its independence from management; |
| • | reviewing with our independent registered public accounting firm the scope and results of its audit; |
| • | approving all audit and permissiblenon-audit services to be performed by our independent registered public accounting firm; |
115
Table of Contents
| • | overseeing the financial reporting process and discussing with management and our independent registered public accounting firm the interim and annual financial statements that we file with the SEC; |
| • | reviewing and monitoring our accounting principles, accounting policies, financial and accounting controls and compliance with legal and regulatory requirements; and |
| • | establishing procedures for the confidential anonymous submission of concerns regarding questionable accounting, internal controls or auditing matters. |
Upon the closing of this offering, our audit committee will consist of , , and .Rule 10A-3 of the Exchange Act and the New York Stock Exchange rules require us to have one independent audit committee member upon the listing of our common stock on the New York Stock Exchange, a majority of independent directors on our audit committee within 90 days of the date of this prospectus and an audit committee composed entirely of independent directors within one year of the date of this prospectus. Our board of directors has affirmatively determined that each of meets the definition of “independent director” for purposes of serving on an audit committee underRule 10A-3 and the New York Stock Exchange rules, and we intend to comply with the other independence requirements within the time periods specified. In addition, our board of directors has determined that will qualify as an “audit committee financial expert,” as such term is defined in Item 407(d)(5) ofRegulation S-K. Our board of directors has adopted a new written charter for the audit committee, which will be available on our principal corporate website atwww.advantagesolutions.net substantially concurrently with the closing of this offering.
Compensation Committee
Our compensation committee will be responsible for, among other matters:
| • | reviewing and approving the compensation of our directors, Chief Executive Officer and other executive officers; and |
| • | appointing and overseeing any compensation consultants. |
Upon the closing of this offering, our compensation committee will consist of , , and . As a controlled company, we will rely upon the exemption from the requirement that we have a compensation committee composed entirely of independent directors. Our board of directors has adopted a new written charter for the compensation committee, which will be available on our principal corporate website atwww.advantagesolutions.netsubstantially concurrently with the closing of this offering.
Nominating and Corporate Governance Committee
Our nominating and corporate governance committee will be responsible for, among other matters:
| • | identifying individuals qualified to become members of our board of directors, consistent with criteria approved by our board of directors; and |
| • | developing and recommending to our board of directors a set of corporate governance guidelines and principles. |
Upon the closing of this offering, our nominating and corporate governance committee will consist of , , and . As a controlled company, we will rely upon the exemption from the requirement that we have a nominating and corporate governance committee composed entirely of independent directors. Our board of directors has adopted a new written charter for the nominating and corporate governance committee, which will be available on our principal corporate website atwww.advantagesolutions.netsubstantially concurrently with the closing of this offering.
116
Table of Contents
Risk Oversight
Our board of directors is responsible for overseeing our risk management process. Our board of directors focuses on our general risk management strategy, the most significant risks facing us, and oversees the implementation of risk mitigation strategies by management. Our board of directors is also apprised of particular risk management matters in connection with its general oversight and approval of corporate matters and significant transactions.
Compensation Committee Interlocks and Insider Participation
Prior to this offering, our board of directors has not had a compensation committee. In her capacity as our Chief Executive Officer, Ms. Domier typically has been responsible for negotiating compensation arrangements for our executive officers, with the oversight and final approval of the members of the compensation committee of the board of directors of Karman Topco, or the Karman Compensation Committee. The members of the Karman Compensation Committee are Mr. Breitner, Ms. Domier, and Mr. Flynn. Ms. Domier has not had a role in determining her own compensation.
None of our executive officers served as a director or a member of a compensation committee (or other committee serving an equivalent function) of any other entity, of which any of the executive officers served as a director or member of the Karman Compensation Committee during the year ended December 31, 2016.
Code of Ethics
We have adopted a code of business conduct and ethics applicable to our principal executive, financial and accounting officers and all persons performing similar functions. A copy of that code will be available on our principal corporate website atwww.advantagesolutions.net substantially concurrently with to the closing of this offering. We expect that any amendments to the code, or any waivers of its requirements, will be disclosed on our website.
117
Table of Contents
Compensation Discussion and Analysis
This section discusses the principles underlying the material components of our executive compensation program for our executive officers who are named in the “Summary Compensation Table” below and the factors relevant to an analysis of these policies and decisions. These “Named Executive Officers” for 2016 are:
| • | Tanya Domier, who serves as Chief Executive Officer and is our principal executive officer; |
| • | Brian Stevens, who serves as Chief Financial Officer and Chief Operating Officer and is our principal financial officer; |
| • | Jeff Hansberry, who serves as our President and Chief Commercial Officer; |
| • | Jill Griffin, who serves as our President of Marketing; and |
| • | Michael O’Keefe, who serves as our President of Sales. |
Fiscal Year 2016 Compensation
Compensation Philosophy and Objectives
We compete with many other companies seeking to attract and retain experienced and skilled executives. To meet this challenge, we have embraced a compensation philosophy of offering our executive officers competitive compensation and benefits packages. We strive to create a compensation program that rewards profitable company growth and differentiates pay based on business unit, division, and individual contributions. The principles and objectives of our compensation and benefits programs for our executive officers and other associates are to:
| • | encourage highly talented executives to come, stay, grow, and lead, enabling us to be an employer of choice in our industry; |
| • | differentiate pay for superior performers to recognize and reward individual contributions to our success; |
| • | focus leadership on our long-term strategies and value creation by providing a substantial percentage of compensation weighted towards equity incentives that are subject to certain performance conditions and vesting requirements (as described further below); and |
| • | ensure that our total compensation is fair, reasonable and competitive relative to the various industries in which we compete for talent. |
Determination of Compensation
The current compensation levels of our executive officers, including the Named Executive Officers, primarily reflect the varying roles and responsibilities of each individual, as well as the length of time each executive officer has been an executive officer with the Company.Typically, our Chief Executive Officer has been responsible for negotiating compensation arrangements with our executives, except with respect to her own compensation, subject to the oversight and final approval of the Karman Compensation Committee. The initial compensation arrangements with our executive officers, including the Named Executive Officers, have been determined inarm’s-length negotiations with each individual executive. The focus of these arrangements has been to recruit skilled individuals to help us achieve our financial goals, as well as to maintain the level of talent and experience needed to further grow our business.
118
Table of Contents
Following the completion of these arrangements, our Chief Executive Officer has been responsible for overseeing our executive compensation program; however, the Karman Compensation Committee has been responsible for overseeing our long-term equity incentive plan compensation program, and approving the ongoing compensation arrangements for our Chief Executive Officer and other executive officers, including the other Named Executive Officers. No member of management, including our Chief Executive Officer, has a role in determining his or her own compensation.
We design the principal components of our executive compensation program to fulfill one or more of the principles and objectives described above. Compensation of our Named Executive Officers consists of the following elements:
| • | base salary; |
| • | annual performance-based cash compensation; |
| • | equity incentive compensation; |
| • | certain severance and change in control benefits; |
| • | a 401(k) retirement savings plan; and |
| • | health and welfare benefits and certain limited perquisites and other personal benefits. |
Historically, not all components have been provided to all executive officers. We have determined the appropriate level for each compensation component based on a number of factors, including our understanding of the competitive market (which is in part determined based on the experience of members of our Board of Directors), our recruiting and retention goals, our view of internal equity and consistency, the length of service of our executive officers, our overall performance, and other considerations the Karman Compensation Committee considers relevant.
Historically, equity compensation decisions involving our executive officers were made by the Karman Compensation Committee. During 2016, the Karman Compensation Committee was comprised of Cameron Breitner, Timothy Flynn, and Tanya Domier. Prior to the completion of this offering, the board of directors of Advantage Solutions Inc. will form its own compensation committee, or the Company Compensation Committee, which will be comprised of .
Executive Compensation Program Components
We offer cash compensation in the form of base salaries and annual performance-based bonuses that we believe appropriately reward our executive officers for their individual contributions to our business. When making performance-based bonus decisions, the Karman Compensation Committee has considered the Company’s financial and operational performance as well as each executive officer’s individual contributions during the year. The key component of our executive compensation program, however, is equity awards for restricted equity-based interests in Karman Topco. As a privately-held company and consistent with our compensation philosophy, we have emphasized the use of equity to incent our executive officers to focus on the growth of our overall enterprise value and, correspondingly, the creation of value for the Sponsors. As a result of this compensation practice, we have tied a greater percentage of an executive officer’s total compensation to the returns of equity funds affiliated with or advised by the Sponsors that own equity interests in Karman Topco and kept cash compensation at more modest levels, while providing the opportunity to be well-rewarded through equity if we perform well over time. While we believe that we offer competitive base salaries, we consider equity-based compensation a significant motivator in encouraging executives to come, stay, grow, and lead.
The following describes the primary components of our executive compensation program for each of our Named Executive Officers, the rationale for that component, and how compensation amounts are determined.
119
Table of Contents
Base Salary
Our Named Executive Officers’ initial annual base salaries were established through arm’s-length negotiation at the time the individual was hired or promoted into their current role, taking into account his or her qualifications, experience and prior salary level. Thereafter, the base salaries of our executive officers, including the Named Executive Officers (except for our Chief Executive Officer), are reviewed periodically by our Chief Executive Officer and human resources team, and adjustments are made as deemed appropriate.
In 2016, there were no increases in the annual base salaries of our Named Executive Officers, with the exception of Mr. O’Keefe. Mr. O’Keefe’s annual base salary was increased from $280,000 to $310,000 in May 2016 to better reflect increased responsibilities in his role. To further align their pay with responsibilities going forward, Messrs. Stevens’ and O’Keefe’s annual base salaries were increased to $531,910 and $360,000, respectively, in 2017.
As of the end of fiscal year 2016, our Named Executive Officers were entitled to the following base salaries:
Named Executive Officer | Annual Base Salary | |||
Tanya Domier | $ | 850,000 | ||
Brian Stevens | $ | 431,910 | ||
Jeff Hansberry | $ | 550,000 | ||
Jill Griffin | $ | 360,000 | ||
Michael O’Keefe | $ | 310,000 | ||
Annual Performance-BasedNon-Equity Incentive Compensation
Historically, we have used cash performance-basednon-equity compensation, which we call our annual incentive, to motivate our executive officers to achieve our strategic and annual financial objectives while making progress towards our longer-term growth and other goals. Our Named Executive Officers have had target annual incentive opportunities and the determination of whether and how much of an annual incentive was awarded was determined after reviewing each Named Executive Officer’s performance and the Company’s performance relative topre-established objectives. Our Chief Executive Officer and the Karman Compensation Committee considered the level of an executive and the Company’s performance against our annual budget as well as performance on annual financial results within each executive’s area of responsibility or other strategic achievements in determining the level of achievement of each Named Executive Officer’s target annual incentive.
The following table lists 2016 target annual incentives for our Named Executive Officers, which we view as the level of bonus that would be earned by achieving a superior level of performance. We believe our target goals are challenging and attaining our target goals would indicate an exceptional level of performance. As a result, targets listed below for our Named Executive Officers also represent each Named Executive Officer’s maximum annual incentive opportunity, and performance below our target goals would earn a below target payout.
Named Executive Officer | 2016 Target Annual Incentive | |
Tanya Domier | 100.0% of annual base salary | |
Brian Stevens(1) | 98.4% of annual base salary | |
Jeff Hansberry | 100.0% of annual base salary | |
Jill Griffin | 100.0% of annual base salary | |
Michael O’Keefe | 100.0% of annual base salary |
| (1) | Mr. Stevens’ employment agreement provides that he is eligible to receive a discretionary annual bonus with a target bonus equal to 100% of his base salary; however, prior to 2017, through a |
120
Table of Contents
| verbal agreement with Mr. Stevens, his bonuses remained tied to the $425,000 base salary specified in his employment agreement and not his current base salary. |
Annual incentive compensation targets for 2016 for all of our Named Executive Officers included strategic initiatives for their respective area of responsibility, and a financial performance objective for our business. In addition, Ms. Griffin and Mr. O’Keefe had a portion of their 2016 annual incentive compensation include a financial performance objective for their respective business unit. The financial performance objectives are derived from our audited financial statements after making the various adjustments associated with Adjusted EBITDA, excluding associate bonus expense and such other items that the Karman Compensation Committee considered appropriate (e.g., certain expenses associated with new platform launches, severances, and relocations). For a definition of Adjusted EBITDA, please see “Non-GAAP Financial Measures.”
Named Executive Officer | % of Target Annual Incentive Tied to | |||||
| Adjusted EBITDA(1) | Adjusted EBITDA for Business Unit(2) | Strategic Initiatives | ||||
Tanya Domier | 60% | — | 40% | |||
Brian Stevens | 60% | — | 40% | |||
Jeff Hansberry | 60% | — | 40% | |||
Jill Griffin | 20% | 60% | 20% | |||
Michael O’Keefe | 20% | 60% | 20% | |||
| (1) | Represents a metric derived from Adjusted EBITDA after excluding associate bonus expenses and such other items that the Karman Compensation Committee considered appropriate. |
| (2) | Represents a metric derived from Adjusted EBITDA for our respective business units, after excluding associate bonus expenses and such other items that the Karman Compensation Committee considered appropriate. |
Our practice is to set financial performance objectives for annual incentive compensation that require substantial growth year over year. In 2016, we did not achieve our annual financial performance objective, or the annual financial performance objectives for our business units (each of which is calculated as described above). As a result, we did not pay annual incentive compensation with respect to the financial performance objectives. We did pay annual incentive compensation related to our strategic initiatives. Each Named Executive Officer had a strategic initiative tied to achieving growth objectives through acquisitions, which was 20% of the total target annual incentive and paid out at the target level for each individual. Ms. Domier and Messrs. Hansberry and Stevens had additional strategic initiatives tied to their area of responsibility that were 20% of their total target annual incentive. Ms. Domier’s strategic initiative was measured based on growth in our new business ventures. Mr. Hansberry’s strategic initiative was measured based on new business wins. Mr. Stevens’ strategic initiative was measured based on operating improvements in our field operations. Ms. Domier’s and Mr. Hansberry’s individual strategic initiative paid out below target and Mr. Stevens’ individual strategic initiative paid out at target. The table below reflects the total annual incentive payout as a percentage of target for each Named Executive Officer. Mr. Hansberry’s 2016 payout of the annual incentive was pro-rated based on the portion of the year he was employed by the Company (the percentage below represents 25% of his pro-rated target annual incentive).
Named Executive Officer | 2016 Payout as % of Target Annual Incentive | |
Tanya Domier | 30% | |
Brian Stevens | 40% | |
Jeff Hansberry | 25% | |
Jill Griffin | 20% | |
Michael O’Keefe | 20% |
121
Table of Contents
Annual incentives paid to each Named Executive Officer are set forth in the “Summary Compensation Table” below.
No discretionary bonuses were paid to our Named Executive Officers in 2016.
Long-Term Equity Incentives
In December 2014, following the 2014 Topco Acquisition, each of our Named Executive Officers, other than Mr. Hansberry who joined us in 2016, was granted equity-based interests in Karman Topco, which allow them to share in the future appreciation of Karman Topco’s equity value, subject to certain vesting conditions including continued employment and achievement of specified targets substantially similar to Adjusted EBITDA, as described in more detail below. These equity-based interests are designed to foster a long-term commitment to us by our Named Executive Officers, provide a balance to the short-term cash components of our compensation program, align a significant portion of our executives’ compensation to the interests of our principal equity holders, promote retention and reinforce ourpay-for-performance structure (as discussed in more detail below).
The equity interests were granted pursuant to the limited partnership agreement of Karman Topco in the form of profits interests, called “Common Series C Units.” Common Series C Units represent an ownership interest in Karman Topco providing the holder with the opportunity to receive, upon certain vesting events described below, a return based on the appreciation of Karman Topco’s equity value from the date of grant. These Common Series C Units were issued as an upfront grant designed to provide a long-term incentive. The awards were structured so that if Karman Topco’s equity value were to appreciate, the executive would share in the growth in value from the date of grant solely with respect to the vested portion of the executive’s Common Series C Units. If Karman Topco’s equity were not to appreciate in value or decrease in value in the future, then the Common Series C Units would have no value.
These equity awards also function as a retention device because 75% of the award, or the Performance Vesting Units, vests ratably over a four-year period, commencing on December 31 of the year of grant, subject to Karman Topco’s achievement of specified annual targets substantially similar to Adjusted EBITDA. If the specified annual targets are not achieved for a given year, the Performance Vesting Units may still vest upon either achievement of a cumulative adjusted EBITDA threshold target that is substantially similar to Adjusted EBITDA or a vesting exit event. A vesting exit event means the earlier to occur of an Approved Partnership Sale, or a Qualified Public Offering, provided that, at the time of such event, the pre-tax internal rate of return to the Common Series A Limited Partners is at least 8% compounded annually with respect to the Common Series A Units held by them, based on cash proceeds received or, in respect of a sale of Karman Topco or a sale of substantially all of its assets, available to be received by them pursuant to the definitive agreement relating thereto, and after giving effect to the vesting of the Common Series C Units in accordance with the terms of any Restricted Unit Agreement and the vesting of the Common Series D Units. However, all of these Performance Vesting Units (whether vested or unvested units) are subject to forfeiture upon an Approved Partnership Sale or a Qualified Public Offering in which the 8% pre-tax internal rate of return is not achieved.
The remaining 25% of the Common Series C Units, or the 20% IRR Vesting Units, only vest upon the earlier to occur of an Approved Partnership Sale, or a Qualified Public Offering, provided that, at the time of such event, thepre-tax internal rate of return to the Common Series A Limited Partners is at least 20% compounded annually with respect to the Common Series A Units held by them, based on cash proceeds received or, in respect of a sale of Karman Topco or a sale of substantially all of its assets, available to be received by them pursuant to the definitive agreement relating thereto, and after giving effect to the vesting of the Common Series C Units in accordance with the terms of any
122
Table of Contents
Restricted Unit Agreement and the vesting of the Common Series D Units. These 20% IRR Vesting Units are subject to forfeiture upon an Approved Partnership Sale or Qualified Public Offering if thepre-tax internal rate of return to the Common Series A Limited Partners is less than 20% compounded annually with respect to the Common Series A Units held by them, based on cash proceeds received or, in respect of a sale of Karman Topco or a sale of substantially all of its assets, available to be received by them pursuant to the definitive agreement relating thereto, and after giving effect to the vesting of the Common Series C Units in accordance with the terms of any Restricted Unit Agreement and the vesting of the Common Series D Units. However, all 20% IRR Vesting Units (whether vested or unvested) are subject to forfeiture upon an Approved Partnership Sale or a Qualified Public Offering in which a 20% pre-tax internal rate of return is not achieved.
Prior Equity Award Decisions
In the fourth quarter of 2014, the Karman Compensation Committee determined the aggregate size of the initial long-term equity incentive grant to our associates, the specific equity grants to each participating associate, and the annual adjusted EBITDA targets for each of the four years ending December 31, 2017. Each of our Named Executive Officers participated in that initial grant, other than Mr. Hansberry, who joined us in 2016. Since that initial grant the Karman Compensation Committee has made other equity grants as it deemed appropriate and established additional targets substantially similar to Adjusted EBITDA for the years ending December 31, 2018, 2019 and 2020.
Fiscal Year 2016 Equity Award Decisions
In the first quarter of 2016, the Karman Compensation Committee made additional grants to the Named Executive Officers, excluding Ms. Domier and Mr. Stevens who have not received an additional equity grant since the original 2014 equity grant.
The equity grants made to our Named Executive Officers in 2016 are shown in the table below. In making these equity awards, the Karman Compensation Committee took into consideration the performance of the individual and the Company, the size of prior grants to the individual, the individual’s historical and expected contribution to the attainment of our financial and strategic objectives, the factors described above, and in the case of Mr. Hansberry, as a material inducement to attract him to our organization.
Named Executive Officer | Number of Performance Vesting Units | Number of 20% IRR Vesting Units | ||||||
Tanya Domier | 0.000 | 0.000 | ||||||
Brian Stevens | 0.000 | 0.000 | ||||||
Jeff Hansberry | 5,625.000 | 1,875.000 | ||||||
Jill Griffin | 2,250.000 | 750.000 | ||||||
Michael O’Keefe | 1,125.000 | 375.000 | ||||||
The equity grants made to the Named Executive Officers during 2016 are also set forth in the “Summary Compensation Table” and the “Grants of Plan-Based Awards Table” below.
Additionally, in the three months ended March 31, 2017, the Karman Compensation Committee made an additional grant to each of Ms. Griffin and Mr. O’Keefe of 93.750 Performance Vesting Units and 31.250 20% IRR Vesting Units, and to Mr. Hansberry of 937.500 Performance Vesting Units and 312.500 20% IRR Vesting Units (in accordance with his employment agreement).
As a privately-held company, there has been no market for shares of our common stock or for the equity-based interests in Karman Topco. Accordingly, in 2016, we had no program, plan, or practice pertaining to the timing of equity award grants to our executive officers coinciding with the release of
123
Table of Contents
materialnon-public information about the Company. We intend to adopt a formal policy regarding the timing of equity award grants in connection with this offering.
Retirement Savings and Other Benefits
We have established 401(k) retirement savings plans for our associates that satisfy certain eligibility requirements. Our Named Executive Officers are eligible to participate on the same terms as all of our associates. Under the 401(k) plans, eligible associates may elect to reduce their current compensation by up to the prescribed annual limit, and contribute these amounts to the 401(k) plan. Subject to eligibility limits, we provide a matching contribution of up to 50% of the first 6% of salaries contributed by participating associates.
Benefits and Perquisites
Additional benefits received by our Named Executive Officers include certain benefits provided to our associates generally, including medical, dental, and vision benefits, flexible spending and/or health care saving accounts, basic and voluntary life and accidental death and dismemberment insurance, short-term and long-term disability insurance, critical illness and accident insurance, as well as certain benefits provided only to executives, including executive health care insurance premiums, supplemental disability insurance, monthly car allowances, and club memberships.
Currently, as well as in the future, we may provide perquisites or other personal benefits in limited circumstances, such as where we believe it is appropriate to assist an individual executive officer in the performance of his or her duties, to make our executive officers more efficient and effective, and for recruitment, motivation or retention purposes.
Severance and Change in Control Benefits
We have entered into employment or severance award agreements with our Named Executive Officers, each of which has its own terms. The material elements of these employment agreements are summarized below under “Narrative Disclosure to Summary Compensation Table and Grants of Plan-Based Awards Table—Employment Agreements” and “—Potential Payments Upon Termination or Change in Control.”
We expect to enter into new employment agreements with certain of our Named Executive Officers, which will provide for certain payments and benefits upon a qualifying termination or change in control of the Company. For additional information, see “—Changes to Compensation Approach in 2017” below.
Changes to Compensation Approach in 2017
Engagement of a Compensation Consultant and Use of Competitive Market Data
The Company Compensation Committee will be authorized to retain the services of one or more executive compensation advisors, in its discretion, to assist with the establishment and review of our compensation programs and related policies. Prior to 2017, the Karman Compensation Committee did not engage the services of an executive compensation advisor in reviewing and establishing its compensation programs and policies. The Karman Compensation Committee has not previously conducted an analysis of, or surveyed, compensation market data or benchmarked total executive compensation or individual compensation elements against a peer group.
In April 2017, and in connection with the preparation of this offering, the Karman Compensation Committee engaged Semler Brossy Consulting Group, LLC, a national compensation consulting firm, to provide executive compensation advisory services, help evaluate our compensation philosophy and objectives, and provide guidance in administering our compensation program.
124
Table of Contents
The Karman Compensation Committee directed Semler Brossy to develop a peer group of comparable companies to our Company and prepare a competitive market analysis of our executive compensation program to assist it in determining the appropriate level of overall compensation, as well as assess each separate component of compensation, with the goal of understanding the competitiveness of the compensation we offer to our executive officers. Following the completion of this analysis, we anticipate that the Company Compensation Committee will base its executive compensation decisions, at least in part, by reference to the compensation of the executives holding comparable positions at this group of comparable peer companies as it may be adjusted from time to time. We anticipate that the Company Compensation Committee will conduct further reviews in the future, and make changes as it deems appropriate.
The compensation consultant serves at the discretion of the Karman Compensation Committee and has not provided any other services to us in 2017. The Karman Compensation Committee considered Semler Brossy’s independence in light of applicable SEC rules and the New York Stock Exchange listing standards and determined that Semler Brossy’s work did not raise any conflicts of interest that would prevent it from serving as an independent compensation consultant to the Karman Compensation Committee. We anticipate that the Company Compensation Committee will subsequently affirm and ratify this decision for itself.
Severance and Change in Control Benefits
We expect to enter into new employment agreements with certain of our Named Executive Officers, which will provide for certain payments and benefits upon a qualifying termination or change in control of the Company. For additional information, see “Narrative Disclosure to Summary Compensation Table and Grants of Plan-Based Awards Table—Employment Agreements” below.
Tax and Accounting Considerations
Section 162(m) of the Internal Revenue Code
Generally, Section 162(m) of the Internal Revenue Code of 1986, as amended, or the Code, disallows a tax deduction to any publicly held corporation for any individual remuneration in excess of $1 million paid in any taxable year to its chief executive officer and each of its other Named Executive Officers, other than its chief financial officer. However, remuneration in excess of $1 million may be deducted if, among other things, it qualifies as “performance-based compensation” within the meaning of the Code.
We expect that the Company Compensation Committee will consider the potential future effects of Section 162(m) on the deductibility of executive compensation paid to our Named Executive Officers, as applicable, and intends to qualify compensation paid to the covered Named Executive Officers for an exemption from the deductibility limitations of Section 162(m) under the transition period applicable to the Company as a new publicly-traded company. As such, in approving the amount and form of compensation for our Named Executive Officers in the future, the Company Compensation Committee will consider all elements of the cost to us of providing such compensation, including the potential impact of Section 162(m). In appropriate circumstances, however, the Company Compensation Committee may implement programs that recognize a full range of criteria important to our success and to ensure that our executive officers are compensated in a manner consistent with our best interests and those of our stockholders, even where the compensation paid under such programs may not be deductible under Section 162(m) of the Code.
Section 280G of the Internal Revenue Code
Section 280G of the Code disallows a tax deduction with respect to excess parachute payments to certain executives of companies which undergo a change in control. In addition, Section 4999 of the
125
Table of Contents
Code imposes a 20% penalty on the individual receiving the excess payment. Parachute payments are compensation that is linked to or triggered by a change in control and may include, but are not limited to, bonus payments, severance payments, certain fringe benefits, and payments and acceleration of vesting from long-term incentive plans including stock options and other equity-based compensation. Excess parachute payments are parachute payments that exceed a threshold determined under Section 280G based on the executive’s prior compensation. In approving the compensation arrangements for our Named Executive Officers in the future, we anticipate that the Company Compensation Committee will consider all elements of the cost to us of providing such compensation, including the potential impact of Section 280G. However, the Company Compensation Committee may, in its judgment, authorize compensation arrangements that could give rise to loss of deductibility under Section 280G and the imposition of excise taxes under Section 4999 when it believes that such arrangements are appropriate to attract and retain executive talent. We do not provide for excise taxgross-ups to our executives.
Section 409A of the Internal Revenue Code
Section 409A of the Code requires that “nonqualified deferred compensation” be deferred and paid under plans or arrangements that satisfy the requirements of the statute with respect to the timing of deferral elections, timing of payments and certain other matters. Failure to satisfy these requirements can expose associates and other service providers to accelerated income tax liabilities, penalty taxes and interest on their vested compensation under such plans. Accordingly, as a general matter, it is our intention to design and administer our compensation and benefits plans and arrangements for all of our associates and other service providers, including our Named Executive Officers, so that they are either exempt from, or satisfy the requirements of, Section 409A.
Accounting for Stock-Based Compensation
We follow Financial Accounting Standards Board Accounting Standards Codification Topic 718 (formerly known as FASB No. 123(R)), or ASC Topic 718, for our stock-based compensation awards. ASC Topic 718 requires companies to calculate the grant date “fair value” of their stock-based awards using a variety of assumptions. ASC Topic 718 also requires companies to recognize the compensation cost of their stock-based awards in their income statements over the period that an associate is required to render service in exchange for the award. Grants of stock options, restricted stock, restricted stock units and other equity-based awards under our equity incentive award plans will be accounted for under ASC Topic 718. We anticipate that the Company Compensation Committee will regularly consider the accounting implications of significant compensation decisions, especially in connection with decisions that relate to our equity incentive award plans and programs. As accounting standards change, we may revise certain programs to appropriately align accounting expenses of our equity awards with our overall executive compensation philosophy and objectives.
126
Table of Contents
Summary Compensation Table
The following table sets forth information concerning the compensation of our Named Executive Officers for the year ended December 31, 2016.
Name and Principal Position | Year | Salary | Stock Award(1) | Non-Equity Incentive Plan Compensation | All Other Compensation(3) | Total | ||||||||||||||||||
Tanya Domier Chief Executive Officer | 2016 | $ | 850,000 | — | $ | 255,000 | $ | 55,363 | $ | 1,160,363 | ||||||||||||||
Brian Stevens Chief Financial Officer and Chief Operating Officer | 2016 | $ | 431,910 | — | $ | 170,000 | $ | 49,397 | $ | 651,307 | ||||||||||||||
Jeff Hansberry President and Chief Commercial Officer | 2016 | $ | 433,654 | (2) | $ | 2,520,000 | $ | 110,000 | $ | 247,928 | $ | 3,311,582 | ||||||||||||
Jill Griffin President of Marketing | 2016 | $ | 360,000 | $ | 1,008,000 | $ | 72,000 | $ | 29,894 | $ | 1,469,894 | |||||||||||||
Michael O’Keefe President of Sales | 2016 | $ | 299,615 | $ | 504,000 | $ | 59,896 | $ | 31,422 | $ | 894,933 | |||||||||||||
| (1) | Amounts reflect the grant date fair value of profits interests granted during 2016 computed in accordance with FASB ASC Topic 718, rather than the amounts paid to or realized by the named individual. The assumptions used in determining the amounts in this column are set forth in Note 11 to our consolidated financial statements for 2016. For information regarding the number of profits units awarded in 2016, see the “—Grants of Plan-Based Awards in 2016” table below. |
| (2) | Mr. Hansberry commenced employment with the Company on March 21, 2016. The amount reflected in the “Salary” column represents thepro-rated amount of his annual base salary earned following commencement of employment. |
| (3) | Amounts in this column include the following: |
Name and Principal | Relocation Expenses | Car Allowance | Club Membership | 401(k) Matching Contribution | Executive Health Insurance | Life Insurance Premiums | Total | |||||||||||||||||||||
Tanya Domier Chief Executive Officer | — | $ | 27,000 | $ | 11,040 | $ | 7,950 | $ | 8,821 | $ | 552 | $ | 55,363 | |||||||||||||||
Brian Stevens Chief Financial Officer and Chief Operating Officer | — | $ | 24,000 | $ | 11,220 | $ | 7,950 | $ | 5,987 | $ | 240 | $ | 49,397 | |||||||||||||||
Jeff Hansberry President and Chief Commercial Officer | $ | 218,023 | $ | 19,385 | — | $ | 1,768 | $ | 8,370 | $ | 382 | $ | 247,928 | |||||||||||||||
Jill Griffin President of Marketing | — | $ | 6,000 | — | $ | 7,950 | $ | 15,704 | $ | 240 | $ | 29,894 | ||||||||||||||||
Michael O’Keefe President of Sales | — | $ | 24,000 | — | $ | 5,148 | $ | 690 | $ | 1,584 | $ | 31,422 | ||||||||||||||||
127
Table of Contents
Grants of Plan-Based Awards in 2016
The following table sets forth information regarding grants of plan-based awards made to our Named Executive Officers during the year ended December 31, 2016:
| All Other Stock Awards: | ||||||||||||||||||||||
Name | Grant Date | Estimated Future Payouts UnderNon-Equity Incentive Plan Awards | Number of Shares of Stock or Units (#) | Grant Date Fair Value of Awards(1) | ||||||||||||||||||
| Threshold ($) | Target ($) | Maximum ($) | ||||||||||||||||||||
Tanya Domier | — | $ | 212,500 | $ | 850,000 | $ | 850,000 | — | — | |||||||||||||
Brian Stevens | — | $ | 106,250 | $ | 425,000 | $ | 425,000 | — | — | |||||||||||||
Jeff Hansberry | — | $ | 108,414 | $ | 433,654 | $ | 433,654 | — | — | |||||||||||||
| March 21, 2016 | 5,625 | $ | 2,047,500 | |||||||||||||||||||
| March 21, 2016 | 1,875 | $ | 472,500 | |||||||||||||||||||
Jill Griffin | $ | 90,000 | $ | 360,000 | $ | 360,000 | ||||||||||||||||
| February 25, 2016 | 2,250 | $ | 819,000 | |||||||||||||||||||
| February 25, 2016 | 750 | $ | 189,000 | |||||||||||||||||||
Michael O’Keefe | $ | 74,903 | $ | 299,615 | $ | 299,615 | ||||||||||||||||
| February 25, 2016 | 1,125 | $ | 409,500 | |||||||||||||||||||
| February 25, 2016 | 375 | $ | 94,500 | |||||||||||||||||||
| (1) | The amounts shown in this column represent the aggregate grant date fair value of profits interests granted in 2016, computed in accordance with ASC Topic 718. See Note 11 to our consolidated financial statements for the fiscal year ended December 31, 2016 included in this prospectus, for a discussion of valuation assumptions for the aggregate grant date fair values. |
Narrative Disclosure to Summary Compensation Table and Grants of Plan-Based Awards Table
Employment Agreements
We have entered into employment or severance award agreements with our Named Executive Officers. The material elements of these employment agreements as in effect on December 31, 2016 are summarized below.
Tanya Domier and Brian Stevens
Ms. Domier serves as our Chief Executive Officer and Mr. Stevens serves as our Chief Financial Officer and Chief Operating Officer. As of December 31, 2016, each was party to an employment agreement with our primary operating company, Advantage Sales & Marketing LLC. These employment agreements were based on the same general form, but provided for individualized economic terms. Pursuant to these agreements, Ms. Domier and Mr. Stevens received an annual base salary of at least $850,000, and $425,000, respectively. Ms. Domier and Mr. Stevens were eligible to receive annual bonuses with a target bonus equal to 100% of his or her respective base salary (prior to 2017, through a verbal agreement with Mr. Stevens, his bonuses remained tied to the $425,000 base salary specified in his employment agreement and not his current base salary). Ms. Domier and Mr. Stevens were also eligible to participate in standard benefit plans as well as our executive health care insurance premiums, executive long-term disability plan and other benefit programs, an auto allowance and reimbursement of reasonable business expenses. Under their employment agreements as in effect on December 31, 2016, in the event Ms. Domier’s or Mr. Stevens’ employment was terminated by us without “Cause” or the executive terminated his or her employment for “Good Reason” (as such terms were defined in each executive’s respective employment agreement), then in
128
Table of Contents
addition to any accrued amounts, Ms. Domier was generally entitled to receive continued payment of her base salary and continued health insurance coverage for 24 months and Mr. Stevens was generally entitled to receive continued payment of his base salary and continued health insurance coverage for 18 months.
Jeff Hansberry
Mr. Hansberry serves as our President and Chief Commercial Officer. As of December 31, 2016, Mr. Hansberry was party to an employment agreement, or the Hansberry Employment Agreement, with Advantage Sales & Marketing LLC, under which Mr. Hansberry received an annual base salary of at least $550,000 and an annual bonus with a target bonus equal to 100% of his base salary. The Hansberry Employment Agreement also provided Mr. Hansberry with the right to receive equity interests in Karman Topco, including a grant of 1,250 Common Series C Units in Karman Topco if we achieve our 2017 adjusted EBITDA performance goal that is substantially similar to Adjusted EBITDA, and eligibility to participate in standard benefit plans as well as our executive health care insurance premiums, executive long-term disability plan and other benefit programs, an auto allowance and reimbursement of reasonable business expenses.
Under the Hansberry Employment Agreement as in effect on December 31, 2016, in the event Mr. Hansberry’s employment was terminated by us without “Cause” or Mr. Hansberry terminated his employment for “Good Reason” (as such terms were defined in the Hansberry Employment Agreement), then in addition to any accrued amounts, Mr. Hansberry was generally entitled to receive for a period of 24 months continued payment of his base salary and payment of the employer-portion of post-employment sponsored health insurance premiums. The Hansberry Employment Agreement also provided that if he is terminated without “Cause” or someone other than Ms. Domier or Mr. Hansberry is appointed our Chief Executive Officer, Mr. Hansberry shall additionally be entitled to require us to repurchase his vested Common Series C Units and, effective on September 30, 2017, a lump sum cash payment ranging from $2 million to $6 million depending on the date such event occurs and that, if, as of October 1, 2019, Mr. Hansberry remains employed by us and has not been appointed our Chief Executive Officer, Mr. Hansberry shall have the right, during the period beginning on October 1, 2019, and ending on March 21, 2020, to resign and receive the foregoing severance payment of 24 months of his base salary and the lump sum cash payment of $6 million and require us to repurchase his vested Common Series C Units.
Jill Griffin
Ms. Griffin serves as our President of Marketing. As of December 31, 2016, Ms. Griffin was party to an employment agreement with Advantage Sales & Marketing LLC, under which Ms. Griffin received an annual base salary of at least $360,000, an annual bonus and the right to participate in standard benefit plans as well as our executive health care insurance plan, executive long-term disability plan and other benefit programs, an auto allowance and reimbursement of reasonable business expenses. Under her employment agreement as in effect on December 31, 2016, in the event Ms. Griffin’s employment was terminated by us without “Cause” or Ms. Griffin terminated her employment for “Good Reason” (as such terms are defined in the Griffin Employment Agreement), then in addition to any accrued amounts, Ms. Griffin was entitled to receive for a period of 12 months continued payment of her base salary and payment of the employer-portion of post-employment sponsored health insurance premiums.
Michael O’Keefe
Mr. O’Keefe serves as our President of Sales. As of December 31, 2016, Mr. O’Keefe was party to a severance award agreement, or the O’Keefe Agreement, with Advantage Sales & Marketing LLC.
129
Table of Contents
The O’Keefe Agreement provided that if Mr. O’Keefe was terminated by us without “Cause” (as such term is defined in the O’Keefe Agreement), then in addition to any accrued amounts, Mr. O’Keefe would be entitled to receive (i) continued payment of an amount equal to (A) 39 weeks of his base salary, plus (B) an additional one week of base salary for every full year of service up to the termination date (as of May 1, 2017, Mr. O’Keefe’s years of service would entitle him to an additional 37 weeks of his base salary under this clause (B)) and (ii) payment of the employer-portion of post-employment sponsored health insurance premiums for up to 18 months.
Outstanding Equity Awards at 2016 FiscalYear-End
The following table summarizes the number of Common Series C Units of Karman Topco underlying outstanding equity incentive plan awards for each Named Executive Officer as of December 31, 2016:
Name | Grant Date | Number of Units That Have Not Vested (#) | Market Value of Units That Have Not Vested ($)(5) | |||||||
Tanya Domier | December 23, 2014 | 8,747.625 | (1) | $ | 3,429,069 | |||||
| December 23, 2014 | 11,663.500 | (2) | $ | — | ||||||
Brian Stevens | December 23, 2014 | 1,875.000 | (1)(3) | $ | 735,000 | |||||
| December 23, 2014 | 2,500.000 | (2)(3) | $ | — | ||||||
Jeff Hansberry | March 21, 2016 | 4,218.750 | (1) | $ | 898,594 | |||||
| March 21, 2016 | 1,875.000 | (2) | $— | |||||||
Jill Griffin | December 23, 2014 | 656.250 | (1)(3) | $ | 257,250 | |||||
| December 23, 2014 | 875.000 | (2)(3) | $ | — | ||||||
| February 26, 2016 | 1,687.500 | (1)(3) | $ | 359,438 | ||||||
| February 26, 2016 | 750.000 | (2)(3) | $ | — | ||||||
Michael O’Keefe | December 23, 2014 | 93.750 | (1)(4) | $ | 36,750 | |||||
| December 23, 2014 | 125.000 | (2)(4) | $ | — | ||||||
| November 6, 2015 | 750.000 | (1)(4) | $ | 232,500 | ||||||
| November 6, 2015 | 500.000 | (2)(4) | $ | — | ||||||
| February 25, 2016 | 843.750 | (1)(4) | $ | 179,719 | ||||||
| February 25, 2016 | 375.000 | (2)(4) | $ | — | ||||||
| (1) | Reflects the unvested Performance Vesting Units outstanding for the Named Executive Officer. Performance Vesting Units vest ratably over a four-year period commencing on December 31 of the year of grant, subject to Karman Topco’s achievement of specified annual targets substantially similar to Adjusted EBITDA. If the specified annual targets are not achieved, the Performance Vesting Units may still vest upon achievement of a cumulative threshold target that is substantially similar to Adjusted EBITDA or a qualifying event. These 8% Performance Vesting Units (whether vested or unvested units) are subject to forfeiture upon a sale of Karman Topco or a sale of substantially all of its assets that is not a qualifying event. |
| (2) | Reflects the unvested 20% IRR Vesting Units outstanding for the Named Executive Officer. The 20% IRR Vesting Units only vest upon a sale or qualified public offering if thepre-tax internal rate of return to the Common Series A Limited Partners is at least 20% compounded annually with respect to the Common Series A Units held by them, based on cash proceeds received or, in respect of a sale of Karman Topco or a sale of substantially all of its assets, available to be received by them pursuant to the definitive agreement relating thereto, and after giving effect to the vesting of the Common Series C Units in accordance with the terms of any Restricted Unit Agreement and the vesting of the Common Series D Units. These 20% IRR Vesting Units are subject to forfeiture upon a sale or exit event if thepre-tax internal rate of return to the Common |
130
Table of Contents
| Series A Limited Partners is less than twenty percent (20%) compounded annually with respect to the Common Series A Units held by them, based on cash proceeds received or, in respect of a sale of Karman Topco or a sale of substantially all of its assets, available to be received by them pursuant to the definitive agreement relating thereto, and after giving effect to the vesting of the Common Series C Units in accordance with the terms of any Restricted Unit Agreement and the vesting of the Common Series D Units. |
| (3) | Such units were transferred to trusts for estate planning purposes on December 27, 2016. |
| (4) | Such units were transferred to trusts for estate planning purposes on December 31, 2016. |
| (5) | There is no public market for the Common Series C Units. For purposes of this disclosure, we have valued the Common Series C Units using a third-party valuation on a per-unit basis of the profits interests as of December 31, 2016. The amount reported above under the heading “Market Value of Units That Have Not Vested” reflects the intrinsic value of the profits interests as of December 31, 2016. |
2016 Units Vested
The following table summarizes Common Series C units applicable to our Named Executive Officers during the year ended December 31, 2016 that met the time conditions and the performance conditions related to achievement of specified annual targets substantially similar to Adjusted EBITDA required for vesting. These Common Series C Units are subject to forfeiture upon a sale of Karman Topco or a sale of substantially all of its assets that is not a vesting exit event.
| Units | ||||||||
Name | Number of Units Vested(1) | Value Realized on Vesting(2) | ||||||
Tanya Domier | 8,747.625 | $ | 3,429,069 | |||||
Brian Stevens | 1,875.000 | $ | 735,000 | |||||
Jeff Hansberry | 1,406.250 | $ | 299,531 | |||||
Jill Griffin | 1,218.750 | $ | 377,063 | |||||
Michael O’Keefe | 750.000 | $ | 212,906 | |||||
| (1) | Amounts reflect the number of Performance Vesting Units that vested in 2016 for each Named Executive Officer, based on achievement of specified annual targets substantially similar to Adjusted EBITDA. However, such awards are subject to forfeiture upon a sale of Karman Topco or a sale of substantially all of its assets that is not a vesting exit event. For additional information regarding the Common Series C Units, please see “—Executive Compensation Program Components—Long-Term Equity Incentives” above. |
| (2) | There is no public market for the Common Series C Units. For purposes of this disclosure, we have valued the Common Series C Units using third-party valuation of the value per share of profit interest unit as of December 31, 2016. The amount reported above reflects the intrinsic value of the profits interests as of December 31, 2016. |
Potential Payments Upon Termination or Change in Control
As discussed above, we have entered into employment or severance award agreements with each of our Named Executive Officers, which provide for certain payments upon a qualifying termination of employment or a change in control.
The agreements generally provide for a severance amount tied to each respective Named Executive Officer’s base salary and continuing health care benefits for a severance period that ranges between six and 24 months.
131
Table of Contents
In addition, Mr. Hansberry is entitled to certain succession payments, and has the ability to require us to repurchase his vested Common Series C Units, but he was not entitled to any such succession payments or repurchase rights as of December 31, 2016. For additional information regarding these succession payments and rights, see “Narrative Disclosure to Summary Compensation Table and Grants of Plan-Based Awards Table—Employment Agreements” above. Additional key terms of the employment and severance award agreements include:
| • | The covered executive is employed “at will.” |
| • | The executive has agreed to provide certain number of days’ notice of termination. |
| • | Many of the agreements allow for automatic renewal for successiveone-year periods. |
| • | Amounts are owed depending upon the nature of the executive’s termination. |
| • | For terminations other than death or disability, the executive must sign a release to become eligible for severance benefits. |
| • | The agreements provide for certain restrictions on the executive competing or soliciting against us. Additionally, the executive must maintain the confidentiality of, and refrain from disclosing or using, our trade secrets for any period of time as the information remains a trade secret under applicable law, and our confidential information at all times. |
Summary of Potential Payments
The following table summarizes the payments that would be made to our Named Executive Officers upon the occurrence of a qualifying termination of employment or change in control, assuming that each Named Executive Officer’s termination of employment with the Company occurred on December 31, 2016. Except as noted below for Ms. Griffin, we do not have special agreements associated with change in control so if a Named Executive Officer is terminated without Cause or for Good Reason in connection with change in control, he or she would receive the same general severance payments as if a termination occurred without a change in control. Amounts shown do not include (i) accrued but unpaid salary through the date of termination, and (ii) other benefits earned or accrued by the Named Executive Officer during his or her employment that are available to all salaried associates.
Name | Benefit | Termination without Cause or for Good Reason ($)(5) | Termination due to death or Disability ($)(6) | Change in Control ($)(8) | ||||||||||
Tanya Domier | Severance Pay | $ | 1,700,000 | $ | 850,000 | $ | 0 | |||||||
| Healthcare Benefits(1) | $ | 12,196 | $ | 6,098 | $ | 0 | ||||||||
| Unit Vesting(4) | $ | 0 | $ | 0 | $ | 3,429,069 | ||||||||
Brian Stevens | Severance Pay | $ | 647,865 | $ | 431,910 | $ | 0 | |||||||
| Healthcare Benefits(1) | $ | 9,147 | $ | 6,098 | $ | 0 | ||||||||
| Unit Vesting(4) | $ | 0 | $ | 0 | $ | 735,000 | ||||||||
Jeff Hansberry | Severance Pay | $ | 1,100,000 | $ | 550,000 | $ | 0 | |||||||
| Healthcare Benefits(1) | $ | 12,196 | $ | 6,098 | $ | 0 | ||||||||
| Repurchase of Equity(3) | $ | 299,531 | $ | 0 | $ | 0 | ||||||||
| Unit Vesting(4) | $ | 0 | $ | 0 | $ | 898,594 | ||||||||
Jill Griffin | Severance Pay | $ | 360,000 | (7) | $ | 180,000 | $ | 0 | ||||||
| Healthcare Benefits(1) | $ | 4,016 | (7) | $ | 2,008 | $ | 0 | |||||||
| Unit Vesting(4) | $ | 0 | $ | 0 | $ | 616,688 | ||||||||
Michael O’Keefe(2) | Severance Pay | $ | 453,077 | $ | 0 | $ | 0 | |||||||
| Healthcare Benefits(1) | $ | 12,166 | $ | 0 | $ | 0 | ||||||||
| Unit Vesting(4) | $ | 0 | $ | 0 | $ | 448,969 | ||||||||
| (1) | Reflects company portion of payments paid during severance period, as defined in the respective agreements. For termination due to death or Disability, healthcare benefits continue only for termination related to Disability. |
| (2) | Mr. O’Keefe is eligible to receive severance pay for a period of 39 weeks, plus one week for every full year of service as of his termination date. He is also entitled to healthcare benefits for the severance pay period, up to maximum of 18 months. As of December 31, 2016, Mr. O’Keefe was entitled to 76 weeks of severance pay and 18 months of healthcare benefits. |
132
Table of Contents
| (3) | There is no public market for the Common Series C Units. For purposes of this disclosure, we have valued the Common Series C Units using third-party valuation of the value per share of profit interest unit as of December 31, 2016. The amount reported here reflects the intrinsic value of the Common Series C Units as of December 31, 2016. |
| (4) | There is no public market for the Common Series C Units. For purposes of this disclosure, we have valued the Common Series C Units using a third-party valuation on a per-unit basis of the profits interests as of December 31, 2016. The amount reported above reflects the intrinsic value of the profits interests as of December 31, 2016. |
| (5) | Except with respect to Ms. Griffin, the amounts in this column are payable in connection with a termination without Cause or for Good Reason whether before or after a change in control. |
| (6) | The amounts in this column are payable in connection with a termination due to death or Disability whether before or after a change in control. |
| (7) | Upon a termination of Ms. Griffin’s employment which results from a change in control, Ms. Griffin is not eligible to receive the Severance Pay or Healthcare Benefits above. |
| (8) | Each of the Named Executive Officers holds Common Series C Units in Karman Topco. Seventy-five percent (75%) of each award is subject to accelerated vesting upon the earlier to occur of an Approved Partnership Sale or a Qualified Public Offering, provided that, at the time of such event, the pre-tax internal rate of return with respect to the Common Series A Limited Partners is at least 8% compounded annually with respect to the Common Series A Units held by them (such Units, the Performance Vesting Units). The remaining 25% of the Common Series C Units with respect to each award only vests upon the earliest to occur of an Approved Partnership Sale or a Qualified Public Offering, provided that, at the time of such event, the pre-tax internal rate of return with respect to the Common Series A Limited Partners is at least 20% compounded annually with respect to the Common Series A Units held by them (such Units, the 20% IRR Vesting Units). If an Approved Partnership Sale or a Qualified Public Offering would have occurred as of December 31, 2016, the Performance Vesting Units would have accelerated and vested in full, but the 20% IRR Vesting Units would not have vested and would have had no value. The amounts set forth above reflect the value of Common Series C Units subject to accelerated vesting on December 31, 2016 based on the value of such Units on such date. For additional information regarding the Common Series C Units as in effect on December 31, 2016, please see “—Executive Compensation Program Components—Long-Term Equity Incentives” above. |
2016 Director Compensation
The following table sets forth information concerning the compensation of ournon-employee directors during the year ended December 31, 2016:
Name | Fees Earned or Paid in Cash(1) | Total | ||||||
Jack Stahl | $ | 100,000 | $ | 100,000 | ||||
| (1) | Amount represents fees earned by Mr. Stahl in 2016. |
Narrative Disclosure to Director Compensation Table
In 2016, Mr. Stahl was the onlynon-employee director who earned fees. He received $100,000 in annual retainer fees.
Incentive Award Plans
2017 Incentive Award Plan
We intend to adopt the Advantage Solutions Inc. 2017 Incentive Award Plan, or the Plan, subject to approval by our stockholders, under which we may grant cash and equity-based incentive awards to eligible service providers in order to attract, motivate and retain the talent for which we compete. The material terms of the Plan, as it is currently contemplated, are summarized below. Our board of directors is still in the process of developing, approving and implementing the Plan and, accordingly, this summary is subject to change.
Eligibility and Administration
Our associates, consultants and directors, and associates, consultants and directors of our subsidiaries will be eligible to receive awards under the Plan. Following our initial public offering, the
133
Table of Contents
Plan will be administered by our board of directors with respect to awards tonon-employee directors and by our compensation committee with respect to other participants, each of which may delegate its duties and responsibilities to committees of our directors or officers (referred to collectively as the plan administrator below), subject to certain limitations that may be imposed under Section 162(m) of the Code, Section 16 of the Securities Exchange Act of 1934, as amended, or the Exchange Act, or stock exchange rules, as applicable. The plan administrator will have the authority to make all determinations and interpretations under, prescribe all forms for use with, and adopt rules for the administration of, the Plan, subject to its express terms and conditions. The plan administrator will also set the terms and conditions of all awards under the Plan, including any vesting and vesting acceleration conditions.
Limitation on Awards and Shares Available
The maximum number of shares of our common stock which will be authorized for sale under the Plan is equal to the sum of (a) shares of common stock and (b) an annual increase on the first day of each year beginning in 2018 and ending in 2027, equal to the lesser of (i) % of the shares of common stock outstanding on the last day of the immediately preceding fiscal year and (ii) such number of shares of common stock as determined by our board of directors; provided, however, no more than shares of common stock may be issued under the Plan. If an award under the Plan is forfeited, expires or is settled for cash, any shares subject to such award may, to the extent of such forfeiture, expiration or cash settlement, be used again for new grants under the Plan. However, the following shares may not be used again for grant under the Plan: (1) shares tendered or withheld to satisfy grant or exercise price or tax withholding obligations associated with an award; (2) shares subject to a stock appreciation right, or SAR, that are not issued in connection with the stock settlement of the SAR on its exercise; and (3) shares purchased on the open market with the cash proceeds from the exercise of options.
Awards granted under the Plan upon the assumption of, or in substitution for, awards authorized or outstanding under a qualifying equity plan maintained by an entity with which we enter into a merger or similar corporate transaction will not reduce the shares available for grant under the Plan. The maximum number of shares of our common stock that may be subject to one or more awards granted to any director pursuant to the Plan during any calendar year will be and the maximum amount that may be paid under a cash award pursuant to the Plan to any one participant during any calendar year period will be $ .
Awards
The Plan provides for the grant of stock options, including incentive stock options, or ISOs, and nonqualified stock options, or NSOs, restricted stock, dividend equivalents, stock payments, restricted stock units, or RSUs, performance shares, other incentive awards, stock appreciation rights, or SARs, and cash awards. No determination has been made as to the types or amounts of awards that will be granted to specific individuals pursuant to the Plan. Certain awards under the Plan may constitute or provide for a deferral of compensation, subject to Section 409A of the Code, which may impose additional requirements on the terms and conditions of such awards. All awards under the Plan will be set forth in award agreements, which will detail all terms and conditions of the awards, including any applicable vesting and payment terms and post-termination exercise limitations. Awards other than cash awards generally will be settled in shares of our common stock, but the plan administrator may provide for cash settlement of any award. A brief description of each award type follows.
| • | Stock Options. Stock options provide for the purchase of shares of our common stock in the future at an exercise price set on the grant date. ISOs, by contrast to NSOs, may provide tax deferral beyond exercise and favorable capital gains tax treatment to their holders if certain holding period and other requirements of the Code are satisfied. The exercise price of a stock option may not be less than 100% of the fair market value of the underlying share on the date |
134
Table of Contents
of grant (or 110% in the case of ISOs granted to certain significant stockholders), except with respect to certain substitute options granted in connection with a corporate transaction. The term of a stock option may not be longer than ten years (or five years in the case of ISOs granted to certain significant stockholders). Vesting conditions determined by the plan administrator may apply to stock options and may include continued service, performance or other conditions. |
| • | SARs. SARs entitle their holder, upon exercise, to receive from us an amount equal to the appreciation of the shares subject to the award between the grant date and the exercise date. The exercise price of a SAR may not be less than 100% of the fair market value of the underlying share on the date of grant (except with respect to certain substitute SARs granted in connection with a corporate transaction) and the term of a SAR may not be longer than ten years. Vesting conditions determined by the plan administrator may apply to SARs and may include continued service, performance or other conditions. |
| • | Restricted Stock, RSUs, and Performance Shares. Restricted stock is an award of nontransferable shares of our common stock that remain forfeitable unless and until specified conditions are met, and which may be subject to a purchase price. RSUs are contractual promises to deliver shares of our common stock in the future, which may also remain forfeitable unless and until specified conditions are met. Delivery of the shares underlying RSUs may be deferred under the terms of the award or at the election of the participant, if the plan administrator permits such a deferral. Performance shares are contractual rights to receive a range of shares of our common stock in the future based on the attainment of specified performance goals, in addition to other conditions which may apply to these awards. Conditions applicable to restricted stock, RSUs and performance shares may be based on continuing service, the attainment of performance goals or such other conditions as the plan administrator may determine. |
| • | Stock Payments, Other Incentive Awards and Cash Awards. Stock payments are awards of fully vested shares of our common stock that may, but need not, be made in lieu of base salary, bonus, fees or other cash compensation otherwise payable to any individual who is eligible to receive awards. Other incentive awards are awards other than those enumerated in this summary that are denominated in, linked to or derived from shares of our common stock or value metrics related to our shares, and may remain forfeitable unless and until specified conditions are met. Cash awards are cash incentive bonuses subject to performance goals. |
| • | Dividend Equivalents. Dividend equivalents represent the right to receive the equivalent value of dividends paid on shares of our common stock and may be granted alone or in tandem with awards other than stock options or SARs. Dividend equivalents are credited as of dividend record dates during the period between the date an award is granted and the date such award vests, is exercised, is distributed or expires, as determined by the plan administrator. Dividend equivalents may not be paid on awards granted under the Plan unless and until such awards have vested. |
Performance Awards
Performance awards include any of the foregoing awards that are granted subject to vesting or payment based on the attainment of specified performance goals. The plan administrator will determine whether performance awards are intended to constitute “qualified performance-based compensation,” or QPBC, within the meaning of Section 162(m) of the Code, in which case the applicable performance criteria will be selected from the list below in accordance with the requirements of Section 162(m) of the Code.
Section 162(m) of the Code imposes a $1,000,000 cap on the compensation deduction that a public company may take in respect of compensation paid to our “covered employees” (which should
135
Table of Contents
include our Chief Executive Officer and our next three most highly compensated employees other than our Chief Financial Officer), but excludes from the calculation of amounts subject to this limitation any amounts that constitute QPBC. Under current tax law, we do not expect Section 162(m) of the Code to apply to certain awards under the Plan until the earliest to occur of (1) our annual stockholders’ meeting at which members of our board of directors are to be elected that occurs after the close of the third calendar year following the calendar year in which occurred the first registration of our equity securities under Section 12 of the Exchange Act; (2) a material modification of the Plan; (3) an exhaustion of the share supply under the Plan; or (4) the expiration of the Plan. However, QPBC performance criteria may be used with respect to performance awards that are not intended to constitute QPBC. In addition, the company may issue awards that are not intended to constitute QPBC even if such awards might benon-deductible as a result of Section 162(m) of the Code.
In order to constitute QPBC under Section 162(m) of the Code, in addition to certain other requirements, the relevant amounts must be payable only upon the attainment ofpre-established, objective performance goals set by our compensation committee and linked to stockholder-approved performance criteria. For purposes of the Plan, one or more of the following performance criteria will be used in setting performance goals applicable to QPBC, and may be used in setting performance goals applicable to other performance awards: (1) net earnings (either before or after one or more of the following: (a) interest, (b) taxes, (c) depreciation, (d) amortization and(e) non-cash equity-based compensation expense); (2) gross or net sales or revenue; (3) net income (either before or after taxes); (4) adjusted net income; (5) operating earnings or profit; (6) cash flow (including, but not limited to, operating cash flow and free cash flow); (7) return on assets; (8) return on capital; (9) return on stockholders’ equity; (10) total stockholder return; (11) return on sales; (12) gross or net profit or operating margin; (13) costs; (14) funds from operations; (15) expenses; (16) working capital; (17) earnings per share; (18) adjusted earnings per share; (19) price per share of common stock; (20) regulatory body approval for commercialization of a product; (21) implementation or completion of critical projects; (22) market share; (23) economic value; (24) debt levels or reduction; (25) sales-related goals; (26) comparisons with other stock market indices; (27) operating efficiency; (28) employee satisfaction; (29) financing and other capital raising transactions; (30) recruiting and maintaining personnel; and(31) year-end cash, any of which may be measured either in absolute terms for us or any operating unit of our company or as compared to any incremental increase or decrease or as compared to results of a peer group or to market performance indicators or indices. The Plan also permits the plan administrator to provide for objectively determinable adjustments to the applicable performance criteria in setting performance goals for QPBC awards.
Certain Transactions
The plan administrator has broad discretion to take action under the Plan, as well as make adjustments to the terms and conditions of existing and future awards, to prevent the dilution or enlargement of intended benefits and facilitate necessary or desirable changes in the event of certain transactions and events affecting our common stock, such as stock dividends, stock splits, mergers, acquisitions, consolidations and other corporate transactions. In addition, in the event of certainnon-reciprocal transactions with our stockholders known as “equity restructurings,” the plan administrator will make equitable adjustments to the Plan and outstanding awards. In the event of a change in control (as defined in the Plan) of us, to the extent that the surviving entity declines to continue, convert, assume or replace outstanding awards, then all such awards will become fully vested and exercisable in connection with the transaction. Upon or in anticipation of a change of control, the plan administrator may cause any outstanding awards to terminate at a specified time in the future and give the participant the right to exercise such awards during a period of time determined by the plan administrator in its sole discretion. Individual award agreements may provide for additional accelerated vesting and payment provisions.
136
Table of Contents
Foreign Participants, Claw-Back Provisions, Transferability, and Participant Payments
The plan administrator may modify award terms, establish subplans or adjust other terms and conditions of awards, subject to the share limits described above, in order to facilitate grants of awards subject to the laws or stock exchange rules of countries outside of the United States. All awards will be subject to the provisions of any claw-back policy implemented by our company to the extent set forth in such claw-back policy or in the applicable award agreement. With limited exceptions for estate planning, domestic relations orders, certain beneficiary designations and the laws of descent and distribution, awards under the Plan are generallynon-transferable prior to vesting, and are exercisable only by the participant. With regard to tax withholding, exercise price and purchase price obligations arising in connection with awards under the Plan, the plan administrator may, in its discretion, accept cash or check, shares of our common stock that meet specified conditions, a “market sell order” or such other consideration as it deems suitable.
Plan Amendment and Termination
Our board of directors may amend or terminate the Plan at any time; however, except in connection with certain changes in our capital structure, stockholder approval will be required for any amendment that increases the number of shares available under the Plan, “reprices” any stock option or SAR, or cancels any stock option or SAR in exchange for cash or another award when the option or SAR price per share exceeds the fair market value of the underlying shares. No award may be granted pursuant to the Plan after the tenth anniversary of the date on which our board of directors adopts the Plan.
2017 Executive Annual Incentive Plan
Prior to the completion of this offering, our board of directors intends to adopt the Advantage Solutions 2017 Executive Annual Incentive Plan, or the Executive Annual Plan. Upon completion of this offering, annual award opportunities for certain key associates, including our Named Executive Officers, will be granted under the Executive Annual Plan. The following summary describes what we anticipate to be the material terms of the Executive Annual Plan.
Administration
The Executive Annual Plan will be administered by the Company Compensation Committee.
Eligibility. Executive officers and other key associates of the company and its affiliates will be selected from time to time by the Company Compensation Committee to participate in the Executive Annual Plan.
Awards. Award opportunities under the Executive Annual Plan will be granted by the Company Compensation Committee prior to, or within a specified period of time following the beginning of, the fiscal year of the Company (or other performance period selected by the Company Compensation Committee). The Company Compensation Committee will establish the performance criteria applicable to the award, the amount or amounts payable if the performance criteria are achieved, and such other terms as the Company Compensation Committee deems appropriate. The Executive Annual Plan permits the grant of awards that are intended to qualify as exempt performance-based compensation under Section 162(m) of the Code as well as awards that are not intended to so qualify.
Performance Criteria. Awards under the Executive Annual Plan will be made based on, and subject to achieving, “performance criteria” established by the Company Compensation Committee. Performance criteria for awards intended to qualify as performance-based compensation for purposes of Section 162(m) of the Code are limited to the objectively determinable measures of performance relating to any or any combination of the following (measured either absolutely or by reference to an
137
Table of Contents
index or indices or the performance of one or more companies and determined either on a consolidated basis or, as the context permits, on a divisional, subsidiary, line of business, project or geographical basis or in combinations thereof): net sales; system-wide sales; comparable store sales; revenue; revenue growth or product revenue growth; operating income (before or after taxes); adjusted operating income; adjusted net income; adjusted earnings per share; channel revenue; channel revenue growth; franchising commitments; manufacturing profit; manufacturing profit margin; store closures;pre- orafter-tax income or loss (before or after allocation of corporate overhead and bonus); earnings or loss per share; net income or loss (before or after taxes); return on equity; total stockholder return; return on assets or net assets; appreciation in or maintenance of the price of the shares or any other publicly-traded securities of the Company; market share; gross profits; earnings or losses (including earnings or losses before taxes, before interest and taxes, or before interest, taxes, depreciation or amortization); adjusted earnings or losses (including adjusted earnings or losses before taxes, before interest and taxes, or before interest, taxes, depreciation or amortization); economic value-added models or equivalent metrics; comparisons with various stock market indices; reductions in costs; cash flow or cash flow per share (before or after dividends); return on capital (including return on total capital or return on invested capital); cash flow return on investment; improvement in or attainment of expense levels or working capital levels, including cash, inventory and accounts receivable; operating margin; gross margin;year-end cash; cash margin; debt reduction; stockholders equity; operating efficiencies; market share; customer satisfaction; customer growth; employee satisfaction; supply chain achievements (including establishing relationships with manufacturers or suppliers of component materials and manufacturers of the Company’s products); points of distribution; gross or net store openings;co-development,co-marketing, profit sharing, joint venture or other similar arrangements; financial ratios, including those measuring liquidity, activity, profitability or leverage; cost of capital or assets under management; financing and other capital raising transactions (including sales of the Company’s equity or debt securities; factoring transactions; sales or licenses of the Company’s assets, including its intellectual property, whether in a particular jurisdiction or territory or globally; or through partnering transactions); implementation, completion or attainment of measurable objectives with respect to research, development, manufacturing, commercialization, products or projects, production volume levels, acquisitions and divestitures; factoring transactions; and recruiting and maintaining personnel.
To the extent consistent with the requirements of Section 162(m), the Company Compensation Committee may establish that, in the case of any award intended to qualify as exempt performance-based compensation under Section 162(m), one or more of the performance criteria applicable to such award be adjusted in an objectively determinable manner to reflect events occurring during the performance period of such award that affect the applicable performance criteria.
Payment. A participant will be entitled to payment under an award only if all conditions to payment have been satisfied under the award. Following the close of the performance period, the Company Compensation Committee will determine (and, to the extent required by Section 162(m), certify) as to whether and to what extent the applicable performance criteria have been satisfied. The Company Compensation Committee will then determine the actual payment, if any, under each award.
Payment Limits. The maximum payment to any participant under the Executive Annual Plan for any fiscal year will in no event exceed $ .
Amendment and Termination. The Company Compensation Committee may amend or terminate the Executive Annual Plan at any time, provided that any amendment will be approved by the Company’s stockholders if required by Section 162(m) of the Code.
138
Table of Contents
EQUITY COMPENSATION PLAN INFORMATION
2017 Employee Stock Purchase Plan
In connection with this offering, we intend to adopt the Advantage Solutions Inc. 2017 Employee Stock Purchase Plan, or the 2017 ESPP, which will be effective immediately prior to the effectiveness of the registration statement to which this prospectus relates, subject to approval thereof by our stockholders. The ESPP is designed to allow our eligible employees to purchase shares of our common stock, at semi-annual intervals, with their accumulated payroll deductions. The ESPP is intended to qualify under Section 423 of the Code. Our board of directors is still in the process of developing, approving and implementing the ESPP and, accordingly, there can be no assurance that the ESPP will be implemented or will contain the terms described below.
Plan Administration. Subject to the terms and conditions of the ESPP, our compensation committee will administer the ESPP. The ESPP administrator will have the authority to administer and interpret the ESPP. The ESPP administrator’s interpretations and determinations with respect to the ESPP or any rights thereunder will be conclusive and binding on all parties. We will bear all expenses and liabilities incurred by the ESPP administrator in connection with the administration of the ESPP.
Shares Available Under ESPP. The maximum number of shares of our common stock which will be authorized for sale under the ESPP is equal to the sum of (a) shares of common stock and (b) an annual increase on the first day of each year beginning in 2018 and ending in 2027, equal to the lesser of (i) % of the shares of common stock outstanding on the last day of the immediately preceding fiscal year and (ii) such number of shares of common stock as determined by our board of directors; provided, however, no more than shares of common stock may be issued under the ESPP.
Eligible Employees. Employees eligible to participate in the ESPP for a given offering period generally include employees who are employed by us or one of our designated subsidiaries on the first day of the offering period, or the enrollment date. However, an employee who owns (or is deemed to own through attribution) 5% or more of the combined voting power or value of all classes of our or one of our subsidiaries’ stock will not be allowed to participate in the ESPP. In addition, the ESPP administrator may provide, with respect to any offering period, that employees of the company and its subsidiaries who qualify as highly compensated employees within the meaning of Section 423 of the Code, who customarily work less than five months in a calendar year or are customarily scheduled to work less than 20 hours per week, who have not met certain service requirements or who reside outside of the United States may not participate in such offering period.
Participation. Employees will enroll under the ESPP by completing a subscription agreement permitting the deduction from their compensation of at least % of their compensation but not more than the lesser of 15% of their compensation and $ per offering period. Such payroll deductions are expressed as either a whole number or percentage and the accumulated deductions will be applied to the purchase of shares on each purchase date. However, a participant may not purchase more than shares during any one offering period, and may not subscribe for more than $25,000 in fair market value of shares our common stock (determined at the time the purchase right is granted) per calendar year falling in the offering period.
Offering. Under the ESPP, participants are offered the right to purchase shares of our common stock at a discount during a series of successive offering periods. The offering periods will commence and end on dates as determined by the ESPP administrator and set forth in an offering document. However, in no event may an offering period be longer than 27 months in length.
139
Table of Contents
The purchase price for an offering period will be designated by the ESPP administrator in the applicable offering document or, in the absence of a designation by the ESPP administrator, the purchase price will be the lower of 85% of the closing trading price per share of our common stock on the first trading date of an offering period in which a participant is enrolled or 85% of the closing trading price per share on the applicable purchase date, which will occur on the last trading day of each offering period.
Unless a participant has previously withdrawn his or her participation in, or has otherwise become ineligible to participate in, the ESPP prior to the purchase date of any offering period, the participant will be deemed to have exercised his or her purchase right in full as of each purchase date. Upon exercise, the participant will purchase the maximum number of whole shares of common stock that his or her accumulated payroll deductions will buy at the purchase price, subject to the participation limitations listed above.
A participant may increase or decrease his or her payroll deductions once during any offering period. In addition, a participant may cancel his or her payroll deductions and withdraw his or her participation from the ESPP at any time by submitting written notice to us at least one week prior to the end of the then-current offering period. Upon withdrawal, the participant will receive a refund of the participant’s account balance in cash without interest, and his or her payroll deductions shall cease.
A participant may not transfer (other than by will or the laws of descent and distribution) any right granted under the ESPP and, during a participant’s lifetime, purchase rights granted under the ESPP shall be exercisable only by such participant.
Adjustments; Changes in Capitalization. The ESPP administrator has broad discretion to take action under the ESPP, as well as make adjustments to the terms and conditions of existing and future purchase rights, to prevent the dilution or enlargement of intended benefits and facilitate necessary or desirable changes in the event of certain transactions and events affecting our common stock, such as stock dividends, stock splits, mergers, acquisitions, consolidations and other corporate transactions.
Amendment and Termination. The ESPP administrator may amend, suspend or terminate the ESPP at any time. However, the ESPP administrator may not amend the ESPP without obtaining stockholder approval within 12 months before or after such amendment to the extent required by applicable laws. The ESPP will terminate on the tenth anniversary of the date on which it is initially approved by our stockholders, unless earlier terminated.
140
Table of Contents
EQUITY COMPENSATION PLAN INFORMATION
The following table provides information as of December 31, 2016 regarding compensation plans under which our equity securities are authorized for issuance:
Plan Category | Number of Securities to be Issued Upon Exercise of Outstanding Options, Warrants and Rights | Weighted Average Exercise Price of Outstanding Options, Warrants and Rights | Number of Securities Remaining Available for Future Issuance Under Equity Compensation Plans | |||||||||
Equity compensation plans approved by stockholders(1) | $ | |||||||||||
Equity compensation plans not approved by stockholders(1) | ||||||||||||
Total | ||||||||||||
| (1) | In 2014, certain entities affiliated with or advised by the Sponsors and certain members of management entered into the Karman Topco limited partnership agreement, which reserves for issuance 173,178.394 Common Series C Units. As of December 31, 2016, 126,673.625 Common Series C Units were outstanding. |
141
Table of Contents
The following table sets forth information, as of , 2017, after giving effect to the filing of our restated certificate of incorporation, which includes the effect ofa -for-1 stock split with respect to our common stock, which occurred on , 2017, regarding the beneficial ownership of our common stock after giving effect to this offering, by:
| • | each person known by us to beneficially own more than 5% of our common stock; |
| • | each of our directors and director nominees; |
| • | each of our named executive officers; and |
| • | all of our executive officers, directors, and director nominees as a group. |
Percentage ownership of our common stock “before this offering” in the table is based on shares of common stock issued and outstanding as of , 2017, after giving effect to the filing of our restated certificate of incorporation, which includes the effect ofa -for-1 stock split with respect to our common stock. Percentage ownership of our common stock “after this offering” in the table is based on shares of common stock issued and outstanding on , 2017, adjusted as described above, and which gives further effect to the issuance of shares of common stock in this offering and assumes no exercise of the underwriters’ option to purchase additional shares.
The amounts and percentages of shares beneficially owned by each stockholder are determined on the basis of rules issued by the SEC. Under these rules, beneficial ownership includes any shares as to which the individual or entity has sole or shared voting power or investment power and any shares as to which the individual or entity has the right to acquire beneficial ownership within 60 days of , 2017. In computing the number and percentage of shares beneficially owned by an individual or entity, shares of common stock subject to options, warrants or other rights held by such person that are currently exercisable or will become exercisable within 60 days of , 2017 are considered outstanding, although these shares are not considered outstanding for purposes of computing the percentage ownership of any other person. Unless otherwise indicated, the address of each of the individuals and entities named below is c/o Advantage Solutions Inc., 18100 Von Karman Avenue, Suite 1000, Irvine CA 92612. Each of the stockholders listed has sole voting and investment power with respect to the shares beneficially owned by the stockholder unless noted otherwise, subject to community property laws where applicable.
142
Table of Contents
Name of Owner | Beneficial ownership prior to this offering | Beneficial ownership after this offering assuming no exercise of option to purchase additional shares | Beneficial ownership assuming full exercise of option to purchase additional shares | |||||||||||||||||||||
| Number | Percent | Number | Percent | Number | Percent | |||||||||||||||||||
More than 5% Stockholders | ||||||||||||||||||||||||
Karman Topco L.P.(1) | 100 | % | ||||||||||||||||||||||
Named Executive Officers | ||||||||||||||||||||||||
Tanya Domier | ||||||||||||||||||||||||
Brian Stevens | ||||||||||||||||||||||||
Jeff Hansberry | ||||||||||||||||||||||||
Jill Griffin | ||||||||||||||||||||||||
Michael O’Keefe | ||||||||||||||||||||||||
Director Nominees | ||||||||||||||||||||||||
Cameron Breitner | ||||||||||||||||||||||||
Robert F. End | ||||||||||||||||||||||||
Timothy J. Flynn | ||||||||||||||||||||||||
Sonny King | ||||||||||||||||||||||||
Christopher J. Stadler | ||||||||||||||||||||||||
Jack L. Stahl | ||||||||||||||||||||||||
Jonathan D. Sokoloff | ||||||||||||||||||||||||
All directors, director nominees and executive officers as a group | ||||||||||||||||||||||||
| (1) | The board of directors of Karman Topco, consisting of Cameron Breitner, John Danhakl, Tanya Domier, Timothy Flynn, James Kilts, Sonny King, James Mahoney, Jonathan Sokoloff, Christopher Stadler, Jack Stahl, and Brian Stevens, exercises voting and dispositive power with respect to these securities. No person or entity has the right to appoint a majority of Karman Topco’s directors. |
The following table sets forth information, as of June 6, 2017, regarding the beneficial ownership of the equity securities of Karman Topco by:
| • | each of our directors and director nominees; |
| • | each of our named executive officers; and |
| • | all of our executive officers, directors, and director nominees as a group. |
Percentage ownership of the Common Series A Units of Karman Topco in the table is based on 1,595,000.00 Common Series A Units of Karman Topco issued and outstanding as of June 6, 2017. Percentage ownership of the Common Series B Units of Karman Topco in the table is based on 67,365.48 Common Series B Units of Karman Topco issued and outstanding as of June 6, 2017. None of the individuals set forth in the following table would be deemed to beneficially own any units of any other series of equity securities of Karman Topco as of June 6, 2017.
The amounts and percentages of units of Karman Topco beneficially owned by each unitholder are determined on the basis of rules issued by the SEC. Under these rules, beneficial ownership includes any units as to which the individual or entity has sole or shared voting power or investment power and any units as to which the individual or entity has the right to acquire beneficial ownership within 60 days of June 6, 2017. In computing the number and percentage of units beneficially owned by an individual or entity, Common Series A Units of Karman Topco and Common Series B Units of Karman Topco subject to options, warrants or other rights held by such person that are currently
143
Table of Contents
exercisable or will become exercisable within 60 days of June 6, 2017 are considered outstanding, although these units are not considered outstanding for purposes of computing the percentage ownership of any other person. Unless otherwise indicated, the address of each of the individuals and entities named below is c/o Advantage Solutions Inc., 18100 Von Karman Avenue, Suite 1000, Irvine CA 92612. Each of the unitholders listed has sole voting and investment power with respect to the units beneficially owned by the unitholder unless noted otherwise, subject to community property laws where applicable.
Name and Address of Owner | Beneficial ownership of Common Series A Units of Karman Topco | Beneficial ownership of Common Series B Units of Karman Topco | ||||||||||||||
| Number | Percent of Common Series A Units of Karman Topco | Number | Percent of Common Series B Units of Karman Topco | |||||||||||||
Named Executive Officers | ||||||||||||||||
Tanya L. Domier | — | — | 14,199.392 | (2) | 21.1 | % | ||||||||||
Brian Stevens | — | — | 4,376.209 | (3) | 6.5 | % | ||||||||||
Jeff Hansberry | — | — | — | — | ||||||||||||
Jill Griffin | — | — | 3,211.044 | (4) | 4.8 | % | ||||||||||
Michael O’Keefe | — | — | — | — | ||||||||||||
Director Nominees | ||||||||||||||||
Cameron Breitner | — | — | — | — | ||||||||||||
Robert F. End | — | — | — | — | ||||||||||||
Timothy J. Flynn | — | — | — | — | ||||||||||||
Sonny King | — | — | 5,000.000 | (5) | 7.4 | % | ||||||||||
Christopher J. Stadler | — | — | — | — | ||||||||||||
Jack L. Stahl | — | — | — | — | ||||||||||||
Jonathan D. Sokoloff | 792,500.000 | (1) | 49.7 | % | — | — | ||||||||||
All directors, director nominees and executive officers as a group (16 total) | 792,500.000 | (1) | 49.7 | % | 28,039.511 | 41.6 | % | |||||||||
| (1) | Represents Common Series A Units of Karman Topco held by Green Equity Investors VI, L.P. and Green Equity Investors Side VI, L.P. (collectively, the “Green Funds”), LGP Associates VI-A LLC and LGP Associates VI-A LLC (collectively, “LGP Associates”), Karman Co-Invest L.P. (“Karman Co-Invest”), and Karman II Co-Invest L.P. (“Karman II Co-Invest”). Leonard Green & Partners, L.P. (“LGP”) is the management company of the Green Funds. Peridot Coinvest Manager LLC (“Peridot”) is the Manager of LGP Associates, one of two members of the General Partner of Karman Co-Invest, and General Partner of Karman II Co-Invest. LGP is the Manager of Peridot. Jonathan D. Sokoloff is a director of Karman Topco and is a managing partner of LGP. As such, Mr. Sokoloff may be deemed to beneficially own the Common Series A Units of Karman Topco held by the Green Funds, LGP Associates, Karman Co-Invest, and Karman II Co-Invest, and he disclaims beneficial ownership of such units. Mr. Sokoloff’s address is c/o Leonard Green & Partners, L.P., 11111 Santa Monica Boulevard, Suite 2000, Los Angeles, California 90025. |
| (2) | Includes 14,199.392 units held by a trust, which Ms. Domier may be deemed to indirectly beneficially own. |
| (3) | Includes 4,376.209 units held by a trust, which Mr. Stevens may be deemed to indirectly beneficially own. |
| (4) | Includes 3,211.044 units held by a trust, which Ms. Griffin may be deemed to indirectly beneficially own. |
| (5) | Includes 5,000.000 units held by a trust, which Mr. King may be deemed to indirectly beneficially own. |
144
Table of Contents
CERTAIN RELATIONSHIPS AND RELATED PARTY TRANSACTIONS
The following includes summaries of transactions or agreements, during our last three fiscal years, to which we have been a party, in which the amount involved in the transaction exceeded $120,000, and in which any of our directors, executive officers or beneficial owners of more than 5% of our capital stock, affiliates of our directors, executive officers and holders of more than 5% of our voting securities or any member of the immediate family of any of the foregoing persons had or will have a direct or indirect material interest, other than equity and other compensation, termination, change in control and other similar arrangements, which are described under “Executive Compensation.” The following summaries are qualified in their entirety by reference to such agreements, copies of which (or forms of such agreements) have been filed as exhibits to the registration statement of which this prospectus is a part, and are available electronically on the website of the SEC at www.sec.gov.
Management Services Agreement
On July 25, 2014, and in connection with the 2014 Topco Acquisition, and as later amended on September 29, 2014, Advantage Sales & Marketing Inc., our wholly owned subsidiary, entered into a management services agreement with the Sponsors, pursuant to which the Sponsors have provided management, consulting and financial planning services to us and our subsidiaries. In exchange for those services, we have paid the Sponsors (other than Centerview Capital) an aggregate annual fee of $4.0 million, payable in equal monthly installments and pro rata with respect to the respective ownership percentage of Karman Topco of the Sponsors (other than Centerview Capital), and we have agreed to reimburse the Sponsors for all reasonableout-of-pocket expenses incurred in connection with the services rendered under the management services agreement. In 2016, 2015 and 2014, we paid $4.0 million, $4.0 million and $1.7 million, respectively, in fees and reimbursed expenses to the Sponsors under the management services agreement. In addition, we indemnified the Sponsors to the fullest extent permitted by law from and against all losses arising from their performance under the management services agreement. At the completion of this offering, the management services agreement with the Sponsors will terminate, and we will be obligated to make a final payment of $4.0 million to the Sponsors (other than Centerview Capital).
Common Series D Units of Karman Topco
In September 2014, Karman Topco issued a total of 30,000 of its Common Series D Units to Centerview Capital, L.P. and Centerview Employees, L.P, for services provided to us. These units vest over a five-year term, ending in September 2019. During the years ended December 31, 2016 and 2015 and the period from July 26, 2014 to December 31, 2014, we recorded equity-based compensation expense of $3.2 million, $3.1 million and $0.5 million, respectively, related to these units.
2014 Topco Acquisition Transaction Costs
In connection with the 2014 Topco Acquisition, we paid transaction costs of $12.3 million to certain entities affiliated with or advised by CVC Capital Partners, Leonard Green & Partners, and Juggernaut Capital Partners. Additionally, Advantage Sales & Marketing Inc. paid its previous private equity sponsor, Apax Partners, $20.8 million, also in connection with the 2014 Topco Acquisition.
Predecessor Management Fees
Prior to the 2014 Topco Acquisition, Advantage Sales & Marketing Inc. paid $0.8 million in management fees to its previous private equity sponsor, Apax Partners, for the period from January 1, 2014 to July 25, 2014.
145
Table of Contents
Registration Rights Agreement
On July 25, 2014, and in connection with the 2014 Topco Acquisition, Karman Topco, certain entities affiliated with or advised by CVC Capital Partners, Leonard Green & Partners, and Juggernaut Capital Partners and the other holders of Common Series B Units and Vested Common Series C Units of Karman Topco (i.e., members of our management) entered into a registration rights agreement. On September 29, 2014, the parties to the registration rights agreement, along with affiliates of Centerview Capital, amended and restated that agreement, which, as amended and restated, we refer to as the Registration Rights Agreement, to provide certain registration rights, which are described below.
Demand Registration Rights
At any time beginning after this offering, subject to certain restrictions and thelock-up agreement Karman Topco has entered into with the underwriters for this offering, certain entities affiliated with or advised by Leonard Green & Partners, CVC Capital Partners, and certain other investors in Karman Topco (but excluding Centerview Capital, L.P. and Centerview Employees, L.P), and any transferee controlled directly or indirectly by such entities or any of their affiliates, will be able to require us to use our reasonable best efforts to register our common stock issued in exchange for or distributed in respect of their Karman Topco units under the Securities Act at any time as well as any shares of common stock issued in exchange for or distributed in respect of other Karman Topco units which certain other Karman Topco unit holders request to be included in such registration. Following this offering, and subject to certain restrictions and the lock-up agreement Karman Topco has entered into with the underwriters for this offering, we expect that some or all of the investors in Karman Topco that hold such rights may exchange their units in Karman Topco for shares of our common stock.
At any time following thetwo-year anniversary of this offering, subject to certain restrictions, Centerview Capital, L.P. and Centerview Employees, L.P. and any transferee controlled directly or indirectly by such entities or any of their affiliates will be able to require us to use our reasonable best efforts to register the shares of our common stock, whether issued in exchange for or distributed in respect of their Karman Topco units, under the Securities Act, including the right to require us to register such shares on FormS-3. Centerview Capital, L.P. and Centerview Employees, L.P., together, are limited to requiring one such registration.
Piggyback Registration Rights
If we propose to register any of our own securities under the Securities Act in a public offering after this offering, we will be required to provide notice to all holders of our common stock and Karman Topco’s units with registration rights under the Registration Rights Agreement relating to the registration and provide them with the right to include their shares, or shares that may be issued in exchange for or distributed in respect to their units of Karman Topco, in the registration statement. These piggy-back registration rights are subject to certain exceptions set forth in the Registration Rights Agreement.
Expenses of Registration
We will be required to bear the registration expenses, other than underwriting discounts and commissions and transfer taxes, associated with any registration of shares of our common stock held by the holders of our common stock with registration rights under the Registration Rights Agreement.
Intercompany Promissory Notes
Prior to this offering, from time to time, Advantage Sales & Marketing Inc. has entered into intercompany loan agreements with Karman Topco, pursuant to which Karman Topco borrowed
146
Table of Contents
between $200 and $137,000 from Advantage Sales & Marketing Inc. to facilitate the payment to certain former associates for their equity interests in Karman Topco. On July 16, 2015, Advantage Sales & Marketing Inc. entered into one such intercompany loan agreement with Karman Topco, pursuant to which Karman Topco borrowed $137,000 at an interest rate of 0.58% per annum. The loan matures at the earlier of (i) December 31, 2017, or (ii) a Partnership Sale, as defined in the limited partnership agreement of Karman Topco. We expect all of the outstanding intercompany loan agreements will be repaid and terminated prior to the closing of this offering.
Indemnification Agreements
Our amended and restated bylaws, as will be in effect prior to the closing of this offering, provide that we will indemnify our directors and officers to the fullest extent permitted by the DGCL, subject to certain exceptions contained in our amended and restated bylaws. In addition, our restated certificate of incorporation, as will be in effect prior to the closing of this offering, will provide that our directors will not be liable for monetary damages for breach of fiduciary duty.
Prior to the closing of this offering, we will enter into indemnification agreements with each of our executive officers, directors, and director nominees. The indemnification agreements will provide the indemnitees with contractual rights to indemnification, and expense advancement and reimbursement, to the fullest extent permitted under the DGCL, subject to certain exceptions contained in those agreements.
There is no pending litigation or proceeding naming any of our directors or officers for which indemnification is being sought, and we are not aware of any pending litigation that may result in claims for indemnification by any director or executive officer.
Our Policy Regarding Related Party Transactions
Our board of directors recognizes the fact that transactions with related persons present a heightened risk of conflicts of interests or improper valuation (or the perception thereof). In connection with this offering, our board of directors intends to adopt a written policy on transactions with related persons that is in conformity with the requirements for issuers having publicly held common stock that is listed on the New York Stock Exchange. Under such policy:
| • | any related person transaction, and any material amendment or modification to a related person transaction, must be reviewed and approved or ratified by a committee of the board of directors composed solely of independent directors who are disinterested or by the disinterested members of the board of directors; and |
| • | any employment relationship or transaction involving an executive officer and any related compensation must be approved by the compensation committee of the board of directors or recommended by the compensation committee to the board of directors for its approval. |
In connection with the review and approval or ratification of a related person transaction:
| • | management must disclose to the committee or disinterested directors, as applicable, the name of the related person and the basis on which the person is a related person, the material terms of the related person transaction, including the approximate dollar value of the amount involved in the transaction, and all the material facts as to the related person’s direct or indirect interest in, or relationship to, the related person transaction; |
| • | management must advise the committee or disinterested directors, as applicable, as to whether the related person transaction complies with the terms of our agreements governing our material outstanding indebtedness that limit or restrict our ability to enter into a related person transaction; |
147
Table of Contents
| • | management must advise the committee or disinterested directors, as applicable, as to whether the related person transaction will be required to be disclosed in our applicable filings under the Securities Act or the Exchange Act, and related rules, and, to the extent required to be disclosed, management must ensure that the related person transaction is disclosed in accordance with such Acts and related rules; and |
| • | management must advise the committee or disinterested directors, as applicable, as to whether the related person transaction constitutes a “personal loan” for purposes of Section 402 of the Sarbanes-Oxley Act. |
In addition, the related person transaction policy will provide that the committee or disinterested directors, as applicable, in connection with any approval or ratification of a related person transaction involving anon-employee director or director nominee, should consider whether such transaction would compromise the director or director nominee’s status as an “independent,” “outside,” or“non-employee” director, as applicable, under the rules and regulations of the SEC, the New York Stock Exchange and the Code.
148
Table of Contents
The following descriptions of our capital stock and provisions of our restated certificate of incorporation and our amended and restated bylaws, each of which will be in effect prior to the completion of this offering, are summaries and are qualified by reference to the restated certificate of incorporation and the amended and restated bylaws, which are filed as exhibits to the registration statement of which this prospectus forms a part.
General
Our authorized capital stock consists of shares of common stock, par value $0.01 per share, and shares of preferred stock, par value $0.01 per share. The following description of our capital stock and provisions of our restated certificate of incorporation and amended and restated bylaws are summaries and are qualified by reference to the restated certificate of incorporation and amended and restated bylaws. We urge you to read our restated certificate of incorporation and our amended and restated bylaws. Copies of these documents have been filed with the SEC as exhibits to the registration statement of which this prospectus forms a part.
Common Stock
Our restated certificate of incorporation authorizes a total of shares of common stock. Upon the completion of this offering, we expect that shares of common stock, or shares of common stock if the underwriters exercise their option to purchase additional shares from us in full, will be issued and outstanding.
Holders of our common stock are entitled to one vote for each share held on all matters submitted to a vote of stockholders and do not have cumulative voting rights. An election of directors by our stockholders shall be determined by a plurality of the votes cast by the stockholders entitled to vote on the election. Holders of common stock are entitled to receive proportionately any dividends as may be declared by our board of directors, subject to any preferential dividend rights of any series of preferred stock that we may designate and issue in the future.
In the event of our liquidation or dissolution, the holders of common stock are entitled to receive proportionately our net assets available for distribution to stockholders after the payment of all debts and other liabilities and subject to the prior rights of any outstanding preferred stock. Holders of common stock have no preemptive, subscription, redemption or conversion rights. The rights, preferences and privileges of holders of common stock are subject to and may be adversely affected by the rights of the holders of shares of any series of preferred stock that we may designate and issue in the future.
Preferred Stock
Our restated certificate of incorporation authorizes a total of shares of preferred stock. Upon the closing of this offering, we will have no shares of preferred stock outstanding.
Under the terms of our restated certificate of incorporation, our board of directors is authorized to direct us to issue shares of preferred stock in one or more series without stockholder approval. Our board of directors has the discretion to determine the rights, preferences, privileges and restrictions, including voting rights, dividend rights, conversion rights, redemption privileges and liquidation preferences, of each series of preferred stock.
149
Table of Contents
The purpose of authorizing our board of directors to issue preferred stock and determine its rights and preferences is to eliminate delays associated with a stockholder vote on specific issuances. The issuance of preferred stock, while providing flexibility in connection with possible acquisitions, future financings and other corporate purposes, could have the effect of making it more difficult for a third party to acquire, or could discourage a third party from seeking to acquire, a majority of our outstanding voting stock. We have no present plans to issue any shares of preferred stock.
Authorized but Unissued Shares
The authorized but unissued shares of our common stock and our preferred stock are available for future issuance without stockholder approval, subject to any limitations imposed by the listing standards of the New York Stock Exchange. These additional shares may be used for a variety of corporate finance transactions, acquisitions and employee benefit plans. The existence of authorized but unissued and unreserved common stock and preferred stock could make more difficult or discourage an attempt to obtain control of us by means of a proxy contest, tender offer, merger or otherwise.
Registration Rights
Upon the closing of this offering, the holders of shares of our common stock, or their transferees, will be entitled to various rights with respect to the registration of these shares under the Securities Act. Registration of these shares under the Securities Act would result in these shares becoming fully tradable without restriction under the Securities Act immediately upon the effectiveness of the registration, except for shares purchased by affiliates. Shares covered by a registration statement will be eligible for sale in the public market upon the expiration or release from the terms of thelock-up agreement. See “Certain Relationships and Related Party Transactions—Registration Rights Agreement” elsewhere in this prospectus.
Exclusive Venue
Our restated certificate of incorporation requires, to the fullest extent permitted by law, that (i) any derivative action or proceeding brought on our behalf, (ii) any action asserting a claim of breach of a fiduciary duty owed by any of our directors, officers or other employees to us or our stockholders, (iii) any action asserting a claim against us arising pursuant to any provision of the DGCL or our restated certificate of incorporation or our amended and restated bylaws, or (iv) any action asserting a claim against us governed by the internal affairs doctrine will have to be brought only in the Court of Chancery in the State of Delaware. Although we believe this provision benefits us by providing increased consistency in the application of Delaware law in the types of lawsuits to which it applies, the provision may have the effect of discouraging lawsuits against our directors and officers.
Anti-Takeover Effects of Provisions of Our Restated Certificate of Incorporation, Our Amended and Restated Bylaws and Delaware Law
Certain provisions of Delaware law and our restated certificate of incorporation and amended and restated bylaws contain provisions that may delay, defer or discourage another party from acquiring control of us. We expect that these provisions, which are summarized below, will discourage coercive takeover practices or inadequate takeover bids. These provisions are also designed to encourage persons seeking to acquire control of us to first negotiate with our board of directors, which we believe may result in an improvement of the terms of any such acquisition in favor of our stockholders. However, they also give our board of directors the power to discourage acquisitions that some stockholders may favor.
150
Table of Contents
Classified Board of Directors
Our restated certificate of incorporation provides that our board of directors is divided into three classes, with the classes as nearly equal in number as possible and, following the expiration of specified initial terms for each class, each class serving three-year staggered terms. In addition, our restated certificate of incorporation provides that, on and after the date on which Karman Topco and its affiliates cease to beneficially own, in the aggregate, more than % in voting power of our stock entitled to vote generally in the election of directors, directors may only be removed from our board of directors with cause. These provisions may have the effect of deferring, delaying or discouraging hostile takeovers, or changes in control of us or our management.
Requirements for Advance Notification of Stockholder Meetings, Nominations and Proposals
Our restated certificate of incorporation provides that special meetings of the stockholders may be called only by a resolution adopted by the affirmative vote of the majority of the directors then in office. Our amended and restated bylaws prohibit the conduct of any business at a special meeting other than as specified in the notice for such meeting. In addition, any stockholder who wishes to bring business before an annual meeting or nominate directors must comply with the advance notice requirements set forth in our amended and restated bylaws. These provisions may have the effect of deferring, delaying or discouraging hostile takeovers or changes in control of us or our management.
Stockholder Action by Written Consent
Pursuant to Section 228 of the DGCL, any action required to be taken at any annual or special meeting of the stockholders may be taken without a meeting, without prior notice and without a vote if a consent or consents in writing, setting forth the action so taken, is signed by the holders of outstanding stock having not less than the minimum number of votes that would be necessary to authorize or take such action at a meeting at which all shares of our stock entitled to vote thereon were present and voted, unless our restated certificate of incorporation provides otherwise. Our restated certificate of incorporation precludes stockholder action by written consent on and after the date on which Karman Topco and its affiliates cease to beneficially own, in the aggregate, more than % in voting power of our stock entitled to vote generally in the election of directors.
Approval for Amendment of Certificate of Incorporation and Bylaws
Our restated certificate of incorporation further provides that, on and after the date on which Karman Topco and its affiliates cease to beneficially own, in the aggregate, more than % in voting power of our stock entitled to vote generally in the election of directors, the affirmative vote of holders of at leasttwo-thirds of the voting power of all of the then outstanding shares of voting stock, voting as a single class, is required to amend certain provisions of our certificate of incorporation, including provisions relating to the size of the board, removal of directors, special meetings, actions by written consent and cumulative voting. The affirmative vote of holders of at leasttwo-thirds of the voting power of all of the then outstanding shares of voting stock, voting as a single class, is required to amend or repeal our bylaws, although our bylaws may be amended by a simple majority vote of our board of directors.
Business Combinations
We have opted out of Section 203 of the DGCL; however, our restated certificate of incorporation contains similar provisions providing that we may not engage in certain “business combinations” with
151
Table of Contents
any “interested stockholder” for a three-year period following the time that the stockholder became an interested stockholder, unless:
| • | prior to such time, our board of directors approved either the business combination or the transaction which resulted in the stockholder becoming an interested stockholder; |
| • | upon consummation of the transaction that resulted in the stockholder becoming an interested stockholder, the interested stockholder owned at least 85% of our voting stock outstanding at the time the transaction commenced, excluding certain shares; or |
| • | at or subsequent to that time, the business combination is approved by our board of directors and by the affirmative vote of holders of at least 66 2/3% of our outstanding voting stock that is not owned by the interested stockholder. |
Generally, a “business combination” includes a merger, asset, or stock sale or other transaction resulting in a financial benefit to the interested stockholder. Subject to certain exceptions, an “interested stockholder” is a person who, together with that person’s affiliates and associates, owns, or within the previous three years owned, 15% or more of our outstanding voting stock. For purposes of this section only, “voting stock” has the meaning given to it in Section 203 of the DGCL.
Under certain circumstances, this provision will make it more difficult for a person who would be an “interested stockholder” to effect various business combinations with us for a three-year period. This provision may encourage companies interested in acquiring us to negotiate in advance with our board of directors because the stockholder approval requirement would be avoided if our board of directors approves either the business combination or the transaction which results in the stockholder becoming an interested stockholder. These provisions also may have the effect of preventing changes in our board of directors and may make it more difficult to accomplish transactions which stockholders may otherwise deem to be in their best interests.
Our restated certificate of incorporation provides that Karman Topco and its affiliates, and any of their respective direct or indirect transferees and any group as to which such persons are a party, do not constitute “interested stockholders” for purposes of this provision.
Transfer Agent and Registrar
The transfer agent and registrar for our common stock will be .
The New York Stock Exchange
We intend to apply to list our common stock on the New York Stock Exchange under the symbol “ADV.”
152
Table of Contents
The following is a summary of the material terms of our material indebtedness. This summary is qualified in its entirety by reference to the related agreements, which are filed as exhibits to the registration statement of which this prospectus is a part.
Credit Facilities
On July 25, 2014, certain of our subsidiaries entered into the following credit facilities with different syndicates of lenders in connection with the 2014 Topco Acquisition:
| • | the First Lien Credit Agreement, which provided for: |
| • | a $200.0 million revolving credit facility, or the Revolving Credit Facility, of which up to $75.0 million may be used for letters of credit; |
| • | a $1,800.0 million term loan facility, or the Initial First Lien Term Loans; |
| • | commitments for an additional $60.0 million of unfunded delayed draw term loans, which we refer to as the Delayed Draw Commitments; |
| • | uncommitted incremental revolving and first lien term loan facilities, subject to certain incurrence tests; and |
| • | the Second Lien Credit Agreement, which provided for: |
| • | a $760.0 million term loan facility, or the Second Lien Term Loans; and |
| • | uncommitted incremental second lien term loan facilities, subject to certain incurrence tests. |
Borrower, Guarantors, and Collateral. Advantage Sales & Marketing Inc., our wholly owned, indirect subsidiary, is the borrower under the credit facilities. Obligations under the credit facilities are guaranteed by Karman Intermediate Corp., the Borrower’s direct parent and our wholly owned, direct subsidiary, and by certain wholly owned, domestic material subsidiaries of the Borrower. Obligations under the credit facilities are secured by a lien on substantially all of the property and assets of the Borrower and the Guarantors and which, in the case of the First Lien Credit Agreement, is a first-priority lien and, in the case of the Second Lien Credit Agreement, is a second-priority lien. Advantage Solutions Inc. is not a party to the credit agreements, is not a Guarantor and has not granted any liens on any of its assets to secure the credit facilities.
Borrowings and Use of Proceeds. The Borrower incurred $1,800.0 million of Initial First Lien Term Loans and $760.0 million of Second Lien Term Loans in July 2014, and used the proceeds to finance the 2014 Topco Acquisition and to pay related fees and expenses. The Borrower incurred an aggregate of $60.0 million of additional first lien term loans under the Delayed Draw Commitments in September and November 2014, and used the proceeds to finance certain acquisitions and to pay related fees and expenses. The Borrower incurred $150.0 million of additional first lien term loans under the incremental facilities in April 2015 and used the proceeds to finance additional acquisitions, to pay related fees and expenses, to repay loans under the Revolving Credit Facility and for general corporate purposes. We refer to these $150.0 million in additional first lien term loans, collectively with the initial First Lien Term Loans and the additional first lien term loans under the Delayed Draw Commitments, as the First Lien Term Loans. From time to time the Borrower has incurred and repaid loans under the Revolving Credit Facility, and those borrowings generally are used for working capital purposes, including to fund acquisitions. The Borrower also uses the Revolving Credit Facility to maintain various letters of credit.
153
Table of Contents
Amortization. The First Lien Term Loans amortize at a rate that approximates 1.0% per annum of the principal amount of First Lien Term Loans borrowed, and amortization payments are due quarterly on the last business day of each fiscal quarter. In the years ended December 31, 2016 and 2015, the Borrower paid $20.1 million and $19.7 million, respectively, of principal in amortization on the First Lien Term Loans. As of December 31, 2016, the amortization payments were $5.0 million per quarter. The Second Lien Term Loans do not amortize.
Prepayments. The following mandatory prepayments of First Lien Term Loans are required:
| • | Excess Cash Flow—the Borrower must prepay First Lien Term Loans with 50% of its Excess Cash Flow (as defined in the First Lien Credit Agreement) in excess of $20.0 million (net of certain voluntary prepayments of debt) for each fiscal year commencing with the year ended December 31, 2015. Payment is due annually at approximately the time when the Borrower is required to deliver its audited financial statements for the prior fiscal year. The percentage of Excess Cash Flow that must be applied to prepay loans declines to 25% or 0% if the Borrower achieves a first lien net leverage ratio of 4.50:1.00 or 3.75:1.00, respectively, for the applicable fiscal year. |
| • | Asset Sales and Casualty Events—the Borrower must prepay First Lien Term Loans with 100% of the Net Cash Proceeds (as defined in the First Lien Credit Agreement) from certain types ofnon-ordinary course asset sales, insurance proceeds or condemnation awards. However, in lieu of making the mandatory prepayment, the Borrower has the option to reinvest Net Cash Proceeds in other assets within 12 months of receipt of the proceeds or, if a commitment to reinvest such proceeds is made within such12-month period, within 180 days after such12-month period. |
| • | Other Debt—the Borrower must prepay First Lien Term Loans with the proceeds of debt that otherwise is not permitted to be incurred under the First Lien Credit Agreement. |
The Borrower also may make voluntary prepayments of First Lien Term Loans at any time without penalty or premium. In 2016, the Borrower was not required to make any Excess Cash Flow payment for the year ended December 31, 2015, and the Borrower did not make any other mandatory or voluntary prepayments of First Lien Term Loans for the years ended December 31, 2016 or 2015.
The Second Lien Credit Agreement includes comparable mandatory prepayment provisions, but they do not have effect prior to the date that the First Lien Credit Agreement is terminated. The Borrower may make voluntary prepayments of the Second Lien Term Loans at any time without penalty or premium, as the original call protection in the Second Lien Credit Agreement is no longer applicable. However, under certain circumstances, the First Lien Credit Agreement restricts the Borrower’s ability to prepay the Second Lien Term Loans. The Borrower did not make any prepayments of the Second Lien Term Loans in the three months ended March 31, 2017 and in the years ended December 31, 2016 or 2015.
Interest and Fees. Interest on the credit facilities accrues at a floating rate. For each borrowing and interest period, the Borrower has the right to choose either a base rate or eurodollar rate of interest. The base rate is, as of any date, the highest of (a) the federal funds rate plus 0.5%, (b) Bank of America’s “prime rate” and (c) the eurodollar rate for an interest period of one month plus 1.00%. The eurodollar rate is, for a specified interest period of one, two, three, six or 12 months, the rate equal to the Intercontinental Exchange London Interbank Offered Rates, or the ICE LIBOR Rate, determined two business days prior to the start of the applicable interest period, further adjusted for statutory reserves. The base rate and eurodollar rate for term loans are each subject to a “floor” of 2.00% and 1.00%, respectively. Base rate interest is payable at the end of each quarter, and eurodollar rate interest is payable at the end of the applicable interest period or, if more than three months, every
154
Table of Contents
three months. If a eurodollar rate loan is prepaid or converted to base rate prior to the end of the applicable interest period, the Borrower may be liable for customary “breakage” costs. Both base rate loans and eurodollar rate loans accrue interest at the applicable rate plus a margin, as follows:
| • | for the Revolving Credit Facility, there is a pricing grid based on first lien net leverage where the base rate margins range between 2.25% to 1.75% and the eurodollar rate margins range between 3.25% and 2.75%, with the margin determined based on whether the Borrower is above or below a leverage ratio of 4.50:1.00 or 4.00:1.00; |
| • | for First Lien Term Loans, the base rate margin is 2.25% and the eurodollar rate margin is 3.25%; and |
| • | for Second Lien Term Loans, the base rate margin is 5.50% and the eurodollar rate margin is 6.50%. |
The Borrower generally elects the eurodollar rate. In both 2016 and 2015, the effective total interest rate on the First Lien Term Loans was 4.25% per annum, and the effective total interest rate on the Second Lien Term Loans was 7.50% per annum.
The Revolving Credit Facility accrues a commitment fee for unfunded commitments, calculated based on daily unused commitments and payable quarterly, at a rate of 0.50% per annum or, if the Borrower achieves a first lien net leverage ratio equal to or below 4.50:1.00 for the applicable quarter, 0.375% per annum. Outstanding letters of credit accrue a fee, calculated based on daily outstandings and payable quarterly, equal to the eurodollar rate margin applicable to the Revolving Credit Facility times the face value of outstanding undrawn letters of credit. The Borrower also pays customary “fronting fees” upon the issuance of letters of credit. As of March 31, 2017, December 31, 2016 and 2015, the Borrower had $75.0 million, $20.0 million and $0, respectively, of loans outstanding under the Revolving Credit Facility and $44.4 million, $43.4 million and $40.0 million, respectively, of undrawn letters of credit outstanding under the Revolving Credit Facility.
Covenants. The Revolving Credit Facility has a “springing” financial maintenance covenant. If, at the end of any fiscal quarter, the Borrower has used more than 30% of the Revolving Credit Facility commitments (excluding letters of credit), then the Borrower must demonstrate that its first lien net leverage ratio is equal to or less than 8.25:1.00 for the12-month period ended as of such fiscal quarter. If the financial covenant is required to be tested and cannot be met, the Borrower has a customary right to “cure” the default with the proceeds of a specified capital contribution (if made available to the Borrower by us or its equityholders), which is treated as EBITDA for purposes of demonstrating compliance with the financial covenant. The Borrower was in compliance with the financial covenant as of March 31, 2017, December 31, 2016 and 2015 (regardless of whether the covenant was required to be tested).
The First Lien Credit Agreement and Second Lien Credit Agreement also contain customary affirmative and negative covenants. These covenants restrict the ability of the Borrower, the Guarantors, and their subsidiaries to incur debt, permit liens on pledged assets, make investments, make distributions to equityholders, prepay junior debt, engage in mergers or restructurings, and sell assets, among other things. These covenants are subject to a number of exceptions that generally provide the Borrower and its subsidiaries with adequate flexibility to operate their business in the ordinary course. Importantly, the credit agreements contain customary covenants that restrict our ability to receive distributions of cash or assets from the Borrower, the Guarantors and their Subsidiaries, which collectively constitute substantially all of our operating business. However, the covenants do permit the Borrower to:
| • | following an IPO, pay dividends up to 6% of the net proceeds from public offerings; |
155
Table of Contents
| • | make up to $100.0 million of distributions (which amount increases based on a formula related to EBITDA growth compared to EBITDA at the time of the 2014 Topco Acquisition); |
| • | make additional distributions of “Available Amounts” (as defined in the First Lien Credit Agreement) if the Borrower has a total net leverage ratio equal to or less than 7.85:1.00; |
| • | make unlimited distributions if the Borrower has a senior secured net leverage ratio equal to or less than 6.00:1.00; |
| • | repurchase equity from our personnel upon death, disability, or termination, subject to limits; |
| • | reimburse fees and expenses related to financing transactions; |
| • | pay our overhead and operating costs attributable to our ownership of the Borrower; |
| • | pay director and officer fees, salaries, and benefits; and |
| • | pay taxes and maintain our existence. |
The Second Lien Credit Agreement contains restrictive covenants that are substantially the same as those in the First Lien Credit Agreement, with exceptions that are generally the same as, but more lenient than, those in the First Lien Credit Agreement.
Although prior to this offering the Borrower does not currently have a senior secured net leverage ratio equal to or less than 6.00:1.00, we expect that after giving effect to this offering and the application of the net proceeds from this offering, the Borrower would be below the applicable leverage ratio. Therefore, after giving effect to this offering and for as long as the Borrower remains below the 6.00:1.00 leverage level thereafter, we expect to be entitled to receive unlimited distributions from the Borrower and its subsidiaries. To the extent the Borrower from time to time in the future is not able to meet this leverage test, we would still be able to receive distributions from the Borrower and its subsidiaries under other baskets to the covenant which include, among other things, distributions:
| • | in an amount of up to 6% per annum of the net proceeds of public offerings of stock; |
| • | to pay salary, bonus, and benefits to our officers and employees; |
| • | to repurchase management equity upon termination, retirement, death, or disability, subject to a cap; |
| • | to pay taxes on behalf of the Borrower and its subsidiaries; |
| • | to pay our costs, fees, and expenses of being a public company, including compliance with regulations applicable to public reporting companies and listed companies; |
| • | to pay the costs and expenses related to our operations as a holding company of the Borrower, including administrative, legal, accounting, and similar expenses; and |
| • | to pay the costs of any unsuccessful equity or debt offering we may attempt. |
As of March 31, 2017, December 31, 2016 and 2015, the Borrower was in compliance with the negative and affirmative covenants under the credit agreements.
On May 2, 2017, pursuant to an amendment to the First Lien Credit Agreement, entered into by the Borrower and the Guarantors, the Borrower (a) incurred $225.0 million in the Incremental TermB-2 Loans and (b) extended the termination date with respect to a $150.0 million portion of the Revolving Credit Facility, or the Series A Revolving Loan Facility, and the maturity date for any and all loans made pursuant to the Series A Revolving Loan Facility, from July 25, 2019 to April 25, 2021. The Borrower will use the proceeds of the Incremental TermB-2 Loans to pay related fees and expenses,
156
Table of Contents
to finance additional acquisitions, to repay existing loans under the Revolving Credit Facility and for general corporate purposes. From time to time, the Borrower may incur and repay loans under the Revolving Credit Facility, and these borrowings generally will be used for working capital purposes, including to fund acquisitions. The Borrower may also use the Revolving Credit Facility (including the Series A Revolving Loan Facility) to maintain various letters of credit.
Maturity. Except for the Series A Revolving Loan Facility (as described above), the Revolving Credit Facility matures on July 25, 2019. The Series A Revolving Loan Facility matures on April 25, 2021. The First Lien Term Loans, as well as the IncrementalTerm B-2 Loans, mature on July 23, 2021. The Second Lien Term Loans mature on July 25, 2022.
We intend to use the net proceeds that we receive from this offering to repay borrowings outstanding under our Second Lien Term Loans.
157
Table of Contents
SHARES ELIGIBLE FOR FUTURE SALE
Immediately prior to this offering, there was no public market for our common stock. Future sales of substantial amounts of common stock in the public market, or the perception that such sales may occur, could adversely affect the market price of our common stock. Although we intend to apply to list our common stock on the New York Stock Exchange, we cannot assure you that our application will be approved or that there will be an active public market for our common stock.
Upon the closing of this offering, we will have outstanding an aggregate of shares of common stock, assuming the issuance of shares of common stock offered by us in this offering. Of these shares, all shares sold in this offering (other than any shares sold to our directors, director nominees, or executive officers pursuant to the directed share program, which would be subject to the180-day lock-up agreements referenced below) will be freely tradable without restriction or further registration under the Securities Act, except for any shares purchased, through the directed share program or otherwise, by our “affiliates,” as that term is defined in Rule 144 under the Securities Act.
The remaining outstanding shares of our common stock will be “restricted securities,” as that term is defined in Rule 144. Restricted securities may be sold in the public market only if they are registered under the Securities Act or if they qualify for an exemption from registration under Rule 144 or Rule 701 under the Securities Act, or Rule 701, which are summarized below. As a result, subject to thelock-up agreements described below and the provisions of Rule 144 or Rule 701, shares of our common stock that will be deemed restricted securities after this offering will be available for sale in the public market as follows:
| • | no shares will be available for sale until 180 days after the date of this prospectus, subject to certain limited exceptions provided for in thelock-up agreements; and |
| • | beginning 181 days after the date of this prospectus, shares of our common stock will become eligible for sale in the public market, of which shares are expected to be held by affiliates and subject to the volume and other restrictions of Rule 144, as described below. |
Lock-Up Agreements
We, our executive officers, our directors, our director nominees, and Karman Topco have agreed that, subject to certain customary exceptions, for a period of 180 days from the date of this prospectus, we and they will not, without the prior written consent of Goldman Sachs & Co. LLC and Morgan Stanley & Co. LLC in this offering, offer, sell, contract to sell, pledge, or otherwise dispose of, directly or indirectly, any shares of our common stock or any securities convertible into or exchangeable for our common stock. Goldman Sachs & Co. LLC and Morgan Stanley & Co. LLC may release any of the securities subject to theselock-up agreements at any time without notice. See “Underwriting.”
Rule 144
In general, beginning 90 days after the date of this prospectus, a person who is not our affiliate for purposes of Rule 144 at any time during the 90 days preceding a sale will generally be entitled to sell any shares of our common stock that the person has beneficially owned for at least six months, including the holding period of any prior owner other than one of our affiliates, without complying with the manner of sale, volume limitation or notice provisions of Rule 144, subject to our compliance with the public information requirements of Rule 144. In addition, such a person would be entitled to sell any shares of our common stock that the person has beneficially owned for at least one year, including the holding period of any prior owner other than one of our affiliates, without complying with any of the requirements of Rule 144.
158
Table of Contents
Additionally, in general, beginning 90 days after the date of this prospectus, a person who is our affiliate for purposes of Rule 144, or a person selling shares on behalf of an affiliate, and who has beneficially owned shares of our common stock for at least six months, including the holding period of any prior owner other than one of our affiliates, will be entitled to sell, within any three-month period, a number of shares that does not exceed the greater of:
| • | 1% of the number of shares of our common stock then outstanding, which will equal approximately shares immediately after completion of this offering; or |
| • | the average weekly trading volume of our common stock during the four calendar weeks preceding the filing of a notice on Form 144 with respect to the sale. |
Rule 701
In general, under Rule 701, any of an issuer’s employees, directors, officers, consultants, or advisors who purchases shares from the issuer in connection with a compensatory stock or option plan or other written agreement before the effective date of a registration statement under the Securities Act is entitled to sell such shares 90 days after such effective date in reliance on Rule 144. An affiliate of the issuer can resell shares in reliance on Rule 144 without having to comply with the holding period requirement, andnon-affiliates of the issuer can resell shares in reliance on Rule 144 without having to comply with the current public information and holding period requirements.
The SEC has indicated that Rule 701 will apply to typical stock options granted by an issuer before it becomes subject to the reporting requirements of the Exchange Act, along with the shares acquired upon exercise of such options, including exercises after an issuer becomes subject to the reporting requirements of the Exchange Act.
Equity Plans
We intend to file one or more registration statements onForm S-8 under the Securities Act to register all shares of common stock subject to outstanding stock options and common stock issued or issuable under our stock plans. We expect to file the registration statement covering shares offered pursuant to our stock plans shortly after the date of this prospectus, permitting the resale of such shares by nonaffiliates in the public market without restriction under the Securities Act and the sale by affiliates in the public market, subject to compliance with the resale provisions of Rule 144.
Registration Rights and Units of Karman Topco
Upon the closing of this offering, certain equity funds affiliated with or advised by the Sponsors and certain members of our management that own equity interests of Karman Topco, or their transferees, will be entitled to various rights with respect to the registration of shares of our common stock issued in exchange for, or distributed in respect of their units in Karman Topco. Registration of these shares under the Securities Act would result in these shares becoming fully tradable without restriction under the Securities Act immediately upon the effectiveness of the registration, except for shares purchased by affiliates. See “Certain Relationships and Related Party Transactions—Registration Rights Agreement” elsewhere in this prospectus for additional information. Shares covered by a registration statement will be eligible for sale in the public market upon the expiration or release from the terms of thelock-up agreement.
Additionally, following this offering, the units of Karman Topco will not be publicly traded, but, pursuant to the limited partnership agreement (and subject to the lockup agreement entered into by
159
Table of Contents
Karman Topco in connection with this offering) of Karman Topco, Karman Topco will be required to use its commercially reasonable efforts to distribute shares of our common stock in redemption of the units held by affiliates of Centerview Capital, repurchase such units for cash, or otherwise provide an opportunity for such affiliates of Centerview Capital to transfer their units as if the units were publicly traded.
160
Table of Contents
MATERIAL U.S. FEDERAL INCOME TAX CONSEQUENCES TONON-U.S. HOLDERS
The following discussion is a summary of the material U.S. federal income tax consequences toNon-U.S. Holders (as defined below) of the purchase, ownership, and disposition of our common stock issued pursuant to this offering, but does not purport to be a complete analysis of all potential tax effects. The effects of other U.S. federal tax laws, such as estate and gift tax laws, and any applicable state, local, ornon-U.S. tax laws are not discussed. This discussion is based on the U.S. Internal Revenue Code of 1986, as amended, or the Code, Treasury Regulations promulgated thereunder, judicial decisions, and published rulings and administrative pronouncements of the U.S. Internal Revenue Service, or the IRS, in each case in effect as of the date hereof. These authorities may change or be subject to differing interpretations. Any such change or differing interpretation may be applied retroactively in a manner that could adversely affect aNon-U.S. Holder of our common stock. We have not sought and will not seek any rulings from the IRS regarding the matters discussed below. There can be no assurance the IRS or a court will not take a contrary position to that discussed below regarding the tax consequences of the purchase, ownership and disposition of our common stock.
This discussion is limited toNon-U.S. Holders that hold our common stock as a “capital asset” within the meaning of Section 1221 of the Code (generally, property held for investment). This discussion does not address all U.S. federal income tax consequences relevant to aNon-U.S. Holder’s particular circumstances, including the impact of the Medicare contribution tax on net investment income. In addition, it does not address consequences relevant toNon-U.S. Holders subject to special rules, including, without limitation:
| • | U.S. expatriates and former citizens or long-term residents of the United States; |
| • | persons subject to the alternative minimum tax; |
| • | persons holding our common stock as part of a hedge, straddle, or other risk reduction strategy or as part of a conversion transaction or other integrated investment; |
| • | banks, insurance companies, and other financial institutions; |
| • | brokers, dealers, or traders in securities; |
| • | “controlled foreign corporations,” “passive foreign investment companies,” and corporations that accumulate earnings to avoid U.S. federal income tax; |
| • | partnerships or other entities or arrangements treated as partnerships for U.S. federal income tax purposes (and investors therein); |
| • | tax-exempt organizations or governmental organizations; |
| • | persons deemed to sell our common stock under the constructive sale provisions of the Code; |
| • | persons who hold or receive our common stock pursuant to the exercise of any employee stock option or otherwise as compensation; |
| • | persons that own, or are deemed to own, more than 5% of our common stock (except to the extent specifically set forth below); |
| • | tax-qualified retirement plans; and |
| • | “qualified foreign pension funds” as defined in Section 897(l)(2) of the Code and entities all of the interests of which are held by qualified foreign pension funds. |
If an entity (or arrangement) treated as a partnership for U.S. federal income tax purposes holds our common stock, the tax treatment of a partner or beneficial owner of the entity will depend on the status of the owner, the activities of the entity and certain determinations made at the partner or
161
Table of Contents
beneficial owner level. Accordingly, entities treated as partnerships for U.S. federal income tax purposes holding our common stock and the partners or beneficial owners in such entities should consult their tax advisors regarding the U.S. federal income tax consequences to them.
THIS DISCUSSION IS FOR INFORMATIONAL PURPOSES ONLY AND IS NOT TAX ADVICE. INVESTORS SHOULD CONSULT THEIR TAX ADVISORS WITH RESPECT TO THE APPLICATION OF THE U.S. FEDERAL INCOME TAX LAWS TO THEIR PARTICULAR SITUATIONS AS WELL AS ANY TAX CONSEQUENCES OF THE PURCHASE, OWNERSHIP, AND DISPOSITION OF OUR COMMON STOCK ARISING UNDER THE U.S. FEDERAL ESTATE OR GIFT TAX LAWS OR UNDER THE LAWS OF ANY STATE, LOCAL ORNON-U.S. TAXING JURISDICTION OR UNDER ANY APPLICABLE INCOME TAX TREATY.
Definition of aNon-U.S. Holder
For purposes of this discussion, a“Non-U.S. Holder” is any beneficial owner of our common stock that is neither a “U.S. person” nor an entity (or arrangement) treated as a partnership for U.S. federal income tax purposes. A U.S. person is any person that, for U.S. federal income tax purposes, is or is treated as any of the following:
| • | an individual who is a citizen or resident of the United States; |
| • | an entity created or organized under the laws of the United States, any state thereof, or the District of Columbia that is treated as a corporation for U.S. federal income tax purposes; |
| • | an estate, the income of which is subject to U.S. federal income tax regardless of its source; or |
| • | a trust that (1) is subject to the primary supervision of a U.S. court and the control of one or more “United States persons” (within the meaning of Section 7701(a)(30) of the Code), or (2) has a valid election in effect to be treated as a United States person for U.S. federal income tax purposes. |
Distributions
As described in the section of this prospectus entitled “Dividend Policy,” we do not anticipate declaring or paying dividends to holders of our common stock in the foreseeable future. However, if we do make distributions of cash or property on our common stock, such distributions will constitute dividends for U.S. federal income tax purposes to the extent paid from our current or accumulated earnings and profits, as determined under U.S. federal income tax principles. Amounts not treated as dividends for U.S. federal income tax purposes will first constitute a return of capital and be applied against and reduce aNon-U.S. Holder’s adjusted tax basis in its common stock, but not below zero. Any excess will be treated as capital gain and will be treated as described below under “—Sale or Other Taxable Disposition.”
Except as described below with respect to effectively connected dividends and subject to the discussions below of backup withholding and Sections 1471 to 1474 of the Code (such Sections and related Treasury Regulations commonly referred to as the Foreign Account Tax Compliance Act, or FATCA), dividends paid to aNon-U.S. Holder of our common stock will be subject to U.S. federal withholding tax at a rate of 30% of the gross amount of the dividends (or such lower rate specified by an applicable income tax treaty, provided theNon-U.S. Holder furnishes a valid IRS FormW-8BEN orW-8BEN-E (or other applicable documentation) certifying qualification for the lower treaty rate). If aNon-U.S. Holder holds the stock through a financial institution or other intermediary, theNon-U.S. Holder will be required to provide appropriate documentation to the intermediary, which then will be required to provide appropriate documentation to the applicable withholding agent, either directly or
162
Table of Contents
through other intermediaries. ANon-U.S. Holder that does not timely furnish the required documentation, but that qualifies for a reduced treaty rate, may obtain a refund of any excess amounts withheld by timely filing an appropriate claim for refund with the IRS.Non-U.S. Holders should consult their tax advisors regarding their entitlement to benefits under any applicable income tax treaty.
If dividends paid to aNon-U.S. Holder are effectively connected with theNon-U.S. Holder’s conduct of a trade or business within the United States (and, if required by an applicable income tax treaty, theNon-U.S. Holder maintains a permanent establishment in the United States to which such dividends are attributable), theNon-U.S. Holder will be exempt from the U.S. federal withholding tax described above. To claim the exemption, theNon-U.S. Holder must furnish to the applicable withholding agent a valid IRS FormW-8ECI, certifying that the dividends are effectively connected with theNon-U.S. Holder’s conduct of a trade or business within the United States.
Any such effectively connected dividends will be subject to U.S. federal income tax generally in the same manner as if theNon-U.S. Holder were a U.S. person and be subject to regular graduated U.S. federal income tax rates. ANon-U.S. Holder that is a corporation also may be subject to a branch profits tax at a rate of 30% (or such lower rate specified by an applicable income tax treaty) on its effectively connected earnings and profits for the taxable year that are attributable to such dividends, as adjusted for certain items.Non-U.S. Holders should consult their tax advisors regarding any applicable tax treaties that may provide for different rules or rates.
Sale or Other Taxable Disposition
Subject to the discussions below regarding FATCA and backup withholding, aNon-U.S. Holder will not be subject to U.S. federal income tax on any gain realized upon the sale or other taxable disposition of our common stock unless:
| • | the gain is effectively connected with theNon-U.S. Holder’s conduct of a trade or business within the United States (and, if required by an applicable income tax treaty, theNon-U.S. Holder maintains a permanent establishment in the United States to which such gain is attributable); |
| • | theNon-U.S. Holder is a nonresident alien individual present in the United States for 183 days or more during the taxable year of the disposition and certain other requirements are met; or |
| • | our common stock constitutes a U.S. real property interest, or USRPI, by reason of our status as a U.S. real property holding corporation, or USRPHC, for U.S. federal income tax purposes. |
Gain described in the first bullet point above generally will be subject to U.S. federal income tax generally in the same manner as if theNon-U.S. Holder were a U.S. person and be taxed on the net gain derived from the sale or other taxable disposition under regular graduated U.S. federal income tax rates. ANon-U.S. Holder that is a corporation also may be subject to a branch profits tax at a rate of 30% (or such lower rate specified by an applicable income tax treaty) on a portion of its effectively connected earnings and profits for the taxable year that are attributable to such gain, as adjusted for certain items.
Gain described in the second bullet point above will be subject to U.S. federal income tax at a rate of 30% (or such lower rate specified by an applicable income tax treaty), which may be offset by U.S. source capital losses of theNon-U.S. Holder (even though the individual is not considered a resident of the United States), provided theNon-U.S. Holder has timely filed U.S. federal income tax returns with respect to such losses.
With respect to the third bullet point above, we believe we currently are not, and do not anticipate becoming, a USRPHC. Because the determination of whether we are a USRPHC depends, however,
163
Table of Contents
on the fair market value of our USRPIs relative to the fair market value of ournon-U.S. real property interests and our other business assets, there can be no assurance that we currently are not a USRPHC or that will not become a USRPHC in the future. Even if we are or were to become a USRPHC, our common stock will not be treated as a USRPI if our common stock is “regularly traded,” as defined by applicable Treasury Regulations, on an established securities market, and suchNon-U.S. Holder owned, actually or constructively, 5% or less of our common stock throughout the shorter of the five-year period ending on the date of the sale or other taxable disposition of, or theNon-U.S. Holder’s holding period for, our common stock.
Non-U.S. Holders should consult their tax advisors regarding potentially applicable income tax treaties that may provide for different rules.
Information Reporting and Backup Withholding
Payments of dividends on our common stock will not be subject to backup withholding, provided the applicable withholding agent does not have actual knowledge or reason to know the holder is a U.S. person and the holder either certifies itsnon-U.S. status, such as by furnishing a valid IRS FormW-8BEN,W-8BEN-E,W-8ECI, orW-8EXP, or otherwise establishes an exemption. However, information returns are required to be filed with the IRS in connection with any dividends on our common stock paid to theNon-U.S. Holder, regardless of whether any tax was actually withheld. In addition, proceeds of the sale or other taxable disposition of our common stock within the United States or conducted through certain U.S.-related brokers generally will not be subject to backup withholding or information reporting, if the applicable withholding agent receives the certification described above and does not have actual knowledge or reason to know that such holder is a U.S. person, or the holder otherwise establishes an exemption. Proceeds of a disposition of our common stock conducted through anon-U.S. office of anon-U.S. broker generally will not be subject to backup withholding or information reporting.
Copies of information returns that are filed with the IRS may also be made available under the provisions of an applicable treaty or agreement to the tax authorities of the country in which theNon-U.S. Holder resides or is established or organized.
Backup withholding is not an additional tax. Any amounts withheld under the backup withholding rules may be allowed as a refund or a credit against aNon-U.S. Holder’s U.S. federal income tax liability, provided the required information is timely furnished to the IRS.
Additional Withholding Tax on Payments Made to Foreign Accounts
Withholding taxes may be imposed under FATCA on certain types of payments made tonon-U.S. financial institutions and certain othernon-U.S. entities. Specifically, a 30% withholding tax may be imposed on dividends on, or gross proceeds from the sale or other disposition of, our common stock paid to a “foreign financial institution” (as defined by the Code to include, in addition to banks and traditional financial institutions, entities such as investment funds and certain holding companies) or a“non-financial foreign entity” (as defined in the Code), unless (1) the foreign financial institution undertakes certain diligence, reporting, and withholding obligations, (2) thenon-financial foreign entity either certifies it does not have any “substantial United States owners” (as defined in the Code) or furnishes identifying information regarding each substantial United States owner, or (3) the foreign financial institution ornon-financial foreign entity otherwise qualifies for an exemption from these rules. If the payee is a foreign financial institution and is subject to the diligence, reporting, and withholding requirements in (1) above, it must enter into an agreement with the U.S. Department of the Treasury requiring, among other things, that it undertake to identify accounts held by certain “specified United
164
Table of Contents
States persons” or “United States-owned foreign entities” (each as defined in the Code), annually report certain information about such accounts, and withhold 30% on certain payments tonon-compliant foreign financial institutions and certain other account holders. Accordingly, the entity through which our common stock is held will affect the determination of whether such withholding is required. Foreign financial institutions located in jurisdictions that have an intergovernmental agreement with the United States governing FATCA may be subject to different rules.
Under the applicable Treasury Regulations and related guidance published by the IRS, withholding under FATCA generally applies currently to payments of dividends on our common stock and will apply to payments of gross proceeds from the sale or other disposition of such stock on or after January 1, 2019. The FATCA withholding tax will apply to all withholdable payments without regard to whether the beneficial owner of the payment would otherwise be entitled to an exemption from imposition of withholding tax pursuant to an applicable tax treaty with the United States or U.S. domestic law.
Prospective investors should consult their tax advisors regarding the potential application of withholding under FATCA to their investment in our common stock.
165
Table of Contents
The Company and the underwriters named below have entered into an underwriting agreement with respect to the shares being offered. Subject to certain conditions, each underwriter has severally agreed to purchase the number of shares indicated in the following table. Goldman Sachs & Co. LLC and Morgan Stanley & Co. LLC are the representatives of the underwriters.
Underwriters | Number of Shares | |||
Goldman Sachs & Co. LLC | ||||
Morgan Stanley & Co. LLC | ||||
|
| |||
Total | ||||
|
| |||
The underwriters are committed to take and pay for all of the shares being offered, if any are taken, other than the shares covered by the option described below unless and until this option is exercised. The offering of the shares by the underwriters is subject to receipt and acceptance and subject to the underwriters’ right to reject any order in whole or in part.
The underwriters have an option to buy up to an additional shares from the Company to cover sales by the underwriters of a greater number of shares than the total number set forth in the table above. They may exercise that option for 30 days. If any shares are purchased pursuant to this option, the underwriters will severally purchase shares in approximately the same proportion as set forth in the table above.
The following table shows the per share and the total underwriting discounts and commissions to be paid to the underwriters by the Company. Such amounts are shown assuming both no exercise and full exercise of the underwriters’ option to purchase additional shares.
Paid by the Company
| No Exercise | Full Exercise | |||||||
Per Share | $ | $ | ||||||
Total | $ | $ | ||||||
Shares sold by the underwriters to the public will initially be offered at the initial public offering price set forth on the cover of this prospectus. Any shares sold by the underwriters to securities dealers may be sold at a discount of up to $ per share from the initial public offering price. After the initial offering of the shares, the representatives may change the offering price and the other selling terms. The offering of the shares by the underwriters is subject to receipt and acceptance and subject to the underwriters’ right to reject any order in whole or in part. We have agreed to reimburse the underwriters for certain out-of-pocket expenses of the underwriters, including the reasonable fees, disbursements, and expenses of counsel in connection with the required review by the Financial Industry Regulatory Authority, in an amount not to exceed $ .
The Company, its executive officers and directors, and Karman Topco have agreed with the underwriters, subject to certain exceptions, not to dispose of or hedge any of their common stock or securities convertible into or exchangeable for shares of common stock during the period from the date of this prospectus continuing through the date 180 days after the date of this prospectus, except with the prior written consent of the representatives. This agreement does not apply to any existing employee benefit plans. See “Shares Available for Future Sale” for a discussion of certain transfer restrictions.
166
Table of Contents
Prior to the offering, there has been no public market for the shares. The initial public offering price has been negotiated among the Company and the representatives. Among the factors to be considered in determining the initial public offering price of the shares, in addition to prevailing market conditions, will be the Company’s historical performance, estimates of the business potential and earnings prospects of the Company, an assessment of the Company’s management, and the consideration of the above factors in relation to market valuation of companies in related businesses.
An application has been made to list the common stock on the New York Stock Exchange under the symbol “ADV.” In order to meet one of the requirements for listing the common stock on the New York Stock Exchange, the underwriters have undertaken to sell lots of 100 or more shares to a minimum of 400 beneficial holders.
In connection with the offering, the underwriters may purchase and sell shares of common stock in the open market. These transactions may include short sales, stabilizing transactions, and purchases to cover positions created by short sales. Short sales involve the sale by the underwriters of a greater number of shares than they are required to purchase in the offering, and a short position represents the amount of such sales that have not been covered by subsequent purchases. A “covered short position” is a short position that is not greater than the amount of additional shares for which the underwriters’ option described above may be exercised. The underwriters may cover any covered short position by either exercising their option to purchase additional shares or purchasing shares in the open market. In determining the source of shares to cover the covered short position, the underwriters will consider, among other things, the price of shares available for purchase in the open market as compared to the price at which they may purchase additional shares pursuant to the option described above. “Naked” short sales are any short sales that create a short position greater than the amount of additional shares for which the option described above may be exercised. The underwriters must cover any such naked short position by purchasing shares in the open market. A naked short position is more likely to be created if the underwriters are concerned that there may be downward pressure on the price of the common stock in the open market after pricing that could adversely affect investors who purchase in the offering. Stabilizing transactions consist of various bids for or purchases of common stock made by the underwriters in the open market prior to the completion of the offering.
The underwriters may also impose a penalty bid. This occurs when a particular underwriter repays to the underwriters a portion of the underwriting discount received by it because the representatives have repurchased shares sold by or for the account of such underwriter in stabilizing or short covering transactions.
Purchases to cover a short position and stabilizing transactions, as well as other purchases by the underwriters for their own accounts, may have the effect of preventing or retarding a decline in the market price of the company’s stock, and together with the imposition of the penalty bid, may stabilize, maintain, or otherwise affect the market price of the common stock. As a result, the price of the common stock may be higher than the price that otherwise might exist in the open market. The underwriters are not required to engage in these activities and may end any of these activities at any time. These transactions may be effected on New York Stock Exchange, in theover-the-counter market or otherwise.
European Economic Area
In relation to each Member State of the European Economic Area which has implemented the Prospectus Directive (each, a “Relevant Member State”) an offer to the public of our common shares may not be made in that Relevant Member State, except that an offer to the public in that Relevant
167
Table of Contents
Member State of our common shares may be made at any time under the following exemptions under the Prospectus Directive:
(a) to any legal entity which is a qualified investor as defined in the Prospectus Directive;
(b) to fewer than 150 natural or legal persons (other than qualified investors as defined in the Prospectus Directive), subject to obtaining the prior consent of the representatives for any such offer; or
(c) in any other circumstances falling within Article 3(2) of the Prospectus Directive,
provided that no such offer of shares of our common stock shall result in a requirement for the publication by us or any underwriter of a prospectus pursuant to Article 3 of the Prospectus Directive.
For the purposes of this provision, the expression an “offer to the public” in relation to our common shares in any Relevant Member State means the communication in any form and by any means of sufficient information on the terms of the offer and our common shares to be offered so as to enable an investor to decide to purchase our common shares, as the same may be varied in that Member State by any measure implementing the Prospectus Directive in that Member State, the expression “Prospectus Directive” means Directive 2003/71/EC (as amended), including by Directive 2010/73/EU, and includes any relevant implementing measure in the Relevant Member State.
This European Economic Area selling restriction is in addition to any other selling restrictions set out below.
United Kingdom
In the United Kingdom, this prospectus is only addressed to and directed to qualified investors who are (i) investment professionals falling within Article 19(5) of the Financial Services and Markets Act 2000 (Financial Promotion) Order 2005, or the Order; or (ii) high net worth entities and other persons to whom it may lawfully be communicated, falling within Article 49(2)(a) to (d) of the Order (all such persons together being referred to as “relevant persons”). Any investment or investment activity to which this prospectus relates is available only to relevant persons and will only be engaged with relevant persons. Any person who is not a relevant person should not act or rely on this prospectus or any of its contents.
Canada
The securities may be sold in Canada only to purchasers purchasing, or deemed to be purchasing, as principal that are accredited investors, as defined in National Instrument45-106 Prospectus Exemptions or subsection 73.3(1) of the Securities Act (Ontario), and are permitted clients, as defined in National Instrument31-103 Registration Requirements, Exemptions, and Ongoing Registrant Obligations. Any resale of the securities must be made in accordance with an exemption form, or in a transaction not subject to, the prospectus requirements of applicable securities laws.
Securities legislation in certain provinces or territories of Canada may provide a purchaser with remedies for rescission or damages if this offering memorandum (including any amendment thereto) contains a misrepresentation, provided that the remedies for rescission or damages are exercised by the purchaser within the time limit prescribed by the securities legislation of the purchaser’s province or territory. The purchaser should refer to any applicable provisions of the securities legislation of the purchaser’s province or territory of these rights or consult with a legal advisor.
168
Table of Contents
Pursuant to section 3A.3 of National Instrument33-105 Underwriting Conflicts, or NI33-105, the underwriters are not required to comply with the disclosure requirements of NI33-105 regarding underwriter conflicts of interest in connection with this offering.
Hong Kong
The shares may not be offered or sold by means of any document other than (i) in circumstances which do not constitute an offer to the public within the meaning of the Companies Ordinance (Cap.32, Laws of Hong Kong), or (ii) to “professional investors” within the meaning of the Securities and Futures Ordinance (Cap.571, Laws of Hong Kong) and any rules made thereunder, or (iii) in other circumstances which do not result in the document being a “prospectus” within the meaning of the Companies Ordinance (Cap.32, Laws of Hong Kong), and no advertisement, invitation, or document relating to the shares may be issued or may be in the possession of any person for the purpose of issue (in each case whether in Hong Kong or elsewhere), which is directed at, or the contents of which are likely to be accessed or read by, the public in Hong Kong (except if permitted to do so under the laws of Hong Kong) other than with respect to shares which are or are intended to be disposed of only to persons outside Hong Kong or only to “professional investors” within the meaning of the Securities and Futures Ordinance (Cap. 571, Laws of Hong Kong) and any rules made thereunder.
Singapore
This prospectus has not been registered as a prospectus with the Monetary Authority of Singapore. Accordingly, this prospectus and any other document or material in connection with the offer or sale, or invitation for subscription or purchase, of the shares may not be circulated or distributed, nor may the shares be offered or sold, or be made the subject of an invitation for subscription or purchase, whether directly or indirectly, to persons in Singapore other than (i) to an institutional investor under Section 274 of the Securities and Futures Act, Chapter 289 of Singapore (the “SFA”), (ii) to a relevant person, or any person pursuant to Section 275(1A), and in accordance with the conditions, specified in Section 275 of the SFA or (iii) otherwise pursuant to, and in accordance with the conditions of, any other applicable provision of the SFA.
Where the shares are subscribed or purchased under Section 275 by a relevant person which is: (a) a corporation (which is not an accredited investor) the sole business of which is to hold investments and the entire share capital of which is owned by one or more individuals, each of whom is an accredited investor; or (b) a trust (where the trustee is not an accredited investor) whose sole purpose is to hold investments and each beneficiary is an accredited investor, shares, debentures, and units of shares and debentures of that corporation or the beneficiaries’ rights and interest in that trust shall not be transferable for 6 months after that corporation or that trust has acquired the shares under Section 275 except: (1) to an institutional investor under Section 274 of the SFA or to a relevant person, or any person pursuant to Section 275(1A), and in accordance with the conditions, specified in Section 275 of the SFA; (2) where no consideration is given for the transfer; or (3) by operation of law.
Japan
The securities have not been and will not be registered under the Financial Instruments and Exchange Law of Japan (the Financial Instruments and Exchange Law) and each underwriter has agreed that it will not offer or sell any securities, directly or indirectly, in Japan or to, or for the benefit of, any resident of Japan (which term as used herein means any person resident in Japan, including any corporation or other entity organized under the laws of Japan), or to others for re-offering or resale, directly or indirectly, in Japan or to a resident of Japan, except pursuant to an exemption from the registration requirements of, and otherwise in compliance with, the Financial Instruments and Exchange Law and any other applicable laws, regulations, and ministerial guidelines of Japan.
169
Table of Contents
Directed Share Program
At our request, the underwriters have reserved percent of the shares of common stock to be issued by the Company and offered by this prospectus for sale, at the initial public offering price, to the Company’s directors, director nominees, officers, and full-time associates, certain persons affiliated with Smollan, the Company’s international strategic partner, and certain other persons associated with such officers, as designated by the Company. The number of shares of common stock available for sale to the general public will be reduced to the extent these individuals purchase such reserved shares. Any reserved shares that are not so purchased will be offered by the underwriters to the general public on the same basis as the other shares offered by this prospectus. Other than any shares sold to our directors, director nominees, or executive officers pursuant to the directed share program, any shares sold in the directed share program will not be subject to any lock-up agreement with the underwriters.
The Company estimates that its share of the total expenses of the offering, excluding the underwriting discounts and commissions, will be approximately $ .
The Company has agreed to indemnify the several underwriters against certain liabilities, including liabilities under the Securities Act.
The underwriters and their respective affiliates are full service financial institutions engaged in various activities, which may include sales and trading, commercial and investment banking, advisory, investment management, investment research, principal investment, hedging, market making, brokerage, and other financial andnon-financial activities and services. Certain of the underwriters and their respective affiliates have provided, and may in the future provide, a variety of these services to the issuer and to persons and entities with relationships with the issuer, for which they received or will receive customary fees and expenses.
In the ordinary course of their various business activities, the underwriters and their respective affiliates, officers, directors, and employees may purchase, sell or hold a broad array of investments and actively trade securities, derivatives, loans, commodities, currencies, credit default swaps, and other financial instruments for their own account and for the accounts of their customers, and such investment and trading activities may involve or relate to assets, securities, or instruments of the issuer (directly, as collateral securing other obligations or otherwise) or persons and entities with relationships with the issuer. The underwriters and their respective affiliates may also communicate independent investment recommendations, market color, or trading ideas or publish or express independent research views in respect of such assets, securities, or instruments and may at any time hold, or recommend to clients that they should acquire, long or short positions in such assets, securities, and instruments.
170
Table of Contents
The validity of the shares of common stock offered hereby will be passed upon for us by Latham & Watkins LLP, Costa Mesa, California. Shearman & Sterling LLP, Menlo Park, California, has acted as counsel for the underwriters in connection with certain legal matters related to this offering.
The consolidated financial statements of Advantage Solutions Inc. and its subsidiaries (Successor) as of December 31, 2016 and 2015 and for each of the two years in the period ended December 31, 2016, and for the period from July 26, 2014 to December 31, 2014 included in this prospectus have been so included in reliance on the report of PricewaterhouseCoopers LLP, an independent registered public accounting firm, given on the authority of said firm as experts in auditing and accounting.
The consolidated financial statements of Advantage Sales & Marketing Inc. and its subsidiaries (Predecessor) for the period from January 1, 2014 to July 25, 2014 included in this prospectus have been so included in reliance on the report of PricewaterhouseCoopers LLP, an independent registered public accounting firm, given on the authority of said firm as experts in auditing and accounting.
Certain estimates of industry and market data included in this prospectus in the sections entitled “Prospectus Summary” and “Business” are derived from market information prepared for us by Dechert-Hampe & Company, a sales and marketing management consulting firm focusing on the consumer products and services industry, and are included in this prospectus in reliance on Dechert-Hampe & Company’s authority as an expert in such matters.
171
Table of Contents
WHERE YOU CAN FIND MORE INFORMATION
We have filed with the SEC a registration statement onForm S-1 under the Securities Act with respect to the shares of common stock offered hereby. This prospectus, which constitutes a part of the registration statement, does not contain all of the information set forth in the registration statement or the exhibits and schedules filed therewith. For further information about us and the common stock offered hereby, we refer you to the registration statement and the exhibits and schedules filed thereto. Statements contained in this prospectus regarding the contents of any contract or any other document that is filed as an exhibit to the registration statement are not necessarily complete, and each such statement is qualified in all respects by reference to the full text of such contract or other document filed as an exhibit to the registration statement.
Upon the closing of this offering, we will be required to file periodic reports, proxy statements, and other information with the SEC pursuant to the Securities Exchange Act of 1934. You may read and copy this information at the Public Reference Room of the SEC, 100 F Street, N.E., Room 1580, Washington, D.C. 20549. You may obtain information on the operation of the public reference rooms by calling the SEC at1-800-SEC-0330. The SEC also maintains an Internet website that contains reports, proxy statements and other information about registrants, like us, that file electronically with the SEC. The address of that site iswww.sec.gov.
172
Table of Contents
INDEX TO CONSOLIDATED FINANCIAL STATEMENTS
| Page | ||||
Consolidated Financial Statements | ||||
| F-2 | ||||
| F-4 | ||||
| F-5 | ||||
| F-6 | ||||
| F-7 | ||||
| F-8 | ||||
| F-51 | ||||
Unaudited Condensed Consolidated Financial Statements | ||||
| F-54 | ||||
| F-55 | ||||
| F-56 | ||||
| F-57 | ||||
F-1
Table of Contents
REPORT OF INDEPENDENT REGISTERED PUBLIC ACCOUNTING FIRM
To the Board of Directors and Stockholder of Advantage Solutions Inc.
In our opinion, the accompanying consolidated balance sheets and the related consolidated statements of comprehensive income (loss), stockholder’s equity and cash flows present fairly, in all material respects, the financial position of Advantage Solutions Inc. and its subsidiaries (Successor) as of December 31, 2016 and 2015, and the results of their operations and their cash flows for the years then ended and for the period from July 26, 2014 to December 31, 2014 in conformity with accounting principles generally accepted in the United States of America. In addition, in our opinion, the financial statement schedule listed in the accompanying index for the two years in the period ended December 31, 2016 and for the period from July 26, 2014 to December 31, 2014 presents fairly, in all material respects, the information set forth therein when read in conjunction with the related consolidated financial statements. These financial statements and financial statement schedule are the responsibility of the Company’s management. Our responsibility is to express an opinion on these financial statements and financial statement schedule based on our audits. We conducted our audits of these financial statements in accordance with the standards of the Public Company Accounting Oversight Board (United States). Those standards require that we plan and perform the audit to obtain reasonable assurance about whether the financial statements are free of material misstatement. An audit includes examining, on a test basis, evidence supporting the amounts and disclosures in the financial statements, assessing the accounting principles used and significant estimates made by management, and evaluating the overall financial statement presentation. We believe that our audits provide a reasonable basis for our opinion.
/s/ PricewaterhouseCoopers LLP
Los Angeles, California
May 4, 2017, except for Note 2 to the consolidated financial statements, as to which the date is June 9, 2017
F-2
Table of Contents
REPORT OF INDEPENDENT REGISTERED PUBLIC ACCOUNTING FIRM
To the Board of Directors and Stockholder of Advantage Sales & Marketing Inc.
In our opinion, the accompanying consolidated statements of comprehensive income (loss), stockholder’s equity and cash flows present fairly, in all material respects, the results of operations and cash flows of Advantage Sales & Marketing Inc. and its subsidiaries (Predecessor) for the period from January 1, 2014 to July 25, 2014 in conformity with accounting principles generally accepted in the United States of America. These financial statements are the responsibility of the Company’s management. Our responsibility is to express an opinion on these financial statements based on our audit. We conducted our audit of these financial statements in accordance with the standards of the Public Company Accounting Oversight Board (United States) and in accordance with auditing standards generally accepted in the United States of America. Those standards require that we plan and perform the audit to obtain reasonable assurance about whether the financial statements are free of material misstatement. An audit includes examining, on a test basis, evidence supporting the amounts and disclosures in the financial statements, assessing the accounting principles used and significant estimates made by management, and evaluating the overall financial statement presentation. We believe that our audit provides a reasonable basis for our opinion.
/s/ PricewaterhouseCoopers LLP
Los Angeles, California
May 4, 2017
F-3
Table of Contents
ADVANTAGE SOLUTIONS INC.
| December 31, | ||||||||
| (in thousands except share data) | 2016 | 2015 | ||||||
| ASSETS | ||||||||
Current assets | ||||||||
Cash and cash equivalents | $ | 40,268 | $ | 70,563 | ||||
Restricted cash | 7,806 | 9,093 | ||||||
Accounts receivable, net of allowances of $3,052 and $904, respectively | 370,313 | 283,424 | ||||||
Accounts receivable from related parties | 37,831 | 51,137 | ||||||
Prepaid expenses and other current assets | 33,698 | 34,374 | ||||||
|
|
|
| |||||
Total current assets | 489,916 | 448,591 | ||||||
Property and equipment, net | 71,867 | 65,539 | ||||||
Goodwill | 2,082,344 | 1,996,986 | ||||||
Other intangible assets, net | 3,212,868 | 3,285,840 | ||||||
Investments in unconsolidated affiliates | 84,721 | 83,208 | ||||||
Deferred income tax assets | 1,949 | — | ||||||
Other assets | 6,135 | 6,856 | ||||||
|
|
|
| |||||
Total assets | $ | 5,949,800 | $ | 5,887,020 | ||||
|
|
|
| |||||
| LIABILITIES AND STOCKHOLDER’S EQUITY | ||||||||
Current liabilities | ||||||||
Current portion of long-term debt | $ | 41,047 | $ | 23,420 | ||||
Accounts payable | 94,621 | 70,770 | ||||||
Accrued compensation and benefits | 63,394 | 63,235 | ||||||
Other accrued expenses | 98,159 | 111,594 | ||||||
Deferred revenues | 26,408 | 9,548 | ||||||
|
|
|
| |||||
Total current liabilities | 323,629 | 278,567 | ||||||
Long-term debt, net of current portion | 2,651,686 | 2,660,358 | ||||||
Deferred income tax liabilities, net | 1,156,285 | 1,186,042 | ||||||
Other long-term liabilities | 79,898 | 52,440 | ||||||
|
|
|
| |||||
Total liabilities | 4,211,498 | 4,177,407 | ||||||
|
|
|
| |||||
Commitments and contingencies (Note 16) | ||||||||
Redeemable noncontrolling interest | 2,457 | — | ||||||
Equity attributable to stockholder of Advantage Solutions Inc. | ||||||||
Common stock authorized, 1,000 shares of $0.01 par value; issued and outstanding 100 shares as of December 31, 2016 and 2015, respectively | — | — | ||||||
Additional paid in capital | 1,668,003 | 1,673,503 | ||||||
Retained earnings | 46,804 | 14,655 | ||||||
Loans to Karman Topco L.P. | (218 | ) | (172 | ) | ||||
Accumulated other comprehensive loss | (12,482 | ) | (5,611 | ) | ||||
|
|
|
| |||||
Total equity attributable to stockholder of Advantage Solutions Inc. | 1,702,107 | 1,682,375 | ||||||
Nonredeemable noncontrolling interest | 33,738 | 27,238 | ||||||
|
|
|
| |||||
Total stockholder’s equity | 1,735,845 | 1,709,613 | ||||||
|
|
|
| |||||
Total liabilities, redeemable noncontrolling interest, and stockholder’s equity | $ | 5,949,800 | $ | 5,887,020 | ||||
|
|
|
| |||||
See notes to consolidated financial statements
F-4
Table of Contents
CONSOLIDATED STATEMENTS OF COMPREHENSIVE INCOME (LOSS)
| Successor | Predecessor | |||||||||||||||
| (in thousands, except share and per share data) | Year Ended December 31, 2016 | Year Ended December 31, 2015 | Period From July 26, 2014 to December 31, 2014 | Period From January 1, 2014 to July 25, 2014 | ||||||||||||
Revenues | $ | 1,891,823 | $ | 1,717,341 | $ | 731,049 | $ | 810,374 | ||||||||
Revenues from related parties | 208,412 | 177,705 | 77,026 | 95,272 | ||||||||||||
|
|
|
|
|
|
|
| |||||||||
Total Revenues | 2,100,235 | 1,895,046 | 808,075 | 905,646 | ||||||||||||
Cost of revenues | 1,611,285 | 1,454,255 | 601,649 | 715,104 | ||||||||||||
Selling, general, and administrative expenses | 97,542 | 72,224 | 59,540 | 141,300 | ||||||||||||
Depreciation and amortization | 170,260 | 164,584 | 68,683 | 75,271 | ||||||||||||
|
|
|
|
|
|
|
| |||||||||
Total expenses | 1,879,087 | 1,691,063 | 729,872 | 931,675 | ||||||||||||
|
|
|
|
|
|
|
| |||||||||
Operating income (loss) | 221,148 | 203,983 | 78,203 | (26,029 | ) | |||||||||||
Interest expense, net | 167,360 | 160,895 | 84,227 | 83,896 | ||||||||||||
|
|
|
|
|
|
|
| |||||||||
Income (loss) before income taxes | 53,788 | 43,088 | (6,024 | ) | (109,925 | ) | ||||||||||
Provision for (benefit from) income taxes | 22,623 | 18,202 | 3,861 | (20,826 | ) | |||||||||||
|
|
|
|
|
|
|
| |||||||||
Net income (loss) | 31,165 | 24,886 | (9,885 | ) | (89,099 | ) | ||||||||||
Less: net (loss) income attributable to noncontrolling interests | (984 | ) | 292 | 54 | 116 | |||||||||||
Net income (loss) attributable to stockholder of Advantage Solutions Inc. | 32,149 | 24,594 | (9,939 | ) | (89,215 | ) | ||||||||||
|
|
|
|
|
|
|
| |||||||||
Other comprehensive (loss) income, net tax: | ||||||||||||||||
Foreign currency translation adjustments | (6,871 | ) | (4,635 | ) | (976 | ) | (1,227 | ) | ||||||||
Total comprehensive income (loss) attributable to stockholder of Advantage Solutions Inc. | $ | 25,278 | $ | 19,959 | $ | (10,915 | ) | $ | (90,442 | ) | ||||||
|
|
|
|
|
|
|
| |||||||||
Net income per common share: | ||||||||||||||||
Basic | $ | 321,486 | $ | 245,946 | $ | (99,385 | ) | |||||||||
|
|
|
|
|
| |||||||||||
Diluted | $ | 321,486 | $ | 245,946 | $ | (99,385 | ) | |||||||||
|
|
|
|
|
| |||||||||||
Weighted-average number of common shares: | ||||||||||||||||
Basic | 100 | 100 | 100 | |||||||||||||
|
|
|
|
|
| |||||||||||
Diluted | 100 | 100 | 100 | |||||||||||||
|
|
|
|
|
| |||||||||||
See notes to consolidated financial statements
F-5
Table of Contents
CONSOLIDATED STATEMENTS OF STOCKHOLDER’S EQUITY
| (thousands of dollars, except share data) | Common Stock | Additional Paid-in Capital | Retained Earnings (Deficit) | Loans to Parent | Accumulated Other Comprehensive Income (Loss) | Advantage Solutions Inc. Stockholder’s Equity | Nonredeemable noncontrolling Interests | Total Stockholder’s Equity | ||||||||||||||||||||||||||||
| Shares | Amount | |||||||||||||||||||||||||||||||||||
(Predecessor) | ||||||||||||||||||||||||||||||||||||
Balances at December 31, 2013 | 100 | — | $ | 607,741 | $ | (18,782 | ) | $ | (10,920 | ) | $ | (3,005 | ) | $ | 575,034 | $ | 58,687 | $ | 633,721 | |||||||||||||||||
Comprehensive income (loss) | ||||||||||||||||||||||||||||||||||||
Net income (loss) | — | — | — | (89,215 | ) | — | — | (89,215 | ) | 116 | (89,099 | ) | ||||||||||||||||||||||||
Foreign currency translation adjustments | — | — | — | — | — | (1,227 | ) | (1,227 | ) | — | (1,227 | ) | ||||||||||||||||||||||||
|
|
|
|
|
| |||||||||||||||||||||||||||||||
Total comprehensive income (loss) | (90,442 | ) | 116 | (90,326 | ) | |||||||||||||||||||||||||||||||
|
|
|
|
|
| |||||||||||||||||||||||||||||||
Loans to Predecessor parent | — | — | — | — | (40 | ) | — | (40 | ) | — | (40 | ) | ||||||||||||||||||||||||
Redemption of noncontrolling interest | — | — | (43,264 | ) | — | — | — | (43,264 | ) | (55,836 | ) | (99,100 | ) | |||||||||||||||||||||||
Equity-based compensation | — | — | 51,564 | — | — | — | 51,564 | — | 51,564 | |||||||||||||||||||||||||||
Distribution paid | — | — | — | — | — | — | — | (240 | ) | (240 | ) | |||||||||||||||||||||||||
|
|
|
|
|
|
|
|
|
|
|
|
|
|
|
|
|
| |||||||||||||||||||
Balance at July 25, 2014 | 100 | — | 616,041 | (107,997 | ) | (10,960 | ) | (4,232 | ) | 492,852 | 2,727 | 495,579 | ||||||||||||||||||||||||
|
|
|
|
|
|
|
|
|
|
|
|
|
|
|
|
|
| |||||||||||||||||||
(Successor) | ||||||||||||||||||||||||||||||||||||
Issuance of equity | 100 | — | 1,662,865 | — | — | — | 1,662,865 | — | 1,662,865 | |||||||||||||||||||||||||||
Fair value of noncontrolling interest units | — | — | — | — | — | — | — | 7,686 | 7,686 | |||||||||||||||||||||||||||
Comprehensive income (loss) | ||||||||||||||||||||||||||||||||||||
Net income (loss) | — | — | — | (9,939 | ) | — | — | (9,939 | ) | 54 | (9,885 | ) | ||||||||||||||||||||||||
Foreign currency translation adjustments | — | — | — | — | — | (976 | ) | (976 | ) | — | (976 | ) | ||||||||||||||||||||||||
|
|
|
|
|
| |||||||||||||||||||||||||||||||
Total comprehensive income (loss) | (10,915 | ) | 54 | (10,861 | ) | |||||||||||||||||||||||||||||||
|
|
|
|
|
| |||||||||||||||||||||||||||||||
Redemption of noncontrolling interest | — | — | — | — | — | — | — | (3,750 | ) | (3,750 | ) | |||||||||||||||||||||||||
Loans to Karman Topco L.P. | — | — | — | — | (33 | ) | — | (33 | ) | — | (33 | ) | ||||||||||||||||||||||||
Equity-based compensation | — | — | 450 | — | — | — | 450 | — | 450 | |||||||||||||||||||||||||||
|
|
|
|
|
|
|
|
|
|
|
|
|
|
|
|
|
| |||||||||||||||||||
Balance at December 31, 2014 | 100 | — | 1,663,315 | (9,939 | ) | (33 | ) | (976 | ) | 1,652,367 | 3,990 | 1,656,357 | ||||||||||||||||||||||||
|
|
|
|
|
|
|
|
|
|
|
|
|
|
|
|
|
| |||||||||||||||||||
Comprehensive income (loss) | ||||||||||||||||||||||||||||||||||||
Net income | — | — | — | 24,594 | — | — | 24,594 | 292 | 24,886 | |||||||||||||||||||||||||||
Foreign currency translation adjustments | — | — | — | — | — | (4,635 | ) | (4,635 | ) | (964 | ) | (5,599 | ) | |||||||||||||||||||||||
|
|
|
|
|
| |||||||||||||||||||||||||||||||
Total comprehensive income (loss) | 19,959 | (672 | ) | 19,287 | ||||||||||||||||||||||||||||||||
|
|
|
|
|
| |||||||||||||||||||||||||||||||
Issuance of equity | — | — | 7,000 | — | — | — | 7,000 | — | 7,000 | |||||||||||||||||||||||||||
Increase in noncontrolling interest | — | — | — | — | — | — | — | 23,920 | 23,920 | |||||||||||||||||||||||||||
Loans to Karman Topco L.P. | — | — | — | — | (139 | ) | — | (139 | ) | — | (139 | ) | ||||||||||||||||||||||||
Equity-based compensation | — | — | 3,188 | — | — | — | 3,188 | — | 3,188 | |||||||||||||||||||||||||||
|
|
|
|
|
|
|
|
|
|
|
|
|
|
|
|
|
| |||||||||||||||||||
Balance at December 31, 2015 | 100 | — | 1,673,503 | 14,655 | (172 | ) | (5,611 | ) | 1,682,375 | 27,238 | 1,709,613 | |||||||||||||||||||||||||
|
|
|
|
|
|
|
|
|
|
|
|
|
|
|
|
|
| |||||||||||||||||||
Comprehensive income (loss) | ||||||||||||||||||||||||||||||||||||
Net income | — | — | — | 32,149 | — | — | 32,149 | (984 | ) | 31,165 | ||||||||||||||||||||||||||
Foreign currency translation adjustments | — | — | — | — | — | (6,871 | ) | (6,871 | ) | (4,235 | ) | (11,106 | ) | |||||||||||||||||||||||
|
|
|
|
|
| |||||||||||||||||||||||||||||||
Total comprehensive income (loss) | 25,278 | (5,219 | ) | 20,059 | ||||||||||||||||||||||||||||||||
|
|
|
|
|
| |||||||||||||||||||||||||||||||
Issuance of equity | 1,995 | 1,995 | 1,995 | |||||||||||||||||||||||||||||||||
Increase in noncontrolling interest | — | — | — | — | — | — | — | 15,709 | 15,709 | |||||||||||||||||||||||||||
Redemption of noncontrolling interest | — | — | (10,677 | ) | — | — | — | (10,677 | ) | (3,990 | ) | (14,667 | ) | |||||||||||||||||||||||
Loans to Karman Topco L.P. | — | — | — | — | (46 | ) | — | (46 | ) | — | (46 | ) | ||||||||||||||||||||||||
Equity-based compensation | — | — | 3,182 | — | — | — | 3,182 | — | 3,182 | |||||||||||||||||||||||||||
|
|
|
|
|
|
|
|
|
|
|
|
|
|
|
|
|
| |||||||||||||||||||
Balance at December 31, 2016 | 100 | — | 1,668,003 | 46,804 | (218 | ) | (12,482 | ) | 1,702,107 | 33,738 | 1,735,845 | |||||||||||||||||||||||||
|
|
|
|
|
|
|
|
|
|
|
|
|
|
|
|
|
| |||||||||||||||||||
See notes to consolidated financial statements
F-6
Table of Contents
CONSOLIDATED STATEMENTS OF CASH FLOWS
| Successor | Predecessor | |||||||||||||||
| (in thousands) | Year Ended December 31, 2016 | Year Ended December 31, 2015 | Period From July 26, 2014 to December 31, 2014 | Period From January 1, 2014 to July 25, 2014 | ||||||||||||
CASH FLOWS FROM OPERATING ACTIVITIES | ||||||||||||||||
Net income (loss) | $ | 31,165 | $ | 24,886 | $ | (9,885 | ) | $ | (89,099 | ) | ||||||
Adjustments to reconcile net income (loss) to net cash provided by operating activities | ||||||||||||||||
Noncash interest expense | 15,050 | 7,526 | 20,559 | 24,994 | ||||||||||||
Depreciation and amortization | 170,260 | 164,584 | 68,699 | 75,256 | ||||||||||||
Fair value adjustments related to contingent consideration | 3,336 | (25,577 | ) | — | (11,936 | ) | ||||||||||
Deferred income taxes | (36,657 | ) | (37,500 | ) | (26,201 | ) | (23,893 | ) | ||||||||
Equity-based compensation | 3,182 | 3,188 | 450 | 51,564 | ||||||||||||
Equity in earnings of unconsolidated affiliates | (1,631 | ) | (711 | ) | — | — | ||||||||||
Distribution received from unconsolidated affiliates | 4,148 | 786 | — | — | ||||||||||||
Changes in operating assets and liabilities, net effects from purchases of businesses: | ||||||||||||||||
Accounts receivable | (54,678 | ) | (28,114 | ) | (35,664 | ) | 6,651 | |||||||||
Prepaid expense and other assets | 1,751 | 219 | 20,817 | 20,404 | ||||||||||||
Accounts payable | 18,507 | 8,305 | (75,221 | ) | 45,607 | |||||||||||
Accrued compensation and benefits | (584 | ) | 4,479 | 28,449 | (19,199 | ) | ||||||||||
Deferred revenues | 13,226 | (8,112 | ) | (1,446 | ) | 2,693 | ||||||||||
Other accrued expenses | (2,668 | ) | 2,986 | 27,488 | (16,479 | ) | ||||||||||
|
|
|
|
|
|
|
| |||||||||
Net cash provided by operating activities | 164,407 | 116,945 | 18,045 | 66,563 | ||||||||||||
|
|
|
|
|
|
|
| |||||||||
CASH FLOWS FROM INVESTING ACTIVITIES | ||||||||||||||||
Purchase of businesses, net of cash acquired | (111,483 | ) | (138,464 | ) | (3,741,541 | ) | (68,780 | ) | ||||||||
Purchase of investment in unconsolidated affiliate | (4,030 | ) | (77,985 | ) | — | (11,000 | ) | |||||||||
Proceeds from sale of interest in unconsolidated affiliates | — | 6,116 | — | — | ||||||||||||
Purchase of property and equipment | (34,755 | ) | (32,328 | ) | (10,193 | ) | (11,924 | ) | ||||||||
Restricted cash | 1,287 | 1,692 | (7,992 | ) | (189 | ) | ||||||||||
|
|
|
|
|
|
|
| |||||||||
Net cash used in investing activities | (148,981 | ) | (240,969 | ) | (3,759,726 | ) | (91,893 | ) | ||||||||
|
|
|
|
|
|
|
| |||||||||
CASH FLOWS FROM FINANCING ACTIVITIES | ||||||||||||||||
Borrowings under lines of credit | 205,000 | 85,000 | 50,000 | — | ||||||||||||
Payments on lines of credit | (185,000 | ) | (85,000 | ) | (75,000 | ) | — | |||||||||
Proceeds from issuance of long-term debt | — | 150,000 | 2,645,000 | 325,000 | ||||||||||||
Principal payments on long-term debt | (23,364 | ) | (26,680 | ) | (9,630 | ) | (50,206 | ) | ||||||||
Divestiture of investment | — | 23,920 | — | — | ||||||||||||
Proceeds from issuance of equity | — | — | 1,094,949 | — | ||||||||||||
Termination of swap | — | — | — | (4,468 | ) | |||||||||||
Contingent consideration payments | (34,144 | ) | (22,919 | ) | (2,123 | ) | (5,052 | ) | ||||||||
Holdback payments | (6,109 | ) | (11,887 | ) | — | (688 | ) | |||||||||
Payments of financing fees | (46 | ) | (139 | ) | (80,687 | ) | (5,026 | ) | ||||||||
Contribution from noncontrolling interest | 15,709 | — | — | — | ||||||||||||
Redemption of noncontrolling interests | (14,667 | ) | — | (2,910 | ) | (99,100 | ) | |||||||||
Other financing activities | — | — | — | (240 | ) | |||||||||||
|
|
|
|
|
|
|
| |||||||||
Net cash provided by (used in) financing activities | (42,621 | ) | 112,295 | 3,619,599 | 160,220 | |||||||||||
|
|
|
|
|
|
|
| |||||||||
Net effect of foreign currency fluctuations on cash | (3,100 | ) | (2,504 | ) | (824 | ) | (114 | ) | ||||||||
|
|
|
|
|
|
|
| |||||||||
Net change in cash and cash equivalents | (30,295 | ) | (14,233 | ) | (122,906 | ) | 134,776 | |||||||||
|
|
|
|
|
|
|
| |||||||||
Cash and cash equivalents, beginning of period | 70,563 | 84,796 | 207,702 | 72,926 | ||||||||||||
|
|
|
|
|
|
|
| |||||||||
Cash and cash equivalents, end of period | $ | 40,268 | $ | 70,563 | $ | 84,796 | $ | 207,702 | ||||||||
|
|
|
|
|
|
|
| |||||||||
SUPPLEMENTAL CASH FLOW INFORMATION | ||||||||||||||||
Cash payments for interest | 148,681 | 146,453 | 60,159 | 44,282 | ||||||||||||
Cash payments for income taxes | 54,170 | 53,067 | 10,887 | 36,069 | ||||||||||||
Non-cash issuance of management rollover shares | — | — | 67,025 | — | ||||||||||||
Non-cash issuance of equity | 1,995 | 7,000 | 500,000 | — | ||||||||||||
Purchase of property and equipment recorded in accounts payable and accrued expenses | 1,836 | 1,538 | 1,158 | 473 | ||||||||||||
See notes to consolidated financial statements
F-7
Table of Contents
ADVANTAGE SOLUTIONS INC.
NOTES TO CONSOLIDATED FINANCIAL STATEMENTS
1. Organization and Significant Accounting Policies
Advantage Solutions Inc. (the “Company,” “Advantage” or “Successor”) is a corporation initially formed under the laws of the State of Delaware on June 13, 2014 under the name Karman Holding Corp. solely for the purpose of the 2014 Topco Acquisition (as defined below). From June 13, 2014 to July 25, 2014, the Company had no operations. Operations commenced on July 25, 2014.
On July 25, 2014, the Company acquired Advantage Sales & Marketing Inc. (the “2014 Topco Acquisition”) from AGS Topco Holdings, L.P. and its private equity sponsor, Apax Partners. As a result of the 2014 Topco Acquisition, Advantage Sales & Marketing Inc. became a wholly owned indirect subsidiary of the Company, of which Karman Topco L.P. (“Karman Topco”) was the parent. The units of Karman Topco are held by equity funds affiliated with or advised by CVC Capital Partners, Leonard Green & Partners, Juggernaut Capital Partners, Centerview Capital, L.P., and Centerview Employees, L.P., as well as by members of the Company’s management. The assets and liabilities acquired as part of the 2014 Topco Acquisition have been recorded at fair value for the interests acquired by new investors.
On March 16, 2016, the Company changed its name from “Karman Holding Corp.” to “Advantage Solutions Inc.”
The Company is headquartered in Irvine, California and is a leading business solutions provider to consumer goods manufacturers and retailers. The Company’s customizable suite of technology-enabled sales and marketing solutions is designed to help manufacturers and retailers across a broad range of channels drive consumer demand, increase sales, and achieve operating efficiencies.
The consolidated financial statements for the period from July 26, 2014 to December 31, 2014 are those of Advantage Solutions Inc., the “Successor.” The consolidated financial statements presented for the period from January 1, 2014 to July 25, 2014, prior to the 2014 Topco Acquisition, are those of Advantage Sales & Marketing Inc., the “Predecessor.” References to “the Company” mean the Predecessor or the Successor depending on the respective period or date.
Basis of Presentation
The accompanying consolidated financial statements include the accounts of the Company and its wholly owned subsidiaries, and have been prepared in accordance with accounting principles generally accepted in the United States (“U.S. GAAP”). The financial information set forth herein reflects: (a) the consolidated results of operations and cash flows of Successor for the fiscal years ended December 31, 2016 and 2015, the period from July 26, 2014 to December 31, 2014 and of the Predecessor for the period from January 1, 2014 to July 25, 2014 and (b) the consolidated balance sheets of Successor as of December 31, 2016 and 2015. The consolidated financial statements for the years ended December 31, 2016, 2015, and the period from July 26, 2014 to December 31, 2014 (Successor), reflect Karman Topco’s basis in the assets and liabilities of the Company, as a result of the 2014 Topco Acquisition.
Principles of Consolidation
The consolidated financial statements include the accounts of Advantage Solutions Inc. and its controlled subsidiaries. All intercompany balances and transactions are eliminated in consolidation. The Company’s share in the earnings or losses for its joint ventures is reflected in “Investments in unconsolidated affiliates” in the Consolidated Balance Sheets.
F-8
Table of Contents
ADVANTAGE SOLUTIONS INC.
NOTES TO CONSOLIDATED FINANCIAL STATEMENTS
Use of Estimates
The preparation of the Company’s consolidated financial statements in conformity with U.S. GAAP requires management to make estimates and assumptions that affect the reported amounts of assets and liabilities and disclosure of contingent assets and liabilities at the balance sheet date and the reported amounts of revenues and expenses during the reporting period. Actual results could differ from such estimates. The most significant estimates include, revenues and related reserves, workers’ compensation and employee medical claim reserves, amortization periods for tangible and intangible assets, fair value of contingent consideration, derivatives instruments and fair value considerations in applying purchase accounting and assessing goodwill and other asset impairments.
Foreign Currency
The Company’s reporting currency is U.S. dollars as that is the currency of the primary economic environment in which the Company operates. The Company translates the assets and liabilities of itsnon-U.S. dollar functional currency subsidiaries into U.S. dollars using exchange rates in effect at the end of each period. Revenues and expenses for these subsidiaries are translated using rates that approximate those in effect during the period. Gains and losses from these translations are included in “Accumulated other comprehensive income (loss)” in the Consolidated Statements of Stockholder’s Equity. Transactions in foreign currencies other than the entities’ functional currency are converted using the rate of exchange at the date of transaction. The gains or losses arising from the revaluation of foreign currency transactions to functional currency are included in “Selling, general, and administrate expenses” in the Consolidated Statements of Comprehensive Income (Loss).
Cash and Cash Equivalents
Cash and cash equivalents include cash on hand and highly liquid investments having an original maturity of three months or less. The Company’s investments consist primarily of institutional money market funds and U.S. Treasury securities. The Company’s investments are carried at cost, which approximates fair value. The Company has restricted cash related to contingent consideration and funds received from clients that will be disbursed at the direction of those clients. Restricted cash was $7.8 million and $9.1 million, as of December 31, 2016 and 2015, respectively of which zero and $3.0 million related to contingent consideration restrictions and $7.8 million and $6.1 million related to funds received from clients as of December 31, 2016 and 2015, respectively. Corresponding liabilities have been recorded in “Other accrued expenses” in the Consolidated Balance Sheets.
Accounts Receivable and Allowance for Doubtful Accounts
Accounts receivable consist of amounts due from clients for services provided in normal business activities and are recorded at invoiced amounts. The Company maintains allowances for doubtful accounts against certain billed receivables based upon the latest information regarding whether invoices are ultimately collectible. Assessing the collectability of client receivables requires management judgment. The Company determines its allowance for doubtful accounts by specifically analyzing individual accounts receivable, historical bad debts, client credit-worthiness, current economic conditions, and accounts receivable aging trends. Valuation reserves are periodicallyre-evaluated and adjusted as more information about the ultimate collectability of accounts receivable becomes available. Upon determination that a receivable is uncollectible, the receivable balance and any associated reserve are written off.
F-9
Table of Contents
ADVANTAGE SOLUTIONS INC.
NOTES TO CONSOLIDATED FINANCIAL STATEMENTS
Concentration of Credit Risk
Financial instruments that potentially subject the Company to significant concentrations of credit risk consist principally of accounts receivable and cash in banks. The Company maintains cash balances at various financial institutions. At times such balances may exceed federally insured limits. The Company has not experienced any losses in such accounts.
Derivatives
The Company uses derivative financial instruments to hedge interest rate and foreign exchange risk. Derivative instruments, used to hedge interest rates consist of interest rate swaps and interest rate caps. Interest rate swap contracts involve the exchange of floating rate interest payment obligations for fixed interest rate payments without the exchange of the underlying principal amounts. Interest rate cap contracts limit the floating interest rate exposure to the indicative rate in the agreement. Derivatives are initially recognized at fair value on the date a contract is entered into and are subsequentlyre-measured at fair value. The fair values of derivatives are measured using observable market prices or, where market prices are not available, by using discounted expected future cash flows at prevailing interest and exchange rates. The Company does not designate these derivatives as hedges for accounting purposes, and as a result, all changes in the fair value of derivatives, used to hedge interest rates and foreign exchange risk, are recorded in “Interest expense” and in “Selling, general, and administrative expenses” in the Consolidated Statement of Comprehensive Income (Loss), respectively. These arrangements contain an element of risk in that the counterparties may be unable to meet the terms of such arrangements. In the event the counterparties are unable to fulfill their related obligations, the Company could potentially incur significant additional costs by replacing the positions at then current market rates. The Company manages its risk of exposure by limiting counterparties to those banks and institutions deemed appropriate by management.
Property and Equipment
Property and equipment are stated at cost, and the balances are presented net of accumulated depreciation. Depreciation expense is calculated using the straight-line method over the estimated useful lives of the assets. The following table provides the range of estimated useful lives used for each asset type:
Leasehold improvements | 3—10 years | |
Furniture and fixtures | 3—5 years | |
Computer hardware and other equipment | 3—5 years | |
Software | 3 years |
Leasehold improvements are amortized over the shorter of the useful life of the asset or the lease term. Maintenance and repairs are charged to expense as incurred.
Equity Method Investments
Investments in companies in which the Company exercises significant influence over the operating and financial policies of the investee and are not required to be consolidated are accounted for using the equity method. The Company’s proportionate share of the net income or loss of equity method investments is included in results of operations and any dividends received reduce the carrying
F-10
Table of Contents
ADVANTAGE SOLUTIONS INC.
NOTES TO CONSOLIDATED FINANCIAL STATEMENTS
value of the investment. The excess of the cost of the Company’s investment over its proportionate share of the fair value of the net assets of the investee at the acquisition date is recognized as goodwill and included in the carrying amount of the investment. Goodwill in the equity method investments is not amortized. Gains and losses from changes in the Company’s ownership interests are recorded in results of operations until control is achieved. In instances in which a change in the Company’s ownership interest results in obtaining control, the existing carrying value of the investment is remeasured to the acquisition date fair value and any gain or loss is recognized in results of operations.
Business Combinations
The Company accounts for business combinations using the acquisition method. Under this method, the purchase price of an acquisition is allocated to the underlying assets acquired and liabilities assumed based upon their estimated fair values at the date of acquisition. To the extent the purchase price exceeds the fair value of the net identifiable tangible and intangible assets acquired and liabilities assumed, such excess is allocated to goodwill. Factors giving rise to goodwill generally include assembled workforce, geographic presence, expertise, and synergies that are anticipated as a result of the business combination, including enhanced product and service offerings. The Company determines the estimated fair values after review and consideration of relevant information, including discounted cash flows, quoted market prices and estimates made by management. The Company adjusts the preliminary purchase price allocation, as necessary, during the measurement period of up to one year after the acquisition closing date as the Company obtains more information as to facts and circumstances existing at the acquisition date impacting asset valuations and liabilities assumed. Goodwill acquired in business combinations is assigned to the reporting unit expected to benefit from the combination as of the acquisition date. Acquisition-related costs are recognized separately from the acquisition and are expensed as incurred.
Goodwill and Indefinite Lived Intangible Assets
Goodwill represents the excess of the purchase price over the fair value of the net identifiable tangible and intangible assets acquired in an acquisition. The Company tests for impairment of goodwill at the reporting unit level. The Company generally combines reporting units, which are a component of an operating segment when they have similar economic characteristics, nature of services, types of customer, distribution methods and regulatory environment. The Company has two reporting units, Sales and Marketing, which are also the Company’s operating segments.
The Company tests its goodwill for impairment annually in the third quarter and whenever events or changes in circumstances indicate that the carrying value of a reporting unit may exceed its fair value. The Company has the option to perform a qualitative assessment of whether it is more likely than not that a reporting unit’s fair value is less than its carrying value before applying thetwo-step goodwill impairment test. If it concludes it is not more likely than not that the fair value of a reporting unit is less that the carrying amount, then there is no need to perform thetwo-step impairment test. The Company’s annual goodwill impairment assessment as of October 1, 2016 was performed using a qualitative approach. The qualitative assessment considered industry and market considerations for any deterioration in the environment in which the Company operates, the competitive environment, a decline (both absolute and relative to peers) in market-dependent multiples or metrics, any changes in the market for its services, and regulatory and political developments. Additionally, the Company assessed financial performance by reporting unit and considered cost factors, such as labor or other costs that would have a negative effect on results. The annual goodwill impairment assessments
F-11
Table of Contents
ADVANTAGE SOLUTIONS INC.
NOTES TO CONSOLIDATED FINANCIAL STATEMENTS
performed for fiscal year 2016 have indicated that it is more likely than not that the fair value of its reporting units is substantially in excess of carrying value and not at risk of failing step one of the quantitative goodwill impairment test. Based on its qualitative assessment, the Company has determined that goodwill is not impaired.
The Company’s indefinite lived intangible assets are its sales and marketing tradenames. Intangible assets with indefinite useful lives are not amortized but tested annually, in the third quarter, for impairment or more often if events or circumstances change that would create a triggering event. The Company tests its indefinite-lived intangible assets for impairment by comparing the estimated fair values of the indefinite lived intangible assets with the carrying values. Determining the fair value of a reporting unit or an indefinite lived intangible asset is subjective in nature and involves the use of significant estimates and assumptions. These estimates and assumptions include revenue growth rates, weighted average cost of capital and royalty rates. The Company based its fair value estimates on assumptions it believes to be reasonable but which are unpredictable and inherently uncertain. Actual future results may differ from the estimates. Based on this quantitative assessment, the Company has determined that indefinite lived intangible assets are not impaired.
Long-Lived Assets
Long-lived assets to be held and used, including intangible assets, are reviewed for impairment whenever events or changes in circumstances indicate that the carrying amount of an asset may not be fully recoverable. These events or changes in circumstances may include a significant deterioration of operating results, changes in business plans, or changes in anticipated future cash flows. If an impairment indicator is present, the Company evaluates recoverability by a comparison of the carrying amount of the assets to future undiscounted net cash flows expected to be generated by the assets. If the assets are impaired, the impairment recognized is measured as the amount by which the carrying amount exceeds the fair value of the assets. Fair value is generally determined by estimates of discounted cash flows. The discount rate used in any estimate of discounted cash flows would be the rate required for a similar investment of like risk. No impairment related to the Company’s long-lived assets was recorded during the fiscal years ended December 31, 2016 and 2015, the period from July 26, 2014 to December 31, 2014 (Successor) and the period from January 1, 2014 to July 25, 2014 (Predecessor).
As the Company assesses impairment of long-lived assets at the lowest level for which identifiable cash flows are largely independent of the cash flows of other assets and liabilities, the Company has determined that the asset group for impairment testing is comprised of the assets and liabilities of each component within the Company’s operating segments. The Company has identified client relationships as the primary asset because it is the principal asset from which the components derive their cash flow generating capacity and has the longest remaining useful life.
Contingent Consideration
Certain of the Company’s acquisition agreements include contingent consideration arrangements, which are generally based on the achievement of future financial performance. If it is determined the contingent consideration arrangements are not compensatory, the fair values of these contingent consideration arrangements are included as part of the purchase price of the acquired companies on their respective acquisition dates. For each transaction, the Company estimates the fair value of contingent consideration payments as part of the initial purchase price and records the estimated fair value of contingent consideration as a liability in “Other accrued expenses” or “Other long-term liabilities” on the Consolidated Balance Sheets.
F-12
Table of Contents
ADVANTAGE SOLUTIONS INC.
NOTES TO CONSOLIDATED FINANCIAL STATEMENTS
The Company reviews and assesses the estimated fair value of contingent consideration on a quarterly basis, and the updated fair value could differ materially from the initial estimates. Changes in the estimated fair value of contingent consideration liabilities related to the time component of the present value calculation are reported in “Interest expense” in the Consolidated Statements of Comprehensive Income (Loss). Adjustments to the estimated fair value related to changes in all other unobservable inputs are reported in “Selling, general, and administrative expenses” in the Consolidated Statements of Comprehensive Income (Loss).
Leases
The Company has obligations under various real estate leases, equipment leases, and software license agreements. The Company assesses whether these arrangements meet the criteria for capital leases by determining whether the agreement transfers ownership of the asset, whether the lease includes a bargain purchase option, whether the lease term is for greater than 75% of the asset’s useful life or whether the minimum lease payments exceed 90% of the leased equipment’s fair market value.
Real estate leases are evaluated and classified as operating lease or capital lease for financial reporting purposes. The Company recognizes rent expense from operating leases with periods of free rent, tenant allowances, and scheduled rent increases on a straight-line basis over the applicable lease term. The difference between rents paid and straight-line rent expense is recorded as deferred rent.
Leasehold improvements are amortized on a straight-line basis over the shorter of the lease term or their estimated useful lives. The cost and accumulated depreciation of assets sold or otherwise disposed of are removed from the Consolidated Balance Sheets and the resulting gain or loss is reflected in the “Cost of revenues” and “Selling, general, administrative expenses” within the Consolidated Statement of Comprehensive Income (Loss), depending on the nature of the expenditure. Expenditures for maintenance and repairs are expenses as incurred, whereas expenditures for improvements and replacements are capitalized.
Self-Insurance Liability
The Company maintains a high deductible program for workers’ compensation claims. Losses and liabilities relating to workers’ compensation claims are fully insured beyond the Company’s deductible limits. The Company’s estimated liabilities are not discounted and are based on information provided by third party administrators, combined with management’s judgment regarding a number of assumptions and factors, including the frequency and severity of claims, claims development history, case jurisdiction, applicable legislation and claims settlement practices.
Redeemable Noncontrolling Interest
The Company is party to a put arrangement with respect to the common securities that represent the remaining noncontrolling interest from a majority-owned subsidiary, which was established through a majority-owned international joint venture during the year ended December 31, 2016. The put arrangement representing 34% of the total outstanding noncontrolling equity interest of that subsidiary, may be exercised at the discretion of the noncontrolling interest holder by providing written notice to the Company beginning in 2018 and expiring in April 2019. The redemption value of the put arrangement is based on a multiple of the majority-owned subsidiary earnings before interest, taxes, depreciation and amortization subject to certain adjustments. The noncontrolling interest is subject to a
F-13
Table of Contents
ADVANTAGE SOLUTIONS INC.
NOTES TO CONSOLIDATED FINANCIAL STATEMENTS
put option that is outside of the Company’s control, and is classified outside of permanent equity and presented as redeemablenon-controlling interest in the temporary equity section of the consolidated balance sheets. The Company recorded its redeemable noncontrolling interest at fair value on the date of the related business combination transaction and recognizes changes in the redemption value at the end of each reporting period. The carrying value of the redeemable noncontrolling interest was $2.5 million and zero as of December 31, 2016 and 2015, respectively.
| (in thousands) | 2016 | |||
Beginning Balance | $ | — | ||
Fair value at acquisition | 2,447 | |||
Net income attributable to noncontrolling interests | 402 | |||
Foreign currency translation adjustment | (392 | ) | ||
|
| |||
Ending Balance | $ | 2,457 | ||
|
| |||
Revenue Recognition
The Company recognizes revenues when the following four criteria are met: (i) persuasive evidence of an arrangement exists; (ii) the sales price is fixed or determinable; (iii) delivery, performance, and acceptance are achieved in accordance with the client arrangement; and (iv) collection is reasonably assured. Contracts with customers are individually negotiated and the amounts earned vary significantly.
Revenues related to the sales segment are primarily recognized in the form of commissions, fee-for-service, or on a cost-plus basis for providing headquarter relationship management, analytics, insights, and intelligence services,administrative services, retail services, retailer client relationships and in-store media programs, and digital technology solutions (which include our business intelligence solutions, e-commerce services, and content services).
Marketing segment revenues are primarily recognized in the form of a fee-for-service (including retainer fees, fees charged to clients based on hours incurred, project-based fees, or fees for executing in-person consumer engagements or experiences, which engagements or experiences the Company refers to as “events”) or on a cost-plus basis for providing experiential marketing, shopper and consumer marketing services, and digital, social, and media services.
Commission revenues are earned and recognized upon performance of headquarter relationship management, retail, administrative, e-commerce, and analytics, insights, and intelligence services. The Company may be entitled to additional fees upon meeting specific performance goals or thresholds, which we refer to as bonus revenue. The Company recognizes the bonus revenue when the specific performance goals are assured or when its clients determine performance against these goals has been achieved. Non-refundable retainer fees are generally recognized on a straight-line basis over the term of the specific client arrangement. Fees for services are recognized upon completion of performance of the service or acceptance by the client.
The Company’s revenue recognition policies are designed to recognize revenues at the time services are performed which requires the Company to make certain estimates related to the amount of fees which have been earned. The Company records an allowance as a reduction to revenue for differences between estimated revenues and the amounts ultimately invoiced to the Company’s clients
F-14
Table of Contents
ADVANTAGE SOLUTIONS INC.
NOTES TO CONSOLIDATED FINANCIAL STATEMENTS
based on its historical experience and current trends. Cash collected in advance of services being performed is recorded as deferred revenues.
The Company evaluates each client contract individually in accordance with the applicable accounting guidance to determine whether it acts as a principal (whereby the Company would present revenue on a gross basis), or as an agent (whereby the Company would present revenue on a net basis). While the Company primarily acts as a principal in its arrangements and reports revenues on a gross basis, given the varying terms of its client contracts, the Company will occasionally act as an agent and accordingly presents revenues on a net basis. For example, for certain advertising arrangements, the Company’s clients purchase media content in advance, and the Company does not take on any risk of recovering its cost to acquire the media. As a result, the Company determined it acts as the agent in these arrangements and records revenues and their related costs on a net basis. However, in cases where media is not purchased in advance by its clients, the Company records such revenues and its related costs on a gross basis, as it bears the risk of recovering the costs to acquire the media.
Income Taxes
The Company accounts for income taxes using the asset and liability method, under which deferred tax assets and liabilities are recognized for the expected future tax consequences of temporary differences between the financial reporting and tax bases of assets and liabilities, and for operating losses and tax credit carry-forwards. Deferred tax assets and liabilities are measured using the currently enacted tax rates that apply to taxable income in effect for the years in which those tax assets are expected to be realized or settled. The income tax provision (benefit) is computed on thepre-tax income (loss) of the entities located within each taxing jurisdiction based on current tax law. A valuation allowance for deferred tax assets is recorded to the extent that the ultimate realization of the deferred tax assets is not considered more likely than not. The Company believes its deferred tax assets are more likely than not to be realized based on historical and projected future results.
Realization of the Company’s deferred tax assets is principally dependent upon its achievement of future taxable income, the estimation of which requires significant management judgment. These judgments regarding future profitability may change due to many factors, including future market conditions and the Company’s ability to successfully execute its business plans. These changes, if any, may require adjustments to deferred tax asset balances and deferred income tax expense.
Uncertain Tax Positions
The Company accounts for uncertain tax positions when it is more likely than not that the tax position will be sustained on examination by the taxing authorities, based on the technical merits of the position.
As of December 31, 2016 and 2015 the unrecognized tax benefits were zero and $0.6 million, respectively. The reductions for lapses and settlements were $0.6 million, zero, zero, and zero during the years ended December 31, 2016 and 2015, the period from July 26, 2014 to December 31, 2014 (Successor) and the period from January 1, 2014 to July 25, 2014 (Predecessor), respectively.
Of this amount, no unrecognized tax benefits would be included in the effective tax rate if recognized in the years ended December 31, 2016 and 2015.
F-15
Table of Contents
ADVANTAGE SOLUTIONS INC.
NOTES TO CONSOLIDATED FINANCIAL STATEMENTS
The Company is unaware of any positions for which it is reasonably possible that the total amounts of unrecognized tax benefits will significantly increase within the next 12 months. The Company files tax returns in the United States, various state jurisdictions and foreign jurisdictions. As of December 31, 2016, the Company is no longer subject to federal, state, ornon-U.S. income tax examinations by tax authorities for years before 2012.
All unrecognized tax benefits are classified as long term because the Company does not anticipate payment of cash within one year. The Company has elected to classify interest and penalties as components of tax expense. These amounts were immaterial for the years ended December 31, 2016, 2015, the period from July 26, 2014 to December 31, 2014 (Successor) and the period from January 1, 2014 to July 25, 2014 (Predecessor), respectively.
Equity-based Compensation
Karman Topco has a long-term equity incentive plan that allows for the grant of equity-based interests in Karman Topco to certain directors and employees in exchange for services provided to the Company. The Company receives the benefit associated with such services, and accordingly, the related expense is recorded within the Consolidated Statements of Comprehensive Income. These profit interests are subject to certain vesting requirements including time and performance requirements based on specified annual targets substantially similar to Adjusted EBITDA thresholds. These awards are subject to forfeiture unless the following performance conditions are met: (i) 75% of the awards will vest when the Common Series A Limited Partners of Karman Topco realize apre-tax internal rate of return of 8% compounded annually, and (ii) the remaining 25% of the awards vest when the Common Series A Limited Partners of Karman Topco realize an internal rate of return of 20% compounded annually. No expense has been recorded in the years ended December 31, 2016, 2015, and the period from July 26, 2014 to December 31, 2014 (Successor) and the period from January 1, 2014 to July 25, 2014 (Predecessor) since performance conditions are not yet deemed probable of occurring.
The Company measures the cost ofnon-employee services received in exchange for an award of equity instruments based on the measurement date fair value consistent with the vesting of the awards and measuring the fair value of these units at the end of each measurement period. The cost is recognized over the requisite service period. The Company utilizes the Backsolve Option Pricing Method (“OPM”) to estimate the fair value for granted profits interest.
Other Comprehensive (Loss) Income
The Company’s comprehensive income includes net income (loss) as well as foreign currency translation adjustments, net of tax.
Earnings Per Share
Basic net income (loss) per share attributable to common stockholder is calculated by dividing net income (loss) available to common stockholder by the weighted average number of shares of common stock outstanding for the period. Diluted net income (loss) per share attributable to common stockholder is calculated by dividing net income (loss) available to common stockholder by the diluted weighted average number of shares of common stock outstanding for the period. There were no potentially dilutive securities outstanding during the Successor years ended December 31, 2016 and 2015 and the Successor period July 26, 2014 to December 31, 2014.
F-16
Table of Contents
ADVANTAGE SOLUTIONS INC.
NOTES TO CONSOLIDATED FINANCIAL STATEMENTS
Fair Value Measurements
The Company defines fair value as the price that would be received from selling an asset or paid to transfer a liability in an orderly transaction between market participants at the measurement date. When determining the fair value measurements for assets and liabilities, which are required to be recorded at fair value, the Company considers the principal or most advantageous market in which the Company would transact and the market-based risk measurements or assumptions that market participants would use in pricing the asset or liability, such as risks inherent in valuation techniques, transfer restrictions and credit risk. Fair value is estimated by applying the following hierarchy, which prioritizes the inputs used to measure fair value into three levels and bases the categorization within the hierarchy upon the lowest level of input that is available and significant to the fair value measurement:
Level 1 | — | Quoted prices in active markets for identical assets or liabilities. | ||||
Level 2 | — | Observable inputs other than quoted prices in active markets for identical assets and liabilities, quoted prices for identical or similar assets or liabilities in inactive markets, or other inputs that are observable or can be corroborated by observable market data for substantially the full term of the assets or liabilities. | ||||
Level 3 | — | Inputs that are generally unobservable and typically reflect management’s estimate of assumptions that market participants would use in pricing the asset or liability. |
The valuation techniques used to measure the fair value of all other financial instruments, all of which have counterparties with high credit ratings, were valued based on quoted market prices or model driven valuations using significant inputs derived from or corroborated by observable market data.
Variable Interest Entities and Investments
The accompanying consolidated financial statements include the accounts of the Company and its subsidiaries over which it has control. All intercompany accounts have been eliminated in consolidation. In accordance with the guidance for the consolidation of a variable interest entity (“VIE”), the Company analyzes its variable interests, including loans, leases, guarantees, and equity investments, to determine if the entity in which it has a variable interest is a VIE. The Company’s analysis includes both quantitative and qualitative considerations. The Company bases its quantitative analysis on the forecasted cash flows of the entity, and its qualitative analysis on its review of the design of the entity, its organizational structure including decision-making ability and financial agreements. The Company also uses its quantitative and qualitative analyses to determine if it is the primary beneficiary of the VIE, and if such determination is made, it includes the accounts of the VIE in its consolidated financial statements.
Recent Accounting Pronouncements
Except for rules and interpretive releases of the SEC under authority of federal securities laws and a limited number of grandfathered standards, the Financial Accounting Standards Board (“FASB”) Accounting Standards Codification (“ASC”) is the sole source of authoritative U.S. GAAP literature recognized by the FASB and applicable to the Company. The Company has reviewed the FASB issued Accounting Standards Update (“ASU”) accounting pronouncements and interpretations thereof that have effectiveness dates during the periods reported and in future periods. For any new
F-17
Table of Contents
ADVANTAGE SOLUTIONS INC.
NOTES TO CONSOLIDATED FINANCIAL STATEMENTS
pronouncements announced, management considers whether the new pronouncements could alter previous generally accepted accounting principles and determine whether any new or modified principles will have a material impact on the Company’s reported financial position or operations in the near term. The applicability of any standard is subject to the formal review of the Company’s financial management and certain standards are under consideration.
Recent Accounting Standards Adopted by the Company
In August 2014, the FASB issued ASU2014-15,Presentation of Financial Statements—Going Concern. The authoritative guidance requiring management to evaluate whether there are conditions and events that raise substantial doubt about the entity’s ability to continue as a going concern and to provide disclosures in certain circumstances. For each reporting period, management will be required to evaluate whether there are conditions or events that raise substantial doubt about a company’s ability to continue as a going concern within one year from the date the consolidated financial statements are issued. The Company adopted the new standard in the first quarter of fiscal year 2016. The adoption of this standard did not have a material effect on the Company’s financial statements or related disclosures.
In February 2015, the FASB issued ASU2015-02,Amendments to the Consolidation Analysis. ASU2015-02 changes the guidance with respect to the analysis that a reporting entity must perform to determine whether it should consolidate certain types of legal entities. All legal entities are subject to revaluation under the revised consolidation mode. ASU2015-02 affects the following areas: (1) limited partnerships and similar legal entities; (2) evaluating fees paid to a decision maker or a service provider as a variable interest; (3) the effect of fee arrangements on the primary beneficiary determination; (4) the effect of related parties on the primary beneficiary determination; and (5) certain investment funds. ASU2015-02 is effective for fiscal years, and for interim periods within those fiscal years, beginning after December 15, 2015. A reporting entity may apply the amendments in this guidance using a modified retrospective approach by recording a cumulative-effect adjustment to equity as of the beginning of the fiscal year of adoption. A reporting entity also may apply the amendments retrospectively. The Company adopted this new standard in the first quarter of fiscal year 2016. The adoption of this standard did not have a material effect on its financial statements.
In April 2015, the FASB issued ASU2015-03, Simplifying the Presentation of Debt Issuance Costs. Under ASU2015-03 the Company has the option to present debt issuance costs in the balance sheet as a reduction from the related debt liability rather than as an asset. Amortization of such costs will continue to be reported as interest expense. In August 2015, the FASB issued ASU2015-15Interest—Imputed Interest (Subtopic835-30): Presentation and Subsequent Measurement of Debt Issuance Costs Associated withLine-of-Credit Arrangements, which clarifies that the guidance in ASU2015-03 does not apply toline-of-credit arrangements. According to ASU2015-15, debt issuance costs related toline-of-credit arrangements will continue to be deferred and presented as an asset and subsequently amortized ratably over the term of the arrangement. The amendments in ASU2015-03 and clarifications of ASU2015-15 are effective for fiscal years—and interim periods within those fiscal years—beginning after December 15, 2015, but early adoption is allowed. The Company adopted this amendment during the first quarter of fiscal year 2016. Consequently, the Company reclassified $4.5 million of debt issuance costs from “Other assets” to “Long-term debt, net of current portion” on the Company’s consolidated balance sheet as of December 31, 2015. See Note 8, Debt, to the Notes to the Consolidated Financial Statements.”
In September 2015, the FASB issued ASU2015-16, Business Combinations (Topic 805): Simplifying the Accounting for Measurement-Period Adjustments, which eliminates the requirement
F-18
Table of Contents
ADVANTAGE SOLUTIONS INC.
NOTES TO CONSOLIDATED FINANCIAL STATEMENTS
that an acquirer retrospectively adjust provisional amounts recognized in a business combination during the measurement period. The measurement period is one year from the date of the acquisition. The amendments require that an acquirer recognize adjustments to provisional amounts that are identified during the measurement period in the reporting period in which the adjustment amounts are determined. The financial statements should contain the effect on earnings of changes in depreciation, amortization or other income effects calculated as if the accounting had been completed at the acquisition date. The financial statements should also separately present on the face of the income statement, or disclose in the footnotes, the amount of adjustments recorded in the current period by line item that would have been recorded in prior periods had the adjustment been made at the date of acquisition. The guidance is effective for fiscal years beginning after December 15, 2015. The amendments should be applied prospectively to adjustments to provisional amounts that occur after the effective date of this Update with earlier application permitted for financial statements that have not been issued. The adoption of this standard did not have a material effect on the Company’s financial statements.
In November 2015, the FASB issued ASU2015-17,Balance Sheet Classification of Deferred Taxes, which will require entities to present deferred tax assets (“DTAs”) and deferred tax liabilities (“DTLs”) as noncurrent in a classified balance sheet. The ASU simplifies the current guidance, which requires entities to separately present DTAs and DTLs as current and noncurrent in a classified balance sheet. The adoption of ASU2015-17 is effective for annual reporting periods beginning after December 15, 2016. Early adoption is permitted. In order to simplify reporting, the Company elected to early adopt ASU2015-17 effective December 31, 2015. As a result, deferred tax assets and liabilities as of December 31, 2015 and 2016 have been classified asnon-current liabilities on the Company’s financial statements.
Accounting Standards Recently Issued but Not Yet Adopted by the Company
In May 2014, the FASB issued ASUNo. 2014-09,Revenue from Contracts with Customers. The new guidance will replace all current U.S. GAAP guidance on this topic and eliminate all industry-specific guidance. According to the new guidance, revenue is recognized when promised goods or services are transferred to customers in an amount that reflects the consideration for which the Company expects to be entitled in exchange for those goods or services. This guidance will be effective for annual periods, and interim periods within those annual periods, beginning after December 15, 2017. The Company will adopt the standard as of January 1, 2018, using the modified retrospective method. Since the issuance of the original standard, the FASB has issued several other subsequent updates including the following: 1) clarification of the implementation guidance on principal versus agent considerations (ASU2016-08); 2) further guidance on identifying performance obligations in a contract as well as clarifications on the licensing implementation guidance (ASU2016-10); 3) rescission of several SEC Staff Announcements that are codified in Topic 605 (ASU2016-11); 4) additional guidance and practical expedients in response to identified implementation issues (ASU2016-12); and 5) technical corrections and improvements to the standard (ASU2016-20). The Company has initiated an adoption plan in the current fiscal year 2017, beginning with preliminary evaluation of the standard, and will continue by performing additional analysis of revenue streams and transactions for which the accounting may change under the new standard. The Company’s evaluation of the impact to the consolidated financial statements is ongoing and will be completed by the end of fiscal year 2017. The Company expects the primary impact of the change will be in the timing of revenue recognition within the quarters of a fiscal year.
In January 2016, the FASB issued ASU2016-01,Recognition and Measurement of Financial Assets and Liabilities. The ASU requires, among other things, that entities measure equity investments
F-19
Table of Contents
ADVANTAGE SOLUTIONS INC.
NOTES TO CONSOLIDATED FINANCIAL STATEMENTS
(except those accounted for under the equity method of accounting or those that result in consolidation of the investee) at fair value, with changes in fair value recognized in net income. Under this ASU, entities will no longer be able to recognize unrealized holding gains and losses onavailable-for-sale equity securities in other comprehensive income, and they will no longer be able to use the cost method of accounting for equity securities that do not have readily determinable fair values. The guidance for classifying and measuring investments in debt securities and loans is not impacted. ASU2016-01 eliminates certain disclosure requirements related to financial instruments measured at amortized cost and adds disclosures related to the measurement categories of financial assets and financial liabilities. The guidance is effective for annual periods beginning after December 15, 2017. Early adoption is permitted for only certain portions of the ASU. The Company is currently assessing the impact of this guidance on its consolidated financial statements.
In February 2016, the FASB issued amended authoritative guidance on accounting for leases, ASU2016-02. The new provisions require that a lessee of operating leases recognize in the statement of financial position a liability representing future lease payments and an asset representing its right to use the underlying asset for the lease term. The lease liability will be equal to the present value of lease payments, with theright-of-use asset based upon the lease liability. The classification criteria for distinguishing between finance (or capital) leases and operating leases are substantially similar to the previous lease guidance, but with no explicit bright lines. As such, operating leases will result in straight-line rent expense similar to current practice. For short term leases (term of 12 months or less), a lessee is permitted to make an accounting election not to recognize lease assets and lease liabilities, which would generally result in lease expense being recognized on a straight-line basis over the lease term. This guidance applies to all entities and is effective for annual periods beginning after December 15, 2018, which will be the Company’s fiscal year 2019, with early adoption permitted. The Company is currently evaluating the impact this guidance will have on its consolidated financial statements but expects this adoption will result in a significant increase in the assets and liabilities on its consolidated balance sheet.
In March 2016, the FASB issued ASU2016-07,Simplifying the Transition to the Equity Method of Accounting, which will eliminate the requirement that when an investment qualifies for use of the equity method as a result of an increase in the level of ownership interest or degree of influence, an investor must adjust the investment, results of operations, and retained earnings retroactively on astep-by-step basis as if the equity method had been in effect during all previous periods that the investment had been held. The amendments require that the equity method investor add the cost of acquiring the additional interest in the investee to the current basis of the investor’s previously held interest and adopt the equity method of accounting as of the date the investment becomes qualified for equity method accounting. Therefore, upon qualifying for the equity method of accounting, no retroactive adjustment of the investment is required. The guidance is effective for all entities for fiscal years, and interim periods within those fiscal years, beginning after December 15, 2016. The amendments should be applied prospectively upon their effective date to increases in the level of ownership interest or degree of influence that result in the adoption of the equity method. Earlier application is permitted. The adoption of this standard is not expected to have a material impact on the Company’s financial position or results of operations.
In March 2016, the FASB issued ASUNo. 2016-09,Improvements to Employee Share-Based Payment Accounting, to simplify several aspects of the accounting for employee share-based payment transactions, which includes the accounting for income taxes, forfeitures, and statutory tax withholding requirements, as well as classification in the statement of cash flows. This guidance is effective for annual periods beginning after December 15, 2016, which will be the Company’s fiscal year 2017, with
F-20
Table of Contents
ADVANTAGE SOLUTIONS INC.
NOTES TO CONSOLIDATED FINANCIAL STATEMENTS
early adoption permitted. Most notably, the Company will be required to recognize all excess tax benefits and shortfalls as income tax expense or benefit in the statement of operations within the reporting period in which they occur. The Company adopted the standard January 1, 2017 using the required prospective method of adoption. Additionally the Company will present its gross excess tax benefits as cash flows from operating activities in its consolidated statements of cash flows (no longer as cash flows from financing activities). The new standard also allows for a policy election to account for forfeitures as they occur rather than on an estimated basis. The Company has elected to continue to account for forfeitures on an estimated basis. The adoption of this standard did not have a material impact on the Company’s financial position or results of operations.
In August 2016, the FASB issued ASU2016-15,Statement of Cash Flows (Topic 230): Classification of Certain Cash Receipts and Cash Payments, which amended authoritative guidance to reduce the diversity in practice related to the presentation and classification of certain cash receipts and cash payments in the statement of cash flows. The new provisions target cash flow issues related to (i) debt prepayment or debt extinguishment costs, (ii) settlement of debt instruments with coupon rates that are insignificant relative to effective interest rates, (iii) contingent consideration payments made after a business combination, (iv) proceeds from settlement of insurance claims, (v) proceeds from the settlement of corporate-owned life insurance and bank-owned life insurance policies, (vi) distributions received from equity method investees, (vii) beneficial interests in securitization transactions and (viii) separately identifiable cash flows and application of the predominance principle. This guidance will be effective for fiscal years beginning after December 15, 2017, which will be the Company’s fiscal year 2018, with early adoption permitted. The Company is continuing to evaluate the impact of the adoption of this guidance on its financial statements.
In October 2016, the FASB issued ASU2016-16,Income Taxes (Topic 740): Intra-Entity Transfers of Assets Other Than Inventory (“ASU2016-16”), which eliminates the exception in existing guidance which defers the recognition of the tax effects of intra-entity asset transfers other than inventory until the transferred asset is sold to a third party. Rather, the amended guidance requires an entity to recognize the income tax consequences of an intra-entity transfer of an asset other than inventory when the transfer occurs. This guidance is effective for interim and annual periods beginning after December 15, 2017, with early adoption permitted as of the beginning of an annual reporting period. The Company is currently assessing the impact of this guidance on its consolidated financial statements.
In November 2016, the FASB issued ASU2016-18,Statement of Cash Flows (Topic 230): Restricted Cash (a consensus of the FASB Emerging Issues Task Force). This ASU requires the statement of cash flows to explain the change during the period in the total of cash, cash equivalents, and amounts generally described as restricted cash or restricted cash equivalents. Therefore, amounts generally described as restricted cash and restricted cash equivalents are to be included with cash and cash equivalents when reconciling the beginning of period and end of period amounts shown on the statement of cash flows. ASUNo. 2016-18 will be effective for the Company as of January 1, 2018. The Company is continuing to evaluate the impact of the adoption of this guidance on its financial statements.
In January 2017, the FASB issued ASU2017-01,Business Combinations (Topic 805)—Clarifying the Definition of a Business to clarify the definition of a business in order to allow for the evaluation of whether transactions should be accounted for as acquisitions or disposals of assets or businesses. ASU2017-01 will be effective for fiscal years beginning after December 15, 2017, including interim periods within those fiscal years. Early adoption is permitted. The future impact of ASU2017-01 will be dependent upon the nature of future acquisitions or dispositions made by the Company.
F-21
Table of Contents
ADVANTAGE SOLUTIONS INC.
NOTES TO CONSOLIDATED FINANCIAL STATEMENTS
In January 2017, the FASB issued ASUNo. 2017-04,Simplifying the Accounting for Goodwill Impairment (ASUNo. 2017-04). ASUNo. 2017-04 removes the second step of the current goodwill impairment test, which currently requires a hypothetical purchase price allocation if the fair value of a reporting unit were to be less than its book value, for purposes of determining the amount of goodwill impaired. Under ASUNo. 2017-04, the Company would now recognize an impairment charge for the amount by which the carrying amount of a reporting unit exceeds the fair value of the reporting unit; however, the loss recognized would not exceed the total amount of goodwill allocated to that reporting unit. ASUNo. 2017-04 will be effective for the Company beginning in the first quarter of fiscal 2020, to be applied on a prospective basis. Early adoption is permitted for any impairment tests performed after January 1, 2017. The pending adoption of this guidance is not expected to have a material impact on the Company’s consolidated financial statements.
2. Correction of Error
The Company’s financial statements for the year ended December 31, 2016 have been revised to correct an immaterial error related to the cash paid for interest supplemental disclosure which is presented on the consolidated statement of cash flows. The error resulted in cash paid for interest being overstated by $48.5 million and occurred due to a computation error.
3. Acquisitions
2016 Acquisitions
As part of the Company’s growth strategy to expand through strategic and synergistic acquisitions, the Company completed 11 business acquisitions during fiscal year 2016. The Company acquired six sales agencies, one sales digital agency and two marketing agencies in the United States and Canada. The Company acquired one sales digital agency and one sales agency in Europe. The acquisitions were accounted for under the acquisition method of accounting. As such, the purchase consideration for each acquired business was allocated to the acquired tangible and intangible assets and liabilities based upon their respective fair values. Although the final purchase price allocations have not been completed, the Company does not expect material changes to the preliminary purchase price allocations. The excess of the purchase consideration over the fair value of the net tangible and identifiable intangible assets acquired was recorded as goodwill. The results of operations of each acquired business have been included in the Company’s financial statements from the date of each acquisition.
The aggregate purchase price for the acquisitions was $160.2 million, of which $110.4 million was paid in cash, $48.7 million was recorded as contingent consideration and $1.1 million was recorded as holdbacks. Contingent consideration payments are determined based on future financial performance and payment obligations (as defined in the applicable purchase agreement) and recorded at fair value. Holdback payments are used to withhold payment on a portion of the purchase price until certain post-closing conditions are satisfied and are typically settled within 24 months of the acquisition. The goodwill related to the acquisitions represented the value paid for the assembled workforce, geographic presence, and expertise; $39.7 million of this goodwill is deductible for tax purposes. The identifiable intangible assets are being amortized on a straight-line basis over their estimated useful lives.
F-22
Table of Contents
ADVANTAGE SOLUTIONS INC.
NOTES TO CONSOLIDATED FINANCIAL STATEMENTS
The preliminary fair value of the identifiable assets and liabilities of the acquisitions completed during the year ended December 31, 2016, at the respective acquisition dates, are as follows:
| (in thousands) | ||||
Consideration: | ||||
Cash | $ | 110,371 | ||
Holdbacks | 1,150 | |||
Fair value of contingent consideration | 48,694 | |||
|
| |||
Total consideration | $ | 160,215 | ||
|
| |||
Recognized amounts of identifiable assets acquired and liabilities assumed: | ||||
Assets | ||||
Accounts receivable | $ | 20,821 | ||
Other assets | 971 | |||
Property and equipment | 2,545 | |||
Identifiable intangible assets | 68,662 | |||
|
| |||
Total assets | 92,999 | |||
Liabilities | ||||
Total liabilities and noncontrolling interest | 22,851 | |||
|
| |||
Total identifiable net assets | 70,148 | |||
|
| |||
Goodwill arising from acquisitions | $ | 90,067 | ||
|
| |||
Following are the details of the purchase price allocated to the intangible assets acquired:
| (in thousands) | Amount | Weighted Average Useful Life | ||||||
Client relationships | $ | 65,006 | 15 years | |||||
Tradename | 3,656 | 5 years | ||||||
|
| |||||||
Total identifiable intangible assets | $ | 68,662 | ||||||
|
| |||||||
The operating results of the businesses acquired during 2016 contributed total revenues of $46.0 million in the year ended December 31, 2016. The Company has determined that the presentation of net income from the date of acquisition is impracticable due to the integration of the operations upon acquisition.
During the year ended December 31, 2016, the Company incurred $2.5 million in transaction costs as a result of the above acquisitions. These costs have been included in “Selling, general, and administrative expenses” in the Consolidated Statement of Comprehensive Income (Loss).
2015 Acquisitions
The Company completed 12 business acquisitions during the year ended December 31, 2015. The Company acquired nine sales agencies, and two marketing agencies in the United States. The Company acquired one sales agency in Europe. The acquisitions were accounted for under the acquisition method of accounting. As such, the purchase consideration for each acquired business was allocated to the acquired tangible and intangible assets and liabilities based upon their respective fair values. The excess of the purchase consideration over the fair value of the net tangible and identifiable
F-23
Table of Contents
ADVANTAGE SOLUTIONS INC.
NOTES TO CONSOLIDATED FINANCIAL STATEMENTS
intangible assets acquired was recorded as goodwill. The results of operations of each acquired business have been included in the Company’s consolidated financial statements from the date of each acquisition.
The aggregate purchase price for the acquisitions was $180.6 million, of which $138.5 million was paid in cash, $7.0 million was funded by an issuance of equity of Karman Topco, $32.7 million was recorded as contingent consideration and $2.4 million was recorded as holdbacks. The goodwill related to the acquisitions represented the value paid for the assembled workforce, geographic presence and expertise; $23.4 million of this goodwill is deductible for tax purposes. The identifiable intangible assets are being amortized on a straight-line basis over their estimated useful lives.
The fair value of the identifiable assets and liabilities of the acquisitions completed during the year ended December 31, 2015, at the respective acquisition dates, are as follows:
| (in thousands) | ||||
Consideration: | ||||
Cash | $ | 138,464 | ||
Holdbacks | 2,436 | |||
Issuance of equity of Karman Topco | 7,000 | |||
Fair value of contingent consideration | 32,683 | |||
|
| |||
Total consideration | $ | 180,583 | ||
|
| |||
Recognized amounts of identifiable assets acquired and liabilities assumed: | ||||
Assets | ||||
Accounts receivable | $ | 26,820 | ||
Other assets | 3,946 | |||
Property and equipment | 5,660 | |||
Identifiable intangible assets | 79,652 | |||
|
| |||
Total assets | 116,078 | |||
Liabilities | ||||
Total liabilities | 27,231 | |||
|
| |||
Total identifiable net assets | 88,847 | |||
|
| |||
Goodwill arising from acquisitions | $ | 91,736 | ||
|
| |||
Following are the details of the purchase price allocated to the intangible assets acquired:
| (in thousands) | Amount | Weighted Average Useful Life | ||||||
Client relationships | $ | 75,149 | 15 years | |||||
Tradename | 4,503 | 5 years | ||||||
|
| |||||||
Total identifiable intangible assets | $ | 79,652 | ||||||
|
| |||||||
The operating results of the businesses acquired during 2015 contributed total revenues of $83.0 million in the year ended December 31, 2015. The Company has determined that the presentation of net income from the date of acquisition is impracticable due to the integration of the operations upon acquisition.
F-24
Table of Contents
ADVANTAGE SOLUTIONS INC.
NOTES TO CONSOLIDATED FINANCIAL STATEMENTS
During the year ended December 31, 2015, the Company incurred $1.5 million in transaction costs as a result of the 2015 acquisitions. These costs have included in “Selling, general, and administrative expenses” in the Consolidated Statement of Comprehensive Income (Loss).
2014 Acquisitions
Karman Topco
In connection with the 2014 Topco Acquisition, Karman Topco acquired all of the voting interests in the Company. The total purchase price of $4,267.7 million was financed with the sale of equity units of $1,595.0 million (including $500.0 million in cash funded directly by Karman Topco’s unitholders), borrowings of $2,585.0 million (including $1,636.1 million used to pay off the Predecessor’s debt at closing), the roll-over of management’s equity in the Predecessor with a fair value of $67.0 million, and cash on hand.
The total purchase price has been allocated to the assets and liabilities of the Company based on their respective fair values at the date of acquisition in accordance with the acquisition method of accounting. The fair value of the identifiable assets and liabilities of the Company, at the acquisition date, are as follows:
| (in thousands) | ||||
Consideration: | ||||
Fair value of consideration | $ | 4,267,654 | ||
Recognized amounts of identifiable assets acquired and liabilities assumed: | ||||
Assets | ||||
Current assets | $ | 444,972 | ||
Other assets | 42,206 | |||
Property and equipment | 38,047 | |||
Identifiable intangible assets | 3,340,000 | |||
|
| |||
Total assets | 3,865,225 | |||
Liabilities | ||||
Total liabilities | 1,470,509 | |||
Noncontrolling interest | 7,687 | |||
|
| |||
Total identifiable net assets | 2,387,029 | |||
|
| |||
Goodwill arising from acquisition | $ | 1,880,625 | ||
|
| |||
Following are the details of the purchase price allocated to the intangible assets acquired:
| (in thousands) | Amount | Weighted Average Useful Life | ||||||
Client relationships | $ | 1,860,000 | 15 years | |||||
Tradename | 1,480,000 | Indefinite | ||||||
|
| |||||||
Total identifiable intangible assets | $ | 3,340,000 | ||||||
|
| |||||||
None of the goodwill is expected to be deductible for tax purposes.
During the period from July 26, 2014 to December 31, 2014 (Successor) and period from January 1, 2014 to July 25, 2014 (Predecessor), the Company incurred transaction related costs of
F-25
Table of Contents
ADVANTAGE SOLUTIONS INC.
NOTES TO CONSOLIDATED FINANCIAL STATEMENTS
$12.3 million and $47.8 million, respectively. These costs have been expensed by the Company as such expenses directly and indirectly benefited the Company. These costs have been included in “Selling, general, and administrative expenses” in the Consolidated Statement of Comprehensive Income (Loss). These transaction costs were comprised of the following:
| Successor | Predecessor | |||||||||||||||
| Period from July 26, 2014 to December 31, 2014 | Period from January 1, 2014 to July 25, 2014 | |||||||||||||||
| (in thousands) | ||||||||||||||||
Financial advisory, accounting and tax | $ | 4,008 | $ | 23,487 | ||||||||||||
Legal | 7,112 | 3,476 | ||||||||||||||
Other consulting | 1,228 | 20,854 | ||||||||||||||
|
|
|
| |||||||||||||
Total transaction related costs | $ | 12,348 | $ | 47,817 | ||||||||||||
|
|
|
| |||||||||||||
Sunflower Group
In August 2014, the Company acquired the Sunflower Group (“Sunflower”), a promotional services firm that builds brand awareness and sales through targeted product sampling and high-impact promotional vehicles, for an aggregate purchase price of $60.3 million of which $26.5 million was paid in cash, $33.1 million was recorded as contingent consideration, and $0.7 million was recorded as holdbacks. The contingent payment of $33.1 million was determined based on future financial performance (as defined in the applicable purchase agreement) and recorded at fair value. The goodwill related to the Sunflower acquisition represented the value paid for the assembled workforce, geographic presence and expertise. None of this goodwill is deductible for tax purposes. The identifiable intangible assets are being amortized on a straight-line basis over their estimated useful lives. The fair value of the identifiable assets and liabilities of Sunflower, at the acquisition date, are as follows:
| (in thousands) | ||||
Consideration: | ||||
Cash | $ | 26,450 | ||
Holdbacks | 743 | |||
Fair value of contingent consideration | 33,088 | |||
|
| |||
Total consideration | $ | 60,281 | ||
|
| |||
Recognized amounts of identifiable assets acquired and liabilities assumed: | ||||
Assets | ||||
Other assets | $ | 15,801 | ||
Property and equipment | 864 | |||
Identifiable intangible assets | 44,493 | |||
|
| |||
Total assets | 61,158 | |||
Liabilities | ||||
Total liabilities | 11,797 | |||
|
| |||
Total identifiable net assets | 49,361 | |||
|
| |||
Goodwill arising from acquisition | $ | 10,920 | ||
|
| |||
F-26
Table of Contents
ADVANTAGE SOLUTIONS INC.
NOTES TO CONSOLIDATED FINANCIAL STATEMENTS
Following are the details of the purchase price allocated to the intangible assets acquired:
| Amount | Weighted Average Useful Life | |||||||
| (in thousands) | ||||||||
Client relationships | $ | 22,964 | 15 years | |||||
Tradename | 21,529 | 5 years | ||||||
|
| |||||||
Total identifiable intangible assets | $ | 44,493 | ||||||
|
| |||||||
The operating results of Sunflower contributed total revenues of $28.1 million and zero in the periods from July 26, 2014 to December 31, 2014 (Successor) and January 1, 2014 to July 25, 2014 (Predecessor), respectively. The Company has determined that the presentation of net income from the date of acquisition is impracticable due to the integration of the operations upon acquisition.
The Company has reassessed the fair value of contingent consideration related to the Sunflower acquisition, noting that as of December 31, 2015, expected revenues related to specific new clients, which were anticipated to contribute to measurement period revenues, were no longer achievable. This reassessment resulted in a fair value adjustment of a $33.1 million gain which is included in “Selling, general, and administrative expenses” in the Consolidated Statements of Comprehensive Income (Loss) during the year ended December 31, 2015.
Other 2014 Acquisitions
In addition to the 2014 Topco Acquisition and Sunflower acquisition noted above, the Company completed two and seven business acquisitions during the period from July 26, 2014 to December 31, 2014 (Successor) and period from January 1, 2014 to July 25, 2014 (Predecessor), respectively. During the period from July 26, 2014 to December 31, 2014 (Successor), the Company acquired a sales agency and a marketing agency. Business acquisitions during the period from January 1, 2014 to July 25, 2014 (Predecessor) included two marketing agencies and six sales brokerage agencies.
The aggregate purchase price for the remaining acquisitions was $124.9 million of which $80.1 million was paid in cash, $35.1 million was recorded as contingent consideration and $9.7 million was recorded as holdbacks. The goodwill related to the acquisitions represented the value paid for the assembled workforce, geographic presence and expertise; $37.6 million of this goodwill is deductible for tax purposes. The identifiable intangible assets are being amortized on a straight-line basis over their estimated useful lives.
F-27
Table of Contents
ADVANTAGE SOLUTIONS INC.
NOTES TO CONSOLIDATED FINANCIAL STATEMENTS
The fair value of the identifiable assets and liabilities of the 2014 acquisitions other than the 2014 Topco Acquisition and Sunflower acquisition noted above, at the respective acquisition dates, are as follows:
| (in thousands) | ||||
Consideration: | ||||
Cash | $ | 80,059 | ||
Fair value of contingent consideration | 35,111 | |||
Holdbacks | 9,693 | |||
|
| |||
Total consideration | $ | 124,863 | ||
|
| |||
Recognized amounts of identifiable assets acquired and liabilities assumed: | ||||
Assets | ||||
Other assets | $ | 18,312 | ||
Property and equipment | 157 | |||
Identifiable intangible assets | 44,482 | |||
|
| |||
Total assets | 62,951 | |||
Liabilities | ||||
Total liabilities | 11,055 | |||
|
| |||
Total identifiable net assets | 51,896 | |||
|
| |||
Goodwill arising from acquisitions | $ | 72,967 | ||
|
| |||
Following are the details of the purchase price allocated to the intangible assets acquired;
| Amount | Weighted Average Useful Life | |||||||
| (in thousands) | ||||||||
Client relationships | $ | 39,196 | 15 years | |||||
Tradename | 4,444 | 5 years | ||||||
Non-compete covenants | 842 | 2 years | ||||||
|
| |||||||
Total identifiable intangible assets | $ | 44,482 | ||||||
|
| |||||||
Other than the 2014 Topco Acquisition and Sunflower acquisition noted above, the operating results of the acquisitions contributed total revenues of $58.4 million and $7.7 million in the periods ended from July 26, 2014 to December 31, 2014 (Successor) and January 1, 2014 to July 25, 2014 (Predecessor) respectively. The Company has determined that the presentation of net income from the date of acquisition, is impracticable due to the integration of the operations upon acquisition.
The acquisitions were accounted for under the acquisition method of accounting. As such, the purchase consideration for each acquired business was allocated to the acquired tangible and intangible assets and liabilities based upon their respective fair values.
F-28
Table of Contents
ADVANTAGE SOLUTIONS INC.
NOTES TO CONSOLIDATED FINANCIAL STATEMENTS
Supplemental Pro Forma Information (Unaudited)
Supplemental information on an unaudited pro forma basis, as if the acquisitions executed during the fiscal years ended December 31, 2016 and 2015, had been consummated as of the beginning of the comparative prior period, as follows:
| Year Ended December 31, 2016 | Year Ended December 31, 2015 | |||||||
| (in thousands, except per share data) | ||||||||
Total revenues | $ | 2,169,275 | $ | 2,045,557 | ||||
Net income attributable to stockholder of Advantage Solutions Inc. | $ | 38,102 | $ | 33,321 | ||||
Basic earnings per share | $ | 381,018 | $ | 333,206 | ||||
Diluted earnings per share | $ | 381,018 | $ | 333,206 | ||||
The unaudited pro forma supplemental information is based on estimates and assumptions which the Company believes are reasonable and reflects the pro forma impact of additional amortization related to the fair value of acquired intangible assets, the pro forma impact of acquisition costs which consisted of legal, advisory and due diligence fees and expenses, and the pro forma tax effect of the pro forma adjustments for the years ended December 31, 2016 and 2015. This supplemental pro forma information has been prepared for comparative purposes and does not purport to be indicative of what would have occurred had the acquisition been consummated during the periods for which pro forma information is presented.
4. Goodwill and Intangible Assets
Changes in goodwill for the years ended December 31, 2016 and 2015, are as follows:
| Sales | Marketing | Total | ||||||||||
| (in thousands) | ||||||||||||
Balance at December 31, 2014 | $ | 1,525,647 | $ | 380,879 | $ | 1,906,526 | ||||||
Acquisitions | 79,284 | 12,452 | 91,736 | |||||||||
Measurement period adjustments | 958 | (1,964 | ) | (1,006 | ) | |||||||
Foreign exchange translation effects | (270 | ) | — | (270 | ) | |||||||
|
|
|
|
|
| |||||||
Balance at December 31, 2015 | $ | 1,605,619 | $ | 391,367 | $ | 1,996,986 | ||||||
|
|
|
|
|
| |||||||
Acquisitions | 58,570 | 31,497 | 90,067 | |||||||||
Measurement period adjustments | 1,115 | (1,230 | ) | (115 | ) | |||||||
Foreign exchange translation effects | (4,594 | ) | — | (4,594 | ) | |||||||
|
|
|
|
|
| |||||||
Balance at December 31, 2016 | $ | 1,660,710 | $ | 421,634 | $ | 2,082,344 | ||||||
|
|
|
|
|
| |||||||
The excess of the purchase consideration over the fair value of the net tangible and identifiable intangible assets acquired was recorded as goodwill. The results of operations of each acquired business have been included in the Company’s consolidated financial statements from the date of each acquisition.
F-29
Table of Contents
ADVANTAGE SOLUTIONS INC.
NOTES TO CONSOLIDATED FINANCIAL STATEMENTS
The following tables set forth information for intangible assets:
| December 31, 2016 | ||||||||||||||||
| (in thousands) | Useful Life | Gross Carrying Value | Accumulated Amortization | Net Carrying Value | ||||||||||||
Finite-lived intangible assets: | ||||||||||||||||
Client relationships | 15 years | $ | 2,032,912 | $ | 317,223 | $ | 1,715,689 | |||||||||
Tradenames | 5 years | 28,881 | 11,702 | 17,179 | ||||||||||||
|
|
|
|
|
| |||||||||||
Total finite-lived intangible assets | 2,061,793 | 328,925 | 1,732,868 | |||||||||||||
|
|
|
|
|
| |||||||||||
Indefinite-lived intangible assets: | ||||||||||||||||
Tradenames | 1,480,000 | — | 1,480,000 | |||||||||||||
|
|
|
|
|
| |||||||||||
Total other intangible assets | $ | 3,541,793 | $ | 328,925 | $ | 3,212,868 | ||||||||||
|
|
|
|
|
| |||||||||||
| December 31, 2015 | ||||||||||||||||
| (in thousands) | Useful Life | Gross Carrying Value | Accumulated Amortization | Net Carrying Value | ||||||||||||
Finite-lived intangible assets: | ||||||||||||||||
Client relationships | 15 years | $ | 1,970,688 | $ | 184,435 | $ | 1,786,253 | |||||||||
Tradenames | 5 years | 25,987 | 6,400 | 19,587 | ||||||||||||
|
|
|
|
|
| |||||||||||
Total finite-lived intangible assets | 1,996,675 | 190,835 | 1,805,840 | |||||||||||||
|
|
|
|
|
| |||||||||||
Indefinite-lived intangible assets: | ||||||||||||||||
Tradenames | 1,480,000 | — | 1,480,000 | |||||||||||||
|
|
|
|
|
| |||||||||||
Total other intangible assets | $ | 3,476,675 | $ | 190,835 | $ | 3,285,840 | ||||||||||
|
|
|
|
|
| |||||||||||
Estimated future amortization expenses of the Company’s existing intangible assets are as follows
| (in thousands) | ||||
For the years ending December 31, | ||||
2017 | $ | 141,274 | ||
2018 | 141,274 | |||
2019 | 139,839 | |||
2020 | 136,413 | |||
2021 | 135,880 | |||
Thereafter | 1,038,188 | |||
|
| |||
Total amortization expense | $ | 1,732,868 | ||
|
| |||
The Company recorded all intangible assets at their respective fair values and assessed the useful lives of the assets. Client relationships were valued using the multi-period excess earnings method under the Income Approach. The value of client relationship are generally regarded as the estimated economic benefit derived from the incremental revenues and related cash flow as a direct result of the client relationships in place versus having to replicate them. Further, the Company evaluated the legal, regulatory, contractual, competitive, economic or other factors in determining the useful life. Tradenames were valued using the Relief-from-Royalty Method under the Income Approach. This method relies on the premise that, in lieu of ownership, a company would be willing to pay a royalty to obtain access to the use and benefits of the tradenames. The Company has
F-30
Table of Contents
ADVANTAGE SOLUTIONS INC.
NOTES TO CONSOLIDATED FINANCIAL STATEMENTS
considered its sales and marketing tradenames related to the 2014 Topco Acquisition to be indefinite, as there is no foreseeable limit on the period of time over which such tradenames are expected to contribute to the cash flows of the reporting entity. Further, the Company evaluated legal, regulatory, contractual, competitive, economic and other factors in determining the useful life.
In connection with the acquisitions during the years ended December 31, 2016 and 2015, the Company recorded intangible assets of $68.7 million and $79.7 million, respectively. Amortization expense included in the accompanying consolidated statements of comprehensive income for the years ended December 31, 2016, 2015, the period from July 26, 2014 to December 31, 2014 (Successor) and the period from January 1, 2014 to July 25, 2014 (Predecessor), was $138.5 million, $134.7 million, $56.2 million and $59.6 million, respectively.
5. Prepaid and Other Assets
Prepaid and other current assets consist of the following:
| December 31, | ||||||||
| (in thousands) | 2016 | 2015 | ||||||
Prepaid expenses | $ | 15,046 | $ | 15,198 | ||||
Miscellaneous receivables | 9,706 | 4,557 | ||||||
Inventory | 3,317 | 4,459 | ||||||
Market production costs | 2,651 | 2,903 | ||||||
Workers’ compensation receivables | 2,027 | 1,710 | ||||||
Insurance receivable | — | 3,564 | ||||||
Other current assets | 951 | 1,983 | ||||||
|
|
|
| |||||
Total prepaid expenses and other current assets | $ | 33,698 | $ | 34,374 | ||||
|
|
|
| |||||
6. Property and Equipment
Property and equipment consist of the following:
| December 31, | ||||||||
| (in thousands) | 2016 | 2015 | ||||||
Software | $ | 59,041 | $ | 39,663 | ||||
Computer hardware | 45,054 | 34,952 | ||||||
Leasehold improvements | 28,727 | 22,416 | ||||||
Furniture, fixtures and other | 11,464 | 10,142 | ||||||
Total property and equipment | 144,286 | 107,173 | ||||||
Less: accumulated depreciation | (72,419 | ) | (41,634 | ) | ||||
|
|
|
| |||||
Total property and equipment, net | $ | 71,867 | $ | 65,539 | ||||
|
|
|
| |||||
Depreciation expense was $31.8 million $29.9 million, $12.5 million, and $15.6 million related to property and equipment for the years ended December 31, 2016, 2015, the period from July 26, 2014 to December 31, 2014 (Successor) and period from January 1, 2014 to July 25, 2014 (Predecessor), respectively.
Included in computer hardware and other equipment are assets under capital leases recorded at $9.6 million and $9.5 million as of December 31, 2016 and 2015, respectively. Assets under capital
F-31
Table of Contents
ADVANTAGE SOLUTIONS INC.
NOTES TO CONSOLIDATED FINANCIAL STATEMENTS
lease had a net book value of $0.8 million and $2.7 million as of December 31, 2016 and 2015, respectively.
7. Other Liabilities
Other accrued expenses consist of the following:
| December 31, | ||||||||
| (in thousands) | 2016 | 2015 | ||||||
Contingent consideration | $ | 37,962 | $ | 42,078 | ||||
Accrued interest payable | 24,247 | 24,773 | ||||||
Accrued income taxes | 9,779 | 5,285 | ||||||
Client deposits | 9,945 | 11,927 | ||||||
Employee medical insurance reserve | 8,279 | 8,467 | ||||||
Interest rate swap and cap | 4,080 | 4,740 | ||||||
Holdbacks | 1,132 | 5,839 | ||||||
Insurance liability | — | 5,548 | ||||||
Other accrued expenses | 2,735 | 2,937 | ||||||
|
|
|
| |||||
Total other accrued expenses | $ | 98,159 | $ | 111,594 | ||||
|
|
|
| |||||
Other long-term liabilities consist of the following:
| December 31, | ||||||||
| (in thousands) | 2016 | 2015 | ||||||
Contingent consideration | $ | 38,022 | $ | 20,488 | ||||
Workers’ compensation insurance reserve | 20,525 | 19,648 | ||||||
Deferred rent | 10,086 | 3,059 | ||||||
Interest rate swap and cap | 4,406 | 5,406 | ||||||
Unfavorable leases | 3,116 | 1,785 | ||||||
Other long-term liabilities | 3,743 | 2,054 | ||||||
|
|
|
| |||||
Total other long-term liabilities | $ | 79,898 | $ | 52,440 | ||||
|
|
|
| |||||
Under the workers’ compensation programs, the estimated liability for claims incurred but unpaid at December 31, 2016 and 2015 was $32.9 million and $35.0 million, respectively. These amounts include reported claims as well as claims incurred but not reported. As of December 31, 2016, $12.4 million and $20.5 million of this liability was included in the “Accrued compensation and benefits” and “Other long-term liabilities” in the Consolidated Balance Sheets, respectively. As of December 31, 2015, $15.4 million and $19.6 million of this liability was included in the “Accrued compensation and benefits” and “Other long-term liabilities” in the Consolidated Balance Sheets, respectively. In connection with its deductible limits, the Company has standbyletters-of-credit as of December 31, 2016 and 2015 supporting the estimated unpaid claim liabilities in the amount of $43.4 million and $40.0 million, respectively.
Contingent Consideration
Each reporting period, the Company measures the fair value of its contingent liabilities by evaluating the significant unobservable inputs and probability weightings using Monte Carlo
F-32
Table of Contents
ADVANTAGE SOLUTIONS INC.
NOTES TO CONSOLIDATED FINANCIAL STATEMENTS
simulations. Any resulting decreases or increases in the fair value result in a corresponding gain or loss reported in “Selling, general, and administrative expenses” in the Consolidated Statements of Comprehensive Income (Loss). As of December 31, 2016, the maximum potential payment outcomes were $131.9 million. During the year ended December 31, 2016, the Company settled $2.0 million of contingent consideration liabilities in equity of Karman Topco.
The Company reassessed the fair value of contingent consideration related to the Sunflower acquisition, noting that as of December 31, 2015, expected revenues related to specific new clients, which were anticipated to contribute to measurement period revenues were no longer achievable. This reassessment resulted in a fair value adjustment of a $33.1 million gain which is included in “Selling, general, and administrative expenses” in the Consolidated Statements of Comprehensive Income (Loss). This gain was offset by a $7.6 million loss related to the contingent consideration associated with the 2013 acquisition of Eventus Marketing, Inc. On October 19, 2015 the Company amended the definition of earnings in the purchase agreement related to this acquisition to include a portion of revenues attributable to a specific client contract, which increased the fair value of the contingent consideration liability as of December 31, 2015.
The following table summarizes the changes in the carrying value of estimated contingent consideration liabilities:
| Successor | Predecessor | |||||||||||||||
| December 31, | July 25, | |||||||||||||||
| (in thousands) | 2016 | 2015 | 2014 | 2014 | ||||||||||||
Beginning of the period | $ | 62,566 | $ | 80,573 | $ | 34,360 | $ | 31,484 | ||||||||
Fair value of acquisitions | 48,694 | 32,683 | 48,336 | 19,864 | ||||||||||||
Payments | (38,604 | ) | (24,891 | ) | (2,123 | ) | (5,052 | ) | ||||||||
Changes in fair value | 3,336 | (25,577 | ) | — | (11,936 | ) | ||||||||||
Foreign exchange translation effects | (8 | ) | (222 | ) | — | — | ||||||||||
|
|
|
|
|
|
|
| |||||||||
End of the period | $ | 75,984 | $ | 62,566 | $ | 80,573 | $ | 34,360 | ||||||||
|
|
|
|
|
|
|
| |||||||||
8. Debt
| December 31, | ||||||||
| (in thousands) | 2016 | 2015 | ||||||
First lien term loan | $ | 1,965,512 | $ | 1,985,619 | ||||
Second lien term loan | 760,000 | 760,000 | ||||||
Revolving credit facility | 20,000 | — | ||||||
Notes payable and deferred obligations | 1,892 | 4,734 | ||||||
|
|
|
| |||||
| 2,747,404 | 2,750,353 | |||||||
Less: current portion | 41,047 | 23,420 | ||||||
Less: debt issuance costs | 54,671 | 66,575 | ||||||
|
|
|
| |||||
Long-term debt, net of current portion | $ | 2,651,686 | $ | 2,660,358 | ||||
|
|
|
| |||||
F-33
Table of Contents
ADVANTAGE SOLUTIONS INC.
NOTES TO CONSOLIDATED FINANCIAL STATEMENTS
On July 25, 2014, certain subsidiaries of the Company entered into the following credit facilities with different syndicates of lenders in connection with the 2014 Topco Acquisition:
| • | a first lien credit agreement (the “First Lien Credit Agreement”) that provided for: |
| • | a $200.0 million revolving line of credit (the “Revolving Credit Facility”), of which up to $75.0 million may be used for letters of credit, |
| • | a $1,800.0 million term loan facility (the “Initial First Lien Term Loans”), |
| • | commitments for an additional $60.0 million of unfunded delayed draw term loans (the “Delayed Draw Commitments”), and |
| • | uncommitted incremental revolving and first lien term loan facilities, subject to certain incurrence tests; and |
| • | a second lien credit agreement (the “Second Lien Credit Agreement”) that provided for: |
| • | a $760.0 million term loan facility (the “Second Lien Term Loans”), and |
| • | uncommitted incremental second lien term loan facilities, subject to certain incurrence tests. |
Borrower, Guarantors, and Collateral. Advantage Sales & Marketing Inc., a wholly owned indirect subsidiary of the Company, is the borrower under the credit facilities (the “Borrower”). Obligations under the credit facilities are guaranteed by Karman Intermediate Corp., the Borrower’s direct parent and a wholly owned, direct subsidiary of the Company, and by certain wholly owned, domestic material subsidiaries of the Borrower (collectively, the “Guarantors”). Obligations under the credit facilities are secured by a lien on substantially all of the property and assets of the Borrower and the Guarantors and which, in the case of the First Lien Credit Agreement, is a first-priority lien and, in the case of the Second Lien Credit Agreement, is a second-priority lien. Advantage Solutions Inc. not a party to the credit agreements, is not a Guarantor and has not granted any liens on any of its assets to secure the credit facilities.
Borrowings and Use of Proceeds. The Borrower incurred $1,800.0 million of Initial First Lien Term Loans and $760 million of Second Lien Term Loans in July 2014, and used the proceeds to finance the 2014 Topco Acquisition and to pay related fees and expenses. The Borrower incurred an aggregate of $60 million of additional first lien term loans under the Delayed Draw Commitments in September and November 2014, and used the proceeds to finance certain acquisitions and to pay related fees and expenses. The Borrower incurred $150 million of additional first lien term loans under the incremental facilities in April 2015 and used the proceeds to finance additional acquisitions, to pay related fees and expenses, to repay loans under the Revolving Credit Facility and for general corporate purposes. From time to time the Borrower has incurred and repaid loans under the Revolving Credit Facility, and those borrowings generally are used for working capital purposes, including to fund acquisitions. The Borrower also uses the Revolving Credit Facility to maintain various letters of credit.
Maturity. The Revolving Credit Facility matures on July 25, 2019. The Initial First Lien Term Loans, the first lien term loans funded under the Delayed Draw Commitments and the first lien term loans funded under the incremental facilities (collectively, the “First Lien Term Loans”) mature on July 23, 2021. The Second Lien Term Loans mature on July 25, 2022.
Amortization. The First Lien Term Loans amortize at a rate that approximates 1.0% per annum of the principal amount of First Lien Term Loans borrowed, and amortization payments are due quarterly on the last business day of each fiscal quarter. In the years ended December 31, 2016 and
F-34
Table of Contents
ADVANTAGE SOLUTIONS INC.
NOTES TO CONSOLIDATED FINANCIAL STATEMENTS
2015, the Borrower paid $20.1 million and $19.7 million, respectively, of principal on the First Lien Term Loans. As of December 31, 2016, the amortization payments were $5.0 million per quarter. The Second Lien Term Loans do not amortize.
Prepayments. The following mandatory prepayments of First Lien Term Loans are required:
| • | Excess Cash Flow—the Borrower must prepay First Lien Term Loans with 50% of its “Excess Cash Flow” (as defined in the First Lien Credit Agreement) in excess of $20.0 million (net of certain voluntary prepayments of debt) for each fiscal year commencing with the year ended December 31, 2015. Payment is due annually at approximately the time when the Borrower is required to deliver its audited financial statements for the prior fiscal year. The percentage of Excess Cash Flow that must be applied to prepay loans declines to 25.0% or 0.0% if the Borrower achieves a first lien net leverage ratio of 4.50:1.00 or 3.75:1.00, respectively, for the applicable fiscal year. |
| • | Asset Sales and Casualty Events—the Borrower must prepay First Lien Term Loans with 100% of the “Net Cash Proceeds” (as defined in the First Lien Credit Agreement) from certain types ofnon-ordinary course asset sales, insurance proceeds or condemnation awards. However, in lieu of making the mandatory prepayment, the Borrower has the option to reinvest Net Cash Proceeds in other assets within 12 months of receipt of the proceeds or, if a commitment to reinvest such proceeds is made within such12-month period, within 180 days after such12-month period. |
| • | Other Debt—the Borrower must prepay First Lien Term Loans with the proceeds of debt that otherwise is not permitted to be incurred under the First Lien Credit Agreement. |
The Borrower also may make voluntary prepayments of First Lien Term Loans at any time without penalty or premium. In 2016, the Borrower was not required to make any Excess Cash Flow payment for the year ended December 31, 2015, and the Borrower did not make any other mandatory or voluntary prepayments of First Lien Term Loans for the years ended December 31, 2016 or 2015.
The Second Lien Credit Agreement includes comparable mandatory prepayment provisions, but they do not have effect prior to the date that the First Lien Credit Agreement is terminated. The Borrower may make voluntary prepayments of the Second Lien Term Loans at any time without penalty or premium, as the original call protection in the Second Lien Credit Agreement is no longer applicable. However the First Lien Credit Agreement restricts the Borrower’s ability to prepay the Second Lien Term Loans. The Borrower did not make any prepayments of the Second Lien Term Loans in the years ended December 31, 2016 or 2015.
Interest and Fees. Interest on the credit facilities accrues at a floating rate. For each borrowing and interest period, the Borrower has the right to choose either a base rate or eurodollar rate of interest. The base rate is, as of any date, the highest of (a) the federal funds rate plus 0.5%, (b) Bank of America’s “prime rate” and (c) the eurodollar rate for an interest period of one month plus 1.00%. The eurodollar rate is, for a specified interest period of one, two, three, six, or 12 months, the rate equal to the ICE LIBOR Rate determined two business days prior to the start of the applicable interest period, further adjusted for statutory reserves. The base rate and eurodollar rate for term loans are each subject to a “floor” of 2.00% and 1.00%, respectively. Base rate interest is payable at the end of each quarter, and eurodollar rate interest is payable at the end of the applicable interest period or, if more than three months, every three months. If a eurodollar rate loan is prepaid or converted to base rate prior to the end of the applicable interest period, the Borrower may be liable for customary
F-35
Table of Contents
ADVANTAGE SOLUTIONS INC.
NOTES TO CONSOLIDATED FINANCIAL STATEMENTS
“breakage” costs. Both base rate loans and eurodollar rate loans accrue interest at the applicable rate plus a margin, as follows:
| • | for the Revolving Credit Facility, there is a pricing grid based on first lien net leverage where the base rate margins range between 2.25% to 1.75% and the eurodollar rate margins range between 3.25% and 2.75%, with the margin determined based on whether the Borrower is above or below a leverage ratio of 4.50:1.00 or 4.00:1.00; |
| • | for First Lien Term Loans, the base rate margin is 2.25% and the eurodollar rate margin is 3.25%; and |
| • | for Second Lien Term Loans, the base rate margin is 5.50% and the eurodollar rate margin is 6.50%. |
The Borrower generally elects the eurodollar rate. In both 2016 and 2015, the effective total interest rate on the First Lien Term Loans was 4.25% per annum, and the effective total interest rate on the Second Lien Term Loans was 7.50% per annum.
The Revolving Credit Facility accrues a commitment fee for unfunded commitments, calculated based on daily unused commitments and payable quarterly, at a rate of 0.50% per annum or, if the Borrower achieves a first lien net leverage ratio equal to or below 4.50:1.00 for the applicable quarter, 0.375% per annum. Outstanding letters of credit accrue a fee, calculated based on daily outstandings and payable quarterly, equal to the eurodollar rate margin applicable to the Revolving Credit Facility times the face value of outstanding undrawn letters of credit. The Borrower also pays customary “fronting fees” upon the issuance of letters of credit. As of December 31, 2016 and 2015, the Borrower had $20.0 million and $0, respectively, of loans outstanding under the Revolving Credit Facility and $43.4 million and $40.0 million, respectively, of undrawn letters of credit outstanding under the Revolver.
Covenants. The Revolving Credit Facility has a “springing” financial maintenance covenant. If, at the end of any fiscal quarter, the Borrower has used more than 30% of the Revolving Credit Facility commitments (excluding letters of credit), then the Borrower must demonstrate that its first lien net leverage ratio is equal to or less than 8.25:1.00 for the twelve-month period ended as of such fiscal quarter. If the financial covenant is required to be tested and cannot be met, the Borrower has a customary right to “cure” the default with the proceeds of a specified capital contribution (if made available to the Borrower by its parent entity or that entity’s equityholders), which is treated as EBITDA for purposes of demonstrating compliance with the financial covenant. The Borrower was in compliance with the financial covenant as of December 31, 2016 and 2015.
The First Lien Credit Agreement and Second Lien Credit Agreement also contain customary affirmative and negative covenants. These covenants restrict the ability of the Borrower, the Guarantors and their subsidiaries to incur debt, permit liens on pledged assets, make investments, make distributions to equity holders, prepay junior debt, engage in mergers or restructurings, and sell assets, among other things. These covenants are subject to a number of exceptions. Importantly, the credit agreements restrict the ability of the Company, the Guarantors and their Subsidiaries (which collectively constitute substantially all of the operating business of the Company) to make distributions of cash or assets to the Company’s parent entity. However, these covenants are subject to a number of exceptions, including an exception that permits unlimited distributions if the Borrower’s senior secured net leverage ratio is equal to or less than 6.00:1.00. As of December 31, 2016 and 2015, the Borrower did not meet such leverage ratio.
F-36
Table of Contents
ADVANTAGE SOLUTIONS INC.
NOTES TO CONSOLIDATED FINANCIAL STATEMENTS
As of December 31, 2016 and 2015, the Borrower was in compliance with the negative and affirmative covenants under the credit agreements.
Loss on Extinguishment of Debt. As a result of the 2014 Topco Acquisition financing, the Company recorded a loss on the extinguishment of debt consisting of awrite-off of unamortized debt issuance costs of $22.9 million. The loss on extinguishment is included in “Interest expense” in the Consolidated Statements of Comprehensive Income (Loss) during the period from January 1, 2014 to July 25, 2014 (Predecessor).
Notes Payable and Deferred Obligations Payable to Former Members, Owners, Employees and Related Parties
The deferred obligations arose in connection with business combinations occurring before 2004. The obligations have varying terms and stated interest rates, and are either expressly subordinated or unsecured and thus junior to the Company’s credit facilities. The Company applied an imputed rate of 12.0% to the subordinated notes payable at the origination date of each obligation. Certain of the notes are collateralized by the assets of the Company and are payable in installments of principal and interest on a monthly, quarterly and annual basis.
In conjunction with certain acquisitions, the Company acquired various promissory notes, deferred obligations and capital leases. The obligations have varying terms and stated interest rates. Certain of the notes are collateralized by the assets of the Company and are payable in installments of principal and interest on a monthly, quarterly and semi-annual basis.
Fees related to the issuance or refinancing of long-term debt are generally capitalized and amortized over the term of the debt using the effective interest rate method. The amortization of deferred debt issuance costs is included in “Interest expense, net,” in the Consolidated Statement of Comprehensive Income (Loss), and amounted to $11.8 million, $11.8 million, $5.0 million and $3.9 million for the year ended December 31, 2016, 2015, period from July 26, 2014 to December 31, 2014 (Successor) and period from January 1, 2014 to July 25, 2014 (Predecessor), respectively. As of December 31, 2016, “Long-term debt” in the Consolidated Balance Sheets included debt issuance costs of $83.2 million less accumulated amortization of $28.5 million. As of December 31, 2015, “Long-term debt” in the Consolidated Balance Sheets included debt issuance costs of $83.2 million less accumulated amortization of $16.7 million.
Future minimum principal payments on long-term debt are as follows:
| (in thousands) | ||||
For the fiscal years ending December 31, | ||||
2017 | $ | 41,047 | ||
2018 | 20,384 | |||
2019 | 20,233 | |||
2020 | 20,235 | |||
2021 | 1,885,116 | |||
Thereafter | 760,389 | |||
|
| |||
Total minimum principal payments | $ | 2,747,404 | ||
|
| |||
F-37
Table of Contents
ADVANTAGE SOLUTIONS INC.
NOTES TO CONSOLIDATED FINANCIAL STATEMENTS
9. Fair Value of Financial Instruments
The Company measures fair value based on the prices that would be received to sell an asset or paid to transfer a liability in an orderly transaction between market participants at the measurement date. Fair value measurements are based on a three-tier hierarchy that prioritizes the inputs used to measure fair value. These tiers include: Level 1, defined as observable inputs such as quoted prices in active markets; Level 2, defined as inputs other than quoted prices in active markets that are either directly or indirectly observable; and Level 3, defined as unobservable inputs for which little or no market data exists, therefore requiring an entity to develop its own assumptions.
As of December 31, 2016 and 2015, the Company’s interest rate derivatives and forward contracts are Level 2 liabilities with the related fair values based on third-party pricing service models. These models use discounted cash flows that utilize market-based forward swap curves commensurate with the terms of the underlying instruments.
As of December 31, 2016 and 2015, the contingent consideration liabilities are Level 3 liabilities with the related fair values based on the significant unobservable inputs and probability weightings in using the income approach. The following table sets forth the Company’s financial liabilities measured on a recurring basis at fair value, categorized by input level within the fair value hierarchy.
| December 31, 2016 | ||||||||||||||||
| (in thousands) | Fair Value | Level 1 | Level 2 | Level 3 | ||||||||||||
Assets measured at fair value | ||||||||||||||||
Cash and cash equivalents | $ | 40,268 | $ | 40,268 | $ | — | $ | — | ||||||||
|
|
|
|
|
|
|
| |||||||||
Total assets measured at fair value | $ | 40,268 | $ | 40,268 | $ | — | $ | — | ||||||||
|
|
|
|
|
|
|
| |||||||||
Liabilities measured at fair value | ||||||||||||||||
Derivative financial instruments | $ | 8,486 | $ | — | $ | 8,486 | $ | — | ||||||||
Contingent consideration | 75,984 | — | — | 75,984 | ||||||||||||
|
|
|
|
|
|
|
| |||||||||
Total liabilities measured at fair value | $ | 84,470 | $ | — | $ | 8,486 | $ | 75,984 | ||||||||
|
|
|
|
|
|
|
| |||||||||
| December 31, 2015 | ||||||||||||||||
| (in thousands) | Fair Value | Level 1 | Level 2 | Level 3 | ||||||||||||
Assets measured at fair value | ||||||||||||||||
Cash and cash equivalents | $ | 70,563 | $ | 70,563 | $ | — | $ | — | ||||||||
|
|
|
|
|
|
|
| |||||||||
Total assets measured at fair value | $ | 70,563 | $ | 70,563 | $ | — | $ | — | ||||||||
|
|
|
|
|
|
|
| |||||||||
Liabilities measured at fair value | ||||||||||||||||
Derivative financial instruments | $ | 10,146 | $ | — | $ | 10,146 | $ | — | ||||||||
Contingent consideration | 62,566 | — | — | 62,566 | ||||||||||||
|
|
|
|
|
|
|
| |||||||||
Total liabilities measured at fair value | $ | 72,712 | $ | — | $ | 10,146 | $ | 62,566 | ||||||||
|
|
|
|
|
|
|
| |||||||||
As of December 31, 2016, the Company had no outstanding interest rate swap contracts. As of December 31, 2015, the Company had one outstanding interest rate swap contract with notional amount of $100.0 million and a maturity date of June 30, 2016. The Company also had three outstanding interest rate cap contracts with notional amounts of $850.0 million, $650.0 million and $200.0 million, all which mature on April 23, 2019. The aggregate fair value of the Company’s outstanding interest rate swaps and interest rate caps at December 31, 2016 and 2015 represented an
F-38
Table of Contents
ADVANTAGE SOLUTIONS INC.
NOTES TO CONSOLIDATED FINANCIAL STATEMENTS
outstanding net liability of $8.5 million and $10.1 million, respectively. As of December 31, 2016, $4.1 million and $4.4 million of the Company’s fair value of outstanding interest rate caps were included in “Other current liabilities” and “Other long-term liabilities” in the Consolidated Balance Sheets, respectively, with changes in fair value recognized as a component of “Interest expense, net” in the accompanying Consolidated Statements of Comprehensive Income (Loss). As of December 31, 2015, $4.7 million and $5.4 million of the Company’s fair value of outstanding interest rate swaps and interest rate caps were included in “Other current liabilities” and “Other long-term liabilities” in the Consolidated Balance Sheets, respectively, with changes in fair value recognized as a component of “Interest expense, net” in the accompanying Consolidated Statements of Comprehensive Income (Loss). During the years ended December 31, 2016, 2015, the period from July 26, 2014 to December 31, 2014 (Successor) and period from January 1, 2014 to July 25, 2014 (Predecessor), the Company recorded interest expense in the amount of $2.8 million, interest income of $5.8 million, interest expense of $15.7 million and interest income of $2.5 million, related to changes in the fair value of its derivative instruments, respectively.
As of December 31, 2016, the Company had four open Euro forward contracts to hedge foreign currency exposure on€3.5 million,€3.0 million,€0.5 million and€0.1 million, with maturities of September 1, 2017, October 2, 2017, October 2, 2017 and October 2, 2017, respectively. As of December 31, 2015, the Company had two open Euro forward contracts to hedge foreign currency exposure on€3.5 million and€3.2 million, with maturities of September 30, 2016 and October 31, 2016, respectively.
During the years ended December 31, 2016 and 2015, the period from July 26, 2014 to December 31, 2014 (Successor) and the period from January 1, 2014 to July 25, 2014 (Predecessor), the Company recorded losses of $0.2 million, $0.5 million, $0.2 million and zero, respectively, related to changes in fair value of the forward contracts as a component of “Selling, general, and administrative expenses” in the Consolidated Statements of Comprehensive Income (Loss).
The Company estimates the fair value of the contingent consideration liabilities by employing Monte Carlo simulations to estimate the volatility and systematic relative risk of revenues subject to sales milestone payments and discounting the associated cash payment amounts to their present values using a credit-risk-adjusted interest rate. The unobservable inputs to the valuation models that have the most significant effect on the fair value of the Company’s contingent consideration liabilities are the probabilities that certain operating results will be achieved. Fair value changes are included in “Selling, general, and administrative expenses” in the Consolidated Statement of Comprehensive Income (Loss). During the years ended December 31, 2016 and 2015, the period from July 26, 2014 to December 31, 2014 and the period from January 1, 2014 to July 25, 2014, the Company recorded losses in the amount of $3.3 million, gains of $25.6 million, zero and $12.0 million, respectively.
During the years ended December 31, 2016 and 2015, there were no transfers between Level 1 and Level 2 fair value measurements. For a reconciliation of fair value measurements of Level 3 financial instruments, refer to Note 7,Other Liabilities, to our “Notes to Consolidated Financial Statements, for a summary of change in the carrying value of estimated contingent consideration liabilities.
F-39
Table of Contents
ADVANTAGE SOLUTIONS INC.
NOTES TO CONSOLIDATED FINANCIAL STATEMENTS
The following table sets forth the carrying values and fair values of the Company’s financial liabilities measured on a nonrecurring basis, categorized by input level within the fair value hierarchy:
| (in thousands) | Carrying Value | Fair Value (Level 2) | ||||||
Balance at December 31, 2016 | ||||||||
First lien term loan | $ | 1,965,512 | $ | 1,857,497 | ||||
Second lien term loan | 760,000 | 720,045 | ||||||
Revolving credit facility | 20,000 | 20,000 | ||||||
Notes payable and deferred obligations | 1,892 | 1,847 | ||||||
|
|
|
| |||||
Total long-term debt | $ | 2,747,404 | $ | 2,599,389 | ||||
|
|
|
| |||||
| Carrying Value | Fair Value (Level 2) | |||||||
Balance at December 31, 2015 | ||||||||
First lien term loan | $ | 1,985,619 | $ | 1,609,659 | ||||
Second lien term loan | 760,000 | 615,653 | ||||||
Notes payable and deferred obligations | 4,734 | 4,425 | ||||||
|
|
|
| |||||
Total long-term debt | $ | 2,750,353 | $ | 2,229,737 | ||||
|
|
|
| |||||
10. Variable Interest Entities and Investments
Variable Interest Entities
The Company possesses a variable interest in an event planning company to plan the execution ofin-store demonstrations in conjunction with another company. The Company has no equity interest in the entity but is entitled to 50% of its profits and losses as determined by the applicable governing agreement. The Company’s maximum exposure to loss is limited to the unpaid portion of its 50% residual interest in the entity. The Company neither has the power to direct the activities that most significantly impact the economic performance of the entity nor does it absorb a majority of the entity’s expected losses. Therefore, the Company does not consider itself to be the primary beneficiary and, accordingly, does not consolidate the entity. The Company accounts for its investment under the cost method. Under the cost method, the Company records its investment at its carrying value and assesses the recoverability of the carrying value using the other than temporary impairment model.
The Company recorded its proportionate share of the entity’s net loss of $1.2 million and $0.4 million for the years ended December 31, 2016 and 2015, respectively, and net income of $1.0 million and $0.4 million, for the period from July 26, 2014 to December 31, 2014 and the period from January 1, 2014 to July 25, 2014, respectively.
Investments in Unconsolidated Affiliates
On March 31, 2015, the Company acquired the REL Companies, a full service field marketing agency in the United Kingdom for $45.6 million. The Company accounted for the acquisition as a business combination. On June 15, 2015, the Company completed the following transactions:
| (i) | sold anon-controlling 49.9% interest in the holding company of the REL Companies to Partnership SPV 1 Limited (“SPV”) for $23.9 million, and renamed such holding company Advantage Smollan Limited; |
F-40
Table of Contents
ADVANTAGE SOLUTIONS INC.
NOTES TO CONSOLIDATED FINANCIAL STATEMENTS
| (ii) | purchased a 12.5% of SPV’s equity for $3.0 million; and |
| (iii) | purchased 25% of Global Smollan Holdings (“GSH”) (the controlling interest holder of SPV), and 25% of Smollan Holdings Proprietary Limited (“SHPL”) for $75 million in the aggregate. |
The Company has determined that it has a controlling financial interest in Advantage Smollan Limited and therefore has included the assets, liabilities and any noncontrolling interests of Advantage Smollan Limited in the consolidated financial statements. As the Company has the ability to exercise influence in operating and financial decisions, through its voting interest on the Board of Directors of GSH, SPV and SHPL, it has recorded the investments using the equity method of accounting.
On March 25, 2014, the Company acquired 19.9% of the outstanding common shares of Ceuta Holdings Limited, a company incorporated in England and Wales (“Ceuta”), for $11.0 million. The Company accounts for its investment using the equity method which is included in “Other assets” on the Consolidated Balance Sheets. The Company adjusts the carrying amount of its investment by the proportional share of Ceuta’s earnings or losses and reduces its investments for any cash distributions received. On November 15, 2015, the Company reduced its interest in Ceuta from 19.9% to 8.8% in exchange for $6.1 million. The Company has the ability to exercise influence in operating and financial decisions, through its representation on the Ceuta Board of Directors, and therefore, continues to account for its investment using the equity method. There was no gain or loss recognized as a result of the divestiture.
Income from the Company’s equity method investments, included in “Cost of revenues” in the Consolidated Statement of Comprehensive Income (Loss), was $1.6 million, $0.8 million and $0.1 million during the years ended December 31, 2016 and 2015 and the period from July 26, 2014 to December 31, 2014, respectively. The Company’s proportionate share in their net assets at December 31, 2016 and 2015 was $84.7 million and $83.2 million, respectively. The Company’s equity method investments are not material to the Company’s results of operations or financial position; therefore, summarized financial information is not required to be presented.
11. Equity-Based Compensation
Successor
The limited partnership agreement of Karman Topco (the “Successor Plan”) allows profits interests in Karman Topco to be granted to directors, officers and employees of Karman Topco, and its subsidiaries. The performance-based profits interests (“Common Series C Units”) are subject to certain vesting requirements, as described below.
Additionally, during the Successor period ended December 31, 2014, Karman Topco issued 30,000 time-vesting profits interests (“Common Series D Units”) to entities affiliated with one equity sponsor of Karman Topco. Time-vesting profits interests vest on a monthly basis beginning on October 1, 2014 and end on September 1, 2019. The compensation expense associated with the issuance of such awards fornon-employees is recorded by the Company as the Company receives the benefit of the services being provided by thenon-employees.
Common Series C Units
During the years ended December 31, 2016 and 2015 and the period from July 26, 2014 to December 31, 2014, 40,352, 8,560 and 88,398 Common Series C Units, respectively, were granted at
F-41
Table of Contents
ADVANTAGE SOLUTIONS INC.
NOTES TO CONSOLIDATED FINANCIAL STATEMENTS
no cost to employees of the Company. Seventy-five percent of the Common Series C Units (the “Performance Vesting Units”) are subject to certain vesting requirements, including performance requirements based either on the achievement of specific annual or cumulative thresholds substantially similar to Adjusted EBITDA or on the occurrence of a vesting exit event. For the Performance Vesting Units, a vesting exit event means the earlier to occur of (i) a sale of (a) 50% of more of the outstanding equity units of Karman Topco held by the equity funds affiliated with or advised by each of CVC Capital Partners, and Leonard Green & Partners or (b) substantially all of the assets of Karman Topco and its subsidiaries, in each case that is approved by Karman Topco’s board of directors (each, an “Approved Partnership Sale”), or (ii) a public offering that results in the sale of at least 30% of the equity securities of Karman Topco or any of its subsidiaries that are held by the equity funds affiliated with or advised by each of CVC Capital Partners and Leonard Green & Partners,(a “Qualified Public Offering”), provided that, at the time of such event, the pre-tax internal rate of return to the Common Series A Limited Partners is at least 8% compounded annually with respect to the Common Series A Units held by them, based on cash proceeds received or, in respect of a sale of Karman Topco or a sale of substantially all of its assets, available to be received by them pursuant to the definitive agreement relating thereto, and after giving effect to the vesting of the Common Series C Units in accordance with the terms of any Restricted Unit Agreement and the vesting of the Common Series D Units. The remaining 25% of the awards (the “20% IRR Vesting Units”) vest upon the earlier of an Approved Partnership Sale or a Qualified Public Offering, provided that, at the time of such event, the Common Series A Limited Partners of Karman Topco realize a pre-tax internal rate of return of 20% compounded annually, with respect to the Common Series A Units of Karman Topco held by them. However, each of the Common Series C Unit awards (whether Performance Vesting Units or 20% IRR Units, vested or unvested) is subject to forfeiture upon an Approved Partnership Sale or a Qualified Public Offering in which the requisite minimum pre-tax annual rate of return applicable to those units is not achieved.
An option pricing model was used to estimate the Common Series C Units’ fair value with a weighted average grant date fair value of $332, $337 and $275, during the years ended December 31, 2016, 2015 and the period from July 26, 2014 to December 31, 2014, respectively. The expected share price volatility is based on the average of the historical volatility of comparable public companies. The risk-free rate is based on U.S. Treasury yields in effect at the time of grant over the expected term. The Company did not use a dividend yield as it has not historically paid distributions.
The following weighted average assumptions were used in determining the fair value of Common Series C Unit grants made during the years ended December 31, 2016 and 2015 and the period from July 26, 2014 to December 31, 2014, respectively:
| Year Ended December 31, 2016 | Year Ended December 31, 2015 | Period from July 26, 2014 to December 31, 2014 | ||||||||||
Dividend yield | 0.0% | 0.0% | 0.0% | |||||||||
Expected volatility | 43.2% | 49.6% | 48.7% | |||||||||
Risk-free interest rate | 1.0% | 1.3% | 1.7% | |||||||||
Lack of marketability discount | 29.4% | 30.3% | 30.5% | |||||||||
Expected term (years) | 3.0 | 4.0 | 5.0 | |||||||||
F-42
Table of Contents
ADVANTAGE SOLUTIONS INC.
NOTES TO CONSOLIDATED FINANCIAL STATEMENTS
Repurchases of Common Series C Units are in exchange for contingent promissory notes, bearing a market rate of interest, issued by Karman Topco which would be due and payable upon a vesting exit event. The following table summarizes the activity in the Common Series C units:
| Successor | Predecessor | |||||||||||||||
| Year Ended December 31, 2016 | Year Ended December 31, 2015 | Period From July 26, 2014 to December 31, 2014 | Period From January 1, 2014 to July 25, 2014 | |||||||||||||
Beginning of the period | 90,624 | 88,398 | — | 51,574 | ||||||||||||
Grants | 40,352 | 8,560 | 88,398 | 9,720 | ||||||||||||
Forfeitures | (3,981 | ) | (5,148 | ) | — | (145 | ) | |||||||||
Repurchases | (322 | ) | (1,186 | ) | — | (61,149 | ) | |||||||||
|
|
|
|
|
|
|
| |||||||||
End of the period | 126,673 | 90,624 | 88,398 | — | ||||||||||||
|
|
|
|
|
|
|
| |||||||||
No compensation expense has been recorded in the years ended December 31, 2016 and 2015 and the period from July 26, 2014 to December 31, 2014 since a vesting exit event is not yet deemed probable of occurring. If a vesting exit event becomes probable, the Company would have compensation expense of $50.5 million for the year ended December 31, 2016.
Common Series D Units
The Company measures the fair value of the Common Series D Units monthly throughout thefive-year vesting period and recognizes this cost ratably over the vesting period. During the period from July 26, 2014 to December 31, 2014, 30,000 units were granted at no cost to the recipients. There were no grants during the years ended December 31, 2016 and 2015. The OPM was used to estimate the Common Series D Units fair value of $300 as of the grant date. The expected share price volatility is based on the average of the historical volatility of comparable public companies. The risk-free rate is based on U.S. Treasury yields in effect at the time of grant over the expected term. The Company did not use a dividend yield as it has not historically paid distributions. The fair value of these units at the end of each measurement period were $515, $485 and $300 per unit as of December 31, 2016, 2015 and 2014. Since the Common Series D Units issued under the Successor Plan are for interests in Karman Topco, which is outside of the consolidated group, the value of the profits interests were marked to market at each of the Company’s reporting periods.
The following assumptions were used in determining the fair value for the periods ended December 31, 2016, 2015 and 2014:
| December 31, | ||||||||||||
| 2016 | 2015 | 2014 | ||||||||||
Dividend yield | 0.0 | % | 0.0 | % | 0.0 | % | ||||||
Expected volatility | 42.6 | % | 45.2 | % | 48.7 | % | ||||||
Risk-free interest rate | 1.5 | % | 1.5 | % | 1.7 | % | ||||||
Lack of marketability discount | 25.0 | % | 28.0 | % | 30.0 | % | ||||||
Expected term (years) | 3.0 | 4.0 | 5.0 | |||||||||
On December 31, 2016, there were 30,000 Common Series D Units outstanding. During the years ended December 31, 2016, 2015 and the period from July 26, 2014 to December 31, 2014,
F-43
Table of Contents
ADVANTAGE SOLUTIONS INC.
NOTES TO CONSOLIDATED FINANCIAL STATEMENTS
equity-based compensation expense included in “Selling, general, and administrative expenses” in the Consolidated Statement of Comprehensive Income (Loss), was $3.2 million, $3.1 million and $0.5 million, respectively. The remaining expense is $8.5 million with a remaining amortization period of 2.75 years as of December 31, 2016.
Predecessor
During the period from January 1, 2014 to July 2014, 9,720 profits interests (Predecessor) were granted at no costs to the recipients. The Predecessor’s limited partnership agreement and award agreements contained performance, market and service conditions required for vesting. A Monte Carlo simulation was used to estimate the Predecessor units’ fair value to be $700 per unit. The model used to determine the fair value for the units granted in June, October, November and December 2013 assumed a vesting period of 1.1 years, a risk free rate of 0.2%, a volatility rate of 50.0%, and a 23.0% discount for lack of marketability. The volatility and marketability rate assumptions were based on historical averages for comparable companies. As of the result of the 2014 Topco Acquisition, all performance units (Predecessor) vested as of July 25, 2014 and the predecessor Company recognizedequity-based compensation expense of $51.6 million included in “Selling, general, and administrative expenses” in the Consolidated Statements of Comprehensive Income (Loss).
12. Employee Benefit Plans
The Company sponsors 401(k) plans for certain employees who meet specified age and length of service requirements. The 401(k) plans include a deferral feature under which employees may elect to defer a portion of their salary, subject to Internal Revenue Service limitations. The Company provides a matching contribution of up to 50% of the first 6% of salaries contributed by participating employees. Total contributions to the plan for the years ended December 31, 2016, 2015, the period from July 26, 2014 to December 31, 2014 (Successor) and the period from January 1, 2014 to July 25, 2014 (Predecessor) were $6.9 million, $6.5 million, $2.4 million and $3.5 million, respectively.
13. Related Party Transactions
2014 Topco Acquisition Transaction Costs
As part of the 2014 Topco Acquisition, the Company paid transaction costs of $12.3 million to certain entities affiliated with or advised by CVC Capital Partners, Leonard Green & Partners, and Juggernaut Management, LLC which were recorded as “Selling, general, and administrative expenses” in the period from July 26, 2014 to December 31, 2014 (Successor). Additionally, Advantage Sales & Marketing Inc. paid $20.8 million in transaction costs to its previous private equity sponsor, Apax Partners, which were recorded in the period from January 1, 2014 to July 25, 2014 (Predecessor).
Management Fees
The Company incurred $4.0 million, $4.0 million and $1.7 million in management fees to certain entities affiliated with or advised by CVC Capital Partners, Leonard Green & Partners, and Juggernaut Management, LLC for the years ended December 31, 2016, 2015 and the period from July 26, 2014 to December 31, 2014 (Successor), respectively. During the period from July 26, 2014 to December 31, 2014 (Successor), 30,000 Common Series D Units of Karman Topco were issued to Centerview Capital, L.P. and Centerview Employees, L.P., which vest over a five-year term, ending in September 2019. Prior to the 2014 Topco Acquisition, Advantage Sales & Marketing Inc. paid $0.8 million in management fees to its previous private equity sponsor, Apax Partners, for the period from January 1, 2014 to July 25, 2014 (Predecessor).
F-44
Table of Contents
ADVANTAGE SOLUTIONS INC.
NOTES TO CONSOLIDATED FINANCIAL STATEMENTS
Overlapping Directors
During the years ended December 31, 2016 and 2015, the period from July 26, 2014 to December 31, 2014 (Successor), and the period from January 1, 2014 to July 25, 2014 (Predecessor), the Company recognized revenues of $41.9 million, $6.3 million, zero and zero, respectively, from a client of the Company, of which three members of the client’s holding company’s board of directors also serve as members of the board of directors of Karman Topco. Accounts receivable from this client were $8.8 million and $7.4 million as of December 31, 2016 and 2015, respectively.
Variable Interest Entities
During the years ended December 31, 2016 and 2015, the period from July 26, 2014 to December 31, 2014 (Successor), and the period from January 1, 2014 to July 25, 2014 (Predecessor), the Company recognized revenues of $166.5 million, $171.4 million, $77.0 million and $95.3 million, respectively, from the Company’s variable interest entity. Accounts receivable from this client were $29.0 million and $43.7 million as of December 31, 2016 and 2015, respectively.
14. Income Taxes
The provision for (benefit from) income taxes is as follows:
| Successor | Predecessor | |||||||||||||||
| (in thousands) | Year Ended December 31, 2016 | Year Ended December 31, 2015 | Period From July 26, 2014 to December 31, 2014 | Period From January 1, 2014 to July 25, 2014 | ||||||||||||
Current tax expense | ||||||||||||||||
Federal | $ | 48,014 | $ | 42,796 | $ | 22,862 | $ | 1,791 | ||||||||
State | 8,568 | 9,888 | 5,639 | 538 | ||||||||||||
Foreign | 2,698 | 3,018 | 1,561 | 738 | ||||||||||||
|
|
|
|
|
|
|
| |||||||||
Total current tax expense | 59,280 | 55,702 | 30,062 | 3,067 | ||||||||||||
|
|
|
|
|
|
|
| |||||||||
Deferred tax (benefit) expense | ||||||||||||||||
Federal | (28,883 | ) | (31,841 | ) | (21,121 | ) | (20,056 | ) | ||||||||
State | (7,975 | ) | (5,786 | ) | (5,127 | ) | (3,596 | ) | ||||||||
Foreign | 201 | 127 | 47 | (241 | ) | |||||||||||
|
|
|
|
|
|
|
| |||||||||
Total deferred tax benefit | (36,657 | ) | (37,500 | ) | (26,201 | ) | (23,893 | ) | ||||||||
|
|
|
|
|
|
|
| |||||||||
Total provision for (benefit from) income taxes | $ | 22,623 | $ | 18,202 | $ | 3,861 | $ | (20,826 | ) | |||||||
|
|
|
|
|
|
|
| |||||||||
F-45
Table of Contents
ADVANTAGE SOLUTIONS INC.
NOTES TO CONSOLIDATED FINANCIAL STATEMENTS
As of December 31, 2016 and 2015, $29.2 million and $33.0 million, respectively, of the Company’s cash, cash equivalents, and marketable securities were held by foreign subsidiaries. It is not the intention of the Company to repatriate the cash back to the United States. However, if the cash were repatriated, the Company may be subject to additional United States income taxes and/or foreign withholding taxes. The additional taxes are not expected to be material.
A reconciliation of the provision for taxes based on the federal statutory income tax rate attributable to the Company’s effective income tax rate is as follows.
| Successor | Predecessor | |||||||||||||||
| Year Ended December 31, 2016 | Year Ended December 31, 2015 | Period From July 26, 2014 to December 31, 2014 | Period From January 1, 2014 to July 25, 2014 | |||||||||||||
Statutory U.S. rate | 35.0 | % | 35.0 | % | (35.0 | %) | (35.0 | %) | ||||||||
State tax, net of federal tax benefit | 0.7 | % | 6.2 | % | 5.5 | % | (1.8 | %) | ||||||||
Meals and entertainment | 2.8 | % | 3.3 | % | 9.5 | % | 0.7 | % | ||||||||
Non-deductible expenses | 3.2 | % | 1.2 | % | 47.2 | % | 17.6 | % | ||||||||
Bonus payout | — | % | — | % | 64.7 | % | — | % | ||||||||
Return to provision on permanent differences | 2.3 | % | (0.3 | %) | 0.3 | % | (0.2 | %) | ||||||||
Work opportunity tax credit | (0.6 | %) | (0.6 | %) | (18.6 | %) | (0.1 | %) | ||||||||
Research and development credit | (0.4 | %) | — | % | — | % | — | % | ||||||||
Foreign rate differential | (1.0 | %) | (2.6 | %) | (9.5 | %) | (0.1 | %) | ||||||||
|
|
|
|
|
|
|
| |||||||||
Effective tax rate | 42.0 | % | 42.2 | % | 64.1 | % | (18.9 | %) | ||||||||
|
|
|
|
|
|
|
| |||||||||
The geographic components of income (loss) before income taxes are as follows:
| Successor | Predecessor | |||||||||||||||
| (in thousands) | Year Ended December 31, 2016 | Year Ended December 31, 2015 | Period From July 26, 2014 to December 31, 2014 | Period From January 1, 2014 to July 25, 2014 | ||||||||||||
U.S. sources | $ | 45,937 | $ | 31,229 | $ | (12,207 | ) | $ | (111,643 | ) | ||||||
Non-U.S. sources | 7,851 | 11,859 | 6,183 | 1,718 | ||||||||||||
|
|
|
|
|
|
|
| |||||||||
Income (loss) before income taxes | $ | 53,788 | $ | 43,088 | $ | (6,024 | ) | $ | (109,925 | ) | ||||||
|
|
|
|
|
|
|
| |||||||||
F-46
Table of Contents
ADVANTAGE SOLUTIONS INC.
NOTES TO CONSOLIDATED FINANCIAL STATEMENTS
Net deferred tax liabilities consist of the following:
| December 31, | ||||||||
| (in thousands) | 2016 | 2015 | ||||||
Deferred tax assets | ||||||||
Accrued liabilities | $ | 28,510 | $ | 33,484 | ||||
Deferred rent | 4,410 | 942 | ||||||
Acquired intangibles, including goodwill | 2,173 | 2,529 | ||||||
Insurance reserves | 3,235 | 2,417 | ||||||
Depreciation | 1,572 | — | ||||||
Unrealized hedge transactions | — | 267 | ||||||
Other | 793 | 594 | ||||||
|
|
|
| |||||
Total deferred tax assets | 40,693 | 40,233 | ||||||
|
|
|
| |||||
Deferred tax liabilities | ||||||||
Deferred compensation | 540 | 330 | ||||||
Depreciation | — | 4,148 | ||||||
Unrealized transactions | 4,878 | — | ||||||
Acquired intangibles including goodwill | 1,189,611 | 1,221,797 | ||||||
|
|
|
| |||||
Total deferred tax liabilities | 1,195,029 | 1,226,275 | ||||||
|
|
|
| |||||
Net deferred tax liabilities | $ | 1,154,336 | 1,186,042 | |||||
|
|
|
| |||||
Reported as: | ||||||||
Noncurrent deferred tax asset | $ | 1,949 | $ | — | ||||
Noncurrent deferred tax liability | 1,156,285 | 1,186,042 | ||||||
|
|
|
| |||||
Net deferred tax liabilities | $ | 1,154,336 | $ | 1,186,042 | ||||
|
|
|
| |||||
At December 31, 2016 and 2015, the Company has no net operating loss carryforwards. As of December 31, 2016 and 2015, U.S. taxes were not provided for on the earnings of the Company’s foreign subsidiaries of $37.5 million and $25.9 million, respectively, as the Company expects to invest the undistributed earnings in those subsidiaries indefinitely. If in the future, these earnings are repatriated to the U.S., or if the Company determines that the earnings will be remitted in the foreseeable future, additional tax provisions may be required. It is not practical to calculate the deferred taxes associated with these earnings because of the variability of multiple factors that would need to be assessed at the time of assumed repatriation; however, U.S. foreign tax credits may be available to reduce federal income taxes in the event of distribution.
15. Segments and geographic information
The Company’s operations are organized into two reportable segments, sales and marketing. The operating segments reported below are the segments of the Company for which separate financial information is available and for which segment results are evaluated regularly by the chief operating decision maker (the chief executive officer) in deciding how to allocate resources and in assessing performance. Through the Company’s sales segment, it serves as a strategic intermediary between consumer goods manufacturers and their retailer partners. Through the Company’s marketing segment, it develops and executes marketing programs for manufacturers and retailers. These reportable segments are organized by the types of services provided, similar economic characteristics, and how the Company manages its business. The assets and liabilities of the Company are managed
F-47
Table of Contents
ADVANTAGE SOLUTIONS INC.
NOTES TO CONSOLIDATED FINANCIAL STATEMENTS
centrally and are reported internally in the same manner as the consolidated financial statements; therefore, no additional information is produced or included herein. The Company and its chief operating decision maker evaluate performance based on revenues and operating income.
| Sales | Marketing | Total | ||||||||||
(in thousands) | ||||||||||||
Year ended December 31, 2016 | ||||||||||||
Revenues | $ | 1,448,278 | $ | 651,957 | $ | 2,100,235 | ||||||
Depreciation and amortization | $ | 132,007 | $ | 38,253 | $ | 170,260 | ||||||
Operating income | $ | 186,766 | $ | 34,382 | $ | 221,148 | ||||||
Year ended December 31, 2015 | ||||||||||||
Revenues | $ | 1,377,452 | $ | 517,594 | $ | 1,895,046 | ||||||
Depreciation and amortization | $ | 128,362 | $ | 36,222 | $ | 164,584 | ||||||
Operating income | $ | 163,396 | $ | 40,587 | $ | 203,983 | ||||||
Period from July 26, 2014 to December 31, 2014 | ||||||||||||
Revenues | $ | 598,608 | $ | 209,467 | $ | 808,075 | ||||||
Depreciation and amortization | $ | 54,138 | $ | 14,545 | $ | 68,683 | ||||||
Operating income | $ | 68,299 | $ | 9,904 | $ | 78,203 | ||||||
Period from January 1, 2014 to July 25, 2014 | ||||||||||||
Revenues | $ | 660,597 | $ | 245,049 | $ | 905,646 | ||||||
Depreciation and amortization | $ | 64,205 | $ | 11,066 | $ | 75,271 | ||||||
Operating income (loss) | $ | (33,908 | ) | $ | 7,879 | $ | (26,029 | ) | ||||
Revenues and long-lived assets by services provided in geographic region are as follows:
| Successor | Predecessor | |||||||||||||||
| Year Ended December 31, 2016 | Year Ended December 31, 2015 | Period from July 26, 2014 to December 31, 2014 | Period from January 1, 2014 to July 25, 2014 | |||||||||||||
| (in thousands) | ||||||||||||||||
Revenues | ||||||||||||||||
North America | $ | 2,042,352 | $ | 1,854,823 | $ | 808,075 | $ | 905,646 | ||||||||
Europe | 57,883 | 40,223 | — | — | ||||||||||||
|
|
|
|
|
|
|
| |||||||||
Total revenues | $ | 2,100,235 | $ | 1,895,046 | $ | 808,075 | $ | 905,646 | ||||||||
|
|
|
|
|
|
|
| |||||||||
| December 31, | ||||||||
| (in thousands) | 2016 | 2015 | ||||||
Long-lived assets | ||||||||
North America | $ | 69,733 | $ | 62,809 | ||||
Europe | 2,134 | 2,730 | ||||||
|
|
|
| |||||
Total long-lived assets | $ | 71,867 | $ | 65,539 | ||||
|
|
|
| |||||
The classification “North America” is comprised of the Company’s U.S. and Canadian operations and the classification “Europe” includes the Company’s U.K. and Portuguese operations. Revenues by location of services provided in the U.S. were $1.9 billion, $1.8 billion, $766.9 million and $870.0 million during the fiscal years ended December 31, 2016 and 2015, the period from July 26, 2014 to December 31, 2014 and the period from January 1, 2014 to July 25, 2014, respectively.
F-48
Table of Contents
ADVANTAGE SOLUTIONS INC.
NOTES TO CONSOLIDATED FINANCIAL STATEMENTS
As a result of the wide range of services the Company provides, it is impracticable to provide revenue information by service type.
16. Commitments and Contingencies
Operating Leases
The Company leases facilities, software, and equipment under noncancelable leases that have been classified as operating leases for financial reporting purposes. During the years ended December 31, 2016, 2015, the period from July 26, 2014 to December 31, 2014 (Successor) and the period from January 1, 2014 to July 25, 2014 (Predecessor), the Company incurred $35.7 million, $32.2 million, $13.5 million and $15.7 million, respectively, under these leases.
Future minimum lease payments required under these leases as of December 31, 2016 are as follows:
| (in thousands) | Real Property | Software, Equipment and Vehicles | Total | |||||||||
Years Ending December 31, | ||||||||||||
2017 | $ | 26,513 | $ | 3,890 | $ | 30,403 | ||||||
2018 | 23,036 | 1,877 | 24,913 | |||||||||
2019 | 18,874 | 436 | 19,310 | |||||||||
2020 | 11,824 | 3 | 11,827 | |||||||||
2021 | 7,186 | — | 7,186 | |||||||||
Thereafter | 3,017 | — | 3,017 | |||||||||
|
|
|
|
|
| |||||||
Total future minimum lease payments | $ | 90,450 | $ | 6,206 | $ | 96,656 | ||||||
|
|
|
|
|
| |||||||
Litigation
The Company is involved in various legal matters that arise in the ordinary course of its business. Some of these legal matters purport or may be determined to be class actions or seek substantial damages.
The Company is currently engaged in arbitration relating to a business acquisition that closed in 2014. The arbitration concerns the parties’ disagreement over the proper interpretation of certain terms in the purchase agreement that set the amount of a post-closingearn-out payment (i.e., contingent consideration) due under that agreement. The principal amount in dispute is $5.7 million. The Company has retained outside counsel to represent it in this matter and is vigorously defending its interests
The Company is also currently engaged in litigation matters in Delaware and Kansas relating to post-closing disputes arising from a separate business acquisition that closed in 2014. The litigation matters involve various indemnity and other claims primarily regarding severance payments, lease obligations, purchase price adjustments, and contingentearn-out amounts. Each litigation matter is in early stages. The Company has retained outside counsel to represent it in this matter and is vigorously defending its interests.
In connection with the above matters and other legal matters, the Company has accrued immaterial amounts. There can be no assurance, however, that the above matters and other legal
F-49
Table of Contents
ADVANTAGE SOLUTIONS INC.
NOTES TO CONSOLIDATED FINANCIAL STATEMENTS
matters will not result in the Company having to make payments in excess of such accruals or that the above matters or other legal matters will not materially or adversely affect the Company’s business, financial position, or results of operations or cash flows.
17. Subsequent Events
Subsequent to December 31, 2016, the Company completed six business acquisitions; three sales agencies and a marketing design agency in the United States and two sales agencies in Europe. The aggregate cash paid for these acquisitions consummated was $40.6 million. The purchase agreements included contingent consideration with a maximum payment outcome of $13.7 million. Management has not completed the evaluation of the significant unobservable inputs and probability weightings using Monte Carlo simulations to determine the fair value of the contingent consideration as it is it is impracticable to provide as of the date of this filing.
On May 2, 2017, pursuant to a Second Amendment to the First Lien Credit Agreement, entered into by the Borrower and the Guarantors, the Borrower (a) incurred $225.0 million of additional first lien term loans and (b) extended the termination date with respect to a $150.0 million portion of the Revolving Credit Facility held by certain lenders (such portion, the “Series A Revolving Loan Facility”) and the maturity date for any and all loans made pursuant to the Series A Revolving Loan Facility, from July 25, 2019 to April 25, 2021.
The Company has completed an evaluation of all subsequent events through May 4, 2017, the date the financial statements were available to be issued. The Company has concluded that no other subsequent events have occurred that require recognition or disclosure.
F-50
Table of Contents
ADVANTAGE SOLUTIONS INC.
CONDENSED FINANCIAL INFORMATION
OF REGISTRANT
CONDENSED BALANCE SHEETS
| December 31, | ||||||||
| (in thousands) | 2016 | 2015 | ||||||
| ASSETS | ||||||||
Investment in subsidiaries | $ | 1,702,107 | $ | 1,682,375 | ||||
|
|
|
| |||||
Total assets | $ | 1,702,107 | $ | 1,682,375 | ||||
|
|
|
| |||||
| LIABILITIES AND STOCKHOLDER’S EQUITY | ||||||||
Equity attributable to stockholder of Advantage Solutions Inc. | ||||||||
Common stock authorized, 1,000 shares of $0.01 par value; issued and outstanding 100 shares as of December 31, 2016 and 2015, respectively | $ | — | $ | — | ||||
Additional paid in capital | 1,668,003 | 1,673,503 | ||||||
Retained earnings | 46,804 | 14,655 | ||||||
Loans to Karman Topco L.P. | (218 | ) | (172 | ) | ||||
Accumulated other comprehensive loss | (12,482 | ) | (5,611 | ) | ||||
|
|
|
| |||||
Total equity attributable to stockholder of Advantage Solutions Inc. | 1,702,107 | 1,682,375 | ||||||
Equity attributable to noncontrolling interest | — | — | ||||||
|
|
|
| |||||
Total stockholder’s equity | 1,702,107 | 1,682,375 | ||||||
|
|
|
| |||||
Total liabilities and stockholder’s equity | $ | 1,702,107 | $ | 1,682,375 | ||||
|
|
|
| |||||
See notes to condensed financial statements
F-51
Table of Contents
ADVANTAGE SOLUTIONS INC.
CONDENSED FINANCIAL INFORMATION
OF REGISTRANT
CONDENSED STATEMENTS OF OPERATIONS
| Successor | ||||||||||||
| (in thousands) | Year Ended December 31, 2016 | Year Ended December 31, 2015 | Period From July 26, 2014 to December 31, 2014 | |||||||||
Revenues | $ | — | $ | — | $ | — | ||||||
Cost of revenues | — | — | — | |||||||||
Selling, general, and administrative expenses | — | — | — | |||||||||
Depreciation and amortization | — | — | — | |||||||||
|
|
|
|
|
| |||||||
Total expenses | — | — | — | |||||||||
|
|
|
|
|
| |||||||
Operating income | — | — | — | |||||||||
Interest expense, net | — | — | — | |||||||||
|
|
|
|
|
| |||||||
Income before income taxes and equity in net income of subsidiaries | — | — | — | |||||||||
Provision for income taxes | — | — | — | |||||||||
|
|
|
|
|
| |||||||
Net income before equity in net income of subsidiaries | — | — | — | |||||||||
Less: net income attributable to noncontrolling interests | — | — | — | |||||||||
Equity in net (loss) income of subsidiaries | 32,149 | 24,594 | (9,939 | ) | ||||||||
|
|
|
|
|
| |||||||
Other comprehensive (loss) income, net tax | ||||||||||||
Equity in comprehensive (loss) of Subsidiaries | (6,871 | ) | (4,635 | ) | (976 | ) | ||||||
|
|
|
|
|
| |||||||
Total comprehensive (loss) income | $ | 25,278 | $ | 19,959 | $ | (10,915 | ) | |||||
|
|
|
|
|
| |||||||
See notes to condensed financial statements
F-52
Table of Contents
ADVANTAGE SOLUTIONS INC.
CONDENSED FINANCIAL INFORMATION
OF REGISTRANT
NOTES TO THE CONDENSED FINANCIAL STATEMENTS
1. Basis of Presentation
In the parent company only financial statements, Advantage Solutions Inc.’s (“Parent”) investment in subsidiaries is stated at cost plus equity in undistributed earnings of the subsidiaries during the years ended December 31, 2016, 2015 and the period from July 26, 2014 to December 31, 2014. The accompanying condensed parent company financial statements have been prepared in accordance with Rule12-04, Schedule 1 of RegulationS-X. A condensed statement of cash flows was not presented because Advantage Solutions, Inc.‘s operating activities have no cash impact and there were no investing or financing cash flow activities during the years ended December 31, 2016, 2015 and the period from July 26, 2014 to December 31, 2014. This information should be read in conjunction with the accompanying Consolidated Financial Statements.
2. Credit Agreement Restrictions
Pursuant to the terms of the First Lien Credit Agreement and Second Lien Credit Agreement discussed in Note 8,Debt, of the Notes to the Consolidated Financial Statements, the Parent’s subsidiaries have restrictions on their ability to pay dividends or make intercompany loans and advances to the Parent. Since the restricted net assets of the Parent’s subsidiaries exceed 25% of the consolidated net assets of the Parent and its subsidiaries, the accompanying condensed parent company financial statements have been prepared in accordance with Rule12-04, Schedule 1 ofRegulation S-X.
The First Lien Credit Agreement includes restrictions on the ability of Karman Intermediate Corp. (“Holdings”) to conduct activities other than as a passive holding company, and on the ability of Advantage Sales & Marketing Inc. (the “Borrower”) and its restricted subsidiaries to incur liens and indebtedness, make investments, acquisitions and dispositions, make dividends, distributions or payments in respect of junior debt, merge or make other fundamental changes or enter into transactions with affiliates, among other restrictions, in each case subject to certain financial limits and other exceptions. These covenants are subject to a number of exceptions, including an exception that permits unlimited distributions if the Borrower’s senior secured net leverage ratio is equal to or less than 6.00:1.00. As of December 31, 2016 and 2015, the Borrower did not meet such leverage ratio.
The Second Lien Credit Agreement contains restrictive covenants that are substantially the same as those in the First Lien Credit Agreement, with exceptions that are generally the same as, but more lenient than, those in the First Lien Credit Agreement. As a result of these restrictions, the Parent’s subsidiaries held approximately $1,635.8 million and $1,609.6 million of restricted net assets as of December 31, 2016 and 2015, respectively.
F-53
Table of Contents
CONDENSED CONSOLIDATED BALANCE SHEETS
(UNAUDITED)
| (in thousands, except share data) | March 31, 2017 | December 31, 2016 | ||||||
| ASSETS | ||||||||
Current assets | ||||||||
Cash and cash equivalents | $ | 67,233 | $ | 40,268 | ||||
Restricted cash | 8,106 | 7,806 | ||||||
Accounts receivable, net of allowances of $3,266 and $3,052, respectively | 396,529 | 370,313 | ||||||
Accounts receivable from related parties | 19,303 | 37,831 | ||||||
Prepaid expenses and other current assets | 37,394 | 33,698 | ||||||
|
|
|
| |||||
Total current assets | 528,565 | 489,916 | ||||||
Property and equipment, net | 69,972 | 71,867 | ||||||
Goodwill | 2,092,038 | 2,082,344 | ||||||
Other intangible assets, net | 3,181,708 | 3,212,868 | ||||||
Investments in unconsolidated affiliates | 85,188 | 84,721 | ||||||
Deferred income tax assets | 2,149 | 1,949 | ||||||
Other assets | 5,904 | 6,135 | ||||||
|
|
|
| |||||
Total assets | $ | 5,965,524 | $ | 5,949,800 | ||||
|
|
|
| |||||
| LIABILITIES AND STOCKHOLDER’S EQUITY | ||||||||
Current liabilities | ||||||||
Current portion of long-term debt | $ | 95,686 | $ | 41,047 | ||||
Accounts payable | 73,051 | 94,621 | ||||||
Accrued compensation and benefits | 62,207 | 63,394 | ||||||
Other accrued expenses | 93,428 | 98,159 | ||||||
Deferred revenues | 32,064 | 26,408 | ||||||
|
|
|
| |||||
Total current liabilities | 356,436 | 323,629 | ||||||
Long-term debt, net of current portion | 2,649,199 | 2,651,686 | ||||||
Deferred income tax liabilities, net | 1,143,871 | 1,156,285 | ||||||
Other long-term liabilities | 84,999 | 79,898 | ||||||
|
|
|
| |||||
Total liabilities | 4,234,505 | 4,211,498 | ||||||
|
|
|
| |||||
Redeemable noncontrolling interest | 2,496 | 2,457 | ||||||
Equity attributable to stockholder of Advantage Solutions Inc. | ||||||||
Common stock authorized, 1,000 shares of $0.01 par value; issued and outstanding 100 shares as of March 31, 2017 and December 31, 2016, respectively | — | — | ||||||
Additional paid in capital | 1,668,503 | 1,668,003 | ||||||
Retained earnings | 37,454 | 46,804 | ||||||
Loans to Karman Topco L.P. | (224 | ) | (218 | ) | ||||
Accumulated other comprehensive loss | (11,615 | ) | (12,482 | ) | ||||
|
|
|
| |||||
Total equity attributable to stockholder’s of Advantage Solutions Inc. | 1,694,118 | 1,702,107 | ||||||
Nonredeemable noncontrolling interest | 34,405 | 33,738 | ||||||
|
|
|
| |||||
Total stockholder’s equity | 1,728,523 | 1,735,845 | ||||||
|
|
|
| |||||
Total liabilities, redeemable noncontrolling interest, and stockholder’s equity | $ | 5,965,524 | $ | 5,949,800 | ||||
|
|
|
| |||||
See accompanying notes to unaudited condensed consolidated financial statements
F-54
Table of Contents
CONDENSED CONSOLIDATED STATEMENTS OF COMPREHENSIVE LOSS
(UNAUDITED)
| Three Months Ended | ||||||||
| (in thousands, except per share amounts) | March 31, 2017 | March 31, 2016 | ||||||
Revenues | $ | 508,468 | $ | 458,276 | ||||
Cost of revenues | 413,153 | 370,368 | ||||||
Selling, general, and administrative expenses | 26,668 | 23,025 | ||||||
Depreciation and amortization | 42,894 | 42,639 | ||||||
|
|
|
| |||||
Total expenses | 482,715 | 436,032 | ||||||
|
|
|
| |||||
Operating income | 25,753 | 22,244 | ||||||
Interest expense, net | 41,362 | 44,066 | ||||||
|
|
|
| |||||
Loss before income taxes | (15,609 | ) | (21,822 | ) | ||||
Benefit from income taxes | (6,406 | ) | (8,821 | ) | ||||
|
|
|
| |||||
Net loss | (9,203 | ) | (13,001 | ) | ||||
Less: net income (loss) attributable to noncontrolling interests | 147 | (37 | ) | |||||
|
|
|
| |||||
Net loss attributable to stockholder of Advantage Solutions Inc. | (9,350 | ) | (12,964 | ) | ||||
Other comprehensive loss, net of tax | ||||||||
Foreign currency translation adjustments | 867 | 531 | ||||||
|
|
|
| |||||
Total comprehensive loss attributable to stockholder of Advantage Solutions Inc. | $ | (8,483 | ) | $ | (12,433 | ) | ||
|
|
|
| |||||
Net loss per common share: | ||||||||
Basic | $ | (93,502 | ) | $ | (129,645 | ) | ||
Diluted | $ | (93,502 | ) | $ | (129,645 | ) | ||
Weighted-average number of common shares: | ||||||||
Basic | 100 | 100 | ||||||
Diluted | 100 | 100 | ||||||
See accompanying notes to unaudited condensed consolidated financial statements
F-55
Table of Contents
CONDENSED CONSOLIDATED STATEMENTS OF CASH FLOWS
(UNAUDITED)
| Three Months Ended | ||||||||
| (in thousands) | March 31, 2017 | March 31, 2016 | ||||||
CASH FLOWS FROM OPERATING ACTIVITIES | ||||||||
Net loss | $ | (9,203 | ) | $ | (13,001 | ) | ||
Adjustments to reconcile net loss to net cash provided by operating activities: | ||||||||
Noncash interest expense | 3,766 | 5,601 | ||||||
Depreciation and amortization | 42,894 | 42,639 | ||||||
Fair value adjustments related to contingent consideration | 3,917 | (778 | ) | |||||
Deferred income taxes | (12,716 | ) | (13,398 | ) | ||||
Equity-based compensation | 500 | 728 | ||||||
Equity in earnings of unconsolidated affiliates | (467 | ) | (365 | ) | ||||
Distribution received from unconsolidated affiliates | — | 371 | ||||||
Changes in operating assets and liabilities, net effects from purchases of businesses: | ||||||||
Accounts receivable | (6,038 | ) | 27,637 | |||||
Prepaid expense and other assets | (1,640 | ) | 4,712 | |||||
Accounts payable | (20,936 | ) | (22,938 | ) | ||||
Accrued compensation and benefits | (1,227 | ) | (6,735 | ) | ||||
Deferred revenue | 5,593 | 1,295 | ||||||
Other accrued expenses | (6,615 | ) | (1,875 | ) | ||||
|
|
|
| |||||
Net cash (used in) provided by operating activities | (2,172 | ) | 23,893 | |||||
|
|
|
| |||||
CASH FLOWS FROM INVESTING ACTIVITIES | ||||||||
Purchase of businesses, net of cash acquired | (10,250 | ) | (33,087 | ) | ||||
Purchase of investment in unconsolidated affiliate | — | (333 | ) | |||||
Purchase of property and equipment | (6,917 | ) | (8,603 | ) | ||||
Restricted cash | (300 | ) | (1,873 | ) | ||||
|
|
|
| |||||
Net cash used in investing activities | (17,467 | ) | (43,896 | ) | ||||
|
|
|
| |||||
CASH FLOWS FROM FINANCING ACTIVITIES | ||||||||
Borrowings under lines of credit | 85,000 | 60,000 | ||||||
Payments on lines of credit | (30,000 | ) | (40,000 | ) | ||||
Principal payments on long-term debt | (5,752 | ) | (5,972 | ) | ||||
Contingent consideration payments | (2,953 | ) | (1,625 | ) | ||||
Financing fees paid | (6 | ) | (11 | ) | ||||
Redemption of noncontrolling interests | — | 2,673 | ||||||
|
|
|
| |||||
Net cash provided by financing activities | 46,289 | 15,065 | ||||||
|
|
|
| |||||
Net effect of foreign currency fluctuations on cash | 315 | 169 | ||||||
|
|
|
| |||||
Net change in cash and cash equivalents | 26,965 | (4,769 | ) | |||||
|
|
|
| |||||
Cash and cash equivalents, beginning of period | 40,268 | 70,563 | ||||||
|
|
|
| |||||
Cash and cash equivalents, end of period | $ | 67,233 | $ | 65,794 | ||||
|
|
|
| |||||
SUPPLEMENTAL CASH FLOW INFORMATION | ||||||||
Purchases of property and equipment recorded in accounts payable and accrued expenses | (1,691 | ) | (1,139 | ) | ||||
See accompanying notes to unaudited condensed consolidated financial statements
F-56
Table of Contents
NOTES TO CONDENSED CONSOLIDATED FINANCIAL STATEMENTS
1. Organization and Significant Accounting Policies
Advantage Solutions Inc. (the “Company” or “Advantage”) provides outsourced sales, marketing, and merchandising solutions to consumer goods manufacturers and retailers. The Company provides customized services to its clients to improve marketing effectiveness, selling efficiency, market coverage, distribution and placement of client products across various retail channels of trade.
Basis of Presentation
The accompanying unaudited condensed consolidated financial statements include the accounts of the Company and its subsidiaries, and have been prepared in accordance with Article 10 of the Securities and Exchange Commission’s or the SEC, RegulationS-X. Accordingly, as permitted by Article 10, the unaudited condensed consolidated financial statements do not include all of the information required by accounting principles generally accepted in the United States (“U.S. GAAP”). The Condensed Consolidated Balance Sheet at December 31, 2016 was derived from the audited financial statements at that date and does not include all the disclosures required by U.S. GAAP. In the opinion of management, all adjustments which are of a normal recurring nature and necessary for a fair statement of the results as of and for the three months ended March 31, 2017 and 2016 have been reflected in the consolidated financial statements. These unaudited condensed consolidated financial statements should be read in conjunction with the audited financial statements as of and for the year ended December 31, 2016 and the related footnotes thereto. Operating results for the three months ended March 31, 2017 are not necessarily indicative of the results to be expected during the remainder of the current year or for any future period.
Accounting Standards Recently Issued but Not Yet Adopted by the Company
In January 2017, the FASB issued ASU2017-01,Business Combinations (Topic 805)—Clarifying the Definition of a Business to clarify the definition of a business in order to allow for the evaluation of whether transactions should be accounted for as acquisitions or disposals of assets or businesses. ASU2017-01 will be effective for fiscal years beginning after December 15, 2017, including interim periods within those fiscal years. Early adoption is permitted. The future impact of ASU2017-01 will be dependent upon the nature of future acquisitions or dispositions made by the Company.
In January 2017, the FASB issued ASUNo. 2017-04,Simplifying the Accounting for Goodwill Impairment (ASUNo. 2017-04). ASUNo. 2017-04 removes the second step of the current goodwill impairment test, which currently requires a hypothetical purchase price allocation if the fair value of a reporting unit were to be less than its book value, for purposes of determining the amount of goodwill impaired. Under ASUNo. 2017-04, the Company would now recognize an impairment charge for the amount by which the carrying amount of a reporting unit exceeds the fair value of the reporting unit; however, the loss recognized would not exceed the total amount of goodwill allocated to that reporting unit. ASUNo. 2017-04 will be effective for the Company beginning in the first quarter of fiscal 2021, to be applied on a prospective basis. The pending adoption of this guidance is not expected to have a material impact on the Company’s Consolidated Financial Statements.
2. Acquisitions
The Company acquired one business during the three months ended March 31, 2017 for total consideration of $15.1 million, which includes $10.3 million of cash consideration, net of cash acquired, and the fair value of contingent consideration of $4.8 million. The acquisition was not material to the Company’s results of operations, financial position, or cash flows and, therefore, the pro forma impact of this acquisition is not presented.
F-57
Table of Contents
ADVANTAGE SOLUTIONS INC.
NOTES TO CONDENSED CONSOLIDATED FINANCIAL STATEMENTS
Assets acquired and liabilities assumed in the business combination were recorded on the Company’s Condensed Consolidated Balance Sheets as of the acquisition date based upon the estimated fair value at such date. The results of operations of the business acquired by the Company have been included in the Condensed Consolidated Statements of Comprehensive Loss since the date of acquisition. The excess of the purchase price over the estimated fair value of the underlying assets acquired and liabilities assumed was allocated to goodwill. The allocation of the excess purchase price was based upon preliminary estimates and assumptions and is subject to revision when the Company receives final information. Accordingly, the measurement period for such purchase price allocations will end when the information, or the facts and circumstances, becomes available, but will not exceed twelve months.
The results of operations of each company acquired have been included in the Company’s consolidated financial statements from the date of each acquisition.
3. Goodwill and Intangible Assets
Changes in goodwill for the three months ended March 31, 2017 are as follows:
| (in thousands) | Sales | Marketing | Total | |||||||||
Balance at December 31, 2016 | $ | 1,660,710 | $ | 421,634 | $ | 2,082,344 | ||||||
Acquisitions | 8,997 | — | 8,997 | |||||||||
Foreign exchange translation effects | 697 | — | 697 | |||||||||
|
|
|
|
|
| |||||||
Balance at March 31, 2017 | $ | 1,670,404 | $ | 421,634 | $ | 2,092,038 | ||||||
|
|
|
|
|
| |||||||
The following tables set forth information for intangible assets:
| March 31, 2017 | ||||||||||||||||
| (in thousands) | Useful Life | Gross Carrying Value | Accumulated Amortization | Net Carrying Value | ||||||||||||
Finite-lived intangible assets: | ||||||||||||||||
Client relationships | 15 years | $ | 2,037,264 | $ | 351,340 | $ | 1,685,924 | |||||||||
Tradenames | 5 years | 28,956 | 13,172 | 15,784 | ||||||||||||
|
|
|
|
|
| |||||||||||
Total finite-lived intangible assets | 2,066,220 | 364,512 | 1,701,708 | |||||||||||||
Indefinite-lived intangible assets: | ||||||||||||||||
Tradenames | 1,480,000 | — | 1,480,000 | |||||||||||||
|
|
|
|
|
| |||||||||||
Total other intangible assets | $ | 3,546,220 | $ | 364,512 | $ | 3,181,708 | ||||||||||
|
|
|
|
|
| |||||||||||
| December 31, 2016 | ||||||||||||||||
| (in thousands) | Useful Life | Gross Carrying Value | Accumulated Amortization | Net Carrying Value | ||||||||||||
Finite-lived intangible assets: | ||||||||||||||||
Client relationships | 15 years | $ | 2,032,912 | $ | 317,223 | $ | 1,715,689 | |||||||||
Tradenames | 5 years | 28,881 | 11,702 | 17,179 | ||||||||||||
|
|
|
|
|
| |||||||||||
Total finite-lived intangible assets | 2,061,793 | 328,925 | 1,732,868 | |||||||||||||
Indefinite-lived intangible assets: | ||||||||||||||||
Tradenames | 1,480,000 | — | 1,480,000 | |||||||||||||
|
|
|
|
|
| |||||||||||
Total other intangible assets | $ | 3,541,793 | $ | 328,925 | $ | 3,212,868 | ||||||||||
|
|
|
|
|
| |||||||||||
F-58
Table of Contents
ADVANTAGE SOLUTIONS INC.
NOTES TO CONDENSED CONSOLIDATED FINANCIAL STATEMENTS
4. Debt
| (in thousands) | March 31, 2017 | December 31, 2016 | ||||||
First lien term loan | $ | 1,960,485 | $ | 1,965,512 | ||||
Second lien term loan | 760,000 | 760,000 | ||||||
Revolving Credit Facility | 75,000 | 20,000 | ||||||
Notes payable and deferred obligations | 1,169 | 1,892 | ||||||
|
|
|
| |||||
| 2,796,654 | 2,747,404 | |||||||
Less: current portion | 95,686 | 41,047 | ||||||
Less: debt issuance costs | 51,769 | 54,671 | ||||||
|
|
|
| |||||
Long-term debt, net of current portion and creditor fees | $ | 2,649,199 | $ | 2,651,686 | ||||
|
|
|
| |||||
Under its credit facilities, the Company is required to meet customary affirmative and negative covenants; including financial covenants relating to leverage to earnings before interest, taxes, depreciation and amortization ratios. The Company was in compliance with the negative and affirmative covenants as of March 31, 2017. In addition, the Company is required to repay the first lien term loans in the greater amount of its excess cash flow as defined in the First Lien Credit Agreement, or $20.1 million, in quarterly payments of $5.0 million. The excess cash flow calculation requires an annual principal payment in 2017 based on 2016 results of zero to 50% of net income less principal payments of indebtedness, capital expenditures, permitted acquisitions, and changes in net working capital. The Company made the minimum quarterly principal payment of $5.0 million during the three months ended March 31, 2017 and no payments under the aforementioned excess cash flow calculation were required. The Company’s credit facilities are collateralized by substantially all of the assets of the Company.
5. Fair Value of Financial Instruments
The Company measures fair value based on the prices that would be received to sell an asset or paid to transfer a liability in an orderly transaction between market participants at the measurement date. Fair value measurements are based on a three-tier hierarchy that prioritizes the inputs used to measure fair value. These tiers include: Level 1, defined as observable inputs such as quoted prices in active markets; Level 2, defined as inputs other than quoted prices in active markets that are either directly or indirectly observable; and Level 3, defined as unobservable inputs for which little or no market data exists, therefore requiring an entity to develop its own assumptions.
As of March 31, 2017, and December 31, 2016, the Company’s interest rate derivatives and forward contracts are Level 2 liabilities with the related fair values based on third-party pricing service models. These models use discounted cash flows that utilize market-based forward swap curves commensurate with the terms of the underlying instruments.
As of March 31, 2017, and December 31, 2016, the contingent consideration liabilities are Level 3 liabilities with the related fair values based on the significant unobservable inputs and probability weightings used in the income approach.
F-59
Table of Contents
ADVANTAGE SOLUTIONS INC.
NOTES TO CONDENSED CONSOLIDATED FINANCIAL STATEMENTS
The following table sets forth the Company’s financial assets and liabilities measured on a recurring basis at fair value, categorized by input level within the fair value hierarchy.
| March 31, 2017 | ||||||||||||||||
| (in thousands) | Fair Value | Level 1 | Level 2 | Level 3 | ||||||||||||
Assets measured at fair value | ||||||||||||||||
Cash and cash equivalents | $ | 67,233 | $ | 67,233 | $ | — | $ | — | ||||||||
|
|
|
|
|
|
|
| |||||||||
Total assets measured at fair value | $ | 67,233 | $ | 67,233 | $ | — | $ | — | ||||||||
|
|
|
|
|
|
|
| |||||||||
Liabilities measured at fair value | ||||||||||||||||
Derivative financial instruments | $ | 8,328 | $ | — | $ | 8,328 | $ | — | ||||||||
Contingent consideration | 81,985 | — | — | 81,985 | ||||||||||||
|
|
|
|
|
|
|
| |||||||||
Total liabilities measured at fair value | $ | 90,313 | $ | — | $ | 8,328 | $ | 81,985 | ||||||||
|
|
|
|
|
|
|
| |||||||||
| December 31, 2016 | ||||||||||||||||
| (in thousands) | Fair Value | Level 1 | Level 2 | Level 3 | ||||||||||||
Assets measured at fair value | ||||||||||||||||
Cash and cash equivalents | $ | 40,268 | $ | 40,268 | $ | — | $ | — | ||||||||
|
|
|
|
|
|
|
| |||||||||
Total assets measured at fair value | $ | 40,268 | $ | 40,268 | $ | — | $ | — | ||||||||
|
|
|
|
|
|
|
| |||||||||
Liabilities measured at fair value | ||||||||||||||||
Derivative financial instruments | $ | 8,486 | $ | — | $ | 8,486 | $ | — | ||||||||
Contingent consideration | 75,984 | — | — | 75,984 | ||||||||||||
|
|
|
|
|
|
|
| |||||||||
Total liabilities measured at fair value | $ | 84,470 | $ | — | $ | 8,486 | $ | 75,984 | ||||||||
|
|
|
|
|
|
|
| |||||||||
As of March 31, 2017 and December 31, 2016, the Company had three outstanding interest rate cap contracts with notional amounts of $850.0 million, $650.0 million and $200.0 million, all which mature on April 23, 2019. The aggregate fair value of the Company’s outstanding interest rate caps at March 31, 2017 and December 31, 2016 represented an outstanding net liability of $8.3 million and $8.5 million, respectively. As of March 31, 2017, $4.1 million and $4.2 million of the Company’s fair value of outstanding interest rate caps were included in “Other current liabilities” and “Other long-term liabilities” in the Condensed Consolidated Balance Sheets, respectively, with changes in fair value recognized as a component of “Interest expense, net” in the accompanying Condensed Consolidated Statements of Comprehensive Loss. As of December 31, 2016, $4.1 million and $4.4 million of the Company’s fair value of outstanding interest rate caps were included in “Other current liabilities” and “Other long-term liabilities” in the Consolidated Balance Sheets, respectively. During the three months ended March 31, 2017 and March 31, 2016, the Company recorded interest expense in the amount of $0.9 million and $2.5 million, related to changes in the fair value of its derivative instruments, respectively.
As of March 31, 2017, the Company had eight open Euro forward contracts to hedge total foreign currency exposure of€9.4 million with maturities in September and October of 2017. During the three months ended March 31, 2017 and March 31, 2016, the Company recorded a gain of $0.1 million and $0.3 million, respectively, related to changes in fair value of the forward contracts as a component of “Selling, general, and administrative expenses” in the Condensed Consolidated Statements of Comprehensive Loss.
F-60
Table of Contents
ADVANTAGE SOLUTIONS INC.
NOTES TO CONDENSED CONSOLIDATED FINANCIAL STATEMENTS
Contingent Consideration
Each reporting period, the Company measures the fair value of its contingent liabilities by evaluating the significant unobservable inputs and probability weightings using Monte Carlo simulations. Any resulting decreases or increases in the fair value result in a corresponding gain or loss reported in “Selling, general, and administrative expenses” in the Consolidated Statements of Comprehensive Loss. As of March 31, 2017, the maximum potential payment outcome of all outstanding contingent consideration in the aggregate was $135.3 million. During the three month ended March 31, 2017, there were no transfers between Level 1 and Level 2 fair value measurements. The following table sets forth the reconciliation of fair value measurements of Level 3 financial instruments:
| Three Months Ended March 31, | ||||||||
| (in thousands) | 2017 | 2016 | ||||||
Beginning of the period | $ | 75,984 | $ | 62,566 | ||||
Fair value of acquisitions | 4,832 | 5,601 | ||||||
Payments | (3,131 | ) | (1,632 | ) | ||||
Changes in fair value | 3,917 | (778 | ) | |||||
Foreign exchange translation effects | 383 | 48 | ||||||
|
|
|
| |||||
End of the period | $ | 81,985 | $ | 65,805 | ||||
|
|
|
| |||||
The following table sets forth the carrying values and fair values of the Company’s financial liabilities measured on a nonrecurring basis, categorized by input level within the fair value hierarchy:
| (in thousands) | Carrying Value | Fair Value (Level 2) | ||||||
Balance at March 31, 2017 | ||||||||
First lien term loan | $ | 1,960,485 | $ | 1,870,068 | ||||
Second lien term loan | 760,000 | 744,060 | ||||||
Revolving Credit Facility | 75,000 | 75,000 | ||||||
Notes payable and deferred obligations | 1,169 | 1,150 | ||||||
|
|
|
| |||||
Total long-term debt | $ | 2,796,654 | $ | 2,690,278 | ||||
|
|
|
| |||||
| (in thousands) | Carrying Value | Fair Value (Level 2) | ||||||
Balance at December 31, 2016 | ||||||||
First lien term loan | $ | 1,965,512 | $ | 1,857,497 | ||||
Second lien term loan | 760,000 | 720,045 | ||||||
Revolving Credit Facility | 20,000 | 20,000 | ||||||
Notes payable and deferred obligations | 1,892 | 1,847 | ||||||
|
|
|
| |||||
Total long-term debt | $ | 2,747,404 | $ | 2,599,389 | ||||
|
|
|
| |||||
6. Income Taxes
The Company’s effective tax rate was 41.0% and 40.4% during the three months ended March 31, 2017 and 2016, respectively. The effective income tax rate is based upon the estimated income before taxes for the year, by jurisdiction, and adjusted for estimated permanent tax adjustments.
F-61
Table of Contents
ADVANTAGE SOLUTIONS INC.
NOTES TO CONDENSED CONSOLIDATED FINANCIAL STATEMENTS
7. Interim Financial Data by Segment
The Company’s operations are organized into two reportable segments, sales and marketing. The operating segments reported below are the segments of the Company for which separate financial information is available and for which segment results are evaluated regularly by the chief operating decision maker (the chief executive officer) in deciding how to allocate resources and in assessing performance. Through the Company’s sales segment, it serves as a strategic intermediary between consumer goods manufacturers and their retailer partners. Through the Company’s marketing segment, it develops and executes marketing programs for manufacturers and retailers. These reportable segments are organized by the types of services provided, similar economic characteristics, and how the Company manages its business. The assets and liabilities of the Company are managed centrally and are reported internally in the same manner as the consolidated financial statements; therefore, no additional information is produced or included herein. The Company and its chief operating decision maker evaluate performance based on revenues and operating income (loss).
| (in thousands) | Sales | Marketing | Total | |||||||||
Three Months Ended March 31, 2017 | ||||||||||||
Revenues | $ | 343,078 | $ | 165,390 | $ | 508,468 | ||||||
Depreciation and amortization | 33,427 | 9,467 | 42,894 | |||||||||
Operating income (loss) | $ | 28,702 | $ | (2,949 | ) | $ | 25,753 | |||||
|
|
|
|
|
| |||||||
Three Months Ended March 31, 2016 | ||||||||||||
Revenues | $ | 325,431 | $ | 132,845 | $ | 458,276 | ||||||
Depreciation and amortization | 33,015 | 9,624 | 42,639 | |||||||||
Operating income (loss) | $ | 22,698 | $ | (454 | ) | $ | 22,244 | |||||
|
|
|
|
|
| |||||||
Revenues and long-lived assets by services provided in geographic region are as follows:
| Three months ended March 31, | ||||||||
| (in thousands) | 2017 | 2016 | ||||||
Revenues | ||||||||
North America | $ | 492,620 | $ | 446,018 | ||||
Europe | 15,848 | 12,258 | ||||||
|
|
|
| |||||
Total revenues | $ | 508,468 | $ | 458,276 | ||||
|
|
|
| |||||
| (in thousands) | March 31, 2017 | December 31, 2016 | ||||||
Long-lived assets | ||||||||
North America | $ | 67,941 | $ | 69,733 | ||||
Europe | 2,031 | 2,134 | ||||||
|
|
|
| |||||
Total long-lived assets | $ | 69,972 | $ | 71,867 | ||||
|
|
|
| |||||
The classification “North America” is comprised of the Company’s U.S. and Canadian operations and the classification “Europe” includes the Company’s U.K. and Portuguese operations. Revenues by location of services provided in the U.S. were $476.8 million and $426.3 million during the three months ended March 31, 2017 and 2016, respectively.
As a result of the wide range of services the Company provides, it is impracticable to provide revenue information by service type.
F-62
Table of Contents
ADVANTAGE SOLUTIONS INC.
NOTES TO CONDENSED CONSOLIDATED FINANCIAL STATEMENTS
8. Nonredeemable Noncontrolling Interest
Nonredeemable noncontrolling interest represents the minority stockholders’ proportionate share of the results of the Company’s subsidiaries that are not wholly owned. A reconciliation of noncontrolling interest during the three months ended March 31, 2017 are as follows:
| (in thousands) | March 31, 2017 | |||
Beginning balance | $ | 33,738 | ||
Net income attributable to noncontrolling interest | 147 | |||
Foreign currency translation adjustment | 520 | |||
|
| |||
Ending balance | $ | 34,405 | ||
|
| |||
9. Subsequent Events
Subsequent to March 31, 2017, the Company completed five business acquisitions: two sales agencies and a marketing design agency in the United States and two sales agencies in Europe. The aggregate cash consideration paid for these acquisitions was $30.4 million. The purchase agreements included contingent consideration with a maximum payment outcome of $7.0 million. Management has not completed the evaluation of the significant unobservable inputs and probability weightings using Monte Carlo simulations to determine the fair value of the contingent consideration as it is impracticable to provide as of the date of this filing.
On May 2, 2017, pursuant to a Second Amendment to the First Lien Credit Agreement, entered into by the Borrower and the Guarantors, the Borrower (a) incurred $225.0 million of additional first lien term loans and (b) extended the termination date with respect to a $150.0 million portion of the Revolving Credit Facility held by certain lenders (such portion, the “Series A Revolving Loan Facility”) and the maturity date for any and all loans made pursuant to the Series A Revolving Loan Facility, from July 25, 2019 to April 25, 2021.
The Company has completed an evaluation of all subsequent events through May 4, 2017, the date the financial statements were available to be issued. The Company has concluded that no other subsequent events have occurred that require recognition or disclosure.
F-63
Table of Contents
Shares
Advantage Solutions Inc.
Common Stock
Goldman Sachs & Co. LLC
Morgan Stanley
Through and including , 2017 (the 25th day after the date of this prospectus), all dealers effecting transactions in these securities, whether or not participating in this offering, may be required to deliver a prospectus. This is in addition to a dealer’s obligation to deliver a prospectus when acting as an underwriter and with respect to an unsold allotment or subscription.
Table of Contents
PART II
INFORMATION NOT REQUIRED IN PROSPECTUS
Item 13. Other Expenses of Issuance and Distribution.
The following table indicates the expenses to be incurred in connection with the offering described in this registration statement, other than the underwriting discounts and commissions, all of which will be paid by us. All amounts are estimated except the Securities and Exchange Commission registration fee, the FINRA filing fee and the New York Stock Exchange listing fee.
Item | Amount | |||
Securities and Exchange Commission registration fee | $ | 11,590 | ||
FINRA filing fee | 15,500 | |||
New York Stock Exchange listing fee | * | |||
Accountants’ fees and expenses | * | |||
Legal fees and expenses | * | |||
Blue Sky fees and expenses | * | |||
Transfer Agent’s fees and expenses | * | |||
Printing and engraving expenses | * | |||
Miscellaneous | * | |||
|
| |||
Total expenses | $ | |||
|
| |||
| * To | be completed by amendment. |
Item 14. Indemnification of Directors and Officers.
Section 102 of the General Corporation Law of the State of Delaware permits a corporation to eliminate the personal liability of directors of a corporation to the corporation or its stockholders for monetary damages for a breach of fiduciary duty as a director, except where the director breached his duty of loyalty, failed to act in good faith, engaged in intentional misconduct or knowingly violated a law, authorized the payment of a dividend or approved a stock repurchase in violation of Delaware corporate law or obtained an improper personal benefit. Our restated certificate of incorporation provides that no director of the Registrant shall be personally liable to it or its stockholders for monetary damages for any breach of fiduciary duty as a director, notwithstanding any provision of law imposing such liability, except to the extent that the General Corporation Law of the State of Delaware prohibits the elimination or limitation of liability of directors for breaches of fiduciary duty.
Section 145 of the General Corporation Law of the State of Delaware provides that a corporation has the power to indemnify a director, officer, employee, or agent of the corporation, or a person serving at the request of the corporation for another corporation, partnership, joint venture, trust or other enterprise in related capacities against expenses (including attorneys’ fees), judgments, fines and amounts paid in settlement actually and reasonably incurred by the person in connection with an action, suit or proceeding to which he was or is a party or is threatened to be made a party to any threatened, ending or completed action, suit or proceeding by reason of such position, if such person acted in good faith and in a manner he reasonably believed to be in or not opposed to the best interests of the corporation, and, in any criminal action or proceeding, had no reasonable cause to believe his conduct was unlawful, except that, in the case of actions brought by or in the right of the corporation, no indemnification shall be made with respect to any claim, issue or matter as to which such person shall have been adjudged to be liable to the corporation unless and only to the extent that the Court of Chancery or other adjudicating court determines that, despite the adjudication of liability but in view of all of the circumstances of the case, such person is fairly and reasonably entitled to indemnity for such expenses which the Court of Chancery or such other court shall deem proper.
II-1
Table of Contents
Our amended and restated certificate of incorporation provides that we will indemnify each person who was or is a party or threatened to be made a party to any threatened, pending or completed action, suit or proceeding (other than an action by or in the right of us) by reason of the fact that he or she is or was, or has agreed to become, a director or officer, or is or was serving, or has agreed to serve, at our request as a director, officer, partner, employee or trustee of, or in a similar capacity with, another corporation, partnership, joint venture, trust or other enterprise (all such persons being referred to as an “Indemnitee”), or by reason of any action alleged to have been taken or omitted in such capacity, against all expenses (including attorneys’ fees), judgments, fines and amounts paid in settlement actually and reasonably incurred in connection with such action, suit or proceeding and any appeal therefrom, if such Indemnitee acted in good faith and in a manner he or she reasonably believed to be in, or not opposed to, our best interests, and, with respect to any criminal action or proceeding, he or she had no reasonable cause to believe his or her conduct was unlawful. Our amended and restated certificate of incorporation provides that we will indemnify any Indemnitee who was or is a party to an action or suit by or in the right of us to procure a judgment in our favor by reason of the fact that the Indemnitee is or was, or has agreed to become, a director or officer, or is or was serving, or has agreed to serve, at our request as a director, officer, partner, employee or trustee of, or in a similar capacity with, another corporation, partnership, joint venture, trust or other enterprise, or by reason of any action alleged to have been taken or omitted in such capacity, against all expenses (including attorneys’ fees) and, to the extent permitted by law, amounts paid in settlement actually and reasonably incurred in connection with such action, suit or proceeding, and any appeal therefrom, if the Indemnitee acted in good faith and in a manner he or she reasonably believed to be in, or not opposed to, our best interests, except that no indemnification shall be made with respect to any claim, issue or matter as to which such person shall have been adjudged to be liable to us, unless a court determines that, despite such adjudication but in view of all of the circumstances, he or she is entitled to indemnification of such expenses. Notwithstanding the foregoing, to the extent that any Indemnitee has been successful, on the merits or otherwise, he or she will be indemnified by us against all expenses (including attorneys’ fees) actually and reasonably incurred in connection therewith. Expenses must be advanced to an Indemnitee under certain circumstances.
We intend to enter into indemnification agreements with each of our directors and officers. These indemnification agreements may require us, among other things, to indemnify our directors and officers for some expenses, including attorneys’ fees, judgments, fines and settlement amounts incurred by a director or officer in any action or proceeding arising out of his or her service as one of our directors or officers, or any of our subsidiaries or any other company or enterprise to which the person provides services at our request.
We maintain a general liability insurance policy that covers certain liabilities of directors and officers of our corporation arising out of claims based on acts or omissions in their capacities as directors or officers.
In any underwriting agreement we enter into in connection with the sale of common stock being registered hereby, the underwriters will agree to indemnify, under certain conditions, us, our directors, our officers and persons who control us within the meaning of the Securities Act of 1933, as amended, or the Securities Act, against certain liabilities.
Item 15. Recent Sales of Unregistered Securities.
In connection with the 2014 Topco Acquisition, on June 13, 2014, we issued 100 shares of common stock to Karman Topco. This transaction was exempt from the registration requirements pursuant to Section 4(2) of the Securities Act, as a transaction by the Registrant not involving a public offering. We determined that the purchaser of the securities was a sophisticated investor and was provided access to all relevant information necessary to evaluate the investment.
II-2
Table of Contents
Item 16. Exhibits and financial statement schedules.
(a) Exhibits. See the Exhibit Index attached to this registration statement, which is incorporated by reference herein.
(b) Financial statement schedules. All schedules have been omitted because the information required to be set forth in the schedules is either not applicable or is shown in the financial statements or notes or schedules thereto included in the prospectus.
Item 17. Undertakings.
The undersigned registrant hereby undertakes to provide to the underwriter, at the closing specified in the underwriting agreement, certificates in such denominations and registered in such names as required by the underwriter to permit prompt delivery to each purchaser.
Insofar as indemnification for liabilities arising under the Securities Act may be permitted to directors, officers and controlling persons of the registrant pursuant to the foregoing provisions, or otherwise, the registrant has been advised that in the opinion of the Securities and Exchange Commission such indemnification is against public policy as expressed in the Securities Act and is, therefore, unenforceable. In the event that a claim for indemnification against such liabilities (other than the payment by the registrant of expenses incurred or paid by a director, officer or controlling person of the registrant in the successful defense of any action, suit or proceeding) is asserted by such director, officer or controlling person in connection with the securities being registered, the registrant will, unless in the opinion of its counsel the matter has been settled by controlling precedent, submit to a court of appropriate jurisdiction the question whether such indemnification by it is against public policy as expressed in the Securities Act and will be governed by the final adjudication of such issue.
The undersigned hereby undertakes that:
(1) For purposes of determining any liability under the Securities Act, the information omitted from the form of prospectus filed as part of this registration statement in reliance upon Rule 430A and contained in a form of prospectus filed by the registrant pursuant to Rule 424(b)(1) or (4) or 497(h) under the Securities Act shall be deemed to be part of this registration statement as of the time it was declared effective.
(2) For the purpose of determining any liability under the Securities Act, each post-effective amendment that contains a form of prospectus shall be deemed to be a new registration statement relating to the securities offered therein, and the offering of such securities at that time shall be deemed to be the initial bona fide offering thereof.
(3) For the purpose of determining liability under the Securities Act to any purchaser, each prospectus filed pursuant to Rule 424(b) as part of a registration statement relating to an offering, other than registration statements relying on Rule 430B or other than prospectuses filed in reliance on Rule 430A, shall be deemed to be part of and included in the registration statement as of the date it is first used after effectiveness. Provided, however, that no statement made in a registration statement or prospectus that is part of the registration statement or made in a document incorporated or deemed incorporated by reference into the registration statement or prospectus that is part of the registration statement will, as to a purchaser with a time of contract of sale prior to such first use, supersede or modify any statement that was made in the registration statement or prospectus that was part of the registration statement or made in any such document immediately prior to such date of first use.
(4) In a primary offering of securities of the undersigned registrant pursuant to this registration statement, regardless of the underwriting method used to sell the securities to the purchaser, if the
II-3
Table of Contents
securities are offered or sold to such purchaser by means of any of the following communications, the undersigned registrant will be a seller to the purchaser and will be considered to offer or sell such securities to such purchaser:
(i) Any preliminary prospectus or prospectus of the undersigned registrant relating to the offering required to be filed pursuant to Rule 424;
(ii) Any free writing prospectus relating to the offering prepared by or on behalf of the undersigned registrant or used or referred to by the undersigned registrant;
(iii) The portion of any other free writing prospectus relating to the offering containing material information about the undersigned registrant or its securities provided by or on behalf of the undersigned registrant; and
(iv) Any other communication that is an offer in the offering made by the undersigned registrant to the purchaser.
II-4
Table of Contents
SIGNATURES
Pursuant to the requirements of the Securities Act, the registrant has duly caused this Registration Statement to be signed on its behalf by the undersigned, thereunto duly authorized, in the City of Irvine, State of California, on this 9th day of June, 2017.
| ADVANTAGE SOLUTIONS INC. | ||
By: | /s/ Tanya Domier | |
Tanya Domier Chief Executive Officer | ||
Pursuant to the requirements of the Securities Act of 1933, as amended, this Registration Statement has been signed below by the following persons on behalf of the Registrant and in the capacities and on the dates indicated.
Signature | Title | Date | ||
/s/ Tanya Domier Tanya Domier | Chief Executive Officer and Director (principal executive officer) | June 9, 2017 | ||
/s/ Brian Stevens Brian Stevens | Chief Financial Officer, Chief Operating Officer and Director (principal financial officer) | June 9, 2017 | ||
/s/ Dean Kaye Dean Kaye | Executive Vice President—Finance and Accounting (principal accounting officer) | June 9, 2017 | ||
Table of Contents
EXHIBIT INDEX
Exhibit number | Description of exhibit | |
| 1.1* | Form of Underwriting Agreement. | |
| 3.1* | Restated Certificate of Incorporation of the Registrant. | |
| 3.2* | Amended and Restated Bylaws of the Registrant. | |
| 4.1* | Specimen Stock Certificate evidencing the shares of common stock. | |
| 4.2* | Amended and Restated Registration Rights Agreement, as of September 29, 2014, by and among Karman Topco L.P., Green Equity Investors VI, L.P., LGP AssociatesVI-A LLC, LGP AssociatesVI-B LLC, Karman Coinvest L.P., CVC ASM Holdco, LP, JCP ASM Holdco, L.P., Centerview Capital, L.P., Centerview Employees, L.P., and the other parties listed on the scheduled thereto. | |
| 5.1* | Opinion of Latham & Watkins LLP. | |
| 10.1+ | First Lien Credit Agreement, dated July 25, 2014, by and among Karman Buyer Corp., Karman Intermediate Corp., Bank of America, N.A., Credit Suisse Securities (USA) LLC, Deutsche Bank Securities Inc., and Jefferies Finance LLC. | |
| 10.1(a)+ | First Lien Credit Agreement Supplement, dated July 25, 2014, by and among Advantage Sales & Marketing Inc., Karman Intermediate Corp., Advantage Sales & Marketing LLC, Advantage Waypoint LLC, and Bank of America, N.A., as administrative agent. | |
| 10.1(b)+ | First Amendment to First Lien Credit Agreement, dated April 8, 2015, by and among Advantage Sales & Marketing Inc., Karman Intermediate Corp., the other guarantors party thereto, Bank of America, N.A., as administrative agent and as collateral agent under the loan documents, and Jefferies Finance LLC, as incremental lender. | |
| 10.1(c)+ | Second Amendment to First Lien Credit Agreement, dated May 2, 2017, by and among Advantage Sales & Marketing Inc., Karman Intermediate Corp., the other guarantors party thereto, Bank of America, N.A. as administrative agent and as collateral agent under the loan documents, Bank of America, N.A. as incremental lender, the revolving lenders signatory thereto as extending lenders, Bank of America, N.A. as swingline lender, and Bank of America, N.A. and Credit Suisse AG, Cayman Islands Branch as issuing banks. | |
| 10.2+ | First Lien Security Agreement, dated July 25, 2014, by and among Karman Buyer Corp., Karman Intermediate Corp., the Subsidiary Guarantors party thereto from time to time and Bank of America, N.A. | |
| 10.2(a)+ | First Lien Security Agreement Supplement, dated August 22, 2014, by and among Advantage Sales & Marketing Inc., Karman Intermediate Corp., the Subsidiary Guarantors party thereto, and Bank of America, N.A. | |
| 10.3+ | Second Lien Credit Agreement, dated July 25, 2014, by and among Karman Buyer Corp., Karman Intermediate Corp., Bank of America, N.A., and other lenders party thereto. | |
| 10.3(a)+ | Second Lien Credit Agreement Supplement, dated July 25, 2014, by and among Advantage Sales & Marketing Inc., Karman Intermediate Corp., Advantage Sales & Marketing LLC, Advantage Waypoint LLC, and Bank of America, N.A., as administrative agent. | |
| 10.4+ | Second Lien Security Agreement, dated July 25, 2014, by and among Karman Buyer Corp., Karman Intermediate Corp., the Subsidiary Guarantors party thereto from time to time, and Bank of America N.A. | |
| 10.4(a)+ | Second Lien Security Agreement Supplement, dated August 22, 2014, by and among Advantage Sales & Marketing Inc., Karman Intermediate Corp., the Subsidiary Guarantors party thereto, and Bank of America, N.A. | |
Table of Contents
Exhibit number | Description of exhibit | |
| 10.5+ | Intercreditor Agreement, dated July 25, 2014, by and among Bank of America, N.A. (in its capacity as the First Lien collateral agent), and Bank of America, N.A. (in its capacity as the Second Lien Collateral Agent). | |
| 10.6+ | Management Services Agreement, dated as of July 25, 2014, by and among Advantage Sales & Marketing Inc., Leonard Green & Partners, L.P., CVC Capital Partners Advisory Company (Luxembourg) Sarl, and Juggernaut Management, LLC. | |
| 10.6(a)+ | First Amendment to the Management Services Agreement, dated as of September 29, 2014, by and among Advantage Sales & Marketing Inc., Leonard Green & Partners, L.P., CVC Capital Partners Advisory Company (Luxembourg) Sarl, Juggernaut Management, LLC, and Centerview Capital Management, LLC. | |
| 10.7* | Form of Indemnification Agreement to be entered into between Advantage Solutions Inc. and certain of its directors and officers, to be effective upon the closing of this offering. | |
| 10.8*† | Advantage Solutions Inc. 2017 Incentive Award Plan. | |
| 10.9*† | Advantage Solutions Inc. 2017 Executive Annual Incentive Plan. | |
| 10.10*† | Advantage Solutions Inc. 2017 Employee Stock Purchase Plan. | |
| 21.1+ | Subsidiary List. | |
| 23.1 | Consent of PricewaterhouseCoopers LLP. | |
| 23.2 | Consent of PricewaterhouseCoopers LLP. | |
| 23.3* | Consent of Latham & Watkins LLP (included in Exhibit 5.1). | |
| 23.4+ | Consent of Dechert-Hampe & Company. | |
| 99.1+ | Consent of Cameron Breitner to be named a director nominee. | |
| 99.2+ | Consent of Robert F. End to be named a director nominee. | |
| 99.3+ | Consent of Timothy J. Flynn to be named a director nominee. | |
| 99.4+ | Consent of Sonny King to be named a director nominee. | |
| 99.5+ | Consent of Christopher J. Stadler to be named a director nominee. | |
| 99.6+ | Consent of Jack L. Stahl to be named a director nominee. | |
| 99.7+ | Consent of Jonathan D. Sokoloff to be named a director nominee. | |
| * | To be filed by amendment. |
| + | Previously filed. |
| † | Indicates a management contract or compensatory plan or arrangement. |