Investor Presentation May 2018 FORWARD LOOKING STATEMENTS Exhibit 99.1
Disclaimer and Forward-Looking Statements FORWARD LOOKING STATEMENTS This presentation contains certain statements and information that may constitute “forward-looking statements” within the meaning of Section 27A of the Securities Act of 1933, as amended, and Section 21E of the Securities Exchange Act of 1934, as amended. All statements, other than statements of historical fact, that address activities, events or developments that we expect, believe or anticipate will or may occur in the future are forward-looking statements. The words “anticipate,” “believe,” “ensure,” “expect,” “if,” “once” “intend,” “plan,” “estimate,” “project,” “forecasts,” “predict,” “outlook,” “will,” “could,” “should,” “potential,” “would,” “may,” “probable,” “likely,” and similar expressions that convey the uncertainty of future events or outcomes, and the negative thereof, are intended to identify forward-looking statements. Forward-looking statements contained in this presentation, which are not generally historical in nature, include those that express a belief, expectation or intention regarding our future activities, plans and goals and our current expectations with respect to, among other things: our operating cash flows, the availability of capital and our liquidity; our future revenue, income and operating performance; our ability to sustain and improve our utilization, revenue and margins; our ability to maintain acceptable pricing for our services; future capital expenditures; our ability to finance equipment, working capital and capital expenditures; our ability to execute our long-term growth strategy; our ability to successfully develop our research and technology capabilities and implement technological developments and enhancements; and the timing and success of strategic initiatives and special projects. Forward-looking statements are not assurances of future performance and actual results could differ materially from our historical experience and our present expectations or projections. These forward-looking statements are based on management’s current expectations and beliefs, forecasts for our existing operations, experience, expectations and perception of historical trends, current conditions, anticipated future developments and their effect on us, and other factors believed to be appropriate. Although management believes the expectations and assumptions reflected in these forward-looking statements are reasonable as and when made, no assurance can be given that these assumptions are accurate or that any of these expectations will be achieved (in full or at all). Our forward-looking statements involve significant risks, contingencies and uncertainties, most of which are difficult to predict and many of which are beyond our control. Known material factors that could cause actual results to differ materially from those in the forward-looking statements include, but are not limited to, risks associated with the following: a decline in demand for our services, including due to declining commodity prices, overcapacity and other competitive factors affecting our industry; the cyclical nature and volatility of the oil and gas industry, which impacts the level of exploration, production and development activity and spending patterns by our customers; a decline in, or substantial volatility of, crude oil and gas commodity prices, which generally leads to decreased spending by our customers and negatively impacts drilling, completion and production activity; pressure on pricing for our core services, including due to competition and industry and/or economic conditions, which may impact, among other things, our ability to implement price increases or maintain pricing on our core services; the loss of, or interruption or delay in operations by, one or more significant customers; the failure by one or more of our significant customers to amounts when due, or at all; changes in customer requirements in markets or industries we serve; costs, delays, compliance requirements and other difficulties in executing our short-and long-term business plans and growth strategies; the effects of recent or future acquisitions on our business, including our ability to successfully integrate our operations and the costs incurred in doing so; business growth outpacing the capabilities of our infrastructure; operating hazards inherent in our industry, including the possibility of accidents resulting in personal injury or death, property damage or environmental damage; adverse weather conditions in oil or gas producing regions; the loss of, or interruption or delay in operations by, one or more of our key suppliers; the effect of environmental and other governmental regulations on our operations, including the risk that future changes in the regulation of hydraulic fracturing could reduce or eliminate demand for our services; the incurrence of significant costs and liabilities resulting from litigation; the incurrence of significant costs and liabilities or severe restrictions on our operations or the inability to perform certain operations resulting from a failure to comply, or our compliance with, new or existing regulations; the effect of new or existing regulations, industry and/or commercial conditions on the availability of and costs for raw materials, consumables and equipment; the loss of, or inability to attract, key management personnel; a shortage of qualified workers; damage to or malfunction of equipment; our ability to maintain sufficient liquidity and/or obtain adequate financing to allow us to execute our business plan; and our ability to comply with covenants under our new credit facility. For additional information regarding known material factors that could affect our operating results and performance, please see Quintana Energy Services Inc.’s (“Quintana,” “QES,” “Company,” “us,” “we” or “our”) most recently filed Annual Report on Form 10-K, subsequent Quarterly Reports on Form 10-Q, and recent Current Reports on Form 8-K, which are available at the SEC’s website, http://www.sec.gov. Should one or more of these known material risks occur, or should the underlying assumptions change or prove incorrect, our actual results, performance, achievements or plans could differ materially from those expressed or implied in any forward-looking statement. Readers are cautioned not to place undue reliance on forward-looking statements, which speak only as of the date hereof. All subsequent written or oral forward-looking statements concerning us are expressly qualified in their entirety by the cautionary statements above. We undertake no obligation to publicly update or revise any forward-looking statements after the date they are made, whether as a result of new information, future events or otherwise, except as required by law. All information in this presentation is as of March 31, 2018 unless otherwise indicated. Non-GAAP Financial Measures: This presentation includes Adjusted EBITDA, a measure not calculated in accordance with generally accepted accounting principles in the U.S. ("U.S. GAAP"). Please see the Appendix slide(s) for a reconciliation of net income (loss), the nearest measure calculated in accordance with U.S. GAAP, or pro forma net income (loss) prepared and presented in accordance with Article 11 of Regulation S-X, to Adjusted EBITDA.
Multi-Service Offering Across Diverse Geographic Base with In-Basin Scale High-Quality and Broad Customer Base Strong Balance Sheet with Returns-Focused Mentality Significant Growth Opportunities Demonstrated Consolidator with Proven Ability to Achieve Synergies Recent Results Reflect Significant Operating Leverage 1 2 3 4 5 6 Investment Highlights FORWARD LOOKING STATEMENTS
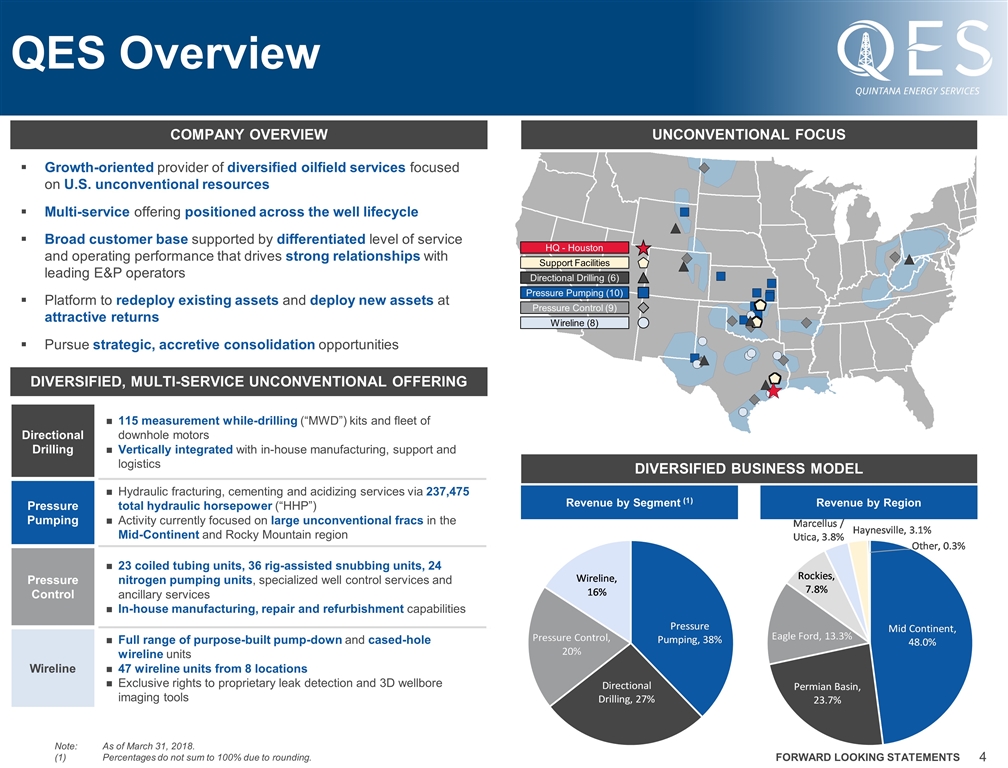
QES Overview Growth-oriented provider of diversified oilfield services focused on U.S. unconventional resources Multi-service offering positioned across the well lifecycle Broad customer base supported by differentiated level of service and operating performance that drives strong relationships with leading E&P operators Platform to redeploy existing assets and deploy new assets at attractive returns Pursue strategic, accretive consolidation opportunities DIVERSIFIED, Multi-Service UNCONVENTIONAL Offering Company Overview UNCONVENTIONAL FOCUS Diversified Business Model Revenue by Region Revenue by Segment (1) Note:As of March 31, 2018. Percentages do not sum to 100% due to rounding. Support Facilities Pressure Pumping (10) Directional Drilling (6) Pressure Control (9) Wireline (8) HQ - Houston Directional Drilling 115 measurement while-drilling (“MWD”) kits and fleet of downhole motors Vertically integrated with in-house manufacturing, support and logistics Pressure Pumping Hydraulic fracturing, cementing and acidizing services via 237,475 total hydraulic horsepower (“HHP”) Activity currently focused on large unconventional fracs in the Mid-Continent and Rocky Mountain region Pressure Control 23 coiled tubing units, 36 rig-assisted snubbing units, 24 nitrogen pumping units, specialized well control services and ancillary services In-house manufacturing, repair and refurbishment capabilities Wireline Full range of purpose-built pump-down and cased-hole wireline units 47 wireline units from 8 locations Exclusive rights to proprietary leak detection and 3D wellbore imaging tools FORWARD LOOKING STATEMENTS
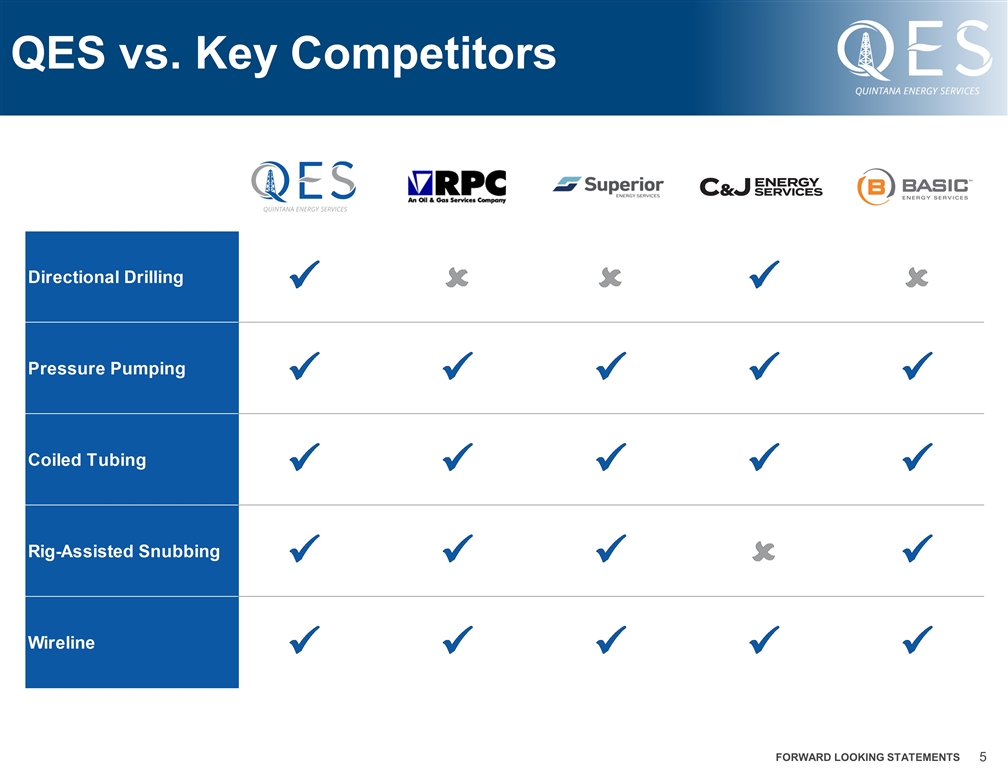
QES vs. Key Competitors FORWARD LOOKING STATEMENTS
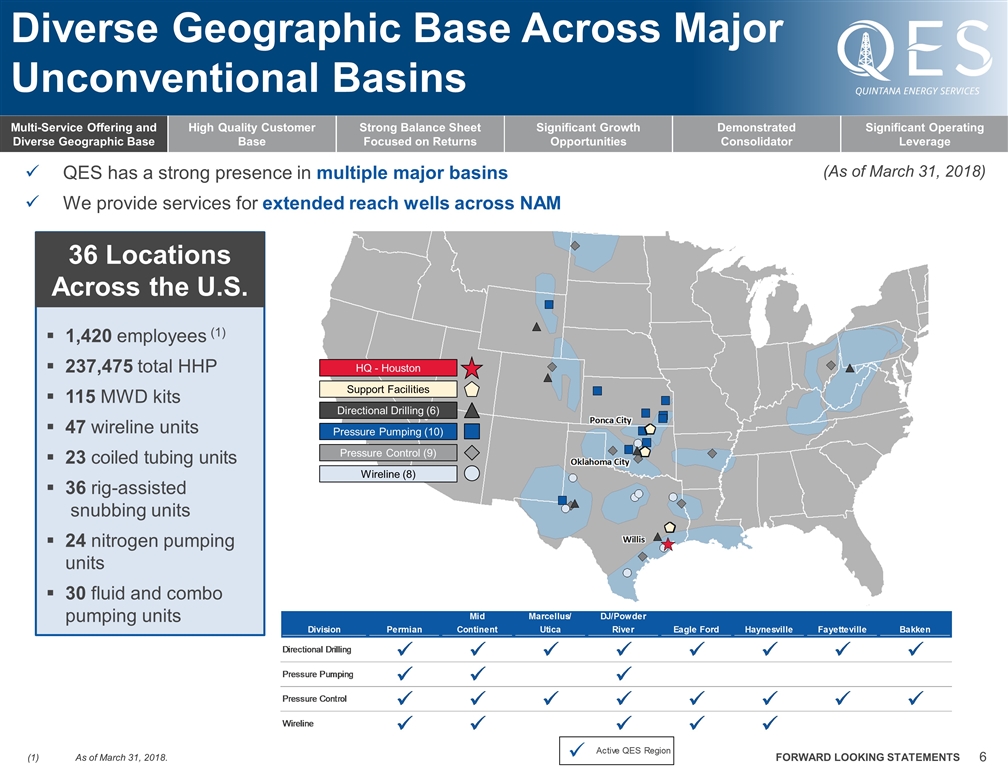
Diverse Geographic Base Across Major Unconventional Basins QES has a strong presence in multiple major basins We provide services for extended reach wells across NAM (As of March 31, 2018) 1,420 employees (1) 237,475 total HHP 115 MWD kits 47 wireline units 23 coiled tubing units 36 rig-assisted snubbing units 24 nitrogen pumping units 30 fluid and combo pumping units 36 Locations Across the U.S. As of March 31, 2018. Multi-Service Offering and Diverse Geographic Base High Quality Customer Base Strong Balance Sheet Focused on Returns Significant Growth Opportunities Demonstrated Consolidator Significant Operating Leverage Support Facilities Pressure Pumping (10) Directional Drilling (6) Pressure Control (9) Wireline (8) HQ - Houston FORWARD LOOKING STATEMENTS
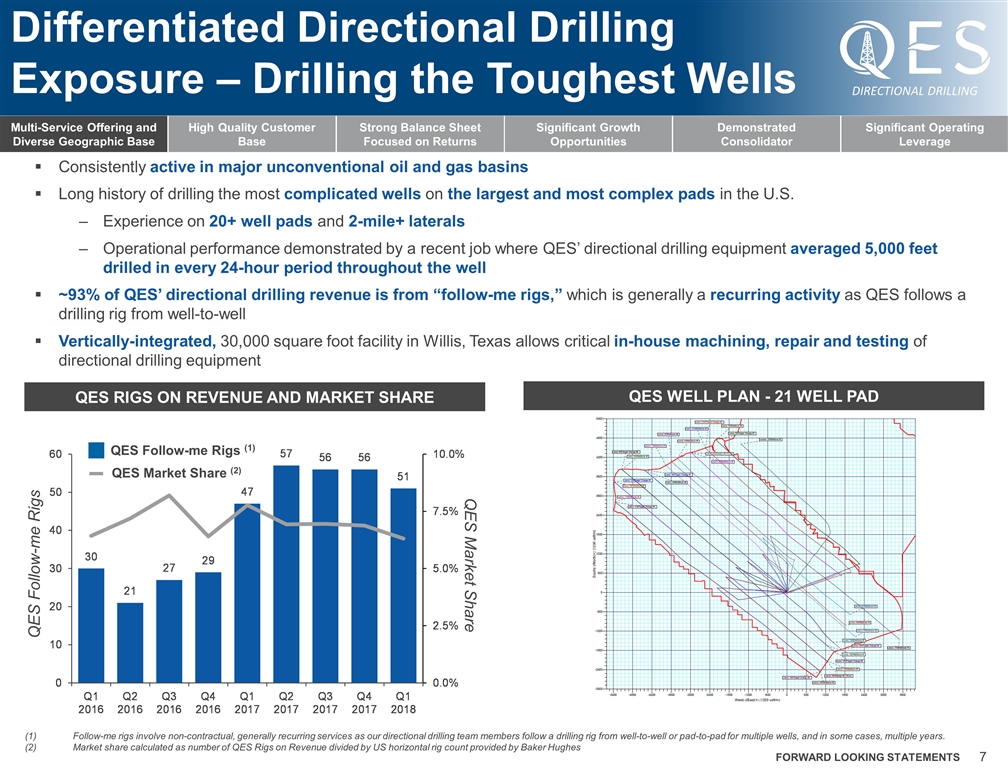
Differentiated Directional Drilling Exposure – Drilling the Toughest Wells Consistently active in major unconventional oil and gas basins Long history of drilling the most complicated wells on the largest and most complex pads in the U.S. Experience on 20+ well pads and 2-mile+ laterals Operational performance demonstrated by a recent job where QES’ directional drilling equipment averaged 5,000 feet drilled in every 24-hour period throughout the well ~93% of QES’ directional drilling revenue is from “follow-me rigs,” which is generally a recurring activity as QES follows a drilling rig from well-to-well Vertically-integrated, 30,000 square foot facility in Willis, Texas allows critical in-house machining, repair and testing of directional drilling equipment QES RIGS ON REVENUE and Market Share QES Well Plan - 21 Well Pad QES Follow-me Rigs QES Market Share QES Follow-me Rigs (1) QES Market Share (2) Follow-me rigs involve non-contractual, generally recurring services as our directional drilling team members follow a drilling rig from well-to-well or pad-to-pad for multiple wells, and in some cases, multiple years. Market share calculated as number of QES Rigs on Revenue divided by US horizontal rig count provided by Baker Hughes Multi-Service Offering and Diverse Geographic Base High Quality Customer Base Strong Balance Sheet Focused on Returns Significant Growth Opportunities Demonstrated Consolidator Significant Operating Leverage DIRECTIONAL DRILLING FORWARD LOOKING STATEMENTS
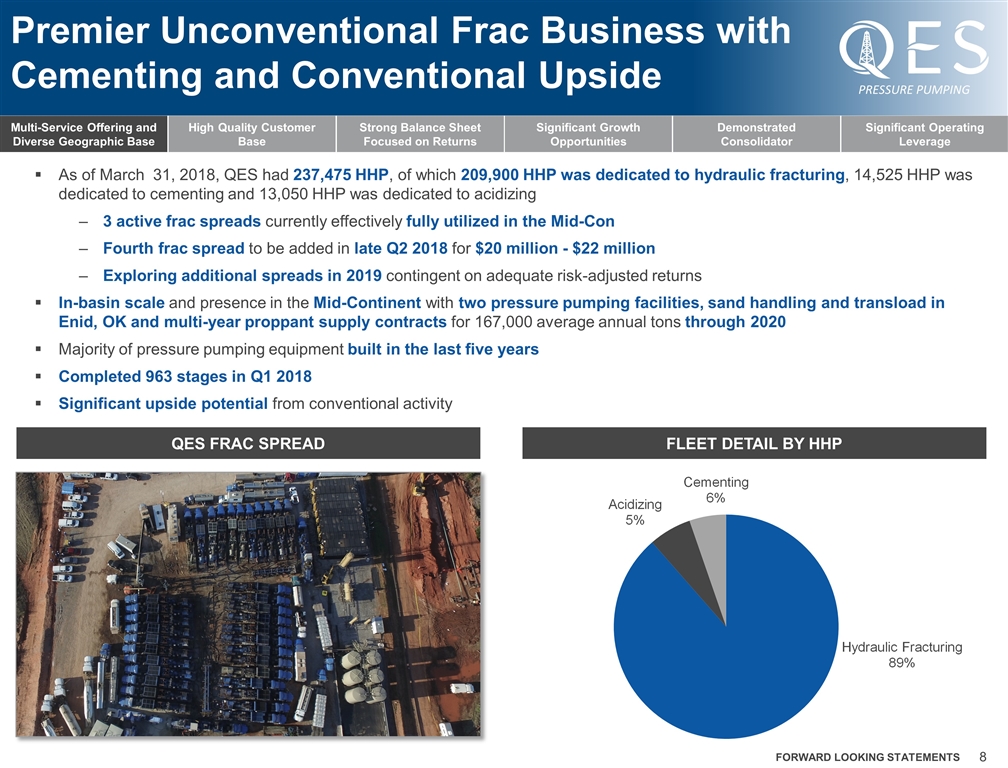
Premier Unconventional Frac Business with Cementing and Conventional Upside As of March 31, 2018, QES had 237,475 HHP, of which 209,900 HHP was dedicated to hydraulic fracturing, 14,525 HHP was dedicated to cementing and 13,050 HHP was dedicated to acidizing 3 active frac spreads currently effectively fully utilized in the Mid-Con Fourth frac spread to be added in late Q2 2018 for $20 million - $22 million Exploring additional spreads in 2019 contingent on adequate risk-adjusted returns In-basin scale and presence in the Mid-Continent with two pressure pumping facilities, sand handling and transload in Enid, OK and multi-year proppant supply contracts for 167,000 average annual tons through 2020 Majority of pressure pumping equipment built in the last five years Completed 963 stages in Q1 2018 Significant upside potential from conventional activity fleet detail by HHP QES Frac Spread 209,100 Hydraulic Fracturing HHP Multi-Service Offering and Diverse Geographic Base High Quality Customer Base Strong Balance Sheet Focused on Returns Significant Growth Opportunities Demonstrated Consolidator Significant Operating Leverage PRESSURE PUMPING FORWARD LOOKING STATEMENTS
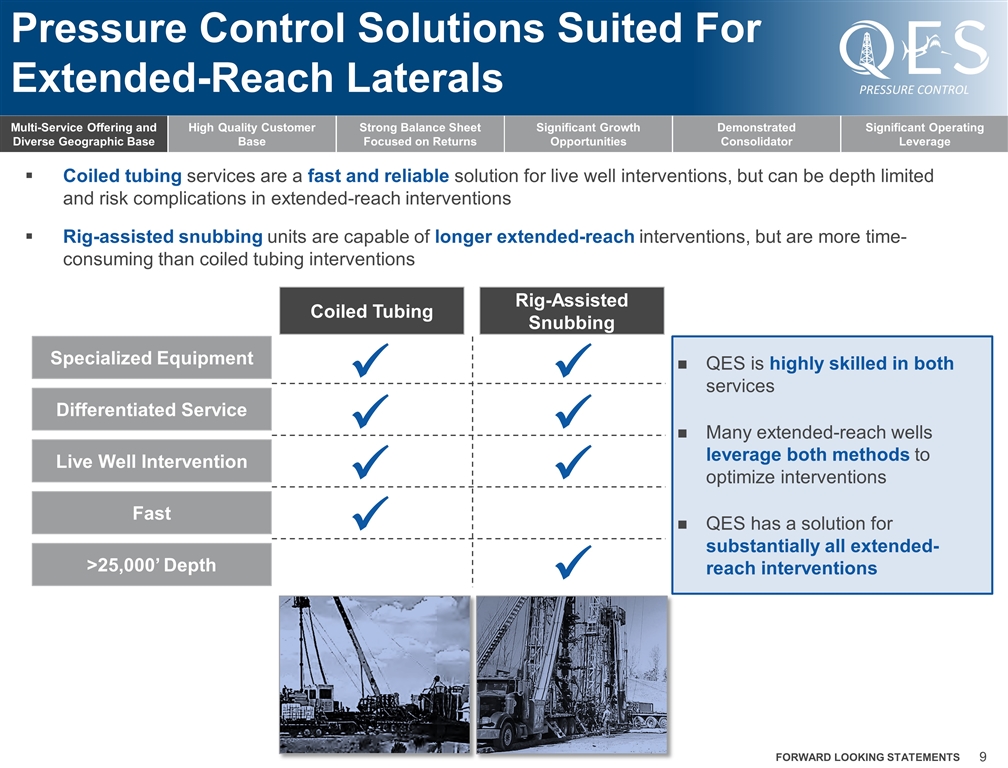
Pressure Control Solutions Suited For Extended-Reach Laterals Coiled tubing services are a fast and reliable solution for live well interventions, but can be depth limited and risk complications in extended-reach interventions Rig-assisted snubbing units are capable of longer extended-reach interventions, but are more time-consuming than coiled tubing interventions QES is highly skilled in both services Many extended-reach wells leverage both methods to optimize interventions QES has a solution for substantially all extended-reach interventions Specialized Equipment ü ü Differentiated Service ü ü Live Well Intervention ü ü Fast ü >25,000’ Depth ü Coiled Tubing Rig-Assisted Snubbing Multi-Service Offering and Diverse Geographic Base High Quality Customer Base Strong Balance Sheet Focused on Returns Significant Growth Opportunities Demonstrated Consolidator Significant Operating Leverage PRESSURE CONTROL FORWARD LOOKING STATEMENTS
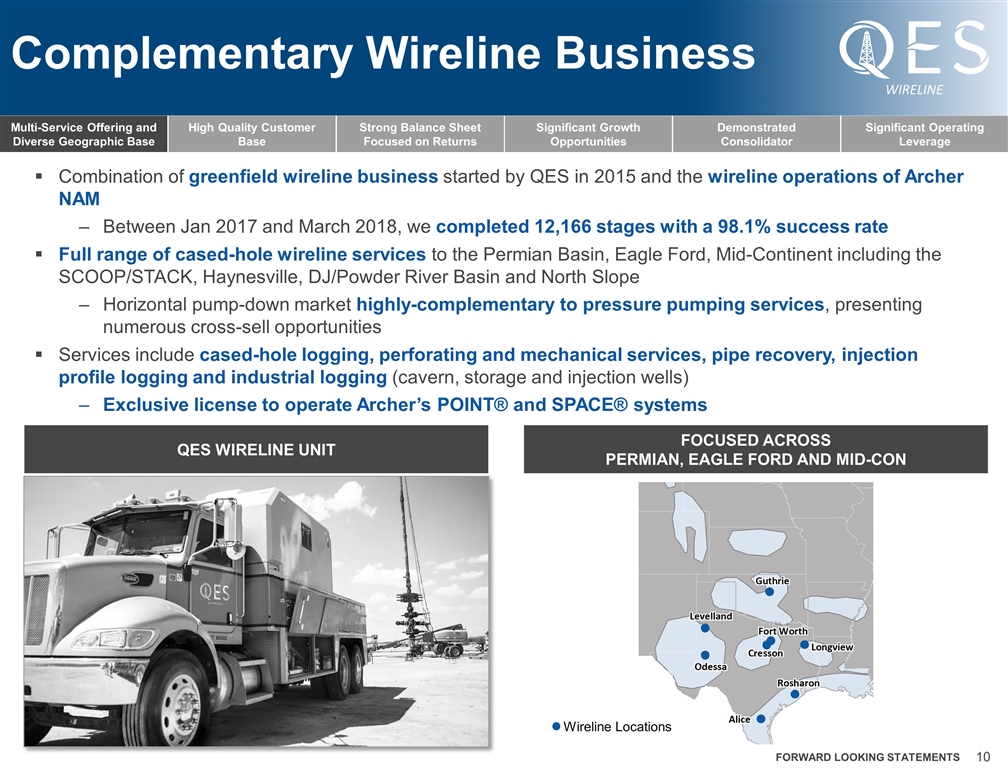
Complementary Wireline Business Combination of greenfield wireline business started by QES in 2015 and the wireline operations of Archer NAM Between Jan 2017 and March 2018, we completed 12,166 stages with a 98.1% success rate Full range of cased-hole wireline services to the Permian Basin, Eagle Ford, Mid-Continent including the SCOOP/STACK, Haynesville, DJ/Powder River Basin and North Slope Horizontal pump-down market highly-complementary to pressure pumping services, presenting numerous cross-sell opportunities Services include cased-hole logging, perforating and mechanical services, pipe recovery, injection profile logging and industrial logging (cavern, storage and injection wells) Exclusive license to operate Archer’s POINT® and SPACE® systems focused across Permian, eagle ford and mid-Con QES Wireline Unit Multi-Service Offering and Diverse Geographic Base High Quality Customer Base Strong Balance Sheet Focused on Returns Significant Growth Opportunities Demonstrated Consolidator Significant Operating Leverage Wireline Locations WIRELINE FORWARD LOOKING STATEMENTS
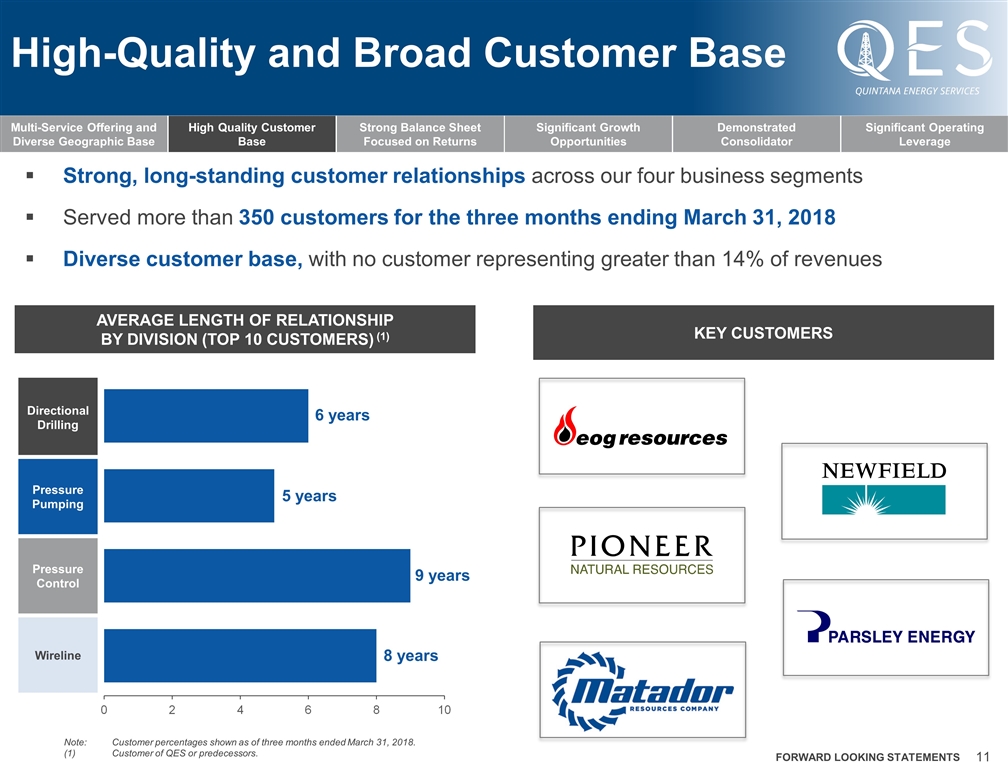
High-Quality and Broad Customer Base Strong, long-standing customer relationships across our four business segments Served more than 350 customers for the three months ending March 31, 2018 Diverse customer base, with no customer representing greater than 14% of revenues Key customers Average Length of Relationship By Division (Top 10 Customers) (1) Note: Customer percentages shown as of three months ended March 31, 2018. (1)Customer of QES or predecessors. Directional Drilling Pressure Pumping Pressure Control Wireline Multi-Service Offering and Diverse Geographic Base High Quality Customer Base Strong Balance Sheet Focused on Returns Significant Growth Opportunities Demonstrated Consolidator Significant Operating Leverage 6 years 5 years 9 years 8 years FORWARD LOOKING STATEMENTS
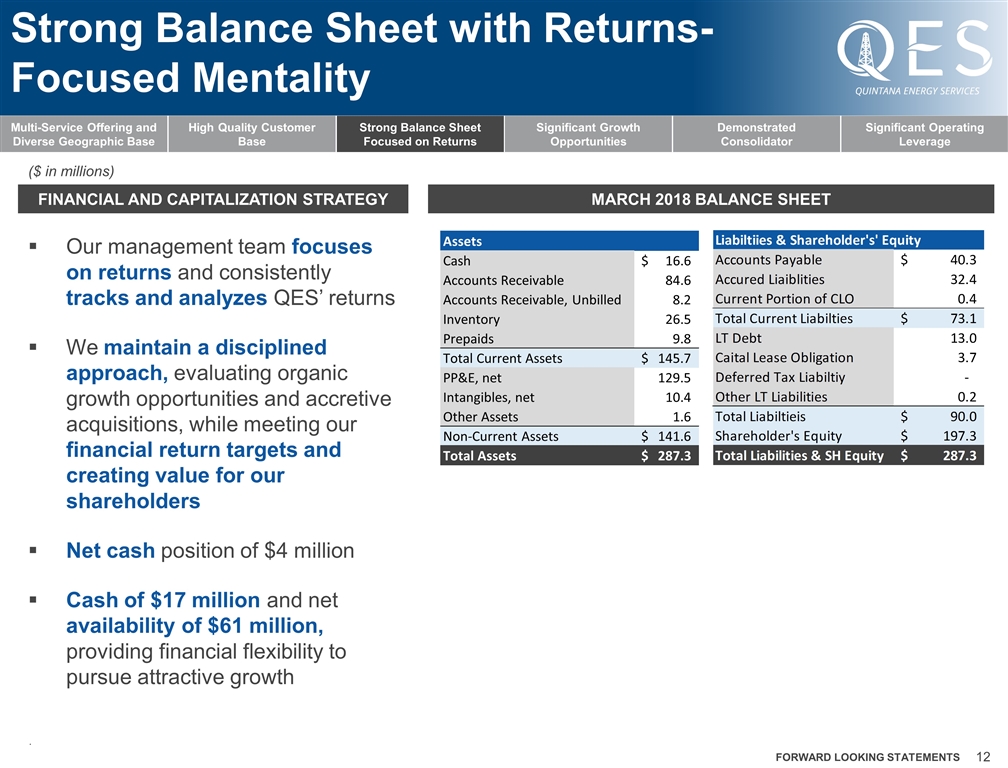
Strong Balance Sheet with Returns-Focused Mentality Financial and capitalization strategy Our management team focuses on returns and consistently tracks and analyzes QES’ returns We maintain a disciplined approach, evaluating organic growth opportunities and accretive acquisitions, while meeting our financial return targets and creating value for our shareholders Net cash position of $4 million Cash of $17 million and net availability of $61 million, providing financial flexibility to pursue attractive growth March 2018 balance sheet . Multi-Service Offering and Diverse Geographic Base High Quality Customer Base Strong Balance Sheet Focused on Returns Significant Growth Opportunities Demonstrated Consolidator Significant Operating Leverage FORWARD LOOKING STATEMENTS ($ in millions) Assets Cash 16.6 $ Accounts Receivable 84.6 Accounts Receivable, Unbilled 8.2 Inventory 26.5 Prepaids 9.8 Total Current Assets 145.7 $ PP&E, net 129.5 Intangibles, net 10.4 Other Assets 1.6 Non-Current Assets 141.6 $ Total Assets 287.3 $
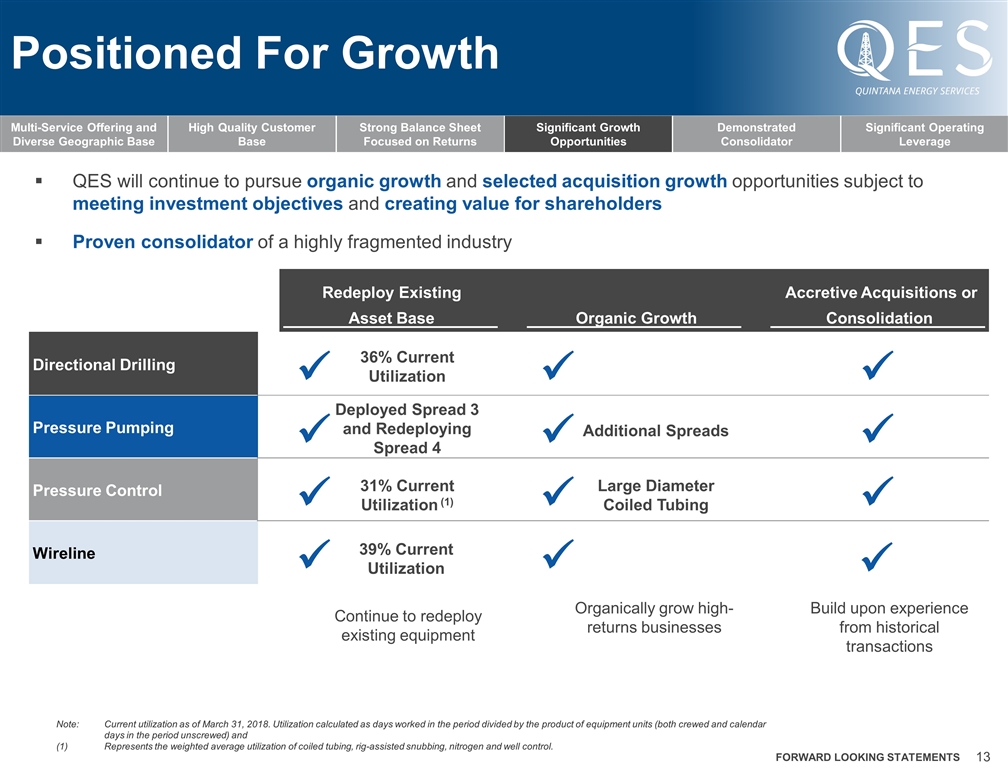
Positioned For Growth QES will continue to pursue organic growth and selected acquisition growth opportunities subject to meeting investment objectives and creating value for shareholders Proven consolidator of a highly fragmented industry Deployed Spread 3 and Redeploying Spread 4 Additional Spreads Large Diameter Coiled Tubing 39% Current Utilization 36% Current Utilization 31% Current Utilization (1) Continue to redeploy existing equipment Organically grow high-returns businesses Build upon experience from historical transactions Note:Current utilization as of March 31, 2018. Utilization calculated as days worked in the period divided by the product of equipment units (both crewed and calendar days in the period unscrewed) and Represents the weighted average utilization of coiled tubing, rig-assisted snubbing, nitrogen and well control. Multi-Service Offering and Diverse Geographic Base High Quality Customer Base Strong Balance Sheet Focused on Returns Significant Growth Opportunities Demonstrated Consolidator Significant Operating Leverage Redeploy Existing Asset Base Organic Growth Accretive Acquisitions or Consolidation Directional Drilling ü ü ü Pressure Pumping ü ü ü Pressure Control ü ü ü Wireline ü ü ü FORWARD LOOKING STATEMENTS
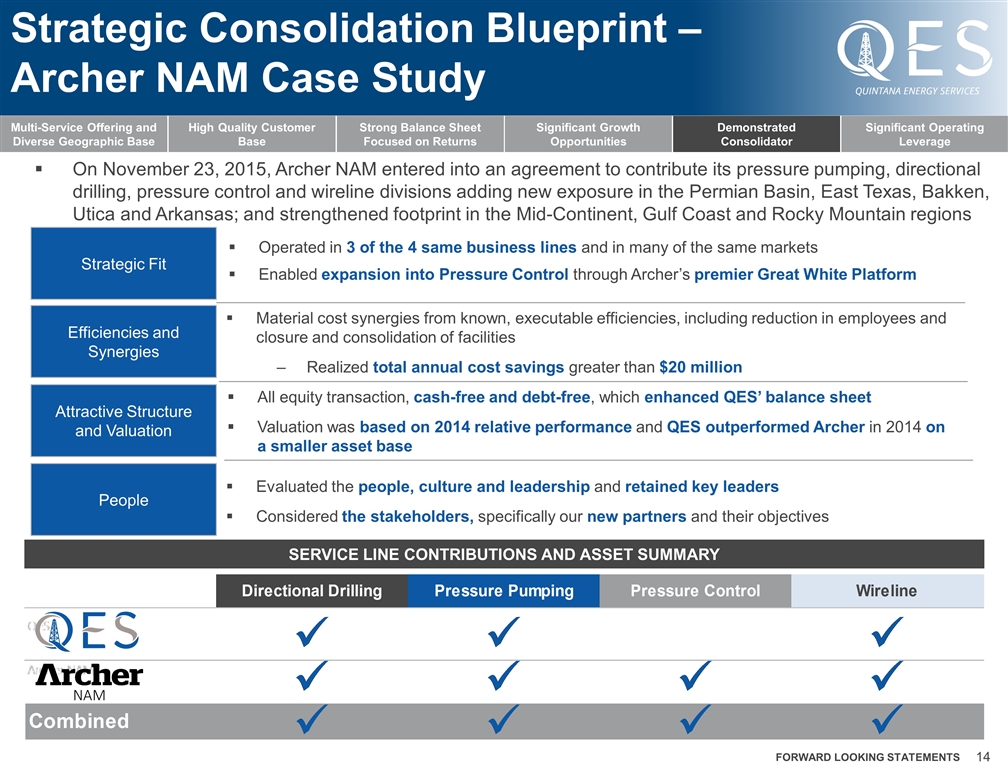
Strategic Consolidation Blueprint – Archer NAM Case Study NAM Service line contributions and Asset summary Multi-Service Offering and Diverse Geographic Base High Quality Customer Base Strong Balance Sheet Focused on Returns Significant Growth Opportunities Demonstrated Consolidator Significant Operating Leverage On November 23, 2015, Archer NAM entered into an agreement to contribute its pressure pumping, directional drilling, pressure control and wireline divisions adding new exposure in the Permian Basin, East Texas, Bakken, Utica and Arkansas; and strengthened footprint in the Mid-Continent, Gulf Coast and Rocky Mountain regions Strategic Fit Efficiencies and Synergies Attractive Structure and Valuation People Operated in 3 of the 4 same business lines and in many of the same markets Enabled expansion into Pressure Control through Archer’s premier Great White Platform Material cost synergies from known, executable efficiencies, including reduction in employees and closure and consolidation of facilities Realized total annual cost savings greater than $20 million All equity transaction, cash-free and debt-free, which enhanced QES’ balance sheet Valuation was based on 2014 relative performance and QES outperformed Archer in 2014 on a smaller asset base Evaluated the people, culture and leadership and retained key leaders Considered the stakeholders, specifically our new partners and their objectives FORWARD LOOKING STATEMENTS
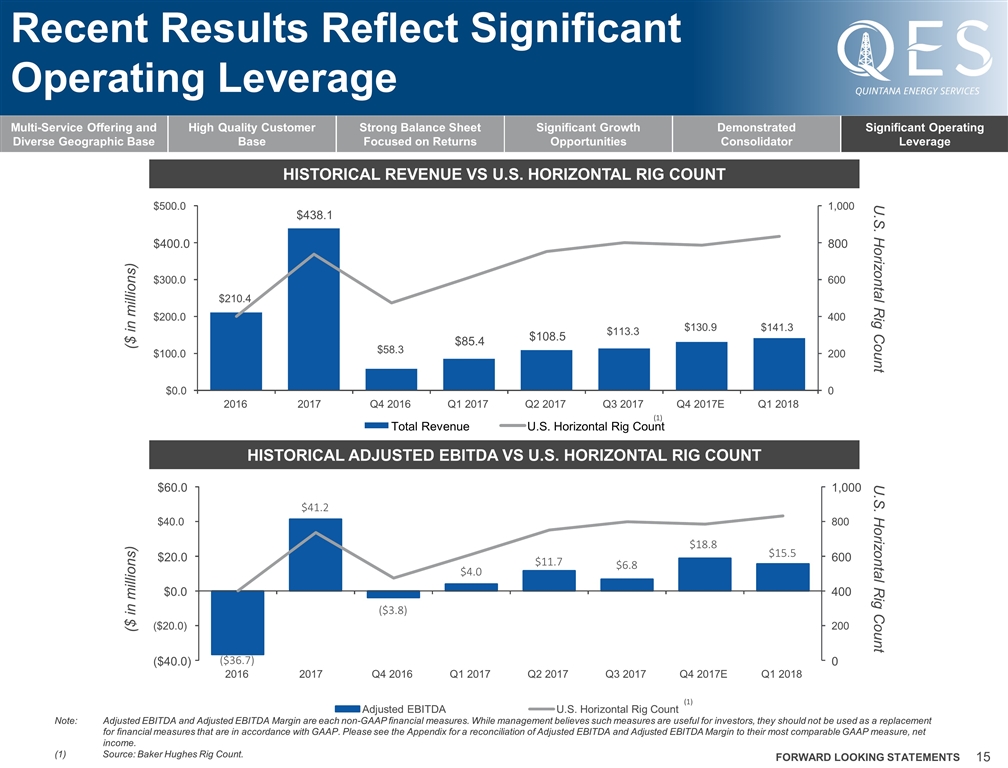
Recent Results Reflect Significant Operating Leverage Historical Revenue vs U.S. Horizontal Rig Count Historical Adjusted EBITDA vs U.S. Horizontal Rig Count Note:Adjusted EBITDA and Adjusted EBITDA Margin are each non-GAAP financial measures. While management believes such measures are useful for investors, they should not be used as a replacement for financial measures that are in accordance with GAAP. Please see the Appendix for a reconciliation of Adjusted EBITDA and Adjusted EBITDA Margin to their most comparable GAAP measure, net income. Source: Baker Hughes Rig Count. ($ in millions) ($ in millions) U.S. Horizontal Rig Count U.S. Horizontal Rig Count (1) (1) Multi-Service Offering and Diverse Geographic Base High Quality Customer Base Strong Balance Sheet Focused on Returns Significant Growth Opportunities Demonstrated Consolidator Significant Operating Leverage FORWARD LOOKING STATEMENTS $210.4 $438.1 $58.3 $85.4 $108.5 $113.3 $130.9 $141.3 0 200 400 600 800 1,000 $0.0 $100.0 $200.0 $300.0 $400.0 $500.0 2016 2017 Q4 2016 Q1 2017 Q2 2017 Q3 2017 Q4 2017E Q1 2018 Total Revenue U.S. Horizontal Rig Count ($36.7) $41.2 ($3.8) $4.0 $11.7 $6.8 $18.8 $15.5 0 200 400 600 800 1,000 ($40.0) ($20.0) $0.0 $20.0 $40.0 $60.0 2016 2017 Q4 2016 Q1 2017 Q2 2017 Q3 2017 Q4 2017E Q1 2018 Adjusted EBITDA U.S. Horizontal Rig Count
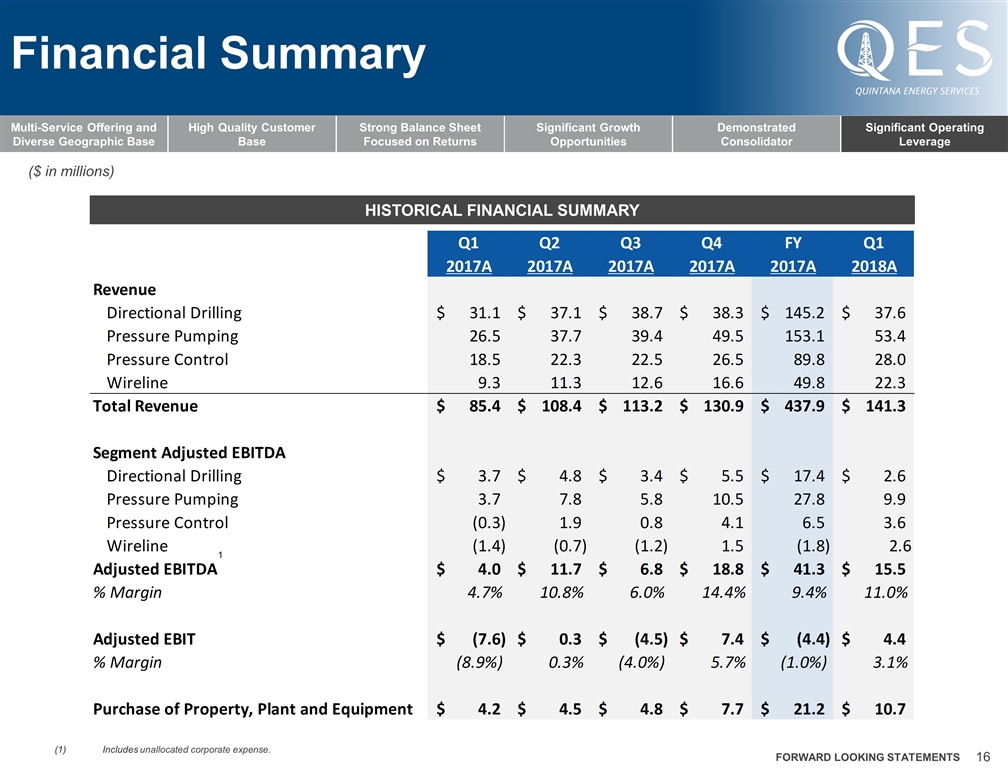
Financial Summary ($ in millions) Historical financial summary (1) Includes unallocated corporate expense. Multi-Service Offering and Diverse Geographic Base High Quality Customer Base Strong Balance Sheet Focused on Returns Significant Growth Opportunities Demonstrated Consolidator Significant Operating Leverage FORWARD LOOKING STATEMENTS 1
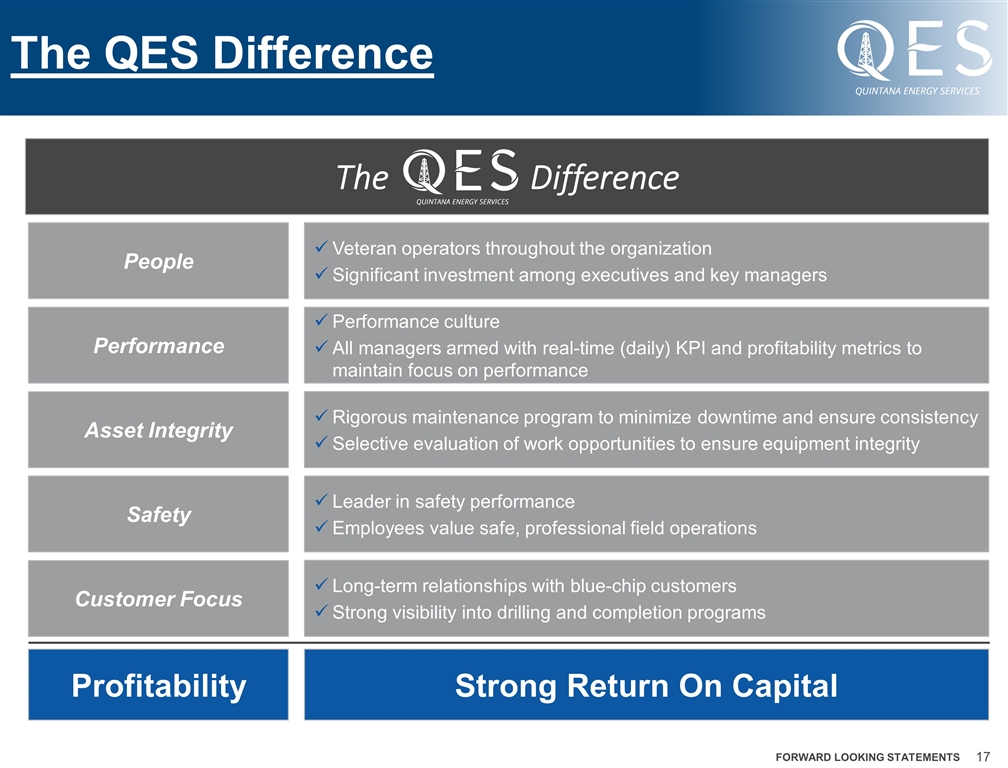
The QES Difference Strong Return On Capital Profitability Customer Focus Long-term relationships with blue-chip customers Strong visibility into drilling and completion programs Leader in safety performance Employees value safe, professional field operations Rigorous maintenance program to minimize downtime and ensure consistency Selective evaluation of work opportunities to ensure equipment integrity Performance culture All managers armed with real-time (daily) KPI and profitability metrics to maintain focus on performance Veteran operators throughout the organization Significant investment among executives and key managers The Difference Safety Asset Integrity Performance People FORWARD LOOKING STATEMENTS
Appendix FORWARD LOOKING STATEMENTS
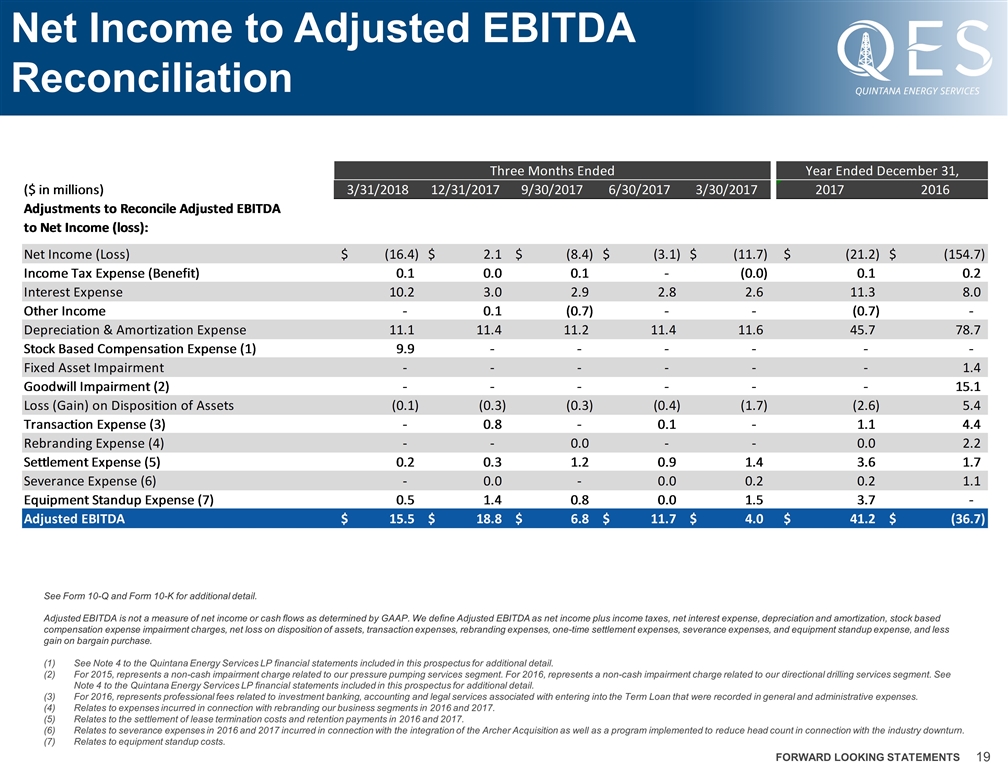
Net Income to Adjusted EBITDA Reconciliation See Form 10-Q and Form 10-K for additional detail. Adjusted EBITDA is not a measure of net income or cash flows as determined by GAAP. We define Adjusted EBITDA as net income plus income taxes, net interest expense, depreciation and amortization, stock based compensation expense impairment charges, net loss on disposition of assets, transaction expenses, rebranding expenses, one-time settlement expenses, severance expenses, and equipment standup expense, and less gain on bargain purchase. See Note 4 to the Quintana Energy Services LP financial statements included in this prospectus for additional detail. For 2015, represents a non-cash impairment charge related to our pressure pumping services segment. For 2016, represents a non-cash impairment charge related to our directional drilling services segment. See Note 4 to the Quintana Energy Services LP financial statements included in this prospectus for additional detail. For 2016, represents professional fees related to investment banking, accounting and legal services associated with entering into the Term Loan that were recorded in general and administrative expenses. Relates to expenses incurred in connection with rebranding our business segments in 2016 and 2017. Relates to the settlement of lease termination costs and retention payments in 2016 and 2017. Relates to severance expenses in 2016 and 2017 incurred in connection with the integration of the Archer Acquisition as well as a program implemented to reduce head count in connection with the industry downturn. Relates to equipment standup costs. FORWARD LOOKING STATEMENTS