
First Quarter 2019 Earnings May 2, 2019 Exhibit 99.2
Cautionary Notes This presentation contains forward-looking statements within the meaning of the Private Securities Litigation Reform Act of 1995. All statements other than statements of historical facts contained in this presentation, including statements regarding our future results of operations and financial position, industry dynamics, our mission, growth opportunities and business strategy and plans and our objectives for future operations, including expanding into new product categories, broadening our retailer network and increasing international sales, are forward-looking statements. The words “may,” “will,” “should,” “expects,” “plans,” “anticipates,” “could,” “intends,” “targets,” “projects,” “contemplates,” “believes,” “estimates,” “predicts,” “potential” or “continue” or the negative of these terms and similar expressions are intended to identify forward-looking statements. The forward-looking statements in this presentation are only predictions. We have based these forward-looking statements largely on our current expectations and projections about future events and financial trends that we believe may affect our business, financial condition and results of operations. Forward-looking statements involve known and unknown risks, uncertainties and other important factors that may cause our actual results, performance or achievements to be materially different from any future results, performance or achievements expressed or implied by the forward-looking statements, including without limitation our ability to maintain and realize the full value of our license agreements; the ongoing level of popularity of our products with consumers; changes in the retail industry and markets for our consumer products; our ability to maintain our relationships with retail customers and distributors; our ability to compete effectively; fluctuations in our gross margin; our dependence on content development and creation by third parties; our ability to develop and introduce products in a timely and cost-effective manner; increases in tariffs, trade restrictions or taxes; risks related to Brexit; counterfeit product risks; risks relating to intellectual property; our ability to attract and retain qualified employees and maintain our corporate culture; risks associated with our international operations; changes in U.S. tax law; foreign currency exchange rate exposure; economic downturns; our dependence on vendors and outsourcers; risks relating to government regulation; risks relating to litigation; any failure to successfully integrate or realize the anticipated benefits of acquisitions or investments; reputational risk resulting from our e-commerce business and social media presence; risks relating to our indebtedness and our ability to secure additional financing; the potential for our electronic data to be compromised, and the important factors discussed under the caption “Risk Factors” in our Form 10-K for the year ended December 31, 2018 and our other filings with the Securities and Exchange Commission. Because forward-looking statements are inherently subject to risks and uncertainties, some of which cannot be predicted or quantified, you should not rely on these forward-looking statements as predictions of future events. The events and circumstances reflected in our forward-looking statements may not be achieved or occur and actual results could differ materially from those projected in the forward-looking statements. In addition, statements that “we believe” and similar statements reflect our beliefs and opinions on the relevant subject. These statements are based upon information available to us as of the date hereof, and while we believe such information forms a reasonable basis for such statements, such information may be limited or incomplete, and our statements should not be read to indicate that we have conducted an exhaustive inquiry into, or review of, all potentially available relevant information. These statements are inherently uncertain and investors are cautioned not to unduly rely upon these statements. You should read this presentation with the understanding that our actual future results, levels of activity, performance and achievements may be materially different from what we expect. We qualify all of our forward-looking statements by these cautionary statements. These forward-looking statements speak only as of the date of this presentation, and except as otherwise required by law, we do not plan to publicly update or revise any forward-looking statements contained in this presentation, whether as a result of any new information, future events or otherwise. Unless otherwise indicated, information contained in this presentation concerning our industry, competitive position and the markets in which we operate is based on information from independent industry and research organizations, other third-party sources and management estimates. Management estimates are derived from publicly available information released by independent industry analysts and other third-party sources, as well as data from our internal research, and are based on assumptions made by us upon reviewing such data, and our experience in, and knowledge of, such industry and markets, which we believe to be reasonable. In addition, projections, assumptions and estimates of the future performance of the industry in which we operate and our future performance are necessarily subject to uncertainty and risk due to a variety of factors, including those described above. These and other factors could cause results to differ materially from those expressed in the estimates made by independent parties and by us.

is built on the principle that everyone is a fan of something…
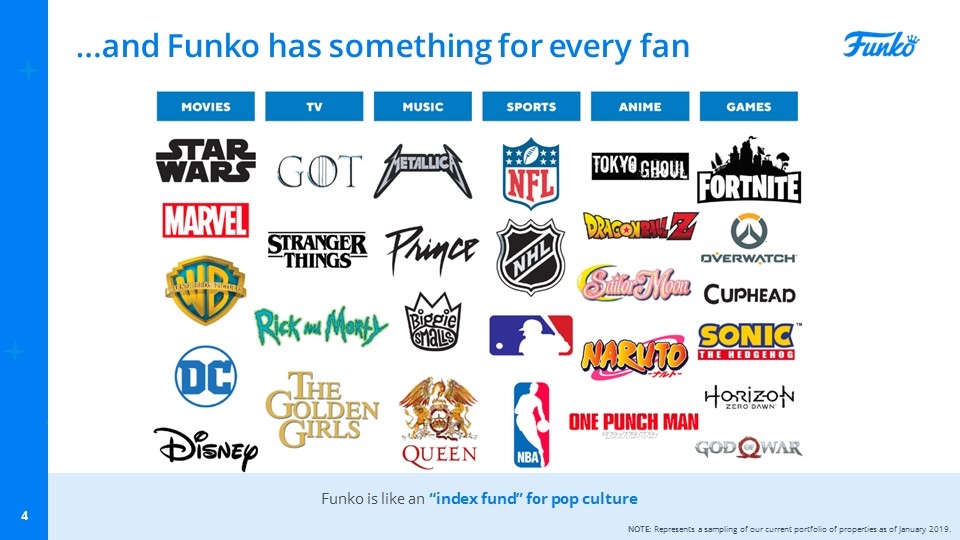
…and Funko has something for every fan NOTE: Represents a sampling of our current portfolio of properties as of January 2019. Funko is like an “index fund” for pop culture
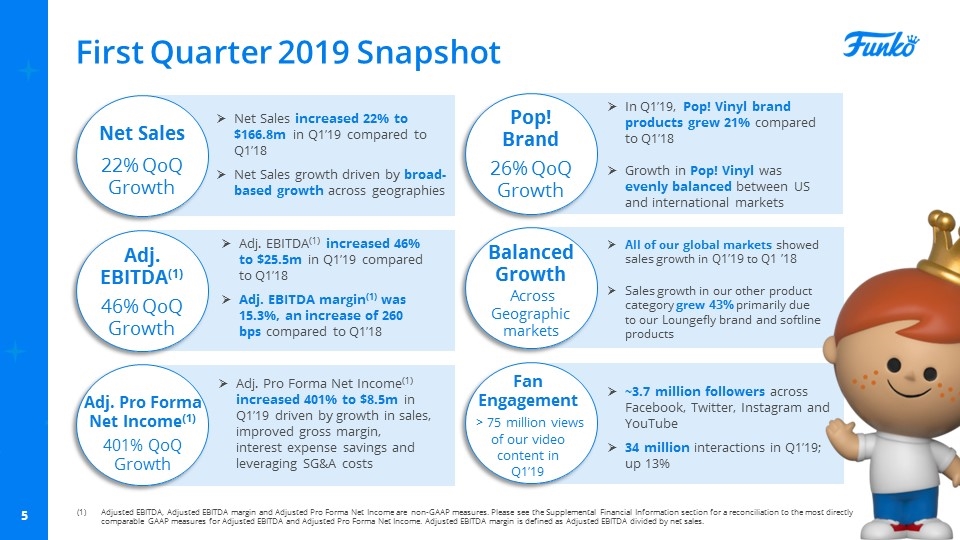
First Quarter 2019 Snapshot Net Sales 22% QoQ Growth Adj. EBITDA(1) 46% QoQ Growth Adj. Pro Forma Net Income(1) 401% QoQ Growth Net Sales increased 22% to $166.8m in Q1’19 compared to Q1’18 Net Sales growth driven by broad-based growth across geographies Pop! Brand 26% QoQ Growth Balanced Growth Across Geographic markets Adj. EBITDA(1) increased 46% to $25.5m in Q1’19 compared to Q1’18 Adj. EBITDA margin(1) was 15.3%, an increase of 260 bps compared to Q1’18 Adj. Pro Forma Net Income(1) increased 401% to $8.5m in Q1’19 driven by growth in sales, improved gross margin, interest expense savings and leveraging SG&A costs In Q1’19, Pop! Vinyl brand products grew 21% compared to Q1’18 Growth in Pop! Vinyl was evenly balanced between US and international markets All of our global markets showed sales growth in Q1’19 to Q1 ’18 Sales growth in our other product category grew 43% primarily due to our Loungefly brand and softline products ~3.7 million followers across Facebook, Twitter, Instagram and YouTube 34 million interactions in Q1’19; up 13% Adjusted EBITDA, Adjusted EBITDA margin and Adjusted Pro Forma Net Income are non-GAAP measures. Please see the Supplemental Financial Information section for a reconciliation to the most directly comparable GAAP measures for Adjusted EBITDA and Adjusted Pro Forma Net Income. Adjusted EBITDA margin is defined as Adjusted EBITDA divided by net sales. Fan Engagement > 75 million views of our video content in Q1’19
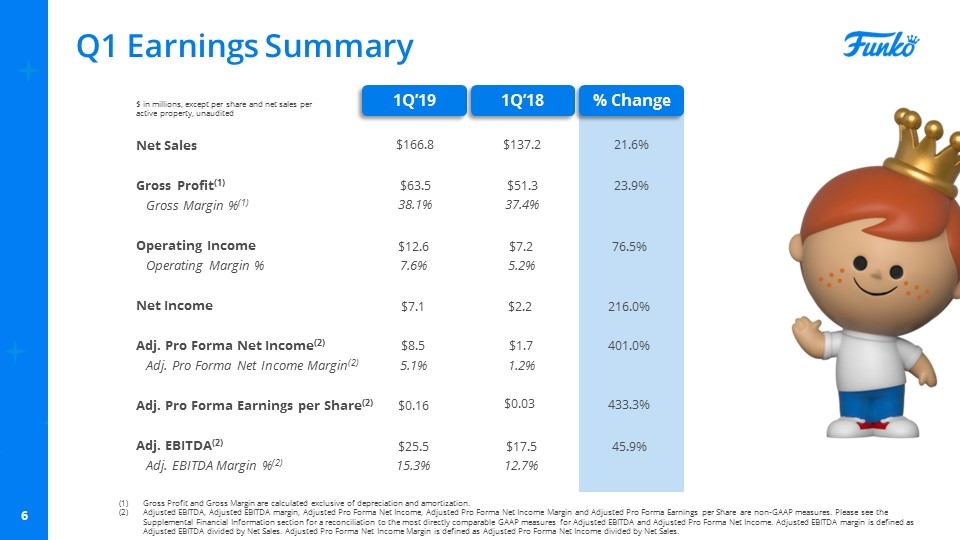
Q1 Earnings Summary Gross Profit and Gross Margin are calculated exclusive of depreciation and amortization. Adjusted EBITDA, Adjusted EBITDA margin, Adjusted Pro Forma Net Income, Adjusted Pro Forma Net Income Margin and Adjusted Pro Forma Earnings per Share are non-GAAP measures. Please see the Supplemental Financial Information section for a reconciliation to the most directly comparable GAAP measures for Adjusted EBITDA and Adjusted Pro Forma Net Income. Adjusted EBITDA margin is defined as Adjusted EBITDA divided by Net Sales. Adjusted Pro Forma Net Income Margin is defined as Adjusted Pro Forma Net Income divided by Net Sales. 1Q’19 1Q’18 % Change Net Sales Gross Profit(1) Gross Margin %(1) Operating Income Operating Margin % Net Income Adj. Pro Forma Net Income(2) Adj. Pro Forma Net Income Margin(2) Adj. Pro Forma Earnings per Share(2) Adj. EBITDA(2) Adj. EBITDA Margin %(2) $ in millions, except per share and net sales per active property, unaudited $166.8 $137.2 21.6% $63.5 $51.3 23.9% 38.1% 37.4% $12.6 $7.2 76.5% 7.6% 5.2% $0.16 $0.03 433.3% $25.5 $17.5 45.9% 15.3% 12.7% $8.5 $1.7 401.0% 5.1% 1.2% $7.1 $2.2 216.0%
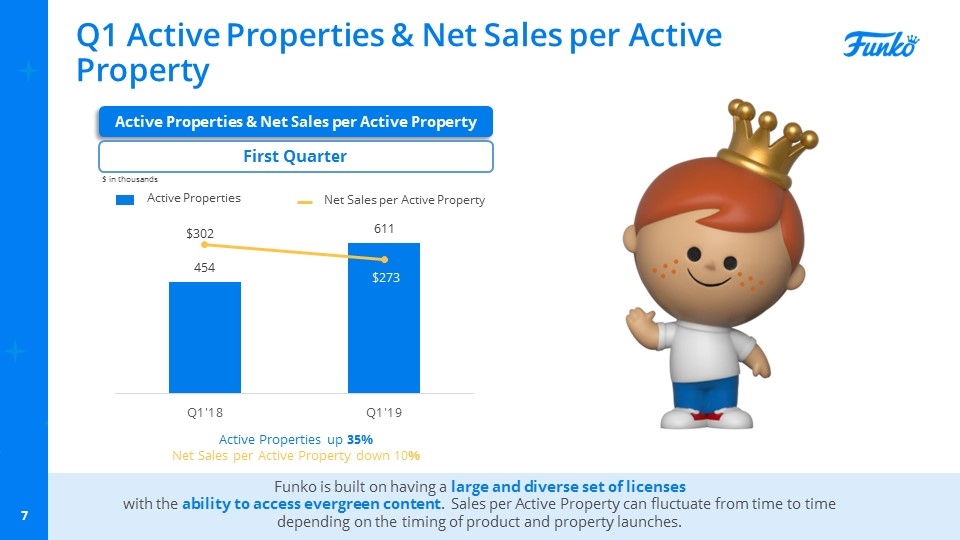
Q1 Active Properties & Net Sales per Active Property Active Properties & Net Sales per Active Property First Quarter Active Properties Net Sales per Active Property Active Properties up 35% Net Sales per Active Property down 10% Funko is built on having a large and diverse set of licenses with the ability to access evergreen content. Sales per Active Property can fluctuate from time to time depending on the timing of product and property launches. $ in thousands
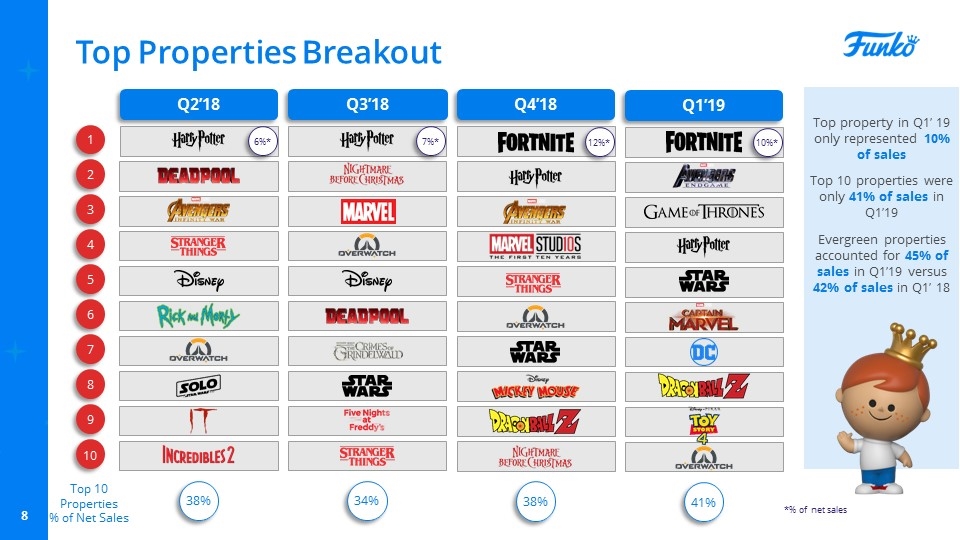
Top Properties Breakout Q2’18 Q3’18 1 2 3 5 7 4 6 8 9 10 Top 10 Properties % of Net Sales 38% 34% Top property in Q1’ 19 only represented 10% of sales Top 10 properties were only 41% of sales in Q1’19 Evergreen properties accounted for 45% of sales in Q1’19 versus 42% of sales in Q1’ 18 Q4’18 38% 12%* 7%* 6%* *% of net sales Q1’19 41% 10%*
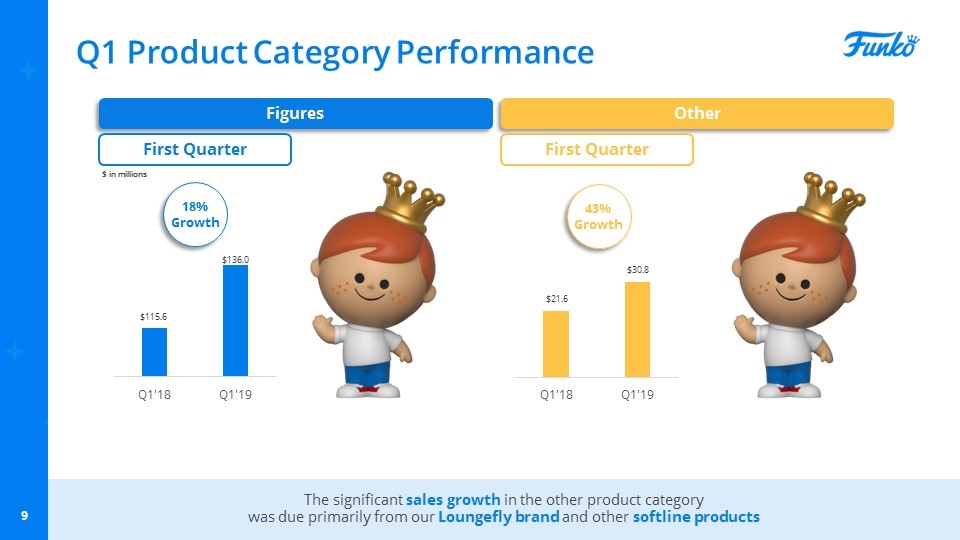
Q1 Product Category Performance $ in millions 18% Growth 43% Growth The significant sales growth in the other product category was due primarily from our Loungefly brand and other softline products Figures Other First Quarter First Quarter $ in millions
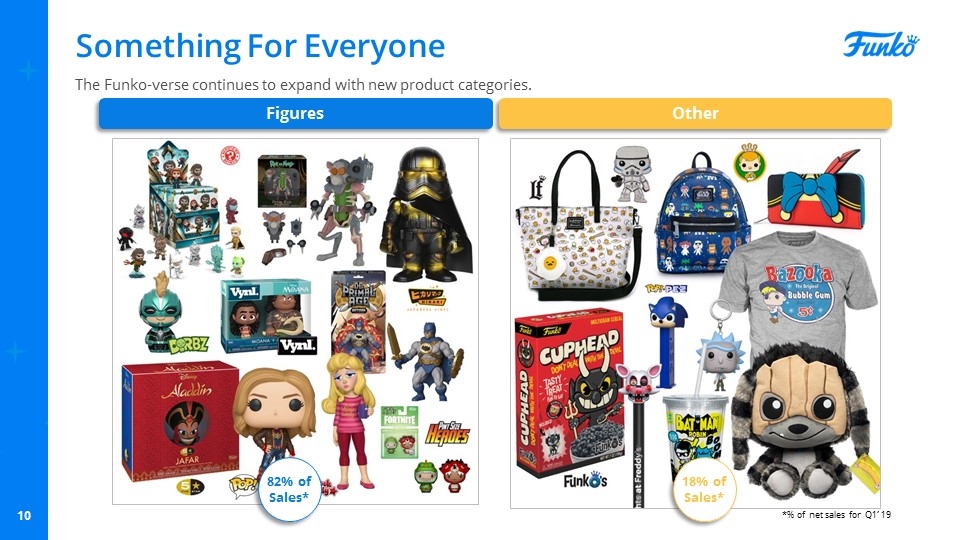
Something For Everyone The Funko-verse continues to expand with new product categories. Figures Other 82% of Sales* 18% of Sales* *% of net sales for Q1’ 19
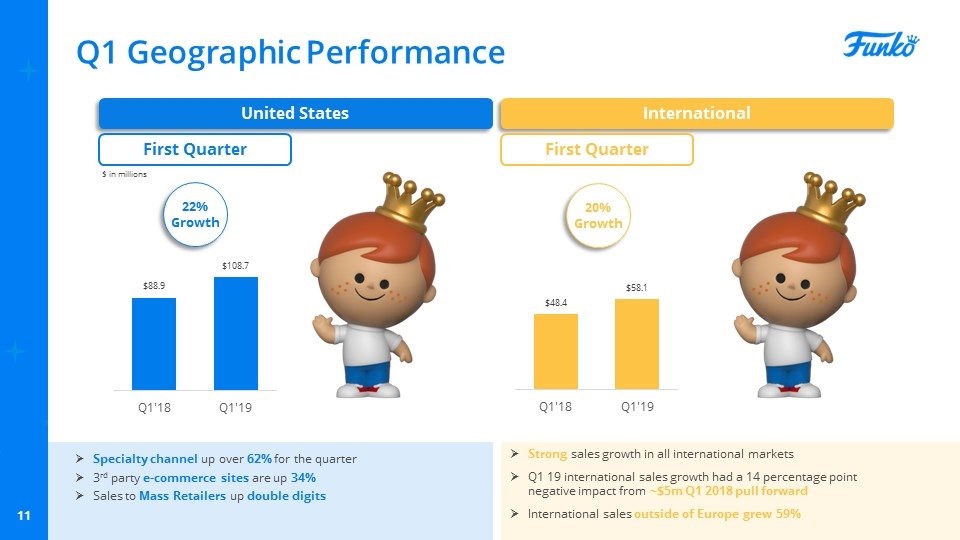
Q1 Geographic Performance United States International First Quarter First Quarter Specialty channel up over 62% for the quarter 3rd party e-commerce sites are up 34% Sales to Mass Retailers up double digits Strong sales growth in all international markets Q1 19 international sales growth had a 14 percentage point negative impact from ~$5m Q1 2018 pull forward International sales outside of Europe grew 59% $ in millions 22% Growth 20% Growth
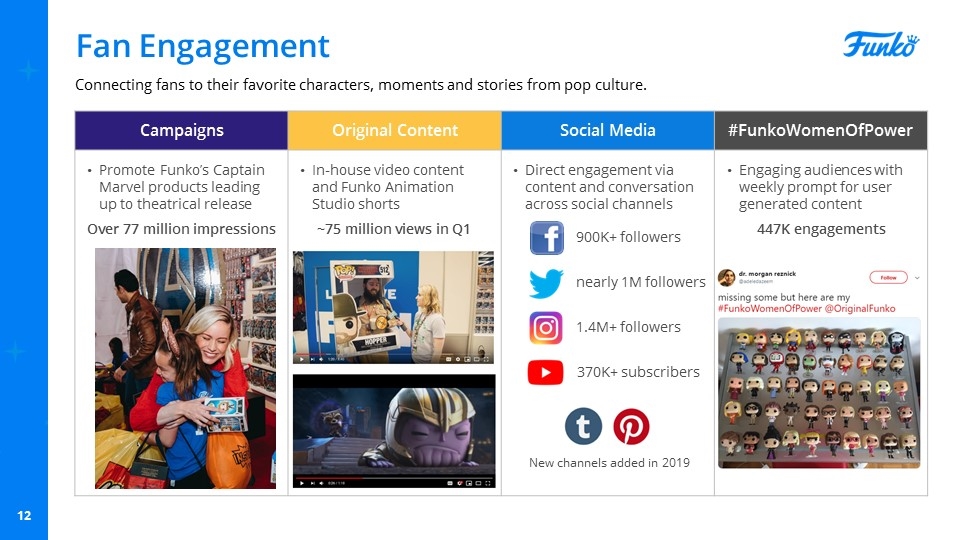
Fan Engagement Connecting fans to their favorite characters, moments and stories from pop culture. Campaigns Original Content Social Media #FunkoWomenOfPower Promote Funko’s Captain Marvel products leading up to theatrical release Over 77 million impressions In-house video content and Funko Animation Studio shorts ~75 million views in Q1 Direct engagement via content and conversation across social channels Engaging audiences with weekly prompt for user generated content 447K engagements 900K+ followers nearly 1M followers 1.4M+ followers 370K+ subscribers New channels added in 2019
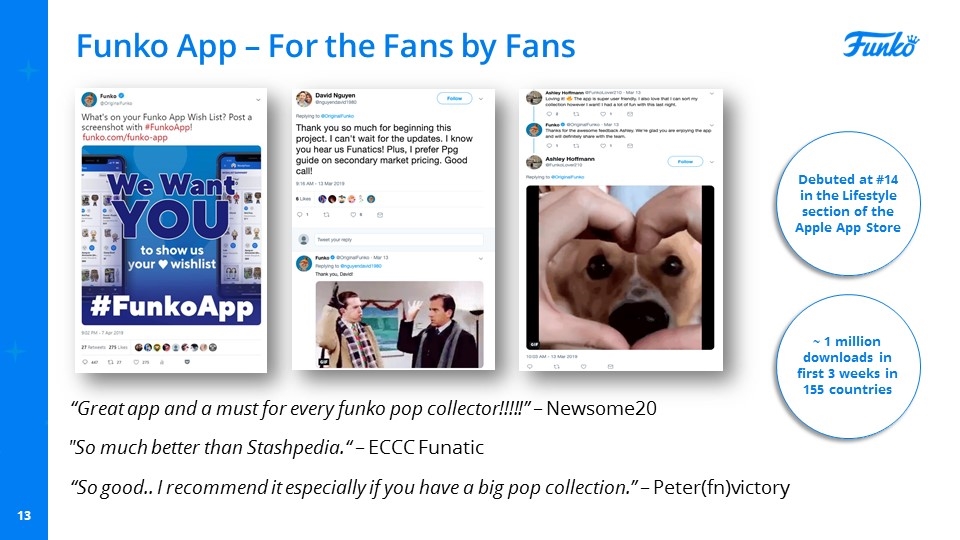
Funko App – For the Fans by Fans “Great app and a must for every funko pop collector!!!!!” – Newsome20 “So good.. I recommend it especially if you have a big pop collection.” – Peter(fn)victory "So much better than Stashpedia.“ – ECCC Funatic Debuted at #14 in the Lifestyle section of the Apple App Store ~ 1 million downloads in first 3 weeks in 155 countries
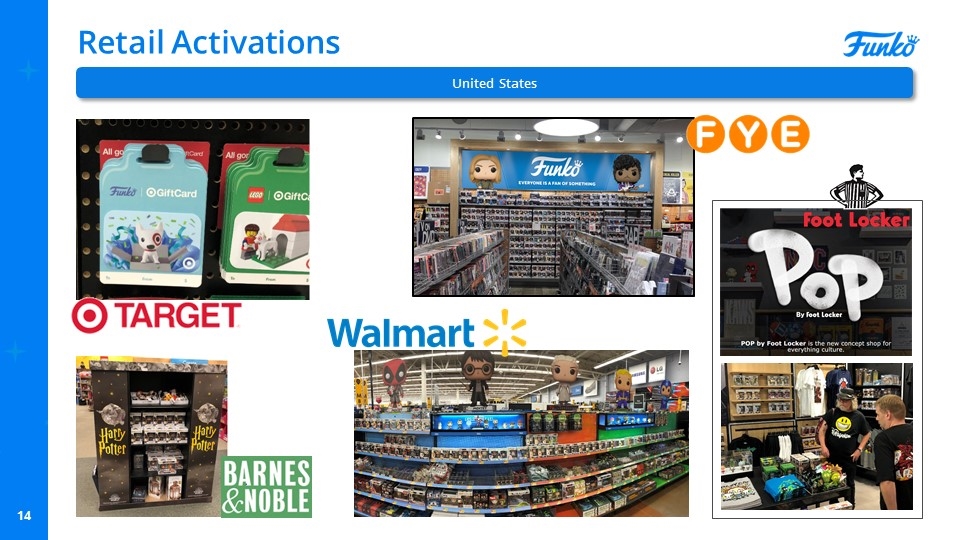
Retail Activations United States
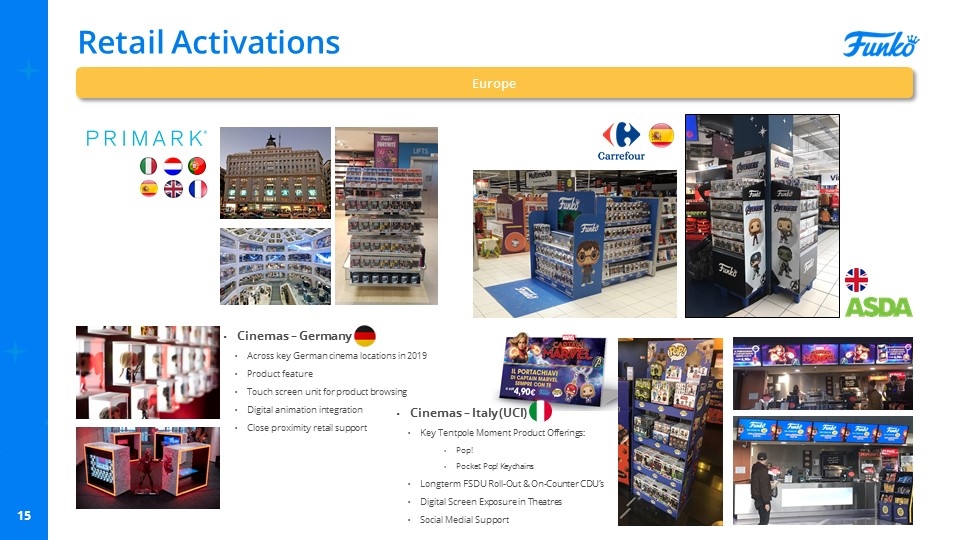
Retail Activations Europe Cinemas – Germany Across key German cinema locations in 2019 Product feature Touch screen unit for product browsing Digital animation integration Close proximity retail support Cinemas – Italy (UCI) Key Tentpole Moment Product Offerings: Pop! Pocket Pop! Keychains Longterm FSDU Roll-Out & On-Counter CDU’s Digital Screen Exposure in Theatres Social Medial Support
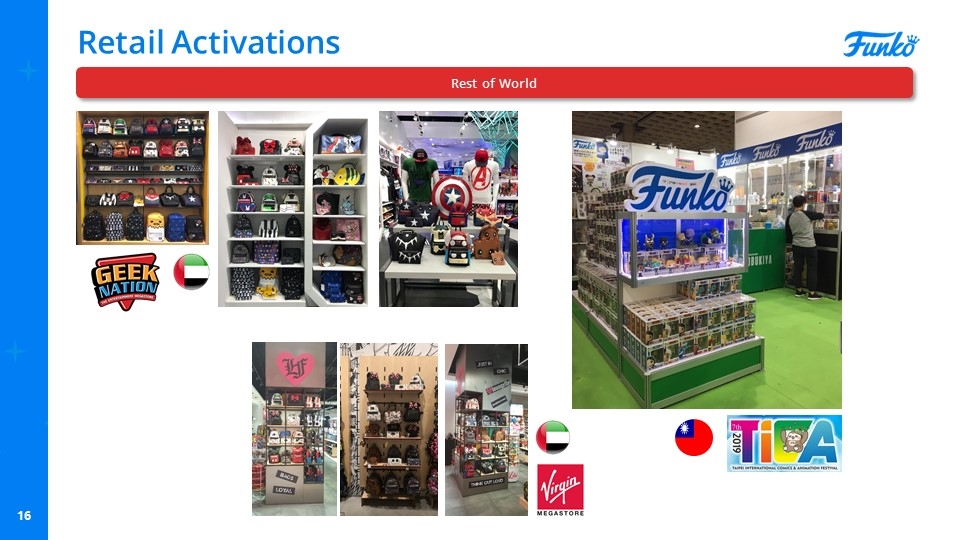
Retail Activations Rest of World
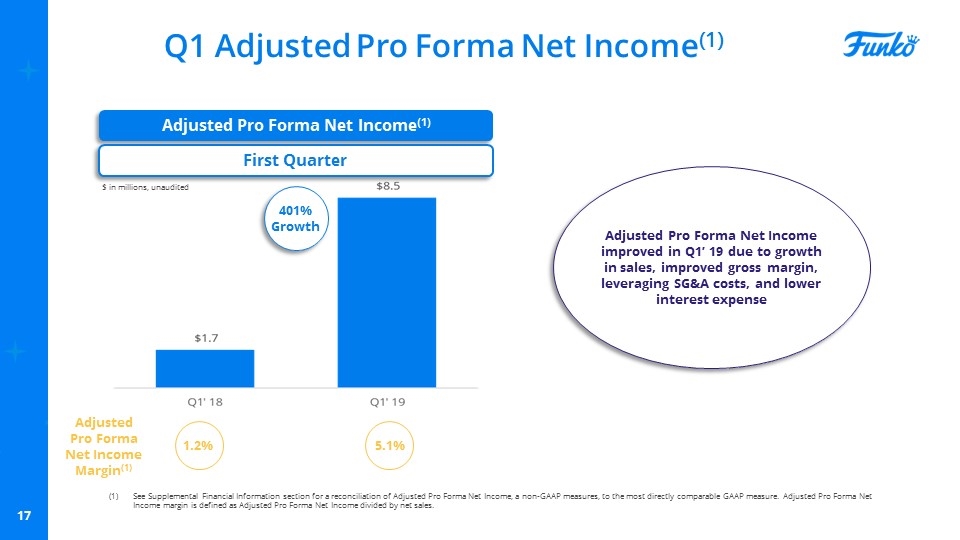
Q1 Adjusted Pro Forma Net Income(1) Adjusted Pro Forma Net Income(1) First Quarter Adjusted Pro Forma Net Income Margin(1) 1.2% 5.1% $ in millions, unaudited See Supplemental Financial Information section for a reconciliation of Adjusted Pro Forma Net Income, a non-GAAP measures, to the most directly comparable GAAP measure. Adjusted Pro Forma Net Income margin is defined as Adjusted Pro Forma Net Income divided by net sales. 401% Growth Adjusted Pro Forma Net Income improved in Q1’ 19 due to growth in sales, improved gross margin, leveraging SG&A costs, and lower interest expense
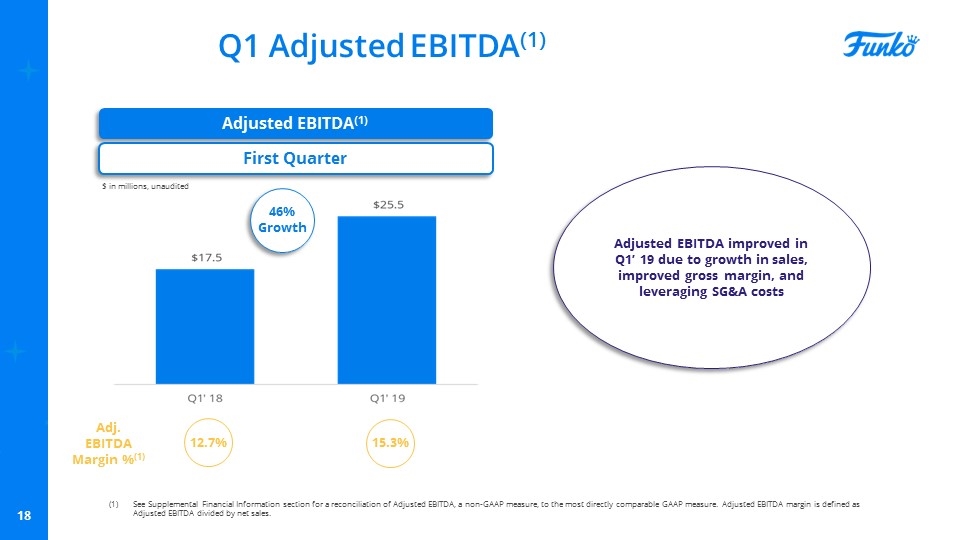
Q1 Adjusted EBITDA(1) See Supplemental Financial Information section for a reconciliation of Adjusted EBITDA, a non-GAAP measure, to the most directly comparable GAAP measure. Adjusted EBITDA margin is defined as Adjusted EBITDA divided by net sales. Adjusted EBITDA(1) First Quarter Adj. EBITDA Margin %(1) 12.7% 15.3% $ in millions, unaudited 46% Growth Adjusted EBITDA improved in Q1’ 19 due to growth in sales, improved gross margin, and leveraging SG&A costs
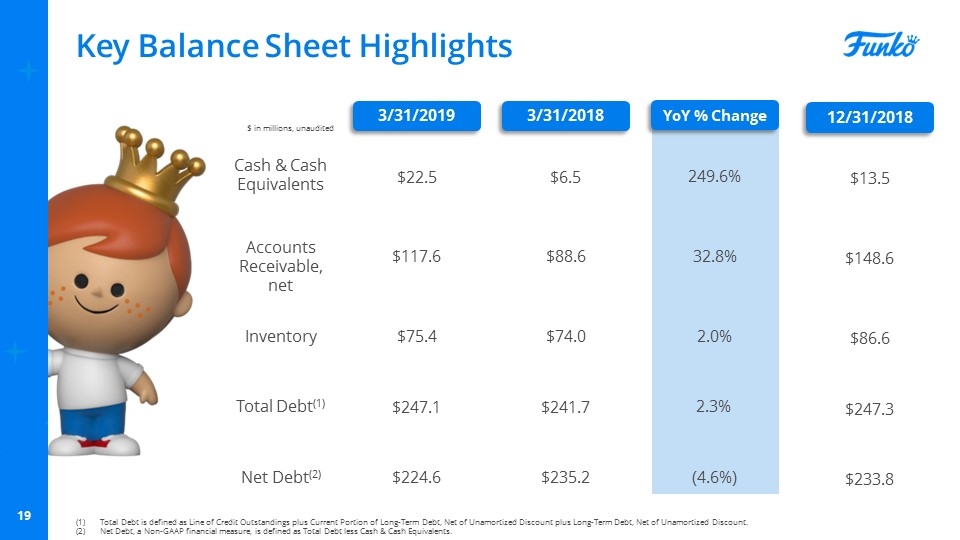
Key Balance Sheet Highlights Total Debt is defined as Line of Credit Outstandings plus Current Portion of Long-Term Debt, Net of Unamortized Discount plus Long-Term Debt, Net of Unamortized Discount. Net Debt, a Non-GAAP financial measure, is defined as Total Debt less Cash & Cash Equivalents. 3/31/2018 YoY % Change Cash & Cash Equivalents Accounts Receivable, net Inventory Total Debt(1) $6.5 $88.6 $74.0 $241.7 $ in millions, unaudited Net Debt(2) $235.2 249.6% 32.8% 2.0% 2.3% (4.6%) 3/31/2019 $22.5 $117.6 $75.4 $247.1 $224.6 12/31/2018 $13.5 $148.6 $86.6 $247.3 $233.8
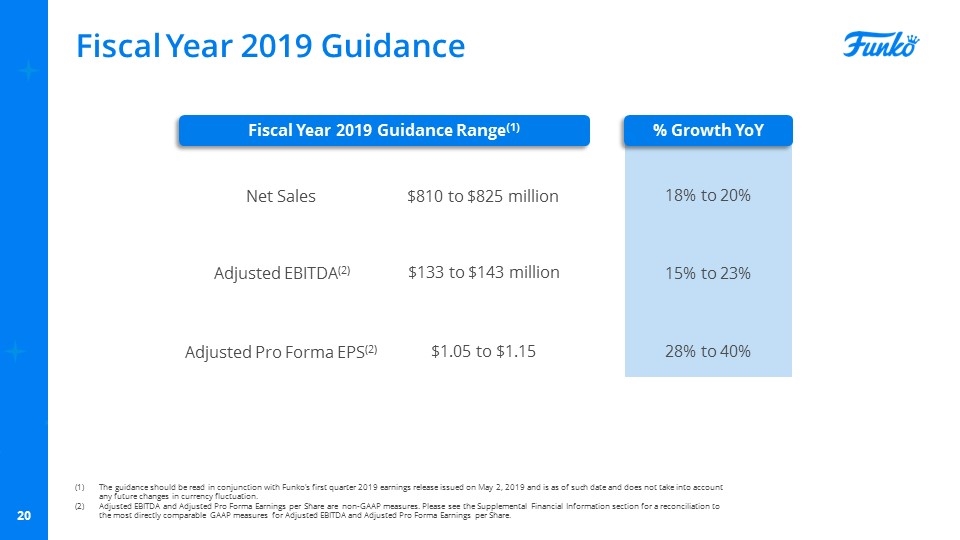
Fiscal Year 2019 Guidance Fiscal Year 2019 Guidance Range(1) % Growth YoY Net Sales Adjusted EBITDA(2) Adjusted Pro Forma EPS(2) $810 to $825 million $133 to $143 million $1.05 to $1.15 18% to 20% 15% to 23% 28% to 40% The guidance should be read in conjunction with Funko’s first quarter 2019 earnings release issued on May 2, 2019 and is as of such date and does not take into account any future changes in currency fluctuation. Adjusted EBITDA and Adjusted Pro Forma Earnings per Share are non-GAAP measures. Please see the Supplemental Financial Information section for a reconciliation to the most directly comparable GAAP measures for Adjusted EBITDA and Adjusted Pro Forma Earnings per Share.

Supplemental Financial Information
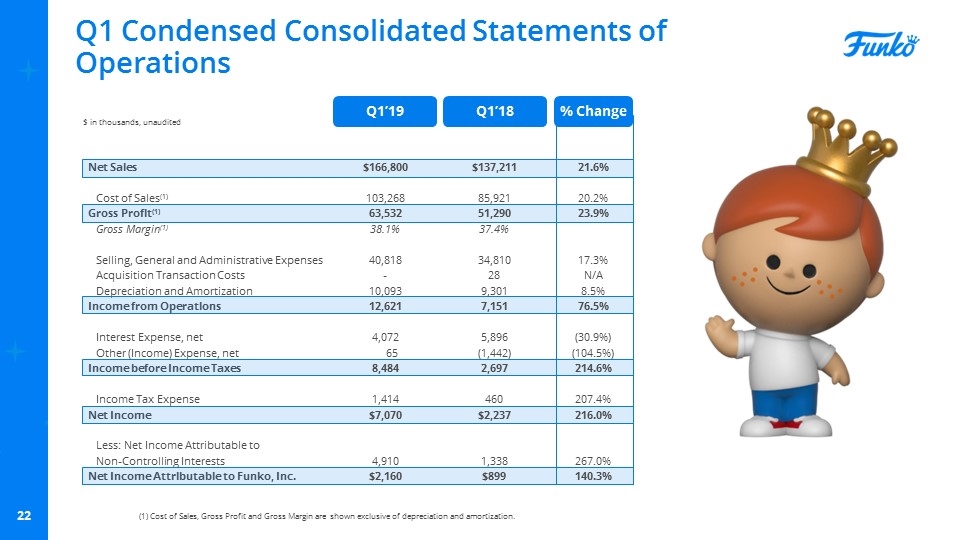
Net Sales Cost of Sales(1) Gross Profit(1) Gross Margin(1) Selling, General and Administrative Expenses Acquisition Transaction Costs Depreciation and Amortization Income from Operations Interest Expense, net Other (Income) Expense, net Income before Income Taxes Income Tax Expense Net Income Less: Net Income Attributable to Non-Controlling Interests Net Income Attributable to Funko, Inc. Q1 Condensed Consolidated Statements of Operations $166,800 103,268 63,532 38.1% 40,818 - 10,093 12,621 4,072 65 8,484 1,414 $7,070 4,910 $2,160 $ in thousands, unaudited $137,211 85,921 51,290 37.4% 34,810 28 9,301 7,151 5,896 (1,442) 2,697 460 $2,237 1,338 $899 Q1’19 Q1’18 % Change 21.6% 20.2% 23.9% 17.3% N/A 8.5% 76.5% (30.9%) (104.5%) 214.6% 207.4% 216.0% 267.0% 140.3% (1) Cost of Sales, Gross Profit and Gross Margin are shown exclusive of depreciation and amortization.
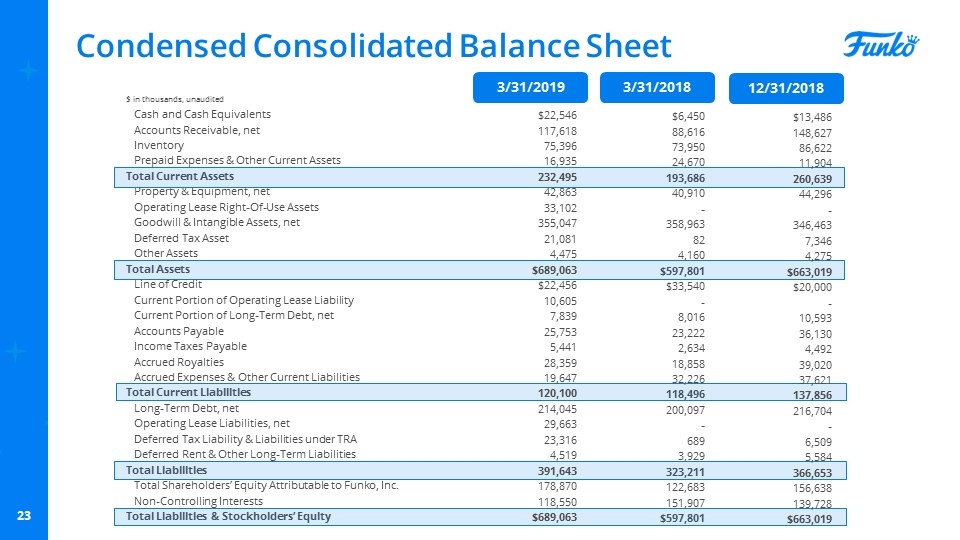
Condensed Consolidated Balance Sheet Cash and Cash Equivalents Accounts Receivable, net Inventory Prepaid Expenses & Other Current Assets Total Current Assets Property & Equipment, net Operating Lease Right-Of-Use Assets Goodwill & Intangible Assets, net Deferred Tax Asset Other Assets Total Assets Line of Credit Current Portion of Operating Lease Liability Current Portion of Long-Term Debt, net Accounts Payable Income Taxes Payable Accrued Royalties Accrued Expenses & Other Current Liabilities Total Current Liabilities Long-Term Debt, net Operating Lease Liabilities, net Deferred Tax Liability & Liabilities under TRA Deferred Rent & Other Long-Term Liabilities Total Liabilities Total Shareholders’ Equity Attributable to Funko, Inc. Non-Controlling Interests Total Liabilities & Stockholders’ Equity $6,450 88,616 73,950 24,670 193,686 40,910 - 358,963 82 4,160 $597,801 $33,540 - 8,016 23,222 2,634 18,858 32,226 118,496 200,097 - 689 3,929 323,211 122,683 151,907 $597,801 3/31/2019 3/31/2018 $ in thousands, unaudited $22,546 117,618 75,396 16,935 232,495 42,863 33,102 355,047 21,081 4,475 $689,063 $22,456 10,605 7,839 25,753 5,441 28,359 19,647 120,100 214,045 29,663 23,316 4,519 391,643 178,870 118,550 $689,063 12/31/2018 $13,486 148,627 86,622 11,904 260,639 44,296 - 346,463 7,346 4,275 $663,019 $20,000 - 10,593 36,130 4,492 39,020 37,621 137,856 216,704 - 6,509 5,584 366,653 156,638 139,728 $663,019
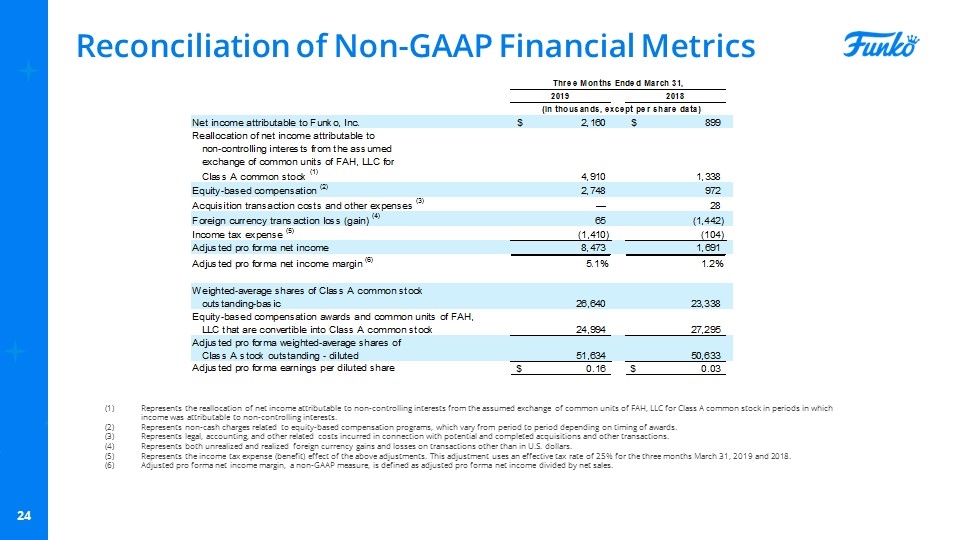
Reconciliation of Non-GAAP Financial Metrics Represents the reallocation of net income attributable to non-controlling interests from the assumed exchange of common units of FAH, LLC for Class A common stock in periods in which income was attributable to non-controlling interests. Represents non-cash charges related to equity-based compensation programs, which vary from period to period depending on timing of awards. Represents legal, accounting, and other related costs incurred in connection with potential and completed acquisitions and other transactions. Represents both unrealized and realized foreign currency gains and losses on transactions other than in U.S. dollars. Represents the income tax expense (benefit) effect of the above adjustments. This adjustment uses an effective tax rate of 25% for the three months March 31, 2019 and 2018. Adjusted pro forma net income margin, a non-GAAP measure, is defined as adjusted pro forma net income divided by net sales.
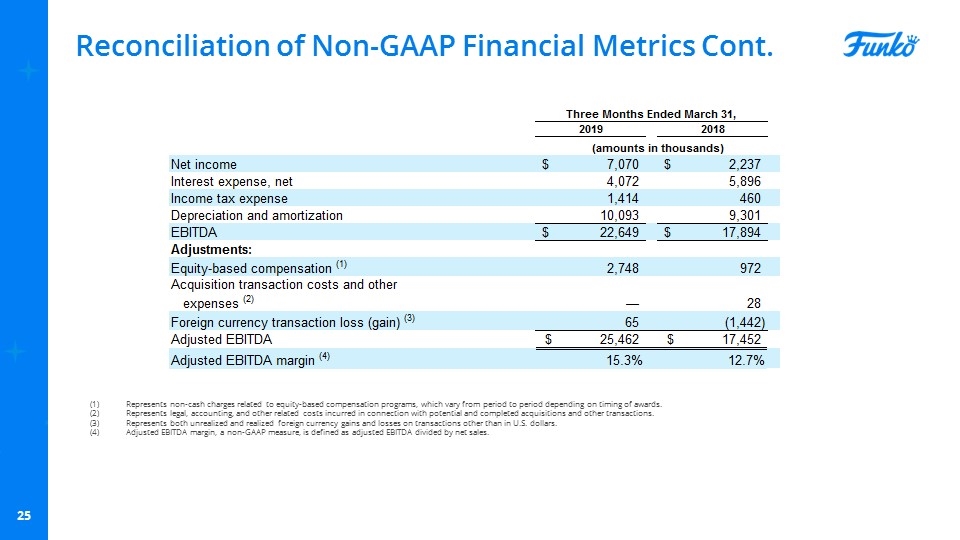
Reconciliation of Non-GAAP Financial Metrics Cont. Represents non-cash charges related to equity-based compensation programs, which vary from period to period depending on timing of awards. Represents legal, accounting, and other related costs incurred in connection with potential and completed acquisitions and other transactions. Represents both unrealized and realized foreign currency gains and losses on transactions other than in U.S. dollars. Adjusted EBITDA margin, a non-GAAP measure, is defined as adjusted EBITDA divided by net sales. 3Q’18
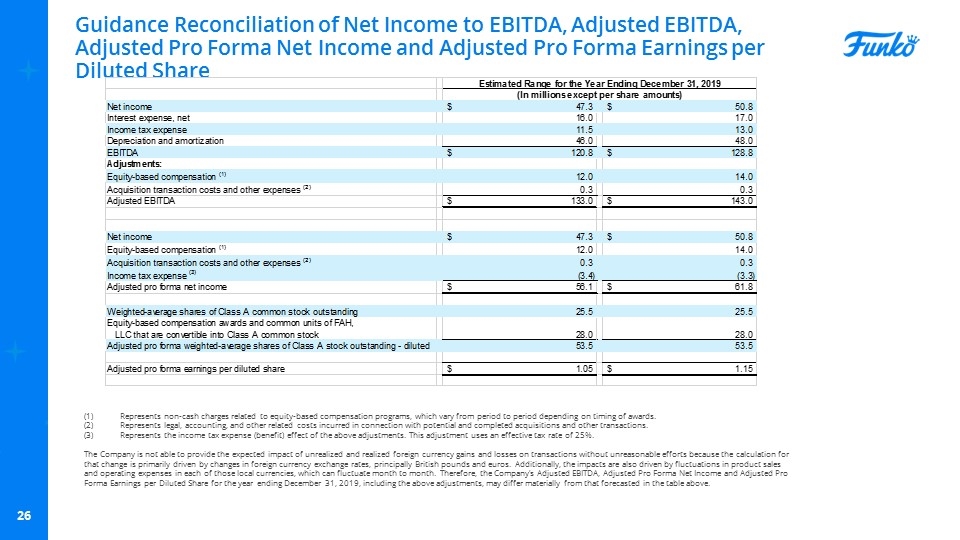
Guidance Reconciliation of Net Income to EBITDA, Adjusted EBITDA, Adjusted Pro Forma Net Income and Adjusted Pro Forma Earnings per Diluted Share Represents non-cash charges related to equity-based compensation programs, which vary from period to period depending on timing of awards. Represents legal, accounting, and other related costs incurred in connection with potential and completed acquisitions and other transactions. Represents the income tax expense (benefit) effect of the above adjustments. This adjustment uses an effective tax rate of 25%. The Company is not able to provide the expected impact of unrealized and realized foreign currency gains and losses on transactions without unreasonable efforts because the calculation for that change is primarily driven by changes in foreign currency exchange rates, principally British pounds and euros. Additionally, the impacts are also driven by fluctuations in product sales and operating expenses in each of those local currencies, which can fluctuate month to month. Therefore, the Company’s Adjusted EBITDA, Adjusted Pro Forma Net Income and Adjusted Pro Forma Earnings per Diluted Share for the year ending December 31, 2019, including the above adjustments, may differ materially from that forecasted in the table above.


