
Second Quarter 2019 Earnings August 8, 2019 Exhibit 99.2
Cautionary Notes This presentation contains forward-looking statements within the meaning of the Private Securities Litigation Reform Act of 1995. All statements other than statements of historical facts contained in this presentation, including statements regarding our future results of operations and financial position, industry dynamics, our mission, growth opportunities and business strategy and plans and our objectives for future operations, including expanding into new product categories, broadening our retailer network and increasing international sales, are forward-looking statements. The words “may,” “will,” “should,” “expects,” “plans,” “anticipates,” “could,” “intends,” “targets,” “projects,” “contemplates,” “believes,” “estimates,” “predicts,” “potential” or “continue” or the negative of these terms and similar expressions are intended to identify forward-looking statements. The forward-looking statements in this presentation are only predictions. We have based these forward-looking statements largely on our current expectations and projections about future events and financial trends that we believe may affect our business, financial condition and results of operations. Forward-looking statements involve known and unknown risks, uncertainties and other important factors that may cause our actual results, performance or achievements to be materially different from any future results, performance or achievements expressed or implied by the forward-looking statements, including without limitation our ability to maintain and realize the full value of our license agreements; the ongoing level of popularity of our products with consumers; changes in the retail industry and markets for our consumer products; our ability to maintain our relationships with retail customers and distributors; our ability to compete effectively; fluctuations in our gross margin; our dependence on content development and creation by third parties; our ability to develop and introduce products in a timely and cost-effective manner; increases in tariffs, trade restrictions or taxes; risks related to Brexit; counterfeit product risks; risks relating to intellectual property; our ability to attract and retain qualified employees and maintain our corporate culture; risks associated with our international operations; changes in U.S. tax law; foreign currency exchange rate exposure; economic downturns; our dependence on vendors and outsourcers; risks relating to government regulation; risks relating to litigation; any failure to successfully integrate or realize the anticipated benefits of acquisitions or investments; reputational risk resulting from our e-commerce business and social media presence; risks relating to our indebtedness and our ability to secure additional financing; the potential for our electronic data to be compromised, and the important factors discussed under the caption “Risk Factors” in our Form 10-Q for the quarter ended June 30, 2019 and our other filings with the Securities and Exchange Commission. Because forward-looking statements are inherently subject to risks and uncertainties, some of which cannot be predicted or quantified, you should not rely on these forward-looking statements as predictions of future events. The events and circumstances reflected in our forward-looking statements may not be achieved or occur and actual results could differ materially from those projected in the forward-looking statements. In addition, statements that “we believe” and similar statements reflect our beliefs and opinions on the relevant subject. These statements are based upon information available to us as of the date hereof, and while we believe such information forms a reasonable basis for such statements, such information may be limited or incomplete, and our statements should not be read to indicate that we have conducted an exhaustive inquiry into, or review of, all potentially available relevant information. These statements are inherently uncertain and investors are cautioned not to unduly rely upon these statements. You should read this presentation with the understanding that our actual future results, levels of activity, performance and achievements may be materially different from what we expect. We qualify all of our forward-looking statements by these cautionary statements. These forward-looking statements speak only as of the date of this presentation, and except as otherwise required by law, we do not plan to publicly update or revise any forward-looking statements contained in this presentation, whether as a result of any new information, future events or otherwise. Unless otherwise indicated, information contained in this presentation concerning our industry, competitive position and the markets in which we operate is based on information from independent industry and research organizations, other third-party sources and management estimates. Management estimates are derived from publicly available information released by independent industry analysts and other third-party sources, as well as data from our internal research, and are based on assumptions made by us upon reviewing such data, and our experience in, and knowledge of, such industry and markets, which we believe to be reasonable. In addition, projections, assumptions and estimates of the future performance of the industry in which we operate and our future performance are necessarily subject to uncertainty and risk due to a variety of factors, including those described above. These and other factors could cause results to differ materially from those expressed in the estimates made by independent parties and by us.

is built on the principle that everyone is a fan of something…
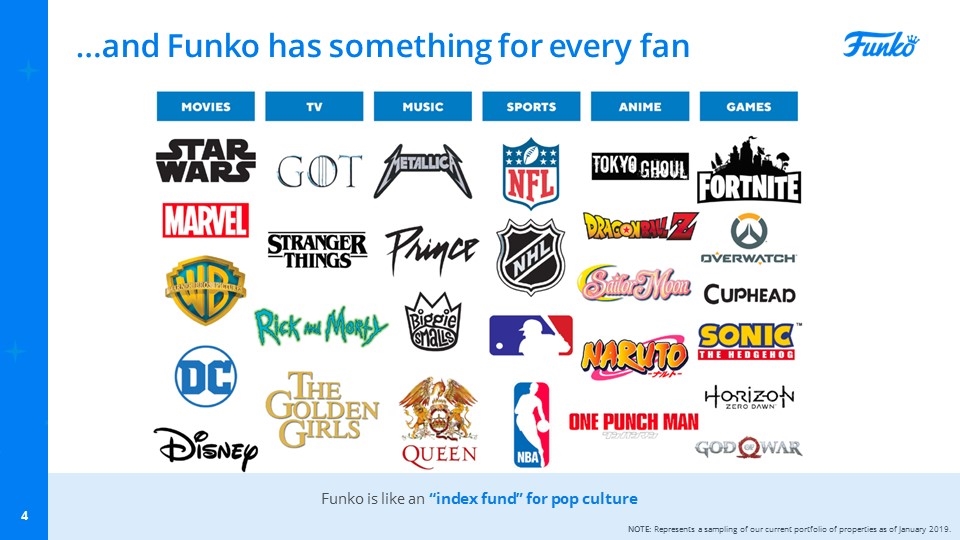
…and Funko has something for every fan NOTE: Represents a sampling of our current portfolio of properties as of January 2019. Funko is like an “index fund” for pop culture
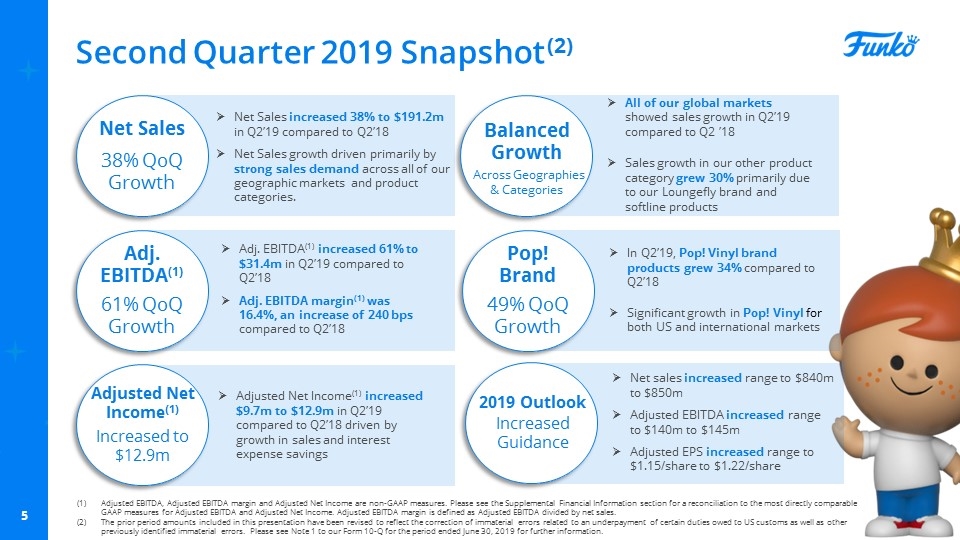
Second Quarter 2019 Snapshot (2) Net Sales 38% QoQ Growth Adj. EBITDA(1) 61% QoQ Growth Adjusted Net Income(1) Increased to $12.9m Net Sales increased 38% to $191.2m in Q2’19 compared to Q2’18 Net Sales growth driven primarily by strong sales demand across all of our geographic markets and product categories. Adj. EBITDA(1) increased 61% to $31.4m in Q2’19 compared to Q2’18 Adj. EBITDA margin(1) was 16.4%, an increase of 240 bps compared to Q2’18 Adjusted Net Income(1) increased $9.7m to $12.9m in Q2’19 compared to Q2’18 driven by growth in sales and interest expense savings Pop! Brand 49% QoQ Growth In Q2’19, Pop! Vinyl brand products grew 34% compared to Q2’18 Significant growth in Pop! Vinyl for both US and international markets Balanced Growth Across Geographies & Categories All of our global markets showed sales growth in Q2’19 compared to Q2 ’18 Sales growth in our other product category grew 30% primarily due to our Loungefly brand and softline products Net sales increased range to $840m to $850m Adjusted EBITDA increased range to $140m to $145m Adjusted EPS increased range to $1.15/share to $1.22/share Adjusted EBITDA, Adjusted EBITDA margin and Adjusted Net Income are non-GAAP measures. Please see the Supplemental Financial Information section for a reconciliation to the most directly comparable GAAP measures for Adjusted EBITDA and Adjusted Net Income. Adjusted EBITDA margin is defined as Adjusted EBITDA divided by net sales. The prior period amounts included in this presentation have been revised to reflect the correction of immaterial errors related to an underpayment of certain duties owed to US customs as well as other previously identified immaterial errors. Please see Note 1 to our Form 10-Q for the period ended June 30, 2019 for further information. 2019 Outlook Increased Guidance
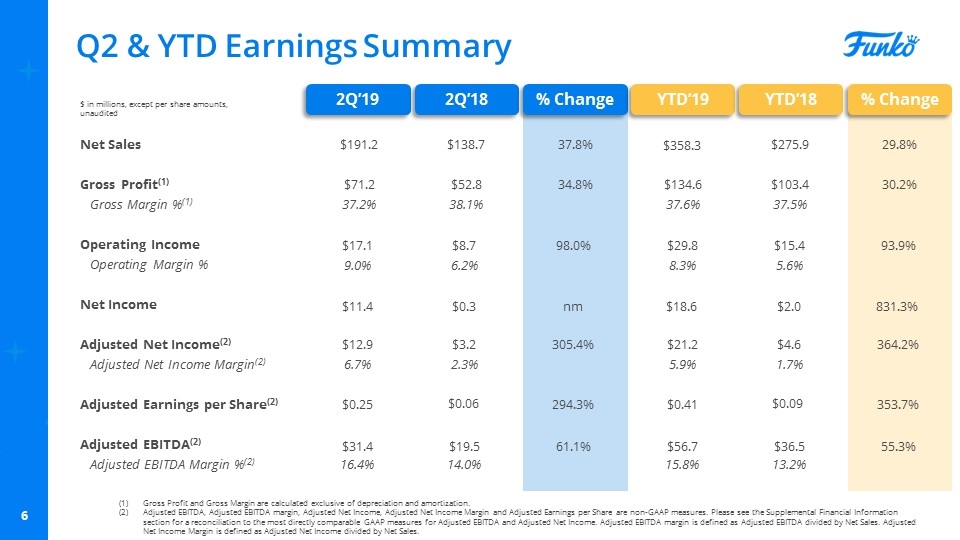
Q2 & YTD Earnings Summary Gross Profit and Gross Margin are calculated exclusive of depreciation and amortization. Adjusted EBITDA, Adjusted EBITDA margin, Adjusted Net Income, Adjusted Net Income Margin and Adjusted Earnings per Share are non-GAAP measures. Please see the Supplemental Financial Information section for a reconciliation to the most directly comparable GAAP measures for Adjusted EBITDA and Adjusted Net Income. Adjusted EBITDA margin is defined as Adjusted EBITDA divided by Net Sales. Adjusted Net Income Margin is defined as Adjusted Net Income divided by Net Sales. 2Q’19 2Q’18 % Change Net Sales Gross Profit(1) Gross Margin %(1) Operating Income Operating Margin % Net Income Adjusted Net Income(2) Adjusted Net Income Margin(2) Adjusted Earnings per Share(2) Adjusted EBITDA(2) Adjusted EBITDA Margin %(2) $ in millions, except per share amounts, unaudited $191.2 $138.7 37.8% $71.2 $52.8 34.8% 37.2% 38.1% $17.1 $8.7 98.0% 9.0% 6.2% $0.25 $0.06 294.3% $31.4 $19.5 61.1% 16.4% 14.0% $12.9 $3.2 305.4% 6.7% 2.3% $11.4 $0.3 nm YTD’19 YTD’18 % Change $358.3 $275.9 29.8% $134.6 $103.4 30.2% 37.6% 37.5% $29.8 $15.4 93.9% 8.3% 5.6% $0.41 $0.09 353.7% $56.7 $36.5 55.3% 15.8% 13.2% $21.2 $4.6 364.2% 5.9% 1.7% $18.6 $2.0 831.3%
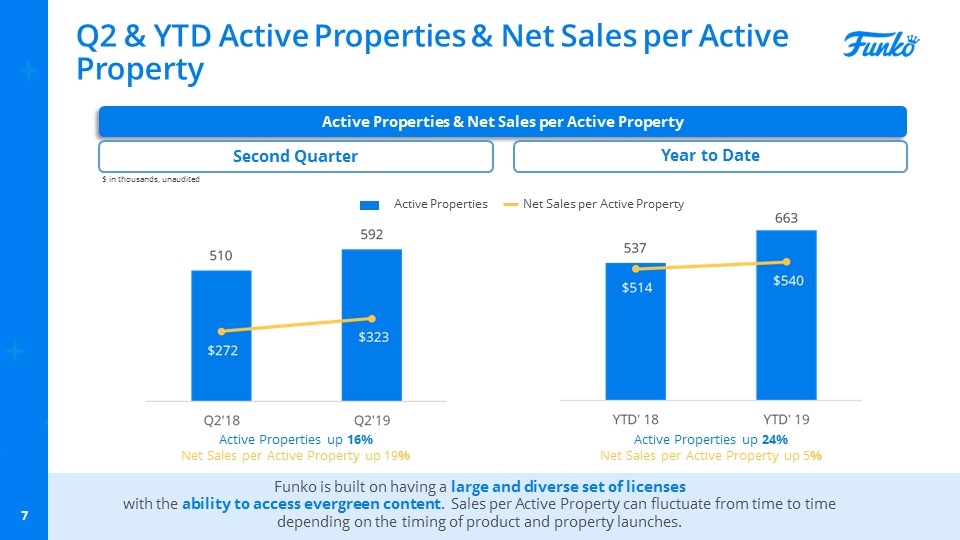
Q2 & YTD Active Properties & Net Sales per Active Property Active Properties & Net Sales per Active Property Second Quarter Active Properties Net Sales per Active Property Active Properties up 16% Net Sales per Active Property up 19% Funko is built on having a large and diverse set of licenses with the ability to access evergreen content. Sales per Active Property can fluctuate from time to time depending on the timing of product and property launches. $ in thousands, unaudited Year to Date Active Properties up 24% Net Sales per Active Property up 5%
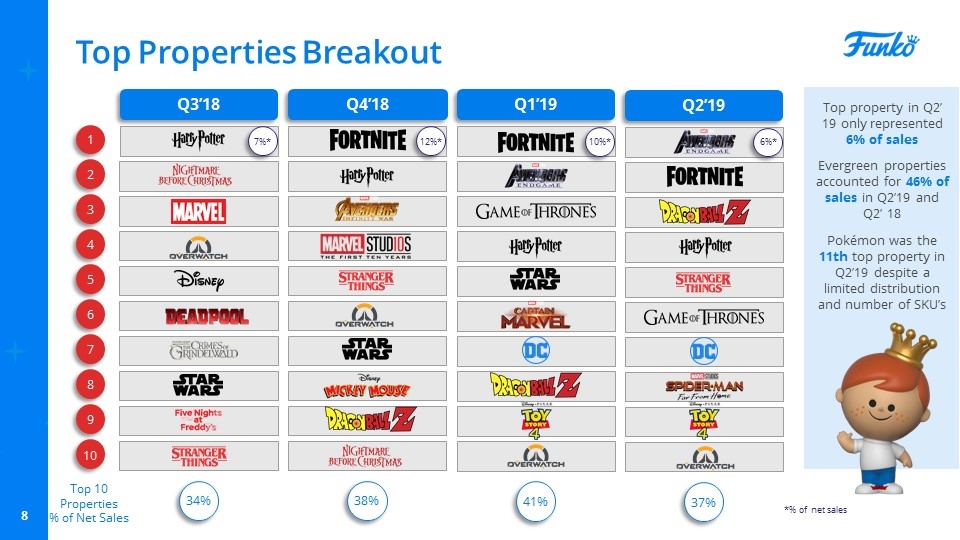
Top Properties Breakout Q3’18 Q4’18 1 2 3 5 7 4 6 8 9 10 Top 10 Properties % of Net Sales 34% 38% Top property in Q2’ 19 only represented 6% of sales Evergreen properties accounted for 46% of sales in Q2’19 and Q2’ 18 Pokémon was the 11th top property in Q2’19 despite a limited distribution and number of SKU’s Q1’19 41% 12%* 7%* *% of net sales Q2’19 37% 10%* 6%*
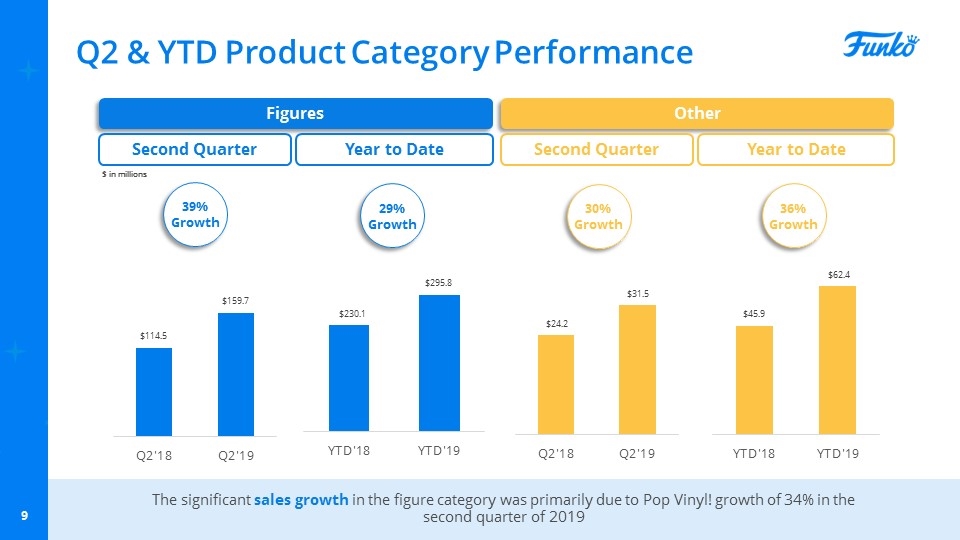
Q2 & YTD Product Category Performance $ in millions 39% Growth 30% Growth The significant sales growth in the figure category was primarily due to Pop Vinyl! growth of 34% in the second quarter of 2019 Figures Other Second Quarter Second Quarter $ in millions Year to Date Year to Date 29% Growth 36% Growth
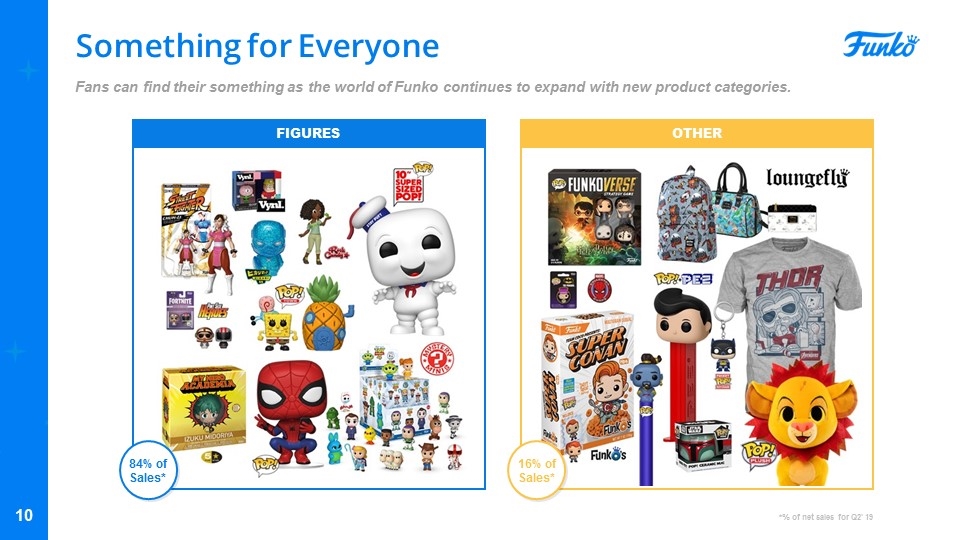
Something for Everyone FIGURES OTHER *% of net sales for Q2’ 19 84% of Sales* 16% of Sales* Fans can find their something as the world of Funko continues to expand with new product categories.
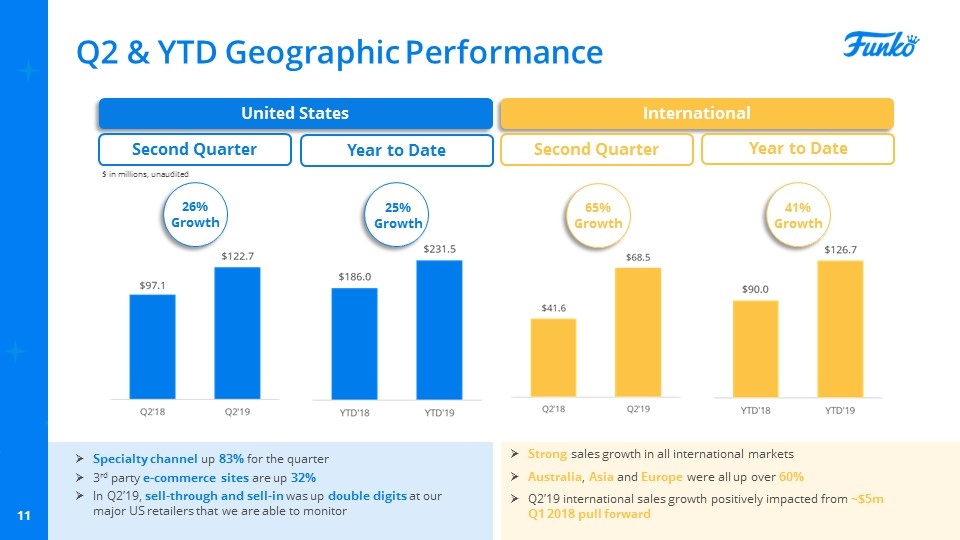
Q2 & YTD Geographic Performance United States International Second Quarter Second Quarter Specialty channel up 83% for the quarter 3rd party e-commerce sites are up 32% In Q2’19, sell-through and sell-in was up double digits at our major US retailers that we are able to monitor Strong sales growth in all international markets Australia, Asia and Europe were all up over 60% Q2’19 international sales growth positively impacted from ~$5m Q1 2018 pull forward $ in millions, unaudited 26% Growth 65% Growth Year to Date Year to Date 25% Growth 41% Growth
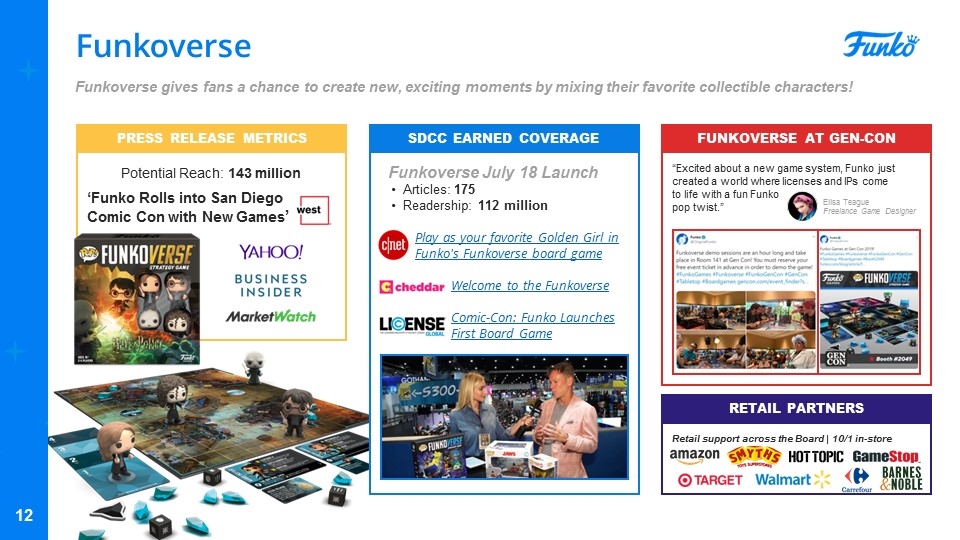
Funkoverse PRESS RELEASE METRICS ‘Funko Rolls into San Diego Comic Con with New Games’ SDCC EARNED COVERAGE Funkoverse July 18 Launch Articles: 175 Readership: 112 million Play as your favorite Golden Girl in Funko's Funkoverse board game Welcome to the Funkoverse Comic-Con: Funko Launches First Board Game FUNKOVERSE AT GEN-CON “Excited about a new game system, Funko just created a world where licenses and IPs come to life with a fun Funko pop twist.” Retail support across the Board | 10/1 in-store RETAIL PARTNERS Funkoverse gives fans a chance to create new, exciting moments by mixing their favorite collectible characters! Potential Reach: 143 million Elisa Teague Freelance Game Designer
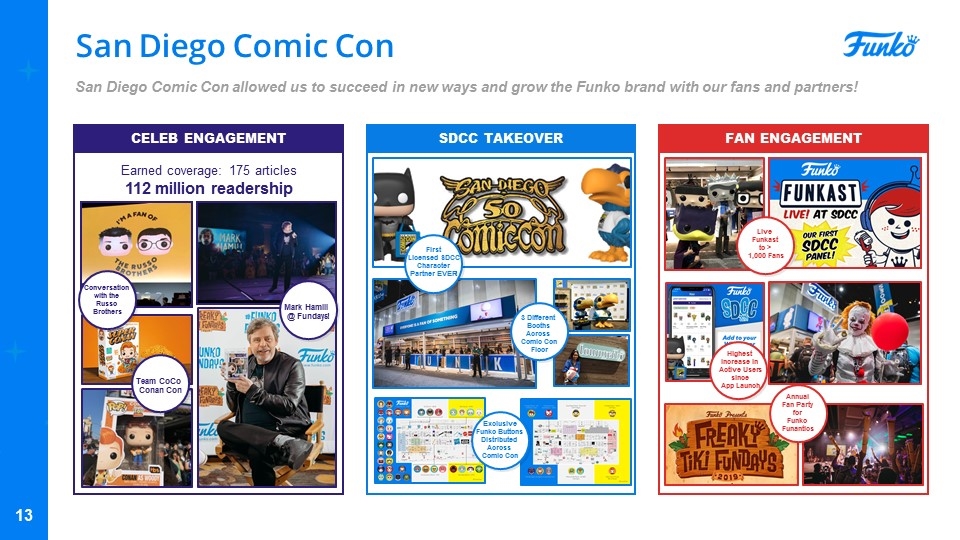
San Diego Comic Con San Diego Comic Con allowed us to succeed in new ways and grow the Funko brand with our fans and partners! CELEB ENGAGEMENT Earned coverage: 175 articles 112 million readership SDCC TAKEOVER FAN ENGAGEMENT First Licensed SDCC Character Partner EVER! 3 Different Booths Across Comic Con Floor Annual Fan Party for Funko Funantics Highest Increase in Active Users since App Launch Conversation with the Russo Brothers Mark Hamill @ Fundays! Live Funkast to > 1,000 Fans Exclusive Funko Buttons Distributed Across Comic Con Team CoCo Conan Con
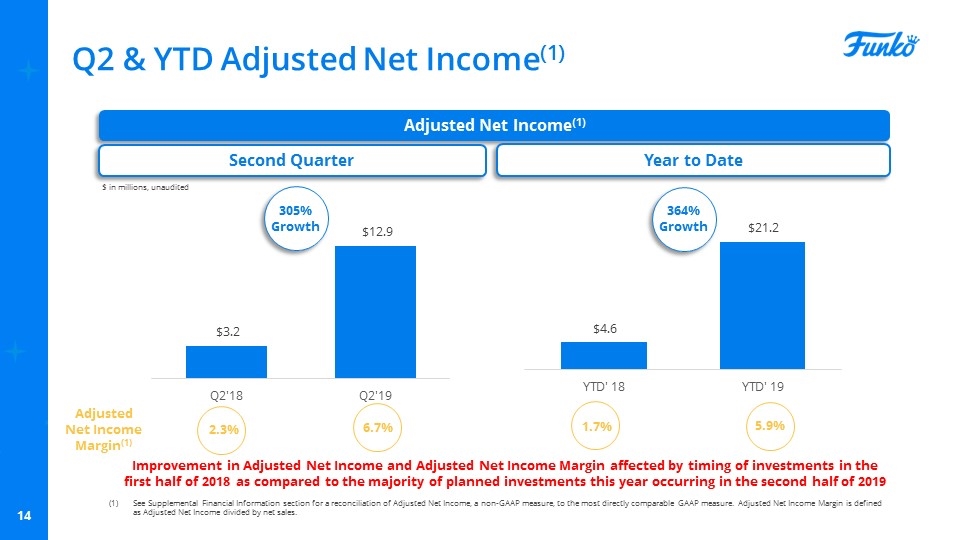
Q2 & YTD Adjusted Net Income(1) Adjusted Net Income(1) Second Quarter Adjusted Net Income Margin(1) 2.3% 6.7% $ in millions, unaudited See Supplemental Financial Information section for a reconciliation of Adjusted Net Income, a non-GAAP measure, to the most directly comparable GAAP measure. Adjusted Net Income Margin is defined as Adjusted Net Income divided by net sales. 305% Growth Improvement in Adjusted Net Income and Adjusted Net Income Margin affected by timing of investments in the first half of 2018 as compared to the majority of planned investments this year occurring in the second half of 2019 Year to Date 6.6% 1.7% 5.9% 364% Growth
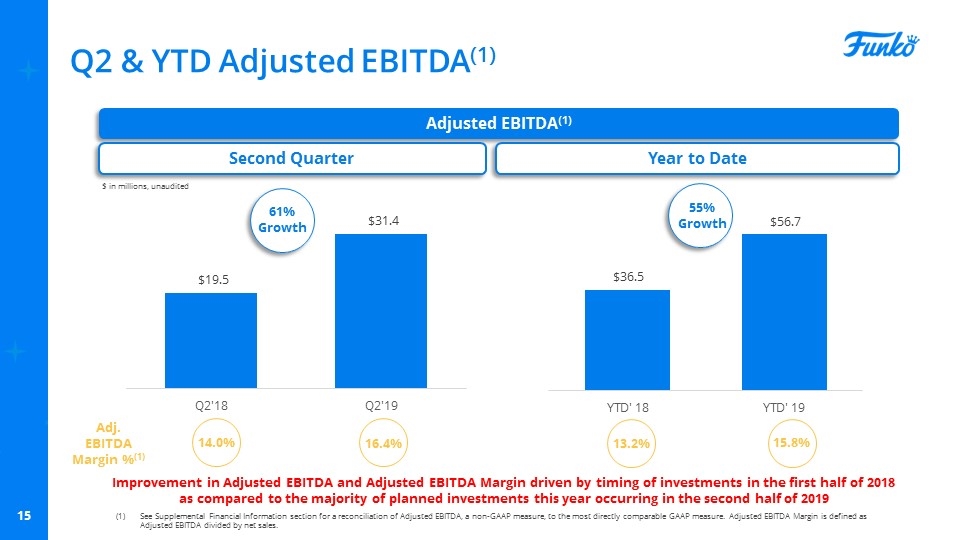
Q2 & YTD Adjusted EBITDA(1) See Supplemental Financial Information section for a reconciliation of Adjusted EBITDA, a non-GAAP measure, to the most directly comparable GAAP measure. Adjusted EBITDA Margin is defined as Adjusted EBITDA divided by net sales. Adjusted EBITDA(1) Second Quarter Adj. EBITDA Margin %(1) 14.0% 16.4% $ in millions, unaudited 61% Growth Improvement in Adjusted EBITDA and Adjusted EBITDA Margin driven by timing of investments in the first half of 2018 as compared to the majority of planned investments this year occurring in the second half of 2019 Year to Date 55% Growth 15.8% 13.2%
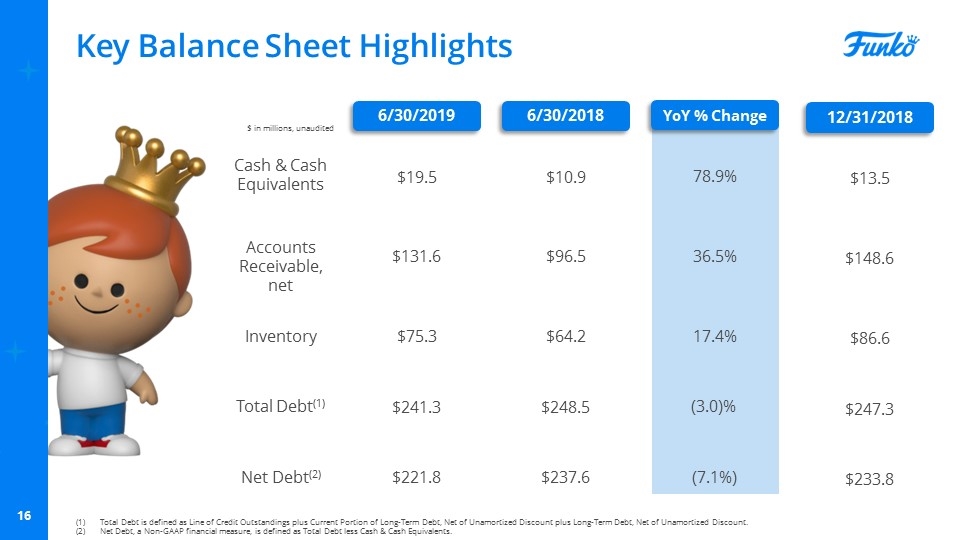
Key Balance Sheet Highlights Total Debt is defined as Line of Credit Outstandings plus Current Portion of Long-Term Debt, Net of Unamortized Discount plus Long-Term Debt, Net of Unamortized Discount. Net Debt, a Non-GAAP financial measure, is defined as Total Debt less Cash & Cash Equivalents. 6/30/2018 YoY % Change Cash & Cash Equivalents Accounts Receivable, net Inventory Total Debt(1) $10.9 $96.5 $64.2 $248.5 $ in millions, unaudited Net Debt(2) $237.6 78.9% 36.5% 17.4% (3.0)% (7.1%) 6/30/2019 $19.5 $131.6 $75.3 $241.3 $221.8 12/31/2018 $13.5 $148.6 $86.6 $247.3 $233.8
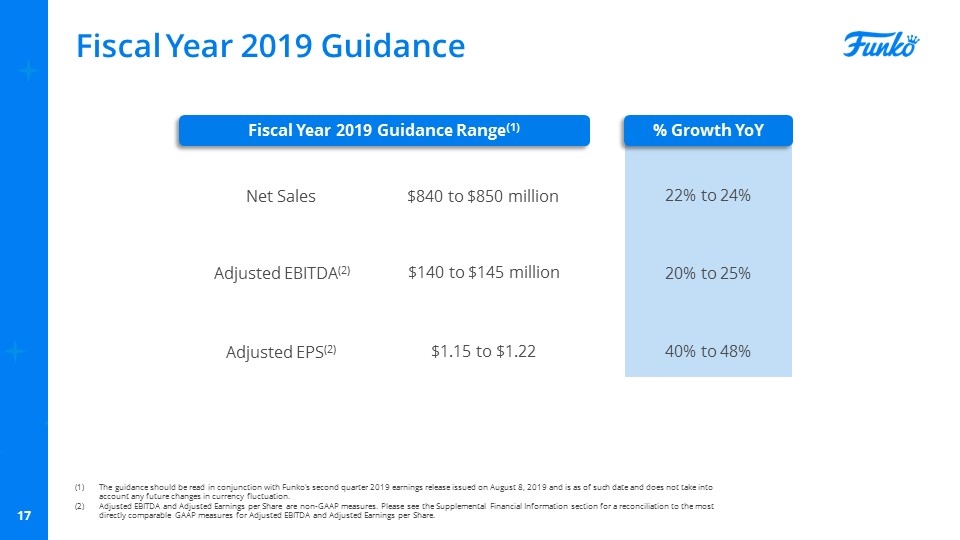
Fiscal Year 2019 Guidance Fiscal Year 2019 Guidance Range(1) % Growth YoY Net Sales Adjusted EBITDA(2) Adjusted EPS(2) $840 to $850 million $140 to $145 million $1.15 to $1.22 22% to 24% 20% to 25% 40% to 48% The guidance should be read in conjunction with Funko’s second quarter 2019 earnings release issued on August 8, 2019 and is as of such date and does not take into account any future changes in currency fluctuation. Adjusted EBITDA and Adjusted Earnings per Share are non-GAAP measures. Please see the Supplemental Financial Information section for a reconciliation to the most directly comparable GAAP measures for Adjusted EBITDA and Adjusted Earnings per Share.

Supplemental Financial Information
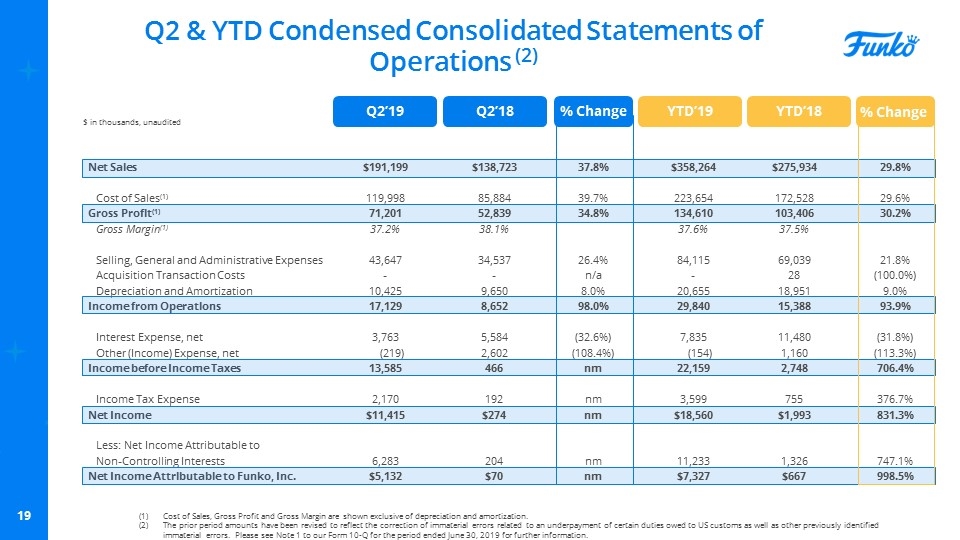
Net Sales Cost of Sales(1) Gross Profit(1) Gross Margin(1) Selling, General and Administrative Expenses Acquisition Transaction Costs Depreciation and Amortization Income from Operations Interest Expense, net Other (Income) Expense, net Income before Income Taxes Income Tax Expense Net Income Less: Net Income Attributable to Non-Controlling Interests Net Income Attributable to Funko, Inc. Q2 & YTD Condensed Consolidated Statements of Operations (2) $191,199 119,998 71,201 37.2% 43,647 - 10,425 17,129 3,763 (219) 13,585 2,170 $11,415 6,283 $5,132 $ in thousands, unaudited $138,723 85,884 52,839 38.1% 34,537 - 9,650 8,652 5,584 2,602 466 192 $274 204 $70 Q2’19 Q2’18 % Change 37.8% 39.7% 34.8% 26.4% n/a 8.0% 98.0% (32.6%) (108.4%) nm nm nm nm nm Cost of Sales, Gross Profit and Gross Margin are shown exclusive of depreciation and amortization. The prior period amounts have been revised to reflect the correction of immaterial errors related to an underpayment of certain duties owed to US customs as well as other previously identified immaterial errors. Please see Note 1 to our Form 10-Q for the period ended June 30, 2019 for further information. YTD’19 YTD’18 $358,264 223,654 134,610 37.6% 84,115 - 20,655 29,840 7,835 (154) 22,159 3,599 $18,560 11,233 $7,327 $275,934 172,528 103,406 37.5% 69,039 28 18,951 15,388 11,480 1,160 2,748 755 $1,993 1,326 $667 29.8% 29.6% 30.2% 21.8% (100.0%) 9.0% 93.9% (31.8%) (113.3%) 706.4% 376.7% 831.3% 747.1% 998.5% % Change

Condensed Consolidated Balance Sheet(1) Cash and Cash Equivalents Accounts Receivable, net Inventory Prepaid Expenses & Other Current Assets Total Current Assets Property & Equipment, net Operating Lease Right-Of-Use Assets Goodwill & Intangible Assets, net Deferred Tax Asset Other Assets Total Assets Line of Credit Current Portion of Operating Lease Liability Current Portion of Long-Term Debt, net Accounts Payable Income Taxes Payable Accrued Royalties Accrued Expenses & Other Current Liabilities Total Current Liabilities Long-Term Debt, net Operating Lease Liabilities, net Deferred Tax Liability & Liabilities under TRA Deferred Rent & Other Long-Term Liabilities Total Liabilities Total Shareholders’ Equity Attributable to Funko, Inc. Non-Controlling Interests Total Liabilities & Stockholders’ Equity $10,892 96,474 64,153 18,515 190,034 43,022 - 357,649 78 4,033 $594,816 $42,323 - 7,956 22,219 2,073 19,351 32,391 126,313 198,178 - 160 4,802 329,453 133,506 131,857 $594,816 6/30/2019 6/30/2018 $ in thousands, unaudited $19,485 131,646 75,298 17,170 243.599 43,331 41,759 353,826 29,673 3,986 $716,174 $19,329 10,619 8,602 32,852 1,046 29,819 26,931 129,198 211,383 40,401 33,039 5,788 419,809 192,397 103,968 $716,174 12/31/2018 $13,486 148,627 86,622 11,904 260,639 44,296 - 349,723 7,407 4,275 $666,340 $20,000 - 10,593 36,130 4,492 39,020 33,015 143,250 216,704 - 6,509 6,623 373,086 154,708 138,546 $666,340 The prior period amounts have been revised to reflect the correction of immaterial errors related to an underpayment of certain duties owed to US customs as well as other previously identified immaterial errors. Please see Note 1 to our Form 10-Q for the period ended June 30, 2019 for further information.
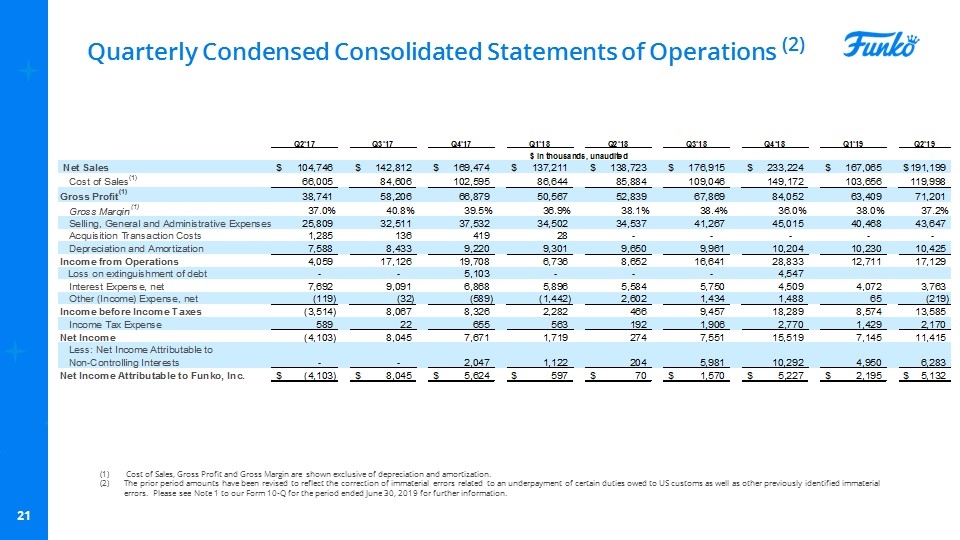
Quarterly Condensed Consolidated Statements of Operations (2) Cost of Sales, Gross Profit and Gross Margin are shown exclusive of depreciation and amortization. The prior period amounts have been revised to reflect the correction of immaterial errors related to an underpayment of certain duties owed to US customs as well as other previously identified immaterial errors. Please see Note 1 to our Form 10-Q for the period ended June 30, 2019 for further information.
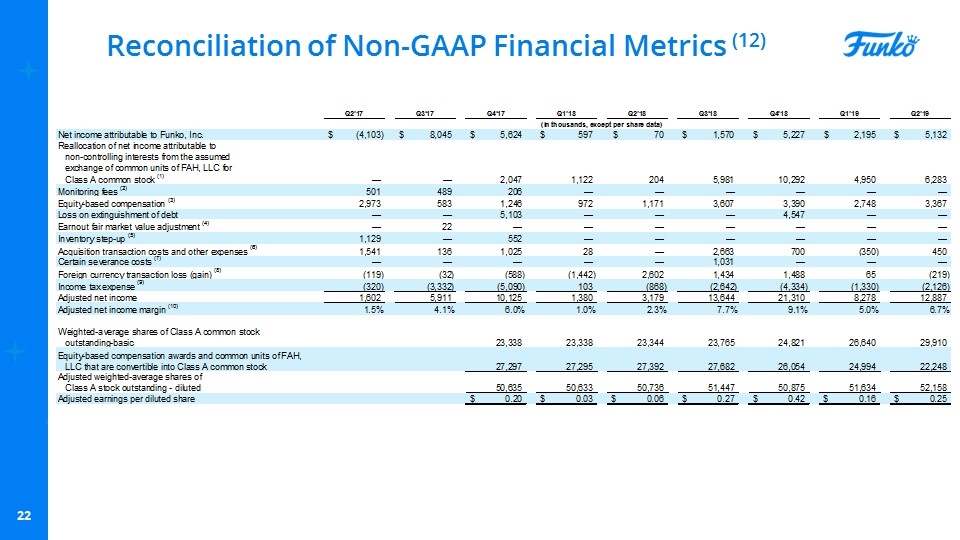
Reconciliation of Non-GAAP Financial Metrics (12)
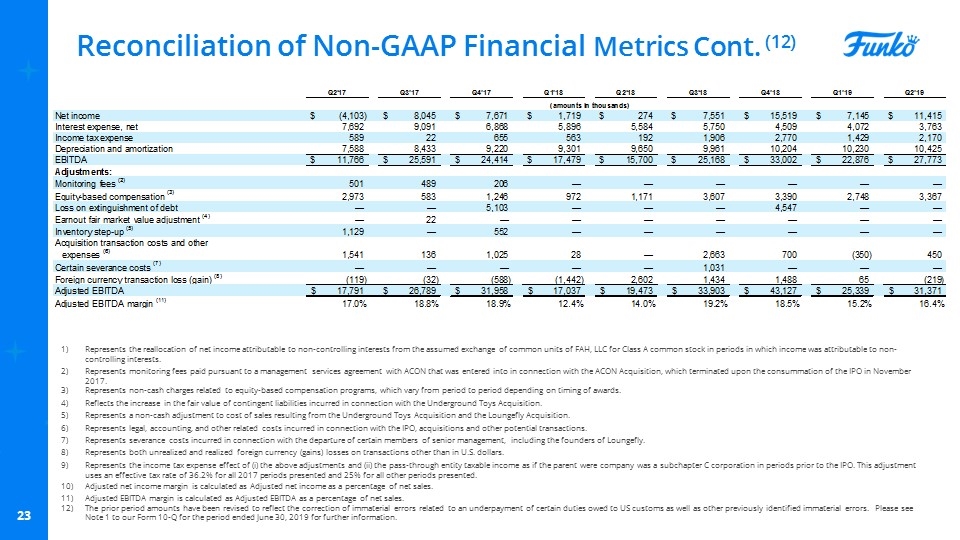
Reconciliation of Non-GAAP Financial Metrics Cont. (12) 3Q’18 Represents the reallocation of net income attributable to non-controlling interests from the assumed exchange of common units of FAH, LLC for Class A common stock in periods in which income was attributable to non-controlling interests. Represents monitoring fees paid pursuant to a management services agreement with ACON that was entered into in connection with the ACON Acquisition, which terminated upon the consummation of the IPO in November 2017. Represents non-cash charges related to equity-based compensation programs, which vary from period to period depending on timing of awards. Reflects the increase in the fair value of contingent liabilities incurred in connection with the Underground Toys Acquisition. Represents a non-cash adjustment to cost of sales resulting from the Underground Toys Acquisition and the Loungefly Acquisition. Represents legal, accounting, and other related costs incurred in connection with the IPO, acquisitions and other potential transactions. Represents severance costs incurred in connection with the departure of certain members of senior management, including the founders of Loungefly. Represents both unrealized and realized foreign currency (gains) losses on transactions other than in U.S. dollars. Represents the income tax expense effect of (i) the above adjustments and (ii) the pass-through entity taxable income as if the parent were company was a subchapter C corporation in periods prior to the IPO. This adjustment uses an effective tax rate of 36.2% for all 2017 periods presented and 25% for all other periods presented. Adjusted net income margin is calculated as Adjusted net income as a percentage of net sales. Adjusted EBITDA margin is calculated as Adjusted EBITDA as a percentage of net sales. The prior period amounts have been revised to reflect the correction of immaterial errors related to an underpayment of certain duties owed to US customs as well as other previously identified immaterial errors. Please see Note 1 to our Form 10-Q for the period ended June 30, 2019 for further information.
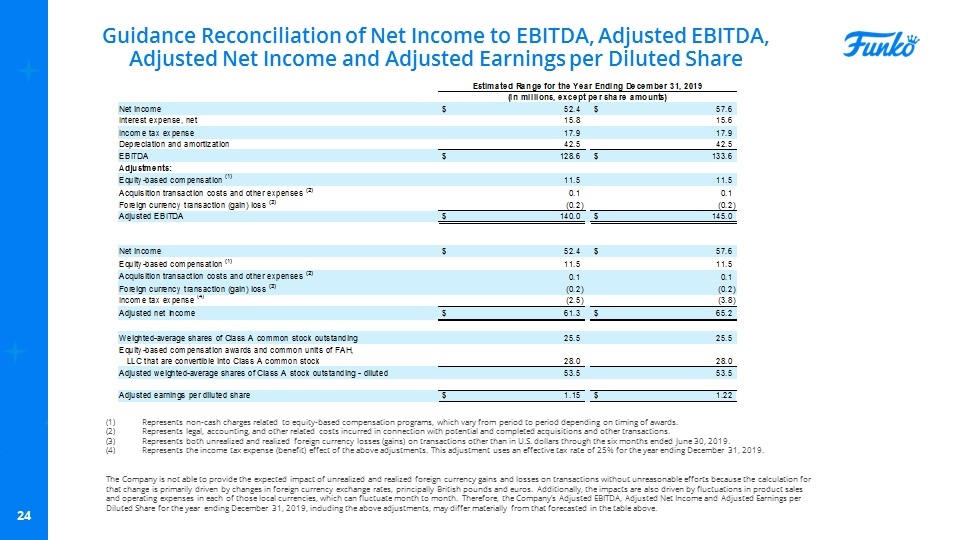
Guidance Reconciliation of Net Income to EBITDA, Adjusted EBITDA, Adjusted Net Income and Adjusted Earnings per Diluted Share Represents non-cash charges related to equity-based compensation programs, which vary from period to period depending on timing of awards. Represents legal, accounting, and other related costs incurred in connection with potential and completed acquisitions and other transactions. Represents both unrealized and realized foreign currency losses (gains) on transactions other than in U.S. dollars through the six months ended June 30, 2019. Represents the income tax expense (benefit) effect of the above adjustments. This adjustment uses an effective tax rate of 25% for the year ending December 31, 2019. The Company is not able to provide the expected impact of unrealized and realized foreign currency gains and losses on transactions without unreasonable efforts because the calculation for that change is primarily driven by changes in foreign currency exchange rates, principally British pounds and euros. Additionally, the impacts are also driven by fluctuations in product sales and operating expenses in each of those local currencies, which can fluctuate month to month. Therefore, the Company’s Adjusted EBITDA, Adjusted Net Income and Adjusted Earnings per Diluted Share for the year ending December 31, 2019, including the above adjustments, may differ materially from that forecasted in the table above.


