Contura Energy: 3Q19 Earnings Presentation November 2019 1
Forward Looking Statements 2 This document includes forward - looking statements. These forward - looking statements are based on Contura's expectations and beli efs concerning future events and involve risks and uncertainties that may cause actual results to differ materially from current expectations. These factors are difficult to pr edi ct accurately and may be beyond Contura’s control. Examples of forward - looking statements include, but are not limited to: ▪ the financial performance of the company; ▪ our liquidity, results of operations and financial condition; ▪ our ability to generate sufficient cash or obtain financing to fund our business operations; ▪ depressed levels or declines in coal prices; ▪ worldwide market demand for coal, steel, and electricity, including demand for U.S. coal exports, and competition in coal mar ket s; ▪ the imposition or continuation of barriers to trade, such as tariffs; ▪ utilities switching to alternative energy sources such as natural gas, renewables and coal from basins where we do not operat e; ▪ reductions or increases in customer coal inventories and the timing of those changes; ▪ our production capabilities and costs; ▪ inherent risks of coal mining beyond our control; ▪ changes in, interpretations of, or implementations of domestic or international tax or other laws and regulations, including the Tax Cuts and Jobs Act and its related regulations; ▪ changes in domestic or international environmental laws and regulations, and court decisions, including those directly affect ing our coal mining and production, and those affecting our customers’ coal usage, including potential climate change initiatives; ▪ our relationships with, and other conditions affecting, our customers, including the inability to collect payments from our c ust omers if their creditworthiness declines; ▪ changes in, renewal or acquisition of, terms of and performance of customers under coal supply arrangements and the refusal b y o ur customers to receive coal under agreed contract terms; ▪ our ability to obtain, maintain or renew any necessary permits or rights, and our ability to mine properties due to defects i n t itle on leasehold interests; ▪ attracting and retaining key personnel and other employee workforce factors, such as labor relations; ▪ funding for and changes in employee benefit obligations; ▪ any new or increased liabilities, including reclamation obligations, that we may incur in connection with our former mines in Wy oming; ▪ cybersecurity attacks or failures, threats to physical security, extreme weather conditions or other natural disasters; ▪ reclamation and mine closure obligations; ▪ our assumptions concerning economically recoverable coal reserve estimates; ▪ our ability to negotiate new United Mine Workers of America wage agreements on terms acceptable to us, increased unionization of our workforce in the future, and any strikes by our workforce; ▪ disruptions in delivery or changes in pricing from third party vendors of key equipment and materials that are necessary for our operations, such as diesel fuel, steel products, explosives, tires and purchased coal; ▪ inflationary pressures on supplies and labor and significant or rapid increases in commodity prices; ▪ railroad, barge, truck and other transportation availability, performance and costs; ▪ disruption in third party coal supplies; ▪ the consummation of financing or refinancing transactions, acquisitions or dispositions and the related effects on our busine ss and financial position; ▪ our indebtedness and potential future indebtedness; and ▪ our ability to obtain or renew surety bonds on acceptable terms or maintain our current bonding status; Forward - looking statements in this document or elsewhere speak only as of the date made. New uncertainties and risks arise from time to time, and it is impossible for Contura to predict these events or how they may affect Contura. Except as required by law, Contura has no duty to, and does not intend to, update or r evi se the forward - looking statements in this document or elsewhere. In light of these risks and uncertainties, investors should keep in mind that results, events or developments discussed in any f orw ard - looking statement made in this document may not occur. Third Party Information This presentation, including certain forward - looking statements herein, includes information obtained from third party sources t hat we believe to be reliable. However, we have not independently verified this third party information and cannot assure you of its accuracy or completeness. While we are not aware of any mi sst atements regarding any third party data contained in this presentation, such data involve risks and uncertainties and are subject to change based on various factors, including those d isc ussed in detail in our filings with the U.S. Securities and Exchange Commission. We assume no obligation to revise or update this third party information to reflect future events or circumstance s.
3 Highlights: Third Quarter 2019 • Shipped 3.0 million tons of met coal in 3Q19; Total coal shipments of 5.8 million tons in 3Q19 • Reported net loss from continuing operation ($43.6) million • Reported Adjusted EBITDA (2) of $40 million in 3Q19 • Repurchased 1.03 million CTRA common shares for a total of $32 million • Eliminated uncertainty related to the PRB permits through transaction with Eagle Specialty Materials • Transaction closed on October 18, 2019 • Introducing 2020 operational guidance • 12.7 - 13.3 million tons of met shipments anticipated • $76.00 to $81.00 expected CAPP – Met cost of coal sales per ton (1) • Enhanced focus on cost containment, efficiency and safe mining • Softer end markets create opportunities for selective, bolt - on acquisitions (1) Excluding Idle Operations Expenses (2) Adjusted EBITDA is a Non - GAAP measure. Refer to slide 21 for Non - GAAP reconciliation.
4 Highlights: 2019 – Year of Transition • 2019 has been a transition year with disappointing financial results and unexpected challenges • The company has faced multiple issues in 2019: • Blackjewel bankruptcy created uncertainty around the PRB permits, which now has been resolved with the recently closed transaction with Eagle Specialty Materials • Cumberland requires capital expenditures over the next two years for an impoundment, earlier than originally planned • Black Castle reclamation was accelerated due to weak end markets for CAPP thermal coal • Significant turnover at the senior management and board level • Cost inflation at operations in 2019 is being addressed with future costs expected to be meaningfully reduced • Positioning the company for 2020 and beyond
5 Contura Vision: Key Focus Areas • Reduce thermal footprint • Divest • Wind down methodically, minimizing ARO • Expand metallurgical coal reserves, operations and offerings • Continue to focus on safe operations • Increase operational efficiencies at: • Mines (feet/shift) • Prep plants (organic yield) • Logistics • Improve coordination between sales and operations • Reduce outstanding debt • Reduce SG&A/Overhead costs Strategic Operational Financial
6 Low Cost Metallurgical Projects Overview of Metallurgical Projects Est. Production (mm tons / year) Initial Production Timing Run Rate Production Timing Quality Estimated Cost of Coal Sales/ton Reserve in tons (mm) Rail Road Fork 52 1.1 – 1.3 Q1 2020 Q4 2020 LV ~$70 20 CSX, NS Black Eagle 0.7 – 0.8 Q4 2018 Q3 2020 HVA ~$70 20 CSX Lynn Branch 0.9 – 1.2 Q2 2020 Q1 2021 HVB+ ~$65 20 CSX • Significant progress on multiple metallurgical coal projects with direct mining costs at or below $70 per ton: • Contributes to driving average CAPP – Met cost of coal sales below $80 per ton in 2020 and beyond • Reserve bases with lives from ~18 to ~25 years • Further strengthens product portfolio with LV, HVA and HVB+ qualities
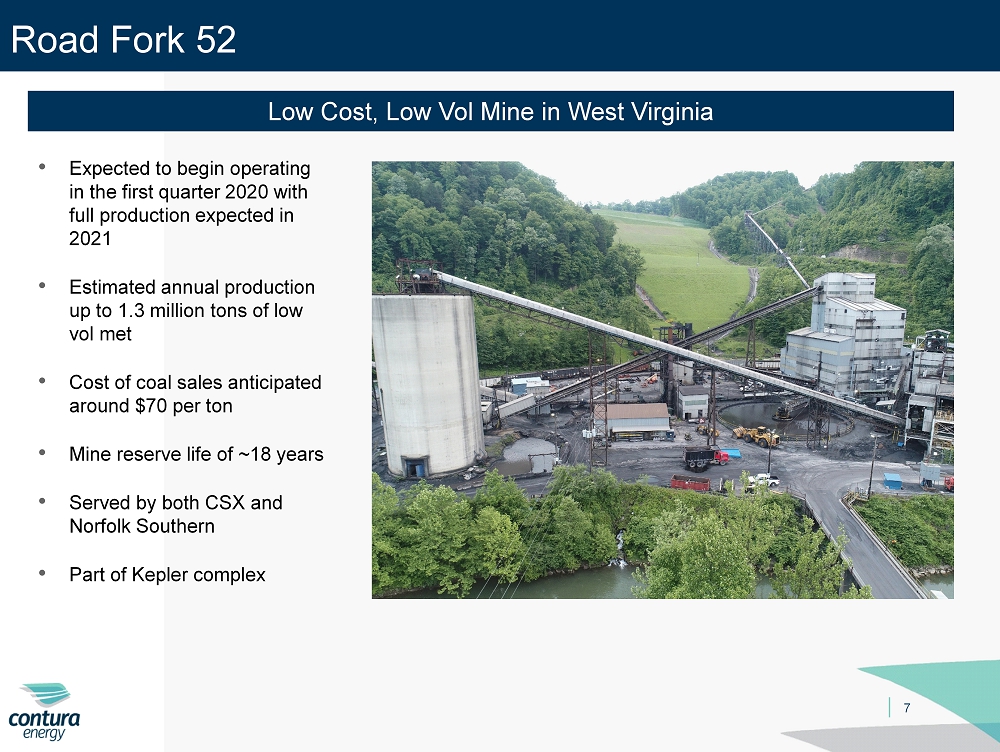
7 Road Fork 52 Low Cost, Low Vol Mine in West Virginia • Expected to begin operating in the first quarter 2020 with full production expected in 2021 • Estimated annual production up to 1.3 million tons of low vol met • Cost of coal sales anticipated around $70 per ton • Mine reserve life of ~18 years • Served by both CSX and Norfolk Southern • Part of Kepler complex
8 Black Eagle Cost Competitive, High Vol A Mine in West Virginia • Began operating in the fourth quarter 2018 with full production expected in 2022 • Estimated annual production up to 0.8 million tons of high vol A met • Cost of coal sales anticipated at $70 per ton • Mine reserve life of ~25 years • Served by CSX • Part of Marfork complex
9 Lynn Branch Low Cost, High Vol B+ Mine in West Virginia • Expected to begin operating in the second quarter 2020 with full production expected in 2021 • Estimated annual production up to 1.2 million tons of high vol B+ met • Cost of coal sales anticipated in the mid - $60s per ton • Mine reserve life of ~20 years • Served by CSX • Part of Bandmill complex
10 Key Metrics: Third Quarter 2019 Shipments in millions of tons 3Q19 CAPP - Met Shipments 3.0 CAPP – Thermal Shipments 1.1 NAPP Shipments 1.6 Coal Sales Realization per ton (1) CAPP - Met (includes T&L) $108.35 CAPP – Thermal $61.46 NAPP $41.33 Cost of Coal Sales per ton (1) CAPP Met (includes T&L) $87.32 CAPP Thermal $59.17 NAPP $43.87 Financial Metrics in millions Net Loss from Continuing Operations $43.6 Adjusted EBITDA (1) $40.0 Cash From Operations $20.4 Capital Expenditures $60.3 Shipments in millions of tons 2Q19 CAPP - Met Shipments 3.4 CAPP – Thermal Shipments 1.2 NAPP Shipments 1.7 Coal Sales Realization per ton (1) CAPP - Met (includes T&L) $124.34 CAPP – Thermal $61.83 NAPP $43.64 Cost of Coal Sales per ton (1) CAPP Met (includes T&L) $87.13 CAPP Thermal $51.45 NAPP $30.86 Financial Metrics in millions Net Income $24.3 Adjusted EBITDA (1) $140.8 Cash From Operations $102.5 Capital Expenditures $42.8 Note: Numbers may not add due to rounding (1) Non - GAAP measures. Refer to slides 21 - 23 for Non - GAAP reconciliations.
11 Adjusted EBITDA Bridge: Third Quarter 2019 Note: Numbers may not add due to rounding
12 2019 Operating and Financial Guidance (as of 11/14/19) Shipments (million tons) Low High CAPP – Metallurgical 12.4 13.0 CAPP – Thermal 4.3 4.7 NAPP 6.5 6.9 Total Shipments 23.2 24.6 Committed / Priced Volumes (1) % Committed (2) Average Price ($/ton) CAPP – Metallurgical 96% $117.65 CAPP – Thermal 100% 58.26 NAPP 100% 43.13 Cost per ton ($/ton) Low High CAPP – Metallurgical $87.00 $90.00 CAPP – Thermal 55.00 59.00 NAPP 36.00 38.00 Other Items (US$ millions, except taxes) Low High SG&A (includes CIB) $60 $65 Idle Operations Expense 16 20 Cash Interest Expense 45 49 DD&A 245 255 Capital Expenditures 170 190 Cash Tax Rate 0% 5% (1) Committed status as of October 28, 2019. An additional 4% CAPP - Met volumes are committed but unpriced. (2) Based on the mid - point of guidance. Note: CAPP – Met and T&L are now reported as a single reportable segment under the CAPP – Met designation.
13 2020 Operating and Financial Guidance (as of 11/14/19) Shipments (million tons) Low High CAPP – Metallurgical 12.7 13.3 CAPP – Thermal 3.4 4.0 NAPP 6.0 6.8 Total Shipments 22.1 24.1 Committed / Priced Volumes (1) % Committed (2) Average Price ($/ton) CAPP – Metallurgical 32% $102.88 CAPP – Thermal 92% 55.90 NAPP 97% 43.42 Cost per ton ($/ton) Low High CAPP – Metallurgical $76.00 $81.00 CAPP – Thermal 56.00 60.00 NAPP 34.00 38.00 Other Items (US$ millions, except taxes) Low High SG&A (includes CIB) $60 $65 Idle Operations Expense 14 18 Cash Interest Expense 48 52 DD&A 230 260 Capital Expenditures 175 195 Cash Tax Rate 0% 5% (1) Committed status as of November 4, 2019. An additional 15% CAPP - Met volumes are committed but unpriced. (2) Based on the mid - point of guidance. Note: CAPP – Met and T&L are now reported as a single reportable segment under the CAPP – Met designation.
14 CAPP – Met: Estimated 2020 Production and Export Mix Domestic 31% Export 69% Balanced Export/Domestic Mix Approximately 2/3 of Contura’s CAPP – Met coal exported Estimated 2020 Met Export Mix (2) (1) Based on estimated captive production in 2020 14% CAPP - Met volumes are committed but unpriced. (2) Based on the mid - point of guidance. HVA 42% HVB 29% MV 21% LV 8% Broad, High Quality Product Portfolio More than 70% of Contura’s production volume is in the higher grades of the quality spectrum Estimated 2020 Met Production Mix (1)
15 Coal Market Commentary: Third Quarter 2019 • Metallurgical coal prices, which have showed significant weakness since the beginning of the third quarter, stabilized for a short period, before declining again in recent weeks to two - year lows • Global economies showed continued softness in the 3 rd quarter and early 4 th quarter with manufacturing indices and crude steel production declining • Europe and South America quite soft • Asia the only main region showing growth • This malaise is affecting met coal demand while supply reductions, especially in the U.S., have been announced with increased frequency • Australian future strip indicates further price firming with the 2020 price indications at approximately $150 per metric ton, or $15 higher than the current spot prices • Increased stimulus provided by central banks should help boost global economic growth
17 Summary: • 2019 has been a year of disappointing financial results and unexpected challenges • The management team is fully committed to improved performance going forward – FOCUS on Controllables • Reduce costs • Improve efficiencies • Improve overall performance • Reduce uncertainty • Positioning the company for 2020 and beyond • Continue to emphasize met coal over thermal • Grow met through organic opportunities and bolt - on acquisitions • Divest thermal operations where possible • Improve balance sheet by reducing debt
Appendix November 2019 16
19 Expected Tax Refunds and Restricted Cash Releases Meaningful Releases of Restricted Cash, Investments and Deposits Anticipated Significant Tax Benefits Expected (1) The refund of $68.8 million for 2018 tax year expected to be received in the first quarter 2020. 2019 - 2021 tax year AMT Credit M onetization may be impacted by limitations due to Section 382 of the IRS Code. Amounts and timing subject to material change. (2) Potential refund expected to be received in 2021. Amount and timing subject to material change. (3) Workers’ Comp will be transferred to ABL, making the transaction liquidity neutral (US$ Millions) 2020 2021 2022 2023 AMT Credit Monetization (1) $68.8 $34.4 $17.2 $17.2 172(f) 10 Year NOL Carryback (2) - 43.8 - - Total Expected Cash Refunds $68.8 $78.2 $17.2 $17.2 Gross Federal NOL Available $146.3 $36.8 $20.1 $18.5 (US$ Millions) 4Q19 Workers’ Comp related release (3) ~$53 PRB related release ~$9 Other expected Surety releases ~$15 Total Expected Restricted Cash Release ~$77 Remaining Available ~$40
20 Overview of Select 2020 - 2023 Estimated Cash Obligations as of 9/30/19 Note: Obligations presented represent long - term liabilities related to asset retirement obligations and obligations entered into as part of Contura’s formation and Alpha’s exit from bankruptcy which are not considered part of the long - term capital structure of Contura. (1) Annual payment of 1.5% of Alpha revenue up to $500 million and 1.0% thereafter. The contingent revenue obligation is a 5 - year ag reement, which began January 2018. The payments reflected in each year are based on estimated annual revenues of the previous year. The final payment for the Alpha revenues estimated in 2022 is payable in 2023.The estimated payments above reflect the expected timing of cash paid into restricted cash escrow and released in April of the following year. (2) Inclusive of both LCC Notes Payable and LCC Water Treatment Stipulation, both of which are characterized as debt on the balan ce sheet. (3) Excludes PRB related asset retirement obligation. Payments to decline significantly over the next several years once payments for Contingent Revenue and LCC Obligations conclude in 2023 (US$ Millions) 2020 2021 2022 2023 Acquisition Related Obligations $20.8 $7.9 $4.2 $ -- Contingent Revenue Obligation (1) 15.1 16.1 15.7 3.9 Asset Retirement Obligation (3) 24.7 26.7 30.2 32.1 LCC Obligations (2) 20.0 20.0 12.5 2.5 Total $80.6 $70.7 $62.6 $38.5
21 Reconciliation of Net Income to Adjusted EBITDA In addition to U.S. GAAP financials, this presentation includes certain non - GAAP financial measures. These non - GAAP measures are in addition to, not a substitute for or superior to, measures of financial performance prepared in accordance with U.S. GAAP. A reconciliation of non - GAAP measures to GAAP measures for Contura on a standalone basis is provided below.
22 Reconciliation of Coal Revenues and Cost of Coal Sales In addition to U.S. GAAP financials, this presentation includes certain non - GAAP financial measures. These non - GAAP measures are in addition to, not a substitute for or superior to, measures of financial performance prepared in accordance with U.S. GAAP. A reconciliation of non - GAAP measures to GAAP measures for Contura on a standalone basis is provided below.
23 Reconciliation of Coal Revenues and Cost of Coal Sales In addition to U.S. GAAP financials, this presentation includes certain non - GAAP financial measures. These non - GAAP measures are in addition to, not a substitute for or superior to, measures of financial performance prepared in accordance with U.S. GAAP. A reconciliation of non - GAAP measures to GAAP measures for Contura on a standalone basis is provided below.
We use cookies on this site to provide a more responsive and personalized service. Continuing to browse, clicking I Agree, or closing this banner indicates agreement. See our Cookie Policy for more information.