Exhibit 99.2
Premier Provider of Unified Communications and Cloud-Focused Managed Services Investor Presentation February 2019 Reach a Higher State of Connectedness
This presentation is provided for informational purposes only and has been prepared to assist interested parties in making their own evaluation with respect to a potential business combination between U.S. TelePacific Holdings Corp. (“TPx” or the “Company”) and Pensare Acquisition Corp. (“Pensare”) and related transactions (the “Potential Business Combination”). The information contained in this presentation is not, and should not be assumed to be, complete and does not present all the information that investors may require or desire in considering the Potential Business Combination. It is not intended to form the basis of any investment decision or any other decision in respect of the Potential Business Combination. No representation is made as to the reasonableness of the assumptions made in this presentation or the accuracy or completeness of any projections or modeling or any other information contained in this presentation. Any data on past performance or modeling contained in this presentation is no indication as to future performance. Neither Pensare nor TPx assume any obligation to update the information in this presentation. Industry Data Market data and industry data used throughout this presentation is based on information derived from third-party sources, TPx management’s knowledge of its industry and good faith estimates of TPx management. While TPx management believes that the third-party sources from which market and industry data has been derived are reputable, TPx has not independently verified such market and industry data, and you are cautioned not to give undue weight to such market and industry data. Cautionary Statement Concerning Forward-Looking Statements This presentation contains forward-looking statements within the meaning of Section 27A of the Securities Act of 1933, as amended, and Section 21E of the Securities Exchange Act of 1934, as amended, conveying the expectations of management of TPx and/or Pensare as to the future based on plans, estimates and projections at the time the Company and/or Pensare makes the statements. Forward-looking statements involve inherent risks and uncertainties and the Company and Pensare caution you that a number of important factors could cause actual results to differ materially from those contained in any such forward-looking statement. The forward-looking statements contained in this presentation include, but are not limited to, statements related to anticipated growth in the Company’s industry, the Company’s strategy and ability to grow, the Company’s anticipated future financial performance, the anticipated timing of the transactions described herein, the completion of the transactions on the terms proposed, the financing of the transactions on terms currently anticipated, and the potential impact the transactions will have on the Company and Pensare. Such statements generally include words such as “believes,” “plans,” “intends,” “targets,” “will,” “expects,” “suggests,” “anticipates,” “outlook,” “continues” or similar expressions. The forward-looking statements contained in this presentation are based on the Company’s and/or Pensare’s current expectations and projections about future events and trends that it believes may affect TPx’s or the combined company’s financial condition, results of operations, strategy, short-term and long-term business operations and objectives and financial needs. You should not place undue reliance upon these forward-looking statements as predictions of future events. Although the Company and Pensare believe that the expectations reflected in the forward-looking statements are reasonable, no guarantee can be made as to future results, level of activity, performance or achievements. Important factors, among others, that may affect actual results or outcomes include: the inability to complete the transactions contemplated by the Potential Business Combination, including the proposed private placement of Pensare’s equity securities to certain institutional and other investors in connection with the Potential Business Combination; the inability to recognize the anticipated benefits of the Potential Business Combination, which may be affected by, among other things, the amount of cash available following any redemptions by Pensare stockholders; the ability to meet NASDAQ’s listing standards following the consummation of the transactions contemplated by the Potential Business Combination; costs related to the Potential Business Combination; TPx’s ability to execute on its plans to develop and market new products and the timing of these development programs; TPx’s estimates of the size of the markets for its solutions; the rate and degree of market acceptance of TPx’s solutions; the success of other competing technologies that may become available; TPx’s ability to identify and integrate acquisitions; the performance and security of TPx’s services; actual and/or potential litigation involving Pensare or TPx (including, without limitation, certain class action lawsuits that have been filed against TPx asserting claims of failure to pay overtime wages, failure to provide all meal and rest periods, failure to provide accurate wage statements, failure to pay wages upon termination and claims under the California Unfair Competition Law); and general economic and market conditions impacting demand for TPx’s services. Other factors include the possibility that the proposed transaction does not close, including due to the failure to receive required stockholder or regulatory approvals, or the failure of other closing conditions. The forward-looking statements included in this document are made as of the date of this presentation. The Company and Pensare disclaim any duty to update any of these forward-looking statements after the date of this presentation to confirm these statements in relationship to actual results or revised expectations. Use of Projections This presentation contains financial forecast information with respect to TPx. Such financial forecast information constitutes forward looking information, and is for illustrative purposes only and should not be relied upon as necessarily being indicative of future results. The assumptions and estimates underlying such financial forecast information are inherently uncertain and are subject to a wide variety of significant business, economic, competitive and other risks and uncertainties. See “Cautionary Statement Concerning Forward-Looking Statements” above. Actual results may differ materially from the results contemplated by the financial forecast information contained in this presentation, and the inclusion of such information in this presentation should not be regarded as a representation by any person that the results reflected in such forecasts will be achieved. Important Information for Investors and Stockholders In connection with the Potential Business Combination, Pensare and TPx expect that a preliminary proxy statement of Pensare, which may include a registration statement, will be filed with the Securities and Exchange Commission (the “SEC”) and that Pensare will mail a definitive proxy statement to its stockholders. This Presentation is not a substitute for the proxy statement or registration statement or for any other document that Pensare may file with the SEC and send to its stockholders in connection with the Potential Business Combination. INVESTORS AND SECURITY HOLDERS ARE URGED TO READ THE PROXY STATEMENT AND OTHER DOCUMENTS FILED WITH THE SEC CAREFULLY AND IN THEIR ENTIRETY WHEN THEY BECOME AVAILABLE BECAUSE THEY WILL CONTAIN IMPORTANT INFORMATION. Investors and security holders may obtain free copies of the proxy statement (when available) and other documents filed with the SEC by Pensare through the website maintained by the SEC at http://www.sec.gov. Copies of the documents filed with the SEC by Pensare are available free of charge and archived on www.pensaregrp.com. Non-GAAP Financial Terms Some of the financial information and data contained in this presentation is unaudited and does not conform to the SEC’s Regulation S-X. Accordingly, such information and data may not be included in, may be adjusted in or may be presented differently in, the proxy statement to be filed with the SEC. This presentation includes references to financial measures that are calculated and presented on the basis of methodologies other than in accordance with generally accepted accounting principles in the United States of America (“GAAP”), including the measure Adjusted EBITDA. A reconciliation of certain of the non-GAAP measures contained herein can be found in the Appendix to the presentation. Any non-GAAP financial measures used in this presentation are in addition to, and not meant to be considered superior to, or a substitute for, the Company’s financial statements prepared in accordance with GAAP. The principal limitation of these non-GAAP financial measures is that they exclude significant expenses and income that are required by GAAP to be recorded in the Company’s financial statements. In addition, they are subject to inherent limitations as they reflect the exercise of judgments by management about which expense and income are excluded or included in determining these non-GAAP financial measures. The non-GAAP measures presented herein may not be comparable to similar non-GAAP measures presented by other companies. Participants in the Solicitation Pensare and TPx and their respective directors and certain of their respective executive officers may be considered participants in the solicitation of proxies with respect to the Potential Business Combination under the rules of the SEC. Information about the directors and executive officers of Pensare is set forth in its Annual Report on Form 10-K for the fiscal year ended March 31, 2018. Additional information regarding the participants in the proxy solicitations and a description of their direct and indirect interests, by security holdings or otherwise, will be included in the proxy statement and other relevant materials to be filed with the SEC when they become available. These documents can be obtained free of charge from the sources indicated above. 2
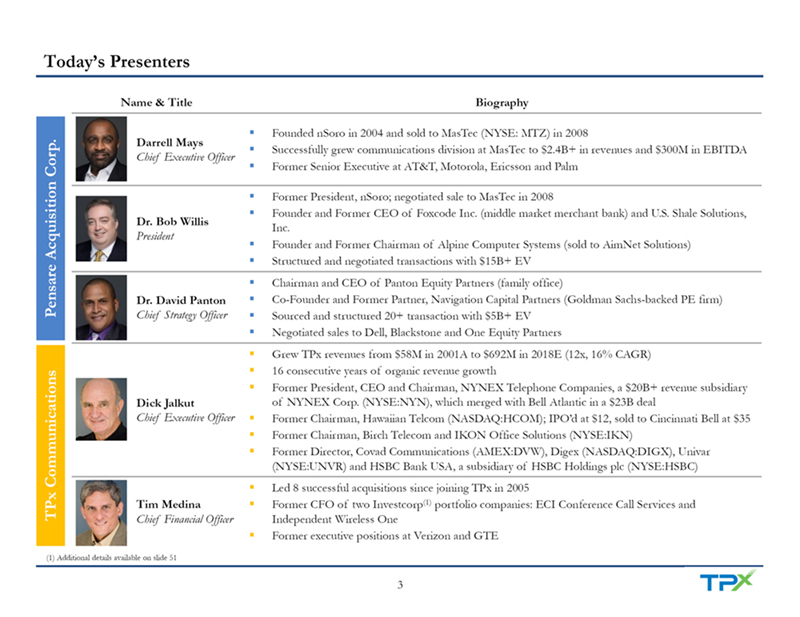
Today’s Presenters Name & Title Biography Founded nSoro in 2004 and sold to MasTec (NYSE: MTZ) in 2008 Darrell Mays Successfully grew communications division at MasTec to $2.4B+ in revenues and $300M in EBITDA Chief Executive Officer Corp. Former Senior Executive at AT&T, Motorola, Ericsson and PalmFormer President, nSoro; negotiated sale to MasTec in 2008 Founder and Former CEO of Foxcode Inc. (middle market merchant bank) and U.S. Shale Solutions, Dr. Bob Willis Inc. President Founder and Former Chairman of Alpine Computer Systems (sold to AimNet Solutions) Structured and negotiated transactions with $15B+ EV Chairman and CEO of Panton Equity Partners (family office) Pensare Acquisition Dr. David Panton Co-Founder and Former Partner, Navigation Capital Partners (Goldman Sachs-backed PE firm) Chief Strategy Officer Sourced and structured 20+ transaction with $5B+ EV Negotiated sales to Dell, Blackstone and One Equity Partners Grew TPx revenues from $58M in 2001A to $692M in 2018E (12x, 16% CAGR) 16 consecutive years of organic revenue growth Former President, CEO and Chairman, NYNEX Telephone Companies, a $20B+ revenue subsidiary Dick Jalkut of NYNEX Corp. (NYSE:NYN), which merged with Bell Atlantic in a $23B deal Chief Executive OfficerFormer Chairman, Hawaiian Telcom (NASDAQ:HCOM); IPO’d at $12, sold to Cincinnati Bell at $35Former Chairman, Birch Telecom and IKON Office Solutions (NYSE:IKN)Former Director, Covad Communications (AMEX:DVW), Digex (NASDAQ:DIGX), Univar (NYSE:UNVR) and HSBC Bank USA, a subsidiary of HSBC Holdings plc (NYSE:HSBC)Led 8 successful acquisitions since joining TPx in 2005 TPx Communications Tim Medina Former CFO of two Investcorp(1)portfolio companies: ECI Conference Call Services and Chief Financial Officer Independent Wireless OneFormer executive positions at Verizon and GTE (1) Additional details available on slide 51 3

Today’s Agenda I. Introduction II. TPx Business Overview III. TPx Growth Strategy IV. TPx Financial Overview V. Transaction Details Appendix

I. Introduction
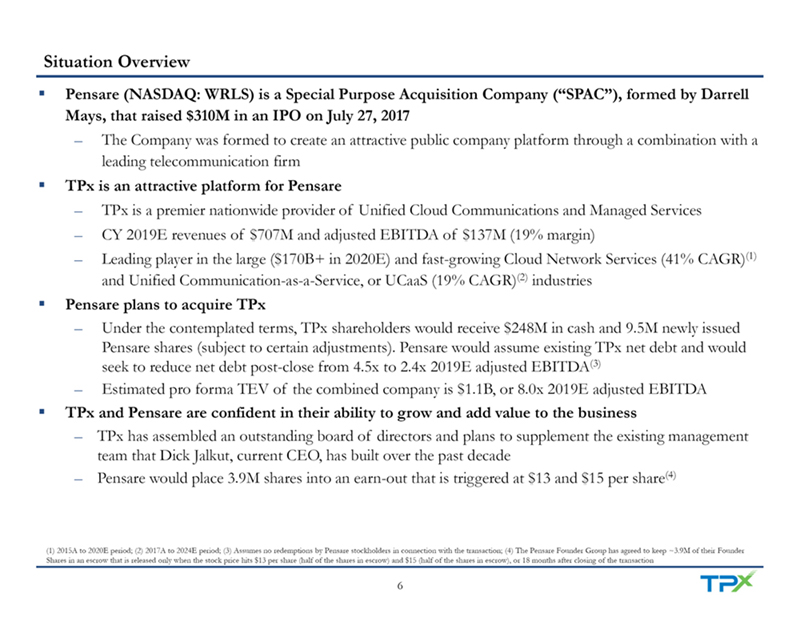
Situation Overview Pensare (NASDAQ: WRLS) is a Special Purpose Acquisition Company (“SPAC”), formed by Darrell Mays, that raised $310M in an IPO on July 27, 2017 – The Company was formed to create an attractive public company platform through a combination with a leading telecommunication firm TPx is an attractive platform for Pensare – TPx is a premier nationwide provider of Unified Cloud Communications and Managed Services – CY 2019E revenues of $707M and adjusted EBITDA of $137M (19% margin) – Leading player in the large ($170B+ in 2020E) and fast-growing Cloud Network Services (41% CAGR)(1)and Unified Communication-as-a-Service, or UCaaS (19% CAGR)(2)industries Pensare plans to acquire TPx – Under the contemplated terms, TPx shareholders would receive $248M in cash and 9.5M newly issued Pensare shares (subject to certain adjustments). Pensare would assume existing TPx net debt and would seek to reduce net debt post-close from 4.5x to 2.4x 2019E adjusted EBITDA(3)– Estimated pro forma TEV of the combined company is $1.1B, or 8.0x 2019E adjusted EBITDA TPx and Pensare are confident in their ability to grow and add value to the business – TPx has assembled an outstanding board of directors and plans to supplement the existing management team that Dick Jalkut, current CEO, has built over the past decade – Pensare would place 3.9M shares into an earn-out that is triggered at $13 and $15 per share(4)(1) 2015A to 2020E period; (2) 2017A to 2024E period; (3) Assumes no redemptions by Pensare stockholders in connection with the transaction; (4) The Pensare Founder Group has agreed to keep ~3.9M of their Founder Shares in an escrow that is released only when the stock price hits $13 per share (half of the shares in escrow) and $15 (half of the shares in escrow), or 18 months after closing of the transaction 6
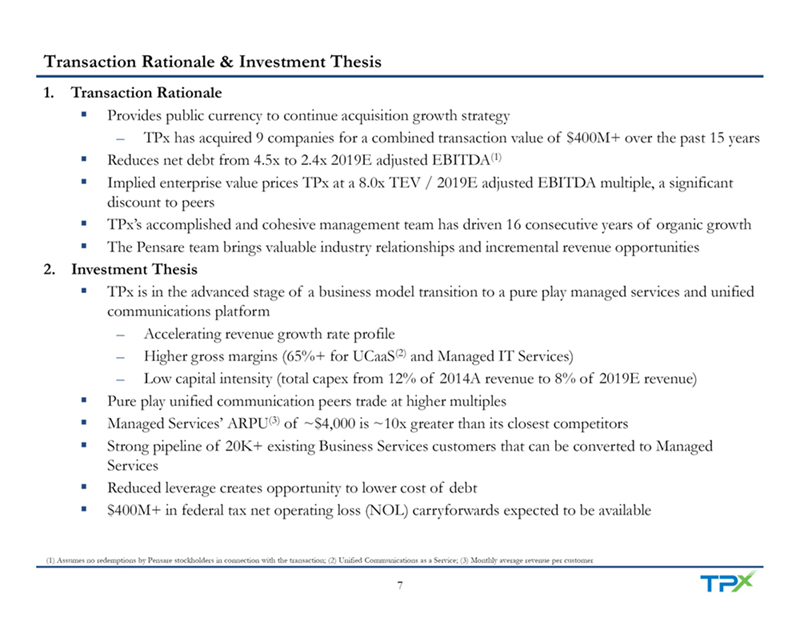
Transaction Rationale & Investment Thesis 1. Transaction Rationale Provides public currency to continue acquisition growth strategy – TPx has acquired 9 companies for a combined transaction value of $400M+ over the past 15 yearsReduces net debt from 4.5x to 2.4x 2019E adjusted EBITDA(1)Implied enterprise value prices TPx at a 8.0x TEV / 2019E adjusted EBITDA multiple, a significant discount to peers TPx’s accomplished and cohesive management team has driven 16 consecutive years of organic growthThe Pensare team brings valuable industry relationships and incremental revenue opportunities 2. Investment Thesis TPx is in the advanced stage of a business model transition to a pure play managed services and unified communications platform – Accelerating revenue growth rate profile – Higher gross margins (65%+ for UCaaS(2)and Managed IT Services) – Low capital intensity (total capex from 12% of 2014A revenue to 8% of 2019E revenue)Pure play unified communication peers trade at higher multiplesManaged Services’ ARPU(3)of ~$4,000 is ~10x greater than its closest competitorsStrong pipeline of 20K+ existing Business Services customers that can be converted to Managed ServicesReduced leverage creates opportunity to lower cost of debt$400M+ in federal tax net operating loss (NOL) carryforwards expected to be available (1) Assumes no redemptions by Pensare stockholders in connection with the transaction; (2) Unified Communications as a Service; (3) Monthly average revenue per customer 7

II. TPx Business Overview
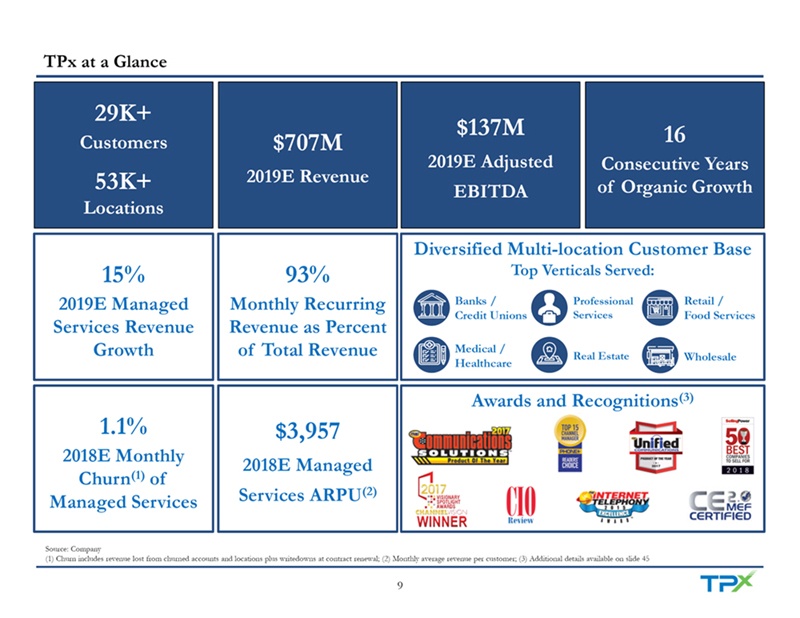
TPx at a Glance 29K+ $137M 16 Customers $707M 2019E Adjusted Consecutive Years 53K+ 2019E Revenue EBITDA of Organic Growth Locations Diversified Multi-location Customer Base 15% 93% Top Verticals Served: 2019E Managed Monthly Recurring Banks / Professional Retail / Credit Unions Services Food Services Services Revenue Revenue as Percent Growth of Total Revenue Medical / Real Estate Wholesale Healthcare Awards and Recognitions(3)1.1% $3,957 2018E Monthly 2018E Managed Churn(1)of Managed Services Services ARPU(2)Source: Company (1) Churn includes revenue lost from churned accounts and locations plus writedowns at contract renewal; (2) Monthly average revenue per customer; (3) Additional details available on slide 45 9
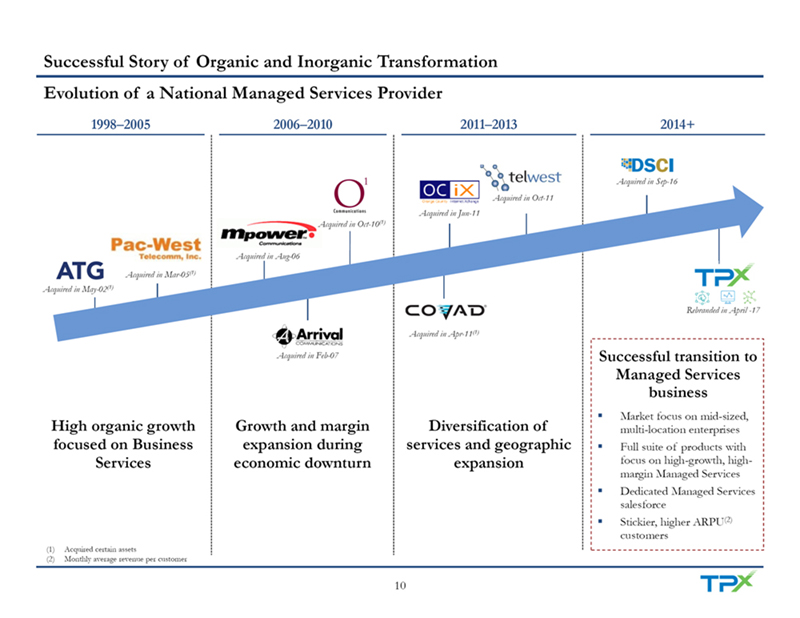
Successful Story of Organic and Inorganic Transformation Evolution of a National Managed Services Provider 1998–2005 2006–2010 2011–2013 2014+ Acquired in Sep-16 Acquired in Oct-11 Acquired in Jun-11 Acquired in Oct-10(1)Acquired in Aug-06 Acquired in Mar-05(1)Acquired in May-02(1)Rebranded in April -17 Acquired in Apr-11(1)Acquired in Feb-07 Successful transition to Managed Services business Market focus on mid-sized, High organic growth Growth and margin Diversification of multi-location enterprises focused on Business expansion during services and geographic Full suite of products with Services economic downturn expansion focus on high-growth, high- margin Managed ServicesDedicated Managed Services salesforce Stickier, higher ARPU(2)customers (1) Acquired certain assets (2) Monthly average revenue per customer 10

Robust Product Portfolio with End-to-End Solutions for Mid-Sized Enterprises Broad Managed Services Platform Solving Communication, Collaboration, Security, Cloud Networking and Continuity Needs of Customers Full range of essential managed Communications & services ideal for mid-market Collaboration (UCaaS) $155M 2019E Revenue (+24% YoY)(1) Addressing complex collaboration Unified Communications Suite challenges of distributed, multi-CRM(2)Integration location organizations Call Center Professional Install / Training Nationwide footprint (physical and SD-WAN(5)) for seamless connectivity UCaaS and Managed IT line of business structure brings focus / expertise in an integrated and Cloud Connectivity / complementary fashion Managed Networking Managed IT $210M 2019E Revenue (-1% YoY)(1) $90M 2019E Revenue (+79% YoY)(1)Industry-leading customer service SIP(3)Trunking SD-WAN(5) Backups Internet Access focus / performance WAN(6) Servers MPLS / VPLS / EPL(4)Office 365 Data Centers Cloud Connect (Azure, Google, Unique integrated IT infrastructure Firewall SOCs(7)Amazon Web Services) Endpoints (Dash) – proprietary, OSS / BSS(8)capabilities (1) Total 2019E Managed Services Revenue of $474M includes $18M of Other Managed Services Revenue, which is not shown in the above graphic; (2) Customer Relationship Management; (3) Session Initiation Protocol; (4) MPLS: Multiprotocol Label Switching, VPLS: Virtual Private LAN Services, EPL: Ethernet Private Line; (5) Software-defined Wide Area Network; (6) Wide Area Network; (7) Security Operations Centers; (8) Operations Support System / Business Support System 11

Full-featured, Unified Communications Service in the Cloud Cloud-based platform with best-in-class performance and quality built on Broadsoft technology platformIntegrated platform with deep feature functionality and ability to bolt on additional servicesHighly scalable and reliable platform with best-in-class customer supportFlexible solution that allows customers to seamlessly incorporate third-party applications UCaaS offering includes collaboration, desktop sharing, video conferencing and full mobility, all in an integrated format with flexible and advanced delivery methods VOICE VIDEO INSTANT PRESENCE CALL CENTER MESSAGING DESKTOP MOBILITY COLLABORATION INTEGRATION SHARING 12
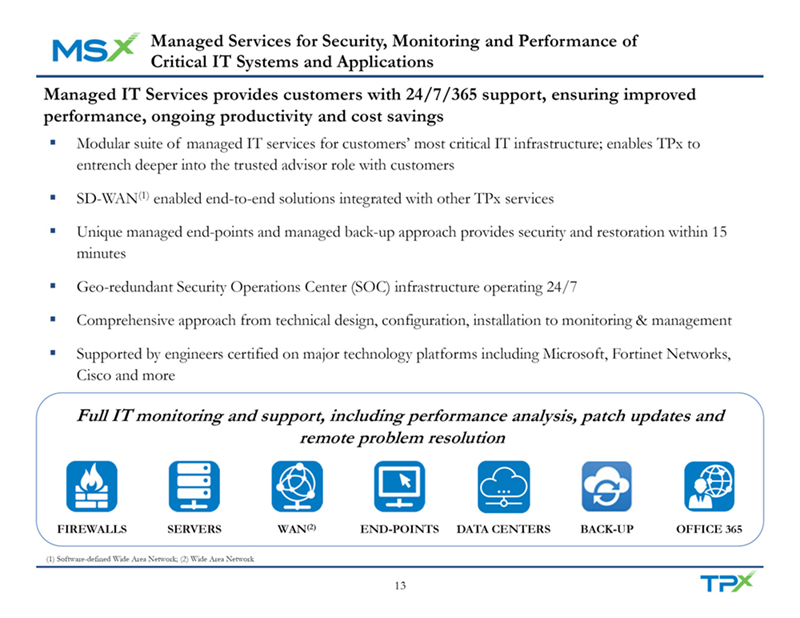
Managed Services for Security, Monitoring and Performance of Critical IT Systems and Applications Managed IT Services provides customers with 24/7/365 support, ensuring improved performance, ongoing productivity and cost savings Modular suite of managed IT services for customers’ most critical IT infrastructure; enables TPx to entrench deeper into the trusted advisor role with customers SD-WAN(1)enabled end-to-end solutions integrated with other TPx services Unique managed end-points and managed back-up approach provides security and restoration within 15 minutes Geo-redundant Security Operations Center (SOC) infrastructure operating 24/7 Comprehensive approach from technical design, configuration, installation to monitoring & management Supported by engineers certified on major technology platforms including Microsoft, Fortinet Networks, Cisco and more Full IT monitoring and support, including performance analysis, patch updates and remote problem resolution FIREWALLS SERVERS WAN(2) END-POINTS DATA CENTERS BACK-UP OFFICE 365 (1) Software-defined Wide Area Network; (2) Wide Area Network 13
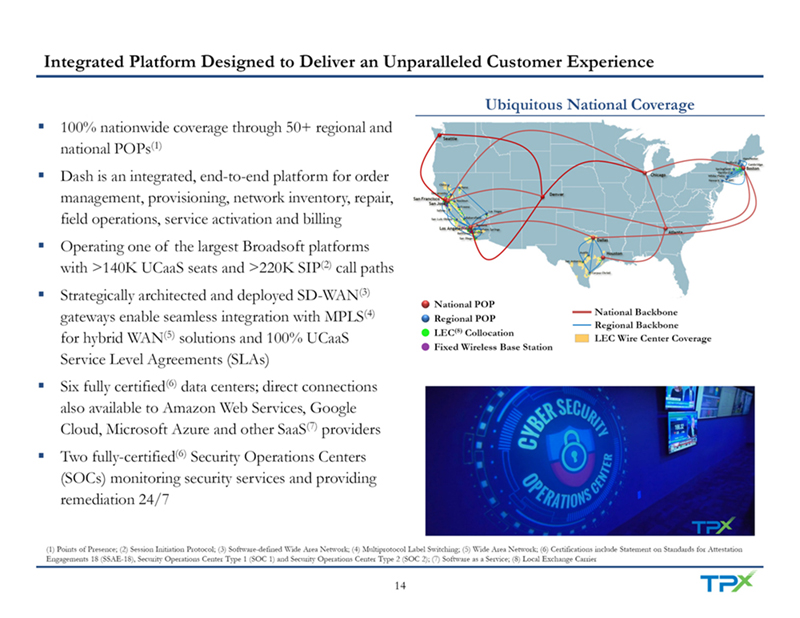
Integrated Platform Designed to Deliver an Unparalleled Customer Experience Ubiquitous National Coverage 100% nationwide coverage through 50+ regional and national POPs(1)Dash is an integrated, end-to-end platform for order management, provisioning, network inventory, repair, field operations, service activation and billingOperating one of the largest Broadsoft platforms with >140K UCaaS seats and >220K SIP(2)call pathsStrategically architected and deployed SD-WAN(3)National POP gateways enable seamless integration with MPLS(4) National Backbone Regional POP Regional Backbone LEC(8)Collocation for hybrid WAN(5)solutions and 100% UCaaS LEC Wire Center Coverage Fixed Wireless Base Station Service Level Agreements (SLAs) Six fully certified(6)data centers; direct connections also available to Amazon Web Services, Google Cloud, Microsoft Azure and other SaaS(7)providersTwo fully-certified(6)Security Operations Centers (SOCs) monitoring security services and providing remediation 24/7 (1) Points of Presence; (2) Session Initiation Protocol; (3) Software-defined Wide Area Network; (4) Multiprotocol Label Switching; (5) Wide Area Network; (6) Certifications include Statement on Standards for Attestation Engagements 18 (SSAE-18), Security Operations Center Type 1 (SOC 1) and Security Operations Center Type 2 (SOC 2); (7) Software as a Service; (8) Local Exchange Carrier 14
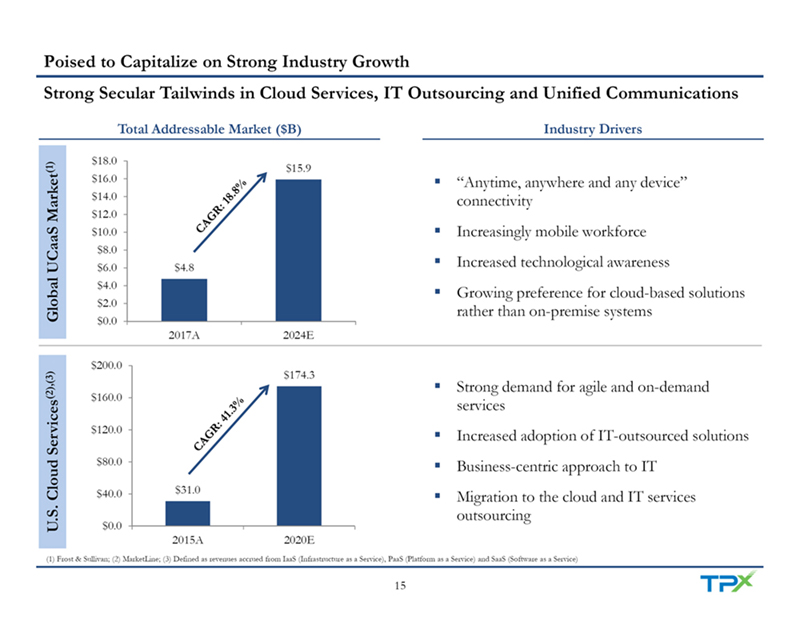
Poised to Capitalize on Strong Industry Growth Strong Secular Tailwinds in Cloud Services, IT Outsourcing and Unified Communications Total Addressable Market ($B) Industry Drivers $18.0(1) $15.9 $16.0 ”Anytime, anywhere and any device” $14.0 connectivity $12.0 $10.0 Increasingly mobile workforce $8.0 $6.0 $4.8 Increased technological awareness $4.0 Growing preference for cloud-based solutions $2.0 Global UCaaS Market rather than on-premise systems $0.0 2017A 2024E $200.0 $174.3(2),(3)Strong demand for agile and on-demand $160.0 services $120.0 Increased adoption of IT-outsourced solutions $80.0 Business-centric approach to IT $40.0 $31.0 Migration to the cloud and IT services outsourcing U.S. Cloud Services $0.0 2015A 2020E (1) Frost & Sullivan; (2) MarketLine; (3) Defined as revenues accrued from IaaS (Infrastructure as a Service), PaaS (Platform as a Service) and SaaS (Software as a Service) 15
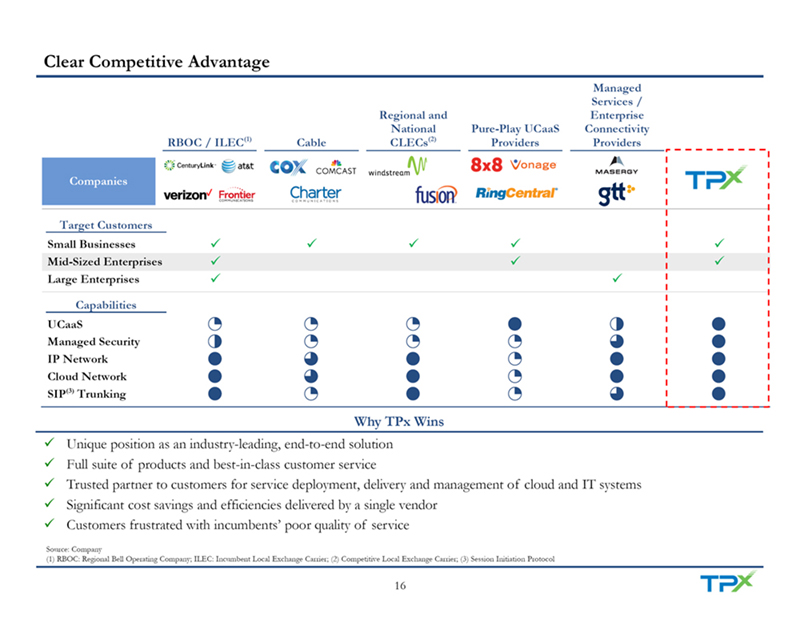
Clear Competitive Advantage Managed Services / Regional and Enterprise National Pure-Play UCaaS Connectivity RBOC / ILEC(1) Cable CLECs(2)Providers Providers Companies Target Customers Small Businesses Mid-Sized Enterprises Large Enterprises Capabilities UCaaS Managed Security IP Network Cloud Network SIP(3) Trunking Why TPx Wins Unique position as an industry-leading, end-to-end solutionFull suite of products and best-in-class customer service Trusted partner to customers for service deployment, delivery and management of cloud and IT systemsSignificant cost savings and efficiencies delivered by a single vendorCustomers frustrated with incumbents’ poor quality of service Source: Company (1) RBOC: Regional Bell Operating Company; ILEC: Incumbent Local Exchange Carrier; (2) Competitive Local Exchange Carrier; (3) Session Initiation Protocol 16

Diversified and Resilient Customer Base Attractive Customer Base 29K+ customers; 53K+ locationsPrimarily targeting mid-sized enterprises Top 25 customers account for just 5.0% of total monthly revenue, with no customer accounting for >0.5%Longstanding customer tenure – average customer life of 5.6 years (10.4 years for Managed Services)(1)Top Verticals Medical / Professional Financial, Retail Wholesale Healthcare Services Insurance & Real Restaurants Durable / Non-Medical Offices / Legal Estate Services Car Dealerships durable goods Clinics Business / Banks / Credit Unions Misc. Retails Stores Allied Services Management Real Estate Agents Grocery Stores General Medical / Consulting Surgical Hospitals Social Services (Individual & Family Services) Source: Company (1) Implied average customer life based on monthly churn divided by account base 17
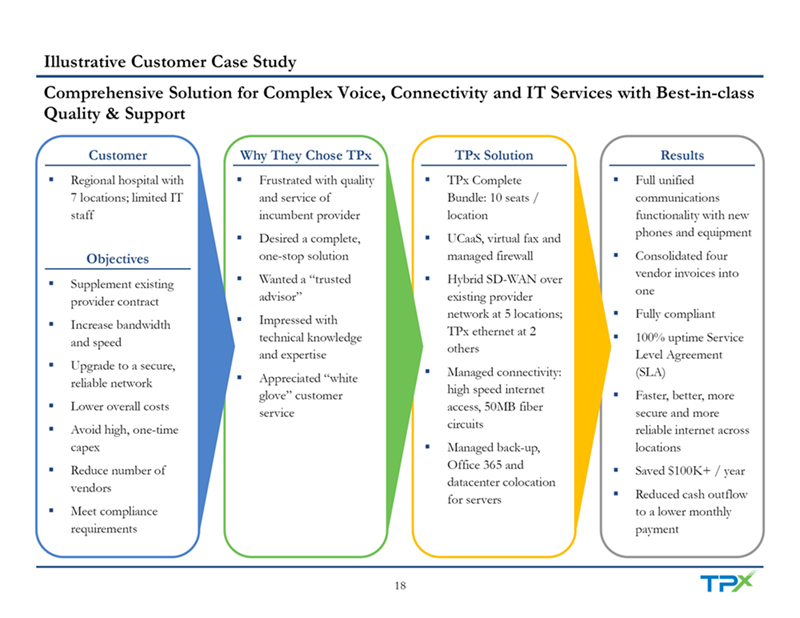
Illustrative Customer Case Study Comprehensive Solution for Complex Voice, Connectivity and IT Services with Best-in-class Quality & Support Customer Why They Chose TPx TPx Solution Results Regional hospital with Frustrated with quality TPx Complete Full unified 7 locations; limited IT and service of Bundle: 10 seats / communications staff incumbent provider location functionality with new phones and equipmentDesired a complete, UCaaS, virtual fax and Objectives one-stop solution managed firewall Consolidated four vendor invoices into Supplement existing Wanted a “trusted Hybrid SD-WAN over one provider contract advisor” existing provider network at 5 locations; Fully compliantIncrease bandwidth Impressed with TPx ethernet at 2 and speed technical knowledge 100% uptime Service others and expertise Level Agreement Upgrade to a secure, Managed connectivity: (SLA) reliable network Appreciated “white high speed internet glove” customer Faster, better, more Lower overall costs access, 50MB fiber service secure and more circuits Avoid high, one-time reliable internet across capex Managed back-up, locations Office 365 and Reduce number of Saved $100K+ / year datacenter colocation vendors for servers Reduced cash outflow Meet compliance to a lower monthly requirements payment 18
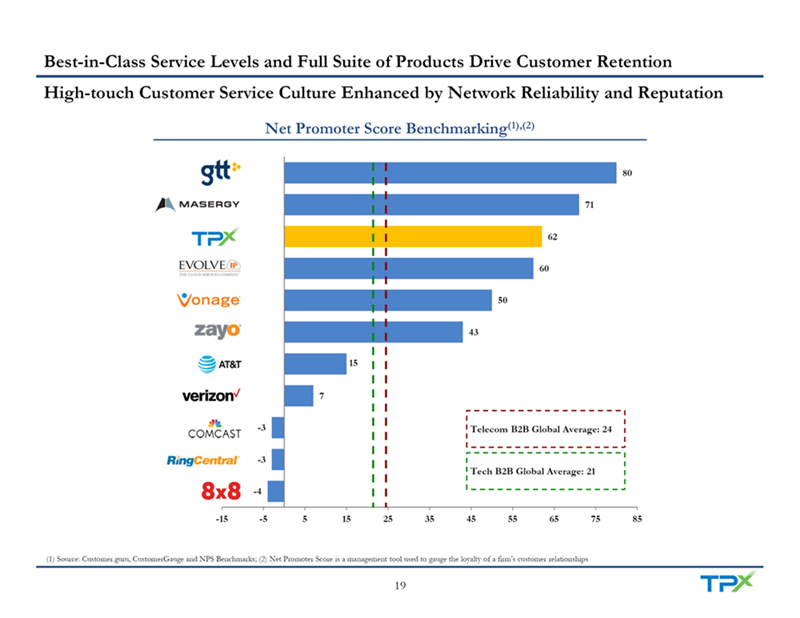
Best-in-Class Service Levels and Full Suite of Products Drive Customer Retention High-touch Customer Service Culture Enhanced by Network Reliability and Reputation Net Promoter Score Benchmarking(1),(2)80 71 62 60 50 43 15 7 -3 Telecom B2B Global Average: 24 -3 Tech B2B Global Average: 21 -4 -15 -5 5 15 25 35 45 55 65 75 85 (1) Source: Customer.guru, CustomerGauge and NPS Benchmarks; (2) Net Promoter Score is a management tool used to gauge the loyalty of a firm’s customer relationships 19
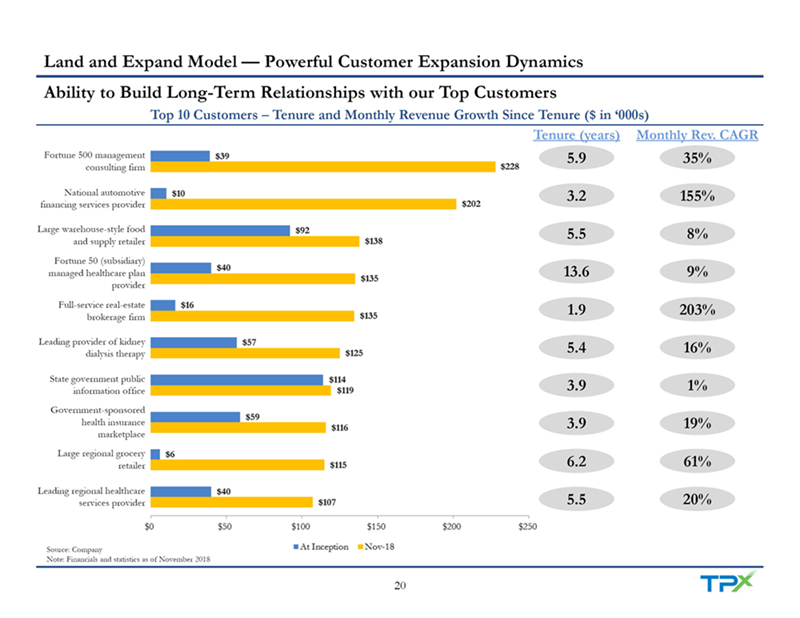
Land and Expand Model — Powerful Customer Expansion Dynamics Ability to Build Long-Term Relationships with our Top Customers Top 10 Customers – Tenure and Monthly Revenue Growth Since Tenure ($ in ‘000s) Tenure (years) Monthly Rev. CAGR Fortune 500 management 5.9 35% consulting firm National automotive 3.2 155% financing services provider Large warehouse-style food 5.5 8% and supply retailer Fortune 50 (subsidiary) managed healthcare plan 13.6 9% provider Full-service real-estate 1.9 203% brokerage firm Leading provider of kidney 5.4 16% dialysis therapy State government public 3.9 1% information office Government-sponsored health insurance 3.9 19% marketplace Large regional grocery retailer 6.2 61% Leading regional healthcare services provider 5.5 20% Source: Company Note: Financials and statistics as of November 2018 20

Visionary and Experienced Management Team Years of Experience Name & Title Background (TPx / Industry) Richard (Dick) A. Jalkut Home Wireless Networks 17 / 40 Chairman, President and CEO Pathnet Timothy J. Medina ECI Conference Call Services 14 / 30 EVP and CFO Independent Wireless One Holdings Russ Shipley 16 / 34 EVP, Wholesale Engineering & Operations David Zahn 15 / 24 SVP, Marketing Ken Bisnoff 20 / 30 CallManage SVP, Strategic Opportunities Michael James 19 / 40 SVP, Customer Experience Josephine Young Digital Access 12 / 26 SVP, Information Technology Southern Pacific Telecommunications Andrew Paretti 17 / 33 Brooks Fiber Communications President, California & Nevada Jim Delis 2 / 30 SVP, National Channel Development Bill Hunt 3 / 25 SVP, General Counsel and Secretary Jamie Minner 1 / 15 Vice President, UCx Jared Martin 7 / 20 BigCity Networks Vice President, MSx Nathan Bledsoe 1 / 23 CloudPeer Networks Starlink Vice President, Managed Connectivity 21
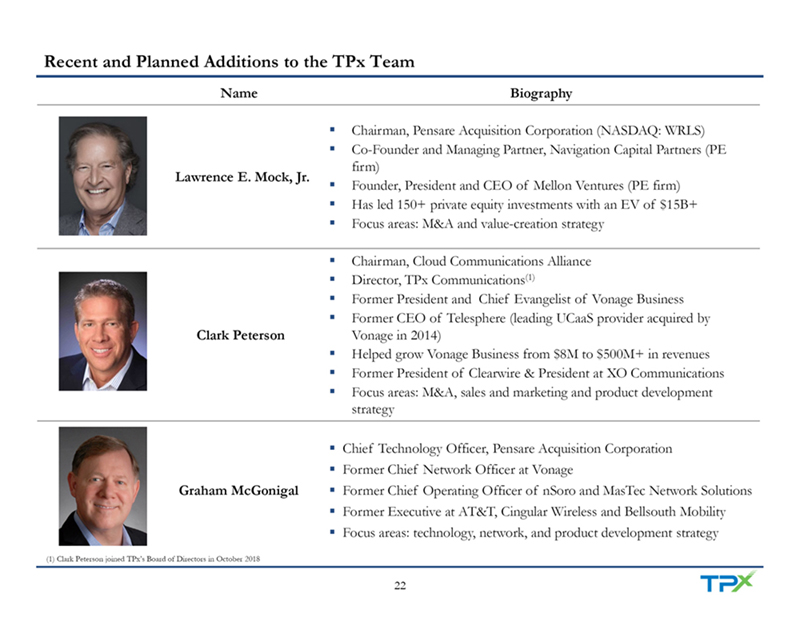
Recent and Planned Additions to the TPx Team Name Biography Chairman, Pensare Acquisition Corporation (NASDAQ: WRLS)Co-Founder and Managing Partner, Navigation Capital Partners (PE firm) Lawrence E. Mock, Jr. Founder, President and CEO of Mellon Ventures (PE firm)Has led 150+ private equity investments with an EV of $15B+Focus areas: M&A and value-creation strategy Chairman, Cloud Communications AllianceDirector, TPx Communications(1)Former President and Chief Evangelist of Vonage BusinessFormer CEO of Telesphere (leading UCaaS provider acquired by Clark Peterson Vonage in 2014)Helped grow Vonage Business from $8M to $500M+ in revenuesFormer President of Clearwire & President at XO CommunicationsFocus areas: M&A, sales and marketing and product development strategy Chief Technology Officer, Pensare Acquisition CorporationFormer Chief Network Officer at Vonage Graham McGonigal Former Chief Operating Officer of nSoro and MasTec Network SolutionsFormer Executive at AT&T, Cingular Wireless and Bellsouth MobilityFocus areas: technology, network, and product development strategy (1) Clark Peterson joined TPx’s Board of Directors in October 2018 22

III. TPx Growth Strategy
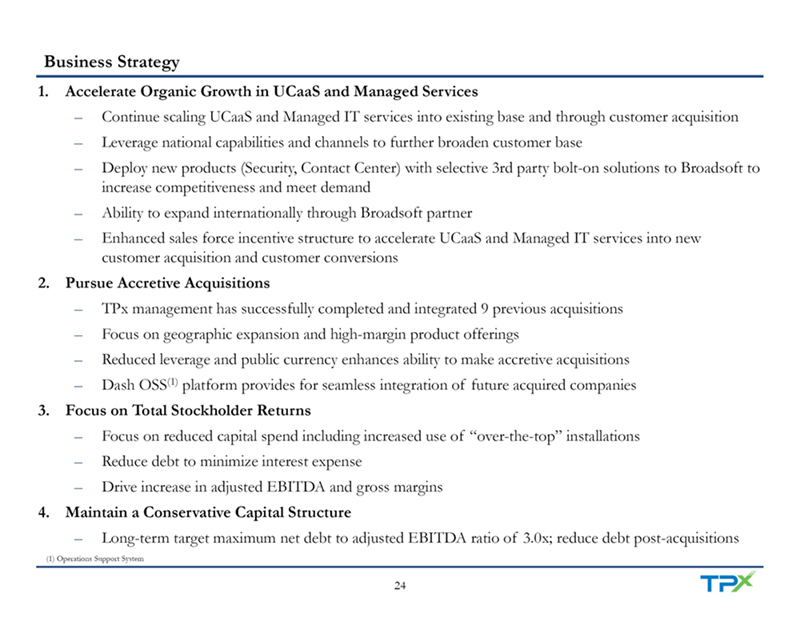
Business Strategy 1. Accelerate Organic Growth in UCaaS and Managed Services – Continue scaling UCaaS and Managed IT services into existing base and through customer acquisition – Leverage national capabilities and channels to further broaden customer base – Deploy new products (Security, Contact Center) with selective 3rd party bolt-on solutions to Broadsoft to increase competitiveness and meet demand – Ability to expand internationally through Broadsoft partner – Enhanced sales force incentive structure to accelerate UCaaS and Managed IT services into new customer acquisition and customer conversions 2. Pursue Accretive Acquisitions – TPx management has successfully completed and integrated 9 previous acquisitions – Focus on geographic expansion and high-margin product offerings – Reduced leverage and public currency enhances ability to make accretive acquisitions – Dash OSS(1)platform provides for seamless integration of future acquired companies 3. Focus on Total Stockholder Returns – Focus on reduced capital spend including increased use of “over-the-top” installations – Reduce debt to minimize interest expense – Drive increase in adjusted EBITDA and gross margins 4. Maintain a Conservative Capital Structure – Long-term target maximum net debt to adjusted EBITDA ratio of 3.0x; reduce debt post-acquisitions (1) Operations Support System 24
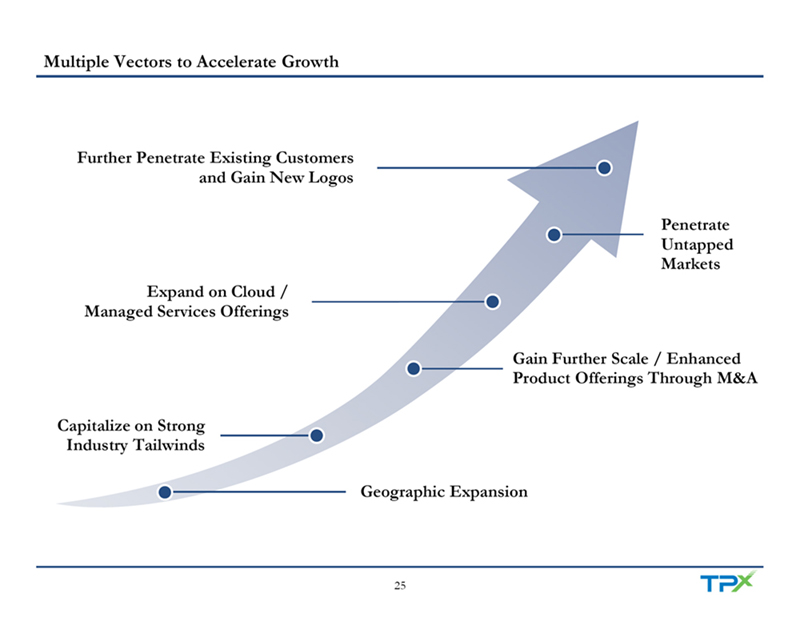
Multiple Vectors to Accelerate Growth Further Penetrate Existing Customers and Gain New Logos Penetrate Untapped Markets Expand on Cloud / Managed Services Offerings Gain Further Scale / Enhanced Product Offerings Through M&A Capitalize on Strong Industry Tailwinds Geographic Expansion 25
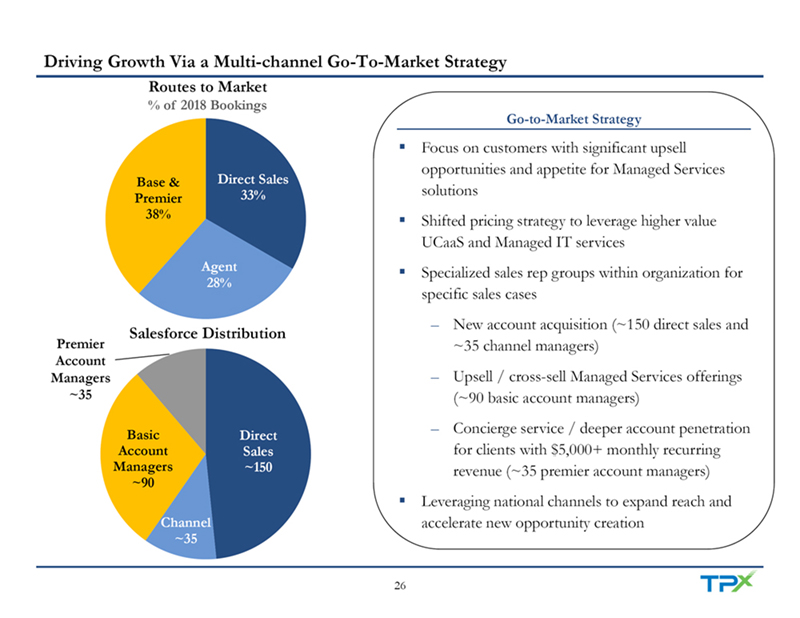
Driving Growth Via a Multi-channel Go-To-Market Strategy Routes to Market % of 2018 Bookings Go-to-Market Strategy Focus on customers with significant upsell opportunities and appetite for Managed Services Base & Direct Sales 33% solutions Premier 38% Shifted pricing strategy to leverage higher value UCaaS and Managed IT services Agent Specialized sales rep groups within organization for 28% specific sales cases – New account acquisition (~150 direct sales and Salesforce Distribution Premier ~35 channel managers) Account Managers – Upsell / cross-sell Managed Services offerings ~35 (~90 basic account managers) – Concierge service / deeper account penetration Basic Direct Account Sales for clients with $5,000+ monthly recurring Managers ~150 revenue (~35 premier account managers) ~90 Leveraging national channels to expand reach and Channel accelerate new opportunity creation ~35 26
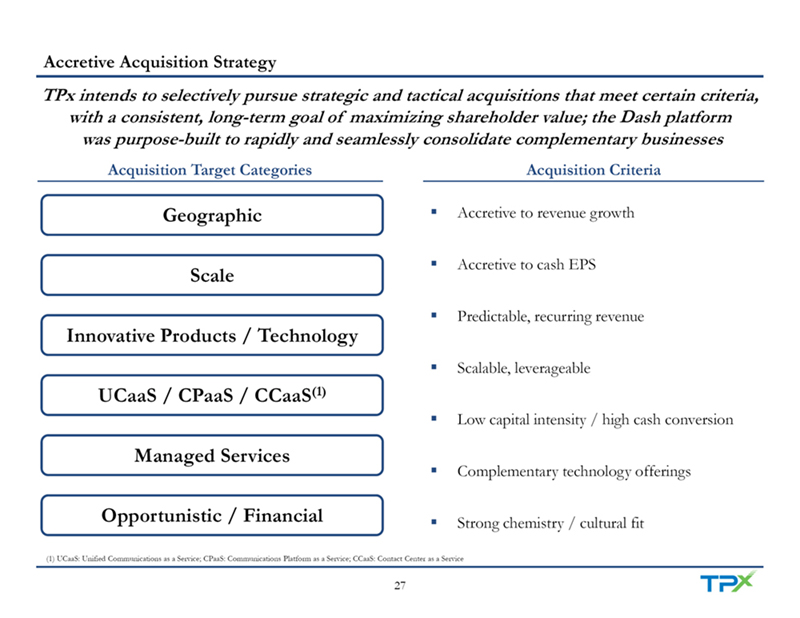
Accretive Acquisition Strategy TPx intends to selectively pursue strategic and tactical acquisitions that meet certain criteria, with a consistent, long-term goal of maximizing shareholder value; the Dash platform was purpose-built to rapidly and seamlessly consolidate complementary businesses Acquisition Target Categories Acquisition Criteria Geographic Accretive to revenue growth Accretive to cash EPS Scale Predictable, recurring revenue Innovative Products / Technology Scalable, leverageable UCaaS / CPaaS / CCaaS(1)Low capital intensity / high cash conversion Managed Services Complementary technology offerings Opportunistic / Financial Strong chemistry / cultural fit (1) UCaaS: Unified Communications as a Service; CPaaS: Communications Platform as a Service; CCaaS: Contact Center as a Service 27

IV. TPx Financial Overview
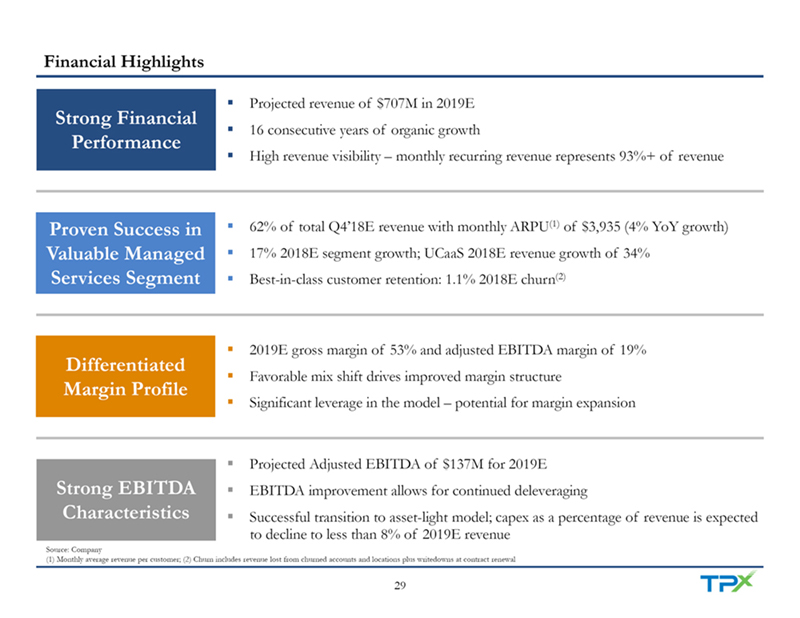
Financial Highlights Projected revenue of $707M in 2019E Strong Financial 16 consecutive years of organic growth Performance High revenue visibility – monthly recurring revenue represents 93%+ of revenue Proven Success in 62% of total Q4’18E revenue with monthly ARPU(1)of $3,935 (4% YoY growth) Valuable Managed 17% 2018E segment growth; UCaaS 2018E revenue growth of 34% Services Segment Best-in-class customer retention: 1.1% 2018E churn(2)2019E gross margin of 53% and adjusted EBITDA margin of 19% Differentiated Favorable mix shift drives improved margin structure Margin Profile Significant leverage in the model – potential for margin expansion Projected Adjusted EBITDA of $137M for 2019E Strong EBITDA EBITDA improvement allows for continued deleveraging Characteristics Successful transition to asset-light model; capex as a percentage of revenue is expected to decline to less than 8% of 2019E revenue Source: Company (1) Monthly average revenue per customer; (2) Churn includes revenue lost from churned accounts and locations plus writedowns at contract renewal 29
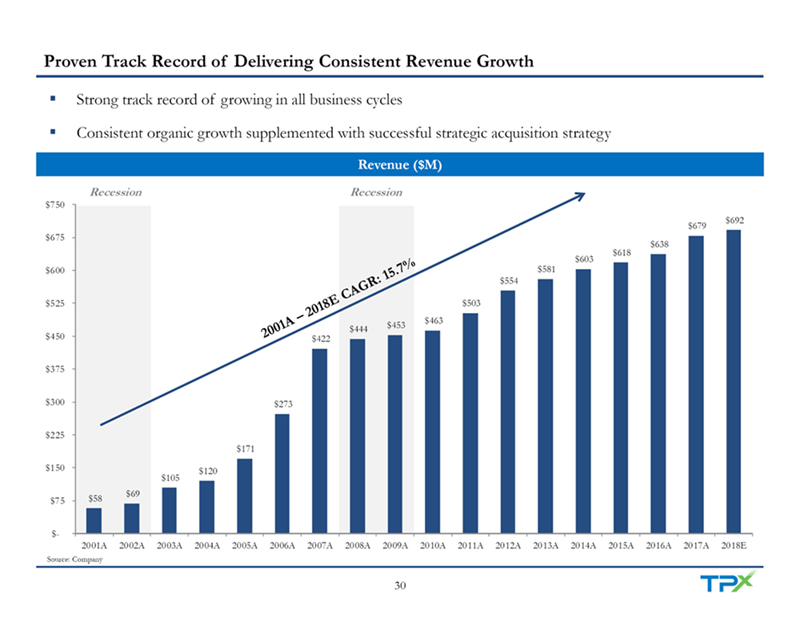
Proven Track Record of Delivering Consistent Revenue Growth ($ in MM) Strong track record of growing in all business cycles Consistent organic growth supplemented with successful strategic acquisition strategy Revenue ($M) Recession Recession $750 $692 $679 $675 $638 $618 $603 $600 $581 $554 $525 $503 $463 $444 $453 $450 $422 $375 $300 $273 $225 $171 $150 $120 $105 $69 $75 $58 $- 2001A 2002A 2003A 2004A 2005A 2006A 2007A 2008A 2009A 2010A 2011A 2012A 2013A 2014A 2015A 2016A 2017A 2018E Source: Company 30
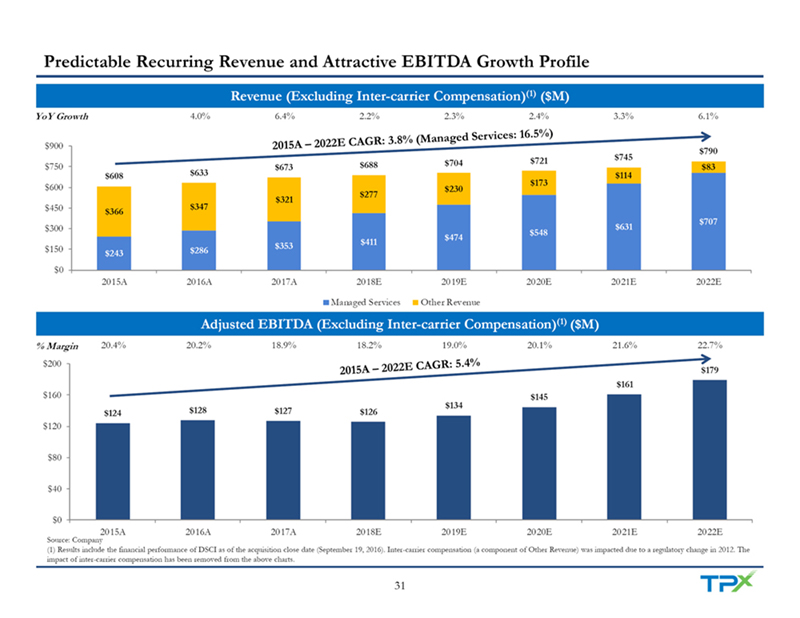
Predictable Recurring Revenue and Attractive EBITDA Growth Profile Revenue (Excluding Inter-carrier Compensation)(1)($M) YoY Growth 4.0% 6.4% 2.2% 2.3% 2.4% 3.3% 6.1% $900 $790 $721 $745 $750 $688 $704 $83 $673 $608 $633 $114 $173 $600 $230 $277 $321 $450 $347 $366 $707 $300 $631 $548 $474 $353 $411 $150 $286 $243 $0 2015A 2016A 2017A 2018E 2019E 2020E 2021E 2022E Managed Services Other Revenue Adjusted EBITDA (Excluding Inter-carrier Compensation)(1)($M) % Margin 20.4% 20.2% 18.9% 18.2% 19.0% 20.1% 21.6% 22.7% $200 $179 $161 $160 $145 $134 $124 $128 $127 $126 $120 $80 $40 $0 2015A 2016A 2017A 2018E 2019E 2020E 2021E 2022E Source: Company (1) Results include the financial performance of DSCI as of the acquisition close date (September 19, 2016). Inter-carrier compensation (a component of Other Revenue) was impacted due to a regulatory change in 2012. The impact of inter-carrier compensation has been removed from the above charts. 31

Accelerating Managed Service Performance Monthly Contracted Orders Managed SD-WAN(1)Locations (‘000s) UCaaS Seats (‘000s) 1,000 7 180 782 6 5.4 138 144 800 740 150 129 633 5 120 4.4 114 120 600 496 4 3.6 395 2.8 90 400 3 2.1 60 2 200 30 1 0 0 0 Q4’17A Q1’18A Q2’18A Q3’18A Q4’18E Q4’17A Q1’18A Q2’18A Q3’18A Q4’18E Q4’17A Q1’18A Q2’18A Q3’18A Q4’18E Firewall Locations Managed Services Accounts (‘000s) Managed Services ARPU(2)800 12.0 $4,800 663 $3,897 $3,957 626 9.5 574 9.0 $4,000 600 545 9.0 8.2 8.5 8.0 480 $3,200 400 6.0 $2,400 $1,600 200 3.0 $800 0 0.0 $0 Q4’17A Q1’18A Q2’18A Q3’18A Q4’18E Q4’17A Q1’18A Q2’18A Q3’18A Q4’18E 2017A 2018E Source: Company (1) Software-defined Wide Area Network; (2) Monthly average revenue per customer 32
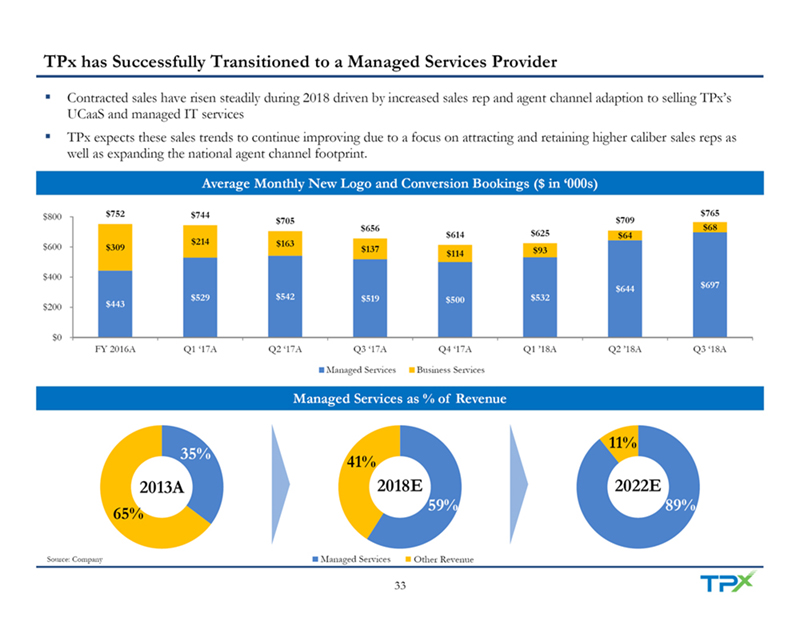
TPx has Successfully Transitioned to a Managed Services Provider Contracted sales have risen steadily during 2018 driven by increased sales rep and agent channel adaption to selling TPx’s UCaaS and managed IT servicesTPx expects these sales trends to continue improving due to a focus on attracting and retaining higher caliber sales reps as well as expanding the national agent channel footprint. Average Monthly New Logo and Conversion Bookings ($ in ‘000s) $800 $752 $744 $765 $705 $709 $656 $68 $614 $625 $64 $214 $163 $600 $309 $137 $93 $114 $400 $644 $697 $529 $542 $519 $500 $532 $200 $443 $0 FY 2016A Q1 ‘17A Q2 ‘17A Q3 ‘17A Q4 ‘17A Q1 ‘18A Q2 ‘18A Q3 ‘18A Managed Services Business Services Managed Services as % of Revenue 11% 35% 41% 2013A 2018E 2022E 59% 89% 65% Source: Company Managed Services Other Revenue 33
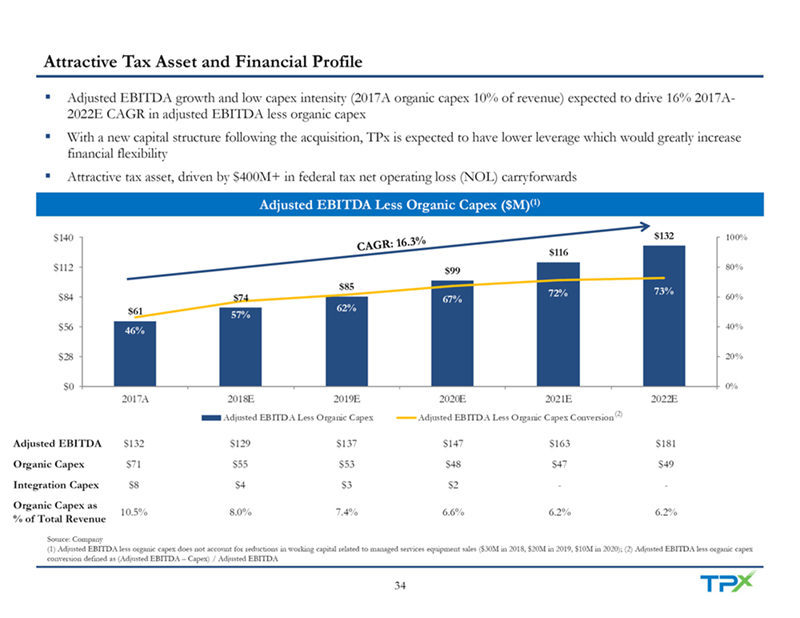
Attractive Tax Asset and Financial Profile Adjusted EBITDA growth and low capex intensity (2017A organic capex 10% of revenue) expected to drive 16% 2017A-2022E CAGR in adjusted EBITDA less organic capexWith a new capital structure following the acquisition, TPx is expected to have lower leverage which would greatly increase financial flexibilityAttractive tax asset, driven by $400M+ in federal tax net operating loss (NOL) carryforwards Adjusted EBITDA Less Organic Capex ($M)(1)$140 $132 100% $116 $112 $99 80% $85 73% $84 72% 60% $74 67% $61 62% 57% $56 46% 40% $28 20% $0 0% 2017A 2018E 2019E 2020E 2021E 2022E Adjusted EBITDA Less Organic Capex Adjusted EBITDA Less Organic Capex Conversion(2) Adjusted EBITDA $132 $129 $137 $147 $163 $181 Organic Capex $71 $55 $53 $48 $47 $49 Integration Capex $8 $4 $3 $2 - -Organic Capex as 10.5% 8.0% 7.4% 6.6% 6.2% 6.2% % of Total Revenue Source: Company (1) Adjusted EBITDA less organic capex does not account for reductions in working capital related to managed services equipment sales ($30M in 2018, $20M in 2019, $10M in 2020); (2) Adjusted EBITDA less organic capex conversion defined as (Adjusted EBITDA – Capex) / Adjusted EBITDA 34

Compelling Financial Model Driving Margin Expansion 2017A 2018E 2022E Revenue Growth 1% 2% 5%+ Gross Margin 53% 52% 57%+ Adjusted EBITDA Margin 19% 19% 22%+ Adjusted EBITDA Less 9% 11% 15%+ Organic Capex Margin Source: Company 35

V. Transaction Details
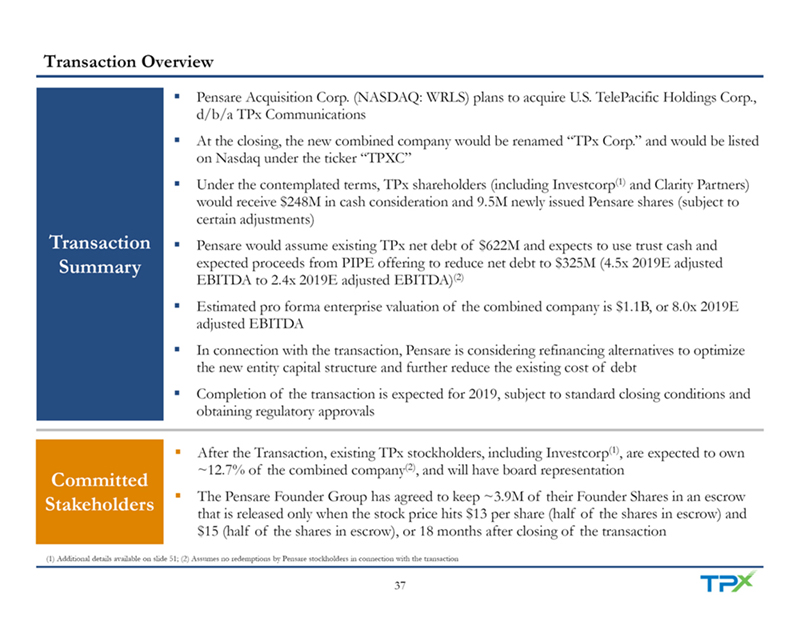
Transaction Overview Pensare Acquisition Corp. (NASDAQ: WRLS) plans to acquire U.S. TelePacific Holdings Corp., d/b/a TPx CommunicationsAt the closing, the new combined company would be renamed “TPx Corp.” and would be listed on Nasdaq under the ticker “TPXC”Under the contemplated terms, TPx shareholders (including Investcorp(1)and Clarity Partners) would receive $248M in cash consideration and 9.5M newly issued Pensare shares (subject to certain adjustments) Transaction Pensare would assume existing TPx net debt of $622M and expects to use trust cash and Summary expected proceeds from PIPE offering to reduce net debt to $325M (4.5x 2019E adjusted EBITDA to 2.4x 2019E adjusted EBITDA)(2)Estimated pro forma enterprise valuation of the combined company is $1.1B, or 8.0x 2019E adjusted EBITDA In connection with the transaction, Pensare is considering refinancing alternatives to optimize the new entity capital structure and further reduce the existing cost of debtCompletion of the transaction is expected for 2019, subject to standard closing conditions and obtaining regulatory approvals After the Transaction, existing TPx stockholders, including Investcorp(1), are expected to own ~12.7% of the combined company(2), and will have board representation Committed Stakeholders The Pensare Founder Group has agreed to keep ~3.9M of their Founder Shares in an escrow that is released only when the stock price hits $13 per share (half of the shares in escrow) and $15 (half of the shares in escrow), or 18 months after closing of the transaction (1) Additional details available on slide 51; (2) Assumes no redemptions by Pensare stockholders in connection with the transaction 37
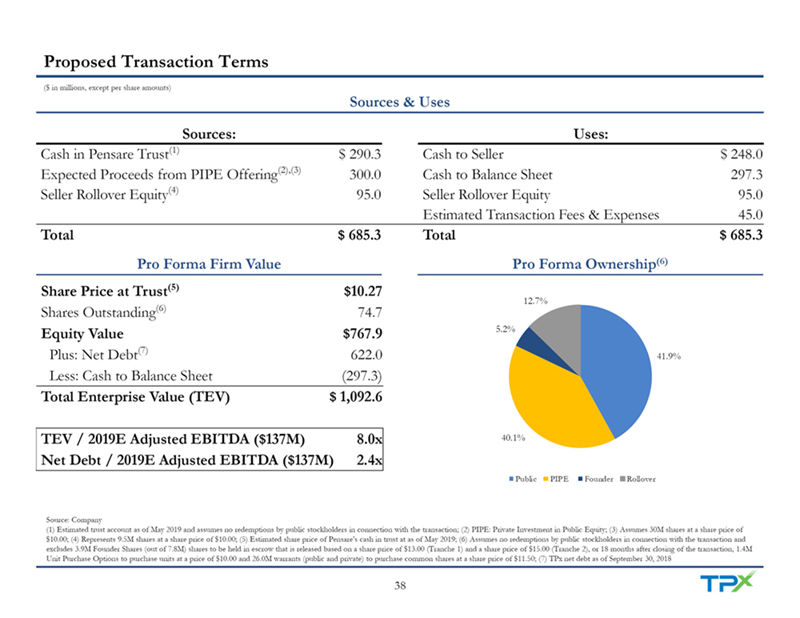
Proposed Transaction Terms ($ in millions, except per share amounts) Sources & Uses Sources: Uses: Cash in Pensare Trust(1) $ 290.3 Cash to Seller $ 248.0 Expected Proceeds from PIPE Offering(2),(3) 300.0 Cash to Balance Sheet 297.3 Seller Rollover Equity(4) 95.0 Seller Rollover Equity 95.0 Estimated Transaction Fees & Expenses 45.0 Total $ 685.3 Total $ 685.3 Pro Forma Firm Value Pro Forma Ownership(6)Share Price at Trust(5) $10.27 12.7% Shares Outstanding(6)74.7 Equity Value $767.9 5.2% Plus: Net Debt(7) 622.0 41.9% Less: Cash to Balance Sheet (297.3) Total Enterprise Value (TEV) $ 1,092.6 TEV / 2019E Adjusted EBITDA ($137M) 8.0x 40.1% Net Debt / 2019E Adjusted EBITDA ($137M) 2.4x Public PIPE Founder Rollover Source: Company (1) Estimated trust account as of May 2019 and assumes no redemptions by public stockholders in connection with the transaction; (2) PIPE: Private Investment in Public Equity; (3) Assumes 30M shares at a share price of $10.00; (4) Represents 9.5M shares at a share price of $10.00; (5) Estimated share price of Pensare’s cash in trust at as of May 2019; (6) Assumes no redemptions by public stockholders in connection with the transaction and excludes 3.9M Founder Shares (out of 7.8M) shares to be held in escrow that is released based on a share price of $13.00 (Tranche 1) and a share price of $15.00 (Tranche 2), or 18 months after closing of the transaction, 1.4M Unit Purchase Options to purchase units at a price of $10.00 and 26.0M warrants (public and private) to purchase common shares at a share price of $11.50; (7) TPx net debt as of September 30, 2018 38
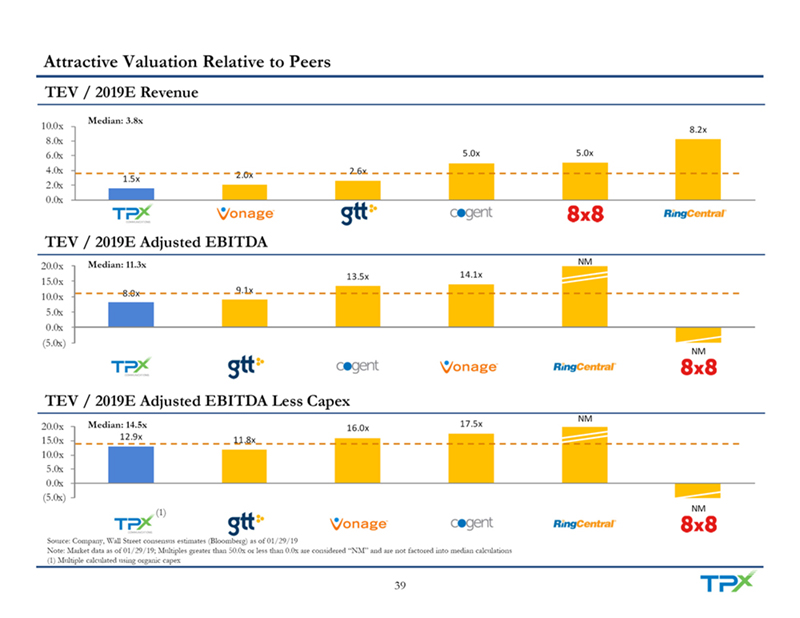
Attractive Valuation Relative to Peers TEV / 2019E Revenue Median: 3.8x 10.0x 8.2x 8.0x 6.0x 5.0x 5.0x 4.0x 2.6x 2.0x 1.5x 2.0x 0.0x TEV / 2019E Adjusted EBITDA 20.0x Median: 11.3x NM 13.5x 14.1x 15.0x 8.0x 9.1x 10.0x 5.0x 0.0x (5.0x) NM TEV / 2019E Adjusted EBITDA Less Capex NM 20.0x Median: 14.5x 17.5x 16.0x 15.0x 12.9x 11.8x 10.0x 5.0x 0.0x (5.0x) (1) NM Source: Company, Wall Street consensus estimates (Bloomberg) as of 01/29/19 Note: Market data as of 01/29/19; Multiples greater than 50.0x or less than 0.0x are considered “NM” and are not factored into median calculations (1) Multiple calculated using organic capex 39
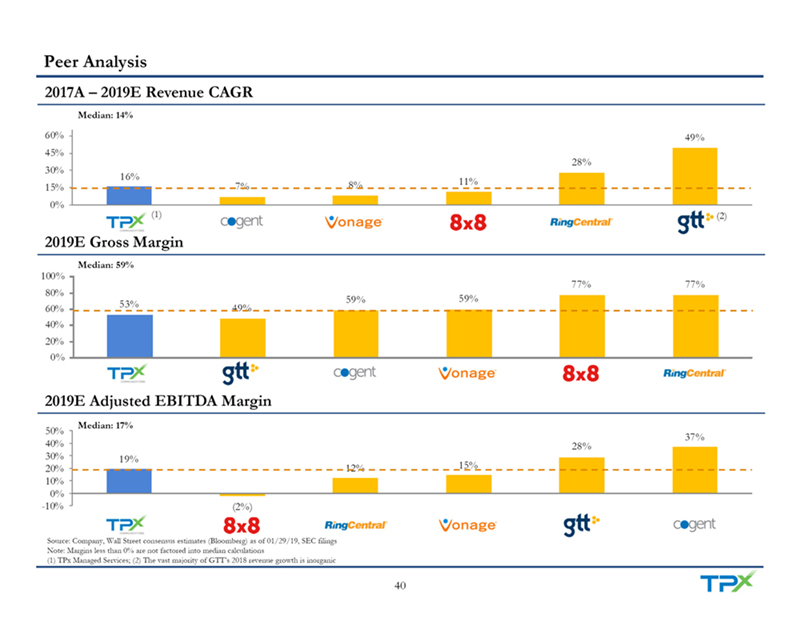
Peer Analysis 2017A – 2019E Revenue CAGR Median: 14% 60% 49% 45% 28% 30% 16% 8% 11% 15% 7% 0% (1) (2) 2019E Gross Margin Median: 59% 100% 77% 77% 80% 59% 59% 60% 53% 49% 40% 20% 0% 2019E Adjusted EBITDA Margin Median: 17% 50% 37% 40% 28% 30% 19% 20% 12% 15% 10% 0% -10% (2%) Source: Company, Wall Street consensus estimates (Bloomberg) as of 01/29/19, SEC filings Note: Margins less than 0% are not factored into median calculations (1) TPx Managed Services; (2) The vast majority of GTT’s 2018 revenue growth is inorganic 40
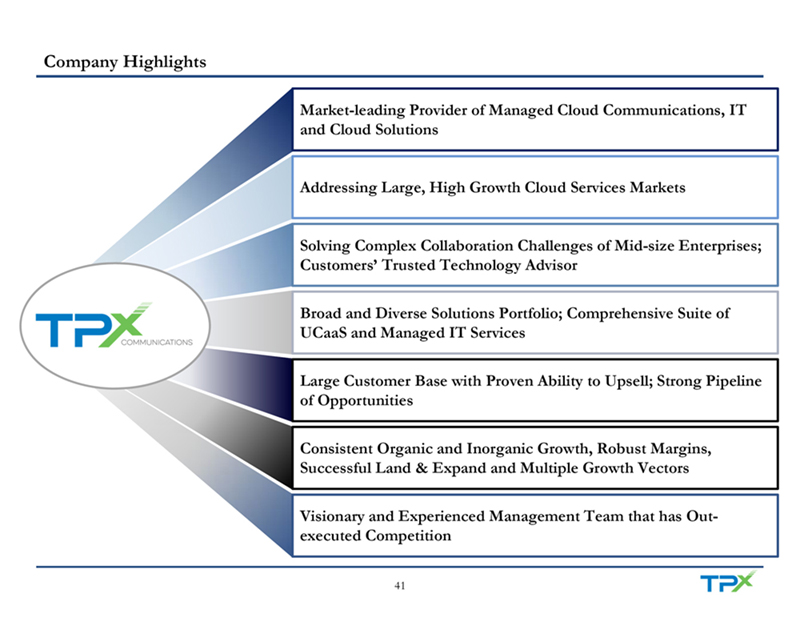
Company Highlights Market-leading Provider of Managed Cloud Communications, IT and Cloud Solutions Addressing Large, High Growth Cloud Services Markets Solving Complex Collaboration Challenges of Mid-size Enterprises; Customers’ Trusted Technology Advisor Broad and Diverse Solutions Portfolio; Comprehensive Suite of UCaaS and Managed IT Services Large Customer Base with Proven Ability to Upsell; Strong Pipeline of Opportunities Consistent Organic and Inorganic Growth, Robust Margins, Successful Land & Expand and Multiple Growth Vectors Visionary and Experienced Management Team that has Out-executed Competition 41

Appendix
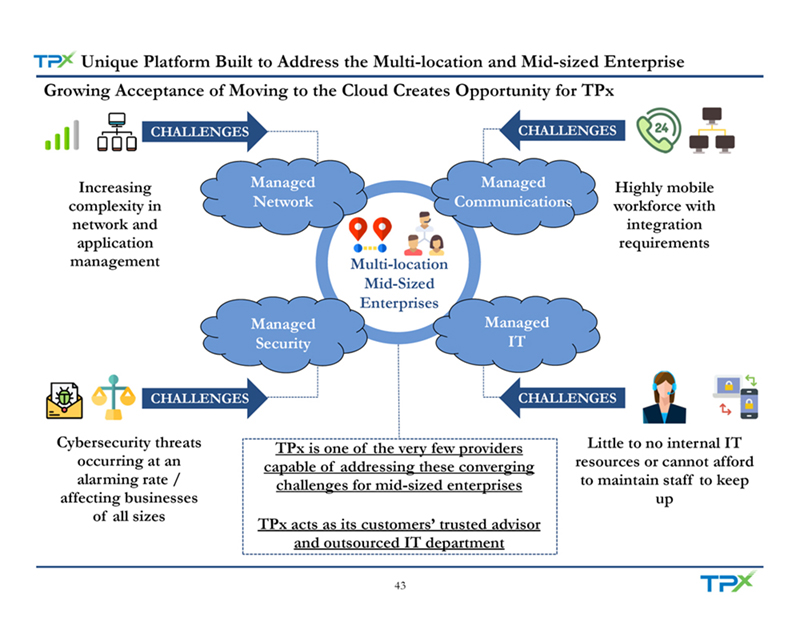
Unique Platform Built to Address the Multi-location and Mid-sized Enterprise Growing Acceptance of Moving to the Cloud Creates Opportunity for TPx CHALLENGES CHALLENGES Increasing Managed Managed Highly mobile complexity in Network Communications workforce with network and integration application requirements management Multi-location Mid-Sized Enterprises Managed Managed Security IT CHALLENGES CHALLENGES Cybersecurity threats TPx is one of the very few providers Little to no internal IT occurring at an capable of addressing these converging resources or cannot afford alarming rate / challenges for mid-sized enterprises to maintain staff to keep affecting businesses up of all sizes TPx acts as its customers’ trusted advisor and outsourced IT department 43
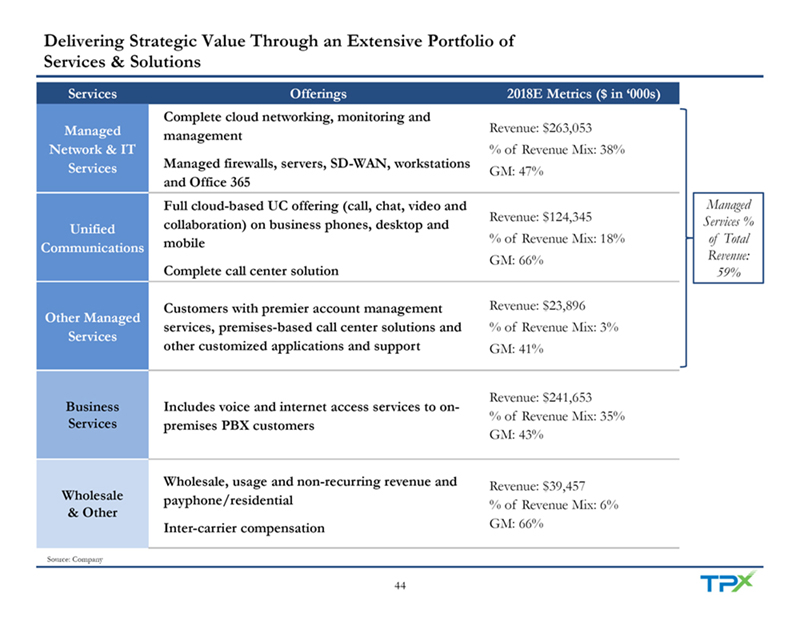
Delivering Strategic Value Through an Extensive Portfolio of Services & Solutions Services Offerings 2018E Metrics ($ in ‘000s) Complete cloud networking, monitoring and Managed Revenue: $263,053 management Network & IT % of Revenue Mix: 38% Services Managed firewalls, servers, SD-WAN, workstations GM: 47% and Office 365 Full cloud-based UC offering (call, chat, video and Managed Revenue: $124,345 Services % Unified collaboration) on business phones, desktop and mobile % of Revenue Mix: 18% of Total Communications GM: 66% Revenue: Complete call center solution 59% Customers with premier account management Revenue: $23,896 Other Managed services, premises-based call center solutions and % of Revenue Mix: 3% Services other customized applications and support GM: 41% Revenue: $241,653 Business Includes voice and internet access services to on- % of Revenue Mix: 35% Services premises PBX customers GM: 43% Wholesale, usage and non-recurring revenue and Revenue: $39,457 Wholesale payphone/residential % of Revenue Mix: 6% & Other Inter-carrier compensation GM: 66% Source: Company 44
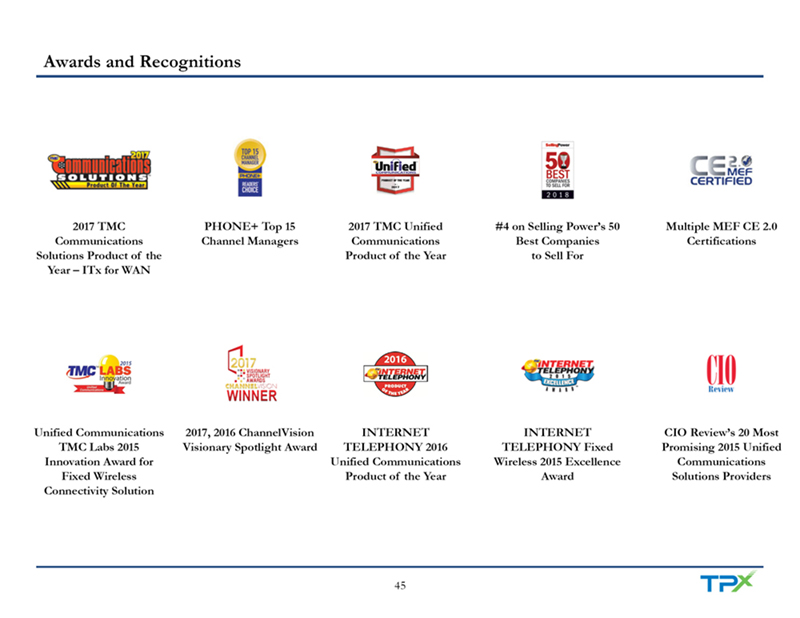
Awards and Recognitions 2017 TMC PHONE+ Top 15 2017 TMC Unified #4 on Selling Power’s 50 Multiple MEF CE 2.0 Communications Channel Managers Communications Best Companies Certifications Solutions Product of the Product of the Year to Sell For Year – ITx for WAN Unified Communications 2017, 2016 ChannelVision INTERNET INTERNET CIO Review’s 20 Most TMC Labs 2015 Visionary Spotlight Award TELEPHONY 2016 TELEPHONY Fixed Promising 2015 Unified Innovation Award for Unified Communications Wireless 2015 Excellence Communications Fixed Wireless Product of the Year Award Solutions Providers Connectivity Solution 45

Financial Summary ($ in thousands) Actual Actual Actual Forecast Forecast Forecast Forecast Forecast 2015A 2016A 2017A 2018E 2019E 2020E 2021E 2022E Revenues $ 618,219 $ 637,521 $ 678,959 $ 692,433 $ 707,345 $ 723,664 $ 747,155 $ 791,985 Cost of Revenues 275,623 291,443 321,169 335,878 330,549 328,678 329,770 340,844 Selling General & Administrative 217,661 229,568 251,028 248,305 242,353 248,867 255,401 271,200 Gain on Fiber Sales - - - (11,222) - - - -Depreciation & Amortization 90,992 91,958 95,208 91,708 82,318 73,716 65,025 57,386 Income from Operations 33,943 24,551 11,554 27,764 52,125 72,403 96,959 122,556 Other (Income) Expense Loss on extinguishment of debt - - 4,120 - - - - - Interest Expense, Net 38,581 41,152 46,650 49,963 49,061 50,418 48,942 46,956 Total Other Expense 38,581 41,152 66,492 49,963 49,061 50,418 48,942 46,956 Income (Loss) Before Income Taxes (4,638) (16,601) (54,938) (22,199) 3,064 21,985 48,018 75,600 Provision for Income Taxes 947 1,156 144 1,925 2,158 2,585 2,973 3,836 Net Income (Loss) $ (5,585) $ (17,757) $ (55,082) $ (24,122) $ 906 $ 19,400 $ 45,045 $ 71,764 Source: Company 46
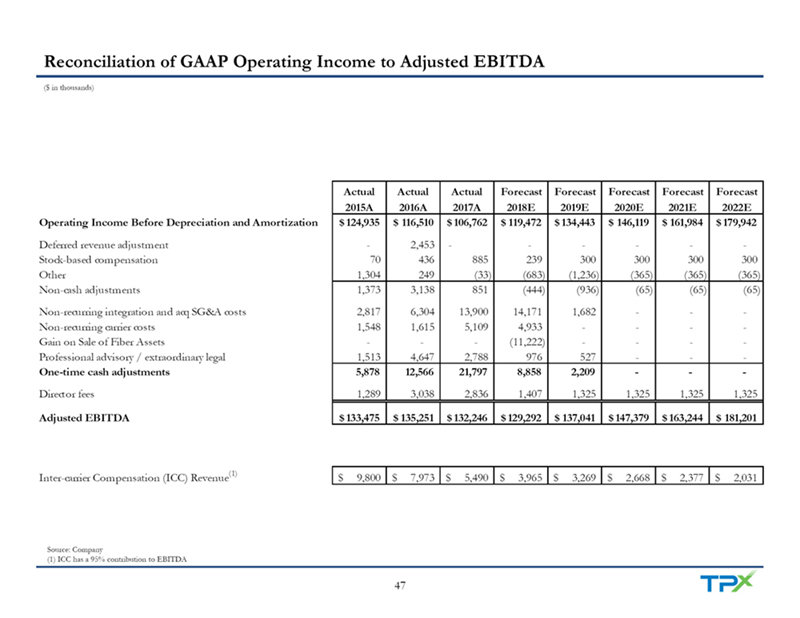
Reconciliation of GAAP Operating Income to Adjusted EBITDA ($ in thousands) Actual Actual Actual Forecast Forecast Forecast Forecast Forecast 2015A 2016A 2017A 2018E 2019E 2020E 2021E 2022E Operating Income Before Depreciation and Amortization $ 124,935 $ 116,510 $ 106,762 $ 119,472 $ 134,443 $ 146,119 $ 161,984 $ 179,942 Deferred revenue adjustment - 2,453 - - - - - -Stock-based compensation 70 436 885 239 300 300 300 300 Other 1,304 249 (33) (683) (1,236) (365) (365) (365) Non-cash adjustments 1,373 3,138 851 (444) (936) (65) (65) (65) Non-recurring integration and acq SG&A costs 2,817 6,304 13,900 14,171 1,682 - - -Non-recurring carrier costs 1,548 1,615 5,109 4,933 - - - -Gain on Sale of Fiber Assets - - - (11,222) - - - -Professional advisory / extraordinary legal 1,513 4,647 2,788 976 527 - - - One-time cash adjustments 5,878 12,566 21,797 8,858 2,209 - - - Director fees 1,289 3,038 2,836 1,407 1,325 1,325 1,325 1,325 Adjusted EBITDA $ 133,475 $ 135,251 $ 132,246 $ 129,292 $ 137,041 $ 147,379 $ 163,244 $ 181,201 Inter-carrier Compensation (ICC) Revenue(1) $ 9,800 $ 7,973 $ 5,490 $ 3,965 $ 3,269 $ 2,668 $ 2,377 $ 2,031 Source: Company (1) ICC has a 95% contribution to EBITDA 47
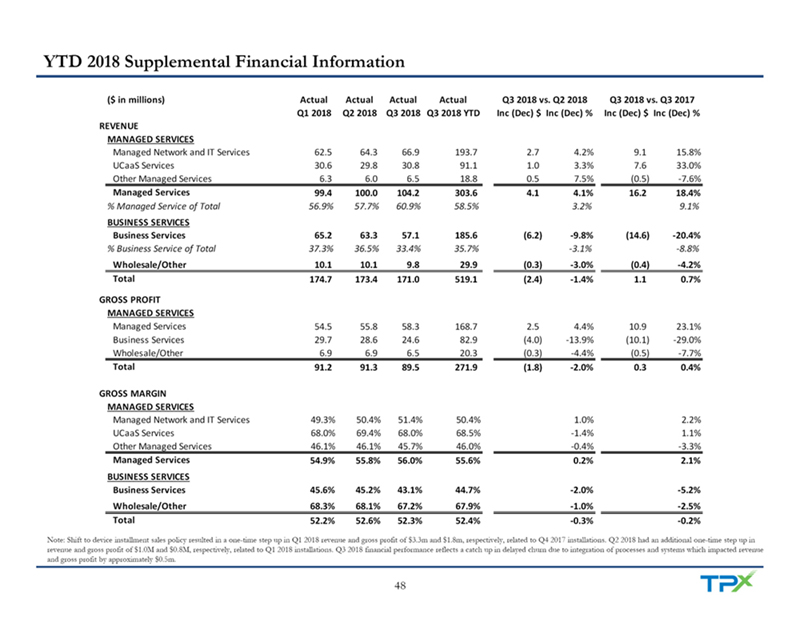
YTD 2018 Supplemental Financial Information ($ in millions) Actual Actual Actual Actual Q3 2018 vs. Q2 2018 Q3 2018 vs. Q3 2017 Q1 2018 Q2 2018 Q3 2018 Q3 2018 YTD Inc (Dec) $ Inc (Dec) % Inc (Dec) $ Inc (Dec) % REVENUE MANAGED SERVICES Managed Network and IT Services 62.5 64.3 66.9 193.7 2.7 4.2% 9.1 15.8% UCaaS Services 30.6 29.8 30.8 91.1 1.0 3.3% 7.6 33.0% Other Managed Services 6.3 6.0 6.5 18.8 0.5 7.5% (0.5) -7.6% Managed Services 99.4 100.0 104.2 303.6 4.1 4.1% 16.2 18.4% % Managed Service of Total 56.9% 57.7% 60.9% 58.5% 3.2% 9.1% BUSINESS SERVICES Business Services 65.2 63.3 57.1 185.6 (6.2) -9.8% (14.6) -20.4% % Business Service of Total 37.3% 36.5% 33.4% 35.7% -3.1% -8.8% Wholesale/Other 10.1 10.1 9.8 29.9 (0.3) -3.0% (0.4) -4.2% Total 174.7 173.4 171.0 519.1 (2.4) -1.4% 1.1 0.7% GROSS PROFIT MANAGED SERVICES Managed Services 54.5 55.8 58.3 168.7 2.5 4.4% 10.9 23.1% Business Services 29.7 28.6 24.6 82.9 (4.0) -13.9% (10.1) -29.0% Wholesale/Other 6.9 6.9 6.5 20.3 (0.3) -4.4% (0.5) -7.7% Total 91.2 91.3 89.5 271.9 (1.8) -2.0% 0.3 0.4% GROSS MARGIN MANAGED SERVICES Managed Network and IT Services 49.3% 50.4% 51.4% 50.4% 1.0% 2.2% UCaaS Services 68.0% 69.4% 68.0% 68.5% -1.4% 1.1% Other Managed Services 46.1% 46.1% 45.7% 46.0% -0.4% -3.3% Managed Services 54.9% 55.8% 56.0% 55.6% 0.2% 2.1% BUSINESS SERVICES Business Services 45.6% 45.2% 43.1% 44.7% -2.0% -5.2% Wholesale/Other 68.3% 68.1% 67.2% 67.9% -1.0% -2.5% Total 52.2% 52.6% 52.3% 52.4% -0.3% -0.2% Note: Shift to device installment sales policy resulted in a one-time step up in Q1 2018 revenue and gross profit of $3.3m and $1.8m, respectively, related to Q4 2017 installations. Q2 2018 had an additional one-time step up in revenue and gross profit of $1.0M and $0.8M, respectively, related to Q1 2018 installations. Q3 2018 financial performance reflects a catch up in delayed churn due to integration of processes and systems which impacted revenue and gross profit by approximately $0.5m. 48
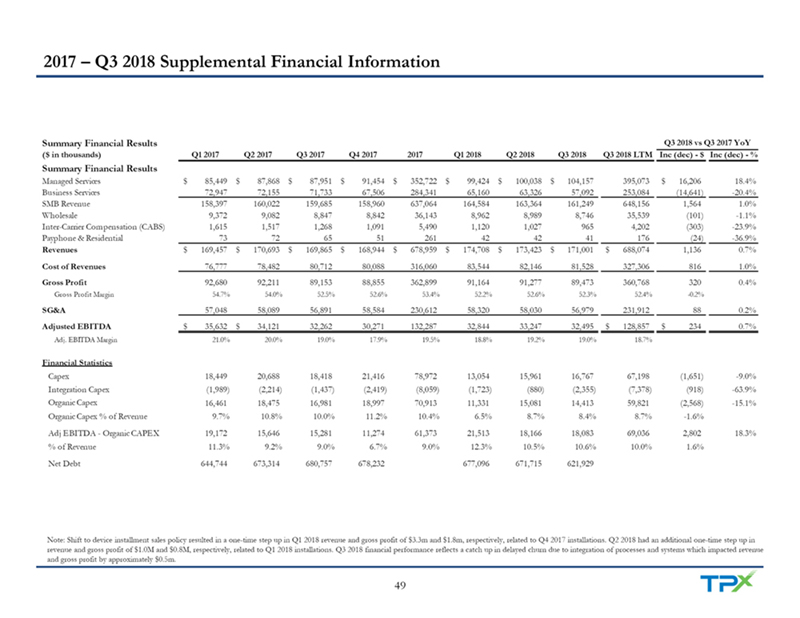
2017 – Q3 2018 Supplemental Financial Information Summary Financial Results Q3 2018 vs Q3 2017 YoY ($ in thousands) Q1 2017 Q2 2017 Q3 2017 Q4 2017 2017 Q1 2018 Q2 2018 Q3 2018 Q3 2018 LTM Inc (dec) - $ Inc (dec) - % Summary Financial Results Managed Services $ 85,449 $ 87,868 $ 87,951 $ 91,454 $ 352,722 $ 99,424 $ 100,038 $ 104,157 395,073 $ 16,206 18.4% Business Services 72,947 72,155 71,733 67,506 284,341 65,160 63,326 57,092 253,084 (14,641) -20.4% SMB Revenue 158,397 160,022 159,685 158,960 637,064 164,584 163,364 161,249 648,156 1,564 1.0% Wholesale 9,372 9,082 8,847 8,842 36,143 8,962 8,989 8,746 35,539 (101) -1.1% Inter-Carrier Compensation (CABS) 1,615 1,517 1,268 1,091 5,490 1,120 1,027 965 4,202 (303) -23.9% Payphone & Residential 73 72 65 51 261 42 42 41 176 (24) -36.9% Revenues $ 169,457 $ 170,693 $ 169,865 $ 168,944 $ 678,959 $ 174,708 $ 173,423 $ 171,001 $ 688,074 1,136 0.7% Cost of Revenues 76,777 78,482 80,712 80,088 316,060 83,544 82,146 81,528 327,306 816 1.0% Gross Profit 92,680 92,211 89,153 88,855 362,899 91,164 91,277 89,473 360,768 320 0.4% Gross Profit Margin 54.7% 54.0% 52.5% 52.6% 53.4% 52.2% 52.6% 52.3% 52.4% -0.2% SG&A 57,048 58,089 56,891 58,584 230,612 58,320 58,030 56,979 231,912 88 0.2% Adjusted EBITDA $ 35,632 $ 34,121 32,262 30,271 132,287 32,844 33,247 32,495 $ 128,857 $ 234 0.7% Adj. EBITDA Margin 21.0% 20.0% 19.0% 17.9% 19.5% 18.8% 19.2% 19.0% 18.7% Financial Statistics Capex 18,449 20,688 18,418 21,416 78,972 13,054 15,961 16,767 67,198 (1,651) -9.0% Integration Capex (1,989) (2,214) (1,437) (2,419) (8,059) (1,723) (880) (2,355) (7,378) (918) -63.9% Organic Capex 16,461 18,475 16,981 18,997 70,913 11,331 15,081 14,413 59,821 (2,568) -15.1% Organic Capex % of Revenue 9.7% 10.8% 10.0% 11.2% 10.4% 6.5% 8.7% 8.4% 8.7% -1.6% Adj EBITDA - Organic CAPEX 19,172 15,646 15,281 11,274 61,373 21,513 18,166 18,083 69,036 2,802 18.3% % of Revenue 11.3% 9.2% 9.0% 6.7% 9.0% 12.3% 10.5% 10.6% 10.0% 1.6% Net Debt 644,744 673,314 680,757 678,232 677,096 671,715 621,929 Note: Shift to device installment sales policy resulted in a one-time step up in Q1 2018 revenue and gross profit of $3.3m and $1.8m, respectively, related to Q4 2017 installations. Q2 2018 had an additional one-time step up in revenue and gross profit of $1.0M and $0.8M, respectively, related to Q1 2018 installations. Q3 2018 financial performance reflects a catch up in delayed churn due to integration of processes and systems which impacted revenue and gross profit by approximately $0.5m. 49
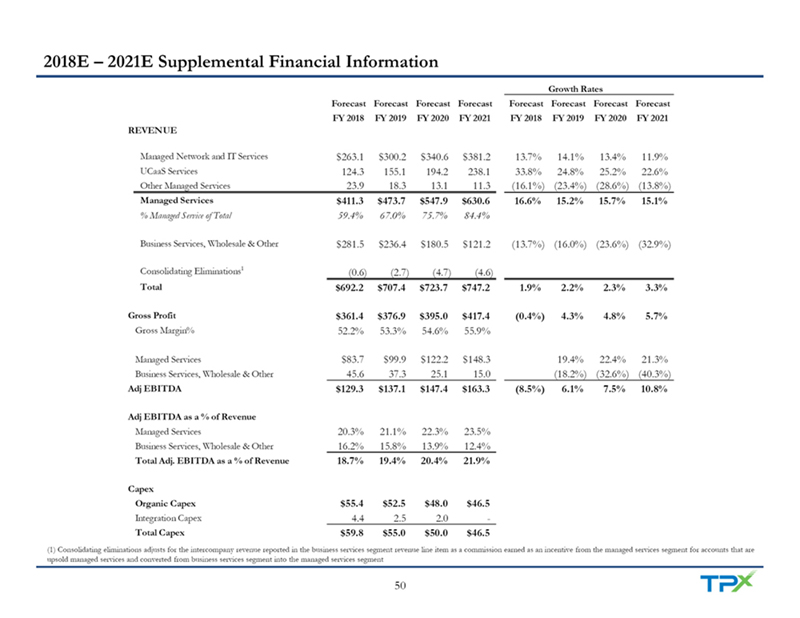
2018E – 2021E Supplemental Financial Information Growth Rates Forecast Forecast Forecast Forecast Forecast Forecast Forecast Forecast FY 2018 FY 2019 FY 2020 FY 2021 FY 2018 FY 2019 FY 2020 FY 2021 REVENUE Managed Network and IT Services $263.1 $300.2 $340.6 $381.2 13.7% 14.1% 13.4% 11.9% UCaaS Services 124.3 155.1 194.2 238.1 33.8% 24.8% 25.2% 22.6% Other Managed Services 23.9 18.3 13.1 11.3 (16.1%) (23.4%) (28.6%) (13.8%) Managed Services $411.3 $473.7 $547.9 $630.6 16.6% 15.2% 15.7% 15.1% % Managed Service of Total 59.4% 67.0% 75.7% 84.4% Business Services, Wholesale & Other $281.5 $236.4 $180.5 $121.2 (13.7%) (16.0%) (23.6%) (32.9%) Consolidating Eliminations1 (0.6) (2.7) (4.7) (4.6) Total $692.2 $707.4 $723.7 $747.2 1.9% 2.2% 2.3% 3.3% Gross Profit $361.4 $376.9 $395.0 $417.4 (0.4%) 4.3% 4.8% 5.7% Gross Margin% 52.2% 53.3% 54.6% 55.9% Managed Services $83.7 $99.9 $122.2 $148.3 19.4% 22.4% 21.3% Business Services, Wholesale & Other 45.6 37.3 25.1 15.0 (18.2%) (32.6%) (40.3%) Adj EBITDA $129.3 $137.1 $147.4 $163.3 (8.5%) 6.1% 7.5% 10.8% Adj EBITDA as a % of Revenue Managed Services 20.3% 21.1% 22.3% 23.5% Business Services, Wholesale & Other 16.2% 15.8% 13.9% 12.4% Total Adj. EBITDA as a % of Revenue 18.7% 19.4% 20.4% 21.9% Capex Organic Capex $55.4 $52.5 $48.0 $46.5 Integration Capex 4.4 2.5 2.0 - Total Capex $59.8 $55.0 $50.0 $46.5 (1) Consolidating eliminations adjusts for the intercompany revenue reported in the business services segment revenue line item as a commission earned as an incentive from the managed services segment for accounts that are upsold managed services and converted from business services segment into the managed services segment 50
Investcorp Overview Strong Track Record of Investing in Technology and Tech-enabled Services Companies Founded in 1982 with 30+ years of success in global private equity investing Invested ~$53B since inception with current assets under management of ~$23B 150+ investments in companies across a range of sectors including technology, business services, industrials and consumer retail Partner with exceptional management teams to create value through organic growth, operational improvements and acquisitions Investcorp brings strong operational and execution support to TPx, having supported the company through organic growth initiatives, as well as through several strategic acquisitions which have enabled TPx to scale and transition into a leading national managed services provider 51

World Class Board of Directors (Select Members) Name & Title Biography Lawrence E. Mock, Jr. Co-Founder and Managing Partner, Navigation Capital Partners Independent Director (Chairman) Has led 150+ private equity investments with an EV of $15Bn+ Former Chairman & CEO, ATT International Corp. Ray Wilkins, Jr. Director of Morgan Stanley (NYSE: MS), Valero Energy (NYSE: VLO) and Caterpillar (NYSE: CAT) Independent Director Former Director, America Movil (NYSE: AMXL) CEO, MasTec (NYSE: MTZ) Jose Mas Grew MasTec from $700M to $4Bn market cap Independent Director Director, Helmerich & Payne (NYSE: HP) Former President, United Technologies (NYSE: UTX) Karl Krapek Lead Director, Prudential Financial (NYSE: PRU) Independent Director Pensare Acquisition Director, Northrop Grumman (NYSE: NOC) Suzanne Shank Chairman, CEO and majority owner of Siebert Cisneros Shank & Co., a boutique investment bank that has managed or Independent Director co-managed over $2 trillion in transactions Chairman, National Cloud Communications Alliance Clark Peterson Former President and Chief Evangelist, Vonage Business Independent Director Former President of Clearwire and Regional President at XO Communications Head of North American Private Equity at Investcorp David Tayeh Former Partner, CVC Capital Partners Independent Director Director of AlixPartners, United Talent Agency, KS Group, ICR, PRO Unlimited and Paper Source Principal, Wilson Walsh George Ross Consulting LLC; Director, NIC Inc. (NASDAQ: EGOV) and the Irvine Company Pete Wilson Former California Governor and US Senator Independent Director TPx Communications Former Director, IDT Entertainment (NYSE: IDT); Advisory Board Member, Thomas Weisel Partners 52