Exhibit 99.1
Reach a Higher State of Connectedness Investor Presentation March 2019
Confidential 2 This Presentation is being delivered to a limited number of sophisticated investors who have agreed with Oppenheimer & Co. In c. and EarlyBirdCapital, Inc. to hold it in confidence. Do not show it to or review it with any person other than the intended recipient and its authorized representatives. Although the information herein relating to U.S. TelePacific Holdings Corp. (“TPx” or the “Company”) has been prepared by TPx ma nagement and is believed to be accurate, the Company, Pensare Acquisition Corp. (“Pensare” or the “Issuer”), Oppenheimer & Co. Inc. and EarlyBirdCapital, Inc. (as well as their respective directors, office rs and shareholders) each expressly disclaims liability for, and makes no expressed or implied representation or warranty with respect to, any such information contained in or omitted from this Presentation, or any other wr itten or oral communication transmitted to any prospective investor in the Issuer. Only those representations and warranties made in a definitive securities purchase agreement counter - signed by Pensare shall have any legal effect. Cautionary Statement Concerning Forward - Looking Statements This presentation contains forward - looking statements within the meaning of Section 27A of the Securities Act of 1933, as amende d, and Section 21E of the Securities Exchange Act of 1934, as amended, conveying the expectations of management of TPx and/or Pensare as to the future based on plans, estimates and projections at the time the C omp any and/or Pensare makes the statements. Forward - looking statements involve inherent risks and uncertainties and the Company and Pensare caution you that a number of important factors could cause actual results to differ materially from those contained in any such forward - looking statement. The forward - looking statements contained in this presentation include, but are not limited to, statements related to anticipated gro wth in the Company’s industry, the Company’s strategy and ability to grow, the Company’s anticipated future financial performance, the anticipated timing of the transactions described herein, the completion of the tra nsactions on the terms proposed, the financing of the transactions on terms currently anticipated, and the potential impact the transactions will have on the Company and Pensare. Such statements generally includ e w ords such as “believes,” “plans,” “intends,” “targets,” “will,” “expects,” “suggests,” “anticipates,” “outlook,” “continues” or similar expressions. The forward - looking statements contained in this presentation are based on the Company’s and/or Pensare’s current expectations and projections about future events and trends that it believes may affect TPx’s or the combined company’s financial condition, results of operations, str ate gy, short - term and long - term business operations and objectives and financial needs. You should not place undue reliance upon these forward - looking statements as predictions of future events. Although the Company and Pensare believe that the expectations reflected in the forward - looking statements are reasonable, no guarantee can be made as to future results, level of activity, performance or achievements. Factors that could ca use the Company’s actual results to differ materially from those expressed or implied in such “forward - looking statements,” include, but are not limited to, the level of redemptions in connection with the proposed transact ions; receipt of regulatory approvals without unexpected delays or conditions; changes in estimates of future financial performance; changes in expectations as to the closing of the transaction; retention of custome rs and suppliers in connection with the transactions described herein or other acquisitions; the cost of capital necessary to finance the transactions described herein and any future acquisitions; and unanticipated changes in laws, regulations, or other industry standards affecting the Company or Pensare. The forward - looking statements included in this document are made as of the date of this presentation. The Company and Pensare disclaim a ny duty to update any of these forward - looking statements after the date of this presentation to confirm these statements in relationship to actual results or revised expectations. Use of Projections This presentation contains financial forecast information with respect to TPx. Such financial forecast information constitute s f orward looking information, and is for illustrative purposes only and should not be relied upon as necessarily being indicative of future results. The assumptions and estimates underlying such financial forecast informati on are inherently uncertain and are subject to a wide variety of significant business, economic, competitive and other risks and uncertainties. See “Cautionary Statement Concerning Forward - Looking Statements” above. Actual re sults may differ materially from the results contemplated by the financial forecast information contained in this presentation, and the inclusion of such information in this presentation should not be regarded as a representation by any person that the results reflected in such forecasts will be achieved. Non - GAAP and Other Financial Information The financial information contained in this presentation has not been prepared with a view towards compliance with SEC rules app licable to disclosures by SEC reporting companies generally or with a view towards compliance with the SEC’s rules relating to non - GAAP financial information. This presentation includes references to financial measures that are calculated and presented on the basis of methodologies o the r than in accordance with generally accepted accounting principles in the United States of America (“GAAP”), including the measure Adjusted EBITDA. A reconciliation of certain of the non - GAAP measures contained herein c an be found in the Appendix to the presentation. Any non - GAAP financial measures used in this presentation are in addition to, and not meant to be considered superior to, or a substitute for, the C omp any’s financial statements prepared in accordance with GAAP. The principal limitation of these non - GAAP financial measures is that they exclude significant expenses and income that are required by GAAP to be recorded in the Company’s financial statements. In addition, they are subject to inherent limitations as they reflect the exercise of judgments by management about which expense and income are excluded or included i n d etermining these non - GAAP financial measures. The non - GAAP measures presented herein not be comparable to similar non - GAAP measures presented by other companies. Industry Data Market data and industry data used throughout this presentation is based on information derived from third party sources, TPx ma nagement’s knowledge of its industry and good faith estimates of TPx management. While TPx management believes that the third party sources from which market and industry data has been derived are reputable , T Px has not independently verified such market and industry data, and you are cautioned not to give undue weight to such market and industry data. INVESTMENT IN THE SECURITIES DESCRIBED HEREIN HAS NOT BEEN APPROVED OR DISAPPROVED BY THE SECURITIES AND EXCHANGE COMMISSION OR ANY OTHER REGULATORY AUTHORITY NOR HAS ANY AUTHORITY PASSED UPON OR ENDORSED THE MERITS OF THE OFFERING OR THE ACCURACY OR ADEQUACY OF THE INFORMATION CONTAINED HEREIN. AN Y REPRESENTATION TO THE CONTRARY IS A CRIMINAL OFFENSE. THIS PRESENTATION DOES NOT CONSTITUTE AN OFFER OR SOLICITATION OF ANY SECURITIES. PENSARE WILL MAKE ANY OFFER TO SEL L S ECURITIES ONLY PURSUANT TO A DEFINITIVE SUBSCRIPTION AGREEMENT. PENSARE RESERVES THE RIGHT TO WITHDRAW OR AMEND FOR ANY REASON ANY OFFERING AND TO REJECT ANY SUBSCRIPTION AGREEME NT FOR ANY REASON.
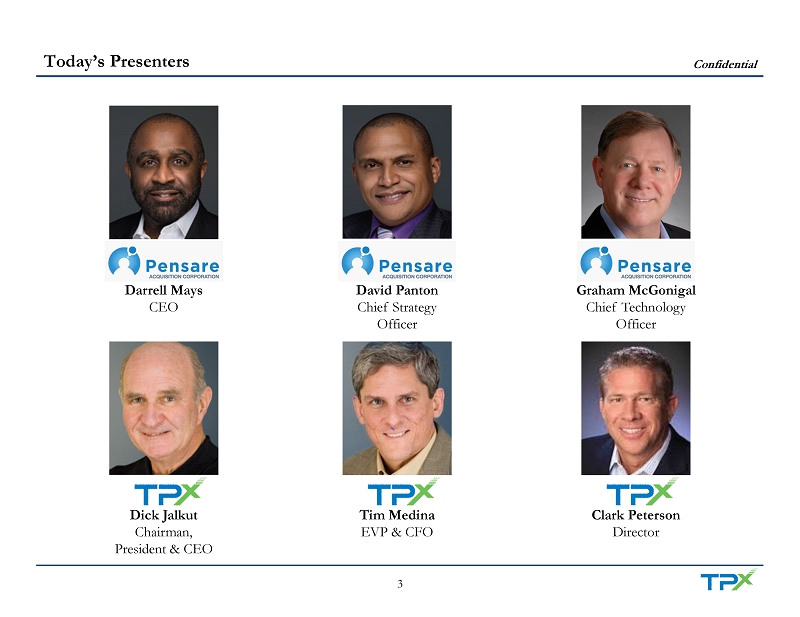
Confidential 3 Today’s Presenters David Panton Chief Strategy Officer Tim Medina EVP & CFO Darrell Mays CEO Dick Jalkut Chairman, President & CEO Clark Peterson Director Graham McGonigal Chief Technology Officer
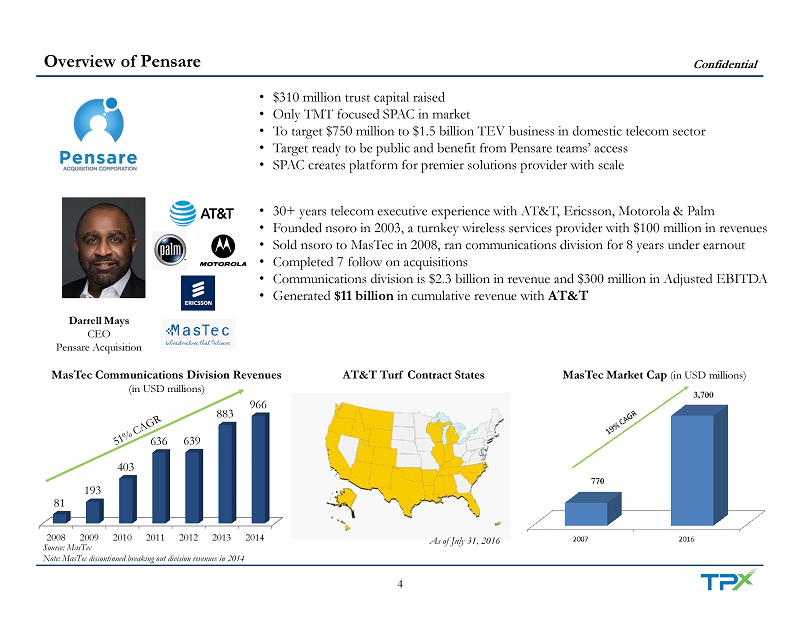
Confidential 4 Overview of Pensare Source: MasTec Note: MasTec discontinued breaking out division revenues in 2014 Source: MasTec Darrell Mays CEO Pensare Acquisition • 30+ years telecom executive experience with AT&T, Ericsson, Motorola & Palm • Founded nsoro in 2003, a turnkey wireless services provider with $100 million in revenues • Sold nsoro to MasTec in 2008, ran communications division for 8 years under earnout • Completed 7 follow on acquisitions • Communications division is $2.3 billion in revenue and $300 million in Adjusted EBITDA • Generated $11 billion in cumulative revenue with AT&T AT&T Turf Contract States As of July 31, 2016 2008 2009 2010 2011 2012 2013 2014 81 193 403 636 639 883 966 MasTec Communications Division Revenues (in USD millions) • $310 million trust capital raised • Only TMT focused SPAC in market • To target $750 million to $1.5 billion TEV business in domestic telecom sector • Target ready to be public and benefit from Pensare teams’ access • SPAC creates platform for premier solutions provider with scale MasTec Market Cap (in USD millions)
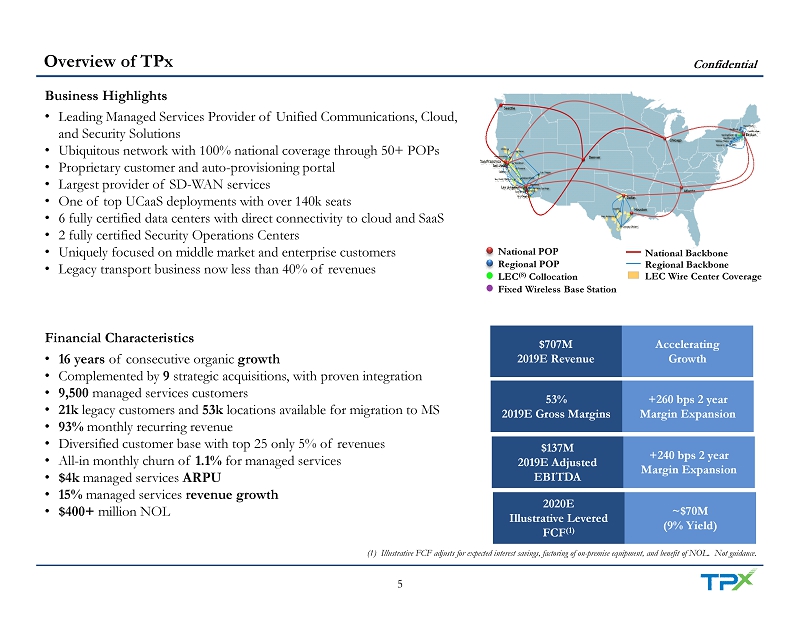
Confidential 5 Overview of TPx Business Highlights • Leading Managed Services Provider of Unified Communications, Cloud, and Security Solutions • Ubiquitous network with 100% national coverage through 50+ POPs • Proprietary customer and auto - provisioning portal • Largest provider of SD - WAN services • One of top UCaaS deployments with over 140k seats • 6 fully certified data centers with direct connectivity to cloud and SaaS • 2 fully certified Security Operations Centers • Uniquely focused on middle market and enterprise customers • Legacy transport business now less than 40% of revenues Financial Characteristics • 16 years of consecutive organic growth • Complemented by 9 strategic acquisitions, with proven integration • 9,500 managed services customers • 21k legacy customers and 53k locations available for migration to MS • 93% monthly recurring revenue • Diversified customer base with top 25 only 5% of revenues • All - in monthly churn of 1.1% for managed services • $4k managed services ARPU • 15% managed services revenue growth • $400+ million NOL National POP Regional POP LEC (8) Collocation Fixed Wireless Base Station LEC Wire Center Coverage National Backbone Regional Backbone $707M 2019E Revenue Accelerating Growth 53% 2019E Gross Margins +260 bps 2 year Margin Expansion $137M 2019E Adjusted EBITDA +240 bps 2 year Margin Expansion 2020E Illustrative Levered FCF (1) ~$70M (9% Yield) (1) Illustrative FCF adjusts for expected interest savings, factoring of on - premise equipment, and benefit of NOL. Not guidanc e.
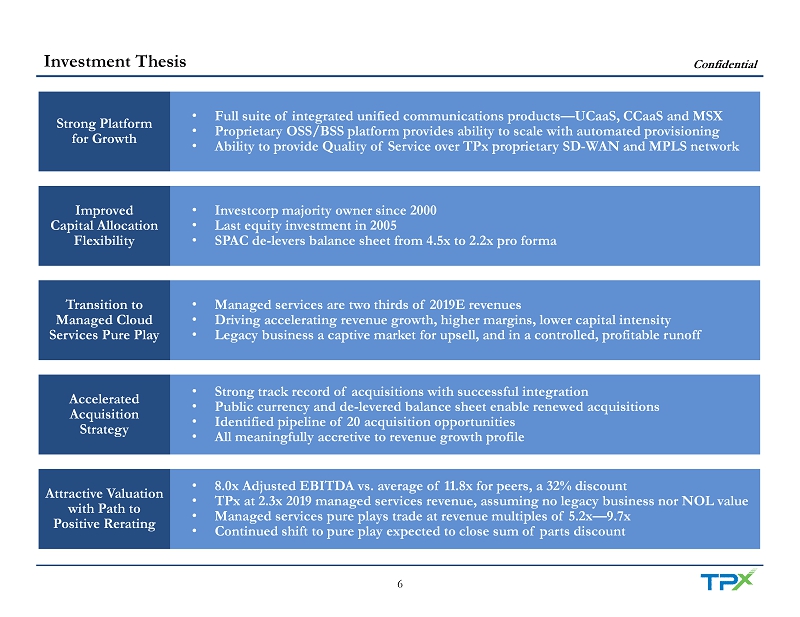
Confidential 6 Investment Thesis Strong Platform for Growth • Full suite of integrated unified communications products — UCaaS, CCaaS and MSX • Proprietary OSS/BSS platform provides ability to scale with automated provisioning • Ability to provide Quality of Service over TPx proprietary SD - WAN and MPLS network Improved Capital Allocation Flexibility • Investcorp majority owner since 2000 • Last equity investment in 2005 • SPAC de - levers balance sheet from 4.5x to 2.2x pro forma Transition to Managed Cloud Services Pure Play • Managed services are two thirds of 2019E revenues • Driving accelerating revenue growth, higher margins, lower capital intensity • Legacy business a captive market for upsell, and in a controlled, profitable runoff Attractive Valuation with Path to Positive Rerating • 8.0x Adjusted EBITDA vs. average of 11.8x for peers, a 32% discount • TPx at 2.3x 2019 managed services revenue, assuming no legacy business nor NOL value • Managed services pure plays trade at revenue multiples of 5.2x — 9.7x • Continued shift to pure play expected to close sum of parts discount Accelerated Acquisition Strategy • Strong track record of acquisitions with successful integration • Public currency and de - levered balance sheet enable renewed acquisitions • Identified pipeline of 20 acquisition opportunities • All meaningfully accretive to revenue growth profile
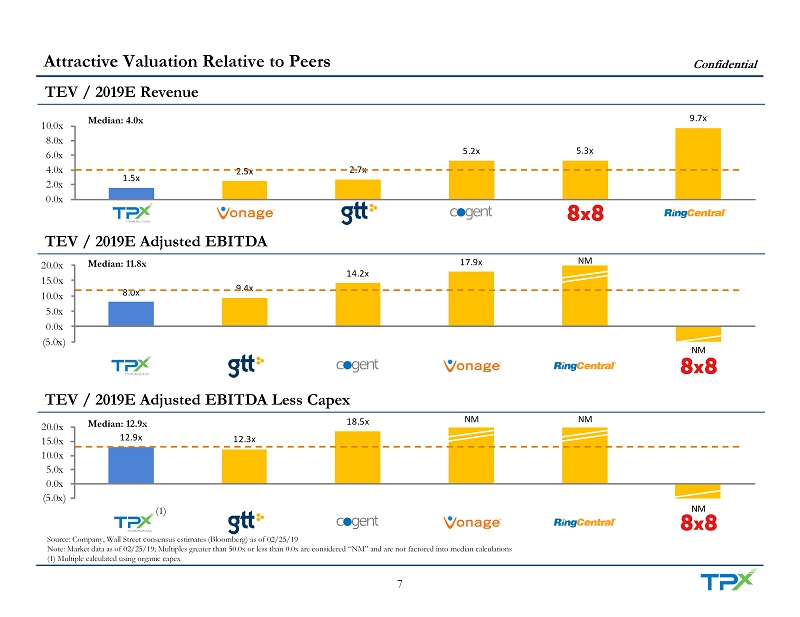
Confidential 7 12.9x 12.3x 18.5x NM NM NM (5.0x) 0.0x 5.0x 10.0x 15.0x 20.0x 8.0x 9.4x 14.2x 17.9x NM NM (5.0x) 0.0x 5.0x 10.0x 15.0x 20.0x 1.5x 2.5x 2.7x 5.2x 5.3x 9.7x 0.0x 2.0x 4.0x 6.0x 8.0x 10.0x TEV / 2019E Revenue Source: Company, Wall Street consensus estimates (Bloomberg) as of 02/25/19 Note: Market data as of 02/25/19; Multiples greater than 50.0x or less than 0.0x are considered “NM” and are not factored int o m edian calculations (1) Multiple calculated using organic capex Median: 4.0x Median: 11.8x TEV / 2019E Adjusted EBITDA TEV / 2019E Adjusted EBITDA Less Capex Median: 12.9x (1) Attractive Valuation Relative to Peers

Confidential 8 19% (2%) 13% 14% 28% 37% -10% 0% 10% 20% 30% 40% 50% 53% 49% 59% 59% 77% 77% 0% 20% 40% 60% 80% 100% 16% 7% 9% 11% 30% 49% 0% 15% 30% 45% 60% 2017A – 2019E Revenue CAGR 2019E Gross Margin 2019E Adjusted EBITDA Margin Median: 14% Median: 17% Median: 59% Source: Company, Wall Street consensus estimates (Bloomberg) as of 02/25/19, SEC filings Note: Margins less than 0% are not factored into median calculations (1) TPx Managed Services; (2) The vast majority of GTT’s 2018 revenue growth is inorganic (1) (2) Peer Analysis
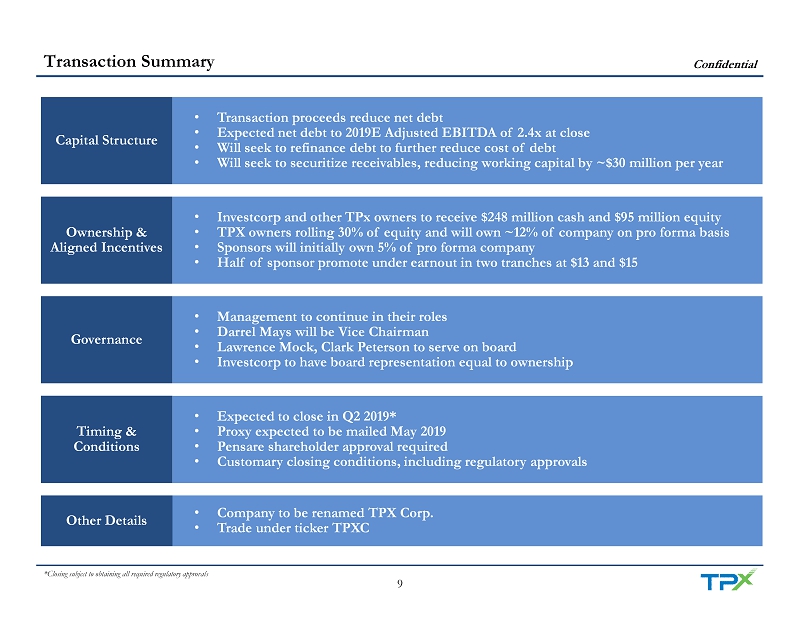
Confidential 9 Transaction Summary Capital Structure • Transaction proceeds reduce net debt • Expected net debt to 2019E Adjusted EBITDA of 2.4x at close • Will seek to refinance debt to further reduce cost of debt • Will seek to securitize receivables, reducing working capital by ~$30 million per year Ownership & Aligned Incentives • Investcorp and other TPx owners to receive $248 million cash and $95 million equity • TPX owners rolling 30% of equity and will own ~12% of company on pro forma basis • Sponsors will initially own 5% of pro forma company • Half of sponsor promote under earnout in two tranches at $13 and $15 Governance • Management to continue in their roles • Darrel Mays will be Vice Chairman • Lawrence Mock, Clark Peterson to serve on board • Investcorp to have board representation equal to ownership Other Details • Company to be renamed TPX Corp. • Trade under ticker TPXC Timing & Conditions • Expected to close in Q2 2019* • Proxy expected to be mailed May 2019 • Pensare shareholder approval required • Customary closing conditions, including regulatory approvals *Closing subject to obtaining all required regulatory approvals
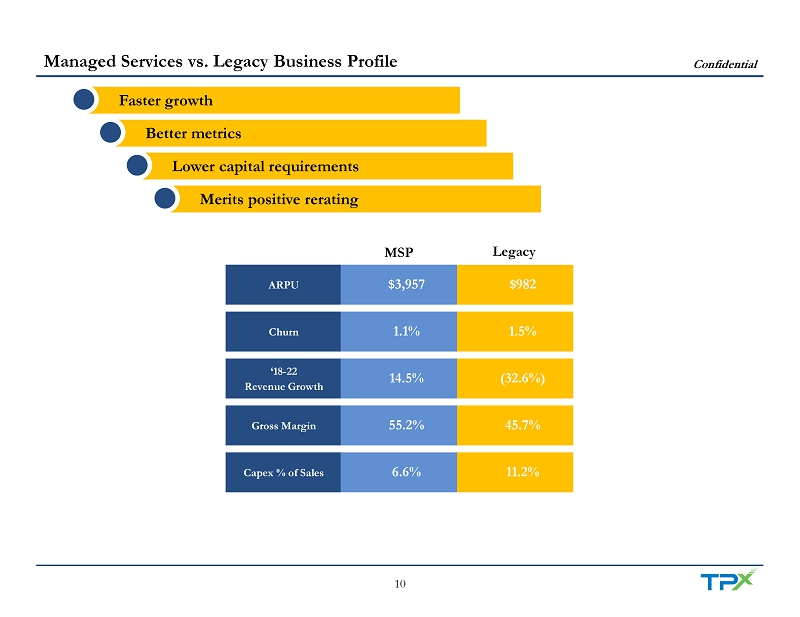
Confidential 10 Managed Services vs. Legacy Business Profile ARPU $982 $3,957 Churn 1.5% 1.1% ‘18 - 22 Revenue Growth (32.6%) 14.5% Gross Margin 45.7% 55.2% Capex % of Sales 11.2% 6.6% MSP Legacy Faster growth Better metrics Lower capital requirements Merits positive rerating
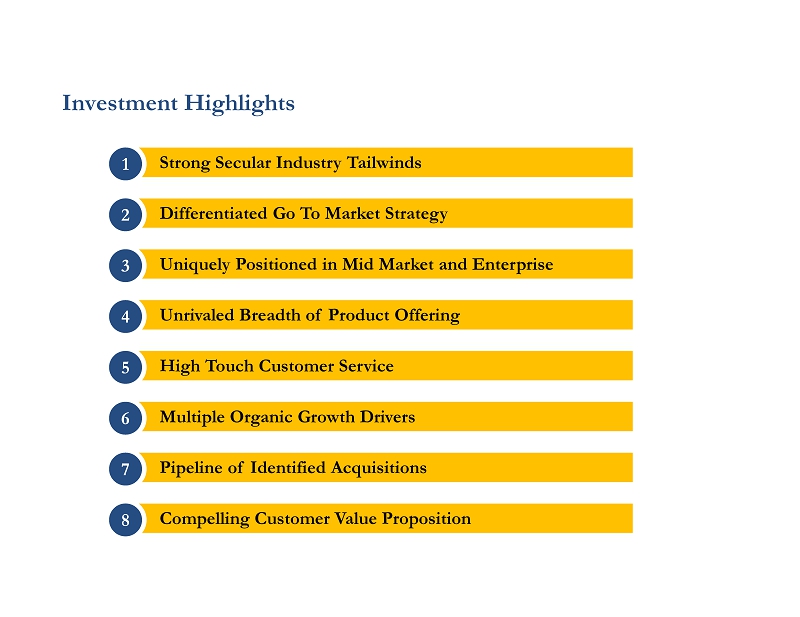
Investment Highlights Strong Secular Industry Tailwinds 1 Differentiated Go To Market Strategy 2 Unrivaled Breadth of Product Offering 4 High Touch Customer Service 5 Multiple Organic Growth Drivers 6 Pipeline of Identified Acquisitions 7 Uniquely Positioned in Mid Market and Enterprise 3 Compelling Customer Value Proposition 8
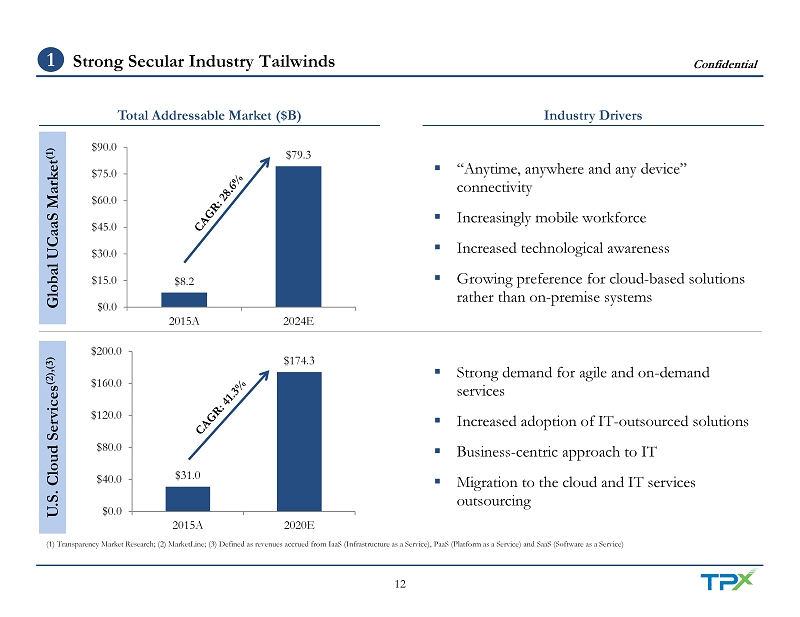
Confidential 12 Total Addressable Market ($B) Industry Drivers U.S. Cloud Services (2),(3) ▪ Strong demand for agile and on - demand services ▪ Increased adoption of IT - outsourced solutions ▪ Business - centric approach to IT ▪ Migration to the cloud and IT services outsourcing $31.0 $174.3 $0.0 $40.0 $80.0 $120.0 $160.0 $200.0 2015A 2020E Global UCaaS Market (1) ▪ “Anytime, anywhere and any device” connectivity ▪ Increasingly mobile workforce ▪ Increased technological awareness ▪ Growing preference for cloud - based solutions rather than on - premise systems $8.2 $79.3 $0.0 $15.0 $30.0 $45.0 $60.0 $75.0 $90.0 2015A 2024E (1) Transparency Market Research; (2) MarketLine; (3) Defined as revenues accrued from IaaS (Infrastructure as a Service), Pa aS (Platform as a Service) and SaaS (Software as a Service) Strong Secular Industry Tailwinds 1

Confidential 13 Differentiated Go To Market Strategy 2 RBOC / ILEC (1) Cable Regional and National CLECs (2) Pure-Play UCaaS Providers Managed Services / Enterprise Connectivity Providers Companies Target Customers Small Businesses x x x x x Mid-Sized Enterprises x x x Large Enterprises x x Capabilities UCaaS Managed Security IP Network Cloud Network SIP (3) Trunking Source: Company (1) RBOC: Regional Bell Operating Company; ILEC: Incumbent Local Exchange Carrier; (2) Competitive Local Exchange Carrier; (3 ) S ession Initiation Protocol Uniquely Focused on Mid - Size Enterprise Full, Integrated UC Product Suite Obsessive High - Touch Customer Service
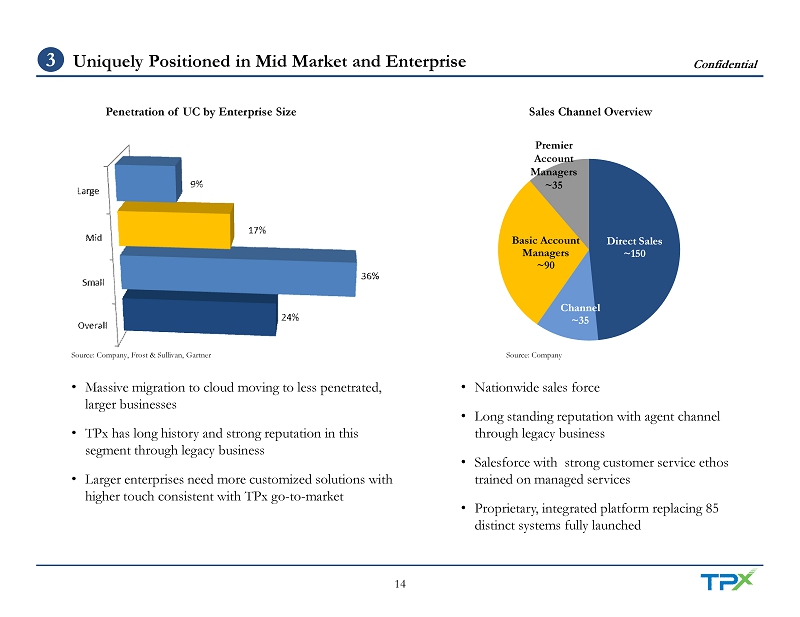
Confidential 14 Uniquely Positioned in Mid Market and Enterprise 3 Direct Sales ~150 Channel ~35 Basic Account Managers ~90 Premier Account Managers ~35 • Massive migration to cloud moving to less penetrated, larger businesses • TPx has long history and strong reputation in this segment through legacy business • Larger enterprises need more customized solutions with higher touch consistent with TPx go - to - market Sales Channel Overview Penetration of UC by Enterprise Size • Nationwide sales force • Long standing reputation with agent channel through legacy business • Salesforce with strong customer service ethos trained on managed services • Proprietary, integrated platform replacing 85 distinct systems fully launched Source: Company, Frost & Sullivan, Gartner Source: Company
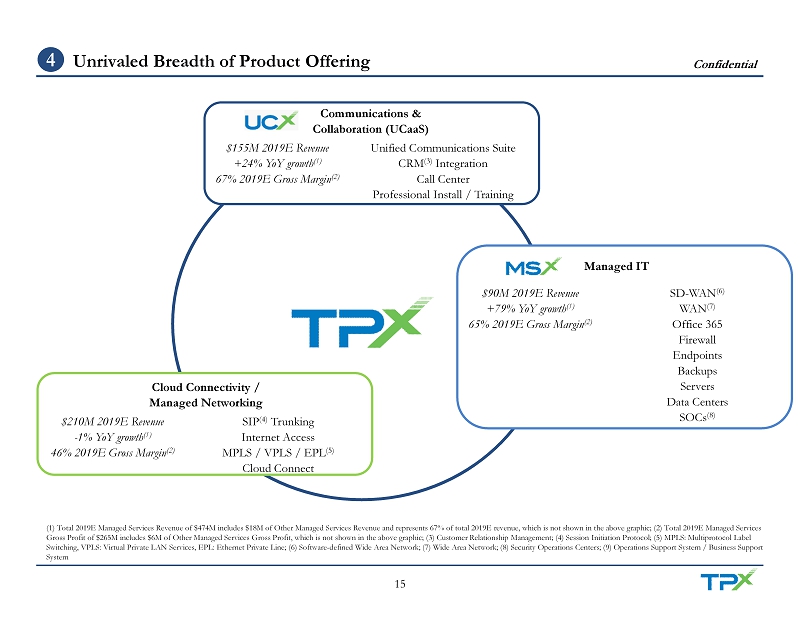
Confidential 15 Unrivaled Breadth of Product Offering 4 ▪ Full range of essential managed services ideal for mid - market ▪ Addressing complex collaboration challenges of distributed, multi - location organizations ▪ Nationwide footprint (physical and SD - WAN (6) ) for seamless connectivity ▪ UCaaS and Managed IT line of business structure brings focus / expertise in an integrated and complementary fashion ▪ Industry - leading customer service focus / performance ▪ Unique integrated IT infrastructure (Dash) – proprietary, OSS / BSS (9) capabilities (1) Total 2019E Managed Services Revenue of $474M includes $18M of Other Managed Services Revenue and represents 67% of total 20 19E revenue, which is not shown in the above graphic; (2) Total 2019E Managed Services Gross Profit of $265M includes $6M of Other Managed Services Gross Profit, which is not shown in the above graphic; (3) Custo mer Relationship Management; (4) Session Initiation Protocol; (5) MPLS: Multiprotocol Label Switching, VPLS: Virtual Private LAN Services, EPL: Ethernet Private Line; (6) Software - defined Wide Area Network; (7) Wide Area Network; (8) Security Operations Centers; (9) Operations Support System / Business Support System Communications & Collaboration (UCaaS) Unified Communications Suite CRM (3) Integration Call Center Professional Install / Training $155M 2019E Revenue +24% YoY growth (1) 67% 2019E Gross Margin (2) Cloud Connectivity / Managed Networking SIP (4) Trunking Internet Access MPLS / VPLS / EPL (5) Cloud Connect $210M 2019E Revenue - 1% YoY growth (1) 46% 2019E Gross Margin (2) Managed IT SD - WAN (6) WAN (7) Office 365 Firewall Endpoints Backups Servers Data Centers SOCs (8) $90M 2019E Revenue +79% YoY growth (1) 65% 2019E Gross Margin (2)

Confidential 16 High Touch Customer Service 5 Net Promoter Score Benchmarking (1),(2) (1) Source: Customer.guru, CustomerGauge and NPS Benchmarks; (2) Net Promoter Score is a management tool used to gauge the loyalty of a firm’s customer relationships Customer Service Culture Enhanced by Network Reliability and Reputation - 4 - 3 - 3 7 15 43 50 60 62 71 80 -15 -5 5 15 25 35 45 55 65 75 85 Telecom B2B Global Average: 24 Tech B2B Global Average: 21

Confidential 17 5.9 35% 3.2 155% 5.5 8% 13.6 9% 1.9 203% 5.4 16% 3.9 1% 3.9 19% 6.2 61% 5.5 20% Fortune 500 management consulting firm National automotive financing services provider Large warehouse - style food and supply retailer Fortune 50 (subsidiary) managed healthcare plan provider Full - service real - estate brokerage firm Leading provider of kidney dialysis therapy State government public information office Government - sponsored health insurance marketplace Large regional grocery retailer Leading regional healthcare services provider Multiple Organic Growth Drivers 6 Source: Company Note: Financials and statistics as of November 2018 Top 10 Customers – Tenure and Monthly Revenue Growth Since Tenure ($ in ‘000s) Tenure (years) Monthly Rev. CAGR Migrate legacy customers to managed services Add new logos Upsell additional managed services
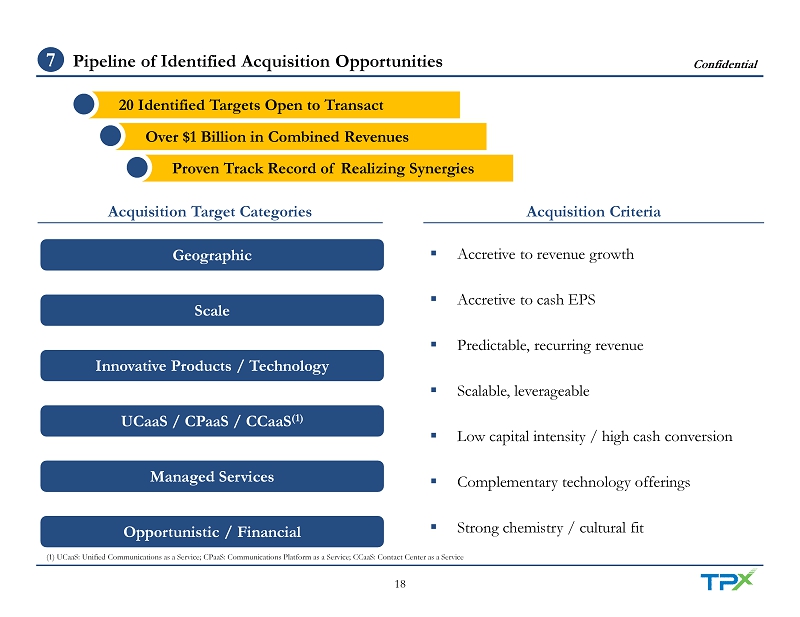
Confidential 18 Pipeline of Identified Acquisition Opportunities 7 20 Identified Targets Open to Transact Over $1 Billion in Combined Revenues Proven Track Record of Realizing Synergies ▪ Accretive to revenue growth ▪ Accretive to cash EPS ▪ Predictable, recurring revenue ▪ Scalable, leverageable ▪ Low capital intensity / high cash conversion ▪ Complementary technology offerings ▪ Strong chemistry / cultural fit Acquisition Target Categories Acquisition Criteria Geographic UCaaS / CPaaS / CCaaS (1) Managed Services Scale Innovative Products / Technology Opportunistic / Financial (1) UCaaS: Unified Communications as a Service; CPaaS: Communications Platform as a Service; CCaaS: Contact Center as a Servi ce
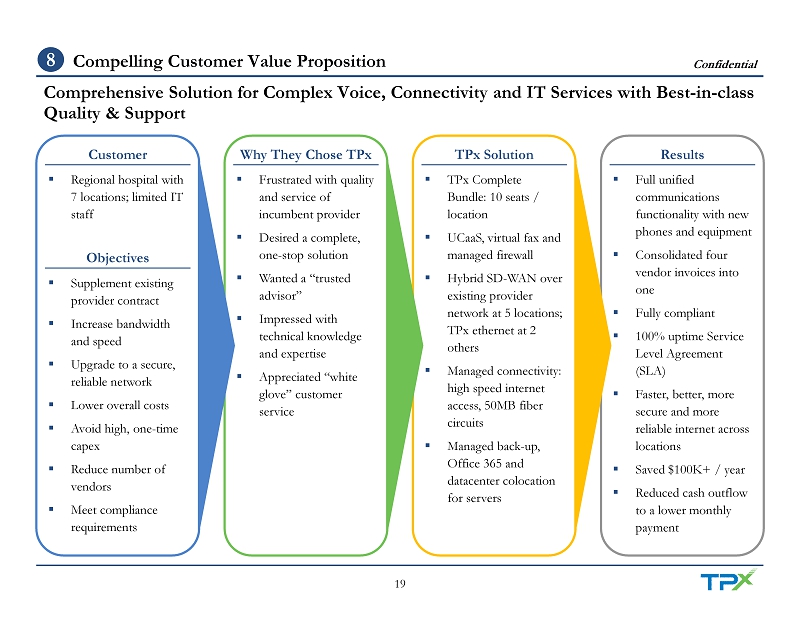
Confidential 19 ▪ Regional hospital with 7 locations; limited IT staff ▪ Supplement existing provider contract ▪ Increase bandwidth and speed ▪ Upgrade to a secure, reliable network ▪ Lower overall costs ▪ Avoid high, one - time capex ▪ Reduce number of vendors ▪ Meet compliance requirements ▪ Frustrated with quality and service of incumbent provider ▪ Desired a complete, one - stop solution ▪ Wanted a “trusted advisor” ▪ Impressed with technical knowledge and expertise ▪ Appreciated “white glove” customer service ▪ TPx Complete Bundle: 10 seats / location ▪ UCaaS, virtual fax and managed firewall ▪ Hybrid SD - WAN over existing provider network at 5 locations; TPx ethernet at 2 others ▪ Managed connectivity: high speed internet access, 50MB fiber circuits ▪ Managed back - up, Office 365 and datacenter colocation for servers ▪ Full unified communications functionality with new phones and equipment ▪ Consolidated four vendor invoices into one ▪ Fully compliant ▪ 100% uptime Service Level Agreement (SLA) ▪ Faster, better, more secure and more reliable internet across locations ▪ Saved $100K+ / year ▪ Reduced cash outflow to a lower monthly payment Comprehensive Solution for Complex Voice, Connectivity and IT Services with Best - in - class Quality & Support Customer Why They Chose TPx TPx Solution Results Objectives Compelling Customer Value Proposition 8

Financials Proven Track Record of Consistent Revenue Growth 1 Predictable Recurring Revenue & Attractive Adjusted EBITDA Growth 2 Successful Transition to Managed Services Provider 4 Levered Free Cash Flow Inflection 5 Leverage in Business Model Leads to Margin Expansion 6 Value Creation Roadmap 7 Accelerating Managed Service Performance 3 Compelling Customer Value Proposition 8
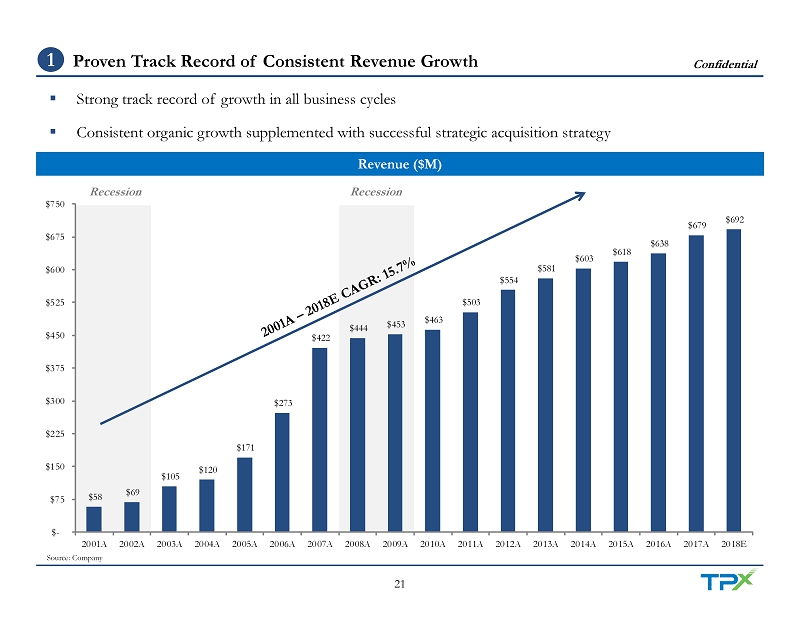
Confidential 21 ($ in MM) Revenue ($M) ▪ Strong track record of growth in all business cycles ▪ Consistent organic growth supplemented with successful strategic acquisition strategy Source: Company Recession Recession $58 $69 $105 $120 $171 $273 $422 $444 $453 $463 $503 $554 $581 $603 $618 $638 $679 $692 $- $75 $150 $225 $300 $375 $450 $525 $600 $675 $750 2001A 2002A 2003A 2004A 2005A 2006A 2007A 2008A 2009A 2010A 2011A 2012A 2013A 2014A 2015A 2016A 2017A 2018E Proven Track Record of Consistent Revenue Growth 1
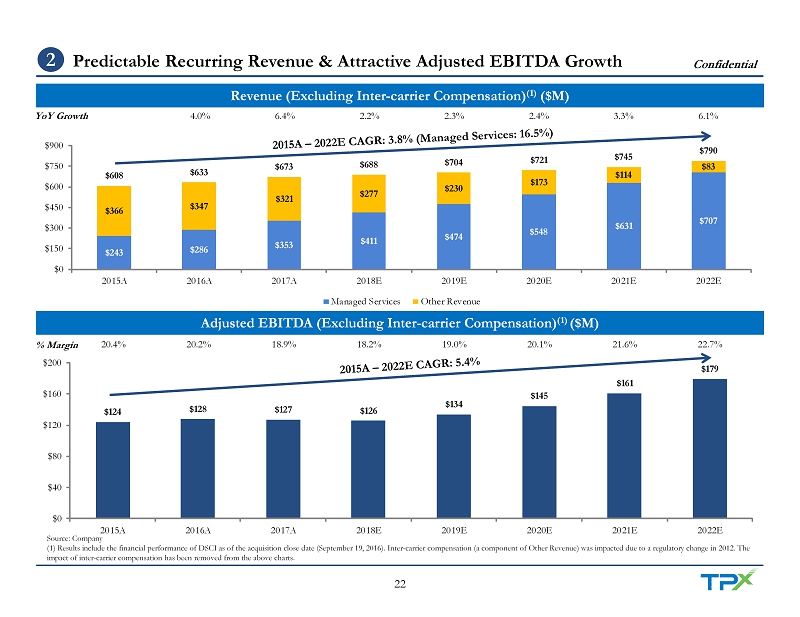
Confidential 22 $124 $128 $127 $126 $134 $145 $161 $179 $0 $40 $80 $120 $160 $200 2015A 2016A 2017A 2018E 2019E 2020E 2021E 2022E $243 $286 $353 $411 $474 $548 $631 $707 $366 $347 $321 $277 $230 $173 $114 $83 $608 $633 $673 $688 $704 $721 $745 $790 $0 $150 $300 $450 $600 $750 $900 2015A 2016A 2017A 2018E 2019E 2020E 2021E 2022E Managed Services Other Revenue ($ in MM) Adjusted EBITDA (Excluding Inter - carrier Compensation) (1) ($M) Revenue (Excluding Inter - carrier Compensation) (1) ($M) Source: Company (1) Results include the financial performance of DSCI as of the acquisition close date (September 19, 2016). Inter - carrier compe nsation (a component of Other Revenue) was impacted due to a regulatory change in 2012. The impact of inter - carrier compensation has been removed from the above charts. 4.0% 2.2% 2.4% 6.1% 6.4% 2.3% 3.3% 20.2% 18.2% 20.1% 22.7% 20.4% 18.9% 19.0% 21.6% % Margin YoY Growth Predictable Recurring Revenue & Attractive Adjusted EBITDA Growth 2
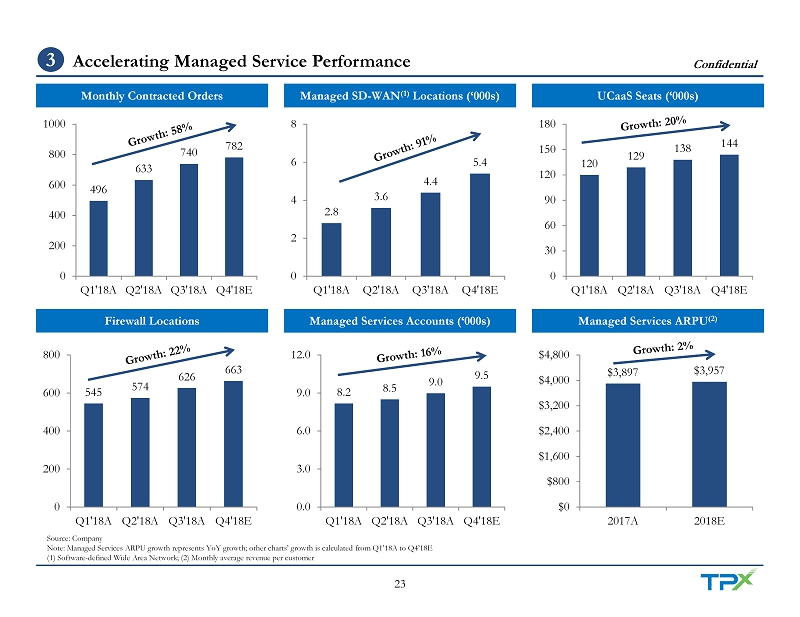
Confidential 23 120 129 138 144 0 30 60 90 120 150 180 Q1'18A Q2'18A Q3'18A Q4'18E Source: Company Note: Managed Services ARPU growth represents YoY growth; other charts’ growth is calculated from Q1’18A to Q4’18E (1) Software - defined Wide Area Network; (2) Monthly average revenue per customer Managed SD - WAN (1) Locations (‘000s) Monthly Contracted Orders UCaaS Seats (‘000s) Firewall Locations Managed Services Accounts (‘000s) Managed Services ARPU (2) 496 633 740 782 0 200 400 600 800 1000 Q1'18A Q2'18A Q3'18A Q4'18E 8.2 8.5 9.0 9.5 0.0 3.0 6.0 9.0 12.0 Q1'18A Q2'18A Q3'18A Q4'18E $3,897 $3,957 $0 $800 $1,600 $2,400 $3,200 $4,000 $4,800 2017A 2018E 2.8 3.6 4.4 5.4 0 2 4 6 8 Q1'18A Q2'18A Q3'18A Q4'18E 545 574 626 663 0 200 400 600 800 Q1'18A Q2'18A Q3'18A Q4'18E Accelerating Managed Service Performance 3
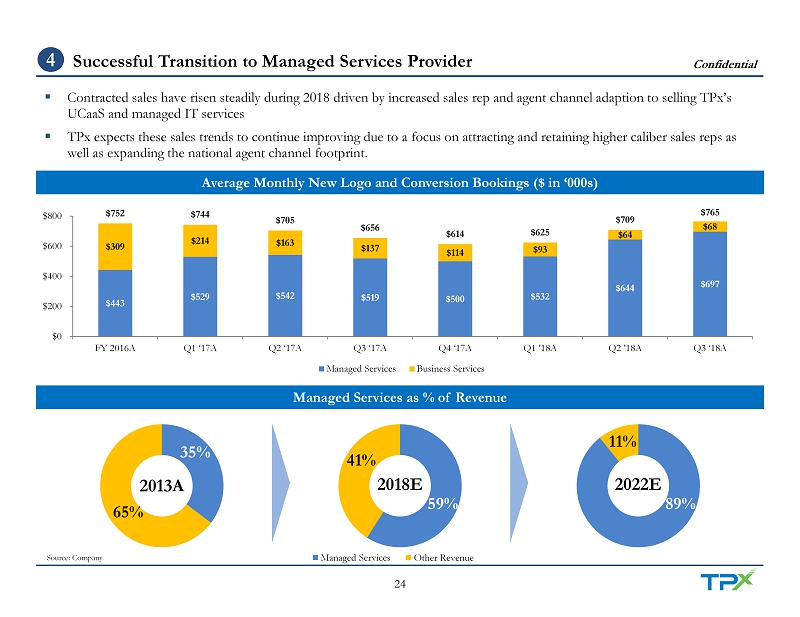
Confidential 24 ▪ Contracted sales have risen steadily during 2018 driven by increased sales rep and agent channel adaption to selling TPx’s UCaaS and managed IT services ▪ TPx expects these sales trends to continue improving due to a focus on attracting and retaining higher caliber sales reps as well as expanding the national agent channel footprint. $443 $529 $542 $519 $500 $532 $644 $697 $309 $214 $163 $137 $114 $93 $64 $68 $752 $744 $705 $656 $614 $625 $709 $765 $0 $200 $400 $600 $800 FY 2016A Q1 ‘17A Q2 ‘17A Q3 ‘17A Q4 ‘17A Q1 ’18A Q2 ’18A Q3 ‘18A Managed Services Business Services Managed Services as % of Revenue Average Monthly New Logo and Conversion Bookings ($ in ‘000s) Source: Company Managed Services Other Revenue 89% 2022E 11% 35% 2013A 65% 59% 2018E 41% Successful Transition to Managed Services Provider 4
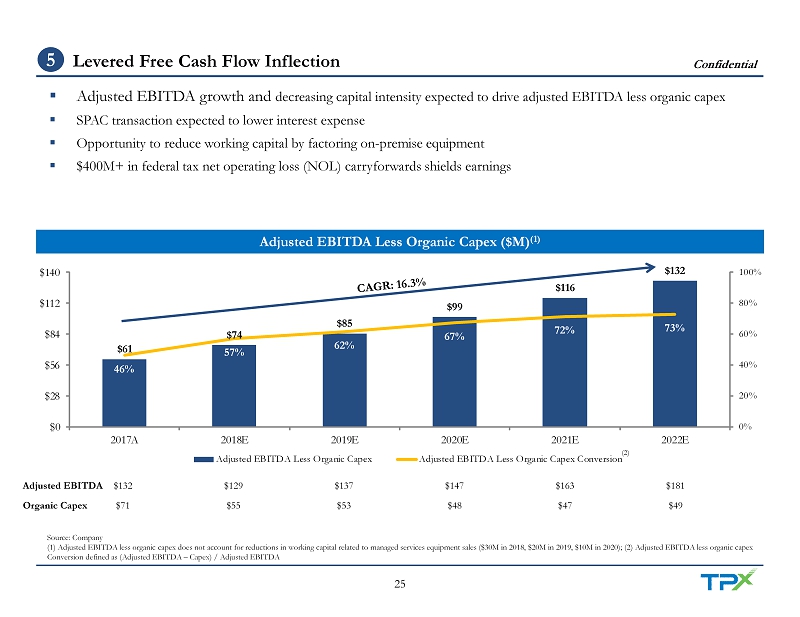
Confidential 25 $61 $74 $85 $99 $116 $132 46% 57% 62% 67% 72% 73% 0% 20% 40% 60% 80% 100% $0 $28 $56 $84 $112 $140 2017A 2018E 2019E 2020E 2021E 2022E Adjusted EBITDA Less Organic Capex Adjusted EBITDA Less Organic Capex Conversion ▪ Adjusted EBITDA growth and decreasing capital intensity expected to drive adjusted EBITDA less organic capex ▪ SPAC transaction expected to lower interest expense ▪ Opportunity to reduce working capital by factoring on - premise equipment ▪ $400M+ in federal tax net operating loss (NOL) carryforwards shields earnings Adjusted EBITDA Less Organic Capex ($M) (1) $132 $129 $137 $147 $163 $181 $71 $55 $53 $48 $47 $49 Source: Company (1) Adjusted EBITDA less organic capex does not account for reductions in working capital related to managed services equipme nt sales ($30M in 2018, $20M in 2019, $10M in 2020); (2) Adjusted EBITDA less organic capex Conversion defined as (Adjusted EBITDA – Capex) / Adjusted EBITDA Adjusted EBITDA Organic Capex (2) Levered Free Cash Flow Inflection 5
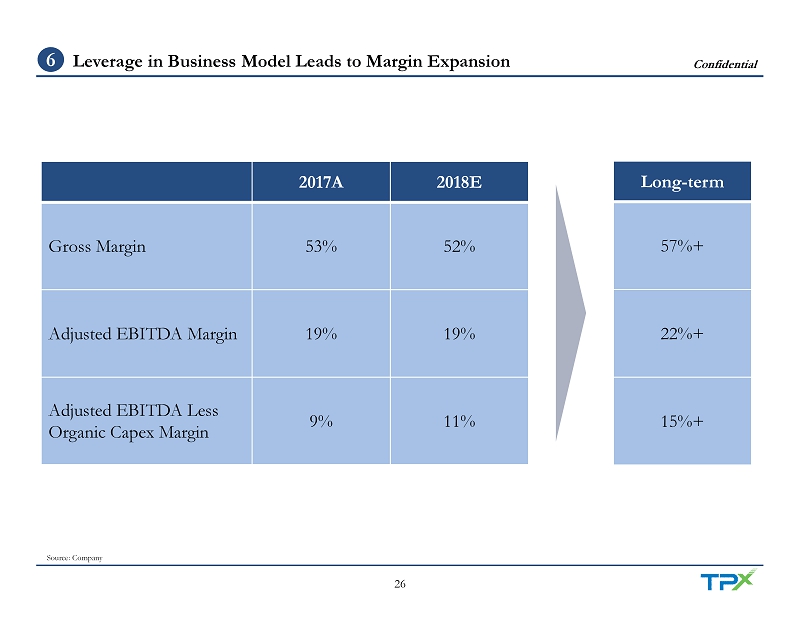
Confidential 26 2017A 2018E Gross Margin 53% 52% Adjusted EBITDA Margin 19% 19% Adjusted EBITDA Less Organic Capex Margin 9% 11% Long - term 57%+ 22%+ 15%+ Source: Company Leverage in Business Model Leads to Margin Expansion 6
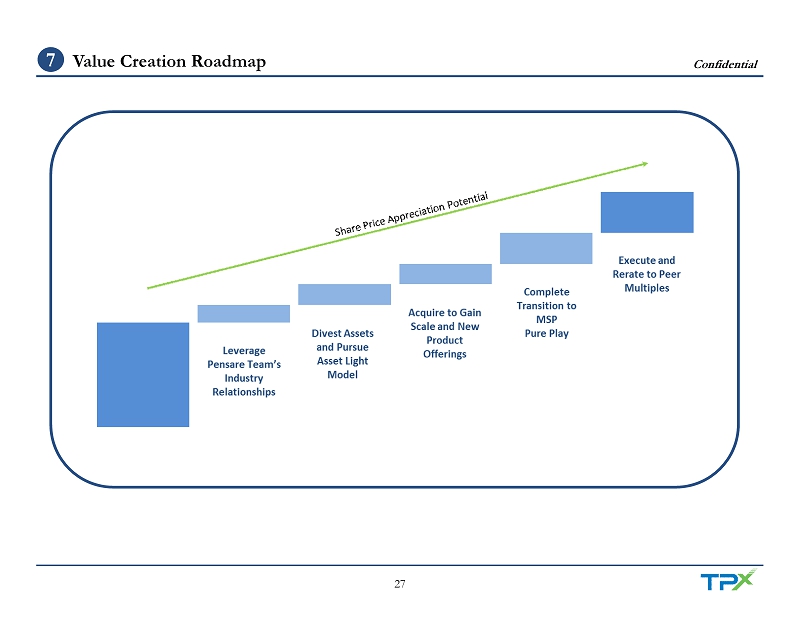
Confidential 27 Value Creation Roadmap 7

Appendix
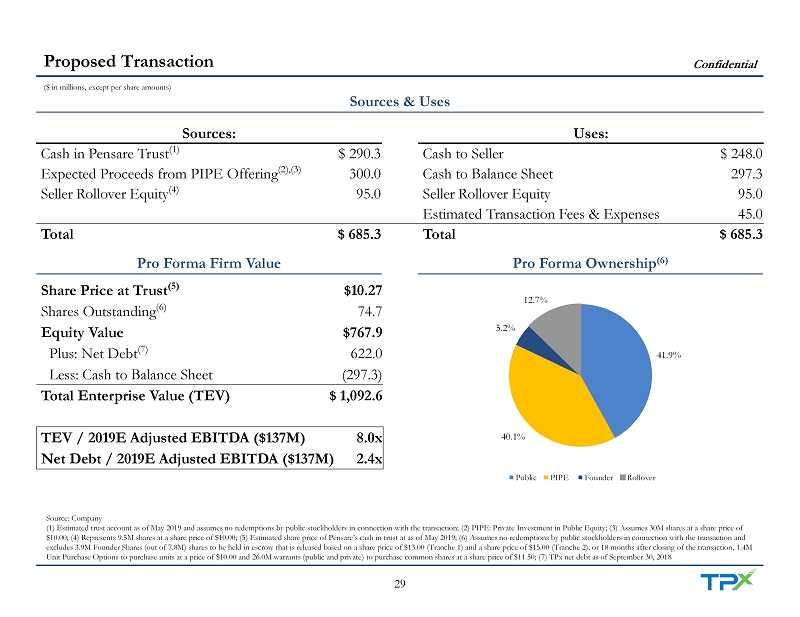
Confidential 29 Proposed Transaction ($ in millions, except per share amounts) 41.9% 40.1% 5.2% 12.7% Public PIPE Founder Rollover Sources: Uses: Cash in Pensare Trust (1) $ 290.3 Cash to Seller $ 248.0 Expected Proceeds from PIPE Offering (2),(3) 300.0 Cash to Balance Sheet 297.3 Seller Rollover Equity (4) 95.0 Seller Rollover Equity 95.0 Estimated Transaction Fees & Expenses 45.0 Total $ 685.3 Total $ 685.3 Sources & Uses Pro Forma Firm Value Share Price at Trust (5) $10.27 Shares Outstanding (6) 74.7 Equity Value $767.9 Plus: Net Debt (7) 622.0 Less: Cash to Balance Sheet (297.3) Total Enterprise Value (TEV) $ 1,092.6 TEV / 2019E Adjusted EBITDA ($137M) 8.0x Net Debt / 2019E Adjusted EBITDA ($137M) 2.4x Source: Company (1) Estimated trust account as of May 2019 and assumes no redemptions by public stockholders in connection with the transacti on; (2) PIPE: Private Investment in Public Equity; (3) Assumes 30M shares at a share price of $10.00; (4) Represents 9.5M shares at a share price of $10.00; (5) Estimated share price of Pensare’s cash in trust at as of May 2019; (6) Assumes no redemptions by public stockholders in connection with the transaction and excludes 3.9M Founder Shares (out of 7.8M) shares to be held in escrow that is released based on a share price of $13.00 (Tra nch e 1) and a share price of $15.00 (Tranche 2), or 18 months after closing of the transaction, 1.4M Unit Purchase Options to purchase units at a price of $10.00 and 26.0M warrants (public and private) to purchase common share s a t a share price of $11.50; (7) TPx net debt as of September 30, 2018 Pro Forma Ownership (6)
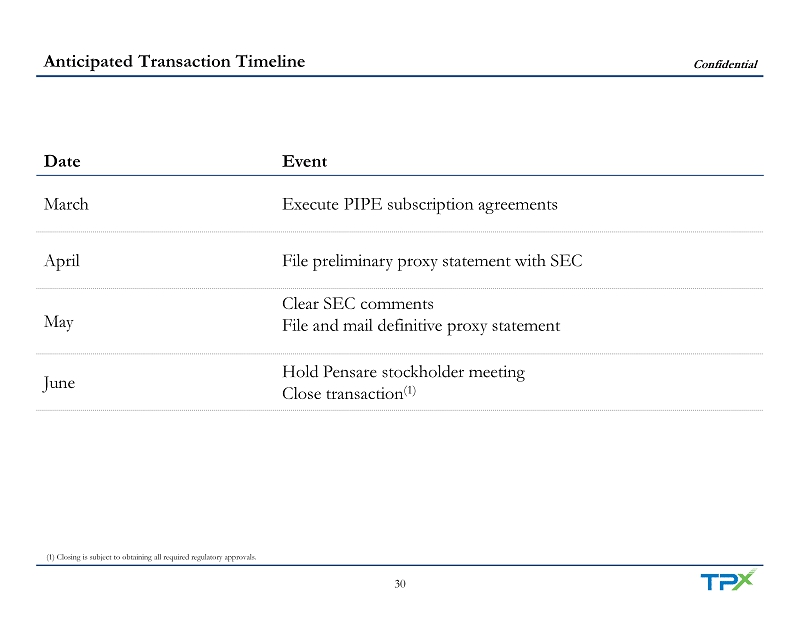
Confidential 30 Anticipated Transaction Timeline Date Event March Execute PIPE subscription agreements April File preliminary proxy statement with SEC May Clear SEC comments File and mail definitive proxy statement June Hold Pensare stockholder meeting Close transaction (1) (1) Closing is subject to obtaining all required regulatory approvals.
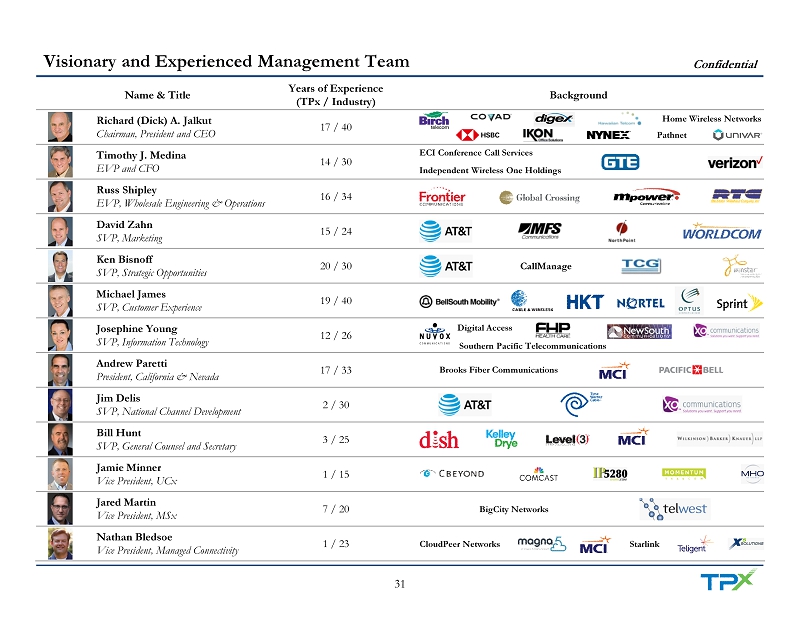
Confidential 31 Visionary and Experienced Management Team Name & Title Years of Experience (TPx / Industry) Background Richard (Dick) A. Jalkut Chairman, President and CEO 17 / 40 Timothy J. Medina EVP and CFO 14 / 30 Russ Shipley EVP, Wholesale Engineering & Operations 16 / 34 David Zahn SVP, Marketing 15 / 24 Ken Bisnoff SVP, Strategic Opportunities 20 / 30 Michael James SVP, Customer Experience 19 / 40 Josephine Young SVP, Information Technology 12 / 26 Andrew Paretti President, California & Nevada 17 / 33 Jim Delis SVP, National Channel Development 2 / 30 Bill Hunt SVP, General Counsel and Secretary 3 / 25 Jamie Minner Vice President, UCx 1 / 15 Jared Martin Vice President, MSx 7 / 20 Nathan Bledsoe Vice President, Managed Connectivity 1 / 23 Home Wireless Networks Pathnet ECI Conference Call Services Independent Wireless One Holdings CallManage Digital Access Southern Pacific Telecommunications Brooks Fiber Communications BigCity Networks CloudPeer Networks Starlink
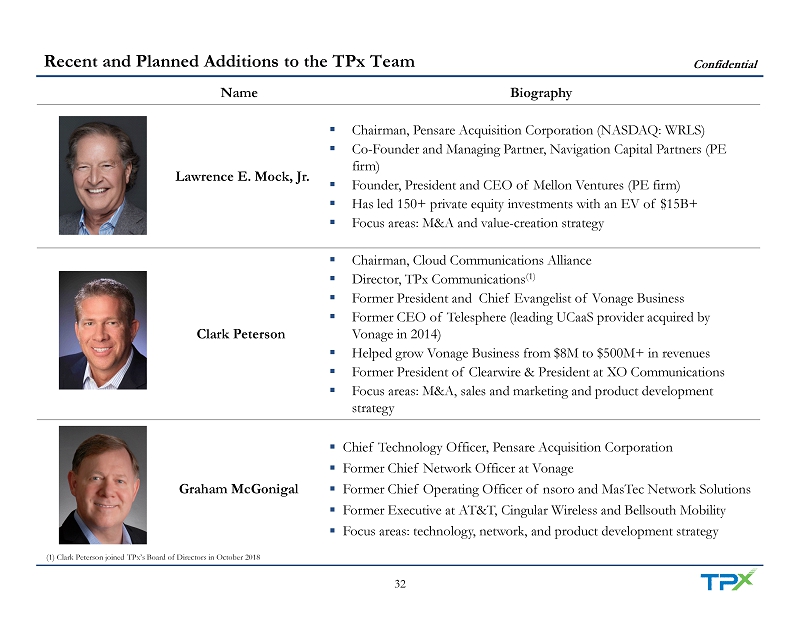
Confidential 32 Recent and Planned Additions to the TPx Team Name Biography Lawrence E. Mock, Jr. ▪ Chairman, Pensare Acquisition Corporation (NASDAQ: WRLS) ▪ Co - Founder and Managing Partner, Navigation Capital Partners (PE firm) ▪ Founder, President and CEO of Mellon Ventures (PE firm) ▪ Has led 150+ private equity investments with an EV of $15B+ ▪ Focus areas: M&A and value - creation strategy Clark Peterson ▪ Chairman, Cloud Communications Alliance ▪ Director, TPx Communications (1) ▪ Former President and Chief Evangelist of Vonage Business ▪ Former CEO of Telesphere (leading UCaaS provider acquired by Vonage in 2014) ▪ Helped grow Vonage Business from $8M to $500M+ in revenues ▪ Former President of Clearwire & President at XO Communications ▪ Focus areas: M&A, sales and marketing and product development strategy Graham McGonigal ▪ Chief Technology Officer, Pensare Acquisition Corporation ▪ Former Chief Network Officer at Vonage ▪ Former Chief Operating Officer of nsoro and MasTec Network Solutions ▪ Former Executive at AT&T, Cingular Wireless and Bellsouth Mobility ▪ Focus areas: technology, network, and product development strategy (1) Clark Peterson joined TPx’s Board of Directors in October 2018

Confidential 33 Awards and Recognitions 2017 TMC Communications Solutions Product of the Year – ITx for WAN 2017, 2016 ChannelVision Visionary Spotlight Award INTERNET TELEPHONY Fixed Wireless 2015 Excellence Award 2017 TMC Unified Communications Product of the Year CIO Review’s 20 Most Promising 2015 Unified Communications Solutions Providers INTERNET TELEPHONY 2016 Unified Communications Product of the Year Unified Communications TMC Labs 2015 Innovation Award for Fixed Wireless Connectivity Solution Multiple MEF CE 2.0 Certifications #4 on Selling Power’s 50 Best Companies to Sell For PHONE+ Top 15 Channel Managers
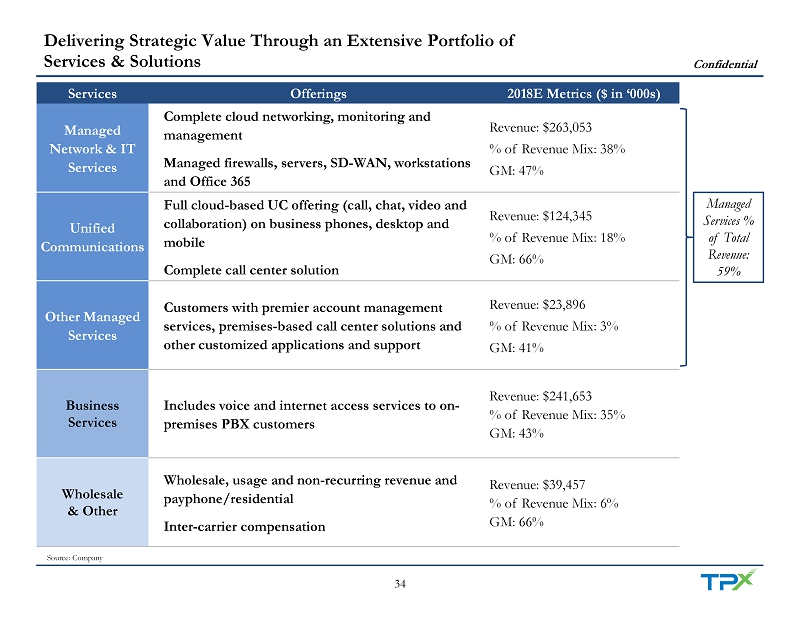
Confidential 34 Delivering Strategic Value Through an Extensive Portfolio of Services & Solutions Services Offerings 2018E Metrics ($ in ‘000s) Managed Network & IT Services Complete cloud networking, monitoring and management Managed firewalls, servers, SD - WAN, workstations and Office 365 Revenue: $263,053 % of Revenue Mix: 38% GM: 47% Unified Communications Full cloud - based UC offering (call, chat, video and collaboration) on business phones, desktop and mobile Complete call center solution Revenue: $124,345 % of Revenue Mix: 18% GM: 66% Other Managed Services Customers with premier account management services, premises - based call center solutions and other customized applications and support Revenue: $23,896 % of Revenue Mix: 3% GM: 41% Business Services Includes voice and internet access services to on - premises PBX customers Revenue: $241,653 % of Revenue Mix: 35% GM: 43% Wholesale & Other Wholesale, usage and non - recurring revenue and payphone/residential Inter - carrier compensation Revenue: $39,457 % of Revenue Mix: 6% GM: 66% Source: Company Managed Services % of Total Revenue: 59%
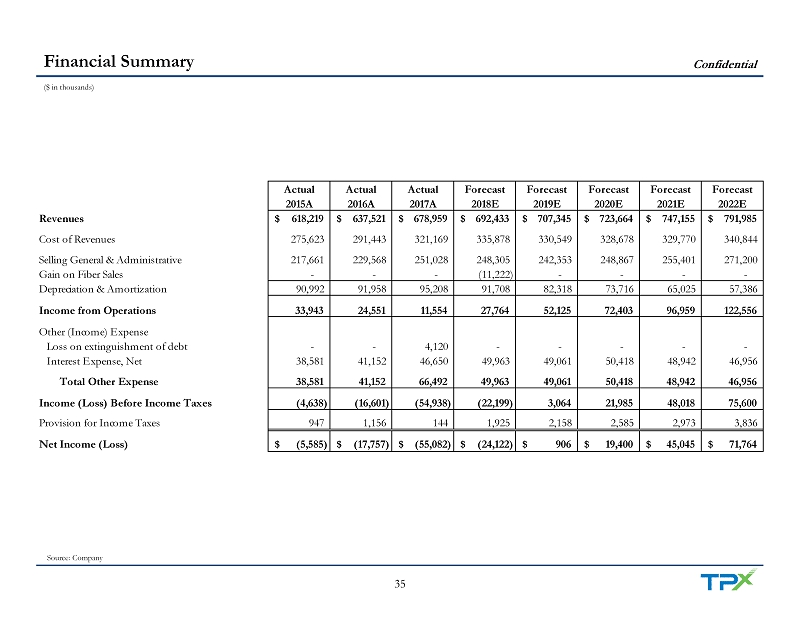
Confidential 35 Financial Summary Source: Company ($ in thousands) Actual Actual Actual Forecast Forecast Forecast Forecast Forecast 2015A 2016A 2017A 2018E 2019E 2020E 2021E 2022E Revenues 618,219$ 637,521$ 678,959$ 692,433$ 707,345$ 723,664$ 747,155$ 791,985$ Cost of Revenues 275,623 291,443 321,169 335,878 330,549 328,678 329,770 340,844 Selling General & Administrative 217,661 229,568 251,028 248,305 242,353 248,867 255,401 271,200 Gain on Fiber Sales - - - (11,222) - - - - Depreciation & Amortization 90,992 91,958 95,208 91,708 82,318 73,716 65,025 57,386 Income from Operations 33,943 24,551 11,554 27,764 52,125 72,403 96,959 122,556 Other (Income) Expense Loss on extinguishment of debt - - 4,120 - - - - - Interest Expense, Net 38,581 41,152 46,650 49,963 49,061 50,418 48,942 46,956 Total Other Expense 38,581 41,152 66,492 49,963 49,061 50,418 48,942 46,956 Income (Loss) Before Income Taxes (4,638) (16,601) (54,938) (22,199) 3,064 21,985 48,018 75,600 Provision for Income Taxes 947 1,156 144 1,925 2,158 2,585 2,973 3,836 Net Income (Loss) (5,585)$ (17,757)$ (55,082)$ (24,122)$ 906$ 19,400$ 45,045$ 71,764$
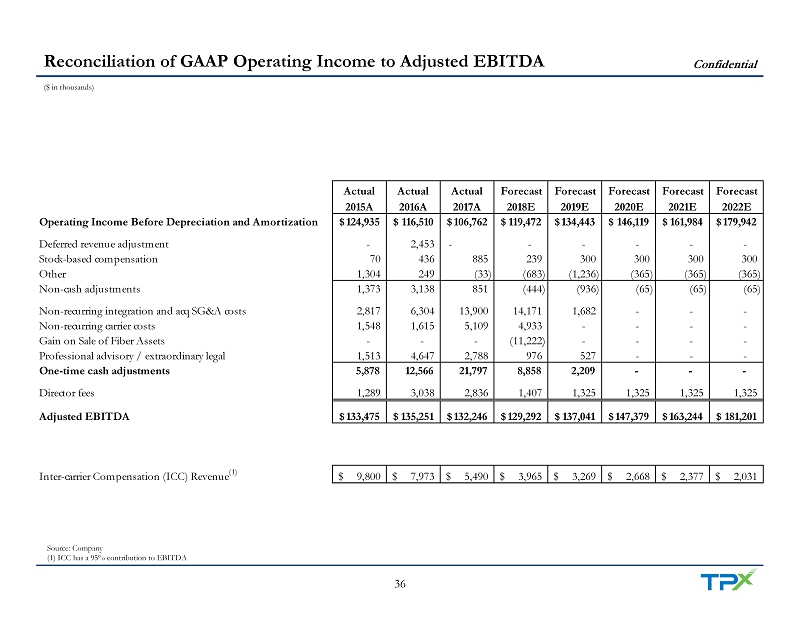
Confidential 36 Actual Actual Actual Forecast Forecast Forecast Forecast Forecast 2015A 2016A 2017A 2018E 2019E 2020E 2021E 2022E Operating Income Before Depreciation and Amortization 124,935$ 116,510$ 106,762$ 119,472$ 134,443$ 146,119$ 161,984$ 179,942$ Deferred revenue adjustment - 2,453 - - - - - - Stock-based compensation 70 436 885 239 300 300 300 300 Other 1,304 249 (33) (683) (1,236) (365) (365) (365) Non-cash adjustments 1,373 3,138 851 (444) (936) (65) (65) (65) Non-recurring integration and acq SG&A costs 2,817 6,304 13,900 14,171 1,682 - - - Non-recurring carrier costs 1,548 1,615 5,109 4,933 - - - - Gain on Sale of Fiber Assets - - - (11,222) - - - - Professional advisory / extraordinary legal 1,513 4,647 2,788 976 527 - - - One-time cash adjustments 5,878 12,566 21,797 8,858 2,209 - - - Director fees 1,289 3,038 2,836 1,407 1,325 1,325 1,325 1,325 Adjusted EBITDA 133,475$ 135,251$ 132,246$ 129,292$ 137,041$ 147,379$ 163,244$ 181,201$ Inter-carrier Compensation (ICC) Revenue (1) 9,800$ 7,973$ 5,490$ 3,965$ 3,269$ 2,668$ 2,377$ 2,031$ Reconciliation of GAAP Operating Income to Adjusted EBITDA Source: Company (1) ICC has a 95% contribution to EBITDA ($ in thousands)
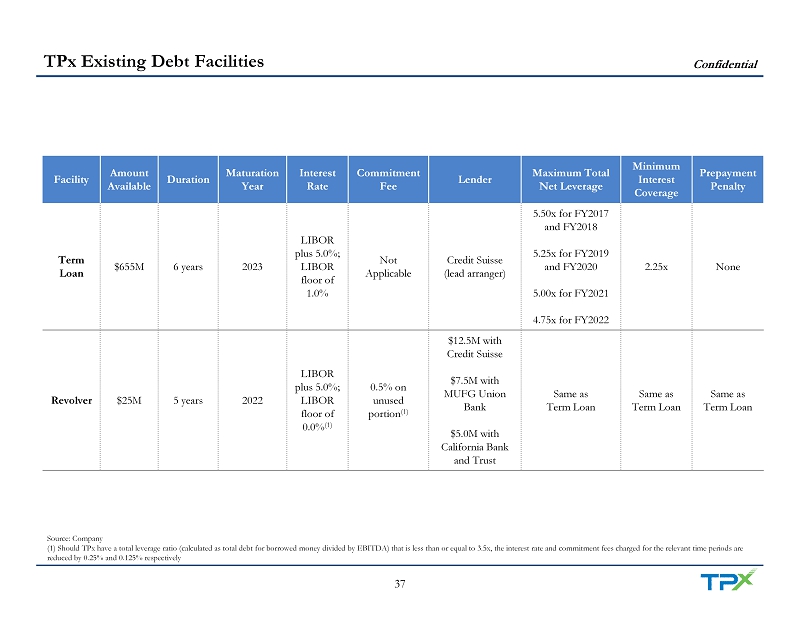
Confidential 37 TPx Existing Debt Facilities Source: Company (1) Should TPx have a total leverage ratio (calculated as total debt for borrowed money divided by EBITDA) that is less than or equal to 3.5x, the interest rate and commitment fees charged for the relevant time periods are reduced by 0.25% and 0.125% respectively Facility Amount Available Duration Maturation Year Interest Rate Commitment Fee Lender Maximum Total Net Leverage Minimum Interest Coverage Prepayment Penalty Term Loan $655M 6 years 2023 LIBOR plus 5.0%; LIBOR floor of 1.0% N ot Applicable Credit Suisse (lead arranger) 5.50x for FY2017 and FY2018 5.25x for FY2019 and FY2020 5.00x for FY2021 4.75x for FY2022 2.25x None Revolver $25M 5 years 2022 LIBOR plus 5.0%; LIBOR floor of 0.0% (1) 0.5% on unused portion (1) $12.5M with Credit Suisse $7.5M with MUFG Union Bank $5.0M with California Bank and Trust Same as Term Loan Same as Term Loan Same as Term Loan
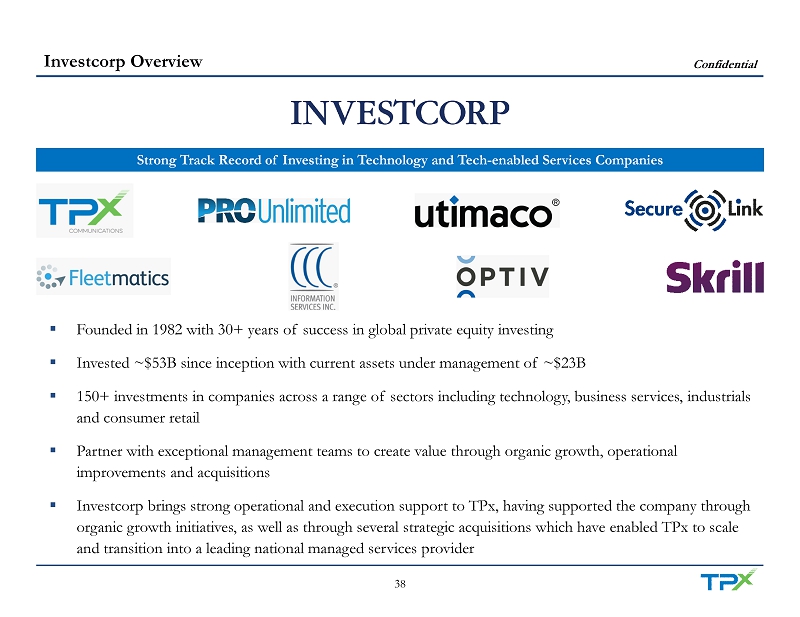
Confidential 38 Investcorp Overview Strong Track Record of Investing in Technology and Tech - enabled Services Companies ▪ Founded in 1982 with 30+ years of success in global private equity investing ▪ Invested ~$53B since inception with current assets under management of ~$23B ▪ 150+ investments in companies across a range of sectors including technology, business services, industrials and consumer retail ▪ Partner with exceptional management teams to create value through organic growth, operational improvements and acquisitions ▪ Investcorp brings strong operational and execution support to TPx, having supported the company through organic growth initiatives, as well as through several strategic acquisitions which have enabled TPx to scale and transition into a leading national managed services provider