
Q1 2022 EARNINGS SUPPLEMENT MAY 5, 2022
LEGAL DISCLAIMER This Earnings Supplement contains forward-looking statements within the meaning of the Private Securities Litigation Reform Act of 1995, including statements relating to the future financial performance and growth of the Company, the Company’s ability to open stores in the development pipeline, and the Company’s ability to conduct future accretive and successful acquisitions and integrate acquired brands. Forward-looking statements reflect the Company’s expectations concerning the future and are subject to significant business, economic and competitive risks, uncertainties and contingencies including, but not limited to, uncertainties surrounding the severity, duration and effects of the COVID-19 pandemic. These risks, uncertainties and contingencies are difficult to predict and beyond our control, and could cause our actual results to differ materially from those expressed or implied in such forward-looking statements. We refer you to the documents that we file from time to time with the Securities and Exchange Commission, including our reports on Form 10-K, Form 10-Q and Form 8-K, for a discussion of these and other risks and uncertainties that could cause our actual results to differ materially from our current expectations and from the forward-looking statements contained in this Earnings Supplement. We undertake no obligation to update any forward-looking statement to reflect events or circumstances occurring after the date of this Earnings Supplement. 2

Q1 2022 HIGHLIGHTS
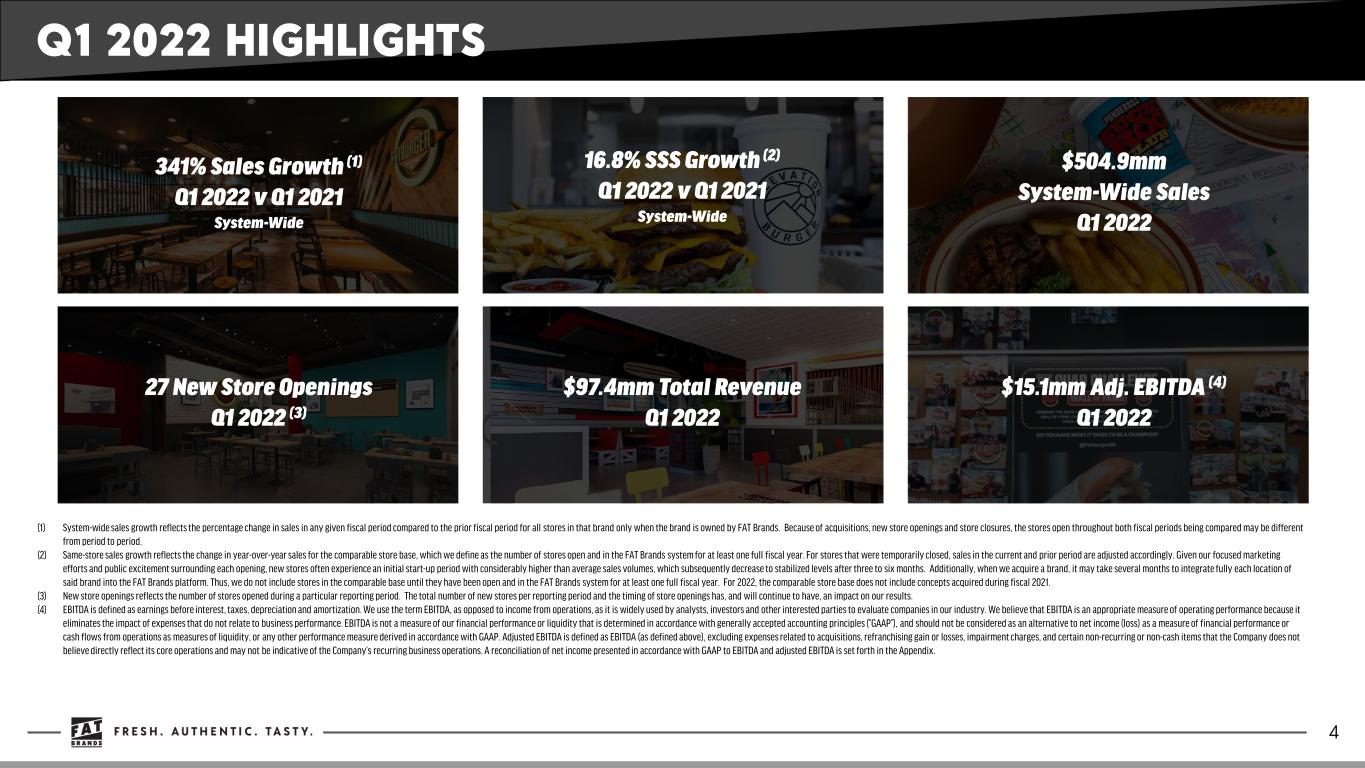
Q1 2022 HIGHLIGHTS 4 341% Sales Growth (1) Q1 2022 v Q1 2021 System-Wide 16.8% SSS Growth (2) Q1 2022 v Q1 2021 System-Wide 27 New Store Openings Q1 2022 (3) $97.4mm Total Revenue Q1 2022 $15.1mm Adj. EBITDA (4) Q1 2022 $504.9mm System-Wide Sales Q1 2022 (1) System-wide sales growth reflects the percentage change in sales in any given fiscal period compared to the prior fiscal period for all stores in that brand only when the brand is owned by FAT Brands. Because of acquisitions, new store openings and store closures, the stores open throughout both fiscal periods being compared may be different from period to period. (2) Same-store sales growth reflects the change in year-over-year sales for the comparable store base, which we define as the number of stores open and in the FAT Brands system for at least one full fiscal year. For stores that were temporarily closed, sales in the current and prior period are adjusted accordingly. Given our focused marketing efforts and public excitement surrounding each opening, new stores often experience an initial start-up period with considerably higher than average sales volumes, which subsequently decrease to stabilized levels after three to six months. Additionally, when we acquire a brand, it may take several months to integrate fully each location of said brand into the FAT Brands platform. Thus, we do not include stores in the comparable base until they have been open and in the FAT Brands system for at least one full fiscal year. For 2022, the comparable store base does not include concepts acquired during fiscal 2021. (3) New store openings reflects the number of stores opened during a particular reporting period. The total number of new stores per reporting period and the timing of store openings has, and will continue to have, an impact on our results. (4) EBITDA is defined as earnings before interest, taxes, depreciation and amortization. We use the term EBITDA, as opposed to income from operations, as it is widely used by analysts, investors and other interested parties to evaluate companies in our industry. We believe that EBITDA is an appropriate measure of operating performance because it eliminates the impact of expenses that do not relate to business performance. EBITDA is not a measure of our financial performance or liquidity that is determined in accordance with generally accepted accounting principles (“GAAP”), and should not be considered as an alternative to net income (loss) as a measure of financial performance or cash flows from operations as measures of liquidity, or any other performance measure derived in accordance with GAAP. Adjusted EBITDA is defined as EBITDA (as defined above), excluding expenses related to acquisitions, refranchising gain or losses, impairment charges, and certain non-recurring or non-cash items that the Company does not believe directly reflect its core operations and may not be indicative of the Company’s recurring business operations. A reconciliation of net income presented in accordance with GAAP to EBITDA and adjusted EBITDA is set forth in the Appendix.
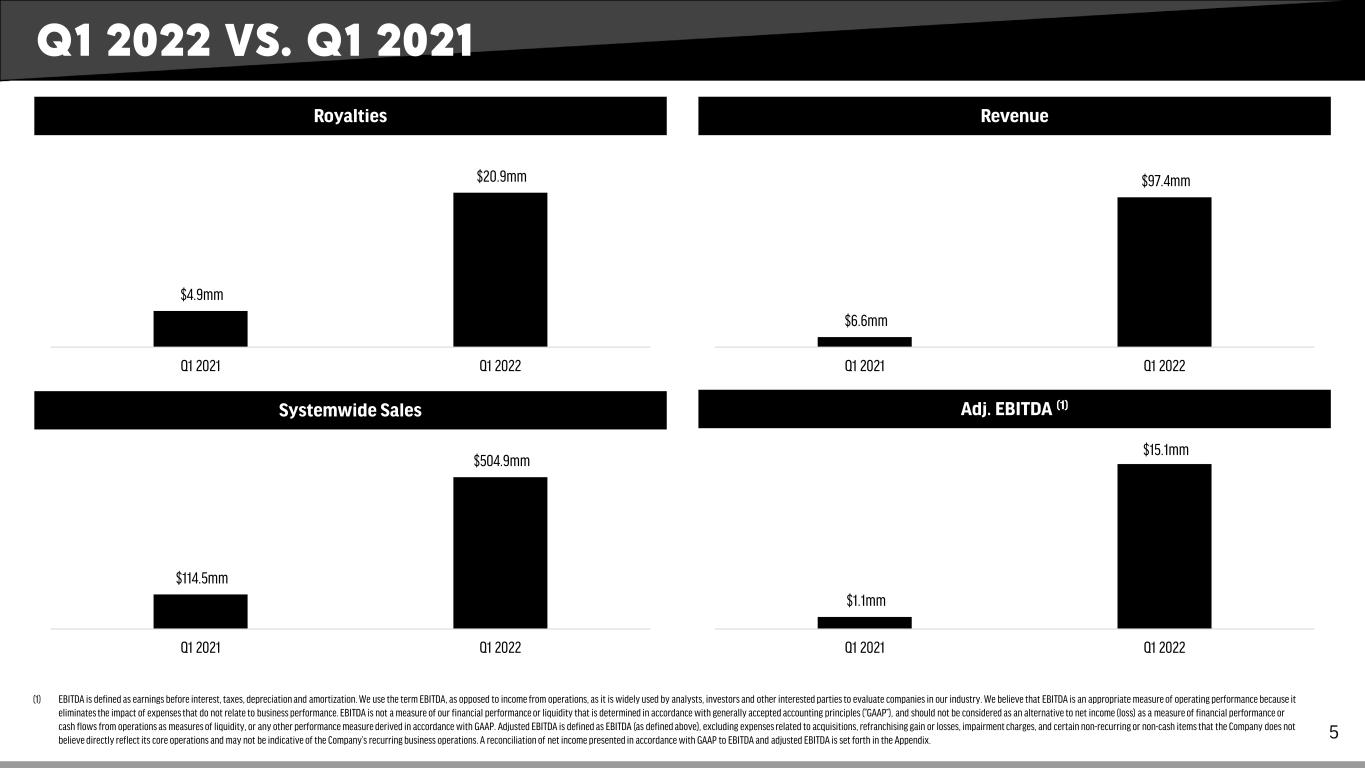
Q1 2022 VS. Q1 2021 5 (1) EBITDA is defined as earnings before interest, taxes, depreciation and amortization. We use the term EBITDA, as opposed to income from operations, as it is widely used by analysts, investors and other interested parties to evaluate companies in our industry. We believe that EBITDA is an appropriate measure of operating performance because it eliminates the impact of expenses that do not relate to business performance. EBITDA is not a measure of our financial performance or liquidity that is determined in accordance with generally accepted accounting principles (“GAAP”), and should not be considered as an alternative to net income (loss) as a measure of financial performance or cash flows from operations as measures of liquidity, or any other performance measure derived in accordance with GAAP. Adjusted EBITDA is defined as EBITDA (as defined above), excluding expenses related to acquisitions, refranchising gain or losses, impairment charges, and certain non-recurring or non-cash items that the Company does not believe directly reflect its core operations and may not be indicative of the Company’s recurring business operations. A reconciliation of net income presented in accordance with GAAP to EBITDA and adjusted EBITDA is set forth in the Appendix. Royalties $4.9mm $20.9mm Q1 2021 Q1 2022 Systemwide Sales Revenue $6.6mm $97.4mm Q1 2021 Q1 2022 Adj. EBITDA (1) $1.1mm $15.1mm Q1 2021 Q1 2022 $114.5mm $504.9mm Q1 2021 Q1 2022
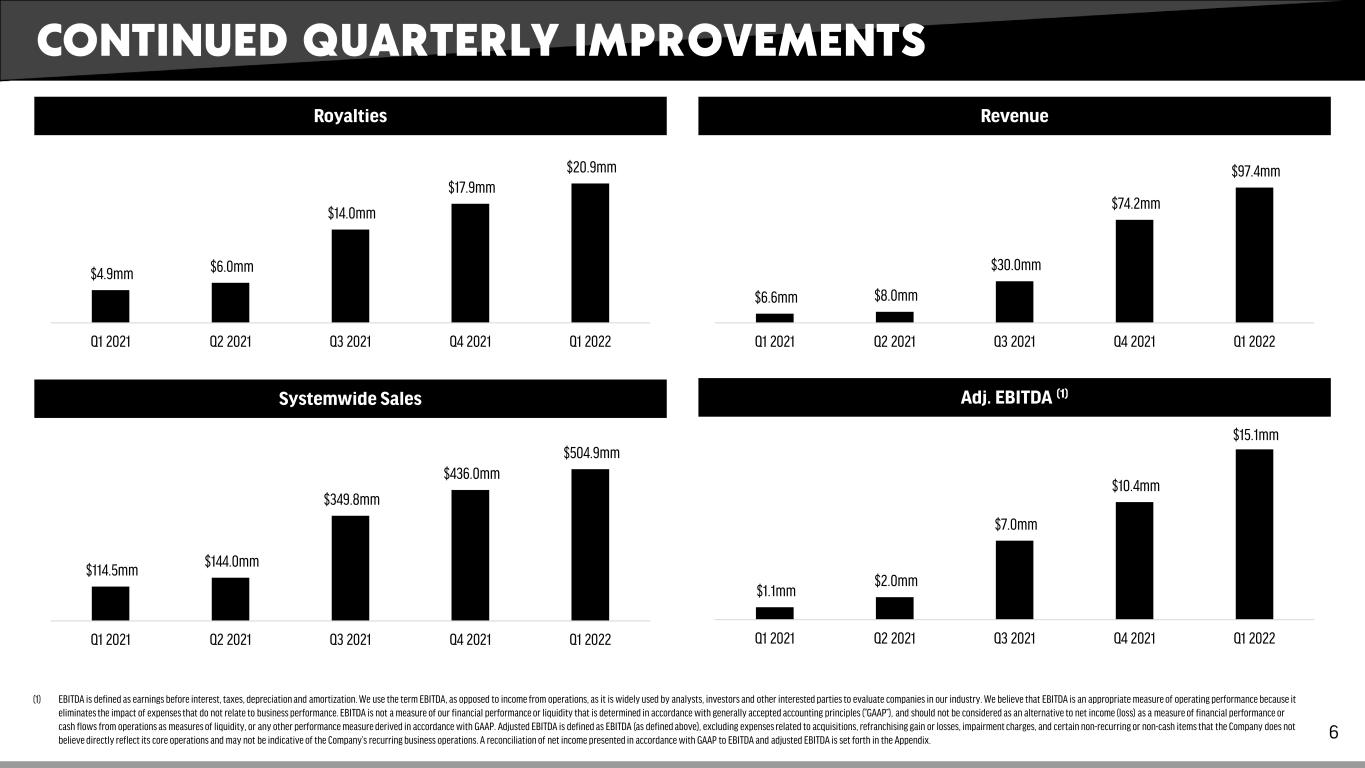
CONTINUED QUARTERLY IMPROVEMENTS 6 Royalties $4.9mm $6.0mm $14.0mm $17.9mm $20.9mm Q1 2021 Q2 2021 Q3 2021 Q4 2021 Q1 2022 Systemwide Sales $114.5mm $144.0mm $349.8mm $436.0mm $504.9mm Q1 2021 Q2 2021 Q3 2021 Q4 2021 Q1 2022 Revenue $6.6mm $8.0mm $30.0mm $74.2mm $97.4mm Q1 2021 Q2 2021 Q3 2021 Q4 2021 Q1 2022 Adj. EBITDA (1) $1.1mm $2.0mm $7.0mm $10.4mm $15.1mm Q1 2021 Q2 2021 Q3 2021 Q4 2021 Q1 2022 (1) EBITDA is defined as earnings before interest, taxes, depreciation and amortization. We use the term EBITDA, as opposed to income from operations, as it is widely used by analysts, investors and other interested parties to evaluate companies in our industry. We believe that EBITDA is an appropriate measure of operating performance because it eliminates the impact of expenses that do not relate to business performance. EBITDA is not a measure of our financial performance or liquidity that is determined in accordance with generally accepted accounting principles (“GAAP”), and should not be considered as an alternative to net income (loss) as a measure of financial performance or cash flows from operations as measures of liquidity, or any other performance measure derived in accordance with GAAP. Adjusted EBITDA is defined as EBITDA (as defined above), excluding expenses related to acquisitions, refranchising gain or losses, impairment charges, and certain non-recurring or non-cash items that the Company does not believe directly reflect its core operations and may not be indicative of the Company’s recurring business operations. A reconciliation of net income presented in accordance with GAAP to EBITDA and adjusted EBITDA is set forth in the Appendix.

While we don’t include acquired concepts in same-store-sales calculation until they are owned for a full fiscal year, comparable same-store-sales including recently acquired concepts were very strong in Q1 2022 compared to Q1 2021 Q1 2022 SAME-STORE-SALES 7 (1) Same-store sales growth reflects the change in year-over-year sales for the comparable store base, which we define as the number of stores open and in the FAT Brands system for at least one full fiscal year. For stores that were temporarily closed, sales in the current and prior period are adjusted accordingly. Given our focused marketing efforts and public excitement surrounding each opening, new stores often experience an initial start-up period with considerably higher than average sales volumes, which subsequently decrease to stabilized levels after three to six months. Additionally, when we acquire a brand, it may take several months to integrate fully each location of said brand into the FAT Brands platform. Thus, we do not include stores in the comparable base until they have been open and in the FAT Brands system for at least one full fiscal year. For 2022, the comparable store base does not include concepts acquired during fiscal 2021. 6.7% 6.4%24.4% 1.7% Same-Store-Sales (as reported, excl. acquired concepts) 16.8% Comparable Same-Store-Sales (incl. acquired concepts) 11.8% Concepts Acquired in FY 2021
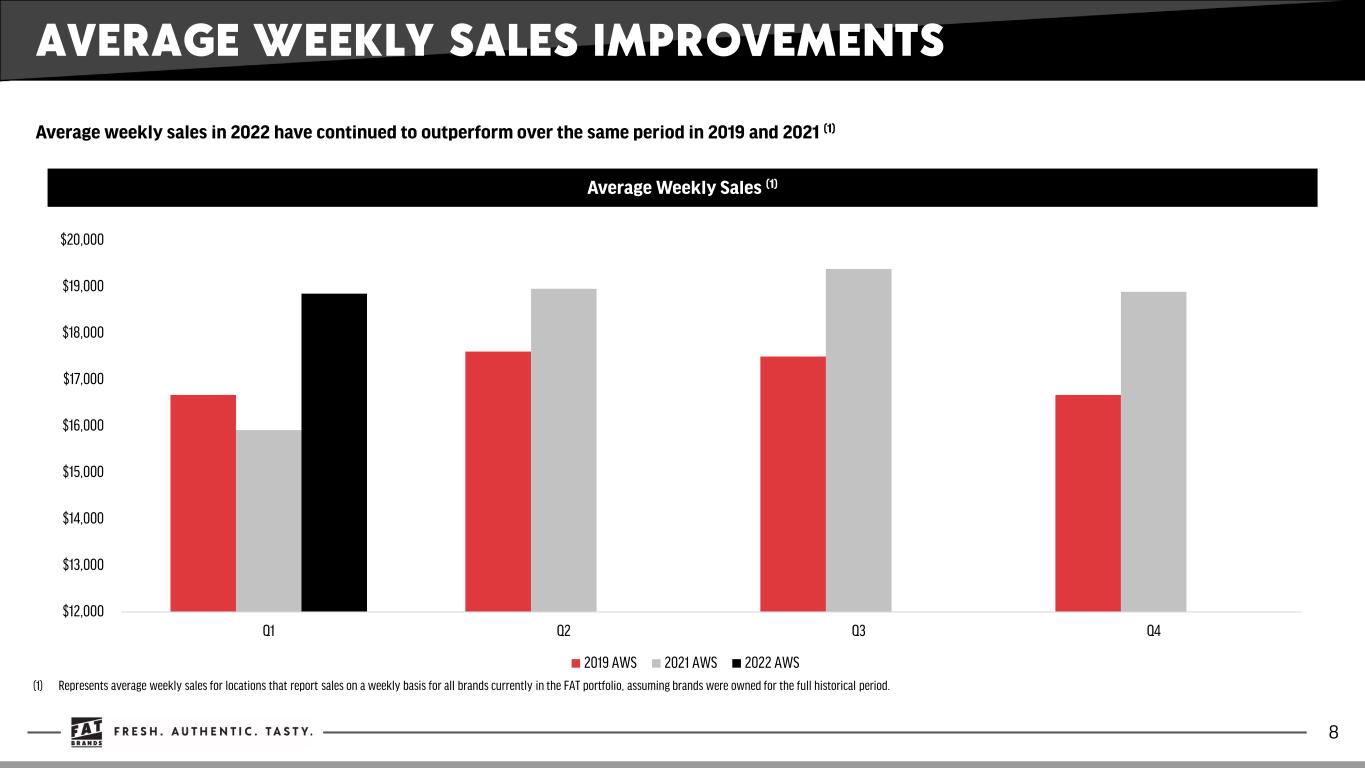
$12,000 $13,000 $14,000 $15,000 $16,000 $17,000 $18,000 $19,000 $20,000 Q1 Q2 Q3 Q4 2019 AWS 2021 AWS 2022 AWS AVERAGE WEEKLY SALES IMPROVEMENTS Average weekly sales in 2022 have continued to outperform over the same period in 2019 and 2021 (1) 8 (1) Represents average weekly sales for locations that report sales on a weekly basis for all brands currently in the FAT portfolio, assuming brands were owned for the full historical period. Average Weekly Sales (1)
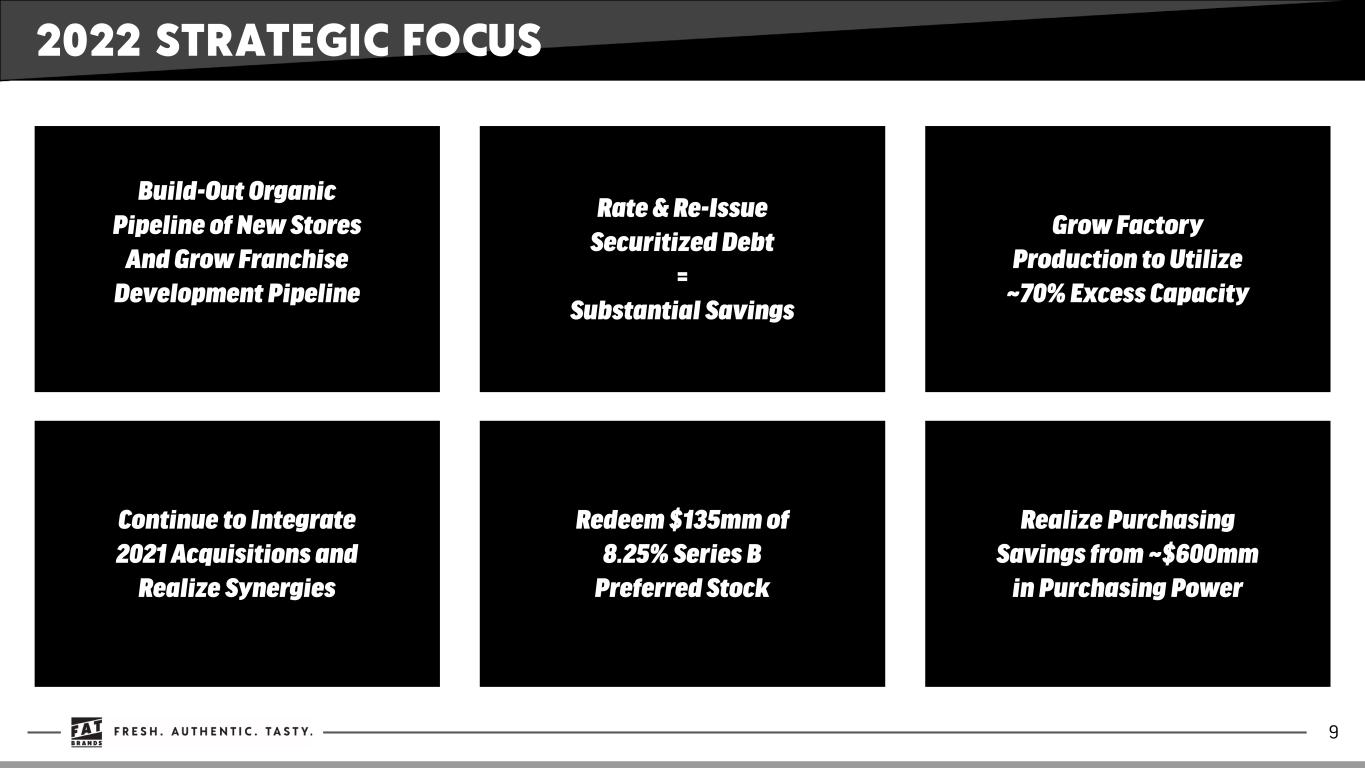
2022 STRATEGIC FOCUS 9 Build-Out Organic Pipeline of New Stores And Grow Franchise Development Pipeline Continue to Integrate 2021 Acquisitions and Realize Synergies Rate & Re-Issue Securitized Debt = Substantial Savings Redeem $135mm of 8.25% Series B Preferred Stock Grow Factory Production to Utilize ~70% Excess Capacity Realize Purchasing Savings from ~$600mm in Purchasing Power
APPENDIX
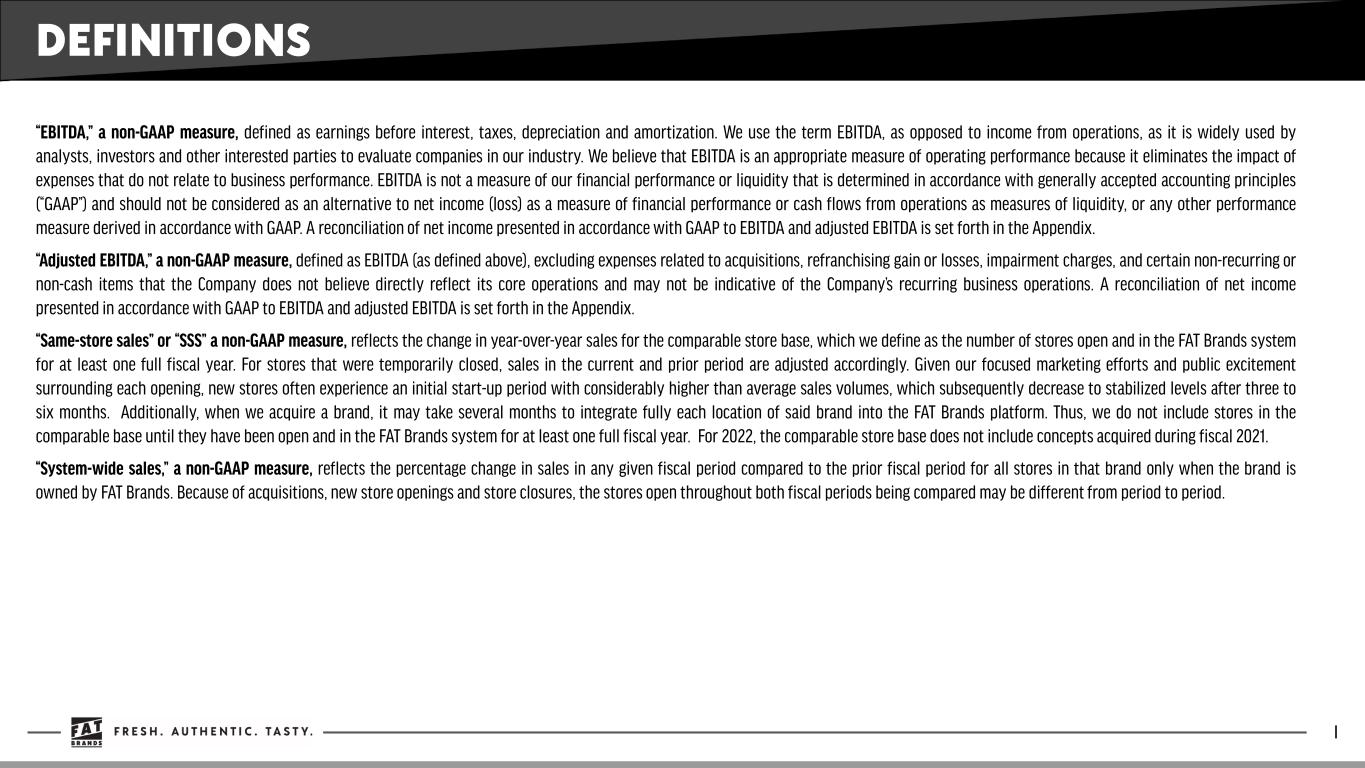
DEFINITIONS “EBITDA,” a non-GAAP measure, defined as earnings before interest, taxes, depreciation and amortization. We use the term EBITDA, as opposed to income from operations, as it is widely used by analysts, investors and other interested parties to evaluate companies in our industry. We believe that EBITDA is an appropriate measure of operating performance because it eliminates the impact of expenses that do not relate to business performance. EBITDA is not a measure of our financial performance or liquidity that is determined in accordance with generally accepted accounting principles (“GAAP”) and should not be considered as an alternative to net income (loss) as a measure of financial performance or cash flows from operations as measures of liquidity, or any other performance measure derived in accordance with GAAP. A reconciliation of net income presented in accordance with GAAP to EBITDA and adjusted EBITDA is set forth in the Appendix. “Adjusted EBITDA,” a non-GAAP measure, defined as EBITDA (as defined above), excluding expenses related to acquisitions, refranchising gain or losses, impairment charges, and certain non-recurring or non-cash items that the Company does not believe directly reflect its core operations and may not be indicative of the Company’s recurring business operations. A reconciliation of net income presented in accordance with GAAP to EBITDA and adjusted EBITDA is set forth in the Appendix. “Same-store sales” or “SSS” a non-GAAP measure, reflects the change in year-over-year sales for the comparable store base, which we define as the number of stores open and in the FAT Brands system for at least one full fiscal year. For stores that were temporarily closed, sales in the current and prior period are adjusted accordingly. Given our focused marketing efforts and public excitement surrounding each opening, new stores often experience an initial start-up period with considerably higher than average sales volumes, which subsequently decrease to stabilized levels after three to six months. Additionally, when we acquire a brand, it may take several months to integrate fully each location of said brand into the FAT Brands platform. Thus, we do not include stores in the comparable base until they have been open and in the FAT Brands system for at least one full fiscal year. For 2022, the comparable store base does not include concepts acquired during fiscal 2021. “System-wide sales,” a non-GAAP measure, reflects the percentage change in sales in any given fiscal period compared to the prior fiscal period for all stores in that brand only when the brand is owned by FAT Brands. Because of acquisitions, new store openings and store closures, the stores open throughout both fiscal periods being compared may be different from period to period. I
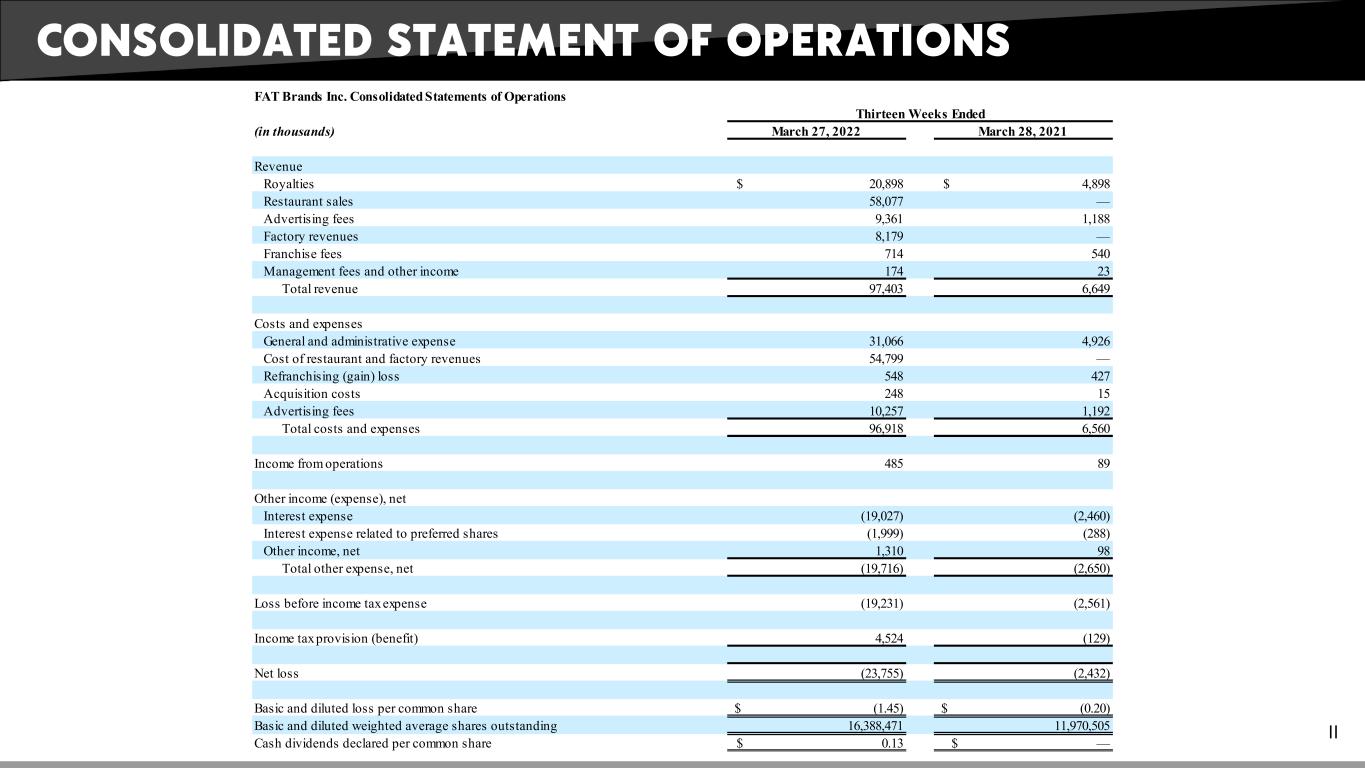
CONSOLIDATED STATEMENT OF OPERATIONS II FAT Brands Inc. Consolidated Statements of Operations Thirteen Weeks Ended (in thousands) March 27, 2022 March 28, 2021 Revenue Royalties $ 20,898 $ 4,898 Restaurant sales 58,077 — Advertising fees 9,361 1,188 Factory revenues 8,179 — Franchise fees 714 540 Management fees and other income 174 23 Total revenue 97,403 6,649 Costs and expenses General and administrative expense 31,066 4,926 Cost of restaurant and factory revenues 54,799 — Refranchising (gain) loss 548 427 Acquisition costs 248 15 Advertising fees 10,257 1,192 Total costs and expenses 96,918 6,560 Income from operations 485 89 Other income (expense), net Interest expense (19,027) (2,460) Interest expense related to preferred shares (1,999) (288) Other income, net 1,310 98 Total other expense, net (19,716) (2,650) Loss before income tax expense (19,231) (2,561) Income tax provision (benefit) 4,524 (129) Net loss (23,755) (2,432) Basic and diluted loss per common share $ (1.45) $ (0.20) Basic and diluted weighted average shares outstanding 16,388,471 11,970,505 Cash dividends declared per common share $ 0.13 $ —
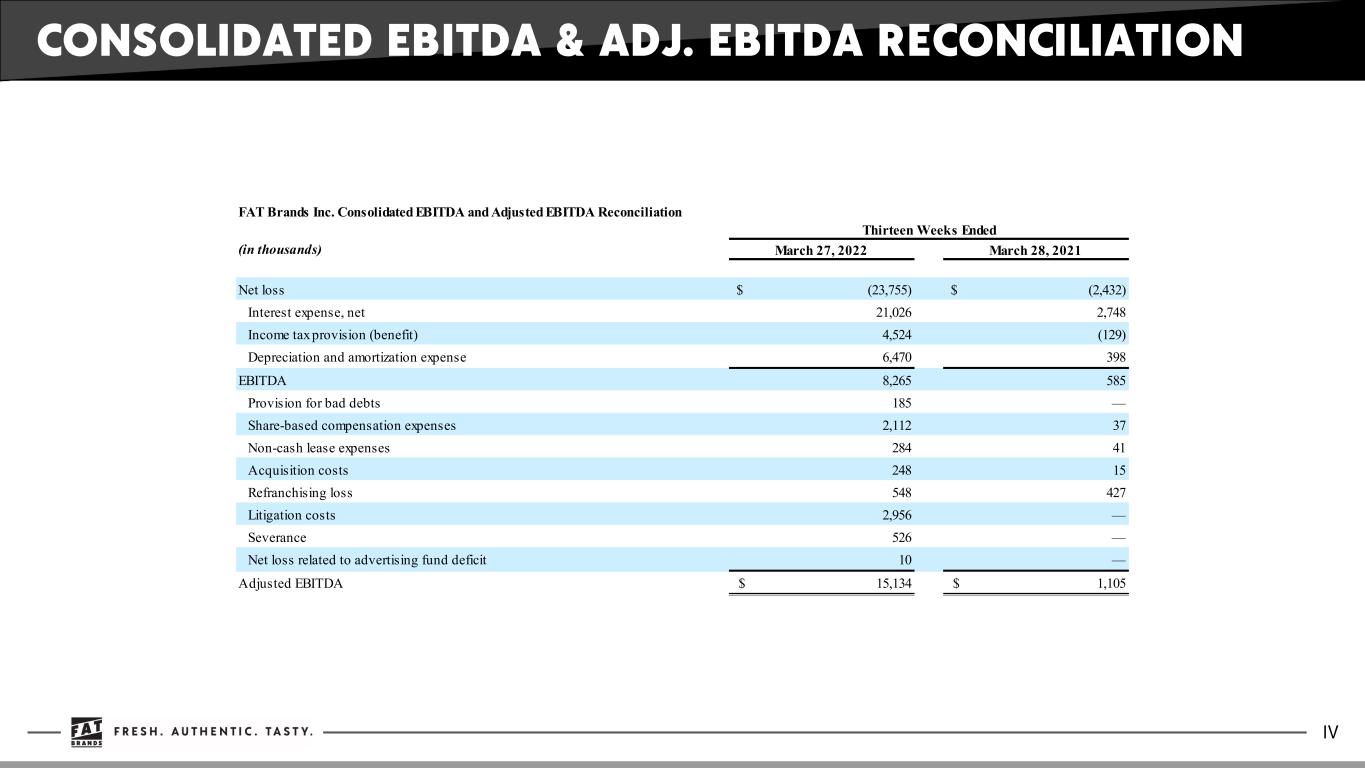
CONSOLIDATED EBITDA & ADJ. EBITDA RECONCILIATION IV FAT Brands Inc. Consolidated EBITDA and Adjusted EBITDA Reconciliation Thirteen Weeks Ended (in thousands) March 27, 2022 March 28, 2021 Net loss $ (23,755) $ (2,432) Interest expense, net 21,026 2,748 Income tax provision (benefit) 4,524 (129) Depreciation and amortization expense 6,470 398 EBITDA 8,265 585 Provision for bad debts 185 — Share-based compensation expenses 2,112 37 Non-cash lease expenses 284 41 Acquisition costs 248 15 Refranchising loss 548 427 Litigation costs 2,956 — Severance 526 — Net loss related to advertising fund deficit 10 — Adjusted EBITDA $ 15,134 $ 1,105
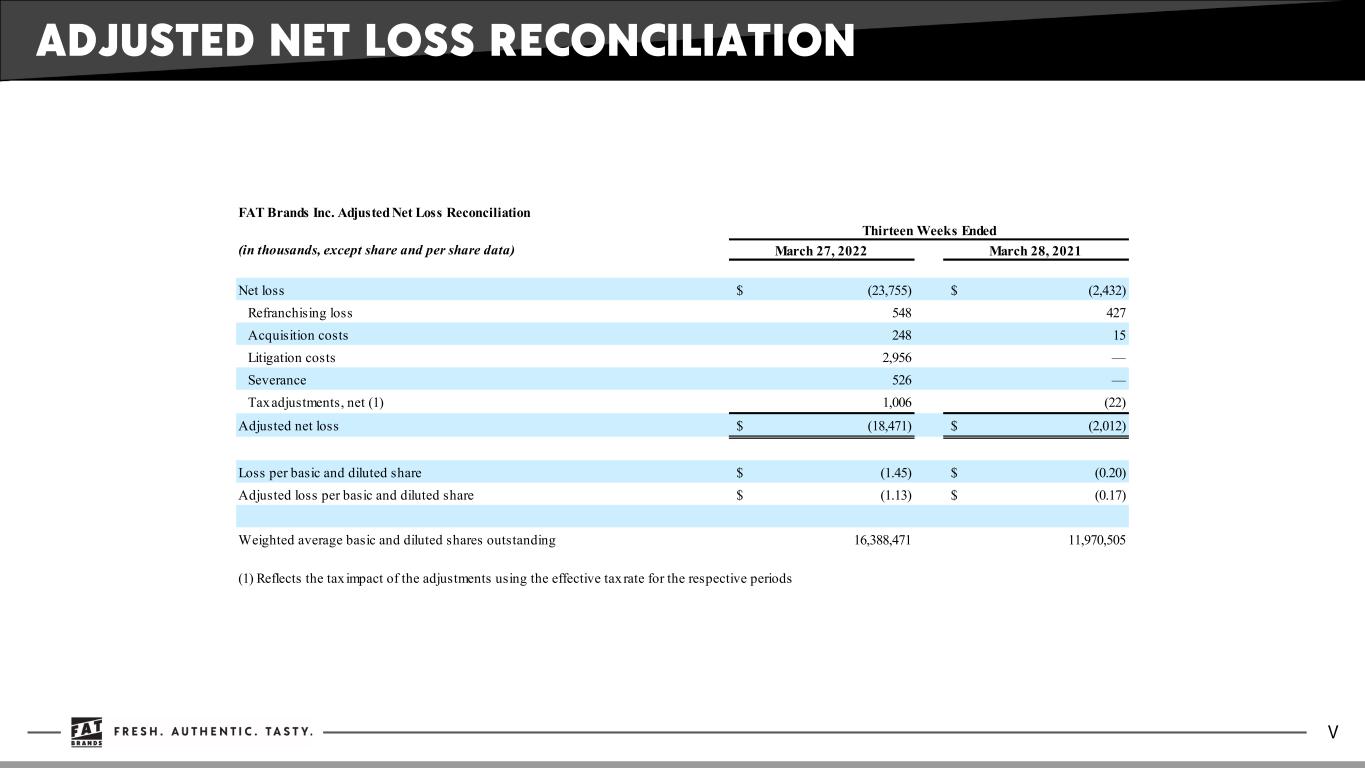
ADJUSTED NET LOSS RECONCILIATION V FAT Brands Inc. Adjusted Net Loss Reconciliation Thirteen Weeks Ended (in thousands, except share and per share data) March 27, 2022 March 28, 2021 Net loss $ (23,755) $ (2,432) Refranchising loss 548 427 Acquisition costs 248 15 Litigation costs 2,956 — Severance 526 — Tax adjustments, net (1) 1,006 (22) Adjusted net loss $ (18,471) $ (2,012) Loss per basic and diluted share $ (1.45) $ (0.20) Adjusted loss per basic and diluted share $ (1.13) $ (0.17) Weighted average basic and diluted shares outstanding 16,388,471 11,970,505 (1) Reflects the tax impact of the adjustments using the effective tax rate for the respective periods

CONTACT INVESTOR RELATIONS: MEDIA RELATIONS: ICR LYNNE COLLIER IR-FATBRANDS@ICRINC.COM 646-430-2216 FAT BRANDS ERIN MANDZIK EMANDZIK@FATBRANDS.COM 860-212-6509


