
CORPORATE PRESENTATION January 2018 POLYMETALLIC PRODUCER with exciting RESOURCE GROWTH POTENTIAL TSX: SMT | NYSE AMERICAN: SMTS | BVL: SMT FREE WRITING PROSPECTUS Filed Pursuant to Rule 433 Registration Statement No . 333 - 218076 A final base shelf prospectus and prospectus supplement containing important information relating to the securities described in this document have been filed with the securities regulatory authorities in the provinces of British Columbia, Alberta and Ontario collectively, the “Canadian Securities Commissions” (“CSC”) and with the U . S . Securities and Exchange Commission (“SEC”) . Delivery of this document must be preceded or accompanied by a copy of the final base shelf prospectus, any amendment to the final base shelf prospectus and any applicable shelf prospectus supplement that has been filed . This document does not provide full disclosure of all material facts relating to the securities offered . Investors should read the final base shelf prospectus, any amendment, any applicable shelf prospectus supplement and the documents incorporated by reference therein for disclosure of those facts, especially risk factors relating to the securities offered, before making an investment decision .

Disclaimer Certain statements in this presentation constitute forward - looking information within the meaning of Canadian and United States securities legislation . Forward - looking information relates to future events or the anticipated performance of Sierra and reflect management's expectations or beliefs regarding such future events and anticipated performance based on an assumed set of economic conditions and courses of action . In certain cases, statements that contain forward - looking information can be identified by the use of words such as "plans", "expects", "is expected", "budget", "scheduled", "estimates", "forecasts", "intends", "anticipates", "believes" or variations of such words and phrases or statements that certain actions, events or results "may", "could", "would", "might", or "will be taken", "occur" or "be achieved" or the negative of these words or comparable terminology . By its very nature forward - looking information involves known and unknown risks, uncertainties and other factors that may cause actual performance of Sierra to be materially different from any anticipated performance expressed or implied by such forward - looking information . These include estimates of future production levels ; expectations regarding mine production costs ; expected trends in mineral prices ; changes in general economic conditions and financial markets ; changes in prices for silver and other metals ; technological and operational hazards in Sierra's mining and mine development activities ; risks inherent in mineral exploration ; uncertainties inherent in the estimation of mineral reserves, mineral resources, and metal recoveries ; the timing and availability of financing ; governmental and other approvals ; political unrest or instability in countries where Sierra is active ; labor relations and other risk factors disclosed in Sierra's Annual Information Form, which is available on SEDAR at www . sedar . com and which is incorporated by reference into the prospectus forming part of the Company’s registration statement on Form F - 10 , filed with the SEC and available at www . sec . gov and the prospectus supplement to the Company’s base shelf prospectus, filed in Canada on SEDAR at www . sedar . com (collectively, the “Prospectus”) . Although Sierra has attempted to identify important factors that could cause actual performance to differ materially from that described in forward - looking information, there may be other factors that cause its performance not to be as anticipated . Sierra neither intends nor assumes any obligation to update these statements containing forward - looking information to reflect changes in assumptions or circumstances other than as required by applicable law . There can be no assurance that forward - looking information will prove to be accurate as actual results and future events could differ materially from those currently anticipated . Accordingly, readers should not place undue reliance on forward - looking information . This presentation uses the terms "measured resources", "indicated resources" and "inferred resources" as such terms are recognized under National Instrument 43 - 101 - Standards of Disclosure for Mineral Projects ("NI 43 - 101 ") adopted by the Canadian Securities Administrators . Readers are cautioned not to assume that any part or all of the mineral deposits in these categories will ever be converted into reserves . In addition, "inferred resources" have a great amount of uncertainty as to their existence and economic and legal feasibility . It cannot be assumed that all or any part of an inferred mineral resource will ever be upgraded to a higher category . Under Canadian securities rules, estimates of inferred mineral resources may not form the basis of feasibility or pre - feasibility studies, or economic studies, except for a "preliminary assessment" as defined under NI 43 - 101 . Investors are cautioned not to assume that part or all of an inferred resource exists, or is economically or legally mineable . Gordon Babcock B . Sc . , P . Eng . , is the qualified person as defined in NI 43 - 101 and Chief Operating Officer for Sierra Metals supervised the preparation of the operational scientific and technical information for Sierra Metals included in this presentation . Americo Zuzunaga, MAusIMM CP (Mining Engineer) and Vice President of Corporate Planning is a Qualified Person and chartered professional qualifying as a Competent Person under the Joint Ore Reserves Committee (JORC) Australasian Code for Reporting of Exploration Results, Mineral Resources and Ore Reserves . Augusto Chung, FAusIMM CP (Metallurgist) and Consultant to Sierra Metals is a Qualified Person and chartered professional qualifying as a Competent Person on metallurgical processes . Neither the SEC, nor any state securities regulator has approved or disapproved the securities offered under the Prospectus or passed upon the accuracy or adequacy of the Prospectus . Any representation to the contrary is a criminal offence . Sierra is permitted, under a multijurisdictional disclosure system adopted by the securities regulatory authorities in Canada and the United States, to prepare the Prospectus in accordance with Canadian disclosure requirements, which are different from those of the United States . Sierra prepares its financial statements, which are incorporated by reference in the Prospectus, in accordance with International Financial Reporting Standards as issued by the International Accounting Standards Board, and such financial statements and subject to Canadian auditing and auditor independence standards . Sierra’s financial statements may not be comparable to the financial statements of United States issuers . The enforcement by investors of civil liabilities under United States federal securities laws may be affected adversely because Sierra is a corporation existing under the federal laws of Canada, and all of its executive offices, administrative activities and assets are located outside the United States . In addition, certain of the directors and officers of Sierra are residents of jurisdictions other than the United States and all or a substantial portion of the assets of those persons are or may be located outside the United States .

Disclaimer (continued) Prospective investors should be aware that the purchase of securities of Sierra may have tax consequences in the United States and Canada that may not be fully described in this Prospectus, and should carefully review the tax discussion, if any, in the applicable prospectus supplement and in any event consult with a tax adviser . An investment in Sierra’s securities involves a high degree of risk . You should carefully read the “ Risk Factors ” section of the Prospectus for a more complete discussion of these risks . No person is authorized by Sierra to provide any information or to make any representation other than as contained in the Prospectus in connection with the issue and sale of the securities offered thereunder . Cautionary Note to U . S . Investors : While the terms “measured resources”, “indicated resources”, and “inferred resources” are defined in and required to be disclosed by NI 43 - 101 these terms are not defined under SEC Industry Guide 7 and are normally not permitted to be used in reports and registration statements filed with the SEC . Investors are cautioned not to assume that all or any part of a mineral deposit in these categories will ever be converted into reserves . Accordingly, information concerning mineral deposits contained in or referred to in this presentation may not be comparable to similar information made public by U . S . companies subject to the reporting and disclosure requirements under the United States federal securities laws and the rules and regulations thereunder . Use of Non - IFRS Financial Measures : This presentation contains “Non - IFRS” financial measures including all in - sustaining costs, EBITDA, Free Cash Flow and Net Debt . Sierra uses these Non - IFRS performance measures and ratios in managing its business . Sierra believes that these measures assist investors in understanding the company’s performance . Non - IFRS financial measures should be viewed in addition to, and not as an alternative for, the reported operating results or cash flow from operations or any other measures prepared in accordance with IFRS . In addition, the presentation of these measures may not be comparable to similarly situated titled measures that other companies use . Please see Reconciliation of IFRS to Non - IFRS Financial Measures in the Appendix to this presentation for a reconciliation to the most comparable IFRS financial measure . Additional Information : Sierra Metals Inc . has filed a base prospectus and a prospectus supplement with the CSC and a registration statement (including a prospectus and prospectus supplement) with the SEC for an “at the market” offering of its Common Shares (“ATM offering”) . Investors considering a purchase of shares in the ATM offering should read these documents (including the incorporated therein by reference) and other documents that Sierra Metals has filed with the SEC and CSC for more information concerning the ATM offering and the issuer . These documents are available without charge from the SEC’s EDGAR database at www . sec . com and on SEDAR at www . sedar . com .

INVESTMENT HIGHLIGHTS A Base and Precious Metal Growth Story 3 MINES 2 COUNTRIES 1 SOLID INVESTMENT OPPORTUNITY Yauricocha Mine, Peru Bolivar Mine, Mexico Cusi Mine, Mexico

Debt Position 1 US$69M Net Debt Position 1,3 US$40M Cash Position 1 US$29M CF Before Movements in WC 2,4 US$61.9M INVESTMENT HIGHLIGHTS A Base and Precious Metal Growth Story TSX SMT | NYSE American SMTS | BVL SMT 5 1. All figures as reported in Sierra’s Financial statements and Management Discussion & Analysis (MD&A) for the nine - month perio d ending Sept 30, 2017 as filed on SEDAR. 2. Non - IFRS number; please see Appendix for reconciliation to IFRS measures. 3. Net debt, a non - IFRS measure equals consolidated debt minus cash and cash equivalents. 4. Cash Flow from Operations before movements in working capital – excludes the movement from period to period in working capital i tems including trade and other receivables, prepaid expenses, cash taxes paid, deposits, inventories, trade and other payables and the effects of foreign exchange rates on these items. SOLID FINANCIAL POSITION CONSISTENT FREE CASH FLOW STRONG GROWTH BROWNFIELD EXPLORATION & PRODUCTION PRODUCTION OPTIMIZATION Near - Mine Exploration Progress and Further Potential Successfully Implementing Modern Mining Practices

CAPITAL Structure Major Shareholders Arias Resource Capital 50% BlackRock 10% Ingalls & Snyder 5% Omega Advisors 3% 1. As at Jan 24, 2018 2. As at Jan 24, 2018 6 Outstanding 1 162.8 M RSUs 1 1.3 M Options 1 Nil Fully Diluted 1 164.1 M TSX ($CAD) NYSE Am. ($US) Recent Price 2 $3.27 $2.64 52 Week High 2 $3.75 $3.10 52 Week Low 2 $2.17 $1.75 Market Cap $532.4 M $429.8M Actions to address liquidity include: • NYSE American listing (July 11, 2017) • Major shareholder willing to dilute below 50% TSX SMT | NYSE American SMTS | BVL SMT

7 Brownfield Exploration Plan Aggressively Drilling to Increase Resources TSX SMT | NYSE American SMTS | BVL SMT Targeting increases in resources and reserves through on - going aggressive exploration programs at all three properties Update of Technical Reports for all three Mines – Yauricocha and Cusi already completed, Bolivar to be completed in Q1 - 2018 (Jan ‘17 to Oct ’17) (Nov ‘17 to Oct ’18) (Nov ‘18 to Oct ’22) Completed * Planned drilling in meters subject to uncertainty, may or may not be completed. 0 50,000 100,000 150,000 200,000 250,000 300,000 350,000 Completed Shorter Term Longer Term (4 year period) Drilling (meters) Yauricocha (18,000) Bolivar (17,000) Cusi (48,000) Yauricocha (70,000) Bolivar (30,000) Cusi (30,000) Peru (160,000) Mexico (170,000) 83,000 130,000 – 160,000* 330,000*

Strategic Growth Building Resources and Infrastructure for Increased Production 8 › Detailed engineering › Construction of expanded facilities (mine and plant) › Mine infrastructure upgrades to meet new capacities › Optimum plant size definition › Best technology to process new resources › Permitting › Focus on Organic Growth › Exploration of Target Rich Properties › Short, and Longer Term Drilling Programs › Targeting Increases in Resources and Reserves › Yauricocha NI 43 - 101 Technical Report completed › Cusi Resource update released Dec 29, 2017. NI 43 - 101 Technical Report to follow within 45 days › Bolivar Resource and Reserve update in Q1 2018 › Upgrading of infrastructure and equipment 3 2 1 CONSTRUCTION & OPERATION FEASIBILITY & ENGINEERING STUDIES BROWNFIELD EXPLORATION INFRASTRUCTURE UPDATES TSX SMT | NYSE American SMTS | BVL SMT

Revenue Mix (Trailing 12 months ending Sep 30, 2017) 27% COPPER 16% LEAD 37% ZINC 17% SILVER 2% GOLD YAURICOCHA BOLIVAR CUSI LOCATION YAUYOS, PERU CHIHUAHUA, MEXICO CHIHUAHUA, MEXICO OWNERSHIP 82% 100% 100% STAGE PRODUCTION PRODUCTION PRODUCTION / DEVELOPMENT MINE TYPE UG UG UG MILL THROUGHPUT (TPD) 1 3,000 3,000 growing to 3,500 300 growing to 650 METALS Zn, Cu, Pb , Ag, Au Cu, Ag, Au Ag, Pb , Zn, Au CF BEFORE MOVEMENTS IN WC (9M - 2017) 2 $58.2M 3 $7.5M $(818)K 1. TPD is measured using the metric system. 2. Cash Flow from Operations before movements in working capital is a non - IFRS number and excludes the movement from period to period in working capital items including trade and other receivables, prepai d expenses, cash taxes paid, deposits, inventories, trade and other payables and the effects of foreign exchange rates on these items. Please see Appendix for reconciliation to comparable IFRS measure. 3. Assumes 100% ownership of Yauricocha. 9 DIVERSIFIED 3 Projects in 2 Countries TSX SMT | NYSE American SMTS | BVL SMT

SOLID Financial Position 10 TSX SMT | NYSE American SMTS | BVL SMT Figures in US ($000’s) 2014 2015 2016 9M - 2017 Revenue 172,614 134,052 143,180 153,948 Net Income (Loss) 11,356 (33,302) (12,721) (4,579) CF Before Movements in WC 1 71,276 32,475 44,303 61,973 Capex (39,866) (37,601) (25,352) (38,313) Free Cash Flow 2,4 31,410 (5,126) 18,951 23,660 Cash and Cash Equivalents 41,273 25,102 42,145 28,607 Debt Outstanding 81,879 76,086 78,681 68,537 Net Debt 3 40,603 50,984 36,537 39,930 All figures as reported in Sierra’s MD&A for the relevant period. 1. Cash Flow from Operations before movements in working capital – excludes the movement from period to period in working capital i tems including trade and other receivables, prepaid expenses, cash taxes paid, deposits, inventories, trade and other payables and the effects of foreign exchange rates on these items. 2. Free Cash Flow represents Cash Flow from Operations before movements in working capital less capex. See Appendix for reconcil iat ion. 3. Net Debt represents Consolidated debt minus total cash and cash equivalents. 4. Non - IFRS number. $71.3 $32.5 $44.3 $62.0 2014 2015 2016 9M 2017 0.6 x 1.6 x 0.8 x 0.6 x 2014 2015 2016 9M 2017 Cash Flow Before Movements in Working Capital Net Debt / CF Before Movements in WC

2017 Production (000’s) 2018 Production Guidance (000’s) Total Low High Zinc Eq. (M lbs ) 1 193.2 Zinc Eq. (M lbs ) 1 183.8 214.5 Copper Eq. (M lbs ) 1 90.4 Copper Eq. (M lbs ) 1 89.2 104.0 Silver Eq. (M ozs ) 1 14.9 Silver Eq. (M ozs ) 1 13.9 16.2 PRODUCTION 2017 Production & Costs vs Guidance 11 9M - 2017 Costs 2017 Guidance 2018 Cost Guidance Cash Costs per Equivalent Oz / Lb Sold AISC per Equivalent Oz / Lb Sold 2 Cash Costs per Equivalent Oz / Lb Sold AISC per Equivalent Oz / Lb Sold 2 Cash Costs per Equivalent Oz / Lb Sold AISC per Equivalent Oz / Lb Sold2 Yauricocha (Ag Eq Oz) $6.49/ oz $9.99/ oz $7.17/ oz $10.70/ oz Yauricocha (Zn Eq Lb )** $0.62/ lb $0.78/ lb Bolivar (Cu Eq Lb ) $1.41/ lb $2.56/ lb $1.15/ lb $2.07/ lb Bolivar (Cu Eq Lb ) $1.60/ lb $1.96/ lb Cusi (Ag Eq Oz) $14.72/ oz $33.59/ oz $10.12/ oz $20.24/ oz Cusi (Ag Eq Oz) $11.12/ oz $14.28/ oz 1. Silver equivalent ounces, copper and zinc equivalent pounds were calculated using quarterly realized metal prices. Silver, co ppe r and zinc equivalent guidance figures will change based on metal prices used each quarter in the equivalent metal calculations. See Appendix for quarterly realized metal price s f or the last 15 quarters. 2. All - In - Sustaining - Costs (AISC) include treatment and refining charges, selling costs, g&a and sustaining capex. AISC is a non - IFRS number. Please see Appendix for a reconciliation of non - IFRS numbers to comparable IFRS numbers. TSX SMT | NYSE American SMTS | BVL SMT **2018 Cost Guidance for Yauricocha in Zinc Eq

YAURICOCHA MINE In Continuous Operation Since 1948 (69 Years) Cuye / Mascota Esperanza Escondida

PERU Yauricocha Polymetallic Mine Tonnes M Ag (g/t) Cu (%) Pb (%) Zn (%) Au (g/t) Ag Eq (g/t) Ag Eq (M oz ) Proven & Probable 8.9 48.3 1.20 0.77 2.43 0.52 367 105 Measured & Indicated 13.2 62.3 1.52 0.92 2.79 0.65 445 189 Inferred 6.6 43.0 1.19 0.47 2.16 0.55 329 70 *Includes P&P Details of the reserve & resource estimates for Yauricocha are presented in the Appendix. Ownership 82% Size 18,000 Hectares Commodities Silver, lead, zinc, copper, gold Operation Underground mine: sub - level caving & cut and fill Mill throughput 3,000 TPD Annual Production 147 M lbs Zinc Equivalent Concentrates Polymetallic Circuit Lead, Copper and Zinc concentrate Lead Oxide Circuit Lead Oxide concentrate Copper Oxide Circuit Copper Oxide concentrate Reserve Life* 8.7 years Deposit Type High - temperature, carbonate - replacement deposit 13 TAILINGS TSX SMT | NYSE American SMTS | BVL SMT *Reserve Life calculated as Proven & Probable Reserves divided by Annual Mill throughput.

100 110 120 130 140 150 160 170 2014 2015 2016 2017 Zn Eq M Lbs Zinc Equivalent Production (M lbs) . Production 2014 2015 2016 2017 Tonnes processed 1 885,495 832,225 897,169 1,023,491 Tonnes per day 2,545 2,378 2,563 2,924 Zinc Eq (M Lbs ) 2 167.8 132.4 140.9 146.8 Financial Summary 2014 2015 2016 9M - 2017 Revenue ($000’s) $119,027 $80,113 $97,290 $115,926 Net Income (Loss) $8,196 $(13,910) $(5,250) $10,029 CF Before Movements in WC ($000’s) 3 $57,089 $24,146 $34,902 $58,247 Cash Cost per tonne processed $46.64 $52.65 $55.78 $61.55 Cash Cost per Zn Eq pound sold $0.28 $0.38* $0.42* $0.48 All - in Sustaining Cost per Zn Eq ounce sold 4 $0.58 $0.70* $0.71* $0.74 All figures as reported in Sierra’s MD&A for the relevant period . 1 . Metric tonnes 2 . Zinc equivalent pounds were calculated using quarterly realized metal prices . Zinc equivalent figures will change based on metal prices used each quarter in the equivalent metal calculations . See Appendix for quarterly realized metal prices for the last 15 quarters . 3 . Cash Flow from Operations before movements in working capital is a non - IFRS number and excludes the movement from period to period in working capital items including trade and other receivables, prepaid expenses, cash taxes paid, deposits, inventories, trade and other payables and the effects of foreign exchange rates on these items . Please see Appendix for reconciliation to comparable IFRS measure . 4 . All - in Sustaining Costs is a non - IFRS number and includes Treatment and Refining Charges, Selling Costs, G&A Costs and Sustaining Capex . Please see Appendix for reconciliation to comparable IFRS measure . * Includes non - recurring or one - time restructuring costs. Revenue Mix Trailing 12 months ending September 30, 2017 PERU Yauricocha Production & Costs 14 TSX SMT | NYSE American SMTS | BVL SMT 14% COPPER 20% LEAD 49% ZINC 16% SILVER 1% GOLD

Exploration Progress New Zones Discovered with Continued Exploration at Yauricocha 15 TSX SMT | NYSE American SMTS | BVL SMT Esperanza North Zone Esperanza Ore Body Escondida Zone

› Escondida is the largest deposit found at Cachi - Cachi to date . High grade Zinc potential may contribute additional mineral resources › Escondida has a strike length of over 300 meters › Extends the foot print of the Cachi - Cachi mine to over one kilometer in the direction of Esperanza and Yaurichocha’s central mine zone Esperanza & Escondida Zone Discoveries Exploration Progress at Yauricocha 16 Hole No. Ag ( gpt ) Pb (%) Cu (%) Zn (%) Au ( gpt ) Width (m) ESC 17 - 01 94 3.41 0.01 7.91 0.23 over 7.6 ESC 17 - 05 104 5.83 0.09 10.59 0.71 over 3.8 ESC 17 - 05 86 7.42 0.07 13.79 0.20 over 3.8 ESC 17 - 09 40 1.00 0.05 11.69 0.64 over 5.5 ESC 17 - 10 10 0.04 0.02 5.05 0.20 over 30.2 Esperanza Zone at Central Mine Escondida Zone at Cachi - Cachi Mine › Hole ESP 15 is 183 meters from Collar to exit of mineralization › Contains intercept of 70 meters of polymetallic mineralization with many more smaller rich veins

YAURICOCHA MINE Longitudinal Section 17 Central Mine Cachi Cachi Mine Central Mine Area • Average width: 6 - 8 Meters Esperanza Area • Average width: 15 - 20 Meters Cuerpos Chicos / Cuerpos Pequenos • Average width: 1 - 5 Meters • These areas continue to be defined as part of the definition drilling program Catas & Cuye are the same orebody at depth • As a result of continued exploration, wider zones with significantly higher metal grades have been discovered, which may prov ide the potential for greater amounts of metals produced.

TSX SMT | NYSE American SMTS | BVL SMT YAURICOCHA MINE Regional Growth Potential Targets 18 Chonta Trend Yauricocha Fault Kilkasca 2,500m La Fortuna Central Mine Area Ipillo Land Package: 180 km 2 (18,000 Hectares) › Very large land package containing over 18 , 000 Hectares . 82 % owned by Sierra . › Current brownfield exploration and drilling focused on the Central Mine Area which is only a small portion of the total land package . › La Fortuna has significant outcrops of copper . Further drilling may determine if there is potential for higher grade copper source . › Kilkasca was a former producing mine, halting production while still in ore, with mine life remaining . This may represent a promising target for future organic growth and expansion .

BOLIVAR MINE Reinterpretation of Geology - Metal Production Increases

MEXICO - BOLIVAR MINE Bolivar Copper Mine Tonnes M Ag (g/t) Cu (%) Au (g/t) Cu Eq (%) Cu Eq (M lb) Probable 4.3 17.5 0.85 0.31 1.18 112.1 Indicated* 9.3 18.1 0.90 0.30 1.23 252.9 Inferred 9.1 17.9 0.86 0.33 1.20 239.8 *Includes Probable Details of the reserve & resource estimates for Bolivar are presented in the Appendix. Ownership 100% Size 15,217 Hectares Commodities Copper, silver, gold Operation Underground mine: room and pillar Mill throughput 3,000 TPD increasing to 3,500 TPD Annual Production 18.3 M Lbs Copper Equivalent Concentrates Copper with silver and gold by - product credits Reserve Life* 5 years Deposit Type Copper skarn 20 TSX SMT | NYSE American SMTS | BVL SMT *Reserve Life calculated as Proven & Probable Reserves divided by Annual Mill throughput

0 5 10 15 20 25 2014 2015 2016 2017 Cu Eq M lbs Copper Equivalent Production (M lbs) Production 2014 2015 2016 2017 Tonnes processed 1 665,950 830,447 950,398 887,237 Tonnes per day 1,903 2,373 2,715 2,535 Copper Eq (M lbs ) 2 18.38 21.90 21.89 18.34 Financial Summary 2014 2015 2016 9M - 2017 Revenue ($000’s) $41,712 $41,778 $33,267 $32,970 Net Income (Loss) $6,579 $(3,286) $(6,853) $(2,146) CF Before Movements in WC ($000’s) 3 $13,926 $4,058 $5,120 $7,516 Cash Cost per tonne processed $33.19 $27.90 $24.37 $23.60 Cash Cost per Cu Eq pound sold $1.29 $1.34 $1.12 $1.41 All - in Sustaining Cost per Cu Eq pound sold 4 $2.46 $2.34 $2.22 $2.56 Revenue Mix Trailing 12 months ending Sept 30, 2017 79% COPPER 13% SILVER 8% GOLD MEXICO - BOLIVAR MINE Production & Costs 21 TSX SMT | NYSE American SMTS | BVL SMT All figures as reported in Sierra’s MD&A for the relevant period . 1 . Metric tonnes 2 . Silver equivalent ounces and copper equivalent pounds were calculated using quarterly realized metal prices . Silver and copper equivalent figures will change based on metal prices used each quarter in the equivalent metal calculations . See Appendix for quarterly realized metal prices for the last 15 quarters . 3 . Cash Flow from Operations before movements in working capital is a non - IFRS number and excludes the movement from period to period in working capital items including trade and other receivables, cash taxes paid, prepaid expenses, deposits, inventories, trade and other payables and the effects of foreign exchange rates on these items . Please see Appendix for reconciliation to comparable IFRS measure . 4 . All - in Sustaining Costs is a non - IFRS number and includes Treatment and Refining Charges, Selling Costs, G&A Costs and Sustaining Capex . Please see Appendix for reconciliation to comparable IFRS measure .

22 TSX SMT | BVL SMT Bolivar NW El Gallo Bolivar 2 1 Bolivar West MEXICO - BOLIVAR MINE Bolivar Northwest and Bolivar West Targets › Titan 24 Geophysical Survey completed on Bolivar West and Northwest areas resulting in 24 anomalies and 8 high value drill targets . › 17 , 000 Meters of drilling program completed in 2017 with the majority occurring at Bolivar West where high grade copper intercepts have occurred . › 28 holes ( 12 , 300 meters), recently completed which provided the Company with higher Copper, Zinc and Silver grades . This detailed drill data will be used to update the current mineral resources report at the Bolivar mine and is expected in Q 1 2018 . › Bolivar West average grade of 2 . 55 % copper equivalent with an average true width of 9 . 1 meters , which is significantly above El Gallo’s current resource grade and current head grades . › Bolivar West still has further potential resource growth prospects and remains open to the northeast .
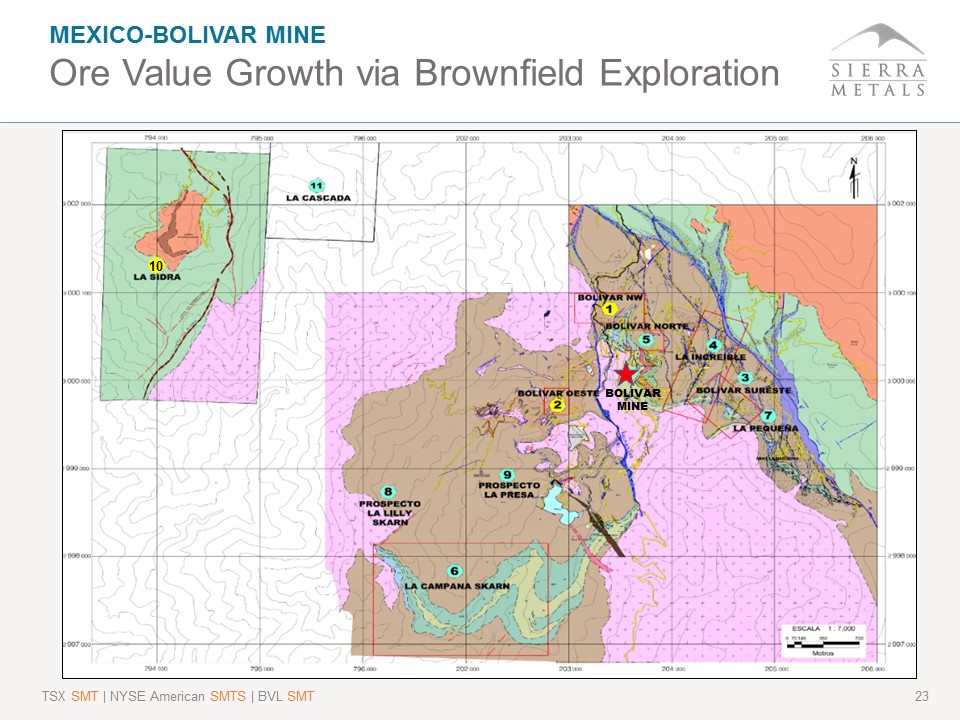
23 MEXICO - BOLIVAR MINE Ore Value Growth via Brownfield Exploration BOLIVAR MINE 10 TSX SMT | NYSE American SMTS | BVL SMT

CUSI MINE Reinterpretation of Geology – New High - Grade Silver Discovery

MEXICO - CUSI MINE Cusi Silver Mine Tonnes M Ag (g/t) Pb (%) Zn (%) Au (g/t) Ag Eq (g/t) Ag Eq (M oz ) Measured 0.4 225 0.55 0.68 0.13 268 3.1 Indicated 4.2 217 0.64 0.66 0.21 267 36.0 Inferred 1.6 158 0.54 0.84 0.16 207 10.9 Ownership 100% Size 11,671 Hectares Commodities Silver, zinc, lead, gold Operation Underground mine in development; cut and fill Mill throughput 300 TPD increasing to 650 TPD Annual Production 549 K Oz Silver Equivalent Concentrates Lead and Zinc concentrates with significant silver Deposit Type High - grade, low sulphidation epithermal deposit 25 Revenue Mix Trailing 12 months ending Sept 30, 2017 72% SILVER 5% GOLD 13% LEAD 11% ZINC Details of the resource estimates for Cusi are presented in the Appendix. TSX SMT | NYSE American SMTS | BVL SMT
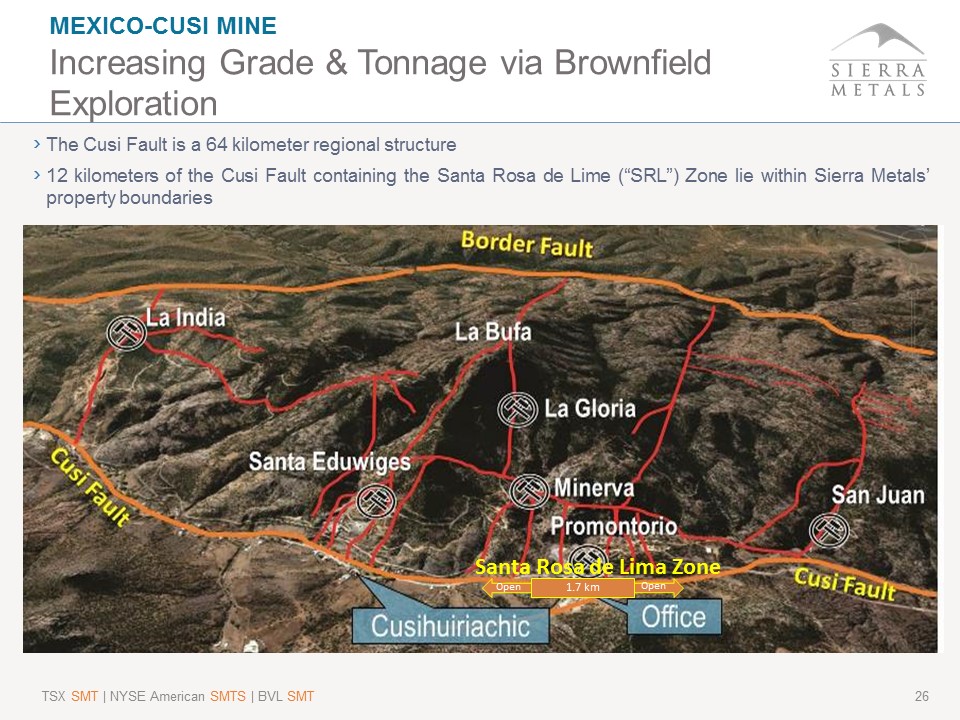
26 MEXICO - CUSI MINE Increasing Grade & Tonnage via Brownfield Exploration › The Cusi Fault is a 64 kilometer regional structure › 12 kilometers of the Cusi Fault containing the Santa Rosa de Lime (“SRL”) Zone lie within Sierra Metals’ property boundaries TSX SMT | NYSE American SMTS | BVL SMT 1.7 km Santa Rosa de Lima Zone Open Open

27 MEXICO - CUSI MINE Santa Rosa de Lima Zone Average grade of the intercepts for 29,500 meter program is 372 g/t AgEq with Average true width of 3.8 meters. Step out drilling extends silver mineralization beyond the Santa Rosa de Lima zone with similar high - grade characteristics. Zone extended from 1 km to 1.7 km all within the 12 km structure running inside Sierra Metals property boundary. New Mineral Resource published December 29, 2017. TSX SMT | NYSE American SMTS | BVL SMT

28 MEXICO - CUSI MINE SRL Conceptual Mine Design TSX SMT | NYSE American SMTS | BVL SMT Mine Design Long Hole Mine Plan › Drift development underway on four primary sub levels › Ramp development continues to the lower part of SRL complex

Debt Position 1 US$69M Net Debt Position 1,3 US$40M Cash Position 1 US$29M CF Before Movements in WC 2,4 US$61.9M INVESTMENT HIGHLIGHTS A Base and Precious Metal Growth Story TSX SMT | NYSE American SMTS | BVL SMT 29 1. All figures as reported in Sierra’s Financial statements and Management Discussion & Analysis (MD&A) for the nine - month perio d ending Sept 30, 2017 as filed on SEDAR. 2. Non - IFRS number; please see Appendix for reconciliation to IFRS measures. 3. Net debt, a non - IFRS measure equals consolidated debt minus cash and cash equivalents. 4. Cash Flow from Operations before movements in working capital – excludes the movement from period to period in working capital i tems including trade and other receivables, prepaid expenses, cash taxes paid, deposits, inventories, trade and other payables and the effects of foreign exchange rates on these items. SOLID FINANCIAL POSITION CONSISTENT FREE CASH FLOW STRONG GROWTH BROWNFIELD EXPLORATION & PRODUCTION PRODUCTION OPTIMIZATION Near - Mine Exploration Progress and Further Potential Successfully Implementing Modern Mining Practices

CONTACT Information 30 Investor Relations Sierra Metals Inc. Mike McAllister VP, Corporate Development T: 1.416.366.7777 | TF: 1.866.493.9646 E: info@sierrametals.com Corporate Office TD South Tower 79 Wellington Street West, Suite 2100 Toronto, ON M5K 1H1 T: 1.416.366.7777 | TF: 1.866.493.9646 Follow us: www.sierrametals.com TSX SMT | NYSE American SMTS | BVL SMT

APPENDIX APPENDIX

HISTORICAL Financial Performance 32 Revenue ($M) CAPEX ($M) Operating CF before WC ($M) 1 Cash and Cash Equivalents ($M) Debt ($M) TSX SMT | NYSE American SMTS | BVL SMT All figures as reported in Sierra’s MD&A for the relevant period. 1. Cash Flow from Operations before movements in working capital is a non - IFRS number and excludes the movement from period to period in working capital items including trade and other receivables, prepaid expenses, cash taxes paid, deposits, inventories, trade and other payables and the effects of fore ign exchange rates on these items. Please see Appendix for reconciliation to comparable IFRS measure. 172.6 134 .0 143.2 153.9 2014 2015 2016 9M 2017 71.3 32.5 44.3 61.9 2014 2015 2016 9M 2017 39.9 37.6 .0 25.4 38.3 2014 2015 2016 9M 2017 41.3 25.1 42.1 28.6 2014 2015 2016 9M 2017 81.9 76 .0 78.7 69 .0 2014 2015 2016 9M 2017

CONSOLIDATED DEBT Breakdown 33 Estimated as of September 30 , 2017 BCP Acquisition Credit Facility Credit Facility with BCP Corona Loan with BCP FIFOMI Mexican Government Debt Facility Who’s Debt: Dia Bras Peru Dia Bras Peru Corona Dia Bras Mexico Amount (USD): $41.8M $15.0M $7.9M $3.8M Term (years): 5 1 3 5 Maturity Date: Aug 31, 2020 Aug 31, 2018 Oct 17, 2018 Dec 23, 2019 Interest Rate: 3M LIBOR + 3.65% 3M LIBOR + 1.0% 3M LIBOR + 4.5% TIIE 1 + 1.75% Payment Schedule 2 : Quarterly Quarterly Quarterly Monthly Use of Proceeds: Corona’s Acquisition Working Capital CAPEX Working Capital 1. TIIE: Tasa de Interes Interbancaria del Banco de Mexico. 2. In accordance with our amended acquisition credit facility with Banco de Credito del Peru (“BCP”), at least 50% of the proceeds which we receive from any equity capital transaction must be allocated to the mandatory prepayment of the amounts owing to BCP under such facility. › BCP Acquisition Credit Facility has a $ 24 million bullet payment due in August of 2020 . TSX SMT | NYSE American SMTS | BVL SMT

Yauricocha Production 2014 2015 2016 2017 Tonnes processed 1 885,495 832,225 897,169 1,023,491 Tonnes per day 2,545 2,378 2,563 2,924 Silver ounces (M oz ) 2.12 1.79 1.84 1.65 Copper (K lbs ) 7,697 5,567 6,281 11,719 Lead (K lbs ) 46,714 39,430 36,440 27,934 Zinc (K lbs ) 54,256 42,077 54,805 75,151 Gold ounces 5,683 5,018 4,664 2,894 Zinc Eq (M lbs ) 2 167.8 132.4 140.93 146.82 All figures as reported in Sierra’s Q3 2017 MD&A. 1. Metric tonnes 2. Silver equivalent ounces and copper equivalent pounds were calculated using quarterly realized metal prices. Silver and coppe r e quivalent guidance figures will change based on metal prices used each quarter in the equivalent metal calculations. Production Guidance and Production by Metal 34 Bolivar Production 2014 2015 2016 2017 Tonnes processed 1 665,950 830,447 950,398 887,237 Tonnes per day 1,903 2,373 2,715 2,535 Silver ounces (M oz ) 0.40 0.44 0.40 0.33 Copper (K lbs ) 14,946 17,629 17,109 15,056 Gold ounces 2,485 3,216 2,986 2,880 Copper Eq (M lbs ) 2 18.38 21.90 21.89 18.33 2017 Production 2018 Guidance Mine Yauricocha Bolivar Cusi Total Low High Silver (M oz ) 1.7 0.3 0.3 2.3 Silver (M oz ) 2.5 2.9 Copper (M lb ) 11.7 15.1 - 26.8 Copper (M lb ) 32.7 38.1 Lead (M lb ) 27.9 - 1.7 29.6 Lead (M lb ) 19.1 22.3 Zinc (M lb ) 75.2 - 0.9 76.1 Zinc (M lb ) 62.9 73.4 Gold (K oz ) 2.9 2.9 0.4 6.2 Gold (K oz ) 6.7 7.8 TSX SMT | NYSE American SMTS | BVL SMT

HISTORICAL Realized Metal Prices 35 TSX SMT | NYSE American SMTS | BVL SMT Realized Metal Prices (In US dollars) Q1 2014 Q2 2014 Q3 2014 Q4 2014 Q1 2015 Q2 2015 Q3 2015 Q4 2015 Q1 2016 Q2 2016 Q3 2016 Q4 2016 Q1 2017 Q2 2017 Q3 2017 Q4 2017 Silver (oz) 20.17$ 19.87$ 19.22$ 16.36$ 16.78$ 16.28$ 14.64$ 14.76$ 15.26$ 17.08$ 19.17$ 16.82$ 17.71$ 17.22$ 16.86$ 16.77$ Copper (lb) 3.14$ 3.14$ 3.14$ 2.95$ 2.63$ 2.75$ 2.38$ 2.19$ 2.13$ 2.15$ 2.16$ 2.38$ 2.64$ 2.58$ 2.93$ 3.13$ Lead (lb) 0.95$ 0.96$ 0.99$ 0.89$ 0.81$ 0.89$ 0.77$ 0.77$ 0.80$ 0.79$ 0.85$ 0.95$ 1.04$ 0.99$ 1.08$ 1.11$ Zinc (lb) 0.91$ 0.96$ 1.06$ 1.01$ 0.95$ 0.99$ 0.82$ 0.73$ 0.77$ 0.86$ 1.02$ 1.16$ 1.27$ 1.20$ 1.36$ 1.45$ Gold (oz) 1,288.00$ 1,290.00$ 1,267.00$ 1,201.00$ 1,224.00$ 1,180.00$ 1,101.00$ 1,096.00$ 1,212.00$ 1,246.00$ 1,347.00$ 1,210.00$ 1,231.00$ 1,265.00$ 1,280.00$ 1,282.00$ Realized Metal Prices (In US dollars) 3M 2014 6M 2014 9M 2014 FY 2014 3M 2015 6M 2015 9M 2015 FY 2015 3M 2016 6M 2016 9M 2016 FY 2016 3M 2017 6M 2017 9M 2017 FY 2017 Silver (oz) 20.17$ 20.02$ 19.76$ 18.91$ 16.78$ 16.53$ 15.90$ 15.78$ 15.26$ 16.54$ 17.61$ 17.16$ 17.71$ 17.47$ 17.31$ 17.14$ Copper (lb) 3.14$ 3.14$ 3.13$ 3.08$ 2.63$ 2.69$ 2.59$ 2.51$ 2.13$ 2.14$ 2.15$ 2.23$ 2.64$ 2.63$ 2.70$ 2.82$ Lead (lb) 0.95$ 0.96$ 0.97$ 0.96$ 0.81$ 0.85$ 0.82$ 0.82$ 0.80$ 0.79$ 0.82$ 0.84$ 1.04$ 1.01$ 1.03$ 1.06$ Zinc (lb) 0.91$ 0.94$ 0.97$ 1.02$ 0.95$ 0.97$ 0.92$ 0.89$ 0.77$ 0.83$ 0.90$ 0.98$ 1.27$ 1.24$ 1.28$ 1.32$ Gold (oz) 1,288.00$ 1,289.00$ 1,282.00$ 1,261.00$ 1,224.00$ 1,202.00$ 1,168.00$ 1,161.00$ 1,212.00$ 1,203.00$ 1,276.00$ 1,267.00$ 1,231.00$ 1,243.00$ 1,253.00$ 1,265.00$ 2014 2015 2016 2017 2014 2015 2016 2017

Base Metals London Metal Exchange (LME) Inventories 36 TSX SMT | NYSE American SMTS | BVL SMT Source: LME, SHFE, Comex , Bloomberg, Scotiabank GCM, Charts Created by Scotiabank Mining Sales

CONSOLIDATED Reserve and Resource Table * 37 * See “cautionary note to US investors” on Disclaimers page Tonnes Ag Cu Pb Zn Au AgEq CuEq Ag Cu Pb Zn Au AgEq CuEq (x1000) (g/t) (%) (%) (%) (g/t) (g/t) (%) (M oz) (M lb) (M lb) (M lb) (K oz) (M oz) (M lb) Yauricocha Proven 1,836 46.6 1.08 0.84 2.59 0.64 369.3 - 2.8 43.7 33.8 105.0 37.7 21.8 - Probable 7,081 48.8 1.23 0.75 2.38 0.49 365.9 - 11.1 191.6 117.3 372.2 111.9 83.3 - Proven & Probable 8,917 48.3 1.20 0.77 2.43 0.52 366.6 - 13.9 235.3 151.1 477.2 149.6 105.1 - Bolivar Proven - - - - - - - - - - - - - - - Probable 4,327 17.5 0.85 - - 0.31 - 1.18 2.4 80.7 - - 44.0 - 112.1 Proven & Probable 4,327 17.5 0.85 - - 0.31 - 1.18 2.4 80.7 - - 44.0 - 112.1 Total Proven & Probable 13,244 38.2 1.08 0.77 2.43 0.45 16.3 316.0 151.1 477.2 193.6 Tonnes Ag Cu Pb Zn Au AgEq CuEq Ag Cu Pb Zn Au AgEq CuEq (x1000) (g/t) (%) (%) (%) (g/t) (g/t) (%) (M oz) (M lb) (M lb) (M lb) (K oz) (M oz) (M lb) Yauricocha Measured 3,094 70.0 1.72 1.23 3.20 0.79 515.7 7.0 117.3 83.7 218.5 78.3 51.3 - Indicated 10,112 59.9 1.46 0.83 2.67 0.60 424.0 19.5 326.3 185.4 594.8 195.6 137.8 - Measured & Indicated 13,206 62.3 1.52 0.92 2.79 0.65 445.5 0.00 26.4 443.6 269.1 813.3 274.0 189.1 - Bolivar Measured - - 0.0 - - - - - - - - - - - - Indicated 9,335 18.1 0.90 - - 0.30 - 1.23 5.4 184.9 - - 91.0 - 252.9 Measured & Indicated 9,335 18.1 0.90 0.0 0.0 0.30 0.00 1.23 5.4 184.9 - - 91.0 - 252.9 Cusi Measured 362 225.0 - 0.55 0.68 0.13 268 - 2.6 - 4.4 5.4 1.5 3.1 - Indicated 4,195 217.0 - 0.64 0.66 0.21 267 - 29.2 - 59.0 60.8 28.7 36.0 Measured & Indicated 4,557 217.6 0.0 0.63 0.66 0.20 267.1 0.00 31.8 - 63.4 66.2 30.2 39.1 - Total Measured & Indicated 27,098 73.2 1.05 0.56 1.47 0.45 262.02 0.42 63.6 628.5 332.5 879.5 395.2 Tonnes Ag Cu Pb Zn Au AgEq CuEq Ag Cu Pb Zn Au AgEq CuEq (x1000) (g/t) (%) (%) (%) (g/t) (g/t) (%) (M oz) (M lb) (M lb) (M lb) (K oz) (M oz) (M lb) Yauricocha 6,632 43.0 1.19 0.47 2.16 0.55 329.24 0.00 9.2 174.7 68.0 315.2 117.0 70.2 - Bolivar 9,055 17.9 0.86 0.00 0.00 0.33 0.00 1.20 5.2 171.6 - - 97.0 - 239.8 Cusi 1,633 158.0 0.00 0.54 0.84 0.16 207 0.00 8.3 - 19.6 30.4 8.3 10.9 - Total Inferred 17,320 40.7 0.91 0.23 0.90 0.40 145.6 0.63 22.7 346.3 87.6 345.6 222.3 Reserves - Proven and Probable Contained Metal Resources - Measured and Indicated Contained Metal Resources - Inferred Contained Metal

NOTES Reserve and Resource Estimate 38 Yauricocha Mine: 1. The effective date of the mineral reserve and resource statement for the Yauricocha Mine including Mina Central, Cachi - Cachi, Mascota and Cuerpos mineral reserve estimate is Jul 31 , 2017 . Details of the estimate are provided in a NI 43 - 101 technical report filed on SEDAR on November 10 , 2017 . Silver/copper equivalent is based on the following metal price : US $ 17 . 31 / oz Ag, US $ 2 . 70 / lb Cu, US $ 1 . 03 / lb Pb and US $ 1 . 28 Zn and US $ 1 , 253 / oz Au . Metallurgical recovery assumptions are based on Yauricocha actual plant data for 2017 and are 67 % Ag, 65 % Cu, 85 % Pb, 89 % Zn, 16 % Au . The equivalency expression is designed to present an in - situ silver equivalent, considering the recovered value of the other metals expressed in the value of silver g/t . • The equation is : AgEq = ((Ag*Ag $ * Agrec )+(Cu*Cu $ * Curec )+(Pb*Pb $ * Pbrec )+(Zn*Zn $ * Znrec )+(Au*Au $ * Aurec )) / (Ag $ * Agrec ) . 2. Mineral resources that are not mineral reserves do not have demonstrated economic viability . Bolivar Mine : 1. The effective date of the Bolivar mineral reserve and resource estimate is Sep 31 , 2016 . Details of the estimate are provided in the Company’s Apr 11 , 2017 press releases and a NI 43 - 101 technical report filed on SEDAR on Apr 19 , 2017 . Measured, Indicated and Inferred Resources include Proven and Probable Reserves . 2. Copper equivalent is based on the following metal prices : US $ 18 . 30 / oz Ag, US 2 . 43 / lb Cu and US $ 1 , 283 Au . 3. Totals for proven and probable are diluted for internal waste . 4. Mineral resources that are not mineral reserves do not have demonstrated economic viability . Cusi Mine : 1. The effective date of the Cusi mineral resource estimate is Aug 31 , 2017 . Details of the estimate are provided in the Company’s December 29 , 2017 press release, a NI 43 - 101 technical report will be filed on SEDAR within 45 days of the December 29 , 2017 press release . 2. Silver equivalent is based on the following metal price assumptions : US $ 18 . 30 / oz Ag, US $ 0 . 93 / lb Pb and US $ 1 . 15 Zn and US $ 1 , 283 / oz Au . Based on the historical production information for Cusi , the metallurgical recovery assumptions are 84 % Ag, 86 % Pb , 51 % Zn, 57 % Au . 3. Mineral resources that are not mineral reserves do not have demonstrated economic viability TSX SMT | NYSE American SMTS | BVL SMT

39 Consolidated: Yauricocha: The following tables provide detailed information on cost of sales, cash cost, and all - in sustaining cost per silver equivalent payable ounce and copper equivalent payable pound taken from the Management Discussion and Analysis reports for 2014 , 2015 and 2016 (using budgeted metals prices) and for the nine months ended September 30 , 2017 and 2016 (using realized metals prices) : From time to time Sierra Metals Inc may publicly disclose certain “Non - IFRS” financial measures in the course of its financial p resentations, earnings releases, earnings conference calls and otherwise. The Company uses certain Non - IFRS performance measures and ratios in managing its business . The Company believes that these measures assist investors in evaluation the Company’s performance by providing users of the Company’s financial information with additional meaningful comparisons between current results and results from prior operating periods . Non - IFRS financial measures should be viewed in addition to and not as an alternative to the reported operating results or any other measure of financial performance in accordance with IFRS . In addition, the presentation of these measures may not be comparable to similarly titled measures that other companies use . Non - IFRS Disclosure All - in Sustaining Costs Year End Year End Year End (In thousand of US dollars, unless stated) 2014 2015 2016 Sep 30, 2017 Cash Cost (recovery) per silver payable ounce Total Cash Cost 41,296 43,813 50,045 46,612 Variation in Finished inventory (125) 714 1,472 (691) Total Cash Cost of Sales 41,171 44,527 51,517 45,921 Treatment and Refining Charges 27,997 24,085 19,502 7,986 Selling Costs 4,619 3,382 3,613 3,099 G&A Costs 5,692 4,583 4,928 4,210 Sustaining Capital Expenditures 7,215 6,579 7,357 9,476 All-In Sustaining Cash Costs 86,694 83,156 86,917 70,692 Silver Equivalent Payable Ounces (000's) 7,268 6,275 6,628 7,078 Cost of Sales 46,700 45,940 53,705 49,099 Cost of Sales per Silver Equivalent Payable Ounce (US$) 6.43 7.32 8.10 6.94 Cash Cost per Silver Equivalent Payable Ounce (US$) 5.66 7.10 7.77 6.49 All-In Sustaining Cash Cost per Silver Equivalent Payable Ounce (US$) 11.93 13.25 13.11 9.99 Zinc Equivalent Payable Pounds (000's) 149,159 118,053 121,742 95,710 Cost of Sales per Zinc Equivalent Pound (US$) 0.31 0.39 0.44 0.51 Cash Cost per Zinc Equivalent Payable Pound (US$) 0.28 0.38 0.42 0.48 All-In Sustaining Cash Cost per Zinc Equivalent Payable Pound (US$) 0.58 0.70 0.71 0.74 Nine months Year End Year End Year End (In thousand of US dollars, unless stated) 2014 2015 2016 Sep 30, 2017 Total Cash Cost of Sales 69,212 78,840 79,894 70,674 All-In Sustaining Cash Costs 147,582 153,169 143,195 118,247 Silver Equivalent Payable Ounces (000's) 10,364 10,166 10,049 9,567 Cost of Sales 73,101 79,988 (81,832) 73,852 Cost of Sales per Silver Equivalent Payable Ounce (US$) 7.05 7.87 8.14 7.72 Cash Cost per Silver Equivalent Payable Ounce (US$) 6.68 7.76 7.95 7.39 All-In Sustaining Cash Cost per Silver Equivalent Payable Ounce (US$) 14.24 15.07 14.25 12.36 Copper Equivalent Payable Pounds (000's) 169,800 67,593 666,811 61,336 Cost of Sales per Copper Equivalent Pound (US$) 0.43 1.18 1.22 1.20 Cash Cost per Copper Equivalent Payable Pound (US$) 0.41 1.17 1.20 1.15 All-In Sustaining Cash Cost per Copper Equivalent Payable Pound (US$) 0.87 2.27 2.14 1.93 Nine months

40 Bolivar: Cusi: Non - IFRS Disclosure All - in Sustaining Costs (continued) Year End Year End Year End (In thousand of US dollars, unless stated) 2014 2015 2016 Sep 30, 2017 Cash Cost per copper payable pound Total Cash Cost 22,100 23,171 23,162 15,581 Variation in Finished inventory (1,850) 2,740 (3,462) 3,475 Total Cash Cost of Sales 20,250 25,911 19,700 19,056 Treatment and Refining Charges 6,736 6,427 5,697 3,543 Selling Costs 3,091 3,085 2,610 2,051 G&A Costs 5,210 3,656 3,219 1,743 Sustaining Capital Expenditures 3,330 5,708 7,827 8,163 All-In Sustaining Cash Costs 38,617 44,787 39,052 34,556 Silver Equivalent Payable Ounces (000's) 2,381 2,938 2,577 2,102 Cost of Sales 21,649 27,238 23,064 20,297 Cost of Sales per Silver Equivalent Payable Ounce (US$) 9.09 9.27 8.95 9.66 Cash Cost per Silver Equivalent Payable Ounce (US$) 8.50 8.82 7.64 9.07 All-In Sustaining Cash Cost per Silver Equivalent Payable Ounce (US$) 16.22 15.24 15.15 16.44 Copper Equivalent Payable Pounds (000's) 15,871 19,535 17,131 13,475 Cost of Sales per Copper Equivalent Pound (US$) 1.36 1.39 1.35 1.51 Cash Cost per Copper Equivalent Payable Pound (US$) 1.28 1.33 1.15 1.41 All-In Sustaining Cash Cost per Copper Equivalent Payable Pound (US$) 2.43 2.29 2.28 2.56 Nine months Year End Year End Year End (In thousand of US dollars, unless stated) 2014 2015 2016 Sep 30, 2017 Cash Cost (recovery) per silver payable ounce Total Cash Cost 5,816 7,868 9,121 5,721 Variation in Finished inventory (66) 534 (444) (24) Total Cash Cost of Sales 5,750 8,402 8,677 5,697 Treatment and Refining Charges 1,696 2,354 2,868 2,231 Selling Costs 546 724 573 450 G&A Costs 919 857 707 383 Sustaining Capital Expenditures 13,360 12,889 4,401 4,239 All-In Sustaining Cash Costs 22,271 25,226 17,226 13,000 Silver Equivalent Payable Ounces (000's) 715 953 844 387 Cost of Sales 4,752 6,810 5,063 4,456 Cost of Sales per Silver Equivalent Payable Ounce (US$) 6.65 7.15 6.00 11.51 Cash Cost per Silver Equivalent Payable Ounce (US$) 8.04 8.82 10.28 14.72 All-In Sustaining Cash Cost per Silver Equivalent Payable Ounce (US$) 31.15 26.47 20.41 33.59 Copper Equivalent Payable Pounds (000's) 4,770 6,339 5,611 2,484 Cost of Sales per Copper Equivalent Pound (US$) 1.00 1.07 0.90 1.79 Cash Cost per Copper Equivalent Payable Pound (US$) 1.21 1.33 1.55 2.29 All-In Sustaining Cash Cost per Copper Equivalent Payable Pound (US$) 4.67 3.98 3.07 5.23 Nine months

41 Consolidated Statement of Cash Flows: Non - IFRS Disclosure Cash Flows From time to time Sierra Metals Inc may publicly disclose certain “Non - IFRS” financial measures in the course of its financial p resentations, earnings releases, earnings conference calls and otherwise. The Company uses certain Non - IFRS performance measures and ratios in managing its business . The Company believes that these measures assist investors in evaluation the Company’s performance by providing users of the Company’s financial information with additional meaningful comparisons between current results and results from prior operating periods . Non - IFRS financial measures should be viewed in addition to and not as an alternative to the reported operating results or any other measure of financial performance in accordance with IFRS . In addition, the presentation of these measures may not be comparable to similarly titled measures that other companies use . Year End Year End Year End (In thousand of US dollars, unless stated) 2014 2015 2016 Sep 30, 2017 Sep 30, 2016 Sep 30, 2017 Sep 30, 2016 Cash flows from operating activities Net Income (loss) from operations 11,356 (35,313) (12,721) (6,010) 2,048 (4,579) (7,511) Adjustments for: Items not affecting cash: Depletion, depreciation and amortization 51,038 46,840 45,711 17,112 10,538 50,330 30,410 Share-based compensation 1,766 1,317 819 189 252 644 455 Impairment change - 19,000 - - - - - Loss on sale of supplies (28) 11 - - - - - Interest expense and other finance costs 4,815 4,776 3,676 874 1,335 2,779 3,950 Loss on spin out of Plexmar net assets - - - 4,412 - 4,412 - Non-cash dividend distribution of Plexmar net assets - - - 2,700 - 2,700 - Current income tax espense 20,225 6,841 9,629 5,591 3,779 17,823 5,056 Deferred income tax recovery (17,502) (9,664) (3,872) (3,675) (1,459) (12,434) (5,641) Unrealized foreign currency exchange gain (loss) (394) (1,333) 1,061 625 377 298 1,387 Operating cash flows before movements in working capital 71,276 32,475 44,303 21,818 16,870 61,973 28,106 Capital Expenditures (39,866) (37,601) (25,352) (18,705) (6,673) (38,313) (18,203) Free Cash Flow 31,410 (5,126) 18,951 3,113 10,197 23,660 9,903 Three months ended Nine months ended

PROVEN & EXPERIENCED Management Team Igor Gonzales, President & Chief Executive Officer › Mr . Gonzales has more than 35 years of experience in the mining industry, most recently he was Vice President Operations at Buenaventura and prior to that was with Barrick Gold from 1998 to 2013 where he most recently held the position of Executive VP and COO . Prior to joining Barrick, he served in various roles with Southern Peru Copper Gordon Babcock, P . Eng . , Chief Operating Officer › Over 34 years of experience in mine production management, project development, engineering, exploration and mine consulting in precious, base metals and aggregate operations in the Americas . Most recently COO at Jaguar Mining and has previously worked for Nyrstar, Breakwater Resources, Coeur Mining Inc . , Milpo , The Hochschild group in Peru, Muscocho Explorations, and The Noranda Group Ed Guimaraes, Chief Financial Officer › 25 years experience in the mining industry, most recently in a consulting role and Board directorships, senior management positions with Aur Resources between 1995 and 2007 , ultimately serving as Executive Vice - President, Finance and Chief Financial Officer . Prior to 1995 , worked in the Toronto mining group of PricewaterhouseCoopers Alonso Lujan, Vice President Exploration › 26 years international experience in mineral exploration with a positive track record for increasing companies' resources, output and company value . Mr . Lujan most recently spent 6 years with Mata - Trafigura as the General Manger . Prior to that he worked with Hochschild Mining and Minas de Bacis SA de CV Americo Zuzunaga, CP (Geologist by Mining Engineer) , Vice President Corporate Planning › Over 30 years of international experience in mining operations, mine and business planning, engineering studies (PEA, PFS, FS), Project Management and optimizing development . Mr . Zuzunaga was most recently at BISA as a Technical Studies Manager and previously worked at BHP Billiton in successive planning roles . Previously he has been employed with Antamina , Yanacocha and Southern Peru Copper Augusto Chung, CP (Metallurgist) , Consultant to Sierra Metals › 34 years metallurgical and mine management experience with a positive track record for increasing companies' output and company value . Mr . Chung was most recently with Rio Alto Mining as the Vice President of Projects . Prior to that he worked with Milpo , Barrick and Antamina and Southern Peru Copper Dante Vargas, Vice President, Human Resources and Continuous Improvement › Over 40 years of experience in management, strategic planning, organizational effectiveness and security and risk management in different countries in Latin America . Most recently he was the Operational Excellence Manager for Buenaventura . Previously he was with Barrick South America and Barrick Peru, where he managed the implementation of HR processes and systems and managed large projects including participation in the construction of the Pascua Lama project Mike McAllister, Vice President, Corporate Development › 12 years experience working with public mining companies, the last 7 as a mining specialized investor relations professional . Mr . McAllister previously worked for Avion Gold which was Acquired by Endeavour Mining, Savary Gold, Alder Resources and Black Iron in their Investor Relations and Corporate Development programs . Previously Mr . McAllister worked at BMO Capital Markets in the Metals & Mining Group

EXPERIENCED & ACCOMPLISHED Board of Directors Alberto Arias, Chairman & Director › Mr . Arias has over 21 years of experience in the field of international mining finance . He is the founder and President of Arias Resource Capital Management LP (“ARCM”) . Prior to ARCM, he was Managing Director & Head of Equity Research for Metals and Mining at Goldman Sachs and a former mining analyst at UBS . Igor Gonzales, President & Chief Operating Officer › Mr . Gonzales has more than 35 years of experience in the mining industry, most recently he was Vice President Operations at Buenaventura and prior to that was with Barrick Gold from 1998 to 2013 where he most recently held the position of Executive VP and COO . Prior to joining Barrick, he served in various roles with Southern Peru Copper . Doug Cater, Director › Mr . Cater, a seasoned geologist with over 30 years of experience in the gold mining and exploration business and is currently Vice President, Exploration at Kirkland Lake Gold . He also serves as a Council member of the Association of Professional Geoscientists of Ontario (APGO), representing the Southwest Ontario district . Steven Dean, Director › Mr . Dean has extensive international experience in the mining industry and is currently the Chairman & CEO of Atlantic Gold . Previously Mr . Dean was the President of Teck Cominco (now Teck Resources) . Prior to joining Teck, he was a founding director of Normandy Poseidon Group (which became Normandy Mining) as well as founder of PacMin Mining . Philip Renaud, Director › Mr . Renaud is Managing Director of LB Advisors, a European investment advisory firm involved in private financings . Prior to joining LB he was a founding partner of Change Capital Partners, a 300 million Euro private equity fund . Dionisio Romero Paoletti , Director › Mr . Romero is Chairman of the Board of Directors of Credicorp and Banco de Credito – BCP, Peru's largest bank, and has been the Chief Executive Officer of Credicorp (NYSE : BAP) since 2009 . Mr . Romero is a graduate of Brown University with a degree in Economics and earned an MBA from Stanford University . Jose Alberto Vizquerra - Benavides, Director › Mr . Vizquerra is the Executive Vice President of Strategic Development and a Director at Osisko Mining Inc . Previously, he served as the President & CEO of Oban Mining Corp . , where he led the successful change of business strategy that resulted in Oban’s acquisition of Corona Gold, Eagle Hill Exploration Corp . and Ryan Gold to form what is now Osisko Mining .

BOARD OF DIRECTORS Adviser and Observers Alberto Beeck, Adviser to the Board › Alberto Beeck is an investor and entrepreneur who combines his time between businesses and social impact activities in the education sector . He is Managing Partner of Cranley Investments Holdings, Managing Partner of VH Properties, Chairman of Lumni and of Sin Limites . Mr Beeck serves on several boards and is a member of the board of trustees of Georgetown University . Alejandro Perellón, Observer to the Board › Alejandro Perellón is a Vice President with Arias Resource Capital Management LP . Previously, Mr . Perellón worked within the Latin America Investment Banking team at UBS in New York, where he focused on the metals and mining industry .

CONTACT Information 45 Investor Relations Sierra Metals Inc. Mike McAllister VP, Corporate Development T: 1.416.366.7777 | TF: 1.866.493.9646 E: info@sierrametals.com Corporate Office TD South Tower 79 Wellington Street West, Suite 2100 Toronto, ON M5K 1H1 T: 1.416.366.7777 | TF: 1.866.493.9646 Follow us: www.sierrametals.com TSX SMT | NYSE American SMTS | BVL SMT