Exhibit 99.3
Investor Presentation May 15, 2023
Disclaimer This presentation (the “Presentation”) is provided for information purposes only . No liability is accepted by any party whatsoever in connection with the contents of this Presentation, including (without limitation) Venator Materials PLC (the “Parent”) and any direct or indirect subsidiary of Parent, and each of their respective investors, advisors (including Kirkland & Ellis LLP, Moelis & Company UK LLP and Alvarez & Marsal (together, the “Advisors ”)) and its and their affiliates, directors, officers or employees, as applicable . No such person undertakes any obligation to update or revise any information contained in this Presentation based on new information, future events or otherwise . Further, certain information contained herein has been derived from sources prepared by third parties . While the information contained herein is believed to be reliable for the purposes used herein and is based upon information reasonably available to Parent as of the date of this Presentation, no representation is provided with respect to the accuracy of the information set out in this Presentation . This Presentation does not purport to contain all of the information that may be required to evaluate Parent or any transactions that might be contemplated by any recipient or Parent, and has solely been prepared for the purpose of generally familiarizing the recipients with Parent . No undue reliance shall be placed upon the information contained herein by any recipient of this Presentation . This Presentation is not intended to constitute, and should not be construed as investment, tax, legal or other advice . The information in this Presentation is confidential and may not be copied or disclosed to any other person without the prior written approval of Parent and this Presentation is not directed to any person in any jurisdiction where the publication or availability of the Presentation is prohibited . The distribution of this Presentation in overseas jurisdictions may be restricted by law and therefore you should inform yourself about and observe any such restrictions . Any failure to comply with these restrictions may constitute a violation of the securities laws of any such jurisdiction . Some or all of the information contained in this Presentation is or may be price - sensitive information and the use of such information may be regulated or prohibited by applicable legislation including securities law relating to insider dealing and market abuse . This Presentation and any information contained herein shall not constitute an offer to sell or the solicitation of an offer to buy any securities of Parent, nor shall there be any sale or offer of any securities in any state or jurisdiction in which such offer, solicitation or sale would be unlawful . This Presentation is for information purposes only and, in member states of the European Economic Area which have implemented the Prospectus Directive (as defined below) (each, a “Relevant Member State”) directed only at persons who are (a) “Qualified Investors”, as defined in article 2 . 1 (e) of Directive 2003 / 71 /EC as amended from time to time and includes any relevant implementing directive measure in any Relevant Member State (the “Prospectus Directive”) and (b) if in the United Kingdom, persons who ( i ) have professional experience in matters relating to investments who fall within the definition of “investment professionals” as defined in the Financial Services and Markets Act 2000 (Financial Promotion) Order 2005 (as amended or replaced) (the “Order”) ; or (ii) are high net worth or other persons to whom it may otherwise lawfully be communicated in accordance with the Order (all such persons together being referred to as “relevant persons”) . This Presentation must not be acted on or relied on by persons who are not relevant persons . Any investment or investment activity to which this Presentation relates are available only to relevant persons . Nothing in this Presentation constitutes investment advice and any recommendations that may be contained herein have not been based upon a consideration of the investment objectives, financial situation or particular needs of any specific recipient . Certain statements contained in this Presentation constitute “forward - looking statements” within the meaning of the U . S . Private Securities Litigation Reform Act of 1995 . These forward - looking statements represent Parent’s expectations or beliefs concerning future events, and it is possible that any expected results described in this Presentation will not be achieved . These forward looking statements are subject to risks, uncertainties and other factors, many of which are outside of Parent’s control, that could cause actual results to differ materially from the results discussed in the forward looking statements, including volatile global economic conditions and a downturn in the worldwide economy due to inflation, geopolitics, changes in raw material and energy prices ; interruptions in raw materials and energy supply ; economic and other impacts from the military conflict in Ukraine and the economic sanctions imposed due to the conflict ; the impacts and duration of the COVID - 19 pandemic and the measures put in place by governments in response ; Parent’s ability to maintain sufficient working capital ; Parent’s ability to engage with shareholders and debtholders with respect to its capital structure or access capital markets on favorable terms or at all ; Parent’s ability to explore and execute on strategic alternatives, including by raising additional equity capital or debt, by reducing or delaying business activities, by initiating reductions in force, by selling assets, by restructuring, refinancing, purchasing, repaying or otherwise retiring Parent’s outstanding debt ; Parent’s ability to remain compliant with all covenants in Parent’s debt agreements ; the volatility in the price of Parent’s ordinary shares, including as a result of us exploring strategic alternatives ; the costs associated with site closures, including the Pori facility ; the execution of cost reduction programs and initiatives ; Parent’s ability to close the divestment of the iron oxide business from within the Color Pigments business ; Parent’s ability to realize financial and operational benefits from cost reduction programs and operational improvement plans and initiatives ; industry production capacity and operating rates ; the supply demand balance for Parent’s products and that of competing products ; pricing pressures ; technological developments ; legal claims by or against us ; changes in government regulations, including increased manufacturing, labeling and waste disposal regulations and the classification of TiO 2 as a carcinogen in the EU ; management of materials resulting from Parent’s manufacturing process, including the ability to develop commercial markets in the regions in which Parent manufactures and its ability to dispose of these materials if necessary ; the impacts of increasing climate change regulations ; geopolitical events ; cyberattacks ; and public health crises . Any forward - looking statement speaks only as of the date on which it is made and Parent does not undertake any obligation to update or revise any forward - looking statement, whether as a result of new information, future events or otherwise . New factors emerge from time to time, and it is not possible for Parent to predict all such factors . When considering these forward - looking statements, you should keep in mind the risk factors and other cautionary statements in Parent’s Annual Report on Form 20 - F for the year ended December 31 , 2022 and such other reports that are subsequently filed with the U . S . Securities and Exchange Commission (the “SEC”) (the “SEC Filings ”) . The risk factors and other factors noted therein could cause its actual results to differ materially from those contained in any forward - looking statement . All subsequent written and oral forward - looking statements attributable to Parent or to persons acting on its behalf are expressly qualified in their entirety by the cautionary statements referred to above and contained elsewhere in this Presentation . Figures set out in this Presentation are not and should not be read as being equivalent to the financial covenant levels and do not constitute confirmations or certifications in respect of any covenant . These figures represent current views based on preliminary data which is indicative and illustrative only . Except as otherwise expressly provided herein, no representation, warranty or undertaking, expressed or implied, is made by Parent, the Advisors or any of their respective affiliates or us or any of their or our respective partners, officers, advisers or employees as to, and no reliance should be placed on, the accuracy, completeness, correctness or fairness of the financial information in this Presentation . Parent’s latest historical financial information is included in its SEC Filings and available to the public over the Internet at the SEC’s website at www . sec . gov . References to Parent’s financial information do not purport to be complete and are qualified in their entirety by the financial information that Parent has filed with the SEC and should be read in conjunction with the financial statements and sections entitled “Risk Factors” and “Operating and Financial Review and Prospects” included in Parent’s SEC Filings . Neither Parent nor any of its affiliates or any of their respective partners, officers, advisers or employees shall have any liability whatsoever (in negligence or otherwise) for any loss howsoever arising from any use of this Presentation or its contents . The information contained in this Presentation does not constitute investment advice . This Presentation may contain financial measures that are not in accordance with generally accepted accounting principles in the U . S . (“GAAP”), including EBITDA, adjusted EBITDA, adjusted EBITDA margin and free cash flow, and certain ratios and other metrics derived therefrom . Each of the Advisors is acting as an advisor to Parent in connection with the subject matter of this Presentation . The Advisors will not be acting as an advisor to any of the recipients of this Presentation and will not be responsible to any of the recipients of this Presentation . By accepting receipt of this Presentation you agree to be bound by the terms and restrictions contained in this disclaimer . If you believe you have received these materials in error or do not accept the terms and restrictions, please return this Presentation to Parent and destroy all copies . 2
Agenda Situation Overview Venator Business Overview − Titanium Dioxide − Performance Additives 2023 Budget and 5 Year Plan − Business Over the Bridge − Financial Performance and Liquidity 3
Situation Overview 4
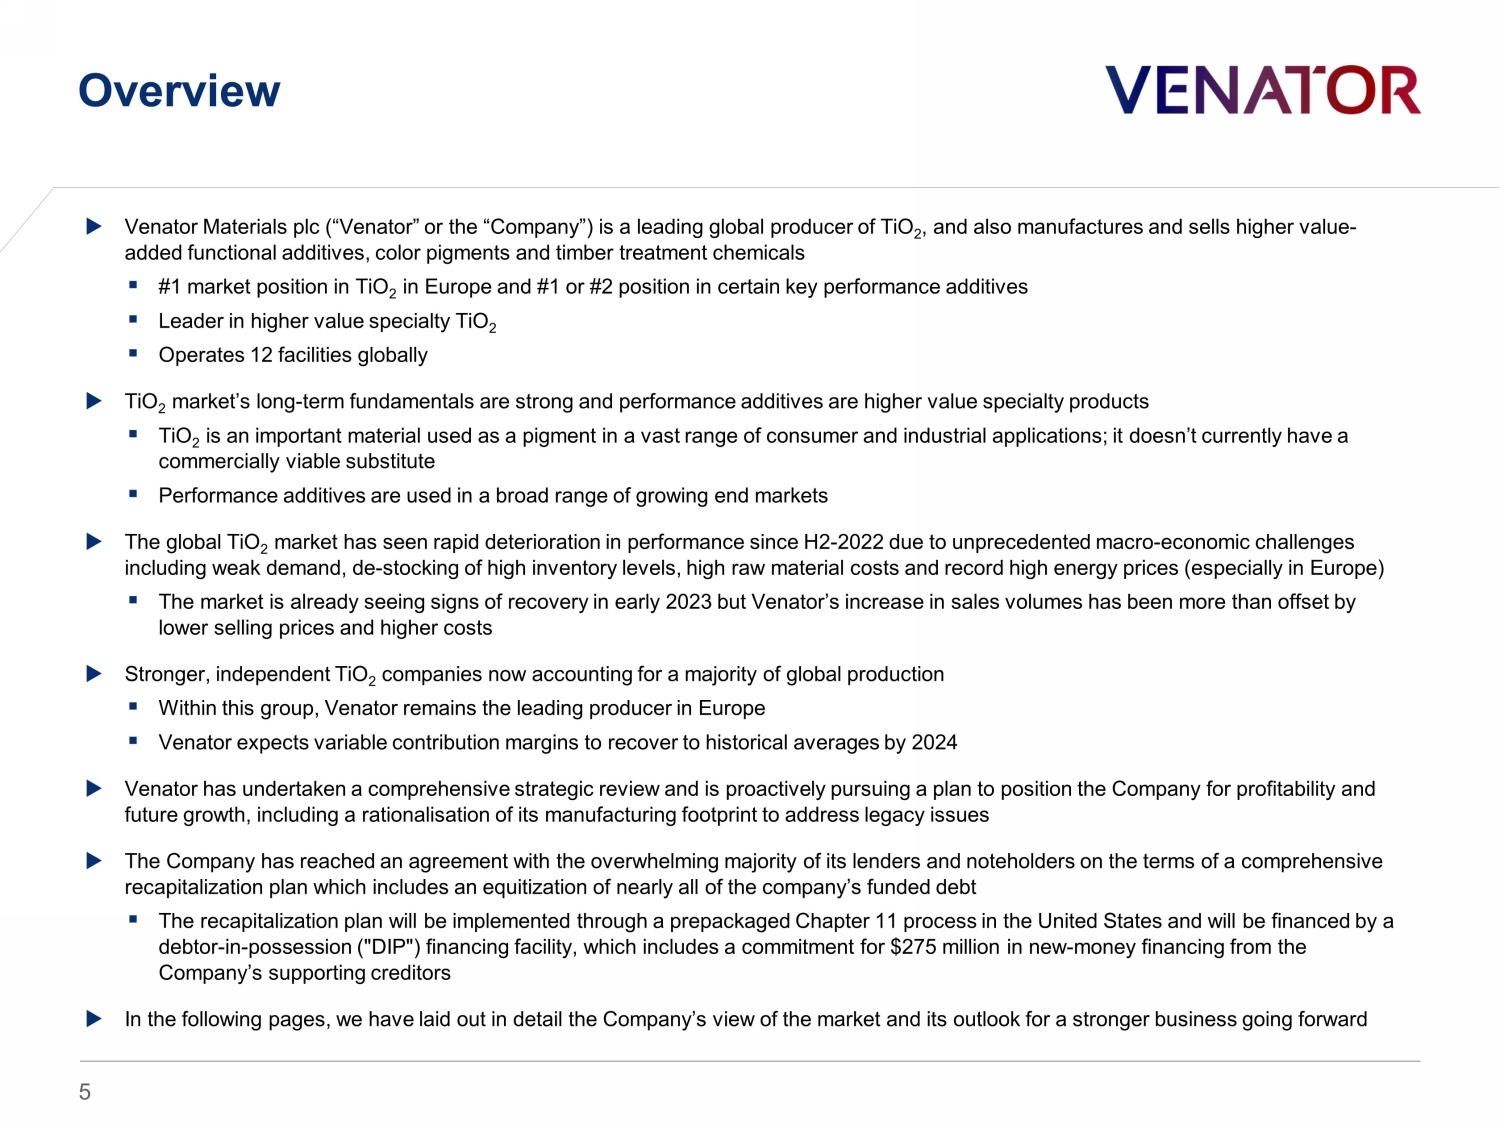
Overview Venator Materials plc (“ Venator ” or the “Company”) is a leading global producer of TiO 2 , and also manufactures and sells higher value - added functional additives, color pigments and timber treatment chemicals ▪ #1 market position in TiO 2 in Europe and #1 or #2 position in certain key performance additives ▪ Leader in higher value specialty TiO 2 ▪ Operates 12 facilities globally TiO 2 market’s long - term fundamentals are strong and performance additives are higher value specialty products ▪ TiO 2 is an important material used as a pigment in a vast range of consumer and industrial applications; it doesn’t currently have a commercially viable substitute ▪ Performance additives are used in a broad range of growing end markets The global TiO 2 market has seen rapid deterioration in performance since H2 - 2022 due to unprecedented macro - economic challenges including weak demand, de - stocking of high inventory levels, high raw material costs and record high energy prices (especially i n Europe) ▪ The market is already seeing signs of recovery in early 2023 but Venator’s increase in sales volumes has been more than offset by lower selling prices and higher costs Stronger , independent TiO 2 companies now accounting for a majority of global production ▪ Within this group, Venator remains the leading producer in Europe ▪ Venator expects variable contribution margins to recover to historical averages by 2024 Venator has undertaken a comprehensive strategic review and is proactively pursuing a plan to position the Company for profitability and future growth, including a rationalisation of its manufacturing footprint to address legacy issues The Company has reached an agreement with the overwhelming majority of its lenders and noteholders on the terms of a comprehensive recapitalization plan which includes an equitization of nearly all of the company’s funded debt ▪ The recapitalization plan will be implemented through a prepackaged Chapter 11 process in the United States and will be financed by a debtor - in - possession ("DIP") financing facility, which includes a commitment for $275 million in new - money financing from the Company’s supporting creditors In the following pages, we have laid out in detail the Company’s view of the market and its outlook for a stronger business goin g f orward 5

Situation Summary Significant European presence impacted Venator more than competitors Unsustainable balance sheet and tightening liquidity ▪ FY22A leverage of c.18x to deteriorate further in light of negative ($120m ) EBITDA in FY23E ▪ Current liquidity down to c.$33m as of 12 - May with expected further tightening ▪ Significant operational restructuring will be implemented to right - size Venator’s manufacturing footprint and position the Company for future growth ▪ A comprehensive recapitalization agreement has been reached with the Company’s creditors to significantly reduce debt and secure $275m of “DIP” new - money financing 4 Leverage (Adj. EBITDA / Net Debt) Rapid and dramatic TiO 2 industry d ownturn ▪ Functional TiO 2 (“CPI”) volume decreased ~40% YoY in 2H 2022 with modest recovery expected in H2 2023 ▪ Inventory de - stocking intensified impact of weaker demand 1 TiO 2 Revenue ($m) Unprecedented energy and cost dynamics in Europe ▪ Direct costs increased ~50% compared to FY18 - 21A average ▪ Cost increase largely attributable to energy (impact of war in Ukraine on European prices) and feedstocks 2 TiO 2 Direct Cost (1) Weak current operating performance ▪ EBITDA expected to be negative ($120m ) in 2023 ▪ Negative free cash flow excluding debt service and ABL drawdowns of ($186m) in 2023 3 Adj. EBITDA (2) ($m) (1) Rebased to TZMI 2021 Venator manufacturing cost estimate on a $/t basis (TZMI, 2022, Comparative Cost & Profitability Study) (2) Reported adjusted EBITDA; includes Iron Oxide EBITDA of $25m, $16m and negative ($4m) for FY21A, FY22A, and 1Q FY23E, respectively 6 185 53 (120) FY21A FY22A FY23E 996 601 1H22 2H22 1.0 1.5 1.6 FY18A FY22A FY23E 4x 18x FY21A FY22A
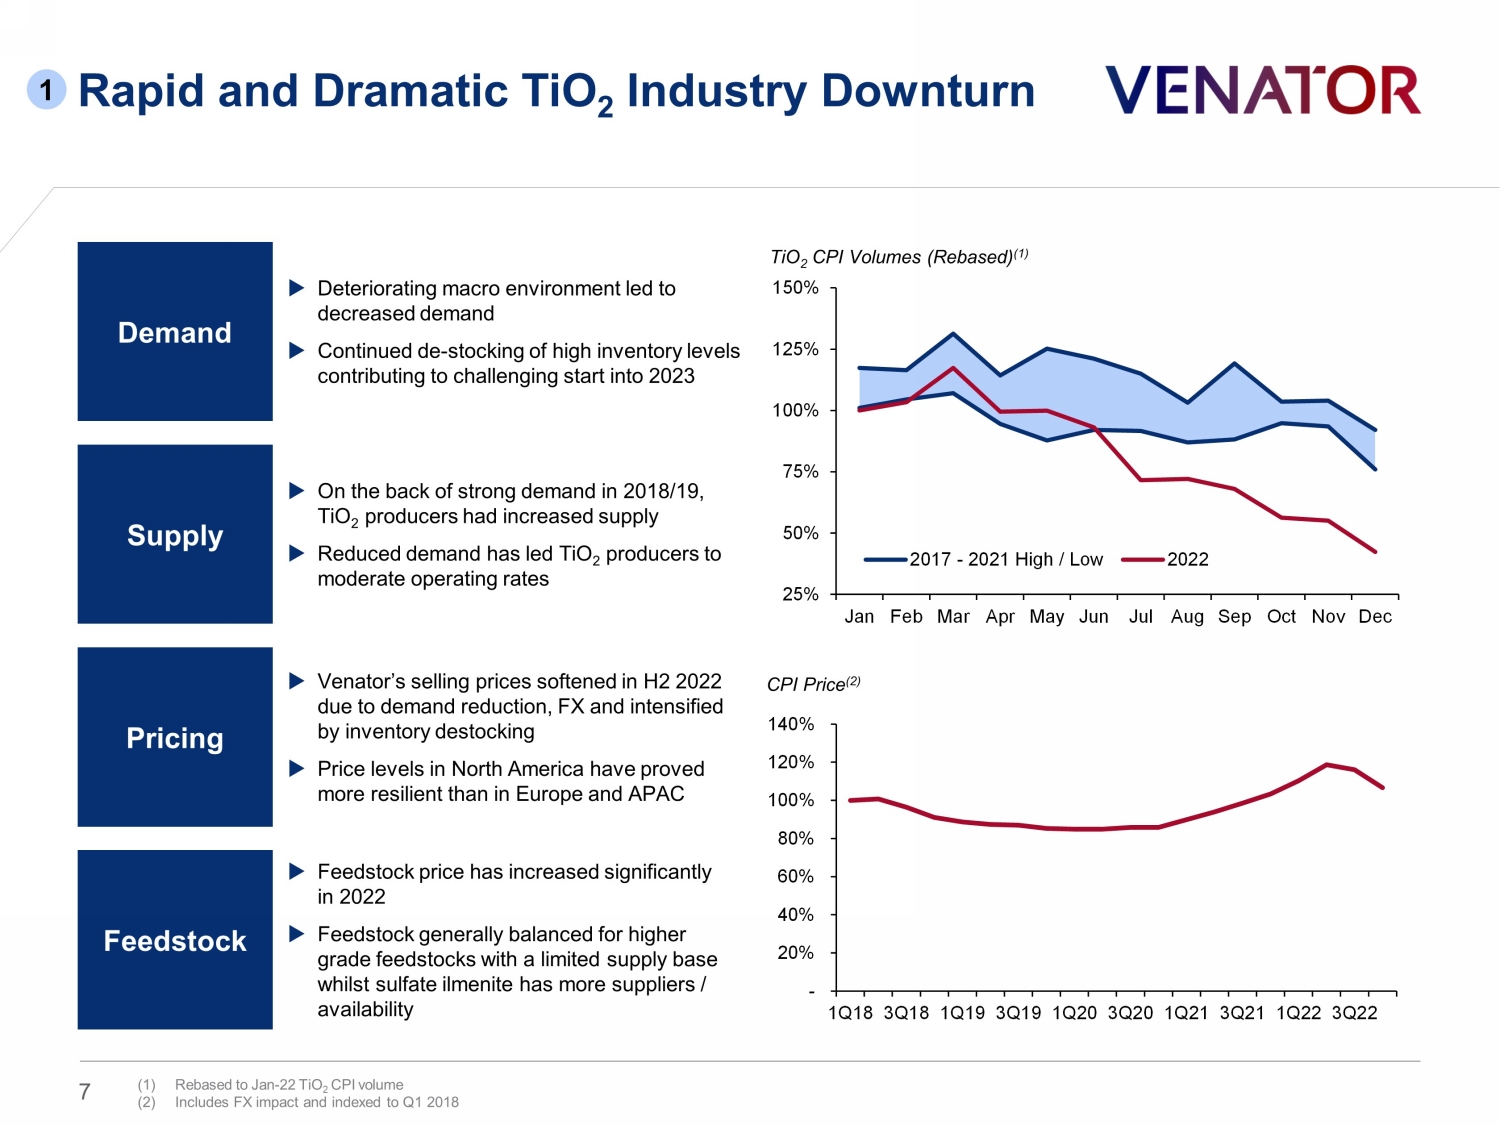
Rapid and Dramatic TiO 2 Industry Downturn Demand Supply Pricing Feedstock Deteriorating macro environment led to decreased demand Continued de - stocking of high inventory levels contributing to challenging start into 2023 On the back of strong demand in 2018/19, TiO 2 producers had increased supply Reduced demand has led TiO 2 producers to moderate operating rates Venator’s selling prices softened in H2 2022 due to demand reduction, FX and intensified by inventory destocking Price levels in North America have proved more resilient than in Europe and APAC Feedstock price has increased significantly in 2022 Feedstock generally balanced for higher grade feedstocks with a limited supply base whilst sulfate ilmenite has more suppliers / availability TiO 2 CPI Volumes (Rebased) (1 ) CPI Price (2) 1 (1) Rebased to Jan - 22 TiO 2 CPI volume (2) Includes FX impact and indexed to Q1 2018 7 - 20% 40% 60% 80% 100% 120% 140% 1Q18 3Q18 1Q19 3Q19 1Q20 3Q20 1Q21 3Q21 1Q22 3Q22 25% 50% 75% 100% 125% 150% Jan Feb Mar Apr May Jun Jul Aug Sep Oct Nov Dec 2017 - 2021 High / Low 2022
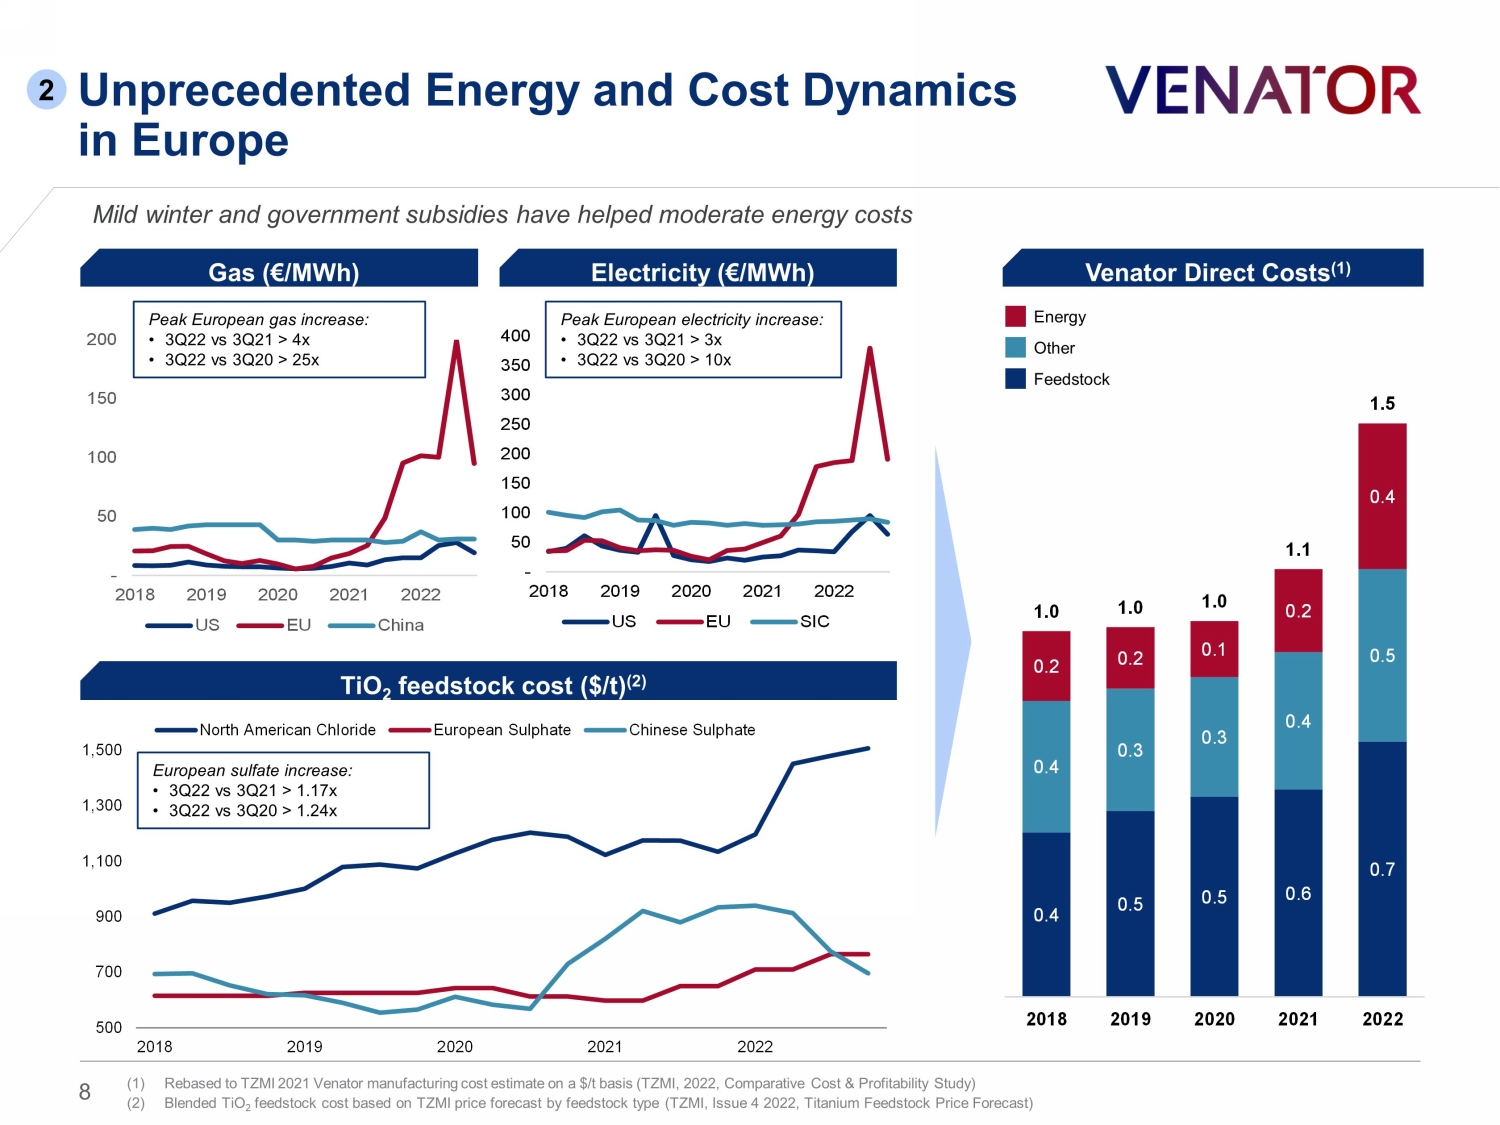
500 700 900 1,100 1,300 1,500 2018 2019 2020 2021 2022 North American Chloride European Sulphate Chinese Sulphate - 50 100 150 200 2018 2019 2020 2021 2022 US EU China Unprecedented Energy and Cost Dynamics in Europe Gas (€/ MWh ) Peak European gas increase: • 3Q22 vs 3Q21 > 4x • 3Q22 vs 3Q20 > 25x Electricity (€/ MWh ) Mild winter and government subsidies have helped moderate energy costs 2 TiO 2 feedstock cost ($/t) (2) - 50 100 150 200 250 300 350 400 2018 2019 2020 2021 2022 US EU SIC Peak European electricity increase: • 3Q22 vs 3Q21 > 3x • 3Q22 vs 3Q20 > 10x European sulfate i ncrease : • 3Q22 vs 3Q21 > 1.17x • 3Q22 vs 3Q20 > 1.24x Venator Direct Costs (1) Energy Feedstock Other 8 (1) Rebased to TZMI 2021 Venator manufacturing cost estimate on a $/t basis (TZMI, 2022, Comparative Cost & Profitability Study ) (2) Blended TiO 2 feedstock cost based on TZMI price forecast by feedstock type (TZMI, Issue 4 2022, Titanium Feedstock Price Forecast) 0.4 0.5 0.5 0.6 0.7 0.4 0.3 0.3 0.4 0.5 0.2 0.2 0.1 0.2 0.4 1.0 1.0 1.0 1.1 1.5 2018 2019 2020 2021 2022
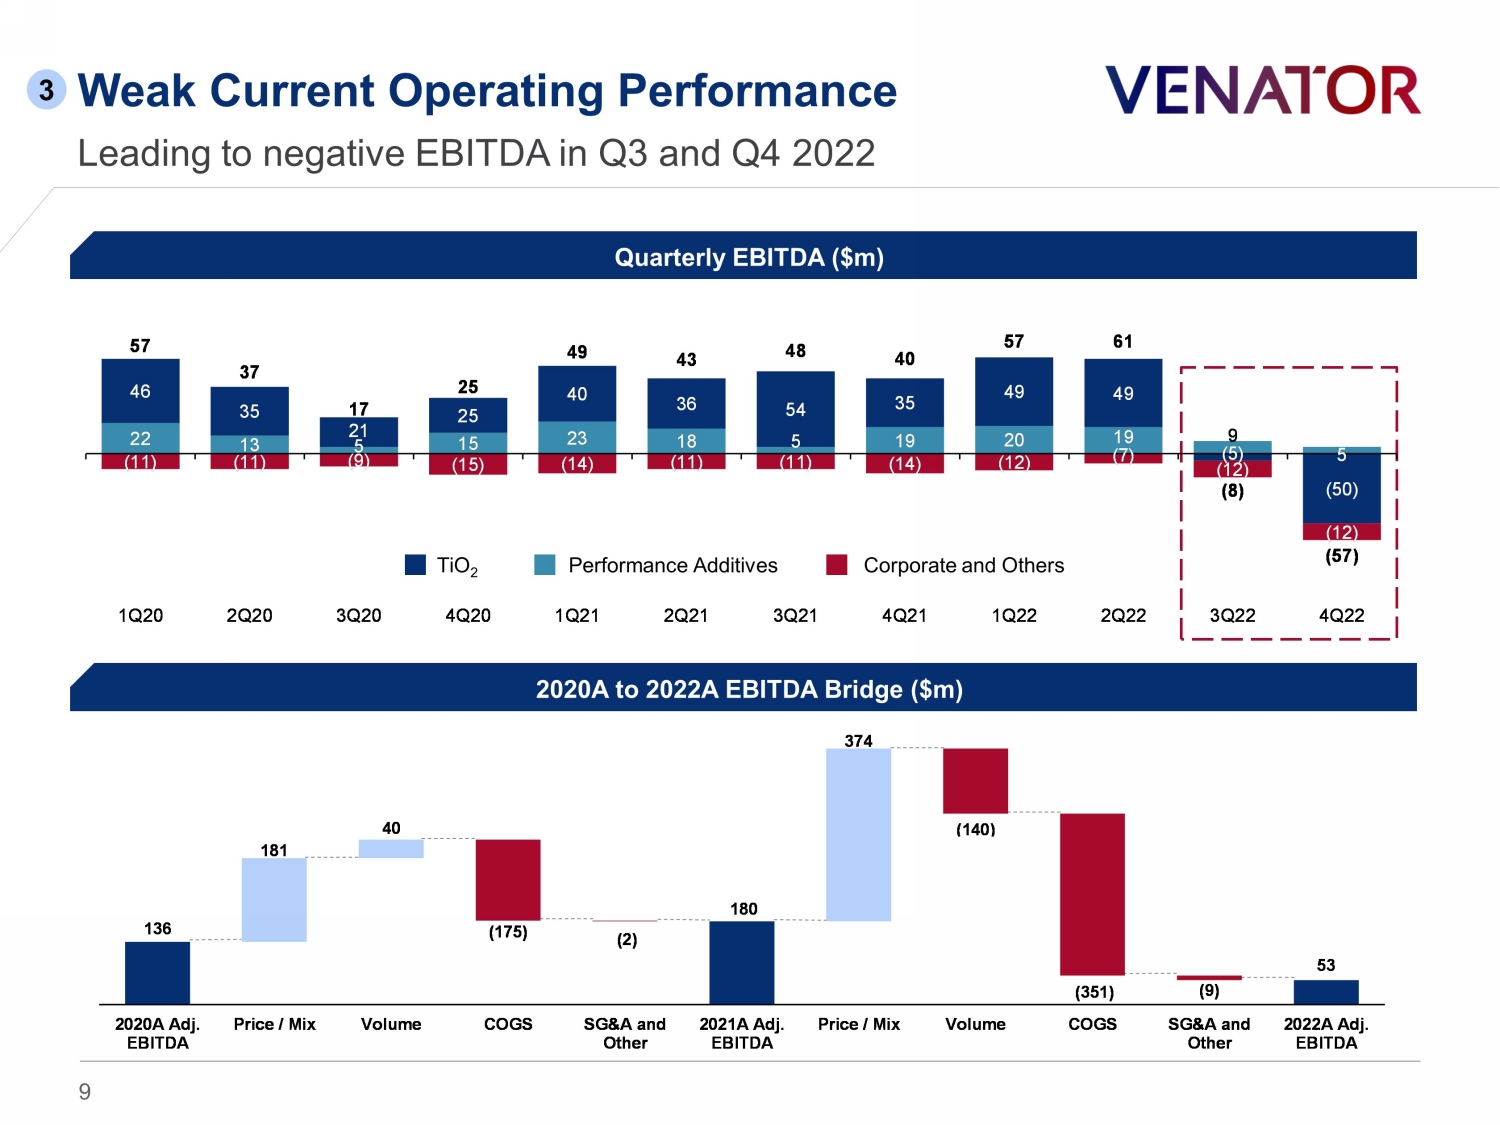
2020A to 2022A EBITDA Bridge ($m) Quarterly EBITDA ($m) Weak Current Operating Performance Leading to negative EBITDA in Q3 and Q4 2022 3 TiO 2 Performance Additives Corporate and Others 22 13 5 15 23 18 5 19 20 19 9 5 46 35 21 25 40 36 54 35 49 49 (5) (50) (11) (11) (9) (15) (14) (11) (11) (14) (12) (7) (12) (12) 57 37 17 25 49 43 48 40 57 61 (8) (57) 1Q20 2Q20 3Q20 4Q20 1Q21 2Q21 3Q21 4Q21 1Q22 2Q22 3Q22 4Q22 136 181 40 (175) (2) 180 374 (140) (351) (9) 53 2020A Adj. EBITDA Price / Mix Volume COGS SG&A and Other 2021A Adj. EBITDA Price / Mix Volume COGS SG&A and Other 2022A Adj. EBITDA 9
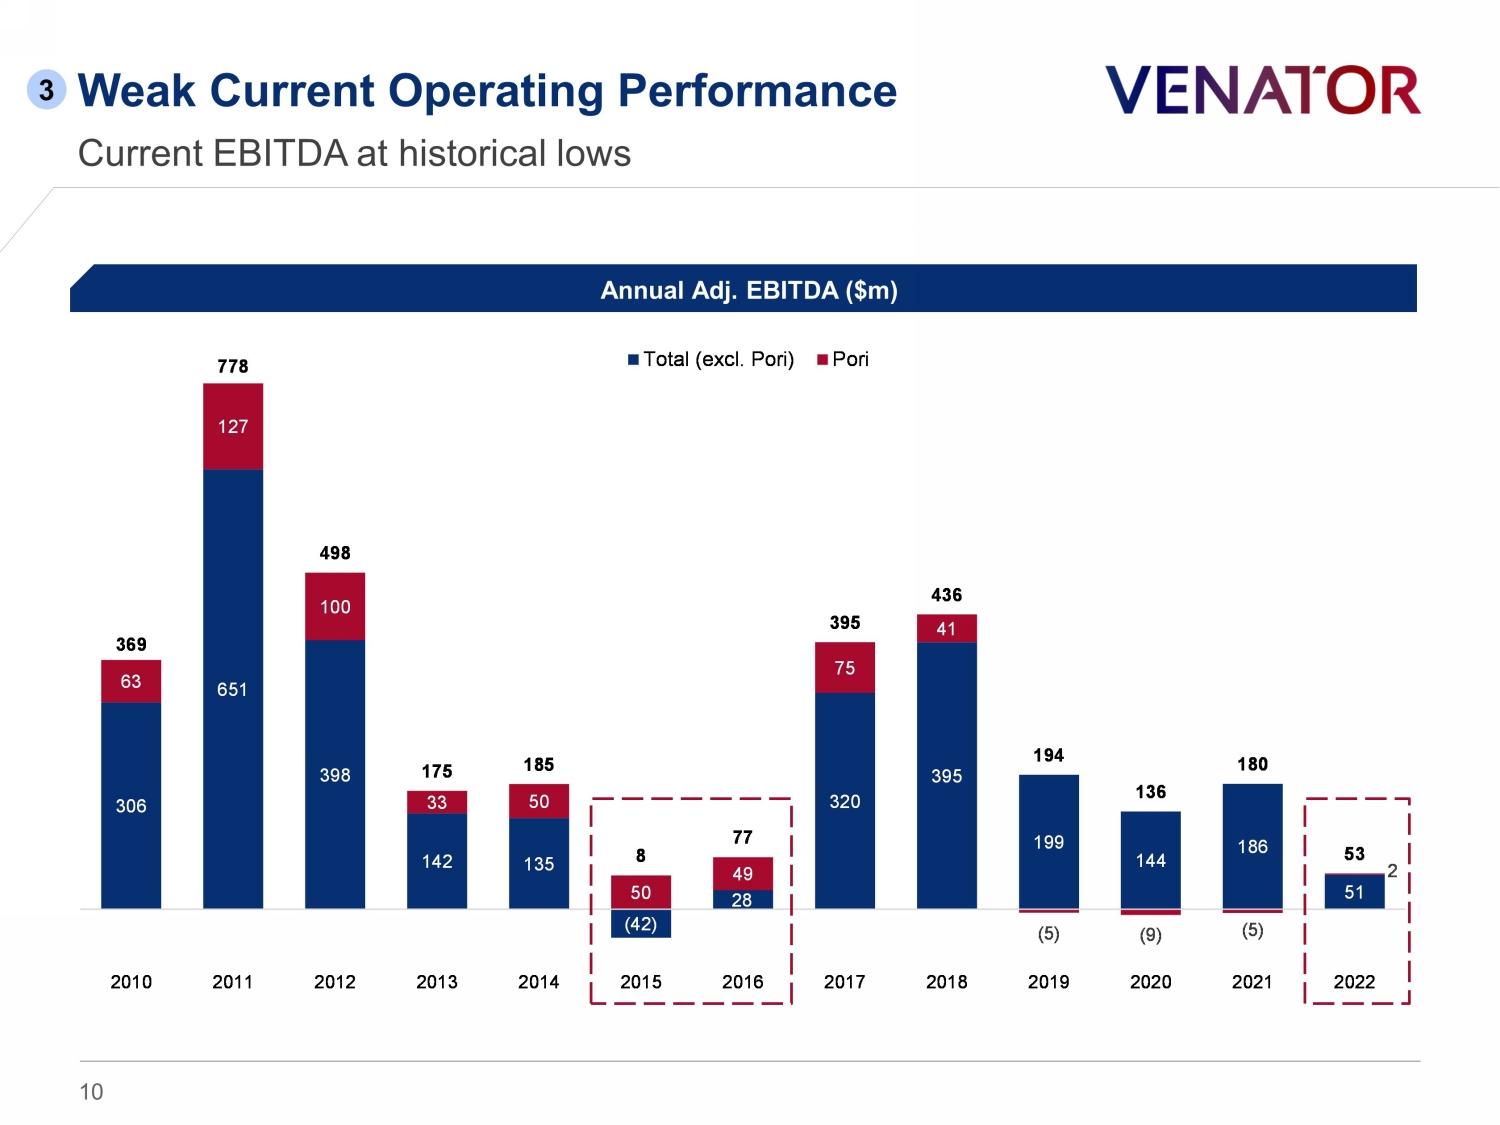
306 651 398 142 135 (42) 28 320 395 199 144 186 51 63 127 100 33 50 50 49 75 41 (5) (9) (5) 2 369 778 498 175 185 8 77 395 436 194 136 180 53 2010 2011 2012 2013 2014 2015 2016 2017 2018 2019 2020 2021 2022 Total (excl. Pori) Pori Weak Current Operating Performance Current EBITDA at historical lows Annual Adj. EBITDA ($m) 3 10
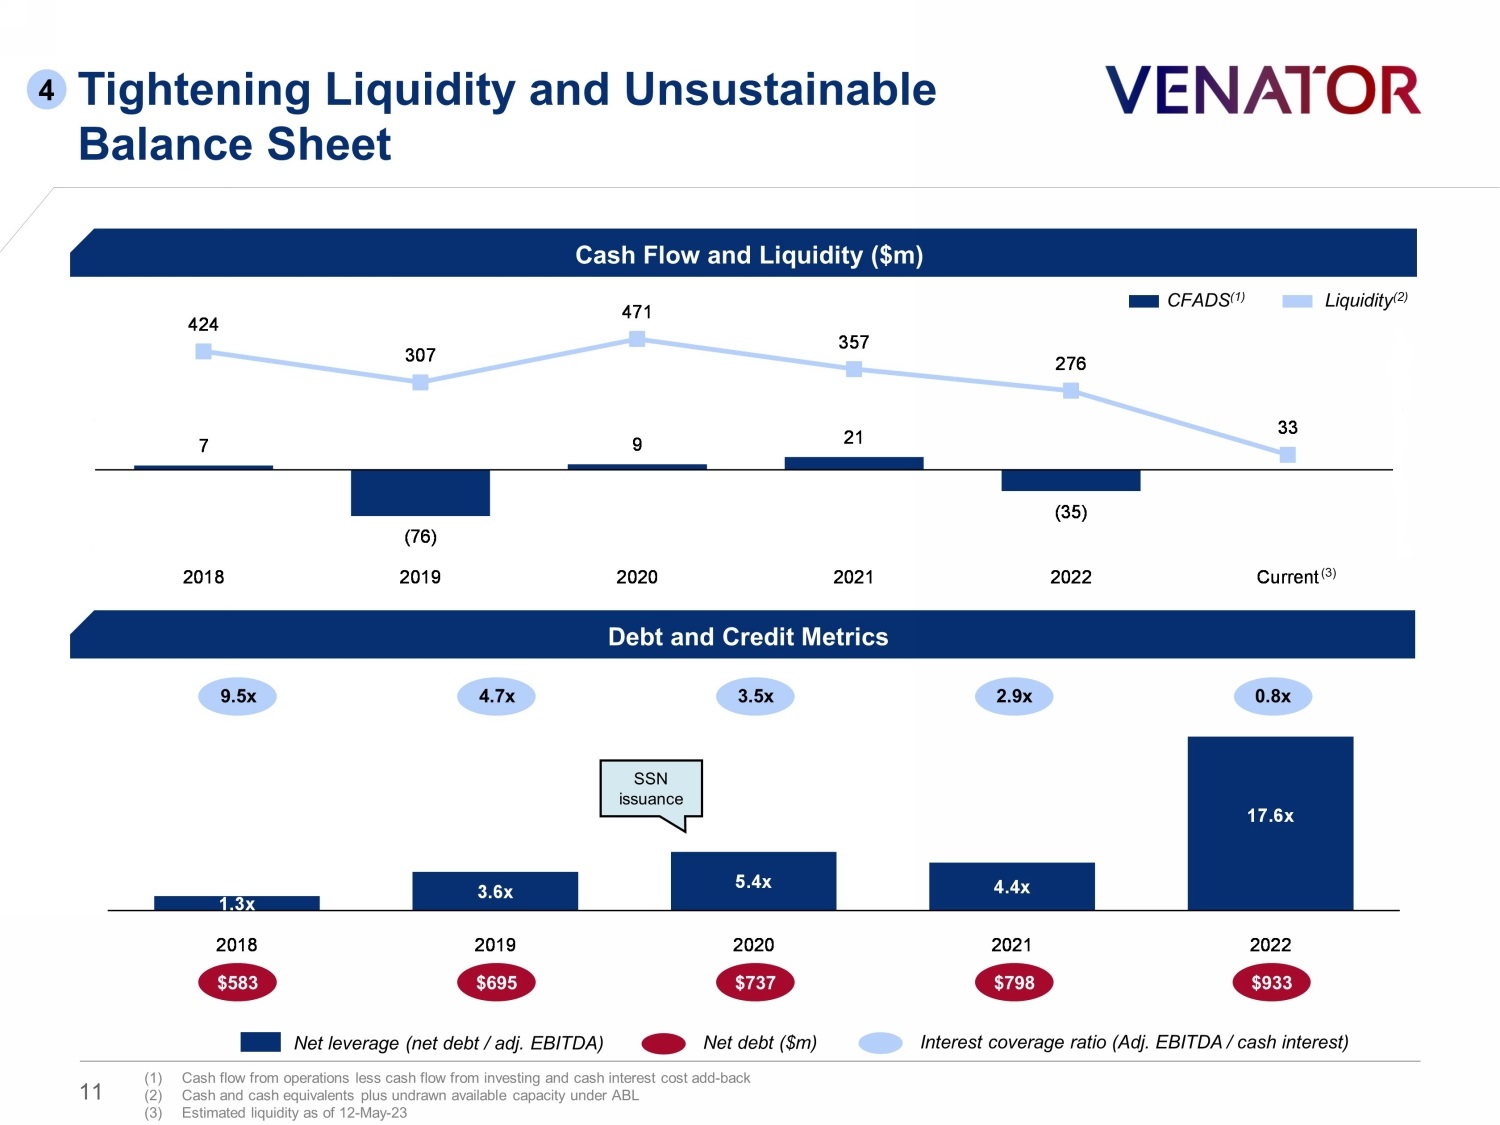
7 (76) 9 21 (35) 424 307 471 357 276 33 (300) (200) (100) -- 100 200 300 400 500 (120) (70) (20) 30 80 130 180 230 2018 2019 2020 2021 2022 Current 1.3x 3.6x 5.4x 4.4x 17.6x 2018 2019 2020 2021 2022 $583 $695 $737 $798 $933 Tightening Liquidity and Unsustainable Balance Sheet Debt and Credit Metrics Cash Flow and Liquidity ($m) (1) Cash flow from operations less cash flow from investing and cash interest cost add - back (2) Cash and cash equivalents plus undrawn available capacity under ABL (3) Estimated liquidity as of 12 - May - 23 Net debt ($m) Liquidity (2) CFADS (1) SSN issuance 9.5x 4.7x 3.5x 2.9x 0.8x Interest coverage ratio (Adj. EBITDA / cash interest ) ( 3 ) 4 Net leverage (net debt / adj. EBITDA) 11
Venator Business Overview 12
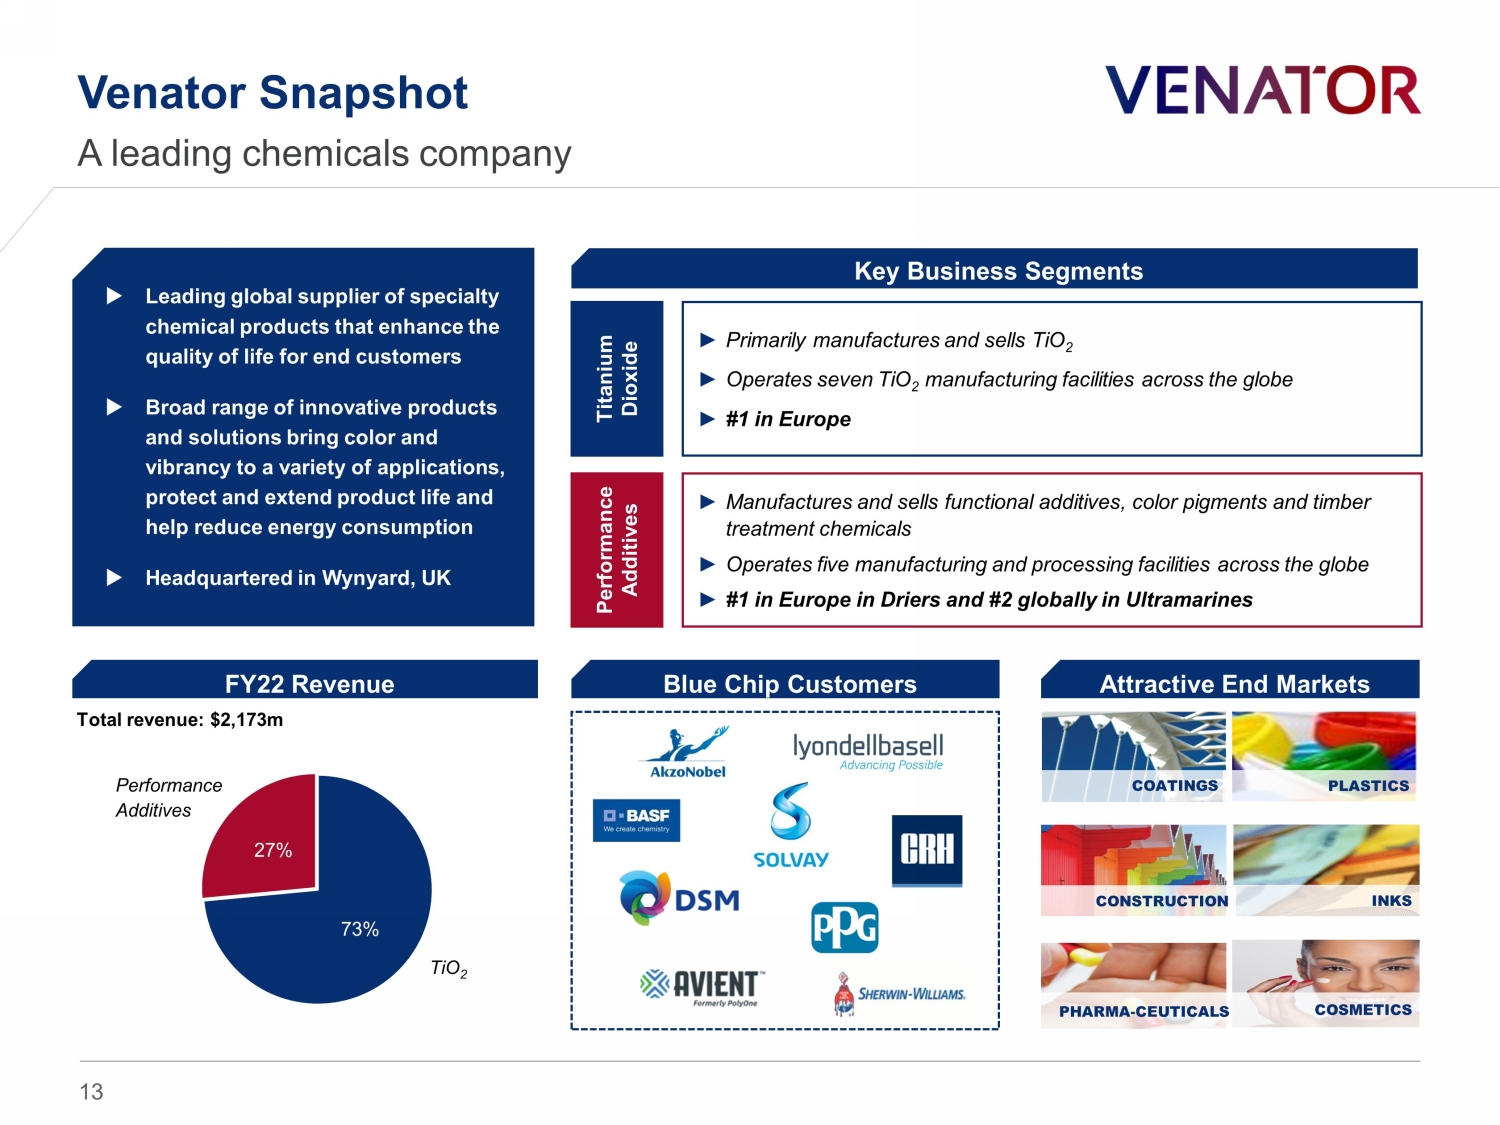
PHARMA - CEUTICALS Venator Snapshot A leading chemicals company Key Business Segments Leading global supplier of specialty chemical products that enhance the quality of life for end customers Broad range of innovative products and solutions bring color and vibrancy to a variety of applications, protect and extend product life and help reduce energy consumption Headquartered in Wynyard, UK Titanium Dioxide ► Primarily manufactures and sells TiO 2 ► Operates seven TiO 2 manufacturing facilities across the globe ► #1 in Europe Performance Additives ► Manufactures and sells functional additives, color pigments and timber treatment chemicals ► Operates five manufacturing and processing facilities across the globe ► #1 in Europe in Driers and #2 globally in Ultramarines FY22 Revenue Blue Chip Customers Attractive End Markets 73% 27% COATINGS PLASTICS INKS CONSTRUCTION COSMETICS Total revenue: $2,173m Performance Additives TiO 2 13
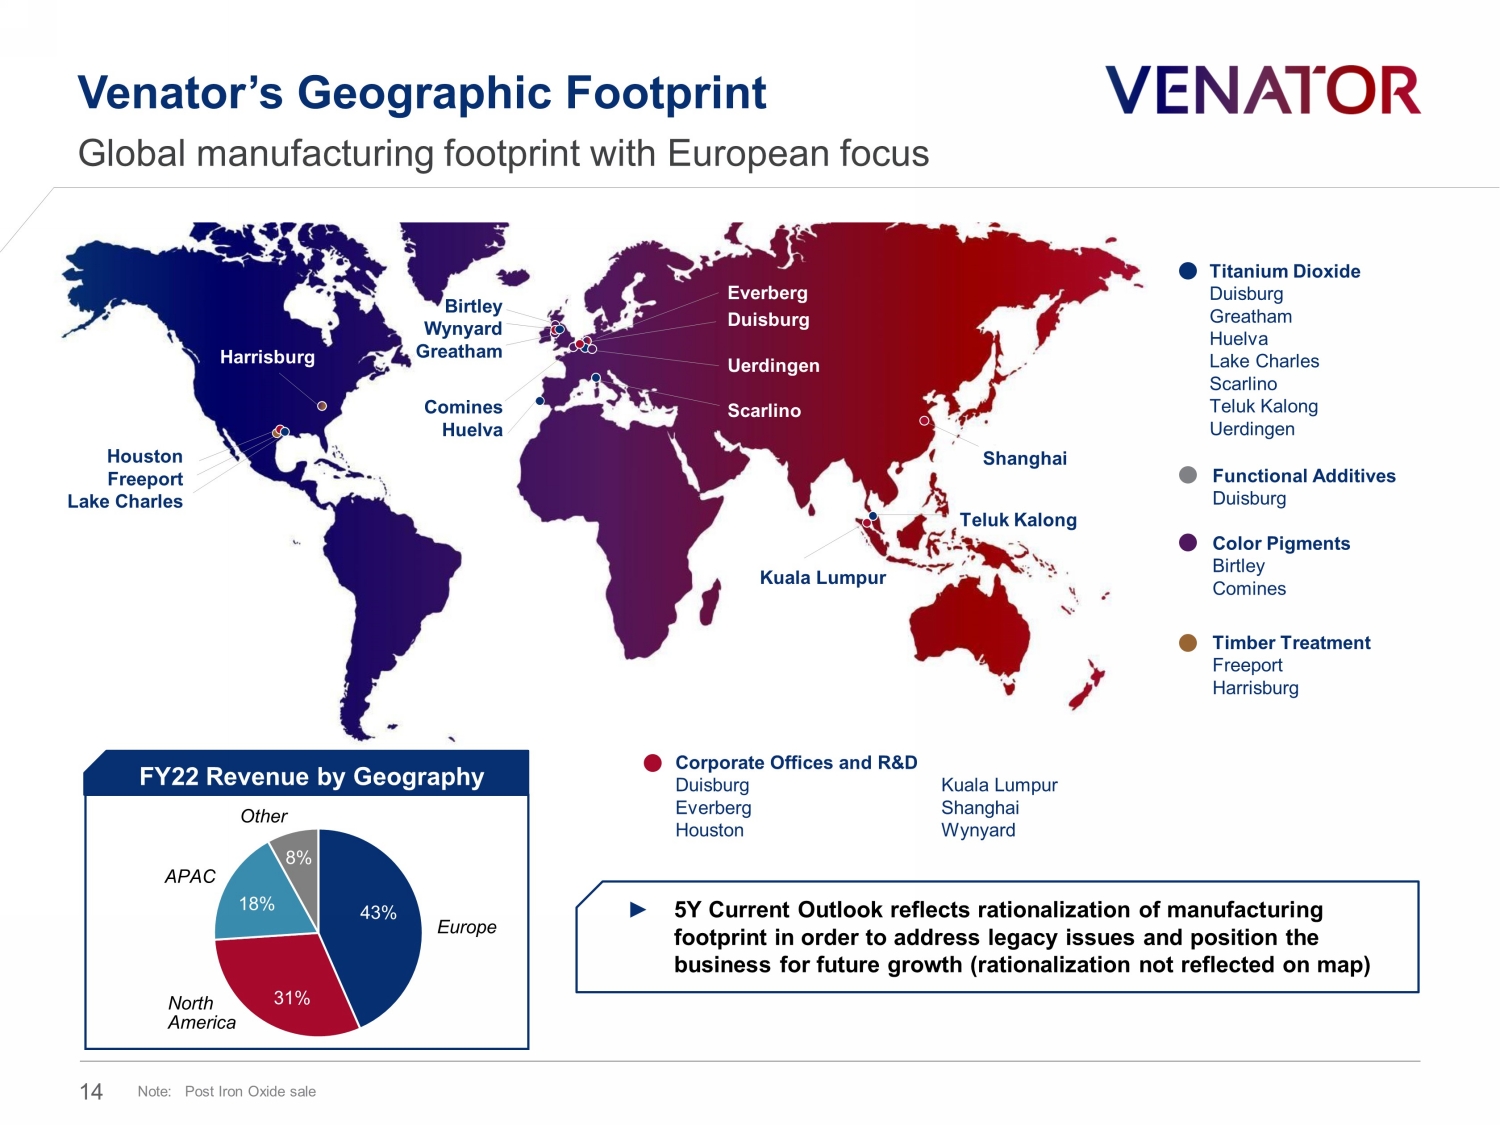
Houston Freeport Lake Charles Teluk Kalong Kuala Lumpur Shanghai Birtley Wynyard Greatham Everberg Duisburg Uerdingen Scarlino Harrisburg Comines Huelva 43% 31% 18% 8% FY22 Revenue by Geography APAC Other Europe North America Venator’s Geographic Footprint Global manufacturing footprint with European focus Titanium Dioxide Duisburg Greatham Huelva Lake Charles Scarlino Teluk Kalong Uerdingen Functional Additives Duisburg Timber Treatment Freeport Harrisburg ► 5Y Current Outlook reflects rationalization of manufacturing footprint in order to address legacy issues and position the business for future growth (rationalization not reflected on map) Corporate Offices and R&D Duisburg Everberg Houston Kuala Lumpur Shanghai Wynyard Note: Post Iron Oxide sale 14 Color Pigments Birtley Comines
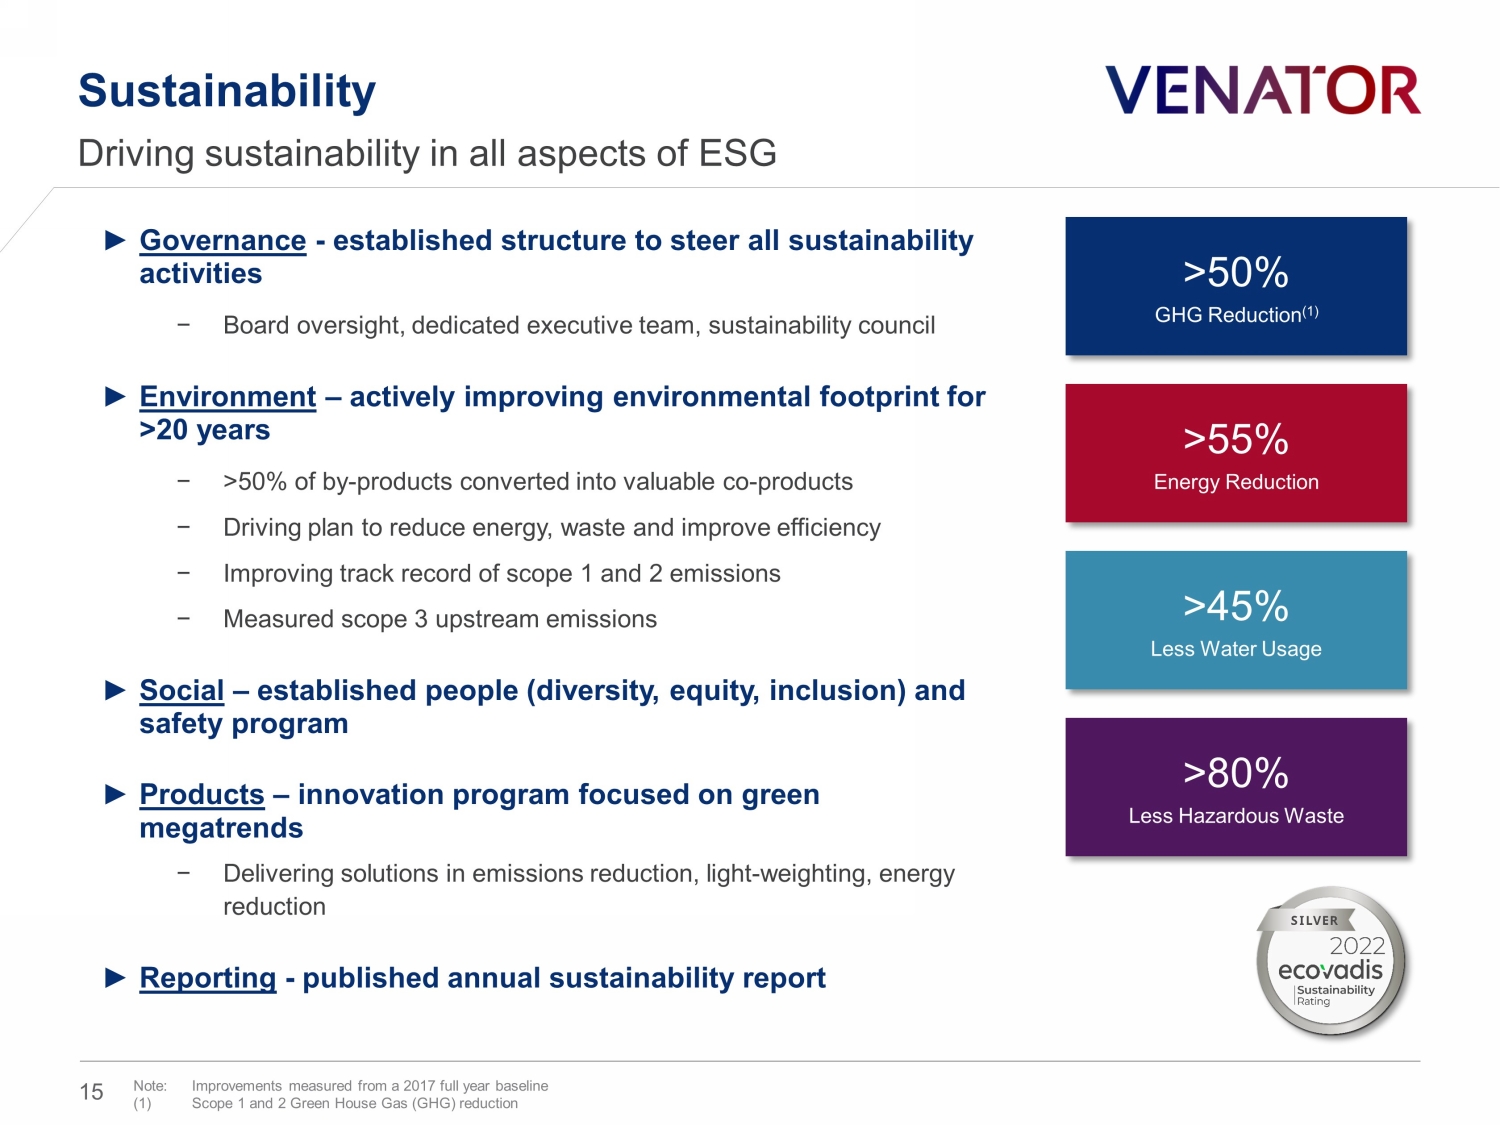
Sustainability Driving sustainability in all aspects of ESG ► Governance - established structure to steer all sustainability activities − Board oversight, dedicated executive team, sustainability council ► Environment – actively improving environmental footprint for >20 years − >50% of by - products converted into valuable co - products − Driving plan to reduce energy, waste and improve efficiency − Improving track record of scope 1 and 2 emissions − Measured scope 3 upstream emissions ► Social – established people (diversity, equity, inclusion) and safety program ► Products – innovation program focused on green megatrends − Delivering solutions in emissions reduction, light - weighting, energy reduction ► Reporting - published annual sustainability report >50% GHG Reduction (1) >55% Energy Reduction >45% Less Water Usage >80% Less Hazardous Waste Note: Improvements measured from a 2017 full year baseline (1) Scope 1 and 2 Green House Gas (GHG) reduction 15
Venator Business Overview – Titanium Dioxide 16
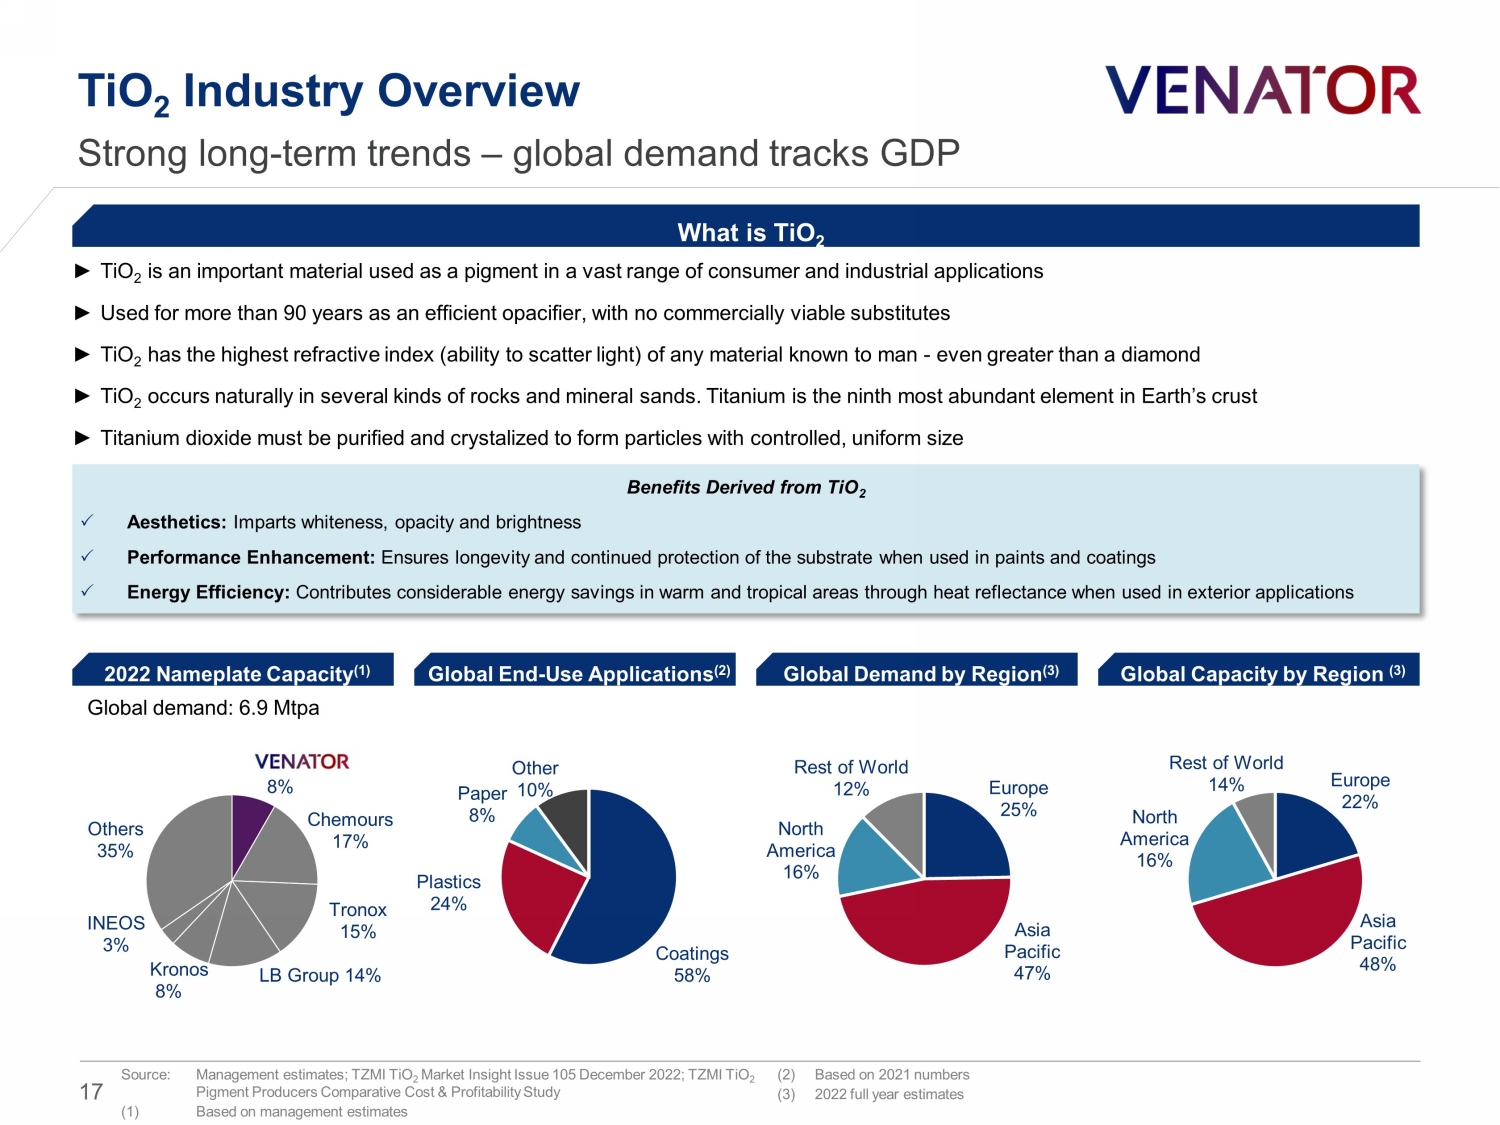
8% Chemours 17% Tronox 15% LB Group 14% Kronos 8% INEOS 3% Others 35% TiO 2 Industry Overview Strong long - term trends – g lobal demand tracks GDP ► TiO 2 is an important material used as a pigment in a vast range of consumer and industrial applications ► Used for more than 90 years as an efficient opacifier , with no commercially viable substitutes ► TiO 2 has the highest refractive index (ability to scatter light) of any material known to man - even greater than a diamond ► TiO 2 occurs naturally in several kinds of rocks and mineral sands. Titanium is the ninth most abundant element in Earth’s crust ► Titanium dioxide must be purified and crystalized to form particles with controlled, uniform size What is TiO 2 Source: Management estimates; TZMI TiO 2 Market Insight Issue 105 December 2022; TZMI TiO 2 Pigment Producers Comparative Cost & Profitability Study (1) Based on management estimates (2) Based on 2021 numbers (3) 2022 full year estimates Benefits Derived from TiO 2 Aesthetics: Imparts whiteness, opacity and brightness Performance Enhancement: Ensures longevity and continued protection of the substrate when used in paints and coatings Energy Efficiency: Contributes considerable energy savings in warm and tropical areas through heat reflectance when used in exterior application s 2022 Nameplate Capacity (1) Global End - Use Applications (2) Global Demand by Region (3) Coatings 58% Plastics 24% Paper 8% Other 10% Europe 25% Asia Pacific 47% North America 16% Rest of World 12% Global demand: 6.9 Mtpa Europe 22% Asia Pacific 48% North America 16% Rest of World 14% Global Capacity by Region (3) 17
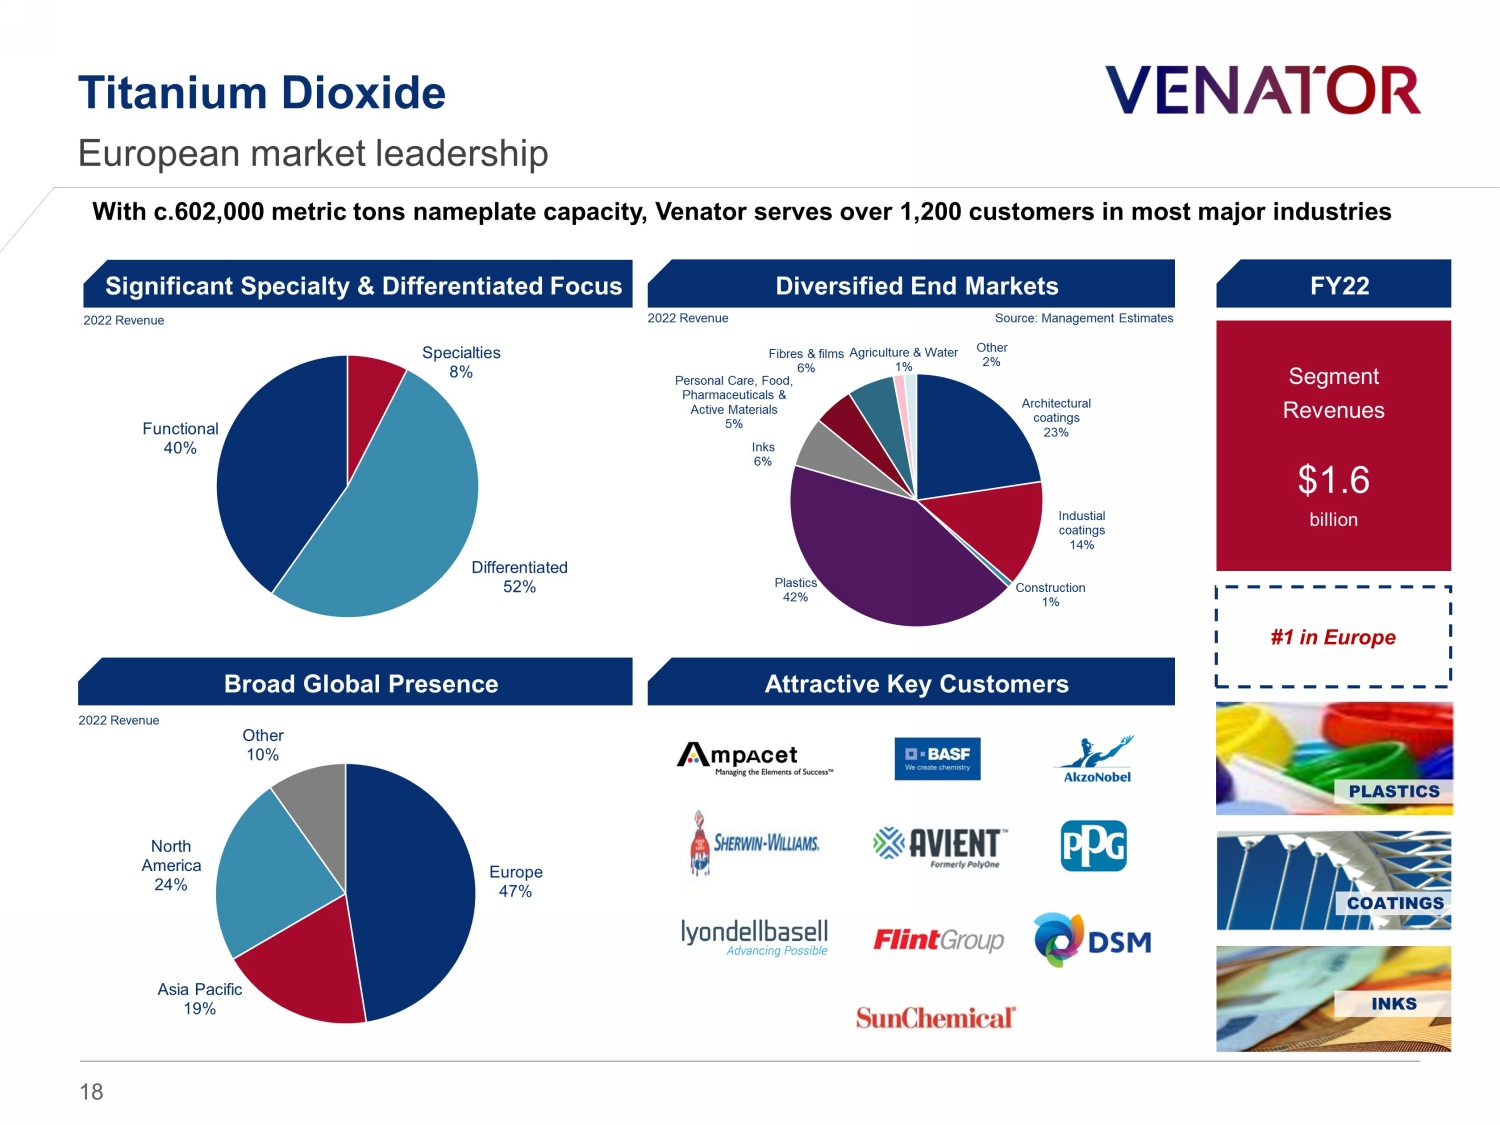
Venator , 8% Tronox , 15% Kronos , 8% Chemours , 17% Lomon Billions , 14% INEOS , 3% Others , 35% Titanium Dioxide European market leadership 2022 Revenue Source: Management Estimates Segment Revenues $ 1.6 billion COATINGS INKS Significant Specialty & Differentiated Focus Diversified End Markets Broad Global Presence PLASTICS Europe 47% Asia Pacific 19% North America 24% Other 10% Specialties 8% Differentiated 52% Functional 40% 2022 Revenue 2022 Revenue #1 in Europe With c.602,000 metric tons nameplate capacity, Venator serves over 1,200 customers in most major industries Attractive Key Customers Architectural coatings 23% Industial coatings 14% Construction 1% Plastics 42% Inks 6% Personal Care, Food, Pharmaceuticals & Active Materials 5% Fibres & films 6% Agriculture & Water 1% Other 2% FY22 18
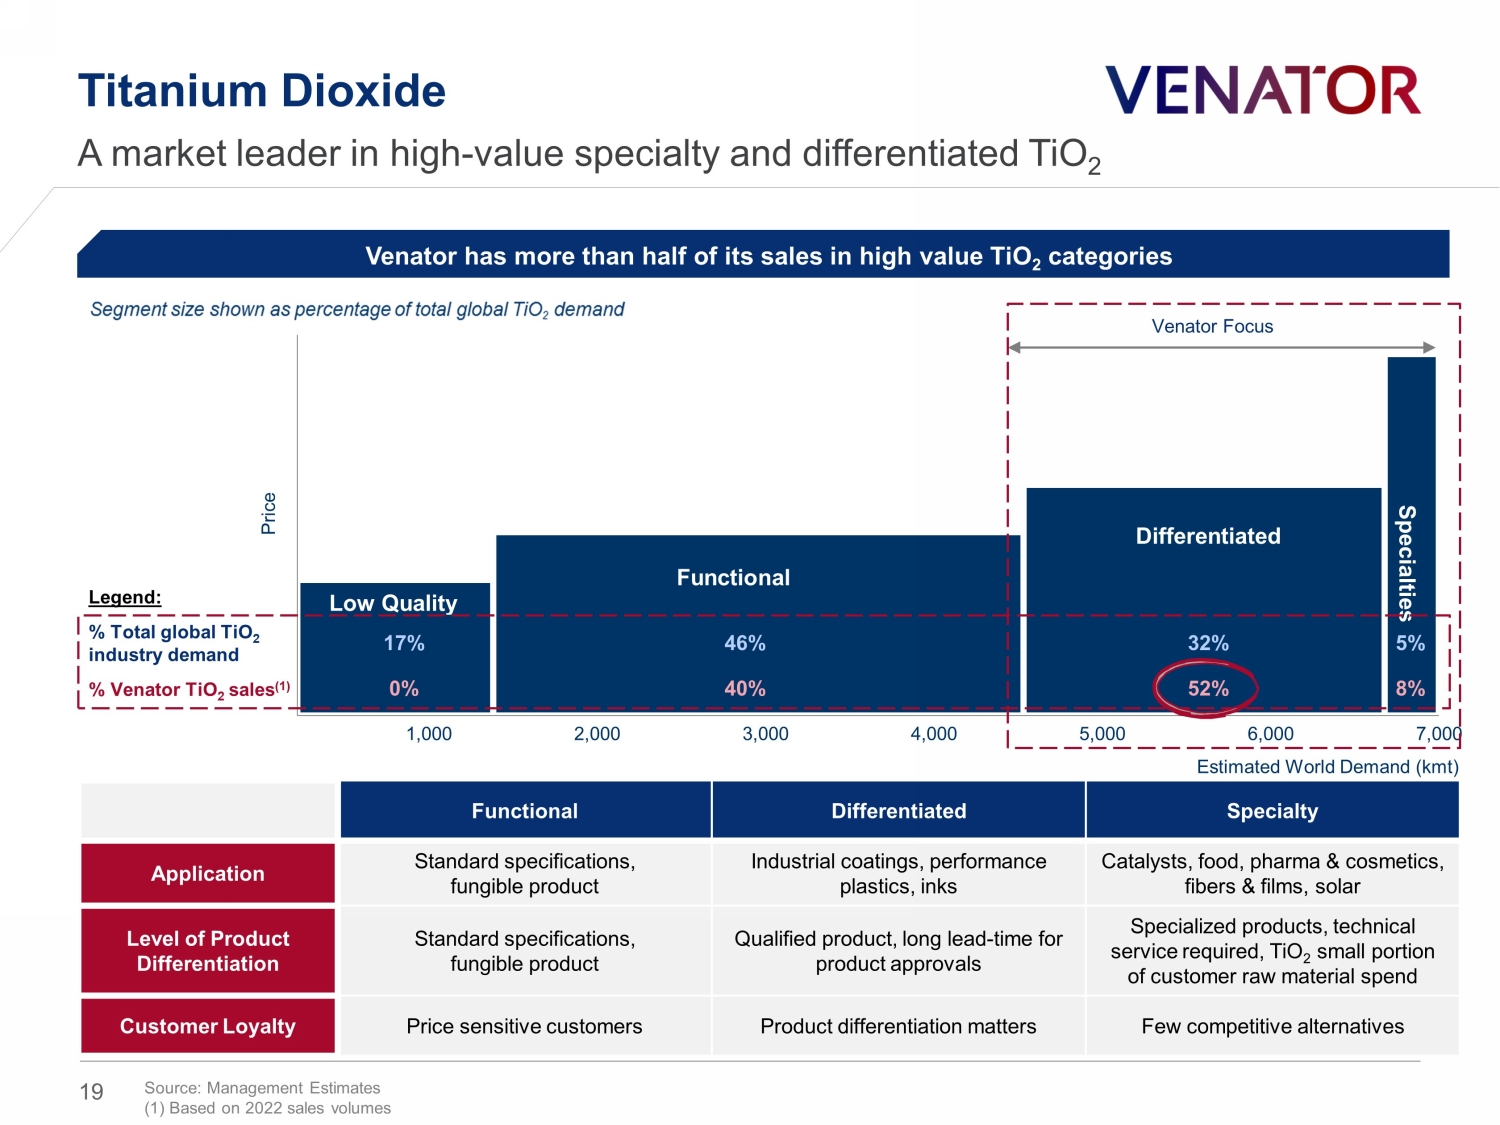
Titanium Dioxide A market leader in high - value specialty and differentiated TiO 2 Source: Management Estimates (1) Based on 2022 sales volumes Venator has more than half of its sales in high value TiO 2 categories Estimated World Demand ( kmt ) Functional Differentiated Specialty Application Standard specifications, fungible product Industrial coatings, performance plastics, inks Catalysts, food, pharma & cosmetics, fibers & films, solar Level of Product Differentiation Standard specifications, fungible product Qualified product, long lead - time for product approvals Specialized products, technical service required, TiO 2 small portion of customer raw material spend Customer Loyalty Price sensitive customers Product differentiation matters Few competitive alternatives Price Low Quality Functional Differentiated Specialties 5% 17% 46 % 32% 8 % 0% 40% 52 % Legend: % Total global TiO 2 industry demand % Venator TiO 2 sales (1) Venator Focus 1,000 2,000 3,000 4,000 5,000 6,000 7,000 19
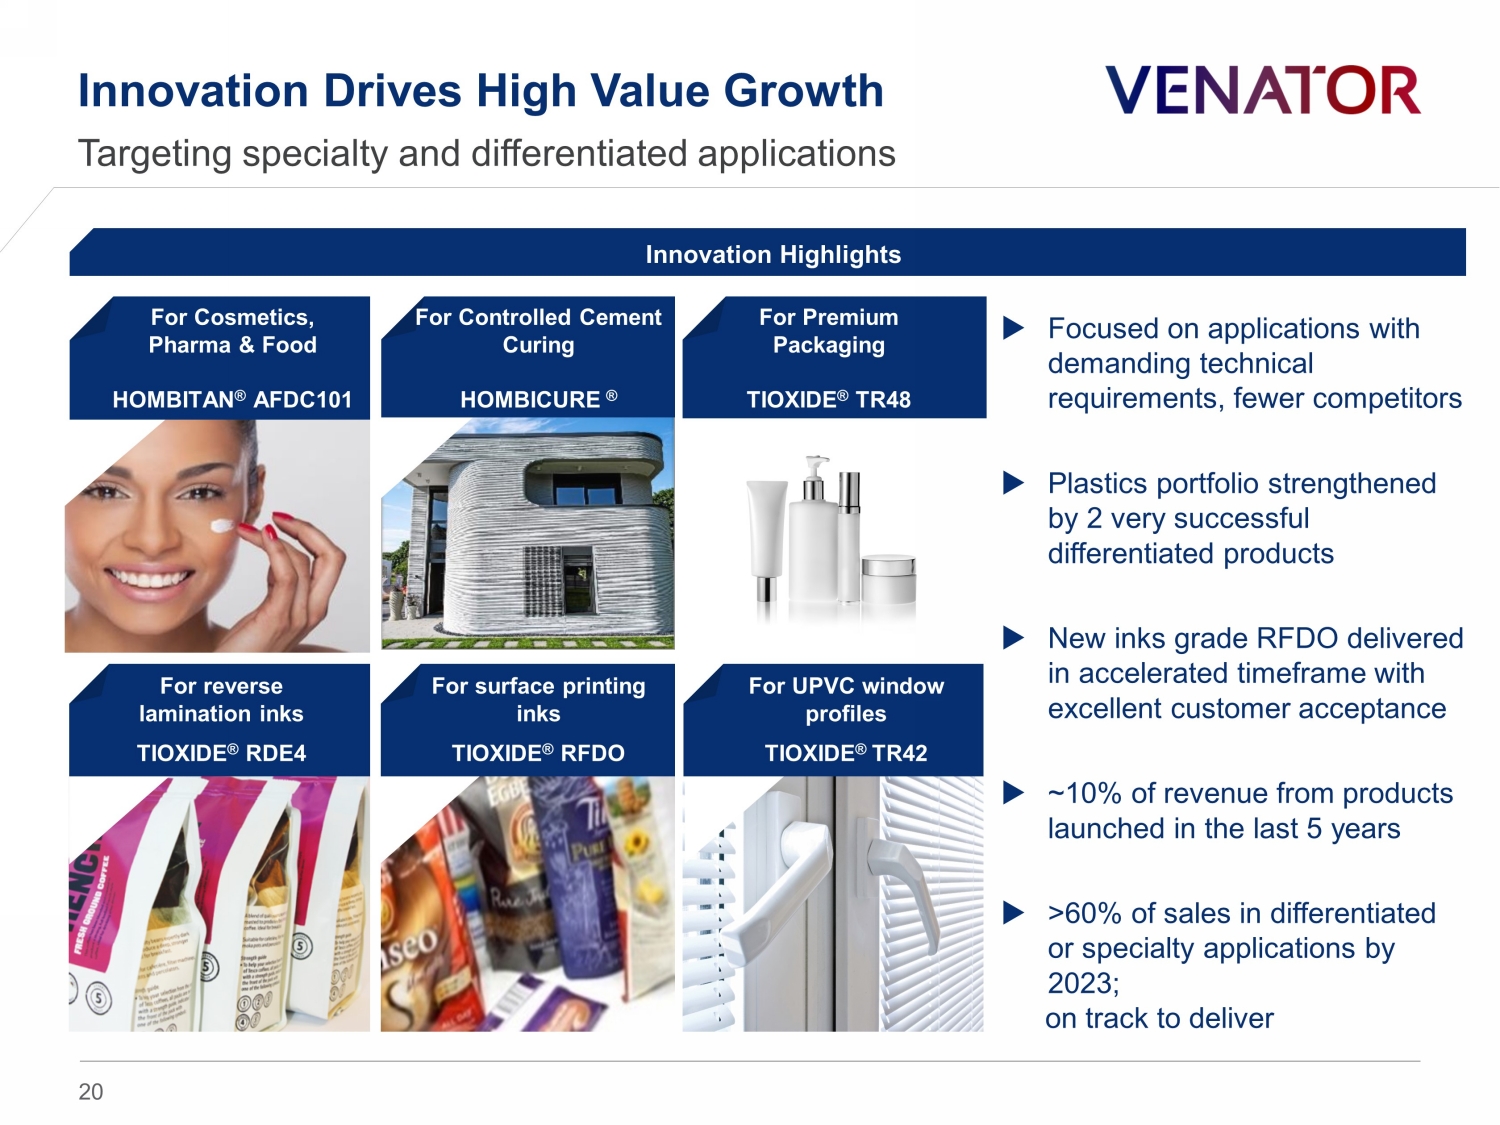
Innovation Drives High Value Growth Targeting specialty and differentiated applications For Controlled Cement Curing HOMBICURE ® Innovation Highlights For Premium Packaging TIOXIDE ® TR48 For reverse lamination inks TIOXIDE ® RDE4 For surface printing inks TIOXIDE ® RFDO For UPVC window profiles TIOXIDE ® TR42 Focused on applications with demanding technical requirements, fewer competitors Plastics portfolio strengthened by 2 very successful differentiated products New inks grade RFDO delivered in accelerated timeframe with excellent customer acceptance ~10% of revenue from products launched in the last 5 years >60% of sales in differentiated or specialty applications by 2023; on track to deliver For Cosmetics, Pharma & Food HOMBITAN ® AFDC101 20
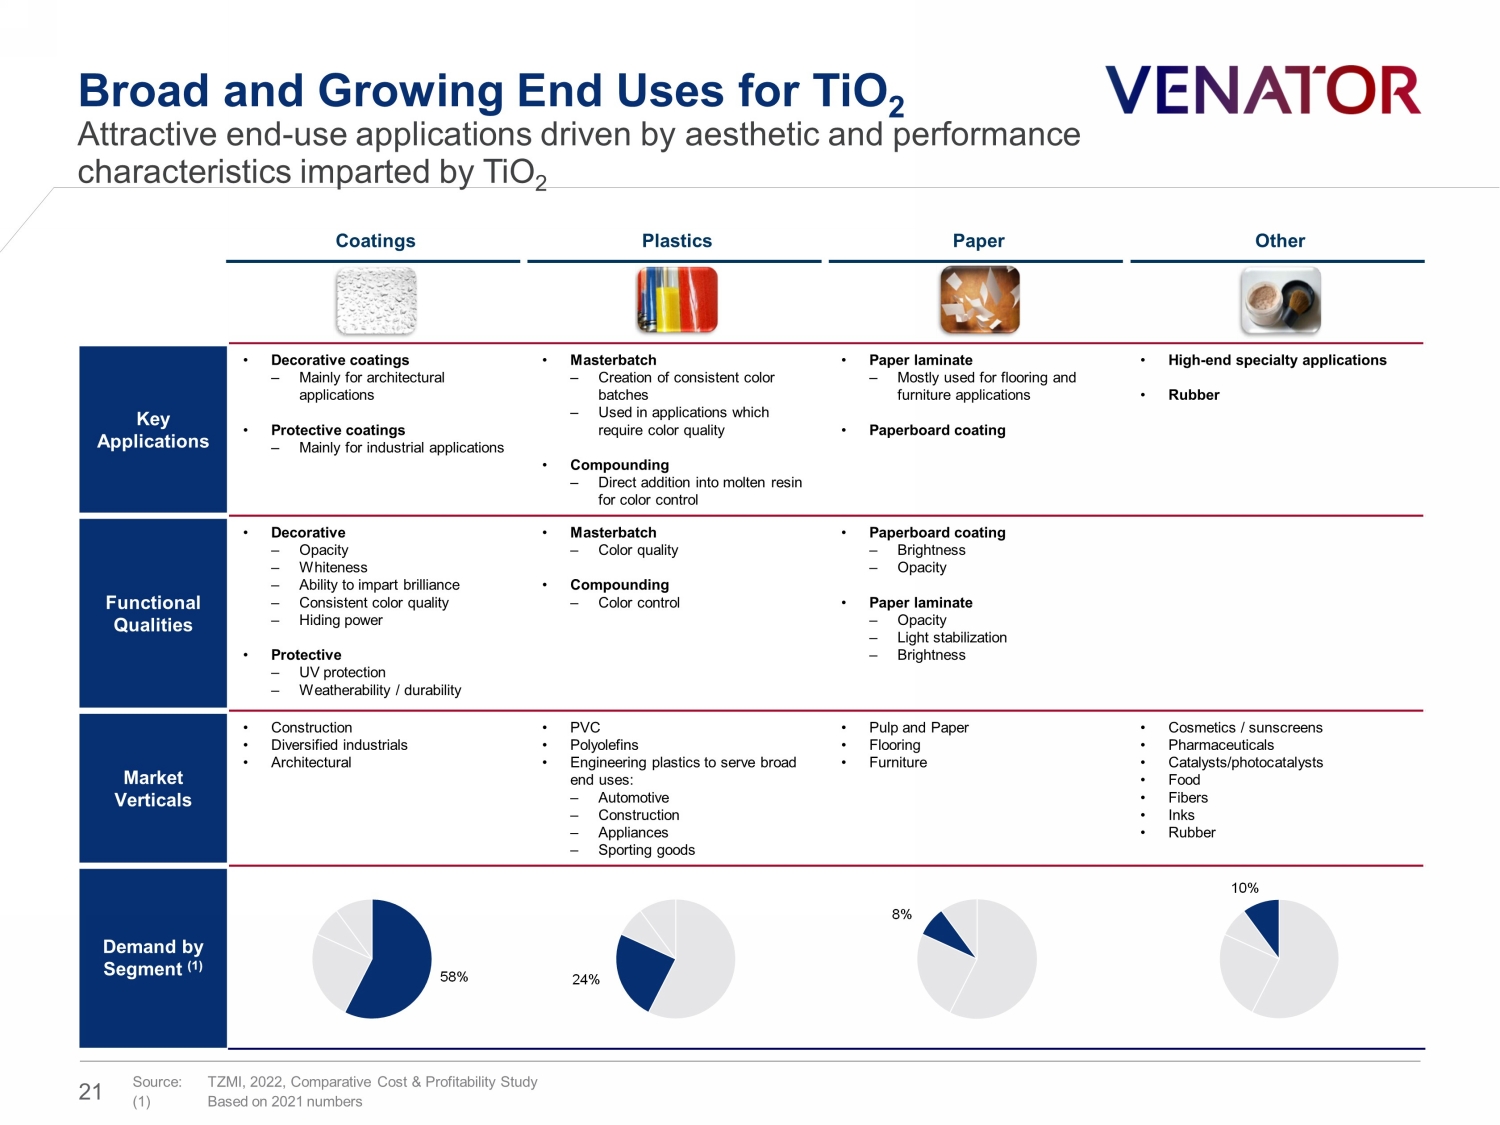
Key Applications • Decorative coatings ‒ Mainly for architectural applications • Protective coatings ‒ Mainly for industrial applications • Masterbatch ‒ Creation of consistent color batches ‒ Used in applications which require color quality • Compounding ‒ Direct addition into molten resin for color control • Paper laminate ‒ Mostly used for flooring and furniture applications • Paperboard coating • High - end specialty applications • Rubber Functional Qualities • Decorative ‒ Opacity ‒ Whiteness ‒ Ability to impart brilliance ‒ Consistent color quality ‒ Hiding power • Protective ‒ UV protection ‒ Weatherability / durability • Masterbatch ‒ Color quality • Compounding ‒ Color control • Paperboard coating ‒ Brightness ‒ Opacity • Paper laminate ‒ Opacity ‒ Light stabilization ‒ Brightness Market Verticals • Construction • Diversified industrials • Architectural • PVC • Polyolefins • Engineering plastics to serve broad end uses: ‒ Automotive ‒ Construction ‒ Appliances ‒ Sporting goods • Pulp and Paper • Flooring • Furniture • Cosmetics / sunscreens • Pharmaceuticals • Catalysts/photocatalysts • Food • Fibers • Inks • Rubber Demand by Segment (1) Broad and Growing End Uses for TiO 2 Attractive end - use applications driven by aesthetic and performance characteristics imparted by TiO 2 Coatings Plastics Paper Other 58% 24% 8% 10% Source: TZMI , 2022, Comparative Cost & Profitability Study (1) Based on 2021 numbers 21
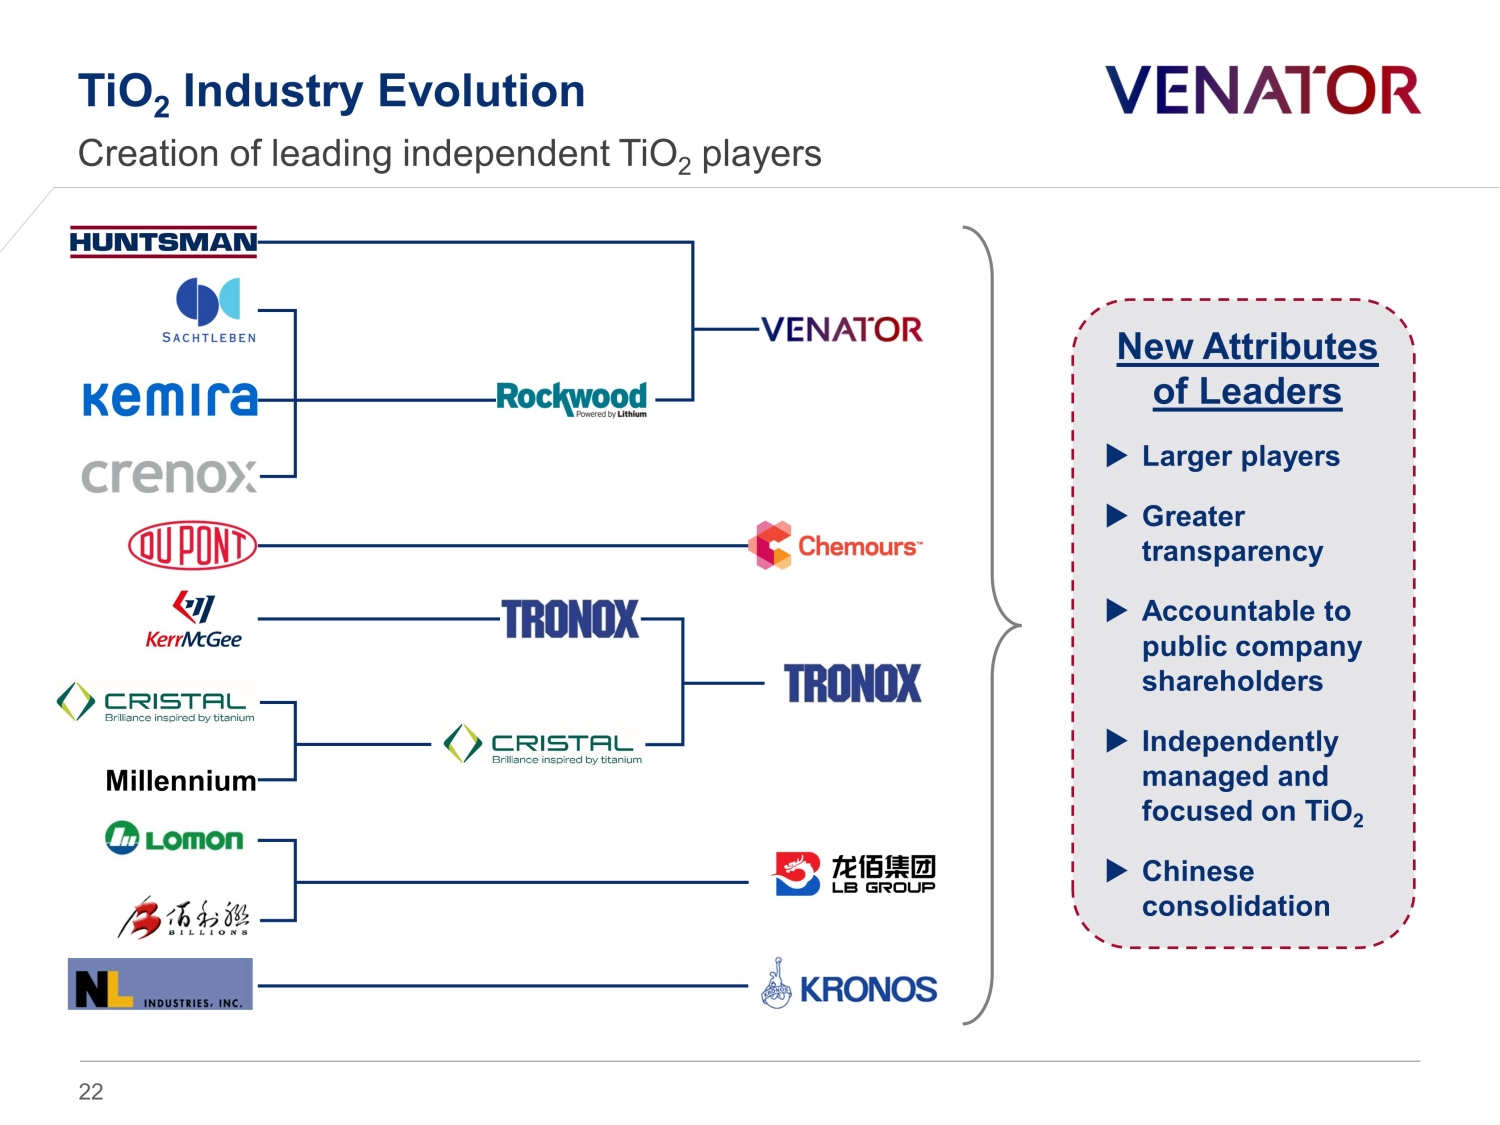
TiO 2 Industry Evolution Creation of l eading independent TiO 2 players Millennium New Attributes of Leaders Larger players Greater transparency Accountable to public company shareholders Independently managed and focused on TiO 2 Chinese consolidation 22
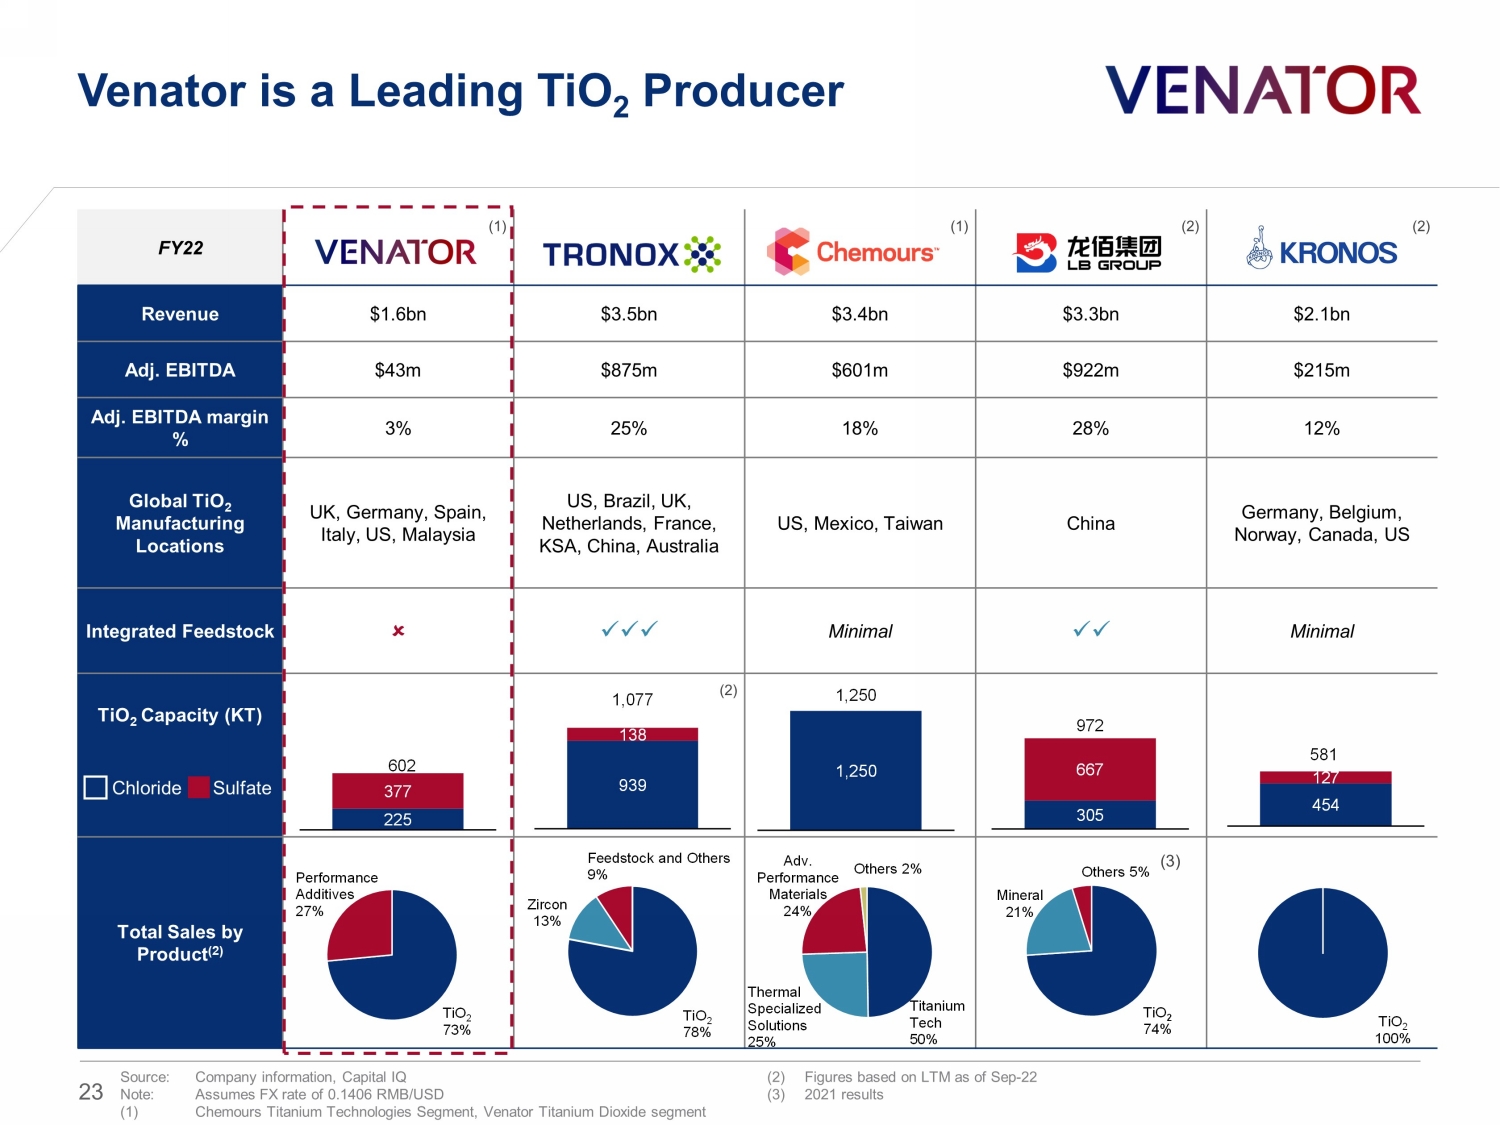
FY22 (1) (1) (2) (2) Revenue $1.6bn $3.5bn $3.4bn $3.3bn $2.1bn Adj. EBITDA $43m $875m $601m $922m $215m Adj. EBITDA margin % 3% 25% 18% 28% 12% Global TiO 2 Manufacturing Locations UK, Germany, Spain, Italy, US, Malaysia US, Brazil, UK, Netherlands, France, KSA, China, Australia US, Mexico, Taiwan China Germany, Belgium, Norway, Canada, US Integrated Feedstock xxx Minimal xx Minimal TiO 2 Capacity (KT) (2) Total Sales by Product (2) Venator is a Leading TiO 2 Producer Chloride Sulfate (3) 305 667 972 454 127 581 Source: Company information, Capital IQ Note: Assumes FX rate of 0.1406 RMB/USD (1) Chemours Titanium Technologies Segment, Venator Titanium Dioxide segment (2) Figures based on LTM as of Sep - 22 (3) 2021 results 939 138 1,077 TiO 2 74% Mineral 21% Others 5% TiO 2 100% 225 377 602 TiO 2 73% Performance Additives 27% 1,250 1,250 Titanium Tech 50% Thermal Specialized Solutions 25% Adv. Performance Materials 24% Others 2% TiO 2 78% Zircon 13% Feedstock and Others 9% 23
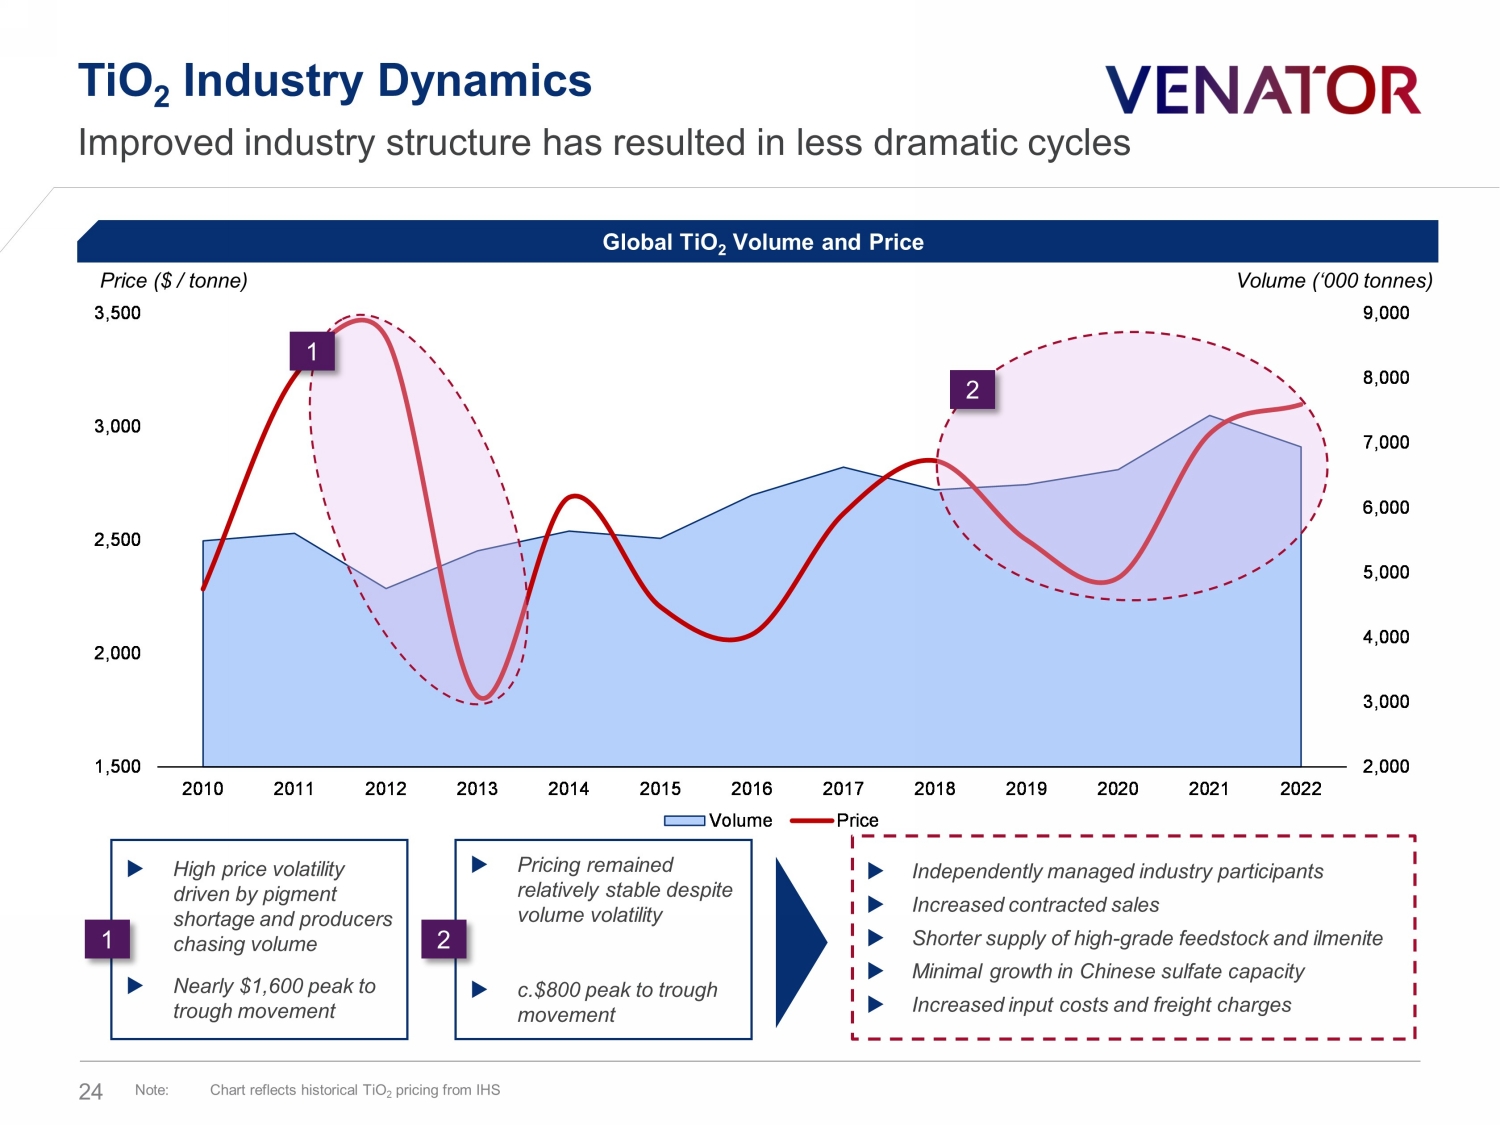
2,000 3,000 4,000 5,000 6,000 7,000 8,000 9,000 1,500 2,000 2,500 3,000 3,500 2010 2011 2012 2013 2014 2015 2016 2017 2018 2019 2020 2021 2022 Volume Price TiO 2 Industry Dynamics Improved industry structure has resulted in less dramatic cycles Note: Chart reflects historical TiO 2 pricing from IHS Global TiO 2 Volume and Price 1 2 High price volatility driven by pigment shortage and producers chasing volume Nearly $1,600 peak to trough movement 1 Pricing remained relatively stable despite volume volatility c.$800 peak to trough movement 2 Independently managed industry participants Increased contracted sales Shorter supply of high - grade feedstock and ilmenite Minimal growth in Chinese sulfate capacity Increased input costs and freight charges Price ($ / tonne) Volume (‘000 tonnes) 24
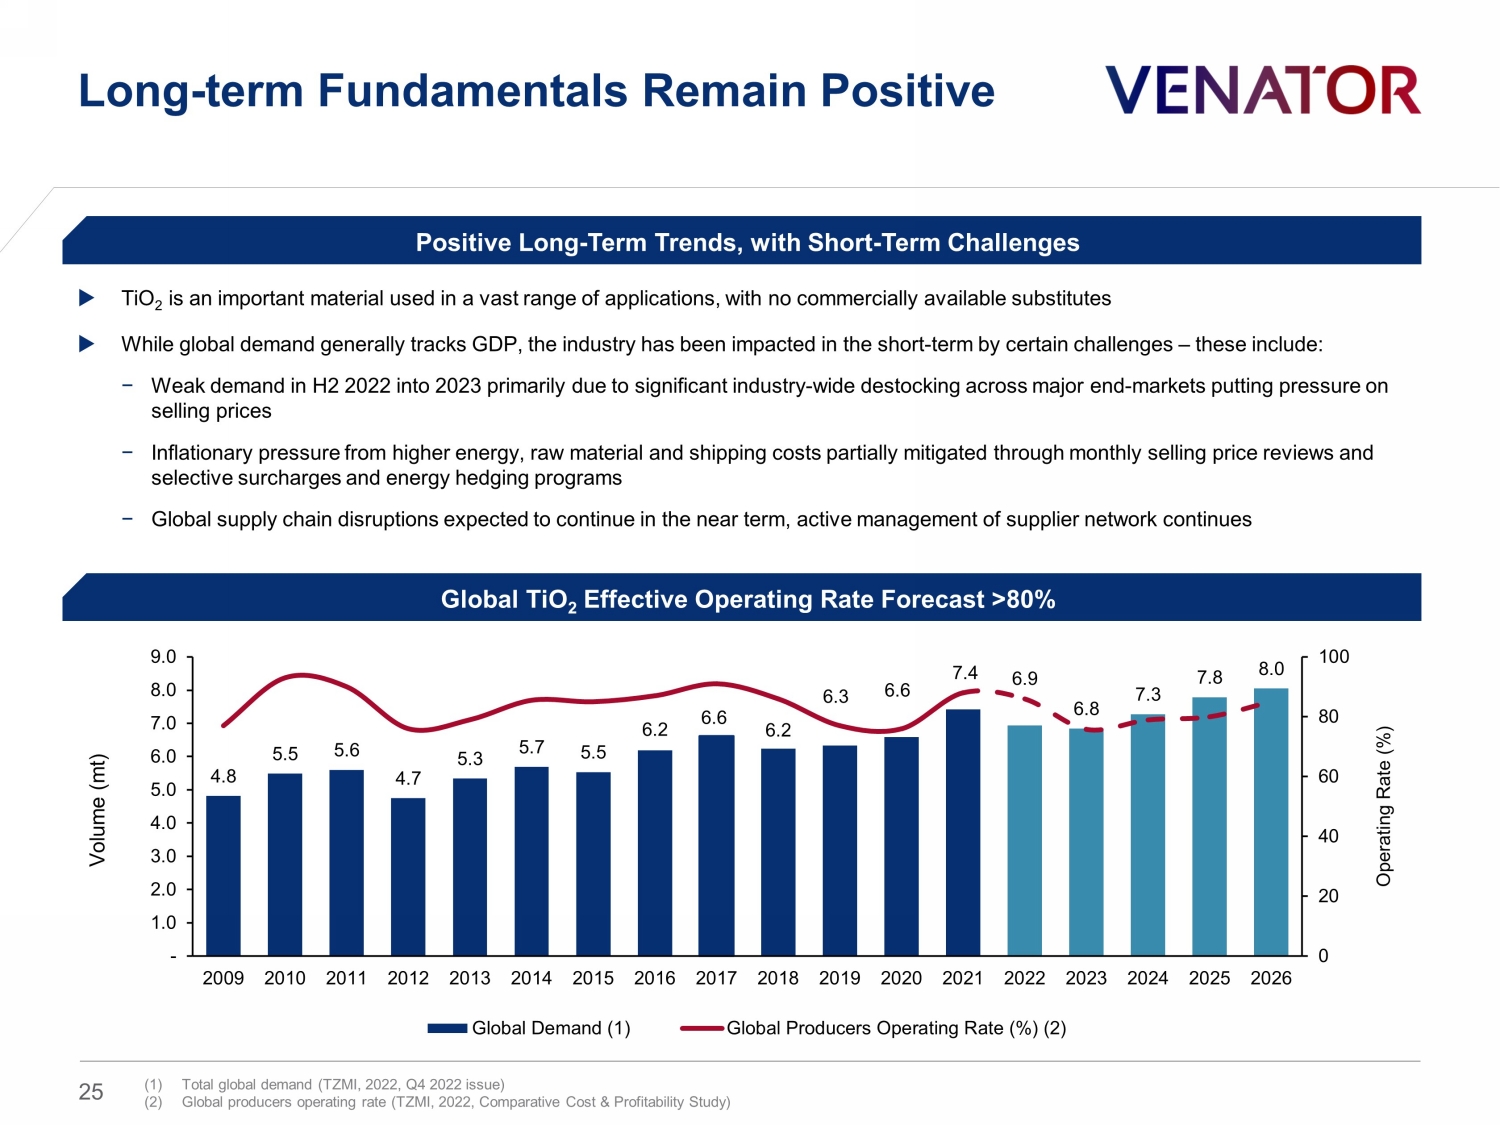
Long - term Fundamentals Remain Positive Global TiO 2 Effective Operating Rate Forecast >80% Positive Long - Term Trends, with Short - Term Challenges TiO 2 is an important material used in a vast range of applications, with no commercially available substitutes While global demand generally tracks GDP , the industry has been impacted in the short - term by certain challenges – these include: − Weak demand in H2 2022 into 2023 primarily due to significant industry - wide destocking across major end - markets putting pressure on selling prices − Inflationary pressure from higher energy, raw material and shipping costs partially mitigated through monthly selling price reviews and selective surcharges and energy hedging programs − Global supply chain disruptions expected to continue in the near term, active management of supplier network continues 4.8 5.5 5.6 4.7 5.3 5.7 5.5 6.2 6.6 6.2 6.3 6.6 7.4 6.9 6.8 7.3 7.8 8.0 0 20 40 60 80 100 - 1.0 2.0 3.0 4.0 5.0 6.0 7.0 8.0 9.0 2009 2010 2011 2012 2013 2014 2015 2016 2017 2018 2019 2020 2021 2022 2023 2024 2025 2026 Operating Rate (%) Volume ( m t ) Global Demand (1) Global Producers Operating Rate (%) (2) (1) Total global demand (TZMI , 2022, Q4 2022 issue) (2) Global producers operating rate (TZMI, 2022, Comparative Cost & Profitability Study ) 25
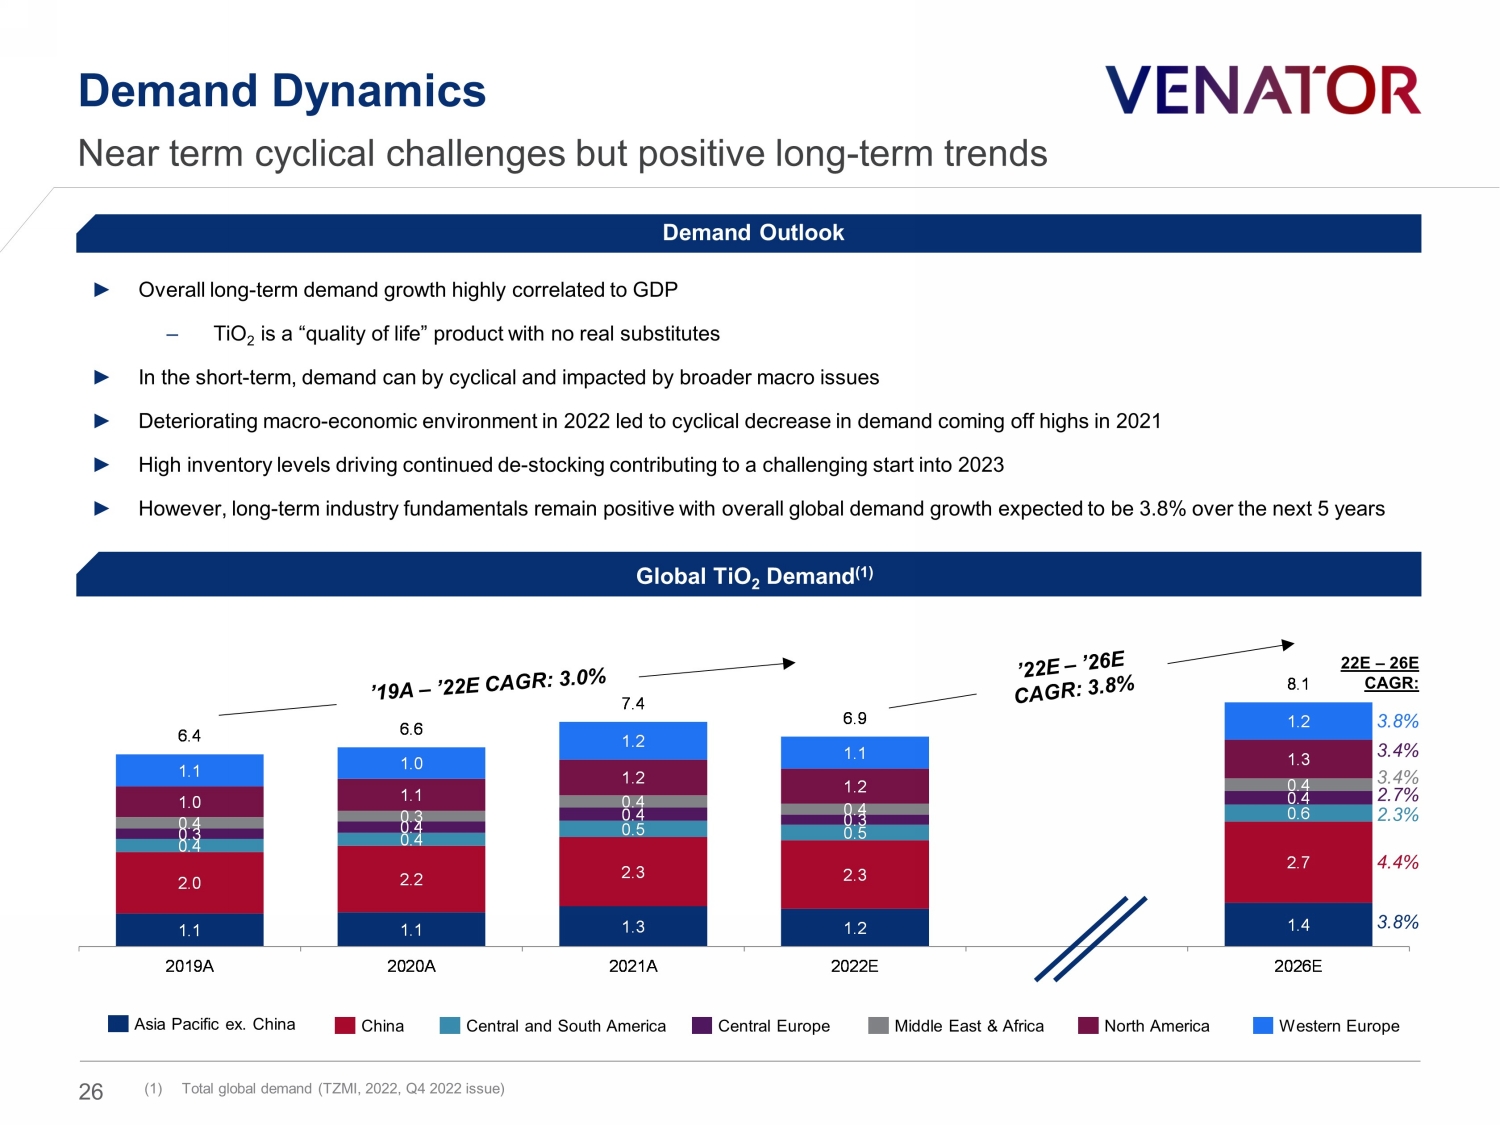
1.1 1.1 1.3 1.2 1.4 2.0 2.2 2.3 2.3 2.7 0.4 0.4 0.5 0.5 0.6 0.3 0.4 0.4 0.3 0.4 0.4 0.3 0.4 0.4 0.4 1.0 1.1 1.2 1.2 1.3 1.1 1.0 1.2 1.1 1.2 6.4 6.6 7.4 6.9 8.1 2019A 2020A 2021A 2022E 2026E Demand Dynamics Near term cyclical challenges but positive long - term trends ► Overall long - term demand growth highly correlated to GDP – TiO 2 is a “quality of life” product with no real substitutes ► In the short - term, demand can by cyclical and impacted by broader macro issues ► Deteriorating macro - economic environment in 2022 led to cyclical decrease in demand coming off highs in 2021 ► High inventory levels driving continued de - stocking contributing to a challenging start into 2023 ► However, long - term industry fundamentals remain positive with overall global demand growth expected to be 3.8% over the next 5 y ears 22E – 26E CAGR: 3.8% 2.7% 4.4% 3.8% Asia Pacific ex. China China Central and South America Central Europe Middle East & Africa North America Western Europe (1) Total global demand (TZMI , 2022, Q4 2022 issue) Demand Outlook Global TiO 2 Demand (1) 2.3% 3.4% 3.4% 26
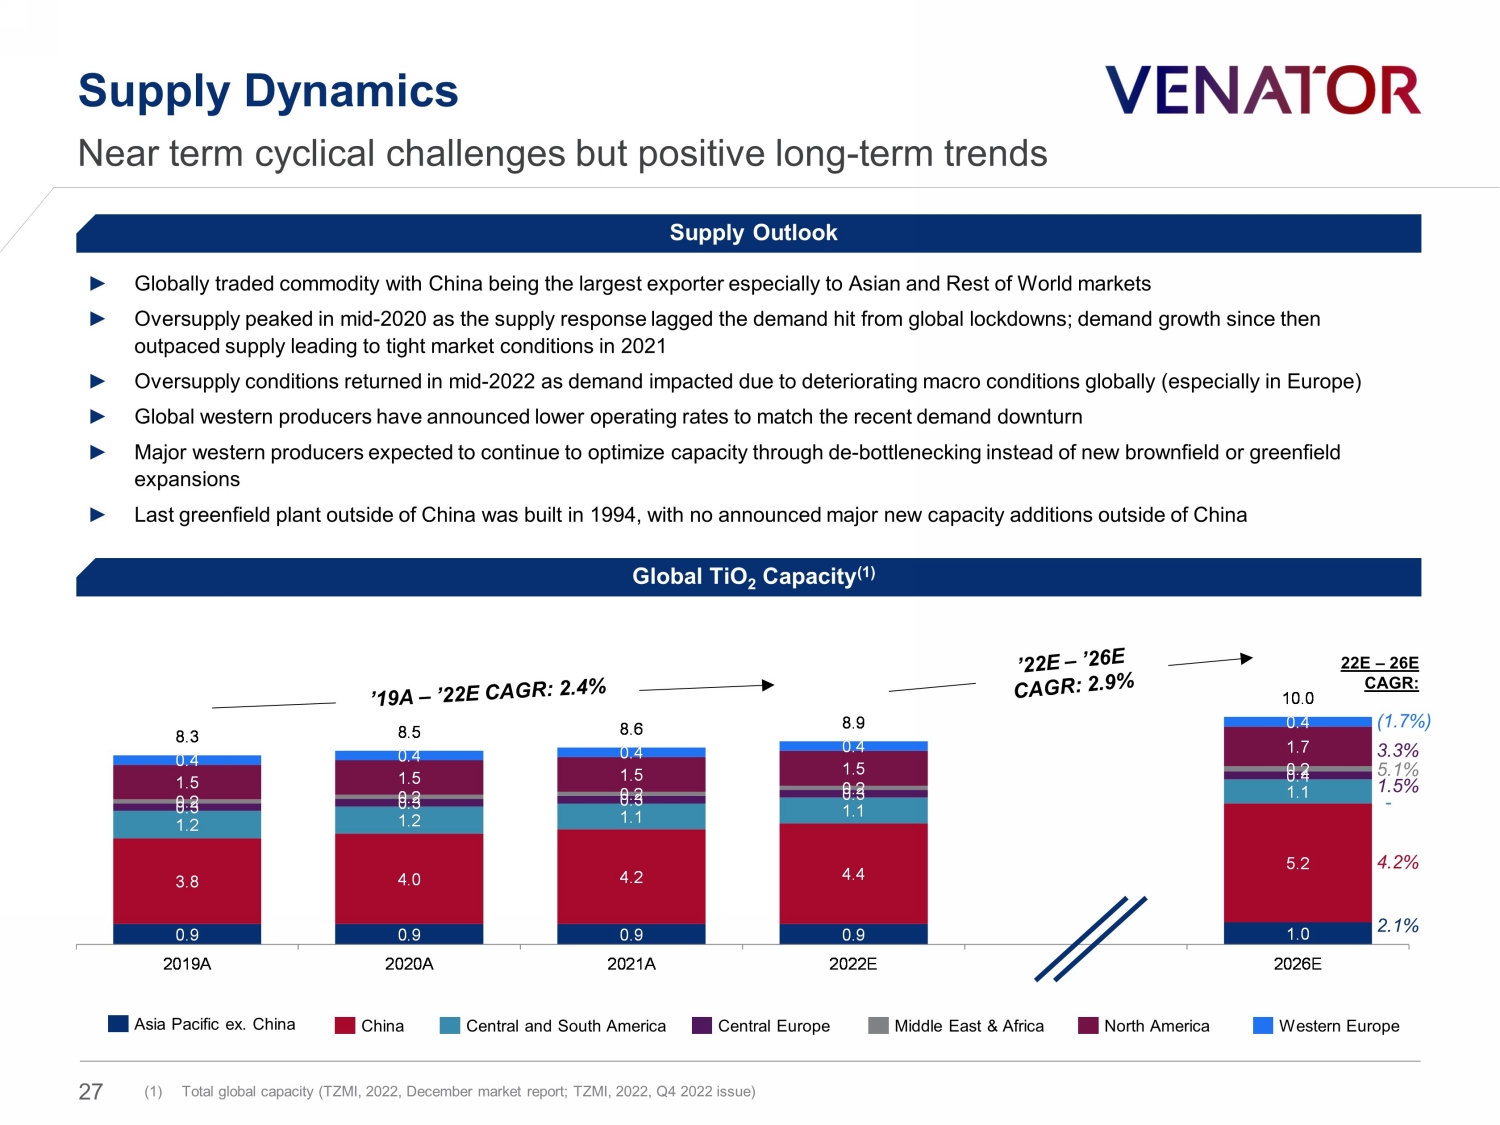
Supply Dynamics Near term cyclical challenges but positive long - term trends (1) Total global capacity (TZMI, 2022, December market report; TZMI, 2022, Q4 2022 issue) Supply Outlook ► Globally traded commodity with China being the largest exporter especially to Asian and Rest of World markets ► Oversupply peaked in mid - 2020 as the supply response lagged the demand hit from global lockdowns; demand growth since then outpaced supply leading to tight market conditions in 2021 ► Oversupply conditions returned in mid - 2022 as demand impacted due to deteriorating macro conditions globally (especially in Euro pe) ► Global western producers have announced lower operating rates to match the recent demand downturn ► Major western producers expected to continue to optimize capacity through de - bottlenecking instead of new brownfield or greenfie ld expansions ► Last greenfield plant outside of China was built in 1994, with no announced major new capacity additions outside of China Global TiO 2 Capacity (1) Asia Pacific ex. China China Central and South America Central Europe Middle East & Africa North America Western Europe 0.9 0.9 0.9 0.9 1.0 3.8 4.0 4.2 4.4 5.2 1.2 1.2 1.1 1.1 1.1 0.3 0.3 0.3 0.3 0.4 0.2 0.2 0.2 0.2 0.2 1.5 1.5 1.5 1.5 1.7 0.4 0.4 0.4 0.4 0.4 8.3 8.5 8.6 8.9 10.0 2019A 2020A 2021A 2022E 2026E 22E – 26E CAGR: ( 1.7%) 1.5% 4.2% 2.1% - 5.1% 3.3% 27
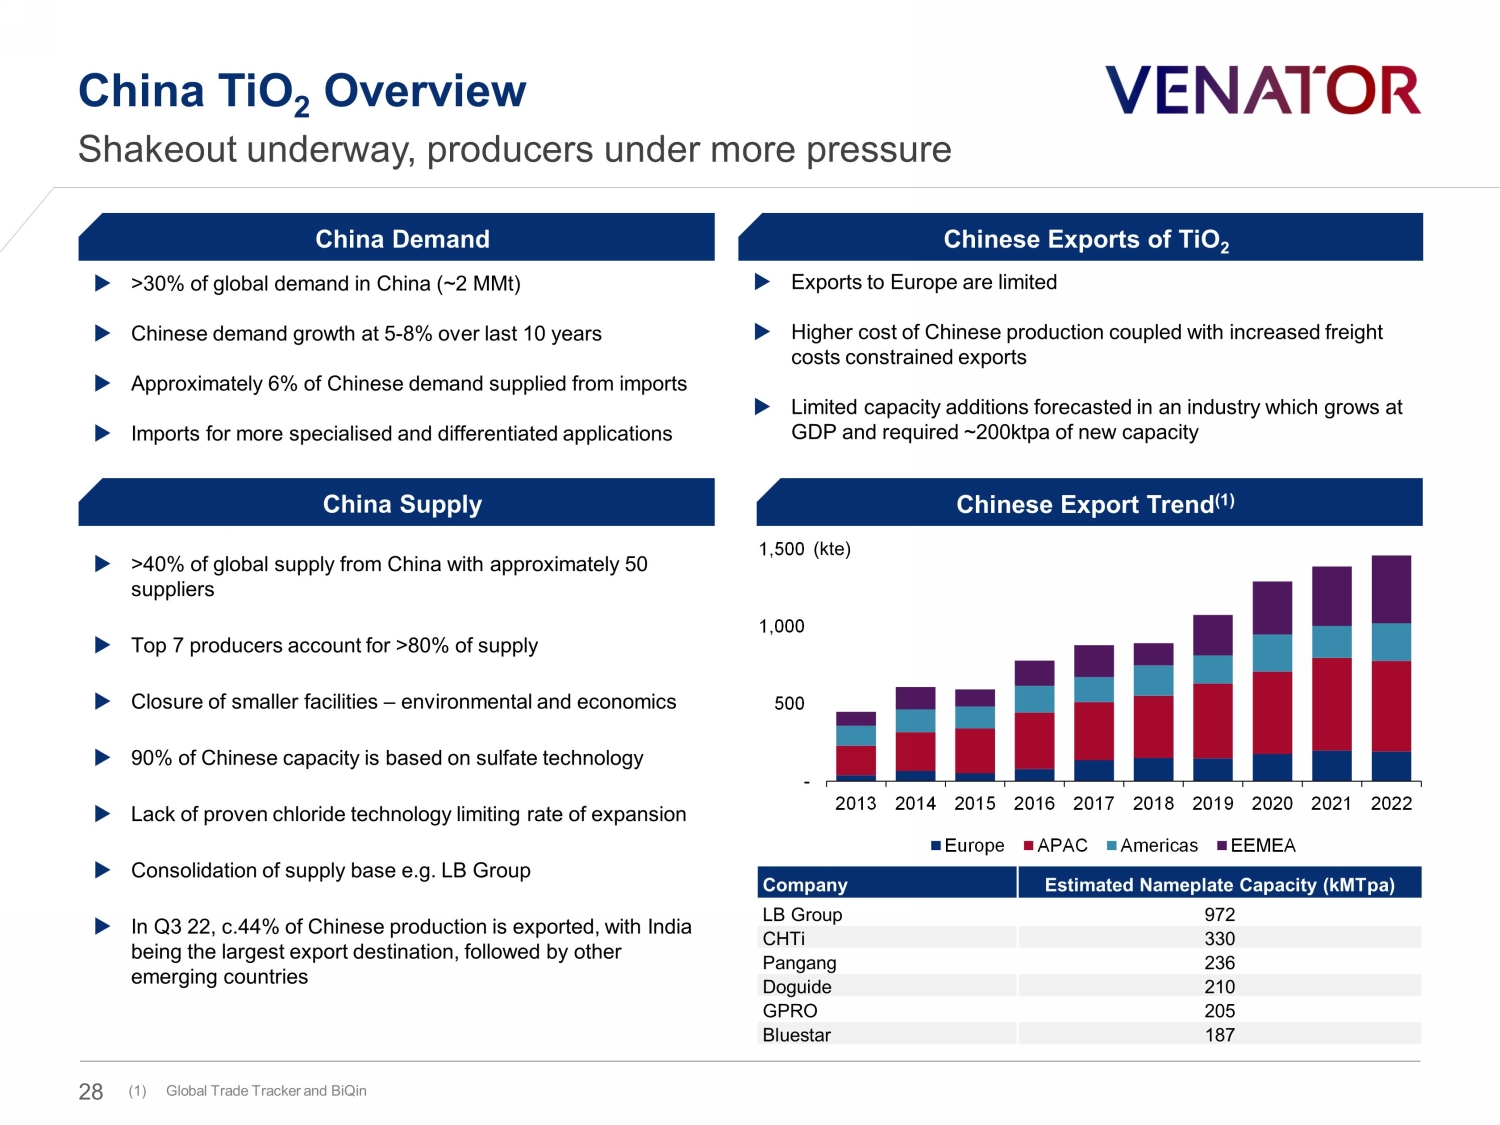
China TiO 2 Overview > 30 % of global demand in China (~2 MMt ) Chinese demand growth at 5 - 8% over last 10 years Approximately 6% of Chinese demand supplied from imports Imports for more specialised and differentiated applications Company Estimated Nameplate Capacity ( kMTpa ) LB Group 972 CHTi 330 Pangang 236 Doguide 210 GPRO 205 Bluestar 187 China Demand China Supply Shakeout underway , producers under more pressure Chinese Exports of TiO 2 Exports to Europe are limited Higher cost of Chinese production coupled with increased freight costs constrained exports Limited capacity additions forecasted in an industry which grows at GDP and required ~200ktpa of new capacity Chinese Export Trend (1) ( kte ) > 40% of global supply from China with approximately 50 suppliers Top 7 producers account for >80% of supply Closure of smaller facilities – environmental and economics 90% of Chinese capacity is based on sulfate technology Lack of proven chloride technology limiting rate of expansion Consolidation of supply base e.g. LB Group In Q3 22, c.44% of Chinese production is exported, with India being the largest export destination, followed by other emerging countries (1) Global Trade Tracker and BiQin - 500 1,000 1,500 2013 2014 2015 2016 2017 2018 2019 2020 2021 2022 Europe APAC Americas EEMEA 28
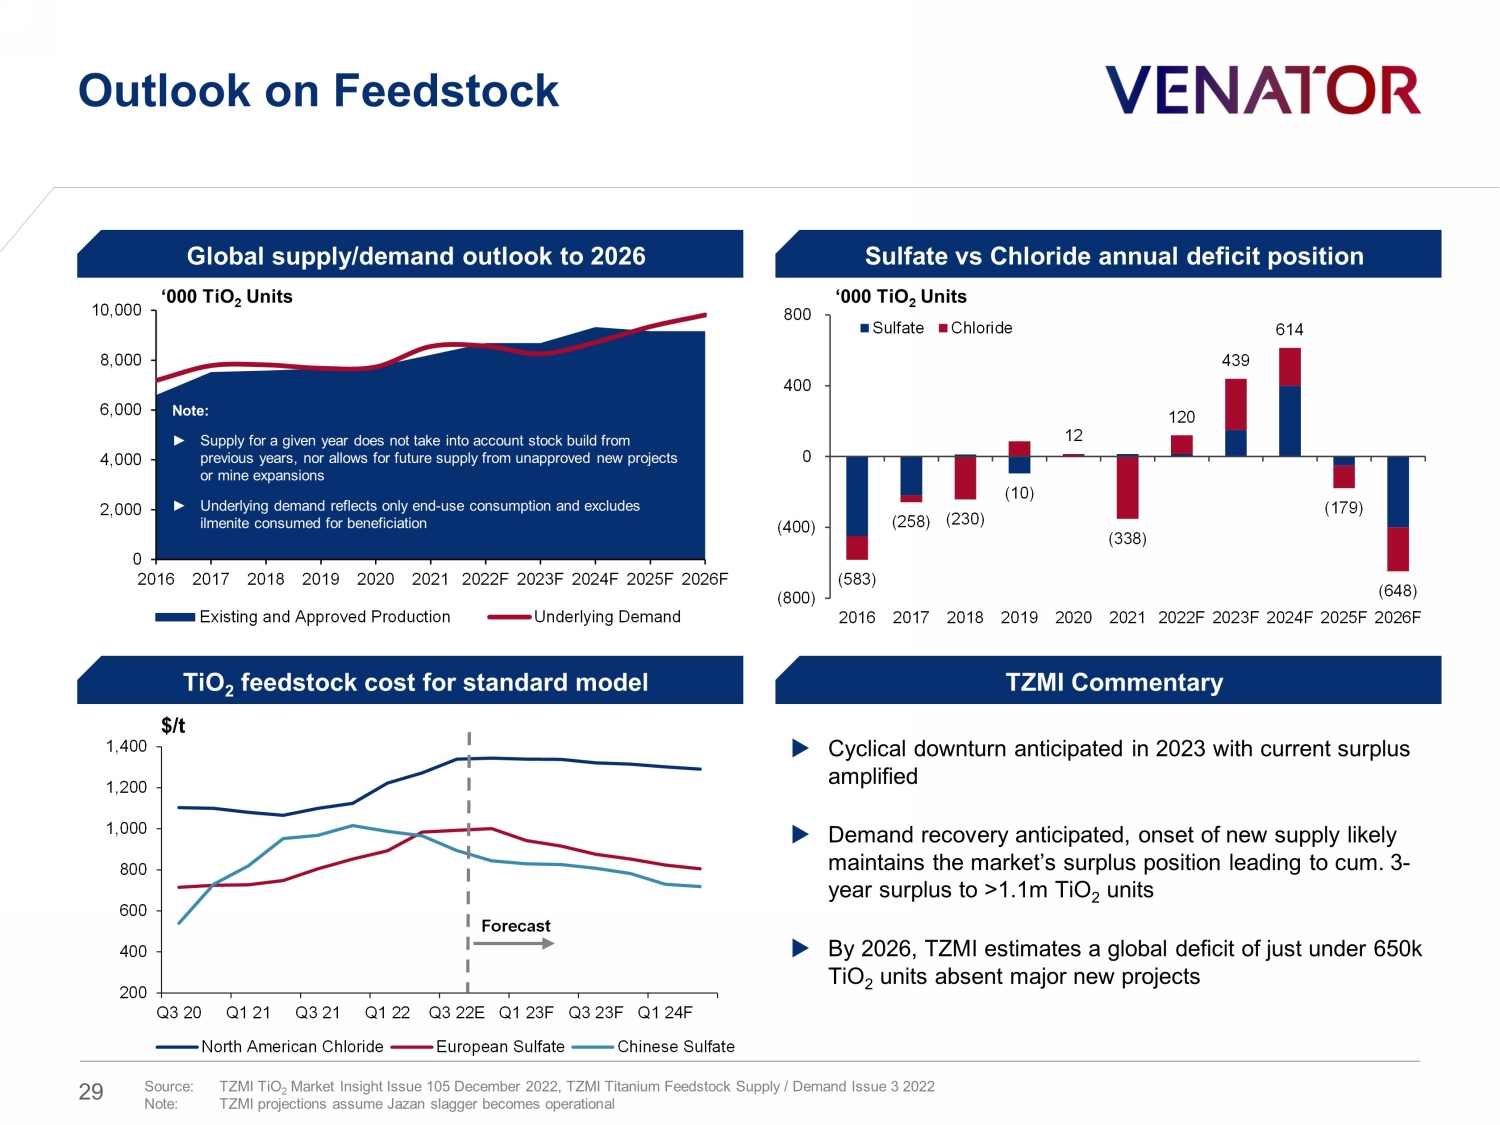
0 2,000 4,000 6,000 8,000 10,000 2016 2017 2018 2019 2020 2021 2022F 2023F 2024F 2025F 2026F Existing and Approved Production Underlying Demand Outlook on Feedstock ‘000 TiO 2 Units Note: ► Supply for a given year does not take into account stock build from previous years, nor allows for future supply from unapproved new projects or mine expansions ► Underlying demand reflects only end - use consumption and excludes ilmenite consumed for beneficiation Source: TZMI TiO 2 Market Insight Issue 105 December 2022, TZMI Titanium Feedstock Supply / Demand Issue 3 2022 Note : TZMI projections assume Jazan slagger becomes operational $/t Global supply/demand outlook to 2026 Sulfate vs Chloride annual deficit position TiO 2 feedstock cost for standard model TZMI Commentary Cyclical downturn anticipated in 2023 with current surplus amplified Demand recovery anticipated, onset of new supply likely maintains the market’s surplus position leading to cum. 3 - year surplus to >1.1m TiO 2 units By 2026, TZMI estimates a global deficit of just under 650k TiO 2 units absent major new projects ‘000 TiO 2 Units 200 400 600 800 1,000 1,200 1,400 Q3 20 Q1 21 Q3 21 Q1 22 Q3 22E Q1 23F Q3 23F Q1 24F North American Chloride European Sulfate Chinese Sulfate Forecast (583) (258) (230) (10) 12 (338) 120 439 614 (179) (648) (800) (400) 0 400 800 2016 2017 2018 2019 2020 2021 2022F 2023F 2024F 2025F 2026F Sulfate Chloride 29
Venator Business Overview – Performance Additives 30
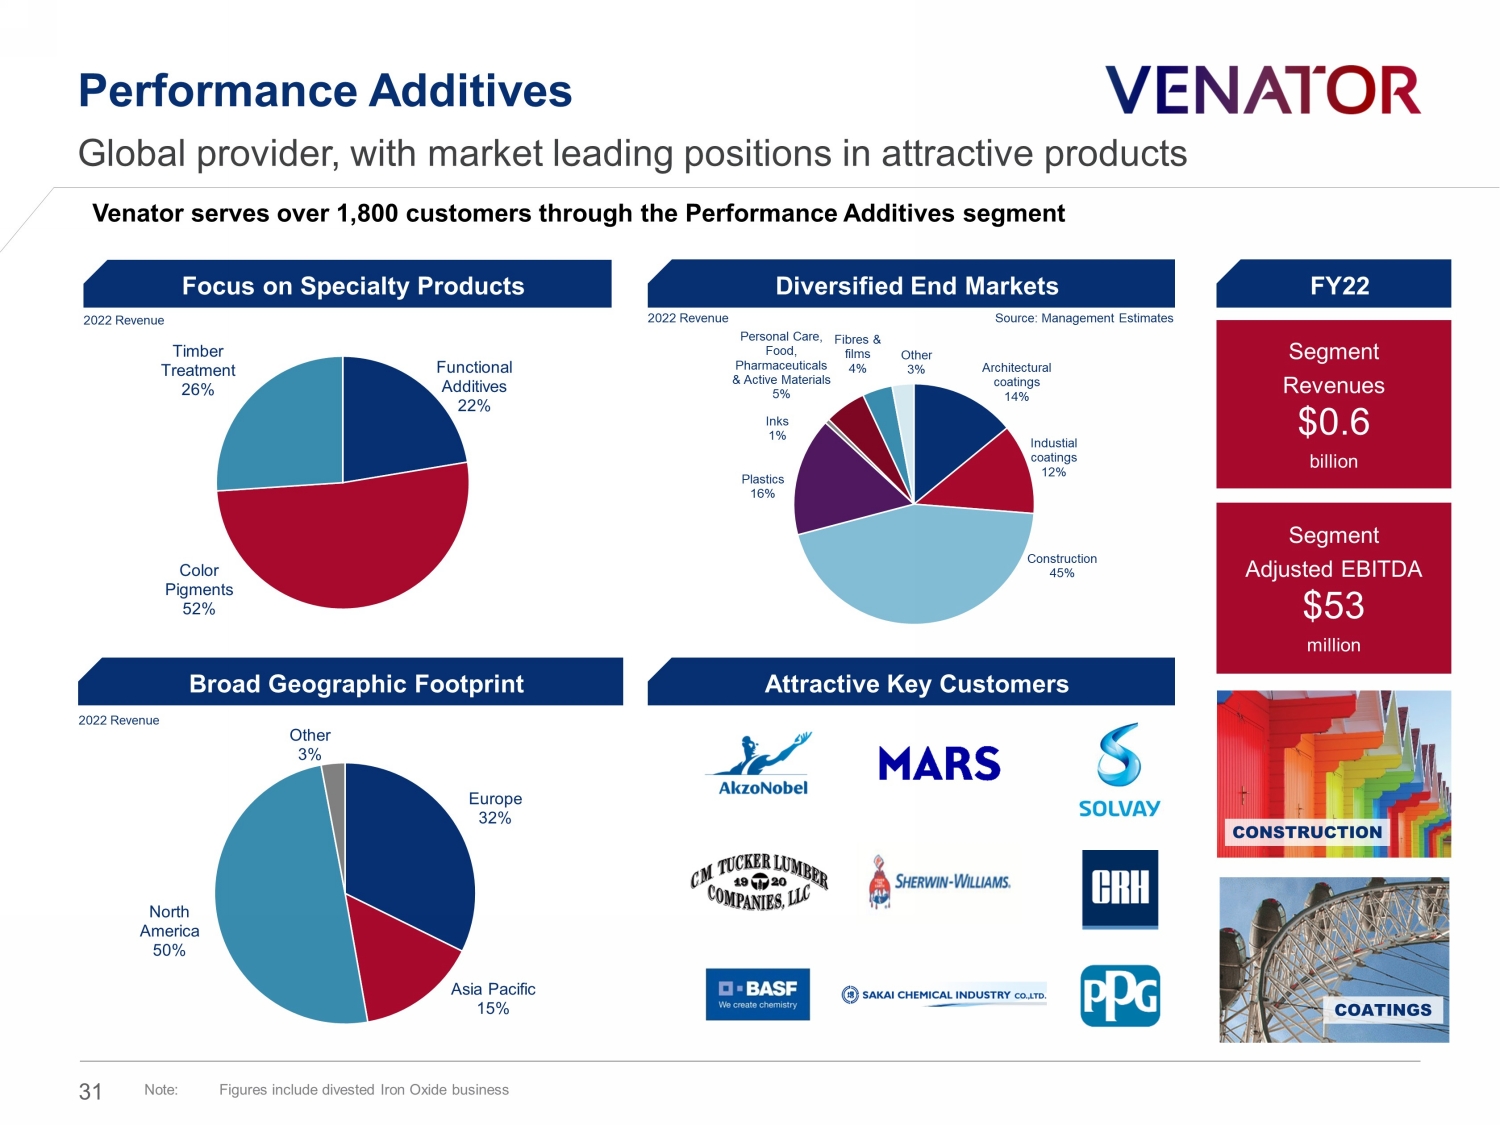
Segment Revenues $0.6 billion Segment Adjusted EBITDA $ 53 million CONSTRUCTION COATINGS FY22 Architectural coatings 14% Industial coatings 12% Construction 45% Plastics 16% Inks 1% Personal Care, Food, Pharmaceuticals & Active Materials 5% Fibres & films 4% Other 3% Functional Additives 22% Color Pigments 52% Timber Treatment 26% Venator serves over 1,800 customers through the Performance Additives segment Performance Additives Global provider, with market leading positions in attractive products Europe 32% Asia Pacific 15% North America 50% Other 3% 2022 Revenue Source: Management Estimates 2022 Revenue Focus on Specialty Products Diversified End Markets Broad Geographic Footprint Attractive Key Customers 2022 Revenue 31 Note : Figures include divested Iron Oxide business
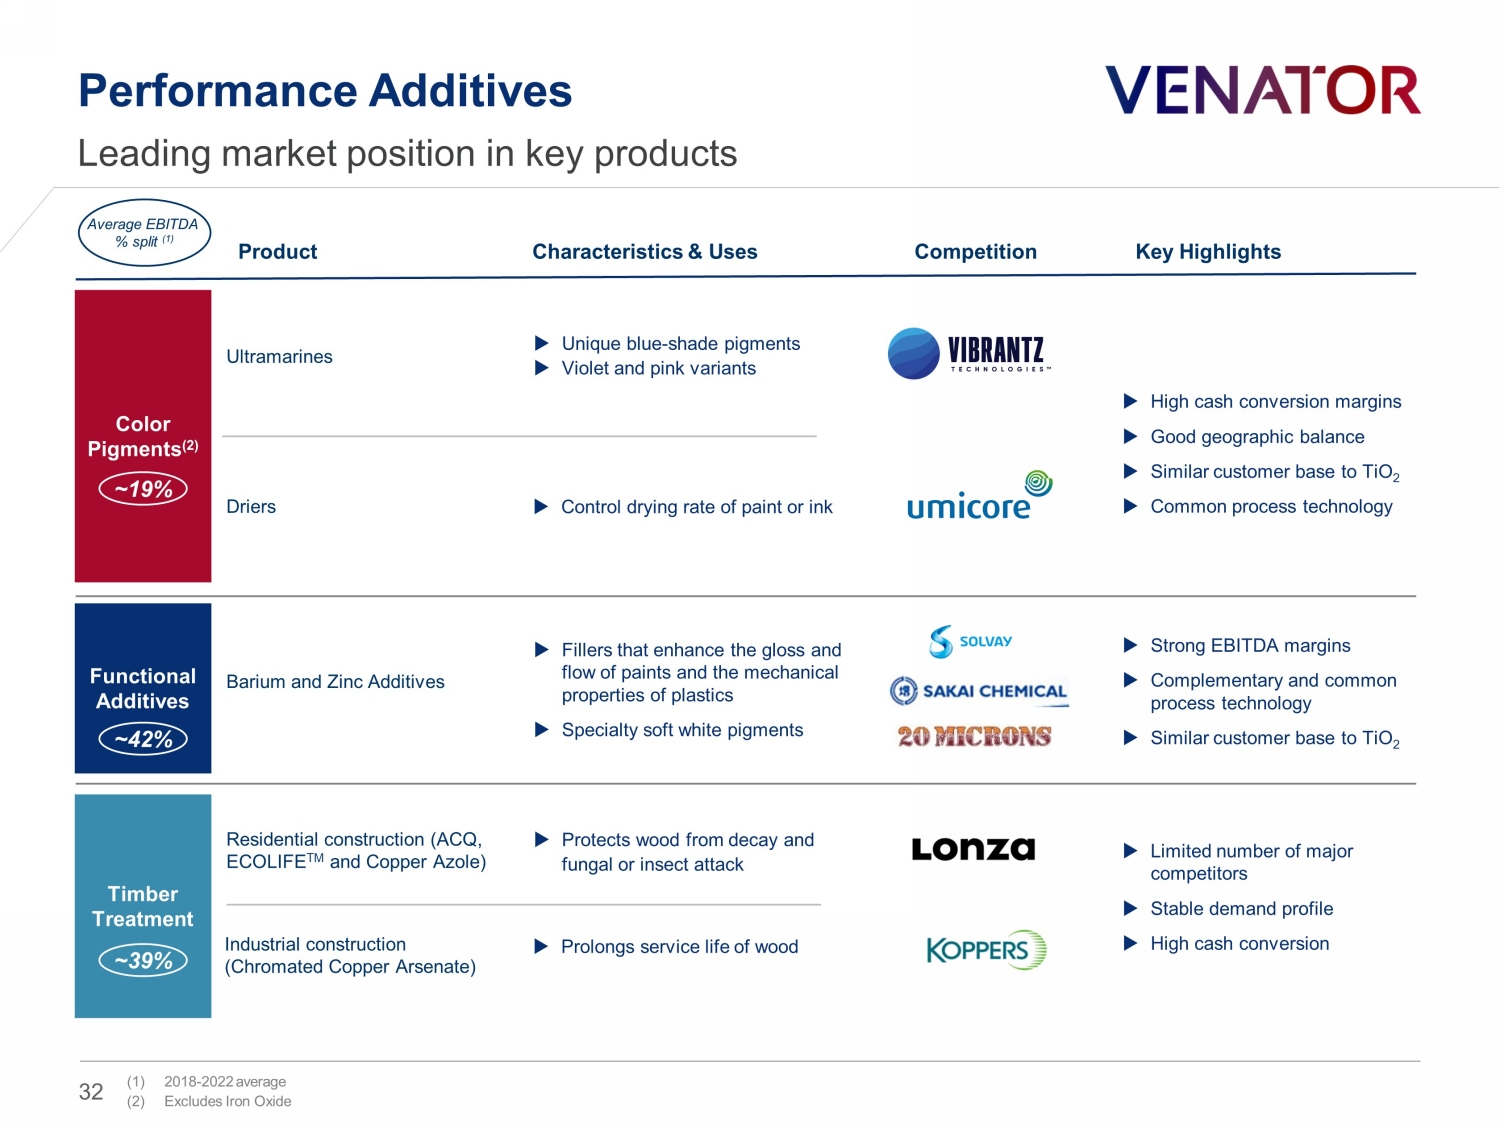
Functional Additives Performance Additives Leading market position in key products Residential construction (ACQ, ECOLIFE TM and Copper Azole) Protects wood from decay and fungal or insect attack Industrial construction (Chromated Copper Arsenate) Prolongs service life of wood Unique blue - shade pigments Violet and pink variants Ultramarines Driers Control drying rate of paint or ink Color Pigments (2) Timber Treatment Barium and Zinc Additives Fillers that enhance the gloss and flow of paints and the mechanical properties of plastics Specialty soft white pigments Product Characteristics & Uses Competition Key Highlights ~42% ~19% ~39% Average EBITDA % split (1) Strong EBITDA margins Complementary and common process technology Similar customer base to TiO 2 High cash conversion margins Good geographic balance Similar customer base to TiO 2 Common process technology Limited number of major competitors Stable demand profile High cash conversion (1) 2018 - 2022 average (2) Excludes Iron Oxide 32
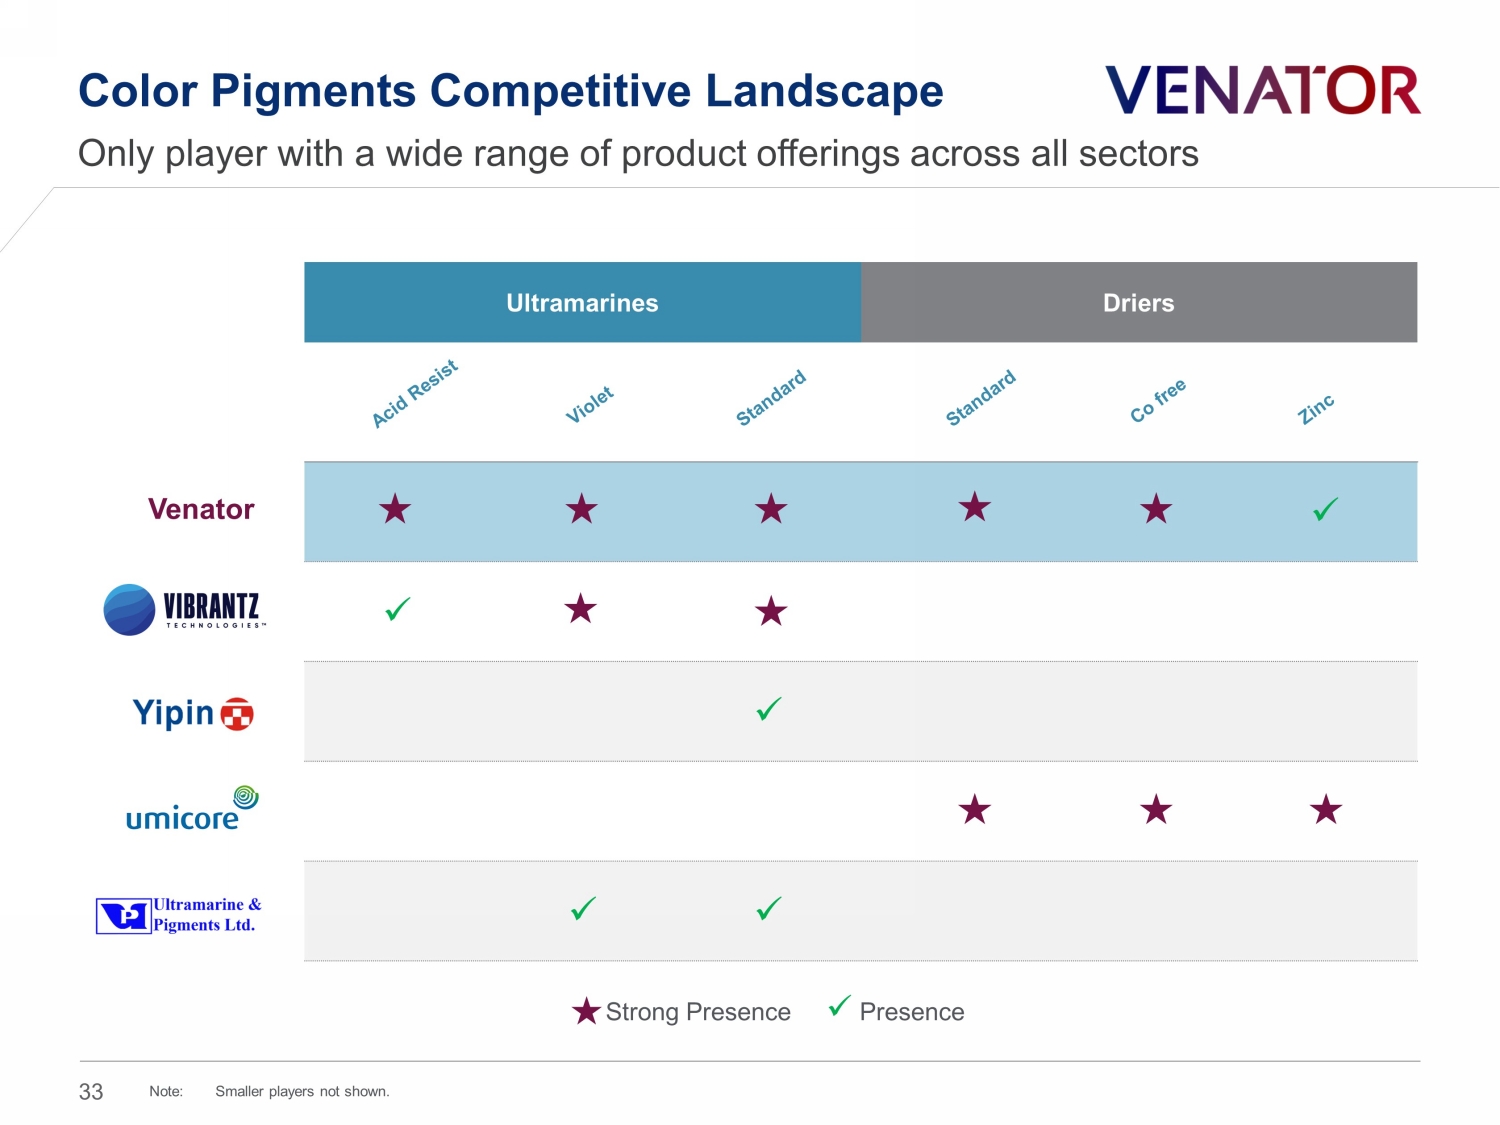
Ultramarines Driers x x x x x Color Pigments Competitive Landscape Only player with a wide range of product offerings across all sectors Strong Presence x Presence Venator Note: Smaller players not shown. 33
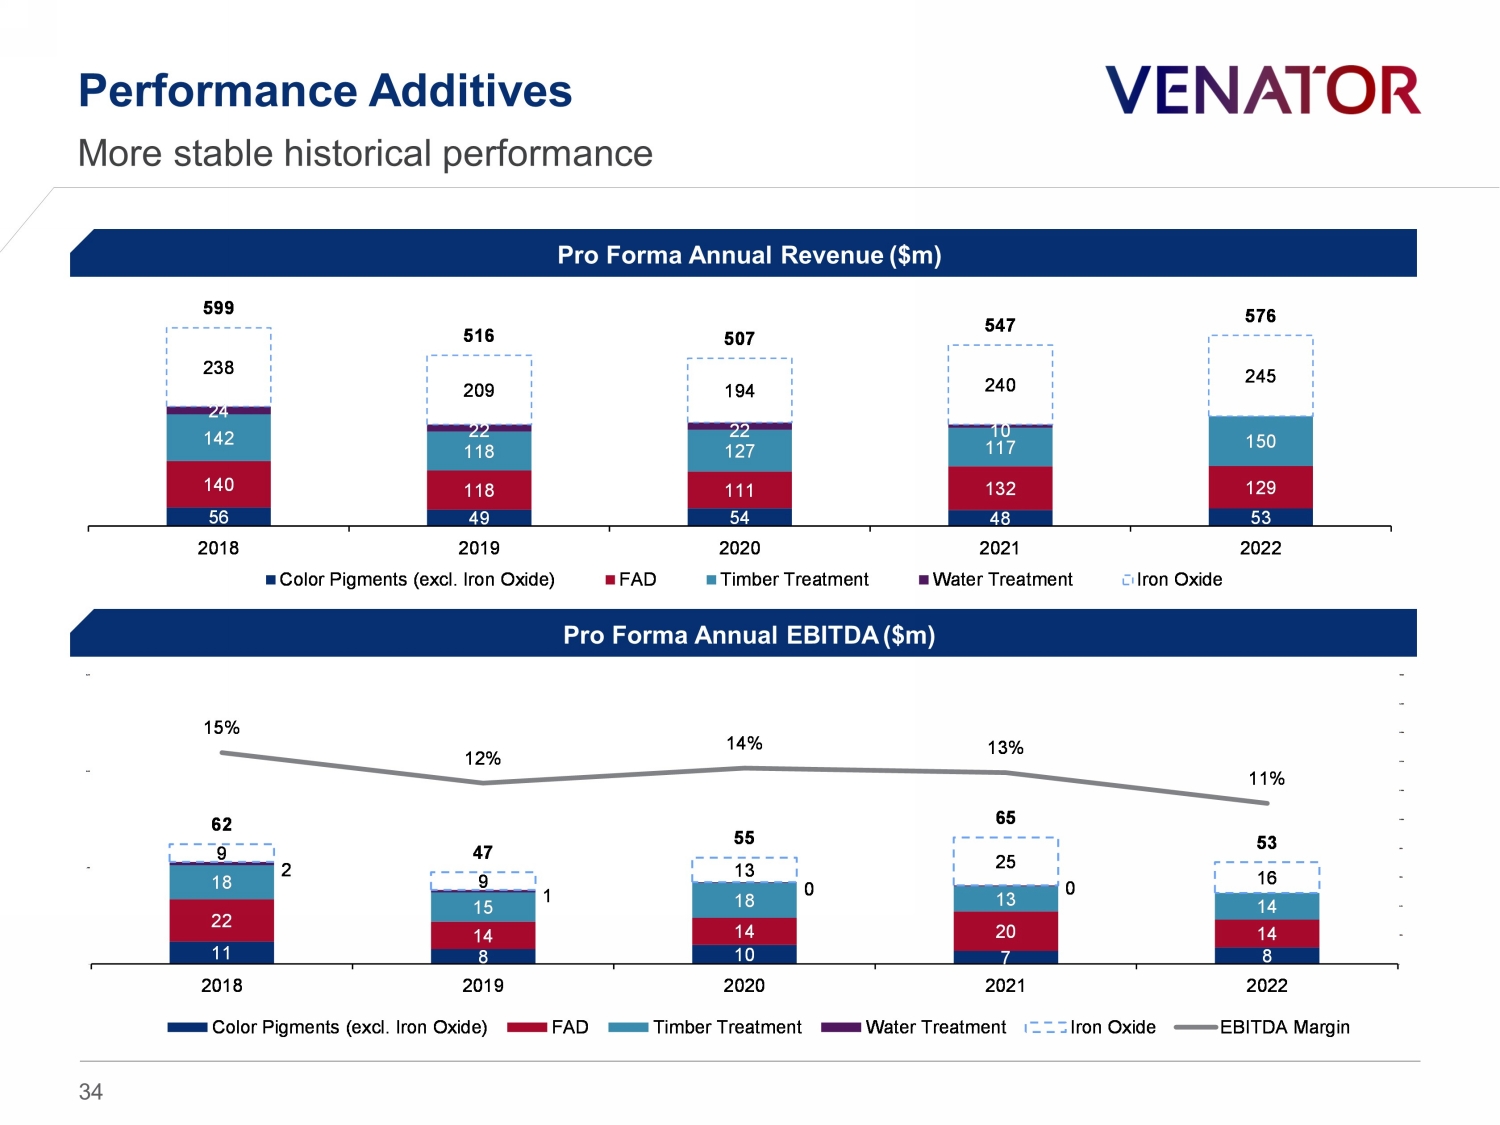
Pro Forma Annual Revenue ($m) Performance Additives 34 More stable historical performance Pro Forma Annual EBITDA ($m) 56 49 54 48 53 140 118 111 132 129 142 118 127 117 150 24 22 22 10 238 209 194 240 245 599 516 507 547 576 2018 2019 2020 2021 2022 Color Pigments (excl. Iron Oxide) FAD Timber Treatment Water Treatment Iron Oxide 11 8 10 7 8 22 14 14 20 14 18 15 18 13 14 2 1 0 0 9 9 13 25 16 62 47 55 65 53 15% 12% 14% 13% 11% - 2% 4% 6% 8% 10% 12% 14% 16% 18% 20% - 50 100 150 2018 2019 2020 2021 2022 Color Pigments (excl. Iron Oxide) FAD Timber Treatment Water Treatment Iron Oxide EBITDA Margin
2023 Budget and 5 Year Plan (2023 - 27) 35
Business over the Bridge 36
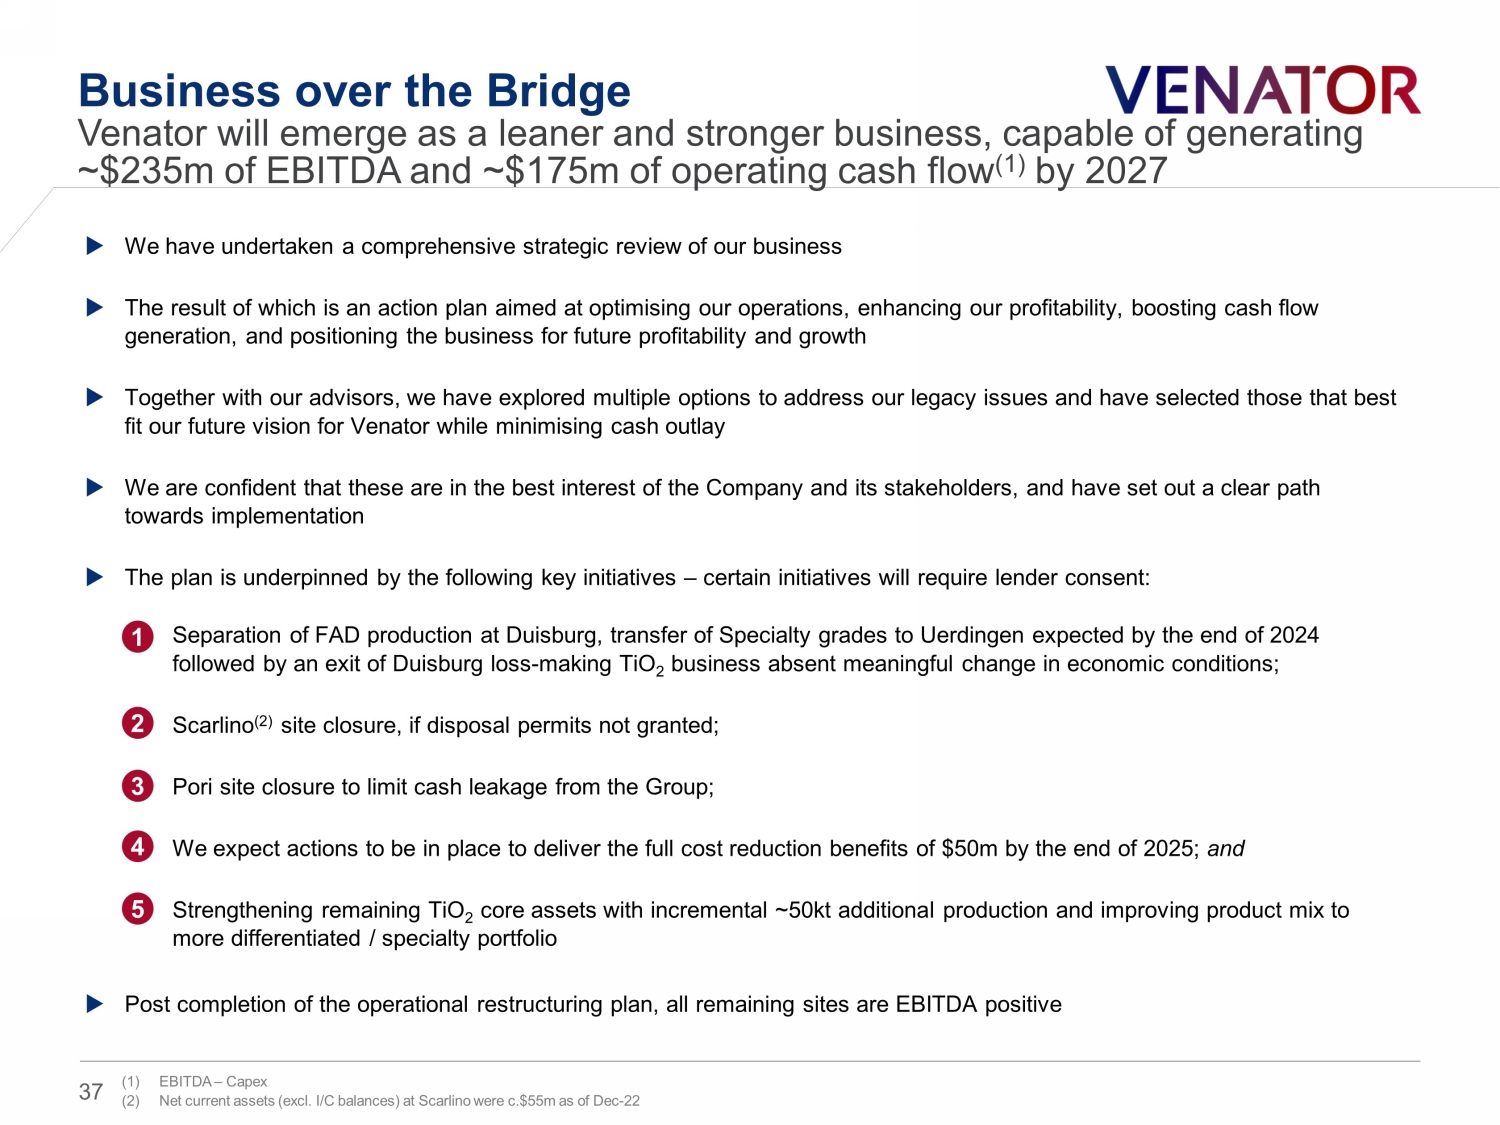
Business over the Bridge We have undertaken a comprehensive strategic review of our business The result of which is an action plan aimed at optimising our operations, enhancing our profitability, boosting cash flow generation, and positioning the business for future profitability and growth Together with our advisors, we have explored multiple options to address our legacy issues and have selected those that best fit our future vision for Venator while minimising cash outlay We are confident that these are in the best interest of the Company and its stakeholders, and have set out a clear path towards implementation The plan is underpinned by the following key initiatives – certain initiatives will require lender consent: ▪ Separation of FAD production at Duisburg, transfer of Specialty grades to Uerdingen expected by the end of 2024 followed by an exit of Duisburg loss - making TiO 2 business absent meaningful change in economic conditions; ▪ Scarlino (2) site closure, if disposal permits not granted; ▪ Pori site closure to limit cash leakage from the Group; ▪ We expect actions to be in place to deliver the full cost reduction benefits of $50m by the end of 2025; and ▪ Strengthening remaining TiO 2 core assets with incremental ~50kt additional production and improving product mix to more differentiated / specialty portfolio Post completion of the operational restructuring plan, all remaining sites are EBITDA positive Venator will emerge as a leaner and stronger business, capable of generating ~$ 235m of EBITDA and ~$ 175m of operating cash flow (1) by 2027 1 2 3 4 (1) EBITDA – Capex (2) Net current assets (excl. I/C balances) at Scarlino were c.$55m as of Dec - 22 37 5

Status Quo Adj. Mini Duisburg TiO 2 - Duisburg EBITDA (93) 22 (71) FAD - Duisburg EBITDA 114 (38) 75 Uerdingen EBITDA 23 68 91 Total EBITDA 43 52 95 Capex (141) 31 (111) Total Restructuring Costs - (100) (100) Net Working Capital Impact (61) 52 (9) Total Cash Flow (159) 35 (125) 2027E EBITDA - Capex 22 18 41 Germany – Operational Restructuring 38 Mini Duisburg to result in c .$41m annual operating cash flow (1) by 2027E Illustrative 2023 - 27E Cumulative Financial Impact ($m) Status Quo: ► Continue operating Duisburg FAD and loss - making TiO 2 business ► Continue operating Uerdingen TiO 2 business Mini Duisburg: ► Retain existing Uerdingen TiO 2 EBITDA ► Strengthen Uerdingen with transfer of Duisburg specialty TiO 2 EBITDA ► Retain FAD business at Duisburg − FAD business to absorb burden of stranded fixed costs at Duisburg ► 2027E EBITDA – capex from remaining Duisburg & Uerdingen business of ~$41m , ~$20m higher than Status Quo ► More economic value creation with significantly higher NPV and IRR 1 2 2 1 (1) EBITDA – Capex
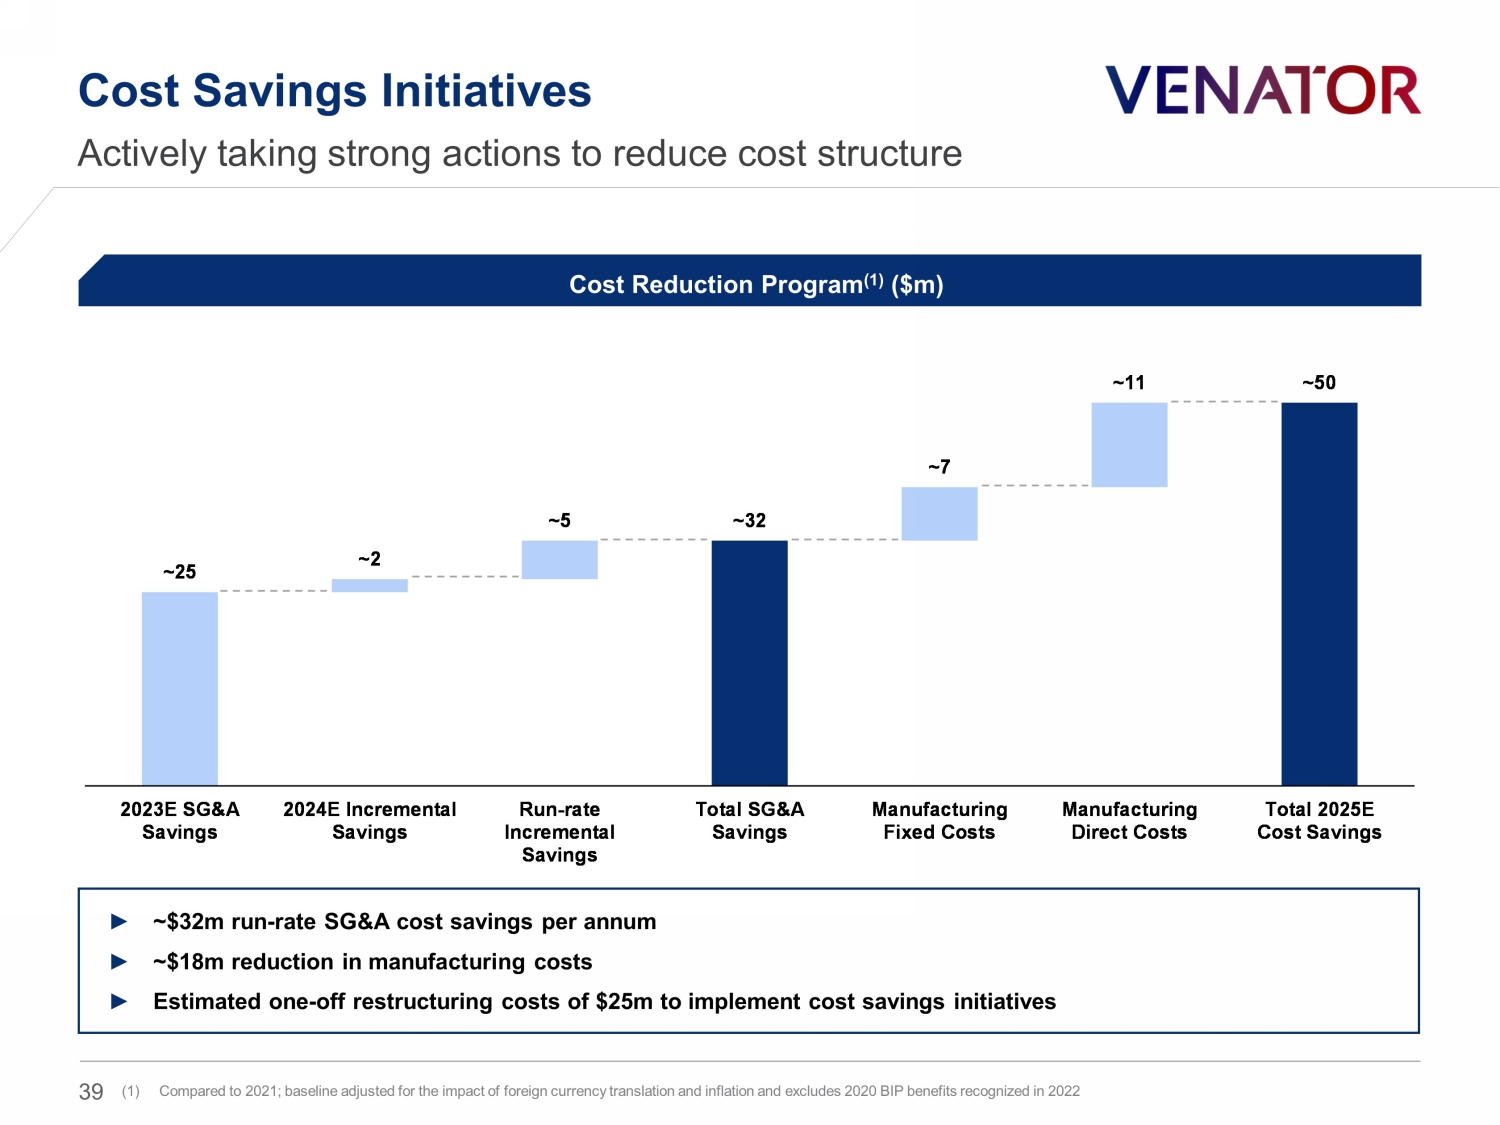
~25 ~2 ~5 ~32 ~7 ~11 ~50 2023E SG&A Savings 2024E Incremental Savings Run-rate Incremental Savings Total SG&A Savings Manufacturing Fixed Costs Manufacturing Direct Costs Total 2025E Cost Savings Cost Savings Initiatives Actively taking strong actions to reduce cost structure ► ~$32m run - rate SG&A cost savings per annum ► ~$18m reduction in manufacturing costs ► Estimated one - off restructuring costs of $25m to implement cost savings initiatives (1) Compared to 2021; baseline adjusted for the impact of foreign currency translation and inflation and excludes 2020 BIP benefits recognized in 2022 39 Cost Reduction Program (1) ($m)
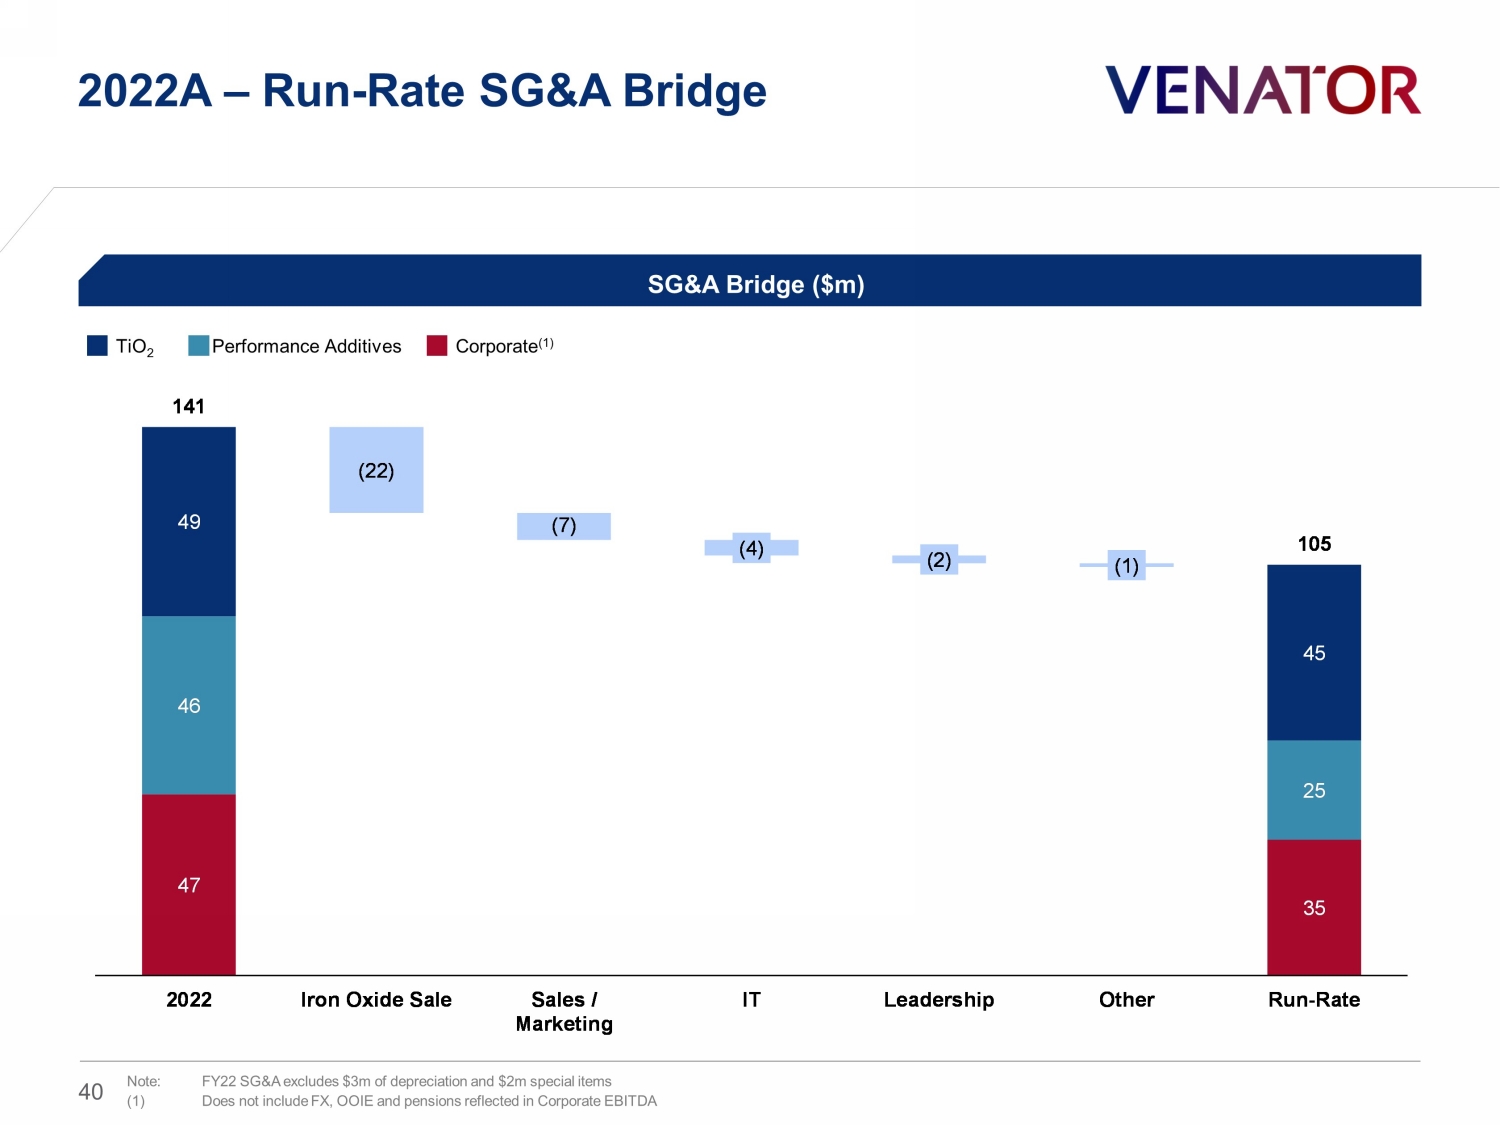
2022A – Run - Rate SG&A Bridge 40 SG&A Bridge ($m) Performance Additives TiO 2 Corporate (1) 47 35 46 25 49 45 141 105 (22) (7) (4) (2) (1) 2022 Iron Oxide Sale Sales / Marketing IT Leadership Other Run-Rate Note: FY22 SG&A excludes $3m of depreciation and $2m special items (1) Does not include FX, OOIE and pensions reflected in Corporate EBITDA
Key Drivers and Assumptions of the Business Plan 41
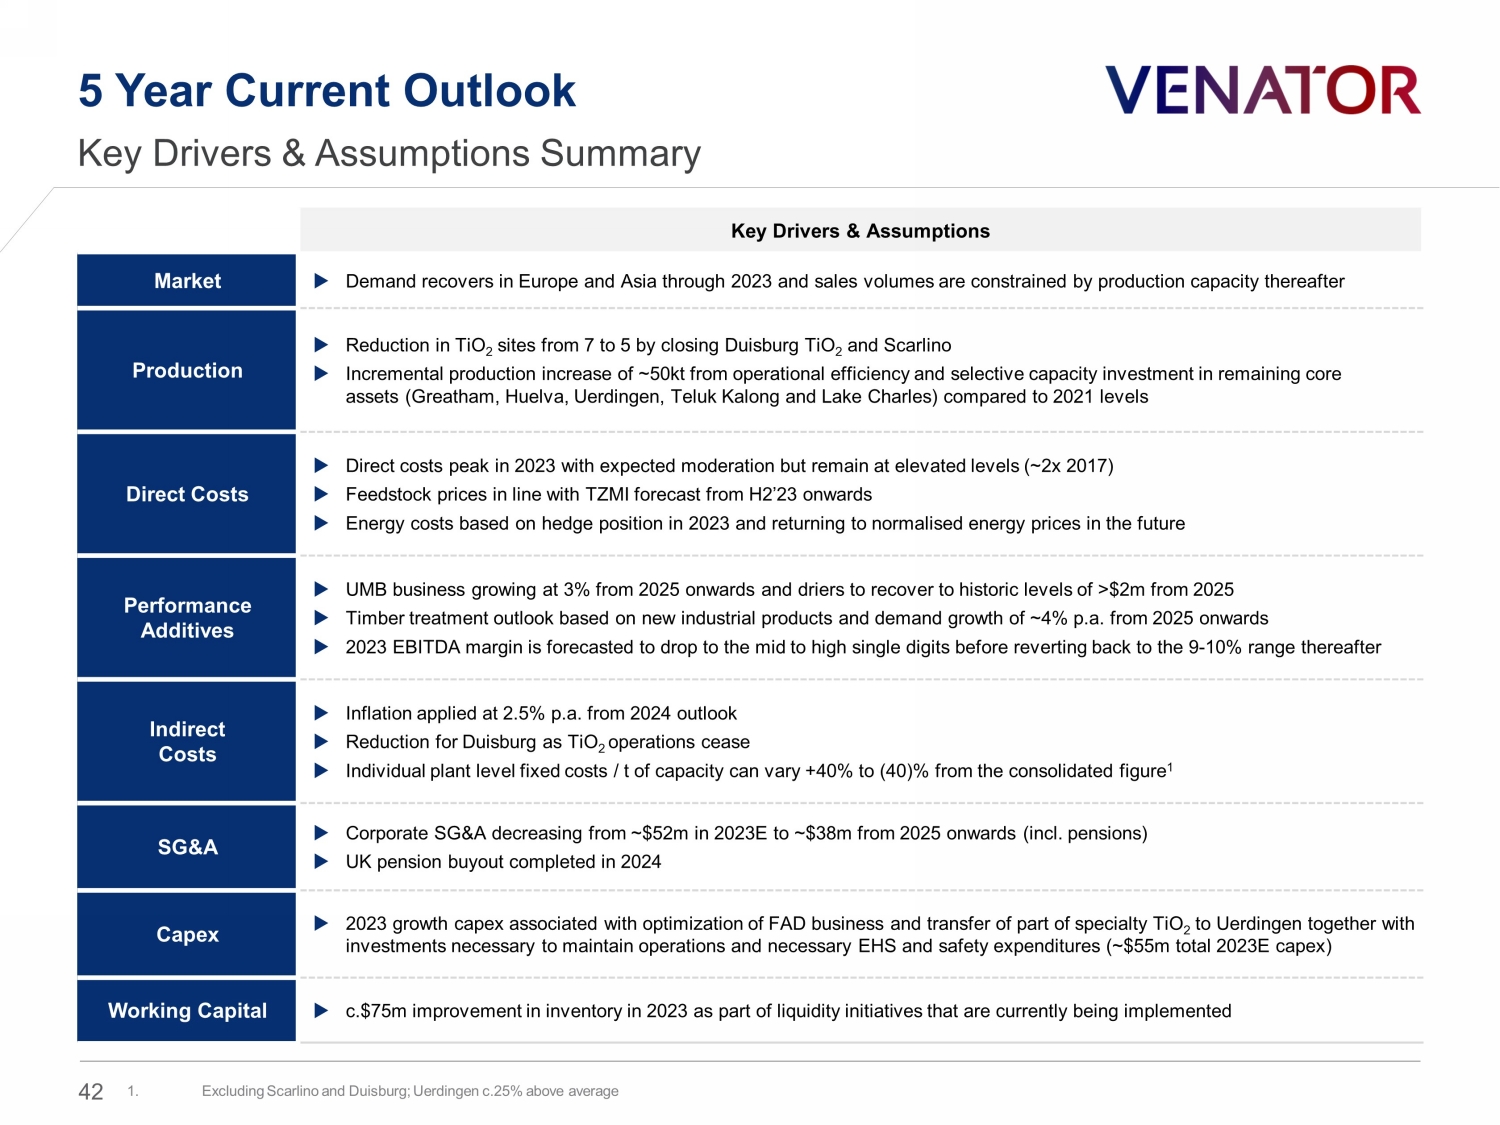
5 Year Current Outlook Key Drivers & Assumptions Summary Key Drivers & Assumptions Market Demand recovers in Europe and Asia through 2023 and sales volumes are constrained by production capacity thereafter Production Reduction in TiO 2 sites from 7 to 5 by closing Duisburg TiO 2 and Scarlino Incremental production increase of ~50kt from operational efficiency and selective capacity investment in remaining core assets ( Greatham , Huelva, Uerdingen , Teluk Kalong and Lake Charles) compared to 2021 levels Direct Costs Direct costs peak in 2023 with expected moderation but remain at elevated levels (~2x 2017) Feedstock prices in line with TZMI forecast from H2’23 onwards Energy costs based on hedge position in 2023 and returning to normalised energy prices in the future Performance Additives UMB business growing at 3% from 2025 onwards and driers to recover to historic levels of >$2m from 2025 Timber treatment outlook based on new industrial products and demand growth of ~4% p.a. from 2025 onwards 2023 EBITDA margin is forecasted to drop to the mid to high single digits before reverting back to the 9 - 10% range thereafter Indirect Costs Inflation applied at 2.5% p.a. from 2024 outlook Reduction for Duisburg as TiO 2 operations cease Individual plant level fixed costs / t of capacity can vary +40% to (40)% from the consolidated figure 1 SG&A Corporate SG&A decreasing from ~$52m in 2023E to ~$38m from 2025 onwards (incl. pensions) UK pension buyout completed in 2024 Capex 2023 growth capex associated with optimization of FAD business and transfer of part of specialty TiO 2 to Uerdingen together with investments necessary to maintain operations and necessary EHS and safety expenditures (~$55m total 2023E capex) Working Capital c.$75m improvement in inventory in 2023 as part of liquidity initiatives that are currently being implemented 42 1. Excluding Scarlino and Duisburg; Uerdingen c.25% above average
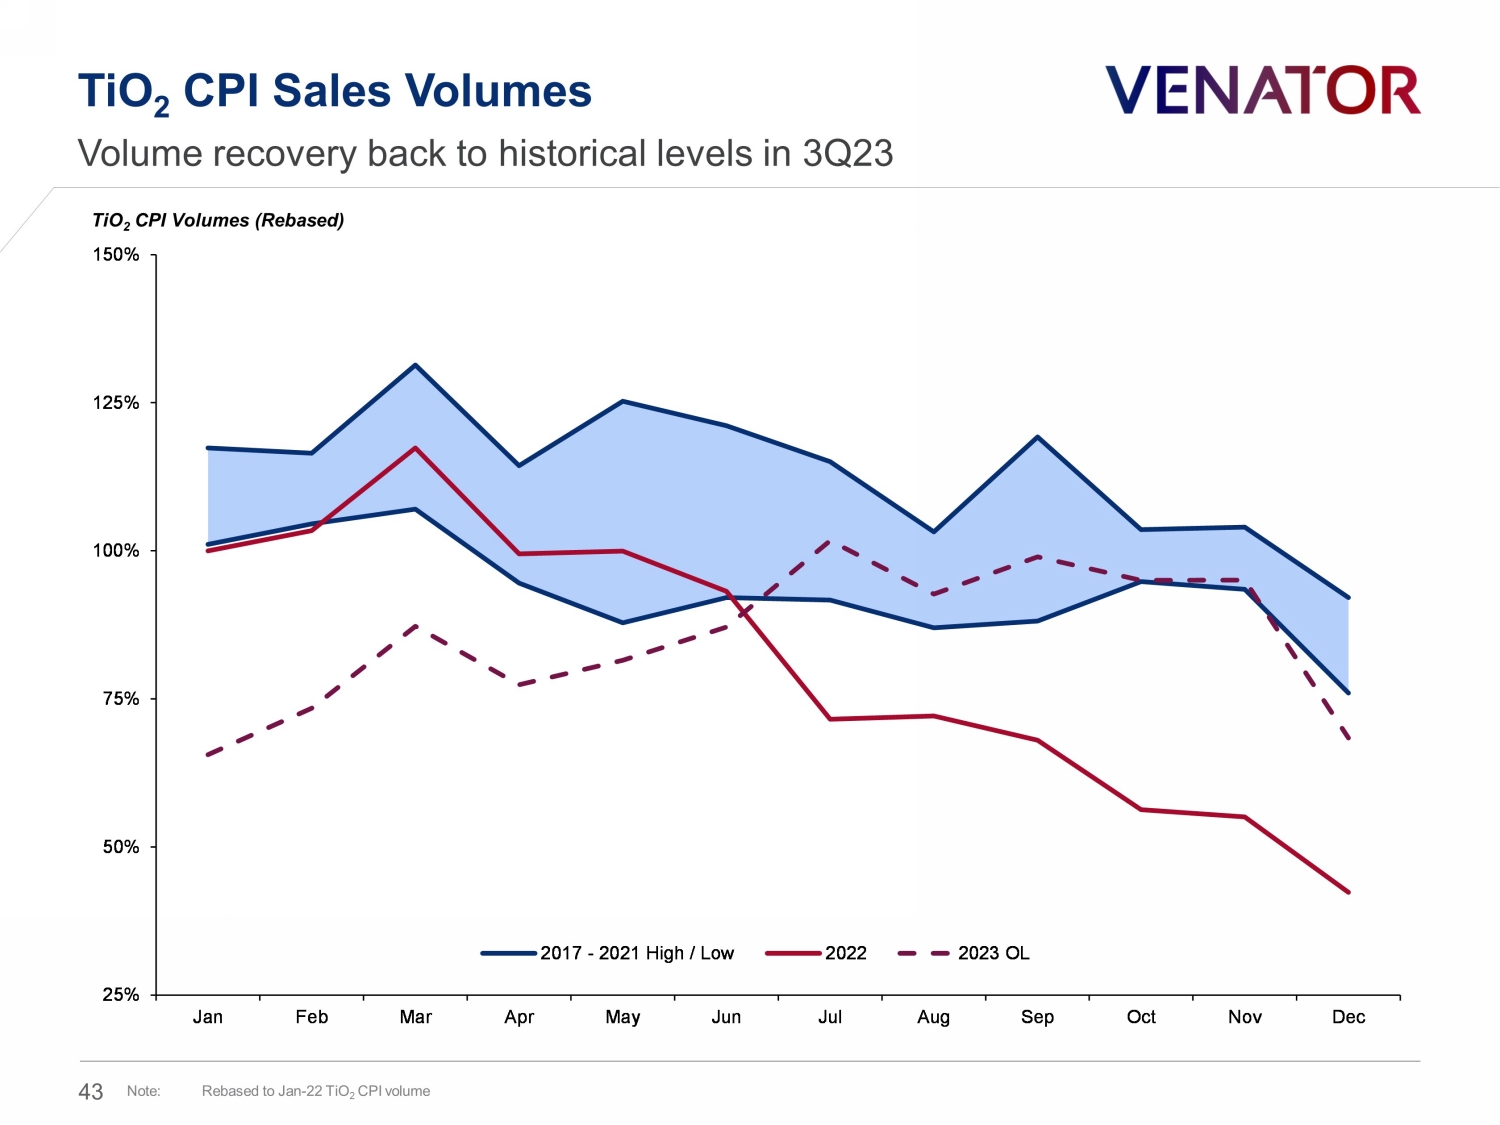
TiO 2 CPI Sales Volumes Volume recovery back to historical levels in 3Q23 43 TiO 2 CPI Volumes (Rebased) Note : Rebased to Jan - 22 TiO 2 CPI volume 25% 50% 75% 100% 125% 150% Jan Feb Mar Apr May Jun Jul Aug Sep Oct Nov Dec 2017 - 2021 High / Low 2022 2023 OL
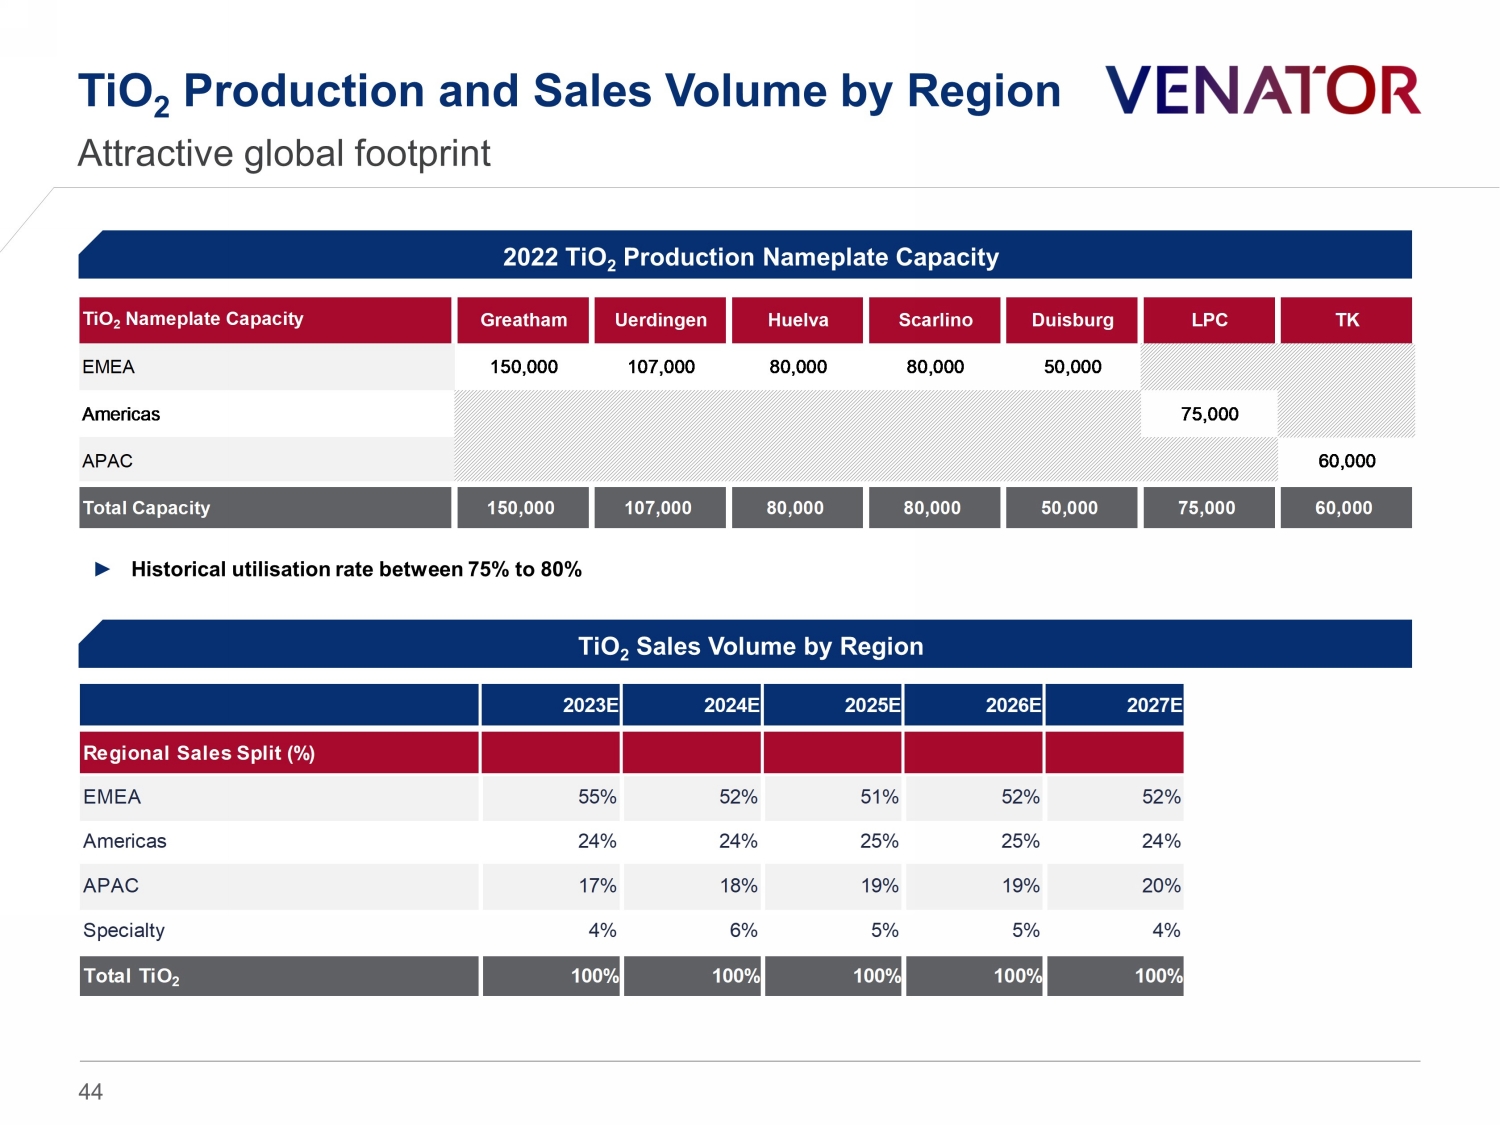
TiO 2 Production and Sales Volume by Region Attractive global footprint 44 2022 TiO 2 Production Nameplate Capacity TiO 2 Sales Volume by Region TiO 2 Nameplate Capacity Greatham Uerdingen Huelva Scarlino Duisburg LPC TK EMEA 150,000 107,000 80,000 80,000 50,000 Americas 75,000 APAC 60,000 Total Capacity 150,000 107,000 80,000 80,000 50,000 75,000 60,000 ► Historical utilisation rate between 75% to 80% 2023E 2024E 2025E 2026E 2027E Regional Sales Split (%) EMEA 55% 52% 51% 52% 52% Americas 24% 24% 25% 25% 24% APAC 17% 18% 19% 19% 20% Specialty 4% 6% 5% 5% 4% Total TiO 2 100% 100% 100% 100% 100%
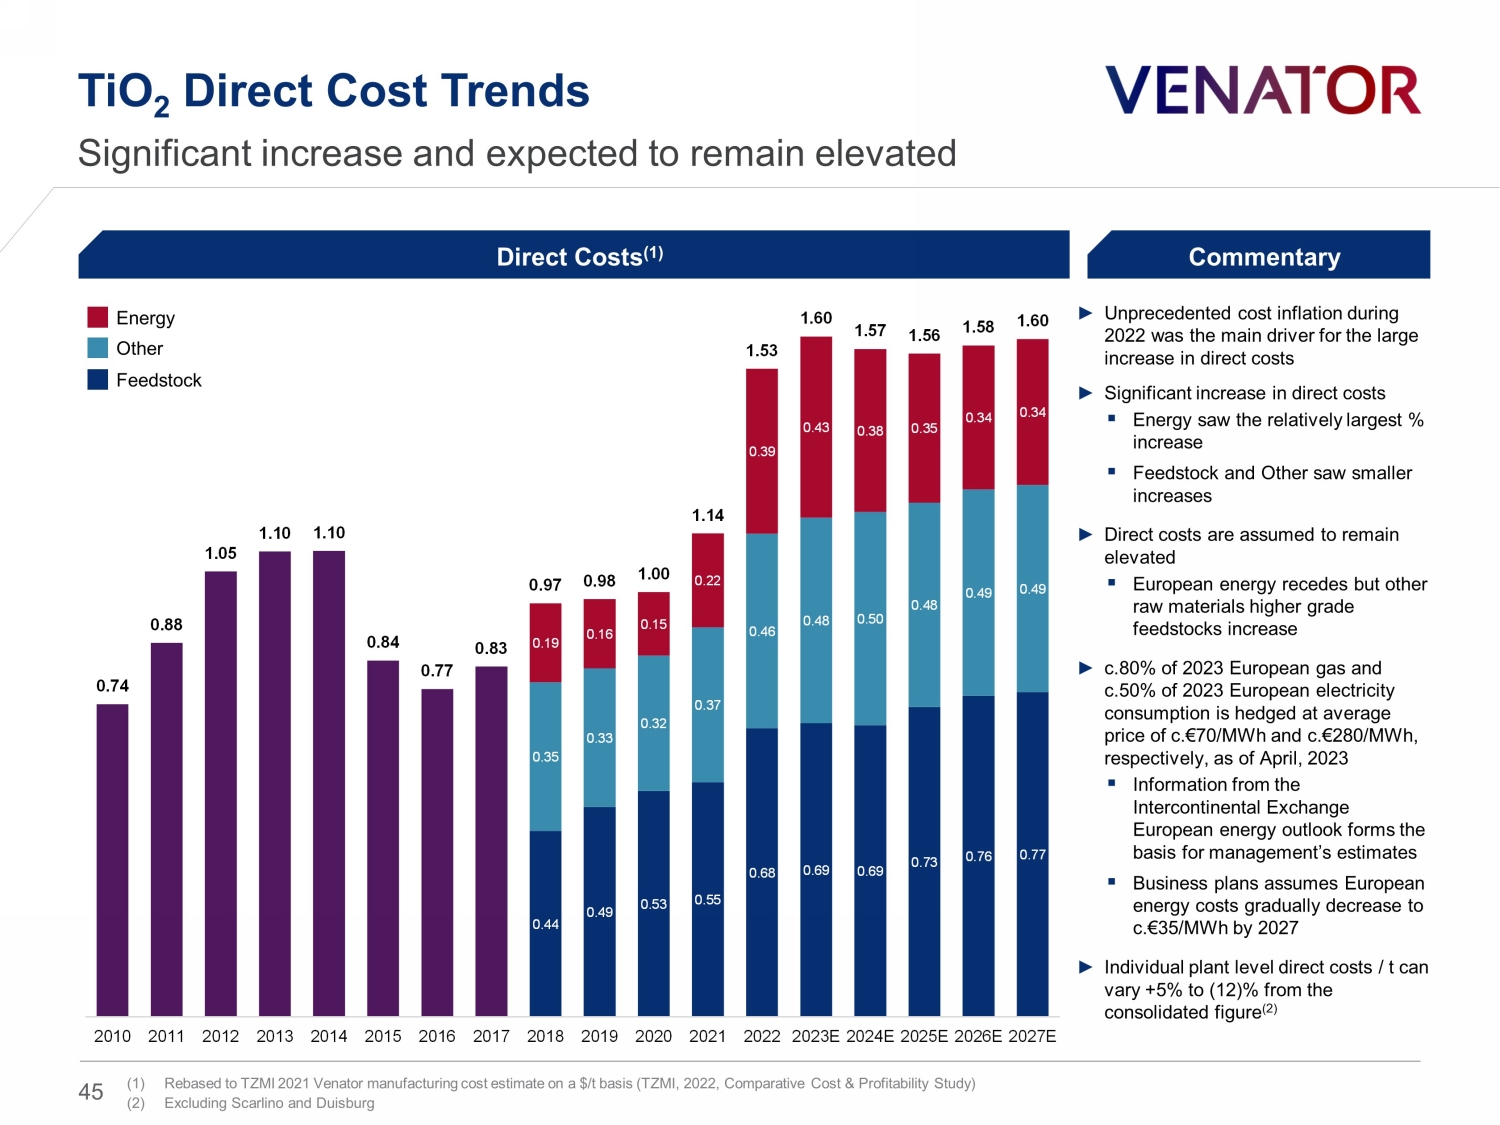
0.44 0.49 0.53 0.55 0.68 0.69 0.69 0.73 0.76 0.77 0.35 0.33 0.32 0.37 0.46 0.48 0.50 0.48 0.49 0.49 0.19 0.16 0.15 0.22 0.39 0.43 0.38 0.35 0.34 0.34 0.97 0.98 1.00 1.14 1.53 1.60 1.57 1.56 1.58 1.60 0.74 0.88 1.05 1.10 1.10 0.84 0.77 0.83 2010 2011 2012 2013 2014 2015 2016 2017 2018 2019 2020 2021 2022 2023E 2024E 2025E 2026E 2027E Direct Costs (1) TiO 2 Direct Cost Trends Significant increase and expected to remain elevated ► Unprecedented cost inflation during 2022 was the main driver for the large increase in direct costs ► Significant increase in direct costs ▪ Energy saw the relatively largest % increase ▪ Feedstock and Other saw smaller increases ► Direct costs are assumed to remain elevated ▪ European energy recedes but other raw materials higher grade feedstocks increase ► c.80% of 2023 European gas and c.50% of 2023 European electricity consumption is hedged at average price of c.€70/MWh and c.€ 280/MWh, respectively, as of April, 2023 ▪ Information from the Intercontinental Exchange European energy outlook forms the basis for management’s estimates ▪ Business plans assumes European energy costs gradually decrease to c.€35/MWh by 2027 ► Individual plant level direct costs / t can vary +5% to (12)% from the consolidated figure (2) Commentary Energy Feedstock Other 45 (1) Rebased to TZMI 2021 Venator manufacturing cost estimate on a $/t basis (TZMI, 2022, Comparative Cost & Profitability Study ) (2) Excluding Scarlino and Duisburg
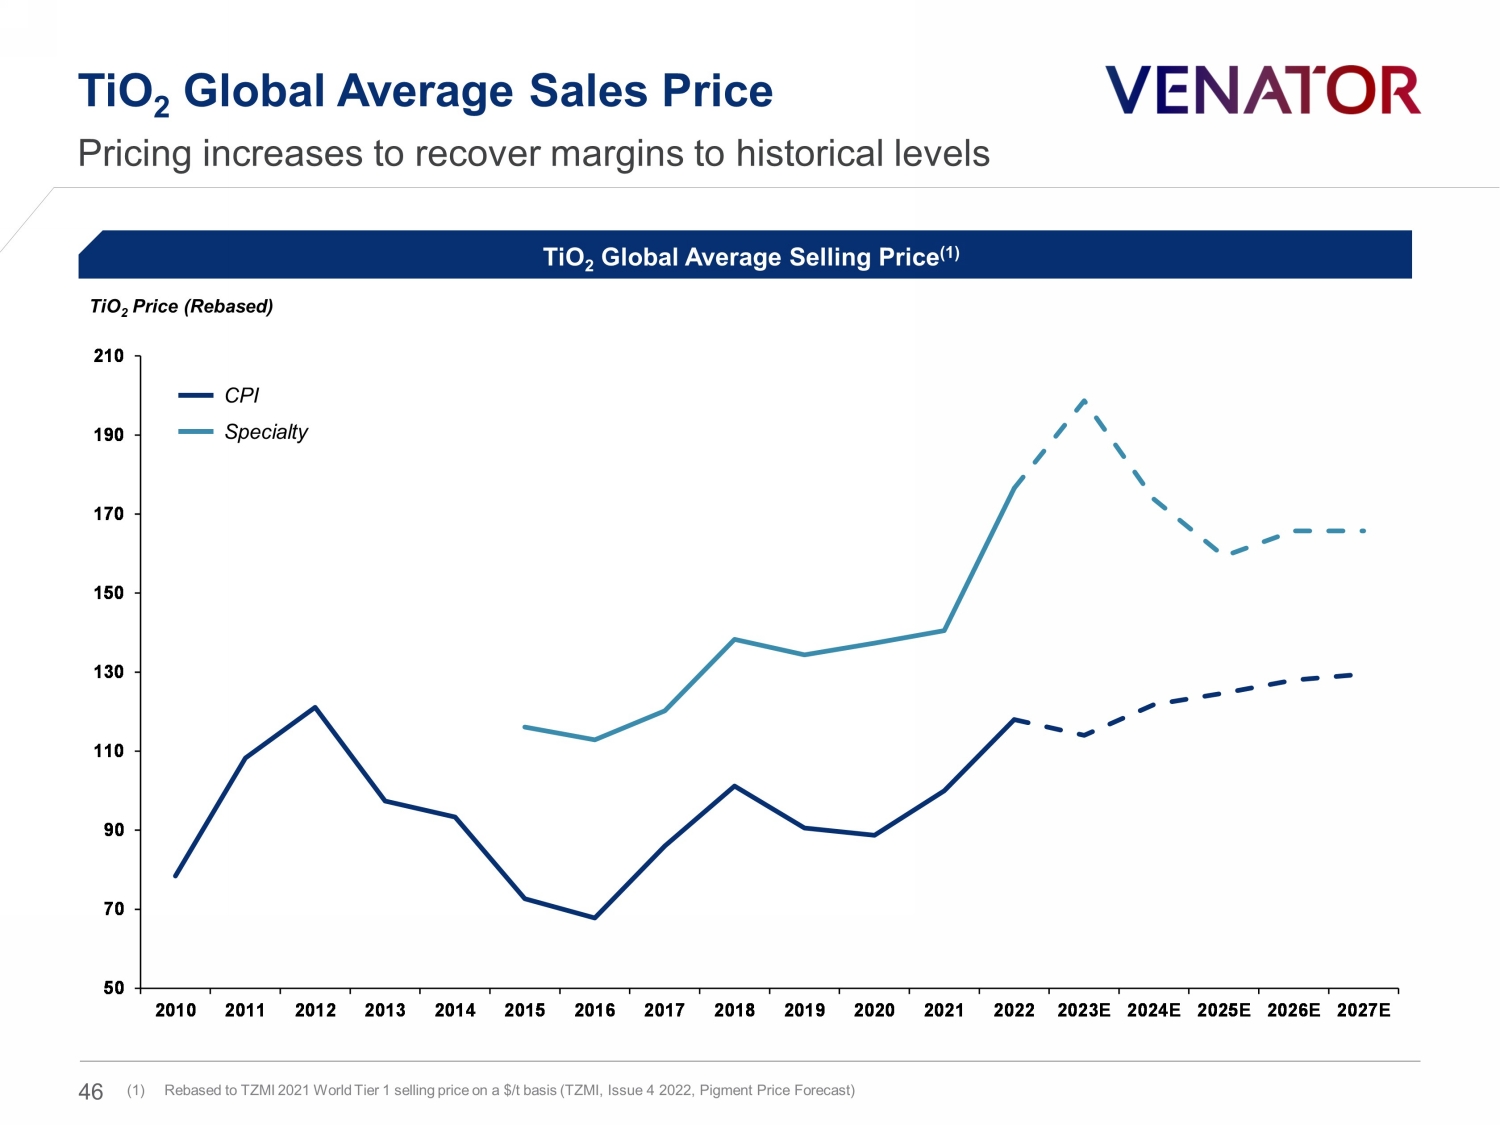
50 70 90 110 130 150 170 190 210 2010 2011 2012 2013 2014 2015 2016 2017 2018 2019 2020 2021 2022 2023E 2024E 2025E 2026E 2027E TiO 2 Global Average Sales Price Pricing increases to recover margins to historical levels TiO 2 Global Average Selling Price (1) 46 TiO 2 Price (Rebased) (1) Rebased to TZMI 2021 World Tier 1 selling price on a $/t basis (TZMI, Issue 4 2022 , Pigment Price Forecast) CPI Specialty
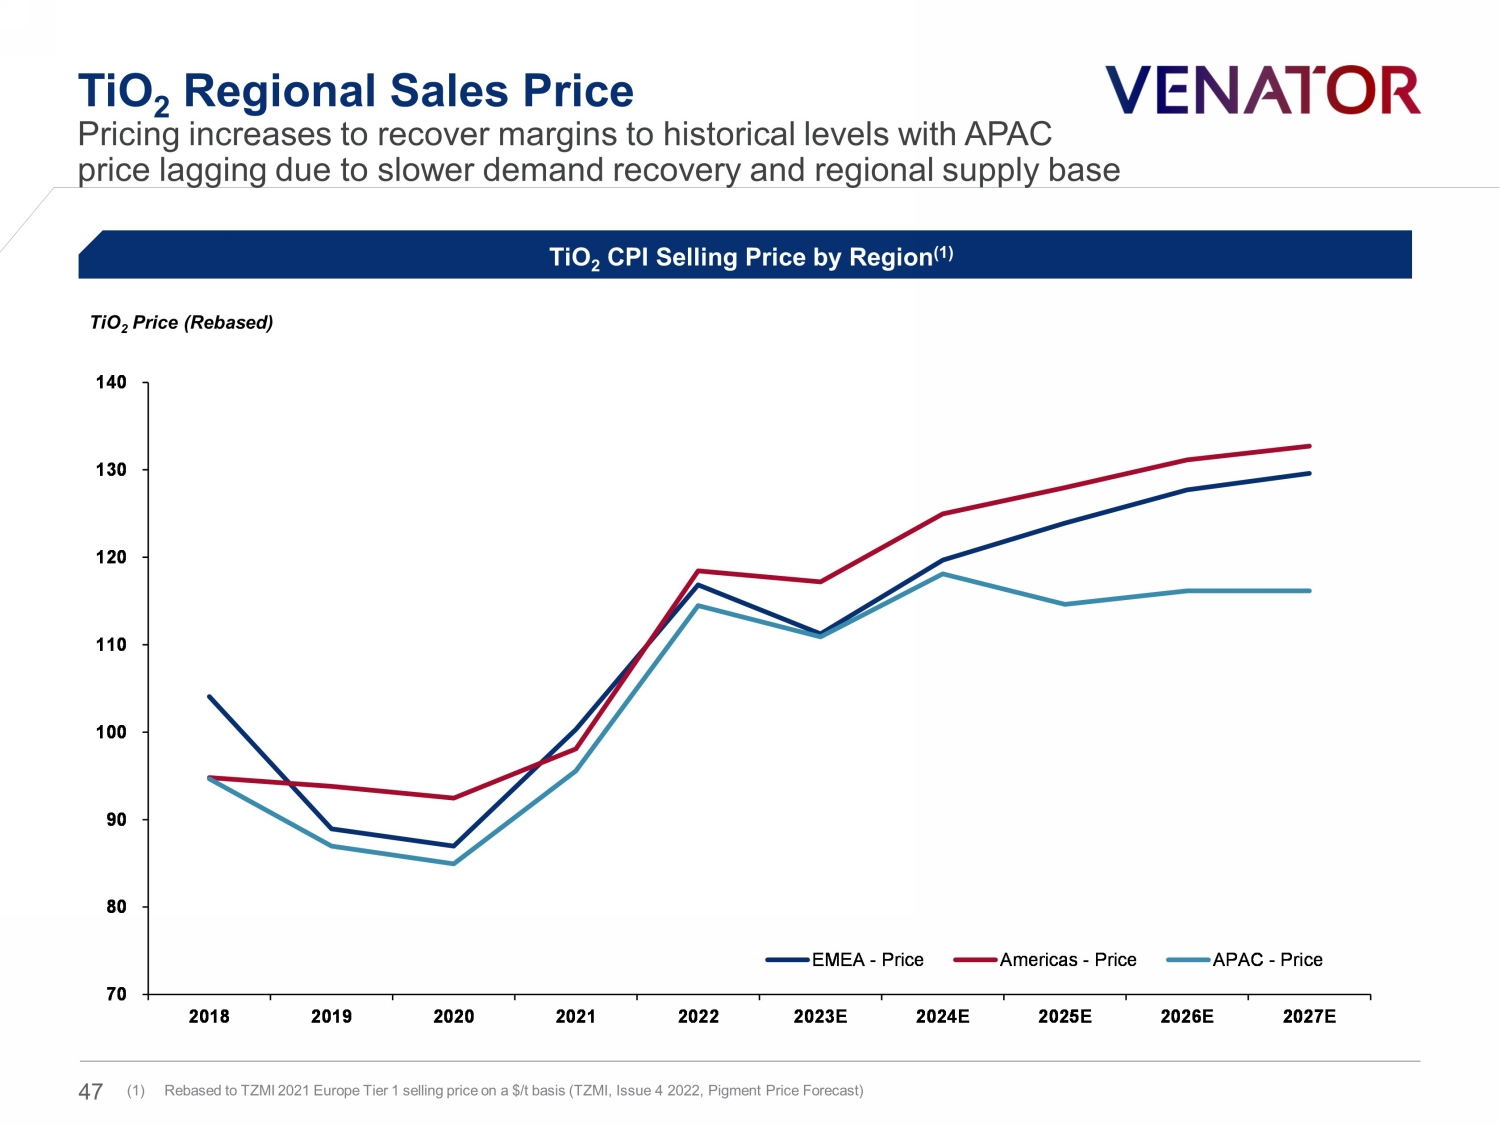
TiO 2 Regional Sales Price Pricing increases to recover margins to historical levels with APAC price lagging due to slower demand recovery and regional supply base TiO 2 CPI Selling Price by Region (1) 47 TiO 2 Price (Rebased) (1) Rebased to TZMI 2021 Europe Tier 1 selling price on a $/t basis (TZMI, Issue 4 2022, Pigment Price Forecast ) 70 80 90 100 110 120 130 140 2018 2019 2020 2021 2022 2023E 2024E 2025E 2026E 2027E EMEA - Price Americas - Price APAC - Price
Financial Performance and Liquidity 48
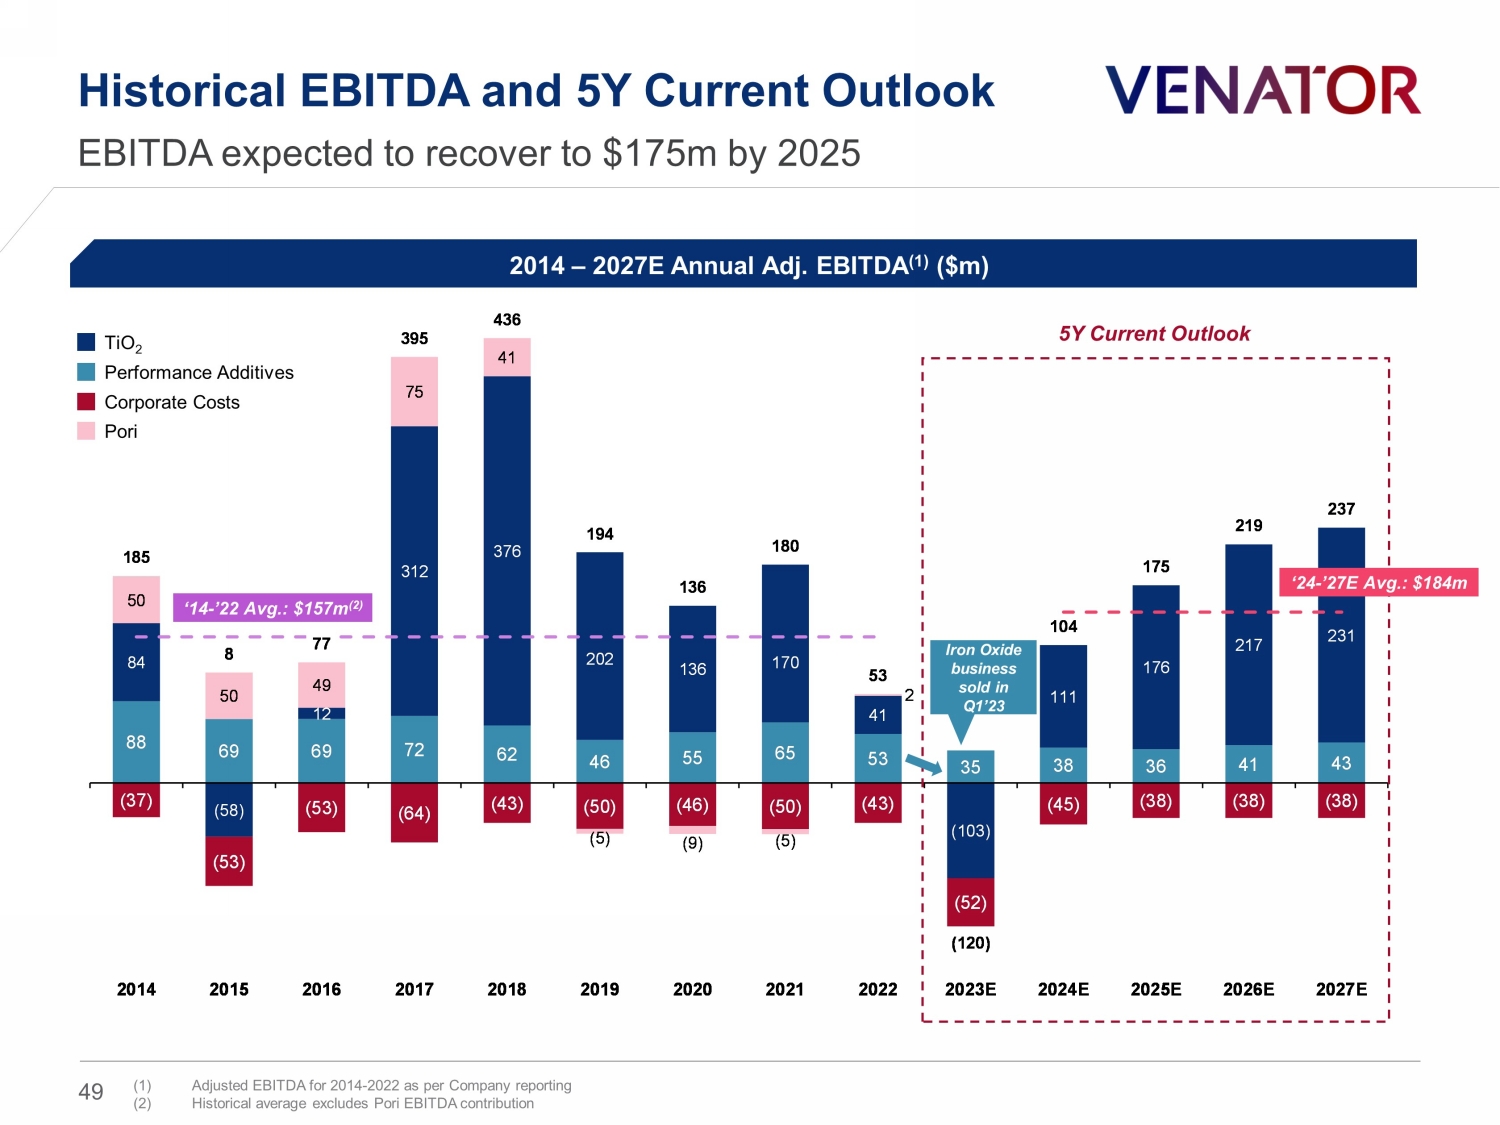
88 69 69 72 62 46 55 65 53 35 38 36 41 43 84 (58) 12 312 376 202 136 170 41 (103) 111 176 217 231 (37) (53) (53) (64) (43) (50) (46) (50) (43) (52) (45) (38) (38) (38) 50 50 49 75 41 (5) (9) (5) 2 185 8 77 395 436 194 136 180 53 (120) 104 175 219 237 2014 2015 2016 2017 2018 2019 2020 2021 2022 2023E 2024E 2025E 2026E 2027E ‘14 - ’22 Avg.: $157m (2) Historical EBITDA and 5Y Current Outlook 49 EBITDA expected to recover to $175m by 2025 2014 – 2027E Annual Adj. EBITDA (1) ($m) 5Y Current Outlook TiO 2 Performance Additives Corporate Costs Pori ‘24 - ’27E Avg.: $184m Iron Oxide business sold in Q1’23 (1) Adjusted EBITDA for 2014 - 2022 as per Company reporting (2) Historical average excludes Pori EBITDA contribution
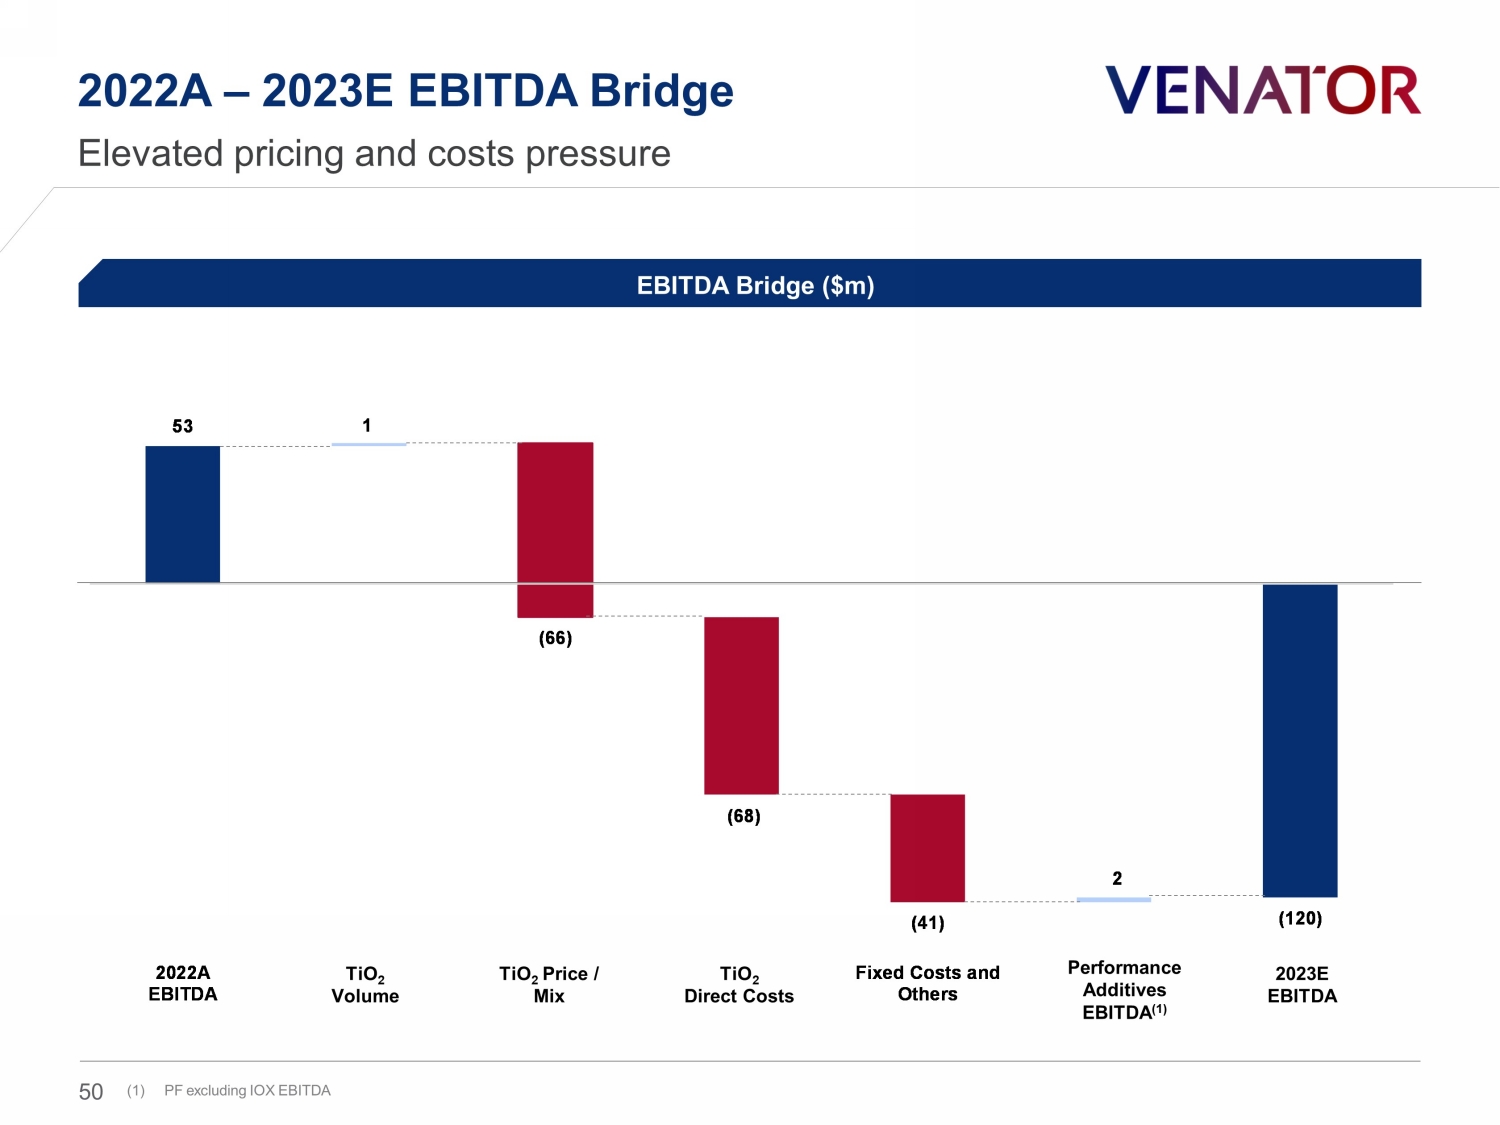
53 1 (66) (68) (41) 2 (120) 2022A EBITDA TiO2 Volume TiO2 Price / Mix TiO2 Direct Costs Fixed Costs and Others PA EBITDA 2023E EBITDA TiO 2 Direct Costs 2022A – 2023E EBITDA Bridge Elevated pricing and costs pressure 50 EBITDA Bridge ($m) TiO 2 Volume TiO 2 Price / Mix 2023E EBITDA Performance Additives EBITDA (1) (1) PF excluding IOX EBITDA
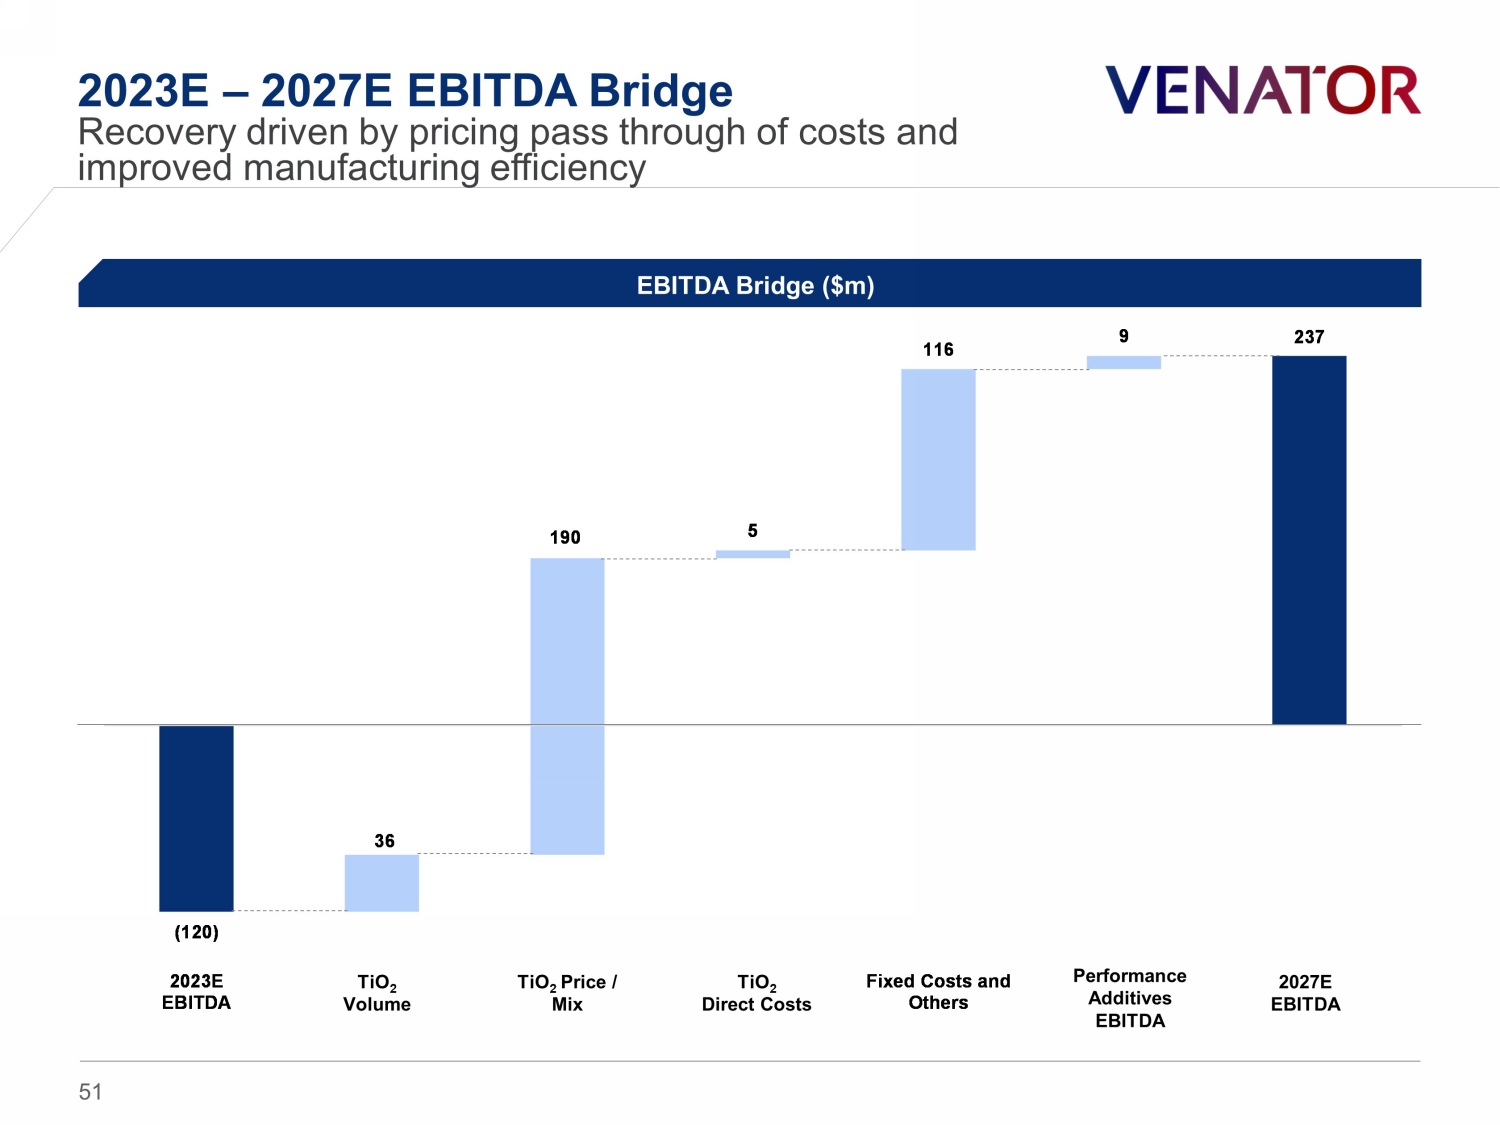
237 (120) 36 190 5 116 9 2023E EBITDA TiO2 Volume TiO2 Price / Mix TiO2 Direct Costs Fixed Costs and Others PA EBITDA 2027E EBITDA 2023E – 2027E EBITDA Bridge Recovery driven by pricing pass through of costs and improved manufacturing efficiency 51 TiO 2 Volume TiO 2 Price / Mix TiO 2 Direct Costs 2027E EBITDA Performance Additives EBITDA EBITDA Bridge ($m)
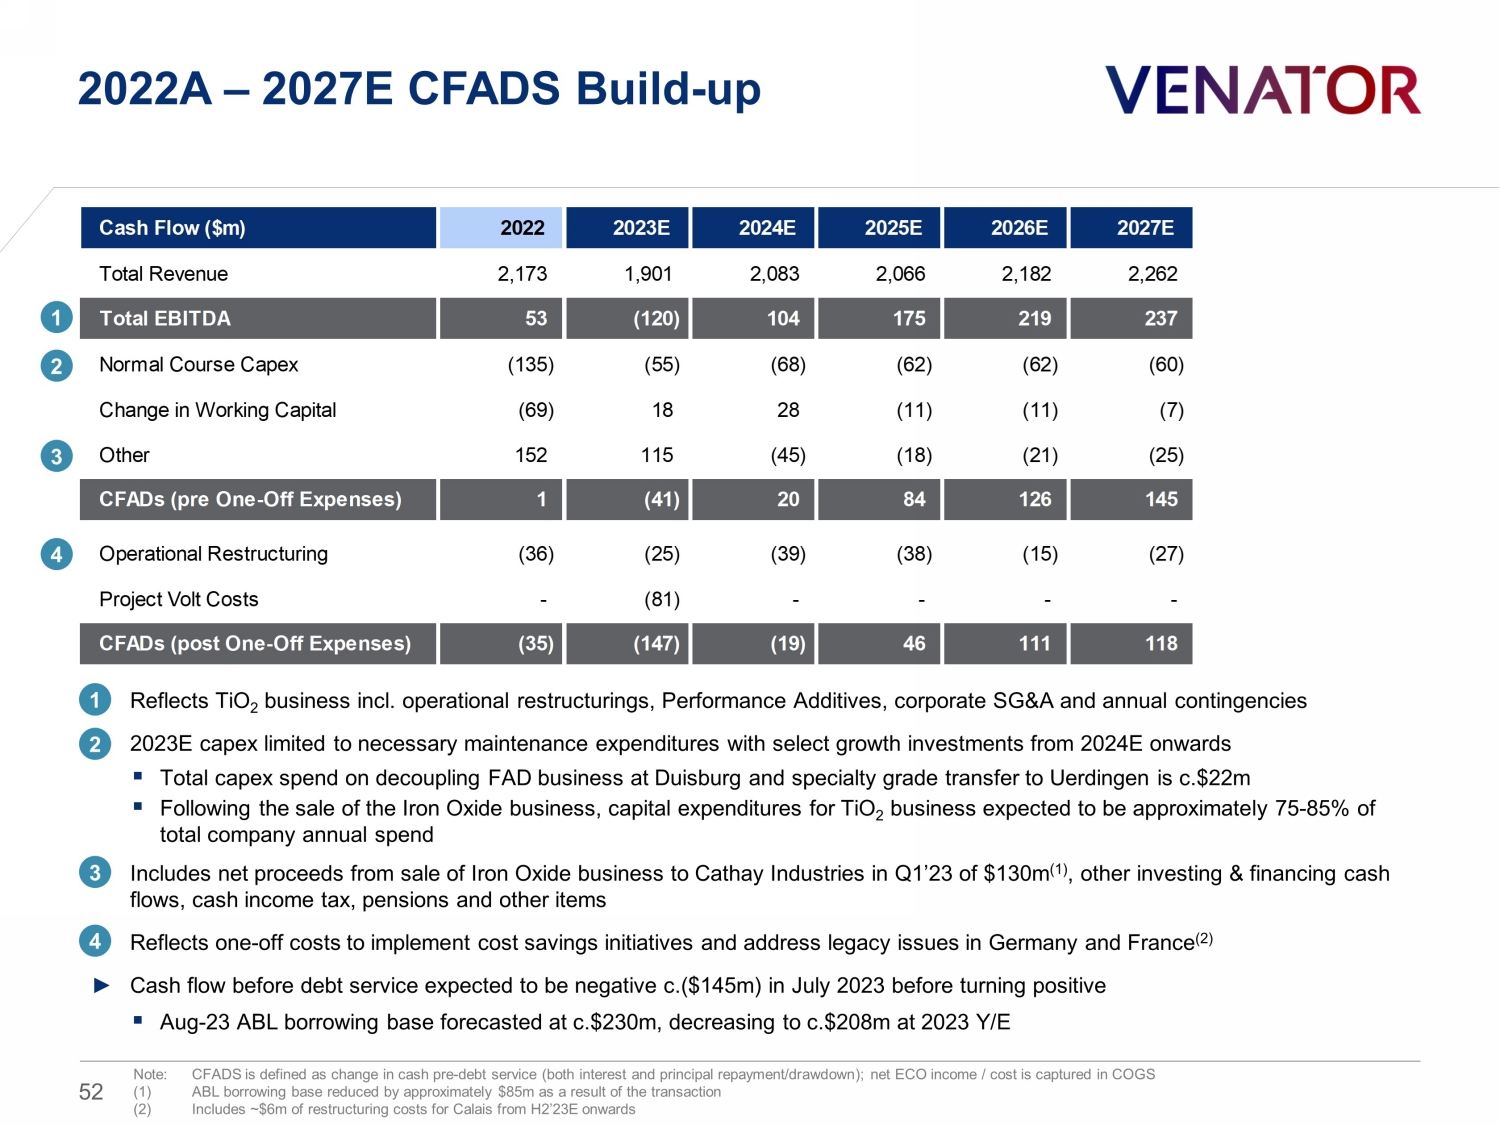
Cash Flow ($m) 2022 2023E 2024E 2025E 2026E 2027E Total Revenue 2,173 1,901 2,083 2,066 2,182 2,262 Total EBITDA 53 (120) 104 175 219 237 Normal Course Capex (135) (55) (68) (62) (62) (60) Change in Working Capital (69) 18 28 (11) (11) (7) Other 152 115 (45) (18) (21) (25) CFADs (pre One-Off Expenses) 1 (41) 20 84 126 145 Operational Restructuring (36) (25) (39) (38) (15) (27) Project Volt Costs - (81) - - - - CFADs (post One-Off Expenses) (35) (147) (19) 46 111 118 2022A – 2027E CFADS Build - up 1 ► Reflects TiO 2 business incl. operational restructurings, Performance Additives, corporate SG&A and annual contingencies ► 2023E capex limited to necessary maintenance expenditures with select growth investments from 2024E onwards ▪ Total capex spend on decoupling FAD business at Duisburg and specialty grade transfer to Uerdingen is c.$22m ▪ Following the sale of the Iron Oxide business, capital expenditures for TiO 2 business expected to be approximately 75 - 85% of total company annual spend ► Includes net proceeds from sale of Iron Oxide business to Cathay Industries in Q1’23 of $130m (1) , other investing & financing cash flows, cash income tax, pensions and other items ► Reflects one - off costs to implement cost savings initiatives and address legacy issues in Germany and France (2) ► Cash flow before debt service expected to be negative c.($145m) in July 2023 before turning positive ▪ Aug - 23 ABL borrowing base forecasted at c.$230m, decreasing to c.$208m at 2023 Y/E 3 2 4 1 3 2 4 Note: CFADS is defined as change in cash pre - debt service (both interest and principal repayment/drawdown); net ECO income / cos t is captured in COGS (1) ABL borrowing base reduced by approximately $85m as a result of the transaction (2) Includes ~$6m of restructuring costs for Calais from H2’23E onwards 52
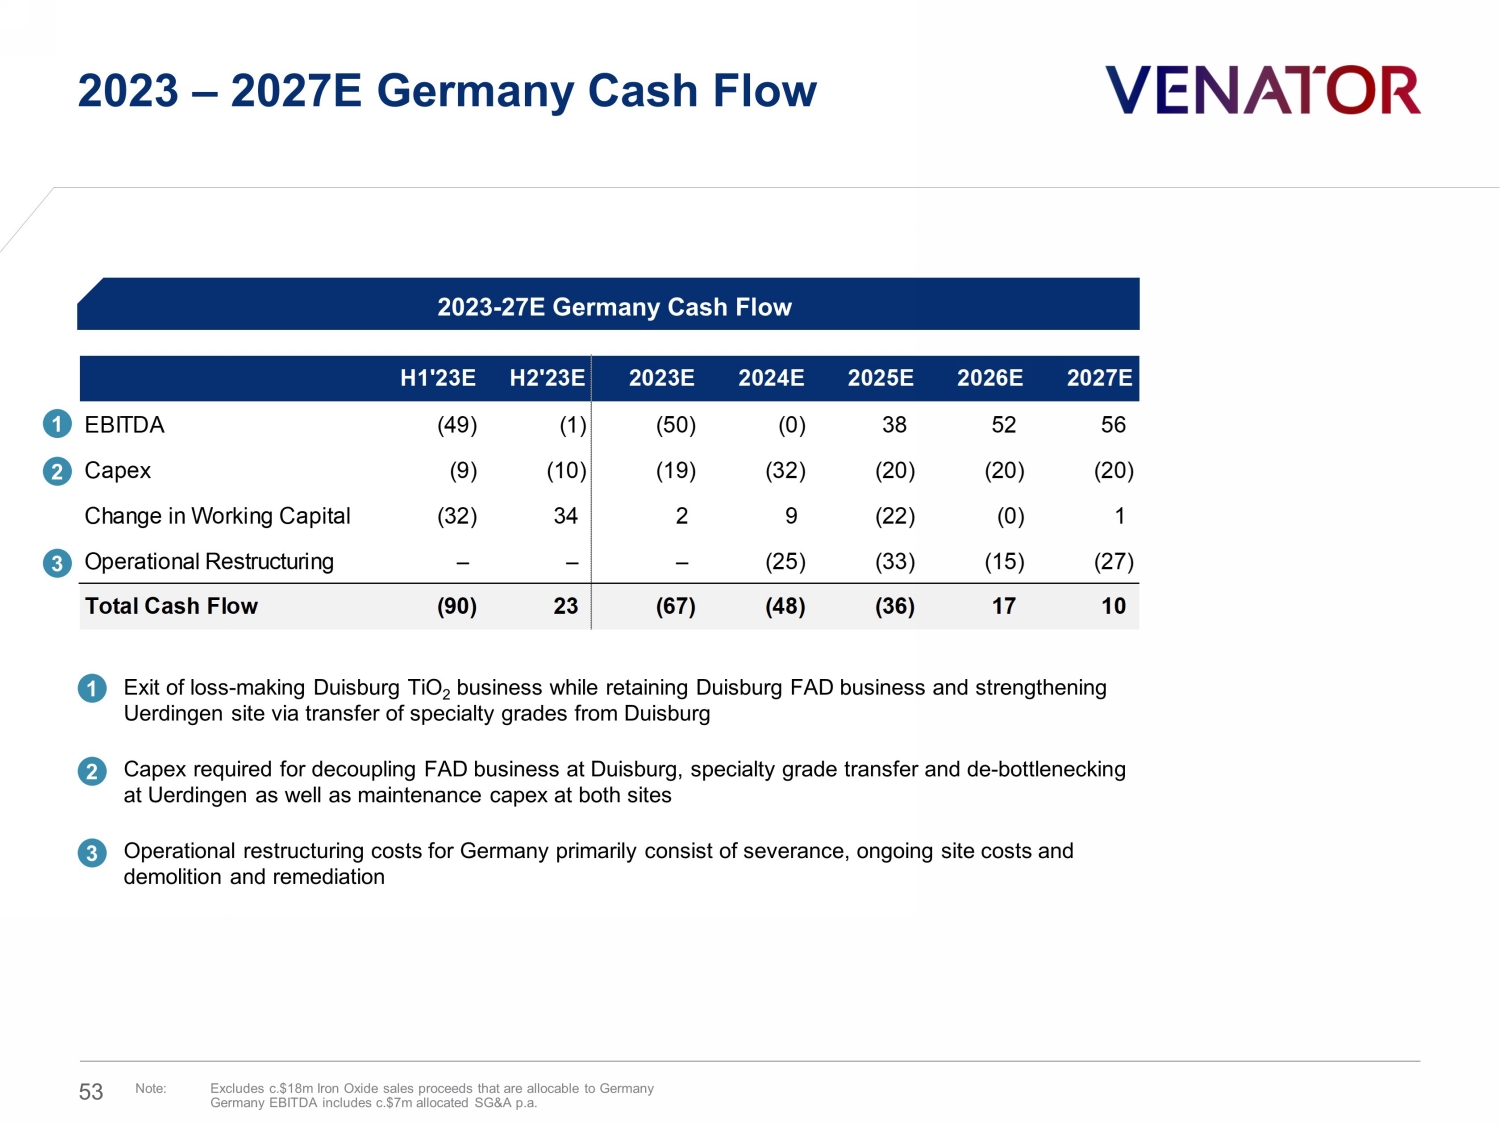
2023 – 2027E Germany Cash Flow 53 Note: Excludes c.$18m Iron Oxide sales proceeds that are allocable to Germany Germany EBITDA includes c.$ 7 m allocated SG&A p.a. ► Exit of loss - making Duisburg TiO 2 business while retaining Duisburg FAD business and strengthening Uerdingen site via t ransfer of specialty grades from Duisburg ► Capex required for decoupling FAD business at Duisburg, specialty grade transfer and de - bottlenecking at Uerdingen as well as maintenance capex at both sites ► Operational restructuring costs for Germany primarily consist of severance, ongoing site costs and demolition and remediation 2023 - 27E Germany Cash Flow H1'23E H2'23E 2023E 2024E 2025E 2026E 2027E EBITDA (49) (1) (50) (0) 38 52 56 Capex (9) (10) (19) (32) (20) (20) (20) Change in Working Capital (32) 34 2 9 (22) (0) 1 Operational Restructuring – – – (25) (33) (15) (27) Total Cash Flow (90) 23 (67) (48) (36) 17 10 1 2 3 1 2 3
Appendix 54
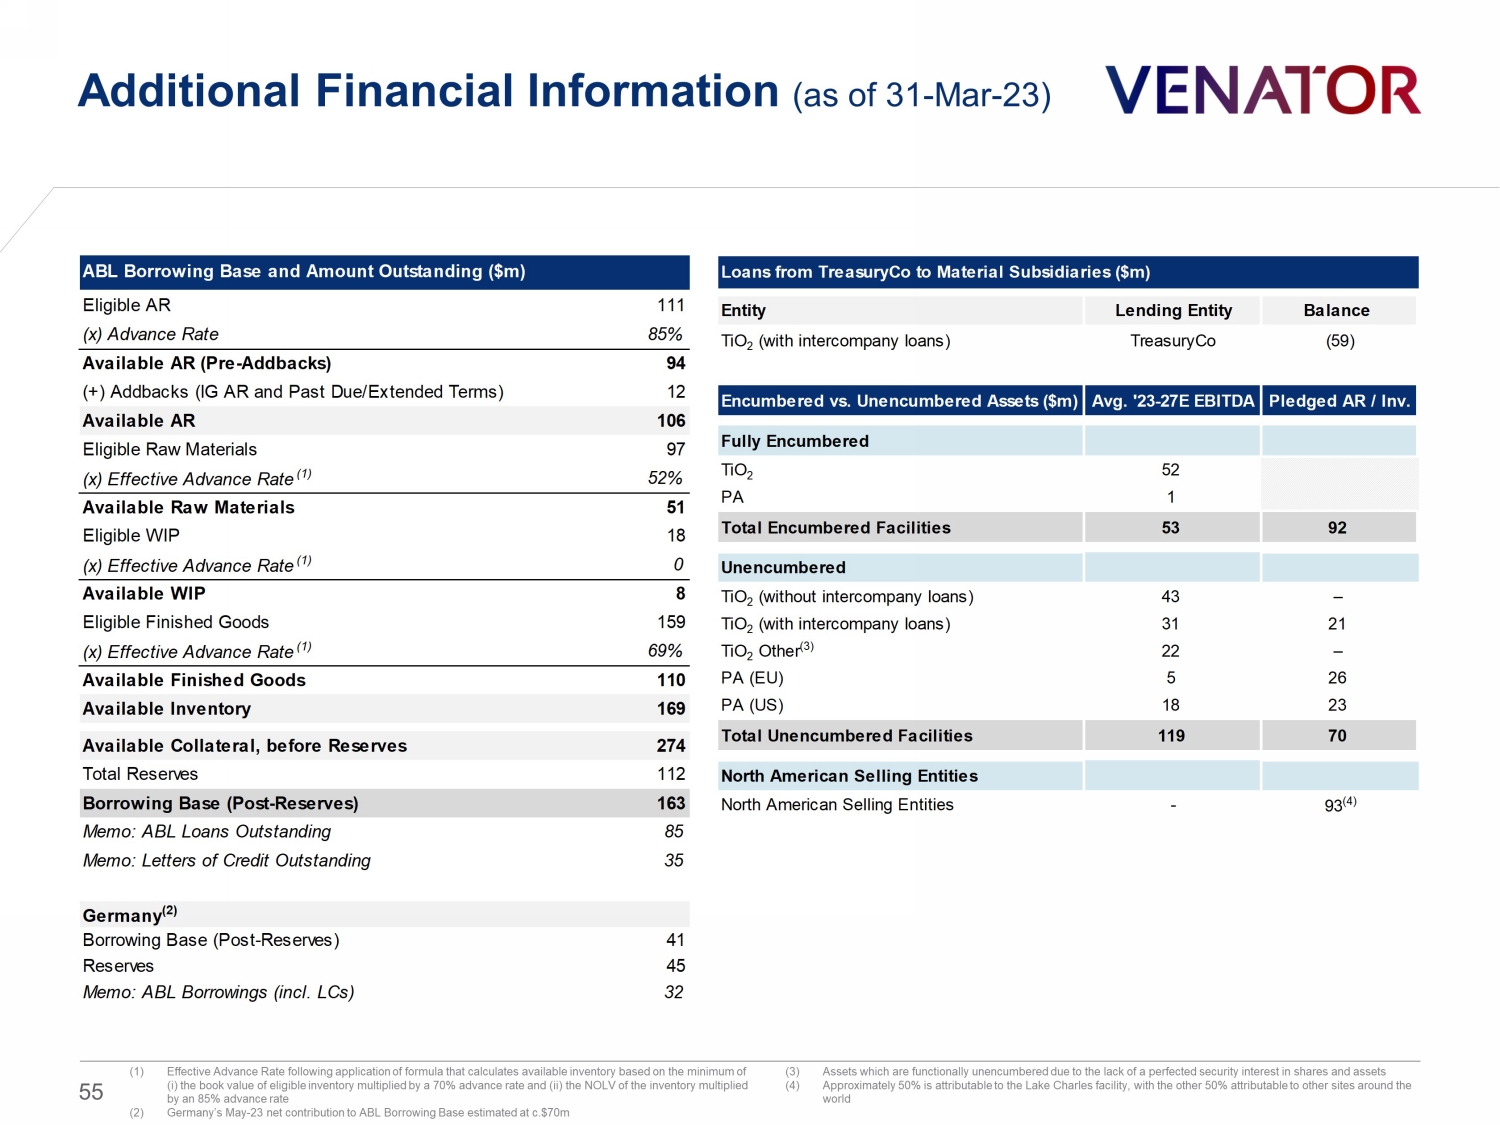
Additional Financial Information (as of 31 - Mar - 23) 55 (1) Effective Advance Rate following application of formula that calculates available inventory based on the minimum of ( i ) the book value of eligible inventory multiplied by a 70% advance rate and (ii) the NOLV of the inventory multiplied by an 85% advance rate (2) Germany’s May - 23 net contribution to ABL Borrowing Base estimated at c.$70m (3) Assets which are functionally unencumbered due to the lack of a perfected security interest in shares and assets (4) Approximately 50% is attributable to the Lake Charles facility, with the other 50% attributable to other sites around the world ABL Borrowing Base and Amount Outstanding ($m) Eligible AR 111 (x) Advance Rate 85% Available AR (Pre-Addbacks) 94 (+) Addbacks (IG AR and Past Due/Extended Terms) 12 Available AR 106 Eligible Raw Materials 97 (x) Effective Advance Rate (1) 52% Available Raw Materials 51 Eligible WIP 18 (x) Effective Advance Rate (1) 0 Available WIP 8 Eligible Finished Goods 159 (x) Effective Advance Rate (1) 69% Available Finished Goods 110 Available Inventory 169 Available Collateral, before Reserves 274 Total Reserves 112 Borrowing Base (Post-Reserves) 163 Memo: ABL Loans Outstanding 85 Memo: Letters of Credit Outstanding 35 Germany (2) Borrowing Base (Post-Reserves) 41 Reserves 45 Memo: ABL Borrowings (incl. LCs) 32 Loans from TreasuryCo to Material Subsidiaries ($m) Entity Lending Entity Balance TiO 2 (with intercompany loans) TreasuryCo (59) Encumbered vs. Unencumbered Assets ($m) Avg. '23-27E EBITDA Pledged AR / Inv. Fully Encumbered TiO 2 52 PA 1 Total Encumbered Facilities 53 92 Unencumbered TiO 2 (without intercompany loans) 43 – TiO 2 (with intercompany loans) 31 21 TiO 2 Other (3) 22 – PA (EU) 5 26 PA (US) 18 23 Total Unencumbered Facilities 119 70 North American Selling Entities North American Selling Entities - 93 (4)