
Exhibit 99.1 INVESTOR PRESENTATION

DISCLAIMERS Forward Looking Statements Certain statements in this presentation and that may be made in meetings are forward‐looking statements. Forward‐looking statements are based on VICI Properties Inc.’s (“VICI or the “Company”) current plans, expectations and projections about future events and are not guarantees of future performance. These statements can be identified by the fact that they do not relate to strictly historical and current facts and by the use of the words such as "expects", "plans", "opportunities" and similar words and variations thereof. Although the Company believes that the expectations reflected in such forward‐looking statements are based on reasonable assumptions, its results, performance and achievements could differ materially from those expressed in or by the forward‐looking statements and may be affected by a variety of risks and other factors including, among others: risks that the pending acquisition of JACK Cincinnati Casino (“JACK Cincinnati”) may not be consummated on the terms or timeframe described herein, or at all; the ability of the parties to satisfy the conditions set forth in the definitive transaction documents for the pending acquisition of JACK Cincinnati, including the ability to receive, or delays in obtaining, the regulatory and other approvals and/or consents required to consummate the transaction; the terms on which the Company finances the pending transaction, including the source of funds used to finance such transaction; disruptions to the real property and operations of JACK Cincinnati during the pendency of the closing; risks that the Company may not achieve the benefits contemplated by our pending and recently completed acquisitions of real estate assets (including any expected accretion or the amount of any future rent payments); risks that not all potential risks and liabilities have been identified in the due diligence for our pending and recently completed transactions; the Company's dependence on subsidiaries of Caesars Entertainment Corporation (“Caesars”) and Penn National Gaming, Inc. (“Penn”) as tenants of all of its properties and Caesars and Penn or their subsidiaries as guarantors of the relevant lease payments, and the consequences of any material adverse effect on their respective businesses could have on the Company; the Company's dependence on the gaming industry; the Company's ability to pursue its business and growth strategies may be limited by its substantial debt service requirements and by the requirement that the Company distribute 90% of its real estate investment trust (“REIT”) taxable income in order to qualify for taxation as a REIT and that the Company distribute 100% of its REIT taxable income in order to avoid current entity level U.S. Federal income taxes; the impact of extensive regulation from gaming and other regulatory authorities; the ability of the Company's tenants to obtain and maintain regulatory approvals in connection with the operation of the Company's properties; the possibility that the Company’s tenants may choose not to renew their lease agreements with the Company following the initial or subsequent terms of the leases; restrictions on the Company's ability to sell its properties subject to the lease agreements; the Company's indebtedness and ability to service and refinance such indebtedness; the Company's historical and pro forma financial information may not be reliable indicators of its future results of operations and financial condition; limits on the Company's operational and financial flexibility imposed by its debt agreements; and the possibility the Company's separation from Caesars Entertainment Operating Company, Inc. fails to qualify as a tax‐free spin‐off, which could subject the Company to significant tax liabilities. Additional important factors that may affect the Company’s business, results of operations and financial position are described from time to time in the Company’s Annual Report on Form 10‐K for the year ended December 31, 2018, Quarterly Reports on Form 10‐Q and the Company’s other filings with the Securities and Exchange Commission. The Company does not undertake any obligation to update or revise any forward‐looking statement, whether as a result of new information, future events, or otherwise, except as may be required by applicable law. Caesars and Penn Information The Company makes no representation as to the accuracy or completeness of the information regarding Caesars and/or Penn included in this presentation. The historical audited and unaudited financial statements of Caesars, as the parent and guarantor of CEOC, LLC (“CEOC”), the Company's significant lessee, have been filed with the SEC. Certain financial and other information for Caesars, CEOC and Penn included in this presentation have been derived from Caesars’ and Penn’s public filings, as applicable, and other publicly available presentations and press releases. Market and Industry Data This presentation contains estimates and information concerning the Company's industry, including market position, rent growth and rent coverage of the Company's peers, that are based on industry publications, reports and peer company public filings. This information involves a number of assumptions and limitations, and you are cautioned not to rely on or give undue weight to this information. The Company has not independently verified the accuracy or completeness of the data contained in these industry publications, reports or filings. The industry in which the Company operates is subject to a high degree of uncertainty and risk due to variety of factors, including those described in the "Risk Factors" section of the Company's public filings with the SEC. Non‐GAAP Financial Measures This presentation includes reference to Funds From Operations (“FFO”), FFO per share, Adjusted Funds From Operations (“AFFO”), AFFO per share, and Adjusted EBITDA, which are not required by, or presented in accordance with, generally accepted accounting principles in the United States (“GAAP”). These are non-GAAP financial measures and should not be construed as alternatives to net income or as an indicator of operating performance (as determined in accordance with GAAP). We believe FFO, FFO per share, AFFO, AFFO per share and Adjusted EBITDA provide a meaningful perspective of the underlying operating performance of our business. For additional information regarding these non-GAAP financial measures, as well as certain non-GAAP financial measures of Caesars and CEOC see “Definitions of Non-GAAP Financial Measures” included in the Appendix at the end of this presentation. Financial Data Financial information provided herein is as of March 31, 2019 unless otherwise indicated. Published June 3, 2019. 2

VICI IS THE NEXT GENERATION EXPERIENTIAL REAL ESTATE COMPANY MISSION TO BE AMERICA’S MOST DYNAMIC LEISURE & HOSPITALITY EXPERIENTIAL REAL ESTATE COMPANY VISION WE SEEK TO BE THE REAL ESTATE PARTNER OF CHOICE FOR THE LEADING CREATORS & OPERATORS OF PLACE -BASED, SCALED LEISURE & HOSPITALITY EXPERIENCES WE SEEK TO LEASE PROPERTIES TO TENANTS WITH MARKET - LEADING RELATIONSHIPS WITH HIGH VALUE CONSUMERS OF LEISURE & HOSPITALITY 3
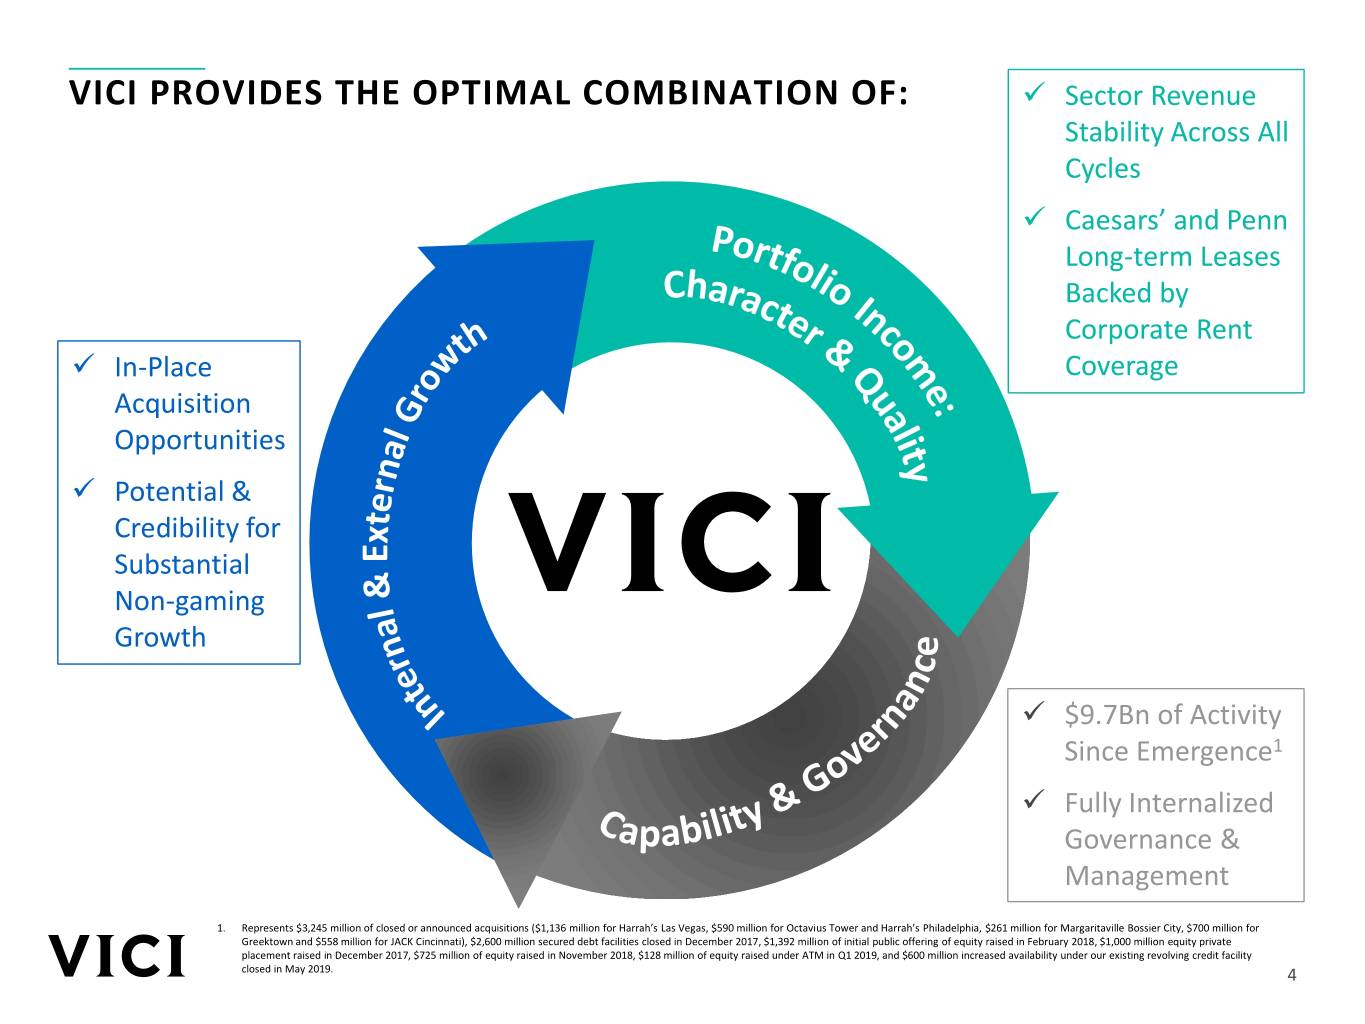
VICI PROVIDES THE OPTIMAL COMBINATION OF: ✓ Sector Revenue Stability Across All Cycles ✓ Caesars’ and Penn Long-term Leases Backed by Corporate Rent ✓ In-Place Coverage Acquisition Opportunities ✓ Potential & Credibility for Substantial Non-gaming Growth ✓ $9.7Bn of Activity Since Emergence1 ✓ Fully Internalized Governance & Management 1. Represents $3,245 million of closed or announced acquisitions ($1,136 million for Harrah’s Las Vegas, $590 million for Octavius Tower and Harrah’s Philadelphia, $261 million for Margaritaville Bossier City, $700 million for Greektown and $558 million for JACK Cincinnati), $2,600 million secured debt facilities closed in December 2017, $1,392 million of initial public offering of equity raised in February 2018, $1,000 million equity private placement raised in December 2017, $725 million of equity raised in November 2018, $128 million of equity raised under ATM in Q1 2019, and $600 million increased availability under our existing revolving credit facility closed in May 2019. 4
1Portfolio Income: Character & Quality 5

FUNDAMENTAL ADVANTAGES OF OUR EXPERIENTIAL AND GAMING REAL ESTATE PORTFOLIO Diversified High Barriers to State & Local Triple Net REIT Revenue Streams Entry Given 1 2 3 4 Incentives to with 100% from Gaming, Legislative & Ensure Casinos Occupancy F&B, Retail and Regulatory Thrive Entertainment Controls Regional Gaming Lack of Near Cash Flows Show 5 Tenant Financial 7 Term Supply 8 6 Transparent Low Volatility Transparency & Growth in Highly Growth Pipeline Through All Strength Desirable Las Cycles, Including Vegas Market Financial Crisis 6
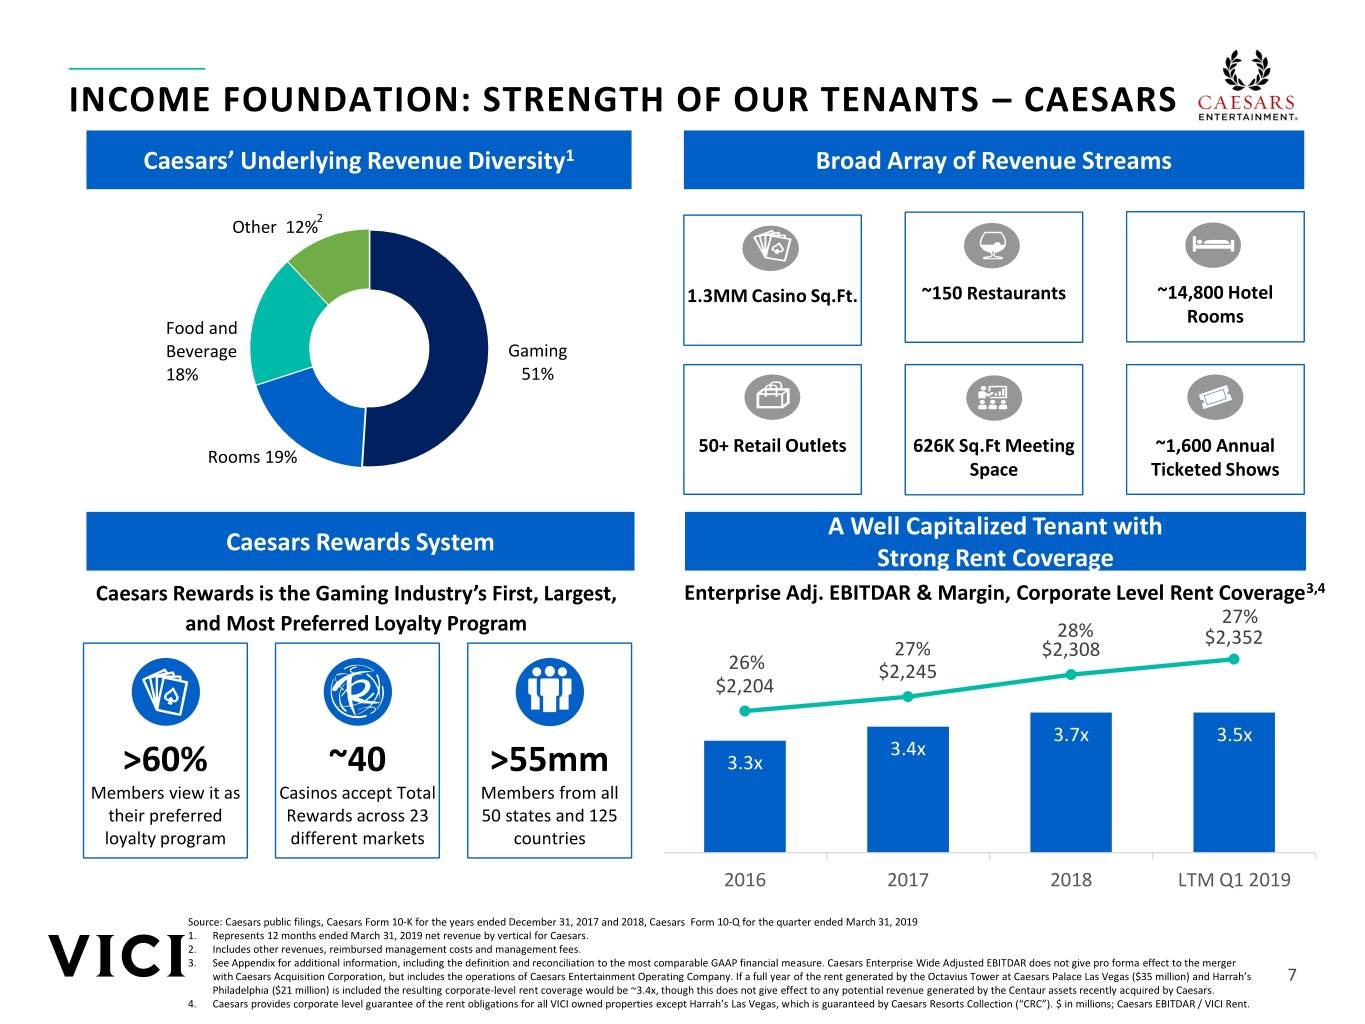
INCOME FOUNDATION: STRENGTH OF OUR TENANTS – CAESARS Caesars’ Underlying Revenue Diversity1 Broad Array of Revenue Streams Other 12%2 1.3MM Casino Sq.Ft. ~150 Restaurants ~14,800 Hotel Rooms Food and Beverage Gaming 18% 51% 50+ Retail Outlets 626K Sq.Ft Meeting ~1,600 Annual Rooms 19% Space Ticketed Shows A Well Capitalized Tenant with Caesars Rewards System Strong Rent Coverage Caesars Rewards is the Gaming Industry’s First, Largest, Enterprise Adj. EBITDAR & Margin, Corporate Level Rent Coverage3,4 and Most Preferred Loyalty Program 27% 28% $2,352 27% $2,308 26% $2,245 $2,204 3.7x 3.5x 3.4x >60% ~40 >55mm 3.3x Members view it as Casinos accept Total Members from all their preferred Rewards across 23 50 states and 125 loyalty program different markets countries 2016 2017 2018 LTM Q1 2019 Source: Caesars public filings, Caesars Form 10-K for the years ended December 31, 2017 and 2018, Caesars Form 10-Q for the quarter ended March 31, 2019 1. Represents 12 months ended March 31, 2019 net revenue by vertical for Caesars. 2. Includes other revenues, reimbursed management costs and management fees. 3. See Appendix for additional information, including the definition and reconciliation to the most comparable GAAP financial measure. Caesars Enterprise Wide Adjusted EBITDAR does not give pro forma effect to the merger with Caesars Acquisition Corporation, but includes the operations of Caesars Entertainment Operating Company. If a full year of the rent generated by the Octavius Tower at Caesars Palace Las Vegas ($35 million) and Harrah’s 7 Philadelphia ($21 million) is included the resulting corporate-level rent coverage would be ~3.4x, though this does not give effect to any potential revenue generated by the Centaur assets recently acquired by Caesars. 4. Caesars provides corporate level guarantee of the rent obligations for all VICI owned properties except Harrah’s Las Vegas, which is guaranteed by Caesars Resorts Collection (“CRC”). $ in millions; Caesars EBITDAR / VICI Rent.

INCOME FOUNDATION: STRENGTH OF OUR TENANTS 1 – PENN Leading Regional Operator Diversified Portfolio Largest U.S. regional gaming operator 40 Properties in 18 jurisdictions across the U.S. 193 Food & Beverage locations 49,400 Gaming machines 1,200 Table games 8,800 Hotel rooms 35,000+ Employees Strong Regional Brands Across the U.S. Continued Tenant Diversification Greektown Margaritaville Source: Penn public filings 1. On January 2, 2019, the Company completed the acquisition of the real estate assets of Margaritaville Bossier City and entered into a triple net lease agreement with Penn. On May 23, 2019, the Company completed the acquisition of the real estate assets associated with Greektown Casino-Hotel and entered into a triple net lease agreement with Penn. 8

INCOME FOUNDATION: CAESARS' INVESTMENT IN OUR PROPERTIES Historical CEOC Capital Expenditures¹ Capital Expenditures by Type¹ $ 223 $ 222 $ 223 $ 220 $ 222 $ 220 $ 30 $ 27 $ 35 $ 94 $ 46 $ 145 $ 106 $ 145 $ 98 Caesars Total Capex $ 6 $ 14 $ 15 2017: $598MM $ 222 $ 223 $ 53 $ 220 $ 22 $ 12 2018: $565MM $ 195$ 27 $ 188 $ 35 $ 145 $ 70 $ 106 $ 141 LTM Q1’19: $698MM $ 53 $ 114 $ 109 $ 195 $ 188 $ 92 $ 95 $ 92 $ 114 $ 46 20132013 20142014 20152015 20162016 2013 2014 2015 2016 Regional CPLV General Hotel Renovation F&B Slot 2 Capital Expenditures Since 2011 In-line with Peers as a % of Revenue Peer Average: 4.2% 7.2% CEOC Average: 4.1% 6.6% 6.2% 5.7% 5.7% 5.7% 5.5% 4.8% 4.9% 5.1% 4.8% 4.6% 4.8% 4.7% 3.6% 4.1% 4.4% 3.8% 3.7% 3.7% 3.4% 3.2% 2.8% 3.0% 2.8% 2.2% 2.6% 0.4% 2011 2012 2013 2014 2015 2016 MGM BYD PNK PENN ERI RRR Peer Average CEOC Average 1. Source: Caesars Lender Presentation and Documentation, filed with the SEC on 3/21/2017. 2013 and 2014 include corporate capital expenditures that were moved out of CEOC following the formation of CES. Caesars’ 2017, 2018 and LTM Q1 2019 capex per company filings. 2. CEOC capital expenditures include general capital expenditures as well as hotel renovation, slot, and F&B capex. Peers’ capital expenditures per company filings, Wall Street Research; represents capital expenditures less expansion-related capital expenditures. 9
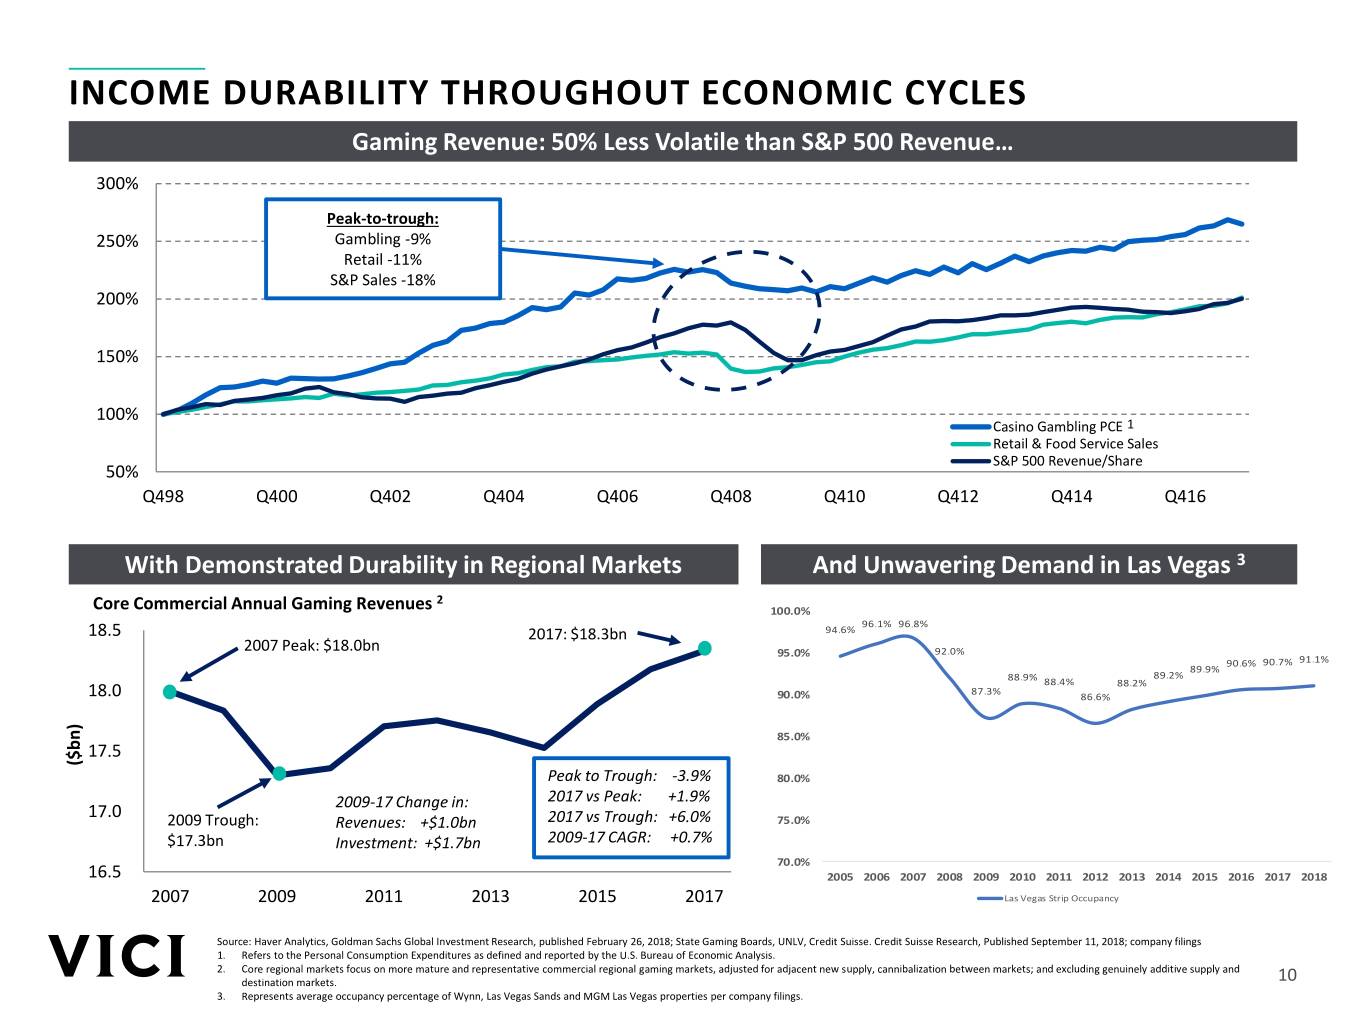
INCOME DURABILITY THROUGHOUT ECONOMIC CYCLES Gaming Revenue: 50% Less Volatile than S&P 500 Revenue… 300% Peak-to-trough: 250% Gambling -9% Retail -11% S&P Sales -18% 200% 150% 100% Casino Gambling PCE 1 Retail & Food Service Sales S&P 500 Revenue/Share 50% Q498 Q400 Q402 Q404 Q406 Q408 Q410 Q412 Q414 Q416 With Demonstrated Durability in Regional Markets And Unwavering Demand in Las Vegas 3 2 Core Commercial Annual Gaming Revenues 100.0% 96.1% 96.8% 18.5 2017: $18.3bn 94.6% 2007 Peak: $18.0bn 95.0% 92.0% 90.6% 90.7% 91.1% 89.9% 88.9% 89.2% 88.4% 88.2% 87.3% 18.0 90.0% 86.6% 85.0% 17.5 ($bn) Peak to Trough: -3.9% 80.0% 2017 vs Peak: +1.9% 17.0 2009-17 Change in: 2009 Trough: Revenues: +$1.0bn 2017 vs Trough: +6.0% 75.0% $17.3bn Investment: +$1.7bn 2009-17 CAGR: +0.7% 70.0% 16.5 2005 2006 2007 2008 2009 2010 2011 2012 2013 2014 2015 2016 2017 2018 2007 2009 2011 2013 2015 2017 Las Vegas Strip Occupancy Source: Haver Analytics, Goldman Sachs Global Investment Research, published February 26, 2018; State Gaming Boards, UNLV, Credit Suisse. Credit Suisse Research, Published September 11, 2018; company filings 1. Refers to the Personal Consumption Expenditures as defined and reported by the U.S. Bureau of Economic Analysis. 2. Core regional markets focus on more mature and representative commercial regional gaming markets, adjusted for adjacent new supply, cannibalization between markets; and excluding genuinely additive supply and destination markets. 10 3. Represents average occupancy percentage of Wynn, Las Vegas Sands and MGM Las Vegas properties per company filings.
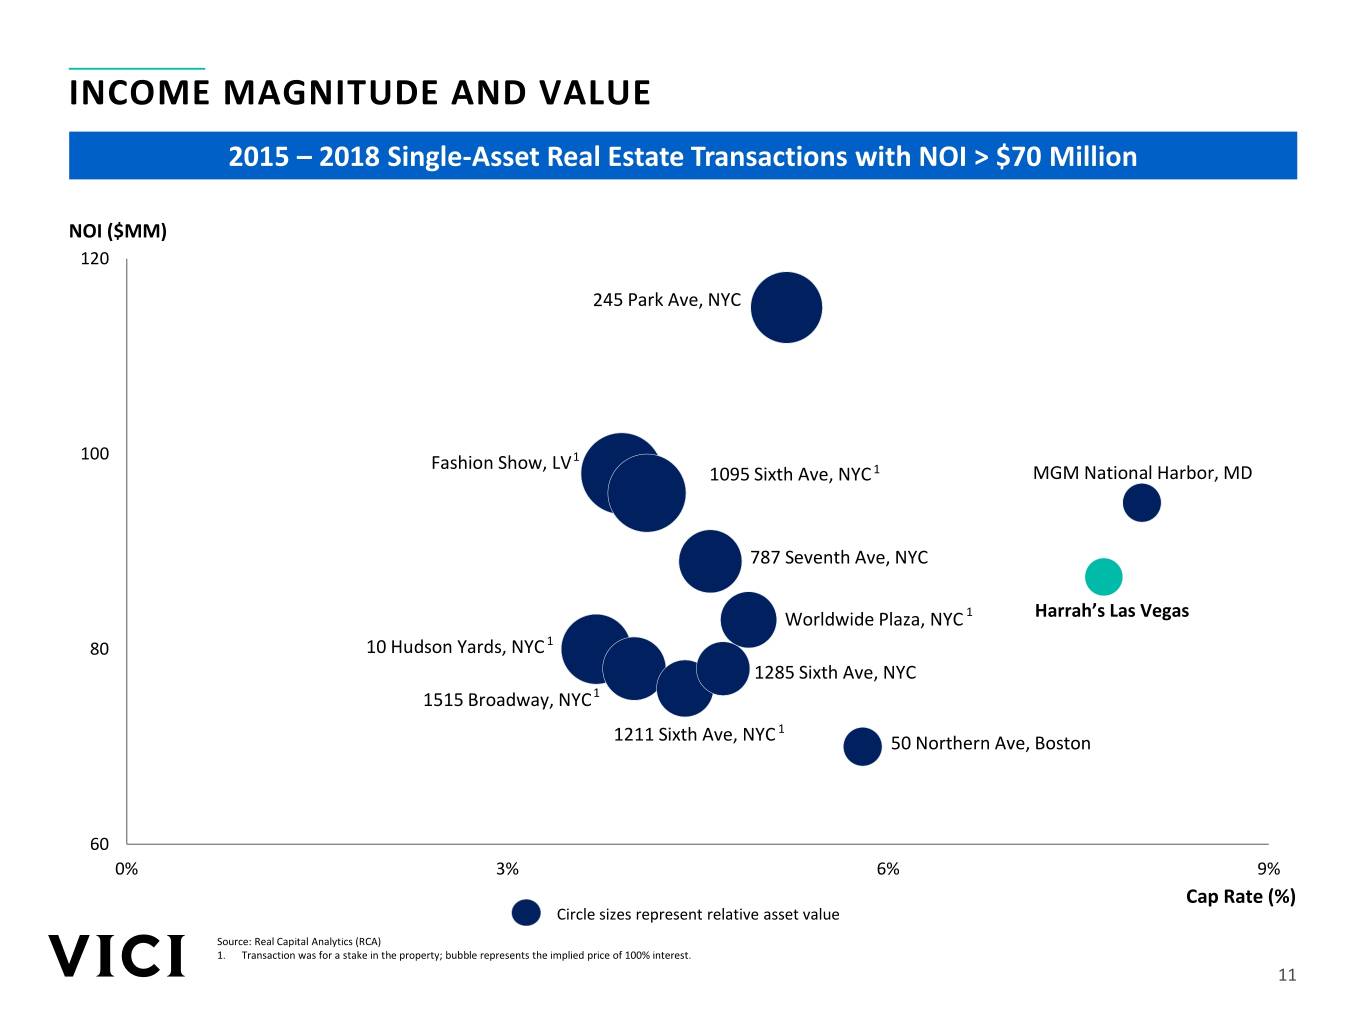
INCOME MAGNITUDE AND VALUE 2015 – 2018 Single-Asset Real Estate Transactions with NOI > $70 Million NOI ($MM) 120 245 Park Ave, NYC 100 Fashion Show, LV1 1095 Sixth Ave, NYC 1 MGM National Harbor, MD 787 Seventh Ave, NYC Worldwide Plaza, NYC 1 Harrah’s Las Vegas 80 10 Hudson Yards, NYC 1 1285 Sixth Ave, NYC 1515 Broadway, NYC1 1 1211 Sixth Ave, NYC 50 Northern Ave, Boston 60 0% 3% 6% 9% Cap Rate (%) Circle sizes represent relative asset value Source: Real Capital Analytics (RCA) 1. Transaction was for a stake in the property; bubble represents the implied price of 100% interest. 11
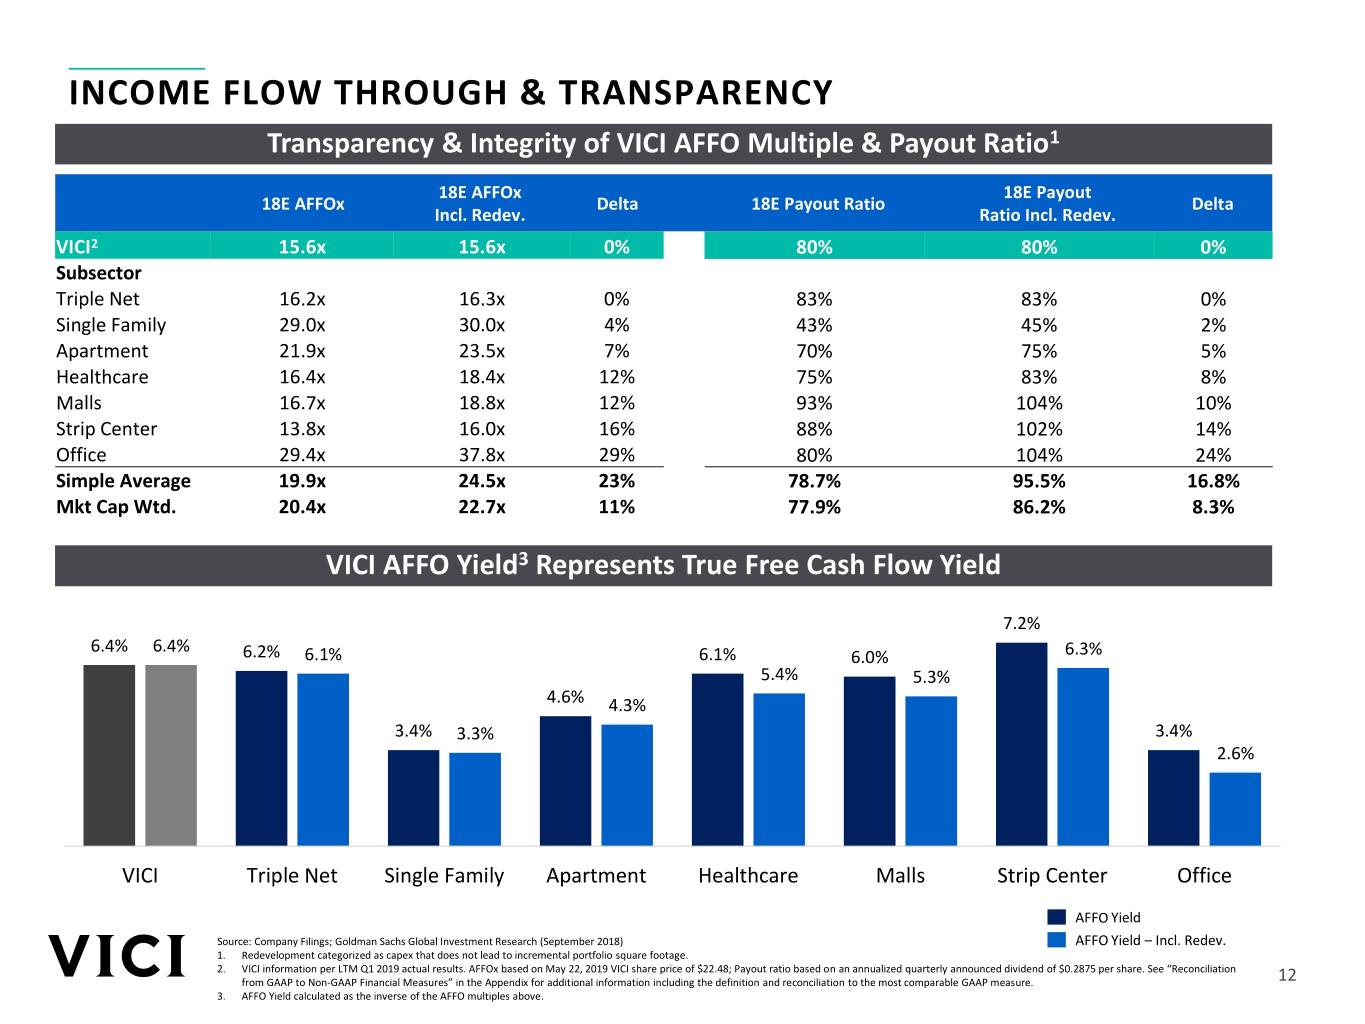
INCOME FLOW THROUGH & TRANSPARENCY Transparency & Integrity of VICI AFFO Multiple & Payout Ratio1 18E AFFOx 18E Payout 18E AFFOx Delta 18E Payout Ratio Delta Incl. Redev. Ratio Incl. Redev. VICI2 15.6x 15.6x 0% 80% 80% 0% Subsector Triple Net 16.2x 16.3x 0% 83% 83% 0% Single Family 29.0x 30.0x 4% 43% 45% 2% Apartment 21.9x 23.5x 7% 70% 75% 5% Healthcare 16.4x 18.4x 12% 75% 83% 8% Malls 16.7x 18.8x 12% 93% 104% 10% Strip Center 13.8x 16.0x 16% 88% 102% 14% Office 29.4x 37.8x 29% 80% 104% 24% Simple Average 19.9x 24.5x 23% 78.7% 95.5% 16.8% Mkt Cap Wtd. 20.4x 22.7x 11% 77.9% 86.2% 8.3% VICI AFFO Yield3 Represents True Free Cash Flow Yield 7.2% 6.4% 6.4% 6.2% 6.1% 6.1% 6.0% 6.3% 5.4% 5.3% 4.6% 4.3% 3.4% 3.3% 3.4% 2.6% VICI Triple Net Single Family Apartment Healthcare Malls Strip Center Office AFFO Yield Source: Company Filings; Goldman Sachs Global Investment Research (September 2018) AFFO Yield – Incl. Redev. 1. Redevelopment categorized as capex that does not lead to incremental portfolio square footage. 2. VICI information per LTM Q1 2019 actual results. AFFOx based on May 22, 2019 VICI share price of $22.48; Payout ratio based on an annualized quarterly announced dividend of $0.2875 per share. See “Reconciliation from GAAP to Non-GAAP Financial Measures” in the Appendix for additional information including the definition and reconciliation to the most comparable GAAP measure. 12 3. AFFO Yield calculated as the inverse of the AFFO multiples above.
2Growth Opportunities

CLEARLY IDENTIFIED AND ACTIONABLE GROWTH Broad Opportunities Across Identified and Other Experiential Real Estate Assets # of Properties Additional ROFR on Any +95% Increase in Caesars Real Estate Number of Purchased Outside Clark Properties County, NV Octavius Tower at Caesars Palace Las Vegas1 2 3 Clear Pipeline for Growth + Other Gaming Assets + Other Leisure, Hospitality and Entertainment Assets 1. On July 11, 2018, the Company completed the acquisition of the Octavius Tower at Caesars Palace Las Vegas, representing the consolidation of the portion of the remaining real estate of Caesars Palace Las Vegas not previously owned by the Company. 2. On April 5, 2019, the Company announced that it entered into definitive agreements pursuant to which VICI will acquire the land and real estate assets associated with JACK Cincinnati. Acquisition is pending completion, subject to customary closing conditions and regulatory approvals. 14 3. Caesars does not have a contractual obligation to sell these properties to VICI and will make an independent financial decision in any potential transaction.

SUBSTANTIAL ORGANIC RENT & AFFO GROWTH 5-Year Call Option Until October 2022 to Acquire Three Properties at a 10% Cap Rate1 with $130 Million of Total Rent as of June 20162 HARRAH’S ATLANTIC CITY HARRAH’S LAUGHLIN HARRAH’S NEW ORLEANS Ability to Generate Highly Attractive Internal AFFO Growth Reinvested Same-Store Lease Internal Free Cash Flow3 Escalation4 AFFO Growth ~2-2.5% ~2% ~4-4.5% 1. Under the Call Right Agreements, rent equates to 60% of the trailing Property EBITDAR at the time of exercise. The purchase price is set at 10.0x rent. 2. Source: Caesars Entertainment Operating Company Disclosure Statement for the Debtors’ Second Amended Joint Plan of Reorganization filed in the United States Bankruptcy Court, Northern District of Illinois, Eastern Division on June 28, 2016. In conjunction with the Plan of Reorganization, the Debtors’ investment banker performed a valuation analysis. Such valuation assumed annual rent associated with the option properties of $130.0 million. These estimates were prepared by the Debtors. There can be no assurance that the Company will acquire any or all of the option properties, and the acquisition of the option properties is subject to various risks and uncertainties, including business, regulatory and others. 15 3. Assumes AFFO payout ratio of 75%, AFFO/share per midpoint of Company guidance on May 1, 2019, acquisition at cap rates of 7.5-8.5% on an assumed 5.5x leverage and illustrative debt costs of 5.5%. 4. Same-store lease escalation is pro forma for the completed close of the acquisition of the Octavius Tower at Caesars Palace Las Vegas, Harrah’s Philadelphia (and associated lease modifications), Margaritaville Bossier City and Greektown Casino-Hotel as well as pending close of the JACK Cincinnati acquisition. Assumes illustrative debt / TEV of 37-39%.

LAS VEGAS LAND PROVIDES OPPORTUNITY FOR FURTHER GROWTH Unrivaled Opportunity to Deepen the Strip at its Center VICI has a Put-Call Rights Agreement The Mirage on 18 acres for Caesars’ expected Caesars Forum Convention Center Venetian Caesars Harrah’s Caesars-owned 41 acres Palace The LINQ VICI-owned 27 acres of land that is part of the Non-CPLV lease Bellagio strategically located adjacent Paris to the LINQ and behind Planet Hollywood The Cosmopolitan Planet Hollywood VICI-owned 7 acres of Strip frontage property at Caesars Palace part of the CPLV lease and available for redevelopment Note: Map is illustrative and may not be shown exactly to scale. 16
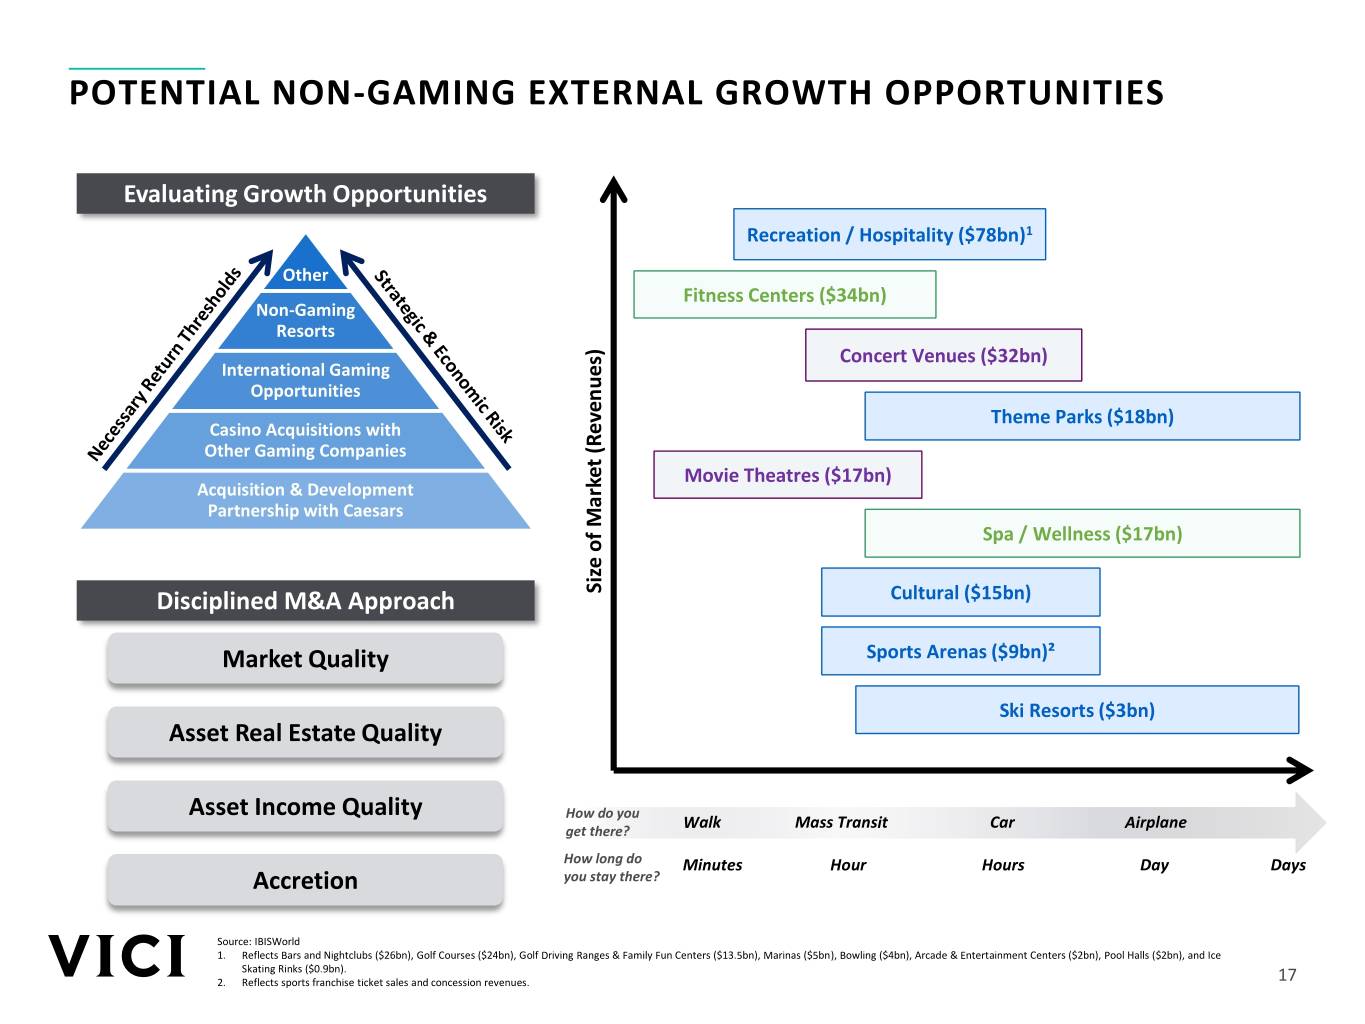
POTENTIAL NON-GAMING EXTERNAL GROWTH OPPORTUNITIES Evaluating Growth Opportunities Recreation / Hospitality ($78bn)1 Other Fitness Centers ($34bn) Non-Gaming Resorts Concert Venues ($32bn) International Gaming Opportunities Theme Parks ($18bn) Casino Acquisitions with Other Gaming Companies Movie Theatres ($17bn) Acquisition & Development Partnership with Caesars Spa / Wellness ($17bn) Disciplined M&A Approach (Revenues) of Market Size Cultural ($15bn) Market Quality Sports Arenas ($9bn)² Ski Resorts ($3bn) Asset Real Estate Quality Asset Income Quality How do you get there? Walk Mass Transit Car Airplane How long do Minutes Hour Hours Day Days Accretion you stay there? Source: IBISWorld 1. Reflects Bars and Nightclubs ($26bn), Golf Courses ($24bn), Golf Driving Ranges & Family Fun Centers ($13.5bn), Marinas ($5bn), Bowling ($4bn), Arcade & Entertainment Centers ($2bn), Pool Halls ($2bn), and Ice Skating Rinks ($0.9bn). 2. Reflects sports franchise ticket sales and concession revenues. 17

THE ADVANTAGE OF EXPERIENTIAL REAL ESTATE Consumer Spending on “Experiences” Has Greatly Outpaced “Things” During the Past 15 Years 2,000 5.3% 1,500 Shift in Spending 2.8% Behavior 1,000 2.3% Indexed Performance Indexed PCE 500 1.5% 0 0% 1% 2% 3% 4% 5% 6% CAGR Since 2000 Motor Vehicles Clothing Home Furnishings Consumer Experiences Source: Bureau of Economic Analysis, William Blair Equity Research, Published July 20, 2017 18

3Capability & Governance
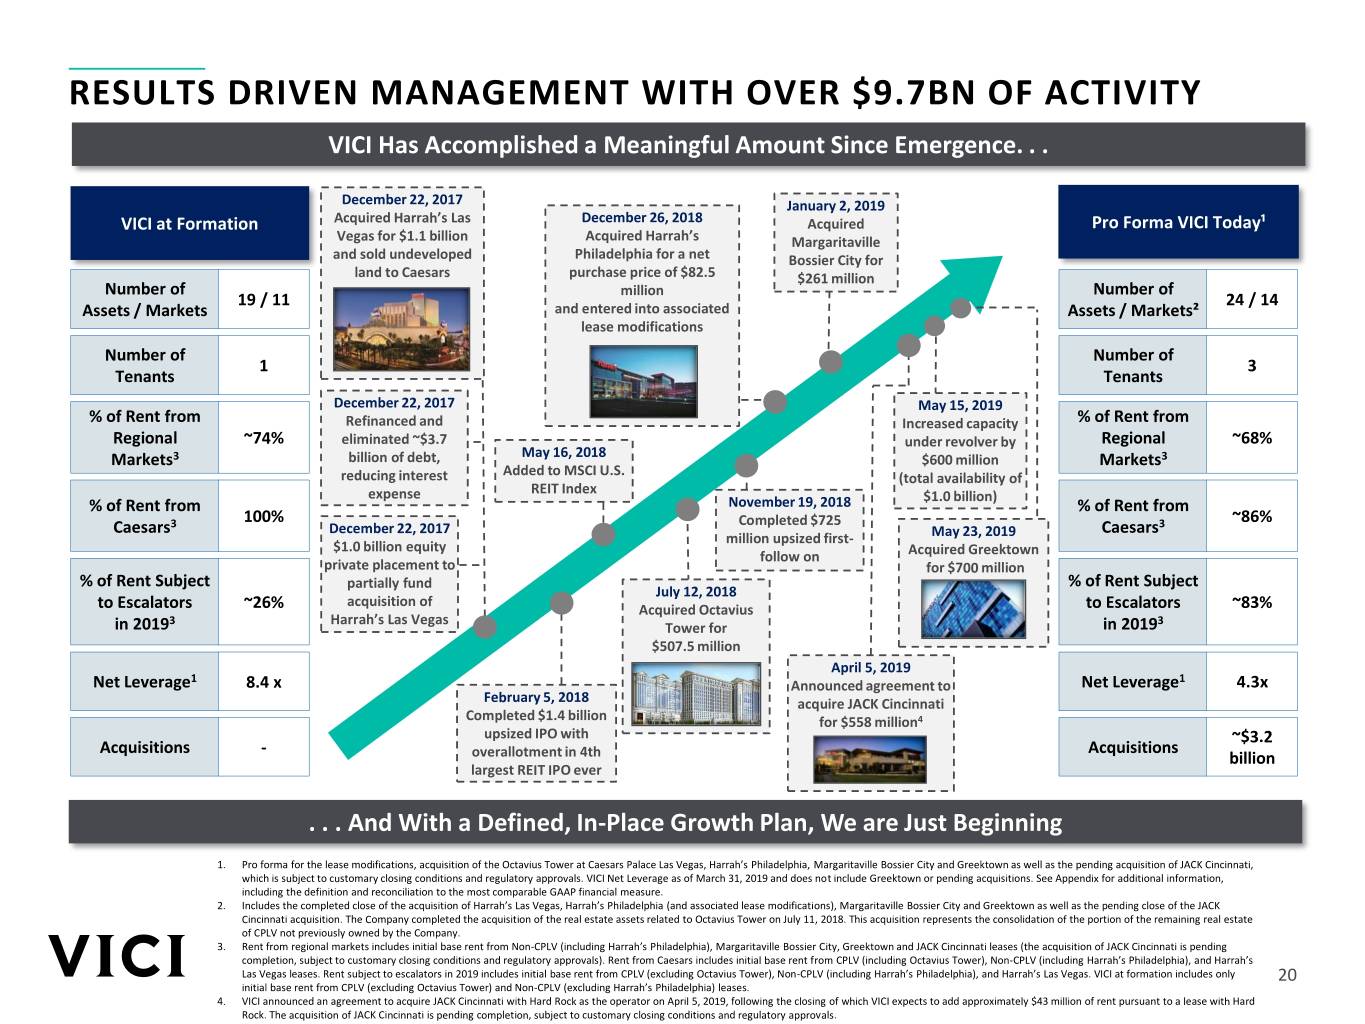
IBDROOT\PROJECTS\IBD-NY\VIGILS2017\608254_1\Docs\44. Jack - Project Gordie\2018-11-14 Roadshow Presentation\04. Greektown Only\Archive\Project Julius Roadshow Presentation (Pages 14, 15, 18).pptx RESULTS DRIVEN MANAGEMENT WITH OVER $9.7BN OF ACTIVITY VICI Has Accomplished a Meaningful Amount Since Emergence. . . December 22, 2017 January 2, 2019 VICI at Formation Acquired Harrah’s Las December 26, 2018 Acquired Pro Forma VICI Today¹ Vegas for $1.1 billion Acquired Harrah’s Margaritaville and sold undeveloped Philadelphia for a net Bossier City for land to Caesars purchase price of $82.5 $261 million Number of million Number of 19 / 11 24 / 14 Assets / Markets and entered into associated Assets / Markets² lease modifications Number of Number of 1 3 Tenants Tenants December 22, 2017 May 15, 2019 % of Rent from Refinanced and Increased capacity % of Rent from Regional ~74% eliminated ~$3.7 under revolver by Regional ~68% May 16, 2018 Markets3 billion of debt, $600 million Markets3 Added to MSCI U.S. reducing interest (total availability of REIT Index expense $1.0 billion) % of Rent from November 19, 2018 % of Rent from 100% Completed $725 ~86% Caesars3 December 22, 2017 Caesars3 million upsized first- May 23, 2019 $1.0 billion equity follow on Acquired Greektown private placement to for $700 million % of Rent Subject partially fund % of Rent Subject July 12, 2018 acquisition of to Escalators ~26% Acquired Octavius to Escalators ~83% 3 Harrah’s Las Vegas 3 in 2019 Tower for in 2019 $507.5 million April 5, 2019 1 1 Net Leverage 8.4 x Announced agreement to Net Leverage 4.3x February 5, 2018 acquire JACK Cincinnati Completed $1.4 billion for $558 million4 upsized IPO with ~$3.2 Acquisitions - Acquisitions overallotment in 4th billion largest REIT IPO ever . . . And With a Defined, In-Place Growth Plan, We are Just Beginning 1. Pro forma for the lease modifications, acquisition of the Octavius Tower at Caesars Palace Las Vegas, Harrah’s Philadelphia, Margaritaville Bossier City and Greektown as well as the pending acquisition of JACK Cincinnati, which is subject to customary closing conditions and regulatory approvals. VICI Net Leverage as of March 31, 2019 and does not include Greektown or pending acquisitions. See Appendix for additional information, including the definition and reconciliation to the most comparable GAAP financial measure. 2. Includes the completed close of the acquisition of Harrah’s Las Vegas, Harrah’s Philadelphia (and associated lease modifications), Margaritaville Bossier City and Greektown as well as the pending close of the JACK Cincinnati acquisition. The Company completed the acquisition of the real estate assets related to Octavius Tower on July 11, 2018. This acquisition represents the consolidation of the portion of the remaining real estate of CPLV not previously owned by the Company. 3. Rent from regional markets includes initial base rent from Non-CPLV (including Harrah’s Philadelphia), Margaritaville Bossier City, Greektown and JACK Cincinnati leases (the acquisition of JACK Cincinnati is pending completion, subject to customary closing conditions and regulatory approvals). Rent from Caesars includes initial base rent from CPLV (including Octavius Tower), Non-CPLV (including Harrah’s Philadelphia), and Harrah’s Las Vegas leases. Rent subject to escalators in 2019 includes initial base rent from CPLV (excluding Octavius Tower), Non-CPLV (including Harrah’s Philadelphia), and Harrah’s Las Vegas. VICI at formation includes only 20 initial base rent from CPLV (excluding Octavius Tower) and Non-CPLV (excluding Harrah’s Philadelphia) leases. 4. VICI announced an agreement to acquire JACK Cincinnati with Hard Rock as the operator on April 5, 2019, following the closing of which VICI expects to add approximately $43 million of rent pursuant to a lease with Hard Rock. The acquisition of JACK Cincinnati is pending completion, subject to customary closing conditions and regulatory approvals.
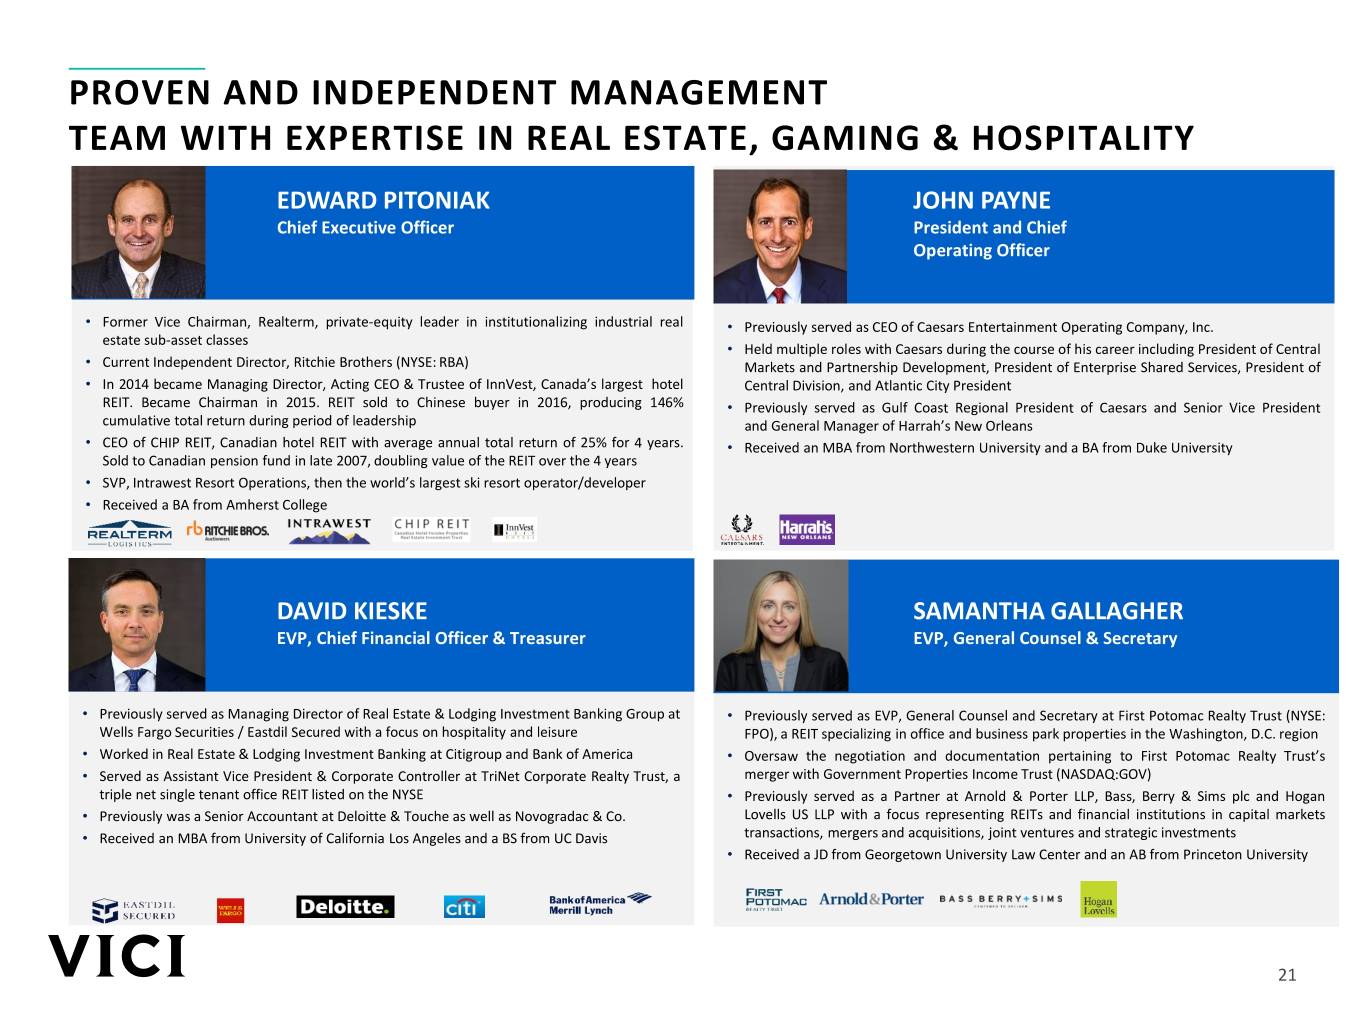
PROVEN AND INDEPENDENT MANAGEMENT TEAM WITH EXPERTISE IN REAL ESTATE, GAMING & HOSPITALITY EDWARD PITONIAK JOHN PAYNE Chief Executive Officer President and Chief Operating Officer • Former Vice Chairman, Realterm, private-equity leader in institutionalizing industrial real • Previously served as CEO of Caesars Entertainment Operating Company, Inc. estate sub-asset classes • Held multiple roles with Caesars during the course of his career including President of Central • Current Independent Director, Ritchie Brothers (NYSE: RBA) Markets and Partnership Development, President of Enterprise Shared Services, President of • In 2014 became Managing Director, Acting CEO & Trustee of InnVest, Canada’s largest hotel Central Division, and Atlantic City President REIT. Became Chairman in 2015. REIT sold to Chinese buyer in 2016, producing 146% • Previously served as Gulf Coast Regional President of Caesars and Senior Vice President cumulative total return during period of leadership and General Manager of Harrah’s New Orleans • CEO of CHIP REIT, Canadian hotel REIT with average annual total return of 25% for 4 years. • Received an MBA from Northwestern University and a BA from Duke University Sold to Canadian pension fund in late 2007, doubling value of the REIT over the 4 years • SVP, Intrawest Resort Operations, then the world’s largest ski resort operator/developer • Received a BA from Amherst College DAVID KIESKE SAMANTHA GALLAGHER EVP, Chief Financial Officer & Treasurer EVP, General Counsel & Secretary • Previously served as Managing Director of Real Estate & Lodging Investment Banking Group at • Previously served as EVP, General Counsel and Secretary at First Potomac Realty Trust (NYSE: Wells Fargo Securities / Eastdil Secured with a focus on hospitality and leisure FPO), a REIT specializing in office and business park properties in the Washington, D.C. region • Worked in Real Estate & Lodging Investment Banking at Citigroup and Bank of America • Oversaw the negotiation and documentation pertaining to First Potomac Realty Trust’s • Served as Assistant Vice President & Corporate Controller at TriNet Corporate Realty Trust, a merger with Government Properties Income Trust (NASDAQ:GOV) triple net single tenant office REIT listed on the NYSE • Previously served as a Partner at Arnold & Porter LLP, Bass, Berry & Sims plc and Hogan • Previously was a Senior Accountant at Deloitte & Touche as well as Novogradac & Co. Lovells US LLP with a focus representing REITs and financial institutions in capital markets • Received an MBA from University of California Los Angeles and a BS from UC Davis transactions, mergers and acquisitions, joint ventures and strategic investments • Received a JD from Georgetown University Law Center and an AB from Princeton University 21
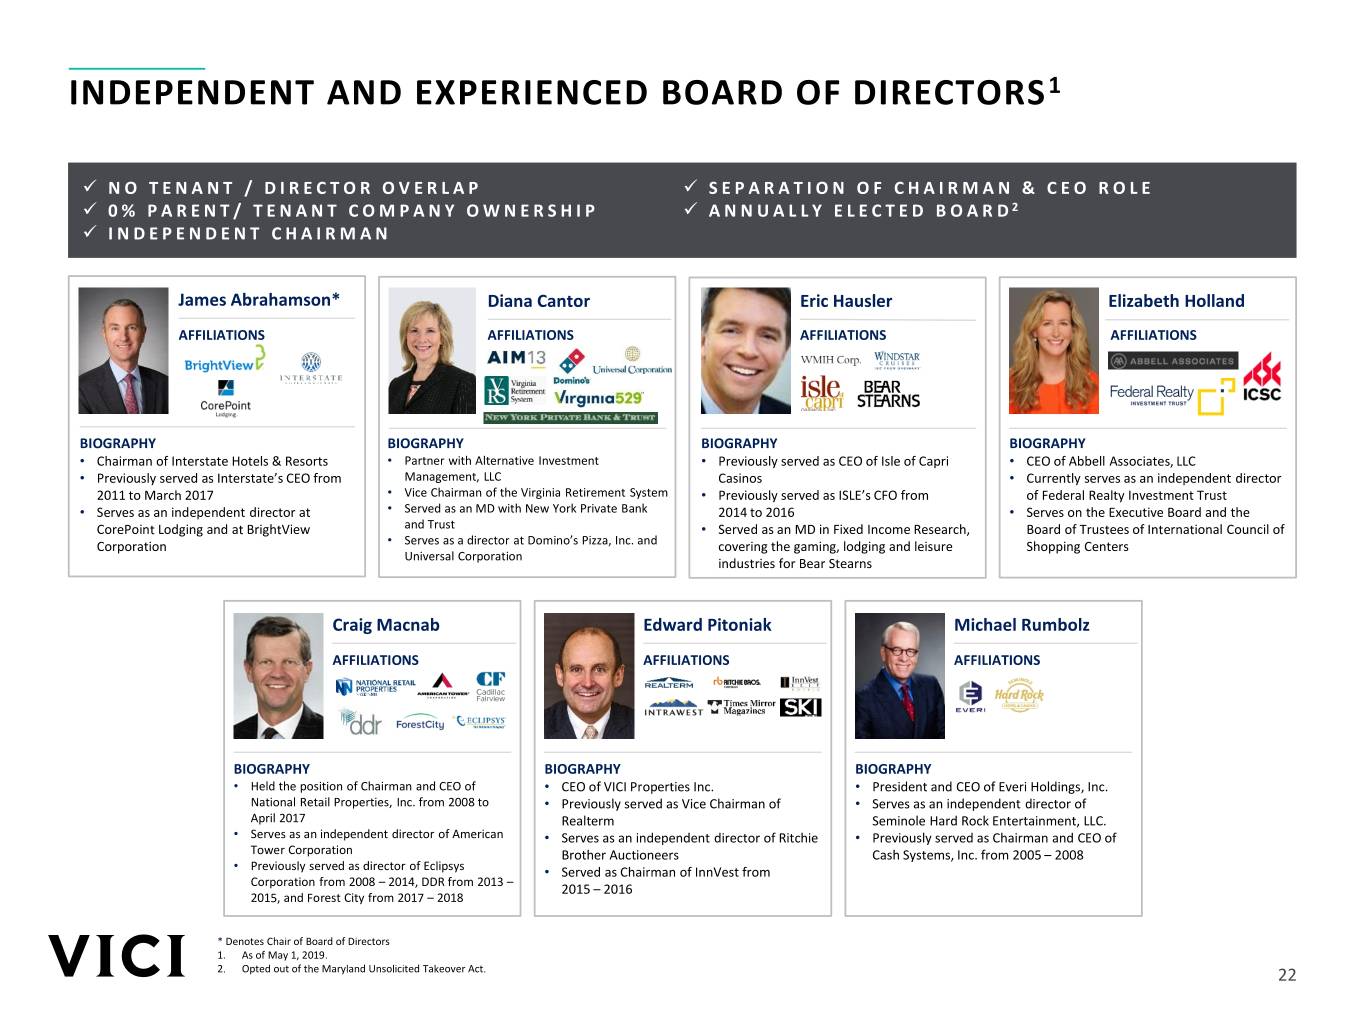
INDEPENDENT AND EXPERIENCED BOARD OF DIRECTORS 1 ✓ NO TENANT / DIRECTOR OVERLAP ✓ SEPARATION OF CHAIRMAN & CEO ROLE ✓ 0% PARENT/ TENANT COMPANY OWNERSHIP ✓ ANNUALLY ELECTED BOARD 2 ✓ INDEPENDENT CHAIRMAN James Abrahamson* Diana Cantor Eric Hausler Elizabeth Holland AFFILIATIONS AFFILIATIONS AFFILIATIONS AFFILIATIONS BIOGRAPHY BIOGRAPHY BIOGRAPHY BIOGRAPHY • Chairman of Interstate Hotels & Resorts • Partner with Alternative Investment • Previously served as CEO of Isle of Capri • CEO of Abbell Associates, LLC • Previously served as Interstate’s CEO from Management, LLC Casinos • Currently serves as an independent director 2011 to March 2017 • Vice Chairman of the Virginia Retirement System • Previously served as ISLE’s CFO from of Federal Realty Investment Trust • Serves as an independent director at • Served as an MD with New York Private Bank 2014 to 2016 • Serves on the Executive Board and the CorePoint Lodging and at BrightView and Trust • Served as an MD in Fixed Income Research, Board of Trustees of International Council of Corporation • Serves as a director at Domino’s Pizza, Inc. and covering the gaming, lodging and leisure Shopping Centers Universal Corporation industries for Bear Stearns Craig Macnab Edward Pitoniak Michael Rumbolz AFFILIATIONS AFFILIATIONS AFFILIATIONS BIOGRAPHY BIOGRAPHY BIOGRAPHY • Held the position of Chairman and CEO of • CEO of VICI Properties Inc. • President and CEO of Everi Holdings, Inc. National Retail Properties, Inc. from 2008 to • Previously served as Vice Chairman of • Serves as an independent director of April 2017 Realterm Seminole Hard Rock Entertainment, LLC. • Serves as an independent director of American • Serves as an independent director of Ritchie • Previously served as Chairman and CEO of Tower Corporation Brother Auctioneers Cash Systems, Inc. from 2005 – 2008 • Previously served as director of Eclipsys • Served as Chairman of InnVest from Corporation from 2008 – 2014, DDR from 2013 – 2015 – 2016 2015, and Forest City from 2017 – 2018 * Denotes Chair of Board of Directors 1. As of May 1, 2019. 2. Opted out of the Maryland Unsolicited Takeover Act. 22
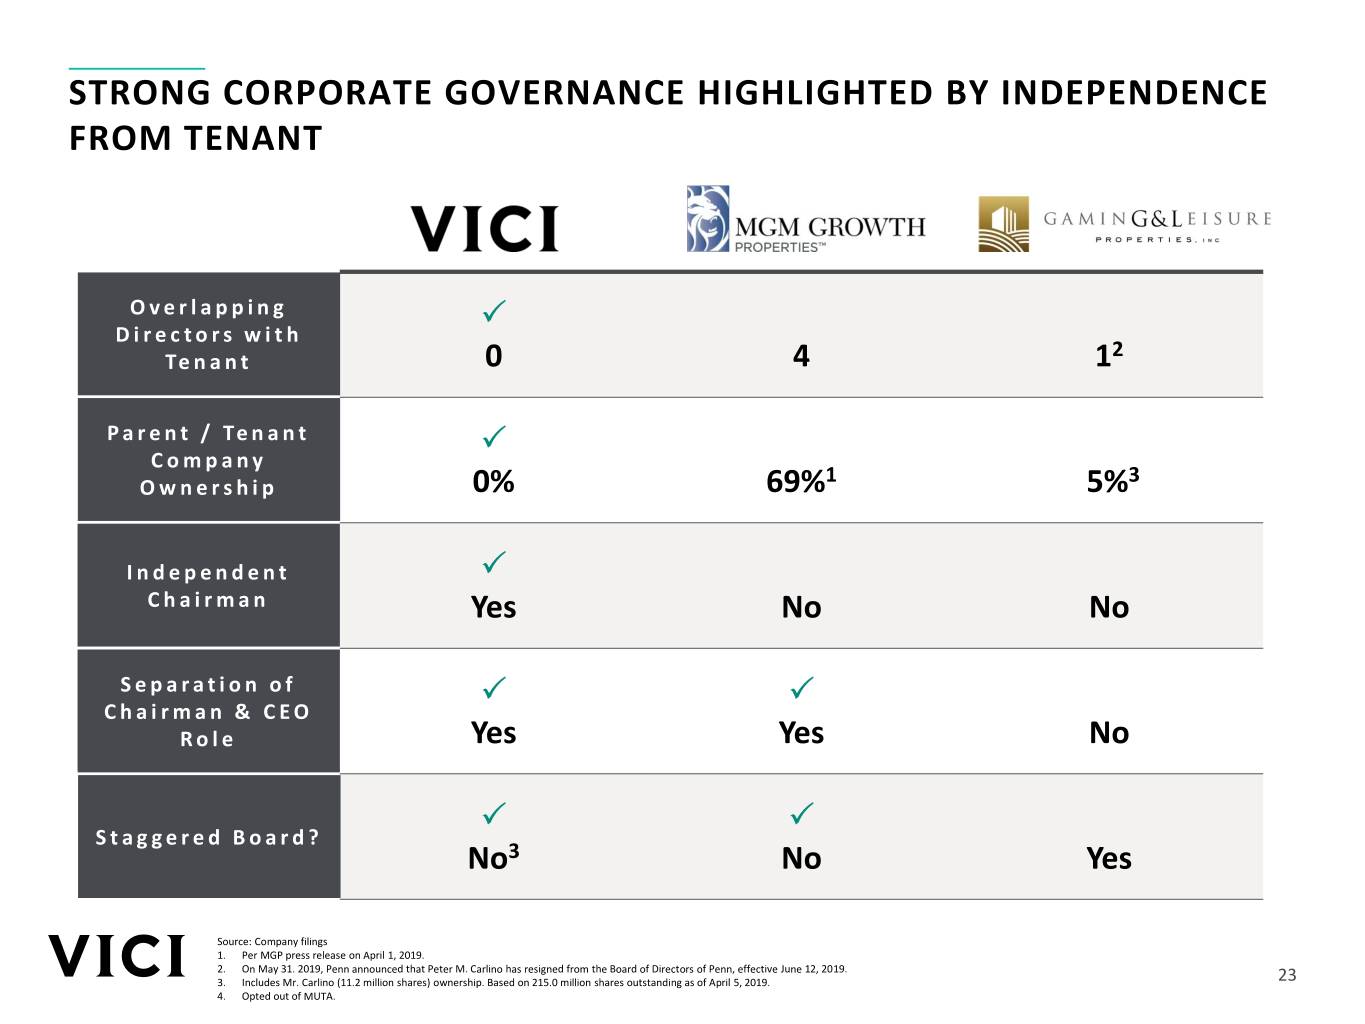
STRONG CORPORATE GOVERNANCE HIGHLIGHTED BY INDEPENDENCE FROM TENANT Overlapping P Directors with 2 Te n a n t 0 4 1 Parent / Tenant P C o m p a n y 1 3 O w n e r s h i p 0% 69% 5% Independent P C h a i r m a n Yes No No Separation of P P Chairman & CEO R o l e Yes Yes No P P Staggered Board? No3 No Yes Source: Company filings 1. Per MGP press release on April 1, 2019. 2. On May 31. 2019, Penn announced that Peter M. Carlino has resigned from the Board of Directors of Penn, effective June 12, 2019. 3. Includes Mr. Carlino (11.2 million shares) ownership. Based on 215.0 million shares outstanding as of April 5, 2019. 23 4. Opted out of MUTA.

Appendix

HIGH QUALITY REAL ESTATE ANCHORED BY ICONIC ASSETS COUNCIL BLUFFS METROPOLIS CINCINNATI DETROIT JOLIET / HAMMOND Harrah’s Horseshoe Harrah’s Horseshoe Harrah’s JACK Greektown Council Council Metropolis Cincinnati1 Joliet Hammond Bluffs Bluffs N. KANSAS CITY PHILADELPHIA Harrah’s Harrah’s N. Kansas Philadelphia City LAKE TAHOE / RENO ATLANTIC CITY Harrah’s Detroit Bally’s Reno Lake Tahoe / Reno Joliet / Hammond Atlantic City Council Bluffs Philadelphia Harvey’s Cincinnati Atlantic City Caesars Lake Tahoe Atlantic City Las Vegas North Kansas City Louisville Harrah’s Metropolis Lake Tahoe Laughlin LOUISVILLE Tunica Resorts / Robinsonville Horseshoe Southern LAS VEGAS Bossier City Indiana Harrah’s Biloxi Las Vegas New Orleans PADUCAH Bluegrass Caesars Downs Palace Las Vegas BOSSIER CITY TUNICA RESORTS / ROBINSONVILLE BILOXI Octavius Horseshoe Tunica Margaritaville Louisiana Horseshoe Harrah’s Tower Bossier Roadhouse Bossier City Downs Tunica Gulf Coast City Hotel CURRENT PORTFOLIO ANNOUNCED ACQUISITIONS CALL OPTION PROPERTIES DESIGNATED ROFR (CENTAUR) / PUT-CALL OWNED GOLF COURSES JACK Cincinnati Harrah’s New Orleans (CONVENTION CENTER) PROPERTIES Cascata, Boulder City, NV Harrah’s Laughlin Indiana Grand, Centaur Rio Secco, Henderson, NV Harrah’s Atlantic City Hoosier Park, Centaur Grand Bear, Harrison County, MS Caesars Forum Convention Center, Vegas Chariot Run, Laconia, IN 1. On April 5, 2019, the Company announced that it entered into definitive agreements pursuant to which VICI will acquire the land and real estate assets associated with JACK Cincinnati. Acquisition is pending completion, subject to customary closing conditions and regulatory approvals. 25

SHAREHOLDER BASE TRANSFORMATION VICI is Successfully Transforming its Shareholder Base From Foundational Ownership to Institutional REIT, Index & Other Long-Term Holders Steadily eliminated a sizable equity overhang by successfully reducing ownership by foundational investors, while shareholders realized total returns of +29.3%, outperforming the RMZ by over +2,400 bps since spin-off1 $24.00 22% 27% 33% $23.00 52% November 2018 Secondary 45% 8% Offering ($21.00) $22.00 February 2018 IPO 16% ($20.00) $21.00 18% 100% 21% $20.00 22% November 2017 Private Placement 70% 58% $19.00 ($18.50) 49% 26% $18.00 34% $17.00 10/6/2017 3/31/2018 6/30/2018 9/30/2018 12/31/2018 3/31/2019 Foundational Investors Index Institutional / REIT Investors Share Price Source: Ipreo Holdings Data, and 13-F filings 1. VICI share price as of December 18, 2018 ($18.50) and May 22, 2019 ($22.48). 26
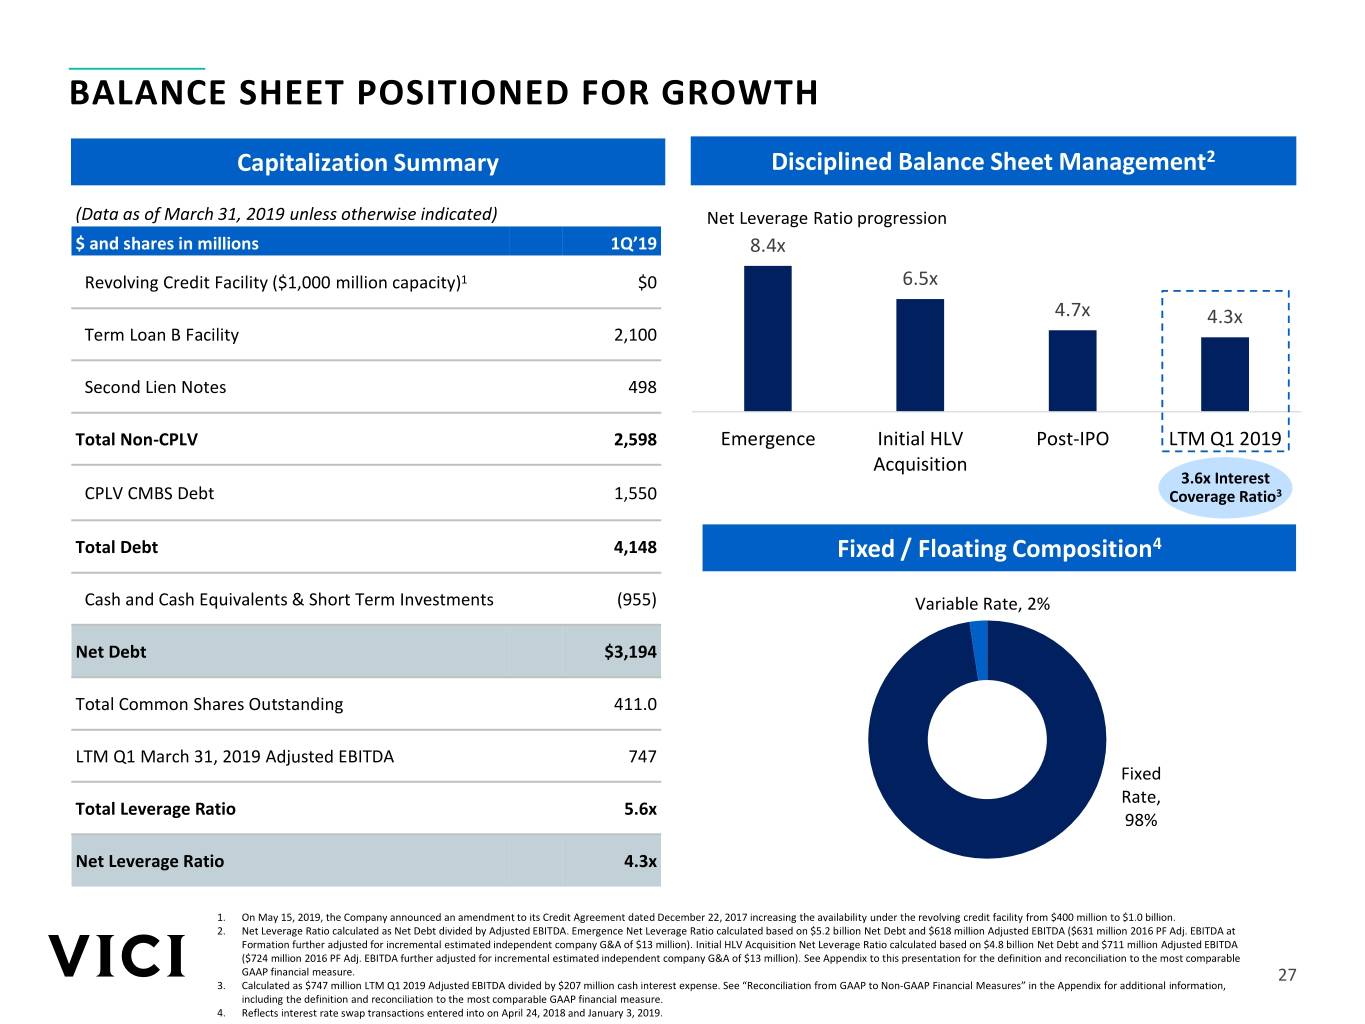
BALANCE SHEET POSITIONED FOR GROWTH Capitalization Summary Disciplined Balance Sheet Management2 (Data as of March 31, 2019 unless otherwise indicated) Net Leverage Ratio progression $ and shares in millions 1Q’19 8.4x Revolving Credit Facility ($1,000 million capacity)1 $0 6.5x 4.7x 4.3x Term Loan B Facility 2,100 Second Lien Notes 498 Total Non-CPLV 2,598 Emergence Initial HLV Post-IPO LTM Q1 2019 Acquisition 3.6x Interest CPLV CMBS Debt 1,550 Coverage Ratio3 Total Debt 4,148 Fixed / Floating Composition4 Cash and Cash Equivalents & Short Term Investments (955) Variable Rate, 2% Net Debt $3,194 Total Common Shares Outstanding 411.0 LTM Q1 March 31, 2019 Adjusted EBITDA 747 Fixed Rate, Total Leverage Ratio 5.6x 98% Net Leverage Ratio 4.3x 1. On May 15, 2019, the Company announced an amendment to its Credit Agreement dated December 22, 2017 increasing the availability under the revolving credit facility from $400 million to $1.0 billion. 2. Net Leverage Ratio calculated as Net Debt divided by Adjusted EBITDA. Emergence Net Leverage Ratio calculated based on $5.2 billion Net Debt and $618 million Adjusted EBITDA ($631 million 2016 PF Adj. EBITDA at Formation further adjusted for incremental estimated independent company G&A of $13 million). Initial HLV Acquisition Net Leverage Ratio calculated based on $4.8 billion Net Debt and $711 million Adjusted EBITDA ($724 million 2016 PF Adj. EBITDA further adjusted for incremental estimated independent company G&A of $13 million). See Appendix to this presentation for the definition and reconciliation to the most comparable GAAP financial measure. 27 3. Calculated as $747 million LTM Q1 2019 Adjusted EBITDA divided by $207 million cash interest expense. See “Reconciliation from GAAP to Non-GAAP Financial Measures” in the Appendix for additional information, including the definition and reconciliation to the most comparable GAAP financial measure. 4. Reflects interest rate swap transactions entered into on April 24, 2018 and January 3, 2019.

MASTER LEASE AGREEMENTS: TRIPLE NET STRUCTURE PROVIDES SECURITY & EARNINGS PREDICTABILITY Non-CPLV & Joliet Caesars Palace Las Margaritaville Harrah’s Las Vegas Greektown (2 Leases)1 Vegas2 Bossier City Initial Cash $493.9 Million $200.0 Million $87.4 Million $23.2 Million $55.6 Million Rent Current $501.0 Million $204.4 Million $88.3 Million $23.2 Million $55.6 Million Cash Rent3 1% per year for years 2 – 5 Annual 1.5% in years 2-5 >2% / change in CPI beginning 2% for Building Base Rent 2% for Building Base Rent and >2% / change in CPI >2% / change in CPI thereafter in year 2 ($17.2 Million) ($42.8 Million) Escalator thereafter Percentage (Variable) Rent Percentage (Variable) Rent Rent Year 8: 70% Base / 30% Variable Year 8 & 11: 80% Base / 20% Year 8 & 11: 80% Base / 20% adjusts every 2 years adjusts every 2 years Year 11: 80% Base / 20% Variable Variable Variable Adjustment beginning in year 3 beginning in year 3 4% of revenue increase/decrease 4% of revenue increase/decrease Variable 4% of revenue increase in 4% of the average net 4% of the average net Year 8: Average of years 5-7 less Year 8: Average of years 5-7 less Rent year 8 (less year 0); revenues for trailing 2-year revenues for trailing 2-year average of years 0-2 average of years 0-2 additional resets indexed to period less threshold period less threshold Adjustment Year 11: Average of years 8-10 Year 11: Average of years 8-10 prior 3 years amount amount Mechanic less average of years 5-7 less average of years 5-7 Term 15-year initial term with four 5-year renewal options Caesars Resorts Collection Penn National Gaming Penn National Gaming Guarantee Caesars (CEC) (CRC) (PENN) (PENN) EBITDAR Coverage 1.2x beginning in year 8 1.7x beginning in year 8 1.6x beginning in year 6 1.9x beginning in year 2 1.85x beginning in year 2 Floor Minimum 1% of Net Minimum 1% of Net $350 Million Capex spending required over rolling 3 year $171 Million between 2017 Capex Revenue based on a four- Revenue based on a four- period at $100 Million minimum per year4 and 20215 year average year average 1. Cash rent amounts are presented prior to accounting for the portion of rent payable to the 20% JV partner at Harrah’s Joliet. After adjusting for the portion of rent payable to the 20% JV partner, Initial Cash Rent and Current Cash Rent are $486.0 million and $493.0 million, respectively. 2. Initial CPLV cash rent of $165 million, which is subject to annual escalators, as well as Octavius Tower cash rent of $35 million, which is not subject to annual escalators. 3. In relation to the Non-CPLV Lease Agreement, Joliet Lease Agreement and CPLV Lease Agreement, the amount represents the current annual base rent payable for the current lease year which is the period from November 1, 2018 through October 31, 2019. In relation to the HLV Lease Agreement the amount represents current annual base rent payable for the current lease year which is the period from January 1, 2019 through December 31, 2019. 28 4. Over the three years, the $350 million minimum is allocated $84 million to CPLV, $255 million to Non‐CPLV (total $339 million) and the rest to CPLV/Non‐CPLV as tenant may elect. 5. Capex at 1% of net revenue thereafter.
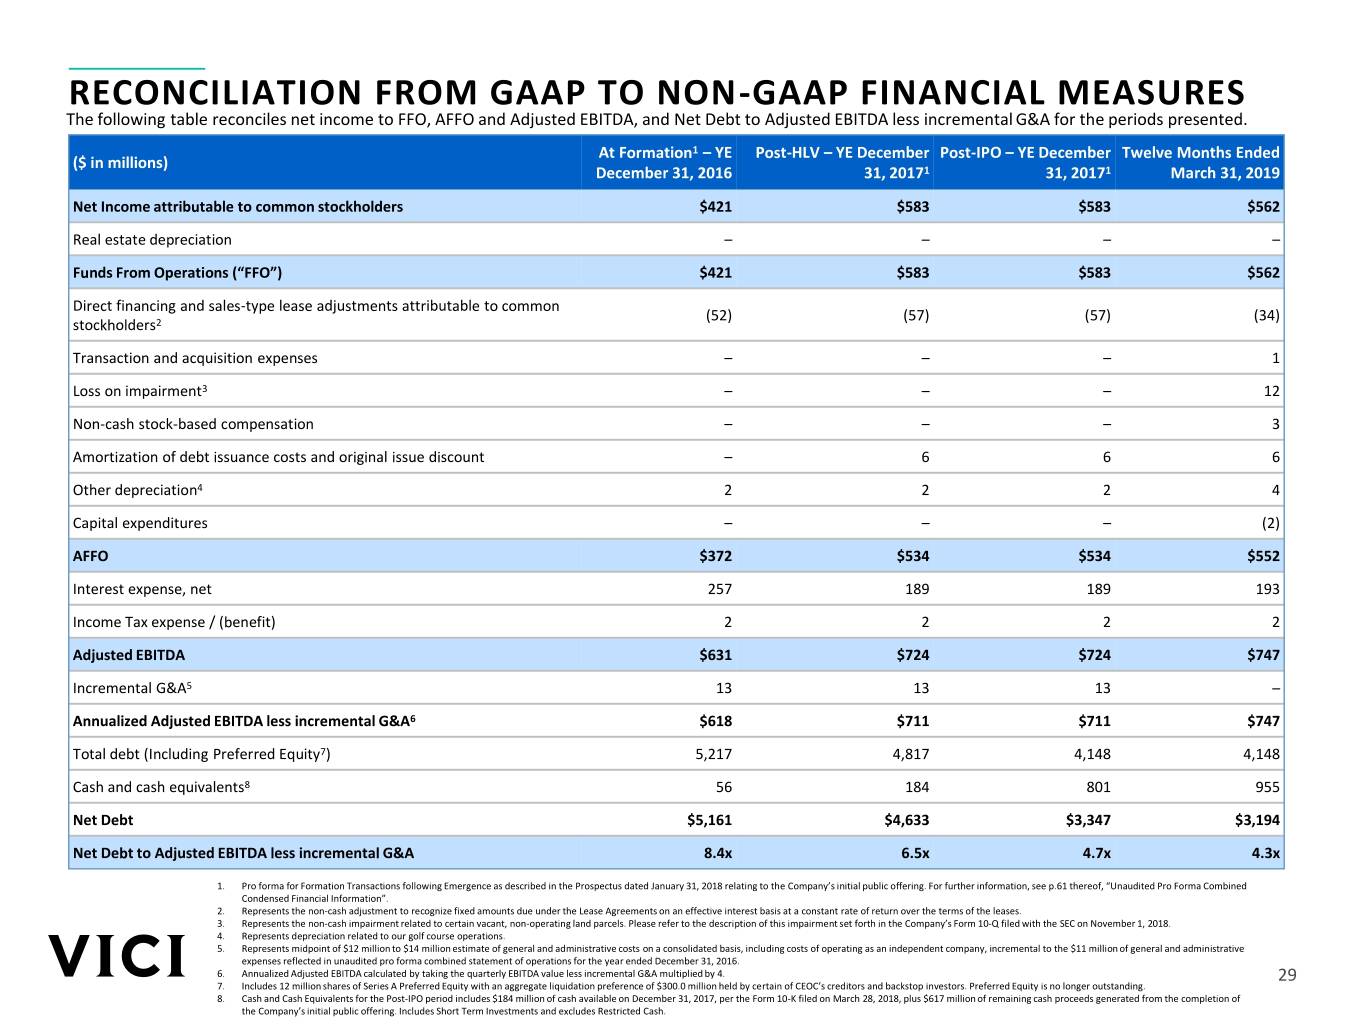
RECONCILIATION FROM GAAP TO NON-GAAP FINANCIAL MEASURES The following table reconciles net income to FFO, AFFO and Adjusted EBITDA, and Net Debt to Adjusted EBITDA less incremental G&A for the periods presented. At Formation1 – YE Post-HLV – YE December Post-IPO – YE December Twelve Months Ended ($ in millions) December 31, 2016 31, 20171 31, 20171 March 31, 2019 Net Income attributable to common stockholders $421 $583 $583 $562 Real estate depreciation – – – – Funds From Operations (“FFO”) $421 $583 $583 $562 Direct financing and sales-type lease adjustments attributable to common (52) (57) (57) (34) stockholders2 Transaction and acquisition expenses – – – 1 Loss on impairment3 – – – 12 Non-cash stock-based compensation – – – 3 Amortization of debt issuance costs and original issue discount – 6 6 6 Other depreciation4 2 2 2 4 Capital expenditures – – – (2) AFFO $372 $534 $534 $552 Interest expense, net 257 189 189 193 Income Tax expense / (benefit) 2 2 2 2 Adjusted EBITDA $631 $724 $724 $747 Incremental G&A5 13 13 13 – Annualized Adjusted EBITDA less incremental G&A6 $618 $711 $711 $747 Total debt (Including Preferred Equity7) 5,217 4,817 4,148 4,148 Cash and cash equivalents8 56 184 801 955 Net Debt $5,161 $4,633 $3,347 $3,194 Net Debt to Adjusted EBITDA less incremental G&A 8.4x 6.5x 4.7x 4.3x 1. Pro forma for Formation Transactions following Emergence as described in the Prospectus dated January 31, 2018 relating to the Company’s initial public offering. For further information, see p.61 thereof, “Unaudited Pro Forma Combined Condensed Financial Information”. 2. Represents the non-cash adjustment to recognize fixed amounts due under the Lease Agreements on an effective interest basis at a constant rate of return over the terms of the leases. 3. Represents the non-cash impairment related to certain vacant, non-operating land parcels. Please refer to the description of this impairment set forth in the Company’s Form 10-Q filed with the SEC on November 1, 2018. 4. Represents depreciation related to our golf course operations. 5. Represents midpoint of $12 million to $14 million estimate of general and administrative costs on a consolidated basis, including costs of operating as an independent company, incremental to the $11 million of general and administrative expenses reflected in unaudited pro forma combined statement of operations for the year ended December 31, 2016. 6. Annualized Adjusted EBITDA calculated by taking the quarterly EBITDA value less incremental G&A multiplied by 4. 29 7. Includes 12 million shares of Series A Preferred Equity with an aggregate liquidation preference of $300.0 million held by certain of CEOC’s creditors and backstop investors. Preferred Equity is no longer outstanding. 8. Cash and Cash Equivalents for the Post-IPO period includes $184 million of cash available on December 31, 2017, per the Form 10-K filed on March 28, 2018, plus $617 million of remaining cash proceeds generated from the completion of the Company’s initial public offering. Includes Short Term Investments and excludes Restricted Cash.

RECONCILIATION FROM GAAP TO NON-GAAP FINANCIAL MEASURES The following table reconciles net income to FFO, AFFO and Adjusted EBITDA. Three Months Ended June 30, September 30, December 31, March 31, Twelve Months Ended ($ in millions) 2018 2018 2018 2019 March 31, 2019 Net Income attributable to common stockholders $139 $130 $143 $151 $562 Real estate depreciation – – – – – Funds From Operations (“FFO”) $139 $130 $143 $151 $562 Direct financing and sales-type lease adjustments attributable to (13) (13) (6) (2) (34) common stockholders Transaction and acquisition expenses – – – 1 1 Loss on impairment1 – 12 – – 12 Non-cash stock-based compensation – 1 1 1 3 Amortization of debt issuance costs and original issue discount 1 1 1 1 6 Other depreciation2 1 1 1 1 4 Capital expenditures – – – (1) (2) AFFO $129 $132 $140 $152 $552 Interest expense, net 46 51 49 47 193 Income Tax expense / (benefit) – – 1 1 2 Adjusted EBITDA $175 $183 $189 $199 $747 1. Represents the non-cash impairment related to certain vacant, non-operating land parcels. Please refer to the description of this impairment set forth in the Company’s Form 10-Q filed with the SEC on November 1, 2018. 2. Represents depreciation related to our golf course operations. 30
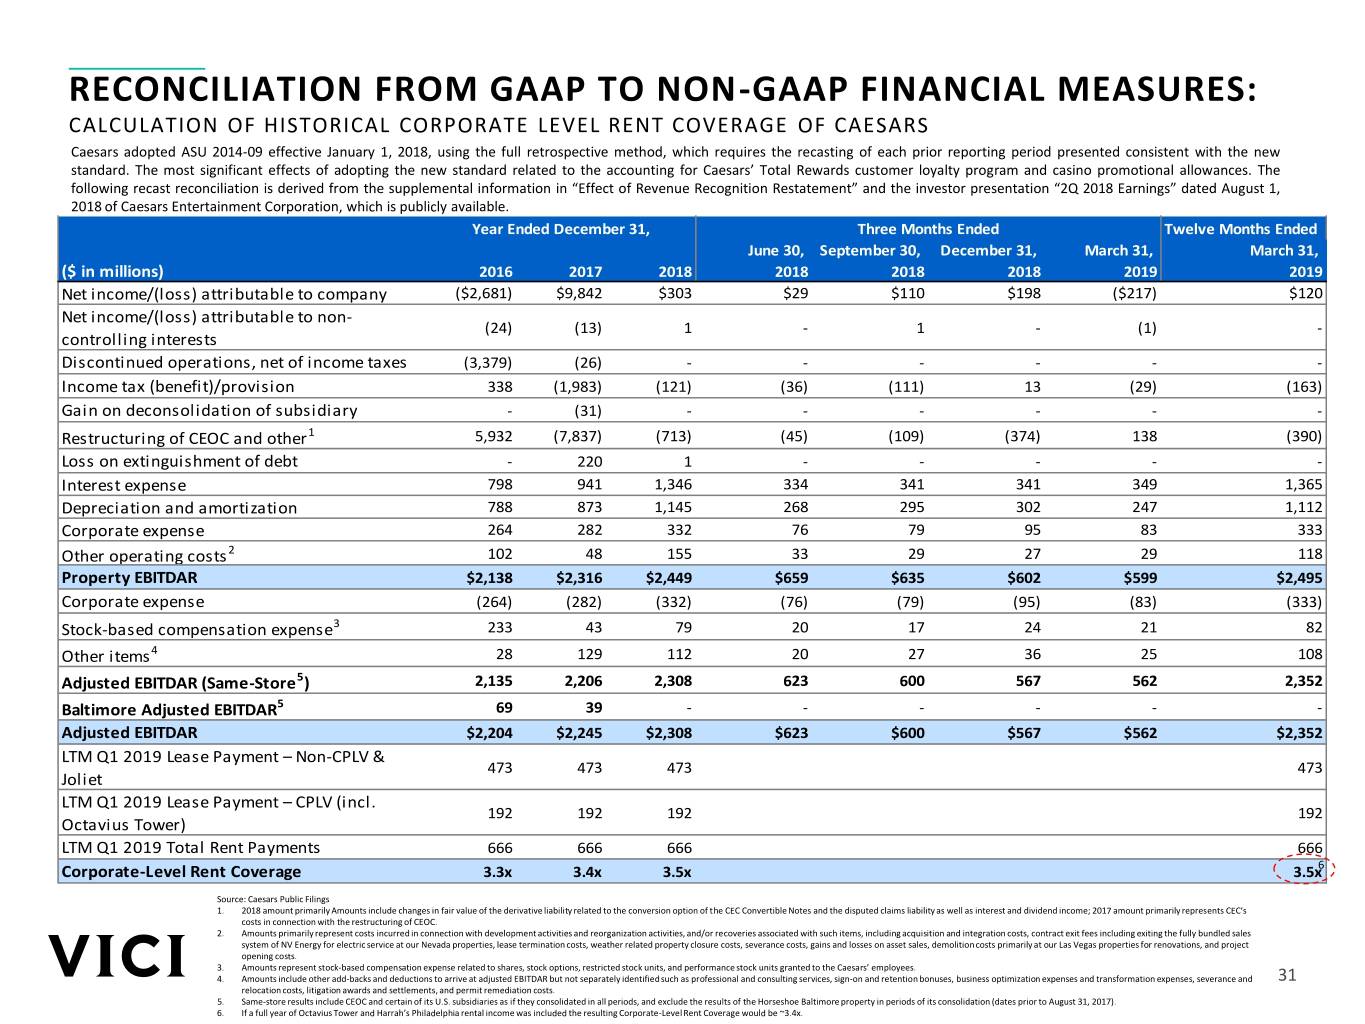
RECONCILIATION FROM GAAP TO NON-GAAP FINANCIAL MEASURES: CALCULATION OF HISTORICAL CORPORATE LEVEL RENT COVERAGE OF CAESARS Caesars adopted ASU 2014-09 effective January 1, 2018, using the full retrospective method, which requires the recasting of each prior reporting period presented consistent with the new standard. The most significant effects of adopting the new standard related to the accounting for Caesars’ Total Rewards customer loyalty program and casino promotional allowances. The following recast reconciliation is derived from the supplemental information in “Effect of Revenue Recognition Restatement” and the investor presentation “2Q 2018 Earnings” dated August 1, 2018 of Caesars Entertainment Corporation, which is publicly available. Year Ended December 31, Three Months Ended Twelve Months Ended June 30, September 30, December 31, March 31, March 31, ($ in millions) 2016 2017 2018 2018 2018 2018 2019 2019 Net income/(loss) attributable to company ($2,681) $9,842 $303 $29 $110 $198 ($217) $120 Net income/(loss) attributable to non- (24) (13) 1 - 1 - (1) - controlling interests Discontinued operations, net of income taxes (3,379) (26) - - - - - - Income tax (benefit)/provision 338 (1,983) (121) (36) (111) 13 (29) (163) Gain on deconsolidation of subsidiary - (31) - - - - - - Restructuring of CEOC and other1 5,932 (7,837) (713) (45) (109) (374) 138 (390) Loss on extinguishment of debt - 220 1 - - - - - Interest expense 798 941 1,346 334 341 341 349 1,365 Depreciation and amortization 788 873 1,145 268 295 302 247 1,112 Corporate expense 264 282 332 76 79 95 83 333 Other operating costs 2 102 48 155 33 29 27 29 118 Property EBITDAR $2,138 $2,316 $2,449 $659 $635 $602 $599 $2,495 Corporate expense (264) (282) (332) (76) (79) (95) (83) (333) Stock-based compensation expense3 233 43 79 20 17 24 21 82 Other items4 28 129 112 20 27 36 25 108 Adjusted EBITDAR (Same-Store5) 2,135 2,206 2,308 623 600 567 562 2,352 Baltimore Adjusted EBITDAR5 69 39 - - - - - - Adjusted EBITDAR $2,204 $2,245 $2,308 $623 $600 $567 $562 $2,352 LTM Q1 2019 Lease Payment – Non-CPLV & 473 473 473 473 Joliet LTM Q1 2019 Lease Payment – CPLV (incl. 192 192 192 192 Octavius Tower) LTM Q1 2019 Total Rent Payments 666 666 666 666 Corporate-Level Rent Coverage 3.3x 3.4x 3.5x 3.5x6 Source: Caesars Public Filings 1. 2018 amount primarily Amounts include changes in fair value of the derivative liability related to the conversion option of the CEC Convertible Notes and the disputed claims liability as well as interest and dividend income; 2017 amount primarily represents CEC’s costs in connection with the restructuring of CEOC. 2. Amounts primarily represent costs incurred in connection with development activities and reorganization activities, and/or recoveries associated with such items, including acquisition and integration costs, contract exit fees including exiting the fully bundled sales system of NV Energy for electric service at our Nevada properties, lease termination costs, weather related property closure costs, severance costs, gains and losses on asset sales, demolition costs primarily at our Las Vegas properties for renovations, and project opening costs. 3. Amounts represent stock-based compensation expense related to shares, stock options, restricted stock units, and performance stock units granted to the Caesars’ employees. 4. Amounts include other add-backs and deductions to arrive at adjusted EBITDAR but not separately identified such as professional and consulting services, sign-on and retention bonuses, business optimization expenses and transformation expenses, severance and 31 relocation costs, litigation awards and settlements, and permit remediation costs. 5. Same-store results include CEOC and certain of its U.S. subsidiaries as if they consolidated in all periods, and exclude the results of the Horseshoe Baltimore property in periods of its consolidation (dates prior to August 31, 2017). 6. If a full year of Octavius Tower and Harrah’s Philadelphia rental income was included the resulting Corporate-Level Rent Coverage would be ~3.4x.
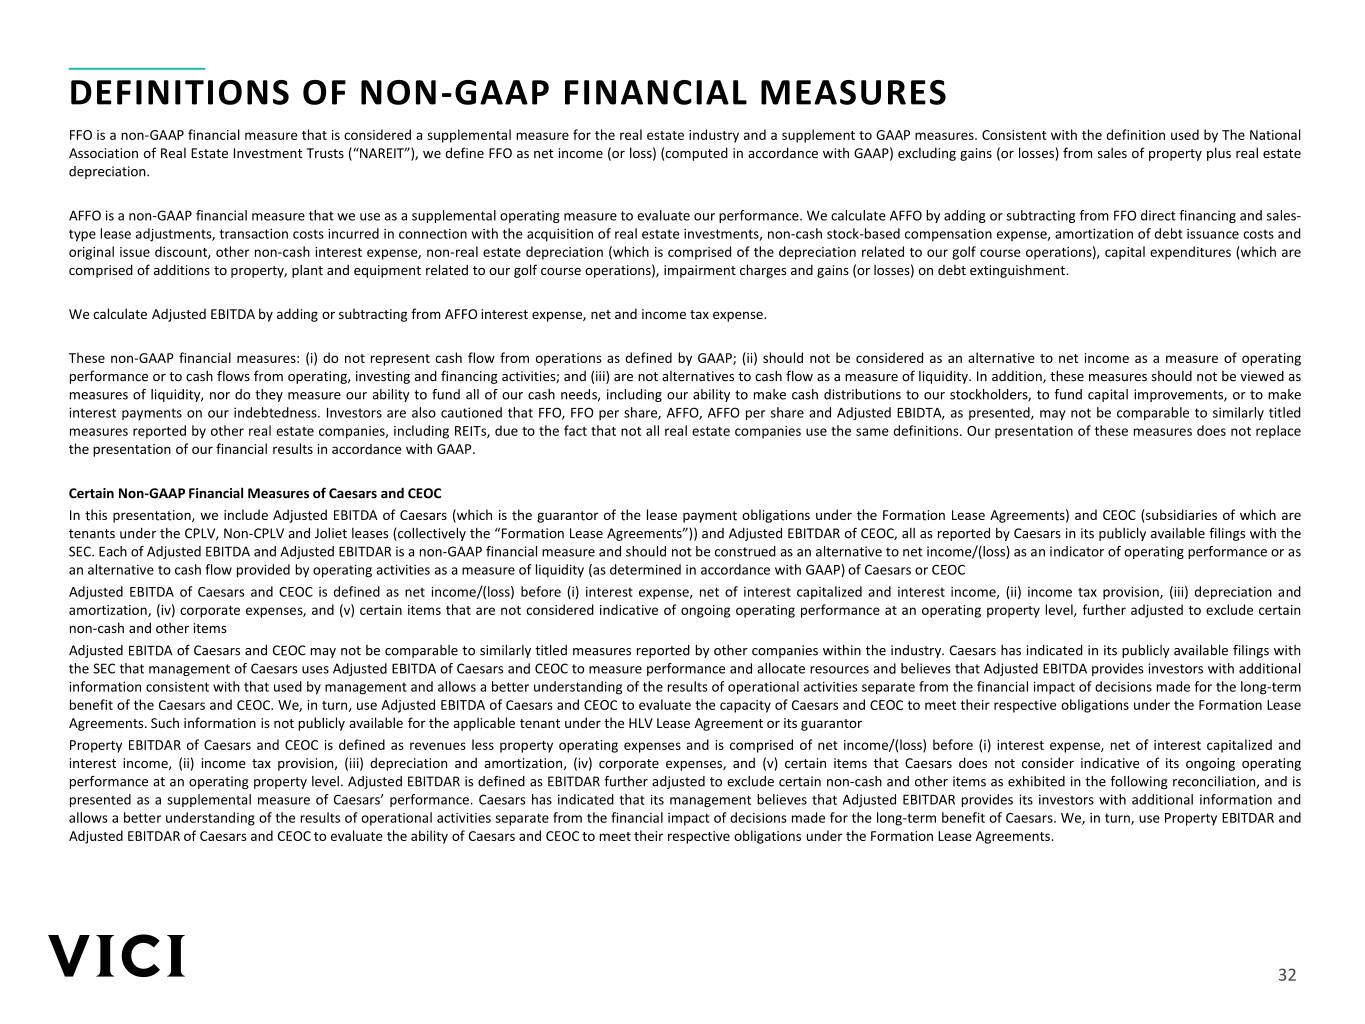
DEFINITIONS OF NON-GAAP FINANCIAL MEASURES FFO is a non-GAAP financial measure that is considered a supplemental measure for the real estate industry and a supplement to GAAP measures. Consistent with the definition used by The National Association of Real Estate Investment Trusts (“NAREIT”), we define FFO as net income (or loss) (computed in accordance with GAAP) excluding gains (or losses) from sales of property plus real estate depreciation. AFFO is a non-GAAP financial measure that we use as a supplemental operating measure to evaluate our performance. We calculate AFFO by adding or subtracting from FFO direct financing and sales- type lease adjustments, transaction costs incurred in connection with the acquisition of real estate investments, non-cash stock-based compensation expense, amortization of debt issuance costs and original issue discount, other non-cash interest expense, non-real estate depreciation (which is comprised of the depreciation related to our golf course operations), capital expenditures (which are comprised of additions to property, plant and equipment related to our golf course operations), impairment charges and gains (or losses) on debt extinguishment. We calculate Adjusted EBITDA by adding or subtracting from AFFO interest expense, net and income tax expense. These non-GAAP financial measures: (i) do not represent cash flow from operations as defined by GAAP; (ii) should not be considered as an alternative to net income as a measure of operating performance or to cash flows from operating, investing and financing activities; and (iii) are not alternatives to cash flow as a measure of liquidity. In addition, these measures should not be viewed as measures of liquidity, nor do they measure our ability to fund all of our cash needs, including our ability to make cash distributions to our stockholders, to fund capital improvements, or to make interest payments on our indebtedness. Investors are also cautioned that FFO, FFO per share, AFFO, AFFO per share and Adjusted EBIDTA, as presented, may not be comparable to similarly titled measures reported by other real estate companies, including REITs, due to the fact that not all real estate companies use the same definitions. Our presentation of these measures does not replace the presentation of our financial results in accordance with GAAP. Certain Non-GAAP Financial Measures of Caesars and CEOC In this presentation, we include Adjusted EBITDA of Caesars (which is the guarantor of the lease payment obligations under the Formation Lease Agreements) and CEOC (subsidiaries of which are tenants under the CPLV, Non-CPLV and Joliet leases (collectively the “Formation Lease Agreements”)) and Adjusted EBITDAR of CEOC, all as reported by Caesars in its publicly available filings with the SEC. Each of Adjusted EBITDA and Adjusted EBITDAR is a non-GAAP financial measure and should not be construed as an alternative to net income/(loss) as an indicator of operating performance or as an alternative to cash flow provided by operating activities as a measure of liquidity (as determined in accordance with GAAP) of Caesars or CEOC Adjusted EBITDA of Caesars and CEOC is defined as net income/(loss) before (i) interest expense, net of interest capitalized and interest income, (ii) income tax provision, (iii) depreciation and amortization, (iv) corporate expenses, and (v) certain items that are not considered indicative of ongoing operating performance at an operating property level, further adjusted to exclude certain non-cash and other items Adjusted EBITDA of Caesars and CEOC may not be comparable to similarly titled measures reported by other companies within the industry. Caesars has indicated in its publicly available filings with the SEC that management of Caesars uses Adjusted EBITDA of Caesars and CEOC to measure performance and allocate resources and believes that Adjusted EBITDA provides investors with additional information consistent with that used by management and allows a better understanding of the results of operational activities separate from the financial impact of decisions made for the long-term benefit of the Caesars and CEOC. We, in turn, use Adjusted EBITDA of Caesars and CEOC to evaluate the capacity of Caesars and CEOC to meet their respective obligations under the Formation Lease Agreements. Such information is not publicly available for the applicable tenant under the HLV Lease Agreement or its guarantor Property EBITDAR of Caesars and CEOC is defined as revenues less property operating expenses and is comprised of net income/(loss) before (i) interest expense, net of interest capitalized and interest income, (ii) income tax provision, (iii) depreciation and amortization, (iv) corporate expenses, and (v) certain items that Caesars does not consider indicative of its ongoing operating performance at an operating property level. Adjusted EBITDAR is defined as EBITDAR further adjusted to exclude certain non-cash and other items as exhibited in the following reconciliation, and is presented as a supplemental measure of Caesars’ performance. Caesars has indicated that its management believes that Adjusted EBITDAR provides its investors with additional information and allows a better understanding of the results of operational activities separate from the financial impact of decisions made for the long-term benefit of Caesars. We, in turn, use Property EBITDAR and Adjusted EBITDAR of Caesars and CEOC to evaluate the ability of Caesars and CEOC to meet their respective obligations under the Formation Lease Agreements. 32


