
Exhibit 99.2 TRANSFORMATIVE PARTNERSHIP WITH ELDORADO RESORTS TRANSACTION OVERVIEW JUNE 24, 2019

DISCLAIMERS Forward-Looking Statements This presentation contains forward-looking statements within the meaning of the federal securities laws. You can identify these statements by our use of the words “assumes,” “believes,” “estimates,” “expects,” “guidance,” “intends,” “plans,” “projects,” and similar expressions that do not relate to historical matters. All statements other than statements of historical fact are forward-looking statements. You should exercise caution in interpreting and relying on forward-looking statements because they involve known and unknown risks, uncertainties, and other factors which are, in some cases, beyond the control of VICI Properties Inc. and its subsidiaries (collectively, the “Company” or “VICI”) and could materially affect actual results, performance, or achievements. Among those risks, uncertainties and other factors are risks that the consummation of the Company’s transactions with Eldorado Resorts, Inc. (“ERI” or “Eldorado”) described herein, including the Company’s acquisition of the New Properties, additional ROFR and call option opportunities, and lease enhancements, are subject to the closing of the recently announced agreement pursuant to which ERI is expected to acquire Caesars Entertainment Corporation (“CEC”) (the “ERI/CZR Merger”), to which the Company is not a party, the Company’s pending acquisitions, including the acquisitions of Harrah’s New Orleans, Harrah’s Atlantic City, and/or Harrah’s Laughlin (collectively, the “New Properties”) may not be consummated on the terms or timeframe described herein, or at all; the ability of the parties to satisfy the conditions set forth in the definitive transaction documents, including the ability to receive, or delays in obtaining, the regulatory approvals required to consummate the transactions; the terms on which the Company finances the transactions, including the source of funds used to finance such transactions; disruptions to the real property and operations of the New Properties during the pendency of the closings; risks that the Company may not achieve the benefits contemplated by the acquisitions of the real estate assets (including any expected accretion or the amount of any future rent payments); and risks that not all potential risks and liabilities have been identified by the Company in its due diligence relating to its pending transactions. Additional important factors that may affect the Company’s business, results of operations and financial position are described from time to time in the Company’s Annual Report on Form 10-K for the year ended December 31, 2018, Quarterly Reports on Form 10-Q and the Company’s other filings with the U.S. Securities and Exchange Commission. The Company does not undertake any obligation to update or revise any forward-looking statement, whether as a result of new information, future events, or otherwise, except as may be required by applicable law. Third Party Information/Information Pro Forma For Pending ERI/CZR Merger The Company makes no representation as to the accuracy or completeness of the information regarding ERI or CEC included in this presentations. The historical audited and unaudited financial statements of ERI and CEC have been filed with the SEC. Certain financial and other information for ERI and CEC included in this presentation have been derived from public filings and other publicly available presentations and press releases. This presentation includes information about third parties that we have obtained from publicly available information and other industry sources. While we believe this information to be reliable, we have not independently investigated or verified such data. For example, this presentation includes pro forma information reflecting the recently announced ERI/CZR Merger. Upon completion of the ERI/CZR Merger, the combined company resulting from the ERI/CZR Merger (“Combined ERI/CZR”), through itself, its subsidiaries and affiliates, as applicable, will become our significant lessee, and will guarantee certain of our leases. We have based this pro forma information on ERI’s public statements and other publicly available information. Such information includes pro forma portfolio and financial statistics, as well as synergies projected by ERI, for Combined ERI/CZR. We have not independently verified this information and are presenting it pursuant to, and in accordance with, ERI’s public statements. ERI has indicated that it expects the ERI/CZR Merger to be completed in the first half of 2020; however, the ERI/CZR Merger is subject to numerous conditions and approvals, including the receipt of required regulatory approvals and customary closing conditions, and we can provide no assurance that the merger will be consummated on its current terms, or at all, or that it will be completed within the timeframe indicated by ERI. Market and Industry Data This presentation contains estimates and information concerning the Company's industry and certain relevant markets, including macroeconomic data and gross gaming revenue, that are based on industry publications, reports and public filings. This information involves a number of assumptions and limitations, and you are cautioned not to rely on or give undue weight to this information. The Company has not independently verified the accuracy or completeness of the data contained in these industry publications, reports or filings. The industry in which the Company operates is subject to a high degree of uncertainty and risk due to variety of factors, including those described above under “Forward-Looking Statements.” Non‐GAAP Financial Measures This presentation includes reference to Adjusted Funds From Operations (“AFFO”), and Adjusted EBITDAR, which are not required by, or presented in accordance with, generally accepted accounting principles in the United States (“GAAP”). These are non-GAAP financial measures and should not be construed as alternatives to net income or as an indicator of operating performance (as determined in accordance with GAAP). We believe AFFO provides a meaningful perspective of the underlying operating performance of our business. In this presentation, we include the 2019E EBITDAR for certain gaming operators based on consensus estimates. EBITDAR is a non-GAAP measure that companies, including gaming operators, use as a supplemental performance measure. EBITDAR should not be considered as an alternative to net income as determined in accordance with GAAP or as an indicator of our operating performance. In addition, EBITDAR may not be calculated in the same manner by all companies, and it is not necessarily comparable to other similarly titled measures used by other companies. Due to the forward-looking nature of the 2019E EBITDA of gaming operators included herein, information to reconcile such estimated EBITDA to estimated net income from operating activities for such gaming operators is not available as management. These non-GAAP financial measures: (i) do not represent cash flow from operations as defined by GAAP; (ii) should not be considered as an alternative to net income as a measure of operating performance or to cash flows from operating, investing and financing activities; and (iii) are not alternatives to cash flow as a measure of liquidity. In addition, these measures should not be viewed as measures of liquidity, nor do they measure our ability to fund all of our cash needs, including our ability to make cash distributions to our stockholders, to fund capital improvements, or to make interest payments on our indebtedness. Investors are also cautioned that Adjusted EBITDAR, as presented, may not be comparable to similarly titled measures reported by other real estate companies, including REITs due to the fact that not all real estate companies use the same definitions. Our presentation of these measures does not replace the presentation of our financial results in accordance with GAAP. 2

TRANSACTION HIGHLIGHTS Transformative Partnership with Eldorado Resorts, Inc. (NASDAQ: ERI) Related to its Proposed Combination with Caesars Entertainment Corporation (NASDAQ: CZR) Combined ERI/CZR will be the Largest Owner and Operator of U.S. Gaming Assets Materially Contributes to the Refuels Our Grows Our Rent Strengthening of Accretive to Improves the Growth Pipeline Base by Our Largest AFFO Quality, Security with Two New $253 million, Tenant’s Market Immediately and Term of Our Call Properties or 27%, at a Penetration, Upon Closing Caesars Leases and Three New 7.9% Cap Rate Financial ROFRs Capabilities and Growth Prospects 3
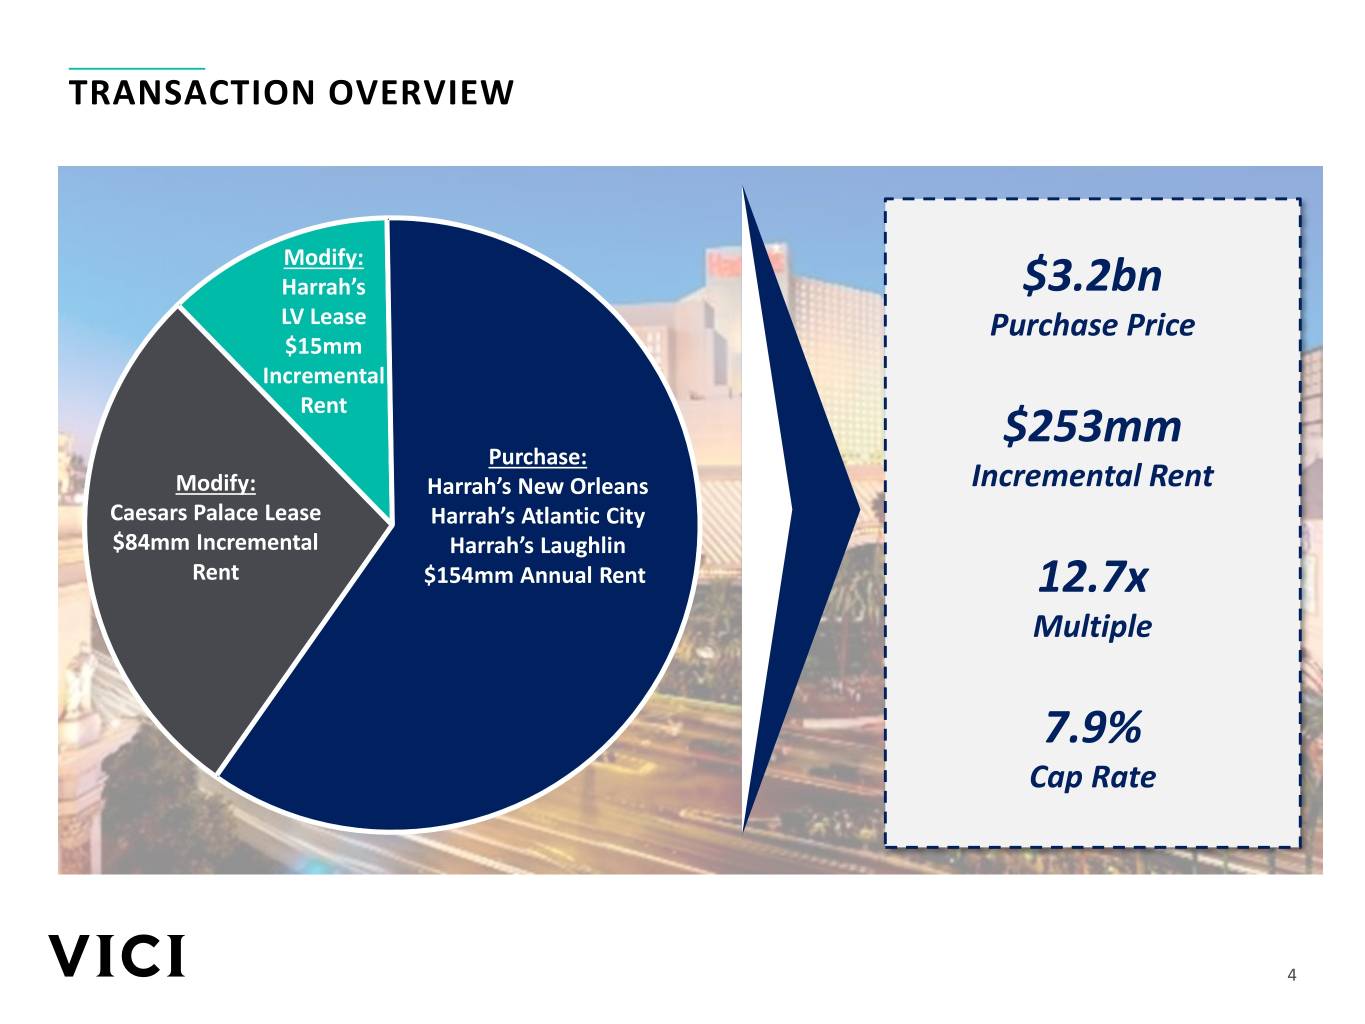
TRANSACTION OVERVIEW Modify: Harrah’s $3.2bn LV Lease Purchase Price $15mm Incremental Rent $253mm Purchase: Modify: Harrah’s New Orleans Incremental Rent Caesars Palace Lease Harrah’s Atlantic City $84mm Incremental Harrah’s Laughlin Rent $154mm Annual Rent 12.7x Multiple 7.9% Cap Rate 4

TRANSACTION STRATEGIC RATIONALE Transaction Highlights ✓ Transaction grows rent base by $253 million, or 27%, at a 7.9% blended cap rate ✓ Acquisition of Harrah’s New Orleans, Harrah’s Atlantic City and Harrah’s Laughlin (collectively, the “New Properties”) is immediately accretive to AFFO upon closing ✓ Materially contributes to the strengthening of our largest tenant’s business ✓ Improves the quality, security and term of our Caesars leases Harrah’s New Orleans − Removal of all EBITDAR coverage floors on current Caesars leases − Combines Harrah’s Las Vegas lease into current CPLV lease (the “Las Vegas Master Lease”) and adds the New Properties into the existing Non-CPLV Master Lease − Extends the initial term of all existing Caesars leases such that following closing there will be a full 15- year period prior to expiration of the initial term ✓ Refreshes embedded growth pipeline with a new call option on Harrah’s Hoosier Park and Indiana Grand Racing & Casino (collectively, the “Centaur Properties”) and three new ROFR opportunities – two on the Las Vegas Strip and Horseshoe Baltimore sale leaseback Harrah’s Atlantic City Strong Pro Forma Tenant Solidify Future Growth Credit Enhancing ✓ Materially contributes to the ✓ Refuels embedded growth ✓ Corporate guarantee from strengthening of our largest pipeline with a call option on Combined ERI/CZR tenant’s market penetration, two properties and three new ✓ Corporate rent coverage financial capabilities and ROFR opportunities improved by increased growth prospects ✓ Demonstrates ability to grow EBITDA from owned Eldorado portfolio and position assets Harrah’s Laughlin company for future upside 5

TRANSACTION DETAIL Acquisition of New Properties and Lease Modifications OpCo Partnership with Combined ERI/CZR CPLV Lease HLV Lease Wholly owned subsidiary of New Properties Tenant Modifications Modifications Combined ERI/CZR Guarantor Combined ERI/CZR Purchase Price $1,809 million $1,190 million $214 million Triple-Net Initial term of 15 years, followed by four 5-year renewal Lease Terms options (at Tenant’s option) New Properties: Annual escalator of 1.5% increasing to the greater of CPI or 2% beginning in November 2023, consistent Escalator Total Rent $154 million $84 million $15 million with terms of Non-CPLV Master Lease Summary Las Vegas Master Lease: Annual escalator of the greater of CPI or 2%, consistent with terms of CPLV lease Multiple / New Properties: Year 8 with Base Rent at 70% of Rent and Implied RE 11.75x / 8.5% 14.25x / 7.0% 14.25x / 7.0% Variable Rent at 30% of Rent +/- 4% of average portfolio net Cap Rate revenue; Year 11 with Base Rent at 80% of Rent and Variable Rent Resets1 Rent at 20% of Rent +/- 4% of average portfolio net revenue Las Vegas Master Lease: Year 8 & 11 with Base Rent at 80% Total Consideration: $3,213 million of Rent and Variable Rent at 20% of Rent +/- 4% of average portfolio net revenue Total Rent: $253 million Blended Multiple: 12.7x Tenant Capex Same requirements as existing leases Blended Cap Rate: 7.9% Requirements 1. For purposes of the lease years, lease year 1 remains 2017 and will not restart upon closing of the transaction. The transaction extends the initial lease term such that upon closing the transaction, each lease will have a remaining initial lease term of 15 years. Average portfolio net revenue in lease year 8 defined as average net revenue from lease years 5 to 7 less lease years 1 to 3; Variable Rent will be reset in lease year 11 and calculated as 4% of change in average net revenue from lease years 8 to 10 less lease years 5 to 7. 6

TRANSACTION DETAIL (CONT’D) Growth Enhancing Credit Enhancing Refreshed Growth Pipeline Rent Escalators ✓ New put / call option on Centaur ✓ Removal of rent coverage floors in ✓ Master lease enhancements Properties existing Caesars lease agreements − Combine HLV and CPLV leases into one master − 13.0x call / 12.5x put option lease − Provides certainty around rent − Exercisable between January 1, − New Properties added to existing Non-CPLV escalators 2022 and December 31, 2024 Master Lease − Attractive markets with potential − Enhanced rent protection growth from legislation of table ✓ Creation of Las Vegas Master Lease games ✓ Corporate guarantee from Combined ERI/CZR Harrah’s Las Vegas lease to be ✓ Two ROFRs on Las Vegas Strip assets − ✓ Extend the initial term of all existing Caesars leases combined into the existing CPLV such that following closing there will be a full 15-year − Opportunity to expand presence lease period prior to expiration of the initial term on Las Vegas Strip ✓ ROFR on Horseshoe Baltimore sale ✓ Corporate rent coverage improved by increased − Las Vegas Master Lease subject to leaseback EBITDA from owned Eldorado assets all existing terms of CPLV lease − Enter attractive Maryland market ✓ Consent/repay $1.55bn of CMBS financing at CPLV in desirable urban core location These growth and credit enhancing components create significant value to VICI shareholders beyond immediate accretion 7
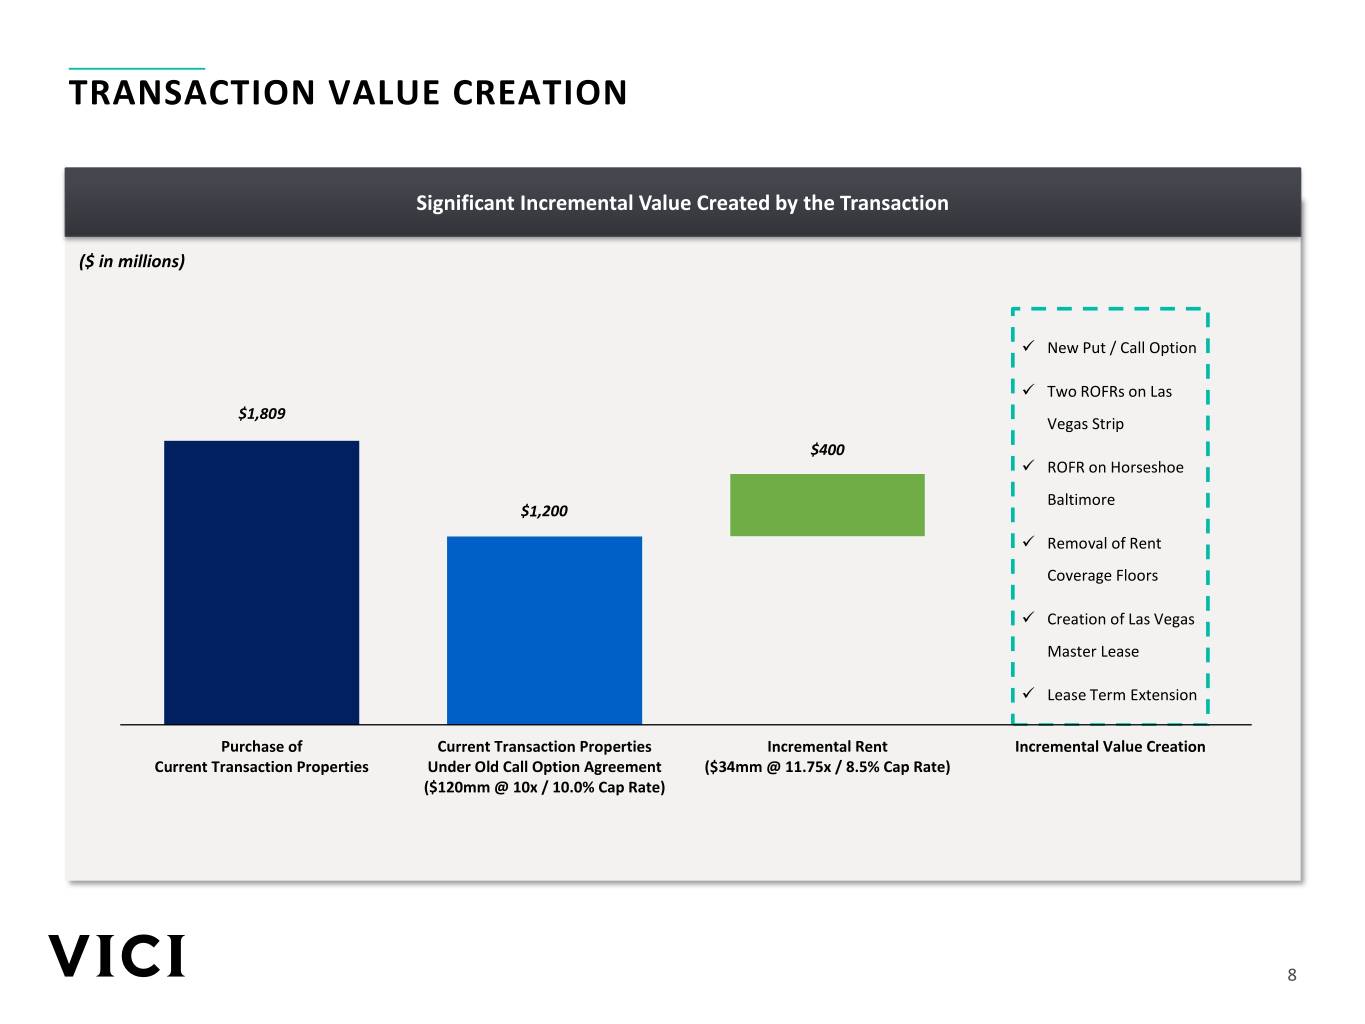
TRANSACTION VALUE CREATION Significant Incremental Value Created by the Transaction ($ in millions) ✓ New Put / Call Option ✓ Two ROFRs on Las $1,809 Vegas Strip $400 ✓ ROFR on Horseshoe Baltimore $1,200 ✓ Removal of Rent Coverage Floors ✓ Creation of Las Vegas Master Lease ✓ Lease Term Extension Purchase of Current Transaction Properties Incremental Rent Incremental Value Creation Current Transaction Properties Under Old Call Option Agreement ($34mm @ 11.75x / 8.5% Cap Rate) ($120mm @ 10x / 10.0% Cap Rate) 8

2 POTENTIAL GROWTH FROM NEW CALL OPTIONS & ROFR AGREEMENTS Two New Las Vegas Strip ROFRs New New Put / Call Option Assets First Asset Baltimore ROFR Second Asset Paris Planet Hoosier Park Indiana Grand Bally’s Las Vegas Flamingo LV The LINQ Horseshoe Casino Las Vegas Hollywood Baltimore Location Anderson,IN Shelbyville,IN LV Strip LV Strip LV Strip LV Strip LV Strip Baltimore, MD Casino Space 54,000 83,800 68,400 73,000 95,300 64,500 32,900 122,000 Sq. Ft. # of Tables -- -- 70 110 100 100 50 210 # of Slots 1,710 2,070 920 1,140 950 1,010 800 2,200 # of Rooms -- -- 2,810 3,460 2,920 2,500 2,250 -- − 13.0x call / 12.5x put option − Two ROFRs on first two Las Vegas Strip assets to be sold period commencing on − First asset can only be Bally's, Flamingo, Paris or Planet Hollywood − ROFR on sale Terms January 1, 2022 and expiring − Second asset can be from the same group plus The LINQ leaseback on December 31, 2024 − Similar terms as current Centaur ROFR − Enter high- − Highly attractive Indianapolis performing − Opportunity to expand presence on Las Vegas Strip (current rent exposure market Maryland market Benefits including all announced acquisitions of 31%) − Potential growth from with a new property − ROFR on iconic Las Vegas Strip assets legalization of table games in a desirable urban core location DRAFT 9
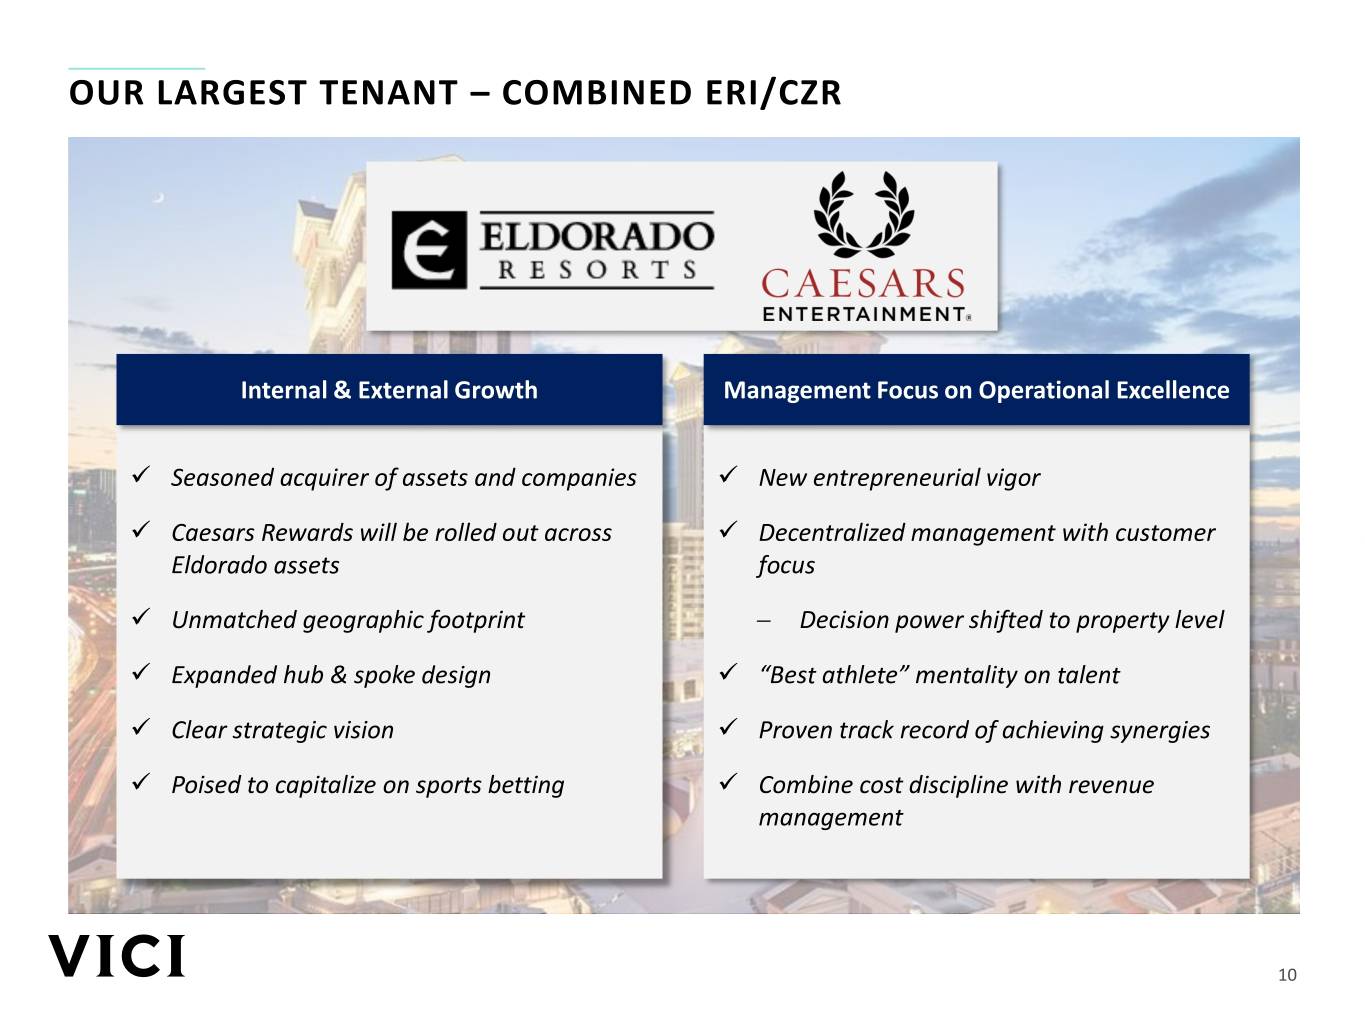
OUR LARGEST TENANT – COMBINED ERI/CZR Internal & External Growth Management Focus on Operational Excellence ✓ Seasoned acquirer of assets and companies ✓ New entrepreneurial vigor ✓ Caesars Rewards will be rolled out across ✓ Decentralized management with customer Eldorado assets focus ✓ Unmatched geographic footprint − Decision power shifted to property level ✓ Expanded hub & spoke design ✓ “Best athlete” mentality on talent ✓ Clear strategic vision ✓ Proven track record of achieving synergies ✓ Poised to capitalize on sports betting ✓ Combine cost discipline with revenue management 10
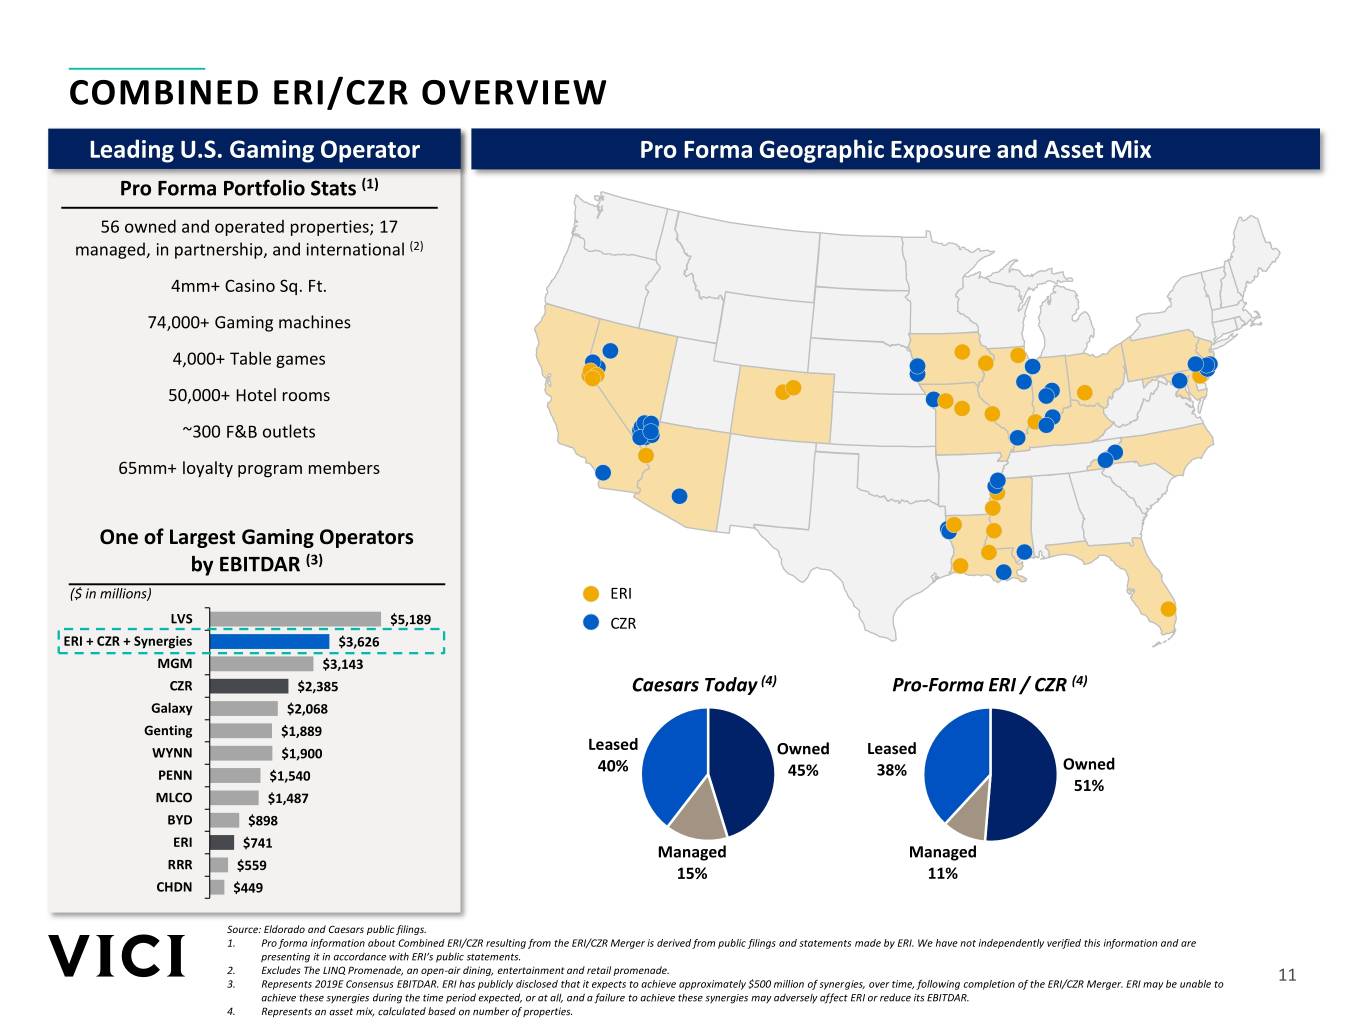
COMBINED ERI/CZR OVERVIEW Leading U.S. Gaming Operator Pro Forma Geographic Exposure and Asset Mix Pro Forma Portfolio Stats (1) 56 owned and operated properties; 17 managed, in partnership, and international (2) 4mm+ Casino Sq. Ft. 74,000+ Gaming machines 4,000+ Table games 50,000+ Hotel rooms ~300 F&B outlets 65mm+ loyalty program members One of Largest Gaming Operators by EBITDAR (3) ($ in millions) ERI LVS $5,189 CZR ERI + CZR + Synergies $3,626 MGM $3,143 CZR $2,385 Caesars Today (4) Pro-Forma ERI / CZR (4) Galaxy $2,068 Genting $1,889 Leased WYNN $1,900 Owned Leased 40% Owned PENN $1,540 45% 38% 51% MLCO $1,487 BYD $898 ERI $741 Managed Managed RRR $559 15% 11% CHDN $449 Source: Eldorado and Caesars public filings. 1. Pro forma information about Combined ERI/CZR resulting from the ERI/CZR Merger is derived from public filings and statements made by ERI. We have not independently verified this information and are presenting it in accordance with ERI’s public statements. 2. Excludes The LINQ Promenade, an open-air dining, entertainment and retail promenade. 3. Represents 2019E Consensus EBITDAR. ERI has publicly disclosed that it expects to achieve approximately $500 million of synergies, over time, following completion of the ERI/CZR Merger. ERI may be unable to 11 achieve these synergies during the time period expected, or at all, and a failure to achieve these synergies may adversely affect ERI or reduce its EBITDAR. 4. Represents an asset mix, calculated based on number of properties.

HARRAH’S NEW ORLEANS – IRREPLACEABLE REAL ESTATE IN THE HEART OF NEW ORLEANS Property Overview Harrah’s New Orleans ✓ Harrah’s New Orleans opened in October 1999 near the foot of Canal Street, a block from the Mississippi River ✓ AAA Four Diamond Award-winning hotel located in the heart of one of the 125,100 world’s most exhilarating cities Sq. ft. of ✓ 26-story hotel tower with 450 oversized rooms and suites provides an gaming floor unparalleled escape ✓ Provides spectacular views of the Mississippi River and New Orleans skyline ✓ The Governor of Louisiana signed a bill to extend the casino’s operating license until 2054 1,460 / 170 Asset Highlights Slot machines and tables ✓ Irreplaceable real estate in the urban core of New Orleans ✓ Largest casino in New Orleans and 2nd largest regional casino in Louisiana by 2018 gross gaming revenue 450 ✓ AAA Four Diamond Award-winning casino located just steps from Hotel rooms the French Quarter & suites ✓ Only land-based casino in Louisiana Source: Caesars public filings, Louisiana Gaming Control Board 12
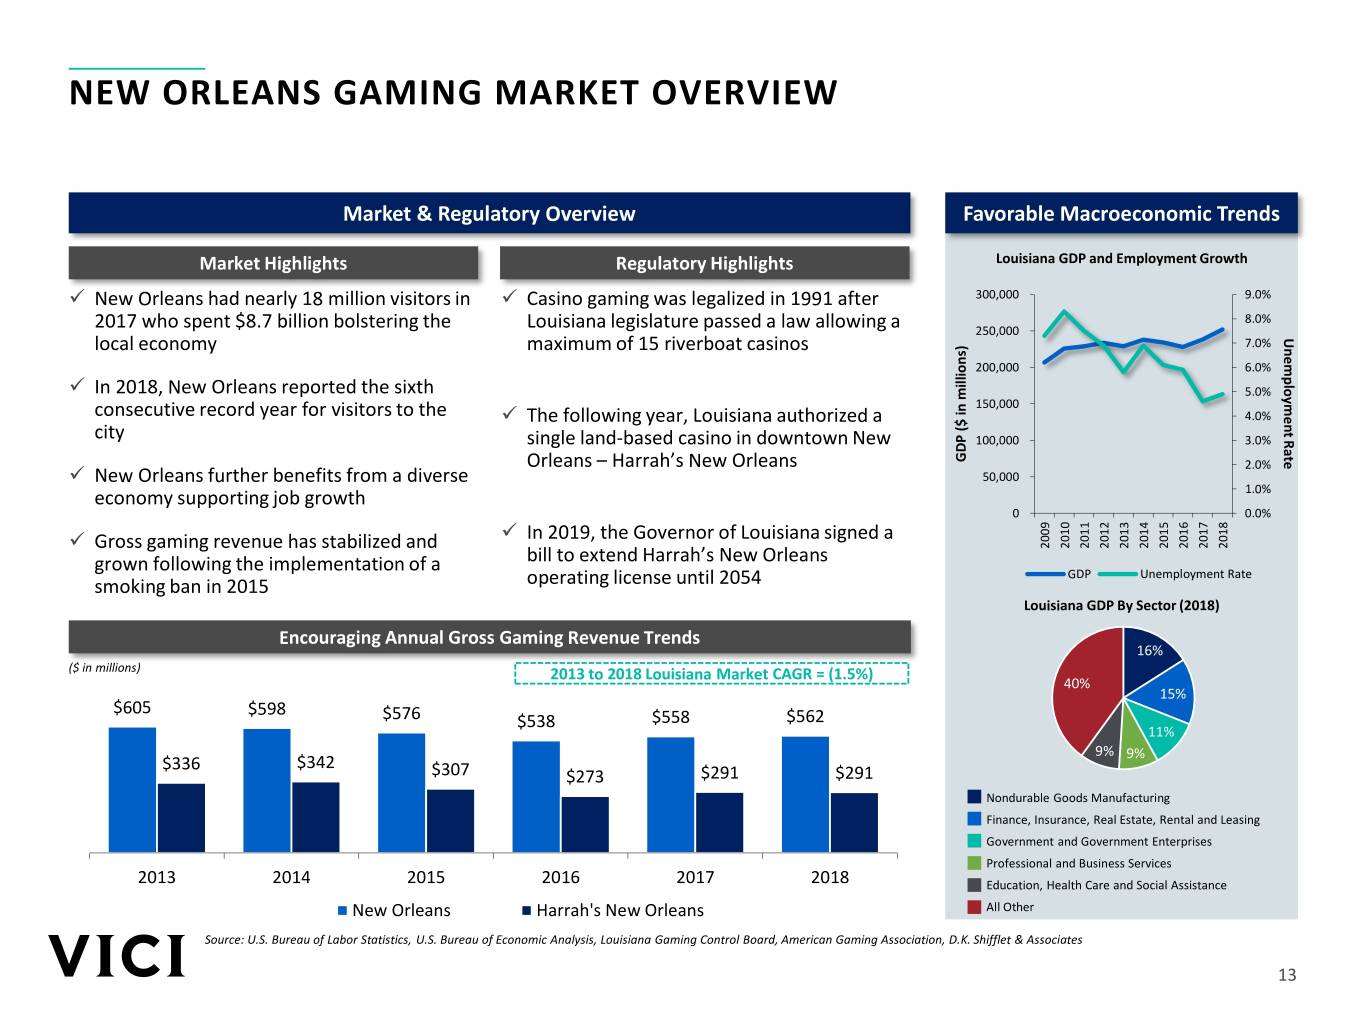
NEW ORLEANS GAMING MARKET OVERVIEW Market & Regulatory Overview Favorable Macroeconomic Trends Market Highlights Regulatory Highlights Louisiana GDP and Employment Growth ✓ New Orleans had nearly 18 million visitors in ✓ Casino gaming was legalized in 1991 after 300,000 9.0% 8.0% 2017 who spent $8.7 billion bolstering the Louisiana legislature passed a law allowing a 250,000 local economy maximum of 15 riverboat casinos 7.0% Unemployment Rate 200,000 6.0% ✓ In 2018, New Orleans reported the sixth 5.0% 150,000 consecutive record year for visitors to the ✓ The following year, Louisiana authorized a 4.0% city single land-based casino in downtown New 100,000 3.0% Orleans – Harrah’s New Orleans millions) ($GDPin 2.0% ✓ New Orleans further benefits from a diverse 50,000 economy supporting job growth 1.0% 0 0.0% ✓ In 2019, the Governor of Louisiana signed a 2010 2011 2012 2013 2014 2015 2016 2017 2018 ✓ Gross gaming revenue has stabilized and 2009 bill to extend Harrah’s New Orleans grown following the implementation of a GDP Unemployment Rate smoking ban in 2015 operating license until 2054 Louisiana GDP By Sector (2018) Encouraging Annual Gross Gaming Revenue Trends 16% ($ in millions) 2013 to 2018 Louisiana Market CAGR = (1.5%) 40% 15% $605 $598 $576 $538 $558 $562 11% 9% 9% $336 $342 $307 $273 $291 $291 Nondurable Goods Manufacturing Finance, Insurance, Real Estate, Rental and Leasing Government and Government Enterprises Professional and Business Services 2013 2014 2015 2016 2017 2018 Education, Health Care and Social Assistance New Orleans Harrah's New Orleans All Other Source: U.S. Bureau of Labor Statistics, U.S. Bureau of Economic Analysis, Louisiana Gaming Control Board, American Gaming Association, D.K. Shifflet & Associates 13
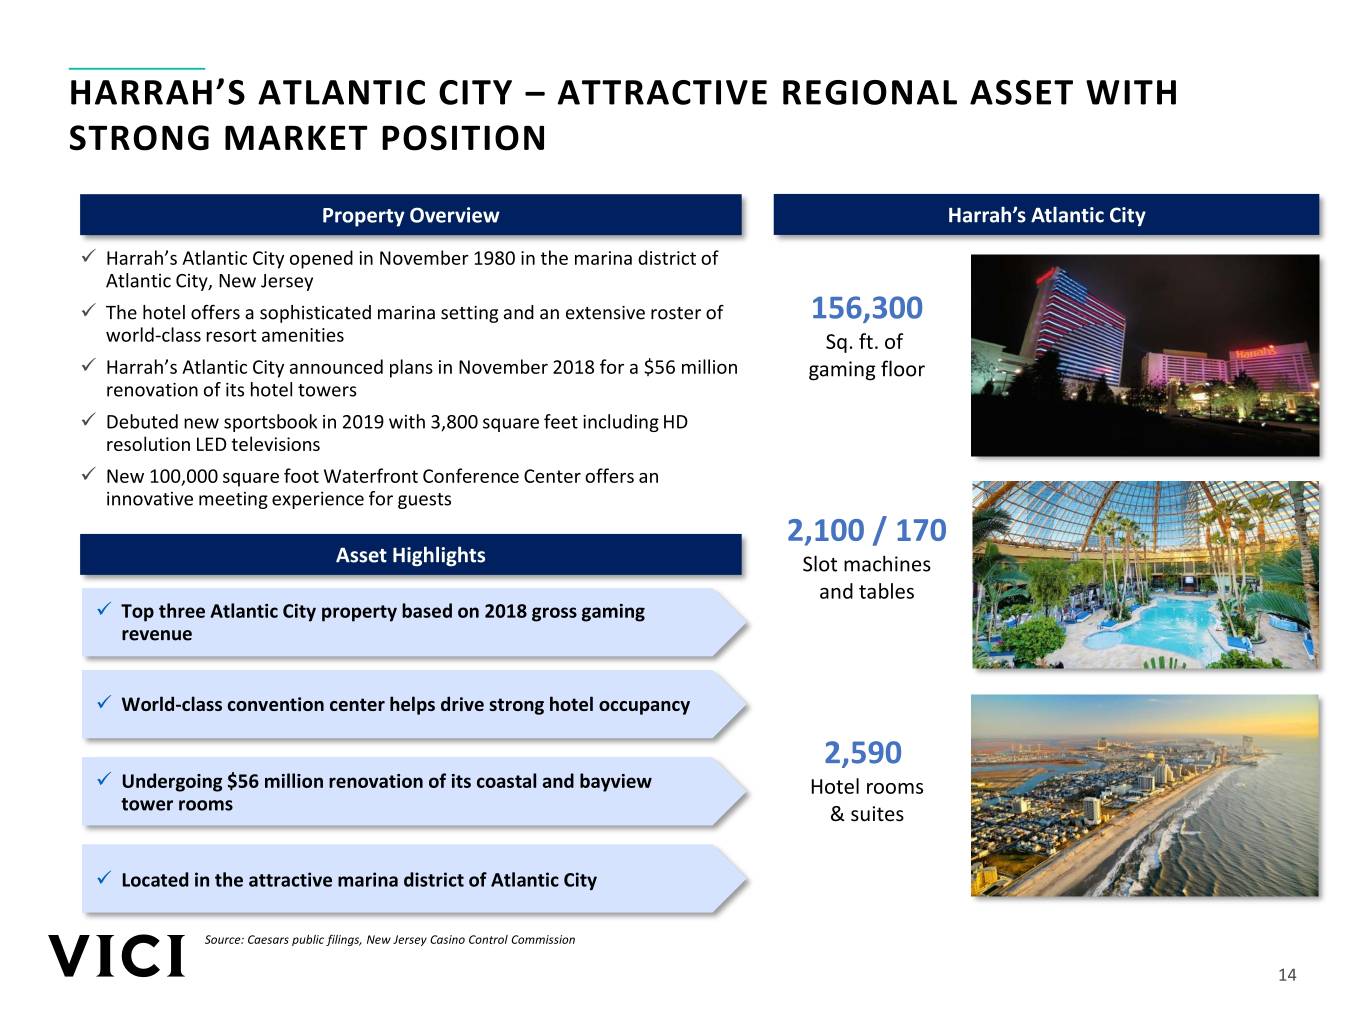
HARRAH’S ATLANTIC CITY – ATTRACTIVE REGIONAL ASSET WITH STRONG MARKET POSITION Property Overview Harrah’s Atlantic City ✓ Harrah’s Atlantic City opened in November 1980 in the marina district of Atlantic City, New Jersey ✓ The hotel offers a sophisticated marina setting and an extensive roster of 156,300 world-class resort amenities Sq. ft. of ✓ Harrah’s Atlantic City announced plans in November 2018 for a $56 million gaming floor renovation of its hotel towers ✓ Debuted new sportsbook in 2019 with 3,800 square feet including HD resolution LED televisions ✓ New 100,000 square foot Waterfront Conference Center offers an innovative meeting experience for guests 2,100 / 170 Asset Highlights Slot machines and tables ✓ Top three Atlantic City property based on 2018 gross gaming revenue ✓ World-class convention center helps drive strong hotel occupancy 2,590 ✓ Undergoing $56 million renovation of its coastal and bayview Hotel rooms tower rooms & suites ✓ Located in the attractive marina district of Atlantic City Source: Caesars public filings, New Jersey Casino Control Commission 14
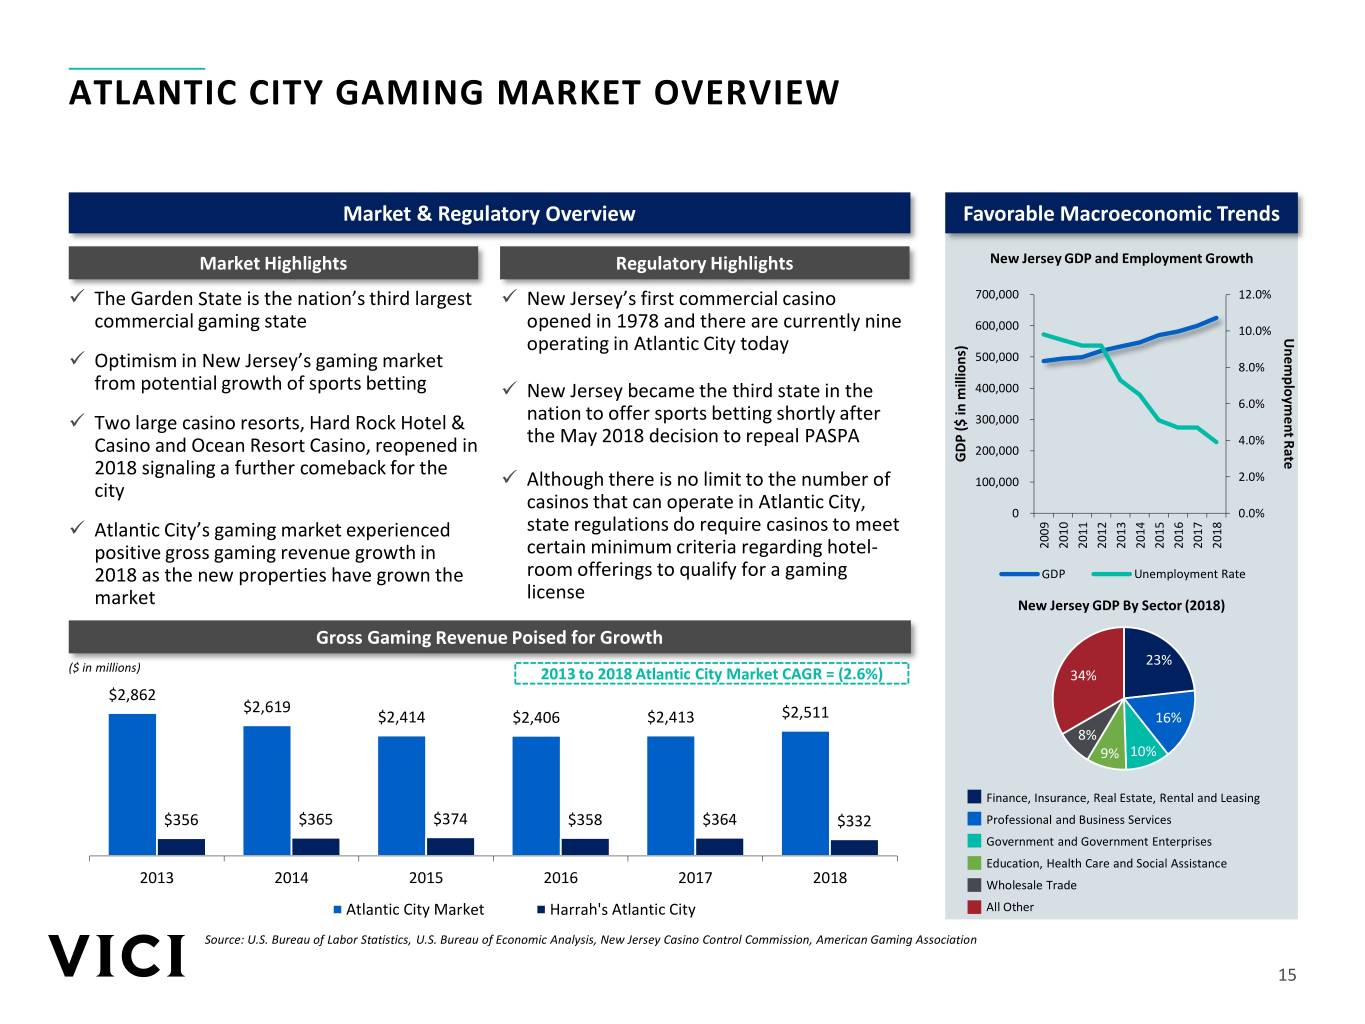
ATLANTIC CITY GAMING MARKET OVERVIEW Market & Regulatory Overview Favorable Macroeconomic Trends Market Highlights Regulatory Highlights New Jersey GDP and Employment Growth ✓ The Garden State is the nation’s third largest ✓ New Jersey’s first commercial casino 700,000 12.0% commercial gaming state opened in 1978 and there are currently nine 600,000 10.0% operating in Atlantic City today Unemployment Rate 500,000 ✓ Optimism in New Jersey’s gaming market 8.0% from potential growth of sports betting ✓ New Jersey became the third state in the 400,000 6.0% ✓ Two large casino resorts, Hard Rock Hotel & nation to offer sports betting shortly after 300,000 the May 2018 decision to repeal PASPA 4.0% Casino and Ocean Resort Casino, reopened in 200,000 2018 signaling a further comeback for the millions) in ($ GDP ✓ Although there is no limit to the number of 100,000 2.0% city casinos that can operate in Atlantic City, 0 0.0% ✓ Atlantic City’s gaming market experienced state regulations do require casinos to meet 2010 2011 2012 2013 2014 2015 2016 2017 2018 positive gross gaming revenue growth in certain minimum criteria regarding hotel- 2009 2018 as the new properties have grown the room offerings to qualify for a gaming GDP Unemployment Rate license market New Jersey GDP By Sector (2018) Gross Gaming Revenue Poised for Growth ($ in millions) 23% 2013 to 2018 Atlantic City Market CAGR = (2.6%) 34% $2,862 $2,619 $2,414 $2,406 $2,413 $2,511 16% 8% 9% 10% Finance, Insurance, Real Estate, Rental and Leasing $356 $365 $374 $358 $364 $332 Professional and Business Services Government and Government Enterprises Education, Health Care and Social Assistance 2013 2014 2015 2016 2017 2018 Wholesale Trade Atlantic City Market Harrah's Atlantic City All Other Source: U.S. Bureau of Labor Statistics, U.S. Bureau of Economic Analysis, New Jersey Casino Control Commission, American Gaming Association 15
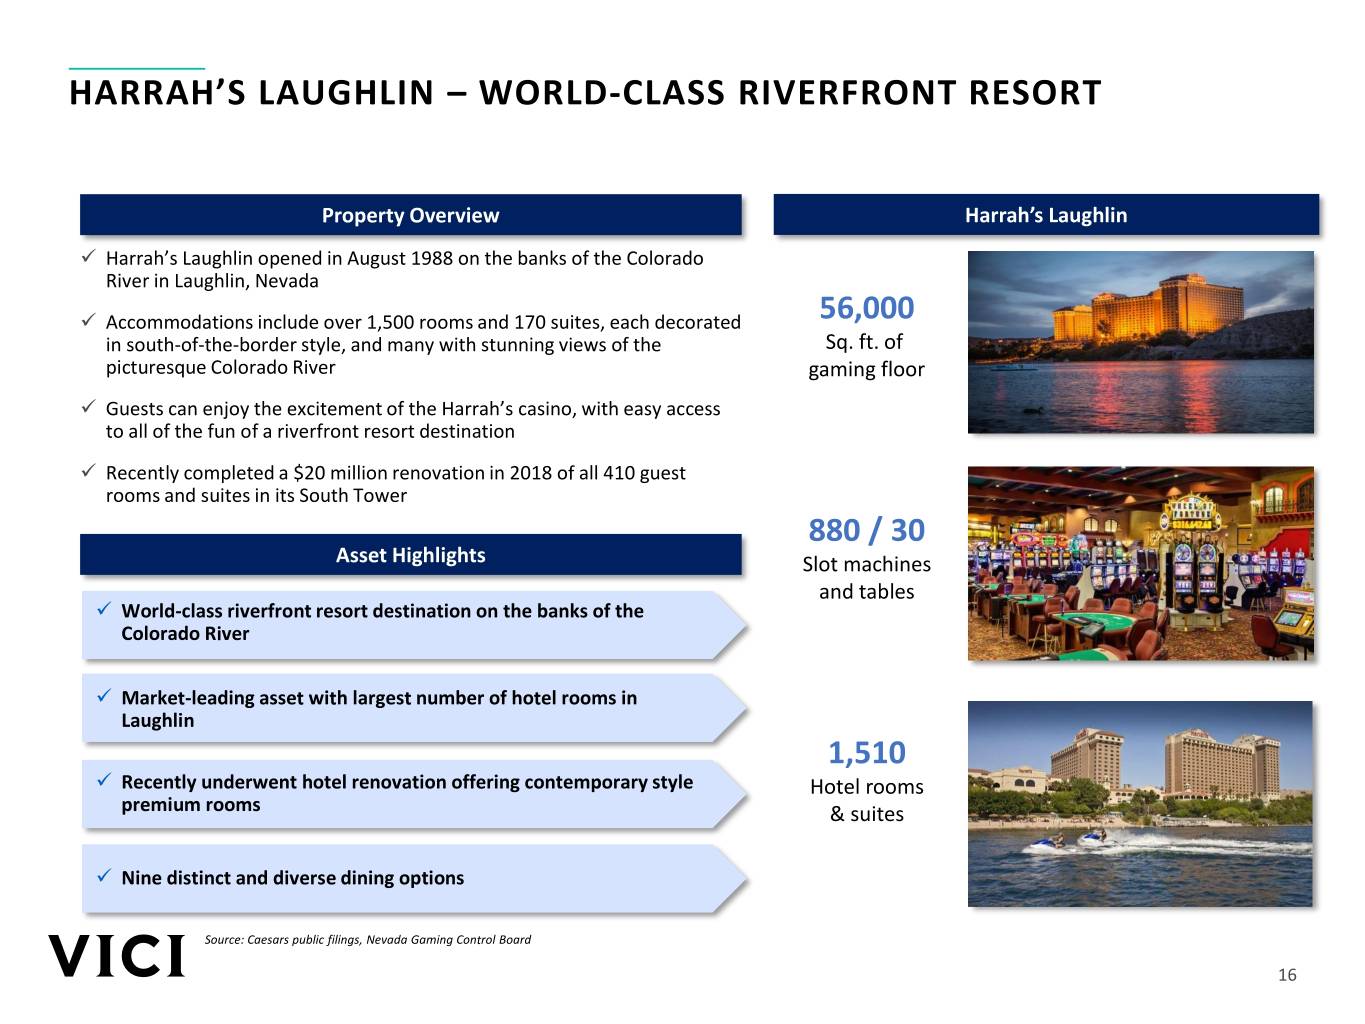
HARRAH’S LAUGHLIN – WORLD-CLASS RIVERFRONT RESORT Property Overview Harrah’s Laughlin ✓ Harrah’s Laughlin opened in August 1988 on the banks of the Colorado River in Laughlin, Nevada ✓ Accommodations include over 1,500 rooms and 170 suites, each decorated 56,000 in south-of-the-border style, and many with stunning views of the Sq. ft. of picturesque Colorado River gaming floor ✓ Guests can enjoy the excitement of the Harrah’s casino, with easy access to all of the fun of a riverfront resort destination ✓ Recently completed a $20 million renovation in 2018 of all 410 guest rooms and suites in its South Tower 880 / 30 Asset Highlights Slot machines and tables ✓ World-class riverfront resort destination on the banks of the Colorado River ✓ Market-leading asset with largest number of hotel rooms in Laughlin 1,510 ✓ Recently underwent hotel renovation offering contemporary style Hotel rooms premium rooms & suites ✓ Nine distinct and diverse dining options Source: Caesars public filings, Nevada Gaming Control Board 16
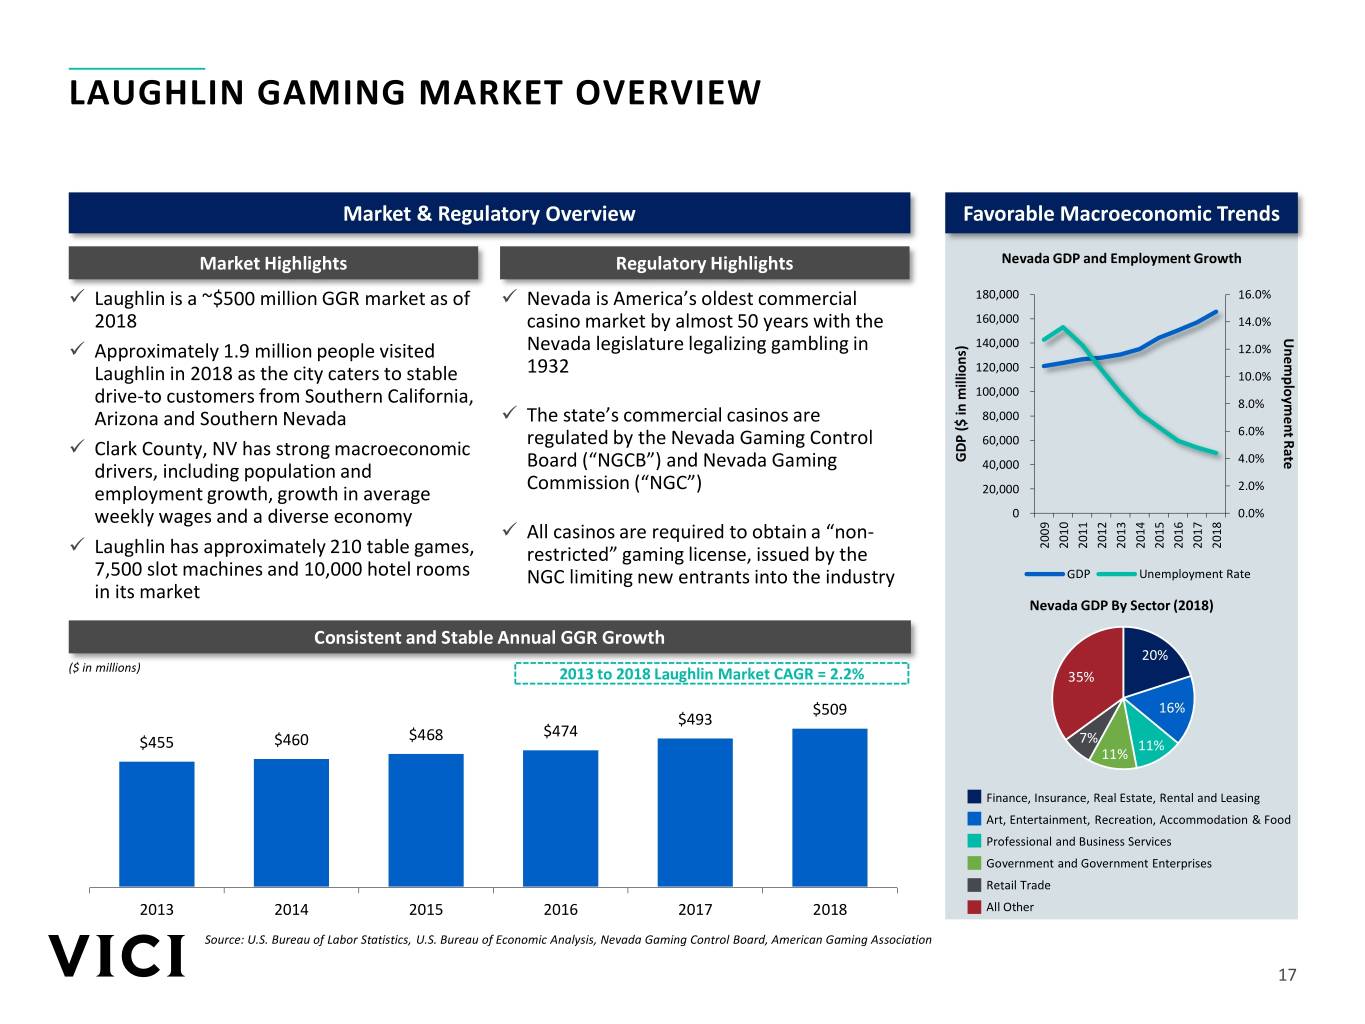
LAUGHLIN GAMING MARKET OVERVIEW Market & Regulatory Overview Favorable Macroeconomic Trends Market Highlights Regulatory Highlights Nevada GDP and Employment Growth ✓ Laughlin is a ~$500 million GGR market as of ✓ Nevada is America’s oldest commercial 180,000 16.0% 2018 casino market by almost 50 years with the 160,000 14.0% Unemployment Unemployment Rate ✓ Approximately 1.9 million people visited Nevada legislature legalizing gambling in 140,000 12.0% 1932 120,000 Laughlin in 2018 as the city caters to stable 10.0% 100,000 drive-to customers from Southern California, 8.0% Arizona and Southern Nevada ✓ The state’s commercial casinos are 80,000 6.0% regulated by the Nevada Gaming Control 60,000 ✓ Clark County, NV has strong macroeconomic Board (“NGCB”) and Nevada Gaming millions) ($GDPin 4.0% drivers, including population and 40,000 Commission (“NGC”) 2.0% employment growth, growth in average 20,000 weekly wages and a diverse economy 0 0.0% ✓ All casinos are required to obtain a “non- 2010 2011 2012 2013 2014 2015 2016 2017 2018 ✓ Laughlin has approximately 210 table games, restricted” gaming license, issued by the 2009 7,500 slot machines and 10,000 hotel rooms NGC limiting new entrants into the industry GDP Unemployment Rate in its market Nevada GDP By Sector (2018) Consistent and Stable Annual GGR Growth 20% ($ in millions) 2013 to 2018 Laughlin Market CAGR = 2.2% 35% $509 16% $493 $468 $474 $455 $460 7% 11% 11% Finance, Insurance, Real Estate, Rental and Leasing Art, Entertainment, Recreation, Accommodation & Food Professional and Business Services Government and Government Enterprises Retail Trade 2013 2014 2015 2016 2017 2018 All Other Source: U.S. Bureau of Labor Statistics, U.S. Bureau of Economic Analysis, Nevada Gaming Control Board, American Gaming Association 17

RECONCILIATION FROM GAAP TO NON-GAAP FINANCIAL MEASURES The following table reconciles net income to FFO, AFFO and Adjusted EBITDA. Reconciliation from GAAP to Non-GAAP Financial Measures ($ in millions) Three Months Ended Twelve Months Ended March 31, June 30, September 30, December 31, December 31, 2018 2018 2018 2018 2018 Net Income attributable to common stockholders $112 $139 $130 $143 $524 Real estate depreciation - - - - - Funds From Operations (“FFO”) $112 $139 $130 $143 $524 Direct financing and sales-type lease adjustments attributable to common stockholders ⁽¹⁾ (13) (13) (13) (6) (45) Transaction and acquisition expenses - - - - 1 Loss on impairment (2) - - 12 - 12 Loss on extinguishment of debt 23 - - - 23 Non-cash stock-based compensation 1 - 1 1 2 Amortization of debt issuance costs and original issue discount 1 1 1 1 6 Other depreciation (3) 1 1 1 1 4 Capital expenditures - - - - (1) AFFO $125 $128 $132 $140 $526 Interest expense, net 50 46 51 49 195 Income tax expense 1 - - 1 1 Adjusted EBITDA $175 $174 $183 $189 $722 Annualized Adjusted EBITDA $699 $702 $731 $758 $722 Annualize Octavius Tower & Harrah’s Philadelphia rent (4) 39 Initial base rent – Margaritaville & Greektown completed acquisitions (5) 79 Initial base rent – JACK Cincinnati & Century pending acquisitions ⁽⁶⁾ 68 Adjusted EBITDA (Incl. Acquisitions) $908 Initial base rent – Eldorado Transaction 253 Pro Forma Adjusted EBITDA for Eldorado Transaction $1,161 1. Represents the non-cash adjustment to recognize fixed amounts due under the lease agreements on an effective interest basis at a constant rate of return over the terms of the leases. 2. Represents the non-cash impairment related to certain vacant, non-operating land parcels. Please refer to the description of this impairment set forth in the Company’s Form 10-Q filed with the SEC on November 1, 2018. 3. Represents depreciation related to our golf course operations. 4. Octavius Tower closed July 12, 2018 and Harrah’s Philadelphia closed December 26, 2018 for annualized adjustments of $18mm and $21mm, respectively. 18 5. Margaritaville acquisition closed January 2, 2019 and Greektown acquisition closed May 23, 2019 for initial base rent of $23mm and $56mm, respectively. 6. JACK Cincinnati acquisition announced April 5, 2019 and Century Acquisition announced June 17, 2019 for initial base rent of $43mm and $25mm, respectively.

RECONCILIATION FROM GAAP TO NON-GAAP FINANCIAL MEASURES The following table reconciles net income to FFO, AFFO and Adjusted EBITDA, and Net Debt to Adjusted EBITDA for the periods presented. Reconciliation from GAAP to Non-GAAP Financial Measures ($ in millions) Pro Forma for Eldorado Transaction At Formation (1) Post-HLV ⁽¹⁾ Twelve Months Ended YE December 31, 2016 YE December 31, 2017 December 31, 2018 Net Income attributable to common stockholders $421 $583 $524 Real estate depreciation - - - Funds From Operations (“FFO”) $421 $583 $524 Direct financing and sales-type lease adjustments attributable to common (52) (57) (45) stockholders (2) Transaction and acquisition expenses - - 1 Loss on impairment (3) - - 12 Loss on extinguishment of debt - - 23 Non-cash stock-based compensation - - 2 Amortization of debt issuance costs and original issue discount - 6 6 Other depreciation (4) 2 2 4 Capital expenditures - - (1) AFFO $372 $534 $526 Interest expense, net 257 189 195 Income Tax expense / (benefit) 2 2 1 Adjusted EBITDA $631 $724 $722 Incremental G&A (5) 13 13 - Annualize Octavius Tower & Harrah’s Philadelphia rent (6) - - 39 Initial base rent – Margaritaville & Greektown completed acquisitions (7) - - 79 Initial base rent – JACK Cincinnati & Century pending acquisitions (8) - - 68 Initial base rent – Eldorado Transaction - - 253 Annualized Adjusted EBITDA $618 $711 $1,161 Total debt (Including Preferred Equity) (9) 5,217 4,817 6,848 Cash and cash equivalents (10) 56 184 665 Net Debt 5,161 4,633 6,183 Net Debt to Adjusted EBITDA 8.4x 6.5x 5.3x 1. Pro forma for Formation Transactions following Emergence as described in the Prospectus dated January 31, 2018 relating to the Company’s initial public offering. For further information, see p.61 thereof, “Unaudited Pro Forma Combined Condensed Financial Information”. 2. Represents the non-cash adjustment to recognize fixed amounts due under the lease agreements on an effective interest basis at a constant rate of return over the terms of the leases. 3. Represents the non-cash impairment related to certain vacant, non-operating land parcels. Please refer to the description of this impairment set forth in the Company’s Form 10-Q filed with the SEC on November 1, 2018. 4. Represents depreciation related to our golf course operations. 5. Represents midpoint of $12 million to $14 million estimate of general and administrative costs on a consolidated basis, including costs of operating as an independent company, incremental to the $11 million of general and administrative expenses reflected in unaudited pro forma combined statement of operations for the year ended December 31, 2016. 6. Octavius Tower closed July 12, 2018 and Harrah’s Philadelphia closed December 26, 2018 for annualized adjustments of $18mm and $21mm, respectively. 7. Margaritaville acquisition closed January 2, 2019 and Greektown acquisition closed May 23, 2019 for initial base rent of $23mm and $56mm, respectively. 8. JACK Cincinnati acquisition announced April 5, 2019 and Century Acquisition announced June 17, 2019 for initial base rent of $43mm and $25mm, respectively. 19 9. Includes 12 million shares of Series A Preferred Equity with an aggregate liquidation preference of $300.0 million held by certain of CEOC’s creditors and backstop investors. Preferred Equity is no longer outstanding. 10. Cash and Cash Equivalents for the Post-IPO period includes $184 million of cash available on December 31, 2017, per the Form 10-K filed on March 28, 2018, plus $617 million of remaining cash proceeds generated from the completion of the Company’s initial public offering. Includes Short Term Investments and excludes Restricted Cash.

DEFINITIONS OF NON-GAAP FINANCIAL MEASURES FFO is a non-GAAP financial measure that is considered a supplemental measure for the real estate industry and a supplement to GAAP measures. Consistent with the definition used by The National Association of Real Estate Investment Trusts (“NAREIT”), we define FFO as net income (or loss) (computed in accordance with GAAP) excluding gains (or losses) from sales of property plus real estate depreciation. AFFO is a non-GAAP financial measure that we use as a supplemental operating measure to evaluate our performance. We calculate AFFO by adding or subtracting from FFO direct financing and sales- type lease adjustments, transaction costs incurred in connection with the acquisition of real estate investments, non-cash stock-based compensation expense, amortization of debt issuance costs and original issue discount, other non-cash interest expense, non-real estate depreciation (which is comprised of the depreciation related to our golf course operations), capital expenditures (which are comprised of additions to property, plant and equipment related to our golf course operations), impairment charges and gains (or losses) on debt extinguishment. We calculate Adjusted EBITDA by adding or subtracting from AFFO interest expense, net and income tax expense. These non-GAAP financial measures: (i) do not represent cash flow from operations as defined by GAAP; (ii) should not be considered as an alternative to net income as a measure of operating performance or to cash flows from operating, investing and financing activities; and (iii) are not alternatives to cash flow as a measure of liquidity. In addition, these measures should not be viewed as measures of liquidity, nor do they measure our ability to fund all of our cash needs, including our ability to make cash distributions to our stockholders, to fund capital improvements, or to make interest payments on our indebtedness. Investors are also cautioned that FFO, FFO per share, AFFO, AFFO per share and Adjusted EBIDTA, as presented, may not be comparable to similarly titled measures reported by other real estate companies, including REITs, due to the fact that not all real estate companies use the same definitions. Our presentation of these measures does not replace the presentation of our financial results in accordance with GAAP. 20


