Making the food you love a healthier choice™ NASDAQ: CLXT Investor Presentation January 2020
Forward Looking Statements This communication contains “forward-looking statements” within the meaning of the safe harbor provisions of the U.S. Private Securities Litigation Reform Act of 1995. In some cases, you can identify these statements by forward-looking words such as “may,” “might,” “will,” “should,” “expects,” “plans,” “anticipates,” “believes,” “estimates,” “predicts,” “potential” or “continue,” the negative of these terms and other comparable terminology. These forward-looking statements, which are subject to risks, uncertainties and assumptions about us, may include projections of our future financial performance, our anticipated growth strategies and anticipated trends in our business. These statements are only predictions based on our current expectations and projections about future events. There are important factors that could cause our actual results, level of activity, performance or achievements to differ materially from the results, level of activity, performance or achievements expressed or implied by the forward-looking statements, including those factors discussed under the caption entitled “Risk Factors” in our Annual Report on Form 10-K, along with our other filings with the U.S. Securities and Exchange Commission. We do not assume any obligation to publicly provide revisions or updates to any forward-looking statements, whether as a result of new information, future developments or otherwise, should circumstances change, except as otherwise required by securities and other applicable laws.
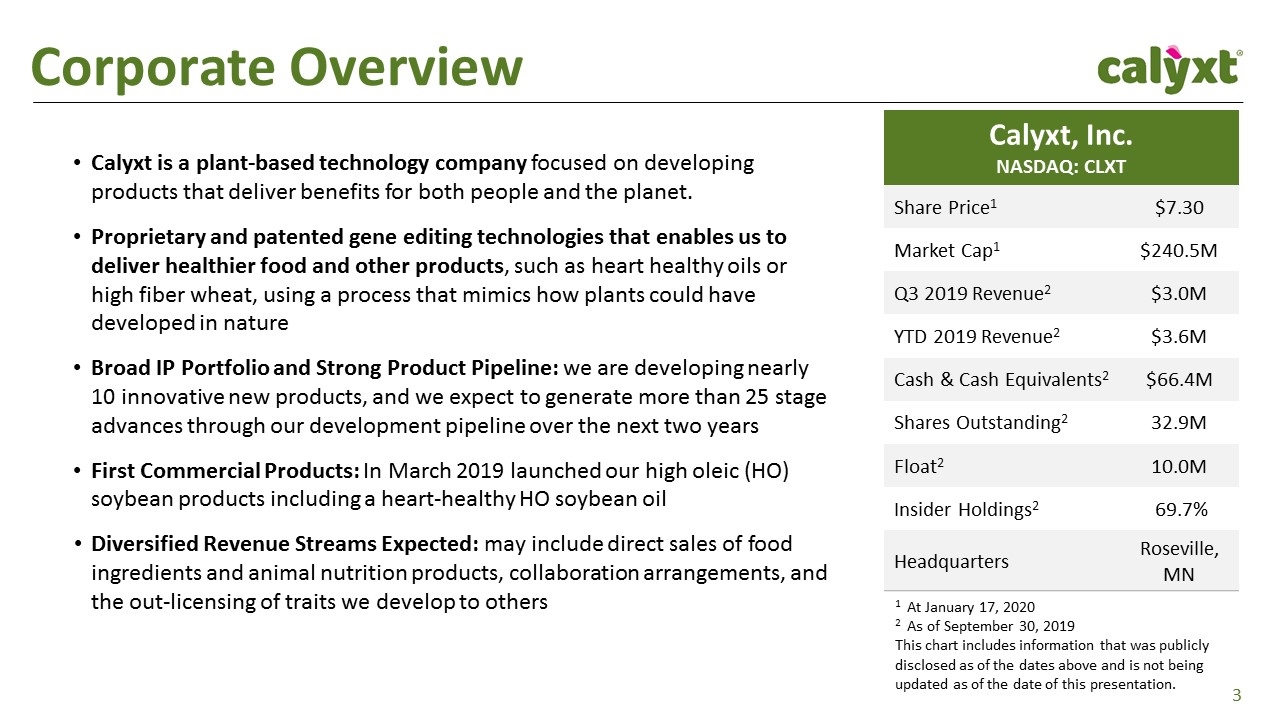
Calyxt is a plant-based technology company focused on developing products that deliver benefits for both people and the planet. Proprietary and patented gene editing technologies that enables us to deliver healthier food and other products, such as heart healthy oils or high fiber wheat, using a process that mimics how plants could have developed in nature Broad IP Portfolio and Strong Product Pipeline: we are developing nearly 10 innovative new products, and we expect to generate more than 25 stage advances through our development pipeline over the next two years First Commercial Products: In March 2019 launched our high oleic (HO) soybean products including a heart-healthy HO soybean oil Diversified Revenue Streams Expected: may include direct sales of food ingredients and animal nutrition products, collaboration arrangements, and the out-licensing of traits we develop to others Corporate Overview Calyxt, Inc. NASDAQ: CLXT Share Price1 $7.30 Market Cap1 $240.5M Q3 2019 Revenue2 $3.0M YTD 2019 Revenue2 $3.6M Cash & Cash Equivalents2 $66.4M Shares Outstanding2 32.9M Float2 10.0M Insider Holdings2 69.7% Headquarters Roseville, MN 1 At January 17, 2020 2 As of September 30, 2019 This chart includes information that was publicly disclosed as of the dates above and is not being updated as of the date of this presentation.
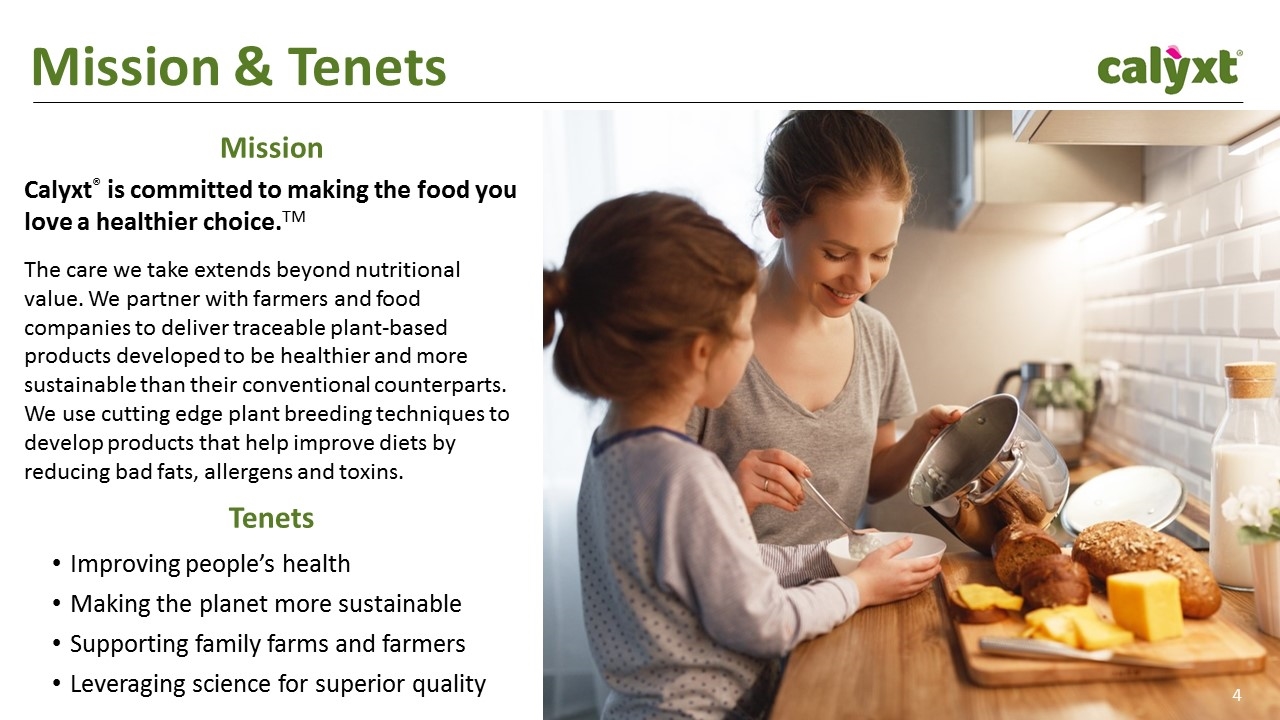
Mission & Tenets Calyxt® is committed to making the food you love a healthier choice.TM The care we take extends beyond nutritional value. We partner with farmers and food companies to deliver traceable plant-based products developed to be healthier and more sustainable than their conventional counterparts. We use cutting edge plant breeding techniques to develop products that help improve diets by reducing bad fats, allergens and toxins. Improving people’s health Making the planet more sustainable Supporting family farms and farmers Leveraging science for superior quality Tenets Mission
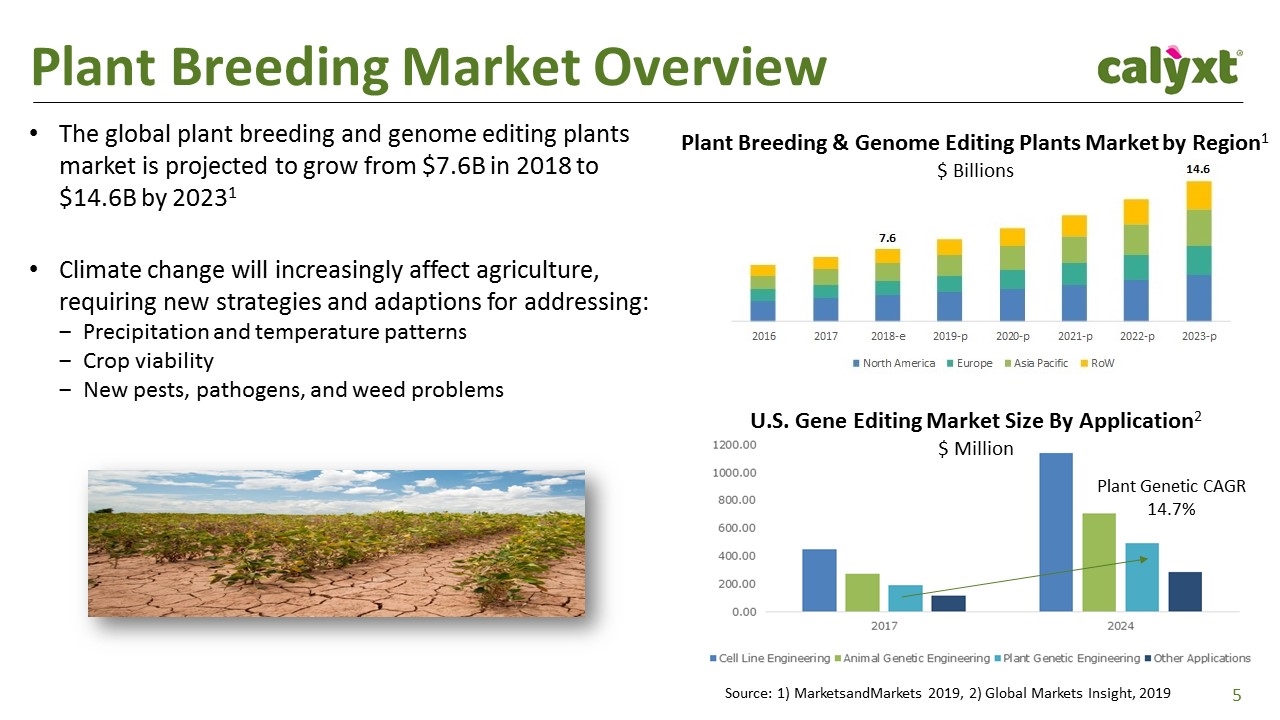
Plant Breeding Market Overview The global plant breeding and genome editing plants market is projected to grow from $7.6B in 2018 to $14.6B by 20231 Climate change will increasingly affect agriculture, requiring new strategies and adaptions for addressing: Precipitation and temperature patterns Crop viability New pests, pathogens, and weed problems Source: 1) MarketsandMarkets 2019, 2) Global Markets Insight, 2019 U.S. Gene Editing Market Size By Application2 $ Million Plant Breeding & Genome Editing Plants Market by Region1 $ Billions Plant Genetic CAGR 14.7%
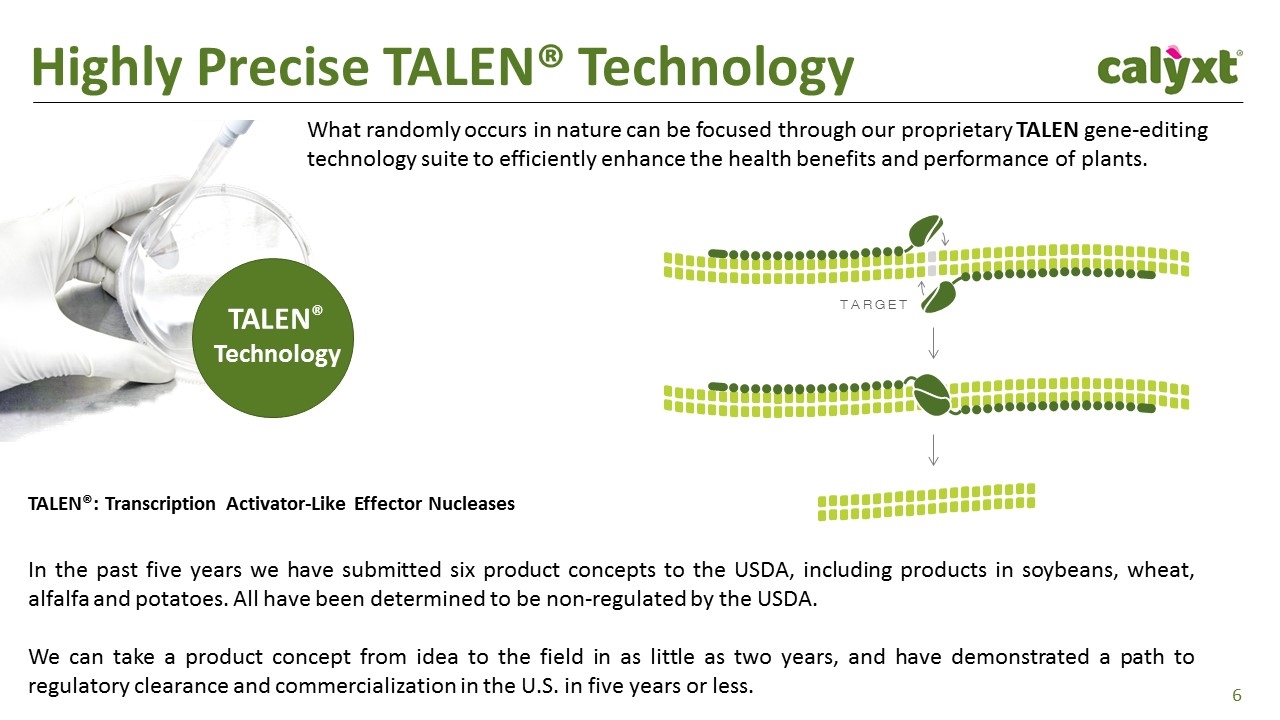
Highly Precise TALEN® Technology What randomly occurs in nature can be focused through our proprietary TALEN gene-editing technology suite to efficiently enhance the health benefits and performance of plants. TALEN® Technology TALEN®: Transcription Activator-Like Effector Nucleases In the past five years we have submitted six product concepts to the USDA, including products in soybeans, wheat, alfalfa and potatoes. All have been determined to be non-regulated by the USDA. We can take a product concept from idea to the field in as little as two years, and have demonstrated a path to regulatory clearance and commercialization in the U.S. in five years or less. TARGET
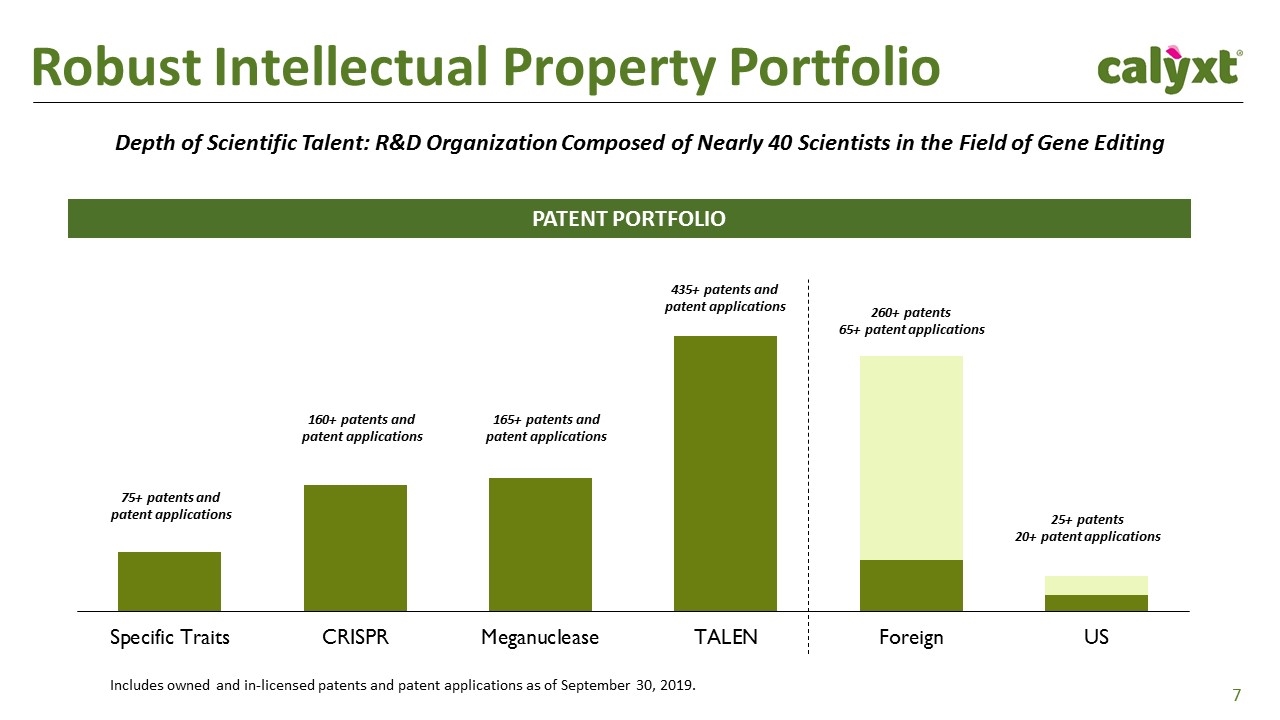
Robust Intellectual Property Portfolio Depth of Scientific Talent: R&D Organization Composed of Nearly 40 Scientists in the Field of Gene Editing PATENT PORTFOLIO 25+ patents 20+ patent applications 435+ patents and patent applications 165+ patents and patent applications 160+ patents and patent applications 75+ patents and patent applications 260+ patents 65+ patent applications Includes owned and in-licensed patents and patent applications as of September 30, 2019.
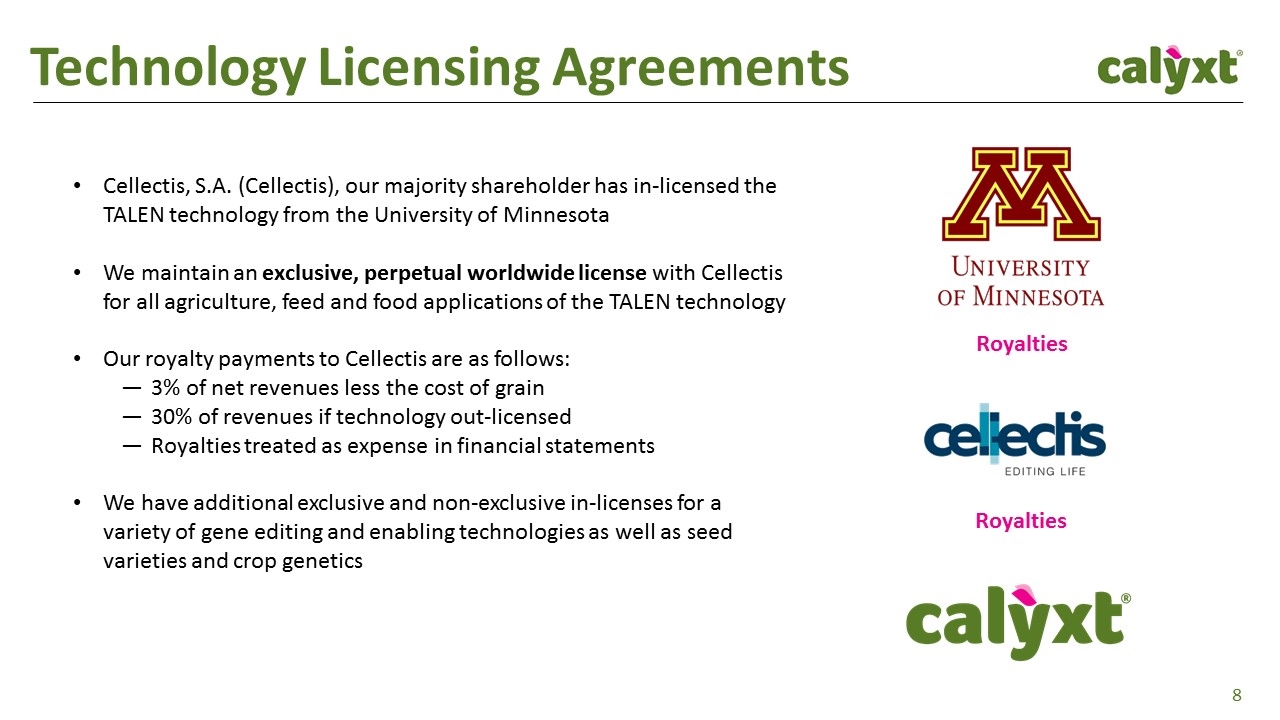
Technology Licensing Agreements Cellectis, S.A. (Cellectis), our majority shareholder has in-licensed the TALEN technology from the University of Minnesota We maintain an exclusive, perpetual worldwide license with Cellectis for all agriculture, feed and food applications of the TALEN technology Our royalty payments to Cellectis are as follows: 3% of net revenues less the cost of grain 30% of revenues if technology out-licensed Royalties treated as expense in financial statements We have additional exclusive and non-exclusive in-licenses for a variety of gene editing and enabling technologies as well as seed varieties and crop genetics Royalties Royalties
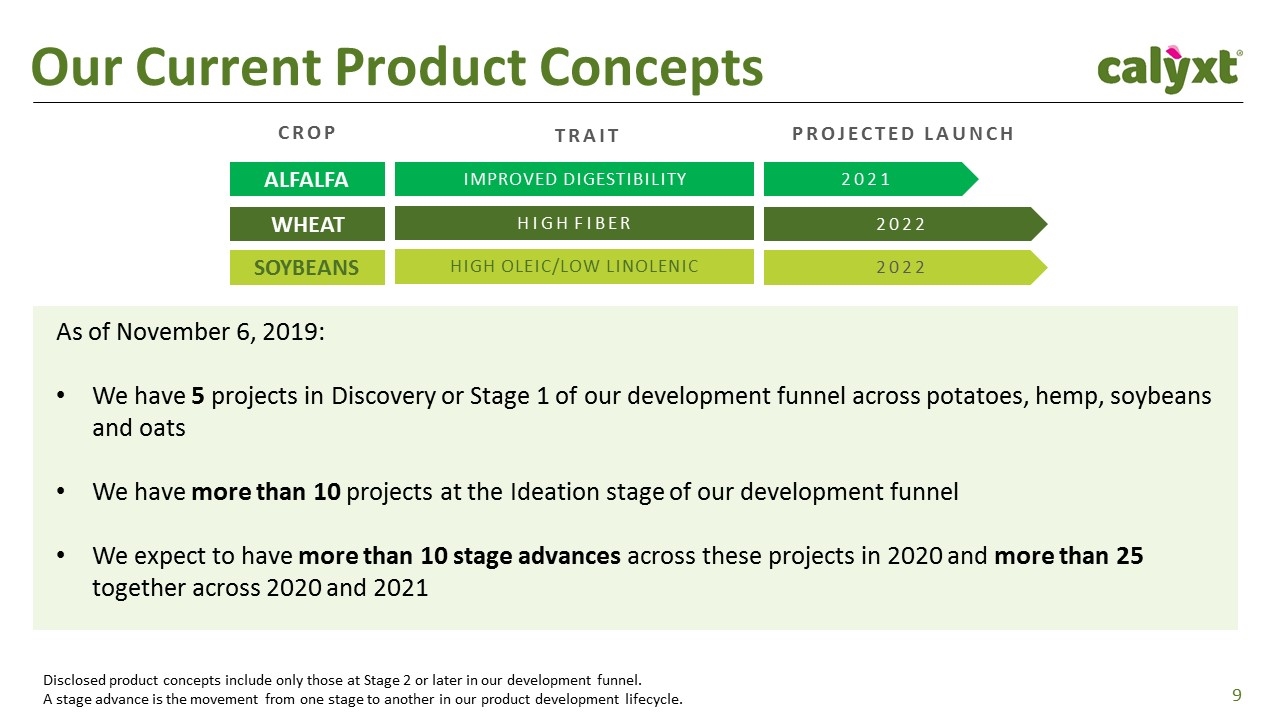
Our Current Product Concepts WHEAT SOYBEANS HIGH FIBER 2022 HIGH OLEIC/LOW LINOLENIC 2022 ALFALFA IMPROVED DIGESTIBILITY 2021 HEMP TO BE ANNOUNCED PROJECTED LAUNCH TRAIT CROP TO BE ANNOUNCED Disclosed product concepts include only those at Stage 2 or later in our development funnel. A stage advance is the movement from one stage to another in our product development lifecycle. As of November 6, 2019: We have 5 projects in Discovery or Stage 1 of our development funnel across potatoes, hemp, soybeans and oats We have more than 10 projects at the Ideation stage of our development funnel We expect to have more than 10 stage advances across these projects in 2020 and more than 25 together across 2020 and 2021
High Oleic (HO) Soybean Our First Commercial Product Launched March 2019
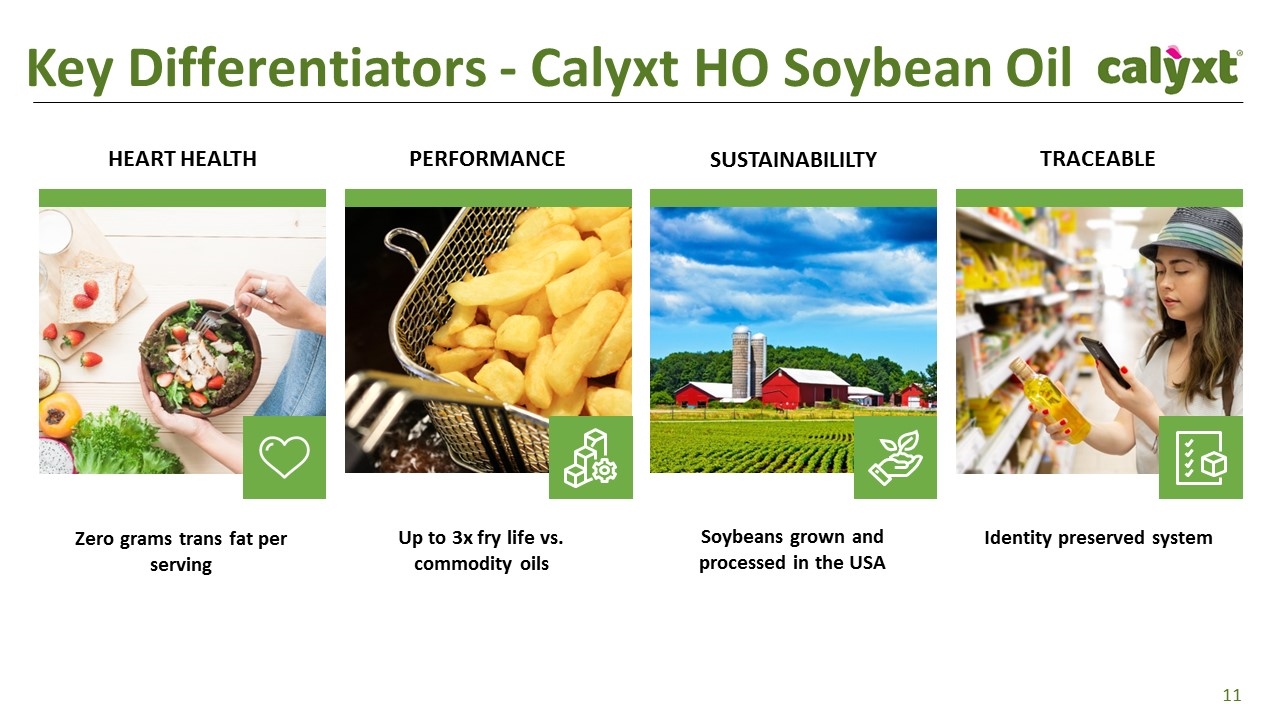
Key Differentiators - Calyxt HO Soybean Oil HEART HEALTH PERFORMANCE SUSTAINABILILTY TRACEABLE Zero grams trans fat per serving Up to 3x fry life vs. commodity oils Soybeans grown and processed in the USA Identity preserved system
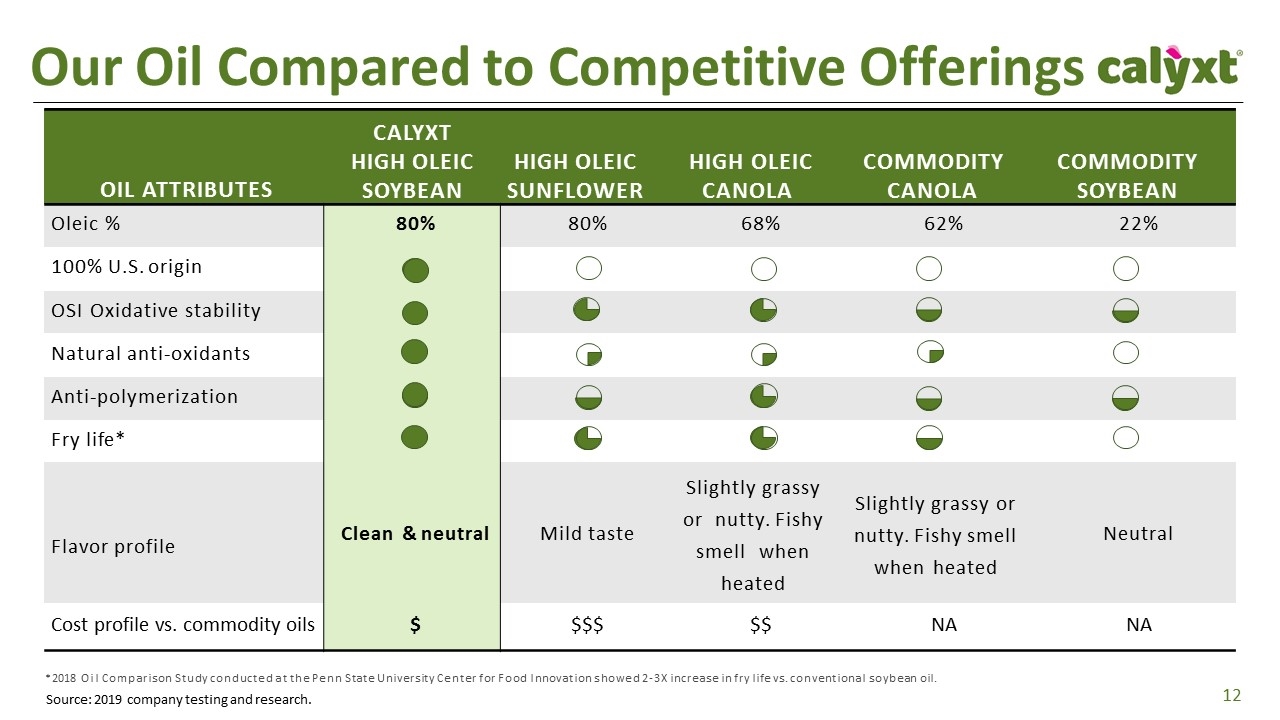
OIL ATTRIBUTES CALYXT HIGH OLEIC SOYBEAN HIGH OLEIC SUNFLOWER HIGH OLEIC CANOLA COMMODITY CANOLA COMMODITY SOYBEAN Oleic % 80% 80% 68% 62% 22% 100% U.S. origin OSI Oxidative stability Natural anti-oxidants Anti-polymerization Fry life* Flavor profile Clean & neutral Mild taste Slightly grassy or nutty. Fishy smell when heated Slightly grassy or nutty. Fishy smell when heated Neutral Cost profile vs. commodity oils $ $$$ $$ NA NA Our Oil Compared to Competitive Offerings * 2018 Oil Comparison Study conducted at the Penn State University Center for Food Innovation showed 2-3X increase in fry life vs. conventional soybean oil. Source: 2019 company testing and research.
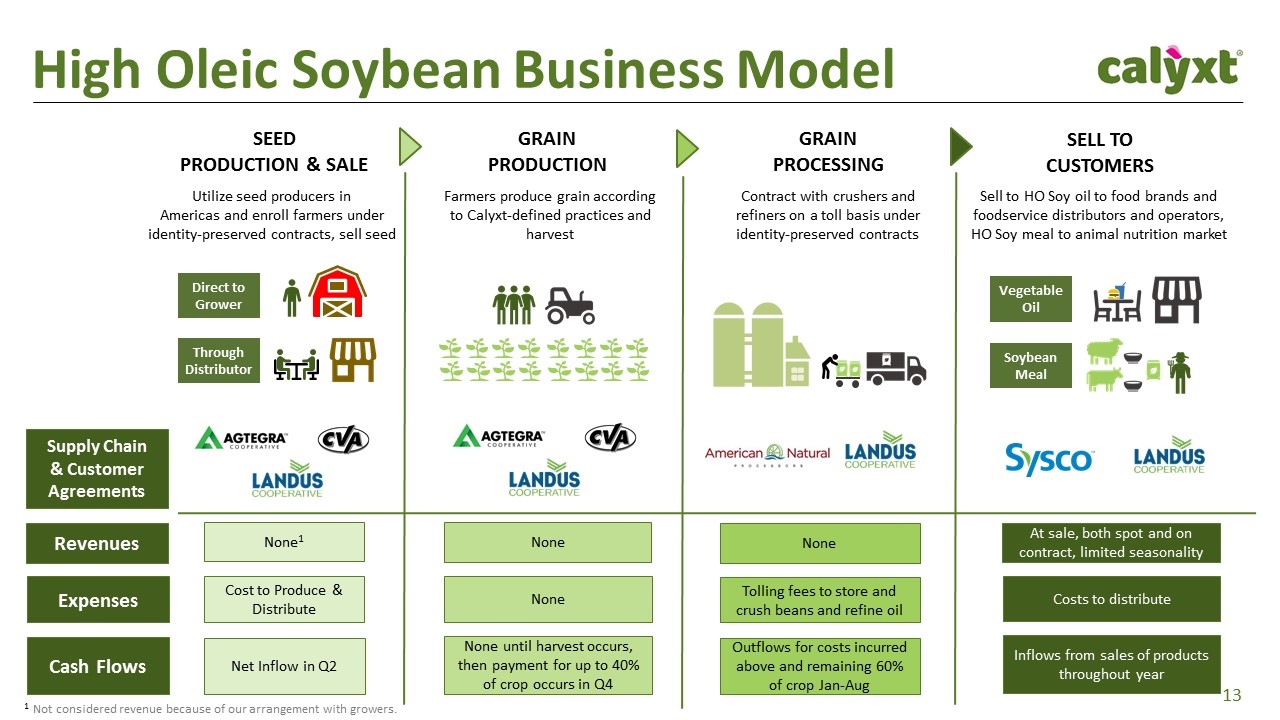
High Oleic Soybean Business Model Utilize seed producers in Americas and enroll farmers under identity-preserved contracts, sell seed Farmers produce grain according to Calyxt-defined practices and harvest Contract with crushers and refiners on a toll basis under identity-preserved contracts Sell to HO Soy oil to food brands and foodservice distributors and operators, HO Soy meal to animal nutrition market GRAIN PRODUCTION SELL TO CUSTOMERS SEED PRODUCTION & SALE GRAIN PROCESSING Through Distributor Direct to Grower Vegetable Oil Soybean Meal Supply Chain & Customer Agreements None1 Revenues None None At sale, both spot and on contract, limited seasonality Expenses Cost to Produce & Distribute None Tolling fees to store and crush beans and refine oil Costs to distribute Cash Flows Net Inflow in Q2 None until harvest occurs, then payment for up to 40% of crop occurs in Q4 Outflows for costs incurred above and remaining 60% of crop Jan-Aug Inflows from sales of products throughout year 1 Not considered revenue because of our arrangement with growers.
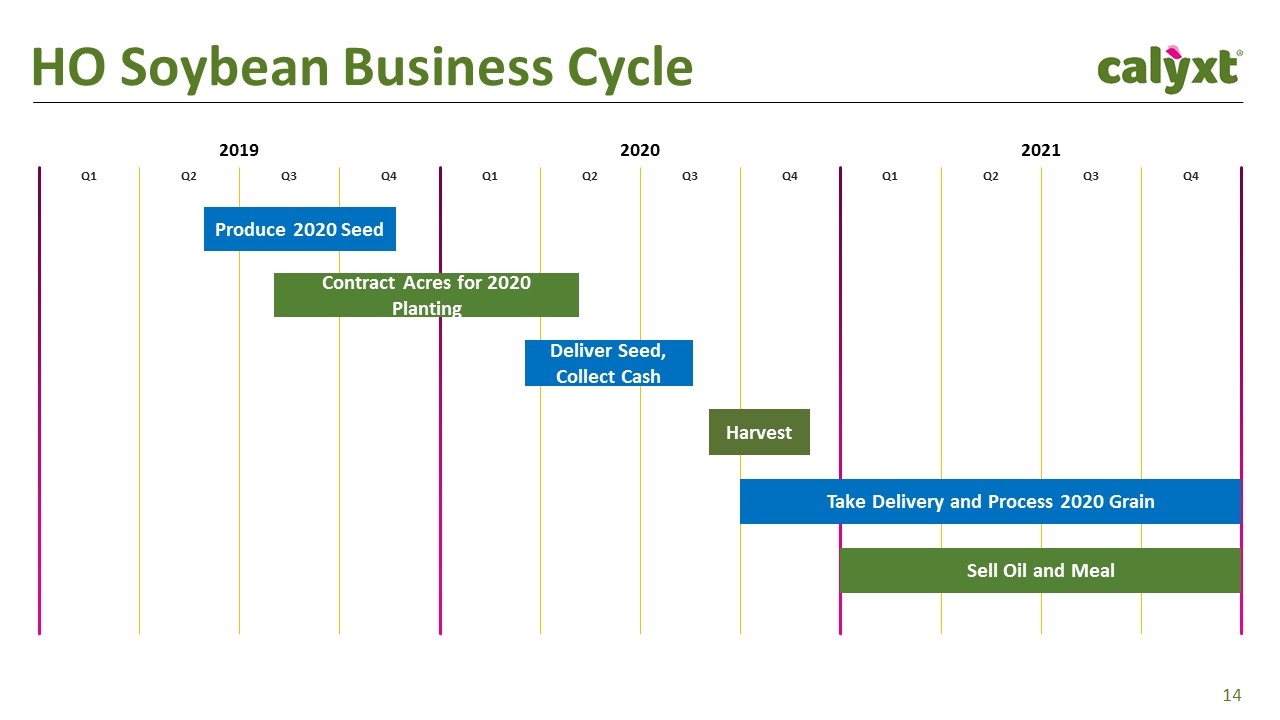
HO Soybean Business Cycle 2019 2020 2021 Q1 Q2 Q3 Q4 Q1 Q2 Q3 Q4 Q1 Q2 Q3 Q4 Produce 2020 Seed Contract Acres for 2020 Planting Deliver Seed, Collect Cash Sell Oil and Meal Take Delivery and Process 2020 Grain Harvest
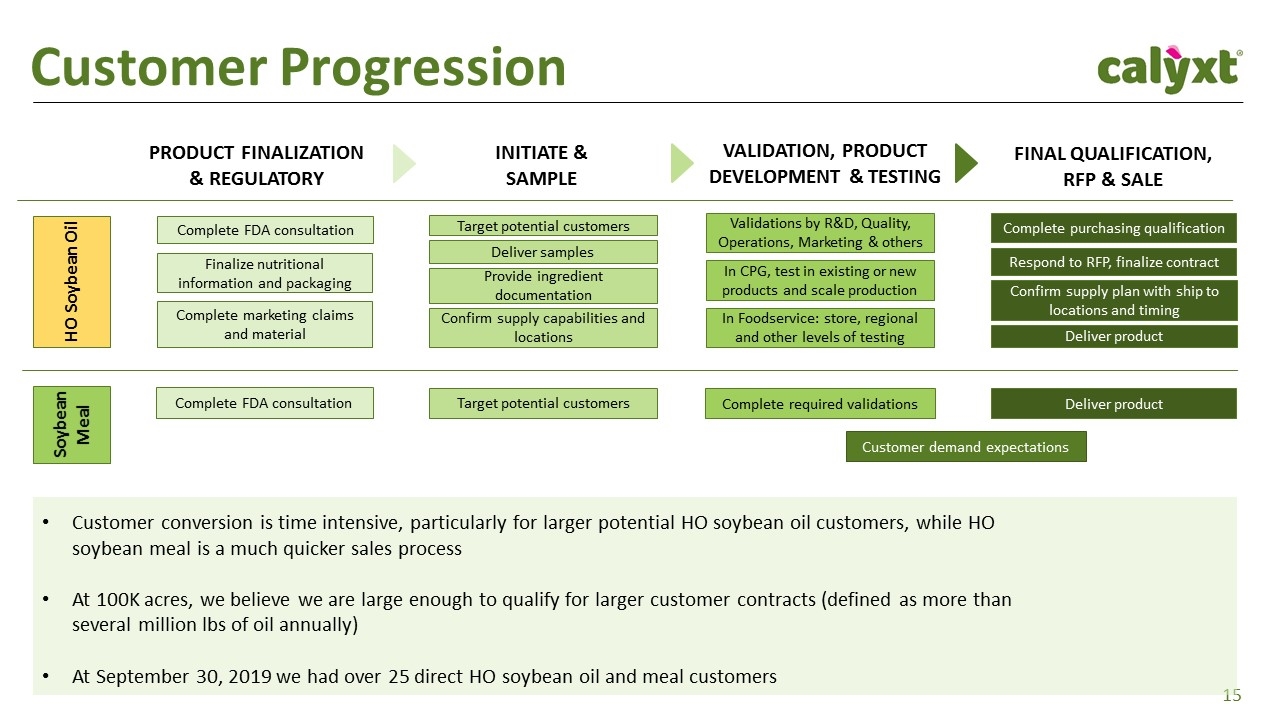
Customer Progression INITIATE & SAMPLE FINAL QUALIFICATION, RFP & SALE PRODUCT FINALIZATION & REGULATORY VALIDATION, PRODUCT DEVELOPMENT & TESTING Complete FDA consultation Target potential customers Validations by R&D, Quality, Operations, Marketing & others Complete purchasing qualification Customer conversion is time intensive, particularly for larger potential HO soybean oil customers, while HO soybean meal is a much quicker sales process At 100K acres, we believe we are large enough to qualify for larger customer contracts (defined as more than several million lbs of oil annually) At September 30, 2019 we had over 25 direct HO soybean oil and meal customers HO Soybean Oil Soybean Meal Finalize nutritional information and packaging Deliver samples Respond to RFP, finalize contract Complete marketing claims and material Provide ingredient documentation In CPG, test in existing or new products and scale production Confirm supply plan with ship to locations and timing Complete FDA consultation Target potential customers Complete required validations Deliver product In Foodservice: store, regional and other levels of testing Deliver product Confirm supply capabilities and locations Customer demand expectations
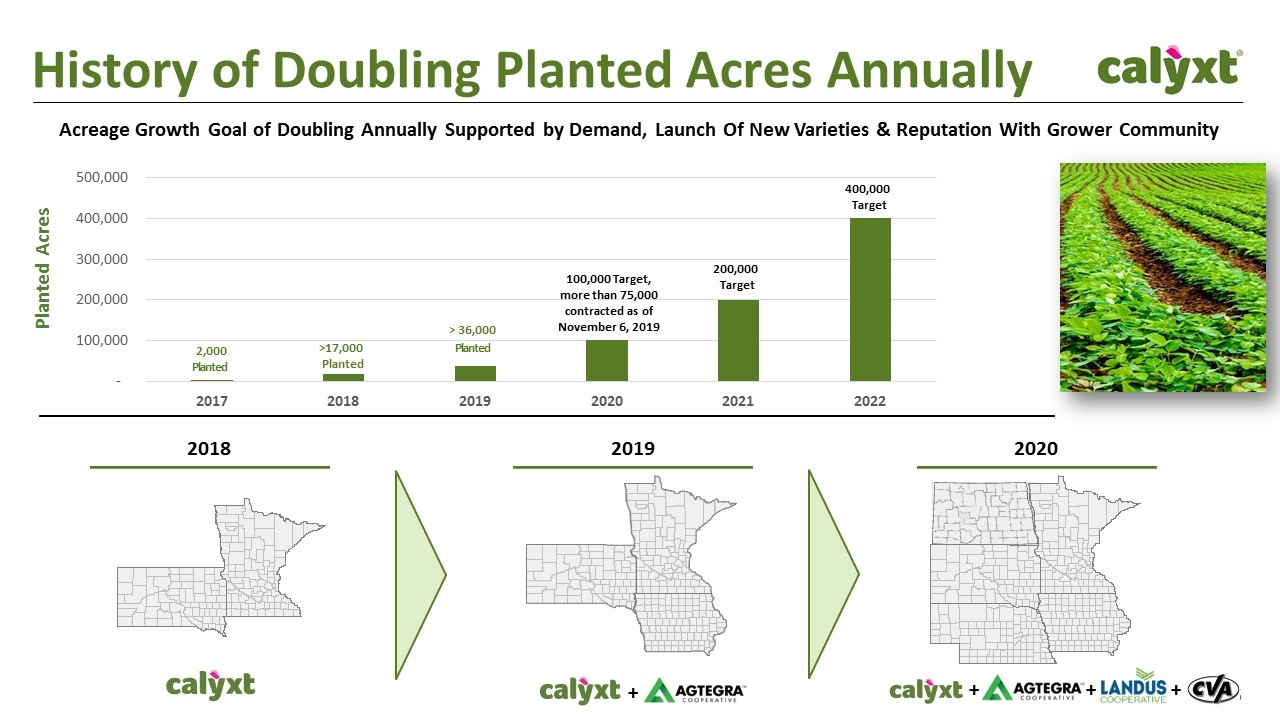
2,000 Planted >17,000 Planted > 36,000 Planted 100,000 Target, more than 75,000 contracted as of November 6, 2019 200,000 Target 400,000 Target Planted Acres History of Doubling Planted Acres Annually Acreage Growth Goal of Doubling Annually Supported by Demand, Launch Of New Varieties & Reputation With Grower Community 2018 2019 2020 + + + +
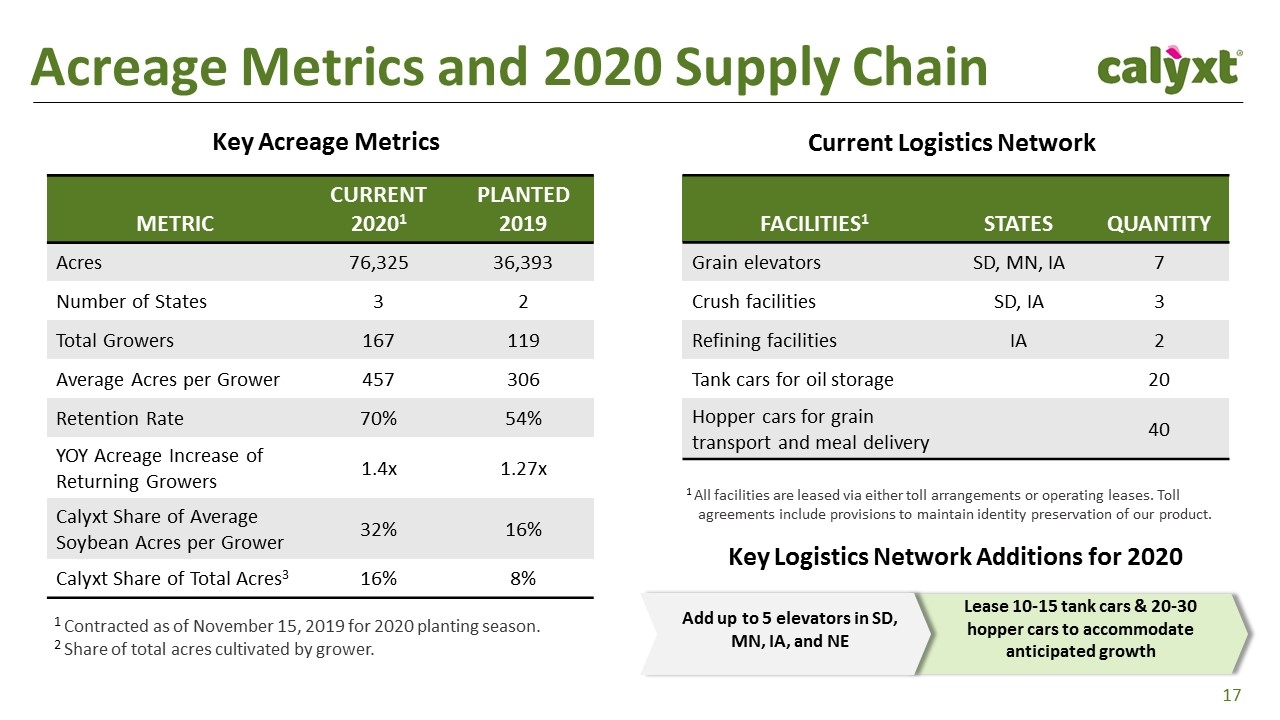
Acreage Metrics and 2020 Supply Chain Key Acreage Metrics METRIC CURRENT 20201 PLANTED 2019 Acres 76,325 36,393 Number of States 3 2 Total Growers 167 119 Average Acres per Grower 457 306 Retention Rate 70% 54% YOY Acreage Increase of Returning Growers 1.4x 1.27x Calyxt Share of Average Soybean Acres per Grower 32% 16% Calyxt Share of Total Acres3 16% 8% 1 Contracted as of November 15, 2019 for 2020 planting season. 2 Share of total acres cultivated by grower. Current Logistics Network Lease 10-15 tank cars & 20-30 hopper cars to accommodate anticipated growth Add up to 5 elevators in SD, MN, IA, and NE Key Logistics Network Additions for 2020 FACILITIES1 STATES QUANTITY Grain elevators SD, MN, IA 7 Crush facilities SD, IA 3 Refining facilities IA 2 Tank cars for oil storage 20 Hopper cars for grain transport and meal delivery 40 1 All facilities are leased via either toll arrangements or operating leases. Toll agreements include provisions to maintain identity preservation of our product.
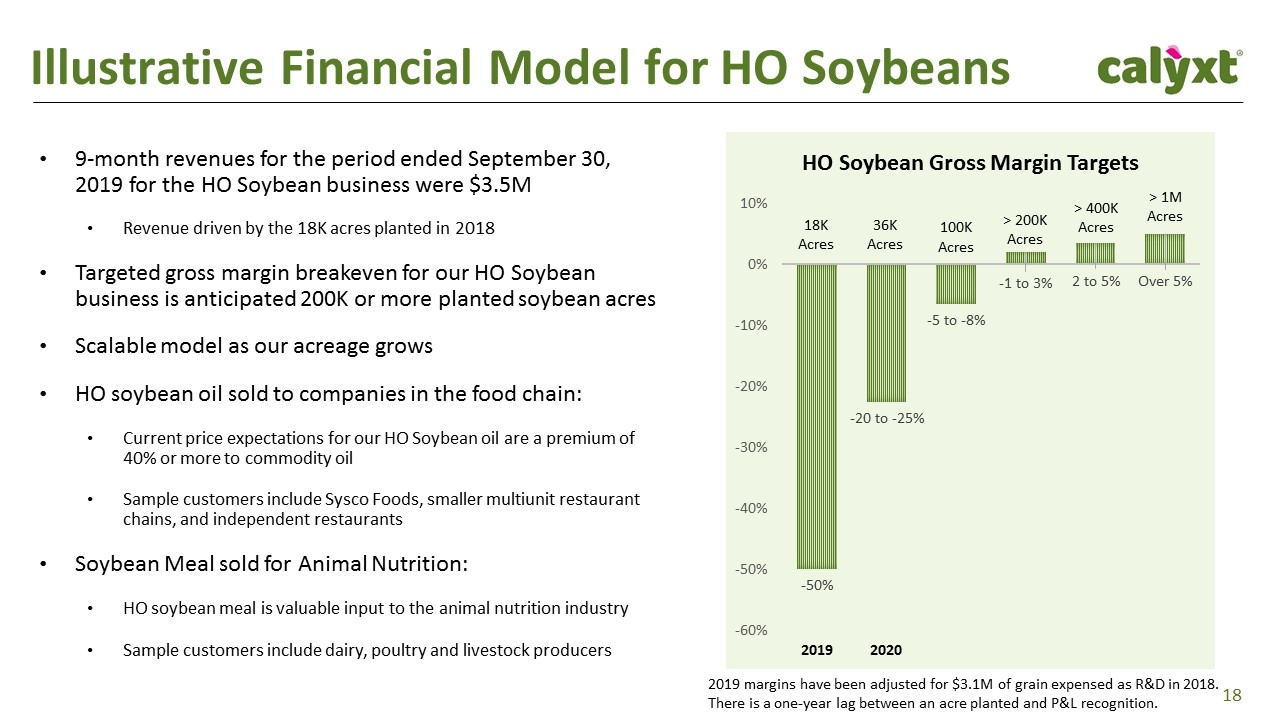
Illustrative Financial Model for HO Soybeans 9-month revenues for the period ended September 30, 2019 for the HO Soybean business were $3.5M Revenue driven by the 18K acres planted in 2018 Targeted gross margin breakeven for our HO Soybean business is anticipated 200K or more planted soybean acres Scalable model as our acreage grows HO soybean oil sold to companies in the food chain: Current price expectations for our HO Soybean oil are a premium of 40% or more to commodity oil Sample customers include Sysco Foods, smaller multiunit restaurant chains, and independent restaurants Soybean Meal sold for Animal Nutrition: HO soybean meal is valuable input to the animal nutrition industry Sample customers include dairy, poultry and livestock producers 18K Acres 36K Acres 100K Acres > 200K Acres > 400K Acres > 1M Acres HO Soybean Gross Margin Targets 2019 margins have been adjusted for $3.1M of grain expensed as R&D in 2018. There is a one-year lag between an acre planted and P&L recognition.
Collaborations Solving Problems by Leveraging Our Technology Platform and Capabilities of Partner Companies
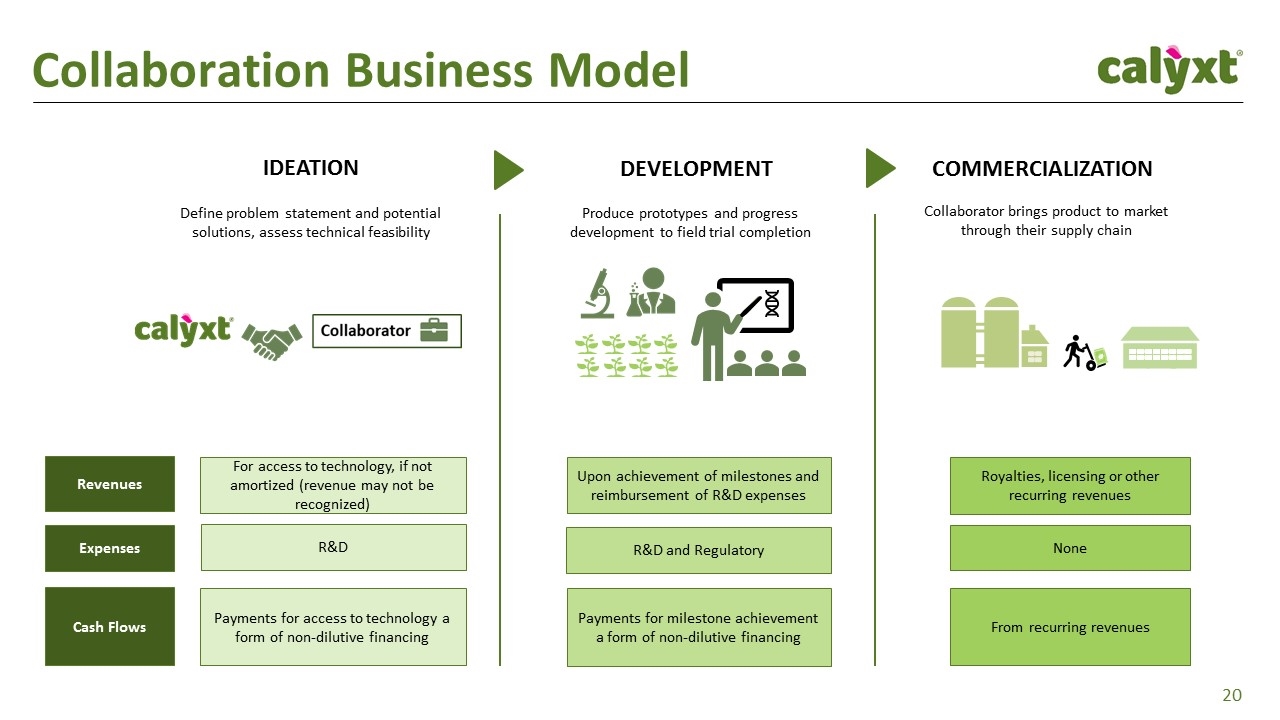
Collaboration Business Model Define problem statement and potential solutions, assess technical feasibility Produce prototypes and progress development to field trial completion DEVELOPMENT IDEATION COMMERCIALIZATION For access to technology, if not amortized (revenue may not be recognized) Revenues Upon achievement of milestones and reimbursement of R&D expenses Royalties, licensing or other recurring revenues Expenses R&D R&D and Regulatory None Cash Flows Payments for access to technology a form of non-dilutive financing Payments for milestone achievement a form of non-dilutive financing From recurring revenues Collaborator brings product to market through their supply chain Collaborator
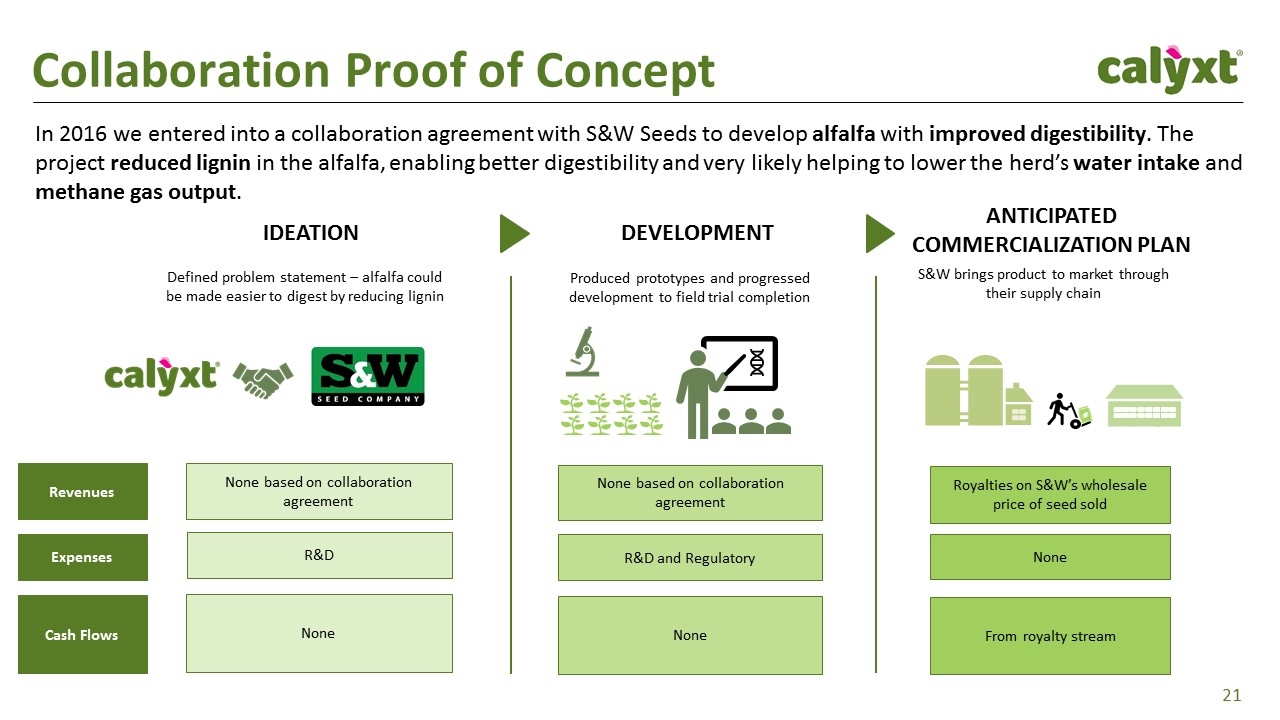
Collaboration Proof of Concept Defined problem statement – alfalfa could be made easier to digest by reducing lignin Produced prototypes and progressed development to field trial completion DEVELOPMENT IDEATION ANTICIPATED COMMERCIALIZATION PLAN None based on collaboration agreement Revenues None based on collaboration agreement Royalties on S&W’s wholesale price of seed sold Expenses R&D R&D and Regulatory None Cash Flows None None From royalty stream S&W brings product to market through their supply chain In 2016 we entered into a collaboration agreement with S&W Seeds to develop alfalfa with improved digestibility. The project reduced lignin in the alfalfa, enabling better digestibility and very likely helping to lower the herd’s water intake and methane gas output. Collaborator
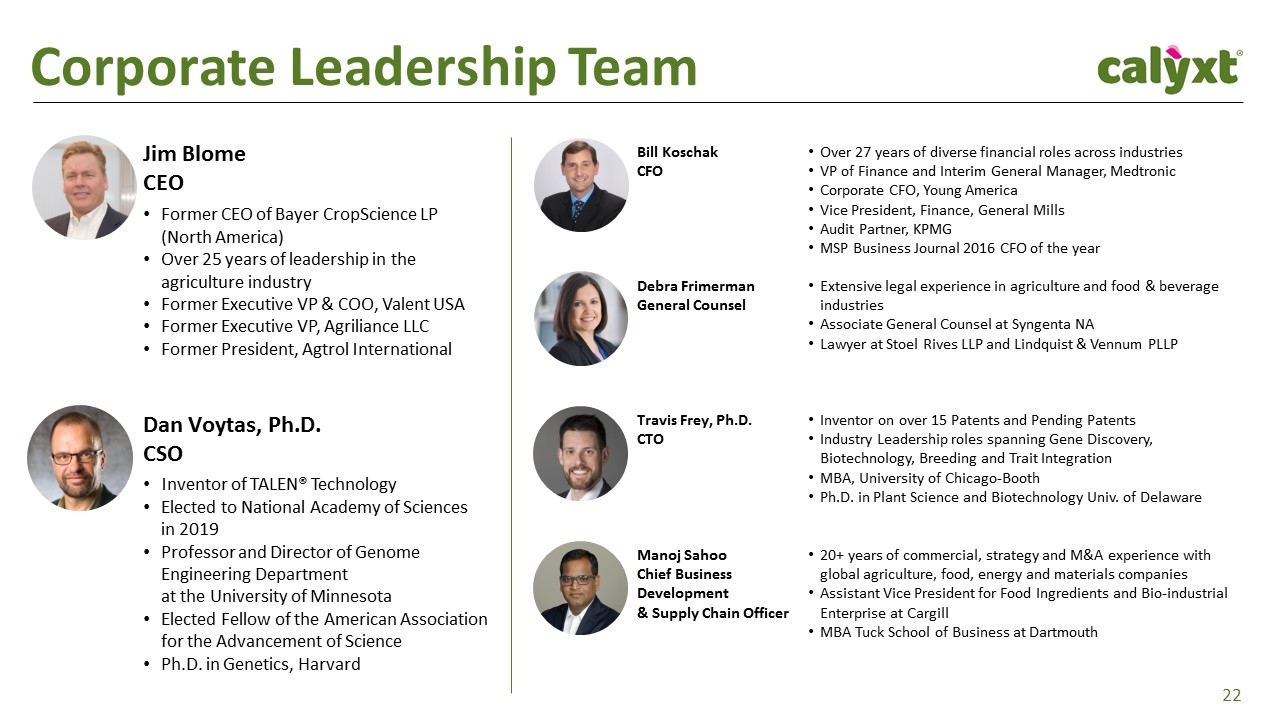
Bill Koschak CFO Over 27 years of diverse financial roles across industries VP of Finance and Interim General Manager, Medtronic Corporate CFO, Young America Vice President, Finance, General Mills Audit Partner, KPMG MSP Business Journal 2016 CFO of the year Debra Frimerman General Counsel Extensive legal experience in agriculture and food & beverage industries Associate General Counsel at Syngenta NA Lawyer at Stoel Rives LLP and Lindquist & Vennum PLLP Travis Frey, Ph.D. CTO Inventor on over 15 Patents and Pending Patents Industry Leadership roles spanning Gene Discovery, Biotechnology, Breeding and Trait Integration MBA, University of Chicago-Booth Ph.D. in Plant Science and Biotechnology Univ. of Delaware Manoj Sahoo Chief Business Development & Supply Chain Officer 20+ years of commercial, strategy and M&A experience with global agriculture, food, energy and materials companies Assistant Vice President for Food Ingredients and Bio-industrial Enterprise at Cargill MBA Tuck School of Business at Dartmouth Corporate Leadership Team Dan Voytas, Ph.D. CSO Jim Blome CEO Former CEO of Bayer CropScience LP (North America) Over 25 years of leadership in the agriculture industry Former Executive VP & COO, Valent USA Former Executive VP, Agriliance LLC Former President, Agtrol International Inventor of TALEN® Technology Elected to National Academy of Sciences in 2019 Professor and Director of Genome Engineering Department at the University of Minnesota Elected Fellow of the American Association for the Advancement of Science Ph.D. in Genetics, Harvard
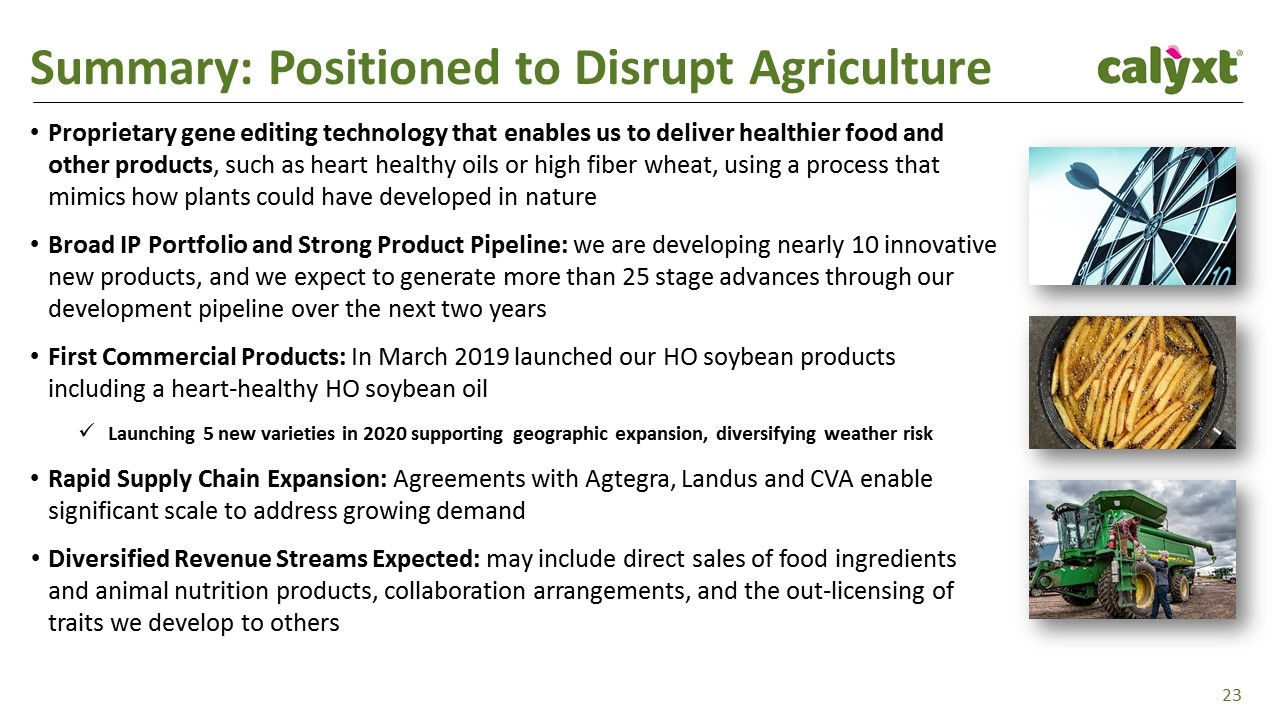
Summary: Positioned to Disrupt Agriculture Proprietary gene editing technology that enables us to deliver healthier food and other products, such as heart healthy oils or high fiber wheat, using a process that mimics how plants could have developed in nature Broad IP Portfolio and Strong Product Pipeline: we are developing nearly 10 innovative new products, and we expect to generate more than 25 stage advances through our development pipeline over the next two years First Commercial Products: In March 2019 launched our HO soybean products including a heart-healthy HO soybean oil Launching 5 new varieties in 2020 supporting geographic expansion, diversifying weather risk Rapid Supply Chain Expansion: Agreements with Agtegra, Landus and CVA enable significant scale to address growing demand Diversified Revenue Streams Expected: may include direct sales of food ingredients and animal nutrition products, collaboration arrangements, and the out-licensing of traits we develop to others
Contact Making the food you love a healthier choice™ calyxt.com Company Bill Koschak Chief Financial Officer Calyxt, Inc. 2800 Mount Ridge Road Roseville, MN 55113 www.calyxt.com Investor Relations Chris Tyson Managing Director – MZ North America Direct: 949-491-8235 IR@calyxt.com www.mzgroup.us 2800 Mount Ridge Road | Roseville, MN 55113
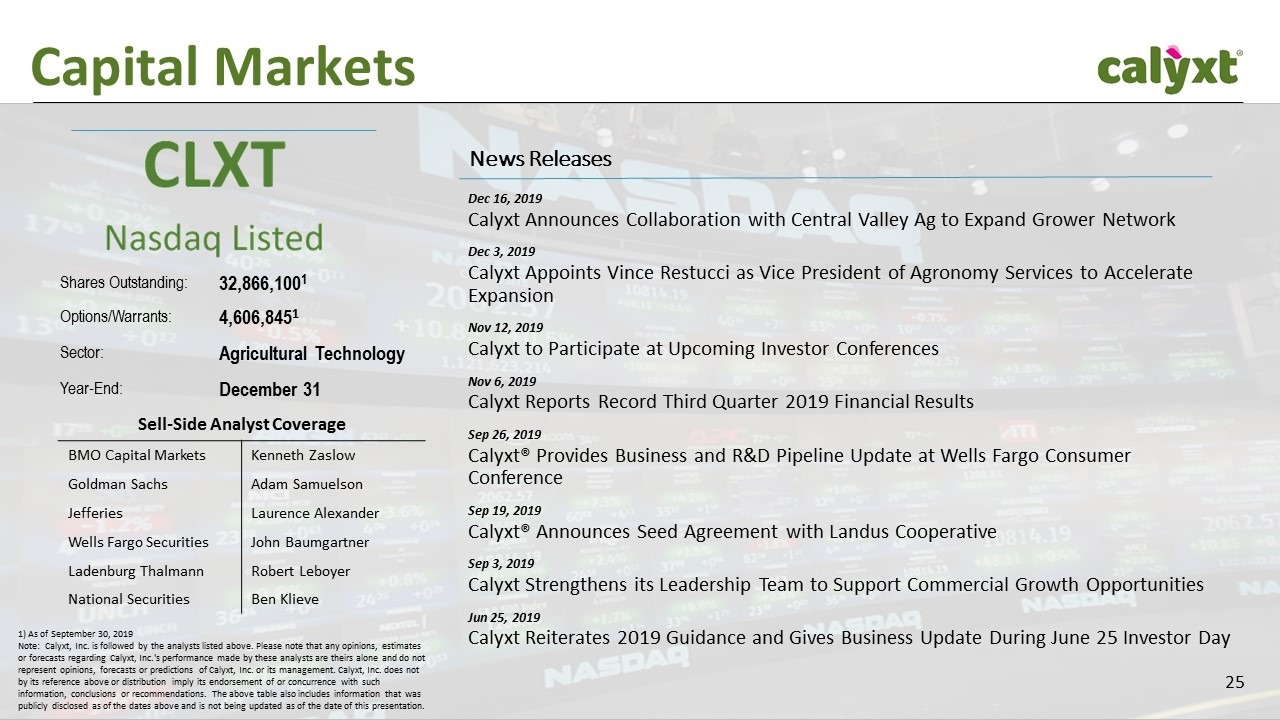
Capital Markets Shares Outstanding: 32,866,1001 Options/Warrants: 4,606,8451 Sector: Agricultural Technology Year-End: December 31 News Releases Dec 16, 2019 Calyxt Announces Collaboration with Central Valley Ag to Expand Grower Network Dec 3, 2019 Calyxt Appoints Vince Restucci as Vice President of Agronomy Services to Accelerate Expansion Nov 12, 2019 Calyxt to Participate at Upcoming Investor Conferences Nov 6, 2019 Calyxt Reports Record Third Quarter 2019 Financial Results Sep 26, 2019 Calyxt® Provides Business and R&D Pipeline Update at Wells Fargo Consumer Conference Sep 19, 2019 Calyxt® Announces Seed Agreement with Landus Cooperative Sep 3, 2019 Calyxt Strengthens its Leadership Team to Support Commercial Growth Opportunities Jun 25, 2019 Calyxt Reiterates 2019 Guidance and Gives Business Update During June 25 Investor Day Sell-Side Analyst Coverage BMO Capital Markets Kenneth Zaslow Goldman Sachs Adam Samuelson Jefferies Laurence Alexander Wells Fargo Securities John Baumgartner Ladenburg Thalmann Robert Leboyer National Securities Ben Klieve 1) As of September 30, 2019 Note: Calyxt, Inc. is followed by the analysts listed above. Please note that any opinions, estimates or forecasts regarding Calyxt, Inc.'s performance made by these analysts are theirs alone and do not represent opinions, forecasts or predictions of Calyxt, Inc. or its management. Calyxt, Inc. does not by its reference above or distribution imply its endorsement of or concurrence with such information, conclusions or recommendations. The above table also includes information that was publicly disclosed as of the dates above and is not being updated as of the date of this presentation.


