Exhibit 99.2 INVESTOR PRESENTATION (NASDAQ: CLXT) March 5 , 2020 Exhibit 99.2
FORWARDLOOKINGSTATEMENTS This communication contains “forward-looking statements” within the meaning of the safe harbor provisions of the U.S. Private Securities Litigation Reform Act of 1995. In some cases, you can identify these statements by forward-looking words such as “may,” “might,” “will,” “should,” “expects,” “plans,” “anticipates,” “believes,” “estimates,” “predicts,” “potential” or “continue,” the negative of these terms and other comparable terminology. These forward-looking statements, which are based on our current assumptions and expectations, are subject to risks and uncertainties. Forward-looking statements in this presentation may include statements about our future financial performance, product pipeline and development, commercialization efforts, regulatory progression, potential collaborations and partnerships, growth strategies, and anticipated trends in our business. These statements are predictions based on our current expectations and projections about future events and trends. Our actual results could be materially different than those expressed, implied, or anticipated by forward-looking statements. There are important factors that could cause our actual results, level of activity, performance or achievements to differ materially from the results, level of activity, performance or achievements expressed or implied by the forward-looking statements, including those factors discussed under the caption entitled “Risk Factors” in our Annual Report on Form 10-K, along with our other filings with the U.S. Securities and Exchange Commission. We do not assume any obligation to publicly provide revisions or updates to any forward-looking statements, whether as a result of new information, future developments or otherwise, should circumstances change, except as otherwise required by law.
Calyxt is a technology company focused on delivering plant-based solutions that are healthy and sustainable. Proprietary and patented gene editing technologies enable us to deliver the promise of plant-based solutions using a process that mimics how plants could have developed in nature. Broad IP Portfolio and Strong Product Pipeline: we have over 70 patent families across gene editing platforms, we have 14 innovative new products in our development process, and expect to launch as many as six product candidates over the next four years. First to Commercialize a Gene-Edited Food Product: completed successful voluntary consultation with the FDA in February 2019 and launched our high oleic (HO) soybean products shortly thereafter. Diversified Revenue Streams Expected: may include revenues from direct sales of products, royalties and other payments from collaboration arrangements, and payments from the strategic licensing of our innovation to others. Gross margin profile improves as we optimize margins for our soybean products and introduce new revenue streams from collaborations, where we expect gross margins >80%. CORPORATEOVERVIEW
ESGGUIDINGPRINCIPLES Business Success and Strong Corporate Governance Our business success could revolutionize agriculture. Our Code of Business Conduct and Ethics establishes the principles of ethical business to which we adhere. Environmental Stewardship • We are developing unique science-based products and solutions intended to deliver sustainability benefits. We are committed to reducing emissions to align with the fight against climate change. Social Responsibility We support sustainable agricultural and fair labor practices. We strive to: Improve the sustainability of our supply chain systems Foster a diverse work environment Give back to the communities where we live and work
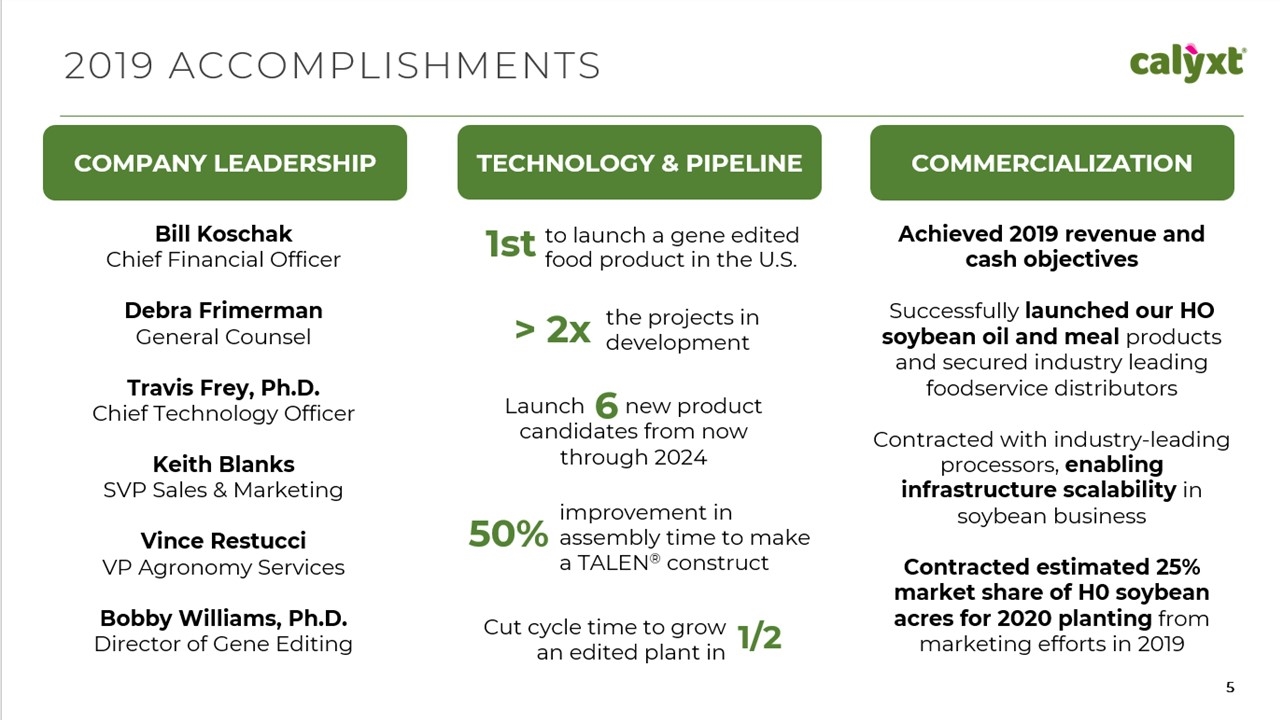
TECHNOLOGY & PIPELINE 2019ACCOMPLISHMENTS Bill Koschak Chief Financial Officer Debra Frimerman General Counsel Travis Frey, Ph.D. Chief Technology Officer Keith Blanks SVP Sales & Marketing Vince Restucci VP Agronomy Services Bobby Williams, Ph.D. Director of Gene Editing Achieved 2019 revenue and cash objectives Successfully launched our HO soybean oil and meal products and secured industry leading foodservice distributors Contracted with industry-leading processors, enabling infrastructure scalability in soybean business Contracted estimated 25% market share of H0 soybean acres for 2020 planting from marketing efforts in 2019 1st to launch a gene edited food product in the U.S. improvement in 50% assembly time to make a TALEN® construct Cut cycle time to grow 1/2 an edited plant in > 2xthe projects in development candidates from now through 2024 Launch 6 new product COMMERCIALIZATION COMPANY LEADERSHIP
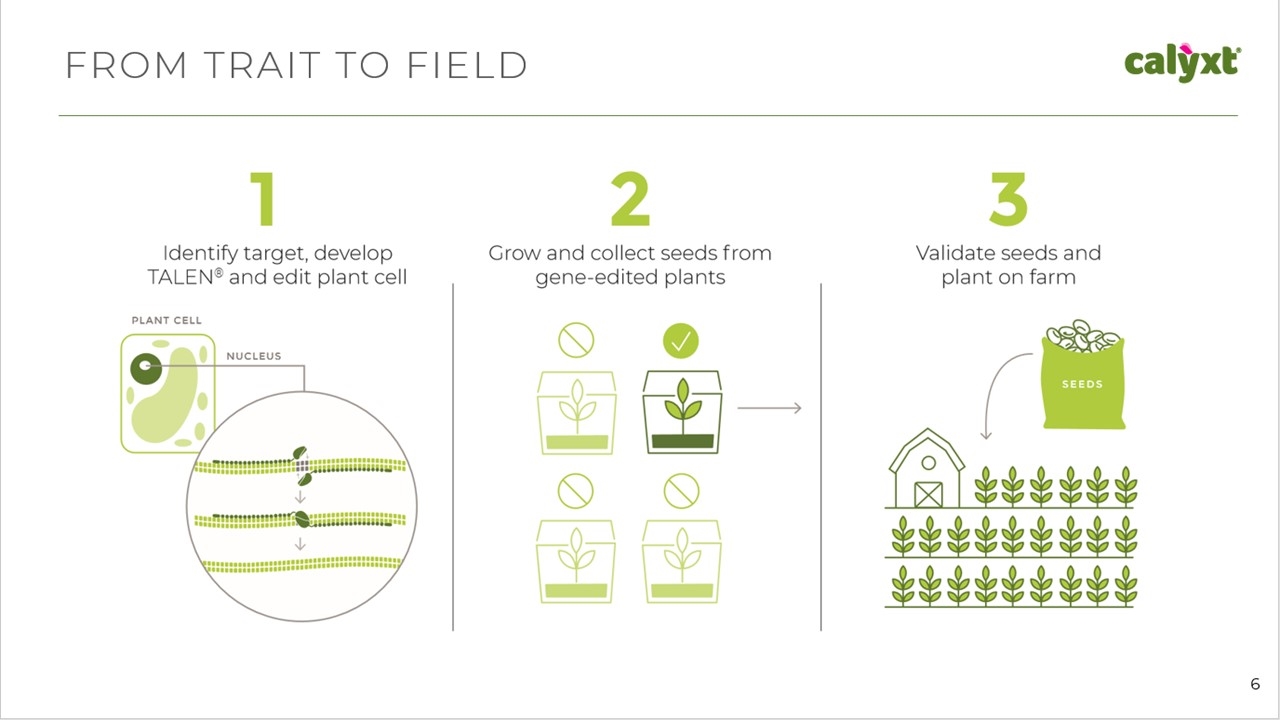
FROM TRAIT TO FIELD 6 Indentify target, develop TALEN and edit plant cell Grow and collect seeds from gene-edited plants Validate seeds and plain on farm
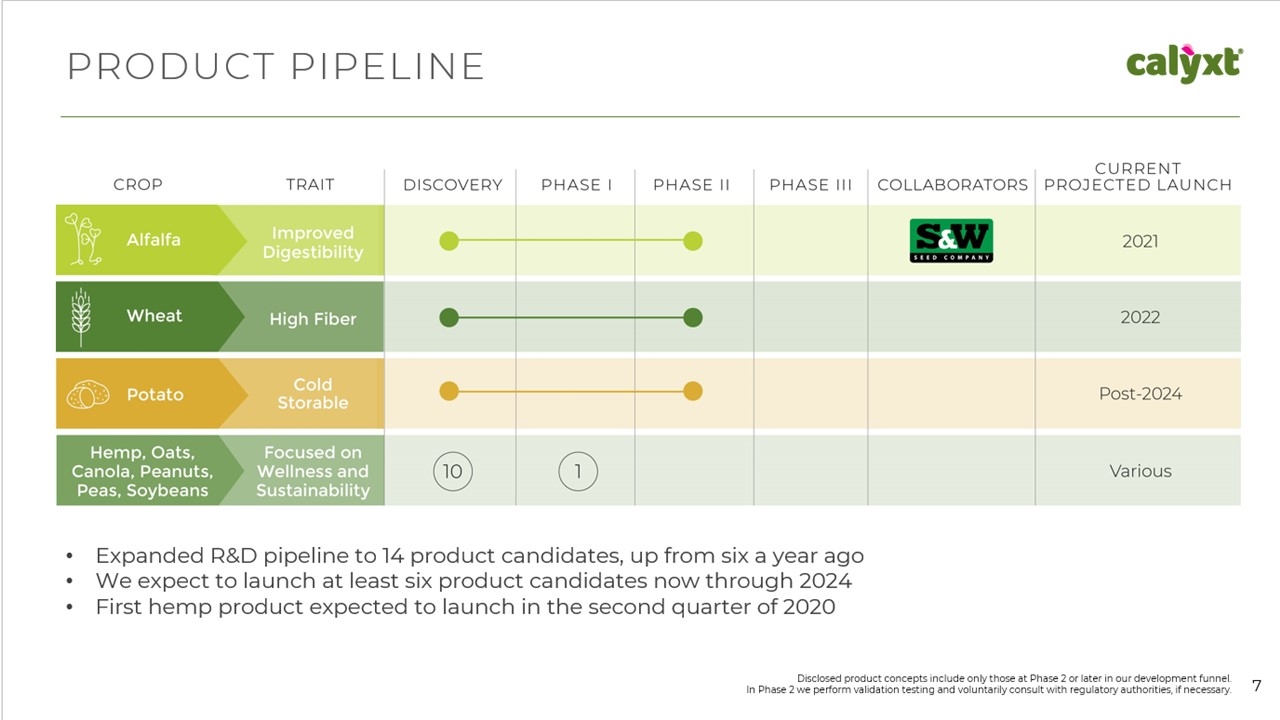
PRODUCTPIPELINE Disclosed product concepts include only those at Phase 2 or later in our development funnel. In Phase 2 we perform validation testing and voluntarily consult with regulatory authorities, if necessary.7 Expanded R&D pipeline to 14 product candidates, up from six a year ago We expect to launch at least six product candidates now through 2024 First hemp product expected to launch in the second quarter of 2020 CROP TRAIT DISCOVER PHASE I PHASE II PHASE III COLLABORATORS CURRENT PROJECTED LAUNCH Alfalfa Improved Digestibility Wheat Hihg Fiber Potato Cold Storable Hemp, Oeats, Canola, Peanuts, Peas, Soybeans Focused on Wellness and Sustainability 2021 2022 Post-2024 Various 10 1
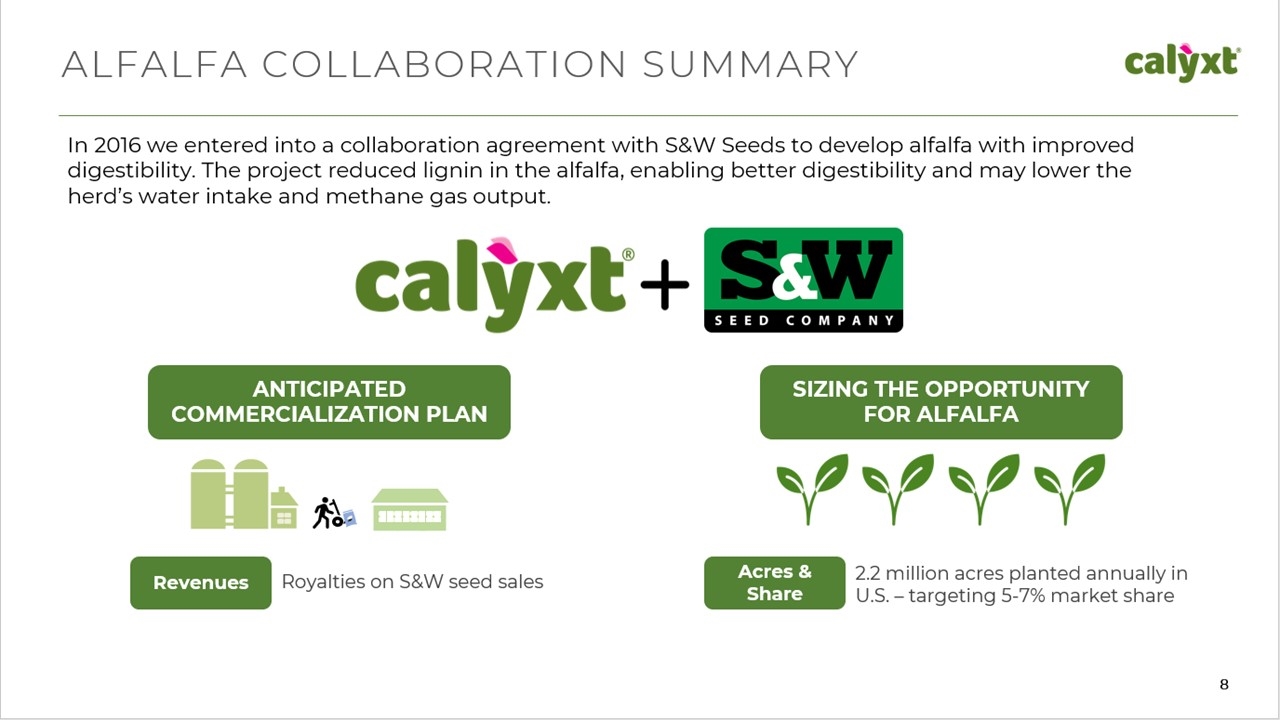
ALFALFACOLLABORATIONSUMMARY In 2016 we entered into a collaboration agreement with S&W Seeds to develop alfalfa with improved digestibility. The project reduced lignin in the alfalfa, enabling better digestibility and may lower the herd’s water intake and methane gas output. SIZING THE OPPORTUNITY FOR ALFALFA ANTICIPATED COMMERCIALIZATION PLAN Royalties on S&W seed sales Revenues Acres & Share 2.2 million acres planted annually in U.S. – targeting 5-7% market share
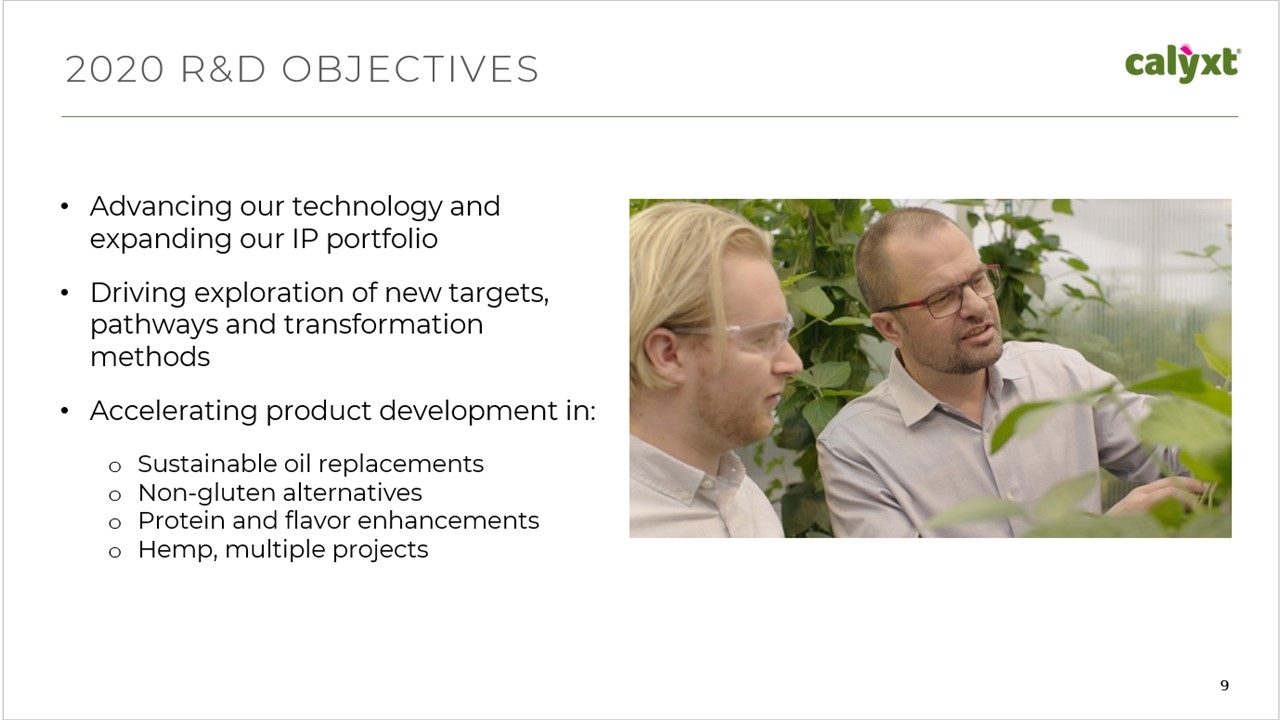
2020R&DOBJECTIVES Advancing our technology and expanding our IP portfolio Driving exploration of new targets, pathways and transformation methods Accelerating product development in: Sustainable oil replacements Non-gluten alternatives Protein and flavor enhancements Hemp, multiple projects
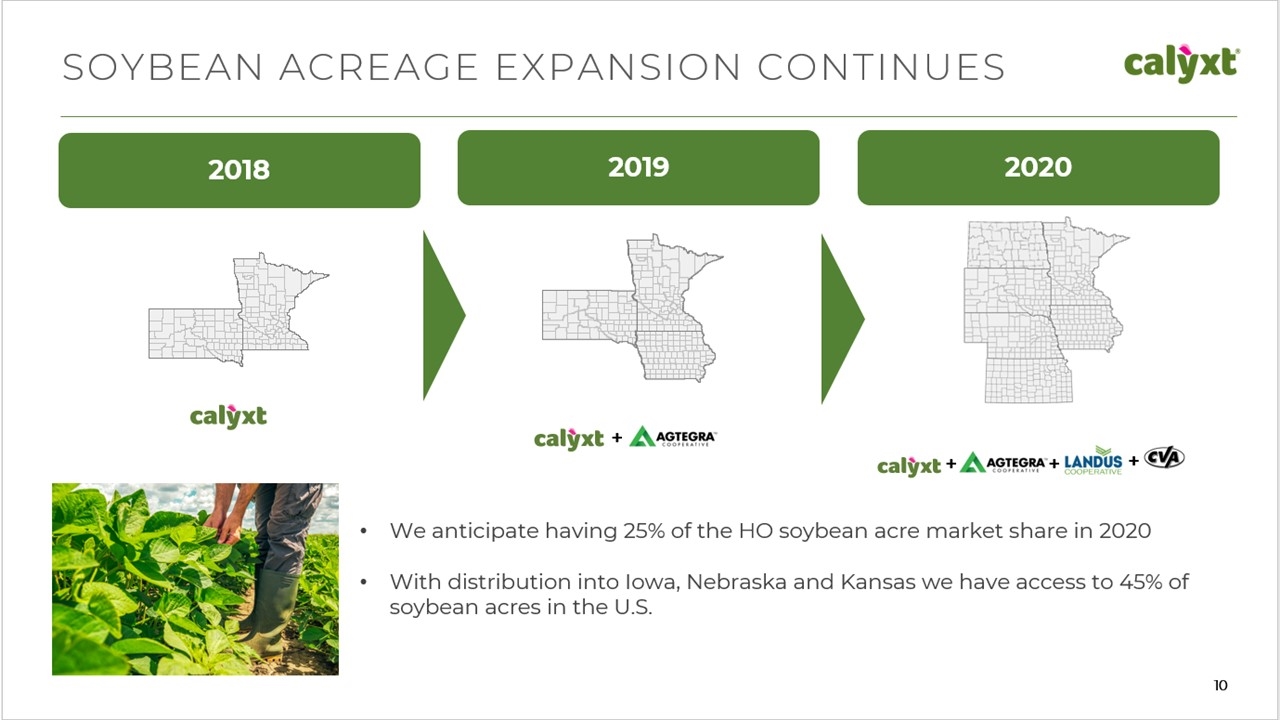
2020 SOYBEANACREAGEEXPANSIONCONTINUES We anticipate having 25% of the HO soybean acre market share in 2020 With distribution into Iowa, Nebraska and Kansas we have access to 45% of soybean acres in the U.S. + + + + 2018 2019
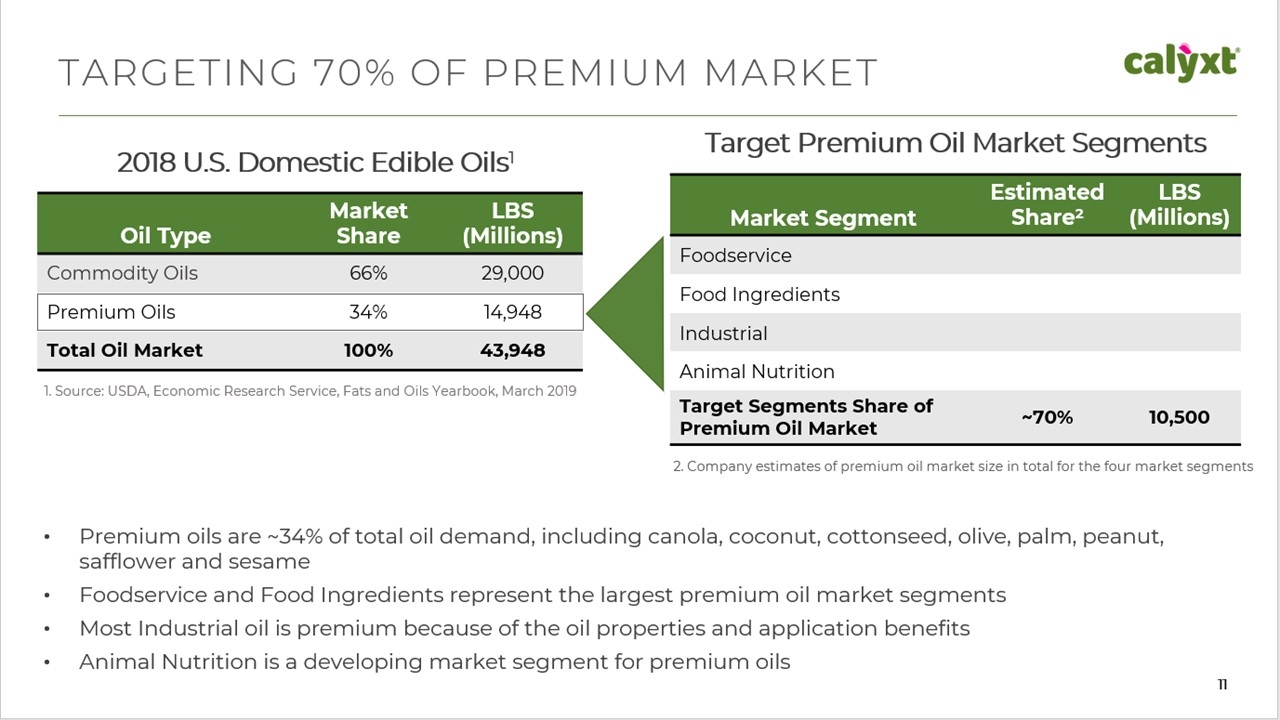
TARGETING70%OFPREMIUMMARKET 2018 U.S. Domestic Edible Oils1 1. Source: USDA, Economic Research Service, Fats and Oils Yearbook, March 2019 Target Premium Oil Market Segments Market Segment Estimated Share2 LBS (Millions) Foodservice Food Ingredients Industrial Animal Nutrition Target Segments Share of Premium Oil Market ~70% 10,500 Oil Type Market Share LBS (Millions) Commodity Oils 66% 29,000 Premium Oils 34% 14,948 Total Oil Market 100% 43,948 2. Company estimates of premium oil market size in total for the four market segments Premium oils are ~34% of total oil demand, including canola, coconut, cottonseed, olive, palm, peanut, safflower and sesame Foodservice and Food Ingredients represent the largest premium oil market segments Most Industrial oil is premium because of the oil properties and application benefits Animal Nutrition is a developing market segment for premium oils
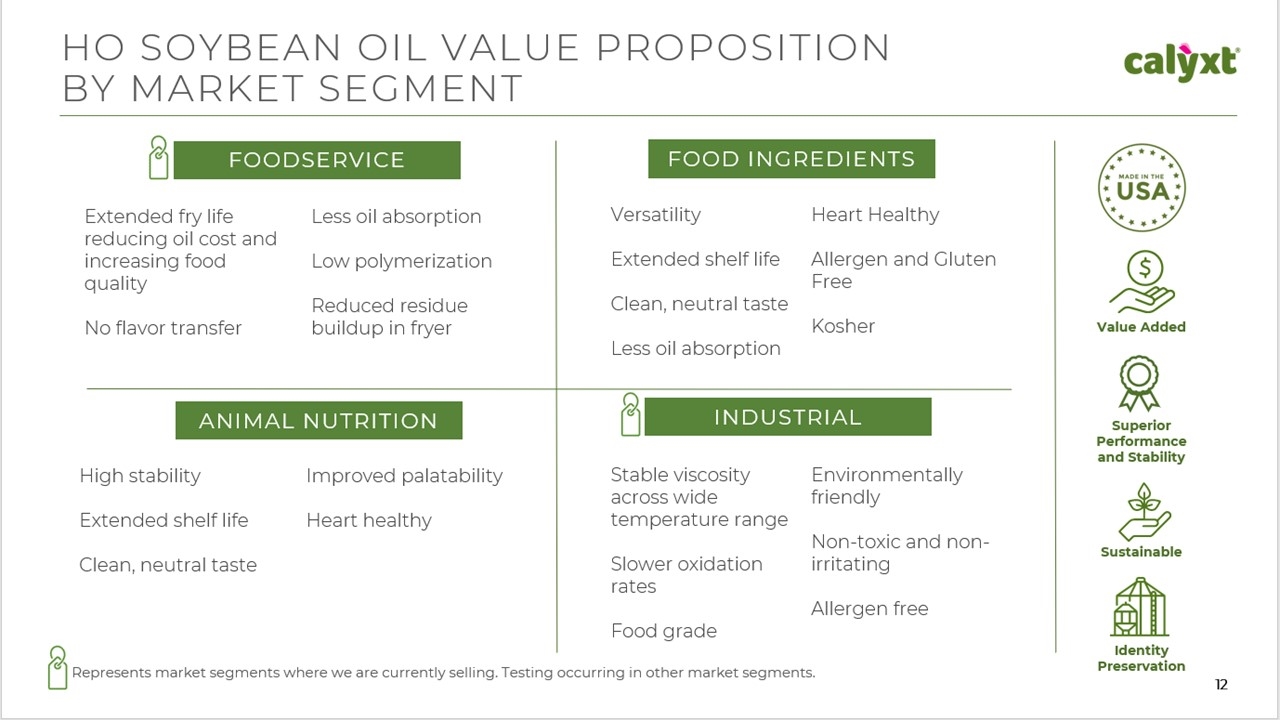
HOSOYBEANOILVALUEPROPOSITION BYMARKETSEGMENT Represents market segments where we are currently selling. Testing occurring in other market segments. Extended fry life reducing oil cost and increasing food quality No flavor transfer FOODSERVICE Less oil absorption Low polymerization Reduced residue buildup in fryer Extended shelf life Clean, neutral taste Less oil absorption FOOD INGREDIENTS VersatilityHeart Healthy Allergen and Gluten Free Kosher ANIMAL NUTRITION High stabilityImproved palatability Extended shelf lifeHeart healthy Clean, neutral taste Stable viscosity across wide temperature range Slower oxidation rates INDUSTRIAL Environmentally friendly Non-toxic and non- irritating Allergen free Food grade Value Added Superior Performance and Stability Sustainable Identity Preservation
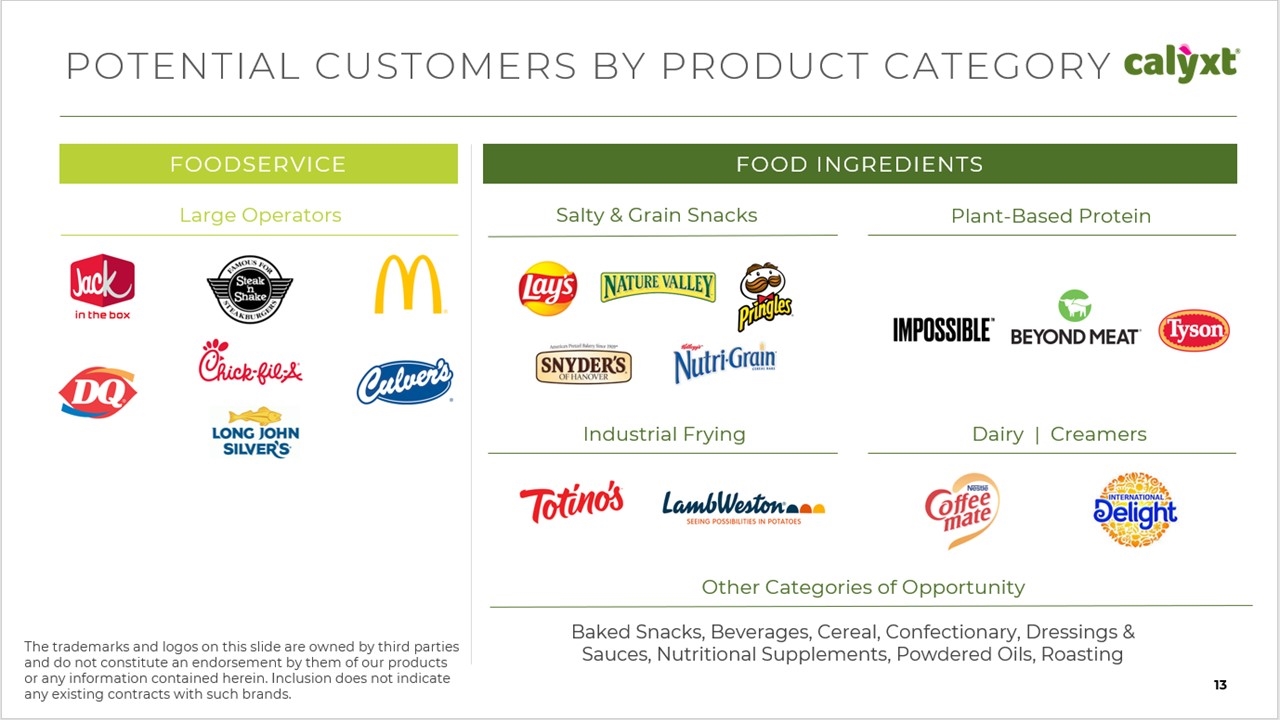
POTENTIALCUSTOMERSBYPRODUCTCATEGORY Baked Snacks, Beverages, Cereal, Confectionary, Dressings & Sauces, Nutritional Supplements, Powdered Oils, Roasting FOODSERVICE FOOD INGREDIENTS Salty & Grain SnacksPlant-Based Protein Large Operators Industrial Frying Dairy | Creamers Other Categories of Opportunity 13 The trademarks and logos on this slide are owned by third parties and do not constitute an endorsement by them of our products or any information contained herein. Inclusion does not indicate any existing contracts with such brands.
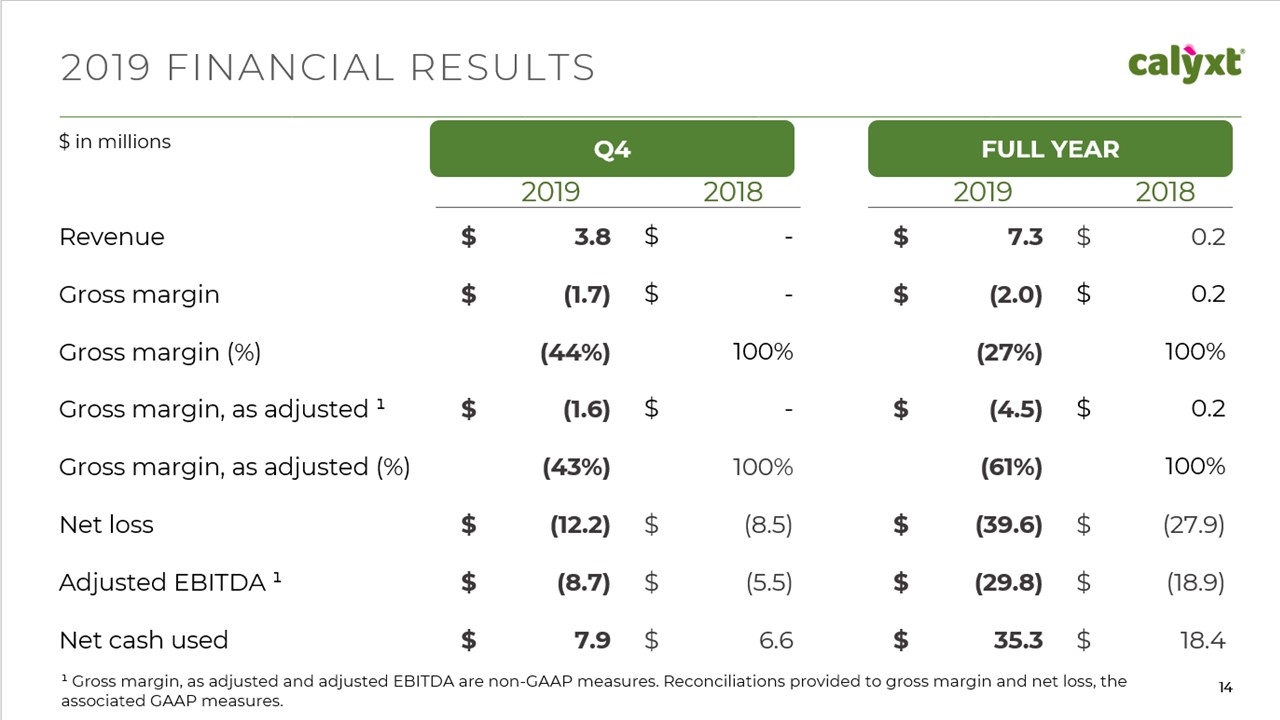
2019FINANCIALRESULTS 14 ¹ Gross margin, as adjusted and adjusted EBITDA are non-GAAP measures. Reconciliations provided to gross margin and net loss, the associated GAAP measures. $ in millions Q4 FULL YEAR 2019 2018 2019 2018 Revenue $ 3.8 $ - $ 7.3 $ 0.2 Gross margin $ (1.7) $ - $ (2.0) $ 0.2 Gross margin (%) (44%) 100% (27%) 100% Gross margin, as adjusted ¹ $ (1.6) $ - $ (4.5) $ 0.2 Gross margin, as adjusted (%) (43%) 100% (61%) 100% Net loss $ (12.2) $ (8.5) $ (39.6) $ (27.9) Adjusted EBITDA ¹ $ (8.7) $ (5.5) $ (29.8) $ (18.9) Net cash used $ 7.9 $ 6.6 $ 35.3 $ 18.4
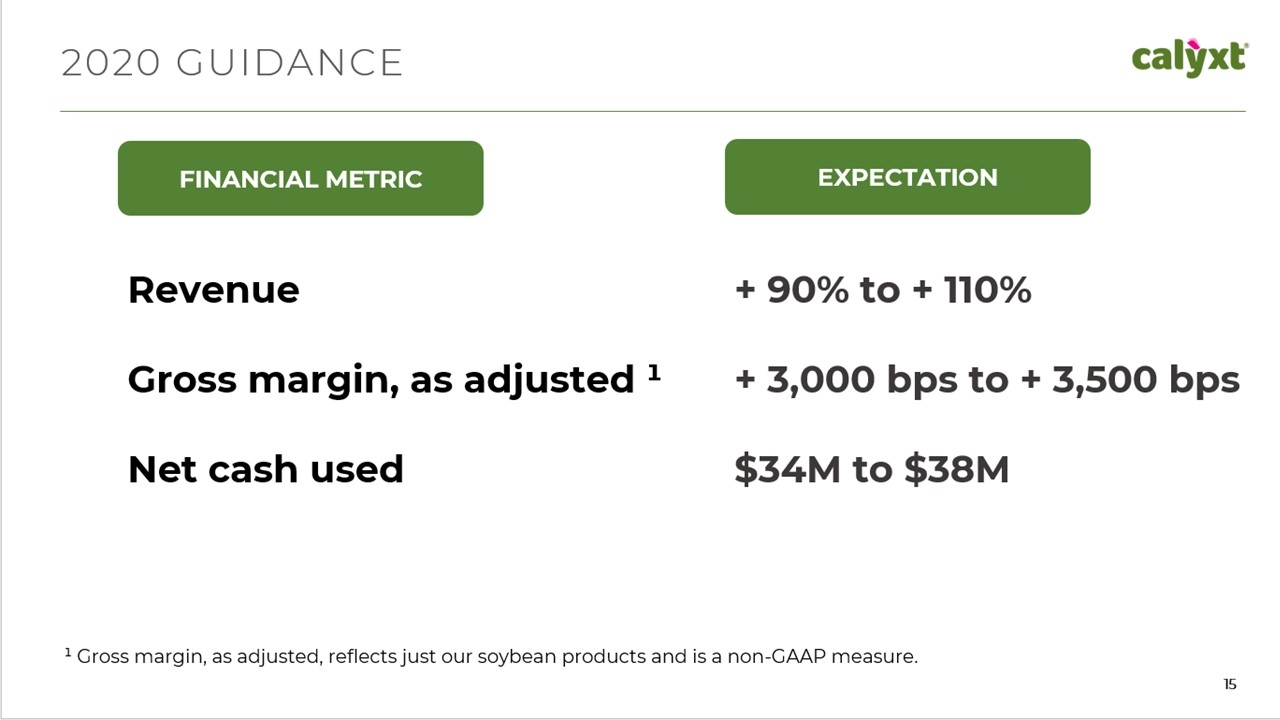
2020GUIDANCE ¹ Gross margin, as adjusted, reflects just our soybean products and is a non-GAAP measure. FINANCIAL METRIC Revenue Gross margin, as adjusted ¹ Net cash used EXPECTATION + 90% to + 110% + 3,000 bps to + 3,500 bps $34M to $38M
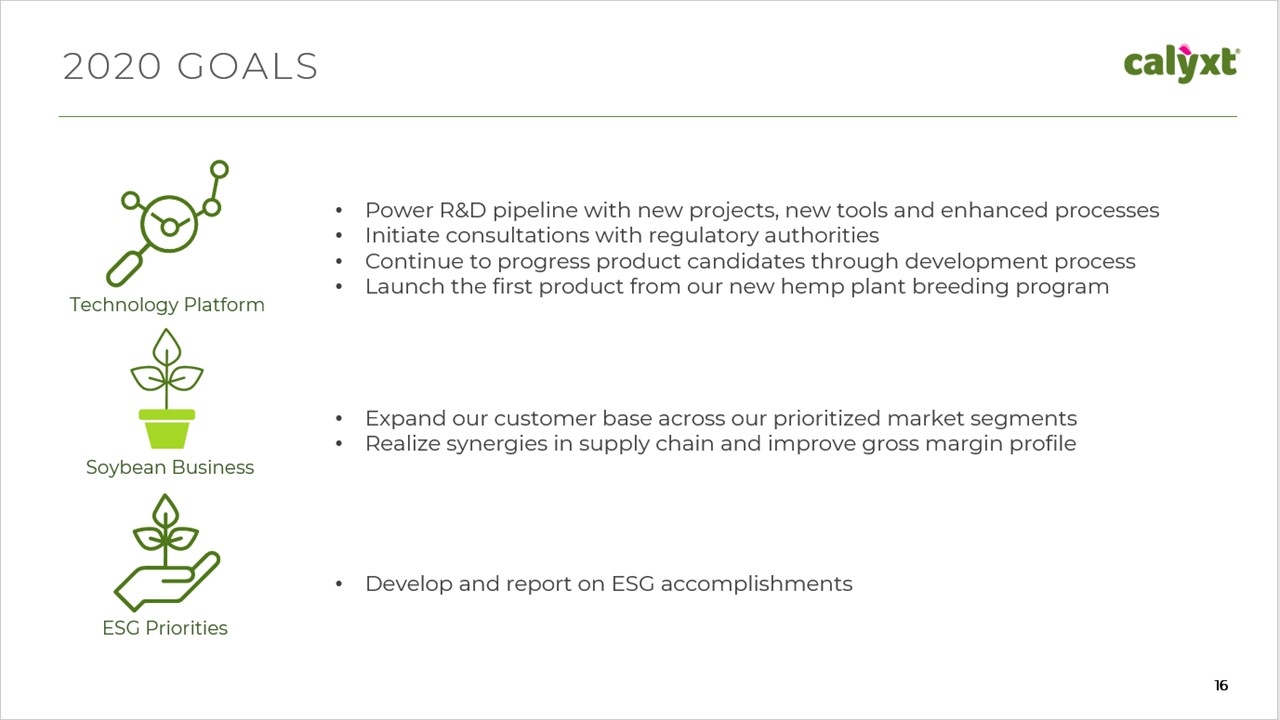
2020GOALS Power R&D pipeline with new projects, new tools and enhanced processes Initiate consultations with regulatory authorities Continue to progress product candidates through development process Launch the first product from our new hemp plant breeding program Technology Platform Expand our customer base across our prioritized market segments Realize synergies in supply chain and improve gross margin profile Soybean Business Develop and report on ESG accomplishments ESG Priorities
CONCLUSION & Q&A
USEOFNON-GAAPFINANCIALINFORMATION 18 To supplement our audited financial results prepared in accordance with GAAP, we have prepared certain non-GAAP measures that include or exclude special items. These non-GAAP measures are not meant to be considered in isolation or as a substitute for financial information presented in accordance with GAAP and should be viewed as supplemental and in addition to our financial information presented in accordance with GAAP. Investors are cautioned that there are material limitations associated with the use of non-GAAP financial measures. In addition, other companies may report similarly titled measures, but calculate them differently, which reduces their usefulness as a comparative measure. Management utilizes these non-GAAP metrics as performance measures in evaluating and making operational decisions regarding our business. We provide gross margin, as adjusted, a non-GAAP measure that reflects the impact grain costs expensed as R&D and net realizable value adjustments to inventories have on our reported gross margins. Grain costs expensed as R&D before we commercialize a product have the effect of increasing our reported margins post-launch in periods when product with no associated cost were sold. Net realizable value adjustments to our inventories have the effect of decreasing gross margins in a current period that would have been recorded in the future when the underlying product was sold. We provide in the table below a reconciliation of gross margin, as adjusted to gross margin, which is the most directly comparable GAAP financial measure. We provide gross margin, as adjusted, because we believe that this non-GAAP financial metric provides investors with useful supplemental information at this early stage of commercialization as the amounts being adjusted affect the period to period comparability of our gross margins and financial performance. We do not provide a reconciliation of gross margin, as adjusted, on a forward-looking basis as we are not able to determine this measure without unreasonable effort for future periods. The potential amount of net realizable value adjustments to our inventories at year end 2020 is unknown at this time. We are not able to determine that amount because it involves making assumptions about 2020 ending inventories from 2019 and 2020 plantings, 2021 margin expectations based on future selling prices and product costs and future changes in commodity futures markets prices for soybeans. We present adjusted EBITDA and define it as net loss excluding interest, net, income tax expense, depreciation and amortization expenses, stock- based compensation expenses, Section 16 officer transition expenses, R&D payroll tax credits that are no longer realizable, grain costs expensed as R&D and net realizable value adjustments to inventories. We provide in the table below a reconciliation of adjusted EBITDA to net loss, which is the most directly comparable GAAP financial measure. Because adjusted EBITDA excludes non-cash items and discrete or infrequently occurring items, we believe that adjusted EBITDA provides investors with useful supplemental information about the operational performance of our business and facilitates comparison of our financial results between periods where certain items may vary significantly independent of our business performance.
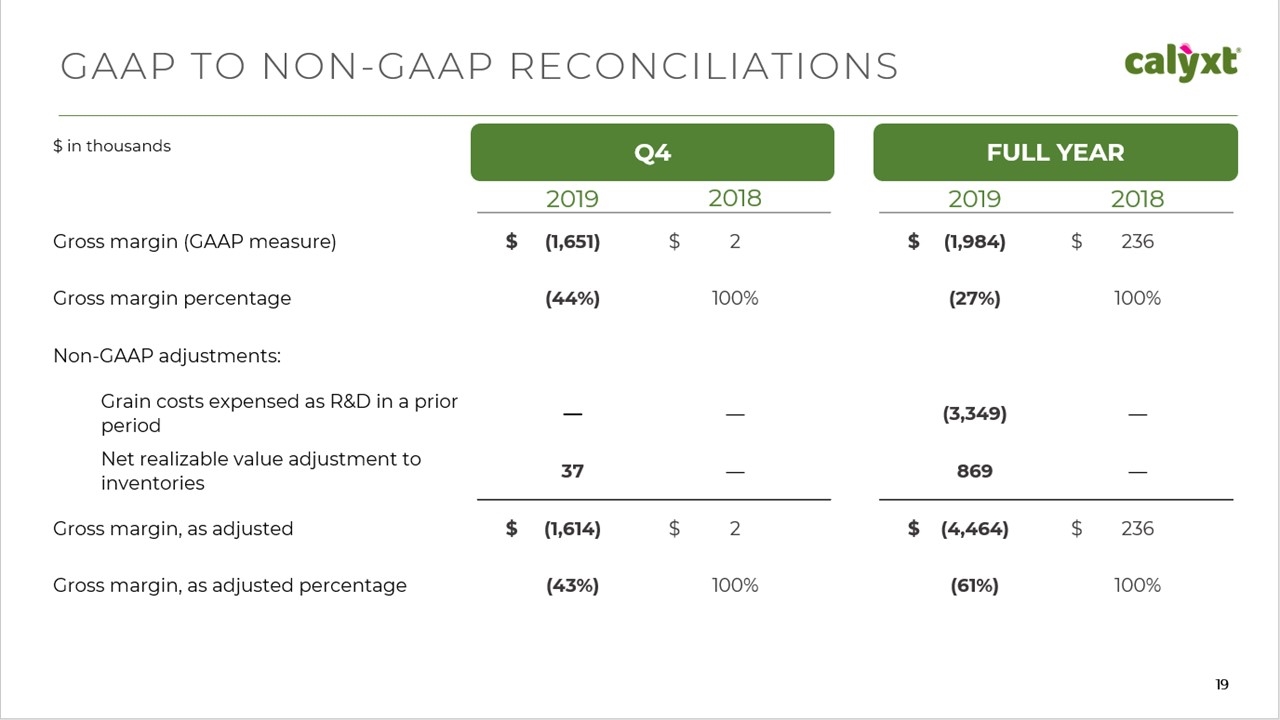
GAAPTONON-GAAPRECONCILIATIONS $ in thousands Q4 FUL L YE AR 2019 2018 2019 2018 Gross margin (GAAP measure) $ (1,651) $ 2 $ (1,984) $ 236 Gross margin percentage (44%) 100% (27%) 100% Non-GAAP adjustments: Grain costs expensed as R&D in a prior period — — (3,349) — Net realizable value adjustment to inventories 37 — 869 — Gross margin, as adjusted $ (1,614) $ 2 $ (4,464) $ 236 Gross margin, as adjusted percentage (43%) 100% (61%) 100%
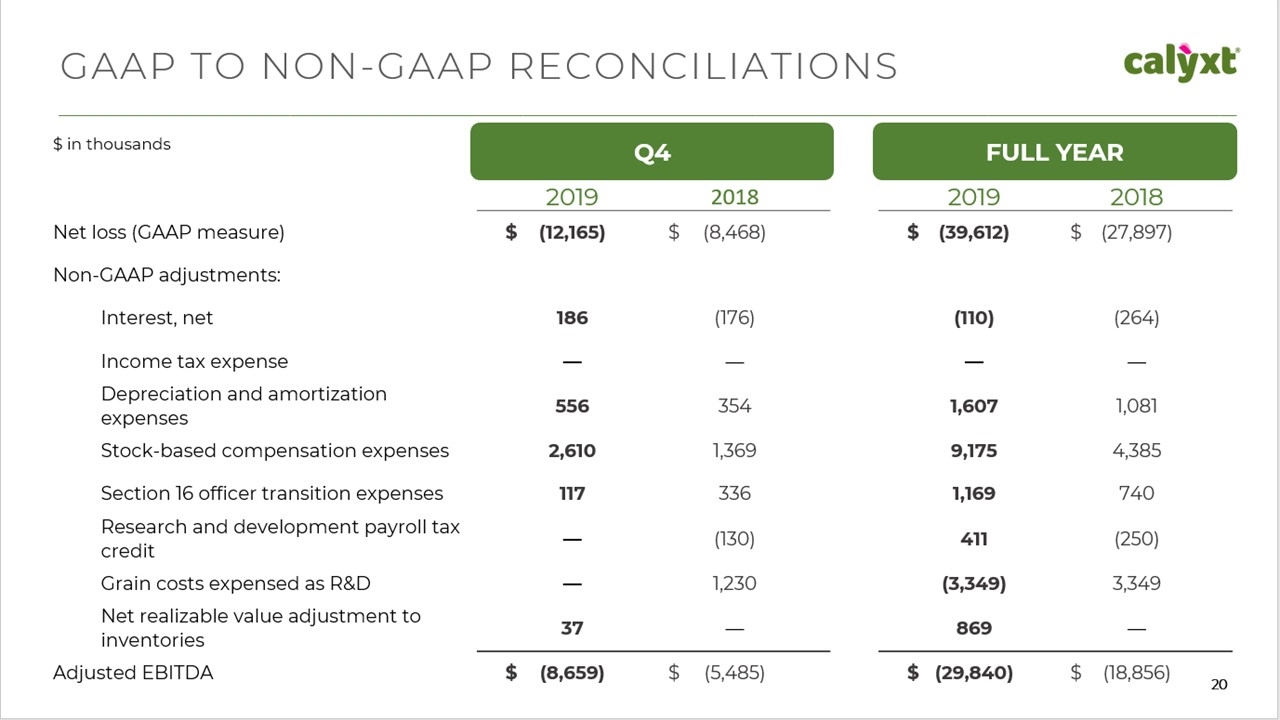
GAAPTONON-GAAPRECONCILIATIONS $ in thousands Q4 FUL L YEA R 2019 2018 2019 2018 Net loss (GAAP measure) $ (12,165) $ (8,468) $ (39,612) $ (27,897) Non-GAAP adjustments: Interest, net 186 (176) (110) (264) Income tax expense — — — — Depreciation and amortization expenses 556 354 1,607 1,081 Stock-based compensation expenses 2,610 1,369 9,175 4,385 Section 16 officer transition expenses 117 336 1,169 740 Research and development payroll tax credit — (130) 411 (250) Grain costs expensed as R&D — 1,230 (3,349) 3,349 Net realizable value adjustment to inventories 37 — 869 — Adjusted EBITDA $ (8,659) $ (5,485) $ (29,840) $ (18,856)


