Exhibit 99.2 Investor Presentation November 2018 Exhibit 99.2 Investor Presentation November 2018

DISCLAIMER This investor presentation (“Investor Presentation”) is for informational purposes only and does not constitute an offer to sell, a solicitation of an offer to buy, or a recommendation to purchase any equity, debt or other financial instruments of Haymaker Acquisition Corporation (“Haymaker”) or One Spa World (”OSW”) or any of OSW or Haymaker’s affiliates’ securities (as such term is defined under the U.S. federal securities laws). This Investor Presentation has been prepared to assist interested parties in making their own evaluation with respect to the proposed business combination of OSW and Haymaker (the “Business Combination”), as contemplated in the term sheet relating to the Business Combination (the “Term Sheet”), and for no other purpose. The information contained herein does not purport to be all-inclusive. The data contained herein is derived from various internal and external sources. No representation is made as to the reasonableness of the assumptions made within or the accuracy or completeness of any projections, modeling or any other information contained herein. All levels, prices and spreads are historical and do not represent current market levels, prices or spreads, some or all of which may have changed since the issuance of this document. Any data on past performance, modeling contained herein is not an indication as to future performance. OSW and Haymaker assume no obligation to update the information in this Investor Presentation. Neither OSW or Haymaker accepts any liability whatsoever for any losses arising from the use of this Investor Presentation or reliance on the information contained herein. Nothing herein shall be deemed to constitute investment, legal, tax, financial, accounting or other advice. This Investor Presentation is being provided for use only by the intended recipient. The information contained herein must be kept strictly confidential and may not be reproduced or distributed in any format, in whole or in part, without the prior written consent of OSW and Haymaker. By accepting delivery of this Investor Presentation, you agree with OSW and Haymaker that you will maintain the strict confidentiality of the information contained herein. The distribution of this Investor Presentation may also be restricted by law and persons into whose possession this Investor Presentation comes should inform themselves about and observe any such restrictions. The recipient acknowledges that it is (a) aware that the United States securities laws prohibit any person who has material, non-public information concerning a company from purchasing or selling securities of such company or from communicating such information to any other person under circumstances in which it is reasonably foreseeable that such person is likely to purchase or sell such securities, and (b) familiar with the Securities Exchange Act of 1934, as amended, and the rules and regulations promulgated thereunder (collectively, the “Exchange Act”), and that recipient will neither use, nor cause any third party to use, this Investor Presentation or any information contained herein in contravention of the Exchange Act, including, without limitation, Rule 10b-5 thereunder. No representation or warranty (whether expressed or implied) has been made by Haymaker, OSW or any of their respective affiliates with respect to the matters set forth in this Investor Presentation, and the recipient disclaims any such representation or warranty. Only those particular representations and warranties of Haymaker, OSW or any of their respective affiliates made in a definite written subscription agreement, if any, regarding the matters set forth in this Investor Presentation (which will not contain any representation or warranty relating to this Investor Presentation or information contained in or omitted from this Investor Presentation) when and if executed, and subject to such limitations and restrictions as specified therein, shall have any legal effect. At any time upon the request of the Haymaker for any reason, recipient shall promptly deliver to the Haymaker or securely destroy this Investor Presentation and any other documents furnished to recipient by or on behalf of Haymaker or OSW without keeping any copies, in whole or part, thereof. Use of Projections This Investor Presentation contains financial forecasts, including with respect to OSW estimated revenues, net income, Adj. Net Income, EBITDA, Adjusted EBITDA Margin, Free Cash Flow and Free Cash Flow Conversion for OSW fiscal years 2018 to 2020. Neither OSW’s independent auditors, nor the independent registered public accounting firm of Haymaker, audited, reviewed, compiled, or performed any procedures with respect to the projections for the purpose of their inclusion in this Investor Presentation, and accordingly, neither of them expressed an opinion or provided any other form of assurance with respect thereto for the purpose of this Investor Presentation. These projections should not be relied upon as being necessarily indicative of future results. In this Investor Presentation, certain of the above-mentioned estimated information has been repeated (subject to the qualifications presented herein), for purposes of providing comparisons with historical data. The assumptions and estimates underlying the prospective financial information are inherently uncertain and are subject to a wide variety of significant business, economic and competitive risks and uncertainties that could cause actual results to differ materially from those contained in the prospective financial information. Accordingly, there can be no assurance that the prospective results are indicative of the future performance of OSW, Haymaker or the combined company or that actual results will not differ materially from those presented in the prospective financial information. Inclusion of the prospective financial information in this Investor Presentation should not be regarded as a representation by any person that the results contained in the prospective financial information will be achieved. DISCLAIMER This investor presentation (“Investor Presentation”) is for informational purposes only and does not constitute an offer to sell, a solicitation of an offer to buy, or a recommendation to purchase any equity, debt or other financial instruments of Haymaker Acquisition Corporation (“Haymaker”) or One Spa World (”OSW”) or any of OSW or Haymaker’s affiliates’ securities (as such term is defined under the U.S. federal securities laws). This Investor Presentation has been prepared to assist interested parties in making their own evaluation with respect to the proposed business combination of OSW and Haymaker (the “Business Combination”), as contemplated in the term sheet relating to the Business Combination (the “Term Sheet”), and for no other purpose. The information contained herein does not purport to be all-inclusive. The data contained herein is derived from various internal and external sources. No representation is made as to the reasonableness of the assumptions made within or the accuracy or completeness of any projections, modeling or any other information contained herein. All levels, prices and spreads are historical and do not represent current market levels, prices or spreads, some or all of which may have changed since the issuance of this document. Any data on past performance, modeling contained herein is not an indication as to future performance. OSW and Haymaker assume no obligation to update the information in this Investor Presentation. Neither OSW or Haymaker accepts any liability whatsoever for any losses arising from the use of this Investor Presentation or reliance on the information contained herein. Nothing herein shall be deemed to constitute investment, legal, tax, financial, accounting or other advice. This Investor Presentation is being provided for use only by the intended recipient. The information contained herein must be kept strictly confidential and may not be reproduced or distributed in any format, in whole or in part, without the prior written consent of OSW and Haymaker. By accepting delivery of this Investor Presentation, you agree with OSW and Haymaker that you will maintain the strict confidentiality of the information contained herein. The distribution of this Investor Presentation may also be restricted by law and persons into whose possession this Investor Presentation comes should inform themselves about and observe any such restrictions. The recipient acknowledges that it is (a) aware that the United States securities laws prohibit any person who has material, non-public information concerning a company from purchasing or selling securities of such company or from communicating such information to any other person under circumstances in which it is reasonably foreseeable that such person is likely to purchase or sell such securities, and (b) familiar with the Securities Exchange Act of 1934, as amended, and the rules and regulations promulgated thereunder (collectively, the “Exchange Act”), and that recipient will neither use, nor cause any third party to use, this Investor Presentation or any information contained herein in contravention of the Exchange Act, including, without limitation, Rule 10b-5 thereunder. No representation or warranty (whether expressed or implied) has been made by Haymaker, OSW or any of their respective affiliates with respect to the matters set forth in this Investor Presentation, and the recipient disclaims any such representation or warranty. Only those particular representations and warranties of Haymaker, OSW or any of their respective affiliates made in a definite written subscription agreement, if any, regarding the matters set forth in this Investor Presentation (which will not contain any representation or warranty relating to this Investor Presentation or information contained in or omitted from this Investor Presentation) when and if executed, and subject to such limitations and restrictions as specified therein, shall have any legal effect. At any time upon the request of the Haymaker for any reason, recipient shall promptly deliver to the Haymaker or securely destroy this Investor Presentation and any other documents furnished to recipient by or on behalf of Haymaker or OSW without keeping any copies, in whole or part, thereof. Use of Projections This Investor Presentation contains financial forecasts, including with respect to OSW estimated revenues, net income, Adj. Net Income, EBITDA, Adjusted EBITDA Margin, Free Cash Flow and Free Cash Flow Conversion for OSW fiscal years 2018 to 2020. Neither OSW’s independent auditors, nor the independent registered public accounting firm of Haymaker, audited, reviewed, compiled, or performed any procedures with respect to the projections for the purpose of their inclusion in this Investor Presentation, and accordingly, neither of them expressed an opinion or provided any other form of assurance with respect thereto for the purpose of this Investor Presentation. These projections should not be relied upon as being necessarily indicative of future results. In this Investor Presentation, certain of the above-mentioned estimated information has been repeated (subject to the qualifications presented herein), for purposes of providing comparisons with historical data. The assumptions and estimates underlying the prospective financial information are inherently uncertain and are subject to a wide variety of significant business, economic and competitive risks and uncertainties that could cause actual results to differ materially from those contained in the prospective financial information. Accordingly, there can be no assurance that the prospective results are indicative of the future performance of OSW, Haymaker or the combined company or that actual results will not differ materially from those presented in the prospective financial information. Inclusion of the prospective financial information in this Investor Presentation should not be regarded as a representation by any person that the results contained in the prospective financial information will be achieved.
DISCLAIMER (CONT’D) Forward-Looking Statements This Investor Presentation includes “forward-looking statements” within the meaning of the “safe harbor” provisions of the United States Private Securities Litigation Reform Act of 1995. Forward-looking statements such as projected financial information may be identified by the use of words such as “forecast,” “intend,” “seek,” “target,” “anticipate,” “believe,” “will,” “expect,” “estimate,” “plan,” “outlook,” and “project” and other similar expressions that predict or indicate future events or trends or that are not statements of historical matters. Such forward-looking statements include statements about our beliefs and expectations and the estimated financial information and other projections contained herein. Such forward-looking statements with respect to revenues, earnings, performance, strategies, prospects and other aspects of the businesses of OSW, Haymaker or the combined company after completion of the Business Combination are based on current expectations that are subject to risks and uncertainties. A number of factors could cause actual results or outcomes to differ materially from those expressed or implied by such forward-looking statements. These factors include, but are not limited to: (1) the occurrence of any event, change or other circumstances that could give rise to the termination of negotiations and any subsequent definitive agreements with respect to the Business Combination; (2) the possibility that the terms and conditions set forth in any definitive agreements with respect to the Business Combination may differ materially from the terms and conditions set forth in the Term Sheet; (3) the outcome of any legal proceedings that may be instituted against Haymaker, the combined company or others following the announcement of the Business Combination and any definitive agreements with respect thereto; (4) the inability to complete the Business Combination due to the failure to obtain approval of the stockholders of Haymaker, to obtain financing to complete the Business Combination or to satisfy other conditions to closing in the Term Sheet and subsequent definitive agreements with respect to the Business Combination; (5) changes to the proposed structure of the Business Combination that may be required or appropriate as a result of applicable laws or regulations or as a condition to obtaining regulatory approval of the Business Combination; (6) the ability to meet NASDAQ’s listing standards following the consummation of the Business Combination; (7) the risk that the Business Combination disrupts current plans and operations of OSW as a result of the announcement and consummation of the Business Combination; (9) the ability to recognize the anticipated benefits of the Business Combination, which may be affected by, among other things, competition, the ability of the combined company to grow and manage growth profitably, maintain relationships with customers, cruise operators, hotels and suppliers, obtain adequate supply of products and retain its management and key employees; (8) costs related to the Business Combination; (10) changes in applicable laws or regulations; (11) the possibility that OSW or the combined company may be adversely affected by other economic, business, and/or competitive factors; (12) OSW estimates of expenses and profitability; (13) the impact of foreign currency exchange rates and interest rate fluctuations on the results of OSW or the combined company; and (14) other risks and uncertainties indicated from time to time in the final prospectus of Haymaker, including those under “Risk Factors” therein, and other documents filed or to be filed with the Securities and Exchange Commission (“SEC”) by Haymaker. You are cautioned not to place undue reliance upon any forward-looking statements, which speak only as of the date made. OSW and Haymaker undertake no commitment to update or revise the forward-looking statements, whether as a result of new information, future events or otherwise, except as required by law. Industry and Market Data In this Investor Presentation, OSW relies on and refers to information and statistics regarding market shares in the sectors in which it competes and other industry data. OSW obtained this information and statistics from third-party sources believed to be reliable, including reports by market research firms, such as The Boston Consulting Group. OSW has supplemented this information where necessary with information from discussions with its customers and its own internal estimates, taking into account publicly available information about other industry participants and its management’s best view as to information that is not publicly available. Neither OSW nor Haymaker has independently verified the accuracy or completeness of any such third-party information. DISCLAIMER (CONT’D) Forward-Looking Statements This Investor Presentation includes “forward-looking statements” within the meaning of the “safe harbor” provisions of the United States Private Securities Litigation Reform Act of 1995. Forward-looking statements such as projected financial information may be identified by the use of words such as “forecast,” “intend,” “seek,” “target,” “anticipate,” “believe,” “will,” “expect,” “estimate,” “plan,” “outlook,” and “project” and other similar expressions that predict or indicate future events or trends or that are not statements of historical matters. Such forward-looking statements include statements about our beliefs and expectations and the estimated financial information and other projections contained herein. Such forward-looking statements with respect to revenues, earnings, performance, strategies, prospects and other aspects of the businesses of OSW, Haymaker or the combined company after completion of the Business Combination are based on current expectations that are subject to risks and uncertainties. A number of factors could cause actual results or outcomes to differ materially from those expressed or implied by such forward-looking statements. These factors include, but are not limited to: (1) the occurrence of any event, change or other circumstances that could give rise to the termination of negotiations and any subsequent definitive agreements with respect to the Business Combination; (2) the possibility that the terms and conditions set forth in any definitive agreements with respect to the Business Combination may differ materially from the terms and conditions set forth in the Term Sheet; (3) the outcome of any legal proceedings that may be instituted against Haymaker, the combined company or others following the announcement of the Business Combination and any definitive agreements with respect thereto; (4) the inability to complete the Business Combination due to the failure to obtain approval of the stockholders of Haymaker, to obtain financing to complete the Business Combination or to satisfy other conditions to closing in the Term Sheet and subsequent definitive agreements with respect to the Business Combination; (5) changes to the proposed structure of the Business Combination that may be required or appropriate as a result of applicable laws or regulations or as a condition to obtaining regulatory approval of the Business Combination; (6) the ability to meet NASDAQ’s listing standards following the consummation of the Business Combination; (7) the risk that the Business Combination disrupts current plans and operations of OSW as a result of the announcement and consummation of the Business Combination; (9) the ability to recognize the anticipated benefits of the Business Combination, which may be affected by, among other things, competition, the ability of the combined company to grow and manage growth profitably, maintain relationships with customers, cruise operators, hotels and suppliers, obtain adequate supply of products and retain its management and key employees; (8) costs related to the Business Combination; (10) changes in applicable laws or regulations; (11) the possibility that OSW or the combined company may be adversely affected by other economic, business, and/or competitive factors; (12) OSW estimates of expenses and profitability; (13) the impact of foreign currency exchange rates and interest rate fluctuations on the results of OSW or the combined company; and (14) other risks and uncertainties indicated from time to time in the final prospectus of Haymaker, including those under “Risk Factors” therein, and other documents filed or to be filed with the Securities and Exchange Commission (“SEC”) by Haymaker. You are cautioned not to place undue reliance upon any forward-looking statements, which speak only as of the date made. OSW and Haymaker undertake no commitment to update or revise the forward-looking statements, whether as a result of new information, future events or otherwise, except as required by law. Industry and Market Data In this Investor Presentation, OSW relies on and refers to information and statistics regarding market shares in the sectors in which it competes and other industry data. OSW obtained this information and statistics from third-party sources believed to be reliable, including reports by market research firms, such as The Boston Consulting Group. OSW has supplemented this information where necessary with information from discussions with its customers and its own internal estimates, taking into account publicly available information about other industry participants and its management’s best view as to information that is not publicly available. Neither OSW nor Haymaker has independently verified the accuracy or completeness of any such third-party information.
DISCLAIMER (CONT’D) Use of Non-GAAP Financial Measures This Investor Presentation includes non-GAAP financial measures for OSW which do not conform to SEC Regulation S-X in that it includes financial information (EBITDA, Adj. Net Income and FCF Conversion) not derived in accordance with US GAAP. Accordingly, such information and data will be adjusted and presented differently in Haymaker’s preliminary proxy statement to be filed with the SEC to solicit stockholder approval of the proposed transaction. OSW believe that the presentation of non-GAAP measures provides information that is useful to investors as it indicates more clearly the ability of OSW to meet capital expenditure and working capital requirements and provides an additional tool for investors to use in evaluating ongoing operating results and trends. You should review OSW’s audited and interim financial statements, which will be presented in Haymaker’s preliminary proxy statement to be filed with the SEC, and not rely on any single financial measure to evaluate their respective businesses. Other companies may calculate EBITDA, Adj. Net Income FCF Conversion and other non-GAAP measures differently, and therefore OSW’s respective EBITDA, Adjusted EBITDA, Adj. Net Income, FCF Conversion and margin and other non-GAAP measures may not be directly comparable to similarly titled measures of other companies. Additional Information In connection with the Business Combination, Haymaker intends to file with the SEC a preliminary proxy statement and will mail a definitive proxy statement and other relevant documentation to Haymaker stockholders. This Investor Presentation does not contain all the information that should be considered concerning the Business Combination. It is not intended to form the basis of any investment decision or any other decision with respect to the Business Combination. The definitive agreements with respect to the Business Combination may contain terms and conditions that differ materially from the terms and conditions set forth in the Term Sheet and/or other material terms relevant to an investment decision. Haymaker stockholders and other interested persons are advised to read, when available, the preliminary proxy statement and any amendments thereto, and the definitive proxy statement in connection with Haymaker’s solicitation of proxies for the special meeting to be held to approve the Business Combination, because these materials will contain important information about OSW and Haymaker and the proposed transactions. The definitive proxy statement will be mailed to Haymaker stockholders as of a record date to be established for voting on the Business Combination when it becomes available. Stockholders will also be able to obtain a copy of the preliminary proxy statement and definitive proxy statement once they are available, without charge, at the SEC’s website at http://sec.gov or by directing a request to Haymaker at 650 Fifth Avenue, Floor 10, New York, NY 10019. This Investor Presentation shall not constitute a solicitation of a proxy, consent or authorization with respect to any securities or in respect of the Business Combination. Participants in the Solicitation Haymaker, OSW and their respective directors and officers may be deemed participants in the solicitation of proxies of Haymaker stockholders in connection with the Business Combination. Haymaker stockholders and other interested persons may obtain, without charge, more detailed information regarding the directors and officers of Haymaker in Haymaker’s Annual Report on Form 10-K for the fiscal year ended December 31, 2017, which was filed with the SEC on March 30, 2018. Information regarding the persons who may, under SEC rules, be deemed participants in the solicitation of proxies to Haymaker stockholders in connection with the Business Combination will be set forth in the proxy statement for the Business Combination when available. Additional information regarding the interests of participants in the solicitation of proxies in connection with the Business Combination will be included in the proxy statement that Haymaker intends to file with the SEC. DISCLAIMER (CONT’D) Use of Non-GAAP Financial Measures This Investor Presentation includes non-GAAP financial measures for OSW which do not conform to SEC Regulation S-X in that it includes financial information (EBITDA, Adj. Net Income and FCF Conversion) not derived in accordance with US GAAP. Accordingly, such information and data will be adjusted and presented differently in Haymaker’s preliminary proxy statement to be filed with the SEC to solicit stockholder approval of the proposed transaction. OSW believe that the presentation of non-GAAP measures provides information that is useful to investors as it indicates more clearly the ability of OSW to meet capital expenditure and working capital requirements and provides an additional tool for investors to use in evaluating ongoing operating results and trends. You should review OSW’s audited and interim financial statements, which will be presented in Haymaker’s preliminary proxy statement to be filed with the SEC, and not rely on any single financial measure to evaluate their respective businesses. Other companies may calculate EBITDA, Adj. Net Income FCF Conversion and other non-GAAP measures differently, and therefore OSW’s respective EBITDA, Adjusted EBITDA, Adj. Net Income, FCF Conversion and margin and other non-GAAP measures may not be directly comparable to similarly titled measures of other companies. Additional Information In connection with the Business Combination, Haymaker intends to file with the SEC a preliminary proxy statement and will mail a definitive proxy statement and other relevant documentation to Haymaker stockholders. This Investor Presentation does not contain all the information that should be considered concerning the Business Combination. It is not intended to form the basis of any investment decision or any other decision with respect to the Business Combination. The definitive agreements with respect to the Business Combination may contain terms and conditions that differ materially from the terms and conditions set forth in the Term Sheet and/or other material terms relevant to an investment decision. Haymaker stockholders and other interested persons are advised to read, when available, the preliminary proxy statement and any amendments thereto, and the definitive proxy statement in connection with Haymaker’s solicitation of proxies for the special meeting to be held to approve the Business Combination, because these materials will contain important information about OSW and Haymaker and the proposed transactions. The definitive proxy statement will be mailed to Haymaker stockholders as of a record date to be established for voting on the Business Combination when it becomes available. Stockholders will also be able to obtain a copy of the preliminary proxy statement and definitive proxy statement once they are available, without charge, at the SEC’s website at http://sec.gov or by directing a request to Haymaker at 650 Fifth Avenue, Floor 10, New York, NY 10019. This Investor Presentation shall not constitute a solicitation of a proxy, consent or authorization with respect to any securities or in respect of the Business Combination. Participants in the Solicitation Haymaker, OSW and their respective directors and officers may be deemed participants in the solicitation of proxies of Haymaker stockholders in connection with the Business Combination. Haymaker stockholders and other interested persons may obtain, without charge, more detailed information regarding the directors and officers of Haymaker in Haymaker’s Annual Report on Form 10-K for the fiscal year ended December 31, 2017, which was filed with the SEC on March 30, 2018. Information regarding the persons who may, under SEC rules, be deemed participants in the solicitation of proxies to Haymaker stockholders in connection with the Business Combination will be set forth in the proxy statement for the Business Combination when available. Additional information regarding the interests of participants in the solicitation of proxies in connection with the Business Combination will be included in the proxy statement that Haymaker intends to file with the SEC.
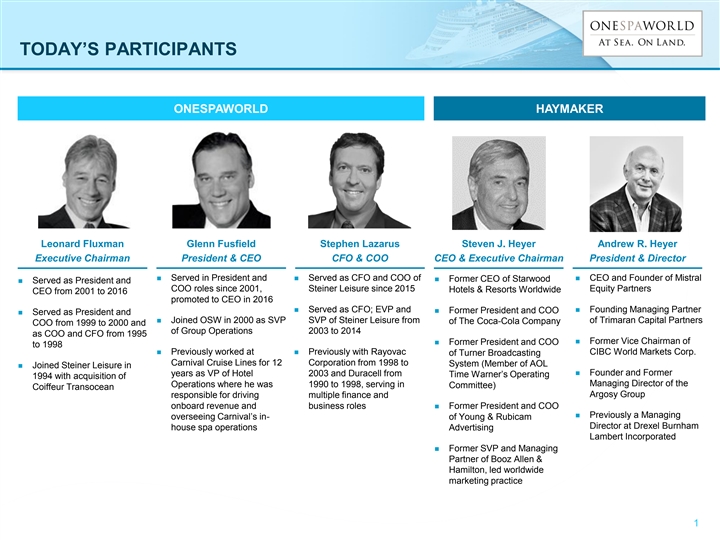
TODAY’S PARTICIPANTS ONESPAWORLD HAYMAKER Leonard Fluxman Glenn Fusfield Stephen Lazarus Steven J. Heyer Andrew R. Heyer Executive Chairman President & CEO CFO & COO CEO & Executive Chairman President & Director n Served in President and n Served as CFO and COO of n CEO and Founder of Mistral n Former CEO of Starwood n Served as President and COO roles since 2001, Steiner Leisure since 2015 Equity Partners Hotels & Resorts Worldwide CEO from 2001 to 2016 promoted to CEO in 2016 n Served as CFO; EVP and n Founding Managing Partner n Former President and COO n Served as President and n Joined OSW in 2000 as SVP SVP of Steiner Leisure from of Trimaran Capital Partners of The Coca-Cola Company COO from 1999 to 2000 and of Group Operations 2003 to 2014 as COO and CFO from 1995 n Former Vice Chairman of n Former President and COO to 1998 n Previously worked at n Previously with Rayovac CIBC World Markets Corp. of Turner Broadcasting Carnival Cruise Lines for 12 Corporation from 1998 to System (Member of AOL n Joined Steiner Leisure in years as VP of Hotel 2003 and Duracell from n Founder and Former Time Warner’s Operating 1994 with acquisition of Managing Director of the Operations where he was 1990 to 1998, serving in Committee) Coiffeur Transocean Argosy Group responsible for driving multiple finance and onboard revenue and business roles n Former President and COO n Previously a Managing overseeing Carnival’s in- of Young & Rubicam Director at Drexel Burnham house spa operations Advertising Lambert Incorporated n Former SVP and Managing Partner of Booz Allen & Hamilton, led worldwide marketing practice 1 TODAY’S PARTICIPANTS ONESPAWORLD HAYMAKER Leonard Fluxman Glenn Fusfield Stephen Lazarus Steven J. Heyer Andrew R. Heyer Executive Chairman President & CEO CFO & COO CEO & Executive Chairman President & Director n Served in President and n Served as CFO and COO of n CEO and Founder of Mistral n Former CEO of Starwood n Served as President and COO roles since 2001, Steiner Leisure since 2015 Equity Partners Hotels & Resorts Worldwide CEO from 2001 to 2016 promoted to CEO in 2016 n Served as CFO; EVP and n Founding Managing Partner n Former President and COO n Served as President and n Joined OSW in 2000 as SVP SVP of Steiner Leisure from of Trimaran Capital Partners of The Coca-Cola Company COO from 1999 to 2000 and of Group Operations 2003 to 2014 as COO and CFO from 1995 n Former Vice Chairman of n Former President and COO to 1998 n Previously worked at n Previously with Rayovac CIBC World Markets Corp. of Turner Broadcasting Carnival Cruise Lines for 12 Corporation from 1998 to System (Member of AOL n Joined Steiner Leisure in years as VP of Hotel 2003 and Duracell from n Founder and Former Time Warner’s Operating 1994 with acquisition of Managing Director of the Operations where he was 1990 to 1998, serving in Committee) Coiffeur Transocean Argosy Group responsible for driving multiple finance and onboard revenue and business roles n Former President and COO n Previously a Managing overseeing Carnival’s in- of Young & Rubicam Director at Drexel Burnham house spa operations Advertising Lambert Incorporated n Former SVP and Managing Partner of Booz Allen & Hamilton, led worldwide marketing practice 1
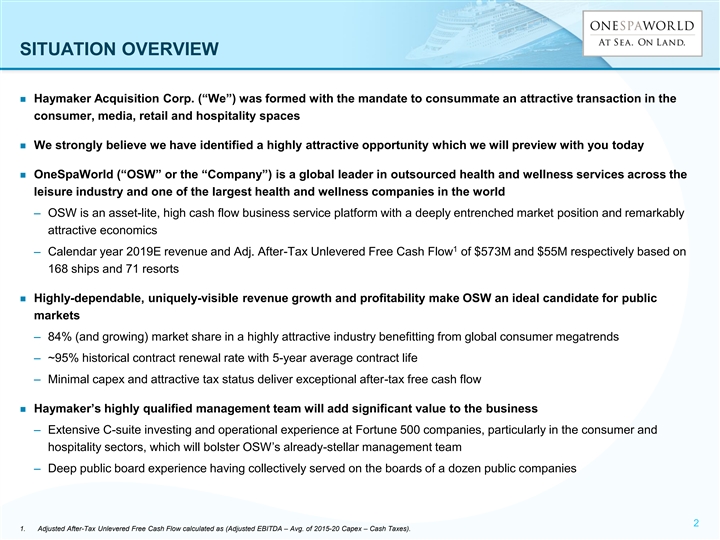
SITUATION OVERVIEW n Haymaker Acquisition Corp. (“We”) was formed with the mandate to consummate an attractive transaction in the consumer, media, retail and hospitality spaces n We strongly believe we have identified a highly attractive opportunity which we will preview with you today n OneSpaWorld (“OSW” or the “Company”) is a global leader in outsourced health and wellness services across the leisure industry and one of the largest health and wellness companies in the world – OSW is an asset-lite, high cash flow business service platform with a deeply entrenched market position and remarkably attractive economics 1 – Calendar year 2019E revenue and Adj. After-Tax Unlevered Free Cash Flow of $573M and $55M respectively based on 168 ships and 71 resorts n Highly-dependable, uniquely-visible revenue growth and profitability make OSW an ideal candidate for public markets – 84% (and growing) market share in a highly attractive industry benefitting from global consumer megatrends – ~95% historical contract renewal rate with 5-year average contract life – Minimal capex and attractive tax status deliver exceptional after-tax free cash flow n Haymaker’s highly qualified management team will add significant value to the business – Extensive C-suite investing and operational experience at Fortune 500 companies, particularly in the consumer and hospitality sectors, which will bolster OSW’s already-stellar management team – Deep public board experience having collectively served on the boards of a dozen public companies 2 1. Adjusted After-Tax Unlevered Free Cash Flow calculated as (Adjusted EBITDA – Avg. of 2015-20 Capex – Cash Taxes). SITUATION OVERVIEW n Haymaker Acquisition Corp. (“We”) was formed with the mandate to consummate an attractive transaction in the consumer, media, retail and hospitality spaces n We strongly believe we have identified a highly attractive opportunity which we will preview with you today n OneSpaWorld (“OSW” or the “Company”) is a global leader in outsourced health and wellness services across the leisure industry and one of the largest health and wellness companies in the world – OSW is an asset-lite, high cash flow business service platform with a deeply entrenched market position and remarkably attractive economics 1 – Calendar year 2019E revenue and Adj. After-Tax Unlevered Free Cash Flow of $573M and $55M respectively based on 168 ships and 71 resorts n Highly-dependable, uniquely-visible revenue growth and profitability make OSW an ideal candidate for public markets – 84% (and growing) market share in a highly attractive industry benefitting from global consumer megatrends – ~95% historical contract renewal rate with 5-year average contract life – Minimal capex and attractive tax status deliver exceptional after-tax free cash flow n Haymaker’s highly qualified management team will add significant value to the business – Extensive C-suite investing and operational experience at Fortune 500 companies, particularly in the consumer and hospitality sectors, which will bolster OSW’s already-stellar management team – Deep public board experience having collectively served on the boards of a dozen public companies 2 1. Adjusted After-Tax Unlevered Free Cash Flow calculated as (Adjusted EBITDA – Avg. of 2015-20 Capex – Cash Taxes).
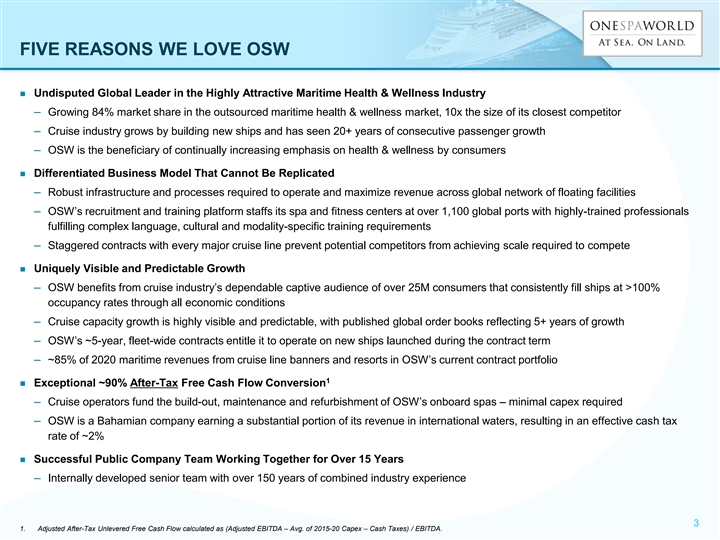
FIVE REASONS WE LOVE OSW n Undisputed Global Leader in the Highly Attractive Maritime Health & Wellness Industry – Growing 84% market share in the outsourced maritime health & wellness market, 10x the size of its closest competitor – Cruise industry grows by building new ships and has seen 20+ years of consecutive passenger growth – OSW is the beneficiary of continually increasing emphasis on health & wellness by consumers n Differentiated Business Model That Cannot Be Replicated – Robust infrastructure and processes required to operate and maximize revenue across global network of floating facilities – OSW’s recruitment and training platform staffs its spa and fitness centers at over 1,100 global ports with highly-trained professionals fulfilling complex language, cultural and modality-specific training requirements – Staggered contracts with every major cruise line prevent potential competitors from achieving scale required to compete n Uniquely Visible and Predictable Growth – OSW benefits from cruise industry’s dependable captive audience of over 25M consumers that consistently fill ships at >100% occupancy rates through all economic conditions – Cruise capacity growth is highly visible and predictable, with published global order books reflecting 5+ years of growth – OSW’s ~5-year, fleet-wide contracts entitle it to operate on new ships launched during the contract term – ~85% of 2020 maritime revenues from cruise line banners and resorts in OSW’s current contract portfolio 1 n Exceptional ~90% After-Tax Free Cash Flow Conversion – Cruise operators fund the build-out, maintenance and refurbishment of OSW’s onboard spas – minimal capex required – OSW is a Bahamian company earning a substantial portion of its revenue in international waters, resulting in an effective cash tax rate of ~2% n Successful Public Company Team Working Together for Over 15 Years – Internally developed senior team with over 150 years of combined industry experience 3 1. Adjusted After-Tax Unlevered Free Cash Flow calculated as (Adjusted EBITDA – Avg. of 2015-20 Capex – Cash Taxes) / EBITDA. FIVE REASONS WE LOVE OSW n Undisputed Global Leader in the Highly Attractive Maritime Health & Wellness Industry – Growing 84% market share in the outsourced maritime health & wellness market, 10x the size of its closest competitor – Cruise industry grows by building new ships and has seen 20+ years of consecutive passenger growth – OSW is the beneficiary of continually increasing emphasis on health & wellness by consumers n Differentiated Business Model That Cannot Be Replicated – Robust infrastructure and processes required to operate and maximize revenue across global network of floating facilities – OSW’s recruitment and training platform staffs its spa and fitness centers at over 1,100 global ports with highly-trained professionals fulfilling complex language, cultural and modality-specific training requirements – Staggered contracts with every major cruise line prevent potential competitors from achieving scale required to compete n Uniquely Visible and Predictable Growth – OSW benefits from cruise industry’s dependable captive audience of over 25M consumers that consistently fill ships at >100% occupancy rates through all economic conditions – Cruise capacity growth is highly visible and predictable, with published global order books reflecting 5+ years of growth – OSW’s ~5-year, fleet-wide contracts entitle it to operate on new ships launched during the contract term – ~85% of 2020 maritime revenues from cruise line banners and resorts in OSW’s current contract portfolio 1 n Exceptional ~90% After-Tax Free Cash Flow Conversion – Cruise operators fund the build-out, maintenance and refurbishment of OSW’s onboard spas – minimal capex required – OSW is a Bahamian company earning a substantial portion of its revenue in international waters, resulting in an effective cash tax rate of ~2% n Successful Public Company Team Working Together for Over 15 Years – Internally developed senior team with over 150 years of combined industry experience 3 1. Adjusted After-Tax Unlevered Free Cash Flow calculated as (Adjusted EBITDA – Avg. of 2015-20 Capex – Cash Taxes) / EBITDA.

OUR INVESTMENT THESIS Investment Highlights Why This is a Great Deal for a SPAC n OSW provides investors a world class health & wellness services n OSW used to be a public company (Steiner Leisure) and therefore platform with global operations and distribution capabilities that already has public company-ready accounting systems and reporting deliver unparalleled customer experiences mechanisms n We believe we are well positioned to grow earnings and deliver n OSW management team has significant public company experience shareholder value over the long term by: n The financial profile is highly predictable and dependable which 1. Capitalizing on global cruise tailwind with Asia leading the next 1 provides visibility into forecasting uniquely well suited for public decade of aggressive growth company quarterly reporting requirements 2. Driving onboard guest engagement and expand and innovate 2 n OSW provides investors exposure to the most desirable mix of secular health & wellness service and product offering trends in the consumer industry, including leisure and health & - Global consumers continually increasing health & wellness wellness, in an asset-lite, capital efficient economic model; exposure services and products in their daily routines that few other public companies can offer investors - Increasing collaboration with cruise lines enables significant n Haymaker’s original SPAC mandate was to find a business that was enhancements in guest relationships capital efficient and had market-leadership in its respective sector – 3. Targeting high profile land-based resorts to deliver OSW 3 OSW is the “dream-come-true” target for Haymaker capabilities and offerings 4. Identifying emerging health & wellness services and products 4 businesses for partnership or acquisition Haymaker Expertise Haymaker’s management has unique experience with… …which can be leveraged to enhance growth at OSW through n Service & product innovation n Introducing new services and experiences n Design & branding n Strategic alliances with hospitality & wellness companies n Hospitality & wellness market development n Off-ship consumer relationship management n Logistics-based businesses 4 OUR INVESTMENT THESIS Investment Highlights Why This is a Great Deal for a SPAC n OSW provides investors a world class health & wellness services n OSW used to be a public company (Steiner Leisure) and therefore platform with global operations and distribution capabilities that already has public company-ready accounting systems and reporting deliver unparalleled customer experiences mechanisms n We believe we are well positioned to grow earnings and deliver n OSW management team has significant public company experience shareholder value over the long term by: n The financial profile is highly predictable and dependable which 1. Capitalizing on global cruise tailwind with Asia leading the next 1 provides visibility into forecasting uniquely well suited for public decade of aggressive growth company quarterly reporting requirements 2. Driving onboard guest engagement and expand and innovate 2 n OSW provides investors exposure to the most desirable mix of secular health & wellness service and product offering trends in the consumer industry, including leisure and health & - Global consumers continually increasing health & wellness wellness, in an asset-lite, capital efficient economic model; exposure services and products in their daily routines that few other public companies can offer investors - Increasing collaboration with cruise lines enables significant n Haymaker’s original SPAC mandate was to find a business that was enhancements in guest relationships capital efficient and had market-leadership in its respective sector – 3. Targeting high profile land-based resorts to deliver OSW 3 OSW is the “dream-come-true” target for Haymaker capabilities and offerings 4. Identifying emerging health & wellness services and products 4 businesses for partnership or acquisition Haymaker Expertise Haymaker’s management has unique experience with… …which can be leveraged to enhance growth at OSW through n Service & product innovation n Introducing new services and experiences n Design & branding n Strategic alliances with hospitality & wellness companies n Hospitality & wellness market development n Off-ship consumer relationship management n Logistics-based businesses 4
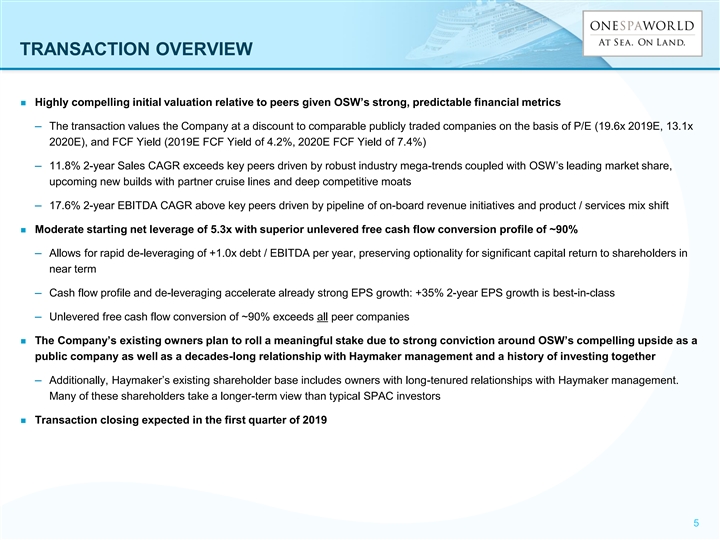
TRANSACTION OVERVIEW n Highly compelling initial valuation relative to peers given OSW’s strong, predictable financial metrics – The transaction values the Company at a discount to comparable publicly traded companies on the basis of P/E (19.6x 2019E, 13.1x 2020E), and FCF Yield (2019E FCF Yield of 4.2%, 2020E FCF Yield of 7.4%) – 11.8% 2-year Sales CAGR exceeds key peers driven by robust industry mega-trends coupled with OSW’s leading market share, upcoming new builds with partner cruise lines and deep competitive moats – 17.6% 2-year EBITDA CAGR above key peers driven by pipeline of on-board revenue initiatives and product / services mix shift n Moderate starting net leverage of 5.3x with superior unlevered free cash flow conversion profile of ~90% – Allows for rapid de-leveraging of +1.0x debt / EBITDA per year, preserving optionality for significant capital return to shareholders in near term – Cash flow profile and de-leveraging accelerate already strong EPS growth: +35% 2-year EPS growth is best-in-class – Unlevered free cash flow conversion of ~90% exceeds all peer companies n The Company’s existing owners plan to roll a meaningful stake due to strong conviction around OSW’s compelling upside as a public company as well as a decades-long relationship with Haymaker management and a history of investing together – Additionally, Haymaker’s existing shareholder base includes owners with long-tenured relationships with Haymaker management. Many of these shareholders take a longer-term view than typical SPAC investors n Transaction closing expected in the first quarter of 2019 5 TRANSACTION OVERVIEW n Highly compelling initial valuation relative to peers given OSW’s strong, predictable financial metrics – The transaction values the Company at a discount to comparable publicly traded companies on the basis of P/E (19.6x 2019E, 13.1x 2020E), and FCF Yield (2019E FCF Yield of 4.2%, 2020E FCF Yield of 7.4%) – 11.8% 2-year Sales CAGR exceeds key peers driven by robust industry mega-trends coupled with OSW’s leading market share, upcoming new builds with partner cruise lines and deep competitive moats – 17.6% 2-year EBITDA CAGR above key peers driven by pipeline of on-board revenue initiatives and product / services mix shift n Moderate starting net leverage of 5.3x with superior unlevered free cash flow conversion profile of ~90% – Allows for rapid de-leveraging of +1.0x debt / EBITDA per year, preserving optionality for significant capital return to shareholders in near term – Cash flow profile and de-leveraging accelerate already strong EPS growth: +35% 2-year EPS growth is best-in-class – Unlevered free cash flow conversion of ~90% exceeds all peer companies n The Company’s existing owners plan to roll a meaningful stake due to strong conviction around OSW’s compelling upside as a public company as well as a decades-long relationship with Haymaker management and a history of investing together – Additionally, Haymaker’s existing shareholder base includes owners with long-tenured relationships with Haymaker management. Many of these shareholders take a longer-term view than typical SPAC investors n Transaction closing expected in the first quarter of 2019 5
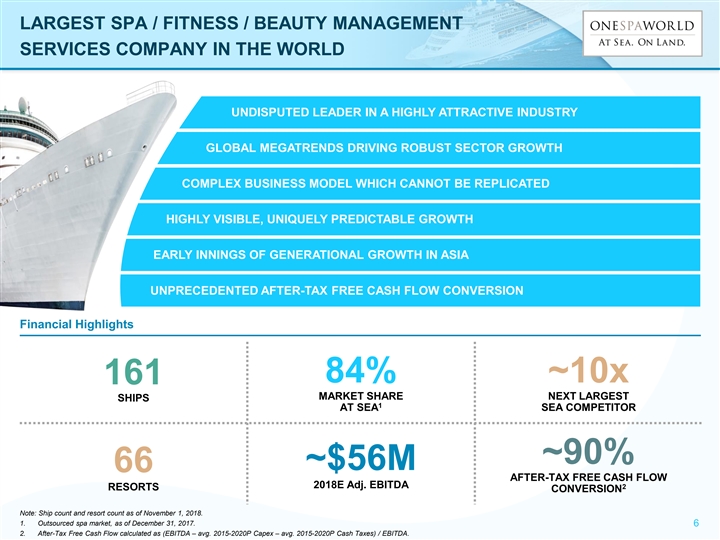
LARGEST SPA / FITNESS / BEAUTY MANAGEMENT SERVICES COMPANY IN THE WORLD UNDISPUTED LEADER IN A HIGHLY ATTRACTIVE INDUSTRY GLOBAL MEGATRENDS DRIVING ROBUST SECTOR GROWTH COMPLEX BUSINESS MODEL WHICH CANNOT BE REPLICATED HIGHLY VISIBLE, UNIQUELY PREDICTABLE GROWTH EARLY INNINGS OF GENERATIONAL GROWTH IN ASIA UNPRECEDENTED AFTER-TAX FREE CASH FLOW CONVERSION Financial Highlights 84% ~10x 161 MARKET SHARE NEXT LARGEST SHIPS 1 AT SEA SEA COMPETITOR ~90% ~$56M 66 AFTER-TAX FREE CASH FLOW 2018E Adj. EBITDA 2 RESORTS CONVERSION Note: Ship count and resort count as of November 1, 2018. 1. Outsourced spa market, as of December 31, 2017. 6 2. After-Tax Free Cash Flow calculated as (EBITDA – avg. 2015-2020P Capex – avg. 2015-2020P Cash Taxes) / EBITDA. LARGEST SPA / FITNESS / BEAUTY MANAGEMENT SERVICES COMPANY IN THE WORLD UNDISPUTED LEADER IN A HIGHLY ATTRACTIVE INDUSTRY GLOBAL MEGATRENDS DRIVING ROBUST SECTOR GROWTH COMPLEX BUSINESS MODEL WHICH CANNOT BE REPLICATED HIGHLY VISIBLE, UNIQUELY PREDICTABLE GROWTH EARLY INNINGS OF GENERATIONAL GROWTH IN ASIA UNPRECEDENTED AFTER-TAX FREE CASH FLOW CONVERSION Financial Highlights 84% ~10x 161 MARKET SHARE NEXT LARGEST SHIPS 1 AT SEA SEA COMPETITOR ~90% ~$56M 66 AFTER-TAX FREE CASH FLOW 2018E Adj. EBITDA 2 RESORTS CONVERSION Note: Ship count and resort count as of November 1, 2018. 1. Outsourced spa market, as of December 31, 2017. 6 2. After-Tax Free Cash Flow calculated as (EBITDA – avg. 2015-2020P Capex – avg. 2015-2020P Cash Taxes) / EBITDA.

OSW BENEFITS FROM OVER 20 CONSECUTIVE YEARS OF GLOBAL PASSENGER GROWTH The global cruise industry has proven resilient through recessions, with passenger counts growing consistently for more than 20 years Global Cruise Ship Passengers (M) Recession Recession 28.0 26.7 25.2 23.1 22.3 21.3 20.9 20.5 19.1 17.8 17.2 16.6 15.9 14.8 13.9 12.6 11.5 9.9 9.6 8.4 7.8 7.1 6.6 6.3 Sources: CLIA, Cruise Industry News, Management. Note: CLIA changed methodology for calculating passenger volume as of 2009, therefore consistent data for non-CLIA member cruise lines is 7 unavailable prior to 2009. All passenger figures prior to 2009 are extrapolated by indexing CLIA-reported statistics to 2009 total of 17.8M. 1995 1996 1997 1998 1999 2000 2001 2002 2003 2004 2005 2006 2007 2008 2009 2010 2011 2012 2013 2014 2015 2016 2017 2018POSW BENEFITS FROM OVER 20 CONSECUTIVE YEARS OF GLOBAL PASSENGER GROWTH The global cruise industry has proven resilient through recessions, with passenger counts growing consistently for more than 20 years Global Cruise Ship Passengers (M) Recession Recession 28.0 26.7 25.2 23.1 22.3 21.3 20.9 20.5 19.1 17.8 17.2 16.6 15.9 14.8 13.9 12.6 11.5 9.9 9.6 8.4 7.8 7.1 6.6 6.3 Sources: CLIA, Cruise Industry News, Management. Note: CLIA changed methodology for calculating passenger volume as of 2009, therefore consistent data for non-CLIA member cruise lines is 7 unavailable prior to 2009. All passenger figures prior to 2009 are extrapolated by indexing CLIA-reported statistics to 2009 total of 17.8M. 1995 1996 1997 1998 1999 2000 2001 2002 2003 2004 2005 2006 2007 2008 2009 2010 2011 2012 2013 2014 2015 2016 2017 2018P
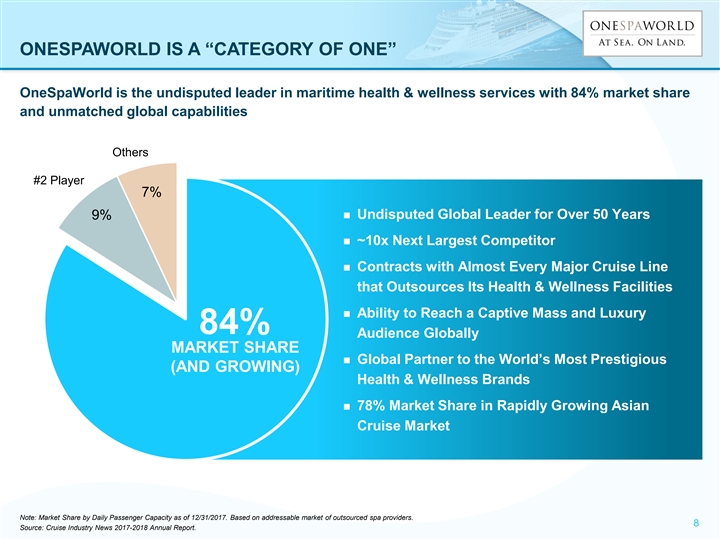
ONESPAWORLD IS A “CATEGORY OF ONE” OneSpaWorld is the undisputed leader in maritime health & wellness services with 84% market share and unmatched global capabilities Others #2 Player 7% n Undisputed Global Leader for Over 50 Years 9% n ~10x Next Largest Competitor n Contracts with Almost Every Major Cruise Line that Outsources Its Health & Wellness Facilities n Ability to Reach a Captive Mass and Luxury 84% Audience Globally MARKET SHARE n Global Partner to the World’s Most Prestigious (AND GROWING) Health & Wellness Brands n 78% Market Share in Rapidly Growing Asian Cruise Market Note: Market Share by Daily Passenger Capacity as of 12/31/2017. Based on addressable market of outsourced spa providers. 8 Source: Cruise Industry News 2017-2018 Annual Report. ONESPAWORLD IS A “CATEGORY OF ONE” OneSpaWorld is the undisputed leader in maritime health & wellness services with 84% market share and unmatched global capabilities Others #2 Player 7% n Undisputed Global Leader for Over 50 Years 9% n ~10x Next Largest Competitor n Contracts with Almost Every Major Cruise Line that Outsources Its Health & Wellness Facilities n Ability to Reach a Captive Mass and Luxury 84% Audience Globally MARKET SHARE n Global Partner to the World’s Most Prestigious (AND GROWING) Health & Wellness Brands n 78% Market Share in Rapidly Growing Asian Cruise Market Note: Market Share by Daily Passenger Capacity as of 12/31/2017. Based on addressable market of outsourced spa providers. 8 Source: Cruise Industry News 2017-2018 Annual Report.
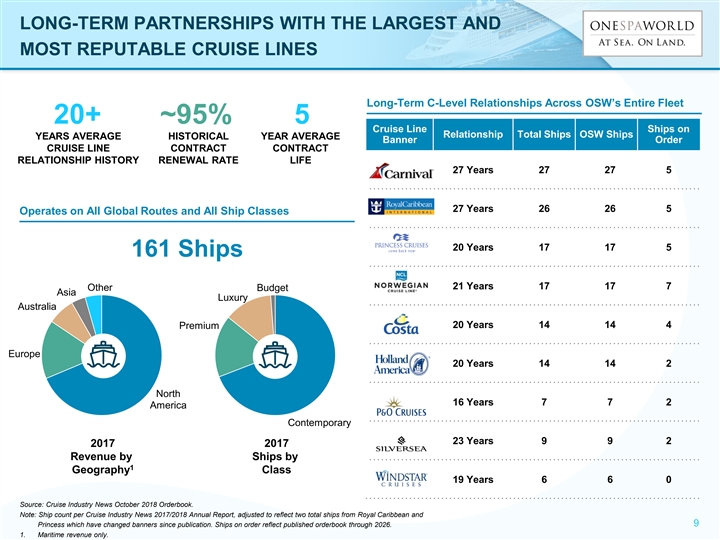
LONG-TERM PARTNERSHIPS WITH THE LARGEST AND MOST REPUTABLE CRUISE LINES Long-Term C-Level Relationships Across OSW’s Entire Fleet 20+ ~95% 5 Cruise Line Ships on Relationship Total Ships OSW Ships YEARS AVERAGE HISTORICAL YEAR AVERAGE Banner Order CRUISE LINE CONTRACT CONTRACT RELATIONSHIP HISTORY RENEWAL RATE LIFE 27 Years 27 27 5 27 Years 26 26 5 Operates on All Global Routes and All Ship Classes 20 Years 17 17 5 161 Ships 21 Years 17 17 7 Other Budget Asia Luxury Australia 20 Years 14 14 4 Premium Europe 20 Years 14 14 2 North 16 Years 7 7 2 America Contemporary 23 Years 9 9 2 2017 2017 Revenue by Ships by 1 Geography Class 19 Years 6 6 0 Source: Cruise Industry News October 2018 Orderbook. Note: Ship count per Cruise Industry News 2017/2018 Annual Report, adjusted to reflect two total ships from Royal Caribbean and Princess which have changed banners since publication. Ships on order reflect published orderbook through 2026. 9 1. Maritime revenue only. LONG-TERM PARTNERSHIPS WITH THE LARGEST AND MOST REPUTABLE CRUISE LINES Long-Term C-Level Relationships Across OSW’s Entire Fleet 20+ ~95% 5 Cruise Line Ships on Relationship Total Ships OSW Ships YEARS AVERAGE HISTORICAL YEAR AVERAGE Banner Order CRUISE LINE CONTRACT CONTRACT RELATIONSHIP HISTORY RENEWAL RATE LIFE 27 Years 27 27 5 27 Years 26 26 5 Operates on All Global Routes and All Ship Classes 20 Years 17 17 5 161 Ships 21 Years 17 17 7 Other Budget Asia Luxury Australia 20 Years 14 14 4 Premium Europe 20 Years 14 14 2 North 16 Years 7 7 2 America Contemporary 23 Years 9 9 2 2017 2017 Revenue by Ships by 1 Geography Class 19 Years 6 6 0 Source: Cruise Industry News October 2018 Orderbook. Note: Ship count per Cruise Industry News 2017/2018 Annual Report, adjusted to reflect two total ships from Royal Caribbean and Princess which have changed banners since publication. Ships on order reflect published orderbook through 2026. 9 1. Maritime revenue only.

REVENUE SHARING CONTRACTS OFFER COMPELLING VALUE FOR OSW & CRUISE LINE PARTNERS ALIKE ONBOARD SALE OF HEALTH AND WELLNESS PRODUCTS $ $ AND SERVICES Cruise Line Partners Responsibility Responsibility n D esign state-of-the-art facilities n Fund multi-million dollar buildout n Recruit, train and manage the world’s largest n Dependably fill ships with captive audience onboard staff n Market OSW’s onboard services n Offer comprehensive and innovative services n Curate exclusive selection of products Benefits Benefits n Asset-lite n Maximized revenue yield n Access to large captive audience n No operating expense n Exclusive provider n Superior guest experience REVENUE SHARING ALIGNS INCENTIVES CRUISE LINES ARE ECONOMIC PARTNERS, NOT FIXED-RENT LANDLORDS 10 REVENUE SHARING CONTRACTS OFFER COMPELLING VALUE FOR OSW & CRUISE LINE PARTNERS ALIKE ONBOARD SALE OF HEALTH AND WELLNESS PRODUCTS $ $ AND SERVICES Cruise Line Partners Responsibility Responsibility n D esign state-of-the-art facilities n Fund multi-million dollar buildout n Recruit, train and manage the world’s largest n Dependably fill ships with captive audience onboard staff n Market OSW’s onboard services n Offer comprehensive and innovative services n Curate exclusive selection of products Benefits Benefits n Asset-lite n Maximized revenue yield n Access to large captive audience n No operating expense n Exclusive provider n Superior guest experience REVENUE SHARING ALIGNS INCENTIVES CRUISE LINES ARE ECONOMIC PARTNERS, NOT FIXED-RENT LANDLORDS 10
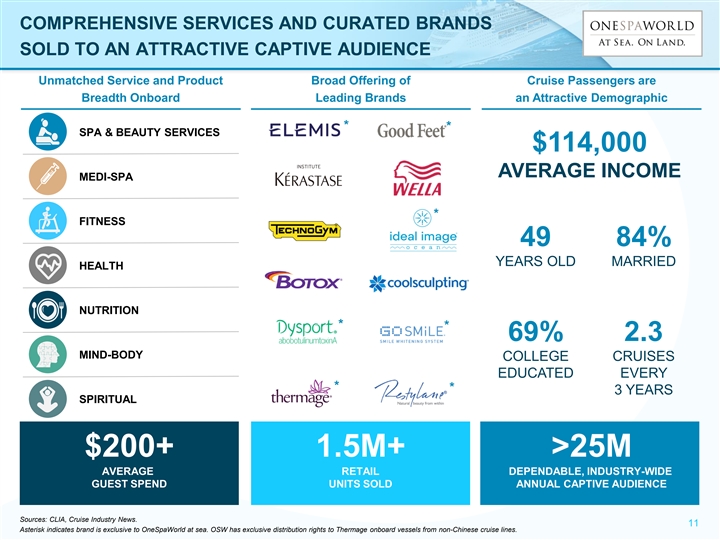
COMPREHENSIVE SERVICES AND CURATED BRANDS SOLD TO AN ATTRACTIVE CAPTIVE AUDIENCE Unmatched Service and Product Broad Offering of Cruise Passengers are Breadth Onboard Leading Brands an Attractive Demographic * * SPA & BEAUTY SERVICES $114,000 AVERAGE INCOME MEDI-SPA * FITNESS 49 84% YEARS OLD MARRIED HEALTH NUTRITION * * 69% 2.3 MIND-BODY COLLEGE CRUISES EDUCATED EVERY * * 3 YEARS SPIRITUAL $200+ 1.5M+ >25M AVERAGE RETAIL DEPENDABLE, INDUSTRY-WIDE GUEST SPEND UNITS SOLD ANNUAL CAPTIVE AUDIENCE Sources: CLIA, Cruise Industry News. 11 Asterisk indicates brand is exclusive to OneSpaWorld at sea. OSW has exclusive distribution rights to Thermage onboard vessels from non-Chinese cruise lines. COMPREHENSIVE SERVICES AND CURATED BRANDS SOLD TO AN ATTRACTIVE CAPTIVE AUDIENCE Unmatched Service and Product Broad Offering of Cruise Passengers are Breadth Onboard Leading Brands an Attractive Demographic * * SPA & BEAUTY SERVICES $114,000 AVERAGE INCOME MEDI-SPA * FITNESS 49 84% YEARS OLD MARRIED HEALTH NUTRITION * * 69% 2.3 MIND-BODY COLLEGE CRUISES EDUCATED EVERY * * 3 YEARS SPIRITUAL $200+ 1.5M+ >25M AVERAGE RETAIL DEPENDABLE, INDUSTRY-WIDE GUEST SPEND UNITS SOLD ANNUAL CAPTIVE AUDIENCE Sources: CLIA, Cruise Industry News. 11 Asterisk indicates brand is exclusive to OneSpaWorld at sea. OSW has exclusive distribution rights to Thermage onboard vessels from non-Chinese cruise lines.
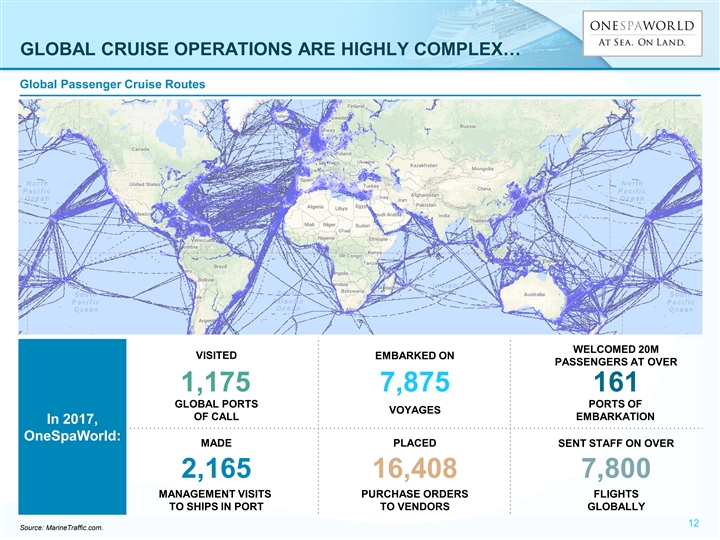
GLOBAL CRUISE OPERATIONS ARE HIGHLY COMPLEX… Global Passenger Cruise Routes WELCOMED 20M VISITED EMBARKED ON PASSENGERS AT OVER 1,175 7,875 161 GLOBAL PORTS PORTS OF VOYAGES OF CALL EMBARKATION In 2017, OneSpaWorld: MADE PLACED SENT STAFF ON OVER 2,165 16,408 7,800 MANAGEMENT VISITS PURCHASE ORDERS FLIGHTS TO SHIPS IN PORT TO VENDORS GLOBALLY 12 Source: MarineTraffic.com. GLOBAL CRUISE OPERATIONS ARE HIGHLY COMPLEX… Global Passenger Cruise Routes WELCOMED 20M VISITED EMBARKED ON PASSENGERS AT OVER 1,175 7,875 161 GLOBAL PORTS PORTS OF VOYAGES OF CALL EMBARKATION In 2017, OneSpaWorld: MADE PLACED SENT STAFF ON OVER 2,165 16,408 7,800 MANAGEMENT VISITS PURCHASE ORDERS FLIGHTS TO SHIPS IN PORT TO VENDORS GLOBALLY 12 Source: MarineTraffic.com.
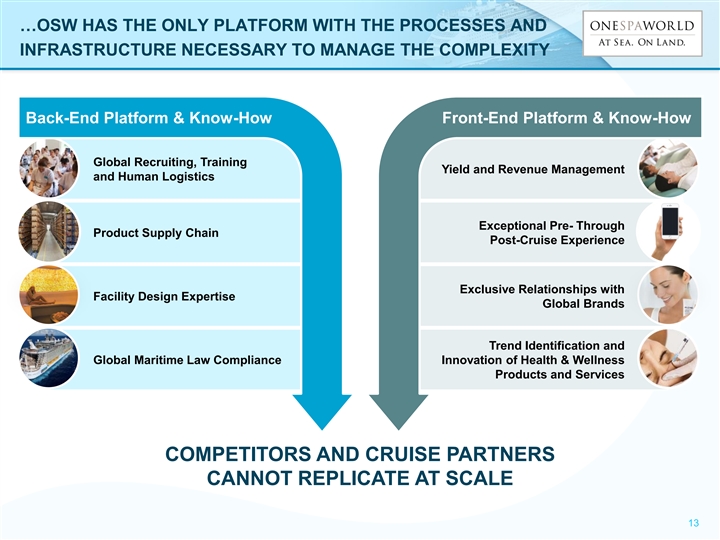
…OSW HAS THE ONLY PLATFORM WITH THE PROCESSES AND INFRASTRUCTURE NECESSARY TO MANAGE THE COMPLEXITY Back-End Platform & Know-How Front-End Platform & Know-How Global Recruiting, Training Yield and Revenue Management and Human Logistics Exceptional Pre- Through Product Supply Chain Post-Cruise Experience Exclusive Relationships with Facility Design Expertise Global Brands Trend Identification and Global Maritime Law Compliance Innovation of Health & Wellness Products and Services COMPETITORS AND CRUISE PARTNERS CANNOT REPLICATE AT SCALE 13 …OSW HAS THE ONLY PLATFORM WITH THE PROCESSES AND INFRASTRUCTURE NECESSARY TO MANAGE THE COMPLEXITY Back-End Platform & Know-How Front-End Platform & Know-How Global Recruiting, Training Yield and Revenue Management and Human Logistics Exceptional Pre- Through Product Supply Chain Post-Cruise Experience Exclusive Relationships with Facility Design Expertise Global Brands Trend Identification and Global Maritime Law Compliance Innovation of Health & Wellness Products and Services COMPETITORS AND CRUISE PARTNERS CANNOT REPLICATE AT SCALE 13
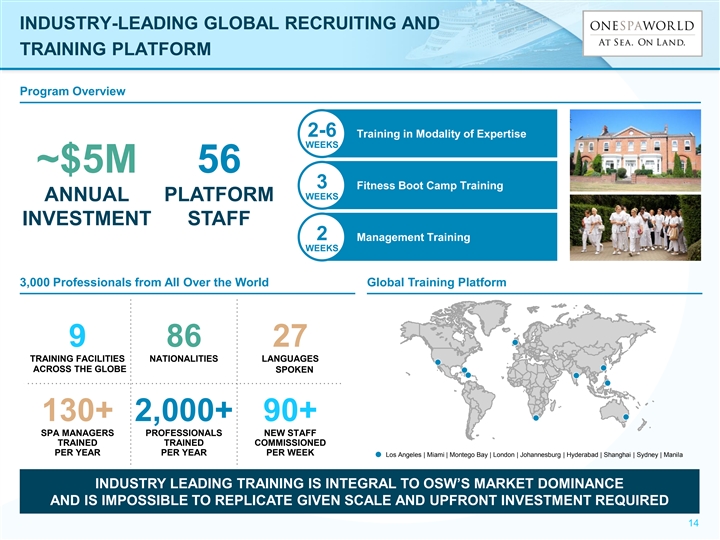
INDUSTRY-LEADING GLOBAL RECRUITING AND TRAINING PLATFORM Program Overview 2-6 Training in Modality of Expertise WEEKS ~$5M 56 3 Fitness Boot Camp Training WEEKS ANNUAL PLATFORM INVESTMENT STAFF 2 Management Training WEEKS 3,000 Professionals from All Over the World Global Training Platform 9 86 27 TRAINING FACILITIES NATIONALITIES LANGUAGES ACROSS THE GLOBE SPOKEN 130+ 2,000+ 90+ SPA MANAGERS PROFESSIONALS NEW STAFF TRAINED TRAINED COMMISSIONED PER YEAR PER YEAR PER WEEK Los Angeles | Miami | Montego Bay | London | Johannesburg | Hyderabad | Shanghai | Sydney | Manila INDUSTRY LEADING TRAINING IS INTEGRAL TO OSW’S MARKET DOMINANCE AND IS IMPOSSIBLE TO REPLICATE GIVEN SCALE AND UPFRONT INVESTMENT REQUIRED 14 INDUSTRY-LEADING GLOBAL RECRUITING AND TRAINING PLATFORM Program Overview 2-6 Training in Modality of Expertise WEEKS ~$5M 56 3 Fitness Boot Camp Training WEEKS ANNUAL PLATFORM INVESTMENT STAFF 2 Management Training WEEKS 3,000 Professionals from All Over the World Global Training Platform 9 86 27 TRAINING FACILITIES NATIONALITIES LANGUAGES ACROSS THE GLOBE SPOKEN 130+ 2,000+ 90+ SPA MANAGERS PROFESSIONALS NEW STAFF TRAINED TRAINED COMMISSIONED PER YEAR PER YEAR PER WEEK Los Angeles | Miami | Montego Bay | London | Johannesburg | Hyderabad | Shanghai | Sydney | Manila INDUSTRY LEADING TRAINING IS INTEGRAL TO OSW’S MARKET DOMINANCE AND IS IMPOSSIBLE TO REPLICATE GIVEN SCALE AND UPFRONT INVESTMENT REQUIRED 14
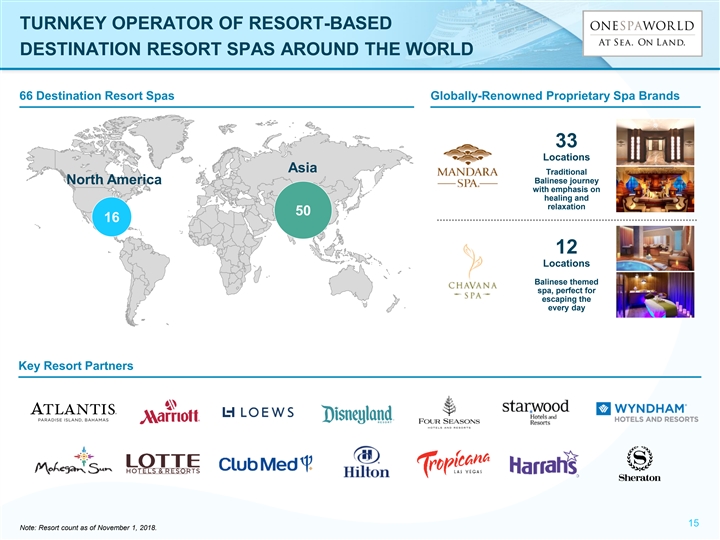
TURNKEY OPERATOR OF RESORT-BASED DESTINATION RESORT SPAS AROUND THE WORLD 66 Destination Resort Spas Globally-Renowned Proprietary Spa Brands 33 Locations Asia Traditional Balinese journey North America with emphasis on healing and relaxation 50 16 12 Locations Balinese themed spa, perfect for escaping the every day Key Resort Partners 15 Note: Resort count as of November 1, 2018. TURNKEY OPERATOR OF RESORT-BASED DESTINATION RESORT SPAS AROUND THE WORLD 66 Destination Resort Spas Globally-Renowned Proprietary Spa Brands 33 Locations Asia Traditional Balinese journey North America with emphasis on healing and relaxation 50 16 12 Locations Balinese themed spa, perfect for escaping the every day Key Resort Partners 15 Note: Resort count as of November 1, 2018.
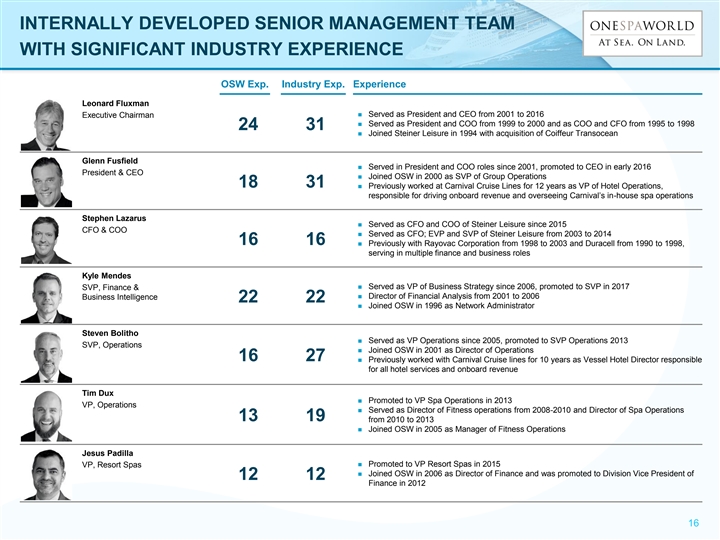
INTERNALLY DEVELOPED SENIOR MANAGEMENT TEAM WITH SIGNIFICANT INDUSTRY EXPERIENCE OSW Exp. Industry Exp. Experience Leonard Fluxman n Served as President and CEO from 2001 to 2016 Executive Chairman n Served as President and COO from 1999 to 2000 and as COO and CFO from 1995 to 1998 24 31 n Joined Steiner Leisure in 1994 with acquisition of Coiffeur Transocean Glenn Fusfield n Served in President and COO roles since 2001, promoted to CEO in early 2016 President & CEO n Joined OSW in 2000 as SVP of Group Operations 18 31 n Previously worked at Carnival Cruise Lines for 12 years as VP of Hotel Operations, responsible for driving onboard revenue and overseeing Carnival’s in-house spa operations Stephen Lazarus n Served as CFO and COO of Steiner Leisure since 2015 CFO & COO n Served as CFO; EVP and SVP of Steiner Leisure from 2003 to 2014 16 16 n Previously with Rayovac Corporation from 1998 to 2003 and Duracell from 1990 to 1998, serving in multiple finance and business roles Kyle Mendes n Served as VP of Business Strategy since 2006, promoted to SVP in 2017 SVP, Finance & n Director of Financial Analysis from 2001 to 2006 Business Intelligence 22 22 n Joined OSW in 1996 as Network Administrator Steven Bolitho n Served as VP Operations since 2005, promoted to SVP Operations 2013 SVP, Operations n Joined OSW in 2001 as Director of Operations 16 27 n Previously worked with Carnival Cruise lines for 10 years as Vessel Hotel Director responsible for all hotel services and onboard revenue Tim Dux n Promoted to VP Spa Operations in 2013 VP, Operations n Served as Director of Fitness operations from 2008-2010 and Director of Spa Operations 13 19 from 2010 to 2013 n Joined OSW in 2005 as Manager of Fitness Operations Jesus Padilla n Promoted to VP Resort Spas in 2015 VP, Resort Spas n Joined OSW in 2006 as Director of Finance and was promoted to Division Vice President of 12 12 Finance in 2012 16 INTERNALLY DEVELOPED SENIOR MANAGEMENT TEAM WITH SIGNIFICANT INDUSTRY EXPERIENCE OSW Exp. Industry Exp. Experience Leonard Fluxman n Served as President and CEO from 2001 to 2016 Executive Chairman n Served as President and COO from 1999 to 2000 and as COO and CFO from 1995 to 1998 24 31 n Joined Steiner Leisure in 1994 with acquisition of Coiffeur Transocean Glenn Fusfield n Served in President and COO roles since 2001, promoted to CEO in early 2016 President & CEO n Joined OSW in 2000 as SVP of Group Operations 18 31 n Previously worked at Carnival Cruise Lines for 12 years as VP of Hotel Operations, responsible for driving onboard revenue and overseeing Carnival’s in-house spa operations Stephen Lazarus n Served as CFO and COO of Steiner Leisure since 2015 CFO & COO n Served as CFO; EVP and SVP of Steiner Leisure from 2003 to 2014 16 16 n Previously with Rayovac Corporation from 1998 to 2003 and Duracell from 1990 to 1998, serving in multiple finance and business roles Kyle Mendes n Served as VP of Business Strategy since 2006, promoted to SVP in 2017 SVP, Finance & n Director of Financial Analysis from 2001 to 2006 Business Intelligence 22 22 n Joined OSW in 1996 as Network Administrator Steven Bolitho n Served as VP Operations since 2005, promoted to SVP Operations 2013 SVP, Operations n Joined OSW in 2001 as Director of Operations 16 27 n Previously worked with Carnival Cruise lines for 10 years as Vessel Hotel Director responsible for all hotel services and onboard revenue Tim Dux n Promoted to VP Spa Operations in 2013 VP, Operations n Served as Director of Fitness operations from 2008-2010 and Director of Spa Operations 13 19 from 2010 to 2013 n Joined OSW in 2005 as Manager of Fitness Operations Jesus Padilla n Promoted to VP Resort Spas in 2015 VP, Resort Spas n Joined OSW in 2006 as Director of Finance and was promoted to Division Vice President of 12 12 Finance in 2012 16

INDUSTRY OVERVIEW INDUSTRY OVERVIEW
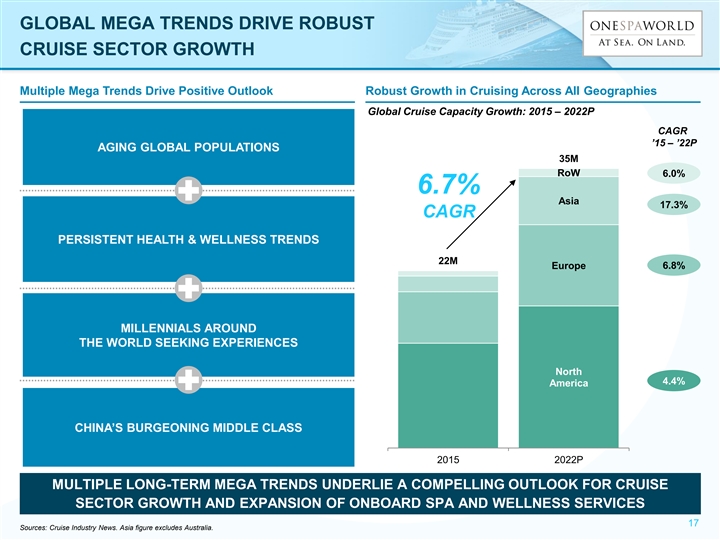
GLOBAL MEGA TRENDS DRIVE ROBUST CRUISE SECTOR GROWTH Multiple Mega Trends Drive Positive Outlook Robust Growth in Cruising Across All Geographies Global Cruise Capacity Growth: 2015 – 2022P CAGR ’15 – ’22P AGING GLOBAL POPULATIONS 35M RoW 6.0% 6.7% 9 Asia 17.3% CAGR PERSISTENT HEALTH & WELLNESS TRENDS 22M Europe 6.8% 9 MILLENNIALS AROUND THE WORLD SEEKING EXPERIENCES North 9 4.4% America CHINA’S BURGEONING MIDDLE CLASS 2015 2022P MULTIPLE LONG-TERM MEGA TRENDS UNDERLIE A COMPELLING OUTLOOK FOR CRUISE SECTOR GROWTH AND EXPANSION OF ONBOARD SPA AND WELLNESS SERVICES 17 Sources: Cruise Industry News. Asia figure excludes Australia. GLOBAL MEGA TRENDS DRIVE ROBUST CRUISE SECTOR GROWTH Multiple Mega Trends Drive Positive Outlook Robust Growth in Cruising Across All Geographies Global Cruise Capacity Growth: 2015 – 2022P CAGR ’15 – ’22P AGING GLOBAL POPULATIONS 35M RoW 6.0% 6.7% 9 Asia 17.3% CAGR PERSISTENT HEALTH & WELLNESS TRENDS 22M Europe 6.8% 9 MILLENNIALS AROUND THE WORLD SEEKING EXPERIENCES North 9 4.4% America CHINA’S BURGEONING MIDDLE CLASS 2015 2022P MULTIPLE LONG-TERM MEGA TRENDS UNDERLIE A COMPELLING OUTLOOK FOR CRUISE SECTOR GROWTH AND EXPANSION OF ONBOARD SPA AND WELLNESS SERVICES 17 Sources: Cruise Industry News. Asia figure excludes Australia.
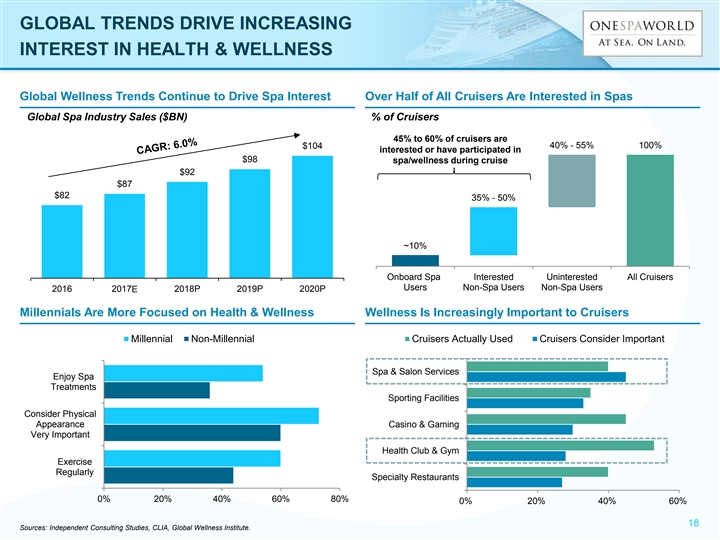
GLOBAL TRENDS DRIVE INCREASING INTEREST IN HEALTH & WELLNESS Global Wellness Trends Continue to Drive Spa Interest Over Half of All Cruisers Are Interested in Spas Global Spa Industry Sales ($BN) % of Cruisers 45% to 60% of cruisers are 40% - 55% 100% $104 interested or have participated in $98 spa/wellness during cruise $92 $87 $82 35% - 50% ~10% Onboard Spa- Interested Uninterested All Cruisers Users Non-Spa Users Non-Spa Users 2016 2017P E 2018P 2019P 2020P Millennials Are More Focused on Health & Wellness Wellness Is Increasingly Important to Cruisers Millennial Non-Millennial Cruisers Actually Used Cruisers Consider Important Spa & Salon Services Enjoy Spa Treatments Sporting Facilities Consider Physical Appearance Casino & Gaming Very Important Health Club & Gym Exercise Regularly Specialty Restaurants 0% 20% 40% 60% 80% 0% 20% 40% 60% 18 Sources: Independent Consulting Studies, CLIA, Global Wellness Institute. GLOBAL TRENDS DRIVE INCREASING INTEREST IN HEALTH & WELLNESS Global Wellness Trends Continue to Drive Spa Interest Over Half of All Cruisers Are Interested in Spas Global Spa Industry Sales ($BN) % of Cruisers 45% to 60% of cruisers are 40% - 55% 100% $104 interested or have participated in $98 spa/wellness during cruise $92 $87 $82 35% - 50% ~10% Onboard Spa- Interested Uninterested All Cruisers Users Non-Spa Users Non-Spa Users 2016 2017P E 2018P 2019P 2020P Millennials Are More Focused on Health & Wellness Wellness Is Increasingly Important to Cruisers Millennial Non-Millennial Cruisers Actually Used Cruisers Consider Important Spa & Salon Services Enjoy Spa Treatments Sporting Facilities Consider Physical Appearance Casino & Gaming Very Important Health Club & Gym Exercise Regularly Specialty Restaurants 0% 20% 40% 60% 80% 0% 20% 40% 60% 18 Sources: Independent Consulting Studies, CLIA, Global Wellness Institute.

ASIA’S CRUISE EXPANSION IS A GENERATIONAL OPPORTUNITY th Asia is the 4 Wave of Global Cruise Expansion Early Growth in Asia… Global Capacity Growth (M) Total Asian Capacity Growth (M) nd rd th 2 Wave 3 Wave 4 Wave 8.0 Europe Rest of World (ex. Asia) Asia th 4 Wave 7.0 1997 - 2001 2006 - 2010 2016 – ? Asia 40.0 6.0 2016 – ? 5.0 2011-2015 35.0 4.0 2015-2022 CAGR: CAGR: 44.3% 3.0 15.2% 30.0 2.0 1.0 25.0 0.0 2008 2010 2012 2014 2016 2018 2020 2022 …Mirrors Early Stages of North American Growth 20.0 Total North American Capacity Growth (M) 4.0 15.0 st 3.5 1 Wave U.S. 3.0 1982 - 1986 10.0 2.5 st 1 Wave 2.0 5.0 U.S. 1.5 1982 - 1986 1982-1986 1.0 0 CAGR: 0.5 15.5% 0.0 1982 1984 1986 1988 1990 1992 1994 19 Sources: CLIA, Cruise Industry News. 1998 2000 2002 2004 2006 2008 2010 2012 2014 2016 2018 2020 2022ASIA’S CRUISE EXPANSION IS A GENERATIONAL OPPORTUNITY th Asia is the 4 Wave of Global Cruise Expansion Early Growth in Asia… Global Capacity Growth (M) Total Asian Capacity Growth (M) nd rd th 2 Wave 3 Wave 4 Wave 8.0 Europe Rest of World (ex. Asia) Asia th 4 Wave 7.0 1997 - 2001 2006 - 2010 2016 – ? Asia 40.0 6.0 2016 – ? 5.0 2011-2015 35.0 4.0 2015-2022 CAGR: CAGR: 44.3% 3.0 15.2% 30.0 2.0 1.0 25.0 0.0 2008 2010 2012 2014 2016 2018 2020 2022 …Mirrors Early Stages of North American Growth 20.0 Total North American Capacity Growth (M) 4.0 15.0 st 3.5 1 Wave U.S. 3.0 1982 - 1986 10.0 2.5 st 1 Wave 2.0 5.0 U.S. 1.5 1982 - 1986 1982-1986 1.0 0 CAGR: 0.5 15.5% 0.0 1982 1984 1986 1988 1990 1992 1994 19 Sources: CLIA, Cruise Industry News. 1998 2000 2002 2004 2006 2008 2010 2012 2014 2016 2018 2020 2022

GROWTH PLAN GROWTH PLAN
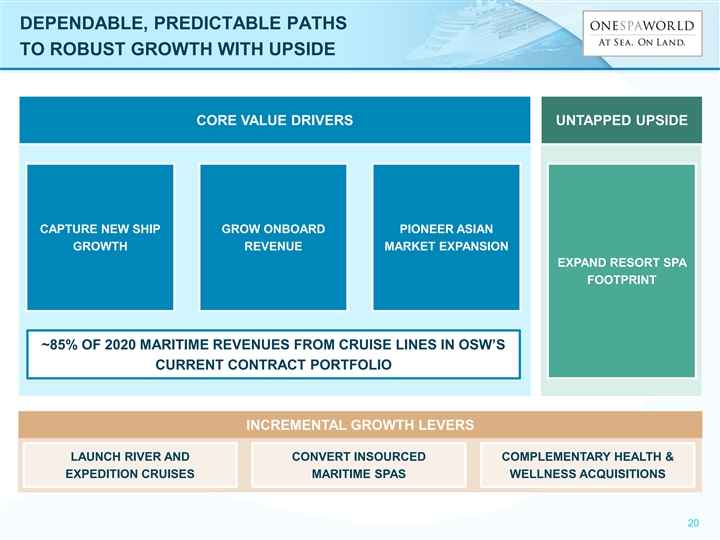
DEPENDABLE, PREDICTABLE PATHS TO ROBUST GROWTH WITH UPSIDE CORE VALUE DRIVERS UNTAPPED UPSIDE CAPTURE NEW SHIP GROW ONBOARD PIONEER ASIAN GROWTH REVENUE MARKET EXPANSION EXPAND RESORT SPA FOOTPRINT ~85% OF 2020 MARITIME REVENUES FROM CRUISE LINES IN OSW’S CURRENT CONTRACT PORTFOLIO INCREMENTAL GROWTH LEVERS LAUNCH RIVER AND CONVERT INSOURCED COMPLEMENTARY HEALTH & EXPEDITION CRUISES MARITIME SPAS WELLNESS ACQUISITIONS 20 DEPENDABLE, PREDICTABLE PATHS TO ROBUST GROWTH WITH UPSIDE CORE VALUE DRIVERS UNTAPPED UPSIDE CAPTURE NEW SHIP GROW ONBOARD PIONEER ASIAN GROWTH REVENUE MARKET EXPANSION EXPAND RESORT SPA FOOTPRINT ~85% OF 2020 MARITIME REVENUES FROM CRUISE LINES IN OSW’S CURRENT CONTRACT PORTFOLIO INCREMENTAL GROWTH LEVERS LAUNCH RIVER AND CONVERT INSOURCED COMPLEMENTARY HEALTH & EXPEDITION CRUISES MARITIME SPAS WELLNESS ACQUISITIONS 20
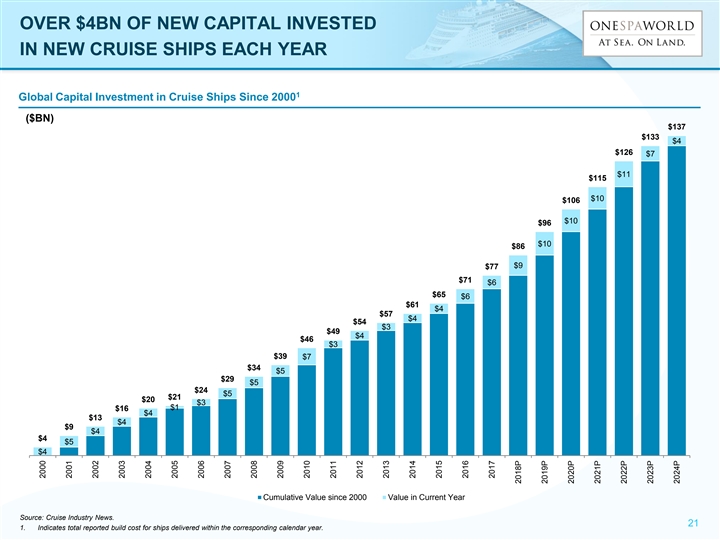
OVER $4BN OF NEW CAPITAL INVESTED IN NEW CRUISE SHIPS EACH YEAR 1 Global Capital Investment in Cruise Ships Since 2000 ($BN) $137 $133 $4 $126 $7 $11 $115 $10 $106 $10 $96 $10 $86 $9 $77 $71 $6 $65 $6 $61 $4 $57 $4 $54 $3 $49 $4 $46 $3 $39 $7 $34 $5 $29 $5 $24 $5 $21 $20 $3 $1 $16 $4 $13 $4 $9 $4 $4 $5 $4 Cumulative Value since 2000 Value in Current Year Source: Cruise Industry News. 21 1. Indicates total reported build cost for ships delivered within the corresponding calendar year. 2000 2001 2002 2003 2004 2005 2006 2007 2008 2009 2010 2011 2012 2013 2014 2015 2016 2017 2018P 2019P 2020P 2021P 2022P 2023P 2024POVER $4BN OF NEW CAPITAL INVESTED IN NEW CRUISE SHIPS EACH YEAR 1 Global Capital Investment in Cruise Ships Since 2000 ($BN) $137 $133 $4 $126 $7 $11 $115 $10 $106 $10 $96 $10 $86 $9 $77 $71 $6 $65 $6 $61 $4 $57 $4 $54 $3 $49 $4 $46 $3 $39 $7 $34 $5 $29 $5 $24 $5 $21 $20 $3 $1 $16 $4 $13 $4 $9 $4 $4 $5 $4 Cumulative Value since 2000 Value in Current Year Source: Cruise Industry News. 21 1. Indicates total reported build cost for ships delivered within the corresponding calendar year. 2000 2001 2002 2003 2004 2005 2006 2007 2008 2009 2010 2011 2012 2013 2014 2015 2016 2017 2018P 2019P 2020P 2021P 2022P 2023P 2024P

PREDICTABLE NEW SHIP ORDERBOOK Global Cruise Orderbook History of On-Time Cruise Ship Builds 2,500+ Berth Ships Delivered On-Time as of 2-Year Forward Order Book Orderbook in Ships and Berths (000s) 2018 5 Berths Ordered <1,000 1,000 – 2,999 3,000+ Per Ship YTD 5 Delivered On-Time 5 2017 Long-Term 5 Orderbook Will 4 Continue to Grow 2016 4 4 2015 4 Each 47.0 44.7 44.8 Block 4 43.0 42.5 2014 is a 4 Ship on 37.1 2 Order 2013 2 33.5 2 2012 2 1 2011 1 4 2010 4 5 2009 5 7 2008 7 5 2007 5 2018 2019 2020 2021 2022 2023 2024+ New ALL RECENT NEW SHIPS HAVE BEEN DELIVERED 13 25 19 20 17 9 18 Ships ON-TIME SINCE 2007 22 Source: Cruise Industry News October 2018 Orderbook. PREDICTABLE NEW SHIP ORDERBOOK Global Cruise Orderbook History of On-Time Cruise Ship Builds 2,500+ Berth Ships Delivered On-Time as of 2-Year Forward Order Book Orderbook in Ships and Berths (000s) 2018 5 Berths Ordered <1,000 1,000 – 2,999 3,000+ Per Ship YTD 5 Delivered On-Time 5 2017 Long-Term 5 Orderbook Will 4 Continue to Grow 2016 4 4 2015 4 Each 47.0 44.7 44.8 Block 4 43.0 42.5 2014 is a 4 Ship on 37.1 2 Order 2013 2 33.5 2 2012 2 1 2011 1 4 2010 4 5 2009 5 7 2008 7 5 2007 5 2018 2019 2020 2021 2022 2023 2024+ New ALL RECENT NEW SHIPS HAVE BEEN DELIVERED 13 25 19 20 17 9 18 Ships ON-TIME SINCE 2007 22 Source: Cruise Industry News October 2018 Orderbook.

DEPENDABLE, CAPTIVE AUDIENCE OF HIGHLY ATTRACTIVE CONSUMERS Cruise Lines Consistently Fill Ships with Passengers Small Percentage of Passengers Needed to Drive Revenue Occupancy by Operator OSW Cruise Passenger Spa Participation Rate 110% 105% OSW ONLY NEEDS ~10% OF CRUISE AVERAGE CRUISE PASSENGERS IN ORDER TO MEET ITS INDUSTRY OCCUPANCY ~105% REVENUE TARGETS 100% Global Financial Crisis 95% 2008 2009 2010 2011 2012 2013 2014 2015 2016 2017 Carnival Corporation 11% 11% 11% 11% 11% 11% Royal Caribbean International 2013 2014 2015 2016 2017 2018 Norwegian Cruise Lines Holdings Spa Participation Rate 23 Source: CLIA, Cruise Industry News, SEC filings. DEPENDABLE, CAPTIVE AUDIENCE OF HIGHLY ATTRACTIVE CONSUMERS Cruise Lines Consistently Fill Ships with Passengers Small Percentage of Passengers Needed to Drive Revenue Occupancy by Operator OSW Cruise Passenger Spa Participation Rate 110% 105% OSW ONLY NEEDS ~10% OF CRUISE AVERAGE CRUISE PASSENGERS IN ORDER TO MEET ITS INDUSTRY OCCUPANCY ~105% REVENUE TARGETS 100% Global Financial Crisis 95% 2008 2009 2010 2011 2012 2013 2014 2015 2016 2017 Carnival Corporation 11% 11% 11% 11% 11% 11% Royal Caribbean International 2013 2014 2015 2016 2017 2018 Norwegian Cruise Lines Holdings Spa Participation Rate 23 Source: CLIA, Cruise Industry News, SEC filings.

ONESPAWORLD EXISTING CUSTOMER NEW SHIP PIPELINE: 2018 – 2023 Cruise Line Berths Market Azamara 690 Premium Norwegian Cruise Line 4,200 Contemporary 2018 Royal Caribbean 5,400 Contemporary Seabourn 604 Luxury 7 SHIPS Carnival 4,000 Contemporary 20,454 BERTHS Celebrity Cruises 2,900 Premium Holland America 2,660 Premium Carnival 4,200 Contemporary Costa 4,200 Contemporary Costa 5,200 Contemporary 2019 Norwegian Cruise Line 4,200 Contemporary 7 SHIPS Princess 3,600 Contemporary 26,500 BERTHS Royal Caribbean 4,100 Contemporary SAGA 1,000 Premium Carnival 5,000 Contemporary Costa 4,200 Contemporary Princess 3,600 Contemporary Royal Caribbean 4,100 Contemporary 2020 SAGA 1,000 Premium 9 SHIPS Silversea 596 Luxury 29,196 BERTHS Celebrity Cruises 2,900 Premium Virgin Cruises 2,800 Premium P&O 5,000 Premium 2021 2022 2023 6 SHIPS / 21,460 BERTHS 8 SHIPS / 26,100 BERTHS 5 SHIPS / 16,100 BERTHS ROBUST NEW SHIP PIPELINE WITH 42 NEW SHIPS REPRESENTS OVER 140,000 NEW BERTHS COMING ONLINE THROUGH 2023 24 Note: As of November 1, 2018. Shaded vessels reflect those currently in service. ONESPAWORLD EXISTING CUSTOMER NEW SHIP PIPELINE: 2018 – 2023 Cruise Line Berths Market Azamara 690 Premium Norwegian Cruise Line 4,200 Contemporary 2018 Royal Caribbean 5,400 Contemporary Seabourn 604 Luxury 7 SHIPS Carnival 4,000 Contemporary 20,454 BERTHS Celebrity Cruises 2,900 Premium Holland America 2,660 Premium Carnival 4,200 Contemporary Costa 4,200 Contemporary Costa 5,200 Contemporary 2019 Norwegian Cruise Line 4,200 Contemporary 7 SHIPS Princess 3,600 Contemporary 26,500 BERTHS Royal Caribbean 4,100 Contemporary SAGA 1,000 Premium Carnival 5,000 Contemporary Costa 4,200 Contemporary Princess 3,600 Contemporary Royal Caribbean 4,100 Contemporary 2020 SAGA 1,000 Premium 9 SHIPS Silversea 596 Luxury 29,196 BERTHS Celebrity Cruises 2,900 Premium Virgin Cruises 2,800 Premium P&O 5,000 Premium 2021 2022 2023 6 SHIPS / 21,460 BERTHS 8 SHIPS / 26,100 BERTHS 5 SHIPS / 16,100 BERTHS ROBUST NEW SHIP PIPELINE WITH 42 NEW SHIPS REPRESENTS OVER 140,000 NEW BERTHS COMING ONLINE THROUGH 2023 24 Note: As of November 1, 2018. Shaded vessels reflect those currently in service.

EXCLUSIVE ACCESS TO A HIGHLY ATTRACTIVE GLOBAL CHANNEL SERVICE & PRODUCT FLEET ROLLOUT CATEGORY CREATION INNOVATION Pain Management § Acupuncture § Electro Acupuncture § Cupping § Posture & Gait Analysis § Good Feet Arch Supports ~$50M § Physical Therapy Acupuncture 110 Vessels Annual § NormaTec Recovery st 1 Vessel 2005 By 2010 Revenue Introduction of High Value Services Drives Revenue Growth Across Existing Footprint OSW Medi-Spa Rollout – Vessel Count by Year Service Brand(s) Avg. Spend 86 Cryolipolysis ~$2,500 Average 75 Spend 66 Injectables ~$500 62 Up To 55 47 10x-plus Skin Tightening ~$2,800 34 Traditional Fillers ~$1,200 22 Services 10 Bamboo Massage ~$160 Acupuncture ~$150 2008 2009 2010 2011 2012 2013 2014 2015 2016 25 EXCLUSIVE ACCESS TO A HIGHLY ATTRACTIVE GLOBAL CHANNEL SERVICE & PRODUCT FLEET ROLLOUT CATEGORY CREATION INNOVATION Pain Management § Acupuncture § Electro Acupuncture § Cupping § Posture & Gait Analysis § Good Feet Arch Supports ~$50M § Physical Therapy Acupuncture 110 Vessels Annual § NormaTec Recovery st 1 Vessel 2005 By 2010 Revenue Introduction of High Value Services Drives Revenue Growth Across Existing Footprint OSW Medi-Spa Rollout – Vessel Count by Year Service Brand(s) Avg. Spend 86 Cryolipolysis ~$2,500 Average 75 Spend 66 Injectables ~$500 62 Up To 55 47 10x-plus Skin Tightening ~$2,800 34 Traditional Fillers ~$1,200 22 Services 10 Bamboo Massage ~$160 Acupuncture ~$150 2008 2009 2010 2011 2012 2013 2014 2015 2016 25
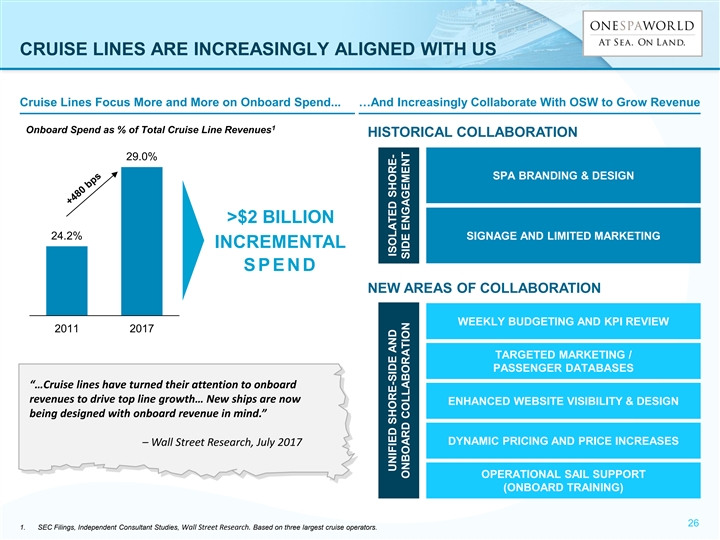
CRUISE LINES ARE INCREASINGLY ALIGNED WITH US Cruise Lines Focus More and More on Onboard Spend... …And Increasingly Collaborate With OSW to Grow Revenue 1 Onboard Spend as % of Total Cruise Line Revenues HISTORICAL COLLABORATION 29.0% SPA BRANDING & DESIGN >$2 BILLION 24.2% SIGNAGE AND LIMITED MARKETING INCREMENTAL SP E ND NEW AREAS OF COLLABORATION WEEKLY BUDGETING AND KPI REVIEW 2011 2017 TARGETED MARKETING / PASSENGER DATABASES “…Cruise lines have turned their attention to onboard revenues to drive top line growth… New ships are now ENHANCED WEBSITE VISIBILITY & DESIGN being designed with onboard revenue in mind.” DYNAMIC PRICING AND PRICE INCREASES – Wall Street Research, July 2017 OPERATIONAL SAIL SUPPORT (ONBOARD TRAINING) 26 1. SEC Filings, Independent Consultant Studies, Wall Street Research. Based on three largest cruise operators. UNIFIED SHORE-SIDE AND ISOLATED SHORE- ONBOARD COLLABORATION SIDE ENGAGEMENTCRUISE LINES ARE INCREASINGLY ALIGNED WITH US Cruise Lines Focus More and More on Onboard Spend... …And Increasingly Collaborate With OSW to Grow Revenue 1 Onboard Spend as % of Total Cruise Line Revenues HISTORICAL COLLABORATION 29.0% SPA BRANDING & DESIGN >$2 BILLION 24.2% SIGNAGE AND LIMITED MARKETING INCREMENTAL SP E ND NEW AREAS OF COLLABORATION WEEKLY BUDGETING AND KPI REVIEW 2011 2017 TARGETED MARKETING / PASSENGER DATABASES “…Cruise lines have turned their attention to onboard revenues to drive top line growth… New ships are now ENHANCED WEBSITE VISIBILITY & DESIGN being designed with onboard revenue in mind.” DYNAMIC PRICING AND PRICE INCREASES – Wall Street Research, July 2017 OPERATIONAL SAIL SUPPORT (ONBOARD TRAINING) 26 1. SEC Filings, Independent Consultant Studies, Wall Street Research. Based on three largest cruise operators. UNIFIED SHORE-SIDE AND ISOLATED SHORE- ONBOARD COLLABORATION SIDE ENGAGEMENT
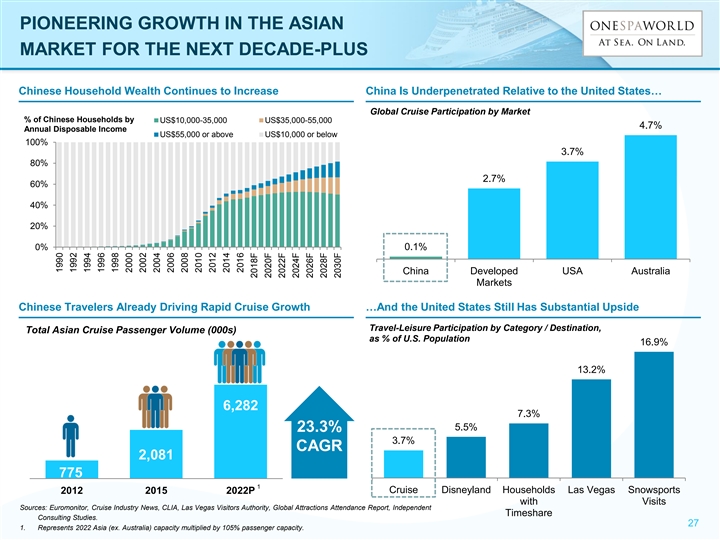
PIONEERING GROWTH IN THE ASIAN MARKET FOR THE NEXT DECADE-PLUS Chinese Household Wealth Continues to Increase China Is Underpenetrated Relative to the United States… Global Cruise Participation by Market % of Chinese Households by US$10,000-35,000 US$35,000-55,000 4.7% Annual Disposable Income US$55,000 or above US$10,000 or below 100% 3.7% 80% 2.7% 60% 40% 20% 0% 0.1% China Developed USA Australia Markets Chinese Travelers Already Driving Rapid Cruise Growth …And the United States Still Has Substantial Upside Travel-Leisure Participation by Category / Destination, Total Asian Cruise Passenger Volume (000s) as % of U.S. Population 16.9% 13.2% 6,282 7.3% 5.5% 23.3% 3.7% CAGR 2,081 775 1 Cruise Disneyland Households Las Vegas Snowsports 2012 2015 2022P with Visits Sources: Euromonitor, Cruise Industry News, CLIA, Las Vegas Visitors Authority, Global Attractions Attendance Report, Independent Timeshare Consulting Studies. 27 1. Represents 2022 Asia (ex. Australia) capacity multiplied by 105% passenger capacity. 1990 1992 1994 1996 1998 2000 2002 2004 2006 2008 2010 2012 2014 2016 2018F 2020F 2022F 2024F 2026F 2028F 2030FPIONEERING GROWTH IN THE ASIAN MARKET FOR THE NEXT DECADE-PLUS Chinese Household Wealth Continues to Increase China Is Underpenetrated Relative to the United States… Global Cruise Participation by Market % of Chinese Households by US$10,000-35,000 US$35,000-55,000 4.7% Annual Disposable Income US$55,000 or above US$10,000 or below 100% 3.7% 80% 2.7% 60% 40% 20% 0% 0.1% China Developed USA Australia Markets Chinese Travelers Already Driving Rapid Cruise Growth …And the United States Still Has Substantial Upside Travel-Leisure Participation by Category / Destination, Total Asian Cruise Passenger Volume (000s) as % of U.S. Population 16.9% 13.2% 6,282 7.3% 5.5% 23.3% 3.7% CAGR 2,081 775 1 Cruise Disneyland Households Las Vegas Snowsports 2012 2015 2022P with Visits Sources: Euromonitor, Cruise Industry News, CLIA, Las Vegas Visitors Authority, Global Attractions Attendance Report, Independent Timeshare Consulting Studies. 27 1. Represents 2022 Asia (ex. Australia) capacity multiplied by 105% passenger capacity. 1990 1992 1994 1996 1998 2000 2002 2004 2006 2008 2010 2012 2014 2016 2018F 2020F 2022F 2024F 2026F 2028F 2030F
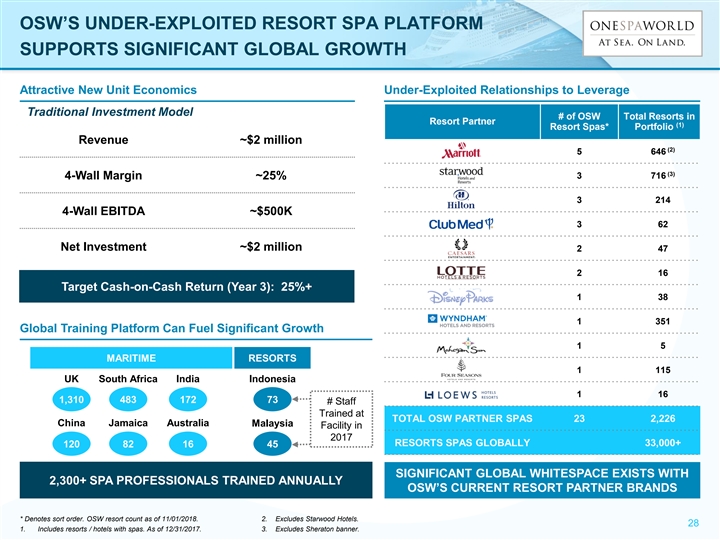
OSW’S UNDER-EXPLOITED RESORT SPA PLATFORM SUPPORTS SIGNIFICANT GLOBAL GROWTH Attractive New Unit Economics Under-Exploited Relationships to Leverage Traditional Investment Model # of OSW Total Resorts in Resort Partner (1) Resort Spas* Portfolio Revenue ~$2 million (2) 5 646 (3) 3 716 4-Wall Margin ~25% 3 214 4-Wall EBITDA ~$500K 3 62 Net Investment ~$2 million 2 47 2 16 Target Cash-on-Cash Return (Year 3): 25%+ 1 38 1 351 Global Training Platform Can Fuel Significant Growth 1 5 MARITIME RESORTS 1 115 UK South Africa India Indonesia 1 16 1,310 483 172 73 # Staff Trained at TOTAL OSW PARTNER SPAS 23 2,226 China Jamaica Australia Malaysia Facility in 2017 RESORTS SPAS GLOBALLY 33,000+ 120 82 16 45 SIGNIFICANT GLOBAL WHITESPACE EXISTS WITH 2,300+ SPA PROFESSIONALS TRAINED ANNUALLY OSW’S CURRENT RESORT PARTNER BRANDS * Denotes sort order. OSW resort count as of 11/01/2018. 2. Excludes Starwood Hotels. 28 1. Includes resorts / hotels with spas. As of 12/31/2017. 3. Excludes Sheraton banner. OSW’S UNDER-EXPLOITED RESORT SPA PLATFORM SUPPORTS SIGNIFICANT GLOBAL GROWTH Attractive New Unit Economics Under-Exploited Relationships to Leverage Traditional Investment Model # of OSW Total Resorts in Resort Partner (1) Resort Spas* Portfolio Revenue ~$2 million (2) 5 646 (3) 3 716 4-Wall Margin ~25% 3 214 4-Wall EBITDA ~$500K 3 62 Net Investment ~$2 million 2 47 2 16 Target Cash-on-Cash Return (Year 3): 25%+ 1 38 1 351 Global Training Platform Can Fuel Significant Growth 1 5 MARITIME RESORTS 1 115 UK South Africa India Indonesia 1 16 1,310 483 172 73 # Staff Trained at TOTAL OSW PARTNER SPAS 23 2,226 China Jamaica Australia Malaysia Facility in 2017 RESORTS SPAS GLOBALLY 33,000+ 120 82 16 45 SIGNIFICANT GLOBAL WHITESPACE EXISTS WITH 2,300+ SPA PROFESSIONALS TRAINED ANNUALLY OSW’S CURRENT RESORT PARTNER BRANDS * Denotes sort order. OSW resort count as of 11/01/2018. 2. Excludes Starwood Hotels. 28 1. Includes resorts / hotels with spas. As of 12/31/2017. 3. Excludes Sheraton banner.

FINANCIAL OVERVIEW FINANCIAL OVERVIEW
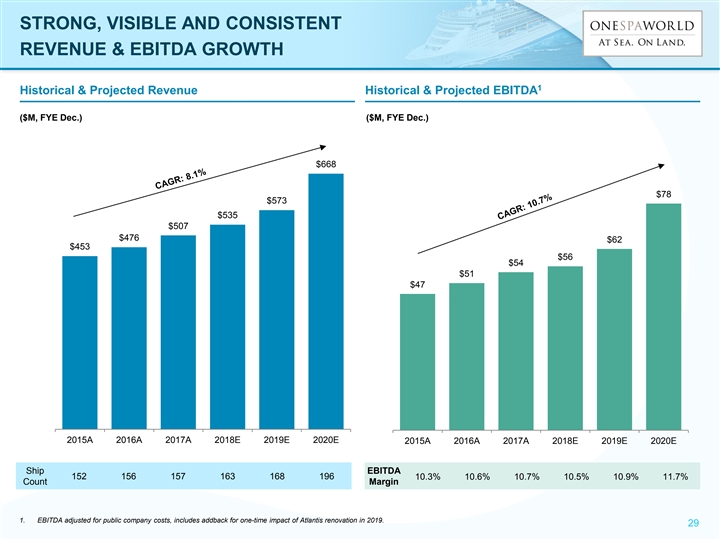
STRONG, VISIBLE AND CONSISTENT REVENUE & EBITDA GROWTH 1 Historical & Projected Revenue Historical & Projected EBITDA ($M, FYE Dec.) ($M, FYE Dec.) $668 $78 $573 $535 $507 $476 $62 $453 $56 $54 $51 $47 2015A 2016A 2017A 2018E 2019E 2020E 2015A 2016A 2017A 2018E 2019E 2020E Ship EBITDA 152 156 157 163 168 196 10.3% 10.6% 10.7% 10.5% 10.9% 11.7% Count Margin 1. EBITDA adjusted for public company costs, includes addback for one-time impact of Atlantis renovation in 2019. 29 STRONG, VISIBLE AND CONSISTENT REVENUE & EBITDA GROWTH 1 Historical & Projected Revenue Historical & Projected EBITDA ($M, FYE Dec.) ($M, FYE Dec.) $668 $78 $573 $535 $507 $476 $62 $453 $56 $54 $51 $47 2015A 2016A 2017A 2018E 2019E 2020E 2015A 2016A 2017A 2018E 2019E 2020E Ship EBITDA 152 156 157 163 168 196 10.3% 10.6% 10.7% 10.5% 10.9% 11.7% Count Margin 1. EBITDA adjusted for public company costs, includes addback for one-time impact of Atlantis renovation in 2019. 29
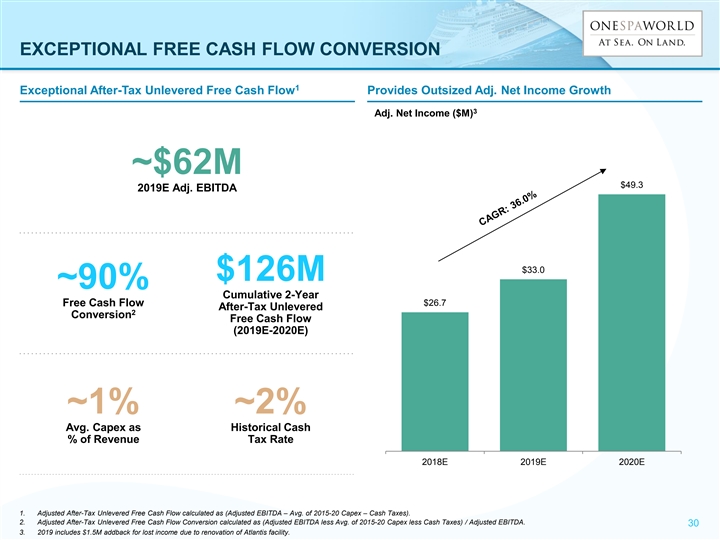
EXCEPTIONAL FREE CASH FLOW CONVERSION 1 Exceptional After-Tax Unlevered Free Cash Flow Provides Outsized Adj. Net Income Growth 3 Adj. Net Income ($M) ~$62M $49.3 2019E Adj. EBITDA $33.0 $126M ~90% Cumulative 2-Year Free Cash Flow $26.7 After-Tax Unlevered 2 Conversion Free Cash Flow (2019E-2020E) ~1% ~2% Avg. Capex as Historical Cash % of Revenue Tax Rate 2018E 2019E 2020E 1. Adjusted After-Tax Unlevered Free Cash Flow calculated as (Adjusted EBITDA – Avg. of 2015-20 Capex – Cash Taxes). 2. Adjusted After-Tax Unlevered Free Cash Flow Conversion calculated as (Adjusted EBITDA less Avg. of 2015-20 Capex less Cash Taxes) / Adjusted EBITDA. 30 3. 2019 includes $1.5M addback for lost income due to renovation of Atlantis facility. EXCEPTIONAL FREE CASH FLOW CONVERSION 1 Exceptional After-Tax Unlevered Free Cash Flow Provides Outsized Adj. Net Income Growth 3 Adj. Net Income ($M) ~$62M $49.3 2019E Adj. EBITDA $33.0 $126M ~90% Cumulative 2-Year Free Cash Flow $26.7 After-Tax Unlevered 2 Conversion Free Cash Flow (2019E-2020E) ~1% ~2% Avg. Capex as Historical Cash % of Revenue Tax Rate 2018E 2019E 2020E 1. Adjusted After-Tax Unlevered Free Cash Flow calculated as (Adjusted EBITDA – Avg. of 2015-20 Capex – Cash Taxes). 2. Adjusted After-Tax Unlevered Free Cash Flow Conversion calculated as (Adjusted EBITDA less Avg. of 2015-20 Capex less Cash Taxes) / Adjusted EBITDA. 30 3. 2019 includes $1.5M addback for lost income due to renovation of Atlantis facility.
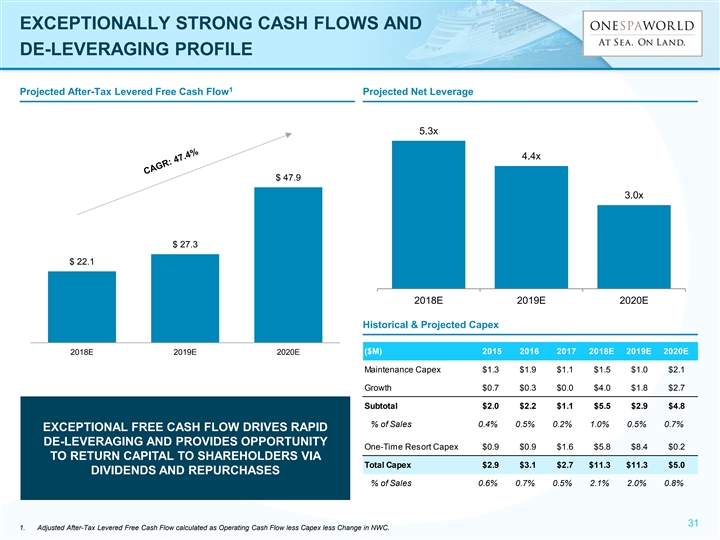
EXCEPTIONALLY STRONG CASH FLOWS AND DE-LEVERAGING PROFILE 1 Projected After-Tax Levered Free Cash Flow Projected Net Leverage 5.3x 4.4x $ 47.9 3.0x $ 27.3 $ 22.1 2018E 2019E 2020E Historical & Projected Capex ($M) 2015 2016 2017 2018E 2019E 2020E 2018E 2019E 2020E Maintenance Capex $1.3 $1.9 $1.1 $1.5 $1.0 $2.1 Growth $0.7 $0.3 $0.0 $4.0 $1.8 $2.7 Subtotal $2.0 $2.2 $1.1 $5.5 $2.9 $4.8 % of Sales 0.4% 0.5% 0.2% 1.0% 0.5% 0.7% EXCEPTIONAL FREE CASH FLOW DRIVES RAPID DE-LEVERAGING AND PROVIDES OPPORTUNITY One-Time Resort Capex $0.9 $0.9 $1.6 $5.8 $8.4 $0.2 TO RETURN CAPITAL TO SHAREHOLDERS VIA Total Capex $2.9 $3.1 $2.7 $11.3 $11.3 $5.0 DIVIDENDS AND REPURCHASES % of Sales 0.6% 0.7% 0.5% 2.1% 2.0% 0.8% 31 1. Adjusted After-Tax Levered Free Cash Flow calculated as Operating Cash Flow less Capex less Change in NWC. EXCEPTIONALLY STRONG CASH FLOWS AND DE-LEVERAGING PROFILE 1 Projected After-Tax Levered Free Cash Flow Projected Net Leverage 5.3x 4.4x $ 47.9 3.0x $ 27.3 $ 22.1 2018E 2019E 2020E Historical & Projected Capex ($M) 2015 2016 2017 2018E 2019E 2020E 2018E 2019E 2020E Maintenance Capex $1.3 $1.9 $1.1 $1.5 $1.0 $2.1 Growth $0.7 $0.3 $0.0 $4.0 $1.8 $2.7 Subtotal $2.0 $2.2 $1.1 $5.5 $2.9 $4.8 % of Sales 0.4% 0.5% 0.2% 1.0% 0.5% 0.7% EXCEPTIONAL FREE CASH FLOW DRIVES RAPID DE-LEVERAGING AND PROVIDES OPPORTUNITY One-Time Resort Capex $0.9 $0.9 $1.6 $5.8 $8.4 $0.2 TO RETURN CAPITAL TO SHAREHOLDERS VIA Total Capex $2.9 $3.1 $2.7 $11.3 $11.3 $5.0 DIVIDENDS AND REPURCHASES % of Sales 0.6% 0.7% 0.5% 2.1% 2.0% 0.8% 31 1. Adjusted After-Tax Levered Free Cash Flow calculated as Operating Cash Flow less Capex less Change in NWC.

SUPERIOR AFTER-TAX FREE CASH FLOW 1 After-Tax Unlevered Free Cash Flow Conversion 2 ~90% MINIMAL NEW SPA CAPEX 72% n Cruise lines fund nearly all 63% 62% 62% maritime spa buildout costs 51% ASSET-LITE MODEL n OneSpaWorld does not own 9% any of its maritime spas – all major maintenance requirements funded by cruise OSW Highly Franchised Health & Asset-Light Best-in-Class Asset-Heavy Cruise Restaurants Wellness Leisure Service Leisure lines Capex as % EFFECTIVE TAX RATE: ~2% 1% 3% 5% 6% 3% 14% 28% of Revenue n Significant majority of income Effective 2% 21% 21% 21% 21% 21% 2% Tax Rate earned in international waters Source: SEC filings, Wall Street research. Note: Highly Franchised Restaurants includes YUM, QSR, DNKN, DPZ and PZZA. Health & Wellness includes WTW, LULU, EYE, NKE and PLNT. Asset-Light Leisure includes MAR, HLT, IHG, H, AC- FR and CHH. Best-in-Class Service includes BFAM, CTAS, ROL, ECL and SITE. Asset-Heavy Leisure includes MTN, SIX, PLYA, MGM, LVS and BEL. Cruise includes CCL, RCL and NCLH. 1. Adjusted After-Tax Unlevered FCF Conversion calculated as (Adjusted EBITDA less Estimated Unlevered Cash Taxes less Capex) / Adjusted EBITDA. Average conversion shown by sector. 32 2. OneSpaWorld Adjusted After-Tax Unlevered Free Cash Flow Conversion calculated as (2019 Adjusted EBITDA less Avg. of 2015-20 Capex less Cash Taxes) / 2019E Adjusted EBITDA. SUPERIOR AFTER-TAX FREE CASH FLOW 1 After-Tax Unlevered Free Cash Flow Conversion 2 ~90% MINIMAL NEW SPA CAPEX 72% n Cruise lines fund nearly all 63% 62% 62% maritime spa buildout costs 51% ASSET-LITE MODEL n OneSpaWorld does not own 9% any of its maritime spas – all major maintenance requirements funded by cruise OSW Highly Franchised Health & Asset-Light Best-in-Class Asset-Heavy Cruise Restaurants Wellness Leisure Service Leisure lines Capex as % EFFECTIVE TAX RATE: ~2% 1% 3% 5% 6% 3% 14% 28% of Revenue n Significant majority of income Effective 2% 21% 21% 21% 21% 21% 2% Tax Rate earned in international waters Source: SEC filings, Wall Street research. Note: Highly Franchised Restaurants includes YUM, QSR, DNKN, DPZ and PZZA. Health & Wellness includes WTW, LULU, EYE, NKE and PLNT. Asset-Light Leisure includes MAR, HLT, IHG, H, AC- FR and CHH. Best-in-Class Service includes BFAM, CTAS, ROL, ECL and SITE. Asset-Heavy Leisure includes MTN, SIX, PLYA, MGM, LVS and BEL. Cruise includes CCL, RCL and NCLH. 1. Adjusted After-Tax Unlevered FCF Conversion calculated as (Adjusted EBITDA less Estimated Unlevered Cash Taxes less Capex) / Adjusted EBITDA. Average conversion shown by sector. 32 2. OneSpaWorld Adjusted After-Tax Unlevered Free Cash Flow Conversion calculated as (2019 Adjusted EBITDA less Avg. of 2015-20 Capex less Cash Taxes) / 2019E Adjusted EBITDA.

TRANSACTION DETAILS TRANSACTION DETAILS

TRANSACTION OVERVIEW n Enterprise value of $948M (19.6x 2019E P/E, 13.1x 2020E P/E) — Pro forma net debt of $300M (5.3x net leverage @ 2018E EBITDA of $56.3M) — Common stock private placement in the amount of $122M — Existing shareholder Steiner Leisure to be paid $717M in cash consideration and issued 16.5M of rollover shares at closing n Transaction closing expected in Q1 of 2019 Pro Forma Valuation Sources and Uses Haymaker Cash in Trust Account $ 330 Illustrative Haymaker Share Price $ 10.00 Selling Shareholder Equity Rollover 165 Pro Forma Shares Outstanding (M) 64.8 Common Stock Private Placement 122 Sources New Net Debt¹ 300 Equity Value $ 648 Sponsor Promote 30 Net Debt 300 Total $ 948 Enterprise Value $ 948 Cash Consideration to Selling Shareholders $ 717 Selling Shareholder Equity Rollover 165 Uses Haymaker Estimated Transaction Costs² 35 Valuation Multiples Metric Sponsor Promote 30 Total $ 948 2019 P / E $ 33.0 19.6 x 2020 P / E $ 49.3 13.1 x 3 Pro Forma Equity Ownership HYAC Founders' Shares 2019 Levered FCF Yield $ 27.3 4.2 % 5% Common PIPE Investors 2020 Levered FCF Yield $ 47.9 7.4 % HYAC Class A 19% Shareholders 51% Selling Shareholders 26% Note: Dollars in millions. FYE December. Assumes $20.0M Revolving Credit Facility, $275M of 1st Lien, and $25M of 2nd Lien. Selling shareholder rollover is prior to any contractual commitments the seller may have to sell additional rollover shares. Excludes interest earned on cash in trust. 1. Assumes RCF draw of ~$8M at close to fund purchase of OSW cash. 2. Estimated transaction costs include new debt financing fees, private placement fees, original deferred underwriting discount and other advisory and diligence related fees. 3. Pro forma share count includes 33.0M HYAC Class A shares outstanding, 3.0M HYAC Founders’ shares, 12.2M shares issued to PIPE investors, and 16.5M rollover shares issued to selling shareholders. Excludes 16.5M HYAC IPO warrants and 8.0M Founders’ warrants with $11.50 strike price. 3.25M HYAC Founders’ shares to be cancelled as part of transaction. Excludes deferred shares to sponsor 33 (converted from HYAC Founders’ shares) and deferred shares to selling shareholders, which vest at $20.00 per share (adjusted for dividends to shareholders). TRANSACTION OVERVIEW n Enterprise value of $948M (19.6x 2019E P/E, 13.1x 2020E P/E) — Pro forma net debt of $300M (5.3x net leverage @ 2018E EBITDA of $56.3M) — Common stock private placement in the amount of $122M — Existing shareholder Steiner Leisure to be paid $717M in cash consideration and issued 16.5M of rollover shares at closing n Transaction closing expected in Q1 of 2019 Pro Forma Valuation Sources and Uses Haymaker Cash in Trust Account $ 330 Illustrative Haymaker Share Price $ 10.00 Selling Shareholder Equity Rollover 165 Pro Forma Shares Outstanding (M) 64.8 Common Stock Private Placement 122 Sources New Net Debt¹ 300 Equity Value $ 648 Sponsor Promote 30 Net Debt 300 Total $ 948 Enterprise Value $ 948 Cash Consideration to Selling Shareholders $ 717 Selling Shareholder Equity Rollover 165 Uses Haymaker Estimated Transaction Costs² 35 Valuation Multiples Metric Sponsor Promote 30 Total $ 948 2019 P / E $ 33.0 19.6 x 2020 P / E $ 49.3 13.1 x 3 Pro Forma Equity Ownership HYAC Founders' Shares 2019 Levered FCF Yield $ 27.3 4.2 % 5% Common PIPE Investors 2020 Levered FCF Yield $ 47.9 7.4 % HYAC Class A 19% Shareholders 51% Selling Shareholders 26% Note: Dollars in millions. FYE December. Assumes $20.0M Revolving Credit Facility, $275M of 1st Lien, and $25M of 2nd Lien. Selling shareholder rollover is prior to any contractual commitments the seller may have to sell additional rollover shares. Excludes interest earned on cash in trust. 1. Assumes RCF draw of ~$8M at close to fund purchase of OSW cash. 2. Estimated transaction costs include new debt financing fees, private placement fees, original deferred underwriting discount and other advisory and diligence related fees. 3. Pro forma share count includes 33.0M HYAC Class A shares outstanding, 3.0M HYAC Founders’ shares, 12.2M shares issued to PIPE investors, and 16.5M rollover shares issued to selling shareholders. Excludes 16.5M HYAC IPO warrants and 8.0M Founders’ warrants with $11.50 strike price. 3.25M HYAC Founders’ shares to be cancelled as part of transaction. Excludes deferred shares to sponsor 33 (converted from HYAC Founders’ shares) and deferred shares to selling shareholders, which vest at $20.00 per share (adjusted for dividends to shareholders).

COMPARABLE PUBLICLY TRADED COMPANIES ANALYSIS – OPERATIONAL METRICS ($ in millions) Best-in-Class Service Operators Health & Wellness Asset-Light Leisure Health & Wellness Median: 9.8 % Best-in-Class Service Operators Median: 6.3 % Asset-Light Leisure Median: 4.6 % 12.5 % 11.8 % 12.2 % 10.7 % 9.8 % 8.4 % 7.6 % 7.3 % 6.3 % 7.3 % 5.7 % 5.5 % 5.2 % 4.8 % 4.5 % 4.4 % 4.0 % Best-in-Class Service Operators Median: 10.1 % Health & Wellness Median: 14.6 % Asset-Light Leisure Median: 8.4 % 21.3 % 17.6 % 16.0 % 16.0 % 14.6 % 14.2 % 10.6 % 11.1 % 10.5 % 10.1 % 9.9 % 8.3 % 8.8 % 8.8 % 8.0 % 7.6 % 4.3 % Health & Wellness Median: 18.7 % Asset-Light Leisure Median: 16.1 % 36.0 % Best-in-Class Service Operators Median: 13.8 % 27.5 % 21.7 % 22.3 % 18.7 % 20.4 % 17.4 % 16.8 % 14.8 % 13.8 % 13.6 % 19.1 % 14.0 % 12.3 % 14.6 % 11.4 % 8.3 % Asset-Light Leisure Median: 64.0 % Best-in-Class Service Operators Median: 62.4 % Health & Wellness Median: 65.6 % ~90 % 74.6 % 72.2 % 70.2 % 71.5 % 71.3 % 68.3 % 67.2 % 62.4 % 65.6 % 60.2 % 59.8 % 56.7 % 50.4 % 44.3 % 31.1 % 30.3 % Source: Company Management, Wall Street Research, Bloomberg, IBES as of 10/19/2018. All estimates calendarized to December. Note: Assumes $20.0M Revolving Credit Facility, $275M of 1st Lien, and $25M of 2nd Lien. 1. Assumes full year pro forma interest expense for OSW in 2018. 34 2. Free Cash Flow defined as Adjusted EBITDA less capex and cash taxes. 2019 Unlevered 2018-2020 2018 – 2020 2018 – 2020 FCF Conversion² EPS CAGR¹ EBITDA CAGR Sales CAGR (% of EBITDA) OneSpa OneSpa OneSpa OneSpa World World World World Rollins SiteOne SiteOne SiteOne Bright Bright Bright SiteOne Horizons Horizons Horizons Cintas Cintas Rollins Rollins Bright Ecolab Cintas Cintas Horizons Ecolab Rollins Ecolab Ecolab Weight Weight Weight Weight Watchers Watchers Watchers Watchers Planet Planet Nike Nike Fitness Fitness Planet National National National Fitness Vision Vision Vision Planet Lululemon Nike Nike Fitness National Lululemon Lululemon Lululemon Vision Hilton Accor Accor Accor Marriott Hyatt Choice Marriott Choice Hilton Marriott Hyatt IHG Marriott IHG Choice Hyatt Choice Hilton Hilton IHG Accor Hyatt IHGCOMPARABLE PUBLICLY TRADED COMPANIES ANALYSIS – OPERATIONAL METRICS ($ in millions) Best-in-Class Service Operators Health & Wellness Asset-Light Leisure Health & Wellness Median: 9.8 % Best-in-Class Service Operators Median: 6.3 % Asset-Light Leisure Median: 4.6 % 12.5 % 11.8 % 12.2 % 10.7 % 9.8 % 8.4 % 7.6 % 7.3 % 6.3 % 7.3 % 5.7 % 5.5 % 5.2 % 4.8 % 4.5 % 4.4 % 4.0 % Best-in-Class Service Operators Median: 10.1 % Health & Wellness Median: 14.6 % Asset-Light Leisure Median: 8.4 % 21.3 % 17.6 % 16.0 % 16.0 % 14.6 % 14.2 % 10.6 % 11.1 % 10.5 % 10.1 % 9.9 % 8.3 % 8.8 % 8.8 % 8.0 % 7.6 % 4.3 % Health & Wellness Median: 18.7 % Asset-Light Leisure Median: 16.1 % 36.0 % Best-in-Class Service Operators Median: 13.8 % 27.5 % 21.7 % 22.3 % 18.7 % 20.4 % 17.4 % 16.8 % 14.8 % 13.8 % 13.6 % 19.1 % 14.0 % 12.3 % 14.6 % 11.4 % 8.3 % Asset-Light Leisure Median: 64.0 % Best-in-Class Service Operators Median: 62.4 % Health & Wellness Median: 65.6 % ~90 % 74.6 % 72.2 % 70.2 % 71.5 % 71.3 % 68.3 % 67.2 % 62.4 % 65.6 % 60.2 % 59.8 % 56.7 % 50.4 % 44.3 % 31.1 % 30.3 % Source: Company Management, Wall Street Research, Bloomberg, IBES as of 10/19/2018. All estimates calendarized to December. Note: Assumes $20.0M Revolving Credit Facility, $275M of 1st Lien, and $25M of 2nd Lien. 1. Assumes full year pro forma interest expense for OSW in 2018. 34 2. Free Cash Flow defined as Adjusted EBITDA less capex and cash taxes. 2019 Unlevered 2018-2020 2018 – 2020 2018 – 2020 FCF Conversion² EPS CAGR¹ EBITDA CAGR Sales CAGR (% of EBITDA) OneSpa OneSpa OneSpa OneSpa World World World World Rollins SiteOne SiteOne SiteOne Bright Bright Bright SiteOne Horizons Horizons Horizons Cintas Cintas Rollins Rollins Bright Ecolab Cintas Cintas Horizons Ecolab Rollins Ecolab Ecolab Weight Weight Weight Weight Watchers Watchers Watchers Watchers Planet Planet Nike Nike Fitness Fitness Planet National National National Fitness Vision Vision Vision Planet Lululemon Nike Nike Fitness National Lululemon Lululemon Lululemon Vision Hilton Accor Accor Accor Marriott Hyatt Choice Marriott Choice Hilton Marriott Hyatt IHG Marriott IHG Choice Hyatt Choice Hilton Hilton IHG Accor Hyatt IHG

COMPARABLE PUBLICLY TRADED COMPANIES ANALYSIS – VALUATION METRICS ($ in millions) Best-in-Class Service Operators Health & Wellness Asset-Light Leisure Asset-Light Leisure Median: 20.2 x Best-in-Class Service Operators Median: 27.9 x Health & Wellness Median: 34.8 x 46.6 x 48.6 x 35.0 x 39.1 x 31.3 x 27.9 x 34.8 x 24.7 x 23.1 x 23.4 x 22.3 x 25.8 x 19.6 x 18.1 x 17.9 x 17.3 x 17.2 x Health & Wellness Median: 29.2 x Best-in-Class Service Operators Median: 22.1 x Asset-Light Leisure Median: 17.5 x 42.5 x 41.0 x 34.8 x 31.3 x 29.2 x 27.5 x 22.1 x 22.0 x 21.8 x 20.6 x 19.6 x 19.1 x 15.9 x 15.6 x 15.6 x 13.8 x 13.1 x Best-in-Class Service Operators Median: 3.8 % Health & Wellness Median: 2.8 % Asset-Light Leisure Median: 5.5 % 6.3 % 6.2 % 5.7 % 5.9 % 5.6 % 5.5 % 5.2 % 4.7 % 4.2 % 4.1 % 3.4 % 2.9 % 2.8 % 2.5 % 2.2 % 1.1 % NA Best-in-Class Service Operators Median: 3.7 % Health & Wellness Median: 3.7 % Asset-Light Leisure Median: 5.0 % 7.9 % 7.4 % 6.9 % 5.7 % 5.0 % 4.9 % 4.9 % 3.7 % 3.8 % 3.7 % 3.9 % 3.6 % 2.7 % 2.2 % NA NA NA Net 5.3 x 1.8 x 3.6 x 2.4 x (0.2)x 4.0 x 4.1 x (0.2)x 2.8 x (0.9)x 3.7 x 4.1 x 2.1 x 3.0 x (1.1)x 0.6 x 2.1 x Leverage² Source: Company Management, Wall Street Research, Bloomberg, IBES as of 10/19/2018. All estimates calendarized to December. Note: Assumes $20.0M Revolving Credit Facility, $275M of 1st Lien, and $25M of 2nd Lien. 1. Free Cash Flow defined as Operating Cash Flow less Capex. FCF Yield calculated based on IBES free cash flow per share estimates, where available. 35 2. Net Leverage for peers calculated as current net debt / LTM EBITDA. Net leverage for OSW as of transaction close. 2020 FCF Yield¹ 2019 FCF Yield¹ 2020 P/E 2019 P/E OneSpa OneSpa OneSpa OneSpa World World World World Cintas Cintas Rollins Rollins Bright Bright Bright Ecolab Horizons Horizons Horizons Bright Ecolab SiteOne SiteOne Horizons Rollins Rollins Ecolab Ecolab SiteOne SiteOne Cintas Cintas Weight Weight National National Watchers Watchers Vision Vision Nike Nike Lululemon Lululemon Planet Planet Planet Planet Fitness Fitness Fitness Fitness Nike Lululemon Lululemon Nike Weight National National Weight Watchers Vision Vision Watchers Hyatt Hilton Marriott Hyatt Accor IHG Hilton Accor Hilton Marriott Choice Hilton Marriott Accor IHG Marriott Choice Hyatt Hyatt IHG IHG Choice Accor ChoiceCOMPARABLE PUBLICLY TRADED COMPANIES ANALYSIS – VALUATION METRICS ($ in millions) Best-in-Class Service Operators Health & Wellness Asset-Light Leisure Asset-Light Leisure Median: 20.2 x Best-in-Class Service Operators Median: 27.9 x Health & Wellness Median: 34.8 x 46.6 x 48.6 x 35.0 x 39.1 x 31.3 x 27.9 x 34.8 x 24.7 x 23.1 x 23.4 x 22.3 x 25.8 x 19.6 x 18.1 x 17.9 x 17.3 x 17.2 x Health & Wellness Median: 29.2 x Best-in-Class Service Operators Median: 22.1 x Asset-Light Leisure Median: 17.5 x 42.5 x 41.0 x 34.8 x 31.3 x 29.2 x 27.5 x 22.1 x 22.0 x 21.8 x 20.6 x 19.6 x 19.1 x 15.9 x 15.6 x 15.6 x 13.8 x 13.1 x Best-in-Class Service Operators Median: 3.8 % Health & Wellness Median: 2.8 % Asset-Light Leisure Median: 5.5 % 6.3 % 6.2 % 5.7 % 5.9 % 5.6 % 5.5 % 5.2 % 4.7 % 4.2 % 4.1 % 3.4 % 2.9 % 2.8 % 2.5 % 2.2 % 1.1 % NA Best-in-Class Service Operators Median: 3.7 % Health & Wellness Median: 3.7 % Asset-Light Leisure Median: 5.0 % 7.9 % 7.4 % 6.9 % 5.7 % 5.0 % 4.9 % 4.9 % 3.7 % 3.8 % 3.7 % 3.9 % 3.6 % 2.7 % 2.2 % NA NA NA Net 5.3 x 1.8 x 3.6 x 2.4 x (0.2)x 4.0 x 4.1 x (0.2)x 2.8 x (0.9)x 3.7 x 4.1 x 2.1 x 3.0 x (1.1)x 0.6 x 2.1 x Leverage² Source: Company Management, Wall Street Research, Bloomberg, IBES as of 10/19/2018. All estimates calendarized to December. Note: Assumes $20.0M Revolving Credit Facility, $275M of 1st Lien, and $25M of 2nd Lien. 1. Free Cash Flow defined as Operating Cash Flow less Capex. FCF Yield calculated based on IBES free cash flow per share estimates, where available. 35 2. Net Leverage for peers calculated as current net debt / LTM EBITDA. Net leverage for OSW as of transaction close. 2020 FCF Yield¹ 2019 FCF Yield¹ 2020 P/E 2019 P/E OneSpa OneSpa OneSpa OneSpa World World World World Cintas Cintas Rollins Rollins Bright Bright Bright Ecolab Horizons Horizons Horizons Bright Ecolab SiteOne SiteOne Horizons Rollins Rollins Ecolab Ecolab SiteOne SiteOne Cintas Cintas Weight Weight National National Watchers Watchers Vision Vision Nike Nike Lululemon Lululemon Planet Planet Planet Planet Fitness Fitness Fitness Fitness Nike Lululemon Lululemon Nike Weight National National Weight Watchers Vision Vision Watchers Hyatt Hilton Marriott Hyatt Accor IHG Hilton Accor Hilton Marriott Choice Hilton Marriott Accor IHG Marriott Choice Hyatt Hyatt IHG IHG Choice Accor Choice

SUMMARY FINANCIALS Financial Overview For the Fiscal Year Ended December 31, $M 2015A 2016A 2017A 2018 2019 2020 Revenue 1 $ 403.0 $ 429.1 $ 462.6 $ 490.1 $ 529.0 $ 618.7 At Sea On Land $ 50.0 $ 47.2 $ 44.1 $ 45.1 $ 44.1 $ 49.7 Total Revenue $ 453.0 $ 476.3 $ 506.7 $ 535.2 $ 573.1 $ 668.4 EBIT $ 41.4 $ 41.2 $ 44.9 $ 47.5 $ 52.1 $ 68.6 Interest (Expense) / Income² - $ 0.3 - $(20.9) $(20.5) $(18.7) Other Income / (Expense) $ 0.0 $(0.2) - - - - Cash Taxes $(1.5) $(4.9) $(4.6) $(0.5) $(0.6) $(0.9) Net Income $ 39.9 $ 36.5 $ 40.3 $ 26.1 $ 31.0 $ 49.0 (-) Incremental Public Company Costs $(2.8) $(2.8) $(2.8) $(2.8) $(2.8) $(3.0) (+) Atlantis Adjustment³ - - - - $ 1.5 - (+) Amortization of Intangibles⁴ $ 0.4 $ 3.4 $ 3.4 $ 3.4 $ 3.4 $ 3.4 Pro Forma Adj. Net Income $ 37.5 $ 37.1 $ 40.9 $ 26.7 $ 33.0 $ 49.3 Average Weekly Revenue per Ship⁵ $51,721 $53,741 $56,999 $59,414 $61,838 $63,622 Average Ships 147 151 154 156 162 184 Bridge to Levered Free Cash Flow For the Fiscal Year Ended December 31, $M 2018 2019 2020 Adj. Net Income $ 26.7 $ 33.0 $ 49.3 (+) Depreciation & Amortization⁶ $ 8.5 $ 8.3 $ 9.2 (-) Increase in Net Working Capital $(1.9) $(2.8) $(5.7) (-) Maintenance Capex $(1.5) $(1.0) $(2.1) (-) Growth Capex $(4.0) $(1.8) $(2.7) (-) One-Time Resort Spa Capex $(5.8) $(8.4) $(0.2) Free Cash Flow $ 22.1 $ 27.3 $ 47.9 1. Includes revenue from Timetospa.com. 4. Tax-effected value of amortization of intangibles recognized when L Catterton acquired 2. Includes amortization of financing fees. 2018 interest expense pro forma for a full year of debt Steiner Leisure in 2015. with no paydown. 2019 and 2020 assume 100% sweep to free cash flow. 5. Excludes revenue from Timetospa.com. 36 3. Addback of lost net income due to planned renovation of Atlantis facility in 2019. 6. Excludes amortization of intangibles and includes amortization of financing fees. SUMMARY FINANCIALS Financial Overview For the Fiscal Year Ended December 31, $M 2015A 2016A 2017A 2018 2019 2020 Revenue 1 $ 403.0 $ 429.1 $ 462.6 $ 490.1 $ 529.0 $ 618.7 At Sea On Land $ 50.0 $ 47.2 $ 44.1 $ 45.1 $ 44.1 $ 49.7 Total Revenue $ 453.0 $ 476.3 $ 506.7 $ 535.2 $ 573.1 $ 668.4 EBIT $ 41.4 $ 41.2 $ 44.9 $ 47.5 $ 52.1 $ 68.6 Interest (Expense) / Income² - $ 0.3 - $(20.9) $(20.5) $(18.7) Other Income / (Expense) $ 0.0 $(0.2) - - - - Cash Taxes $(1.5) $(4.9) $(4.6) $(0.5) $(0.6) $(0.9) Net Income $ 39.9 $ 36.5 $ 40.3 $ 26.1 $ 31.0 $ 49.0 (-) Incremental Public Company Costs $(2.8) $(2.8) $(2.8) $(2.8) $(2.8) $(3.0) (+) Atlantis Adjustment³ - - - - $ 1.5 - (+) Amortization of Intangibles⁴ $ 0.4 $ 3.4 $ 3.4 $ 3.4 $ 3.4 $ 3.4 Pro Forma Adj. Net Income $ 37.5 $ 37.1 $ 40.9 $ 26.7 $ 33.0 $ 49.3 Average Weekly Revenue per Ship⁵ $51,721 $53,741 $56,999 $59,414 $61,838 $63,622 Average Ships 147 151 154 156 162 184 Bridge to Levered Free Cash Flow For the Fiscal Year Ended December 31, $M 2018 2019 2020 Adj. Net Income $ 26.7 $ 33.0 $ 49.3 (+) Depreciation & Amortization⁶ $ 8.5 $ 8.3 $ 9.2 (-) Increase in Net Working Capital $(1.9) $(2.8) $(5.7) (-) Maintenance Capex $(1.5) $(1.0) $(2.1) (-) Growth Capex $(4.0) $(1.8) $(2.7) (-) One-Time Resort Spa Capex $(5.8) $(8.4) $(0.2) Free Cash Flow $ 22.1 $ 27.3 $ 47.9 1. Includes revenue from Timetospa.com. 4. Tax-effected value of amortization of intangibles recognized when L Catterton acquired 2. Includes amortization of financing fees. 2018 interest expense pro forma for a full year of debt Steiner Leisure in 2015. with no paydown. 2019 and 2020 assume 100% sweep to free cash flow. 5. Excludes revenue from Timetospa.com. 36 3. Addback of lost net income due to planned renovation of Atlantis facility in 2019. 6. Excludes amortization of intangibles and includes amortization of financing fees.

RECONCILIATION TO ADJUSTED EBITDA Fiscal Year Ended December 31, $M 2015A 2016A 2017A 2018 2019 2020 Net Income $ 39.9 $ 36.5 $ 40.3 $ 26.1 $ 31.0 $ 49.0 (+) Other (Income) / Expense $(0.0) $ 0.2 $ 0.0 $ 0.0 $ 0.0 $ 0.0 (+) Interest (Income) / Expense¹ $ 0.0 $(0.3) $ 0.0 $ 20.9 $ 20.5 $ 18.7 (+) Cash Taxes $ 1.5 $ 4.9 $ 4.6 $ 0.5 $ 0.6 $ 0.9 (+) Depreciation and Amortization² $ 7.2 $ 12.2 $ 12.3 $ 11.7 $ 11.5 $ 12.3 EBITDA $ 48.6 $ 53.4 $ 57.2 $ 59.1 $ 63.7 $ 81.0 (+) One-Time Deal Costs (2015 Acquisition) $ 1.2 $ 0.0 $ 0.0 $ 0.0 $ 0.0 $ 0.0 (-) Incremental Public Company Costs $(2.9) $(2.9) $(2.9) $(2.9) $(2.9) $(3.1) (+) Atlantis Adjustment³ $ 0.0 $ 0.0 $ 0.0 $ 0.0 $ 1.5 $ 0.0 Pro Forma Adj. EBITDA $ 46.9 $ 50.6 $ 54.3 $ 56.3 $ 62.3 $ 77.9 1. Includes amortization of financing fees. 2018 interest expense pro forma for a full year of debt with no paydown. 2019 and 2020 assume 100% sweep to free cash flow. 2. Includes $3.5M of amortization of intangibles recognized when L Catterton acquired Steiner Leisure in December 2015. 3. Addback of lost net income due to planned renovation of Atlantis facility in 2019. 37 RECONCILIATION TO ADJUSTED EBITDA Fiscal Year Ended December 31, $M 2015A 2016A 2017A 2018 2019 2020 Net Income $ 39.9 $ 36.5 $ 40.3 $ 26.1 $ 31.0 $ 49.0 (+) Other (Income) / Expense $(0.0) $ 0.2 $ 0.0 $ 0.0 $ 0.0 $ 0.0 (+) Interest (Income) / Expense¹ $ 0.0 $(0.3) $ 0.0 $ 20.9 $ 20.5 $ 18.7 (+) Cash Taxes $ 1.5 $ 4.9 $ 4.6 $ 0.5 $ 0.6 $ 0.9 (+) Depreciation and Amortization² $ 7.2 $ 12.2 $ 12.3 $ 11.7 $ 11.5 $ 12.3 EBITDA $ 48.6 $ 53.4 $ 57.2 $ 59.1 $ 63.7 $ 81.0 (+) One-Time Deal Costs (2015 Acquisition) $ 1.2 $ 0.0 $ 0.0 $ 0.0 $ 0.0 $ 0.0 (-) Incremental Public Company Costs $(2.9) $(2.9) $(2.9) $(2.9) $(2.9) $(3.1) (+) Atlantis Adjustment³ $ 0.0 $ 0.0 $ 0.0 $ 0.0 $ 1.5 $ 0.0 Pro Forma Adj. EBITDA $ 46.9 $ 50.6 $ 54.3 $ 56.3 $ 62.3 $ 77.9 1. Includes amortization of financing fees. 2018 interest expense pro forma for a full year of debt with no paydown. 2019 and 2020 assume 100% sweep to free cash flow. 2. Includes $3.5M of amortization of intangibles recognized when L Catterton acquired Steiner Leisure in December 2015. 3. Addback of lost net income due to planned renovation of Atlantis facility in 2019. 37