| FREE WRITING PROSPECTUS | ||
| FILED PURSUANT TO RULE 433 | ||
| REGISTRATION FILE NO.: 333-207361-05 | ||

June 14, 2017 HSBCCo-ManagerCredit SuisseCo-Lead Manager and Joint BookrunnerNatixisCo-Lead Manager and Joint BookrunnerCSAIL 2017-C8 Commercial Mortgage Trust Free Writing Prospectus Structural and Collateral Term Sheet Credit Suisse Commercial Mortgage Securities Corp.as DepositorCommercial Mortgage Pass-Through Certificates Series 2017-C8 Column Financial, Inc. Natixis Real Estate Capital LLC Benefit Street Partners CRE Finance LLCas Sponsors and Mortgage Loan SellersTHE DEPOSITOR HAS FILED A REGISTRATION STATEMENT (INCLUDING A PROSPECTUS) WITH THE SEC (SEC FILE NO. 333-207361) FOR THE OFFERING TO WHICH THIS COMMUNICATION RELATES. BEFORE YOU INVEST, YOU SHOULD READ THE PROSPECTUS IN THAT REGISTRATION STATEMENT AND OTHER DOCUMENTS THE ISSUER HAS FILED WITH THE SEC FOR MORE COMPLETE INFORMATION ABOUT THE ISSUER AND THIS OFFERING. YOU MAY GET THESE DOCUMENTS FOR FREE BY VISITING EDGAR ON THE SEC WEB SITE AT WWW.SEC.GOV. ALTERNATIVELY, CREDIT SUISSE WILL ARRANGE TO SEND YOU THE PROSPECTUS IF YOU REQUEST IT BY CALLING TOLL FREE 1-800-221-1037.
STATEMENT REGARDING ASSUMPTIONS AS TO
SECURITIES, PRICING ESTIMATES AND OTHER INFORMATION
This material is for your information, and neither Credit Suisse Securities (USA) LLC nor the other underwriters (collectively, the “Underwriters”) are soliciting any action based upon it. This material is not to be construed as an offer to sell or the solicitation of any offer to buy any security in any jurisdiction where such an offer or solicitation would be illegal.
Neither this document nor anything contained herein shall form the basis for any contract or commitment whatsoever. The information contained herein is preliminary as of the date hereof. These materials are subject to change, completion or amendment from time to time. The information contained herein will be superseded by similar information delivered to you prior to the time of sale, including as part of the Preliminary Prospectus referred to herein relating to the CSAIL 2017-C8 Commercial Mortgage Trust, Commercial Mortgage Pass-Through Certificates (the “Offering Document”). The information supersedes any such information previously delivered. The information should be reviewed only in conjunction with the entire Offering Document. All of the information contained herein is subject to the same limitations and qualifications contained in the Offering Document. The information contained herein does not contain all relevant information relating to the underlying mortgage loans or mortgaged properties. Such information is described elsewhere in the Offering Document. The information contained herein will be more fully described elsewhere in the Offering Document. The information contained herein should not be viewed as projections, forecasts, predictions or opinions with respect to value. Prior to making any investment decision, prospective investors are strongly urged to read the Offering Document in its entirety. Neither the Securities and Exchange Commission nor any state securities commission has approved or disapproved of these securities or determined if this Free Writing Prospectus is truthful or complete. Any representation to the contrary is a criminal offense.
The attached information contains certain tables and other statistical analyses (the “Computational Materials”) which have been prepared in reliance upon information furnished by the Mortgage Loan Sellers. Numerous assumptions were used in preparing the Computational Materials, which may or may not be reflected herein. As such, no assurance can be given as to the appropriateness of the assumptions used in preparing the Computational Materials, or as to whether the Computational Materials and/or the assumptions upon which they are based reflect present market conditions or future market performance. The Computational Materials should not be construed as either projections or predictions or as legal, tax, financial or accounting advice. You should consult your own counsel, accountant and other advisors as to the legal, tax, business, financial and related aspects of a purchase of these securities. Any weighted average lives, yields and principal payment periods shown in the Computational Materials are based on prepayment and/or loss assumptions, and changes in such prepayment and/or loss assumptions may dramatically affect such weighted average lives, yields and principal payment periods. In addition, it is possible that prepayments or losses on the underlying assets will occur at rates higher or lower than the rates shown in the attached Computational Materials. The specific characteristics of the securities may differ from those shown in the Computational Materials due to differences between the final underlying assets and the preliminary underlying assets used in preparing the Computational Materials. The principal amount and designation of any security described in the Computational Materials are subject to change prior to issuance. None of the Underwriters nor any of their respective affiliates makes any representation or warranty as to the actual rate or timing of payments or losses on any of the underlying assets or the payments or yield on the securities.
This document contains forward-looking statements. Those statements are subject to certain risks and uncertainties that could cause the success of collections and the actual cash flow generated to differ materially from the information set forth herein. While such information reflects projections prepared in good faith based upon methods and data that are believed to be reasonable and accurate as of the dates thereof, the depositor undertakes no obligation to revise these forward-looking statements to reflect subsequent events or circumstances. Individuals should not place undue reliance on forward-looking statements and are advised to make their own independent analysis and determination with respect to the forecasted periods, which reflect the issuer’s view only as of the date hereof.
IMPORTANT NOTICE RELATING TO AUTOMATICALLY GENERATED EMAIL DISCLAIMERS
Any legends, disclaimers or other notices that may appear at the bottom of the email communication to which this Free Writing Prospectus is attached relating to (1) these materials not constituting an offer (or a solicitation of an offer), (2) no representation being made that these materials are accurate or complete and may not be updated or (3) these materials possibly being confidential, are not applicable to these materials and should be disregarded. Such legends, disclaimers or other notices have been automatically generated as a result of these materials having been sent via Bloomberg or another system.
2

Publicly Offered Certificates
| Class | Expected Ratings (KBRA/Fitch/DBRS/Moody’s) | Approximate Initial Certificate Principal Balance or Notional Amount(1) | Approximate Initial Available Certificate Principal Balance or Notional Amount(1)(2) | Approximate Initial Retained Certificate Principal Balance or Notional Amount(1)(2) | Approximate Initial Credit Support | Expected Weighted Avg. Life (years)(3) | Expected Principal Window(3) | Certificate Principal to Value Ratio(4) | Underwritten NOI Debt Yield(5) |
| A-1 | AAA(sf)/AAAsf/AAA(sf)/Aaa(sf) | $17,863,000 | $17,125,000 | $738,000 | 30.000%(6) | 2.82 | 1-56 | 35.5% | 17.5% |
| A-2 | AAA(sf)/AAAsf/AAA(sf)/Aaa(sf) | $163,585,000 | $156,828,000 | $6,757,000 | 30.000%(6) | 4.72 | 56-58 | 35.5% | 17.5% |
| A-3 | AAA(sf)/AAAsf/AAA(sf)/Aaa(sf) | $142,336,000 | $136,457,000 | $5,879,000 | 30.000%(6) | 9.61 | 114-117 | 35.5% | 17.5% |
| A-4 | AAA(sf)/AAAsf/AAA(sf)/Aaa(sf) | $213,505,000 | $204,687,000 | $8,818,000 | 30.000%(6) | 9.88 | 117-120 | 35.5% | 17.5% |
| A-SB | AAA(sf)/AAAsf/AAA(sf)/Aaa(sf) | $30,449,000 | $29,191,000 | $1,258,000 | 30.000%(6) | 7.26 | 58-114 | 35.5% | 17.5% |
| X-A | AAA(sf)/AAAsf/AAA(sf)/Aa1(sf) | $651,885,000(7) | $624,959,000 | $26,926,000 | N/A | N/A | N/A | N/A | N/A |
| X-B | AAA(sf)/A-sf/A(high)(sf)/NR | $78,065,000(7) | $74,840,000 | $3,225,000 | N/A | N/A | N/A | N/A | N/A |
| A-S | AAA(sf)/AAAsf/AAA(sf)/Aa3(sf) | $84,147,000 | $80,671,000 | $3,476,000 | 19.625% | 9.96 | 120-120 | 40.8% | 15.2% |
| B | AA-(sf)/AA-sf/AA(sf)/NR | $44,608,000 | $42,765,000 | $1,843,000 | 14.125% | 9.96 | 120-120 | 43.6% | 14.3% |
| C | A-(sf)/A-sf/A(sf)/NR | $33,457,000 | $32,075,000 | $1,382,000 | 10.000% | 9.96 | 120-120 | 45.7% | 13.6% |
Privately Offered Pooled Certificates(8)
| Class | Expected Ratings (KBRA/Fitch/DBRS/Moody’s) | Approximate Initial Certificate Principal Balance or Notional Amount(1) | Approximate Initial Available Certificate Principal Balance or Notional Amount(1)(2) | Approximate Initial Retained Certificate Principal Balance or Notional Amount(1)(2) | Approximate Initial Credit Support | Expected Weighted Avg. Life (years)(3) | Expected Principal Window(3) | Certificate Principal to Value Ratio(4) | Underwritten NOI Debt Yield(5) |
| D | BBB-(sf)/BBB-sf/BBB(sf)/NR | $32,442,000 | $31,102,000 | $1,340,000 | 6.000% | 9.96 | 120-120 | 47.7% | 13.0% |
| E | BB-(sf)/BB-sf/BB(sf)/NR | $18,248,000 | $17,494,000 | $754,000 | 3.750% | 9.96 | 120-120 | 48.9% | 12.7% |
| F | B-(sf)/B-sf/B(high)(sf)/NR | $7,097,000 | $6,803,000 | $294,000 | 2.875% | 9.96 | 120-120 | 49.3% | 12.6% |
| NR | NR/NR/NR/NR | $23,318,563 | $22,355,000 | $963,563 | 0.000% | 9.96 | 120-120 | 50.8% | 12.2% |
Privately Offered Loan-Specific Certificates
| Class | Expected Ratings (DBRS) | Approximate Initial Certificate Principal Balance or Notional Amount(1) | Approximate Initial Available Certificate Principal Balance or Notional Amount(1) | Approximate Initial Retained Certificate Principal Balance or Notional Amount(1) | Approximate Initial Credit Support | Expected Weighted Avg. Life (years)(3) | Expected Principal Window(3) | Loan- Specific Certificate Principal to Value Ratio(9) | Loan- Specific Underwritten NOI Debt Yield(10) |
| 85BD-A | AA(low)(sf) | $7,000,000 | $6,650,000 | $350,000 | 90.278% | 9.96 | 120-120 | 27.0% | 14.7% |
| 85BD-X | BBB(sf) | $72,000,000 | $68,400,000 | $3,600,000 | N/A | N/A | N/A | N/A | N/A |
| 85BD-B | A(low)(sf) | $33,000,000 | $31,350,000 | $1,650,000 | 44.444% | 9.96 | 120-120 | 32.1% | 12.4% |
| 85BD-C | BBB(low)(sf) | $32,000,000 | $30,400,000 | $1,600,000 | 0.000% | 9.96 | 120-120 | 37.0% | 10.8% |
| (1) | Approximate, subject to a variance of plus or minus 5%. |
| (2) | On the Closing Date, the certificates (other than the Privately Offered Loan-Specific Certificates and the Class R certificates) with the initial certificate balances or notional amounts, as applicable, set forth in the table under “Initial Retained Certificate Balance or Notional Amount” are expected to be sold by the Underwriters to Natixis as described in “Credit Risk Retention” in the Preliminary Prospectus relating to the Publicly Offered Certificates, dated June 14, 2017 (the “Preliminary Prospectus”). Additionally, with respect to the Class F and Class NR certificates, the Approximate Initial Available Certificate Principal Balance or Notional Amount of each of the Class F and Class NR certificates (collectively, the “HRR Certificates”) is subject to change based on final pricing of all certificates and the final determination of the Class F and Class NR certificates that will be retained by the retaining |
THE INFORMATION IN THIS STRUCTURAL AND COLLATERAL TERM SHEET IS NOT COMPLETE AND MAY BE AMENDED PRIOR TO THE TIME OF SALE. THIS TERM SHEET IS NOT AN OFFER TO SELL THESE SECURITIES AND IT IS NOT A SOLICITATION OF AN OFFER TO BUY THESE SECURITIES IN ANY JURISDICTION WHERE THE OFFER OR SALE IS NOT PERMITTED.
3
third-party purchaser as part of the sponsor’s satisfaction of its U.S. risk retention requirements. For more information regarding the methodology and key inputs and assumptions used to determine the sizing of the HRR Certificates, see “Credit Risk Retention” in the Preliminary Prospectus.
| (3) | Assumes 0% CPR / 0% CDR and a June 29, 2017 closing date. Based on “Modeling Assumptions” as described in the Preliminary Prospectus relating to the Publicly Offered Certificates, dated June 14, 2017 (the “Preliminary Prospectus”). Capitalized terms used but not defined herein have the meanings ascribed to them in the Preliminary Prospectus. |
| (4) | The “Certificate Principal to Value Ratio” for any class (other than the Class A-1, Class A-2, Class A-3, Class A-4 and Class A-SB certificates) is calculated as the product of (a) the weighted average Cut-off Date LTV Ratio for the mortgage loans, multiplied by (b) a fraction, the numerator of which is the total initial certificate principal balance of such class of certificates and all classes of principal balance certificates senior to such class of certificates and the denominator of which is the total initial certificate principal balance of all of the principal balance certificates. The Class A-1, Class A-2, Class A-3, Class A-4 and Class A-SB Certificate Principal to Value Ratios are calculated in the aggregate for those classes as if they were a single class. Investors should note, however, that excess mortgaged property value associated with a mortgage loan will not be available to offset losses on any other mortgage loan. |
| (5) | The “Underwritten NOI Debt Yield” for any class (other than the Class A-1, Class A-2, Class A-3, Class A-4 and Class A-SB certificates) is calculated as the product of (a) the weighted average UW NOI Debt Yield for the mortgage loans and (b) the total initial certificate principal balance of all of the classes of principal balance certificates divided by the total initial certificate principal balance for such class and all classes of principal balance certificates senior to such class of certificates. The Underwritten NOI Debt Yield for each class of the Class A-1, Class A-2, Class A-3, Class A-4 and Class A-SB certificates is calculated in the aggregate for those classes as if they were a single class. Investors should note, however, that net operating income from any mortgaged property supports only the related mortgage loan and will not be available to support any other mortgage loan. |
| (6) | The credit support percentages set forth for the Class A-1, Class A-2, Class A-3, Class A-4 and Class A-SB certificates are represented in the aggregate. |
| (7) | The notional amounts of the Class X-A and Class X-B certificates (collectively, the “Class X Certificates”) are defined in the Preliminary Prospectus. |
| (8) | The Class Z and Class R certificates are not shown above. |
| (9) | The “Loan-Specific Certificate Principal to Value Ratio” for the Class 85BD-A, Class 85BD-B and Class 85BD-C certificates is calculated as the total of the initial certificate principal balance of such class of certificates, all classes of principal balance certificates senior to such class of certificates and the related A Notes divided by the 85 Broad Street appraised value of $652.0 million as of April 30, 2017. Investors should note, however, that excess mortgaged property value associated with a mortgage loan will not be available to offset losses on any other mortgage loan. |
| (10) | The “Loan-Specific Underwritten NOI Debt Yield” for the Class 85BD-A, Class 85BD-B and Class 85BD-C is calculated as the 85 Broad Street UW NOI of $25,930,418 divided by the total of the total initial certificate principal balance for such class all classes of principal balance certificates senior to such class of certificates and the related A Notes. Investors should note, however, that net operating income from any mortgaged property supports only the related mortgage loan and will not be available to support any other mortgage loan. |
THE INFORMATION IN THIS STRUCTURAL AND COLLATERAL TERM SHEET IS NOT COMPLETE AND MAY BE AMENDED PRIOR TO THE TIME OF SALE. THIS TERM SHEET IS NOT AN OFFER TO SELL THESE SECURITIES AND IT IS NOT A SOLICITATION OF AN OFFER TO BUY THESE SECURITIES IN ANY JURISDICTION WHERE THE OFFER OR SALE IS NOT PERMITTED.
4
Summary of Transaction Terms
| Securities: | $811,055,563 monthly pay, multi-class, commercial mortgage REMIC Pass-Through Certificates. |
| Managers and Bookrunners: | Credit Suisse Securities (USA) LLC and Natixis Securities Americas LLC, as Co-Lead Managers and Joint Bookrunners, and HSBC Securities (USA) Inc., as Co-Manager. |
| Mortgage Loan Sellers: | Natixis Real Estate Capital LLC (“Natixis”) (46.3%), Benefit Street Partners CRE Finance LLC (“BSP”) (32.0%) and Column Financial, Inc. (“Column”) (24.4%). |
| Master Servicer: | Wells Fargo Bank, National Association (“Wells Fargo”). |
| Special Servicer: | Midland Loan Services, a dvision of PNC Bank, National Association (“Midland”). |
| Directing Certificateholder: | Eightfold Real Estate Capital Fund V, L.P. or another affiliate of Eightfold Real Estate Capital, L.P. |
| Trustee: | Wilmington Trust National Association (“Wilmington”). |
| Certificate Administrator: | Wells Fargo. |
| Operating Advisor: | Park Bridge Lender Services LLC (“Park Bridge”). |
| Asset Representations Reviewer: | Park Bridge. |
| U.S. Credit Risk Retention: | For a discussion of the manner by which Natixis, as retaining sponsor, intends to satisfy the credit risk requirements of the Credit Risk Retention Rules, see “Credit Risk Retention” in the Preliminary Prospectus. Note that this securitization transaction is not structured to satisfy the EU risk retention and due diligence requirements. |
| Risk Retention Consultation Party: | Natixis. |
| Closing Date: | On or about June 29, 2017. |
| Cut-off Date: | With respect to each mortgage loan, the respective due date for the monthly debt service payment that is due in June 2017 (or, in the case of any mortgage loan that has its first due date in July 2017, the date that would have been its due date in June 2017 under the terms of that mortgage loan if a monthly payment were scheduled to be due in that month.) |
| Distribution Date: | The 4th business day following each Determination Date, commencing in July 2017. |
| Determination Date: | 11thday of each month, or if the 11th day is not a business day, then the business day immediately following such 11th day, commencing in July 2017. |
| Rated Final Distribution Date: | The Distribution Date in June 2050. |
| Tax Treatment: | The Publicly Offered Certificates are expected to be treated as REMIC regular interests for U.S. federal income tax purposes. |
| Form of Offering: | The Class A-1, Class A-2, Class A-3, Class A-4, Class A-SB, Class X-A, Class X-B, Class A-S, Class B and Class C certificates will be offered publicly (the “Publicly Offered Certificates”). The Class D, Class E, Class F, Class NR and Class R certificates (the “Privately Offered Certificates”) and the Class Z certificates will be offered domestically to Qualified Institutional Buyers and to Institutional Accredited Investors and to institutions that are not U.S. Persons pursuant to Regulation S. |
| SMMEA Status: | The certificates willnot constitute “mortgage related securities” for purposes of SMMEA. |
| ERISA: | The Publicly Offered Certificates are expected to be ERISA eligible. |
| Optional Termination: | 1% clean-up call (or, if the 71 Fifth Ave mortgage loan remains an asset of the trust fund, the product of (x) the product of (A) the percentage that is calculated by dividing (A) the sum of the outstanding principal balance of the 71 Fifth Ave mortgage loan and 1% of the outstanding principal balance of the aggregate principal balance of the mortgage loans as of the Cut-off Date by (B) the aggregate principal balance of the mortgage loans as of the Cut-off Date and (y) the aggregate principal balance of the mortgage loans as of the Cut-off Date). |
| Minimum Denominations: | The Publicly Offered Certificates (other than the Class X-A and Class X-B certificates) will be issued in minimum denominations of $10,000 and integral multiples of $1 in excess of $10,000. The Class X-A and Class X-B certificates will be issued in minimum denominations of $1,000,000 and in integral multiples of $1 in excess of $1,000,000. |
| Settlement Terms: | DTC, Euroclear and Clearstream Banking. |
| Analytics: | The transaction is expected to be available on Bloomberg Financial Markets, L.P., CMBS.com, Inc., Thomson Reuters Corporation, Trepp, LLC, Intex Solutions, Inc., Moody’s Analytics and BlackRock Financial Management, Inc. |
THE INFORMATION IN THIS STRUCTURAL AND COLLATERAL TERM SHEET IS NOT COMPLETE AND MAY BE AMENDED PRIOR TO THE TIME OF SALE. THIS TERM SHEET IS NOT AN OFFER TO SELL THESE SECURITIES AND IT IS NOT A SOLICITATION OF AN OFFER TO BUY THESE SECURITIES IN ANY JURISDICTION WHERE THE OFFER OR SALE IS NOT PERMITTED.
5
Collateral Characteristics(1)
| Loan Pool | |
| Initial Pool Balance (“IPB”)(2): | $811,055,563 |
| Number of Mortgage Loans: | 32 |
| Number of Mortgaged Properties: | 55 |
| Average Cut-off Date Balance per Mortgage Loan: | $25,345,486 |
| Weighted Average Current Mortgage Rate: | 4.4871% |
| 10 Largest Mortgage Loans as % of IPB: | 62.9% |
| Weighted Average Remaining Term to Maturity: | 106 |
| Weighted Average Seasoning: | 2 |
| Credit Statistics | |
| Weighted Average UW NCF DSCR(3)(4): | 2.48x |
| Weighted Average UW NOI Debt Yield(3): | 12.2% |
| Weighted Average Cut-off Date Loan-to-Value Ratio (“LTV”)(3)(5): | 50.8% |
| Weighted Average Maturity Date LTV(3)(5): | 46.7% |
| Other Statistics | |
| % of Credit Assessed Mortgage Loans(6): | 39.9% |
| % of Mortgage Loans with Additional Debt: | 41.0% |
| % of Mortgaged Properties with Single Tenants: | 13.1% |
| Amortization | |
| Weighted Average Original Amortization Term(7): | 355 |
| Weighted Average Remaining Amortization Term(7): | 355 |
| % of Mortgage Loans with Interest-Only: | 54.7% |
| % of Mortgage Loans with Partial Interest-Only followed by Amortizing Balloon: | 26.5% |
| % of Mortgage Loans with Amortizing Balloon: | 15.7% |
| % of Mortgage Loans with Interest-Only, followed by ARD Structure | 3.1% |
| Cash Management(8) | |
| % of Mortgage Loans with In-Place, Hard Lockboxes: | 70.5% |
| % of Mortgage Loans with Springing Lockboxes: | 15.8% |
| % of Mortgage Loans with In-Place, Soft Lockboxes: | 7.8% |
| % of Mortgage Loans with No Lockbox: | 4.5% |
| % of Mortgage Loans with Hard Commercial Units & Soft Residential Units Lockbox | 1.4% |
| Reserves | |
| % of Mortgage Loans Requiring Upfront or Ongoing Tax Reserves: | 76.4% |
| % of Mortgage Loans Requiring Upfront or Ongoing Insurance Reserves: | 72.4% |
| % of Mortgage Loans Requiring Upfront or Ongoing CapEx Reserves(9): | 80.4% |
| % of Mortgage Loans Requiring Upfront or Ongoing TI/LC Reserves(10): | 53.9% |
| (1) | Except where expressly stated otherwise, statistical information in this table does not include the 85 Broad Street trust subordinate companion loan. |
| (2) | Subject to a permitted variance of plus or minus 5%. |
| (3) | In the case of Loan Nos. 1, 2, 3, 6, 7, 8, 11, 13, 14, 16 and 25, the UW NCF DSCR, UW NOI Debt Yield, Cut-off Date LTV and Maturity Date LTV calculations include the relatedpari passu companion loan(s). In the case of Loan Nos. 1, 2, 3 and 6 the UW NCF DSCR, UW NOI Debt Yield, Cut-off Date LTV and Maturity Date LTV calculations exclude the subordinate companion loan(s) or other subordinate indebtedness. In the case of Loan Nos. 2, 3, 6 and 8, the UW NCF DSCR, UW NOI Debt Yield, Cut-off Date LTV and Maturity Date LTV calculations exclude the mezzanine loan. In the case of Loan No. 12, with an anticipated repayment date, Remaining Loan Term and Maturity Date LTV are calculated through or as of, as applicable, the related anticipated repayment date. |
| (4) | For each partial interest-only mortgage loan, the UW NCF DSCR is calculated using the first principal and interest payment to be made into the trust during the term of the mortgage loan once amortization has commenced. |
| (5) | In the case of Loan No. 21, the Cut-off Date LTV and Maturity Date LTV are calculated based upon an “as-stabilized” appraised value as of October 1, 2017. The as-is Cut-off Date LTV is 75.2%. |
| (6) | At least one of Moody’s, Fitch, DBRS or KBRA have indicated that the credit characteristics of each of Loan Nos. 1, 2, 3, 6, 12 and 13, in the context of their inclusion in the Initial Pool Balance, are consistent with an investment grade obligation. |
| (7) | Excludes eleven (11) mortgage loans that are interest-only or interest-only, ARD for the entire term. |
| (8) | For a detailed description of cash management, refer to“Description of the Mortgage Pool—Certain Terms of the Mortgage Loans—Mortgaged Property Accounts—Lockbox Accounts” in the Preliminary Prospectus. |
| (9) | CapEx Reserves include FF&E reserves for hospitality properties. |
| (10) | Calculated only with respect to Cut-off Date Balance of mortgage loans secured by industrial, office, mixed use and retail properties. |
THE INFORMATION IN THIS STRUCTURAL AND COLLATERAL TERM SHEET IS NOT COMPLETE AND MAY BE AMENDED PRIOR TO THE TIME OF SALE. THIS TERM SHEET IS NOT AN OFFER TO SELL THESE SECURITIES AND IT IS NOT A SOLICITATION OF AN OFFER TO BUY THESE SECURITIES IN ANY JURISDICTION WHERE THE OFFER OR SALE IS NOT PERMITTED.
6
Collateral Characteristics
| Originator | Sponsor | Number of Mortgage Loans | Number of Mortgaged Properties | Aggregate Cut-off Date Balance | % of IPB | |||||||||
| Natixis(1)(2) | Natixis | 10 | 12 | $353,686,428 | 43.6 | % | ||||||||
| BSP | BSP | 16 | 36 | 259,684,135 | 32.0 | |||||||||
| Column Financial, Inc.(2)(3) | Column | 6 | 7 | 197,685,000 | 24.4 | |||||||||
| Total: | 32 | 55 | $811,055,563 | 100.0 | % | |||||||||
| (1) | Loan No. 2, originated by Natixis, representing approximately 9.9% of IPB, is part of a whole loan that was co-originated by JPMorgan Chase Bank, National Association, Natixis, Société Générale, Deutsche Bank AG, New York Branch and Barclays Bank PLC. |
| (2) | One of the two notes that secures Loan No. 1, identified as note A-A-2, represents approximately 2.5% of IPB, is part of a whole loan that was originated by Natixis. The other note that secures Loan No. 1, identified as note A-A-1, represents approximately 8.6% of IPB, and was acquired by Column from Natixis prior to the date hereof. Such mortgage loan was underwritten in accordance with the procedures described under “Transaction Parties—The Sponsors and Mortgage Loan Sellers—Natixis Real Estate Capital LLC” in the preliminary prospectus. The “Number of Mortgage Loans” shown in the table above for Natixis does not include this note; however, the “Aggregate Principal Balance of Mortgage Loans” and the “Approx. % of Initial Pool Balance” shown in the table above for Natixis do include this note. |
| (3) | Loan No. 27, representing approximately 0.8% of IPB, was originated by Regions Bank, an Alabama state banking corporation, and acquired and re-underwritten by Column in accordance with the procedures described under “Transaction Parties—The Sponsors and Mortgage Loan Sellers—Column Financial, Inc.” in the preliminary prospectus. |
Ten Largest Mortgage Loans
| No. | Loan Name | Mortgage Loan Seller | No. of Properties | Cut-off Date Balance | % of IPB | SF/ Rooms/ Units | Property Type | UW NCF DSCR(1)(2) | UW NOI Debt Yield(1) | Cut-off Date LTV(1) | Maturity Date LTV(1) | Credit Assessment (Moody’s/Fitch/ DBRS/KBRA) |
| 1 | 85 Broad Street | Column / Natixis | 1 | $90,000,000 | 11.1% | 1,118,512 | Office | 4.11x | 15.3% | 25.9% | 25.9% | NR/BBB-/ AA(low)/BBB+ |
| 2 | 245 Park Avenue | Natixis | 1 | 80,000,000 | 9.9 | 1,723,993 | Office | 2.73x | 10.7% | 48.9% | 48.9% | NR/BBB-/ NR/BBB |
| 3 | Apple Sunnyvale | Natixis | 1 | 70,350,000 | 8.7 | 349,758 | Office | 3.40x | 14.6% | 35.7% | 35.7% | Baa3/BBB-/ A/BBB- |
| 4 | Ritz Carlton Rancho Mirage | Column | 1 | 54,000,000 | 6.7 | 244 | Hotel | 1.81x | 13.4% | 58.2% | 58.2% | NR/NR/NR/NR |
| 5 | Hotel Eastlund | Column | 1 | 41,000,000 | 5.1 | 168 | Hotel | 1.74x | 12.1% | 59.8% | 51.7% | NR/NR/NR/NR |
| 6 | Urban Union Amazon | Natixis | 1 | 38,231,428 | 4.7 | 295,793 | Office | 5.44x | 18.7% | 23.1% | 23.1% | A2/AA/AAA/AA- |
| 7 | Broadway Portfolio | Natixis | 3 | 38,000,000 | 4.7 | 77,419 | Various | 1.59x | 7.6% | 59.8% | 59.8% | NR/NR/NR/NR |
| 8 | St. Luke’s Office | BSP | 1 | 34,000,000 | 4.2 | 566,622 | Office | 1.72x | 11.8% | 55.4% | 46.4% | NR/NR/NR/NR |
| 9 | Northridge Plaza | BSP | 1 | 32,500,000 | 4.0 | 209,652 | Retail | 1.38x | 9.3% | 64.9% | 55.8% | NR/NR/NR/NR |
| 10 | 449 South Broadway | Natixis | 1 | 31,750,000 | 3.9 | 88 | Multifamily | 1.70x | 7.9% | 64.1% | 64.1% | NR/NR/NR/NR |
| Top 3 Total/Weighted Average | 3 | $240,350,000 | 29.6% | 3.44x | 13.6% | 36.4% | 36.4% | |||||
| Top 5 Total/Weighted Average | 5 | $335,350,000 | 41.3% | 2.97x | 13.4% | 42.8% | 41.8% | |||||
| Top 10 Total/Weighted Average | 12 | $509,831,428 | 62.9% | 2.79x | 12.6% | 46.2% | 44.3% | |||||
| (1) | In the case of Loan Nos. 1, 2, 3, 6, 7 and 8, the UW NCF DSCR, UW NOI Debt Yield, Cut-off Date LTV and Maturity Date LTV calculations include the relatedpari passu companion loan(s). In the case of Loan Nos. 1, 2, 3 and 6, the UW NCF DSCR, UW NOI Debt Yield, Cut-off Date LTV and Maturity Date LTV calculations exclude the subordinate companion loan(s) or other subordinate indebtedness. In the case of Loan Nos. 2, 3, 6 and 8, the UW NCF DSCR, UW NOI Debt Yield, Cut-off Date LTV and Maturity Date LTV calculations exclude the mezzanine loan. |
| (2) | For each partial interest-only mortgage loan, the UW NCF DSCR is calculated using the first principal and interest payment to be made into the trust during the term of the mortgage loan once amortization has commenced. |
THE INFORMATION IN THIS STRUCTURAL AND COLLATERAL TERM SHEET IS NOT COMPLETE AND MAY BE AMENDED PRIOR TO THE TIME OF SALE. THIS TERM SHEET IS NOT AN OFFER TO SELL THESE SECURITIES AND IT IS NOT A SOLICITATION OF AN OFFER TO BUY THESE SECURITIES IN ANY JURISDICTION WHERE THE OFFER OR SALE IS NOT PERMITTED.
7
Whole Loan Summary
| No. | Loan Name | Trust Cut-off Date Balance | Pari Passu Companion Loan Cut-off Date Balance | Whole Loan Cut-off Date Balance(1)(2) | Lead Pooling and Servicing Agreement | Master Servicer | Special Servicer |
| 1 | 85 Broad Street | $90,000,000 | $79,000,000 | $358,600,000 | CSAIL 2017-C8 | Wells Fargo | Midland |
| 2 | 245 Park Avenue | $80,000,000 | $1,000,000,000 | $1,200,000,000 | PRKAV 2017-245P | Wells Fargo | AEGON |
| 3 | Apple Sunnyvale | $70,350,000 | $34,000,000 | $186,240,000 | CSAIL 2017-C8 | Wells Fargo | Midland |
| 6 | Urban Union Amazon | $38,231,428 | $24,000,000 | $149,207,361 | CSAIL 2017-C8 | Wells Fargo | Midland |
| 7 | Broadway Portfolio | $38,000,000 | $20,000,000 | $58,000,000 | CSAIL 2017-C8 | Wells Fargo | Midland |
| 8 | St. Luke’s Office | $34,000,000 | $17,000,000 | $51,000,000 | CSAIL 2017-C8 | Wells Fargo | Midland |
| 11 | Columbus Office Portfolio I | $30,000,000 | $15,300,000 | $45,300,000 | CSAIL 2017-C8 | Wells Fargo | Midland |
| 13 | Acropolis Garden | $20,000,000 | $25,000,000 | $45,000,000 | CSAIL 2017-C8 | Wells Fargo | Midland |
| 14 | Alexandria Corporate Park | $20,000,000 | $14,500,000 | $34,500,000 | CSAIL 2017-C8 | Wells Fargo | Midland |
| 16 | Garden Multifamily Portfolio | $18,000,000 | $39,500,000 | $57,500,000 | CSAIL 2017-C8 | Wells Fargo | Midland |
| 25 | Marble Hall Gardens | $11,500,000 | $10,000,000 | $21,500,000 | CSAIL 2017-C8 | Wells Fargo | Midland |
| (1) | In the case of Loan Nos. 1, 2, 3 and 6, includes subordinate debt of one or more B notes. |
| (2) | In the case of Loan Nos. 2, 3, 6 and 8, excludes one or more mezzanine loans. |
Additional Debt Summary
| No. | Loan Name | Trust Cut-off Date Balance | Subordinate and Mezzanine Debt Cut-off Date Balance(1) | Total Debt Cut-off Date Balance(1)(2) | Mortgage Loan UW NCF DSCR | Total Debt UW NCF DSCR | Mortgage Loan Cut- off Date LTV | Total Debt Cut-off Date LTV | Mortgage Loan UW NOI Debt Yield | Total Debt UW NOI Debt Yield |
| 1 | 85 Broad Street | $90,000,000 | $189,600,000 | $358,600,000 | 4.11x | 1.75x | 25.9% | 55.0% | 15.3% | 7.2% |
| 2 | 245 Park Avenue | $80,000,000 | $688,000,000 | $1,768,000,000 | 2.73x | 1.42x | 48.9% | 80.0% | 10.7% | 6.5% |
| 3 | Apple Sunnyvale | $70,350,000 | $128,210,000 | $232,560,000 | 3.40x | 1.32x | 35.7% | 79.6% | 14.6% | 6.6% |
| 6 | Urban Union Amazon | $38,231,428 | $166,367,944 | $228,599,372 | 5.44x | 1.03x | 23.1% | 85.0% | 18.7% | 5.1% |
| 8 | St. Luke’s Office | $34,000,000 | $14,000,000 | $65,000,000 | 1.72x | 1.12x | 55.4% | 70.7% | 11.8% | 9.3% |
| (1) | In the case of Loan Nos. 2, 3, 6 and 8, includes one or more mezzanine loans. In the case of Loan Nos. 1, 2, 3 and 6, the subordinate debt includes one or more B notes, secured debt and unsecured debt. |
| (2) | Includes the mortgage loan in this securitization,pari passu loans, subordinate debt and mezzanine debt. |
THE INFORMATION IN THIS STRUCTURAL AND COLLATERAL TERM SHEET IS NOT COMPLETE AND MAY BE AMENDED PRIOR TO THE TIME OF SALE. THIS TERM SHEET IS NOT AN OFFER TO SELL THESE SECURITIES AND IT IS NOT A SOLICITATION OF AN OFFER TO BUY THESE SECURITIES IN ANY JURISDICTION WHERE THE OFFER OR SALE IS NOT PERMITTED.
8
Mortgaged Properties by Type(1)
| Weighted Average | |||||||||
| Property Type | Property Subtype | Number of Properties | Cut-off Date Principal Balance | % of IPB | Occupancy | UW NCF DSCR(2)(3) | UW NOI Debt Yield(2) | Cut-off Date LTV(2)(4) | Maturity Date LTV(2)(4) |
| Office | |||||||||
| CBD | 3 | $208,231,428 | 25.7% | 90.9% | 3.82x | 14.2% | 34.2% | 34.2% | |
| Suburban | 9 | 159,174,350 | 19.6 | 94.1% | 2.39x | 12.8% | 51.0% | 46.0% | |
| Subtotal | 12 | $367,405,778 | 45.3% | 92.2% | 3.20x | 13.6% | 41.5% | 39.3% | |
| Hotel | |||||||||
| Full Service | 2 | $95,000,000 | 11.7% | 77.5% | 1.78x | 12.8% | 58.9% | 55.4% | |
| Select Service | 1 | 16,660,000 | 2.1 | 72.8% | 1.49x | 12.0% | 68.3% | 55.4% | |
| Limited Service | 1 | 6,150,000 | 0.8 | 71.1% | 1.92x | 16.0% | 64.1% | 45.0% | |
| Subtotal | 4 | $117,810,000 | 14.5% | 76.5% | 1.74x | 12.9% | 60.5% | 54.9% | |
| Retail | |||||||||
| Anchored | 4 | $62,279,367 | 7.7% | 93.5% | 1.56x | 9.5% | 64.3% | 57.2% | |
| Unanchored | 2 | 32,975,000 | 4.1 | 81.7% | 1.53x | 9.9% | 60.1% | 52.0% | |
| Single Tenant | 5 | 22,350,001 | 2.8 | 100.0% | 1.59x | 10.0% | 58.2% | 52.5% | |
| Subtotal | 11 | $117,604,368 | 14.5% | 91.4% | 1.56x | 9.7% | 61.9% | 54.8% | |
| Multifamily | |||||||||
| Garden | 20 | $52,997,381 | 6.5% | 97.2% | 1.50x | 10.1% | 66.2% | 54.9% | |
| Mid-Rise | 1 | 31,750,000 | 3.9 | 97.7% | 1.70x | 7.9% | 64.1% | 64.1% | |
| Cooperative | 1 | 20,000,000 | 2.5 | 0.0% | 5.31x | 20.4% | 25.4% | 25.4% | |
| Subtotal | 22 | $104,747,381 | 12.9% | 78.8% | 2.29x | 11.4% | 57.8% | 52.1% | |
| Mixed Use | |||||||||
| Office/Retail | 3 | $46,182,433 | 5.7% | 79.1% | 1.53x | 8.1% | 61.2% | 59.4% | |
| Subtotal | 3 | $46,182,433 | 5.7% | 79.1% | 1.53x | 8.1% | 61.2% | 59.4% | |
| Industrial | |||||||||
| Flex | 2 | $32,305,605 | 4.0% | 96.8% | 1.41x | 10.8% | 66.8% | 56.1% | |
| Subtotal | 2 | $32,305,605 | 4.0% | 96.8% | 1.41x | 10.8% | 66.8% | 56.1% | |
| Other | |||||||||
| Leased Fee | 1 | $25,000,000 | 3.1% | 0.0% | 3.74x | 14.7% | 19.2% | 19.2% | |
| Subtotal | 1 | $25,000,000 | 3.1% | 0.0% | 3.74x | 14.7% | 19.2% | 19.2% | |
| Total / Wtd. Avg.: | 55 | $811,055,563 | 100.0% | 84.7% | 2.48x | 12.2% | 50.8% | 46.7% | |
| (1) | Because this table presents information relating to the mortgaged properties and not mortgage loans, the information for mortgage loans secured by more than one mortgaged property is based on allocated loan amounts. |
| (2) | In the case of Loan Nos. 1, 2, 3, 6, 7, 8, 11, 13, 14, 16 and 25, the UW NCF DSCR, UW NOI Debt Yield, Cut-off Date LTV and Maturity Date LTV calculations include the relatedpari passu companion loan(s). In the case of Loan Nos. 1, 2, 3 and 6 the UW NCF DSCR, UW NOI Debt Yield, Cut-off Date LTV and Maturity Date LTV calculations exclude the subordinate companion loan(s) or other subordinate indebtedness. In the case of Loan Nos. 2, 3, 6 and 8, the UW NCF DSCR, UW NOI Debt Yield, Cut-off Date LTV and Maturity Date LTV calculations exclude the mezzanine loan. In the case of Loan No. 12, with an anticipated repayment date, Maturity Date LTV, is calculated through or as of, as applicable, the related anticipated repayment date. |
| (3) | For each partial interest-only mortgage loan, the UW NCF DSCR is calculated using the first principal and interest payment to be made into the trust during the term of the mortgage loan once amortization has commenced. |
| (4) | In the case of Loan No. 21, the Cut-off Date LTV and Maturity Date LTV are calculated based upon an “as-stabilized” appraised value as of October 1, 2017. The as-is Cut-off Date LTV is 75.2%. In the case of Loan No. 12, with an anticipated repayment date, Maturity Date LTV is calculated through or as of, as applicable, the related anticipated repayment date. |
THE INFORMATION IN THIS STRUCTURAL AND COLLATERAL TERM SHEET IS NOT COMPLETE AND MAY BE AMENDED PRIOR TO THE TIME OF SALE. THIS TERM SHEET IS NOT AN OFFER TO SELL THESE SECURITIES AND IT IS NOT A SOLICITATION OF AN OFFER TO BUY THESE SECURITIES IN ANY JURISDICTION WHERE THE OFFER OR SALE IS NOT PERMITTED.
9
Mortgaged Properties by Location(1)
| State | Number of Properties | Cut-off Date Principal Balance | % of IPB | Weighted Average | ||||
| Occupancy | UW NCF DSCR(2)(3) | UW NOI Debt Yield(2) | Cut-off Date LTV(2)(4) | Maturity Date LTV(2)(4) | ||||
| NY | 8 | $268,750,000 | 33.1% | 72.6% | 3.29x | 12.9% | 38.7% | 38.7% |
| CA | 3 | 156,100,000 | 19.2 | 91.0% | 2.50x | 12.8% | 49.3% | 49.3% |
| PA | 2 | 50,660,000 | 6.2 | 85.1% | 1.64x | 11.9% | 59.6% | 49.4% |
| OR | 1 | 41,000,000 | 5.1 | 80.4% | 1.74x | 12.1% | 59.8% | 51.7% |
| OH | 11 | 38,452,174 | 4.7 | 87.1% | 1.56x | 11.5% | 70.3% | 60.3% |
| WA | 1 | 38,231,428 | 4.7 | 100.0% | 5.44x | 18.7% | 23.1% | 23.1% |
| KS | 1 | 32,500,000 | 4.0 | 88.2% | 1.38x | 9.3% | 64.9% | 55.8% |
| NV | 2 | 30,405,605 | 3.7 | 80.2% | 1.49x | 10.3% | 63.6% | 52.8% |
| GA | 4 | 26,609,398 | 3.3 | 98.9% | 1.33x | 9.5% | 67.2% | 55.9% |
| VA | 1 | 20,000,000 | 2.5 | 100.0% | 1.32x | 10.5% | 65.1% | 55.0% |
| FL | 3 | 18,649,460 | 2.3 | 90.5% | 1.64x | 12.0% | 58.9% | 47.4% |
| NJ | 1 | 14,875,000 | 1.8 | 92.9% | 1.64x | 10.3% | 60.7% | 55.4% |
| CT | 1 | 13,230,000 | 1.6 | 100.0% | 1.41x | 9.0% | 64.7% | 57.0% |
| MD | 1 | 11,500,000 | 1.4 | 96.2% | 1.74x | 11.8% | 68.5% | 56.3% |
| LA | 2 | 10,027,089 | 1.2 | 94.4% | 1.61x | 11.2% | 61.1% | 50.5% |
| UT | 1 | 9,250,000 | 1.1 | 98.8% | 1.30x | 10.1% | 67.0% | 58.0% |
| TX | 2 | 6,775,000 | 0.8 | 100.0% | 1.25x | 8.2% | 65.3% | 57.6% |
| AZ | 1 | 6,567,261 | 0.8 | 75.4% | 1.39x | 11.6% | 65.0% | 55.2% |
| MA | 1 | 3,900,541 | 0.5 | 100.0% | 1.50x | 10.1% | 56.3% | 48.6% |
| WY | 1 | 3,133,245 | 0.4 | 100.0% | 1.86x | 9.6% | 63.3% | 63.3% |
| MI | 2 | 3,036,522 | 0.4 | 95.1% | 1.37x | 9.4% | 71.7% | 59.0% |
| MO | 1 | 2,816,755 | 0.3 | 100.0% | 1.86x | 9.6% | 63.3% | 63.3% |
| IN | 2 | 2,391,652 | 0.3 | 98.2% | 1.37x | 9.4% | 71.7% | 59.0% |
| KY | 2 | 2,194,435 | 0.3 | 96.7% | 1.37x | 9.4% | 71.7% | 59.0% |
| Total/Wtd. Avg.: | 55 | $811,055,564 | 100.0% | 84.7% | 2.48x | 12.2% | 50.8% | 46.7% |
| (1) | Because this table presents information relating to the mortgaged properties and not mortgage loans, the information for mortgage loans secured by more than one mortgaged property is based on allocated loan amounts. |
| (2) | In the case of Loan Nos. 1, 2, 3, 6, 7, 8, 11, 13, 14, 16 and 25, the UW NCF DSCR, UW NOI Debt Yield, Cut-off Date LTV and Maturity Date LTV calculations include the relatedpari passu companion loan(s). In the case of Loan Nos. 1, 2, 3 and 6, the UW NCF DSCR, UW NOI Debt Yield, Cut-off Date LTV and Maturity Date LTV calculations exclude the subordinate companion loan(s) or other subordinate indebtedness. In the case of Loan Nos. 2, 3, 6 and 8, the UW NCF DSCR, UW NOI Debt Yield, Cut-off Date LTV and Maturity Date LTV calculations exclude the mezzanine loan. In the case of Loan No. 12, with an anticipated repayment date, Maturity Date LTV, is calculated through or as of, as applicable, the related anticipated repayment date. |
| (3) | For each partial interest-only mortgage loan, the UW NCF DSCR is calculated using the first principal and interest payment to be made into the trust during the term of the mortgage loan once amortization has commenced. |
| (4) | In the case of Loan No. 21, the Cut-off Date LTV and Maturity Date LTV are calculated based upon an “as-stabilized” appraised value as of October 1, 2017. The as-is Cut-off Date LTV is 75.2%. In the case of Loan No. 12, with an anticipated repayment date, Maturity Date LTV is calculated through or as of, as applicable, the related anticipated repayment date. |
THE INFORMATION IN THIS STRUCTURAL AND COLLATERAL TERM SHEET IS NOT COMPLETE AND MAY BE AMENDED PRIOR TO THE TIME OF SALE. THIS TERM SHEET IS NOT AN OFFER TO SELL THESE SECURITIES AND IT IS NOT A SOLICITATION OF AN OFFER TO BUY THESE SECURITIES IN ANY JURISDICTION WHERE THE OFFER OR SALE IS NOT PERMITTED.
10
Cut-off Date Principal Balance
| Weighted Average | |||||||||
| Range of Principal Balances | Number of Loans | Cut-off Date Principal Balance | % of IPB | Mortgage Rate | Remaining Loan Term(1) | UW NCF DSCR(2)(3) | UW NOI Debt Yield(2) | Cut-off Date LTV(2)(4) | Maturity Date LTV(1)(2)(4) |
| 5,000,000 - 9,999,999 | 7 | $44,719,350 | 5.5% | 5.1662% | 118 | 1.53x | 11.0% | 64.2% | 54.8% |
| 10,000,000 - 14,999,999 | 6 | 76,594,786 | 9.4 | 4.9560% | 118 | 1.50x | 10.2% | 66.0% | 56.3% |
| 15,000,000 - 19,999,999 | 5 | 84,910,000 | 10.5 | 4.8937% | 120 | 1.59x | 10.2% | 62.8% | 53.9% |
| 20,000,000 - 34,999,999 | 7 | 193,250,000 | 23.8 | 4.6605% | 119 | 2.23x | 11.9% | 53.9% | 48.3% |
| 35,000,000 - 49,999,999 | 3 | 117,231,428 | 14.5 | 4.3387% | 96 | 2.90x | 12.8% | 47.8% | 45.0% |
| 50,000,000 - 90,000,000 | 4 | 294,350,000 | 36.3 | 4.0898% | 94 | 3.14x | 13.5% | 40.4% | 40.4% |
| Total/Wtd. Avg.: | 32 | $811,055,563 | 100.0% | 4.4871% | 106 | 2.48x | 12.2% | 50.8% | 46.7% |
Mortgage Interest Rates
| Weighted Average | ||||||||||
| Range of Mortgage Interest Rates | Number of Loans | Cut-off Date Principal Balance | % of IPB | Mortgage Rate | Remaining Loan Term(1) | UW NCF DSCR(2)(3) | UW NOI Debt Yield(2) | Cut-off Date LTV(2)(4) | Maturity Date LTV(1)(2)(4) | |
| 3.3812% - 3.9999% | 5 | $253,231,428 | 31.2% | 3.5594% | 110 | 3.93x | 14.7% | 32.0% | 32.0% | |
| 4.0000% - 4.4999% | 4 | 132,725,000 | 16.4 | 4.3054% | 86 | 2.66x | 12.0% | 47.9% | 47.3% | |
| 4.5000% - 4.9999% | 9 | 198,627,381 | 24.5 | 4.7916% | 118 | 1.58x | 10.1% | 60.1% | 53.0% | |
| 5.0000% - 5.4999% | 10 | 132,942,694 | 16.4 | 5.1151% | 118 | 1.54x | 11.1% | 67.6% | 56.7% | |
| 5.5000% - 5.9000% | 4 | 93,529,061 | 11.5 | 5.7171% | 83 | 1.59x | 12.1% | 62.0% | 57.6% | |
| Total/Wtd. Avg.: | 32 | $811,055,563 | 100.0% | 4.4871% | 106 | 2.48x | 12.2% | 50.8% | 46.7% | |
Original Term to Maturity/ARD in Months
| Weighted Average | |||||||||
| Original Term to Maturity/ARD in Months | Number of Loans | Cut-off Date Principal Balance | % of IPB | Mortgage Rate | Remaining Loan Term(1) | UW NCF DSCR(2)(3) | UW NOI Debt Yield(2) | Cut-off Date LTV(2)(4) | Maturity Date LTV(1)(2)(4) |
| 60 | 3 | $162,581,428 | 20.0% | 4.5049% | 57 | 3.35x | 15.2% | 40.2% | 40.2% |
| 120 | 29 | 648,474,135 | 80.0 | 4.4826% | 119 | 2.27x | 11.5% | 53.4% | 48.3% |
| Total/Wtd. Avg.: | 32 | $811,055,563 | 100.0% | 4.4871% | 106 | 2.48x | 12.2% | 50.8% | 46.7% |
| (1) | In the case of Loan No. 12, with an anticipated repayment date, Remaining Loan Term and Maturity Date LTV are calculated through or as of, as applicable, the related anticipated repayment date. |
| (2) | In the case of Loan Nos. 1, 2, 3, 6, 7, 8, 11, 13, 14, 16 and 25, the UW NCF DSCR, UW NOI Debt Yield, Cut-off Date LTV and Maturity Date LTV calculations include the relatedpari passu companion loan(s). In the case of Loan Nos. 1, 2, 3 and 6, the UW NCF DSCR, UW NOI Debt Yield, Cut-off Date LTV and Maturity Date LTV calculations exclude the subordinate companion loan(s) or other subordinate indebtedness. In the case of Loan Nos. 2, 3, 6 and 8, the UW NCF DSCR, UW NOI Debt Yield, Cut-off Date LTV and Maturity Date LTV calculations exclude the mezzanine loan. |
| (3) | For each partial interest-only mortgage loan, the UW NCF DSCR is calculated using the first principal and interest payment to be made into the trust during the term of the mortgage loan once amortization has commenced. |
| (4) | In the case of Loan No. 21, the Cut-off Date LTV and Maturity Date LTV are calculated based upon an “as-stabilized” appraised value as of October 1, 2017. The as-is Cut-off Date LTV is 75.2%. |
THE INFORMATION IN THIS STRUCTURAL AND COLLATERAL TERM SHEET IS NOT COMPLETE AND MAY BE AMENDED PRIOR TO THE TIME OF SALE. THIS TERM SHEET IS NOT AN OFFER TO SELL THESE SECURITIES AND IT IS NOT A SOLICITATION OF AN OFFER TO BUY THESE SECURITIES IN ANY JURISDICTION WHERE THE OFFER OR SALE IS NOT PERMITTED.
11
Remaining Term to Maturity/ARD in Months
| Weighted Average | |||||||||
| Remaining Term to Maturity/ARD in Months | Number of Loans | Cut-off Date Principal Balance | % of IPB | Mortgage Rate | Remaining Loan Term(1) | UW NCF DSCR(2)(3) | UW NOI Debt Yield(2) | Cut-off Date LTV(2)(4) | Maturity Date LTV(1)(2)(4) |
| 56 - 60 | 3 | $162,581,428 | 20.0% | 4.5049% | 57 | 3.35x | 15.2% | 40.2% | 40.2% |
| 61 - 120 | 29 | 648,474,135 | 80.0 | 4.4826% | 119 | 2.27x | 11.5% | 53.4% | 48.3% |
| Total/Wtd. Avg.: | 32 | $811,055,563 | 100.0% | 4.4871% | 106 | 2.48x | 12.2% | 50.8% | 46.7% |
Original Amortization Term in Months
| Weighted Average | |||||||||
| Original Amortization Term in Months | Number of Loans | Cut-off Date Principal Balance | % of IPB | Mortgage Rate | Remaining Loan Term(1) | UW NCF DSCR(2)(3) | UW NOI Debt Yield(2) | Cut-off Date LTV(2)(4) | Maturity Date LTV(1)(2)(4) |
| Interest Only | 11 | $469,031,428 | 57.8% | 4.0915% | 97 | 3.18x | 13.3% | 41.3% | 41.3% |
| 270 | 1 | 6,150,000 | 0.8 | 5.2500% | 120 | 1.92x | 16.0% | 64.1% | 45.0% |
| 300 | 1 | 16,660,000 | 2.1 | 5.0800% | 120 | 1.49x | 12.0% | 68.3% | 55.4% |
| 360 | 19 | 319,214,135 | 39.4 | 5.0226% | 118 | 1.52x | 10.7% | 63.6% | 54.2% |
| Total/Wtd. Avg.: | 32 | $811,055,563 | 100.0% | 4.4871% | 106 | 2.48x | 12.2% | 50.8% | 46.7% |
Remaining Amortization Term in Months
| Weighted Average | |||||||||
| Remaining Amortization Term in Months | Number of Loans | Cut-off Date Principal Balance | % of IPB | Mortgage Rate | Remaining Loan Term(1) | UW NCF DSCR(2)(3) | UW NOI Debt Yield(2) | Cut-off Date LTV(2)(4) | Maturity Date LTV(1)(2)(4) |
| Interest Only | 11 | $469,031,428 | 57.8% | 4.0915% | 97 | 3.18x | 13.3% | 41.3% | 41.3% |
| 270 - 300 | 2 | 22,810,000 | 2.8 | 5.1258% | 120 | 1.60x | 13.1% | 67.2% | 52.6% |
| 301 - 359 | 5 | 48,584,135 | 6.0 | 5.3425% | 116 | 1.40x | 10.3% | 67.5% | 56.4% |
| 360 - 360 | 14 | 270,630,000 | 33.4 | 4.9652% | 119 | 1.54x | 10.7% | 62.9% | 53.8% |
| Total/Wtd. Avg.: | 32 | $811,055,563 | 100.0% | 4.4871% | 106 | 2.48x | 12.2% | 50.8% | 46.7% |
| (1) | In the case of Loan No. 12, with an anticipated repayment date, Remaining Loan Term and Maturity Date LTV are calculated through or as of, as applicable, the related anticipated repayment date. |
| (2) | In the case of Loan Nos. 1, 2, 3, 6, 7, 8, 11, 13, 14, 16 and 25, the UW NCF DSCR, UW NOI Debt Yield, Cut-off Date LTV and Maturity Date LTV calculations include the relatedpari passu companion loan(s). In the case of Loan Nos. 1, 2, 3 and 6, the UW NCF DSCR, UW NOI Debt Yield, Cut-off Date LTV and Maturity Date LTV calculations exclude the subordinate companion loan(s) or other subordinate indebtedness. In the case of Loan Nos. 2, 3, 6 and 8, the UW NCF DSCR, UW NOI Debt Yield, Cut-off Date LTV and Maturity Date LTV calculations exclude the mezzanine loan. |
| (3) | For each partial interest-only mortgage loan, the UW NCF DSCR is calculated using the first principal and interest payment to be made into the trust during the term of the mortgage loan once amortization has commenced. |
| (4) | In the case of Loan No. 21, the Cut-off Date LTV and Maturity Date LTV are calculated based upon an “as-stabilized” appraised value as of October 1, 2017. The as-is Cut-off Date LTV is 75.2%. |
THE INFORMATION IN THIS STRUCTURAL AND COLLATERAL TERM SHEET IS NOT COMPLETE AND MAY BE AMENDED PRIOR TO THE TIME OF SALE. THIS TERM SHEET IS NOT AN OFFER TO SELL THESE SECURITIES AND IT IS NOT A SOLICITATION OF AN OFFER TO BUY THESE SECURITIES IN ANY JURISDICTION WHERE THE OFFER OR SALE IS NOT PERMITTED.
12
Amortization Types
| Weighted Average | |||||||||
| Amortization Types | Number of Loans | Cut-off Date Principal Balance | % of IPB | Mortgage Rate | Remaining Loan Term(1) | UW NCF DSCR(2)(3) | UW NOI Debt Yield(2) | Cut-off Date LTV(2)(4) | Maturity Date LTV(1)(2)(4) |
| Interest Only | 10 | $444,031,428 | 54.7% | 4.1034% | 96 | 3.15x | 13.2% | 42.5% | 42.5% |
| IO-Balloon | 10 | 214,690,000 | 26.5 | 4.8730% | 118 | 1.56x | 10.9% | 62.5% | 53.8% |
| Balloon | 11 | 127,334,135 | 15.7 | 5.2934% | 119 | 1.46x | 10.6% | 66.0% | 54.4% |
| Interest Only, ARD | 1 | 25,000,000 | 3.1 | 3.8800% | 116 | 3.74x | 14.7% | 19.2% | 19.2% |
| Total/Wtd. Avg.: | 32 | $811,055,563 | 100.0% | 4.4871% | 106 | 2.48x | 12.2% | 50.8% | 46.7% |
Interest Only Periods(5)
| Weighted Average | |||||||||
| Interest Only Periods | Number of Loans | Cut-off Date Principal Balance | % of IPB | Mortgage Rate | Remaining Loan Term(1) | UW NCF DSCR(2)(3) | UW NOI Debt Yield(2) | Cut-off Date LTV(2)(4) | Maturity Date LTV(1)(2)(4) |
| 12 - 24 | 7 | $179,810,000 | 22.2% | 4.9245% | 118 | 1.58x | 11.2% | 62.4% | 53.3% |
| 25 - 48 | 2 | 20,005,000 | 2.5 | 4.8037% | 119 | 1.36x | 8.7% | 64.9% | 57.2% |
| 49 - 60 | 4 | 177,456,428 | 21.9 | 4.4913% | 62 | 3.21x | 14.8% | 41.9% | 41.5% |
| 61 - 120 | 8 | 306,450,000 | 37.8 | 3.8722% | 119 | 3.09x | 12.3% | 41.8% | 41.8% |
| Total/Wtd. Avg.: | 21 | $683,721,428 | 84.3% | 4.3369% | 104 | 2.67x | 12.6% | 47.9% | 45.2% |
Underwritten Net Cash Flow Debt Service Coverage Ratios(2)(3)
| Weighted Average | |||||||||
| Underwritten Net Cash Flow Debt Service Coverage Ratios | Number of Loans | Cut-off Date Principal Balance | % of IPB | Mortgage Rate | Remaining Loan Term(1) | UW NCF DSCR(2)(3) | UW NOI Debt Yield(2) | Cut-off Date LTV(2)(4) | Maturity Date LTV(1)(2)(4) |
| 1.21 - 1.49 | 13 | $187,193,530 | 23.1% | 5.1204% | 119 | 1.39x | 9.9% | 65.1% | 55.0% |
| 1.50 - 1.74 | 8 | 213,430,605 | 26.3 | 4.7886% | 117 | 1.67x | 10.4% | 62.2% | 56.3% |
| 1.75 - 1.99 | 4 | 71,100,000 | 8.8 | 5.5109% | 73 | 1.83x | 13.2% | 58.8% | 56.4% |
| 2.00 - 2.99 | 2 | 95,750,000 | 11.8 | 3.7764% | 120 | 2.64x | 10.6% | 50.3% | 50.3% |
| 3.00 - 5.44 | 5 | 243,581,428 | 30.0 | 3.7166% | 91 | 4.17x | 16.0% | 27.6% | 27.6% |
| Total/Wtd. Avg.: | 32 | $811,055,563 | 100.0% | 4.4871% | 106 | 2.48x | 12.2% | 50.8% | 46.7% |
| (1) | In the case of Loan No. 12, with an anticipated repayment date, Remaining Loan Term and Maturity Date LTV are calculated through or as of, as applicable, the related anticipated repayment date. |
| (2) | In the case of Loan Nos. 1, 2, 3, 6, 7, 8, 11, 13, 14, 16 and 25, the UW NCF DSCR, UW NOI Debt Yield, Cut-off Date LTV and Maturity Date LTV calculations include the relatedpari passu companion loan(s). In the case of Loan Nos. 1, 2, 3 and 6, the UW NCF DSCR, UW NOI Debt Yield, Cut-off Date LTV and Maturity Date LTV calculations exclude the subordinate companion loan(s) or other subordinate indebtedness. In the case of Loan Nos. 2, 3, 6 and 8, the UW NCF DSCR, UW NOI Debt Yield, Cut-off Date LTV and Maturity Date LTV calculations exclude the mezzanine loan. |
| (3) | For each partial interest-only mortgage loan, the UW NCF DSCR is calculated using the first principal and interest payment to be made into the trust during the term of the mortgage loan once amortization has commenced. |
| (4) | In the case of Loan No. 21, the Cut-off Date LTV and Maturity Date LTV are calculated based upon an “as-stabilized” appraised value as of October 1, 2017. The as-is Cut-off Date LTV is 75.2%. |
| (5) | Excluding eleven (11) loans that have no interest-only period during the loan term. |
THE INFORMATION IN THIS STRUCTURAL AND COLLATERAL TERM SHEET IS NOT COMPLETE AND MAY BE AMENDED PRIOR TO THE TIME OF SALE. THIS TERM SHEET IS NOT AN OFFER TO SELL THESE SECURITIES AND IT IS NOT A SOLICITATION OF AN OFFER TO BUY THESE SECURITIES IN ANY JURISDICTION WHERE THE OFFER OR SALE IS NOT PERMITTED.
13
LTV Ratios as of the Cut-off Date(1)(2)
| Weighted Average | ||||||||||
| Range of Cut-off Date LTVs | Number of Loans | Cut-off Date Principal Balance | % of IPB | Mortgage Rate | Remaining Loan Term(1) | UW NCF DSCR(2)(3) | UW NOI Debt Yield(2) | Cut-off Date LTV(2)(4) | Maturity Date LTV(1)(2)(4) | |
| 19.2% - 44.9% | 5 | $243,581,428 | 30.0% | 3.7166% | 91 | 4.17x | 16.0% | 27.6% | 27.6% | |
| 45.0% - 54.9% | 2 | 85,000,000 | 10.5 | 3.7341% | 120 | 2.68x | 10.8% | 49.2% | 48.6% | |
| 55.0% - 59.9% | 7 | 217,250,000 | 26.8 | 4.9950% | 103 | 1.72x | 11.1% | 58.3% | 53.9% | |
| 60.0% - 64.9% | 7 | 116,177,381 | 14.3 | 4.6832% | 119 | 1.57x | 9.4% | 63.7% | 57.4% | |
| 65.0% - 69.9% | 9 | 118,084,955 | 14.6 | 5.2911% | 118 | 1.48x | 11.2% | 67.9% | 57.4% | |
| 70.0% - 71.7% | 2 | 30,961,800 | 3.8 | 5.2486% | 119 | 1.30x | 9.4% | 71.7% | 59.5% | |
| Total/Wtd. Avg.: | 32 | $811,055,563 | 100.0% | 4.4871% | 106 | 2.48x | 12.2% | 50.8% | 46.7% | |
LTV Ratios as of the Maturity Date(1)(2)
| Weighted Average | |||||||||
| Range of Maturity/ARD Date LTVs | Number of Loans | Cut-off Date Principal Balance | % of IPB | Mortgage Rate | Remaining Loan Term(1) | UW NCF DSCR(2)(3) | UW NOI Debt Yield(2) | Cut-off Date LTV(2)(4) | Maturity Date LTV(1)(2)(4) |
| 19.2% - 34.9% | 4 | $173,231,428 | 21.4% | 3.5086% | 105 | 4.49x | 16.6% | 24.3% | 24.3% |
| 35.0% - 44.9% | 2 | 75,350,000 | 9.3 | 4.2648% | 61 | 3.30x | 14.5% | 36.9% | 36.2% |
| 45.0% - 54.9% | 7 | 207,372,381 | 25.6 | 4.4305% | 119 | 2.06x | 11.1% | 54.8% | 49.0% |
| 55.0% - 59.9% | 15 | 274,439,955 | 33.8 | 5.0764% | 106 | 1.58x | 10.5% | 63.4% | 57.3% |
| 60.0% - 64.1% | 4 | 80,661,800 | 9.9 | 4.9362% | 118 | 1.60x | 9.8% | 67.4% | 62.1% |
| Total/Wtd. Avg.: | 32 | $811,055,563 | 100.0% | 4.4871% | 106 | 2.48x | 12.2% | 50.8% | 46.7% |
Prepayment Protection
| Weighted Average | |||||||||
| Amortization Types | Number of Loans | Cut-off Date Principal Balance | % of IPB | Mortgage Rate | Remaining Loan Term(1) | UW NCF DSCR(2)(3) | UW NOI Debt Yield(2) | Cut-off Date LTV(2)(4) | Maturity Date LTV(1)(2)(4) |
| Defeasance | 28 | $571,474,135 | 70.5% | 4.7267% | 113 | 1.97x | 11.1% | 57.7% | 52.5% |
| Defeasance/Yield Maintenance | 3 | 198,581,428 | 24.5 | 3.6957% | 85 | 4.11x | 15.7% | 28.8% | 28.8% |
| Yield Maintenance | 1 | 41,000,000 | 5.1 | 4.9800% | 117 | 1.74x | 12.1% | 59.8% | 51.7% |
| Total/Wtd. Avg.: | 32 | $811,055,563 | 100.0% | 4.4871% | 106 | 2.48x | 12.2% | 50.8% | 46.7% |
| (1) | In the case of Loan No. 12, with an anticipated repayment date, Remaining Loan Term and Maturity Date LTV are calculated through or as of, as applicable, the related anticipated repayment date. |
| (2) | In the case of Loan Nos. 1, 2, 3, 6, 7, 8, 11, 13, 14, 16 and 25, the UW NCF DSCR, UW NOI Debt Yield, Cut-off Date LTV and Maturity Date LTV calculations include the relatedpari passu companion loan(s). In the case of Loan Nos. 1, 2, 3 and 6, the UW NCF DSCR, UW NOI Debt Yield, Cut-off Date LTV and Maturity Date LTV calculations exclude the subordinate companion loan(s) or other subordinate indebtedness. In the case of Loan Nos. 2, 3, 6 and 8, the UW NCF DSCR, UW NOI Debt Yield, Cut-off Date LTV and Maturity Date LTV calculations exclude the mezzanine loan. |
| (3) | For each partial interest-only mortgage loan, the UW NCF DSCR is calculated using the first principal and interest payment to be made into the trust during the term of the mortgage loan once amortization has commenced. |
| (4) | In the case of Loan No. 21, the Cut-off Date LTV and Maturity Date LTV are calculated based upon an “as-stabilized” appraised value as of October 1, 2017. The as-is Cut-off Date LTV is 75.2%. |
THE INFORMATION IN THIS STRUCTURAL AND COLLATERAL TERM SHEET IS NOT COMPLETE AND MAY BE AMENDED PRIOR TO THE TIME OF SALE. THIS TERM SHEET IS NOT AN OFFER TO SELL THESE SECURITIES AND IT IS NOT A SOLICITATION OF AN OFFER TO BUY THESE SECURITIES IN ANY JURISDICTION WHERE THE OFFER OR SALE IS NOT PERMITTED.
14
Loan Purpose
| Weighted Average | |||||||||
| Amortization Types | Number of Loans | Cut-off Date Principal Balance | % of IPB | Mortgage Rate | Remaining Loan Term(1) | UW NCF DSCR(2)(3) | UW NOI Debt Yield(2) | Cut-off Date LTV(2)(4) | Maturity Date LTV(1)(2)(4) |
| Refinance | 22 | $446,714,135 | 55.1% | 4.8965% | 111 | 1.89x | 11.2% | 57.7% | 52.0% |
| Acquisition | 10 | 364,341,428 | 44.9 | 3.9851% | 101 | 3.22x | 13.6% | 42.2% | 40.1% |
| Total/Wtd. Avg.: | 32 | $811,055,563 | 100.0% | 4.4871% | 106 | 2.48x | 12.2% | 50.8% | 46.7% |
| (1) | In the case of Loan No. 12, with an anticipated repayment date, Remaining Loan Term and Maturity Date LTV are calculated through or as of, as applicable, the related anticipated repayment date. |
| (2) | In the case of Loan Nos. 1, 2, 3, 6, 7, 8, 11, 13, 14, 16 and 25, the UW NCF DSCR, UW NOI Debt Yield, Cut-off Date LTV and Maturity Date LTV calculations include the relatedpari passu companion loan(s). In the case of Loan Nos. 1, 2, 3 and 6, the UW NCF DSCR, UW NOI Debt Yield, Cut-off Date LTV and Maturity Date LTV calculations exclude the subordinate companion loan(s) or other subordinate indebtedness. In the case of Loan Nos. 2, 3, 6 and 8, the UW NCF DSCR, UW NOI Debt Yield, Cut-off Date LTV and Maturity Date LTV calculations exclude the mezzanine loan. |
| (3) | For each partial interest-only mortgage loan, the UW NCF DSCR is calculated using the first principal and interest payment to be made into the trust during the term of the mortgage loan once amortization has commenced. |
| (4) | In the case of Loan No. 21, the Cut-off Date LTV and Maturity Date LTV are calculated based upon an “as-stabilized” appraised value as of October 1, 2017. The as-is Cut-off Date LTV is 75.2%. |
Previous Securitization History(1)
| No. | Loan / Property Name | Location | Property Type | Previous Securitization |
| 22 | Walmart Shopping Center Moultrie | Moultrie, GA | Retail | JPMCC 2006-CB17 |
| 23 | Valley View I | Las Vegas, NV | Industrial | WBCMT 2007-C30 |
| 26 | Plaza 7-21 | Salt Lake City, UT | Mixed Use | MSC 2007-IQ16 |
| 30 | Walgreens - WY and MO | Various, Various | Retail | JPMCC 2007-LDPX |
| (1) | The table above represents the properties for which the previously existing debt was most recently securitized, based on information provided by the related borrower or obtained through searches of a third-party database. While loans secured by the above mortgaged properties may have been securitized multiple times in prior transactions, mortgage loans in this securitization are only listed in the above chart if the mortgage loan in this securitization paid off a loan in another securitization. |
THE INFORMATION IN THIS STRUCTURAL AND COLLATERAL TERM SHEET IS NOT COMPLETE AND MAY BE AMENDED PRIOR TO THE TIME OF SALE. THIS TERM SHEET IS NOT AN OFFER TO SELL THESE SECURITIES AND IT IS NOT A SOLICITATION OF AN OFFER TO BUY THESE SECURITIES IN ANY JURISDICTION WHERE THE OFFER OR SALE IS NOT PERMITTED.
15
Class A-2(1)
| No. | Loan Name | Location | Cut-off Date Balance | % of IPB | Maturity/ARD Balance | % of Certificate Class | Original Loan Term | Remaining Loan Term | UW NCF DSCR(2) | UW NOI Debt Yield(2) | Cut-off Date LTV Ratio(2) | Maturity Date LTV Ratio(2) |
| 3 | Apple Sunnyvale | Sunnyvale, CA | $70,350,000 | 8.7% | $70,350,000 | 43.0% | 60 | 57 | 3.40x | 14.6% | 35.7% | 35.7% |
| 4 | Ritz Carlton Rancho Mirage | Rancho Mirage, CA | $54,000,000 | 6.7% | $54,000,000 | 33.0% | 60 | 58 | 1.81x | 13.4% | 58.2% | 58.2% |
| 6 | Urban Union Amazon | Seattle, WA | $38,231,428 | 4.7% | $38,231,428 | 23.4% | 60 | 56 | 5.44x | 18.7% | 23.1% | 23.1% |
| Total /Wtd. Avg.: | $162,581,428 | 20.0% | $162,581,428 | 60 | 57 | 3.35x | 15.2% | 40.2% | 40.2% | |||
| (1) | The table above presents the mortgage loans whose balloon payments would be applied to pay down the majority of the principal balance of the Class A-2 certificates, assuming a 0% CPR and applying the “Modeling Assumptions” described in the Preliminary Prospectus, including the assumptions that (i) none of the mortgage loans in the pool experience prepayments prior to the maturity date, defaults or losses; (ii) there are no extensions of maturity dates of any mortgage loans in the pool; and (iii) each mortgage loan in the pool is paid in full on its stated maturity date. Each class of certificates, including the Class A-2 certificates, evidences undivided ownership interests in the entire pool of mortgage loans. Debt service coverage ratio, debt yield and loan-to-value ratio information does not take into account subordinate debt (whether or not secured by the mortgaged property), if any, that is allowed under the terms of any mortgage loan. See Annex A-1 to the Preliminary Prospectus. |
| (2) | In the case of Loan Nos. 3 and 6, the UW NCF DSCR, UW NOI Debt Yield, Cut-off Date LTV and Maturity Date LTV calculations include the related pari passu companion loan(s). In the case of Loan Nos. 3 and 6, the UW NCF DSCR, UW NOI Debt Yield, Cut-off Date LTV and Maturity Date LTV calculations exclude the subordinate companion loan(s) or other subordinate indebtedness. In the case of Loan Nos. 3 and 6, the UW NCF DSCR, UW NOI Debt Yield, Cut-off Date LTV and Maturity Date LTV calculations exclude the mezzanine loan. |
THE INFORMATION IN THIS STRUCTURAL AND COLLATERAL TERM SHEET IS NOT COMPLETE AND MAY BE AMENDED PRIOR TO THE TIME OF SALE. THIS TERM SHEET IS NOT AN OFFER TO SELL THESE SECURITIES AND IT IS NOT A SOLICITATION OF AN OFFER TO BUY THESE SECURITIES IN ANY JURISDICTION WHERE THE OFFER OR SALE IS NOT PERMITTED.
16
Structural Overview
| Order of Distribution: | On each Distribution Date, funds available for distribution from the pooled mortgage loans, net of specified trust expenses, yield maintenance charges, prepayment premiums and excess interest distributable to the Class Z Certificates, will be distributed in the following amounts and order of priority (in each case to the extent of remaining pooled available funds):
First:To interest on the Class A-1, Class A-2, Class A-3, Class A-4, Class A-SB, Class X-A and Class X-B certificates, up to, andpro rata in accordance with, their respective interest entitlements.
Second:To the extent of funds allocated to principal and available for distribution: (i) first,to principal on the Class A-SB certificates, until the certificate balance of the Class A-SB certificates is reduced to the scheduled principal balance for the related distribution date set forth in Annex E to the Preliminary Prospectus, (ii) second,to principal on the Class A-1 certificates, until the certificate balance of the Class A-1 certificates has been reduced to zero, (iii)third,to principal on the Class A-2 certificates, until the certificate balance of the Class A-2 certificates has been reduced to zero, (iv) fourth,to principal on the Class A-3 certificates, until the certificate balance of the Class A-3 certificates has been reduced to zero, (v)fifth, to principal on the Class A-4 certificates until the certificate balance of the Class A-4 certificates has been reduced to zero and (vi)sixth, to principal on the Class A-SB certificates, until the certificate balance of the Class A-SB certificates has been reduced to zero. If the certificate balance of each and every class of certificates other than the Class A-1, Class A-2, Class A-3, Class A-4 and Class A-SB certificates has been reduced to zero as a result of the allocation of mortgage loan losses to those certificates, funds available for distributions of principal will be distributed to the Class A-1, Class A-2, Class A-3, Class A-4 and Class A-SB certificates,pro rata, based on their respective certificate balances, without regard to the distribution priorities described above or the planned principal balance of the Class A-SB certificates.
Third:To reimburse the Class A-1, Class A-2, Class A-3, Class A-4 and Class A-SB certificates,pro rata, for any previously unreimbursed losses on the mortgage loans allocable to principal that were previously borne by those classes, together with interest on that amount at the pass-through rate for such class.
Fourth:(i)first, to interest on the Class A-S certificates in the amount of their interest entitlement; (ii)second, to the extent of funds allocated to principal remaining after any distributions in respect of principal to each class of certificates with a higher payment priority (in this case, the Class A-1, Class A-2, Class A-3, Class A-4 and Class A-SB certificates), to principal on the Class A-S certificates until their certificate balance is reduced to zero; and (iii)third, to reimburse the Class A-S certificates for any previously unreimbursed losses on the mortgage loans allocable to principal that were previously borne by that class, together with interest at its pass-through rate.
Fifth:(i)first, to interest on the Class B certificates in the amount of their interest entitlement; (ii)second, to the extent of funds allocated to principal remaining after any distributions in respect of principal to each class of certificates with a higher payment priority (in this case, the Class A-1, Class A-2, Class A-3, Class A-4, Class A-SB and Class A-S certificates), to principal on the Class B certificates until their certificate balance |
THE INFORMATION IN THIS STRUCTURAL AND COLLATERAL TERM SHEET IS NOT COMPLETE AND MAY BE AMENDED PRIOR TO THE TIME OF SALE. THIS TERM SHEET IS NOT AN OFFER TO SELL THESE SECURITIES AND IT IS NOT A SOLICITATION OF AN OFFER TO BUY THESE SECURITIES IN ANY JURISDICTION WHERE THE OFFER OR SALE IS NOT PERMITTED.
17
| Order of Distribution (continued): | is reduced to zero; and (iii)third, to reimburse the Class B certificates for any previously unreimbursed losses on the mortgage loans allocable to principal that were previously borne by that class, together with interest at its pass-through rate.
Sixth:(i)first, to interest on the Class C certificates in the amount of their interest entitlement; (ii)second, to the extent of funds allocated to principal remaining after any distributions in respect of principal to each class of certificates with a higher payment priority (in this case, the Class A-1, Class A-2, Class A-3, Class A-4, Class A-SB, Class A-S and Class B certificates), to principal on the Class C certificates until their certificate balance is reduced to zero; and (iii)third, to reimburse the Class C certificates for any previously unreimbursed losses on the mortgage loans allocable to principal that were previously borne by that class, together with interest at its pass-through rate.
Seventh:After the Class A-1, Class A-2, Class A-3, Class A-4, Class A-SB, Class X-A, Class X-B, Class A-S, Class B and Class C certificates are paid all amounts to which they are entitled, the remaining funds available for distribution will be used to pay interest and principal and to reimburse any unreimbursed losses to the Class D, Class E, Class F and Class NR certificates sequentially in that order in a manner analogous to that described in clausesixthabove with respect to the Class C certificates, until the certificate balance of each such class is reduced to zero.
The holders of the 85 Broad Street loan-specific certificates will only be entitled to receive distributions at the related pass-through rate in respect of, and will only incur losses with respect to, the 85 Broad Street trust subordinate companion loan, which is included as an asset of the issuing entity, but not part of the pool of mortgage loans backing the other classes of certificates, as described under “—Realized Losses” below.
For more detailed information regarding the distributions on the pooled certificates, see “Description of the Certificates—Distributions—Priority of Distributions” in the Preliminary Prospectus. |
Realized Losses:
| The certificate balances of the Class A-1, Class A-2, Class A-3, Class A-4, Class A-SB, Class A-S, Class B, Class C, Class D, Class E, Class F and Class NR certificates will each be reduced without distribution on any Distribution Date as a write-off to the extent of any loss realized on the mortgage loans allocated to such class of certificates on such Distribution Date. On each Distribution Date, any such write-offs will be applied to such classes of certificates in the following order, in each case until the related certificate balance is reduced to zero:first, to the Class NR certificates;second, to the Class F certificates;third, to the Class E certificates;fourth, to the Class D certificates;fifth, to the Class C certificates;sixth, to the Class B certificates;seventh, to the Class A-S certificates; and,finally,pro rata, to the Class A-1, Class A-2, Class A-3, Class A-4 and Class A-SB certificates, based on their then-current respective certificate balances. The notional amount of the Class X-A certificates will be reduced to reflect reductions in the certificate balances of the Class A-1, Class A-2, Class A-3, Class A-4, Class A-SB and Class A-S certificates resulting from allocations of losses realized on the mortgage loans. The notional amount of the Class X-B certificates will be reduced to reflect reductions in the certificate balance of the Class B and Class C certificates resulting from allocations of losses realized on the mortgage loans.
The certificate balances of the privately offered 85 Broad Street loan-specific certificates will each be reduced without distribution on any Distribution Date as a write off to the |
THE INFORMATION IN THIS STRUCTURAL AND COLLATERAL TERM SHEET IS NOT COMPLETE AND MAY BE AMENDED PRIOR TO THE TIME OF SALE. THIS TERM SHEET IS NOT AN OFFER TO SELL THESE SECURITIES AND IT IS NOT A SOLICITATION OF AN OFFER TO BUY THESE SECURITIES IN ANY JURISDICTION WHERE THE OFFER OR SALE IS NOT PERMITTED.
18
| Realized Losses (continued): | extent of any loss realized on the 85 Broad Street trust subordinate companion loan allocated to such class of certificates on such Distribution Date. On each Distribution Date, any such write offs will be applied to such classes of certificates:first, to the Class 85-D certificates,second, to the Class 85-C certificates,third, to the 85-B certificates and,then, to the 85-A certificates, in each case until the related certificate balance is reduced to zero. The notional amount of the Class X-85 certificates will be reduced to reflect reductions in the certificate balances of the 85 Broad Street loan-specific certificates resulting from allocations of losses realized on the 85 Broad Street trust subordinate companion loan. |
| Prepayment Premiums and Yield Maintenance Charges: | On each Distribution Date, each yield maintenance charge collected on the pooled mortgage loans during the one-month period ending on the related Determination Date is required to be distributed to certificateholders (excluding the Class E, Class F, Class NR, Class Z and Class R certificates) as follows: (1)pro rata, between (x) the group (the “YM Group A”) of Class A-1, Class A-2, Class A-3, Class A-4, Class A-SB, Class X-A and Class A-S certificates, and (y) the group (the “YM Group B” and collectively with the YM Group A, the “YM Groups”) of the Class X-B, Class B, Class C and Class D certificates, based upon the aggregate amount of principal distributed to the classes of pooled principal balance certificates in each YM Group on such Distribution Date, and (2) as among the respective classes of pooled principal balance certificates in each YM Group in the following manner: (A) on apro rata basis in accordance with their respective entitlements in those yield maintenance charges, to each class of pooled principal balance certificates in such YM Group with a certificate balance in an amount equal to the product of (x) a fraction whose numerator is the amount of principal distributed to such class of pooled principal balance certificates on such Distribution Date and whose denominator is the total amount of principal distributed to all of the certificates in such YM Group with certificate balances on such Distribution Date, (y) the Base Interest Fraction for the related principal prepayment with respect to such class of pooled principal balance certificates, and (z) the aggregate amount of such yield maintenance charge allocated to such YM Group; and (B) the portion of such yield maintenance charge allocated to such YM Group remaining after such distributions to the applicable class(es) of pooled principal balance certificates in such YM Group, in the case of amounts distributable to YM Group A, to the Class X-A certificates and in the case of amounts distributable to YM Group B, to the Class X-B certificates.
Any yield maintenance charges payable in respect of the 85 Broad Street trust subordinate companion loan will be distributed to the 85 Broad Street loan-specific certificates and will not be allocated to the other classes of certificates.
The “Base Interest Fraction” with respect to any principal prepayment on any mortgage loan and with respect to any class of Class A-1, Class A-2, Class A-3, Class A-4, Class A-SB, Class A-S, Class B, Class C and Class D certificates is a fraction (a) whose numerator is the greater of (x) zero and (y) the difference between (i) the pass-through rate on such class of certificates and (ii) the discount rate used in accordance with the related mortgage loan documents in calculating the yield maintenance charge with respect to such principal prepayment and (b) whose denominator is the greater of zero and the difference between (i) the mortgage loan rate on such mortgage loan (or serviced whole loan) and (ii) the discount rate used in accordance with the related mortgage loan documents in calculating the yield maintenance charge with respect to such principal prepayment; |
THE INFORMATION IN THIS STRUCTURAL AND COLLATERAL TERM SHEET IS NOT COMPLETE AND MAY BE AMENDED PRIOR TO THE TIME OF SALE. THIS TERM SHEET IS NOT AN OFFER TO SELL THESE SECURITIES AND IT IS NOT A SOLICITATION OF AN OFFER TO BUY THESE SECURITIES IN ANY JURISDICTION WHERE THE OFFER OR SALE IS NOT PERMITTED.
19
| Prepayment Premiums and Yield Maintenance Charges (continued): | provided,however, that under no circumstances will the Base Interest Fraction be greater than one or less than zero. If such discount rate is greater than or equal to the lesser of (x) the mortgage loan rate on the related mortgage loan and (y) the pass-through rate described in the preceding sentence, then the Base Interest Fraction will equal zero;provided,however, that if such discount rate is greater than or equal to the mortgage loan rate, but less than the pass-through rate, the fraction will be one.
If a prepayment premium (calculated as a fixed percentage of the amount prepaid) is imposed in connection with a prepayment rather than a yield maintenance charge, then the prepayment premium so collected will be allocated as described above. For this purpose, the discount rate used to calculate the Base Interest Fraction will be the discount rate used to determine the yield maintenance charge for mortgage loans that require payment at the greater of a yield maintenance charge or a minimum amount equal to a fixed percentage of the principal balance of the mortgage loan or, for mortgage loans that only have a prepayment premium based on a fixed percentage of the principal balance of the mortgage loan, such other discount rate as may be specified in the related loan documents.
No prepayment premiums or yield maintenance charges will be distributed to holders of the Class E, Class F, Class NR, Class Z or Class R certificates. Instead, after the notional amounts of the Class X-A and Class X-B certificates and the certificate balances of the Class A-1, Class A-2, Class A-3, Class A-4, Class A-SB, Class A-S, Class B, Class C and Class D certificates have been reduced to zero, all prepayment premiums and yield maintenance charges with respect to the pooled mortgage loans will be distributed to holders of the Class X-B certificates, regardless of whether the notional amount of the Class X-B certificates has been reduced to zero. For a description of prepayment premiums and yield maintenance charges required on the mortgage loans, see Annex A-1 to the Preliminary Prospectus. See also“Certain Legal Aspects of the Mortgage Loans—Default Interest and Limitations on Prepayments” in the Preliminary Prospectus. Prepayment premiums and yield maintenance charges will be distributed on any Distribution Date only to the extent they are received in respect of the mortgage loans as of the related Determination Date. See also“Description of the Certificates—Distributions”in the Preliminary Prospectus. |
Non-Serviced Mortgage Loans:
| Each of the 245 Park Avenue mortgage loan, the Acropolis Garden mortgage loan (on and after the related servicing shift securitization date) and the Garden Multifamily Portfolio mortgage loan (on and after the related servicing shift securitization date) is referred to in this Term Sheet as, individually, a “non-serviced mortgage loan” and, collectively, the “non-serviced mortgage loans”. Each non-serviced mortgage loan and the related companion loan(s) are being serviced and administered in accordance with, and all decisions, consents, waivers, approvals and other actions on the part of the holders of the non-serviced mortgage loan and the related companion loan(s) will be effected in accordance with, the Lead Pooling and Servicing Agreement set forth in the “Whole Loan Summary” table above and the related co-lender agreement. Consequently, the servicing provisions set forth in this Term Sheet will generally not be applicable to the non-serviced mortgage loans, but instead such servicing and administration of the non-serviced mortgage loans will, in each case, be governed by the related Lead Pooling and Servicing Agreement. Each Lead Pooling and Servicing Agreement provides for servicing in a manner acceptable for rated transactions similar in nature to this securitization. The non-serviced mortgage loans are discussed further under“—Whole Loans” below. |
THE INFORMATION IN THIS STRUCTURAL AND COLLATERAL TERM SHEET IS NOT COMPLETE AND MAY BE AMENDED PRIOR TO THE TIME OF SALE. THIS TERM SHEET IS NOT AN OFFER TO SELL THESE SECURITIES AND IT IS NOT A SOLICITATION OF AN OFFER TO BUY THESE SECURITIES IN ANY JURISDICTION WHERE THE OFFER OR SALE IS NOT PERMITTED.
20
Advances:
| The master servicer and, if it fails to do so, the trustee, will be obligated to make (i) P&I advances with respect to each mortgage loan in the issuing entity and the 85 Broad Street trust subordinate companion loan and, (ii) with respect to each mortgage loan (other than the non-serviced mortgage loans) and serviced whole loan, servicing advances, including paying delinquent real estate taxes, assessments and hazard insurance premiums, but only to the extent that those advances are not deemed nonrecoverable from collections on the related mortgage loan (or, if applicable, serviced whole loan) and, in the case of P&I advances, subject to reduction in connection with any appraisal reduction amounts that may occur. The special servicer will have no obligation to make servicing advances;providedthat with respect to a specially serviced loan, the special servicer will be entitled to make a servicing advance in an urgent or emergency situation, and the master servicer will be required to reimburse the special servicer for such advance, with interest;provided that the advance is not determined by the master servicer to be nonrecoverable. Notwithstanding the foregoing, servicing advances for the non-serviced mortgage loans will be made by the parties to, and pursuant to, the applicable Lead Pooling and Servicing Agreement. |
| Appraisal Reduction Amounts: | An appraisal reduction amount generally will be created with respect to a required appraisal loan (which is a serviced mortgage loan (or serviced whole loan, if applicable)) as to which certain defaults, modifications or insolvency events have occurred (as further described in the Preliminary Prospectus) in the amount, if any, by which the principal balance of such required appraisal loan, exceeds 90% of the appraised value of the related mortgaged property (as determined by one or more appraisals obtained by the special servicer) plus certain escrows and reserves (including letters of credit) held with respect to such required appraisal loan (net of other amounts overdue or advanced in connection with such required appraisal loan). In general, subject to the discussion in the next paragraphs, any appraisal reduction amount calculated with respect to a whole loan will be allocated to the related mortgage loan andpari passu companion loan(s) on apro rata basis in accordance with their respective outstanding principal balances. In the case of the non-serviced mortgage loans, any appraisal reduction amounts will be calculated pursuant to, and by a party to, the related Lead Pooling and Servicing Agreement (as discussed under “—Whole Loans” below). As a result of an appraisal reduction amount being calculated for and/or allocated to a given mortgage loan, the interest portion of any P&I advance for such mortgage loan will be reduced, which will have the effect of reducing the amount of interest available for distribution to the most subordinate class(es) of certificates (exclusive of the Class Z and Class R certificates) then outstanding (i.e., first to the Class NR certificates, then to the Class F certificates, then to the Class E certificates, then to the Class D certificates, then to the Class C certificates, then to the Class B certificates, then to the Class A-S certificates, and then,pro rata based on their respective interest entitlements, to the Class A-1, Class A-2, Class A-3, Class A-4, Class A-SB, Class X-A and Class X-B certificates). In general, a mortgage loan (or whole loan, if applicable) serviced under the pooling and servicing agreement for this transaction will cease to be a required appraisal loan, and no longer be subject to an appraisal reduction amount, when the same has ceased to be a specially serviced loan (if applicable), has been brought current for at least three consecutive months and no other circumstances exist that would cause such serviced loan to be a required appraisal loan. |
THE INFORMATION IN THIS STRUCTURAL AND COLLATERAL TERM SHEET IS NOT COMPLETE AND MAY BE AMENDED PRIOR TO THE TIME OF SALE. THIS TERM SHEET IS NOT AN OFFER TO SELL THESE SECURITIES AND IT IS NOT A SOLICITATION OF AN OFFER TO BUY THESE SECURITIES IN ANY JURISDICTION WHERE THE OFFER OR SALE IS NOT PERMITTED.
21
| Appraisal Reduction Amounts (continued): | Appraisal reduction amounts with respect to each of the 85 Broad Street whole loan, the 245 Park Avenue whole loan, the Apple Sunnyvale whole loan and the Urban Union Amazon whole loan will be allocated to notionally reduce the outstanding principal balance of the related subordinate companion loan(s) prior topro rata allocation to the related mortgage loan and any relatedpari passu companion loans.
At any time an appraisal is ordered under the pooling and servicing agreement with respect to a property that would result in an appraisal reduction amount with respect to a mortgage loan that would result in a change in the controlling class, certain certificateholders will have a right to request a new appraisal as described in the Preliminary Prospectus. |
Age of Appraisals:
| Appraisals (which can be an update of a prior appraisal) with respect to a mortgage loan serviced under the pooling and servicing agreement are required to be no older than 9 months for purposes of determining appraisal reduction amounts, market value, and other calculations as described in the Preliminary Prospectus. |
| Sale of Defaulted Loans: | There will be no “Fair Market Value Purchase Option”, instead defaulted loans will be sold in a process similar to the sale process for REO property. |
| Cleanup Call: | On any distribution date on which the aggregate unpaid principal balance of the pooled mortgage loans and the 85 Broad Street trust subordinate companion loan remaining in the issuing entity is less than (or, in the case of clause (ii) below, less than or equal to) the greater of (i) 1% of the aggregate principal balance of the pooled mortgage loans and the 85 Broad Street trust subordinate companion loan as of the Cut-off Date, or (ii) if the mortgage loan identified on Annex A-1 as 71 Fifth Ave is an asset of the trust fund, the product of (x) a percentage that is calculated by dividing (A) the sum of the outstanding principal balance of the mortgage loan identified on Annex A-1 as 71 Fifth Ave on any date of determination and 1% of the aggregate principal balance of the mortgage loans and the 85 Broad Street trust subordinate companion loan as of the cut-off date by (B) the aggregate principal balance of the mortgage loans as of the cut-off date and (y) the aggregate principal balance of the mortgage loans as of the cut-off date, certain entities specified in the Preliminary Prospectus will have the option to purchase all of the remaining mortgage loans and 85 Broad Street trust subordinate companion loan (and all property acquired through exercise of remedies in respect of any mortgage loan) at the price specified in the Preliminary Prospectus; provided, however, that this termination right will not be exercisable at the percentage threshold specified in clause (ii) above earlier than the distribution date in June 2027. If the aggregate certificate balances of all certificates (exclusive of the Class X Certificates) senior to the Class D certificates, and the notional amounts of the Class X-A and Class X-B certificates have been reduced to zero, and if the master servicer has consented, the issuing entity could also be terminated in connection with a voluntary exchange of all the then-outstanding certificates (including the loan-specific certificates but excluding the Class Z and Class R certificates), for the mortgage loans and the 85 Broad Street trust subordinate companion loan remaining in the issuing entity, but all of the holders of those classes of outstanding certificates (excluding the Class Z and Class R certificates) would have to voluntarily participate in the exchange. |
| Directing Certificateholder / Directing Holder: | The “Directing Certificateholder” will generally be the controlling class certificateholder or other representative designated by the holder(s) of at least a majority of the voting rights of the controlling class. The controlling class is the most subordinate class of the Class E, |
THE INFORMATION IN THIS STRUCTURAL AND COLLATERAL TERM SHEET IS NOT COMPLETE AND MAY BE AMENDED PRIOR TO THE TIME OF SALE. THIS TERM SHEET IS NOT AN OFFER TO SELL THESE SECURITIES AND IT IS NOT A SOLICITATION OF AN OFFER TO BUY THESE SECURITIES IN ANY JURISDICTION WHERE THE OFFER OR SALE IS NOT PERMITTED.
22
| Directing Holder / Directing Certificateholder (continued): | Class F and Class NR certificates (the “Control Eligible Certificates”) that has an aggregate certificate balance as notionally reduced by any Cumulative Appraisal Reduction Amounts allocated to such class, that is equal to or greater than 25% of the initial certificate balance of such class of certificates, or if no class of Control Eligible Certificates meets the preceding requirement, the most senior class of Control Eligible Certificates. The Controlling Class as of the Closing Date will be the Class NR certificates. At any time when Class NR is the controlling class, the majority Class NR certificateholders may elect under certain circumstances to opt-out from its rights under the pooling and servicing agreement. See “Pooling and Servicing Agreement—The Directing Holder” in the Preliminary Prospectus. No other class of certificates will be eligible to act as the controlling class or appoint a Directing Certificateholder.
Eightfold Real Estate Capital Fund V, L.P. (or its affiliate) is expected to purchase the Class E, Class F, Class NR and a portion of the Class Z certificates on the Closing Date, is expected to be the initial Directing Certificateholder.
The “Directing Holder” will initially be:
(a) with respect to any Mortgage Loan (other than any Non-Serviced Mortgage Loan, Servicing Shift Mortgage Loan, the 85 Broad Street Mortgage Loan, the Apple Sunnyvale Mortgage Loan and the Urban Union Amazon Mortgage Loan) or Serviced Whole Loan (other than the 85 Broad Street Whole Loan and any Serviced AB Whole Loan), the Directing Certificateholder;
(b) with respect to the 85 Broad Street Whole Loan, (i) for so long as no 85 Broad Street Trust Subordinate Companion Loan Control Termination Event exists, the 85 Broad Street Directing Holder and (ii) for so long as an 85 Broad Street Trust Subordinate Companion Loan Control Termination Event exists, the Directing Certificateholder;
(c) with respect to any Serviced AB Whole Loan, (i) for so long as no related Control Appraisal Period exists, the AB Whole Loan Controlling Holder and (ii) for so long as a related Control Appraisal Period exists, the Directing Certificateholder; and
(d) with respect to any Servicing Shift Whole Loan, (i) prior to the date on which the related controlling companion loan is securitized (the “Servicing Shift Securitization Date”), the related controlling noteholder and (ii) on and after the related Servicing Shift Securitization Date, the directing certificateholder under the related pooling and servicing agreement entered into in connection with the securitization of the related controlling companion loan.
The “85 Broad Street Directing Holder” will be:
■ initially, the holder of the 85 Broad Street Non-Trust Junior Subordinate Companion Loan;
■ if an 85 Broad Street Non-Trust Junior Subordinate Companion Loan Control Termination Event has occurred and is continuing, but an 85 Broad Street Non-Trust Senior Subordinate Companion Loan Control Termination Event has not occurred and is not continuing, the holder of the 85 Broad Street Non-Trust Senior Subordinate Companion Loan;
■ if an 85 Broad Street Non-Trust Senior Subordinate Companion Loan Control Termination Event has occurred and is continuing, but an 85 Broad Street Trust |
THE INFORMATION IN THIS STRUCTURAL AND COLLATERAL TERM SHEET IS NOT COMPLETE AND MAY BE AMENDED PRIOR TO THE TIME OF SALE. THIS TERM SHEET IS NOT AN OFFER TO SELL THESE SECURITIES AND IT IS NOT A SOLICITATION OF AN OFFER TO BUY THESE SECURITIES IN ANY JURISDICTION WHERE THE OFFER OR SALE IS NOT PERMITTED.
23
| Directing Holder / Directing Certificateholder (continued): | Subordinate Companion Loan Control Termination Event has not occurred and is not continuing, the 85 Broad Street Directing Certificateholder (or its representative).
The “85 Broad Street Directing Certificateholder” will be the 85 Broad Street controlling class certificateholder selected by a majority of the 85 Broad Street controlling class (by certificate balance, as certified by the certificate registrar from time to time as provided for in the PSA). After the occurrence and during the continuation of an 85 Broad Street Trust Subordinate Companion Loan Control Termination Event, there will be no 85 Broad Street Directing Certificateholder.
The initial Directing Holder with respect to the Apple Sunnyvale whole loan is anticipated to be Koramco US Debt Strategy Private Real Estate Investment Trust No. 3, which is expected to be the holder of the related subordinate companion loan. The initial Directing Holder with respect to the Urban Union Amazon whole loan is anticipated to be Hangang US Real Estate Fund No. 1, Hangang US Real Estate Fund No. 1-1 and Hangang US Real Estate Fund No. 1-2, collectively, which are expected to be the holders of the related subordinate companion loan.
For a description of the directing holder for the Non-Serviced Whole Loan, see “Description of the Mortgage Pool—The Whole Loans” in the Preliminary Prospectus. |
Control/Consultation Rights:
| The Directing Certificateholder will be entitled to have consultation and approval rights with respect to certain major decisions (including with respect to assumptions, waivers, loan modifications and workouts) for so long as no Control Termination Event exists.
So long as a Control Termination Event does not exist, the Directing Certificateholder will be entitled to direct the special servicer to take, or refrain from taking, certain actions that would constitute major decisions with respect to a mortgage loan or whole loan serviced under the pooling and servicing agreement (or, with respect to the 85 Broad Street whole loan, during the occurrence and continuation of an 85 Broad Street Trust Subordinate Companion Loan Control Termination Event, and with respect to each of the Apple Sunnyvale whole loan and the Urban Union Amazon whole loan, during the related control appraisal period) and will also have the right to notice and to consent to certain material actions that would constitute major decisions that the master servicer or the special servicer plan on taking with respect to any such mortgage loan or serviced whole loan subject to the servicing standard and other restrictions as described in the Preliminary Prospectus.
Following the occurrence and during the continuation of a Control Termination Event and until the occurrence of a Consultation Termination Event, all of the rights of the Directing Certificateholder will terminate other than a right to consult with respect to the major decisions and other matters as to which it previously had approval rights. After the occurrence and during the continuation of an Operating Advisor Consultation Event, the operating advisor will be entitled to consult with the special servicer with respect to certain major decisions on behalf of the issuing entity and in the best interest of, and for the benefit of, the certificateholders, as if those certificateholders and, with respect to a serviced pari passu companion loan, the related pari passu companion loan holder(s) constituted a single lender.
A “Control Termination Event” will occur with respect to any mortgage loan (or, with respect to the 85 Broad Street mortgage loan, when each of an 85 Broad Street Non- |
THE INFORMATION IN THIS STRUCTURAL AND COLLATERAL TERM SHEET IS NOT COMPLETE AND MAY BE AMENDED PRIOR TO THE TIME OF SALE. THIS TERM SHEET IS NOT AN OFFER TO SELL THESE SECURITIES AND IT IS NOT A SOLICITATION OF AN OFFER TO BUY THESE SECURITIES IN ANY JURISDICTION WHERE THE OFFER OR SALE IS NOT PERMITTED.
24
| Control/Consultation Rights (continued): | Trust Junior Subordinate Companion Loan Control Termination Event, an 85 Broad Street Non-Trust Senior Subordinate Companion Loan Control Termination Event and an 85 Broad Street Trust Subordinate Companion Loan Control Termination Event exists, or, with respect to each of the Apple Sunnyvale whole loan and the Urban Union Amazon whole loans, during the related control appraisal period) and any related serviced companion loan when (i) no Class of Control Eligible Certificates exists that has a certificate balance (as notionally reduced by any Cumulative Appraisal Reduction Amounts allocable to such Class) that is at least equal to 25% of the initial certificate balance of such Class; (ii) such mortgage loan or whole loan is an excluded loan; or (iii) a holder of the Class E Certificates becoming the majority controlling class certificateholder and having irrevocably waived its right, in writing, to exercise any of the rights of the controlling class certificateholder and such rights have not been reinstated to a successor controlling class certificateholder; provided that a Control Termination Event shall not be deemed continuing in the event that the certificate balances of the Certificates other than the Control Eligible Certificates have been reduced to zero as a result of principal payments on the mortgage loans. The “Cumulative Appraisal Reduction Amount” as of any date of determination for any mortgage loan, is equal to the sum of (i) all appraisal reduction amounts then in effect, and (ii) with respect to any AB Modified Loan, any Collateral Deficiency Amount then in effect. “AB Modified Loan” means any corrected loan (1) that became a corrected loan (which includes for purposes of this definition any non-serviced mortgage loan that became a “corrected loan” (or any term substantially similar thereto) pursuant to the Lead Pooling and Servicing Agreement governing the servicing of such non-serviced mortgage loan) due to a modification thereto that resulted in the creation of an A/B note structure (or similar structure) and as to which the new junior note(s) did not previously exist or the principal amount of the new junior note(s) was previously part of either an A note held by the issuing entity or the original unmodified mortgage loan and (2) as to which an appraisal reduction amount is not in effect.
“Collateral Deficiency Amount” means, with respect to any AB Modified Loan as of any date of determination, the excess of (i) the principal balance of such AB Modified Loan (taking into account the related junior note(s) and any pari passu notes included therein), over (ii) the sum of (in the case of a Whole Loan, solely to the extent allocable to the subject mortgage loan) (x) the most recent Appraised Value for the related mortgaged property or mortgaged properties, plus (y) solely to the extent not reflected or taken into account in such Appraised Value (or in the calculation of any related appraisal reduction amount) and to the extent on deposit with, or otherwise under the control of, the lender as of the date of such determination, any capital or additional collateral contributed by the related borrower at the time the mortgage loan became (and as part of the modification related to) such AB Modified Loan for the benefit of the related mortgaged property or mortgaged properties (provided that in the case of a non-serviced mortgage loan, the amounts set forth in this clause (y) will be taken into account solely to the extent relevant information is received by the master servicer), plus (z) any other escrows or reserves (in addition to any amounts set forth in the immediately preceding clause (y) and solely to the extent not reflected or taken into account in the calculation of any related appraisal reduction amount) held by the lender in respect of such AB Modified Loan as of the date of such determination, which such excess, for the avoidance of doubt, will be determined separately from and exclude any related appraisal reduction amounts. A “Consultation Termination Event” will occur with respect to any mortgage loan (or, with respect to the 85 |
THE INFORMATION IN THIS STRUCTURAL AND COLLATERAL TERM SHEET IS NOT COMPLETE AND MAY BE AMENDED PRIOR TO THE TIME OF SALE. THIS TERM SHEET IS NOT AN OFFER TO SELL THESE SECURITIES AND IT IS NOT A SOLICITATION OF AN OFFER TO BUY THESE SECURITIES IN ANY JURISDICTION WHERE THE OFFER OR SALE IS NOT PERMITTED.
25
Control/Consultation Rights (continued):
| Broad Street mortgage loan, when each of an 85 Broad Street Non-Trust Junior Subordinate Companion Loan Control Termination Event, an 85 Broad Street Non-Trust Senior Subordinate Companion Loan Control Termination Event and an 85 Broad Street Trust Subordinate Companion Loan Control Termination Event exists, or, with respect to each of the Apple Sunnyvale whole loan and the Urban Union Amazon whole loans, during the related control appraisal period) and any related serviced companion loan when (i) no class of Control Eligible Certificates exists where such class’ aggregate certificate balance is at least equal to 25% of the initial certificate balance of that class, in each case, without regard to the application of any Cumulative Appraisal Reduction Amounts or (ii) a holder of Class E Certificates is the majority controlling class certificateholder and has irrevocably waived its right, in writing, to exercise any of the rights of the controlling class certificateholder, and such rights have not been reinstated to a successor controlling class certificateholder;providedthat no Consultation Termination Event resulting solely from the operation of clause (ii) shall be deemed to have existed or be in continuance with respect to a successor holder of a majority of the Class E Certificates that has not irrevocably waived its right to exercise any of the rights of the controlling class certificateholder;provided,further, that a Consultation Termination Event shall not be deemed to be continuing in the event the certificate balances of all Classes of Certificates (other than the Class X certificates and the Control Eligible Certificates) have been reduced to zero. With respect to each non-serviced whole loan, so long as a Consultation Termination Event does not exist, the Directing Certificateholder for this transaction will have certain consultation rights with respect to certain major decisions regarding the non-serviced whole loans, and the applicable directing certificateholder (or equivalent entity) pursuant to the related Lead Pooling and Servicing Agreement will have consultation, approval and direction rights, with respect to certain major decisions (including with respect to assumptions, waivers, loan modifications and workouts) regarding such non-serviced whole loan, as provided for in the related co-lender agreement and in the related Lead Pooling and Servicing Agreement, and as described under “Description of the Mortgage Pool—The Whole Loans” in the Preliminary Prospectus.
Notwithstanding any contrary description set forth above, in the event that, with respect to any mortgage loan, the Directing Certificateholder or any controlling class certificateholder is a Borrower Party (any of the above, as applicable, an “Excluded Controlling Class Holder”), such Excluded Controlling Class Holder will not have any consultation or approval rights with respect to such mortgage loan and will have no right to receive asset status reports or such other information as may be specified in the pooling and servicing agreement. A “Borrower Party” is a borrower, a mortgagor, a manager of a mortgaged property or the holder of a mezzanine loan that has been accelerated or as to which foreclosure or enforcement proceedings have been commenced against the equity collateral pledged to secure the related mezzanine loan, a person controlling or controlled by or under common control with the foregoing or any other such person owning, directly or indirectly, 25% or more of the beneficial interests in such borrower, mortgagor, manager of a mortgaged property or mezzanine lender;provided that with respect to the 85 Broad Street loan-specific certificates and any matter relating thereto, including rights and obligations of the holders thereof or any servicing matters relating thereto, the term “Borrower Party” means such parties with respect to the 85 Broad Street whole loan. |
THE INFORMATION IN THIS STRUCTURAL AND COLLATERAL TERM SHEET IS NOT COMPLETE AND MAY BE AMENDED PRIOR TO THE TIME OF SALE. THIS TERM SHEET IS NOT AN OFFER TO SELL THESE SECURITIES AND IT IS NOT A SOLICITATION OF AN OFFER TO BUY THESE SECURITIES IN ANY JURISDICTION WHERE THE OFFER OR SALE IS NOT PERMITTED.
26
| Risk Retention Consultation Party: | The risk retention consultation party will be the party selected by the holder or holders of more than 50% of the VRR Interest. Natixis is expected to be appointed as the initial risk retention consultation party with respect to the mortgage loans. Except with respect to an excluded loan as to such party, the risk retention consultation party will have certain non-binding consultation rights with respect to certain matters relating to specially serviced loans. |
| Whole Loans: | The 85 Broad Street mortgage loan, which will be contributed to the issuing entity, has an outstanding principal balance as of the Cut-off Date of $90,000,000, represents approximately 11.1% of the Initial Pool Balance, and has (i) one related companion loan that ispari passu in right of payment with the 85 Broad Street mortgage loan, which is currently held by Natixis Real Estate Capital LLC and is expected to be contributed to one or more future securitization trusts (the “85 Broad Street Pari Passu Companion Loan”), (ii) one related companion loan that is generally subordinate in right of payment with the 85 Broad Street mortgage loan and which is included in the issuing entity (the “85 Broad Street Trust Subordinate Companion Loan” and (iii) two related companion loans that are generally subordinate in right of payment with the 85 Broad Street mortgage loan, the 85 Broad Street Pari Passu Companion Loan and the 85 Broad Street Trust Subordinate Companion Loan, which are currently held by Natixis Real Estate Capital LLC or an affiliate (the “85 Broad Street Non-Trust Senior Subordinate Companion Loan” and the “85 Broad Street Non-Trust Junior Subordinate Companion Loan”). Eachpari passu companion loan described above is referred to in this Term Sheet as a “pari passu companion loan”, a “serviced companion loan” and a “companion loan”. Each subordinate companion loan described above is referred to in this Term Sheet as a “subordinate companion loan”, a “serviced companion loan” and a “companion loan”. The 85 Broad Street mortgage loan and the related companion loans are collectively referred to in this Term Sheet as the “85 Broad Street whole loan”, a “serviced whole loan” and a “whole loan”.
The 245 Park Avenue mortgage loan, which will be contributed to the issuing entity, has an outstanding principal balance as of the Cut-off Date of $80,000,000, represents approximately 9.9% of the Initial Pool Balance, and has (i) 19 related companion loans that arepari passu in right of payment with the 245 Park Avenue mortgage loan, of which (a) five notes were contributed to the 245 Park Avenue Trust 2017-245P securitization transaction, (b) one note was contributed to the JPMCC 2017-JP6 securitization transaction, (c) two notes are expected to be contributed to the DBJPM 2017-C6 securitization transaction, (d) two notes are currently held by JPMorgan Chase Bank, National Association and are expected to be contributed to one or more future securitization trusts, (e) two notes are currently held by Natixis Real Estate Capital LLC or an affiliate and are expected to be contributed to one or more future securitization trusts, (f) two notes are currently held by Deutsche Bank AG, New York Branch or an affiliate and are expected to be contributed to one or more future securitization trusts, (g) three notes are currently held by Société Générale and are expected to be contributed to one or more future securitization trusts and (h) two notes are currently held by Barclays Bank PLC and are expected to be contributed to one or more future securitization trusts, and (ii) five related companion loans that are subordinate in right of payment with the 245 Park Avenue mortgage loan, of which all five subordinate companion notes were contributed to the 245 Park Avenue Trust 2017-245P securitization transaction. Eachpari passu companion loan |
THE INFORMATION IN THIS STRUCTURAL AND COLLATERAL TERM SHEET IS NOT COMPLETE AND MAY BE AMENDED PRIOR TO THE TIME OF SALE. THIS TERM SHEET IS NOT AN OFFER TO SELL THESE SECURITIES AND IT IS NOT A SOLICITATION OF AN OFFER TO BUY THESE SECURITIES IN ANY JURISDICTION WHERE THE OFFER OR SALE IS NOT PERMITTED.
27
| Whole Loans (continued): | described above is referred to in this Term Sheet as a “pari passu companion loan”, a “non-serviced companion loan” and a “companion loan”. Each subordinate companion loan described above is referred to in this Term Sheet as a “subordinate companion loan”, a “non-serviced companion loan” and a “companion loan”. The 245 Park Avenue mortgage loan and the related companion loans are collectively referred to in this Term Sheet as the “245 Park Avenue whole loan”, a “non-serviced whole loan” and a “whole loan”. The 245 Park Avenue whole loan will be serviced by the 245 Park Avenue Trust 2017-245P transaction master servicer and, if and to the extent necessary, the 245 Park Avenue Trust 2017-245P transaction special servicer under the 245 Park Avenue Trust 2017-245P transaction trust and servicing agreement (referred to as the “245 Park Avenue Trust 2017-245P TSA” in this Term Sheet). Wilmington, as the 245 Park Avenue Trust 2017-245P transaction trustee, or a custodian on its behalf, will hold the mortgage file for the 245 Park Avenue whole loan pursuant to the 245 Park Avenue Trust 2017-245P TSA (other than the promissory note for the related mortgage loan, which will be held by the custodian under the pooling and servicing agreement for this securitization, and any related companion loans not included in the 245 Park Avenue Trust 2017-245P transaction).
The Apple Sunnyvale mortgage loan, which will be contributed to the issuing entity, has an outstanding principal balance as of the Cut-off Date of $70,350,000, represents approximately 8.7% of the Initial Pool Balance, and has (i) one related companion loan that ispari passu in right of payment with the Apple Sunnyvale mortgage loan, which was contributed to the UBS Commercial Mortgage Trust 2017-C1 securitizaiton transaction and (ii) one related companion loan that is subordinate in right of payment with the Apple Sunnyvale mortgage loan, which was sold to a third party investor. Thepari passucompanion loan described above is referred to in this Term Sheet as a “pari passu companion loan”, a “serviced companion loan” and a “companion loan”. The subordinate companion loan described above is referred to in this Term Sheet as a “subordinate companion loan”, a “serviced companion loan” and a “companion loan”. The Apple Sunnyvale mortgage loan and the related companion loans are collectively referred to in this Term Sheet as the “Apple Sunnyvale whole loan”, a “serviced whole loan” and a “whole loan”.
The Urban Union Amazon mortgage loan, which will be contributed to the issuing entity, has an outstanding principal balance as of the Cut-off Date of $38,231,428, represents approximately 4.7% of the Initial Pool Balance, and has (i) one related companion loan that ispari passu in right of payment with the Urban Union Amazon mortgage loan, which was contributed to the CGCMT 2017-P7 securitiztion transaction and (ii) one related companion loan that is subordinate in right of payment with the Urban Union Amazon mortgage loan, which was sold to a third party investor. Thepari passu companion loan described above is referred to in this Term Sheet as a “pari passu companion loan”, a “serviced companion loan” and a “companion loan”. The subordinate companion loan described above is referred to in this Term Sheet as “subordinate companion loan”, a “serviced companion loan” and a “companion loan”. The Urban Union Amazon mortgage loan and the related companion loans are collectively referred to in this Term Sheet as the “Urban Union Amazon whole loan”, a “serviced whole loan” and a “whole loan”.
The Broadway Portfolio mortgage loan, which will be contributed to the issuing entity, has an outstanding principal balance as of the Cut-off Date of $38,000,000, represents |
THE INFORMATION IN THIS STRUCTURAL AND COLLATERAL TERM SHEET IS NOT COMPLETE AND MAY BE AMENDED PRIOR TO THE TIME OF SALE. THIS TERM SHEET IS NOT AN OFFER TO SELL THESE SECURITIES AND IT IS NOT A SOLICITATION OF AN OFFER TO BUY THESE SECURITIES IN ANY JURISDICTION WHERE THE OFFER OR SALE IS NOT PERMITTED.
28
| Whole Loans (continued): | approximately 4.7% of the Initial Pool Balance, and has one related companion loan that ispari passu in right of payment with the Broadway Portfolio mortgage loan, which was contributed to the CGCMT 2017-P7 securitization transaction. Thepari passu companion loan described above is referred to in this Term Sheet as a “pari passu companion loan”, a “serviced companion loan” and a “companion loan”. The Broadway Portfolio mortgage loan and the related companion loan are collectively referred to in this Term Sheet as the “Broadway Portfolio whole loan”, a “serviced whole loan” and a “whole loan”.
The St. Luke’s Office mortgage loan, which will be contributed to the issuing entity, has an outstanding principal balance as of the Cut-off Date of $34,000,000, represents approximately 4.2% of the Initial Pool Balance, and has one related companion loan that ispari passu in right of payment with the St. Luke’s Office mortgage loan, which is currently held by Benefit Street Partners CRE Finance LLC or an affiliate and is expected to be contributed to one or more future securitization trusts. Thepari passu companion loan described above is referred to in this Term Sheet as a “pari passu companion loan”, a “serviced companion loan” and a “companion loan”. The St. Luke’s Office mortgage loan and the related companion loan are collectively referred to in this Term Sheet as the “St. Luke’s Office whole loan”, a “serviced whole loan” and a “whole loan”.
The Columbus Office Portfolio I mortgage loan, which will be contributed to the issuing entity, has an outstanding principal balance as of the Cut-off Date of $30,000,000, represents approximately 3.7% of the Initial Pool Balance, and has one related companion loan that ispari passu in right of payment with the Columbus Office Portfolio I mortgage loan, which is currently held by Benefit Street Partners CRE Finance LLC or an affiliate and is expected to be contributed to one or more future securitization trusts. Thepari passu companion loan described above is referred to in this Term Sheet as a “pari passu companion loan”, a “serviced companion loan” and a “companion loan”. The Columbus Office Portfolio I mortgage loan and the related companion loan are collectively referred to in this Term Sheet as the “Columbus Office Portfolio I whole loan”, a “serviced whole loan” and a “whole loan”.
The Acropolis Garden mortgage loan, which will be contributed to the issuing entity, has an outstanding principal balance as of the Cut-off Date of $20,000,000, represents approximately 2.5% of the Initial Pool Balance and has one related companion loan that ispari passu in right of payment with the Acropolis Garden mortgage loan, is currently held by Natixis Real Estate Capital LLC or an affiliate and is expected to be contributed to one or more future securitization trusts. Thepari passu companion loan described above is referred to in this Term Sheet as a “pari passu companion loan”, a “serviced whole loan” (prior to the related servicing shift securitization date), a “non-serviced companion loan” (on and after the related servicing shift securitization date) and a “companion loan”. The Acropolis Garden mortgage loan and the related companion loan are collectively referred to in this Term Sheet as the “Acropolis Garden whole loan”, a “serviced whole loan” (prior to the related servicing shift securitization date), a “non-serviced whole loan” (on and after the related servicing shift securitization date) and a “whole loan”.
The Alexandria Corporate Park mortgage loan, which will be contributed to the issuing entity, has an outstanding principal balance as of the Cut-off Date of $20,000,000, represents approximately 2.5% of the Initial Pool Balance, and has one related companion loan that ispari passu in right of payment with the Alexandria Corporate Park mortgage loan, which is currently held by Benefit Street Partners CRE Finance LLC or an affiliate |
THE INFORMATION IN THIS STRUCTURAL AND COLLATERAL TERM SHEET IS NOT COMPLETE AND MAY BE AMENDED PRIOR TO THE TIME OF SALE. THIS TERM SHEET IS NOT AN OFFER TO SELL THESE SECURITIES AND IT IS NOT A SOLICITATION OF AN OFFER TO BUY THESE SECURITIES IN ANY JURISDICTION WHERE THE OFFER OR SALE IS NOT PERMITTED.
29
| Whole Loans (continued): | and is expected to be contributed to one or more future securitization trusts. Thepari passu companion loan described above is referred to in this Term Sheet as a “pari passu companion loan”, a “serviced companion loan” and a “companion loan”. The Alexandria Corporate Park mortgage loan and the related companion loan are collectively referred to in this Term Sheet as the “Alexandria Corporate Park whole loan”, a “serviced whole loan” and a “whole loan”.
The Garden Multifamily Portfolio mortgage loan, which will be contributed to the issuing entity, has an outstanding principal balance as of the Cut-off Date of $18,000,000, represents approximately 2.2% of the Initial Pool Balance, and has four related companion loans that arepari passu in right of payment with the Garden Multifamily Portfolio mortgage loan, are currently held by Benefit Street Partners CRE Finance LLC or an affiliate and are expected to be contributed to one or more future securitization trusts. Eachpari passu companion loan described above is referred to in this Term Sheet as a “pari passu companion loan”, a “serviced companion loan” (prior to the related servicing shift securitization date), a “non-serviced companion loan” (on and after the related servicing shift securitization date)and a “companion loan”. The Garden Multifamily Portfolio mortgage loan and the related companion loans are collectively referred to in this Term Sheet as the “Garden Multifamily Portfolio whole loan”, a “serviced whole loan” (prior to the related servicing shift securitization date), a “non-serviced whole loan” (on and after the related servicing shift securitization date) and a “whole loan”.
The Marble Hall Gardens mortgage loan, which will be contributed to the issuing entity, has an outstanding principal balance as of the Cut-off Date of $11,500,000, represents approximately 1.4% of the Initial Pool Balance, and has one related companion loan that ispari passu in right of payment with the Marble Hall Gardens mortgage loan. Thepari passucompanion loan described above is referred to in this Term Sheet as a “pari passu companion loan”, a “serviced companion loan” and a “companion loan”, is currently held by Natixis Real Estate Capital LLC or an affiliate and is expected to be contributed to one or more future securitization trusts. The Marble Hall Gardens mortgage loan and the related companion loan are collectively referred to in this Term Sheet as the “Marble Hall Gardens whole loan”, a “serviced whole loan” and a “whole loan”.
Each of the Servicing Shift PSAs and 245 Park Avenue TSA is also referred to in this Term Sheet as a “Lead Pooling and Servicing Agreement” insofar as it relates to the non-serviced whole loan serviced thereunder.
In the case of the non-serviced whole loans, the related mortgage loans are referred to as “non-serviced mortgage loans”.
The 85 Broad Street whole loan, the Apple Sunnyvale whole loan, the Urban Union Amazon whole loan, the Broadway Portfolio whole loan, the St. Luke’s Office whole loan, the Columbus Office Portfolio I whole loan, the Acropolis Garden whole loan (prior to the related servicing shift securitization date), the Alexandria Corporate Park whole loan, the Garden Multifamily Portfolio whole loan (prior to the related servicing shift securitization date) and the Marble Hall Gardens whole loan will be serviced by Wells Fargo, as the CSAIL 2017-C8 master servicer, and special serviced by Midland, as the CSAIL 2017-C8 special servicer pursuant to the terms of the CSAIL 2017-C8 PSA. Wilmington, as the CSAIL 2017-C8 trustee, or a custodian on its behalf, will hold the mortgage file for 85 Broad Street whole loan, the Apple Sunnyvale whole loan, the Urban Union Amazon whole
|
THE INFORMATION IN THIS STRUCTURAL AND COLLATERAL TERM SHEET IS NOT COMPLETE AND MAY BE AMENDED PRIOR TO THE TIME OF SALE. THIS TERM SHEET IS NOT AN OFFER TO SELL THESE SECURITIES AND IT IS NOT A SOLICITATION OF AN OFFER TO BUY THESE SECURITIES IN ANY JURISDICTION WHERE THE OFFER OR SALE IS NOT PERMITTED.
30
| Whole Loans (continued): | loan, the Broadway Portfolio whole loan, the St. Luke’s Office whole loan, the Columbus Office Portfolio I whole loan, the Acropolis Garden whole loan (prior to the related servicing shift securitization date) , the Alexandria Corporate Park whole loan, the Garden Multifamily Portfolio whole loan (prior to the related servicing shift securitization date) and the Marble Hall Gardens whole loan pursuant to the CSAIL 2017-C8 PSA (other than the promissory notes for any related companion loans that are not assets of the CSAIL 2017-C8 securitization). The Acropolis Garden whole loan (on and after the related servicing shift securitization date) and the Garden Multifamily Portfolio whole loan (on and after the related servicing shift securitization date) will be serviced pursuant to the terms of the related Servicing Shift PSA, and the related trustee, or a custodian on its behalf, will hold the mortgage file for the Acropolis Garden whole loan and the Garden Multifamily Portfolio whole loan (in each case, after the related servicing shift securitization date) pursuant to the related Servicing Shift PSA (other than the promissory note for the related mortgage loan and any other promissory note not included in the related securitization).
For more information regarding the whole loans, see “Description of the Mortgage Pool—The Whole Loans” in the Preliminary Prospectus. |
Servicing Standard:
| Each of the mortgage loans (other than the non-serviced mortgage loans) and serviced whole loan(s) will be serviced by the master servicer and the special servicer pursuant to the terms of the pooling and servicing agreement. In all circumstances, each of the master servicer and the special servicer are obligated to act in the best interests of the certificateholders (and, in the case of a serviced whole loan, the holder of the related serviced companion loan) as a collective whole as if such certificateholders (and, if applicable, such companion loan holder), constituted a single lender (taking into account thepari passu or subordinate nature of any related companion loan(s). The special servicer is required to determine the effect on net present value of various courses of action (including workout or foreclosure), using the Calculation Rate as the discount rate, and pursue the course of action that it determines would maximize recovery on a net present value basis.
“Calculation Rate” means:
(a) for principal and interest payments on a mortgage loan or proceeds from the sale of a defaulted loan, the highest of (i) the rate determined by the master servicer or the special servicer, as applicable, that approximates the market rate that would be obtainable by borrowers on similar debt of the borrowers as of such date of determination, (ii) the mortgage loan rate and (iii) the yield on 10-year US treasuries; and
(b) for all other cash flows, including property cash flow, the “discount rate” set forth in the most recent appraisal (or update of such appraisal). |
| Termination of Special Servicer: | Except as limited by certain conditions described in the Preliminary Prospectus, the special servicer may generally be replaced, prior to the occurrence and continuance of a Control Termination Event, at any time and without cause, by the Directing Holder so long as, among other things, the Directing Holder provides a replacement special servicer that meets the requirements of the pooling and servicing agreement.
After the occurrence and during the continuance of a Control Termination Event (but for so long as no control termination event is continuing with respect to the 85 Broad Street |
THE INFORMATION IN THIS STRUCTURAL AND COLLATERAL TERM SHEET IS NOT COMPLETE AND MAY BE AMENDED PRIOR TO THE TIME OF SALE. THIS TERM SHEET IS NOT AN OFFER TO SELL THESE SECURITIES AND IT IS NOT A SOLICITATION OF AN OFFER TO BUY THESE SECURITIES IN ANY JURISDICTION WHERE THE OFFER OR SALE IS NOT PERMITTED.
31
| Termination of Special Servicer (continued): | whole loan), the holders of at least 25% of the pooled voting rights of the pooled principal balance certificates (other than Class R certificates) may request a vote to replace the special servicer (other than with respect to the 85 Broad Street mortgage loan). The subsequent vote may result in the termination and replacement of such special servicer if, within 180 days of the initial request for that vote, the holders of (a) at least 66-2/3% of a “pooled certificateholder quorum” (holders of pooled certificates evidencing at least 66-2/3% of the aggregate pooled voting rights (taking into account the application of realized losses) of the certificates (other than the Class X, Class Z and Class R certificates)), or (b) more than 66-2/3% of the pooled voting rights of each class of pooled non-reduced certificates other than any Class X, Class Z and Class R certificates (but in the case of this clause (b) only such classes of pooled principal balance certificates that, in each case, have an outstanding certificate balance, as notionally reduced by any appraisal reduction amounts allocated to such class, equal to or greater than 25% of the initial certificate balance of such class, minus all payments of principal made on such class of certificates), vote affirmatively to so replace such special servicer.
If the operating advisor determines, in its sole discretion exercised in good faith, that (1) the special servicer is not performing its duties as required under the pooling and servicing agreement or is otherwise not acting in accordance with the servicing standard and (2) the replacement of the special servicer would be in the best interest of the certificateholders as a collective whole, the operating advisor will have the right to recommend the replacement of the special servicer. The operating advisor’s recommendation to replace the special servicer must be confirmed within 180 days of after the notice is posted to the certificate administrator’s website by an affirmative vote of holders of certificates evidencing at least a majority of a quorum of certificateholders (which, for this purpose, is the holders of certificates that (i) evidence at least 20% of the voting rights (taking into account the application of any appraisal reduction amounts to notionally reduce the respective certificate balances) of all principal balance certificates on an aggregate basis, and (ii) consist of at least three certificateholders or certificate owners that are not Risk Retention Affiliated with each other). In the event the holders of such principal balance certificates elect to remove and replace the special servicer, the certificate administrator will be required to obtain a rating agency confirmation from each of the rating agencies at that time. |
Excluded Special Servicer:
| In the event that, with respect to any mortgage loan (other than any non-serviced mortgage loan), the special servicer has obtained knowledge that it is a Borrower Party with respect to any mortgage loan or serviced whole loan, the special servicer will be required to resign as special servicer of such mortgage loan (an “Excluded Special Servicer Loan”), and, prior to the occurrence and continuance of a Control Termination Event, the Directing Certificateholder or the majority controlling class certificateholder on its behalf will be required to select a successor special servicer that is not a Borrower Party in accordance with the terms of the pooling and servicing agreement (an “Excluded Special Servicer”) with respect to such Excluded Special Servicer Loan unless such Excluded Special Servicer Loan is also an excluded loan with respect to such Directing Certificateholder or the holder of the majority of the controlling class, in which case the resigning special servicer will be required to use reasonable efforts to appoint the Excluded Special Servicer. |
| Servicing Compensation: | Modification Fees: Certain fees resulting from modifications, amendments, waivers or other changes to the terms of the loan documents, as more fully described in the |
THE INFORMATION IN THIS STRUCTURAL AND COLLATERAL TERM SHEET IS NOT COMPLETE AND MAY BE AMENDED PRIOR TO THE TIME OF SALE. THIS TERM SHEET IS NOT AN OFFER TO SELL THESE SECURITIES AND IT IS NOT A SOLICITATION OF AN OFFER TO BUY THESE SECURITIES IN ANY JURISDICTION WHERE THE OFFER OR SALE IS NOT PERMITTED.
32
| Servicing Compensation (continued): | Preliminary Prospectus, will be used to offset expenses on the related serviced mortgage loan (i.e., a mortgage loan other than a non-serviced mortgage loan) or serviced whole loan, if applicable (i.e., reimburse the trust for certain expenses including unreimbursed advances and interest on unreimbursed advances previously incurred (other than special servicing fees, workout fees and liquidation fees) on the related mortgage loan (other than a non-serviced mortgage loan) or serviced whole loan, if applicable, but not yet reimbursed to the trust or servicers), or to pay expenses (other than special servicing fees, workout fees and liquidation fees) that are still outstanding, in each case unless as part of the written modification the related borrower is required to pay these amounts on a going forward basis or in the future). Any excess modification fees not so applied to offset expenses will be available as compensation to the master servicer and/or applicable special servicer. Within any prior 12-month period, all excess modification fees earned by the master servicer or by the applicable special servicer (after taking into account the offset described below applied during such 12-month period) with respect to any mortgage loan (other than a non-serviced mortgage loan) or serviced whole loan, if applicable, will be subject to a cap equal to the greater of (i) 1.0% of the outstanding principal balance of such mortgage loan after giving effect to such transaction and (ii) $25,000.
All excess modification fees earned by either special servicer will be required to offset any future workout fees or liquidation fees payable with respect to the related mortgage loan (other than a non-serviced mortgage loan) or serviced whole loan, if applicable, or related REO property;provided that if the mortgage loan (other than a non-serviced mortgage loan) or serviced whole loan, if applicable, ceases being a corrected loan, and is subject to a subsequent modification, any excess modification fees earned by the applicable special servicer prior to such mortgage loan (other than a non-serviced mortgage loan) or serviced whole loan, if applicable, ceasing to be a corrected loan will no longer be offset against future liquidation fees and workout fees unless such mortgage loan (other than a non-serviced mortgage loan) or serviced whole loan, if applicable, ceased to be a corrected loan within 12 months of it becoming a modified mortgage loan (or modified whole loan, if applicable).
Penalty Charges: All late fees and default interest will first be used to reimburse certain expenses previously incurred with respect to the related mortgage loan (other than a non-serviced mortgage loan) or serviced whole loan, if applicable (other than special servicing fees, workout fees and liquidation fees) but not yet reimbursed to the trust, the master servicer or the applicable special servicer or to pay certain expenses (other than special servicing fees, workout fees and liquidation fees) that are still outstanding on the related mortgage loan (other than a non-serviced mortgage loan) or serviced whole loan, if applicable, and any excess received with respect to a serviced loan will be paid to the master servicer (for penalty charges accrued while a non-specially serviced loan), and the applicable special servicer (for penalty charges accrued while a specially serviced loan). To the extent any amounts reimbursed out of penalty charges are subsequently recovered on a related serviced loan, they will be paid to the master servicer or applicable special servicer who would have been entitled to the related penalty charges that were previously used to reimburse such expense.
Liquidation / Workout Fees: Liquidation fees will be calculated at the lesser of (a) 1.0% and (b) such lower rate as would result in a liquidation fee of $1,000,000, for each |
THE INFORMATION IN THIS STRUCTURAL AND COLLATERAL TERM SHEET IS NOT COMPLETE AND MAY BE AMENDED PRIOR TO THE TIME OF SALE. THIS TERM SHEET IS NOT AN OFFER TO SELL THESE SECURITIES AND IT IS NOT A SOLICITATION OF AN OFFER TO BUY THESE SECURITIES IN ANY JURISDICTION WHERE THE OFFER OR SALE IS NOT PERMITTED.
33
| Servicing Compensation (continued): | mortgage loan (other than a non-serviced mortgage loan) or serviced whole loan that is a specially serviced loan and any REO property, subject in any case to a minimum liquidation fee of $25,000, except that the liquidation fee will be zero with respect to certain liquidation events set forth in the pooling and servicing agreement, and the liquidation fee with respect to each mortgage loan or REO mortgage loan repurchased or substituted for after more than 180 days following the Mortgage Loan Seller’s receipt of notice or discovery of a material breach or material defect will be in an amount equal to the liquidation fee rate described above of the outstanding principal balance of such mortgage loan or REO loan. For any mortgage loan (other than a non-serviced loan) or serviced whole loan that is a corrected loan, workout fees will be calculated at the lesser of (a) 1.0% and (b) such lower rate as would result in a workout fee of $1,000,000 when applied to each expected payment of principal and interest (other than default interest) on the related mortgage loan (other than a non-serviced mortgage loan) or serviced whole loan, if applicable, from the date such serviced loan becomes a corrected loan through and including the then related maturity date; or in any case such higher rate as would result in a workout fee of $25,000 when applied to each expected payment of principal and interest (other than default interest) on any mortgage loan from the date such serviced loan becomes a corrected loan through and including the then related maturity date.
Notwithstanding the foregoing, in connection with a maturity default, no liquidation or workout fee will be payable in connection with a payoff or refinancing of the related serviced loan within 90 days of the maturity default. |
| Operating Advisor: | The operating advisor will have access to any final asset status report and information available with respect to the transaction on the certificate administrator’s website and will have certain monitoring responsibilities on behalf of the entire issuing entity. After the occurrence and during the continuance of an Operating Advisor Consultation Event, the operating advisor will be entitled to consult with the special servicer with respect of the asset status reports and certain major decisions processed by the special servicer on behalf of the issuing entity and in the best interest of, and for the benefit of, the certificateholders and, in the case of a serviced whole loan, the related companion loan holder(s), as a collective whole, as if those certificateholders and, if applicable, such companion loan holder(s) constituted a single lender (taking into account thepari passu or subordinate nature of any related companion loan(s)).
After the occurrence and during the continuance of a Consultation Termination Event, the operating advisor may be removed without cause if the holders of at least 25% of the voting rights request a vote to replace the operating advisor and such vote is approved by the holders of at least 75% of the voting rights.
An “Operating Advisor Consultation Event” will occur when with respect to any mortgage loan or serviced whole loan (i) the HRR Certificates have an aggregate certificate balance (as notionally reduced by any appraisal reduction amounts allocable to any class of the HRR certificates) is 25% or less of the initial aggregate certificate balance of the HRR Certificates, or (ii) a Control Termination Event has occurred and is continuing. |
| Asset Representations Reviewer: | The asset representations reviewer will be required to review certain delinquent mortgage loans after a specified delinquency threshold has been exceeded and the required percentage of certificateholders vote to direct a review of such delinquent mortgage loans. An asset review will occur when either (1) mortgage loans with an aggregate outstanding |
THE INFORMATION IN THIS STRUCTURAL AND COLLATERAL TERM SHEET IS NOT COMPLETE AND MAY BE AMENDED PRIOR TO THE TIME OF SALE. THIS TERM SHEET IS NOT AN OFFER TO SELL THESE SECURITIES AND IT IS NOT A SOLICITATION OF AN OFFER TO BUY THESE SECURITIES IN ANY JURISDICTION WHERE THE OFFER OR SALE IS NOT PERMITTED.
34
| Asset Representations Reviewer (continued): | principal balance of 25.0% or more of the aggregate outstanding principal balance of all of the mortgage loans (including any REO loans (or a portion of any REO loan in the case of a whole loan)) held by the issuing entity as of the end of the applicable collection period are delinquent loans or (2) at least 15 mortgage loans are delinquent loans as of the end of the applicable collection period and the outstanding principal balance of such delinquent loans in the aggregate constitutes at least 20.0% of the aggregate outstanding principal balance of all of the mortgage loans (including any REO loans (or a portion of any REO loan in the case of a whole loan)) held by the issuing entity as of the end of the applicable collection period. |
| Replacement of the Asset Representations Reviewer: | The asset representations reviewer may be terminated and replaced without cause. Upon (i) the written direction of pooled certificateholders evidencing not less than 25% of the pooled voting rights (without regard to the application of any cumulative appraisal reduction amounts) requesting a vote to terminate and replace the asset representations reviewer with a proposed successor asset representations reviewer that is an eligible asset representations reviewer, and (ii) payment by such holders to the certificate administrator of the reasonable fees and expenses to be incurred by the certificate administrator in connection with administering such vote, the certificate administrator will promptly provide notice to all pooled certificateholders and the asset representations reviewer of such request. Upon the written direction of pooled certificateholders evidencing at least 75% of a pooled certificateholder quorum (without regard to the application of any cumulative appraisal reduction amounts), the trustee will terminate all of the rights and obligations of the asset representations reviewer under the pooling and servicing agreement, and the proposed successor asset representations reviewer will be appointed. |
| Dispute Resolution Provisions: | Each Mortgage Loan Seller will be subject to the dispute resolution provisions set forth in the pooling and servicing agreement to the extent those provisions are triggered with respect to any mortgage loan or the 85 Broad Street whole loan sold to the depositor by a Mortgage Loan Seller and such Mortgage Loan Seller will be obligated under the related mortgage loan purchase agreement to comply with all applicable provisions and to take part in any mediation or arbitration proceedings that may result.
Generally, in the event that a repurchase request is not “Resolved” (as defined below) within 180 days after the related Mortgage Loan Seller receives such repurchase request, then the enforcing servicer will be required to send a notice to the “initial requesting certificateholder” (if any) and to the certificate administrator who will make such notice available to all other certificateholders and certificate owners indicating the enforcing servicer’s intended course of action with respect to the repurchase request. Such notice will notify all certificateholders and certificate owners that in the event any certificateholder disagrees with the enforcing servicer’s intended course of action, the enforcing servicer will be required to follow the course of action agreed to and/or proposed by the majority of the responding certificateholders that involves referring the matter to mediation or arbitration, as the case may be. If (a) the enforcing servicer’s intended course of action with respect to the repurchase request does not involve pursuing further action to exercise rights against the related Mortgage Loan Seller with respect to the repurchase request and the initial requesting certificateholder, if any, or any other certificateholder or certificate owner wishes to exercise its right to refer the matter to mediation (including nonbinding arbitration) or arbitration, or (b) the enforcing servicer’s intended course of action is to pursue further action to exercise rights against the related Mortgage Loan Seller with |
THE INFORMATION IN THIS STRUCTURAL AND COLLATERAL TERM SHEET IS NOT COMPLETE AND MAY BE AMENDED PRIOR TO THE TIME OF SALE. THIS TERM SHEET IS NOT AN OFFER TO SELL THESE SECURITIES AND IT IS NOT A SOLICITATION OF AN OFFER TO BUY THESE SECURITIES IN ANY JURISDICTION WHERE THE OFFER OR SALE IS NOT PERMITTED.
35
| Dispute Resolution Provisions (continued): | respect to the repurchase request but the initial requesting certificateholder, if any, or any other certificateholder or certificate owner does not agree with the dispute resolution method selected by the enforcing servicer, then the initial requesting certificateholder, if any, or such other certificateholder or certificate owner may deliver a written notice to the enforcing servicer indicating its intent to exercise its right to refer the matter to either mediation or arbitration.
“Resolved” means, with respect to a repurchase request, (i) that related material defect has been cured, (ii) the related mortgage loan or the 85 Broad Street whole loan has been repurchased in accordance with the related mortgage loan purchase agreement, (iii) a mortgage loan has been substituted for the related mortgage loan in accordance with the related mortgage loan purchase agreement, (iv) the applicable Mortgage Loan Seller has paid a loss of value payment, (v) a contractually binding agreement is entered into between the enforcing servicer, on behalf of the issuing entity, and the related Mortgage Loan Seller that settles the related Mortgage Loan Seller’s obligations under the related mortgage loan purchase agreement, or (vi) the related mortgage loan is no longer property of the issuing entity as a result of a sale or other disposition in accordance with the pooling and servicing agreement. |
| Deal Website: | The Certificate Administrator will maintain a deal website including, but not limited to:
■ all special notices delivered
■ summaries of final asset status reports
■ all appraisals in connection with appraisal reduction amounts plus any subsequent appraisal updates
■ an “Investor Q&A Forum” and a voluntary investor registry |
THE INFORMATION IN THIS STRUCTURAL AND COLLATERAL TERM SHEET IS NOT COMPLETE AND MAY BE AMENDED PRIOR TO THE TIME OF SALE. THIS TERM SHEET IS NOT AN OFFER TO SELL THESE SECURITIES AND IT IS NOT A SOLICITATION OF AN OFFER TO BUY THESE SECURITIES IN ANY JURISDICTION WHERE THE OFFER OR SALE IS NOT PERMITTED.
36
(THIS PAGE INTENTIONALLY LEFT BLANK)
37
Mortgage Loan No. 1 — 85 Broad Street

THE INFORMATION IN THIS STRUCTURAL AND COLLATERAL TERM SHEET IS NOT COMPLETE AND MAY BE AMENDED PRIOR TO THE TIME OF SALE. THIS TERM SHEET IS NOT AN OFFER TO SELL THESE SECURITIES AND IT IS NOT A SOLICITATION OF AN OFFER TO BUY THESE SECURITIES IN ANY JURISDICTION WHERE THE OFFER OR SALE IS NOT PERMITTED.
38
Mortgage Loan No. 1 — 85 Broad Street

THE INFORMATION IN THIS STRUCTURAL AND COLLATERAL TERM SHEET IS NOT COMPLETE AND MAY BE AMENDED PRIOR TO THE TIME OF SALE. THIS TERM SHEET IS NOT AN OFFER TO SELL THESE SECURITIES AND IT IS NOT A SOLICITATION OF AN OFFER TO BUY THESE SECURITIES IN ANY JURISDICTION WHERE THE OFFER OR SALE IS NOT PERMITTED.
39
Mortgage Loan No. 1 — 85 Broad Street

THE INFORMATION IN THIS STRUCTURAL AND COLLATERAL TERM SHEET IS NOT COMPLETE AND MAY BE AMENDED PRIOR TO THE TIME OF SALE. THIS TERM SHEET IS NOT AN OFFER TO SELL THESE SECURITIES AND IT IS NOT A SOLICITATION OF AN OFFER TO BUY THESE SECURITIES IN ANY JURISDICTION WHERE THE OFFER OR SALE IS NOT PERMITTED.
40

THE INFORMATION IN THIS STRUCTURAL AND COLLATERAL TERM SHEET IS NOT COMPLETE AND MAY BE AMENDED PRIOR TO THE TIME OF SALE. THIS TERM SHEET IS NOT AN OFFER TO SELL THESE SECURITIES AND IT IS NOT A SOLICITATION OF AN OFFER TO BUY THESE SECURITIES IN ANY JURISDICTION WHERE THE OFFER OR SALE IS NOT PERMITTED.
41
Mortgage Loan No. 1 — 85 Broad Street

THE INFORMATION IN THIS STRUCTURAL AND COLLATERAL TERM SHEET IS NOT COMPLETE AND MAY BE AMENDED PRIOR TO THE TIME OF SALE. THIS TERM SHEET IS NOT AN OFFER TO SELL THESE SECURITIES AND IT IS NOT A SOLICITATION OF AN OFFER TO BUY THESE SECURITIES IN ANY JURISDICTION WHERE THE OFFER OR SALE IS NOT PERMITTED.
42
Mortgage Loan No. 1 — 85 Broad Street
| Mortgage Loan Information | Property Information | |||
| Mortgage Loan Sellers(1): | Column / Natixis | Single Asset / Portfolio: | Single Asset | |
| Original Principal Balance(2): | $90,000,000 | Title: | Fee | |
| Cut-off Date Principal Balance: | $90,000,000 | Property Type - Subtype: | Office – CBD | |
| % of Pool by IPB: | 11.1% | Net Rentable Area (SF): | 1,118,512 | |
Credit Assessment (Moody’s/Fitch/DBRS/KBRA)(3): | NR / BBB- / AA(low) / BBB+ | Location: | New York, NY | |
| Loan Purpose: | Acquisition | Year Built / Renovated: | 1983 / 2015 | |
| Borrowers: | 85 Broad Street Property Owner LLC; 85 Broad Street TRS LLC | Occupancy: | 87.1% | |
| Sponsor: | ICR US LP | Occupancy Date: | 4/19/2017 | |
| Interest Rate: | 3.41253% | Number of Tenants: | 13 | |
| Note Date: | 5/24/2017 | 2014 NOI(4): | N/A | |
| Maturity Date: | 6/5/2027 | 2015 NOI(4): | $14,270,387 | |
| Interest-only Period: | 120 months | 2016 NOI(4): | $23,122,035 | |
| Original Term: | 120 months | TTM NOI(5): | $23,906,564 | |
| Original Amortization: | None | UW Economic Occupancy: | 86.8% | |
| Amortization Type: | Interest Only | UW Revenues: | $47,225,377 | |
| Call Protection: | L(11),YM1(13),Def or YM1(89),O(7) | UW Expenses: | $21,294,959 | |
| Lockbox(6): | Hard | UW NOI: | $25,930,418 | |
| Additional Debt(2): | Yes | UW NCF: | $24,028,948 | |
| Additional Debt Balance(2): | $268,600,000 | Appraised Value / Per SF: | $652,000,000 / $583 | |
| Additional Debt Type(2): | Pari Passu, B-Note, Mezzanine | Appraisal Date: | 4/30/2017 | |
| Additional Future Debt Permitted(7): | Yes |
| Escrows and Reserves(8) | Financial Information(2) | |||||
| Initial | Monthly | Initial Cap | Cut-off Date Loan / SF: | $151 | ||
| Taxes: | $0 | Springing | N/A | Maturity Date Loan / SF: | $151 | |
| Insurance: | $0 | Springing | N/A | Cut-off Date LTV: | 25.9% | |
| Replacement Reserves: | $0 | Springing | N/A | Maturity Date LTV: | 25.9% | |
| TI/LC: | $0 | Springing | N/A | UW NCF DSCR: | 4.11x | |
| Upfront Free Rent: | $570,850 | $0 | N/A | UW NOI Debt Yield: | 15.3% | |
| Upfront Unfunded Lease Obligations: | $8,170,739 | $0 | N/A |
Sources and Uses
| Sources | Proceeds | % of Total | Uses | Proceeds | % of Total | |
| Mortgage Loan (Senior Notes) | $169,000,000 | 25.3% | Purchase Price | $652,000,000 | 97.7% | |
| Mortgage Loan (Subordinate Notes) | 189,600,000 | 28.4 | Upfront Reserves | 8,741,590 | 1.3 | |
| Sponsor Equity | 308,786,179 | 46.3 | Closing Costs | 6,644,590 | 1.0 | |
| Total Sources | $667,386,179 | 100.0% | Total Uses | $667,386,179 | 100.0% |
| (1) | The 85 Broad Street loan is loan is comprised of two notes, a $20 million A-A-2 note which is being contributed by Natixis Real Estate Capital LLC and a $70 million A-A-1 note which is being contributed by Column Financial, Inc. |
| (2) | The 85 Broad Street loan is a part of a larger split whole loan evidenced by three seniorpari passu notes, the 85 Broad Street Trust Subordinate Companion Loan (as defined below) and the 85 Broad Street Non-Trust Subordinate Companion Loans (as defined below) with an aggregate original principal balance of $358.6 million. The Financial Information presented in the chart above and herein reflects the cut-off date balance of the $169.0 million |
THE INFORMATION IN THIS STRUCTURAL AND COLLATERAL TERM SHEET IS NOT COMPLETE AND MAY BE AMENDED PRIOR TO THE TIME OF SALE. THIS TERM SHEET IS NOT AN OFFER TO SELL THESE SECURITIES AND IT IS NOT A SOLICITATION OF AN OFFER TO BUY THESE SECURITIES IN ANY JURISDICTION WHERE THE OFFER OR SALE IS NOT PERMITTED.
43
Mortgage Loan No. 1 — 85 Broad Street
| A Notes (as defined below), but not the $72.0 million 85 Broad Street Trust Subordinate Companion Loan or the $117.6 million 85 Broad Street Subordinate Companion Loans. For a more detailed description of the 85 Broad Street Whole Loan (as defined below), please refer to “Additional Debt” below. |
| (3) | Fitch, DBRS and KBRA have each indicated that the 85 Broad Street loan has, in the context of its inclusion in the Initial Pool Balance, credit characteristics consistent with an investment grade obligation. |
| (4) | The property was built to suit for Goldman Sachs in 1983. The seller bought the property in 2014 following Goldman Sachs vacating the building, and leased up the building from approximately 25% at acquisition to its current occupancy of 87.1%. For more details, please refer to “Operating History and Underwritten Net Cash Flow” below. |
| (5) | Represents the trailing twelve month period ending February 28, 2017. |
| (6) | For a more detailed description of the lockbox, please refer to“Lockbox / Cash Management”below. |
| (7) | For a more detailed description of the additional future debt permitted, please refer to “Additional Debt” below. |
| (8) | For a more detailed description of escrows and reserves, please refer to “Escrows and Reserves” below. |
The Loan. The 85 Broad Street loan, which is part of a larger split whole loan, is a first mortgage loan secured by the borrowers’ fee interest in a Class A office building comprising 1,118,512 SF and located at 85 Broad Street in New York, New York.
The whole loan has an outstanding principal balance as of the cut-off date of $358.6 million (the “85 Broad Street Whole Loan”), and is comprised of threepari passu senior notes, Note A-A-1 ($20,000,000), Note A-A-2 ($70,000,000) and Note A-A-3 ($79,000,000) (collectively, the “A Notes”), one subordinate Note A-B with an outstanding principal balance of $72.0 million (the “85 Broad Street Trust Subordinate Companion Loan”), one non-controlling subordinate Note B-A with an outstanding principal balance of $58.8 million (the “85 Broad Street Non-Trust Senior Subordinate Companion Loan”) and one initially controlling subordinate Note B-B with an outstanding principal balance of $58.8 million (the “85 Broad Street Non-Trust Junior Subordinate Companion Loan”, and together with 85 Broad Street Non-Trust Senior Subordinate Companion Loan, the “85 Broad Street Non-Trust Subordinate Companion Loans”, and collectively with the 85 Broad Street Trust Subordinate Companion Loan, the “85 Broad Street Subordinate Companion Loans”). Note A-A-1 is being contributed by Column Financial, Inc. and Note A-A-2 is being contributed by Natixis.
Note A-A-1 and Note A-A-2 have an aggregate outstanding principal balance as of the cut-off date of $90.0 million and are being contributed to the CSAIL 2017-C8 Commercial Mortgage Trust. Note A-A-3, with an aggregate principal balance as of the cut-off date of $79.0 million is currently held by Natixis and is expected to be contributed to one or more future securitization transactions. The 85 Broad Street Trust Subordinate Companion Loan will be an asset of the issuing entity but will not be pooled together with the other mortgage loans, and payments of interest and principal received in respect of the 85 Broad Street Trust Subordinate Companion Loan will be available to make distributions in respect of four loan-specific classes of certificates only. The 85 Broad Street Trust Subordinate Companion Loan is subordinate to the Notes A-A-1, A-A-2 and A-A-3 and is senior to Note B-A and Note B-B. The 85 Broad Street Non-Trust Senior Subordinate Companion Loan and the 85 Broad Street Non-Trust Junior Subordinate Companion Loan will not be an asset of the issuing entity.
Under the 85 Broad Street Co-Lender Agreement and the CSAIL 2017-C8 pooling and servicing agreement, the directing holder will be (i) until the outstanding principal balance of the 85 Broad Street Non-Trust Junior Subordinate Companion Loan (taking into account any appraisal reduction amounts or realized losses allocated to the 85 Broad Street Non-Trust Junior Subordinate Companion) is less than 25% of the initial principal balance of the 85 Broad Street Non-Trust Junior Subordinate Companion Loan less any principal payment allocated to and received by the holder of such companion loan (a “85 Broad Street Non-Trust Junior Subordinate Companion Loan Control Termination Event”), the holder of the 85 Broad Street Non-Trust Junior Subordinate Companion Loan; (ii) during the continuance of an 85 Broad Street Non-Trust Junior Subordinate Companion Loan Control Termination Event, and until the outstanding principal balance of the 85 Broad Street Non-Trust Senior Subordinate Companion Loan (taking into account any appraisal reduction amounts or realized losses allocated to the 85 Broad Street Non-Trust Senior Subordinate Companion Loan) is less than 25% of the initial principal balance of the 85 Broad Street Non-Trust Senior Subordinate Companion Loan less any principal payment allocated to and received by the holder of such companion loan (the “85 Broad Street Non-Trust Senior Subordinate Companion Loan Control Termination Event”), the holder of the 85 Broad Street Non-Trust Senior Subordinate Companion Loan; (iii) during the continuance of an 85 Broad Street Non-Trust Senior Subordinate Companion Loan Control Termination Event, and until the outstanding principal balance of the 85 Broad Street Trust Subordinate Companion Loan (taking into account any appraisal reduction amounts or realized losses allocated to the 85 Broad Street Trust Subordinate Companion Loan) is less than 25% of the initial principal balance of the 85
THE INFORMATION IN THIS STRUCTURAL AND COLLATERAL TERM SHEET IS NOT COMPLETE AND MAY BE AMENDED PRIOR TO THE TIME OF SALE. THIS TERM SHEET IS NOT AN OFFER TO SELL THESE SECURITIES AND IT IS NOT A SOLICITATION OF AN OFFER TO BUY THESE SECURITIES IN ANY JURISDICTION WHERE THE OFFER OR SALE IS NOT PERMITTED.
44
Mortgage Loan No. 1 — 85 Broad Street
Broad Street Trust Subordinate Companion Loan less any principal payment allocated to and received by the holder of such companion loan (the “85 Broad Street Trust Subordinate Companion Loan Control Termination Event”), the holder of the 85 Broad Street Trust Subordinate Companion Loan (which rights will be exercised by the 85 Broad Street directing certificateholder), and (iv) during the continuance of an 85 Broad Street Trust Subordinate Companion Loan Control Termination Event, the trustee of the CSAIL 2017-C8 Commercial Mortgage Trust (or, prior to the occurrence and continuance of a control termination event under the CSAIL 2017-C8 pooling and servicing agreement, the CSAIL 2017-C8 directing certificateholder) as holder of the Note A-A-1; however, the holder of Note A-A-3 will be entitled, under certain circumstances, to consult with the directing holder with respect to certain major decisions under the CSAIL 2017-C8 pooling and servicing agreement.
Note A-A-1 and Note A-A-2 accrue interest at the same rate as thepari passu Note A-A-3 and are entitled to payments of interest and principal on apro rata andpari passu basis with Note A-A-3. Note A-B, Note B-A and Note B-B are subordinate notes. For more information see “Description of the Mortgage Pool—The Whole Loans” in the Preliminary Prospectus.
Whole Loan Note Summary
| Original Balance | Cut-off Date Balance | Note Holder | Lead Servicer for Whole Loan (Y/N) | Controlling Piece (Y/N) | |
| Note A-A-1 | $70,000,000 | $70,000,000 | CSAIL 2017-C8 | Y | N |
| Note A-A-2 | 20,000,000 | 20,000,000 | CSAIL 2017-C8 | N | N |
| Note A-A-3 | 79,000,000 | 79,000,000 | Natixis | N | N |
| Note A-B | 72,000,000 | 72,000,000 | CSAIL 2017-C8 Loan-Specific Certificates | N | N |
| Note B-A | 58,800,000 | 58,800,000 | Third Party Investor | N | N |
| Note B-B | 58,800,000 | 58,800,000 | Third Party Investor | N | Y |
| Total | $358,600,000 | $358,600,000 |
THE INFORMATION IN THIS STRUCTURAL AND COLLATERAL TERM SHEET IS NOT COMPLETE AND MAY BE AMENDED PRIOR TO THE TIME OF SALE. THIS TERM SHEET IS NOT AN OFFER TO SELL THESE SECURITIES AND IT IS NOT A SOLICITATION OF AN OFFER TO BUY THESE SECURITIES IN ANY JURISDICTION WHERE THE OFFER OR SALE IS NOT PERMITTED.
45
Mortgage Loan No. 1 — 85 Broad Street
85 Broad Street Total Debt Capital Structure

| (1) | Based on an as-is appraised value of $652.0 million as of April 30, 2017 per the appraisal. |
| (2) | Based on the UW NOI of $25,930,418. |
| (3) | Based on the UW NCF of $24,028,948 and the coupon of 3.41253% on the aggregation of the Note A-A-1 Note and Note A-A-2 Note, the coupon of 3.69300% on the 85 Broad Street Trust Subordinate Companion Loan, the coupon of 4.08000% on the 85 Broad Street Non-Trust Senior Subordinate Companion Loan and the coupon of 4.60000% on the 85 Broad Street Non-Trust Junior Subordinate Companion Loan. |
| (4) | Implied Equity is based on the as-is appraised value of $652.0 million, less total debt of $358.6 million. |
The Borrowers. The borrowing entities for the loan are 85 Broad Street Property Owner LLC and 85 Broad Street TRS LLC, both of which are Delaware limited liability companies and special purpose entities.
The Sponsor. The loan’s sponsor and nonrecourse carve-out guarantor is ICR US LP, which is required to maintain a minimum net worth of $100.0 million. The maximum aggregate liability of the guarantor for the non-recourse carveouts for bankruptcy will be capped at 15.0% of the original 85 Broad Street Whole Loan plus costs of enforcement and collection. ICR US LP is controlled by Ivanhoé Cambridge, the real estate subsidiary of the Caisse de dépôt et placement du Québec, one of Canada’s leading institutional fund managers. La Caisse de dépôt et placement du Québec (“CDPQ”) is a long-term institutional investor that manages funds primarily for public and parapublic pension and insurance plans. As of December 31, 2016, it held CDN$270.7 billion in net assets.
Ivanhoé Cambridge is a global real estate firm that invests in high-quality properties and companies in select cities around the world. Founded in Québec in 1953, Ivanhoé Cambridge has built a vertically integrated business across Canada. Internationally, the company invests alongside key partners that are leaders in their respective markets. Through subsidiaries and partnerships, Ivanhoé Cambridge holds interests in close to 500 properties, consisting primarily in office, retail, residential and logistics real estate. Ivanhoé Cambridge held more than CDN$55.0 billion in assets as of June 30, 2016.
The Property.The property consists of a 30-story, Class A, platinum LEED certified office building totaling 1,118,512 SF, located at 85 Broad Street in New York, New York. Originally constructed in 1983 as Goldman Sachs’ headquarters, the property was converted to a multi-tenant building after Goldman Sachs vacated in 2011. The property features unique physical characteristics, including extensive light and panoramic views resulting from all four exposed sides, column-free floor plates and a full city block location. The property underwent an extensive $112.0 million ($100 PSF) capital improvement program in 2015,
THE INFORMATION IN THIS STRUCTURAL AND COLLATERAL TERM SHEET IS NOT COMPLETE AND MAY BE AMENDED PRIOR TO THE TIME OF SALE. THIS TERM SHEET IS NOT AN OFFER TO SELL THESE SECURITIES AND IT IS NOT A SOLICITATION OF AN OFFER TO BUY THESE SECURITIES IN ANY JURISDICTION WHERE THE OFFER OR SALE IS NOT PERMITTED.
46
Mortgage Loan No. 1 — 85 Broad Street
which entailed numerous building systems upgrades, lobby and plaza enhancements, elevator modifications and tenant amenity spaces. The lobby is finished with marble floors and walls. Investment in new HVAC, electrical and chilled water systems has resulted in the recently awarded LEED platinum certification in January 2017. The property has a modernized security system that includes card-key access in the elevators and security cameras located in the lobby and elevators. The lobby is equipped with a concierge desk and security personnel that patrol the perimeter of the property after hours. The interiors include high-end finishing and decorative fluorescent or incandescent light fixtures. The majority of the floors are column less floors due to the prior trading floor use. Amenities to the tenants include a 976 SF bike room that has space for 84 bicycles, a 10,461 SF cafeteria in concourse operated by Le Pain Quotidien, a full-service Belgium bistro, a high-end 14,007 SF wellness center operated by WeWork which is expected to open in August 2017 and be available to all tenants at a nominal rate.
As of April 19, 2017, the property was 87.1% occupied by 10 office tenants and 3 retail tenants. The largest tenant at the property, WeWork, leases 292,956 SF (26.2% of the net rentable area) through August 2033, with two, five-year extension options remaining. WeWork is a New York-based provider of shared office space that brings together entrepreneurs, freelancers, startups, and small businesses, creating both physical and virtual communities where members learn from, grow with, and support each other. The property is WeWork’s first full service location with a wellness center, restaurant & bar, and lounge floor fully operated by the company. The main lobby entrance is located on Broad Street and WeWork is in the process of constructing a private entrance on South William Street. The tenant initially was leasing 253,857 SF in 2015 and expanded in 2016 to the 27th floor. The second largest tenant at the property, Oppenheimer, leases 275,792 SF (24.7% of the net rentable area) through February 2028 with one five or ten-year extension option remaining. Oppenheimer provides a range of financial services including brokerage, investment banking, asset management, lending, and research. Oppenheimer’s Private Client segment, which offers retail brokerage, wealth management, and margin lending to affluent business clients in the US and Latin America makes up the bulk of sales. Oppenheimer has been a tenant at the property since 2011 and is rated B2/B/NR by Moody’s, S&P and Fitch, respectively. The third largest tenant at the property, Nielsen, leases 117,207 SF (10.5% of the net rentable area) through March 2025 with one, five- or ten-year extension option remaining. Founded in 1923, Nielsen operates as an information and measurement company. The company provides media and marketing information, analytics, and manufacturer and retailer expertise about what and where consumers buy, read, watch and listen. Nielsen has been a tenant at the property since 2013 and is rated Ba3/BB+/NR by Moody’s, S&P and Fitch, respectively.
The Market. The property is located on Broad Street between South William Street and Pearl Street, in close proximity to Wall Street, Battery Park, the Federal Reserve, the New York Stock Exchange, the National Museum of the American Indian, Federal Hall, the National September 11 Memorial and Museum, St. Paul’s Chapel, New York City Hall and the Fulton Street Transit Center, which is a recently completed $1.4 billion project by the Metropolitan Transit providing access to five different subway lines. Additionally, the property is near the World Trade Center Transportation Hub, which connects 11 different subway lines, the PATH rail system, the Battery Park City Ferry Terminal, and the Westfield World Trade Center, which opened in August 2016. Santiago Calatrava designed the center that is now home to over 125 retail shops and restaurants including: Apple, Michael Kors, Breitling and Eataly.
The area offers easy access to 15 subway lines, 30 local and express bus routes, 20 ferry routes, and the PATH transit system. In addition, the Brooklyn-Battery tunnel and the Brooklyn and Manhattan bridges connect Lower Manhattan with Brooklyn, Queens and Long Island, while the Holland Tunnel, directly north of the district, connects Lower Manhattan to New Jersey. Furthermore, the district is accessible via the FDR Drive, located on the east side of the district, and the West Side Highway.
According to a third party research report, the property is located in Lower Manhattan within the Class A Financial District submarket. As of the first quarter of 2017, the Class A Financial District submarket of New York City had approximately 35.2 million SF of office inventory with a vacancy of 9.7% and asking rents of $53.86 PSF. According to a third party research report as April 2017, the Financial District had the strongest rent growth in Manhattan and the New York Metro in 2016, with rent growth of 10.1%.
THE INFORMATION IN THIS STRUCTURAL AND COLLATERAL TERM SHEET IS NOT COMPLETE AND MAY BE AMENDED PRIOR TO THE TIME OF SALE. THIS TERM SHEET IS NOT AN OFFER TO SELL THESE SECURITIES AND IT IS NOT A SOLICITATION OF AN OFFER TO BUY THESE SECURITIES IN ANY JURISDICTION WHERE THE OFFER OR SALE IS NOT PERMITTED.
47
Mortgage Loan No. 1 — 85 Broad Street
According to a third party research report, the estimated 2017 population within a one-, three- and five-mile radius of the property is 82,908, 838,005 and 2,304,923, respectively. The estimated 2017 average household income within a one-, three- and five-mile radius of the property is $189,852, $139,663 and $114,797, respectively.
According to the appraisal, the property’s competitive set consists of the seven properties detailed in the table below.
Competitive Set Summary(1)
| Property | Year Built / Renovated | Total GLA (SF) | Est. Rent PSF(2) | Est. Occ. | Proximity (miles) | Anchor Tenants |
| 85 Broad Street | 1983 / 2015 | 1,118,512(3) | $44.79(3) | 87.1%(3) | N/A | WeWork |
| 225 Liberty Street | 1987 / NAV | 2,200,000 | $70.00 | 97.2% | 0.8 | Rauxa |
| 1 Liberty Street | 1972 / NAV | 2,121,437 | $54.00 | NAV | 0.7 | AON, New Avon |
| 200 Vesey Street | 1985 / NAV | 2,300,000 | $55.00 | 91.0% | 0.9 | Tullett Prebon |
| 28 Liberty Street | 1960 / NAV | 1,898,158 | $58.00 | 77.9% | 0.7 | New York State Attorney General’s Office |
| One New York Plaza | 1968 / 1994 | 2,103,750 | $57.00 | 95.3% | 0.2 | Revlon, Inc. |
| 200 Vesey Street | 1985 / NAV | 2,300,000 | $59.00 | 91.0% | 0.9 | Royal Bank of Canada |
| 1 Whitehall Street | 1962 / 1989 | 285,000 | $50.00 | 97.6% | 0.2 | Selligent |
| (1) | Source: Appraisal. |
| (2) | Est. Rent PSF includes leases the appraiser identified for the specific properties for a 12-month period. |
| (3) | Based on the April 19, 2017 underwritten rent roll. |
Historical and Current Occupancy(1)
| 2012 | 2013 | 2014 | 2015 | 2016 | Current(2) |
| 31.3% | 43.1% | 43.1% | 74.8% | 88.7% | 87.1% |
| (1) | Historical Occupancy is provided by the sponsor. Occupancies are as of December 31 of each respective year. The property was built to suit for Goldman Sachs in 1983. The seller bought the property in 2014 following Goldman Sachs vacating the building, and leased up the building from approximately 25.0% at acquisition to its current occupancy of 87.1%. |
| (2) | Based on the April 19, 2017 underwritten rent roll. |
THE INFORMATION IN THIS STRUCTURAL AND COLLATERAL TERM SHEET IS NOT COMPLETE AND MAY BE AMENDED PRIOR TO THE TIME OF SALE. THIS TERM SHEET IS NOT AN OFFER TO SELL THESE SECURITIES AND IT IS NOT A SOLICITATION OF AN OFFER TO BUY THESE SECURITIES IN ANY JURISDICTION WHERE THE OFFER OR SALE IS NOT PERMITTED.
48
Mortgage Loan No. 1 — 85 Broad Street
Tenant Summary(1)
| Tenant | Ratings Moody’s/S&P/Fitch(2) | Net Rentable Area (SF) | % of Total NRA | Base Rent PSF | Annual Base Rent | % of Total Base Rent | Lease Expiration Date |
| WeWork(3) | NR / NR / NR | 292,956 | 26.2% | $45.79 | $13,414,234 | 30.8% | 8/31/2033 |
| Oppenheimer(4) | B2 / B / NR | 275,792 | 24.7% | $44.83 | $12,363,838 | 28.4% | 2/28/2028 |
| Nielsen(5) | Ba3 / BB+ / NR | 117,207 | 10.5% | $48.56 | $5,691,743 | 13.1% | 3/31/2025 |
| Vox Media(6) | NR / NR / NR | 85,733 | 7.7% | $48.00 | $4,115,184 | 9.4% | 1/31/2031 |
| Banco Popular(7) | (P)Ba1 / B / A- | 53,229 | 4.8% | $40.85 | $2,174,153 | 5.0% | 2/28/2026 |
| Berkshire Hathaway(8) | Aa2 / AA / A+ | 38,407 | 3.4% | $45.50 | $1,747,519 | 4.0% | 1/31/2024 |
| Year-Up(9) | NR / NR / NR | 38,407 | 3.4% | $41.00 | $1,574,687 | 3.6% | 11/30/2030 |
| Modern Language(10) | NR / NR / NR | 30,534 | 2.7% | $36.85 | $1,125,229 | 2.6% | 5/31/2036 |
| SunGuard Systems(11) | B3 / NR / NR | 12,598 | 1.1% | $42.50 | $535,415 | 1.2% | 10/31/2019 |
| Friedman Vartolo(12) | NR / NR / NR | 8,082 | 0.7% | $51.00 | $412,182 | 0.9% | 2/28/2027 |
| (1) | Based on the underwritten rent roll, including rent increases occurring through May 2018. |
| (2) | Ratings provided are for the parent company of the entity listed in the “Tenant” field whether or not the parent company guarantees the lease. |
| (3) | WeWork occupies 11 suites within the property; each lease has two, five-year renewal options remaining. |
| (4) | Oppenheimer occupies ten suites of which two are storage within the property; each lease has one, 5- or 10-year renewal option remaining. The eight office suites have a one-time termination option effective as of February 1, 2024 to either terminate (i) the highest full floor; (ii) the lowest full floor; or (iii) the entirety of its lease with 18 months’ notice and a penalty equal to the unamortized transaction costs at an interest rate of 8%. |
| (5) | Nielsen occupies four suites within the property, each subject to a separate lease that has one, 5- or 10-year renewal option remaining. Following the 7th anniversary of the rent commencement date, Nielsen has the ability to terminate a portion or the entirety of its lease with 15 months’ notice. The termination payment is the sum of five times the annual rent, tax payments, operating payments and cafeteria rent, the landlord’s contribution, rent, tax and operating payments during the abatement period amortized on a monthly basis with a 7.0% interest rate and brokerage commissions. 50% of the termination payment is due concurrently with the termination notice and the remaining 50% is due on or before the termination date. |
| (6) | Vox Media occupies three suites within the property; each lease has one, five-year renewal option remaining. |
| (7) | Banco Popular occupies two suites within the property; each lease has one, five-year renewal option remaining. On June 7, 2017, Banco Popular was acquired by Banco Santander rated A3/A-/NR by Moody’s/S&P/Fitch. |
| (8) | Berkshire Hathaway has one, five-year renewal option remaining. |
| (9) | Year-Up has one, five-year renewal option remaining. |
| (10) | Modern Language has one, five-year renewal option remaining. |
| (11) | SunGuard Systems has one, five-year renewal option remaining. |
| (12) | Friedman Vartolo has one, five-year renewal option remaining. |
THE INFORMATION IN THIS STRUCTURAL AND COLLATERAL TERM SHEET IS NOT COMPLETE AND MAY BE AMENDED PRIOR TO THE TIME OF SALE. THIS TERM SHEET IS NOT AN OFFER TO SELL THESE SECURITIES AND IT IS NOT A SOLICITATION OF AN OFFER TO BUY THESE SECURITIES IN ANY JURISDICTION WHERE THE OFFER OR SALE IS NOT PERMITTED.
49
Mortgage Loan No. 1 — 85 Broad Street
Lease Rollover Schedule(1)
| Year | Number of Leases Expiring(2) | NRA Expiring | % of NRA Expiring | Base Rent Expiring | % of Base Rent Expiring | Cumulative NRA Expiring | Cumulative % of NRA Expiring | Cumulative Base Rent Expiring | Cumulative % of Base Rent Expiring |
| Vacant | NAP | 144,836 | 12.9% | NAP | NAP | 144,836 | 12.9% | NAP | NAP |
| MTM | 0 | 0 | 0.0 | $0 | 0.0% | 144,836 | 12.9% | $0 | 0.0% |
| 2017 | 0 | 0 | 0.0 | 0 | 0.0 | 144,836 | 12.9% | $0 | 0.0% |
| 2018 | 0 | 0 | 0.0 | 0 | 0.0 | 144,836 | 12.9% | $0 | 0.0% |
| 2019 | 1 | 12,598 | 1.1 | 535,415 | 1.2 | 157,434 | 14.1% | $535,415 | 1.2% |
| 2020 | 0 | 0 | 0.0 | 0 | 0.0 | 157,434 | 14.1% | $535,415 | 1.2% |
| 2021 | 1 | 484 | 0.0 | 27,012 | 0.1 | 157,918 | 14.1% | $562,427 | 1.3% |
| 2022 | 0 | 0 | 0.0 | 0 | 0.0 | 157,918 | 14.1% | $562,427 | 1.3% |
| 2023 | 0 | 0 | 0.0 | 0 | 0.0 | 157,918 | 14.1% | $562,427 | 1.3% |
| 2024 | 1 | 38,407 | 3.4 | 1,747,519 | 4.0 | 196,325 | 17.6% | $2,309,946 | 5.3% |
| 2025 | 4 | 117,207 | 10.5 | 5,691,743 | 13.1 | 313,532 | 28.0% | $8,001,689 | 18.3% |
| 2026 | 2 | 53,229 | 4.8 | 2,174,153 | 5.0 | 366,761 | 32.8% | $10,175,842 | 23.3% |
| 2027 & Beyond | 32 | 751,751 | 67.2 | 33,432,738 | 76.7 | 1,118,512 | 100.0% | $43,608,580 | 100.0% |
| Total | 41 | 1,118,512 | 100.0% | $43,608,580 | 100.0% |
| (1) | Based on the underwritten rent roll dated April 19, 2017, base rent including rent steps through May 2018. |
| (2) | Multiple tenants operate under more than one lease. There are 13 tenants at the property. |
Operating History and Underwritten Net Cash Flow
| 2014 | 2015 | 2016 | TTM(1) | Underwritten(2) | PSF | %(3) | |
| Rents in Place(4) | N/A | $19,589,718 | $33,990,919 | $35,096,005 | $43,608,579 | $38.97 | 82.0% |
| Vacancy Gross Up | N/A | 0 | 0 | 0 | 7,162,525 | 6.40 | 13.5 |
| Rent Adjustment(5) | N/A | 12,425,956 | 6,570,969 | 6,463,290 | 0 | 0.00 | 0.0 |
| Gross Potential Rent | N/A | $32,015,674 | $40,561,888 | $41,559,295 | $50,771,104 | $45.37 | 95.5% |
| Total Reimbursements | N/A | 2,121,256 | 2,330,022 | 2,386,220 | 2,415,192 | 2.16 | 4.5 |
| Net Rental Income | N/A | $34,136,930 | $42,891,910 | $43,945,515 | $53,186,296 | $47.53 | 100.0% |
| (Vacancy/Collection Loss) | N/A | 0 | 0 | 0 | (7,162,525) | (6.40) | (13.5) |
| Other Income | N/A | 1,340,413 | 1,299,980 | 1,267,039 | 1,201,605 | 1.07 | 2.3 |
| Effective Gross Income | N/A | $35,477,343 | $44,191,890 | $45,212,554 | $47,225,377 | $42.20 | 88.8% |
| Total Expenses | N/A | $21,206,955 | $21,069,855 | $21,305,990 | $21,294,959 | $19.03 | 40.0% |
| Net Operating Income | N/A | $14,270,387 | $23,122,035 | $23,906,564 | $25,930,418 | $23.17 | 48.8% |
| Total TI/LC, Capex/RR | N/A | 0 | 0 | 0 | 1,901,470 | 1.70 | 3.6 |
| Net Cash Flow | N/A | $14,270,387 | $23,122,035 | $23,906,564 | $24,028,948 | $21.47 | 45.2% |
| Avg. Rents in Place PSF(6) | N/A | $40.87 | $42.01 | $42.68 | $44.79 |
| (1) | Represents the trailing twelve month period ending February 28, 2017. |
| (2) | Rent includes base rent and rent steps through May 2018. |
| (3) | Percentage column represents percent of Net Rental Income. |
| (4) | The property was built to suit for Goldman Sachs in 1983. The seller bought the property in 2014 following Goldman Sachs vacating the building, and leased up the building from approximately 25.0% at acquisition to its current occupancy of 87.1%. 2015 cash flows are significantly lower than historical as the seller offered free rent and TI packages in order to attract tenants. The seller also completed a $112 million ($100 PSF) capital improvement program, which entailed numerous building systems upgrades, lobby and plaza enhancements, elevator modifications and tenant amenity spaces. |
| (5) | Rent adjustment is rent from FAS 13 GAAP Adjustment. This adjustment allows for rent payment based on lease term to be included in the operating statements. |
| (6) | The 2015, 2016 and TTM Average Rents in Place PSF are calculated using aggregation of Rents in Place and Rent Adjustment, and actual leased SF at such period. |
THE INFORMATION IN THIS STRUCTURAL AND COLLATERAL TERM SHEET IS NOT COMPLETE AND MAY BE AMENDED PRIOR TO THE TIME OF SALE. THIS TERM SHEET IS NOT AN OFFER TO SELL THESE SECURITIES AND IT IS NOT A SOLICITATION OF AN OFFER TO BUY THESE SECURITIES IN ANY JURISDICTION WHERE THE OFFER OR SALE IS NOT PERMITTED.
50
Mortgage Loan No. 1 — 85 Broad Street
Property Management. The property is managed by Callahan Properties.
Escrows and Reserves. At origination, the borrowers deposited into escrow $8,170,739 for unfunded lease obligations and $570,850 for free rent. Provided that no event of default has occurred and is continuing, the lender will be required to disburse funds held in such unfunded lease obligations reserve to the borrower within 15 days after the borrower delivers a request to the lender therefor (but not more than once per month) in increments of at least $5,000, provided that (i) such disbursement is for an approved leasing expense as provided in the related loan documents, (ii) if applicable, the lender has, at its discretion, verified the performance of any construction work associated with such approved leasing expense and (iii) the request is accompanied by certain information and an officer’s certificate as detailed under the related loan documents. If an event of default exists, any such disbursement in an amount of more than $10,000 may, at the lender’s discretion, be made by joint check payable to the borrower and the payee of any such approved leasing expense.
Tax Escrows -During a Cash Management Period (as defined below), the borrowers are required to escrow 1/12th of annual tax payments, currently equal to $787,180.
Insurance Escrows -The loan documents do not require monthly escrows for insurance provided that (i) no event of default under the loan has occurred and is continuing, (ii) the borrowers provide evidence that the insurance coverages required pursuant to the loan documents are being maintained under an acceptable blanket insurance policy and (iii) the borrowers maintain an amount in the insurance escrow equal to six months’ worth of monthly insurance premiums.
Replacement Reserves -During a Cash Management Period, the borrowers are required to escrow for $18,636 ($0.20 per square foot annually) for replacement reserves.
TI/LC Reserves -During a Cash Management Period, the borrowers are required to escrow for $139,768 ($1.50 per square foot annually) for TI/LC reserves.
Lockbox / Cash Management. The 85 Broad Street Whole Loan is structured with a hard lockbox and springing cash management. Tenants have been directed to remit all payments due under their respective leases directly into the lockbox account. During the continuance of a Cash Management Period, all funds in the lockbox account are required to be swept daily to a cash management account under the control of the lender and disbursed during each interest period of the term of the loan in accordance with the loan documents.
A “Cash Management Period” will commence upon: (i) an event of default under the 85 Broad Street Whole Loan documents; (ii) the failure by the borrowers, after the end of two consecutive calendar quarters, to maintain a debt service coverage ratio of at least 1.20x; (iii) a Primary Tenant Sweep Period (as defined below); or (iv) an approved mezzanine loan exists; and will end with respect to clause (i) above, if such event of default has been cured or waived by the lender; with respect to clause (ii) above, if for two consecutive calendar quarters since the commencement of the existing Cash Management Period (A) no event of default under the 85 Broad Street Whole Loan documents has occurred, (B) no event that constitutes another Cash Management Period has occurred, and (C) the debt service coverage ratio at least equal to 1.20x, and with respect to clause (iii) above, a Primary Tenant Sweep Period Cure (as defined below) has occurred and no event that triggers another Cash Management Period has occurred.
A “Primary Tenant Sweep Period” will commence on the earliest of (i) the earlier of the date that is 12 months prior to (x) the then-scheduled expiration, termination or contraction date of any Primary Tenant (as defined below) lease, whether such lease is in its initial term or any renewal term and (y) the date by which any Primary Tenant is required to exercise its renewal option under any Primary Tenant lease (provided such renewal has not yet been exercised);(ii) any termination, cancellation or surrender of, or receipt by the borrowers of a notice to terminate any one of the Primary Tenant leases; (iii) a Primary Tenant “going dark” (i.e. vacates, surrenders or otherwise ceases to operate its business) in a majority of the applicable Primary Tenant premises; (iv) the occurrence of any monetary or material non-monetary default (beyond any applicable notice and/or cure period) under any Primary Tenant lease or (v) a Primary Tenant, its corporate parent and/or guarantor becoming the subject of a bankruptcy action.
THE INFORMATION IN THIS STRUCTURAL AND COLLATERAL TERM SHEET IS NOT COMPLETE AND MAY BE AMENDED PRIOR TO THE TIME OF SALE. THIS TERM SHEET IS NOT AN OFFER TO SELL THESE SECURITIES AND IT IS NOT A SOLICITATION OF AN OFFER TO BUY THESE SECURITIES IN ANY JURISDICTION WHERE THE OFFER OR SALE IS NOT PERMITTED.
51
Mortgage Loan No. 1 — 85 Broad Street
A “Primary Tenant Sweep Period Cure” will commence (A) with respect to clause (i), (ii), (iv) and (v) above, if a Primary Tenant Replacement Event (as defined below) has occurred; (B) with respect to clause (iii) above, if the Primary Tenant or an acceptable replacement tenant re-opens for business for a continuous period of not less than three months; (C) with respect to clause (iv) above, if the default is cured and no other default (beyond any applicable notice and/or cure period) exists under the Primary Tenant lease; (D) with respect to clause (v) above, if the bankruptcy action is dismissed and the primary tenant lease is affirmed and (E) the date on which the following amounts have accumulated in the Primary Tenant reserve subaccount (exclusive of any amounts on deposit in the Primary Tenant reserve subaccount attributable to the Primary Tenant Sweep Period Cure with respect to any other trigger): (x) $80.00 PSF with respect to any portion of the applicable Primary Tenant premises that has not been re-tenanted and (y) to the extent all or a portion of the applicable Primary Tenant premises has been demised to an acceptable replacement tenant, in the lender’s judgment, sufficient funds to cover all anticipated Primary Tenant re-leasing costs related to the space that has been re-tenanted and all the cost of landlord work required under such replacement tenant lease.
A “Primary Tenant Replacement Event” means (X) either (a) the termination of a Primary Tenant lease and the borrowers entering into one or more new leases that, in the aggregate, demise all of the applicable Primary Tenant premises or (b) the renewal of the applicable Primary Tenant lease for the entire Primary Tenant premises in accordance with its terms as in existence on the date hereof or otherwise on terms and conditions approved in writing by the lender, such approval not to be unreasonably conditioned, withheld or delayed and, (Y) in either instance, in the lender’s judgment, sufficient funds have been accumulated and remain available on deposit in the Primary Tenant reserve subaccount (exclusive of any amounts on deposit attributable to the Primary Tenant Sweep Period Cure with respect to any other trigger) to pay all Primary Tenant re- leasing costs with respect to both such new lease and/or renewal of a Primary Tenant lease.
A “Primary Tenant” means initially either or both of Oppenheimer and WeWork and thereafter any acceptable replacement tenant that leases in excess of 160,000 SF.
Additional Debt.In addition to Note A-A-1 and Note A-A-2, the mortgage property is also security for thepari passu Note A-A-3 and the 85 Broad Street Subordinate Companion Loans. The 85 Broad Street Trust Subordinate Companion Loan has an outstanding principal balance as of the cut-off date of $72.0 million and a coupon of 3.69300%. The 85 Broad Street Non-Trust Senior Subordinate Companion Loan has an outstanding principal balance as of the cut-off date of $58.8 million and a coupon of 4.08000%. The 85 Broad Street Non-Trust Junior Subordinate Companion Loan has an outstanding principal balance as of the cut-off date of $58.8 million and a coupon of 4.60000%. The 85 Broad Street Whole Loan (inclusive of the 85 Broad Street Subordinate Companion Loans) has a Cut-off Date LTV of 55.0%, an UW NCF DSCR of 1.75x and an UW NOI Debt Yield of 7.2%.
In addition, the borrowers have the one-time right, at any time following the securitization of the 85 Broad Street Whole Loan, upon no less than 45 business days prior written notice to the lender to obtain a mezzanine loan secured by a pledge of all of the direct ownership interests in the borrowers upon satisfaction of certain terms and conditions which include, without limitation, (i) the mezzanine lender meets a qualified lender provision in the loan documents; (ii) the combined loan-to-value ratio on the origination date of the mezzanine loan does not exceed 55.0%; (iii) the combined debt service coverage ratio is not less than 1.75x, (iv) the combined debt yield is not less than 6.6%; and (v) the lenders enter into an intercreditor agreement in form and substance reasonably acceptable to the mortgage lender and the rating agencies.
THE INFORMATION IN THIS STRUCTURAL AND COLLATERAL TERM SHEET IS NOT COMPLETE AND MAY BE AMENDED PRIOR TO THE TIME OF SALE. THIS TERM SHEET IS NOT AN OFFER TO SELL THESE SECURITIES AND IT IS NOT A SOLICITATION OF AN OFFER TO BUY THESE SECURITIES IN ANY JURISDICTION WHERE THE OFFER OR SALE IS NOT PERMITTED.
52
(THIS PAGE INTENTIONALLY LEFT BLANK)
53
Mortgage Loan No. 2 — 245 Park Avenue
THE INFORMATION IN THIS STRUCTURAL AND COLLATERAL TERM SHEET IS NOT COMPLETE AND MAY BE AMENDED PRIOR TO THE TIME OF SALE. THIS TERM SHEET IS NOT AN OFFER TO SELL THESE SECURITIES AND IT IS NOT A SOLICITATION OF AN OFFER TO BUY THESE SECURITIES IN ANY JURISDICTION WHERE THE OFFER OR SALE IS NOT PERMITTED.
54
Mortgage Loan No. 2 — 245 Park Avenue
THE INFORMATION IN THIS STRUCTURAL AND COLLATERAL TERM SHEET IS NOT COMPLETE AND MAY BE AMENDED PRIOR TO THE TIME OF SALE. THIS TERM SHEET IS NOT AN OFFER TO SELL THESE SECURITIES AND IT IS NOT A SOLICITATION OF AN OFFER TO BUY THESE SECURITIES IN ANY JURISDICTION WHERE THE OFFER OR SALE IS NOT PERMITTED.
55
THE INFORMATION IN THIS STRUCTURAL AND COLLATERAL TERM SHEET IS NOT COMPLETE AND MAY BE AMENDED PRIOR TO THE TIME OF SALE. THIS TERM SHEET IS NOT AN OFFER TO SELL THESE SECURITIES AND IT IS NOT A SOLICITATION OF AN OFFER TO BUY THESE SECURITIES IN ANY JURISDICTION WHERE THE OFFER OR SALE IS NOT PERMITTED.
56
Mortgage Loan No. 2 — 245 Park Avenue
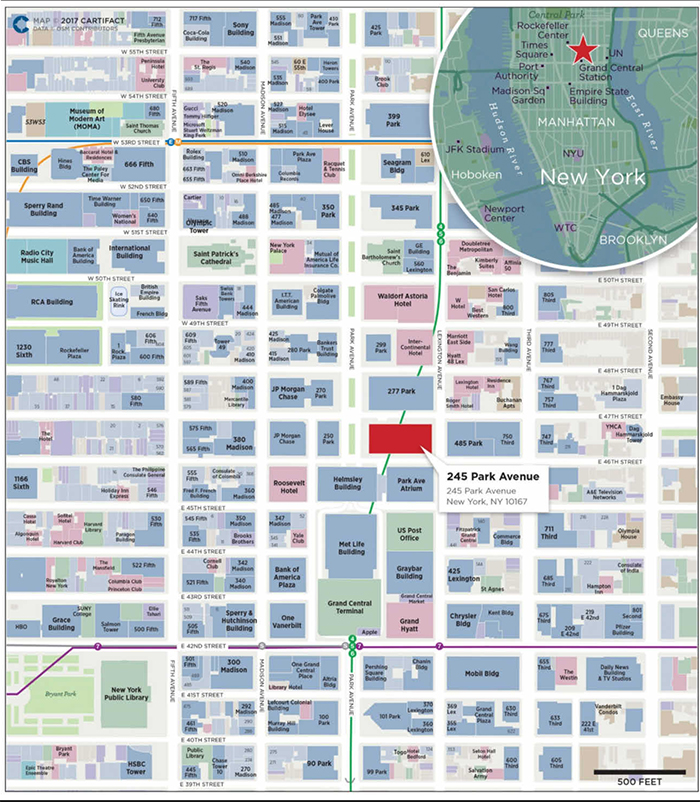
THE INFORMATION IN THIS STRUCTURAL AND COLLATERAL TERM SHEET IS NOT COMPLETE AND MAY BE AMENDED PRIOR TO THE TIME OF SALE. THIS TERM SHEET IS NOT AN OFFER TO SELL THESE SECURITIES AND IT IS NOT A SOLICITATION OF AN OFFER TO BUY THESE SECURITIES IN ANY JURISDICTION WHERE THE OFFER OR SALE IS NOT PERMITTED.
57
Mortgage Loan No. 2 — 245 Park Avenue
| Mortgage Loan Information | Property Information | |||
| Mortgage Loan Seller(1): | Natixis | Single Asset / Portfolio: | Single Asset | |
| Original Principal Balance(2): | $80,000,000 | Title: | Fee | |
| Cut-off Date Principal Balance(2): | $80,000,000 | Property Type - Subtype: | Office – CBD | |
| % of Pool by IPB: | 9.9% | Net Rentable Area (SF)(5): | 1,779,515 | |
| Credit Assessment (Moody’s/Fitch/DBRS/KBRA)(3): | NR / BBB- / NR / BBB | Location: | New York, NY | |
| Loan Purpose: | Acquisition | Year Built / Renovated: | 1965 / 2006 | |
| Borrower: | 245 Park Avenue Property LLC | Occupancy(6)(7): | 91.2% | |
| Sponsor: | HNA Group | Occupancy Date: | 2/28/2017 | |
| Interest Rate: | 3.6694% | Number of Tenants: | 19 | |
| Note Date: | 5/5/2017 | 2014 NOI: | $98,558,306 | |
| Maturity Date: | 6/1/2027 | 2015 NOI: | $102,667,705 | |
| Interest-only Period: | 120 months | 2016 NOI: | $106,715,962 | |
| Original Term: | 120 months | TTM NOI(8): | $107,676,675 | |
| Original Amortization: | None | UW Economic Occupancy: | 88.5% | |
| Amortization Type: | Interest Only | UW Revenues: | $177,756,680 | |
| Call Protection(4): | L(24),Def (92),O(4) | UW Expenses: | $62,448,738 | |
| Lockbox(5): | Hard | UW NOI: | $115,307,942 | |
| Additional Debt(2): | Yes | UW NCF: | $109,564,903 | |
| Additional Debt Balance(2): | $1,688,000,000 | Appraised Value / Per SF(6): | $2,210,000,000 / $1,242 | |
| Additional Debt Type(2): | Pari Passu, B-Notes, Mezzanine | Appraisal Date: | 4/1/2017 | |
| Additional Future Debt Permitted: | No |
| Escrows and Reserves(9) | Financial Information(2) | |||||
| Initial | Monthly | Initial Cap | Cut-off Date Loan / SF(6): | $607 | ||
| Taxes: | $0 | $3,878,518 | N/A | Maturity Date Loan / SF(6): | $607 | |
| Insurance: | $227,000 | $113,500 | N/A | Cut-off Date LTV: | 48.9% | |
| Replacement Reserves: | $47,738 | $47,738 | N/A | Maturity Date LTV: | 48.9% | |
| TI/LC: | $0 | Springing | N/A | UW NCF DSCR: | 2.73x | |
| Other: | $11,431,608 | $0 | N/A | UW NOI Debt Yield: | 10.7% |
Sources and Uses
| Sources | Proceeds | % of Total | Uses | Proceeds | % of Total | |
| Mortgage Loan | $1,200,000,000 | 52.4% | Purchase Price | $2,210,000,000 | 96.4% | |
| Mezzanine Loan A | 236,500,000 | 10.3 | Upfront Reserves | 11,706,346 | 0.5 | |
| Mezzanine Loan B | 221,000,000 | 9.6 | Closing Costs | 70,356,2333 | 3.1 | |
| Mezzanine Loan C | 110,500,000 | 4.8 | ||||
| Cash Equity | 524,062,579 | 22.9 | ||||
| Total Sources | $2,292,062,579 | 100.0% | Total Uses | $2,292,062,579 | 100.0% |
| (1) | The 245 Park Avenue Whole Loan was co-originated by JPMorgan Chase Bank, National Association, Natixis Real Estate Capital LLC, Barclays Bank PLC, Deutsche Bank AG, New York Branch and Société Générale. |
| (2) | The 245 Park Avenue loan is part of a larger split whole loan evidenced by 20pari passunotes (collectively, “A Notes”) and five subordinate notes (collectively, “B Notes”) with an aggregate original principal balance of $1.2 billion. The financial information presented in the chart above and herein reflects the cut-off date balance of the $1.08 billion of A Notes, but not the $568.0 million of mezzanine loans or the $120.0 million of B Notes. The additional debt consists of 19pari passucompanion loans with an outstanding principal balance of $1.0 billion, $120.0 million of B Notes and $568.0 million of mezzanine loans. For a more detailed description of the additional debt, please refer to “Additional Debt” below. |
THE INFORMATION IN THIS STRUCTURAL AND COLLATERAL TERM SHEET IS NOT COMPLETE AND MAY BE AMENDED PRIOR TO THE TIME OF SALE. THIS TERM SHEET IS NOT AN OFFER TO SELL THESE SECURITIES AND IT IS NOT A SOLICITATION OF AN OFFER TO BUY THESE SECURITIES IN ANY JURISDICTION WHERE THE OFFER OR SALE IS NOT PERMITTED.
58
Mortgage Loan No. 2 — 245 Park Avenue
| (3) | Fitch and KBRA have each indicated that the 245 Park Avenue loan has, in the context of its inclusion in the Initial Pool Balance, credit characteristics consistent with an investment grade obligation. |
| (4) | The lockout period will be at least 24 payments beginning with and including the first payment date of July 1, 2017. Defeasance of the full $1.2 billion 245 Park Avenue Whole Loan is permitted at any time after the earlier to occur of (i) July 1, 2020 or (ii) the date that is two years after the closing date of the securitization that includes the last note to be securitized. |
| (5) | For a more detailed description of the lockbox, please refer to “Lockbox / Cash Management” below. |
| (6) | Based on remeasured net rentable area of 1,779,515 SF in accordance with current REBNY standards, which is the basis for the square footage in future leasing. The property’s contractual square footage is 1,723,993 SF as leased. |
| (7) | Occupancy includes HNA Capital USA LLC (an affiliate of the loan sponsor) and MIO Partners (together, approximately 2.7% of the remeasured net rentable area), which have executed leases but have not yet taken occupancy. |
| (8) | Represents the trailing twelve month period ending March 31, 2017. |
| (9) | For a more detailed description of escrows and reserves, please refer to “Escrows and Reserves” below. |
The Loan. The 245 Park Avenue loan, which is part of a larger split whole loan, is a first mortgage loan secured by the borrower’s fee interest in a 44-story, remeasured 1,779,515 SF office building that occupies the entire city block between 46th and 47th Streets and Park and Lexington Avenues in Midtown Manhattan, New York. The whole loan has an outstanding principal balance of $1.2 billion (the “245 Park Avenue Whole Loan”) and is comprised of (i) a senior loan, evidenced by 20pari passu notes, with an aggregate outstanding principal balance of $1.08 billion (collectively, the “A Notes”) and (ii) a subordinate companion loan, evidenced by fivepari passu notes, with an aggregate outstanding principal balance of $120.0 million (collectively, the “B Notes”). One of the A Notes, Note A-2-B-1, has an outstanding principal balance as of the cut-off date of $80.0 million and is being contributed to the CSAIL 2017-C8 Commercial Mortgage Trust. Five of the A Notes, including the controlling A-1-A, along with all five of the B Notes were contributed to the 245 Park Avenue Trust 2017-245P securitization which governs the servicing and administration of the 245 Park Avenue Whole Loan and is the controlling note under the related intercreditor agreement, the rights of which will be exercised by the related trustee (or, prior to the occurrence and continuance of a control termination event under the related trust and servicing agreement (the “245 Park Avenue Trust 2017-245P Trust and Servicing Agreement”), the directing certificateholder under the 245 Park Avenue Trust 2017-245P Trust and Servicing Agreement). However, the CSAIL 2017-C8 Trust will be entitled, under certain circumstances, to be consulted with respect to certain major decisions (which rights will be exercised by the directing certificateholder prior to a control termination event). The 245 Park Avenue Whole Loan has a 10-year term and will be interest-only for the term of the loan. Additionally, Note A-2-A-1, which has an outstanding principal balance as of the cut-off date of $98.0 million was contributed to the JPMCC 2017-JP6 securitization and Note A-2-A-2 and Note A-2-C-1-A, which have an aggregate outstanding principal balance as of the cut-off date of $93.75 million are expected to be contributed to the DBJPM 2017-C6 securitization. The remaining A Notes are currently held by their respective co-originators as depicted in the chart below and are expected to be contributed to one or more future securitizations.
THE INFORMATION IN THIS STRUCTURAL AND COLLATERAL TERM SHEET IS NOT COMPLETE AND MAY BE AMENDED PRIOR TO THE TIME OF SALE. THIS TERM SHEET IS NOT AN OFFER TO SELL THESE SECURITIES AND IT IS NOT A SOLICITATION OF AN OFFER TO BUY THESE SECURITIES IN ANY JURISDICTION WHERE THE OFFER OR SALE IS NOT PERMITTED.
59
Mortgage Loan No. 2 — 245 Park Avenue
Whole Loan Note Summary
| Original Balance | Cut-off Date Balance | Note Holder | Lead Servicer for Whole Loan (Y/N) | Controlling Piece (Y/N) | |
| Note A-1-A | $152,000,000 | $152,000,000 | 245 Park Avenue Trust 2017-245 | Y | N |
| Note A-1-B | 114,000,000 | 114,000,000 | 245 Park Avenue Trust 2017-245 | N | N |
| Note A-1-C | 38,000,000 | 38,000,000 | 245 Park Avenue Trust 2017-245 | N | N |
| Note A-1-D | 38,000,000 | 38,000,000 | 245 Park Avenue Trust 2017-245 | N | N |
| Note A-1-E | 38,000,000 | 38,000,000 | 245 Park Avenue Trust 2017-245 | N | N |
| Note A-2-A-1 | 98,000,000 | 98,000,000 | JPMCC 2017-JP6 | N | N |
| Note A-2-A-2 | 75,000,000 | 75,000,000 | DBJPM 2017-C6 | N | N |
| Note A-2-A-3 | 75,000,000 | 75,000,000 | JPMorgan Chase | N | N |
| Note A-2-A-4 | 32,000,000 | 32,000,000 | JPMorgan Chase | N | N |
| Note A-2-B-1 | 80,000,000 | 80,000,000 | CSAIL 2017-C8 | N | N |
| Note A-2-B-2 | 70,000,000 | 70,000,000 | Natixis | N | N |
| Note A-2-B-3 | 60,000,000 | 60,000,000 | Natixis | N | N |
| Note A-2-C-1-A | 18,750,000 | 18,750,000 | DBJPM 2017-C6 | N | N |
| Note A-2-C-1-B | 6,250,000 | 6,250,000 | Deutsche Bank | N | N |
| Note A-2-C-2 | 45,000,000 | 45,000,000 | Deutsche Bank | N | N |
| Note A-2-D-1 | 30,000,000 | 30,000,000 | Société Générale | N | N |
| Note A-2-D-2 | 25,000,000 | 25,000,000 | Société Générale | N | N |
| Note A-2-D-3 | 15,000,000 | 15,000,000 | Société Générale | N | N |
| Note A-2-E-1 | 55,000,000 | 55,000,000 | Barclays | N | N |
| Note A-2-E-2 | 15,000,000 | 15,000,000 | Barclays | N | N |
| Note B-1 | 48,000,000 | 48,000,000 | 245 Park Avenue Trust 2017-245 | N | N |
| Note B-2 | 36,000,000 | 36,000,000 | 245 Park Avenue Trust 2017-245 | N | N |
| Note B-3 | 12,000,000 | 12,000,000 | 245 Park Avenue Trust 2017-245 | N | N |
| Note B-4 | 12,000,000 | 12,000,000 | 245 Park Avenue Trust 2017-245 | N | N |
| Note B-5 | 12,000,000 | 12,000,000 | 245 Park Avenue Trust 2017-245 | N | Y |
| Total | $1,200,000,000 | $1,200,000,000 |
THE INFORMATION IN THIS STRUCTURAL AND COLLATERAL TERM SHEET IS NOT COMPLETE AND MAY BE AMENDED PRIOR TO THE TIME OF SALE. THIS TERM SHEET IS NOT AN OFFER TO SELL THESE SECURITIES AND IT IS NOT A SOLICITATION OF AN OFFER TO BUY THESE SECURITIES IN ANY JURISDICTION WHERE THE OFFER OR SALE IS NOT PERMITTED.
60
Mortgage Loan No. 2 — 245 Park Avenue
245 Park Avenue Total Debt Capital Structure
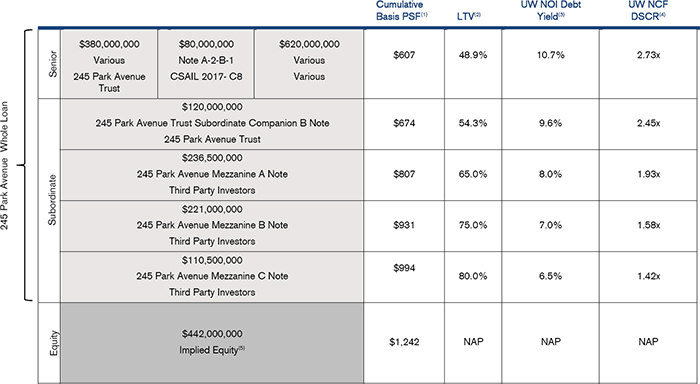
| (1) | Based on remeasured net rentable area of 1,779,515 SF in accordance with current REBNY standards which is the basis for the square footage in future leasing. The property’s contractual square footage is 1,723,993 SF as leased. |
| (2) | Based on an as-is appraised value of $2.21 billion ($1,242 PSF) as of April 1, 2017 per the appraisal. |
| (3) | Based on the UW NOI of $115,307,942. |
| (4) | Based on assumed coupons of 3.6694% for the Mortgage Loan, 5.0000% for the Mezzanine Loan A, 5.7000% for the Mezzanine Loan B, 6.8500% for the Mezzanine Loan C and 4.3000% for the Total Debt. |
| (5) | Implied Equity is based on the as-is appraised value of $2.21 billion, less total debt of $1.77 billion. |
The Borrower. The borrowing entity for the loan is 245 Park Avenue Property LLC, a Delaware limited liability company and special purpose entity.
The Sponsor. The loan sponsor is HNA Group (“HNA”) and the nonrecourse carve-out guarantor is 181 West Madison Holding LLC, an affiliate of the loan sponsor. HNA is a China based global Fortune 500 conglomerate with core divisions of aviation, hospitality, tourism, real estate, retail, finance, logistics, shipbuilding and eco-tech. In 2016, HNA had total assets of approximately $140.0 billion with revenues of approximately $87.0 billion. The main business of HNA Finance, a subsidiary of HNA, is leasing and insurance and it also provides financial services such as securities, banking, futures, fund and investment banking. HNA Real Estate, a subsidiary of HNA, focuses on the development and management of central business district and urban real estate assets and, as of December 31, 2016, it had 34 real estate investments in over 40 cities. HNA owns more than $1.3 billion of commercial real estate in the United States including 850 Third Avenue in New York, New York, 1180 Sixth Avenue in New York, New York, the Cassa Hotel at 70 West 45th Street in New York, New York and two golf courses, Nicklaus Club Monterey in Monterey, California and Somers Pointe Country Club in Somers, New York. In 2016, HNA purchased a 25% stake in Hilton Worldwide Holdings Inc. from Blackstone Group LP for $6.5 billion.
THE INFORMATION IN THIS STRUCTURAL AND COLLATERAL TERM SHEET IS NOT COMPLETE AND MAY BE AMENDED PRIOR TO THE TIME OF SALE. THIS TERM SHEET IS NOT AN OFFER TO SELL THESE SECURITIES AND IT IS NOT A SOLICITATION OF AN OFFER TO BUY THESE SECURITIES IN ANY JURISDICTION WHERE THE OFFER OR SALE IS NOT PERMITTED.
61
Mortgage Loan No. 2 — 245 Park Avenue
The Property.The property is a Class A office tower located along Park Avenue between 46th and 47th Streets that consists of 44 stories with 42 office levels, 57,799 SF of retail space and 1,580 SF of lobby retail space in Midtown Manhattan, New York. The property is one of approximately 12 buildings that feature direct underground access to Grand Central Terminal, Metro North Transit and the 4, 5, 6, 7 and S subway lines. The property is located in the Park Avenue office submarket, adjacent to Grand Central Terminal, and within 0.6 miles of 5th Avenue, Rockefeller Center, Radio City Music Hall, St. Patrick’s Cathedral and the Museum of Modern Art. According to the appraisal, Park Avenue is widely considered to be one of the premier office corridors in the United States due to its central location, prestigious tenancy, proximity to Grand Central Station and other amenities. As of February 28, 2017, the property was 91.2% leased to 19 tenants based on remeasured net rentable area and the property has demonstrated average occupancy of 95.0% from 2007 to 2016.
The property’s largest tenant is Société Générale, a French multinational banking and financial services company, which utilizes the property as its United States headquarters and leases 33.3% of the remeasured net rentable area through October 2032 across 12 floors. In 2010, Société Générale executed a sublease from JPMorgan Chase Bank for 562,347 contractual SF through October 31, 2022. Additionally, in 2010, Société Générale executed a 10-year direct lease with the prior owner of 245 Park Avenue for 593,344 remeasured SF which lease has a start date of November 1, 2022 at (i) approximately $88.00 PSF for the first five years of the term and (ii) a base rent for the second five years of the term equal to the higher of the rent payable for the first five years and a fair market rental value (no more than $110 PSF). Société Générale’s direct lease has a base year of 2013. As of May 25, 2017, Société Générale reported a market capitalization of approximately €40.5 billion and had revenues of €25.3 billion in 2016. Société Générale has offices in 67 countries, employing 145,700 people and serving approximately 31 million customers as of December 31, 2016. The second largest tenant, JPMorgan Chase Bank, N.A. (“JPMorgan Chase Bank”), leases 13.4% of the remeasured net rentable area through October 2022. JPMorgan Chase Bank is the largest banking institution in the United States with a market capitalization of $303.2 billion as of May 25, 2017, operates in more than 60 countries, has more than 250,000 employees and serves consumers, small businesses, corporate, institutional and government clients. As of 2016, JPMorgan Chase Bank reported revenues of $95.7 billion and assets of $2.5 trillion. The JPMorgan Chase Bank space does not include the space subleased to Société Générale due to the fact that Société Générale has executed the direct lease described above. Of the 225,438 total contractual SF leased by JPMorgan Chase Bank, 189,686 contractual SF is subleased through October 30, 2022, this including 90,556 contractual SF to Houlihan Lokey Howard & Zukin Financial Advisors, Inc., 49,133 contractual SF to The Nemec Agency, Inc., 34,058 contractual SF to Pierpont Capital Holdings LLC and 15,939 contractual SF to JLL Partners, LLC. JPMorgan Chase Bank also utilizes 17,813 contractual SF of its leased space at the property. The third largest tenant at the property, Major League Baseball (“MLB”), is currently headquartered at the property and leases 12.6% of the remeasured net rentable area through October 2022. MLB is a professional baseball league in North America. MLB reported record revenues in 2015, up $500.0 million from the prior year and approaching $9.5 billion. MLB had attendance of more than 73.0 million fans in 2016. MLB subleases 37,385 contractual SF to the National Australia Bank, LTD., 24,840 contractual SF to Houlihan Lokey, Inc. and 10,525 contractual SF to Anthos U.S.A. Inc. through October 30, 2022. MLB’s lease expires in October 2022 and MLB has already announced that it plans to vacate its space at the end of its lease term. In addition, MLB has signed a lease at 1271 Avenue of the Americas and declared its intention to move into that space in 2019, which is approximately three years prior to its lease expiration date. If MLB does not renew its lease 12 months before the expiration date or if MLB vacates or abandons all or substantially all of its space, a Cash Sweep Event (as defined in “Escrows and Reserves” below) will occur.
As of February 28, 2017, 62.8% of the property’s annual in-place base rent was attributed to investment grade tenants. The property serves as the United States headquarters for Société Générale (33.3% of remeasured net rentable area, rated A2/A by Moody’s and S&P) and features other investment grade and institutional tenants including JPMorgan Chase Bank (13.4% of remeasured net rentable area, rated Aa3/A+/AA- by Moody’s, S&P and Fitch), Major League Baseball (12.6% of remeasured net rentable area), Angelo Gordon & Co., L.P. (6.4% of remeasured net rentable area) and Rabobank Nederland (6.3% of remeasured net rentable area, rated Aa2/A+/AA- by Moody’s, S&P and Fitch). Midtown Manhattan is home to numerous national and multinational corporations, such as Bloomberg L.P., BlackRock, Inc., the Blackstone Group L.P., Colgate-Palmolive Company, J.P.Morgan Chase & Co. and NBC Universal. The surrounding area offers a number of luxury hotels
THE INFORMATION IN THIS STRUCTURAL AND COLLATERAL TERM SHEET IS NOT COMPLETE AND MAY BE AMENDED PRIOR TO THE TIME OF SALE. THIS TERM SHEET IS NOT AN OFFER TO SELL THESE SECURITIES AND IT IS NOT A SOLICITATION OF AN OFFER TO BUY THESE SECURITIES IN ANY JURISDICTION WHERE THE OFFER OR SALE IS NOT PERMITTED.
62
Mortgage Loan No. 2 — 245 Park Avenue
including the Waldorf Astoria, The Four Seasons and the New York Palace as well as Michelin starred restaurants such as Aquavit, The Modern and Le Bernardin.
The Market. The property occupies the entire city block between 46th and 47th Streets and Park and Lexington Avenues in Midtown Manhattan. The property is one of approximately 12 buildings that feature direct underground access to Grand Central Terminal, Metro North Transit and the 4, 5, 6, 7 and S subway lines. The property is located in the Park Avenue office submarket, adjacent to Grand Central Terminal, and within 0.6 miles of 5th Avenue, Rockefeller Center, Radio City Music Hall, St. Patrick’s Cathedral and the Museum of Modern Art. According to the appraisal, Park Avenue is widely considered to be one of the premier office corridors in the United States due to its central location, prestigious tenancy, proximity to Grand Central Station and other amenities.
According to the appraisal, as of the fourth quarter of 2016, the Park Avenue office submarket had approximately 21.8 million SF of office inventory, direct weighted average Class A asking rents of $102.15 PSF and a vacancy rate of 10.5%. The appraisal identified seven comparable Class A office buildings including 200 Park Avenue, 277 Park Avenue, 299 Park Avenue, 300 Park Avenue, 320 Park Avenue, 345 Park Avenue and 350 Park Avenue with current asking rents ranging from $85.00 PSF to $125.00 PSF which is in-line with the property. The comparable buildings had a weighted average occupancy of 97.0%. The property’s weighted average in place office rent of $80.72 PSF is approximately $15.82 PSF lower than the appraiser’s concluded weighted average in place market rent of $96.54 PSF. According to the appraisal, the property’s competitive set consists of the 10 properties detailed in the table below.
Competitive Set Summary(1)
| Property | Year Built / Renovated | Total GLA (SF) | Est. Rent PSF | Est. Occ. | Proximity (miles) | Anchor Tenant |
| 245 Park Avenue | 1965 / 2006 | 1,779,515 | $73.00 | 91. 2%(2) | N/A | Société Générale |
| 1177 Avenue of the Americas | 1992 / NAV | 960,050 | $80.00 | 93.1% | 0.5 | Kramer Levin Naftalis & Frankel LLP |
| 280 Park Avenue | 1962 & 1968 / NAV | 1,283,145 | $110.00 | 97.1% | 0.1 | Orix USA, Wells Fargo |
| 599 Lexington Avenue | 1986 / NAV | 955,274 | $85.00 | 100.0% | 0.3 | Vroom |
| 520 Madison Avenue | 1982 / NAV | 849,600 | $127.00 | 94.3% | 0.5 | CIC Eurepeenne Internation et Cie |
| 237 Park Avenue | 1981 / 2015 | 1,142,196 | $79.00 | 65.6% | 0.1 | Permanent Mission of Canada to the UN |
| 399 Park Avenue | 1961 / NAV | 1,250,000 | $108.50 | 98.6% | 0.4 | Morgan Stanley |
| 75 Rockefeller Plaza | 1947 / 2017 | 635,917 | $82.50 | 39.4% | 0.5 | Merrill Lynch Wealth Management |
| 90 Park Ave | 1964 / NAV | 785,000 | $80.00 | 96.8% | 0.5 | Alston & Bird |
| 1285 Avenue of the Americas | 1960 / NAV | 1,473,950 | $79.00 | 100.0% | 0.7 | UBS |
| 601 Lexington Avenue | 1977 / NAV | 1,671,702 | $140.00 | 98.9% | 0.4 | BTG Pactual |
| 277 Park Avenue | 1964 / 2001 | 1,529,945 | $116.00 | 98.1% | 0.1 | Visa |
| (1) | Source: Appraisal and a third party report. |
| (2) | Current occupancy is as of February 28, 2017, is based on remeasured net rentable area of 1,779,515 and includes HNA Capital USA LLC (an affiliate of loan sponsor) and MIO Partners (together, approximately 2.7% of the remeasured net rentable area), which has executed leases but have not yet taken occupancy. For more information, see “Description of the Mortgage Pool—Tenant Issues—Lease Expirations and Terminations—Other” in the Preliminary Prospectus. |
Historical and Current Occupancy(1)
| 2013 | 2014 | 2015 | 2016 | Current(2) |
| 93.6% | 93.6% | 93.6.% | 95.0% | 91.2% |
| (1) | Source: Historical occupancy is provided by the sponsor. Occupancies are as of December 31 of each respective year. |
| (2) | Current occupancy is as of February 28, 2017, is based on remeasured net rentable area of 1,779,515 and includes HNA Capital USA LLC (an affiliate of the loan sponsor) and MIO Partners (together, approximately 2.7% of the remeasured net rentable area), which have executed leases but have not yet taken occupancy. |
THE INFORMATION IN THIS STRUCTURAL AND COLLATERAL TERM SHEET IS NOT COMPLETE AND MAY BE AMENDED PRIOR TO THE TIME OF SALE. THIS TERM SHEET IS NOT AN OFFER TO SELL THESE SECURITIES AND IT IS NOT A SOLICITATION OF AN OFFER TO BUY THESE SECURITIES IN ANY JURISDICTION WHERE THE OFFER OR SALE IS NOT PERMITTED.
63
Mortgage Loan No. 2 — 245 Park Avenue
Tenant Summary(1)
| Tenant | Ratings Moody’s/S&P/Fitch(2) | Net Rentable Area (SF)(3) | % of Total NRA(3) | Base Rent PSF(4) | Lease Expiration Date |
| Société Générale(5)(6) | A2 /A /NA | 593,344 | 33.3% | $61.50 | 10/31/2032 |
| JPMorgan Chase Bank(5)(7) | Aa3 / A+ / AA- | 237,781 | 13.4% | $52.42 | 10/31/2022 |
| MLB(8) | NA / NA / NA | 224,477 | 12.6% | $124.75 | 10/31/2022 |
| Angelo Gordon & Co., L.P. | NA / NA / NA | 113,408 | 6.4% | $81.00 | 5/31/2026 |
| Rabobank Nederland | Aa2 / A+ / AA- | 112,662 | 6.3% | $138.00 | 9/30/2026 |
| Ares Capital Corporation | NA / BBB / BBB | 97,101 | 5.5% | $83.91 | 5/31/2026 |
| Regus Business Centre LLC | NA / NA / NA | 38,383 | 2.2% | $84.00 | 9/30/2021 |
| HNA Capital US LLC(9) | NA / NA / NA | 38,382 | 2.2% | $74.00 | 1/31/2026 |
| WisdomTree Investments, Inc.(10) | NA / NA / NA | 37,924 | 2.1% | $73.00 | 8/31/2029 |
| The Norinchukin Bank | A1 / A / NA | 37,342 | 2.1% | $99.00 | 3/31/2022 |
| (1) | Based on the underwritten rent roll dated February 28, 2017, including rent increases occurring through April 30, 2018. |
| (2) | Ratings provided are for the parent company of the entity listed in the “Tenant” field whether or not the parent company guarantees the lease. |
| (3) | Based on remeasured net rentable SF of 1,779,515. |
| (4) | Based on 1,723,993 contractual SF which includes BOP 245 Park LLC. |
| (5) | JPMorgan Chase Bank subleases 562,347 contractual SF to Société Générale through October 31, 2022. In 2010, Société Générale executed a 10-year direct lease with the prior owner for 593,344 remeasured SF which has a start date of November 1, 2022 at (i) approximately $88.00 PSF for the first five years of the term, (ii) a base rent for the second five-year period of the term equal to the higher of the rent payable for the first five years and a fair market rental value (not to exceed $110 PSF). Société Générale’s direct lease has a base year of 2013 and two five-year renewal options. The terms shown for Société Générale in the table above are based on JPMorgan Chase Bank’s direct lease. |
| (6) | Société Générale has the right to terminate either the highest floor or the highest two full floors that it leases (if such floors are contiguous) under either the related sublease described above or under its direct lease with the borrower, with notice by May 1, 2021. Société Générale may not exercise the option if all or any portion of the termination space is covered by a non-disturbance agreement granted by the borrower. |
| (7) | The JPMorgan Chase Bank space does not include the space subleased to Société Générale due to the fact that Société Générale has executed a direct lease which begins November 1, 2022. Of the 225,438 contractual SF of JPMorgan Chase Bank space, a total of 189,686 contractual SF is subleased through October 30, 2022. This includes 90,556 contractual SF to Houlihan Lokey Howard & Zukin Financial Advisors, Inc., 49,133 contractual SF to The Nemec Agency, Inc., 34,058 contractual SF to Pierpont Capital Holdings LLC and 15,939 contractual SF to JLL Partners, LLC. The JPMorgan Chase Bank space also includes 17,813 contractual SF of retail space that it leases at the property. The terms shown for JPMorgan Chase Bank in the table above are based on its direct lease. JPMorgan Chase Bank may not extend any portion of its lease currently subleased to Société Générale pursuant to its sublease agreement with Société Générale. |
| (8) | MLB subleases 37,385 contractual SF to the National Bank of Australia, 24,840 contractual SF to Houlihan Lokey Inc. and 10,525 contractual SF to Anthos USA Inc. through October 30, 2022. MLB does not have any remaining renewal options. The terms shown for MLB in the table above are based on its direct lease. |
| (9) | The HNA Capital US LLC space was originally leased to Heineken Americas Inc. from January 2010 through January 2026. On May 4, 2017, Heineken Americas Inc. assigned its space at the property to HNA Capital US LLC, an affiliate of the sponsor. |
| (10) | WisdomTree Investments, Inc. has the right to terminate its lease effective as of August 20, 2024, with 12 months’ notice and the payment of a termination fee. |
THE INFORMATION IN THIS STRUCTURAL AND COLLATERAL TERM SHEET IS NOT COMPLETE AND MAY BE AMENDED PRIOR TO THE TIME OF SALE. THIS TERM SHEET IS NOT AN OFFER TO SELL THESE SECURITIES AND IT IS NOT A SOLICITATION OF AN OFFER TO BUY THESE SECURITIES IN ANY JURISDICTION WHERE THE OFFER OR SALE IS NOT PERMITTED.
64
Mortgage Loan No. 2 — 245 Park Avenue
Lease Rollover Schedule(1)(2)
| Year | Number of Leases Expiring(3) | NRA Expiring(4) | % of NRA Expiring(4) | Base Rent Expiring | % of Base Rent Expiring | Cumulative NRA Expiring(2) | Cumulative % of NRA Expiring(2) | Cumulative Base Rent Expiring | Cumulative % of Base Rent Expiring |
| Vacant | NAP | 153,915 | 8.9% | NAP | NAP | 153,915 | 8.9% | NAP | NAP |
| MTM | 0 | 0 | 0.0 | $0 | 0.0% | 153,915 | 8.9% | $0 | 0.0% |
| 2017 | 0 | 0 | 0.0 | 0 | 0.0 | 153,915 | 8.9% | $0 | 0.0% |
| 2018 | 2 | 13,352 | 0.8 | 1,282,100 | 1.0 | 167,267 | 9.7% | $1,282,100 | 1.0% |
| 2019 | 0 | 0 | 0.0 | 0 | 0.0 | 167,267 | 9.7% | $1,282,100 | 1.0% |
| 2020 | 1 | 22,502 | 1.3 | 1,597,404 | 1.3 | 189,769 | 11.0% | $2,879,504 | 2.3% |
| 2021 | 1 | 38,382 | 2.2 | 3,224,088 | 2.6 | 228,151 | 13.2% | $6,103,592 | 4.8% |
| 2022(5) | 6 | 505,781 | 29.3 | 45,017,995 | 35.7 | 733,932 | 42.6% | $51,121,587 | 40.5% |
| 2023 | 0 | 0 | 0.0 | 0 | 0.0 | 733,932 | 42.6% | $51,121,587 | 40.5% |
| 2024 | 0 | 0 | 0.0 | 0 | 0.0 | 733,932 | 42.6% | $51,121,587 | 40.5% |
| 2025 | 0 | 0 | 0.0 | 0 | 0.0 | 733,932 | 42.6% | $51,121,587 | 40.5% |
| 2026 | 6 | 376,592 | 21.8 | 36,765,311 | 29.1 | 1,110,524 | 64.4% | $87,886,898 | 69.7% |
| 2027 & Beyond(5) | 3 | 613,469 | 35.6 | 38,290,601 | 30.3 | 1,723,993 | 100.0% | $126,177,500 | 100.0% |
| Total | 19 | 1,723,993 | 100.0% | $126,177,500 | 100.0% |
| (1) | Based on the underwritten rent roll dated February 28, 2017. Rent includes base rent and rent increases occurring through April 30, 2018. |
| (2) | Certain tenants may have termination or contraction options (which are exercisable prior to the originally stated expiration date of the tenant lease) that are not considered in the above Lease Rollover Schedule. |
| (3) | Certain tenants have more than one lease. |
| (4) | Based on 1,723,993 contractual SF which includes BOP 245 Park LLC. |
| (5) | JPMorgan Chase Bank subleases 562,347 SF to Société Générale through October 31, 2022. In 2010, Société Générale executed a direct lease with the prior owner that has a start date of November 1, 2022 and is for an initial term of 10 years, with two five-year extension options. The lease maturity of this space is reflected as 2032 in the table above. |
THE INFORMATION IN THIS STRUCTURAL AND COLLATERAL TERM SHEET IS NOT COMPLETE AND MAY BE AMENDED PRIOR TO THE TIME OF SALE. THIS TERM SHEET IS NOT AN OFFER TO SELL THESE SECURITIES AND IT IS NOT A SOLICITATION OF AN OFFER TO BUY THESE SECURITIES IN ANY JURISDICTION WHERE THE OFFER OR SALE IS NOT PERMITTED.
65
Mortgage Loan No. 2 — 245 Park Avenue
Operating History and Underwritten Net Cash Flow
| 2014 | 2015 | 2016 | TTM(1) | Underwritten(2) | PSF(3) | %(4) | |
| Rents in Place | $118,736,577 | $125,320,974 | $128,705,034 | $129,095,683 | $126,177,500 | $73.19 | 65.1% |
| Vacant Income | 0 | 0 | 0 | 0 | 16,425,575 | 9.53 | 8.5 |
| Rent Steps | 0 | 0 | 0 | 0 | 10,341,838 | 6.00 | 5.3 |
| Gross Potential Rent(5) | $118,736,577 | $125,320,974 | $128,705,034 | $129,095,683 | $152,944,913 | $88.72 | 78.9% |
| Total Reimbursements(6) | 31,667,499 | 34,635,748 | 37,032,022 | 37,903,249 | 40,918,609 | 23.73 | 21.1 |
| Net Rental Income | $150,404,076 | $159,956,722 | $165,737,056 | $166,998,932 | $193,863,523 | $112.45 | 100.0% |
| (Vacancy/Collection Loss) | 0 | 0 | 0 | 0 | (16,425,575) | (9.53) | (8.5) |
| Other Income(7) | 488,183 | 704,333 | 1,901,893 | 1,888,513 | 318,732 | 0.18 | 0.2 |
| Effective Gross Income | $150,892,259 | $160,661,056 | $167,638,950 | $168,887,445 | $177,756,680 | $103.11 | 91.7% |
| Total Expenses | $52,333,953 | $57,993,351 | $60,922,988 | $61,210,770 | $62,448,738 | $36.22 | 35.1% |
| Net Operating Income(8) | $98,558,306 | $102,667,705 | $106,715,962 | $107,676,675 | $115,307,942 | $66.88 | 64.9% |
| Total TI/LC, Capex/RR | 0 | 0 | 0 | 0 | 5,743,040 | 3.33 | 3.2 |
| Net Cash Flow | $98,558,306 | $102,667,705 | $106,715,962 | $107,676,675 | $ 109,564,903 | $63.55 | 61.6% |
| (1) | TTM represents the trailing 12-month period ending March 31, 2017. |
| (2) | Rent includes Base Rent and Rent Increases occurring through April 30, 2018. |
| (3) | Based on 1,723,993 contractual SF. |
| (4) | Percentage column represents percent of Net Rental Income for all revenue lines and represents percent of Effective Gross Income for the remainder of fields. |
| (5) | The increase in Underwritten Gross Potential Rent from TTM Gross Potential Rent is primarily due to the inclusion of rent steps, which are underwritten to (i) for noninvestment-grade tenants, rent steps through April 2018 and (ii) for investment-grade tenants, the average base rent over the lesser of the 245 Park Avenue Whole Loan term and the applicable lease term. With respect to the Société Générale subleased space, rent steps are underwritten based on the average of the JPMorgan Chase base rent of $61.50 PSF through October 2022 and base rent pursuant to Société Générale’s direct lease of $88.00 PSF through the remainder of the loan term. |
| (6) | Total Reimbursements are calculated on a tenant-by-tenant basis according to each tenant’s reimbursement methodology. Reimbursements for the JPMorgan Chase Bank space subleased to Société Générale are underwritten pursuant to the triple-net JPMorgan Chase Bank lease; upon the commencement of Société Générale’s direct modified gross lease in October 2022, the tenant will reimburse expenses over a base year of 2013. |
| (7) | Other Income consists of licensing fees, utility fees, generator fees and other miscellaneous items. |
| (8) | The increase in 2015 Net Operating Income from 2014 Net Operating Income was primarily due to contractual rent increases resulting in an increase in the weighted average base rent PSF from approximately $68.87 to approximately $72.69 PSF. |
Property Management. The property is managed by Brookfield Properties Management LLC (“Brookfield”) on an interim basis subject to a property management agreement that is in place until October 31, 2017. The borrower has indicated that it expects to replace Brookfield and select a long term property manager on or before the expiration of the current management agreement. Under the loan agreement, the loan sponsor may replace the property manager with a qualified manager, which will include certain preapproved parties or, among other criteria, a nationally recognized property management company having at least 7.5 million rentable SF (excluding the property) under management, including at least 5.0 million rentable SF under management in office properties in New York City.
Escrows and Reserves. At origination, the borrower deposited $10,298,441 for outstanding tenant improvements and leasing commissions, $1,133,167 for free rent, $227,000 for insurance reserves and $47,738 for replacement reserves. In lieu of depositing any reserve amounts required under the loan documents in cash, the borrower may deliver to the lender one or more letters of credit for all or any portion of the deposit requirements. The amount of any such letter(s) of credit may not exceed 10.0% of the 245 Park Avenue Whole Loan, unless such excess is permitted under a new non-consolidation opinion delivered to the lender.
Tax Escrows - On a monthly basis, the borrower is required to escrow 1/12th of annual estimated tax payments, which currently equates to $3,878,518 (approximately $26.15 per remeasured SF annually).
Insurance Escrows - On a monthly basis, the borrower is required to escrow 1/12th of the annual insurance premiums, which currently equates to $113,500 (approximately $0.77 per remeasured SF annually).
Replacement Reserves - On a monthly basis, the borrower is required to escrow $47,738 (approximately $0.32 per remeasured SF annually) for ongoing replacement reserves.
THE INFORMATION IN THIS STRUCTURAL AND COLLATERAL TERM SHEET IS NOT COMPLETE AND MAY BE AMENDED PRIOR TO THE TIME OF SALE. THIS TERM SHEET IS NOT AN OFFER TO SELL THESE SECURITIES AND IT IS NOT A SOLICITATION OF AN OFFER TO BUY THESE SECURITIES IN ANY JURISDICTION WHERE THE OFFER OR SALE IS NOT PERMITTED.
66
Mortgage Loan No. 2 — 245 Park Avenue
Rollover Reserves - Commencing on May 1, 2025 and continuing on a monthly basis, the borrower is required to deposit $446,775 per month ($3.00 per remeasured SF annually) with the lender for costs related to tenant improvements and leasing commissions.
The borrower is also required to deposit any lease modification fees, settlement of claims against third parties related to any lease, any rejection, termination, cancellation or surrender fee and any holdover rents or use and occupancy fees from any current or former tenants.
Lockbox / Cash Management. The 245 Park Avenue Whole Loan is structured with a hard lockbox and springing cash management. The borrower and the property manager were required at origination to deliver letters to all tenants at the property directing them to pay rents into a lockbox account. All funds in the lockbox account are required to be swept within one business day into the borrower’s operating account, unless a Cash Sweep Event (as defined below) has occurred, in which event such funds are required to be swept each business day into the cash management account controlled by the lender and disbursed on each payment date in accordance with the loan documents. The lenders have been granted a first priority security interest in the cash management account.
A “Cash Sweep Event” means the occurrence of (a) an event of default under the loan documents or an event of default under the mezzanine loan documents, (b) the bankruptcy or insolvency of the borrower or the property manager (in the case of the property manager, to the extent such action results in the cash or bank accounts associated with the property being included in the bankruptcy action or that has a material adverse effect on the property or the value or security of the lender’s interests), (c) if the debt service coverage ratio (as calculated in the loan documents) for the 245 Park Avenue Whole Loan and the related mezzanine loans, based on underwritten net cash flow and the trailing three-month period, falls below 1.15x at the end of any quarter, or (d) if MLB does not renew all or substantially all of its premises at least 12 months before its lease expiration date or if MLB vacates or abandons all or substantially all of its premises (this clause (d), a “Tenant Trigger Event”); (provided that, in the case of a Tenant Trigger Event, such sweep will be capped at $85.00 PSF with respect to the space leased by MLB.
A Cash Sweep Event may be cured in accordance with the following conditions: (i) with respect to a Cash Sweep Event caused solely by clause (a) above, the acceptance of a cure by the applicable lender(s) of the related event of default, (ii) with respect to a Cash Sweep Event caused by clause (b) above, if the borrower replaces such manager within 60 days of such action in accordance with the loan documents, (iii) with respect to a Cash Sweep Event caused solely by clause (c) above, either (1) the achievement of a debt service coverage ratio for the 245 Park Avenue Whole Loan and the related mezzanine loans of at least 1.15x for six consecutive months based on the trailing three-month period or (2) the borrower effects a DSCR Cure (as defined below) or (iv) with respect to a Cash Sweep Event caused solely by a Tenant Trigger Event, the occurrence of a Tenant Trigger Cure (as defined below). Each Cash Sweep Event cure is also subject to the following: (x) no other event of default has occurred and is continuing, (y) a cure may not occur more than five times in the aggregate during the term of the loan (except that there are no limits on the number of times a DSCR Cure may occur and a DSCR Cure is excluded from the foregoing limit) and (z) borrower has paid all of lender’s reasonable expenses incurred in connection with such Cash Sweep Event. The borrower may not cure a Cash Sweep Event caused by a bankruptcy or insolvency of the borrower.
A “DSCR Cure” means the satisfaction of the following conditions: (a) the borrower delivers a letter of credit with a notional amount which, if applied to the 245 Park Avenue Whole Loan and each related mezzanine loan, would result in a debt service coverage ratio of at least 1.15x based upon the trailing three-month period immediately preceding the date of determination; and (b) no Cash Sweep Event resulting from a separate event has occurred that has not been cured; provided that (x) the amount of the letter of credit (together with the amount of any other letters of credit that have been delivered by the borrower under the loan documents) may not exceed 10.0% of the 245 Park Avenue Whole Loan, unless such excess is permitted under a new non-consolidation opinion and (y) the borrower has no reimbursement obligations with respect to such letter of credit.
A “Tenant Trigger Cure” means either (x) the replacement of MLB with one or more tenants approved by the lender if required under the loan documents leasing not less than 90.0% of the leasable area of the MLB space (including any portion of the space retained by MLB), which tenant(s) are in occupancy and paying full contractual rent, without right of offset or free rent credit, as evidenced by an estoppel certificate or (y) during the period of any Cash Sweep Event from and after a Tenant Trigger
THE INFORMATION IN THIS STRUCTURAL AND COLLATERAL TERM SHEET IS NOT COMPLETE AND MAY BE AMENDED PRIOR TO THE TIME OF SALE. THIS TERM SHEET IS NOT AN OFFER TO SELL THESE SECURITIES AND IT IS NOT A SOLICITATION OF AN OFFER TO BUY THESE SECURITIES IN ANY JURISDICTION WHERE THE OFFER OR SALE IS NOT PERMITTED.
67
Mortgage Loan No. 2 — 245 Park Avenue
Event, excess cash flow has been deposited in the cash management account in an amount equal to or exceeding $85.00 PSF with respect to the space demised under the MLB lease.
Additional Debt.The $568.0 million mezzanine debt consists of a $236.5 million mezzanine loan A, a $221.0 million mezzanine loan B and a $110.5 million mezzanine loan C. The mezzanine loan A has a 5.0000% coupon, the mezzanine loan B has a 5.7000% coupon and the mezzanine loan C has a 6.8500% coupon. The mezzanine loans are interest-only for the full term of the loans and are coterminous with the 245 Park Avenue Whole Loan. Including the 245 Park Avenue Subordinate Companion Loan and mezzanine loans, the cumulative cut-off date LTV, cumulative UW NOI DSCR and cumulative UW NOI Debt Yield are 80.0%, 1.42x and 6.5%, respectively. The mortgage and mezzanine lenders have entered into an intercreditor agreement. The mezzanine loans have been or are expected to be sold to institutional investors.
THE INFORMATION IN THIS STRUCTURAL AND COLLATERAL TERM SHEET IS NOT COMPLETE AND MAY BE AMENDED PRIOR TO THE TIME OF SALE. THIS TERM SHEET IS NOT AN OFFER TO SELL THESE SECURITIES AND IT IS NOT A SOLICITATION OF AN OFFER TO BUY THESE SECURITIES IN ANY JURISDICTION WHERE THE OFFER OR SALE IS NOT PERMITTED.
68
(THIS PAGE INTENTIONALLY LEFT BLANK)
69
Mortgage Loan No. 3 — Apple Sunnyvale
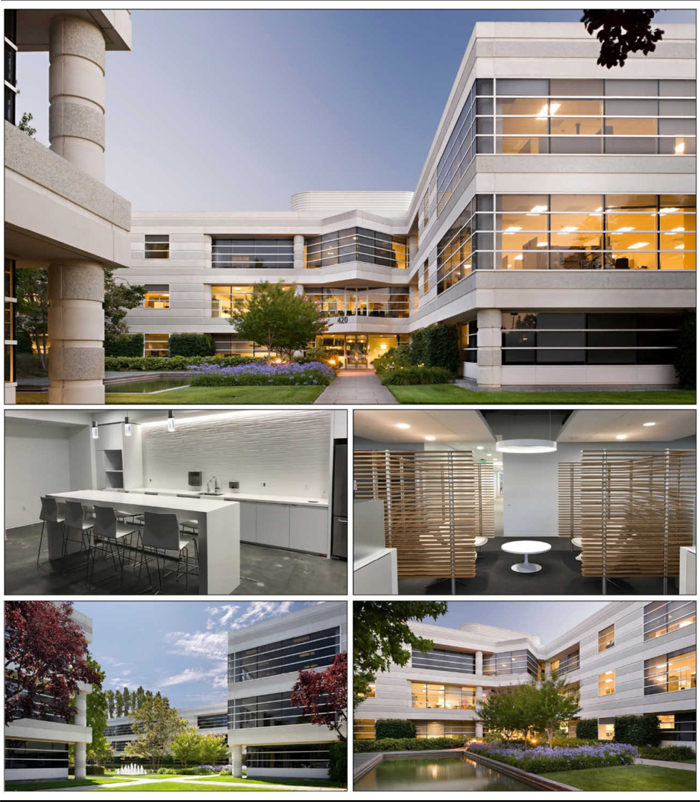
THE INFORMATION IN THIS STRUCTURAL AND COLLATERAL TERM SHEET IS NOT COMPLETE AND MAY BE AMENDED PRIOR TO THE TIME OF SALE. THIS TERM SHEET IS NOT AN OFFER TO SELL THESE SECURITIES AND IT IS NOT A SOLICITATION OF AN OFFER TO BUY THESE SECURITIES IN ANY JURISDICTION WHERE THE OFFER OR SALE IS NOT PERMITTED.
70
Mortgage Loan No. 3 — Apple Sunnyvale
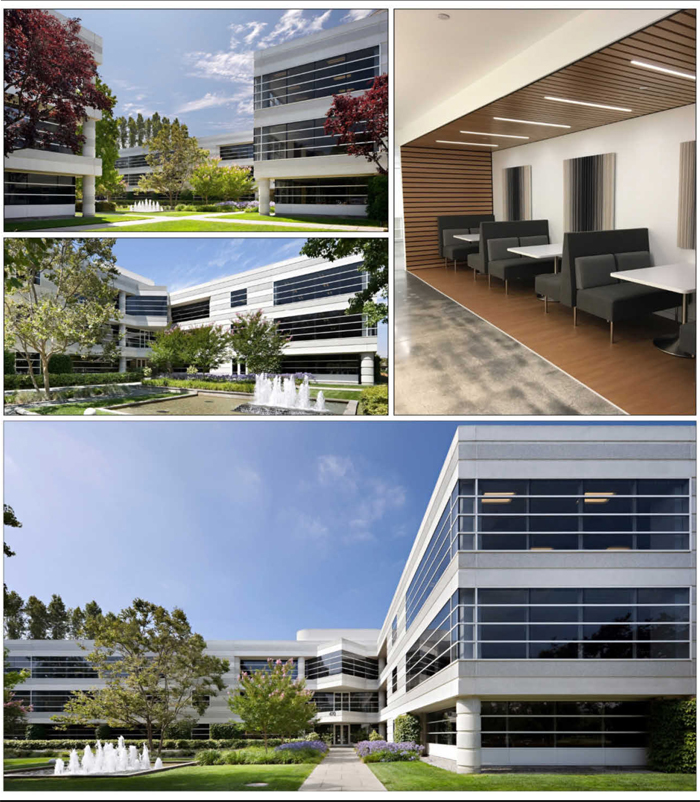
THE INFORMATION IN THIS STRUCTURAL AND COLLATERAL TERM SHEET IS NOT COMPLETE AND MAY BE AMENDED PRIOR TO THE TIME OF SALE. THIS TERM SHEET IS NOT AN OFFER TO SELL THESE SECURITIES AND IT IS NOT A SOLICITATION OF AN OFFER TO BUY THESE SECURITIES IN ANY JURISDICTION WHERE THE OFFER OR SALE IS NOT PERMITTED.
71
Mortgage Loan No. 3 — Apple Sunnyvale
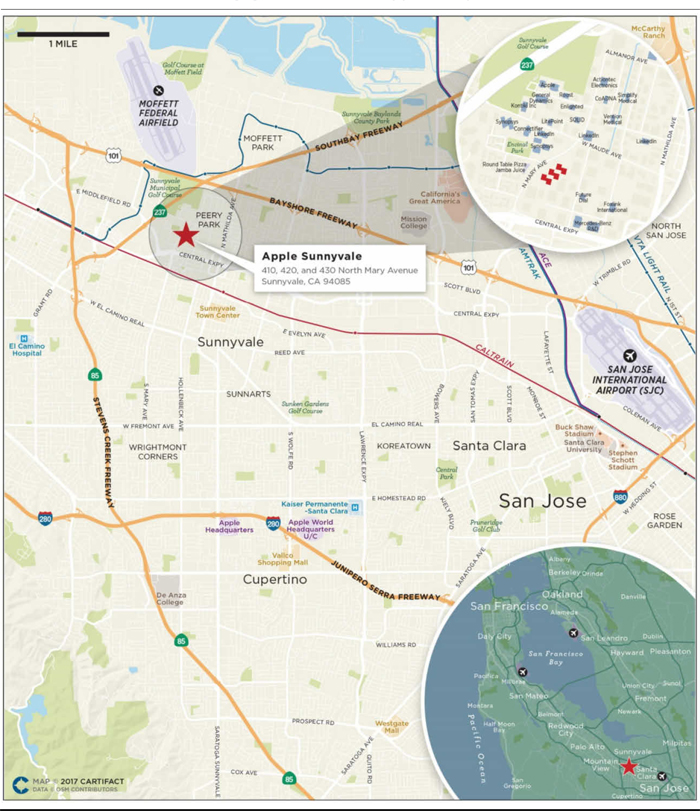
THE INFORMATION IN THIS STRUCTURAL AND COLLATERAL TERM SHEET IS NOT COMPLETE AND MAY BE AMENDED PRIOR TO THE TIME OF SALE. THIS TERM SHEET IS NOT AN OFFER TO SELL THESE SECURITIES AND IT IS NOT A SOLICITATION OF AN OFFER TO BUY THESE SECURITIES IN ANY JURISDICTION WHERE THE OFFER OR SALE IS NOT PERMITTED.
72
Mortgage Loan No. 3 — Apple Sunnyvale
| Mortgage Loan Information | Property Information | |||
| Mortgage Loan Seller: | Natixis | Single Asset / Portfolio: | Single Asset | |
| Original Principal Balance(1): | $70,350,000 | Title: | Fee | |
| Cut-off Date Principal Balance: | $70,350,000 | Property Type - Subtype: | Office – Suburban | |
| % of Pool by IPB: | 8.7% | Net Rentable Area (SF): | 349,758 | |
| Credit Assessment (Moody’s/Fitch/DBRS/KBRA)(2): | Baa3 / BBB- / A / BBB- | Location: | Sunnyvale, CA | |
| Loan Purpose: | Acquisition | Year Built / Renovated: | 1989 / 2016 | |
| Borrowers: | Risingstar II LLC; Desert Sunrise LLC | Occupancy: | 100.0% | |
| Sponsor: | David Edelstein | Occupancy Date: | 6/6/2017 | |
| Interest Rate: | 4.22892% | Number of Tenants: | 1 | |
| Note Date: | 2/16/2017 | 2014 NOI: | $10,916,160 | |
| Maturity Date: | 3/6/2022 | 2015 NOI: | $10,365,765 | |
| Interest-only Period: | 60 months | 2016 NOI: | $11,162,184 | |
| Original Term: | 60 months | TTM NOI(3): | NAV | |
| Original Amortization: | None | UW Economic Occupancy: | 97.0% | |
| Amortization Type: | Interest Only | UW Revenues: | $20,466,492 | |
| Call Protection: | L(27),Def or YM1(29),O(4) | UW Expenses: | $5,186,906 | |
| Lockbox(4): | Hard | UW NOI: | $15,279,587 | |
| Additional Debt(1): | Yes | UW NCF: | $15,213,133 | |
| Additional Debt Balance(1): | $162,210,000 | Appraised Value / Per SF: | $292,000,000 / $835 | |
| Additional Debt Type(1): | Pari Passu, B-Note, Mezzanine | Appraisal Date: | 1/13/2017 | |
| Additional Future Debt Permitted: | No |
| Escrows and Reserves(5) | Financial Information(1) | |||||
| Initial | Monthly | Initial Cap | Cut-off Date Loan / SF: | $298 | ||
| Taxes: | $0 | Springing | N/A | Maturity Date Loan / SF: | $298 | |
| Insurance: | $0 | Springing | N/A | Cut-off Date LTV: | 35.7% | |
| Replacement Reserves: | $0 | $5,538 | N/A | Maturity Date LTV: | 35.7% | |
| Deferred Maintenance: | $18,375 | N/A | N/A | UW NCF DSCR: | 3.40x | |
| UW NOI Debt Yield: | 14.6% |
| Sources and Uses | ||||||||
| Sources | Proceeds | % of Total | Uses | Proceeds | % of Total | |||
| Mortgage Loan (A Notes) | $104,350,000 | 35.6 | % | Purchase Price | $290,700,000 | 99.1 | % | |
| Mortgage Loan (B Note) | 81,890,000 | 27.9 | Upfront Reserves | 18,375 | 0.0 | |||
| Mezzanine Loan | 46,320,000 | 15.8 | Closing Costs | 2,581,436 | 0.9 | |||
| Sponsor Equity | 60,739,811 | 20.7 | ||||||
| Total Sources | $293,299,811 | 100.0 | % | Total Uses | $293,299,811 | 100.0 | % | |
| (1) | The Apple Sunnyvale loan is a part of a larger split whole loan evidenced by two seniorpari passu notes and one subordinate note with an aggregate original principal balance of $186.24 million. The Apple Sunnyvale Whole Loan is accompanied by a mezzanine loan with an original principal balance of $46.32 million (the “Apple Sunnyvale Mezzanine Loan”). The financial information presented in the chart above and herein reflects the cut-off date balance of the $104.35 million A Notes, but not the $81.89 million B Note or the $46.32 million Apple Sunnyvale Mezzanine Loan. For a more detailed description of the Apple Sunnyvale Whole Loan, please refer to “Additional Debt” below. |
| (2) | Moody’s, Fitch, DBRS and KBRA have each confirmed that the Apple Sunnyvale loan has, in the context of its inclusion in the Initial Pool Balance, credit characteristics consistent with an investment grade obligation. |
THE INFORMATION IN THIS STRUCTURAL AND COLLATERAL TERM SHEET IS NOT COMPLETE AND MAY BE AMENDED PRIOR TO THE TIME OF SALE. THIS TERM SHEET IS NOT AN OFFER TO SELL THESE SECURITIES AND IT IS NOT A SOLICITATION OF AN OFFER TO BUY THESE SECURITIES IN ANY JURISDICTION WHERE THE OFFER OR SALE IS NOT PERMITTED.
73
Mortgage Loan No. 3 — Apple Sunnyvale
| (3) | The property was acquired on February 16, 2017 and the 2017 most recent financials were not provided by the seller. |
| (4) | For a more detailed description of the lockbox, please refer to“Lockbox / Cash Management” below. |
| (5) | For a more detailed description of escrows and reserves, please refer to “Escrows and Reserves” below. |
The Loan. The Apple Sunnyvale loan, which is part of a larger split whole loan, is a first mortgage loan secured by the borrower’s fee interest in three Class A office buildings comprising 349,758 SF and located on a 14.8-acre site in Sunnyvale, California. The whole loan has an outstanding principal balance of $186.24 million (the “Apple Sunnyvale Whole Loan”), which is comprised of three notes identified as Note A-1 and Note A-2 (collectively, the “A Notes”), and Note B (the “B Note”). The three notes have outstanding balances of $70.35 million, $34.0 million and $81.89 million for Note A-1, Note A-2 and Note B, respectively.
Note A-1 has an outstanding principal balance as of the cut-off date of $70.35 million and is being contributed to the CSAIL 2017-C8 Commercial Mortgage Trust. Note A-2 was previously securitized in UBS 2017-C1 Commercial Mortgage Trust and the B Note was sold to an unaffiliated third party investor. Under the related co-lender agreement, prior to a control appraisal period with respect to the related subordinate companion loan, the B Note is the controlling note, and after a control appraisal period occurs with respect to the related subordinate companion loan, Note A-1 will be the controlling note. The holder of Note A-1 and Note A-2 or their respective representatives, will be entitled, under certain circumstances, to consult with respect to certain major decisions.
Note A-1 accrues interest at the same rate as thepari passu Note A-2 and is entitled to payments of interest and principal on a pro rata andpari passu basis with Note A-2, and Note B is a subordinate note, as and to the extent described under “Description of the Mortgage Pool—The Whole Loans” in the Preliminary Prospectus. The holders of Note A-1, Note A-2 and Note B have entered in to an agreement among note holders which sets forth the allocation of collections on the Apple Sunnyvale Whole Loan. The Apple Sunnyvale Whole Loan will be serviced pursuant to terms of the pooling and servicing agreement governing CSAIL 2017-C8. See “Description of the Mortgage Pool—The Whole Loans” in the Preliminary Prospectus.
Whole Loan Note Summary
| Original Balance | Cut-off Date Balance | Note Holder | Lead Servicer for Whole Loan (Y/N) | Controlling Piece (Y/N) | |
| Note A-1 | $70,350,000 | $70,350,000 | CSAIL 2017-C8 | Y | N |
| Note A-2 | 34,000,000 | 34,000,000 | UBS 2017-C1 | N | Y |
| Note B | 81,890,000 | 81,890,000 | Third Party Investor | N | Y |
| Total | $186,240,000 | $186,240,000 |
The Borrowers. The borrowing entities for the loan are two tenants-in-common, Risingstar II LLC and Desert Sunrise LLC, both of which are Delaware limited liability companies and special purpose entities.
The Sponsor. The loan’s sponsor and nonrecourse carve-out guarantor is David Edelstein. David Edelstein is the president and founder of TriStar Capital (“TriStar”), a New York City based real estate firm that both develops and invests in commercial and residential properties. TriStar has operated out of New York City for over 25 years and has expanded into additional markets such as South Florida and Las Vegas. TriStar’s most notable projects include the redevelopment of the Lincoln Road pedestrian mall in Miami Beach and, in conjunction with RFR Holding LLC, the W South Beach Hotel & Residences.
The Property.The property consists of three, three-story, Class A office buildings totaling 349,758 SF located on a 14.8-acre site at 410, 420 and 430 North Mary Avenue in Sunnyvale, California. The property also includes a two-level parking structure and features 1,129 surface and parking spaces (3.23 spaces per 1,000 SF). The property was constructed in 1989 and was most recently renovated in 2016. Capital expenditures over the past five years have totaled approximately $2.6 million and primarily included structural upgrades, landscaping and new courtyard furniture. The property size and configuration is suited for single and multi-tenant use.
THE INFORMATION IN THIS STRUCTURAL AND COLLATERAL TERM SHEET IS NOT COMPLETE AND MAY BE AMENDED PRIOR TO THE TIME OF SALE. THIS TERM SHEET IS NOT AN OFFER TO SELL THESE SECURITIES AND IT IS NOT A SOLICITATION OF AN OFFER TO BUY THESE SECURITIES IN ANY JURISDICTION WHERE THE OFFER OR SALE IS NOT PERMITTED.
74
Mortgage Loan No. 3 — Apple Sunnyvale
As of June 6, 2017 the property was 100.0% leased to and 77.8% physically occupied by Apple Inc. (“Apple”). Apple leases 349,758 SF through multiple lease agreements. Apple leases 116,586 SF at 410 North Mary Avenue (33.3% of the net rentable area through February 2023), with one, seven-year extension option remaining, 116,586 SF at 420 North Mary Avenue (33.3% of the net rentable area through June 2026), with one seven-year renewal option remaining and 116,586 SF at 430 North Mary Avenue (33.3% of net rentable area through November 2025), with one seven-year renewal option remaining. Apple has fully leased the property since 2015 and plans to fully occupy the premises by the end of 2017. Apple has taken occupancy of the 410 North Mary Avenue building, the 420 North Mary Avenue building and the ground floor of the 430 North Mary Avenue building. Apple is currently planning the space configurations of the second and third floors of the 430 North Mary Avenue building. According to the sponsor, Apple is spending approximately $61.2 million ($175 PSF) on improvements for all three buildings.
Apple is a leading multinational technology company that designs, manufactures, and markets mobile communication and media devices, personal computers, and portable digital music players. Apple is rated Aa1/AA+/NR by Moody’s, S&P and Fitch, respectively. Apple had a market cap of $811.8 billion as of May 19, 2017. As of September 24, 2016, Apple reported annual revenue of $215.6 billion and net income of $45.7 billion. As of April 1, 2017, Apple reported record first two quarters total revenue of $131.2 billion and total net income of $28.9 billion.
The property is located on the northwestern side of Sunnyvale, California in the heart of Silicon Valley. According to the appraisal, Sunnyvale is located along the southern shores of the San Francisco Bay and is bordered by Cupertino to the south, Santa Clara to the east, and Mountain View to the west. The property is surrounded by major regional highways including US Highway 101 (three blocks north) and CA Highway 237 (two blocks west). Sunnyvale features one of the highest concentrations of technology, software and creative tenants within Silicon Valley. The property is located approximately one mile south of Moffett Park, which is a 519-acre area comprised of recently developed office spaces and research and development buildings. Moffett Park is home to several notable technology firms including Amazon.com, Google Inc., Hewlett-Packard, Juniper Networks, Lockheed-Martin, Microsoft, and Yahoo!. Other notable companies in the vicinity of the property include Synopsys, Verisign, Symantec, KPMG and LinkedIn.
The Market. The property is located in the Sunnyvale / Cupertino office submarket within the greater South Bay / San Jose office market. The estimated 2017 population within a one-, three- and five-mile radius of the property is 18,891, 179,488 and 399,221, respectively. According to a third party research report, the estimated 2017 median household income within a one-, three- and five-mile radius of the property is $118,153, $112,691 and $118,080, respectively.
According to a third party research report as of the first quarter of 2017, the Sunnyvale / Cupertino office submarket contained 20.6 million SF of office space with an overall vacancy rate of 2.5% and asking rents of $51.82 PSF. According to the third party research report, vacancy and asking rents for Class A office buildings in the Sunnyvale / Cupertino office submarket were 1.8% and $68.16 PSF, respectively.
THE INFORMATION IN THIS STRUCTURAL AND COLLATERAL TERM SHEET IS NOT COMPLETE AND MAY BE AMENDED PRIOR TO THE TIME OF SALE. THIS TERM SHEET IS NOT AN OFFER TO SELL THESE SECURITIES AND IT IS NOT A SOLICITATION OF AN OFFER TO BUY THESE SECURITIES IN ANY JURISDICTION WHERE THE OFFER OR SALE IS NOT PERMITTED.
75
Mortgage Loan No. 3 — Apple Sunnyvale
According to the appraisal, the property’s competitive set consists of the eight properties detailed in the table below.
Competitive Set Summary(1)
| Property | Year Built / Renovated | Total GLA (SF) | Est. Rent PSF(2) | Est. Occ. | Proximity (miles) | Anchor Tenants |
| Apple Sunnyvale | 1989 / 2016 | 349,758(3) | $45.50(3) | 100.0%(3) | N/A | Apple |
| Sunnyvale Business Park | 1979 / 1997 | 162,550 | $47.40 | 100.0% | 1.0 | Raytheon Company |
| Sunnyvale City Center | 2003 / NAP | 134,544 | $70.80 | NAV | 1.3 | Red Hat |
| Moffett Towers II Bldg. 2 | 2017 / NAP | 362,600 | $48.00 | 100.0% | 2.8 | Confidential |
| Moffett Gateway | 2015 / NAP | 612,691 | $44.40 | 100.0% | 3.2 | Google Inc. |
| 222 N. Wolfe Road | 2017 - 2018 / NAP | 871,214 | $40.08 | 100.0% | 2.1 | Apple, Inc. |
| Moffett Towers I Bldg. A | 2008 / NAP | 317,166 | $44.40 | NAV | 2.7 | Google Inc. |
| Santa Clara Square(4) | 2016 / NAP | 220,156 | $43.80 | NAV | 5.1 | Cambridge Industries |
| Santa Clara Square(4) | 2016 / NAP | 220,156 | $42.60 | 100.0% | 5.2 | AMD |
| (1) | Source: Appraisal. |
| (2) | Est. Rent PSF includes leases the appraiser identified for the specific properties for a 12 month period. |
| (3) | Based on the underwritten rent roll dated June 6, 2017. |
| (4) | The appraiser identified two Santa Clara Square properties, one located at 2445 Augustine Drive, Santa Clara, California and the other located at 2485 Augustine Drive, Santa Clara, California. |
Historical and Current Occupancy(1)
| 2014 | 2015 | 2016 | Current(2) |
| 90.0% | 100.0% | 100.0% | 100.0% |
| (1) | Source: Historical Occupancy is provided by the sponsor. Occupancies are as of December 31 of each respective year. |
| (2) | Based on the June 6, 2017 underwritten rent roll. |
Tenant Summary(1)
| Tenant | Ratings Moody’s/S&P/Fitch(2) | Net Rentable Area (SF) | % of Total NRA | Base Rent PSF | Lease Expiration Date(3) |
| Apple | Aa1 / AA+ / NR | 349,758 | 100.0% | $45.54 | Various |
| (1) | Based on the underwritten rent roll dated June 6, 2017, including rent averaging through the loan term totaling $980,401. |
| (2) | Ratings provided are for the parent company of the entity listed in the “Tenant” field whether or not the parent company guarantees the lease. |
| (3) | Apple has three separate leases at the property. Apple leases 116,586 SF at 410 North Mary Avenue through February 28, 2023, 116,586 SF at 420 North Mary Avenue through June 30, 2026 and 116,586 SF at 430 North Mary Avenue through November 30, 2025. For each lease, Apple has an one-time option to extend for a period of 84 months upon delivery of irrevocable written notice to landlord at least 14 months, but not more than 18 months prior to the expiration of the initial lease term at the greater of (a) the base rent due with respect to the last month of the initial lease term, and (b) 100.0% of fair market rent. |
THE INFORMATION IN THIS STRUCTURAL AND COLLATERAL TERM SHEET IS NOT COMPLETE AND MAY BE AMENDED PRIOR TO THE TIME OF SALE. THIS TERM SHEET IS NOT AN OFFER TO SELL THESE SECURITIES AND IT IS NOT A SOLICITATION OF AN OFFER TO BUY THESE SECURITIES IN ANY JURISDICTION WHERE THE OFFER OR SALE IS NOT PERMITTED.
76
Mortgage Loan No. 3 — Apple Sunnyvale
Lease Rollover Schedule(1)
| Year | Number of Leases Expiring(2) | NRA Expiring | % of NRA Expiring | Base Rent Expiring | % of Base Rent Expiring | Cumulative NRA Expiring | Cumulative % of NRA Expiring | Cumulative Base Rent Expiring | Cumulative % of Base Rent Expiring |
| Vacant | NAP | 0 | 0.0% | NAP | NAP | 0 | 0.0% | NAP | NAP |
| MTM | 0 | 0 | 0.0 | $0 | 0.0% | 0 | 0.0% | $0 | 0.0% |
| 2017 | 0 | 0 | 0.0 | 0 | 0.0 | 0 | 0.0% | $0 | 0.0% |
| 2018 | 0 | 0 | 0.0 | 0 | 0.0 | 0 | 0.0% | $0 | 0.0% |
| 2019 | 0 | 0 | 0.0 | 0 | 0.0 | 0 | 0.0% | $0 | 0.0% |
| 2020 | 0 | 0 | 0.0 | 0 | 0.0 | 0 | 0.0% | $0 | 0.0% |
| 2021 | 0 | 0 | 0.0 | 0 | 0.0 | 0 | 0.0% | $0 | 0.0% |
| 2022 | 0 | 0 | 0.0 | 0 | 0.0 | 0 | 0.0% | $0 | 0.0% |
| 2023 | 1 | 116,586 | 33.3 | 5,118,338 | 32.1 | 116,586 | 33.3% | $5,118,338 | 32.1% |
| 2024 | 0 | 0 | 0.0 | 0 | 0.0 | 116,586 | 33.3% | $5,118,338 | 32.1% |
| 2025 | 1 | 116,586 | 33.3 | 5,437,855 | 34.1 | 233,172 | 66.7% | $10,556,193 | 66.3% |
| 2026 | 1 | 116,586 | 33.3 | 5,371,378 | 33.7 | 349,758 | 100.0% | $15,927,571 | 100.0% |
| 2027 & Beyond | 0 | 0 | 0.0 | 0 | 0.0 | 349,758 | 100.0% | $15,927,571 | 100.0% |
| Total | 3 | 349,758 | 100.0% | $15,927,571 | 100.0% |
| (1) | Based on the underwritten rent roll dated June 6, 2017. Base rent includes rent averaging through the loan term totaling $980,401. |
| (2) | Apple currently has three leases at the property. |
Operating History and Underwritten Net Cash Flow
| 2014 | 2015 | 2016 | Underwritten(1) | PSF | %(2) | |
| Rents in Place | $10,944,934 | $10,524,555 | $11,201,691 | $15,927,571 | $45.54 | 75.5% |
| Vacant Income | 0 | 0 | 0 | 0 | 0.00 | 0.0 |
| Gross Potential Rent | $10,944,934 | $10,524,555 | $11,201,691 | $15,927,571 | $45.54 | 75.5% |
| Total Reimbursements | 3,220,783 | 3,173,591 | 2,826,011 | 5,171,906 | $14.79 | 24.5 |
| Net Rental Income | $14,165,717 | $13,698,146 | $14,027,702 | $21,099,477 | $60.33 | 100.0% |
| (Vacancy/Collection Loss) | 0 | 0 | 0 | (632,984) | (1.81) | (3.0) |
| Other Income | 0 | 0 | 0 | 0 | 0.00 | 0.0 |
| Effective Gross Income | $14,165,717 | $13,698,146 | $14,027,702 | $20,466,492 | $58.52 | 97.0% |
| Total Expenses | $3,249,557 | $3,332,381 | $2,865,518 | $5,186,906 | $14.83 | 25.3% |
| Net Operating Income | $10,916,160 | $10,365,765 | $11,162,184 | $15,279,587 | $43.69 | 74.7% |
| Total TI/LC, Capex/RR | 0 | 0 | 0 | 66,454 | 0.19 | 0.3 |
| Net Cash Flow | $10,916,160 | $10,365,765 | $11,162,184 | $15,213,133 | $43.50 | 74.3% |
| (1) | Rent includes base rent and rent averaging through the loan term totaling $980,401. |
| (2) | Percentage column represents percent of Net Rental Income for all revenue lines and represents percent of Effective Gross Income for the remainder of fields. |
Property Management. The property is managed by Tristar Management LLC, an affiliate of the borrowers and sub-managed by Dostart Development Company, LLC.
Escrows and Reserves. At origination, the borrowers deposited into escrow $18,375 for required repairs.
Tax Escrows -The requirement of the borrowers to make monthly deposits to the real estate taxes reserve is waived so long as (i) no event of default has occurred and is continuing, (ii) Apple pays the tax premiums when due and payable and the borrowers provide the lender evidence of same within 10 days of payment, and (iii) Apple maintains a BBB rating or above.
Insurance Escrows -The requirement of the borrowers to make monthly deposits to the insurance reserve is waived so long as (i) no event of default has occurred and is continuing, (ii) Apple pays the insurance premiums when due and payable and the borrowers provide the lender evidence of same within 10 days of payment, and (iii) Apple maintains a BBB rating or above.
THE INFORMATION IN THIS STRUCTURAL AND COLLATERAL TERM SHEET IS NOT COMPLETE AND MAY BE AMENDED PRIOR TO THE TIME OF SALE. THIS TERM SHEET IS NOT AN OFFER TO SELL THESE SECURITIES AND IT IS NOT A SOLICITATION OF AN OFFER TO BUY THESE SECURITIES IN ANY JURISDICTION WHERE THE OFFER OR SALE IS NOT PERMITTED.
77
Mortgage Loan No. 3 — Apple Sunnyvale
Replacement Reserves -On a monthly basis, the borrowers are required to escrow $5,538 (approximately $0.19 PSF annually) for replacement reserves relating to the property.
Lockbox / Cash Management. The Apple Sunnyvale Whole Loan is structured with a hard lockbox and in-place cash management. The Apple Sunnyvale Whole Loan requires all rents to be transmitted directly into a lockbox account controlled by the lender (including, without limitation, by sending tenant direction letters to all tenants at origination/new lease execution). All funds in the lockbox account are required to be swept on each business day to a clearing account controlled by the lender, and applied and disbursed in accordance with the Apple Sunnyvale Whole Loan agreement. If a Cash Sweep Period (as defined below) is occurring, excess cash will be held as additional security for the Apple Sunnyvale Whole Loan. Upon the termination of any Cash Sweep Period, excess cash will no longer be held by the lender and, provided that no event of default has occurred and is continuing, all amounts then on deposit in the cash collateral reserve account will be disbursed to the borrowers.
A “Cash Sweep Period” will commence upon: (i) an event of default under the Apple Sunnyvale Whole Loan documents or (ii) the failure by the borrowers, after the end of a calendar quarter, to maintain a debt service coverage ratio of at least 1.075x or (iii) a Primary Tenant Sweep Period (as defined below); and will end with respect to clause (i) above, if such event of default has been cured or waived by the lender and no event that would trigger another Cash Sweep Period exists; with respect to clause (ii) above, if for six consecutive months since the commencement of the existing Cash Sweep Period (A) no event of default under the Apple Sunnyvale Whole Loan documents has occurred, (B) no event that constitutes another Cash Sweep Period has occurred, and (C) the debt service coverage ratio is greater than 1.075x, and with respect to clause (iii) above, a Primary Tenant Sweep Period Cure (as defined below) has occurred and no event that triggers another Cash Sweep Period has occurred.
A “Primary Tenant Sweep Period” will commence on the earliest of (i) any termination of, or receipt by the borrowers of a notice to terminate any one of the Primary Tenant (as defined below) leases, provided, however, that the Primary Tenant Sweep Period will commence upon the date that is twelve months prior to the date set forth in the notice for such lease to terminate, provided that if such period is less than 12 months the Primary Tenant Sweep Period will commence immediately; (ii) the Primary Tenant becoming the subject of a bankruptcy action; (iii) the Primary Tenant “going dark” in a majority of the applicable Primary Tenant premises, or (iv) the occurrence of any monetary or material non-monetary default (beyond any applicable notice and/or cure period) under any Primary Tenant lease.
A “Primary Tenant Sweep Period Cure” will commence if a Primary Tenant Replacement Event (as defined below) has occurred and such acceptable replacement tenant has delivered an acceptable tenant estoppel and adequate sums are on deposit in the Primary Tenant reserve subaccount with respect to all tenant improvements, leasing commissions and free rent periods still due under any lease for an acceptable replacement tenant; with respect to clause (i) above, if the combined debt service coverage ratio (including the Apple Sunnyvale Mezzanine Loan) is greater than 1.15x; with respect to clause (ii) above if the bankruptcy action is dismissed and the primary tenant lease is affirmed; with respect to clause (iii) above if the Primary Tenant or another tenant re-opens for business for a continuous period of not less than three months; or with respect to clause (iv) above if the monetary or material non-monetary default is cured and no other monetary or material non-monetary default (beyond any applicable notice and/or cure period) exists under the Primary Tenant lease.
A “Primary Tenant Replacement Event” means the termination of a Primary Tenant lease and the borrowers entering into one or more new leases for all or substantially all of the applicable Primary Tenant premises with acceptable replacement tenant(s) and upon such terms and conditions as are reasonably acceptable to the lender in all respects.
A “Primary Tenant” means initially Apple and thereafter any acceptable replacement tenant(s) thereof occupying all or substantially all of the applicable Primary Tenant premises under a lease that qualifies as a Material Lease (as defined below).
A “Material Lease” means (x) individually, the three Apple leases or (y) all leases which individually or in the aggregate with respect to the same tenant and its affiliates (i) constitute 10.0% or more of the property’s gross leasable area, (ii) have a gross annual rent of 10.0% or more of the total annual rents, or (iii) demise at least one full floor of the improvements.
THE INFORMATION IN THIS STRUCTURAL AND COLLATERAL TERM SHEET IS NOT COMPLETE AND MAY BE AMENDED PRIOR TO THE TIME OF SALE. THIS TERM SHEET IS NOT AN OFFER TO SELL THESE SECURITIES AND IT IS NOT A SOLICITATION OF AN OFFER TO BUY THESE SECURITIES IN ANY JURISDICTION WHERE THE OFFER OR SALE IS NOT PERMITTED.
78
Mortgage Loan No. 3 — Apple Sunnyvale
Additional Debt. In addition to Note A-1, the property is also security for the pari passu Note A-2 and the B Note. The B Note has an outstanding principal balance as of the cut-off date of $81.89 million and a coupon of 4.8500%. The Apple Sunnyvale Whole Loan (inclusive of the B Note) has a Cut-off Date LTV of 63.8%, an UW NCF DSCR of 1.79x and an UW NOI Debt Yield of 8.2%. A $46.32 million mezzanine loan was provided in connection with the financing of the property that is secured by the mezzanine borrower’s equity interest in the borrowers and is coterminous with the mortgage loan. The mezzanine loan has a coupon of 6.4500%. Including the mezzanine loan, the Cut-off Date LTV is 79.6%, the UW NCF DSCR is 1.32x and the UW NOI Debt Yield is 6.6%.
THE INFORMATION IN THIS STRUCTURAL AND COLLATERAL TERM SHEET IS NOT COMPLETE AND MAY BE AMENDED PRIOR TO THE TIME OF SALE. THIS TERM SHEET IS NOT AN OFFER TO SELL THESE SECURITIES AND IT IS NOT A SOLICITATION OF AN OFFER TO BUY THESE SECURITIES IN ANY JURISDICTION WHERE THE OFFER OR SALE IS NOT PERMITTED.
79
Mortgage Loan No. 4 — Ritz Carlton Rancho Mirage

THE INFORMATION IN THIS STRUCTURAL AND COLLATERAL TERM SHEET IS NOT COMPLETE AND MAY BE AMENDED PRIOR TO THE TIME OF SALE. THIS TERM SHEET IS NOT AN OFFER TO SELL THESE SECURITIES AND IT IS NOT A SOLICITATION OF AN OFFER TO BUY THESE SECURITIES IN ANY JURISDICTION WHERE THE OFFER OR SALE IS NOT PERMITTED.
80
Mortgage Loan No. 4 — Ritz Carlton Rancho Mirage
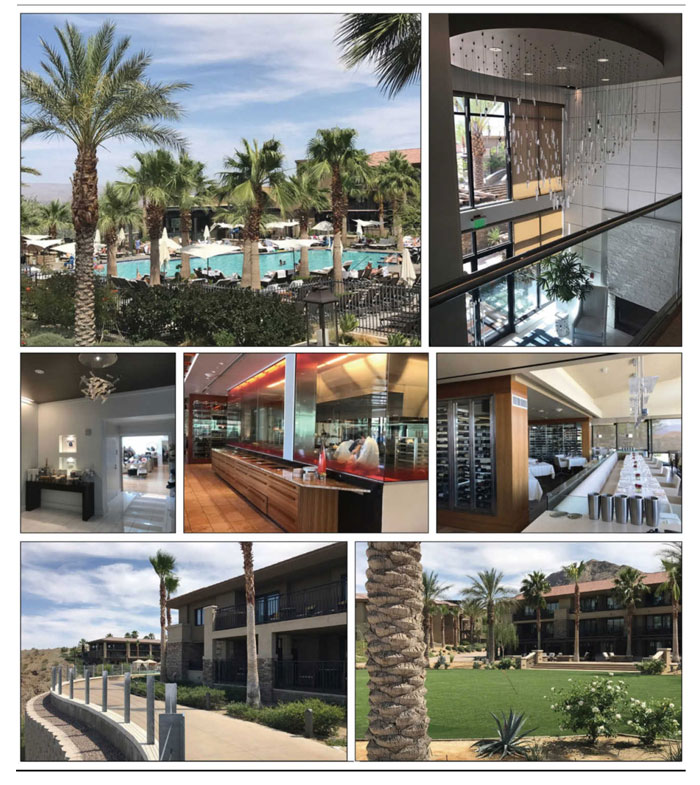
THE INFORMATION IN THIS STRUCTURAL AND COLLATERAL TERM SHEET IS NOT COMPLETE AND MAY BE AMENDED PRIOR TO THE TIME OF SALE. THIS TERM SHEET IS NOT AN OFFER TO SELL THESE SECURITIES AND IT IS NOT A SOLICITATION OF AN OFFER TO BUY THESE SECURITIES IN ANY JURISDICTION WHERE THE OFFER OR SALE IS NOT PERMITTED.
81
Mortgage Loan No. 4 — Ritz Carlton Rancho Mirage
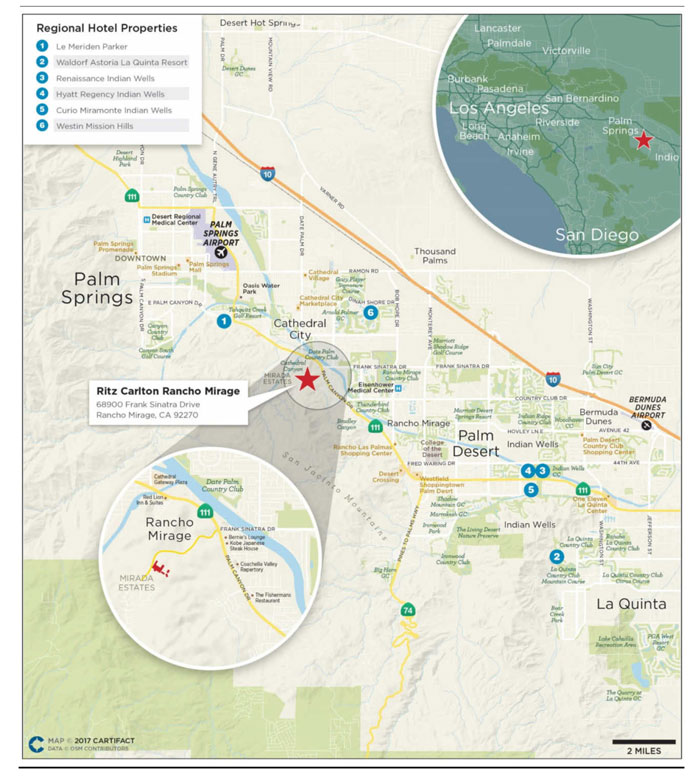
THE INFORMATION IN THIS STRUCTURAL AND COLLATERAL TERM SHEET IS NOT COMPLETE AND MAY BE AMENDED PRIOR TO THE TIME OF SALE. THIS TERM SHEET IS NOT AN OFFER TO SELL THESE SECURITIES AND IT IS NOT A SOLICITATION OF AN OFFER TO BUY THESE SECURITIES IN ANY JURISDICTION WHERE THE OFFER OR SALE IS NOT PERMITTED.
82
Mortgage Loan No. 4 — Ritz Carlton Rancho Mirage
| Mortgage Loan Information | Property Information |
| Mortgage Loan Seller: | Column | Single Asset / Portfolio: | Single Asset | |
| Original Principal Balance: | $54,000,000 | Title: | Fee | |
| Cut-off Date Principal Balance: | $54,000,000 | Property Type - Subtype: | Hotel - Full Service | |
| % of Pool by IPB: | 6.7% | Net Rentable Area (Rooms): | 244 | |
| Loan Purpose: | Refinance | Location: | Rancho Mirage, CA | |
| Borrower: | Newage Rancho Mirage II, LLC | Year Built / Renovated: | 1988 / 2013 - 2014 | |
| Sponsors: | Kam Sang Co., Inc.; Ronnie Lam | Occupancy / ADR / RevPAR: | 75.3% / $361.12 / $271.84 | |
| Interest Rate: | 5.660% | Occupancy / ADR / RevPAR Date: | 4/30/2017 | |
| Note Date: | 3/7/2017 | Number of Tenants: | N/A | |
| Maturity Date: | 4/6/2022 | 2014 NOI(2): | N/A | |
| Interest-only Period: | 60 months | 2015 NOI(2): | $2,573,293 | |
| Original Term: | 60 months | 2016 NOI(2): | $6,776,766 | |
| Original Amortization: | None | TTM NOI(3): | $7,418,179 | |
| Amortization Type: | Interest Only | UW Occupancy / ADR / RevPAR: | 75.3% / $361.12 / $271.84 | |
| Call Protection: | L(26),Def(29),O(5) | UW Revenues: | $45,259,973 | |
| Lockbox(1): | Soft | UW Expenses: | $38,024,546 | |
| Additional Debt: | No | UW NOI: | $7,235,427 | |
| Additional Debt Balance: | N/A | UW NCF: | $5,606,068 | |
| Additional Debt Type: | N/A | Appraised Value / Per Room: | $92,800,000 / $380,328 | |
| Additional Future Debt Permitted: | No | Appraisal Date: | 1/31/2017 |
| Escrows and Reserves(4) | Financial Information |
| Initial | Monthly | Initial Cap | Cut-off Date Loan / Room: | $221,311 | ||
| Taxes: | $0 | $119,784 | N/A | Maturity Date Loan / Room: | $221,311 | |
| Insurance: | $0 | $22,159 | N/A | Cut-off Date LTV: | 58.2% | |
| Deferred Maintenance: | $6,250 | N/A | N/A | Maturity Date LTV: | 58.2% | |
| Environmental Reserve: | $625 | N/A | N/A | UW NCF DSCR: | 1.81x | |
| FF&E Reserve: | $0 | $111,590 | N/A | UW NOI Debt Yield: | 13.4% | |
| Seasonality Reserve: | $750,000 | Springing | $750,000 |
| Sources and Uses |
| Sources | Proceeds | % of Total | Uses | Proceeds | % of Total | |
| Mortgage Loan | $54,000,000 | 75.4% | Payoff Existing Debt | $40,038,828 | 55.9% | |
| Borrower Equity | 17,609,664 | 24.6 | Partner Buyout | 30,005,706 | 41.9 | |
| Upfront Reserves | 756,875 | 1.1 | ||||
| Closing Costs | 808,225 | 1.1 | ||||
| Total Sources | $71,609,634 | 100.0% | Total Uses | $71,609,634 | 100.0% |
| (1) | For a more detailed description of the lockbox, please refer to “Lockbox / Cash Management” below. |
| (2) | The property reopened in April 2014 with the Ritz Carlton affiliation. The increase in NOI from 2015 to 2016 is primarily due to an increase in occupancy from 61.2% to 74.7%. For a more detailed description of the property’s operating history, please refer to “The Property” below. |
| (3) | Represents the trailing twelve month period ending April 30, 2017. |
| (4) | For a more detailed description of escrows and reserves, please refer to “Escrows and Reserves” below. |
THE INFORMATION IN THIS STRUCTURAL AND COLLATERAL TERM SHEET IS NOT COMPLETE AND MAY BE AMENDED PRIOR TO THE TIME OF SALE. THIS TERM SHEET IS NOT AN OFFER TO SELL THESE SECURITIES AND IT IS NOT A SOLICITATION OF AN OFFER TO BUY THESE SECURITIES IN ANY JURISDICTION WHERE THE OFFER OR SALE IS NOT PERMITTED.
83
Mortgage Loan No. 4 — Ritz Carlton Rancho Mirage
The Loan.The Ritz Carlton Rancho Mirage loan is a $54.0 million first mortgage loan secured by the fee interest in a 244-room, full-service hotel property located in Rancho Mirage, California. The loan has a five-year term and is interest-only for the term of the loan.
The Borrower.The borrowing entity for the loan is Newage Rancho Mirage II, LLC, a Delaware limited liability company and special purpose entity. The borrowing entity is owned by Newage Rancho Fund, LLC (77.5%), Lamco Fund I, LLC (11.25%) and Lamco Fund II, LLC (11.25%).
The Sponsors. The loan’s sponsors and nonrecourse carve-out guarantors are Kam Sang Co., Inc. and Ronnie Lam. Kam Sang Co., Inc., established in 1979 by current President and CEO Ronnie Lam, owns hospitality, retail, residential, restaurants, and mixed-use properties. In total, the sponsors own 1,248 keys in California and Nevada.
The Property. The property is an AAA Four Diamond, 244-room, full-service hotel located in Rancho Mirage, California. The property is three-stories and was constructed in 1988. The property originally opened with a Ritz Carlton flag as the seventh hotel in the chain. Vail Resorts Management Company (“Vail”) purchased the hotel in 2001. Vail operated the property as the Lodge at Rancho Mirage until they sold the property in 2005 to Gencom with financing from Lehman Brothers. Gencom closed the hotel for renovations in 2006. Gencom was not able to complete the renovations and the hotel did not re-open. In 2013, the sponsors purchased control of the vacant property. The sponsors completed an extensive renovation at a cost of approximately $29.4 million. The renovation and modernization included all guestrooms, ballrooms, common areas and facilities. The newly renovated Ritz Carlton Rancho Mirage reopened to the public in April 2014.
The unit mix at the property consists of 171 king units, 57 queen units, 12 king suites, two queen suites and two presidential suites. Each of the guestrooms features a flat-screen television, desk, chair, dresser, nightstands as well as a partition separating the bathroom from the guestroom area. Numerous rooms include a private outdoor fire pit or balcony. Amenities at the hotel include two restaurants, a lounge, 14,798 SF of meeting space, two outdoor swimming pools, a two-story 20,000 SF full-service spa with 15 treatment rooms, outdoor plunge pools and a fitness center. The food and beverage outlets are State Fare Bar & Kitchen, Lobby Lounge, Air Pool Bar, and the Edge Steakhouse. State Fare Bar & Kitchen is a three-meal restaurant, located directly off the lobby, offering classic cocktails and prized California wines. The lobby lounge is adjacent to State Fare Bar & Restaurant and leverages their kitchen and bar. The Edge Steakhouse is a signature steakhouse, situated along a cliff overlooking the valley. The meeting space includes the following: The Ritz-Carlton Ballroom (8,400 SF), Mirada Terrace (2,700 SF) and Sunrise (824 SF). There is also 25,000 SF of outdoor event space including two cliff-side event lawns. The property has a 377-space subterranean parking garage with valet services as well as self-parking. The site includes sixteen luxury condominiums, located adjacent to the spa building, which are not part of the collateral of the loan.
The Ritz Carlton Rancho Mirage property is located along Frank Sinatra Drive elevated above the Coachella Valley on a site graded on the side of the Santa Rosa Mountains in the City of Rancho Mirage. The property is located 0.8 miles west of State Route 111 (Palm Canyon Drive), and approximately 7.0 miles southeast of the Palm Springs International Airport.
The Market. The property is located in Rancho Mirage, California in the Riverside-San Bernardino-Ontario Metropolitan Statistical Area (or “Inland Empire”). Rancho Mirage is a resort city located in the Coachella Valley and was incorporated as a city in 1973. The Coachella Valley includes the cities of Palm Desert, Palm Springs, Indian Wells, Rancho Mirage, Cathedral City, Indio, Thousand Palms, and La Quinta, and is a two-hour drive from the cities of Los Angeles, San Diego and the Mexican border. According to the appraisal, Rancho Mirage and the Coachella Valley are known for their recreation and resort activities, especially golf, swimming, tennis, biking and hiking. The Coachella Valley boasts at least 116 golf courses, 12 of which are located in Rancho Mirage. According to appraisal, the Coachella Valley has become home to popular events and festivals including the Palm Springs Film Festival, Bob Hope Classic, Coachella Valley Music Festival, BNP Paribas Tennis Open, Stagecoach Country Music Festival and Desert Trip for a total of over 1.6 million people visiting the region annually. The area is also home to the Palm Springs Convention Center, an over 200,000 SF convention space located in downtown Palm Springs that completed an expansion and renovation in 2005, at a cost of $34.7 million.
THE INFORMATION IN THIS STRUCTURAL AND COLLATERAL TERM SHEET IS NOT COMPLETE AND MAY BE AMENDED PRIOR TO THE TIME OF SALE. THIS TERM SHEET IS NOT AN OFFER TO SELL THESE SECURITIES AND IT IS NOT A SOLICITATION OF AN OFFER TO BUY THESE SECURITIES IN ANY JURISDICTION WHERE THE OFFER OR SALE IS NOT PERMITTED.
84
Mortgage Loan No. 4 — Ritz Carlton Rancho Mirage
According to the California Employment Development Department, the Inland Empire’s employment increased 2.3% over the twelve months ending September 2016. The increase was driven primarily by payroll increases in the Government and Trade, Transportation, and Utilities sectors. Top employers in the area include Stater Brothers Markets, Arrowhead Regional Medical Center, U.S. Marine Corps. Air Ground Combat Center, Fort Irwin, Wal-Mart Stores Inc., March Air Reserve Base, United Parcel Services Inc., Loma Linda University, and U.C. Riverside and Ontario.
Primary Local Market Historical Occupancy, ADR, RevPAR(1)
Competitive Set | Ritz Carlton Rancho Mirage | Penetration Factor | |||||||||
| Year | Occupancy | ADR | RevPAR | Occupancy | ADR | RevPAR | Occupancy | ADR | RevPAR | ||
| 2016 | 61.1% | $255.51 | $156.14 | 73.9% | $353.53 | $261.33 | 121.0% | 138.4% | 167.4% | ||
| TTM(2) | 60.9% | $256.83 | $156.35 | 74.9% | $353.44 | $264.69 | 123.0% | 137.6% | 169.3% | ||
(1) | Source: Third Party Data Provider. The competitive set consists of the following hotels: Omni Rancho Las Palmas Resort & Spa, Waldorf Astoria La Quinta Resort & Club, Hyatt regency Indian Wells Resort & Spa, Le Meridien Parker Palm Springs. |
| (2) | Represents the trailing twelve month period ending March 31, 2017. |
Primary Local Market Competitive Hotels Profile(1)
Estimated Market Mix | 2016 Estimated Operating Statistics | ||||||||
| Property | Rooms | Year Built | Meeting Space (SF) | Transient | Meeting & Group | Occupancy | ADR | RevPAR | |
| Ritz Carlton Rancho Mirage | 244 | 2014 | 18,200 | 71% | 29% | 74% | $353.53 | $261.33 | |
| Le Meriden Parker | 144 | 1959 | 11,000 | 80% | 20% | 65% | $362.00 | $235.30 | |
| Waldorf Astoria La Quinta Resort | 796 | 1926 | 40,940 | 35% | 65% | 59% | $276.00 | $162.84 | |
| Renaissance Indian Wells | 560 | 1989 | 51,861 | 45% | 55% | 59% | $230.00 | $135.70 | |
| Hyatt Regency Indian Wells | 530 | 1986 | 26,200 | 45% | 55% | 60% | $223.00 | $133.80 | |
| Curio Miramonte Indian Wells | 215 | 1963 | 18,000 | 55% | 45% | 47% | $192.00 | $90.24 | |
| Westin Mission Hills | 512 | 1991 | 70,161 | 40% | 60% | 59% | $210.00 | $123.90 | |
| Total(2) | 3,001 | ||||||||
| (1) | Source: Appraisal. |
| (2) | Excludes the subject property. |
Regional Hotel Competition – Alternative Destinations
The property also competes in the luxury segment with regional hotels and resorts for leisure travelers and corporate events. Select properties in the Phoenix MSA are the leading regional competition.
Historical Occupancy, ADR, RevPAR(1)
Competitive Set | Ritz Carlton Rancho Mirage | Penetration Factor | |||||||||
| Year | Occupancy | ADR | RevPAR | Occupancy | ADR | RevPAR | Occupancy | ADR | RevPAR | ||
| 2015 | 68.8% | $359.03 | $246.86 | 61.2% | $349.27 | $213.68 | 89.0% | 97.3% | 86.6% | ||
| 2016 | 70.8% | $382.87 | $270.90 | 73.9% | $353.53 | $261.33 | 104.5% | 92.3% | 96.5% | ||
| TTM(2) | 70.7% | $389.49 | $275.41 | 74.9% | $353.44 | $264.69 | 105.9% | 90.7% | 96.1% | ||
| (1) | Source: Third Party Data Provider. The competitive set consists of the following hotels: L`Auberge De Sedona, The Unbound Collection Royal Palms Resort & Spa, Sanctuary On Camelback Mountain, Ojai Valley Inn & Spa, Four Seasons Resort Scottsdale @ Troon North. |
| (2) | Represents the trailing twelve month period ending March 31, 2017. |
THE INFORMATION IN THIS STRUCTURAL AND COLLATERAL TERM SHEET IS NOT COMPLETE AND MAY BE AMENDED PRIOR TO THE TIME OF SALE. THIS TERM SHEET IS NOT AN OFFER TO SELL THESE SECURITIES AND IT IS NOT A SOLICITATION OF AN OFFER TO BUY THESE SECURITIES IN ANY JURISDICTION WHERE THE OFFER OR SALE IS NOT PERMITTED.
85
Mortgage Loan No. 4 — Ritz Carlton Rancho Mirage
Regional Competitive Hotels Profile(1)
Estimated Market Mix | ||||||
| Property | Location | Rooms | Year Opened | Meeting Space (SF) | Transient | Meeting & Group |
| Ritz Carlton Rancho Mirage | Rancho Mirage, CA | 244 | 2014 | 18,200 | 71% | 29% |
| Sanctuary on Camelback Mountain | Paradise Valley, AZ | 109 | 1970 | 5,918 | 69% | 31% |
| Royal Palms | Phoenix, AZ | 119 | 1948 | 6,392 | 55% | 45% |
| Four Seasons Scottsdale Troon North | Scottsdale, AZ | 210 | 1999 | 17,838 | 50% | 50% |
| L’Auburge De Sedona | Sedona, AZ | 88 | 1984 | 4,480 | 90% | 10% |
| Ojai Valley Inn & Spa | Ojai, CA | 303 | 1923 | 10,800 | 75% | 25% |
| Total(2) | 3,586 | |||||
(1) | Source: Appraisal. |
| (2) | Excludes the subject property. |
Operating History and Underwritten Net Cash Flow
| 2014(1) | 2015 | 2016 | TTM(2) | Underwritten | Per Room(3) | %(4) | |
| Occupancy | N/A | 61.2% | 73.9% | 75.3% | 75.3% | ||
| ADR | N/A | $353.44 | $353.53 | $361.12 | $361.12 | ||
| RevPAR | N/A | $216.23 | $261.33 | $271.84 | $271.84 | ||
| Room Revenue | N/A | $19,257,439 | $23,337,948 | $24,209,669 | $24,209,669 | $99,220 | 53.5% |
| Food and Beverage | N/A | 14,573,769 | 16,118,364 | 16,234,662 | 16,234,662 | 66,536 | 35.9% |
| Other Departmental Revenues | N/A | 3,895,874 | 4,583,729 | 4,815,642 | 4,815,642 | 19,736 | 10.6% |
| Total Revenue | N/A | $37,727,081 | $44,040,041 | $45,259,973 | $45,259,973 | $185,492 | 100.0% |
| Room Expense | N/A | 5,824,627 | 6,637,189 | 6,785,578 | 6,785,578 | 27,810 | 28.0% |
| Food and Beverage Expense | N/A | 13,435,104 | 13,980,215 | 14,007,048 | 14,007,048 | 57,406 | 86.3% |
| Other Departmental Expenses | N/A | 2,424,047 | 2,403,051 | 2,539,223 | 2,539,223 | 10,407 | 52.7% |
| Departmental Expenses | N/A | $21,683,778 | $23,020,455 | $23,331,848 | $23,331,848 | $95,622 | 51.6% |
| Departmental Profit | N/A | $16,043,304 | $21,019,586 | $21,928,125 | $21,928,125 | $89,869 | 48.4% |
| Operating Expenses | N/A | $12,041,424 | $12,489,948 | $12,837,552 | $12,796,081 | $52,443 | 28.3% |
| Gross Operating Profit | N/A | $4,001,879 | $8,529,638 | $9,090,572 | $9,132,043 | $37,426 | 20.2% |
| Fixed Expenses | N/A | 1,428,586 | 1,752,872 | 1,672,393 | 1,896,617 | 7,773 | 4.2% |
| Net Operating Income | N/A | $2,573,293 | $6,776,766 | $7,418,179 | $7,235,427 | $29,653 | 16.0% |
| FF&E | N/A | 536,016 | 1,053,282 | 1,282,164 | 1,629,359 | 6,678 | 3.6% |
| Net Cash Flow | N/A | $2,037,277 | $5,723,484 | $6,136,015 | $5,606,068 | $22,976 | 12.4% |
| (1) | Historical financials are not available due to the property re-opening in April 2014 after a renovation. |
| (2) | The TTM column represents the trailing twelve month period ending April 30, 2017. |
| (3) | Per room values are based on 244 rooms. |
| (4) | % column represents percent of Total Revenue except for Room Expense, Food and Beverage and Other Department Expenses, which is based on their corresponding revenue line items. |
THE INFORMATION IN THIS STRUCTURAL AND COLLATERAL TERM SHEET IS NOT COMPLETE AND MAY BE AMENDED PRIOR TO THE TIME OF SALE. THIS TERM SHEET IS NOT AN OFFER TO SELL THESE SECURITIES AND IT IS NOT A SOLICITATION OF AN OFFER TO BUY THESE SECURITIES IN ANY JURISDICTION WHERE THE OFFER OR SALE IS NOT PERMITTED.
86
Mortgage Loan No. 4 — Ritz Carlton Rancho Mirage
Property Management. The property operates as a Ritz-Carlton hotel under an operating agreement with the owner that expires on December 31, 2039, approximately 17 years beyond the loan term. The Ritz-Carlton brand operates 91 luxury hotels worldwide in 30 countries and territories.
Escrows and Reserves. At origination, the borrower deposited into escrow $756,875; $750,000 in the seasonality reserve, $6,250 for deferred maintenance and $625 in the environmental reserve.
Tax Escrows – On a monthly basis, the borrower is required to escrow 1/12th of the annual estimated tax payments, which currently equates to $119,784, except to the extent the borrower has provided to the lender evidence that the property manager has paid all taxes then due and payable.
Insurance Escrows – On a monthly basis, the borrower is required to escrow 1/12th of the annual estimated insurance payments, which currently equates to $22,159, except to the extent the borrower has provided to the lender evidence that the property manager has paid all insurance premiums then due and payable.
FF&E Reserve – On a monthly basis, the borrower is required to escrow an amount equal to the greater of (a) 1/12th of three percent of gross income from operations for the property over the trailing twelve month period, which currently equates to $111,590 and (b) the amount required to be deposited into the reserve as defined in the management agreement (up to 5% of gross revenues).
Seasonality Reserve – At origination, the borrower made an initial seasonality reserve deposit of $750,000. After the occurrence of a Seasonality Deposit Trigger (as defined below) on each payment date occurring in January, February, March, April, May, October, November and December, the borrower is required to escrow $129,119, subject to a cap of $750,000.
A “Seasonality Deposit Trigger” commences upon any application of the initial seasonality reserve deposit. The requirement to post the monthly seasonality deposits will be suspended to the extent the balance of the seasonality reserve account is $750,000.
Lockbox / Cash Management. The Ritz Carlton Rancho Mirage loan is structured with a hard lockbox with in place cash management. Pursuant to the property management agreement, the manager collects all income from the property, pays all operating expenses and establishes an FF&E reserve pursuant to the management agreement. On a monthly basis, the property manager remits all income from the property, less expenses, working capital, the FF&E reserve and the management fee to a cash management account under the control of the lender and disbursed during each interest period of the term of the loan in accordance with the loan documents. During the continuance of a Cash Sweep Event (as defined below), all excess cash flow, after payments made in accordance with the loan documents for, amongst other things, debt service, required reserves and operating expenses, will be held as additional collateral for the loan.
A “Cash Sweep Event” means: (i) an event of default (ii) any bankruptcy action of the borrower or property manager, or (iii) the debt service coverage ratio is less than 1.20x. A Cash Sweep Event expires upon, with regard to clause (i) above, the cure of such event of default, with regards to clause (ii) above, the replacement of such property manager with another qualified manager under a replacement management agreement, and with regard to clause (iii) above, the date that the debt service coverage ratio is at least 1.25x for two consecutive calendar quarters.
The property is part of a larger project that is subject to an operating covenant with the City of Rancho Mirage, whereby the City of Rancho Mirage is required to issue tax rebates of up to 50% of to the net transient occupancy tax collected in connection with the property for each calendar year in excess of $250,000, up to $1 million per year and $10 million in the aggregate to the borrower. For more information see “Description of the Mortgage Pool – Real Estate and Other Tax Considerations” in the Preliminary Prospectus.
THE INFORMATION IN THIS STRUCTURAL AND COLLATERAL TERM SHEET IS NOT COMPLETE AND MAY BE AMENDED PRIOR TO THE TIME OF SALE. THIS TERM SHEET IS NOT AN OFFER TO SELL THESE SECURITIES AND IT IS NOT A SOLICITATION OF AN OFFER TO BUY THESE SECURITIES IN ANY JURISDICTION WHERE THE OFFER OR SALE IS NOT PERMITTED.
87
Mortgage Loan No. 5 — Hotel Eastlund

THE INFORMATION IN THIS STRUCTURAL AND COLLATERAL TERM SHEET IS NOT COMPLETE AND MAY BE AMENDED PRIOR TO THE TIME OF SALE. THIS TERM SHEET IS NOT AN OFFER TO SELL THESE SECURITIES AND IT IS NOT A SOLICITATION OF AN OFFER TO BUY THESE SECURITIES IN ANY JURISDICTION WHERE THE OFFER OR SALE IS NOT PERMITTED.
88
Mortgage Loan No. 5 — Hotel Eastlund

THE INFORMATION IN THIS STRUCTURAL AND COLLATERAL TERM SHEET IS NOT COMPLETE AND MAY BE AMENDED PRIOR TO THE TIME OF SALE. THIS TERM SHEET IS NOT AN OFFER TO SELL THESE SECURITIES AND IT IS NOT A SOLICITATION OF AN OFFER TO BUY THESE SECURITIES IN ANY JURISDICTION WHERE THE OFFER OR SALE IS NOT PERMITTED.
89
Mortgage Loan No. 5 — Hotel Eastlund

THE INFORMATION IN THIS STRUCTURAL AND COLLATERAL TERM SHEET IS NOT COMPLETE AND MAY BE AMENDED PRIOR TO THE TIME OF SALE. THIS TERM SHEET IS NOT AN OFFER TO SELL THESE SECURITIES AND IT IS NOT A SOLICITATION OF AN OFFER TO BUY THESE SECURITIES IN ANY JURISDICTION WHERE THE OFFER OR SALE IS NOT PERMITTED.
90
Mortgage Loan No. 5 — Hotel Eastlund

THE INFORMATION IN THIS STRUCTURAL AND COLLATERAL TERM SHEET IS NOT COMPLETE AND MAY BE AMENDED PRIOR TO THE TIME OF SALE. THIS TERM SHEET IS NOT AN OFFER TO SELL THESE SECURITIES AND IT IS NOT A SOLICITATION OF AN OFFER TO BUY THESE SECURITIES IN ANY JURISDICTION WHERE THE OFFER OR SALE IS NOT PERMITTED.
91
Mortgage Loan No. 5 — Hotel Eastlund
| Mortgage Loan Information | Property Information | |||
| Mortgage Loan Seller: | Column | Single Asset / Portfolio: | Single Asset | |
| Original Principal Balance: | $41,000,000 | Title: | Fee | |
| Cut-off Date Principal Balance: | $41,000,000 | Property Type - Subtype: | Hotel - Full Service | |
| % of Pool by IPB: | 5.1% | Net Rentable Area (Rooms): | 168 | |
| Loan Purpose: | Refinance | Location: | Portland, OR | |
| Borrower: | Grand Ventures Eastlund Hotel LLC | Year Built / Renovated: | 1961 / 2014-2015 | |
| Sponsors: | Alan Battersby; Craig Schafer; Desmond Mollendor | Occupancy / ADR /RevPAR: | 80.4% / $173.46 / $139.50 | |
| Interest Rate: | 4.9800% | Occupancy / ADR / RevPAR Date: | 3/31/2017 | |
| Note Date: | 2/10/2017 | Number of Tenants: | N/A | |
| Maturity Date: | 3/6/2027 | 2014 NOI(3): | N/A | |
| Interest-only Period: | 24 months | 2015 NOI(3): | N/A | |
| Original Term: | 120 months | 2016 NOI: | $4,774,715 | |
| Original Amortization: | 360 months | TTM NOI(4): | $5,031,089 | |
| Amortization Type: | IO-Balloon | UW Occupancy / ADR / RevPAR: | 80.4% / $173.46 / $139.50 | |
| Call Protection: | L(35),YM1(78),O(7) | UW Revenues: | $9,612,202 | |
| Lockbox(1): | Hard | UW Expenses: | $4,644,483 | |
| Additional Debt: | No | UW NOI: | $4,967,719 | |
| Additional Debt Balance: | N/A | UW NCF: | $4,583,231 | |
| Additional Debt Type: | N/A | Appraised Value / Per Room: | $68,600,000 / $408,333 | |
| Additional Future Debt Permitted(2): | Yes – Mezzanine Debt | Appraisal Date: | 1/17/2017 |
| Escrows and Reserves(5) | Financial Information | |||||
| Initial | Monthly | Initial Cap | Cut-off Date Loan / Room: | $244,048 | ||
| Taxes: | $142,480 | $35,620 | N/A | Maturity Date Loan / Room: | $211,087 | |
| Insurance: | $91,765 | $10,196 | N/A | Cut-off Date LTV: | 59.8% | |
| FF&E Reserve: | $0 | $16,770 | N/A | Maturity Date LTV: | 51.7% | |
| UW NCF DSCR: | 1.74x | |||||
| UW NOI Debt Yield: | 12.1% |
| Sources and Uses | ||||||
| Sources | Proceeds | % of Total | Uses | Proceeds | % of Total | |
| Mortgage Loan | $41,000,000 | 100.0% | Payoff Existing Debt | $24,902,735 | 60.7% | |
| Return of Equity | 15,189,660 | 37.0 | ||||
| Upfront Reserves | 234,244 | 0.6 | ||||
| Closing Costs | 673,361 | 1.6 | ||||
| Total Sources | $41,000,000 | 100.0% | Total Uses | $41,000,000 | 100.0% |
| (1) | For a more detailed description of the lockbox, please refer to “Lockbox / Cash Management” below. |
| (2) | For a more detailed description of additional future debt permitted, please refer to “Additional Debt” below. |
| (3) | The property closed for renovations in 2014 and re-opened in June 2015; for a more detailed description of the property’s operating history, please refer to “The Property” below. |
| (4) | Represents the trailing twelve month period ending March 31, 2017. |
| (5) | For a more detailed description of escrows and reserves, please refer to “Escrows and Reserves” below. |
THE INFORMATION IN THIS STRUCTURAL AND COLLATERAL TERM SHEET IS NOT COMPLETE AND MAY BE AMENDED PRIOR TO THE TIME OF SALE. THIS TERM SHEET IS NOT AN OFFER TO SELL THESE SECURITIES AND IT IS NOT A SOLICITATION OF AN OFFER TO BUY THESE SECURITIES IN ANY JURISDICTION WHERE THE OFFER OR SALE IS NOT PERMITTED.
92
Mortgage Loan No. 5 — Hotel Eastlund
The Loan. The Hotel Eastlund loan is a $41.0 million first mortgage loan secured by the fee interest in a 168-room, full-service hotel property located in Portland, Oregon. The loan has a 10-year term and will amortize on a 30-year schedule after an initial 24-month interest only period.
The Borrower. The borrowing entity for the loan is Grand Ventures Eastlund Hotel LLC, a Delaware limited liability company and special purpose entity. The borrowing entity is owned by Alan Battersby, Craig Schafer and Desmond Mollendor.
The Sponsors. The loan’s sponsors and nonrecourse carve-out guarantors are Alan Battersby, Craig Schafer and Desmond Mollendor. The sponsors have been owners and operators of hotels for 30 years, primarily in the Pacific Northwest from San Francisco to Seattle. Mr. Battersby worked at the Four Seasons Hotel before forming his own management and advising practice. He has purchased, repositioned and sold five hotels for his own account. His management company has managed, repositioned and sold six other hotels. Mr. Mollendor worked as the General Manager overseeing the day-to-day operations and capital renovation projects for all of Mr. Battersby’s hotels in Washington and Oregon. Mr. Schafer’s most recent conversion project was the Hotel Modera, a former Days Inn in downtown Portland.
The Property. The property is an AAA Three Diamond luxury, 168-room, full-service hotel known as Hotel Eastlund, located in Portland, Oregon. The borrower acquired the property in 2013 for $12.5 million when it operated as a Red Lion Hotel. In September 2014, the sponsors closed the property and commenced an approximately $33.0 million renovation, rehabilitation, and rebranding. The conversion including stripping most of the building to concrete and its steel core. The renovation re-positioned the property from a lower tiered full service property to a luxury hotel. All aspects of the property were renovated. Amenities include two restaurants, a fitness center, garage parking with 131 spaces, a sundry shop and 4,800 SF of meeting space across a main ballroom, two conference rooms, two private dining rooms and flexible breakout space on the 6th floor. According to the appraisal, the hotel is considered new and in excellent condition. The property re-opened in June 2015, after completion of the renovation, and features 168 guestrooms offered in king (124), double queen (32), premiere suite (8) and junior suite (4) configurations. According to the appraisal, after its complete renovation, Hotel Eastlund is now one of the most technologically advanced hotels in Portland. The property offers internet connectivity and all guestrooms feature smart suite systems including fully integrated smart climate control systems, smart doorbells and smart TVs.
The property is also home to two restaurants, Altabira City Tavern and Citizen Baker, run by and restaurateur David Machado. Mr. Machado has headed several acclaimed restaurants on the east side and in downtown Portland, including Nel Centro, located in Hotel Modera, where he currently serves as chef d’entreprise. Altabira City Tavern has signed to a ten-year lease through April 2026 for a total of 5,455 SF on the top (6th) floor of the hotel. It offers indoor and outdoor seating and includes a full service bar. Altabira City Tavern pays base rent of $59,700 per year with annual increases of 3.0% each March. Additionally, Altabria City Tavern pays percentage rent equal to 6.0% of gross sales in excess of $2.5 million per annum as well as 6.0% of banquet and catering sales which utilize the hotel’s facilities. The hotel has 4,800 SF of ballroom, banquet and meeting space on the 6th floor that is catered from Altabira City Tavern. Gross sales for Altabira City Tavern totaled just over $5.24 million in 2016. Citizen Baker has a ten-year lease through April 2026 for a total of 3,131 SF on the lobby level. Citizen Baker pays base rent of approximately $27,400 per year in addition to percentage rent equal to 6.0% of gross sales in excess of $750,000 per annum as well as 6.0% of banquet and catering sales which utilize the hotel’s facilities. Citizen Baker had gross sales of just under $720,000 in 2016. Both tenants also pay their share of operating expenses. Additionally, the property features a rooftop patio with tables, chairs and fire pits.
The Hotel Eastlund property is located in the Lloyd District neighborhood of Portland, northeast of downtown across the Willamette River. The property is across the street from the 1.0 million SF Oregon Convention Center. The property is within walking distance of the Lloyd Center Mall and the Moda Center (home to the Portland Trailblazers). Downtown Portland and the Portland Art Museum are within two miles of the property. The Max Light Rail System Rose Quarter Station is immediately across from the property providing access to the Red, Green and Blue rail lines connecting to downtown, the airport and other employment areas.
THE INFORMATION IN THIS STRUCTURAL AND COLLATERAL TERM SHEET IS NOT COMPLETE AND MAY BE AMENDED PRIOR TO THE TIME OF SALE. THIS TERM SHEET IS NOT AN OFFER TO SELL THESE SECURITIES AND IT IS NOT A SOLICITATION OF AN OFFER TO BUY THESE SECURITIES IN ANY JURISDICTION WHERE THE OFFER OR SALE IS NOT PERMITTED.
93
Mortgage Loan No. 5 — Hotel Eastlund
The Market. The property is located in Portland, Oregon and is part of Multnomah County. The property’s market area is defined as Portland-Vancouver-Hillsboro OR-WA. According to a third-party data provider, the technology sector is expected to propel Portland’s economic growth over the next few years given the highly educated population and increasing reputation as a cost-effective alternative to the Silicon Valley. Computer components manufacturer Intel Corp. is the Portland area’s largest employer, providing jobs for more than 17,000 people, with several campuses to the west of central Portland in the city of Hillsboro. According to the appraisal, top employers in the area include Intel Corp, Providence Health Systems, Oregon Health & Science University, Kaiser Permanente, Legacy Health System, Fred Meyer Stores, Nike Inc., Well Fargo & Co, Portland State University, and U.S. Bank. According to a third-party data provider, a highly educated workforce, strong population trends, and an increasing number of tech firms are factors expected to cement Portland as a regional technology hub and an above-average performer over the long run.
In mid-2017, the 600-key Hyatt Regency Portland is scheduled to break ground at the Oregon Convention Center. According to the appraisal, the hotel is expected to help attract larger attended events to the Oregon Convention Center. It includes $74.0 million in public funding and is scheduled to open in 2019.
Historical Occupancy, ADR, RevPAR(1)
Competitive Set | Hotel Eastlund | Penetration Factor | |||||||
| Year | Occupancy | ADR | RevPAR | Occupancy | ADR | RevPAR | Occupancy | ADR | RevPAR |
| 2016 | 82.0% | $160.99 | $132.05 | 78.6% | $171.21 | $134.62 | 95.9% | 106.3% | 101.9% |
| TTM(2) | 80.7% | $157.57 | $127.18 | 80.4% | $173.57 | $139.59 | 99.6% | 110.2% | 109.8% |
| (1) | Source: Third Party Data Provider. The competitive set consists of the following hotels: Crowne Plaza Portland Downtown Convention Center, Doubletree Portland, Courtyard Portland Lloyd Center Downtown, Hotel Modera (2016 only), Residence Inn Portland Downtown Lloyd Center (2016 only) and Jupiter Hotel (TTM only). |
| (2) | Represents the trailing twelve month period ending March 31, 2017. |
Competitive Hotels Profile(1)
Estimated Market Mix | 2016 Estimated Operating Statistics(2) | ||||||||
| Property | Rooms | Year Built | Meeting Space (SF) | Corp. Individual | Meeting & Group | Leisure | Occupancy | ADR | RevPAR |
| Hotel Eastlund | 168 | 1961 | 4,800 | 35% | 30% | 35% | 79% | $171.21 | $134.57 |
| Crowne Plaza Lloyd District | 241 | 1980 | 9,348 | 25% | 50% | 25% | 80% - 85% | $150 - $160 | $120 - $125 |
| Hotel Modera | 174 | 1962 | 2,732 | 45% | 25% | 30% | 85% - 90% | $200 - $210 | $175 - $185 |
| Doubletree Lloyd Center | 477 | 1964 | 44,462 | 17% | 50% | 33% | 80% - 85% | $145 - $155 | $120 - $125 |
| Residence Inn Lloyd Center | 162 | 1990 | 1,004 | 50% | 20% | 30% | 85% - 90% | $170 - $180 | $145 - $150 |
| Courtyard Lloyd center Downtown | 202 | 1999 | 3,103 | 75% | 10% | 15% | 80% - 85% | $145 - $150 | $120 - $125 |
| Total(3) | 1,256 | ||||||||
| (1) | Source: Appraisal. |
| (2) | The variances between the underwriting, the appraisal and the industry report data with respect to Occupancy, ADR and RevPAR at the property are attributable to variances in reporting methodologies and/or timing differences. |
| (3) | Excludes the subject property. |
THE INFORMATION IN THIS STRUCTURAL AND COLLATERAL TERM SHEET IS NOT COMPLETE AND MAY BE AMENDED PRIOR TO THE TIME OF SALE. THIS TERM SHEET IS NOT AN OFFER TO SELL THESE SECURITIES AND IT IS NOT A SOLICITATION OF AN OFFER TO BUY THESE SECURITIES IN ANY JURISDICTION WHERE THE OFFER OR SALE IS NOT PERMITTED.
94
Mortgage Loan No. 5 — Hotel Eastlund
Operating History and Underwritten Net Cash Flow
| 2014(1) | 2015(1) | 2016 | TTM(2) | Underwritten | Per Room(3) | %(4) | |
| Occupancy | N/A | N/A | 78.6% | 80.4% | 80.4% | ||
| ADR | N/A | N/A | $171.03 | $173.46 | $173.46 | ||
| RevPAR | N/A | N/A | $134.48 | $139.50 | $139.50 | ||
| Room Revenue | N/A | N/A | $8,268,799 | $8,553,956 | $8,553,956 | $50,916 | 89.0% |
| Food and Beverage | N/A | N/A | 212,441 | 230,204 | 230,204 | 1,370 | 2.4% |
| Parking Revenue | N/A | N/A | 509,487 | 513,528 | 513,528 | 3,057 | 5.3% |
| Other Departmental Revenues | N/A | N/A | 260,003 | 314,514 | 314,514 | 1,872 | 3.3% |
| Total Revenue | N/A | N/A | $9,250,730 | $9,612,202 | $9,612,202 | $57,215 | 100.0% |
| Room Expense | N/A | N/A | 1,869,132 | 1,917,580 | 1,917,580 | 11,414 | 22.4% |
| Other Departmental Expenses | N/A | N/A | 239,043 | 242,999 | 242,999 | 1,446 | 77.3% |
| Departmental Expenses | N/A | N/A | $2,108,176 | $2,160,579 | $2,160,579 | $12,861 | 22.5% |
| Departmental Profit | N/A | N/A | $7,142,554 | $7,451,623 | $7,451,623 | $44,355 | 77.5% |
| Operating Expenses | N/A | N/A | $1,996,202 | $2,029,669 | $1,937,159 | $11,531 | 20.2% |
| Gross Operating Profit | N/A | N/A | $5,146,352 | $5,421,954 | $5,514,465 | $32,824 | 57.4% |
| Fixed Expenses | N/A | N/A | 371,637 | 390,865 | 546,746 | 3,254 | 5.7% |
| Net Operating Income | N/A | N/A | $4,774,715 | $5,031,089 | $4,967,719 | $29,570 | 51.7% |
| FF&E | N/A | N/A | 370,029 | 384,488 | 384,488 | 2,289 | 4.0% |
| Net Cash Flow | N/A | N/A | $4,404,686 | $4,646,601 | $4,583,231 | $27,281 | 47.7% |
| (1) | Historical financials are not available due to the property re-opening in June 2015. |
| (2) | The TTM column represent the trailing twelve month period ending March 31, 2017. |
| (3) | Per room values are based on 168 rooms. |
| (4) | % column represents percent of Total Revenue except for Room Expense and Other Department Expenses, which is based on their corresponding revenue line items. |
Property Management. The property is managed by Battersby Hotels, LLC, an affiliate of the sponsors. Battersby Hotels has managed, repositioned and sold six other hotels.
Escrows and Reserves. At origination, the borrower deposited into escrow $234,245; $142,480 for real estate tax and $91,765 for insurance.
Tax Escrows – On a monthly basis, the borrower is required to escrow 1/12th of the annual estimated tax payments, which currently equates to $35,620.
Insurance Escrows – On a monthly basis, the borrower is required to escrow 1/12th of the annual estimated tax payments, which currently equates to $10,196.
FF&E Reserve – On a monthly basis, the borrower is required to escrow an amount equal to (i) from and including April 6, 2017 to February 6, 2018, 1/12th of 2.0% of gross income from operations for the property over the trailing 12 month period; (ii) from and including March 6, 2018 to February 6, 2019, 1/12th of 3.0% of gross income from operations for the property over the trailing 12 month period; (iii) from March 6, 2019 and thereafter, 1/12th of 4.0% of gross income from operations for the property over the trailing 12 month period, which currently equates to $16,770.
THE INFORMATION IN THIS STRUCTURAL AND COLLATERAL TERM SHEET IS NOT COMPLETE AND MAY BE AMENDED PRIOR TO THE TIME OF SALE. THIS TERM SHEET IS NOT AN OFFER TO SELL THESE SECURITIES AND IT IS NOT A SOLICITATION OF AN OFFER TO BUY THESE SECURITIES IN ANY JURISDICTION WHERE THE OFFER OR SALE IS NOT PERMITTED.
95
Mortgage Loan No. 5 — Hotel Eastlund
Lockbox / Cash Management. The Hotel Eastlund loan is structured with a hard lockbox and springing cash management. The property manager will deposit all rental, credit card deposits and other income directly into the lockbox account controlled by the lender. So long as there is no Cash Sweep Event (as defined below), all funds in the lockbox account are swept daily to the borrower operating account during each interest period of the term of the loan in accordance with the loan documents. During the continuance of a Cash Sweep Event, all funds in the lockbox account are swept on a daily basis into a cash management account controlled by the lender. All excess cash flow in the cash management account, after payments made in accordance with the loan documents for, among other things, debt service, required reserves and operating expenses, will be held as additional collateral for the loan so long as the Cash Sweep Event exists.
A “Cash Sweep Event” means: (i) an event of default (ii) any bankruptcy action of the borrower or the property manager, or (iii) the debt yield is less than 8.0%. A Cash Sweep Event expires upon, with regard to clause (i) above, the cure of such event of default, with regards to clause (ii) above, the replacement of such property manager with another qualified manager under a replacement management agreement, and with regard to clause (iii) above, the date that the debt yield is at least 8.0% for two consecutive calendar quarters.
Additional Debt. Future mezzanine debt is permitted subject to the satisfaction of certain conditions, including: (i) a combined loan-to-value ratio not greater than 61.2%; (ii) a combined debt service coverage ratio not less than 1.64x; (iii) a combined debt yield greater than or equal to 10.31%; (iv) the execution of an intercreditor agreement acceptable to the lender; and (v) receipt of a rating agency confirmation from DBRS, Morningstar, Fitch and Moody’s that the mezzanine financing will not result in a downgrade, withdrawal or qualification of the respective ratings assigned to the CSAIL Series 2017-C8 Certificates.
THE INFORMATION IN THIS STRUCTURAL AND COLLATERAL TERM SHEET IS NOT COMPLETE AND MAY BE AMENDED PRIOR TO THE TIME OF SALE. THIS TERM SHEET IS NOT AN OFFER TO SELL THESE SECURITIES AND IT IS NOT A SOLICITATION OF AN OFFER TO BUY THESE SECURITIES IN ANY JURISDICTION WHERE THE OFFER OR SALE IS NOT PERMITTED.
96
(THIS PAGE INTENTIONALLY LEFT BLANK)
97
Mortgage Loan No. 6 — Urban Union Amazon
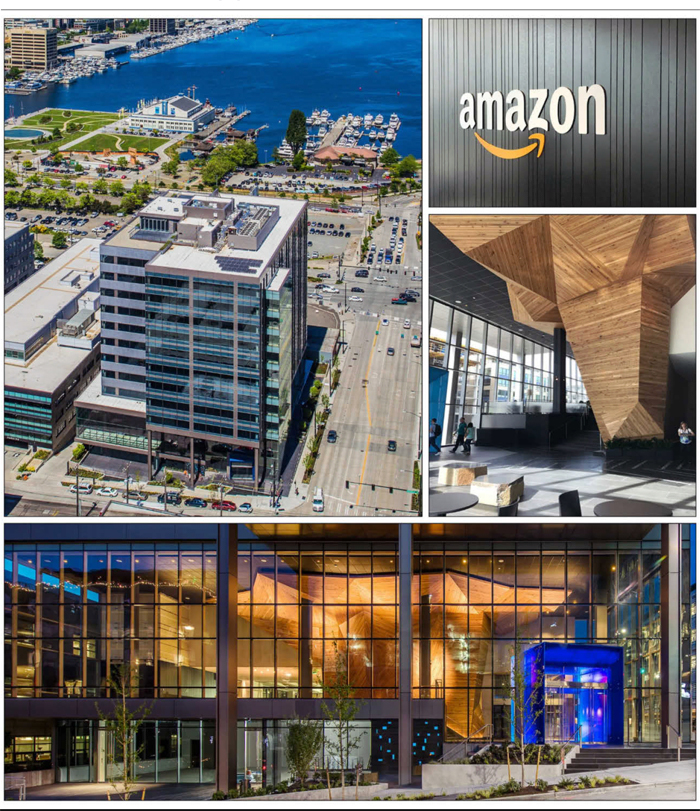
THE INFORMATION IN THIS STRUCTURAL AND COLLATERAL TERM SHEET IS NOT COMPLETE AND MAY BE AMENDED PRIOR TO THE TIME OF SALE. THIS TERM SHEET IS NOT AN OFFER TO SELL THESE SECURITIES AND IT IS NOT A SOLICITATION OF AN OFFER TO BUY THESE SECURITIES IN ANY JURISDICTION WHERE THE OFFER OR SALE IS NOT PERMITTED.
98
Mortgage Loan No. 6 — Urban Union Amazon
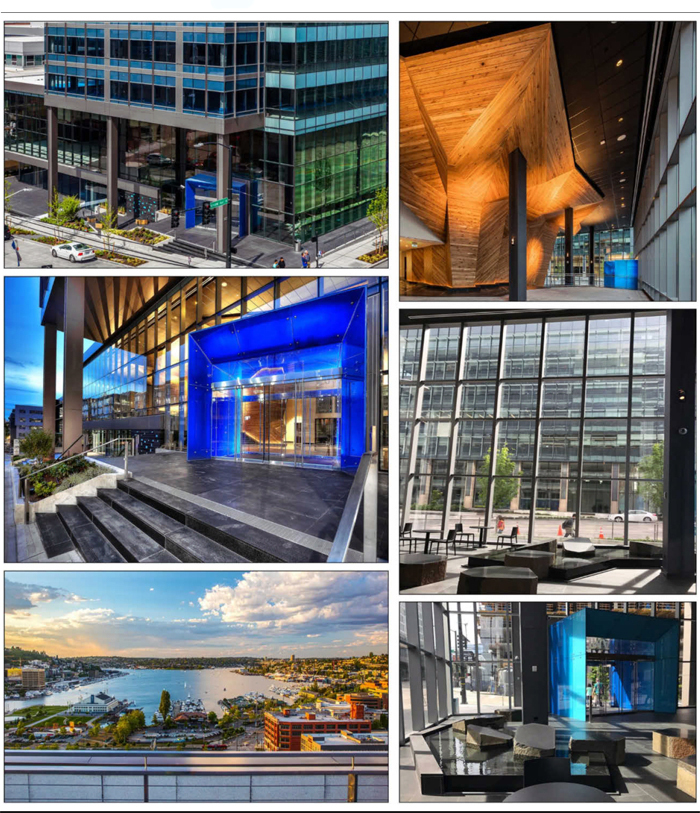
THE INFORMATION IN THIS STRUCTURAL AND COLLATERAL TERM SHEET IS NOT COMPLETE AND MAY BE AMENDED PRIOR TO THE TIME OF SALE. THIS TERM SHEET IS NOT AN OFFER TO SELL THESE SECURITIES AND IT IS NOT A SOLICITATION OF AN OFFER TO BUY THESE SECURITIES IN ANY JURISDICTION WHERE THE OFFER OR SALE IS NOT PERMITTED.
99
Mortgage Loan No. 6 — Urban Union Amazon

THE INFORMATION IN THIS STRUCTURAL AND COLLATERAL TERM SHEET IS NOT COMPLETE AND MAY BE AMENDED PRIOR TO THE TIME OF SALE. THIS TERM SHEET IS NOT AN OFFER TO SELL THESE SECURITIES AND IT IS NOT A SOLICITATION OF AN OFFER TO BUY THESE SECURITIES IN ANY JURISDICTION WHERE THE OFFER OR SALE IS NOT PERMITTED.
100
Mortgage Loan No. 6 — Urban Union Amazon
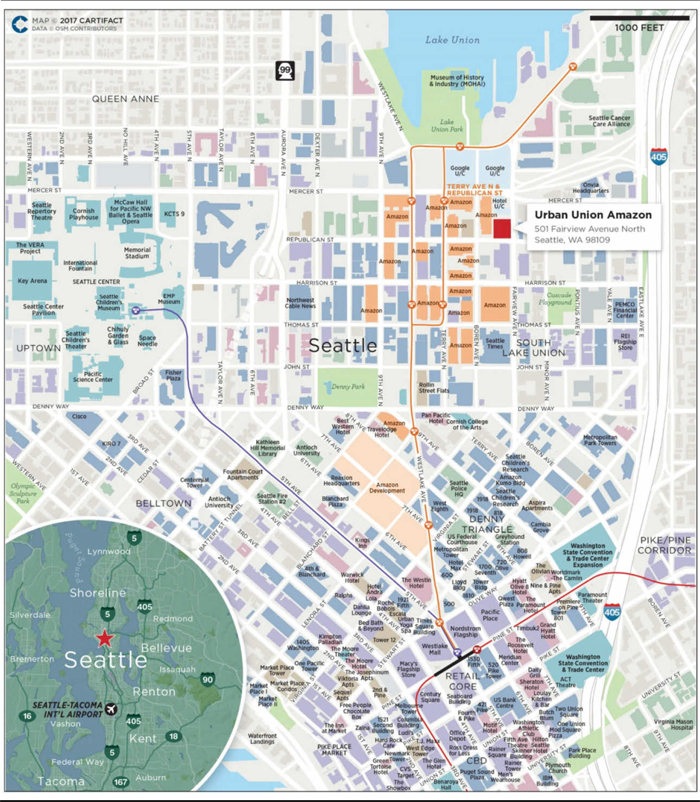
THE INFORMATION IN THIS STRUCTURAL AND COLLATERAL TERM SHEET IS NOT COMPLETE AND MAY BE AMENDED PRIOR TO THE TIME OF SALE. THIS TERM SHEET IS NOT AN OFFER TO SELL THESE SECURITIES AND IT IS NOT A SOLICITATION OF AN OFFER TO BUY THESE SECURITIES IN ANY JURISDICTION WHERE THE OFFER OR SALE IS NOT PERMITTED.
101
Mortgage Loan No. 6 — Urban Union Amazon
| Mortgage Loan Information | Property Information | |||
| Mortgage Loan Seller: | Natixis | Single Asset / Portfolio: | Single Asset | |
| Original Principal Balance(1): | $38,231,428 | Title: | Fee | |
| Cut-off Date Principal Balance(1): | $38,231,428 | Property Type - Subtype: | Office - CBD | |
| % of Pool by IPB: | 4.7% | Net Rentable Area (SF): | 295,793 | |
| Credit Assessment (Moody’s/Fitch/DBRS/KBRA)(2): | A2 / AA / AAA / AA- | Location: | Seattle, WA | |
| Loan Purpose: | Acquisition | Year Built / Renovated: | 2016 / N/A | |
| Borrower: | Urbansea Holding LLC | Occupancy(4): | 100.0% | |
| Sponsors: | Aby Rosen; Michael Fuchs; David Edelstein | Occupancy Date: | 1/1/2017 | |
| Interest Rate: | 3.3812% | Number of Tenants: | 3 | |
| Note Date: | 1/13/2017 | 2014 NOI(4): | N/A | |
| Maturity Date: | 2/6/2022 | 2015 NOI(4): | N/A | |
| Interest-only Period: | 60 months | 2016 NOI(4): | N/A | |
| Original Term: | 60 months | TTM NOI(4): | N/A | |
| Original Amortization: | None | UW Economic Occupancy(5): | 97.0% | |
| Amortization Type: | Interest Only | UW Revenues: | $16,148,162 | |
| Call Protection: | L(28),Def or YM1(28),O(4) | UW Expenses: | $4,519,828 | |
| Lockbox(3): | Hard | UW NOI: | $11,628,334 | |
| Additional Debt(1): | Yes | UW NCF: | $11,598,755 | |
| Additional Debt Balance(1): | $190,367,944 | Appraised Value / Per SF: | $269,000,000 / $909 | |
| Additional Debt Type(1): | Pari Passu ; B-Note; Mezzanine | Appraisal Date: | 1/11/2017 | |
| Additional Future Debt Permitted: | No | |||
| Escrows and Reserves(6) | Financial Information(1) | |||||
| Initial | Monthly | Initial Cap | Cut-off Date Loan / SF: | $210 | ||
| Taxes: | $247,344 | $61,836 | N/A | Maturity Date Loan / SF: | $210 | |
| Insurance: | $54,438 | $6,805 | N/A | Cut-off Date LTV: | 23.1% | |
| Replacement Reserves: | $0 | Springing | N/A | Maturity Date LTV: | 23.1% | |
| TI/LC: | $7,955,593 | $0 | N/A | UW NCF DSCR: | 5.44x | |
| Retail Tenant Reserves: | $100,144 | $0 | N/A | UW NOI Debt Yield: | 18.7% | |
Sources and Uses
| Sources | Proceeds | % of Total | Uses | Proceeds | % of Total | |
| Mortgage Loan (A Notes) | $62,231,428 | 21.9% | Purchase Price | $268,940,438 | 94.6% | |
| Mortgage Loan (B Note) | 86,975,933 | 30.6 | Upfront Reserves | 8,357,519 | 2.9 | |
| Mezzanine Loan | 79,392,011 | 27.9 | Closing Costs | 7,003,894 | 2.5 | |
| Sponsor Equity | 55,702,479 | 19.6 | ||||
| Total Sources | $284,301,851 | 100.0% | Total Uses | $284,301,851 | 100.0% |
| (1) | The Urban Union Amazon loan is a part of a larger split whole loan evidenced by two seniorpari passu notes and one subordinate note with an aggregate original principal balance as of the Cut-off Date of approximately $149.2 million. The Urban Union Amazon Whole Loan is accompanied by a mezzanine loan with an original principal balance as of the Cut-off Date of approximately $79.4 million (the “Urban Union Amazon Mezzanine Loan”). The financial information presented in the chart above and herein reflects the Cut-off Date balance of the approximately $62.2 million A Notes, but not the approximately $87.0 million B Note or the approximately $79.4 million Urban Union Amazon Mezzanine Loan. For a more detailed description of the additional debt please refer to “Additional Debt” below. |
THE INFORMATION IN THIS STRUCTURAL AND COLLATERAL TERM SHEET IS NOT COMPLETE AND MAY BE AMENDED PRIOR TO THE TIME OF SALE. THIS TERM SHEET IS NOT AN OFFER TO SELL THESE SECURITIES AND IT IS NOT A SOLICITATION OF AN OFFER TO BUY THESE SECURITIES IN ANY JURISDICTION WHERE THE OFFER OR SALE IS NOT PERMITTED.
102
Mortgage Loan No. 6 — Urban Union Amazon
| (2) | Moody’s, Fitch, DBRS and KBRA have each confirmed that the Urban Union Amazon loan has, in the context of its inclusion in the Initial Pool Balance, credit characteristics consistent with an investment grade obligation. |
| (3) | For a more detailed description of the lockbox, please refer to“Lockbox / Cash Management”below. |
| (4) | Historical financials are not available due to the property being built in 2016. |
| (5) | Underwritten economic occupancy at the property is 97.0%. The property is 100.0% leased and 97.6% physically occupied based on the January 1, 2017 rent roll. |
| (6) | For a more detailed description of escrows and reserves, please refer to “Escrows and Reserves” below. |
The Loan. The Urban Union Amazon loan, which is part of a larger split whole loan, is a first mortgage loan secured by the borrower’s fee interest in a 295,793 SF Class A+ office building located on a 0.87 acre site in Seattle, Washington. The whole loan has an outstanding principal balance of approximately $149.2 million (the “Urban Union Amazon Whole Loan”), which is comprised of three notes, identified as Note A-1 and Note A-2 (collectively, the “A Notes”), and Note B (the “B Note”). The three notes have outstanding balances of approximately $38.2 million, $24.0 million and $87.0 million for Note A-1, Note A-2 and Note B, respectively.
Note A-1 has an outstanding principal balance of $38,231,428 and is being contributed to the CSAIL 2017-C8 Commercial Mortgage Trust. Note A-2 was previously securitized in CGCMT 2017-P7 Commercial Mortgage Trust and the B Note was sold to an unaffiliated third party investor. Under the related co-lender agreement, prior to a control appraisal period with respect to the related subordinate companion loan, the B Note is the controlling note, and after a control appraisal period occurs with respect to the related subordinate companion loan, Note A-1 will be the controlling note. The holder of Note A-1 and Note A-2 or their respective representatives, will be entitled, under certain circumstances, to consult with respect to certain major decisions.
Note A-1 accrues interest at the same rate as thepari passu Note A-2 and is entitled to payments of interest and principal on a pro rata andpari passu basis with Note A-2, and Note B is a subordinate note, as and to the extent described under “Description of the Mortgage Pool—The Whole Loans” in the Preliminary Prospectus.
Whole Loan Note Summary
| Original Balance | Cut-off Date Balance | Note Holder | Lead Servicer for Whole Loan (Y/N) | Controlling Piece (Y/N) | |
| Note A-1 | $38,231,428 | $38,231,428 | CSAIL 2017-C8 | Y | Y |
| Note A-2 | 24,000,000 | 24,000,000 | CGCMT 2017-P7 | N | N |
| Note B | 86,975,933 | 86,975,933 | Third Party Investor | N | N |
| Total | $149,207,361 | $149,207,361 |
The Borrower. The borrowing entity for the loan is Urbansea Holding LLC, a Delaware limited liability company and special purpose entity.
The Sponsor. The loan’s sponsors are Aby Rosen, Michael Fuchs, and David Edelstein. Mr. Rosen and Mr. Fuchs founded RFR Holding LLC (“RFR”), a Manhattan based real estate investment, development and management company, in 1991. RFR Holding LLC has a diverse portfolio of office, retail, residential, and hospitality assets in New York City, Connecticut, Las Vegas, Miami, Israel and Germany. Notably, RFR’s portfolio includes 375 Park Avenue (The Seagram Building) and 390 Park Avenue (Lever House). Mr. Edelstein is the president of TriStar Capital. Mr. Edelstein began his career in real estate in the 1970s and made a career in buying and selling residential buildings and shopping plazas, including the Miracle Mile Shops in Las Vegas and the Lincoln Road Pedestrian Mall in South Beach. Mr. Edelstein also developed the 408-room W South Beach in Miami Beach, Florida.
The Property.The property is a 295,793 SF Class A+, newly-constructed, LEED certified office building located in Seattle, Washington. The property is 12-story building situated on approximately 0.87 acres, in the Seattle CBD. The property consists of 288,534 SF of office space with 7,259 SF of retail space. Parking at the property consists of 468 total parking spaces in four levels of below-grade parking for a ratio of 1.58 spaces per 1,000 SF net rentable area.
THE INFORMATION IN THIS STRUCTURAL AND COLLATERAL TERM SHEET IS NOT COMPLETE AND MAY BE AMENDED PRIOR TO THE TIME OF SALE. THIS TERM SHEET IS NOT AN OFFER TO SELL THESE SECURITIES AND IT IS NOT A SOLICITATION OF AN OFFER TO BUY THESE SECURITIES IN ANY JURISDICTION WHERE THE OFFER OR SALE IS NOT PERMITTED.
103
Mortgage Loan No. 6 — Urban Union Amazon
As of January 1, 2017, the property was 100.0% leased by 3 tenants. The largest tenant at the property, Amazon Corporate LLC (“Amazon”), leases in the aggregate of 288,534 SF space under two leases (97.5% of the net rentable area through December 2032) with three, five-year extension options remaining. Amazon is an internet-based retailer and provides cloud computing services that outpace its competitors by more than ten times of next fourteen cloud providers combined. As of May 18, 2017 Amazon had a market capitalization of $458.1 billion. Amazon is rated Baa1/AA- by Moody’s and S&P, respectively, and took occupancy of the property in January 2017. Commencing in 2010, Amazon began to occupy a new corporate headquarters in the South Lake Union neighborhood, which will eventually total over 2.0 million SF at completion and house an estimated 9,000 employees. The second largest tenant at the property, Restaurants Unlimited Inc dba Henry’s Tavern (“Henry’s Tavern”), leases in the aggregate of 5,282 SF space under two leases (1.8% of the net rentable area through July 2027) with three, five-year extension options remaining. Henry’s Tavern is a chain restaurant based in Portland with another location in Seattle. The restaurant is known for a vast range of food options and caters to the local demographic. Henry’s Tavern’s lease commences in August 2017. The third largest tenant at the property, Sprout Good Greens, Inc. (“Sprout”), leases 1,977 SF (0.7% of the net rentable area through July 2027) with two, five-year extension options remaining. Sprout is an organic fast food restaurant. Sprout aims to be zero waste, use carbon neutral products, compost and use reused building materials. Sprout’s lease commences in August 2017.
The property benefits from its location along Fairview Avenue North which provides 240 feet of frontage and access to the nearby Lake Union Park and Museum of History & Industry. Primary access to the location is provided by Interstate-5. The property is centrally located in the South Lake Union neighborhood, which is convenient to employment centers, entertainment and retail. The property’s floor-plates layouts are well suited for both single and multi-tenant configurations. The property amenities include bike parking, locker rooms, a cafeteria, outside decks and a building conference room.
The Market. The property is located in the South Lake Union neighborhood of the Seattle CBD in the Lake Union submarket of the Downtown Seattle area market. South Lake Union has experienced significant planning and growth, including high performance workplaces, a 12-acre lakefront park and vibrant open public space, a street car connecting Downtown Seattle to South Lake Union, luxury multifamily, eclectic restaurants hotels and boutiques, waterfront boardwalks, museums and access to kayaking, sailing and biking trails. The development in the area is expected to create approximately 32,000 jobs by the year 2025.
According to the appraisal as of January 6, 2017, the population within a one-, three- and five-mile radius of the property in 2016 was approximately 60,169, 237,695 and 443,644, respectively, and population is expected to grow by 2.9%, 2.1% and 1.7%, respectively, by 2021. Average household income within a one-, three- and five-mile radius of the property in 2016 was $83,391, $94,110 and $103,379, respectively.
According to a third party report as of May 18, 2017, the South Lake Union office market contained 15.0 million SF of office space at the end of 2016 and had an overall vacancy rate of 6.8% as of May 2017 with a projected 12-month rent growth of 6.4%. Four and five star buildings had an overall vacancy rate of 3.6% and average asking rent of $43.92. The appraisal concluded PSF market rents of $35.00 PSF NNN for ground floor retail space and $36.50 PSF NNN for the office space. According to the appraisal, the property’s competitive set consists of the eight properties detailed in the table below.
THE INFORMATION IN THIS STRUCTURAL AND COLLATERAL TERM SHEET IS NOT COMPLETE AND MAY BE AMENDED PRIOR TO THE TIME OF SALE. THIS TERM SHEET IS NOT AN OFFER TO SELL THESE SECURITIES AND IT IS NOT A SOLICITATION OF AN OFFER TO BUY THESE SECURITIES IN ANY JURISDICTION WHERE THE OFFER OR SALE IS NOT PERMITTED.
104
Mortgage Loan No. 6 — Urban Union Amazon
Competitive Set Summary(1)
| Property | Year Built | Total GLA (SF) | Est. Rent PSF | Est. Occ. | Proximity (miles) | Anchor Tenants |
| Urban Union Amazon | 2016 | 295,793(2) | $36(2) | 100%(2) | N/A | Amazon |
| Hawk Tower | 2017 | 208,840 | $38-$40 | 64% | 1.7 | Avalara, WeWork |
| 400 Fairview Building | 2015 | 349,152 | $36-$38 | 99% | 0.1 | Delta Dental, Wireless Advocates, Impinj, Stantec |
| Hill 7 | 2015 | 285,553 | $35-$37 | 80% | 0.5 | Redfin, HBO |
| 450 Alaskan | 2017 | 166,772 | $37-$40 | 54% | 1.7 | Saltchuk |
| NorthEdge | 2016 | 211,348 | $35 | 99% | 1.7 | Tableau Software |
| Weyerhaeuser Headquarters | 2016 | 188,160 | $34 | 90% | 1.6 | Weyerhauser |
| Troy Laundry Block | 2016 | 820,000 | $34 | 100% | 0.2 | Amazon |
| Eleven01 Westlake | 2015 | 153,708 | $37.50 | 100% | 0.5 |
| (1) | Source: Appraisal. |
| (2) | Based on underwritten rent roll dated January 1, 2017. |
Historical and Current Occupancy
| 2013(1) | 2014(1) | 2015(1) | 2016(1) | Current(2) |
| N/A | N/A | N/A | N/A | 100.0% |
| (1) | Historical occupancies are not available due to the property being built in 2016. |
| (2) | Based on the January 1, 2017 underwritten rent roll. |
Tenant Summary(1)
| Tenant | Ratings Moody’s/S&P/Fitch(2) | Net Rentable Area (SF) | % of Total NRA | UW Base Rent PSF(3) | Lease Expiration Date |
| Amazon | Baa1 / AA- / NA | 288,534 | 97.5% | $36.46 | 12/31/2032 |
| Henry’s Tavern | NA / NA / NA | 5,282 | 1.8% | $32.40 | 7/31/2027 |
| Sprout | NA / NA / NA | 1,977 | 0.7% | $35.00 | 7/31/2027 |
| (1) | Based on the underwritten rent roll dated January 1, 2017, including five-year rent averaging for Amazon totaling $463,278. |
| (2) | Ratings provided are for the parent company of the entity listed in the “Tenant” field whether or not the parent company guarantees the lease. |
| (3) | UW Base Rent PSF reflects the UW base rent PSF of the weighted average UW Base Rent of Amazon and Henry’s Tavern, both of which have more than one lease at the property. |
THE INFORMATION IN THIS STRUCTURAL AND COLLATERAL TERM SHEET IS NOT COMPLETE AND MAY BE AMENDED PRIOR TO THE TIME OF SALE. THIS TERM SHEET IS NOT AN OFFER TO SELL THESE SECURITIES AND IT IS NOT A SOLICITATION OF AN OFFER TO BUY THESE SECURITIES IN ANY JURISDICTION WHERE THE OFFER OR SALE IS NOT PERMITTED.
105
Mortgage Loan No. 6 — Urban Union Amazon
Lease Rollover Schedule(1)
| Year | Number of Leases Expiring(2) | NRA (SF) Expiring | % of NRA Expiring | UW Base Rent Expiring | % of UW Base Rent Expiring | Cumulative NRA Expiring | Cumulative % of NRA Expiring | Cumulative UW Base Rent Expiring | Cumulative % of Base Rent Expiring |
| Vacant | NAP | 0 | 0.0% | NAP | NAP | 0 | 0.0% | NAP | NAP |
| MTM | 0 | 0 | 0.0 | $0 | 0.0 | 0 | 0.0% | $0 | 0.0% |
| 2017 | 0 | 0 | 0.0 | 0 | 0.0 | 0 | 0.0% | $0 | 0.0% |
| 2018 | 0 | 0 | 0.0 | 0 | 0.0 | 0 | 0.0% | $0 | 0.0% |
| 2019 | 0 | 0 | 0.0 | 0 | 0.0 | 0 | 0.0% | $0 | 0.0% |
| 2020 | 0 | 0 | 0.0 | 0 | 0.0 | 0 | 0.0% | $0 | 0.0% |
| 2021 | 0 | 0 | 0.0 | 0 | 0.0 | 0 | 0.0% | $0 | 0.0% |
| 2022 | 0 | 0 | 0.0 | 0 | 0.0 | 0 | 0.0% | $0 | 0.0% |
| 2023 | 0 | 0 | 0.0 | 0 | 0.0 | 0 | 0.0% | $0 | 0.0% |
| 2024 | 0 | 0 | 0.0 | 0 | 0.0 | 0 | 0.0% | $0 | 0.0% |
| 2025 | 0 | 0 | 0.0 | 0 | 0.0 | 0 | 0.0% | $0 | 0.0% |
| 2026 | 0 | 0 | 0.0 | 0 | 0.0 | 0 | 0.0% | $0 | 0.0% |
| 2027 & Beyond | 5 | 295,793 | 100.0 | 10,761,406 | 100.0 | 295,793 | 100.0% | $10,761,406 | 100.0% |
| Total | 5 | 295,793 | 100.0% | $10,761,406 | 100.0% |
| (1) | Based on the underwritten rent roll dated January 1, 2017, including five-year rent averaging for Amazon totaling $463,278. |
| (2) | Amazon and Henry’s Tavern each have more than one lease. |
Operating History and Underwritten Net Cash Flow
| 2014(1) | 2015(1) | 2016(1) | Underwritten(2) | PSF | %(3) | |
| Rents in Place | N/A | N/A | N/A | $10,761,406 | $36.38 | 70.6% |
| Vacant Income | N/A | N/A | N/A | 0 | 0.00 | 0.0 |
| Gross Potential Rent | N/A | N/A | N/A | $10,761,406 | $36.38 | 70.6% |
| Total Reimbursements | N/A | N/A | N/A | 4,488,111 | 15.17 | 29.4 |
| Net Rental Income | N/A | N/A | N/A | $15,249,518 | $51.55 | 100.0% |
| (Vacancy/Collection Loss) | N/A | N/A | N/A | (505,356) | (1.71) | (3.3) |
| Other Income | N/A | N/A | N/A | 1,404,000 | 4.75 | 9.2 |
| Effective Gross Income | N/A | N/A | N/A | $16,148,162 | $54.59 | 105.9% |
| Total Expenses | N/A | N/A | N/A | 4,519,828 | $15.28 | 28.0% |
| Net Operating Income | N/A | N/A | N/A | $11,628,334 | $39.31 | 72.0% |
| Total TI/LC, Capex/RR | N/A | N/A | N/A | 29,579 | 0.10 | 0.2 |
| Net Cash Flow | N/A | N/A | N/A | $11,598,755 | $39.21 | 71.8% |
| (1) | Historical financials are not available due to the property being built in 2016. |
| (2) | Rent includes Base Rent and five-year rent averaging for Amazon totaling $463,278. |
| (3) | Percentage column represents percent of Net Rental Income for all revenue lines and represents percent of Effective Gross Income for the remainder of fields. |
Property Management. The property is managed by SW Capital Investment Management LLC, a Delaware limited liability company.
Escrows and Reserves. At origination, the borrower deposited into escrow $7,955,593 for TI/LC reserves, $247,344 for real estate taxes, $100,144 for retail tenant reserves and $54,438 for insurance.
Tax Escrow -On a monthly basis, the borrower is required to escrow 1/12th of the annual estimated tax payments, which currently equates to $61,836.
Insurance Escrow -On a monthly basis, the borrower is required to escrow 1/12th of the annual estimated insurance payments, which currently equates to $6,805.
THE INFORMATION IN THIS STRUCTURAL AND COLLATERAL TERM SHEET IS NOT COMPLETE AND MAY BE AMENDED PRIOR TO THE TIME OF SALE. THIS TERM SHEET IS NOT AN OFFER TO SELL THESE SECURITIES AND IT IS NOT A SOLICITATION OF AN OFFER TO BUY THESE SECURITIES IN ANY JURISDICTION WHERE THE OFFER OR SALE IS NOT PERMITTED.
106
Mortgage Loan No. 6 — Urban Union Amazon
Replacement Reserves -Commencing on the 37th payment date and on a monthly basis, the borrower is required to escrow an amount initially equal to $2,465. The lender may reassess the amount of the monthly payment required from time to time in its reasonable discretion.
Lockbox / Cash Management. The Urban Union Amazon loan is structured with a hard lockbox and in place cash management. Funds deposited into the lockbox account are required to be swept on a daily basis into a cash management account controlled by the lender and applied and disbursed in accordance with the loan documents. Following the occurrence of a Cash Sweep Period (as defined below), excess cash will be held as additional collateral for the Urban Union Amazon Whole Loan. Upon the termination of any Cash Sweep Period, excess cash will no longer be held by the lender and, provided that no event of default has occurred and is continuing (and no other Cash Sweep Period is then in effect), all amounts then on deposit in the lockbox account will be disbursed to the borrower.
A “Cash Sweep Period” will commence upon: (i) the occurrence of an event of default under the loan documents, (ii) the Urban Union Amazon Whole Loan debt service coverage ratio falling below 1.05x at the end of any calendar quarter, or (iii) the commencement of a Primary Tenant Sweep Period (as defined below). A Cash Sweep Period will end with respect to clause (ii), if for three consecutive months (a) no default or event of default has occurred; (b) no event that would trigger another Cash Sweep Period has occurred; and (c) the Urban Union Amazon Whole Loan debt service coverage ratio is at least 1.05x; and, with respect to clause (iii), such Primary Tenant Sweep Period has ended (and no other Cash Sweep Period is then continuing).
An “Amazon Lease” means the certain lease agreement, dated February 24, 2016 by and between SWB-II Seattle, LLC, a Delaware limited liability company, as landlord, and Amazon, as tenant, as the same may be amended, modified, supplemented or replaced from time to time.
An “Amazon Lease Guaranty” means the certain limited guaranty of lease, dated February 24, 2016 by and between SWB-II Seattle, LLC, a Delaware limited liability company, as landlord, and Amazon.Com, Inc., a Delaware corporation, as guarantor, as the same may be amended, modified, supplemented or replaced from time to time.
A “Material Lease” means the (x) Amazon Lease or (y) all leases which individually or in the aggregate with respect to the same tenant and its affiliates (i) constitute 10.0% or more of the property’s gross leasable area, (ii) have a gross annual rent of 10.0% or more of the total annual rents, or (iii) demise at least one full floor of the improvements.
A “Primary Tenant” means Amazon as a tenant under the Amazon Lease and thereafter any acceptable replacement tenants occupying all or substantially all of the Primary Tenant Premises under a lease that qualifies as a Material Lease.
A “Primary Tenant Lease” means Amazon Lease and thereafter the lease of any acceptable replacement tenants occupying all or substantially all of the Primary Tenant Premises under a lease that qualifies as a Material Lease.
A “Primary Tenant Premises” means the space at the property occupied by the Primary Tenant pursuant to the Primary Tenant Lease.
A “Primary Tenant Sweep Period” will commence upon: (i) any termination of a Primary Tenant lease, (ii) the Primary Tenant has become the subject of a bankruptcy action, (iii) the Primary Tenant has gone dark in a majority of the Primary Tenant Premises, provided, however, Primary Tenant Sweep Period shall not be triggered under this subsection (iii) if the Amazon Lease Guaranty with respect to the Primary Tenant Lease is in place and the Amazon.Com, Inc., maintains a senior long-term debt rating by a S&P or Moody’s of at least A-, provided further that notwithstanding the foregoing, in the event the Primary Tenant is dark in a majority of the Primary Tenant Premises during the last twelve months of the term of the loan the Primary Tenant Sweep Period will be triggered regardless if the Amazon Lease Guaranty is in place or the Amazon.Com, Inc. has an A- rating or above, or (iv) the occurrence of any monetary or material non-monetary default under the Primary Tenant Lease.
THE INFORMATION IN THIS STRUCTURAL AND COLLATERAL TERM SHEET IS NOT COMPLETE AND MAY BE AMENDED PRIOR TO THE TIME OF SALE. THIS TERM SHEET IS NOT AN OFFER TO SELL THESE SECURITIES AND IT IS NOT A SOLICITATION OF AN OFFER TO BUY THESE SECURITIES IN ANY JURISDICTION WHERE THE OFFER OR SALE IS NOT PERMITTED.
107
Mortgage Loan No. 6 — Urban Union Amazon
Additional Debt.In addition to Note A-1, the property is also security for thepari passu Note A-2 and the B Note. The B Note has an outstanding principal balance as of the Cut-off Date of approximately $87.0 million and a coupon of 4.2000%. The Urban Union Amazon Whole Loan (inclusive of the B Note) has a Cut-off Date LTV of 55.5%, an UW NCF DSCR of 1.99x and an UW NOI Debt Yield of 7.8%. An approximately $79.4 million mezzanine loan was provided in connection with the financing of the property that is secured by the mezzanine borrower’s equity interest in the borrower and is coterminous with the mortgage loan. The mezzanine loan has a coupon of 6.7500%. Including the mezzanine loan, the Cut-off Date LTV is 85.0%, the UW NCF DSCR is 1.03x and the UW NOI Debt Yield is 5.1%.
THE INFORMATION IN THIS STRUCTURAL AND COLLATERAL TERM SHEET IS NOT COMPLETE AND MAY BE AMENDED PRIOR TO THE TIME OF SALE. THIS TERM SHEET IS NOT AN OFFER TO SELL THESE SECURITIES AND IT IS NOT A SOLICITATION OF AN OFFER TO BUY THESE SECURITIES IN ANY JURISDICTION WHERE THE OFFER OR SALE IS NOT PERMITTED.
108
(THIS PAGE INTENTIONALLY LEFT BLANK)
109
Mortgage Loan No. 7 — Broadway Portfolio
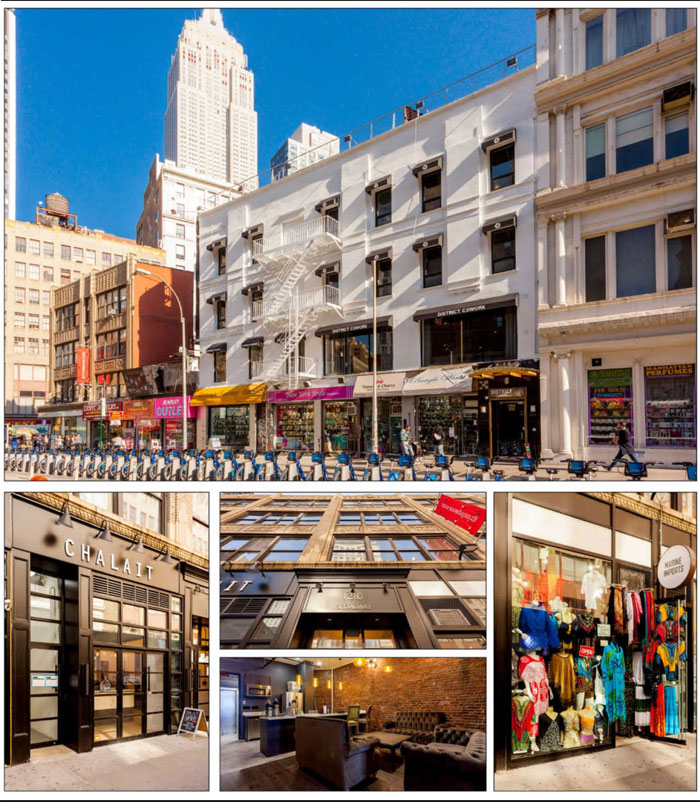
THE INFORMATION IN THIS STRUCTURAL AND COLLATERAL TERM SHEET IS NOT COMPLETE AND MAY BE AMENDED PRIOR TO THE TIME OF SALE. THIS TERM SHEET IS NOT AN OFFER TO SELL THESE SECURITIES AND IT IS NOT A SOLICITATION OF AN OFFER TO BUY THESE SECURITIES IN ANY JURISDICTION WHERE THE OFFER OR SALE IS NOT PERMITTED.
110
Mortgage Loan No. 7 — Broadway Portfolio
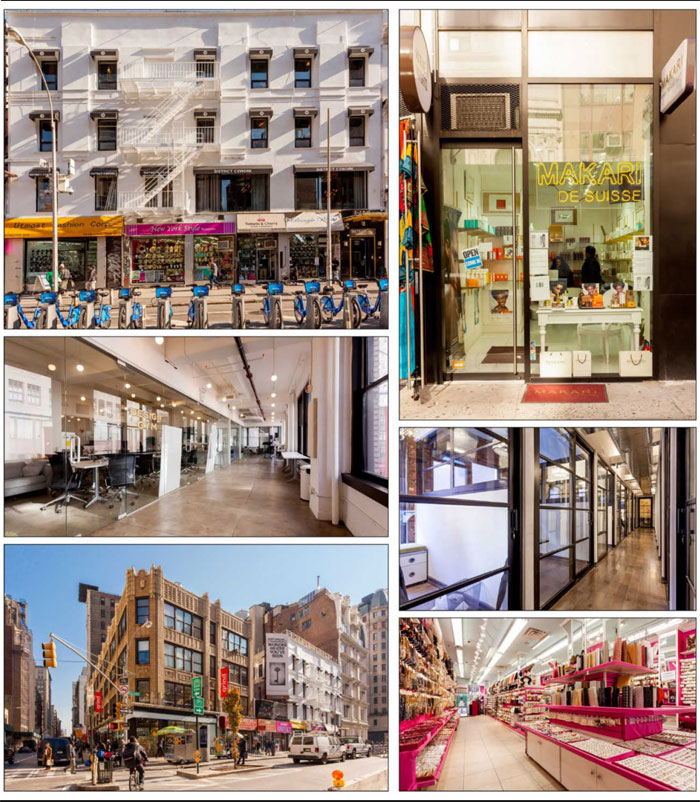
THE INFORMATION IN THIS STRUCTURAL AND COLLATERAL TERM SHEET IS NOT COMPLETE AND MAY BE AMENDED PRIOR TO THE TIME OF SALE. THIS TERM SHEET IS NOT AN OFFER TO SELL THESE SECURITIES AND IT IS NOT A SOLICITATION OF AN OFFER TO BUY THESE SECURITIES IN ANY JURISDICTION WHERE THE OFFER OR SALE IS NOT PERMITTED.
111
Mortgage Loan No. 7 — Broadway Portfolio
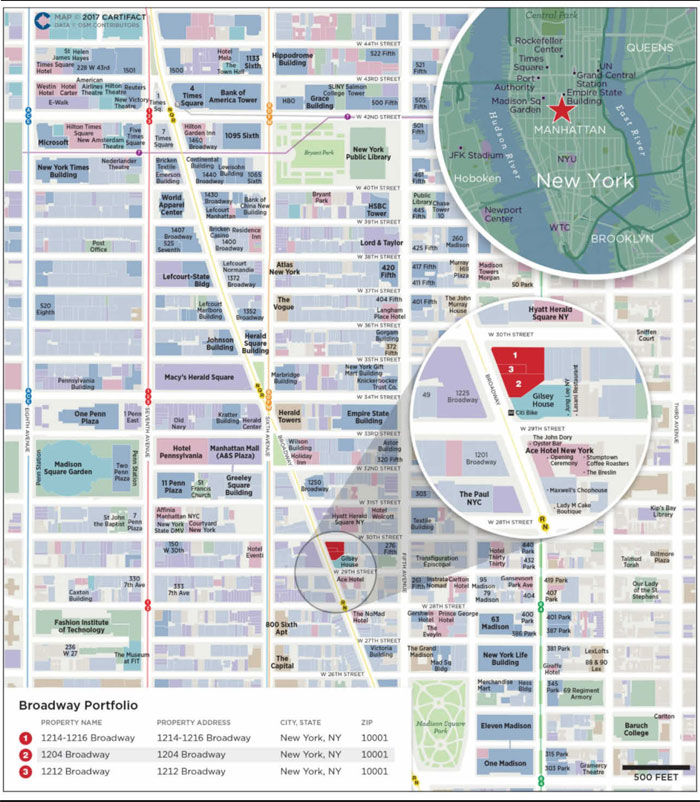
THE INFORMATION IN THIS STRUCTURAL AND COLLATERAL TERM SHEET IS NOT COMPLETE AND MAY BE AMENDED PRIOR TO THE TIME OF SALE. THIS TERM SHEET IS NOT AN OFFER TO SELL THESE SECURITIES AND IT IS NOT A SOLICITATION OF AN OFFER TO BUY THESE SECURITIES IN ANY JURISDICTION WHERE THE OFFER OR SALE IS NOT PERMITTED.
112
Mortgage Loan No. 7 — Broadway Portfolio
| Mortgage Loan Information | Property Information | |||
| Mortgage Loan Seller: | Natixis | Single Asset / Portfolio: | Portfolio of 3 Properties | |
| Original Principal Balance(1): | $38,000,000 | Title: | Fee | |
| Cut-off Date Principal Balance(1): | $38,000,000 | Property Type - Subtype: | Various - Various | |
| % of Pool by IPB: | 4.7% | Net Rentable Area (SF): | 77,419 | |
| Loan Purpose: | Refinance | Location: | New York, NY | |
| Borrowers: | 1204 Broadway DE LLC; 1212 Broadway DE LLC; 1214-1216 Broadway DE LLC | Year Built / Renovated: | Various / Various | |
| Sponsor: | Raizada S. Vaid | Occupancy(5): | 74.9% | |
| Interest Rate: | 4.6100% | Occupancy Date(5): | 2/1/2017 | |
| Note Date: | 11/18/2016 | Number of Tenants: | 15 | |
| Maturity Date: | 12/5/2026 | 2014 NOI: | $2,494,238 | |
| Interest-only Period: | 120 months | 2015 NOI: | $2,662,566 | |
| Original Term: | 120 months | 2016 NOI(6): | N/A | |
| Original Amortization: | None | TTM NOI(6): | $2,977,855 | |
| Amortization Type: | Interest Only | UW Economic Occupancy: | 87.0% | |
| Call Protection: | L(30); Def(86); O(4) | UW Revenues: | $6,055,691 | |
| Lockbox(2): | Hard | UW Expenses: | $1,658,632 | |
| Additional Debt(3): | Yes | UW NOI(7): | $4,397,059 | |
| Additional Debt Balance(3): | $20,000,000 | UW NCF: | $4,308,031 | |
| Additional Debt Type(3): | Pari Passu | Appraised Value / Per SF: | $97,000,000 / $1,253 | |
| Additional Future Debt Permitted: | No | Appraisal Date: | 8/25/2016 |
| Escrows and Reserves(4) | Financial Information(1) |
| Initial | Monthly | Initial Cap | Cut-off Date Loan / SF: | $749 | ||
| Taxes: | $400,000 | $102,322 | N/A | Maturity Date Loan / SF: | $749 | |
| Insurance: | $22,738 | $4,548 | N/A | Cut-off Date LTV: | 59.8% | |
| Replacement Reserves: | $0 | $980 | N/A | Maturity Date LTV: | 59.8% | |
| TI/LC: | $0 | $6,535 | N/A | UW NCF DSCR: | 1.59x | |
| Earnout Reserve: | $5,000,000 | $0 | N/A | UW NOI Debt Yield: | 7.6% | |
| Free Rent | $294,208 | $0 | N/A |
Sources and Uses
| Sources | Proceeds | % of Total | Uses | Proceeds | % of Total | |
| Mortgage Loan(1) | $58,000,000 | 100.0% | Loan Payoff: | $51,489,830 | 88.8% | |
| Earnout Reserve: | 5,000,000 | 8.6 | ||||
| Closing Costs: | 793,223 | 1.4 | ||||
| Other Reserves: | 716,946 | 1.2 | ||||
| Total Sources | $58,000,000 | 100.0% | Total Uses | $58,000,000 | 100.0% |
| (1) | The Broadway Portfolio Mortgage Loan is part of a larger split whole loan evidenced by twopari passu promissory notes with an aggregate original principal balance of $58,000,000 (collectively, the “Broadway Portfolio Whole Loan”). The Financial Information presented in the chart above is based on the Cut-off Date balance of the promissory notes comprising the Broadway Portfolio Whole Loan. Net of the $5.0 million earnout reserve, the loan has a UW NOI Debt Yield of 8.3% and a UW NCF DSCR of 1.74x. |
| (2) | For a more detailed description of the lockbox, please refer to “Lockbox/Cash Management” below. |
| (3) | For a more detailed description, please refer to “The Loan” below. |
| (4) | For a more detailed description of escrows and reserves, please refer to “Escrows and Reserves” below. |
THE INFORMATION IN THIS STRUCTURAL AND COLLATERAL TERM SHEET IS NOT COMPLETE AND MAY BE AMENDED PRIOR TO THE TIME OF SALE. THIS TERM SHEET IS NOT AN OFFER TO SELL THESE SECURITIES AND IT IS NOT A SOLICITATION OF AN OFFER TO BUY THESE SECURITIES IN ANY JURISDICTION WHERE THE OFFER OR SALE IS NOT PERMITTED.
113
Mortgage Loan No. 7 — Broadway Portfolio
| (5) | The properties were 99.6% leased and 65.9% physically occupied as of February 1, 2017. Grind-1216 Broadway LLC (the “Grind”) took occupancy of its space on the 4th floor of the 1214-1216 Broadway property on May 5, 2017, bringing the property’s physical occupancy to 74.9%. Occupancy reflects information provided by the borrower. |
| (6) | The borrowers did not provide 2016 year end financials. The Broadway Portfolio NOI as of TTM April 30, 2017 was $2,977,855. |
| (7) | UW NOI includes UW Gross Potential Rent which has been underwritten based on the February 1, 2017 rent roll and includes rent steps of $131,731 through February 28, 2018. |
The Loan. The Broadway Portfolio loan, which is part of a larger split whole loan is secured by a first mortgage lien on a 77,419 SF office and retail portfolio located on a 0.36-acre site in New York, New York. The whole loan has an outstanding principal balance of $58.0 million (the “Broadway Portfolio Whole Loan”), which is evidenced by two notes identified as Note A-1 and Note A-2. The two notes have outstanding balances of $38.0 million and $20.0 million, respectively.
Note A-1 has an outstanding principal balance as of the Cut-off Date of $38.0 million and is being contributed to the CSAIL 2017-C8 Commercial Mortgage Trust. Note A-2, which has an outstanding principal balance as of the Cut-off Date of $20.0 million, was previously securitized in CGCMT 2017-P7. The holder of Note A-1 will be the controlling noteholder of the Broadway Portfolio Whole Loan. The trustee of the CSAIL 2017-C8 Commercial Mortgage Trust, as the holder of Note A-1 (or, prior to the occurrence and continuance of a control termination event under the pooling and servicing agreement, the directing certificateholder), will be entitled to exercise all of the rights of the controlling noteholder with respect to the related Broadway Portfolio Whole Loan; however, the CGCMT2017-P7 Commercial Mortgage Trust, as the holder of Note A-2, will be entitled, under certain circumstances, to consult with respect to certain major decisions.
Note A-1 accrues interest at the same rate as thepari passu Note A-2 and is entitled to payments of interest and principal on apro rata andpari passu basis with Note A-2, as and to the extent described under “Description of the Mortgage Pool—The Whole Loans” in the Preliminary Prospectus.
Whole Loan Note Summary
| Original Balance | Cut-off Date Balance | Note Holder | Lead Servicer for Whole Loan (Y/N) | |
| Note A-1 | $38,000,000 | $38,000,000 | CSAIL 2017-C8 | Y |
| Note A-2 | 20,000,000 | 20,000,000 | CGCMT 2017-P7 | N |
| Total | $58,000,000 | $58,000,000 |
The Borrower. The borrowing entities for the loan are 1204 Broadway DE LLC, 1212 Broadway DE LLC and 1214-1216 Broadway DE LLC, (the “Broadway Portfolio Borrowers”) each of which is a Delaware limited liability company and special purpose entity. The borrowing entities are owned by 85.0% by Raizada S. Vaid and 15.0% by Seema Vaid.
The Sponsor. The loan’s sponsor and nonrecourse carve-out guarantor is Raizada S. Vaid. Raizada S. Vaid is a real estate owner and entrepreneur who developed and jointly owns the newly built 200 room Refinery Hotel. The sponsor made his first commercial real estate purchase in 2004 and as of September 30, 2016, the sponsor owns 10 commercial properties in New York. According to his personal financial statement dated September 30, 2016, Mr. Vaid has a net worth of $133.3 million and $1.8 million liquidity.
The Properties. The portfolio is composed of two mixed-use retail/office buildings and one retail building located at 1214-1216, 1204, and 1212 Broadway, totaling 77,419 SF of rentable space across a 0.36-acre site. The three buildings operate as a single site with frontage on Broadway. The exterior walls are a mix of masonry, brick cladding, exterior limestone, and stone panels. The sponsor acquired the portfolio in stages with the purchase of 1204 Broadway in 2006 for $14.6 million, 1212 Broadway in 2007 for $8.0 million, and 1214-1216 Broadway in 2013 for $42.0 million. As of February 1, 2017, the portfolio is 83.9% leased to a mix of non-credit retail and office tenants and 74.9% physically occupied. The property is 99.6% leased including the PRYM rooftop space and the District CoWork basement space, which have rent start dates of July 1, 2018 and February 1, 2018, respectively. All unoccupied spaces have been delivered to the tenants. Per signed leases, approximately $7.0 million ($91.39 PSF) of capital improvements will be carried out at the portfolio at no cost to the Broadway Portfolio Borrowers throughout 2016 and 2017. These improvements include buildout of the basement for District CoWork Nomad LLC
THE INFORMATION IN THIS STRUCTURAL AND COLLATERAL TERM SHEET IS NOT COMPLETE AND MAY BE AMENDED PRIOR TO THE TIME OF SALE. THIS TERM SHEET IS NOT AN OFFER TO SELL THESE SECURITIES AND IT IS NOT A SOLICITATION OF AN OFFER TO BUY THESE SECURITIES IN ANY JURISDICTION WHERE THE OFFER OR SALE IS NOT PERMITTED.
114
Mortgage Loan No. 7 — Broadway Portfolio
(“District CoWork”) to be used as a speakeasy at 1204 Broadway, and buildout of rooftop bar, street level pizzeria, and basement lounge for PRYM 1216, LLC (“PRYM”) at 1214-1216 Broadway.
1214-1216 Broadway is a 51,844 SF four story mixed-use retail/office building that is 70.1% physically occupied and 81.7% leased to 10 tenants. The property is 99.4% leased inclusive of the PRYM rooftop space, which begins paying rent July 1, 2018. The largest tenant at 1214-1216 Broadway, Grind, leases 27,600 SF (53.2% of the building net rentable area) on the 2nd, 3rd, and 4th floors, through May 31, 2028. Grind recently took possession of 4th floor and is building out its space. Grind is a members-only shared workspace and co-working community with four locations in New York City and one in Chicago. The second largest tenant at 1214-1216 Broadway, PRYM, leases 15,200 SF (29.3% of the building net rentable area) of street level space, basement space, and rooftop space though various leases with expiration in December 2029, April 2030 and June 2031. PRYM is part of the Yves Jadot Restaurant Group, which operates several restaurant lounges and bars in New York City. PRYM is currently building out its three spaces, with include a ground level pizza restaurant and bar, a rooftop lounge and bar, and a below grade speakeasy. Recent capital improvements at 1214-1216 Broadway include renovation of the lobby, elevator replacement, and tenant improvements for buildout of 2nd-4th floors. The building is located at the corner of West 30th Street and Broadway, and the building generates $96,854 per year of signage income.
1204 Broadway is a 23,400 SF four story mixed-use retail/office building that is 83.3% physically occupied and 87.2% leased by four tenants. The property is 100.0% leased inclusive of the District CoWork basement space, which starts paying rent on February 1, 2018. The largest tenant at 1204 Broadway, District CoWork, leases 17,400 SF (74.4% of the building net rentable area) on ground floor retail, 2nd, 3rd, and 4th floors and the basement under various leases: 13,500 SF expires on November 1, 2019, with one, 5-year renewal option and 3,900 SF expires in December, 2026. District CoWork recently signed the lease for the 3,000 SF basement space, and is building out a speakeasy. District CoWork is a shared workspace and co-working community focused on start-ups. District CoWork is 50.0% owned by the sponsor. The building also generates $61,800 per year of signage income.
1212 Broadway is a 2,175 SF single story retail building that is 100.0% physically occupied and leased to two tenants. The largest tenant at 1212 Broadway, Viral Vinus Jewelry Inc DBA Earrings Plaza, occupies 1,100 SF (50.6% of the building net rentable area) through October 31, 2019.
PRYM, with respect to its basement and rooftop spaces, and District CoWork, with respect to its basement space, have the option to terminate their leases if tenants do not receive liquor licenses. The loan is structured with an upfront earnout reserve of $5,000,000, which will be held in escrow as cash collateral against the loan. For a more detailed description of the earnout reserve, please refer to “Escrows and Reserves” below.
The properties are located within the NoMad District of Manhattan. Within a 5-block radius of the properties there is access to the 1, 2, 3, 6, B, D, F, M, N, Q and R subway lines.
The Market. The properties are located in the central business district of New York, New York in the Chelsea submarket. The properties are located within in the NoMad District of Manhattan, which is home to many hotels including: the NoMad Hotel, Ace Hotel, restaurants, and a number of entertainment facilities including movie theaters. Nearby neighborhoods include Chelsea, Midtown, and Murray Hill. According to the appraisal, tourism is also a major demand driver for the area with nearby attractions including the Empire State Building and Madison Square Garden. The world’s second Virgin Hotel, which is currently under construction and is expected to open in 2018, is located directly across from the properties. The 412,000 SF, 464-key, 40-story project, is expected to include approximately 70,000 SF of retail space at the base that will be leased to national and international brands.
NoMad has seen substantial growth in the number of residential buildings in the past few years, between luxury condo conversions and construction of new condo towers. Furthermore, the 1, 2, 3, B, D, F, M, N, Q and R subway lines are within a 5-block radius of the properties and nearby cross town bus service is available in both directions.
THE INFORMATION IN THIS STRUCTURAL AND COLLATERAL TERM SHEET IS NOT COMPLETE AND MAY BE AMENDED PRIOR TO THE TIME OF SALE. THIS TERM SHEET IS NOT AN OFFER TO SELL THESE SECURITIES AND IT IS NOT A SOLICITATION OF AN OFFER TO BUY THESE SECURITIES IN ANY JURISDICTION WHERE THE OFFER OR SALE IS NOT PERMITTED.
115
Mortgage Loan No. 7 — Broadway Portfolio
As of Q1 2017, the Chelsea retail market contained 5.5 million SF of office space with an overall vacancy rate of 5.2%, and the Chelsea office market contained 42.1 million SF with an overall vacancy rate of 6.6%. The appraisal concluded per SF market rents of $230.34 PSF NNN for ground floor retail space and $50.00 PSF NNN for the office space. According to the appraisal, the properties’ competitive set consists of the six properties and detailed in the table below.
Competitive Set Summary(1)
| Property | Year Built / Renovated | Total GLA (SF) | Est. Rent PSF | Est. Occ. | Proximity (miles) | Anchor Tenants |
| 125 West 25th Street | 1906 / 2016 | 138,021 | N/A | 81% | 0.4 | N/A |
| 275 Madison Avenue | 1931 / 2004 | 305,849 | N/A | 93% | 0.9 | N/A |
| 56 West 45th Street | 1914 / 2011-2016 | 65,292 | N/A | 95% | 0.9 | N/A |
| 123-127 Lafayette Street | 1920 / 2015 | 21,916 | N/A | 100% | 2.1 | N/A |
| 1369 Broadway | 1928 / 2003 | 30,245 | N/A | 100% | 0.4 | N/A |
| 200 Lafayette Street | 1914 / 2014 | 83,171 | N/A | 100% | 1.9 | N/A |
| (1) | Source: Appraisal. |
Historical and Current Occupancy(1)
| 2014 | 2015 | 2016 | Current(2) |
| 94.3% | 77.9% | 68.9% | 74.9% |
| (1) | Occupancy figures reflect physical occupancy numbers, exclusive of basement space and rooftop space. |
| (2) | Based on the February 1, 2017 rent roll. As of May 5 2017, the properties were 74.9% physically occupied and 99.6% leased. Occupancy reflects information provided by the borrower. |
THE INFORMATION IN THIS STRUCTURAL AND COLLATERAL TERM SHEET IS NOT COMPLETE AND MAY BE AMENDED PRIOR TO THE TIME OF SALE. THIS TERM SHEET IS NOT AN OFFER TO SELL THESE SECURITIES AND IT IS NOT A SOLICITATION OF AN OFFER TO BUY THESE SECURITIES IN ANY JURISDICTION WHERE THE OFFER OR SALE IS NOT PERMITTED.
116
Mortgage Loan No. 7 — Broadway Portfolio
Tenant Summary(1)
| Tenant | Ratings Moody’s / S&P / Fitch | Net Rentable Area (SF) | % of Total NRA(2) | Base Rent PSF(3) | Lease Expiration Date |
| Grind | NR / NR / NR | 27,600 | 35.7% | $46.35 | 5/31/2028 |
| District CoWork(4) | NR / NR / NR | 17,400 | 22.5% | $58.30 | Various(5) |
| PRYM(6) | NR / NR / NR | 15,200 | 19.6% | $72.88 | Various(7) |
| Pinky World Inc. | NR / NR / NR | 4,500 | 5.8% | $115.36 | 9/1/2019 |
| Fantasia World Inc. | NR / NR / NR | 4,000 | 5.2% | $60.00 | 6/1/2019 |
| LX Jewelry Inc | NR / NR / NR | 1,744 | 2.3% | $317.89 | 2/28/2019 |
| Emily Hou | NR / NR / NR | 1,500 | 1.9% | $254.62 | MTM |
| Jewelry in Trend, LLC | NR / NR / NR | 1,400 | 1.8% | $325.71 | 6/30/2019 |
| Viral Vinus Jewelry Inc | NR / NR / NR | 1,100 | 1.4% | $280.91 | 10/31/2019 |
| Roader Group USA Inc | NR / NR / NR | 1,075 | 1.4% | $243.96 | 2/1/2019 |
| (1) | Based on the underwritten rent roll including rent increases occurring through February 28, 2018. |
| (2) | % of Total net rentable area is based off SF including PRYM rooftop space and basement space for District CoWork. |
| (3) | Base Rent PSF includes UW rent from space marked as vacant. Notably, Tenant SF and Annual UW Rent includes SF and UW Rent for District CoWork basement space (3,000 SF, 3.9% of net rentable area) and PRYM rooftop space (9,200 SF, 11.9% of net rentable area), which are marked as vacant in the UW as the tenants are not in occupancy. |
| (4) | District CoWork has a termination option on the basement space (3,000 SF, 3.9% of net rentable area). If the Community Board or the New York State Liquor Authority denies the tenant’s application to gain a liquor license, the tenant may terminate the lease within 10 days after the tenant’s receipt of refusal. |
| (5) | The District CoWork lease for the space on the 2nd floor, 3rd floor and 4th floor (13,500 SF, 17.4% of net rentable area) expires on November 1, 2019. The ground floor retail space (900 SF, 1.2% of net rentable area) lease expires December 31, 2026. The basement space (3,000 SF, 3.9% of net rentable area) lease expires December 1, 2026. |
| (6) | PRYM has a termination option on the entirety of its space. If the Community Board or the New York State Liquor Authority denies the tenant’s application to gain a liquor license, the tenant may terminate the lease within 10 days after the tenant’s receipt of refusal. |
| (7) | The PRYM lease for the basement space (3,500 SF, 4.5% of net rentable area) expires on April 1, 2030. The lease for the street-level retail (2,500 SF, 3.2% of net rentable area) expires on December 1, 2029. The lease for the rooftop (9,200 SF, 11.9% of net rentable area) expires on June 1, 2031. |
THE INFORMATION IN THIS STRUCTURAL AND COLLATERAL TERM SHEET IS NOT COMPLETE AND MAY BE AMENDED PRIOR TO THE TIME OF SALE. THIS TERM SHEET IS NOT AN OFFER TO SELL THESE SECURITIES AND IT IS NOT A SOLICITATION OF AN OFFER TO BUY THESE SECURITIES IN ANY JURISDICTION WHERE THE OFFER OR SALE IS NOT PERMITTED.
117
Mortgage Loan No. 7 — Broadway Portfolio
Lease Rollover Schedule(1)
| Year | Number of Leases Expiring(2) | NRA (SF) Expiring(3) | % of NRA Expiring(3) | Base Rent Expiring(3) | % of Base Rent Expiring | Cumulative NRA (SF) Expiring(3) | Cumulative % of NRA Expiring(3) | Cumulative Base Rent Expiring | Cumulative % of Base Rent Expiring |
| Vacant | NAP | 300 | 0.4% | NAP | NAP | 300 | 0.4% | NAP | NAP |
| MTM | 1 | 1,500 | 1.9 | $381,924 | 5.8% | 1,800 | 2.3% | $381,924 | 5.8% |
| 2017 | 2 | 500 | 0.6 | 180,000 | 2.7 | 2,300 | 3.0% | $561,924 | 8.5% |
| 2018 | 1 | 400 | 0.5 | 15,000 | 0.2 | 2,700 | 3.5% | $576,924 | 8.7% |
| 2019 | 10 | 27,319 | 35.3 | 3,065,274 | 46.3 | 30,019 | 38.8% | $3,642,198 | 55.0% |
| 2020 | 0 | 0 | 0.0 | 0 | 0.0 | 30,019 | 38.8% | $3,642,198 | 55.0% |
| 2021 | 1 | 500 | 0.6 | 90,854 | 1.4 | 30,519 | 39.4% | $3,733,052 | 56.3% |
| 2022 | 0 | 0 | 0.0 | 0 | 0.0 | 30,519 | 39.4% | $3,733,052 | 56.3% |
| 2023 | 0 | 0 | 0.0 | 0 | 0.0 | 30,519 | 39.4% | $3,733,052 | 56.3% |
| 2024 | 1 | 0 | 0.0 | 100,489 | 1.5 | 30,519 | 39.4% | $3,833,541 | 57.9% |
| 2025 | 1 | 0 | 0.0 | 63,654 | 1.0 | 30,519 | 39.4% | $3,897,195 | 58.8% |
| 2026 | 3 | 4,100 | 5.3 | 340,576 | 5.1 | 34,619 | 44.7% | $4,237,771 | 64.0% |
| 2027 & Beyond | 7 | 42,800 | 55.3 | 2,386,992 | 36.0 | 77,419 | 100.0% | $6,624,763 | 100.0% |
| Total | 27 | 77,419 | 100.0% | $6,624,763 | 100.0% |
| (1) | Based on the underwritten rent roll. Rent includes base rent and rent increases occurring through February 28, 2018. |
| (2) | Certain tenants may have lease termination options that are exercisable prior to the originally stated expiration date of the subject lease and that are not considered in the lease rollover schedule. |
| (3) | Base Rent Expiring excludes vacant space, but include signed leases for tenants not in occupancy. Notably, Tenant SF and UW Rent includes SF and UW Rent for District CoWork basement space (3,000 SF, 3.9% of net rentable area) and PRYM rooftop space (9,200 SF, 11.9% of net rentable area), which are marked as vacant in the UW as the tenants are not in occupancy. |
Operating History and Underwritten Net Cash Flow
| 2014 | 2015 | TTM – 6/30/2016(1) | TTM – 4/30/2017 | Underwritten(2)(3) | PSF(3) | %(3) | |
| Rents in Place | $3,931,686 | $4,035,981 | $4,030,032 | $4,309,605 | $6,774,763 | $87.51 | 97.3% |
| Vacant Income | 0 | 0 | 0 | 0 | 0 | 0 | 0.0 |
| Gross Potential Rent | $3,931,686 | $4,035,981 | $4,030,032 | $4,309,605 | $6,774,763 | $87.51 | 97.3% |
| Total Reimbursements | 102,610 | 189,496 | 151,444 | 128,570 | 185,428 | 2.40 | 2.7 |
| Net Rental Income | $4,034,296 | $4,225,477 | $4,181,476 | $4,438,175 | $6,960,191 | $89.90 | 100.0% |
| (Vacancy/Collection Loss)(4) | (0) | (0) | (0) | (0) | (904,500) | (11.68) | (13.0) |
| Other Income | 18,396 | 501 | 500 | 0 | 0 | 0 | 0.0 |
| Effective Gross Income | $4,052,691 | $4,225,978 | $4,181,976 | $4,438,175 | $6,055,691 | $78.22 | 87.0% |
| Total Expenses | $1,558,454 | $1,563,410 | $1,525,832 | $1,460,321 | $1,658,632 | $21.42 | 23.8% |
| Net Operating Income | $2,494,238 | $2,662,566 | $2,656,144 | $2,977,855 | $4,397,059 | $56.79 | 63.2% |
| Total TI/LC, Capex/RR | 0 | 0 | 0 | 0 | 89,028 | 1.15 | 1.3 |
| Net Cash Flow | $2,494,238 | $2,662,566 | $2,656,144 | $2,977,855 | $4,308,031 | $55.64 | 61.9% |
| (1) | The borrowers did not provide 2016 year end financials. |
| (2) | Rents in Place have been underwritten based on the February 1, 2017 rent roll and includes rent steps of $131,731 through February 28, 2018, Gross Potential Rent also includes $164,143 of signage income. |
| (3) | Underwritten Effective Gross Income increased from the TTM - April 30, 2017 as multiple tenants began paying rent after May 1, 2016 including Chalait Broadway LLC (rent commencement July 15, 2016), PRYM street level (rent commencement January 1, 2017), Grind 2nd and 3rd floor spaces (rent commencement October 1, 2016), Grind 4th floor space (rent commencement May 1, 2017), and PRYM basement space (rent commencement May 1, 2017). |
| (4) | Underwritten (Vacancy/Collection Loss) is based on in place occupancy as of the rent roll dated February 1, 2017. Vacancy was underwritten at 13.0%. The underwriting designates the PRYM rooftop space and District CoWork basement space as vacant. |
THE INFORMATION IN THIS STRUCTURAL AND COLLATERAL TERM SHEET IS NOT COMPLETE AND MAY BE AMENDED PRIOR TO THE TIME OF SALE. THIS TERM SHEET IS NOT AN OFFER TO SELL THESE SECURITIES AND IT IS NOT A SOLICITATION OF AN OFFER TO BUY THESE SECURITIES IN ANY JURISDICTION WHERE THE OFFER OR SALE IS NOT PERMITTED.
118
Mortgage Loan No. 7 — Broadway Portfolio
Property Management.The portfolio is self-managed by the sponsor.
Escrows and Reserves. At origination, the borrowers deposited into escrow $5,000,000 for the earnout reserve, $400,000 for real estate taxes, $22,738 for insurance reserves and $294,208 for free rent reserves.
Tax Escrows – On a monthly basis, the borrowers are required to escrow 1/12th of the annual estimated tax payments, which currently equates to $102,322. The required deposit is recourse to the borrower.
Insurance Escrows – On a monthly basis, the borrowers are required to escrow 1/12th of the annual insurance premiums, which currently equates to $4,548.
TI/LC Reserves – On a monthly basis, the borrowers are required to escrow an amount equal to $6,535.
Replacement Reserves – On a monthly basis, the borrowers are required to escrow $980 for replacement reserves.
Required Repairs Reserves – If the required repairs are not completed to the lender’s satisfaction prior to May 18, 2017, the lender will transfer sufficient amounts from the earnout reserve to the required repairs reserve necessary to pay for the completion of the outstanding required repairs. The inflated reserve amount will also be recourse to the borrower.
Earnout Reserve– At origination, $5,000,000 was deposited into an earnout reserve and held as additional security for the Broadway Portfolio Whole Loan. Provided no event of default has occurred and is continuing, at any time prior to December 5, 2018, the borrowers have the right up to three times to request a release of all of the funds on deposit in the earnout reserve, provided that, (i) the ratio of the then-underwritten net cash flow to the outstanding principal is equal to or greater than 7.50% based on the trailing calendar quarter and (ii) the lease termination options have expired for the following tenants: (a) PRYM for the rooftop space, (b) PRYM for the basement space, (c) District CoWork and (d) any new leases entered into thereafter. If, however, one of the aforementioned tenants exercises a termination option, funds in the earnout reserve will still be available to the borrower if the space demised by the terminating tenant is leased to a replacement tenant, such replacement tenant provides an acceptable tenant estoppel and such replacement lease does not contain a termination option exercisable during the first five (5) years of such replacement lease’s term. Any amounts remaining in the earnout reserve on December 5, 2018 will be applied to paydown the outstanding principal (the “Holdback Prepayment”). Any such holdback prepayment will be subject to the yield maintenance premium, but in no event less than 3.0% of the amount repaid.
Lockbox / Cash Management. The Broadway Portfolio loan is structured with a lender-controlled hard lockbox and springing cash management. Tenants have been directed to remit all payments due under their respective leases directly into the lockbox account. During the continuance of a Cash Management Period (as defined below), all funds in the lockbox account are required to be swept daily to a cash management account under the control of the lender and disbursed during each interest period of the term of the loan in accordance with the loan documents.
A “Cash Management Period” will commence upon (i) a default or an event of default; (ii) the amortizing debt service coverage ratio being less than 1.10x at the end of any calendar quarter or (iii) an Earnout Trigger Event (as defined below). A Cash Management Period will end with respect to clause (ii) above, if for six consecutive months since the commencement of the existing Cash Management Period (A) no default or event of default has occurred, (B) no event that would trigger another Cash Management Period has occurred, and (C) the amortizing debt service coverage ratio is at least equal to 1.15x; with respect to clause (iii) above, an Earnout Trigger Event Cure (as defined below).
A “Earnout Trigger Event” will commence (i) If the required repairs are not completed to the lender’s satisfaction prior to May 18, 2017, (ii) If the borrower fails to deposit with the lender the difference between the $400,000 on deposit in the tax and insurance subaccount and the amount of taxes due and payable in January 2017 as required in the loan documents by December 15, 2016.
A “Earnout Trigger Cure Event” will occur when the balance of funds in the earnout reserve subaccount equals $5,000,000.
Property Release. The loan documents permit the release of the air rights to the portfolio. The release is subject to the following conditions, among others: (i) no event of default exists; (ii) the borrowers provide notice and documentation acceptable to the
THE INFORMATION IN THIS STRUCTURAL AND COLLATERAL TERM SHEET IS NOT COMPLETE AND MAY BE AMENDED PRIOR TO THE TIME OF SALE. THIS TERM SHEET IS NOT AN OFFER TO SELL THESE SECURITIES AND IT IS NOT A SOLICITATION OF AN OFFER TO BUY THESE SECURITIES IN ANY JURISDICTION WHERE THE OFFER OR SALE IS NOT PERMITTED.
119
Mortgage Loan No. 7 — Broadway Portfolio
lender; (iii) the release parcel is conveyed to a non-borrower affiliated bona fide thirty party; (iv) the borrowers have obtained all necessary approvals; (v) the borrowers have delivered to lender at the time of the consummation of the partial release an endorsement to the existing loan title insurance policy; (vi) the borrowers provide any additional information and execute any additional documentation reasonably requested by lender and (vii) the borrowers pay the lender, concurrently with the closing or termination of the partial release an amount equal to all out–of–pocket costs and expenses associated with the partial release.
THE INFORMATION IN THIS STRUCTURAL AND COLLATERAL TERM SHEET IS NOT COMPLETE AND MAY BE AMENDED PRIOR TO THE TIME OF SALE. THIS TERM SHEET IS NOT AN OFFER TO SELL THESE SECURITIES AND IT IS NOT A SOLICITATION OF AN OFFER TO BUY THESE SECURITIES IN ANY JURISDICTION WHERE THE OFFER OR SALE IS NOT PERMITTED.
120
(THIS PAGE INTENTIONALLY LEFT BLANK)
121
Mortgage Loan No. 8 — St. Luke’s Office

THE INFORMATION IN THIS STRUCTURAL AND COLLATERAL TERM SHEET IS NOT COMPLETE AND MAY BE AMENDED PRIOR TO THE TIME OF SALE. THIS TERM SHEET IS NOT AN OFFER TO SELL THESE SECURITIES AND IT IS NOT A SOLICITATION OF AN OFFER TO BUY THESE SECURITIES IN ANY JURISDICTION WHERE THE OFFER OR SALE IS NOT PERMITTED.
122
Mortgage Loan No. 8 — St. Luke’s Office

THE INFORMATION IN THIS STRUCTURAL AND COLLATERAL TERM SHEET IS NOT COMPLETE AND MAY BE AMENDED PRIOR TO THE TIME OF SALE. THIS TERM SHEET IS NOT AN OFFER TO SELL THESE SECURITIES AND IT IS NOT A SOLICITATION OF AN OFFER TO BUY THESE SECURITIES IN ANY JURISDICTION WHERE THE OFFER OR SALE IS NOT PERMITTED.
123
Mortgage Loan No. 8 — St. Luke’s Office

THE INFORMATION IN THIS STRUCTURAL AND COLLATERAL TERM SHEET IS NOT COMPLETE AND MAY BE AMENDED PRIOR TO THE TIME OF SALE. THIS TERM SHEET IS NOT AN OFFER TO SELL THESE SECURITIES AND IT IS NOT A SOLICITATION OF AN OFFER TO BUY THESE SECURITIES IN ANY JURISDICTION WHERE THE OFFER OR SALE IS NOT PERMITTED.
124
Mortgage Loan No. 8 — St. Luke’s Office
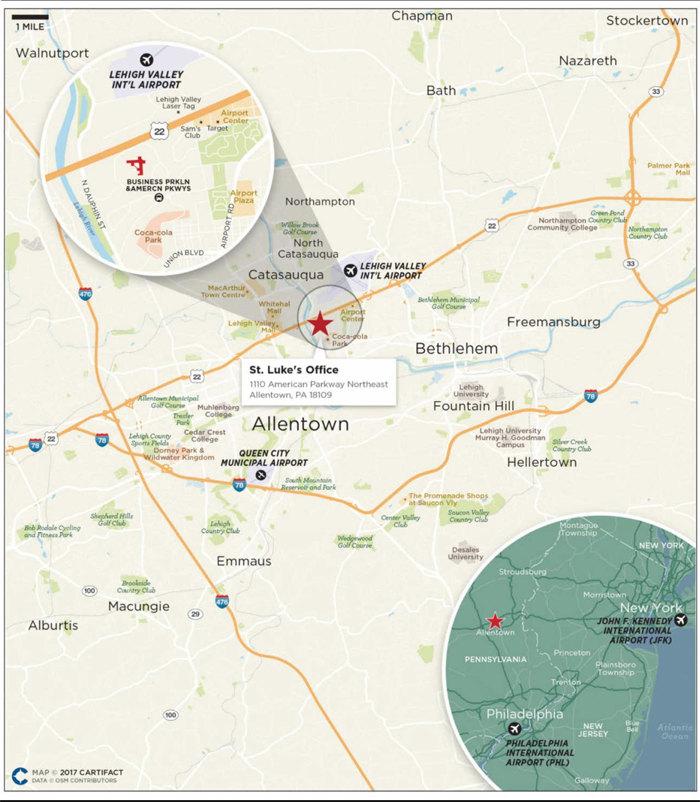
THE INFORMATION IN THIS STRUCTURAL AND COLLATERAL TERM SHEET IS NOT COMPLETE AND MAY BE AMENDED PRIOR TO THE TIME OF SALE. THIS TERM SHEET IS NOT AN OFFER TO SELL THESE SECURITIES AND IT IS NOT A SOLICITATION OF AN OFFER TO BUY THESE SECURITIES IN ANY JURISDICTION WHERE THE OFFER OR SALE IS NOT PERMITTED.
125
Mortgage Loan No. 8 — St. Luke’s Office
| Mortgage Loan Information | Property Information | |||
| Mortgage Loan Seller: | BSP | Single Asset / Portfolio: | Single Asset | |
| Original Principal Balance(1): | $34,000,000 | Title: | Fee | |
| Cut-off Date Principal Balance(1): | $34,000,000 | Property Type - Subtype: | Office – Suburban | |
| % of Pool by IPB: | 4.2% | Net Rentable Area (SF): | 566,622 | |
| Loan Purpose: | Refinance | Location: | Allentown, PA | |
| Borrower: | Patriot American Parkway, L.P. | Year Built / Renovated: | 2001 / 2015 | |
| Sponsors: | Eric Kolar; Alan Werther; Michael Kolar and Geoffrey Gardner | Occupancy: | 91.1% | |
| Interest Rate: | 4.69000% | Occupancy Date: | 3/1/2017 | |
| Note Date: | 4/18/2017 | Number of Tenants: | 6 | |
| Maturity Date: | 5/6/2027 | 2014 NOI(4): | N/A | |
| Interest-only Period: | 12 months | 2015 NOI(5)(6): | $2,446,496 | |
| Original Term: | 120 months | 2016 NOI(6): | $4,773,689 | |
| Original Amortization: | 360 months | TTM NOI(6)(7): | $5,439,349 | |
| Amortization Type: | IO-Balloon | UW Economic Occupancy: | 90.0% | |
| Call Protection(2): | L(25),Def(90),O(5) | UW Revenues: | $11,394,613 | |
| Lockbox(3): | Hard | UW Expenses: | $5,356,662 | |
| Additional Debt(1): | Yes | UW NOI: | $6,037,950 | |
| Additional Debt Balance(1): | $31,000,000 | UW NCF: | $5,438,004 | |
| Additional Debt Type(1): | Pari Passu,Mezzanine | Appraised Value / Per SF: | $92,000,000 / $162 | |
| Additional Future Debt Permitted: | No | Appraisal Date: | 12/5/2016 |
| Escrows and Reserves(8) | Financial Information(1) |
| Initial | Monthly | Initial Cap | Cut-off Date Loan / SF: | $90 | ||
| Taxes: | $214,607 | $71,536 | N/A | Maturity Date Loan / SF: | $75 | |
| Insurance: | $101,597 | $10,160 | N/A | Cut-off Date LTV: | 55.4% | |
| Replacement Reserves: | $0 | $9,444 | N/A | Maturity Date LTV: | 46.4% | |
| TI/LC: | $800,000 | $23,750 | N/A | UW NCF DSCR: | 1.72x | |
| Rent Abatement Reserve: | $136,780 | $0 | N/A | UW NOI Debt Yield: | 11.8% |
| Sources and Uses |
| Sources | Proceeds | % of Total | Uses | Proceeds | % of Total | |
| Mortgage Loan(1) | $51,000,000 | 78.5% | Payoff Existing Debt | $40,259,471 | 61.9% | |
| Mezzanine Loan | 14,000,000 | 21.5% | Return of Equity | 21,981,749 | 33.8 | |
| Closing Costs | 1,505,797 | 2.3 | ||||
| Upfront Reserves | 1,252,983 | 1.9 | ||||
| Total Sources | $65,000,000 | 100.0% | Total Uses | $65,000,000 | 100.0% |
| (1) | The St. Luke’s Office loan consists of two of threepari passu notes evidencing a whole loan with an aggregate original principal balance of $51.0 million (the “St. Luke’s Office Whole Loan”). In addition, the borrower’s interest in the Mortgaged Property secures a $14.0 million mezzanine loan. The Financial Information presented in the chart above reflects the Cut-off Date balance of the St. Luke’s Office Whole Loan, but excludes the related mezzanine loan. |
| (2) | The lockout period will be at least 25 payment dates beginning with and including the first payment date of June 6, 2017. Defeasance of the full $51.0 million St. Luke’s Office Whole Loan is permitted after the date that is two years from the closing date of the securitization that includes the note to be last securitized. |
| (3) | For a more detailed description of the lockbox, please refer to“Lockbox / Cash Management”below. |
| (4) | The sponsors purchased the property in March 2015; 2014 financials are not available. |
| (5) | 2015 financials are based on the annualized trailing 10-month period ending December 2015. |
THE INFORMATION IN THIS STRUCTURAL AND COLLATERAL TERM SHEET IS NOT COMPLETE AND MAY BE AMENDED PRIOR TO THE TIME OF SALE. THIS TERM SHEET IS NOT AN OFFER TO SELL THESE SECURITIES AND IT IS NOT A SOLICITATION OF AN OFFER TO BUY THESE SECURITIES IN ANY JURISDICTION WHERE THE OFFER OR SALE IS NOT PERMITTED.
126
Mortgage Loan No. 8 — St. Luke’s Office
| (6) | The increase in NOI from 2015 through TTM is attributable to the expiration of free rent periods as well as the total of 445,511 SF of leasing, representing 78.6% of net rentable area and 73.3% of UW rent during the twenty-four month term. |
| (7) | Represents the trailing twelve month period ending March 31, 2017. |
| (8) | For a more detailed description of escrows and reserves, please refer to “Escrows and Reserves” below. |
The Loan. The St. Luke’s Office loan is secured by a first mortgage lien on the borrower’s fee interest in a three-story Class A office building, totaling 566,622 SF located in Allentown, Pennsylvania. The whole loan has an outstanding principal balance as of the Cut-off Date of $51.0 million (the “St. Luke’s Office Whole Loan”) and is comprised of threepari passu notes, each as described below. The controlling Note A-1 and the non-controlling Note A-2, each with an outstanding principal balance as of the Cut-off Date of $17.0 million, are being contributed to the CSAIL 2017-C8 Trust. The non-controlling Note A-3, with an outstanding principal balance as of the Cut-off Date of $17.0 million, is expected to be contributed to one or more future securitization trusts. The loan has a 10-year term and, subsequent to a one-year interest-only period, will amortize on a 30-year schedule.
Whole Loan Note Summary
| Original Balance | Cut-off Date Balance | Note Holder | Lead Servicer for Whole Loan (Y/N) | |
| Note A-1 | $17,000,000 | $17,000,000 | CSAIL 2017-C8 | Y |
| Note A-2 | 17,000,000 | 17,000,000 | CSAIL 2017-C8 | N |
| Note A-3 | 17,000,000 | 17,000,000 | BSP | N |
| Total | $51,000,000 | $51,000,000 |
The Borrower. The borrowing entity for the St. Luke’s Office Whole Loan is Patriot American Parkway, L.P., a Pennsylvania limited partnership and special purpose entity. The borrowing entity is owned 43.7% by Erik Kolar, 19.7% by Alan Werther, 15.3% by Michael Kolar and 8.7% by Geoffrey Gardner.
The Sponsors. The loan’s sponsors and nonrecourse carve-out guarantors are Eric Kolar, Alan Werther, Michael Kolar and Geoffrey Gardner of Patriot Equities. Founded in 2005, Patriot Equities is a Pennsylvania-based real estate investment and development company that specializes in the acquisition and ownership of corporate real estate assets throughout North America. Patriot Equities’ principals have developed and repositioned in excess of 21.0 million SF, with a total transaction volume in excess of $1.5 billion. These projects have been developed across 15 states plus the District of Columbia and Toronto, Canada. Mr. Eric Kolar is a founding partner and President & Chief Executive Officer of Patriot Equities. Mr. Werther is a founding Partner & Managing Director at Patriot Equities. Mr. Michael Kolar is a founding partner, Executive Vice President and Director of Operations & Development at Patriot Equities. Mr. Gardner is a founding partner and Chief Investment Officer of Patriot Equities.
The Property.The St. Luke’s Office property consists of a three-story Class A multi-tenant office building totaling 566,622 SF. The property is located in Allentown, Pennsylvania, two miles northeast of the Allentown central business district and 50.0 miles northwest of Philadelphia. Built in 2001 and renovated in 2015, the building is situated on an approximately 77.7-acre site, which contains a lobby atrium, a fitness center with locker rooms, and a cafeteria. Additionally, the property contains two parking garages and an open lot parking area totaling 2,045 parking spaces, resulting in a parking ratio of approximately 3.6 spaces per 1,000 SF. The property was originally constructed as an east coast headquarters for Lucent Technologies (also known as Agere) in 2001, and is located on the municipal bounds of Hanover Township, along the eastern alignment of US Route 22, in Lehigh county, Pennsylvania. The largest tenant at the property, St. Luke’s University Health Network (“St. Luke’s”) is comprised of 1,341 physicians, 1,300 volunteers, and over 10,000 employees, making it the region’s second largest healthcare employer. Founded in 1872, St. Luke’s provides services at over 200 locations and is comprised of six main hospital campuses. St. Luke’s has four renewal options totaling 16 years (two, three-year options followed by two, five-year options). St. Luke’s also has the right of first purchase of all or any portion of the property if the landlord desires to sell such portion of the property.
THE INFORMATION IN THIS STRUCTURAL AND COLLATERAL TERM SHEET IS NOT COMPLETE AND MAY BE AMENDED PRIOR TO THE TIME OF SALE. THIS TERM SHEET IS NOT AN OFFER TO SELL THESE SECURITIES AND IT IS NOT A SOLICITATION OF AN OFFER TO BUY THESE SECURITIES IN ANY JURISDICTION WHERE THE OFFER OR SALE IS NOT PERMITTED.
127
Mortgage Loan No. 8 — St. Luke’s Office
As of March 1, 2017, the St. Luke’s Office property was 91.1% leased to a mix of national and regional tenants spanning a variety of industries. In total, the property is 86.4% leased to investment grade tenants accounting for 80.5% of the underwritten base rent. The largest tenant, St. Luke’s University Health Network (248,770 SF; 43.9% of NRA) (“St. Luke’s”) is a non-profit, regional, fully integrated, nationally recognized network providing services at seven hospitals and more than 200 sites, primarily in Lehigh, Northampton, Carbon, Schuylkill, Bucks, Montgomery, Berks and Monroe counties in Pennsylvania and in Warren county, New Jersey. The second largest tenant, Intel (136,134 SF; 24.0% of NRA), an American multinational corporation headquartered in Santa Clara, CA, is a semiconductor chip maker. Intel has 107,600 employees worldwide, with 55% of employees residing in the United States. Intel is ranked 51st on the Fortune 500 2015 list and 60th on the Forbes – The World’s Biggest Public Companies list. Intel has been at the property since January 2011 (57,323 SF), renewed in February 2017, and has one five-year renewal option. The third largest tenant, LSI (104,690 SF; 18.5% of NRA), was acquired by Broadcom Limited (NASDAQ: AVGO) in 2014, a designer, developer and global supplier of a broad range of analog and digital semiconductor connectivity solutions. Broadcom Limited’s extensive product portfolio serves four primary end markets: wired infrastructure, wireless communications, enterprise storage and industrial and others. As of April 26, 2017, Broadcom Limited has a market capitalization of approximately $94.0 billion. LSI has one, five-year extension option. United Way is the only tenant on a gross lease. Lab tenants reimburse for compressed air, vacuum and nitrogen and data center tenants reimburse additionally for service contracts. All other tenants are under triple net leases.
The Market. The St. Luke’s Office property is located in Allentown, Lehigh County, Pennsylvania, which is part of the Allentown-Bethlehem-Easton, PA-NJ metropolitan statistical area (“MSA”), also known as the Allentown MSA. Allentown MSA is the state’s third largest MSA, behind only Philadelphia and Pittsburgh, and is locally known as the Lehigh Valley. Lehigh County has estimated 2016 population of 360,353, which represents an average annual 0.5% increase over the 2010 population census of 349,497. Lehigh County added an average of 1,809 residents per year over the 2010-2016 period, and its annual growth rate exceeded the state of Pennsylvania’s rate of 0.1%. Total employment in Lehigh County is currently estimated at 185,006 jobs. Lehigh County’s rate of employment growth over the last decade surpassed that of Pennsylvania, which experienced an increase in employment of 2.6% or 147,452 jobs over this period. The employment sector concentrations in Lehigh County are education and health services, trade, transportation and utilities, professional and business services, and information. Major employers across the Lehigh Valley include Lehigh Valley Hospital and Health Network, Air Products and Chemicals, Giant Food Stores, Inc. and Amazon.com. The largest tenant at the property, St. Luke’s, is ranked the 2nd largest employer in Lehigh Valley.
The Lehigh Valley Class A Office submarket, where the property is situated, had a 2016 vacancy of 8.9%, and five-year and fifteen-year averages indicate vacancy rates of 10.5% and 11.3%, respectively, and the 2016 average asking rent of $22.15 PSF. The appraisal identified six most relevant comparable office rentals ranging in size from 21,621 and 178,330 SF and reported average asking rents ranging from $14.50 to $18.50 PSF.
THE INFORMATION IN THIS STRUCTURAL AND COLLATERAL TERM SHEET IS NOT COMPLETE AND MAY BE AMENDED PRIOR TO THE TIME OF SALE. THIS TERM SHEET IS NOT AN OFFER TO SELL THESE SECURITIES AND IT IS NOT A SOLICITATION OF AN OFFER TO BUY THESE SECURITIES IN ANY JURISDICTION WHERE THE OFFER OR SALE IS NOT PERMITTED.
128
Mortgage Loan No. 8 — St. Luke’s Office
Competitive Set Summary(1)
| Property | Year Built / Renovated | Total GLA (SF) | Est. Rent PSF | Est. Occ. | Proximity (miles) |
| St. Luke’s Office | 2001 / 2015 | 566,622(2) | $12.24(2)(3) | 91.1%(2) | N/A |
| 3501 Corporate Parkway | 2006 / NA | 178,330 | $16.50 | 100.0% | 8.5 |
| 3701 Corporate Parkway | 2007 / NA | 75,000 | N/A | 100.0% | 8.3 |
| 3773 Corporate Parkway | 2001 / NA | 71,000 | $17.50 | 100.0% | 8.1 |
| 3479 Corporate Parkway | 2009 / NA | 83,056 | N/A | 94.0% | 8.6 |
| 3800 Sierra Circle | 2006 / NA | 35,409 | N/A | 96.0% | 8.5 |
| 3435 Winchester Road | 2000 / NA | 80,000 | N/A | 87.0% | 7.0 |
| 3500 Winchester Road | 2000 / NA | 63,492 | N/A | 75.0% | 7.0 |
| 1605 N. Cedar Crest Boulevard | 1994 / NA | 214,700 | N/A | 85.0% | 6.0 |
| 701 W. Hamilton Street (One City Center) | 2014 / NA | 186,170 | N/A | 100.0% | 3.9 |
| 645 W. Hamilton Street (Two City Center) | 2014 / NA | 287,097 | N/A | 100.0% | 3.5 |
| 513 W. Hamilton Street (Three City Center) | 2015 / NA | 166,104 | $16.50 | 95.0% | 3.3 |
| 1605 Valley Center Parkway | 2003 / NA | 95,000 | N/A | 96.0% | 4.5 |
| 1525 Valley Center Parkway | 1997 / NA | 75,000 | N/A | 100.0% | 4.7 |
| 1495 Valley Center Parkway | 1991 / NA | 43,770 | N/A | 68.0% | 4.8 |
| (1) | Source: Appraisal. |
| (2) | Based on the March 1, 2017 underwritten rent roll. |
| (3) | Based on current in-place rent. |
Historical and Current Occupancy(1)
| 2013(2) | 2014(3) | 2015(3) | 2016 | Current(4) |
| 100.0% | 31.9% | 46.6% | 91.7% | 91.1% |
| (1) | Source: Historical Occupancy is provided by the sponsor. Occupancies are as of December 31 of each respective year. |
| (2) | The property was originally built by LSI/Broadcom in 2002 as their headquarters. In 2013, LSI was the sole tenant at the St. Luke’s Office property. |
| (3) | Historical occupancy from 2014-2015 is low due to the property transitioning from a single-tenant to a multi-tenant building. |
| (4) | Based on the March 1, 2017 underwritten rent roll. |
THE INFORMATION IN THIS STRUCTURAL AND COLLATERAL TERM SHEET IS NOT COMPLETE AND MAY BE AMENDED PRIOR TO THE TIME OF SALE. THIS TERM SHEET IS NOT AN OFFER TO SELL THESE SECURITIES AND IT IS NOT A SOLICITATION OF AN OFFER TO BUY THESE SECURITIES IN ANY JURISDICTION WHERE THE OFFER OR SALE IS NOT PERMITTED.
129
Mortgage Loan No. 8 — St. Luke’s Office
Tenant Summary(1)
| Tenant | Ratings Moody’s/S&P/Fitch(2) | Net Rentable Area (SF) | % of Total NRA | Base Rent PSF | Lease Expiration Date |
| St. Luke’s University Health Network(3) | A3 / NA / NA | 248,770 | 43.9% | $8.81 | 12/31/2026 |
| Intel(4) | A1 / A+ / A+ | 136,134 | 24.0% | $15.69 | 3/12/2020 |
| LSI | NA / BBB / NA | 104,690 | 18.5% | $15.51 | 3/31/2025 |
| United Way(5) | NA / NA / NA | 13,634 | 2.4% | $18.00 | 12/1/2023 |
| Agile Datasites | NA / NA / NA | 10,575 | 1.9% | $31.81 | 8/1/2026 |
| Synopsys | NA / NA / NA | 2,665 | 0.5% | $14.94 | 9/1/2021 |
| (1) | Based on the underwritten rent roll dated March 1, 2017, including rent increases occurring through March 2018. |
| (2) | Ratings provided are for the parent company of the entity listed in the “Tenant” field whether or not the parent company guarantees the lease. |
| (3) | St. Luke’s University Health Network has the right to lease and purchase any portion of the property if the landlord desires to lease or sell all or any portion of the net rentable area. |
| (4) | Intel has a termination option that applies to the 3,109 SF data center space only. Provided that Intel is not in default in the performance of any of its obligations under the lease, Intel has the right to terminate the lease of the data center space from and after the expiration of the second lease year of the term by providing a written notice not more than 270 days and not less than 180 days prior to the effective date of the termination along with a termination fee of $50,000. |
| (5) | United Way is the only tenant on a gross lease. Lab tenants reimburse for compressed air, vacuum and nitrogen and data center tenants reimburse additionally for service contract. All other tenants are under triple net leases. |
Lease Rollover Schedule(1)
| Year | Number of Leases Expiring(2) | NRA Expiring | % of NRA Expiring | Base Rent Expiring | % of Base Rent Expiring | Cumulative NRA Expiring | Cumulative % of NRA Expiring | Cumulative Base Rent Expiring | Cumulative % of Base Rent Expiring |
| Vacant | NAP | 50,154 | 8.9% | NAP | NAP | 50,154 | 8.9% | NAP | NAP |
| MTM | 0 | 0 | 0.0 | $0 | 0.0% | 50,154 | 8.9% | $0 | 0.0% |
| 2017 | 0 | 0 | 0.0 | 0 | 0.0 | 50,154 | 8.9% | $0 | 0.0% |
| 2018 | 0 | 0 | 0.0 | 0 | 0.0 | 50,154 | 8.9% | $0 | 0.0% |
| 2019 | 0 | 0 | 0.0 | 0 | 0.0 | 50,154 | 8.9% | $0 | 0.0% |
| 2020 | 1 | 136,134 | 24.0 | 2,135,926 | 32.5 | 186,288 | 32.9% | $2,135,926 | 32.5% |
| 2021 | 1 | 2,665 | 0.5 | 39,815 | 0.6 | 188,953 | 33.3% | $2,175,741 | 33.1% |
| 2022 | 0 | 0 | 0.0 | 0 | 0.0 | 188,953 | 33.3% | $2,175,741 | 33.1% |
| 2023 | 1 | 13,634 | 2.4 | 245,412 | 3.7 | 202,587 | 35.8% | $2,421,153 | 36.8% |
| 2024 | 0 | 0 | 0.0 | 0 | 0.0 | 202,587 | 35.8% | $2,421,153 | 36.8% |
| 2025 | 1 | 104,690 | 18.5 | 1,623,227 | 24.7 | 307,277 | 54.2% | $4,044,380 | 61.5% |
| 2026 | 2 | 259,345 | 45.8 | 2,528,892 | 38.5 | 566,622 | 100.0% | $6,573,272 | 100.0% |
| 2027 & Beyond | 0 | 0 | 0.0 | 0 | 0.0 | 566,622 | 100.0% | $6,573,272 | 100.0% |
| Total | 6 | 566,622 | 100.0% | $6,573,272 | 100.0% |
| (1) | Based on the underwritten rent roll dated March 1, 2017. Rent includes base rent and rent increases occurring through March 2018. |
| (2) | Certain tenants have more than one lease. |
THE INFORMATION IN THIS STRUCTURAL AND COLLATERAL TERM SHEET IS NOT COMPLETE AND MAY BE AMENDED PRIOR TO THE TIME OF SALE. THIS TERM SHEET IS NOT AN OFFER TO SELL THESE SECURITIES AND IT IS NOT A SOLICITATION OF AN OFFER TO BUY THESE SECURITIES IN ANY JURISDICTION WHERE THE OFFER OR SALE IS NOT PERMITTED.
130
Mortgage Loan No. 8 — St. Luke’s Office
Operating History and Underwritten Net Cash Flow(1)
| 2014 | 2015(2)(3) | 2016(3) | TTM(3)(4) | Underwritten(5) | PSF | %(6) | |
| Rents in Place | N/A | $4,905,860 | $5,590,218 | $6,210,115 | $6,661,214 | $11.76 | 52.8% |
| Vacant Income | N/A | 0 | 0 | 0 | 822,164 | 1.45 | 6.5 |
| Gross Potential Rent | N/A | $4,905,860 | $5,590,218 | $6,210,115 | $7,483,378 | $13.21 | 59.3% |
| Total Reimbursements | N/A | 2,408,379 | 4,158,818 | 4,162,272 | 5,139,283 | 9.07 | 40.7 |
| Net Rental Income | N/A | $7,314,239 | $9,749,036 | $10,372,387 | $12,622,661 | $22.28 | 100.0% |
| (Vacancy/Collection Loss) | N/A | 0 | 0 | 0 | (1,266,068) | (2.23) | (10.0) |
| Other Income | N/A | 36,527 | 38,570 | 41,672 | 38,020 | 0.07 | 0.3 |
| Effective Gross Income | N/A | $7,350,766 | $9,787,606 | $10,414,059 | $11,394,613 | $20.11 | 90.3% |
| Total Expenses | N/A | $4,904,270 | $5,013,917 | $4,974,710 | $5,356,662 | $9.45 | 47.0% |
| Net Operating Income | N/A | $2,446,496 | $4,773,689 | $5,439,349 | $6,037,950 | $10.66 | 53.0% |
| Total TI/LC, Capex/RR | N/A | 599,946 | 599,946 | 599,946 | 599,946 | 1.06 | 5.3 |
| Net Cash Flow | N/A | $1,846,550 | $4,173,743 | $4,839,403 | $5,438,004 | $9.60 | 47.7% |
| (1) | Financial information prior to 2015 is not available due to the borrower’s acquisition of the property in March 2015. |
| (2) | 2015 financials are based on the annualized trailing 10-month period ending December 2015. |
| (3) | Over the past twenty-four months, the St. Luke’s Office property has had a total of 445,511 SF leased, representing 78.6% of net rentable area and 73.3% of UW rent. This significant leasing, along with the expiration of free rent periods during this duration, accounts for the increase in cash from 2015-2016 and through the TTM. |
| (4) | TTM column represents the trailing 12-month period ending March 31, 2017. |
| (5) | Underwritten Rent in Place includes base rent, straight line rent of $87,942 and rent increases occurring through March 2018. |
| (6) | Percentage column represents percent of Net Rental Income for all revenue lines and represents percent of Effective Gross Income for the remainder of fields. |
Property Management. The property is managed by CBRE, Inc.
Escrows and Reserves. At origination, the borrower deposited into escrow $800,000 for TI/LC reserves, $214,607 for real estate tax reserves, $136,780 for rent abatement reserves in regards to St. Luke’s and $101,597 for insurance reserves.
Tax Escrows - On a monthly basis, the borrower is required to escrow 1/12th of annual estimated tax payments, which currently equates to $71,536.
Insurance Escrows - On a monthly basis, the borrower is required to escrow 1/12th of annual insurance premiums, which currently equates to $10,160.
Replacement Reserves - On a monthly basis, the borrower is required to escrow $9,444 for ongoing replacement reserves.
TI/LC Reserves - On a monthly basis, the borrower is required to escrow $23,750 for tenant improvements and leasing commissions in year one of the loan term. The required monthly deposit amount increases in year two through year six as follows: $28,500 in year two, $33,250 in year three, $38,000 in year four, $42,750 in year five, and $47,500 in year six and thereafter.
Lockbox / Cash Management. The St. Luke’s Office Whole Loan is structured with a hard lockbox and springing cash management. The borrower was required at origination to deliver tenant direction letters instructing all tenants to deposit rents into a lockbox account controlled by the lender. All funds in the lockbox account are required to be swept each business day into the borrower’s operating account, unless a Cash Sweep Period (as defined below) is continuing, in which event such funds are required to be swept each business day into a cash management account controlled by the lender and disbursed on each payment date in accordance with the loan documents.
A “Cash Sweep Period” commences upon the occurrence of (i) an event of default, (ii) the debt service coverage ratio (as calculated in the loan documents) based on the trailing 12-month period falling below 1.15x at the date of calculation, (iii) a Major Tenant Sweep Period (as defined below) or (iv) an event of default under the mezzanine loan.
THE INFORMATION IN THIS STRUCTURAL AND COLLATERAL TERM SHEET IS NOT COMPLETE AND MAY BE AMENDED PRIOR TO THE TIME OF SALE. THIS TERM SHEET IS NOT AN OFFER TO SELL THESE SECURITIES AND IT IS NOT A SOLICITATION OF AN OFFER TO BUY THESE SECURITIES IN ANY JURISDICTION WHERE THE OFFER OR SALE IS NOT PERMITTED.
131
Mortgage Loan No. 8 — St. Luke’s Office
A Cash Sweep Period may be cured by (a) if caused solely by clause (i) above, the cure of such event of default, (b) if caused solely by clause (ii) above, the debt service coverage ratio is equal to or greater than 1.25x for two consecutive calendar quarters, (c) if caused solely by clause (iii) above, the Major Tenant Sweep Period Cure (as defined below) and (d) if caused solely by clause (iv) above, lender receives written notice from the mezzanine lender that all event of defaults under the mezzanine loan have been cured.
A “Major Tenant Sweep Period” commences upon: (i) 12 months prior to the Intel lease expiration, (ii) 12 months prior to the LSI lease expiration, (iii) 18 months prior to the St. Luke’s lease expiration, (iv) the date that any Sweep Lease Tenant (as defined below) is required to give notice under its lease of its exercise of a renewal option is such renewal has not been exercised by such date, (v) the early termination, cancellation or surrender of any Sweep Lease Tenant, (vi) any Sweep Lease Tenant vacates, surrenders or ceases to conduct its normal business operations at substantially all of its demised premises at the property or otherwise “goes dark”, (vii) upon a default by any Sweep Lease Tenant beyond any applicable notice and cure periods and/or (viii) upon any Sweep Lease Tenant becoming insolvent or a debtor in any bankruptcy action.
A “Sweep Lease Tenant” means: (i) Intel, (ii) LSI (iii) St. Luke’s, (iv) any tenant which, individually or when aggregated with all other of its leases at the property with the same tenant or its affiliate, demises 95,000 or more SF of the property’s net rentable area and (v) any instrument guaranteeing or providing credit support for any lease meeting the requirement of (i) through (iv) above.
A “Major Tenant Sweep Period Cure” means, under Major Tenant Sweep Period, (a) with respect to clauses (i) through (vii) at such time as such event has been cured or a sufficient portion of the space demised under the Sweep Lease Tenant has been re-tenanted pursuant to one or more qualified replacement tenants such that (1) the resulting debt service coverage ratio is 1.25x (except in the event of a partial renewal by a Sweep Lease Tenant, in which event the resulting debt service coverage ratio is 1.15x and (2) the qualified tenants have accepted the applicable space, opened for business, conducted normal business operations, in addition, the qualified tenants have paid the unabated rent in full and the lender receives an acceptable tenant estoppel certificate from the applicable tenants, or (b) with respect to clause (viii), the date on which the applicable tenants or their parent companies shall become solvent to the lender’s reasonable satisfaction or shall no longer be a debtor in any bankruptcy action and shall have affirmed their leases pursuant to a final non-appealable order of a court of competent jurisdiction.
Additional Debt. The $14.0 million mezzanine loan was provided by SMHF Cayman Hotel, LLC and is coterminous with the St. Luke’s Office Whole Loan. The mezzanine loan has an 11.8500% coupon and is interest only for the full term of the loan. The combined Cut-off Date LTV, combined UW NCF DSCR and combined UW NOI Debt Yield are 70.7%, 1.12x and 9.3%, respectively. The mortgage and mezzanine lenders have entered into an intercreditor agreement which stipulated that a qualified transferee must have assets of $600 million and capital/surplus or market capitalization of at least $250.0 million. As a condition of foreclosing on the mezzanine loan, the mezzanine lender must provide a replacement guarantor with a net worth of $38.25 million and liquid assets of $5.0 million. The mezzanine lender is not subject to any standstill in pursuing claims against guarantors, but is required to turn over any collections if the Senior Loan is in default.
Partial Release. The borrower is permitted to release a certain non-income producing outparcel specified in the loan documents from the lien of the mortgage upon certain terms and conditions set forth in the related loan documents. Please see “Description of the Mortgage Pool – Certain Terms of the Mortgage Loans – Partial Releases” in the Preliminary Prospectus for additional details.
THE INFORMATION IN THIS STRUCTURAL AND COLLATERAL TERM SHEET IS NOT COMPLETE AND MAY BE AMENDED PRIOR TO THE TIME OF SALE. THIS TERM SHEET IS NOT AN OFFER TO SELL THESE SECURITIES AND IT IS NOT A SOLICITATION OF AN OFFER TO BUY THESE SECURITIES IN ANY JURISDICTION WHERE THE OFFER OR SALE IS NOT PERMITTED.
132
(THIS PAGE INTENTIONALLY LEFT BLANK)
133
Mortgage Loan No. 9 — Northridge Plaza
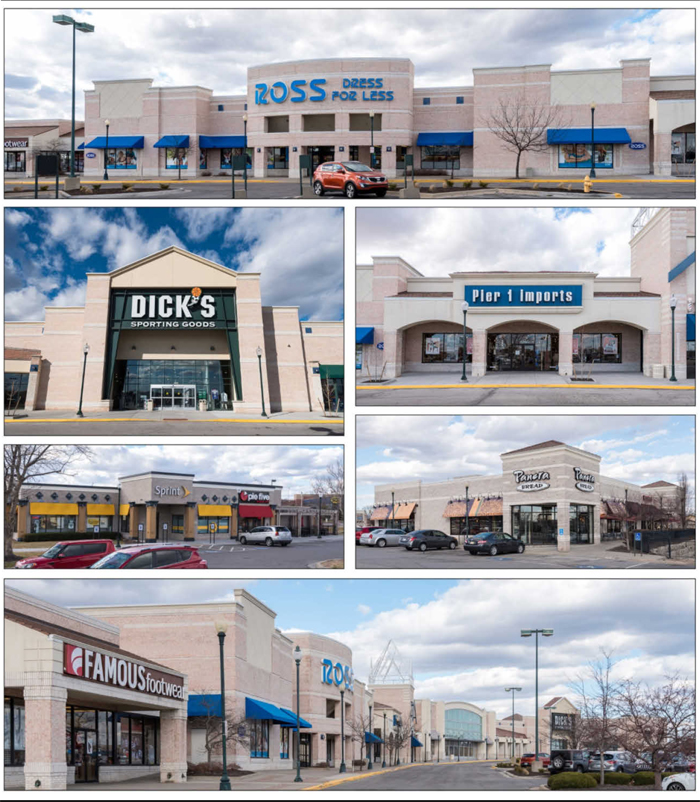
THE INFORMATION IN THIS STRUCTURAL AND COLLATERAL TERM SHEET IS NOT COMPLETE AND MAY BE AMENDED PRIOR TO THE TIME OF SALE. THIS TERM SHEET IS NOT AN OFFER TO SELL THESE SECURITIES AND IT IS NOT A SOLICITATION OF AN OFFER TO BUY THESE SECURITIES IN ANY JURISDICTION WHERE THE OFFER OR SALE IS NOT PERMITTED.
134
Mortgage Loan No. 9 — Northridge Plaza
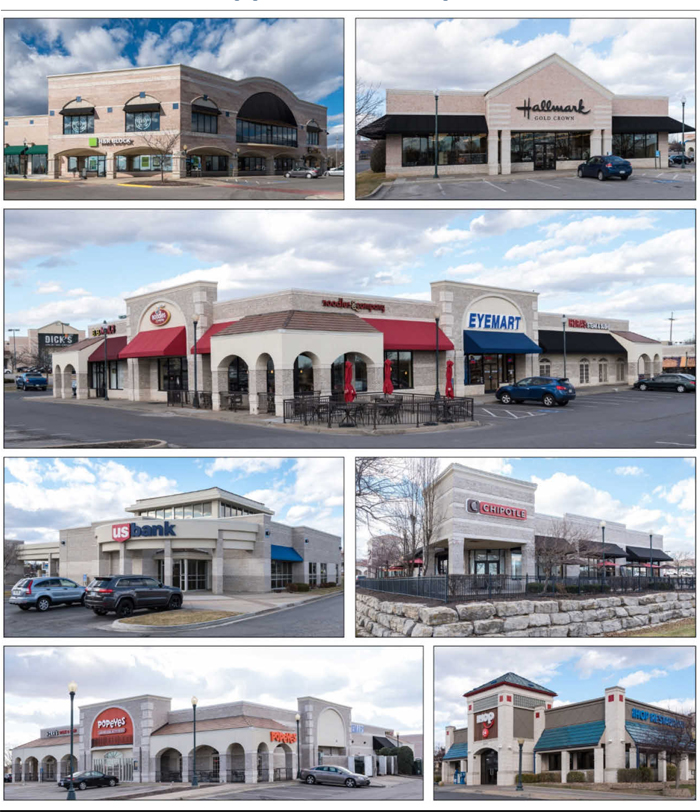
THE INFORMATION IN THIS STRUCTURAL AND COLLATERAL TERM SHEET IS NOT COMPLETE AND MAY BE AMENDED PRIOR TO THE TIME OF SALE. THIS TERM SHEET IS NOT AN OFFER TO SELL THESE SECURITIES AND IT IS NOT A SOLICITATION OF AN OFFER TO BUY THESE SECURITIES IN ANY JURISDICTION WHERE THE OFFER OR SALE IS NOT PERMITTED.
135
Mortgage Loan No. 9 — Northridge Plaza
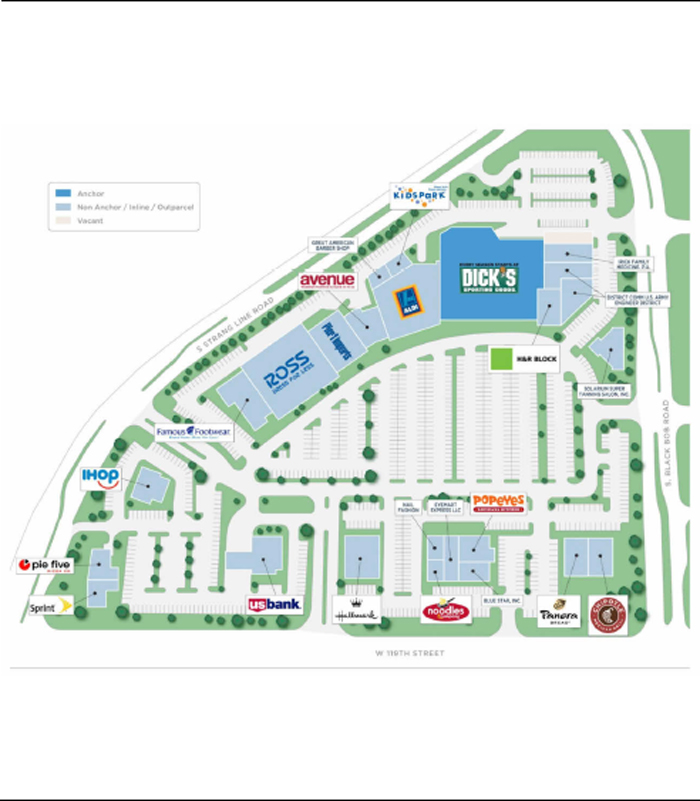
THE INFORMATION IN THIS STRUCTURAL AND COLLATERAL TERM SHEET IS NOT COMPLETE AND MAY BE AMENDED PRIOR TO THE TIME OF SALE. THIS TERM SHEET IS NOT AN OFFER TO SELL THESE SECURITIES AND IT IS NOT A SOLICITATION OF AN OFFER TO BUY THESE SECURITIES IN ANY JURISDICTION WHERE THE OFFER OR SALE IS NOT PERMITTED.
136
Mortgage Loan No. 9 — Northridge Plaza
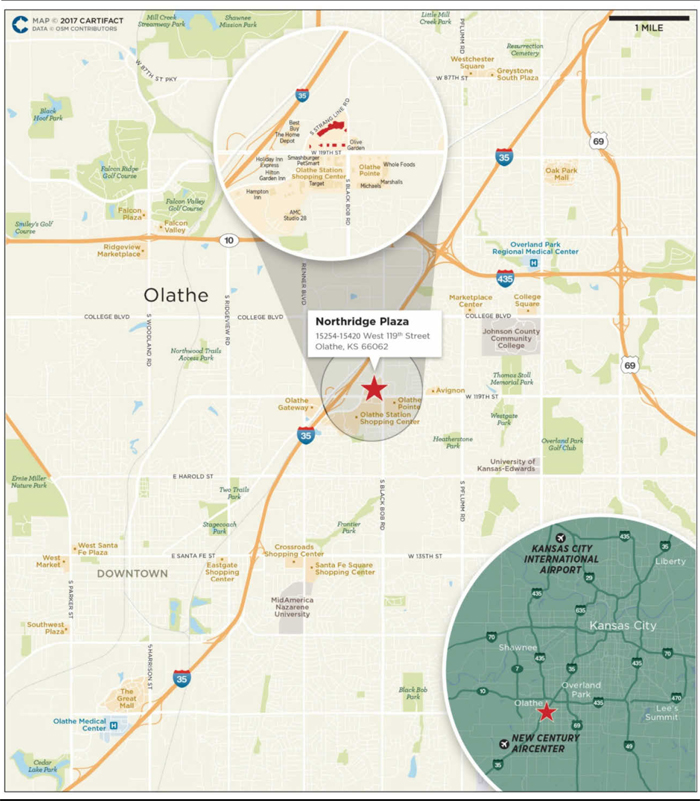
THE INFORMATION IN THIS STRUCTURAL AND COLLATERAL TERM SHEET IS NOT COMPLETE AND MAY BE AMENDED PRIOR TO THE TIME OF SALE. THIS TERM SHEET IS NOT AN OFFER TO SELL THESE SECURITIES AND IT IS NOT A SOLICITATION OF AN OFFER TO BUY THESE SECURITIES IN ANY JURISDICTION WHERE THE OFFER OR SALE IS NOT PERMITTED.
137
Mortgage Loan No. 9 — Northridge Plaza
| Mortgage Loan Information | Property Information | |||
| Mortgage Loan Seller: | BSP | Single Asset / Portfolio: | Single Asset | |
| Original Principal Balance: | $32,500,000 | Title: | Fee | |
| Cut-off Date Principal Balance: | $32,500,000 | Property Type - Subtype: | Retail – Anchored | |
| % of Pool by IPB: | 4.0% | Net Rentable Area (SF): | 209,652 | |
| Loan Purpose: | Refinance | Location: | Olathe, KS | |
| Borrowers: | Northridge 07 A, LLC; Northridge 07 B, LLC; Northridge 07 C, LLC; Northridge 07 D, LLC | Year Built / Renovated: | 1999 / N/A | |
| Sponsor: | Alan C. Fox | Occupancy: | 88.2% | |
| Interest Rate: | 4.8000% | Occupancy Date: | 5/1/2017 | |
| Note Date: | 4/13/2017 | Number of Tenants: | 24 | |
| Maturity Date: | 5/6/2027 | 2014 NOI: | $3,155,793 | |
| Interest-only Period: | 24 months | 2015 NOI: | $3,041,540 | |
| Original Term: | 120 months | 2016 NOI: | $3,291,430 | |
| Original Amortization: | 360 Months | TTM NOI(2): | $3,097,028 | |
| Amortization Type: | IO-Balloon | UW Economic Occupancy: | 92.4% | |
| Call Protection: | L(25),Def(91),O(4) | UW Revenues: | $4,616,091 | |
| Lockbox(1): | Springing | UW Expenses: | $1,586,745 | |
| Additional Debt: | No | UW NOI: | $3,029,345 | |
| Additional Debt Balance: | N/A | UW NCF: | $2,823,713 | |
| Additional Debt Type: | N/A | Appraised Value / Per SF: | $50,100,000 / $239 | |
| Additional Future Debt Permitted: | No | Appraisal Date: | 2/14/2017 | |
| Escrows and Reserves(3) | Financial Information | |||
| Initial | Monthly | Initial Cap | Cut-off Date Loan / SF: | $155 | ||
| Taxes: | $0 | $92,732 | N/A | Maturity Date Loan / SF: | $133 | |
| Insurance: | $0 | Springing | N/A | Cut-off Date LTV: | 64.9% | |
| Replacement Reserves: | $0 | $2,570 | N/A | Maturity Date LTV: | 55.8% | |
| TI/LC: | $0 | $14,566 | $700,000 | UW NCF DSCR: | 1.38x | |
| Engineering: | $478,500 | N/A | N/A | UW NOI Debt Yield: | 9.3% | |
| Gap Rent Reserve: | $400,426 | $0 | N/A | |||
| ALDI Reserve(3)(4): | $4,500,000 | $0 | N/A | |||
| Lease Sweep Reserve: | $0 | Springing | N/A |
Sources and Uses
| Sources | Proceeds | % of Total | Uses | Proceeds | % of Total | |
| Mortgage Loan | $32,500,000 | 97.3% | Payoff Existing Debt | $30,900,846 | 92.5% | |
| Sponsor Equity | 913,236 | 2.7 | Upfront Reserves(4) | 878,926 | 2.6 | |
| Closing Costs | 1,633,464 | 4.9 | ||||
| Total Sources | $33,413,236 | 100.0% | Total Uses | $33,413,236 | 100.0% |
(1) For a more detailed description of the lockbox, please refer to “Lockbox / Cash Management”below.
(2) Represents the trailing twelve month period ending April 30, 2017.
(3) For a more detailed description of escrows and reserves, please refer to “Escrows and Reserves”below.
| (4) | On March 24, 2017 City National Bank issued a letter of credit in the amount of $4.5 million in connection with the ALDI reserve and is not included in upfront reserves. For further description please refer to the“Escrows and Reserves” below. |
THE INFORMATION IN THIS STRUCTURAL AND COLLATERAL TERM SHEET IS NOT COMPLETE AND MAY BE AMENDED PRIOR TO THE TIME OF SALE. THIS TERM SHEET IS NOT AN OFFER TO SELL THESE SECURITIES AND IT IS NOT A SOLICITATION OF AN OFFER TO BUY THESE SECURITIES IN ANY JURISDICTION WHERE THE OFFER OR SALE IS NOT PERMITTED.
138
Mortgage Loan No. 9 — Northridge Plaza
The Loan. The Northridge Plaza loan, is a $32.5 million first mortgage loan secured by the fee interest in a 209,652 SF anchored retail center located in Olathe, Kansas. The loan, which has a 10-year term and will amortize on a 30-year schedule, is interest-only for the first 24 months.
The Borrowers. The borrowing entities for the loan are Northridge 07 A, LLC, a Kansas limited liability company, and Northridge 07 B, LLC, Northridge 07 C, LLC and Northridge 07 D, LLC, each a Delaware limited liability company and special purpose entity. The borrowers own the Northridge Plaza property as tenants-in-common. Each of the borrowing entities is indirectly controlled by the sponsor and nonrecourse guarantor, Alan C. Fox through his control of Northridge Manager 07, LLC, manager of each of the borrowers. Northridge 07 A, LLC is 23.9% owned by The Alan C. Fox Revocable Trust dated December 2, 1999, 0.5% owned by Northridge Manager 07, LLC and the remainder other investors, none of which, in the aggregate owns 20.0% or more. Northridge 07 B, LLC is 100.0% owned by The Allaseba H. Gorham Trust U/A dated January 1, 1982. Northridge 07 C, LLC and Northridge 07 D, LLC are each 100.0% owned by The Alan C. Fox Revocable Trust dated December 2, 1999.
The Sponsor. The loan’s sponsor and nonrecourse carve-out guarantor is Alan C. Fox, who has more than 40 years of real estate experience and a net worth in excess of $250.0 million. Alan C. Fox is founder and president of ACF Property Management, Inc. ACF Property Management, Inc. was formed in 1968 and, as of year-end 2016, owned and controlled 76 properties in 15 states totaling over 7.2 million SF with an estimated value of $1.5 billion.
The Property. The Northridge Plaza property is a Class A 209,652 SF anchored retail center located in Olathe, Kansas. The property was constructed in 1999 and is situated on 24.2 acres, approximately 18.0 miles southwest of downtown Kansas City. The property is anchored by Dick’s Sporting Goods, Ross, and ALDI and contains 113,198 SF of smaller anchors and inline tenants. Additionally, the property includes one tenant, IHOP, that ground leases its space through August 2024. The property includes 1,178 surface parking spaces, resulting in a parking ratio of 5.6 spaces per 1,000 SF of net rentable area.
As of May 1, 2017, the property was approximately 88.2% leased by 24 national and regional retail tenants. The largest tenant at the property, Dick’s Sporting Goods, leases 50,000 SF (23.8% of the net rentable area) through January 2021. Dick’s Sporting Goods has been a tenant at the property for over fifteen years. Dick’s Sporting Goods is a leading omni-channel sporting goods retailer and is the owner-operator of Golf Galaxy and Field & Stream, among other specialty concept stores. As of January 30, 2016, Dick’s Sporting Goods employs approximately 37,200 employees and operates approximately 640 Dick’s Sporting Goods stores across 50 states. The second largest tenant at the property, Ross, leases 24,454 SF (11.7% of the net rentable area) through January 2024. Ross offers first-quality, in-season name brand and designer apparel, accessories, footwear and home fashions at discounted prices. At fiscal year-end 2015, Ross reported $11.9 billion in revenues and 1,342 locations in 36 states, the District of Columbia and Guam. Ross is rated A3 / A- / NR by Moody’s, S&P and Fitch, respectively. The third largest tenant at the property, ALDI, leases 22,000 SF (10.5% of the net rentable area) through July 2032. According to the appraiser, ALDI is the nation’s leading low price grocer, with more than 1,600 stores across 35 states and employing over 24,000 people.
The Northridge Plaza property is located in Johnson County and benefits from good access and visibility on both 119th Street and Blackbob Road. Primary access to the neighborhood is provided via Interstate 35 and Interstate 435. Interstate 35 provides north-south access to the area and Interstate 435 provides east-west access in addition to circling and providing access to the Kansas City metropolitan statistical area.
The Market. The Northridge Plaza property is located in Olathe, Kansas, the county seat of Johnson County. Located in northeastern Kansas, Olathe is the fifth most populous city in the state and the fourth largest city in the Kansas City metropolitan area.
According to the appraisal, the property has a primary trade area consisting of a 5-mile radius. In a one-, three-, and five-mile radius, 2016 population was 9,961, 76,654 and 229,462. respectively and average household income was $82,928 $94,238 and $98,333, respectively. The appraiser concluded an average rent PSF of $14.77 for the greater Kansas City metro retail market and $16.36 for the Johnson County retail submarket. Respectively, the Kansas City metro retail submarket and Johnson County retail submarket reported an overall vacancy rate of 10.5% and 10.6% as of year-end 2016.
THE INFORMATION IN THIS STRUCTURAL AND COLLATERAL TERM SHEET IS NOT COMPLETE AND MAY BE AMENDED PRIOR TO THE TIME OF SALE. THIS TERM SHEET IS NOT AN OFFER TO SELL THESE SECURITIES AND IT IS NOT A SOLICITATION OF AN OFFER TO BUY THESE SECURITIES IN ANY JURISDICTION WHERE THE OFFER OR SALE IS NOT PERMITTED.
139
Mortgage Loan No. 9 — Northridge Plaza
According to the appraisal, the property’s competitive set consists of seven retail properties detailed in the table below.
Competitive Set Summary(1)
| Property | Year Built / Renovated | Total GLA (SF) | Base Rent PSF | Est. Occ. | Proximity (miles) | Anchor Tenants |
| Northridge Plaza | 1999 / N/A | 209,652(2) | $16.77(2) | 88.2%(2) | N/A | Dick’s Sporting Goods, Ross, ALDI |
| Deer Creek Marketplace | 1998 / N/A | 161,803 | $18.00 - $26.00 | 91.0% | 7.6 | Rolling Ice Cream, Results by Rob, Basha Mediterranean Grill |
| Park Place – Retail | 2008 / N/A | 120,503 | $15.00 - $31.25 | 89.0% | 8.7 | Bella Couture, Tivol, Soiree Events, Picklemans |
| Deer Creek Woods | 2006 / N/A | 50,675 | $23.00 - $25.40 | 85.0% | 7.8 | TL Alashes, California Closet |
| Corbin Park North | 2015 / N/A | 9,886 | $35.00 - $36.50 | 100.0% | 7.6 | Great Clips, Menchies, Zoe’s Kitchen, Pizzeria Locale |
| Olathe Pointe I | 2006 / N/A | 142,635 | $13.36 - $28.00 | 100.0% | 0.4 | Whole Foods, Natural Grocers |
| Overland Pointe Marketplace | 2002 / N/A | 408,152 | $15.00 - $24.00 | 99.0% | 6.6 | Big Biscuit, Royal Mystique |
| Olathe Station North | 1997 / N/A | 182,480 | $12.00 - $16.00 | 85.0% | 0.2 | Kirklands |
| (1) | Source: Appraisal. |
| (2) | Based on the underwritten rent roll dated May 1, 2017. |
Historical and Current Occupancy(1)
| 2013 | 2014 | 2015 | 2016 | Current(2)(3) |
| 100.0% | 100.0% | 97.4% | 100.0% | 88.2% |
| (1) | Source: Historical Occupancy is provided by the sponsor. Occupancies are as of December 31 of each respective year. |
| (2) | Based on the underwritten rent roll dated May 1, 2017. |
| (3) | Current occupancy includes ALDI, which is not yet open for business. |
THE INFORMATION IN THIS STRUCTURAL AND COLLATERAL TERM SHEET IS NOT COMPLETE AND MAY BE AMENDED PRIOR TO THE TIME OF SALE. THIS TERM SHEET IS NOT AN OFFER TO SELL THESE SECURITIES AND IT IS NOT A SOLICITATION OF AN OFFER TO BUY THESE SECURITIES IN ANY JURISDICTION WHERE THE OFFER OR SALE IS NOT PERMITTED.
140
Mortgage Loan No. 9 — Northridge Plaza
Top Ten Tenant Summary(1)
| Tenant | Ratings Moody’s/S&P/Fitch(2) | Net Rentable Area (SF) | % of Total NRA | Base Rent PSF | Lease Expiration Date |
| Dick’s Sporting Goods(3) | NR / NR / NR | 50,000 | 23.8% | $12.50 | 1/31/2021 |
| Ross(4) | A3 / A- / NR | 24,454 | 11.7% | $10.60 | 1/31/2024 |
| ALDI(5) | NR /NR / NR | 22,000 | 10.5% | $14.62 | 7/31/2032 |
| Pier One(6) | NR / B / NR | 10,025 | 4.8% | $18.76 | 2/29/2020 |
| Famous Footwear Store(7) | NR /NR / NR | 8,507 | 4.1% | $18.00 | 10/31/2020 |
| Hallmark Retail Inc.(8) | NR /NR / NR | 6,840 | 3.3% | $25.58 | 2/28/2022 |
| District CommU.S. Army Engineer District(9) | NR /NR / NR | 5,822 | 2.8% | $16.00 | 1/31/2018 |
| The Avenue(10) | NR /NR / NR | 5,809 | 2.8% | $18.00 | 1/31/2023 |
| US Bank(11) | Aa1 / A+ / AA | 5,000 | 2.4% | $51.43 | 7/31/2019 |
| Solarium Super Tanning Salon, Inc. | NR / NR/ NR | 4,505 | 2.1% | $15.00 | 6/30/2017 |
| (1) | Based on the underwritten rent roll dated May 1, 2017, including rent increases occurring through May 2018. |
| (2) | Ratings provided are for the parent company of the entity listed in the “Tenant” field whether or not the parent company guarantees the lease. |
| (3) | Dick’s Sporting Goods has two, five-year renewal options subject to six months’ written notice prior to the then current lease expiration date. |
| (4) | Ross has four, five-year renewal options subject to 180 days ’ notice prior to the lease expiration date. Additionally, Ross may pay reduced rent, as outlined in its lease, should Dick’s Sporting Goods cease to be open during specified business hours, and occupy less than 50,000 SF. |
| (5) | ALDI has three, five-year automatic renewals and may terminate its lease if it has not obtained all permits and approvals in the timeframe outlined by its lease. |
| (6) | Pier One has two, five-year renewal options subject to 180 days’ notice prior to the then-current lease expiration date. Pier One has the right to terminate its lease if less than 60.0% of the property is occupied and open for business for six months or more. |
| (7) | Famous Footwear Store has co-tenancy operating provisions in its lease relating to certain anchor spaces, including that which is expected to be occupied by ALDI. Should one of the anchor spaces cease to be open for business to the public, Famous Footwear Store has the right to pay 5.0% of gross sales in lieu of minimum rent and percentage rent until the anchor tenant is open for business or a replacement tenant opens for business and occupies at least 80.0% of such premises. |
| (8) | Hallmark Retail Inc. (“Hallmark”) has one, five-year renewal option subject to six months’ notice prior to the then-current lease expiration date. Additionally, Hallmark may pay reduced rent should an anchor tenant, as outlined in the lease, no longer be open during normal business hours. If the anchor tenant still does not operate for 365 days, Hallmark has the right to terminate its lease. |
| (9) | District CommU.S. Army Engineer District may terminate its lease, in whole or in part, by giving 30 days’ notice to the borrowers. |
| (10) | The Avenue has three, five-year renewal options subject to six months’ notice prior to the lease expiration date. The Avenue retains the right to terminate its lease should the Northridge Plaza property cease to be maintained and operated as an integrated whole, as outlined in the tenant lease. Additionally, The Avenue may pay the lesser of minimum rent, as outlined in the lease, or 3.0% of gross sales should an anchor tenant cease operations for nine continuous months and after 12 months it may terminate its lease. |
| (11) | US Bank has four, five-year options remaining subject to 180 days’ notice prior to the then-current lease expiration date. |
THE INFORMATION IN THIS STRUCTURAL AND COLLATERAL TERM SHEET IS NOT COMPLETE AND MAY BE AMENDED PRIOR TO THE TIME OF SALE. THIS TERM SHEET IS NOT AN OFFER TO SELL THESE SECURITIES AND IT IS NOT A SOLICITATION OF AN OFFER TO BUY THESE SECURITIES IN ANY JURISDICTION WHERE THE OFFER OR SALE IS NOT PERMITTED.
141
Mortgage Loan No. 9 — Northridge Plaza
Lease Rollover Schedule(1)
| Year | Number of Leases Expiring | NRA Expiring | % of NRA Expiring | Base Rent Expiring | % of Base Rent Expiring | Cumulative NRA Expiring | Cumulative % of NRA Expiring | Cumulative Base Rent Expiring | Cumulative % of Base Rent Expiring |
| Vacant | NAP | 24,826 | 11.8% | NAP | NAP | 24,826 | 11.8% | NAP | NAP |
| MTM | 0 | 0 | 0.0 | $0 | 0.0% | 24,826 | 11.8% | $0 | 0.0% |
| 2017 | 2 | 8,605 | 4.1 | 122,925 | 3.7 | 33,431 | 15.9% | $122,925 | 3.7% |
| 2018 | 2 | 9,966 | 4.8 | 177,036 | 5.3 | 43,397 | 20.7% | $299,961 | 9.0% |
| 2019 | 2 | 8,974 | 4.3 | 352,543 | 10.6 | 52,371 | 25.0% | $652,504 | 19.7% |
| 2020 | 6 | 28,409 | 13.6 | 636,392 | 19.2 | 80,780 | 38.5% | $1,288,896 | 38.9% |
| 2021 | 4 | 58,964 | 28.1 | 930,908 | 28.1 | 139,744 | 66.7% | $2,219,804 | 66.9% |
| 2022 | 3 | 10,340 | 4.9 | 293,207 | 8.8 | 150,084 | 71.6% | $2,513,011 | 75.8% |
| 2023 | 2 | 9,094 | 4.3 | 140,697 | 4.2 | 159,178 | 75.9% | $2,653,708 | 80.0% |
| 2024 | 2 | 28,474 | 13.6 | 341,208 | 10.3 | 187,652 | 89.5% | $2,994,916 | 90.3% |
| 2025 | 0 | 0 | 0.0 | 0 | 0.0 | 187,652 | 89.5% | $2,994,916 | 90.3% |
| 2026 | 0 | 0 | 0.0 | 0 | 0.0 | 187,652 | 89.5% | $2,994,916 | 90.3% |
| 2027 & Beyond | 1 | 22,000 | 10.5 | 321,640 | 9.7 | 209,652 | 100.0% | $3,316,556 | 100.0% |
| Total | 24 | 209,652 | 100.0% | $3,316,556 | 100.0% |
| (1) | Based on the underwritten rent roll dated May 1. 2017. Rent includes base rent and rent increases occurring through May 2018. |
Operating History and Underwritten Net Cash Flow
| 2014 | 2015 | 2016 | TTM(1) | Underwritten(2) | PSF | %(3) | |
| Rents in Place | $3,150,129 | $3,111,502 | $3,345,446 | $3,231,239 | $3,335,576 | $15.91 | 66.9% |
| Vacant Income | 0 | 0 | 0 | 0 | 198,608 | $0.95 | 4.0 |
| Gross Potential Rent | $3,150,129 | $3,111,502 | $3,345,446 | $3,231,239 | $3,534,184 | $16.86 | 70.9% |
| Total Reimbursements | 1,307,734 | 1,348,765 | 1,431,530 | 1,385,033 | 1,453,219 | $6.93 | 29.1 |
| Net Rental Income | $4,457,863 | $4,460,267 | $4,776,976 | $4,616,272 | $4,987,403 | $23.79 | 100.0% |
| (Vacancy/Collection Loss) | 0 | 0 | 0 | 0 | (380,181) | -$1.81 | -7.6 |
| Other Income | 29,478 | 13,920 | 11,566 | 8,869 | 8,869 | $0.04 | 0.2 |
| Effective Gross Income | $4,487,341 | $4,474,187 | $4,788,542 | $4,625,141 | $4,616,091 | $22.02 | 92.6% |
| Total Expenses | $1,331,548 | $1,432,647 | $1,497,112 | $1,528,113 | $1,586,745 | $7.57 | 31.8% |
| Net Operating Income | $3,155,793 | $3,041,540 | $3,291,430 | $3,097,028 | $3,029,346 | $14.45 | 65.6% |
| Total TI/LC, Capex/RR | 0 | 0 | 0 | 0 | 205,632 | $0.98 | 4.5 |
| Net Cash Flow | $3,155,793 | $3,041,540 | $3,291,430 | $3,097,028 | $2,823,713 | $13.47 | 61.2% |
| (1) | Represents the trailing twelve month period ending April 30, 2017. |
| (2) | Rents in place include base rent, rent increases occurring through May 2018 and straightlined rent for investment grade tenant, Ross, of $19,020. |
| (3) | Percentage column represents percent of Net Rental Income for all revenue and expense lines. The remaining line item percentages represent a percent of the Effective Gross Income. |
THE INFORMATION IN THIS STRUCTURAL AND COLLATERAL TERM SHEET IS NOT COMPLETE AND MAY BE AMENDED PRIOR TO THE TIME OF SALE. THIS TERM SHEET IS NOT AN OFFER TO SELL THESE SECURITIES AND IT IS NOT A SOLICITATION OF AN OFFER TO BUY THESE SECURITIES IN ANY JURISDICTION WHERE THE OFFER OR SALE IS NOT PERMITTED.
142
Mortgage Loan No. 9 — Northridge Plaza
Property Management. The property is managed by ACF Property Management, Inc., an affiliate of the sponsor.
Escrows and Reserves. At origination, the borrowers deposited $478,500 for immediate repairs, and $400,426 into a gap rent reserve associated with gap rent through March 6, 2018.
Additionally, at closing, the sponsor posted a $4.5 million evergreen letter of credit from City National Bank (rated A3/A+/AA- by Moody’s, S&P and Fitch) in connection with the ALDI reserve. The letter of credit can be drawn upon if, eighteen months after the closing date, certain conditions are not satisfied, including, the ALDI lease or ALDI replacement lease is in full force and effect, ALDI or applicable replacement tenant is in possession of the space utilizing the space in the conduct of normal business hours, ALDI or the applicable replacement tenant is paying full unabated rent, and the ALDI lease or ALDI replacement lease does not provide for an exercisable termination right. ALDI is expected to take occupancy in August 2017.
On a monthly basis, the borrowers are required to escrow 1/12th of annual estimated tax payments, currently equating to $92,732.
On a monthly basis, the borrowers are required to escrow $14,566 for tenant improvement and leasing commissions relating to the property. The reserve is subject to a cap of $700,000.
On a monthly basis, the borrowers are required to escrow $2,570 for replacement reserves relating to the property.
The requirement of the borrowers to make monthly deposits to the insurance reserve is waived as long as no event of default has occurred and continuing and the borrower provides satisfactory evidence that the property is insured as part of one or more blanket policies in accordance with the loan documents.
Lockbox / Cash Management. The Northridge Plaza loan is structured with a springing lockbox and springing cash management. Upon written notification from the lender that the first Cash Sweep Period, if any, has occurred, the borrowers are required to promptly establish and maintain a lockbox account with the lockbox bank in trust for the benefit of the lender into which all rents and other income from the property will be deposited. Upon the occurrence and continuance of a Cash Sweep Period all funds in the lockbox account will be swept daily to a cash management account under the control of the lender and all excess cash flow, after payments made in accordance with the loan documents for, amongst other things, debt service, required reserves and operating expenses, and any excess cash flow will be held as additional collateral for the loan.
A “Cash Sweep Period” commences upon any of the following: (i) the occurrence of and continuance of an event of default, (ii) the debt service coverage ratio falling below 1.15x, and (iii) the occurrence of a Specified Tenant Sweep Event as defined below.
A Cash Sweep Period will expire upon (x) with regard to a clause (i) above, the cure (if applicable) of such default, (y) with respect to clause (ii) above the earlier to occur of (a) a Debt Service Coverage Ratio Sweep Cure and (b) (provided no event of default has occurred and is continuing), subject to payment of any yield maintenance premium, as outlined in the Northridge Plaza loan documents, the borrowers may prepay the debt in an amount then necessary to cause the debt service coverage ratio to (a) be equal to or greater to than 1.25x and (z) with respect to clause (iii) above, the expiration of all Specified Tenant Sweep Events.
A “Debt Service Coverage Ration Sweep Event Cure” means the occurrence of either of the following: (i) the debt service coverage ratio being equal to or greater than 1.25x for two consecutive calendar quarters or (ii) within five business days of the debt service coverage falling below 1.15x, the borrowers deposit (or cause to be deposited) a sum equal to 25% of the total debt service for the 12-month period immediately succeeding the date of calculation in the excess cash flow account;provided, however, if the debt service coverage ratio remains bellows 1.15x at the end of the 12-month period following such deposit, a Cash Sweep Period caused solely by the debt service coverage falling below 1.15x will no longer be cured by such deposit and a Cash Sweep Period will commence.
THE INFORMATION IN THIS STRUCTURAL AND COLLATERAL TERM SHEET IS NOT COMPLETE AND MAY BE AMENDED PRIOR TO THE TIME OF SALE. THIS TERM SHEET IS NOT AN OFFER TO SELL THESE SECURITIES AND IT IS NOT A SOLICITATION OF AN OFFER TO BUY THESE SECURITIES IN ANY JURISDICTION WHERE THE OFFER OR SALE IS NOT PERMITTED.
143
Mortgage Loan No. 9 — Northridge Plaza
A “Specified Tenant Sweep Event” shall mean among other conditions, with respect to any specified tenant as defined in the Northridge Plaza loan documents, (i) such specified tenant vacates, abandons, ceases ordinary business at, or otherwise “goes dark” at all or substantially all of the space leased under such specified tenant’s lease, or gives notice of its intent to do any of the foregoing, unless prior to such tenant going dark (or giving notice of its intent ), the borrowers deposit $800,000 with the Lender, (ii) any bankruptcy or similar insolvency of such specified tenant, (iii) the date that is twelve months prior to the scheduled expiration date of such specified tenant’s lease unless such tenant has already renewed its lease in accordance with the loan documents or the borrowers deposit $800,000 with the Lender, (iv) a monetary default by such specified tenant under its lease beyond all applicable notice and/or cure periods.
A “Specified Tenant Sweep Event Cure” will occur upon the following, among other conditions, (a) with respect to clause (i) above, the specified tenant resumes ordinary business operations, (b) with respect to clause (ii) above the applicable specified tenant is no longer insolvent or subject to any bankruptcy or insolvency proceedings and has affirmed the applicable specified tenant lease, (b) with respect to clause (iii) above, the lender receives evidence that the specified tenant has extended or renewed its lease for the entire space for at least five years, at a rental rate not less than 95.0% of the then current rent rate (without taking account any free rent, allowance or abatement) required to be paid by such specified tenant pursuant to terms of its previous lease and among other conditions, the specified tenant is in occupancy of its respective space, open for business and paying full unabated rent under its lease, (d) in the case of any Specified Tenant Sweep Event, the lender receives evidence the entire leased space of the specified tenant has been leased to one or more replacement tenant reasonable acceptable to lender and such tenant is in occupancy if its respective space, open for business and paying full, unabated rent under such replacement lease, (e) with respect clauses (i), (iii) or (iv), within ten business days of such occurrence of a Specified Tenant Sweep Event, the sum of $800,000 is deposited by the borrowers in the lease sweep reserve account, or equivalent letter(s) of credit are delivered to Lender and (f) with respect to clause (iv) above all monetary defaults under the specified tenant lease have been cured and such cures are accepted by the borrowers.
THE INFORMATION IN THIS STRUCTURAL AND COLLATERAL TERM SHEET IS NOT COMPLETE AND MAY BE AMENDED PRIOR TO THE TIME OF SALE. THIS TERM SHEET IS NOT AN OFFER TO SELL THESE SECURITIES AND IT IS NOT A SOLICITATION OF AN OFFER TO BUY THESE SECURITIES IN ANY JURISDICTION WHERE THE OFFER OR SALE IS NOT PERMITTED.
144
(THIS PAGE INTENTIONALLY LEFT BLANK)
145
Mortgage Loan No. 10 — 449 South Broadway
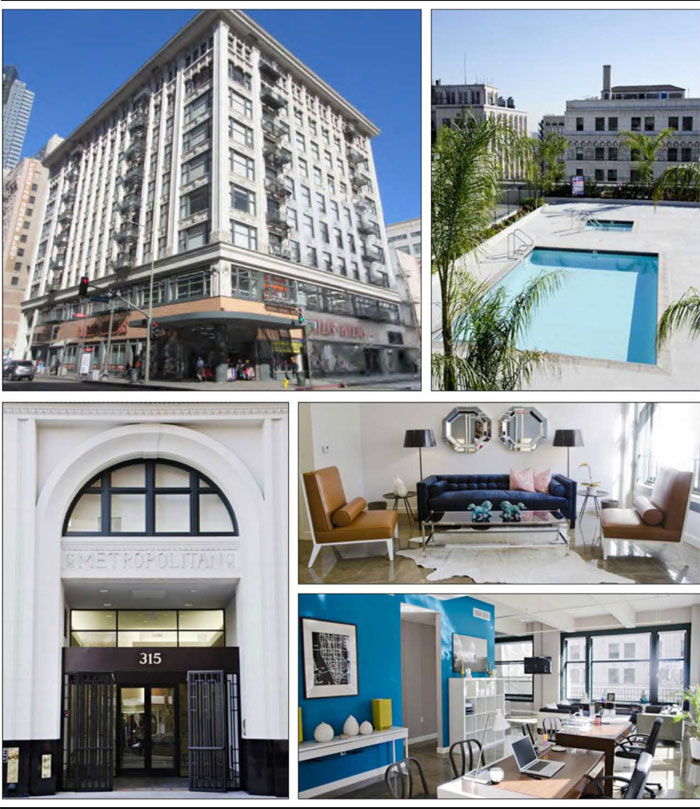
THE INFORMATION IN THIS STRUCTURAL AND COLLATERAL TERM SHEET IS NOT COMPLETE AND MAY BE AMENDED PRIOR TO THE TIME OF SALE. THIS TERM SHEET IS NOT AN OFFER TO SELL THESE SECURITIES AND IT IS NOT A SOLICITATION OF AN OFFER TO BUY THESE SECURITIES IN ANY JURISDICTION WHERE THE OFFER OR SALE IS NOT PERMITTED.
146
Mortgage Loan No. 10 — 449 South Broadway
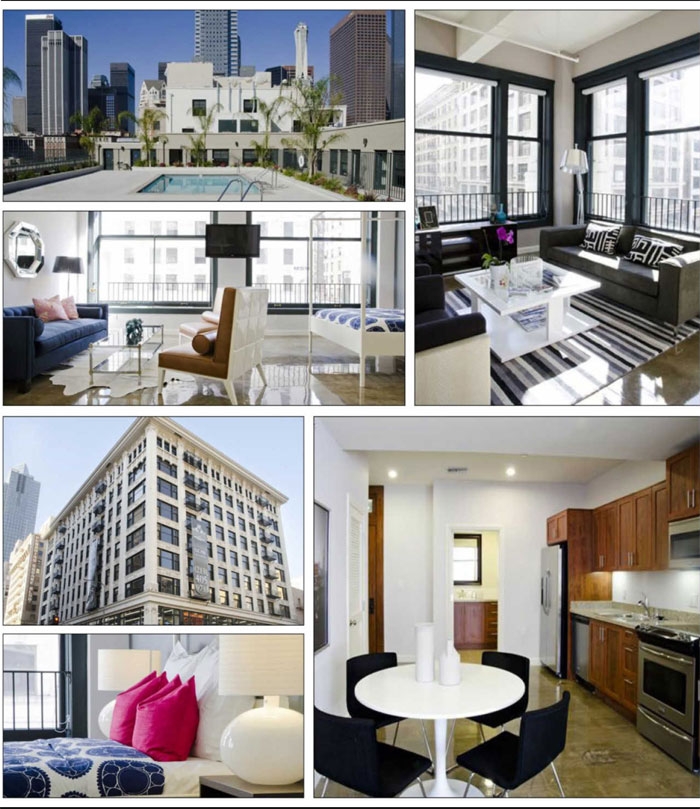
THE INFORMATION IN THIS STRUCTURAL AND COLLATERAL TERM SHEET IS NOT COMPLETE AND MAY BE AMENDED PRIOR TO THE TIME OF SALE. THIS TERM SHEET IS NOT AN OFFER TO SELL THESE SECURITIES AND IT IS NOT A SOLICITATION OF AN OFFER TO BUY THESE SECURITIES IN ANY JURISDICTION WHERE THE OFFER OR SALE IS NOT PERMITTED.
147
Mortgage Loan No. 10 — 449 South Broadway
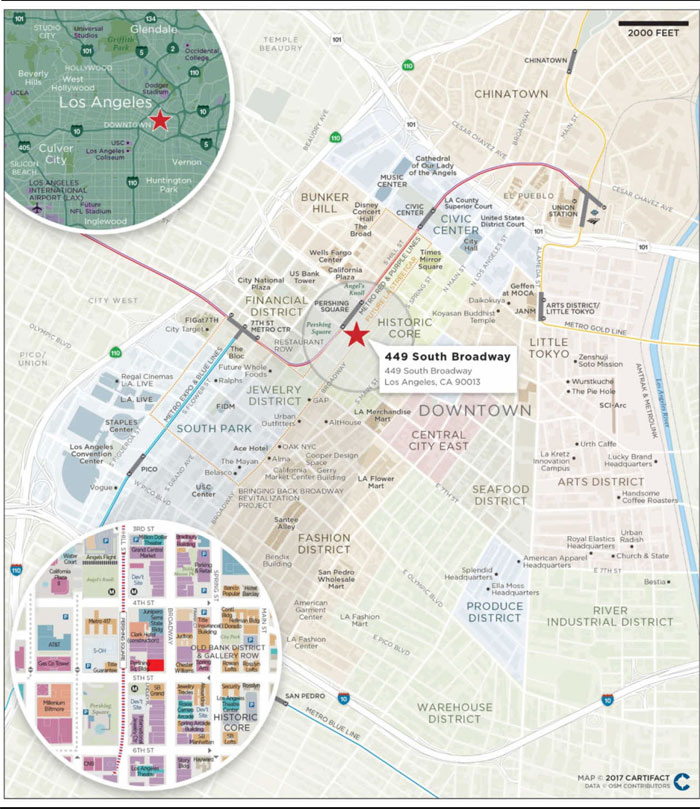
THE INFORMATION IN THIS STRUCTURAL AND COLLATERAL TERM SHEET IS NOT COMPLETE AND MAY BE AMENDED PRIOR TO THE TIME OF SALE. THIS TERM SHEET IS NOT AN OFFER TO SELL THESE SECURITIES AND IT IS NOT A SOLICITATION OF AN OFFER TO BUY THESE SECURITIES IN ANY JURISDICTION WHERE THE OFFER OR SALE IS NOT PERMITTED.
148
Mortgage Loan No. 10 — 449 South Broadway
| Mortgage Loan Information | Property Information | |||
| Mortgage Loan Seller: | Natixis | Single Asset / Portfolio: | Single Asset | |
| Original Principal Balance: | $31,750,000 | Title: | Fee | |
| Cut-off Date Principal Balance: | $31,750,000 | Property Type - Subtype(1): | Multifamily – Mid-rise | |
| % of Pool by IPB: | 3.9% | Net Rentable Area (Units)(1): | 88 | |
| Loan Purpose: | Refinance | Location: | Los Angeles, CA | |
| Borrower: | 449 S. Broadway Borrower, LLC | Year Built / Renovated: | 1913 / 2012 | |
| Sponsors: | Michael Fallas; The Michael Fallas Living Trust | Occupancy(1): | 97.7% | |
| Interest Rate: | 4.45000% | Occupancy Date(1): | 5/12/2017 | |
| Note Date: | 5/18/2017 | Number of Tenants: | N/A | |
| Maturity Date: | 6/5/2027 | 2014 NOI: | $2,476,482 | |
| Interest-only Period: | 120 months | 2015 NOI: | $2,628,786 | |
| Original Term: | 120 months | 2016 NOI: | $2,590,233 | |
| Original Amortization: | None | TTM NOI(2): | $2,576,014 | |
| Amortization Type: | Interest Only | UW Economic Occupancy: | 93.1% | |
| Call Protection: | L(24),Def(92),O(4) | UW Revenues: | $3,318,610 | |
| Lockbox: | Springing | UW Expenses: | $803,282 | |
| Additional Debt: | No | UW NOI: | $2,515,327 | |
| Additional Debt Balance: | N/A | UW NCF: | $2,441,440 | |
| Additional Debt Type: | N/A | Appraised Value / Per Unit(3): | $49,500,000 / $562,500 | |
| Additional Future Debt Permitted: | No | Appraisal Date: | 4/18/2017 |
| Escrows and Reserves(4) | Financial Information | |||||
| Initial | Monthly | Initial Cap | Cut-off Date Loan / Unit: | $360,795 | ||
| Taxes: | $54,442 | $13,611 | N/A | Maturity Date Loan / Unit: | $360,795 | |
| Insurance: | $25,467 | Springing | N/A | Cut-off Date LTV: | 64.1% | |
| Replacement Reserves: | $0 | $2,439 | $90,000 | Maturity Date LTV: | 64.1% | |
| TI/LC: | $0 | $3,760 | N/A | UW NCF DSCR: | 1.70x | |
| UW NOI Debt Yield: | 7.9% |
Sources and Uses
| Sources | Proceeds | % of Total | Uses | Proceeds | % of Total | |
| Mortgage Loan | $31,750,000 | 100.0% | Payoff Existing Debt(5) | $21,333,503 | 67.2% | |
| Return of Equity | 9,391,110 | 29.6 | ||||
| Upfront Reserves | 79,909 | 0.3 | ||||
| Closing Costs | 945,479 | 3.0 | ||||
| Total Sources | $31,750,000 | 100.0% | Total Uses | $31,750,000 | 100.0% |
| (1) | As of May 12, 2017, the property was 97.7% occupied. The property also includes 45,119 SF of retail space which is 93.9% occupied. |
| (2) | Represents the trailing twelve month period ending March 31, 2017. |
| (3) | Due to the property’s designation as a historical building, the borrower is under contract with the City of Los Angeles through December 2022 as part of the Mills Act Historical Property Contract Program, a tax reduction and incentive program. Assuming participation in such program and the related tax treatment, the Appraised Value is $54,300,000. The Appraised Value Per Unit, Cut-Off Date LTV and Maturity Date LTV based on $54,300,000 will be $617,045, 58.5%, 58.5%, respectively. See“Description of the Mortgage Pool—Real Estate and Other Tax Considerations” in the Preliminary Prospectus. |
| (4) | For a more detailed description of escrows and reserves, please refer to “Escrows and Reserves” below. |
| (5) | Payoff Existing Debt includes a first mortgage loan of $18,450,973 together with the prepayment penalty fee of $2,882,530. |
THE INFORMATION IN THIS STRUCTURAL AND COLLATERAL TERM SHEET IS NOT COMPLETE AND MAY BE AMENDED PRIOR TO THE TIME OF SALE. THIS TERM SHEET IS NOT AN OFFER TO SELL THESE SECURITIES AND IT IS NOT A SOLICITATION OF AN OFFER TO BUY THESE SECURITIES IN ANY JURISDICTION WHERE THE OFFER OR SALE IS NOT PERMITTED.
149
Mortgage Loan No. 10 — 449 South Broadway
The Loan. The 449 South Broadway loan is a $31.75 million first mortgage loan secured by the fee interest in the 449 South Broadway, an 88-unit multifamily property with 45,119 SF of commercial space located in Los Angeles, California. The loan has a 10-year term and is interest-only for the term of the loan.
The Borrower. The borrowing entity for the loan is 449 S. Broadway Borrower, LLC, a Nevada limited liability company and special purpose entity. The borrowing entity is owned by 90.0% by Michael Fallas, trustee of The Michael Fallas Living Trust and 10.0% by J&M Properties One, LLC.
The Sponsors. The loan’s sponsors and nonrecourse carve-out guarantors are Michael Fallas and The Michael Fallas Living Trust. Mr. Fallas is the president, CEO and owner of National Stores, Inc, a family-owned company that owns and operates more than 365 off-price stores in 22 states and Puerto Rico. The stores sell apparel products and shoes for men, women, and children, backpacks and school supplies and home decor products. Mr. Fallas currently has an ownership interest in 50 properties valued at over $167.0 million.
The Property. The property is a 10-story apartment building located in the Historic Core neighborhood of Downtown, Los Angeles, California that was built in 1913 and originally was the Los Angeles Public Library. The property is commonly known as the “Metropolitan Building” and was designed by John Parkinson. The property is designated a historical building but was converted to residential use in 2012 by the sponsors for a total cost of $16.0 million. The borrower is currently under contract with the City of Los Angeles through December 2022 to maintain the historical architecture of the building, which may be inspected periodically, and is subject to a 12.5% penalty of the property’s fair market value, which penalty is estimated to be approximately $6.2 million. The sponsor guaranteed any payment of such penalty and has also guaranteed any increases in taxes due to expiration of the contract with the City of Los Angeles. The property consists of 88 loft-style units comprising 92,135 SF on floors three through 10 indicating an average unit size of 1,047 SF. The units feature stainless steel appliances, granite countertops, walk-in closets, central AC/heat, open floor plans, city skyline views, and an average ceiling height of 12 FT. The property amenities include a rooftop pool, BBQ area and jacuzzi, penthouse event space, a fitness center and a resident lounge. Residents at the property are afforded off-site parking on a month-to-month basis, located one block northwest on the corner of West 5th Street and Hill Street. Residents also have access to free on-site bike storage and can lease storage lockers.
The property also includes 45,119 SF of commercial space on the ground floor, basement and second floor that is primarily occupied by J&M Sales, Inc. DBA Fallas Paredes (“Fallas Paredes”), a borrower-affiliated discount retail store. Fallas Paredes has been at the property since 1996 when the sponsors purchased the property. 2,756 SF, formerly leased to a restaurant and fronting 5th Street, is vacant as of May 12, 2017.
The property is located at the northwest corner of South Broadway and West 5th Street in the Historic Core neighborhood of downtown, Los Angeles, California. The Historic Core neighborhood is currently being revitalized through a combination of renovations and new public and private development. Per the Downtown Center BID, over $20.0 billion in public and private projects have been invested in between 1999 and 2015. The property is located directly across the street from the Pershing Square subway station, providing convenient access to public transportation within the Greater Los Angeles area. Union Station is also located approximately 1.2 miles northeast of the property, and is the Los Angeles central hub for all public rail transportation and the largest railroad passenger terminal in the western United States. Freeways serving downtown Los Angeles include: the Santa Monica Freeway (Interstate 10), the Santa Ana/Hollywood Freeway (U.S. Highway 101), the Harbor/Pasadena Freeway (State Route 110) and the Golden State Freeway (Interstate 5).
THE INFORMATION IN THIS STRUCTURAL AND COLLATERAL TERM SHEET IS NOT COMPLETE AND MAY BE AMENDED PRIOR TO THE TIME OF SALE. THIS TERM SHEET IS NOT AN OFFER TO SELL THESE SECURITIES AND IT IS NOT A SOLICITATION OF AN OFFER TO BUY THESE SECURITIES IN ANY JURISDICTION WHERE THE OFFER OR SALE IS NOT PERMITTED.
150
Mortgage Loan No. 10 — 449 South Broadway
Multifamily Unit Mix(1)
| Unit Type | No. of Units | % of Total | Occupied Units | Occupancy | Average Unit Size (SF) | Average Monthly Rental Rate | Average Monthly Rental Rate PSF | Monthly Market Rental Rate(2) | Monthly Market Rental Rate PSF(2) |
| Loft-Style | 88 | 100.0% | 86 | 97.7% | 1,047 | $2,170 | $2.08 | $2,294 | $2.19 |
| Total/Wtd. Avg. | 88 | 100.0% | 86 | 97.7% | 1,047 | $2,170 | $2.08 | $2,294 | $2.19 |
| (1) | Based on the underwritten rent roll dated May 12, 2017. |
| (2) | Source: Appraisal. |
Retail Tenant Summary(1)
| Tenant | Ratings Moody’s/S&P/Fitch | Net Rentable Area (SF) | % of Total NRA | UW Base Rent PSF | Annual UW Base Rent | % of Annual UW Base Rent | Lease Expiration Date |
| Fallas Paredes | NR/NR/NR | 42,363 | 93.9% | $21.55 | $913,008 | 29.0% | 5/1/2032 |
| (1) | Information obtained from the underwritten rent roll dated May 12, 2017. |
The Market. The property is located in Los Angeles, California in the Downtown submarket. As of the first quarter of 2017, the submarket reported an average vacancy of 8.0%. The appraiser concluded a 5.0% vacancy for both the retail and multifamily components of the property.
The appraiser identified eight comparable rental properties, ranging from 42 units to 314 units that were constructed prior to 1928 and renovated between 2005 and 2016. Unit types vary between the buildings, including a mix of loft, studio, 1-bedroom, 2-bedroom, and 3-bedroom apartments. The competitive set reported a weighted average occupancy of approximately 96.0%. Average rents at the property are shown below in the competitive set. The properties in the appraisal’s competitive set are all located in the Historic Core neighborhood within approximately 1.0 mile of the property and are shown in the below table.
Competitive Set Summary(1)
| Property | Year Built / Renovated | No. of Units | Avg. Unit Size (SF) | Avg. $/ Unit | Occupancy | Distance from Property |
| 449 South Broadway | 1913 / 2012 | 88(2) | 1,047(2) | $2,170(2) | 97.7%(2) | N/A |
| Lofts at the Security Building | 1920 / 2006 | 154 | 696 | $2,284 | 96% | 0.1 miles |
| The Blackstone | 1917 / 2011 | 82 | 676 | $2,149 | 95% | 0.5 miles |
| The Chapman | 1913 / 2008 | 168 | 985 | N/A | 99% | 0.4 miles |
| National City Tower Lofts | 1924 / 2008 | 93 | 976 | N/A | 98% | 0.5 miles |
| The Great Republic Lofts | 1923 / 2008 | 72 | 818 | $2,444 | 96% | 0.5 miles |
| Pacific Electric Lofts | 1904 / 2005 | 314 | 1,236 | N/A | 95% | 0.3 miles |
| Union Lofts | 1928 / N/A | 92 | 799 | N/A | 92% | 0.5 miles |
| The Mint | 1923 / 2016 | 42 | 1,179 | $2,394 | 93% | 0.9 miles |
| Total/Wtd. Avg.(3) | 1,017 | 972 | 96% |
| (1) | Source: Appraisal. |
| (2) | Based on the underwritten rent roll dated May 12, 2017. |
| (3) | Excludes the subject property. |
THE INFORMATION IN THIS STRUCTURAL AND COLLATERAL TERM SHEET IS NOT COMPLETE AND MAY BE AMENDED PRIOR TO THE TIME OF SALE. THIS TERM SHEET IS NOT AN OFFER TO SELL THESE SECURITIES AND IT IS NOT A SOLICITATION OF AN OFFER TO BUY THESE SECURITIES IN ANY JURISDICTION WHERE THE OFFER OR SALE IS NOT PERMITTED.
151
Mortgage Loan No. 10 — 449 South Broadway
Historical and Current Occupancy(1)
| 2013 | 2014 | 2015 | 2016 | Current(2) |
| 98.3% | 97.1% | 97.5% | 95.9% | 97.7% |
| (1) | Source: Historical Occupancy reflects the average occupancy for each year as provided by the sponsors. |
| (2) | Based on the underwritten rent roll dated May 12, 2017. |
Operating History and Underwritten Net Cash Flow
| 2014 | 2015 | 2016 | TTM(1) | Underwritten | Per Unit | %(2) | |
| Rents in Place | $2,854,329 | $2,978,509 | $2,972,266 | $2,963,404 | $3,152,424 | $35,823 | 88.4% |
| Other Income | 330,933 | 335,394 | 316,227 | 317,220 | 218,876 | 2,487 | 6.1 |
| Vacant Income | 0 | 0 | 0 | 0 | 194,688 | 2,212 | 5.5 |
| Gross Potential Rent | $3,185,262 | $3,313,903 | $3,288,492 | $3,280,624 | $3,565,988 | $40,523 | 100.0% |
| Total Reimbursements | 0 | 0 | 0 | 0 | 0 | 0 | 0.0 |
| Net Rental Income | $3,185,262 | $3,313,903 | $3,288,492 | $3,280,624 | $3,565,988 | $40,523 | 100.0% |
| (Vacancy/Collection Loss) | 0 | 0 | 0 | 0 | (247,379) | (2,811) | (6.9) |
| Effective Gross Income | $3,185,262 | $3,313,903 | $3,288,492 | $3,280,624 | $3,318,610 | $37,711 | 93.1% |
| Total Expenses(3) | $708,780 | $685,117 | $698,259 | $704,610 | $803,282 | $9,128 | 24.2% |
| Net Operating Income | $2,476,482 | $2,628,786 | $2,590,233 | $2,576,014 | $2,515,327 | $28,583 | 75.8% |
| Total TI/LC, Capex/RR | 0 | 0 | 0 | 0 | 73,887 | 840 | 2.2 |
| Net Cash Flow | $2,476,482 | $2,628,786 | $2,590,233 | $2,576,014 | $2,441,440 | $27,744 | 73.6% |
| (1) | Represents the trailing twelve-month period ending March 31, 2017. |
| (2) | Percentage column represents percent of Net Rental Income for all revenue lines and represents percent of Effective Gross Income for the remainder of fields. |
| (3) | Real estate taxes were underwritten to 2016/2017 actual tax bills. The property’s historic designation allows for participation in the Mills Act Historical Property Contract Program, resulting in a property tax reduction for the purpose of assisting in the costs needed to help rehabilitate, restore and maintain the structure. The borrower most recently entered into a contract with the City of Los Angeles in December 2012 to take part in the Mills Act Historical Property Contract Program for a ten-year term, which is automatically extended by one year with each annual anniversary of the commencement date, unless notice of nonrenewal has been provided by the sponsors or the City of Los Angeles. The sponsor guaranteed any payment of such penalty and has also guaranteed any increases in taxes due to expiration of the contract with the City of Los Angeles. |
Property Management. The property is self-managed by the borrower.
Escrows and Reserves. At origination, the borrower deposited into escrow $54,442 for real estate taxes and $25,467 for insurance.
Tax Escrows- On a monthly basis, the borrower is required to escrow 1/12th of annual estimated tax payments, which currently equates to $13,611.
Insurance Escrows -The loan documents do not require monthly escrows for insurance provided that (i) no event of default under the loan has occurred and is continuing, (ii) the borrower provides evidence that the insurance coverages required pursuant to the loan documents are being maintained under an acceptable blanket insurance policy and (iii) the borrower maintains an amount in the insurance escrow equal to six months’ worth of monthly insurance premiums.
Replacement Reserves -On a monthly basis, the borrower is required to escrow $564 ($0.16 per retail SF annually) for ongoing replacement reserves related to the retail space and $1,875 ($256 per multifamily unit annually) for ongoing replacement reserves related to the multifamily space. The monthly replacement reserve related to the multifamily space is subject to a cap of $90,000. If, at any time during the loan term, the balance of the replacement reserve related to the multifamily space falls below $45,000, monthly deposits of $1,875 are required to resume until the cap is met.
TI/LC -On a monthly basis, the borrower is required to deposit $3,760 per month ($1.07 per retail SF annually) with the lender for costs related to tenant improvements and leasing commissions.
THE INFORMATION IN THIS STRUCTURAL AND COLLATERAL TERM SHEET IS NOT COMPLETE AND MAY BE AMENDED PRIOR TO THE TIME OF SALE. THIS TERM SHEET IS NOT AN OFFER TO SELL THESE SECURITIES AND IT IS NOT A SOLICITATION OF AN OFFER TO BUY THESE SECURITIES IN ANY JURISDICTION WHERE THE OFFER OR SALE IS NOT PERMITTED.
152
Mortgage Loan No. 10 — 449 South Broadway
Lockbox / Cash Management. The loan is structured with a springing lockbox and springing cash management. The 449 South Broadway loan requires all rents to be deposited directly by tenants of the property into the lockbox account. Prior to the occurrence of a Cash Management Period (as defined below), all funds in the lockbox account will be swept to the borrower’s operating account. During a Cash Management Period, all funds in the lockbox account will be swept to a lender-controlled cash management account.
A “Cash Management Period” will commence upon: (i) an event of default under the 449 South Broadway loan documents or (ii) the failure by the borrower, after the end of a calendar quarter, to maintain a debt service coverage ratio of at least 1.15x; and will end with respect to clause (ii) above if for six consecutive calendar quarters since the commencement of the existing Cash Management Period (A) no event of default under the 449 South Broadway loan documents has occurred, (B) no event that constitutes another Cash Management Period has occurred and (C) the debt service coverage ratio is at least equal to 1.20x. In determining the debt service coverage ratio for purposes of clause (ii) above, the lender must include amounts (the initial full monthly rent annualized) for the tenants under executed commercial leases if either (a) such tenants are in occupancy of their demised space but who have not yet commenced paying full rent and are due to begin paying full rent within six months of the date of calculation or (b) such tenants are not yet in occupancy but have signed a lease approved in accordance with the 449 South Broadway loan documents and are scheduled to take occupancy of their demised space within six months of the date of calculation and the borrower has provided the lender with either a letter of credit in form and content wholly acceptable to the lender or a cash deposit in an amount equal to the first 12 months’ full rent due under such lease, such letter of credit or cash deposit amount to be released, so long as no event of default is continuing, to the borrower at such time as such tenant takes full occupancy; provided that, in either case if, when excluding such amounts the debt service coverage ratio at the time of calculation is less than 1.05x, the borrower will be required to deposit the amount of free rent to the rollover reserves to be disbursed in accordance with the terms of the 449 South Broadway loan documents.
THE INFORMATION IN THIS STRUCTURAL AND COLLATERAL TERM SHEET IS NOT COMPLETE AND MAY BE AMENDED PRIOR TO THE TIME OF SALE. THIS TERM SHEET IS NOT AN OFFER TO SELL THESE SECURITIES AND IT IS NOT A SOLICITATION OF AN OFFER TO BUY THESE SECURITIES IN ANY JURISDICTION WHERE THE OFFER OR SALE IS NOT PERMITTED.
153
Mortgage Loan No. 11 – Columbus Office Portfolio I
| Mortgage Loan Information | Property Information | |||
| Mortgage Loan Seller: | BSP | Single Asset / Portfolio: | Portfolio of 4 Properties | |
| Original Principal Balance(1): | $30,000,000 | Title: | Fee | |
| Cut-off Date Principal Balance(1): | $30,000,000 | Property Type - Subtype: | Office – Suburban | |
| % of Pool by IPB: | 3.7% | Net Rentable Area (SF): | 651,596 | |
| Loan Purpose: | Acquisition | Location: | Dublin, OH | |
| Borrower: | DPC1 LP | Year Built / Renovated: | Various / Various | |
| Sponsor: | Raymond Massa | Occupancy: | 84.3% | |
| Interest Rate: | 5.1500% | Occupancy Date: | 5/22/2017 | |
| Note Date: | 2/22/2017 | Number of Tenants: | 29 | |
| Maturity Date: | 3/6/2027 | 2014 NOI(3): | $1,842,128 | |
| Interest-only Period: | 24 months | 2015 NOI(3): | $3,815,130 | |
| Original Term: | 120 months | 2016 NOI(3): | $5,641,565 | |
| Original Amortization: | 360 months | TTM NOI(3): | $5,953,477 | |
| Amortization Type: | IO-Balloon | UW Economic Occupancy: | 84.9% | |
| Call Protection(2): | L(27),Def (86),O(7) | UW Revenues: | $12,204,238 | |
| Lockbox: | Hard | UW Expenses: | $6,710,527 | |
| Additional Debt: | Yes | UW NOI: | $5,493,711 | |
| Additional Debt Balance: | $15,300,000 | UW NCF: | $4,781,476 | |
| Additional Debt Type: | Pari Passu | Appraised Value / Per SF: | $64,800,000 / $99 | |
| Additional Future Debt Permitted: | No | Appraisal Date(4): | Various |
| Escrows and Reserves(5) | Financial Information(1) | |||||
| Initial | Monthly | Initial Cap | Cut-off Date Loan / SF: | $70 | ||
| Taxes: | $1,567,266 | $191,499 | N/A | Maturity Date Loan / SF: | $60 | |
| Insurance: | $71,885 | Springing | N/A | Cut-off Date LTV: | 69.9% | |
| Replacement Reserves: | $0 | $10,860 | N/A | Maturity Date LTV: | 60.7% | |
| TI/LC: | $2,000,000 | $48,870 | $3,000,000 | UW NCF DSCR: | 1.61x | |
| Free Rent Reserve: | $247,905 | $0 | N/A | UW NOI Debt Yield: | 12.1% | |
| Deferred Maintenance: | $33,500 | N/A | N/A | |||
| Unfunded Obligations Reserve: | $182,568 | $0 | N/A | |||
| Prepaid Rent Reserve: | $105,922 | $0 | N/A | |||
| Lease Sweep Reserve: | $0 | Springing | N/A |
Sources and Uses
| Sources | Proceeds | % of Total | Uses | Proceeds | % of Total | |
| Mortgage Loan | $45,300,000 | 71.1% | Purchase Price | $60,536,000 | 95.0% | |
| Sponsor Equity | 18,430,174 | 28.9 | Upfront Reserves | 4,209,046 | 6.6 | |
| Seller Closing Credits(6) | (1,720,663) | (2.7) | ||||
| Closing Costs | 705,792 | 1.1 | ||||
| Total Sources | $63,730,174 | 100.0% | Total Uses | $63,730,174 | 100.0% |
| (1) | The Columbus Office Portfolio I loan is part of a whole loan evidenced by twopari passunotes with an aggregate original principal balance of $45.3 million. The Financial Information presented in the chart above reflects the Cut-off Date balance of the $45.3 million Columbus Office Portfolio I Whole Loan. |
THE INFORMATION IN THIS STRUCTURAL AND COLLATERAL TERM SHEET IS NOT COMPLETE AND MAY BE AMENDED PRIOR TO THE TIME OF SALE. THIS TERM SHEET IS NOT AN OFFER TO SELL THESE SECURITIES AND IT IS NOT A SOLICITATION OF AN OFFER TO BUY THESE SECURITIES IN ANY JURISDICTION WHERE THE OFFER OR SALE IS NOT PERMITTED.
154
Mortgage Loan No. 11 – Columbus Office Portfolio I
| (2) | The lockout period will be at least 27 payments beginning with and including the first payment date of April 6, 2017. Defeasance of the full $45.3 million Columbus Office Portfolio I Whole Loan is permitted at any time after the date that is two years after the closing date of the securitization that includes the last note to be securitized. |
| (3) | The increases in NOI year-over-year are due to the income associated with new tenants and the year-over-year pickup from tenants that moved in the prior year contributing a full year’s worth of rent instead of a partial-year contribution made in the move-in year. |
| (4) | The properties were appraised from November 29, 2016 to December 2, 2016 |
| (5) | At closing the borrower reserved $382,998 into the tax reserve and covenanted in the loan agreement to deposit $1,184,268 into the tax reserve within two days of closing. The $1,184,268 amount is included in this table as part of the initial tax reserve. The borrower satisfied its obligation the day after closing. |
| (6) | Seller Closing Credits include various accrued but not yet paid credits from the seller that lender reserved for so as to not overstate the amount of equity contributed, broken out as follows: (a) tax ($1,184,268); (b) free rent ($247,905); (c) prepaid rent ($105,922); and (d) TI/LC ($182,568). |
The Loan. The Columbus Office Portfolio I loan is secured by a first mortgage lien on the borrower’s fee interest in four Class A office buildings, totaling 651,596 SF, located in Dublin, Ohio. The whole loan has an outstanding principal balance as of the Cut-off Date of $45.3 million (the “Columbus Office Portfolio I Whole Loan”) and is comprised of twopari passu notes, each as described below. The controlling Note A-1, with an outstanding principal balance as of the Cut-off Date of $30.0 million, is being contributed to the CSAIL 2017-C8 Trust. The non-controlling Note A-2, with an outstanding principal balance as of the Cut-off Date of $15.3 million, is expected to be contributed to one or more future securitization trusts. The loan has a 120-month term and will amortize on a 30-year schedule following an initial interest-only period of two years.
Whole Loan Note Summary
| Original Balance | Cut-off Date Balance | Note Holder | Lead Servicer for Whole Loan (Y/N) | |
| Note A-1 | $30,000,000 | $30,000,000 | CSAIL 2017-C8 | Y |
| Note A-2 | 15,300,000 | 15,300,000 | BSP | N |
| Total | $45,300,000 | $45,300,000 |
The Borrower. The borrowing entity for the loan is DPC1 LP, a Delaware limited partnership and special purpose entity. The borrowing entity is owned 99.5% by Dublin Portfolio Columbus LP, of which the sponsor, Raymond Massa, holds a 9.01% share. Except for the organizations and individuals identified on the organizational chart in the loan documents, there are no organizations and no individuals who directly or indirectly hold in the aggregate 20% or more of the membership interest in the borrowing entity.
The Sponsor. The loan’s sponsor and nonrecourse carve-out guarantor is Raymond Massa, a real estate investor and operator who maintains a portfolio of over 5.7 million SF of office space through his company, Group RMC, a real estate co-investment and management company based in New York City. Group RMC focuses on acquiring office properties in secondary markets, principally in the Midwest. Group RMC is currently invested in more than 26 office buildings in the United States and Canada totaling more than $700.0 million in value. Group RMC’s United States assets are located in Alabama, Indiana, Kansas and Ohio. In addition to his active role at Group RMC, Mr. Massa serves as a regional director for Investors Group, a financial services company based in Canada. Investors Group is 100.0% owned by IGM Financial, a Canadian financial services company with approximately $150.0 billion in total assets under management. Mr. Massa has been at Investors Group for 30 years as a financial planner, financial security advisor and mutual fund representative.
The Properties. The collateral is comprised of four Class A office buildings located in Dublin, Ohio. The four properties were part of the sponsor’s acquisition of a seven-property portfolio, totaling 1,100,791 SF. The remaining three properties do not serve as collateral for the Columbus Office Portfolio I Whole Loan. The Columbus Office Portfolio I properties were constructed between 1991 and 2000 and total 651,596 SF. All four properties are located within approximately 0.5 miles of each other, and approximately 15 miles northwest of the Columbus, Ohio central business district. Collectively, the Columbus Office Portfolio I properties include 2,846 parking spaces, resulting in a parking ratio of approximately 4.4 spaces per 1,000 SF of net rentable area.
THE INFORMATION IN THIS STRUCTURAL AND COLLATERAL TERM SHEET IS NOT COMPLETE AND MAY BE AMENDED PRIOR TO THE TIME OF SALE. THIS TERM SHEET IS NOT AN OFFER TO SELL THESE SECURITIES AND IT IS NOT A SOLICITATION OF AN OFFER TO BUY THESE SECURITIES IN ANY JURISDICTION WHERE THE OFFER OR SALE IS NOT PERMITTED.
155
Mortgage Loan No. 11 – Columbus Office Portfolio I
As of May 22, 2017, the Columbus Office Portfolio I properties maintained a physical occupancy of 84.3% with 29 tenants. Of the 548,988 SF of occupied space, 205,033 SF (31.5% of the net rentable area and 37.0% of underwritten rent) is leased to investment-grade tenants. The largest tenant, Cardinal Health Inc. (129,698 SF; Baa2/A-/BBB+ by Moody’s/S&P/Fitch; 19.9% of net rentable area), is the largest employer in Dublin, Ohio. Cardinal Health Inc. specializes in the manufacturing and distribution of pharmaceuticals and medical products. Cardinal Health Inc. provides medical products to nearly 85.0% of hospitals in the United States and serves over 24,000 pharmacies. Cardinal Health Inc. currently employs approximately 40,000 employees in nearly 60 countries and is currently ranked 21 on the Fortune 500. Cardinal Health Inc. has two, two-year renewal options for the 99,346 SF space at 5515 Parkcenter. The second largest tenant, Alcatel-Lucent USA Inc. (“Alcatel-Lucent”) (90,503 SF; B2/BB+ by Moody’s/S&P; 13.9% of NRA), maintains laboratory and office space at Atrium II and is owned by Nokia Corporation. Alcatel-Lucent, headquartered in France, focuses on fixed, mobile, and converged networking hardware, IP technologies, software and services, and has operations in more than 100 countries with over 52,000 employees. In mid-2016, Alcatel-Lucent was acquired by Nokia Corporation (NYSE: NOK, Ba1/BB+ by Moody’s/S&P), a Finnish multinational communication and information technology company. The third largest tenant, The Sygma Network, Inc. (“Sygma”) (44,858 SF; A3/BBB+/BB+ by Moody’s/S&P/Fitch; 6.9% of NRA), which has been headquartered at Blazer I & II since 2000 and expanded in 2007. Sygma is a wholly-owned subsidiary of Sysco, the world’s largest broadline food distributor for restaurants, healthcare, educational facilities, lodging establishments and other customers. Sysco’s family of products also includes equipment and supplies for the foodservice and hospitality industries. As a wholly-owned subsidiary of Sysco, Sygma provides non-food products to chain restaurants throughout the United States. Sygma has two, five-year renewal options.
The Market. The Columbus Office Portfolio I properties are located in the Columbus metropolitan statistical area (“MSA”). According to the appraisal, the Columbus MSA is the 32nd largest MSA in the United States, with a 2015 total population of approximately 2.0 million people, accounting for approximately 17.2% of Ohio’s population. The public sector is a major contributor to the MSA’s economy, with the State of Ohio, The Ohio State University and the City of Columbus accounting for approximately 80,000 employees. The Columbus area has the highest concentration of Fortune 1000 companies in the region including Cardinal Health Inc., Ashland, Inc. and Wendy’s. Financial services is the third largest employment sector in the MSA, with JPMorgan Chase accounting for more than 20,000 jobs. Additionally, the Columbus MSA economy includes manufacturing, retail, food and tech sectors. In manufacturing, Honda operates its largest North American manufacturing complex in the Mayersville area. In the retail sector, L Brands, Abercrombie & Fitch and other leading companies are based in Columbus. Wendy’s and White Castle, two national fast food chains, are also based in the Columbus MSA. The tech companies Microcenter and The Online Computer Library Center are also located in the MSA. The unemployment rate in the Columbus MSA was 3.9% as of November 2016, as compared to Ohio’s unemployment rate of 4.9% and the national average of 4.6%.
The Columbus Office Portfolio I properties are located in the Dublin office submarket. Dublin, Ohio is located just 20 minutes from downtown Columbus in the northwest quadrant of Franklin County. The Dublin area is directly accessible via U.S. Highway 33 and three direct interchanges on the Interstate 270 outer belt with access to Interstate 70 and Interstate 71. According to the appraisal, economic development in Dublin is driven by an active partnership between property owners and the City of Dublin. The City of Dublin has made infrastructure and tax incentive investments to spur growth in the area. The Dublin submarket is the second largest office submarket in Columbus after Downtown and the largest of the suburban office submarkets. According to the appraisal, Dublin has approximately 27.9% of the total Columbus Class A office space, second only to Downtown, and has approximately 5.9 million SF of net rentable area, vacancy of 14.2% and average asking rent of $20.68 PSF as of the third quarter 2016.
THE INFORMATION IN THIS STRUCTURAL AND COLLATERAL TERM SHEET IS NOT COMPLETE AND MAY BE AMENDED PRIOR TO THE TIME OF SALE. THIS TERM SHEET IS NOT AN OFFER TO SELL THESE SECURITIES AND IT IS NOT A SOLICITATION OF AN OFFER TO BUY THESE SECURITIES IN ANY JURISDICTION WHERE THE OFFER OR SALE IS NOT PERMITTED.
156
Mortgage Loan No. 11 – Columbus Office Portfolio I
Competitive Set Summary(1)
| Property | Year Built / Renovated | Total GLA (SF) | Est. Rent PSF | Est. Occ. | Proximity (mile) |
| Columbus Office Portfolio I | 1991-2000 / Various | 651,596 | $8.61 - $13.84(2)(3) | 84.3%(2) | NA |
| 4700 Lakehurst Ct. | 1994 / 2001 | 49,819 | $10.25 - $19.50 | 50.0% | 1.0 |
| 5555 Glendon Court | 1995 / NA | 132,854 | $11.00 - $13.50 | 75.0% | 1.1 |
| 5500 Glendon Court | 1995 / NA | 101,008 | $10.75 - $12.50 | 100.0% | 1.1 |
| Parkwood Place | 1996 / NA | 158,044 | $11.04 - $13.50 | 100.0% | 1.0 |
| One Metro Place | 1998 / NA | 119,354 | $9.00 - $12.50 | 71.0% | 1.8 |
| Emerald III | 1995 / 2003 | 128,280 | $11.25 - $14.01 | 97.0% | 1.2 |
| (1) | Source: Appraisal. |
| (2) | Based on May 22, 2017 underwritten rent roll. |
| (3) | Based on current in-place rent. |
Historical and Current Occupancy(1)
| 2013 | 2014 | 2015 | 2016 | Current(2) |
| N/A | 59.5% | 75.0% | 89.7% | 84.3% |
| (1) | Source: Historical Occupancy is provided by the sponsor. Occupancies are as of December 31 of each respective year. |
| (2) | Based on the May 22, 2017 underwritten rent roll. |
Tenant Summary(1)
| Tenant | Ratings Moody’s/S&P/Fitch(2) | Net Rentable Area (SF) | % of Total NRA | Base Rent PSF | Lease Expiration Date |
| Cardinal Health Inc. | Baa2 / A- / BBB+ | 129,698 | 19.9% | $10.98 | Various(3) |
| Alcatel-Lucent USA Inc. | B2 / BB+ / NR | 90,503 | 13.9% | $13.50 | 12/31/2018 |
| The Sygma Network, Inc. | A3 / BBB+ / NR | 44,858 | 6.9% | $14.25 | 12/31/2017 |
| Hewlett Packard Enterprise Co | Baa2 / BBB / BBB+ | 30,477 | 4.7% | $12.66 | 7/31/2019 |
| Management and Network Services | NR / NR / NR | 28,838 | 4.4% | $9.25 | 9/30/2021 |
| Navidea Biopharmaceuticals, Inc.(4) | NR / NR / NR | 24,710 | 3.8% | $12.38 | 10/31/2022 |
| Exact Software North America | NR / B / NR | 20,848 | 3.2% | $11.75 | 10/31/2022 |
| Netsmart Technologies, Inc. | NR / NR / NR | 17,871 | 2.7% | $14.26 | 5/31/2022 |
| Sedgwick Claims Management Services | NR / B / NR | 17,657 | 2.7% | $11.29 | 3/31/2021 |
| Signature, Inc. | NR / NR / NR | 16,397 | 2.5% | $9.50 | 11/30/2020 |
| (1) | Based on the underwritten rent roll dated May 22, 2017, including rent increases occurring through April 30, 2018. |
| (2) | Ratings provided are for the parent company of the entity listed in the “Tenant” field whether or not the parent company guarantees the lease. |
| (3) | 56,314 SF of Cardinal Health Inc.’s space at 5515 Parkcenter expires on December 31, 2019, 30,352 SF in Atrium II expires on July 31, 2018, and 43,032 SF of space in 5515 Parkcenter expires on October 31, 2019. |
| (4) | Navidea Biopharmaceuticals, Inc. has a one-time option to terminate its lease on October 31, 2021 with 12 months’ notice and a termination fee of unamortized leasing and tenant improvement costs at 9.0% interest. |
THE INFORMATION IN THIS STRUCTURAL AND COLLATERAL TERM SHEET IS NOT COMPLETE AND MAY BE AMENDED PRIOR TO THE TIME OF SALE. THIS TERM SHEET IS NOT AN OFFER TO SELL THESE SECURITIES AND IT IS NOT A SOLICITATION OF AN OFFER TO BUY THESE SECURITIES IN ANY JURISDICTION WHERE THE OFFER OR SALE IS NOT PERMITTED.
157
Mortgage Loan No. 11 – Columbus Office Portfolio I
Lease Rollover Schedule(1)
| Year | Number of Leases Expiring(2) | NRA Expiring(3) | % of NRA Expiring | Base Rent Expiring | % of Base Rent Expiring | Cumulative NRA Expiring | Cumulative % of NRA Expiring | Cumulative Base Rent Expiring | Cumulative % of Base Rent Expiring |
| Vacant | NAP | 102,608 | 15.7% | NAP | NAP | 102,608 | 15.7% | NAP | NAP |
| MTM | 1 | 869 | 0.1 | $12,024 | 0.2% | 103,477 | 15.9% | $12,024 | 0.2% |
| 2017 | 3 | 44,858 | 6.9 | 639,227 | 9.6 | 148,335 | 22.8% | $651,251 | 9.8% |
| 2018 | 6 | 123,882 | 19.0 | 1,574,369 | 23.7 | 272,217 | 41.8% | $2,225,620 | 33.6% |
| 2019 | 7 | 158,395 | 24.3 | 1,871,041 | 28.2 | 430,612 | 66.1% | $4,096,661 | 61.8% |
| 2020 | 3 | 20,848 | 3.2 | 209,413 | 3.2 | 451,460 | 69.3% | $4,306,074 | 64.9% |
| 2021 | 7 | 75,582 | 11.6 | 813,491 | 12.3 | 527,042 | 80.9% | $5,119,564 | 77.2% |
| 2022 | 6 | 75,705 | 11.6 | 954,254 | 14.4 | 602,747 | 92.5% | $6,073,818 | 91.6% |
| 2023 | 2 | 25,844 | 4.0 | 326,694 | 4.9 | 628,591 | 96.5% | $6,400,512 | 96.5% |
| 2024 | 2 | 922 | 0.1 | 7,200 | 0.1 | 629,513 | 96.6% | $6,407,712 | 96.6% |
| 2025 | 1 | 3,205 | 0.5 | 40,062 | 0.6 | 632,718 | 97.1% | $6,447,774 | 97.2% |
| 2026 | 1 | 13,324 | 2.0 | 185,827 | 2.8 | 646,042 | 99.1% | $6,633,601 | 100.0% |
| 2027 & Beyond(4) | 1 | 5,554 | 0.9 | 0 | 0.0 | 651,596 | 100.0% | $6,633,601 | 100.0% |
| Total | 40 | 651,596 | 100.0% | $6,633,601 | 100.0% |
| (1) | Based on the underwritten rent roll dated May 22, 2017. Rent includes base rent and rent increases occurring through April 30, 2018. |
| (2) | Certain tenants have more than one lease. |
| (3) | Certain tenants may have lease termination options that are exercisable prior to the originally stated expiration date of the subject and that are not considered in the lease rollover schedule. |
| (4) | NRA Expiring for 2027 & Beyond represents the fitness center area. |
Operating History and Underwritten Net Cash Flow
| 2014 | 2015 | 2016 | TTM(1) | Underwritten | PSF | %(2) | |
| Rents in Place(3) | $4,129,143 | $4,980,659 | $6,540,938 | $6,500,582 | $6,633,601 | $10.18 | 46.6% |
| Vacant Income | 0 | 0 | 0 | 0 | 1,187,600 | 1.82 | 8.3 |
| Gross Potential Rent | $4,129,143 | $4,980,659 | $6,540,938 | $6,500,582 | $7,821,201 | $12.00 | 54.9% |
| Total Reimbursements | 3,429,050 | 4,309,361 | 5,054,852 | 5,393,052 | 6,422,340 | 9.86 | 45.1 |
| Net Rental Income | $7,558,193 | $9,290,020 | $11,595,790 | $11,893,634 | $14,243,541 | $21.86 | 100.0% |
| (Vacancy/Collection Loss) | 0 | 0 | 0 | 0 | (2,163,705) | (3.32) | (15.2) |
| Other Income | 109,026 | 555,481 | 130,936 | 143,413 | 124,402 | 0.19 | 0.9 |
| Effective Gross Income | $7,667,219 | $9,845,501 | $11,726,726 | $12,037,047 | $12,204,238 | $18.73 | 85.7% |
| Total Expenses | $5,825,091 | $6,030,371 | $6,085,161 | $6,083,570 | $6,710,527 | $10.30 | 55.0% |
| Net Operating Income(4) | $1,842,128 | $3,815,130 | $5,641,565 | $5,953,477 | $5,493,711 | $8.43 | 45.0% |
| Total TI/LC, Capex/RR | 0 | 0 | 0 | 0 | 712,234 | 1.09 | 5.8 |
| Net Cash Flow | $1,842,128 | $3,815,130 | $5,641,565 | $5,953,477 | $4,781,476 | $7.34 | 39.2% |
| (1) | TTM column represents the trailing 12-month period ending February 28, 2017. |
| (2) | Percentage column represents percent of Net Rental Income for all revenue lines and represents percent of Effective Gross Income for the remainder of fields. |
| (3) | Underwritten Rents in Place includes rent steps taken through April 30, 2018. Investment grade tenants’ rents were straight-lined through the lesser of the remaining lease term and loan term. |
| (4) | The increases in Net Operating Income year-over-year is due to the income associated with new tenants and the year-over-year pickup from tenants that moved in the prior year contributing a full year’s worth of rent instead of a partial-year contribution made in the move-in year. |
THE INFORMATION IN THIS STRUCTURAL AND COLLATERAL TERM SHEET IS NOT COMPLETE AND MAY BE AMENDED PRIOR TO THE TIME OF SALE. THIS TERM SHEET IS NOT AN OFFER TO SELL THESE SECURITIES AND IT IS NOT A SOLICITATION OF AN OFFER TO BUY THESE SECURITIES IN ANY JURISDICTION WHERE THE OFFER OR SALE IS NOT PERMITTED.
158
(THIS PAGE INTENTIONALLY LEFT BLANK)
159
Mortgage Loan No. 12 — 71 Fifth Ave
| Mortgage Loan Information | Property Information | |||
| Mortgage Loan Seller: | BSP | Single Asset / Portfolio: | Single Asset | |
| Original Principal Balance: | $25,000,000 | Title: | Fee | |
| Cut-off Date Principal Balance: | $25,000,000 | Property Type - Subtype(3): | Other – Leased Fee | |
| % of Pool by IPB: | 3.1% | Net Rentable Area (SF)(3): | 161,000 | |
| Credit Assessment (Moody’s/Fitch/DBRS/KBRA)(1): | A1 / NR / AAA / BBB+ | Location: | New York, NY | |
| Loan Purpose: | Refinance | Year Built / Renovated: | 1907 / 2011 | |
| Borrower: | 71 Fifth Ground Lessor LLC | Occupancy(4): | N/A | |
| Sponsor: | 71 Fifth, LLC | Occupancy Date(4): | N/A | |
| Interest Rate: | 3.8800% | Number of Tenants: | N/A | |
| Note Date: | 2/3/2017 | 2014 NOI(4): | N/A | |
| Maturity Date(2): | 2/6/2027 | 2015 NOI(4): | N/A | |
| Interest-only Period: | 120 months | 2016 NOI(4): | N/A | |
| Original Term(2): | 120 months | TTM NOI(4): | N/A | |
| Original Amortization: | None | UW Economic Occupancy: | 100.0% | |
| Amortization Type: | Interest Only, ARD | UW Revenues: | $3,675,000 | |
| Call Protection: | L(28),Def(88),O(4) | UW Expenses: | $0 | |
| Lockbox: | Hard | UW NOI: | $3,675,000 | |
| Additional Debt: | No | UW NCF: | $3,675,000 | |
| Additional Debt Balance: | N/A | Appraised Value / Per SF: | $130,000,000 / $807 | |
| Additional Debt Type: | N/A | Appraisal Date: | 2/1/2017 | |
| Additional Future Debt Permitted: | No |
| Escrows and Reserves | Financial Information |
| Initial | Monthly | Initial Cap | Cut-off Date Loan / SF: | $155 | ||
| Taxes: | $0 | Springing | N/A | Maturity Date Loan / SF: | $155 | |
| Insurance: | $0 | Springing | N/A | Cut-off Date LTV: | 19.2% | |
| Maturity Date LTV: | 19.2% | |||||
| UW NCF DSCR: | 3.74x | |||||
| UW NOI Debt Yield: | 14.7% |
Sources and Uses
| Sources | Proceeds | % of Total | Uses | Proceeds | % of Total | |
| Mortgage Loan | $25,000,000 | 100.0% | Payoff Existing Debt | $20,301,387 | 81.2% | |
| Return of Equity | 3,709,854 | 14.8 | ||||
| Closing Costs | 988,760 | 4.0 | ||||
| Total Sources | $25,000,000 | 100.0% | Total Uses | $25,000,000 | 100.0% |
| (1) | Moody’s, DBRS and KBRA have each indicated that the 71 Fifth Ave loan has, in the context of its inclusion in the Initial Pool Balance, credit characteristics consistent with an investment grade obligation. |
| (2) | The 71 Fifth Ave loan has an anticipated repayment date (“ARD”) of February 6, 2027 and a stated maturity date of February 6, 2032. In the event the 71 Fifth Ave loan is not repaid in full by the ARD, the interest rate will increase from the initial interest rate of 3.8800% to 7.3800%. |
| (3) | The 71 Fifth Ave loan is secured by land occupied by an 11-story office building with ground floor retail located at 71 Fifth Avenue in New York, NY and encumbered by a 99-year ground lease that is not part of the collateral. The improvements are not collateral for the 71 Fifth Ave loan. |
| (4) | Historical NOI and occupancy data are not available for this new ground lease; however, certain historical operating information and occupancy data related to the non-collateral improvements are available. |
THE INFORMATION IN THIS STRUCTURAL AND COLLATERAL TERM SHEET IS NOT COMPLETE AND MAY BE AMENDED PRIOR TO THE TIME OF SALE. THIS TERM SHEET IS NOT AN OFFER TO SELL THESE SECURITIES AND IT IS NOT A SOLICITATION OF AN OFFER TO BUY THESE SECURITIES IN ANY JURISDICTION WHERE THE OFFER OR SALE IS NOT PERMITTED.
160
Mortgage Loan No. 12 — 71 Fifth Ave
The Loan. The 71 Fifth Ave loan, is a $25.0 million first mortgage loan secured by the leased fee interest in the non-collateral 161,000 SF Class B office building with ground floor retail space located in New York, New York. The loan has a 10-year term and is interest-only for the entire term.
The Borrower. The borrowing entity for the loan is 71 Fifth Ground Lessor LLC, a Delaware limited liability company and special purpose entity. The borrowing entity is owned approximately 20.1% by Ilana Kessler, approximately 20.1% by Kathryn Lapidus, approximately 20.1% by Varda Associates and approximately 39.7% by various members for whom none of these members owns more than 3.9% of the ownership. Except for the organizations and individuals identified on the organizational chart in the loan documents, there are no organizations and no individuals who directly or indirectly hold in the aggregate 20% or more of the membership interest in the borrowing entity.
The Sponsor. The loan’s sponsor and nonrecourse carve-out guarantor is 71 Fifth, LLC. 71 Fifth, LLC represents a group of families that own both the leased fee interest and the improvements on the 71 Fifth Ave property for over six decades. The sponsor is managed by Smith Affiliate Mgmt. Corp. (“Samco Properties”), which owns and operates commercial office buildings primarily in Midtown-South in Manhattan. Samco Properties’ portfolio consists of 2.0 million SF of commercial real estate and largely consists of loft-style office buildings near major transportation hubs.
The Property.The 71 Fifth Ave property represents both the collateral leased fee interest and the non-collateral 161,000 SF office building (the “71 Fifth Ave Office”) improvements on the parcel. The 71 Fifth Ave Office is a pre-war Class B, multi-tenanted office building situated on 12,250 SF lot in New York, NY. As of January 25, 2017, the 71 Fifth Ave Office was 100.0% leased by 10 tenants. The 71 Fifth Ave Office is under a newly executed 99-year ground lease with the collateral parcel comprising the 71 Fifth Ave loan.
The 71 Fifth Ave property is situated on the southeast corner of Fifth Avenue and East 15th Street in the Flatiron neighborhood of Manhattan. The 71 Fifth Ave parcel is located along the prime commercial corridor of Fifth Avenue and the immediate area is developed with a variety of residential, retail and office properties. Additionally, the 71 Fifth Ave property is located two blocks south of Madison Square Park, the largest public open space in the immediate area and a block west of Union Square Park.
Transportation is accessible through buses running east, west, north and south in the vicinity, the 6 subway line is accessible one block east and the N and R subway lines are accessible two blocks north. The Union Square subway station is located four blocks south of the subject and provides access to the N, Q, R, 4, 5, 6 and L subway lines.
The Market. The property is located in the Madison/Union Square office submarket of Midtown South Manhattan. Office inventory in the Midtown South office market is 66.6 million SF and the Madison/Union Square office submarket consists of approximately 32.0 million SF. According to the appraisal, the Madison/Union Square submarket is Midtown South’s largest and most sought after submarket. According to the appraisal, the direct vacancy rate for the Midtown South Manhattan office market was 5.7% as of the fourth quarter 2016 and for the Madison/Union Square submarket was 5.1%. Asking rents in the area range from $62.98 PSF to $78.39 PSF with the Madison/Union Square office submarket $69.44 PSF. Midtown South is forecasted to be undersupplied in office space in the each of the next five years, with vacancy rates expected to hover around 6.4% - 7.2% over this period.
THE INFORMATION IN THIS STRUCTURAL AND COLLATERAL TERM SHEET IS NOT COMPLETE AND MAY BE AMENDED PRIOR TO THE TIME OF SALE. THIS TERM SHEET IS NOT AN OFFER TO SELL THESE SECURITIES AND IT IS NOT A SOLICITATION OF AN OFFER TO BUY THESE SECURITIES IN ANY JURISDICTION WHERE THE OFFER OR SALE IS NOT PERMITTED.
161
Mortgage Loan No. 12 — 71 Fifth Ave
The appraiser identified ten similar leased fee properties, as outlined in the table below:
Competitive Leased Fee Interest Land Sales Summary(1)
| Property | Lot Size | Buildable SF | Ground Rent | Ground Rent PSF | Proximity (miles) | Sale Price |
| 71 Fifth Ave | 12,250 | 161,000(2) | $3,500,000 | $286 | N/A | $130,000,000 |
| 1700 Broadway | 27,583 | 413,745 | $7,700,000 | $279 | 2.4 | $280,000,000 |
| 885 Third Avenue | 26,135 | 387,000 | $17,068,716 | $653 | 2.4 | $453,000,000 |
| 760 Madison Avenue | 8,937 | 89,370 | $212,000 | $24 | 3.3 | $282,415,000 |
| 1328 Broadway | 28,710 | 430,650 | $11,819,531 | $412 | 1.2 | $365,000,000 |
| 635 Madison Avenue | 9,087 | 136,305 | $3,677,574 | $405 | 2.8 | $145,000,000 |
| 625 Madison Avenue | 35,150 | 476,565 | $4,612,500 | $131 | 2.7 | $400,000,000 |
| 600 Madison Avenue | 18,075 | 254,565 | $2,100,000 | $116 | 2.7 | $210,000,000 |
| 135 West 50th Street | 48,220 | 845,034 | $5,500,000 | $114 | 2.3 | $279,000,000 |
| 1372 Broadway | 29,000 | 435,000 | $6,417,500 | $221 | 1.6 | $151,000,000 |
| 292 Madison Avenue | 9,600 | 144,000 | $3,150,000 | $328 | 1.8 | $85,000,000 |
| (1) | Source: Appraisal. |
| (2) | Represents the non-collateral 71 Fifth Ave Office building with 161,000 SF of net rentable area. |
Historical and Current Occupancy(1)
| 2013 | 2014 | 2015 | 2016 | Current(2) |
| N/A | N/A | N/A | N/A | 100.0% |
| (1) | Historical occupancies for the 71 Fifth Ave Office building are unavailable. Current occupancy represents the occupancy for the non-collateral 71 Fifth Office building and is provided for information purposes only. The information was not collected at the origination as it is not applicable to the collateral. |
| (2) | Based on the underwritten rent roll dated January 25, 2017. |
Tenant Summary(1)
| Tenant | Ratings Moody’s/S&P/Fitch(2) | Net Rentable Area (SF) | % of Total NRA | Base Rent PSF | Lease Expiration Date |
| Ovation Travel Group | NR / NR / NR | 30,000 | 18.6% | $30.10 | 12/31/2019 |
| FHI Development 360 | NR / NR / NR | 30,000 | 18.6% | $35.87 | 12/31/2026 |
| The Martin Agency | NR / NR / NR | 15,000 | 9.3% | $65.00 | 12/31/2021 |
| The New School | NR / NR / NR | 15,000 | 9.3% | $50.53 | 12/31/2026 |
| The Gate Worldwide | NR / NR / NR | 15,000 | 9.3% | $47.07 | 9/30/2024 |
| Atrium Staffing LLC | NR / NR / NR | 15,000 | 9.3% | $48.57 | 9/30/2018 |
| Association of American Publishers | NR / NR / NR | 15,000 | 9.3% | $41.21 | 10/31/2018 |
| Miller Advertising Agency | NR / NR / NR | 15,000 | 9.3% | $26.47 | 8/31/2017 |
| Pier 1 Imports(3) | NR / B /NR | 11,000 | 6.8% | $118.18 | 2/29/2020 |
| (1) | Based on the underwritten rent roll dated January 25, 2017, no rent increases were taken. The improvements are not collateral for the 71 Fifth Ave loan. The tenant information above represents leases of the ground lessee’s non-collateral improvements and is provided for information purposes only. |
| (2) | Ratings provided are for the parent company of the entity listed in the “Tenant” field whether or not the parent company guarantees the lease. |
| (3) | The tenant was occupying the space at the time of the January 25, 2017 underwritten rent roll but has since vacated. The tenant’s lease prescribed significantly below-market rent and the lease was bought-out post-closing for the purpose of retenanting the space at market rent. |
THE INFORMATION IN THIS STRUCTURAL AND COLLATERAL TERM SHEET IS NOT COMPLETE AND MAY BE AMENDED PRIOR TO THE TIME OF SALE. THIS TERM SHEET IS NOT AN OFFER TO SELL THESE SECURITIES AND IT IS NOT A SOLICITATION OF AN OFFER TO BUY THESE SECURITIES IN ANY JURISDICTION WHERE THE OFFER OR SALE IS NOT PERMITTED.
162
Mortgage Loan No. 12 — 71 Fifth Ave
Lease Rollover Schedule(1)
| Year | Number of Leases Expiring(2) | NRA Expiring(3) | % of NRA Expiring | Base Rent Expiring | % of Base Rent Expiring | Cumulative NRA Expiring | Cumulative % of NRA Expiring | Cumulative Base Rent Expiring | Cumulative % of Base Rent Expiring |
| Vacant | NAP | 0 | 0.0% | NAP | NAP | 0 | 0.0% | NAP | NAP |
| MTM | 0 | 0 | 0.0 | $0 | 0.0% | 0 | 0.0% | $0 | 0.0% |
| 2017 | 1 | 15,000 | 9.3 | 397,000 | 5.3 | 15,000 | 9.3% | $397,000 | 5.3% |
| 2018(4) | 2 | 30,000 | 18.6 | 1,356,322 | 18.2 | 45,000 | 28.0% | $1,753,322 | 23.5% |
| 2019 | 1 | 30,000 | 18.6 | 902,867 | 12.1 | 75,000 | 46.6% | $2,656,189 | 35.6% |
| 2020(5) | 1 | 11,000 | 6.8 | 1,300,000 | 17.4 | 86,000 | 53.4% | $3,956,189 | 53.0% |
| 2021 | 1 | 15,000 | 9.3 | 975,000 | 13.0 | 101,000 | 62.7% | $4,931,189 | 66.0% |
| 2022 | 0 | 0 | 0.0 | 0 | 0.0 | 101,000 | 62.7% | $4,931,189 | 66.0% |
| 2023 | 0 | 0 | 0.0 | 0 | 0.0 | 101,000 | 62.7% | $4,931,189 | 66.0% |
| 2024 | 1 | 15,000 | 9.3 | 706,020 | 9.4 | 116,000 | 72.0% | $5,637,209 | 75.5% |
| 2025 | 0 | 0 | 0.0 | 0 | 0.0 | 116,000 | 72.0% | $5,637,209 | 75.5% |
| 2026 | 2 | 45,000 | 28.0 | 1,834,161 | 24.5 | 161,000 | 100.0% | $7,471,370 | 100.0% |
| 2027 & Beyond | 0 | 0 | 0.0 | 0 | 0.0 | 161,000 | 100.0% | $7,471,370 | 100.0% |
| Total | 9 | 161,000 | 100.0% | $7,471,370 | 100.0% |
| (1) | Based on the underwritten rent roll dated January 25, 2017. No rent steps were taken. The improvements are not collateral for the 71 Fifth Ave loan. The lease rollover schedule above represents leases of the ground lessee’s non-collateral improvements and is provided for information purposes only. |
| (2) | Certain tenants have more than one lease. |
| (3) | Certain tenants may have lease termination options that are exercisable prior to the originally stated expiration date of the subject and that are not considered in the lease rollover schedule. |
| (4) | XO Communications Services represents an antenna space. The Number of Leases Expiring exclude such tenant. The Base Rent Expiring includes the $9,600 rent paid by the tenant. |
| (5) | The lease represents Pier 1 Imports, which was occupying the space at the time of the rent roll but has vacated. The tenant’s lease prescribed significantly below market rent and the lease was bought-out post-closing for the purpose retenanting the space at market rent. |
Operating History and Underwritten Net Cash Flow
| Underwritten “Look-Through” to the Non-Collateral Improvements(1) | Underwritten(2) | PSF(2) | %(3) | |
| Rents in Place | $7,471,370 | $3,675,000 | $22.83 | 100.0% |
| Vacant Income | 0 | 0 | 0.00 | 0.0 |
| Gross Potential Rent | $7,471,370 | $3,675,000 | $22.83 | 100.0% |
| Total Reimbursements | $1,154,481 | $0 | 0.00 | 0.0 |
| Net Rental Income | $8,625,851 | $3,675,000 | $22.83 | 100.0% |
| (Vacancy/Collection Loss) | (431,293) | 0 | 0.00 | 0.0 |
| Other Income | 0 | 0 | 0.00 | 0.0 |
| Effective Gross Income | $8,194,558 | $3,675,000 | $22.83 | 100.0% |
| Total Expenses | $3,504,861 | $0 | $0.00 | 0.0% |
| Net Operating Income | $4,689,697 | $3,675,000 | $22.83 | 100.0% |
| Total TI/LC, Capex/RR | 201,250 | 0 | 0.00 | 0.0 |
| Net Cash Flow | $4,488,447 | $3,675,000 | $22.83 | 100.0% |
| (1) | The Underwritten “Look-Through” to the Non-Collateral Improvements assumed cash flow is based on the lender’s estimate of the ground lessee’s income and expenses. |
| (2) | The Underwritten cash flow represents the average ground rent payable to the borrower. |
| (3) | Percentage column represents percent of Net Rental Income for all revenue lines and represents percent of Effective Gross Income for the remainder of fields. |
THE INFORMATION IN THIS STRUCTURAL AND COLLATERAL TERM SHEET IS NOT COMPLETE AND MAY BE AMENDED PRIOR TO THE TIME OF SALE. THIS TERM SHEET IS NOT AN OFFER TO SELL THESE SECURITIES AND IT IS NOT A SOLICITATION OF AN OFFER TO BUY THESE SECURITIES IN ANY JURISDICTION WHERE THE OFFER OR SALE IS NOT PERMITTED.
163
Mortgage Loan No. 13 — Acropolis Garden
| Mortgage Loan Information | Property Information | |||
| Mortgage Loan Seller: | Natixis | Single Asset / Portfolio: | Single Asset | |
| Original Principal Balance(1): | $20,000,000 | Title: | Fee | |
| Cut-off Date Principal Balance(1): | $20,000,000 | Property Type - Subtype: | Multifamily – Cooperative | |
| % of Pool by IPB: | 2.5% | Net Rentable Area (Units): | 618 | |
| Credit Assessment (Moody’s/Fitch/DBRS/KBRA)(2): | Aaa / NR / NR / AAA | Location: | Astoria, NY | |
| Loan Purpose: | Refinance | Year Built / Renovated: | 1923 / 1988 | |
| Borrower: | Acropolis Gardens Realty Corp. | Occupancy(6): | N/A | |
| Sponsor(3): | Acropolis Gardens Realty Corp. | Occupancy Date: | N/A | |
| Interest Rate: | 3.7200% | Number of Tenants: | N/A | |
| Note Date: | 4/24/2017 | 2014 NOI(6): | N/A | |
| Maturity Date: | 5/5/2027 | 2015 NOI(6): | $198,948 | |
| Interest-only Period: | 120 months | 2016 NOI(6): | $558,957 | |
| Original Term: | 120 months | TTM NOI(6) | N/A | |
| Original Amortization: | None | UW Economic Occupancy(6): | 96.0% | |
| Amortization Type: | Interest Only | UW Revenues(6): | $14,965,959 | |
| Call Protection(4): | L(25),Def(92),O(3) | UW Expenses(6): | $5,787,751 | |
| Lockbox: | NAP | UW NOI(6): | $9,178,209 | |
| Additional Debt(5): | Yes | UW NCF(6): | $9,015,057 | |
| Additional Debt Balance(5): | $25,000,000 | Appraised Value / Per Unit(7): | $177,000,000 / $286,408 | |
| Additional Debt Type(5): | Pari Passu; Subordinate | Appraisal Date: | 2/16/2017 | |
| Additional Future Debt Permitted: | No |
| Escrows and Reserves | Financial Information(1)(6)(7) |
| Initial | Monthly | Initial Cap | Cut-off Date Loan / Room: | $72,816 | ||
| Taxes: | $295,949 | $147,974 | N/A | Maturity Date Loan / Room: | $72,816 | |
| Insurance: | $63,643 | $31,821 | N/A | Cut-off Date LTV: | 25.4% | |
| Replacement Reserves: | $0 | $13,596 | N/A | Maturity Date LTV: | 25.4% | |
| Deferred Maintenance: | $322,500 | N/A | N/A | UW NCF DSCR: | 5.31x | |
| Common Charge Reserve | $1,651,824 | Springing | N/A | UW NOI Debt Yield: | 20.4% |
Sources and Uses
| Sources | Proceeds | % of Total | Uses | Proceeds | % of Total | |
| Mortgage Loan | $45,000,000 | 100.0% | Payoff Existing Debt | $35,855,040 | 79.7% | |
| Closing Cost | 3,108,281 | 6.9 �� | ||||
| Upfront Reserves | 2,333,915 | 5.2 | ||||
| Return of Equity | 3,702,764 | 8.2 | ||||
| Total Sources | $45,000,000 | 100.0% | Total Uses | $45,000,000 | 100.0% |
| (1) | The Acropolis Garden loan is a part of a larger split whole loan evidenced by twopari passu notes with an aggregate original principal balance of $45.0 million. The Financial Information presented in the chart above and herein reflects the balance of the $45.0 million Acropolis Gardens Whole Loan (as defined below). |
| (2) | Moody’s and KBRA have each indicated that the Urban Union Amazon loan has, in the context of its inclusion in the Initial Pool Balance, credit characteristics consistent with an investment grade obligation. |
| (3) | For a more detailed description of the sponsor, please refer to “The Sponsor” below. |
THE INFORMATION IN THIS STRUCTURAL AND COLLATERAL TERM SHEET IS NOT COMPLETE AND MAY BE AMENDED PRIOR TO THE TIME OF SALE. THIS TERM SHEET IS NOT AN OFFER TO SELL THESE SECURITIES AND IT IS NOT A SOLICITATION OF AN OFFER TO BUY THESE SECURITIES IN ANY JURISDICTION WHERE THE OFFER OR SALE IS NOT PERMITTED.
164
Mortgage Loan No. 13 — Acropolis Garden
| (4) | The lockout period will be at least 24 payments beginning with and including the first payment date of June 5, 2017. Defeasance of the full $45.0 Acropolis Garden Whole Loan is permitted at any time after the earlier to occur of (i) June 5, 2021 or (ii) the date that is two years after the closing date of the securitization that includes the last note to be securitized. |
| (5) | A subordinate wraparound lien, secured by the property, is currently outstanding with an outstanding principal balance as of the Cut-off Date of $1.00. Such lien has been subordinated and stood still pursuant to a subordination and standstill agreement between Natixis Real Estate Capital, LLC and Acropolis Associates, LLC, the subordinate lender. |
| (6) | The property has been operating as a cooperative and the historical NOI reflects such operation. The underwritten NOI is based on the assumption that the property can be leased as a rental project at estimated market rents reflected in the appraisal. The increase in NOI from 2015 to 2016 is primarily due to switching from fuel to gas. For more detailed description of the financial information, please refer to “Operating History and Underwritten Net Cash Flow” below. |
| (7) | The Appraised Value assumes the property is operated as a multifamily rental property and leased at market rent, see “Certain Characteristics of Mortgage Loans Secured by Residential Cooperatives” in the Preliminary Prospectus. |
The Loan. The Acropolis Garden loan, which is part of a larger split whole loan, is a first mortgage loan secured by the borrower’s fee interest in a 618-unit cooperative multifamily property located in Astoria, New York. The Acropolis Garden Whole Loan has an outstanding principal balance of $45.0 million (the “Acropolis Garden Whole Loan”), which is comprised of twopari passunotes, identified as Note A-1 and Note A-2. The two notes have outstanding balances of $25.0 million and $20.0 million for Note A-1 and Note A-2, respectively.
The non-controlling Note A-2 has an outstanding principal balance of $20.0 million and is being contributed to the CSAIL 2017-C8 Commercial Mortgage Trust. The controlling Note A-1, which has an outstanding principal balance of $25.0 million, is currently held by Natixis and is expected to be contributed to one or more future securitizations. As the holder of Note A-2, the trustee of the CSAIL 2017-C8 Commercial Mortgage Trust is entitled to exercise all of the rights of the controlling noteholder with respect to the Acropolis Garden Whole Loan, before the Note A-1 securitization.
Pari Passu Note Summary
| Original Balance | Cut-off Date Balance | Note Holder | Lead Servicer for Whole Loan (Y/N) | |
| Note A-1 | $25,000,000 | $25,000,000 | Natixis | Y |
| Note A-2 | 20,000,000 | 20,000,000 | CSAIL 2017-C8 | N |
| Total | $45,000,000 | $45,000,000 |
The Borrower. The borrowing entity for the loan is Acropolis Gardens Realty Corp., a New York corporation and special purpose entity.
The Sponsor. The property is owned in fee simple by the borrower. No individual or entity (other than the borrower) has recourse obligations with respect to the Acropolis Gardens Whole Loan, including pursuant to any guaranty or environmental indemnity.
The Property. The Acropolis Garden property is a 618-unit mid-rise cooperative multifamily property located in Astoria, New York. The property is comprised of 16 contiguous 5-story apartment buildings built in 1923 and subsequently converted to cooperative ownership in 1988. The property has 543 sold (owner-occupied) units and 75 investor-owned rental apartments, of which 21 are rent controlled and 54 are rent stabilized.
The property contains 16 studio units, 159 one-bedroom units, 411 two-bedroom units and 32 three-bedroom units. Each of the 16 buildings is serviced by four separate entrances. The front portions of the buildings, along 33rd Street and 35th Street were constructed built over a full basement, while the interior sides of the buildings, along the interior walkway were constructed over crawl space. There is a large garden in the middle of the property’s ground floor as well as landscaped areas consisting of grass areas, shrubs, trees and plantings located along the 21st Avenue, 33rd Street and 35th Street sidewalks. Common laundry facilities at the property are located on the ground floors of 2156 33rd Street and 2157 35th Street. All apartments have video and intercom systems, which provide access via buzzer actuators. The property does not have on-site parking, but is within walking distance of major commercial/retail corridors in the neighborhood.
THE INFORMATION IN THIS STRUCTURAL AND COLLATERAL TERM SHEET IS NOT COMPLETE AND MAY BE AMENDED PRIOR TO THE TIME OF SALE. THIS TERM SHEET IS NOT AN OFFER TO SELL THESE SECURITIES AND IT IS NOT A SOLICITATION OF AN OFFER TO BUY THESE SECURITIES IN ANY JURISDICTION WHERE THE OFFER OR SALE IS NOT PERMITTED.
165
Mortgage Loan No. 13 — Acropolis Garden
Owner-occupied apartments have customized finishes suiting the individual owner occupant and household. The rental apartments have finishes consisting of hardwood floors and painted plaster walls and ceilings. Kitchen finishes consist of tile or linoleum floors, laminate counters, wood wall cabinetry, a 4-burner gas-stove and oven, a refrigerator and steel sink. The bathrooms feature ceramic tile floors, a fiberglass tub and shower, wood vanities and porcelain countertops. Renovated rental apartments have kitchens with marble tile floors, oak wood cabinetry, glass tile back splashes, GE stainless steel appliances and Caesarstone quartz countertops. Bathrooms in the renovated rental apartments have marble tile floors and ceramic tile walls.
The Market. The property is located in the Astoria neighborhood of Queens, New York, which is located in the northwestern portion of the Queens borough of New York City and benefits from its easy access to Manhattan, LaGuardia Airport and the East River waterfront. Subway stations are located throughout the immediate area and provide access to all areas of New York via direct route or connections. Astoria is a residential neighborhood developed with a wide variety of housing types and also provides a cluster of major local commercial/retail strips.
According to third party research report, the Queens County Submarket is ranked 9th within the overall New York market in terms of effective rental growth and ranks 1st in terms of overall occupancy. As of Q1 2017, the submarket had a reported vacancy rate of 2.1% with effective rents of $3,168 per unit per month. The submarket’s occupancy rate was above the overall New York market average of 96.5% in Q1 2017. The appraiser identified 18 comparable rental properties that were constructed between 1901 and 2009 with average rents ranging from $1,400 to $3,400 per unit.
Competitive Set Summary(1)
| Unit Type | Minimum Monthly Rent | Average Monthly Rent | Maximum Monthly Rent |
| Studio | $1,400 | $1,541 | $1,750 |
| One-bedroom | $1,750 | $1,871 | $2,000 |
| Two-bedroom | $2,250 | $2,499 | $2,750 |
| Three-bedroom | $3,000 | $3,226 | $3,400 |
| (1) | Source: Appraisal. |
THE INFORMATION IN THIS STRUCTURAL AND COLLATERAL TERM SHEET IS NOT COMPLETE AND MAY BE AMENDED PRIOR TO THE TIME OF SALE. THIS TERM SHEET IS NOT AN OFFER TO SELL THESE SECURITIES AND IT IS NOT A SOLICITATION OF AN OFFER TO BUY THESE SECURITIES IN ANY JURISDICTION WHERE THE OFFER OR SALE IS NOT PERMITTED.
166
Mortgage Loan No. 13 — Acropolis Garden
Operating History and Underwritten Net Cash Flow(1)
| 2015 | 2016 | Underwritten(1) | Per Unit(3) | %(4) | |
| Rents in Place | $5,633,315 | $5,470,421 | $15,452,541 | $25,004 | 100.0% |
| Vacant Income | 0 | 0 | 0 | 0 | 0.0 |
| Gross Potential Rent | $5,633,315 | $5,470,421 | $15,452,541 | $25,004 | 100.0% |
| Total Reimbursements | 0 | 0 | 0 | 0 | 0.0 |
| Net Rental Income | $5,633,315 | $5,470,421 | $15,452,541 | $25,004 | 100.0% |
| (Vacancy/Collection Loss)(2) | 0 | 0 | (623,582) | ($1,009) | (4.0) |
| Other Income | 0 | 226,401 | 137,000 | 222 | 0.9 |
| Effective Gross Income | $5,633,315 | $5,696,822 | $14,965,959 | $24,217 | 96.9% |
| Total Expenses | $5,434,367 | $5,137,865 | $5,787,751 | $9,365 | 38.7% |
| Net Operating Income | $198,948 | $558,957 | $9,178,209 | $14,851 | 61.3% |
| Total TI/LC, Capex/RR | 0 | 0 | 163,152 | 264 | 1.1 |
| Net Cash Flow | $198,948 | $558,957 | $9,015,057 | $14,587 | 60.2% |
| (1) | Residential cooperatives are generally organized and operated as not-for-profit entities that set maintenance fees to cover current expenses and plan for future capital needs. The property has been operating as a cooperative and the historical NOI reflects such operation. The Underwritten Net Operating Income and the Underwritten Net Cash Flow for the property are the projected net operating income and the projected net cash flow, respectively, reflected in the appraisal. The projected net operating income, in general, equals projected effective gross income at the property assuming such property is operated as a rental property with rents and other income set at the prevailing market rates, reduced by underwritten property operating expenses and a market-rate vacancy assumption – in each case as determined by the appraiser. The rents of 54 rent stabilized units and 21 rent controlled units are assumed to remain below market. The projected net cash flow equals the projected net operating income reduced by the projected replacement reserves – as determined by the property condition report. The projected rental income used in such determinations differs materially from the scheduled monthly maintenance payments from the tenant-shareholders at the property. |
| (2) | The vacancy reported reflects the vacancy assumption in the related appraisal for purposes of determining the appraised value of the property as a multifamily rental property. |
| (3) | Per Units values are based on 618 units. |
| (4) | % column representing percent of Net Rental Income for all revenue lines and represents percent of Effective Gross Income for the remainder of fields. |
THE INFORMATION IN THIS STRUCTURAL AND COLLATERAL TERM SHEET IS NOT COMPLETE AND MAY BE AMENDED PRIOR TO THE TIME OF SALE. THIS TERM SHEET IS NOT AN OFFER TO SELL THESE SECURITIES AND IT IS NOT A SOLICITATION OF AN OFFER TO BUY THESE SECURITIES IN ANY JURISDICTION WHERE THE OFFER OR SALE IS NOT PERMITTED.
167
Mortgage Loan No. 14 — Alexandria Corporate Park
| Mortgage Loan Information | Property Information | |||
| Mortgage Loan Seller: | BSP | Single Asset / Portfolio: | Single Asset | |
| Original Principal Balance(1): | $20,000,000 | Title: | Fee | |
| Cut-off Date Principal Balance(1): | $20,000,000 | Property Type - Subtype: | Industrial – Flex | |
| % of Pool by IPB: | 2.5% | Net Rentable Area (SF): | 259,272 | |
| Loan Purpose: | Refinance | Location: | Alexandria, VA | |
| Borrower: | DC 5-17 Fund, LLC | Year Built / Renovated: | 1962 / 2002 | |
| Sponsor: | Evan Gentry | Occupancy: | 100.0% | |
| Interest Rate: | 5.9000% | Occupancy Date: | 5/23/2017 | |
| Note Date: | 5/22/2017 | Number of Tenants: | 5 | |
| Maturity Date: | 6/6/2027 | 2014 NOI(4): | $2,490,325 | |
| Interest-only Period: | 0 months | 2015 NOI(4)(5)(6): | $1,709,257 | |
| Original Term: | 120 months | 2016 NOI(6): | $2,202,529 | |
| Original Amortization: | 360 months | TTM NOI(6)(7): | $2,662,882 | |
| Amortization Type: | Balloon | UW Economic Occupancy: | 93.0% | |
| Call Protection(2): | L(24),Def (92),O(4) | UW Revenues: | $5,257,034 | |
| Lockbox(3): | Hard | UW Expenses: | $1,638,571 | |
| Additional Debt: | Yes | UW NOI(8): | $3,618,463 | |
| Additional Debt Balance: | $14,500,000 | UW NCF: | $3,252,889 | |
| Additional Debt Type: | Pari Passu | Appraised Value / Per SF: | $53,000,000 / $204 | |
| Additional Future Debt Permitted: | No | Appraisal Date: | 1/19/2017 |
| Escrows and Reserves | Financial Information(1) | |||||
| Initial | Monthly | Initial Cap | Cut-off Date Loan / SF: | $133 | ||
| Taxes: | $297,821 | $42,546 | N/A | Maturity Date Loan / SF: | $113 | |
| Insurance: | $11,398 | $5,699 | N/A | Cut-off Date LTV: | 65.1% | |
| Replacement Reserves: | $0 | $3,457 | N/A | Maturity Date LTV: | 55.0% | |
| Engineering: | $159,531 | N/A | N/A | UW NCF DSCR: | 1.32x | |
| TI/LC: | $0 | $27,008 | N/A | UW NOI Debt Yield: | 10.5% | |
| Astor Furnace TI Allowance: | $338,548 | $0 | N/A | |||
| Gap Rent Reserve: | $375,000 | $0 | N/A | |||
| Unfunded Obligations Reserve: | $249,360 | $0 | N/A | |||
| Lease Sweep Reserve: | $0 | Springing | N/A | |||
Sources and Uses
| Sources | Proceeds | % of Total | Uses | Proceeds | % of Total | |
| Mortgage Loan(1) | $34,500,000 | 100.0% | Return of Equity(9) | $32,457,495 | 94.1% | |
| Upfront Reserves | $1,431,658 | 4.1% | ||||
| Closing Costs | $610,847 | 1.8% | ||||
| Total Sources | $34,500,000 | 100.0% | Total Uses | $34,500,000 | 100.0% |
| (1) | The Alexandria Corporate Park loan is part of a whole loan evidenced by twopari passunotes with an aggregate original principal balance of approximately $34.5 million. The financial information presented in the chart above reflects the Cut-off date balance of the approximately $34.5 million Alexandria Corporate Park Whole Loan. |
| (2) | The lockout period will be at least 24 payments beginning with and including the first payment date of July 6, 2017. Defeasance of the full $34.5 million Alexandria Corporate Park Whole Loan is permitted at any time after the date that is two years after the closing date of the securitization that includes the last note to be securitized. |
THE INFORMATION IN THIS STRUCTURAL AND COLLATERAL TERM SHEET IS NOT COMPLETE AND MAY BE AMENDED PRIOR TO THE TIME OF SALE. THIS TERM SHEET IS NOT AN OFFER TO SELL THESE SECURITIES AND IT IS NOT A SOLICITATION OF AN OFFER TO BUY THESE SECURITIES IN ANY JURISDICTION WHERE THE OFFER OR SALE IS NOT PERMITTED.
168
Mortgage Loan No. 14 — Alexandria Corporate Park
| (3) | The Alexandria Corporate Park loan is structured with a hard lockbox and in place cash management. |
| (4) | The decrease in NOI from 2014 to September 2015 TTM was primarily the result of the GSA receiving approximately $667,000 in free rent in connection with its 10-year lease extension. |
| (5) | 2015 NOI represents the trailing twelve-month period ending September 2015. Financial information was not available from October to December 2015 as the sponsor was granted in rem relief in September 2016 and the prior owner no longer controlled the asset. |
| (6) | The increase in NOI from September 2015 TTM to 2016 was the result of GSA signing an approximately 36,000 SF expansion lease for which rent commenced in September 2016. |
| (7) | Represents the trailing twelve month period ending April 30, 2017. |
| (8) | The increase in NOI from TTM NOI to UW NOI is attributable to an increase in leasing activity at the Alexandria Corporate Park property. |
| (9) | The sponsor originally acquired the property via a $24.5 million note purchase and subsequent foreclosure. G8 Capital owned the asset unencumbered prior to financing. Additionally, the sponsor has invested in the property by improving the roof, parking lot and power to the property. Total capital improvements from 2015-2016 exceeded $485,000. The sponsor’s cost basis is approximately $30.8 million. |
The Loan. The Alexandria Corporate Park loan is secured by a first mortgage lien on the borrower’s fee interest in a 259,272 SF Class B industrial flex building located in Alexandria, Virginia. The whole loan has an outstanding principal balance as of the Cut-off Date of $34.5 million (the “Alexandria Corporate Park Whole Loan”) and is comprised of twopari passu notes, each as described below. Note A-1, with an outstanding principal balance as of the Cut-off Date of $20.0 million, is the controlling note and is expected to be contributed to the CSAIL 2017-C8 Trust. The non-controlling Note A-2, with an aggregate outstanding principal balance as of the Cut-off Date of $14.5 million, is expected to be contributed to one or more future securitizations. The Alexandria Corporate Park Whole Loan has a 10-year term and will amortize on a 30-year schedule.
Whole Loan Note Summary
| Original Balance | Cut-off Date Balance | Note Holder | Lead Servicer for Whole Loan (Y/N) | |
| Note A-1 | $20,000,000 | $20,000,000 | CSAIL 2017-C8 | Y |
| Note A-2 | 14,500,000 | 14,500,000 | BSP | N |
| Total | $34,500,000 | $34,500,000 |
The Borrower. The borrowing entity for the Alexandria Corporate Park Whole Loan is DC 5-17 Fund, LLC, a Delaware limited liability company and special purpose entity. The borrowing entity is owned by various common members, of which no single member owns more than 12.2% of the borrowing entity.
The Sponsor. The loan’s sponsor and nonrecourse carve-out guarantor is Evan Gentry. Evan Gentry is the CEO of G8 Capital and managing director of G8 Holdings’ portfolio investments. G8 Capital has delivered and managed more than 65 portfolio acquisitions across 40 managed funds since 2007, representing over $500.0 million in principal balance of real estate value. G8 Capital’s management team has collectively managed more than $10.0 billion in real estate related transactions spanning several decades. Prior to G8 Capital, Evan Gentry co-founded MoneyLine Lending Services (“MoneyLine”) in 1996 and served as its president and CEO through mid-2007. MoneyLine specializes in providing outsourced mortgage lending services for regional and national banks and financial institutions. These services include loan origination, processing, underwriting, delivery to secondary markets, and post-closing/interim servicing functions. Evan Gentry also served as CEO and chairman of First Premier Escrow, a MoneyLine subsidiary.
The Property.The Alexandria Corporate Park property consists of a 259,272 SF Class B multi-tenanted industrial flex building located in Alexandria, Virginia. The property was constructed in 1962 and renovated in 2002. The property is a three-story building situated on approximately 16.1 acres on Bren Mar Drive and is located on a major industrial hub within the Greater Washington D.C. metropolitan area. Tenant spaces in the property are adaptable and feature a mixture of warehouse and/or office space with various amenities, including generators, HVAC systems, and air filtration systems. There are 744 parking spaces resulting in a ratio of 2.87 spaces per 1,000 SF.
As of May 23 2017, the property was 100.0% leased by 5 tenants. The largest tenant at the property, GSA, leases 143,454 SF (55.3% of the net rentable area) through April 2025. The GSA is rated Aaa/AA+ by Moody’s and S&P, respectively, and
THE INFORMATION IN THIS STRUCTURAL AND COLLATERAL TERM SHEET IS NOT COMPLETE AND MAY BE AMENDED PRIOR TO THE TIME OF SALE. THIS TERM SHEET IS NOT AN OFFER TO SELL THESE SECURITIES AND IT IS NOT A SOLICITATION OF AN OFFER TO BUY THESE SECURITIES IN ANY JURISDICTION WHERE THE OFFER OR SALE IS NOT PERMITTED.
169
Mortgage Loan No. 14 — Alexandria Corporate Park
provides centralized procurement for the federal government, facilitates the federal government’s purchase of goods and services from commercial vendors and offers billions of dollars’ worth of products, services and facilities. The GSA operates two divisions of the Department of Homeland Security at the property: the Federal Protective Services and Immigration and Customs Employment. The second largest tenant at the property, Astor Enterprises, Inc. (“Astor Enterprises”) leases 49,194 SF (19.0% of the net rentable area) through June 2027 with one, five-year extension option remaining. Founded in 1996 by music industry veterans, Astor Enterprises offers media replication, duplication and packaging services as well as serving as a full-service creative partner. The third largest tenant at the property, CACI, Inc., (“CACI”) leases 41,424 SF (16.0% of the net rentable area) through September 2021 with one, five-year extension option remaining. With 20,000 employees worldwide, CACI, rated Ba2/BB+ by Moody’s and S&P respectively, provides information solutions and services in support of national security missions and government transformation for intelligence, defense and federal civilian customers. CACI is a member of the Fortune 1000 Largest Companies as well as a Fortune’s World’s Most Admired Company in the IT service industry. Additionally, CACI is listed in Russell 2000 Index and the S&P SmallCap600 Index.
The Market. The Alexandria Corporate Park property is located in Fairfax County within Alexandria, Virginia. The property is located on Bren Mar Drive which is approximately 1.0 mile off of Interstate 395 and 1.1 miles from the I-95 / I-395 / I-495 interchange, known as the “Mixing Bowl”. According to the appraisal, the Mixing Bowl is one of the busiest highway junctions in the United States. Additionally, the neighborhood surrounding the property is located about 10.0 miles from Reagan National Airport and 24.0 miles from Washington Dulles International Airport.
The Alexandria Corporate Park property is located in the Springfield Industrial submarket, the Springfield Flex submarket, and the Springfield/Newington office submarket. According to the appraiser, as of the fourth quarter of 2016, the Springfield Industrial submarket contained 6.1 million SF of industrial space with a direct vacancy rate of 9.9%. The Springfield Flex office and Springfield/Newington office submarket inventories are 2.0 million SF and 4.6 million SF, respectively, and direct vacancy rates are 6.6% and 22.2%, respectively.
According to the appraisal, the property’s industrial competitive set consists of seven properties with SF ranging from 41,860 to 506,825 and rents PSF from $6.50 to $28.08 as detailed in the table below:
Industrial Competitive Set Summary(1)
| Property | Year Built / Renovated | Total GLA (SF) | Est. Rent PSF | Est. Occ. | Proximity (miles) | Major Tenants |
| Alexandria Corporate Park | 1962 / 2002 | 259,272 | $20.12(2)(3) | 100.0%(2) | N/A | GSA, Astor Enterprises, CACI, Inc. |
| 7701 Southern Drive | 1980 | 251,178 | $6.50-$9.49 | 100.0% | 4.5 | Baystate Pools (Ren), Lidl US |
| Shell Oil Industrial Park | 1985 | 41,860 | $10.75 | 100.0% | 1.0 | Barbizon |
| Plaza 500 | 1973 | 506,825 | $9.00-$28.08 | 96.0% | 2.0 | Paxton Van Lines, Inc., Precision Doors & Hardware, Virginia Commonwealth University, International Brotherhood of Teamsters |
| Fleet Distribution Center III | 1971 | 51,526 | $9.00-$10.00 | 100.0% | 2.0 | 7-11 Inc., WMW Enterprises |
| Gibson Warehouse | 1979 | 45,000 | $9.60 | 100.0% | 1.0 | Ferguson Enterprises Inc. |
| 821 South Pickett Street | 1965 | 42,660 | $9.00 | 100.0% | 2.2 | Belvoir Collision Center, Mosaic Tile |
| Alban Business Center | 1982 | 86,967 | $12.10 | 79.0% | 6.5 | CACI, Inc. |
| (1) | Source: Appraisal. |
| (2) | Based on the May 23, 2017 underwritten rent roll. |
| (3) | Represents underwritten base rent across all tenant spaces. |
THE INFORMATION IN THIS STRUCTURAL AND COLLATERAL TERM SHEET IS NOT COMPLETE AND MAY BE AMENDED PRIOR TO THE TIME OF SALE. THIS TERM SHEET IS NOT AN OFFER TO SELL THESE SECURITIES AND IT IS NOT A SOLICITATION OF AN OFFER TO BUY THESE SECURITIES IN ANY JURISDICTION WHERE THE OFFER OR SALE IS NOT PERMITTED.
170
Mortgage Loan No. 14 — Alexandria Corporate Park
Additionally, the appraiser identified six comparable office properties, with SF ranging from 47,368 to 135,604 and rents PSF ranging from $21.75 to $32.70 as detailed in the table below:
Office Competitive Set Summary(1)
| Property | Year Built / Renovated | Total GLA (SF) | Est. Rent PSF | Est. Occ. | Proximity (miles) | Major Tenants |
| Alexandra Corporate Park | 1962 / 2002 | 259,272 | $20.12(2)(3) | 100.0%(2) | N/A | GSA, Astor Enterprises, CACI, Inc. |
| Springfield Corporate Center | 1988 | 135,604 | $28.00-$32.75 | 85.0% | 3.7 | CSCI, PD Systems, Volkert, Novetta Solutions |
| Beauregard Square | 1985 | 75,000 | $22.00 | 90.0% | 3.2 | Confidential |
| 5290 Shawnee Road | 2001 | 47,368 | $23.00 | 50.0% | 1.5 | Pro Pilot Magazine |
| Cherokee Business Center – Building A | 1986 | 57,304 | $22.00-$25.50 | 84.0% | 1.3 | Goldbelt (Parabus), GINIA, Thomas Rutherford |
| Poplar Run Office Park 5 | 1989 | 150,291 | $25.00 | 97.0% | 1.5 | Confidential |
| Cherokee Business Center – Building B | 1985/1993 | 53,000 | $21.75-$24.50 | 69.0% | 1.3 | GINIA Inc, Universolutions, RJK Enterprises Inc |
| (1) | Source: Appraisal. |
| (2) | Based on the May 23, 2017 underwritten rent roll. |
| (3) | Represents underwritten base rent across all tenant spaces. |
Historical and Current Occupancy(1)
| 2013 | 2014 | 2015(2) | 2016 | Current(3) |
| 65.1% | 55.1% | 56.0% | 72.4% | 100.0% |
| (1) | Source: Historical Occupancy is provided by the sponsor. Occupancies are as of December 31 of each respective year. |
| (2) | 2015 Historical Occupancy is based on the trailing twelve-month period ending September 30, 2015. |
| (3) | Based on the May 23, 2017 underwritten rent roll. |
Tenant Summary(1)
| Tenant | Ratings Moody’s/S&P/Fitch(2) | Net Rentable Area (SF) | % of Total NRA | Base Rent PSF | Lease Expiration Date |
| GSA(3) | Aaa / AA+ / NR | 143,454 | 55.3% | $23.61 | 4/14/2025 |
| Astor Enterprises(4) | NR / NR / NR | 49,194 | 19.0% | $7.50 | 6/30/2027 |
| CACI, Inc.(5) | Ba2 /BB+ / NR | 41,424 | 16.0% | $26.69 | 9/30/2021 |
| Action Chapel Virginia, Inc. | NR / NR / NR | 22,500 | 8.7% | $15.00 | 4/30/2018 |
| MJJP Construction, Inc. | NR / NR /NR | 2,700 | 1.0% | $6.90 | 7/1/2018 |
| (1) | Based on the underwritten rent roll dated May 23, 2017. |
| (2) | Ratings provided are for the parent company of the entity listed in the “Tenant” field whether or not the parent company guarantees the lease. |
| (3) | GSA has no termination options. |
| (4) | Astor Enterprises has yet to move into its space and is expecting to receive its construction permit. Astor Enterprises’ lease does not provide a termination option. Rent will commence on 34,194 SF in September 2017 and the remaining 15,000 SF will begin paying rent in December 2018. The Astor Enterprises lease provides for a one time, five-year renewal option subject to exercise of the renewal option 9 months before the termination of the original lease term. For more information, see “Description of the Mortgage Pool—Tenant Issues���Lease Expirations and Terminations—Other” in the Preliminary Prospectus. |
| (5) | CACI has a one time, five year renewal option for its lease, provided it exercises its renewal option nine months before the termination of the original lease term. CACI holds the right to terminate its lease any time after May 31, 2018, provided that it provides six months’ notice and payment of a termination fee. |
THE INFORMATION IN THIS STRUCTURAL AND COLLATERAL TERM SHEET IS NOT COMPLETE AND MAY BE AMENDED PRIOR TO THE TIME OF SALE. THIS TERM SHEET IS NOT AN OFFER TO SELL THESE SECURITIES AND IT IS NOT A SOLICITATION OF AN OFFER TO BUY THESE SECURITIES IN ANY JURISDICTION WHERE THE OFFER OR SALE IS NOT PERMITTED.
171
Mortgage Loan No. 14 — Alexandria Corporate Park
Lease Rollover Schedule(1)
| Year | Number of Leases Expiring(2) | NRA Expiring | % of NRA Expiring | Base Rent Expiring | % of Base Rent Expiring | Cumulative NRA Expiring | Cumulative % of NRA Expiring | Cumulative Base Rent Expiring | Cumulative % of Base Rent Expiring |
| Vacant | NAP | 0 | NAP | NAP | NAP | 0 | 0.0% | NAP | NAP |
| MTM | 0 | 0 | 0.0% | $0 | 0.0% | 0 | 0.0% | $0 | 0.0% |
| 2017 | 0 | 0 | 0.0 | 0 | 0.0 | 0 | 0.0% | $0 | 0.0% |
| 2018 | 2 | 25,200 | 9.7 | 356,130 | 6.8 | 25,200 | 9.7% | $356,130 | 6.8% |
| 2019 | 0 | 0 | 0.0 | 0 | 0.0 | 25,200 | 9.7% | $356,130 | 6.8% |
| 2020 | 0 | 0 | 0.0 | 0 | 0.0 | 25,200 | 9.7% | $356,130 | 6.8% |
| 2021 | 1 | 41,424 | 16.0 | 1,105,607 | 21.2 | 66,624 | 25.7% | $1,461,737 | 28.0% |
| 2022 | 0 | 0 | 0.0 | 0 | 0.0 | 66,624 | 25.7% | $1,461,737 | 28.0% |
| 2023 | 0 | 0 | 0.0 | 0 | 0.0 | 66,624 | 25.7% | $1,461,737 | 28.0% |
| 2024 | 0 | 0 | 0.0 | 0 | 0.0 | 66,624 | 25.7% | $1,461,737 | 28.0% |
| 2025 | 3 | 143,454 | 55.3 | 3,386,254 | 64.9 | 210,078 | 81.0% | $4,847,991 | 92.9% |
| 2026 | 0 | 0 | 0.0 | 0 | 0.0 | 210,078 | 81.0% | $4,847,991 | 92.9% |
| 2027 & Beyond | 1 | 49,194 | 19.0 | 368,955 | 7.1 | 259,272 | 100.0% | $5,216,946 | 100.0% |
| Total | 7 | 259,272 | 100.0% | $5,216,946 | 100.0% |
| (1) | Based on the underwritten rent roll dated May 23, 2017. |
| (2) | Certain tenants have more than one lease. |
Operating History and Underwritten Net Cash Flow
| 2014 | 2015(1) | 2016(2) | TTM(2) | Underwritten(3) | PSF | %(4) | |
| Rents in Place(5) | $3,554,404 | $3,519,537 | $3,937,034 | $4,290,844 | $5,216,942 | $20.12 | 95.2% |
| Free Rent Adjustment | 0 | (667,154) | (407,745) | (407,745) | 0 | $0.00 | 0.0 |
| Gross Potential Rent | $3,554,404 | $2,852,383 | $3,529,289 | $3,883,099 | $5,216,942 | $20.12 | 95.2% |
| Total Reimbursements | 29,106 | 62,694 | 84,910 | 65,279 | 261,387 | $1.01 | 4.8 |
| Net Rental Income | $3,583,509 | $2,915,077 | $3,614,199 | $3,948,378 | $5,478,329 | $21.13 | 100.0% |
| (Vacancy/Collection Loss) | 0 | (4,308) | 0 | 0 | (395,691) | ($1.53) | (7.2) |
| Other Income | 164,748 | 158,853 | 252,396 | 276,847 | 174,396 | $0.67 | 3.2 |
| Effective Gross Income | $3,748,257 | $3,069,622 | $3,866,596 | $4,225,225 | $5,257,034 | $20.28 | 96.0% |
| Total Expenses | $1,257,932 | $1,360,365 | $1,664,067 | $1,562,343 | $1,638,571 | $6.32 | 31.2% |
| Net Operating Income | $2,490,325 | $1,709,257 | $2,202,529 | $2,662,882 | $3,618,463 | $13.96 | 68.8% |
| Total TI/LC, Capex/RR | 365,574 | 365,574 | 365,574 | 365,574 | 365,574 | $1.41 | 7.0 |
| Net Cash Flow | $2,124,752 | $1,343,684 | $1,836,955 | $2,297,308 | $3,252,889 | $12.55 | 61.9% |
| (1) | Represents the trailing twelve month period ending on September 30, 2015. |
| (2) | Represents the trailing twelve month period ending April 30, 2017. |
| (3) | The increase in Net Operating Income from TTM to Underwritten is attributable to the expiration of free rent and the lease commencement of GSA and Astor Enterprises. |
| (4) | Percentage column represents percent of Net Rental Income for all revenue lines and represents percent of Effective Gross Income for the remainder of the fields. |
| (5) | Rents in place include rent steps through October 1, 2017 for CACI and through August 1, 2017 for MJJP Construction, Inc. |
THE INFORMATION IN THIS STRUCTURAL AND COLLATERAL TERM SHEET IS NOT COMPLETE AND MAY BE AMENDED PRIOR TO THE TIME OF SALE. THIS TERM SHEET IS NOT AN OFFER TO SELL THESE SECURITIES AND IT IS NOT A SOLICITATION OF AN OFFER TO BUY THESE SECURITIES IN ANY JURISDICTION WHERE THE OFFER OR SALE IS NOT PERMITTED.
172
(THIS PAGE INTENTIONALLY LEFT BLANK)
173
Mortgage Loan No. 15 — Shoppes at Harmon Square
| Mortgage Loan Information | Property Information | |||
| Mortgage Loan Seller: | BSP | Single Asset / Portfolio: | Single Asset | |
| Original Principal Balance: | $18,100,000 | Title: | Fee | |
| Cut-off Date Principal Balance: | $18,100,000 | Property Type - Subtype: | Retail – Unanchored | |
| % of Pool by IPB: | 2.2% | Net Rentable Area (SF): | 31,036 | |
| Loan Purpose: | Refinance | Location: | Las Vegas, NV | |
| Borrower: | Harmon Square SPE LLC | Year Built / Renovated: | 1987 / 2015 - 2016 | |
| Sponsors: | Eli Applebaum; Gerald Barad | Occupancy: | 72.5% | |
| Interest Rate: | 5.1000% | Occupancy Date: | 4/1/2017 | |
| Note Date: | 5/8/2017 | Number of Tenants: | 10 | |
| Maturity Date: | 6/6/2027 | 2014 NOI: | $548,235 | |
| Interest-only Period: | 0 months | 2015 NOI(2): | $421,547 | |
| Original Term: | 120 months | 2016 NOI(2): | $720,548 | |
| Original Amortization: | 360 months | TTM NOI(3): | $799,715 | |
| Amortization Type: | Balloon | UW Economic Occupancy: | 80.0% | |
| Call Protection: | L(24),Def(92),O(4) | UW Revenues: | $2,045,525 | |
| Lockbox(1): | Hard | UW Expenses: | $316,168 | |
| Additional Debt: | No | UW NOI: | $1,729,357 | |
| Additional Debt Balance: | N/A | UW NCF: | $1,706,251 | |
| Additional Debt Type: | N/A | Appraised Value / Per SF: | $30,370,000 / $979 | |
| Additional Future Debt Permitted: | No | Appraisal Date: | 3/22/2017 |
| Escrows and Reserves | Financial Information | |||||
| Initial | Monthly | Initial Cap | Cut-off Date Loan / SF: | $583 | ||
| Taxes: | $16,621 | $3,324 | N/A | Maturity Date Loan / SF: | $481 | |
| Insurance: | $31,655 | $3,957 | N/A | Cut-off Date LTV: | 59.6% | |
| Replacement Reserves: | $27,187 | $388 | N/A | Maturity Date LTV: | 49.2% | |
| TI/LC: | $250,000 | $3,621 | N/A | UW NCF DSCR: | 1.45x | |
| Deferred Maintenance: | $13,625 | $0 | N/A | UW NOI Debt Yield: | 9.6% | |
| Tenant Specific TI/LC: | $412,652 | $0 | N/A | |||
| Free Rent Reserve: | $61,350 | $0 | N/A | |||
| Lease Sweep Reserve(4): | $0 | Springing | N/A |
Sources and Uses
| Sources | Proceeds | % of Total | Uses | Proceeds | % of Total | |
| Mortgage Loan | $18,100,000 | 100.0% | Payoff Existing Debt | $12,906,899 | 71.3% | |
| Return of Equity | 3,772,643 | 20.8 | ||||
| Upfront Reserves | 813,090 | 4.5 | ||||
| Closing Costs | 607,367 | 3.4 | ||||
| Total Sources | $18,100,000 | 100.0% | Total Uses | $18,100,000 | 100.0% |
| (1) | The loan is structured with a hard lockbox and springing cash management. |
| (2) | The increase in NOI from 2015 to 2016 is attributable to lease-up and repositioning at the property. |
| (3) | Represents the trailing twelve month period ending February 28, 2017. |
| (4) | On each monthly payment date during a cash sweep period that was caused and exists solely due to a specified tenant sweep event (as defined in the loan documents), the borrower is required to deposit all excess cash flow generated by the property, after the payment of debt service, required reserves and operating expenses, among other things, for the immediately preceding interest period into a lease sweep reserve. |
THE INFORMATION IN THIS STRUCTURAL AND COLLATERAL TERM SHEET IS NOT COMPLETE AND MAY BE AMENDED PRIOR TO THE TIME OF SALE. THIS TERM SHEET IS NOT AN OFFER TO SELL THESE SECURITIES AND IT IS NOT A SOLICITATION OF AN OFFER TO BUY THESE SECURITIES IN ANY JURISDICTION WHERE THE OFFER OR SALE IS NOT PERMITTED.
174
Mortgage Loan No. 15 — Shoppes at Harmon Square
The Loan. The Shoppes at Harmon Square loan is secured by a first mortgage lien on the borrower’s fee interest in an unanchored retail strip center, totaling 31,036 SF located in Las Vegas, Nevada. The loan has a 10-year term and will amortize on a 30-year schedule.
The Borrower. The borrowing entity for the Shoppes at Harmon Square is Harmon Square SPE LLC, a Delaware limited liability company and special purpose entity. The borrowing entity is 100.0% owned by HD Harmon Square, LLC, a Nevada limited liability company, which is 25.0% owned by Chris Rokos, 25.0% owned by Andrew Morton, 16.7% owned by Mark Spindel, 16.7% owned by Jason Cummins, 8.3% owned by Jay Moskowitz, 4.2% owned by Eli Applebaum and 4.2% owned by Gerald Barad.
The Sponsors. The loan’s sponsors and nonrecourse carve-out guarantors are Eli Applebaum and Gerald Barad. Eli Applebaum is the President of High Desert Investment Group and Manager of NYLV Investors, and has over 30 years of experience in commercial real estate. High Desert Investment Group focuses on acquiring and developing properties with an emphasis on retail properties in southwestern United States and primarily in the Las Vegas Market. Previously, Mr. Applebaum was Executive Vice President of Executive Home Builders where he was head of its commercial division. Under Mr. Applebaum, EHB was involved in the design, leasing and financing of Tivoli Village, a 1.4 million SF mixed-use development in Las Vegas. The total project cost was approximately $850.0 million. Additionally, he was part of EHB’s senior management team whose responsibilities included the overall strategic and tactical planning and operation of the business. Earlier in his career, Mr. Applebaum was one of the most active build-to-suit developers on the west coast with single tenants ranging from fast food chains, convenience and gas stations to health clubs that included Jack In The Box, Exxon, Turtle Stop, and 24 Hour Fitness. Mr. Applebaum has also developed and operated affiliated companies involved in various businesses including Esmor, which operated one of the nation’s largest groups of private correctional facilities. Gerald Barad is a second-generation hotelier and has been an active investor in commercial and multi-family residential real estate (largely in New York City) for over 20 years, maintaining interests in over 25 hotels and 12,000 apartments. In February 2014, with his business partner Shimmie Horn, Mr. Barad united six boutique properties to form the Triumph Hotels brand. Mr. Barad is also part of the Triumph executive team.
The Property.The Shoppes at Harmon Square property is a 31,036 SF unanchored retail strip center located in Las Vegas, Nevada, approximately 1.5 miles southeast of the Las Vegas Strip and 0.9 miles north of the McCarran International Airport. The property was originally constructed in 1987 and renovated in 2015 and 2016. The property consists of four buildings located at the intersection of Paradise Road, averaging 43,800 vehicles per day, and Harmon Avenue averaging 28,000 vehicles per day. The property is located across the street from the Hard Rock Hotel and Casino, and the University of Nevada, Las Vegas lies a quarter mile east of the property. The property sits across the street from Paradise Esplanade, a CVS anchored retail center, positioned in front of Eller Media Softball Stadium. Additionally, the property contains 200 parking spaces, resulting in a parking ratio of approximately 6.4 spaces per 1,000 SF.
As of April 1, 2017, the Shoppes at Harmon Square property was 72.5% leased to a mix of national and local restaurant tenants, a liquor store and a convenience store. The largest tenant, Liquor World (5,408 SF; 17.4% of net rentable area), has been at the center since January 2016. The triple-net lease prescribes the tenant an initial 10-year term with three, five-year options to renew. Liquor World reported year-end 2016 sales of $735 PSF, which increased by 8.1% to $795 PSF for the TTM March 2017 gross sales. The second largest tenant, Checkers (2,470 SF; 8.0% of net rentable area) has been at the property since December 2015. Checkers has a drive-thru window that is directly accessible via the first curb cut along Paradise Road. Checkers reported sales in the first year of operations at the property with year-end 2016 sales of $575 PSF. Checkers was founded in 1986 in Mobile, Alabama. Checkers Restaurants and Rally’s Hamburgers, Inc. are drive-thru restaurant chains in the US with over 800 locations. The lease prescribes Checkers an initial 10-year term with two, five-year options to renew. The third largest tenant, 7-Eleven (2,417 SF; 7.8% of net rentable area), executed a 10-year triple net lease in November 2016. 7-Eleven’s lease commenced on March 20, 2017, while the rent commencement date was June 20, 2017. 7-Eleven was in the process of building out their space at closing and is expected to open in August 2017. The lease prescribes 7-Eleven one, ten-year option to renew. 7-Eleven is an international convenience store founded in 1927. 7-Eleven has 56,600 locations in 18 countries and is known for the Slurpee and Big Gulp beverages.
THE INFORMATION IN THIS STRUCTURAL AND COLLATERAL TERM SHEET IS NOT COMPLETE AND MAY BE AMENDED PRIOR TO THE TIME OF SALE. THIS TERM SHEET IS NOT AN OFFER TO SELL THESE SECURITIES AND IT IS NOT A SOLICITATION OF AN OFFER TO BUY THESE SECURITIES IN ANY JURISDICTION WHERE THE OFFER OR SALE IS NOT PERMITTED.
175
Mortgage Loan No. 15 — Shoppes at Harmon Square
The Market. The Shoppes at Harmon Square property is located in Clark county, which is known as Paradise Township. A large portion of the property’s neighborhood is improved with large resort and casino projects situated within the Las Vegas Strip resort corridor. According to the appraisal, the 2016 populations within a one-, three- and five-mile radius of the property are 15,408, 118,691 and 391,486, respectively. The average household incomes within a one-, three- and five-mile radius of the property are $39,996, $46,171 and $52,220, respectively. According to a third-party data provider, the property is located in the Las Vegas retail market. As of year-end 2016, the Las Vegas retail market maintains an inventory of approximately 29.6 million SF, a vacancy rate of 13.2% and an average rental rate of $21.87 PSF. The average vacancy over the past 10 years was 11.6%. Additionally, over the past 10 years approximately 3.2 million SF of completions have been added to the market while approximately 665,000 SF represents net absorption.
The property is in the Central East submarket and is considered a Class A neighborhood retail center. The submarket reports an average occupancy of 87.1%, net absorption of 92,718 SF and an average asking rent of $1.30 PSF as of the fourth quarter of 2016. The appraisal identified four most relevant comparable office rentals ranging in size from 42,025 and 904,444 SF and reported quoted average asking rents ranging from $30.00 to $92.00 PSF.
Competitive Set Summary(1)
| Property | Year Built / Renovated | Total GLA (SF) | Est. Rent PSF | Est. Occ. | Proximity (miles) |
| Shoppes at Harmon Square | 1987 / 2015 - 2016 | 31,036 | $62.30(2) | 72.5%(3) | N/A |
| Paradise Esplanade | 2005 | 56,811 | $54.00 | 92% | 0.2 |
| Showcase Island Plaza | 2001 | 42,025 | $92.00 | 100% | 1.8 |
| Gold Key Shops Strip Center | 1961 | 45,081 | $54.00 | 100% | 2.8 |
| Town Square | 2007 | 904,444 | $30.00 | 92% | 4.0 |
| (1) | Source: Appraisal. |
| (2) | Based on current in-place rent. |
| (3) | Based on the April 1, 2017 underwritten rent roll. |
Historical and Current Occupancy(1)
| 2013 | 2014 | 2015 | 2016 | Current(2) |
| N/A | N/A | N/A | 59.0% | 72.5% |
| (1) | Source: Historical Occupancy is provided by the sponsor. Occupancies are as of December 31 of each respective year. 2013, 2014 and 2015 occupancies are not applicable due to lease-up and repositioning at the property. |
| (2) | Based on the April 1, 2017 underwritten rent roll. |
THE INFORMATION IN THIS STRUCTURAL AND COLLATERAL TERM SHEET IS NOT COMPLETE AND MAY BE AMENDED PRIOR TO THE TIME OF SALE. THIS TERM SHEET IS NOT AN OFFER TO SELL THESE SECURITIES AND IT IS NOT A SOLICITATION OF AN OFFER TO BUY THESE SECURITIES IN ANY JURISDICTION WHERE THE OFFER OR SALE IS NOT PERMITTED.
176
Mortgage Loan No. 15 — Shoppes at Harmon Square
Tenant Summary(1)
| Tenant | Ratings Moody’s/S&P/Fitch(2) | Net Rentable Area (SF) | % of Total NRA | Base Rent PSF | Lease Expiration Date |
| Liquor World(3) | NR / NR/ NR | 5,408 | 17.4% | $32.29 | 1/31/2026 |
| Checkers(4) | NR / B- / NR | 2,470 | 8.0% | $98.18 | 12/31/2025 |
| 7-Eleven(5) | Baa1 / AA- / NR | 2,417 | 7.8% | $90.00 | 6/30/2027 |
| Roberto’s Taco Shop | NR / NR / NR | 2,001 | 6.4% | $53.04 | 3/31/2026 |
| Dunkin Donuts(6) | NR / NR / NR | 2,000 | 6.4% | $50.00 | 2/28/2021 |
| Teriyaki Madness | NR / NR / NR | 1,806 | 5.8% | $48.00 | 1/31/2027 |
| H2O Poke& Fish Grill | NR / NR / NR | 1,755 | 5.7% | $61.80 | 2/28/2027 |
| Tropical Smoothie | NR / NR / NR | 1,702 | 5.5% | $50.94 | 4/30/2027 |
| Papaya King | NR / NR / NR | 1,558 | 5.0% | $60.00 | 5/31/2029 |
| Subway(7) | NR / NR / NR | 1,376 | 4.4% | $69.99 | 2/28/2026 |
| (1) | Based on the underwritten rent roll dated April 1, 2017, including rent increases occurring through April 2018. |
| (2) | Ratings provided are for the parent company of the entity listed in the “Tenant” field whether or not the parent company guarantees the lease. |
| (3) | Liquor World has three, five-year options to renew. The initial base rent of $269,800 ($49.89 PSF), will be reduced once 7-Eleven takes occupancy. Liquor World’s percentage rent breakpoint will then decline accordingly and overall based on TTM sales, the tenant will be paying a slightly higher rent overall rent. Liquor World has expressed interest in expanding at the property and absorbing vacant space adjacent to it. |
| (4) | Checkers has two, five-year options to renew its lease. |
| (5) | 7-Eleven has one, ten-year option to renew its lease. |
| (6) | Dunkin Donuts has three, five-year options to renew. Dunkin Donuts does not pay base rent and is on a percentage only lease. |
| (7) | Subway has two, five-year options to renew its lease and received $55,040 ($40.00 PSF) in tenant improvement allowance. |
Lease Rollover Schedule(1)
| Year | Number of Leases Expiring(2) | NRA Expiring | % of NRA Expiring | Base Rent Expiring | % of Base Rent Expiring | Cumulative NRA Expiring | Cumulative % of NRA Expiring | Cumulative Base Rent Expiring | Cumulative % of Base Rent Expiring |
| Vacant | NAP | 8,543 | 27.5% | NAP | NAP | 8,543 | 27.5% | NAP | NAP |
| MTM | 0 | 0 | 0.0 | $0 | 0.0% | 8,543 | 27.5% | $0 | 0.0% |
| 2017 | 0 | 0 | 0.0 | 0 | 0.0 | 8,543 | 27.5% | $0 | 0.0% |
| 2018 | 0 | 0 | 0.0 | 0 | 0.0 | 8,543 | 27.5% | $0 | 0.0% |
| 2019 | 0 | 0 | 0.0 | 0 | 0.0 | 8,543 | 27.5% | $0 | 0.0% |
| 2020 | 0 | 0 | 0.0 | 0 | 0.0 | 8,543 | 27.5% | $0 | 0.0% |
| 2021 | 1 | 2,000 | 6.4 | 100,000 | 7.6 | 10,543 | 34.0% | $100,000 | 7.6% |
| 2022 | 0 | 0 | 0.0 | 0 | 0.0 | 10,543 | 34.0% | $100,000 | 7.6% |
| 2023 | 0 | 0 | 0.0 | 0 | 0.0 | 10,543 | 34.0% | $100,000 | 7.6% |
| 2024 | 0 | 0 | 0.0 | 0 | 0.0 | 10,543 | 34.0% | $100,000 | 7.6% |
| 2025 | 1 | 2,470 | 8.0 | 242,498 | 18.5 | 13,013 | 41.9% | $342,498 | 26.1% |
| 2026 | 3 | 8,785 | 28.3 | 377,067 | 28.7 | 21,798 | 70.2% | $719,565 | 54.8% |
| 2027 & Beyond | 5 | 9,238 | 29.8 | 592,863 | 45.2 | 31,036 | 100.0% | $1,312,428 | 100.0% |
| Total | 10 | 31,036 | 100.0% | $1,312,428 | 100.0% |
| (1) | Based on the underwritten rent roll dated April 1, 2017. Rent includes base rent and rent increases occurring through April 2018. |
| (2) | Certain tenants have more than one lease. |
THE INFORMATION IN THIS STRUCTURAL AND COLLATERAL TERM SHEET IS NOT COMPLETE AND MAY BE AMENDED PRIOR TO THE TIME OF SALE. THIS TERM SHEET IS NOT AN OFFER TO SELL THESE SECURITIES AND IT IS NOT A SOLICITATION OF AN OFFER TO BUY THESE SECURITIES IN ANY JURISDICTION WHERE THE OFFER OR SALE IS NOT PERMITTED.
177
Mortgage Loan No. 15 — Shoppes at Harmon Square
Operating History and Underwritten Net Cash Flow
| 2014 | 2015(1) | 2016(1) | TTM(1)(2) | Underwritten(3) | PSF | %(4) | |
| Rents in Place | $595,108 | $474,086 | $730,301 | $822,129 | $1,426,090 | $45.95 | 65.5% |
| Vacant Income | 0 | 0 | 0 | 0 | 512,580 | 16.52 | 23.5 |
| Gross Potential Rent | $595,108 | $474,086 | $730,301 | $822,129 | $1,938,670 | $62.47 | 89.1% |
| Total Reimbursements | 0 | 0 | 43,648 | 43,648 | 238,135 | 7.67 | 10.9 |
| Net Rental Income | $595,108 | $474,086 | $773,949 | $865,777 | $2,176,805 | $70.14 | 100.0% |
| (Vacancy/Collection Loss) | 0 | 0 | 0 | 0 | (512,580) | (16.52) | (23.5) |
| Other Income | 177,491 | 165,300 | 202,069 | 197,284 | 381,300 | 12.29 | 17.5 |
| Effective Gross Income | $772,599 | $639,386 | $976,018 | $1,063,061 | $2,045,525 | $65.91 | 94.0% |
| Total Expenses | $224,364 | $217,839 | $255,470 | $263,346 | $316,168 | $10.19 | 15.5% |
| Net Operating Income | $548,235 | $421,547 | $720,548 | $799,715 | $1,729,357 | $55.72 | 84.5% |
| Total TI/LC, Capex/RR | 0 | 0 | 0 | 0 | 23,106 | 0.74 | 1.1 |
| Net Cash Flow | $548,235 | $421,547 | $720,548 | $799,715 | $1,706,251 | $54.98 | 83.4% |
| (1) | The increase in Net Operating Income from 2015 to 2016 is attributable to lease-up and repositioning at the property. The Increase in Underwritten Net Operating Income from previous years is attributable to the newly executed leases and vacant units grossed-up at market rent. |
| (2) | TTM column represents the trailing 12-month period ending February 28, 2017. |
| (3) | Underwritten Rent in Place includes the $113,662 percentage rent in regards to Liquor World which is based on underwritten 90% of the TTM March 2017 sales and rent increases through April 2018. |
| (4) | Percentage column represents percent of Net Rental Income for all revenue lines and represents percent of Effective Gross Income for the remainder of fields. |
THE INFORMATION IN THIS STRUCTURAL AND COLLATERAL TERM SHEET IS NOT COMPLETE AND MAY BE AMENDED PRIOR TO THE TIME OF SALE. THIS TERM SHEET IS NOT AN OFFER TO SELL THESE SECURITIES AND IT IS NOT A SOLICITATION OF AN OFFER TO BUY THESE SECURITIES IN ANY JURISDICTION WHERE THE OFFER OR SALE IS NOT PERMITTED.
178