UNITED STATES
SECURITIES AND EXCHANGE COMMISSION
Washington, D.C. 20549
FORM N-CSR
CERTIFIED SHAREHOLDER REPORT OF REGISTERED
MANAGEMENT INVESTMENT COMPANIES
| | |
| Investment Company Act file number | | 811-23262 |
Nuveen Emerging Markets Debt 2022 Target Term Fund
(Exact name of registrant as specified in charter)
Nuveen Investments
333 West Wacker Drive, Chicago, IL 60606
(Address of principal executive offices) (Zip code)
Gifford R. Zimmerman
Nuveen Investments
333 West Wacker Drive, Chicago, IL 60606
(Name and address of agent for service)
Registrant’s telephone number, including area code: (312) 917-7700
Date of fiscal year end: December 31
Date of reporting period: June 30, 2018
Form N-CSR is to be used by management investment companies to file reports with the Commission not later than 10 days after the transmission to stockholders of any report that is required to be transmitted to stockholders under Rule 30e-1 under the Investment Company Act of 1940 (17 CFR 270.30e-1). The Commission may use the information provided on Form N-CSR in its regulatory, disclosure review, inspection, and policy making roles.
A registrant is required to disclose the information specified by Form N-CSR, and the Commission will make this information public. A registrant is not required to respond to the collection of information contained in Form N-CSR unless the Form displays a currently valid Office of Management and Budget (“OMB”) control number. Please direct comments concerning the accuracy of the information collection burden estimate and any suggestions for reducing the burden to Secretary, Securities and Exchange Commission, 450 Fifth Street, NW, Washington, DC 20549-0609. The OMB has reviewed this collection of information under the clearance requirements of 44 U.S.C. ss.3507.
ITEM 1. REPORTS TO STOCKHOLDERS.

Closed-End Funds
30 June
2018
Nuveen Closed-End Funds
| | |
| JEMD | | Nuveen Emerging Markets Debt 2022 Target Term Fund |
Semiannual Report
Life is Complex.
Nuveen makes things e-simple.
It only takes a minute to sign up for e-Reports. Once enrolled, you’ll receive an e-mail as soon as your Nuveen Fund information is ready—no more waiting for delivery by regular mail. Just click on the link within the e-mail to see the report and save it on your computer if you wish.
Free e-Reports right to your e-mail!
www.investordelivery.com
If you receive your Nuveen Fund dividends and statements from your financial advisor or brokerage account.
or
www.nuveen.com/client-access
If you receive your Nuveen Fund dividends and statements directly from Nuveen.
Table of Contents
3
Chairman’s Letter to Shareholders
Dear Shareholders,
I am honored to serve as the new independent chairman of the Nuveen Fund Board, effective July 1, 2018. I’d like to gratefully acknowledge the stewardship of my predecessor William J. Schneider and, on behalf of my fellow Board members, reinforce our commitment to the legacy of strong, independent oversight of your Funds.
The increase in market volatility this year reflects greater uncertainty among investors. The global economic outlook is less clear cut than it was in 2017. U.S. growth is again decoupling from that of the rest of the world, and the U.S. dollar and interest rates have risen in response. Trade concern rhetoric and the imposition of tariffs between the U.S. and its major trading partners has recently dampened business sentiment and could pose a risk to growth expectations going forward. A host of other geopolitical concerns, including the ongoing Brexit and North American Free Trade Agreement negotiations, North Korea relations and rising populism around the world, remain on the horizon.
Despite these risks, global growth remains intact, albeit at a slower pace, providing support to corporate earnings. Fiscal stimulus, an easing regulatory environment and robust consumer spending recently helped boost the U.S. economy’s momentum. Subdued inflation pressures have kept central bank policy accommodative, even as Europe moves closer to winding down its monetary stimulus and the Federal Reserve remains on a moderate tightening course.
Headlines and political noise will continue to obscure underlying fundamentals at times and cause temporary bouts of volatility. We encourage you to work with your financial advisor to evaluate your goals, timeline and risk tolerance if short-term market fluctuations are a concern. On behalf of the other members of the Nuveen Fund Board, we look forward to continuing to earn your trust in the months and years ahead.
Sincerely,

Terence J. Toth
Chairman of the Board
August 24, 2018
4
Portfolio Managers’ Comments
Nuveen Emerging Markets Debt 2022 Target Term Fund (JEMD)
The Fund features portfolio management by Teachers Advisors, LLC, an affiliate of Nuveen Fund Advisors, LLC. Portfolio managers Anupam Damani, CFA, and Katherine Renfrew discuss key investment strategies and the six-month performance of JEMD. Anupam and Katherine have managed the Fund since its inception.
What strategies were used to manage the Fund during the six-month reporting period ended June 30, 2018?
The Fund seeks to provide a high level of current income and return the original $9.85 net asset value (NAV) per common share on or about December 1, 2022.
JEMD seeks to provide high current income from a portfolio of shorter maturity, emerging market sovereign, quasi-sovereign and corporate debt securities, including high yield securities. The Fund invests at least 80% of its managed assets in emerging market debt securities and may invest without limit in investment grade securities and securities rated below investment grade (BB+/Ba1 or lower). However, the Fund invests no more than 10% of its managed assets in securities rated below B-/B3 or that are unrated but judged by the managers to be of comparable quality. The Fund invests 100% of its managed assets in U.S. dollar denominated securities. No more than 25% is invested in securities of issuers located in a single country.
In seeking to return the original NAV on or about December 1, 2022, the Fund intends to utilize various portfolio and cash flow management techniques, including setting aside a portion of its net investment income, possibly retaining gains and limiting the longest effective maturity on any holding to no later than June 1, 2023. This Fund uses leverage. Leverage is discussed in more detail later in the Fund Leverage Section of this report.
How did the Fund perform during the six-month reporting period ended June 30, 2018?
The table in the Performance Overview and Holding Summaries section of this report provides total return performance for the Fund for the six-month and since inception periods ended June 30, 2018. The Fund’s total returns at net asset value (NAV) are compared with the performance of a corresponding market index. For the six-month reporting period ended June 30, 2018, the Fund underperformed the JP Morgan EMBI Global Diversified Index.
Emerging markets assets faced a challenging first half of 2018. Volatility arising from higher U.S. interest rates, a stronger U.S. dollar, trade tensions and home-grown problems in some countries drove declining performance and widening
This material is not intended to be a recommendation or investment advice, does not constitute a solicitation to buy or sell securities, and is not provided in a fiduciary capacity. The information provided does not take into account the specific objectives or circumstances of any particular investor, or suggest any specific course of action. Investment decisions should be made based on an investor’s objectives and circumstances and in consultation with his or her advisors.
Certain statements in this report are forward-looking statements. Discussions of specific investments are for illustration only and are not intended as recommendations of individual investments. The forward-looking statements and other views expressed herein are those of the portfolio managers as of the date of this report. Actual future results or occurrences may differ significantly from those anticipated in any forward-looking statements and the views expressed herein are subject to change at any time, due to numerous market and other factors. The Fund disclaims any obligation to update publicly or revise any forward-looking statements or views expressed herein.
For financial reporting purposes, the ratings disclosed are the highest rating given by one of the following national rating agencies: Standard & Poor’s (S&P), Moody’s Investors Service, Inc. (Moody’s) or Fitch, Inc. (Fitch). This treatment of split-rated securities may differ from that used for other purposes, such as for Fund investment policies. Credit ratings are subject to change. AAA, AA, A and BBB are investment grade ratings; BB, B, CCC, CC, C and D are below investment grade ratings. Holdings designated N/R are not rated by these national rating agencies.
Refer to the Glossary of Terms Used in this Report for further definition of the terms used within this section.
5
Portfolio Managers’ Comments (continued)
credit spreads in emerging market debt. Heavy issuance in frontier markets and concerns about Argentina and Turkey’s economic programs weighed on the high yield segment, causing it to significantly underperform the high grade segment.
The Fund holds the majority of its portfolio in high yield securities, which was disadvantageous to performance in this reporting period. However, the Fund’s shorter duration than the benchmark contributed positively.
The Fund’s position in Barbados sovereign debt was the largest detractor in this reporting period. The credits performed poorly after the country’s newly elected government announced it would suspend payments on external debt while it negotiated with the International Monetary Fund on an aid program and implemented wider restructuring. Another large detractor was Digicel, a pan-Caribbean telecom, which came under pressure following negative guidance related to its continued high leverage, leading investors to question its ability to refinance its 2020 bonds. Argentine sovereign paper and Turkish bank paper also hurt performance due to these countries’ challenging economic, political and policy environments. Other drags included exposures to Zambia, Lebanon and Ecuador. On the positive side, Ghana, Egypt and central Asia sovereign debt performed well, along with Asian and South American corporates.
Subsequent to the end of the reporting period, volatility increased in the asset class, in particular related to Turkey. The market was questioning Turkey’s policy framework and credibility and a spat with the U.S. that resulted in some symbolic tariffs. The market was also unsettled by concerns that Turkey could create contagion into other countries due to deteriorating investor sentiment amidst fears of elevated trade war risks. Despite the increased volatility, the portfolio’s exposure to Turkey remains diversified amongst some of the largest banks that have ample cushion in terms of their tier 1 capital ratios and are likely to receive government support if needed. Although the performance of the Fund was further negatively impacted, markets and prices have stabilized since the peak in volatility. We view most countries taking prudent measures to shore up macroeconomic stability, which should further help restore confidence and flows. The expected Fed hikes have been priced in, the U.S. dollar should start giving way to some weakness and China has introduced policy stimulus, which should provide further support to the asset class going forward, given the significant spread widening in the short term. The Fund is diversified across regions, countries, credits and industries as well as between sovereigns and corporates to withstand periods of market volatility and the negative impact of Barbados’ suspended interest payments over its term. We remain comfortable in our assessment in achieving the Fund’s objective of returning its original NAV at its target termination date.
6
Fund Leverage
IMPACT OF THE FUND’S LEVERAGE STRATEGIES ON PERFORMANCE
One important factor impacting the returns of the Fund’s common shares relative to its comparative benchmark was the Fund’s use of leverage through the use of reverse repurchase agreements. The Fund uses leverage because our research has shown that, over time, leveraging provides opportunities for additional income and total return, particularly in the recent market environment where short-term market rates are at or near historical lows, meaning that the short-term rates the Fund has been paying on its leveraging instruments in recent years have been much lower than the interest the Fund has been earning on its portfolio securities that it has bought with the proceeds of that leverage.
However, use of leverage can expose Fund common shares to additional price volatility. When the Fund uses leverage, the Fund common shares will experience a greater increase in their net asset value if the securities acquired through the use of leverage increase in value, but will also experience a correspondingly larger decline in their net asset value if the securities acquired through leverage decline in value, which will make the shares’ net asset value more volatile, and total return performance more variable, over time.
In addition, common share income in levered funds will typically decrease in comparison to unlevered funds when short-term interest rates increase and increase when short-term interest rates decrease. Over the last few quarters, short-term interest rates have indeed increased from their extended lows after the 2007-09 financial crisis. This increase has reduced common share net income, and also reduced potential for long-term total returns. Nevertheless, the ability to effectively borrow at current short-term rates is still resulting in enhanced common share income, and management believes that the advantages of continuation of leverage outweigh the associated increase in risk and volatility described above.
The Fund’s use of leverage had a negative impact on performance during this reporting period.
As of June 30, 2018, the Fund’s percentages of leverage are as shown in the accompanying table.
| | | | |
| | | JEMD | |
Effective Leverage* | | | 27.38 | % |
Regulatory Leverage* | | | 0.00 | % |
| * | Effective leverage is the Fund’s effective economic leverage, and includes both regulatory leverage and the leverage effects of certain derivative and other investments in the Fund’s portfolio that increase the Fund’s investment exposure. Regulatory leverage consists of borrowings of the Fund, which is part of the Fund’s capital structure. The Fund, however, may from time to time borrow on a typically transient basis in connection with its day-to-day operations, primarily in connection with the need to settle portfolio trades. Such incidental borrowings are excluded from the calculation of the Fund’s effective leverage ratio. Regulatory leverage is subject to asset coverage limits set forth in the Investment Company Act of 1940. |
THE FUND’S LEVERAGE
Reverse Repurchase Agreements
As noted above, the Fund utilized reverse repurchase agreements. The Fund’s transactions in reverse repurchase agreements are as shown in the accompanying table.
| | | | | | | | | | | | | | | | | | | | | | | | | | | | | | | | | | |
| Current Reporting Period | | | | | | Subsequent to the Close of
the Reporting Period | |
| January 1, 2018 | | | Purchases | | | Sales | | | June 30, 2018 | | | Average Balance
Outstanding | | | | | | Purchases | | | Sales | | | August 27, 2018 | |
| | $47,000,000 | | | $ | — | | | $ | — | | | $ | 47,000,000 | | | $ | 47,000,000 | | | | | | | $ | — | | | $ | — | | | $ | 47,000,000 | |
Refer to Notes to Financial Statements, Note 8 – Fund Leverage for further details.
7
Share Information
DISTRIBUTION INFORMATION
The following information regarding the Fund’s distributions is current as of June 30, 2018. The Fund’s distribution levels may vary over time based on the Fund’s investment activity and portfolio investment value changes.
During the current reporting period, the Fund’s distributions to shareholders were as shown in the accompanying table.
| | | | |
| Monthly Distributions (Ex-Dividend Date) | | Per Share
Amounts | |
January 2018 | | $ | 0.0435 | |
February | | | 0.0435 | |
March | | | 0.0435 | |
April | | | 0.0435 | |
May | | | 0.0435 | |
June 2018 | | | 0.0435 | |
Total Distributions | | $ | 0.2610 | |
| |
Current Distribution Rate* | | | 5.97 | % |
| * | Current distribution rate is based on the Fund’s current annualized monthly distribution divided by the Fund’s current market price. The Fund’s monthly distributions to its shareholders may be comprised of ordinary income, net realized capital gains and, if at the end of the fiscal year the Fund’s cumulative net ordinary income and net realized gains are less than the Fund’s distributions, a return of capital for tax purposes. |
The Fund seeks to pay regular monthly dividends out of its net investment income at a rate that reflects its past and projected net income performance. To permit the Fund to maintain a more stable monthly dividend, the Fund may pay dividends at a rate that may be more or less than the amount of net income actually earned by the Fund during the period. If the Fund has cumulatively earned more than it has paid in dividends, it will hold the excess in reserve as undistributed net investment income (UNII) as part of the Fund’s net asset value. Conversely, if the Fund has cumulatively paid in dividends more than it has earned, the excess will constitute a negative UNII that will likewise be reflected in the Fund’s net asset value. The Fund will, over time, pay all its net investment income as dividends to shareholders.
As of June 30, 2018, the Fund had a positive UNII balance, based upon our best estimate, for tax purposes and a positive UNII balance for financial reporting purposes.
All monthly dividends paid by the Fund during the current reporting period were paid from net investment income. If a portion of the Fund’s monthly distributions was sourced from or comprised of elements other than net investment income, including capital gains and/or a return of capital, shareholders would have received a notice to that effect. For financial reporting purposes the composition and per share amounts of the Fund’s dividends for the reporting period are presented in this report’s Statement of Changes in Net Assets and Financial Highlights, respectively. For income tax purposes, distribution information for the Fund as of its most recent tax year end is presented in Note 6 – Income Tax Information within the Notes to Financial Statements of this report.
COMMON SHARE REPURCHASES
During August 2018 (subsequent to the close of this reporting period), the Fund’s Board of Trustees authorized the Fund to participate in Nuveen’s closed-end fund complex-wide share repurchase program, allowing the Fund to repurchase an aggregate of up to approximately 10% of its outstanding shares.
8
OTHER SHARE INFORMATION
As of June 30, 2018, and during the current reporting period, the Fund’s share price was trading at a premium/(discount) to its NAV as shown in the accompanying table.
| | | | |
NAV | | $ | 8.76 | |
Share price | | $ | 8.74 | |
Premium/(Discount) to NAV | | | (0.23 | )% |
6-month average premium/(discount) to NAV | | | (4.22 | )% |
The Fund has an investment objective to return $9.85 (the original net asset value following the Fund’s initial public offering (the “Original NAV”)) to shareholders on or about the end of the Fund’s term. There can be no assurance that the Fund will be able to return the Original NAV to shareholders, and such return is not backed or otherwise guaranteed by the Fund’s investment adviser, Nuveen Fund Advisors, LLC (the “Adviser”), or any other entity.
The Fund’s ability to return Original NAV to shareholders on or about its termination date will depend on market conditions and the success of various portfolio and cash flow management techniques. The Fund currently intends to set aside and retain in its net assets a portion of its net investment income and possibly all or a portion of its gains. This will reduce the amounts otherwise available for distribution prior to the liquidation of the Fund, and the Fund may incur taxes on such retained amount, which will reduce the overall amounts that the Fund would have otherwise been able to distribute. Such retained income or gains, net of any taxes, would constitute a portion of the liquidating distribution returned to investors at the end of the Fund’s term. In addition, the Fund’s investment in shorter term and lower yielding securities, especially as the Fund nears the end of its term, may reduce investment income and, therefore, the monthly dividends during the period prior to termination. Investors that purchase shares in the secondary market (particularly if their purchase price differs meaningfully from the Original NAV) may receive more or less than their original investment.
9
Risk Considerations
Fund shares are not guaranteed or endorsed by any bank or other insured depository institution, and are not federally insured by the Federal Deposit Insurance Corporation.
Nuveen Emerging Markets Debt 2022 Target Term Fund (JEMD)
Investing in closed-end funds involves risk; principal loss is possible. There is no guarantee the Fund’s investment objectives will be achieved. Closed-end fund shares may frequently trade at a discount or premium to their net asset value. Emerging markets, particularly including frontier markets, involve additional risks, including smaller capitalization, illiquidity, price volatility, political and economic instability that could lead to diminished security values, and different legal and accounting standards. Debt or fixed income securities such as those held by the Fund, are subject to market risk, credit risk, interest rate risk, derivatives risk, liquidity risk, and income risk. As interest rates rise, bond prices fall. Lower credit debt securities may be more likely to fail to make timely interest or principal payments. Leverage increases return volatility and magnifies the Fund’s potential return and its risks; there is no guarantee a fund’s leverage strategy will be successful. These and other risk considerations such as limited term risk are described in more detail on the Fund’s web page at www.nuveen.com/JEMD.
10
THIS PAGE INTENTIONALLY LEFT BLANK
11
| | |
| JEMD | | Nuveen Emerging Markets Debt 2022 Target Term Fund Performance Overview and Holding Summaries as of June 30, 2018 |
Refer to the Glossary of Terms Used in this Report for further definition of the terms used within this section.
Cumulative Total Returns as of June 30, 2018
| | | | | | | | |
| | | Cumulative | |
| | | 6-Month | | | Since Inception | |
| JEMD at NAV | | | (8.48)% | | | | (7.76)% | |
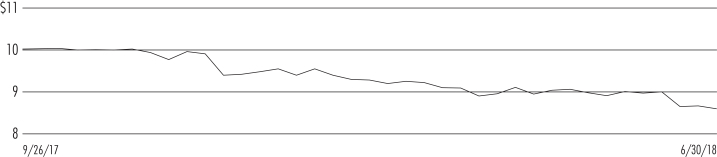
| JEMD at Share Price | | | (4.32)% | | | | (9.25)% | |
| JP Morgan EMBI Global Diversified Index | | | (5.23)% | | | | (4.18)% | |
Since inception returns are from 9/26/17. Past performance is not predictive of future results. Current performance may be higher or lower than the data shown. Returns do not reflect the deduction of taxes that shareholders may have to pay on Fund distributions or upon the sale of Fund shares. Returns at NAV are net of Fund expenses, and assume reinvestment of distributions. Comparative index return information is provided for the Fund’s shares at NAV only. Indexes are not available for direct investment.
Share Price Performance — Weekly Closing Price
12
This data relates to the securities held in the Fund’s portfolio of investments as of the end of the reporting period. It should not be construed as a measure of performance for the Fund itself. Holdings are subject to change.
For financial reporting purposes, the ratings disclosed are the highest rating given by one of the following national rating agencies: Standard & Poor’s Group, Moody’s Investors Service, Inc. or Fitch, Inc. This treatment of split-rated securities may differ from that used for other purposes, such as for Fund investment policies. Credit ratings are subject to change. AAA, AA, A and BBB are investment grade ratings; BB, B, CCC, CC, C and D are below-investment grade ratings. Holdings designated N/R are not rated by these national rating agencies.
Fund Allocation
(% of net assets)
| | | | |
| Emerging Market Debt | | | 73.7% | |
| Corporate Bonds | | | 60.9% | |
| U.S. Government and Agency Obligations | | | 1.2% | |
| Other Assets Less Liabilities | | | 1.9% | |
Net Assets Plus Reverse Repurchase Agreements | | | 137.7% | |
| Reverse Repurchase Agreements | | | (37.7)% | |
Net Assets | | | 100% | |
Portfolio Credit Quality
(% of total fixed-income investments)
| | | | |
| AAA | | | 0.8% | |
| BBB | | | 1.6% | |
| BB or Lower | | | 97.6% | |
Total | | | 100% | |
Portfolio Composition
(% of total investments)
| | | | |
| Emerging Market Debt | | | 54.3% | |
| Banks | | | 19.8% | |
| Oil, Gas & Consumable Fuels | | | 5.6% | |
| Metals & Mining | | | 3.1% | |
| Wireless Telecommunication Services | | | 2.9% | |
| Other | | | 13.4% | |
| U.S. Government and Agency Obligations | | | 0.9% | |
Total | | | 100% | |
Top Five Issuers
(% of total investments)
| | | | |
| Republic of Rwanda | | | 4.9% | |
| Republic of Lebanon | | | 4.5% | |
| Republic of Ecuador | | | 4.5% | |
| Republic of Ukraine | | | 4.4% | |
| Republic of Iraq | | | 4.3% | |
Country Allocation¹
(% of total investments)
| | | | |
Ukraine | | | 8.5% | |
| Turkey | | | 7.6% | |
| South Africa | | | 6.6% | |
| Rwanda | | | 4.9% | |
| Lebanon | | | 4.5% | |
| Ecuador | | | 4.5% | |
| Iraq | | | 4.3% | |
| Argentina | | | 4.1% | |
| El Salvador | | | 3.9% | |
| Nigeria | | | 3.8% | |
| Zambia | | | 3.7% | |
| Ghana | | | 3.6% | |
| Egypt | | | 3.4% | |
| United States | | | 3.3% | |
| Barbados | | | 2.8% | |
| Mongolia | | | 2.6% | |
| Kazakhstan | | | 2.3% | |
| China | | | 2.2% | |
| Sri Lanka | | | 2.0% | |
| Brazil | | | 2.0% | |
| Other | | | 19.4% | |
Total | | | 100% | |
| 1 | Includes 96.1% (as a percentage of total investments) in emerging market countries. |
13
Shareholder Meeting Report
The annual meeting of shareholders was held in the offices of Nuveen on April 11, 2018 for JEMD; at this meeting the shareholders were asked to elect Board Members.
| | | | |
| | | JEMD | |
| | | Common
Shares | |
Approval of the Board Members was reached as follows: | | | | |
Margo L. Cook | | | | |
For | | | 12,504,349 | |
Withhold | | | 68,401 | |
Total | | | 12,572,750 | |
Jack B. Evans | | | | |
For | | | 12,501,766 | |
Withhold | | | 70,984 | |
Total | | | 12,572,750 | |
Albin F. Moschner | | | | |
For | | | 12,502,283 | |
Withhold | | | 70,467 | |
Total | | | 12,572,750 | |
William J. Schneider | | | | |
For | | | 12,503,834 | |
Withhold | | | 68,916 | |
Total | | | 12,572,750 | |
14
| | |
| JEMD | | Nuveen Emerging Markets Debt 2022
Target Term Fund Portfolio of Investments June 30, 2018 |
| | | (Unaudited) |
| | | | | | | | | | | | | | | | | | | | |
Principal
Amount (000) | | | Description (1) | | Coupon | | | Maturity | | | Ratings (2) | | | Value | |
| |
| | | | LONG-TERM INVESTMENTS – 134.6% (99.1% of Total Investments) | |
| |
| | | | EMERGING MARKET DEBT – 73.7% (54.3% of Total Investments) | |
| | | | | |
| | | | Argentina – 5.5% | | | | | | | | | | | | |
| | | | | |
| $ | 7,575 | | | Province of Buenos Aires, 144A | | | 6.500% | | | | 2/15/23 | | | | B+ | | | $ | 6,914,915 | |
| | | | | |
| | | | Bahrain – 1.3% | | | | | | | | | | | | |
| | | | | |
| | 1,675 | | | Kingdom of Bahrain, 144A, (3) | | | 6.125% | | | | 7/05/22 | | | | BB– | | | | 1,628,938 | |
| | | | | |
| | | | Barbados – 3.8% | | | | | | | | | | | | |
| | | | | |
| | 7,500 | | | Barbados Government, 144A | | | 7.000% | | | | 8/04/22 | | | | CC | | | | 4,125,000 | |
| | 650 | | | Barbados Government, 144A | | | 7.250% | | | | 12/15/21 | | | | Caa3 | | | | 357,500 | |
| | 517 | | | Barbados Government, Reg S | | | 7.000% | | | | 8/04/22 | | | | CC | | | | 284,350 | |
| | 8,667 | | | Total Barbados | | | | | | | | | | | | | | | 4,766,850 | |
| | | | | |
| | | | Belarus – 0.6% | | | | | | | | | | | | |
| | | | | |
| | 750 | | | Republic of Belarus, 144A | | | 6.875% | | | | 2/28/23 | | | | B | | | | 775,463 | |
| | | | | |
| | | | Costa Rica – 1.8% | | | | | | | | | | | | |
| | | | | |
| | 2,400 | | | Republic of Costa Rica, 144A, (3) | | | 4.250% | | | | 1/26/23 | | | | Ba2 | | | | 2,274,168 | |
| | | | | |
| | | | Dominican Republic – 0.5% | | | | | | | | | | | | |
| | | | | |
| | 600 | | | Dominican Republic, 144A, (3) | | | 7.500% | | | | 5/06/21 | | | | BB– | | | | 628,200 | |
| | | | | |
| | | | Ecuador – 6.1% | | | | | | | | | | | | |
| | | | | |
| | 7,350 | | | Republic of Ecuador, 144A | | | 10.750% | | | | 3/28/22 | | | | B | | | | 7,546,245 | |
| | | | | |
| | | | Egypt – 4.6% | | | | | | | | | | | | |
| | | | | |
| | 5,775 | | | Arab Republic of Egypt, 144A, (3) | | | 6.125% | | | | 1/31/22 | | | | B | | | | 5,677,125 | |
| | | | | |
| | | | El Salvador – 5.4% | | | | | | | | | | | | |
| | | | | |
| | 6,375 | | | Republic of El Salvador, 144A, (3) | | | 7.750% | | | | 1/24/23 | | | | B3 | | | | 6,689,734 | |
| | | | | |
| | | | Ghana – 3.4% | | | | | | | | | | | | |
| | | | | |
| | 3,750 | | | Republic of Ghana, 144A, (3) | | | 9.250% | | | | 9/15/22 | | | | B | | | | 4,239,915 | |
| | | | | |
| | | | Honduras – 0.9% | | | | | | | | | | | | |
| | | | | |
| | 1,000 | | | Honduras Government, 144A | | | 8.750% | | | | 12/16/20 | | | | BB– | | | | 1,080,950 | |
| | | | | |
| | | | Iraq – 5.8% | | | | | | | | | | | | |
| | | | | |
| | 7,500 | | | Republic of Iraq, 144A, (3) | | | 6.750% | | | | 3/09/23 | | | | B– | | | | 7,194,300 | |
| | | | | |
| | | | Lebanon – 6.1% | | | | | | | | | | | | |
| | | | | |
| | 4,000 | | | Republic of Lebanon | | | 6.400% | | | | 5/26/23 | | | | B– | | | | 3,377,084 | |
| | 5,000 | | | Republic of Lebanon, Reg S | | | 6.000% | | | | 1/27/23 | | | | B– | | | | 4,201,000 | |
| | 9,000 | | | Total Lebanon | | | | | | | | | | | | | | | 7,578,084 | |
| | | | | |
| | | | Mongolia – 3.5% | | | | | | | | | | | | |
| | | | | |
| | 1,650 | | | Mongolia Government International Bond, 144A | | | 5.625% | | | | 5/01/23 | | | | B– | | | | 1,559,636 | |
| | 3,000 | | | Mongolia Government International Bond, 144A, (3) | | | 5.125% | | | | 12/05/22 | | | | B– | | | | 2,805,672 | |
| | 4,650 | | | Total Mongolia | | | | | | | | | | | | | | | 4,365,308 | |
| | | | | |
| | | | Nigeria – 1.2% | | | | | | | | | | | | |
| | | | | |
| | 1,500 | | | Nigerian Government International Bond, (3) | | | 5.625% | | | | 6/27/22 | | | | B+ | | | | 1,470,000 | |
15
| | |
| JEMD | | Nuveen Emerging Markets Debt 2022 Target Term Fund (continued) |
| | Portfolio of Investments June 30, 2018 |
| | (Unaudited) |
| | | | | | | | | | | | | | | | | | | | |
Principal
Amount (000) | | | Description (1) | | Coupon | | | Maturity | | | Ratings (2) | | | Value | |
| | | | | |
| | | | Pakistan – 0.7% | | | | | | | | | | | | |
| | | | | |
| $ | 1,000 | | | Third Pakistan International Sukuk Co Ltd., 144A | | | 5.625% | | | | 12/05/22 | | | | B | | | $ | 901,079 | |
| | | | | |
| | | | Paraguay – 0.3% | | | | | | | | | | | | |
| | | | | |
| | 500 | | | Republic of Paraguay, 144A, (3) | | | 4.625% | | | | 1/25/23 | | | | Ba1 | | | | 506,250 | |
| | | | | |
| | | | Rwanda – 6.7% | | | | | | | | | | | | |
| | | | | |
| | 8,400 | | | Republic of Rwanda, 144A, (3) | | | 6.625% | | | | 5/02/23 | | | | B+ | | | | 8,333,690 | |
| | | | | |
| | | | Senegal – 1.0% | | | | | | | | | | | | |
| | | | | |
| | 925 | | | Republic of Senegal, 144A | | | 8.750% | | | | 5/13/21 | | | | Ba3 | | | | 995,067 | |
| | 235 | | | Republic of Senegal, Reg S | | | 8.750% | | | | 5/13/21 | | | | Ba3 | | | | 252,594 | |
| | 1,160 | | | Total Senegal | | | | | | | | | | | | | | | 1,247,661 | |
| | | | | |
| | | | Sri Lanka – 2.8% | | | | | | | | | | | | |
| | | | | |
| | 600 | | | Republic of Sri Lanka, 144A, (3) | | | 5.875% | | | | 7/25/22 | | | | B+ | | | | 589,093 | |
| | 3,000 | | | Sri Lanka Government International Bond, 144A | | | 5.750% | | | | 4/18/23 | | | | B+ | | | | 2,872,230 | |
| | 3,600 | | | Total Sri Lanka | | | | | | | | | | | | | | | 3,461,323 | |
| | | | | |
| | | | Turkey – 0.7% | | | | | | | | | | | | |
| | | | | |
| | 1,000 | | | Export Credit Bank of Turkey, 144A | | | 4.250% | | | | 9/18/22 | | | | BB+ | | | | 892,500 | |
| | | | | |
| | | | Ukraine – 6.0% | | | | | | | | | | | | |
| | | | | |
| | 7,650 | | | Republic of Ukraine, 144A, (3) | | | 7.750% | | | | 9/01/22 | | | | B– | | | | 7,468,481 | |
| | | | | |
| | | | Zambia – 5.0% | | | | | | | | | | | | |
| | | | | |
| | 7,500 | | | Republic of Zambia, 144A, (3) | | | 5.375% | | | | 9/20/22 | | | | B | | | | 6,235,140 | |
| $ | 99,377 | | | Total Emerging Markets Debt (cost $101,833,454) | | | | | | | | 91,876,319 | |
| | | | | |
Principal
Amount (000) | | | Description (1) | | Coupon | | | Maturity | | | Ratings (2) | | | Value | |
| |
| | | | CORPORATE BONDS – 60.9% (44.8% of Total Investments) | |
| | | | | |
| | | | Banks – 26.9% | | | | | | | | | | | | |
| | | | | |
| $ | 750 | | | Akbank TAS, 144A | | | 5.000% | | | | 10/24/22 | | | | BB+ | | | $ | 708,750 | |
| | 600 | | | Banco De Bogota, 144A | | | 5.375% | | | | 2/19/23 | | | | BBB– | | | | 612,000 | |
| | 750 | | | Banco Do Brasil, 144A | | | 5.875% | | | | 1/19/23 | | | | Ba3 | | | | 739,463 | |
| | 2,500 | | | Credit Bank of Moscow Via CBOM Finance PLC, 144A | | | 5.875% | | | | 11/07/21 | | | | BB– | | | | 2,443,000 | |
| | 2,000 | | | Credit Bank of Moscow Via CBOM Finance PLC, 144A | | | 5.550% | | | | 2/14/23 | | | | BB– | | | | 1,906,000 | |
| | 3,900 | | | Kazkommertsbank, 144A | | | 5.500% | | | | 12/21/22 | | | | BB | | | | 3,888,690 | |
| | 4,000 | | | TC Ziraat Bankasi AS, 144A, (3) | | | 5.125% | | | | 5/03/22 | | | | BB+ | | | | 3,700,832 | |
| | 1,200 | | | Trade and Development Bank of Mongolia, 144A, (3) | | | 9.375% | | | | 5/19/20 | | | | B– | | | | 1,261,998 | |
| | 5,000 | | | Turkiye IS Bankasi (Isbank), 144A, (3) | | | 6.000% | | | | 10/24/22 | | | | BB | | | | 4,416,530 | |
| | 300 | | | Turkiye IS Bankasi (Isbank), 144A | | | 5.250% | | | | 9/13/22 | | | | BBB– | | | | 282,249 | |
| | 3,304 | | | Turkiye Vakiflar Bankasi T.A.O, 144A, (3) | | | 6.000% | | | | 11/01/22 | | | | BB | | | | 2,848,874 | |
| | 4,300 | | | Ukreximbank Via Biz Finance PLC, 144A | | | 9.625% | | | | 4/27/22 | | | | B– | | | | 4,300,860 | |
| | 3,000 | | | United Bank for Africa PLC, 144A, (3) | | | 7.750% | | | | 6/08/22 | | | | B | | | | 2,911,860 | |
| | 3,500 | | | Zenith Bank PLC, 144A, (3) | | | 7.375% | | | | 5/30/22 | | | | B+ | | | | 3,472,280 | |
| | 35,104 | | | Total Banks | | | | | | | | | | | | | | | 33,493,386 | |
| | | | | |
| | | | Commercial Services & Supplies – 0.9% | | | | | | | | | | | | |
| | | | | |
| | 1,000 | | | Atento Luxco 1 SA, 144A | | | 6.125% | | | | 8/10/22 | | | | BB | | | | 960,000 | |
| | | | | |
| | | | Communications Equipment – 2.5% | | | | | | | | | | | | |
| | | | | |
| | 3,250 | | | IHS Netherlands Holdco B.V, 144A, (3) | | | 9.500% | | | | 10/27/21 | | | | B+ | | | | 3,108,141 | |
| | | | | |
| | | | Diversified Telecommunication Services – 0.8% | | | | | | | | | | | | |
| | | | | |
| | 1,000 | | | Colombia Telecommunicaciones S.A. ESP, 144A | | | 5.375% | | | | 9/27/22 | | | | BB+ | | | | 993,500 | |
16
| | | | | | | | | | | | | | | | | | | | |
Principal
Amount (000) | | | Description (1) | | Coupon | | | Maturity | | | Ratings (2) | | | Value | |
| | | | | |
| | | | Electric Utilities – 3.9% | | | | | | | | | | | | |
| | | | | |
| $ | 5,000 | | | Esckom Holdings Limited, 144A, (3) | | | 5.750% | | | | 1/26/21 | | | | B3 | | | $ | 4,824,760 | |
| | | | | |
| | | | Food Products – 2.1% | | | | | | | | | | | | |
| | | | | |
| | 2,700 | | | Kernel Holding SA, 144A, (3) | | | 8.750% | | | | 1/31/22 | | | | B+ | | | | 2,646,540 | |
| |
| | | | Independent Power & Renewable Electricity Producers – 2.4% | |
| | | | | |
| | 2,000 | | | Azure Power Energy Ltd, 144A, (3) | | | 5.500% | | | | 11/03/22 | | | | Ba3 | | | | 1,828,000 | |
| | 1,250 | | | Greenko Dutch BV, 144A, (3) | | | 4.875% | | | | 7/24/22 | | | | Ba2 | | | | 1,170,000 | |
| | 3,250 | | | Total Independent Power & Renewable Electricity Producers | | | | | | | | | | | | | | | 2,998,000 | |
| | | | | |
| | | | Metals & Mining – 4.2% | | | | | | | | | | | | |
| | | | | |
| | 3,000 | | | Petra Diamonds US$ Treasury PLC, 144A, (3) | | | 7.250% | | | | 5/01/22 | | | | B | | | | 2,891,250 | |
| | 2,500 | | | Vedanta Resources PLC, 144A, (3) | | | 7.125% | | | | 5/31/23 | | | | B+ | | | | 2,356,250 | |
| | 5,500 | | | Total Metals & Mining | | | | | | | | | | | | | | | 5,247,500 | |
| | | | | |
| | | | Oil, Gas & Consumable Fuels – 7.6% | | | | | | | | | | | | |
| | 2,000 | | | Azerbaijan State Oil Company, Reg S | | | 4.750% | | | | 3/13/23 | | | | BB+ | | | | 1,969,600 | |
| | 3,000 | | | Medco Straits Services PTE LTD, 144A, (3) | | | 8.500% | | | | 8/17/22 | | | | B | | | | 2,990,601 | |
| | 2,800 | | | Petrobras Global Finance BV, (3) | | | 4.375% | | | | 5/20/23 | | | | Ba2 | | | | 2,615,900 | |
| | 2,000 | | | Tullow Oil PLC, 144A | | | 6.250% | | | | 4/15/22 | | | | B | | | | 1,940,000 | |
| | 9,800 | | | Total Oil, Gas & Consumable Fuels | | | | | | | | | | | | | | | 9,516,101 | |
| | | | | |
| | | | Pharmaceuticals – 1.9% | | | | | | | | | | | | |
| | | | | |
| | 2,600 | | | Teva Pharmaceutical Finance Company B.V., Series D | | | 2.950% | | | | 12/18/22 | | | | BB | | | | 2,365,669 | |
| | | | | |
| | | | Real Estate Management & Development – 3.0% | | | | | | | | | | | | |
| | | | | |
| | 3,200 | | | China Evergrande Group, Reg S | | | 8.250% | | | | 3/23/22 | | | | B2 | | | | 3,053,616 | |
| | 750 | | | Country Garden Holding Company, Reg S | | | 4.750% | | | | 7/25/22 | | | | BBB– | | | | 713,717 | |
| | 3,950 | | | Total Real Estate Management & Development | | | | | | | | | | | | | | | 3,767,333 | |
| | | | | |
| | | | Road & Rail – 0.8% | | | | | | | | | | | | |
| | | | | |
| | 1,100 | | | Transnet SOC Limited, 144A | | | 4.000% | | | | 7/26/22 | | | | Baa3 | | | | 1,042,120 | |
| | | | | |
| | | | Wireless Telecommunication Services – 3.9% | | | | | | | | | | | | |
| | | | | |
| | 3,700 | | | Digicel Group, Limited, 144A | | | 7.125% | | | | 4/01/22 | | | | B– | | | | 2,432,750 | |
| | 2,525 | | | MTN Mauritius Investments Ltd, 144A | | | 5.373% | | | | 2/13/22 | | | | BB+ | | | | 2,487,973 | |
| | 6,225 | | | Total Wireless Telecommunication Services | | | | | | | | | | | | | | | 4,920,723 | |
| $ | 80,479 | | | Total Corporate Bonds (cost $82,088,781) | | | | | | | | | | | | | | | 75,883,773 | |
| | | | Total Long-Term Investments (cost $183,922,235) | | | | | | | | | | | | | | | 167,760,092 | |
| | | | | |
Principal
Amount (000) | | | Description (1) | | Coupon | | | Maturity | | | Ratings (2) | | | Value | |
| |
| | | | SHORT-TERM INVESTMENTS – 1.2% (0.9% of Total Investments) | |
| |
| | | | U.S. GOVERNMENT AND AGENCY OBLIGATIONS – 1.2% (0.9% of Total Investments) | |
| | | | | |
| $ | 1,460 | | | Federal Agricultural Mortgage Corp Discount Notes | | | 0.010% | | | | 7/02/18 | | | | Aaa | | | $ | 1,459,934 | |
| | | | Total Short-Term Investments (cost $1,459,934) | | | | | | | | | | | | | | | 1,459,934 | |
| | | | Total Investments (cost $185,382,169) – 135.8% | | | | | | | | | | | | | | | 169,220,026 | |
| | | | Reverse Repurchase Agreements – (37.7)% (4) | | | | | | | | | | | | | | | (47,000,000 | ) |
| | | | Other Assets Less Liabilities – 1.9% | | | | | | | | | | | | | | | 2,419,266 | |
| | | | Net Assets – 100% | | | | | | | | | | | | | | $ | 124,639,292 | |
17
| | |
| JEMD | | Nuveen Emerging Markets Debt 2022 Target Term Fund (continued) |
| | Portfolio of Investments June 30, 2018 |
| | (Unaudited) |
For Fund portfolio compliance purposes, the Fund’s industry classifications refer to any one or more of the industry sub-classifications used by one or more widely recognized market indexes or ratings group indexes, and/or as defined by Fund management. This definition may not apply for purposes of this report, which may combine industry sub-classifications into sectors for reporting ease.
| (1) | All percentages shown in the Portfolio of Investments are based on net assets unless otherwise noted. |
| (2) | For financial reporting purposes, the ratings disclosed are the highest of Standard & Poor’s Group (“Standard & Poor’s”), Moody’s Investors Service, Inc. (“Moody’s”) or Fitch, Inc. (“Fitch”) rating. This treatment of split-rated securities may differ from that used for other purposes, such as for Fund investment policies. Ratings below BBB by Standard & Poor’s, Baa by Moody’s or BBB by Fitch are considered to be below investment grade. Holdings designated N/R are not rated by any of these national rating agencies. |
| (3) | Investment, or portion of investment, has been pledged to collateralize the net payment obligations for investments in reverse repurchase agreements. |
| (4) | Reverse repurchase agreements as a percentage of Total Investments is 27.8%. |
| 144A | Investment is exempt from registration under Rule 144A of the Securities Act of 1933, as amended. These investments may only be resold in transactions exempt from registration, which are normally those transactions with qualified institutional buyers. |
| Reg S | Regulation S allows U.S. companies to sell securities to persons or entities located outside of the United States without registering those securities with the Securities and Exchange Commission. Specifically, Regulation S provides a safe harbor from the registration requirements of the Securities Act for the offers and sales of securities by both foreign and domestic issuers that are made outside the United States. |
See accompanying notes to financial statements.
18
Statement of Assets and Liabilities
June 30, 2018
(Unaudited)
| | | | |
Assets | | | | |
Long-term investments, at value (cost $183,922,235) | | $ | 167,760,092 | |
Short-term investments, at value (cost approximates value) | | | 1,459,934 | |
Cash | | | 25,089 | |
Receivable for interest | | | 3,272,359 | |
Other assets | | | 3,414 | |
Total assets | | | 172,520,888 | |
Liabilities | | | | |
Reverse repurchase agreements | | | 47,000,000 | |
Payable for dividends | | | 598,649 | |
Accrued expenses: | | | | |
Interest | | | 75,409 | |
Management fees | | | 136,985 | |
Trustees fees | | | 1,129 | |
Other | | | 69,424 | |
Total liabilities | | | 47,881,596 | |
Net assets | | $ | 124,639,292 | |
Shares outstanding | | | 14,235,550 | |
Net asset value (“NAV”) per share outstanding | | $ | 8.76 | |
Net assets consist of: | | | | |
Shares, $.01 par value per share | | $ | 142,356 | |
Paid-in surplus | | | 139,777,946 | |
Undistributed (Over-distribution of) net investment income | | | 732,031 | |
Accumulated net realized gain (loss) | | | 149,102 | |
Net unrealized appreciation (depreciation) | | | (16,162,143 | ) |
Net assets | | $ | 124,639,292 | |
Authorized shares | | | Unlimited | |
See accompanying notes to financial statements.
19
Statement of Operations
Six Months Ended June 30, 2018
(Unaudited)
| | | | |
Investment Income | | $ | 5,526,764 | |
Expenses | | | | |
Management fees | | | 868,387 | |
Interest expense | | | 555,069 | |
Custodian fees | | | 22,881 | |
Trustees fees | | | 1,985 | |
Professional fees | | | 47,450 | |
Shareholder reporting expenses | | | 13,105 | |
Shareholder servicing agent fees | | | 78 | |
Stock exchange listing fees | | | 3,358 | |
Investor relations expense | | | 6,366 | |
Other | | | 3,113 | |
Total expenses | | | 1,521,792 | |
Net investment income (loss) | | | 4,004,972 | |
Realized and Unrealized Gain (Loss) | | | | |
Net realized gain (loss) from investments | | | 133,758 | |
Change in net unrealized appreciation (depreciation) of investments | | | (15,861,101 | ) |
Net realized and unrealized gain (loss) | | | (15,727,343 | ) |
Net increase (decrease) in net assets from operations | | $ | (11,722,371 | ) |
See accompanying notes to financial statements.
20
Statement of Changes in Net Assets
| | | | | | | | |
| | | Six Months
Ended
6/30/18 | | | For the period September 26, 2017
(commencement of operations)
through December 31, 2017 | |
Operations | | | | | | | | |
Net investment income (loss) | | | 4,004,972 | | | $ | 1,655,173 | |
Net realized gain (loss) from investments | | | 133,758 | | | | 25,841 | |
Change in net unrealized appreciation (depreciation) of investments | | | (15,861,101 | ) | | | (301,042 | ) |
Net increase (decrease) in net assets from operations | | | (11,722,371 | ) | | | 1,379,972 | |
Distributions to Shareholders | | | | | | | | |
From net investment income | | | (3,715,479 | ) | | | (1,212,635 | ) |
From accumulated net realized gains | | | — | | | | (25,841 | ) |
Decrease in net assets from distributions to shareholders | | | (3,715,479 | ) | | | (1,238,476 | ) |
Capital Share Transactions | | | | | | | | |
Proceeds from sale of shares, net of offering costs | | | — | | | | 139,831,750 | |
Proceeds from shares issued to shareholders due to reinvestment of distributions | | | — | | | | 3,820 | |
Net increase (decrease) in net assets from capital share transactions | | | — | | | | 139,835,570 | |
Net increase (decrease) in net assets | | | (15,437,850 | ) | | | 139,977,066 | |
Net assets at the beginning of period | | | 140,077,142 | | | | 100,076 | |
Net assets at the end of period | | | 124,639,292 | | | $ | 140,077,142 | |
Undistributed (Over-distribution of) net investment income at the end of period | | | 732,031 | | | $ | 442,538 | |
See accompanying notes to financial statements.
21
Statement of Cash Flows
Six Months Ended June 30, 2018
(Unaudited)
| | | | |
Cash Flows from Operating Activities: | | | | |
Net Increase (Decrease) in Net Assets from Operations | | $ | (11,722,371 | ) |
Adjustments to reconcile the net increase (decrease) in net assets from operations to net cash provided by (used in) operating activities: | | | | |
Purchases of investments | | | (6,203,663 | ) |
Proceeds from sales and maturities of investments | | | 6,076,715 | |
Proceeds from (Purchases of) short-term investments, net | | | (1,459,934 | ) |
Taxes paid | | | (15,344 | ) |
Amortization (Accretion) of premiums and discounts, net | | | 506,526 | |
(Increase) Decrease in: | | | | |
Receivable for interest | | | 121,395 | |
Receivable for investments sold | | | 421,179 | |
Other assets | | | (3,414 | ) |
Increase (Decrease) in: | | | | |
Payable for investments purchased | | | (1,133,291 | ) |
Accrued interest | | | 13,675 | |
Accrued management fees | | | (15,200 | ) |
Accrued Trustees fees | | | (363 | ) |
Accrued other expenses | | | (3,459 | ) |
Net realized (gain) loss from investments | | | (133,758 | ) |
Change in net unrealized (appreciation) depreciation of investments | | | 15,861,101 | |
Net cash provided by (used in) operating activities | | | 2,309,794 | |
Cash Flows from Financing Activities | | | | |
Cash distributions paid to shareholders | | | (3,116,830 | ) |
Net cash provided by (used in) financing activities | | | (3,116,830 | ) |
Net Increase (Decrease) in Cash | | | (807,036 | ) |
Cash at the beginning of period | | | 832,125 | |
Cash at the end of period | | $ | 25,089 | |
| |
| Supplemental Disclosure of Cash Flow Information | | | |
Cash paid for interest on borrowings (excluding borrowing costs) | | $ | 541,394 | |
See accompanying notes to financial statements.
22
THIS PAGE INTENTIONALLY LEFT BLANK
23
Financial Highlights
(Unaudited)
Selected data for a share outstanding throughout each period:
| | | | | | | | | | | | | | | | | | | | | | | | | | | | | | | | | | | | | | | | |
| | | | | | |
| | | | | | Investment Operations | | | Less Distributions | | | | | | | | | | |
| | | Beginning
NAV | | | Net
Investment
Income (Loss)(a) | | | Net
Realized/
Unrealized
Gain (Loss) | | | Total | | | From Net
Investment
Income | | | From
Accumulated
Net Realized
Gains | | | Total | | | Offering
Costs | | | Ending
NAV | | | Ending
Share
Price | |
Year Ended 12/31: | |
2018(f) | | $ | 9.84 | | | $ | 0.28 | | | $ | (1.10 | ) | | $ | (0.82 | ) | | $ | (0.26 | ) | | $ | — | | | $ | (0.26 | ) | | $ | — | | | $ | 8.76 | | | $ | 8.74 | |
2017(e) | | | 9.85 | | | | 0.12 | | | | (0.02 | ) | | | 0.10 | | | | (0.09 | ) | | | — | * | | | (0.09 | ) | | | (0.02 | ) | | | 9.84 | | | | 9.40 | |
24
| | | | | | | | | | | | | | | | | | | | | | |
| | | | | | | Ratios/Supplemental Data | |
| Total Returns | | | | | | Ratios to Average Net Assets(c) | | | | |
Based
on
NAV(b) | | | Based
on
Share
Price(b) | | | Ending
Net
Assets
(000) | | | Expenses | | | Net
Investment
Income (Loss) | | | Portfolio
Turnover
Rate(d) | |
| | | | | | | | | | | | | | | | | | | | | | |
| | (8.48 | )% | | | (4.32 | )% | | $ | 124,639 | | | | 2.26 | %** | | | 5.96 | %** | | | 3 | % |
| | 0.79 | | | | (5.15 | ) | | | 140,077 | | | | 1.85 | ** | | | 4.70 | ** | | | 7 | |
| (a) | Per share Net Investment Income (Loss) is calculated using the average daily shares method. |
| (b) | Total Return Based on NAV is the combination of changes in NAV, reinvested dividend income at NAV and reinvested capital gains distributions at NAV, if any. The last dividend declared in the period, which is typically paid on the first business day of the following month, is assumed to be reinvested at the ending NAV. The actual reinvest price for the last dividend declared in the period may often be based on the Fund’s market price (and not its NAV), and therefore may be different from the price used in the calculation. Total returns are not annualized. |
Total Return Based on Share Price is the combination of changes in the market price per share and the effect of reinvested dividend income and reinvested capital gains distributions, if any, at the average price paid per share at the time of reinvestment. The last dividend declared in the period, which is typically paid on the first business day of the following month, is assumed to be reinvested at the ending market price. The actual reinvestment for the last dividend declared in the period may take place over several days, and in some instances may not be based on the market price, so the actual reinvestment price may be different from the price used in the calculation. Total returns are not annualized.
| | | | |
| (c) | | • | | Net Investment Income (Loss) ratios reflect income earned and expense incurred on assets attributable to reverse repurchase agreements (as described in Note 8 – Fund Leverage, Reverse Repurchase Agreements), where applicable. |
| | • | | Each ratio includes the effect of all interest expenses paid and other costs related to reverse repurchase agreements, where applicable, as follows: |
| | | | |
Ratio of Interest Expense to Average Net Assets | |
Year Ended 12/31: | |
2018(f) | | | 0.83 | %** |
2017(e) | | | 0.48 | ** |
| (d) | Portfolio Turnover Rate is calculated based on the lesser of long-term purchases or sales (as disclosed in Note 5 – Investment Transactions) divided by the average long-term market value during the period. |
| (e) | For the period September 26, 2017 (commencement of operations) through December 31, 2017. |
| (f) | For the six months ended June 30, 2018. |
| * | Rounds to less than 0.01. |
See accompanying notes to financial statements.
25
Notes to Financial Statements
(Unaudited)
1. General Information and Significant Accounting Policies
General Information
Fund Information
Nuveen Emerging Markets Debt 2022 Target Term Fund (the “Fund”) is registered under the Investment Company Act of 1940, as amended, as a non-diversified, closed-end management investment company. The Fund’s shares are listed on the New York Stock Exchange (“NYSE”) and trade under the ticker symbol “JEMD.” The Fund was organized as a Massachusetts business trust on June 1, 2017.
The end of the reporting period for the Fund is June 30, 2018, and the period covered by these Notes to Financial Statements is for the six months ended June 30, 2018 (the “current fiscal period”).
Investment Adviser
The Fund’s investment adviser is Nuveen Fund Advisors, LLC (the “Adviser”), a subsidiary of Nuveen, LLC (“Nuveen”). Nuveen is the investment management arm of Teachers Insurance and Annuity Association of America (TIAA). The Adviser has overall responsibility for management of the Fund, oversees the management of the Fund’s portfolio, manages the Fund’s business affairs and provides certain clerical, bookkeeping and other administrative services, and, if necessary, asset allocation decisions. The Adviser has entered into a sub-advisory agreement with Teachers Advisors, LLC (the “Sub-Adviser”), an affiliate of the Adviser, under which the Sub-Adviser manages the Fund’s investment portfolio.
Investment Objectives and Principal Investment Strategies
The Fund seeks to provide a high level of current income and return the original $9.85 net asset value (“NAV”) per share on or about December 1, 2022 (the “Termination Date”). The Fund generally invests in a portfolio of below investment grade emerging market debt securities. At least 80% of the Fund’s managed assets (as defined in Note 7 – Management Fees) will be in emerging market debt securities. However, the Fund invests no more than 10% of its managed assets in securities rated below B-/B3 or that are unrated but judged by the Sub-Adviser to be of comparable quality. The Fund invests 100% of its managed assets in U.S. dollar denominated securities. No more than 25% is invested in securities of issuers located in a single country.
Significant Accounting Policies
The Fund is an investment company and follows accounting and reporting guidance under Financial Accounting Standards Board (“FASB”) Accounting Standards Codification (ASC) Topic 946 “Financial Services-Investment Companies.” The following is a summary of significant accounting policies followed by the Fund in the preparation of its financial statements in accordance with U.S. generally accepted accounting principles (“U.S. GAAP”).
Investment Transactions
Investment transactions are recorded on a trade date basis. Realized gains and losses from investment transactions are determined on the specific identification method, which is the same basis used for federal income tax purposes. Investments purchased on a when-issued/delayed delivery basis may have extended settlement periods. Any investments so purchased are subject to market fluctuation during this period. The Fund has earmarked securities in its portfolio with a current value at least equal to the amount of the when-issued/delayed delivery purchase commitments.
As of the end of the reporting period, the Fund did not have any outstanding when-issued/delayed delivery purchase commitments.
Investment Income
Investment income is comprised of interest income, which reflects the amortization of premiums and accretion of discounts for financial reporting purposes, and is recorded on an accrual basis. Investment income also reflects payment-in-kind (“PIK”) interest, fees earned from reverse repurchase agreements and paydown gains and losses, if any. PIK interest represents income received in the form of securities in lieu of cash.
Professional Fees
Professional fees presented on the Statement of Operations consist of legal fees incurred in the normal course of operations, audit fees, tax consulting fees and, in some cases, workout expenditures. Workout expenditures are incurred in an attempt to protect or enhance an investment or to pursue other claims or legal actions on behalf of Fund shareholders. If a refund is received for workout expenditures paid in a prior reporting period, such amounts will be recognized as “Legal fee refund” on the Statement of Operations.
26
Dividends and Distributions to Shareholders
Dividends to shareholders, if any, are declared monthly. Net realized capital gains from investment transactions, if any, are declared and distributed to shareholders at least annually. However, in seeking to achieve its investment objectives, the Fund currently intends to set aside and retain in its net assets (and therefore its NAV) a portion of its net investment income, and possibly all or a portion of its gains. This will reduce the amounts otherwise available for distribution prior to the liquidation of the Fund, and the Fund may incur taxes on such retained amount. Such retained income or gains, net of any taxes, would constitute a portion of the liquidating distribution returned to investors on or about the Termination Date. Furthermore, capital gains are distributed only to the extent they exceed available capital loss carryforwards.
Distributions to shareholders are recorded on the ex-dividend date. The amount and timing of distributions are determined in accordance with federal income tax regulations, which may differ from U.S. GAAP.
Compensation
The Fund pays no compensation directly to those of its trustees who are affiliated with the Adviser or to its officers, all of whom receive renumeration for their services to the Fund from the Adviser or its affiliates. The Fund’s Board of Trustees (the “Board”) has adopted a deferred compensation plan for independent trustees that enables trustees to elect to defer receipt of all or a portion of the annual compensation they are entitled to receive from certain Nuveen-advised funds. Under the plan, deferred amounts are treated as though equal dollar amounts had been invested in shares of select Nuveen-advised funds.
Indemnifications
Under the Fund’s organizational documents, its officers and trustees are indemnified against certain liabilities arising out of the performance of their duties to the Fund. In addition, in the normal course of business, the Fund enters into contracts that provide general indemnifications to other parties. The Fund’s maximum exposure under these arrangements is unknown as this would involve future claims that may be made against the Fund that have not yet occurred. However, the Fund has not had prior claims or losses pursuant to these contracts and expects the risk of loss to be remote.
Netting Agreements
In the ordinary course of business, the Fund may enter into transactions subject to enforceable International Swaps and Derivatives Association, Inc. (ISDA) master agreements or other similar arrangements (“netting agreements”). Generally, the right to offset in netting agreements allows the Fund to offset certain securities and derivatives with a specific counterparty, when applicable, as well as any collateral received or delivered to that counterparty based on the terms of the agreements. Generally, the Fund manages its cash collateral and securities collateral on a counterparty basis.
The Fund’s investments subject to netting agreements as of the end of the reporting period, if any, are further described in Note 3 – Portfolio Securities and Investments in Derivatives.
Use of Estimates
The preparation of financial statements in conformity with U.S. GAAP requires management to make estimates and assumptions that affect the reported amounts of assets and liabilities at the date of the financial statements and the reported amounts of increases and decreases in net assets from operations during the current fiscal period. Actual results may differ from those estimates.
2. Investment Valuation and Fair Value Measurements
The fair valuation input levels as described below are for fair value measurement purposes.
Fair value is defined as the price that would be received upon selling an investment or transferring a liability in an orderly transaction to an independent buyer in the principal or most advantageous market for the investment. A three-tier hierarchy is used to maximize the use of observable market data and minimize the use of unobservable inputs and to establish classification of fair value measurements for disclosure purposes. Observable inputs reflect the assumptions market participants would use in pricing the asset or liability. Observable inputs are based on market data obtained from sources independent of the reporting entity. Unobservable inputs reflect the reporting entity’s own assumptions about the assumptions market participants would use in pricing the asset or liability. Unobservable inputs are based on the best information available in the circumstances. The following is a summary of the three-tiered hierarchy of valuation input levels.
| | | | |
| Level 1 – | | Inputs are unadjusted and prices are determined using quoted prices in active markets for identical securities. |
| Level 2 – | | Prices are determined using other significant observable inputs (including quoted prices for similar securities, interest rates, prepayment speeds, credit risk, etc.). |
| Level 3 – | | Prices are determined using significant unobservable inputs (including management’s assumptions in determining the fair value of investments). |
27
Notes to Financial Statements (continued)
(Unaudited)
Prices of fixed-income securities are provided by an independent pricing service (“pricing service”) approved by the Board. The pricing service establishes a security’s fair value using methods that may include consideration of the following: yields or prices of investments of comparable quality, type of issue, coupon, maturity and rating, market quotes or indications of value from security dealers, evaluations of anticipated cash flows or collateral, general market conditions and other information and analysis, including the obligor’s credit characteristics considered relevant. These securities are generally classified as Level 2. In pricing certain securities, particularly less liquid and lower quality securities, the pricing service may consider information about a security, its issuer or market activity provided by the Adviser. These securities are generally classified as Level 2 or Level 3 depending on the observability of the significant inputs.
Certain securities may not be able to be priced by the pre-established pricing methods as described above. Such securities may be valued by the Board and/or its appointee at fair value. These securities generally include, but are not limited to, restricted securities (securities which may not be publicly sold without registration under the Securities Act of 1933, as amended) for which a pricing service is unable to provide a market price; securities whose trading has been formally suspended; debt securities that have gone into default and for which there is no current market quotation; a security whose market price is not available from a pre-established pricing source; a security with respect to which an event has occurred that is likely to materially affect the value of the security after the market has closed but before the calculation of the Fund’s NAV (as may be the case in non-U.S. markets on which the
security is primarily traded) or make it difficult or impossible to obtain a reliable market quotation; and a security whose price, as provided by the pricing service, is not deemed to reflect the security’s fair value. As a general principle, the fair value of a security would appear to be the amount that the owner might reasonably expect to receive for it in a current sale. A variety of factors may be considered in determining the fair value of such securities, which may include consideration of the following: yields or prices of investments of comparable quality, type of issue, coupon, maturity and rating, market quotes or indications of value from security dealers, evaluations of anticipated cash flows or collateral, general market conditions and other information and analysis, including the obligor’s credit characteristics considered relevant. These securities are generally classified as Level 2 or Level 3 depending on the observability of the significant inputs. Regardless of the method employed to value a particular security, all valuations are subject to review by the Board and/or its appointee.
The inputs or methodologies used for valuing securities are not an indication of the risks associated with investing in those securities. The following is a summary of the Fund’s fair value measurements as of the end of the reporting period:
| | | | | | | | | | | | | | | | |
| | | Level 1 | | | Level 2 | | | Level 3 | | | Total | |
Long-Term Investments*: | | | | | | | | | | | | | | | | |
Emerging Markets Debt | | $ | — | | | $ | 91,876,319 | | | $ | — | | | $ | 91,876,319 | |
Corporate Bonds | | | — | | | | 75,883,773 | | | | — | | | | 75,883,773 | |
| | | | |
Short-Term Investments | | | | | | | | | | | | | | | | |
U.S. Government and Agency Obligations | | | — | | | | 1,459,934 | | | | — | | | | 1,459,934 | |
Total | | $ | — | | | $ | 169,220,026 | | | $ | — | | | $ | 169,220,026 | |
| * | Refer to the Fund’s Portfolio of Investments for industry and country classifications, where applicable. |
The Board is responsible for the valuation process and has appointed the oversight of the daily valuation process to the Adviser’s Valuation Committee. The Valuation Committee, pursuant to the valuation policies and procedures adopted by the Board, is responsible for making fair value determinations, evaluating the effectiveness of the Fund’s pricing policies and reporting to the Board. The Valuation Committee is aided in its efforts by the Adviser’s dedicated Securities Valuation Team, which is responsible for administering the daily valuation process and applying fair value methodologies as approved by the Valuation Committee. When determining the reliability of independent pricing services for investments owned by the Fund, the Valuation Committee, among other things, conducts due diligence reviews of the pricing services and monitors the quality of security prices received through various testing reports conducted by the Securities Valuation Team.
The Valuation Committee will consider pricing methodologies it deems relevant and appropriate when making a fair value determination, based on the facts and circumstances specific to the portfolio instrument. Fair value determinations generally will be derived as follows, using public or private market information:
| | (i) | If available, fair value determinations shall be derived by extrapolating from recent transactions or quoted prices for identical or comparable securities. |
| | (ii) | If such information is not available, an analytical valuation methodology may be used based on other available information including, but not limited to: analyst appraisals, research reports, corporate action information, issuer financial statements and shelf registration statements. Such analytical valuation methodologies may include, but are not limited to: multiple of earnings, discount from market value of a similar freely-traded security, discounted cash flow analysis, book value or a multiple thereof, risk premium/yield analysis, yield to maturity and/or fundamental investment analysis. |
The purchase price of a portfolio instrument will be used to fair value the instrument only if no other valuation methodology is available or deemed appropriate, and it is determined that the purchase price fairly reflects the instrument’s current value.
28
For each portfolio security that has been fair valued pursuant to the policies adopted by the Board, the fair value price is compared against the last available and next available market quotations. The Valuation Committee reviews the results of such testing and fair valuation occurrences are reported to the Board.
3. Portfolio Securities and Investments in Derivatives
Portfolio Securities
Zero Coupon Securities
A zero coupon security does not pay a regular interest coupon to its holders during the life of the security. Income to the holder of the security comes from accretion of the difference between the original purchase price of the security at issuance and the par value of the security at maturity and is effectively paid at maturity. The market prices of zero coupon securities generally are more volatile than the market prices of securities that pay interest periodically.
Investments in Derivatives
The Fund is authorized to invest in certain derivative instruments, such as futures, options and swap contracts. The Fund limits its investments in futures, options on futures and swap contracts to the extent necessary for the Adviser to claim the exclusion from registration by the Commodity Futures Trading Commission as a commodity pool operator with respect to the Fund. The Fund records derivative instruments at fair value, with changes in fair value recognized on the Statement of Operations, when applicable. Even though the Fund’s investments in derivatives may represent economic hedges, they are not considered to be hedge transactions for financial reporting purposes.
Although the Fund is authorized to invest in derivative instruments, and may do so in the future, it did not make any such investments during the current fiscal period.
Market and Counterparty Credit Risk
In the normal course of business the Fund may invest in financial instruments and enter into financial transactions where risk of potential loss exists due to changes in the market (market risk) or failure of the other party to the transaction to perform (counterparty credit risk). The potential loss could exceed the value of the financial assets recorded on the financial statements. Financial assets, which potentially expose the Fund to counterparty credit risk, consist principally of cash due from counterparties on forward, option and swap transactions, when applicable. The extent of the Fund’s exposure to counterparty credit risk in respect to these financial assets approximates their carrying value as recorded on the Statement of Assets and Liabilities.
The Fund helps manage counterparty credit risk by entering into agreements only with counterparties the Adviser believes have the financial resources to honor their obligations and by having the Adviser monitor the financial stability of the counterparties. Additionally, counterparties may be required to pledge collateral daily (based on the daily valuation of the financial asset) on behalf of the Fund with a value approximately equal to the amount of any unrealized gain above a pre-determined threshold. Reciprocally, when the Fund has an unrealized loss, the Fund has instructed the custodian to pledge assets of the Fund as collateral with a value approximately equal to the amount of the unrealized loss above a pre-determined threshold. Collateral pledges are monitored and subsequently adjusted if and when the valuations fluctuate, either up or down, by at least the pre-determined threshold amount.
4. Fund Shares
Share Transactions
Transactions in shares during the Fund’s current and prior fiscal period were as follows:
| | | | | | | | |
| | | Six Months Ended
6/30/18 | | | For the Period 9/26/17
(commencement of operations)
through 12/31/17 | |
Shares:* | | | | | | | | |
Sold | | | — | | | | 14,225,000 | |
Issued to shareholders due to reinvestment of distributions | | | — | | | | 390 | |
Total | | | — | | | | 14,225,390 | |
| * | Prior to the commencement of operations, the Adviser purchased 10,160 shares, which are still held as of the end of the reporting period. |
5. Investment Transactions
Long-term purchases and sales (including maturities) during the current fiscal period aggregated $6,203,663 and $6,076,715, respectively.
29
Notes to Financial Statements (continued)
(Unaudited)
6. Income Tax Information
The Fund intends to distribute substantially all of its net investment company taxable income to shareholders and to otherwise comply with the requirements of Subchapter M of the Internal Revenue Code applicable to regulated investment companies. In any year when the Fund realizes net capital gains, the Fund may choose to distribute all or a portion of its net capital gains to shareholders, or alternatively, to retain all or a portion of its net capital gains and pay federal corporate income taxes on such retained gains.
For all open tax years and all major taxing jurisdictions, management of the Fund has concluded that there are no significant uncertain tax positions that would require recognition in the financial statements. Open tax years are those that are open for examination by taxing authorities (i.e., generally the last four tax year ends and the interim tax period since then). Furthermore, management of the Fund is also not aware of any tax positions for which it is reasonably possible that the total amounts of unrecognized tax benefits will significantly change in the next twelve months.
The following information is presented on an income tax basis. Differences between amounts for financial statement and federal income tax purposes are primarily due to timing differences in recognizing certain gains and losses on investment transactions. To the extent that differences arise that are permanent in nature, such amounts are reclassified within the capital accounts as detailed below. Temporary differences do not require reclassification. Temporary and permanent differences do not impact the NAV of the Fund.
The table below presents the cost and unrealized appreciation (depreciation) of the Fund’s investment portfolio, as determined on a federal income tax basis, as of June 30, 2018.
| | | | |
Tax cost of investments | | | $185,382,169 | |
Gross unrealized: | | | | |
Appreciation | | $ | 72,820 | |
Depreciation | | | (16,234,963 | ) |
Net unrealized appreciation (depreciation) of investments | | $ | (16,162,143 | ) |
As of December 31, 2017, the Fund’s last tax year end, the Fund did not have any permanent differences.
The tax components of undistributed net ordinary income and net long-term capital gains as of December 31, 2017, the Fund’s last tax year end, were as follows:
| | | | |
Undistributed net ordinary income1 | | | $442,538 | |
Undistributed net long-term capital gains | | | — | |
1 Net ordinary income consists of net taxable income derived from dividends, interest, and net short-term capital gains, if any. | |
The tax character of distributions paid during the Fund’s last tax year end December 31, 2017 was designated for purposes of the dividends paid deduction as follows:
| | | | |
Distributions from net ordinary income¹ | | | $1,238,476 | |
Distributions from net long-term capital gains | | | — | |
1 Net ordinary income consists of net taxable income derived from dividends, interest, and net short-term capital gains, if any. | |
7. Management Fees
The Fund’s management fee compensates the Adviser for overall investment advisory and administrative services and general office facilities. The Sub-Adviser is compensated for its services to the Fund from the management fees paid to the Adviser.
The Fund’s management fee consists of two components – a fund-level fee, based only on the amount of assets within the Fund, and a complex-level fee, based on the aggregate amount of all eligible fund assets managed by the Adviser. This pricing structure enables Fund shareholders to benefit from growth in the assets within the Fund as well as from growth in the amount of complex-wide assets managed by the Adviser.
The annual fund-level fee, payable monthly, is calculated according to the following schedule:
| | | | |
| Average Daily Managed Assets* | | Fund-Level Fee Rate | |
For the first $500 million | | | 0.8000 | % |
For the next $250 million | | | 0.7875 | |
For managed assets over $750 million | | | 0.7750 | |
30
The annual complex-level fee, payable monthly, is calculated by multiplying the current complex-wide fee rate, determined according to the following schedule by the Fund’s daily managed assets:
| | | | |
| Complex-Level Eligible Asset Breakpoint Level* | | Effective Complex-Level Fee Rate at Breakpoint Level | |
$55 billion | | | 0.2000 | % |
$56 billion | | | 0.1996 | |
$57 billion | | | 0.1989 | |
$60 billion | | | 0.1961 | |
$63 billion | | | 0.1931 | |
$66 billion | | | 0.1900 | |
$71 billion | | | 0.1851 | |
$76 billion | | | 0.1806 | |
$80 billion | | | 0.1773 | |
$91 billion | | | 0.1691 | |
$125 billion | | | 0.1599 | |
$200 billion | | | 0.1505 | |
$250 billion | | | 0.1469 | |
$300 billion | | | 0.1445 | |
| * | For the complex-level fees, managed assets include closed-end fund assets managed by the Adviser that are attributable to certain types of leverage. For these purposes, leverage includes the funds’ use of preferred stock and borrowings and certain investments in the residual interest certificates (also called inverse floating rate securities) in tender option bond (TOB) trusts, including the portion of assets held by a TOB trust that has been effectively financed by the trust’s issuance of floating rate securities, subject to an agreement by the Adviser as to certain funds to limit the amount of such assets for determining managed assets in certain circumstances. The complex-level fee is calculated based upon the aggregate daily managed assets of all Nuveen open-end and closed-end Funds that constitute “eligible assets.” Eligible assets do not include assets attributable to investments in other Nuveen Funds or assets in excess of a determined amount (originally $2 billion) added to the Nuveen fund complex in connection with the Adviser’s assumption of the management of the former First American Funds effective January 1, 2011. As of June 30, 2018, the complex-level fee for the Fund was 0.1591%. |
8. Fund Leverage
Reverse Repurchase Agreements
During the current fiscal period, the Fund used reverse repurchase agreements as a means of leverage.
In a reverse repurchase agreement, the Fund sells to the counterparty a security that it holds with a contemporaneous agreement to repurchase the same security at an agreed-upon price and date, with the Fund retaining the risk of loss that is associated with that security. The Fund will pledge assets determined to be liquid by the Adviser to cover its obligations under reverse repurchase agreements. Securities sold under reverse repurchase agreements are recorded as a liability and recognized as “Reverse repurchase agreements” on the Statement of Assets and Liabilities.
Payments made on reverse repurchase agreements are recognized as a component of “Interest expense” on the Statement of Operations.
As of the end of the reporting period, the Fund’s outstanding balances on its reverse repurchase agreements were as follows:
| | | | | | | | | | | | | | | | | | | | |
| Counterparty | | Coupon | | | Principal
Amount | | | Maturity | | | Value | | | Value and
Accrued Interest | |
JP Morgan Chase Bank N.A. | | | 2.600 | % | | $ | (25,000,000 | ) | | | N/A | | | $ | (25,000,000 | ) | | $ | (25,019,861 | ) |
Societe Generale | | | 2.755 | | | | (22,000,000 | ) | | | N/A | | | | (22,000,000 | ) | | | (22,055,548 | ) |
| | | | | | | $ | (47,000,000 | ) | | | | | | $ | (47,000,000 | ) | | $ | (47,075,409 | ) |
N/A – Maturity is not applicable. The final repurchase date will be established following pre-specified advance notice by the Fund or the counterparty to the reverse repurchase agreement.
During the current fiscal period, the average daily balance outstanding and average interest rate on the Fund’s reverse repurchase agreements were as follows:
| | | | |
Average daily balance outstanding | | | $47,000,000 | |
Average interest rate | | | 2.38 | % |
31
Notes to Financial Statements (continued)
(Unaudited)
The following table presents the reverse repurchase agreements subject to netting agreements and the collateral delivered related to those reverse repurchase agreements.
| | | | | | | | | | | | |
| Counterparty | | Reverse Repurchase*
Agreements | | | Collateral Pledged**
to Counterparty | | | Net
Exposure | |
JP Morgan Chase Bank N.A. | | $ | (25,019,861 | ) | | $ | 25,019,861 | | | $ | — | |
Societe General | | | (22,055,548 | ) | | | 22,055,548 | | | | — | |
| | | $ | (47,075,409 | ) | | $ | 47,075,409 | | | $ | — | |
| * | Represents gross value and accrued interest for the counterparty as reported in the preceding table. |
| ** | As of the end of the reporting period, the value of the collateral pledged to the counterparty exceeded the value of the reverse repurchase agreements. |
9. Inter-Fund Lending
Inter-Fund Borrowing and Lending
The Securities and Exchange Commission (“SEC”) has granted an exemptive order permitting registered open-end and closed-end Nuveen funds to participate in an inter-fund lending facility whereby the Nuveen funds may directly lend to and borrow money from each other for temporary purposes (e.g., to satisfy redemption requests or when a sale of securities “fails,” resulting in an unanticipated cash shortfall) (the “Inter-Fund Program”). The closed-end Nuveen funds, including the Fund covered by this shareholder report, will participate only as lenders, and not as borrowers, in the Inter-Fund Program because such closed-end funds rarely, if ever, need to borrow cash to meet redemptions. The Inter-Fund Program is subject to a number of conditions, including, among other things, the requirements that (1) no fund may borrow or lend money through the Inter-Fund Program unless it receives a more favorable interest rate than is typically available from a bank or other financial institution for a comparable transaction; (2) no fund may borrow on an unsecured basis through the Inter-Fund Program unless the fund’s outstanding borrowings from all sources immediately after the inter-fund borrowing total 10% or less of its total assets; provided that if the borrowing fund has a secured borrowing outstanding from any other lender, including but not limited to another fund, the inter-fund loan must be secured on at least an equal priority basis with at least an equivalent percentage of collateral to loan value; (3) if a fund’s total outstanding borrowings immediately after an inter-fund borrowing would be greater than 10% of its total assets, the fund may borrow through the inter-fund loan on a secured basis only; (4) no fund may lend money if the loan would cause its aggregate outstanding loans through the Inter-Fund Program to exceed 15% of its net assets at the time of the loan; (5) a fund’s inter-fund loans to any one fund shall not exceed 5% of the lending fund’s net assets; (6) the duration of inter-fund loans will be limited to the time required to receive payment for securities sold, but in no event more than seven days; and (7) each inter-fund loan may be called on one business day’s notice by a lending fund and may be repaid on any day by a borrowing fund. In addition, a Nuveen fund may participate in the Inter-Fund Program only if and to the extent that such participation is consistent with the fund’s investment objective and investment policies. The Board is responsible for overseeing the Inter-Fund Program.
The limitations detailed above and the other conditions of the SEC exemptive order permitting the Inter-Fund Program are designed to minimize the risks associated with Inter-Fund Program for both the lending fund and the borrowing fund. However, no borrowing or lending activity is without risk. When a fund borrows money from another fund, there is a risk that the loan could be called on one day’s notice or not renewed, in which case the fund may have to borrow from a bank at a higher rate or take other actions to payoff such loan if an inter-fund loan is not available from another fund. Any delay in repayment to a lending fund could result in a lost investment opportunity or additional borrowing costs.
During the current reporting period, the Fund did not enter into any inter-fund loan activity.
10. New Accounting Pronouncements
FASB Accounting Standards Update (“ASU”) 2017-08 (“ASU 2017-08”) Premium Amortization on Purchased Callable Debt Securities
The FASB has issued ASU 2017-08, which shortens the premium amortization period for purchased non-contingently callable debt securities. ASU 2017-08 specifies that the premium amortization period ends at the earliest call date, for purchased non-contingently callable debt securities. ASU 2017-08 is effective for fiscal years, and interim periods within those fiscal years, beginning after December 15, 2018. Management is currently evaluating the implications of ASU 2017-08, if any.
32
Additional Fund Information
| | | | | | | | | | |
| Board of Trustees | | | | | | | | | | |
| Margo Cook* | | Jack B. Evans | | William C. Hunter | | Albin F. Moschner | | John K. Nelson | | William J. Schneider |
Judith M. Stockdale | | Carole E. Stone | | Terence J. Toth | | Margaret L. Wolff | | Robert L. Young | | |
| * | Interested Board Member. |
| | | | | | | | |
| | | | | |
Fund Manager Nuveen Fund Advisors, LLC 333 West Wacker Drive Chicago, IL 60606 | | Custodian State Street Bank
& Trust Company One Lincoln Street Boston, MA 02111 | | Legal Counsel Chapman and Cutler LLP Chicago, IL 60603 | | Independent Registered
Public Accounting Firm KPMG LLP 200 East Randolph Street Chicago, IL 60601 | | Transfer Agent and
Shareholder Services Computershare Trust Company, N.A. 250 Royall Street Canton, MA 02021 (800) 257-8787 |
Quarterly Form N-Q Portfolio of Investments Information
The Fund is required to file its complete schedule of portfolio holdings with the Securities and Exchange Commission (SEC) for the first and third quarters of each fiscal year on Form N-Q. You may obtain this information directly from the SEC. Visit the SEC on-line at http://www.sec.gov or in person at the SEC’s Public Reference Room in Washington, D.C. Call the SEC toll-free at (800) SEC-0330 for room hours and operation.
Nuveen Funds’ Proxy Voting Information
You may obtain (i) information regarding how each fund voted proxies relating to portfolio securities held during the most recent twelve-month period ended June 30, without charge, upon request, by calling Nuveen toll-free at (800) 257-8787 or on Nuveen’s website at www.nuveen.com and (ii) a description of the policies and procedures that each fund used to determine how to vote proxies relating to portfolio securities without charge, upon request, by calling Nuveen toll free at (800) 257-8787. You may also obtain this information directly from the SEC. Visit the SEC on-line at http://www.sec.gov.
CEO Certification Disclosure
The Fund’s Chief Executive Officer (CEO) has submitted to the New York Stock Exchange (NYSE) the annual CEO certification as required by Section 303A.12(a) of the NYSE Listed Company Manual. The Fund has filed with the SEC the certification of its CEO and Chief Financial Officer required by Section 302 of the Sarbanes-Oxley Act.
FINRA BrokerCheck
The Financial Industry Regulatory Authority (FINRA) provides information regarding the disciplinary history of FINRA member firms and associated investment professionals. This information as well as an investor brochure describing FINRA BrokerCheck is available to the public by calling the FINRA BrokerCheck Hotline number at (800) 289-9999 or by visiting www.FINRA.org.
33
Glossary of Terms Used in this Report
| ∎ | | Average Annual Total Return: This is a commonly used method to express an investment’s performance over a particular, usually multi-year time period. It expresses the return that would have been necessary each year to equal the investment’s actual cumulative performance (including change in NAV or market price and reinvested dividends and capital gains distributions, if any) over the time period being considered. |
| ∎ | | Duration: Duration is a measure of the expected period over which a bond’s principal and interest will be paid, and consequently is a measure of the sensitivity of a bond’s or bond fund’s value to changes when market interest rates change. Generally, the longer a bond’s or fund’s duration, the more the price of the bond or fund will change as interest rates change. |
| ∎ | | Effective Leverage: Effective leverage is a fund’s effective economic leverage, and includes both regulatory leverage (see below) and the leverage effects of certain derivative investments in the fund’s portfolio. |
| ∎ | | JP Morgan EMBI Global Diversified Index: A uniquely-weighted version of the JP Morgan EMBI Global Index. It limits the weights of those index countries with larger debt stocks by only including specified portions of these countries’ eligible current face amounts of debt outstanding. The countries covered are identical to those covered by the JP Morgan EMBI Global Index which tracks total returns for U.S.-dollar denominated debt instruments issued by emerging market sovereign and quasi-sovereign entities: Brady bonds, loans, Eurobonds. Index returns assume reinvestment of distributions, but do not reflect any applicable sales charges or management fees. |
| ∎ | | Leverage: Leverage is created whenever a fund has investment exposure (both reward and/or risk) equivalent to more than 100% of the investment capital. |
| ∎ | | Net Asset Value (NAV) Per Share: A fund’s Net Assets is equal to its total assets (securities, cash, accrued earnings and receivables) less its total liabilities. NAV per share is equal to the fund’s Net Assets divided by its number of shares outstanding. |
| ∎ | | Regulatory Leverage: Regulatory leverage consists of preferred shares issued by or borrowings of a fund. Both of these are part of a fund’s capital structure. Regulatory leverage is subject to asset coverage limits set in the Investment Company Act of 1940. |
34
Reinvest Automatically, Easily and Conveniently
Nuveen makes reinvesting easy. A phone call is all it takes to set up your reinvestment account.
Nuveen Closed-End Funds Automatic Reinvestment Plan
Your Nuveen Closed-End Fund allows you to conveniently reinvest distributions in additional Fund shares.
By choosing to reinvest, you’ll be able to invest money regularly and automatically, and watch your investment grow through the power of compounding. Just like distributions in cash, there may be times when income or capital gains taxes may be payable on distributions that are reinvested.
It is important to note that an automatic reinvestment plan does not ensure a profit, nor does it protect you against loss in a declining market.
Easy and convenient
To make recordkeeping easy and convenient, each quarter you’ll receive a statement showing your total distributions, the date of investment, the shares acquired and the price per share, and the total number of shares you own.
How shares are purchased
The shares you acquire by reinvesting will either be purchased on the open market or newly issued by the Fund. If the shares are trading at or above net asset value at the time of valuation, the Fund will issue new shares at the greater of the net asset value or 95% of the then-current market price. If the shares are trading at less than net asset value, shares for your account will be purchased on the open market. If the Plan Agent begins purchasing Fund shares on the open market while shares are trading below net asset value, but the Fund’s shares subsequently trade at or above their net asset value before the Plan Agent is able to complete its purchases, the Plan Agent may cease open-market purchases and may invest the uninvested portion of the distribution in newly-issued Fund shares at a price equal to the greater of the shares’ net asset value or 95% of the shares’ market value on the last business day immediately prior to the purchase date. Distributions received to purchase shares in the open market will normally be invested shortly after the distribution payment date. No interest will be paid on distributions awaiting reinvestment. Because the market price of the shares may increase before purchases are completed, the average purchase price per share may exceed the market price at the time of valuation, resulting in the acquisition of fewer shares than if the distribution had been paid in shares issued by the Fund. A pro rata portion of any applicable brokerage commissions on open market purchases will be paid by Plan participants. These commissions usually will be lower than those charged on individual transactions.
Flexible
You may change your distribution option or withdraw from the Plan at any time, should your needs or situation change.
You can reinvest whether your shares are registered in your name, or in the name of a brokerage firm, bank, or other nominee. Ask your investment advisor if his or her firm will participate on your behalf. Participants whose shares are registered in the name of one firm may not be able to transfer the shares to another firm and continue to participate in the Plan.
The Fund reserves the right to amend or terminate the Plan at any time. Although the Fund reserves the right to amend the Plan to include a service charge payable by the participants, there is no direct service charge to participants in the Plan at this time.
Call today to start reinvesting distributions
For more information on the Nuveen Automatic Reinvestment Plan or to enroll in or withdraw from the Plan, speak with your financial advisor or call us at (800) 257-8787.
35
Nuveen:
Serving Investors for Generations
Since 1898, financial advisors and their clients have relied on Nuveen to provide
dependable investment solutions through continued adherence to proven, long-term investing
principles. Today, we offer a range of high quality solutions designed to
be integral components of a well-diversified core portfolio.
Focused on meeting investor needs.
Nuveen is the investment manager of TIAA. We have grown into one of the world’s premier global asset managers, with specialist knowledge across all major asset classes and particular strength in solutions that provide income for investors and that draw on our expertise in alternatives and responsible investing. Nuveen is driven not only by the independent investment processes across the firm, but also the insights, risk management, analytics and other tools and resources that a truly world-class platform provides. As a global asset manager, our mission is to work in partnership with our clients to create solutions which help them secure their financial future.
Find out how we can help you.
To learn more about how the products and services of Nuveen may be able to help you meet your financial goals, talk to your financial advisor, or call us at (800) 257-8787. Please read the information provided carefully before you invest. Investors should consider the investment objective and policies, risk considerations, charges and expenses of any investment carefully. Where applicable, be sure to obtain a prospectus, which contains this and other relevant information. To obtain a prospectus, please contact your securities representative or Nuveen, 333 W. Wacker Dr., Chicago, IL 60606. Please read the prospectus carefully before you invest or send money.
Learn more about Nuveen Funds at: www.nuveen.com/closed-end-funds
| | | | |
| Securities offered through Nuveen Securities, LLC, member FINRA and SIPC | 333 West Wacker Drive Chicago, IL 60606 | www.nuveen.com | |  | | ESA-P-0618D
569783-INV-B-08/19 |
Item 2. Code of Ethics.
Not applicable to this filing.
Item 3. Audit Committee Financial Expert.
Not applicable to this filing.
Item 4. Principal Accountant Fees and Services.
Not applicable to this filing.
Item 5. Audit Committee of Listed Registrants.
Not applicable to this filing.
Item 6. Schedule of Investments.
(a) See Portfolio of Investments in Item 1.
(b) Not applicable.
Item 7. Disclosure of Proxy Voting Policies and Procedures for Closed-End Management Investment Companies.
Not applicable to this filing.
Item 8. Portfolio Managers of Closed-End Management Investment Companies.
Not applicable to this filing.
Item 9. Purchases of Equity Securities by Closed-End Management Investment Company and Affiliated Purchasers.
Not applicable.
Item 10. Submission of Matters to a Vote of Security Holders.
There have been no material changes to the procedures by which shareholders may recommend nominees to the registrant’s Board implemented after the registrant last provided disclosure in response to this item.
Item 11. Controls and Procedures.
| (a) | The registrant’s principal executive and principal financial officers, or persons performing similar functions, have concluded that the registrant’s disclosure controls and procedures (as defined in Rule 30a-3(c) under the Investment Company Act of 1940, as amended (the “1940 Act”) (17 CFR 270.30a-3(c))) are effective, as of a date within 90 days of the filing date of this report that includes the disclosure required by this paragraph, based on their evaluation of the controls and procedures required by Rule 30a-3(b) under the 1940 Act (17 CFR 270.30a-3(b)) and Rules 13a-15(b) or 15d-15(b) under the Securities Exchange Act of 1934, as amended (the “Exchange Act”) (17 CFR 240.13a-15(b) or 240.15d-15(b)). |
| (b) | There were no changes in the registrant’s internal control over financial reporting (as defined in Rule 30a-3(d) under the 1940 Act (17 CFR 270.30a-3(d)) that occurred during the second fiscal quarter of the period covered by this report that has materially affected, or is reasonably likely to materially affect, the registrant’s internal control over financial reporting. |
Item 12. Disclosure of Securities Lending Activities for Closed-End Management Investment Companies.
Not applicable.
Item 13. Exhibits.
File the exhibits listed below as part of this Form.
(a)(1) Any code of ethics, or amendment thereto, that is the subject of the disclosure required by Item 2, to the extent that the registrant intends to satisfy the Item 2 requirements through filing of an exhibit: Not applicable to this filing.
(a)(2) A separate certification for each principal executive officer and principal financial officer of the registrant as required by Rule 30a-2(a) under the 1940 Act (17 CFR 270.30a-2(a)) in the exact form set forth below: See EX-99.CERT attached hereto.
(a)(3) Any written solicitation to purchase securities under Rule 23c-1 under the 1940 Act (17 CFR 270.23c-1) sent or given during the period covered by the report by or on behalf of the registrant to 10 or more persons: Not applicable.
(b) If the report is filed under Section 13(a) or 15(d) of the Exchange Act, provide the certifications required by Rule 30a-2 (b) under the 1940 Act (17 CFR 270.30a-2(b)), Rule 13a-14(b) or Rule 15d-14(b) under the Exchange Act (17 CFR 240.13a-14(b) or 240.15d-14(b)), and Section 1350 of Chapter 63 of Title 18 of the United States Code (18 U.S.C. 1350) as an Exhibit. A certification furnished pursuant to this paragraph will not be deemed “filed” for purposes of Section 18 of the Exchange Act (15 U.S.C. 78r), or otherwise subject to the liability of that section. Such certification will not be deemed to be incorporated by reference into any filing under the Securities Act of 1933 or the Exchange Act, except to the extent that the registration specifically incorporates it by reference: See EX-99.906 CERT attached hereto.
SIGNATURES
Pursuant to the requirements of the Securities Exchange Act of 1934 and the Investment Company Act of 1940, the registrant has duly caused this report to be signed on its behalf by the undersigned, thereunto duly authorized.
(Registrant) Nuveen Emerging Markets Debt 2022 Target Term Fund
| | | | |
| By (Signature and Title) | | /s/ Gifford R. Zimmerman | | |
| | Gifford R. Zimmerman | | |
| | Vice President and Secretary | | |
Date: September 6, 2018
Pursuant to the requirements of the Securities Exchange Act of 1934 and the Investment Company Act of 1940, this report has been signed below by the following persons on behalf of the registrant and in the capacities and on the dates indicated.
| | | | |
| By (Signature and Title) | | /s/ Cedric H. Antosiewicz | | |
| | Cedric H. Antosiewicz | | |
| | Chief Administrative Officer | | |
| | (principal executive officer) | | |
Date: September 6, 2018
| | | | |
| By (Signature and Title) | | /s/ Stephen D. Foy | | |
| | Stephen D. Foy | | |
| | Vice President and Controller | | |
| | (principal financial officer) | | |
Date: September 6, 2018