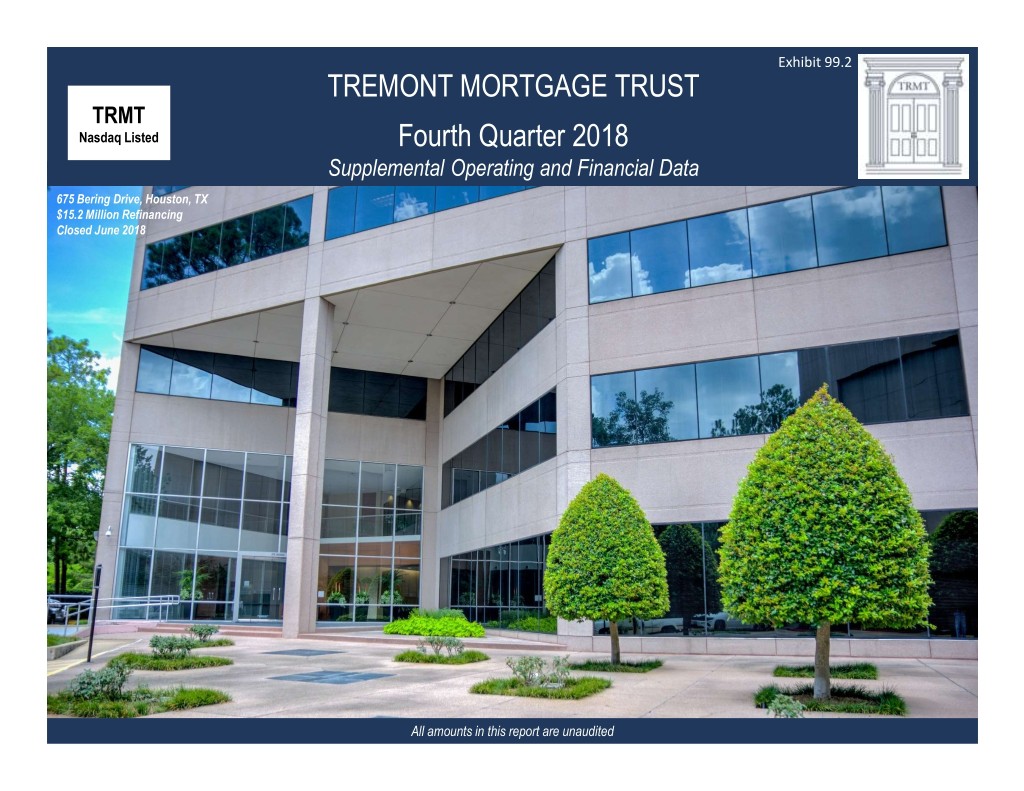
Exhibit 99.2 TREMONT MORTGAGE TRUST TRMT Nasdaq Listed Fourth Quarter 2018 Supplemental Operating and Financial Data 675 Bering Drive, Houston, TX $15.2 Million Refinancing Closed June 2018 Tremont Mortgage Trust Confidential Supplemental Operating and Financial Data, December 31, 2018All amounts in this report are unaudited 1
TABLE OF CONTENTS CORPORATE INFORMATION Page Company Profile 7 Investor Information 8 Research Coverage 9 TABLECONTENTS OF FINANCIALS Fourth Quarter 2018 Highlights 11 Consolidated Balance Sheets 12 Consolidated Statements of Operations 13 Consolidated Statements of Cash Flows 14 Debt Summary 16 Reconciliation of Net Income (Loss) to Core Earnings 17 PORTFOLIO OVERVIEW Loan Origination Summary 19 Loan Investment Portfolio Details 20 CRE Portfolio Diversification 21 Interest Rate Sensitivity 22 Capital Structure Overview 23 Tremont Mortgage Trust ConfidentialSupplemental Operating and Financial Data, December 31, 2018 2
WARNING CONCERNING FORWARD LOOKING STATEMENTS THIS PRESENTATION OF SUPPLEMENTAL OPERATING AND FINANCIAL DATA CONTAINS STATEMENTS THAT CONSTITUTE FORWARD LOOKING STATEMENTS WITHIN THE MEANING OF THE PRIVATE SECURITIES LITIGATION REFORM ACT OF 1995 AND OTHER SECURITIES LAWS. ALSO, WHENEVER WE USE WORDS SUCH AS “BELIEVE”, “EXPECT”, “ANTICIPATE”, “INTEND”, “PLAN”, “ESTIMATE”, “WILL”, “MAY” AND NEGATIVES OR DERIVATIVES OF THESE OR SIMILAR EXPRESSIONS, WE ARE MAKING FORWARD LOOKING STATEMENTS. THESE FORWARD LOOKING STATEMENTS ARE BASED UPON OUR PRESENT INTENT, BELIEFS OR EXPECTATIONS, BUT FORWARD LOOKING STATEMENTS ARE NOT GUARANTEED TO OCCUR AND MAY NOT OCCUR. FORWARD LOOKING STATEMENTS IN THIS REPORT RELATE TO VARIOUS ASPECTS OF OUR BUSINESS, INCLUDING: • OUR ABILITY TO CARRY OUT OUR BUSINESS STRATEGY AND THE OPPORTUNITIES FOR OUR BUSINESS THAT WE BELIEVE EXIST, • OUR OPERATING AND INVESTMENT TARGETS, GUIDELINES, INVESTMENT AND FINANCING STRATEGIES AND LEVERAGE POLICIES, • THE ABILITY OF TREMONT REALTY ADVISORS LLC, OR OUR MANAGER, TO LOCATE SUITABLE INVESTMENTS FOR US, MONITOR, SERVICE AND ADMINISTER OUR EXISTING INVESTMENTS AND IMPLEMENT OUR INVESTMENT STRATEGY, • OUR EXPECTED OPERATING RESULTS, • THE AMOUNT AND TIMING OF ANY CASH FLOWS WE RECEIVE FROM OUR INVESTMENTS, • OUR ABILITY TO PAY DISTRIBUTIONS TO OUR SHAREHOLDERS AND TO SUSTAIN THE AMOUNT OF ANY SUCH DISTRIBUTIONS, • OUR ABILITY TO OBTAIN AND MAINTAIN FINANCING TO ENABLE US TO USE LEVERAGE TO MAKE ADDITIONAL INVESTMENTS OR TO INCREASE OUR POTENTIAL RETURNS, • OUR ABILITY TO MAINTAIN AND INCREASE THE NET INTEREST SPREAD BETWEEN THE INTEREST WE EARN ON OUR INVESTMENTS AND THE INTEREST WE PAY ON OUR BORROWINGS, • THE ORIGINATION, EXTENSION, EXIT, PREPAYMENT OR OTHER FEES WE MAY EARN, • YIELDS THAT MAY BE AVAILABLE TO US FROM MORTGAGES ON SPECIALIZED REAL ESTATE, • THE DURATION AND OTHER TERMS OF OUR LOANS, • THE CREDIT QUALITIES OF OUR BORROWERS, • THE ABILITY AND WILLINGNESS OF OUR BORROWERS TO REPAY OUR LOANS AND INVESTMENTS IN A TIMELY MANNER OR AT ALL, • OUR PROJECTED LEVERAGE, • THE COST AND AVAILABILITY OF FINANCING UNDER OUR MASTER REPURCHASE FACILITY OR OTHER REPURCHASE OR BANK FACILITIES WE MAY OBTAIN FROM TIME TO TIME, • OUR QUALIFICATION FOR TAXATION AS A REAL ESTATE INVESTMENT TRUST, OR REIT, • OUR ABILITY TO MAINTAIN OUR EXEMPTION FROM REGISTRATION UNDER THE INVESTMENT COMPANY ACT OF 1940, AS AMENDED, OR THE INVESTMENT COMPANY ACT, • OUR UNDERSTANDING OF OUR COMPETITION AND OUR ABILITY TO COMPETE, • MARKET TRENDS IN OUR INDUSTRY OR WITH RESPECT TO INTEREST RATES, REAL ESTATE VALUES, THE DEBT SECURITIES MARKETS OR THE ECONOMY GENERALLY, AND • OTHER MATTERS. WARNING CONCERNING FORWARD STATEMENTSLOOKING OUR ACTUAL RESULTS MAY DIFFER MATERIALLY FROM THOSE CONTAINED IN OR IMPLIED BY OUR FORWARD LOOKING STATEMENTS AS A RESULT OF VARIOUS FACTORS. FACTORS THAT COULD HAVE A MATERIAL ADVERSE EFFECT ON OUR FORWARD LOOKING STATEMENTS AND UPON OUR BUSINESS, FINANCIAL CONDITION, LIQUIDITY AND RESULTS OF OPERATIONS INCLUDE, BUT ARE NOT LIMITED TO: • THE IMPACT OF CONDITIONS IN THE ECONOMY, THE COMMERCIAL REAL ESTATE, OR CRE, INDUSTRY AND THE CAPITAL MARKETS ON US AND OUR BORROWERS, • COMPETITION WITHIN THE CRE LENDING INDUSTRY, Tremont Mortgage Trust ConfidentialSupplemental Operating and Financial Data, December 31, 2018 3
WARNING CONCERNING FORWARD LOOKING STATEMENTS (CONTINUED) • CHANGES IN THE AVAILABILITY, SOURCING AND STRUCTURING OF CRE LENDING, • DEFAULTS BY OUR BORROWERS, • COMPLIANCE WITH, AND CHANGES TO, FEDERAL, STATE OR LOCAL LAWS OR REGULATIONS, ACCOUNTING RULES, TAX LAWS OR SIMILAR MATTERS, • LIMITATIONS IMPOSED ON OUR BUSINESS AND OUR ABILITY TO SATISFY COMPLEX RULES IN ORDER FOR US TO QUALIFY FOR TAXATION AS A REIT FOR U.S. FEDERAL INCOME TAX PURPOSES, • ACTUAL AND POTENTIAL CONFLICTS OF INTEREST WITH OUR RELATED PARTIES, INCLUDING OUR MANAGING TRUSTEES, OUR MANAGER, THE RMR GROUP LLC, OR RMR LLC, AND OTHERS AFFILIATED WITH THEM, AND • ACTS OF TERRORISM, OUTBREAKS OF SO CALLED PANDEMICS OR OTHER MANMADE OR NATURAL DISASTERS BEYOND OUR CONTROL. FOR EXAMPLE: • WE HAVE A LIMITED OPERATING HISTORY, AND WE MAY NOT BE ABLE TO OPERATE OUR BUSINESS SUCCESSFULLY OR GENERATE SUFFICIENT REVENUE TO MAKE OR SUSTAIN DISTRIBUTIONS TO OUR SHAREHOLDERS, • WE DECLARED A DISTRIBUTION OF $0.11 PER COMMON SHARE IN JANUARY 2019, AND WE EXPECT TO DECLARE A DISTRIBUTION OF BETWEEN $0.20 AND $0.24 PER COMMON SHARE IN THE SECOND QUARTER OF 2019. WE MAY NOT DECLARE A DISTRIBUTION OF BETWEEN $0.20 TO $0.24 PER COMMON SHARE IN THE SECOND QUARTER OF 2019, OR THEREAFTER. ANY DISTRIBUTIONS WE MAY MAKE ARE SUBJECT TO BEING DECLARED BY OUR BOARD OF TRUSTEES, IN ITS SOLE DISCRETION. OUR BOARD OF TRUSTEES CONSIDERS MANY FACTORS WHEN DETERMINING WHETHER TO DECLARE DISTRIBUTIONS, INCLUDING OUR HISTORICAL AND PROJECTED INCOME, OUR CORE EARNINGS (LOSS), OUR THEN CURRENT AND EXPECTED NEEDS AND AVAILABILITY OF CASH TO PAY OUR OBLIGATIONS AND FUND OUR INVESTMENTS, DISTRIBUTIONS WHICH WE MAY BE REQUIRED TO PAY TO MAINTAIN OUR QUALIFICATION FOR TAXATION AS A REIT AND OTHER FACTORS DEEMED RELEVANT BY OUR BOARD OF TRUSTEES IN ITS DISCRETION. ACCORDINGLY, WE MAY NOT DECLARE A DISTRIBUTION OF BETWEEN $0.20 AND $0.24 PER COMMON SHARE IN THE SECOND QUARTER OF 2019, OR AT ALL, AND ANY FUTURE DISTRIBUTIONS BY US COULD DECLINE IN AMOUNT OR BE SUSPENDED OR DISCONTINUED, • COMPETITION MAY LIMIT OUR ABILITY TO IDENTIFY AND MAKE DESIRABLE INVESTMENTS, • OUR BELIEF THAT THERE CONTINUES TO BE STRONG DEMAND FOR ALTERNATIVE SOURCES OF CRE DEBT CAPITAL MAY NOT BE CORRECT; FURTHER, ANY DEMAND THAT NOW EXISTS COULD BE REDUCED. REDUCED DEMAND FOR ALTERNATIVE SOURCES OF CRE DEBT CAPITAL WOULD FURTHER INCREASE COMPETITION FOR INVESTMENTS IN THE CRE DEBT MARKET, • CONTINGENCIES RELATED TO LOANS THAT WE HAVE ENTERED APPLICATIONS WITH BORROWERS FOR BUT HAVE NOT CLOSED MAY NOT BE SATISFIED AND THE CLOSINGS OF PENDING LOANS MAY NOT OCCUR, MAY BE DELAYED OR THE TERMS MAY CHANGE, • THE VALUE OF OUR LOANS DEPENDS UPON OUR BORROWERS’ ABILITY TO GENERATE CASH FLOW FROM OPERATING THE PROPERTIES THAT ARE OUR COLLATERAL FOR OUR LOANS. OUR BORROWERS MAY NOT HAVE SUFFICIENT CASH FLOW TO REPAY OUR LOANS ACCORDING TO THEIR TERMS, WHICH MAY RESULT IN DELINQUENCY AND FORECLOSURE ON OUR LOANS, • PREPAYMENT OF OUR LOANS MAY ADVERSELY AFFECT THE VALUE OF OUR INVESTMENT PORTFOLIO AND OUR ABILITY TO MAKE OR SUSTAIN DISTRIBUTIONS TO OUR SHAREHOLDERS, • LOANS SECURED BY PROPERTIES IN TRANSITION INVOLVE A GREATER RISK OF LOSS THAN LOANS SECURED BY STABILIZED PROPERTIES, • OUR MANAGER'S AND RMR LLC'S ONLY EXPERIENCE MANAGING OR SERVICING A MORTGAGE REIT IS WITH RESPECT TO US, AND WE HAVE A LIMITED OPERATING HISTORY, • WE MAY INCUR SIGNIFICANT DEBT, AND OUR GOVERNING DOCUMENTS CONTAIN NO LIMIT ON THE AMOUNT OF DEBT WE MAY INCUR, WARNING CONCERNING FORWARD WARNINGSTATEMENTS CONCERNING LOOKING (CONTINUED) Tremont Mortgage Trust ConfidentialSupplemental Operating and Financial Data, December 31, 2018 4
WARNING CONCERNING FORWARD LOOKING STATEMENTS (CONTINUED) • CONTINUED AVAILABILITY OF FINANCING UNDER OUR MASTER REPURCHASE FACILITY AND OUR NOTE PAYABLE ARE SUBJECT TO OUR SATISFYING CERTAIN FINANCIAL COVENANTS AND OTHER CONDITIONS, AS APPLICABLE, THAT WE MAY BE UNABLE TO SATISFY, • FINANCING FOR FLOATING RATE MORTGAGES AND OTHER RELATED ASSETS THAT WE MAY SEEK TO SELL PURSUANT TO OUR MASTER REPURCHASE FACILITY IS SUBJECT TO APPROVAL BY THE LENDER UNDER OUR MASTER REPURCHASE FACILITY, WHICH CONSENT WE MAY NOT OBTAIN, • ACTUAL COSTS UNDER OUR MASTER REPURCHASE FACILITY AND OUR NOTE PAYABLE WILL BE HIGHER THAN LIBOR PLUS A PREMIUM BECAUSE OF FEES AND EXPENSES ASSOCIATED WITH OUR DEBT, • OUR OPTIONS TO EXTEND THE MATURITY DATE OF OUR NOTE PAYABLE ARE SUBJECT TO OUR PAYMENT OF EXTENSION FEES AND MEETING OTHER CONDITIONS, BUT THE APPLICABLE CONDITIONS MAY NOT BE MET, • OUR ABILITY TO OBTAIN ADDITIONAL FINANCING UNDER OUR MASTER REPURCHASE FACILITY IS CONTINGENT UPON OUR ABILITY TO EFFECTIVELY ORIGINATE ADDITIONAL INVESTMENTS. HOWEVER, WE CANNOT BE SURE THAT WE WILL BE ABLE TO USE OUR MASTER REPURCHASE FACILITY AS WE EXPECT OR EFFECTIVELY ORIGINATE ADDITIONAL INVESTMENTS IN THE NEAR FUTURE OR AT ALL, • IN ORDER TO CONTINUE TO GROW OUR INVESTMENTS AND BUSINESS, WE WILL NEED TO OBTAIN ADDITIONAL FINANCING, WHETHER BY EXPANDING OUR EXISTING CREDIT ARRANGEMENTS OR OBTAINING NEW FINANCING SOURCES. WE CANNOT BE SURE THAT WE WOULD BE SUCCESSFUL IN OBTAINING ANY SUCH ADDITIONAL FINANCING. IF WE ARE UNABLE TO OBTAIN FINANCING, WE MAY NOT BE ABLE TO FURTHER GROW OUR INVESTMENTS AND BUSINESS, • OUR MANAGER HAS COMMITTED TO US $25 MILLION OF ADDITIONAL CAPITAL. OUR MANAGER’S OBLIGATION TO FUND THIS COMMITMENT IS SUBJECT TO CONDITIONS; IF THOSE CONDITIONS ARE NOT SATISFIED OR WAIVED BY OUR MANAGER, WE MAY NOT RECEIVE ANY OR ALL OF THOSE FUNDS. • ANY PHASE OUT OF LIBOR MAY HAVE AN IMPACT ON OUR INVESTMENTS AND OUR DEBT FINANCING ARRANGEMENTS, • WE ARE DEPENDENT UPON OUR MANAGER, ITS AFFILIATES AND THEIR PERSONNEL. WE MAY BE UNABLE TO FIND SUITABLE REPLACEMENTS IF OUR MANAGEMENT AGREEMENT IS TERMINATED, • WE BELIEVE THAT OUR RELATIONSHIPS WITH OUR RELATED PARTIES, INCLUDING OUR MANAGING TRUSTEES, OUR MANAGER, RMR LLC AND OTHERS AFFILIATED WITH THEM MAY BENEFIT US AND PROVIDE US WITH COMPETITIVE ADVANTAGES IN OPERATING AND GROWING OUR BUSINESS. HOWEVER, THE ADVANTAGES WE BELIEVE WE MAY REALIZE FROM THESE RELATIONSHIPS MAY NOT MATERIALIZE, • OUR INTENTION TO REMAIN EXEMPT FROM REGISTRATION UNDER THE INVESTMENT COMPANY ACT IMPOSES LIMITS ON OUR OPERATIONS, AND WE MAY FAIL TO REMAIN EXEMPT FROM REGISTRATION UNDER THE INVESTMENT COMPANY ACT, AND • OUR FAILURE TO REMAIN QUALIFIED FOR TAXATION AS A REIT COULD HAVE SIGNIFICANT ADVERSE CONSEQUENCES. CURRENTLY UNEXPECTED RESULTS COULD OCCUR DUE TO MANY DIFFERENT CIRCUMSTANCES, SOME OF WHICH ARE BEYOND OUR CONTROL, SUCH AS ACTS OF TERRORISM, NATURAL DISASTERS OR CHANGES IN CAPITAL MARKETS OR THE ECONOMY GENERALLY. THE INFORMATION CONTAINED IN OUR FILINGS WITH THE SECURITIES AND EXCHANGE COMMISSION, OR SEC, INCLUDING UNDER THE CAPTION “RISK FACTORS” IN OUR PERIODIC REPORTS, OR INCORPORATED HEREIN OR THEREIN, IDENTIFIES OTHER IMPORTANT FACTORS THAT COULD CAUSE DIFFERENCES FROM OUR FORWARD LOOKING STATEMENTS. OUR FILINGS WITH THE SEC ARE AVAILABLE ON THE SEC’S WEBSITE AT WWW.SEC.GOV. YOU SHOULD NOT PLACE UNDUE RELIANCE UPON OUR FORWARD LOOKING STATEMENTS. EXCEPT AS REQUIRED BY LAW, WE DO NOT INTEND TO UPDATE OR CHANGE ANY FORWARD LOOKING STATEMENTS AS A RESULT OF NEW INFORMATION, FUTURE EVENTS OR OTHERWISE. WARNING CONCERNING FORWARD WARNINGSTATEMENTS CONCERNING LOOKING (CONTINUED) Tremont Mortgage Trust ConfidentialSupplemental Operating and Financial Data, December 31, 2018 5

CORPORATE INFORMATION Holiday Inn Atlanta Airport North, Atlanta, GA $24.0 Million Refinancing Closed December 2018 6
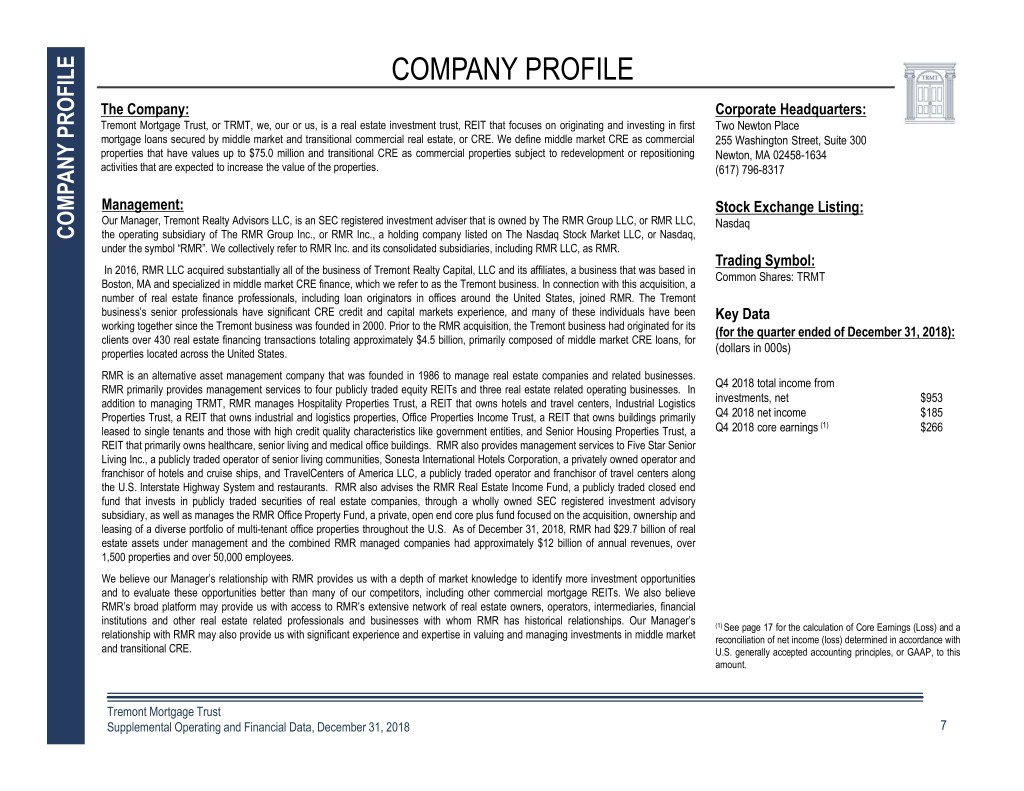
COMPANY PROFILE The Company: Corporate Headquarters: Tremont Mortgage Trust, or TRMT, we, our or us, is a real estate investment trust, REIT that focuses on originating and investing in first Two Newton Place mortgage loans secured by middle market and transitional commercial real estate, or CRE. We define middle market CRE as commercial 255 Washington Street, Suite 300 properties that have values up to $75.0 million and transitional CRE as commercial properties subject to redevelopment or repositioning Newton, MA 02458-1634 activities that are expected to increase the value of the properties. (617) 796-8317 Management: Stock Exchange Listing: Our Manager, Tremont Realty Advisors LLC, is an SEC registered investment adviser that is owned by The RMR Group LLC, or RMR LLC, Nasdaq COMPANY PROFILE the operating subsidiary of The RMR Group Inc., or RMR Inc., a holding company listed on The Nasdaq Stock Market LLC, or Nasdaq, under the symbol “RMR”. We collectively refer to RMR Inc. and its consolidated subsidiaries, including RMR LLC, as RMR. Trading Symbol: In 2016, RMR LLC acquired substantially all of the business of Tremont Realty Capital, LLC and its affiliates, a business that was based in Common Shares: TRMT Boston, MA and specialized in middle market CRE finance, which we refer to as the Tremont business. In connection with this acquisition, a number of real estate finance professionals, including loan originators in offices around the United States, joined RMR. The Tremont business’s senior professionals have significant CRE credit and capital markets experience, and many of these individuals have been Key Data working together since the Tremont business was founded in 2000. Prior to the RMR acquisition, the Tremont business had originated for its (for the quarter ended of December 31, 2018): clients over 430 real estate financing transactions totaling approximately $4.5 billion, primarily composed of middle market CRE loans, for properties located across the United States. (dollars in 000s) RMR is an alternative asset management company that was founded in 1986 to manage real estate companies and related businesses. Q4 2018 total income from RMR primarily provides management services to four publicly traded equity REITs and three real estate related operating businesses. In addition to managing TRMT, RMR manages Hospitality Properties Trust, a REIT that owns hotels and travel centers, Industrial Logistics investments, net $953 Properties Trust, a REIT that owns industrial and logistics properties, Office Properties Income Trust, a REIT that owns buildings primarily Q4 2018 net income $185 (1) leased to single tenants and those with high credit quality characteristics like government entities, and Senior Housing Properties Trust, a Q4 2018 core earnings $266 REIT that primarily owns healthcare, senior living and medical office buildings. RMR also provides management services to Five Star Senior Living Inc., a publicly traded operator of senior living communities, Sonesta International Hotels Corporation, a privately owned operator and franchisor of hotels and cruise ships, and TravelCenters of America LLC, a publicly traded operator and franchisor of travel centers along the U.S. Interstate Highway System and restaurants. RMR also advises the RMR Real Estate Income Fund, a publicly traded closed end fund that invests in publicly traded securities of real estate companies, through a wholly owned SEC registered investment advisory subsidiary, as well as manages the RMR Office Property Fund, a private, open end core plus fund focused on the acquisition, ownership and leasing of a diverse portfolio of multi-tenant office properties throughout the U.S. As of December 31, 2018, RMR had $29.7 billion of real estate assets under management and the combined RMR managed companies had approximately $12 billion of annual revenues, over 1,500 properties and over 50,000 employees. We believe our Manager’s relationship with RMR provides us with a depth of market knowledge to identify more investment opportunities and to evaluate these opportunities better than many of our competitors, including other commercial mortgage REITs. We also believe RMR’s broad platform may provide us with access to RMR’s extensive network of real estate owners, operators, intermediaries, financial institutions and other real estate related professionals and businesses with whom RMR has historical relationships. Our Manager’s (1) See page 17 for the calculation of Core Earnings (Loss) and a relationship with RMR may also provide us with significant experience and expertise in valuing and managing investments in middle market reconciliation of net income (loss) determined in accordance with and transitional CRE. U.S. generally accepted accounting principles, or GAAP, to this amount. Tremont Mortgage Trust ConfidentialSupplemental Operating and Financial Data, December 31, 2018 7
INVESTOR INFORMATION Board of Trustees John L. Harrington Joseph L. Morea Jeffrey P. Somers Independent Trustee Independent Trustee Independent Trustee David M. Blackman Adam D. Portnoy Managing Trustee Managing Trustee INVESTORINFORMATION Senior Management David M. Blackman G. Douglas Lanois President and Chief Executive Officer Chief Financial Officer and Treasurer Contact Information Investor Relations Inquiries Tremont Mortgage Trust Financial inquiries should be directed to Two Newton Place G. Douglas Lanois, Chief Financial Officer and Treasurer, 255 Washington Street, Suite 300 at (617) 658-0755 or dlanois@tremontadv.com Newton, MA 02458-1634 (617) 796-7651 Investor and media inquiries should be directed to cranjitkar@trmtreit.com Christopher Ranjitkar, Senior Director, Investor Relations, www.trmtreit.com at (617) 796-7651 or cranjitkar@trmtreit.com Tremont Mortgage Trust ConfidentialSupplemental Operating and Financial Data, December 31, 2018 8
RESEARCH COVERAGE Equity Research Coverage UBS Citibank Brock Vandervliet Arren Cyganovich, CFA (212) 713-2382 (212) 816-3733 brock.vandervliet@ubs.com arren.cyganovich@citi.com RESEARCH COVERAGE RESEARCH TRMT is followed by the analysts listed above. Please note that any opinions, estimates or forecasts regarding TRMT’s performance made by these analysts do not represent opinions, forecast or predictions of TRMT or its management. TRMT does not by its reference above imply its endorsement of or concurrence with any information, conclusions or recommendations provided by any of these analysts. Tremont Mortgage Trust ConfidentialSupplemental Operating and Financial Data, December 31, 2018 9
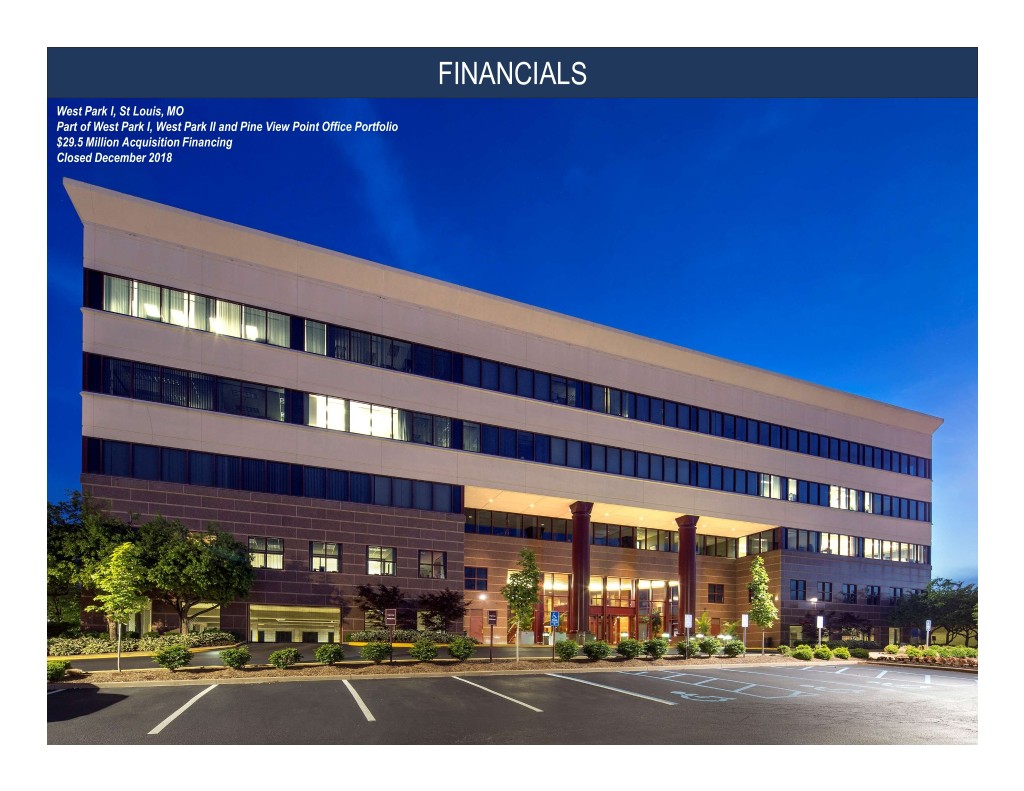
FINANCIALS West Park I, St Louis, MO Part of West Park I, West Park II and Pine View Point Office Portfolio $29.5 Million Acquisition Financing Closed December 2018 10
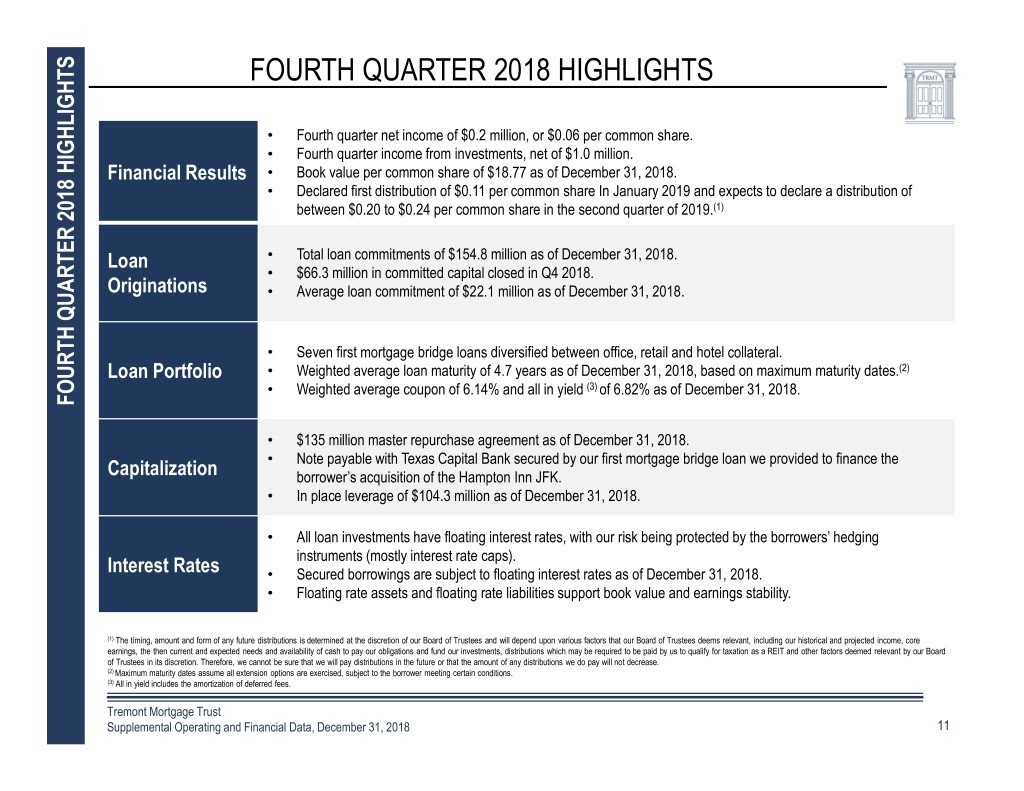
FOURTH QUARTER 2018 HIGHLIGHTS • Fourth quarter net income of $0.2 million, or $0.06 per common share. • Fourth quarter income from investments, net of $1.0 million. Financial Results • Book value per common share of $18.77 as of December 31, 2018. • Declared first distribution of $0.11 per common share In January 2019 and expects to declare a distribution of between $0.20 to $0.24 per common share in the second quarter of 2019.(1) Loan • Total loan commitments of $154.8 million as of December 31, 2018. • $66.3 million in committed capital closed in Q4 2018. Originations • Average loan commitment of $22.1 million as of December 31, 2018. • Seven first mortgage bridge loans diversified between office, retail and hotel collateral. Loan Portfolio • Weighted average loan maturity of 4.7 years as of December 31, 2018, based on maximum maturity dates.(2) • Weighted average coupon of 6.14% and all in yield (3) of 6.82% as of December 31, 2018. FOURTH QUARTER HIGHLIGHTS 2018QUARTER FOURTH • $135 million master repurchase agreement as of December 31, 2018. • Note payable with Texas Capital Bank secured by our first mortgage bridge loan we provided to finance the Capitalization borrower’s acquisition of the Hampton Inn JFK. • In place leverage of $104.3 million as of December 31, 2018. • All loan investments have floating interest rates, with our risk being protected by the borrowers’ hedging instruments (mostly interest rate caps). Interest Rates • Secured borrowings are subject to floating interest rates as of December 31, 2018. • Floating rate assets and floating rate liabilities support book value and earnings stability. (1) The timing, amount and form of any future distributions is determined at the discretion of our Board of Trustees and will depend upon various factors that our Board of Trustees deems relevant, including our historical and projected income, core earnings, the then current and expected needs and availability of cash to pay our obligations and fund our investments, distributions which may be required to be paid by us to qualify for taxation as a REIT and other factors deemed relevant by our Board of Trustees in its discretion. Therefore, we cannot be sure that we will pay distributions in the future or that the amount of any distributions we do pay will not decrease. (2) Maximum maturity dates assume all extension options are exercised, subject to the borrower meeting certain conditions. (3) All in yield includes the amortization of deferred fees. Tremont Mortgage Trust ConfidentialSupplemental Operating and Financial Data, December 31, 2018 11
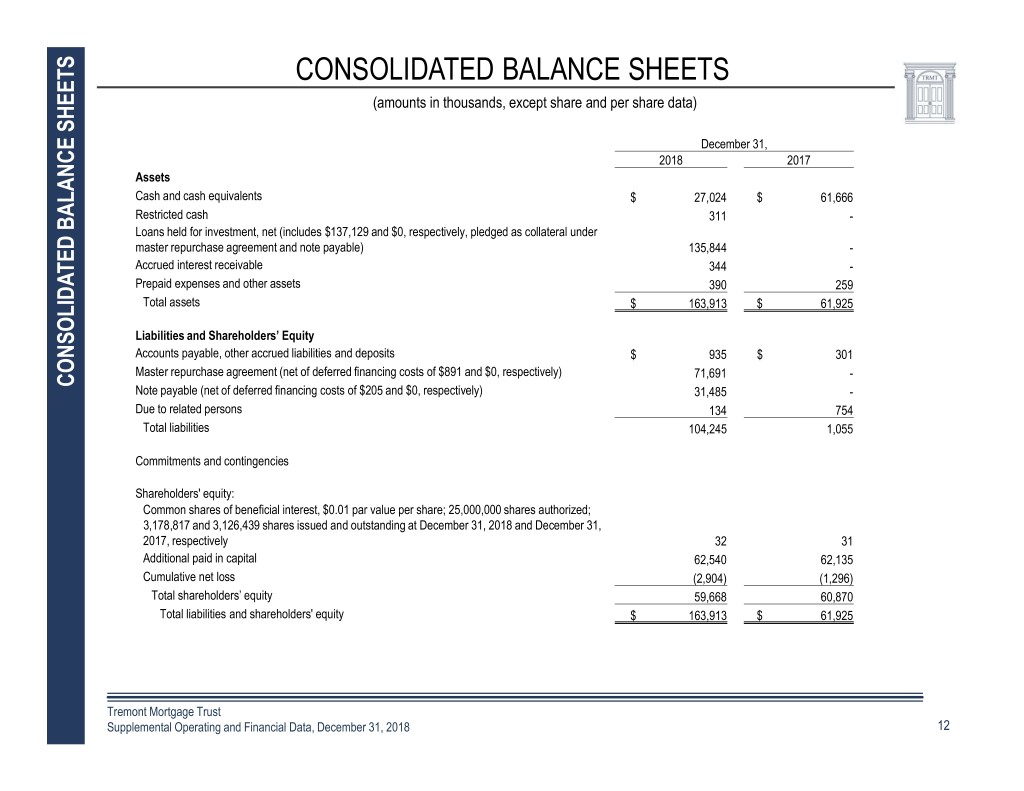
CONSOLIDATED BALANCE SHEETS (amounts in thousands, except share and per share data) December 31, 2018 2017 Assets Cash and cash equivalents $ 27,024 $ 61,666 Restricted cash 311 - Loans held for investment, net (includes $137,129 and $0, respectively, pledged as collateral under master repurchase agreement and note payable) 135,844 - Accrued interest receivable 344 - Prepaid expenses and other assets 390 259 Total assets $ 163,913 $ 61,925 Liabilities and Shareholders’ Equity AccountsFinancial payable, other accrued liabilities and deposits $ 935 $ 301 Master repurchase agreement (net of deferred financing costs of $891 and $0, respectively) 71,691 - CONSOLIDATED BALANCE SHEETS Note payable (net of deferred financing costs of $205 and $0, respectively) 31,485 - SummaryDue to related persons 134 754 Total liabilities 104,245 1,055 Commitments and contingencies Shareholders' equity: Common shares of beneficial interest, $0.01 par value per share; 25,000,000 shares authorized; 3,178,817 and 3,126,439 shares issued and outstanding at December 31, 2018 and December 31, 2017, respectively 32 31 Additional paid in capital 62,540 62,135 Cumulative net loss (2,904) (1,296) Total shareholders’ equity 59,668 60,870 Total liabilities and shareholders' equity $ 163,913 $ 61,925 Tremont Mortgage Trust ConfidentialSupplemental Operating and Financial Data, December 31, 2018 12
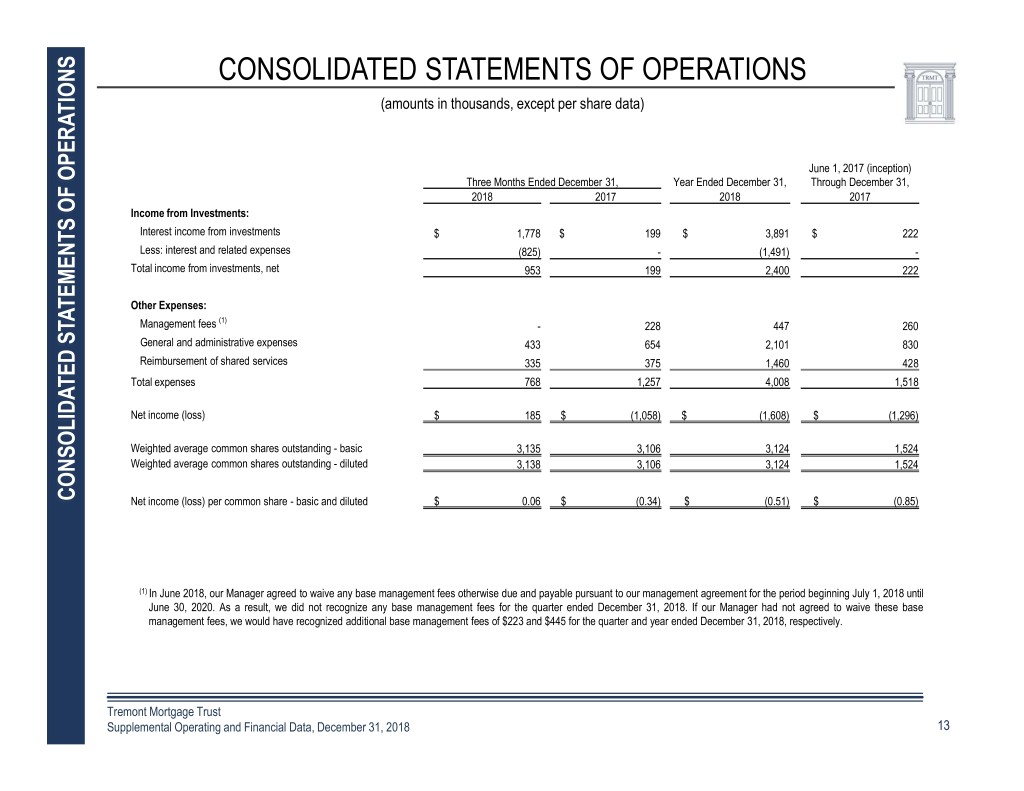
CONSOLIDATED STATEMENTS OF OPERATIONS (amounts in thousands, except per share data) June 1, 2017 (inception) Three Months Ended December 31, Year Ended December 31, Through December 31, 2018 2017 2018 2017 Income from Investments: Interest income from investments $ 1,778 $ 199 $ 3,891 $ 222 Less: interest and related expenses (825) - (1,491) - Total income from investments, net 953 199 2,400 222 Other Expenses: (1) Management fees - 228 447 260 General and administrative expenses 433 654 2,101 830 ReimbursementFinancial of shared services 335 375 1,460 428 Total expenses 768 1,257 4,008 1,518 NetSummary income (loss) $ 185 $ (1,058) $ (1,608) $ (1,296) Weighted average common shares outstanding - basic 3,135 3,106 3,124 1,524 Weighted average common shares outstanding - diluted 3,138 3,106 3,124 1,524 CONSOLIDATED STATEMENTSOPERATIONS OF CONSOLIDATED STATEMENTS FLOWS CASH OF Net income (loss) per common share - basic and diluted $ 0.06 $ (0.34) $ (0.51) $ (0.85) (1) In June 2018, our Manager agreed to waive any base management fees otherwise due and payable pursuant to our management agreement for the period beginning July 1, 2018 until June 30, 2020. As a result, we did not recognize any base management fees for the quarter ended December 31, 2018. If our Manager had not agreed to waive these base management fees, we would have recognized additional base management fees of $223 and $445 for the quarter and year ended December 31, 2018, respectively. Tremont Mortgage Trust ConfidentialSupplemental Operating and Financial Data, December 31, 2018 13
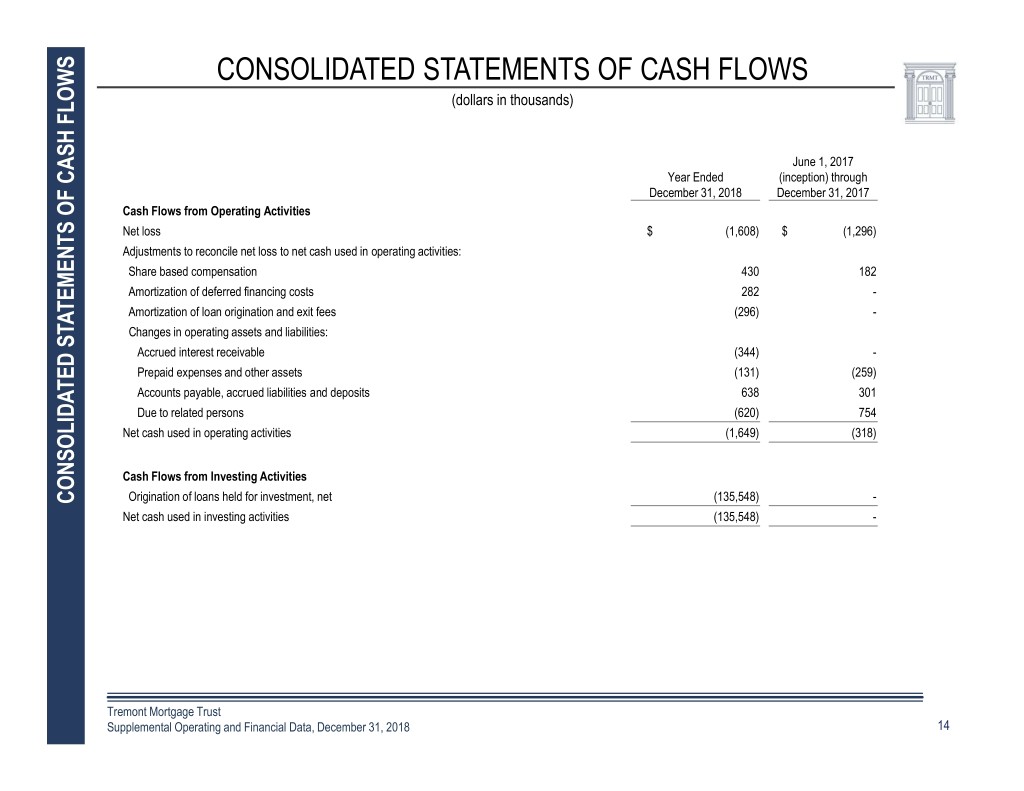
CONSOLIDATED STATEMENTS OF CASH FLOWS (dollars in thousands) June 1, 2017 Year Ended (inception) through December 31, 2018 December 31, 2017 Cash Flows from Operating Activities Net loss $ (1,608) $ (1,296) Adjustments to reconcile net loss to net cash used in operating activities: Share based compensation 430 182 Amortization of deferred financing costs 282 - Amortization of loan origination and exit fees (296) - Changes in operating assets and liabilities: AccruedFinancial interest receivable (344) - Prepaid expenses and other assets (131) (259) Accounts payable, accrued liabilities and deposits 638 301 SummaryDue to related persons (620) 754 Net cash used in operating activities (1,649) (318) Cash Flows from Investing Activities Origination of loans held for investment, net (135,548) - CONSOLIDATED STATEMENTS FLOWS CASH OF Net cash used in investing activities (135,548) - Tremont Mortgage Trust ConfidentialSupplemental Operating and Financial Data, December 31, 2018 14
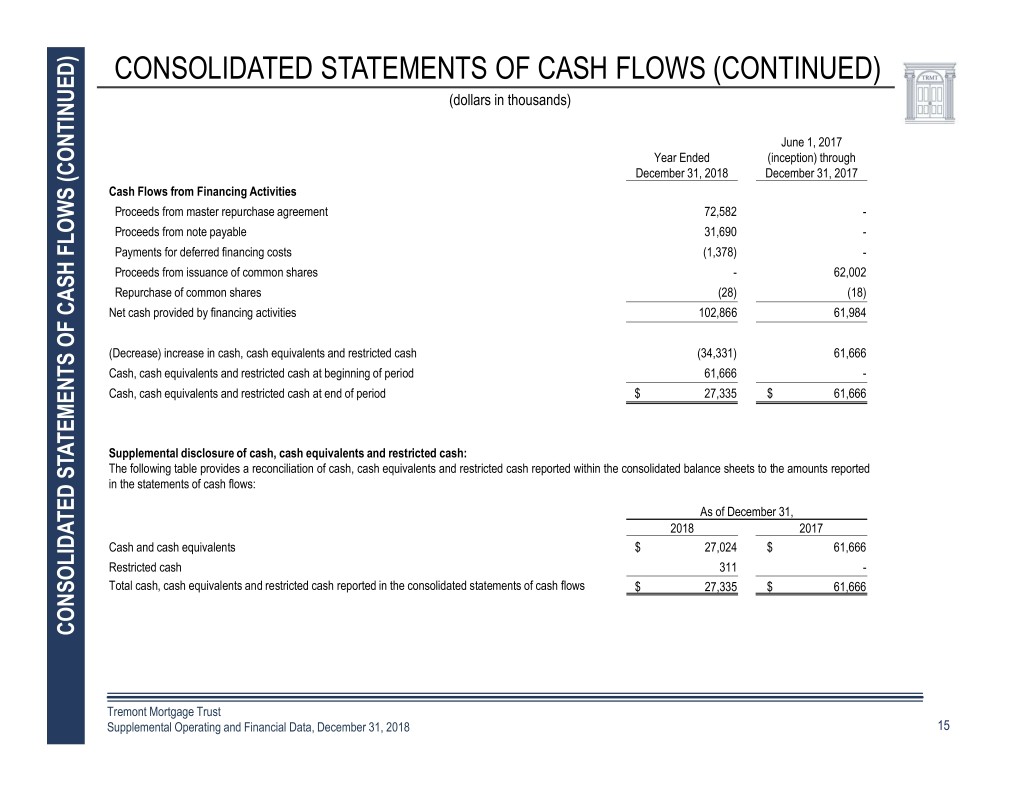
CONSOLIDATED STATEMENTS OF CASH FLOWS (CONTINUED) (dollars in thousands) June 1, 2017 Year Ended (inception) through December 31, 2018 December 31, 2017 Cash Flows from Financing Activities Proceeds from master repurchase agreement 72,582 - Proceeds from note payable 31,690 - Payments for deferred financing costs (1,378) - Proceeds from issuance of common shares - 62,002 Repurchase of common shares (28) (18) Net cash provided by financing activities 102,866 61,984 (Decrease)Financial increase in cash, cash equivalents and restricted cash (34,331) 61,666 Cash, cash equivalents and restricted cash at beginning of period 61,666 - Cash,Summary cash equivalents and restricted cash at end of period $ 27,335 $ 61,666 Supplemental disclosure of cash, cash equivalents and restricted cash: The following table provides a reconciliation of cash, cash equivalents and restricted cash reported within the consolidated balance sheets to the amounts reported in the statements of cash flows: As of December 31, 2018 2017 Cash and cash equivalents $ 27,024 $ 61,666 Restricted cash 311 - Total cash, cash equivalents and restricted cash reported in the consolidated statements of cash flows $ 27,335 $ 61,666 CONSOLIDATED STATEMENTS FLOWS CASH (CONTINUED) OF Tremont Mortgage Trust ConfidentialSupplemental Operating and Financial Data, December 31, 2018 15
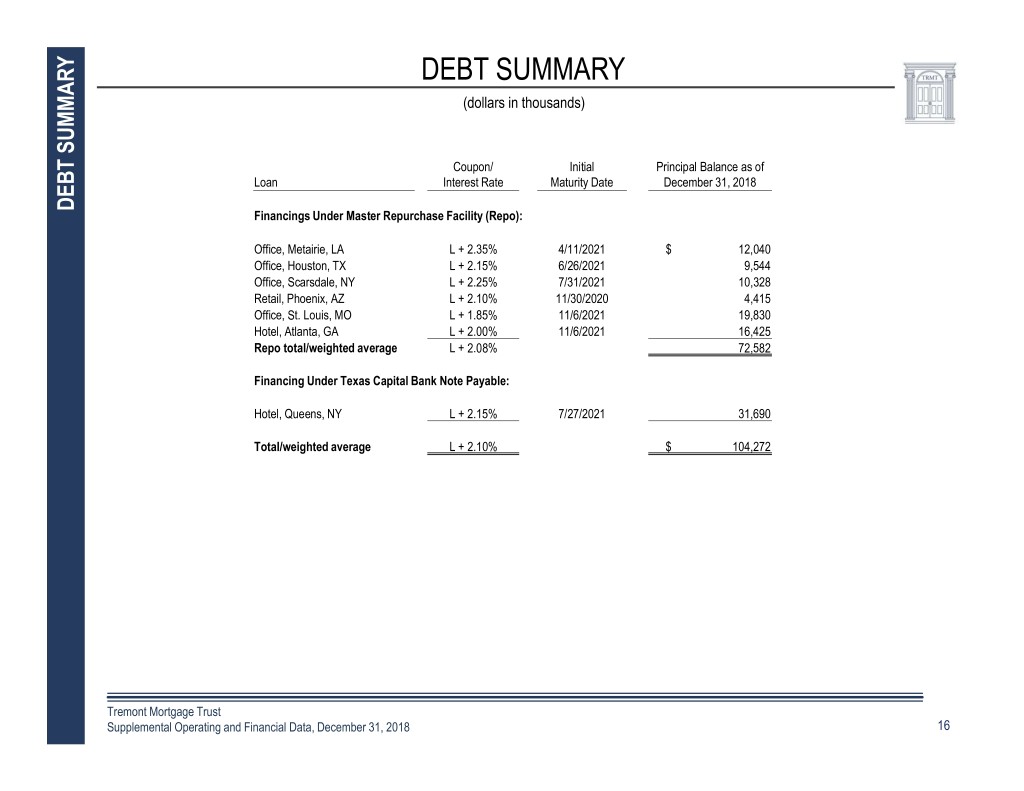
DEBT SUMMARY (dollars in thousands) Coupon/ Initial Principal Balance as of Loan Interest Rate Maturity Date December 31, 2018 DEBT SUMMARY DEBT Financings Under Master Repurchase Facility (Repo): Office, Metairie, LA L + 2.35% 4/11/2021 $ 12,040 Office, Houston, TX L + 2.15% 6/26/2021 9,544 Office, Scarsdale, NY L + 2.25% 7/31/2021 10,328 Retail, Phoenix, AZ L + 2.10% 11/30/2020 4,415 Office, St. Louis, MO L + 1.85% 11/6/2021 19,830 Hotel, Atlanta, GA L + 2.00% 11/6/2021 16,425 FinancialRepo total/weighted average L + 2.08% 72,582 Financing Under Texas Capital Bank Note Payable: SummaryHotel, Queens, NY L + 2.15% 7/27/2021 31,690 Total/weighted average L + 2.10% $ 104,272 Tremont Mortgage Trust ConfidentialSupplemental Operating and Financial Data, December 31, 2018 16
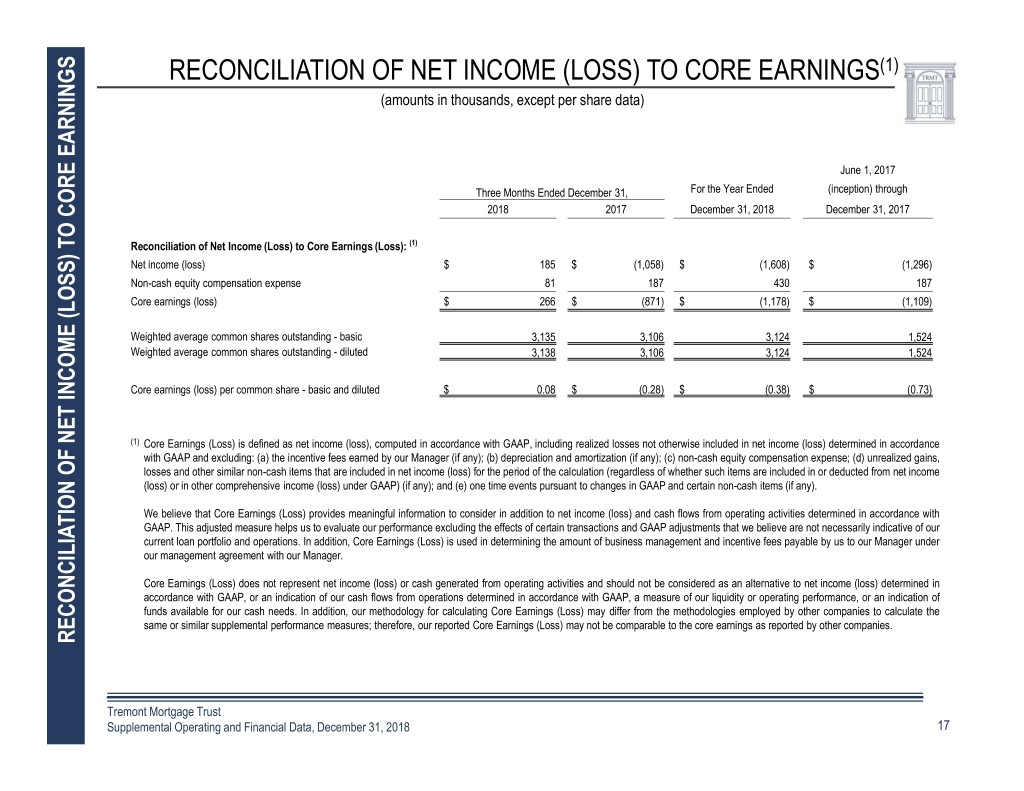
RECONCILIATION OF NET INCOME (LOSS) TO CORE EARNINGS(1) ) (amounts in thousands, except per share data) June 1, 2017 Three Months Ended December 31, For the Year Ended (inception) through 2018 2017 December 31, 2018 December 31, 2017 Reconciliation of Net Income (Loss) to Core Earnings (Loss): (1) Net income (loss) $ 185 $ (1,058) $ (1,608) $ (1,296) Non-cash equity compensation expense 81 187 430 187 Core earnings (loss) $ 266 $ (871) $ (1,178) $ (1,109) Weighted average common shares outstanding - basic 3,135 3,106 3,124 1,524 WeightedFinancial average common shares outstanding - diluted 3,138 3,106 3,124 1,524 CoreSummary earnings (loss) per common share - basic and diluted $ 0.08 $ (0.28) $ (0.38) $ (0.73) (1) Core Earnings (Loss) is defined as net income (loss), computed in accordance with GAAP, including realized losses not otherwise included in net income (loss) determined in accordance with GAAP and excluding: (a) the incentive fees earned by our Manager (if any); (b) depreciation and amortization (if any); (c) non-cash equity compensation expense; (d) unrealized gains, losses and other similar non-cash items that are included in net income (loss) for the period of the calculation (regardless of whether such items are included in or deducted from net income (loss) or in other comprehensive income (loss) under GAAP) (if any); and (e) one time events pursuant to changes in GAAP and certain non-cash items (if any). We believe that Core Earnings (Loss) provides meaningful information to consider in addition to net income (loss) and cash flows from operating activities determined in accordance with GAAP. This adjusted measure helps us to evaluate our performance excluding the effects of certain transactions and GAAP adjustments that we believe are not necessarily indicative of our current loan portfolio and operations. In addition, Core Earnings (Loss) is used in determining the amount of business management and incentive fees payable by us to our Manager under our management agreement with our Manager. Core Earnings (Loss) does not represent net income (loss) or cash generated from operating activities and should not be considered as an alternative to net income (loss) determined in accordance with GAAP, or an indication of our cash flows from operations determined in accordance with GAAP, a measure of our liquidity or operating performance, or an indication of funds available for our cash needs. In addition, our methodology for calculating Core Earnings (Loss) may differ from the methodologies employed by other companies to calculate the same or similar supplemental performance measures; therefore, our reported Core Earnings (Loss) may not be comparable to the core earnings as reported by other companies. RECONCILIATION (LOSS) TOEARNINGS OF INCOME CORE NET Tremont Mortgage Trust ConfidentialSupplemental Operating and Financial Data, December 31, 2018 17

PORTFOLIO OVERVIEW West Park I, St Louis, MO Part of West Park I, West Park II and Pine View Point Office Portfolio $29.5 Million Acquisition Financing Closed December 201818
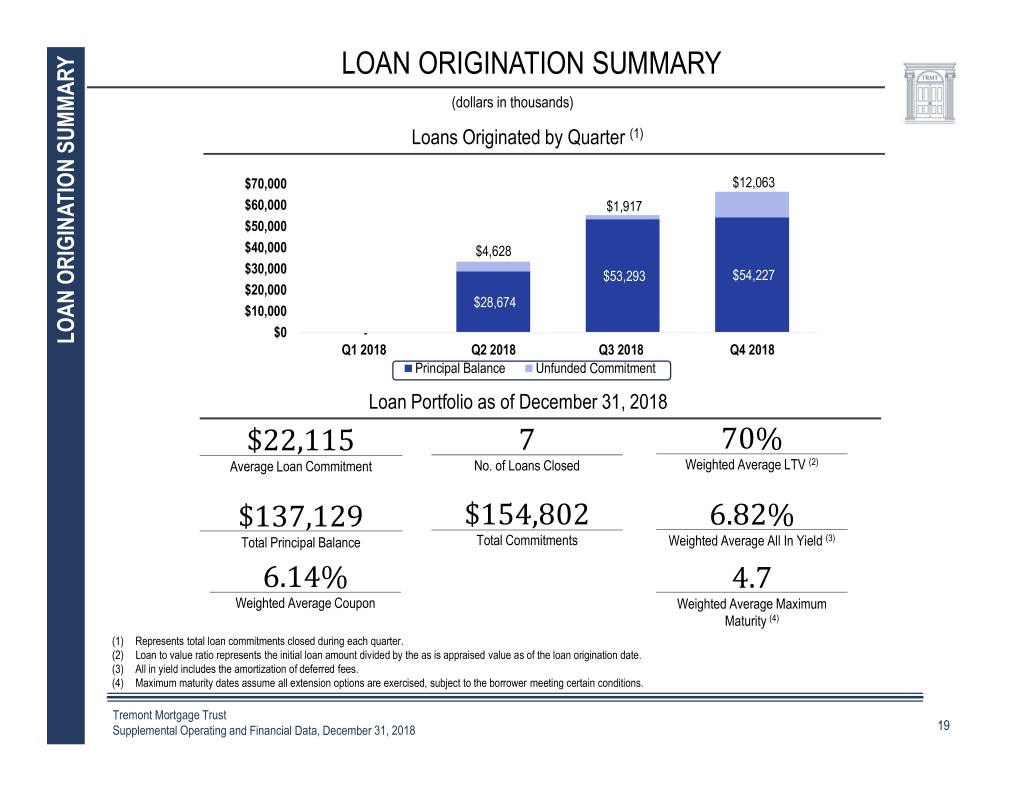
LOAN ORIGINATION SUMMARY (dollars in thousands) Loans Originated by Quarter (1) $70,000 $12,063 $60,000 $1,917 $50,000 $40,000 $4,628 $30,000 $53,293 $54,227 $20,000 $28,674 $10,000 $0 - LOAN ORIGINATIONLOAN SUMMARY Financial Q1 2018 Q2 2018 Q3 2018 Q4 2018 Principal Balance Unfunded Commitment Summary Loan Portfolio as of December 31, 2018 Average Loan Commitment No. of Loans Closed Weighted Average LTV (2) Total Principal Balance Total Commitments Weighted Average All In Yield (3) Weighted Average Coupon Weighted Average Maximum Maturity (4) (1) Represents total loan commitments closed during each quarter. (2) Loan to value ratio represents the initial loan amount divided by the as is appraised value as of the loan origination date. (3) All in yield includes the amortization of deferred fees. (4) Maximum maturity dates assume all extension options are exercised, subject to the borrower meeting certain conditions. Tremont Mortgage Trust Supplemental Operating and Financial Data, December 31, 2018 19

LOAN INVESTMENT PORTFOLIO DETAILS (dollars in thousands) DETAILS First Mortgage Bridge Loans as of December 31, 2018: Committed Outstanding Maximum Origination Principal Principal Interest All in Maximum Years As is Location Property Type Date Amount Balance Rate Yield (1) Maturity (2) Remaining LTV (3) Metairie, LA Office 4/11/2018 $ 18,102 $ 16,415 L + 5.00% L + 5.67% 4/11/2023 4.3 79% Houston, TX Office 6/26/2018 15,200 13,103 L + 4.00% L + 4.63% 6/26/2023 4.6 69% Queens, NY Hotel 7/18/2018 40,363 39,613 L + 3.50% L + 3.89% 7/19/2023 4.6 71% PORTFOLIO Scarsdale, NY Office 7/31/2018 14,847 13,771 L + 4.00% L + 4.58% 7/31/2023 4.7 76% Phoenix, AZ Retail 11/30/2018 12,790 5,887 L + 4.25% L + 6.28% 11/30/2022 4.0 48% St Louis, MO Office 12/19/2018 29,500 26,440 L + 3.25% L + 3.76% 12/19/2023 5.0 72% Atlanta, GA Hotel 12/21/2018 24,000 21,900 L + 3.25% L + 3.75% 12/21/2023 5.0 62% Total/Weighted Average $ 154,802 $ 137,129 L + 3.72% L + 4.30% 4.7 70% First Mortgage Bridge Loans Closed Subsequent to December 31, 2018: Committed Outstanding Origination Principal Principal Interest All in Maximum Years As is Location Property Type Date Amount Balance Rate Yield (1) Maturity (2) Remaining LTV (3) LOANINVESTMENT Rochester, NY Residential 1/22/2019 $ 24,550 $ 24,550 L + 3.25% L + 3.86% 1/22/2024 5.0 74% Coppel, TX Retail 2/5/2019 22,915 20,050 L + 3.50% L + 4.31% 2/5/2021 2.0 73% Total/Weighted Average $ 47,465 $ 44,600 L + 3.36% L + 4.06% 3.7 74% (1) All in yield includes the amortization of deferred fees over the initial term of the loan. (2) Maximum maturity dates assume all extension options are exercised, subject to the borrower meeting certain conditions. (3) LTV, or Loan to value ratio, represents the initial loan amount divided by the as is appraised value as of the loan origination date. Tremont Mortgage Trust ConfidentialSupplemental Operating and Financial Data, December 31, 2018 20
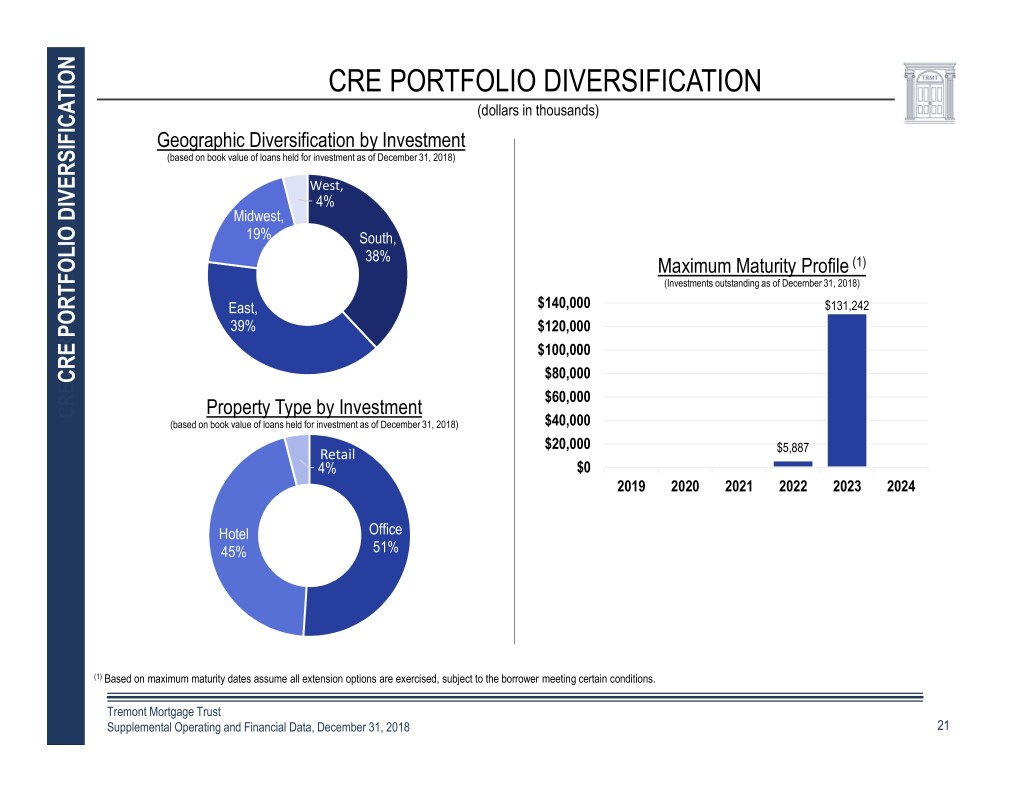
CRE PORTFOLIO DIVERSIFICATION (dollars in thousands) Geographic Diversification by Investment (based on book value of loans held for investment as of December 31, 2018) West, 4% Midwest, 19% South, 38% Maximum Maturity Profile (1) (Investments outstanding as of December 31, 2018) East, $140,000 $131,242 39% $120,000 $100,000 $80,000 CRE PORTFOLIO DIVERSIFICATIONPORTFOLIO CRE $60,000 Property Type by Investment CRE PORTFOLIOCRE DIVERSIFICATION (based on book value of loans held for investment as of December 31, 2018) $40,000 $20,000 Retail $5,887 4% $0 2019 2020 2021 2022 2023 2024 Hotel Office 45% 51% (1) Based on maximum maturity dates assume all extension options are exercised, subject to the borrower meeting certain conditions. Tremont Mortgage Trust ConfidentialSupplemental Operating and Financial Data, December 31, 2018 21 CRE PORTFOLIOCRE DIVERSIFICATION
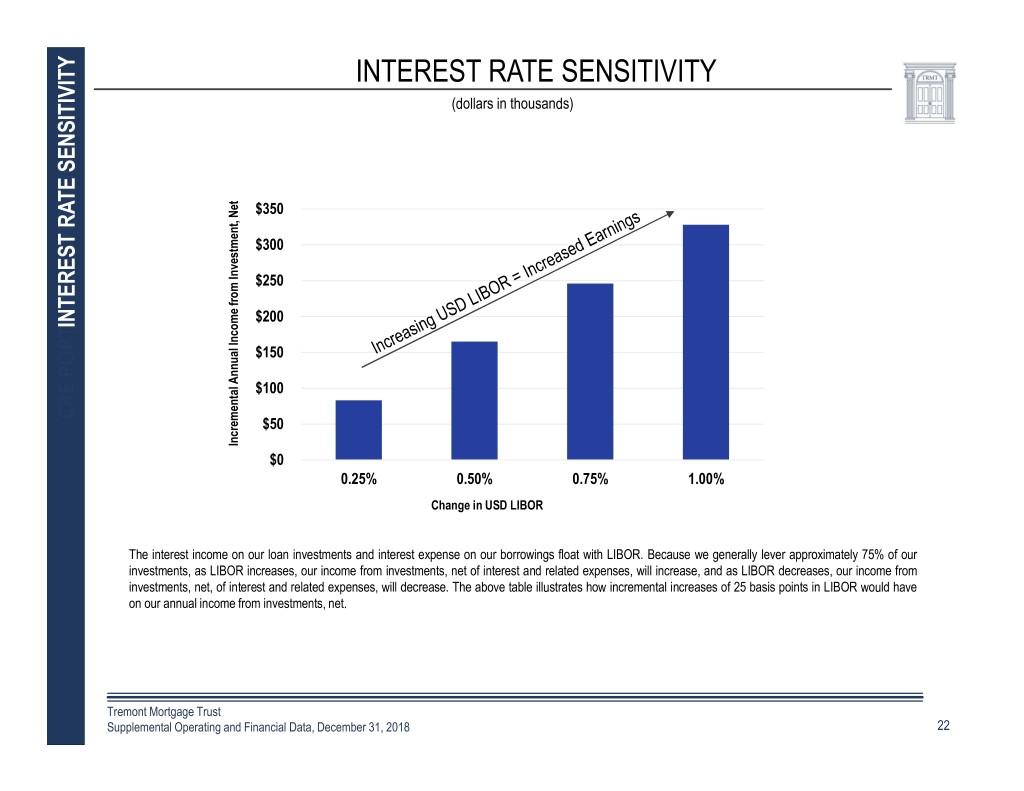
INTEREST RATE SENSITIVITY (dollars in thousands) $350 $300 $250 $200 INTEREST RATE INTEREST SENSITIVITY $150 $100 CRE PORTFOLIOCRE DIVERSIFICATION $50 Incremental Incremental Annual Income Investment, Net from $0 0.25% 0.50% 0.75% 1.00% Change in USD LIBOR The interest income on our loan investments and interest expense on our borrowings float with LIBOR. Because we generally lever approximately 75% of our investments, as LIBOR increases, our income from investments, net of interest and related expenses, will increase, and as LIBOR decreases, our income from investments, net, of interest and related expenses, will decrease. The above table illustrates how incremental increases of 25 basis points in LIBOR would have on our annual income from investments, net. Tremont Mortgage Trust ConfidentialSupplemental Operating and Financial Data, December 31, 2018 22 CRE PORTFOLIOCRE DIVERSIFICATION
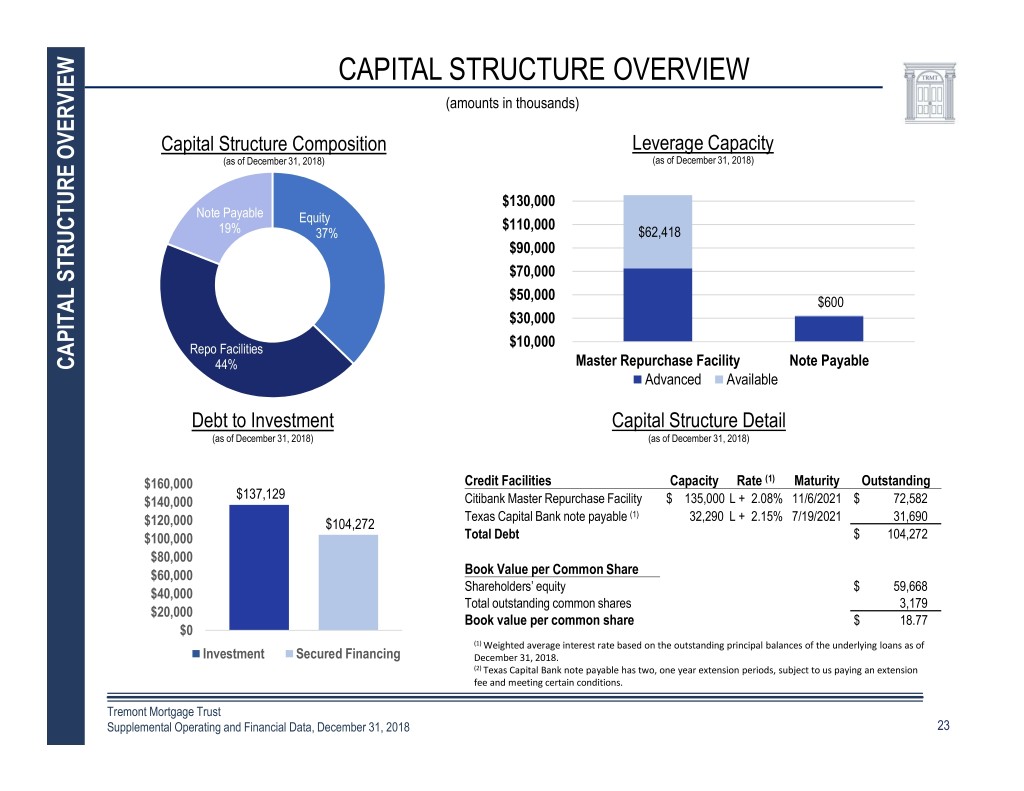
CAPITAL STRUCTURE OVERVIEW (amounts in thousands) Capital Structure Composition Leverage Capacity (as of December 31, 2018) (as of December 31, 2018) $130,000 Note Payable Equity $110,000 19% 37% $62,418 $90,000 $70,000 $50,000 $600 $30,000 Repo Facilities $10,000 Master Repurchase Facility Note Payable CAPITAL STRUCTURE STRUCTURE CAPITAL OVERVIEW 44% Advanced Available Debt to Investment Capital Structure Detail (as of December 31, 2018) (as of December 31, 2018) $160,000 Credit Facilities Capacity Rate (1) Maturity Outstanding $137,129 $140,000 Citibank Master Repurchase Facility $ 135,000 L + 2.08% 11/6/2021 $ 72,582 Texas Capital Bank note payable (1) 32,290 L + 2.15% 7/19/2021 31,690 $120,000 $104,272 $100,000 Total Debt $ 104,272 $80,000 $60,000 Book Value per Common Share Shareholders’ equity $ 59,668 $40,000 Total outstanding common shares 3,179 $20,000 Book value per common share $ 18.77 $0 (1) Weighted average interest rate based on the outstanding principal balances of the underlying loans as of Investment Secured Financing December 31, 2018. (2) Texas Capital Bank note payable has two, one year extension periods, subject to us paying an extension fee and meeting certain conditions. Tremont Mortgage Trust ConfidentialSupplemental Operating and Financial Data, December 31, 2018 23


