Exhibit 99.3
PRO FORMA VALUATION REPORT
MUTUAL HOLDING COMPANY
STOCK OFFERING
Seneca Financial Corp.│Baldwinsville, New York
PROPOSED HOLDING COMPANY FOR:
Seneca Federal Savings and Loan Association│Baldwinsville New York
Dated as of May 12, 2017

1100 North Glebe Road Suite 600
Arlington, Virginia 22201
703.528.1700
rpfinancial.com

Board of Directors
Seneca Financial MHC
Seneca Financial Corp.
Seneca Federal Savings and Loan Association
35 Oswego Street
Baldwinsville, New York 13027
Members of the Board of Directors:
At your request, we have completed and hereby provide an independent appraisal ("Appraisal") of the estimated pro forma market value of the common stock which is to be issued in connection with the stock issuance transaction described below.
This Appraisal is furnished pursuant to the requirements stipulated in the Code of Federal Regulations and has been prepared in accordance with the “Guidelines for Appraisal Reports for the Valuation of Savings and Loan Associations Converting from Mutual to Stock Form of Organization” (the “Valuation Guidelines”) of the Office of Thrift Supervision (“OTS”) and accepted by the Federal Reserve Board (“FRB”), the Office of the Comptroller of the Currency (“OCC”) and the Federal Deposit Insurance Corporation (“FDIC”), and applicable regulatory interpretations thereof.
Description of Plan of Reorganization and Stock Offering
On May 10, 2017, the Board of Directors of Seneca Federal Savings and Loan Association (“Seneca Federal” or the “Association”) adopted a plan of reorganization (the “Reorganization”) pursuant to which Seneca Federal will reorganize into a two-tier mutual holding company structure. After the Reorganization, Seneca Financial Corp. (“Seneca Financial” or the “Company”), a federal corporation, will be the mid-tier stock holding company and Seneca Financial MHC (the “MHC”), a federally chartered mutual holding company, will be the top-tier mutual holding company. The Reorganization will be completed as follows:
| (i) | Seneca Federal will organize an interim stock savings association as a wholly owned subsidiary ("Interim Bank"); |
| (ii) | After Interim Bank receives approval from the FDIC for insurance of accounts and the FDIC has issued it a certificate number, Seneca Federal will transfer pursuant to a purchase and assumption agreement all of its assets and liabilities, except $100,000 in cash, to Interim Bank, and Interim Bank will become the stock savings association resulting from the reorganization, including the purchase and assumption transaction pursuant to the plan (the "Stock Bank"); |
| (iii) | Seneca Federal will amend its charter and bylaws to read in the form of a federal mutual holding company to become Seneca Financial MHC; |
| | |
| Washington Headquarters | |
| Three Ballston Plaza | Telephone: (703) 528-1700 |
| 1100 North Glebe Road, Suite 600 | Fax No.: (703) 528-1788 |
| Arlington, VA 22201 | Toll-Free No.: (866) 723-0594 |
| www.rpfinancial.com | E-Mail: mail@rpfinancial.com |
Board of Directors
May 12, 2017
Page 2
| (iv) | Seneca Financial MHC will organize Seneca Financial Corp. as a wholly-owned subsidiary, and transfer $1,000 to Seneca Financial Corp. in exchange for 100 shares of Seneca Financial Corp. common stock; and |
| (v) | Seneca Financial MHC will transfer all of the initially issued stock of the Stock Bank to Seneca Financial Corp in exchange for additional shares of Seneca Financial Corp. common stock, and the Stock Bank will become a wholly-owned subsidiary of Seneca Financial Corp. |
Following the Reorganization, the new stock savings association will have the legal name Seneca Savings.
Concurrent with the Reorganization, Seneca Financial will issue a majority of its common stock to the MHC and sell a minority of its common stock to the public. At the completion of the public stock offering, the Company will retain up to 50% of the net stock proceeds. The MHC will own a controlling interest in the Company of at least 51%, and the Company will be the sole subsidiary of the MHC. The Company will own 100% of the Association’s outstanding stock. The Company’s initial activity will be ownership of its subsidiary, Seneca Federal, investment of the net cash proceeds retained at the holding company level and extending a loan to the employee stock ownership plan.
Seneca Financial will offer its common stock in a subscription offering to Eligible Account Holders, Tax-Qualified Employee Plans including Seneca Federal’s employee stock ownership plan (the “ESOP”), Supplemental Eligible Account Holders and Other Members as such terms are defined for purposes of applicable regulatory guidelines governing stock offerings by mutual institutions. To the extent that shares remain available for purchase after satisfaction of all subscriptions received in the subscription offering, the shares may be offered for sale to members of the general public in a community offering and a syndicated community offering. At least 50% of the net proceeds from the stock offering will be invested in Seneca Federal and the balance of the net proceeds will be retained by the Company.
At this time, no other activities are contemplated for the Company other than the ownership of Seneca Federal, a loan to the newly-formed ESOP and reinvestment of the proceeds that are retained by the Company. In the future, Seneca Federal may acquire or organize other operating subsidiaries, diversify into other banking-related activities, pay dividends or repurchase its stock, although there are no specific plans to undertake such activities at the present time.
RP® Financial, LC.
RP® Financial, LC. (“RP Financial”) is a financial consulting firm serving the financial services industry nationwide that, among other things, specializes in financial valuations and analyses of business enterprises and securities, including the pro forma valuation for savings institutions converting from mutual-to-stock form. The background and experience of RP Financial is detailed in Exhibit V-1. We believe that, except for the fee we will receive for the Appraisal, we are independent of the Company, the Association, the MHC and the other parties
Board of Directors
May 12, 2017
Page 3
engaged by the Association, the Company or the MHC to assist in the stock conversion process.
Valuation Methodology
In preparing our Appraisal, we have reviewed the regulatory applications of the Company, the Association and the MHC, including the prospectus as filed with the FRB, the OCC and the Securities and Exchange Commission (“SEC”). We have conducted a financial analysis of the Company, the Association and the MHC that has included a review of audited financial information for the years ended December 31, 2015 and December 31, 2016, a review of various unaudited information and internal financial reports through March 31, 2017, and due diligence related discussions with the Association’s management; Baker Tilly Virchow Krause, LLP, the Association’s independent auditor; Luse Gorman, PC, the Association’s counsel for the Reorganization and Raymond James Associates, Inc., the Association’s marketing advisor in connection with the stock offering. All assumptions and conclusions set forth in the Appraisal were reached independently from such discussions. In addition, where appropriate, we have considered information based on other available published sources that we believe are reliable. While we believe the information and data gathered from all these sources are reliable, we cannot guarantee the accuracy and completeness of such information.
We have investigated the competitive environment within which Seneca Federal operates and have assessed Seneca Federal’s relative strengths and weaknesses. We have kept abreast of the changing regulatory and legislative environment for financial institutions and analyzed the potential impact on Seneca Federal and the industry as a whole. We have analyzed the potential effects of the stock offering on Seneca Federal’s operating characteristics and financial performance as they relate to the pro forma market value of Seneca Financial. We have reviewed the economic and demographic characteristics of the Association’s primary market area. We have compared Seneca Federal’s financial performance and condition with selected publicly-traded thrifts in accordance with the Valuation Guidelines, as well as all publicly-traded thrifts and thrift holding companies. We have reviewed the current conditions in the securities markets in general and the market for thrift stocks in particular, including the market for existing thrift issues and initial public offerings by thrifts and thrift holding companies. We have excluded from such analyses thrifts subject to announced or rumored acquisition, and/or institutions that exhibit other unusual characteristics.
The Appraisal is based on Seneca Federal’s representation that the information contained in the regulatory applications and additional information furnished to us by Seneca Federal and its independent auditor, legal counsel and other authorized agents are truthful, accurate and complete. We did not independently verify the financial statements and other information provided by Seneca Federal, or its independent auditor, legal counsel and other authorized agents nor did we independently value the assets or liabilities of Seneca Federal. The valuation considers Seneca Federal only as a going concern and should not be considered as an indication of Seneca Federal’s liquidation value.
Our appraised value is predicated on a continuation of the current operating environment for Seneca Federal and for all thrifts and their holding companies. Changes in the local, state and national economy, the legislative and regulatory environment for financial institutions and mutual holding companies, the stock market, interest rates, and other external forces (such as
Board of Directors
May 12, 2017
Page 4
natural disasters or significant world events) may occur from time to time, often with great unpredictability and may materially impact the value of thrift stocks as a whole or the value of Seneca Federal’s stock alone. It is our understanding that there are no current plans for selling control of Seneca Federal following completion of the stock offering. To the extent that such factors can be foreseen, they have been factored into our analysis.
The estimated pro forma market value is defined as the price at which Seneca Financial’s common stock, immediately upon completion of the stock offering, would change hands between a willing buyer and a willing seller, neither being under any compulsion to buy or sell and both having reasonable knowledge of relevant facts.
Valuation Conclusion
It is our opinion that, as of May 12, 2017, the estimated aggregate pro forma market value of the shares to be issued immediately following the offering, both shares issued publicly as well as to the MHC, was $15,000,000 at the midpoint, equal to 1,500,000 shares issued at a per share value of $10.00. Pursuant to conversion guidelines, the 15% offering range indicates a minimum value of $12,750,000 and a maximum value of $17,250,000. Based on the $10.00 per share offering price determined by the Board, this valuation range equates to total shares outstanding of 1,275,000 shares at the minimum of the valuation range and 1,725,000 total shares outstanding at the maximum of the valuation range. In the event that the appraised value is subject to an increase, the aggregate pro forma market value may be increased up to a super maximum value of $19,837,500 without a resolicitation. Based on the $10.00 per share offering price, the super maximum value would result in total shares outstanding of 1,983,750. The Board of Directors has established a public offering range such that the public ownership of the Company will constitute a 46.0% ownership interest of the Company. Accordingly, the offering range to the public of the minority stock will be $5,865,000 at the minimum, $6,900,000 at the midpoint, $7,935,000 at the maximum and $9,125,250 at the super maximum. Based on the public offering range, the MHC will own 54.0% of the shares.
Limiting Factors and Considerations
The valuation is not intended, and must not be construed, as a recommendation of any kind as to the advisability of purchasing shares of the common stock. Moreover, because such valuation is determined in accordance with applicable regulatory guidelines and is necessarily based upon estimates and projections of a number of matters, all of which are subject to change from time to time, no assurance can be given that persons who purchase shares of common stock in the stock offering will thereafter be able to buy or sell such shares at prices related to the foregoing valuation of the estimated pro forma market value thereof. The appraisal reflects only a valuation range as of this date for the pro forma market value of Seneca Financial immediately upon issuance of the stock and does not take into account any trading activity with respect to the purchase and sale of common stock in the secondary market on the date of issuance of such securities or at anytime thereafter following the completion of the stock offering.
RP Financial’s valuation was based on the financial condition and operations of Seneca Federal as of March 31, 2017, the date of the financial data included in the prospectus.
Board of Directors
May 12, 2017
Page 5
RP Financial is not a seller of securities within the meaning of any federal and state securities laws and any report prepared by RP Financial shall not be used as an offer or solicitation with respect to the purchase or sale of any securities. RP Financial maintains a policy which prohibits RP Financial, its principals or employees from purchasing stock of its client institutions.
This valuation will be updated as provided for in the conversion regulations and guidelines. These updates will consider, among other things, any developments or changes in the financial performance and condition of Seneca Federal, management policies, and current conditions in the equity markets for thrift shares, both existing issues and new issues. These updates may also consider changes in other external factors which impact value including, but not limited to: various changes in the legislative and regulatory environment for financial institutions, the stock market and the market for thrift stocks, and interest rates. Should any such new developments or changes be material, in our opinion, to the valuation of the shares, appropriate adjustments to the estimated pro forma market value will be made. The reasons for any such adjustments will be explained in the update at the date of the release of the update. The valuation will also be updated at the completion of Seneca Financial’s stock offering.
| | Respectfully submitted, |
| | |
| | RP® FINANCIAL, LC. |
| | |
| |  |
| | |
| | James J. Oren |
| | Director |
| |  |
| | Gregory E. Dunn |
| | Director |
| RP® Financial, LC. | TABLE OF CONTENTS
i |
TABLE OF CONTENTS
SENECA FINANCIAL CORP.
SENECA FEDERAL SAVINGS AND LOAN ASSOCIATION
Baldwinsville, New York
| | | PAGE |
| DESCRIPTION | | NUMBER |
| | | |
| CHAPTER ONE | OVERVIEW AND FINANCIAL ANALYSIS |
| | | |
| Introduction | I.1 |
| Plan of Reorganization and Stock Offering | I.1 |
| Strategic Overview | I.3 |
| Balance Sheet Trends | I.5 |
| Income and Expense Trends | I.8 |
| Interest Rate Risk Management | I.11 |
| Lending Activities and Strategy | I.12 |
| Asset Quality | I.15 |
| Funding Composition and Strategy | I.15 |
| Financial Services Activities and Subsidiary | 1.16 |
| Legal Proceedings | I.17 |
| | | |
| CHAPTER TWO | MARKET AREA |
| | | |
| Introduction | II.1 |
| National Economic Factors | II.1 |
| Interest Rate Environment | II.3 |
| Market Area Demographics | II.4 |
| Market Area Regional Economy | II.4 |
| Unemployment Trends | II.7 |
| Market Area Deposit Characteristics and Competition | II.7 |
| | | |
| CHAPTER THREE | PEER GROUP ANALYSIS |
| | | |
| Peer Group Selection | III.1 |
| Financial Condition | III.5 |
| Income and Expense Components | III.8 |
| Loan Composition | III.11 |
| Interest Rate Risk | III.11 |
| Credit Risk | III.14 |
| Summary | III.16 |
| RP® Financial, LC. | TABLE OF CONTENTS
ii |
TABLE OF CONTENTS
SENECA FINANCIAL CORP.
SENECA FEDERAL SAVINGS AND LOAN ASSOCIATION
Baldwinsville, New York
(continued)
| | | PAGE |
| DESCRIPTION | | NUMBER |
| | | |
| CHAPTER FOUR | VALUATION ANALYSIS | |
| | | |
| Introduction | IV.1 |
| Appraisal Guidelines | IV.1 |
| RP Financial Approach to the Valuation | IV.1 |
| Valuation Analysis | IV.2 |
| 1. Financial Condition | IV.3 |
| 2. Profitability, Growth and Viability of Earnings | IV.4 |
| 3. Asset Growth | IV.6 |
| 4. Primary Market Area | IV.6 |
| 5. Dividends | IV.8 |
| 6. Liquidity of the Shares | IV.8 |
| 7. Marketing of the Issue | IV.9 |
| A. The Public Market | IV.9 |
| B. The New Issue Market | IV.13 |
| C. The Acquisition Market | IV.13 |
| 8. Management | IV.16 |
| 9. Effect of Government Regulation and Regulatory Reform | IV.17 |
| Summary of Adjustments | IV.17 |
| Valuation Approaches: Fully-Converted Basis | IV.18 |
| Basis of Valuation- Fully-Converted Pricing Ratios | IV.19 |
| 1. Price-to-Earnings ("P/E") | IV.19 |
| 2. Price-to-Book ("P/B") | IV.20 |
| 3. Price-to-Assets ("P/A") | IV.23 |
| Comparison to Publicly-Traded MHCs | IV.24 |
| Comparison to Recent MHC Offerings | IV.28 |
| Valuation Conclusion | IV.28 |
| RP® Financial, LC. | LIST OF TABLES
iii |
LIST OF TABLES
SENECA FINANCIAL CORP.
SENECA FEDERAL SAVINGS AND LOAN ASSOCIATION
Baldwinsville, New York
| TABLE | | | | |
| Number | | DESCRIPTION | | page |
| | | | | |
| 1.1 | | Historical Balance Sheets | | I.6 |
| 1.2 | | Historical Income Statements | | I.9 |
| | | | | |
| | | | | |
| 2.1 | | Summary Demographic Data | | II.5 |
| 2.2 | | Primary Market Area Employment Sectors | | II.6 |
| 2.3 | | Market Area Largest Employers | | II.6 |
| 2.4 | | Unemployment Trends | | II.7 |
| 2.5 | | Deposit Summary | | II.8 |
| 2.6 | | Market Area Deposit Competitors – As of June 30, 2016 | | II.9 |
| | | | | |
| | | | | |
| 3.1 | | Peer Group of Publicly-Traded Thrifts | | III.3 |
| 3.2 | | Balance Sheet Composition and Growth Rates | | III.6 |
| 3.3 | | Income as a Pct. of Avg. Assets and Yields, Costs, Spreads | | III.9 |
| 3.4 | | Loan Portfolio Composition and Related Information | | III.12 |
| 3.5 | | Interest Rate Risk Measures and Net Interest Income Volatility | | III.13 |
| 3.6 | | Credit Risk Measures and Related Information | | III.15 |
| | | | | |
| | | | | |
| 4.1 | | Market Area Unemployment Rates | | IV.7 |
| 4.2 | | Pricing Characteristics and After-Market Trends | | IV.14 |
| 4.3 | | Market Pricing Comparatives | | IV.15 |
| 4.4 | | Fully-Converted Market Pricing Versus Peer Group | | IV.21 |
| 4.5 | | MHC Market Pricing Versus Peer Group | | IV.22 |
| 4.6 | | Calculation of Implied Per Share Data- Incorporating MHC Second Step Conversion | | IV.26 |
| 4.7 | | MHC Institutions Implied Pricing Ratios, Full Conversion Basis | | IV.27 |
| RP® Financial, LC. | OVERVIEW AND FINANCIAL ANALYSIS
I.1 |
I. Overview and Financial Analysis
Introduction
Seneca Federal Savings and Loan Association (“Seneca Federal” or the “Association”), established in 1928, is a federally-chartered mutual savings association headquartered in Baldwinsville, New York. The Association serves the Syracuse metropolitan area through its headquarters office and two full service branch offices. A map of the Association’s office locations is provided in Exhibit I-1. Seneca Federal is a member of the Federal Home Loan Bank (“FHLB”) system and its deposits are insured up to the maximum allowable amount by the Federal Deposit Insurance Corporation (“FDIC”). As of March 31, 2017, Seneca Federal had total assets of $167.3 million, total deposits of $132.3 million and total equity of 11.0 million equal to 6.57% of total assets. The Association’s audited financial statements are included by reference as Exhibit I-2.
Plan of Reorganization and Stock Offering
On May 10, 2017, the Board of Directors of Seneca Federal adopted a plan of reorganization (the “Reorganization”) pursuant to which Seneca Federal will reorganize into a two-tier mutual holding company structure. After the Reorganization, Seneca Financial Corp. (“Seneca Financial” or the “Company”), a federal corporation, will be the mid-tier stock holding company and Seneca Financial MHC (the “MHC”), a federally chartered mutual holding company, will be the top-tier mutual holding company. The Reorganization will be completed as follows:
| (i) | Seneca Federal will organize an interim stock savings association as a wholly owned subsidiary ("Interim Bank"); |
| (ii) | After Interim Bank receives approval from the FDIC for insurance of accounts and the FDIC has issued it a certificate number, Seneca Federal will transfer pursuant to a purchase and assumption agreement all of its assets and liabilities, except $100,000 in cash, to Interim Bank, and Interim Bank will become the stock savings association resulting from the reorganization, including the purchase and assumption transaction pursuant to the plan (the "Stock Bank"); |
| (iii) | Seneca Federal will amend its charter and bylaws to read in the form of a federal mutual holding company to become Seneca Financial MHC; |
| (iv) | Seneca Financial MHC will organize Seneca Financial Corp. as a wholly-owned |
| RP® Financial, LC. | OVERVIEW AND FINANCIAL ANALYSIS
I.2 |
subsidiary, and transfer $1,000 to Seneca Financial Corp. in exchange for 100 shares of Seneca Financial Corp. common stock; and
| (v) | Seneca Financial MHC will transfer all of the initially issued stock of the Stock Bank to Seneca Financial Corp in exchange for additional shares of Seneca Financial Corp. common stock, and the Stock Bank will become a wholly-owned subsidiary of Seneca Financial Corp. |
Following the Reorganization, the new stock savings association will have the legal name Seneca Savings.
Concurrent with the Reorganization, Seneca Financial will issue a majority of its common stock to the MHC and sell a minority of its common stock to the public. At the completion of the public stock offering, the Company will retain up to 50% of the net stock proceeds. The MHC will own a controlling interest in the Company of at least 51%, and the Company will be the sole subsidiary of the MHC. The Company will own 100% of the Association’s outstanding stock. The Company’s initial activity will be ownership of its subsidiary, Seneca Federal, investment of the net cash proceeds retained at the holding company level and extending a loan to the employee stock ownership plan.
Seneca Financial will offer its common stock in a subscription offering to Eligible Account Holders, Tax-Qualified Employee Plans including Seneca Federal’s employee stock ownership plan (the “ESOP”), Supplemental Eligible Account Holders and Other Members as such terms are defined for purposes of applicable regulatory guidelines governing stock offerings by mutual institutions. To the extent that shares remain available for purchase after satisfaction of all subscriptions received in the subscription offering, the shares may be offered for sale to members of the general public in a community offering and a syndicated community offering. At least 50% of the net proceeds from the stock offering will be invested in Seneca Federal and the balance of the net proceeds will be retained by the Company.
At this time, no other activities are contemplated for the Company other than the ownership of Seneca Federal, a loan to the newly-formed ESOP and reinvestment of the proceeds that are retained by the Company. In the future, Seneca Financial may acquire or organize other operating subsidiaries, diversify into other banking-related activities, pay dividends or repurchase its stock, although there are no specific plans to undertake such activities at the present time.
| RP® Financial, LC. | OVERVIEW AND FINANCIAL ANALYSIS
I.3 |
Strategic Overview
Seneca Federal maintains a local community banking emphasis, with a primary strategic objective of meeting the borrowing and savings needs of its local customer base. Historically, as a traditional thrift institution, the Association’s lending activities were concentrated in origination of 1-4 family permanent mortgage loans and such loans continue to comprise the largest concentration of the loan portfolio. In recent years, the Association has embarked on a new strategic direction designed to build a full service community banking franchise dedicated to meeting the banking needs of business and retail customers in the communities that are served by the Association. To facilitate implementation of new strategic initiatives, the Association added senior management infrastructure including the appointment of a new President and Chief Executive Officer in October 2013. Subsequently, the Association hired two additional executive offices for the positions of Executive President and Chief Financial Officer and Executive Vice President, Director of Retail Banking. In addition, following the Reorganization, the Association intends to hire a new commercial lender to help grow the portfolio. The Association’s objective is to fund asset growth primarily through deposit growth, emphasizing growth of lower cost core deposits. Core deposit growth is expected to be in part facilitated by growth of commercial lending relationships, pursuant to which the Association is seeking to establish a full service banking relationship with its commercial loan customers through offering a full range of commercial loan products that can be packaged with lower cost commercial deposit products.
Investments serve as a supplement to the Association’s lending activities and the investment portfolio is considered to be indicative of a low risk investment philosophy. Mortgage-backed securities that are guaranteed or insured by government sponsored enterprises constitute the largest portion of the Association’s investment portfolio, with other investments consisting of municipal bonds, corporate securities and U.S. government and agency securities.
Deposits have consistently served as the primary funding source for the Association, with supplemental funding provided by utilization of borrowings as an alternative funding source for purposes of managing funding costs and interest rate risk. Certificates of deposit (“CDs”) currently constitute the largest portion of the Association’s deposit base. Borrowings currently held by the Association consist of FHLB advances.
| RP® Financial, LC. | OVERVIEW AND FINANCIAL ANALYSIS
I.4 |
Seneca Federal’s earnings base is largely dependent upon net interest income and operating expense levels. The Association has experienced some net interest margin compression since 2015, which has been primarily attributable to a more significant increase in interest-bearing funding costs relative to interest-earning assets yields. Operating expense ratios have trended lower since 2015, which was been facilitated by leveraging of operating expenses through a faster pace of asset growth. Non-interest operating income has been somewhat of a limited contributor to the Association’s earnings, reflecting limiting diversification into fee-based products and services. The amount of loan loss provisions established has increased in recent years, which has been largely attributable to growth of the loan portfolio including growth of higher risk types of loans. Non-operating gains generally have been a relatively modest factor in the Association’s earnings over the past five and one quarter years.
The post-offering business plan of the Association is expected to continue to focus on implementing strategic initiatives to develop and grow a full service community banking franchise. Accordingly, Seneca Federal will continue to be an independent full service community bank, with a commitment to meeting the retail and commercial banking needs of individuals and businesses in the Syracuse metropolitan area.
The Association’s Board of Directors has elected to complete a public stock offering to sustain growth strategies and facilitate implementation of its strategic plan. The capital realized from the stock offering will increase the Association’s operating flexibility and allow for additional growth of the balance sheet. The additional funds realized from the stock offering will provide an alternative funding source to deposits and borrowings in meeting the Association’s future funding needs, which may facilitate a reduction in Seneca Federal’s funding costs. Additionally, Seneca Federal’s higher equity-to-assets ratio will enable the Association to pursue expansion opportunities. Such expansion would most likely occur through the acquisition of other financial institutions and purchasing or establishing branches that would increase market penetration in the markets currently served by the Association or to gain a market presence into nearby complementary markets. At this time, the Association has no specific plans for expansion. The projected uses of proceeds are highlighted below.
| · | The Company. The Company is expected to retain up to 50% of the net offering proceeds. At present, funds at the Company level, net of the loan to the ESOP, are expected to be primarily invested initially into liquid funds held as a deposit at the Association. Over time, the funds may be utilized for various corporate purposes, possibly including acquisitions, infusing additional equity into the Association, repurchases of common stock and the payment of cash dividends. |
| RP® Financial, LC. | OVERVIEW AND FINANCIAL ANALYSIS
I.5 |
| · | The Association. At least 50% of the net conversion proceeds will be infused into the Association. Cash proceeds (i.e., net proceeds less deposits withdrawn to fund stock purchases) infused into the Association are anticipated to become part of general operating funds and are expected to be primarily utilized to fund loan growth over time. |
Overall, it is the Association’s objective to pursue controlled growth that will serve to increase returns, while continuing to emphasize management of the overall risk associated with Seneca Federal’s operations.
Balance Sheet Trends
Table 1.1 shows the Association’s historical balance sheet data for the past five and one-quarter years. From yearend 2012 through March 31, 2017, Seneca Federal’s assets increased at a 3.48% annual rate. Total assets trended lower from yearend 2012 through yearend 2014, which was followed by asset growth over the past two and one-quarter years. A decrease in cash and cash equivalents accounted for the Association’s asset shrinkage during 2013 and 2014, while asset growth over the past two and one-quarter years was primarily sustained by loan growth. Asset shrinkage and a slight increase in borrowings during 2013 funded deposit run-off from yearend 2012 through yearend 2014, while deposit growth and, to a lesser extent, borrowings funded asset growth over the past two and one-quarter years. A summary of Seneca Federal’s key operating ratios for the past two and one-quarter years is presented in Exhibit I-3.
Seneca Federal’s loans receivable portfolio increased at an 11.57% annual rate from yearend 2012 through March 31, 2017, in which the balance of loans receivable has trended steadily higher after declining in 2013. The most significant loan growth was realized during 2015 and 2016, which was primarily attributable to growth of 1-4 family permanent mortgage loans. The faster pace of loan growth relative to asset growth provided for an increase in the loans-to-assets ratio from 58.34% at yearend 2012 to 80.34% at March 31, 2017.
Trends in the Association’s loan portfolio composition over the past two and one-quarter years show that the concentration of 1-4 family permanent mortgage loans comprising total loans decreased from 71.55% at yearend 2015 to 69.89% at March 31, 2017. Commercial real estate loans and commercial business loans constitute the primary types of lending diversification for the Association, with both of those areas of lending diversification remaining fairly stable as a percent of total loans outstanding over the past two and one-quarter years.
| RP® Financial, LC. | OVERVIEW AND FINANCIAL ANALYSIS
I.6 |
Table 1.1
Seneca Federal Savings and Loan Association
Historical Balance Sheets
| | | | | | | | | | | | | | | | | | | | | | | | | | | | | | | | | | | | | | | 12/31/12- | |
| | | | | | | | | | | | | | | | | | | | | | | | | | | | | | | | | | | | | | | 3/31/207 | |
| | | As of December 31, | | | As of March 31, | | | Annualized | |
| | | 2012 | | | 2013 | | | 2014 | | | 2015 | | | 2016 | | | 2017 | | | Growth | |
| | | Amount | | | Pct(1) | | | Amount | | | Pct(1) | | | Amount | | | Pct(1) | | | Amount | | | Pct(1) | | | Amount | | | Pct(1) | | | Amount | | | Pct(1) | | | Pct | |
| | | ($000) | | | (%) | | | ($000) | | | (%) | | | ($000) | | | (%) | | | ($000) | | | (%) | | | ($000) | | | (%) | | | ($000) | | | (%) | | | (%) | |
| Total Amount of: | | | | | | | | | | | | | | | | | | | | | | | | | | | | | | | | | | | | | | | | | | | | | | | | | | | | |
| Assets | | $ | 144,709 | | | | 100.00 | % | | $ | 131,573 | | | | 100.00 | % | | $ | 130,285 | | | | 100.00 | % | | $ | 137,359 | | | | 100.00 | % | | $ | 161,411 | | | | 100.00 | % | | $ | 167,325 | | | | 100.00 | % | | | 3.48 | % |
| Loans Receivable (net) | | | 84,426 | | | | 58.34 | % | | | 79,234 | | | | 60.22 | % | | | 85,842 | | | | 65.89 | % | | | 105,257 | | | | 76.63 | % | | | 132,364 | | | | 82.00 | % | | | 134,424 | | | | 80.34 | % | | | 11.57 | % |
| Cash and Equivalents | | | 32,236 | | | | 22.28 | % | | | 19,346 | | | | 14.70 | % | | | 2,309 | | | | 1.77 | % | | | 4,045 | | | | 2.94 | % | | | 1,762 | | | | 1.09 | % | | | 5,784 | | | | 3.46 | % | | | -33.25 | % |
| Investment Securities | | | 24,601 | | | | 17.00 | % | | | 27,638 | | | | 21.01 | % | | | 36,283 | | | | 27.85 | % | | | 22,664 | | | | 16.50 | % | | | 19,450 | | | | 12.05 | % | | | 19,090 | | | | 11.41 | % | | | -5.79 | % |
| FHLB Stock | | | 1,066 | | | | 0.74 | % | | | 873 | | | | 0.66 | % | | | 1,056 | | | | 0.81 | % | | | 1,247 | | | | 0.91 | % | | | 2,090 | | | | 1.29 | % | | | 1,833 | | | | 1.10 | % | | | 13.60 | % |
| Bank Owned Life Insurance | | | 0 | | | | 0.00 | % | | | 0 | | | | 0.00 | % | | | 0 | | | | 0.00 | % | | | 0 | | | | 0.00 | % | | | 2,141 | | | | 1.33 | % | | | 2,158 | | | | 1.29 | % | | | NM | |
| Deposits | | $ | 116,635 | | | | 80.60 | % | | $ | 107,134 | | | | 81.43 | % | | $ | 100,008 | | | | 76.76 | % | | $ | 108,672 | | | | 79.12 | % | | $ | 119,542 | | | | 74.06 | % | | $ | 132,338 | | | | 79.09 | % | | | 3.02 | % |
| Borrowings | | | 15,900 | | | | 10.99 | % | | | 11,800 | | | | 8.97 | % | | | 17,000 | | | | 13.05 | % | | | 15,500 | | | | 11.28 | % | | | 28,000 | | | | 17.35 | % | | | 21,000 | | | | 12.55 | % | | | 6.76 | % |
| Equity | | | 10,715 | | | | 7.40 | % | | | 10,640 | | | | 8.09 | % | | | 11,565 | | | | 8.88 | % | | | 10,096 | | | | 7.35 | % | | | 10,780 | | | | 6.68 | % | | | 10,985 | | | | 6.57 | % | | | 0.59 | % |
| Tangible Retained Earnings | | | 10,715 | | | | 7.40 | % | | | 10,640 | | | | 8.09 | % | | | 11,565 | | | | 8.88 | % | | | 10,096 | | | | 7.35 | % | | | 10,780 | | | | 6.68 | % | | | 10,985 | | | | 6.57 | % | | | 0.59 | % |
| | | | | | | | | | | | | | | | | | | | | | | | | | | | | | | | | | | | | | | | | | | | | | | | | | | | | |
| AOCI | | $ | (1,889 | ) | | | -1.31 | % | | $ | (1,823 | ) | | | -1.39 | % | | $ | (1,078 | ) | | | -0.83 | % | | $ | (2,944 | ) | | | -2.14 | % | | $ | (2,787 | ) | | | -1.73 | % | | $ | (2,746 | ) | | | -1.64 | % | | | | |
| | | | | | | | | | | | | | | | | | | | | | | | | | | | | | | | | | | | | | | | | | | | | | | | | | | | | |
| Loans/Deposits | | | 72.38 | % | | | | | | | 73.96 | % | | | | | | | 85.84 | % | | | | | | | 96.86 | % | | | | | | | 110.73 | % | | | | | | | 101.58 | % | | | | | | | | |
| Offices Open | | | 3 | | | | | | | | 3 | | | | | | | | 3 | | | | | | | | 3 | | | | | | | | 3 | | | | | | | | 3 | | | | | | | | | |
| (1) | Ratios are as a percent of ending assets. |
Sources: Seneca Federal's preliminary prospectus, audited financial reports and call reports.
| RP® Financial, LC. | OVERVIEW AND FINANCIAL ANALYSIS
I.7 |
From yearend 2015 to March 31, 2017, commercial real estate loans increased from 13.38% of total loans to 14.70% of total loans and commercial business loans decreased from 6.96% of total loans to 6.35% of total loans. Other areas of lending diversification for the Association have been fairly limited, consisting primarily of home equity loans lines of credit and, to a lesser extent, construction loans and consumer loans. As of March 31, 2017, home equity loans and lines of credit equaled 4.46% of total loans, construction loans equaled 2.56% of total loans and consumer loans equaled 2.04% of total loans.
The intent of the Association’s investment policy is to provide adequate liquidity and to generate a favorable return within the context of supporting Seneca Federal’s overall credit and interest rate risk objectives. It is anticipated that proceeds retained at the holding company level will be invested into liquid funds held as a deposit at the Association. Since yearend 2012, the Association’s level of cash and investment securities (inclusive of FHLB stock) ranged from a low of 14.44% of assets at yearend 2016 to a high of 40.01% of assets at yearend 2012. The decrease in the balance of cash and investments since yearend 2012 was largely related to redeployment of those funds for purposes of funding loan growth and, to a lesser extent, to fund deposit run-off during 2013 and 2014. Mortgage-backed securities totaling $9.4 million comprised the most significant component of the Association’s investment portfolio at March 31, 2017. Other investments held by the Association at March 31, 2017 consisted of municipal bonds ($8.6 million), corporate securities ($814,000) and U.S. government and agency securities ($269,000). As of March 31, 2017, all investments were maintained as available for sale and reflected a net unrealized loss of $351,000. Exhibit I-4 provides historical detail of the Association’s investment portfolio. As of March 31, 2017, the Association also held $5.8 million of cash and cash equivalents and $1.8 million of FHLB stock.
The Association also maintains an investment in bank-owned life insurance (“BOLI”) policies, as a source of funding for employee benefit expenses. As of March 31, 2017, the cash surrender value of the Association’s BOLI equaled $2.2 million or 1.29% of assets.
Since yearend 2012, Seneca Federal’s funding needs have been addressed through a combination of deposits, borrowings and internal cash flows. From yearend 2012 through March 31, 2017, the Association’s deposits increased at a 3.02% annual rate. Deposits declined from yearend 2012 through yearend 2014, which was followed by deposit growth during the past two and one-quarter years. Overall, deposits as a percent of assets remained fairly stable over the past five and one-quarter years, equaling 80.60% of assets at yearend
| RP® Financial, LC. | OVERVIEW AND FINANCIAL ANALYSIS
I.8 |
2012 and 79.09% of assets at March 31, 2017. CDs account for the largest concentration of the Association’s deposits and comprised 49.23% of average deposits during first quarter of 2017.
Borrowings serve as an alternative funding source for the Association to address funding needs for growth and to support management of deposit costs and interest rate risk. From yearend 2012 through March 31, 2017, borrowings ranged from a low of $11.8 million or 8.97% of assets at yearend 2013 to a high of $28.0 million or 17.35% of assets at yearend 2016. As of March 31, 2017, the Association’s borrowings totaled $21.0 million or 12.55% of assets. Borrowing held by the Association at March 31, 2017 consisted of FHLB advances.
The Association’s equity increased at a 0.59% annual rate from yearend 2012 through March 31, 2017, as the retention of earning since yearend 2012 was largely offset by the net loss recorded in 2013 and an increase in the accumulated other comprehensive loss. The comparatively slower rate of equity growth relative to asset growth since yearend 2012 provided for a decrease in the Association’s equity-to-assets ratio from 7.40% at yearend 2012 to 6.57% at March 31, 2017. All of the Association’s capital is tangible capital, and the Association maintained capital surpluses relative to all of its regulatory capital requirements at March 31, 2017. The addition of stock proceeds will serve to strengthen the Association’s capital position, as well as support growth opportunities. At the same time, the increase in Seneca Federal’s pro forma capital position will initially depress its ROE.
Income and Expense Trends
Table 1.2 shows the Association’s historical income statements for the past five years and for the twelve months ended March 31, 2017. The Association’s reported earnings ranged from a net loss of $208,000 or 0.15% of average assets during 2013 to net income of $600,000 or 0.39% of average assets for the twelve months ended March 31, 2017. Net interest income and operating expenses represent the primary components of the Association’s recurring earnings, while non-operating income has been somewhat of a limited source of earnings for the Association. Loan loss provisions have had a varied impact on the Association’s earnings over the past five and one-quarter years. Gains and losses from the sale of investments and fixed assets have generally been a relatively minor factor in the Association’s earnings over the past five and one-quarter years.
During the period covered in Table 1.2, the Association’s net interest income to average assets ratio ranged from a low of 2.50% during 2013 to a high of 3.42% during 2015. For the
| RP® Financial, LC. | OVERVIEW AND FINANCIAL ANALYSIS
I.9 |
Table 1.2
Seneca Federal Savings and Loan Association
Historical Income Statements
| | | For the Fiscal Year Ended December 31, | | | 12 Months Ended, | |
| | | 2012 | | | 2013 | | | 2014 | | | 2015 | | | 2016 | | | March 31, 2017 | |
| | | Amount | | | Pct(1) | | | Amount | | | Pct(1) | | | Amount | | | Pct(1) | | | Amount | | | Pct(1) | | | Amount | | | Pct(1) | | | Amount | | | Pct(1) | |
| | | ($000) | | | (%) | | | ($000) | | | (%) | | | ($000) | | | (%) | | | ($000) | | | (%) | | | ($000) | | | (%) | | | ($000) | | | (%) | |
| | | | | | | | | | | | | | | | | | | | | | | | | | | | | | | | | | | | | |
| Interest Income | | $ | 5,472 | | | | 3.75 | % | | $ | 4,761 | | | | 3.45 | % | | $ | 4,844 | | | | 3.70 | % | | $ | 5,167 | | | | 3.94 | % | | $ | 5,844 | | | | 3.96 | % | | $ | 6,068 | | | | 3.95 | % |
| Interest Expense | | | (1,694 | ) | | | -1.16 | % | | | (1,311 | ) | | | -0.95 | % | | | (865 | ) | | | -0.66 | % | | | (681 | ) | | | -0.52 | % | | | (992 | ) | | | -0.67 | % | | | (1,085 | ) | | | -0.71 | % |
| Net Interest Income | | $ | 3,778 | | | | 2.59 | % | | $ | 3,450 | | | | 2.50 | % | | $ | 3,979 | | | | 3.04 | % | | $ | 4,486 | | | | 3.42 | % | | $ | 4,852 | | | | 3.29 | % | | $ | 4,983 | | | | 3.24 | % |
| Provision for Loan Losses | | | (239 | ) | | | -0.16 | % | | | 0 | | | | 0.00 | % | | | (20 | ) | | | -0.02 | % | | | (8 | ) | | | -0.01 | % | | | (247 | ) | | | -0.17 | % | | | (274 | ) | | | -0.18 | % |
| Net Interest Income after Provisions | | $ | 3,539 | | | | 2.43 | % | | $ | 3,450 | | | | 2.50 | % | | $ | 3,959 | | | | 3.02 | % | | $ | 4,478 | | | | 3.41 | % | | $ | 4,605 | | | | 3.12 | % | | $ | 4,709 | | | | 3.06 | % |
| | | | | | | | | | | | | | | | | | | | | | | | | | | | | | | | | | | | | | | | | | | | | | | | | |
| Gain(Loss) on Sale of Loans | | $ | 85 | | | | 0.06 | % | | $ | 19 | | | | 0.01 | % | | $ | 5 | | | | 0.00 | % | | $ | 91 | | | | 0.07 | % | | $ | 105 | | | | 0.07 | % | | $ | 108 | | | | 0.07 | % |
| Other Income | | | 669 | | | | 0.46 | % | | | 593 | | | | 0.43 | % | | | 672 | | | | 0.51 | % | | | 584 | | | | 0.44 | % | | | 435 | | | | 0.30 | % | | | 427 | | | | 0.28 | % |
| Operating Expense | | | (4,103 | ) | | | -2.82 | % | | | (4,453 | ) | | | -3.22 | % | | | (4,441 | ) | | | -3.39 | % | | | (4,783 | ) | | | -3.64 | % | | | (4,808 | ) | | | -3.26 | % | | | (4,835 | ) | | | -3.14 | % |
| Net Operating Income | | $ | 190 | | | | 0.13 | % | | $ | (391 | ) | | | -0.28 | % | | $ | 195 | | | | 0.15 | % | | $ | 370 | | | | 0.28 | % | | $ | 337 | | | | 0.23 | % | | $ | 409 | | | | 0.27 | % |
| | | | | | | | | | | | | | | �� | | | | | | | | | | | | | | | | | | | | | | | | | | | | | | | | | | |
| Gain(Loss) on Sale of Fixed Assets | | $ | 0 | | | | 0.00 | % | | $ | 0 | | | | 0.00 | % | | $ | 0 | | | | 0.00 | % | | $ | 0 | | | | 0.00 | % | | $ | 158 | | | | 0.11 | % | | $ | 158 | | | | 0.10 | % |
| Gain on Sale of Investments | | | 9 | | | | 0.01 | % | | | 34 | | | | 0.02 | % | | | 90 | | | | 0.07 | % | | | 48 | | | | 0.04 | % | | | 96 | | | | 0.07 | % | | | 90 | | | | 0.06 | % |
| Total Non-Operating Income (Exp.) | | $ | 9 | | | | 0.01 | % | | $ | 34 | | | | 0.02 | % | | $ | 90 | | | | 0.07 | % | | $ | 48 | | | | 0.04 | % | | $ | 254 | | | | 0.17 | % | | $ | 248 | | | | 0.16 | % |
| | | | | | | | | | | | | | | | | | | | | | | | | | | | | | | | | | | | | | | | | | | | | | | | | |
| Net Income Before Tax | | $ | 199 | | | | 0.14 | % | | $ | (357 | ) | | | -0.26 | % | | $ | 285 | | | | 0.22 | % | | $ | 418 | | | | 0.32 | % | | $ | 591 | | | | 0.40 | % | | $ | 657 | | | | 0.43 | % |
| Income Taxes | | | (24 | ) | | | -0.02 | % | | | 149 | | | | 0.11 | % | | | (104 | ) | | | -0.08 | % | | | (22 | ) | | | -0.02 | % | | | (64 | ) | | | -0.04 | % | | | (57 | ) | | | -0.04 | % |
| Net Income (Loss) | | $ | 175 | | | | 0.12 | % | | $ | (208 | ) | | | -0.15 | % | | $ | 181 | | | | 0.14 | % | | $ | 396 | | | | 0.30 | % | | $ | 527 | | | | 0.36 | % | | $ | 600 | | | | 0.39 | % |
| | | | | | | | | | | | | | | | | | | | | | | | | | | | | | | | | | | | | | | | | | | | | | | | | |
| Adjusted Earnings: | | | | | | | | | | | | | | | | | | | | | | | | | | | | | | | | | | | | | | | | | | | | | | | | |
| Net Income | | $ | 175 | | | | 0.12 | % | | $ | (208 | ) | | | -0.15 | % | | $ | 181 | | | | 0.14 | % | | $ | 396 | | | | 0.30 | % | | $ | 527 | | | | 0.36 | % | | $ | 600 | | | | 0.39 | % |
| Add(Deduct): Non-Operating (Inc)/Exp | | | (9 | ) | | | -0.01 | % | | | (34 | ) | | | -0.02 | % | | | (90 | ) | | | -0.07 | % | | | (48 | ) | | | -0.04 | % | | | (254 | ) | | | -0.17 | % | | | (248 | ) | | | -0.16 | % |
| Tax Effect | | | 3 | | | | 0.00 | % | | | 12 | | | | 0.01 | % | | | 31 | | | | 0.02 | % | | | 16 | | | | 0.01 | % | | | 86 | | | | 0.06 | % | | | 85 | | | | 0.06 | % |
| Adjusted Earnings: | | $ | 169 | | | | 0.12 | % | | $ | (230 | ) | | | -0.17 | % | | $ | 122 | | | | 0.09 | % | | $ | 364 | | | | 0.28 | % | | $ | 359 | | | | 0.24 | % | | $ | 437 | | | | 0.28 | % |
| | | | | | | | | | | | | | | | | | | | | | | | | | | | | | | | | | | | | | | | | | | | | | | | | |
| Memo: | | | | | | | | | | | | | | | | | | | | | | | | | | | | | | | | | | | | | | | | | | | | | | | | |
| Efficiency Ratio (%) | | | 90.53 | % | | | | | | | 109.63 | % | | | | | | | 95.38 | % | | | | | | | 92.68 | % | | | | | | | 89.17 | % | | | | | | | 87.47 | % | | | | |
| (1) | Ratios are as a percent of average assets. |
Sources: Seneca Federal's preliminary prospectus, audited financial reports and call reports.
| RP® Financial, LC. | OVERVIEW AND FINANCIAL ANALYSIS
I.10 |
twelve months ended March 31, 2017, the Association’s net interest income to average assets ratio equaled 3.24%. The increase in the Association’s net interest income ratio during 2013 and 2014 was facilitated by interest rate spread expansion, as the result of an increase in the average yield earned on interest-earning assets and a decrease in the average rate paid on interest-bearing liabilities. Comparatively, the decline in the Association’s net interest income ratio since 2014 has been largely attributable to interest rate spread compression that has resulted from a more significant increase in the Association’s cost of interest-bearing liabilities relative to the yield earned on interest-earnings assets. In fact, the Association’s yield earned on interest-earning assets during the first quarter of 2017 was down slightly compared to the year ago quarter (4.10% versus 4.18% for the first quarter of 2016). Partially offsetting decline in yield earned on interest-earning assets during the past two and one-quarter years has been a shift in the Association’s interest-earning asset composition towards a higher concentration of loans, which earn higher yields relative to investments and short-term liquid funds. Overall, during the two and one quarter years, the Association’s interest rate spread declined from 3.42% during 2015 to 3.23% during the first quarter of 2017 The Association’s net interest rate spreads and yields and costs for the past two and one-quarter years are set forth in Exhibit I-3 and Exhibit I-5.
Non-interest operating income has been somewhat of a limited contributor to the Association’s earnings over the past five and one-quarter years, reflecting the Association’s limited diversification into products and services that generate non-interest operating income. Revenues derived from non-interest income sources is also limited by the relatively high concentration of deposits maintained in CDs, as opposed to fee-based deposit products. Throughout the period shown in Table 1.2, non-interest operating income ranged from a low of $535,000 or 0.35% of average assets during the twelve months ended March 31, 2017 to a high of $754,000 or 0.52% of average assets during 2012. Service and other fee income, income from financial services activities and gains on the sale of 1-4 family loans constitute the major sources of the Association’s non-interest operating revenues.
Operating expenses represent the other major component of the Association’s earnings, ranging from a low of $4.103 million or 2.82% of average assets during 2012 to a high of $4.835 million or 3.14% of average assets during the twelve months ended March 31, 2017. In general, the Association has maintained a relatively high level of operating expenses, which can in part be attributed to certain inherent fixed operating costs Seneca Federal incurs as a regulated financial institution that are spread over a relatively small asset base. Further upward pressure
| RP® Financial, LC. | OVERVIEW AND FINANCIAL ANALYSIS
I.11 |
will be placed on the Association’s operating expense ratio following the stock offering, due to expenses associated with operating as a publicly-traded company, including expenses related to the stock benefit plans. At the same time, the increase in capital realized from the stock offering will increase the Association’s capacity to leverage operating expenses through pursuing a more aggressive growth strategy.
Overall, during the past five and one-quarter years, the Association’s expense coverage ratios (net interest income divided by operating expenses) ranged from a low of .78x during 2013 to a high of 1.03x during the twelve months ended March 31, 2017. Similarly, the Association’s efficiency ratio (operating expenses as a percent of the sum of net interest income and other operating income) reflected an upward trend in core earnings since 2013, based on efficiency ratios of 109.63% and 87.47% during 2013 and during the twelve months ended March 31, 2017, respectively.
During the period covered in Table 1.2, the amount of loan loss provisions established ranged from no loan loss provisions recorded during 2013 to a high of $274,000 or 0.18% of average assets during the twelve months ended March 31, 2017. The increase in loan loss provisions established during 2016 and the most recent twelve month period was related to loan growth, as opposed to deterioration in credit quality. As of March 31, 2017, the Association maintained loan loss allowances of $1.085 million, equal to 0.80% of total loans receivable and 114.45% of non-accruing loans. Exhibit I-6 sets forth the Association’s loan loss allowance activity for the past two and one-quarter years.
Over the past five and one-quarter years, the Association’s effective tax rate ranged from a tax benefit of 41.74% during 2013 to a tax expense of 36.49% during 2014 and equaled 8.68% during the twelve months ended March 31, 2017. As set forth in the prospectus, the Association’s marginal effective tax rate is 34.0%.
Interest Rate Risk Management
The Association’s balance sheet is liability-sensitive in the short-term (less than one year) and, thus, the net interest margin will typically be adversely affected during periods of rising and higher interest rates. Comparatively, the Association’s net interest margin generally benefits from a declining interest rate environment. As of March 31, 2017, an analysis of the Association’s Economic Value of Equity (“EVE”) indicatedthat a 2.0% instantaneous and
| RP® Financial, LC. | OVERVIEW AND FINANCIAL ANALYSIS
I.12 |
sustained parallel increase in the yield curve would result in a 23.0% decline in EVE (see Exhibit I-7).
The Association pursues a number of strategies to manage interest rate risk, particularly with respect to seeking to limit the repricing mismatch between interest rate sensitive assets and liabilities. The Association manages interest rate risk from the asset side of the balance sheet through maintaining the investment portfolio as available for sale, selling originations of longer term 1-4 family fixed rate loans and diversifying into other types of lending beyond 1-4 family permanent mortgage loans which consist primarily of adjustable rate or shorter term fixed rate loans. As of December 31, 2016, of the Association’s total loans due after December 31, 2017, adjustable rate loans comprised 25.42%% of total loans receivable (see Exhibit I-8). On the liability side of the balance sheet, management of interest rate risk has been pursued through emphasizing growth of lower costing and less interest rate sensitive transaction and savings accounts and utilizing fixed rate FHLB advances with terms of more than one year. Transaction and savings account deposits comprised 46.48% of the Association’s average total deposits during the three months ended March 31, 2017.
The infusion of stock proceeds will serve to further limit the Association’s interest rate risk exposure, as most of the net proceeds will be redeployed into interest-earning assets and the increase in the Association’s capital position will lessen the proportion of interest rate sensitive liabilities funding assets.
Lending Activities and Strategy
Historically, Seneca Federal’s lending activities have emphasized 1-4 family permanent mortgage loans and such loans continue to comprise the largest concentration of the Association’s loan portfolio composition. Pursuant to the Association’s strategic plan, the Association is pursuing a diversified lending strategy emphasizing commercial real estate loans and commercial business loans as the primary areas of targeted loan growth. Other areas of lending diversification for the Association include home equity loans and lines of credit, construction loans and consumer loans. Exhibit I-9 provides historical detail of Seneca Federal’s loan portfolio composition for the past two and one-quarter years and Exhibit I-10 provides the contractual maturity of the Association’s loan portfolio by loan type as of March 31, 2017.
| RP® Financial, LC. | OVERVIEW AND FINANCIAL ANALYSIS
I.13 |
1-4 Family Residential Loans. Seneca Federal offers both fixed rate and ARM 1-4 family permanent mortgage loans with terms of up to 30 years. Loans are generally underwritten to secondary market guidelines, as the Association’s current philosophy has been to sell most originations of conforming fixed rate loans with terms of 20 years or more. Loans are generally sold on a servicing retained basis and without recourse. ARM loans and shorter-term fixed rate loan originations are retained for the Association’s loans portfolio. ARM loans offered by the Association have initial repricing terms of one, five, seven or ten years and then adjust annually thereafter. ARM loans are indexed to the average yield on U.S. Treasury securities, adjusted to a constant maturity of one year, as published weekly by the Federal Reserve Board. As of March 31, 2017, the Association’s outstanding balance of 1-4 family residential mortgage loans totaled $94.3 million or 69.89% of total loans outstanding and included $7.2 million of non-owner occupied loans.
Home Equity Loans and Lines of Credit. The Association’s 1-4 family lending activities include home equity loans and lines of credit, although the Association no longer originates home equity loans. Home equity lines of credit are tied to the prime rate as published inThe Wall Street Journal and are offered for terms of up to a ten year draw period followed by a 15 year repayment period. The Association will originate home equity lines of credit up to a maximum loan-to value (“LTV”) ratio of 80% (or 90% if Seneca Federal holds the first mortgage), inclusive of other liens on the property. As of March 31, 2017, the Association’s outstanding balance of home equity loans and lines of credit totaled $6.0 million or 4.46% of total loans outstanding and included $600,000 of home equity loans.
Construction Loans. The Association’s construction lending activities consist primarily of loans to individuals for the construction of their primary residence. On a more limited basis, construction loans are extended to contractors and builders of single-family homes. Construction loans are offered up to a maximum LTV ratio of 90% of the estimated appraised market value upon completion of the project and provide for the payment of interest only during the construction phase which is typically up to six months. At the end of the construction phase, the loan may convert to a permanent mortgage loan or the loan may be repaid in full. As of March 31, 2017, the Association’s outstanding balance of construction loans equaled $3.5 million or 2.56% of total loans receivable and all such loans were extended to individuals.
Commercial Real Estate Loans. Commercial real estate consist substantially of loans originated by the Association, which are collateralized by properties in the Association’s regional
| RP® Financial, LC. | OVERVIEW AND FINANCIAL ANALYSIS
I.14 |
lending area. Seneca Federal generally originates commercial real estate loans up to a LTV ratio of 80% (75% for non-owner occupied properties) and generally requires a minimum debt-coverage ratio of 1.2 times. Commercial real estate loans are originated with amortization terms of up to 20 years. Loan terms offered on commercial real estate loans generally consist of adjustable rate loans, which are indexed to the 5-year FHLB advance rate. Properties securing the commercial real estate loan portfolio include office buildings, industrial facilities, retail facilities, motels, apartments and other commercial properties. At March 31, 2017, the Association’s largest commercial real estate loan had an outstanding balance of $1.6 million and is secured by a hotel. At March 31, 2017, this loan was performing in accordance with its original terms. As of March 31, 2017, the Association’s outstanding balance of commercial real estate loans totaled $19.8 million equal to 14.70% of total loans outstanding and included $5.4 million of multi-family loans.
Commercial Business Loans. The commercial business loan portfolio is generated through extending loans to businesses operating in the local market area. Expansion of commercial business lending activities is a desired area of loan growth for the Association, pursuant to which the Association is seeking to become a full service community bank to its commercial loan customers through offering a full range of commercial loan products that can be packaged with lower cost commercial deposit products. Commercial business loans are made with either adjustable or fixed rates of interest and are indexed toThe Wall Street Journal prime rate. The commercial business loan portfolio consists substantially of loans secured by business assets such as accounts receivable, inventory, equipment and real estate. At March 31, 2017, the Association’s largest commercial business loan had an outstanding balance of $999,000 and is secured by building lots. At March 31, 2017, this loan was performing in accordance with its original terms. As of March 31, 2017, the Association’s outstanding balance of commercial business loans equaled $8.6 million or 6.35% of total loans receivable.
Consumer Loans. Consumer lending other than home equity loans and lines of credit has been somewhat of a limited area of lending diversification for the Association, with such loans consisting principally of loans extended to existing customers of the Association. The consumer loan portfolio includes loans secured by manufactured homes, deposit accounts, new and used automobiles and unsecured personal loans. As of March 31, 2017, the Association held $2.8 million of consumer loans equal to 2.04% of total loans receivable.
| RP® Financial, LC. | OVERVIEW AND FINANCIAL ANALYSIS
I.15 |
The substantial portion of loans held in the Association’s loan portfolio were originated directory by the Association. The Association generally does not purchase loans from third parties. However, from time to time, the Association has purchased or sold participation interest in loans. Loan participation interests that are purchased by the Association are underwritten in accordance with the Association’s underwriting criteria and procedures. At March 31, 2017, the Association’s loan portfolio included $2.0 million of purchased loan participation interests and no loans for which the Association had sold participation interests.
Asset Quality
Historically, the Association’s lending emphasis on lending in local and familiar markets has generally supported maintenance of relatively favorable credit quality measures. Over the past two and one-quarter years, Seneca Federal’s balance of non-performing assets ranged from a high of $1.9 million or 1.35% of assets at yearend 2015 to a low of $1.1 million or 0.64% of assets at March 31, 2017. As shown in Exhibit I-11, non-performing assets at March 31, 2017 consisted of $948,000 of non-accruing loans and $130,000 of real estate owned. Non-accruing loans held by the Association at March 31, 2017 were concentrated in 1-4 family permanent mortgage loans totaling $929,000.
To track the Association’s asset quality and the adequacy of valuation allowances, the Association has established detailed asset classification policies and procedures which are consistent with regulatory guidelines. Classified assets are reviewed monthly by senior management and quarterly by the Board. Pursuant to these procedures, when needed, the Association establishes additional valuation allowances to cover anticipated losses in classified or non-classified assets. As of March 31, 2017, the Association maintained loan loss allowances of $1.1 million, equal to 0.80% of total loans receivable and 114.45% of non-performing loans.
Funding Composition and Strategy
Deposits have consistently served as the Association’s primary funding source and at March 31, 2017 deposits accounted for 86.30% of Seneca Federal’s combined balance of deposits and borrowings. Exhibit I-12 sets forth the Association’s deposit composition for the past two and one-quarter years and Exhibit I-13 provides the maturity composition of the Association’s jumbo CDs (CD deposits with balances of $100,000 or more) at March 31, 2017. CDs constitute the largest component of the Association’s deposit composition and the
| RP® Financial, LC. | OVERVIEW AND FINANCIAL ANALYSIS
I.16 |
concentration of CDs comprising total deposits has increased during the past two and one-quarter years, as the result of comparatively strong growth of CD deposits relative to growth of transaction and savings account deposits. For the three months ended March 31, 2017, the balance of CDs averaged $61.5 million or 49.23% of average deposits, versus comparable measures of $47.2 million and 45.42% of average deposits for 2015. As of March 31, 2017, jumbo CDs (CD accounts with balances of $100,000 or more) amounted to $42.2 million or 59.99% of total CDs. Jumbo CDs with scheduled maturities of one year or less comprised 50.19% of the Association’s jumbo’s CDs at March 31, 2017. The Association maintained $11.0 million of brokered deposit as of March 31, 2017.
Transaction and savings account deposits in total comprised 50.77% of average total deposits during the three months ended March 31, 2017, as compared to 54.58% of average total deposits during 2015. Savings account deposits comprised the largest concentration of the Association’s core deposits during the three months ended March 31, 2017, averaging $23.3 million or 36.67% of average core deposits.
Borrowings serve as an alternative funding source for the Association to facilitate management of funding costs and interest rate risk Borrowings totaled $21.0 million at March 31, 2017 and consisted entirely of FHLB advances. FHLB advances held by the Association at March 31, 2017 had fixed interest rates with ladder terms out to March 2021 and had a weighted average rate of 2.01%. Exhibit I-14 provides further detail of the Association’s borrowings activities during the past two and one-quarter years.
Financial Services Activities and Subsidiary
Financial Quest, a division of Seneca Federal, offers asset management, financial planning, insurance, annuities and other financial products in partnership with Centera Financial Services, a registered broker dealer. The Association has dedicated investment representatives that evaluates the needs of clients to determine suitable investment and insurance solutions to meet their short and long-term wealth management goals. At March 31, 2017, the Association had $43.0 million of assets held under management. Seneca Savings Agency Services, Inc., a wholly-owned subsidiary of the Association, collects fee income on fixed annuities and life insurance from legacy relationships. The Association is not actively using this subsidiary to generate new business.
| RP® Financial, LC. | OVERVIEW AND FINANCIAL ANALYSIS
I.17 |
Legal Proceedings
The Association is not currently party to any pending legal proceedings that the Association’s management believes would have a material adverse effect on the Association’s financial condition, results of operations or cash flows.
| RP® Financial, LC. | MARKET AREA
II.1 |
II. MARKET AREA ANALYSIS
Introduction
Seneca Federal serves the Syracuse Metropolitan Statistical Area (“MSA”) through the main office in Baldwinsville, New York and two branch offices in North Syracuse and Liverpool. All three offices are located in Onondaga County. Baldwinsville is approximately 20 miles northwest of the city of Syracuse. Exhibit II-1 provides information on the Association’s office properties.
The regional market area has a diversified economy, with education/healthcare/social services, services and wholesale/retail trade constituting the primary sectors of employment. With operations in a metropolitan area, the Association’s competitive environment includes a significant number of thrifts, commercial banks and other financial services companies, some of which have a regional or national presence and are larger than the Association in terms of deposits, loans, scope of operations, and number of branches. These institutions also have greater resources at their disposal than the Association. Within this region, community banking institutions remain a part of the banking industry.
Future business and growth opportunities will be partially influenced by economic and demographic characteristics of the markets served by the Association, particularly the future growth trends of the regional economy, demographic growth trends, and the nature and intensity of the competitive environment for financial institutions. These factors outlined herein have been accounted for in the determination of the Association’s pro forma market value.
National Economic Factors
The business potential of a financial institution is partially dependent on the future operating environment and growth opportunities for the financial services industry and the economy as a whole. Since the end of the “great recession” in 2009, the national economy has recorded modest growth rates, in terms of gross domestic product (“GDP”), ranging from a low of 1.5% in calendar year 2013 to a high of 2.8% in calendar year 2010. GDP growth was 2.6% for calendar years 2014 and 2015, 1.6% for calendar year 2016, and an annualized 0.9% for the three months ended March 31, 2017, indicating positive, yet modest growth for the US economy. As a result of the recession, approximately 8 million jobs were lost as consumers cut back on
| RP® Financial, LC. | MARKET AREA
II.2 |
spending, causing a reduction in the need for many products and services. Total personal wealth declined notably due to the housing crisis and the drop in real estate values. The economy has recorded slow, but steady job growth since reaching a low in early 2010, with approximately 2.7 million jobs added in 2015, 2.2 million jobs added in 2016, and a total of 527,000 jobs created for the three months ended March 31, 2017, or an annualized rate of 2.1 million jobs.
For the year ended December 2016 and the four months ended April 2017, the annualized national inflation rate was 1.3% and 2.5%, respectively, showing that inflation remains under control but has risen in recent periods. Indicating a level of continued improvement, the national unemployment rate equaled 4.1% as of April 2017, lower than the 4.7% rate as of April 2016. Future job growth is uncertain as the economy is approaching a full employment level nationally. The Federal Reserve has indicated that it will continue efforts to stimulate growth in the economy although market interest rates have been raised three times in the last year as a check on the rise in inflation and to avoid an overheating economy. Forecasts indicate modest economic growth through 2017, with GDP increasing by an estimated 2.3% in 2017.
Regarding factors that most directly impactthe banking and financial services industries, the residential real estate industry has recovered from the 2007-2009 housing crisis and recession. Following a relatively slow recovery through early 2012, in recent periods the number of housing foreclosures has remained modest, new and previously-owned home sales have increased, and residential housing prices have continued to trend upward in most metropolitan areas of the country. In certain areas, in particular metropolitan areas, there are supply shortages of housing stock. National home price indices have, to a large extent, recovered from the lows reached in 2009, with the national median home price reaching $236,400 in March 2017, versus $169,000 in March 2009.
According to the March 2017 housing forecast from the Mortgage Bankers Association (the “MBA”), existing home sales are projected to increase by approximately 1.6% and new home sales are expected to increase by 8.6% through the course of 2017. The MBA forecast also showed increases in the median sales prices for existing homes in 2017 and 2018 (5.6% in 2017 and 3.7% in 2018. Total mortgage production is forecasted to decrease in 2017 to $1.567 trillion compared to $1.941 trillion in 2016. The slowdown in 2017 originations is due to a 45% decrease in home refinance mortgage originations, with refinance lending forecasted to total $510 billion in 2017 (reflecting the recent rise in interest rates, with expectations for further increases in market interest rates). Comparatively, home purchase volumes are predicted to increase by 4.2% in
| RP® Financial, LC. | MARKET AREA
II.3 |
2017, with purchase volume forecasted to total $1.057 trillion in 2017. For 2018, refinancing volume is projected to further decline, while home purchase mortgage originations are projected to continue growing.
Based onthe consensus outlook of over 60 economists surveyed by The Wall Street Journal in April 2017, the U.S. economy is poised for stronger growth in 2017, with GDP growth forecasted at 2.2% for the year, along with a tighter job market and expectation of steady wage gains. The forecast reveals the U.S. economy should grow at a faster pace of 2.5% in 2018. Economists expect that the unemployment rate will continue to steadily decline, from 4.7% in December 2016 to 4.2% by December 2018 (although such rate has declined to 4.1% as of April 2017. On average, the economists expect the Federal Reserve to continue raising its target rate during 2017, and forecast an increase in 10-year Treasury yield to 2.79% by the end of 2017; thereafter increasing to 3.29% through December 2018. Inflation pressures were forecasted to remain below 2.2% through the end of 2017, increasing to 2.4% for calendar year 2018. The price of oil was expected to remain relatively stable, reaching $55 a barrel through the end of 2018.
Interest Rate Environment
The Federal Reserve manages interest rates in order to promote economic growth and to avoid inflationary periods. Amid increased indications of the economic downturn developing in 2007, the Fed began reducing market interest rates. The low interest rate environment was maintained as part of a strategy to stimulate the economy by keeping both personal and business borrowing costs as low as possible. The strategy has achieved its goals, as borrowing costs for residential housing have been at historical lows, and the prime rate of interest remains at a low level. Following an approximate 10-year period of historically low interest rates, the Fed has increased the targeted interest rates three times, by a total of 0.75%, through May 2017.
As of May 12, 2017, the bond equivalent yields for U.S. Treasury bonds with terms of one and ten years equaled 1.11% and 2.33%, respectively, versus comparable year ago yields of 0.54% and 1.75%. The overall low interest rates have had an unfavorable impact on the net interest margins of many financial institutions, as they rely on a spread between the yields on longer term assets and the costs of shorter term funding sources. Over the recent past, asset yields have continued to decline, while material reductions in liability costs have ceased, resulting a gradual reduction in yield/cost spreads for many institutions. In addition, institutions who
| RP® Financial, LC. | MARKET AREA
II.4 |
originate substantial volumes of prime-based loans have also given up yield as the prime rate has also remained relatively low. This low interest rate environment, along with continued competition in the industry for quality loans, has placed downward pressure on net interest margins. Historical interest rate trends are presented in Exhibit II-2.
Market Area Demographics
Key demographic and economic indicators for the Association’s market area include population, number of households and household/per capita income levels. Demographic data for Onondaga County, as well as comparative data for the Syracuse MSA, New York and the U.S., is provided in Table 2.1. In general, the demographics for Onondaga County were similar to the demographics for the Syracuse MSA. Onondaga County’s population showed a nominal increase from 2010 to 2017, versus comparable New York and U.S. annual population growth rates of 0.4% and 0.7%, respectively. Age distribution measures reflect that Onondaga County has a somewhat similarly-aged population relative to New York and the U.S. Similar to population growth trends, Onondaga County’s annual rate of household growth lagged the comparable New York and U.S. annual household growth rates over the past seven years. Projected five-year growth rates for Onondaga County showed increases in population and household growth rates, but remained below the comparable projected growth rates for New York and the U.S.
Onondaga County’s 2017 median household income of $56,285 was somewhat below the New York median of $62,222 and slightly below the U.S. median of $57,462. Similarly, per capita and household income distribution measures also generally reflected lower levels of income for Onondaga County relative to the comparable New York measures and were more consistent with the comparable U.S. measures. Over the next five years, Onondaga County is projected to experience slower growth rates in household and per capita income relative to the comparable projected New York and U.S. growth rates.
Market Area Regional Economy
Comparative employment data shown in Table 2.1 shows that employment in education/healthcare/social services constituted the major source of jobs in Onondaga County, as well as for the state of New York. Service jobs followed by wholesale/retail trade employment represented the second and third largest employment sectors in Onondaga County and the state
| RP® Financial, LC. | MARKET AREA
II.5 |
Table 2.1
Seneca Federal Savings and Loan Association
Summary Demographic Data
| | | Year | | | Growth Rate | |
| | | 2010 | | | 2017 | | | 2022 | | | 2010-2017 | | | 2017-2022 | |
| | | | | | | | | | | | (%) | | | (%) | |
| Population (000) | | | | | | | | | | | | | | | | | | | | |
| USA | | | 308,746 | | | | 325,139 | | | | 337,393 | | | | 0.7 | % | | | 0.7 | % |
| New York | | | 19,378 | | | | 19,892 | | | | 20,287 | | | | 0.4 | % | | | 0.4 | % |
| Onondaga, NY | | | 467 | | | | 469 | | | | 473 | | | | 0.0 | % | | | 0.2 | % |
| Syracuse, NY MSA | | | 663 | | | | 659 | | | | 662 | | | | -0.1 | % | | | 0.1 | % |
| | | | | | | | | | | | | | | | | | | | | |
| Households (000) | | | | | | | | | | | | | | | | | | | | |
| USA | | | 116,716 | | | | 123,357 | | | | 128,247 | | | | 0.8 | % | | | 0.8 | % |
| New York | | | 7,318 | | | | 7,568 | | | | 7,745 | | | | 0.5 | % | | | 0.5 | % |
| Onondaga, NY | | | 188 | | | | 190 | | | | 193 | | | | 0.2 | % | | | 0.3 | % |
| Syracuse, NY MSA | | | 262 | | | | 264 | | | | 267 | | | | 0.1 | % | | | 0.2 | % |
| | | | | | | | | | | | | | | | | | | | | |
| Median Household Income ($) | | | | | | | | | | | | | | | | | | | | |
| USA | | | NA | | | | 57,462 | | | | 61,642 | | | | NA | | | | 1.4 | % |
| New York | | | NA | | | | 62,222 | | | | 65,981 | | | | NA | | | | 1.2 | % |
| Onondaga, NY | | | NA | | | | 56,285 | | | | 58,466 | | | | NA | | | | 0.8 | % |
| Syracuse, NY MSA | | | NA | | | | 55,002 | | | | 57,392 | | | | NA | | | | 0.9 | % |
| | | | | | | | | | | | | | | | | | | | | |
| Per Capita Income ($) | | | | | | | | | | | | | | | | | | | | |
| USA | | | NA | | | | 31,459 | | | | 34,068 | | | | NA | | | | 1.6 | % |
| New York | | | NA | | | | 35,725 | | | | 38,286 | | | | NA | | | | 1.4 | % |
| Onondaga, NY | | | NA | | | | 31,637 | | | | 33,269 | | | | NA | | | | 1.0 | % |
| Syracuse, NY MSA | | | NA | | | | 30,365 | | | | 32,052 | | | | NA | | | | 1.1 | % |
| 2017 Age Distribution (%) | | 0-14 Yrs. | | | 15-34 Yrs. | | | 35-54 Yrs. | | | 55-69 Yrs. | | | 70+ Yrs. | |
| USA | | | 18.8 | | | | 27.1 | | | | 25.7 | | | | 18.1 | | | | 10.3 | |
| New York | | | 17.6 | | | | 27.6 | | | | 26.1 | | | | 18.2 | | | | 10.5 | |
| Onondaga, NY | | | 17.6 | | | | 27.7 | | | | 24.6 | | | | 19.0 | | | | 11.1 | |
| Syracuse, NY MSA | | | 17.3 | | | | 27.7 | | | | 24.6 | | | | 19.4 | | | | 11.0 | |
| | | Less Than | | | $25,000 to | | | $50,000 to | | | | | | | |
| 2017 HH Income Dist. (%) | | 25,000 | | | 50,000 | | | 100,000 | | | $100,000+ | | | | |
| USA | | | 21.9 | | | | 22.9 | | | | 29.5 | | | | 25.7 | | | | | |
| New York | | | 22.1 | | | | 20.2 | | | | 27.6 | | | | 30.1 | | | | | |
| Onondaga, NY | | | 22.7 | | | | 22.7 | | | | 30.9 | | | | 23.7 | | | | | |
| Syracuse, NY MSA | | | 22.6 | | | | 23.7 | | | | 31.2 | | | | 22.5 | | | | | |
Source: SNL Financial
| RP® Financial, LC. | MARKET AREA
II.6 |
of New York. Overall, the market area contains a diverse cross section of employment sectors, which is fairly consistent with the statewide economy.
Table 2.2
Seneca Federal Savaings and Loan Association
Primary Market Area Employment Sectors
(Percent of Labor Force)
| | | | | | Onondaga | |
| Employment Sector | | New York | | | County | |
| | | (%) | | | (%) | |
| | | | | | | |
| Services | | | 26.5 | % | | | 24.2 | % |
| Education,Healthcare, Soc. Serv. | | | 27.4 | % | | | 30.5 | % |
| Wholesale/Retail Trade | | | 13.1 | % | | | 14.7 | % |
| Manufacturing | | | 6.1 | % | | | 7.2 | % |
| Construction | | | 5.6 | % | | | 5.3 | % |
| Finance/Insurance/Real Estate | | | 7.9 | % | | | 6.2 | % |
| Transportation/Utility | | | 5.4 | % | | | 5.1 | % |
| Government | | | 4.4 | % | | | 3.8 | % |
| Information | | | 3.0 | % | | | 2.3 | % |
| Agriculture | | | 0.6 | % | | | 0.7 | % |
| | | | 100.0 | % | | | 100.0 | % |
| | | | | | | | | |
| Source: U.S. Census Bureau | | | | | | | | |
The market area served by the Association has a highly developed and diverse economy, with the presence of Syracuse University serving to attract industries in need of a highly skilled and educated workforce. The largest employers in the Syracuse MSA are concentrated in life sciences, healthcare, service/retail and education. Table 2.3 lists in detail the major employers in the Association’s market area.
Table 2.3
Seneca Federal Savings and Loan Association
Market Area Largest Employers
| Employer | | Industry | | Size | |
| Onondaga County | | | | | | |
| Upstate University Health System | | Life Sciences | | | 9,525 | |
| Syracuse University | | Education | | | 4,621 | |
| St. Joseph's Hospital Health Center | | Health Care | | | 3,745 | |
| Wegmans | | Sevices/Retail | | | 3,713 | |
| Crouse Hospital | | Health Care | | | 2,700 | |
| Loretto | | Life Sciences | | | 2,700 | |
| Lockheed Martin | | Radar & Sensor Devices | | | 2,250 | |
| National Grid | | Finance & Back Office | | | 2,000 | |
| Time Warner Cable | | Finance & Back Office | | | 1,800 | |
| Raymour & Flanigan | | Services/Retail | | | 1,400 | |
| | | | | | | |
| Source: Onondaga Atlas-advertising / Site Selection-Data |
| RP® Financial, LC. | MARKET AREA
II.7 |
Unemployment Trends
Comparative unemployment rates for Onondaga County, as well as for the U.S., New York and the Syracuse MSA, are shown in Table 2.4. The March 2017 unemployment rate for Onondaga County equaled 4.4%, versus 4.4% for the state of New York, 4.6% for the U.S. and 4.9% for the Syracuse MSA. Consistent with U.S. and statewide trends, the March 2017 unemployment rates for Onondaga County and the Syracuse MSA were lower compared to their respective year ago unemployment rates.
Table 2.4
Seneca Federal Savings and Loan Association
Unemployment Trends
| | | Unemployment Rate | | | Net | |
| Region | | March 2016 | | | March 2017 | | | Change | |
| | | | | | | | | | |
| USA | | | 5.1 | % | | | 4.6 | % | | | -0.5 | % |
| New York | | | 5.1 | % | | | 4.4 | % | | | -0.7 | % |
| Onondaga, NY | | | 4.7 | % | | | 4.4 | % | | | -0.3 | % |
| Syracuse, NY | | | 5.2 | % | | | 4.9 | % | | | -0.3 | % |
| | | | | | | | | | | | | |
| Source: SNL Financial, LC. | | | | | | | | | | | | |
Market Area Deposit Characteristics and Competition
The Association’s deposit base is closely tied to the economic fortunes of Onondaga County and, in particular, the areas of Onondaga County that are nearby to one of the Association’s three office locations. Table 2.5 displays deposit market trends from June 30, 2012 through June 30, 2016 for Seneca Federal, as well as for all commercial bank and savings institution branches located in Onondaga County, the Syracuse MSA and the state of New York. Consistent with the state of New York, commercial banks maintained a significantly larger market share of deposits than savings institutions in Onondaga County. For the four year period covered in Table 2.5, savings institutions experienced a decline in deposits and deposit market share in Onondaga County, as well as statewide and in the Syracuse MSA. Overall, from June 30, 2012 to June 30, 2016, bank and thrift deposits increased at an annual rate of 3.2% in Onondaga County.
| RP® Financial, LC. | MARKET AREA
II.8 |
Table 2.5
Seneca Federal Savings and Loan Association
Deposit Summary
| | | As of June 30, | | | | |
| | | 2012 | | | 2016 | | | Deposit | |
| | | | | | Market | | | No. of | | | | | | Market | | | No. of | | | Growth Rate | |
| | | Deposits | | | Share | | | Branches | | | Deposits | | | Share | | | Branches | | | 2012-2016 | |
| | | (Dollars in Thousands) | | | (%) | |
| | | | | | | | | | | | | | | | | | | | | | |
| New York | | $ | 1,043,365,000 | | | | 100.0 | % | | | 5,433 | | | $ | 1,496,993,000 | | | | 100.0 | % | | | 5,167 | | | | 9.4 | % |
| Commercial Banks | | | 969,334,000 | | | | 92.9 | % | | | 4,484 | | | | 1,426,672,000 | | | | 95.3 | % | | | 4,406 | | | | 10.1 | % |
| Savings Institutions | | | 74,031,000 | | | | 7.1 | % | | | 949 | | | | 70,321,000 | | | | 4.7 | % | | | 761 | | | | -1.3 | % |
| | | | | | | | | | | | | | | | | | | | | | | | | | | | | |
| Syracuse, NY MSA | | $ | 10,691,931 | | | | 100.0 | % | | | 196 | | | $ | 12,242,699 | | | | 100.0 | % | | | 170 | | | | 3.4 | % |
| Commercial Banks | | | 8,583,045 | | | | 80.3 | % | | | 167 | | | | 11,459,748 | | | | 93.6 | % | | | 159 | | | | 7.5 | % |
| Savings Institutions | | | 2,108,886 | | | | 19.7 | % | | | 29 | | | | 782,951 | | | | 6.4 | % | | | 11 | | | | -21.9 | % |
| Seneca Federal Savings & Loan Association | | | 117,215 | | | | 1.1 | % | | | 3 | | | | 115,502 | | | | 0.9 | % | | | 3 | | | | -0.4 | % |
| | | | | | | | | | | | | | | | | | | | | | | | | | | | | |
| Onondaga | | $ | 8,509,116 | | | | 100.0 | % | | | 139 | | | $ | 9,637,623 | | | | 100.0 | % | | | 126 | | | | 3.2 | % |
| Commercial Banks | | | 7,401,336 | | | | 87.0 | % | | | 129 | | | | 9,052,829 | | | | 93.9 | % | | | 120 | | | | 5.2 | % |
| Savings Institutions | | | 1,107,780 | | | | 13.0 | % | | | 10 | | | | 584,794 | | | | 6.1 | % | | | 6 | | | | -14.8 | % |
| Seneca Federal Savings & Loan Association | | | 117,215 | | | | 1.4 | % | | | 3 | | | | 115,502 | | | | 1.2 | % | | | 3 | | | | -0.4 | % |
| | | | | | | | | | | | | | | | | | | | | | | | | | | | | |
| Source: FDIC. | | | | | | | | | | | | | | | | | | | | | | | | | | | | |
Based on June 30, 2016 deposit data, the Association maintained a 1.2% deposit market share of bank and thrift deposits in Onondaga County. During the four year period covered in Table 2.5, the Association’s deposits declined at a 0.4% annual rate which translated in a slight decline in deposit market share.
As implied by the Association’s very low market share of deposits, competition among financial institutions in Onondaga County is significant. Financial institution competitors in Onondaga County include other locally-based thrifts and banks, as well as regional, super-regional and money center banks. With regard to lending competition, the Association encounters the most significant competition from the same institutions providing deposit services. In addition, the Association competes with mortgage companies and independent mortgage brokers in originating mortgage loans.
Table 2.6 lists the Association’s largest competitors in Onondaga County, based on deposit market share. As of June 30, 2016, the Association’s market share of deposits represented the 11thlargest market share of bank and thrift deposits in Onondaga County.
| RP® Financial, LC. | MARKET AREA
II.9 |
Table 2.6
Seneca Federal Savings and Loan Association
Market Area Deposit Competitors - As of June 30, 2016
| | | | | Market Share | | | | |
| Location | | Name | | Share | | | Rank | |
| | | | | (%) | | | | |
| | | | | | | | | |
| Onondaga County | | M&T Bank Corp (NY) | | | 30.86 | | | | | |
| | | KeyCorp (OH) | | | 21.19 | | | | | |
| | | Bank of America Corp. (NC) | | | 11.90 | | | | | |
| | | JPMorgan Chase & Co. (NY) | | | 9.34 | | | | | |
| | | Solvay Bank Corp. (NY) | | | 7.77 | | | | | |
| | | Seneca Federal Savings & Loan Association | | | 1.20 | | | | 11 out of 15 | |
Source: SNL Financial, LC.
| RP® Financial, LC. | PEER GROUP ANALYSIS
III.1 |
III. PEER GROUP ANALYSIS
This chapter presents an analysis of Seneca Federal’s operations versus a group of comparable savings institutions (the "Peer Group") selected from the universe of all publicly-traded savings institutions in a manner consistent with the regulatory valuation guidelines. The basis of the pro forma market valuation of Seneca Federal is derived from the pricing ratios of the Peer Group institutions, incorporating valuation adjustments for key differences in relation to the Peer Group. Since no Peer Group can be exactly comparable to Seneca Federal, key areas examined for differences are: financial condition; profitability, growth and viability of earnings; asset growth; primary market area; dividends; liquidity of the shares; marketing of the issue; management; and effect of government regulations and regulatory reform.
Peer Group Selection
The Peer Group selection process is governed by the general parameters set forth in the regulatory valuation guidelines. Accordingly, the Peer Group is comprised of only those publicly-traded savings institutions whose common stock is either listed on the NYSE or NASDAQ, since their stock trading activity is regularly reported and generally more frequent than non-publicly traded and closely-held institutions. Institutions that are not listed on the NYSE or NASDAQ are inappropriate, since the trading activity for thinly-traded or closely-held stocks are typically highly irregular in terms of frequency and price and thus may not be a reliable indicator of market value. We have also excluded from the Peer Group those companies under acquisition or subject to rumored acquisition and recent conversions, since their pricing ratios are subject to unusual distortion and/or have limited trading history. A recent listing of the universe of all publicly-traded savings institutions is included as Exhibit III-1.
Ideally, the Peer Group, which must have at least 10 members to comply with the regulatory valuation guidelines, should be comprised of publicly-traded MHCs with comparable resources, strategies and financial characteristics as Seneca Federal. However, there are currently only nine publicly-traded MHCs. Accordingly, in deriving a Peer Group comprised of institutions with relatively comparable characteristics as Seneca Federal, the companies selected for Seneca Federal’s Peer Group are all fully-converted companies. The valuation adjustments applied in the Chapter IV analysis will take into consideration differences between the Association’s MHC form of ownership relative to the fully-converted Peer Group companies.
| RP® Financial, LC. | PEER GROUP ANALYSIS
III.2 |
Also included in Chapter IV is a pricing analysis of the publicly-traded MHCs on a fully-converted basis.
From the universe of publicly-traded thrifts, we selected ten institutions with characteristics similar to those of Seneca Federal. In the selection process, we applied three “screens” to the universe of all public companies that were eligible for consideration:
| o | Screen #1 Mid-Atlantic institutions with assets less than $525 million, tangible equity-to-assets ratios of greater than 7.5% and positive reported and core earnings. Four companies met the criteria for Screen #1 and three were included in the Peer Group: Hamilton Bancorp, Inc. of Maryland, MSB Financial Corp. of New Jersey and WVS Financial Corp. of Pennsylvania. FSB Bancorp, Inc. of New York was excluded due its recent conversion status, as the result of completing its conversion in July 2016. Exhibit III-2 provides financial and public market pricing characteristics of all publicly-traded Mid-Atlantic thrifts. |
| o | Screen #2 New England institutions with assets less than $525 million, tangible equity-to-assets ratios of greater than 7.5% and positive reported and core earnings. Three companies met the criteria for Screen #2 and two were included in the Peer Group: Melrose Bancorp, Inc. of Massachusetts and PB Bancorp, Inc. of Connecticut. Randolph Bancorp, Inc. of Massachusetts was excluded due to its recent conversion status, as the result of completing its conversion in July 2016. Exhibit III-3 provides financial and public market pricing characteristics of all publicly-traded New England thrifts. |
| o | Screen #3 Midwest institutions with assets less than $525 million, tangible equity-to-assets ratios of greater than 7.5% and positive reported and core earnings. Six companies met the criteria for Screen #3 and five were included in the Peer Group: Equitable Financial Corp. of Nebraska, Jacksonville Bancorp, Inc. of Illinois, Poage Bankshares, Inc. of Kentucky, Wayne Savings Bancshares, Inc. of Ohio and Wolverine Bancorp, Inc. of Michigan. WCF Bancorp, Inc. of Iowa was excluded due to its recent conversion status, as the result of completing its conversion in July 2016. Exhibit III-4 provides financial and public market pricing characteristics of all publicly-traded Midwest thrifts. |
Table 3.1 shows the general characteristics of each of the ten Peer Group companies and Exhibit III-5 provides summary demographic and deposit market share data for the primary market areas served by each of the Peer Group companies. While there are expectedly some differences between the Peer Group companies and Seneca Federal, we believe that the Peer Group companies, on average, provide a good basis for valuation subject to valuation adjustments. The following sections present a comparison of Seneca Federal’s financial condition, income and expense trends, loan composition, interest rate risk and credit risk versus the Peer Group as of the most recent publicly available date. Comparative data for all publicly-traded thrifts has been included in the Chapter III tables as well.
| RP® Financial, LC. | PEER GROUP ANALYSIS
III.3 |
Table 3.1
Peer Group of Publicly-Traded Thrifts
As of March 31, 2017 or the Most Recent Date Available.
| | | | | | | | | | | | | | | | | | | | | | As of | |
| | | | | | | | | | | | | | | | | | | | | | 5/12/2017 | |
| | | | | | | | | | | | | Total | | | | | Fiscal | | Conv. | | Stock | | | Market | |
| Ticker | | Financial Institution | | Exchange | | Region | | City | | State | | Assets | | | Offices | | Mth End | | Date | | Price | | | Value | |
| | | | | | | | | | | | | ($Mil) | | | | | | | | | ($) | | | ($Mil) | |
| | | | | | | | | | | | | | | | | | | | | | | | | | |
| EQFN | | Equitable Financial Corp. | | NASDAQ | | MW | | Grand Island | | NE | | | 241 | | | 6 | | Jun | | 11/9/2005 | | | 10.25 | | | | 35 | |
| HBK | | Hamilton Bancorp, Inc. | | NASDAQ | | MA | | Towson | | MD | | | 500 | (1) | | 7 | | Mar | | 10/10/2012 | | | 15.16 | | | | 52 | |
| JXSB | | Jacksonville Bancorp, Inc. | | NASDAQ | | MW | | Jacksonville | | IL | | | 318 | | | 6 | | Dec | | 7/15/2010 | | | 30.50 | | | | 55 | |
| MELR | | Melrose Bancorp, Inc. | | NASDAQ | | NE | | Melrose | | MA | | | 269 | | | 1 | | Dec | | 10/22/2014 | | | 16.80 | | | | 44 | |
| MSBF | | MSB Financial Corp. | | NASDAQ | | MA | | Millington | | NJ | | | 482 | | | 5 | | Dec | | 1/5/2007 | | | 17.25 | | | | 99 | |
| PBBI | | PB Bancorp, Inc. | | NASDAQ | | NE | | Putnam | | CT | | | 511 | | | 8 | | Jun | | 10/5/2004 | | | 10.40 | | | | 81 | |
| PBSK | | Poage Bankshares, Inc. | | NASDAQ | | MW | | Ashland | | KY | | | 461 | | | 10 | | Dec | | 9/13/2011 | | | 19.41 | | | | 71 | |
| WAYN | | Wayne Savings Bancshares, Inc. | | NASDAQ | | MW | | Wooster | | OH | | | 449 | | | 11 | | Dec | | 1/9/2003 | | | 17.71 | | | | 49 | |
| WBKC | | Wolverine Bancorp, Inc. | | NASDAQ | | MW | | Midland | | MI | | | 379 | | | 3 | | Dec | | 1/20/2011 | | | 31.29 | | | | 66 | |
| WVFC | | WVS Financial Corp. | | NASDAQ | | MA | | Pittsburgh | | PA | | | 345 | | | 6 | | Jun | | 11/29/1993 | | | 15.15 | | | | 31 | |
Source: SNL Financial, LC.
| RP® Financial, LC. | PEER GROUP ANALYSIS
III.4 |
In addition to the selection criteria used to identify the Peer Group companies, a summary description of the key comparable characteristics of each of the Peer Group companies relative to Seneca Federal’s characteristics is detailed below.
| o | Equitable Financial Corp. of Nebraska. Comparable due to similar asset size, similar concentration of deposits funding assets, similar return on average assets ratio, similar net interest income to average assets ratio, similar impact of loan loss provisions on earnings, relatively high operating expense ratio and lending diversification emphasis on commercial real estate loans. |
| o | Hamilton Bancorp, Inc. of Maryland. Comparable due to similar concentration of deposits funding assets, limited earnings contribution from sources of non-interest operating income, lending diversification emphasis on commercial real estate loans and relatively favorable credit quality measures. |
| o | Jacksonville Bancorp, Inc. of Illinois. Similar concentration of deposits funding assets, similar net interest income to average assets ratio, relatively high operating expense ratio and relatively favorable credit quality measures. |
| o | Melrose Bancorp, Inc. of Massachusetts. Comparable due to similar interest-earning asset composition, similar concentration of deposits funding assets, limited earnings contribution from sources of non-interest operating income and relatively favorable credit quality measures. |
| o | MSB Financial Corp. of New Jersey. Comparable due to similar interest-earning asset composition, similar return on average assets ratio, similar impact of loan loss provisions on earnings, limited earnings contribution from sources of non-interest operating income and lending diversification emphasis on commercial real estate loans. |
| o | PB Bancorp, Inc. of Connecticut. Comparable due to similar return on average assets ratio, limited earnings contribution from sources of non-interest operating income, lending diversification emphasis on commercial real estate loans and relatively favorable credit quality measures. |
| o | Poage Bankshares, Inc. of Kentucky. Comparable due to similar concentration of deposits funding assets, similar return on average assets ratio, relatively high operating expense ratio and lending diversification emphasis on commercial real estate loans. |
| o | Wayne Savings Bancshares, Inc. of Ohio. Similar concentration of deposits funding assets, similar return on average assets ratio, limited earnings contribution from sources of non-interest operating income, lending diversification emphasis on commercial real estate loans and relatively favorable credit quality measures. |
| o | Wolverine Bancorp, Inc. of Michigan. Comparable due to same size of branch network, similar interest-earning asset composition, similar net interest income to average assets ratio, limited earnings contribution from sources of non-interest operating income and lending diversification emphasis on commercial real estate loans. |
| o | WVS Financial Corp. of Pennsylvania. Comparable due to similar return on average assets ratio, limited earnings contribution from sources of non-interest operating income and relatively favorable credit quality measures. |
| RP® Financial, LC. | PEER GROUP ANALYSIS
III.5 |
In aggregate, the Peer Group companies maintained a higher level of tangible equity than the industry average (13.58% of assets versus 11.92% for all public companies), generated lower earnings as a percent of average assets (0.51% core ROAA versus 0.74% for all public companies), and earned a lower ROE (3.60% core ROE versus 6.12% for all public companies). Overall, the Peer Group's average P/TB ratio and average core P/E multiple were below and approximately the same compared to the respective averages for all publicly-traded thrifts.
| | | All | | | | |
| | | Publicly-Traded | | | Peer Group | |
| | | | | | | |
| Financial Characteristics (Averages) | | | | | | | | |
| Assets ($Mil) | | $ | 3,327 | | | $ | 395 | |
| Market capitalization ($Mil) | | $ | 547 | | | $ | 58 | |
| Tangible equity/assets (%) | | | 11.92 | % | | | 13.58 | % |
| Core return on average assets (%) | | | 0.74 | | | | 0.51 | |
| Core return on average equity (%) | | | 6.12 | | | | 3.60 | |
| | | | | | | | | |
| Pricing Ratios (Averages)(1) | | | | | | | | |
| Core price/earnings (x) | | | 20.83 | x | | | 20.80 | x |
| Price/tangible book (%) | | | 145.09 | % | | | 108.93 | % |
| Price/assets (%) | | | 15.96 | | | | 14.78 | |
| (1) | Based on market prices as of May 12, 2017. |
Ideally, the Peer Group companies would be comparable to Seneca Federal in terms of all of the selection criteria, but the universe of publicly-traded thrifts does not provide for an appropriate number of such companies. However, in general, the companies selected for the Peer Group were fairly comparable to Seneca Federal, as will be highlighted in the following comparative analysis.
Financial Condition
Table 3.2 shows comparative balance sheet measures for Seneca Federal and the Peer Group, reflecting the expected similarities and some differences given the selection procedures outlined above. The Association’s and the Peer Group's ratios reflect balances as of March 31, 2017. Seneca Federal’s equity-to-assets ratio of 6.57% was well below the Peer Group's average net worth ratio of 14.03%. With the infusion of the net proceeds, the Association’s pro forma equity-to-assets ratio will remain below the Peer Group’s equity-to-assets ratio. Tangible equity-to-assets ratios for the Association and the Peer Group equaled 6.57% and 13.58%,
| RP® Financial, LC. | PEER GROUP ANALYSIS
III.6 |
Table 3.2
Balance Sheet Composition and Growth Rates
Comparable Institution Analysis
As of March 31, 2017 or the Most Recent Date Available.
| | | | | | | | | Balance Sheet as a Percent of Assets | | | Balance Sheet Annual Growth Rates | | | Regulatory Capital | |
| | | | | | | | | Cash & | | | MBS & | | | | | | Net | | | | | | Borrowed | | | Sub. | | | Total | | | Goodwill | | | Tangible | | | | | | MBS, Cash & | | | | | | | | | Borrows. | | | Total | | | Tangible | | | Tier 1 | | | Tier 1 | | | Risk-Based | |
| | | | | | | | | Equivalents | | | Invest | | | BOLI | | | Loans (1) | | | Deposits | | | Funds | | | Debt | | | Equity | | | & Intang | | | Equity | | | Assets | | | Investments | | | Loans | | | Deposits | | | &Sub debt | | | Equity | | | Equity | | | Leverage | | | Risk-Based | | | Capital | |
| | | | | | | | | | | | | | | | | | | | | | | | | | | | | | | | | | | | | | | | | | | | | | | | | | | | | | | | | | | | | | | | | | | |
| Seneca FS&LA | | | | | | | | | | | | | | | | | | | | | | | | | | | | | | | | | | | | | | | | | | | | | | | | | | | | | | | | | | | | | | | | | | | | | | | | | | | | | | | | | | | | |
| March 31, 2017 | | | | | | | 3.46 | % | | | 12.50 | % | | | 1.29 | % | | | 80.34 | % | | | 79.09 | % | | | 12.55 | % | | | 0.00 | % | | | 6.57 | % | | | 0.00 | % | | | 6.57 | % | | | 16.88 | % | | | -3.60 | % | | | 21.26 | % | | | 16.85 | % | | | 26.94 | % | | | 6.96 | % | | | 6.96 | % | | | 8.29 | % | | | 14.11 | % | | | 15.23 | % |
| | | | | | | | | | | | | | | | | | | | | | | | | | | | | | | | | | | | | | | | | | | | | | | | | | | | | | | | | | | | | | | | | | | | | | | | | | | | | | | | | | | | | | | |
| All Thrifts | | | | | | | | | | | | | | | | | | | | | | | | | | | | | | | | | | | | | | | | | | | | | | | | | | | | | | | | | | | | | | | | | | | | | | | | | | | | | | | | | | | | |
| Averages | | | | | | | 6.55 | % | | | 14.30 | % | | | 1.60 | % | | | 72.26 | % | | | 76.33 | % | | | 9.94 | % | | | 0.42 | % | | | 12.49 | % | | | 0.53 | % | | | 11.92 | % | | | 12.16 | % | | | 7.28 | % | | | 14.66 | % | | | 13.29 | % | | | 7.08 | % | | | 13.20 | % | | | 10.46 | % | | | 11.95 | % | | | 17.86 | % | | | 18.92 | % |
| Medians | | | | | | | 5.11 | % | | | 12.45 | % | | | 1.64 | % | | | 74.84 | % | | | 77.65 | % | | | 8.18 | % | | | 0.00 | % | | | 11.24 | % | | | 0.00 | % | | | 10.89 | % | | | 6.83 | % | | | 2.72 | % | | | 9.70 | % | | | 7.22 | % | | | 0.64 | % | | | 2.59 | % | | | 2.15 | % | | | 10.35 | % | | | 14.72 | % | | | 16.13 | % |
| | | | | | | | | | | | | | | | | | | | | | | | | | | | | | | | | | | | | | | | | | | | | | | | | | | | | | | | | | | | | | | | | | | | | | | | | | | | | | | | | | | | | | | |
| Comparable Group | | | | | | | | | | | | | | | | | | | | | | | | | | | | | | | | | | | | | | | | | | | | | | | | | | | | | | | | | | | | | | | | | | | | | | | | | | | | | | | | | | | | |
| Averages | | | | | | | 4.66 | % | | | 21.97 | % | | | 1.85 | % | | | 68.59 | % | | | 75.10 | % | | | 9.87 | % | | | 0.06 | % | | | 14.03 | % | | | 0.45 | % | | | 13.58 | % | | | 9.81 | % | | | -11.61 | % | | | 19.09 | % | | | 11.21 | % | | | 14.58 | % | | | 6.26 | % | | | 6.85 | % | | | 12.08 | % | | | 17.72 | % | | | 18.68 | % |
| Medians | | | | | | | 3.42 | % | | | 15.93 | % | | | 2.20 | % | | | 73.98 | % | | | 80.70 | % | | | 5.44 | % | | | 0.00 | % | | | 14.94 | % | | | 0.00 | % | | | 14.89 | % | | | 4.00 | % | | | -15.07 | % | | | 18.66 | % | | | 4.80 | % | | | -3.57 | % | | | 0.92 | % | | | 0.76 | % | | | 12.70 | % | | | 18.32 | % | | | 19.57 | % |
| | | | | | | | | | | | | | | | | | | | | | | | | | | | | | | | | | | | | | | | | | | | | | | | | | | | | | | | | | | | | | | | | | | | | | | | | | | | | | | | | | | | | | | |
| Comparable Group | | | | | | | | | | | | | | | | | | | | | | | | | | | | | | | | | | | | | | | | | | | | | | | | | | | | | | | | | | | | | | | | | | | | | | | | | | | | | | | | | | | | |
| EQFN | | Equitable Financial Corp. | | | | NE | | | 3.07 | % | | | 1.00 | % | | | 0.00 | % | | | 91.58 | % | | | 84.10 | % | | | 0.00 | % | | | 0.00 | % | | | 14.85 | % | | | 0.00 | % | | | 14.85 | % | | | 2.90 | % | | | -70.30 | % | | | 15.64 | % | | | 3.21 | % | | | NA | | | | 1.01 | % | | | 0.69 | % | | | 11.83 | % | | | 13.00 | % | | | 14.25 | % |
| HBK | | Hamilton Bancorp, Inc. | | (2) | | MD | | | 3.76 | % | | | 21.69 | % | | | 3.63 | % | | | 65.89 | % | | | 81.69 | % | | | 5.24 | % | | | 0.00 | % | | | 12.14 | % | | | 1.88 | % | | | 10.26 | % | | | 35.73 | % | | | 13.71 | % | | | 45.42 | % | | | 41.27 | % | | | 55.48 | % | | | 0.05 | % | | | -4.19 | % | | | 7.65 | % | | | 11.71 | % | | | 12.31 | % |
| JXSB | | Jacksonville Bancorp, Inc. | | | | IL | | | 2.96 | % | | | 34.38 | % | | | 2.30 | % | | | 56.32 | % | | | 81.46 | % | | | 1.04 | % | | | 0.00 | % | | | 14.94 | % | | | 0.86 | % | | | 14.08 | % | | | 5.11 | % | | | 26.50 | % | | | -5.29 | % | | | 6.04 | % | | | -16.29 | % | | | 1.49 | % | | | 2.04 | % | | | 13.16 | % | | | 18.96 | % | | | 20.21 | % |
| MELR | | Melrose Bancorp, Inc. | | (2) | | MA | | | 5.46 | % | | | 12.21 | % | | | 2.19 | % | | | 79.35 | % | | | 79.94 | % | | | 3.72 | % | | | 0.00 | % | | | 16.12 | % | | | 0.00 | % | | | 16.12 | % | | | 16.44 | % | | | -25.03 | % | | | 32.98 | % | | | 16.39 | % | | | NA | | | | -4.92 | % | | | -4.92 | % | | | 13.61 | % | | | 21.04 | % | | | 22.14 | % |
| MSBF | | MSB Financial Corp. | | | | NJ | | | 2.33 | % | | | 9.41 | % | | | 2.88 | % | | | 82.68 | % | | | 73.65 | % | | | 10.20 | % | | | 0.00 | % | | | 15.37 | % | | | 0.00 | % | | | 15.37 | % | | | 26.77 | % | | | -36.77 | % | | | 47.18 | % | | | 28.21 | % | | | 116.87 | % | | | -4.16 | % | | | -3.26 | % | | | 13.52 | % | | | 17.68 | % | | | 18.93 | % |
| PBBI | | PB Bancorp, Inc. | | | | CT | | | 0.98 | % | | | 35.94 | % | | | 2.44 | % | | | 57.16 | % | | | 70.53 | % | | | 12.14 | % | | | 0.00 | % | | | 16.44 | % | | | 1.35 | % | | | 15.09 | % | | | 2.78 | % | | | -18.50 | % | | | 22.72 | % | | | 1.83 | % | | | 13.00 | % | | | 66.03 | % | | | 76.25 | % | | | 12.24 | % | | | 20.87 | % | | | 21.72 | % |
| PBSK | | Poage Bankshares, Inc. | | | | KY | | | 7.35 | % | | | 13.56 | % | | | 1.55 | % | | | 73.49 | % | | | 81.81 | % | | | 1.91 | % | | | 0.62 | % | | | 14.94 | % | | | 0.00 | % | | | 14.94 | % | | | 5.65 | % | | | 15.26 | % | | | 4.11 | % | | | 9.32 | % | | | -34.68 | % | | | -3.57 | % | | | -3.57 | % | | | 13.85 | % | | | 20.64 | % | | | 21.43 | % |
| WAYN | | Wayne Savings Bancshares, Inc. | | | | OH | | | 2.51 | % | | | 18.29 | % | | | 2.21 | % | | | 74.47 | % | | | 84.32 | % | | | 5.63 | % | | | 0.00 | % | | | 9.23 | % | | | 0.38 | % | | | 8.84 | % | | | 2.52 | % | | | -15.07 | % | | | 9.13 | % | | | 3.47 | % | | | -7.27 | % | | | 2.81 | % | | | 1.78 | % | | | 8.74 | % | | | 13.26 | % | | | 14.25 | % |
| WBKC | | Wolverine Bancorp, Inc. | | | | MI | | | 14.30 | % | | | 0.71 | % | | | 0.00 | % | | | 83.29 | % | | | 71.47 | % | | | 11.07 | % | | | 0.00 | % | | | 16.47 | % | | | 0.00 | % | | | 16.47 | % | | | -1.71 | % | | | 5.73 | % | | | -2.71 | % | | | -1.20 | % | | | -10.64 | % | | | 0.82 | % | | | 0.82 | % | | | 17.02 | % | | | 22.50 | % | | | 23.78 | % |
| WVFC | | WVS Financial Corp. | | | | PA | | | 3.82 | % | | | 72.49 | % | | | 1.31 | % | | | 21.72 | % | | | 42.07 | % | | | 47.73 | % | | | 0.00 | % | | | 9.77 | % | | | 0.00 | % | | | 9.77 | % | | | 1.92 | % | | | NA | | | | 21.67 | % | | | 3.56 | % | | | 0.13 | % | | | 3.08 | % | | | 2.84 | % | | | 9.20 | % | | | 17.55 | % | | | 17.79 | % |
| (1) | Includes loans held for sale. |
| (2) | As of December 31, 2016 or the latest date available. |
| Source: | SNL Financial, LC. and RP® Financial, LC. calculations. The information provided in this table has been obtained from sources we believe are reliable, but we cannot guarantee the accuracy or completeness of such information. |
Copyright (c) 2017 by RP® Financial, LC.
| RP® Financial, LC. | PEER GROUP ANALYSIS
III.7 |
respectively. The increase in Seneca Federal’s pro forma capital position will be favorable from a risk perspective and in terms of future earnings potential that could be realized through leverage and lower funding costs. At the same time, the Association’s higher pro forma capitalization will initially depress return on equity. Both Seneca Federal’s and the Peer Group's capital ratios reflected capital surpluses with respect to the regulatory capital requirements.
The interest-earning asset compositions for the Association and the Peer Group were somewhat similar, with loans constituting the bulk of interest-earning assets for both Seneca Federal and the Peer Group. The Association’s loans-to-assets ratio of 80.34% was higher than the comparable Peer Group ratio of 68.59%. Comparatively, the Association’s cash and investments-to-assets ratio of 15.96% was lower than the comparable Peer Group ratio of 26.63%. Overall, Seneca Federal’s interest-earning assets amounted to 96.30% of assets, which was slightly higher than the comparable Peer Group ratio of 95.22%. The Peer Group’s non-interest earning assets included bank-owned life insurance (“BOLI”) equal to 1.85% of assets and goodwill/intangibles equal to 0.45% of assets, while the Association maintained BOLI equal to 1.29% of assets and a zero balance of goodwill/intangibles.
Seneca Federal’s funding composition reflected a funding strategy that was somewhat similar to that of the Peer Group's funding composition. The Association’s deposits equaled 79.09% of assets, which was above the Peer Group’s ratio of 75.10%. Likewise, the Association maintained a higher level of borrowings to fund assets, as indicated by borrowings-to-assets ratios of 12.55% and 9.93% for Seneca Federal and the Peer Group, respectively. Total interest-bearing liabilities maintained by the Association and the Peer Group, as a percent of assets, equaled 91.64% and 85.03%, respectively.
A key measure of balance sheet strength for a thrift institution is its interest-earnings assets/interest-bearing liabilities (“IEA/IBL”) ratio. Presently, the Association’s IEA/IBL ratio is lower than the Peer Group’s ratio, based on IEA/IBL ratios of 105.09% and 111.98%, respectively. The additional capital realized from stock proceeds should serve to provide Seneca Federal with an IEA/IBL ratio that is more comparable to the Peer Group’s ratio, as the increase in capital provided by the infusion of stock proceeds will serve to lower the level of interest-bearing liabilities funding assets and will be primarily deployed into interest-earning assets.
The growth rate section of Table 3.2 shows annual growth rates for key balance sheet items. Seneca Federal’s and the Peer Group’s growth rates are based on annualized growth for
| RP® Financial, LC. | PEER GROUP ANALYSIS
III.8 |
the fifteen months and the twelve months ended March 31, 2017, respectively. Seneca Federal recorded a 16.88% increase in assets, versus asset growth of 9.81% recorded by the Peer Group. Asset growth for Seneca Federal was driven by a 21.26% increase in loans, which was in part funded by a 3.60% reduction in cash and investments. Comparatively, asset growth for the Peer Group was driven by a 19.09% increase in loans, which was in part funded by an 11.61% reduction in cash and investments.
Asset growth for Seneca Federal was funded by a 16.85% increase in deposits and a 26.94% increase in borrowings. Asset growth for the Peer Group was funded through deposit growth of 11.21% and a 14.58% increase in borrowings. The Association’s tangible capital increased 6.96%, which was largely attributable to retention of earnings. Comparatively, the Peer Group’s tangible capital increased by 6.85%, in which the Peer Group’s growth rate was largely attributable to PB Bancorp’s relatively high capital growth rate realized in connection with its second-step conversion offering. The Association’s post-conversion capital growth rate will initially be constrained by maintenance of a higher pro forma capital position. Additionally, implementation of any stock repurchases and dividend payments, pursuant to regulatory limitations and guidelines, could also slow the Association’s capital growth rate in the longer term following the stock offering.
Income and Expense Components
Table 3.3 displays statements of operations for the Association and the Peer Group. The Association’s and the Peer Group’s ratios are based on earnings for the twelve months ended March 31, 2017. Seneca Federal and the Peer Group reported net income to average assets ratios of 0.39% and 0.53%, respectively. The Peer Group’s higher return was realized through a higher ratio for non-interest operating income, a lower ratio for operating expenses and a lower ratio for loan loss provisions, which were partially offset by the Association’s higher ratio for net interest income, higher ratio for non-operating gains and lower effective rate.
The Association’s higher net interest income to average assets ratio was realized through a higher interest income ratio, which was partially offset by the Peer Group’s lower interest expense ratio. The Association’s higher interest income ratio was supported by maintaining a higher overall yield earned on interest-earning assets (4.10% versus 3.90% for the Peer Group), as well as maintaining a slightly higher concentration of interest-earning assets as a percent of assets. Likewise, the Peer Group’s lower interest expense ratio was supported
| RP® Financial, LC. | PEER GROUP ANALYSIS
III.9 |
Table 3.3
Income as Percent of Average Assets and Yields, Costs, Spreads
Comparable Institution Analysis
For the 12 Months Ended March 31, 2017 or the Most Recent 12 Months Available
| | | | | | | | | | | | Net Interest Income | | | | | | Non-Interest Income | | | | | | Non-Op. Items | | | | | | Yields, Costs, and Spreads | | | | | | | |
| | | | | | | | | | | | | | | | | | | | | Loss | | | NII | | | Gain | | | Other | | | Total | | | | | | | | | Provision | | | | | | | | | | | | MEMO: | | | MEMO: | |
| | | | | | | | | Net | | | | | | | | | | | | Provis. | | | After | | | on Sale of | | | Non-Int | | | Non-Int | | | Net Gains/ | | | Extrao. | | | for | | | Yield | | | Cost | | | Yld-Cost | | | Assets/ | | | Effective | |
| | | | | | | | | Income | | | Income | | | Expense | | | NII | | | on IEA | | | Provis. | | | Loans | | | Income | | | Expense | | | Losses (1) | | | Items | | | Taxes | | | On IEA | | | Of IBL | | | Spread | | | FTE Emp. | | | Tax Rate | |
| | | | | | | | | (%) | | | | | | | | | | | | | | | | | | | | | | | | | | | | | | | | | | | | | | | | | | | | | | | | | |
| Seneca FS&LA | | | | | | | | | | | | | | | | | | | | | | | | | | | | | | | | | | | | | | | | | | | | | | | | | | | | | | | | | | | | | | | | | | | | | | | | |
| March 31, 2017 | | | | | | | 0.39 | % | | | 3.94 | % | | | 0.71 | % | | | 3.24 | % | | | 0.18 | % | | | 3.06 | % | | | 0.07 | % | | | 0.28 | % | | | 3.14 | % | | | 0.16 | % | | | 0.00 | % | | | 0.04 | % | | | 4.10 | % | | | 0.87 | % | | | 3.23 | % | | $ | 4,290 | | | | 8.68 | % |
| | | | | | | | | | | | | | | | | | | | | | | | | | | | | | | | | | | | | | | | | | | | | | | | | | | | | | | | | | | | | | | | | | | | | | | | | | | |
| All Thrifts | | | | | | | | | | | | | | | | | | | | | | | | | | | | | | | | | | | | | | | | | | | | | | | | | | | | | | | | | | | | | | | | | | | | | | | | |
| Averages | | | | | | | 0.64 | % | | | 3.64 | % | | | 0.60 | % | | | 3.06 | % | | | 0.09 | % | | | 0.27 | % | | | 0.36 | % | | | 0.51 | % | | | 2.93 | % | | | -0.02 | % | | | 0.00 | % | | | 0.22 | % | | | 3.86 | % | | | 0.80 | % | | | 2.99 | % | | $ | 7,867 | | | | 25.78 | % |
| Medians | | | | | | | 0.60 | % | | | 3.61 | % | | | 0.57 | % | | | 3.04 | % | | | 0.06 | % | | | 0.00 | % | | | 0.03 | % | | | 0.39 | % | | | 2.83 | % | | | 0.00 | % | | | 0.00 | % | | | 0.25 | % | | | 3.79 | % | | | 0.80 | % | | | 2.81 | % | | $ | 5,606 | | | | 32.46 | % |
| | | | | | | | | | | | | | | | | | | | | | | | | | | | | | | | | | | | | | | | | | | | | | | | | | | | | | | | | | | | | | | | | | | | | | | | | | | |
| Comparable Group | | | | | | | | | | | | | | | | | | | | | | | | | | | | | | | | | | | | | | | | | | | | | | | | | | | | | | | | | | | | | | | | | | | | | | | | |
| Averages | | | | | | | 0.53 | % | | | 3.44 | % | | | 0.57 | % | | | 2.87 | % | | | 0.10 | % | | | 0.00 | % | | | 0.07 | % | | | 0.42 | % | | | 2.53 | % | | | 0.05 | % | | | 0.00 | % | | | 0.25 | % | | | 3.90 | % | | | 0.72 | % | | | 3.18 | % | | $ | 5,215 | | | | 29.66 | % |
| Medians | | | | | | | 0.47 | % | | | 3.55 | % | | | 0.57 | % | | | 3.03 | % | | | 0.11 | % | | | 0.00 | % | | | 0.03 | % | | | 0.33 | % | | | 2.52 | % | | | 0.00 | % | | | 0.00 | % | | | 0.23 | % | | | 3.83 | % | | | 0.71 | % | | | 3.20 | % | | $ | 4,678 | | | | 30.97 | % |
| | | | | | | | | | | | | | | | | | | | | | | | | | | | | | | | | | | | | | | | | | | | | | | | | | | | | | | | | | | | | | | | | | | | | | | | | | | |
| Comparable Group | | | | | | | | | | | | | | | | | | | | | | | | | | | | | | | | | | | | | | | | | | | | | | | | | | | | | | | | | | | | | | | | | | | | | | | | |
| EQFN | | Equitable Financial Corp. | | | | NE | | | 0.50 | % | | | 3.87 | % | | | 0.47 | % | | | 3.40 | % | | | 0.22 | % | | | 0.00 | % | | | 0.34 | % | | | 0.78 | % | | | 3.51 | % | | | -0.02 | % | | | 0.00 | % | | | 0.27 | % | | | 4.10 | % | | | 0.67 | % | | | 3.43 | % | | $ | 3,438 | | | | 35.10 | % |
| HBK | | Hamilton Bancorp, Inc. | | (2) | | MD | | | 0.03 | % | | | 3.31 | % | | | 0.57 | % | | | 2.74 | % | | | 0.27 | % | | | 0.00 | % | | | 0.00 | % | | | 0.22 | % | | | 2.55 | % | | | -0.10 | % | | | 0.00 | % | | | 0.01 | % | | | 3.84 | % | | | 0.45 | % | | | 3.39 | % | | $ | 3,567 | | | | 16.33 | % |
| JXSB | | Jacksonville Bancorp, Inc. | | | | IL | | | 0.94 | % | | | 3.59 | % | | | 0.33 | % | | | 3.25 | % | | | 0.04 | % | | | 0.00 | % | | | 0.10 | % | | | 1.14 | % | | | 3.31 | % | | | 0.14 | % | | | 0.00 | % | | | 0.33 | % | | | 3.35 | % | | | 0.89 | % | | | 2.46 | % | | $ | 9,051 | | | | 26.12 | % |
| MELR | | Melrose Bancorp, Inc. | | (2) | | MA | | | 0.56 | % | | | 2.93 | % | | | 0.65 | % | | | 2.28 | % | | | 0.12 | % | | | 0.00 | % | | | 0.00 | % | | | 0.09 | % | | | 1.77 | % | | | 0.40 | % | | | 0.00 | % | | | 0.32 | % | | | 3.82 | % | | | 0.79 | % | | | 3.03 | % | | $ | 7,413 | | | | 35.89 | % |
| MSBF | | MSB Financial Corp. | | | | NJ | | | 0.37 | % | | | 3.59 | % | | | 0.57 | % | | | 3.01 | % | | | 0.20 | % | | | 0.00 | % | | | 0.00 | % | | | 0.26 | % | | | 2.49 | % | | | 0.00 | % | | | 0.00 | % | | | 0.21 | % | | | 4.24 | % | | | 0.49 | % | | | 3.75 | % | | $ | 4,728 | | | | 36.67 | % |
| PBBI | | PB Bancorp, Inc. | | | | CT | | | 0.37 | % | | | 2.91 | % | | | 0.63 | % | | | 2.29 | % | | | 0.10 | % | | | 0.00 | % | | | 0.01 | % | | | 0.46 | % | | | 2.25 | % | | | 0.10 | % | | | 0.00 | % | | | 0.14 | % | | | 4.49 | % | | | 0.74 | % | | | 3.75 | % | | $ | 4,040 | | | | 27.27 | % |
| PBSK | | Poage Bankshares, Inc. | | | | KY | | | 0.39 | % | | | 4.24 | % | | | 0.56 | % | | | 3.68 | % | | | 0.27 | % | | | 0.00 | % | | | 0.13 | % | | | 0.54 | % | | | 3.55 | % | | | 0.00 | % | | | 0.00 | % | | | 0.13 | % | | | 3.46 | % | | | 0.51 | % | | | 2.95 | % | | $ | 2,288 | | | | 25.43 | % |
| WAYN | | Wayne Savings Bancshares, Inc. | | | | OH | | | 0.47 | % | | | 3.50 | % | | | 0.47 | % | | | 3.04 | % | | | 0.10 | % | | | 0.00 | % | | | 0.05 | % | | | 0.41 | % | | | 2.77 | % | | | 0.00 | % | | | 0.00 | % | | | 0.15 | % | | | 3.74 | % | | | 0.58 | % | | | 3.16 | % | | $ | 4,628 | | | | 23.69 | % |
| WBKC | | Wolverine Bancorp, Inc. | | | | MI | | | 1.21 | % | | | 4.32 | % | | | 1.00 | % | | | 3.32 | % | | | -0.35 | % | | | 0.00 | % | | | 0.10 | % | | | 0.14 | % | | | 2.04 | % | | | 0.00 | % | | | 0.00 | % | | | 0.66 | % | | | 3.39 | % | | | 0.75 | % | | | 2.64 | % | | $ | 5,692 | | | | 35.40 | % |
| WVFC | | WVS Financial Corp. | | | | PA | | | 0.48 | % | | | 2.17 | % | | | 0.49 | % | | | 1.68 | % | | | 0.01 | % | | | 0.00 | % | | | 0.00 | % | | | 0.15 | % | | | 1.09 | % | | | 0.00 | % | | | 0.00 | % | | | 0.25 | % | | | 4.53 | % | | | 1.30 | % | | | 3.23 | % | | $ | 7,304 | | | | 34.67 | % |
| (1) | Net gains/losses includes gain/loss on sale of securities and nonrecurring income and expense. |
| (2) | For the 12 months ended December, 2016 or the latest date available. |
| Source: | SNL Financial, LC. and RP® Financial, LC. calculations. The information provided in this table has been obtained from sources we believe are reliable, but we cannot guarantee the accuracy or completeness of such information. |
Copyright (c) 2017 by RP® Financial, LC.
| RP® Financial, LC. | PEER GROUP ANALYSIS
III.10 |
by a lower cost of funds (0.72% versus 0.87% for the Association), as well as maintaining a lower ratio of interest-bearing liabilities funding assets. Overall, Seneca Federal and the Peer Group reported net interest income to average assets ratios of 3.24% and 2.87%, respectively.
In another key area of core earnings strength, the Association maintained a significantly higher level of operating expenses than the Peer Group. For the period covered in Table 3.3, the Association and the Peer Group reported operating expense to average assets ratios of 3.14% and 2.53%, respectively. The Association’s higher operating expense ratio was consistent with the comparatively higher number of employees maintained relative to its asset size. Assets per full time equivalent employee equaled $4.290 million for the Association, versus $5.215 million for the Peer Group.
When viewed together, net interest income and operating expenses provide considerable insight into a thrift's earnings strength, since those sources of income and expenses are typically the most prominent components of earnings and are generally more predictable than losses and gains realized from the sale of assets or other non-recurring activities. In this regard, as measured by their expense coverage ratios (net interest income divided by operating expenses), the Association’s earnings were less favorable than the Peer Group’s. Expense coverage ratios for Seneca Federal and the Peer Group equaled 1.03x and 1.13x, respectively.
Sources of non-interest operating income provided a larger contribution to the Peer Group’s earnings, with such income amounting to 0.35% and 0.49% of Seneca Federal’s and the Peer Group’s average assets, respectively. Taking non-interest operating income into account in comparing the Association’s and the Peer Group's earnings, Seneca Federal’s efficiency ratio (operating expenses, as a percent of the sum of non-interest operating income and net interest income) of 87.47% was less favorable than the Peer Group's efficiency ratio of 75.30%.
Loan loss provisions had a larger impact on the Association’s earnings, with loan loss provisions established by the Association equaling 0.18% of average assets. Comparatively, the Peer Group recorded loan loss provisions equal to 0.10% of average assets.
Net non-operating gains equaled 0.16% of average assets for the Association and 0.05% of average assets for the Peer Group. Typically, gains and losses generated from the sale of assets and other non-operating activities are viewed as earnings with a relatively high degree of volatility, particularly to the extent that such gains and losses result from the sale of
| RP® Financial, LC. | PEER GROUP ANALYSIS
III.11 |
investments or other assets that are not considered to be part of an institution’s core operations. Extraordinary items were not a factor in either the Association’s or the Peer Group's earnings.
Taxes had a less significant impact on the Association’s earnings, as the Association and the Peer Group posted effective tax rates of 8.68% and 29.66%, respectively. As indicated in the prospectus, the Association’s effective marginal tax rate is equal to 34.0%.
Loan Composition
Table 3.4 presents data related to the Association’s and the Peer Group’s loan portfolio compositions (including the investment in mortgage-backed securities). The Association’s loan portfolio composition reflected a higher combined concentration of 1-4 family permanent mortgage loans and mortgage-backed securities in comparison to the Peer Group (62.01% of assets versus 42.54% for the Peer Group), as the Association’s higher concentration of 1-4 family loans was only partially offset by the Peer Group’s slightly higher concentration of mortgage-backed securities. Loan servicing intangibles constituted a modest balance sheet item for the Peer Group, versus a zero balance maintained by the Association.
Overall, diversification into higher risk and higher yielding types of lending was more significant for the Peer Group, which was primarily attributable to the Peer Group’s higher concentration of commercial real estate loans (16.21% of assets versus 8.60% for the Association). The Peer Group also maintained slightly higher concentrations of construction/land loans, multi-family loans and commercial business loans, while the Association maintained a slightly higher concentrations of consumer loans. In total, construction/land, commercial real estate, multi-family, commercial business and consumer loans comprised 20.68% and 30.87% of the Association’s and the Peer Group’s assets, respectively. Overall, the Association’s asset composition provided for a lower risk weighted assets-to-assets ratio of 57.74%, versus a comparable Peer Group ratio of 68.84%.
Interest Rate Risk
Table 3.5 reflects various key ratios highlighting the relative interest rate risk exposure of the Association versus the Peer Group. In terms of balance sheet composition, Seneca Federal’s interest rate risk characteristics were considered to be less favorable than the comparable measures for the Peer Group. Most notably, the Association’s tangible equity-to-
| RP® Financial, LC. | PEER GROUP ANALYSIS
III.12 |
| Table 3.4 |
| Loan Portfolio Composition and Related Information |
| Comparable Institution Analysis |
| | | | | Portfolio Composition as a Percent of Assets | | | | | | | |
| | | | | | | | 1-4 | | | Constr. | | | Multi- | | | | | | Commerc. | | | | | | RWA/ | | | Servicing | |
| | | | | MBS | | | Family | | | & Land | | | Family | | | Comm RE | | | Business | | | Consumer | | | Assets | | | Assets | |
| | | | | (%) | | | (%) | | | (%) | | | (%) | | | (%) | | | (%) | | | (%) | | | (%) | | | ($000) | |
| Seneca FS&LA | | | | | | | | | | | | | | | | | | | | | | | | | | | | | | | | | | | | | | |
| March 31, 2017 | | | | | 5.65 | % | | | 56.36 | % | | | 2.06 | % | | | 3.25 | % | | | 8.60 | % | | | 5.12 | % | | | 1.65 | % | | | 57.74 | % | | $ | 0 | |
| | | | | | | | | | | | | | | | | | | | | | | | | | | | | | | | | | | | | | | |
| All Public Thrifts | | | | | | | | | | | | | | | | | | | | | | | | | | | | | | | | | | | | | | |
| Averages | | | | | 8.58 | % | | | 40.79 | % | | | 3.08 | % | | | 3.87 | % | | | 11.22 | % | | | 4.60 | % | | | 2.31 | % | | | 60.39 | % | | $ | 3,117 | |
| Medians | | | | | 4.39 | % | | | 41.30 | % | | | 2.10 | % | | | 1.50 | % | | | 9.08 | % | | | 3.94 | % | | | 0.50 | % | | | 60.93 | % | | $ | 0 | |
| | | | | | | | | | | | | | | | | | | | | | | | | | | | | | | | | | | | | | | |
| Comparable Group | | | | | | | | | | | | | | | | | | | | | | | | | | | | | | | | | | | | | | |
| Averages | | | | | 7.10 | % | | | 35.44 | % | | | 3.34 | % | | | 4.05 | % | | | 16.21 | % | | | 6.13 | % | | | 1.14 | % | | | 68.84 | % | | $ | 228 | |
| Medians | | | | | 2.65 | % | | | 40.02 | % | | | 2.86 | % | | | 2.36 | % | | | 16.10 | % | | | 4.89 | % | | | 0.27 | % | | | 66.04 | % | | $ | 77 | |
| | | | | | | | | | | | | | | | | | | | | | | | | | | | | | | | | | | | | | | |
| Comparable Group | | | | | | | | | | | | | | | | | | | | | | | | | | | | | | | | | | | | | | |
| Equitable Financial Corp. | | NE | | | 0.26 | % | | | 21.76 | % | | | 10.01 | % | | | 3.19 | % | | | 26.86 | % | | | 16.15 | % | | | 1.56 | % | | | 91.23 | % | | $ | 810 | |
| Hamilton Bancorp, Inc. | | MD | | | 15.21 | % | | | 39.62 | % | | | 2.75 | % | | | 1.90 | % | | | 17.46 | % | | | 4.28 | % | | | 0.44 | % | | | 64.80 | % | | $ | 0 | |
| Jacksonville Bancorp, Inc. | | IL | | | 16.72 | % | | | 17.59 | % | | | 2.97 | % | | | 1.87 | % | | | 7.60 | % | | | 10.32 | % | | | 4.60 | % | | | 66.68 | % | | $ | 555 | |
| Melrose Bancorp, Inc. | | MA | | | 0.00 | % | | | 69.40 | % | | | 3.60 | % | | | 3.53 | % | | | 4.54 | % | | | 0.00 | % | | | 0.05 | % | | | 63.88 | % | | $ | 0 | |
| MSB Financial Corp. | | NJ | | | 5.04 | % | | | 40.41 | % | | | 3.47 | % | | | 8.12 | % | | | 21.62 | % | | | 9.94 | % | | | 0.08 | % | | | 81.23 | % | | $ | 0 | |
| PB Bancorp, Inc. | | CT | | | 27.57 | % | | | 43.18 | % | | | 1.24 | % | | | 1.05 | % | | | 10.53 | % | | | 2.47 | % | | | 0.14 | % | | | 63.61 | % | | $ | 99 | |
| Poage Bankshares, Inc. | | KY | | | 6.24 | % | | | 40.54 | % | | | 1.97 | % | | | 1.55 | % | | | 16.35 | % | | | 8.36 | % | | | 3.96 | % | | | 66.31 | % | | $ | 344 | |
| Wayne Savings Bancshares, Inc. | | OH | | | 0.00 | % | | | 42.76 | % | | | 1.57 | % | | | 2.81 | % | | | 15.86 | % | | | 5.49 | % | | | 0.31 | % | | | 65.77 | % | | $ | 421 | |
| Wolverine Bancorp, Inc. | | MI | | | 0.00 | % | | | 20.34 | % | | | 4.74 | % | | | 15.42 | % | | | 40.64 | % | | | 4.00 | % | | | 0.24 | % | | | 76.10 | % | | $ | 54 | |
| WVS Financial Corp. | | PA | | | 0.00 | % | | | 18.77 | % | | | 1.06 | % | | | 1.08 | % | | | 0.63 | % | | | 0.26 | % | | | 0.06 | % | | | 48.82 | % | | $ | 0 | |
| (1) | As of December 31, 2016 or the latest date available. |
Note: Bank level data
| Source: | SNL Financial LC. and RP® Financial, LC. calculations. The information provided in this table has been obtained from sources we believe are reilable, but we cannot guarantee the accuracy or completeness of such information. |
Copyright (c) 2017 by RP® Financial, LC.
| RP® Financial, LC. | PEER GROUP ANALYSIS
III.13 |
Table 3.5
Interest Rate Risk Measures and Net Interest Income Volatility
Comparable Institution Analysis
As of March 31, 2017 or the Most Recent Date Available.
| | | | | | | | | Balance Sheet Measures | | | | | | | | | | | | | | | | | | | |
| | | | | | | | | Tangible | | | | | | Non-Earn. | | | Quarterly Change in Net Interest Income | |
| | | | | | | | | Equity/ | | | | | | Assets/ | | | | | | | | | | | | | | | | | | | |
| | | | | | | Assets | | | IEA/IBL | | | Assets | | | 3/31/2017 | | | 12/31/2016 | | | 9/30/2016 | | | 6/30/2016 | | | 3/31/2016 | | | 12/31/2015 | |
| | | | | | | | | (%) | | | (%) | | | (%) | | | (change in net interest income is annualized in basis points) | |
| Seneca FS&LA | | | | | | | | | | | | | | | | | | | | | | | | | | | | | | | | | | | | | | | | |
| March 31, 2017 | | | | | | | 6.6 | % | | | 105.1 | % | | | 3.7 | % | | | 1 | | | | -16 | | | | 18 | | | | -25 | | | | 1 | | | | -5 | |
| | | | | | | | | | | | | | | | | | | | | | | | | | | | | | | | | | | | | | | | | | | |
| All Public Thrifts | | | | | | | | | | | | | | | | | | | | | | | | | | | | | | | | | | | | | | | | |
| Average | | | | | | | | | 12.0 | % | | | 124.9 | % | | | 7.2 | % | | | -1 | | | | -1 | | | | -1 | | | | 1 | | | | -3 | | | | 0 | |
| Median | | GA | | | | | | | 11.1 | % | | | 122.4 | % | | | 7.0 | % | | | 0 | | | | -1 | | | | 1 | | | | -1 | | | | -2 | | | | 0 | |
| | | | | | | | | | | | | | | | | | | | | | | | | | | | | | | | | | | | | | | | | | | |
| Comparable Group | | | | | | | | | | | | | | | | | | | | | | | | | | | | | | | | | | | | | | | | |
| Average | | | | | | | | | 14.4 | % | | | 107.4 | % | | | 6.9 | % | | | 4 | | | | -6 | | | | 6 | | | | 2 | | | | -8 | | | | 2 | |
| Median | | | | | | | | | 15.0 | % | | | 107.6 | % | | | 7.6 | % | | | 3 | | | | 2 | | | | 5 | | | | 1 | | | | 2 | | | | 3 | |
| | | | | | | | | | | | | | | | | | | | | | | | | | | | | | | | | | | | | | | | | | | |
| Comparable Group | | | | | | | | | | | | | | | | | | | | | | | | | | | | | | | | | | | | | | | | |
| EQFN | | Equitable Financial Corp. | | | | NE | | | 14.8 | % | | | 113.7 | % | | | 4.4 | % | | | 0 | | | | 3 | | | | 18 | | | | 17 | | | | -20 | | | | -26 | |
| HBK | | Hamilton Bancorp, Inc. | | (1) | | MD | | | 10.3 | % | | | 105.1 | % | | | 8.7 | % | | | NA | | | | 10 | | | | 4 | | | | 1 | | | | -29 | | | | 21 | |
| JXSB | | Jacksonville Bancorp, Inc. | | | | IL | | | 14.1 | % | | | 113.5 | % | | | 6.3 | % | | | 9 | | | | -12 | | | | -18 | | | | -12 | | | | 7 | | | | 13 | |
| MELR | | Melrose Bancorp, Inc. | | (1) | | MA | | | 16.1 | % | | | 116.0 | % | | | 3.0 | % | | | NA | | | | 6 | | | | 6 | | | | -3 | | | | 6 | | | | 2 | |
| MSBF | | MSB Financial Corp. | | | | NJ | | | 15.4 | % | | | 112.6 | % | | | 5.6 | % | | | 11 | | | | 13 | | | | -14 | | | | 5 | | | | 18 | | | | 6 | |
| PBBI | | PB Bancorp, Inc. | | | | CT | | | 15.1 | % | | | 113.8 | % | | | 5.9 | % | | | 3 | | | | 6 | | | | 6 | | | | 6 | | | | -1 | | | | 0 | |
| PBSK | | Poage Bankshares, Inc. | | | | KY | | | 17.2 | % | | | 111.9 | % | | | 5.6 | % | | | -7 | | | | -15 | | | | 0 | | | | -11 | | | | -40 | | | | 36 | |
| WAYN | | Wayne Savings Bancshares, Inc. | | | | OH | | | 8.8 | % | | | 105.9 | % | | | 4.7 | % | | | 8 | | | | -3 | | | | 9 | | | | -12 | | | | 8 | | | | 5 | |
| WBKC | | Wolverine Bancorp, Inc. | | | | MI | | | 22.9 | % | | | 119.1 | % | | | 1.7 | % | | | 2 | | | | -71 | | | | 45 | | | | 26 | | | | -31 | | | | -31 | |
| WVFC | | WVS Financial Corp. | | | | PA | | | 9.8 | % | | | 109.2 | % | | | 2.0 | % | | | 4 | | | | 1 | | | | 2 | | | | 2 | | | | 6 | | | | -3 | |
NA=Change is greater than 100 basis points during the quarter.
(1) As of December 31, 2016 or the latest date available.
| Source: | SNL Financial LC. and RP® Financial, LC. calculations. The information provided in this table has been obtained from sources we believe are reliable, but we cannot guarantee the accuracy or completeness of such information. |
Copyright (c) 2017 by RP® Financial, LC.
| RP® Financial, LC. | PEER GROUP ANALYSIS
III.14 |
assets ratio and IEA/IBL ratio were lower than the comparable Peer Group ratios. However, the Association maintained a slight balance sheet interest rate risk advantage with respect to its lower ratio of non-interest earning assets as a percent of assets. On a pro forma basis, the infusion of stock proceeds should serve to provide the Association with more comparable balance sheet interest rate risk characteristics as maintained by the Peer Group, as the result of the increases that will be realized in the Association’s equity-to-assets and IEA/IBL ratios following the infusion of stock proceeds.
To analyze interest rate risk associated with the net interest margin, we reviewed quarterly changes in net interest income as a percent of average assets for Seneca Federal and the Peer Group. In general, the comparative fluctuations in the Association’s and the Peer Group’s net interest income ratios implied that the interest rate risk associated with the Association’s net interest margin was greater than the Peer Group’s implied net interest margin interest rate risk, based on the interest rate environment that prevailed during the period covered in Table 3.5. The stability of the Association’s net interest margin should be enhanced by the infusion of stock proceeds, as interest rate sensitive liabilities will be funding a lower portion of Seneca Federal’s assets and the proceeds will be substantially deployed into interest-earning assets.
Credit Risk
Overall, based on a comparison of credit risk measures, the Association’s implied credit risk exposure was viewed to be lower relative to the Peer Group’s credit risk exposure. As shown in Table 3.6, the Association’s ratios for non-performing/assets and non-performing loans/loans equaled 0.64% and 0.70%, respectively, versus comparable measures of 1.32% and 1.65% for the Peer Group. The Association’s and Peer Group’s loss reserves as a percent of non-performing loans equaled 114.45% and 87.89%, respectively. Loss reserves maintained as percent of loans receivable equaled 0.80% for the Association, versus 1.11% for the Peer Group. Net loan charge-offs were a larger factor for the Association, as net loan charge-offs for the Association equaled 0.29% loans. Comparatively, the Peer Group recorded net charge-offs equal to 0.12% of loans.
| RP® Financial, LC. | PEER GROUP ANALYSIS
III.15 |
Table 3.6
Credit Risk Measures and Related Information
Comparable Institution Analysis
As of March 31, 2017 or the Most Recent Date Available.
| | | | | | | | NPAs & | | | Adj NPAs & | | | | | | | | | | | | Rsrves/ | | | | | | | |
| | | | | REO/ | | | 90+Del/ | | | 90+Del/ | | | NPLs/ | | | Rsrves/ | | | Rsrves/ | | | NPAs & | | | Net Loan | | | NLCs/ | |
| | | | | Assets | | | Assets (1) | | | Assets (2) | | | Loans (3) | | | Loans HFI | | | NPLs (3) | | | 90+Del (1) | | | Chargeoffs (4) | | | Loans | |
| | | | | (%) | | | (%) | | | (%) | | | (%) | | | (%) | | | (%) | | | (%) | | | ($000) | | | (%) | |
| Seneca FS&LA | | | | | | | | | | | | | | | | | | | | | | | | | | | | | | | | | | | | | | |
| March 31, 2017 | | | | | 0.08 | % | | | 0.64 | % | | | 0.64 | % | | | 0.70 | % | | | 0.80 | % | | | 114.45 | % | | | 100.65 | % | | $ | 393 | | | | 0.29 | % |
| | | | | | | | | | | | | | | | | | | | | | | | | | | | | | | | | | | | | | | |
| All Public Thrifts | | | | | | | | | | | | | | | | | | | | | | | | | | | | | | | | | | | | | | |
| Averages | | | | | 0.19 | % | | | 1.42 | % | | | 0.85 | % | | | 1.75 | % | | | 1.06 | % | | | 121.27 | % | | | 100.77 | % | | $ | 5,975 | | | | 0.11 | % |
| Medians | | | | | 0.02 | % | | | 0.91 | % | | | 0.56 | % | | | 1.14 | % | | | 0.93 | % | | | 76.79 | % | | | 62.05 | % | | $ | 51 | | | | 0.03 | % |
| | | | | | | | | | | | | | | | | | | | | | | | | | | | | | | | | | | | | | | |
| Comparable Group | | | | | | | | | | | | | | | | | | | | | | | | | | | | | | | | | | | | | | |
| Averages | | | | | 0.08 | % | | | 1.32 | % | | | 0.83 | % | | | 1.65 | % | | | 1.11 | % | | | 87.89 | % | | | 84.69 | % | | $ | 397 | | | | 0.12 | % |
| Medians | | | | | 0.03 | % | | | 1.17 | % | | | 0.85 | % | | | 1.69 | % | | | 0.90 | % | | | 68.44 | % | | | 67.08 | % | | $ | 20 | | | | 0.01 | % |
| | | | | | | | | | | | | | | | | | | | | | | | | | | | | | | | | | | | | | | |
| Comparable Group | | | | | | | | | | | | | | | | | | | | | | | | | | | | | | | | | | | | | | |
| Equitable Financial Corp. | | NE | | | 0.09 | % | | | 2.26 | % | | | 1.13 | % | | | 2.32 | % | | | 1.48 | % | | | 63.36 | % | | | 60.76 | % | | $ | 21 | | | | 0.01 | % |
| Hamilton Bancorp, Inc. | | MD | | | 0.10 | % | | | 0.93 | % | | | 0.55 | % | | | 1.24 | % | | | 0.65 | % | | | 52.16 | % | | | 46.39 | % | | $ | 2,910 | | | | 0.90 | % |
| Jacksonville Bancorp, Inc. | | IL | | | 0.06 | % | | | 1.09 | % | | | 0.56 | % | | | 1.80 | % | | | 1.67 | % | | | 92.70 | % | | | 87.51 | % | | $ | 19 | | | | 0.01 | % |
| Melrose Bancorp, Inc. | | MA | | | 0.00 | % | | | 0.19 | % | | | 0.19 | % | | | 0.24 | % | | | 0.39 | % | | | 166.67 | % | | | 166.67 | % | | $ | 0 | | | | 0.00 | % |
| MSB Financial Corp. | | NJ | | | 0.00 | % | | | 3.07 | % | | | 1.54 | % | | | 3.66 | % | | | 1.15 | % | | | 31.39 | % | | | 31.32 | % | | $ | -99 | | | | -0.03 | % |
| PB Bancorp, Inc. | | CT | | | 0.32 | % | | | 1.25 | % | | | 1.22 | % | | | 1.58 | % | | | 0.90 | % | | | 57.20 | % | | | 42.44 | % | | $ | 106 | | | | 0.04 | % |
| Poage Bankshares, Inc. | | KY | | | 0.19 | % | | | 1.82 | % | | | 1.34 | % | | | 2.20 | % | | | 0.72 | % | | | 32.81 | % | | | 29.43 | % | | $ | 889 | | | | 0.26 | % |
| Wayne Savings Bancshares, Inc. | | OH | | | 0.00 | % | | | 0.92 | % | | | 0.39 | % | | | 1.23 | % | | | 0.90 | % | | | 73.51 | % | | | 73.40 | % | | $ | 195 | | | | 0.06 | % |
| Wolverine Bancorp, Inc. | | MI | | | 0.00 | % | | | 1.60 | % | | | 1.31 | % | | | 1.87 | % | | | 2.69 | % | | | 144.20 | % | | | 144.01 | % | | $ | -67 | | | | -0.02 | % |
| WVS Financial Corp. | | PA | | | 0.00 | % | | | 0.07 | % | | | 0.07 | % | | | 0.33 | % | | | 0.54 | % | | | 164.92 | % | | | 164.92 | % | | $ | 0 | | | | 0.00 | % |
(1) NPAs are defined as nonaccrual loans, performing TDRs, and OREO.
(2) Adjusted NPAs are defined as nonaccrual loans and OREO (performing TDRs are excluded).
(3) NPLs are defined as nonaccrual loans and performing TDRs.
(4) Net loan chargeoffs are shown on a last twelve month basis.
| Source: | SNL Financial, LC and RP® Financial, LC. calculations. The information provided in this table has been obrained from sources we believe are reliable, but we cannot guarantee the accuracy or completeness of such information. |
Copyright (c) 2017 by RP® Financial, LC.
| RP® Financial, LC. | PEER GROUP ANALYSIS
III.16 |
Summary
Based on the above analysis, RP Financial concluded that the Peer Group forms a reasonable basis for determining the pro forma market value of the Association. Such general characteristics as asset size, capital position, interest-earning asset composition, funding composition, core earnings measures, loan composition, credit quality and exposure to interest rate risk all tend to support the reasonability of the Peer Group from a financial standpoint. Those areas where differences exist will be addressed in the form of valuation adjustments to the extent necessary.
| RP® Financial, LC. | VALUATION ANALYSIS
IV.1 |
IV. VALUATION ANALYSIS
Introduction
This chapter presents the valuation analysis and methodology prepared pursuant to the regulatory guidelines, and valuation adjustments and assumptions used to determine the estimated pro forma market value of the common stock to be issued in conjunction with the Association’s minority stock offering.
Appraisal Guidelines
The federal regulatory appraisal guidelines required by the OCC, FRB, the FDIC and state banking agencies specify the pro forma market value methodology for estimating the pro forma market value of an institution. Pursuant to this methodology: (1) a peer group of comparable publicly-traded institutions is selected; (2) a financial and operational comparison of the subject company to the peer group is conducted to discern key differences; and (3) a valuation analysis in which the pro forma market value of the subject company is determined based on the market pricing of the peer group as of the date of valuation, incorporating valuation adjustments for key differences. In addition, the pricing characteristics of recent conversions, both at conversion and in the aftermarket, must be considered. Given the unique differences in the pricing characteristics of publicly-traded MHCs relative to fully-converted thrift stocks, we have also reviewed the pricing characteristics of publicly-traded MHCs on a fully-converted basis.
RP Financial Approach to the Valuation
The valuation analysis herein complies with such regulatory approval guidelines. Accordingly, the valuation incorporates a detailed analysis based on the Peer Group, discussed in Chapter III, which constitutes "fundamental analysis" techniques. Additionally, the valuation incorporates a "technical analysis" of recently completed conversions, including closing pricing and aftermarket trading of such offerings. It should be noted that these valuation analyses cannot possibly fully account for all the market forces which impact trading activity and pricing characteristics of a stock on a given day.
| RP® Financial, LC. | VALUATION ANALYSIS
IV.2 |
The pro forma market value determined herein is a preliminary value for the Company’s to-be-issued stock. Throughout the stock issuance process, RP Financial will: (1) review changes in the Association’s operations and financial condition; (2) monitor the Association’s operations and financial condition relative to the Peer Group to identify any fundamental changes; (3) monitor the external factors affecting value including, but not limited to, local and national economic conditions, interest rates, and the stock market environment, including the market for thrift stocks; and (4) monitor pending conversion offerings, both regionally and nationally. If material changes should occur prior to the close of the offering, RP Financial will evaluate if updated valuation reports should be prepared reflecting such changes and their related impact on value, if any. RP Financial will also prepare a final valuation update at the closing of the offering to determine if the prepared valuation analysis and resulting range of value continues to be appropriate.
The appraised value determined herein is based on the current market and operating environment for the Association and for all thrifts. Subsequent changes in the local and national economy, the legislative and regulatory environment, the stock market, interest rates, and other external forces (such as natural disasters or major world events), which may occur from time to time (often with great unpredictability) may materially impact the market value of all thrift stocks, including Seneca Federal’s value, the market value of the stocks of public MHC institutions, or Seneca Federal’s value alone. To the extent a change in factors impacting the Association’s value can be reasonably anticipated and/or quantified, RP Financial has incorporated the estimated impact into its analysis.
Valuation Analysis
A fundamental analysis discussing similarities and differences relative to the Peer Group was presented in Chapter III. The following sections summarize the key differences between the Association and the Peer Group and how those differences affect the pro forma valuation. Emphasis is placed on the specific strengths and weaknesses of the Association relative to the Peer Group in such key areas as financial condition, profitability, growth and viability of earnings, asset growth, primary market area, dividends, liquidity of the shares, marketing of the issue, management, and the effect of government regulations and/or regulatory reform. We have also considered the market for thrift stocks, in particular new issues, to assess the impact on value of Seneca Federal coming to market at this time.
| RP® Financial, LC. | VALUATION ANALYSIS
IV.3 |
The financial condition of an institution is an important determinant in pro forma market value because investors typically look to such factors as liquidity, capital, asset composition and quality, and funding sources in assessing investment attractiveness. The similarities and differences in the Association’s and the Peer Group's financial strengths are noted as follows:
| o | Overall A/L Composition. Loans funded by retail deposits were the primary components of both Seneca Federal’s and the Peer Group's balance sheets. The Association’s interest-earning asset composition exhibited a higher concentration of loans and a lesser degree of diversification into higher risk types of loans. Overall, the Association’s asset composition provided for a higher yield earned on interest-earning assets and a lower risk weighted assets-to-assets ratio in comparison to the Peer Group’s ratios. Seneca Federal’s funding composition reflected higher levels of deposits and borrowings in comparison to the Peer Group’s ratios, which provided the Association with a slightly higher cost of funds than maintained by the Peer Group. Overall, as a percent of assets, the Association maintained higher levels of interest-earning assets and interest-bearing liabilities relative to the comparable ratios for the Peer Group, which translated into a lower IEA/IBL ratio for the Association. After factoring in the impact of the net stock proceeds, the Association’s IEA/IBL ratio will be more comparable to the Peer Group’s ratio. On balance, RP Financial concluded that asset/liability composition was a neutral factor in our adjustment for financial condition. |
| o | Credit Quality. The Association’s ratios for non-performing assets as a percent of assets and non-performing loans as a percent of loans were lower than the comparable ratios for the Peer Group. In comparison to the Peer Group, the Association maintained higher loss reserves as a percent of non-performing loans and lower reserves as a percent of loans. Net loan charge-offs as a percent of loans were higher for the Association. The Association’s risk weighted assets-to-assets ratio was lower than the Peer Group’s ratio. Overall, RP Financial concluded that credit quality was a slightly positive factor in our adjustment for financial condition. |
| o | Balance Sheet Liquidity. The Peer Group operated with a higher level of cash and investment securities relative to the Association (26.63% of assets versus 15.96% for the Association). Following the infusion of stock proceeds, the Association’s cash and investments ratio is expected to increase as a portion of the proceeds retained at the holding company level will initially be held in short-term liquid funds. The Association’s future borrowing capacity was considered to be slightly less than the Peer Group’s borrowing capacity, based on the higher level of borrowings that are funding the Association’s assets. Overall, RP Financial concluded that balance sheet liquidity was a neutral factor in our adjustment for financial condition. |
| o | Funding Liabilities. The Association’s interest-bearing funding composition reflected higher concentrations of deposits and borrowings relative to the comparable Peer Group ratios, which translated into a higher cost of funds for |
| RP® Financial, LC. | VALUATION ANALYSIS
IV.4 |
the Association. The Association’s ratio of total interest-bearing liabilities as a percent of assets was above the Peer Group’s ratio. Following the stock offering, the increase in the Association’s capital position will reduce the level of interest-bearing liabilities funding the Association’s assets to a level that is will be more comparable to the Peer Group’s ratio of interest-bearing liabilities as a percent of assets. Overall, RP Financial concluded that funding liabilities were a neutral factor in our adjustment for financial condition.
| o | Capital. The Peer Group currently operates with a significantly higher equity-to-assets ratio than the Association. Following the stock offering, Seneca Federal’s pro forma capital position will remain below the Peer Group's equity-to-assets ratio. On balance, RP Financial concluded that capital strength was a slightly negative factor in our adjustment for financial condition. |
On balance, Seneca Federal’s balance sheet strength was considered to be comparable to the Peer Group’s balance sheet strength and, thus, no adjustment was applied for the Association’s financial condition.
| 2. | Profitability, Growth and Viability of Earnings |
Earnings are a key factor in determining pro forma market value, as the level and risk characteristics of an institution's earnings stream and prospects to generate future earnings heavily influence the multiple that the investment community will pay for earnings. The major factors considered in the valuation are described below.
| o | Reported Earnings. The Association’s reported earnings were lower than the Peer Group’s on a ROAA basis (0.39% of average assets versus 0.53% for the Peer Group). The Peer Group maintained more favorable ratios for loan loss provisions, non-interest operating income and operating expenses, which were partially offset by the Association’s more favorable ratios for net interest income, net non-operating gains and effective tax rate. Reinvestment of stock proceeds into interest-earning assets will serve to increase the Association’s earnings, with the benefit of reinvesting proceeds expected to be somewhat offset by higher operating expenses associated with operating as a publicly-traded company and the implementation of stock benefit plans. Overall, the Association’s reported earnings were considered to be less favorable than the Peer Group’s reported earnings and, thus, RP Financial concluded that this was a slightly negative factor in our adjustment for profitability, growth and viability of earnings. |
| o | Core Earnings. Net interest income, operating expenses, non-interest operating income and loan loss provisions were reviewed in assessing the relative strengths and weaknesses of the Association’s and the Peer Group’s core earnings. In these measures, the Association operated with a higher net interest income ratio, a higher operating expense ratio and a lower level of non-interest operating income. The Association’s higher net interest income and operating expense ratios translated into a lower expense coverage ratio in comparison to the Peer Group’s ratio (equal to 1.03x versus 1.13x for the Peer Group). Similarly, the Association’s efficiency ratio of 87.47% was less favorable than the |
| RP® Financial, LC. | VALUATION ANALYSIS
IV.5 |
Peer Group’s efficiency ratio of 75.30%. Loan loss provisions had a larger impact on the Association’s earnings. Overall, these measures, as well as the expected earnings benefits the Association should realize from the redeployment of stock proceeds into interest-earning assets and leveraging of post-conversion capital, which will be somewhat negated by expenses associated with the stock benefit plans and operating as a publicly-traded company, indicate that the Association’s pro forma core earnings will remain less favorable than the Peer Group’s core earnings. Therefore, RP Financial concluded that this was a slightly negative factor in our adjustment for profitability, growth and viability of earnings.
| o | Interest Rate Risk. Quarterly changes in the Association’s and the Peer Group's net interest income to average assets ratios indicated that a greater degree of volatility was associated with the Association’s net interest margin. Other measures of interest rate risk, such as capital levels, IEA/IBL ratios and levels of non-interest earning assets were generally more favorable for the Peer Group. On a pro forma basis, the infusion of stock proceeds can be expected to provide the Association with equity-to-assets and IEA/ILB ratios that are more comparable to the Peer Group ratios, as well as enhance the stability of the Association’s net interest margin. Accordingly, on balance, this was a neutral factor in our adjustment for profitability, growth and viability of earnings. |
| o | Credit Risk. Loan loss provisions were a slightly larger factor in the Association’s earnings (0.18% of average assets versus 0.10% of average assets for the Association). In terms of future exposure to credit quality related losses, the Association maintained a higher concentration of assets in loans and the Peer Group exhibited greater diversification into higher risk types of loans. The Association’s credit quality measures generally implied a lower degree of credit risk exposure relative to the comparable credit quality measures indicated for the Peer Group. Overall, RP Financial concluded that credit risk was a slightly positive factor in our adjustment for profitability, growth and viability of earnings. |
| o | Earnings Growth Potential. Several factors were considered in assessing earnings growth potential. First, the Association currently maintains a slightly higher interest rate spread than the Peer Group, which would tend to facilitate a continuation of a higher net interest margin for the Association goring forward. Second, following the infusion of stock proceeds the Association’s growth potential through leverage will remain less than currently maintained by the Peer Group. Third, the Association’s lower ratios of non-interest operating income and higher operating expenses were viewed as disadvantages to sustain earnings growth during periods when net interest margins come under pressure as the result of adverse changes in interest rates. Overall, earnings growth potential was considered to be a slightly negative factor in our adjustment for profitability, growth and viability of earnings. |
| o | Return on Equity. Currently, the Association’s core ROE is slightly higher than the Peer Group’s core ROE. As the result of the increase in capital that will be realized from the infusion of net stock proceeds into the Association’s equity, the Association’s pro forma return equity on a core earnings basis will initially decrease and be comparable to the Peer Group’s core ROE. Accordingly, this |
| RP® Financial, LC. | VALUATION ANALYSIS
IV.6 |
was a neutral factor in the adjustment for profitability, growth and viability of earnings.
On balance, Seneca Federal’s pro forma earnings strength was considered to be less favorable than the Peer Group’s and, thus, a slight downward adjustment was applied for profitability, growth and viability of earnings.
Comparative asset growth rates for the Association and the Peer Group showed a 16.88% increase in the Association’s assets, versus a 9.81% increase in the Peer Group’s assets. Asset growth for the Association was sustained by a 21.26% increase in loans, which was partially funded with cash and investments. The Peer Group’s asset growth was sustained by a 19.09% increase in loans, which was also partially funded with cash and investments. Overall, the Association recent asset growth trends would tend to be viewed slightly more favorable relative to the Peer Group’s asset growth trends in terms of supporting future earnings growth. On a pro forma basis, the Association’s tangible equity-to-assets ratio will remain below the Peer Group's tangible equity-to-assets ratio and, thus, the Association’s pro forma leverage capacity will remain less compared to the Peer Group’s leverage capacity. On balance, no adjustment was applied for asset growth.
The general condition of an institution’s market area has an impact on value, as future success is in part dependent upon opportunities for profitable activities in the local market served. Seneca Federal serves the Syracuse metropolitan area through the main office and two full service branches. Operating in a metropolitan area such as Syracuse provides the Association with growth opportunities, but such growth must be achieved in a highly competitive market environment. The Association competes against significantly larger institutions that provide a larger array of services and have significantly larger branch networks than maintained by Seneca Federal.
The Peer Group companies generally operate in markets with smaller populations compared to Onondaga County. Population growth for the primary market area counties served by the Peer Group companies reflected a range of growth rates, but, overall, population growth rates in the markets served by the Peer Group companies were slightly above Onondaga County’s recent historical and projected population growth rates. Onondaga County has a per
| RP® Financial, LC. | VALUATION ANALYSIS
IV.7 |
capita income that was between the Peer Group’s average and median per capita income measures and, on average, the Peer Group’s primary market area counties were more affluent markets within their respective states compared to Onondaga County’s per capita income as a percent of New York’s per capita income (100.9% for the Peer Group versus 88.6% for Onondaga County). The average and median deposit market shares maintained by the Peer Group companies were well above the Association’s market share of deposits in Onondaga County. Overall, the degree of competition faced by the Peer Group companies was viewed as less than the Association’s competitive environment in Onondaga County, while the growth potential in the markets served by the Peer Group companies was for the most part viewed to be similar to the Association’s primary market area. Summary demographic and deposit market share data for the Association and the Peer Group companies is provided in Exhibit III-5. As shown in Table 4.1, the average unemployment rate for the primary market area counties served by the Peer Group companies was slightly above the unemployment rate reflected for Onondaga County. On balance, we concluded that no adjustment was appropriate for the Association’s market area.
Table 4.1
Market Area Unemployment Rates
Seneca Federal and the Peer Group Companies (1)
| | | | | March 2017 | |
| | | County | | Unemployment | |
| | | | | | |
| Seneca Federal - NY | | Onondaga | | | 4.4 | % |
| | | | | | | |
| Peer Group Average | | | | | 4.6 | |
| | | | | | | |
| The Peer Group | | | | | | |
| | | | | | | |
| Equitable Financial Corp. – NE | | Hall | | | 3.5 | |
| Hamilton Bancorp, Inc. - MD | | Baltimore | | | 4.6 | |
| Jacksonville Bancorp, Inc. – IL | | Morgan | | | 4.4 | |
| Melrose Bancorp, Inc. – MA | | Middlesex | | | 3.0 | |
| MSB Financial Corp. – NJ | | Morris | | | 3.4 | |
| PB Bancorp, Inc. - CT | | Windham | | | 5.7 | |
| Poage Bankshares, Inc. – KY | | Boyd | | | 8.3 | |
| Wayne Savings Bancshares, Inc. – OH | | Wayne | | | 4.0 | |
| Wolverine Bancorp, Inc. – MI | | Midland | | | 4.6 | |
| WVS Financial Corp. – PA | | Allegheny | | | 5.0 | |
(1) Unemployment rates are not seasonally adjusted.
Source: SNL Financial, LC; Department of Labor.
| RP® Financial, LC. | VALUATION ANALYSIS
IV.8 |
At this time the Association has not established a dividend policy. Future declarations of dividends by the Board of Directors will depend upon a number of factors, including investment opportunities, growth objectives, financial condition, profitability, tax considerations, minimum capital requirements, regulatory limitations, stock market characteristics and general economic conditions.
Six out of the ten Peer Group companies pay regular cash dividends, with implied dividend yields ranging from 1.24% to 5.04%. The average dividend yield on the stocks of the Peer Group institutions equaled 1.28% as of May 12, 2017. Comparatively, as of May 12, 2017, the average dividend yield on the stocks of all fully-converted publicly-traded thrifts equaled 1.66%.
Our valuation adjustment for dividends for Seneca Federal also considered the regulatory policy with regard to payment of dividends to the MHC. Under current FRB and OCC policy, any dividends declared by the Company would be required to be paid to all shareholders. Accordingly, dividends paid by the Company would increase the amount of assets held by the MHC, after adjusting for applicable income taxes, and, thereby, increase the implied dilution incurred by the minority shareholders in a second-step conversion pursuant to the calculation to account for net assets held by the MHC in a second-step offering.
Overall, while the Association has not established a definitive dividend policy prior to its stock offering, the Association will have the capacity to pay a dividend comparable to the Peer Group’s average dividend yield based on pro forma earnings and capitalization. At the same time, dividend payments retained by the MHC would increase the implied dilution to minority shareholders in a second-step offering. On balance, we concluded that a slight downward adjustment was warranted for purposes of the Association’s dividend policy.
| 6. | Liquidity of the Shares |
The Peer Group is by definition composed of companies that are traded in the public markets. All ten of the Peer Group members trade on the NASDAQ system. Typically, the number of shares outstanding and market capitalization provides an indication of how much liquidity there will be in a particular stock. The market capitalization of the Peer Group companies ranged from $30.9 million to 98.8 million as of May 12, 2017, with average and
| RP® Financial, LC. | VALUATION ANALYSIS
IV.9 |
median market values of $58.3 million and $53.4 million, respectively. The shares issued and outstanding of the Peer Group companies ranged from 1.8 million to 7.9 million, with average and median shares outstanding of 3.5 million and 3.1 million, respectively. The Association’s stock offering is expected to have a pro forma public market value and shares outstanding of public shareholders that will be less than the lower end of comparable Peer Group ranges. It is anticipated that the Association’s stock will be quoted on the OTC Ping Marketplace following the stock offering, which generally suggest lower liquidity compared to a stock listed on NASDAQ. Overall, we anticipate that the Association’s public stock will have a less liquid trading market compared to the stocks of the Peer Group companies and, therefore, concluded a slight downward adjustment was necessary for this factor.
Three separate markets exist for thrift stocks: (1) the after-market for public companies, both fully-converted stock companies and MHCs, in which trading activity is regular and investment decisions are made based upon financial condition, earnings, capital, ROE, dividends and future prospects; (2) the new issue market in which converting thrifts are evaluated on the basis of the same factors but on a pro forma basis without the benefit of prior operations as a publicly-held company and stock trading history; and (3) the thrift acquisition market. All three of these markets were considered in the valuation of the Association’s to-be-issued stock.
The value of publicly-traded thrift stocks is easily measurable, and is tracked by most investment houses and related organizations. Exhibit IV-1 provides pricing and financial data on all publicly-traded thrifts. In general, thrift stock values react to market stimuli such as interest rates, inflation, perceived industry health, projected rates of economic growth, regulatory issues and stock market conditions in general. Exhibit IV-2 displays historical stock market trends for various indices and includes historical stock price index values for thrifts and commercial banks. Exhibit IV-3 displays various stock price indices as of May 12, 2017.
In terms of assessing general stock market conditions, the overall stock market has trended higher in recent quarters. Stocks traded unevenly at the start of the fourth quarter of 2016, as investors reacted to third quarter earnings reports that had varied results. Consumer
| RP® Financial, LC. | VALUATION ANALYSIS
IV.10 |
shares weighed on the broader stock market in the second half of October, following a string of disappointing earnings reports coming out of the consumer sector and a downbeat outlook for the rest of 2016. The Dow Jones Industrial Average (the “DJIA”) fell for a third month in a row to close out October, with a monthly decline of 0.9%. Stocks extended their losing streak in early-November, as investors reacted to tightening polls for the presidential election. News of the FBI finding no new evidence to warrant charges against Democratic candidate Hillary Clinton sent stocks sharply higher the day before the presidential election. However, investors embraced Trump’s election, as stocks surged higher based on expectations for reduced corporate taxes and regulation and greater infrastructure spending under a Trump administration. Following seven consecutive sessions of closing higher, the DJIA closed down in mid-November 2016 as investors pared gains in shares that led the post-election stock market rally. The post-election stock market rally resumed during the second half of November, as U.S. stocks notched new record highs. Overall, the DJIA finished up 5.4% for the month of November. Led by gains in financial shares, stocks continued to surge higher during the first half of December. Stocks retreated after the Federal Reserve raised its target rate by a quarter of a percentage point at the conclusion of its mid-December policy meeting. After trading in a narrow range heading into late-December, stocks slumped in the final trading days of 2016. However, overall, the major U.S. stock indexes posted solid gains for 2016, with the DJIA and NASDAQ increasing 13.4% and 7.5%, respectively, in 2016.
Bank and healthcare stocks led the stock market higher at the start of 2017, as the DJIA approached the 20000 milestone in the first week of trading during 2017. Stocks traded in a narrow range heading into the fourth quarter earnings season and then edged lower in mid-January, as investors weighed both the timing and ultimate impact of expected policy changes from the Trump administration. The DJIA closed above 20000 for the first time in late-January, as President Trump’s moves during his first week in office to promote infrastructure spending and cut regulation propelled stocks higher. Stocks stumbled at the end of January, as President Trump’s restriction on immigration took a toll on the stock market’s optimism. The broader stock market rebounded during the first half of February, as the major U.S. stock indexes moved to fresh highs in response to President Trump taking action to scale back financial regulations and advancing campaign promises to lower taxes. Data pointing towards continuing growth in the U.S. economy sustained the bull market in the second half of February 2017, as the DJIA notched twelve consecutive highs through February 27, 2017. The streak of consecutive gains in the DJIA ended on the last day of February, which was followed by a surge in U.S. stock
| RP® Financial, LC. | VALUATION ANALYSIS
IV.11 |
market indexes at the start of March. On March 1, 2017, the DJIA posted a gain of over 300 points and closed above 21000 for the first time as investors embraced optimism from President Trump’s State of the Union address and signals from the Federal Reserve that they were growing confident enough in the U.S. economy to raise short-term interest rates in the near future. Stocks retreated following the record breaking day for the DJIA, with energy shares leading the decline as a supply glut of oil sent oil prices for lower for seven consecutive sessions going into mid-March. The Federal Reserve’s decision to raise its benchmark federal funds rate by a quarter helped to propel stocks higher at the conclusion of its mid-March meeting. Stocks reversed course during the second half of March, as the DJIA fell for eight consecutive trading sessions. Stocks that led the post-election rally, such as financial and infrastructure companies, were among the biggest decliners, amid political uncertainty over the fate of President Trump’s pro-business growth agenda and deregulation of the financial industry after Republicans pulled their healthcare bill from the House floor due to lack of adequate support.
The downward trend in the broader stock market continued during the first half of April 2017, with geopolitical uncertainty and weaker-than-expected job growth reflected in the March employment contributing to the pullback. Stocks rallied during the second half of April, led by a rebound in financial and industrial shares. Easing geopolitical concerns, a series of upbeat first quarter earnings reports and a victory by a centrist candidate in the first round of France’s presidential election were among the factors that supported the rally. The broader market traded in a narrow range at the end of April and into early-May, as gains in technology and industrial companies offset losses in the energy sector. A slightly stronger-than-expected jobs report for April helped to lift the S&P 500 index and the NASDAQ Composite index to record highs at the close of the first week of May. Stocks retreated heading in mid-May, which was attributable to falling oil prices and disappointing earnings posted by some larger retailers. On May 12, 2017, the DJIA closed at 20896.61, an increase of 19.2% from one year ago and an increase of 5.7% year-to-date, and the NASDAQ Composite index closed at 6121.23, an increase of 29.8% from one year ago and an increase of 13.7% year-to-date. The S&P 500 Index closed at 2390.90 on May 12, 2017, an increase of 16.8% from one year ago and an increase of 6.8% year-to-date.
The market for thrift stocks has also generally trended higher in recent quarters.In advance of third quarter earnings reports, thrift shares remained stable during the first half of October 2016. Financial shares led the stock market higher heading into the second half of
| RP® Financial, LC. | VALUATION ANALYSIS
IV.12 |
October, in light of third quarter earnings reports generally offering fresh evidence of profitability improving for banks. Thrift stocks were largely trendless through the end of October and then pulled back along with the broader stock market in early-November. Bank and thrift stocks were among the strongest performers in leading the post-election stock market rally, reflecting investor expectations for reduced regulation of the banking sector. Financial shares retreated along with the broader stock market following the mid-December rate hike by the Federal Reserve. While thrift shares traded in a tight range in the closing weeks of 2016, the SNL Index for all publicly-traded thrifts finished 2016 with a gain of 19.49% in which the substantial portion of the gains occurred following the presidential election.
Financial shares led the stock market higher at the start of 2017, which was followed by a pullback as investors dumped shares of financial companies and bought government bonds. Despite generally favorable fourth quarter earnings reports posted by the money center banks, the downturn in financial shares continued heading into the second half of January. Financial shares paralleled trends in the broader stock market in late-January and then led the stock market rally in early-February following action by President Trump to scale back financial regulations. Financial shares also led the market lower heading into mid-February, as investors reacted to a flattening of the yield curve. Data indicating the U.S. economy was poised for additional growth contributed to thrift stocks rallying along with the broader stock market during the second half of February. Financial shares spiked higher at the start of March, which was followed by a general downward trend in thrift stocks through the first half of March. Thrift shares declined sharply along with the broader stock market heading into the close of the first quarter, amid growing uncertainty of how successful the Trump administration would be in pushing its agenda through Congress. A fresh round of upbeat economic data contributed to a rebound in thrift stocks at the close of the first quarter.
Financial shares led the broader stock market lower during the first half of April 2017, as investors pulled back from sectors that led the post-election rally in favor of technology stocks. Some favorable first quarter earnings reports posted by large banks and deal activity in the financial sector bolstered thrift stocks in the final week of April. Thrift shares traded in a tight range throughout the first week of May and then declined slightly heading into mid-May, as bank stocks led the market lower on growing investor anxiety about the future of President Trump’s legislative agenda. On May 12, 2017, the SNL Index for all publicly-traded thrifts closed at 894.7, an increase of 15.1% from one year ago and a decrease of 7.5% year-to-date.
| RP® Financial, LC. | VALUATION ANALYSIS
IV.13 |
In addition to thrift stock market conditions in general, the new issue market for converting thrifts is also an important consideration in determining the Association’s pro forma market value. The new issue market is separate and distinct from the market for seasoned thrift stocks in that the pricing ratios for converting issues are computed on a pro forma basis, specifically: (1) the numerator and denominator are both impacted by the conversion offering amount, unlike existing stock issues in which price change affects only the numerator; and (2) the pro forma pricing ratio incorporates assumptions regarding source and use of proceeds, effective tax rates, stock plan purchases, etc. which impact pro forma financials, whereas pricing for existing issues are based on reported financials. The distinction between pricing of converting and existing issues is perhaps no clearer than in the case of the price/book ("P/B") ratio in that the P/B ratio of a converting thrift will typically result in a discount to book value whereas in the current market for existing thrifts the P/B ratio often reflects a premium to book value. Therefore, it is appropriate to also consider the market for new issues, both at the time of the conversion and in the aftermarket.
As shown in Table 4.2, one standard conversion offering and one first-step MHC offering were completed during the past three months. For purposes of our analysis, the first-step MHC offering is considered to be more relevant. The first-step MHC offering was completed by Community First Bancshares of Georgia, which completed its mutual holding company offering on April 28, 2017. Community First Bancshares’ offering was closed at the top of its offering range equal to gross proceeds of $34.7 million and a pro forma fully-converted price/tangible book ratio of 68.5%. After the first week of trading, Community First Bancshares’ stock price was up 33.7% from its IPO price.
Shown in Table 4.3 is the current pricing ratios for PCSB Financial Corporation, which was the only fully-converted offering completed during the past three months that trades on NASDAQ. PCSB Financial’s current P/TB ratio is 116.15%, based on its closing stock price as of May 12, 2017.
Also considered in the valuation was the potential impact on Seneca Federal’s stock price of recently completed and pending acquisitions of other thrifts operating in New York.
| RP® Financial, LC. | VALUATION ANALYSIS
IV.14 |
Table 4.2
Pricing Characteristics and After-Market Trends
Conversions Completed in the Last Three Months
| Institutional Information | | Pre-Conversion Data | | | Offering Information | | | Contribution to | | Insider Purchases | | | | | | Pro Forma Data | | | | | | Post-IPO Pricing Trends | |
| | | | | | | Financial Info. | | | Asset Quality | | | | | | | | | | | | | | | Char. Found. | | % Off Incl. Fdn.+Merger Shares | | | | | | Pricing Ratios(2)(5) | | | Financial Charac. | | | | | | Closing Price: | |
| | | | | | | | | | | | | | | | | | | Excluding Foundation | | | | | % of | | | Benefit Plans | | | | | | Initial | | | | | | | | | | | | | | | | | | | | | | | | First | | | | | | After | | | | | | After | | | | | | | | | | |
| | | Conversion | | | | | | | Equity/ | | | NPAs/ | | | Res. | | | Gross | | | % | | | % of | | | Exp./ | | | | | Public Off. | | | | | | Recog. | | | Stk | | | Mgmt.& | | | Div. | | | | | | Core | | | | | | Core | | | | | | Core | | | IPO | | | Trading | | | % | | | First | | | % | | | First | | | % | | | Thru | | | % | |
| Institution | | Date | | Ticker | | Assets | | | Assets | | | Assets | | | Cov. | | | Proc. | | | Offer | | | Mid. | | | Proc. | | | Form | | Inc. Fdn. | | | ESOP | | | Plans | | | Option | | | Dirs. | | | Yield | | | P/TB | | | P/E | | | P/A | | | ROA | | | TE/A | | | ROE | | | Price | | | Day | | | Chge | | | Week(3) | | | Chge | | | Month(4) | | | Chge | | | 5/12/2017 | | | Chge | |
| | | | | | | ($Mil) | | | (%) | | | (%) | | | (%) | | | ($Mil.) | | | (%) | | | (%) | | | (%) | | | | | (%) | | | (%) | | | (%) | | | (%) | | | (%)(1) | | | (%) | | | (%) | | | (x) | | | (%) | | | (%) | | | (%) | | | (%) | | | ($) | | | ($) | | | (%) | | | ($) | | | (%) | | | ($) | | | (%) | | | ($) | | | (%) | |
| | | | | | | | | | | | | | | | | | | | | | | | | | | | | | | | | | | | | | | | | | | | | | | | | | | | | | | | | | | | | | | | | | | | | | | | | | | | | | | | | | | | | | | | | | | | | | |
| Standard Conversions | | | | | | | | | | | | | | | | | | | | | | | | | | | | | | | | | | | | | | | | | | | | | | | | | | | | | | | | | | | | | | | | | | | | | | | | | | | | | | | | | | | | | | | | | | | | | | | | | | | | | | | | | | | | | | | | | | | | | | |
| PCSB Financial Corporation - NY* | | 4/21/17 | | PCSB-NASDAQ | | $ | 1,241 | | | | 9.09 | % | | | 0.88 | % | | | 53 | % | | $ | 178.3 | | | | 98 | % | | | 102 | % | | | 1.8 | % | | S/C | | | 2.8 | % | | | 8.0 | % | | | 4.0 | % | | | 10.0 | % | | | 1.4 | % | | | 0.00 | % | | | 70.1 | % | | | 83.2 | x | | | 13.0 | % | | | 0.2 | % | | | 18.7 | % | | | 0.8 | % | | $ | 10.00 | | | $ | 16.46 | | | | 64.6 | % | | $ | 16.58 | | | | 65.8 | % | | $ | 16.58 | | | | 65.8 | % | | $ | 16.46 | | | | 64.6 | % |
| | | | | | | | | | | | | | | | | | | | | | | | | | | | | | | | | | | | | | | | | | | | | | | | | | | | | | | | | | | | | | | | | | | | | | | | | | | | | | | | | | | | | | | | | | | | | | | | | | | | | | | | | | | | | | | | | | | | | | | | | | | |
| Averages - Standard Conversions: | | $ | 1,241 | | | | 9.09 | % | | | 0.88 | % | | | 53 | % | | $ | 178.3 | | | | 98 | % | | | 102 | % | | | 102 | % | | N.A. | | | 2.8 | % | | | 8.0 | % | | | 4.0 | % | | | 10.0 | % | | | 1.4 | % | | | 0.00 | % | | | 70.1 | % | | | 83.2 | x | | | 13.0 | % | | | 0.2 | % | | | 18.7 | % | | | 0.8 | % | | $ | 10.00 | | | $ | 16.46 | | | | 64.6 | % | | $ | 16.58 | | | | 65.8 | % | | $ | 16.58 | | | | 65.8 | % | | $ | 16.46 | | | | 64.6 | % |
| Medians - Standard Conversions: | | $ | 1,241 | | | | 9.09 | % | | | 0.88 | % | | | 53 | % | | $ | 178.3 | | | | 98 | % | | | 102 | % | | | 1.8 | % | | N.A. | | | 2.8 | % | | | 8.0 | % | | | 4.0 | % | | | 10.0 | % | | | 1.4 | % | | | 0.00 | % | | | 70.1 | % | | | 83.2 | x | | | 13.0 | % | | | 0.2 | % | | | 18.7 | % | | | 0.8 | % | | $ | 10.00 | | | $ | 16.46 | | | | 64.6 | % | | $ | 16.58 | | | | 65.8 | % | | $ | 16.58 | | | | 65.8 | % | | $ | 16.46 | | | | 64.6 | % |
| | | | | | | | | | | | | | | | | | | | | | | | | | | | | | | | | | | | | | | | | | | | | | | | | | | | | | | | | | | | | | | | | | | | | | | | | | | | | | | | | | | | | | | | | | | | | | | | | | | | | | | | | | | | | | | | | | | | | | | | | | | |
| Mutual Holding Companies | | | | | | | | | | | | | | | | | | | | | | | | | | | | | | | | | | | | | | | | | | | | | | | | | | | | | | | | | | | | | | | | | | | | | | | | | | | | | | | | | | | | | | | | | | | | | | | | | | | | | | | | | | | | | | | | | | | | | | |
| Community First Bancshares, Inc. - GA* | | 4/28/17 | | CFBI-NASDAQ | | $ | 238 | | | | 19.10 | % | | | 2.05 | % | | | 95 | % | | $ | 34.7 | | | | 54 | % | | | 132 | % | | | 4.0 | % | | N.A. | | | N.A. | | | | 3.9 | % | | | 2.0 | % | | | 4.9 | % | | | 2.1 | % | | | 0.00 | % | | | 68.5 | % | | | 73.0 | x | | | 24.9 | % | | | 0.3 | % | | | 36.4 | % | | | 0.9 | % | | $ | 10.00 | | | $ | 13.29 | | | | 32.9 | % | | $ | 13.37 | | | | 33.7 | % | | $ | 13.08 | | | | 30.8 | % | | $ | 13.08 | | | | 30.8 | % |
| | | | | | | | | | | | | | | | | | | | | | | | | | | | | | | | | | | | | | | | | | | | | | | | | | | | | | | | | | | | | | | | | | | | | | | | | | | | | | | | | | | | | | | | | | | | | | | | | | | | | | | | | | | | | | | | | | | | | | | | | | | |
| Averages - MHC Conversions: | | $ | 238 | | | | 19.10 | % | | | 2.05 | % | | | 95 | % | | $ | 34.7 | | | | 54 | % | | | 132 | % | | | 4.0 | % | | N.A. | | | N.A. | | | | 3.9 | % | | | 2.0 | % | | | 4.9 | % | | | 2.1 | % | | | 0.00 | % | | | 68.5 | % | | | 73.0 | x | | | 24.9 | % | | | 0.3 | % | | | 36.4 | % | | | 0.9 | % | | $ | 10.00 | | | $ | 13.29 | | | | 32.9 | % | | $ | 13.37 | | | | 33.7 | % | | $ | 13.08 | | | | 30.8 | % | | $ | 13.08 | | | | 30.8 | % |
| Medians - MHC Conversions: | | $ | 238 | | | | 19.10 | % | | | 2.05 | % | | | 95 | % | | $ | 34.7 | | | | 54 | % | | | 132 | % | | | 4.0 | % | | N.A. | | | N.A. | | | | 3.9 | % | | | 2.0 | % | | | 4.9 | % | | | 2.1 | % | | | 0.00 | % | | | 68.5 | % | | | 73.0 | x | | | 24.9 | % | | | 0.3 | % | | | 36.4 | % | | | 0.9 | % | | $ | 10.00 | | | $ | 13.29 | | | | 32.9 | % | | $ | 13.37 | | | | 33.7 | % | | $ | 13.08 | | | | 30.8 | % | | $ | 13.08 | | | | 30.8 | % |
| | | | | | | | | | | | | | | | | | | | | | | | | | | | | | | | | | | | | | | | | | | | | | | | | | | | | | | | | | | | | | | | | | | | | | | | | | | | | | | | | | | | | | | | | | | | | | | | | | | | | | | | | | | | | | | | | | | | | | | | | | | |
| | | | | | | | | | | | | | | | | | | | | | | | | | | | | | | | | | | | | | | | | | | | | | | | | | | | | | | | | | | | | | | | | | | | | | | | | | | | | | | | | | | | | | | | | | | | | | | | | | | | | | | | | | | | | | | | | | | | | | | | | | | |
| Averages - All Conversions: | | $ | 739 | | | | 14.09 | % | | | 1.47 | % | | | 74 | % | | $ | 106.5 | | | | 76 | % | | | 117 | % | | | 2.9 | % | | N.A. | | | N.A. | | | | 6.0 | % | | | 3.0 | % | | | 7.5 | % | | | 1.7 | % | | | 0.00 | % | | | 69.3 | % | | | 78.1 | x | | | 19.0 | % | | | 0.2 | % | | | 27.5 | % | | | 0.9 | % | | $ | 10.00 | | | $ | 14.88 | | | | 48.8 | % | | $ | 14.98 | | | | 49.8 | % | | $ | 14.83 | | | | 48.3 | % | | $ | 14.77 | | | | 47.7 | % |
| Medians - All Conversions: | | $ | 739 | | | | 14.09 | % | | | 1.47 | % | | | 74 | % | | $ | 106.5 | | | | 76 | % | | | 117 | % | | | 2.9 | % | | N.A. | | | N.A. | | | | 6.0 | % | | | 3.0 | % | | | 7.5 | % | | | 1.7 | % | | | 0.00 | % | | | 69.3 | % | | | 78.1 | x | | | 19.0 | % | | | 0.2 | % | | | 27.5 | % | | | 0.9 | % | | $ | 10.00 | | | $ | 14.88 | | | | 48.8 | % | | $ | 14.98 | | | | 49.8 | % | | $ | 14.83 | | | | 48.3 | % | | $ | 14.77 | | | | 47.7 | % |
Note: * - Appraisal performed by RP Financial; BOLD = RP Fin. Did the business plan, "NT" - Not Traded; "NA" - Not Applicable, Not Available; C/S-Cash/Stock.
| (1) | As a percent of MHC offering for MHC transactions. |
| (2) | Does not take into account the adoption of SOP 93-6. |
| (3) | Latest price if offering is less than one week old. |
| (4) | Latest price if offering is more than one week but less than one month old. |
| (5) | Mutual holding company pro forma data on full conversion basis. |
| (6) | Simultaneously completed acquisition of another financial institution. |
| (7) | Simultaneously converted to a commercial bank charter. |
5/12/2017
| RP® Financial, LC. | VALUATION ANALYSIS
IV.15 |
Table 4.3
Market Pricing Comparatives
As of May 12, 2017
| | | | | | | Market | | | Per Share Data | | | | | | | | | | | | | | | | | | | | | | | | | | | | | | | | | | | | | | | | | | | | | | | | | |
| | | | | | | Capitalization | | | Core | | | Book | | | | | | | | | | | | | | | | | | Dividends(3) | | | Financial Characteristics(5) | |
| | | | | | | Price/ | | | Market | | | 12 Month | | | Value/ | | | Pricing Ratios(2) | | | Amount/ | | | | | | Payout | | | Total | | | Equity/ | | | Tang. Eq./ | | | NPAs/ | | | Reported | | | Core | |
| | | | | Share | | | Value | | | EPS(1) | | | Share | | | P/E | | | P/B | | | P/A | | | P/TB | | | P/Core | | | Share | | | Yield | | | Ratio(4) | | | Assets | | | Assets | | | T. Assets | | | Assets | | | ROAA | | | ROAE | | | ROAA | | | ROAE | |
| | | | | | | ($) | | | ($Mil) | | | ($) | | | ($) | | | (x) | | | (%) | | | (%) | | | (%) | | | (x) | | | ($) | | | (%) | | | (%) | | | ($Mil) | | | (%) | | | (%) | | | (%) | | | (%) | | | (%) | | | (%) | | | (%) | |
| | | | | | | | | | | | | | | | | | | | | | | | | | | | | | | | | | | | | | | | | | | | | | | | | | | | | | | | | | | | | | | | | |
| All Non-MHC Public Companies(6) | | | | | | | | | | | | | | | | | | | | | | | | | | | | | | | | | | | | | | | | | | | | | | | | | | | | | | | | | | | | | | | | | | | | | | | | | | | | | | | | | | |
| Averages | | | | $ | 22.35 | | | $ | 546.69 | | | $ | 1.03 | | | $ | 16.64 | | | | 20.24 | x | | | 131.15 | % | | | 15.96 | % | | | 145.09 | % | | | 20.83 | x | | $ | 0.37 | | | | 1.66 | % | | | 56.54 | % | | $ | 3,327 | | | | 12.60 | % | | | 11.54 | % | | | 0.96 | % | | | 0.74 | % | | | 6.30 | % | | | 0.74 | % | | | 6.12 | % |
| Median | | | | $ | 17.55 | | | $ | 161.01 | | | $ | 0.77 | | | $ | 14.81 | | | | 18.98 | x | | | 126.65 | % | | | 15.60 | % | | | 130.77 | % | | | 20.11 | x | | $ | 0.26 | | | | 1.36 | % | | | 45.58 | % | | $ | 1,081 | | | | 11.57 | % | | | 10.67 | % | | | 0.84 | % | | | 0.63 | % | | | 5.99 | % | | | 0.64 | % | | | 5.68 | % |
| | | | | | | | | | | | | | | | | | | | | | | | | | | | | | | | | | | | | | | | | | | | | | | | | | | | | | | | | | | | | | | | | | | | | | | | | | | | | | | | | | | | | |
| Comparable Group | | | | | | | | | | | | | | | | | | | | | | | | | | | | | | | | | | | | | | | | | | | | | | | | | | | | | | | | | | | | | | | | | | | | | | | | | | | | | | | | | | |
| Averages | | | | $ | 16.58 | | | $ | 301.18 | | | $ | 0.12 | | | $ | 14.64 | | | | 97.53 | x | | | 113.25 | % | | | 21.60 | % | | | 116.15 | % | | | 138.17 | x | | $ | 0.00 | | | | 0.00 | % | | | 0.00 | % | | $ | 1,394 | | | | 19.10 | % | | | 18.60 | % | | | 1.40 | % | | | 0.20 | % | | | 1.07 | % | | | 0.16 | % | | | 0.82 | % |
| Medians | | | | $ | 16.58 | | | $ | 301.18 | | | $ | 0.12 | | | $ | 14.64 | | | | 97.53 | x | | | 113.25 | % | | | 21.60 | % | | | 116.15 | % | | | 138.17 | x | | $ | 0.00 | | | | 0.00 | % | | | 0.00 | % | | $ | 1,394 | | | | 19.10 | % | | | 18.60 | % | | | 1.40 | % | | | 0.20 | % | | | 1.07 | % | | | 0.16 | % | | | 0.82 | % |
| | | | | | | | | | | | | | | | | | | | | | | | | | | | | | | | | | | | | | | | | | | | | | | | | | | | | | | | | | | | | | | | | | | | | | | | | | | | | | | | | | | | | |
| Comparable Group | | | | | | | | | | | | | | | | | | | | | | | | | | | | | | | | | | | | | | | | | | | | | | | | | | | | | | | | | | | | | | | | | | | | | | | | | | | | | | | | | | |
| PCSB | | PCSB Financial Corporation | | NY | | $ | 16.58 | | | $ | 301.18 | | | $ | 0.12 | | | $ | 14.64 | | | | 97.53 | x | | | 113.25 | % | | | 21.60 | % | | | 116.15 | % | | | 138.17 | x | | $ | 0.00 | | | | 0.00 | % | | | 0.00 | % | | $ | 1,394 | | | | 19.10 | % | | | 18.60 | % | | | 1.40 | % | | | 0.20 | % | | | 1.07 | % | | | 0.16 | % | | | 0.82 | % |
| (1) | Core income, on a diluted per-share basis. Core income is net income after taxes and before extraordinary items, less net income attributable to noncontrolling interest, gain on the sale of securities, amortization of intangibles, goodwill and nonrecurring items. Assumed tax rate is 35%. |
| (2) | P/E = Price to earnings; P/B = Price to book; P/A = Price to assets; P/TB = Price to tangible book value; and P/Core = Price to core earnings. P/E and P/Core =NM if the ratio is negative or above 35x. |
| (3) | Indicated 12 month dividend, based on last quarterly dividend declared. |
| (4) | Indicated 12 month dividend as a percent of trailing 12 month earnings. |
| (5) | ROAA (return on average assets) and ROAE (return on average equity) are indicated ratios based on trailing 12 month earnings and average equity and assets balances. |
| (6) | Excludes from averages and medians those companies the subject of actual or rumored acquisition activities or unusual operating characteristics. |
| Source: | SNL Financial, LC. and RP Financial, LC. calculations. The information provided in this report has been obtained from sources we believe are reliable, but we cannot guarantee the accuracy or completeness of such information. |
Copyright (c) 2017 by RP® Financial, LC.
| RP® Financial, LC. | VALUATION ANALYSIS
IV.16 |
As shown in Exhibit IV-4, there were three New York thrift acquisitions completed from the beginning of 2013 through year-to-date 2017, and there are currently three acquisitions pending for a New York savings institution. To the extent that speculation of a re-mutualization may impact the Association’s valuation, we have largely taken this into account in selecting companies for the Peer Group which operate in markets that have experienced a comparable level of acquisition activity as the Association’s market and, thus, are subject to the same type of acquisition speculation that may influence the Company’s stock. However, since converting thrifts are subject to a three-year regulatory moratorium from being acquired, acquisition speculation in the Company’s stock would tend to be less compared to the stocks of the Peer Group companies. Furthermore, in comparison to the stocks of the fully-converted Peer Group companies, the degree of acquisition speculation in the Company’s stock is also viewed to be relatively more limited since there will be fewer potential acquirers for the Company’s stock as a re-mutualization transaction can only be completed by a mutual institution or an institution in the MHC form of ownership. Additionally, there tends to be less acquisition speculation in the stocks of publicly-traded MHCs in general, given the majority of the shares are held by the MHC rather than public shareholders which own 100% of the stocks of the fully-converted Peer Group companies. Accordingly, the Peer Group companies are considered to be subject to a greater degree of acquisition speculation relative to the acquisition speculation that may influence the Company’s trading price.
* * * * * * * * * * *
In determining our valuation adjustment for marketing of the issue, we considered trends in both the overall thrift market, the new issue market including the new issue market for MHC shares and the local acquisition market for thrift stocks. Taking these factors and trends into account, RP Financial concluded that no adjustment was appropriate in the valuation analysis for purposes of marketing of the issue.
Seneca Federal’s management team appears to have experience and expertise in all of the key areas of the Association’s operations. Exhibit IV-5 provides summary resumes of Seneca Federal’s Board of Directors and senior management. While the Association does not have the resources to develop a great deal of management depth, given its asset size and the impact it would have on operating expenses, management and the Board have been effective in
| RP® Financial, LC. | VALUATION ANALYSIS
IV.17 |
implementing an operating strategy that can be well managed by the Association’s present organizational structure. The Association currently does not have any senior management positions that are vacant.
Similarly, the returns, capital positions and other operating measures of the Peer Group companies are indicative of well-managed financial institutions, which have Boards and management teams that have been effective in implementing competitive operating strategies. Therefore, on balance, we concluded no valuation adjustment relative to the Peer Group was appropriate for this factor.
| 9. | Effect of Government Regulation and Regulatory Reform |
In summary, as a federally-insured savings institution operating in the MHC form of ownership, Seneca Federal will be operating in substantially the same regulatory environment as the Peer Group members — all of whom are adequately capitalized institutions and the substantial majority are operating with no apparent restrictions. Exhibit IV-6 reflects the Association’s pro forma regulatory capital ratios. Accordingly, no adjustment has been applied for the effect of government regulation and regulatory reform.
Summary of Adjustments
Overall, based on the factors discussed above, we concluded that the Association’s pro forma market value should reflect the following valuation adjustments relative to the Peer Group:
| Key Valuation Parameters: | | Valuation Adjustment |
| | | |
| Financial Condition | | No Adjustment |
| Profitability, Growth and Viability of Earnings | | Slight Downward |
| Asset Growth | | No Adjustment |
| Primary Market Area | | No Adjustment |
| Dividends | | Slight Downward |
| Liquidity of the Shares | | Slight Downward |
| Marketing of the Issue | | No Adjustment |
| Management | | No Adjustment |
| Effect of Government Regulations and Regulatory Reform | | No Adjustment |
| RP® Financial, LC. | VALUATION ANALYSIS
IV.18 |
Valuation Approaches: Fully-Converted Basis
In applying the accepted valuation methodology promulgated by the OCC and the FRB, i.e., the pro forma market value approach, we considered the three key pricing ratios in valuing the Company’s to-be-issued stock — price/earnings ("P/E"), price/book ("P/B"), and price/assets ("P/A") approaches — all performed on a pro forma basis including the effects of the stock proceeds. In computing the pro forma impact of the conversion and the related pricing ratios, we have incorporated the valuation parameters disclosed in the Company’s prospectus for reinvestment rate, effective tax rate, stock benefit plan assumptions and offering expenses (summarized in Exhibits IV-9 and IV-10). The assumptions utilized in the pro forma analysis in calculating the Association’s full conversion value were consistent with the assumptions utilized for the minority stock offering (summarized in Exhibits IV-7 and IV-8).
In our estimate of value, we assessed the relationship of the pro forma pricing ratios relative to the Peer Group, recent conversions and publicly-traded MHCs on a fully-converted basis.
RP Financial's valuation placed an emphasis on the following:
| · | P/E Approach. The P/E approach is generally the best indicator of long-term value for a stock. At the same time, recognizing that (1) the earnings multiples will be evaluated on a pro forma fully-converted basis for the Association; and (2) the Peer Group on average has had the opportunity to realize the benefit of reinvesting net conversion proceeds, we also gave weight to the other valuation approaches. |
| · | P/B Approach. P/B ratios have generally served as a useful benchmark in the valuation of thrift stocks, particularly in the context of an initial public offering, as the earnings approach involves assumptions regarding the use of proceeds. RP Financial considered the P/B approach to be a valuable indicator of pro forma value taking into account the pricing ratios under the P/E and P/A approaches. We have also modified the P/B approach to exclude the impact of intangible assets (i.e., price/tangible book value or “P/TB”), in that the investment community frequently makes this adjustment in its evaluation of this pricing approach. |
| · | P/A Approach. P/A ratios are generally a less reliable indicator of market value, as investors typically assign less weight to assets and attribute greater weight to book value and earnings. Furthermore, this approach as set forth in the regulatory valuation guidelines does not take into account the amount of stock purchases funded by deposit withdrawals, thus understating the pro forma P/A ratio. At the same time, the P/A ratio is an indicator of franchise value, and, in the case of highly capitalized institutions, high P/A ratios may limit the investment community's |
| RP® Financial, LC. | VALUATION ANALYSIS
IV.19 |
willingness to pay market multiples for earnings or book value when ROE is expected to be low.
The Association will adopt “Employers’ Accounting for Employee Stock Ownership Plans” (“ASC 718-40”), which will cause earnings per share computations to be based on shares issued and outstanding excluding unreleased ESOP shares. For purposes of preparing the pro forma pricing analyses, we have reflected all shares issued in the offering, including all ESOP shares, to capture the full dilutive impact, particularly since the ESOP shares are economically dilutive, receive dividends and can be voted. However, we did consider the impact of ASC 718-40 in the valuation.
Based on the application of the three valuation approaches, taking into consideration the valuation adjustments discussed above, RP Financial concluded that as of May 12, 2017, the pro forma market value of Seneca Federal’s full conversion offering equaled $15,000,000 at the midpoint, equal to 1,500,000 shares at $10.00 per share.
Basis of Valuation - Fully-Converted Pricing Ratios
1. Price-to-Earnings ("P/E"). The application of the P/E valuation method requires calculating the Association’s pro forma market value by applying a valuation P/E multiple (fully-converted basis) to the pro forma earnings base. In applying this technique, we considered both reported earnings and a recurring earnings base, that is, earnings adjusted to exclude any one-time non-operating items, plus the estimated after-tax earnings benefit of the reinvestment of the net proceeds. The Association’s reported earnings equaled $600,000 for the twelve months ended March 31, 2017. In deriving Seneca Federal’s core earnings, the only adjustments made to reported earnings were to eliminate gains on sale of fixed assets and investment securities, which equaled $158,000 and $90,000, respectively, for the twelve months ended March 31, 2017. As shown below, on a tax effected basis, assuming an effective marginal tax rate of 34.0% for the earnings adjustments, the Association’s core earnings were determined to equal $437,000 for the twelve months ended March 31, 2017.
| RP® Financial, LC. | VALUATION ANALYSIS
IV.20 |
| | | Amount | |
| | | ($000) | |
| | | | |
| Net income(loss) | | $ | 600 | |
| Deduct: Gain on sale of fixed assets(1) | | | (104 | ) |
| Deduct: Gains on sale of investment securities(1) | | | (59 | ) |
| Core earnings estimate | | $ | 437 | |
(1) Tax effected at 34.0%.
Based on Seneca Federal’s reported and core earnings and incorporating the impact of the pro forma assumptions discussed previously, the Association’s pro forma reported and core P/E multiples (fully-converted basis) at the $15.0 million midpoint value equaled 26.28 times and 36.78 times, respectively, which provided for a discount of 13.15% and a premium of 76.83% relative to the Peer Group's average reported and core P/E multiples of 30.26 times and 20.80 times, respectively (see Table 4.4). In comparison to the Peer Group’s median reported and core earnings multiples which equaled 28.47 times and 20.27 times, respectively, the Association’s pro forma reported and core P/E multiples (fully-converted basis) at the midpoint value indicated a discount of 7.69% and a premium of 81.45%, respectively. The Association’s pro forma P/E ratios based on reported earnings at the minimum equaled 22.25 times and at the super maximum equaled 35.05 times, and based on core earnings at the minimum and the super maximum equaled 31.09 times and 49.23 times, respectively.
On an MHC reported basis, the Association’s reported and core P/E multiples at the midpoint value of $15.0 million equaled 26.24 times and 36.71 times, respectively (see Table 4.5). The Association’s reported and core P/E multiples provided for a discount of 13.28% and a premium of 76.49% relative to the Peer Group’s average reported and core P/E multiples of 30.26 times and 20.80 times, respectively. In comparison to the Peer Group’s median reported and core earnings multiples which equaled 28.47 times and 20.27 times, respectively, the Association’s pro forma reported and core P/E multiples (MHC basis) at the midpoint value indicated a discount of 7.83% and a premium of 81.11%, respectively. The Association’s pro forma P/E ratios (MHC basis) based on reported earnings at the minimum equaled 22.23 times and at the super maximum equaled 34.97 times, and based on core earnings at the minimum and the super maximum equaled 31.06 times and 49.06 times, respectively.
2. Price-to-Book ("P/B"). The application of the P/B valuation method requires calculating the Association’s pro forma market value by applying a valuation P/B ratio, as derived from the Peer Group’s P/B ratio, to Seneca Federal’s pro forma book value (fully-
| RP® Financial, LC. | VALUATION ANALYSIS
IV.21 |
Table 4.4
Fully-Converted Market Pricing Versus Peer Group
Seneca Federal Savings and Loan Association
As of May 12, 2017
| | | | | | | Market | | | Per Share Data | | | | | | | | | | | | | | | | | | | | | | | | | | | | | | | | | | | | | | | | | | | | | | | | | |
| | | | | | | Capitalization | | | Core | | | Book | | | | | | | | | | | | | | | | | | Dividends(3) | | | Financial Characteristics(5) | |
| | | | | | | Price/ | | | Market | | | 12 Month | | | Value/ | | | Pricing Ratios(2) | | | Amount/ | | | | | | Payout | | | Total | | | Comm Eq./ | | | Comm T. Eq./ | | | NPAs/ | | | Reported | | | Core | |
| | | | | Share | | | Value | | | EPS(1) | | | Share | | | P/E | | | P/B | | | P/A | | | P/TB | | | P/Core | | | Share | | | Yield | | | Ratio(4) | | | Assets | | | Assets | | | Assets | | | Assets | | | ROAA | | | ROAE | | | ROAA | | | ROAE | |
| | | | | | | ($) | | | ($Mil) | | | ($) | | | ($) | | | (x) | | | (%) | | | (%) | | | (%) | | | (x) | | | ($) | | | (%) | | | (%) | | | ($Mil) | | | (%) | | | (%) | | | (%) | | | (%) | | | (%) | | | (%) | | | (%) | |
| Seneca FS & LA | | NY | | | | | | | | | | | | | | | | | | | | | | | | | | | | | | | | | | | | | | | | | | | | | | | | | | | | | | | | | | | | | | | | | | | | | | | | | | | | | | | | |
| Super Maximum | | | | $ | 10.00 | | | $ | 19.84 | | | $ | 0.20 | | | $ | 13.78 | | | | 35.05 | x | | | 72.57 | % | | | 10.80 | % | | | 72.57 | % | | | 49.23 | x | | $ | 0.00 | | | | 0.00 | % | | | 0.00 | % | | $ | 184 | | | | 14.89 | % | | | 14.89 | % | | | 0.59 | % | | | 0.31 | % | | | 2.07 | % | | | 0.22 | % | | | 1.47 | % |
| Maximum | | | | $ | 10.00 | | | $ | 17.25 | | | $ | 0.24 | | | $ | 14.53 | | | | 30.34 | x | | | 68.82 | % | | | 9.51 | % | | | 68.82 | % | | | 42..53 | | | $ | 0.00 | | | | 0.00 | % | | | 0.00 | % | | $ | 181 | | | | 13.82 | % | | | 13.82 | % | | | 0.59 | % | | | 0.31 | % | | | 2.27 | % | | | 0.22 | % | | | 1.62 | % |
| Midpoint | | | | $ | 10.00 | | | $ | 15.00 | | | $ | 0.27 | | | $ | 15.39 | | | | 26.28 | x | | | 64.98 | % | | | 8.36 | % | | | 64.98 | % | | | 36.78 | x | | $ | 0.00 | | | | 0.00 | % | | | 0.00 | % | | $ | 179 | | | | 12.87 | % | | | 12.87 | % | | | 0.60 | % | | | 0.32 | % | | | 2.47 | % | | | 0.23 | % | | | 1.77 | % |
| Minimum | | | | $ | 10.00 | | | $ | 12.75 | | | $ | 0.32 | | | $ | 16.55 | | | | 22.25 | x | | | 60.42 | % | | | 7.19 | % | | | 60.42 | % | | | 31.09 | x | | $ | 0.00 | | | | 0.00 | % | | | 0.00 | % | | $ | 177 | | | | 11.89 | % | | | 11.89 | % | | | 0.61 | % | | | 0.32 | % | | | 2.72 | % | | | 0.23 | % | | | 1.94 | % |
| | | | | | | | | | | | | | | | | | | | | | | | | | | | | | | | | | | | | | | | | | | | | | | | | | | | | | | | | | | | | | | | | | | | | | | | | | | | | | | | | | | | | |
| All Non-MHC Public Companies(6) | | | | | | | | | | | | | | | | | | | | | | | | | | | | | | | | | | | | | | | | | | | | | | | | | | | | | | | | | | | | | | | | | | | | | | | | | | | | | | | | | | |
| Averages | | | | $ | 22.35 | | | $ | 546.69 | | | $ | 1.03 | | | $ | 16.64 | | | | 20.24 | x | | | 131.15 | % | | | 15.96 | % | | | 145.09 | % | | | 20.83 | x | | $ | 0.37 | | | | 1.66 | % | | | 56.54 | % | | $ | 3,327 | | | | 12.60 | % | | | 11.54 | % | | | 0.96 | % | | | 0.74 | % | | | 6.30 | % | | | 0.74 | % | | | 6.12 | % |
| Median | | | | $ | 17.55 | | | $ | 161.01 | | | $ | 0.77 | | | $ | 14.81 | | | | 18.98 | x | | | 126.65 | % | | | 15.60 | % | | | 130.77 | % | | | 20.11 | x | | $ | 0.26 | | | | 1.36 | % | | | 45.58 | % | | $ | 1,081 | | | | 11.57 | % | | | 10.67 | % | | | 0.84 | % | | | 0.63 | % | | | 5.99 | % | | | 0.64 | % | | | 5.68 | % |
| | | | | | | | | | | | | | | | | | | | | | | | | | | | | | | | | | | | | | | | | | | | | | | | | | | | | | | | | | | | | | | | | | | | | | | | | | | | | | | | | | | | | |
| All Non-MHC State of NY(6) | | | | | | | | | | | | | | | | | | | | | | | | | | | | | | | | | | | | | | | | | | | | | | | | | | | | | | | | | | | | | | | | | | | | | | | | | | | | | | | | | | |
| Averages | | | | $ | 13.92 | | | $ | 1,036.74 | | | $ | 0.62 | | | $ | 11.62 | | | | 20.01 | x | | | 132.83 | % | | | 11.76 | % | | | 152.19 | % | | | 19.93 | x | | $ | 0.44 | | | | 2.90 | % | | | 57.51 | % | | $ | 7,945 | | | | 9.55 | % | | | 8.49 | % | | | 0.81 | % | | | 0.53 | % | | | 5.26 | % | | | 0.54 | % | | | 5.30 | % |
| Medians | | | | $ | 15.00 | | | $ | 184.45 | | | $ | 0.72 | | | $ | 13.98 | | | | 17.82 | x | | | 121.89 | % | | | 12.29 | % | | | 166.08 | % | | | 17.75 | x | | $ | 0.41 | | | | 3.14 | % | | | 61.54 | % | | $ | 1,105 | | | | 9.19 | % | | | 8.31 | % | | | 0.54 | % | | | 0.58 | % | | | 6.04 | % | | | 0.71 | % | | | 7.36 | % |
| | | | | | | | | | | | | | | | | | | | | | | | | | | | | | | | | | | | | | | | | | | | | | | | | | | | | | | | | | | | �� | | | | | | | | | | | | | | | | | | | | | | | | | |
| Comparable Group | | | | | | | | | | | | | | | | | | | | | | | | | | | | | | | | | | | | | | | | | | | | | | | | | | | | | | | | | | | | | | | | | | | | | | | | | | | | | | | | | | |
| Averages | | | | $ | 18.39 | | | $ | 58.34 | | | $ | 0.74 | | | $ | 17.48 | | | | 30.26 | x | | | 104.94 | % | | | 14.78 | % | | | 108.93 | % | | | 20.80 | x | | $ | 0.30 | | | | 1.28 | % | | | 27.43 | % | | $ | 395 | | | | 14.03 | % | | | 13.59 | % | | | 1.25 | % | | | 0.53 | % | | | 3.74 | % | | | 0.51 | % | | | 3.60 | % |
| Medians | | | | $ | 17.03 | | | $ | 53.38 | | | $ | 0.45 | | | $ | 16.71 | | | | 28.47 | x | | | 102.40 | % | | | 15.71 | % | | | 105.59 | % | | | 20.27 | x | | $ | 0.20 | | | | 1.30 | % | | | 26.17 | % | | $ | 414 | | | | 14.94 | % | | | 14.69 | % | | | 1.11 | % | | | 0.47 | % | | | 3.23 | % | | | 0.46 | % | | | 3.07 | % |
| | | | | | | | | | | | | | | | | | | | | | | | | | | | | | | | | | | | | | | | | | | | | | | | | | | | | | | | | | | | | | | | | | | | | | | | | | | | | | | | | | | | | |
| Comparable Group | | | | | | | | | | | | | | | | | | | | | | | | | | | | | | | | | | | | | | | | | | | | | | | | | | | | | | | | | | | | | | | | | | | | | | | | | | | | | | | | | | |
| EQFN | | Equitable Financial Corp. | | NE | | $ | 10.25 | | | $ | 35.18 | | | $ | 0.35 | | | $ | 10.44 | | | | 30.15 | x | | | 98.19 | % | | | 14.58 | % | | | 98.19 | % | | | 29.55 | x | | $ | 0.00 | | | | 0.00 | % | | | 0.00 | % | | $ | 241 | | | | 14.85 | % | | | 14.85 | % | | | NA | | | | 0.50 | % | | | 3.23 | % | | | 0.51 | % | | | 3.30 | % |
| HBK | | Hamilton Bancorp, Inc. | | MD | | $ | 15.16 | | | $ | 51.67 | | | $ | 0.17 | | | $ | 17.77 | | | | NM | | | | 85.27 | % | | | 10.34 | % | | | 100.88 | % | | | NM | | | $ | 0.00 | | | | 0.00 | % | | | 0.00 | % | | $ | 500 | | | | 12.14 | % | | | 10.46 | % | | | 1.08 | % | | | 0.03 | % | | | 0.27 | % | | | 0.11 | % | | | 0.90 | % |
| JXSB | | Jacksonville Bancorp, Inc. | | IL | | $ | 30.50 | | | $ | 55.10 | | | $ | 1.50 | | | $ | 26.32 | | | | 18.37 | x | | | 115.88 | % | | | 17.35 | % | | | 122.95 | % | | | 20.27 | x | | $ | 0.40 | | | | 1.36 | % | | | 24.10 | % | | $ | 318 | | | | 14.94 | % | | | 14.20 | % | | | 1.11 | % | | | 0.94 | % | | | 6.32 | % | | | 0.86 | % | | | 5.73 | % |
| MELR | | Melrose Bancorp, Inc. | | MA | | $ | 16.80 | | | $ | 43.71 | | | $ | 0.32 | | | $ | 16.64 | | | | 28.47 | x | | | 100.95 | % | | | 16.27 | % | | | 100.95 | % | | | NM | | | $ | 0.00 | | | | 0.00 | % | | | 0.00 | % | | $ | 269 | | | | 16.12 | % | | | 16.12 | % | | | 0.00 | % | | | 0.56 | % | | | 3.23 | % | | | 0.30 | % | | | 1.75 | % |
| MSBF | | MSB Financial Corp. | | NJ | | $ | 17.25 | | | $ | 98.83 | | | $ | 0.28 | | | $ | 12.93 | | | | 61.61 | x | | | 133.43 | % | | | 20.51 | % | | | 133.43 | % | | | NM | | | $ | 0.00 | | | | 0.00 | % | | | 0.00 | % | | $ | 482 | | | | 15.37 | % | | | 15.37 | % | | | 3.30 | % | | | 0.37 | % | | | 2.08 | % | | | 0.37 | % | | | 2.08 | % |
| PBBI | | PB Bancorp, Inc. | | CT | | $ | 10.40 | | | $ | 81.44 | | | $ | 0.22 | | | $ | 10.72 | | | | 40.00 | x | | | 97.00 | % | | | 15.93 | % | | | 105.69 | % | | | NM | | | $ | 0.16 | | | | 1.54 | % | | | 50.00 | % | | $ | 511 | | | | 16.44 | % | | | 15.29 | % | | | 1.20 | % | | | 0.37 | % | | | 2.24 | % | | | 0.31 | % | | | 1.84 | % |
| PBSK | | Poage Bankshares, Inc. | | KY | | $ | 19.41 | | | $ | 71.36 | | | $ | 0.55 | | | $ | 18.69 | | | | 39.60 | x | | | 103.84 | % | | | 15.49 | % | | | 107.27 | % | | | NM | | | $ | 0.24 | | | | 1.24 | % | | | 57.14 | % | | $ | 461 | | | | 14.94 | % | | | 14.53 | % | | | 2.00 | % | | | 0.39 | % | | | 2.51 | % | | | 0.44 | % | | | 2.84 | % |
| WAYN | | Wayne Savings Bancshares, Inc. | | OH | | $ | 17.71 | | | $ | 49.27 | | | $ | 0.77 | | | $ | 14.88 | | | | 23.00 | x | | | 119.01 | % | | | 10.98 | % | | | 124.17 | % | | | 23.00 | x | | $ | 0.36 | | | | 2.03 | % | | | 46.75 | % | | $ | 449 | | | | 9.23 | % | | | 8.88 | % | | | 0.92 | % | | | 0.47 | % | | | 5.12 | % | | | 0.47 | % | | | 5.12 | % |
| WBKC | | Wolverine Bancorp, Inc. | | MI | | $ | 31.29 | | | $ | 65.89 | | | $ | 2.35 | | | $ | 29.66 | | | | 13.31 | x | | | 105.48 | % | | | 17.37 | % | | | 105.48 | % | | | 13.31 | x | | $ | 1.60 | | | | 5.04 | % | | | 68.09 | % | | $ | 379 | | | | 16.47 | % | | | 16.47 | % | | | 1.60 | % | | | 1.21 | % | | | 7.58 | % | | | 1.21 | % | | | 7.58 | % |
| WVFC | | WVS Financial Corp. | | PA | | $ | 15.15 | | | $ | 30.89 | | | $ | 0.85 | | | $ | 16.78 | | | | 17.82 | x | | | 90.29 | % | | | 8.96 | % | | | 90.29 | % | | | 17.89 | x | | $ | 0.24 | | | | 1.58 | % | | | 28.24 | % | | $ | 345 | | | | 9.77 | % | | | 9.77 | % | | | 0.07 | % | | | 0.48 | % | | | 4.86 | % | | | 0.47 | % | | | 4.84 | % |
| (1) | Core income, on a diluted per-share basis. Core income is net income after taxes and before extraordinary items, less net income attributable to noncontrolling interest, gain on the sale of securities, amortization of intangibles, goodwill and nonrecurring items. Assumed tax rate is 35%. |
| (2) | P/E = Price to earnings; P/B = Price to book; P/A = Price to assets; P/TB = Price to tangible book value; and P/Core = Price to core earnings. P/E and P/Core =NM if the ratio is negative or above 35x. |
| (3) | Indicated 12 month dividend, based on last quarterly dividend declared. |
| (4) | Indicated 12 month dividend as a percent of trailing 12 month earnings. |
| (5) | Equity and tangible equity equal common equity and tangible common equity, respectively. ROAA (return on average assets) and ROAE (return on average equity) are indicated ratios based on trailing 12 month earnings and average equity and assets balances. |
| (6) | Excludes from averages and medians those companies the subject of actual or rumored acquisition activities or unusual operating characteristics. |
| Source: | SNL Financial, LC. and RP Financial, LC. calculations. The information provided in this report has been obtained from sources we believe are reliable, but we cannot guarantee the accuracy or completeness of such information. |
Copyright (c) 2017 by RP® Financial, LC.
| RP® Financial, LC. | VALUATION ANALYSIS
IV.22 |
Table 4.5
MHC Market Pricing Versus Peer Group
Seneca Federal Savings and Loan Association
As of May 12, 2017
| | | | | | | Market | | | Per Share Data | | | | | | | | | | | | | | | | | | | | | | | | | | | | | | | | | | | | | | | | | | | | | | | | | |
| | | | | | | Capitalization | | | Core | | | Book | | | | | | | | | | | | | | | | | | Dividends(3) | | | Financial Characteristics(5) | |
| | | | | | | Price/ | | | Market | | | 12 Month | | | Value/ | | | Pricing Ratios(2) | | | Amount/ | | | | | | Payout | | | Total | | | Comm Eq./ | | | Comm T. Eq./ | | | NPAs/ | | | Reported | | | Core | |
| | | | | Share | | | Value | | | EPS(1) | | | Share | | | P/E | | | P/B | | | P/A | | | P/TB | | | P/Core | | | Share | | | Yield | | | Ratio(4) | | | Assets | | | Assets | | | Assets | | | Assets | | | ROAA | | | ROAE | | | ROAA | | | ROAE | |
| | | | | | | ($) | | | ($Mil) | | | ($) | | | ($) | | | (x) | | | (%) | | | (%) | | | (%) | | | (x) | | | ($) | | | (%) | | | (%) | | | ($Mil) | | | (%) | | | (%) | | | (%) | | | (%) | | | (%) | | | (%) | | | (%) | |
| Seneca FS & LA | | NY | | | | | | | | | | | | | | | | | | | | | | | | | | | | | | | | | | | | | | | | | | | | | | | | | | | | | | | | | | | | | | | | | | | | | | | | | | | | | | | | |
| Super Maximum | | | | $ | 10.00 | | | $ | 9.13 | | | $ | 0.29 | | | $ | 8.95 | | | | 34.97 | x | | | 111.73 | % | | | 11.40 | % | | | 111.73 | % | | | 49.06 | x | | $ | 0.00 | | | | 0.00 | % | | | 0.00 | % | | $ | 174 | | | | 10.19 | % | | | 10.19 | % | | | 0.62 | % | | | 0.33 | % | | | 3.20 | % | | | 0.23 | % | | | 2.28 | % |
| Maximum | | | | $ | 10.00 | | | $ | 7.94 | | | $ | 0.33 | | | $ | 9.68 | | | | 30.28 | x | | | 103.31 | % | | | 9.97 | % | | | 103.31 | % | | | 42.43 | x | | $ | 0.00 | | | | 0.00 | % | | | 0.00 | % | | $ | 173 | | | | 9.65 | % | | | 9.65 | % | | | 0.62 | % | | | 0.33 | % | | | 3.41 | % | | | 0.23 | % | | | 2.43 | % |
| Midpoint | | | | $ | 10.00 | | | $ | 6.90 | | | $ | 0.38 | | | $ | 10.53 | | | | 26.24 | x | | | 94.97 | % | | | 8.71 | % | | | 94.97 | % | | | 36.71 | x | | $ | 0.00 | | | | 0.00 | % | | | 0.00 | % | | $ | 172 | | | | 9.18 | % | | | 9.18 | % | | | 0.63 | % | | | 0.33 | % | | | 3.62 | % | | | 0.24 | % | | | 2.59 | % |
| Minimum | | | | $ | 10.00 | | | $ | 5.87 | | | $ | 0.45 | | | $ | 11.69 | | | | 22.23 | x | | | 85.54 | % | | | 7.45 | % | | | 85.54 | % | | | 31.06 | x | | $ | 0.00 | | | | 0.00 | % | | | 0.00 | % | | $ | 171 | | | | 8.70 | % | | | 8.70 | % | | | 0.63 | % | | | 0.33 | % | | | 3.85 | % | | | 0.24 | % | | | 2.76 | % |
| | | | | | | | | | | | | | | | | | | | | | | | | | | | | | | | | | | | | | | | | | | | | | | | | | | | | | | | | | | | | | | | | | | | | | | | | | | | | | | | | | | | | |
| All Non-MHC Public Companies(6) | | | | | | | | | | | | | | | | | | | | | | | | | | | | | | | | | | | | | | | | | | | | | | | | | | | | | | | | | | | | | | | | | | | | | | | | | | | | | | | | | | |
| Averages | | | | $ | 22.35 | | | $ | 546.69 | | | $ | 1.03 | | | $ | 16.64 | | | | 20.24 | x | | | 131.15 | % | | | 15.96 | % | | | 145.09 | % | | | 20.83 | x | | $ | 0.37 | | | | 1.66 | % | | | 56.54 | % | | $ | 3,327 | | | | 12.60 | % | | | 11.54 | % | | | 0.96 | % | | | 0.74 | % | | | 6.30 | % | | | 0.74 | % | | | 6.12 | % |
| Median | | | | $ | 17.55 | | | $ | 161.01 | | | $ | 0.77 | | | $ | 14.81 | | | | 18.98 | x | | | 126.65 | % | | | 15.60 | % | | | 130.77 | % | | | 20.11 | x | | $ | 0.26 | | | | 1.36 | % | | | 45.58 | % | | $ | 1,081 | | | | 11.57 | % | | | 10.67 | % | | | 0.84 | % | | | 0.63 | % | | | 5.99 | % | | | 0.64 | % | | | 5.68 | % |
| | | | | | | | | | | | | | | | | | | | | | | | | | | | | | | | | | | | | | | | | | | | | | | | | | | | | | | | | | | | | | | | | | | | | | | | | | | | | | | | | | | | | |
| All Non-MHC State of NY(6) | | | | | | | | | | | | | | | | | | | | | | | | | | | | | | | | | | | | | | | | | | | | | | | | | | | | | | | | | | | | | | | | | | | | | | | | | | | | | | | | | | |
| Averages | | | | $ | 13.92 | | | $ | 1,036.74 | | | $ | 0.62 | | | $ | 11.62 | | | | 20.01 | x | | | 132.83 | % | | | 11.76 | % | | | 152.19 | % | | | 19.93 | x | | $ | 0.44 | | | | 2.90 | % | | | 57.51 | % | | $ | 7,945 | | | | 9.55 | % | | | 8.49 | % | | | 0.81 | % | | | 0.53 | % | | | 5.26 | % | | | 0.54 | % | | | 5.30 | % |
| Medians | | | | $ | 15.00 | | | $ | 184.45 | | | $ | 0.72 | | | $ | 13.98 | | | | 17.82 | x | | | 121.89 | % | | | 12.29 | % | | | 166.08 | % | | | 17.75 | x | | $ | 0.41 | | | | 3.14 | % | | | 61.54 | % | | $ | 1,105 | | | | 9.19 | % | | | 8.31 | % | | | 0.54 | % | | | 0.58 | % | | | 6.04 | % | | | 0.71 | % | | | 7.36 | % |
| | | | | | | | | | | | | | | | | | | | | | | | | | | | | | | | | | | | | | | | | | | | | | | | | | | | | | | | | | | | | | | | | | | | | | | | | | | | | | | | | | | | | |
| Comparable Group | | | | | | | | | | | | | | | | | | | | | | | | | | | | | | | | | | | | | | | | | | | | | | | | | | | | | | | | | | | | | | | | | | | | | | | | | | | | | | | | | | |
| Averages | | | | $ | 18.39 | | | $ | 58.34 | | | $ | 0.74 | | | $ | 17.48 | | | | 30.26 | x | | | 104.94 | % | | | 14.78 | % | | | 108.93 | % | | | 20.80 | x | | $ | 0.30 | | | | 1.28 | % | | | 27.43 | % | | $ | 395 | | | | 14.03 | % | | | 13.59 | % | | | 1.25 | % | | | 0.53 | % | | | 3.74 | % | | | 0.51 | % | | | 3.60 | % |
| Medians | | | | $ | 17.03 | | | $ | 53.38 | | | $ | 0.45 | | | $ | 16.71 | | | | 28.47 | x | | | 102.40 | % | | | 15.71 | % | | | 105.59 | % | | | 20.27 | x | | $ | 0.20 | | | | 1.30 | % | | | 26.17 | % | | $ | 414 | | | | 14.94 | % | | | 14.69 | % | | | 1.11 | % | | | 0.47 | % | | | 3.23 | % | | | 0.46 | % | | | 3.07 | % |
| | | | | | | | | | | | | | | | | | | | | | | | | | | | | | | | | | | | | | | | | | | | | | | | | | | | | | | | | | | | | | | | | | | | | | | | | | | | | | | | | | | | | |
| Comparable Group | | | | | | | | | | | | | | | | | | | | | | | | | | | | | | | | | | | | | | | | | | | | | | | | | | | | | | | | | | | | | | | | | | | | | | | | | | | | | | | | | | |
| EQFN | | Equitable Financial Corp. | | NE | | $ | 10.25 | | | $ | 35.18 | | | $ | 0.35 | | | $ | 10.44 | | | | 30.15 | x | | | 98.19 | % | | | 14.58 | % | | | 98.19 | % | | | 29.55 | x | | $ | 0.00 | | | | 0.00 | % | | | 0.00 | % | | $ | 241 | | | | 14.85 | % | | | 14.85 | % | | | NA | | | | 0.50 | % | | | 3.23 | % | | | 0.51 | % | | | 3.30 | % |
| HBK | | Hamilton Bancorp, Inc. | | MD | | $ | 15.16 | | | $ | 51.67 | | | $ | 0.17 | | | $ | 17.77 | | | | NM | | | | 85.27 | % | | | 10.34 | % | | | 100.88 | % | | | NM | | | $ | 0.00 | | | | 0.00 | % | | | 0.00 | % | | $ | 500 | | | | 12.14 | % | | | 10.46 | % | | | 1.08 | % | | | 0.03 | % | | | 0.27 | % | | | 0.11 | % | | | 0.90 | % |
| JXSB | | Jacksonville Bancorp, Inc. | | IL | | $ | 30.50 | | | $ | 55.10 | | | $ | 1.50 | | | $ | 26.32 | | | | 18.37 | x | | | 115.88 | % | | | 17.35 | % | | | 122.95 | % | | | 20.27 | x | | $ | 0.40 | | | | 1.36 | % | | | 24.10 | % | | $ | 318 | | | | 14.94 | % | | | 14.20 | % | | | 1.11 | % | | | 0.94 | % | | | 6.32 | % | | | 0.86 | % | | | 5.73 | % |
| MELR | | Melrose Bancorp, Inc. | | MA | | $ | 16.80 | | | $ | 43.71 | | | $ | 0.32 | | | $ | 16.64 | | | | 28.47 | x | | | 100.95 | % | | | 16.27 | % | | | 100.95 | % | | | NM | | | $ | 0.00 | | | | 0.00 | % | | | 0.00 | % | | $ | 269 | | | | 16.12 | % | | | 16.12 | % | | | 0.00 | % | | | 0.56 | % | | | 3.23 | % | | | 0.30 | % | | | 1.75 | % |
| MSBF | | MSB Financial Corp. | | NJ | | $ | 17.25 | | | $ | 98.83 | | | $ | 0.28 | | | $ | 12.93 | | | | 61.61 | x | | | 133.43 | % | | | 20.51 | % | | | 133.43 | % | | | NM | | | $ | 0.00 | | | | 0.00 | % | | | 0.00 | % | | $ | 482 | | | | 15.37 | % | | | 15.37 | % | | | 3.30 | % | | | 0.37 | % | | | 2.08 | % | | | 0.37 | % | | | 2.08 | % |
| PBBI | | PB Bancorp, Inc. | | CT | | $ | 10.40 | | | $ | 81.44 | | | $ | 0.22 | | | $ | 10.72 | | | | 40.00 | x | | | 97.00 | % | | | 15.93 | % | | | 105.69 | % | | | NM | | | $ | 0.16 | | | | 1.54 | % | | | 50.00 | % | | $ | 511 | | | | 16.44 | % | | | 15.29 | % | | | 1.20 | % | | | 0.37 | % | | | 2.24 | % | | | 0.31 | % | | | 1.84 | % |
| PBSK | | Poage Bankshares, Inc. | | KY | | $ | 19.41 | | | $ | 71.36 | | | $ | 0.55 | | | $ | 18.69 | | | | 39.60 | x | | | 103.84 | % | | | 15.49 | % | | | 107.27 | % | | | NM | | | $ | 0.24 | | | | 1.24 | % | | | 57.14 | % | | $ | 461 | | | | 14.94 | % | | | 14.53 | % | | | 2.00 | % | | | 0.39 | % | | | 2.51 | % | | | 0.44 | % | | | 2.84 | % |
| WAYN | | Wayne Savings Bancshares, Inc. | | OH | | $ | 17.71 | | | $ | 49.27 | | | $ | 0.77 | | | $ | 14.88 | | | | 23.00 | x | | | 119.01 | % | | | 10.98 | % | | | 124.17 | % | | | 23.00 | x | | $ | 0.36 | | | | 2.03 | % | | | 46.75 | % | | $ | 449 | | | | 9.23 | % | | | 8.88 | % | | | 0.92 | % | | | 0.47 | % | | | 5.12 | % | | | 0.47 | % | | | 5.12 | % |
| WBKC | | Wolverine Bancorp, Inc. | | MI | | $ | 31.29 | | | $ | 65.89 | | | $ | 2.35 | | | $ | 29.66 | | | | 13.31 | x | | | 105.48 | % | | | 17.37 | % | | | 105.48 | % | | | 13.31 | x | | $ | 1.60 | | | | 5.04 | % | | | 68.09 | % | | $ | 379 | | | | 16.47 | % | | | 16.47 | % | | | 1.60 | % | | | 1.21 | % | | | 7.58 | % | | | 1.21 | % | | | 7.58 | % |
| WVFC | | WVS Financial Corp. | | PA | | $ | 15.15 | | | $ | 30.89 | | | $ | 0.85 | | | $ | 16.78 | | | | 17.82 | x | | | 90.29 | % | | | 8.96 | % | | | 90.29 | % | | | 17.89 | x | | $ | 0.24 | | | | 1.58 | % | | | 28.24 | % | | $ | 345 | | | | 9.77 | % | | | 9.77 | % | | | 0.07 | % | | | 0.48 | % | | | 4.86 | % | | | 0.47 | % | | | 4.84 | % |
| (1) | Core income, on a diluted per-share basis. Core income is net income after taxes and before extraordinary items, less net income attributable to noncontrolling interest, gain on the sale of securities, amortization of intangibles, goodwill and nonrecurring items. Assumed tax rate is 35%. |
| (2) | P/E = Price to earnings; P/B = Price to book; P/A = Price to assets; P/TB = Price to tangible book value; and P/Core = Price to core earnings. P/E and P/Core =NM if the ratio is negative or above 35x. |
| (3) | Indicated 12 month dividend, based on last quarterly dividend declared. |
| (4) | Indicated 12 month dividend as a percent of trailing 12 month earnings. |
| (5) | Equity and tangible equity equal common equity and tangible common equity, respectively. ROAA (return on average assets) and ROAE (return on average equity) are indicated ratios based on trailing 12 month earnings and average equity and assets balances. |
| (6) | Excludes from averages and medians those companies the subject of actual or rumored acquisition activities or unusual operating characteristics. |
| Source: | SNL Financial, LC. and RP Financial, LC. calculations. The information provided in this report has been obtained from sources we believe are reliable, but we cannot guarantee the accuracy or completeness of such information. |
Copyright (c) 2017 by RP® Financial, LC.
| RP® Financial, LC. | VALUATION ANALYSIS
IV.23 |
converted basis). Based on the $15.0 million midpoint valuation, Seneca Federal’s pro forma P/B and P/TB ratios (fully-converted basis) both equaled 64.98%. In comparison to the average P/B and P/TB ratios for the Peer Group of 104.94% and 108.93%, respectively, the Association’s ratios reflected a discount of 38.07% on a P/B basis and a discount of 40.35% on a P/TB basis. In comparison to the Peer Group’s median P/B and P/TB ratios of 102.40% and 105.59%, respectively, the Association’s pro forma P/B and P/TB ratios (fully-converted basis) at the midpoint value reflected discounts of 36.54% and 38.46%, respectively. At the top of the super range, the Association’s P/B and P/TB ratios (fully-converted basis) both equaled 72.57%. In comparison to the Peer Group’s average P/B and P/TB ratios, the Association’s P/B and P/TB ratios at the top of the super range reflected discounts of 30.85% and 33.38%, respectively. In comparison to the Peer Group’s median P/B and P/TB ratios, the Association’s P/B and P/TB ratios at the top of the super range reflected discounts of 29.13% and 31.27%, respectively. RP Financial considered the discounts under the P/B approach to be reasonable, given the nature of the calculation of the P/B ratio which mathematically results in a ratio discounted to book value. The discounts reflected under the P/B approach were also supported by the significant premiums reflected in the Association’s core P/E multiples.
On an MHC reported basis, the Association’s P/B and P/TB ratios at the $15.0 million midpoint value both equaled 94.97%. In comparison to the average P/B and P/TB ratios indicated for the Peer Group of 104.94% and 108.93%, respectively, Seneca Federal’s ratios were discounted by 9.50% on a P/B basis and 12.82% on a P/TB basis. In comparison to the Peer Group’s median P/B and P/TB ratios of 102.40% and 105.59%, respectively, the Association’s pro forma P/B and P/TB ratios (MHC basis) at the midpoint value reflected discounts of 7.26% and 10.06%, respectively. At the top of the super range, the Association’s P/B and P/TB ratios (MHC basis) both equaled 111.73%. In comparison to the Peer Group’s average P/B and P/TB ratios, the Association’s P/B and P/TB ratios at the top of the super range reflected premiums of 6.47% and 2.57%, respectively. In comparison to the Peer Group’s median P/B and P/TB ratios, the Association’s P/B and P/TB ratios at the top of the super range reflected premiums of 9.11% and 5.81%, respectively.
3. Price-to-Assets ("P/A"). The P/A valuation methodology determines market value by applying a valuation P/A ratio (fully-converted basis) to the Association’s pro forma asset base, conservatively assuming no deposit withdrawals are made to fund stock purchases. In all likelihood there will be deposit withdrawals, which results in understating the pro forma P/A
| RP® Financial, LC. | VALUATION ANALYSIS
IV.24 |
ratio which is computed herein. At the $15.0 million midpoint of the valuation range, Seneca Federal’s pro forma P/A ratio (fully-converted basis) equaled 8.36% of pro forma assets. Comparatively, the Peer Group companies exhibited an average P/A ratio of 14.78%, which implies a discount of 43.44% has been applied to the Association’s pro forma P/A ratio. In comparison to the Peer Group’s median P/A ratio of 15.71%, the Association’s pro forma P/A ratio (fully-converted basis) at the midpoint value reflects a discount of 46.88%.
On an MHC reported basis, Seneca Federal’s pro forma P/A ratio at the $15.0 million midpoint value equaled 8.71%. In comparison to the Peer Group's average P/A ratio of 14.78%, Seneca Federal’s P/A ratio (MHC basis) indicated a discount of 41.07%. In comparison to the Peer Group’s median P/A ratio of 15.71%, the Association’s pro forma P/A ratio (MHC basis) at the midpoint value reflects a discount of 44.56%.
Comparison to Publicly-Traded MHCs
As indicated in Chapter III, we believe there are a number of characteristics of MHC shares that make them different from the shares of fully-converted companies. These factors include: (1) lower aftermarket liquidity in the MHC shares since less than 50% of the shares are available for trading; (2) no opportunity for public shareholders to exercise voting control; (3) the potential pro forma impact of second-step conversions on the pricing of MHC institutions; and (4) the regulatory policies regarding the accounting for net assets held by the MHC in a second-step conversion and, thereby, lessening the attractiveness of paying cash dividends. The above characteristics of MHC shares have provided MHC stocks with different trading characteristics versus fully-converted companies. To account for the unique trading characteristics of MHC shares, RP Financial has placed the financial data and pricing ratios of the publicly-traded MHCs on a fully-converted basis to make them comparable for valuation purposes. Using the per share and pricing information of the publicly-traded MHCs on a fully-converted basis accomplishes a number of objectives. First, such figures eliminate distortions that result when trying to compare institutions that have different public ownership interests outstanding. Secondly, such an analysis provides ratios that are comparable to the pricing information of fully-converted public companies and are directly applicable to determining the pro forma market value range of the 100% ownership interest in Seneca Federal as an MHC. This technique is validated by the investment community's evaluation of MHC pricing, which also
| RP® Financial, LC. | VALUATION ANALYSIS
IV.25 |
incorporates the pro forma impact of a second-step conversion based on the current market price.
To calculate the fully-converted pricing information for MHCs, the reported financial information for the public MHCs incorporates the following assumptions: (1) all shares owned by the MHC are assumed to be sold at the current trading price in a second step-conversion; (2) the gross proceeds from such a sale are adjusted to reflect reasonable offering expenses and standard stock based benefit plan parameters that would be factored into a second-step conversion of an MHC institution; and (3) net proceeds are assumed to be reinvested at market rates on a tax effected basis. Book value per share and earnings per share figures for the public MHCs were adjusted by the impact of the assumed second step-conversion, resulting in an estimation of book value per share and earnings per share figures on a fully-converted basis. Table 4.6 on the following page shows the calculation of per share financial data (fully-converted basis) for each of the nine publicly-traded MHC institutions.
The table below shows a comparative pricing analysis of the publicly-traded MHCs on a fully-converted basis versus the Association’s Peer Group. In comparison to the Peer Group’s P/TB ratio, the P/TB ratio of the publicly-traded MHCs reflected a discount of 14.62%. In comparison to the Peer Group’s core P/E multiple, the core P/E multiple of the publicly-traded MHCs reflected a premium of 84.18%. Detailed pricing characteristics of the fully-converted MHCs is shown in Table 4.7.
| | | Publicly-Traded | | | | |
| | | MHCs | | | Peer Group | |
| | | | | | | |
| Pricing Ratios (Averages)(1) | | | | | | | | |
| Core price/earnings (x) | | | 38.31 | x | | | 20.80 | x |
| Price/tangible book (%) | | | 93.00 | % | | | 108.93 | % |
| Price/assets (%) | | | 22.90 | | | | 14.78 | |
(1) Based on market prices as of May 12, 2017.
In comparison to the publicly-traded MHCs, the Association’s pro forma P/TB ratio (fully-converted basis) of 64.98% at the midpoint of the valuation range reflected a discount of 30.13%. At the top of the super range, the Association’s P/TB ratio (fully-converted basis) of 72.57% reflected a discount of 21.97%. In comparison to the publicly-traded MHCs, the Association’s pro forma core P/E multiple (fully-converted basis) of 33.68 times at the midpoint of the valuation range reflected a discount of 14.32%. At the top of the super range, the
| RP® Financial, LC. | VALUATION ANALYSIS
IV.26 |
Table 4.6
Calculation of Implied Per Share Data - Incorporating MHC Second Step Conversion
Publicly Traded MHC Institutions
| | | | | | | | | | | | | | | | | | | | | | Per Share | | | | | | | | | Net | | | Net | | | Pro Forma | |
| | | | | | | | | | | | | Current Ownership | | | TTM Net Income | | | Book | | | Tang. | | | | | | Share | | | Gross | | | Capital | | | Income | | | Net Inc./ | | | Core Net Inc./ | | | Bk Value/ | | | Tang. Bk. | | | Assets/ | |
| | | Ticker | | Name | | City | | State | | Exhange | | Public | | | MHC Shares | | | Total Shares | | | Reported | | | Core | | | Value | | | Bk Value | | | Assets | | | Price | | | Proceeds(1) | | | Increase(2) | | | Increase(3) | | | Share | | | Share | | | Share | | | Value/Share | | | Share | |
| | | | | | | | | | | | | | | | | | | | | | | | | | | | | | | | | | | | | | | | | | | | | | | | | | | | | | | | | | | | | | |
| 1 | | CFBI | | Community First Bancshares, Inc. (MHC) | | Covington | | GA | | NASDAQ | | | 3,467,595 | | | | 4,070,655 | | | | 7,538,250 | | | $ | 0.14 | | | $ | 0.16 | | | $ | 9.84 | | | $ | 9.84 | | | $ | 31.57 | | | $ | 13.03 | | | $ | 53,034,122 | | | $ | 45,609,345 | | | $ | 493,536 | | | $ | 0.21 | | | $ | 0.23 | | | $ | 15.89 | | | $ | 15.89 | | | $ | 37.62 | |
| 2 | | GCBC | | Greene County Bancorp, Inc. (MHC) | | Catskill | | NY | | NASDAQ | | | 3,893,350 | | | | 4,609,264 | | | | 8,502,614 | | | $ | 1.25 | | | $ | 1.25 | | | $ | 9.52 | | | $ | 9.52 | | | $ | 112.73 | | | $ | 24.00 | | | $ | 110,622,336 | | | $ | 95,135,209 | | | $ | 1,029,451 | | | $ | 1.38 | | | $ | 1.38 | | | $ | 20.71 | | | $ | 20.71 | | | $ | 123.92 | |
| 3 | | HONE | | HarborOne Bancorp, Inc. (MHC) | | Brockton | | MA | | NASDAQ | | | 14,839,846 | | | | 17,281,034 | | | | 32,120,880 | | | $ | 0.27 | | | $ | 0.36 | | | $ | 10.36 | | | $ | 9.94 | | | $ | 79.89 | | | $ | 20.11 | | | $ | 347,521,594 | | | $ | 298,868,571 | | | $ | 3,234,036 | | | $ | 0.37 | | | $ | 0.47 | | | $ | 19.66 | | | $ | 19.24 | | | $ | 89.19 | |
| 4 | | KFFB | | Kentucky First Federal Bancorp (MHC) | | Frankfort | | KY | | NASDAQ | | | 3,716,577 | | | | 4,727,938 | | | | 8,444,515 | | | $ | 0.13 | | | $ | 0.13 | | | $ | 7.96 | | | $ | 6.25 | | | $ | 36.15 | | | $ | 9.50 | | | $ | 44,915,411 | | | $ | 38,627,253 | | | $ | 417,983 | | | $ | 0.18 | | | $ | 0.17 | | | $ | 12.54 | | | $ | 10.82 | | | $ | 40.72 | |
| 5 | | LSBK | | Lake Shore Bancorp, Inc. (MHC) | | Dunkirk | | NY | | NASDAQ | | | 2,478,947 | | | | 3,636,875 | | | | 6,115,822 | | | $ | 0.37 | | | $ | 0.35 | | | $ | 12.53 | | | $ | 12.53 | | | $ | 80.75 | | | $ | 15.65 | | | $ | 56,920,003 | | | $ | 48,951,203 | | | $ | 529,698 | | | $ | 0.46 | | | $ | 0.44 | | | $ | 20.53 | | | $ | 20.53 | | | $ | 88.76 | |
| 6 | | MGYR | | Magyar Bancorp, Inc. (MHC) | | New Brunswick | | NJ | | NASDAQ | | | 2,620,296 | | | | 3,200,450 | | | | 5,820,746 | | | $ | 0.21 | | | $ | 0.21 | | | $ | 8.29 | | | $ | 8.29 | | | $ | 100.10 | | | $ | 12.65 | | | $ | 40,474,491 | | | $ | 34,808,062 | | | $ | 376,656 | | | $ | 0.28 | | | $ | 0.28 | | | $ | 14.27 | | | $ | 14.27 | | | $ | 106.08 | |
| 7 | | OFED | | Oconee Federal Financial Corp. (MHC) | | Seneca | | SC | | NASDAQ | | | 1,609,112 | | | | 4,164,415 | | | | 5,773,527 | | | $ | 0.94 | | | $ | 0.94 | | | $ | 14.68 | | | $ | 14.12 | | | $ | 83.25 | | | $ | 28.00 | | | $ | 116,603,620 | | | $ | 100,279,113 | | | $ | 1,085,113 | | | $ | 1.13 | | | $ | 1.13 | | | $ | 32.05 | | | $ | 31.49 | | | $ | 100.62 | |
| 8 | | PVBC | | Provident Bancorp, Inc. (MHC) | | Amesbury | | MA | | NASDAQ | | | 4,606,665 | | | | 5,034,323 | | | | 9,640,988 | | | $ | 0.69 | | | $ | 0.61 | | | $ | 11.54 | | | $ | 11.54 | | | $ | 86.40 | | | $ | 20.30 | | | $ | 102,196,757 | | | $ | 87,889,211 | | | $ | 951,043 | | | $ | 0.79 | | | $ | 0.71 | | | $ | 20.65 | | | $ | 20.65 | | | $ | 95.51 | |
| 9 | | TFSL | | TFS Financial Corporation (MHC) | | Cleveland | | OH | | NASDAQ | | | 55,948,835 | | | | 227,119,132 | | | | 283,067,967 | | | $ | 0.31 | | | $ | 0.31 | | | $ | 5.93 | | | $ | 5.89 | | | $ | 47.36 | | | $ | 16.14 | | | $ | 3,665,702,790 | | | $ | 3,152,504,400 | | | $ | 34,113,030 | | | $ | 0.43 | | | $ | 0.43 | | | $ | 17.07 | | | $ | 17.03 | | | $ | 58.50 | |
| (1) | Gross proceeds calculated as stock price multiplied by the number of shares owned by the MHC (i.e. non-public shares). |
| (2) | Net increase in capital reflects gross proceeds less offering expenses, contra-equity account for leveraged ESOP and Restricted Stock Plan. For MHC's with assets at the MHC level, the net increase in capital also includes consolidation of MHC assets with the capital of the institution concurrent with hypothetical second step. |
| Offering Expense Percent: | | | 2.00 | % |
| ESOP Percent Purchase: | | | 8.00 | % |
| RRP Percent Purchase: | | | 4.00 | % |
| (3) | Net increase in earnings reflects after-tax reinvestment income (assumes ESOP and RRP do not generate reinvestment income), less after-tax ESOP amortization and RRP vesting. |
| After-Tax Reinvestment Rate: | | | 3.50 | % |
| ESOP Loan Term (Yrs.): | | | 10 | |
| Recognition Plan Vesting (Yrs.): | | | 5 | |
| Effective Tax Rate: | | | 34.00 | % |
Source: SNL Securities, LC and RP Financial, LC. calculations.
| RP® Financial, LC. | VALUATION ANALYSIS
IV.27 |
Table 4.7
MHC Institutions, Implied Pricing Ratios, Full Conversion Basis
Financial Data as of the Most Recent Quarter or Twelve Month Period Available
Prices as of May 12, 2017
| | | | | | | | | | | | | | | | | | | | | | | | | | | | | | | | | | | | | | | | | | | | | | | | | | | | | | | Key Financial Data(2) | |
| | | | | | | | | | | | | | | | | | | Per Share Data | | | Pricing Ratios(2) | | | Dividends | | | | | | | | | LTM | |
| | | | | | | | | | | | | Stock | | | Mkt | | | LTM | | | LTM | | | BV/ | | | Tang. | | | P/E | | | P/E Cre | | | Price/ | | | Price/ | | | Price/ | | | Ann Div | | | Div. | | | Div Pay | | | Total | | | Tang. | | | Reported | | | Core | |
| | | Ticker | | Company Name | | City | | State | | Exchange | | Price(1) | | | Value | | | EPS | | | Cr EPS | | | Shr | | | BV/Sh | | | LTM | | | LTM | | | Book | | | TBk | | | Assts | | | Rate | | | Yield | | | Ratio | | | Assets | | | E/A | | | ROAA | | | ROAE | | | ROAA | | | ROAE | |
| | | | | | | | | | | | | ($) | | | ($M) | | | ($) | | | ($) | | | ($) | | | ($) | | | (x) | | | (x) | | | (%) | | | (%) | | | (%) | | | ($) | | | (%) | | | (%) | | | ($000) | | | (%) | | | (%) | | | (%) | | | (%) | | | (%) | |
| | | | | | | | | | | | | | | | | | | | | | | | | | | | | | | | | | | | | | | | | | | | | | | | | | | | | | | | | | | | | | | | | | | | | | | |
| | | Publicly Traded MHCs, Full Conversion Basis - Averages | | | | | | | | | 17.71 | | | | 680.4 | | | | 0.58 | | | | 0.58 | | | | 19.26 | | | | 18.96 | | | | 39.60 | | | | 38.31 | | | | 91.22 | | | | 93.00 | | | | 22.90 | | | | 0.22 | | | | 1.37 | | | | 52.51 | | | | 2,640,765 | | | | 25.08 | | | | 0.66 | | | | 2.81 | | | | 0.70 | | | | 3.00 | |
| | | Publicly Traded MHCs, Full Conversion Basis - Medians | | | | | | | | | 16.14 | | | | 161.7 | | | | 0.43 | | | | 0.44 | | | | 19.66 | | | | 19.24 | | | | 37.88 | | | | 37.88 | | | | 88.61 | | | | 88.91 | | | | 22.55 | | | | 0.32 | | | | 1.43 | | | | 27.64 | | | | 617,487 | | | | 23.13 | | | | 0.55 | | | | 2.24 | | | | 0.66 | | | | 2.43 | |
| | | | | | | | | | | | | | | | | | | | | | | | | | | | | | | | | | | | | | | | | | | | | | | | | | | | | | | | | | | | | | | | | | | | | | | | | | | | | | | | | | | | | | | | | | | |
| | | Publicly Traded MHCs, Full Conversion Basis | | | | | | | | | | | | | | | | | | | | | | | | | | | | | | | | | | | | | | | | | | | | | | | | | | | | | | | | | | | | | | | | | | | | | | | | | | | | | | | | | | | | | | |
| 1 | | CFBI | | Community First Bancshares, Inc. (MHC) | | Covington | | GA | | NASDAQ | | | 13.03 | | | | 98.2 | | | | 0.21 | | | | 0.23 | | | | 15.89 | | | | 15.89 | | | | 63.50 | | | | 57.69 | | | | 81.97 | | | | 81.97 | | | | 34.63 | | | | 0.00 | | | | 0.00 | | | | 0.0 | | | | 283,608 | | | | 42.25 | | | | 0.55 | | | | 1.29 | | | | 0.60 | | | | 1.42 | |
| 2 | | GCBC | | Greene County Bancorp, Inc. (MHC) | | Catskill | | NY | | NASDAQ | | | 24.00 | | | | 204.1 | | | | 1.38 | | | | 1.38 | | | | 20.71 | | | | 20.71 | | | | 17.45 | | | | 17.45 | | | | 115.89 | | | | 115.89 | | | | 19.37 | | | | 0.38 | | | | 1.58 | | | | 27.6 | | | | 1,053,626 | | | | 16.71 | | | | 1.11 | | | | 6.64 | | | | 1.11 | | | | 6.64 | |
| 3 | | HONE | | HarborOne Bancorp, Inc. (MHC) | | Brockton | | MA | | NASDAQ | | | 20.11 | | | | 646.0 | | | | 0.37 | | | | 0.47 | | | | 19.66 | | | | 19.24 | | | | 54.85 | | | | 43.24 | | | | 102.27 | | | | 104.52 | | | | 22.55 | | | | 0.00 | | | | 0.00 | | | | 0.0 | | | | 2,865,013 | | | | 21.57 | | | | 0.41 | | | | 1.86 | | | | 0.52 | | | | 2.37 | |
| 4 | | KFFB | | Kentucky First Federal Bancorp (MHC) | | Frankfort | | KY | | NASDAQ | | | 9.50 | | | | 80.2 | | | | 0.18 | | | | 0.17 | | | | 12.54 | | | | 10.82 | | | | 52.85 | | | | 54.35 | | | | 75.77 | | | | 87.80 | | | | 23.33 | | | | 0.40 | | | | 4.21 | | | | 222.5 | | | | 343,893 | | | | 26.57 | | | | 0.44 | | | | 1.43 | | | | NM | | | | NM | |
| 5 | | LSBK | | Lake Shore Bancorp, Inc. (MHC) | | Dunkirk | | NY | | NASDAQ | | | 15.65 | | | | 95.7 | | | | 0.46 | | | | 0.44 | | | | 20.53 | | | | 20.53 | | | | 34.10 | | | | 35.51 | | | | 76.24 | | | | 76.24 | | | | 17.63 | | | | 0.32 | | | | 2.04 | | | | 69.7 | | | | 542,818 | | | | 23.13 | | | | 0.52 | | | | 2.24 | | | | 0.50 | | | | 2.15 | |
| 6 | | MGYR | | Magyar Bancorp, Inc. (MHC) | | New Brunswick | | NJ | | NASDAQ | | | 12.65 | | | | 73.6 | | | | 0.28 | | | | 0.28 | | | | 14.27 | | | | 14.27 | | | | 45.25 | | | | 45.42 | | | | 88.61 | | | | 88.61 | | | | 11.92 | | | | 0.00 | | | | 0.00 | | | | 0.0 | | | | 617,487 | | | | 13.45 | | | | 0.26 | | | | 1.96 | | | | 0.26 | | | | 1.95 | |
| 7 | | OFED | | Oconee Federal Financial Corp. (MHC) | | Seneca | | SC | | NASDAQ | | | 28.00 | | | | 161.7 | | | | 1.13 | | | | 1.13 | | | | 32.05 | | | | 31.49 | | | | 24.76 | | | | 24.74 | | | | 87.37 | | | | 88.91 | | | | 27.83 | | | | 0.40 | | | | 1.43 | | | | 35.4 | | | | 580,914 | | | | 31.30 | | | | 1.12 | | | | 3.53 | | | | 1.12 | | | | 3.53 | |
| 8 | | PVBC | | Provident Bancorp, Inc. (MHC) | | Amesbury | | MA | | NASDAQ | | | 20.30 | | | | 195.7 | | | | 0.79 | | | | 0.71 | | | | 20.65 | | | | 20.65 | | | | 25.73 | | | | 28.55 | | | | 98.29 | | | | 98.29 | | | | 21.25 | | | | 0.00 | | | | 0.00 | | | | 0.0 | | | | 920,830 | | | | 21.62 | | | | 0.83 | | | | 3.82 | | | | 0.74 | | | | 3.44 | |
| 9 | | TFSL | | TFS Financial Corporation (MHC) | | Cleveland | | OH | | NASDAQ | | | 16.14 | | | | 4,568.7 | | | | 0.43 | | | | 0.43 | | | | 17.07 | | | | 17.03 | | | | 37.88 | | | | 37.88 | | | | 94.57 | | | | 94.76 | | | | 27.59 | | | | 0.50 | | | | 3.10 | | | | 117.3 | | | | 16,558,696 | | | | 29.12 | | | | 0.73 | | | | 2.50 | | | | 0.73 | | | | 2.50 | |
| (1) | Current stock price of minority stock. |
| (2) | Ratios are pro forma assumings a second step conversion to full stock form. |
| Source: | SNL Financial, LC. And RP Financial, LC. Calculations. The information provided in this report has been obtained from sources we believe are reliable, but we cannot guarantee the accuracy or completeness of such information. |
| RP® Financial, LC. | VALUATION ANALYSIS
IV.28 |
Association’s core P/E multiple (fully-converted basis) of 43.72 times reflected a premium of 14.12%.
It should be noted that in a comparison of the publicly-traded MHCs to Seneca Federal, the publicly-traded MHCs maintain certain inherit characteristics in support of increasing the attractiveness of their stocks relative to Seneca Federal’s stock as an MHC that will just be completing an IPO: (1) the seasoned publicly-traded MHCs are viewed as potential candidates to complete a second-step offering; and (2) some of the publicly-traded MHCs have been grandfathered to waive dividend payments to the MHC pursuant to receiving an annual majority vote by the depositors to approve the waiver of dividends.
Comparison to Recent MHC Offerings
As indicated at the beginning of this chapter, RP Financial’s analysis of recent conversion offering pricing characteristics at closing and in the aftermarket has been limited to a “technical” analysis and, thus, the pricing characteristics of recent conversion offerings can not be a primary determinate of value. Particular focus was placed on the P/TB approach in this analysis, since the P/E multiples do not reflect the actual impact of reinvestment and the source of the stock proceeds (i.e., external funds vs. deposit withdrawals). The most recent first-step MHC offering that is comparable to Seneca Federal’s first-step MHC offering was completed by Community First Bancshares of Covington, Georgia. Community First Bancshares’ offering, which closed in April 2017, raised gross proceeds of $34.7 million through the sale of 46.0% of its stock in a public offering. Community First Bancshares’ offering closed at the top of the super range at a fully-converted pro forma price/tangible book ratio of 68.50%. In comparison, the Association’s pro forma fully-converted price/tangible book ratio at the midpoint value reflects an implied discount of 5.14% and at the top of the range reflects an implied premium of 5.94%.
Valuation Conclusion
Based on the foregoing, it is our opinion that, as of May 12, 2017, the estimated aggregate pro forma market value of the shares to be issued immediately following the conversion, both shares issued publicly as well as to the MHC, equaled $15,000,000 at the midpoint, equal to 1,500,000 shares offered at a per share value of $10.00. Pursuant to conversion guidelines, the 15% offering range indicates a minimum value of $12,750,000 and a
| RP® Financial, LC. | VALUATION ANALYSIS
IV.29 |
maximum value of $17,250,000. Based on the $10.00 per share offering price determined by the Board, this valuation range equates to total shares outstanding of 1,275,000 at the minimum and 1,725,000 at the maximum. In the event the appraised value is subject to an increase, the aggregate pro forma market value may be increased up to a super maximum value of $19,837,500 without a resolicitation. Based on the $10.00 per share offering price, the super maximum value would result in total shares outstanding of 1,983,750. The Board of Directors has established a public offering range such that the public ownership of the Association will constitute a 46.0% ownership interest. Accordingly, the offering to the public of the minority stock will equal $5,865,000 at the minimum, $6,900,000 at the midpoint, $7,935,000 at the maximum and $9,125,250 at the super maximum of the valuation range. The pro forma valuation calculations relative to the Peer Group (fully-converted basis) are shown in Table 4.4 and are detailed in Exhibit IV-7 and Exhibit IV-8; the pro forma valuation calculations relative to the Peer Group based on reported financials are shown in Table 4.5 and are detailed in Exhibits IV-9 and IV-10.
EXHIBITS
LIST OF EXHIBITS
| Exhibit | | |
| Number | | Description |
| | | |
| I-1 | | Map of Office Locations |
| | | |
| I-2 | | Audited Financial Statements |
| | | |
| I-3 | | Key Operating Ratios |
| | | |
| I-4 | | Investment Portfolio Composition |
| | | |
| I-5 | | Yields and Costs |
| | | |
| I-6 | | Loan Loss Allowance Activity |
| | | |
| I-7 | | Interest Rate Risk Analysis |
| | | |
| I-8 | | Fixed and Adjustable Rate Loans |
| | | |
| I-9 | | Loan Portfolio Composition |
| | | |
| I-10 | | Contractual Maturity by Loan Type |
| | | |
| I-11 | | Non-Performing Assets |
| | | |
| I-12 | | Deposit Composition |
| | | |
| I-13 | | Maturity of Jumbo Time Deposits |
| | | |
| I-14 | | Borrowing Activity |
| | | |
| II-1 | | Description of Office Properties |
| | | |
| II-2 | | Historical Interest Rates |
LIST OF EXHIBITS (continued)
| Exhibit | | |
| Number | | Description |
| | | |
| III-1 | | General Characteristics of Publicly-Traded Institutions |
| | | |
| III-2 | | Public Market Pricing of Mid-Atlantic Thrift Institutions |
| | | |
| III-3 | | Public Market Pricing of New England Thrift Institutions |
| | | |
| III-4 | | Public Market Pricing of Midwest Thrift Institutions |
| | | |
| III-5 | | Peer Group Market Area Comparative Analysis |
| | | |
| IV-1 | | Stock Prices: As of May 12, 2017 |
| | | |
| IV-2 | | Historical Stock Price Indices |
| | | |
| IV-3 | | Stock Indices as of May 12, 2017 |
| | | |
| IV-4 | | New York Thrift Acquisitions 2013 - Present |
| | | |
| IV-5 | | Director and Senior Management Summary Resumes |
| | | |
| IV-6 | | Pro Forma Regulatory Capital Ratios |
| | | |
| IV-7 | | Pro Forma Analysis Sheet – Fully Converted Basis |
| | | |
| IV-8 | | Pro Forma Effect of Conversion Proceeds – Fully Converted Basis |
| | | |
| IV-9 | | Pro Forma Analysis Sheet – Minority Stock Offering |
| | | |
| IV-10 | | Pro Forma Effect of Conversion Proceeds – Minority Stock Offering |
| | | |
| V-1 | | Firm Qualifications Statement |
EXHIBIT I-1
Seneca Federal Savings and Loan Association
Map of Office Locations
Exhibit I-1
Seneca Federal Savings and Loan Association
Map of Office Locations
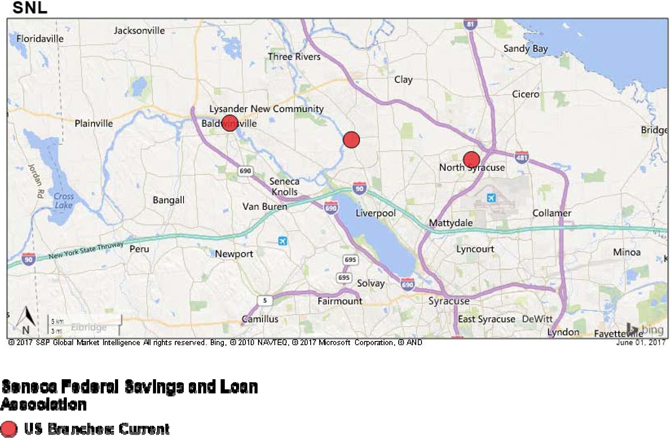
Source: SNL Financial, LC.
EXHIBIT I-2
Seneca Federal Savings and Loan Association
Audited Financial Statements
[Incorporated by Reference]
EXHIBIT I-3
Seneca Federal Savings and Loan Association
Key Operating Ratios
Exhibit I-3
Seneca Federal Savings and Loan Association
Key Operating Ratios
| | | At or For the Three
Months Ended March 31, | | | At or For the Years Ended
December 31, | |
| | | 2017 | | | 2016 | | | 2016 | | | 2015 | |
| | | | | | | | | | | | | |
| Selected Financial Ratios and Other Data(1): | | | | | | | | | | | | | | | | |
| | | | | | | | | | | | | | | | | |
| Performance Ratios: | | | | | | | | | | | | | | | | |
| Return on average assets | | | 0.40 | % | | | 0.26 | % | | | 0.35 | % | | | 0.30 | % |
| Return on average equity | | | 6.15 | % | | | 3.66 | % | | | 5.19 | % | | | 4.14 | % |
| Interest rate spread (2) | | | 3.23 | % | | | 3.44 | % | | | 3.30 | % | | | 3.42 | % |
| Net interest margin (3) | | | 3.33 | % | | | 3.55 | % | | | 3.42 | % | | | 3.51 | % |
| Efficiency ratio (4) | | | 83.30 | % | | | 88.74 | % | | | 85.16 | % | | | 91.82 | % |
| Non-interest expense to average total assets | | | 2.97 | % | | | 3.44 | % | | | 3.26 | % | | | 3.64 | % |
| Average interest-earning assets to average interest-bearing liabilities | | | 114 | % | | | 118 | % | | | 117 | % | | | 119 | % |
| | | | | | | | | | | | | | | | | |
| Asset Quality Ratios: | | | | | | | | | | | | | | | | |
| Non-performing assets as a percent of total assets | | | 0.64 | % | | | 1.02 | % | | | 1.06 | % | | | 1.35 | % |
| Non-performing loans as a percent of total loans | | | 0.70 | % | | | 1.27 | % | | | 1.27 | % | | | 1.75 | % |
| Allowance for loan losses as a percent of non-performing loans | | | 114.45 | % | | | 83.61 | % | | | 69.07 | % | | | 71.94 | % |
| Allowance for loan losses as a percent of total loans | | | 0.80 | % | | | 1.07 | % | | | 0.88 | % | | | 1.15 | % |
| Net charge-offs to average outstanding loans during the period | | | 0.09 | % | | | 0.02 | % | | | 0.25 | % | | | — | % |
| | | | | | | | | | | | | | | | | |
| Capital Ratios(5): | | | | | | | | | | | | | | | | |
| Common equity tier 1 capital (to risk weighted assets) | | | 14.21 | % | | | 16.72 | % | | | 14.32 | % | | | 16.72 | % |
| Tier 1 leverage (core) capital (to adjusted tangible assets) | | | 8.35 | % | | | 9.53 | % | | | 8.65 | % | | | 9.67 | % |
| Tier 1 risk-based capital (to risk weighted assets) | | | 14.21 | % | | | 16.72 | % | | | 14.32 | % | | | 16.72 | % |
| Total risk-based capital (to risk weighted assets) | | | 15.33 | % | | | 17.97 | % | | | 15.56 | % | | | 17.98 | % |
| Average equity to average total assets | | | 6.51 | % | | | 7.19 | % | | | 6.88 | % | | | 7.28 | % |
| | | | | | | | | | | | | | | | | |
| Other Data: | | | | | | | | | | | | | | | | |
| Number of full service offices | | | 3 | | | | 3 | | | | 3 | | | | 3 | |
| Number of fulltime equivalent employees | | | 39 | | | | 40 | | | | 40 | | | | 39 | |
| (1) | Annualized for the three-month periods ended March 31, 2017 and 2016. |
Represents the difference between the weighted-average yield on interest-earning assets and the weighted-average cost of interest-bearing liabilities for the period.
| (2) | The net interest margin represents net interest income as a percent of average interest-earning assets for the period. |
| (3) | The efficiency ratio represents non-interest expense divided by the sum of net interest income and non-interest income. |
| (4) | Capital ratios are for Seneca Savings. |
Source: Seneca Federal’s prospectus.
EXHIBIT I-4
Seneca Federal Savings and Loan Association
Investment Portfolio Composition
Exhibit I-4
Seneca Federal Savings and Loan Association
Investment Portfolio Composition
| | | At March 31, | | | At December 31, | |
| | | 2017 | | | 2016 | | | 2015 | |
| | | Amortized
Cost | | | Fair
Value | | | Amortized
Cost | | | Fair
Value | | | Amortized
Cost | | | Fair
Value | |
| | | (In thousands) | |
| | | | | | | | | | | | | | | | | | | |
| Municipal securities | | $ | 8,812 | | | $ | 8,560 | | | $ | 10,903 | | | $ | 10,592 | | | $ | 9,650 | | | $ | 9,621 | |
| Mortgage-backed securities | | | 984 | | | | 978 | | | | — | | | | — | | | | 1,542 | | | | 1,529 | |
| Collateralized mortgage obligations | | | 8,572 | | | | 8,469 | | | | 7,839 | | | | 7,736 | | | | 6,592 | | | | 6,597 | |
| Corporate securities | | | 801 | | | | 814 | | | | 802 | | | | 807 | | | | 534 | | | | 530 | |
| U.S. government and agency securities | | | 272 | | | | 269 | | | | 320 | | | | 315 | | | | 4,431 | | | | 4,387 | |
| Total securities available for sale | | $ | 19,441 | | | $ | 19,090 | | | $ | 19,864 | | | $ | 19,450 | | | $ | 22,749 | | | $ | 22,664 | |
Source: Seneca Federal’s prospectus.
EXHIBIT I-5
Seneca Federal Savings and Loan Association
Yields and Costs
Exhibit I-5
Seneca Federal Savings and Loan Association
Yields and Costs
| | | For the Three Months Ended March 31, | |
| | | 2017 | | | 2016 | |
| | | Average
Outstanding
Balance | | | Interest | | | Yield/ Rate(5) | | | Average
Outstanding
Balance | | | Interest | | | Yield/ Rate(5) | |
| | | (Dollars in thousands) | |
| | | | | | | | | | | | | | | | | | | |
| Interest-earning assets: | | | | | | | | | | | | | | | | | | | | | | | | |
| Loans(1) | | $ | 134,641 | | | $ | 1,498 | | | | 4.45 | % | | $ | 109,893 | | | $ | 1,269 | | | | 4.62 | % |
| Available-for-sale securities | | | 19,856 | | | | 90 | | | | 1.81 | | | | 21,239 | | | | 112 | | | | 2.11 | |
| FHLB Stock | | | 2,106 | | | | 30 | | | | 5.70 | | | | 1,363 | | | | 15 | | | | 4.40 | |
| Other interest-earning assets | | | 1,572 | | | | 3 | | | | 0.76 | | | | 1,189 | | | | 1 | | | | 0.34 | |
| Total interest-earning assets | | | 158,175 | | | | 1,621 | | | | 4.10 | | | | 133,684 | | | | 1,397 | | | | 4.18 | |
| Noninterest-earning assets | | | 5,730 | | | | | | | | | | | | 4,727 | | | | | | | | | |
| Total assets | | $ | 163,905 | | | | | | | | | | | $ | 138,411 | | | | | | | | | |
| | | | | | | | | | | | | | | | | | | | | | | | | |
| Interest-bearing liabilities: | | | | | | | | | | | | | | | | | | | | | | | | |
| NOW accounts | | | 11,345 | | | | 4 | | | | 0.14 | | | | 8,781 | | | | 3 | | | | 0.14 | |
| Regular savings and demand club accounts | | | 23,257 | | | | 3 | | | | 0.05 | | | | 23,553 | | | | 3 | | | | 0.05 | |
| Money market accounts | | | 15,209 | | | | 22 | | | | 0.58 | | | | 12,231 | | | | 17 | | | | 0.56 | |
| Certificates of deposit and retirement accounts | | | 61,514 | | | | 171 | | | | 1.11 | | | | 51,561 | | | | 121 | | | | 0.95 | |
| Total interest-bearing deposits | | | 111,325 | | | | 200 | | | | 0.72 | | | | 96,126 | | | | 144 | | | | 0.60 | |
| FHLB of New York borrowings | | | 27,882 | | | | 104 | | | | 1.49 | | | | 17,480 | | | | 67 | | | | 1.53 | |
| Total interest-bearing liabilities | | | 139,207 | | | | 304 | | | | 0.87 | | | | 113,606 | | | | 211 | | | | 0.75 | |
| Noninterest-bearing deposits | | | 13,618 | | | | | | | | | | | | 14,089 | | | | | | | | | |
| Other non-interest bearing liabilities | | | 408 | | | | | | | | | | | | 762 | | | | | | | | | |
| Total liabilities | | | 153,233 | | | | | | | | | | | | 128,457 | | | | | | | | | |
| Equity | | | 10,672 | | | | | | | | | | | | 9,954 | | | | | | | | | |
| Total liabilities and equity | | $ | 163,905 | | | | | | | | | | | $ | 138,411 | | | | | | | | | |
| | | | | | | | | | | | | | | | | | | | | | | | | |
| Net interest income | | | | | | $ | 1,317 | | | | | | | | | | | $ | 1,186 | | | | | |
| Net interest rate spread(2) | | | | | | | | | | | 3.23 | % | | | | | | | | | | | 3.44 | % |
| Net interest-earning assets(3) | | $ | 18,968 | | | | | | | | | | | $ | 20,078 | | | | | | | | | |
| Net interest margin(4) | | | | | | | | | | | 3.33 | % | | | | | | | | | | | 3.55 | % |
| Average interest-earning assets to average interest-bearing liabilities | | | 114 | % | | | | | | | | | | | 118 | % | | | | | | | | |
Exhibit I-5 (continued)
Seneca Federal Savings and Loan Association
Yields and Costs
| | | For the Year Ended December 31, | |
| | | 2016 | | | 2015 | |
| | | Average
Outstanding
Balance | | | Interest | | | Yield/ Rate | | | Average
Outstanding
Balance | | | Interest | | | Yield/ Rate | |
| | | (Dollars in thousands) | |
| | | | | | | | | | | | | | | | | | | |
| Interest-earning assets: | | | | | | | | | | | | | | | | | | | | | | | | |
| Loans(1) | | $ | 119,313 | | | $ | 5,457 | | | | 4.57 | % | | $ | 95,575 | | | $ | 4,525 | | | | 4.71 | % |
| Available-for-sale securities | | | 19,880 | | | | 310 | | | | 1.56 | | | | 29,517 | | | | 589 | | | | 2.00 | |
| FHLB Stock | | | 1,635 | | | | 72 | | | | 4.40 | | | | 1,213 | | | | 50 | | | | 4.12 | |
| Other interest-earning assets | | | 1,161 | | | | 5 | | | | 0.43 | | | | 1,351 | | | | 3 | | | | 0.22 | |
| Total interest-earning assets | | | 141,989 | | | | 5,844 | | | | 4.12 | | | | 127,656 | | | | 5,167 | | | | 4.05 | |
| Noninterest-earning assets | | | 5,432 | | | | | | | | | | | | 3,590 | | | | | | | | | |
| Total assets | | $ | 147,421 | | | | | | | | | | | $ | 131,246 | | | | | | | | | |
| | | | | | | | | | | | | | | | | | | | | | | | | |
| Interest-bearing liabilities: | | | | | | | | | | | | | | | | | | | | | | | | |
| NOW accounts | | $ | 9,405 | | | | 14 | | | | 0.15 | | | | 9,279 | | | | 5 | | | | 0.05 | |
| Regular savings and demand club accounts | | | 23,222 | | | | 12 | | | | 0.05 | | | | 23,711 | | | | 12 | | | | 0.05 | |
| Money market accounts | | | 13,087 | | | | 77 | | | | 0.59 | | | | 9,972 | | | | 59 | | | | 0.59 | |
| Certificates of deposit and retirement accounts | | | 54,514 | | | | 570 | | | | 1.05 | | | | 47,214 | | | | 365 | | | | 0.77 | |
| Total interest-bearing deposits | | | 100,228 | | | | 673 | | | | 0.67 | | | | 90,176 | | | | 441 | | | | 0.49 | |
| FHLB borrowings | | | 20,780 | | | | 319 | | | | 1.54 | | | | 17,109 | | | | 240 | | | | 1.40 | |
| Total interest-bearing liabilities | | | 121,008 | | | | 992 | | | | 0.82 | | | | 107,285 | | | | 681 | | | | 0.63 | |
| Noninterest-bearing deposits | | | 15,472 | | | | | | | | | | | | 13,767 | | | | | | | | | |
| Other non-interest bearing liabilities | | | 793 | | | | | | | | | | | | 635 | | | | | | | | | |
| Total liabilities | | | 137,273 | | | | | | | | | | | | 121,687 | | | | | | | | | |
| Equity | | | 10,148 | | | | | | | | | | | | 9,559 | | | | | | | | | |
| Total liabilities and equity | | $ | 147,421 | | | | | | | | | | | $ | 131,246 | | | | | | | | | |
| | | | | | | | | | | | | | | | | | | | | | | | | |
| Net interest income | | | | | | $ | 4,852 | | | | | | | | | | | $ | 4,486 | | | | | |
| Net interest rate spread(2) | | | | | | | | | | | 3.30 | % | | | | | | | | | | | 3.42 | % |
| Net interest-earning assets(3) | | $ | 20,981 | | | | | | | | | | | $ | 20,371 | | | | | | | | | |
| Net interest margin(4) | | | | | | | | | | | 3.42 | % | | | | | | | | | | | 3.51 | % |
| Average interest-earning assets to average interest-bearing liabilities | | | 117 | % | | | | | | | | | | | 119 | % | | | | | | | | |
| (1) | Includes loans held for sale. |
| (2) | Interest rate spread represents the difference between the yield on average interest-earning assets and the cost of average interest-bearing liabilities. |
| (3) | Net interest-earning assets represents total interest-earning assets less total interest-bearing liabilities. |
| (4) | Net interest margin represents net interest income divided by total interest-earning assets. |
Source: Seneca Federal’s prospectus.
EXHIBIT I-6
Seneca Federal Savings and Loan Association
Loan Loss Allowance Activity
Exhibit I-6
Seneca Federal Savings and Loan Association
Loan Loss Allowance Activity
| | | At or for the Three Months
Ended March 31, | | | At or For the Years Ended
December 31, | |
| | | 2017 | | | 2016 | | | 2016 | | | 2015 | |
| | | (Dollars in thousands) | |
| | | | | | | | | | | | | |
| Balance at beginning of period | | $ | 1,170 | | | $ | 1,218 | | | $ | 1,218 | | | $ | 1,211 | |
| | | | | | | | | | | | | | | | | |
| Charge-offs: | | | | | | | | | | | | | | | | |
| Residential: | | | | | | | | | | | | | | | | |
| One- to four-family | | | 52 | | | | 27 | | | | 143 | | | | — | |
| Home equity loans and lines of credit | | | — | | | | — | | | | — | | | | — | |
| Construction | | | — | | | | — | | | | — | | | | — | |
| Commercial real estate | | | 12 | | | | — | | | | — | | | | — | |
| Commercial and industrial | | | 61 | | | | — | | | | 153 | | | | — | |
| Consumer and other | | | — | | | | — | | | | — | | | | 1 | |
| Total charge-offs | | | 125 | | | | 27 | | | | 296 | | | | 1 | |
| | | | | | | | | | | | | | | | | |
| Recoveries: | | | | | | | | | | | | | | | | |
| Residential: | | | | | | | | | | | | | | | | |
| One- to four-family | | | — | | | | — | | | | 1 | | | | — | |
| Home equity loans and lines of credit | | | — | | | | — | | | | — | | | | — | |
| Construction | | | — | | | | — | | | | — | | | | — | |
| Commercial real estate | | | — | | | | — | | | | — | | | | — | |
| Commercial and industrial | | | — | | | | — | | | | — | | | | — | |
| Consumer and other | | | — | | | | — | | | | — | | | | — | |
| Total recoveries | | | — | | | | — | | | | 1 | | | | — | |
| | | | | | | | | | | | | | | | | |
| Net charge-offs | | | 125 | | | | 27 | | | | 295 | | | | 1 | |
| Provision for loan losses | | | 40 | | | | 13 | | | | 247 | | | | 8 | |
| | | | | | | | | | | | | | | | | |
| Balance at end of period | | $ | 1,085 | | | $ | 1,204 | | | $ | 1,170 | | | $ | 1,218 | |
| | | | | | | | | | | | | | | | | |
| Ratios: | | | | | | | | | | | | | | | | |
| Net charge-offs to average loans outstanding | | | 0.09 | % | | | 0.02 | % | | | 0.25 | % | | | — | % |
| Allowance for loan losses to non-performing loans at end of period | | | 100.65 | % | | | 83.61 | % | | | 68.14 | % | | | 71.94 | % |
| Allowance for loan losses to total loans at end of period | | | 0.80 | % | | | 1.07 | % | | | 0.88 | % | | | 1.15 | % |
Source: Seneca Federal’s prospectus.
EXHIBIT I-7
Seneca Federal Savings and Loan Association
Interest Rate Risk Analysis
Exhibit I-7
Seneca Federal Savings and Loan Association
Interest Rate Risk Analysis
| | | | | | | | | EVE as a Percentage of Fair
Value of Assets (3) | |
Change in
Interest Rates | | Estimated | | | Estimated Increase
(Decrease) in EVE | | | EVE | | | Increase
(Decrease) | |
| (basis points) (1) | | EVE (2) | | | Amount | | | Percent | | | Ratio (4) | | | (basis points) | |
| (Dollars in thousands) |
| | | | | | | | | | | | | | | | |
| +400 | | $ | 8,757 | | | $ | (6,407 | ) | | | (42.3 | )% | | | 6.1 | % | | | (0.8 | ) |
| +300 | | | 10,273 | | | | (4,891 | ) | | | (32.3 | )% | | | 6.9 | % | | | (0.7 | ) |
| +200 | | | 11,681 | | | | (3,483 | ) | | | (23.0 | )% | | | 7.6 | % | | | (0.7 | ) |
| +100 | | | 13,212 | | | | (1,952 | ) | | | (13.9 | )% | | | 8.3 | % | | | (0.9 | ) |
| — | | | 15,164 | | | | — | | | | — | | | | 9.2 | % | | | — | |
| -100 | | | 17,627 | | | | 2,463 | | | | 16.2 | % | | | 10.3 | % | | | 1.1 | |
| (1) | Assumes an immediate uniform change in interest rates at all maturities. |
| (2) | EVE is the fair value of expected cash flows from assets, less the fair value of the expected cash flows arising from our liabilities adjusted for the value of off-balance sheet contracts. |
| (3) | Fair value of assets represents the amount at which an asset could be exchanged between knowledgeable and willing parties in an arms-length transaction. |
| (4) | EVE Ratio represents EVE divided by the fair value of assets. |
Source: Seneca Federal’s prospectus.
EXHIBIT I-8
Seneca Federal Savings and Loan Association
Fixed and Adjustable Rate Loans
Exhibit I-8
Seneca Federal Savings and Loan Association
Fixed and Adjustable Rate Loans
| | | Due After December 31, 2017 | |
| | | Fixed | | | Adjustable | | | Total | |
| | | (In thousands) | |
| | | | | | | | | | |
| Residential: | | | | | | | | | | | | |
| One- to four-family | | $ | 87,067 | | | $ | 5,211 | | | $ | 92,278 | |
| Home equity loans and lines of credit | | | 775 | | | | 4,699 | | | | 5,474 | |
| Construction | | | — | | | | 3,091 | | | | 3,091 | |
| Commercial real estate | | | 4,500 | | | | 14,279 | | | | 18,779 | |
| Commercial and industrial | | | 2,841 | | | | 5,994 | | | | 8,835 | |
| Consumer and other | | | 2,817 | | | | — | | | | 2,817 | |
| Total | | $ | 98,000 | | | $ | 33,274 | | | $ | 131,274 | |
Source: Seneca Federal’s prospectus.
EXHIBIT I-9
Seneca Federal Savings and Loan Association
Loan Portfolio Composition
Exhibit I-9
Seneca Federal Savings and Loan Association
Loan Portfolio Composition
| | | | | | At December 31, | |
| | | At March 31, 2017 | | | 2016 | | | 2015 | |
| | | Amount | | | Percent | | | Amount | | | Percent | | | Amount | | | Percent | |
| | | (Dollars in thousands) | |
| | | | | | | | | | | | | | | | | | | |
| Residential: | | | | | | | | | | | | | | | | | | | | | | | | |
| One- to four-family | | $ | 94,296 | | | | 69.9 | % | | $ | 93,443 | | | | 70.3 | % | | $ | 75,934 | | | | 71.6 | % |
| Home equity loans and lines of credit | | | 6,012 | | | | 4.4 | | | | 5,504 | | | | 4.1 | | | | 3,223 | | | | 3.0 | |
| Construction | | | 3,451 | | | | 2.6 | | | | 3,091 | | | | 2.3 | | | | 2,173 | | | | 2.0 | |
| Commercial real estate | | | 19,826 | | | | 14.7 | | | | 18,879 | | | | 14.2 | | | | 14,201 | | | | 13.4 | |
| Commercial and industrial | | | 8,571 | | | | 6.4 | | | | 9,105 | | | | 6.9 | | | | 7,388 | | | | 7.0 | |
| Consumer and other | | | 2,758 | | | | 2.0 | | | | 2,907 | | | | 2.2 | | | | 3,201 | | | | 3.0 | |
| | | | | | | | | | | | | | | | | | | | | | | | | |
| Total loans receivable | | | 134,914 | | | | 100.0 | % | | | 132,929 | | | | 100.0 | % | | | 106,120 | | | | 100.0 | % |
| | | | | | | | | | | | | | | | | | | | | | | | | |
| Deferred loan costs | | | 595 | | | | | | | | 605 | | | | | | | | 355 | | | | | |
| Allowance for loan losses | | | (1,085 | ) | | | | | | | (1,170 | ) | | | | | | | (1,218 | ) | | | | |
| | | | | | | | | | | | | | | | | | | | | | | | | |
| Total loans receivable, net | | $ | 134,424 | | | | | | | $ | 132,364 | | | | | | | $ | 105,257 | | | | | |
Source: Seneca Federal’s prospectus.
EXHIBIT I-10
Seneca Federal Savings and Loan Association
Contractual Maturity by Loan Type
Exhibit I-10
Seneca Federal Savings and Loan Association
Contractual Maturity by Loan Type
| | | One- to four-
family | | | Home equity
loans and
lines of
credit | | | Residential
Construction | | | Commercial
real estate | | | Commercial
and
industrial | | | Consumer
and other | | | Total | |
| | | (In thousands) | |
| | | | | | | | | | | | | | | | | | | | | | |
Due During the Years
Ending December 31, | | | | | | | | | | | | | | | | | | | | | | | | | | | | |
| 2017 | | $ | 1,165 | | | $ | 30 | | | $ | — | | | $ | 100 | | | $ | 270 | | | $ | 90 | | | $ | 1,655 | |
| 2018 | | | 226 | | | | 5 | | | | — | | | | 67 | | | | 1,589 | | | | 87 | | | | 1,974 | |
| 2019 | | | 230 | | | | 21 | | | | — | | | | 401 | | | | 283 | | | | 154 | | | | 1,089 | |
| 2020 to 2021 | | | 1,609 | | | | 21 | | | | — | | | | — | | | | 1,916 | | | | 730 | | | | 4,276 | |
| 2022 to 2026 | | | 6,272 | | | | 27 | | | | — | | | | 179 | | | | 1,917 | | | | 369 | | | | 8,764 | |
| 2027 to 2031 | | | 12,294 | | | | 1,372 | | | | — | | | | 3,846 | | | | 172 | | | | 762 | | | | 18,446 | |
| 2032 and beyond | | | 71,647 | | | | 4,028 | | | | 3,091 | | | | 14,286 | | | | 2,958 | | | | 715 | | | | 96,725 | |
| | | | | | | | | | | | | | | | | | | | | | | | | | | | | |
| Total | | $ | 93,443 | | | $ | 5,504 | | | $ | 3,091 | | | $ | 18,879 | | | $ | 9,105 | | | $ | 2,907 | | | $ | 132,929 | |
Source: Seneca Federal’s prospectus.
EXHIBIT I-11
Seneca Federal Savings and Loan Association
Non-Performing Assets
Exhibit I-11
Seneca Federal Savings and Loan Association
Non-Performing Assets
| | | At March 31, | | | At December 31, | |
| | | 2017 | | | 2016 | | | 2015 | |
| | | (Dollars in thousands) | |
| | | | | | | | | | |
| Non-accrual loans: | | | | | | | | | | | | |
| Residential: | | | | | | | | | | | | |
| One- to four-family | | | 929 | | | | 1,321 | | | | 1,214 | |
| Home equity loans and lines of credit | | | — | | | | — | | | | — | |
| Construction | | | — | | | | — | | | | — | |
| Commercial real estate | | | — | | | | — | | | | — | |
| Commercial and industrial | | | — | | | | 354 | | | | 640 | |
| Consumer and other | | | 19 | | | | 19 | | | | — | |
| Totalnon-accrual loans | | | 948 | | | | 1,694 | | | | 1,854 | |
| | | | | | | | | | | | | |
| Accruing loans 90 days or more past due: | | | | | | | | | | | | |
| Residential: | | | | | | | | | | | | |
| One- to four-family | | | — | | | | — | | | | — | |
| Home equity loans and lines of credit | | | — | | | | — | | | | — | |
| Construction | | | — | | | | — | | | | — | |
| Commercial real estate | | | — | | | | — | | | | — | |
| Commercial and industrial | | | — | | | | — | | | | — | |
| Consumer and other | | | — | | | | — | | | | — | |
| Total loans 90 days or more past due | | | — | | | | — | | | | — | |
| | | | | | | | | | | | | |
| Total non-performing loans | | | 948 | | | | 1,694 | | | | 1,854 | |
| | | | | | | | | | | | | |
| Real estate owned | | | 130 | | | | 23 | | | | — | |
| Other non-performing assets | | | — | | | | — | | | | — | |
| | | | | | | | | | | | | |
| Total non-performing assets | | $ | 1,078 | | | $ | 1,717 | | | $ | 1,854 | |
| | | | | | | | | | | | | |
| Ratios: | | | | | | | | | | | | |
| Total non-performing loans to total loans | | | 0.70 | % | | | 1.27 | % | | | 1.75 | % |
| Total non-performing loans to total assets | | | 0.57 | % | | | 1.05 | % | | | 1.35 | % |
| Total non-performing assets to total assets | | | 0.64 | % | | | 1.06 | % | | | 1.35 | % |
Source: Seneca Federal’s prospectus.
EXHIBIT I-12
Seneca Federal Savings and Loan Association
Deposit Composition
Exhibit I-12
Seneca Federal Savings and Loan Association
Deposit Composition
| | | For the Three Months Ended | | | For the Years Ended December 31, | |
| | | March 31, 2017 | | | 2016 | | | 2015 | |
| | | Average
Balance | | | Percent | | | Weighted
Average
Rate | | | Average
Balance | | | Percent | | | Weighted
Average
Rate | | | Average
Balance | | | Percent | | | Weighted
Average
Rate | |
| | | (Dollars in thousands) | |
| Deposit type: | | | | | | | | | | | | | | | | | | | | | | | | | | | | | | | | | | | | |
| NOW accounts | | $ | 11,345 | | | | 9.1 | % | | | 0.14 | % | | $ | 9,405 | | | | 8.1 | % | | | 0.15 | % | | $ | 9,279 | | | | 8.9 | % | | | 0.05 | % |
| Regular savings and demand club accounts | | | 23,257 | | | | 18.6 | | | | 0.05 | | | | 23,222 | | | | 20.1 | | | | 0.05 | | | | 23,711 | | | | 22.8 | | | | 0.05 | |
| Money market accounts | | | 15,209 | | | | 12.2 | | | | 0.58 | | | | 13,087 | | | | 11.3 | | | | 0.59 | | | | 9,972 | | | | 9.6 | | | | 0.59 | |
| Certificates of deposit and retirement accounts | | | 61,514 | | | | 49.2 | | | | 1.11 | | | | 54,514 | | | | 47.1 | | | | 1.05 | | | | 47,214 | | | | 45.4 | | | | 0.77 | |
| Non-interest bearing deposits | | | 13,618 | | | | 10.9 | | | | — | | | | 15,472 | | | | 13.4 | | | | — | | | | 13,767 | | | | 13.3 | | | | — | |
| Total deposits | | $ | 124,943 | | | | 100.0 | % | | | 0.72 | % | | $ | 115,700 | | | | 100.0 | % | | | 0.67 | % | | $ | 103,943 | | | | 100.0 | % | | | 0.49 | % |
Source: Seneca Federal Savings and Loan Association’s prospectus.
EXHIBIT I-13
Seneca Federal Savings and Loan Association
Maturity of Jumbo Time Deposits
Exhibit I-13
Seneca Federal Savings and Loan Association
Maturity of Jumbo Time Deposits
| | | At
March 31, 2017 | |
| | | (In thousands) | |
| | | | |
| Three months or less | | $ | 3,002 | |
| Over three months through six months | | | 7,845 | |
| Over six months through one year | | | 10,316 | |
| Over one year to three years | | | 15,331 | |
| Over three years | | | 5,669 | |
| | | | | |
| Total | | $ | 42,163 | |
Source: Seneca Federal’s prospectus.
EXHIBIT I-14
Seneca Federal Savings and Loan Association
Borrowing Activity
Exhibit I-14
Seneca Federal Savings and Loan Association
Borrowing Activity
| | | At or for the Three Months Ended March 31, | | | At or For the Years Ended December 31, | |
| | | 2017 | | | 2016 | | | 2016 | | | 2015 | |
| | | (Dollars in thousands) | |
| | | | | | | | | | | | | |
| Balance at end of period | | $ | 21,000 | | | $ | 28,000 | | | $ | 28,000 | | | $ | 15,500 | |
| Average balance during period | | $ | 27,882 | | | $ | 17,480 | | | $ | 20,780 | | | $ | 17,109 | |
| Maximum outstanding at any month end | | $ | 29,300 | | | $ | 18,500 | | | $ | 28,000 | | | $ | 22,000 | |
| Weighted average interest rate at end of period | | | 2.01 | % | | | 1.67 | % | | | 1.50 | % | | | 1.79 | % |
| Average interest rate during period | | | 1.49 | % | | | 1.53 | % | | | 1.54 | % | | | 1.40 | % |
Source: Seneca Federal’s prospectus.
EXHIBIT II-1
Description of Office Properties
Exhibit II-1
Seneca Federal Savings and Loan Association
Description of Office Properties
| Location | | Leased or
Owned | | Year Acquired | | Net Book Value of
Real Property | |
| | | | | | | (In thousands) | |
| Main Office: | | | | | | | | |
| 35 Oswego Street | | Owned | | 1964 | | $ | 659,000 | |
| Baldwinsville, New York 13027 | | | | | | | | |
| | | | | | | | | |
| Other Properties: | | | | | | | | |
| Liverpool Branch | | Owned | | 2015 | | | 1,047,000 | |
| 7799 Oswego Road | | | | | | | | |
| Liverpool, New York 13089 | | | | | | | | |
| | | | | | | | | |
| North Syracuse Branch | | Owned | | 1973 | | | 310,000 | |
| 201 North Main Street | | | | | | | | |
| North Syracuse, New York 13212 | | | | | | | | |
Source: Seneca Federal’s prospectus.
EXHIBIT II-2
Historical Interest Rates
Exhibit II-2
Historical Interest Rates(1)
| | | | | Prime | | | 90 Day | | | One Year | | | 10 Year | |
| Year/Qtr. Ended | | Rate | | | T-Note | | | T-Note | | | T-Note | |
| | | | | | | | | | | | | | | |
| 2004: | | Quarter 1 | | | 4.00 | % | | | 0.95 | % | | | 1.20 | % | | | 3.86 | % |
| | | Quarter 2 | | | 4.00 | % | | | 1.33 | % | | | 2.09 | % | | | 4.62 | % |
| | | Quarter 3 | | | 4.75 | % | | | 1.70 | % | | | 2.16 | % | | | 4.12 | % |
| | | Quarter 4 | | | 5.25 | % | | | 2.22 | % | | | 2.75 | % | | | 4.24 | % |
| | | | | | | | | | | | | | | | | | | |
| 2005: | | Quarter 1 | | | 5.75 | % | | | 2.80 | % | | | 3.43 | % | | | 4.51 | % |
| | | Quarter 2 | | | 6.00 | % | | | 3.12 | % | | | 3.51 | % | | | 3.98 | % |
| | | Quarter 3 | | | 6.75 | % | | | 3.55 | % | | | 4.01 | % | | | 4.34 | % |
| | | Quarter 4 | | | 7.25 | % | | | 4.08 | % | | | 4.38 | % | | | 4.39 | % |
| | | | | | | | | | | | | | | | | | | |
| 2006: | | Quarter 1 | | | 7.75 | % | | | 4.63 | % | | | 4.82 | % | | | 4.86 | % |
| | | Quarter 2 | | | 8.25 | % | | | 5.01 | % | | | 5.21 | % | | | 5.15 | % |
| | | Quarter 3 | | | 8.25 | % | | | 4.88 | % | | | 4.91 | % | | | 4.64 | % |
| | | Quarter 4 | | | 8.25 | % | | | 5.02 | % | | | 5.00 | % | | | 4.71 | % |
| | | | | | | | | | | | | | | | | | | |
| 2007: | | Quarter 1 | | | 8.25 | % | | | 5.04 | % | | | 4.90 | % | | | 4.65 | % |
| | | Quarter 2 | | | 8.25 | % | | | 4.82 | % | | | 4.91 | % | | | 5.03 | % |
| | | Quarter 3 | | | 7.75 | % | | | 3.82 | % | | | 4.05 | % | | | 4.59 | % |
| | | Quarter 4 | | | 7.25 | % | | | 3.36 | % | | | 3.34 | % | | | 3.91 | % |
| | | | | | | | | | | | | | | | | | | |
| 2008: | | Quarter 1 | | | 5.25 | % | | | 1.38 | % | | | 1.55 | % | | | 3.45 | % |
| | | Quarter 2 | | | 5.00 | % | | | 1.90 | % | | | 2.36 | % | | | 3.99 | % |
| | | Quarter 3 | | | 5.00 | % | | | 0.92 | % | | | 1.78 | % | | | 3.85 | % |
| | | Quarter 4 | | | 3.25 | % | | | 0.11 | % | | | 0.37 | % | | | 2.25 | % |
| | | | | | | | | | | | | | | | | | | |
| 2009: | | Quarter 1 | | | 3.25 | % | | | 0.21 | % | | | 0.57 | % | | | 2.71 | % |
| | | Quarter 2 | | | 3.25 | % | | | 0.19 | % | | | 0.56 | % | | | 3.53 | % |
| | | Quarter 3 | | | 3.25 | % | | | 0.14 | % | | | 0.40 | % | | | 3.31 | % |
| | | Quarter 4 | | | 3.25 | % | | | 0.06 | % | | | 0.47 | % | | | 3.85 | % |
| | | | | | | | | | | | | | | | | | | |
| 2010: | | Quarter 1 | | | 3.25 | % | | | 0.16 | % | | | 0.41 | % | | | 3.84 | % |
| | | Quarter 2 | | | 3.25 | % | | | 0.18 | % | | | 0.32 | % | | | 2.97 | % |
| | | Quarter 3 | | | 3.25 | % | | | 0.18 | % | | | 0.32 | % | | | 2.97 | % |
| | | Quarter 4 | | | 3.25 | % | | | 0.12 | % | | | 0.29 | % | | | 3.30 | % |
| | | | | | | | | | | | | | | | | | | |
| 2011: | | Quarter 1 | | | 3.25 | % | | | 0.09 | % | | | 0.30 | % | | | 3.47 | % |
| | | Quarter 2 | | | 3.25 | % | | | 0.03 | % | | | 0.19 | % | | | 3.18 | % |
| | | Quarter 3 | | | 3.25 | % | | | 0.02 | % | | | 0.13 | % | | | 1.92 | % |
| | | Quarter 4 | | | 3.25 | % | | | 0.02 | % | | | 0.12 | % | | | 1.89 | % |
| | | | | | | | | | | | | | | | | | | |
| 2012: | | Quarter 1 | | | 3.25 | % | | | 0.07 | % | | | 0.19 | % | | | 2.23 | % |
| | | Quarter 2 | | | 3.25 | % | | | 0.09 | % | | | 0.21 | % | | | 1.67 | % |
| | | Quarter 3 | | | 3.25 | % | | | 0.10 | % | | | 0.17 | % | | | 1.65 | % |
| | | Quarter 4 | | | 3.25 | % | | | 0.05 | % | | | 0.16 | % | | | 1.78 | % |
| | | | | | | | | | | | | | | | | | | |
| 2013: | | Quarter 1 | | | 3.25 | % | | | 0.07 | % | | | 0.14 | % | | | 1.87 | % |
| | | Quarter 2 | | | 3.25 | % | | | 0.04 | % | | | 0.15 | % | | | 2.52 | % |
| | | Quarter 3 | | | 3.25 | % | | | 0.02 | % | | | 0.10 | % | | | 2.64 | % |
| | | Quarter 4 | | | 3.25 | % | | | 0.07 | % | | | 0.13 | % | | | 3.04 | % |
| | | | | | | | | | | | | | | | | | | |
| 2014: | | Quarter 1 | | | 3.25 | % | | | 0.05 | % | | | 0.13 | % | | | 2.73 | % |
| | | Quarter 2 | | | 3.25 | % | | | 0.04 | % | | | 0.11 | % | | | 2.53 | % |
| | | Quarter 3 | | | 3.25 | % | | | 0.02 | % | | | 0.13 | % | | | 2.52 | % |
| | | Quarter 4 | | | 3.25 | % | | | 0.04 | % | | | 0.25 | % | | | 2.17 | % |
| | | | | | | | | | | | | | | | | | | |
| 2015: | | Quarter 1 | | | 3.25 | % | | | 0.03 | % | | | 0.26 | % | | | 1.94 | % |
| | | Quarter 2 | | | 3.25 | % | | | 0.01 | % | | | 0.28 | % | | | 2.35 | % |
| | | Quarter 3 | | | 3.25 | % | | | 0.00 | % | | | 0.33 | % | | | 2.06 | % |
| | | Quarter 4 | | | 3.50 | % | | | 0.16 | % | | | 0.65 | % | | | 2.27 | % |
| | | | | | | | | | | | | | | | | | | |
| 2016: | | Quarter 1 | | | 3.50 | % | | | 0.21 | % | | | 0.59 | % | | | 1.78 | % |
| | | Quarter 2 | | | 3.50 | % | | | 0.26 | % | | | 0.45 | % | | | 1.49 | % |
| | | Quarter 3 | | | 3.50 | % | | | 0.29 | % | | | 0.59 | % | | | 1.60 | % |
| | | Quarter 4 | | | 3.75 | % | | | 0.51 | % | | | 0.85 | % | | | 2.45 | % |
| | | | | | | | | | | | | | | | | | | |
| 2017: | | Quarter 1 | | | 4.00 | % | | | 0.76 | % | | | 1.03 | % | | | 2.40 | % |
| As of May 12, 2017 | | | 4.00 | % | | | 0.88 | % | | | 1.11 | % | | | 2.33 | % |
(1) End of period data.
Sources: Federal Reserve and The Wall Street Journal.
EXHIBIT III-1
General Characteristics of Publicly-Traded Institutions
Exhibit III-1
Characteristics of Publicly-Traded Thrifts
May 12, 2017
| | | | | | | | | | | | | | | | | | | | | | | As of | |
| | | | | | | | | | | | | | | | | | | | | | | May 12, 2017 | |
| | | | | | | | | | | | | Total | | | | | | Fiscal | | Conv. | | Stock | | | Market | |
| Ticker | | Financial Institution | | Exchange | | Region | | City | | State | | Assets | | | Offices | | | Mth End | | Date | | Price | | | Value | |
| | | | | | | | | | | | | ($Mil) | | | | | | | | | | ($) | | | ($Mil) | |
| | | | | | | | | | | | | | | | | | | | | | | | | | | |
| BCTF | | Bancorp 34, Inc. | | NASDAQ | | SW | | Alamogordo | | NM | | $ | 334 | | | | 4 | | | Dec | | 5/16/00 | | $ | 12.97 | | | $ | 45 | |
| BKMU | | Bank Mutual Corporation | | NASDAQ | | MW | | Milwaukee | | WI | | | 2,668 | | | | 66 | | | Dec | | 10/30/03 | | | 9.45 | | | | 434 | |
| BYBK | | Bay Bancorp, Inc. | | NASDAQ | | MA | | Columbia | | MD | | | 633 | | | | 14 | | | Dec | | 1/0/00 | | | 7.25 | | | | 77 | |
| BNCL | | Beneficial Bancorp, Inc. | | NASDAQ | | MA | | Philadelphia | | PA | | | 5,862 | | | | 63 | | | Dec | | 7/16/07 | | | 14.95 | | | | 1,144 | |
| BHBK | | Blue Hills Bancorp, Inc. | | NASDAQ | | NE | | Norwood | | MA | | | 2,497 | | | | 11 | | | Dec | | 7/22/14 | | | 18.05 | | | | 485 | |
| BOFI | | BofI Holding, Inc. | | NASDAQ | | WE | | San Diego | | CA | | | 8,700 | | | | 2 | | | Jun | | 3/14/05 | | | 23.42 | | | | 1,484 | |
| BYFC | | Broadway Financial Corporation | | NASDAQ | | WE | | Los Angeles | | CA | | | 454 | | | | 3 | | | Dec | | 1/9/96 | | | 1.95 | | | | 54 | |
| BLMT | | BSB Bancorp, Inc. | | NASDAQ | | NE | | Belmont | | MA | | | 2,287 | | | | 7 | | | Dec | | 10/5/11 | | | 28.60 | | | | 277 | |
| CFFN | | Capitol Federal Financial, Inc. | | NASDAQ | | MW | | Topeka | | KS | | | 9,246 | | | | 47 | | | Sep | | 12/22/10 | | | 14.16 | | | | 1,957 | |
| CARV | | Carver Bancorp, Inc. | | NASDAQ | | MA | | New York | | NY | | | 699 | | | | 9 | | | Mar | | 10/25/94 | | | 3.50 | | | | 13 | |
| CHFN | | Charter Financial Corporation | | NASDAQ | | SE | | West Point | | GA | | | 1,485 | | | | 21 | | | Sep | | 4/8/13 | | | 18.54 | | | | 279 | |
| CSBK | | Clifton Bancorp Inc. | | NASDAQ | | MA | | Clifton | | NJ | | | 1,432 | | | | 12 | | | Mar | | 4/2/14 | | | 16.33 | | | | 368 | |
| CWAY | | Coastway Bancorp, Inc. | | NASDAQ | | NE | | Warwick | | RI | | | 633 | | | | 11 | | | Dec | | 1/15/14 | | | 19.75 | | | | 87 | |
| DCOM | | Dime Community Bancshares, Inc. | | NASDAQ | | MA | | Brooklyn | | NY | | | 6,095 | | | | 27 | | | Dec | | 6/26/96 | | | 20.10 | | | | 756 | |
| ESBK | | Elmira Savings Bank | | NASDAQ | | MA | | Elmira | | NY | | | 557 | | | | 13 | | | Dec | | 3/1/85 | | | 20.50 | | | | 68 | |
| EQFN | | Equitable Financial Corp. | | NASDAQ | | MW | | Grand Island | | NE | | | 241 | | | | 6 | | | Jun | | 11/9/05 | | | 10.25 | | | | 35 | |
| ESSA | | ESSA Bancorp, Inc. | | NASDAQ | | MA | | Stroudsburg | | PA | | | 1,759 | | | | 27 | | | Sep | | 4/4/07 | | | 14.76 | | | | 171 | |
| FCAP | | First Capital, Inc. | | NASDAQ | | MW | | Corydon | | IN | | | 762 | | | | 18 | | | Dec | | 1/4/99 | | | 32.31 | | | | 108 | |
| FBNK | | First Connecticut Bancorp, Inc. | | NASDAQ | | NE | | Farmington | | CT | | | 2,904 | | | | 27 | | | Dec | | 6/30/11 | | | 25.25 | | | | 402 | |
| FDEF | | First Defiance Financial Corp. | | NASDAQ | | MW | | Defiance | | OH | | | 2,929 | | | | 43 | | | Dec | | 10/2/95 | | | 53.58 | | | | 544 | |
| FNWB | | First Northwest Bancorp | | NASDAQ | | WE | | Port Angeles | | WA | | | 1,081 | | | | 11 | | | Jun | | 1/30/15 | | | 16.20 | | | | 196 | |
| FBC | | Flagstar Bancorp, Inc. | | NYSE | | MW | | Troy | | MI | | | 15,361 | | | | 99 | | | Dec | | 4/30/97 | | | 29.46 | | | | 1,681 | |
| FSBW | | FS Bancorp, Inc. | | NASDAQ | | WE | | Mountlake Terrace | | WA | | | 878 | | | | 12 | | | Dec | | 7/10/12 | | | 44.20 | | | | 135 | |
| FSBC | | FSB Bancorp, Inc. | | NASDAQ | | MA | | Fairport | | NY | | | 286 | | | | 5 | | | Dec | | 8/15/07 | | | 14.90 | | | | 29 | |
| HBK | | Hamilton Bancorp, Inc. | | NASDAQ | | MA | | Towson | | MD | | | 500 | | | | 7 | | | Mar | | 10/10/12 | | | 15.16 | | | | 52 | |
| HIFS | | Hingham Institution for Savings | | NASDAQ | | NE | | Hingham | | MA | | | 2,039 | | | | 13 | | | Dec | | 12/13/88 | | | 175.61 | | | | 375 | |
| HMNF | | HMN Financial, Inc. | | NASDAQ | | MW | | Rochester | | MN | | | 681 | | | | 13 | | | Dec | | 6/30/94 | | | 17.90 | | | | 80 | |
| HFBL | | Home Federal Bancorp, Inc. of Louisiana | | NASDAQ | | SW | | Shreveport | | LA | | | 416 | | | | 7 | | | Jun | | 12/22/10 | | | 28.00 | | | | 55 | |
| HVBC | | HV Bancorp, Inc. | | NASDAQ | | MA | | Huntingdon Valley | | PA | | | 217 | | | | 6 | | | Jun | | 1/12/17 | | | 14.35 | | | | 31 | |
| IROQ | | IF Bancorp, Inc. | | NASDAQ | | MW | | Watseka | | IL | | | 591 | | | | 6 | | | Jun | | 7/8/11 | | | 20.00 | | | | 79 | |
| ISBC | | Investors Bancorp, Inc. | | NASDAQ | | MA | | Short Hills | | NJ | | | 23,889 | | | | 154 | | | Dec | | 5/8/14 | | | 13.65 | | | | 4,236 | |
| JXSB | | Jacksonville Bancorp, Inc. | | NASDAQ | | MW | | Jacksonville | | IL | | | 318 | | | | 6 | | | Dec | | 7/15/10 | | | 30.50 | | | | 55 | |
| KRNY | | Kearny Financial Corp. | | NASDAQ | | MA | | Fairfield | | NJ | | | 4,796 | | | | 42 | | | Jun | | 2/24/05 | | | 14.80 | | | | 1,279 | |
| MLVF | | Malvern Bancorp, Inc. | | NASDAQ | | MA | | Paoli | | PA | | | 962 | | | | 9 | | | Sep | | 10/12/12 | | | 22.00 | | | | 145 | |
| MELR | | Melrose Bancorp, Inc. | | NASDAQ | | NE | | Melrose | | MA | | | 269 | | | | 1 | | | Dec | | 10/22/14 | | | 16.80 | | | | 44 | |
| EBSB | | Meridian Bancorp, Inc. | | NASDAQ | | NE | | Peabody | | MA | | | 4,639 | | | | 32 | | | Dec | | 7/29/14 | | | 17.05 | | | | 915 | |
| CASH | | Meta Financial Group, Inc. | | NASDAQ | | MW | | Sioux Falls | | SD | | | 3,986 | | | | 10 | | | Sep | | 9/20/93 | | | 83.45 | | | | 780 | |
| MSBF | | MSB Financial Corp. | | NASDAQ | | MA | | Millington | | NJ | | | 482 | | | | 5 | | | Dec | | 1/5/07 | | | 17.25 | | | | 99 | |
| NYCB | | New York Community Bancorp, Inc. | | NYSE | | MA | | Westbury | | NY | | | 48,825 | | | | 259 | | | Dec | | 11/23/93 | | | 12.92 | | | | 6,319 | |
| NFBK | | Northfield Bancorp, Inc. | | NASDAQ | | MA | | Woodbridge | | NJ | | | 3,844 | | | | 38 | | | Dec | | 1/25/13 | | | 17.31 | | | | 846 | |
| NWBI | | Northwest Bancshares, Inc. | | NASDAQ | | MA | | Warren | | PA | | | 9,732 | | | | 177 | | | Dec | | 12/18/09 | | | 15.57 | | | | 1,589 | |
| OCFC | | OceanFirst Financial Corp. | | NASDAQ | | MA | | Toms River | | NJ | | | 5,196 | | | | 58 | | | Dec | | 7/3/96 | | | 27.21 | | | | 884 | |
| ORIT | | Oritani Financial Corp. | | NASDAQ | | MA | | Township of Washington | | NJ | | | 4,126 | | | | 27 | | | Jun | | 6/24/10 | | | 16.85 | | | | 773 | |
| OTTW | | Ottawa Bancorp, Inc. | | NASDAQ | | MW | | Ottawa | | IL | | | 236 | | | | 3 | | | Dec | | 7/14/05 | | | 13.40 | | | | 46 | |
| PBHC | | Pathfinder Bancorp, Inc. | | NASDAQ | | MA | | Oswego | | NY | | | 802 | | | | 17 | | | Dec | | 10/17/14 | | | 15.10 | | | | 64 | |
| PBBI | | PB Bancorp, Inc. | | NASDAQ | | NE | | Putnam | | CT | | | 511 | | | | 8 | | | Jun | | 10/5/04 | | | 10.40 | | | | 81 | |
| PCSB | | PCSB Financial Corporation | | NASDAQ | | MA | | Yorktown Heights | | NY | | | 1,407 | | | | 16 | | | Jun | | 4/21/17 | | | 16.58 | | | | 301 | |
| PBSK | | Poage Bankshares, Inc. | | NASDAQ | | MW | | Ashland | | KY | | | 461 | | | | 10 | | | Dec | | 9/13/11 | | | 19.41 | | | | 71 | |
| PROV | | Provident Financial Holdings, Inc. | | NASDAQ | | WE | | Riverside | | CA | | | 1,199 | | | | 15 | | | Jun | | 6/28/96 | | | 18.96 | | | | 150 | |
| PFS | | Provident Financial Services, Inc. | | NYSE | | MA | | Iselin | | NJ | | | 9,510 | | | | 87 | | | Dec | | 1/16/03 | | | 24.56 | | | | 1,638 | |
| PBIP | | Prudential Bancorp, Inc. | | NASDAQ | | MA | | Philadelphia | | PA | | | 844 | | | | 11 | | | Sep | | 10/10/13 | | | 17.95 | | | | 162 | |
Exhibit III-1
Characteristics of Publicly-Traded Thrifts
May 12, 2017
| | | | | | | | | | | | | | | | | | | | | | | As of | |
| | | | | | | | | | | | | | | | | | | | | | | May 12, 2017 | |
| | | | | | | | | | | | | Total | | | | | | Fiscal | | Conv. | | Stock | | | Market | |
| Ticker | | Financial Institution | | Exchange | | Region | | City | | State | | Assets | | | Offices | | | Mth End | | Date | | Price | | | Value | |
| | | | | | | | | | | | | ($Mil) | | | | | | | | | | ($) | | | ($Mil) | |
| | | | | | | | | | | | | | | | | | | | | | | | | | | |
| RNDB | | Randolph Bancorp, Inc. | | NASDAQ | | NE | | Stoughton | | MA | | | 482 | | | | 6 | | | Dec | | 7/1/16 | | | 15.06 | | | | 88 | |
| RVSB | | Riverview Bancorp, Inc. | | NASDAQ | | WE | | Vancouver | | WA | | | 1,134 | | | | 19 | | | Mar | | 10/1/97 | | | 6.95 | | | | 156 | |
| SVBI | | Severn Bancorp, Inc. | | NASDAQ | | MA | | Annapolis | | MD | | | 799 | | | | 5 | | | Dec | | 1/0/00 | | | 7.10 | | | | 86 | |
| SIFI | | SI Financial Group, Inc. | | NASDAQ | | NE | | Willimantic | | CT | | | 1,593 | | | | 24 | | | Dec | | 1/13/11 | | | 14.85 | | | | 181 | |
| SBCP | | Sunshine Bancorp, Inc. | | NASDAQ | | SE | | Plant City | | FL | | | 956 | | | | 18 | | | Dec | | 7/15/14 | | | 23.46 | | | | 188 | |
| TBNK | | Territorial Bancorp Inc. | | NASDAQ | | WE | | Honolulu | | HI | | | 1,936 | | | | 29 | | | Dec | | 7/13/09 | | | 30.27 | | | | 298 | |
| TSBK | | Timberland Bancorp, Inc. | | NASDAQ | | WE | | Hoquiam | | WA | | | 947 | | | | 22 | | | Sep | | 1/13/98 | | | 22.18 | | | | 163 | |
| TRST | | TrustCo Bank Corp NY | | NASDAQ | | MA | | Glenville | | NY | | | 4,887 | | | | 144 | | | Dec | | 1/0/00 | | | 7.75 | | | | 744 | |
| UCBA | | United Community Bancorp | | NASDAQ | | MW | | Lawrenceburg | | IN | | | 546 | | | | 8 | | | Jun | | 1/10/13 | | | 18.13 | | | | 76 | |
| UBNK | | United Financial Bancorp, Inc. | | NASDAQ | | NE | | Glastonbury | | CT | | | 6,697 | | | | 54 | | | Dec | | 3/4/11 | | | 16.80 | | | | 853 | |
| WSBF | | Waterstone Financial, Inc. | | NASDAQ | | MW | | Wauwatosa | | WI | | | 1,727 | | | | 13 | | | Dec | | 1/23/14 | | | 18.85 | | | | 555 | |
| WAYN | | Wayne Savings Bancshares, Inc. | | NASDAQ | | MW | | Wooster | | OH | | | 449 | | | | 11 | | | Dec | | 1/9/03 | | | 17.71 | | | | 49 | |
| WCFB | | WCF Bancorp, Inc. | | NASDAQ | | MW | | Webster City | | IA | | | 126 | | | | 2 | | | Dec | | 8/15/94 | | | 10.00 | | | | 26 | |
| WEBK | | Wellesley Bancorp, Inc. | | NASDAQ | | NE | | Wellesley | | MA | | | 704 | | | | 6 | | | Dec | | 1/26/12 | | | 27.25 | | | | 68 | |
| WBB | | Westbury Bancorp, Inc. | | NASDAQ | | MW | | West Bend | | WI | | | 756 | | | | 8 | | | Sep | | 4/10/13 | | | 20.30 | | | | 82 | |
| WNEB | | Western New England Bancorp, Inc. | | NASDAQ | | NE | | Westfield | | MA | | | 2,087 | | | | 23 | | | Dec | | 1/4/07 | | | 10.30 | | | | 317 | |
| WBKC | | Wolverine Bancorp, Inc. | | NASDAQ | | MW | | Midland | | MI | | | 379 | | | | 3 | | | Dec | | 1/20/11 | | | 31.29 | | | | 66 | |
| WSFS | | WSFS Financial Corporation | | NASDAQ | | MA | | Wilmington | | DE | | | 6,853 | | | | 64 | | | Dec | | 11/26/86 | | | 45.05 | | | | 1,417 | |
| WVFC | | WVS Financial Corp. | | NASDAQ | | MA | | Pittsburgh | | PA | | | 345 | | | | 6 | | | Jun | | 11/29/93 | | | 15.15 | | | | 31 | |
| HONE | | HarborOne Bancorp, Inc. (MHC) | | NASDAQ | | NE | | Brockton | | MA | | | 2,566 | | | | 17 | | | Dec | | 6/30/16 | | | 20.42 | | | | 656 | |
| PVBC | | Provident Bancorp, Inc. (MHC) | | NASDAQ | | NE | | Amesbury | | MA | | | 833 | | | | 8 | | | Dec | | 7/16/15 | | | 20.10 | | | | 194 | |
| OFED | | Oconee Federal Financial Corp. (MHC) | | NASDAQ | | SE | | Seneca | | SC | | | 481 | | | | 7 | | | Jun | | 1/14/11 | | | 27.27 | | | | 157 | |
| LSBK | | Lake Shore Bancorp, Inc. (MHC) | | NASDAQ | | MA | | Dunkirk | | NY | | | 494 | | | | 11 | | | Dec | | 4/4/06 | | | 15.63 | | | | 96 | |
| MGYR | | Magyar Bancorp, Inc. (MHC) | | NASDAQ | | MA | | New Brunswick | | NJ | | | 583 | | | | 6 | | | Sep | | 1/24/06 | | | 13.00 | | | | 76 | |
| KFFB | | Kentucky First Federal Bancorp (MHC) | | NASDAQ | | MW | | Frankfort | | KY | | | 305 | | | | 7 | | | Jun | | 3/3/05 | | | 9.64 | | | | 81 | |
| TFSL | | TFS Financial Corporation (MHC) | | NASDAQ | | MW | | Cleveland | | OH | | | 13,406 | | | | 38 | | | Sep | | 4/23/07 | | | 16.46 | | | | 4,654 | |
| GCBC | | Greene County Bancorp, Inc. (MHC) | | NASDAQ | | MA | | Catskill | | NY | | | 958 | | | | 15 | | | Jun | | 12/30/98 | | | 23.45 | | | | 199 | |
Source: SNL Financial, LC.
EXHIBIT III-2
Public Market Pricing of Mid-Atlantic Thrift Institutions
Exhibit III-2
Public Market Pricing of Mid-Atlantic Institutions
As of May 12, 2017
| | | | | | | Market | | | Per Share Data | | | | | | | | | | | | | | | | |
| | | | | | | Capitalization | | | Core | | | Book | | | | | | | | | | | | | | | | |
| | | | | | | Price/ | | | Market | | | 12 Month | | | Value/ | | | Pricing Ratios(2) | |
| | | | | Share | | | Value | | | EPS(1) | | | Share | | | P/E | | | P/B | | | P/A | | | P/TB | | | P/Core | |
| | | | | | | ($) | | | ($Mil) | | | ($) | | | ($) | | | (x) | | | (%) | | | (%) | | | (%) | | | (x) | |
| | | | | | | | | | | | | | | | | | | | | | | | | | | | | | | | |
| All Non-MHC Public Companies(6) | | | | | | | | | | | | | | | | | | | | | | | | | | | | | | | | | | | | | | |
| Averages | | | | $ | 22.02 | | | $ | 534.58 | | | $ | 1.18 | | | $ | 16.50 | | | | 21.86 | x | | | 127.67 | % | | | 15.69 | % | | | 140.58 | % | | | 19.47 | x |
| Median | | | | $ | 17.28 | | | $ | 162.35 | | | $ | 0.83 | | | $ | 14.78 | | | | 20.64 | x | | | 122.58 | % | | | 15.40 | % | | | 131.09 | % | | | 18.05 | x |
| | | | | | | | | | | | | | | | | | | | | | | | | | | | | | | | | | | | | | | | | |
| Comparable Group | | | | | | | | | | | | | | | | | | | | | | | | | | | | | | | | | | | | | | |
| Averages | | | | $ | 16.61 | | | $ | 863.72 | | | $ | 0.77 | | | $ | 13.33 | | | | 23.17 | x | | | 126.85 | % | | | 15.44 | % | | | 145.09 | % | | | 19.61 | x |
| Medians | | | | $ | 15.16 | | | $ | 301.18 | | | $ | 0.71 | | | $ | 13.72 | | | | 20.87 | x | | | 123.90 | % | | | 15.22 | % | | | 135.67 | % | | | 17.98 | x |
| | | | | | | | | | | | | | | | | | | | | | | | | | | | | | | | | | | | | | | | | |
| Comparable Group | | | | | | | | | | | | | | | | | | | | | | | | | | | | | | | | | | | | | | |
| BYBK | | Bay Bancorp, Inc. | | MD | | $ | 7.25 | | | $ | 77.16 | | | $ | 0.26 | | | $ | 6.38 | | | | 31.52 | x | | | 113.62 | % | | | 12.18 | % | | | 118.54 | % | | | 28.12 | x |
| BNCL | | Beneficial Bancorp, Inc. | | PA | | $ | 14.95 | | | $ | 1,144.42 | | | $ | 0.47 | | | $ | 13.46 | | | | 38.33 | x | | | 111.05 | % | | | 19.52 | % | | | 133.45 | % | | | 31.86 | x |
| CARV | | Carver Bancorp, Inc. | | NY | | $ | 3.50 | | | $ | 12.94 | | | $ | (0.64 | ) | | $ | 1.71 | | | | NM | | | | 205.24 | % | | | 1.85 | % | | | 205.24 | % | | | NM | |
| CSBK | | Clifton Bancorp Inc. | | NJ | | $ | 16.33 | | | $ | 368.23 | | | $ | 0.21 | | | $ | 13.15 | | | | NM | | | | 124.14 | % | | | 25.72 | % | | | 124.14 | % | | | NM | |
| DCOM | | Dime Community Bancshares, Inc. | | NY | | $ | 20.10 | | | $ | 756.44 | | | $ | 1.12 | | | $ | 15.26 | | | | 22.09 | x | | | 131.74 | % | | | 12.41 | % | | | 145.90 | % | | | 17.98 | x |
| ESBK | | Elmira Savings Bank | | NY | | $ | 20.50 | | | $ | 67.73 | | | $ | 1.28 | | | $ | 16.82 | | | | 16.14 | x | | | 121.89 | % | | | 12.17 | % | | | 166.08 | % | | | 16.05 | x |
| ESSA | | ESSA Bancorp, Inc. | | PA | | $ | 14.76 | | | $ | 171.01 | | | $ | 0.66 | | | $ | 15.44 | | | | 22.03 | x | | | 95.57 | % | | | 9.72 | % | | | 104.94 | % | | | 22.43 | x |
| FSBC | | FSB Bancorp, Inc. | | NY | | $ | 14.90 | | | $ | 28.93 | | | $ | 0.44 | | | $ | 16.43 | | | | 32.74 | x | | | 90.71 | % | | | 10.11 | % | | | 90.71 | % | | | 33.61 | x |
| HBK | | Hamilton Bancorp, Inc. | | MD | | $ | 15.16 | | | $ | 51.67 | | | $ | 0.17 | | | $ | 17.77 | | | | NM | | | | 85.27 | % | | | 10.34 | % | | | 100.88 | % | | | NM | |
| HVBC | | HV Bancorp, Inc. | | PA | | $ | 14.35 | | | $ | 31.31 | | | | NA | | | $ | 14.24 | | | | NA | | | | 100.77 | % | | | 14.44 | % | | | 100.77 | % | | | NM | |
| ISBC | | Investors Bancorp, Inc. | | NJ | | $ | 13.65 | | | $ | 4,236.47 | | | $ | 0.66 | | | $ | 10.18 | | | | 20.68 | x | | | 134.13 | % | | | 17.73 | % | | | 137.90 | % | | | 20.63 | x |
| KRNY | | Kearny Financial Corp. | | NJ | | $ | 14.80 | | | $ | 1,278.71 | | | $ | 0.21 | | | $ | 12.54 | | | | NM | | | | 118.04 | % | | | 26.66 | % | | | 131.09 | % | | | NM | |
| MLVF | | Malvern Bancorp, Inc. | | PA | | $ | 22.00 | | | $ | 144.60 | | | $ | 1.82 | | | $ | 14.83 | | | | 11.83 | x | | | 148.36 | % | | | 15.03 | % | | | 148.36 | % | | | 12.11 | x |
| MSBF | | MSB Financial Corp. | | NJ | | $ | 17.25 | | | $ | 98.83 | | | $ | 0.28 | | | $ | 12.93 | | | | 61.61 | x | | | 133.43 | % | | | 20.51 | % | | | 133.43 | % | | | NM | |
| NYCB | | New York Community Bancorp, Inc. | | NY | | $ | 12.92 | | | $ | 6,318.58 | | | $ | 0.97 | | | $ | 12.57 | | | | 13.46 | x | | | 102.82 | % | | | 12.94 | % | | | 170.37 | % | | | 13.37 | x |
| NFBK | | Northfield Bancorp, Inc. | | NJ | | $ | 17.31 | | | $ | 845.60 | | | $ | 0.71 | | | $ | 12.91 | | | | 24.73 | x | | | 134.12 | % | | | 22.00 | % | | | 143.22 | % | | | 24.21 | x |
| NWBI | | Northwest Bancshares, Inc. | | PA | | $ | 15.57 | | | $ | 1,588.65 | | | $ | 0.86 | | | $ | 11.55 | | | | 32.44 | x | | | 134.85 | % | | | 16.32 | % | | | 189.16 | % | | | 18.12 | x |
| OCFC | | OceanFirst Financial Corp. | | NJ | | $ | 27.21 | | | $ | 883.57 | | | $ | 1.55 | | | $ | 17.95 | | | | 24.96 | x | | | 151.61 | % | | | 17.00 | % | | | 208.12 | % | | | 17.56 | x |
| ORIT | | Oritani Financial Corp. | | NJ | | $ | 16.85 | | | $ | 773.05 | | | $ | 0.96 | | | $ | 12.13 | | | | 13.06 | x | | | 138.86 | % | | | 18.74 | % | | | 138.86 | % | | | 17.58 | x |
| PBHC | | Pathfinder Bancorp, Inc. | | NY | | $ | 15.10 | | | $ | 64.13 | | | $ | 0.72 | | | $ | 13.98 | | | | 18.41 | x | | | 108.00 | % | | | 7.99 | % | | | 117.35 | % | | | 21.05 | x |
| PCSB | | PCSB Financial Corporation | | NY | | $ | 16.58 | | | $ | 301.18 | | | | NA | | | | NA | | | | NA | | | | NA | | | | 21.40 | % | | | NA | | | | NM | |
| PFS | | Provident Financial Services, Inc. | | NJ | | $ | 24.56 | | | $ | 1,637.64 | | | $ | 1.44 | | | $ | 19.10 | | | | 17.30 | x | | | 128.61 | % | | | 17.22 | % | | | 195.62 | % | | | 17.03 | x |
| PBIP | | Prudential Bancorp, Inc. | | PA | | $ | 17.95 | | | $ | 161.69 | | | $ | 0.28 | | | $ | 14.52 | | | | NM | | | | 123.65 | % | | | 19.15 | % | | | 131.65 | % | | | NM | |
| SVBI | | Severn Bancorp, Inc. | | MD | | $ | 7.10 | | | $ | 86.11 | | | $ | 1.20 | | | $ | 7.06 | | | | 5.92 | x | | | 100.61 | % | | | 10.78 | % | | | 101.01 | % | | | 5.92 | x |
| TRST | | TrustCo Bank Corp NY | | NY | | $ | 7.75 | | | $ | 743.98 | | | $ | 0.44 | | | $ | 4.57 | | | | 17.22 | x | | | 169.45 | % | | | 15.22 | % | | | 169.66 | % | | | 17.52 | x |
| WSFS | | WSFS Financial Corporation | | DE | | $ | 45.05 | | | $ | 1,416.92 | | | $ | 2.31 | | | $ | 22.38 | | | | 21.05 | x | | | 201.30 | % | | | 20.68 | % | | | 275.52 | % | | | 19.48 | x |
| WVFC | | WVS Financial Corp. | | PA | | $ | 15.15 | | | $ | 30.89 | | | $ | 0.85 | | | $ | 16.78 | | | | 17.82 | x | | | 90.29 | % | | | 8.96 | % | | | 90.29 | % | | | 17.89 | x |
| | | | | | | | | | | | | | | | | | | | | | | | | | | | | | | | | | | | | | | | | |
| MHCs | | | | | | | | | | | | | | | | | | | | | | | | | | | | | | | | | | | | | | |
| GCBC | | Greene County Bancorp, Inc. (MHC) | | NY | | $ | 23.45 | | | $ | 199.39 | | | $ | 1.26 | | | $ | 9.52 | | | | 18.61 | x | | | 246.31 | % | | | 20.80 | % | | | 246.31 | % | | | 18.61 | x |
| LSBK | | Lake Shore Bancorp, Inc. (MHC) | | NY | | $ | 15.63 | | | $ | 95.54 | | | $ | 0.36 | | | $ | 12.53 | | | | 41.13 | x | | | 124.79 | % | | | 19.34 | % | | | 124.79 | % | | | NM | |
| MGYR | | Magyar Bancorp, Inc. (MHC) | | NJ | | $ | 13.00 | | | $ | 75.67 | | | $ | 0.21 | | | $ | 8.29 | | | | 61.90 | x | | | 156.77 | % | | | 12.99 | % | | | 156.77 | % | | | NM | |
| | | | | | | | | | | | | | | | | | | | | | | | | | | | | | | | | | | | | | | | | |
| Under Acquisition | | | | | | | | | | | | | | | | | | | | | | | | | | | | | | | | | | | | | | |
| AF | | Astoria Financial Corporation | | NY | | $ | 19.56 | | | $ | 1,989.75 | | | $ | 0.62 | | | $ | 15.67 | | | | 33.72 | x | | | 124.82 | % | | | 13.87 | % | | | 141.22 | % | | | 31.66 | x |
| | | | | | | | | | | | | | | | | | | | | | | | | | | | | | | | | | | | | | |
| | | | | | | Dividends(3) | | | Financial Characteristics(5) | |
| | | | | | | Amount/ | | | | | | Payout | | | Total | | | Equity/ | | | Tang. Eq./ | | | NPAs/ | | | Reported | | | Core | |
| | | | | Share | | | Yield | | | Ratio(4) | | | Assets | | | Assets | | | T. Assets | | | Assets | | | ROAA | | | ROAE | | | ROAA | | | ROAE | |
| | | | | | | ($) | | | (%) | | | (%) | | | ($Mil) | | | (%) | | | (%) | | | (%) | | | (%) | | | (%) | | | (%) | | | (%) | |
| | | | | | | | | | | | | | | | | | | | | | | | | | | | | | | | | | | | | | |
| All Non-MHC Public Companies(6) | | | | | | | | | | | | | | | | | | | | | | | | | | | | | | | | | | | | | | | | | | | | | | |
| Averages | | | | $ | 0.37 | | | | 1.71 | % | | | 56.00 | % | | $ | 3,338 | | | | 12.69 | % | | | 11.73 | % | | | 0.98 | % | | | 0.75 | % | | | 6.34 | % | | | 0.75 | % | | | 6.32 | % |
| Median | | | | $ | 0.28 | | | | 1.48 | % | | | 46.23 | % | | $ | 1,022 | | | | 11.57 | % | | | 10.81 | % | | | 0.83 | % | | | 0.67 | % | | | 5.99 | % | | | 0.67 | % | | | 5.61 | % |
| | | | | | | | | | | | | | | | | | | | | | | | | | | | | | | | | | | | | | | | | | | | | | | | | |
| Comparable Group | | | | | | | | | | | | | | | | | | | | | | | | | | | | | | | | | | | | | | | | | | | | | | |
| Averages | | | | $ | 0.33 | | | | 1.95 | % | | | 66.16 | % | | $ | 5,383 | | | | 12.47 | % | | | 11.43 | % | | | 1.11 | % | | | 0.67 | % | | | 5.56 | % | | | 0.71 | % | | | 5.82 | % |
| Medians | | | | $ | 0.26 | | | | 1.66 | % | | | 56.03 | % | | $ | 1,432 | | | | 11.21 | % | | | 10.18 | % | | | 0.87 | % | | | 0.53 | % | | | 5.32 | % | | | 0.71 | % | | | 5.34 | % |
| | | | | | | | | | | | | | | | | | | | | | | | | | | | | | | | | | | | | | | | | | | | | | | | | |
| Comparable Group | | | | | | | | | | | | | | | | | | | | | | | | | | | | | | | | | | | | | | | | | | | | | | |
| BYBK | | Bay Bancorp, Inc. | | MD | | $ | 0.00 | | | | 0.00 | % | | | NM | | | $ | 633 | | | | 10.62 | % | | | 10.23 | % | | | 2.49 | % | | | 0.47 | % | | | 4.16 | % | | | 0.53 | % | | | 4.62 | % |
| BNCL | | Beneficial Bancorp, Inc. | | PA | | $ | 0.24 | | | | 1.66 | % | | | 61.54 | % | | $ | 5,862 | | | | 17.57 | % | | | 15.07 | % | | | NA | | | | 0.51 | % | | | 2.82 | % | | | 0.61 | % | | | 3.36 | % |
| CARV | | Carver Bancorp, Inc. | | NY | | $ | 0.00 | | | | 0.00 | % | | | NM | | | $ | 699 | | | | 7.36 | % | | | 7.36 | % | | | 2.41 | % | | | -0.28 | % | | | -3.76 | % | | | -0.30 | % | | | -3.91 | % |
| CSBK | | Clifton Bancorp Inc. | | NJ | | $ | 0.24 | | | | 1.48 | % | | | 114.29 | % | | $ | 1,432 | | | | 20.72 | % | | | 20.72 | % | | | NA | | | | 0.36 | % | | | 1.54 | % | | | 0.35 | % | | | 1.53 | % |
| DCOM | | Dime Community Bancshares, Inc. | | NY | | $ | 0.56 | | | | 2.82 | % | | | 61.54 | % | | $ | 6,095 | | | | 9.40 | % | | | 8.57 | % | | | 0.23 | % | | | 0.58 | % | | | 6.04 | % | | | 0.71 | % | | | 7.36 | % |
| ESBK | | Elmira Savings Bank | | NY | | $ | 0.92 | | | | 4.52 | % | | | 72.44 | % | | $ | 557 | | | | 10.08 | % | | | 8.04 | % | | | NA | | | | 0.77 | % | | | 7.82 | % | | | 0.78 | % | | | 7.88 | % |
| ESSA | | ESSA Bancorp, Inc. | | PA | | $ | 0.36 | | | | 2.48 | % | | | 53.73 | % | | $ | 1,759 | | | | 10.16 | % | | | 9.34 | % | | | 1.22 | % | | | 0.41 | % | | | 4.09 | % | | | 0.40 | % | | | 4.02 | % |
| FSBC | | FSB Bancorp, Inc. | | NY | | | NA | | | | NA | | | | NM | | | $ | 286 | | | | 11.14 | % | | | 11.14 | % | | | 0.01 | % | | | 0.33 | % | | | 3.14 | % | | | 0.32 | % | | | 3.06 | % |
| HBK | | Hamilton Bancorp, Inc. | | MD | | | NA | | | | NA | | | | NM | | | $ | 500 | | | | 12.14 | % | | | 10.46 | % | | | 1.08 | % | | | 0.03 | % | | | 0.27 | % | | | 0.11 | % | | | 0.90 | % |
| HVBC | | HV Bancorp, Inc. | | PA | | | NA | | | | NA | | | | NM | | | $ | 217 | | | | 14.32 | % | | | 14.32 | % | | | 0.64 | % | | | NA | | | | 5.40 | % | | | NA | | | | 5.33 | % |
| ISBC | | Investors Bancorp, Inc. | | NJ | | $ | 0.32 | | | | 2.42 | % | | | 45.45 | % | | $ | 23,889 | | | | 13.22 | % | | | 12.91 | % | | | 0.44 | % | | | 0.86 | % | | | 6.16 | % | | | 0.86 | % | | | 6.17 | % |
| KRNY | | Kearny Financial Corp. | | NJ | | $ | 0.12 | | | | 0.85 | % | | | 42.86 | % | | $ | 4,796 | | | | 22.81 | % | | | 21.02 | % | | | NA | | | | 0.42 | % | | | 1.69 | % | | | 0.42 | % | | | 1.70 | % |
| MLVF | | Malvern Bancorp, Inc. | | PA | | $ | 0.11 | | | | 0.00 | % | | | NM | | | $ | 962 | | | | 10.13 | % | | | 10.13 | % | | | 0.33 | % | | | 1.43 | % | | | 13.01 | % | | | 1.40 | % | | | 12.71 | % |
| MSBF | | MSB Financial Corp. | | NJ | | $ | 0.00 | | | | 0.00 | % | | | NM | | | $ | 482 | | | | 15.37 | % | | | 15.37 | % | | | 3.30 | % | | | 0.37 | % | | | 2.08 | % | | | 0.37 | % | | | 2.08 | % |
| NYCB | | New York Community Bancorp, Inc. | | NY | | $ | 0.68 | | | | 5.28 | % | | | 70.83 | % | | $ | 48,825 | | | | 13.61 | % | | | 9.08 | % | | | 0.15 | % | | | 0.96 | % | | | 7.67 | % | | | 0.96 | % | | | 7.73 | % |
| NFBK | | Northfield Bancorp, Inc. | | NJ | | $ | 0.32 | | | | 1.91 | % | | | 45.71 | % | | $ | 3,844 | | | | 16.40 | % | | | 15.52 | % | | | 0.71 | % | | | 0.85 | % | | | 5.24 | % | | | 0.87 | % | | | 5.35 | % |
| NWBI | | Northwest Bancshares, Inc. | | PA | | $ | 0.64 | | | | 4.17 | % | | | 129.17 | % | | $ | 9,732 | | | | 12.10 | % | | | 8.94 | % | | | 1.08 | % | | | 0.53 | % | | | 4.26 | % | | | 0.94 | % | | | 7.54 | % |
| OCFC | | OceanFirst Financial Corp. | | NJ | | $ | 0.60 | | | | 2.23 | % | | | 53.21 | % | | $ | 5,196 | | | | 11.21 | % | | | 8.43 | % | | | 1.11 | % | | | 0.70 | % | | | 6.66 | % | | | 0.98 | % | | | 9.22 | % |
| ORIT | | Oritani Financial Corp. | | NJ | | $ | 0.70 | | | | 4.23 | % | | | 93.02 | % | | $ | 4,126 | | | | 13.49 | % | | | 13.49 | % | | | 0.26 | % | | | 1.50 | % | | | 10.60 | % | | | 1.11 | % | | | 7.85 | % |
| PBHC | | Pathfinder Bancorp, Inc. | | NY | | $ | 0.20 | | | | 1.32 | % | | | 24.39 | % | | $ | 802 | | | | 7.46 | % | | | 6.91 | % | | | 1.20 | % | | | 0.49 | % | | | 5.90 | % | | | 0.43 | % | | | 5.16 | % |
| PCSB | | PCSB Financial Corporation | | NY | | | NA | | | | NA | | | | NM | | | $ | 1,407 | | | | 8.33 | % | | | 7.89 | % | | | NA | | | | NA | | | | NA | | | | NA | | | | NA | |
| PFS | | Provident Financial Services, Inc. | | NJ | | $ | 0.76 | | | | 3.17 | % | | | 52.11 | % | | $ | 9,510 | | | | 13.32 | % | | | NA | | | | 0.83 | % | | | 0.97 | % | | | 7.25 | % | | | 0.97 | % | | | 7.24 | % |
| PBIP | | Prudential Bancorp, Inc. | | PA | | $ | 0.12 | | | | 0.65 | % | | | 171.43 | % | | $ | 844 | | | | 15.49 | % | | | 14.69 | % | | | 2.20 | % | | | 0.06 | % | | | 0.30 | % | | | 0.32 | % | | | 1.71 | % |
| SVBI | | Severn Bancorp, Inc. | | MD | | $ | 0.00 | | | | 0.00 | % | | | NM | | | $ | 799 | | | | 11.12 | % | | | 11.09 | % | | | 3.01 | % | | | 1.98 | % | | | 17.18 | % | | | 1.98 | % | | | 17.18 | % |
| TRST | | TrustCo Bank Corp NY | | NY | | $ | 0.26 | | | | 3.45 | % | | | 58.33 | % | | $ | 4,887 | | | | 8.98 | % | | | 8.97 | % | | | 0.85 | % | | | 0.89 | % | | | 9.97 | % | | | 0.88 | % | | | 9.80 | % |
| WSFS | | WSFS Financial Corporation | | DE | | $ | 0.28 | | | | 0.63 | % | | | 12.62 | % | | $ | 6,853 | | | | 10.27 | % | | | 7.72 | % | | | 0.88 | % | | | 1.06 | % | | | 10.11 | % | | | 1.14 | % | | | 10.93 | % |
| WVFC | | WVS Financial Corp. | | PA | | $ | 0.24 | | | | 1.58 | % | | | 28.24 | % | | $ | 345 | | | | 9.77 | % | | | 9.77 | % | | | 0.07 | % | | | 0.48 | % | | | 4.86 | % | | | 0.47 | % | | | 4.84 | % |
| | | | | | | | | | | | | | | | | | | | | | | | | | | | | | | | | | | | | | | | | | | | | | | | | |
| MHCs | | | | | | | | | | | | | | | | | | | | | | | | | | | | | | | | | | | | | | | | | | | | | | |
| GCBC | | Greene County Bancorp, Inc. (MHC) | | NY | | $ | 0.38 | | | | 1.58 | % | | | 30.16 | % | | $ | 958 | | | | 8.45 | % | | | 8.45 | % | | | 0.49 | % | | | 1.20 | % | | | 13.95 | % | | | 1.20 | % | | | 13.95 | % |
| LSBK | | Lake Shore Bancorp, Inc. (MHC) | | NY | | $ | 0.32 | | | | 2.04 | % | | | 78.95 | % | | $ | 494 | | | | 15.51 | % | | | 15.51 | % | | | 1.02 | % | | | 0.47 | % | | | 2.96 | % | | | 0.45 | % | | | 2.82 | % |
| MGYR | | Magyar Bancorp, Inc. (MHC) | | NJ | | | NA | | | | NA | | | | NM | | | $ | 583 | | | | 8.28 | % | | | 8.28 | % | | | 3.90 | % | | | 0.22 | % | | | 2.63 | % | | | 0.21 | % | | | 2.61 | % |
| | | | | | | | | | | | | | | | | | | | | | | | | | | | | | | | | | | | | | | | | | | | | | | | | |
| Under Acquisition | | | | | | | | | | | | | | | | | | | | | | | | | | | | | | | | | | | | | | | | | | | | | | |
| AF | | Astoria Financial Corporation | | NY | | $ | 0.16 | | | | 0.85 | % | | | 27.59 | % | | $ | 14,343 | | | | 12.02 | % | | | 10.87 | % | | | 1.65 | % | | | 0.46 | % | | | 3.95 | % | | | 0.48 | % | | | 4.17 | % |
(1) Core income, on a diluted per-share basis. Core income is net income after taxes and before extraordinary items, less net income attributable to noncontrolling interest, gain on the sale of securities, amortization of intangibles, goodwill and nonrecurring items. Assumed tax rate is 35%.
(2) P/E = Price to earnings; P/B = Price to book; P/A = Price to assets; P/TB = Price to tangible book value; and P/Core = Price to core earnings. P/E and P/Core =NM if the ratio is negative or above 35x.
(3) Indicated 12 month dividend, based on last quarterly dividend declared.
(4) Indicated 12 month dividend as a percent of trailing 12 month earnings.
(5) ROAA (return on average assets) and ROAE (return on average equity) are indicated ratios based on trailing 12 month earnings and average equity and assets balances.
(6) Excludes from averages and medians those companies the subject of actual or rumored acquisition activities or unusual operating characteristics.
Source: SNL Financial, LC. and RP Financial, LC. calculations. The information provided in this report has been obtained from sources we believe are reliable, but we cannot guarantee the accuracy or completeness of such information.
Copyright (c) 2017 by RP® Financial, LC.
EXHIBIT III-3
Public Market Pricing of New England Thrift Institutions
Exhibit III-3
Public Market Pricing of New England Institutions
As of May 12, 2017
| | | | | | | Market | | | Per Share Data | | | | | | | | | | | | | | | | |
| | | | | | | Capitalization | | | Core | | | Book | | | | | | | | | | | | | | | | |
| | | | | | | Price/ | | | Market | | | 12 Month | | | Value/ | | | Pricing Ratios(2) | |
| | | | | Share | | | Value | | | EPS(1) | | | Share | | | P/E | | | P/B | | | P/A | | | P/TB | | | P/Core | |
| | | | | | | ($) | | | ($Mil) | | | ($) | | | ($) | | | (x) | | | (%) | | | (%) | | | (%) | | | (x) | |
| | | | | | | | | | | | | | | | | | | | | | | | | | | | | | | | |
| All Non-MHC Public Companies(6) | | | | | | | | | | | | | | | | | | | | | | | | | | | | | | | | | | | | | | |
| Averages | | | | $ | 22.02 | | | $ | 534.58 | | | $ | 1.18 | | | $ | 16.50 | | | | 21.86 | x | | | 127.67 | % | | | 15.69 | % | | | 140.58 | % | | | 19.47 | x |
| Median | | | | $ | 17.28 | | | $ | 162.35 | | | $ | 0.83 | | | $ | 14.78 | | | | 20.64 | x | | | 122.58 | % | | | 15.40 | % | | | 131.09 | % | | | 18.05 | x |
| | | | | | | | | | | | | | | | | | | | | | | | | | | | | | | | | | | | | | | | | |
| Comparable Group | | | | | | | | | | | | | | | | | | | | | | | | | | | | | | | | | | | | | | |
| Averages | | | | $ | 30.44 | | | $ | 320.94 | | | $ | 1.63 | | | $ | 19.45 | | | | 24.42 | x | | | 133.18 | % | | | 15.12 | % | | | 138.18 | % | | | 21.31 | x |
| Medians | | | | $ | 17.05 | | | $ | 277.09 | | | $ | 0.77 | | | $ | 14.78 | | | | 23.59 | x | | | 125.95 | % | | | 15.20 | % | | | 125.95 | % | | | 21.19 | x |
| | | | | | | | | | | | | | | | | | | | | | | | | | | | | | | | | | | | | | | | | |
| Comparable Group | | | | | | | | | | | | | | | | | | | | | | | | | | | | | | | | | | | | | | |
| BHBK | | Blue Hills Bancorp, Inc. | | MA | | $ | 18.05 | | | $ | 484.79 | | | $ | 0.44 | | | $ | 14.78 | | | | 30.08 | x | | | 122.13 | % | | | 19.42 | % | | | 125.39 | % | | | NM | |
| BLMT | | BSB Bancorp, Inc. | | MA | | $ | 28.60 | | | $ | 277.09 | | | $ | 1.44 | | | $ | 17.03 | | | | 19.72 | x | | | 167.98 | % | | | 12.12 | % | | | 167.98 | % | | | 19.80 | x |
| CWAY | | Coastway Bancorp, Inc. | | RI | | $ | 19.75 | | | $ | 86.75 | | | $ | 0.83 | | | $ | 15.68 | | | | 23.80 | x | | | 125.95 | % | | | 13.71 | % | | | 125.95 | % | | | 23.80 | x |
| FBNK | | First Connecticut Bancorp, Inc. | | CT | | $ | 25.25 | | | $ | 402.09 | | | $ | 1.08 | | | $ | 16.62 | | | | 23.38 | x | | | 151.91 | % | | | 13.84 | % | | | 151.91 | % | | | 23.38 | x |
| HIFS | | Hingham Institution for Savings | | MA | | $ | 175.61 | | | $ | 374.53 | | | $ | 11.11 | | | $ | 78.29 | | | | 15.67 | x | | | 224.32 | % | | | 18.36 | % | | | 224.32 | % | | | 15.81 | x |
| MELR | | Melrose Bancorp, Inc. | | MA | | $ | 16.80 | | | $ | 43.71 | | | $ | 0.32 | | | $ | 16.64 | | | | 28.47 | x | | | 100.95 | % | | | 16.27 | % | | | 100.95 | % | | | NM | |
| EBSB | | Meridian Bancorp, Inc. | | MA | | $ | 17.05 | | | $ | 914.54 | | | $ | 0.63 | | | $ | 11.49 | | | | 24.71 | x | | | 148.40 | % | | | 19.72 | % | | | 151.77 | % | | | 26.95 | x |
| PBBI | | PB Bancorp, Inc. | | CT | | $ | 10.40 | | | $ | 81.44 | | | $ | 0.22 | | | $ | 10.72 | | | | 40.00 | x | | | 97.00 | % | | | 15.93 | % | | | 105.69 | % | | | NM | |
| RNDB | | Randolph Bancorp, Inc. | | MA | | $ | 15.06 | | | $ | 88.38 | | | | NA | | | $ | 14.14 | | | | NA | | | | 106.53 | % | | | 18.32 | % | | | 105.58 | % | | | NM | |
| SIFI | | SI Financial Group, Inc. | | CT | | $ | 14.85 | | | $ | 181.30 | | | $ | 0.71 | | | $ | 13.61 | | | | 15.31 | x | | | 109.13 | % | | | 11.38 | % | | | 121.86 | % | | | 20.92 | x |
| UBNK | | United Financial Bancorp, Inc. | | CT | | $ | 16.80 | | | $ | 852.74 | | | $ | 1.09 | | | $ | 13.13 | | | | 16.47 | x | | | 127.99 | % | | | 12.73 | % | | | 156.35 | % | | | 15.45 | x |
| WEBK | | Wellesley Bancorp, Inc. | | MA | | $ | 27.25 | | | $ | 67.71 | | | $ | 1.29 | | | $ | 22.69 | | | | 21.12 | x | | | 120.09 | % | | | 9.61 | % | | | 120.09 | % | | | 21.19 | x |
| WNEB | | Western New England Bancorp, Inc. | | MA | | $ | 10.30 | | | $ | 317.13 | | | $ | 0.42 | | | $ | 7.99 | | | | 34.33 | x | | | 128.97 | % | | | 15.20 | % | | | 138.45 | % | | | 24.48 | x |
| | | | | | | | | | | | | | | | | | | | | | | | | | | | | | | | | | | | | | | | | |
| MHCs | | | | | | | | | | | | | | | | | | | | | | | | | | | | | | | | | | | | | | |
| HONE | | HarborOne Bancorp, Inc. (MHC) | | MA | | $ | 20.42 | | | $ | 655.91 | | | | NA | | | $ | 10.36 | | | | NA | | | | 197.13 | % | | | 25.56 | % | | | 205.50 | % | | | NM | |
| PVBC | | Provident Bancorp, Inc. (MHC) | | MA | | $ | 20.10 | | | $ | 193.78 | | | $ | 0.65 | | | $ | 11.54 | | | | 27.53 | x | | | 174.21 | % | | | 23.27 | % | | | 174.21 | % | | | 31.02 | x |
| | | | | | | Dividends(3) | | | Financial Characteristics(5) | |
| | | | | | | Amount/ | | | | | | Payout | | | Total | | | Equity/ | | | Tang. Eq./ | | | NPAs/ | | | Reported | | | Core | |
| | | | | Share | | | Yield | | | Ratio(4) | | | Assets | | | Assets | | | T. Assets | | | Assets | | | ROAA | | | ROAE | | | ROAA | | | ROAE | |
| | | | | | | ($) | | | (%) | | | (%) | | | ($Mil) | | | (%) | | | (%) | | | (%) | | | (%) | | | (%) | | | (%) | | | (%) | |
| | | | | | | | | | | | | | | | | | | | | | | | | | | | | | | | | | | | | | |
| All Non-MHC Public Companies(6) | | | | | | | | | | | | | | | | | | | | | | | | | | | | | | | | | | | | | | | | | | | | | | |
| Averages | | | | $ | 0.37 | | | | 1.71 | % | | | 56.00 | % | | $ | 3,338 | | | | 12.69 | % | | | 11.73 | % | | | 0.98 | % | | | 0.75 | % | | | 6.34 | % | | | 0.75 | % | | | 6.32 | % |
| Median | | | | $ | 0.28 | | | | 1.48 | % | | | 46.23 | % | | $ | 1,022 | | | | 11.57 | % | | | 10.81 | % | | | 0.83 | % | | | 0.67 | % | | | 5.99 | % | | | 0.67 | % | | | 5.61 | % |
| | | | | | | | | | | | | | | | | | | | | | | | | | | | | | | | | | | | | | | | | | | | | | | | | |
| Comparable Group | | | | | | | | | | | | | | | | | | | | | | | | | | | | | | | | | | | | | | | | | | | | | | |
| Averages | | | | $ | 0.36 | | | | 1.34 | % | | | 33.15 | % | | $ | 2,103 | | | | 11.88 | % | | | 11.02 | % | | | 0.76 | % | | | 0.61 | % | | | 5.79 | % | | | 0.58 | % | | | 5.63 | % |
| Medians | | | | $ | 0.20 | | | | 1.19 | % | | | 32.41 | % | | $ | 2,039 | | | | 10.89 | % | | | 10.17 | % | | | 0.68 | % | | | 0.60 | % | | | 5.58 | % | | | 0.55 | % | | | 5.51 | % |
| | | | | | | | | | | | | | | | | | | | | | | | | | | | | | | | | | | | | | | | | | | | | | | | | |
| Comparable Group | | | | | | | | | | | | | | | | | | | | | | | | | | | | | | | | | | | | | | | | | | | | | | |
| BHBK | | Blue Hills Bancorp, Inc. | | MA | | $ | 0.20 | | | | 1.09 | % | | | 65.00 | % | | $ | 2,497 | | | | 15.90 | % | | | 15.55 | % | | | 0.53 | % | | | 0.62 | % | | | 3.69 | % | | | 0.46 | % | | | 2.73 | % |
| BLMT | | BSB Bancorp, Inc. | | MA | | | NA | | | | NA | | | | NM | | | $ | 2,287 | | | | 7.21 | % | | | 7.21 | % | | | 0.30 | % | | | 0.63 | % | | | 8.32 | % | | | 0.63 | % | | | 8.29 | % |
| CWAY | | Coastway Bancorp, Inc. | | RI | | | NA | | | | NA | | | | NM | | | $ | 633 | | | | 10.89 | % | | | 10.89 | % | | | 2.14 | % | | | 0.55 | % | | | 4.95 | % | | | 0.55 | % | | | 4.95 | % |
| FBNK | | First Connecticut Bancorp, Inc. | | CT | | $ | 0.44 | | | | 1.79 | % | | | 32.41 | % | | $ | 2,904 | | | | 9.11 | % | | | 9.11 | % | | | 0.83 | % | | | 0.60 | % | | | 6.45 | % | | | 0.60 | % | | | 6.45 | % |
| HIFS | | Hingham Institution for Savings | | MA | | $ | 1.28 | | | | 0.72 | % | | | 14.09 | % | | $ | 2,039 | | | | 8.19 | % | | | 8.19 | % | | | 0.20 | % | | | 1.23 | % | | | 15.53 | % | | | 1.22 | % | | | 15.38 | % |
| MELR | | Melrose Bancorp, Inc. | | MA | | | NA | | | | NA | | | | NM | | | $ | 269 | | | | 16.12 | % | | | 16.12 | % | | | 0.00 | % | | | 0.56 | % | | | 3.23 | % | | | 0.30 | % | | | 1.75 | % |
| EBSB | | Meridian Bancorp, Inc. | | MA | | $ | 0.16 | | | | 0.96 | % | | | 18.84 | % | | $ | 4,639 | | | | 13.28 | % | | | 13.03 | % | | | 0.58 | % | | | 0.86 | % | | | 6.00 | % | | | 0.79 | % | | | 5.51 | % |
| PBBI | | PB Bancorp, Inc. | | CT | | $ | 0.16 | | | | 1.54 | % | | | 50.00 | % | | $ | 511 | | | | 16.44 | % | | | 15.29 | % | | | NA | | | | 0.37 | % | | | 2.24 | % | | | 0.31 | % | | | 1.84 | % |
| RNDB | | Randolph Bancorp, Inc. | | MA | | | NA | | | | NA | | | | NM | | | $ | 482 | | | | 17.19 | % | | | NA | | | | 1.19 | % | | | 0.00 | % | | | 0.02 | % | | | 0.21 | % | | | 1.38 | % |
| SIFI | | SI Financial Group, Inc. | | CT | | $ | 0.20 | | | | 1.33 | % | | | 18.56 | % | | $ | 1,593 | | | | 10.43 | % | | | 9.44 | % | | | 1.01 | % | | | 0.75 | % | | | 7.09 | % | | | 0.55 | % | | | 5.20 | % |
| UBNK | | United Financial Bancorp, Inc. | | CT | | $ | 0.48 | | | | 2.88 | % | | | 47.06 | % | | $ | 6,697 | | | | 9.95 | % | | | 8.29 | % | | | 0.78 | % | | | 0.80 | % | | | 7.96 | % | | | 0.85 | % | | | 8.49 | % |
| WEBK | | Wellesley Bancorp, Inc. | | MA | | $ | 0.16 | | | | 0.60 | % | | | 12.40 | % | | $ | 704 | | | | 8.01 | % | | | 8.01 | % | | | NA | | | | 0.47 | % | | | 5.58 | % | | | 0.46 | % | | | 5.56 | % |
| WNEB | | Western New England Bancorp, Inc. | | MA | | $ | 0.12 | | | | 1.19 | % | | | 40.00 | % | | $ | 2,087 | | | | 11.78 | % | | | 11.06 | % | | | NA | | | | 0.48 | % | | | 4.21 | % | | | 0.64 | % | | | 5.61 | % |
| | | | | | | | | | | | | | | | | | | | | | | | | | | | | | | | | | | | | | | | | | | | | | | | | |
| MHCs | | | | | | | | | | | | | | | | | | | | | | | | | | | | | | | | | | | | | | | | | | | | | | |
| HONE | | HarborOne Bancorp, Inc. (MHC) | | MA | | | NA | | | | NA | | | | NM | | | $ | 2,566 | | | | 12.97 | % | | | 12.50 | % | | | 1.86 | % | | | 0.36 | % | | | 2.88 | % | | | 0.50 | % | | | 3.95 | % |
| PVBC | | Provident Bancorp, Inc. (MHC) | | MA | | | NA | | | | NA | | | | NM | | | $ | 833 | | | | 13.35 | % | | | 13.35 | % | | | NA | | | | 0.86 | % | | | 6.07 | % | | | 0.76 | % | | | 5.39 | % |
(1) Core income, on a diluted per-share basis. Core income is net income after taxes and before extraordinary items, less net income attributable to noncontrolling interest, gain on the sale of securities, amortization of intangibles, goodwill and nonrecurring items. Assumed tax rate is 35%.
(2) P/E = Price to earnings; P/B = Price to book; P/A = Price to assets; P/TB = Price to tangible book value; and P/Core = Price to core earnings. P/E and P/Core =NM if the ratio is negative or above 35x.
(3) Indicated 12 month dividend, based on last quarterly dividend declared.
(4) Indicated 12 month dividend as a percent of trailing 12 month earnings.
(5) ROAA (return on average assets) and ROAE (return on average equity) are indicated ratios based on trailing 12 month earnings and average equity and assets balances.
(6) Excludes from averages and medians those companies the subject of actual or rumored acquisition activities or unusual operating characteristics.
Source: SNL Financial, LC. and RP Financial, LC. calculations. The information provided in this report has been obtained from sources we believe are reliable, but we cannot guarantee the accuracy or completeness of such information.
Copyright (c) 2017 by RP® Financial, LC.
EXHIBIT III-4
Public Market Pricing of Midwest Thrift Institutions
Exhibit III-4
Public Market Pricing of Midwest Institutions
As of May 12, 2017
| | | | | | | Market | | | Per Share Data | | | | | | | | | | | | | | | | |
| | | | | | | Capitalization | | | Core | | | Book | | | | | | | | | | | | | | | | |
| | | | | | | Price/ | | | Market | | | 12 Month | | | Value/ | | | Pricing Ratios(2) | |
| | | | | Share | | | Value | | | EPS(1) | | | Share | | | P/E | | | P/B | | | P/A | | | P/TB | | | P/Core | |
| | | | | | | ($) | | | ($Mil) | | | ($) | | | ($) | | | (x) | | | (%) | | | (%) | | | (%) | | | (x) | |
| | | | | | | | | | | | | | | | | | | | | | | | | | | | | | | | |
| All Non-MHC Public Companies(6) | | | | | | | | | | | | | | | | | | | | | | | | | | | | | | | | | | | | | | |
| Averages | | | | $ | 22.02 | | | $ | 534.58 | | | $ | 1.18 | | | $ | 16.50 | | | | 21.86 | x | | | 127.67 | % | | | 15.69 | % | | | 140.58 | % | | | 19.47 | x |
| Median | | | | $ | 17.28 | | | $ | 162.35 | | | $ | 0.83 | | | $ | 14.78 | | | | 20.64 | x | | | 122.58 | % | | | 15.40 | % | | | 131.09 | % | | | 18.05 | x |
| | | | | | | | | | | | | | | | | | | | | | | | | | | | | | | | | | | | | | | | | |
| Comparable Group | | | | | | | | | | | | | | | | | | | | | | | | | | | | | | | | | | | | | | |
| Averages | | | | $ | 25.01 | | | $ | 373.63 | | | $ | 1.44 | | | $ | 19.85 | | | | 21.54 | x | | | 120.15 | % | | | 16.59 | % | | | 132.49 | % | | | 20.46 | x |
| Medians | | | | $ | 19.13 | | | $ | 79.64 | | | $ | 0.91 | | | $ | 17.95 | | | | 18.37 | x | | | 112.41 | % | | | 15.88 | % | | | 117.98 | % | | | 19.29 | x |
| | | | | | | | | | | | | | | | | | | | | | | | | | | | | | | | | | | | | | | | | |
| Comparable Group | | | | | | | | | | | | | | | | | | | | | | | | | | | | | | | | | | | | | | |
| BKMU | | Bank Mutual Corporation | | WI | | $ | 9.45 | | | $ | 434.06 | | | $ | 0.36 | | | $ | 6.28 | | | | 26.25 | x | | | 150.47 | % | | | 16.27 | % | | | 150.47 | % | | | 26.18 | x |
| CFFN | | Capitol Federal Financial, Inc. | | KS | | $ | 14.16 | | | $ | 1,956.94 | | | $ | 0.62 | | | $ | 10.00 | | | | 22.84 | x | | | 141.56 | % | | | 21.16 | % | | | 141.56 | % | | | 22.84 | x |
| EQFN | | Equitable Financial Corp. | | NE | | $ | 10.25 | | | $ | 35.18 | | | $ | 0.35 | | | $ | 10.44 | | | | 30.15 | x | | | 98.19 | % | | | 14.58 | % | | | 98.19 | % | | | 29.55 | x |
| FCAP | | First Capital, Inc. | | IN | | $ | 32.31 | | | $ | 107.84 | | | $ | 2.03 | | | $ | 23.09 | | | | 15.84 | x | | | 139.92 | % | | | 14.15 | % | | | 155.44 | % | | | 15.91 | x |
| FDEF | | First Defiance Financial Corp. | | OH | | $ | 53.58 | | | $ | 543.62 | | | $ | 3.14 | | | $ | 34.92 | | | | 18.29 | x | | | 153.44 | % | | | 18.56 | % | | | 211.12 | % | | | 17.05 | x |
| FBC | | Flagstar Bancorp, Inc. | | MI | | $ | 29.46 | | | $ | 1,681.01 | | | $ | 2.43 | | | $ | 24.03 | | | | 11.46 | x | | | 122.58 | % | | | 10.94 | % | | | 122.58 | % | | | 12.11 | x |
| HMNF | | HMN Financial, Inc. | | MN | | $ | 17.90 | | | $ | 80.47 | | | $ | 1.22 | | | $ | 17.22 | | | | 14.79 | x | | | 103.96 | % | | | 11.82 | % | | | 105.64 | % | | | 14.62 | x |
| IROQ | | IF Bancorp, Inc. | | IL | | $ | 20.00 | | | $ | 78.81 | | | $ | 1.12 | | | $ | 21.12 | | | | 16.95 | x | | | 94.72 | % | | | 13.32 | % | | | 94.72 | % | | | 17.78 | x |
| JXSB | | Jacksonville Bancorp, Inc. | | IL | | $ | 30.50 | | | $ | 55.10 | | | $ | 1.50 | | | $ | 26.32 | | | | 18.37 | x | | | 115.88 | % | | | 17.35 | % | | | 122.95 | % | | | 20.27 | x |
| CASH | | Meta Financial Group, Inc. | | SD | | $ | 83.45 | | | $ | 780.26 | | | $ | 6.41 | | | $ | 44.04 | | | | 15.75 | x | | | 189.50 | % | | | 19.58 | % | | | 316.67 | % | | | 13.01 | x |
| OTTW | | Ottawa Bancorp, Inc. | | IL | | $ | 13.40 | | | $ | 46.46 | | | $ | 0.41 | | | $ | 15.06 | | | | 33.91 | x | | | 88.98 | % | | | 19.65 | % | | | 90.70 | % | | | 32.62 | x |
| PBSK | | Poage Bankshares, Inc. | | KY | | $ | 19.41 | | | $ | 71.36 | | | $ | 0.55 | | | $ | 18.69 | | | | 39.60 | x | | | 103.84 | % | | | 15.49 | % | | | 107.27 | % | | | NM | |
| UCBA | | United Community Bancorp | | IN | | $ | 18.13 | | | $ | 76.23 | | | $ | 0.80 | | | $ | 16.64 | | | | 22.67 | x | | | 108.94 | % | | | 13.97 | % | | | 113.38 | % | | | 22.79 | x |
| WSBF | | Waterstone Financial, Inc. | | WI | | $ | 18.85 | | | $ | 555.31 | | | $ | 1.03 | | | $ | 14.09 | | | | 18.30 | x | | | 133.75 | % | | | 32.15 | % | | | 133.94 | % | | | 18.30 | x |
| WAYN | | Wayne Savings Bancshares, Inc. | | OH | | $ | 17.71 | | | $ | 49.27 | | | $ | 0.77 | | | $ | 14.88 | | | | 23.00 | x | | | 119.01 | % | | | 10.98 | % | | | 124.17 | % | | | 23.00 | x |
| WCFB | | WCF Bancorp, Inc. | | IA | | $ | 10.00 | | | $ | 25.60 | | | $ | 0.02 | | | $ | 11.26 | | | | NM | | | | 88.80 | % | | | 20.35 | % | | | 86.81 | % | | | NM | |
| WBB | | Westbury Bancorp, Inc. | | WI | | $ | 20.30 | | | $ | 81.96 | | | $ | 0.72 | | | $ | 19.58 | | | | 24.76 | x | | | 103.70 | % | | | 10.85 | % | | | 103.70 | % | | | 28.00 | x |
| WBKC | | Wolverine Bancorp, Inc. | | MI | | $ | 31.29 | | | $ | 65.89 | | | $ | 2.35 | | | $ | 29.66 | | | | 13.31 | x | | | 105.48 | % | | | 17.37 | % | | | 105.48 | % | | | 13.31 | x |
| | | | | | | | | | | | | | | | | | | | | | | | | | | | | | | | | | | | | | | | | |
| MHCs | | | | | | | | | | | | | | | | | | | | | | | | | | | | | | | | | | | | | | |
| KFFB | | Kentucky First Federal Bancorp (MHC) | | KY | | $ | 9.64 | | | $ | 81.41 | | | $ | 0.14 | | | $ | 7.96 | | | | 68.86 | x | | | 121.05 | % | | | 26.67 | % | | | 154.35 | % | | | NM | |
| TFSL | | TFS Financial Corporation (MHC) | | OH | | $ | 16.46 | | | $ | 4,653.80 | | | | NA | | | $ | 5.93 | | | | 54.87 | x | | | 277.61 | % | | | 34.71 | % | | | 279.22 | % | | | NM | |
| | | | | | | | | | | | | | | | | | | | | | | | | | | | | | | | | | | | | | |
| | | | | | | Dividends(3) | | | Financial Characteristics(5) | |
| | | | | | | Amount/ | | | | | | Payout | | | Total | | | Equity/ | | | Tang. Eq./ | | | NPAs/ | | | Reported | | | Core | |
| | | | | Share | | | Yield | | | Ratio(4) | | | Assets | | | Assets | | | T. Assets | | | Assets | | | ROAA | | | ROAE | | | ROAA | | | ROAE | |
| | | | | | | ($) | | | (%) | | | (%) | | | ($Mil) | | | (%) | | | (%) | | | (%) | | | (%) | | | (%) | | | (%) | | | (%) | |
| | | | | | | | | | | | | | | | | | | | | | | | | | | | | | | | | | | | | | |
| All Non-MHC Public Companies(6) | | | | | | | | | | | | | | | | | | | | | | | | | | | | | | | | | | | | | | | | | | | | | | |
| Averages | | | | $ | 0.37 | | | | 1.71 | % | | | 56.00 | % | | $ | 3,338 | | | | 12.69 | % | | | 11.73 | % | | | 0.98 | % | | | 0.75 | % | | | 6.34 | % | | | 0.75 | % | | | 6.32 | % |
| Median | | | | $ | 0.28 | | | | 1.48 | % | | | 46.23 | % | | $ | 1,022 | | | | 11.57 | % | | | 10.81 | % | | | 0.83 | % | | | 0.67 | % | | | 5.99 | % | | | 0.67 | % | | | 5.61 | % |
| | | | | | | | | | | | | | | | | | | | | | | | | | | | | | | | | | | | | | | | | | | | | | | | | |
| Comparable Group | | | | | | | | | | | | | | | | | | | | | | | | | | | | | | | | | | | | | | | | | | | | | | |
| Averages | | | | $ | 0.43 | | | | 1.76 | % | | | 69.86 | % | | $ | 2,303 | | | | 14.19 | % | | | 13.07 | % | | | 0.89 | % | | | 0.79 | % | | | 6.22 | % | | | 0.80 | % | | | 6.29 | % |
| Medians | | | | $ | 0.35 | | | | 1.92 | % | | | 43.96 | % | | $ | 636 | | | | 13.45 | % | | | 12.39 | % | | | 0.81 | % | | | 0.74 | % | | | 5.80 | % | | | 0.73 | % | | | 5.68 | % |
| | | | | | | | | | | | | | | | | | | | | | | | | | | | | | | | | | | | | | | | | | | | | | | | | |
| Comparable Group | | | | | | | | | | | | | | | | | | | | | | | | | | | | | | | | | | | | | | | | | | | | | | |
| BKMU | | Bank Mutual Corporation | | WI | | $ | 0.22 | | | | 2.39 | % | | | 61.11 | % | | $ | 2,668 | | | | 10.81 | % | | | 10.81 | % | | | 0.50 | % | | | 0.61 | % | | | 5.61 | % | | | 0.62 | % | | | 5.63 | % |
| CFFN | | Capitol Federal Financial, Inc. | | KS | | $ | 0.34 | | | | 2.44 | % | | | 141.94 | % | | $ | 9,246 | | | | 14.95 | % | | | 14.95 | % | | | 0.60 | % | | | 0.74 | % | | | 5.99 | % | | | 0.74 | % | | | 5.99 | % |
| EQFN | | Equitable Financial Corp. | | NE | | | NA | | | | NA | | | | NM | | | $ | 241 | | | | 14.85 | % | | | 14.85 | % | | | NA | | | | 0.50 | % | | | 3.23 | % | | | 0.51 | % | | | 3.30 | % |
| FCAP | | First Capital, Inc. | | IN | | $ | 0.84 | | | | 2.64 | % | | | 41.18 | % | | $ | 762 | | | | 10.13 | % | | | 9.21 | % | | | 1.05 | % | | | 0.92 | % | | | 8.86 | % | | | 0.92 | % | | | 8.83 | % |
| FDEF | | First Defiance Financial Corp. | | OH | | $ | 1.00 | | | | 1.90 | % | | | 32.08 | % | | $ | 2,929 | | | | 12.09 | % | | | 9.09 | % | | | 0.87 | % | | | 1.08 | % | | | 9.11 | % | | | 1.16 | % | | | 9.78 | % |
| FBC | | Flagstar Bancorp, Inc. | | MI | | $ | 0.00 | | | | 0.00 | % | | | NM | | | $ | 15,361 | | | | 8.93 | % | | | 8.93 | % | | | 0.72 | % | | | 1.13 | % | | | 11.27 | % | | | 1.01 | % | | | 10.03 | % |
| HMNF | | HMN Financial, Inc. | | MN | | $ | 0.00 | | | | 0.00 | % | | | NM | | | $ | 681 | | | | 11.37 | % | | | 11.21 | % | | | 0.81 | % | | | 0.87 | % | | | 7.74 | % | | | 0.88 | % | | | 7.83 | % |
| IROQ | | IF Bancorp, Inc. | | IL | | $ | 0.16 | | | | 0.81 | % | | | 13.56 | % | | $ | 591 | | | | 14.07 | % | | | 14.07 | % | | | 0.67 | % | | | 0.75 | % | | | 5.27 | % | | | 0.71 | % | | | 5.02 | % |
| JXSB | | Jacksonville Bancorp, Inc. | | IL | | $ | 0.40 | | | | 1.36 | % | | | 24.10 | % | | $ | 318 | | | | 14.94 | % | | | 14.20 | % | | | 1.11 | % | | | 0.94 | % | | | 6.32 | % | | | 0.86 | % | | | 5.73 | % |
| CASH | | Meta Financial Group, Inc. | | SD | | $ | 0.52 | | | | 0.62 | % | | | 9.81 | % | | $ | 3,986 | | | | 10.33 | % | | | 6.45 | % | | | 0.11 | % | | | 1.36 | % | | | 13.82 | % | | | 1.64 | % | | | 16.70 | % |
| OTTW | | Ottawa Bancorp, Inc. | | IL | | $ | 0.16 | | | | 1.18 | % | | | 10.12 | % | | $ | 236 | | | | 22.08 | % | | | 21.76 | % | | | NA | | | | 0.58 | % | | | 3.44 | % | | | 0.60 | % | | | 3.58 | % |
| PBSK | | Poage Bankshares, Inc. | | KY | | $ | 0.24 | | | | 1.24 | % | | | 57.14 | % | | $ | 461 | | | | 14.94 | % | | | 14.53 | % | | | 2.00 | % | | | 0.39 | % | | | 2.51 | % | | | 0.44 | % | | | 2.84 | % |
| UCBA | | United Community Bancorp | | IN | | $ | 0.36 | | | | 1.95 | % | | | 33.75 | % | | $ | 546 | | | | 12.83 | % | | | 12.39 | % | | | 0.81 | % | | | 0.62 | % | | | 4.68 | % | | | 0.62 | % | | | 4.66 | % |
| WSBF | | Waterstone Financial, Inc. | | WI | | $ | 0.48 | | | | 2.59 | % | | | 87.38 | % | | $ | 1,727 | | | | 24.03 | % | | | 24.00 | % | | | 1.11 | % | | | 1.60 | % | | | 6.94 | % | | | 1.60 | % | | | 6.94 | % |
| WAYN | | Wayne Savings Bancshares, Inc. | | OH | | $ | 0.36 | | | | 2.03 | % | | | 46.75 | % | | $ | 449 | | | | 9.23 | % | | | 8.88 | % | | | 0.92 | % | | | 0.47 | % | | | 5.12 | % | | | 0.47 | % | | | 5.12 | % |
| WCFB | | WCF Bancorp, Inc. | | IA | | $ | 0.20 | | | | 1.98 | % | | | 351.07 | % | | $ | 126 | | | | 22.91 | % | | | NA | | | | NA | | | | 0.09 | % | | | 0.51 | % | | | 0.03 | % | | | 0.15 | % |
| WBB | | Westbury Bancorp, Inc. | | WI | | | NA | | | | NA | | | | NM | | | $ | 756 | | | | 10.47 | % | | | 10.47 | % | | | 0.42 | % | | | 0.44 | % | | | 3.99 | % | | | 0.38 | % | | | 3.52 | % |
| WBKC | | Wolverine Bancorp, Inc. | | MI | | $ | 1.60 | | | | 5.04 | % | | | 68.09 | % | | $ | 379 | | | | 16.47 | % | | | 16.47 | % | | | 1.60 | % | | | 1.21 | % | | | 7.58 | % | | | 1.21 | % | | | 7.58 | % |
| | | | | | | | | | | | | | | | | | | | | | | | | | | | | | | | | | | | | | | | | | | | | | | | | |
| MHCs | | | | | | | | | | | | | | | | | | | | | | | | | | | | | | | | | | | | | | | | | | | | | | |
| KFFB | | Kentucky First Federal Bancorp (MHC) | | KY | | $ | 0.40 | | | | 4.21 | % | | | 285.71 | % | | $ | 305 | | | | 22.03 | % | | | 18.14 | % | | | NA | | | | 0.37 | % | | | 1.63 | % | | | 0.36 | % | | | 1.57 | % |
| TFSL | | TFS Financial Corporation (MHC) | | OH | | $ | 0.50 | | | | 3.10 | % | | | 158.33 | % | | $ | 13,406 | | | | 12.52 | % | | | 12.46 | % | | | 1.45 | % | | | 0.67 | % | | | 5.14 | % | | | NA | | | | NA | |
(1) Core income, on a diluted per-share basis. Core income is net income after taxes and before extraordinary items, less net income attributable to noncontrolling interest, gain on the sale of securities, amortization of intangibles, goodwill and nonrecurring items. Assumed tax rate is 35%.
(2) P/E = Price to earnings; P/B = Price to book; P/A = Price to assets; P/TB = Price to tangible book value; and P/Core = Price to core earnings. P/E and P/Core =NM if the ratio is negative or above 35x.
(3) Indicated 12 month dividend, based on last quarterly dividend declared.
(4) Indicated 12 month dividend as a percent of trailing 12 month earnings.
(5) ROAA (return on average assets) and ROAE (return on average equity) are indicated ratios based on trailing 12 month earnings and average equity and assets balances.
(6) Excludes from averages and medians those companies the subject of actual or rumored acquisition activities or unusual operating characteristics.
Source: SNL Financial, LC. and RP Financial, LC. calculations. The information provided in this report has been obtained from sources we believe are reliable, but we cannot guarantee the accuracy or completeness of such information.
Copyright (c) 2017 by RP® Financial, LC.
EXHIBIT III-5
Peer Group Market Area Comparative Analysis
Exhibit III-5
Peer Group Market Area Comparative Analysis
| | | | | | | | | | | Proj. | | | | | | | | | Per Capita Income | | | Deposit | |
| | | | | Population | | | Pop. | | | 2010-2017 | | | 2017-2022 | | | 2017 | | | % State | | | Market | |
| Institution | | County | | 2010 | | | 2017 | | | 2022 | | | % Change | | | % Change | | | . | | | Average | | | Share(1) | |
| | | | | | | | | | | | | | | | | | | | | | | | | | | |
| Equitable Financial Corp. | | Hall, NE | | | 58,607 | | | | 62,331 | | | | 64,882 | | | | 0.9 | % | | | 0.8 | % | | | 24,469 | | | | 81.5 | % | | | 5.62 | % |
| Hamilton Bancorp, Inc. | | Baltimore, MD | | | 805,029 | | | | 837,393 | | | | 864,191 | | | | 0.6 | % | | | 0.6 | % | | | 37,687 | | | | 114.9 | % | | | 1.32 | % |
| Jacksonville Bancorp, Inc. | | Morgan, IL | | | 35,547 | | | | 34,630 | | | | 34,215 | | | | -0.4 | % | | | -0.2 | % | | | 28,671 | | | | 87.4 | % | | | 26.52 | % |
| Melrose Bancorp, Inc. | | Middlesex, MA | | | 1,503,085 | | | | 1,606,877 | | | | 1,678,407 | | | | 1.0 | % | | | 0.9 | % | | | 50,075 | | | | 120.4 | % | | | 0.39 | % |
| MSB Financial Corp. | | Morris, NJ | | | 492,276 | | | | 500,642 | | | | 507,646 | | | | 0.2 | % | | | 0.3 | % | | | 54,973 | | | | 136.6 | % | | | 0.83 | % |
| PB Bancorp. Inc. | | Windham, CT | | | 118,428 | | | | 115,983 | | | | 114,922 | | | | -0.3 | % | | | -0.2 | % | | | 29,250 | | | | 69.8 | % | | | 18.61 | % |
| Poage Bankshares, Inc. | | Boyd, KY | | | 49,542 | | | | 47,886 | | | | 47,255 | | | | -0.5 | % | | | -0.3 | % | | | 26,760 | | | | 102.8 | % | | | 20.76 | % |
| Wayne Savings Bancshares, Inc. | | Wayne, OH | | | 114,520 | | | | 116,591 | | | | 118,259 | | | | 0.3 | % | | | 0.3 | % | | | 25,572 | | | | 87.0 | % | | | 12.83 | % |
| Wolverine Bancorp, Inc. | | Midland, MI | | | 83,629 | | | | 83,685 | | | | 84,018 | | | | 0.0 | % | | | 0.1 | % | | | 31,329 | | | | 107.7 | % | | | 16.04 | % |
| WVS Financial Corp. | | Allegheny, PA | | | 1,223,348 | | | | 1,229,961 | | | | 1,235,805 | | | | 0.1 | % | | | 0.1 | % | | | 35,897 | | | | 112.1 | % | | | 0.13 | % |
| | | | | | | | | | | | | | | | | | | | | | | | | | | | | | | | | | | |
| | | Averages: | | | 362,296 | | | | 378,446 | | | | 390,422 | | | | 0.2 | % | | | 0.3 | % | | | 34,310 | | | | 100.9 | % | | | 11.44 | % |
| | | Medians: | | | 114,520 | | | | 115,983 | | | | 114,922 | | | | 0.2 | % | | | 0.3 | % | | | 29,250 | | | | 102.8 | % | | | 12.83 | % |
| | | | | | | | | | | | | | | | | | | | | | | | | | | | | | | | | | | |
| Seneca FS & LA | | Onondaga, NY | | | 467,026 | | | | 468,601 | | | | 472,690 | | | | 0.1 | % | | | 0.2 | % | | | 31,637 | | | | 88.6 | % | | | 1.20 | % |
(1) Total institution deposits in headquarters county as percent of total county deposits as of June 30, 2016.
Sources: SNL Financial LC, FDIC.
EXHIBIT IV-1
Stock Prices:
As of May 12, 2017
RP® Financial, LC.
Exhibit IV-1A
Weekly Thrift Market Line - Part One
Prices As of May 12, 2017
| | | | | | | Market Capitalization | | | Price Change Data | | | Current Per Share Financials | |
| | | | | | | Price/ | | | Shares | | | Market | | | 52 Week (1) | | | | | | % Change From | | | LTM | | | LTM Core | | | BV/ | | | TBV/ | | | Assets/ | |
| | | | | Share(1) | | | Outstanding | | | Capitalization | | | High | | | Low | | | Last Wk | | | Last Wk | | | 52 Wks (2) | | | MRY (2) | | | EPS (3) | | | EPS (3) | | | Share | | | Share (4) | | | Share | |
| | | | | | | ($) | | | (000) | | | ($Mil) | | | ($) | | | ($) | | | ($) | | | (%) | | | (%) | | | (%) | | | ($) | | | ($) | | | ($) | | | ($) | | | ($) | |
| Companies | | | | | | | | | | | | | | | | | | | | | | | | | | | | | | | | | | | | | | | | | | | | | | | | | | | | | | | | | | |
| BCTF | | Bancorp 34, Inc. | | WA | | | 12.97 | | | | 3,438 | | | | 44.6 | | | | 13.45 | | | | 10.26 | | | | 13.03 | | | | 0.31 | | | | 23.39 | | | | 3.02 | | | | 1.51 | | | | 1.52 | | | | 14.72 | | | | 14.64 | | | | 97.23 | |
| BKMU | | Bank Mutual Corporation | | NC | | | 9.45 | | | | 45,932 | | | | 434.1 | | | | 10.20 | | | | 7.31 | | | | 9.45 | | | | 0.53 | | | | 19.77 | | | | 0.00 | | | | 0.36 | | | | 0.36 | | | | 6.28 | | | | 6.28 | | | | 58.09 | |
| BYBK | | Bay Bancorp, Inc. | | NM | | | 7.25 | | | | 10,642 | | | | 77.2 | | | | 8.25 | | | | 4.87 | | | | 7.35 | | | | 2.84 | | | | 44.71 | | | | 9.85 | | | | NA | | | | 0.26 | | | | 6.38 | | | | 6.12 | | | | 59.51 | |
| BNCL | | Beneficial Bancorp, Inc. | | WI | | | 14.95 | | | | 76,550 | | | | 1,144.4 | | | | 19.00 | | | | 12.34 | | | | 15.20 | | | | -5.38 | | | | 9.08 | | | | -18.75 | | | | 0.39 | | | | 0.47 | | | | 13.46 | | | | 11.20 | | | | 76.58 | |
| BHBK | | Blue Hills Bancorp, Inc. | | MD | | | 18.05 | | | | 26,858 | | | | 484.8 | | | | 19.73 | | | | 13.78 | | | | 18.20 | | | | -2.17 | | | | 24.48 | | | | -3.73 | | | | 0.60 | | | | 0.44 | | | | 14.78 | | | | 14.40 | | | | 92.95 | |
| BOFI | | BofI Holding, Inc. | | PA | | | 23.42 | | | | 63,390 | | | | 1,484.3 | | | | 32.57 | | | | 15.29 | | | | 23.50 | | | | -2.56 | | | | 32.66 | | | | -17.99 | | | | 2.04 | | | | 2.03 | | | | 12.55 | | | | 12.55 | | | | 137.25 | |
| BYFC | | Broadway Financial Corporation | | MA | | | 1.95 | | | | 27,451 | | | | 53.5 | | | | 2.50 | | | | 1.42 | | | | 1.96 | | | | 3.17 | | | | 1.56 | | | | 19.27 | | | | 0.15 | | | | 0.13 | | | | 1.71 | | | | 1.71 | | | | 16.54 | |
| BLMT | | BSB Bancorp, Inc. | | CA | | | 28.60 | | | | 9,688 | | | | 277.1 | | | | 30.05 | | | | 21.66 | | | | 29.20 | | | | -1.55 | | | | 29.24 | | | | -1.21 | | | | 1.45 | �� | | | 1.44 | | | | 17.03 | | | | 17.03 | | | | 236.04 | |
| CFFN | | Capitol Federal Financial, Inc. | | CA | | | 14.16 | | | | 138,202 | | | | 1,956.9 | | | | 17.04 | | | | 13.09 | | | | 14.32 | | | | -3.34 | | | | 6.07 | | | | -13.97 | | | | 0.62 | | | | 0.62 | | | | 10.00 | | | | 10.00 | | | | 66.91 | |
| CARV | | Carver Bancorp, Inc. | | MA | | | 3.50 | | | | 3,696 | | | | 12.9 | | | | 6.61 | | | | 2.87 | | | | 3.60 | | | | -12.50 | | | | 4.48 | | | | 8.54 | | | | -0.62 | | | | -0.64 | | | | 1.71 | | | | 1.71 | | | | 189.09 | |
| CHFN | | Charter Financial Corporation | | KS | | | 18.54 | | | | 15,073 | | | | 279.5 | | | | 21.11 | | | | 12.36 | | | | 19.11 | | | | -3.19 | | | | 45.07 | | | | 11.22 | | | | 0.90 | | | | 1.10 | | | | 13.84 | | | | 11.70 | | | | 98.51 | |
| CSBK | | Clifton Bancorp Inc. | | NY | | | 16.33 | | | | 22,549 | | | | 368.2 | | | | 17.49 | | | | 14.11 | | | | 16.39 | | | | 0.12 | | | | 9.23 | | | | -3.49 | | | | 0.21 | | | | 0.21 | | | | 13.15 | | | | 13.15 | | | | 63.50 | |
| CWAY | | Coastway Bancorp, Inc. | | GA | | | 19.75 | | | | 4,392 | | | | 86.8 | | | | 20.25 | | | | 12.25 | | | | 19.65 | | | | -2.23 | | | | 57.75 | | | | 26.20 | | | | 0.83 | | | | 0.83 | | | | 15.68 | | | | 15.68 | | | | 144.11 | |
| DCOM | | Dime Community Bancshares, Inc. | | NJ | | | 20.10 | | | | 37,634 | | | | 756.4 | | | | 22.48 | | | | 16.10 | | | | 20.15 | | | | 3.08 | | | | 12.29 | | | | 0.00 | | | | 0.91 | | | | 1.12 | | | | 15.26 | | | | 13.78 | | | | 161.97 | |
| ESBK | | Elmira Savings Bank | | RI | | | 20.50 | | | | 3,304 | | | | 67.7 | | | | 22.25 | | | | 18.50 | | | | 20.53 | | | | -1.44 | | | | 9.63 | | | | 0.24 | | | | 1.27 | | | | 1.28 | | | | 16.82 | | | | 12.34 | | | | 168.48 | |
| EQFN | | Equitable Financial Corp. | | NY | | | 10.25 | | | | 3,432 | | | | 35.2 | | | | 10.60 | | | | 8.16 | | | | 10.42 | | | | -2.33 | | | | 23.49 | | | | 3.54 | | | | 0.34 | | | | 0.35 | | | | 10.44 | | | | 10.44 | | | | 70.30 | |
| ESSA | | ESSA Bancorp, Inc. | | NY | | | 14.76 | | | | 11,586 | | | | 171.0 | | | | 16.91 | | | | 12.93 | | | | 14.58 | | | | 0.00 | | | | 8.77 | | | | -6.11 | | | | 0.67 | | | | 0.66 | | | | 15.44 | | | | 14.07 | | | | 151.80 | |
| FCAP | | First Capital, Inc. | | NE | | | 32.31 | | | | 3,338 | | | | 107.8 | | | | 35.00 | | | | 26.58 | | | | 31.75 | | | | -2.09 | | | | 2.57 | | | | -0.34 | | | | 2.04 | | | | 2.03 | | | | 23.09 | | | | 20.79 | | | | 228.29 | |
| FBNK | | First Connecticut Bancorp, Inc. | | PA | | | 25.25 | | | | 15,924 | | | | 402.1 | | | | 27.50 | | | | 15.74 | | | | 25.55 | | | | -4.36 | | | | 52.75 | | | | 11.48 | | | | 1.08 | | | | 1.08 | | | | 16.62 | | | | 16.62 | | | | 182.38 | |
| FDEF | | First Defiance Financial Corp. | | IN | | | 53.58 | | | | 10,146 | | | | 543.6 | | | | 56.20 | | | | 35.90 | | | | 54.00 | | | | -2.26 | | | | 37.24 | | | | 5.60 | | | | 2.93 | | | | 3.14 | | | | 34.92 | | | | 25.38 | | | | 288.66 | |
| FNWB | | First Northwest Bancorp | | CT | | | 16.20 | | | | 12,078 | | | | 195.7 | | | | 17.24 | | | | 12.42 | | | | 16.32 | | | | -3.40 | | | | 24.90 | | | | 3.85 | | | | 0.47 | | | | 0.41 | | | | 14.78 | | | | 14.78 | | | | 89.53 | |
| FBC | | Flagstar Bancorp, Inc. | | OH | | | 29.46 | | | | 57,061 | | | | 1,681.0 | | | | 30.70 | | | | 21.78 | | | | 29.58 | | | | -3.22 | | | | 27.37 | | | | 9.35 | | | | 2.57 | | | | 2.43 | | | | 24.03 | | | | 24.03 | | | | 269.20 | |
| FSBW | | FS Bancorp, Inc. | | WA | | | 44.20 | | | | 3,065 | | | | 135.5 | | | | 45.76 | | | | 24.47 | | | | 44.42 | | | | 0.20 | | | | 80.41 | | | | 22.95 | | | | 3.85 | | | | NA | | | | 27.39 | | | | 26.11 | | | | 286.40 | |
| FSBC | | FSB Bancorp, Inc. | | MI | | | 14.90 | | | | 1,942 | | | | 28.9 | | | | 15.10 | | | | 11.50 | | | | 14.94 | | | | -0.80 | | | | 21.66 | | | | 4.93 | | | | 0.46 | | | | 0.44 | | | | 16.43 | | | | 16.43 | | | | 147.44 | |
| HBK | | Hamilton Bancorp, Inc. | | WA | | | 15.16 | | | | 3,409 | | | | 51.7 | | | | 15.60 | | | | 13.33 | | | | 15.00 | | | | 0.23 | | | | 9.82 | | | | 6.35 | | | | 0.05 | | | | 0.17 | | | | 17.77 | | | | 15.02 | | | | 146.61 | |
| HIFS | | Hingham Institution for Savings | | NY | | | 175.61 | | | | 2,133 | | | | 374.5 | | | | 203.01 | | | | 120.25 | | | | 174.11 | | | | -2.76 | | | | 37.93 | | | | -10.76 | | | | 11.21 | | | | 11.11 | | | | 78.29 | | | | 78.29 | | | | 956.28 | |
| HMNF | | HMN Financial, Inc. | | MD | | | 17.90 | | | | 4,495 | | | | 80.5 | | | | 18.70 | | | | 12.25 | | | | 17.50 | | | | 1.99 | | | | 43.66 | | | | 2.29 | | | | 1.21 | | | | 1.22 | | | | 17.22 | | | | 16.94 | | | | 151.49 | |
| HFBL | | Home Federal Bancorp, Inc. of Louisiana | | MA | | | 28.00 | | | | 1,952 | | | | 54.7 | | | | 29.89 | | | | 21.20 | | | | 29.33 | | | | -6.32 | | | | 25.62 | | | | 4.24 | | | | 1.89 | | | | 1.89 | | | | 23.12 | | | | 23.12 | | | | 213.11 | |
| HVBC | | HV Bancorp, Inc. | | MN | | | 14.35 | | | | 2,182 | | | | 31.3 | | | | 14.58 | | | | 13.08 | | | | 14.30 | | | | 1.77 | | | | NA | | | | NA | | | | NA | | | | NA | | | | 14.24 | | | | 14.24 | | | | 99.41 | |
| IROQ | | IF Bancorp, Inc. | | LA | | | 20.00 | | | | 3,940 | | | | 78.8 | | | | 20.75 | | | | 18.01 | | | | 20.00 | | | | 0.00 | | | | 11.58 | | | | 8.11 | | | | 1.18 | | | | 1.12 | | | | 21.12 | | | | 21.12 | | | | 150.10 | |
| ISBC | | Investors Bancorp, Inc. | | PA | | | 13.65 | | | | 310,364 | | | | 4,236.5 | | | | 15.11 | | | | 10.67 | | | | 13.57 | | | | 1.49 | | | | 17.57 | | | | -2.15 | | | | 0.66 | | | | 0.66 | | | | 10.18 | | | | 9.90 | | | | 76.97 | |
| JXSB | | Jacksonville Bancorp, Inc. | | IL | | | 30.50 | | | | 1,806 | | | | 55.1 | | | | 37.20 | | | | 26.00 | | | | 30.50 | | | | 0.00 | | | | 16.86 | | | | 1.67 | | | | 1.66 | | | | 1.50 | | | | 26.32 | | | | 24.81 | | | | 175.76 | |
| KRNY | | Kearny Financial Corp. | | NJ | | | 14.80 | | | | 86,399 | | | | 1,278.7 | | | | 16.10 | | | | 12.14 | | | | 14.65 | | | | 1.37 | | | | 17.18 | | | | -4.82 | | | | 0.21 | | | | 0.21 | | | | 12.54 | | | | 11.29 | | | | 55.51 | |
| MLVF | | Malvern Bancorp, Inc. | | IL | | | 22.00 | | | | 6,573 | | | | 144.6 | | | | 22.25 | | | | 15.00 | | | | 22.00 | | | | 0.23 | | | | 39.82 | | | | 4.02 | | | | 1.86 | | | | 1.82 | | | | 14.83 | | | | 14.83 | | | | 146.34 | |
| MELR | | Melrose Bancorp, Inc. | | NJ | | | 16.80 | | | | 2,602 | | | | 43.7 | | | | 18.10 | | | | 14.60 | | | | 16.80 | | | | 0.29 | | | | 11.04 | | | | -6.41 | | | | 0.59 | | | | 0.32 | | | | 16.64 | | | | 16.64 | | | | 103.24 | |
| EBSB | | Meridian Bancorp, Inc. | | PA | | | 17.05 | | | | 53,639 | | | | 914.5 | | | | 20.55 | | | | 13.66 | | | | 17.15 | | | | -1.16 | | | | 17.34 | | | | -9.79 | | | | 0.69 | | | | 0.63 | | | | 11.49 | | | | 11.23 | | | | 86.48 | |
| CASH | | Meta Financial Group, Inc. | | MA | | | 83.45 | | | | 9,350 | | | | 780.3 | | | | 106.90 | | | | 48.09 | | | | 84.20 | | | | -3.64 | | | | 71.88 | | | | -18.90 | | | | 5.30 | | | | 6.41 | | | | 44.04 | | | | 26.35 | | | | 426.27 | |
| MSBF | | MSB Financial Corp. | | MA | | | 17.25 | | | | 5,729 | | | | 98.8 | | | | 17.70 | | | | 12.82 | | | | 17.10 | | | | 1.47 | | | | 32.18 | | | | 17.35 | | | | 0.28 | | | | 0.28 | | | | 12.93 | | | | 12.93 | | | | 84.11 | |
| NYCB | | New York Community Bancorp, Inc. | | SD | | | 12.92 | | | | 489,054 | | | | 6,318.6 | | | | 17.68 | | | | 12.67 | | | | 13.04 | | | | -2.42 | | | | -13.58 | | | | -18.79 | | | | 0.96 | | | | 0.97 | | | | 12.57 | | | | 7.58 | | | | 99.83 | |
| NFBK | | Northfield Bancorp, Inc. | | NJ | | | 17.31 | | | | 48,851 | | | | 845.6 | | | | 20.59 | | | | 14.31 | | | | 17.47 | | | | -3.62 | | | | 11.53 | | | | -13.32 | | | | 0.70 | | | | 0.71 | | | | 12.91 | | | | 12.09 | | | | 78.69 | |
| NWBI | | Northwest Bancshares, Inc. | | NY | | | 15.57 | | | | 102,033 | | | | 1,588.7 | | | | 19.10 | | | | 13.91 | | | | 15.69 | | | | -3.17 | | | | 9.03 | | | | -13.64 | | | | 0.48 | | | | 0.86 | | | | 11.55 | | | | 8.23 | | | | 95.38 | |
| OCFC | | OceanFirst Financial Corp. | | NJ | | | 27.21 | | | | 32,472 | | | | 883.6 | | | | 30.70 | | | | 17.10 | | | | 27.49 | | | | -3.17 | | | | 53.21 | | | | -9.39 | | | | 1.09 | | | | 1.55 | | | | 17.95 | | | | 13.07 | | | | 160.02 | |
| ORIT | | Oritani Financial Corp. | | PA | | | 16.85 | | | | 45,878 | | | | 773.0 | | | | 19.00 | | | | 15.27 | | | | 16.80 | | | | 0.00 | | | | 1.51 | | | | -10.13 | | | | 1.29 | | | | 0.96 | | | | 12.13 | | | | 12.13 | | | | 89.94 | |
| OTTW | | Ottawa Bancorp, Inc. | | NJ | | | 13.40 | | | | 3,467 | | | | 46.5 | | | | 13.99 | | | | 9.06 | | | | 13.43 | | | | -0.07 | | | | 37.12 | | | | 5.26 | | | | 0.40 | | | | 0.41 | | | | 15.06 | | | | 14.77 | | | | 68.19 | |
| PBHC | | Pathfinder Bancorp, Inc. | | NJ | | | 15.10 | | | | 4,247 | | | | 64.1 | | | | 15.35 | | | | 11.12 | | | | 15.00 | | | | 0.40 | | | | 27.00 | | | | 11.93 | | | | 0.82 | | | | 0.72 | | | | 13.98 | | | | 12.87 | | | | 188.22 | |
| PBBI | | PB Bancorp, Inc. | | IL | | | 10.40 | | | | 7,831 | | | | 81.4 | | | | 10.85 | | | | 8.36 | | | | 10.35 | | | | 0.53 | | | | 21.09 | | | | 5.09 | | | | 0.26 | | | | 0.22 | | | | 10.72 | | | | 9.84 | | | | 65.29 | |
| PCSB | | PCSB Financial Corporation | | NY | | | 16.58 | | | | 18,165 | | | | 301.2 | | | | 16.80 | | | | 15.76 | | | | 16.43 | | | | 0.73 | | | | NA | | | | NA | | | | NA | | | | NA | | | | NA | | | | NA | | | | 77.47 | |
| PBSK | | Poage Bankshares, Inc. | | CT | | | 19.41 | | | | 3,678 | | | | 71.4 | | | | 20.90 | | | | 15.81 | | | | 19.49 | | | | -0.23 | | | | 22.43 | | | | 3.22 | | | | 0.49 | | | | 0.55 | | | | 18.69 | | | | 18.09 | | | | 125.29 | |
| PROV | | Provident Financial Holdings, Inc. | | KY | | | 18.96 | | | | 7,892 | | | | 149.6 | | | | 20.66 | | | | 17.25 | | | | 19.03 | | | | -0.21 | | | | 3.61 | | | | -6.23 | | | | 0.83 | | | | 0.84 | | | | 16.69 | | | | 16.69 | | | | 151.99 | |
| PFS | | Provident Financial Services, Inc. | | CA | | | 24.56 | | | | 66,679 | | | | 1,637.6 | | | | 28.92 | | | | 18.59 | | | | 24.88 | | | | -4.25 | | | | 26.01 | | | | -13.22 | | | | 1.42 | | | | 1.44 | | | | 19.10 | | | | NA | | | | 142.62 | |
| PBIP | | Prudential Bancorp, Inc. | | NJ | | | 17.95 | | | | 9,008 | | | | 161.7 | | | | 18.74 | | | | 13.80 | | | | 17.89 | | | | 1.13 | | | | 22.61 | | | | 4.85 | | | | 0.07 | | | | 0.28 | | | | 14.52 | | | | 13.63 | | | | 93.72 | |
| RNDB | | Randolph Bancorp, Inc. | | PA | | | 15.06 | | | | 5,869 | | | | 88.4 | | | | 16.50 | | | | 12.06 | | | | 14.95 | | | | -0.92 | | | | NA | | | | -6.58 | | | | NA | | | | NA | | | | 14.14 | | | | NA | | | | 82.21 | |
| RVSB | | Riverview Bancorp, Inc. | | MA | | | 6.95 | | | | 22,511 | | | | 156.5 | | | | 8.16 | | | | 4.58 | | | | 6.94 | | | | -2.25 | | | | 56.53 | | | | -0.71 | | | | 0.33 | | | | NA | | | | 4.94 | | | | 3.68 | | | | 50.37 | |
| SVBI | | Severn Bancorp, Inc. | | WA | | | 7.10 | | | | 12,128 | | | | 86.1 | | | | 8.08 | | | | 5.69 | | | | 7.10 | | | | -0.07 | | | | 25.44 | | | | -10.13 | | | | 1.20 | | | | 1.20 | | | | 7.06 | | | | 7.03 | | | | 65.86 | |
| SIFI | | SI Financial Group, Inc. | | MD | | | 14.85 | | | | 12,209 | | | | 181.3 | | | | 16.23 | | | | 12.30 | | | | 15.05 | | | | -0.67 | | | | 6.68 | | | | -3.57 | | | | 0.97 | | | | 0.71 | | | | 13.61 | | | | 12.19 | | | | 130.47 | |
| SBCP | | Sunshine Bancorp, Inc. | | CT | | | 23.46 | | | | 8,019 | | | | 188.1 | | | | 23.73 | | | | 13.99 | | | | 23.28 | | | | 5.15 | | | | 59.05 | | | | 36.87 | | | | 0.17 | | | | 0.50 | | | | 14.22 | | | | 11.47 | | | | 119.27 | |
| TBNK | | Territorial Bancorp Inc. | | FL | | | 30.27 | | | | 9,830 | | | | 297.6 | | | | 34.00 | | | | 25.50 | | | | 30.43 | | | | -1.88 | | | | 17.28 | | | | -7.83 | | | | 1.80 | | | | 1.77 | | | | 23.72 | | | | 23.72 | | | | 196.92 | |
| TSBK | | Timberland Bancorp, Inc. | | HI | | | 22.18 | | | | 7,349 | | | | 163.0 | | | | 23.43 | | | | 14.20 | | | | 22.01 | | | | 1.19 | | | | 57.86 | | | | 7.36 | | | | 1.59 | | | | 1.58 | | | | 14.27 | | | | 13.50 | | | | 128.81 | |
| TRST | | TrustCo Bank Corp NY | | WA | | | 7.75 | | | | 95,997 | | | | 744.0 | | | | 9.00 | | | | 6.00 | | | | 7.75 | | | | -2.52 | | | | 22.05 | | | | -11.43 | | | | 0.45 | | | | 0.44 | | | | 4.57 | | | | 4.57 | | | | 50.91 | |
| UCBA | | United Community Bancorp | | NY | | | 18.13 | | | | 4,204 | | | | 76.2 | | | | 18.65 | | | | 13.86 | | | | 18.16 | | | | 0.73 | | | | 25.92 | | | | 8.58 | | | | 0.80 | | | | 0.80 | | | | 16.64 | | | | 15.99 | | | | 129.78 | |
| UBNK | | United Financial Bancorp, Inc. | | IN | | | 16.80 | | | | 50,758 | | | | 852.7 | | | | 18.66 | | | | 12.42 | | | | 17.01 | | | | -2.95 | | | | 29.33 | | | | -7.49 | | | | 1.02 | | | | 1.09 | | | | 13.13 | | | | 10.75 | | | | 131.93 | |
| WSBF | | Waterstone Financial, Inc. | | CT | | | 18.85 | | | | 29,459 | | | | 555.3 | | | | 20.40 | | | | 13.94 | | | | 19.00 | | | | -3.58 | | | | 32.56 | | | | 2.45 | | | | 1.03 | | | | 1.03 | | | | 14.09 | | | | 14.07 | | | | 58.63 | |
| WAYN | | Wayne Savings Bancshares, Inc. | | WI | | | 17.71 | | | | 2,782 | | | | 49.3 | | | | 18.75 | | | | 12.15 | | | | 17.75 | | | | -0.44 | | | | 34.08 | | | | 7.34 | | | | 0.77 | | | | 0.77 | | | | 14.88 | | | | 14.26 | | | | 161.27 | |
| WCFB | | WCF Bancorp, Inc. | | OH | | | 10.00 | | | | 2,562 | | | | 25.6 | | | | 10.35 | | | | 8.15 | | | | 10.00 | | | | -0.05 | | | | -1.69 | | | | -0.05 | | | | 0.06 | | | | 0.02 | | | | 11.26 | | | | NA | | | | 49.12 | |
| WEBK | | Wellesley Bancorp, Inc. | | IA | | | 27.25 | | | | 2,485 | | | | 67.7 | | | | 28.25 | | | | 19.60 | | | | 27.25 | | | | 0.93 | | | | 35.71 | | | | -1.80 | | | | 1.29 | | | | 1.29 | | | | 22.69 | | | | 22.69 | | | | 283.42 | |
| WBB | | Westbury Bancorp, Inc. | | MA | | | 20.30 | | | | 4,038 | | | | 82.0 | | | | 23.00 | | | | 18.80 | | | | 20.21 | | | | 0.00 | | | | 2.84 | | | | -1.93 | | | | 0.82 | | | | 0.72 | | | | 19.58 | | | | 19.58 | | | | 187.13 | |
| WNEB | | Western New England Bancorp, Inc. | | WI | | | 10.30 | | | | 30,790 | | | | 317.1 | | | | 10.75 | | | | 7.35 | | | | 10.50 | | | | -0.48 | | | | 35.17 | | | | 10.16 | | | | 0.30 | | | | 0.42 | | | | 7.99 | | | | 7.44 | | | | 67.77 | |
| WBKC | | Wolverine Bancorp, Inc. | | MA | | | 31.29 | | | | 2,106 | | | | 65.9 | | | | 35.00 | | | | 25.37 | | | | 31.25 | | | | -2.23 | | | | 21.27 | | | | -0.99 | | | | 2.35 | | | | 2.35 | | | | 29.66 | | | | 29.66 | | | | 180.10 | |
| WSFS | | WSFS Financial Corporation | | MI | | | 45.05 | | | | 31,452 | | | | 1,416.9 | | | | 50.55 | | | | 30.56 | | | | 45.15 | | | | -4.45 | | | | 33.05 | | | | -2.80 | | | | 2.14 | | | | 2.31 | | | | 22.38 | | | | 16.35 | | | | 217.88 | |
| WVFC | | WVS Financial Corp. | | DE | | | 15.15 | | | | 2,039 | | | | 30.9 | | | | 15.50 | | | | 10.73 | | | | 15.15 | | | | -0.33 | | | | 28.83 | | | | 2.89 | | | | 0.85 | | | | 0.85 | | | | 16.78 | | | | 16.78 | | | | 169.17 | |
RP® Financial, LC.
Exhibit IV-1A
Weekly Thrift Market Line - Part One
Prices As of May 12, 2017
| | | | | | | Market Capitalization | | | Price Change Data | | | Current Per Share Financials | |
| | | | | | | Price/ | | | Shares | | | Market | | | 52 Week (1) | | | | | | % Change From | | | LTM | | | LTM Core | | | BV/ | | | TBV/ | | | Assets/ | |
| | | | | Share(1) | | | Outstanding | | | Capitalization | | | High | | | Low | | | Last Wk | | | Last Wk | | | 52 Wks (2) | | | MRY (2) | | | EPS (3) | | | EPS (3) | | | Share | | | Share (4) | | | Share | |
| | | | | | | ($) | | | (000) | | | ($Mil) | | | ($) | | | ($) | | | ($) | | | (%) | | | (%) | | | (%) | | | ($) | | | ($) | | | ($) | | | ($) | | | ($) | |
| Companies | | | | | | | | | | | | | | | | | | | | | | | | | | | | | | | | | | | | | | | | | | | | | | | | | | | | | | | | | | |
| MHCs | | | | | | | | | | | | | | | | | | | | | | | | | | | | | | | | | | | | | | | | | | | | | | | | | | | | | | | | | | | | |
| HONE | | HarborOne Bancorp, Inc. (MHC) | | PA | | | 20.42 | | | | 32,121 | | | | 655.9 | | | | 21.44 | | | | 12.53 | | | | 20.75 | | | | -3.59 | | | | NA | | | | 5.58 | | | | NA | | | | NA | | | | 10.36 | | | | 9.94 | | | | 79.89 | |
| PVBC | | Provident Bancorp, Inc. (MHC) | | NY | | | 20.10 | | | | 9,641 | | | | 193.8 | | | | 22.90 | | | | 13.85 | | | | 20.65 | | | | -1.95 | | | | 45.13 | | | | 12.29 | | | | 0.73 | | | | 0.65 | | | | 11.54 | | | | 11.54 | | | | 86.40 | |
| OFED | | Oconee Federal Financial Corp. (MHC) | | MA | | | 27.27 | | | | 5,774 | | | | 157.4 | | | | 28.00 | | | | 19.25 | | | | 27.00 | | | | 3.59 | | | | 39.56 | | | | 16.04 | | | | 0.94 | | | | 0.94 | | | | 14.68 | | | | 14.12 | | | | 83.25 | |
| LSBK | | Lake Shore Bancorp, Inc. (MHC) | | KY | | | 15.63 | | | | 6,112 | | | | 95.5 | | | | 16.59 | | | | 12.97 | | | | 15.63 | | | | -1.26 | | | | 14.93 | | | | -3.92 | | | | 0.38 | | | | 0.36 | | | | 12.53 | | | | 12.53 | | | | 80.80 | |
| MGYR | | Magyar Bancorp, Inc. (MHC) | | NY | | | 13.00 | | | | 5,821 | | | | 75.7 | | | | 14.95 | | | | 9.65 | | | | 13.00 | | | | 0.00 | | | | 27.08 | | | | 8.33 | | | | 0.21 | | | | 0.21 | | | | 8.29 | | | | 8.29 | | | | 100.10 | |
| KFFB | | Kentucky First Federal Bancorp (MHC) | | NJ | | | 9.64 | | | | 8,445 | | | | 81.4 | | | | 10.15 | | | | 8.00 | | | | 9.65 | | | | 0.15 | | | | 7.87 | | | | 7.28 | | | | 0.14 | | | | 0.14 | | | | 7.96 | | | | 6.25 | | | | 36.15 | |
| TFSL | | TFS Financial Corporation (MHC) | | SC | | | 16.46 | | | | 282,734 | | | | 4,653.8 | | | | 19.89 | | | | 15.93 | | | | 16.58 | | | | -1.97 | | | | -9.51 | | | | -13.55 | | | | 0.30 | | | | NA | | | | 5.93 | | | | 5.89 | | | | 47.42 | |
| GCBC | | Greene County Bancorp, Inc. (MHC) | | MA | | | 23.45 | | | | 8,503 | | | | 199.4 | | | | 25.30 | | | | 15.40 | | | | 23.30 | | | | -1.26 | | | | 32.11 | | | | 2.40 | | | | 1.26 | | | | 1.26 | | | | 9.52 | | | | 9.52 | | | | 112.73 | |
| | | | | | | | | | | | | | | | | | | | | | | | | | | | | | | | | | | | | | | | | | | | | | | | | | | | | | | | | | | | | |
| Under Acquisition | | | | | | | | | | | | | | | | | | | | | | | | | | | | | | | | | | | | | | | | | | | | | | | | | | | | | | | | | | |
| ANCB | | Anchor Bancorp | | OH | | | 24.90 | | | | 2,505 | | | | 62.4 | | | | 27.50 | | | | 22.61 | | | | 25.01 | | | | -0.80 | | | | 2.94 | | | | -8.46 | | | | 0.83 | | | | 0.83 | | | | 25.95 | | | | 25.95 | | | | 185.83 | |
| ASBB | | ASB Bancorp, Inc. | | NY | | | 41.10 | | | | 3,788 | | | | 155.7 | | | | 42.00 | | | | 24.31 | | | | 41.00 | | | | -1.20 | | | | 55.09 | | | | 38.15 | | | | 0.46 | | | | 1.75 | | | | 24.75 | | | | 24.75 | | | | 212.12 | |
| AF | | Astoria Financial Corporation | | FL | | | 19.56 | | | | 101,726 | | | | 1,989.8 | | | | 21.66 | | | | 14.11 | | | | 19.87 | | | | -4.21 | | | | 29.54 | | | | 4.88 | | | | 0.58 | | | | 0.62 | | | | 15.67 | | | | 13.85 | | | | 140.99 | |
| EVER | | EverBank Financial Corp | | MA | | | 19.46 | | | | 127,880 | | | | 2,488.5 | | | | 19.52 | | | | 13.71 | | | | 19.45 | | | | -0.21 | | | | 42.04 | | | | 0.05 | | | | 1.13 | | | | NA | | | | 14.94 | | | | 14.56 | | | | 217.21 | |
(1) Average of High/Low or Bid/Ask price per share.
(2) Or since offering price if converted of first listed in the past 52 weeks. Percent change figures are actual year-to-date and are not annualized.
(3) EPS (earnings per share) is based on actual trailing 12 month data and is not shown on a pro forma basis.
(4) Excludes intangibles (such as goodwill, value of core deposits, etc.).
(5) ROA (return on assets) and ROE (return on equity) are indicated ratios based on trailing 12 month common earnings and average common equity and total assets balances.
(6) Annualized based on last regular quarterly cash dividend announcement.
(7) Indicated dividend as a percent of trailing 12 month earnings.
(8) Excluded from averages due to actual or rumored acquisition activities or unusual operating characteristics.
(9) For MHC institutions, market value reflects share price multiplied by public (non-MHC) shares.
Source: SNL Financial, LC. and RP® Financial, LC. calculations. The information provided in this table has been obtained from sources we believe are reliable, but we cannot guarantee the accuracy or completeness of such information.
Copyright (c) 2017 by RP® Financial, LC.
Exhibit IV-1B
Weekly Thrift Market Line - Part Two
Prices As of May 12, 2017
| | | | | | | Key Financial Ratios | | | Asset Quality Ratios | | | Pricing Ratios | | | Dividend Data (6) | |
| | | | | | | Equity/ | | | Tang Equity/ | | | Reported Earnings | | | Core Earnings | | | NPAs/ | | | Rsvs/ | | | Price/ | | | Price/ | | | Price/ | | | Price/ | | | Price/ | | | Div/ | | | Dividend | | | Payout | |
| | | | | Assets(1) | | | Assets(1) | | | ROA(5) | | | ROE(5) | | | ROA(5) | | | ROE(5) | | | Assets | | | NPLs | | | Earnings | | | Book | | | Assets | | | Tang Book | | | Core Earnings | | | Share | | | Yield | | | Ratio (7) | |
| | | | | | | (%) | | | (%) | | | (%) | | | (%) | | | (%) | | | (%) | | | (%) | | | (%) | | | (x) | | | (%) | | | (%) | | | (%) | | | (x) | | | ($) | | | (%) | | | (%) | |
| Companies | | | | | | | | | | | | | | | | | | | | | | | | | | | | | | | | | | | | | | | | | | | | | | | | | | | | | | | | | | | | | | | | | | |
| BCTF | | Bancorp 34, Inc. | | WA | | | 13.96 | | | | 13.96 | | | | 0.46 | | | | 3.18 | | | | 0.46 | | | | 3.18 | | | | NA | | | | 57.50 | | | | 30.18 | | | | 96.55 | | | | 13.48 | | | | 96.55 | | | | 30.18 | | | | NA | | | | NA | | | | NM | |
| BKMU | | Bank Mutual Corporation | | NC | | | 11.67 | | | | 11.67 | | | | 0.24 | | | | 2.09 | | | | 0.79 | | | | 6.81 | | | | 1.28 | | | | 130.70 | | | | NM | | | | 165.78 | | | | 19.34 | | | | 165.78 | | | | 23.48 | | | | NA | | | | NA | | | | NM | |
| BYBK | | Bay Bancorp, Inc. | | NM | | | 15.14 | | | | 15.07 | | | | 1.64 | | | | 14.08 | | | | 1.66 | | | | 14.21 | | | | 1.77 | | | | 46.81 | | | | 8.60 | | | | 87.98 | | | | 13.32 | | | | 88.45 | | | | 8.52 | | | | 0.59 | | | | 0.00 | | | | NM | |
| BNCL | | Beneficial Bancorp, Inc. | | WI | | | 10.81 | | | | 10.81 | | | | 0.61 | | | | 5.61 | | | | 0.62 | | | | 5.63 | | | | 0.50 | | | | 181.63 | | | | 25.56 | | | | 146.49 | | | | 15.83 | | | | 146.49 | | | | 25.48 | | | | 0.22 | | | | 2.39 | | | | 61.11 | |
| BHBK | | Blue Hills Bancorp, Inc. | | MD | | | 10.62 | | | | 10.23 | | | | 0.47 | | | | 4.16 | | | | 0.53 | | | | 4.62 | | | | 2.49 | | | | 20.75 | | | | 30.65 | | | | 110.48 | | | | 11.74 | | | | 115.27 | | | | 27.35 | | | | 0.00 | | | | 0.00 | | | | NM | |
| BOFI | | BofI Holding, Inc. | | PA | | | 17.57 | | | | 15.07 | | | | 0.51 | | | | 2.82 | | | | 0.61 | | | | 3.36 | | | | NA | | | | NA | | | | 37.18 | | | | 107.70 | | | | 18.92 | | | | 129.43 | | | | 30.90 | | | | 0.24 | | | | 1.66 | | | | 61.54 | |
| BYFC | | Broadway Financial Corporation | | MA | | | 15.90 | | | | 15.55 | | | | 0.62 | | | | 3.69 | | | | 0.46 | | | | 2.73 | | | | 0.53 | | | | 142.51 | | | | 30.58 | | | | 124.16 | | | | 19.74 | | | | 127.47 | | | | 41.30 | | | | 0.20 | | | | 1.09 | | | | 65.00 | |
| BLMT | | BSB Bancorp, Inc. | | CA | | | 9.20 | | | | 9.20 | | | | 1.68 | | | | 18.26 | | | | 1.67 | | | | 18.15 | | | | 0.39 | | | | 138.09 | | | | 11.23 | | | | 182.62 | | | | 16.70 | | | | 182.62 | | | | 11.30 | | | | NA | | | | NA | | | | NM | |
| CFFN | | Capitol Federal Financial, Inc. | | CA | | | 10.33 | | | | 10.33 | | | | 0.98 | | | | 8.75 | | | | 0.86 | | | | 7.61 | | | | 2.76 | | | | 35.10 | | | | 13.00 | | | | 114.03 | | | | 11.77 | | | | 114.03 | | | | 15.30 | | | | 0.04 | | | | 0.00 | | | | NM | |
| CARV | | Carver Bancorp, Inc. | | MA | | | 7.21 | | | | 7.21 | | | | 0.63 | | | | 8.32 | | | | 0.63 | | | | 8.29 | | | | 0.30 | | | | 210.14 | | | | 19.90 | | | | 169.45 | | | | 12.22 | | | | 169.45 | | | | 19.97 | | | | NA | | | | NA | | | | NM | |
| CHFN | | Charter Financial Corporation | | KS | | | 14.95 | | | | 14.95 | | | | 0.74 | | | | 5.99 | | | | 0.74 | | | | 5.99 | | | | 0.60 | | | | 16.12 | | | | 22.50 | | | | 139.46 | | | | 20.85 | | | | 139.46 | | | | 22.50 | | | | 0.34 | | | | 2.44 | | | | 141.94 | |
| CSBK | | Clifton Bancorp Inc. | | NY | | | 7.36 | | | | 7.36 | | | | -0.28 | | | | -3.76 | | | | -0.30 | | | | -3.91 | | | | 2.41 | | | | 29.47 | | | | NM | | | | 216.97 | | | | 2.09 | | | | 216.97 | | | | NM | | | | 0.00 | | | | 0.00 | | | | NM | |
| CWAY | | Coastway Bancorp, Inc. | | GA | | | 14.04 | | | | 12.14 | | | | 0.94 | | | | 6.63 | | | | 1.15 | | | | 8.05 | | | | 0.58 | | | | 157.19 | | | | 20.77 | | | | 135.06 | | | | 18.96 | | | | 159.68 | | | | 16.98 | | | | 0.26 | | | | 1.39 | | | | 25.56 | |
| DCOM | | Dime Community Bancshares, Inc. | | NJ | | | 20.72 | | | | 20.72 | | | | 0.36 | | | | 1.54 | | | | 0.35 | | | | 1.53 | | | | NA | | | | NA | | | | NM | | | | 123.68 | | | | 25.62 | | | | 123.68 | | | | 78.39 | | | | 0.24 | | | | 1.48 | | | | 114.29 | |
| ESBK | | Elmira Savings Bank | | RI | | | 10.89 | | | | 10.89 | | | | 0.55 | | | | 4.95 | | | | 0.55 | | | | 4.95 | | | | 2.14 | | | | 19.48 | | | | 24.28 | | | | 128.50 | | | | 14.00 | | | | 128.50 | | | | 24.28 | | | | NA | | | | NA | | | | NM | |
| EQFN | | Equitable Financial Corp. | | NY | | | 9.40 | | | | 8.57 | | | | 0.58 | | | | 6.04 | | | | 0.71 | | | | 7.36 | | | | 0.23 | | | | 168.45 | | | | 21.81 | | | | 130.10 | | | | 12.23 | | | | 144.08 | | | | 17.76 | | | | 0.56 | | | | 2.82 | | | | 61.54 | |
| ESSA | | ESSA Bancorp, Inc. | | NY | | | 10.08 | | | | 8.04 | | | | 0.77 | | | | 7.82 | | | | 0.78 | | | | 7.88 | | | | NA | | | | NA | | | | 16.02 | | | | 121.00 | | | | 10.25 | | | | 164.87 | | | | 15.94 | | | | 0.92 | | | | 4.52 | | | | 72.44 | |
| FCAP | | First Capital, Inc. | | NE | | | 14.85 | | | | 14.85 | | | | 0.50 | | | | 3.23 | | | | 0.51 | | | | 3.30 | | | | NA | | | | NA | | | | 30.57 | | | | 99.58 | | | | 14.79 | | | | 99.58 | | | | 29.97 | | | | NA | | | | NA | | | | NM | |
| FBNK | | First Connecticut Bancorp, Inc. | | PA | | | 10.16 | | | | 9.34 | | | | 0.41 | | | | 4.09 | | | | 0.40 | | | | 4.02 | | | | 1.22 | | | | 51.54 | | | | 21.67 | | | | 94.01 | | | | 9.56 | | | | 103.23 | | | | 22.06 | | | | 0.36 | | | | 2.48 | | | | 53.73 | |
| FDEF | | First Defiance Financial Corp. | | IN | | | 10.13 | | | | 9.21 | | | | 0.92 | | | | 8.86 | | | | 0.92 | | | | 8.83 | | | | 1.05 | | | | 95.08 | | | | 15.61 | | | | 137.93 | | | | 13.95 | | | | 153.23 | | | | 15.69 | | | | 0.84 | | | | 2.64 | | | | 41.18 | |
| FNWB | | First Northwest Bancorp | | CT | | | 9.11 | | | | 9.11 | | | | 0.60 | | | | 6.45 | | | | 0.60 | | | | 6.45 | | | | 0.83 | | | | 88.68 | | | | 22.78 | | | | 148.00 | | | | 13.49 | | | | 148.00 | | | | 22.78 | | | | 0.44 | | | | 1.79 | | | | 32.41 | |
| FBC | | Flagstar Bancorp, Inc. | | OH | | | 12.09 | | | | 9.09 | | | | 1.08 | | | | 9.11 | | | | 1.16 | | | | 9.78 | | | | 0.87 | | | | 103.71 | | | | 17.99 | | | | 150.92 | | | | 18.25 | | | | 207.65 | | | | 16.77 | | | | 1.00 | | | | 1.90 | | | | 32.08 | |
| FSBW | | FS Bancorp, Inc. | | WA | | | 16.51 | | | | 16.51 | | | | 0.50 | | | | 2.78 | | | | 0.43 | | | | 2.41 | | | | 0.76 | | | | 101.67 | | | | 34.70 | | | | 110.34 | | | | 18.22 | | | | 110.34 | | | | 40.06 | | | | NA | | | | NA | | | | NM | |
| FSBC | | FSB Bancorp, Inc. | | MI | | | 8.93 | | | | 8.93 | | | | 1.13 | | | | 11.27 | | | | 1.01 | | | | 10.03 | | | | 0.72 | | | | 145.36 | | | | 11.19 | | | | 119.66 | | | | 10.68 | | | | 119.66 | | | | 11.82 | | | | 0.00 | | | | 0.00 | | | | NM | |
| HBK | | Hamilton Bancorp, Inc. | | WA | | | 9.56 | | | | 9.16 | | | | 1.40 | | | | 14.58 | | | | NA | | | | NA | | | | NA | | | | NA | | | | 11.17 | | | | 157.02 | | | | 15.02 | | | | 164.72 | | | | NA | | | | 0.44 | | | | 1.02 | | | | 10.65 | |
| HIFS | | Hingham Institution for Savings | | NY | | | 11.14 | | | | 11.14 | | | | 0.33 | | | | 3.14 | | | | 0.32 | | | | 3.06 | | | | 0.01 | | | | NM | | | | 32.77 | | | | 90.80 | | | | 10.12 | | | | 90.80 | | | | 33.65 | | | | NA | | | | NA | | | | NM | |
| HMNF | | HMN Financial, Inc. | | MD | | | 12.14 | | | | 10.46 | | | | 0.03 | | | | 0.27 | | | | 0.11 | | | | 0.90 | | | | 1.08 | | | | 41.90 | | | | NM | | | | 85.27 | | | | 10.35 | | | | 100.88 | | | | 88.16 | | | | NA | | | | NA | | | | NM | |
| HFBL | | Home Federal Bancorp, Inc. of Louisiana | | MA | | | 8.19 | | | | 8.19 | | | | 1.23 | | | | 15.53 | | | | 1.22 | | | | 15.38 | | | | 0.20 | | | | 330.16 | | | | 15.97 | | | | 228.65 | | | | 18.72 | | | | 228.65 | | | | 16.12 | | | | 1.28 | | | | 0.72 | | | | 14.09 | |
| HVBC | | HV Bancorp, Inc. | | MN | | | 11.37 | | | | 11.21 | | | | 0.87 | | | | 7.74 | | | | 0.88 | | | | 7.83 | | | | 0.81 | | | | 198.67 | | | | 14.30 | | | | 100.48 | | | | 11.42 | | | | 102.10 | | | | 14.13 | | | | 0.00 | | | | 0.00 | | | | NM | |
| IROQ | | IF Bancorp, Inc. | | LA | | | 10.86 | | | | 10.86 | | | | 0.91 | | | | 7.77 | | | | 0.91 | | | | 7.77 | | | | 1.52 | | | | 135.27 | | | | 15.21 | | | | 124.35 | | | | 13.50 | | | | 124.35 | | | | 15.21 | | | | 0.36 | | | | 1.25 | | | | 19.05 | |
| ISBC | | Investors Bancorp, Inc. | | PA | | | 14.32 | | | | 14.32 | | | | NA | | | | 5.40 | | | | NA | | | | 5.33 | | | | 0.64 | | | | 37.27 | | | | NA | | | | 99.93 | | | | 14.31 | | | | 99.93 | | | | NA | | | | NA | | | | NA | | | | NA | |
| JXSB | | Jacksonville Bancorp, Inc. | | IL | | | 14.07 | | | | 14.07 | | | | 0.75 | | | | 5.27 | | | | 0.71 | | | | 5.02 | | | | 0.67 | | | | 139.99 | | | | 16.82 | | | | 94.01 | | | | 13.22 | | | | 94.01 | | | | 17.64 | | | | 0.16 | | | | 0.81 | | | | 13.56 | |
| KRNY | | Kearny Financial Corp. | | NJ | | | 13.22 | | | | 12.91 | | | | 0.86 | | | | 6.16 | | | | 0.86 | | | | 6.17 | | | | 0.44 | | | | 232.48 | | | | 20.00 | | | | 129.71 | | | | 17.15 | | | | 133.35 | | | | 19.95 | | | | 0.32 | | | | 2.42 | | | | 45.45 | |
| MLVF | | Malvern Bancorp, Inc. | | IL | | | 14.94 | | | | 14.20 | | | | 0.94 | | | | 6.32 | | | | 0.86 | | | | 5.73 | | | | 1.11 | | | | 91.09 | | | | 17.78 | | | | 112.12 | | | | 16.75 | | | | 118.96 | | | | 19.61 | | | | 0.40 | | | | 1.36 | | | | 24.10 | |
| MELR | | Melrose Bancorp, Inc. | | NJ | | | 22.81 | | | | 21.02 | | | | 0.42 | | | | 1.69 | | | | 0.42 | | | | 1.70 | | | | NA | | | | NA | | | | 67.14 | | | | 112.46 | | | | 25.65 | | | | 124.89 | | | | 66.80 | | | | 0.12 | | | | 0.85 | | | | 42.86 | |
| EBSB | | Meridian Bancorp, Inc. | | PA | | | 10.13 | | | | 10.13 | | | | 1.43 | | | | 13.01 | | | | 1.40 | | | | 12.71 | | | | 0.33 | | | | 225.18 | | | | 11.94 | | | | 149.71 | | | | 15.17 | | | | 149.71 | | | | 12.23 | | | | 0.11 | | | | 0.00 | | | | NM | |
| CASH | | Meta Financial Group, Inc. | | MA | | | 16.12 | | | | 16.12 | | | | 0.56 | | | | 3.23 | | | | 0.30 | | | | 1.75 | | | | 0.00 | | | | NM | | | | 30.40 | | | | 107.76 | | | | 17.37 | | | | 107.76 | | | | 56.21 | | | | NA | | | | NA | | | | NM | |
| MSBF | | MSB Financial Corp. | | MA | | | 13.28 | | | | 13.03 | | | | 0.86 | | | | 6.00 | | | | 0.79 | | | | 5.51 | | | | 0.58 | | | | 155.67 | | | | 24.20 | | | | 145.35 | | | | 19.31 | | | | 148.66 | | | | 26.39 | | | | 0.16 | | | | 0.96 | | | | 18.84 | |
| NYCB | | New York Community Bancorp, Inc. | | SD | | | 10.33 | | | | 6.45 | | | | 1.36 | | | | 13.82 | | | | 1.64 | | | | 16.70 | | | | 0.11 | | | | 326.52 | | | | 15.87 | | | | 190.97 | | | | 19.73 | | | | 319.14 | | | | 13.11 | | | | 0.52 | | | | 0.62 | | | | 9.81 | |
| NFBK | | Northfield Bancorp, Inc. | | NJ | | | 15.37 | | | | 15.37 | | | | 0.37 | | | | 2.08 | | | | 0.37 | | | | 2.08 | | | | 3.30 | | | | 29.09 | | | | 60.89 | | | | 131.88 | | | | 20.27 | | | | 131.88 | | | | 60.89 | | | | 0.00 | | | | 0.00 | | | | NM | |
| NWBI | | Northwest Bancshares, Inc. | | NY | | | 13.61 | | | | 9.08 | | | | 0.96 | | | | 7.67 | | | | 0.96 | | | | 7.73 | | | | 0.15 | | | | 270.28 | | | | 13.43 | | | | 102.58 | | | | 13.04 | | | | 169.97 | | | | 13.33 | | | | 0.68 | | | | 5.28 | | | | 70.83 | |
| OCFC | | OceanFirst Financial Corp. | | NJ | | | 16.40 | | | | 15.52 | | | | 0.85 | | | | 5.24 | | | | 0.87 | | | | 5.35 | | | | 0.71 | | | | 95.80 | | | | 23.97 | | | | 130.02 | | | | 21.32 | | | | 138.84 | | | | 23.47 | | | | 0.32 | | | | 1.91 | | | | 45.71 | |
| ORIT | | Oritani Financial Corp. | | PA | | | 12.10 | | | | 8.94 | | | | 0.53 | | | | 4.26 | | | | 0.94 | | | | 7.54 | | | | 1.08 | | | | 61.97 | | | | 32.00 | | | | 133.03 | | | | 16.10 | | | | 186.61 | | | | 17.88 | | | | 0.64 | | | | 4.17 | | | | 129.17 | |
| OTTW | | Ottawa Bancorp, Inc. | | NJ | | | 11.21 | | | | 8.43 | | | | 0.70 | | | | 6.66 | | | | 0.98 | | | | 9.22 | | | | 1.11 | | | | 33.20 | | | | 24.68 | | | | 149.88 | | | | 16.81 | | | | 205.75 | | | | 17.36 | | | | 0.60 | | | | 2.23 | | | | 53.21 | |
| PBHC | | Pathfinder Bancorp, Inc. | | NJ | | | 13.49 | | | | 13.49 | | | | 1.50 | | | | 10.60 | | | | 1.11 | | | | 7.85 | | | | 0.26 | | | | 279.98 | | | | 12.83 | | | | 136.39 | | | | 18.40 | | | | 136.39 | | | | 17.27 | | | | 0.70 | | | | 4.23 | | | | 93.02 | |
| PBBI | | PB Bancorp, Inc. | | IL | | | 22.08 | | | | 21.76 | | | | 0.58 | | | | 3.44 | | | | 0.60 | | | | 3.58 | | | | NA | | | | NA | | | | 34.36 | | | | 90.17 | | | | 19.91 | | | | 91.91 | | | | 33.05 | | | | 0.16 | | | | 1.18 | | | | 10.12 | |
| PCSB | | PCSB Financial Corporation | | NY | | | 7.46 | | | | 6.91 | | | | 0.49 | | | | 5.90 | | | | 0.43 | | | | 5.16 | | | | 1.20 | | | | 67.01 | | | | 18.41 | | | | 108.00 | | | | 8.00 | | | | 117.35 | | | | 21.05 | | | | 0.20 | | | | 1.32 | | | | 24.39 | |
| PBSK | | Poage Bankshares, Inc. | | CT | | | 16.44 | | | | 15.29 | | | | 0.37 | | | | 2.24 | | | | 0.31 | | | | 1.84 | | | | NA | | | | NA | | | | 40.00 | | | | 97.00 | | | | 15.95 | | | | 105.69 | | | | 48.28 | | | | 0.16 | | | | 1.54 | | | | 50.00 | |
| PROV | | Provident Financial Holdings, Inc. | | KY | | | 14.94 | | | | 14.53 | | | | 0.39 | | | | 2.51 | | | | 0.44 | | | | 2.84 | | | | 2.00 | | | | 29.50 | | | | 39.59 | | | | 103.82 | | | | 15.51 | | | | 107.24 | | | | 35.00 | | | | 0.24 | | | | 1.24 | | | | 57.14 | |
| PFS | | Provident Financial Services, Inc. | | CA | | | 10.97 | | | | 10.97 | | | | 0.57 | | | | 5.10 | | | | 0.58 | | | | 5.16 | | | | 0.97 | | | | 93.48 | | | | 22.84 | | | | 113.62 | | | | 12.46 | | | | 113.62 | | | | 22.62 | | | | 0.52 | | | | 2.74 | | | | 62.65 | |
| PBIP | | Prudential Bancorp, Inc. | | NJ | | | 13.32 | | | | NA | | | | 0.97 | | | | 7.25 | | | | 0.97 | | | | 7.24 | | | | 0.83 | | | | 87.06 | | | | 16.87 | | | | 125.42 | | | | 16.71 | | | | 190.76 | | | | 16.61 | | | | 0.76 | | | | 3.17 | | | | 52.11 | |
| RNDB | | Randolph Bancorp, Inc. | | PA | | | 15.49 | | | | 14.69 | | | | 0.06 | | | | 0.30 | | | | 0.32 | | | | 1.71 | | | | 2.20 | | | | 21.15 | | | | NM | | | | 127.03 | | | | 19.68 | | | | 135.25 | | | | 65.41 | | | | 0.12 | | | | 0.65 | | | | 171.43 | |
| RVSB | | Riverview Bancorp, Inc. | | MA | | | 17.19 | | | | NA | | | | 0.00 | | | | 0.02 | | | | 0.21 | | | | 1.38 | | | | 1.19 | | | | 60.05 | | | | NA | | | | 107.31 | | | | 18.45 | | | | NA | | | | NA | | | | NA | | | | NA | | | | NA | |
| SVBI | | Severn Bancorp, Inc. | | WA | | | 9.81 | | | | 7.49 | | | | 0.75 | | | | 6.66 | | | | NA | | | | NA | | | | NA | | | | NA | | | | 20.00 | | | | 133.53 | | | | 13.10 | | | | 179.32 | | | | NA | | | | 0.08 | | | | 1.21 | | | | 24.24 | |
| SIFI | | SI Financial Group, Inc. | | MD | | | 11.12 | | | | 11.09 | | | | 1.98 | | | | 17.18 | | | | 1.98 | | | | 17.18 | | | | 3.01 | | | | 36.52 | | | | 5.88 | | | | 99.90 | | | | 10.75 | | | | 100.29 | | | | 5.88 | | | | 0.00 | | | | 0.00 | | | | NM | |
| SBCP | | Sunshine Bancorp, Inc. | | CT | | | 10.43 | | | | 9.44 | | | | 0.75 | | | | 7.09 | | | | 0.55 | | | | 5.20 | | | | 1.01 | | | | 81.32 | | | | 15.52 | | | | 110.60 | | | | 11.53 | | | | 123.50 | | | | 21.20 | | | | 0.20 | | | | 1.33 | | | | 18.56 | |
| TBNK | | Territorial Bancorp Inc. | | FL | | | 11.93 | | | | 9.85 | | | | 0.21 | | | | 1.64 | | | | 0.45 | | | | 3.45 | | | | 0.11 | | | | 356.11 | | | | NM | | | | 162.55 | | | | 19.38 | | | | 201.55 | | | | 46.61 | | | | NA | | | | NA | | | | NM | |
| TSBK | | Timberland Bancorp, Inc. | | HI | | | 12.02 | | | | 12.02 | | | | 0.90 | | | | 7.37 | | | | 0.89 | | | | 7.24 | | | | 0.31 | | | | 50.91 | | | | 16.69 | | | | 126.62 | | | | 15.22 | | | | 126.62 | | | | 16.99 | | | | 0.80 | | | | 2.66 | | | | 53.33 | |
| TRST | | TrustCo Bank Corp NY | | WA | | | 11.07 | | | | 10.54 | | | | 1.29 | | | | 11.87 | | | | 1.28 | | | | 11.80 | | | | 1.26 | | | | 115.22 | | | | 14.15 | | | | 157.66 | | | | 17.46 | | | | 166.64 | | | | 14.24 | | | | 0.44 | | | | 1.96 | | | | 25.16 | |
| UCBA | | United Community Bancorp | | NY | | | 8.98 | | | | 8.97 | | | | 0.89 | | | | 9.97 | | | | 0.88 | | | | 9.80 | | | | 0.85 | | | | 114.94 | | | | 16.89 | | | | 166.17 | | | | 14.92 | | | | 166.38 | | | | 17.18 | | | | 0.26 | | | | 3.45 | | | | 58.33 | |
| UBNK | | United Financial Bancorp, Inc. | | IN | | | 12.83 | | | | 12.39 | | | | 0.62 | | | | 4.68 | | | | 0.62 | | | | 4.66 | | | | 0.81 | | | | 98.45 | | | | 23.13 | | | | 111.15 | | | | 14.26 | | | | 115.68 | | | | 23.25 | | | | 0.36 | | | | 1.95 | | | | 33.75 | |
| WSBF | | Waterstone Financial, Inc. | | CT | | | 9.95 | | | | 8.29 | | | | 0.80 | | | | 7.96 | | | | 0.85 | | | | 8.49 | | | | 0.78 | | | | 85.75 | | | | 16.31 | | | | 126.77 | | | | 12.61 | | | | 154.86 | | | | 15.30 | | | | 0.48 | | | | 2.88 | | | | 47.06 | |
| WAYN | | Wayne Savings Bancshares, Inc. | | WI | | | 24.03 | | | | 24.00 | | | | 1.60 | | | | 6.94 | | | | 1.60 | | | | 6.94 | | | | 1.11 | | | | 103.85 | | | | 18.01 | | | | 131.62 | | | | 31.63 | | | | 131.81 | | | | 18.01 | | | | 0.48 | | | | 2.59 | | | | 87.38 | |
| WCFB | | WCF Bancorp, Inc. | | OH | | | 9.23 | | | | 8.88 | | | | 0.47 | | | | 5.12 | | | | 0.47 | | | | 5.12 | | | | 0.92 | | | | 73.53 | | | | 22.99 | | | | 118.94 | | | | 10.98 | | | | 124.09 | | | | 22.99 | | | | 0.36 | | | | 2.03 | | | | 46.75 | |
| WEBK | | Wellesley Bancorp, Inc. | | IA | | | 22.91 | | | | NA | | | | 0.09 | | | | 0.51 | | | | 0.03 | | | | 0.15 | | | | NA | | | | 54.88 | | | | NM | | | | 89.56 | | | | 20.52 | | | | NA | | | | NM | | | | 0.20 | | | | 1.98 | | | | 351.07 | |
| WBB | | Westbury Bancorp, Inc. | | MA | | | 8.01 | | | | 8.01 | | | | 0.47 | | | | 5.58 | | | | 0.46 | | | | 5.56 | | | | NA | | | | NA | | | | 20.74 | | | | 117.88 | | | | 9.44 | | | | 117.88 | | | | 20.81 | | | | 0.16 | | | | 0.60 | | | | 12.40 | |
| WNEB | | Western New England Bancorp, Inc. | | WI | | | 10.47 | | | | 10.47 | | | | 0.44 | | | | 3.99 | | | | 0.38 | | | | 3.52 | | | | 0.42 | | | | 173.42 | | | | 24.70 | | | | 103.44 | | | | 10.83 | | | | 103.44 | | | | 27.93 | | | | NA | | | | NA | | | | NM | |
| WBKC | | Wolverine Bancorp, Inc. | | MA | | | 11.78 | | | | 11.06 | | | | 0.48 | | | | 4.21 | | | | 0.64 | | | | 5.61 | | | | NA | | | | NA | | | | 33.67 | | | | 126.47 | | | | 14.90 | | | | 135.76 | | | | 24.00 | | | | 0.12 | | | | 1.19 | | | | 40.00 | |
| WSFS | | WSFS Financial Corporation | | MI | | | 16.47 | | | | 16.47 | | | | 1.21 | | | | 7.58 | | | | 1.21 | | | | 7.58 | | | | 1.60 | | | | 144.22 | | | | 13.51 | | | | 107.04 | | | | 17.63 | | | | 107.04 | | | | 13.51 | | | | 1.60 | | | | 5.04 | | | | 68.09 | |
| WVFC | | WVS Financial Corp. | | DE | | | 10.27 | | | | 7.72 | | | | 1.06 | | | | 10.11 | | | | 1.14 | | | | 10.93 | | | | 0.88 | | | | 69.95 | | | | 20.91 | | | | 199.96 | | | | 20.54 | | | | 273.69 | | | | 19.35 | | | | 0.28 | | | | 0.63 | | | | 12.62 | |
Exhibit IV-1B
Weekly Thrift Market Line - Part Two
Prices As of May 12, 2017
| | | | | | | Key Financial Ratios | | | Asset Quality Ratios | | | Pricing Ratios | | | Dividend Data (6) | |
| | | | | | | Equity/ | | | Tang Equity/ | | | Reported Earnings | | | Core Earnings | | | NPAs/ | | | Rsvs/ | | | Price/ | | | Price/ | | | Price/ | | | Price/ | | | Price/ | | | Div/ | | | Dividend | | | Payout | |
| | | | | Assets(1) | | | Assets(1) | | | ROA(5) | | | ROE(5) | | | ROA(5) | | | ROE(5) | | | Assets | | | NPLs | | | Earnings | | | Book | | | Assets | | | Tang Book | | | Core Earnings | | | Share | | | Yield | | | Ratio (7) | |
| | | | | | | (%) | | | (%) | | | (%) | | | (%) | | | (%) | | | (%) | | | (%) | | | (%) | | | (x) | | | (%) | | | (%) | | | (%) | | | (x) | | | ($) | | | (%) | | | (%) | |
| Companies | | | | | | | | | | | | | | | | | | | | | | | | | | | | | | | | | | | | | | | | | | | | | | | | | | | | | | | | | | | | | | | | | | |
| MHCs | | | | | | | | | | | | | | | | | | | | | | | | | | | | | | | | | | | | | | | | | | | | | | | | | | | | | | | | | | | | | | | | | | | | |
| HONE | | HarborOne Bancorp, Inc. (MHC) | | PA | | | 9.77 | | | | 9.77 | | | | 0.48 | | | | 4.86 | | | | 0.47 | | | | 4.84 | | | | 0.07 | | | | 165.32 | | | | 17.82 | | | | 90.29 | | | | 8.82 | | | | 90.29 | | | | 17.89 | | | | 0.24 | | | | 1.58 | | | | 28.24 | |
| PVBC | | Provident Bancorp, Inc. (MHC) | | NY | | | 8.45 | | | | 8.45 | | | | 1.20 | | | | 13.95 | | | | 1.20 | | | | 13.95 | | | | 0.49 | | | | 238.35 | | | | 19.05 | | | | 252.09 | | | | 21.29 | | | | 252.09 | | | | 19.05 | | | | 0.38 | | | | 1.58 | | | | 30.16 | |
| OFED | | Oconee Federal Financial Corp. (MHC) | | MA | | | 12.97 | | | | 12.50 | | | | 0.36 | | | | 2.88 | | | | 0.50 | | | | 3.95 | | | | 1.86 | | | | 36.88 | | | | NA | | | | 194.13 | | | | 25.17 | | | | 202.38 | | | | NA | | | | NA | | | | NA | | | | NA | |
| LSBK | | Lake Shore Bancorp, Inc. (MHC) | | KY | | | 22.03 | | | | 18.14 | | | | 0.37 | | | | 1.63 | | | | 0.36 | | | | 1.57 | | | | NA | | | | NA | | | | 67.86 | | | | 119.30 | | | | 26.28 | | | | 152.11 | | | | 70.37 | | | | 0.40 | | | | 4.21 | | | | 285.71 | |
| MGYR | | Magyar Bancorp, Inc. (MHC) | | NY | | | 15.51 | | | | 15.51 | | | | 0.47 | | | | 2.96 | | | | 0.45 | | | | 2.82 | | | | 1.02 | | | | 68.97 | | | | 41.19 | | | | 124.96 | | | | 19.38 | | | | 124.96 | | | | 43.25 | | | | 0.32 | | | | 2.04 | | | | 78.95 | |
| KFFB | | Kentucky First Federal Bancorp (MHC) | | NJ | | | 8.28 | | | | 8.28 | | | | 0.22 | | | | 2.63 | | | | 0.21 | | | | 2.61 | | | | 3.90 | | | | 29.43 | | | | 60.22 | | | | 152.50 | | | | 12.63 | | | | 152.50 | | | | 60.50 | | | | NA | | | | NA | | | | NM | |
| TFSL | | TFS Financial Corporation (MHC) | | SC | | | 17.63 | | | | 17.08 | | | | 1.13 | | | | 6.47 | | | | 1.13 | | | | 6.47 | | | | 0.90 | | | | 30.51 | | | | 29.79 | | | | 190.73 | | | | 33.63 | | | | 198.24 | | | | 29.77 | | | | 0.40 | | | | 1.43 | | | | 42.55 | |
| GCBC | | Greene County Bancorp, Inc. (MHC) | | MA | | | 13.35 | | | | 13.35 | | | | 0.86 | | | | 6.07 | | | | 0.76 | | | | 5.39 | | | | NA | | | | NA | | | | 27.81 | | | | 175.94 | | | | 23.50 | | | | 175.94 | | | | 31.33 | | | | NA | | | | NA | | | | NM | |
| | | | | | | | | | | | | | | | | | | | | | | | | | | | | | | | | | | | | | | | | | | | | | | | | | | | | | | | | | | | | | | | | | | | | |
| Under Acquisition | | | | | | | | | | | | | | | | | | | | | | | | | | | | | | | | | | | | | | | | | | | | | | | | | | | | | | | | | | | | | | | | | | |
| ANCB | | Anchor Bancorp | | OH | | | 12.52 | | | | 12.46 | | | | 0.67 | | | | 5.14 | | | | NA | | | | NA | | | | 1.45 | | | | 30.16 | | | | 53.80 | | | | 272.21 | | | | 34.08 | | | | 273.80 | | | | NA | | | | 0.50 | | | | 3.10 | | | | 158.33 | |
| ASBB | | ASB Bancorp, Inc. | | NY | | | 12.02 | | | | 10.87 | | | | 0.46 | | | | 3.95 | | | | 0.48 | | | | 4.17 | | | | 1.65 | | | | 37.01 | | | | 32.33 | | | | 119.65 | | | | 13.42 | | | | 135.38 | | | | 30.35 | | | | 0.16 | | | | 0.85 | | | | 27.59 | |
| AF | | Astoria Financial Corporation | | FL | | | 7.41 | | | | 7.25 | | | | 0.56 | | | | 8.04 | | | | NA | | | | NA | | | | 0.66 | | | | 54.79 | | | | 17.21 | | | | 130.21 | | | | 9.00 | | | | 133.54 | | | | NA | | | | 0.24 | | | | 1.23 | | | | 21.24 | |
| EVER | | EverBank Financial Corp | | MA | | | 10.07 | | | | 10.07 | | | | 0.13 | | | | 1.26 | | | | 0.25 | | | | 2.51 | | | | NA | | | | NA | | | | NM | | | | 147.20 | | | | 14.82 | | | | 147.20 | | | | 59.98 | | | | 0.20 | | | | 0.77 | | | | 90.91 | |
(1) Average of High/Low or Bid/Ask price per share.
(2) Or since offering price if converted of first listed in the past 52 weeks. Percent change figures are actual year-to-date and are not annualized.
(3) EPS (earnings per share) is based on actual trailing 12 month data and is not shown on a pro forma basis.
(4) Exludes intangibles (such as goodwill, value of core deposits, etc.).
(5) ROA (return on assets) and ROE (return on equity) are indicated ratios based on trailing 12 month common earnings and average common equity and total assets balances.
(6) Annualized based on last regular quarterly cash dividend announcement.
(7) Indicated dividend as a percent of trailing 12 month earnings.
(8) Excluded from averages due to actual or rumored acquisition activities or unusual operating characteristics.
(9) For MHC institutions, market value reflects share price multiplied by public (non-MHC) shares.
Source: SNL Financial, LC. and RP® Financial, LC. calculations. The information provided in this table has been obtained from sources we believe are reliable, but we cannot guarantee the accuracy or completeness of such information.
Copyright (c) 2017 by RP® Financial, LC.
EXHIBIT IV-2
Historical Stock Price Indices
Exhibit IV-2
Historical Stock Price Indices(1)
| | | | | | | | | | | | | | SNL | | | SNL | |
| | | | | | | | | | | NASDAQ | | | Thrift | | | Bank | |
| Year/Qtr. Ended | | DJIA | | | S&P 500 | | | Composite | | | Index | | | Index | |
| | | | | | | | | | | | | | | | | | |
| 2004: | | Quarter 1 | | | 10357.7 | | | | 1126.2 | | | | 1994.2 | | | | 1585.3 | | | | 562.20 | |
| | | Quarter 2 | | | 10435.5 | | | | 1140.8 | | | | 2047.8 | | | | 1437.8 | | | | 546.62 | |
| | | Quarter 3 | | | 10080.3 | | | | 1114.6 | | | | 1896.8 | | | | 1495.1 | | | | 556.00 | |
| | | Quarter 4 | | | 10783.0 | | | | 1211.9 | | | | 2175.4 | | | | 1605.6 | | | | 595.10 | |
| | | | | | | | | | | | | | | | | | | | | | | |
| 2005: | | Quarter 1 | | | 10503.8 | | | | 1180.6 | | | | 1999.2 | | | | 1516.6 | | | | 551.00 | |
| | | Quarter 2 | | | 10275.0 | | | | 1191.3 | | | | 2057.0 | | | | 1577.1 | | | | 563.27 | |
| | | Quarter 3 | | | 10568.7 | | | | 1228.8 | | | | 2151.7 | | | | 1527.2 | | | | 546.30 | |
| | | Quarter 4 | | | 10717.5 | | | | 1248.3 | | | | 2205.3 | | | | 1616.4 | | | | 582.80 | |
| | | | | | | | | | | | | | | | | | | | | | | |
| 2006: | | Quarter 1 | | | 11109.3 | | | | 1294.8 | | | | 2339.8 | | | | 1661.1 | | | | 595.50 | |
| | | Quarter 2 | | | 11150.2 | | | | 1270.2 | | | | 2172.1 | | | | 1717.9 | | | | 601.14 | |
| | | Quarter 3 | | | 11679.1 | | | | 1335.9 | | | | 2258.4 | | | | 1727.1 | | | | 634.00 | |
| | | Quarter 4 | | | 12463.2 | | | | 1418.3 | | | | 2415.3 | | | | 1829.3 | | | | 658.60 | |
| | | | | | | | | | | | | | | | | | | | | | | |
| 2007: | | Quarter 1 | | | 12354.4 | | | | 1420.9 | | | | 2421.6 | | | | 1703.6 | | | | 634.40 | |
| | | Quarter 2 | | | 13408.6 | | | | 1503.4 | | | | 2603.2 | | | | 1645.9 | | | | 622.63 | |
| | | Quarter 3 | | | 13895.6 | | | | 1526.8 | | | | 2701.5 | | | | 1523.3 | | | | 595.80 | |
| | | Quarter 4 | | | 13264.8 | | | | 1468.4 | | | | 2652.3 | | | | 1058.0 | | | | 492.85 | |
| | | | | | | | | | | | | | | | | | | | | | | |
| 2008: | | Quarter 1 | | | 12262.9 | | | | 1322.7 | | | | 2279.1 | | | | 1001.5 | | | | 442.5 | |
| | | Quarter 2 | | | 11350.0 | | | | 1280.0 | | | | 2293.0 | | | | 822.6 | | | | 332.2 | |
| | | Quarter 3 | | | 10850.7 | | | | 1166.4 | | | | 2082.3 | | | | 760.1 | | | | 414.8 | |
| | | Quarter 4 | | | 8776.4 | | | | 903.3 | | | | 1577.0 | | | | 653.9 | | | | 268.3 | |
| | | | | | | | | | | | | | | | | | | | | | | |
| 2009: | | Quarter 1 | | | 7608.9 | | | | 797.9 | | | | 1528.6 | | | | 542.8 | | | | 170.1 | |
| | | Quarter 2 | | | 8447.0 | | | | 919.3 | | | | 1835.0 | | | | 538.8 | | | | 227.6 | |
| | | Quarter 3 | | | 9712.3 | | | | 1057.1 | | | | 2122.4 | | | | 561.4 | | | | 282.9 | |
| | | Quarter 4 | | | 10428.1 | | | | 1115.1 | | | | 2269.2 | | | | 587.0 | | | | 260.8 | |
| | | | | | | | | | | | | | | | | | | | | | | |
| 2010: | | Quarter 1 | | | 10856.6 | | | | 1169.4 | | | | 2398.0 | | | | 626.3 | | | | 301.1 | |
| | | Quarter 2 | | | 9744.0 | | | | 1030.7 | | | | 2109.2 | | | | 564.5 | | | | 257.2 | |
| | | Quarter 3 | | | 9744.0 | | | | 1030.7 | | | | 2109.2 | | | | 564.5 | | | | 257.2 | |
| | | Quarter 4 | | | 11577.5 | | | | 1257.6 | | | | 2652.9 | | | | 592.2 | | | | 290.1 | |
| | | | | | | | | | | | | | | | | | | | | | | |
| 2011: | | Quarter 1 | | | 12319.7 | | | | 1325.8 | | | | 2781.1 | | | | 578.1 | | | | 293.1 | |
| | | Quarter 2 | | | 12414.3 | | | | 1320.6 | | | | 2773.5 | | | | 540.8 | | | | 266.8 | |
| | | Quarter 3 | | | 10913.4 | | | | 1131.4 | | | | 2415.4 | | | | 443.2 | | | | 198.9 | |
| | | Quarter 4 | | | 12217.6 | | | | 1257.6 | | | | 2605.2 | | | | 481.4 | | | | 221.3 | |
| | | | | | | | | | | | | | | | | | | | | | | |
| 2012: | | Quarter 1 | | | 13212.0 | | | | 1408.5 | | | | 3091.6 | | | | 529.3 | | | | 284.9 | |
| | | Quarter 2 | | | 12880.1 | | | | 1362.2 | | | | 2935.1 | | | | 511.6 | | | | 257.3 | |
| | | Quarter 3 | | | 13437.1 | | | | 1440.7 | | | | 3116.2 | | | | 557.6 | | | | 276.8 | |
| | | Quarter 4 | | | 13104.1 | | | | 1426.2 | | | | 3019.5 | | | | 565.8 | | | | 292.7 | |
| | | | | | | | | | | | | | | | | | | | | | | |
| 2013: | | Quarter 1 | | | 14578.5 | | | | 1569.2 | | | | 3267.5 | | | | 602.3 | | | | 318.9 | |
| | | Quarter 2 | | | 14909.6 | | | | 1606.3 | | | | 3404.3 | | | | 625.3 | | | | 346.7 | |
| | | Quarter 3 | | | 15129.7 | | | | 1681.6 | | | | 3771.5 | | | | 650.8 | | | | 354.4 | |
| | | Quarter 4 | | | 16576.7 | | | | 1848.4 | | | | 4176.6 | | | | 706.5 | | | | 394.4 | |
| | | | | | | | | | | | | | | | | | | | | | | |
| 2014: | | Quarter 1 | | | 16457.7 | | | | 1872.3 | | | | 4199.0 | | | | 718.9 | | | | 410.8 | |
| | | Quarter 2 | | | 16826.6 | | | | 1960.2 | | | | 4408.2 | | | | 723.9 | | | | 405.2 | |
| | | Quarter 3 | | | 17042.9 | | | | 1972.3 | | | | 4493.4 | | | | 697.7 | | | | 411.0 | |
| | | Quarter 4 | | | 17823.1 | | | | 2058.9 | | | | 4736.1 | | | | 738.7 | | | | 432.8 | |
| | | | | | | | | | | | | | | | | | | | | | | |
| 2015: | | Quarter 1 | | | 17776.1 | | | | 2067.9 | | | | 4900.9 | | | | 749.3 | | | | 418.8 | |
| | | Quarter 2 | | | 17619.5 | | | | 2063.1 | | | | 4986.9 | | | | 795.7 | | | | 448.4 | |
| | | Quarter 3 | | | 16284.7 | | | | 1920.0 | | | | 4620.2 | | | | 811.7 | | | | 409.4 | |
| | | Quarter 4 | | | 17425.0 | | | | 2043.9 | | | | 5007.4 | | | | 809.1 | | | | 431.5 | |
| | | | | | | | | | | | | | | | | | | | | | | |
| 2016: | | Quarter 1 | | | 17685.1 | | | | 2059.7 | | | | 4869.9 | | | | 788.1 | | | | 381.4 | |
| | | Quarter 2 | | | 17930.0 | | | | 2098.9 | | | | 4842.7 | | | | 780.9 | | | | 385.6 | |
| | | Quarter 3 | | | 18308.2 | | | | 2168.3 | | | | 5312.0 | | | | 827.2 | | | | 413.7 | |
| | | Quarter 4 | | | 19762.6 | | | | 2238.8 | | | | 5383.1 | | | | 966.7 | | | | 532.7 | |
| | | | | | | | | | | | | | | | | | | | | | | |
| 2017: | | Quarter 1 | | | 20663.2 | | | | 2362.7 | | | | 5911.7 | | | | 918.9 | | | | 535.8 | |
| As of May 12, 2017 | | | 20896.6 | | | | 2390.9 | | | | 6121.2 | | | | 894.7 | | | | 529.9 | |
(1) End of period data.
EXHIBIT IV-3
Stock Indices as of May 12, 2017
| Index Name | | Close | | | Last Update | | 1 Day | | | 1 week | | | MTD | | | QTD | | | YTD | | | 1 Year | | | 3 Years | | | Price/
Earnings | |
| SNL U.S. Bank and Thrift | | | 507.19 | | | 5/12/2017 | | | -0.48 | % | | | -1.30 | % | | | -0.83 | % | | | -1.15 | % | | | -0.71 | % | | | 33.29 | % | | | 36.06 | % | | | 15.50 | |
| SNL U.S. Bank | | | 529.92 | | | 5/12/2017 | | | -0.48 | % | | | -1.28 | % | | | -0.80 | % | | | -1.10 | % | | | -0.51 | % | | | 33.89 | % | | | 36.31 | % | | | 15.28 | |
| SNL U.S. Thrift | | | 894.70 | | | 5/12/2017 | | | -0.54 | % | | | -1.88 | % | | | -2.21 | % | | | -2.63 | % | | | -7.45 | % | | | 14.17 | % | | | 27.90 | % | | | 24.02 | |
| SNL TARP Participants | | | 81.94 | | | 5/12/2017 | | | -0.13 | % | | | -3.98 | % | | | -4.99 | % | | | 1.52 | % | | | -10.74 | % | | | 46.31 | % | | | 2.90 | % | | | 13.03 | |
| KBW Nasdaq Bank | | | 91.46 | | | 5/12/2017 | | | -0.47 | % | | | -1.27 | % | | | -0.67 | % | | | -0.64 | % | | | -0.36 | % | | | 36.36 | % | | | 33.05 | % | | | NA | |
| S&P 500 Bank | | | 287.03 | | | 5/12/2017 | | | -0.44 | % | | | -0.77 | % | | | -0.14 | % | | | -0.68 | % | | | 0.98 | % | | | 35.93 | % | | | 35.56 | % | | | NA | |
EXHIBIT IV-4
New York Thrift Acquisitions 2013 - Present
Exhibit IV-4
New York Thrift Acquisitions 2013-Present
| | | | | | | | | | | | | Target Financials at Announcement | | | Deal Terms and Pricing at Announcement | |
| | | | | | | | | | | | | Total | | | | | | | | | LTM | | | LTM | | | NPAs/ | | | Rsrvs/ | | | Deal | | | Value/ | | | | | | | | | | | | | | | Prem/ | |
| Announce | | Complete | | | | | | | | | | Assets | | | E/A | | | TE/A | | | ROAA | | | ROAE | | | Assets | | | NPLs | | | Value | | | Share | | | P/B | | | P/TB | | | P/E | | | P/A | | | Cdeps | |
| Date | | Date | | Buyer Short Name | | | | Target Name | | | | ($000) | | | (%) | | | (%) | | | (%) | | | (%) | | | (%) | | | (%) | | | ($M) | | | ($) | | | (%) | | | (%) | | | (x) | | | (%) | | | (%) | |
| | | | | | | | | | | | | | | | | | | | | | | | | | | | | | | | | | | | | | | | | | | | | | | | | | | | | | | | | | | | | | | | | | | |
| 03/15/2017 | | Def. Agrmt. | | Kinderhook Bank Corp. | | NY | | Patriot Federal Bank | | NY | | | 141,246 | | | | 8.73 | | | | 8.61 | | | | 0.37 | | | | 4.09 | | | | 0.55 | | | | 231.02 | | | | 14.6 | | | | 9.945 | | | | 118.10 | | | | 119.86 | | | | 28.65 | | | | 10.30 | | | | 2.61 | |
| 03/07/2017 | | Def. Agrmt. | | Sterling Bancorp | | NY | | Astoria Financial Corporation | | NY | | | 14,558,652 | | | | 11.77 | | | | 10.64 | | | | 0.48 | | | | 4.23 | | | | 1.70 | | | | 37.04 | | | | 2,229.7 | | | | 21.919 | | | | 140.03 | | | | 158.56 | | | | 35.35 | | | | 15.32 | | | | 9.86 | |
| 12/16/2016 | | Def. Agrmt. | | Wallkill Valley FS&LA | | NY | | Hometown Bancorp, Inc. (MHC) | | NY | | | 122,950 | | | | 6.73 | | | | 6.44 | | | | -0.03 | | | | -0.38 | | | | NA | | | | NA | | | | 7.0 | | | | 3.010 | | | | 84.60 | | | | 88.68 | | | | NM | | | | 5.70 | | | | -1.00 | |
| 02/24/2015 | | 12/04/2015 | | Community Bank System Inc. | | NY | | Oneida Financial Corp. | | NY | | | 798,169 | | | | 12.01 | | | | 9.01 | | | | 0.66 | | | | 5.44 | | | | 0.17 | | | | 326.98 | | | | 142.1 | | | | 19.986 | | | | 146.60 | | | | 202.07 | | | | 27.38 | | | | 17.80 | | | | 11.58 | |
| 09/25/2014 | | 04/28/2015 | | Putnam County SB | | NY | | CMS Bancorp, Inc. | | NY | | | 273,045 | | | | 8.72 | | | | 8.72 | | | | 0.25 | | | | 2.91 | | | | NA | | | | NA | | | | 25.4 | | | | 13.250 | | | | 110.58 | | | | 110.58 | | | | 40.15 | | | | 9.29 | | | | 1.72 | |
| 01/30/2014 | | 06/30/2014 | | Kearny Financial Corp. (MHC) | | NJ | | Atlas Bank | | NY | | | 110,480 | | | | 13.68 | | | | 13.68 | | | | -0.93 | | | | -6.18 | | | | 0.60 | | | | 109.79 | | | | NA | | | | NA | | | | NA | | | | NA | | | | NA | | | | NA | | | | NA | |
| | | | | | | | | | | | | | | | | | | | | | | | | | | | | | | | | | | | | | | | | | | | | | | | | | | | | | | | | | | | | | | | | | | |
| | | | | | | | | Average: | | | | | 2,667,424 | | | | 10.27 | | | | 9.52 | | | | 0.13 | | | | 1.68 | | | | 0.75 | | | | 176.21 | | | | | | | | | | | | 119.98 | | | | 135.95 | | | | 32.88 | | | | 11.68 | | | | 4.95 | |
| | | | | | | | | Median: | | | | | 207,146 | | | | 10.25 | | | | 8.87 | | | | 0.31 | | | | 3.50 | | | | 0.58 | | | | 170.40 | | | | | | | | | | | | 118.10 | | | | 119.86 | | | | 32.00 | | | | 10.30 | | | | 2.61 | |
Source: SNL Financial, LC.
EXHIBIT IV-5
Seneca Federal Savings and Loan Association
Director and Senior Management Summary Resumes
Exhibit IV-5
Seneca Federal Savings and Loan Association
Director and Senior Management Summary Resumes
The business experience for the past five years of each of our directors is set forth below. The biographies also contain information regarding the person’s experience, qualifications, attributes or skills that caused the board of directors to determine that the person should serve as a director. Unless otherwise indicated, directors have held their positions for the past five years.
Vincent J. Fazio has served as Executive Vice President and Chief Financial Officer of Seneca Savings since 2013 and has served as a member of the board of directors since May 2017. Mr. Fazio has over 30 years of financial and accounting experience with community banks. Prior to being employed with Seneca Savings, Mr. Fazio has served in various roles with other companies including Patriot Federal Bank, Liberty Enterprise, Central National Bank and Albany Savings Bank. Mr. Fazio also serves as a member of the board of directors of the Baldwinsville Community Scholarship Fund.
Mr. Fazio’s extensive financial and accounting expertise provides the board of directors with experience when assessing our accounting practices and the financial implications of our strategic and corporate initiatives.
William J. Gouldhas served as a member of the board of directors of Seneca Savings since 1988. Mr. Gould is a former certified public accountant and served in various executive officer roles with Seneca Savings from 1987 until 2010, including previously serving as Chief Financial Officer.
As a result of Mr. Gould’s 30 years of experience, including 23 years as an executive officer of Seneca Savings, and leadership skills and extensive accounting and financial expertise, Mr. Gould is an invaluable resource to Seneca Savings and the board of directors.
James Hickeyis currently owner of Charles Signs, Inc., a family business located in Liverpool, New York, which has provided signs and custom graphic designs for businesses with signage needs since 1968. In this capacity, Mr. Hickey is responsible for day-to-day operations and management of Charles Signs, Inc.
Mr. Hickey’s strong business background provides the board of directors and Seneca Savings with invaluable insight to the needs of the bank’s local communities that it serves.
Joan M. Johnsonhas served as a member of the board of directors of Seneca Savings since January 2008. Ms. Johnson is currently a professor at State University of New York, which she has served since 1981. Her current responsibilities as a professor also include the integration of technology throughout the curriculum and the development of new academic programs. She also served as Dean and Associate Professor in the School of Management, Health and Food Technology of State University of New York. She was also a Professor at Rochester Institute of Technology from June 2002 until June 2010.
Ms. Johnson is an executive director of the Global Food Service Initiative, which focuses on the issuances of certifications related to food safety and food security. Ms. Johnson is also President of Madison County Tourism Committee, Inc., a non-profit corporation with the goal of increasing tourism in Madison County, New York. She also serves on the Upstate Revitalization Initiative Central New York Tourism Committee. Ms. Johnson’s leadership skills, academic background and extensive community involvement in upstate New York provides valuable insight to the board of directors.
Exhibit IV-5 (continued)
Seneca Federal Savings and Loan Association
Director and Senior Management Summary Resumes
William Le Beauwas first appointed to the Board of Directors of Seneca Savings in April 2013 and has served as Chairman of Seneca Savings since January 2017. Mr. LeBeau previously served in various roles at Seneca Savings, including Interim President and Chief Executive Officer from April 2013 to October 2013, Executive Vice President from October 2012 until April 2013 and Senior Vice President. Prior to joining Seneca Savings, Mr. LeBeau has over 30 years’ experience in various roles with New York community banks and financial institutions, including OnBank, M&T Bank, BSB Bank & Trust Company, and Partners Trust Financial Group. From 1971 to 1988, Mr. LeBeau was a bank examiner for the FDIC.
Mr. Le Beau’s leadership skills, extensive background in the financial services industry and his experience working for Seneca Savings brings extensive knowledge of the financial services industry in general and our organization and local markets to the board directors.
Francis R. Marloweis the Chief of Police of the Town of Manlius, New York Police Department, which he has served in such role since 2001. Mr. Marlowe’s leadership skills and years of service as a law enforcement officer in our community provides valuable insight into the economic and business needs of our community, as well as insight into where we can best serve our community in other ways, including charitable donations.
Joseph G. Vitale has served as President, Chief Executive Officer and director of Seneca Savings since October 2013. Before joining Seneca Savings in 2013, Mr. Vitale served as Executive Vice President and in other various senior management and employee positions at Savannah Bank, NA from 1996 until 2013. Mr. Vitale also served as a Credit Analyst at Cayuga Savings Bank from 1993 until 1996.
Mr. Vitale’s extensive knowledge of the banking industry and strong leadership skills provide the board of directors and Seneca Savings with invaluable insight and guidance into the business and regulatory requirements of today’s banking environment.
Executive Officer Who is Not a Director
The following sets forth information regarding our executive officer who is not a director. Age information is as of March 31, 2017. The executive officers of Seneca Financial Corp. and Seneca Savings are elected annually.
George J. Sageer, age 59, is our Executive Vice President and Director of Retail Banking, and has served in those positions since December 2015. Mr. Sageer’s is in charge of our residential lending. Mr. Sageer previously served as our Vice President of Retail Banking from December 2014 until December 2015. Prior to joining Seneca Savings, Mr. Sageer served as Vice President of Residential Lending at Solvay Bank until 2007. Mr. Sageer has served in various lending roles with other companies including Alliance Bank. Mr. Sageer filed for a personal bankruptcy in 2014.
Source: Seneca Federal’s prospectus.
EXHIBIT IV-6
Seneca Federal Savings and Loan Association
Pro Forma Regulatory Capital Ratios
Exhibit IV-6
Seneca Federal Savings and Loan Association
Pro Forma Regulatory Capital Ratios
| | | Seneca Savings
Historical at | | | Pro Forma at March 31, 2017, Based Upon the Sale in the Offering of (1) | |
| | | March 31, 2017 | | | 586,500 Shares | | | 690,000 Shares | | | 793,500 Shares | | | 912,525 Shares (2) | |
| | | Amount | | | Percent of
Assets (3) | | | Amount | | | Percent of
Assets (3) | | | Amount | | | Percent of
Assets (3) | | | Amount | | | Percent of
Assets (3) | | | Amount | | | Percent of
Assets (3) | |
| | | (Dollars in thousands) | |
| | | | |
| Equity (4) | | $ | 10,885 | | | | 6.51 | % | | $ | 14,085 | | | | 8.22 | % | | $ | 14,100 | | | | 8.23 | % | | $ | 14,115 | | | | 8.23 | % | | $ | 14,132 | | | | 8.23 | % |
| | | | | | | | | | | | | | | | | | | | | | | | | | | | | | | | | | | | | | | | | |
| Tier 1 leverage capital | | $ | 13,631 | | | | 8.29 | % | | $ | 16,831 | | | | 10.00 | % | | $ | 16,846 | | | | 10.00 | % | | $ | 16,861 | | | | 10.00 | % | | $ | 16,878 | | | | 10.00 | % |
| Tier 1 leverage capital requirement | | | 8,218 | | | | 5.00 | | | | 8,416 | | | | 5.00 | | | | 8,423 | | | | 5.00 | | | | 8,431 | | | | 5.00 | | | | 8,439 | | | | 5.00 | |
| Excess | | $ | 5,413 | | | | 3.29 | % | | $ | 8,415 | | | | 5.00 | % | | $ | 8,423 | | | | 5.00 | % | | $ | 8,430 | | | | 5.00 | % | | $ | 8,439 | | | | 5.00 | % |
| | | | | | | | | | | | | | | | | | | | | | | | | | | | | | | | | | | | | | | | | |
| Tier 1 risk-based capital (5) | | $ | 13,631 | | | | 14.11 | % | | $ | 16,831 | | | | 17.28 | % | | $ | 16,846 | | | | 17.29 | % | | $ | 16,861 | | | | 17.30 | % | | $ | 16,878 | | | | 17.31 | % |
| Tier 1 risk-based requirement | | | 7,729 | | | | 8.00 | | | | 7,792 | | | | 8.00 | | | | 7,794 | | | | 8.00 | | | | 7,797 | | | | 8.00 | | | | 7,799 | | | | 8.00 | |
| Excess | | $ | 5,902 | | | | 6.11 | % | | $ | 9,039 | | | | 9.28 | % | | $ | 9,052 | | | | 9.29 | % | | $ | 9,064 | | | | 9.30 | % | | $ | 9,079 | | | | 9.31 | % |
| | | | | | | | | | | | | | | | | | | | | | | | | | | | | | | | | | | | | | | | | |
| Total risk-based capital (5) | | $ | 14,716 | | | | 15.23 | % | | $ | 17,916 | | | | 18.39 | % | | $ | 17,931 | | | | 18.40 | % | | $ | 17,946 | | | | 18.41 | % | | $ | 17,963 | | | | 18.42 | % |
| Total risk-based requirement | | | 9,661 | | | | 10.00 | | | | 9,740 | | | | 10.00 | | | | 9,743 | | | | 10.00 | | | | 9,746 | | | | 10.00 | | | | 9,749 | | | | 10.00 | |
| Excess | | $ | 5,055 | | | | 5.23 | % | | $ | 8,176 | | | | 8.39 | % | | $ | 8,188 | | | | 8.40 | % | | $ | 8,200 | | | | 8.41 | % | | $ | 8,214 | | | | 8.42 | % |
| | | | | | | | | | | | | | | | | | | | | | | | | | | | | | | | | | | | | | | | | |
| Common equity tier 1 risk-based capital (5) | | $ | 13,631 | | | | 14.11 | % | | $ | 16,831 | | | | 17.28 | % | | $ | 16,846 | | | | 17.29 | % | | $ | 16,861 | | | | 17.30 | % | | $ | 16,878 | | | | 17.31 | % |
| Common equity tier 1 risk-based requirement | | | 6,280 | | | | 6.50 | | | | 6,331 | | | | 6.50 | | | | 6,333 | | | | 6.50 | | | | 6,335 | | | | 6.50 | | | | 6,337 | | | | 6.50 | |
| Excess | | $ | 7,351 | | | | 7.61 | % | | $ | 10,500 | | | | 10.78 | % | | $ | 10,513 | | | | 10.79 | % | | $ | 10,526 | | | | 10.80 | % | | $ | 10,541 | | | | 10.81 | % |
| | | | | | | | | | | | | | | | | | | | | | | | | | | | | | | | | | | | | | | | | |
| Reconciliation of capital infused into Seneca Savings: | | | | | | | | | | | | | | | | | | | | | | | | | | | | | | | | | |
| Net offering proceeds | | | $ | 4,765 | | | | | | | $ | 5,800 | | | | | | | $ | 6,835 | | | | | | | $ | 8,025 | | | | | |
| Proceeds to Seneca Savings | | | $ | 3,949 | | | | | | | $ | 4,097 | | | | | | | $ | 4,245 | | | | | | | $ | 4,414 | | | | | |
| Less: Common stock acquired by employee stock ownership plan | | | | (500 | ) | | | | | | | (588 | ) | | | | | | | (676 | ) | | | | | | | (778 | ) | | | | |
| Less: Common stock acquired by stock-based benefit plans | | | | (250 | ) | | | | | | | (294 | ) | | | | | | | (338 | ) | | | | | | | (389 | ) | | | | |
| Pro forma increase | | | $ | 3,200 | | | | | | | $ | 3,215 | | | | | | | $ | 3,231 | | | | | | | $ | 3,247 | | | | | |
| (1) | Pro forma capital levels assume that the employee stock ownership plan purchases 3.92% of our total outstanding shares (including shares issued to Seneca Financial MHC) with funds we lend and that one or more stock-based benefit plans purchases 1.96% of our total outstanding shares (including shares issued to Seneca Financial MHC) for restricted stock awards. Pro forma capital calculated under U.S. generally accepted accounting principles (“GAAP”) and regulatory capital have been reduced by the amount required to fund these plans. See “Management” for a discussion of the employee stock ownership plan. |
| (2) | As adjusted to give effect to an increase in the number of shares, which could occur due to a 15% increase in the offering range to reflect demand for the shares or changes in market conditions following the commencement of the offering. |
| (3) | Tier 1 leverage capital levels are shown as a percentage of total adjusted assets. Risk-based capital levels are shown as a percentage of risk-weighted assets. |
| (4) | Seneca Savings’ equity as calculated under GAAP was $11.0 million at March 31, 2017. Equity and regulatory capital amounts have been reduced to reflect the $100,000 initial capitalization of Seneca Financial MHC. |
| (5) | Pro forma amounts and percentages assume net proceeds are invested in assets that carry a 20% risk weighting. |
Source: Seneca Federal’s prospectus.
EXHIBIT IV-7
Seneca Federal Savings and Loan Association
Pro Forma Analysis Sheet – Fully Converted Basis
EXHIBIT IV-7
PRO FORMA ANALYSIS SHEET-FULLY CONVERTED BASIS
SENECA FS&LA
Prices as of May 12, 2017
| | | | | | | Subject at | | | Peer Group | | | New York Companies | | | All Public Thrifts | |
| Valuation Pricing Multiples | | | | Symbol | | Midpoint | | | Mean | | | Median | | | Mean | | | Median | | | Mean | | | Median | |
| Price-earnings multiple | | = | | P/E | | | 26.28 | x | | | 30.26 | x | | | 28.47 | x | | | 20.01 | x | | | 17.82 | x | | | 20.24 | x | | | 18.98 | x |
| Price-core earnings multiple | | = | | P/CE | | | 36.78 | x | | | 20.80 | x | | | 20.27 | x | | | 19.93 | x | | | 17.75 | x | | | 20.83 | x | | | 20.11 | x |
| Price-book ratio | | = | | P/B | | | 64.98 | % | | | 104.94 | % | | | 102.40 | % | | | 132.83 | % | | | 121.89 | % | | | 131.15 | % | | | 126.65 | % |
| Price-tangible book ratio | | = | | P/TB | | | 64.98 | % | | | 108.93 | % | | | 105.59 | % | | | 152.19 | % | | | 166.08 | % | | | 145.09 | % | | | 130.77 | % |
| Price-assets ratio | | = | | P/A | | | 8.36 | % | | | 14.78 | % | | | 15.71 | % | | | 11.76 | % | | | 12.29 | % | | | 15.96 | % | | | 15.60 | % |
| Valuation Parameters | | | | | | | | | % of | | | % of Offering | |
| | | | | | | | | | Offering | | | + Foundation | |
| Pre-Conversion Earnings (Y) | | $ | 600,000 | | | (12 Mths 3/17) | | ESOP Stock as % of Offering (E) | | | 8.0000 | % | | | 8.0000 | % |
| Pre-Conversion Core Earnings | | $ | 437,000 | | | (12 Mths 3/17) | | Cost of ESOP Borrowings (S) | | | 0.00 | % | | | | |
| Pre-Conversion Book Value (B) | | $ | 10,985,000 | | | (3/17) | | ESOP Amortization (T) | | | 30.00 years | | | | | |
| Intangibles | | $ | 0 | | | (3/17) | | RRP Stock as % of Offering (M) | | | 4.0000 | % | | | 4.0000 | % |
| Pre-Conv. Tang. Book Value (B) | | $ | 10,985,000 | | | (3/17) | | Stock Programs Vesting (N) | | | 5.00 years | | | | | |
| Pre-Conversion Assets (A) | | $ | 167,325,000 | | | (3/17) | | Fixed Expenses | | $ | 1,100,000 | | | | | |
| Reinv. Rate: (5 Yr Treas)@3/2017 | | | 1.930 | % | | | | Subscr/Dir Comm Exp (Mdpnt) | | $ | 0 | | | | 0.00 | % |
| Tax rate (TAX) | | | 34.00 | % | | | | Total Expenses (Midpoint) | | $ | 1,100,000 | | | | | |
| A-T Reinvestment Rate(R) | | | 1.274 | % | | | | Syndicate Expenses (Mdpnt) | | $ | 0 | | | | 0.00 | % |
| Est. Conversion Expenses (1)(X) | | | 7.33 | % | | | | Syndicate Amount | | $ | 0 | | | | | |
| Insider Purchases ($) | | $ | 0 | | | | | Percent Sold (PCT) | | | 100.00 | % | | | | |
| Price/Share | | $ | 10.00 | | | | | MHC Assets | | $ | 0 | | | | | |
| Foundation Cash Contrib. (FC) | | $ | 0 | | | | | Options as % of Offering (O1) | | | 10.0000 | % | | | 10.00 | % |
| Found. Stk Contrib (% of Total Shrs (FS) | | | 0.0000 | % | | | | Estimated Option Value (O2) | | | 28.30 | % | | | | |
| Foundation Tax Benefit (Z) | | $ | 0 | | | | | Option Vesting Period (O3) | | | 5.00 years | | | | | |
| Foundation Amount (Mdpt.) | | $ | 0 | | | | | % of Options taxable (O4) | | | 25.00 | % | | | | |
| Calculation of Pro Forma Value After Conversion | | | | |
| 1. V= | P/E * (Y) | | V= | $15,000,000 |
| | 1 - P/E * PCT * ((1-X-E-M-FC-FS)*R - (1-TAX)*E/T - (1-TAX)*M/N)-(1-(TAX*O4))*(O1*O2)/O3) | | | |
| | | | | |
| 1. V= | P/E * (Y) | | V= | $15,000,000 |
| | 1 - P/Core E * PCT * ((1-X-E-M-FC-FS)*R - (1-TAX)*E/T - (1-TAX)*M/N)-(1-(TAX*O4))*(O1*O2)/O3) | | | |
| | | | | | |
| 2. V= | P/B * (B+Z) | | | V= | $15,000,000 |
| | 1 - P/B * PCT * (1-X-E-M-FC-FS) | | | | |
| | | | | | |
| 2. V= | P/TB * (TB+Z) | | | V= | $15,000,000 |
| | 1 - P/TB * PCT * (1-X-E-M-FC-FS) | | | | |
| | | | | | |
| 3. V= | P/A * (A+Z+PA) | | | V= | $15,000,000 |
| | 1 - P/A * PCT * (1-X-E-M-FC-FS) | | | | |
| | | | | | | | | | | | | | | | | | Market Value | | | Market Value | |
| | | Shares Issued | | | Shares Sold | | | Foundation | | | Total Shares | | | Price Per | | | of Stock Sold | | | of Stock Issued | |
| Valuation Conclusion | | to MHC | | | to Public | | | Shares | | | Issued | | | Share | | | in Offering | | | in Reorganization | |
| Supermaximum | | | 0 | | | | 1,983,750 | | | | 0 | | | | 1,983,750 | | | $ | 10.00 | | | $ | 19,837,500 | | | $ | 19,837,500 | |
| Maximum | | | 0 | | | | 1,725,000 | | | | 0 | | | | 1,725,000 | | | | 10.00 | | | | 17,250,000 | | | $ | 17,250,000 | |
| Midpoint | | | 0 | | | | 1,500,000 | | | | 0 | | | | 1,500,000 | | | | 10.00 | | | | 15,000,000 | | | $ | 15,000,000 | |
| Minimum | | | 0 | | | | 1,275,000 | | | | 0 | | | | 1,275,000 | | | | 10.00 | | | | 12,750,000 | | | $ | 12,750,000 | |
| | | | | | | | | | | | | | | | | | | | | | | | | | | | | |
| | | Shares Issued | | | Shares Sold | | | Foundation | | | Total Shares | | | | | | | | | | | | | |
| Valuation Conclusion | | to MHC | | | to Public | | | Shares | | | Issued | | | | | | | | | | | | | |
| Supermaximum | | | 0.000 | % | | | 100.000 | % | | | 0.000 | % | | | 100.000 | % | | | | | | | | | | | | |
| Maximum | | | 0.000 | % | | | 100.000 | % | | | 0.000 | % | | | 100.000 | % | | | | | | | | | | | | |
| Midpoint | | | 0.000 | % | | | 100.000 | % | | | 0.000 | % | | | 100.000 | % | | | | | | | | | | | | |
| Minimum | | | 0.000 | % | | | 100.000 | % | | | 0.000 | % | | | 100.000 | % | | | | | | | | | | | | |
(1) Estimated offering expenses at midpoint of the offering.
EXHIBIT IV-8
Seneca Federal Savings and Loan Association
Pro Forma Effect of Conversion Proceeds – Fully Converted Basis
Exhibit IV-8
PRO FORMA EFFECT OF CONVERSION PROCEEDS
SENECA FS&LA
At the Minimum of the Range
| 1. | | Market Value of Shares Sold In Offering: | | $ | 12,750,000 | |
| | | Market Value of Shares Issued to Foundation: | | | 0 | |
| | | Total Market Value of Company: | | $ | 12,750,000 | |
| | | | | | | |
| 2. | | Offering Proceeds of Shares Sold In Offering | | $ | 12,750,000 | |
| | | Less: Estimated Offering Expenses | | | 1,100,000 | |
| | | Net Conversion Proceeds | | $ | 11,650,000 | |
| | | | | | | |
| 3. | | Estimated Additional Equity and Income from Offering Proceeds | | | | |
| | | Net Conversion Proceeds | | $ | 11,650,000 | |
| | | Less: Cash Contribution to Foundation | | | 0 | |
| | | Less: Non-Cash ESOP Stock Purchases (1) | | | (1,020,000 | ) |
| | | Less: Non-Cash MRP Stock Purchases (2) | | | (510,000 | ) |
| | | Net Conversion Proceeds Reinvested | | $ | 10,120,000 | |
| | | Estimated After-Tax Reinvestment Rate | | | 1.27 | % |
| | | Earnings from Reinvestment of Proceeds | | $ | 128,909 | |
| | | Less: Estimated cost of ESOP borrowings(1) | | | 0 | |
| | | Less: Amortization of ESOP borrowings(1) | | | (22,440 | ) |
| | | Less: Stock Programs Vesting (2) | | | (67,320 | ) |
| | | Less: Option Plan Vesting (3) | | | (66,031 | ) |
| | | Net Earnings Increase | | $ | (26,882 | ) |
| | | | | | | | Net | | | | |
| | | | | Before | | | Earnings | | | After | |
| 4. | | Pro Forma Earnings | | Conversion | | | Increase | | | Conversion | |
| | | | | | | | | | | | |
| | | 12 Months ended March 31, 2017 (reported) | | $ | 600,000 | | | $ | (26,882 | ) | | $ | 573,118 | |
| | | 12 Months ended March 31, 2017 (core) | | $ | 437,000 | | | $ | (26,882 | ) | | $ | 410,118 | |
| | | | | Before | | | Net Equity | | | Tax Benefit | | | After | |
| 5. | | Pro Forma Net Worth | | Conversion | | | Proceeds | | | of Foundation | | | Conversion | |
| | | | | | | | | | | | | | | |
| | | March 31, 2017 | | $ | 10,985,000 | | | $ | 10,120,000 | | | $ | 0 | | | $ | 21,105,000 | |
| | | March 31, 2017 (Tangible) | | $ | 10,985,000 | | | $ | 10,120,000 | | | $ | 0 | | | $ | 21,105,000 | |
| | | | | Before | | | Net Cash | | | Tax Benefit | | | After | |
| 6. | | Pro Forma Assets | | Conversion | | | Proceeds | | | of Foundation | | | Conversion | |
| | | | | | | | | | | | | | | | | | | |
| | | March 31, 2017 | | $ | 167,325,000 | | | $ | 10,120,000 | | | $ | 0 | | | $ | 177,445,000 | |
(1) ESOP stock (3.92% of total shares issued in conversion) amortized over 30 years, amortization expense is tax effected at 34%.
(2) Restricted stock program (1.96% of total shares issued in conversion) amortized over 5 years, amortization expense is tax effected at 34%.
(3) Option valuation based on Black-Scholes model, 5 year vesting, and assuming 25% taxable.
Exhibit IV-8
PRO FORMA EFFECT OF CONVERSION PROCEEDS
SENECA FS&LA
At the Midpoint of the Range
| 1. | | Market Value of Shares Sold In Offering: | | $ | 15,000,000 | |
| | | Market Value of Shares Issued to Foundation: | | | 0 | |
| | | Total Market Value of Company: | | $ | 15,000,000 | |
| | | | | | | |
| 2. | | Offering Proceeds of Shares Sold In Offering | | $ | 15,000,000 | |
| | | Less: Estimated Offering Expenses | | | 1,100,000 | |
| | | Net Conversion Proceeds | | $ | 13,900,000 | |
| | | | | | | |
| 3. | | Estimated Additional Equity and Income from Offering Proceeds | | | | |
| | | Net Conversion Proceeds | | $ | 13,900,000 | |
| | | Less: Cash Contribution to Foundation | | | 0 | |
| | | Less: Non-Cash ESOP Stock Purchases (1) | | | (1,200,000 | ) |
| | | Less: Non-Cash MRP Stock Purchases (2) | | | (600,000 | ) |
| | | Net Conversion Proceeds Reinvested | | $ | 12,100,000 | |
| | | Estimated After-Tax Reinvestment Rate | | | 1.27 | % |
| | | Earnings from Reinvestment of Proceeds | | $ | 154,130 | |
| | | Less: Estimated cost of ESOP borrowings(1) | | | 0 | |
| | | Less: Amortization of ESOP borrowings(1) | | | (26,400 | ) |
| | | Less: Stock Programs Vesting (2) | | | (79,200 | ) |
| | | Less: Option Plan Vesting (3) | | | (77,684 | ) |
| | | Net Earnings Increase | | $ | (29,154 | ) |
| | | | | | | | Net | | | | |
| | | | | Before | | | Earnings | | | After | |
| 4. | | Pro Forma Earnings | | Conversion | | | Increase | | | Conversion | |
| | | | | | | | | | | | |
| | | 12 Months ended March 31, 2017 (reported) | | $ | 600,000 | | | $ | (29,154 | ) | | $ | 570,846 | |
| | | 12 Months ended March 31, 2017 (core) | | $ | 437,000 | | | $ | (29,154 | ) | | $ | 407,846 | |
| | | | | Before | | | Net Capital | | | Tax Benefit | | | After | |
| 5. | | Pro Forma Net Worth | | Conversion | | | Proceeds | | | of Foundation | | | Conversion | |
| | | | | | | | | | | | | | | |
| | | | March 31, 2017 | | $ | 10,985,000 | | | $ | 12,100,000 | | | $ | 0 | | | $ | 23,085,000 | |
| | | | March 31, 2017 (Tangible) | | $ | 10,985,000 | | | $ | 12,100,000 | | | $ | 0 | | | $ | 23,085,000 | |
| | | | | Before | | | Net Cash | | | Tax Benefit | | | After | |
| 6. | | Pro Forma Assets | | Conversion | | | Proceeds | | | of Foundation | | | Conversion | |
| | | | | | | | | | | | | | | | | | | |
| | | March 31, 2017 | | $ | 167,325,000 | | | $ | 12,100,000 | | | $ | 0 | | | $ | 179,425,000 | |
(1) ESOP stock (3.92% of total shares issued in conversion) amortized over 30 years, amortization expense is tax effected at 34%.
(2) Restricted stock program (1.96% of total shares issued in conversion) amortized over 5 years, amortization expense is tax effected at 34%.
(3) Option valuation based on Black-Scholes model, 5 year vesting, and assuming 25% taxable.
Exhibit IV-8
PRO FORMA EFFECT OF CONVERSION PROCEEDS
SENECA FS&LA
At the Maximum of the Range
| 1. | | Market Value of Shares Sold In Offering: | | $ | 17,250,000 | |
| | | Market Value of Shares Issued to Foundation: | | | 0 | |
| | | Total Market Value of Company: | | $ | 17,250,000 | |
| | | | | | | |
| 2. | | Offering Proceeds of Shares Sold In Offering | | $ | 17,250,000 | |
| | | Less: Estimated Offering Expenses | | | 1,100,000 | |
| | | Net Conversion Proceeds | | $ | 16,150,000 | |
| | | | | | | |
| 3. | | Estimated Additional Equity and Income from Offering Proceeds | | | | |
| | | Net Conversion Proceeds | | $ | 16,150,000 | |
| | | Less: Cash Contribution to Foundation | | | 0 | |
| | | Less: Non-Cash ESOP Stock Purchases (1) | | | (1,380,000 | ) |
| | | Less: Non-Cash MRP Stock Purchases (2) | | | (690,000 | ) |
| | | Net Conversion Proceeds Reinvested | | $ | 14,080,000 | |
| | | Estimated After-Tax Reinvestment Rate | | | 1.27 | % |
| | | Earnings from Reinvestment of Proceeds | | $ | 179,351 | |
| | | Less: Estimated cost of ESOP borrowings(1) | | | 0 | |
| | | Less: Amortization of ESOP borrowings(1) | | | (30,360 | ) |
| | | Less: Stock Programs Vesting (2) | | | (91,080 | ) |
| | | Less: Option Plan Vesting (3) | | | (89,336 | ) |
| | | Net Earnings Increase | | $ | (31,425 | ) |
| | | | | | | | Net | | | | |
| | | | | Before | | | Earnings | | | After | |
| 4. | | Pro Forma Earnings | | Conversion | | | Increase | | | Conversion | |
| | | | | | | | | | | | |
| | | 12 Months ended March 31, 2017 (reported) | | $ | 600,000 | | | $ | (31,425 | ) | | $ | 568,575 | |
| | | 12 Months ended March 31, 2017 (core) | | $ | 437,000 | | | $ | (31,425 | ) | | $ | 405,575 | |
| | | | | Before | | | Net Capital | | | Tax Benefit | | | After | |
| 5. | | Pro Forma Net Worth | | Conversion | | | Proceeds | | | of Foundation | | | Conversion | |
| | | | | | | | | | | | | | | |
| | | March 31, 2017 | | $ | 10,985,000 | | | $ | 14,080,000 | | | $ | 0 | | | $ | 25,065,000 | |
| | | March 31, 2017 (Tangible) | | $ | 10,985,000 | | | $ | 14,080,000 | | | $ | 0 | | | $ | 25,065,000 | |
| | | | | Before | | | Net Cash | | | Tax Benefit | | | After | |
| 6. | | Pro Forma Assets | | Conversion | | | Proceeds | | | of Foundation | | | Conversion | |
| | | | | | | | | | | | | | | | | | | |
| | | March 31, 2017 | | $ | 167,325,000 | | | $ | 14,080,000 | | | $ | 0 | | | $ | 181,405,000 | |
(1) ESOP stock (3.92% of total shares issued in conversion) amortized over 30 years, amortization expense is tax effected at 34%.
(2) Restricted stock program (1.96% of total shares issued in conversion) amortized over 5 years, amortization expense is tax effected at 34%.
(3) Option valuation based on Black-Scholes model, 5 year vesting, and assuming 25% taxable.
Exhibit IV-8
PRO FORMA EFFECT OF CONVERSION PROCEEDS
SENECA FS&LA
At the Supermaximum Value
| 1. | | Market Value of Shares Sold In Offering: | | $ | 19,837,500 | |
| | | Market Value of Shares Issued to Foundation: | | | 0 | |
| | | Total Market Value of Company: | | $ | 19,837,500 | |
| | | | | | | |
| 2. | | Offering Proceeds of Shares Sold In Offering | | $ | 19,837,500 | |
| | | Less: Estimated Offering Expenses | | | 1,100,000 | |
| | | Net Conversion Proceeds | | $ | 18,737,500 | |
| | | | | | | |
| 3. | | Estimated Additional Equity and Income from Offering Proceeds | | | | |
| | | Net Conversion Proceeds | | $ | 18,737,500 | |
| | | Less: Cash Contribution to Foundation | | | 0 | |
| | | Less: Non-Cash ESOP Stock Purchases (1) | | | (1,587,000 | ) |
| | | Less: Non-Cash MRP Stock Purchases (2) | | | (793,500 | ) |
| | | Net Conversion Proceeds Reinvested | | $ | 16,357,000 | |
| | | Estimated After-Tax Reinvestment Rate | | | 1.27 | % |
| | | Earnings from Reinvestment of Proceeds | | $ | 208,355 | |
| | | Less: Estimated cost of ESOP borrowings(1) | | | 0 | |
| | | Less: Amortization of ESOP borrowings(1) | | | (34,914 | ) |
| | | Less: Stock Programs Vesting (2) | | | (104,742 | ) |
| | | Less: Option Plan Vesting (3) | | | (102,736 | ) |
| | | Net Earnings Increase | | $ | (34,037 | ) |
| | | | | | | | Net | | | | |
| | | | | Before | | | Earnings | | | After | |
| 4. | | Pro Forma Earnings | | Conversion | | | Increase | | | Conversion | |
| | | | | | | | | | | | |
| | | 12 Months ended March 31, 2017 (reported) | | $ | 600,000 | | | $ | (34,037 | ) | | $ | 565,963 | |
| | | 12 Months ended March 31, 2017 (core) | | $ | 437,000 | | | $ | (34,037 | ) | | $ | 402,963 | |
| | | | | Before | | | Net Capital | | | Tax Benefit | | | After | |
| 5. | | Pro Forma Net Worth | | Conversion | | | Proceeds | | | of Foundation | | | Conversion | |
| | | | | | | | | | | | | | | |
| | | March 31, 2017 | | $ | 10,985,000 | | | $ | 16,357,000 | | | $ | 0 | | | $ | 27,342,000 | |
| | | March 31, 2017 (Tangible) | | $ | 10,985,000 | | | $ | 16,357,000 | | | $ | 0 | | | $ | 27,342,000 | |
| | | | | Before | | | Net Cash | | | Tax Benefit | | | After | |
| 6. | | Pro Forma Assets | | Conversion | | | Proceeds | | | of Foundation | | | Conversion | |
| | | | | | | | | | | | | | | | | | | |
| | | March 31, 2017 | | $ | 167,325,000 | | | $ | 16,357,000 | | | $ | 0 | | | $ | 183,682,000 | |
(1) ESOP stock (3.92% of total shares issued in conversion) amortized over 30 years, amortization expense is tax effected at 34%.
(2) Restricted stock program (1.96% of total shares issued in conversion) amortized over 5 years, amortization expense is tax effected at 34%.
(3) Option valuation based on Black-Scholes model, 5 year vesting, and assuming 25% taxable.
EXHIBIT IV-9
Seneca Federal Savings and Loan Association
Pro Forma Analysis Sheet – Minority Stock Offering
EXHIBIT IV-9
PRO FORMA ANALYSIS SHEET-FULLY CONVERTED BASIS
SENECA FS&LA
Prices as of May 12, 2017
| | | | | | | Subject at | | | Peer Group | | | New York Companies | | | All Public Thrifts | |
| Valuation Pricing Multiples | | | | Symbol | | Midpoint | | | Mean | | | Median | | | Mean | | | Median | | | Mean | | | Median | |
| Price-earnings multiple | | = | | P/E | | | 26.24 | x | | | 30.26 | x | | | 28.47 | x | | | 20.01 | x | | | 17.82 | x | | | 20.24 | x | | | 18.98 | x |
| Price-core earnings multiple | | = | | P/CE | | | 36.71 | x | | | 20.80 | x | | | 20.27 | x | | | 19.93 | x | | | 17.75 | x | | | 20.83 | x | | | 20.11 | x |
| Price-book ratio | | = | | P/B | | | 94.92 | % | | | 104.94 | % | | | 102.40 | % | | | 132.83 | % | | | 121.89 | % | | | 131.15 | % | | | 126.65 | % |
| Price-tangible book ratio | | = | | P/TB | | | 94.92 | % | | | 108.93 | % | | | 105.59 | % | | | 152.19 | % | | | 166.08 | % | | | 145.09 | % | | | 130.77 | % |
| Price-assets ratio | | = | | P/A | | | 8.71 | % | | | 14.78 | % | | | 15.71 | % | | | 11.76 | % | | | 12.29 | % | | | 15.96 | % | | | 15.60 | % |
| Valuation Parameters (2) | | | | | | | | | | | | As a % of Offering | |
| | | | | | | | | | | | | + Foundation | |
| Pre-Conversion Earnings (Y) | | $ | 598,726 | | | (12 Mths 3/17) | | ESOP Stock Purchases (E) | | | 8.52 | % | | | 8.52 | % |
| Pre-Conversion Core Earnings | | $ | 435,726 | | | (12 Mths 3/17) | | Cost of ESOP Borrowings (S) | | | 0.00 | % | | | | |
| Pre-Conversion Book Value (B) | | $ | 10,885,000 | | | | | ESOP Amortization (T) | | | 30.00 years | | | | | |
| Pre-Conv. Tang. Book Value (B) | | $ | 10,885,000 | | | | | Stock Programs Amount (M) | | | 4.261 | % | | | 4.26 | % |
| Pre-Conversion Assets (A) | | $ | 167,225,000 | | | | | Stock Programs Vesting (N) | | | 5.00 years | | | | | |
| Reinvestment Rate: | | | 1.93 | % | | | | Fixed Expenses | | $ | 1,100,000 | | | | | |
| Tax rate (TAX) | | | 34.00 | % | | | | Variable Expenses | | | 0.00 | % | | | | |
| A-T Reinvestment Rate(R) | | | 1.27 | % | | | | Percent Sold (PCT) | | | 46.0000 | % | | | | |
| Est. Conversion Expenses (1)(X) | | | 15.94 | % | | | | MHC Assets | | $ | 100,000 | | | | | |
| Insider Purchases | | $ | 0 | | | | | Options as % of Offering (O1) | | | 10.65 | % | | | 10.65 | % |
| Price/Share | | $ | 10.00 | | | | | Estimated Option Value (O2) | | | 28.30 | % | | | | |
| Foundation Cash Contrib. (FC) | | $ | 0 | | | | | Option Vesting Period (O3) | | | 5.00 years | | | | | |
| Foundation Stock Contrib. (FS) | | | 0.00 | % | | | | % of Options taxable (O4) | | | 25.00 | % | | | | |
| Foundation Tax Benefit (Z) | | $ | 0 | | | | | | | | | | | | | |
| Calculation of Pro Forma Value After Conversion | | | |
| | | | | |
| 1. V= | P/E * (Y) | | V= | $15,000,000 |
| | 1 - P/E * PCT * ((1-X-E-M-C-D)*R - (1-TAX)*E/T - (1-TAX)*M/N) | | | |
| | | | | |
| 1. V= | P/E * (Y) | | V= | $15,000,000 |
| | 1 - P/Core E * PCT * ((1-X-E-M-FC-FS)*R - (1-TAX)*E/T - (1-TAX)*M/N)-(1-(TAX*O4))*(O1*O2)/O3) | | | |
| | | | | | |
| 2. V= | P/B * B | | | V= | $15,000,000 |
| | 1 - P/B * PCT * (1-X-E-M-FC-FS) | | | | |
| | | | | | |
| 2. V= | P/TB * TB | | | V= | $15,000,000 |
| | 1 - P/B * PCT * (1-X-E-M-FC-FS) | | | | |
| | | | | | |
| 3. V= | P/A * (A+Z) | | | V= | $15,000,000 |
| | 1 - P/A * PCT * (1-X-E-M-FC-FS) | | | | |
| | | | | | | | | | | | | | | | | | Mark. Val of | | | | |
| | | | | | | | | | | | | | | | | | Stock Sold in | | | | |
| | | Shares Issued | | | Shares Sold | | | Foundation | | | Total Shares | | | Price Per | | | Offering+Issued | | | Full Value of | |
| Valuation Conclusion | | to MHC | | | to Public | | | Shares | | | Issued | | | Share | | | to Foundation | | | Total Shares | |
| Supermaximum | | | 1,071,225 | | | | 912,525 | | | | 0 | | | | 1,983,750 | | | $ | 10.00 | | | $ | 9,125,250 | | | $ | 19,837,500 | |
| Maximum | | | 931,500 | | | | 793,500 | | | | 0 | | | | 1,725,000 | | | | 10.00 | | | | 7,935,000 | | | $ | 17,250,000 | |
| Midpoint | | | 810,000 | | | | 690,000 | | | | 0 | | | | 1,500,000 | | | | 10.00 | | | | 6,900,000 | | | $ | 15,000,000 | |
| Minimum | | | 688,500 | | | | 586,500 | | | | 0 | | | | 1,275,000 | | | | 10.00 | | | | 5,865,000 | | | $ | 12,750,000 | |
| | | | | | | | | | | | | | | | | | | | | | | | | | | | | |
| | | Shares Issued | | | Shares Sold | | | Foundation | | | Total Shares | | | | | | | | | | | | | |
| Valuation Conclusion | | to MHC | | | to Public | | | Shares | | | Issued | | | | | | | | | | | | | |
| Supermaximum | | | 54.000 | % | | | 46.000 | % | | | 0.000 | % | | | 100.000 | % | | | | | | | | | | | | |
| Maximum | | | 54.000 | % | | | 46.000 | % | | | 0.000 | % | | | 100.000 | % | | | | | | | | | | | | |
| Midpoint | | | 54.000 | % | | | 46.000 | % | | | 0.000 | % | | | 100.000 | % | | | | | | | | | | | | |
| Minimum | | | 54.000 | % | | | 46.000 | % | | | 0.000 | % | | | 100.000 | % | | | | | | | | | | | | |
(1) Estimated offering expenses at midpoint of the offering.
(2) Reflects reduction in earnings, equity and assets due to $100,000 contributed to the MHC.
EXHIBIT IV-10
Seneca Federal Savings and Loan Association
Pro Forma Effect of Conversion Proceeds – Minority Stock Offering
Exhibit IV-10
PRO FORMA EFFECT OF CONVERSION PROCEEDS
SENECA FS&LA
At the Minimum of the Range
| 1. | | Market Value of Shares Sold In Offering: | | $ | 5,865,000 | |
| | | Market Value of Shares Issued to Foundation: | | | 0 | |
| | | Market Value of Shares Issued to MHC: | | | 6,885,000 | |
| | | Total Market Value of Company: | | $ | 12,750,000 | |
| | | | | | | |
| 2. | | Offering Proceeds of Shares Sold In Offering | | $ | 5,865,000 | |
| | | Less: Estimated Offering Expenses | | | 1,099,993 | |
| | | Net Conversion Proceeds | | $ | 4,765,007 | |
| | | | | | | |
| 3. | | Estimated Additional Equity and Income from Offering Proceeds | | | | |
| | | Net Conversion Proceeds | | $ | 4,765,007 | |
| | | Less: Cash Contribution to Foundation | | | 0 | |
| | | Less: Cash for Capitalization of the MHC | | | 0 | |
| | | Less: Non-Cash ESOP/MRP Purchases (1) | | | (749,700 | ) |
| | | Net Proceeds Reinvested | | $ | 4,015,307 | |
| | | Estimated net incremental rate of return | | | 1.27 | % |
| | | Earnings Increase | | $ | 51,147 | |
| | | Less: Estimated cost of ESOP borrowings | | | 0 | |
| | | Less: Amortization of ESOP borrowings(2) | | | (10,996 | ) |
| | | Less: Stock Programs Vesting (3) | | | (32,987 | ) |
| | | Less: Option Plan Vesting (4) | | | (32,355 | ) |
| | | Net Earnings Increase | | $ | (25,191 | ) |
| | | | | | | | | | | Net | | | | |
| | | | | | | | Before | | | Earnings | | | After | |
| 4. | | Pro Forma Earnings | | | | | Conversion | | | Increase | | | Conversion | |
| | | | | | | | | | | | | | | |
| | | 12 Months ended March 31, 2017 (reported) | | | | | | $ | 598,726 | | | $ | (25,191 | ) | | $ | 573,536 | |
| | | 12 Months ended March 31, 2017 (core) | | | | | | $ | 435,726 | | | $ | (25,191 | ) | | $ | 410,536 | |
| | | | | | | | | | | | | | | | | | | |
| | | | | Before | | | Net Cash | | | Tax Benefit | | | After | |
| 5. | | Pro Forma Net Worth | | Conversion | | | Proceeds | | | of Foundation | | | Conversion | |
| | | | | | | | | | | | | | | | | | | |
| | | March 31, 2017 | | $ | 10,885,000 | | | $ | 4,015,307 | | | $ | 0 | | | $ | 14,900,307 | |
| | | March 31, 2017 (Tangible) | | $ | 10,885,000 | | | $ | 4,015,307 | | | $ | 0 | | | $ | 14,900,307 | |
| | | | | | | | | | | | | | | | | | | |
| | | | | Before | | | Net Cash | | | Tax Benefit | | | After | |
| 6. | | Pro Forma Assets | | Conversion | | | Proceeds | | | of Foundation | | | Conversion | |
| | | | | | | | | | | | | | | | | | | |
| | | March 31, 2017 | | $ | 167,225,000 | | | $ | 4,015,307 | | | $ | 0 | | | $ | 171,240,307 | |
(1) Includes ESOP purchases equal to 3.92% of total shares issued in the conversion, and stock program purchases equal to 1.96% of total shares issued in the conversion.
(2) ESOP stock amortized over 30 years, and amortization expense is tax effected at 34%.
(3) Stock programs amortized over 5 years, and amortization expense is tax effected at 34%.
(4) Option valuation based on Black-Scholes model, 5 year vesting, and assuming 25% taxable.
Exhibit IV-10
PRO FORMA EFFECT OF CONVERSION PROCEEDS
SENECA FS&LA
At the Midpoint of the Range
| 1. | | Market Value of Shares Sold In Offering: | | $ | 6,900,000 | |
| | | Market Value of Shares Issued to Foundation: | | | 0 | |
| | | Market Value of Shares Issued to MHC: | | | 8,100,000 | |
| | | Total Market Value of Company: | | $ | 15,000,000 | |
| | | | | | | |
| 2. | | Offering Proceeds of Shares Sold In Offering | | $ | 6,900,000 | |
| | | Less: Estimated Offering Expenses | | | 1,100,000 | |
| | | Net Conversion Proceeds | | $ | 5,800,000 | |
| | | | | | | |
| 3. | | Estimated Additional Equity and Income from Offering Proceeds | | | | |
| | | Net Conversion Proceeds | | $ | 5,800,000 | |
| | | Less: Cash Contribution to Foundation | | | 0 | |
| | | Less: Cash for Capitalization of the MHC | | | 0 | |
| | | Less: Non-Cash ESOP/MRP Purchases (1) | | | (882,000 | ) |
| | | Net Proceeds Reinvested | | $ | 4,918,000 | |
| | | Estimated net incremental rate of return | | | 1.27 | % |
| | | Earnings Increase | | $ | 62,645 | |
| | | Less: Estimated cost of ESOP borrowings | | | 0 | |
| | | Less: Amortization of ESOP borrowings(2) | | | (12,936 | ) |
| | | Less: Stock Programs Vesting (3) | | | (38,808 | ) |
| | | Less: Option Plan Vesting (4) | | | (38,065 | ) |
| | | Net Earnings Increase | | $ | (27,163 | ) |
| | | | | | | | | | | Net | | | | |
| | | | | | | | Before | | | Earnings | | | After | |
| 4. | | Pro Forma Earnings | | | | | Conversion | | | Increase | | | Conversion | |
| | | | | | | | | | | | | | | |
| | | 12 Months ended March 31, 2017 (reported) | | | | | | $ | 598,726 | | | $ | (27,163 | ) | | $ | 571,563 | |
| | | 12 Months ended March 31, 2017 (core) | | | | | | $ | 435,726 | | | $ | (27,163 | ) | | $ | 408,563 | |
| | | | | | | | | | | | | | | | | | | |
| | | | | Before | | | Net Cash | | | Tax Benefit | | | After | |
| 5. | | Pro Forma Net Worth | | Conversion | | | Proceeds | | | of Foundation | | | Conversion | |
| | | | | | | | | | | | | | | | | | | |
| | | March 31, 2017 | | $ | 10,885,000 | | | $ | 4,918,000 | | | $ | 0 | | | $ | 15,803,000 | |
| | | March 31, 2017 (Tangible) | | $ | 10,885,000 | | | $ | 4,918,000 | | | $ | 0 | | | $ | 15,803,000 | |
| | | | | | | | | | | | | | | | | | | |
| | | | | Before | | | Net Cash | | | Tax Benefit | | | After | |
| 6. | | Pro Forma Assets | | Conversion | | | Proceeds | | | of Foundation | | | Conversion | |
| | | | | | | | | | | | | | | | | | | |
| | | March 31, 2017 | | $ | 167,225,000 | | | $ | 4,918,000 | | | $ | 0 | | | $ | 172,143,000 | |
(1) Includes ESOP purchases equal to 3.92% of total shares issued in the conversion, and stock program purchases equal to 1.96% of total shares issued in the conversion.
(2) ESOP stock amortized over 30 years, and amortization expense is tax effected at 34%.
(3) Stock programs amortized over 5 years, and amortization expense is tax effected at 34%.
(4) Option valuation based on Black-Scholes model, 5 year vesting, and assuming 25% taxable.
Exhibit IV-10
PRO FORMA EFFECT OF CONVERSION PROCEEDS
SENECA FS&LA
At the Maximum of the Range
| 1. | | Market Value of Shares Sold In Offering: | | $ | 7,935,000 | |
| | | Market Value of Shares Issued to Foundation: | | | 0 | |
| | | Market Value of Shares Issued to MHC: | | | 9,315,000 | |
| | | Total Market Value of Company: | | $ | 17,250,000 | |
| | | | | | | |
| 2. | | Offering Proceeds of Shares Sold In Offering | | $ | 7,935,000 | |
| | | Less: Estimated Offering Expenses | | | 1,100,007 | |
| | | Net Conversion Proceeds | | $ | 6,834,993 | |
| | | | | | | |
| 3. | | Estimated Additional Equity and Income from Offering Proceeds | | | | |
| | | Net Conversion Proceeds | | $ | 6,834,993 | |
| | | Less: Cash Contribution to Foundation | | | 0 | |
| | | Less: Cash for Capitalization of the MHC | | | 0 | |
| | | Less: Non-Cash ESOP/MRP Purchases (1) | | | (1,014,300 | ) |
| | | Net Proceeds Reinvested | | $ | 5,820,693 | |
| | | Estimated net incremental rate of return | | | 1.27 | % |
| | | Earnings Increase | | $ | 74,144 | |
| | | Less: Estimated cost of ESOP borrowings | | | 0 | |
| | | Less: Amortization of ESOP borrowings(2) | | | (14,876 | ) |
| | | Less: Stock Programs Vesting (3) | | | (44,629 | ) |
| | | Less: Option Plan Vesting (4) | | | (43,775 | ) |
| | | Net Earnings Increase | | $ | (29,136 | ) |
| | | | | | | | | | | Net | | | | |
| | | | | | | | Before | | | Earnings | | | After | |
| 4. | | Pro Forma Earnings | | | | | Conversion | | | Increase | | | Conversion | |
| | | | | | | | | | | | | | | |
| | | 12 Months ended March 31, 2017 (reported) | | | | | | $ | 598,726 | | | $ | (29,136 | ) | | $ | 569,590 | |
| | | 12 Months ended March 31, 2017 (core) | | | | | | $ | 435,726 | | | $ | (29,136 | ) | | $ | 406,590 | |
| | | | | | | | | | | | | | | | | | | |
| | | | | Before | | | Net Cash | | | Tax Benefit | | | After | |
| 5. | | Pro Forma Net Worth | | Conversion | | | Proceeds | | | of Foundation | | | Conversion | |
| | | | | | | | | | | | | | | | | | | |
| | | March 31, 2017 | | $ | 10,885,000 | | | $ | 5,820,693 | | | $ | 0 | | | $ | 16,705,693 | |
| | | March 31, 2017 (Tangible) | | $ | 10,885,000 | | | $ | 5,820,693 | | | $ | 0 | | | $ | 16,705,693 | |
| | | | | | | | | | | | | | | | | | | |
| | | | | Before | | | Net Cash | | | Tax Benefit | | | After | |
| 6. | | Pro Forma Assets | | Conversion | | | Proceeds | | | of Foundation | | | Conversion | |
| | | | | | | | | | | | | | | | | | | |
| | | March 31, 2017 | | $ | 167,225,000 | | | $ | 5,820,693 | | | $ | 0 | | | $ | 173,045,693 | |
(1) Includes ESOP purchases equal to 3.92% of total shares issued in the conversion, and stock program purchases equal to 1.96% of total shares issued in the conversion.
(2) ESOP stock amortized over 30 years, and amortization expense is tax effected at 34%.
(3) Stock programs amortized over 5 years, and amortization expense is tax effected at 34%.
(4) Option valuation based on Black-Scholes model, 5 year vesting, and assuming 25% taxable.
Exhibit IV-10
PRO FORMA EFFECT OF CONVERSION PROCEEDS
SENECA FS&LA
At the Supermaximum Value
| 1. | | Market Value of Shares Sold In Offering: | | $ | 9,125,255 | |
| | | Market Value of Shares Issued to Foundation: | | | 0 | |
| | | Market Value of Shares Issued to MHC: | | | 10,712,255 | |
| | | Total Market Value of Company: | | $ | 19,837,510 | |
| | | | | | | |
| 2. | | Offering Proceeds of Shares Sold In Offering | | $ | 9,125,255 | |
| | | Less: Estimated Offering Expenses | | | 1,100,016 | |
| | | Net Conversion Proceeds | | $ | 8,025,239 | |
| | | | | | | |
| 3. | | Estimated Additional Equity and Income from Offering Proceeds | | | | |
| | | Net Conversion Proceeds | | $ | 8,025,239 | |
| | | Less: Cash Contribution to Foundation | | | 0 | |
| | | Less: Cash for Capitalization of the MHC | | | 0 | |
| | | Less: Non-Cash ESOP/MRP Purchases (1) | | | (1,166,446 | ) |
| | | Net Proceeds Reinvested | | $ | 6,858,793 | |
| | | Estimated net incremental rate of return | | | 1.27 | % |
| | | Earnings Increase | | $ | 87,367 | |
| | | Less: Estimated cost of ESOP borrowings | | | 0 | |
| | | Less: Amortization of ESOP borrowings(2) | | | (17,108 | ) |
| | | Less: Stock Programs Vesting (3) | | | (51,324 | ) |
| | | Less: Option Plan Vesting (4) | | | (50,341 | ) |
| | | Net Earnings Increase | | $ | (31,405 | ) |
| | | | | | | | | | | Net | | | | |
| | | | | | | | Before | | | Earnings | | | After | |
| 4. | | Pro Forma Earnings | | | | | Conversion | | | Increase | | | Conversion | |
| | | | | | | | | | | | | | | |
| | | 12 Months ended March 31, 2017 (reported) | | | | | | $ | 598,726 | | | $ | (31,405 | ) | | $ | 567,321 | |
| | | 12 Months ended March 31, 2017 (core) | | | | | | $ | 435,726 | | | $ | (31,405 | ) | | $ | 404,321 | |
| | | | | | | | | | | | | | | | | | | |
| | | | | Before | | | Net Cash | | | Tax Benefit | | | After | |
| 5. | | Pro Forma Net Worth | | Conversion | | | Proceeds | | | of Foundation | | | Conversion | |
| | | | | | | | | | | | | | | | | | | |
| | | March 31, 2017 | | $ | 10,885,000 | | | $ | 6,858,793 | | | $ | 0 | | | $ | 17,743,793 | |
| | | March 31, 2017 (Tangible) | | $ | 10,885,000 | | | $ | 6,858,793 | | | $ | 0 | | | $ | 17,743,793 | |
| | | | | | | | | | | | | | | | | | | |
| | | | | Before | | | Net Cash | | | Tax Benefit | | | After | |
| 6. | | Pro Forma Assets | | Conversion | | | Proceeds | | | of Foundation | | | Conversion | |
| | | | | | | | | | | | | | | | | | | |
| | | March 31, 2017 | | $ | 167,225,000 | | | $ | 6,858,793 | | | $ | 0 | | | $ | 174,083,793 | |
(1) Includes ESOP purchases equal to 3.92% of total shares issued in the conversion, and stock program purchases equal to 1.96% of total shares issued in the conversion.
(2) ESOP stock amortized over 30 years, and amortization expense is tax effected at 34%.
(3) Stock programs amortized over 5 years, and amortization expense is tax effected at 34%.
(4) Option valuation based on Black-Scholes model, 5 year vesting, and assuming 25% taxable.
EXHIBIT V-1
RP® Financial, LC.
Firm Qualifications Statement

FIRM QUALIFICATION STATEMENT
RP® Financial (“RP®) provides financial and management consulting, merger advisory and valuation services to the financial services industry nationwide. We offer a broad array of services, high quality and prompt service, hands-on involvement by principals and senior staff, careful structuring of strategic initiatives and sophisticated valuation and other analyses consistent with industry practices and regulatory requirements. Our staff maintains extensive background in financial and management consulting, valuation and investment banking. Our clients include commercial banks, thrifts, credit unions, mortgage companies, insurance companies and other financial services companies.
STRATEGIC PLANNING SERVICES
RP®’s strategic planning services are designed to provide effective feasible plans with quantifiable results. We analyze strategic options to enhance shareholder value, achieve regulatory approval or realize other objectives. Such services involve conducting situation analyses; establishing mission/vision statements, developing strategic goals and objectives; and identifying strategies to enhance franchise and/or market value, capital management, earnings enhancement, operational matters and organizational issues. Strategic recommendations typically focus on: capital formation and management, asset/liability targets, profitability, return on equity and stock pricing. Our proprietary financial simulation models provide the basis for evaluating the impact of various strategies and assessing their feasibility and compatibility with regulations.
MERGER ADVISORY SERVICES
RP®’s merger advisory services include targeting potential buyers and sellers, assessing acquisition merit, conducting due diligence, negotiating and structuring merger transactions, preparing merger business plans and financial simulations, rendering fairness opinions, preparing mark-to-market analyses, valuing intangible assets and supporting the implementation of post-acquisition strategies. Our merger advisory services involve transactions of financially healthy companies and failed bank deals. RP® is also expert in de novo charters and shelf charters. Through financial simulations, comprehensive data bases, valuation proficiency and regulatory familiarity, RP®’s merger advisory services center on enhancing shareholder returns.
VALUATION SERVICES
RP®’s extensive valuation practice includes bank and thrift mergers, thrift mutual-to-stock conversions, goodwill impairment, insurance company demutualizations, ESOPs, subsidiary companies, merger accounting and other purposes. We are highly experienced in performing appraisals which conform to regulatory guidelines and appraisal standards. RP® is the nation’s leading valuation firm for thrift mutual-to-stock conversions, with appraised values ranging up to $4 billion.
OTHER CONSULTING SERVICES
RP® offers other consulting services including evaluating the impact of regulatory changes (TARP, etc.), branching and diversification strategies, feasibility studies and special research. We assist banks/thrifts in preparing CRA plans and evaluating wealth management activities on a de novo or merger basis. Our other consulting services are facilitated by proprietary valuation and financial simulation models.
KEY PERSONNEL (Years of Relevant Experience & Contact Information)
| Ronald S. Riggins, Managing Director (37) | | (703) 647-6543 | | rriggins@rpfinancial.com |
| William E. Pommerening, Managing Director (33) | | (703) 647-6546 | | wpommerening@rpfinancial.com |
| Marcus Faust, Managing Director (29) | | (703) 647-6553 | | mfaust@rpfinancial.com |
| Gregory E. Dunn, Director (34) | | (703) 647-6548 | | gdunn@rpfinancial.com |
| James P. Hennessey, Director (30) | | (703) 647-6544 | | jhennessey@rpfinancial.com |
| James J. Oren, Director (30) | | (703) 647-6549 | | joren@rpfinancial.com |
| Carla Pollard, Senior Vice President (27) | | (703) 647-6556 | | cpollard@rpfinancial.com |
| | |
| Washington Headquarters | |
| Three Ballston Plaza | Telephone: (703) 528-1700 |
| 1100 North Glebe Road, Suite 600 | Fax No.: (703) 528-1788 |
| Arlington, VA 22201 | Toll-Free No.: (866) 723-0594 |
| www.rpfinancial.com | E-Mail: mail@rpfinancial.com |