Exhibit 99.2
1
2 Disclaimer This confidential Investor Presentation (this “Presentation”) is being provided to a limited number of persons and is for inf orm ational purposes only and does not constitute an offer to sell, a solicitation of an offer to buy, or a recommendation to purchase any equity, debt or other financial instruments of Strike Capital, LLC (the “Company”) or Sentinel En ergy Services Inc. (“SES”) or any of their affiliates’ securities (as such term is defined under the U.S. Federal Securities Laws). Any reproduction or distribution of this Presentation, in whole or in part, or the disclosure of its contents, without prior written consent of the Company and SES is prohibited. By accepting this Presentation, each recipient agrees: ( i ) to maintain the confidentiality of all information that is contained in this Presentation and not already in the public dom ain ; and (ii) to use this Presentation for the sole purpose of evaluating the Company . This Presentation has been prepared to assist interested parties in making their own evaluation with respect to the proposed trans act ion between the Company and SES and for no other purpose. The information contained herein does not purport to be all - inclusive. The data contained herein is derived from various internal and external sources. No representatio n is made as to the reasonableness of the assumptions made within or the accuracy or completeness of any projections, modeling or back - testing or any other information contained herein. All levels, prices and spreads are historical and do not represent current market level, prices or spreads, some or all of which may have changed since the issuance of this P resentation. Any data on past performance, modeling or back - testing contained herein is not indicative as to future performance . The Company and SES assume no obligation to update the information in this Presentation. The names, logos and all related product and service names, design marks and slogans are the trademarks or serv ice marks of their respective companies. This Presentation includes financial forecasts, projections, and other forward - looking statements regarding the Company, its bus iness and prospects that, unless otherwise indicated, were provided by the Company to SES and are within the meaning of the “safe harbor” provisions of the Private Securities Litigation Reform Act of 1995. Forward - looking stat ements may be identified by the use of words such as “anticipate,” “believe,” “expect,” “estimate,” “plan,” “outlook,” and “project” and other similar expressions that predict or indicate future events or trends or that are not state men ts of historical matters, including statements about the Company’s beliefs and expectations and the financial and other projections contained herein. Such forward - looking statements with respect to revenues, earnings, performance, strateg ies, prospects and other aspects of the business of the Company are based on the Company’s current expectations that are subject to risks and uncertainties. Accordingly, actual results and performance may differ materially fro m results or performance expressed or implied by these forward - looking statements. These factors include, but are not limited to: (1) the occurrence of any event, change or other circumstances that could give rise to the terminatio n o f a definitive transaction agreement for the proposed transaction; (2) the outcome of any legal proceedings that may be instituted against the parties or the combined company following announcement of the proposed transaction; (3) th e i nability to complete the transactions contemplated by a definitive transaction agreement due to the failure to obtain approval of the shareholders of SES or other conditions to closing in a definitive transaction agreement; (4) the risk that the proposed transaction disrupts current plans and operations as a resul t of the announcement and consummation of the transactions described herein; (5) the ability of the combined company to meet its financial and stra teg ic goals, due to, among other things, competition, the ability of the combined company to grow and manage growth profitability and maintain relationship with suppliers and customers; (6) costs related to the proposed transac tio n; (7) changes in applicable laws or regulations; (8) the possibility that the combined company may be adversely affected by other economic, business, competitive factors, weather and/or commodity prices; and (9) other risks and un certainties described in documents filed with the U.S. Securities and Exchange Commission (the “SEC”) by SES or the Company. You are cautioned not to place undue reliance upon any forward - looking statements, which speak only as of the date made, and SES and the Company undertake no obligation to update or review the forward - looking statements whether as a result of new information, future events or otherwise. This Presentation includes certain non - GAAP financial measures, including Adjusted EBITDA. These non - GAAP financial measures are not calculated in accordance with generally accepted accounting principles in the United S tates (“GAAP”) and should not be considered as alternatives to GAAP. These non - GAAP financial measures are included herein because th e Company believes such financial measures are key metrics used by management . Other companies may calculate their non - GAAP financial measures differently, and therefore the Company’s non - GAAP financial measures m ay not be directly comparable to similarly titled measures of other companies. For additional information and a reconciliation of these non - GAAP financial measures to the nearest comparable GAAP financial measures, see the section titled “Adjusted EBITDA Reconciliation” in the Appendix at the end of this Presentation. This Presentation also includes financial forecasts, including with respect to the Company’s estimated enterprise value, estimated adjusted EBITDA, estimated unlevered pre - tax cash flow, adjusted EBITDA CAGR, estimated firm value and estimated EPS for the periods 2018E , 2019E and 2020E. Neither SES’s nor the Company’s auditors have audited, reviewed, compiled or performed any procedures with respect to the pro jec tions for the purpose of their inclusion in this Presentation, and accordingly, neither of them expressed an opinion or provided any other form of assurance with resp ect thereto for the purpose of this Presentation. These projections are for illustrative purposes only and should not be relied upon as being necessarily indicative of future results. In this Presentation, certain of the above - mentioned projected information has been provided for purposes of providing compariso ns with historical data. The assumptions and estimates underlying the prospective financial information are inherently uncertain and are subject to a wide variety of significant business, economic and competitive risks and uncert ain ties that could cause actual results to differ materially from those contained in the prospective financial information. Projections are inherently uncertain due to a number of factors outside of the Company’s control. Accordingly, the re can be no assurance that the prospective results are indicative of future performance of the Company or the combined company after the proposed transaction or that actual results will not differ materially from those provided in the prospective financial information. Inclusion of the prospective financial information in this Presentation should not be regarded as a representation by any person that the results contained in the prospective financial information wil l be achieved. Unless otherwise noted, the forecasted industry and market data contained in this Presentation are based upon the Company’s m ana gement’s estimates and industry and market publications and surveys from third - party sources. While the Company believes such third - party information is reliable, there can be no assurance as to the accuracy or completenes s of the included information. The Company has not independently verified the information provided by third - party sources. The financial information presented herein was derived from Strike’s books and records that were prepared and audited in acco rda nce with American Institute of Certified Public Accountants (AICPA) standards. The impact of accounting standards required to be adopted under Public Company Accounting Oversight Board (PCAOB) standards is currently be ing assessed and therefore has not been reflected in the financial information presented within this P resentation. In connection with the proposed transaction, SES intends to file a proxy statement with the SEC and will mail a proxy stateme nt and other relevant documentation to its shareholders. This Presentation does not contain all of the information that should be considered concerning the proposed transaction. SES’s shareholders and other interested persons a re advised to read, when available, the proxy statement and any additional information filed by SES or the Company with the SEC concerning the proposed transaction, as these materials will contain important information about the Company, SES and the proposed transaction . A definitive proxy statement will be mailed to shareholders of SES as of a record date to be established for voting on the proposed transaction . Shareholders will also be able to obtain copies of the proxy statement and other documents filed with the SEC that will be in cor porated by reference in the proxy statement, without charge, once available, at the SEC’s website at www.sec.gov, or by directing a request to Sentin el Energy Services Inc., 700 Louisiana Street, Suite 2700 , Houston Texas 77002, Attention: Kent Jamison, General Counsel and Secretary, (281) 407 - 0686, kent@cslenergy.com. This Presentation does not constitute a solicitation of a proxy, consent or authorization with respect to any securities or i n r espect of the proposed transaction. SES and its directors and executive officers may be deemed participants in the solicitation of proxies from SES’s shareholder s w ith respect to the proposed transaction . A list of names of such directors and executive officers and a description of their interests in SES is contained in SES annual report on Form 10 - K for the fiscal year ended December 31, 2017 , which was filed with the SEC and is available free of charge at the SEC’s website at www.sec.gov, or by directing a request to Sentinel Energy Services Inc., 700 Louisiana Street, Suite 2700 , Houston Texas 77002, Attention: Kent Jamison, General Counsel and Secretary, (281) 407 - 0686, kent@cslenergy.com . Additional information regarding the interests of such directors and executive officers will be contained in the proxy statement for the proposed transaction when available. The Company and its directors and executive officers may also be deemed to be participants in the solicitation of proxies fro m s hareholders of SES in connection with the proposed transaction. A list of the names of such directors and executive officers and a description of their interests in the proposed transaction will be included in the proxy statement f or the proposed transaction when available.
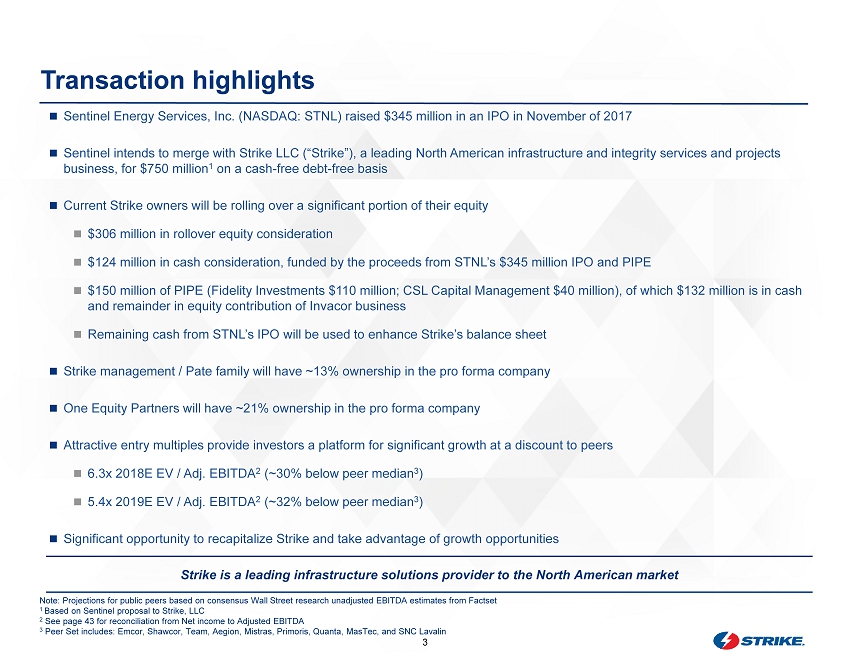
3 Sentinel Energy Services, Inc. (NASDAQ: STNL) raised $345 million in an IPO in November of 2017 Sentinel intends to merge with Strike LLC (“Strike”), a leading North American infrastructure and integrity services and projects business, for $750 million 1 on a cash - free debt - free basis Current Strike owners will be rolling over a significant portion of their equity $306 million in rollover equity consideration $124 million in cash consideration, funded by the proceeds from STNL’s $345 million IPO and PIPE $150 million of PIPE (Fidelity Investments $110 million; CSL Capital Management $40 million), of which $132 million is in cas h and remainder in equity contribution of Invacor business Remaining cash from STNL’s IPO will be used to enhance Strike’s balance sheet Strike management / Pate family will have ~13% ownership in the pro forma company One Equity Partners will have ~21% ownership in the pro forma company Attractive entry multiples provide investors a platform for significant growth at a discount to peers 6.3x 2018E EV / Adj. EBITDA 2 (~30% below peer median 3 ) 5.4x 2019E EV / Adj. EBITDA 2 (~32% below peer median 3 ) Significant opportunity to recapitalize Strike and take advantage of growth opportunities Transaction highlights Note: Projections for public peers based on consensus Wall Street research unadjusted EBITDA estimates from Factset 1 Based on Sentinel proposal to Strike, LLC 2 See page 43 for reconciliation from N et income to Adjusted EBITDA 3 Peer Set includes: Emcor , Shawcor , Team, Aegion , Mistras , Primoris , Quanta, MasTec , and SNC Lavalin Strike is a leading infrastructure solutions provider to the North American market
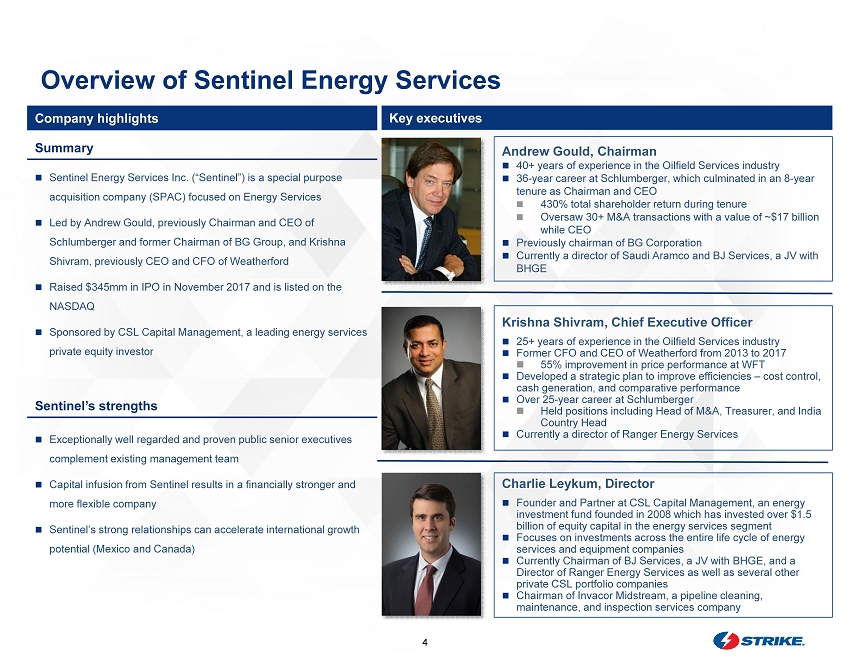
4 Overview of Sentinel Energy Services Andrew Gould, Chairman 40+ years of experience in the Oilfield Services industry 36 - year career at Schlumberger, which culminated in an 8 - year tenure as Chairman and CEO 430% total shareholder return during tenure Oversaw 30+ M&A transactions with a value of ~$17 billion while CEO Previously chairman of BG Corporation Currently a director of Saudi Aramco and BJ Services, a JV with BHGE Krishna Shivram, Chief Executive Officer 25+ years of experience in the Oilfield Services industry Former CFO and CEO of Weatherford from 2013 to 2017 55% improvement in price performance at WFT Developed a strategic plan to improve efficiencies – cost control, cash generation, and comparative performance Over 25 - year career at Schlumberger Held positions including Head of M&A, Treasurer, and India Country Head Currently a director of Ranger Energy Services Exceptionally well regarded and proven public senior executives complement existing management team Capital infusion from Sentinel results in a financially stronger and more flexible company Sentinel’s strong relationships can accelerate international growth potential (Mexico and Canada) Company highlights Key executives Summary Sentinel Energy Services Inc. (“Sentinel”) is a special purpose acquisition company (SPAC) focused on Energy Services Led by Andrew Gould, previously Chairman and CEO of Schlumberger and former Chairman of BG Group, and Krishna Shivram , previously CEO and CFO of Weatherford Raised $345mm in IPO in November 2017 and is listed on the NASDAQ Sponsored by CSL Capital Management, a leading energy services private equity investor Sentinel’s strengths Charlie Leykum , Director Founder and Partner at CSL Capital Management, an energy investment fund founded in 2008 which has invested over $1.5 billion of equity capital in the energy services segment Focuses on investments across the entire life cycle of energy services and equipment companies Currently Chairman of BJ Services, a JV with BHGE, and a Director of Ranger Energy Services as well as several other private CSL portfolio companies Chairman of Invacor Midstream, a pipeline cleaning, maintenance, and inspection services company
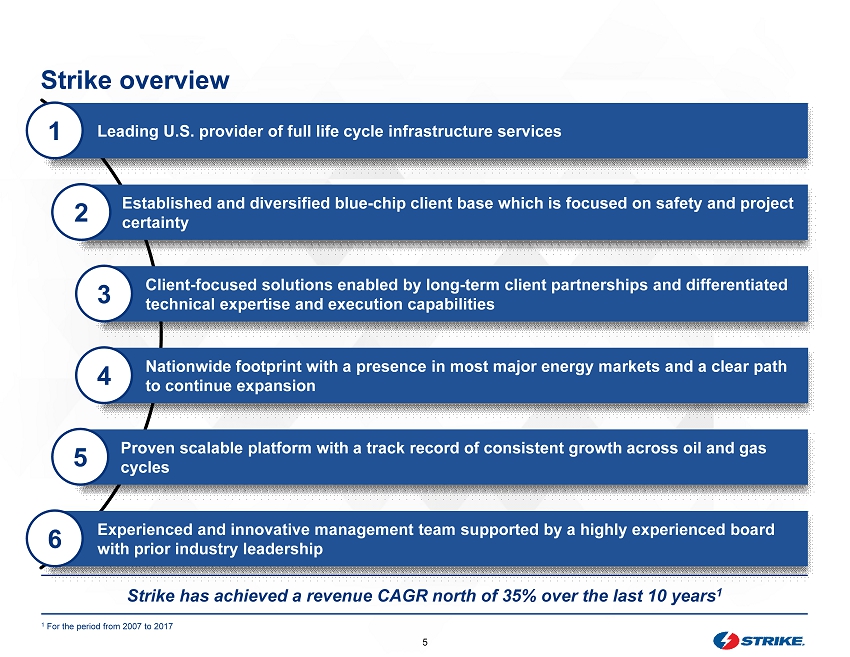
5 Strike overview Established and diversified blue - chip client base which is focused on safety and project certainty 2 Client - focused solutions enabled by long - term client partnerships and differentiated technical expertise and execution capabilities 3 Nationwide footprint with a presence in most major energy markets and a clear path to continue expansion 4 Proven scalable platform with a track record of consistent growth across oil and gas cycles 5 Experienced and innovative management team supported by a highly experienced board with prior industry leadership 6 Leading U.S. provider of full life cycle infrastructure services 1 Strike has achieved a revenue CAGR north of 35% over the last 10 years 1 1 For the period from 2007 to 2017
6 COMPANY OVERVIEW
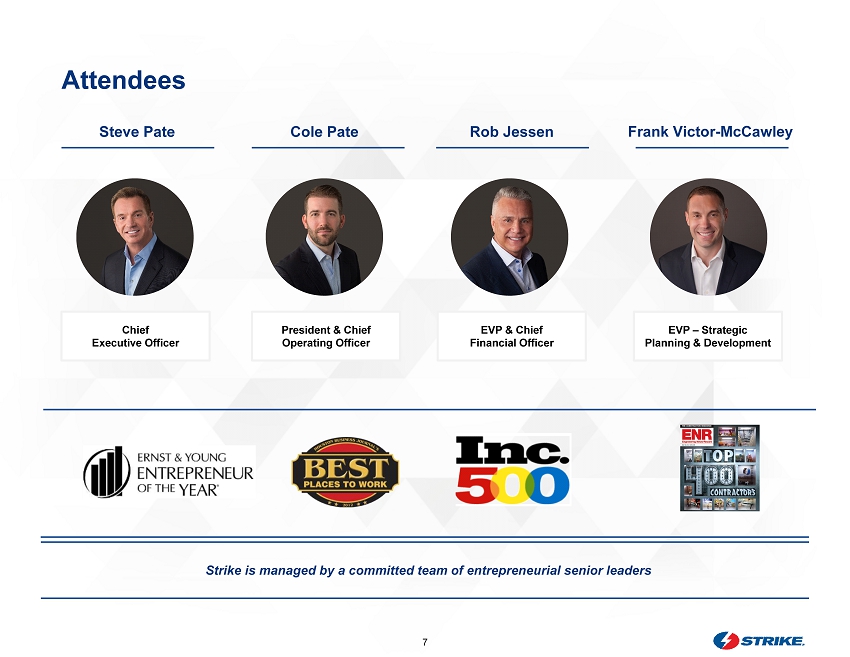
7 Attendees Steve Pate Chief Executive Officer Cole Pate President & Chief Operating Officer Rob Jessen EVP & Chief Financial Officer Frank Victor - McCawley EVP – Strategic Planning & Development Strike is managed by a committed team of entrepreneurial senior leaders
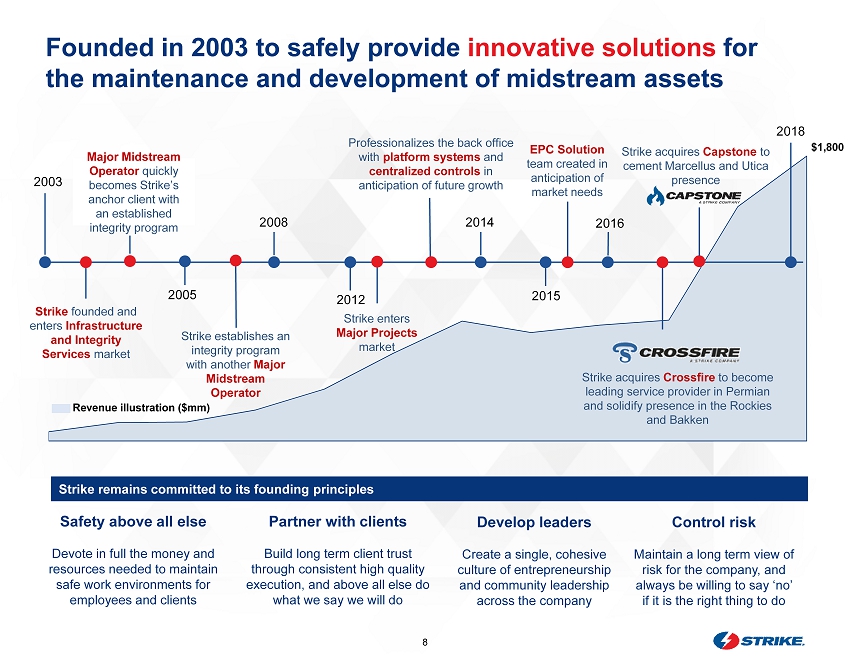
8 F ounded in 2003 to safely provide innovative solutions for the maintenance and development of midstream assets Strike founded and enters Infrastructure and Integrity Services market Strike establishes an integrity program with another Major Midstream Operator Major Midstream Operator quickly becomes Strike’s anchor client with an established integrity program Revenue illustration ($mm) $1,800 2003 2012 2018 2016 2005 2015 Strike enters Major Projects market Strike acquires Capstone to cement Marcellus and Utica presence Strike acquires Crossfire to become leading service provider in Permian and solidify presence in the Rockies and Bakken EPC Solution team created in anticipation of market needs 2008 Strike remains committed to its founding principles Safety above all else Devote in full the money and resources needed to maintain safe work environments for employees and clients Partner with clients Build long term client trust through consistent high quality execution, and above all else do what we say we will do Develop leaders Create a single, cohesive culture of entrepreneurship and community leadership across the company Control risk Maintain a long term view of risk for the company, and always be willing to say ‘no’ if it is the right thing to do 2014 Professionalizes the back office with platform systems and centralized controls in anticipation of future growth
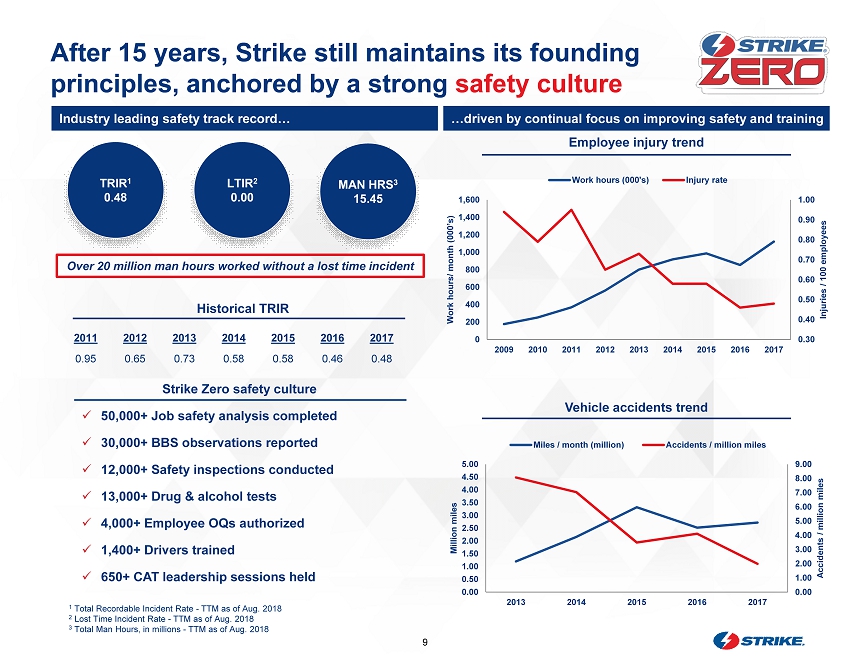
9 After 15 years, Strike still maintains its founding principles, anchored by a strong safety culture LTIR 2 0.00 TRIR 1 0.48 MAN HRS 3 15.45 … driven by continual focus on improving safety and training Industry leading safety track record… 2011 2012 2013 2014 2015 2016 2017 0.95 0.65 0.73 0.58 0.58 0.46 0.48 Historical TRIR Strike Zero safety culture x 50,000+ Job safety analysis completed x 30,000+ BBS observations reported x 12,000+ Safety inspections conducted x 13,000+ Drug & alcohol tests x 4,000+ Employee OQs authorized x 1,400+ Drivers trained x 650+ CAT leadership sessions held 1 Total Recordable Incident Rate - TTM as of Aug. 2018 2 Lost Time Incident Rate - TTM as of Aug. 2018 3 Total Man Hours, in millions - TTM as of Aug. 2018 Over 20 million man hours worked without a lost t ime i ncident Employee injury trend Vehicle accidents trend 0.30 0.40 0.50 0.60 0.70 0.80 0.90 1.00 0 200 400 600 800 1,000 1,200 1,400 1,600 2009 2010 2011 2012 2013 2014 2015 2016 2017 Injuries / 100 employees Work hours/ month (000’s) Work hours (000's) Injury rate 0.00 1.00 2.00 3.00 4.00 5.00 6.00 7.00 8.00 9.00 0.00 0.50 1.00 1.50 2.00 2.50 3.00 3.50 4.00 4.50 5.00 2013 2014 2015 2016 2017 Accidents / million miles Million miles Miles / month (million) Accidents / million miles
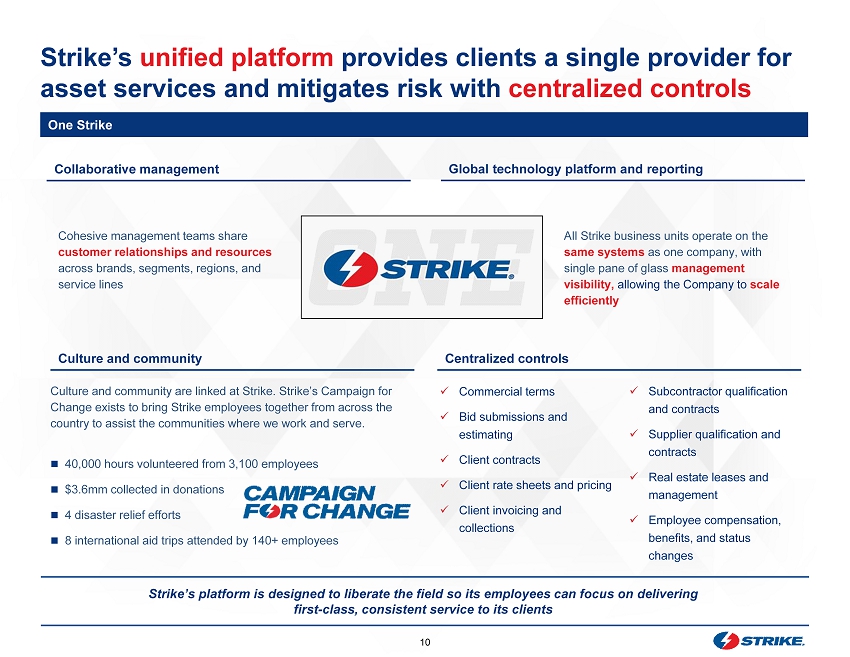
10 Culture and community are linked at Strike. Strike’s Campaign for Change exists to bring Strike employees together from across the country to assist the communities where we work and serve. 40,000 hours volunteered from 3,100 employees $3.6mm collected in donations 4 disaster relief efforts 8 international aid trips attended by 140+ employees Strike’s unified platform provides clients a single provider for asset services and mitigates risk with centralized controls Centralized controls x Commercial terms x Bid submissions and estimating x Client contracts x Client rate sheets and pricing x Client invoicing and collections Cohesive management teams share customer relationships and resources across brands, segments, regions, and service lines Culture and community x Subcontractor qualification and contracts x Supplier qualification and contracts x Real estate leases and management x Employee compensation, benefits, and status changes One Strike Collaborative management Global technology platform and reporting All Strike business units operate on the same systems as one company, with single pane of glass management visibility, allowing the Company to scale efficiently Strike’s platform is designed to liberate the field so its employees can focus on delivering first - class, consistent service to its clients
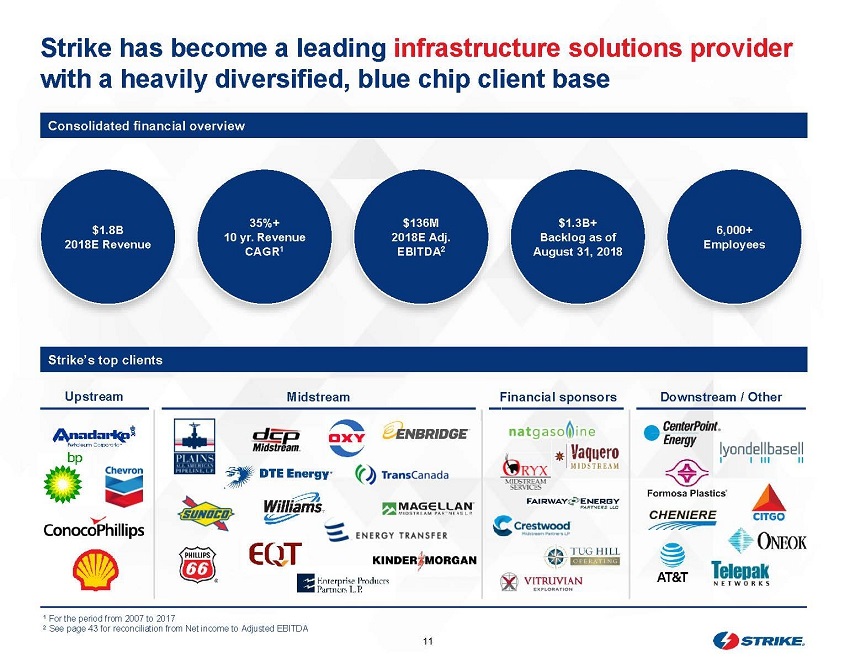
11 Strike has become a leading infrastructure solutions provider with a heavily diversified, blue chip client base $1.8B 2018E Revenue $ 134 M 2018E Adj. EBITDA 2 $1.3B+ Backlog as of August 31, 2018 6,000+ Employees Consolidated financial overview Strike’s top clients Upstream Midstream Financial sponsors Downstream / Other 35%+ 10 yr. Revenue CAGR 1 1 For the period from 2007 to 2017 2 See page 43 for reconciliation from Net i ncome to Adjusted EBITDA
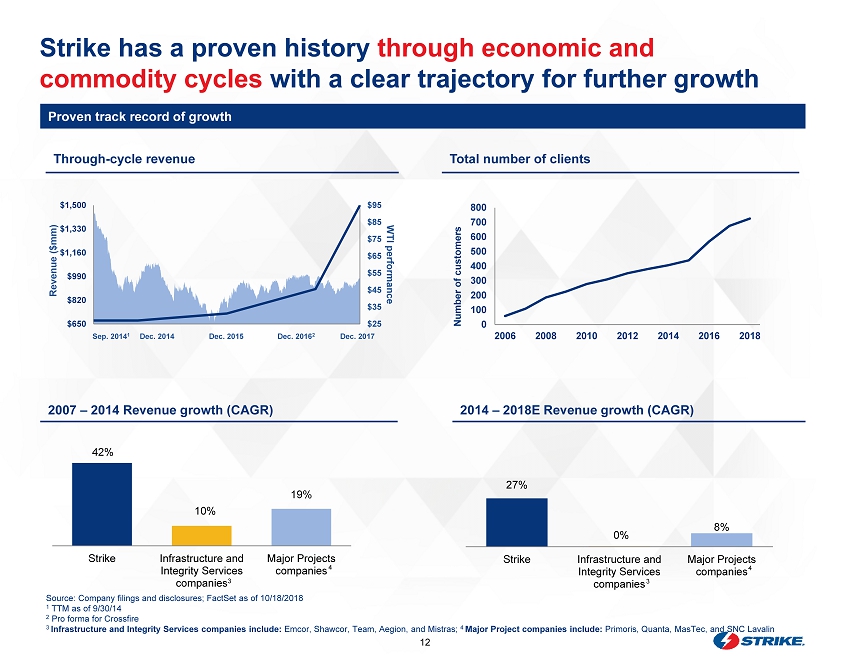
12 $25 $35 $45 $55 $65 $75 $85 $95 $650 $820 $990 $1,160 $1,330 $1,500 WTI performance Revenue ($mm) Strike has a proven history through economic and commodity cycles with a clear trajectory for further growth Proven track record of growth 2014 – 2018E Revenue g rowth (CAGR) 2007 – 2014 R evenue growth (CAGR) 42% 10% 19% Strike Infrastructure and Integrity Services companies Major Projects companies 27% 0% 8% Strike Infrastructure and Integrity Services companies Major Projects companies 3 4 3 4 0 100 200 300 400 500 600 700 800 2006 2008 2010 2012 2014 2016 2018 Number of customers Total number of clients Through - cycle revenue Sep. 2014 1 Dec. 2015 Dec. 2016 2 Dec. 2017 Dec. 2014 Source: Company filings and disclosures; FactSet as of 10/18/2018 1 TTM as of 9/30/14 2 Pro forma for Crossfire 3 Infrastructure and Integrity Services companies include: Emcor , Shawcor , Team, Aegion , and Mistras ; 4 Major Project companies include: Primoris , Quanta, MasTec , and SNC Lavalin
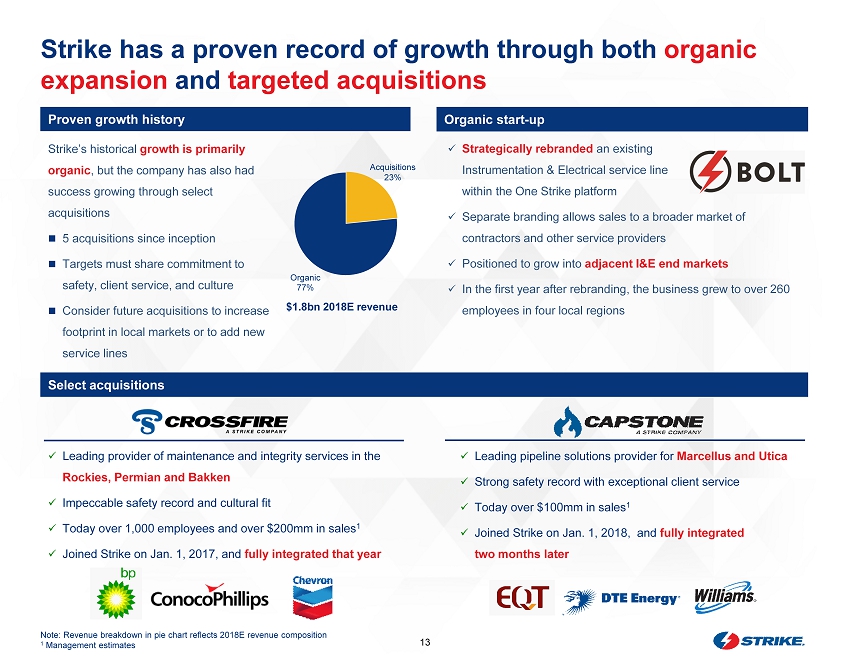
13 x Strategically rebranded an existing Instrumentation & Electrical service line within the One Strike platform x Separate branding allows sales to a broader market of contractors and other service providers x Positioned to grow into adjacent I&E end markets x In the first year after rebranding, the business grew to over 260 employees in four local regions x Leading pipeline solutions provider for Marcellus and Utica x Strong safety record with exceptional client service x Today over $100mm in sales 1 x Joined Strike on Jan. 1, 2018, and fully integrated two months later Strike has a proven record of growth through both organic expansion and targeted acquisitions x Leading provider of maintenance and integrity services in the Rockies, Permian and Bakken x Impeccable safety record and cultural fit x Today over 1,000 employees and over $200mm in sales 1 x Joined Strike on Jan. 1, 2017, and fully integrated that year Organic 77% Select acquisitions Organic start - up Proven growth history Strike’s historical growth is primarily organic , but the company has also had success growing through select acquisitions 5 acquisitions since inception Targets must share commitment to safety, client service, and culture Consider future acquisitions to increase footprint in local markets or to add new service lines $1.8bn 2018E revenue Acquisitions 23% Note: Revenue breakdown in pie chart reflects 2018E revenue composition 1 Management estimates
14 Market and client dynamics strongly favor Strike 1 Maintenance market continues to grow 2 Infrastructure development outlook is stronger than ever 3 Increasing regulation and public scrutiny of pipeline owners 4 Growing technical services markets 5 Client consolidation and asset aggregation 6 Clients continue to turn to full service providers as they consolidate vendors 7 Top clients emphasize safety and project execution 8 Non - traditional owners and sponsor - backed new entrants continue to enter the market 9 Strike is well positioned to follow our clients into adjacent markets Overview of key market and client dynamics at play 10 Strike’s integrated EPC capabilities provide a competitive advantage
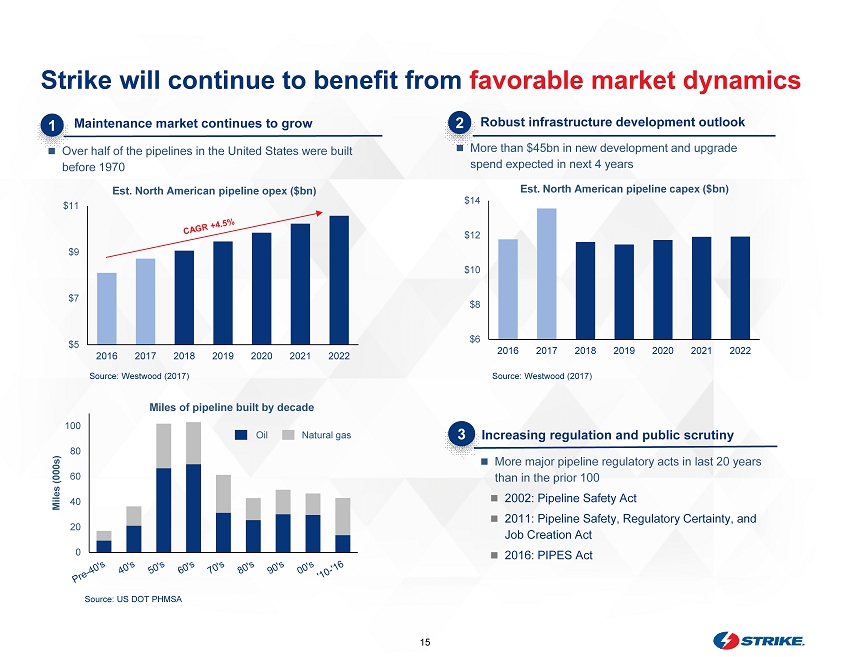
15 Maintenance market continues to grow Robust infrastructure development outlook $6 $8 $10 $12 $14 2016 2017 2018 2019 2020 2021 2022 Strike will continue to benefit from favorable market dynamics 1 2 Increasing regulation and public scrutiny 3 Over half of the pipelines in the United States were built before 1970 More than $45bn in new development and upgrade spend expected in next 4 years More major pipeline regulatory acts in last 20 years than in the prior 100 2002: Pipeline Safety Act 2011: Pipeline Safety, Regulatory Certainty, and Job Creation Act 2016: PIPES Act $5 $7 $9 $11 2016 2017 2018 2019 2020 2021 2022 Est. North American pipeline opex ($bn) Est. North American pipeline capex ($ bn) Source: Westwood (2017) Source: Westwood (2017) Source: US DOT PHMSA 0 20 40 60 80 100 Miles (000s) Miles of pipeline built by decade Oil Natural gas
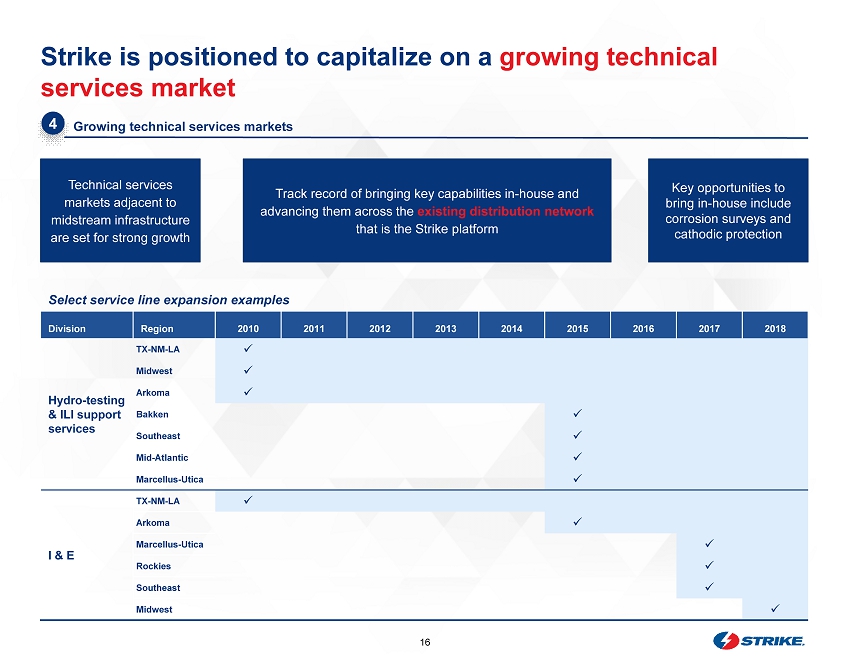
16 Strike is positioned to capitalize on a growing technical services market Select s ervice l ine e xpansion examples 4.4 5.5 2.5 5.7 6.3 Division Region 2010 2011 2012 2013 2014 2015 2016 2017 2018 Hydro - testing & ILI support services TX - NM - LA x Midwest x Arkoma x Bakken x Southeast x Mid - Atlantic x Marcellus - Utica x I & E TX - NM - LA x Arkoma x Marcellus - Utica x Rockies x Southeast x Midwest x Technical services markets adjacent to midstream infrastructure are set for strong growth Track record of bringing key capabilities in - house and advancing them across the existing distribution network that is the Strike platform Key opportunities to bring in - house include corrosion surveys and cathodic protection Growing technical services markets 4
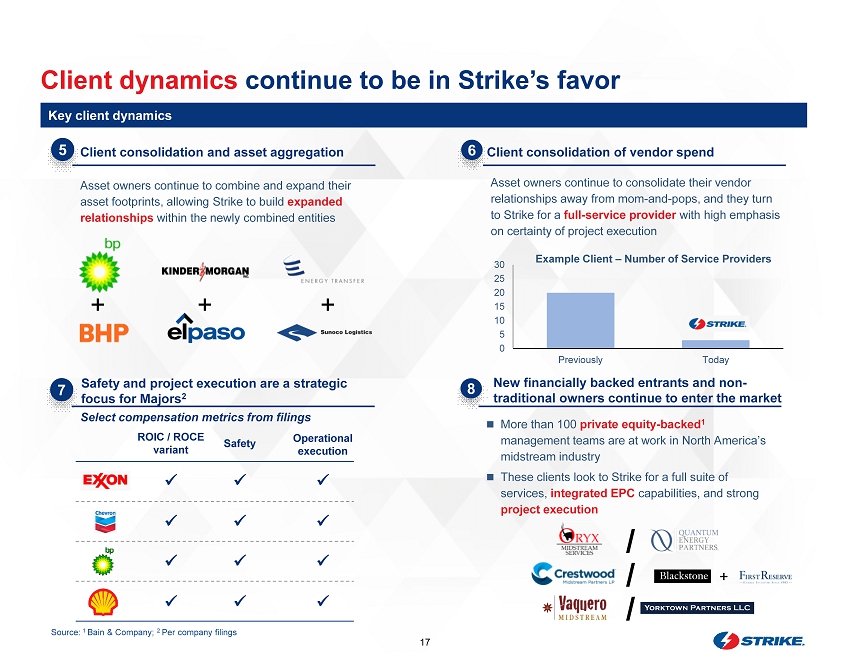
17 Client dynamics continue to be in Strike’s favor 6 Safety and project execution are a strategic focus for Majors 2 Client consolidation and asset aggregation Client consolidation of vendor spend New financially backed entrants and non - traditional owners continue to enter the market 5 7 8 Asset owners continue to combine and expand their asset footprints, allowing Strike to build expanded relationships within the newly combined entities + + + Asset owners continue to consolidate their vendor relationships away from mom - and - pops, and they turn to Strike for a full - service provider with high emphasis on certainty of project execution More than 100 private equity - backed 1 management teams are at work in North America’s midstream industry These clients look to Strike for a full suite of services, integrated EPC capabilities, and strong project execution ` ` ROIC / ROCE v ariant x x x x Operational execution x x x x Safety x x x x / / / Source: 1 Bain & Company; 2 Per company filings 0 5 10 15 20 25 30 Previously Today Example Client – Number of Service Providers Key client dynamics Select compensation metrics from filings +
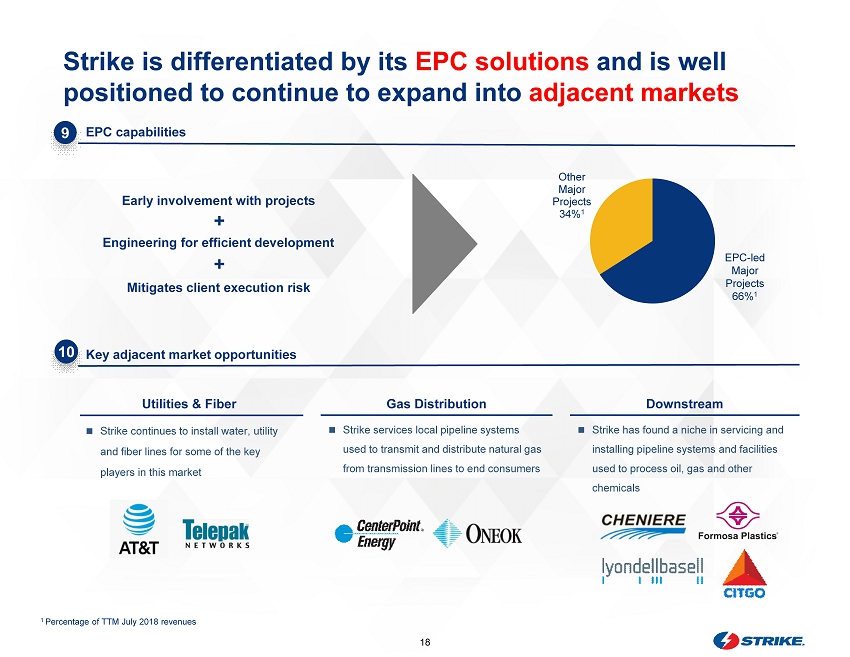
18 Strike is differentiated by its EPC solutions and is well positioned to continue to expand into adjacent markets EPC capabilities 9 Utilities & Fiber Strike continues to install water, utility and fiber lines for some of the key players in this market Strike services local pipeline systems used to transmit and distribute natural gas from transmission lines to end consumers Gas Distribution 10 Key adjacent market opportunities Other Major Projects 34% 1 EPC - led Major Projects 66% 1 Early involvement with projects Engineering for efficient development Mitigates client execution risk + + Strike has found a niche in servicing and installing pipeline systems and facilities used to process oil, gas and other chemicals Downstream 1 Percentage of TTM July 2018 revenues
19 COMPANY OPERATIONS
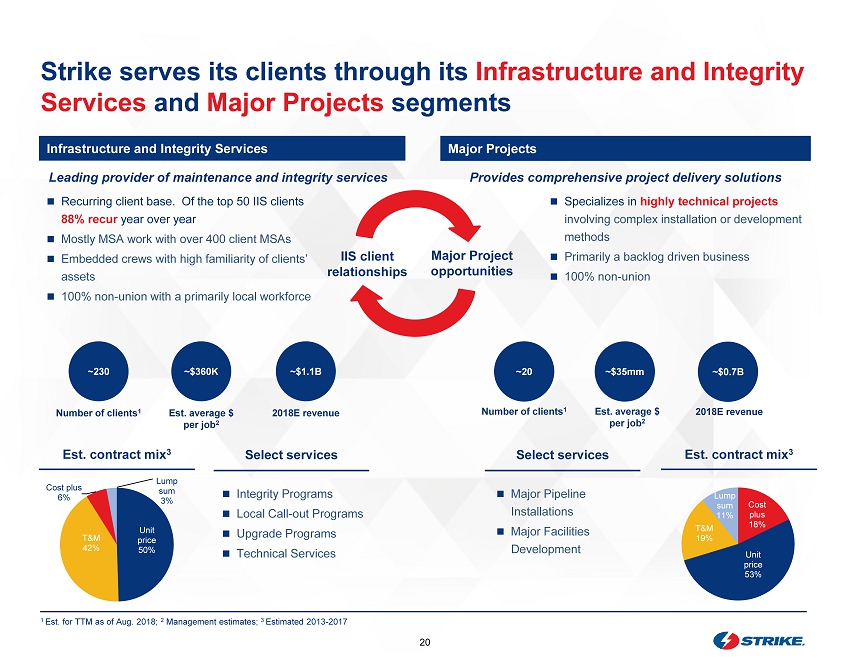
20 Strike serves its clients through its Infrastructure and Integrity Services and Major Projects segments Infrastructure and Integrity Services Major Projects 1 Est. for TTM as of Aug. 2018; 2 Management estimates; 3 Estimated 2013 - 2017 Est. contract mix 3 Recurring client base. Of the top 50 IIS clients 88% recur year over year Mostly MSA work with over 400 client MSAs Embedded crews with high familiarity of clients’ assets 100% non - union with a primarily local workforce Specializes in highly technical projects involving complex installation or development methods Primarily a backlog driven business 100% non - union Provides comprehensive project delivery solutions Leading provider of maintenance and integrity services Number of clients 1 Est. average $ per job 2 ~230 ~$360K ~$ 1.1B 2018E revenue Number of clients 1 Est. average $ per job 2 ~20 ~$35mm ~$0.7B 2018E revenue Select services Integrity Programs Local Call - out Programs Upgrade Programs Technical Services Est. contract mix 3 Select services Major Pipeline Installations Major Facilities Development Major Project opportunities IIS client relationships Unit price 50% T&M 42% Cost plus 6% Lump sum 3% Cost plus 18% Unit price 53% T&M 19% Lump sum 11%
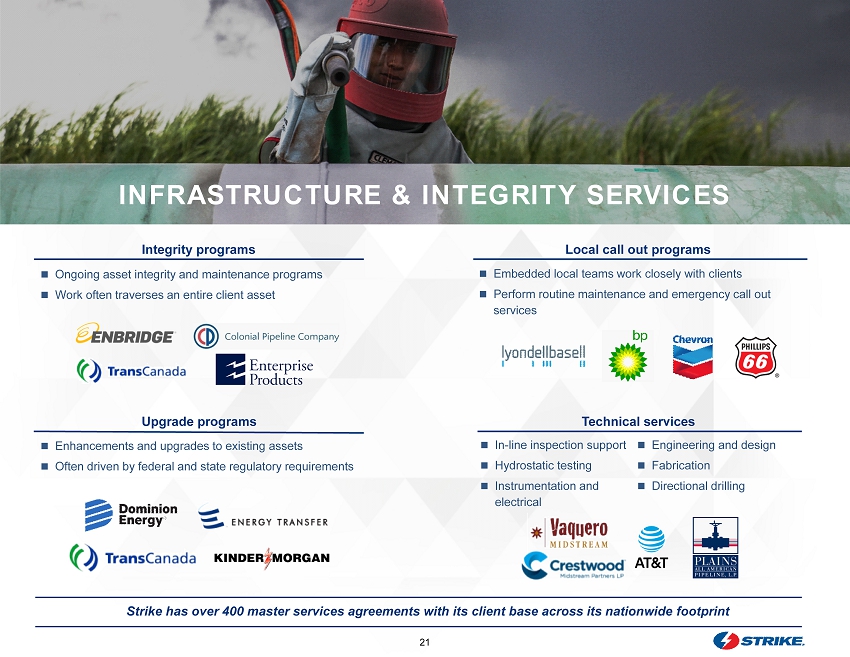
21 Strike has over 400 master services agreements with its client base across its nationwide footprint Integrity programs Local call out programs Upgrade programs Ongoing asset integrity and maintenance programs Work often traverses an entire client asset Embedded local teams work closely with clients Perform routine maintenance and emergency call out services Enhancements and upgrades to existing assets Often driven by federal and state regulatory requirements Technical services In - line inspection support Hydrostatic testing Instrumentation and electrical Engineering and design Fabrication Directional drilling INFRASTRUCTURE & INTEGRITY SERVICES
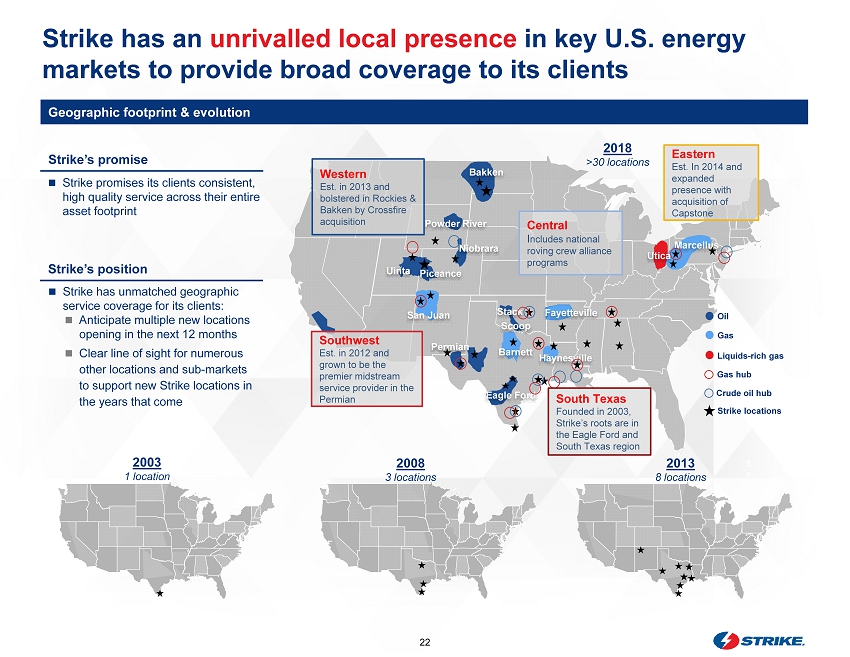
22 Strike has an unrivalled local presence in key U.S. energy markets to provide broad coverage to its clients Bakken Niobrara Haynesville Permian Eagle Ford Barnett Stack Scoop Utica Marcellus San Juan Powder River Piceance Uinta Fayetteville Western 16% South Texas Founded in 2003, Strike’s roots are in the Eagle Ford and South Texas region Southwest Est. in 2012 and grown to be the premier midstream service provider in the Permian Central I ncludes national roving crew alliance programs Western Est . in 2013 and bolstered in Rockies & Bakken by Crossfire acquisition Eastern Est. In 2014 and expanded presence with acquisition of Capstone Strike promises its clients consistent, high quality service across their entire asset footprint 2018 >30 locations Strike has unmatched geographic service coverage for its clients: Anticipate multiple new locations opening in the next 12 months Clear line of sight for numerous other locations and sub - markets to support new Strike locations in the years that come S o u t h T e x a s 2003 1 location 2008 3 locations 2013 8 locations Liquids - rich gas Gas Oil Strike locations Crude oil hub Gas hub Geographic footprint & evolution Strike’s promise Strike’s position
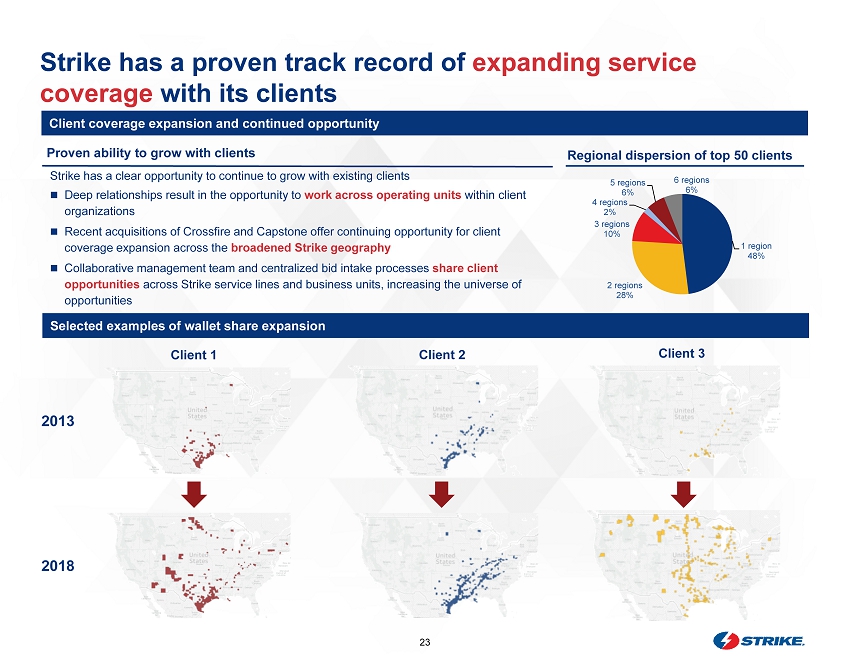
23 Strike has a proven track record of expanding service coverage with its clients Client coverage expansion and continued opportunity 2013 2018 1 region 48% 2 regions 28% 3 regions 10% 4 regions 2% 5 regions 6% 6 regions 6% Regional dispersion of top 50 clients Strike has a clear opportunity to continue to grow with existing clients Deep relationships result in the opportunity to work across operating units within client organizations Recent acquisitions of Crossfire and Capstone offer continuing opportunity for client coverage expansion across the broadened Strike geography Collaborative management team and centralized bid intake processes share client opportunities across Strike service lines and business units, increasing the universe of opportunities Proven ability to grow with clients Selected examples of wallet share expansion Client 1 Client 2 Client 3
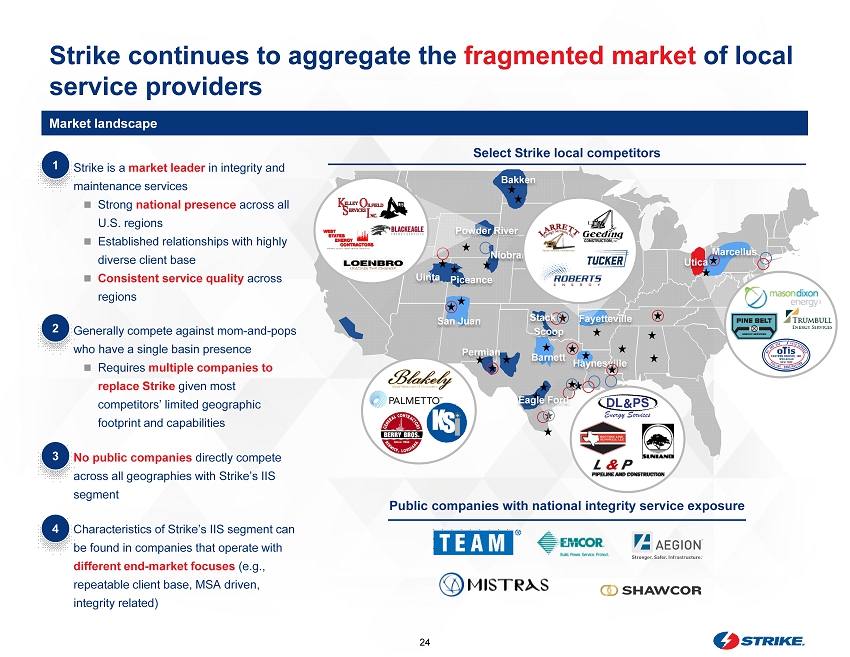
24 Market landscape Bakken Niobrara Haynesville Permian Barnett Scoop Marcellus San Juan Piceance Uinta Select Strike local competitors Public companies with national integrity service exposure Powder River Utica Eagle Ford Fayetteville Stack Strike continues to aggregate the fragmented market of local service providers 1 Strike is a market leader in integrity and maintenance services Strong national presence across all U.S. regions Established relationships with highly diverse client base Consistent service quality across regions 2 Generally compete against mom - and - pops who have a single basin presence Requires multiple companies to replace Strike given most competitors’ limited geographic footprint and capabilities 4 Characteristics of Strike’s IIS segment can be found in companies that operate with different end - market focuses (e.g., repeatable client base, MSA driven, integrity related) 3 No public companies directly compete across all geographies with Strike’s IIS segment
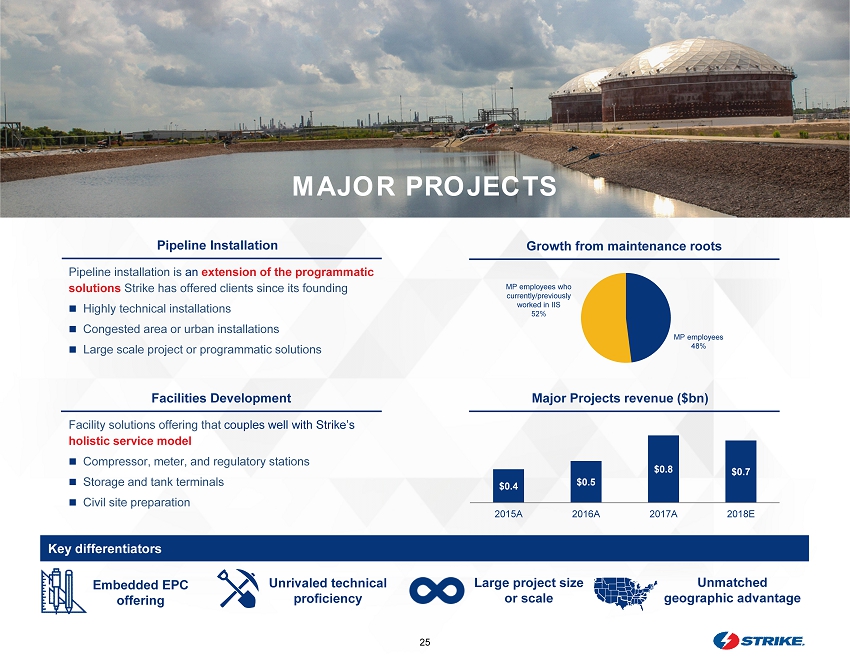
25 Pipeline installation is an extension of the programmatic solutions Strike has offered clients since its founding Highly technical installations Congested area or urban installations Large scale project or programmatic solutions Pipeline Installation Facility solutions offering that couples well with Strike’s holistic service model Compressor , m eter, and regulatory stations Storage and tank terminals Civil site preparation Facilities Development Embedded EPC o ffering Unrivaled technical proficiency Large project size or scale Unmatched geographic a dvantage Key differentiators MAJOR PROJECTS Major Projects revenue ($bn) MP employees 48% Growth from maintenance roots MP employees who currently/previously worked in IIS 52% $0.4 $0.5 $0.8 $0.7 2015A 2016A 2017A 2018E
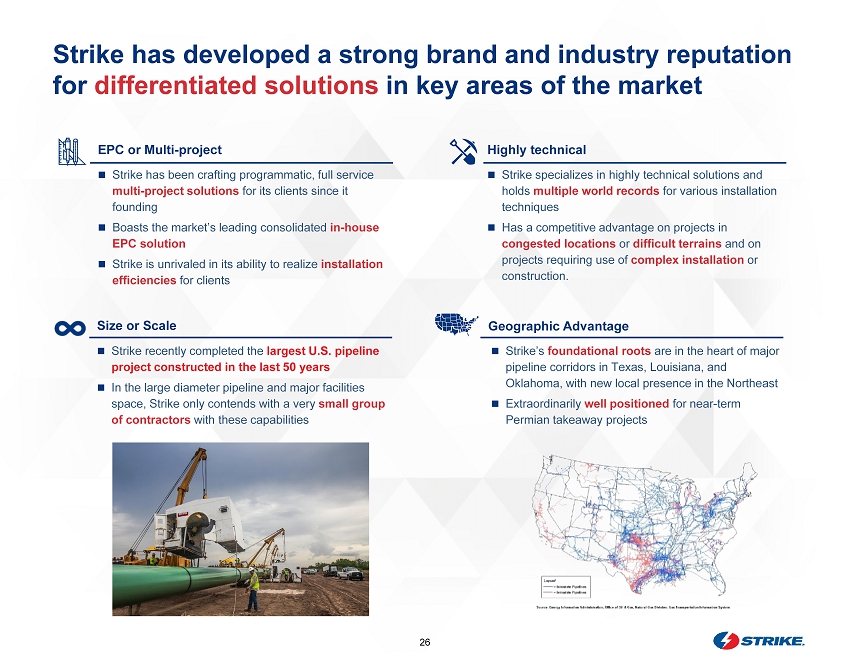
26 Strike has developed a strong brand and industry reputation for differentiated solutions in key areas of the market Geographic Advantage EPC or Multi - project Highly technical Size or Scale Strike has been crafting programmatic, full service multi - project solutions for its clients since it founding Boasts the market’s leading consolidated in - house EPC solution Strike is unrivaled in its ability to realize installation efficiencies for clients Strike specializes in highly technical solutions and holds multiple world records for various installation techniques Has a competitive advantage on projects in congested locations or difficult terrains and on projects requiring use of complex installation or construction. Strike recently completed the largest U.S. pipeline project constructed in the last 50 years In the large diameter pipeline and major facilities space, Strike only contends with a very small group of contractors with these capabilities Strike’s foundational roots are in the heart of major pipeline corridors in Texas, Louisiana, and Oklahoma, with new local presence in the Northeast Extraordinarily well positioned for near - term Permian takeaway projects
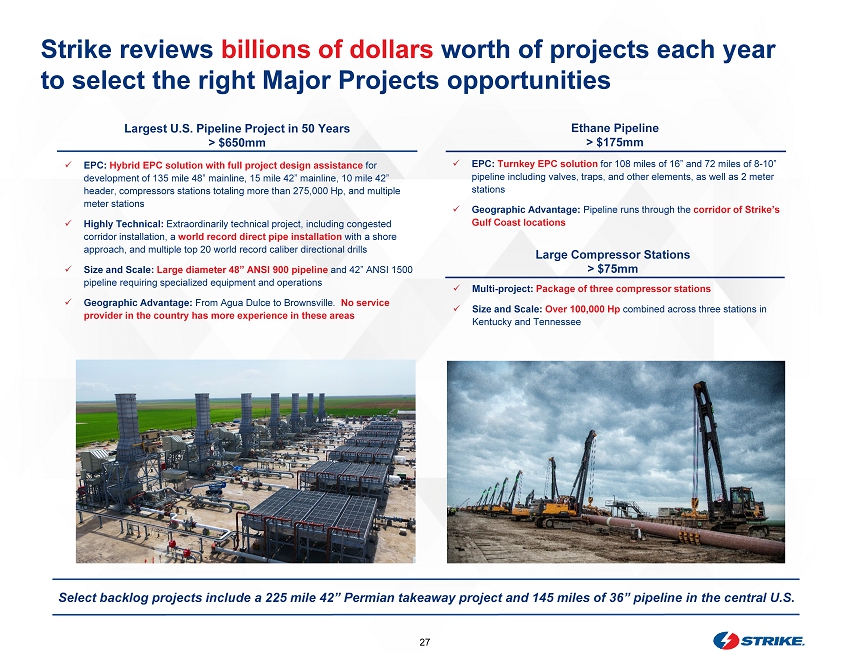
27 Strike reviews billions of dollars worth of projects each year to select the right Major Projects opportunities Largest U.S. Pipeline Project in 50 Years > $650mm x EPC: H ybrid EPC solution with full project design assistance for development of 135 mile 48” mainline, 15 mile 42” mainline, 10 mile 42” header, compressors stations totaling more than 275,000 Hp, and multiple meter stations x Highly Technical: Extraordinarily technical project, including congested corridor installation, a world record direct pipe installation with a shore approach, and multiple top 20 world record caliber directional drills x Size and Scale: Large diameter 48” ANSI 900 pipeline and 42” ANSI 1500 pipeline requiring specialized equipment and operations x Geographic Advantage: From Agua Dulce to Brownsville. No service provider in the country has more experience in these areas Large Compressor Stations > $75mm x Multi - project: Package of three compressor stations x Size and Scale: Over 100,000 Hp combined across three stations in Kentucky and Tennessee x EPC: Turnkey EPC solution for 108 miles of 16” and 72 miles of 8 - 10” pipeline including valves, traps, and other elements, as well as 2 meter stations x Geographic Advantage: Pipeline runs through the corridor of Strike’s Gulf Coast locations Ethane Pipeline > $175mm Select backlog projects include a 225 mile 42” Permian takeaway project and 145 miles of 36” pipeline in the central U.S.
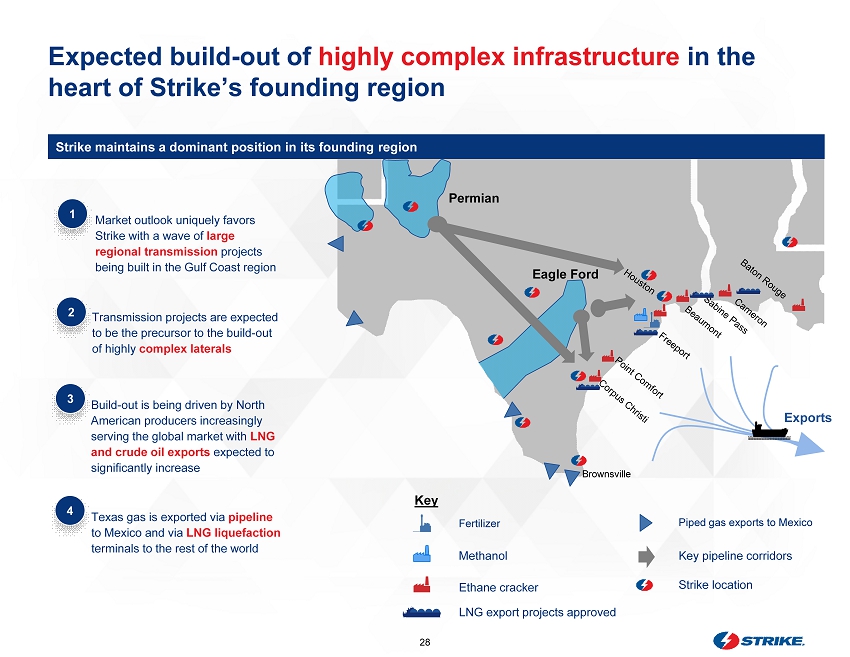
28 Expected build - out of highly complex infrastructure in the heart of Strike’s founding region Strike maintains a dominant position in its founding region 1 Market outlook uniquely favors Strike with a wave of large regional transmission projects being built in the Gulf Coast region Build - out is being driven by North American producers increasingly serving the global market with LNG and crude oil exports expected to significantly increase Fertilizer Brownsville Eagle Ford Exports Permian Piped gas exports to Mexico Methanol Ethane cracker LNG export projects approved Key pipeline corridors Strike location Key Transmission projects are expected to be the precursor to the build - out of highly complex laterals Texas gas is exported via pipeline to Mexico and via LNG liquefaction terminals to the rest of the world 2 3 4
29 FINANCIAL SUMMARY
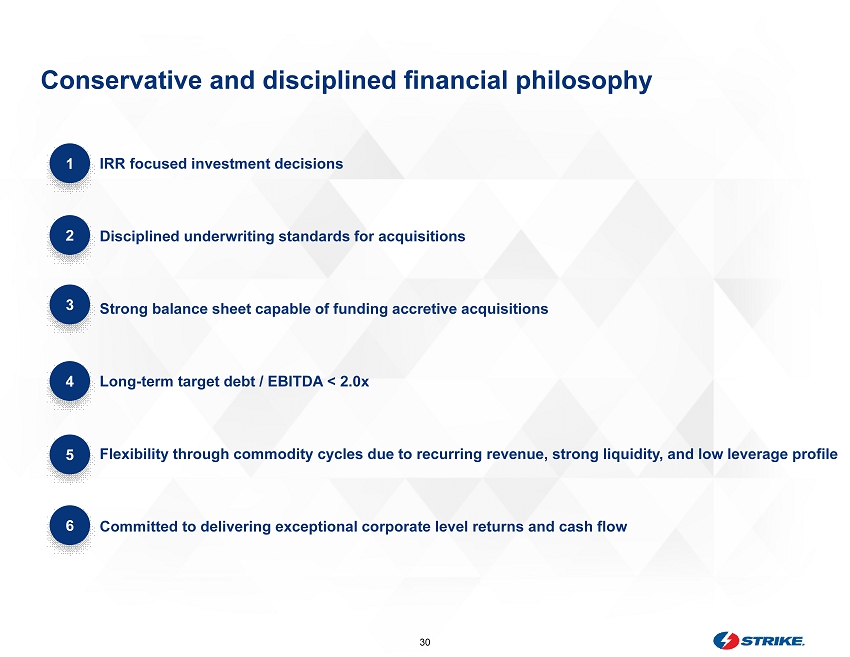
30 IRR focused investment decisions Disciplined underwriting standards for acquisitions Strong balance sheet capable of funding accretive acquisitions Long - term target debt / EBITDA < 2.0x Flexibility through commodity cycles due to recurring revenue, strong liquidity, and low leverage profile Committed to delivering exceptional corporate level returns and cash flow Conservative and disciplined financial p hilosophy 1 2 4 5 6 3
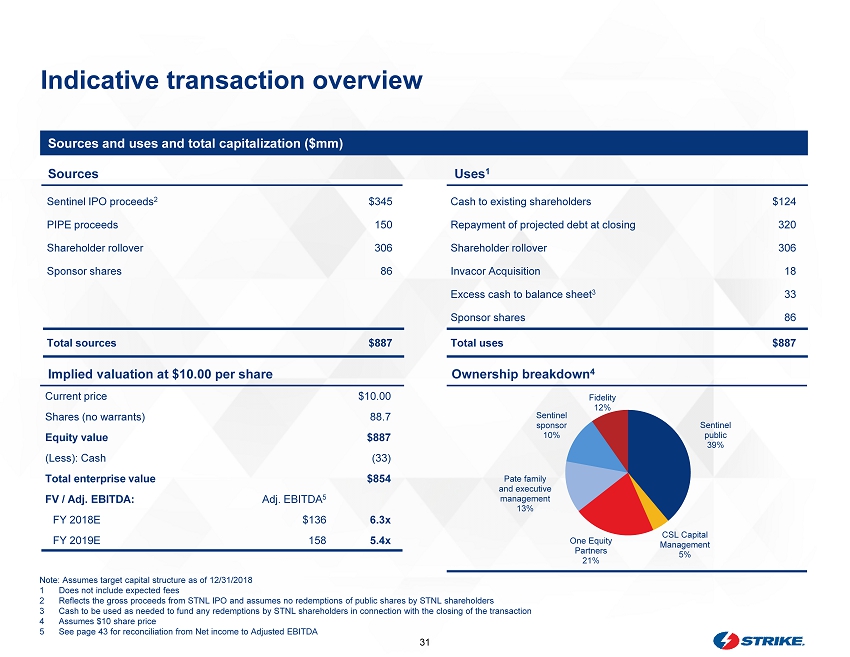
31 Indicative transaction overview Sources and uses and total capitalization ($mm) Uses 1 Sources Current price $10.00 Shares (no warrants) 88.7 Equity value $887 (Less): Cash (33) Total enterprise value $854 FV / Adj. EBITDA: Adj. EBITDA 5 FY 2018E $136 6.3x FY 2019E 158 5.4x Cash to existing shareholders $124 Repayment of projected debt at closing 320 Shareholder rollover 306 Invacor Acquisition 18 Excess cash to balance sheet 3 33 Sponsor shares 86 Total uses $887 Implied valuation at $10.00 per share Sentinel IPO proceeds 2 $345 PIPE proceeds 150 Shareholder rollover 306 Sponsor shares 86 Total sources $887 Note: Assumes target capital structure as of 12/31/2018 1 Does not include expected fees 2 Reflects the gross proceeds from STNL IPO and assumes no redemptions of public shares by STNL shareholders 3 Cash to be used as needed to fund any redemptions by STNL shareholders in connection with the closing of the transaction 4 Assumes $10 share price 5 See page 43 for reconciliation from Net income to Adjusted EBITDA Ownership breakdown 4 Sentinel public 39% CSL Capital Management 5% One Equity Partners 21% Pate family and executive management 13% Fidelity 12% Sentinel sponsor 10%
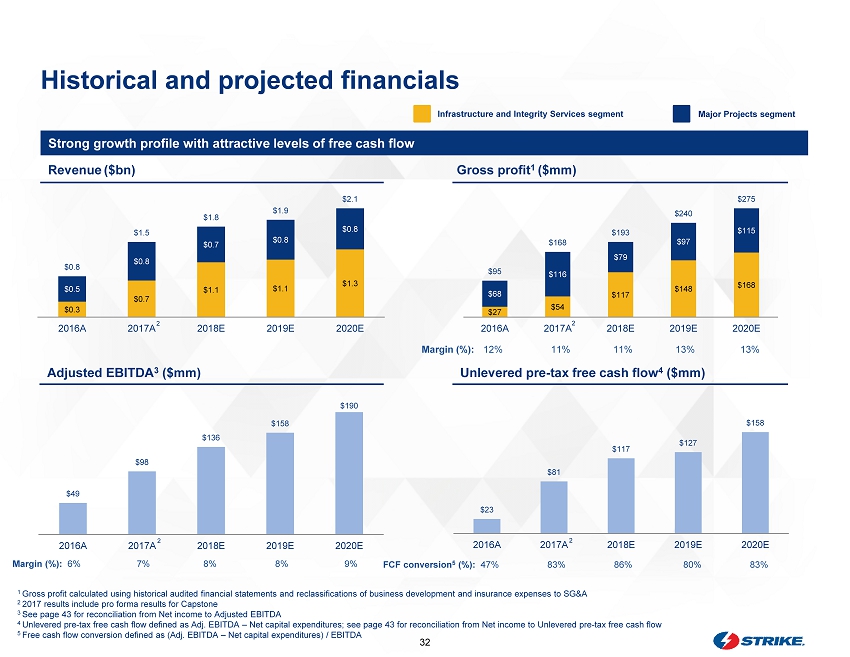
32 $49 $98 $136 $158 $190 2016A 2017A 2018E 2019E 2020E $0.3 $0.7 $1.1 $1.1 $1.3 $0.5 $0.8 $0.7 $0.8 $0.8 $0.8 $1.5 $1.8 $1.9 $2.1 2016A 2017A 2018E 2019E 2020E Historical and projected financials Strong growth profile with attractive levels of free cash flow 1 Gross profit calculated using historical audited financial statements and reclassifications of business development and insurance e xpe nses to SG&A 2 2017 results include pro forma results for Capstone 3 See page 43 for reconciliation from Net income to Adjusted EBITDA 4 Unlevered pre - tax free cash flow defined as Adj. EBITDA – Net capital expenditures ; see page 43 for reconciliation from Net income to Unlevered pre - tax free cash flow 5 Free cash flow conversion defined as (Adj. EBITDA – Net capital expenditures) / EBITDA Infrastructure and Integrity Services segment Major Projects segment Margin (%): 6% 7 % 8% 8% 9% $27 $54 $117 $148 $168 $68 $116 $79 $97 $115 $95 $168 $193 $240 $275 2016A 2017A 2018E 2019E 2020E $23 $81 $117 $127 $158 2016A 2017A 2018E 2019E 2020E M argin (%): 12% 11% 11% 13% 13% Revenue ($ b n ) Gross profit 1 ($mm) Adjusted EBITDA 3 ($mm) Unlevered pre - tax free cash flow 4 ($mm) 2 2 2 2 FCF conversion 5 (%): 47% 83% 86% 80% 83%
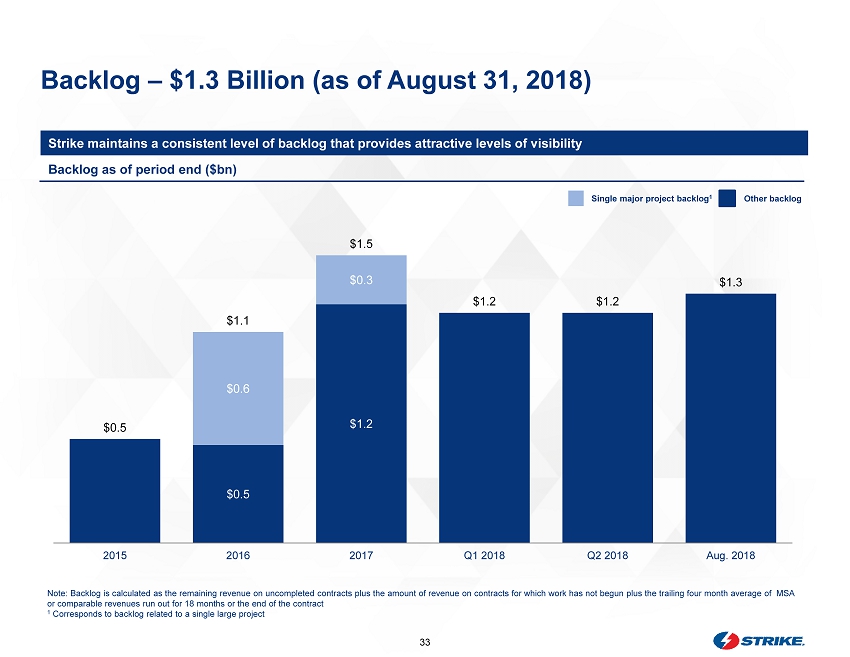
33 Backlog – $1.3 Billion (as of August 31, 2018) Strike maintains a consistent level of backlog that provides attractive levels of visibility $0.5 $1.2 $0.6 $0.3 $0.5 $1.1 $1.5 $1.2 $1.2 $1.3 2015 2016 2017 Q1 2018 Q2 2018 Aug. 2018 Note: Backlog is calculated as the remaining revenue on uncompleted contracts plus the amount of revenue on contracts for whi ch work has not begun plus the trailing four month average of MSA or comparable revenues run out for 18 months or the end of the contract 1 Corresponds to backlog related to a single large project Backlog as of period end ($bn) Single major project backlog 1 Other backlog
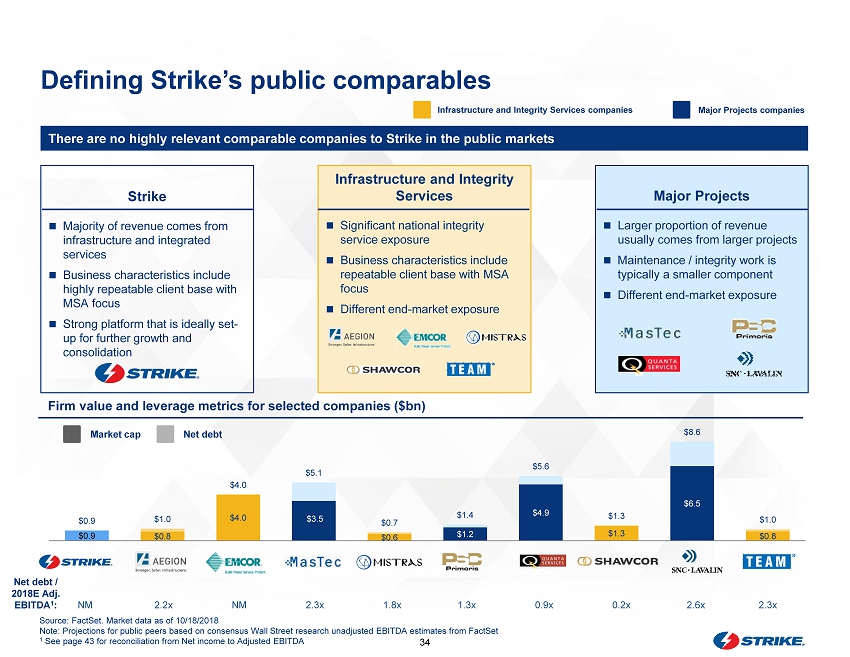
34 $0.9 $0.8 $4.0 $3.5 $0.6 $1.2 $4.9 $1.3 $6.5 $0.8 $0.9 $1.0 $4.0 $5.1 $0.7 $1.4 $5.6 $1.3 $8.6 $1.0 There are no highly relevant comparable companies to Strike in the public markets Firm value and leverage metrics for selected companies ($bn) Defining Strike’s public comparables Infrastructure and Integrity Services companies Major Projects companies Strike Majority of revenue comes from infrastructure and integrated services Business characteristics include highly repeatable client base with MSA focus Strong platform that is ideally set - up for further growth and consolidation Infrastructure and Integrity Services Significant national integrity service exposure Business characteristics include repeatable client base with MSA focus Different end - market exposure Major Projects Larger proportion of revenue usually comes from larger projects Maintenance / integrity work is typically a smaller component Different end - market exposure NM 2.2x NM 2.3x 1.8x 1.3x 0.9x 0.2x 2.6x 2.3x Net debt / 2018E Adj. EBITDA 1 : Market cap Net debt Source: FactSet. Market data as of 10/18/2018 Note: Projections for public peers based on consensus Wall Street research unadjusted EBITDA estimates from FactSet 1 See page 43 for reconciliation from Net income to Adjusted EBITDA
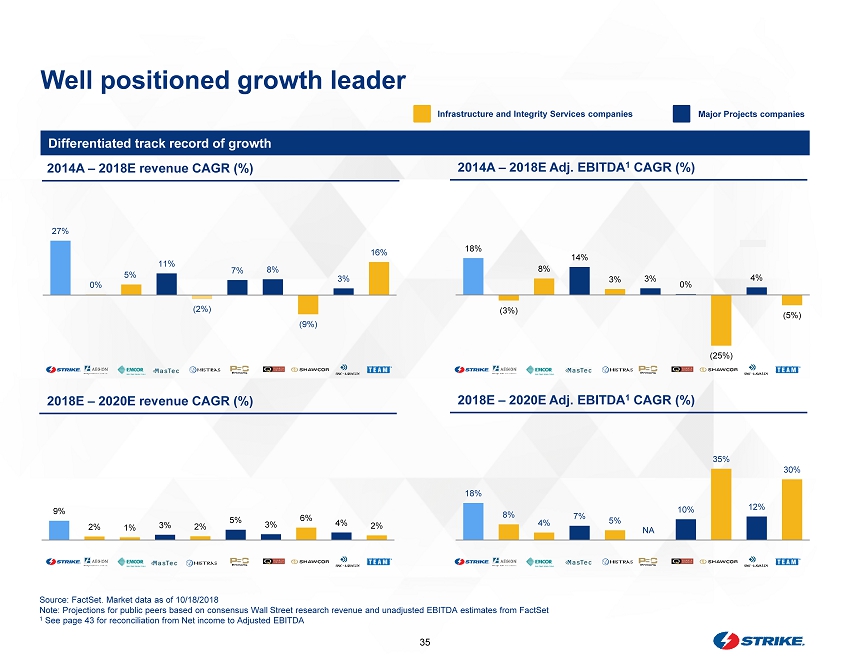
35 9% 2% 1% 3% 2% 5% 3% 6% 4% 2% 27% 0% 5% 11% (2%) 7% 8% (9%) 3% 16% Well positioned growth leader Differentiated track record of growth 18% (3%) 8% 14% 3% 3% 0% (25%) 4% (5%) 18% 8% 4% 7% 5% 10% 35% 12% 30% 2014A – 2018E revenue CAGR (%) 2014A – 2018E A dj. EBITDA 1 CAGR (%) 2018E – 2020E revenue CAGR (%) 2018E – 2020E A dj. EBITDA 1 CAGR (%) Source: FactSet. Market data as of 10/18/2018 Note: Projections for public peers based on consensus Wall Street research revenue and unadjusted EBITDA estimates from FactS et 1 See page 43 for reconciliation from Net income to Adjusted EBITDA Infrastructure and Integrity Services companies Major Projects companies NA NA
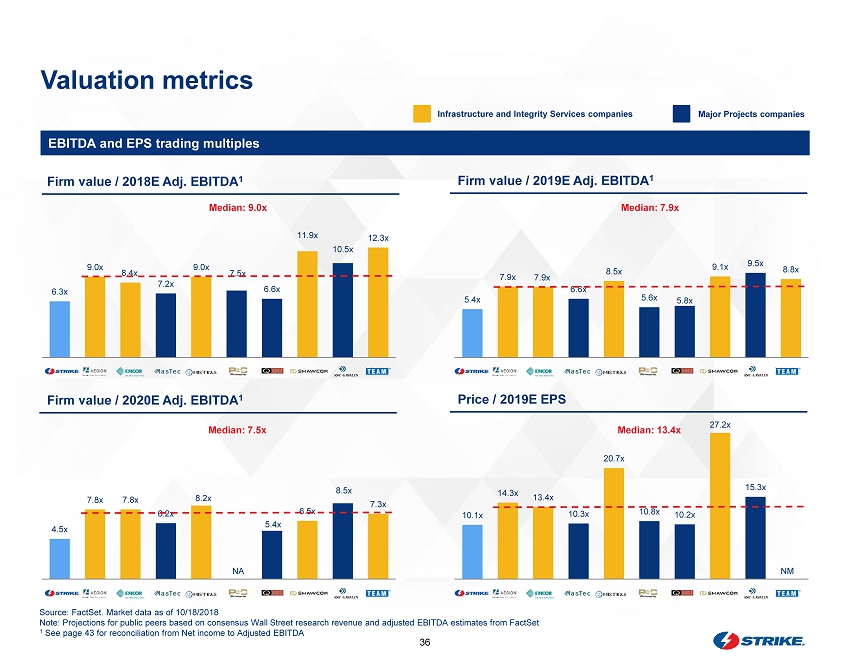
36 6.3x 9.0x 8.4x 7.2x 9.0x 7.5x 6.6x 11.9x 10.5x 12.3x Valuation metrics EBITDA and EPS trading multiples Firm value / 2018E Adj. EBITDA 1 Firm value / 2019E Adj. EBITDA 1 Firm value / 2020E Adj. EBITDA 1 Price / 2019E EPS Source: FactSet. Market data as of 10/18/2018 Note: Projections for public peers based on consensus Wall Street research revenue and adjusted EBITDA estimates from FactSet 1 See page 43 for reconciliation from Net income to Adjusted EBITDA Infrastructure and Integrity Services companies Major Projects companies 4.5x 7.8x 7.8x 6.2x 8.2x 5.4x 6.5x 8.5x 7.3x 10.1x 14.3x 13.4x 10.3x 20.7x 10.8x 10.2x 27.2x 15.3x 5.4x 7.9x 7.9x 6.6x 8.5x 5.6x 5.8x 9.1x 9.5x 8.8x Median: 7.5x Median: 9.0x Median: 7.9x Median: 13.4x NM NA

37 Strike overview Established and diversified blue - chip client base which is focused on safety and project certainty 2 Client - focused solutions enabled by long - term client partnerships and differentiated technical expertise and execution capabilities 3 Nationwide footprint with a presence in most major energy markets and a clear path to continue expansion 4 Proven scalable platform with a track record of consistent growth across oil and gas cycles 5 Experienced and innovative management team supported by a highly experienced board with prior industry leadership 6 Leading U.S. provider of full life cycle infrastructure services 1 Strike has achieved a revenue CAGR north of 35% over the last 10 years 1 1 For the period from 2007 to 2017
38 MARKET ANALYSIS
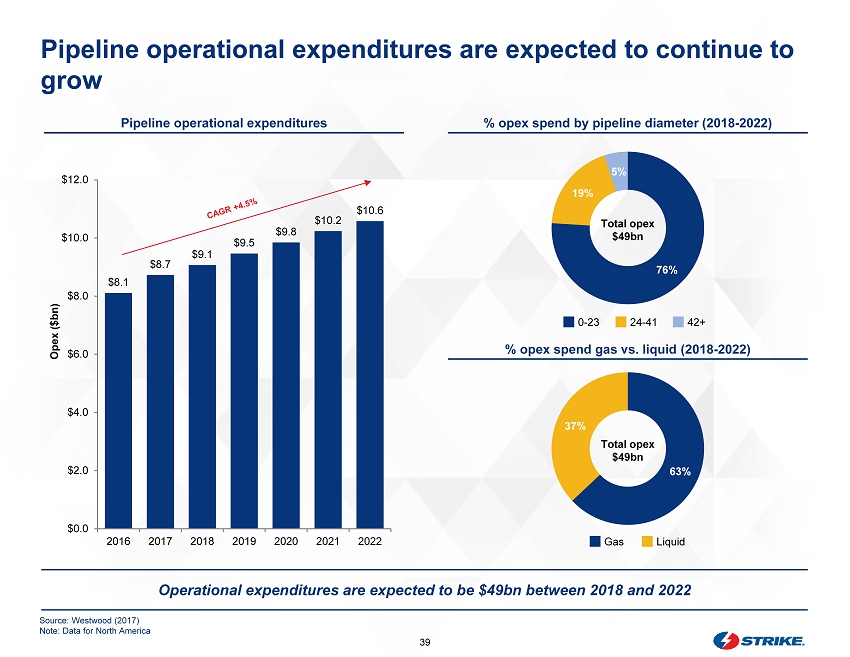
39 63% 37% 76% 19% 5% Pipeline operational expenditures are expected to continue to grow Operational expenditures are expected to be $49bn between 2018 and 2022 Pipeline operational expenditures % opex spend by pipeline diameter (2018 - 2022) % opex spend gas vs. liquid (2018 - 2022) Total opex $49bn Total opex $49bn 0 - 23 24 - 41 42+ Gas Liquid Source: Westwood (2017) Note: Data for North America $8.1 $8.7 $9.1 $9.5 $9.8 $10.2 $10.6 $0.0 $2.0 $4.0 $6.0 $8.0 $10.0 $12.0 2016 2017 2018 2019 2020 2021 2022 Opex ($bn)
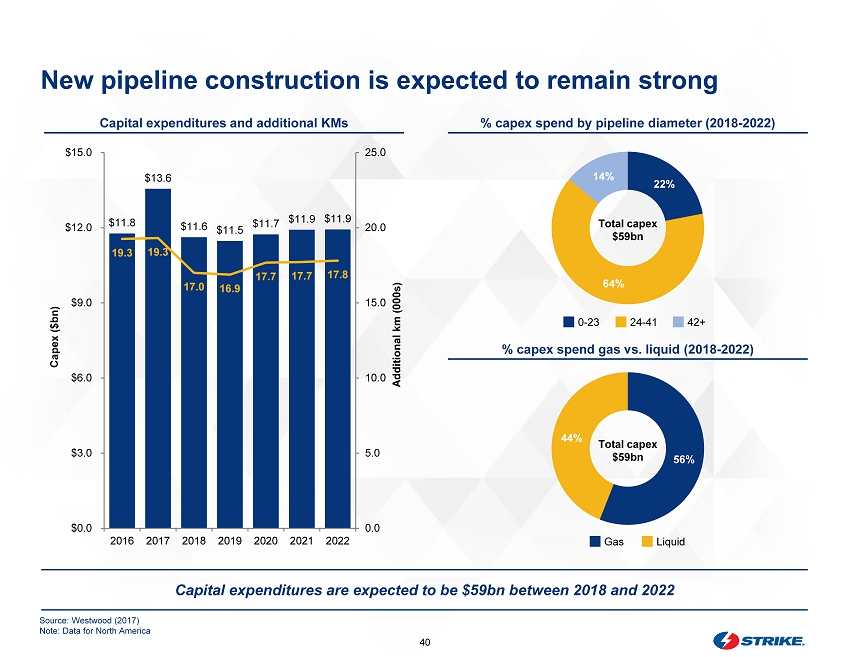
40 56% 44% New pipeline construction is expected to remain strong Capital expenditures are expected to be $59bn between 2018 and 2022 Capital expenditures and additional KMs % capex spend by pipeline diameter (2018 - 2022) % capex spend gas vs. liquid (2018 - 2022) 22% 64% 14% Total capex $59bn Total capex $59bn 0 - 23 24 - 41 42+ Gas Liquid Source: Westwood (2017) Note: Data for North America $11.8 $13.6 $11.6 $11.5 $11.7 $11.9 $11.9 19.3 19.3 17.0 16.9 17.7 17.7 17.8 0.0 5.0 10.0 15.0 20.0 25.0 $0.0 $3.0 $6.0 $9.0 $12.0 $15.0 2016 2017 2018 2019 2020 2021 2022 Additional km (000s) Capex ($bn)
41 APPENDIX
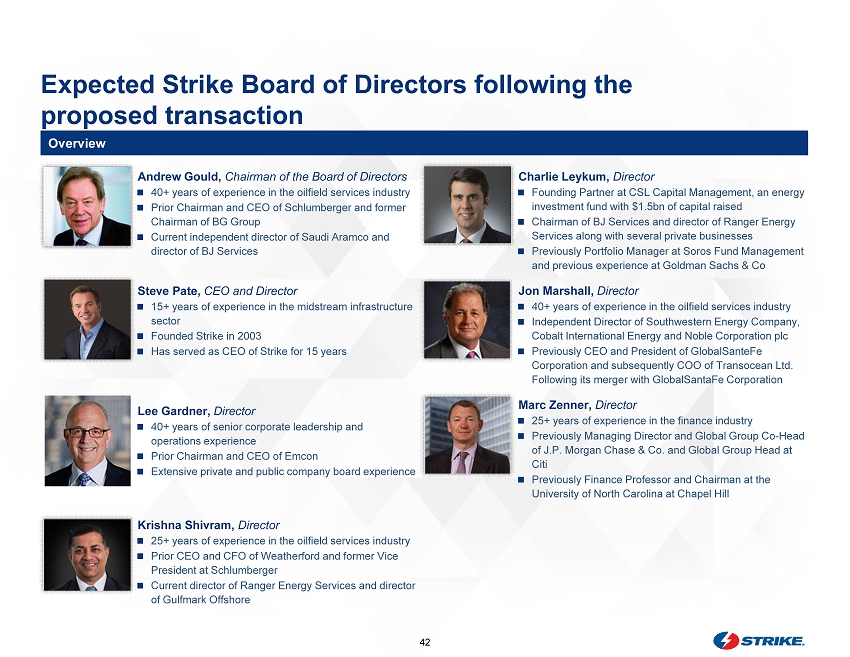
42 Expected Strike Board of Directors following the proposed transaction Overview Andrew Gould, Chairman of the Board of Directors 40+ years of experience in the oilfield services industry Prior Chairman and CEO of Schlumberger and former Chairman of BG Group Current independent director of Saudi Aramco and director of BJ Services Krishna Shivram, Director 25+ years of experience in the oilfield services industry Prior CEO and CFO of Weatherford and former Vice President at Schlumberger Current director of Ranger Energy Services and director of Gulfmark Offshore Charlie Leykum, Director Founding Partner at CSL Capital Management, an energy investment fund with $1.5bn of capital raised Chairman of BJ Services and director of Ranger Energy Services along with several private businesses Previously Portfolio Manager at Soros Fund Management and previous experience at Goldman Sachs & Co Jon Marshall, Director 40+ years of experience in the oilfield services industry Independent Director of Southwestern Energy Company, Cobalt International Energy and Noble Corporation plc Previously CEO and President of GlobalSanteFe Corporation and subsequently COO of Transocean Ltd. Following its merger with GlobalSantaFe Corporation Marc Zenner, Director 25+ years of experience in the finance industry Previously Managing Director and Global Group Co - Head of J.P. Morgan Chase & Co. and Global Group Head at Citi Previously Finance Professor and Chairman at the University of North Carolina at Chapel Hill Steve Pate, CEO and Director 15+ years of experience in the midstream infrastructure sector Founded Strike in 2003 Has served as CEO of Strike for 15 years Lee Gardner, Director 40+ years of senior corporate leadership and operations experience Prior Chairman and CEO of Emcon Extensive private and public company board experience
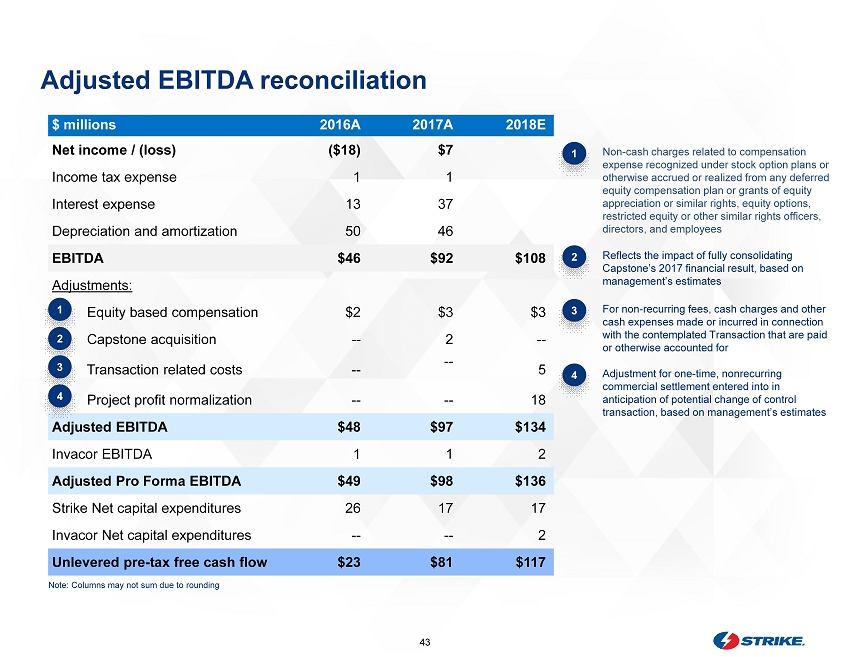
43 Adjusted EBITDA reconciliation $ millions 2016A 2017A 2018E Net income / (loss) ($18) $7 Income tax expense 1 1 Interest expense 13 37 Depreciation and amortization 50 46 EBITDA $46 $92 $108 Adjustments: Equity based compensation $2 $3 $3 Capstone acquisition -- 2 -- Transaction related costs -- -- 5 Project profit normalization -- -- 18 Adjusted EBITDA $48 $97 $134 Invacor EBITDA 1 1 2 Adjusted Pro Forma EBITDA $49 $98 $136 Strike Net c apital expenditures 26 17 17 Invacor Net capital expenditures -- -- 2 Unlevered pre - tax free cash flow $23 $81 $117 1 2 2 Reflects the impact of fully consolidating Capstone’s 2017 financial result, based on management’s estimates 1 Non - cash charges related to compensation expense recognized under stock option plans or otherwise accrued or realized from any deferred equity compensation plan or grants of equity appreciation or similar rights, equity options, restricted equity or other similar rights officers, directors, and employees 3 For non - recurring fees, cash charges and other cash expenses made or incurred in connection with the contemplated Transaction that are paid or otherwise accounted for 3 4 4 Adjustment for one - time, nonrecurring commercial settlement entered into in anticipation of potential change of control transaction, based on management’s estimates Note : Columns may not sum due to rounding
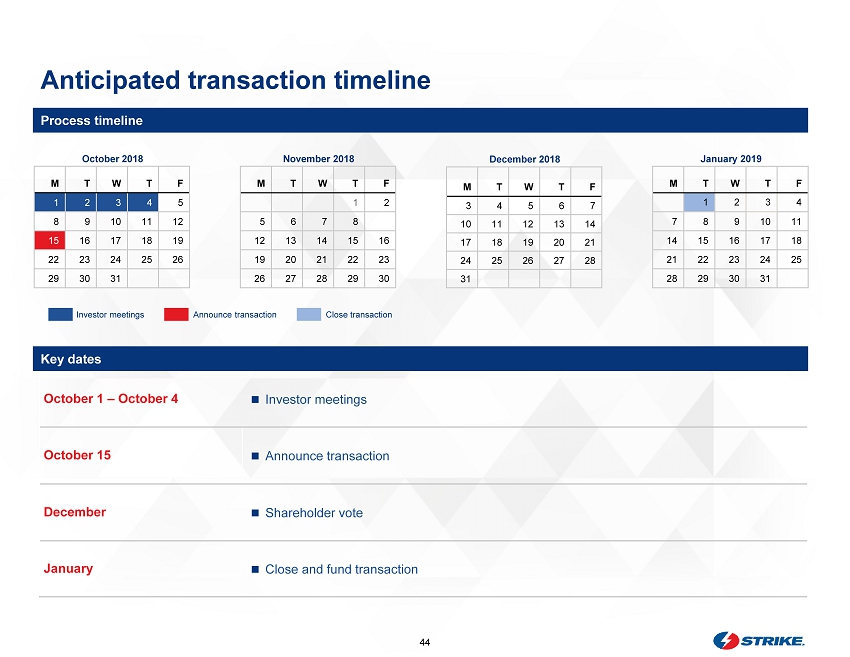
44 January 2019 M T W T F 1 2 3 4 7 8 9 10 11 14 15 16 17 18 21 22 23 24 25 28 29 30 31 October 2018 M T W T F 1 2 3 4 5 8 9 10 11 12 15 16 17 18 19 22 23 24 25 26 29 30 31 November 2018 M T W T F 1 2 5 6 7 8 9 12 13 14 15 16 19 20 21 22 23 26 27 28 29 30 December 2018 M T W T F 3 4 5 6 7 10 11 12 13 14 17 18 19 20 21 24 25 26 27 28 31 Anticipated transaction timeline October 1 – October 4 Investor meetings October 15 Announce transaction December Shareholder vote January Close and fund transaction Investor meetings Announce transaction Close transaction Key dates Process timeline
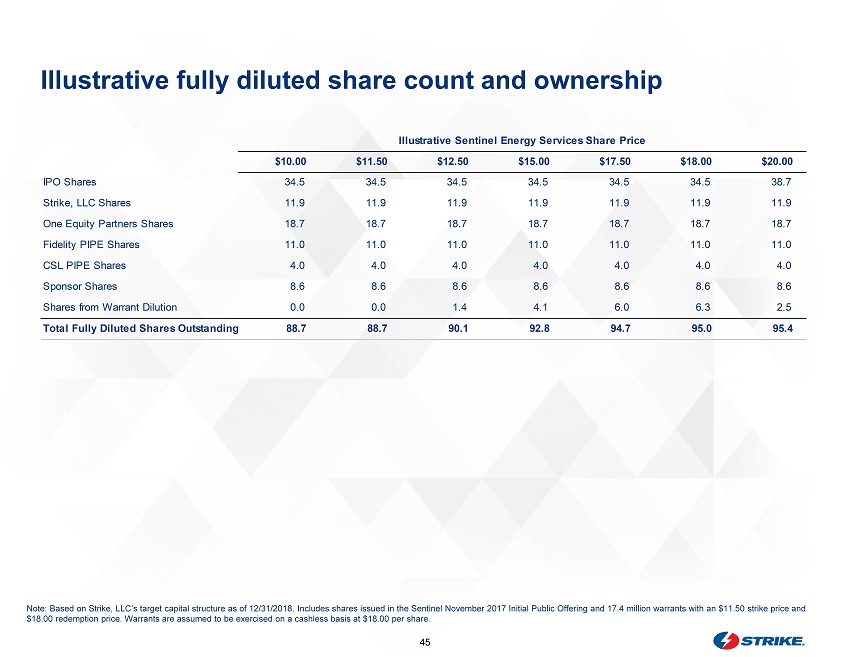
45 TBD Illustrative f ully diluted s hare count and ownership Note: Based on Strike, LLC’s target capital structure as of 12/31/2018. Includes shares issued in the Sentinel November 2017 Ini tial Public Offering and 17.4 million warrants with an $11.50 strike price and $18.00 redemption price. Warrants are assumed to be exercised on a cashless basis at $18.00 per share. Illustrative Sentinel Energy Services Share Price $10.00 $11.50 $12.50 $15.00 $17.50 $18.00 $20.00 IPO Shares 34.5 34.5 34.5 34.5 34.5 34.5 38.7 Strike, LLC Shares 11.9 11.9 11.9 11.9 11.9 11.9 11.9 One Equity Partners Shares 18.7 18.7 18.7 18.7 18.7 18.7 18.7 Fidelity PIPE Shares 11.0 11.0 11.0 11.0 11.0 11.0 11.0 CSL PIPE Shares 4.0 4.0 4.0 4.0 4.0 4.0 4.0 Sponsor Shares 8.6 8.6 8.6 8.6 8.6 8.6 8.6 Shares from Warrant Dilution 0.0 0.0 1.4 4.1 6.0 6.3 2.5 Total Fully Diluted Shares Outstanding 88.7 88.7 90.1 92.8 94.7 95.0 95.4