September 7 -8, 2022Raymond James U.S. Bank Conference |
Forward Looking StatementsInadditiontohistoricalinformation,thispresentationmaycontaincertainforward-lookingstatementswithinthemeaningofthePrivateSecuritiesLitigationReformActof1995whichare basedoncertainassumptionsanddescribefutureplans,strategiesandexpectationsofthe Company.Theseforward-lookingstatementsaregenerallyidentifiedbyuseofthewords “believe,”“expect,”“intend,”“anticipate,”“estimate,”“project,”“will,”“should,”“may,” “view,”“opportunity,”“potential,”orsimilarexpressionsorexpressionsofconfidence.The Company’sabilitytopredictresultsortheactualeffectoffutureplansorstrategiesisinherently uncertain.Factorswhichcouldhaveamaterialadverseeffectontheoperationsofthe Companyanditssubsidiaryinclude,butarenotlimitedtothefollowing:changesininterest rates,generaleconomicconditions,publichealthcrises(suchasthegovernmental,socialand economiceffectsofCOVID),levelsofunemploymentintheBank’slendingarea,realestatemarketvaluesintheBank’slendingarea,futurenaturaldisasters,thelevelofprepaymentsonloansandmortgage-backedsecurities,legislative/regulatorychanges,monetaryandfiscalpoliciesoftheU.S.GovernmentincludingpoliciesoftheU.S.TreasuryandtheBoardof GovernorsoftheFederalReserveSystem,thequalityorcompositionoftheloanorinvestment portfolios,demandforloanproducts,depositflows,competition,demandforfinancialservicesintheCompany’smarketarea,accountingprinciplesandguidelines,andotherconditions whichbytheirnaturearenotsusceptibletoaccurateforecast,andaresubjecttosignificantuncertainty.Theserisksanduncertaintiesshouldbeconsideredinevaluatingforward-looking statementsandunduerelianceshouldnotbeplacedonsuchstatements.TheCompanydoesnotundertake,andspecificallydisclaimsanyobligation,topubliclyreleasetheresultofany revisionswhichmaybemadetoanyforward-lookingstatementstoreflecteventsor circumstancesafterthedateofsuchstatementsortoreflecttheoccurrenceofanticipatedorunanticipatedevents.Annualized,proforma,projectedandestimatednumbersareusedforillustrativepurposeonly,arenotforecastsandmaynotreflectactualresults.2 |
3Franchise OverviewFinancial HighlightsCredit & Asset Quality Funding & Liquidity Appendices |
Company OverviewJohn Marshall Bank is a growth-oriented commercial bank headquartered in Reston, VirginiaEstablished in 2006, the Company has grown organically to over $2.32 billion in assetsSeasoned executive team with decades of in-market banking experienceStrategy emphasizes growth in loans, core funding, and profitability while maintaining strong asset quality and delivering tailored banking services–Hire experienced commercial banking and business development officers–Enhance customer experience by leveraging digital platform–Commercially-oriented bank with focus on deposit-rich industry segments–Diversify loan portfolio and improve funding mix–Grow non-interest income–Continue to leverage existing infrastructure, uphold rigorous expense control and drive profitability–Maintain financial and credit quality discipline4 |
Investment AttributesYTD represents the six months ended June 30, 2022. Inside ownership as of April 29, 2022.PTPP: Pre-Tax, Pre-Provision5 Experienced Management•Combined team brings decades of in-market experience•Inside ownership of 18.44%Conservative Balance Sheet•Well-capitalized•Excellent asset quality•Liquid balance sheet with ample access to contingent liquidity•Well-matched assets and liabilities mitigate interest rate riskStrongEarnings•YTD ROAA of 1.41%•YTD PTPP ROAA of 1.74%•YTD ROAE of 15.02%•YTD Efficiency of 46.1%•YTD Net Interest Margin of 3.24%Attractive Markets•DC metro area one of the best banking markets in the country•Disruption caused by recent bank M&A has created additional growth opportunities |
John Marshall Franchise•Bank commenced operations in April 2006•$22 million recapitalization completed in 2008•Holding company formed March 1, 2017•Chris Bergstrom named President and CEO April 30, 2018•Building value by delivering tailored banking services and exceptional client experiences•Commercially-oriented bank targeting:–Small to medium-sized businesses–Builders / developers–Professionals–Nonprofits / associations / private schools–Health services–Title / property management–Government contractors•8 full service banking centers and 1 loan production office serving ~12,022 accounts•144 FTE employees as of June 30, 2022 Corporate Overview Financial Highlights6December 31, 2020, December 31, 2021 and YTD 2022 loan loss reserves / gross loans excludes guaranteed PPP loans.YTD 2022 profitability figures are for the six months ended 6/30/2022. ($ in millions)YTD2019202020212022Balance SheetTotal Assets$1,582$1,886$2,149$2,316Gross Loans1,3261,5631,6661,690Total Deposits1,3091,6401,8822,044 Loans / Deposits101%95%89%83%Capital (Bank level)Common Equity / Assets11.67%11.05%10.81%9.88%Tier 1 Leverage Ratio11.86%11.01%10.97%10.97%Total Risk-Based Capital Ratio 13.54%14.63%15.26%15.13%ProfitabilityNet Income15,92118,52625,46115,556ROAA1.08%1.06%1.25%1.41%ROAE10.41%10.49%12.90%15.02%Net Interest Margin3.40%3.32%3.27%3.25% Efficiency Ratio57.4%49.9%47.7%46.1%Asset QualityNPAs / Assets0.00%0.00%0.00%0.00%Allowance for Loan Losses / NPLsN/MN/MN/MN/MLoan Loss Reserves / Gross Loans0.81%1.17%1.25%1.18%NCOs / Average Loans0.01%0.00%0.01%0.00%Year Ended December 31, |
Leveraging TechnologySelectiveFinTechpartnershipsprovideoperatingleverageandfueladditionalgrowth7 Customer ExperienceOperatingEfficienciesRiskMitigationFinTech Partnership BenefitsVarious FinTech Partnerships |
Executive LeadershipChris BergstromPresident & CEOChrisBergstromhasover40yearsofexperienceinthebankingindustry.BeforejoiningJohnMarshallBank,ChrisservedinavarietyofexecutivepositionsmostrecentlyservingasPresidentandCEOof CardinalFinancialCorporationandPresidentofUnitedBankuponitsacquisitionofCardinalBankin April2017.ChrisreceivedhisMasterofScienceinFinancefromVirginiaCommonwealthUniversityand aBachelorsofBusinessAdministrationdegreefromJamesMadisonUniversity.Kelly BellEVP, Chief Operating OfficerKellyBellhasover30yearsofcommunitybankingexperience,22ofthoseyearsservingtheWashingtonmetropolitanarea.ShehasservedseveralrolesatJohnMarshallBank,includingExecutiveVicePresident,DirectorofRetailBankingandTreasuryServices.PriortojoiningJohnMarshallBank,Kelly spentthreeyearsasSeniorVicePresident,DirectorofRetailBankingatCardinalBank,and13yearsof increasingrolesofresponsibilityatVirginiaCommerceBank.KellyisagraduateoftheVirginiaBankers AssociationSchoolofBankManagement.Kent CarstaterEVP, Chief Financial OfficerKentCarstaterhasover25yearsoffinancialservicesexperience.BeforejoiningJohnMarshallBankin2016,KentservedasaSeniorVicePresidentandTreasureratBankofGeorgetown.Inthatrole,he oversawfinancialandriskmanagement,investorrelations,capitalmarketsactivitiesandstrategicplanning.Priortobecomingacommercialbankerin2012,Kentadvisedcommunitybankson strategicmattersasaninvestmentbankerandfoundedaprivateequityfirmfocusedoninvestingin financialinstitutions.KentgraduatedfromVirginiaTechwithaBachelorofSciencedegreeinFinance andobtainedanMBAfromtheDardenSchoolofBusiness.Andy PedenEVP, Chief Banking OfficerAndrewPedenistheChiefBankingOfficeratJohnMarshallBank,andwastheChiefLendingOfficerforfouryearsbeforebeingpromotedtohiscurrentposition.PriortojoiningJMB,hehadover18years ofbankingexperience,allbutoneyearwithCardinalBank.AndrewreceivedaBachelorofScience degreeinbusinessfromtheUniversityofRichmond–RobinsSchoolofBusiness.Heisinvolvedinboth thebusinessandlocalcommunity,byservingontheBoardoftheVBAManagementServices,Inc.andasavolunteeryouthsportscoachinArlington,VA.8 |
Executive Leadership9Jason McDonoughEVP, Chief Lending OfficerJasonMcDonoughhasover16yearsofbankingexperience,including11withCardinalBank.Hehasabackgroundinbothretailandcommercialbankingincluding10yearsasaCommercialLender specializinginRealEstateLending.McDonoughmostrecentlyservedastheDirectorofCommercial RealEstateLendingatJMBpriortohispromotiontoChiefLendingOfficer.HereceivedaBachelorof SciencefromVirginiaTech2006andaMastersinRealEstateDevelopmentfromGeorgeMason Universityin2015,wherehewasnamedMostOutstandingStudent,beforegoingontoco-foundthe programsAlumniAssociation.HeisalsoanHonorsGraduateoftheVirginiaBankersSchoolofBank Management.McDonoughhasservedontheBoardofDirectorsofHomeAidNorthernVirginia,alocalnot-for-profitorganization,forthepast8yearsandasBoardPresidentin2020.Anactivememberof theSouthLoudounCountycommunity,McDonoughalsovolunteersmuchofhistimetocoachingyouthathletics.SheilaYosufyEVP, Director of SalesSheilaYosufyhasover20yearsofbankingexperience.ShehasbeenwithJohnMarshallBankforover threeyearsandmostrecentlyservedasSeniorVicePresident–DirectorofBusinessDevelopment beforeherpromotiontoExecutiveVicePresident–DirectorofSales.PriortojoiningJohnMarshallBank, Ms.YosufyspentelevenyearsatCardinalBankwheresheservedastheSeniorVicePresidentoftheir commercialdivision.SheearnedaBachelorofBusinessAdministrationdegreeinInternationalBusiness fromMarymountUniversity.Inaddition,sheearnedherMastersinBusinessAdministrationfromMarymountUniversity.ShecurrentlyservesontheBoardoftheNorthernVirginiaChamberof Commerce.Ms.YosufyisagraduateoftheVBASchoolofBankManagementandLeadershipArlingtonSignatureProgramClassof2015,whereshewasalsorecognizedastheLeadershipArlington 40under40Honoree. |
Banking Center Footprint Banking Center(8)Loan Production Office (1) •Regional banking centers serve as business development hubs.•Approximately 97% of the Bank’s deposit dollars are collected electronically. 10 |
Attractive Metro MarketsSources: S&P Global Market Intelligence, Bureau of Economic Analysis and data.census.govMedian Household Income (2022)Projected Population Growth % (2022-2027)Educational Attainment (>=Bachelors Degree)Unemployment Rate (May 2022, NSA)11 49.8 49.6 47.6 40.6 37.8 37.7 34.1 127,546115,601 103,84792,717 86,80483,335 81,746 5.20 4.53 4.05 3.53 2.63 1.27 1.03 2.2 3.0 3.3 4.0 4.0 4.2 4.2 |
MarketDepositMarketDepositDepositsMarketDepositsMarketCompany($000)Share (%)Company($000)Share (%)1Wells Fargo & Co. (CA)23,769,18215.31Bank of America Corporation (NC)44,325,98315.92Capital One Financial Corp. (VA)22,128,70814.22Capital One Financial Corp. (VA)43,619,99515.73Bank of America Corporation (NC)21,404,12013.83Truist Financial Corp. (NC)41,243,46114.84SunTrust Banks Inc. (GA)16,657,67810.74Wells Fargo & Co. (CA)36,294,10013.05BB&T Corp. (NC)13,255,0258.55The PNC Finl Svcs Grp (PA)19,388,2027.06PNC Financial Services Group (PA)10,708,1986.96Citigroup Inc. (NY)12,740,0004.67Citigroup Inc. (NY)6,617,7644.37United Bankshares Inc. (WV)10,389,6993.78M&T Bank Corp. (NY)4,062,7372.68Eagle Bancorp Inc (MD)9,115,0843.39HSBC Holdings3,270,7772.19Sandy Spring Bancorp Inc. (MD)8,693,2913.110Eagle Bancorp Inc (MD)2,904,3901.910The Toronto-Dominion Bank6,682,4472.411Toronto-Dominion Bank2,322,6641.511M&T Bank Corp. (NY)6,584,8272.412Sandy Spring Bancorp Inc. (MD)2,277,6391.512Atlantic Union Bkshs Corp. (VA)5,682,9292.013Burke & Herbert Bank & Trust (VA)2,204,4021.413Citizens Financial Group Inc. (RI)2,965,7301.114Virginia Commerce Bank2,192,7191.414Burke & Herbert Bank & Trust (VA)2,905,8191.015Cardinal Financial Corporation (VA)2,130,6621.415Workers United (PA)1,959,5040.716United Bankshares Inc. (WV)2,037,6321.316Capital Bancorp Inc. (MD)1,840,7410.717WashingtonFirst Bankshares, Inc. (VA)970,0010.617John Marshall Bancorp Inc. (VA)1,816,9320.718Middleburg Financial Corporation (VA)922,0390.618Forbright Inc. (MD)1,731,9800.619Old Line Bancshares, Inc. (MD)794,4100.519JPMorgan Chase & Co. (NY)1,703,0360.620Bank of Georgetown (DC)772,0850.520FVCBankcorp Inc. (VA)1,658,6400.621Virginia Heritage Bank (VA)729,5300.521WesBanco Inc. (WV)1,646,8570.622Toronto-Dominion Bank703,0560.522MainStreet Bcshs (VA)1,482,9920.523Access National Corporation (VA)669,5470.423The Community Financial Corp. (MD)1,311,1780.524Fauquier Bankshares Inc. (VA)519,8690.324Chain Bridge Bancorp Inc. (VA)915,7950.325Community Finl Corp. (MD)519,1060.325Virginia National Bkshs Corp. (VA)834,6670.326Acacia Federal Savings Bank (VA)496,6120.326Presidential Holdings Inc. (VA)778,0920.327Presidential Bank, FSB (MD)491,8800.327Freedom Finl Holdings Inc. (VA)622,1030.228John Marshall Bancorp Inc. (VA)430,5640.328Primis Financial Corp. (VA)590,7760.229Southern National Bncp of VA (VA)407,4280.329National Capital Bancorp (DC)576,9540.230FVCBankcorp Inc. (VA)392,9920.330Eagle Financial Services Inc. (VA)552,0830.2Other8,703,7275.6Other8,025,3102.9Market Growth + Consolidation = Unique Opportunity12 2,043,741As of 6/30/2022 Sources: S&P Global Market Intelligence and FDICPro forma for pending acquisitions.Data as of: 6/30/2013Data as of: 6/30/2021 |
13Franchise OverviewFinancial HighlightsCredit & Asset QualityFunding & Liquidity Appendices |
•Record quarterly & YTD earnings of $7.9MM ($0.56 diluted EPS) and $15.6MM ($1.10 diluted EPS), respectively. YTD 2Q2022 diluted EPS improved 37.5% vs. the prior yearo14thconsecutive quarter of record earnings•YTD efficiency ratio of 46.1%oRevenues grew 6.2% and overhead decreased 2.9% versus prior yearoFTE’s increased from 143 to 144 over the last twelve monthso1.49% overhead / average assets remains very competitive with peers•Strong year-over-year growthoGross loans, excluding PPP loans, increased $204.1MM or 13.7%oRepresents the 3rdbest quarter of core loan growth in Company’s historyoTotal investment securities increased $167.9MM or 54.9%oTotal deposits increased $228.7MM or 12.6%•Beneficial funding compositionoNon-interest bearing deposits represented 25.1% of total deposits as of June 30, 2022oNon-maturing deposits constituted 66.6% of total deposits vs. 63.2% a year agooAll FHLB advances have been paid offoNew Subordinated Debt issued with 5.25% fixed-to-floating rate•Excellent asset qualityo11thconsecutive quarter with no loans more than 30 days past due, non-accruing loans, or OREO•Liquid, well-capitalized balance sheetoCash & unencumbered AFS securities represent 18.2% of assetso$508MM of secured borrowing capacity available14Second Quarter 2022 Highlights |
$1,007 $1,161 $1,326 $1,563 $1,666 $1,485 $1,690 201720182019202020211H211H22 $897 $1,138 $1,309 $1,640 $1,882 $1,815 $2,044 201720182019202020211H211H22 $105 $105 $130 $159 $352 $306 $474 201720182019202020211H211H22 $1,175 $1,395 $1,582 $1,885 $2,149 $2,066 $2,316 201720182019202020211H211H22Historical Growth Total Assets ($MM) Total Gross Loans ($MM) Total Investment Securities ($MM) Total Deposits ($MM) 15 1sthalf figures reflect balances at the first six months ended of each year.1H21 and 1H22 Total Gross Loan figures represent Total Gross Loans excluding PPP balances |
Loan Portfolio Composition 16Business segment is comprised of Commercial Business, PPP, and Commercial owner-occupied real estate loansLoan Balances are gross loan amounts before allowance for loan losses and deferred fees/costs. Commercial Real Estate -Non-Owner Occupied41.7%Business25.2%Consumer0.0%Residential Construction6.0%CRE & Land Development Construction5.2%Residential21.8% AsofJune30,2022,our$1.69billionloanportfoliocompositionconsistedofthefollowing: Multifamily106,236$ 39 15.1%Office116,335$ 65 16.5%Retail322,563$ 145 45.8%Warehouse35,370$ 26 5.0%Industrual51,040$ 14 7.2%Hotel/Motel42,494$ 8 6.0%Other30,700$ 19 4.4%Total704,737$ 316100.0%Loan Balance ($000s)# of Loans% of PortfolioCollateral type securing non-owner occupied commercial real estate loans Type |
Debt Securities Portfolio 17 Conservative, High Quality, and Liquid Securities Portfolio Debt Securities Portfolio as of June 30, 2022(Dollars in thousands)Amortized CostEstimated Fair Value Held-to-maturityU.S Treasuries$6,001 $5,350 U.S. government and federal agencies35,630 31,385 Collateralized mortgage obligations22,930 19,910 Municipal 6,081 5,071 Mortgage-backed31,623 27,146 Total Held-to-maturity Securities$102,265 $88,862 Available-for-sale U.S Treasuries$63,331 $60,463 U.S. government and federal agencies37,685 35,076 Corporate bonds3,000 2,868 Collateralized mortgage obligations45,425 41,303 Municipal6,650 6,230 Mortgage-backed230,862 219,194 Total Available-for-sale Securities$386,953 $365,134 Total Debt Securities$489,218 $453,996 U.S Treasuries and Gov't Agencies29.2%Mortgage-Backed and Asset-Backed67.6%Municipal2.6%Corporate bonds0.6%Portfolio Mix -Amortized Cost •96.7% of the amortized cost of the debt securities portfolio has an explicit or implicit guaranteed from the federal government •All of the Company’s municipal bonds have a credit rating of AA or better. |
Performance Measures ROAA (%) ROAE (%) Efficiency Ratio (%) Book Value per Share excluding AOCI ($)181SThalf figures reflect amounts at or for the six months ended of each year.BVPS ex. AOCI represents book value per share excluding impacts from Accumulated Other Comprehensive Income 7.14%8.98%10.41%10.49%12.90%11.78%15.02%201720182019202020211H211H22 0.80%0.95%1.08%1.06%1.25%1.13%1.41%1.57%1.29%1.45%1.68%1.73%1.69%1.74%201720182019202020211H211H22 Pre‐tax, pre‐provision ROAA 57.8%63.5%57.4%49.9%47.7%50.4%46.1%201720182019202020211H211H22 $10.10 $11.08 $12.28 $13.40 $15.20 $14.22 $16.00 201720182019202020211H211H22 BVPS BVPS ex. AOCI |
Growth + Efficiency = Core Earnings Power19 PPPPPPPPP 800,000 900,000 1,000,000 1,100,000 1,200,000 1,300,000 1,400,000 1,500,000 1,600,000 1,700,000 1,800,000201720182019202020211H211H22Gross Loans ($M) 1.00%1.20% 1.40% 1.60% 1.80% 2.00% 2.20% 2.40%201720182019202020211H211H22Non-Interest Expense / Average Assets $0.66 $0.89 $1.17 $1.35 $1.83 $0.80 $1.10 $3,000 $8,000 $13,000 $18,000 $23,000 $28,000201720182019202020211H211H22 $- $0.20 $0.40 $0.60 $0.80 $1.00 $1.20 $1.40 $1.60 $1.80 $2.00Net Income ($M) and Per Share Data ($) Diluted Earnings Per Share1SThalf figures reflect amounts at or for the six months ended of each year. PPPPPPPPP3.75%3.51%3.40%3.32%3.27%3.25% 10,000 20,000 30,000 40,000 50,000 60,000 70,000201720182019202020211H220.00%0.50% 1.00% 1.50% 2.00% 2.50% 3.00% 3.50%4.00%Net Interest Income ($M) Net Interest Margin |
COVID-19 Response –PPP Loans20 $138,298 $148,156 $148,156 $114,411 $117,796 $82,190 $75,496 $69,567 $7,781 $224 $- $20,000 $40,000 $60,000 $80,000 $100,000 $120,000 $140,000 $160,000Apr-20Jun-20Sep-20Dec-20Mar-21Jun-21Sep-21Dec-21Mar-22Jun-22 Total PPP PPP Balances Over Time ($M) |
Non-Interest Income InitiativesBankers Insurance: K-1 income, commissions and bonus payments–Annuity model with next year’s commissions building on the current year’sPurchase Card / Credit Card–Revenue share annuity business with provider Merchant Bankcard–Annuity business with three high-quality service providersEach of the above will enable us to increase wallet share with minimal capital investment21 Non-Interest Income ($ in thousands)Year Ended December 31,3-year201920202021CAGR1H 211H 22% ChangeService Charges on Deposit Accounts: Overdrawn Account Fees $ 121 $ 71 $ 76 -14.4%$ 31 $ 41 32.3% Account Service Fees 178 166 186 1.5%87 120 37.9%Other Service Charges and Fees:Interchange Income 326 310 379 5.1%178 198 11.2% Other Charges and Fees 111 90 98 -4.1%42 96 128.6%Bankers Insurance Commissions40 55 284 92.2%177 265 49.7% Bank Owned Life Insurance 501 469 411 -6.4%207 190 -8.2% Other Operating Income (Loss)4 3 52 135.1%50 5 -90.0%Core Non-Interest Income$ 1,281 $ 1,164 $ 1,486 5.1%$ 772 $ 915 18.5%Gain on Sales and Calls of Securities14 309 10 N/M10 -N/M Net Gains (Losses) on Premises and Equipment-44 29 N/M-(1)N/M Non-qualified Deferred Compensation MTM40 96 194 N/M99 (391)N/M Other Non-Interest Income$ 54 $ 449 $ 233 $ 109 $ (392)Total Non-interest Income $ 1,335 $ 1,613 $ 1,719 $ 881 $ 523 1SThalf figures reflect amounts for the six months ended of each year. |
-30.0%-20.0% -10.0%0.0%10.0% 20.0% 30.0% 40.0%1Q 20212Q 20213Q 20214Q 20211Q 20222Q 20223Q QTD 2022Stock Price Performance JMSB KBW Nasdaq Bank Index June 24, 2022 -JMSB added to Russell 2000 Index Stock Price Performance22 April 27, 2022 –SEC Registration Effective Share data through September 1, 2022.Pre-SEC Registration period represents January 1, 2022 to April 27, 2022. Post-SEC Registration period represents April 27, 2022 through September 1, 2022. Period1Days with Trading Value exceeding $1MMTrading Days in Period PercentagePre-SEC Registration 4795.1%Post -SEC Registration618968.5% |
23Franchise OverviewFinancial HighlightsCredit & Asset QualityFunding & Liquidity Appendices |
407%379%411%413%403%384%367%365%340%335%336% 148%120%126%126%130%121%111%109%94%84%71% Decreasing Concentration•$1.690B in gross loans held for investment as of 6/30/2022•93.5% of credit exposure is within the DC MSA•YTD 2Q2022 yield on total loans of 4.39% (4.19% excluding PPP impact)•M&A disruption in the Washington, D.C. market has created opportunities to acquire new talent, new customers, and to further diversify the Bank’s portfolio24 Acquisition, Development & Construction Loansas a percentage of Total Risk-Based Capital Commercial Real Estate (Investor) Loans as a percentage of Total Risk-Based Capital CRE Investor Portfolio has grown 17.1% over the past 36 months; below 50% regulatory threshold. $22.5MM of subordinated debt became Bank capital |
Disciplined Credit Culture25 Asset QualityCapitalLoan Loss Allowance•Historically, the Bank has exhibited excellent loan quality with low levels of classified loans•No NPAs, NPLs or loans 30+ day PD for the eleventhconsecutive quarter•“Well-Capitalized” under Basel III•Stress testing on a quarterly basis•Holding company provides capital alternatives•Conservative reserve methodology•ALLL of 1.18% of loans (excluding guaranteed PPP portfolio)DiversificationMarket AnalysisStress Testing•CRE portfolio is diversified among retail, multifamily, restaurants, shopping centers, churches, warehouses and other loan types•ADC and CRE concentrations have been reduced from 148% and 407%, respectively, at 9/30/2017 (post- subordinated debt) to 71% and 336%.•Bank receives market analysis, both on a national and local basis from a variety of sources•Bank utilizes a rigorous third party loan review program•Quarterly stress testing of LTV and debt service coverage ratiosCredit SelectionBoard OversightLeverage Technology•RMs focus on experienced business owners with financial capacity•Relatively low individual officer discretionary loan authority levels; committee approval •Concentration and monitoring information provided to the Board at least quarterly•Utilize bank-specific CRM application to increase efficiency and optimize loan process management•Utilizeleading construction finance management softwareUnless indicated otherwise, data as of 6/30/2022. |
1.6x7.9x0.0x1.0x 2.0x 3.0x 4.0x 5.0x 6.0x 7.0x 8.0x 9.0x10.0x20152016201720182019202020212Q2022Credit Quality(1) Nonperforming assets include nonaccrual loans and leases, and foreclosed or repossessed assets(2) Reserves / NPLs (%) greater than 1,000% due to no or immaterial non-performing loans(3) Defined as nonperforming assets plus loans 90+ days past due, divided by tangible common equity plus loan loss reserve Nonperforming Assets¹ / Assets (%) Net Charge-Offs / Loans (%) Reserves / Nonperforming Loans (%) Texas Ratio (%)326 NM2 0.32%0.01%0.09%0.03%0.00%0.00%0.00%0.00%0.00%0.50% 1.00%20152016201720182019202020212Q2022 0.08%0.33%0.07%0.03%0.01%0.00%0.01%0.00%0.00%0.20% 0.40% 0.60% 0.80% 1.00%20152016201720182019202020212Q2022YTD NM2 NM2 NM2 NM2 NM2 1.7%2.5%0.0%0.7%0.2%0.0%0.0%0.0%0.0%2.0%4.0%6.0%8.0%10.0%12.0%14.0%16.0%18.0% 20.0%20152016201720182019202020212Q2022 |
27Franchise OverviewFinancial Highlights Credit & Asset QualityFunding & LiquidityAppendices |
Improved Funding Composition($ in thousands); data as of 6/30/202228•Non-maturing deposits increased to 66.6% of total deposits vs. 52.3% at 12/31/2018•Wholesale funding represented 14.9% of Total Funding Sources as of June 30, 2022―Since 12/31/2018, assets have grown $922MM and wholesale funding has only increased $132MM 19.5%20.9%22.1%26.0%25.1%52.3%55.9%60.3%65.166.6%0.0%20.0% 40.0% 60.0%80.0%100.0%12/31/201812/31/201912/31/202012/31/20216/30/2022Deposit Composition Non-Interest Bearing Demand NOW Money Market Intrafi money market and DDA Savings Certificates of Deposit QwickRate Certificates of Deposit Intrafi Certificates of Deposit Brokered Deposits12/31/201812/31/201912/31/202012/31/20216/30/2022QwickRate Certificates of Deposit20,64218,03029,76525,12220,154Brokered Deposits68,197125,093207,579217,748284,759Federal Funds Purchased15,00112,000- - - Federal Home Loan Bank Advances68,50062,00022,00018,000- Total Wholesale Funding172,340217,123259,344260,870304,913Total Funding Sources1,221,8691,382,7041,662,1201,899,5532,043,741Wholesale / Total Funding Sources14.1%15.7%15.6%13.7%14.9%Wholesale Funding Non-MaturingDeposits |
Liquidity PositionCore deposit gathering initiative decreased Loans / Deposits ratio from 97.2% at 6/30/2018 to 82.8% at 6/30/2022Significantly increased FHLB Advance Capacity•Reduced Advances by $68.5MM since 12/31/2018•Enhanced FHLB reporting to increase borrowing capacity$25 million issuance of 5.25% fixed-to-floating rate subordinated debt during Q2 2022•Proceeds used to redeem the 5.75% fixed-to-floating rate subordinated notes due 2027 on July 15, 2022Perform stress tests on liquidity on a quarterly basis•Utilize nationally recognized ALM and liquidity consulting firm•Design stress tests to hypothetically push the bank to insolvency and develop relief scenarios to remediateJMSB has ample liquidity to withstand significant stress•Cash & unencumbered AFS securities represent 18.2% of assets as of June 30, 2022•Extensive brokered, unsecured and secured borrowing capacity29 |
30Franchise OverviewFinancial Highlights Credit & Asset Quality Funding & LiquidityAppendices |
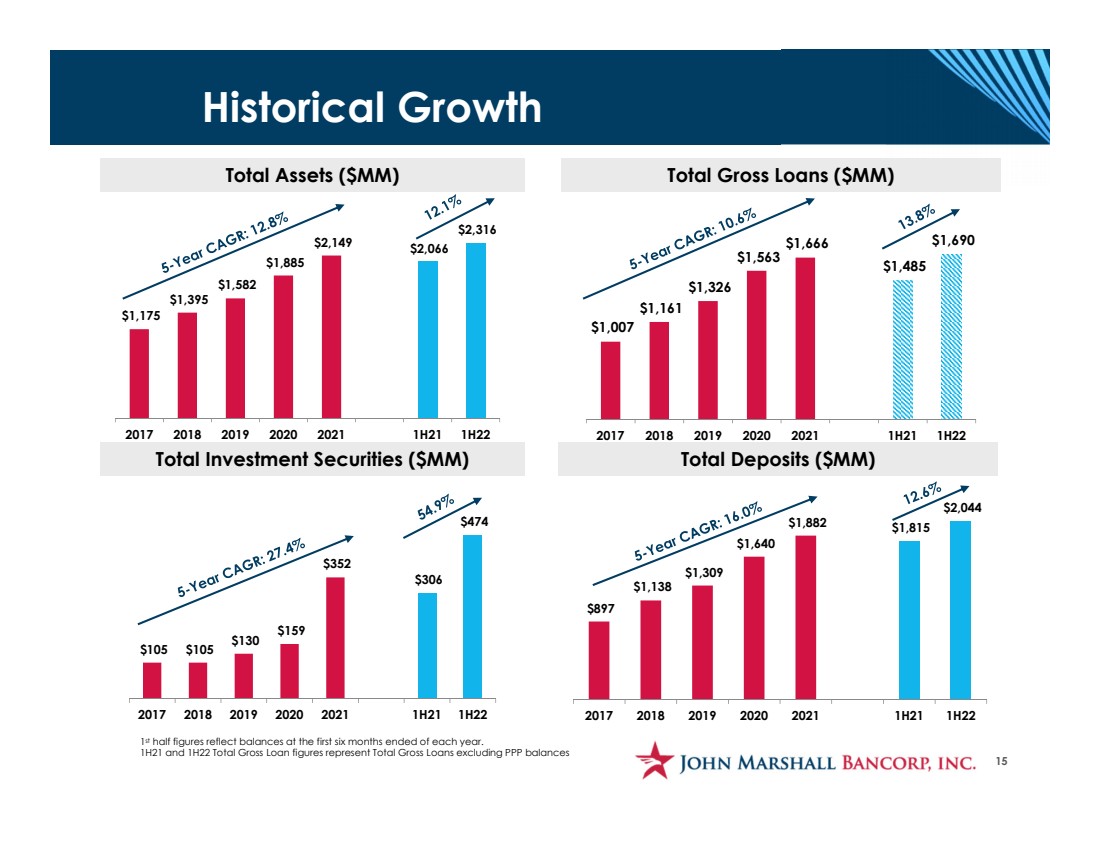
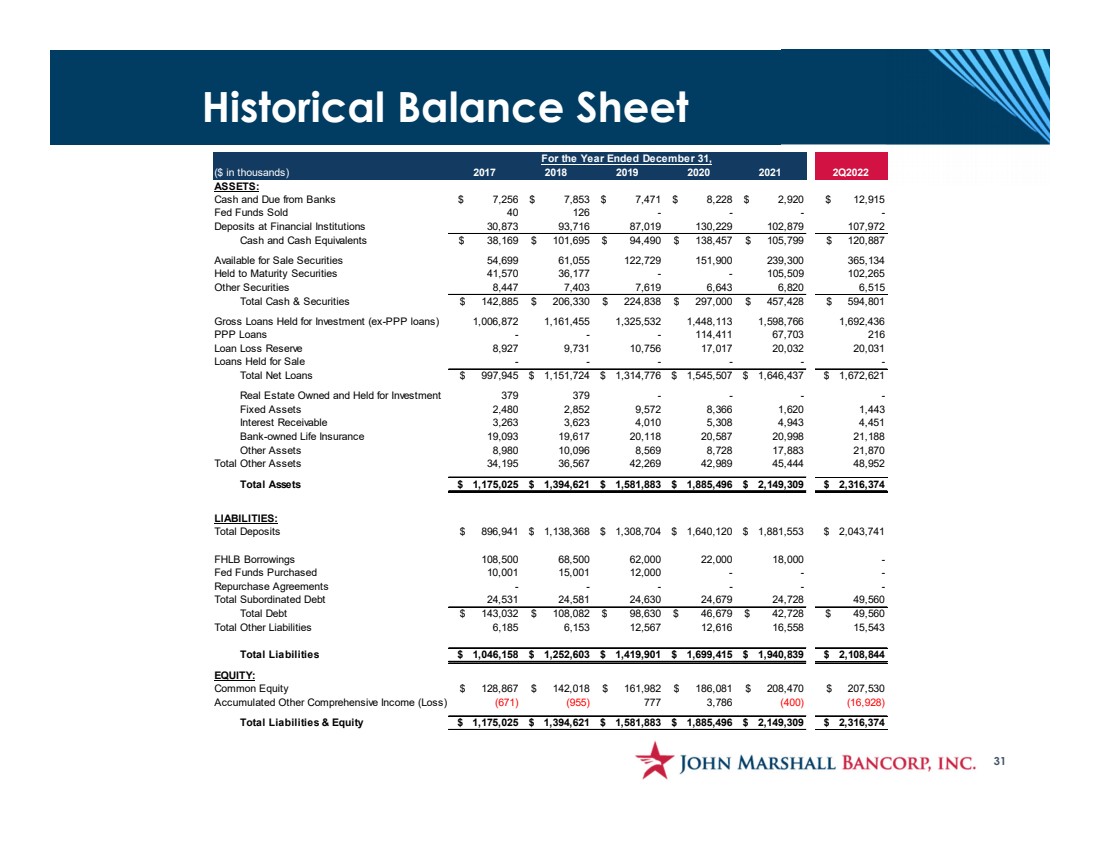
Historical Balance Sheet31 ($ in thousands)201720182019202020212Q2022ASSETS: Cash and Due from Banks $ 7,256 $ 7,853 $ 7,471 $ 8,228 $ 2,920 $ 12,915 Fed Funds Sold 40 126 - - - - Deposits at Financial Institutions 30,873 93,716 87,019 130,229 102,879 107,972 Cash and Cash Equivalents $ 38,169 $ 101,695 $ 94,490 $ 138,457 $ 105,799 $ 120,887 Available for Sale Securities 54,699 61,055 122,729 151,900 239,300 365,134 Held to Maturity Securities 41,570 36,177 - - 105,509 102,265 Other Securities 8,447 7,403 7,619 6,643 6,820 6,515 Total Cash & Securities $ 142,885 $ 206,330 $ 224,838 $ 297,000 $ 457,428 $ 594,801 Gross Loans Held for Investment (ex-PPP loans) 1,006,872 1,161,455 1,325,532 1,448,113 1,598,766 1,692,436 PPP Loans - - - 114,411 67,703 216 Loan Loss Reserve 8,927 9,731 10,756 17,017 20,032 20,031 Loans Held for Sale - - - - - - Total Net Loans $ 997,945 $ 1,151,724 $ 1,314,776 $ 1,545,507 $ 1,646,437 $ 1,672,621 Real Estate Owned and Held for Investment 379 379 - - - - Fixed Assets 2,480 2,852 9,572 8,366 1,620 1,443 Interest Receivable 3,263 3,623 4,010 5,308 4,943 4,451 Bank-owned Life Insurance 19,093 19,617 20,118 20,587 20,998 21,188 Other Assets 8,980 10,096 8,569 8,728 17,883 21,870 Total Other Assets 34,195 36,567 42,269 42,989 45,444 48,952 Total Assets $ 1,175,025 $ 1,394,621 $ 1,581,883 $ 1,885,496 $ 2,149,309 $ 2,316,374 LIABILITIES: Total Deposits $ 896,941 $ 1,138,368 $ 1,308,704 $ 1,640,120 $ 1,881,553 $ 2,043,741 FHLB Borrowings 108,500 68,500 62,000 22,000 18,000 - Fed Funds Purchased 10,001 15,001 12,000 - - - Repurchase Agreements - - - - - - Total Subordinated Debt 24,531 24,581 24,630 24,679 24,728 49,560 Total Debt $ 143,032 $ 108,082 $ 98,630 $ 46,679 $ 42,728 $ 49,560 Total Other Liabilities 6,185 6,153 12,567 12,616 16,558 15,543 Total Liabilities $ 1,046,158 $ 1,252,603 $ 1,419,901 $ 1,699,415 $ 1,940,839 $ 2,108,844 EQUITY: Common Equity $ 128,867 $ 142,018 $ 161,982 $ 186,081 $ 208,470 $ 207,530 Accumulated Other Comprehensive Income (Loss)(671)(955) 777 3,786 (400)(16,928) Total Liabilities & Equity $ 1,175,025 $ 1,394,621 $ 1,581,883 $ 1,885,496 $ 2,149,309 $ 2,316,374 For the Year Ended December 31, |
Historical Income Statement32 Six Months($ in thousands)201720182019202020212Q2022Interest and dividend income49,318$ 57,890$ 68,990$ 72,446$ 74,119$ 39,300$ Interest expense8,793 14,190 20,322 15,607 8,211 4,076 Net interest income40,525$ 43,700$ 48,668$ 56,839$ 65,908$ 35,224$ Provision for loan losses1,380 1,069 1,170 6,217 3,105 — Net interest income after provision for loan losses39,145$ 42,631$ 47,498$ 50,622$ 62,803$ 35,224$ Service charges on deposit accounts228$ 318$ 299$ 237$ 262$ 161$ Bank owned life insurance553 525 501 469 411 190 Other service charges and fees260 384 437 400 477 294 Gains on securities134 - 14 309 10 — Insurance commissions- - 40 55 284 265 Non-qualified deferred compensation MTM- (17) 40 96 194 (391) Other operating income 54 27 4 47 81 4 Total non-interest income1,229$ 1,237$ 1,335$ 1,613$ 1,719$ 523$ Salaries and employee benefits14,820$ 18,327$ 18,012$ 18,167$ 20,411$ 10,682$ Occupancy expense of premises1,843 2,030 2,179 1,950 1,985 975 Furniture and equipment expenses1,183 1,307 1,420 1,626 1,436 666 Other real estate owned expenses20 5 - - - - Other operating expenses6,260 6,853 7,090 7,420 8,430 4,144 Total non-interest expenses24,126$ 28,522$ 28,701$ 29,163$ 32,262$ 16,467$ Net Income before income taxes16,248 15,346 20,132 23,072 32,260 19,280 Income tax expense7,264 3,172 4,211 4,546 6,799 3,724 Net income8,984$ 12,174$ 15,921$ 18,526$ 25,461$ 15,556$ Earnings per share, diluted0.66$ 0.89$ 1.17$ 1.35$ 1.83$ 1.10$ For the Year Ended December 31, |
Contact InformationChristopher W. BergstromPresident and CEOcbergstrom@johnmarshallbank.com (703) 584-08791943 Isaac Newton Square, Suite 100 Reston, Virginia 2019033 |