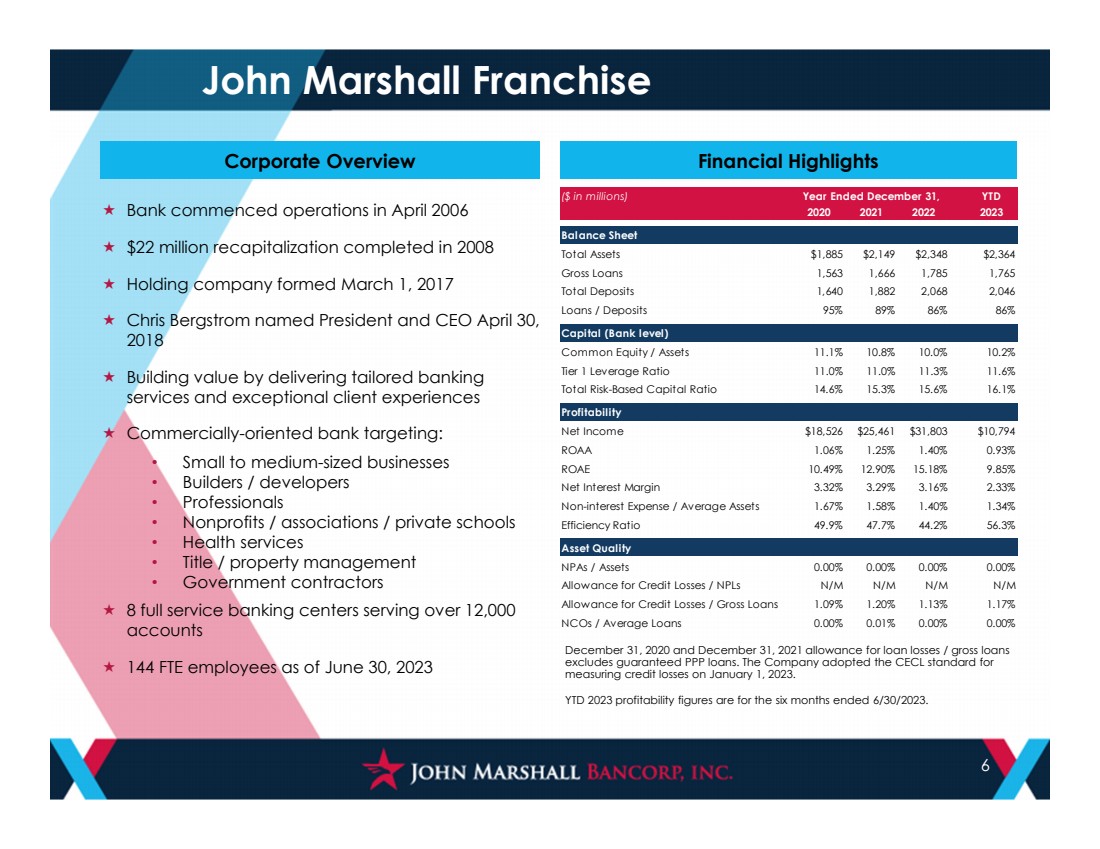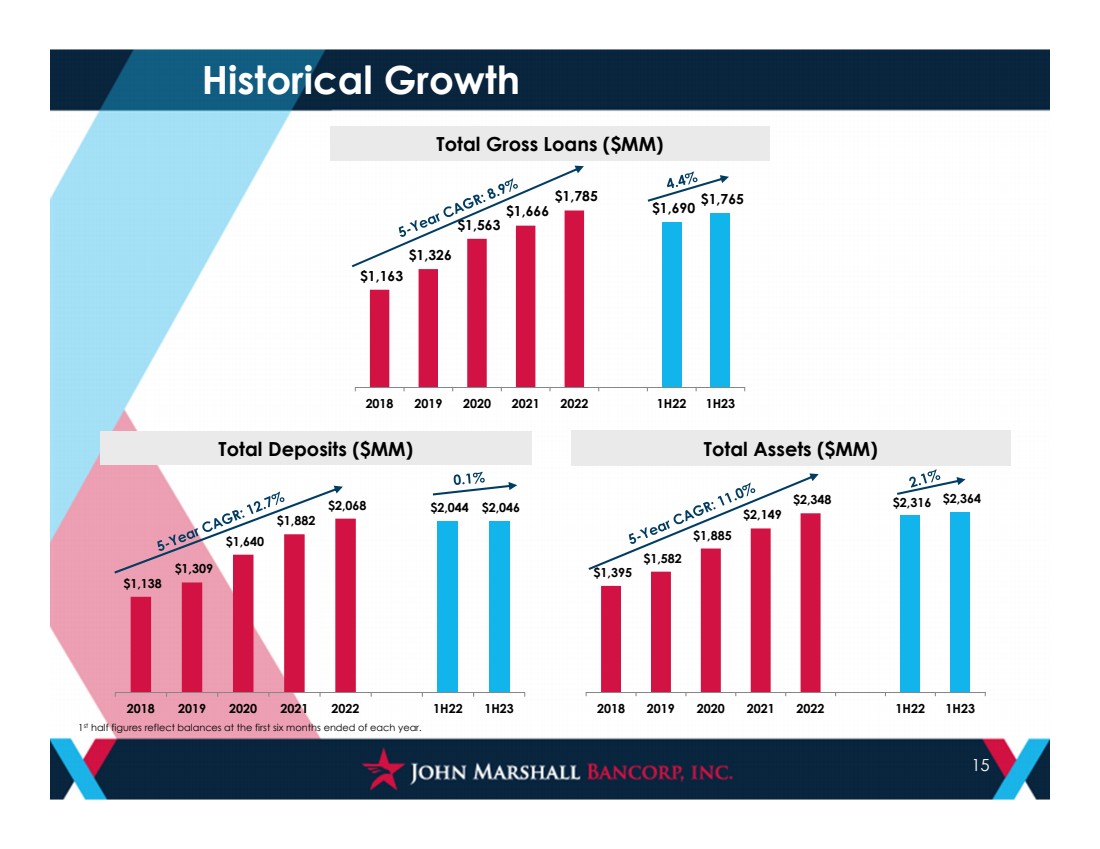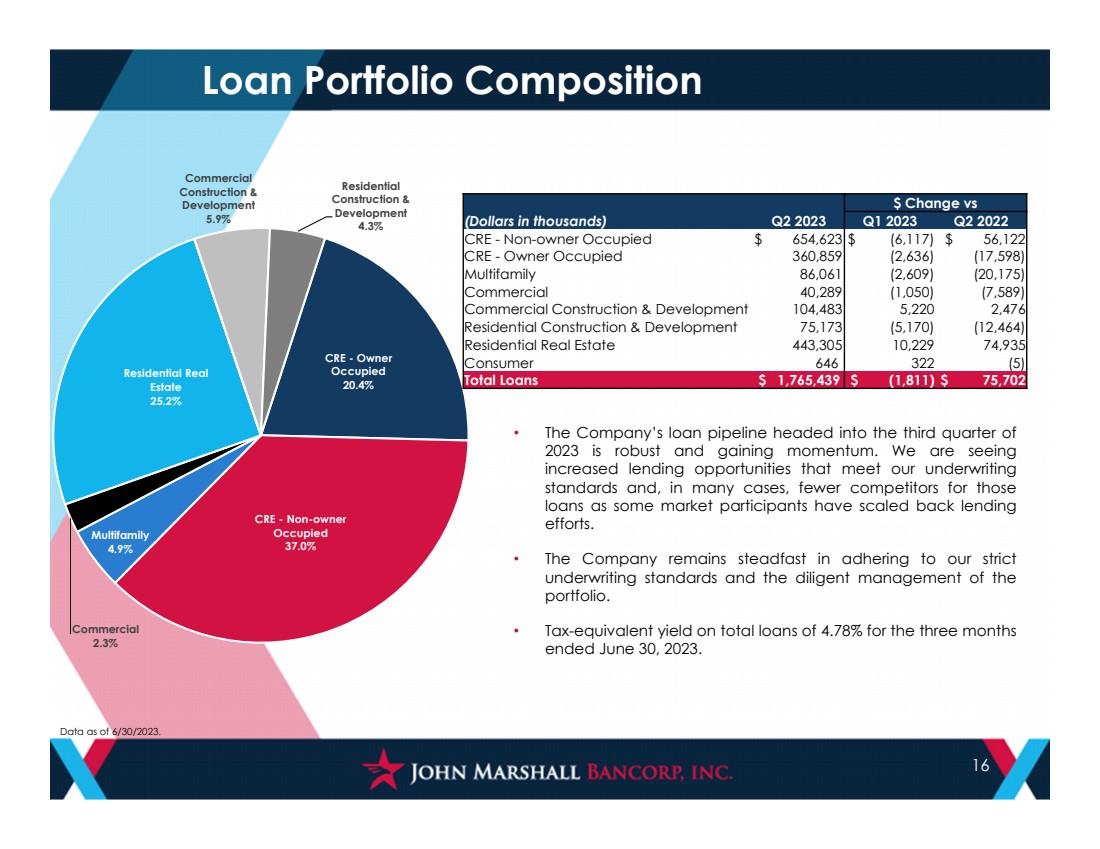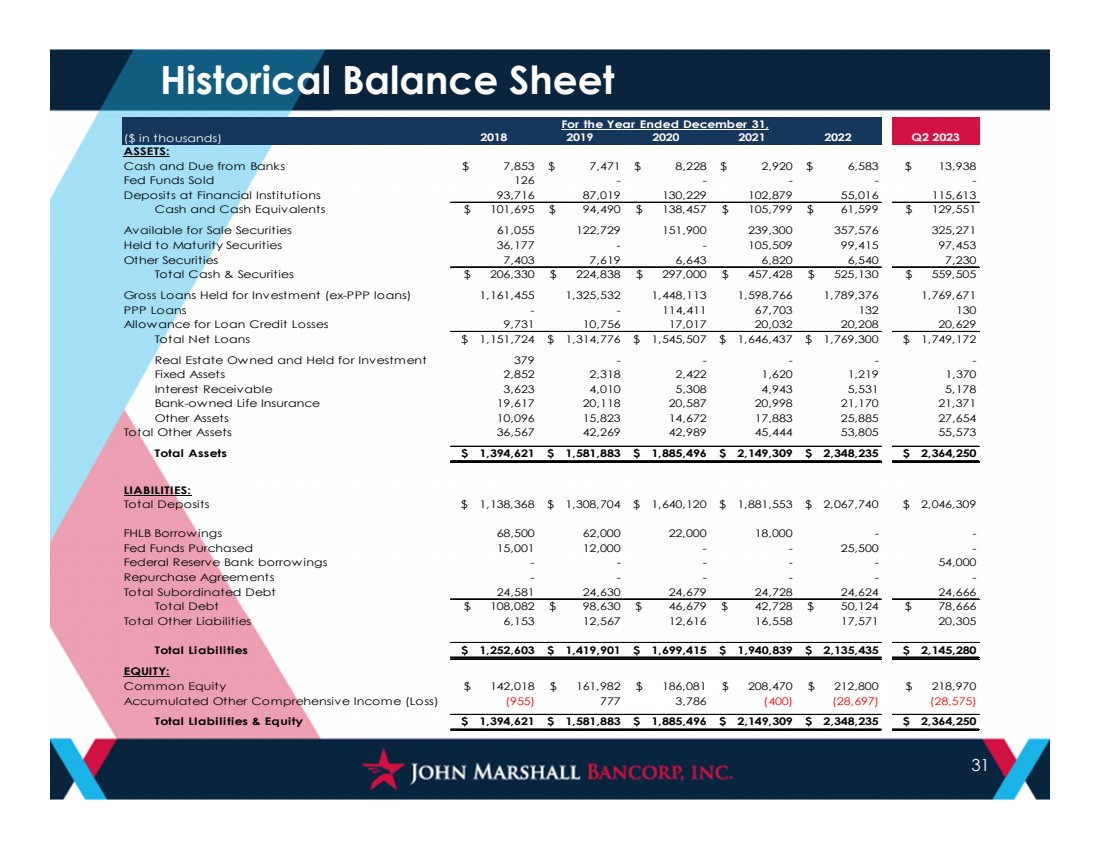
| 31 Historical Balance Sheet ($ in thousands) 2018 2019 2020 2021 2022 Q2 2023 ASSETS: Cash and Due from Banks $ 7,853 $ 7,471 $ 8,228 $ 2,920 $ 6,583 $ 13,938 Fed Funds Sold 126 - - - - - Deposits at Financial Institutions 93,716 87,019 130,229 102,879 55,016 115,613 Cash and Cash Equivalents $ 101,695 $ 94,490 $ 138,457 $ 105,799 $ 61,599 $ 129,551 Available for Sale Securities 61,055 122,729 151,900 239,300 357,576 325,271 Held to Maturity Securities 36,177 - - 105,509 99,415 97,453 Other Securities 7,403 7,619 6,643 6,820 6,540 7,230 Total Cash & Securities $ 206,330 $ 224,838 $ 297,000 $ 457,428 $ 525,130 $ 559,505 Gross Loans Held for Investment (ex-PPP loans) 1,161,455 1,325,532 1,448,113 1,598,766 1,789,376 1,769,671 PPP Loans - - 114,411 67,703 132 130 Allowance for Loan Credit Losses 9,731 10,756 17,017 20,032 20,208 20,629 Total Net Loans $ 1,151,724 $ 1,314,776 $ 1,545,507 $ 1,646,437 $ 1,769,300 $ 1,749,172 Real Estate Owned and Held for Investment 379 - - - - - Fixed Assets 2,852 2,318 2,422 1,620 1,219 1,370 Interest Receivable 3,623 4,010 5,308 4,943 5,531 5,178 Bank-owned Life Insurance 19,617 20,118 20,587 20,998 21,170 21,371 Other Assets 10,096 15,823 14,672 17,883 25,885 27,654 Total Other Assets 36,567 42,269 42,989 45,444 53,805 55,573 Total Assets $ 1,394,621 $ 1,581,883 $ 1,885,496 $ 2,149,309 $ 2,348,235 $ 2,364,250 LIABILITIES: Total Deposits $ 1,138,368 $ 1,308,704 $ 1,640,120 $ 1,881,553 $ 2,067,740 $ 2,046,309 FHLB Borrowings 68,500 62,000 22,000 18,000 - - Fed Funds Purchased 15,001 12,000 - - 25,500 - Federal Reserve Bank borrowings - - - - - 54,000 Repurchase Agreements - - - - - - Total Subordinated Debt 24,581 24,630 24,679 24,728 24,624 24,666 Total Debt $ 108,082 $ 98,630 $ 46,679 $ 42,728 $ 50,124 $ 78,666 Total Other Liabilities 6,153 12,567 12,616 16,558 17,571 20,305 Total Liabilities $ 1,252,603 $ 1,419,901 $ 1,699,415 $ 1,940,839 $ 2,135,435 $ 2,145,280 EQUITY: Common Equity $ 142,018 $ 161,982 $ 186,081 $ 208,470 $ 212,800 $ 218,970 Accumulated Other Comprehensive Income (Loss) (955) 777 3,786 (400) (28,697) (28,575) Total LIabilities & Equity $ 1,394,621 $ 1,581,883 $ 1,885,496 $ 2,149,309 $ 2,348,235 $ 2,364,250 For the Year Ended December 31, |