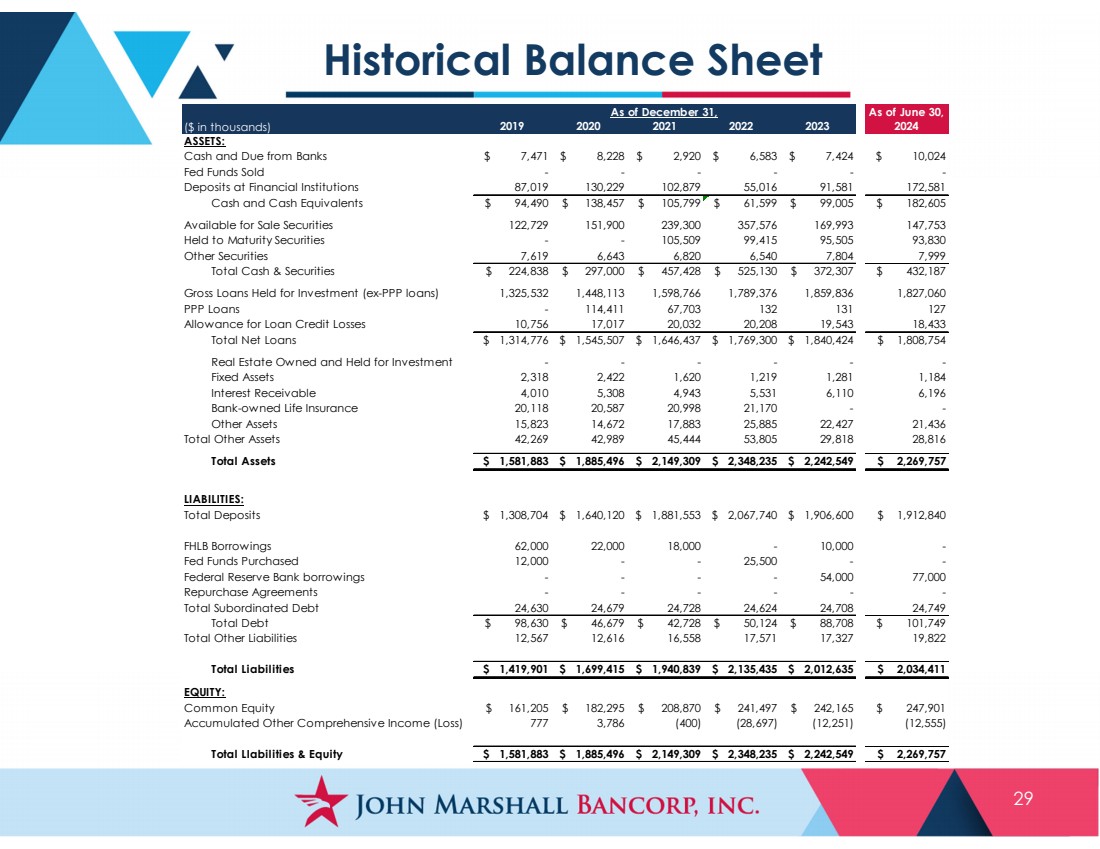
| 29 Historical Balance Sheet As of June 30, ($ in thousands) 2019 2020 2021 2022 2023 2024 ASSETS: Cash and Due from Banks $ 7,471 $ 8,228 $ 2,920 $ 6,583 $ 7,424 $ 10,024 Fed Funds Sold - - - - - - Deposits at Financial Institutions 87,019 130,229 102,879 55,016 91,581 172,581 Cash and Cash Equivalents $ 94,490 $ 138,457 $ 105,799 $ 61,599 $ 99,005 $ 182,605 Available for Sale Securities 122,729 151,900 239,300 357,576 169,993 147,753 Held to Maturity Securities - - 105,509 99,415 95,505 93,830 Other Securities 7,619 6,643 6,820 6,540 7,804 7,999 Total Cash & Securities $ 224,838 $ 297,000 $ 457,428 $ 525,130 $ 372,307 $ 432,187 Gross Loans Held for Investment (ex-PPP loans) 1,325,532 1,448,113 1,598,766 1,789,376 1,859,836 1,827,060 PPP Loans - 114,411 67,703 132 131 127 Allowance for Loan Credit Losses 10,756 17,017 20,032 20,208 19,543 18,433 Total Net Loans $ 1,314,776 $ 1,545,507 $ 1,646,437 $ 1,769,300 $ 1,840,424 $ 1,808,754 Real Estate Owned and Held for Investment - - - - - - Fixed Assets 2,318 2,422 1,620 1,219 1,281 1,184 Interest Receivable 4,010 5,308 4,943 5,531 6,110 6,196 Bank-owned Life Insurance 20,118 20,587 20,998 21,170 - - Other Assets 15,823 14,672 17,883 25,885 22,427 21,436 Total Other Assets 42,269 42,989 45,444 53,805 29,818 28,816 Total Assets $ 1,581,883 $ 1,885,496 $ 2,149,309 $ 2,348,235 $ 2,242,549 $ 2,269,757 LIABILITIES: Total Deposits $ 1,308,704 $ 1,640,120 $ 1,881,553 $ 2,067,740 $ 1,906,600 $ 1,912,840 FHLB Borrowings 62,000 22,000 18,000 - 10,000 - Fed Funds Purchased 12,000 - - 25,500 - - Federal Reserve Bank borrowings - - - - 54,000 77,000 Repurchase Agreements - - - - - - Total Subordinated Debt 24,630 24,679 24,728 24,624 24,708 24,749 Total Debt $ 98,630 $ 46,679 $ 42,728 $ 50,124 $ 88,708 $ 101,749 Total Other Liabilities 12,567 12,616 16,558 17,571 17,327 19,822 Total Liabilities $ 1,419,901 $ 1,699,415 $ 1,940,839 $ 2,135,435 $ 2,012,635 $ 2,034,411 EQUITY: Common Equity $ 161,205 $ 182,295 $ 208,870 $ 241,497 $ 242,165 $ 247,901 Accumulated Other Comprehensive Income (Loss) 777 3,786 (400) (28,697) (12,251) (12,555) Total LIabilities & Equity $ 1,581,883 $ 1,885,496 $ 2,149,309 $ 2,348,235 $ 2,242,549 $ 2,269,757 As of December 31, |