UNITED STATES
SECURITIES AND EXCHANGE COMMISSION
Washington, D.C. 20549
FORM N-CSR
CERTIFIED SHAREHOLDER REPORT OF REGISTERED
MANAGEMENT INVESTMENT COMPANIES
| Investment Company Act file number | 811-23305 | |||||||||||||||||||
| AMERICAN CENTURY ETF TRUST | ||||||||||||||||||||
| (Exact name of registrant as specified in charter) | ||||||||||||||||||||
| 4500 MAIN STREET, KANSAS CITY, MISSOURI | 64111 | |||||||||||||||||||
| (Address of principal executive offices) | (Zip Code) | |||||||||||||||||||
| JOHN PAK 4500 MAIN STREET, KANSAS CITY, MISSOURI 64111 | ||||||||||||||||||||
| (Name and address of agent for service) | ||||||||||||||||||||
| Registrant’s telephone number, including area code: | 816-531-5575 | |||||||||||||||||||
| Date of fiscal year end: | 08-31 | |||||||||||||||||||
| Date of reporting period: | 08-31-2022 | |||||||||||||||||||
ITEM 1. REPORTS TO STOCKHOLDERS.
(a) Provided under separate cover.

| Annual Report | |||||
| August 31, 2022 | |||||
American Century® Diversified Corporate Bond ETF (KORP) | |||||
American Century® Diversified Municipal Bond ETF (TAXF) | |||||
American Century® Emerging Markets Bond ETF (AEMB) | |||||
American Century® Multisector Income ETF (MUSI) | |||||
American Century® Select High Yield ETF (AHYB) | |||||
| Table of Contents | ||
| President’s Letter | |||||
| Diversified Corporate Bond ETF | |||||
| Performance | |||||
| Portfolio Commentary | |||||
| Fund Characteristics | |||||
| Diversified Municipal Bond ETF | |||||
| Performance | |||||
| Portfolio Commentary | |||||
| Fund Characteristics | |||||
| Emerging Markets Bond ETF | |||||
| Performance | |||||
| Portfolio Commentary | |||||
| Fund Characteristics | |||||
| Multisector Income ETF | |||||
| Performance | |||||
| Portfolio Commentary | |||||
| Fund Characteristics | |||||
| Select High Yield ETF | |||||
| Performance | |||||
| Portfolio Commentary | |||||
| Fund Characteristics | |||||
| Shareholder Fee Examples | |||||
| Schedules of Investments | |||||
| Statements of Assets and Liabilities | |||||
| Statements of Operations | |||||
| Statements of Changes in Net Assets | |||||
| Notes to Financial Statements | |||||
| Financial Highlights | |||||
| Report of Independent Registered Public Accounting Firm | |||||
| Management | |||||
| Approval of Management and Subadvisory Agreements | |||||
| Liquidity Risk Management Program | |||||
| Additional Information | |||||
Any opinions expressed in this report reflect those of the author as of the date of the report, and do not necessarily represent the opinions of American Century Investments® or any other person in the American Century Investments organization. Any such opinions are subject to change at any time based upon market or other conditions and American Century Investments disclaims any responsibility to update such opinions. These opinions may not be relied upon as investment advice and, because investment decisions made by American Century Investments funds are based on numerous factors, may not be relied upon as an indication of trading intent on behalf of any American Century Investments fund. Security examples are used for representational purposes only and are not intended as recommendations to purchase or sell securities. Performance information for comparative indices and securities is provided to American Century Investments by third party vendors. To the best of American Century Investments’ knowledge, such information is accurate at the time of printing.
| President’s Letter | ||
 Jonathan Thomas
Dear Investor:
Thank you for reviewing this annual report for the period ended August 31, 2022. Annual reports
help convey important information about fund returns, including market factors that affected
performance. For additional investment insights, please visit americancenturyetfs.com.
Mounting Market Challenges Hampered Performance
Asset class performance weakened dramatically during the funds’ fiscal year. In late 2021,
generally upbeat economic activity and corporate earnings supported gains for most U.S. and
global stock indices. Returns generally remained positive despite rapidly rising inflation and waning
central bank support—factors that had started to weigh on fixed-income indices.
By early 2022, the market climate shifted quickly. Inflation, which was already at multiyear highs,
rose to levels last seen in the early 1980s. Massive fiscal and monetary support unleashed during
the pandemic was partly to blame. In addition, escalating energy prices, supply chain breakdowns
and labor market shortages further aggravated inflation in the U.S. and other developed markets.
Russia’s invasion of Ukraine in February also exacerbated global inflationary pressures.
The Bank of England launched its inflation-fighting campaign in December and continued to lift
rates through period-end. The Federal Reserve responded to surging inflation in March, launching
an aggressive rate-hike campaign and ending its asset purchase program. Policymakers indicated
taming inflation remains their priority, even as the U.S. economy contracted in 2022’s first two
quarters. Facing record-high inflation in the eurozone, the European Central Bank in July embarked
on its first rate-hike effort in 11 years.
The combination of sharply elevated inflation, tighter monetary policy, geopolitical strife and weak
economies triggered sharp market volatility and fueled global recession fears. Against this
backdrop, most U.S. and global stock and bond indices declined sharply for the reporting period.
Staying Disciplined in Uncertain Times
We expect market volatility to linger as investors navigate a complex environment of high inflation,
rising interest rates and economic uncertainty. In addition, Russia’s invasion of Ukraine
complicates an increasingly tense geopolitical backdrop and threatens Europe’s winter energy
supply. We will continue to monitor the broad backdrop and its influence on financial markets.
We appreciate your confidence in us during these extraordinary times. Our firm has a long history
of helping clients weather unpredictable markets, and we’re confident we will continue to meet
today’s challenges.
Sincerely,

Jonathan Thomas
President and Chief Executive Officer
American Century Investments
2
| Performance | ||
| Diversified Corporate Bond ETF (KORP) | ||||||||||||||||||||
| Total Returns as of August 31, 2022 | Average Annual Returns | |||||||||||||||||||
| 1 year | Since Inception | Inception Date | ||||||||||||||||||
| Net Asset Value | -10.30% | 1.10% | 1/11/2018 | |||||||||||||||||
| Market Price | -10.62% | 1.03% | 1/11/2018 | |||||||||||||||||
| Bloomberg U.S. Intermediate Corporate Bond Index | -9.71% | 1.46% | — | |||||||||||||||||
Market price is determined using the bid/ask midpoint at 4:00 p.m. Eastern time, when the net asset value (NAV) is typically calculated. Market performance does not represent the returns you would receive if you traded shares at other times. NAV prices are used to calculate market price performance prior to the date when the fund first traded on the NYSE Arca, Inc.
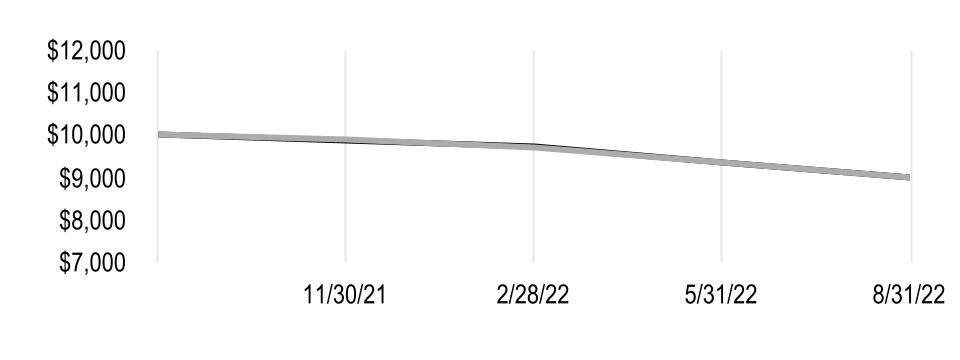
| Growth of $10,000 Over Life of Fund | ||
| $10,000 investment made January 11, 2018 | ||
| Value on August 31, 2022 | |||||
| Net Asset Value — $10,520 | |||||
| Bloomberg U.S. Intermediate Corporate Bond Index — $10,694 | |||||
| Total Annual Fund Operating Expenses | |||||||||||||||||
| 0.29% | |||||||||||||||||
The total annual fund operating expenses shown is as stated in the fund’s prospectus current as of the date of this report. The prospectus may vary from the expense ratio shown elsewhere in this report because it is based on a different time period, includes acquired fund fees and expenses, and, if applicable, does not include fee waivers or expense reimbursements.
Data presented reflect past performance. Past performance is no guarantee of future results. Current performance may be higher or lower than the performance shown. Total returns for periods less than one year are not annualized. Investment return and principal value will fluctuate, and redemption value may be more or less than original cost. Data assumes reinvestment of dividends and capital gains, and none of the charts reflect the deduction of taxes that a shareholder would pay on fund distributions or the redemption of fund shares. To obtain performance data current to the most recent month end, please call 1-800-345-6488 or visit americancenturyetfs.com. For additional information about the funds, please consult the prospectus.
3
| Portfolio Commentary | ||
Portfolio Managers: Charles Tan, Jason Greenblath, Jeffrey Houston, Gavin Fleischman and Le Tran
Fund Strategy
American Century Diversified Corporate Bond ETF seeks to offer enhanced return potential versus passive capitalization-weighted corporate bond portfolios. The fund employs a holistic approach, emphasizing investment-grade credits, while dynamically allocating a portion of the portfolio to high-yield securities to balance interest rate and credit risk. The fund seeks to maintain a duration range of three to seven years, which we believe should mitigate interest rate risk without sacrificing yield.
The fund is an actively managed exchange-traded fund (ETF) that does not seek to replicate the performance of a specific index. To determine whether to buy or sell a security, we consider several factors, including fund requirements and standards, economic conditions, alternative investments, interest rates and various credit metrics.
Performance Review
The fund returned -10.62% on a market price basis for the 12-month period ended August 31, 2022. On a net asset value (NAV) basis, the fund returned -10.30%. For the same time period, the Bloomberg U.S. Intermediate Corporate Bond Index, the fund’s benchmark index, returned -9.71%. The fund’s NAV and market price returns reflect fees and operating expenses, while the index return does not.
Performance in the corporate bond market downshifted swiftly in early 2022 amid escalating volatility. Inflation, which had steadily climbed through 2021, proved persistent as it soared to multidecade highs. Russia’s invasion of Ukraine in February contributed to the mounting market volatility and risk-off sentiment. In March, the Federal Reserve (Fed) adopted an increasingly aggressive rate-hike campaign that drove Treasury yields sharply higher and credit spreads wider through period-end.
Security Selection, Sector Allocation Detracted from Relative Performance
Against this challenging backdrop, most U.S. bond sectors declined sharply for the 12-month period. Within the fund, security selection and sector allocation detracted from performance versus the index. Security selection among financial institutions was a main detractor, largely due to positions in real estate investment trusts, finance companies and life insurers. An overweight position in finance companies versus the index for much of the reporting period also detracted from returns. Security selection within the transportation and building materials sectors also weighed on relative results.
On a positive note, our selections in the gaming, telecommunications, utilities, railroads and health insurance industries provided a boost to the fund’s relative performance. In addition, our efforts in the second half of the reporting period to lift the portfolio’s overall credit quality aided results. For example, we reduced our overweight to securities with BBB credit ratings in favor of higher-quality bonds. We also focused on more-defensive industries, such as utilities, and moved out of lower-quality finance names into higher-quality banking bonds.
High-Yield Strategy Helped
The fund’s out-of-index exposure to high-yield corporates, which generally fared better than investment-grade corporates for the period, boosted relative results. However, given our more-defensive sentiment and expectations for additional spread widening, we significantly reduced the fund’s high-yield allocation, which started the period at approximately 14%. By period-end, approximately 3% of the portfolio was invested in high-yield corporates, and we more recently hedged that exposure with credit default swaps.
4
Elsewhere, our duration and yield curve positioning had a modestly positive influence on performance for the 12 months. We began the reporting period with a shorter duration than the index. As rates began to rise, we shifted to a close-to-neutral duration in the spring and generally maintained that posture through period-end.
Portfolio Positioning
Although we believe the markets have largely priced in the Fed’s remaining rate hikes, we don’t expect market volatility to quickly subside. The Fed faces a difficult task as it attempts to tame inflation without triggering an extended economic downturn. We believe investors’ responses to this uncertain economic and inflation backdrop will continue to generate volatility.
We are maintaining a nimble and opportunistic approach, while remaining defensive, as we navigate the complex backdrop of elevated inflation, an aggressive Fed and a weak economy. We continue to look for opportunities in which investment-grade issuers are still deleveraging balance sheets and can sustain cash flow and margins. We remain mindful of event risks, including rising leveraged mergers and acquisitions activity, spin-offs and share buybacks that often come at the detriment of bondholders.
High inflation and slowing consumer demand are keeping us more patient in the high-yield arena. Also, the uncertain economic climate is placing a longer timeline on certain rising stars moving into the investment-grade universe. We’re awaiting better entry points but still believe select high-yield holdings should be well positioned once the credit environment improves.
5
| Fund Characteristics | ||
| AUGUST 31, 2022 | |||||
| Diversified Corporate Bond ETF | |||||
| Types of Investments in Portfolio | % of net assets | ||||
| Corporate Bonds | 95.3% | ||||
| U.S. Treasury Securities | 2.1% | ||||
| Municipal Securities | 0.3% | ||||
| Short-Term Investments | 4.3% | ||||
| Other Assets and Liabilities | (2.0)% | ||||
6
| Performance | ||
| Diversified Municipal Bond ETF (TAXF) | |||||||||||||||||||||||
| Total Returns as of August 31, 2022 | Average Annual Returns | ||||||||||||||||||||||
| 1 year | Since Inception | Inception Date | |||||||||||||||||||||
| Net Asset Value | -8.82% | 1.97% | 9/10/2018 | ||||||||||||||||||||
| Market Price | -9.04% | 1.95% | 9/10/2018 | ||||||||||||||||||||
| S&P National AMT-Free Municipal Bond Index | -8.34% | 1.51% | — | ||||||||||||||||||||
Market price is determined using the bid/ask midpoint at 4:00 p.m. Eastern time, when the net asset value (NAV) is typically calculated. Market performance does not represent the returns you would receive if you traded shares at other times. NAV prices are used to calculate market price performance prior to the date when the fund first traded on the NYSE Arca, Inc.
| Growth of $10,000 Over Life of Fund | ||
| $10,000 investment made September 10, 2018 | ||
| Value on August 31, 2022 | |||||
| Net Asset Value — $10,806 | |||||
| S&P National AMT-Free Municipal Bond Index — $10,613 | |||||
| Total Annual Fund Operating Expenses | |||||||||||||||||
| 0.29% | |||||||||||||||||
The total annual fund operating expenses shown is as stated in the fund’s prospectus current as of the date of this report. The prospectus may vary from the expense ratio shown elsewhere in this report because it is based on a different time period, includes acquired fund fees and expenses, and, if applicable, does not include fee waivers or expense reimbursements.
Data presented reflect past performance. Past performance is no guarantee of future results. Current performance may be higher or lower than the performance shown. Total returns for periods less than one year are not annualized. Investment return and principal value will fluctuate, and redemption value may be more or less than original cost. Data assumes reinvestment of dividends and capital gains, and none of the charts reflect the deduction of taxes that a shareholder would pay on fund distributions or the redemption of fund shares. To obtain performance data current to the most recent month end, please call 1-800-345-6488 or visit americancenturyetfs.com. For additional information about the funds, please consult the prospectus.
7
| Portfolio Commentary | ||
Portfolio Managers: Joseph Gotelli and Alan Kruss
Steven Permut left the portfolio management team April 30, 2022, ahead of his June 30, 2022, retirement from American Century Investments.
Fund Strategy
American Century Diversified Municipal Bond ETF seeks to provide consistent tax-free income. As an actively managed exchange-traded fund (ETF) that does not seek to replicate the performance of a specific index, the fund employs a research-driven process to select holdings. The fund draws from across the municipal bond (muni) universe and adjusts exposure depending on prevailing market conditions. We dynamically allocate holdings to investment-grade issues and may include up to 35% in high-yield issues when the risk/reward balance is attractive. In selecting securities, we employ an active, time-tested process designed to identify attractive issues with low default risk, aiming to align risk exposures with our highest-conviction ideas.
Performance Review
The fund returned -9.04% on a market price basis for the 12 months ended August 31, 2022. On a net asset value (NAV) basis, the fund returned -8.82%. For the same time period, the S&P National AMT-Free Municipal Bond Index, the fund’s benchmark index, returned -8.34%. The fund’s NAV and market price returns reflect fees and operating expenses, while the index return does not.
After ending 2021 with weakening but still positive performance, the broad muni market faced mounting macroeconomic-driven challenges through the rest of the reporting period. Amid surging inflation, hawkish Federal Reserve (Fed) policy, rising interest rates, mounting recession risk and sharp market volatility, the fund and index declined. Additionally, accelerating investor outflows from muni funds as market volatility escalated added to the difficult backdrop.
Security Selection, Sector Allocations Weighed on Results
Security selection was the main driver of the fund’s underperformance versus the index. Selections in the hospital, state general obligation (GO) bond and transportation sectors detracted and overwhelmed positive results in the special tax, local GO bond and charter school sectors.
Our sector allocation decisions also detracted from performance. Out-of-index positions in corporate munis and continuing care retirement communities and an overweight position versus the index in charter schools weighed on performance. Underweight positions in local GO and public power bonds also hindered results. Meanwhile, out-of-index positions in the hospital and tobacco sectors and an underweight in special tax bonds aided relative results, but not enough to offset the detractors.
Anticipating a more challenging economic environment, we began reducing the fund’s exposure to credit risk in late 2021. This effort pushed the fund’s exposure to out-of-index high-yield munis from approximately 17% on August 31, 2021, to approximately 10% a year later.
Duration Strategy Boosted Results
Our duration positioning had a positive influence on relative performance. Given our expectations for rates to rise throughout the period, we maintained a shorter-than-index duration. This positioning aided results as Fed tightening and surging inflation drove rates higher.
8
Portfolio Positioning
Looking ahead, we believe investors’ adjustments to the hawkish Fed, inflation uncertainties and geopolitical unrest will continue to roil fixed-income markets. Yet, we also believe the markets have largely accounted for significant rate increases from the Fed. We believe investor flows into muni funds will remain volatile until total returns stabilize. Eventually, attractive tax-exempt yields and moderating volatility should provide a tailwind to investor demand.
While seeking to manage the anticipated market volatility, we plan to maintain a short to neutral duration posture. Additionally, we plan to focus new positions on higher-quality issuers and sectors. These may include securities in the hospital, gas-prepaid, development district, higher education and retirement community sectors. Prudent security selection will guide our efforts among lower-rated issuers and sectors. As always, fundamental credit research drives our investment decisions.
9
| Fund Characteristics | ||
| AUGUST 31, 2022 | |||||
| Diversified Municipal Bond ETF | |||||
| Types of Investments in Portfolio | % of net assets | ||||
| Municipal Securities | 97.2% | ||||
| Short-Term Investments | 2.6% | ||||
| Other Assets and Liabilities | 0.2% | ||||
| Top Five States and Territories | % of net assets | ||||
| California | 11.0% | ||||
| New York | 10.2% | ||||
| Texas | 8.9% | ||||
| Florida | 7.4% | ||||
| Illinois | 5.5% | ||||
| Top Five Sectors | % of fund investments | ||||
| Special Tax | 15% | ||||
| General Obligation (GO) - Local | 12% | ||||
| Water & Sewer | 10% | ||||
| General Obligation (GO) - State | 10% | ||||
| Hospital | 10% | ||||
10
| Performance | ||
| Emerging Markets Bond ETF (AEMB) | |||||||||||||||||||||||
| Total Returns as of August 31, 2022 | Average Annual Returns | ||||||||||||||||||||||
| 1 year | Since Inception | Inception Date | |||||||||||||||||||||
| Net Asset Value | -20.60% | -17.19% | 6/29/2021 | ||||||||||||||||||||
| Market Price | -20.99% | -17.56% | 6/29/2021 | ||||||||||||||||||||
| JP Morgan EMBI Global Diversified Index | -20.82% | -17.02% | — | ||||||||||||||||||||
Market price is determined using the bid/ask midpoint at 4:00 p.m. Eastern time, when the net asset value (NAV) is typically calculated. Market performance does not represent the returns you would receive if you traded shares at other times. NAV prices are used to calculate market price performance prior to the date when the fund first traded on the NYSE Arca, Inc.
| Growth of $10,000 Over Life of Fund | ||
| $10,000 investment made June 29, 2021 | ||
| Value on August 31, 2022 | |||||
| Net Asset Value — $8,015 | |||||
| JP Morgan EMBI Global Diversified Index — $8,035 | |||||
| Total Annual Fund Operating Expenses | |||||||||||||||||
| 0.39% | |||||||||||||||||
The total annual fund operating expenses shown is as stated in the fund’s prospectus current as of the date of this report. The prospectus may vary from the expense ratio shown elsewhere in this report because it is based on a different time period, includes acquired fund fees and expenses, and, if applicable, does not include fee waivers or expense reimbursements.
Data presented reflect past performance. Past performance is no guarantee of future results. Current performance may be higher or lower than the performance shown. Total returns for periods less than one year are not annualized. Investment return and principal value will fluctuate, and redemption value may be more or less than original cost. Data assumes reinvestment of dividends and capital gains, and none of the charts reflect the deduction of taxes that a shareholder would pay on fund distributions or the redemption of fund shares. To obtain performance data current to the most recent month end, please call 1-800-345-6488 or visit americancenturyetfs.com. For additional information about the funds, please consult the prospectus.
11
| Portfolio Commentary | ||
Portfolio Managers: John Lovito, Thomas Youn and Rajat Ahuja
Effective May 13, 2022, Rajat Ahuja joined the fund’s portfolio management team, and Alessandra Alecci left the team.
Fund Strategy
American Century Emerging Markets Bond ETF seeks to offer enhanced yield potential versus passive capitalization-weighted emerging markets bond portfolios. The fund employs a holistic approach, emphasizing sovereign credits, while dynamically allocating a portion of the portfolio to corporate securities. The fund integrates fundamental research, quantitative analysis and qualitative assessments. This process considers multiple inputs, such as macroeconomic factors and issuer analysis, in a systematically managed portfolio that includes investment-grade and high-yield securities. The fund strives to mitigate foreign securities risk, emerging markets risk, currency risk and sovereign debt risk, while seeking to balance interest rate risk and credit risk.
The fund is an actively managed exchange-traded fund (ETF) that does not seek to replicate the performance of a specific index. To determine whether to buy or sell a security, we consider several factors, including fund requirements and standards, economic conditions, alternative investments, interest rates and various credit metrics.
Performance Review
The fund returned -20.99% on a market price basis for the 12-month period ended August 31, 2022. On a net asset value (NAV) basis, the fund returned -20.60%. For the same time period, the JP Morgan EMBI Global Diversified Index, the fund’s benchmark index, returned -20.82%. The fund’s NAV and market price returns reflect fees and operating expenses, while the index return does not.
Widespread Turbulence Hampered Results
Mounting market unrest had a material impact on the financial markets and the fund during most of the reporting period. Volatility began brewing in early 2022, as the Federal Reserve (Fed) pivoted to hawkish policy amid surging inflation. Market turbulence escalated in February, as Russia’s invasion of Ukraine triggered a sharp sell-off among global risk assets, including emerging markets bonds.
Soaring inflation, increasingly aggressive central bank tightening, ongoing geopolitical tensions and heightened volatility persisted through period-end. The resulting risk-off spiral weighed on performance across global fixed-income markets.
Managing Riskiest Sovereign Exposure Buffered Losses
Our use of credit default swaps to hedge exposure to Russian sovereign debt helped cushion the market volatility in the wake of Russia’s invasion of Ukraine. However, our corporate exposure in Russia and Ukraine hampered results. We exited our Russian holdings in March, ahead of Russia’s removal from the major emerging markets indices.
We also exited our positions in Ukrainian corporates prior to the invasion. By late spring, we reentered the Ukraine market, purchasing attractively priced sovereign securities on expectations for the war to conclude fairly quickly. Despite the lingering conflict, we continued to hold the securities through August, given their appealing purchase price.
Also, in response to broader non-U.S. risk aversion, we exited positions in select sovereigns at opportune times. For example, we cut exposure to several troubled spots, including Sri Lanka and Lebanon. We also successfully exited an oil and gas corporate holding in Ghana.
12
Portfolio Positioning
In our view, meaningful improvement in emerging markets debt hinges on U.S. inflation and interest rates stabilizing and growth in China improving. If the Fed is unable to manage a soft landing and recession fears escalate, emerging markets debt may continue to struggle as risk appetites further deteriorate. Meanwhile, unless China revises its zero-COVID-19 policy, we expect resulting shutdowns and manufacturing weakness to curb global growth and dampen demand for commodities.
Given these challenges, de-risking remains an overall theme. We expect to reduce the portfolio’s exposure to lower-quality securities, while moving into higher-quality sovereigns and quasi-sovereigns. For example, we are considering investments in Middle Eastern commodity-related securities, which generally are higher-rated bonds.
In addition, Central American sovereigns and corporates remain attractive, including select positions in Panama, Guatemala and the Dominican Republic. We are avoiding potential political hot spots in the region, particularly those facing upcoming elections or other turbulence.
On a sector basis, we continue to modestly overweight the oil and gas and metals and mining sectors, focusing on higher-rated issues. We also favor defensive sectors, such as utilities and telecommunications.
13
| Fund Characteristics | ||
| AUGUST 31, 2022 | |||||
| Emerging Markets Bond ETF | |||||
| Types of Investments in Portfolio | % of net assets | ||||
| Corporate Bonds | 48.2% | ||||
| Sovereign Governments and Agencies | 35.4% | ||||
| U.S. Treasury Securities | 5.4% | ||||
| Preferred Stocks | 2.1% | ||||
| Short-Term Investments | 8.2% | ||||
| Other Assets and Liabilities | 0.7% | ||||
14
| Performance | ||
| Multisector Income ETF (MUSI) | |||||||||||||||||||||||
| Total Returns as of August 31, 2022 | Average Annual Returns | ||||||||||||||||||||||
| 1 year | Since Inception | Inception Date | |||||||||||||||||||||
| Net Asset Value | -9.60% | -7.66% | 6/29/2021 | ||||||||||||||||||||
| Market Price | -9.83% | -7.83% | 6/29/2021 | ||||||||||||||||||||
| Bloomberg U.S. Aggregate Bond Index | -11.52% | -9.13% | — | ||||||||||||||||||||
Market price is determined using the bid/ask midpoint at 4:00 p.m. Eastern time, when the net asset value (NAV) is typically calculated. Market performance does not represent the returns you would receive if you traded shares at other times. NAV prices are used to calculate market price performance prior to the date when the fund first traded on the NYSE Arca, Inc.
| Growth of $10,000 Over Life of Fund | ||
| $10,000 investment made June 29, 2021 | ||
| Value on August 31, 2022 | |||||
| Net Asset Value — $9,108 | |||||
| Bloomberg U.S. Aggregate Bond Index — $8,938 | |||||
| Total Annual Fund Operating Expenses | |||||||||||||||||
| 0.35% | |||||||||||||||||
The total annual fund operating expenses shown is as stated in the fund’s prospectus current as of the date of this report. The prospectus may vary from the expense ratio shown elsewhere in this report because it is based on a different time period, includes acquired fund fees and expenses, and, if applicable, does not include fee waivers or expense reimbursements.
Data presented reflect past performance. Past performance is no guarantee of future results. Current performance may be higher or lower than the performance shown. Total returns for periods less than one year are not annualized. Investment return and principal value will fluctuate, and redemption value may be more or less than original cost. Data assumes reinvestment of dividends and capital gains, and none of the charts reflect the deduction of taxes that a shareholder would pay on fund distributions or the redemption of fund shares. To obtain performance data current to the most recent month end, please call 1-800-345-6488 or visit americancenturyetfs.com. For additional information about the funds, please consult the prospectus.
15
| Portfolio Commentary | ||
Portfolio Managers: Charles Tan, Jason Greenblath and Jeffrey Houston
Fund Strategy
American Century Multisector Income ETF seeks to balance interest rate and credit risk in pursuit of attractive income and total return. The fund strives for less interest rate sensitivity than typical core or core plus bond portfolios. Portfolio managers tactically adjust sector exposures and credit quality in an effort to enhance yield and reduce risk.
The fund may invest in U.S. and non-U.S. bond markets, including investment-grade corporate, high-yield corporate, emerging markets debt and securitized credit. Portfolio managers have the flexibility to invest up to 65% in below investment-grade securities to assist in generating income. The portfolio managers apply fundamental, bottom-up research along with environmental, social and governance factors to select securities. Comprehensive risk measurement, modeling and attribution analysis help set position sizing and provide risk-management guidance.
The fund is an actively managed exchange-traded fund (ETF) that does not seek to replicate the performance of a specific index. To determine whether to buy or sell a security, we consider several factors, including fund requirements and standards, economic conditions, alternative investments, interest rates and various credit metrics.
Performance Review
The fund returned -9.83% on a market price basis for the 12-month period ended August 31, 2022. On a net asset value (NAV) basis, the fund returned -9.60%. For the same time period, the Bloomberg U.S. Aggregate Bond Index, the fund’s benchmark index, returned -11.52%. The fund’s NAV and market price returns reflect fees and operating expenses, while the index return does not.
Performance in the fixed-income market downshifted swiftly in early 2022 amid escalating volatility. Inflation, which had steadily climbed through 2021, proved persistent as it soared to multidecade highs. Russia’s invasion of Ukraine in February contributed to the mounting market volatility and risk-off sentiment. In March, the Federal Reserve (Fed) adopted an increasingly aggressive rate-hike campaign that drove Treasury yields sharply higher and credit spreads wider through period-end.
Duration Strategy Aided Relative Results
Against this challenging backdrop, credit-sensitive fixed-income sectors declined sharply for the 12-month period. Within the fund, our efforts to limit exposure to interest rate risk aided performance versus the index. Our shorter-than-benchmark duration was the main driver of the fund’s outperformance. Additionally, we significantly boosted exposure to U.S. Treasury securities from approximately 1% to nearly 19%, which helped curb losses.
Securitized Positioning Provided a Relative Lift to Performance
In terms of sector exposure, our positioning in the securitized sector aided results compared with the index. Overall, we shifted away from securitized securities with BBB credit ratings and into those with A and AA ratings. For example, asset-backed securities offered attractive valuations, in our view, providing an opportunity to add higher-quality securitized exposure to the portfolio. Meanwhile, we reduced exposure to higher-risk collateralized loan obligations.
Among investment-grade corporates, our positions in finance companies, banks and real estate investment trusts (REITs) were notable detractors. We began reducing exposure to aircraft and other leasing companies and REITs in early 2022 amid mounting geopolitical and economic risks. Elsewhere in the investment-grade corporate sector, positions in the chemicals industry aided relative results.
16
High-Yield, Emerging Markets Debt Weighed on Results
Out-of-index positions in high-yield and emerging markets debt securities were among the largest detractors from performance. Consistent with our strategy of reducing overall portfolio risk, we sharply decreased exposure to these allocations during the period. We sharply cut the high-yield corporate allocation, while boosting investment-grade corporate exposure. Exposure to emerging markets debt dropped from 18% to 5%, mostly due to valuation concerns among sovereigns.
High-yield bonds in the banking, gaming, media and entertainment and REITs segments were notable underperformers. Positions in bank loans and high-yield corporates in the pharmaceuticals and consumer products sectors fared better. Additionally, we hedged our high-yield exposure with credit default swaps, which helped lessen the allocation’s losses.
Among emerging markets, holdings in Brazil, Chile and Mexico were among the largest detractors. Brighter spots included select holdings in Peru and Kazakhstan.
Portfolio Positioning
Although we believe the markets have largely priced in the Fed’s remaining rate hikes, we don’t expect market volatility to quickly subside. The Fed faces a difficult task as it attempts to tame inflation without triggering an extended economic downturn. We believe investors’ responses to this uncertain economic and inflation backdrop will continue to generate volatility.
We anticipate further widening in credit spreads. Corporations are facing growing pressure from high inflation, supply chain challenges and rising input costs, which likely will pressure earnings in the near term. These factors along with a hawkish Fed, a weakening economy and persistent geopolitical tensions likely will push spreads wider.
We are maintaining a nimble and opportunistic approach, with an eye toward defense. In addition to our holdings in U.S. Treasuries, we maintain significant liquidity that should provide the flexibility to add risk exposure as near-term market dislocations emerge. High inflation and slowing consumer demand are keeping us more patient in the high-yield arena. We’re awaiting better entry points but still believe select high-yield holdings should be well positioned once the credit environment improves. We do not expect to meaningfully boost the portfolio’s position in emerging markets bonds until global inflation data temper and China’s economy gathers some momentum.
17
| Fund Characteristics | ||
| AUGUST 31, 2022 | |||||
| Multisector Income ETF | |||||
| Types of Investments in Portfolio | % of net assets | ||||
| Corporate Bonds | 38.7% | ||||
| U.S. Treasury Securities | 18.4% | ||||
| Asset-Backed Securities | 13.5% | ||||
| U.S. Government Agency Mortgage-Backed Securities | 6.7% | ||||
| Commercial Mortgage-Backed Securities | 5.5% | ||||
| Collateralized Mortgage Obligations | 5.3% | ||||
| Collateralized Loan Obligations | 5.2% | ||||
| Preferred Stocks | 4.2% | ||||
| Bank Loan Obligations | 1.3% | ||||
| Sovereign Governments and Agencies | 1.1% | ||||
| Short-Term Investments | 4.6% | ||||
| Other Assets and Liabilities | (4.5)% | ||||
18
| Performance | ||
| Select High Yield ETF (AHYB) | ||||||||||||||||||||
| Total Returns as of August 31, 2022 | Since Inception | Inception Date | ||||||||||||||||||
| Net Asset Value | -10.04% | 11/16/2021 | ||||||||||||||||||
| Market Price | -10.51% | 11/16/2021 | ||||||||||||||||||
| ICE BofA U.S. High Yield Constrained (BB-B) Index | -10.12% | — | ||||||||||||||||||
Market price is determined using the bid/ask midpoint at 4:00 p.m. Eastern time, when the net asset value (NAV) is typically calculated. Market performance does not represent the returns you would receive if you traded shares at other times. NAV prices are used to calculate market price performance prior to the date when the fund first traded on the NYSE Arca, Inc.
| Growth of $10,000 Over Life of Fund | ||
| $10,000 investment made November 16, 2021 | ||
| Value on August 31, 2022 | |||||
| Net Asset Value — $8,996 | |||||
| ICE BofA U.S. High Yield Constrained (BB-B) Index — $8,988 | |||||
| Total Annual Fund Operating Expenses | |||||||||||||||||
| 0.45% | |||||||||||||||||
The total annual fund operating expenses shown is as stated in the fund’s prospectus current as of the date of this report. The prospectus may vary from the expense ratio shown elsewhere in this report because it is based on a different time period, includes acquired fund fees and expenses, and, if applicable, does not include fee waivers or expense reimbursements.
Data presented reflect past performance. Past performance is no guarantee of future results. Current performance may be higher or lower than the performance shown. Total returns for periods less than one year are not annualized. Investment return and principal value will fluctuate, and redemption value may be more or less than original cost. Data assumes reinvestment of dividends and capital gains, and none of the charts reflect the deduction of taxes that a shareholder would pay on fund distributions or the redemption of fund shares. To obtain performance data current to the most recent month end, please call 1-800-345-6488 or visit americancenturyetfs.com. For additional information about the funds, please consult the prospectus.
19
| Portfolio Commentary | ||
Investment Advisor: American Century Investment Management, Inc.
Subadvisor: Nomura Corporate Research and Asset Management Inc.
Portfolio Managers: David Crall, Amy Yu Chang, Stephen Kotsen, Derek Leung and Rene Casis
Fund Strategy
American Century Select High Yield ETF, sub-advised by Nomura Corporate Research and Asset Management, seeks to deliver high current income and risk-adjusted returns. The fund offers investors an opportunity to capture attractive yield and capital appreciation potential from high-yield corporate bonds with BB and B credit ratings. Bonds with these ratings generally have higher credit-quality characteristics and less relative risk than lower-rated high-yield bonds.
The fund is an actively managed exchange-traded fund (ETF) that does not seek to replicate the performance of a specific index. To determine whether to buy or sell a security, we consider several factors, including fund requirements and standards, economic conditions, credit quality and valuation.
Performance Review
The fund returned -10.51%* on a market price basis for the period from inception on November 16, 2021, through August 31, 2022. On a net asset value (NAV) basis, the fund returned -10.04%. For the same time period, the ICE BofA U.S. High Yield Constrained (BB-B) Index, the fund’s benchmark index, returned -10.12%. The fund’s NAV and market price returns reflect fees and operating expenses, while the index return does not.
Tighter Monetary Policy Negatively Influenced Interest Rates and Risk Appetites
A challenging market backdrop persisted during the reporting period, pressuring high-yield bonds and other risk assets. Rising interest rates largely drove the high-yield sell-off in the first quarter of 2022, while widening credit spreads pressured performance in the second quarter. The market’s focus shifted to gauging how persistently high inflation, geopolitical risks, a vigorous Federal Reserve (Fed) tightening cycle and recession worries affected high-yield issuers’ finances. High-yield bonds rallied in July after an aggressive sell-off in June, but uncertainty about growth and inflation continued to drive elevated market volatility.
Sector Positioning Boosted Performance
We positioned the portfolio to benefit from continued reopening after the pandemic-related economic disruption. Overweight positions versus the index to energy and travel and leisure issuers, such as cruise lines and entertainment, contributed to performance. Underweights to pandemic winners, such as the health care, retail and consumer goods sectors, also added value.
The portfolio’s overweight to basic industry issuers dragged down performance, as investors braced for slower economic activity later in 2022. An underweight position to the automobiles sector also detracted from performance. The industry benefited from pent-up demand for cars, and it largely managed to navigate supply chain challenges.
From a ratings perspective, the fund’s overweight to B-rated bonds added value, but there was little difference in performance between bonds with B and BB credit ratings in the reporting period. The
fund’s small allocation to CCC-rated issuers negatively affected performance. Meanwhile, a modest portfolio underweight to duration provided a performance tailwind in the rising interest rate environment.
*Total returns for periods less than one year are not annualized.
20
Slower Inflation, Slower Growth Outlook
Looking forward, we continue to believe U.S. inflation will decline in the coming months. Commodity prices have fallen, the semiconductor shortage and other bottlenecks are easing, and housing, technology and other frothy sectors are slowing down.
Accordingly, we are hopeful the U.S. is approaching peak hawkishness from the Fed. The combination of slower inflation and slower growth may enable policymakers to pause their rate-hike campaign in late 2022 or early 2023.
At the same time, we believe the U.S. will experience either slow growth or a mild recession. We believe the economy can avoid worse outcomes if sectors such as energy, travel and automobiles continue to grow. We expect high-yield defaults to stay below historical averages, and we believe the BB and B segments offer attractive return/risk ratios.
21
| Fund Characteristics | ||
| AUGUST 31, 2022 | |||||
| Select High Yield ETF | |||||
| Types of Investments in Portfolio | % of net assets | ||||
| Corporate Bonds | 94.8% | ||||
| Preferred Stocks | 0.6% | ||||
| Short-Term Investments | 9.9% | ||||
| Other Assets and Liabilities | (5.3)% | ||||
22
| Shareholder Fee Examples | ||
Fund shareholders may incur two types of costs: (1) transaction costs, including brokerage commissions paid on purchases and sales of fund shares; and (2) ongoing costs, including management fees and other fund expenses. This example is intended to help you understand your ongoing costs (in dollars) of investing in your fund and to compare these costs with the ongoing cost of investing in other funds.
The example is based on an investment of $1,000 made at the beginning of the period and held for the entire period from March 1, 2022 to August 31, 2022.
Actual Expenses
The table provides information about actual account values and actual expenses for each fund. You may use the information, together with the amount you invested, to estimate the expenses that you paid over the period. First, identify the fund you own. Then simply divide your account value by $1,000 (for example, an $8,600 account value divided by $1,000 = 8.6), then multiply the result by the number under the heading “Expenses Paid During Period” to estimate the expenses you paid on your account during this period.
Hypothetical Example for Comparison Purposes
The table also provides information about hypothetical account values and hypothetical expenses based on the actual expense ratio of your fund and an assumed rate of return of 5% per year before expenses, which is not the actual return of a fund. The hypothetical account values and expenses may not be used to estimate the actual ending account balance or expenses you paid for the period. You may use this information to compare the ongoing costs of investing in your fund and other funds. To do so, compare this 5% hypothetical example with the 5% hypothetical examples that appear in the shareholder reports of the other funds.
Please note that the expenses shown in the table are meant to highlight your ongoing costs only and do not reflect any transactional costs, such as brokerage commissions paid on purchases and sales of fund shares. Therefore, the table is useful in comparing ongoing costs only, and will not help you determine the relative total costs of owning different funds. In addition, if these transactional costs were included, your costs would have been higher.
23
| Beginning Account Value 3/1/22 | Ending Account Value 8/31/22 | Expenses Paid During Period(1) 3/1/22 - 8/31/22 | Annualized Expense Ratio(1) | |||||||||||
| Diversified Corporate Bond ETF | ||||||||||||||
| Actual | $1,000 | $935.30 | $1.41 | 0.29% | ||||||||||
| Hypothetical | $1,000 | $1,023.74 | $1.48 | 0.29% | ||||||||||
| Diversified Municipal Bond ETF | ||||||||||||||
| Actual | $1,000 | $941.90 | $1.42 | 0.29% | ||||||||||
| Hypothetical | $1,000 | $1,023.74 | $1.48 | 0.29% | ||||||||||
| Emerging Markets Bond ETF | ||||||||||||||
| Actual | $1,000 | $879.50 | $1.85 | 0.39% | ||||||||||
| Hypothetical | $1,000 | $1,023.24 | $1.99 | 0.39% | ||||||||||
| Multisector Income ETF | ||||||||||||||
| Actual | $1,000 | $940.30 | $1.71 | 0.35% | ||||||||||
| Hypothetical | $1,000 | $1,023.44 | $1.79 | 0.35% | ||||||||||
| Select High Yield ETF | ||||||||||||||
| Actual | $1,000 | $924.80 | $2.18 | 0.45% | ||||||||||
| Hypothetical | $1,000 | $1,022.94 | $2.29 | 0.45% | ||||||||||
(1)Expenses are equal to the fund's annualized expense ratio listed in the table above, multiplied by the average account value over the period, multiplied by 184, the number of days in the most recent fiscal half-year, divided by 365, to reflect the one-half year period. Annualized expense ratio reflects actual expenses, including any applicable fee waivers or expense reimbursements and excluding any acquired fund fees and expenses.
24
| Schedules of Investments | ||
AUGUST 31, 2022
| Diversified Corporate Bond ETF | ||||||||
| Principal Amount | Value | |||||||
| CORPORATE BONDS — 95.3% | ||||||||
| Aerospace and Defense — 0.8% | ||||||||
| Boeing Co., 2.20%, 2/4/26 | $ | 284,000 | $ | 259,996 | ||||
| Raytheon Technologies Corp., 2.25%, 7/1/30 | 1,000,000 | 855,617 | ||||||
| 1,115,613 | ||||||||
| Air Freight and Logistics — 0.3% | ||||||||
| GXO Logistics, Inc., 2.65%, 7/15/31 | 492,000 | 374,172 | ||||||
| Airlines — 0.6% | ||||||||
Delta Air Lines, Inc. / SkyMiles IP Ltd., 4.75%, 10/20/28(1) | 245,000 | 234,191 | ||||||
| United Airlines Pass Through Trust, Series 2020-1, Class B, 4.875%, 7/15/27 | 727,544 | 693,703 | ||||||
| 927,894 | ||||||||
| Automobiles — 2.4% | ||||||||
| General Motors Financial Co., Inc., 5.10%, 1/17/24 | 750,000 | 756,776 | ||||||
| General Motors Financial Co., Inc., 1.20%, 10/15/24 | 1,000,000 | 935,260 | ||||||
General Motors Financial Co., Inc., 3.80%, 4/7/25(2) | 400,000 | 390,172 | ||||||
| Toyota Motor Credit Corp., 3.95%, 6/30/25 | 1,350,000 | 1,348,922 | ||||||
| 3,431,130 | ||||||||
| Banks — 21.9% | ||||||||
| Banco Santander SA, 5.29%, 8/18/27 | 285,000 | 279,108 | ||||||
| Bank of America Corp., VRN, 3.38%, 4/2/26 | 145,000 | 139,975 | ||||||
| Bank of America Corp., VRN, 1.32%, 6/19/26 | 2,250,000 | 2,047,827 | ||||||
| Bank of America Corp., VRN, 2.55%, 2/4/28 | 1,080,000 | 979,753 | ||||||
| Bank of America Corp., VRN, 4.57%, 4/27/33 | 2,040,000 | 1,949,696 | ||||||
| Bank of America Corp., VRN, 2.48%, 9/21/36 | 105,000 | 81,464 | ||||||
Bank of Ireland Group PLC, VRN, 2.03%, 9/30/27(1) | 600,000 | 517,154 | ||||||
BPCE SA, 4.50%, 3/15/25(1) | 692,000 | 671,705 | ||||||
| Canadian Imperial Bank of Commerce, 3.30%, 4/7/25 | 925,000 | 901,463 | ||||||
| Canadian Imperial Bank of Commerce, 3.95%, 8/4/25 | 320,000 | 316,075 | ||||||
| Citigroup, Inc., VRN, 3.07%, 2/24/28 | 1,681,000 | 1,555,251 | ||||||
| Citigroup, Inc., VRN, 3.52%, 10/27/28 | 1,731,000 | 1,607,607 | ||||||
| Citigroup, Inc., VRN, 3.79%, 3/17/33 | 135,000 | 121,460 | ||||||
| Discover Bank, 2.45%, 9/12/24 | 380,000 | 365,112 | ||||||
| Discover Bank, VRN, 4.68%, 8/9/28 | 775,000 | 750,093 | ||||||
Fifth Third Bancorp, VRN, 4.06%, 4/25/28(2) | 443,000 | 432,055 | ||||||
| First-Citizens Bank & Trust Co., VRN, 3.93%, 6/19/24 | 515,000 | 510,159 | ||||||
| First-Citizens Bank & Trust Co., VRN, 2.97%, 9/27/25 | 605,000 | 578,006 | ||||||
| FNB Corp., 5.15%, 8/25/25 | 334,000 | 334,331 | ||||||
| HSBC Holdings PLC, VRN, 1.16%, 11/22/24 | 518,000 | 494,708 | ||||||
| HSBC Holdings PLC, VRN, 4.76%, 6/9/28 | 2,000,000 | 1,929,792 | ||||||
| Huntington Bancshares, Inc., VRN, 4.44%, 8/4/28 | 875,000 | 855,657 | ||||||
| JPMorgan Chase & Co., VRN, 1.04%, 2/4/27 | 1,141,000 | 1,005,167 | ||||||
| JPMorgan Chase & Co., VRN, 3.78%, 2/1/28 | 1,200,000 | 1,151,325 | ||||||
| JPMorgan Chase & Co., VRN, 2.95%, 2/24/28 | 930,000 | 863,719 | ||||||
| JPMorgan Chase & Co., VRN, 2.07%, 6/1/29 | 921,000 | 788,020 | ||||||
| JPMorgan Chase & Co., VRN, 2.52%, 4/22/31 | 940,000 | 795,968 | ||||||
| Mitsubishi UFJ Financial Group, Inc., VRN, 4.79%, 7/18/25 | 390,000 | 391,395 | ||||||
25
| Diversified Corporate Bond ETF | ||||||||
| Principal Amount | Value | |||||||
National Australia Bank Ltd., 2.33%, 8/21/30(1) | $ | 835,000 | $ | 664,056 | ||||
| NatWest Group PLC, VRN, 5.52%, 9/30/28 | 1,045,000 | 1,046,319 | ||||||
| PNC Financial Services Group, Inc., VRN, 4.63%, 6/6/33 | 112,000 | 106,169 | ||||||
| Royal Bank of Canada, 3.97%, 7/26/24 | 725,000 | 722,990 | ||||||
Societe Generale SA, VRN, 2.23%, 1/21/26(1) | 1,070,000 | 990,036 | ||||||
| Synchrony Bank, 5.40%, 8/22/25 | 1,110,000 | 1,108,842 | ||||||
| Toronto-Dominion Bank, 4.46%, 6/8/32 | 163,000 | 159,953 | ||||||
| Truist Financial Corp., VRN, 4.12%, 6/6/28 | 650,000 | 637,589 | ||||||
UniCredit SpA, 7.83%, 12/4/23(1) | 475,000 | 485,583 | ||||||
UniCredit SpA, VRN, 2.57%, 9/22/26(1) | 500,000 | 437,677 | ||||||
| US Bancorp, VRN, 2.49%, 11/3/36 | 928,000 | 749,479 | ||||||
| Wells Fargo & Co., VRN, 4.54%, 8/15/26 | 261,000 | 259,339 | ||||||
| Wells Fargo & Co., VRN, 3.35%, 3/2/33 | 1,945,000 | 1,699,589 | ||||||
| 31,481,666 | ||||||||
| Beverages — 1.0% | ||||||||
| Anheuser-Busch Cos. LLC / Anheuser-Busch InBev Worldwide, Inc., 3.65%, 2/1/26 | 1,237,000 | 1,216,458 | ||||||
| PepsiCo, Inc., 3.60%, 2/18/28 | 250,000 | 245,556 | ||||||
| 1,462,014 | ||||||||
| Biotechnology — 0.9% | ||||||||
| AbbVie, Inc., 3.20%, 11/21/29 | 500,000 | 457,062 | ||||||
| Amgen, Inc., 4.05%, 8/18/29 | 450,000 | 438,043 | ||||||
CSL Finance PLC, 3.85%, 4/27/27(1) | 416,000 | 410,471 | ||||||
| 1,305,576 | ||||||||
| Capital Markets — 8.6% | ||||||||
| Bain Capital Specialty Finance, Inc., 2.55%, 10/13/26 | 238,000 | 201,606 | ||||||
| Bank of New York Mellon Corp., VRN, 4.41%, 7/24/26 | 380,000 | 381,873 | ||||||
| Deutsche Bank AG, VRN, 3.96%, 11/26/25 | 850,000 | 815,149 | ||||||
| Deutsche Bank AG, VRN, 2.31%, 11/16/27 | 163,000 | 138,553 | ||||||
| Deutsche Bank AG, VRN, 4.30%, 5/24/28 | 759,000 | 694,330 | ||||||
FS KKR Capital Corp., 4.25%, 2/14/25(1) | 116,000 | 110,342 | ||||||
| Goldman Sachs Group, Inc., VRN, 1.76%, 1/24/25 | 1,628,000 | 1,565,230 | ||||||
| Goldman Sachs Group, Inc., VRN, 1.95%, 10/21/27 | 1,042,000 | 925,928 | ||||||
| Goldman Sachs Group, Inc., VRN, 3.81%, 4/23/29 | 1,034,000 | 968,791 | ||||||
| Hercules Capital, Inc., 2.625%, 9/16/26 | 511,000 | 430,365 | ||||||
| Intercontinental Exchange, Inc., 4.35%, 6/15/29 | 135,000 | 133,323 | ||||||
| Morgan Stanley, VRN, 1.16%, 10/21/25 | 533,000 | 495,054 | ||||||
| Morgan Stanley, VRN, 2.63%, 2/18/26 | 1,026,000 | 975,672 | ||||||
| Morgan Stanley, VRN, 2.70%, 1/22/31 | 660,000 | 571,548 | ||||||
| Morgan Stanley, VRN, 4.89%, 7/20/33 | 2,250,000 | 2,242,270 | ||||||
| Owl Rock Capital Corp., 3.40%, 7/15/26 | 414,000 | 370,590 | ||||||
| OWL Rock Core Income Corp., 3.125%, 9/23/26 | 251,000 | 218,608 | ||||||
Owl Rock Technology Finance Corp., 6.75%, 6/30/25(1) | 75,000 | 74,308 | ||||||
| State Street Corp., VRN, 4.16%, 8/4/33 | 362,000 | 349,904 | ||||||
UBS Group AG, VRN, 4.70%, 8/5/27(1) | 259,000 | 254,362 | ||||||
UBS Group AG, VRN, 4.75%, 5/12/28(1) | 73,000 | 71,650 | ||||||
UBS Group AG, VRN, 2.75%, 2/11/33(1) | 430,000 | 344,891 | ||||||
| 12,334,347 | ||||||||
| Chemicals — 0.4% | ||||||||
| Sherwin-Williams Co., 4.25%, 8/8/25 | 556,000 | 555,916 | ||||||
| Commercial Services and Supplies — 0.7% | ||||||||
Republic Services, Inc., 2.90%, 7/1/26(2) | 1,000,000 | 952,109 | ||||||
26
| Diversified Corporate Bond ETF | ||||||||
| Principal Amount | Value | |||||||
| Construction and Engineering — 0.4% | ||||||||
| Quanta Services, Inc., 2.35%, 1/15/32 | $ | 650,000 | $ | 514,085 | ||||
| Construction Materials — 0.7% | ||||||||
| Eagle Materials, Inc., 2.50%, 7/1/31 | 911,000 | 714,180 | ||||||
| Martin Marietta Materials, Inc., 2.40%, 7/15/31 | 290,000 | 239,333 | ||||||
| 953,513 | ||||||||
| Consumer Finance — 1.0% | ||||||||
| AerCap Ireland Capital DAC / AerCap Global Aviation Trust, 3.00%, 10/29/28 | 229,000 | 194,815 | ||||||
| American Express Co., 3.95%, 8/1/25 | 702,000 | 695,911 | ||||||
BOC Aviation USA Corp., 1.625%, 4/29/24(1) | 510,000 | 484,327 | ||||||
| Capital One Financial Corp., VRN, 4.99%, 7/24/26 | 93,000 | 92,914 | ||||||
| 1,467,967 | ||||||||
| Containers and Packaging — 0.6% | ||||||||
| Berry Global, Inc., 0.95%, 2/15/24 | 518,000 | 490,738 | ||||||
| Sonoco Products Co., 2.25%, 2/1/27 | 481,000 | 437,411 | ||||||
| 928,149 | ||||||||
| Diversified Financial Services — 1.7% | ||||||||
Antares Holdings LP, 2.75%, 1/15/27(1) | 255,000 | 211,712 | ||||||
Antares Holdings LP, 3.75%, 7/15/27(1) | 405,000 | 339,211 | ||||||
Corebridge Financial, Inc., 3.65%, 4/5/27(1) | 700,000 | 658,557 | ||||||
Corebridge Financial, Inc., 3.85%, 4/5/29(1) | 157,000 | 144,697 | ||||||
Corebridge Financial, Inc., VRN, 6.875%, 12/15/52(1) | 410,000 | 396,719 | ||||||
| GE Capital International Funding Co. Unlimited Co., 4.42%, 11/15/35 | 700,000 | 662,679 | ||||||
| 2,413,575 | ||||||||
| Diversified Telecommunication Services — 2.6% | ||||||||
| AT&T, Inc., 4.10%, 2/15/28 | 1,000,000 | 977,033 | ||||||
| AT&T, Inc., 4.35%, 3/1/29 | 1,085,000 | 1,059,383 | ||||||
| Verizon Communications, Inc., 4.02%, 12/3/29 | 1,840,000 | 1,767,221 | ||||||
| 3,803,637 | ||||||||
| Electric Utilities — 4.9% | ||||||||
| Duke Energy Carolinas LLC, 2.55%, 4/15/31 | 1,245,000 | 1,092,236 | ||||||
| Duke Energy Corp., 2.55%, 6/15/31 | 850,000 | 710,639 | ||||||
Exelon Corp., 2.75%, 3/15/27(1) | 1,040,000 | 972,571 | ||||||
Jersey Central Power & Light Co., 4.30%, 1/15/26(1) | 500,000 | 491,004 | ||||||
| MidAmerican Energy Co., 3.65%, 4/15/29 | 1,200,000 | 1,164,700 | ||||||
NextEra Energy Capital Holdings, Inc., 5.00%, 7/15/32(2) | 788,000 | 803,132 | ||||||
NRG Energy, Inc., 2.00%, 12/2/25(1) | 538,000 | 488,572 | ||||||
Public Service Electric and Gas Co., 3.10%, 3/15/32(2) | 338,000 | 309,664 | ||||||
| Southern Co. Gas Capital Corp., 1.75%, 1/15/31 | 719,000 | 572,132 | ||||||
Vistra Operations Co. LLC, 5.125%, 5/13/25(1) | 500,000 | 498,023 | ||||||
| 7,102,673 | ||||||||
| Electronic Equipment, Instruments and Components — 0.8% | ||||||||
| Teledyne Technologies, Inc., 0.95%, 4/1/24 | 1,233,000 | 1,166,330 | ||||||
| Energy Equipment and Services — 0.2% | ||||||||
| Helmerich & Payne, Inc., 2.90%, 9/29/31 | 400,000 | 338,464 | ||||||
| Entertainment — 1.0% | ||||||||
Magallanes, Inc., 3.79%, 3/15/25(1) | 370,000 | 356,823 | ||||||
Magallanes, Inc., 3.76%, 3/15/27(1) | 633,000 | 591,567 | ||||||
| Take-Two Interactive Software, Inc., 3.55%, 4/14/25 | 520,000 | 508,123 | ||||||
| 1,456,513 | ||||||||
27
| Diversified Corporate Bond ETF | ||||||||
| Principal Amount | Value | |||||||
| Equity Real Estate Investment Trusts (REITs) — 4.0% | ||||||||
| American Tower Corp., 3.65%, 3/15/27 | $ | 135,000 | $ | 128,562 | ||||
| American Tower Corp., 3.95%, 3/15/29 | 945,000 | 886,630 | ||||||
| Broadstone Net Lease LLC, 2.60%, 9/15/31 | 359,000 | 282,850 | ||||||
| Camden Property Trust, 4.10%, 10/15/28 | 500,000 | 487,916 | ||||||
| EPR Properties, 4.75%, 12/15/26 | 720,000 | 678,578 | ||||||
| GLP Capital LP / GLP Financing II, Inc., 5.375%, 4/15/26 | 1,093,000 | 1,075,460 | ||||||
| Mid-America Apartments LP, 4.20%, 6/15/28 | 480,000 | 465,467 | ||||||
| National Retail Properties, Inc., 4.30%, 10/15/28 | 680,000 | 651,234 | ||||||
| Phillips Edison Grocery Center Operating Partnership I LP, 2.625%, 11/15/31 | 218,000 | 167,557 | ||||||
| VICI Properties LP, 4.375%, 5/15/25 | 500,000 | 488,882 | ||||||
VICI Properties LP / VICI Note Co., Inc., 4.125%, 8/15/30(1) | 482,000 | 424,478 | ||||||
| 5,737,614 | ||||||||
| Food and Staples Retailing — 1.3% | ||||||||
Albertsons Cos., Inc. / Safeway, Inc. / New Albertsons LP / Albertsons LLC, 3.50%, 2/15/23(1)(2) | 505,000 | 500,619 | ||||||
| Sysco Corp., 3.30%, 7/15/26 | 1,414,000 | 1,369,626 | ||||||
| 1,870,245 | ||||||||
| Food Products — 0.3% | ||||||||
| Mondelez International, Inc., 2.625%, 3/17/27 | 475,000 | 443,268 | ||||||
| Gas Utilities — 0.7% | ||||||||
| Southern California Gas Co., 2.95%, 4/15/27 | 990,000 | 943,803 | ||||||
| Health Care Equipment and Supplies — 1.6% | ||||||||
| Baxter International, Inc., 2.54%, 2/1/32 | 600,000 | 496,256 | ||||||
| Becton Dickinson & Co., 4.30%, 8/22/32 | 112,000 | 108,883 | ||||||
| Cigna Corp., 4.375%, 10/15/28 | 850,000 | 837,706 | ||||||
| Zimmer Biomet Holdings, Inc., 1.45%, 11/22/24 | 900,000 | 846,190 | ||||||
| 2,289,035 | ||||||||
| Health Care Providers and Services — 2.9% | ||||||||
| Centene Corp., 4.25%, 12/15/27 | 342,000 | 325,269 | ||||||
CVS Health Corp., 4.30%, 3/25/28(2) | 420,000 | 415,445 | ||||||
| HCA, Inc., 4.125%, 6/15/29 | 550,000 | 506,980 | ||||||
| Humana, Inc., 3.70%, 3/23/29 | 1,000,000 | 945,592 | ||||||
Roche Holdings, Inc., 2.31%, 3/10/27(1) | 600,000 | 559,110 | ||||||
| UnitedHealth Group, Inc., 2.30%, 5/15/31 | 700,000 | 599,062 | ||||||
Universal Health Services, Inc., 1.65%, 9/1/26(1) | 908,000 | 785,033 | ||||||
| 4,136,491 | ||||||||
| Hotels, Restaurants and Leisure — 0.3% | ||||||||
| Marriott International, Inc., 4.625%, 6/15/30 | 468,000 | 447,637 | ||||||
| Household Durables — 0.3% | ||||||||
| Safehold Operating Partnership LP, 2.85%, 1/15/32 | 468,000 | 371,033 | ||||||
| Insurance — 3.5% | ||||||||
Athene Global Funding, 3.21%, 3/8/27(1) | 453,000 | 412,046 | ||||||
Equitable Financial Life Global Funding, 1.30%, 7/12/26(1)(2) | 1,457,000 | 1,293,877 | ||||||
| Hartford Financial Services Group, Inc., 2.80%, 8/19/29 | 520,000 | 461,130 | ||||||
Protective Life Global Funding, 1.17%, 7/15/25(1) | 1,400,000 | 1,278,250 | ||||||
RGA Global Funding, 2.70%, 1/18/29(1) | 775,000 | 678,728 | ||||||
Sammons Financial Group, Inc., 4.75%, 4/8/32(1) | 182,000 | 159,994 | ||||||
SBL Holdings, Inc., 5.125%, 11/13/26(1) | 782,000 | 745,966 | ||||||
| 5,029,991 | ||||||||
28
| Diversified Corporate Bond ETF | ||||||||
| Principal Amount | Value | |||||||
| Interactive Media and Services — 0.2% | ||||||||
Meta Platforms, Inc., 3.50%, 8/15/27(1) | $ | 365,000 | $ | 353,803 | ||||
| IT Services — 1.2% | ||||||||
| Fidelity National Information Services, Inc., 4.70%, 7/15/27 | 500,000 | 499,138 | ||||||
| Global Payments, Inc., 3.75%, 6/1/23 | 761,000 | 760,149 | ||||||
| International Business Machines Corp., 4.00%, 7/27/25 | 500,000 | 499,323 | ||||||
| 1,758,610 | ||||||||
| Machinery — 1.2% | ||||||||
| Parker-Hannifin Corp., 4.25%, 9/15/27 | 1,000,000 | 990,279 | ||||||
| Westinghouse Air Brake Technologies Corp., 4.95%, 9/15/28 | 767,000 | 744,665 | ||||||
| 1,734,944 | ||||||||
| Media — 1.3% | ||||||||
DISH DBS Corp., 5.25%, 12/1/26(1) | 430,000 | 355,825 | ||||||
Paramount Global, 3.375%, 2/15/28(2) | 337,000 | 315,007 | ||||||
| Paramount Global, 4.95%, 1/15/31 | 440,000 | 417,193 | ||||||
| WPP Finance 2010, 3.75%, 9/19/24 | 780,000 | 768,643 | ||||||
| 1,856,668 | ||||||||
| Metals and Mining — 0.5% | ||||||||
Freeport-McMoRan, Inc., 4.625%, 8/1/30(2) | 211,000 | 195,629 | ||||||
Glencore Funding LLC, 2.625%, 9/23/31(1) | 413,000 | 328,754 | ||||||
South32 Treasury Ltd., 4.35%, 4/14/32(1) | 275,000 | 250,600 | ||||||
| 774,983 | ||||||||
| Multi-Utilities — 3.7% | ||||||||
Abu Dhabi National Energy Co. PJSC, 2.00%, 4/29/28(1) | 400,000 | 360,250 | ||||||
| Ameren Corp., 1.75%, 3/15/28 | 750,000 | 644,161 | ||||||
| Ameren Corp., 3.50%, 1/15/31 | 356,000 | 325,963 | ||||||
| Ameren Illinois Co., 3.85%, 9/1/32 | 233,000 | 223,984 | ||||||
| Dominion Energy, Inc., 4.35%, 8/15/32 | 1,000,000 | 965,449 | ||||||
| DTE Energy Co., 2.85%, 10/1/26 | 650,000 | 610,982 | ||||||
| DTE Energy Co., VRN, 4.22%, 11/1/24 | 438,000 | 436,401 | ||||||
| NiSource, Inc., 3.49%, 5/15/27 | 644,000 | 616,698 | ||||||
| WEC Energy Group, Inc., 1.375%, 10/15/27 | 1,314,000 | 1,136,240 | ||||||
| 5,320,128 | ||||||||
| Oil, Gas and Consumable Fuels — 6.2% | ||||||||
| BP Capital Markets America, Inc., 3.94%, 9/21/28 | 502,000 | 490,661 | ||||||
| Cenovus Energy, Inc., 2.65%, 1/15/32 | 300,000 | 246,467 | ||||||
Continental Resources, Inc., 2.27%, 11/15/26(1) | 376,000 | 332,205 | ||||||
Continental Resources, Inc., 2.875%, 4/1/32(1) | 259,000 | 202,490 | ||||||
| Enbridge, Inc., 1.60%, 10/4/26 | 1,401,000 | 1,247,167 | ||||||
| Energy Transfer LP, 3.60%, 2/1/23 | 558,000 | 557,368 | ||||||
| Energy Transfer LP, 5.50%, 6/1/27 | 500,000 | 505,589 | ||||||
| Energy Transfer LP, 5.25%, 4/15/29 | 946,000 | 923,665 | ||||||
Hess Corp., 3.50%, 7/15/24(2) | 346,000 | 340,964 | ||||||
HF Sinclair Corp., 2.625%, 10/1/23(1) | 425,000 | 412,473 | ||||||
| Sabine Pass Liquefaction LLC, 5.875%, 6/30/26 | 559,000 | 574,859 | ||||||
| Shell International Finance BV, 2.375%, 11/7/29 | 1,000,000 | 883,167 | ||||||
| Southwestern Energy Co., 5.375%, 3/15/30 | 803,000 | 753,744 | ||||||
| Williams Cos., Inc., 4.55%, 6/24/24 | 1,480,000 | 1,484,095 | ||||||
| 8,954,914 | ||||||||
| Paper and Forest Products — 0.7% | ||||||||
Georgia-Pacific LLC, 3.60%, 3/1/25(1) | 1,000,000 | 985,179 | ||||||
29
| Diversified Corporate Bond ETF | ||||||||
| Principal Amount | Value | |||||||
| Personal Products — 0.3% | ||||||||
GSK Consumer Healthcare Capital UK PLC, 3.125%, 3/24/25(1) | $ | 481,000 | $ | 463,716 | ||||
| Pharmaceuticals — 2.4% | ||||||||
| Merck & Co., Inc., 1.70%, 6/10/27 | 460,000 | 417,629 | ||||||
| Pfizer, Inc., 1.70%, 5/28/30 | 400,000 | 338,705 | ||||||
| Royalty Pharma PLC, 1.20%, 9/2/25 | 1,019,000 | 927,018 | ||||||
| Utah Acquisition Sub, Inc., 3.95%, 6/15/26 | 690,000 | 648,767 | ||||||
| Viatris, Inc., 1.65%, 6/22/25 | 600,000 | 547,278 | ||||||
| Zoetis, Inc., 2.00%, 5/15/30 | 650,000 | 547,019 | ||||||
| 3,426,416 | ||||||||
| Real Estate Management and Development — 0.2% | ||||||||
| Essential Properties LP, 2.95%, 7/15/31 | 342,000 | 263,226 | ||||||
| Road and Rail — 2.1% | ||||||||
Ashtead Capital, Inc., 5.50%, 8/11/32(1) | 100,000 | 98,239 | ||||||
| Canadian National Railway Co., 3.85%, 8/5/32 | 500,000 | 484,514 | ||||||
| CSX Corp., 4.10%, 11/15/32 | 400,000 | 386,844 | ||||||
DAE Funding LLC, 1.55%, 8/1/24(1) | 436,000 | 407,840 | ||||||
DAE Funding LLC, 2.625%, 3/20/25(1) | 527,000 | 494,935 | ||||||
Triton Container International Ltd., 1.15%, 6/7/24(1) | 1,225,000 | 1,143,099 | ||||||
| 3,015,471 | ||||||||
| Semiconductors and Semiconductor Equipment — 2.1% | ||||||||
Broadcom, Inc., 4.00%, 4/15/29(1) | 825,000 | 764,832 | ||||||
Intel Corp., 3.75%, 8/5/27(2) | 730,000 | 717,333 | ||||||
| Microchip Technology, Inc., 4.25%, 9/1/25 | 1,270,000 | 1,257,096 | ||||||
| Qorvo, Inc., 4.375%, 10/15/29 | 241,000 | 213,055 | ||||||
| 2,952,316 | ||||||||
| Software — 0.5% | ||||||||
| Oracle Corp., 2.95%, 11/15/24 | 750,000 | 728,991 | ||||||
| Specialty Retail — 1.8% | ||||||||
| Dick's Sporting Goods, Inc., 3.15%, 1/15/32 | 555,000 | 440,143 | ||||||
| Home Depot, Inc., 2.70%, 4/15/25 | 192,000 | 187,772 | ||||||
| Lowe's Cos., Inc., 3.35%, 4/1/27 | 1,037,000 | 1,000,570 | ||||||
| Lowe's Cos., Inc., 2.625%, 4/1/31 | 510,000 | 437,753 | ||||||
| O'Reilly Automotive, Inc., 4.70%, 6/15/32 | 600,000 | 594,970 | ||||||
| 2,661,208 | ||||||||
| Technology Hardware, Storage and Peripherals — 1.4% | ||||||||
| Apple, Inc., 3.25%, 8/8/29 | 595,000 | 569,416 | ||||||
| Apple, Inc., 1.70%, 8/5/31 | 855,000 | 722,881 | ||||||
| Dell International LLC / EMC Corp., 6.02%, 6/15/26 | 680,000 | 706,627 | ||||||
| 1,998,924 | ||||||||
| Thrifts and Mortgage Finance — 0.4% | ||||||||
Nationwide Building Society, 4.85%, 7/27/27(1) | 516,000 | 512,712 | ||||||
| Trading Companies and Distributors — 0.6% | ||||||||
| Aircastle Ltd., 4.125%, 5/1/24 | 526,000 | 513,147 | ||||||
Aircastle Ltd., 5.25%, 8/11/25(1) | 335,000 | 322,456 | ||||||
| 835,603 | ||||||||
| Water Utilities — 0.5% | ||||||||
| American Water Capital Corp., 4.45%, 6/1/32 | 750,000 | 744,979 | ||||||
| Wireless Telecommunication Services — 1.6% | ||||||||
| Sprint Corp., 7.625%, 2/15/25 | 830,000 | 869,432 | ||||||
| T-Mobile USA, Inc., 4.75%, 2/1/28 | 552,000 | 540,667 | ||||||
30
| Diversified Corporate Bond ETF | ||||||||
| Principal Amount/Shares | Value | |||||||
| T-Mobile USA, Inc., 3.375%, 4/15/29 | $ | 980,000 | $ | 884,078 | ||||
| 2,294,177 | ||||||||
TOTAL CORPORATE BONDS (Cost $145,508,726) | 136,991,428 | |||||||
| U.S. TREASURY SECURITIES — 2.1% | ||||||||
| U.S. Treasury Notes, 1.875%, 2/28/29 | 540,000 | 495,071 | ||||||
| U.S. Treasury Notes, 2.875%, 6/15/25 | 2,500,000 | 2,458,789 | ||||||
TOTAL U.S. TREASURY SECURITIES (Cost $2,993,680) | 2,953,860 | |||||||
| MUNICIPAL SECURITIES — 0.3% | ||||||||
| Golden State Tobacco Securitization Corp. Rev., 2.75%, 6/1/34 (Cost $517,791) | 515,000 | 441,073 | ||||||
| SHORT-TERM INVESTMENTS — 4.3% | ||||||||
| Money Market Funds — 4.3% | ||||||||
| State Street Institutional U.S. Government Money Market Fund, Premier Class | 3,338,275 | 3,338,275 | ||||||
State Street Navigator Securities Lending Government Money Market Portfolio(3) | 2,858,788 | 2,858,788 | ||||||
TOTAL SHORT-TERM INVESTMENTS (Cost $6,197,063) | 6,197,063 | |||||||
TOTAL INVESTMENT SECURITIES — 102.0% (Cost $155,217,260) | 146,583,424 | |||||||
| OTHER ASSETS AND LIABILITIES — (2.0)% | (2,898,675) | |||||||
| TOTAL NET ASSETS — 100.0% | $ | 143,684,749 | ||||||
| FUTURES CONTRACTS PURCHASED | ||||||||||||||
| Reference Entity | Contracts | Expiration Date | Notional Amount | Unrealized Appreciation (Depreciation)^ | ||||||||||
| U.S. Treasury 10-Year Notes | 51 | December 2022 | $ | 5,962,219 | $ | (10,857) | ||||||||
| U.S. Treasury 2-Year Notes | 46 | December 2022 | 9,583,094 | (4,925) | ||||||||||
| $ | 15,545,313 | $ | (15,782) | |||||||||||
^Amount represents value and unrealized appreciation (depreciation).
| FUTURES CONTRACTS SOLD | ||||||||||||||
| Reference Entity | Contracts | Expiration Date | Notional Amount | Unrealized Appreciation (Depreciation)^ | ||||||||||
| U.S. Treasury 5-Year Notes | 65 | December 2022 | $ | 7,203,321 | $ | 6,647 | ||||||||
| U.S. Treasury Long Bonds | 4 | December 2022 | 543,375 | 775 | ||||||||||
| U.S. Treasury 10-Year Ultra Notes | 22 | December 2022 | 2,754,125 | 7,223 | ||||||||||
| $ | 10,500,821 | $ | 14,645 | |||||||||||
^Amount represents value and unrealized appreciation (depreciation).
31
| CENTRALLY CLEARED CREDIT DEFAULT SWAP AGREEMENTS | |||||||||||||||||||||||
| Reference Entity | Type | Fixed Rate Received (Paid) Quarterly | Termination Date | Notional Amount | Premiums Paid (Received) | Unrealized Appreciation (Depreciation) | Value^ | ||||||||||||||||
| Markit CDX North America High Yield Index Series 38 | Buy | (5.00)% | 6/20/27 | $ | 2,871,000 | $ | 15,028 | $ | (8,801) | $ | 6,227 | ||||||||||||
^The value for credit default swap agreements serves as an indicator of the current status of the payment/performance risk and represent the likelihood of an expected liability or profit at the period end. Increasing values in absolute terms when compared to the notional amount of the credit default swap agreement represent a deterioration of the referenced entity's credit soundness and an increased likelihood or risk of a credit event occurring as defined in the agreement.
| NOTES TO SCHEDULE OF INVESTMENTS | ||||||||
| CDX | - | Credit Derivatives Indexes | ||||||
| VRN | - | Variable Rate Note. The rate adjusts periodically based upon the terms set forth in the security’s offering documents. The rate shown is effective at the period end and the reference rate and spread, if any, is indicated. The security's effective maturity date may be shorter than the final maturity date shown. | ||||||
(1)Security was purchased pursuant to Rule 144A or Section 4(2) under the Securities Act of 1933 and may be sold in transactions exempt from registration, normally to qualified institutional investors. The aggregate value of these securities at the period end was $25,527,718, which represented 17.8% of total net assets.
(2)Security, or a portion thereof, is on loan. At the period end, the aggregate value of securities on loan was $2,774,845. The amount of securities on loan indicated may not correspond with the securities on loan identified because securities with pending sales are in the process of recall from the brokers.
(3)Investment of cash collateral from securities on loan. At the period end, the aggregate value of the collateral held by the fund was $2,858,788.
See Notes to Financial Statements.
32
AUGUST 31, 2022
| Diversified Municipal Bond ETF | ||||||||
| Principal Amount | Value | |||||||
| MUNICIPAL SECURITIES — 97.2% | ||||||||
| Alabama — 1.4% | ||||||||
| Black Belt Energy Gas District Rev., VRN, 4.00%, 12/1/48 (GA: Goldman Sachs Group, Inc.) | $ | 535,000 | $ | 540,480 | ||||
| Black Belt Energy Gas District Rev., VRN, 4.00%, 12/1/49 (GA: Morgan Stanley) | 250,000 | 252,625 | ||||||
| Black Belt Energy Gas District Rev., VRN, 4.00%, 7/1/52 (LIQ FAC: Royal Bank of Canada) | 415,000 | 421,383 | ||||||
| Black Belt Energy Gas District Rev., VRN, 2.02%, (MUNIPSA plus 0.35%), 10/1/52 (GA: Goldman Sachs Group, Inc.) | 500,000 | 476,405 | ||||||
| Black Belt Energy Gas District Rev., VRN, 5.00%, 5/1/53 (GA: Canadian Imperial Bank) | 500,000 | 531,399 | ||||||
| Southeast Alabama Gas Supply District Rev., VRN, 4.00%, 4/1/49 (GA: Goldman Sachs Group, Inc.) | 455,000 | 460,398 | ||||||
| Southeast Energy Authority A Cooperative District Rev., VRN, 5.00%, 5/1/53 (GA: Goldman Sachs & Co.) | 1,000,000 | 1,047,433 | ||||||
| 3,730,123 | ||||||||
| Arizona — 3.9% | ||||||||
| Arizona Board of Regents Rev., (Arizona State University), 5.00%, 7/1/36 | 250,000 | 283,783 | ||||||
| Arizona Department of Transportation State Highway Fund Rev., 5.00%, 7/1/29 | 160,000 | 167,053 | ||||||
| Arizona Health Facilities Authority Rev., (Banner Health Obligated Group), 5.00%, 1/1/25 | 585,000 | 617,073 | ||||||
| Arizona Health Facilities Authority Rev., (Banner Health Obligated Group), VRN, 1.92%, (MUNIPSA plus 0.25%), 1/1/46 | 155,000 | 153,402 | ||||||
| Arizona Industrial Development Authority Rev., 3.625%, 5/20/33 | 190,088 | 183,862 | ||||||
Arizona Industrial Development Authority Rev., (BASIS Schools, Inc. Obligated Group), 5.00%, 7/1/51(1) | 250,000 | 250,727 | ||||||
Arizona Industrial Development Authority Rev., (Legacy Cares, Inc.), 5.50%, 7/1/31(1) | 150,000 | 141,275 | ||||||
Arizona Industrial Development Authority Rev., (Legacy Cares, Inc.), 7.75%, 7/1/50(1) | 300,000 | 319,473 | ||||||
Arizona Industrial Development Authority Rev., (Legacy Cares, Inc.), 6.00%, 7/1/51(1) | 100,000 | 90,986 | ||||||
Arizona Industrial Development Authority Rev., (Pinecrest Academy of Nevada), 4.00%, 7/15/40(1) | 200,000 | 176,281 | ||||||
| Arizona Industrial Development Authority Rev., (Provident Group-NCCU Properties LLC), 5.00%, 6/1/27 (BAM) | 400,000 | 435,071 | ||||||
Arizona Industrial Development Authority Rev., (Somerset Academy of Las Vegas), 4.00%, 12/15/41(1) | 750,000 | 652,773 | ||||||
| Gilbert Water Resource Municipal Property Corp. Rev., (Town of Gilbert Waterworks & Sewer System Rev.), 5.00%, 7/15/27 | 1,000,000 | 1,118,559 | ||||||
Industrial Development Authority of the City of Phoenix Rev., (BASIS Schools, Inc. Obligated Group), 4.00%, 7/1/25(1) | 325,000 | 325,160 | ||||||
| Industrial Development Authority of the City of Phoenix Rev., (Downtown Phoenix Student Housing LLC), 5.00%, 7/1/32 | 155,000 | 159,889 | ||||||
Industrial Development Authority of the County of Pima Rev., (American Leadership Academy, Inc.), 4.00%, 6/15/41(1) | 620,000 | 526,781 | ||||||
| La Paz County Industrial Development Authority Rev., (Harmony Public Schools), 5.00%, 2/15/27 | 75,000 | 77,812 | ||||||
| La Paz County Industrial Development Authority Rev., (Harmony Public Schools), 5.00%, 2/15/28 | 75,000 | 78,274 | ||||||
Maricopa County Industrial Development Authority Rev., (Legacy Traditional School Obligated Group), 3.00%, 7/1/31(1) | 500,000 | 439,788 | ||||||
Maricopa County Industrial Development Authority Rev., (Legacy Traditional School Obligated Group), 5.00%, 7/1/39(1) | 200,000 | 203,575 | ||||||
| Pima County Sewer System Rev., 5.00%, 7/1/30 | 600,000 | 676,489 | ||||||
33
| Diversified Municipal Bond ETF | ||||||||
| Principal Amount | Value | |||||||
| Salt River Project Agricultural Improvement & Power District Rev., 5.00%, 1/1/30 | $ | 910,000 | $ | 1,019,485 | ||||
| Salt River Project Agricultural Improvement & Power District Rev., 5.00%, 1/1/35 | 250,000 | 275,079 | ||||||
| Salt River Project Agricultural Improvement & Power District Rev., 5.00%, 1/1/38 | 755,000 | 824,502 | ||||||
| Salt Verde Financial Corp. Rev., 5.00%, 12/1/37 (GA: Citigroup Global Markets) | 175,000 | 184,792 | ||||||
| Scottsdale GO, 4.00%, 7/1/31 | 500,000 | 545,095 | ||||||
State of Arizona COP, 5.00%, 9/1/25(2) | 580,000 | 620,286 | ||||||
| State of Arizona COP, 5.00%, 9/1/25 | 240,000 | 257,532 | ||||||
| 10,804,857 | ||||||||
| California — 11.0% | ||||||||
| Anaheim Public Financing Authority Rev., (Anaheim), 5.00%, 9/1/30 (BAM) | 535,000 | 601,390 | ||||||
| Bay Area Toll Authority Rev., 4.00%, 4/1/29 | 275,000 | 291,982 | ||||||
| Bay Area Toll Authority Rev., VRN, 2.12%, (MUNIPSA plus 0.45%), 4/1/56 | 250,000 | 245,890 | ||||||
| California Community Choice Financing Authority Rev., VRN, 2.12%, (MUNIPSA plus 0.45%), 2/1/52 (GA: Morgan Stanley) | 1,755,000 | 1,648,237 | ||||||
| California Community College Financing Authority Rev., (NCCD-Orange Coast Properties LLC), 5.00%, 5/1/30 | 500,000 | 517,654 | ||||||
California County Tobacco Securitization Agency Rev., (Alameda County Tobacco Securitization Corp.), 0.00%, 6/1/50(3) | 100,000 | 18,379 | ||||||
| California Enterprise Development Authority Rev., (Provident Group-SDSU Properties LLC), 5.00%, 8/1/50 | 100,000 | 101,300 | ||||||
| California Health Facilities Financing Authority Rev., (Sutter Health Obligated Group), 5.00%, 11/15/48 | 850,000 | 895,528 | ||||||
| California Housing Finance Rev., 4.00%, 3/20/33 | 383,208 | 380,069 | ||||||
| California Housing Finance Rev., 4.25%, 1/15/35 | 477,729 | 479,373 | ||||||
| California Infrastructure & Economic Development Bank Rev., (California Academy of Sciences), VRN, 2.02%, (MUNIPSA plus 0.35%), 8/1/47 | 250,000 | 246,802 | ||||||
| California Infrastructure & Economic Development Bank Rev., (Museum Associates), VRN, 2.37%, (MUNIPSA plus 0.70%), 12/1/50 | 1,000,000 | 987,402 | ||||||
California Municipal Finance Authority Rev., (Community Health Centers of The Central Coast, Inc.), 5.00%, 12/1/29(1) | 50,000 | 52,686 | ||||||
California Municipal Finance Authority Rev., (Community Health Centers of The Central Coast, Inc.), 5.00%, 12/1/30(1) | 110,000 | 115,905 | ||||||
California Municipal Finance Authority Rev., (Community Health Centers of The Central Coast, Inc.), 5.00%, 12/1/36(1) | 175,000 | 180,859 | ||||||
| California Public Finance Authority Rev., (Henry Mayo Newhall Memorial Hospital), 5.00%, 10/15/37 | 475,000 | 491,238 | ||||||
California Public Finance Authority Rev., (Kendal at Sonoma Obligated Group), 2.375%, 11/15/28(1) | 265,000 | 242,366 | ||||||
California School Finance Authority Rev., (Aspire Public Schools Obligated Group), 4.00%, 8/1/25(1) | 260,000 | 265,039 | ||||||
California School Finance Authority Rev., (Aspire Public Schools Obligated Group), 4.00%, 8/1/26(1) | 405,000 | 413,007 | ||||||
| California State Financial Authority Rev., (Master's University & Seminary), 5.00%, 8/1/34 | 185,000 | 190,548 | ||||||
| California Statewide Communities Development Authority Rev., (CHF-Irvine LLC), 5.00%, 5/15/24 | 250,000 | 256,889 | ||||||
California Statewide Communities Development Authority Rev., (Loma Linda University Medical Center Obligated Group), 5.25%, 12/1/38(1) | 240,000 | 244,606 | ||||||
| California Statewide Communities Development Authority Special Assessment, (San Diego Assessment District No. 18-01), 5.00%, 9/2/29 | 250,000 | 275,463 | ||||||
34
| Diversified Municipal Bond ETF | ||||||||
| Principal Amount | Value | |||||||
| California Statewide Communities Development Authority Special Tax, (Community Facilities District No. 2015), 4.00%, 9/1/40 | $ | 245,000 | $ | 226,549 | ||||
| City & County of San Francisco COP, 4.00%, 4/1/45 | 475,000 | 460,624 | ||||||
City & County of San Francisco, Special Tax District No. 2020-1 Special Tax, 4.00%, 9/1/46(1) | 500,000 | 446,588 | ||||||
CSCDA Community Improvement Authority Rev., (1818 Platinum Triangle-Anaheim), 4.00%, 4/1/57(1) | 350,000 | 258,051 | ||||||
CSCDA Community Improvement Authority Rev., (Escondido Portfolio), 4.00%, 12/1/59(1) | 750,000 | 500,973 | ||||||
CSCDA Community Improvement Authority Rev., (Oceanaire Apartments), 4.00%, 9/1/56(1) | 300,000 | 246,190 | ||||||
CSCDA Community Improvement Authority Rev., (Westgate Apartments), 4.00%, 6/1/57(1) | 290,000 | 218,570 | ||||||
| East Bay Municipal Utility District Wastewater System Rev., 5.00%, 6/1/38 | 700,000 | 820,281 | ||||||
| Eastern Municipal Water District Rev., VRN, 1.77%, (MUNIPSA plus 0.10%), 7/1/46 | 750,000 | 743,592 | ||||||
| Folsom Ranch Financing Authority Special Tax, (Folsom Community Facilities District No. 19), 5.00%, 9/1/39 | 500,000 | 534,849 | ||||||
| Folsom Ranch Financing Authority Special Tax, (Folsom Community Facilities District No. 23), 3.00%, 9/1/25 | 155,000 | 150,764 | ||||||
| Foothill-Eastern Transportation Corridor Agency Rev., 4.00%, 1/15/33 | 250,000 | 249,259 | ||||||
Golden State Tobacco Securitization Corp. Rev., 5.00%, 6/1/25, Prerefunded at 100% of Par(2) | 1,000,000 | 1,070,222 | ||||||
Hastings Campus Housing Finance Authority Rev., 5.00%, 7/1/45(1) | 570,000 | 564,599 | ||||||
Independent Cities Finance Authority Rev., (Compton Sales Tax Rev.), 4.00%, 6/1/31 (AGM)(1) | 215,000 | 226,859 | ||||||
| Irvine Special Assessment, (Irvine Reassessment District No. 15-1), 5.00%, 9/2/25 | 700,000 | 748,665 | ||||||
| Los Angeles Department of Airports Rev., 5.00%, 5/15/45 | 500,000 | 543,355 | ||||||
| Los Angeles Department of Airports Rev., 5.00%, 5/15/47 | 905,000 | 932,721 | ||||||
| Metropolitan Water District of Southern California Rev., VRN, 1.81%, (MUNIPSA plus 0.14%), 7/1/37 | 200,000 | 199,412 | ||||||
Morongo Band of Mission Indians Rev., 5.00%, 10/1/42(1) | 100,000 | 106,402 | ||||||
| Mountain View Los Altos Union High School District GO, 4.00%, 8/1/35 | 1,000,000 | 1,046,389 | ||||||
| Oakland Unified School District/Alameda County GO, 5.00%, 8/1/27 | 1,020,000 | 1,113,094 | ||||||
| Orange County Airport Rev., 5.00%, 7/1/24 | 130,000 | 135,493 | ||||||
| Orange County Community Facilities District Special Tax, (Orange County Community Facilities District No. 2015-1), 5.25%, 8/15/45 | 415,000 | 429,085 | ||||||
| Orange County Transportation Authority Rev., 5.00%, 10/15/24 | 1,715,000 | 1,810,286 | ||||||
| Palomar Health GO, 5.00%, 8/1/27 | 545,000 | 588,404 | ||||||
| Peralta Community College District GO, 5.00%, 8/1/25 | 550,000 | 587,821 | ||||||
| Poway Unified School District Special Tax, (Poway Unified School District Community Facilities District No. 16), 4.00%, 9/1/31 | 315,000 | 316,326 | ||||||
| San Francisco City & County Airport Comm-San Francisco International Airport Rev., 5.00%, 5/1/24 | 1,000,000 | 1,035,300 | ||||||
| San Francisco City & County Airport Comm-San Francisco International Airport Rev., 5.00%, 5/1/38 | 400,000 | 422,178 | ||||||
| Santa Paula Special Tax, (Santa Paula Harvest Community Facilities District No. 1), 5.00%, 9/1/35 | 600,000 | 642,956 | ||||||
| Southern California Public Power Authority Rev., 5.00%, 11/1/33 (GA: Goldman Sachs Group, Inc.) | 630,000 | 677,207 | ||||||
35
| Diversified Municipal Bond ETF | ||||||||
| Principal Amount | Value | |||||||
| State of California GO, 5.00%, 10/1/23 | $ | 725,000 | $ | 746,279 | ||||
| State of California GO, 5.00%, 8/1/34 | 245,000 | 265,094 | ||||||
| State of California GO, 5.00%, 4/1/35 | 1,000,000 | 1,116,222 | ||||||
| State of California GO, 5.00%, 4/1/42 | 250,000 | 270,181 | ||||||
| Tracy Community Facilities District Special Tax, (Tracy Community Facilities District No. 2016-01), 5.00%, 9/1/39 | 280,000 | 293,039 | ||||||
| Tustin Community Facilities District Special Tax, (Tustin Community Facilities District No. 14-1), 5.00%, 9/1/29 | 150,000 | 157,155 | ||||||
| Woodside Fire Protection District COP, 4.00%, 5/1/41 | 445,000 | 450,322 | ||||||
| 30,493,968 | ||||||||
| Colorado — 4.1% | ||||||||
| Adams & Weld Counties School District No. 27J Brighton GO, 5.00%, 12/1/23 | 1,000,000 | 1,033,077 | ||||||
| Board of Governors of Colorado State University System Rev., 4.00%, 3/1/44 | 1,220,000 | 1,151,845 | ||||||
| Brighton Crossing Metropolitan District No. 6 GO, 5.00%, 12/1/40 | 515,000 | 488,375 | ||||||
| City & County of Denver Airport System Rev., 5.50%, 11/15/42 | 750,000 | 822,850 | ||||||
| Colorado Health Facilities Authority Rev., (AdventHealth Obligated Group), VRN, 5.00%, 11/15/49 | 100,000 | 109,274 | ||||||
| Colorado Health Facilities Authority Rev., (Covenant Living Communities and Services Obligated Group), 4.00%, 12/1/40 | 500,000 | 456,782 | ||||||
| Colorado Health Facilities Authority Rev., (Frasier Meadows Manor, Inc.), 5.00%, 5/15/23 | 100,000 | 100,701 | ||||||
| Colorado Health Facilities Authority Rev., (Intermountain Healthcare Obligated Group), VRN, 5.00%, 5/15/62 | 1,500,000 | 1,656,227 | ||||||
| Colorado Health Facilities Authority Rev., (Sanford Obligated Group), 4.00%, 11/1/39 | 380,000 | 360,497 | ||||||
| Colorado Health Facilities Authority Rev., (Sisters of Charity of Leavenworth Health System, Inc. Obligated Group), 4.00%, 1/1/38 | 210,000 | 207,344 | ||||||
| Crystal Valley Metropolitan District No. 2 GO, 4.00%, 12/1/44 (AGM) | 500,000 | 485,382 | ||||||
| Denver City & County School District No. 1 GO, 5.00%, 12/1/24 | 1,500,000 | 1,587,165 | ||||||
Denver Urban Renewal Authority Tax Allocation, (9th & Colorado Urban Redevelopment Area), 5.25%, 12/1/39(1) | 100,000 | 102,552 | ||||||
| Regional Transportation District Rev., (Denver Transit Partners LLC), 5.00%, 1/15/30 | 250,000 | 270,405 | ||||||
| Regional Transportation District Rev., (Denver Transit Partners LLC), 5.00%, 7/15/32 | 600,000 | 645,936 | ||||||
| Regional Transportation District Rev., (Denver Transit Partners LLC), 4.00%, 7/15/34 | 500,000 | 493,438 | ||||||
| State of Colorado COP, 6.00%, 12/15/41 | 615,000 | 748,926 | ||||||
| Vauxmont Metropolitan District GO, 5.00%, 12/15/26 (AGM) | 220,000 | 238,034 | ||||||
| Village Metropolitan District GO, 5.00%, 12/1/49 | 500,000 | 502,246 | ||||||
| 11,461,056 | ||||||||
| Connecticut — 2.4% | ||||||||
Connecticut State Health & Educational Facilities Authority Rev., (McLean Affiliates Obligated Group), 3.25%, 1/1/27(1) | 450,000 | 437,383 | ||||||
| Connecticut State Health & Educational Facilities Authority Rev., (Trinity Health Corp. Obligated Group), 5.00%, 12/1/45 | 1,000,000 | 1,046,156 | ||||||
| State of Connecticut GO, 5.00%, 11/15/31 | 365,000 | 391,015 | ||||||
| State of Connecticut GO, 4.00%, 1/15/34 | 1,000,000 | 1,034,233 | ||||||
| State of Connecticut GO, 5.00%, 6/15/34 | 680,000 | 707,124 | ||||||
| State of Connecticut GO, 4.00%, 6/1/36 | 1,000,000 | 1,008,286 | ||||||
| State of Connecticut Special Tax Rev., 5.00%, 5/1/29 | 1,145,000 | 1,307,246 | ||||||
| Town of Greenwich GO, 5.00%, 1/15/26 | 725,000 | 787,847 | ||||||
| 6,719,290 | ||||||||
36
| Diversified Municipal Bond ETF | ||||||||
| Principal Amount | Value | |||||||
| Delaware — 0.3% | ||||||||
| Delaware Transportation Authority Rev., 5.00%, 7/1/24 | $ | 750,000 | $ | 785,535 | ||||
| District of Columbia — 1.5% | ||||||||
| District of Columbia GO, 5.00%, 2/1/41 | 520,000 | 579,034 | ||||||
| District of Columbia Rev., (District of Columbia Income Tax Rev.), 5.00%, 10/1/26 | 660,000 | 725,236 | ||||||
| District of Columbia Rev., (District of Columbia Income Tax Rev.), 5.00%, 7/1/47 | 750,000 | 834,107 | ||||||
| District of Columbia Rev., (Plenary Infrastructure LLC), 5.00%, 2/28/25 | 1,000,000 | 1,038,313 | ||||||
| District of Columbia Water & Sewer Authority Rev., 5.00%, 10/1/39 | 535,000 | 569,147 | ||||||
| Washington Metropolitan Area Transit Authority Rev., 5.00%, 7/15/28 | 390,000 | 442,046 | ||||||
| 4,187,883 | ||||||||
| Florida — 7.4% | ||||||||
| Alachua County Health Facilities Authority Rev., (Shands Teaching Hospital & Clinics Obligated Group), 5.00%, 12/1/44 | 350,000 | 358,974 | ||||||
| Broward County Port Facilities Rev., 5.00%, 9/1/40 | 1,000,000 | 1,054,661 | ||||||
| Broward County Water & Sewer Utility Rev., 5.00%, 10/1/40 | 925,000 | 1,014,312 | ||||||
| Broward County Water & Sewer Utility Rev., 4.00%, 10/1/45 | 880,000 | 853,016 | ||||||
| Capital Projects Finance Authority Rev., (CAPFA Capital Corp. 2000F), 5.00%, 10/1/28 | 300,000 | 314,062 | ||||||
| Central Florida Expressway Authority Rev., 5.00%, 7/1/28 (AGM) | 750,000 | 848,250 | ||||||
Florida Development Finance Corp. Rev., 3.00%, 7/1/31(1) | 260,000 | 229,730 | ||||||
| Florida Development Finance Corp. Rev., 5.00%, 6/15/35 | 250,000 | 258,698 | ||||||
| Florida Development Finance Corp. Rev., (Glenridge on Palmer Ranch Obligated Group), 3.00%, 6/1/23 | 115,000 | 113,609 | ||||||
| Florida Development Finance Corp. Rev., (Glenridge on Palmer Ranch Obligated Group), 4.00%, 6/1/24 | 105,000 | 103,585 | ||||||
| Florida Development Finance Corp. Rev., (Glenridge on Palmer Ranch Obligated Group), 4.00%, 6/1/25 | 110,000 | 107,312 | ||||||
| Florida Development Finance Corp. Rev., (Glenridge on Palmer Ranch Obligated Group), 4.00%, 6/1/26 | 110,000 | 106,240 | ||||||
| Florida Development Finance Corp. Rev., (Mater Academy Miami-Dade Osceola County Facilities Obligated Group), 5.00%, 6/15/47 | 800,000 | 814,493 | ||||||
| Fort Pierce Utilities Authority Rev., 5.00%, 10/1/29 (AGM) | 1,050,000 | 1,187,253 | ||||||
| Greater Orlando Aviation Authority Rev., 5.00%, 10/1/33 | 180,000 | 191,960 | ||||||
| Hillsborough County Aviation Authority Rev., 5.00%, 10/1/27 | 375,000 | 406,775 | ||||||
Lake County Rev., (Educational Charter Foundation of Florida, Inc.), 5.00%, 1/15/39(1) | 550,000 | 548,749 | ||||||
| Miami-Dade County Aviation Rev., 5.00%, 10/1/38 | 500,000 | 518,132 | ||||||
| Miami-Dade County Water & Sewer System Rev., 4.00%, 10/1/35 | 175,000 | 178,703 | ||||||
| Miami-Dade County Water & Sewer System Rev., 4.00%, 10/1/44 | 1,000,000 | 928,632 | ||||||
| Miami-Dade County Water & Sewer System Rev., 5.00%, 10/1/44 | 1,390,000 | 1,489,429 | ||||||
| Palm Beach County Health Facilities Authority Rev., (Baptist Health South Florida Obligated Group), 5.00%, 8/15/30 | 800,000 | 885,644 | ||||||
| Pinellas County Industrial Development Authority Rev., (Drs. Kiran & Pallavi Patel 2017 Foundation for Global Understanding, Inc.), 5.00%, 7/1/29 | 105,000 | 108,669 | ||||||
| Pinellas County Industrial Development Authority Rev., (Drs. Kiran & Pallavi Patel 2017 Foundation for Global Understanding, Inc.), 5.00%, 7/1/39 | 375,000 | 380,608 | ||||||
37
| Diversified Municipal Bond ETF | ||||||||
| Principal Amount | Value | |||||||
| Pompano Beach Rev., (John Knox Village of Florida, Inc. Obligated Group), 1.45%, 1/1/27 | $ | 750,000 | $ | 669,369 | ||||
| Seminole County Industrial Development Authority Rev., (CCRC Development Corp. Obligated Group), 4.25%, 11/15/26 | 650,000 | 611,001 | ||||||
| South Florida Water Management District COP, 5.00%, 10/1/36 | 560,000 | 599,472 | ||||||
| State of Florida GO, 5.00%, 6/1/23 | 1,700,000 | 1,734,266 | ||||||
| State of Florida Department of Transportation Turnpike System Rev., 5.00%, 7/1/23 | 600,000 | 613,082 | ||||||
| Tampa Water & Wastewater System Rev., 5.00%, 10/1/41 | 1,000,000 | 1,125,151 | ||||||
| Village Community Development District No. 14 Special Assessment, 5.50%, 5/1/53 | 1,000,000 | 1,042,421 | ||||||
| Wildwood Utility Dependent District Rev., 5.00%, 10/1/41 (BAM) | 900,000 | 987,730 | ||||||
| 20,383,988 | ||||||||
| Georgia — 4.0% | ||||||||
| Atlanta Airport Passenger Facility Charge Rev., 4.00%, 7/1/40 | 1,000,000 | 957,942 | ||||||
| Atlanta Water & Wastewater Rev., 4.00%, 11/1/37 | 1,345,000 | 1,358,794 | ||||||
| Cobb County Kennestone Hospital Authority Rev., (WellStar Health System Obligated Group), 4.00%, 4/1/52 | 1,000,000 | 921,226 | ||||||
George L Smith II Congress Center Authority Rev., (Signia Hotel Management LLC), 3.625%, 1/1/31(1) | 475,000 | 424,351 | ||||||
| Georgia Ports Authority Rev., 5.25%, 7/1/52 | 500,000 | 555,377 | ||||||
| Main Street Natural Gas, Inc. Rev., VRN, 4.00%, 5/1/52 (GA: Citigroup Global Markets) | 500,000 | 498,793 | ||||||
| Main Street Natural Gas, Inc. Rev., VRN, 4.00%, 7/1/52 (GA: Royal Bank of Canada) | 600,000 | 609,700 | ||||||
| Main Street Natural Gas, Inc. Rev., VRN, 4.00%, 9/1/52 (GA: Citigroup, Inc.) | 1,190,000 | 1,178,630 | ||||||
| Main Street Natural Gas, Inc. Rev., VRN, 5.00%, 12/1/52 (GA: Citigroup, Inc.) | 1,190,000 | 1,250,121 | ||||||
| Private Colleges & Universities Authority Rev., (Savannah College of Art & Design, Inc.), 4.00%, 4/1/44 | 575,000 | 532,344 | ||||||
| State of Georgia GO, 5.00%, 8/1/23 | 1,000,000 | 1,024,351 | ||||||
| State of Georgia GO, 5.00%, 7/1/29 | 1,465,000 | 1,699,131 | ||||||
| 11,010,760 | ||||||||
| Hawaii — 0.7% | ||||||||
| City & County Honolulu Wastewater System Rev., 4.00%, 7/1/32 | 250,000 | 257,369 | ||||||
| City & County of Honolulu GO, 5.00%, 3/1/29 | 675,000 | 774,121 | ||||||
| City & County of Honolulu GO, 5.25%, 7/1/44 | 760,000 | 876,194 | ||||||
| 1,907,684 | ||||||||
| Idaho — 0.1% | ||||||||
| Idaho Health Facilities Authority Rev., (State Luke's Health System Ltd. Obligated Group), 4.00%, 3/1/46 | 365,000 | 341,675 | ||||||
| Illinois — 5.5% | ||||||||
| Chicago GO, 5.00%, 1/1/26 | 275,000 | 290,345 | ||||||
| Chicago GO, 5.50%, 1/1/49 | 100,000 | 105,393 | ||||||
| Chicago Board of Education GO, 5.00%, 12/1/34 | 280,000 | 290,993 | ||||||
| Chicago Board of Education GO, 5.00%, 12/1/42 | 60,000 | 59,693 | ||||||
Chicago O'Hare International Airport Rev., 5.00%, 1/1/26(4) | 1,000,000 | 1,055,912 | ||||||
| Chicago Wastewater Transmission Rev., 5.50%, 1/1/30 (AGM-CR)(NATL-RE) | 135,000 | 151,013 | ||||||
| Cook County Sales Tax Rev., 5.25%, 11/15/45 | 725,000 | 797,155 | ||||||
| Illinois Finance Authority Rev., (Carle Foundation Obligated Group), VRN, 5.00%, 8/15/53 | 525,000 | 599,618 | ||||||
| Illinois Finance Authority Rev., (NorthShore University HealthSystem Obligated Group), 5.00%, 8/15/47 | 1,000,000 | 1,064,290 | ||||||
38
| Diversified Municipal Bond ETF | ||||||||
| Principal Amount | Value | |||||||
| Illinois Finance Authority Rev., (Presbyterian Homes Obligated Group), VRN, 2.37%, (MUNIPSA plus 0.70%), 5/1/42 | $ | 250,000 | $ | 242,197 | ||||
| Illinois Finance Authority Rev., (State of Illinois Water Revolving Fund - Clean Water Program), 4.00%, 1/1/33 | 1,000,000 | 1,044,525 | ||||||
| Illinois Finance Authority Rev., (State of Illinois Water Revolving Fund - Clean Water Program), 5.00%, 7/1/33 | 1,175,000 | 1,326,088 | ||||||
| Illinois State Toll Highway Authority Rev., 5.00%, 1/1/31 | 465,000 | 532,059 | ||||||
| Illinois State Toll Highway Authority Rev., 5.00%, 1/1/37 | 400,000 | 421,928 | ||||||
| Illinois State Toll Highway Authority Rev., 5.00%, 1/1/46 | 1,150,000 | 1,234,048 | ||||||
| Joliet Waterworks & Sewerage Rev., 5.00%, 1/1/24 | 345,000 | 354,487 | ||||||
| Kane County School District No. 131 Aurora East Side GO, 4.00%, 12/1/31 (AGM) | 200,000 | 210,915 | ||||||
| Metropolitan Water Reclamation District of Greater Chicago GO, 5.00%, 12/1/28 | 605,000 | 662,541 | ||||||
| Northern Illinois University Rev., 5.00%, 10/1/28 (BAM) | 325,000 | 357,857 | ||||||
| Northern Illinois University Rev., 4.00%, 4/1/35 (BAM) | 250,000 | 243,692 | ||||||
| Peoria City School District No. 150 GO, 4.00%, 1/1/26 | 840,000 | 876,175 | ||||||
| State of Illinois GO, 5.00%, 10/1/25 | 175,000 | 183,249 | ||||||
| State of Illinois GO, 5.00%, 11/1/29 | 280,000 | 297,491 | ||||||
| State of Illinois GO, 5.00%, 10/1/30 | 625,000 | 667,733 | ||||||
| State of Illinois GO, 5.00%, 10/1/33 | 200,000 | 210,533 | ||||||
| State of Illinois GO, 5.50%, 5/1/39 | 220,000 | 239,017 | ||||||
| State of Illinois GO, 5.50%, 3/1/42 | 1,250,000 | 1,373,107 | ||||||
| State of Illinois GO, 5.75%, 5/1/45 | 225,000 | 245,941 | ||||||
| 15,137,995 | ||||||||
| Indiana — 0.4% | ||||||||
| Indiana Finance Authority Rev., (Marion County Capital Improvement Board), 5.00%, 2/1/26 | 500,000 | 534,673 | ||||||
| Purdue University Rev., 5.00%, 7/1/26 | 640,000 | 668,680 | ||||||
| 1,203,353 | ||||||||
| Iowa — 1.1% | ||||||||
| Iowa Finance Authority Rev., (Iowa Finance Authority State Revolving Fund), 5.00%, 8/1/44 | 500,000 | 555,592 | ||||||
| Iowa Finance Authority Rev., (Lifespace Communities, Inc. Obligated Group), 5.00%, 5/15/48 | 400,000 | 375,758 | ||||||
| Iowa Finance Authority Rev., (Lifespace Communities, Inc. Obligated Group), VRN, 2.15%, 5/15/56 | 500,000 | 466,934 | ||||||
| Iowa Tobacco Settlement Authority Rev., 4.00%, 6/1/39 | 850,000 | 834,305 | ||||||
| Iowa Tobacco Settlement Authority Rev., 4.00%, 6/1/49 | 645,000 | 611,439 | ||||||
Iowa Tobacco Settlement Authority Rev., 0.00%, 6/1/65(3) | 500,000 | 61,316 | ||||||
| 2,905,344 | ||||||||
| Kansas — 0.5% | ||||||||
| Kansas Development Finance Authority Rev., (AdventHealth Obligated Group), VRN, 5.00%, 11/15/54 | 700,000 | 792,428 | ||||||
| Prairie Village Tax Allocation, (Prairie Village Meadowbrook Redevelopment District), 3.125%, 4/1/36 | 130,000 | 102,714 | ||||||
| State of Kansas Department of Transportation Rev., 5.00%, 9/1/29 | 340,000 | 363,210 | ||||||
| 1,258,352 | ||||||||
| Kentucky — 1.4% | ||||||||
| Ashland Rev., (Ashland Hospital Corp. Obligated Group), 5.00%, 2/1/30 | 370,000 | 404,291 | ||||||
| Kentucky Bond Development Corp. Rev., 5.00%, 9/1/38 | 250,000 | 272,079 | ||||||
| Kentucky Economic Development Finance Authority Rev., (Owensboro Health, Inc. Obligated Group), 5.25%, 6/1/41 | 100,000 | 102,460 | ||||||
39
| Diversified Municipal Bond ETF | ||||||||
| Principal Amount | Value | |||||||
| Kentucky Public Energy Authority Rev., VRN, 4.00%, 4/1/48 (GA: Morgan Stanley) | $ | 300,000 | $ | 302,313 | ||||
| Kentucky Public Energy Authority Rev., VRN, 4.00%, 1/1/49 (GA: BP Corp. North America, Inc.) | 440,000 | 443,858 | ||||||
| Kentucky Public Energy Authority Rev., VRN, 2.73%, 8/1/52 (GA: Morgan Stanley) | 1,000,000 | 939,985 | ||||||
| Kentucky State Property & Building Commission Rev., (Kentucky Finance and Administration Cabinet), 4.00%, 11/1/38 | 500,000 | 504,958 | ||||||
| Kentucky State University COP, 4.00%, 11/1/41 (BAM) | 250,000 | 244,748 | ||||||
| Kentucky State University COP, 4.00%, 11/1/46 (BAM) | 750,000 | 717,943 | ||||||
| 3,932,635 | ||||||||
| Louisiana — 0.3% | ||||||||
East Baton Rouge Sewerage Commission Rev., 5.00%, 2/1/25, Prerefunded at 100% of Par(2) | 520,000 | 551,880 | ||||||
| Louisiana Stadium & Exposition District Rev., 5.00%, 7/3/23 | 100,000 | 100,676 | ||||||
| New Orleans Aviation Board Rev., (Parking Facilities Corp.), 5.00%, 10/1/48 (AGM) | 250,000 | 262,916 | ||||||
| 915,472 | ||||||||
| Maryland — 2.1% | ||||||||
Baltimore Rev., 5.00%, 6/1/51(1)(4) | 400,000 | 403,114 | ||||||
| Baltimore Rev., (East Baltimore Research Park Development District), 4.00%, 9/1/27 | 200,000 | 200,395 | ||||||
| Baltimore County COP, 5.00%, 3/1/28 | 375,000 | 422,257 | ||||||
| Brunswick Special Tax, 5.00%, 7/1/36 | 100,000 | 103,059 | ||||||
| Gaithersburg Rev., (Asbury Maryland Obligated Group), 5.125%, 1/1/42 | 400,000 | 412,659 | ||||||
| Maryland Economic Development Corp. Tax Allocation, (City of Baltimore Port Covington Development District), 4.00%, 9/1/50 | 1,000,000 | 852,858 | ||||||
| Maryland Health & Higher Educational Facilities Authority Rev., (Adventist Healthcare Obligated Group), 4.00%, 1/1/51 | 500,000 | 453,904 | ||||||
| Maryland Stadium Authority Built to Learn Rev., 5.00%, 6/1/25 | 500,000 | 531,129 | ||||||
| State of Maryland GO, 5.00%, 8/1/27 | 320,000 | 358,892 | ||||||
| State of Maryland GO, 5.00%, 6/1/31 | 1,640,000 | 1,943,864 | ||||||
| 5,682,131 | ||||||||
| Massachusetts — 3.2% | ||||||||
| Commonwealth of Massachusetts Transportation Fund Rev., 5.00%, 6/1/43 | 1,190,000 | 1,315,179 | ||||||
| Commonwealth of Massachusetts Transportation Fund Rev., 5.00%, 6/1/51 | 1,000,000 | 1,085,909 | ||||||
| Massachusetts GO, 5.00%, 5/1/25 | 345,000 | 368,062 | ||||||
| Massachusetts GO, 4.00%, 9/1/36 | 400,000 | 405,933 | ||||||
| Massachusetts Bay Transportation Authority Rev., 5.00%, 7/1/41 | 910,000 | 1,003,027 | ||||||
Massachusetts Development Finance Agency Rev., (NewBridge on the Charles Inc Obligated Group), 5.00%, 10/1/37(1) | 150,000 | 157,647 | ||||||
Massachusetts Development Finance Agency Rev., (NewBridge on the Charles, Inc. Obligated Group), 4.00%, 10/1/32(1) | 100,000 | 102,447 | ||||||
| Massachusetts Development Finance Agency Rev., (Wellforce Obligated Group), 5.00%, 7/1/44 | 890,000 | 924,845 | ||||||
| Massachusetts Development Finance Agency Rev., (Wellforce Obligated Group), 4.00%, 10/1/45 (AGM) | 375,000 | 354,488 | ||||||
| Massachusetts Port Authority Rev., 5.00%, 7/1/41 | 800,000 | 861,454 | ||||||
| Massachusetts School Building Authority Rev., 5.00%, 8/15/45 | 730,000 | 808,701 | ||||||
| Massachusetts State College Building Authority Rev., 5.00%, 5/1/31 | 500,000 | 582,056 | ||||||
| Massachusetts State College Building Authority Rev., 5.00%, 5/1/32 | 250,000 | 293,420 | ||||||
40
| Diversified Municipal Bond ETF | ||||||||
| Principal Amount | Value | |||||||
| Massachusetts Transportation Trust Fund Metropolitan Highway System Rev., 5.00%, 1/1/32 | $ | 460,000 | $ | 514,051 | ||||
| 8,777,219 | ||||||||
| Michigan — 1.5% | ||||||||
| Detroit GO, 5.00%, 4/1/25 | 50,000 | 52,031 | ||||||
| Detroit GO, 5.00%, 4/1/36 | 550,000 | 568,387 | ||||||
| Detroit GO, 5.00%, 4/1/37 | 250,000 | 257,396 | ||||||
| Detroit Downtown Development Authority Tax Allocation, (Development Area No. 1), 5.00%, 7/1/23 (AGM) | 350,000 | 356,816 | ||||||
| Michigan Finance Authority Rev., (BHSH System Obligated Group), 5.00%, 4/15/27 | 1,335,000 | 1,476,513 | ||||||
| Michigan Finance Authority Rev., (BHSH System Obligated Group), 4.00%, 4/15/42 | 395,000 | 382,837 | ||||||
| Michigan Finance Authority Rev., (Michigan Finance Authority Tobacco Settlement Rev.), 5.00%, 6/1/32 | 500,000 | 547,905 | ||||||
Michigan Finance Authority Rev., (Thomas M Cooley Law School), 6.75%, 7/1/24, Prerefunded at 100% of Par(1)(2) | 100,000 | 107,016 | ||||||
Michigan Finance Authority Rev., (Thomas M Cooley Law School), 6.75%, 7/1/44(1) | 100,000 | 101,601 | ||||||
| Michigan State Hospital Finance Authority Rev., (Trinity Health Corp. Obligated Group), 5.00%, 12/1/24 | 355,000 | 374,509 | ||||||
| 4,225,011 | ||||||||
| Minnesota — 0.1% | ||||||||
| Minneapolis MN/St Paul Housing & Redevelopment Authority Rev., (Allina Health Obligated Group), 5.00%, 11/15/24 | 370,000 | 390,109 | ||||||
| Mississippi — 0.2% | ||||||||
| State of Mississippi GO, 5.00%, 9/1/26 | 500,000 | 549,355 | ||||||
| Missouri — 1.1% | ||||||||
| Health & Educational Facilities Authority of the State of Missouri Rev., (SSM Health Care Obligated Group), 5.00%, 6/1/27 | 200,000 | 219,112 | ||||||
| Health & Educational Facilities Authority of the State of Missouri Rev., (SSM Health Care Obligated Group), 5.00%, 6/1/28 | 150,000 | 166,458 | ||||||
| Kansas City GO, 5.00%, 2/1/24 | 625,000 | 647,183 | ||||||
| Kansas City Industrial Development Authority Rev., (Kansas City Airport Rev.), 5.00%, 3/1/46 | 1,000,000 | 1,027,283 | ||||||
| Kansas City Industrial Development Authority Rev., (Kansas City), 5.00%, 3/1/37 | 600,000 | 628,484 | ||||||
| Kansas City Sanitary Sewer System Rev., 5.00%, 1/1/26 | 300,000 | 323,816 | ||||||
| 3,012,336 | ||||||||
| Nebraska — 0.1% | ||||||||
| Omaha Public Power District Rev., 5.00%, 2/1/23 | 200,000 | 202,201 | ||||||
| Nevada — 1.7% | ||||||||
| Las Vegas Special Improvement District No. 815 Special Assessment, 4.00%, 12/1/31 | 250,000 | 242,994 | ||||||
| Las Vegas Special Improvement District No. 815 Special Assessment, 5.00%, 12/1/49 | 200,000 | 201,059 | ||||||
| Las Vegas Special Improvement District No. 816 Special Assessment, 2.00%, 6/1/23 | 150,000 | 148,114 | ||||||
| Las Vegas Valley Water District GO, 5.00%, 6/1/38 | 1,340,000 | 1,430,654 | ||||||
Sparks Rev., 2.50%, 6/15/24(1) | 90,000 | 87,481 | ||||||
| State of Nevada GO, 5.00%, 8/1/30 | 1,530,000 | 1,752,312 | ||||||
| State of Nevada Highway Improvement Rev., 5.00%, 12/1/28 | 255,000 | 277,531 | ||||||
| State of Nevada Highway Improvement Rev., 4.00%, 12/1/33 | 375,000 | 392,916 | ||||||
| Tahoe-Douglas Visitors Authority Rev., 4.00%, 7/1/25 | 200,000 | 201,991 | ||||||
| 4,735,052 | ||||||||
41
| Diversified Municipal Bond ETF | ||||||||
| Principal Amount | Value | |||||||
| New Hampshire — 0.6% | ||||||||
| New Hampshire Business Finance Authority Rev., 4.125%, 1/20/34 | $ | 288,969 | $ | 282,106 | ||||
| New Hampshire Business Finance Authority Rev., (Springpoint Senior Living Obligated Group), 4.00%, 1/1/27 | 500,000 | 500,569 | ||||||
| New Hampshire Business Finance Authority Rev., (Waste Management, Inc.), VRN, 2.05%, (MUNIPSA plus 0.38%), 10/1/33 (GA: Waste Management Holdings) | 1,000,000 | 971,983 | ||||||
| 1,754,658 | ||||||||
| New Jersey — 3.4% | ||||||||
New Jersey Economic Development Authority Rev., 5.50%, 12/15/26, Prerefunded at 100% of Par(2) | 260,000 | 292,653 | ||||||
| New Jersey Economic Development Authority Rev., (State of New Jersey Department of the Treasury), 5.50%, 9/1/24 (Ambac) | 1,000,000 | 1,053,155 | ||||||
| New Jersey Educational Facilities Authority Rev., (Trustees of Princeton University), 5.00%, 3/1/32 | 625,000 | 744,015 | ||||||
| New Jersey Transportation Trust Fund Authority Rev., 5.50%, 12/15/22 | 430,000 | 433,871 | ||||||
| New Jersey Transportation Trust Fund Authority Rev., 5.00%, 6/15/27 | 715,000 | 771,003 | ||||||
| New Jersey Transportation Trust Fund Authority Rev., 5.00%, 6/15/28 | 455,000 | 497,330 | ||||||
| New Jersey Transportation Trust Fund Authority Rev., 5.00%, 12/15/28 | 375,000 | 411,455 | ||||||
| New Jersey Transportation Trust Fund Authority Rev., 5.00%, 12/15/32 | 400,000 | 429,661 | ||||||
| New Jersey Transportation Trust Fund Authority Rev., 5.00%, 12/15/33 | 260,000 | 277,870 | ||||||
| New Jersey Transportation Trust Fund Authority Rev., 4.00%, 6/15/38 | 620,000 | 599,390 | ||||||
| New Jersey Turnpike Authority Rev., 5.00%, 1/1/48 | 150,000 | 160,186 | ||||||
| Newark Board of Education GO, 5.00%, 7/15/33 (BAM) | 900,000 | 1,019,519 | ||||||
| State of New Jersey GO, 4.00%, 6/1/31 | 690,000 | 736,905 | ||||||
| State of New Jersey GO, 4.00%, 6/1/32 | 500,000 | 534,148 | ||||||
| Tobacco Settlement Financing Corp. Rev., 5.00%, 6/1/29 | 125,000 | 135,842 | ||||||
| Tobacco Settlement Financing Corp. Rev., 5.00%, 6/1/30 | 180,000 | 194,631 | ||||||
| Tobacco Settlement Financing Corp. Rev., 5.00%, 6/1/46 | 280,000 | 282,204 | ||||||
| Tobacco Settlement Financing Corp. Rev., 5.25%, 6/1/46 | 750,000 | 785,112 | ||||||
| 9,358,950 | ||||||||
| New Mexico — 0.6% | ||||||||
| New Mexico Finance Authority Rev., (New Mexico Finance Authority Public Project Revolving Fund), 5.00%, 6/1/24 | 1,000,000 | 1,044,979 | ||||||
| New Mexico Hospital Equipment Loan Council Rev., (Haverland Carter Lifestyle Obligated Group), 2.25%, 7/1/23 | 100,000 | 99,169 | ||||||
| New Mexico Municipal Energy Acquisition Authority Rev., VRN, 5.00%, 11/1/39 (LIQ FAC: Royal Bank of Canada) | 500,000 | 526,110 | ||||||
| 1,670,258 | ||||||||
| New York — 10.2% | ||||||||
| Brookhaven Local Development Corp. Rev., (Active Retirement Community, Inc. Obligated Group), 5.25%, 11/1/25 | 130,000 | 136,007 | ||||||
| Metropolitan Transportation Authority Rev., 5.00%, 2/1/23 | 350,000 | 352,795 | ||||||
| Metropolitan Transportation Authority Rev., 5.00%, 11/15/33 | 750,000 | 796,182 | ||||||
| Metropolitan Transportation Authority Rev., 5.00%, 11/15/33 | 110,000 | 114,758 | ||||||
| Metropolitan Transportation Authority Rev., 5.00%, 11/15/33 | 560,000 | 584,224 | ||||||
| Metropolitan Transportation Authority Rev., 5.00%, 11/15/38 | 255,000 | 265,393 | ||||||
42
| Diversified Municipal Bond ETF | ||||||||
| Principal Amount | Value | |||||||
| Metropolitan Transportation Authority Rev., VRN, 2.33%, 11/1/32 (AGM) | $ | 250,000 | $ | 237,501 | ||||
| Nassau County Interim Finance Authority Rev., 4.00%, 11/15/35 | 500,000 | 527,699 | ||||||
| New York City GO, 5.00%, 8/1/23 | 365,000 | 373,821 | ||||||
| New York City GO, 5.00%, 8/1/27 | 320,000 | 356,533 | ||||||
| New York City GO, 5.25%, 5/1/41 | 150,000 | 166,876 | ||||||
| New York City GO, 5.00%, 8/1/43 | 500,000 | 537,214 | ||||||
| New York City GO, 4.00%, 8/1/44 | 1,000,000 | 958,092 | ||||||
New York City GO, 4.00%, 9/1/46(4) | 250,000 | 239,080 | ||||||
| New York City Industrial Development Agency Rev., (Queens Ballpark Co. LLC), 5.00%, 1/1/28 (AGM) | 300,000 | 327,456 | ||||||
| New York City Municipal Water Finance Authority Rev., (New York City Water & Sewer System), 5.00%, 6/15/27 | 110,000 | 118,947 | ||||||
| New York City Municipal Water Finance Authority Rev., 5.00%, 6/15/25 | 750,000 | 774,876 | ||||||
| New York City Municipal Water Finance Authority Rev., 5.00%, 6/15/39 | 815,000 | 855,883 | ||||||
| New York City Municipal Water Finance Authority Rev., 5.00%, 6/15/49 | 390,000 | 418,683 | ||||||
New York City Transitional Finance Authority Future Tax Secured Rev., 5.00%, 11/1/26(4) | 1,000,000 | 1,097,218 | ||||||
| New York City Transitional Finance Authority Future Tax Secured Rev., 5.00%, 2/1/36 | 200,000 | 223,883 | ||||||
| New York Liberty Development Corp. Rev., (Goldman Sachs Headquarters LLC), 5.50%, 10/1/37 (GA: Goldman Sachs Group, Inc.) | 175,000 | 200,884 | ||||||
| New York Power Authority Rev., 5.00%, 11/15/27 (AGM) | 1,000,000 | 1,125,062 | ||||||
| New York State Dormitory Authority Rev., 5.00%, 10/1/28 (BAM) | 670,000 | 758,716 | ||||||
| New York State Dormitory Authority Rev., (Fordham University), 5.00%, 7/1/25 | 710,000 | 751,694 | ||||||
| New York State Dormitory Authority Rev., (New York University), 5.00%, 7/1/51 | 550,000 | 597,674 | ||||||
| New York State Dormitory Authority Rev., (Northwell Health Obligated Group), 4.00%, 5/1/45 | 1,000,000 | 930,879 | ||||||
| New York State Dormitory Authority Rev., (State of New York Personal Income Tax Rev.), 4.00%, 2/15/37 | 500,000 | 495,730 | ||||||
| New York State Dormitory Authority Rev., (State of New York Personal Income Tax Rev.), 4.00%, 3/15/40 | 750,000 | 728,705 | ||||||
| New York State Dormitory Authority Rev., (State of New York Sales Tax Rev.), 5.00%, 3/15/26 | 1,100,000 | 1,194,774 | ||||||
| New York State Dormitory Authority Rev., (State of New York Sales Tax Rev.), 5.00%, 3/15/27 | 815,000 | 903,655 | ||||||
| New York State Environmental Facilities Corp. Rev., (State of New York State Revolving Fund), 5.00%, 6/15/24 | 500,000 | 522,963 | ||||||
| New York State Environmental Facilities Corp. Rev., (State of New York State Revolving Fund), 5.00%, 6/15/39 | 850,000 | 967,999 | ||||||
| New York State Thruway Authority Rev., 5.00%, 1/1/27 | 405,000 | 416,780 | ||||||
| New York State Thruway Authority Rev., 5.00%, 1/1/29 | 915,000 | 960,497 | ||||||
| New York State Thruway Authority Rev., 4.00%, 1/1/38 | 700,000 | 683,360 | ||||||
| New York State Thruway Authority Rev., 4.00%, 1/1/45 | 520,000 | 491,456 | ||||||
| New York State Thruway Authority Rev., (State of New York Personal Income Tax Rev.), 4.00%, 3/15/44 | 750,000 | 718,981 | ||||||
| New York State Urban Development Corp. Rev., (State of New York Personal Income Tax Rev.), 5.00%, 3/15/38 | 400,000 | 435,811 | ||||||
| New York Transportation Development Corp. Rev., (American Airlines, Inc.), 3.00%, 8/1/31 (GA: American Airlines Group) | 130,000 | 121,316 | ||||||
| New York Transportation Development Corp. Rev., (Empire State Thruway Partners LLC), 4.00%, 10/31/46 | 500,000 | 435,952 | ||||||
43
| Diversified Municipal Bond ETF | ||||||||
| Principal Amount | Value | |||||||
| New York Transportation Development Corp. Rev., (JFK International Air Terminal LLC), 4.00%, 12/1/41 | $ | 170,000 | $ | 157,786 | ||||
| New York Transportation Development Corp. Rev., (JFK International Air Terminal LLC), 5.00%, 12/1/42 | 640,000 | 662,681 | ||||||
| New York Transportation Development Corp. Rev., (Laguardia Gateway Partners LLC), 4.00%, 7/1/36 (AGM) | 685,000 | 685,534 | ||||||
| Town of Oyster Bay GO, 5.00%, 8/1/25 (AGM) | 545,000 | 583,746 | ||||||
| Triborough Bridge & Tunnel Authority Rev., 5.00%, 11/15/27 | 255,000 | 286,095 | ||||||
| Triborough Bridge & Tunnel Authority Rev., (Metropolitan Transportation Authority Payroll Mobility Tax Rev.), VRN, 5.00%, 5/15/50 | 1,115,000 | 1,193,639 | ||||||
| Triborough Bridge & Tunnel Authority Sales Tax Rev., 5.00%, 5/15/39 | 1,000,000 | 1,119,896 | ||||||
Westchester County Local Development Corp. Rev., (Purchase Senior Learning Community Obligated Group), 2.875%, 7/1/26(1) | 455,000 | 426,654 | ||||||
| Yonkers Economic Development Corp. Rev., (Charter School of Educational Excellence), 5.00%, 10/15/39 | 100,000 | 99,313 | ||||||
| 28,121,353 | ||||||||
| North Carolina — 1.7% | ||||||||
| North Carolina Medical Care Commission Rev., (Forest at Duke, Inc. Obligated Group), 4.00%, 9/1/46 | 715,000 | 657,932 | ||||||
| North Carolina Medical Care Commission Rev., (Maryfield, Inc. Obligated Group), 2.875%, 10/1/26 | 50,000 | 47,719 | ||||||
| State of North Carolina Rev., 5.00%, 5/1/25 | 315,000 | 336,562 | ||||||
| State of North Carolina Rev., 5.00%, 3/1/33 | 345,000 | 383,640 | ||||||
| State of North Carolina Rev., (Highway Trust Fund), 5.00%, 5/1/25 | 1,000,000 | 1,068,451 | ||||||
| Wake County GO, 5.00%, 3/1/26 | 340,000 | 369,945 | ||||||
| Wake County GO, 5.00%, 2/1/27 | 1,000,000 | 1,110,029 | ||||||
| Wake County Rev., 5.00%, 3/1/26 | 750,000 | 815,267 | ||||||
| 4,789,545 | ||||||||
| Ohio — 2.6% | ||||||||
| Allen County Hospital Facilities Rev., (Bon Secours Mercy Health, Inc.), 4.00%, 8/1/47 | 1,000,000 | 956,938 | ||||||
| Buckeye Tobacco Settlement Financing Authority Rev., 4.00%, 6/1/48 | 300,000 | 268,894 | ||||||
| Buckeye Tobacco Settlement Financing Authority Rev., 5.00%, 6/1/55 | 485,000 | 461,952 | ||||||
| Cleveland-Cuyahoga County Port Authority Rev., (Cleveland Museum of Natural History), 4.00%, 7/1/40 | 450,000 | 446,529 | ||||||
| Columbus GO, 5.00%, 4/1/32 | 500,000 | 562,056 | ||||||
| Cuyahoga County Rev., (MetroHealth System), 5.00%, 2/15/42 | 360,000 | 367,585 | ||||||
| Miami University/Oxford Rev., 5.00%, 9/1/36 | 570,000 | 642,149 | ||||||
| Northeast Ohio Regional Sewer District Rev., 4.00%, 11/15/37 | 170,000 | 171,065 | ||||||
| Ohio Higher Educational Facility Commission Rev., (Cleveland Institute of Art), 5.50%, 12/1/53 | 100,000 | 101,414 | ||||||
| Ohio Water Development Authority Water Pollution Control Loan Fund Rev., 5.00%, 12/1/46 | 500,000 | 552,925 | ||||||
| State of Ohio GO, 5.00%, 5/1/40 | 660,000 | 738,072 | ||||||
| State of Ohio GO, 5.00%, 6/15/41 | 275,000 | 307,179 | ||||||
| State of Ohio Rev., (University Hospitals Health System, Inc. Obligated Group), 4.00%, 1/15/39 | 700,000 | 678,210 | ||||||
| Wright State University Rev., 4.00%, 5/1/23 (BAM) | 400,000 | 404,133 | ||||||
| Wright State University Rev., 4.00%, 5/1/24 (BAM) | 430,000 | 440,428 | ||||||
| 7,099,529 | ||||||||
44
| Diversified Municipal Bond ETF | ||||||||
| Principal Amount | Value | |||||||
| Oklahoma — 0.5% | ||||||||
| Oklahoma Capitol Improvement Authority Rev., (Oklahoma Department of Transportation), 4.00%, 7/1/38 | $ | 850,000 | $ | 861,333 | ||||
| Oklahoma Water Resources Board Rev., 4.00%, 4/1/37 | 620,000 | 631,006 | ||||||
| 1,492,339 | ||||||||
| Oregon — 0.4% | ||||||||
| Clackamas County Hospital Facility Authority Rev., (Rose Villa, Inc. Obligated Group), 5.125%, 11/15/40 | 250,000 | 244,625 | ||||||
| Clackamas County Hospital Facility Authority Rev., (Willamette View, Inc.), 5.00%, 11/15/47 | 100,000 | 96,656 | ||||||
| Klamath Falls Intercommunity Hospital Authority Rev., (Sky Lakes Medical Center, Inc.), 4.00%, 9/1/26 | 35,000 | 36,115 | ||||||
| Klamath Falls Intercommunity Hospital Authority Rev., (Sky Lakes Medical Center, Inc.), 5.00%, 9/1/29 | 50,000 | 53,226 | ||||||
| Oregon Health & Science University Rev., (Obligated Group), 4.00%, 7/1/41 | 200,000 | 196,265 | ||||||
| State of Oregon GO, 5.00%, 5/1/26 | 505,000 | 550,908 | ||||||
| 1,177,795 | ||||||||
| Pennsylvania — 2.7% | ||||||||
| Berks County Municipal Authority Rev., (Tower Health Obligated Group), 5.00%, 2/1/28 | 150,000 | 138,634 | ||||||
| Berks County Municipal Authority Rev., (Tower Health Obligated Group), 5.00%, 11/1/40 | 300,000 | 239,086 | ||||||
| Commonwealth Financing Authority Rev., 5.00%, 6/1/24 | 1,625,000 | 1,684,770 | ||||||
| Commonwealth Financing Authority Rev., 5.00%, 6/1/25 | 290,000 | 306,238 | ||||||
| Dauphin County General Authority Rev., (UPMC Obligated Group), 5.00%, 6/1/26 | 15,000 | 16,020 | ||||||
| Delaware County Authority Rev., (Villanova University), 5.00%, 8/1/31 | 1,200,000 | 1,267,621 | ||||||
| Geisinger Authority Rev., (Geisinger Health System Obligated Group), 5.00%, 2/15/32 | 150,000 | 160,481 | ||||||
| Pennsylvania GO, 5.00%, 1/1/24 | 690,000 | 714,017 | ||||||
| Pennsylvania GO, 5.00%, 7/15/29 | 845,000 | 967,390 | ||||||
| Pennsylvania State Public School Building Authority Rev., (School District of Philadelphia), 5.00%, 6/1/29 (AGM) | 290,000 | 326,504 | ||||||
| Pennsylvania Turnpike Commission Rev., 5.25%, 12/1/39 | 340,000 | 350,533 | ||||||
| Pennsylvania Turnpike Commission Rev., 5.00%, 12/1/45 | 1,000,000 | 1,070,416 | ||||||
| Pennsylvania Turnpike Commission Rev., 5.00%, 12/1/46 | 300,000 | 310,634 | ||||||
| 7,552,344 | ||||||||
| South Carolina — 0.4% | ||||||||
| Berkeley County Special Assessment, (Berkeley County Nexton Improvement District), 4.25%, 11/1/40 | 100,000 | 96,726 | ||||||
| Charleston Waterworks & Sewer System Rev., 5.00%, 1/1/37 | 325,000 | 377,308 | ||||||
Richland County Special Assessment, (Richland County Village at Sandhill Improvement District), 3.75%, 11/1/36(1) | 270,000 | 217,147 | ||||||
| South Carolina Jobs-Economic Development Authority Rev., (Bon Secours Mercy Health, Inc.), VRN, 5.00%, 12/1/48 | 500,000 | 535,176 | ||||||
| 1,226,357 | ||||||||
| Tennessee — 0.8% | ||||||||
Metropolitan Government Nashville & Davidson County Industrial Development Board Special Assessment, (South Nashville Central Business Improvement District), Capital Appreciation, 0.00%, 6/1/43(1)(3) | 4,000,000 | 1,308,240 | ||||||
| Metropolitan Government of Nashville & Davidson County Water & Sewer Rev., 4.00%, 7/1/46 | 225,000 | 215,933 | ||||||
| Metropolitan Nashville Airport Authority Rev., 4.00%, 7/1/25 | 150,000 | 155,378 | ||||||
45
| Diversified Municipal Bond ETF | ||||||||
| Principal Amount | Value | |||||||
Nashville Metropolitan Development & Housing Agency Tax Allocation, 5.125%, 6/1/36(1) | $ | 225,000 | $ | 232,036 | ||||
| Tennessee Energy Acquisition Corp. Rev., VRN, 4.00%, 11/1/49 (GA: Goldman Sachs Group, Inc.) | 355,000 | 358,745 | ||||||
| 2,270,332 | ||||||||
| Texas — 8.9% | ||||||||
| Arlington Higher Education Finance Corp. Rev., (Great Hearts America - Texas), 4.00%, 8/15/32 (PSF-GTD) | 425,000 | 439,425 | ||||||
| Arlington Higher Education Finance Corp. Rev., (Harmony Public Schools), 4.00%, 2/15/25 (PSF-GTD) | 170,000 | 175,142 | ||||||
| Arlington Higher Education Finance Corp. Rev., (Harmony Public Schools), 4.00%, 2/15/26 (PSF-GTD) | 280,000 | 290,769 | ||||||
| Arlington Higher Education Finance Corp. Rev., (Riverwalk Education Foundation Inc), 5.00%, 8/15/29 (PSF-GTD) | 400,000 | 455,452 | ||||||
| Austin Airport System Rev., 5.00%, 11/15/41 | 1,000,000 | 1,061,974 | ||||||
Bexar County GO, 4.00%, 6/15/25, Prerefunded at 100% of Par(2) | 950,000 | 990,586 | ||||||
Central Texas Regional Mobility Authority Rev., 5.00%, 1/1/23, Prerefunded at 100% of Par(2) | 600,000 | 605,411 | ||||||
| Central Texas Regional Mobility Authority Rev., 4.00%, 1/1/51 | 1,000,000 | 905,045 | ||||||
| Central Texas Turnpike System Rev., 5.00%, 8/15/42 | 245,000 | 250,468 | ||||||
| Clear Creek Independent School District GO, 5.00%, 2/15/26 (PSF-GTD) | 750,000 | 812,397 | ||||||
| Clifton Higher Education Finance Corp. Rev., (IDEA Public Schools), 5.00%, 8/15/38 (PSF-GTD) | 520,000 | 550,734 | ||||||
| Clifton Higher Education Finance Corp. Rev., (IDEA Public Schools), 4.00%, 8/15/42 (PSF-GTD) | 465,000 | 453,763 | ||||||
| Clifton Higher Education Finance Corp. Rev., (International American Education Federation, Inc.), 6.125%, 8/15/48 | 50,000 | 51,886 | ||||||
| Corpus Christi Utility System Rev., 5.00%, 7/15/33 | 400,000 | 444,928 | ||||||
| Dallas Area Rapid Transit Rev., 5.00%, 12/1/34 | 290,000 | 326,541 | ||||||
| El Paso Water & Sewer Rev., 4.00%, 3/1/40 | 1,000,000 | 986,264 | ||||||
| Fort Bend Independent School District GO, 4.00%, 8/15/35 (PSF-GTD) | 1,000,000 | 1,058,571 | ||||||
| Frisco Independent School District GO, 5.00%, 2/15/26 (PSF-GTD) | 780,000 | 844,893 | ||||||
| Frisco Independent School District GO, 5.00%, 8/15/32 (PSF-GTD) | 1,000,000 | 1,130,722 | ||||||
| Houston GO, 5.00%, 3/1/29 | 340,000 | 386,654 | ||||||
| Houston Higher Education Finance Corp. Rev., (Houston Baptist University), 4.00%, 10/1/51 | 200,000 | 164,914 | ||||||
| Katy Independent School District GO, 5.00%, 2/15/28 (PSF-GTD) | 350,000 | 393,996 | ||||||
| Metropolitan Transit Authority of Harris County Rev., 5.00%, 11/1/26 | 1,755,000 | 1,926,156 | ||||||
New Hope Cultural Education Facilities Finance Corp. Rev., (CHF-Collegiate Housing Island Campus LLC), 5.00%, 4/1/27(2) | 240,000 | 264,699 | ||||||
| North Texas Tollway Authority Rev., (North Texas Tollway System), 5.00%, 1/1/26 | 585,000 | 604,270 | ||||||
| North Texas Tollway Authority Rev., 4.00%, 1/1/35 | 595,000 | 605,186 | ||||||
| San Antonio Water System Rev., 4.00%, 5/15/34 | 275,000 | 287,371 | ||||||
| State of Texas GO, 5.00%, 8/1/40 | 815,000 | 860,226 | ||||||
| Tarrant County Cultural Education Facilities Finance Corp. Rev., (Methodist Hospitals of Dallas Obligated Group), 4.00%, 10/1/42 | 665,000 | 644,222 | ||||||
| Tarrant County Cultural Education Facilities Finance Corp. Rev., (Methodist Hospitals of Dallas Obligated Group), 4.00%, 10/1/47 | 250,000 | 235,524 | ||||||
| Tarrant County Cultural Education Facilities Finance Corp. Rev., (Texas Health Resources Obligated Group), 5.00%, 2/15/24 | 945,000 | 979,566 | ||||||
46
| Diversified Municipal Bond ETF | ||||||||
| Principal Amount | Value | |||||||
| Texas Municipal Gas Acquisition & Supply Corp. III Rev., 5.00%, 12/15/26 (GA: Macquarie Group Ltd.) | $ | 250,000 | $ | 262,570 | ||||
| Texas Private Activity Bond Surface Transportation Corp. Rev., (LBJ Infrastructure Group LLC), 4.00%, 6/30/39 | 1,300,000 | 1,236,220 | ||||||
| Texas Water Development Board Rev., (State Water Implementation Rev. Fund for Texas), 5.00%, 10/15/25 | 850,000 | 916,071 | ||||||
| Texas Water Development Board Rev., (State Water Implementation Rev. Fund for Texas), 4.00%, 10/15/43 | 750,000 | 749,180 | ||||||
| Texas Water Development Board Rev., (Texas Water Development Board State Revolving Fund), 5.00%, 8/1/41 | 1,000,000 | 1,123,417 | ||||||
| Trinity River Authority Central Regional Wastewater System Rev., 5.00%, 8/1/32 | 1,000,000 | 1,180,685 | ||||||
| 24,655,898 | ||||||||
| Utah — 1.6% | ||||||||
| Intermountain Power Agency Rev., 5.00%, 7/1/27 | 500,000 | 556,426 | ||||||
| State of Utah GO, 5.00%, 7/1/26 | 415,000 | 455,141 | ||||||
| State of Utah GO, 5.00%, 7/1/28 | 585,000 | 667,418 | ||||||
UIPA Crossroads Public Infrastructure District Tax Allocation, (AJL Project Area), 4.375%, 6/1/52(1) | 750,000 | 654,752 | ||||||
| University of Utah Rev., 5.00%, 8/1/46 | 755,000 | 832,492 | ||||||
| Utah State University Rev., 4.00%, 12/1/42 (AGM) | 890,000 | 858,996 | ||||||
| Vineyard Redevelopment Agency Tax Allocation, (Geneva Urban Renewal Project Area), 4.00%, 5/1/40 (AGM) | 160,000 | 161,033 | ||||||
| Vineyard Redevelopment Agency Tax Allocation, (Geneva Urban Renewal Project Area), 4.00%, 5/1/41 (AGM) | 175,000 | 175,699 | ||||||
| 4,361,957 | ||||||||
| Virginia — 1.1% | ||||||||
| Fairfax County Industrial Development Authority Rev., (Inova Health System Obligated Group), 5.00%, 5/15/27 | 330,000 | 365,559 | ||||||
| Fairfax County Industrial Development Authority Rev., (Inova Health System Obligated Group), 4.00%, 5/15/42 | 670,000 | 650,177 | ||||||
| Fairfax County Sewer Rev., 5.00%, 7/15/46 | 1,000,000 | 1,121,519 | ||||||
| Lynchburg Economic Development Authority Rev., (Centra Health Obligated Group), 4.00%, 1/1/37 | 825,000 | 801,385 | ||||||
Peninsula Town Center Community Development Authority Special Assessment, 5.00%, 9/1/45(1) | 200,000 | 190,598 | ||||||
| 3,129,238 | ||||||||
| Washington — 4.1% | ||||||||
| Energy Northwest Rev., (Bonneville Power Administration), 5.00%, 7/1/37 | 500,000 | 566,862 | ||||||
| Energy Northwest Rev., (Bonneville Power Administration), 5.00%, 7/1/39 | 525,000 | 577,908 | ||||||
| Energy Northwest Rev., (Bonneville Power Administration), 5.00%, 7/1/40 | 1,080,000 | 1,196,831 | ||||||
| King County School District No. 411 Issaquah GO, 4.00%, 12/1/33 (SCH BD GTY) | 680,000 | 719,949 | ||||||
| Port of Seattle Rev., 5.00%, 4/1/36 | 630,000 | 665,554 | ||||||
| Port of Seattle Rev., 5.50%, 8/1/47 | 1,000,000 | 1,102,562 | ||||||
| Seattle Municipal Light & Power Rev., 5.00%, 7/1/42 | 1,125,000 | 1,266,052 | ||||||
| Seattle Municipal Light & Power Rev., 5.00%, 7/1/52 | 1,000,000 | 1,097,347 | ||||||
| Seattle Municipal Light & Power Rev., VRN, 1.92%, (MUNIPSA plus 0.25%), 5/1/45 | 200,000 | 196,240 | ||||||
| State of Washington GO, 5.00%, 2/1/29 | 420,000 | 473,318 | ||||||
| State of Washington GO, 5.00%, 6/1/36 | 850,000 | 951,096 | ||||||
| State of Washington GO, 5.00%, 8/1/39 | 300,000 | 317,163 | ||||||
| State of Washington GO, 5.00%, 6/1/41 | 750,000 | 823,348 | ||||||
47
| Diversified Municipal Bond ETF | ||||||||
| Principal Amount/Shares | Value | |||||||
| Washington Health Care Facilities Authority Rev., (CommonSpirit Health Obligated Group), VRN, 5.00%, 8/1/49 | $ | 300,000 | $ | 315,730 | ||||
| Washington Health Care Facilities Authority Rev., (Providence State Joseph Health Obligated Group), 5.00%, 10/1/33 | 650,000 | 650,884 | ||||||
Washington State Housing Finance Commission Rev., (Spokane United Methodist Homes Obligated Group), 3.00%, 7/1/27(1) | 300,000 | 270,560 | ||||||
| 11,191,404 | ||||||||
| Wisconsin — 1.6% | ||||||||
| Public Finance Authority Rev., (ACTS Retirement-Life Communities, Inc. Obligated Group), 5.00%, 11/15/41 | 100,000 | 106,067 | ||||||
| Public Finance Authority Rev., (Appalachian Regional Healthcare System Obligated Group), 5.00%, 7/1/41 | 250,000 | 258,861 | ||||||
Public Finance Authority Rev., (Bancroft Neurohealth Obligated Group), 5.125%, 6/1/48(1) | 75,000 | 75,032 | ||||||
| Public Finance Authority Rev., (Beyond Boone LLC), 4.00%, 7/1/39 (AGM) | 150,000 | 148,798 | ||||||
| Public Finance Authority Rev., (Beyond Boone LLC), 5.00%, 7/1/44 (AGM) | 600,000 | 636,785 | ||||||
| Public Finance Authority Rev., (CHF-Wilmington LLC), 5.00%, 7/1/31 (AGM) | 75,000 | 80,257 | ||||||
Public Finance Authority Rev., (Roseman University of Health Sciences), 4.00%, 4/1/52(1) | 250,000 | 201,403 | ||||||
Public Finance Authority Rev., (UHF RISE Student Housing LLC), 4.00%, 7/1/61(1) | 225,000 | 190,654 | ||||||
Public Finance Authority Rev., (UHF RISE Student Housing LLC), 5.25%, 7/1/61(1) | 215,000 | 180,250 | ||||||
| Public Finance Authority Rev., (United Methodist Retirement Homes, Inc. Obligated Group), 4.00%, 10/1/41 | 505,000 | 456,037 | ||||||
| State of Wisconsin GO, 4.00%, 5/1/39 | 750,000 | 766,925 | ||||||
| Wisconsin Health & Educational Facilities Authority Rev., (Advocate Aurora Health Obligated Group), VRN, 1.85%, (MUNIPSA plus 0.18%), 8/15/54 | 1,000,000 | 973,383 | ||||||
| Wisconsin Health & Educational Facilities Authority Rev., (Chiara Communities, Inc.), 5.00%, 7/1/43 | 200,000 | 203,330 | ||||||
| 4,277,782 | ||||||||
TOTAL MUNICIPAL SECURITIES (Cost $283,132,766) | 268,883,123 | |||||||
| SHORT-TERM INVESTMENTS — 2.6% | ||||||||
| Money Market Funds — 2.6% | ||||||||
Morgan Stanley Institutional Liquidity Funds Tax-Exempt Portfolio, Institutional Class (Cost $7,119,348) | 7,119,587 | 7,119,587 | ||||||
TOTAL INVESTMENT SECURITIES — 99.8% (Cost $290,252,114) | 276,002,710 | |||||||
| OTHER ASSETS AND LIABILITIES — 0.2% | 443,554 | |||||||
| TOTAL NET ASSETS — 100.0% | $ | 276,446,264 | ||||||
48
Diversified Municipal Bond ETF
| NOTES TO SCHEDULE OF INVESTMENTS | ||||||||
| AGM | - | Assured Guaranty Municipal Corporation | ||||||
| AGM-CR | - | Assured Guaranty Municipal Corporation - Custodian Receipts | ||||||
| BAM | - | Build America Mutual Assurance Company | ||||||
| COP | - | Certificates of Participation | ||||||
| GA | - | Guaranty Agreement | ||||||
| GO | - | General Obligation | ||||||
| LIQ FAC | - | Liquidity Facilities | ||||||
| MUNIPSA | - | SIFMA Municipal Swap Index | ||||||
| NATL-RE | - | National Public Finance Guarantee Corporation - Reinsured | ||||||
| PSF-GTD | - | Permanent School Fund Guaranteed | ||||||
| SCH BD GTY | - | School Bond Guaranty | ||||||
| VRN | - | Variable Rate Note. The rate adjusts periodically based upon the terms set forth in the security’s offering documents. The rate shown is effective at the period end and the reference rate and spread, if any, is indicated. The security's effective maturity date may be shorter than the final maturity date shown. | ||||||
(1)Security was purchased pursuant to Rule 144A or Section 4(2) under the Securities Act of 1933 and may be sold in transactions exempt from registration, normally to qualified institutional investors. The aggregate value of these securities at the period end was $13,858,916, which represented 5.0% of total net assets.
(2)Escrowed to maturity in U.S. government securities or state and local government securities.
(3)Security is a zero-coupon bond. Zero-coupon securities may be issued at a substantial discount from their value at maturity.
(4)When-issued security. The issue price and yield are fixed on the date of the commitment, but payment and delivery are scheduled for a future date.
See Notes to Financial Statements.
49
AUGUST 31, 2022
| Emerging Markets Bond ETF | ||||||||
| Principal Amount | Value | |||||||
| CORPORATE BONDS — 48.2% | ||||||||
| Brazil — 5.3% | ||||||||
B2W Digital Lux Sarl, 4.375%, 12/20/30(1) | $ | 200,000 | $ | 154,198 | ||||
| Banco BTG Pactual SA, 5.50%, 1/31/23 | 200,000 | 199,983 | ||||||
CSN Resources SA, 4.625%, 6/10/31(1) | 400,000 | 310,588 | ||||||
Embraer Netherlands Finance BV, 6.95%, 1/17/28(1) | 200,000 | 199,752 | ||||||
Guara Norte Sarl, 5.20%, 6/15/34(1) | 187,230 | 157,090 | ||||||
GUSAP III LP, 4.25%, 1/21/30(1) | 250,000 | 233,675 | ||||||
MC Brazil Downstream Trading SARL, 7.25%, 6/30/31(1) | 200,000 | 167,499 | ||||||
| 1,422,785 | ||||||||
| Chile — 2.3% | ||||||||
| Empresa Nacional de Telecomunicaciones SA, 4.75%, 8/1/26 | 100,000 | 98,666 | ||||||
Kenbourne Invest SA, 4.70%, 1/22/28(1) | 400,000 | 322,368 | ||||||
VTR Finance NV, 6.375%, 7/15/28(1) | 400,000 | 180,579 | ||||||
| 601,613 | ||||||||
| Colombia — 5.5% | ||||||||
| Ecopetrol SA, 5.375%, 6/26/26 | 460,000 | 432,529 | ||||||
Geopark Ltd., 5.50%, 1/17/27(1) | 400,000 | 348,024 | ||||||
Millicom International Cellular SA, 4.50%, 4/27/31(1)(2) | 400,000 | 328,598 | ||||||
Oleoducto Central SA, 4.00%, 7/14/27(1) | 400,000 | 347,441 | ||||||
| 1,456,592 | ||||||||
| Dominican Republic — 0.2% | ||||||||
| Banco de Reservas de la Republica Dominicana, 7.00%, 2/1/23 | 50,000 | 50,329 | ||||||
| Guatemala — 2.0% | ||||||||
Central American Bottling Corp. / CBC Bottling Holdco SL / Beliv Holdco SL, 5.25%, 4/27/29(1) | 400,000 | 371,690 | ||||||
CT Trust, 5.125%, 2/3/32(1) | 200,000 | 172,903 | ||||||
| 544,593 | ||||||||
| India — 1.8% | ||||||||
| Greenko Dutch BV, 3.85%, 3/29/26 | 194,000 | 164,900 | ||||||
Greenko Mauritius Ltd., 6.25%, 2/21/23(1) | 100,000 | 97,750 | ||||||
Reliance Industries Ltd., 2.875%, 1/12/32(1) | 250,000 | 212,111 | ||||||
| 474,761 | ||||||||
| Indonesia — 6.2% | ||||||||
Freeport Indonesia PT, 4.76%, 4/14/27(1) | 200,000 | 195,200 | ||||||
Indonesia Asahan Aluminium Persero PT, 5.45%, 5/15/30(1) | 425,000 | 417,656 | ||||||
| Indonesia Asahan Aluminium Persero PT, 5.80%, 5/15/50 | 200,000 | 171,033 | ||||||
Medco Bell Pte Ltd., 6.375%, 1/30/27(1) | 200,000 | 177,135 | ||||||
| Perusahaan Perseroan (Persero) PT Perusahaan Listrik Negara, 5.45%, 5/21/28 | 425,000 | 436,175 | ||||||
| PT Perusahaan Perseroan (Persero) Perusahaan Listrik Negara, 5.25%, 10/24/42 | 300,000 | 265,140 | ||||||
| 1,662,339 | ||||||||
| Israel — 2.5% | ||||||||
Energean Israel Finance Ltd., 4.50%, 3/30/24(1) | 675,000 | 651,025 | ||||||
Leviathan Bond Ltd., 5.75%, 6/30/23(1) | 10,000 | 9,990 | ||||||
| 661,015 | ||||||||
| Jamaica — 0.7% | ||||||||
Digicel International Finance Ltd. / Digicel International Holdings Ltd., 8.75%, 5/25/24(1) | 200,000 | 191,845 | ||||||
50
| Emerging Markets Bond ETF | ||||||||
| Principal Amount | Value | |||||||
| Kazakhstan — 1.7% | ||||||||
KazMunayGas National Co. JSC, 4.75%, 4/19/27(1) | $ | 300,000 | $ | 277,956 | ||||
| KazMunayGas National Co. JSC, 5.75%, 4/19/47 | 200,000 | 164,375 | ||||||
| 442,331 | ||||||||
| Luxembourg — 1.0% | ||||||||
EIG Pearl Holdings Sarl, 4.39%, 11/30/46(1) | 200,000 | 161,923 | ||||||
Petrorio Luxembourg Trading Sarl, 6.125%, 6/9/26(1) | 100,000 | 93,621 | ||||||
| 255,544 | ||||||||
| Mexico — 7.2% | ||||||||
BBVA Bancomer SA, VRN, 5.125%, 1/18/33(1) | 200,000 | 178,626 | ||||||
Braskem Idesa SAPI, 6.99%, 2/20/32(1) | 200,000 | 155,320 | ||||||
Cemex SAB de CV, 5.20%, 9/17/30(1) | 200,000 | 181,793 | ||||||
FEL Energy VI Sarl, 5.75%, 12/1/40(1) | 188,378 | 142,611 | ||||||
Minera Mexico SA de CV, 4.50%, 1/26/50(1) | 140,000 | 109,953 | ||||||
Petroleos Mexicanos, 3.50%, 1/30/23(2) | 650,000 | 645,320 | ||||||
| Petroleos Mexicanos, 6.49%, 1/23/27 | 400,000 | 353,097 | ||||||
| Petroleos Mexicanos, 6.50%, 6/2/41 | 250,000 | 159,963 | ||||||
| 1,926,683 | ||||||||
| Nigeria — 1.4% | ||||||||
IHS Netherlands Holdco BV, 8.00%, 9/18/27(1) | 400,000 | 368,364 | ||||||
| Panama — 1.3% | ||||||||
C&W Senior Financing DAC, 6.875%, 9/15/27(1) | 400,000 | 355,610 | ||||||
| Peru — 2.6% | ||||||||
| Inkia Energy Ltd., 5.875%, 11/9/27 | 400,000 | 380,965 | ||||||
| Petroleos del Peru SA, 4.75%, 6/19/32 | 400,000 | 319,412 | ||||||
| 700,377 | ||||||||
| Qatar — 0.2% | ||||||||
Ooredoo International Finance Ltd., 4.50%, 1/31/43(1) | 50,000 | 50,562 | ||||||
| Saudi Arabia — 2.1% | ||||||||
| Dar Al-Arkan Sukuk Co. Ltd., 6.875%, 3/21/23 | 200,000 | 200,171 | ||||||
| Saudi Arabian Oil Co., 4.25%, 4/16/39 | 400,000 | 374,110 | ||||||
| 574,281 | ||||||||
| South Africa — 0.6% | ||||||||
| Sasol Financing USA LLC, 5.50%, 3/18/31 | 200,000 | 168,306 | ||||||
| Spain — 1.2% | ||||||||
EnfraGen Energia Sur SA / EnfraGen Spain SA / Prime Energia SpA, 5.375%, 12/30/30(1) | 440,000 | 308,000 | ||||||
| United Arab Emirates — 1.7% | ||||||||
| DP World Crescent Ltd., 4.85%, 9/26/28 | 200,000 | 203,055 | ||||||
Galaxy Pipeline Assets Bidco Ltd., 2.16%, 3/31/34(1) | 288,258 | 252,244 | ||||||
| 455,299 | ||||||||
| Zambia — 0.7% | ||||||||
First Quantum Minerals Ltd., 6.875%, 10/15/27(1) | 200,000 | 191,018 | ||||||
TOTAL CORPORATE BONDS (Cost $14,791,791) | 12,862,247 | |||||||
| SOVEREIGN GOVERNMENTS AND AGENCIES — 35.4% | ||||||||
| Argentina — 0.7% | ||||||||
| Argentine Republic Government International Bond, 1.50%, 7/9/35 | 870,000 | 196,725 | ||||||
| Bolivia — 0.6% | ||||||||
| Bolivian Government International Bond, 4.50%, 3/20/28 | 200,000 | 161,100 | ||||||
| Brazil — 0.9% | ||||||||
| Brazilian Government International Bond, 5.00%, 1/27/45 | 300,000 | 231,894 | ||||||
51
| Emerging Markets Bond ETF | ||||||||
| Principal Amount | Value | |||||||
| Chile — 1.4% | ||||||||
| Chile Government International Bond, 2.55%, 1/27/32 | $ | 200,000 | $ | 167,154 | ||||
| Chile Government International Bond, 4.34%, 3/7/42 | 200,000 | 172,045 | ||||||
| Chile Government International Bond, 4.00%, 1/31/52 | 50,000 | 39,510 | ||||||
| 378,709 | ||||||||
| Colombia — 0.8% | ||||||||
| Colombia Government International Bond, 6.125%, 1/18/41 | 250,000 | 200,682 | ||||||
| Costa Rica — 0.7% | ||||||||
| Costa Rica Government International Bond, 7.00%, 4/4/44 | 200,000 | 175,361 | ||||||
| Dominican Republic — 3.5% | ||||||||
Dominican Republic International Bond, 5.50%, 2/22/29(1) | 200,000 | 183,176 | ||||||
| Dominican Republic International Bond, 4.875%, 9/23/32 | 500,000 | 405,323 | ||||||
| Dominican Republic International Bond, 6.40%, 6/5/49 | 450,000 | 354,941 | ||||||
| 943,440 | ||||||||
| Ecuador — 1.2% | ||||||||
| Ecuador Government International Bond, 5.50%, 7/31/30 | 200,000 | 106,685 | ||||||
| Ecuador Government International Bond, 2.50%, 7/31/35 | 550,000 | 213,020 | ||||||
| 319,705 | ||||||||
| Egypt — 2.0% | ||||||||
| Egypt Government International Bond, 5.80%, 9/30/27 | 200,000 | 156,980 | ||||||
| Egypt Government International Bond, 7.05%, 1/15/32 | 550,000 | 386,948 | ||||||
| 543,928 | ||||||||
| El Salvador — 0.3% | ||||||||
| El Salvador Government International Bond, 7.75%, 1/24/23 | 100,000 | 90,816 | ||||||
| Ghana — 0.3% | ||||||||
| Ghana Government International Bond, 8.63%, 6/16/49 | 250,000 | 89,061 | ||||||
| Guatemala — 2.2% | ||||||||
Guatemala Government Bond, 5.25%, 8/10/29(1) | 200,000 | 195,877 | ||||||
| Guatemala Government Bond, 4.90%, 6/1/30 | 400,000 | 382,013 | ||||||
| 577,890 | ||||||||
| Indonesia — 1.9% | ||||||||
| Indonesia Government International Bond, 8.50%, 10/12/35 | 400,000 | 517,233 | ||||||
| Ivory Coast — 0.9% | ||||||||
| Ivory Coast Government International Bond, 5.75%, 12/31/32 | 270,840 | 243,800 | ||||||
| Jordan — 0.8% | ||||||||
Jordan Government International Bond, 7.75%, 1/15/28(1) | 200,000 | 198,650 | ||||||
| Mexico — 1.5% | ||||||||
| Mexico Government International Bond, 4.75%, 4/27/32 | 225,000 | 219,028 | ||||||
| Mexico Government International Bond, 3.50%, 2/12/34 | 200,000 | 167,810 | ||||||
| 386,838 | ||||||||
| Nigeria — 0.6% | ||||||||
| Nigeria Government International Bond, 7.875%, 2/16/32 | 200,000 | 144,911 | ||||||
| Oman — 1.7% | ||||||||
| Oman Government International Bond, 6.75%, 1/17/48 | 500,000 | 448,275 | ||||||
| Pakistan — 0.5% | ||||||||
| Pakistan Government International Bond, 8.25%, 9/30/25 | 200,000 | 137,031 | ||||||
| Panama — 3.3% | ||||||||
| Panama Government International Bond, 4.50%, 4/16/50 | 1,100,000 | 875,047 | ||||||
| Paraguay — 2.9% | ||||||||
| Paraguay Government International Bond, 5.00%, 4/15/26 | 592,000 | 593,500 | ||||||
| Paraguay Government International Bond, 6.10%, 8/11/44 | 200,000 | 186,874 | ||||||
| 780,374 | ||||||||
52
| Emerging Markets Bond ETF | ||||||||
| Principal Amount/Shares | Value | |||||||
| Saudi Arabia — 2.1% | ||||||||
| Saudi Government International Bond, 4.625%, 10/4/47 | $ | 600,000 | $ | 567,515 | ||||
| South Africa — 3.2% | ||||||||
| Republic of South Africa Government International Bond, 5.875%, 9/16/25 | 500,000 | 508,050 | ||||||
| Republic of South Africa Government International Bond, 5.875%, 4/20/32 | 400,000 | 357,300 | ||||||
| 865,350 | ||||||||
| Turkey — 0.5% | ||||||||
| Turkey Government International Bond, 6.625%, 2/17/45 | 200,000 | 135,960 | ||||||
| Ukraine — 0.9% | ||||||||
| Ukraine Government International Bond, 7.25%, 3/15/35 | 1,600,000 | 228,667 | ||||||
TOTAL SOVEREIGN GOVERNMENTS AND AGENCIES (Cost $11,210,645) | 9,438,962 | |||||||
| U.S. TREASURY SECURITIES — 5.4% | ||||||||
| U.S. Treasury Notes, 2.50%, 3/31/27 | 550,000 | 529,719 | ||||||
| U.S. Treasury Notes, 1.375%, 11/15/31 | 400,000 | 342,719 | ||||||
U.S. Treasury Notes, 1.875%, 2/15/32(3) | 650,000 | 581,242 | ||||||
TOTAL U.S. TREASURY SECURITIES (Cost $1,532,253) | 1,453,680 | |||||||
| PREFERRED STOCKS — 2.1% | ||||||||
| India — 1.3% | ||||||||
| Network i2i Ltd., 3.98% | 400,000 | 343,399 | ||||||
| Mexico — 0.8% | ||||||||
Banco Mercantil del Norte SA, 8.375%(1) | 220,000 | 213,980 | ||||||
TOTAL PREFERRED STOCKS (Cost $623,319) | 557,379 | |||||||
| SHORT-TERM INVESTMENTS — 8.2% | ||||||||
| Money Market Funds — 8.2% | ||||||||
| State Street Institutional U.S. Government Money Market Fund, Premier Class | 1,934,277 | 1,934,277 | ||||||
State Street Navigator Securities Lending Government Money Market Portfolio(4) | 256,775 | 256,775 | ||||||
TOTAL SHORT-TERM INVESTMENTS (Cost $2,191,052) | 2,191,052 | |||||||
TOTAL INVESTMENT SECURITIES — 99.3% (Cost $30,349,060) | 26,503,320 | |||||||
| OTHER ASSETS AND LIABILITIES — 0.7% | 190,153 | |||||||
| TOTAL NET ASSETS — 100.0% | $ | 26,693,473 | ||||||
| FUTURES CONTRACTS PURCHASED | ||||||||||||||
| Reference Entity | Contracts | Expiration Date | Notional Amount | Unrealized Appreciation (Depreciation)^ | ||||||||||
| U.S. Treasury 5-Year Notes | 1 | December 2022 | $ | 110,820 | $ | (123) | ||||||||
| U.S. Treasury Long Bonds | 1 | December 2022 | 135,844 | (534) | ||||||||||
| U.S. Treasury Ultra Bonds | 12 | December 2022 | 1,794,000 | (3,398) | ||||||||||
| $ | 2,040,664 | $ | (4,055) | |||||||||||
^Amount represents value and unrealized appreciation (depreciation).
53
Emerging Markets Bond ETF
| FUTURES CONTRACTS SOLD | ||||||||||||||
| Reference Entity | Contracts | Expiration Date | Notional Amount | Unrealized Appreciation (Depreciation)^ | ||||||||||
| U.S. Treasury 10-Year Ultra Notes | 2 | December 2022 | $ | 250,375 | $ | 965 | ||||||||
| U.S. Treasury 2-Year Notes | 10 | December 2022 | 2,083,281 | 1,621 | ||||||||||
| $ | 2,333,656 | $ | 2,586 | |||||||||||
^Amount represents value and unrealized appreciation (depreciation).
| CREDIT DEFAULT SWAP AGREEMENTS | |||||||||||||||||||||||
Counterparty/ Reference Entity | Type | Fixed Rate Received (Paid) Quarterly | Termination Date | Notional Amount | Premiums Paid (Received) | Unrealized Appreciation (Depreciation) | Value^ | ||||||||||||||||
| Bank of America, N.A./ China Government International Bond | Buy | (1.00)% | 6/20/27 | $ | 280,000 | $ | (3,547) | $ | (299) | $ | (3,847) | ||||||||||||
| Barclays Bank PLC/ Brazilian Government International Bond | Buy | (1.00)% | 6/20/27 | $ | 275,000 | 18,135 | (184) | 17,951 | |||||||||||||||
| Morgan Stanley/ Brazilian Government International Bond | Buy | (1.00)% | 6/20/27 | $ | 640,000 | 32,054 | 9,706 | 41,760 | |||||||||||||||
| Morgan Stanley/ Mexico Government International Bond | Buy | (1.00)% | 6/20/27 | $ | 430,000 | 1,893 | 8,794 | 10,687 | |||||||||||||||
| Morgan Stanley/ China Government International Bond | Buy | (1.00)% | 6/20/27 | $ | 250,000 | (2,150) | (1,285) | (3,434) | |||||||||||||||
| $ | 46,385 | $ | 16,732 | $ | 63,117 | ||||||||||||||||||
^The value for credit default swap agreements serves as an indicator of the current status of the payment/ performance risk and represent the likelihood of an expected liability or profit at the period end. Increasing values in absolute terms when compared to the notional amount of the credit default swap agreement represent a deterioration of the referenced entity's credit soundness and an increased likelihood or risk of a credit event occurring as defined in the agreement.
54
Emerging Markets Bond ETF
| NOTES TO SCHEDULE OF INVESTMENTS | ||||||||
| VRN | - | Variable Rate Note. The rate adjusts periodically based upon the terms set forth in the security’s offering documents. The rate shown is effective at the period end and the reference rate and spread, if any, is indicated. The security's effective maturity date may be shorter than the final maturity date shown. | ||||||
(1)Security was purchased pursuant to Rule 144A or Section 4(2) under the Securities Act of 1933 and may be sold in transactions exempt from registration, normally to qualified institutional investors. The aggregate value of these securities at the period end was $8,866,401, which represented 33.2% of total net assets.
(2)Security, or a portion thereof, is on loan. At the period end, the aggregate value of securities on loan was $248,687. The amount of securities on loan indicated may not correspond with the securities on loan identified because securities with pending sales are in the process of recall from the brokers.
(3)Security, or a portion thereof, has been pledged at the custodian bank or with a broker for collateral requirements on futures contracts and/or swap agreements. At the period end, the aggregate value of securities pledged was $226,237.
(4)Investment of cash collateral from securities on loan. At the period end, the aggregate value of the collateral held by the fund was $256,775.
See Notes to Financial Statements.
55
AUGUST 31, 2022
| Multisector Income ETF | |||||||||||
| Principal Amount | Value | ||||||||||
| CORPORATE BONDS — 38.7% | |||||||||||
| Aerospace and Defense — 0.2% | |||||||||||
| TransDigm, Inc., 4.625%, 1/15/29 | $ | 205,000 | $ | 173,608 | |||||||
| Airlines — 1.4% | |||||||||||
Allegiant Travel Co., 7.25%, 8/15/27(1) | 475,000 | 472,357 | |||||||||
American Airlines, Inc., 11.75%, 7/15/25(1) | 490,000 | 542,082 | |||||||||
American Airlines, Inc. / AAdvantage Loyalty IP Ltd., 5.50%, 4/20/26(1) | 205,000 | 195,295 | |||||||||
| United Airlines Pass Through Trust, Series 2020-1, Class B, 4.875%, 7/15/27 | 370,140 | 352,923 | |||||||||
| 1,562,657 | |||||||||||
| Automobiles — 0.8% | |||||||||||
Ford Motor Co., 6.10%, 8/19/32(2) | 300,000 | 292,548 | |||||||||
| Ford Motor Credit Co. LLC, 4.95%, 5/28/27 | 260,000 | 244,457 | |||||||||
| General Motors Financial Co., Inc., 3.80%, 4/7/25 | 415,000 | 404,803 | |||||||||
| 941,808 | |||||||||||
| Banks — 3.6% | |||||||||||
| Banco Santander SA, 5.29%, 8/18/27 | 200,000 | 195,865 | |||||||||
| Bank of America Corp., VRN, 4.57%, 4/27/33 | 135,000 | 129,024 | |||||||||
| Canadian Imperial Bank of Commerce, 3.95%, 8/4/25 | 420,000 | 414,848 | |||||||||
| FNB Corp., 5.15%, 8/25/25 | 373,000 | 373,369 | |||||||||
| HSBC Holdings PLC, VRN, 5.40%, 8/11/33 | 299,000 | 284,820 | |||||||||
| Huntington Bancshares, Inc., VRN, 4.44%, 8/4/28 | 360,000 | 352,042 | |||||||||
| JPMorgan Chase & Co., VRN, 2.07%, 6/1/29 | 78,000 | 66,738 | |||||||||
| JPMorgan Chase & Co., VRN, 2.52%, 4/22/31 | 66,000 | 55,887 | |||||||||
| Mitsubishi UFJ Financial Group, Inc., VRN, 4.79%, 7/18/25 | 320,000 | 321,145 | |||||||||
| NatWest Group PLC, VRN, 5.52%, 9/30/28 | 475,000 | 475,600 | |||||||||
| PNC Financial Services Group, Inc., VRN, 4.63%, 6/6/33 | 213,000 | 201,911 | |||||||||
Societe Generale SA, VRN, 3.65%, 7/8/35(1) | 350,000 | 280,662 | |||||||||
| Synchrony Bank, 5.40%, 8/22/25 | 580,000 | 579,395 | |||||||||
UniCredit SpA, VRN, 5.86%, 6/19/32(1) | 335,000 | 289,090 | |||||||||
| Wells Fargo & Co., VRN, 4.54%, 8/15/26 | 80,000 | 79,491 | |||||||||
| 4,099,887 | |||||||||||
| Beverages — 0.2% | |||||||||||
| PepsiCo, Inc., 3.60%, 2/18/28 | 207,000 | 203,320 | |||||||||
| Building Products — 0.6% | |||||||||||
Builders FirstSource, Inc., 5.00%, 3/1/30(1) | 590,000 | 523,699 | |||||||||
Standard Industries, Inc., 4.375%, 7/15/30(1) | 185,000 | 147,117 | |||||||||
| 670,816 | |||||||||||
| Capital Markets — 5.1% | |||||||||||
| Bain Capital Specialty Finance, Inc., 2.55%, 10/13/26 | 168,000 | 142,310 | |||||||||
| Deutsche Bank AG, VRN, 4.30%, 5/24/28 | 300,000 | 274,439 | |||||||||
FS KKR Capital Corp., 4.25%, 2/14/25(1) | 761,000 | 723,879 | |||||||||
| Goldman Sachs Group, Inc., VRN, 4.39%, 6/15/27 | 318,000 | 312,266 | |||||||||
| Goldman Sachs Group, Inc., VRN, 1.95%, 10/21/27 | 629,000 | 558,933 | |||||||||
| Goldman Sachs Group, Inc., VRN, 3.81%, 4/23/29 | 34,000 | 31,856 | |||||||||
| Hercules Capital, Inc., 2.625%, 9/16/26 | 280,000 | 235,816 | |||||||||
| Intercontinental Exchange, Inc., 4.35%, 6/15/29 | 29,000 | 28,640 | |||||||||
| Morgan Stanley, VRN, 2.63%, 2/18/26 | 240,000 | 228,227 | |||||||||
| Morgan Stanley, VRN, 2.70%, 1/22/31 | 705,000 | 610,517 | |||||||||
56
| Multisector Income ETF | |||||||||||
| Principal Amount | Value | ||||||||||
| Morgan Stanley, VRN, 2.48%, 9/16/36 | $ | 97,000 | $ | 74,733 | |||||||
| Owl Rock Capital Corp., 3.40%, 7/15/26 | 718,000 | 642,713 | |||||||||
Owl Rock Technology Finance Corp., 4.75%, 12/15/25(1) | 86,000 | 80,101 | |||||||||
| Owl Rock Technology Finance Corp., 2.50%, 1/15/27 | 378,000 | 320,019 | |||||||||
| Prospect Capital Corp., 3.71%, 1/22/26 | 544,000 | 489,748 | |||||||||
| State Street Corp., VRN, 4.16%, 8/4/33 | 360,000 | 347,970 | |||||||||
UBS Group AG, VRN, 2.75%, 2/11/33(1) | 860,000 | 689,783 | |||||||||
| 5,791,950 | |||||||||||
| Chemicals — 0.9% | |||||||||||
Braskem Idesa SAPI, 6.99%, 2/20/32(1)(2) | 200,000 | 155,320 | |||||||||
| Celanese US Holdings LLC, 5.90%, 7/5/24 | 490,000 | 493,862 | |||||||||
Tronox, Inc., 4.625%, 3/15/29(1) | 415,000 | 345,733 | |||||||||
| 994,915 | |||||||||||
| Construction and Engineering — 0.4% | |||||||||||
| IHS Netherlands Holdco BV, 8.00%, 9/18/27 | 550,000 | 505,253 | |||||||||
| Consumer Finance — 0.6% | |||||||||||
| AerCap Ireland Capital DAC / AerCap Global Aviation Trust, 3.00%, 10/29/28 | 295,000 | 250,962 | |||||||||
| Capital One Financial Corp., VRN, 4.99%, 7/24/26 | 91,000 | 90,916 | |||||||||
| Navient Corp., 5.50%, 1/25/23 | 319,000 | 317,773 | |||||||||
| 659,651 | |||||||||||
| Containers and Packaging — 0.3% | |||||||||||
Sealed Air Corp., 5.00%, 4/15/29(1) | 375,000 | 356,921 | |||||||||
| Diversified Financial Services — 0.4% | |||||||||||
| Block Financial LLC, 3.875%, 8/15/30 | 312,000 | 284,141 | |||||||||
Corebridge Financial, Inc., 3.85%, 4/5/29(1) | 28,000 | 25,806 | |||||||||
Corebridge Financial, Inc., VRN, 6.875%, 12/15/52(1) | 170,000 | 164,493 | |||||||||
| 474,440 | |||||||||||
| Diversified Telecommunication Services — 1.7% | |||||||||||
| AT&T, Inc., 4.50%, 5/15/35 | 160,000 | 150,466 | |||||||||
Cogent Communications Group, Inc., 7.00%, 6/15/27(1) | 600,000 | 574,128 | |||||||||
Level 3 Financing, Inc., 3.40%, 3/1/27(1) | 625,000 | 555,473 | |||||||||
Telecom Italia SpA, 5.30%, 5/30/24(1) | 665,000 | 640,934 | |||||||||
| 1,921,001 | |||||||||||
| Electric Utilities — 0.8% | |||||||||||
| American Electric Power Co., Inc., VRN, 3.875%, 2/15/62 | 430,000 | 366,044 | |||||||||
FEL Energy VI Sarl, 5.75%, 12/1/40(1) | 753,511 | 570,445 | |||||||||
| 936,489 | |||||||||||
| Electronic Equipment, Instruments and Components — 0.3% | |||||||||||
Sensata Technologies BV, 5.875%, 9/1/30(1) | 300,000 | 293,622 | |||||||||
| Entertainment — 0.7% | |||||||||||
Magallanes, Inc., 3.76%, 3/15/27(1) | 145,000 | 135,509 | |||||||||
Magallanes, Inc., 5.14%, 3/15/52(1) | 157,000 | 125,918 | |||||||||
| Netflix, Inc., 5.875%, 11/15/28 | 305,000 | 309,182 | |||||||||
| Take-Two Interactive Software, Inc., 4.00%, 4/14/32 | 221,000 | 204,002 | |||||||||
| 774,611 | |||||||||||
| Equity Real Estate Investment Trusts (REITs) — 2.7% | |||||||||||
| American Campus Communities Operating Partnership LP, 3.75%, 4/15/23 | 535,000 | 535,620 | |||||||||
| Duke Realty LP, 3.25%, 6/30/26 | 290,000 | 277,196 | |||||||||
| EPR Properties, 4.75%, 12/15/26 | 188,000 | 177,184 | |||||||||
| EPR Properties, 4.95%, 4/15/28 | 89,000 | 81,787 | |||||||||
57
| Multisector Income ETF | |||||||||||
| Principal Amount | Value | ||||||||||
| iStar, Inc., 4.75%, 10/1/24 | $ | 67,000 | $ | 67,113 | |||||||
| National Retail Properties, Inc., 4.30%, 10/15/28 | 595,000 | 569,830 | |||||||||
SBA Tower Trust, 3.45%, 3/15/48(1) | 246,000 | 244,906 | |||||||||
| VICI Properties LP, 4.375%, 5/15/25 | 385,000 | 376,440 | |||||||||
VICI Properties LP / VICI Note Co., Inc., 3.875%, 2/15/29(1) | 590,000 | 525,544 | |||||||||
VICI Properties LP / VICI Note Co., Inc., 4.125%, 8/15/30(1) | 320,000 | 281,811 | |||||||||
| 3,137,431 | |||||||||||
| Food and Staples Retailing — 0.4% | |||||||||||
United Natural Foods, Inc., 6.75%, 10/15/28(1)(2) | 505,000 | 485,876 | |||||||||
| Food Products — 0.1% | |||||||||||
US Foods, Inc., 4.75%, 2/15/29(1) | 70,000 | 62,474 | |||||||||
| Health Care Equipment and Supplies — 0.2% | |||||||||||
Medline Borrower LP, 3.875%, 4/1/29(1) | 285,000 | 241,894 | |||||||||
| Health Care Providers and Services — 0.8% | |||||||||||
| Centene Corp., 3.375%, 2/15/30 | 390,000 | 334,969 | |||||||||
Owens & Minor, Inc., 6.625%, 4/1/30(1) | 310,000 | 286,806 | |||||||||
Tenet Healthcare Corp., 6.125%, 10/1/28(1)(2) | 257,000 | 236,122 | |||||||||
| 857,897 | |||||||||||
| Health Care Technology — 0.2% | |||||||||||
Change Healthcare Holdings LLC / Change Healthcare Finance, Inc., 5.75%, 3/1/25(1)(2) | 283,000 | 279,971 | |||||||||
| Hotels, Restaurants and Leisure — 1.7% | |||||||||||
Caesars Entertainment, Inc., 4.625%, 10/15/29(1)(2) | 135,000 | 108,756 | |||||||||
Carnival Corp., 5.75%, 3/1/27(1) | 165,000 | 128,519 | |||||||||
CDI Escrow Issuer, Inc., 5.75%, 4/1/30(1) | 380,000 | 352,522 | |||||||||
Penn Entertainment, Inc., 4.125%, 7/1/29(1)(2) | 735,000 | 594,670 | |||||||||
Scientific Games International, Inc., 7.25%, 11/15/29(1) | 450,000 | 443,250 | |||||||||
Wynn Las Vegas LLC / Wynn Las Vegas Capital Corp., 5.25%, 5/15/27(1)(2) | 405,000 | 365,995 | |||||||||
| 1,993,712 | |||||||||||
| Household Durables — 0.1% | |||||||||||
| Safehold Operating Partnership LP, 2.85%, 1/15/32 | 211,000 | 167,282 | |||||||||
| Insurance — 0.3% | |||||||||||
Sammons Financial Group, Inc., 4.75%, 4/8/32(1) | 47,000 | 41,317 | |||||||||
SBL Holdings, Inc., VRN, 6.50%, 11/13/26(1) | 403,000 | 316,355 | |||||||||
| 357,672 | |||||||||||
| Internet and Direct Marketing Retail — 0.1% | |||||||||||
B2W Digital Lux Sarl, 4.375%, 12/20/30(1) | 200,000 | 154,198 | |||||||||
| IT Services — 0.2% | |||||||||||
| Fidelity National Information Services, Inc., 5.10%, 7/15/32 | 264,000 | 263,262 | |||||||||
| Media — 2.5% | |||||||||||
CCO Holdings LLC / CCO Holdings Capital Corp., 6.375%, 9/1/29(1)(2) | 305,000 | 296,612 | |||||||||
Directv Financing LLC / Directv Financing Co-Obligor, Inc., 5.875%, 8/15/27(1) | 355,000 | 325,315 | |||||||||
DISH DBS Corp., 5.25%, 12/1/26(1) | 335,000 | 277,212 | |||||||||
| iHeartCommunications, Inc., 8.375%, 5/1/27 | 250,000 | 220,500 | |||||||||
| Paramount Global, VRN, 6.25%, 2/28/57 | 430,000 | 397,750 | |||||||||
| Paramount Global, VRN, 6.375%, 3/30/62 | 415,000 | 382,484 | |||||||||
Sinclair Television Group, Inc., 4.125%, 12/1/30(1) | 736,000 | 600,385 | |||||||||
VTR Finance NV, 6.375%, 7/15/28(1) | 800,000 | 361,159 | |||||||||
| 2,861,417 | |||||||||||
58
| Multisector Income ETF | |||||||||||
| Principal Amount | Value | ||||||||||
| Metals and Mining — 1.2% | |||||||||||
Alcoa Nederland Holding BV, 4.125%, 3/31/29(1)(2) | $ | 445,000 | $ | 392,993 | |||||||
| ATI, Inc., 4.875%, 10/1/29 | 295,000 | 264,304 | |||||||||
Cleveland-Cliffs, Inc., 4.625%, 3/1/29(1)(2) | 530,000 | 471,369 | |||||||||
GUSAP III LP, 4.25%, 1/21/30(1) | 250,000 | 233,675 | |||||||||
| 1,362,341 | |||||||||||
| Mortgage Real Estate Investment Trusts (REITs) — 1.0% | |||||||||||
Ladder Capital Finance Holdings LLLP / Ladder Capital Finance Corp., 5.25%, 10/1/25(1) | 464,000 | 451,880 | |||||||||
Ladder Capital Finance Holdings LLLP / Ladder Capital Finance Corp., 4.75%, 6/15/29(1) | 413,000 | 350,525 | |||||||||
Starwood Property Trust, Inc., 4.375%, 1/15/27(1) | 394,000 | 351,147 | |||||||||
| 1,153,552 | |||||||||||
| Multi-Utilities — 0.4% | |||||||||||
Sempra Energy, VRN, 4.125%, 4/1/52(2) | 540,000 | 454,702 | |||||||||
| Multiline Retail — 0.1% | |||||||||||
Macy's Retail Holdings LLC, 5.875%, 3/15/30(1)(2) | 85,000 | 72,791 | |||||||||
| Oil, Gas and Consumable Fuels — 5.6% | |||||||||||
Antero Resources Corp., 5.375%, 3/1/30(1)(2) | 565,000 | 532,541 | |||||||||
Blue Racer Midstream LLC / Blue Racer Finance Corp., 7.625%, 12/15/25(1) | 405,000 | 403,698 | |||||||||
Callon Petroleum Co., 7.50%, 6/15/30(1) | 150,000 | 138,919 | |||||||||
Comstock Resources, Inc., 5.875%, 1/15/30(1) | 560,000 | 513,046 | |||||||||
CrownRock LP / CrownRock Finance, Inc., 5.00%, 5/1/29(1) | 565,000 | 519,784 | |||||||||
EQM Midstream Partners LP, 7.50%, 6/1/27(1) | 380,000 | 376,217 | |||||||||
Geopark Ltd., 5.50%, 1/17/27(1) | 800,000 | 696,049 | |||||||||
Holly Energy Partners LP / Holly Energy Finance Corp., 6.375%, 4/15/27(1) | 225,000 | 220,167 | |||||||||
MEG Energy Corp., 5.875%, 2/1/29(1) | 645,000 | 600,750 | |||||||||
| Occidental Petroleum Corp., 6.375%, 9/1/28 | 520,000 | 543,790 | |||||||||
Occidental Petroleum Corp., 6.125%, 1/1/31(2) | 384,000 | 399,624 | |||||||||
| Petroleos Mexicanos, 3.50%, 1/30/23 | 300,000 | 297,840 | |||||||||
| Petroleos Mexicanos, 6.875%, 8/4/26 | 535,000 | 501,274 | |||||||||
| Petroleos Mexicanos, 6.70%, 2/16/32 | 85,000 | 66,470 | |||||||||
| Southwestern Energy Co., 5.375%, 3/15/30 | 650,000 | 610,129 | |||||||||
| 6,420,298 | |||||||||||
| Semiconductors and Semiconductor Equipment — 0.3% | |||||||||||
Broadcom, Inc., 4.00%, 4/15/29(1) | 208,000 | 192,830 | |||||||||
| Qorvo, Inc., 4.375%, 10/15/29 | 156,000 | 137,911 | |||||||||
| 330,741 | |||||||||||
| Technology Hardware, Storage and Peripherals — 0.9% | |||||||||||
| Apple, Inc., 3.25%, 8/8/29 | 300,000 | 287,100 | |||||||||
Condor Merger Sub, Inc., 7.375%, 2/15/30(1)(2) | 570,000 | 476,605 | |||||||||
| Dell International LLC / EMC Corp., 6.02%, 6/15/26 | 270,000 | 280,573 | |||||||||
| 1,044,278 | |||||||||||
| Thrifts and Mortgage Finance — 0.5% | |||||||||||
Freedom Mortgage Corp., 8.25%, 4/15/25(1) | 41,000 | 35,528 | |||||||||
Nationwide Building Society, 4.85%, 7/27/27(1) | 497,000 | 493,833 | |||||||||
| 529,361 | |||||||||||
| Wireless Telecommunication Services — 1.4% | |||||||||||
Kenbourne Invest SA, 4.70%, 1/22/28(1) | 600,000 | 483,552 | |||||||||
59
| Multisector Income ETF | |||||||||||
| Principal Amount | Value | ||||||||||
| Sprint Corp., 7.125%, 6/15/24 | $ | 285,000 | $ | 294,613 | |||||||
| Sprint Corp., 7.625%, 2/15/25 | 830,000 | 869,433 | |||||||||
| 1,647,598 | |||||||||||
TOTAL CORPORATE BONDS (Cost $48,706,173) | 44,239,697 | ||||||||||
| U.S. TREASURY SECURITIES — 18.4% | |||||||||||
| U.S. Treasury Notes, 0.875%, 1/31/24 | 7,975,000 | 7,688,087 | |||||||||
| U.S. Treasury Notes, 1.50%, 2/29/24 | 900,000 | 874,336 | |||||||||
| U.S. Treasury Notes, 2.50%, 5/31/24 | 3,050,000 | 2,999,901 | |||||||||
U.S. Treasury Notes, 1.00%, 12/15/24(3) | 4,515,000 | 4,270,908 | |||||||||
| U.S. Treasury Notes, 1.125%, 1/15/25 | 800,000 | 757,313 | |||||||||
| U.S. Treasury Notes, 2.625%, 4/15/25 | 3,200,000 | 3,131,000 | |||||||||
| U.S. Treasury Notes, 2.875%, 6/15/25 | 1,400,000 | 1,376,922 | |||||||||
TOTAL U.S. TREASURY SECURITIES (Cost $21,687,308) | 21,098,467 | ||||||||||
| ASSET-BACKED SECURITIES — 13.5% | |||||||||||
Aligned Data Centers Issuer LLC, Series 2021-1A, Class B, 2.48%, 8/15/46(1) | 400,000 | 339,144 | |||||||||
Applebee's Funding LLC / IHOP Funding LLC, Series 2019-1A, Class A2I SEQ, 4.19%, 6/5/49(1) | 574,200 | 553,358 | |||||||||
Blackbird Capital Aircraft, Series 2021-1A, Class B, 3.45%, 7/15/46(1) | 469,291 | 377,271 | |||||||||
CARS-DB4 LP, Series 2020-1A, Class A4, 3.19%, 2/15/50(1) | 397,583 | 376,500 | |||||||||
CARS-DB4 LP, Series 2020-1A, Class B1, 4.17%, 2/15/50(1) | 100,000 | 92,382 | |||||||||
CARS-DB4 LP, Series 2020-1A, Class B2, 4.52%, 2/15/50(1) | 100,000 | 87,764 | |||||||||
Castlelake Aircraft Securitization Trust, Series 2018-1, Class A SEQ, 4.125%, 6/15/43(1) | 314,227 | 282,920 | |||||||||
Castlelake Aircraft Structured Trust, Series 2021-1A, Class A SEQ, 3.47%, 1/15/46(1) | 408,458 | 363,610 | |||||||||
Clsec Holdings 22t LLC, Series 2021-1, Class C, 6.17%, 5/11/37(1) | 534,508 | 451,442 | |||||||||
Cologix Canadian Issuer LP, Series 2022-1CAN, Class A2 SEQ, 4.94%, 1/25/52(1) | CAD | 450,000 | 318,510 | ||||||||
Cologix Canadian Issuer LP, Series 2022-1CAN, Class C, 7.74%, 1/25/52(1) | CAD | 350,000 | 249,036 | ||||||||
Cologix Data Centers US Issuer LLC, Series 2021-1A, Class A2 SEQ, 3.30%, 12/26/51(1) | $ | 550,000 | 508,484 | ||||||||
Diamond Issuer, Series 2021-1A, Class A SEQ, 2.31%, 11/20/51(1) | 338,000 | 295,362 | |||||||||
Diamond Issuer, Series 2021-1A, Class C, 3.79%, 11/20/51(1) | 575,000 | 483,023 | |||||||||
Domino's Pizza Master Issuer LLC, Series 2015-1A, Class A2II SEQ, 4.47%, 10/25/45(1) | 188,500 | 183,000 | |||||||||
Domino's Pizza Master Issuer LLC, Series 2018-1A, Class A2I SEQ, 4.12%, 7/25/48(1) | 526,488 | 509,248 | |||||||||
Domino's Pizza Master Issuer LLC, Series 2019-1A, Class A2 SEQ, 3.67%, 10/25/49(1) | 472,875 | 425,117 | |||||||||
Edgeconnex Data Centers Issuer LLC, Series 2022-1, Class A2 SEQ, 4.25%, 3/25/52(1) | 293,020 | 273,473 | |||||||||
Falcon Aerospace Ltd., Series 2019-1, Class A SEQ, 3.60%, 9/15/39(1) | 395,396 | 325,779 | |||||||||
FirstKey Homes Trust, Series 2021-SFR1, Class E1, 2.39%, 8/17/38(1) | 600,000 | 520,010 | |||||||||
Flexential Issuer, Series 2021-1A, Class A2 SEQ, 3.25%, 11/27/51(1) | 425,000 | 388,701 | |||||||||
60
| Multisector Income ETF | |||||||||||
| Principal Amount | Value | ||||||||||
Lunar Aircarft Ltd., Series 2020-1A, Class A SEQ, 3.38%, 2/15/45(1) | $ | 294,639 | $ | 250,067 | |||||||
Lunar Structured Aircraft Portfolio Notes, Series 2021-1, Class B, 3.43%, 10/15/46(1) | 359,468 | 316,200 | |||||||||
MACH 1 Cayman Ltd., Series 2019-1, Class A SEQ, 3.47%, 10/15/39(1) | 293,921 | 265,787 | |||||||||
MAPS Trust, Series 2021-1A, Class A SEQ, 2.52%, 6/15/46(1) | 682,725 | 581,204 | |||||||||
NP SPE II LLC, Series 2019-1A, Class A1 SEQ, 2.57%, 9/20/49(1) | 442,026 | 418,476 | |||||||||
Pioneer Aircraft Finance Ltd., Series 2019-1, Class A SEQ, 3.97%, 6/15/44(1) | 419,651 | 384,312 | |||||||||
Progress Residential Trust, Series 2021-SFR1, Class D, 1.81%, 4/17/38(1) | 750,000 | 656,515 | |||||||||
Progress Residential Trust, Series 2021-SFR1, Class E, 2.11%, 4/17/38(1) | 261,000 | 226,874 | |||||||||
Progress Residential Trust, Series 2021-SFR1, Class F, 2.76%, 4/17/38(1) | 445,000 | 391,485 | |||||||||
Progress Residential Trust, Series 2021-SFR8, Class E1, 2.38%, 10/17/38(1) | 200,000 | 172,721 | |||||||||
Sabey Data Center Issuer LLC, Series 2021-1, Class A2 SEQ, 1.88%, 6/20/46(1) | 323,000 | 281,148 | |||||||||
SAPPHIRE AVIATION FINANCE II Ltd., Series 2020-1A, Class A SEQ, 3.23%, 3/15/40(1) | 192,357 | 167,040 | |||||||||
ServiceMaster Funding LLC, Series 2020-1, Class A2I SEQ, 2.84%, 1/30/51(1) | 197,000 | 162,870 | |||||||||
ServiceMaster Funding LLC, Series 2020-1, Class A2II SEQ, 3.34%, 1/30/51(1) | 410,745 | 322,939 | |||||||||
Slam Ltd., Series 2021-1A, Class B, 3.42%, 6/15/46(1) | 463,550 | 389,505 | |||||||||
Stack Infrastructure Issuer LLC, Series 2019-1A, Class A2 SEQ, 4.54%, 2/25/44(1) | 867,535 | 864,295 | |||||||||
Start Ltd., Series 2018-1, Class A SEQ, 4.09%, 5/15/43(1) | 629,618 | 561,782 | |||||||||
Trinity Rail Leasing LP, Series 2009-1A, Class A SEQ, 6.66%, 11/16/39(1) | 187,655 | 186,334 | |||||||||
Vantage Data Centers Issuer LLC, Series 2018-2A, Class A2 SEQ, 4.20%, 11/15/43(1) | 356,125 | 351,061 | |||||||||
Vantage Data Centers Issuer LLC, Series 2020-1A, Class A2 SEQ, 1.65%, 9/15/45(1) | 308,000 | 275,214 | |||||||||
VB-S1 Issuer LLC, Series 2022-1A, Class D, 4.29%, 2/15/52(1) | 425,000 | 383,028 | |||||||||
Wingstop Funding LLC, Series 2020-1A, Class A2 SEQ, 2.84%, 12/5/50(1) | 497,500 | 426,560 | |||||||||
TOTAL ASSET-BACKED SECURITIES (Cost $17,081,619) | 15,439,551 | ||||||||||
| U.S. GOVERNMENT AGENCY MORTGAGE-BACKED SECURITIES — 6.7% | |||||||||||
| Fixed-Rate U.S. Government Agency Mortgage-Backed Securities — 6.7% | |||||||||||
| FHLMC, 2.50%, 10/1/50 | 460,499 | 412,855 | |||||||||
| FNMA, 4.00%, 3/1/50 | 897,956 | 887,156 | |||||||||
| FNMA, 4.00%, 3/1/51 | 886,094 | 874,909 | |||||||||
| FNMA, 4.00%, 3/1/51 | 744,915 | 734,332 | |||||||||
| FNMA, 2.50%, 12/1/51 | 462,201 | 413,436 | |||||||||
| FNMA, 3.50%, 12/1/51 | 1,187,715 | 1,133,133 | |||||||||
| FNMA, 2.50%, 3/1/52 | 1,848,258 | 1,659,894 | |||||||||
| UMBS, 3.50%,TBA | 1,680,000 | 1,601,119 | |||||||||
TOTAL U.S. GOVERNMENT AGENCY MORTGAGE-BACKED SECURITIES (Cost $7,854,939) | 7,716,834 | ||||||||||
61
| Multisector Income ETF | |||||||||||
| Principal Amount | Value | ||||||||||
| COMMERCIAL MORTGAGE-BACKED SECURITIES — 5.5% | |||||||||||
BDS Ltd., Series 2020-FL6, Class E, VRN, 5.37%, (30-day average SOFR plus 3.36%), 9/15/35(1) | $ | 243,000 | $ | 231,932 | |||||||
BX Commercial Mortgage Trust, Series 2020-VIVA, Class D, VRN, 3.67%, 3/11/44(1) | 400,000 | 318,969 | |||||||||
BX Commercial Mortgage Trust, Series 2021-VOLT, Class E, VRN, 4.39%, (1-month LIBOR plus 2.00%), 9/15/36(1) | 400,000 | 381,819 | |||||||||
BX Trust, Series 2021-ARIA, Class G, VRN, 5.53%, (1-month LIBOR plus 3.14%), 10/15/36(1) | 314,000 | 291,123 | |||||||||
BXHPP Trust, Series 2021-FILM, Class D, VRN, 3.89%, (1-month LIBOR plus 1.50%), 8/15/36(1) | 300,000 | 277,423 | |||||||||
BXHPP Trust, Series 2021-FILM, Class E, VRN, 4.39%, (1-month LIBOR plus 2.00%), 8/15/36(1) | 250,000 | 229,285 | |||||||||
Credit Suisse Mortgage Capital Certificates, Series 2019-ICE4, Class E, VRN, 4.54%, (1-month LIBOR plus 2.15%), 5/15/36(1) | 478,000 | 466,715 | |||||||||
Great Wolf Trust, Series 2019-WOLF, Class C, VRN, 4.02%, (1-month LIBOR plus 1.63%), 12/15/36(1) | 253,000 | 243,947 | |||||||||
J.P. Morgan Chase Commercial Mortgage Securities Trust, Series 2018-AON, Class A SEQ, 4.13%, 7/5/31(1) | 282,000 | 276,699 | |||||||||
Life Mortgage Trust, Series 2021-BMR, Class F, VRN, 4.74%, (1-month LIBOR plus 2.35%), 3/15/38(1) | 237,879 | 226,234 | |||||||||
Med Trust, Series 2021-MDLN, Class F, VRN, 6.39%, (1-month LIBOR plus 4.00%), 11/15/38(1) | 371,450 | 349,034 | |||||||||
MF1 Multifamily Housing Mortgage Loan Trust, Series 2021-FL5, Class D, VRN, 4.91%, (1-month SOFR plus 2.61%), 7/15/36(1) | 400,000 | 382,546 | |||||||||
MHP Trust, Series 2022-MHIL, Class D, VRN, 3.92%, (1-month SOFR plus 1.61%), 1/15/27(1) | 504,000 | 477,668 | |||||||||
Morgan Stanley Capital I Trust, Series 2017-CLS, Class F, VRN, 4.99%, (1-month LIBOR plus 2.60%), 11/15/34(1) | 290,000 | 284,760 | |||||||||
One New York Plaza Trust, Series 2020-1NYP, Class B, VRN, 3.89%, (1-month LIBOR plus 1.50%), 1/15/36(1) | 229,000 | 217,547 | |||||||||
Ready Capital Mortgage Financing LLC, Series 2021-FL5, Class C, VRN, 4.69%, (1-month LIBOR plus 2.25%), 4/25/38(1) | 400,000 | 382,662 | |||||||||
Ready Capital Mortgage Financing LLC, Series 2021-FL6, Class C, VRN, 4.34%, (1-month LIBOR plus 1.90%), 7/25/36(1) | 350,000 | 328,249 | |||||||||
Shelter Growth Issuer Ltd., Series 2022-FL4, Class A, VRN, 4.60%, (1-month SOFR plus 2.30%), 6/17/37(1) | 322,000 | 318,827 | |||||||||
SMRT, Series 2022-MINI, Class F, VRN, 5.66%, (1-month SOFR plus 3.35%), 1/15/39(1) | 596,000 | 552,051 | |||||||||
TOTAL COMMERCIAL MORTGAGE-BACKED SECURITIES (Cost $6,568,029) | 6,237,490 | ||||||||||
| COLLATERALIZED MORTGAGE OBLIGATIONS — 5.3% | |||||||||||
| Private Sponsor Collateralized Mortgage Obligations — 4.2% | |||||||||||
Angel Oak Mortgage Trust, Series 2020-2, Class A2, VRN, 3.86%, 1/26/65(1) | 215,731 | 208,931 | |||||||||
Angel Oak Mortgage Trust, Series 2021-3, Class M1, VRN, 2.48%, 5/25/66(1) | 600,000 | 456,880 | |||||||||
Arroyo Mortgage Trust, Series 2019-1, Class M1, VRN, 4.12%, 1/25/49(1) | 590,000 | 542,072 | |||||||||
Bellemeade Re Ltd., Series 2018-1A, Class M2, VRN, 5.34%, (1-month LIBOR plus 2.90%), 4/25/28(1) | 369,141 | 370,437 | |||||||||
Bellemeade Re Ltd., Series 2019-3A, Class M1C, VRN, 4.39%, (1-month LIBOR plus 1.95%), 7/25/29(1) | 300,000 | 297,797 | |||||||||
Credit Suisse Mortgage Trust, Series 2020-AFC1, Class M1, VRN, 2.84%, 2/25/50(1) | 400,000 | 351,065 | |||||||||
62
| Multisector Income ETF | |||||||||||
| Principal Amount | Value | ||||||||||
Credit Suisse Mortgage Trust, Series 2021-NQM1, Class M1, VRN, 2.13%, 5/25/65(1) | $ | 624,000 | $ | 520,629 | |||||||
Farm Mortgage Trust, Series 2021-1, Class B, VRN, 3.24%, 7/25/51(1) | 584,971 | 420,541 | |||||||||
Home RE Ltd., Series 2022-1, Class M1A, VRN, 5.03%, (30-day average SOFR plus 2.85%), 10/25/34(1) | 125,000 | 126,405 | |||||||||
Radnor RE Ltd., Series 2021-2, Class M1A, VRN, 4.03%, (30-day average SOFR plus 1.85%), 11/25/31(1) | 600,155 | 597,772 | |||||||||
Traingle Re Ltd., Series 2021-1, Class M1C, VRN, 5.84%, (1-month LIBOR plus 3.40%), 8/25/33(1) | 265,204 | 265,592 | |||||||||
Triangle Re Ltd., Series 2021-3, Class M1A, VRN, 4.08%, (30-day average SOFR plus 1.90%), 2/25/34(1) | 250,000 | 249,150 | |||||||||
Triangle Re Ltd., Series 2021-2, Class M1A, VRN, 4.49%, (1-month LIBOR plus 2.05%), 10/25/33(1) | 253,196 | 252,819 | |||||||||
Verus Securitization Trust, Series 2021-R1, Class M1 SEQ, 2.34%, 10/25/63(1) | 150,000 | 131,601 | |||||||||
| 4,791,691 | |||||||||||
| U.S. Government Agency Collateralized Mortgage Obligations — 1.1% | |||||||||||
| FHLMC, Series 2017-HRP1, Class M2, VRN, 4.89%, (1-month LIBOR plus 2.45%), 12/25/42 | 212,383 | 212,484 | |||||||||
FHLMC, Series 2020-HQA4, Class M2, VRN, 5.59%, (1-month LIBOR plus 3.15%), 9/25/50(1) | 469,441 | 470,830 | |||||||||
FHLMC, Series 2022-DNA3, Class M1A, VRN, 4.18%, (30-day average SOFR plus 2.00%), 4/25/42(1) | 281,363 | 282,950 | |||||||||
FNMA, Series 2022-R03, Class 1M1, VRN, 4.28%, (30-day average SOFR plus 2.10%), 3/25/42(1) | 262,208 | 262,228 | |||||||||
| 1,228,492 | |||||||||||
TOTAL COLLATERALIZED MORTGAGE OBLIGATIONS (Cost $6,462,133) | 6,020,183 | ||||||||||
| COLLATERALIZED LOAN OBLIGATIONS — 5.2% | |||||||||||
AMMC CLO XIV Ltd., Series 2014-14A, Class BL1R, VRN, 6.38%, (3-month LIBOR plus 3.60%), 7/25/29(1) | 500,000 | 479,253 | |||||||||
Ares XL CLO Ltd., Series 2016-40A, Class CRR, VRN, 5.31%, (3-month LIBOR plus 2.80%), 1/15/29(1) | 350,000 | 322,321 | |||||||||
CIFC Funding Ltd., Series 2016-1A, Class D2RR, VRN, 6.98%, (3-month LIBOR plus 4.25%), 10/21/31(1) | 600,000 | 554,898 | |||||||||
CIFC Funding Ltd., Series 2017-3A, Class C, VRN, 6.36%, (3-month LIBOR plus 3.65%), 7/20/30(1) | 500,000 | 478,967 | |||||||||
Deer Creek CLO Ltd., Series 2017-1A, Class D, VRN, 5.66%, (3-month LIBOR plus 2.95%), 10/20/30(1) | 800,000 | 739,540 | |||||||||
Greystone CRE Notes Ltd., Series 2019-FL2, Class D, VRN, 4.79%, (1-month LIBOR plus 2.40%), 9/15/37(1) | 197,000 | 191,566 | |||||||||
Madison Park Funding XIX Ltd., Series 2015-19A, Class DR, VRN, 7.11%, (3-month LIBOR plus 4.35%), 1/22/28(1) | 475,000 | 428,134 | |||||||||
Marathon CLO V Ltd., Series 2013-5A, Class A1R, VRN, 3.85%, (3-month LIBOR plus 0.87%), 11/21/27(1) | 234,163 | 233,518 | |||||||||
MF1 Ltd., Series 2020-FL4, Class D, VRN, 6.51%, (1-month SOFR plus 4.21%), 11/15/35(1) | 585,000 | 580,855 | |||||||||
Octagon Investment Partners XV Ltd., Series 2013-1A, Class CRR, VRN, 4.74%, (3-month LIBOR plus 2.00%), 7/19/30(1) | 300,000 | 286,468 | |||||||||
Sound Point CLO Ltd., Series 2014-3RA, Class C, VRN, 5.03%, (3-month LIBOR plus 2.25%), 10/23/31(1) | 500,000 | 469,025 | |||||||||
Symphony CLO XIV Ltd., Series 2014-14A, Class CR, VRN, 4.58%, (3-month LIBOR plus 2.10%), 7/14/26(1) | 500,000 | 495,427 | |||||||||
TICP CLO I-2 Ltd., Series 2018-IA, Class C, VRN, 5.81%, (3-month LIBOR plus 3.04%), 4/26/28(1) | 350,000 | 339,475 | |||||||||
63
| Multisector Income ETF | ||||||||
| Principal Amount/Shares | Value | |||||||
Vibrant CLO VII Ltd., Series 2017-7A, Class B, VRN, 5.11%, (3-month LIBOR plus 2.40%), 9/15/30(1) | $ | 350,000 | $ | 335,663 | ||||
TOTAL COLLATERALIZED LOAN OBLIGATIONS (Cost $6,202,184) | 5,935,110 | |||||||
| PREFERRED STOCKS — 4.2% | ||||||||
| Banks — 2.6% | ||||||||
Banco Mercantil del Norte SA, 8.375%(1) | 400,000 | 389,054 | ||||||
| Barclays PLC, 4.375% | 475,000 | 357,553 | ||||||
BNP Paribas SA, 7.75%(1) | 210,000 | 210,315 | ||||||
| ING Groep NV, 3.875% | 570,000 | 424,724 | ||||||
| JPMorgan Chase & Co., 4.60% | 1,415,000 | 1,247,322 | ||||||
| PNC Financial Services Group, Inc., 3.40% | 375,000 | 303,938 | ||||||
| 2,932,906 | ||||||||
| Capital Markets — 0.4% | ||||||||
| Bank of New York Mellon Corp., 3.75% | 545,000 | 460,482 | ||||||
| Insurance — 0.4% | ||||||||
Allianz SE, 3.20%(1) | 585,000 | 447,037 | ||||||
| Trading Companies and Distributors — 0.8% | ||||||||
| Air Lease Corp., 4.125% | 526,000 | 396,472 | ||||||
Aircastle Ltd., 5.25%(1) | 685,000 | 541,174 | ||||||
| 937,646 | ||||||||
TOTAL PREFERRED STOCKS (Cost $5,794,033) | 4,778,071 | |||||||
BANK LOAN OBLIGATIONS(4) — 1.3% | ||||||||
| Media — 0.6% | ||||||||
| Directv Financing, LLC, Term Loan, 7.52%, (1-month LIBOR plus 5.00%), 8/2/27 | $ | 652,750 | 626,313 | |||||
| Pharmaceuticals — 0.4% | ||||||||
| Jazz Financing Lux S.a.r.l., USD Term Loan, 6.02%, (1-month LIBOR plus 3.50%), 5/5/28 | 496,241 | 487,688 | ||||||
| Technology Hardware, Storage and Peripherals — 0.3% | ||||||||
| McAfee Corp., 2022 USD Term Loan B, 6.16%, (1-month SOFR plus 3.75%), 3/1/29 | 355,000 | 337,916 | ||||||
TOTAL BANK LOAN OBLIGATIONS (Cost $1,506,371) | 1,451,917 | |||||||
| SOVEREIGN GOVERNMENTS AND AGENCIES — 1.1% | ||||||||
| Colombia — 0.1% | ||||||||
| Colombia Government International Bond, 6.125%, 1/18/41 | 200,000 | 160,546 | ||||||
| South Africa — 0.7% | ||||||||
| Republic of South Africa Government International Bond, 5.875%, 6/22/30 | 800,000 | 752,016 | ||||||
| Trinidad and Tobago — 0.3% | ||||||||
| Trinidad & Tobago Government International Bond, 4.50%, 8/4/26 | 400,000 | 398,356 | ||||||
TOTAL SOVEREIGN GOVERNMENTS AND AGENCIES (Cost $1,478,226) | 1,310,918 | |||||||
| SHORT-TERM INVESTMENTS — 4.6% | ||||||||
| Money Market Funds — 4.6% | ||||||||
| State Street Institutional U.S. Government Money Market Fund, Premier Class | 1,612,850 | 1,612,850 | ||||||
64
| Multisector Income ETF | ||||||||
| Shares | Value | |||||||
State Street Navigator Securities Lending Government Money Market Portfolio(5) | 3,709,125 | $ | 3,709,125 | |||||
TOTAL SHORT-TERM INVESTMENTS (Cost $5,321,975) | 5,321,975 | |||||||
TOTAL INVESTMENT SECURITIES — 104.5% (Cost $128,662,990) | 119,550,213 | |||||||
| OTHER ASSETS AND LIABILITIES — (4.5)% | (5,187,524) | |||||||
| TOTAL NET ASSETS — 100.0% | $ | 114,362,689 | ||||||
| FUTURES CONTRACTS PURCHASED | ||||||||||||||
| Reference Entity | Contracts | Expiration Date | Notional Amount | Unrealized Appreciation (Depreciation)^ | ||||||||||
| U.S. Treasury 2-Year Notes | 52 | December 2022 | $ | 10,833,063 | $ | (7,570) | ||||||||
| U.S. Treasury 5-Year Notes | 18 | December 2022 | 1,994,766 | (2,220) | ||||||||||
| U.S. Treasury 10-Year Notes | 9 | December 2022 | 1,052,156 | (1,916) | ||||||||||
| U.S. Treasury 10-Year Ultra Notes | 28 | December 2022 | 3,505,250 | (14,994) | ||||||||||
| $ | 17,385,235 | $ | (26,700) | |||||||||||
^Amount represents value and unrealized appreciation (depreciation).
| FUTURES CONTRACTS SOLD | ||||||||||||||
| Reference Entity | Contracts | Expiration Date | Notional Amount | Unrealized Appreciation (Depreciation)^ | ||||||||||
| U.S. Treasury Long Bonds | 17 | December 2022 | $ | 2,309,344 | $ | 3,295 | ||||||||
| U.S. Treasury Ultra Bonds | 2 | December 2022 | 299,000 | 564 | ||||||||||
| $ | 2,608,344 | $ | 3,859 | |||||||||||
^Amount represents value and unrealized appreciation (depreciation).
| CENTRALLY CLEARED CREDIT DEFAULT SWAP AGREEMENTS | |||||||||||||||||||||||
| Reference Entity | Type | Fixed Rate Received (Paid) Quarterly | Termination Date | Notional Amount | Premiums Paid (Received) | Unrealized Appreciation (Depreciation) | Value^ | ||||||||||||||||
| Markit CDX North America High Yield Index Series 37 | Buy | (5.00)% | 12/20/26 | $ | 2,668,050 | $ | (123,163) | $ | 95,619 | $ | (27,544) | ||||||||||||
| Markit CDX North America High Yield Index Series 38 | Buy | (5.00)% | 6/20/27 | $ | 2,277,000 | (4,074) | 9,013 | 4,939 | |||||||||||||||
| $ | (127,237) | $ | 104,632 | $ | (22,605) | ||||||||||||||||||
^The value for credit default swap agreements serves as an indicator of the current status of the payment/performance risk and represent the likelihood of an expected liability or profit at the period end. Increasing values in absolute terms when compared to the notional amount of the credit default swap agreement represent a deterioration of the referenced entity's credit soundness and an increased likelihood or risk of a credit event occurring as defined in the agreement.
65
Multisector Income ETF
| NOTES TO SCHEDULE OF INVESTMENTS | ||||||||
| CAD | - | Canadian Dollar | ||||||
| CDX | - | Credit Derivatives Indexes | ||||||
| FHLMC | - | Federal Home Loan Mortgage Corporation | ||||||
| FNMA | - | Federal National Mortgage Association | ||||||
| LIBOR | - | London Interbank Offered Rate | ||||||
| SEQ | - | Sequential Payer | ||||||
| SOFR | - | Secured Overnight Financing Rate | ||||||
| TBA | - | To-Be-Announced. Security was purchased on a forward commitment basis with an approximate principal amount and maturity date. Actual principal amount and maturity date will be determined upon settlement. | ||||||
| UMBS | - | Uniform Mortgage-Backed Securities | ||||||
| USD | - | United States Dollar | ||||||
| VRN | - | Variable Rate Note. The rate adjusts periodically based upon the terms set forth in the security’s offering documents. The rate shown is effective at the period end and the reference rate and spread, if any, is indicated. The security's effective maturity date may be shorter than the final maturity date shown. | ||||||
(1)Security was purchased pursuant to Rule 144A or Section 4(2) under the Securities Act of 1933 and may be sold in transactions exempt from registration, normally to qualified institutional investors. The aggregate value of these securities at the period end was $57,915,365, which represented 50.6% of total net assets.
(2)Security, or a portion thereof, is on loan. At the period end, the aggregate value of securities on loan was $3,579,726. The amount of securities on loan indicated may not correspond with the securities on loan identified because securities with pending sales are in the process of recall from the brokers.
(3)Security, or a portion thereof, has been pledged at the custodian bank or with a broker for collateral requirements on futures contracts and/or swap agreements. At the period end, the aggregate value of securities pledged was $690,535.
(4)The interest rate on a bank loan obligation adjusts periodically based on a predetermined schedule. Rate or range of rates shown is effective at period end. The maturity date on a bank loan obligation may be less than indicated as a result of contractual or optional prepayments. These prepayments cannot be predicted with certainty.
(5)Investment of cash collateral from securities on loan. At the period end, the aggregate value of the collateral held by the fund was $3,709,125.
See Notes to Financial Statements.
66
AUGUST 31, 2022
| Select High Yield ETF | ||||||||
| Principal Amount | Value | |||||||
| CORPORATE BONDS — 94.8% | ||||||||
| Aerospace and Defense — 1.7% | ||||||||
Spirit AeroSystems, Inc., 7.50%, 4/15/25(1) | $ | 50,000 | $ | 48,985 | ||||
TransDigm, Inc., 6.25%, 3/15/26(1) | 125,000 | 122,965 | ||||||
| TransDigm, Inc., 6.375%, 6/15/26 | 75,000 | 72,090 | ||||||
| TransDigm, Inc., 7.50%, 3/15/27 | 50,000 | 48,819 | ||||||
| TransDigm, Inc., 5.50%, 11/15/27 | 200,000 | 180,243 | ||||||
| TransDigm, Inc., 4.875%, 5/1/29 | 50,000 | 42,487 | ||||||
| 515,589 | ||||||||
| Air Freight and Logistics — 0.2% | ||||||||
Western Global Airlines LLC, 10.375%, 8/15/25(1) | 50,000 | 45,623 | ||||||
| Airlines — 1.6% | ||||||||
Air Canada, 3.875%, 8/15/26(1) | 50,000 | 44,684 | ||||||
American Airlines, Inc., 11.75%, 7/15/25(1) | 150,000 | 165,943 | ||||||
American Airlines, Inc. / AAdvantage Loyalty IP Ltd., 5.50%, 4/20/26(1) | 75,000 | 71,449 | ||||||
Delta Air Lines, Inc., 7.00%, 5/1/25(1) | 75,000 | 77,699 | ||||||
Hawaiian Brand Intellectual Property Ltd. / HawaiianMiles Loyalty Ltd., 5.75%, 1/20/26(1) | 50,000 | 45,708 | ||||||
United Airlines, Inc., 4.375%, 4/15/26(1) | 50,000 | 45,655 | ||||||
United Airlines, Inc., 4.625%, 4/15/29(1) | 50,000 | 43,938 | ||||||
| 495,076 | ||||||||
| Auto Components — 1.8% | ||||||||
Adient Global Holdings Ltd., 4.875%, 8/15/26(1) | 200,000 | 185,337 | ||||||
Clarios Global LP, 6.75%, 5/15/25(1) | 50,000 | 49,803 | ||||||
| Goodyear Tire & Rubber Co., 9.50%, 5/31/25 | 75,000 | 78,468 | ||||||
Goodyear Tire & Rubber Co., 5.00%, 5/31/26(2) | 75,000 | 72,466 | ||||||
Patrick Industries, Inc., 4.75%, 5/1/29(1) | 50,000 | 41,005 | ||||||
Tenneco, Inc., 5.00%, 7/15/26(2) | 125,000 | 119,554 | ||||||
| 546,633 | ||||||||
| Automobiles — 2.5% | ||||||||
| Ford Motor Co., 9.00%, 4/22/25 | 75,000 | 84,004 | ||||||
| Ford Motor Co., 3.25%, 2/12/32 | 50,000 | 39,125 | ||||||
| Ford Motor Co., 6.10%, 8/19/32 | 50,000 | 48,758 | ||||||
| Ford Motor Credit Co. LLC, 4.13%, 8/4/25 | 200,000 | 189,198 | ||||||
| Ford Motor Credit Co. LLC, 3.82%, 11/2/27 | 200,000 | 176,320 | ||||||
Ford Motor Credit Co. LLC, 5.11%, 5/3/29(2) | 200,000 | 185,092 | ||||||
PM General Purchaser LLC, 9.50%, 10/1/28(1) | 50,000 | 43,387 | ||||||
| 765,884 | ||||||||
| Beverages — 0.1% | ||||||||
Primo Water Holdings, Inc., 4.375%, 4/30/29(1) | 50,000 | 42,827 | ||||||
| Building Products — 1.2% | ||||||||
Builders FirstSource, Inc., 4.25%, 2/1/32(1) | 125,000 | 99,935 | ||||||
| Griffon Corp., 5.75%, 3/1/28 | 75,000 | 69,503 | ||||||
Masonite International Corp., 3.50%, 2/15/30(1) | 50,000 | 40,472 | ||||||
PGT Innovations, Inc., 4.375%, 10/1/29(1) | 50,000 | 42,370 | ||||||
Standard Industries, Inc., 4.375%, 7/15/30(1) | 100,000 | 79,523 | ||||||
Standard Industries, Inc., 3.375%, 1/15/31(1) | 50,000 | 36,724 | ||||||
| 368,527 | ||||||||
| Capital Markets — 1.4% | ||||||||
Compass Group Diversified Holdings LLC, 5.25%, 4/15/29(1) | 50,000 | 42,627 | ||||||
67
| Select High Yield ETF | ||||||||
| Principal Amount | Value | |||||||
| Icahn Enterprises LP / Icahn Enterprises Finance Corp., 4.75%, 9/15/24 | $ | 75,000 | $ | 71,445 | ||||
| Icahn Enterprises LP / Icahn Enterprises Finance Corp., 6.25%, 5/15/26 | 75,000 | 72,029 | ||||||
| Icahn Enterprises LP / Icahn Enterprises Finance Corp., 5.25%, 5/15/27 | 125,000 | 113,878 | ||||||
LCM Investments Holdings II LLC, 4.875%, 5/1/29(1) | 50,000 | 41,814 | ||||||
MSCI, Inc., 3.625%, 9/1/30(1) | 100,000 | 84,998 | ||||||
| 426,791 | ||||||||
| Chemicals — 2.5% | ||||||||
Avient Corp., 5.75%, 5/15/25(1) | 50,000 | 49,374 | ||||||
Consolidated Energy Finance SA, 6.50%, 5/15/26(1) | 150,000 | 137,205 | ||||||
FXI Holdings, Inc., 12.25%, 11/15/26(1) | 50,000 | 41,813 | ||||||
NOVA Chemicals Corp., 4.875%, 6/1/24(1) | 75,000 | 71,800 | ||||||
NOVA Chemicals Corp., 5.25%, 6/1/27(1) | 50,000 | 44,219 | ||||||
Olin Corp., 5.00%, 2/1/30(2) | 50,000 | 45,437 | ||||||
SCIH Salt Holdings, Inc., 4.875%, 5/1/28(1) | 50,000 | 42,964 | ||||||
SCIH Salt Holdings, Inc., 6.625%, 5/1/29(1) | 50,000 | 41,239 | ||||||
Trinseo Materials Operating SCA / Trinseo Materials Finance, Inc., 5.375%, 9/1/25(1)(2) | 75,000 | 64,758 | ||||||
Trinseo Materials Operating SCA / Trinseo Materials Finance, Inc., 5.125%, 4/1/29(1) | 50,000 | 35,554 | ||||||
Tronox, Inc., 4.625%, 3/15/29(1) | 50,000 | 41,655 | ||||||
WR Grace Holdings LLC, 4.875%, 6/15/27(1) | 125,000 | 115,766 | ||||||
WR Grace Holdings LLC, 5.625%, 8/15/29(1) | 50,000 | 39,625 | ||||||
| 771,409 | ||||||||
| Commercial Services and Supplies — 1.6% | ||||||||
ADT Security Corp., 4.125%, 8/1/29(1) | 50,000 | 42,999 | ||||||
ADT Security Corp., 4.875%, 7/15/32(1) | 75,000 | 62,849 | ||||||
Allied Universal Holdco LLC / Allied Universal Finance Corp., 6.625%, 7/15/26(1) | 75,000 | 70,313 | ||||||
Brink's Co., 4.625%, 10/15/27(1)(2) | 75,000 | 67,602 | ||||||
Matthews International Corp., 5.25%, 12/1/25(1) | 125,000 | 113,897 | ||||||
Metis Merger Sub LLC, 6.50%, 5/15/29(1) | 50,000 | 43,074 | ||||||
Prime Security Services Borrower LLC / Prime Finance, Inc., 3.375%, 8/31/27(1) | 50,000 | 43,093 | ||||||
Prime Security Services Borrower LLC / Prime Finance, Inc., 6.25%, 1/15/28(1)(2) | 50,000 | 44,081 | ||||||
| 487,908 | ||||||||
| Communications Equipment — 0.2% | ||||||||
CommScope, Inc., 6.00%, 3/1/26(1) | 75,000 | 70,972 | ||||||
| Construction and Engineering — 0.5% | ||||||||
New Enterprise Stone & Lime Co., Inc., 5.25%, 7/15/28(1) | 175,000 | 155,758 | ||||||
| Construction Materials — 0.8% | ||||||||
Cemex SAB de CV, 5.20%, 9/17/30(1) | 200,000 | 181,793 | ||||||
SRM Escrow Issuer LLC, 6.00%, 11/1/28(1) | 75,000 | 68,147 | ||||||
| 249,940 | ||||||||
| Consumer Finance — 1.7% | ||||||||
Global Aircraft Leasing Co. Ltd., 6.50% Cash or 7.25% PIK, 9/15/24(1)(3) | 150,000 | 121,614 | ||||||
| Navient Corp., 7.25%, 9/25/23 | 70,000 | 70,234 | ||||||
| Navient Corp., 5.875%, 10/25/24 | 50,000 | 48,081 | ||||||
| Navient Corp., 6.75%, 6/25/25 | 50,000 | 48,321 | ||||||
| Navient Corp., 5.50%, 3/15/29 | 50,000 | 40,575 | ||||||
68
| Select High Yield ETF | ||||||||
| Principal Amount | Value | |||||||
| OneMain Finance Corp., 6.125%, 3/15/24 | $ | 75,000 | $ | 73,319 | ||||
| OneMain Finance Corp., 6.875%, 3/15/25 | 125,000 | 121,657 | ||||||
| 523,801 | ||||||||
| Containers and Packaging — 1.9% | ||||||||
Ball Corp., 3.125%, 9/15/31(2) | 50,000 | 40,568 | ||||||
Berry Global, Inc., 4.50%, 2/15/26(1) | 75,000 | 72,111 | ||||||
Berry Global, Inc., 4.875%, 7/15/26(1) | 50,000 | 48,742 | ||||||
Mauser Packaging Solutions Holding Co., 5.50%, 4/15/24(1) | 125,000 | 121,163 | ||||||
OI European Group BV, 4.75%, 2/15/30(1) | 50,000 | 40,552 | ||||||
Owens-Brockway Glass Container, Inc., 5.875%, 8/15/23(1) | 150,000 | 149,280 | ||||||
Sealed Air Corp., 5.125%, 12/1/24(1) | 75,000 | 74,360 | ||||||
TriMas Corp., 4.125%, 4/15/29(1) | 50,000 | 43,951 | ||||||
| 590,727 | ||||||||
| Distributors — 0.5% | ||||||||
BCPE Empire Holdings, Inc., 7.625%, 5/1/27(1)(2) | 50,000 | 45,165 | ||||||
Performance Food Group, Inc., 5.50%, 10/15/27(1) | 50,000 | 47,190 | ||||||
Performance Food Group, Inc., 4.25%, 8/1/29(1) | 50,000 | 42,876 | ||||||
| 135,231 | ||||||||
| Diversified Consumer Services — 0.4% | ||||||||
Adtalem Global Education, Inc., 5.50%, 3/1/28(1) | 39,000 | 37,103 | ||||||
| Service Corp. International, 3.375%, 8/15/30 | 50,000 | 41,291 | ||||||
| Service Corp. International, 4.00%, 5/15/31 | 50,000 | 42,826 | ||||||
| 121,220 | ||||||||
| Diversified Financial Services — 0.5% | ||||||||
Jefferson Capital Holdings LLC, 6.00%, 8/15/26(1) | 50,000 | 44,073 | ||||||
MPH Acquisition Holdings LLC, 5.50%, 9/1/28(1) | 75,000 | 64,059 | ||||||
Paysafe Finance PLC / Paysafe Holdings US Corp., 4.00%, 6/15/29(1)(2) | 50,000 | 37,442 | ||||||
| 145,574 | ||||||||
| Diversified Telecommunication Services — 3.6% | ||||||||
Altice France SA, 5.125%, 7/15/29(1) | 200,000 | 152,182 | ||||||
Connect Finco SARL / Connect US Finco LLC, 6.75%, 10/1/26(1) | 200,000 | 183,645 | ||||||
| Embarq Corp., 8.00%, 6/1/36 | 75,000 | 58,399 | ||||||
Level 3 Financing, Inc., 4.25%, 7/1/28(1) | 100,000 | 83,247 | ||||||
Level 3 Financing, Inc., 3.625%, 1/15/29(1) | 50,000 | 40,204 | ||||||
Level 3 Financing, Inc., 3.75%, 7/15/29(1) | 50,000 | 40,235 | ||||||
| Lumen Technologies, Inc., 6.75%, 12/1/23 | 75,000 | 75,952 | ||||||
| Lumen Technologies, Inc., 7.50%, 4/1/24 | 50,000 | 50,465 | ||||||
Lumen Technologies, Inc., 5.125%, 12/15/26(1) | 75,000 | 64,904 | ||||||
Lumen Technologies, Inc., 4.50%, 1/15/29(1) | 50,000 | 37,375 | ||||||
| Sprint Capital Corp., 6.875%, 11/15/28 | 50,000 | 52,862 | ||||||
| Sprint Capital Corp., 8.75%, 3/15/32 | 75,000 | 90,637 | ||||||
| Telecom Italia Capital SA, 6.00%, 9/30/34 | 50,000 | 39,560 | ||||||
| Telecom Italia Capital SA, 7.20%, 7/18/36 | 50,000 | 42,750 | ||||||
Telesat Canada / Telesat LLC, 6.50%, 10/15/27(1) | 75,000 | 31,118 | ||||||
Zayo Group Holdings, Inc., 4.00%, 3/1/27(1) | 75,000 | 64,036 | ||||||
| 1,107,571 | ||||||||
| Electric Utilities — 1.7% | ||||||||
| FirstEnergy Corp., 4.40%, 7/15/27 | 50,000 | 47,440 | ||||||
| FirstEnergy Corp., 5.35%, 7/15/47 | 50,000 | 46,062 | ||||||
NextEra Energy Operating Partners LP, 3.875%, 10/15/26(1) | 75,000 | 70,014 | ||||||
69
| Select High Yield ETF | ||||||||
| Principal Amount | Value | |||||||
| NRG Energy, Inc., 6.625%, 1/15/27 | $ | 50,000 | $ | 49,695 | ||||
NRG Energy, Inc., 3.625%, 2/15/31(1) | 50,000 | 39,778 | ||||||
PG&E Corp., 5.00%, 7/1/28(2) | 50,000 | 44,485 | ||||||
| PG&E Corp., 5.25%, 7/1/30 | 50,000 | 43,310 | ||||||
Vistra Operations Co. LLC, 5.625%, 2/15/27(1) | 75,000 | 72,277 | ||||||
Vistra Operations Co. LLC, 5.00%, 7/31/27(1) | 75,000 | 69,892 | ||||||
Vistra Operations Co. LLC, 4.375%, 5/1/29(1) | 50,000 | 43,678 | ||||||
| 526,631 | ||||||||
| Electrical Equipment — 0.5% | ||||||||
Atkore, Inc., 4.25%, 6/1/31(1) | 75,000 | 63,099 | ||||||
WESCO Distribution, Inc., 7.125%, 6/15/25(1) | 25,000 | 25,035 | ||||||
WESCO Distribution, Inc., 7.25%, 6/15/28(1) | 50,000 | 50,476 | ||||||
| 138,610 | ||||||||
| Electronic Equipment, Instruments and Components — 0.8% | ||||||||
Imola Merger Corp., 4.75%, 5/15/29(1) | 150,000 | 127,535 | ||||||
Sensata Technologies, Inc., 4.375%, 2/15/30(1) | 125,000 | 111,563 | ||||||
| 239,098 | ||||||||
| Energy Equipment and Services — 1.3% | ||||||||
Archrock Partners LP / Archrock Partners Finance Corp., 6.875%, 4/1/27(1) | 50,000 | 46,944 | ||||||
Archrock Partners LP / Archrock Partners Finance Corp., 6.25%, 4/1/28(1) | 75,000 | 68,369 | ||||||
Bristow Group, Inc., 6.875%, 3/1/28(1) | 75,000 | 69,673 | ||||||
Nabors Industries, Inc., 7.375%, 5/15/27(1)(2) | 50,000 | 48,335 | ||||||
Precision Drilling Corp., 6.875%, 1/15/29(1) | 50,000 | 46,005 | ||||||
Transocean Guardian Ltd., 5.875%, 1/15/24(1) | 13,571 | 12,881 | ||||||
Transocean Poseidon Ltd., 6.875%, 2/1/27(1) | 21,875 | 20,636 | ||||||
| USA Compression Partners LP / USA Compression Finance Corp., 6.875%, 9/1/27 | 50,000 | 46,300 | ||||||
Weatherford International Ltd., 8.625%, 4/30/30(1) | 50,000 | 45,283 | ||||||
| 404,426 | ||||||||
| Entertainment — 0.9% | ||||||||
Cinemark USA, Inc., 5.875%, 3/15/26(1)(2) | 50,000 | 44,433 | ||||||
Cinemark USA, Inc., 5.25%, 7/15/28(1)(2) | 50,000 | 40,564 | ||||||
Live Nation Entertainment, Inc., 4.75%, 10/15/27(1)(2) | 75,000 | 68,375 | ||||||
Playtika Holding Corp., 4.25%, 3/15/29(1) | 50,000 | 42,716 | ||||||
WMG Acquisition Corp., 3.875%, 7/15/30(1) | 50,000 | 43,078 | ||||||
WMG Acquisition Corp., 3.00%, 2/15/31(1) | 50,000 | 39,778 | ||||||
| 278,944 | ||||||||
| Equity Real Estate Investment Trusts (REITs) — 3.6% | ||||||||
CTR Partnership LP / CareTrust Capital Corp., 3.875%, 6/30/28(1) | 50,000 | 42,428 | ||||||
| Diversified Healthcare Trust, 9.75%, 6/15/25 | 37,000 | 36,417 | ||||||
| Diversified Healthcare Trust, 4.375%, 3/1/31 | 50,000 | 34,382 | ||||||
HAT Holdings I LLC / HAT Holdings II LLC, 3.375%, 6/15/26(1) | 50,000 | 43,469 | ||||||
Iron Mountain, Inc., 5.25%, 3/15/28(1) | 150,000 | 137,857 | ||||||
Iron Mountain, Inc., 4.875%, 9/15/29(1) | 75,000 | 65,167 | ||||||
Iron Mountain, Inc., 4.50%, 2/15/31(1) | 50,000 | 41,599 | ||||||
MPT Operating Partnership LP / MPT Finance Corp., 4.625%, 8/1/29(2) | 75,000 | 63,985 | ||||||
Park Intermediate Holdings LLC / PK Domestic Property LLC / PK Finance Co-Issuer, 7.50%, 6/1/25(1) | 75,000 | 75,795 | ||||||
70
| Select High Yield ETF | ||||||||
| Principal Amount | Value | |||||||
Park Intermediate Holdings LLC / PK Domestic Property LLC / PK Finance Co-Issuer, 5.875%, 10/1/28(1) | $ | 50,000 | $ | 46,016 | ||||
RLJ Lodging Trust LP, 3.75%, 7/1/26(1) | 50,000 | 44,928 | ||||||
RLJ Lodging Trust LP, 4.00%, 9/15/29(1) | 50,000 | 42,282 | ||||||
| SBA Communications Corp., 3.875%, 2/15/27 | 125,000 | 114,033 | ||||||
Service Properties Trust, 4.35%, 10/1/24(2) | 75,000 | 67,224 | ||||||
| Service Properties Trust, 5.25%, 2/15/26 | 50,000 | 42,624 | ||||||
| Service Properties Trust, 4.95%, 2/15/27 | 75,000 | 60,847 | ||||||
| Service Properties Trust, 4.95%, 10/1/29 | 75,000 | 56,783 | ||||||
Service Properties Trust, 4.375%, 2/15/30(2) | 50,000 | 36,706 | ||||||
Uniti Group LP / Uniti Group Finance, Inc. / CSL Capital LLC, 4.75%, 4/15/28(1) | 50,000 | 41,849 | ||||||
| 1,094,391 | ||||||||
| Food and Staples Retailing — 0.5% | ||||||||
Albertsons Cos., Inc. / Safeway, Inc. / New Albertsons LP / Albertsons LLC, 4.625%, 1/15/27(1) | 50,000 | 45,687 | ||||||
Albertsons Cos., Inc. / Safeway, Inc. / New Albertsons LP / Albertsons LLC, 5.875%, 2/15/28(1) | 50,000 | 47,703 | ||||||
Albertsons Cos., Inc. / Safeway, Inc. / New Albertsons LP / Albertsons LLC, 3.50%, 3/15/29(1) | 50,000 | 41,153 | ||||||
| 134,543 | ||||||||
| Food Products — 0.9% | ||||||||
Herbalife Nutrition Ltd. / HLF Financing, Inc., 7.875%, 9/1/25(1) | 50,000 | 48,232 | ||||||
JBS USA LUX SA / JBS USA Food Co. / JBS USA Finance, Inc., 6.50%, 4/15/29(1) | 12,000 | 12,436 | ||||||
JBS USA LUX SA / JBS USA Food Co. / JBS USA Finance, Inc., 5.50%, 1/15/30(1) | 75,000 | 75,135 | ||||||
Pilgrim's Pride Corp., 5.875%, 9/30/27(1) | 75,000 | 73,979 | ||||||
Post Holdings, Inc., 5.75%, 3/1/27(1) | 28,000 | 27,387 | ||||||
Simmons Foods, Inc. / Simmons Prepared Foods, Inc. / Simmons Pet Food, Inc. / Simmons Feed, Inc., 4.625%, 3/1/29(1) | 50,000 | 44,288 | ||||||
| 281,457 | ||||||||
| Health Care Equipment and Supplies — 0.6% | ||||||||
Avantor Funding, Inc., 3.875%, 11/1/29(1) | 50,000 | 43,328 | ||||||
Medline Borrower LP, 3.875%, 4/1/29(1) | 75,000 | 63,656 | ||||||
Medline Borrower LP, 5.25%, 10/1/29(1)(2) | 100,000 | 84,164 | ||||||
| 191,148 | ||||||||
| Health Care Providers and Services — 4.4% | ||||||||
Catalent Pharma Solutions, Inc., 3.50%, 4/1/30(1) | 50,000 | 41,250 | ||||||
| Centene Corp., 4.25%, 12/15/27 | 125,000 | 118,885 | ||||||
| Centene Corp., 4.625%, 12/15/29 | 76,000 | 71,702 | ||||||
| Centene Corp., 3.375%, 2/15/30 | 50,000 | 42,945 | ||||||
| Centene Corp., 3.00%, 10/15/30 | 50,000 | 41,862 | ||||||
CHS / Community Health Systems, Inc., 8.00%, 3/15/26(1) | 75,000 | 70,219 | ||||||
CHS / Community Health Systems, Inc., 5.625%, 3/15/27(1) | 50,000 | 42,495 | ||||||
CHS / Community Health Systems, Inc., 8.00%, 12/15/27(1)(2) | 50,000 | 43,485 | ||||||
CHS / Community Health Systems, Inc., 4.75%, 2/15/31(1) | 50,000 | 36,985 | ||||||
DaVita, Inc., 4.625%, 6/1/30(1) | 150,000 | 120,940 | ||||||
DaVita, Inc., 3.75%, 2/15/31(1) | 50,000 | 36,878 | ||||||
| HCA, Inc., 5.375%, 2/1/25 | 75,000 | 75,807 | ||||||
| HCA, Inc., 5.875%, 2/15/26 | 50,000 | 51,118 | ||||||
| HCA, Inc., 5.375%, 9/1/26 | 75,000 | 75,301 | ||||||
HealthEquity, Inc., 4.50%, 10/1/29(1) | 50,000 | 44,039 | ||||||
Legacy LifePoint Health LLC, 6.75%, 4/15/25(1) | 50,000 | 49,165 | ||||||
71
| Select High Yield ETF | ||||||||
| Principal Amount | Value | |||||||
Molina Healthcare, Inc., 3.875%, 5/15/32(1) | $ | 50,000 | $ | 43,109 | ||||
Owens & Minor, Inc., 4.50%, 3/31/29(1)(2) | 50,000 | 42,682 | ||||||
Tenet Healthcare Corp., 4.875%, 1/1/26(1) | 150,000 | 142,691 | ||||||
Tenet Healthcare Corp., 6.25%, 2/1/27(1) | 75,000 | 72,412 | ||||||
Tenet Healthcare Corp., 5.125%, 11/1/27(1) | 50,000 | 46,381 | ||||||
Tenet Healthcare Corp., 4.25%, 6/1/29(1) | 50,000 | 43,205 | ||||||
| 1,353,556 | ||||||||
| Hotels, Restaurants and Leisure — 8.1% | ||||||||
1011778 BC ULC / New Red Finance, Inc., 4.375%, 1/15/28(1) | 50,000 | 44,782 | ||||||
1011778 BC ULC / New Red Finance, Inc., 4.00%, 10/15/30(1) | 125,000 | 101,602 | ||||||
Affinity Gaming, 6.875%, 12/15/27(1)(2) | 125,000 | 108,734 | ||||||
Aramark Services, Inc., 6.375%, 5/1/25(1) | 125,000 | 124,064 | ||||||
Caesars Entertainment, Inc., 6.25%, 7/1/25(1) | 50,000 | 48,885 | ||||||
Caesars Entertainment, Inc., 4.625%, 10/15/29(1)(2) | 50,000 | 40,280 | ||||||
Carnival Corp., 10.50%, 2/1/26(1) | 75,000 | 77,347 | ||||||
Carnival Corp., 7.625%, 3/1/26(1) | 75,000 | 63,953 | ||||||
Carnival Corp., 5.75%, 3/1/27(1) | 175,000 | 136,308 | ||||||
Carnival Corp., 9.875%, 8/1/27(1) | 50,000 | 50,254 | ||||||
Carnival Corp., 4.00%, 8/1/28(1) | 50,000 | 41,750 | ||||||
Carnival Corp., 6.00%, 5/1/29(1) | 150,000 | 113,906 | ||||||
Fertitta Entertainment LLC / Fertitta Entertainment Finance Co., Inc., 4.625%, 1/15/29(1) | 75,000 | 65,491 | ||||||
GPS Hospitality Holding Co. LLC / GPS Finco, Inc., 7.00%, 8/15/28(1) | 50,000 | 31,834 | ||||||
Hilton Domestic Operating Co., Inc., 5.75%, 5/1/28(1) | 50,000 | 48,947 | ||||||
| Hilton Domestic Operating Co., Inc., 4.875%, 1/15/30 | 50,000 | 45,756 | ||||||
Hilton Domestic Operating Co., Inc., 3.625%, 2/15/32(1) | 50,000 | 40,438 | ||||||
Hilton Grand Vacations Borrower Escrow LLC / Hilton Grand Vacations Borrower Esc, 5.00%, 6/1/29(1) | 75,000 | 66,472 | ||||||
Hilton Grand Vacations Borrower Escrow LLC / Hilton Grand Vacations Borrower Esc, 4.875%, 7/1/31(1) | 50,000 | 41,342 | ||||||
Life Time, Inc., 8.00%, 4/15/26(1)(2) | 50,000 | 44,218 | ||||||
| MGM Resorts International, 6.75%, 5/1/25 | 100,000 | 100,068 | ||||||
MGM Resorts International, 4.75%, 10/15/28(2) | 50,000 | 44,012 | ||||||
Midwest Gaming Borrower LLC / Midwest Gaming Finance Corp., 4.875%, 5/1/29(1) | 50,000 | 43,962 | ||||||
NCL Corp. Ltd., 3.625%, 12/15/24(1)(2) | 75,000 | 65,105 | ||||||
NCL Corp. Ltd., 5.875%, 3/15/26(1) | 50,000 | 40,500 | ||||||
NCL Finance Ltd., 6.125%, 3/15/28(1) | 50,000 | 38,899 | ||||||
Premier Entertainment Sub LLC / Premier Entertainment Finance Corp., 5.625%, 9/1/29(1) | 50,000 | 37,005 | ||||||
Premier Entertainment Sub LLC / Premier Entertainment Finance Corp., 5.875%, 9/1/31(1)(2) | 50,000 | 35,016 | ||||||
| Royal Caribbean Cruises Ltd., 5.25%, 11/15/22 | 50,000 | 50,108 | ||||||
Royal Caribbean Cruises Ltd., 5.375%, 7/15/27(1)(2) | 25,000 | 19,387 | ||||||
| Royal Caribbean Cruises Ltd., 7.50%, 10/15/27 | 75,000 | 63,932 | ||||||
| Royal Caribbean Cruises Ltd., 3.70%, 3/15/28 | 50,000 | 34,067 | ||||||
Royal Caribbean Cruises Ltd., 5.50%, 4/1/28(1)(2) | 150,000 | 113,439 | ||||||
Scientific Games International, Inc., 7.25%, 11/15/29(1) | 50,000 | 49,250 | ||||||
Sizzling Platter LLC / Sizzling Platter Finance Corp., 8.50%, 11/28/25(1) | 50,000 | 45,074 | ||||||
Travel + Leisure Co., 6.625%, 7/31/26(1) | 50,000 | 48,543 | ||||||
Travel + Leisure Co., 4.50%, 12/1/29(1) | 50,000 | 40,718 | ||||||
Viking Cruises Ltd., 6.25%, 5/15/25(1) | 75,000 | 67,098 | ||||||
72
| Select High Yield ETF | ||||||||
| Principal Amount | Value | |||||||
Viking Ocean Cruises Ship VII Ltd., 5.625%, 2/15/29(1) | $ | 75,000 | $ | 61,397 | ||||
Wynn Las Vegas LLC / Wynn Las Vegas Capital Corp., 5.50%, 3/1/25(1)(2) | 100,000 | 95,880 | ||||||
Wynn Resorts Finance LLC / Wynn Resorts Capital Corp., 7.75%, 4/15/25(1) | 50,000 | 49,919 | ||||||
| 2,479,742 | ||||||||
| Household Durables — 2.2% | ||||||||
Ashton Woods USA LLC / Ashton Woods Finance Co., 4.625%, 4/1/30(1) | 50,000 | 39,511 | ||||||
| Beazer Homes USA, Inc., 6.75%, 3/15/25 | 75,000 | 72,105 | ||||||
| Beazer Homes USA, Inc., 5.875%, 10/15/27 | 50,000 | 41,196 | ||||||
Brookfield Residential Properties, Inc. / Brookfield Residential US LLC, 5.00%, 6/15/29(1) | 75,000 | 59,763 | ||||||
| Century Communities, Inc., 6.75%, 6/1/27 | 125,000 | 122,786 | ||||||
| KB Home, 4.00%, 6/15/31 | 50,000 | 39,508 | ||||||
Mattamy Group Corp., 4.625%, 3/1/30(1) | 50,000 | 40,585 | ||||||
| Newell Brands, Inc., 4.45%, 4/1/26 | 75,000 | 70,633 | ||||||
Taylor Morrison Communities, Inc., 5.125%, 8/1/30(1) | 50,000 | 42,974 | ||||||
Tempur Sealy International, Inc., 4.00%, 4/15/29(1) | 50,000 | 41,155 | ||||||
Tempur Sealy International, Inc., 3.875%, 10/15/31(1)(2) | 50,000 | 38,561 | ||||||
| Tri Pointe Homes, Inc., 5.25%, 6/1/27 | 75,000 | 68,560 | ||||||
| 677,337 | ||||||||
| Independent Power and Renewable Electricity Producers — 1.1% | ||||||||
Calpine Corp., 5.25%, 6/1/26(1) | 37,000 | 35,966 | ||||||
Calpine Corp., 4.50%, 2/15/28(1) | 75,000 | 68,709 | ||||||
Calpine Corp., 5.125%, 3/15/28(1) | 75,000 | 66,737 | ||||||
Clearway Energy Operating LLC, 4.75%, 3/15/28(1) | 75,000 | 70,359 | ||||||
Sunnova Energy Corp., 5.875%, 9/1/26(1)(2) | 50,000 | 46,210 | ||||||
TerraForm Power Operating LLC, 5.00%, 1/31/28(1) | 50,000 | 45,899 | ||||||
| 333,880 | ||||||||
| Insurance — 0.2% | ||||||||
Acrisure LLC / Acrisure Finance, Inc., 4.25%, 2/15/29(1) | 75,000 | 63,731 | ||||||
| Interactive Media and Services — 0.4% | ||||||||
Rackspace Technology Global, Inc., 3.50%, 2/15/28(1) | 50,000 | 36,181 | ||||||
Twitter, Inc., 5.00%, 3/1/30(1) | 50,000 | 47,187 | ||||||
Ziff Davis, Inc., 4.625%, 10/15/30(1) | 50,000 | 42,707 | ||||||
| 126,075 | ||||||||
| Internet and Direct Marketing Retail — 0.3% | ||||||||
Go Daddy Operating Co. LLC / GD Finance Co., Inc., 3.50%, 3/1/29(1) | 25,000 | 21,200 | ||||||
Match Group Holdings II LLC, 3.625%, 10/1/31(1) | 50,000 | 39,179 | ||||||
Millennium Escrow Corp., 6.625%, 8/1/26(1) | 50,000 | 40,654 | ||||||
| 101,033 | ||||||||
| IT Services — 0.3% | ||||||||
| CDW LLC / CDW Finance Corp., 4.125%, 5/1/25 | 50,000 | 49,204 | ||||||
Presidio Holdings, Inc., 4.875%, 2/1/27(1) | 50,000 | 46,856 | ||||||
| 96,060 | ||||||||
| Leisure Products — 0.2% | ||||||||
Mattel, Inc., 5.45%, 11/1/41(2) | 50,000 | 46,016 | ||||||
| Machinery — 0.3% | ||||||||
| Hillenbrand, Inc., 3.75%, 3/1/31 | 50,000 | 42,406 | ||||||
Terex Corp., 5.00%, 5/15/29(1)(2) | 50,000 | 44,805 | ||||||
| 87,211 | ||||||||
73
| Select High Yield ETF | ||||||||
| Principal Amount | Value | |||||||
| Marine — 0.2% | ||||||||
Seaspan Corp., 5.50%, 8/1/29(1) | $ | 75,000 | $ | 61,875 | ||||
| Media — 9.5% | ||||||||
CCO Holdings LLC / CCO Holdings Capital Corp., 5.125%, 5/1/27(1) | 75,000 | 71,287 | ||||||
CCO Holdings LLC / CCO Holdings Capital Corp., 5.375%, 6/1/29(1) | 75,000 | 68,602 | ||||||
CCO Holdings LLC / CCO Holdings Capital Corp., 6.375%, 9/1/29(1) | 50,000 | 48,625 | ||||||
CCO Holdings LLC / CCO Holdings Capital Corp., 4.75%, 3/1/30(1) | 75,000 | 64,552 | ||||||
CCO Holdings LLC / CCO Holdings Capital Corp., 4.50%, 8/15/30(1) | 125,000 | 105,275 | ||||||
CCO Holdings LLC / CCO Holdings Capital Corp., 4.25%, 2/1/31(1) | 125,000 | 102,150 | ||||||
| CCO Holdings LLC / CCO Holdings Capital Corp., 4.50%, 5/1/32 | 150,000 | 121,909 | ||||||
CCO Holdings LLC / CCO Holdings Capital Corp., 4.50%, 6/1/33(1) | 100,000 | 78,629 | ||||||
Clear Channel Outdoor Holdings, Inc., 5.125%, 8/15/27(1)(2) | 50,000 | 44,845 | ||||||
CSC Holdings LLC, 6.50%, 2/1/29(1) | 200,000 | 184,270 | ||||||
CSC Holdings LLC, 5.75%, 1/15/30(1) | 250,000 | 194,019 | ||||||
Directv Financing LLC / Directv Financing Co-Obligor, Inc., 5.875%, 8/15/27(1) | 125,000 | 114,547 | ||||||
| DISH DBS Corp., 5.00%, 3/15/23 | 75,000 | 73,492 | ||||||
| DISH DBS Corp., 7.75%, 7/1/26 | 75,000 | 59,223 | ||||||
DISH DBS Corp., 5.25%, 12/1/26(1) | 75,000 | 62,062 | ||||||
DISH DBS Corp., 5.75%, 12/1/28(1) | 25,000 | 19,244 | ||||||
| DISH DBS Corp., 5.125%, 6/1/29 | 50,000 | 29,701 | ||||||
GCI LLC, 4.75%, 10/15/28(1) | 50,000 | 45,130 | ||||||
Gray Television, Inc., 7.00%, 5/15/27(1)(2) | 125,000 | 123,451 | ||||||
Gray Television, Inc., 4.75%, 10/15/30(1)(2) | 50,000 | 41,275 | ||||||
iHeartCommunications, Inc., 5.25%, 8/15/27(1)(2) | 50,000 | 44,943 | ||||||
iHeartCommunications, Inc., 4.75%, 1/15/28(1)(2) | 50,000 | 42,975 | ||||||
| Lamar Media Corp., 3.75%, 2/15/28 | 50,000 | 44,922 | ||||||
Lamar Media Corp., 4.875%, 1/15/29(2) | 50,000 | 46,500 | ||||||
| Lamar Media Corp., 4.00%, 2/15/30 | 50,000 | 43,609 | ||||||
McGraw-Hill Education, Inc., 8.00%, 8/1/29(1) | 50,000 | 43,452 | ||||||
News Corp., 3.875%, 5/15/29(1) | 75,000 | 65,396 | ||||||
Nexstar Media, Inc., 5.625%, 7/15/27(1) | 50,000 | 47,669 | ||||||
Outfront Media Capital LLC / Outfront Media Capital Corp., 5.00%, 8/15/27(1)(2) | 100,000 | 91,669 | ||||||
| Quebecor Media, Inc., 5.75%, 1/15/23 | 50,000 | 50,063 | ||||||
Sinclair Television Group, Inc., 5.125%, 2/15/27(1)(2) | 50,000 | 42,946 | ||||||
Sinclair Television Group, Inc., 5.50%, 3/1/30(1) | 75,000 | 58,893 | ||||||
Sinclair Television Group, Inc., 4.125%, 12/1/30(1) | 50,000 | 40,787 | ||||||
Sirius XM Radio, Inc., 3.125%, 9/1/26(1) | 25,000 | 22,297 | ||||||
Sirius XM Radio, Inc., 5.00%, 8/1/27(1) | 75,000 | 70,700 | ||||||
Sirius XM Radio, Inc., 4.00%, 7/15/28(1) | 75,000 | 65,437 | ||||||
Sirius XM Radio, Inc., 5.50%, 7/1/29(1) | 50,000 | 46,809 | ||||||
Sirius XM Radio, Inc., 3.875%, 9/1/31(1) | 50,000 | 40,436 | ||||||
Univision Communications, Inc., 5.125%, 2/15/25(1) | 75,000 | 72,540 | ||||||
Univision Communications, Inc., 6.625%, 6/1/27(1) | 50,000 | 48,315 | ||||||
Videotron Ltd., 3.625%, 6/15/29(1)(2) | 50,000 | 41,569 | ||||||
Virgin Media Secured Finance PLC, 5.50%, 5/15/29(1) | 200,000 | 178,138 | ||||||
| 2,902,353 | ||||||||
74
| Select High Yield ETF | ||||||||
| Principal Amount | Value | |||||||
| Metals and Mining — 2.3% | ||||||||
Arconic Corp., 6.00%, 5/15/25(1) | $ | 50,000 | $ | 49,187 | ||||
Arconic Corp., 6.125%, 2/15/28(1) | 50,000 | 47,021 | ||||||
| ATI, Inc., 4.875%, 10/1/29 | 25,000 | 22,399 | ||||||
ATI, Inc., 5.125%, 10/1/31(2) | 50,000 | 44,061 | ||||||
| Carpenter Technology Corp., 6.375%, 7/15/28 | 50,000 | 47,874 | ||||||
Cleveland-Cliffs, Inc., 4.625%, 3/1/29(1)(2) | 25,000 | 22,234 | ||||||
Cleveland-Cliffs, Inc., 4.875%, 3/1/31(1)(2) | 50,000 | 43,735 | ||||||
Coeur Mining, Inc., 5.125%, 2/15/29(1)(2) | 50,000 | 36,478 | ||||||
Compass Minerals International, Inc., 6.75%, 12/1/27(1) | 50,000 | 47,684 | ||||||
| Freeport-McMoRan, Inc., 4.25%, 3/1/30 | 75,000 | 68,059 | ||||||
Hudbay Minerals, Inc., 6.125%, 4/1/29(1) | 50,000 | 44,082 | ||||||
IAMGOLD Corp., 5.75%, 10/15/28(1) | 50,000 | 25,074 | ||||||
Novelis Corp., 4.75%, 1/30/30(1) | 125,000 | 108,900 | ||||||
PT FMG Resources August 2006 Pty Ltd., 4.375%, 4/1/31(1) | 50,000 | 40,848 | ||||||
Taseko Mines Ltd., 7.00%, 2/15/26(1)(2) | 50,000 | 41,324 | ||||||
| 688,960 | ||||||||
| Mortgage Real Estate Investment Trusts (REITs) — 0.2% | ||||||||
Blackstone Mortgage Trust, Inc., 3.75%, 1/15/27(1) | 50,000 | 43,579 | ||||||
| Multiline Retail — 0.2% | ||||||||
Macy's Retail Holdings LLC, 5.875%, 4/1/29(1)(2) | 50,000 | 43,331 | ||||||
| Oil, Gas and Consumable Fuels — 16.3% | ||||||||
Aethon United BR LP / Aethon United Finance Corp., 8.25%, 2/15/26(1) | 50,000 | 50,065 | ||||||
Antero Midstream Partners LP / Antero Midstream Finance Corp., 7.875%, 5/15/26(1) | 50,000 | 50,963 | ||||||
Antero Midstream Partners LP / Antero Midstream Finance Corp., 5.375%, 6/15/29(1) | 50,000 | 45,905 | ||||||
Apache Corp., 4.25%, 1/15/30(2) | 50,000 | 45,234 | ||||||
| Apache Corp., 5.10%, 9/1/40 | 75,000 | 63,836 | ||||||
Ascent Resources Utica Holdings LLC / ARU Finance Corp., 7.00%, 11/1/26(1) | 75,000 | 73,044 | ||||||
Ascent Resources Utica Holdings LLC / ARU Finance Corp., 5.875%, 6/30/29(1) | 50,000 | 45,105 | ||||||
| Cheniere Energy Partners LP, 4.00%, 3/1/31 | 175,000 | 153,574 | ||||||
| Cheniere Energy, Inc., 4.625%, 10/15/28 | 50,000 | 48,250 | ||||||
Citgo Holding, Inc., 9.25%, 8/1/24(1)(2) | 50,000 | 49,890 | ||||||
CITGO Petroleum Corp., 7.00%, 6/15/25(1) | 50,000 | 48,687 | ||||||
CITGO Petroleum Corp., 6.375%, 6/15/26(1) | 50,000 | 47,660 | ||||||
CNX Resources Corp., 7.25%, 3/14/27(1) | 75,000 | 74,587 | ||||||
Comstock Resources, Inc., 6.75%, 3/1/29(1) | 50,000 | 47,812 | ||||||
Comstock Resources, Inc., 5.875%, 1/15/30(1) | 50,000 | 45,808 | ||||||
| Crestwood Midstream Partners LP / Crestwood Midstream Finance Corp., 5.75%, 4/1/25 | 50,000 | 48,259 | ||||||
Crestwood Midstream Partners LP / Crestwood Midstream Finance Corp., 6.00%, 2/1/29(1) | 50,000 | 46,270 | ||||||
CrownRock LP / CrownRock Finance, Inc., 5.625%, 10/15/25(1) | 125,000 | 123,306 | ||||||
| DCP Midstream Operating LP, 5.375%, 7/15/25 | 125,000 | 125,476 | ||||||
| DCP Midstream Operating LP, 5.125%, 5/15/29 | 75,000 | 73,196 | ||||||
| DCP Midstream Operating LP, 3.25%, 2/15/32 | 50,000 | 42,091 | ||||||
Delek Logistics Partners LP / Delek Logistics Finance Corp., 7.125%, 6/1/28(1) | 50,000 | 46,781 | ||||||
EnLink Midstream LLC, 6.50%, 9/1/30(1)(2) | 50,000 | 49,804 | ||||||
| EnLink Midstream Partners LP, 4.85%, 7/15/26 | 75,000 | 73,887 | ||||||
75
| Select High Yield ETF | ||||||||
| Principal Amount | Value | |||||||
EnLink Midstream Partners LP, 5.60%, 4/1/44(2) | $ | 75,000 | $ | 59,027 | ||||
| EnLink Midstream Partners LP, 5.45%, 6/1/47 | 75,000 | 57,380 | ||||||
EQM Midstream Partners LP, 6.00%, 7/1/25(1) | 50,000 | 48,294 | ||||||
EQM Midstream Partners LP, 6.50%, 7/1/27(1)(2) | 50,000 | 48,353 | ||||||
EQM Midstream Partners LP, 4.50%, 1/15/29(1) | 50,000 | 43,134 | ||||||
EQM Midstream Partners LP, 4.75%, 1/15/31(1) | 50,000 | 43,333 | ||||||
| EQT Corp., 3.90%, 10/1/27 | 75,000 | 71,095 | ||||||
| EQT Corp., 7.00%, 2/1/30 | 50,000 | 53,571 | ||||||
Genesis Energy LP / Genesis Energy Finance Corp., 8.00%, 1/15/27(2) | 125,000 | 118,671 | ||||||
| Genesis Energy LP / Genesis Energy Finance Corp., 7.75%, 2/1/28 | 50,000 | 46,426 | ||||||
Harvest Midstream I LP, 7.50%, 9/1/28(1) | 75,000 | 71,071 | ||||||
Hess Midstream Operations LP, 5.625%, 2/15/26(1) | 75,000 | 73,268 | ||||||
Hess Midstream Operations LP, 5.125%, 6/15/28(1) | 50,000 | 46,514 | ||||||
Hilcorp Energy I LP / Hilcorp Finance Co., 6.00%, 2/1/31(1)(2) | 50,000 | 45,394 | ||||||
Holly Energy Partners LP / Holly Energy Finance Corp., 5.00%, 2/1/28(1) | 50,000 | 46,627 | ||||||
ITT Holdings LLC, 6.50%, 8/1/29(1) | 50,000 | 42,305 | ||||||
Laredo Petroleum, Inc., 9.50%, 1/15/25(2) | 75,000 | 75,359 | ||||||
| Matador Resources Co., 5.875%, 9/15/26 | 75,000 | 73,503 | ||||||
MEG Energy Corp., 7.125%, 2/1/27(1) | 50,000 | 50,587 | ||||||
MEG Energy Corp., 5.875%, 2/1/29(1) | 75,000 | 69,855 | ||||||
| Murphy Oil Corp., 5.75%, 8/15/25 | 48,000 | 47,626 | ||||||
| Murphy Oil Corp., 5.875%, 12/1/27 | 50,000 | 48,699 | ||||||
Murphy Oil Corp., 6.375%, 7/15/28(2) | 50,000 | 49,306 | ||||||
NGL Energy Operating LLC / NGL Energy Finance Corp., 7.50%, 2/1/26(1) | 75,000 | 68,727 | ||||||
Northern Oil and Gas, Inc., 8.125%, 3/1/28(1) | 50,000 | 48,087 | ||||||
NuStar Logistics LP, 6.375%, 10/1/30(2) | 50,000 | 45,572 | ||||||
| Occidental Petroleum Corp., 5.50%, 12/1/25 | 50,000 | 51,411 | ||||||
| Occidental Petroleum Corp., 3.40%, 4/15/26 | 50,000 | 48,073 | ||||||
| Occidental Petroleum Corp., 8.50%, 7/15/27 | 75,000 | 84,092 | ||||||
| Occidental Petroleum Corp., 6.375%, 9/1/28 | 50,000 | 52,288 | ||||||
| Occidental Petroleum Corp., 8.875%, 7/15/30 | 75,000 | 87,720 | ||||||
| Occidental Petroleum Corp., 6.625%, 9/1/30 | 50,000 | 53,485 | ||||||
Occidental Petroleum Corp., 6.125%, 1/1/31(2) | 50,000 | 52,034 | ||||||
| Occidental Petroleum Corp., 7.50%, 5/1/31 | 50,000 | 56,384 | ||||||
| Occidental Petroleum Corp., 4.40%, 4/15/46 | 50,000 | 43,451 | ||||||
| Occidental Petroleum Corp., 4.10%, 2/15/47 | 75,000 | 62,562 | ||||||
Parkland Corp., 5.875%, 7/15/27(1)(2) | 50,000 | 48,370 | ||||||
Parkland Corp., 4.625%, 5/1/30(1) | 50,000 | 43,007 | ||||||
| PBF Holding Co. LLC / PBF Finance Corp., 6.00%, 2/15/28 | 50,000 | 44,969 | ||||||
PBF Logistics LP / PBF Logistics Finance Corp., 6.875%, 5/15/23(2) | 75,000 | 75,086 | ||||||
Penn Virginia Holdings LLC, 9.25%, 8/15/26(1) | 50,000 | 49,152 | ||||||
| Range Resources Corp., 8.25%, 1/15/29 | 50,000 | 52,547 | ||||||
Rockcliff Energy II LLC, 5.50%, 10/15/29(1) | 50,000 | 46,265 | ||||||
SM Energy Co., 6.75%, 9/15/26(2) | 75,000 | 73,862 | ||||||
| Southwestern Energy Co., 5.375%, 2/1/29 | 50,000 | 47,351 | ||||||
| Southwestern Energy Co., 5.375%, 3/15/30 | 50,000 | 46,933 | ||||||
| Sunoco LP / Sunoco Finance Corp., 6.00%, 4/15/27 | 50,000 | 48,429 | ||||||
| Sunoco LP / Sunoco Finance Corp., 4.50%, 4/30/30 | 50,000 | 42,731 | ||||||
76
| Select High Yield ETF | ||||||||
| Principal Amount | Value | |||||||
Tallgrass Energy Partners LP / Tallgrass Energy Finance Corp., 6.00%, 12/31/30(1) | $ | 50,000 | $ | 43,851 | ||||
Tallgrass Energy Partners LP / Tallgrass Energy Finance Corp., 6.00%, 9/1/31(1)(2) | 50,000 | 43,817 | ||||||
| Talos Production, Inc., 12.00%, 1/15/26 | 50,000 | 53,045 | ||||||
Tap Rock Resources LLC, 7.00%, 10/1/26(1) | 50,000 | 46,890 | ||||||
| Targa Resources Partners LP / Targa Resources Partners Finance Corp., 6.50%, 7/15/27 | 50,000 | 51,503 | ||||||
| Targa Resources Partners LP / Targa Resources Partners Finance Corp., 5.00%, 1/15/28 | 125,000 | 122,042 | ||||||
| Targa Resources Partners LP / Targa Resources Partners Finance Corp., 4.875%, 2/1/31 | 50,000 | 46,420 | ||||||
Teine Energy Ltd., 6.875%, 4/15/29(1) | 50,000 | 45,730 | ||||||
Venture Global Calcasieu Pass LLC, 3.875%, 8/15/29(1) | 100,000 | 87,390 | ||||||
Viper Energy Partners LP, 5.375%, 11/1/27(1) | 75,000 | 71,924 | ||||||
| Western Midstream Operating LP, 3.35%, 2/1/25 | 75,000 | 70,902 | ||||||
| Western Midstream Operating LP, 5.50%, 2/1/50 | 75,000 | 65,040 | ||||||
| 4,970,030 | ||||||||
| Personal Products — 0.3% | ||||||||
Edgewell Personal Care Co., 5.50%, 6/1/28(1) | 50,000 | 46,234 | ||||||
Edgewell Personal Care Co., 4.125%, 4/1/29(1) | 50,000 | 43,042 | ||||||
| 89,276 | ||||||||
| Pharmaceuticals — 0.9% | ||||||||
Organon & Co. / Organon Foreign Debt Co-Issuer BV, 5.125%, 4/30/31(1) | 200,000 | 175,252�� | ||||||
P&L Development LLC / PLD Finance Corp., 7.75%, 11/15/25(1) | 50,000 | 35,677 | ||||||
Par Pharmaceutical, Inc., 7.50%, 4/1/27(1)(4) | 75,000 | 63,842 | ||||||
| 274,771 | ||||||||
| Professional Services — 0.2% | ||||||||
ASGN, Inc., 4.625%, 5/15/28(1) | 75,000 | 66,381 | ||||||
| Real Estate Management and Development — 0.9% | ||||||||
Cushman & Wakefield US Borrower LLC, 6.75%, 5/15/28(1) | 75,000 | 74,460 | ||||||
Forestar Group, Inc., 3.85%, 5/15/26(1) | 50,000 | 42,557 | ||||||
Howard Hughes Corp., 5.375%, 8/1/28(1) | 50,000 | 44,573 | ||||||
Realogy Group LLC / Realogy Co.-Issuer Corp., 5.75%, 1/15/29(1) | 50,000 | 39,250 | ||||||
Realogy Group LLC / Realogy Co.-Issuer Corp., 5.25%, 4/15/30(1) | 75,000 | 56,511 | ||||||
| 257,351 | ||||||||
| Road and Rail — 1.6% | ||||||||
Avis Budget Car Rental LLC / Avis Budget Finance, Inc., 5.75%, 7/15/27(1)(2) | 75,000 | 71,167 | ||||||
Avis Budget Car Rental LLC / Avis Budget Finance, Inc., 4.75%, 4/1/28(1) | 50,000 | 43,729 | ||||||
Avis Budget Car Rental LLC / Avis Budget Finance, Inc., 5.375%, 3/1/29(1) | 50,000 | 43,656 | ||||||
Hertz Corp., 5.00%, 12/1/29(1) | 50,000 | 40,309 | ||||||
NESCO Holdings II, Inc., 5.50%, 4/15/29(1) | 50,000 | 44,088 | ||||||
Uber Technologies, Inc., 4.50%, 8/15/29(1) | 100,000 | 87,000 | ||||||
| United Rentals North America, Inc., 4.875%, 1/15/28 | 50,000 | 46,797 | ||||||
| United Rentals North America, Inc., 3.875%, 2/15/31 | 75,000 | 64,956 | ||||||
XPO Logistics, Inc., 6.25%, 5/1/25(1)(2) | 34,000 | 34,438 | ||||||
| 476,140 | ||||||||
77
| Select High Yield ETF | ||||||||
| Principal Amount | Value | |||||||
| Semiconductors and Semiconductor Equipment — 0.3% | ||||||||
ON Semiconductor Corp., 3.875%, 9/1/28(1) | $ | 50,000 | $ | 44,685 | ||||
Synaptics, Inc., 4.00%, 6/15/29(1)(2) | 50,000 | 43,174 | ||||||
| 87,859 | ||||||||
| Software — 2.4% | ||||||||
Camelot Finance SA, 4.50%, 11/1/26(1) | 50,000 | 46,574 | ||||||
Castle US Holding Corp., 9.50%, 2/15/28(1) | 75,000 | 59,017 | ||||||
Consensus Cloud Solutions, Inc., 6.00%, 10/15/26(1) | 50,000 | 45,597 | ||||||
Consensus Cloud Solutions, Inc., 6.50%, 10/15/28(1) | 50,000 | 44,785 | ||||||
GoTo Group, Inc., 5.50%, 9/1/27(1) | 50,000 | 36,858 | ||||||
NCR Corp., 5.75%, 9/1/27(1) | 50,000 | 48,162 | ||||||
NCR Corp., 5.125%, 4/15/29(1) | 75,000 | 70,140 | ||||||
NCR Corp., 6.125%, 9/1/29(1)(2) | 50,000 | 47,742 | ||||||
NCR Corp., 5.25%, 10/1/30(1) | 75,000 | 69,376 | ||||||
Open Text Corp., 3.875%, 12/1/29(1) | 75,000 | 60,576 | ||||||
Open Text Holdings, Inc., 4.125%, 2/15/30(1) | 50,000 | 40,319 | ||||||
Open Text Holdings, Inc., 4.125%, 12/1/31(1) | 50,000 | 39,583 | ||||||
SS&C Technologies, Inc., 5.50%, 9/30/27(1) | 75,000 | 71,158 | ||||||
Veritas US, Inc. / Veritas Bermuda Ltd., 7.50%, 9/1/25(1)(2) | 50,000 | 38,588 | ||||||
| 718,475 | ||||||||
| Specialty Retail — 2.2% | ||||||||
Asbury Automotive Group, Inc., 4.625%, 11/15/29(1) | 50,000 | 42,936 | ||||||
Asbury Automotive Group, Inc., 5.00%, 2/15/32(1) | 50,000 | 41,841 | ||||||
Bath & Body Works, Inc., 6.625%, 10/1/30(1) | 50,000 | 45,485 | ||||||
| Bath & Body Works, Inc., 6.75%, 7/1/36 | 75,000 | 64,837 | ||||||
Ferrellgas LP / Ferrellgas Finance Corp., 5.375%, 4/1/26(1) | 50,000 | 43,575 | ||||||
Ferrellgas LP / Ferrellgas Finance Corp., 5.875%, 4/1/29(1) | 75,000 | 61,237 | ||||||
Gap, Inc., 3.875%, 10/1/31(1) | 50,000 | 34,750 | ||||||
Lithia Motors, Inc., 3.875%, 6/1/29(1) | 50,000 | 42,288 | ||||||
LSF9 Atlantis Holdings LLC / Victra Finance Corp., 7.75%, 2/15/26(1) | 75,000 | 69,495 | ||||||
Sonic Automotive, Inc., 4.875%, 11/15/31(1)(2) | 50,000 | 41,760 | ||||||
Staples, Inc., 7.50%, 4/15/26(1) | 125,000 | 105,785 | ||||||
Staples, Inc., 10.75%, 4/15/27(1)(2) | 50,000 | 36,825 | ||||||
Superior Plus LP / Superior General Partner, Inc., 4.50%, 3/15/29(1) | 50,000 | 44,161 | ||||||
| 674,975 | ||||||||
| Technology Hardware, Storage and Peripherals — 0.4% | ||||||||
| Seagate HDD Cayman, 3.375%, 7/15/31 | 50,000 | 39,169 | ||||||
Xerox Holdings Corp., 5.00%, 8/15/25(1) | 50,000 | 46,443 | ||||||
Xerox Holdings Corp., 5.50%, 8/15/28(1) | 50,000 | 43,808 | ||||||
| 129,420 | ||||||||
| Thrifts and Mortgage Finance — 1.3% | ||||||||
Freedom Mortgage Corp., 8.125%, 11/15/24(1) | 25,000 | 22,228 | ||||||
Freedom Mortgage Corp., 7.625%, 5/1/26(1) | 75,000 | 61,472 | ||||||
Freedom Mortgage Corp., 6.625%, 1/15/27(1) | 50,000 | 37,760 | ||||||
| MGIC Investment Corp., 5.25%, 8/15/28 | 75,000 | 70,063 | ||||||
Nationstar Mortgage Holdings, Inc., 5.50%, 8/15/28(1) | 50,000 | 41,887 | ||||||
NMI Holdings, Inc., 7.375%, 6/1/25(1) | 50,000 | 50,584 | ||||||
PennyMac Financial Services, Inc., 4.25%, 2/15/29(1) | 50,000 | 39,170 | ||||||
| Radian Group, Inc., 4.875%, 3/15/27 | 50,000 | 46,645 | ||||||
78
| Select High Yield ETF | ||||||||
| Principal Amount/Shares | Value | |||||||
United Wholesale Mortgage LLC, 5.50%, 4/15/29(1)(2) | $ | 50,000 | $ | 38,984 | ||||
| 408,793 | ||||||||
| Trading Companies and Distributors — 0.5% | ||||||||
Beacon Roofing Supply, Inc., 4.125%, 5/15/29(1)(2) | 50,000 | 41,941 | ||||||
Fly Leasing Ltd., 7.00%, 10/15/24(1) | 75,000 | 41,358 | ||||||
Fortress Transportation and Infrastructure Investors LLC, 6.50%, 10/1/25(1) | 38,000 | 35,467 | ||||||
Fortress Transportation and Infrastructure Investors LLC, 5.50%, 5/1/28(1) | 50,000 | 42,625 | ||||||
| 161,391 | ||||||||
| Wireless Telecommunication Services — 2.1% | ||||||||
| Sprint Corp., 7.875%, 9/15/23 | 75,000 | 77,370 | ||||||
| Sprint Corp., 7.125%, 6/15/24 | 125,000 | 129,216 | ||||||
| T-Mobile USA, Inc., 2.25%, 2/15/26 | 50,000 | 46,013 | ||||||
| T-Mobile USA, Inc., 3.375%, 4/15/29 | 100,000 | 90,212 | ||||||
| T-Mobile USA, Inc., 3.50%, 4/15/31 | 50,000 | 44,348 | ||||||
Vmed O2 UK Financing I PLC, 4.25%, 1/31/31(1)(2) | 200,000 | 162,000 | ||||||
| Vodafone Group PLC, VRN, 7.00%, 4/4/79 | 75,000 | 77,582 | ||||||
| 626,741 | ||||||||
TOTAL CORPORATE BONDS (Cost $32,964,687) | 28,902,651 | |||||||
| PREFERRED STOCKS — 0.6% | ||||||||
| Banks — 0.6% | ||||||||
| Bank of America Corp., 6.25% | 75,000 | 74,312 | ||||||
| Citigroup, Inc., 4.70% | 75,000 | 63,797 | ||||||
JPMorgan Chase & Co., 6.125%(2) | 50,000 | 49,222 | ||||||
TOTAL PREFERRED STOCKS (Cost $210,185) | 187,331 | |||||||
| SHORT-TERM INVESTMENTS — 9.9% | ||||||||
| Money Market Funds — 9.9% | ||||||||
| State Street Institutional U.S. Government Money Market Fund, Premier Class | 820,865 | 820,865 | ||||||
State Street Navigator Securities Lending Government Money Market Portfolio(5) | 2,186,515 | 2,186,515 | ||||||
TOTAL SHORT-TERM INVESTMENTS (Cost $3,007,380) | 3,007,380 | |||||||
TOTAL INVESTMENT SECURITIES — 105.3% (Cost $36,182,252) | 32,097,362 | |||||||
| OTHER ASSETS AND LIABILITIES — (5.3)% | (1,616,554) | |||||||
| TOTAL NET ASSETS — 100.0% | $ | 30,480,808 | ||||||
79
Select High Yield ETF
| NOTES TO SCHEDULE OF INVESTMENTS | ||||||||
| PIK | - | Payment in Kind. Security may pay a cash rate and/or an in kind rate. | ||||||
| VRN | - | Variable Rate Note. The rate adjusts periodically based upon the terms set forth in the security’s offering documents. The rate shown is effective at the period end and the reference rate and spread, if any, is indicated. The security's effective maturity date may be shorter than the final maturity date shown. | ||||||
(1)Security was purchased pursuant to Rule 144A or Section 4(2) under the Securities Act of 1933 and may be sold in transactions exempt from registration, normally to qualified institutional investors. The aggregate value of these securities at the period end was $19,796,550, which represented 64.9% of total net assets.
(2)Security, or a portion thereof, is on loan. At the period end, the aggregate value of securities on loan was $2,120,899. The amount of securities on loan indicated may not correspond with the securities on loan identified because securities with pending sales are in the process of recall from the brokers.
(3)The security's rate was paid in cash at the last payment date.
(4)Security is in default.
(5)Investment of cash collateral from securities on loan. At the period end, the aggregate value of the collateral held by the fund was $2,199,995, which includes securities collateral of $13,480.
See Notes to Financial Statements.
80
| Statements of Assets and Liabilities | ||
| AUGUST 31, 2022 | ||||||||
| Diversified Corporate Bond ETF | Diversified Municipal Bond ETF | |||||||
| Assets | ||||||||
| Investment securities, at value (cost of $152,358,472 and $290,252,114, respectively) — including $2,774,845 and $—, respectively of securities on loan | $ | 143,724,636 | $ | 276,002,710 | ||||
| Investment made with cash collateral received for securities on loan, at value (cost of $2,858,788 and $—, respectively) | 2,858,788 | — | ||||||
| Total investment securities, at value (cost of $155,217,260 and $290,252,114, respectively) | 146,583,424 | 276,002,710 | ||||||
| Deposits with broker for futures contracts | 112,780 | — | ||||||
| Deposits with broker for swap agreements | 173,301 | — | ||||||
| Receivable for investments sold | — | 349,161 | ||||||
| Receivable for capital shares sold | — | 2,490,550 | ||||||
| Receivable for variation margin on swap agreements | 4,378 | — | ||||||
| Interest receivable | 1,238,334 | 2,864,957 | ||||||
| Securities lending receivable | 1,898 | — | ||||||
| 148,114,115 | 281,707,378 | |||||||
| Liabilities | ||||||||
| Payable for collateral received for securities on loan | 2,858,788 | — | ||||||
| Payable for investments purchased | 1,529,867 | 5,195,383 | ||||||
| Payable for variation margin on futures contracts | 4,855 | — | ||||||
| Accrued management fees | 35,856 | 65,731 | ||||||
| 4,429,366 | 5,261,114 | |||||||
| Net Assets | $ | 143,684,749 | $ | 276,446,264 | ||||
| Shares outstanding (unlimited number of shares authorized) | 3,100,000 | 5,550,000 | ||||||
| Net Asset Value Per Share | $ | 46.35 | $ | 49.81 | ||||
| Net Assets Consist of: | ||||||||
| Capital paid in | $ | 161,607,250 | $ | 296,026,544 | ||||
| Distributable earnings | (17,922,501) | (19,580,280) | ||||||
| $ | 143,684,749 | $ | 276,446,264 | |||||
See Notes to Financial Statements.
81
| AUGUST 31, 2022 | ||||||||
| Emerging Markets Bond ETF | Multisector Income ETF | |||||||
| Assets | ||||||||
| Investment securities, at value (cost of $30,092,285 and $124,953,865, respectively) — including $248,687 and $3,579,726, respectively of securities on loan | $ | 26,246,545 | $ | 115,841,088 | ||||
| Investment made with cash collateral received for securities on loan, at value (cost of $256,775 and $3,709,125, respectively) | 256,775 | 3,709,125 | ||||||
| Total investment securities, at value (cost of $30,349,060 and $128,662,990, respectively) | 26,503,320 | 119,550,213 | ||||||
| Cash | — | 1,837 | ||||||
| Receivable for variation margin on futures contracts | — | 2,768 | ||||||
| Receivable for variation margin on swap agreements | — | 7,545 | ||||||
| Swap agreements, at value (including net premiums paid (received) of $52,082 and $—, respectively) | 70,398 | — | ||||||
| Interest and dividends receivable | 421,838 | 877,605 | ||||||
| Securities lending receivable | 163 | 2,431 | ||||||
| 26,995,719 | 120,442,399 | |||||||
| Liabilities | ||||||||
| Payable for collateral received for securities on loan | 256,775 | 3,709,125 | ||||||
| Payable for investments purchased | 17,593 | 2,335,833 | ||||||
| Payable for variation margin on futures contracts | 11,578 | — | ||||||
| Swap agreements, at value (including net premiums paid (received) of $(5,697) and $—, respectively) | 7,281 | — | ||||||
| Accrued management fees | 9,019 | 34,752 | ||||||
| 302,246 | 6,079,710 | |||||||
| Net Assets | $ | 26,693,473 | $ | 114,362,689 | ||||
| Shares outstanding (unlimited number of shares authorized) | 700,000 | 2,600,000 | ||||||
| Net Asset Value Per Share | $ | 38.13 | $ | 43.99 | ||||
| Net Assets Consist of: | ||||||||
| Capital paid in | $ | 33,698,320 | $ | 129,538,684 | ||||
| Distributable earnings | (7,004,847) | (15,175,995) | ||||||
| $ | 26,693,473 | $ | 114,362,689 | |||||
See Notes to Financial Statements.
82
| AUGUST 31, 2022 | |||||
| Select High Yield ETF | |||||
| Assets | |||||
| Investment securities, at value (cost of $33,995,737) — including $2,120,899 of securities on loan | $ | 29,910,847 | |||
| Investment made with cash collateral received for securities on loan, at value (cost of $2,186,515) | 2,186,515 | ||||
| Total investment securities, at value (cost of $36,182,252) | 32,097,362 | ||||
| Receivable for investments sold | 102,733 | ||||
| Interest receivable | 477,921 | ||||
| Securities lending receivable | 1,299 | ||||
| 32,679,315 | |||||
| Liabilities | |||||
| Payable for collateral received for securities on loan | 2,186,515 | ||||
| Accrued management fees | 11,992 | ||||
| 2,198,507 | |||||
| Net Assets | $ | 30,480,808 | |||
| Shares outstanding (unlimited number of shares authorized) | 700,000 | ||||
| Net Asset Value Per Share | $ | 43.54 | |||
| Net Assets Consist of: | |||||
| Capital paid in | $ | 34,890,552 | |||
| Distributable earnings | (4,409,744) | ||||
| $ | 30,480,808 | ||||
See Notes to Financial Statements.
83
| Statements of Operations | ||
| YEAR ENDED AUGUST 31, 2022 | ||||||||
| Diversified Corporate Bond ETF | Diversified Municipal Bond ETF | |||||||
| Investment Income (Loss) | ||||||||
| Income: | ||||||||
| Interest (net of foreign taxes withheld of $455 and $—, respectively) | $ | 3,682,748 | $ | 4,267,122 | ||||
| Securities lending, net | 12,193 | — | ||||||
| 3,694,941 | 4,267,122 | |||||||
| Expenses: | ||||||||
| Management fees | 433,785 | 622,038 | ||||||
| Other expenses | 1,584 | — | ||||||
| 435,369 | 622,038 | |||||||
| Net investment income (loss) | 3,259,572 | 3,645,084 | ||||||
| Realized and Unrealized Gain (Loss) | ||||||||
| Net realized gain (loss) on: | ||||||||
| Investment transactions | (9,580,880) | (5,640,496) | ||||||
| Futures contract transactions | 190,060 | — | ||||||
| Swap agreement transactions | 5,378 | — | ||||||
| (9,385,442) | (5,640,496) | |||||||
| Change in net unrealized appreciation (depreciation) on: | ||||||||
| Investments | (10,073,336) | (18,763,216) | ||||||
| Futures contracts | 14,387 | — | ||||||
| Swap agreements | (8,801) | — | ||||||
| (10,067,750) | (18,763,216) | |||||||
| Net realized and unrealized gain (loss) | (19,453,192) | (24,403,712) | ||||||
| Net Increase (Decrease) in Net Assets Resulting from Operations | $ | (16,193,620) | $ | (20,758,628) | ||||
See Notes to Financial Statements.
84
| YEAR ENDED AUGUST 31, 2022 | ||||||||
| Emerging Markets Bond ETF | Multisector Income ETF | |||||||
| Investment Income (Loss) | ||||||||
| Income: | ||||||||
| Interest (net of foreign taxes withheld of $127 and $—, respectively) | $ | 1,362,648 | $ | 4,335,462 | ||||
| Dividends | — | 25,863 | ||||||
| Securities lending, net | 1,295 | 12,319 | ||||||
| 1,363,943 | 4,373,644 | |||||||
| Expenses: | ||||||||
| Management fees | 101,199 | 392,557 | ||||||
| Other expenses | 98 | 611 | ||||||
| 101,297 | 393,168 | |||||||
| Net investment income (loss) | 1,262,646 | 3,980,476 | ||||||
| Realized and Unrealized Gain (Loss) | ||||||||
| Net realized gain (loss) on: | ||||||||
| Investment transactions | (3,576,515) | (7,443,578) | ||||||
| Futures contract transactions | (215,641) | 527,939 | ||||||
| Swap agreement transactions | 471,342 | 217,551 | ||||||
| Foreign currency translation transactions | — | (313) | ||||||
| (3,320,814) | (6,698,401) | |||||||
| Change in net unrealized appreciation (depreciation) on: | ||||||||
| Investments | (3,903,331) | (9,236,797) | ||||||
| Futures contracts | 47 | (34,076) | ||||||
| Swap agreements | 16,732 | 104,632 | ||||||
| Translation of assets and liabilities in foreign currencies | — | (8) | ||||||
| (3,886,552) | (9,166,249) | |||||||
| Net realized and unrealized gain (loss) | (7,207,366) | (15,864,650) | ||||||
| Net Increase (Decrease) in Net Assets Resulting from Operations | $ | (5,944,720) | $ | (11,884,174) | ||||
See Notes to Financial Statements.
85
| PERIOD ENDED AUGUST 31, 2022 | |||||
Select High Yield ETF(1) | |||||
| Investment Income (Loss) | |||||
| Income: | |||||
| Interest | $ | 1,186,595 | |||
| Securities lending, net | 5,229 | ||||
| 1,191,824 | |||||
| Expenses: | |||||
| Management fees | 112,486 | ||||
| Net investment income (loss) | 1,079,338 | ||||
| Realized and Unrealized Gain (Loss) | |||||
| Net realized gain (loss) on investment transactions | (882,135) | ||||
| Change in net unrealized appreciation (depreciation) on investments | (4,084,890) | ||||
| Net realized and unrealized gain (loss) | (4,967,025) | ||||
| Net Increase (Decrease) in Net Assets Resulting from Operations | $ | (3,887,687) | |||
(1)November 16, 2021 (fund inception) through August 31, 2022.
See Notes to Financial Statements.
86
| Statements of Changes in Net Assets | ||
| YEARS ENDED AUGUST 31, 2022 AND AUGUST 31, 2021 | ||||||||||||||
| Diversified Corporate Bond ETF | Diversified Municipal Bond ETF | |||||||||||||
| Increase (Decrease) in Net Assets | August 31, 2022 | August 31, 2021 | August 31, 2022 | August 31, 2021 | ||||||||||
| Operations | ||||||||||||||
| Net investment income (loss) | $ | 3,259,572 | $ | 2,479,982 | $ | 3,645,084 | $ | 1,833,319 | ||||||
| Net realized gain (loss) | (9,385,442) | 4,742,299 | (5,640,496) | 917,946 | ||||||||||
| Change in net unrealized appreciation (depreciation) | (10,067,750) | (3,021,377) | (18,763,216) | 2,060,753 | ||||||||||
| Net increase (decrease) in net assets resulting from operations | (16,193,620) | 4,200,904 | (20,758,628) | 4,812,018 | ||||||||||
| Distributions to Shareholders | ||||||||||||||
| From earnings | (2,951,390) | (4,110,980) | (3,278,595) | (1,763,405) | ||||||||||
| Capital Share Transactions | ||||||||||||||
| Proceeds from shares sold | 35,965,410 | 128,687,765 | 139,499,410 | 101,658,311 | ||||||||||
| Payments for shares redeemed | (25,964,990) | (97,214,495) | (2,770,640) | (8,220,745) | ||||||||||
| Other capital | 886 | 5,379 | 91,811 | 159,216 | ||||||||||
| Net increase (decrease) in net assets from capital share transactions | 10,001,306 | 31,478,649 | 136,820,581 | 93,596,782 | ||||||||||
| Net increase (decrease) in net assets | (9,143,704) | 31,568,573 | 112,783,358 | 96,645,395 | ||||||||||
| Net Assets | ||||||||||||||
| Beginning of period | 152,828,453 | 121,259,880 | 163,662,906 | 67,017,511 | ||||||||||
| End of period | $ | 143,684,749 | $ | 152,828,453 | $ | 276,446,264 | $ | 163,662,906 | ||||||
| Transactions in Shares of the Funds | ||||||||||||||
| Sold | 700,000 | 2,450,000 | 2,650,000 | 1,850,000 | ||||||||||
| Redeemed | (500,000) | (1,850,000) | (50,000) | (150,000) | ||||||||||
| Net increase (decrease) in shares of the funds | 200,000 | 600,000 | 2,600,000 | 1,700,000 | ||||||||||
See Notes to Financial Statements.
87
| YEAR ENDED AUGUST 31, 2022 AND PERIOD ENDED AUGUST 31, 2021 | ||||||||||||||
| Emerging Markets Bond ETF | Multisector Income ETF | |||||||||||||
| Increase (Decrease) in Net Assets | August 31, 2022 | August 31, 2021(1) | August 31, 2022 | August 31, 2021(1) | ||||||||||
| Operations | ||||||||||||||
| Net investment income (loss) | $ | 1,262,646 | $ | 150,980 | $ | 3,980,476 | $ | 259,604 | ||||||
| Net realized gain (loss) | (3,320,814) | (3,632) | (6,698,401) | (111,081) | ||||||||||
| Change in net unrealized appreciation (depreciation) | (3,886,552) | 56,075 | (9,166,249) | 135,255 | ||||||||||
| Net increase (decrease) in net assets resulting from operations | (5,944,720) | 203,423 | (11,884,174) | 283,778 | ||||||||||
| Distributions to Shareholders | ||||||||||||||
| From earnings | (1,194,630) | (68,920) | (3,577,090) | (52,680) | ||||||||||
| Capital Share Transactions | ||||||||||||||
| Proceeds from shares sold | 11,194,156 | 22,501,450 | 49,086,845 | 82,595,250 | ||||||||||
| Payments for shares redeemed | — | — | (2,224,880) | — | ||||||||||
| Other capital | 2,269 | 445 | 58,230 | 77,410 | ||||||||||
| Net increase (decrease) in net assets from capital share transactions | 11,196,425 | 22,501,895 | 46,920,195 | 82,672,660 | ||||||||||
| Net increase (decrease) in net assets | 4,057,075 | 22,636,398 | 31,458,931 | 82,903,758 | ||||||||||
| Net Assets | ||||||||||||||
| Beginning of period | 22,636,398 | — | 82,903,758 | — | ||||||||||
| End of period | $ | 26,693,473 | $ | 22,636,398 | $ | 114,362,689 | $ | 82,903,758 | ||||||
| Transactions in Shares of the Funds | ||||||||||||||
| Sold | 250,000 | 450,000 | 1,000,000 | 1,650,000 | ||||||||||
| Redeemed | — | — | (50,000) | — | ||||||||||
| Net increase (decrease) in shares of the funds | 250,000 | 450,000 | 950,000 | 1,650,000 | ||||||||||
(1)June 29, 2021 (fund inception) through August 31, 2021.
See Notes to Financial Statements.
88
| PERIOD ENDED AUGUST 31, 2022 | |||||
Select High Yield ETF(1) | |||||
| Increase (Decrease) in Net Assets | |||||
| Operations | |||||
| Net investment income (loss) | $ | 1,079,338 | |||
| Net realized gain (loss) | (882,135) | ||||
| Change in net unrealized appreciation (depreciation) | (4,084,890) | ||||
| Net increase (decrease) in net assets resulting from operations | (3,887,687) | ||||
| Distributions to Shareholders | |||||
| From earnings | (1,026,610) | ||||
| Capital Share Transactions | |||||
| Proceeds from shares sold | 44,736,315 | ||||
| Payments for shares redeemed | (9,346,900) | ||||
| Other capital | 5,690 | ||||
| Net increase (decrease) in net assets from capital share transactions | 35,395,105 | ||||
| Net increase (decrease) in net assets | 30,480,808 | ||||
| Net Assets | |||||
| End of period | $ | 30,480,808 | |||
| Transactions in Shares of the Funds | |||||
| Sold | 900,000 | ||||
| Redeemed | (200,000) | ||||
| Net increase (decrease) in shares of the funds | 700,000 | ||||
(1)November 16, 2021 (fund inception) through August 31, 2022.
See Notes to Financial Statements.
89
| Notes to Financial Statements | ||
AUGUST 31, 2022
1. Organization
American Century ETF Trust (the trust) was registered as a Delaware statutory trust in 2017 and is registered under the Investment Company Act of 1940, as amended (the 1940 Act), as an open-end management investment company. American Century Diversified Corporate Bond ETF (Diversified Corporate Bond ETF), American Century Diversified Municipal Bond ETF (Diversified Municipal Bond ETF), American Century Emerging Markets Bond ETF (Emerging Markets Bond ETF), American Century Multisector Income ETF (Multisector Income ETF) and American Century Select High Yield ETF (Select High Yield ETF) (collectively, the funds) are five funds in a series issued by the trust. Diversified Corporate Bond ETF’s investment objective is to seek to provide current income. Diversified Municipal Bond ETF’s investment objective is to seek current income that is exempt from federal income tax. Emerging Markets Bond ETF's investment objective is to seek to provide current income and capital appreciation. Multisector Income ETF's investment objective is to seek to provide a high level of current income and total return. Select High Yield ETF's investment objective is to seek to provide high current income. Shares of each fund are listed for trading on the NYSE Arca, Inc. Emerging Markets Bond ETF and Multisector Income ETF incepted on June 29, 2021. Select High Yield ETF incepted on November 16, 2021.
2. Significant Accounting Policies
The following is a summary of significant accounting policies consistently followed by the funds in preparation of their financial statements. Each fund is an investment company and follows accounting and reporting guidance in accordance with accounting principles generally accepted in the United States of America. This may require management to make certain estimates and assumptions at the date of the financial statements. Actual results could differ from these estimates. Management evaluated the impact of events or transactions occurring through the date the financial statements were issued that would merit recognition or disclosure.
Investment Valuations — The funds determine the fair value of their investments and compute their net asset value (NAV) per share at the close of regular trading (usually 4 p.m. Eastern time) on the New York Stock Exchange (NYSE) on each day the NYSE is open. The Board of Trustees has adopted valuation policies and procedures to guide the investment advisor in the funds' investment valuation process and to provide methodologies for the oversight of the funds' pricing function.
Fixed income securities are valued at the evaluated mean as provided by independent pricing services or at the mean of the most recent bid and asked prices as provided by investment dealers. Corporate bonds, U.S. Treasury and Government Agency securities, convertible bonds, bank loan obligations, municipal securities, and sovereign governments and agencies are valued using market models that consider trade data, quotations from dealers and active market makers, relevant yield curve and spread data, creditworthiness, trade data or market information on comparable securities, and other relevant security specific information. Mortgage-related and asset-backed securities are valued based on models that consider trade data, prepayment and default projections, benchmark yield and spread data and estimated cash flows of each tranche of the issuer. Collateralized loan obligations are valued based on discounted cash flow models that consider trade and economic data, prepayment assumptions and default projections. Fixed income securities initially expressed in local currencies are translated into U.S. dollars at the mean of the appropriate currency exchange rate at the close of the NYSE as provided by an independent pricing service.
Equity securities that are listed or traded on a domestic securities exchange are valued at the last reported sales price or at the official closing price as provided by the exchange. Equity securities traded on foreign securities exchanges are generally valued at the closing price of such securities on the exchange where primarily traded or at the close of the NYSE, if that is earlier. If no last sales price is reported, or if local convention or regulation so provides, the mean of the latest bid and asked prices may be used. Securities traded over-the-counter are valued at the mean of the latest bid and asked prices, the last sales price, or the official closing price.
90
Hybrid securities are valued at the evaluated mean as provided by independent pricing services or at the mean of the most recent bid and asked prices as provided by investment dealers. Preferred stocks and convertible preferred stocks with perpetual maturities are valued using market models that consider trade data, quotations from dealers and active market makers, relevant yield curve and spread data, creditworthiness, trade data or market information on comparable securities, and other relevant security specific information.
Open-end management investment companies are valued at the reported NAV per share. Exchange-traded futures contracts are valued at the settlement price as provided by the appropriate exchange. Swap agreements are valued at an evaluated mean as provided by independent pricing services or independent brokers.
If the funds determine that the market price for an investment is not readily available or the valuation methods mentioned above do not reflect an investment’s fair value, such investment is valued as determined in good faith by the Board of Trustees or its delegate, in accordance with policies and procedures adopted by the Board of Trustees. In its determination of fair value, the funds may review several factors including, but not limited to, market information regarding the specific investment or comparable investments and correlation with other investment types, futures indices or general market indicators. Circumstances that may cause the funds to use these procedures to value an investment include, but are not limited to: an investment has been declared in default or is distressed; trading in a security has been suspended during the trading day or a security is not actively trading on its principal exchange; prices received from a regular pricing source are deemed unreliable; or there is a foreign market holiday and no trading occurred.
The funds monitor for significant events occurring after the close of an investment’s primary exchange but before each fund’s NAV per share is determined. Significant events may include, but are not limited to: corporate announcements and transactions; governmental action and political unrest that could impact a specific investment or an investment sector; or armed conflicts, natural disasters and similar events that could affect investments in a specific country or region. The funds also monitor for significant fluctuations between domestic and foreign markets, as evidenced by the U.S. market or such other indicators that the Board of Trustees, or its delegate, deems appropriate. The funds may apply a model-derived factor to the closing price of equity securities traded on foreign securities exchanges. The factor is based on observable market data as provided by an independent pricing service.
Security Transactions — Security transactions are accounted for as of the trade date. Net realized gains and losses are determined on the identified cost basis, which is also used for federal income tax purposes.
Investment Income — Interest income less foreign taxes withheld, if any, is recorded on the accrual basis and includes paydown gain (loss) and accretion of discounts and amortization of premiums. Inflation adjustments related to inflation-linked debt securities are reflected as interest income. Dividend income less foreign taxes withheld, if any, is recorded as of the ex-dividend date. Distributions received on securities that represent a return of capital or long-term capital gain are recorded as a reduction of cost of investments and/or as a realized gain. The fund may estimate the components of distributions received that may be considered nontaxable distributions or long-term capital gain distributions for income tax purposes. Securities lending income is net of fees and rebates earned by the lending agent for its services.
Income Tax Status — It is each fund’s policy to distribute substantially all net investment income and net realized gains to shareholders and to otherwise qualify as a regulated investment company under provisions of the Internal Revenue Code. Accordingly, no provision has been made for income taxes. The funds file U.S. federal, state, local and non-U.S. tax returns as applicable. The funds' tax returns are subject to examination by the relevant taxing authority until expiration of the applicable statute of limitations, which is generally three years from the date of filing but can be longer in certain jurisdictions. At this time, management believes there are no uncertain tax positions which, based on their technical merit, would not be sustained upon examination and for which it is reasonably possible that the total amounts of unrecognized tax benefits will significantly change in the next twelve months.
91
Foreign Currency Translations — All assets and liabilities initially expressed in foreign currencies are translated into U.S. dollars at prevailing exchange rates at period end. The funds may enter into spot foreign currency exchange contracts to facilitate transactions denominated in a foreign currency. Purchases and sales of investment securities, dividend and interest income, spot foreign currency exchange contracts, and expenses are translated at the rates of exchange prevailing on the respective dates of such transactions. Net realized and unrealized foreign currency exchange gains or losses related to investment securities are a component of net realized gain (loss) on investment transactions and change in net unrealized appreciation (depreciation) on investments, respectively.
Forward Commitments — The funds may engage in securities transactions on a forward commitment basis. In these transactions, the securities’ prices and yields are fixed on the date of the commitment. The funds may sell a to-be-announced (TBA) security and at the same time make a commitment to purchase the same security at a future date at a specified price. Conversely, the funds may purchase a TBA security and at the same time make a commitment to sell the same security at a future date at a specified price. These types of transactions are known as “TBA roll” transactions and are accounted for as purchases and sales. The funds will segregate cash, cash equivalents or other appropriate liquid securities on its records in amounts sufficient to meet the purchase price.
Segregated Assets — In accordance with the 1940 Act, the funds segregate assets on their books and records to cover certain types of investment securities and other financial instruments. American Century Investment Management, Inc. (ACIM) (the investment advisor) monitors, on a daily basis, the securities segregated to ensure the funds designate a sufficient amount of liquid assets, marked-to-market daily. The funds may also receive assets or be required to pledge assets at the custodian bank or with a broker for collateral requirements.
Distributions to Shareholders — Distributions from net investment income, if any, are generally declared and paid monthly. Distributions from net realized gains, if any, are generally declared and paid annually.
Indemnifications — Under the trust’s organizational documents, its officers and trustees are indemnified against certain liabilities arising out of the performance of their duties to the funds. In addition, in the normal course of business, the funds enter into contracts that provide general indemnifications. The maximum exposure under these arrangements is unknown as this would involve future claims that may be made against a fund. The risk of material loss from such claims is considered by management to be remote.
Securities Lending — Securities are lent to qualified financial institutions and brokers. State Street Bank & Trust Co. serves as securities lending agent to the funds pursuant to a Securities Lending Agreement. The lending of securities exposes the funds to risks such as: the borrowers may fail to return the loaned securities, the borrowers may not be able to provide additional collateral, the funds may experience delays in recovery of the loaned securities or delays in access to collateral, or the funds may experience losses related to the investment collateral. To minimize certain risks, loan counterparties pledge collateral in the form of cash and/or securities. The lending agent has agreed to indemnify the funds in the case of default of any securities borrowed. Cash collateral received is invested in the State Street Navigator Securities Lending Government Money Market Portfolio, a money market mutual fund registered under the 1940 Act. The loans may also be secured by U.S. government securities in an amount at least equal to the market value of the securities loaned, plus accrued interest and dividends, determined on a daily basis and adjusted accordingly. By lending securities, the funds seek to increase their net investment income through the receipt of interest and fees. Such income is reflected separately within the Statements of Operations. The value of loaned securities and related collateral outstanding at period end, if any, are shown on a gross basis within the Schedules of Investments and Statements of Assets and Liabilities.
92
The following table reflects a breakdown of transactions accounted for as secured borrowings, the gross obligation by the type of collateral pledged, and the remaining contractual maturity of those transactions as of August 31, 2022.
| Remaining Contractual Maturity of Agreements | |||||||||||||||||
Fund / Securities Lending Transactions(1) | Overnight and Continuous | <30 days | Between 30 & 90 days | >90 days | Total | ||||||||||||
| Diversified Corporate Bond ETF | |||||||||||||||||
| Corporate Bonds | $ | 2,858,788 | — | — | — | $ | 2,858,788 | ||||||||||
| Gross amount of recognized liabilities for securities lending transactions | $ | 2,858,788 | |||||||||||||||
| Emerging Markets Bond ETF | |||||||||||||||||
| Corporate Bonds | $ | 256,775 | — | — | — | $ | 256,775 | ||||||||||
| Gross amount of recognized liabilities for securities lending transactions | $ | 256,775 | |||||||||||||||
| Multisector Income ETF | |||||||||||||||||
| Corporate Bonds | $ | 3,709,125 | — | — | — | $ | 3,709,125 | ||||||||||
| Gross amount of recognized liabilities for securities lending transactions | $ | 3,709,125 | |||||||||||||||
| Select High Yield ETF | |||||||||||||||||
| Corporate Bonds | $ | 2,160,987 | — | — | — | $ | 2,160,987 | ||||||||||
| Preferred Stocks | 25,528 | — | — | — | 25,528 | ||||||||||||
| Total Borrowings | $ | 2,186,515 | — | — | — | $ | 2,186,515 | ||||||||||
| Gross amount of recognized liabilities for securities lending transactions | $ | 2,186,515 | |||||||||||||||
(1)Amount represents the payable for cash collateral received for securities on loan. This will generally be in the Overnight and Continuous column as the securities are typically callable on demand.
3. Fees and Transactions with Related Parties
Certain officers and trustees of the trust are also officers and/or directors of American Century Companies, Inc. (ACC). The trust's investment advisor, ACIM, and the trust’s administrator, American Century Services, LLC, are wholly owned, directly or indirectly, by ACC. Various funds issued by American Century Strategic Asset Allocations, Inc. own, in aggregate, 39%, 74% and 66% of the shares of Diversified Corporate Bond ETF, Emerging Markets Bond ETF and Multisector Income ETF, respectively. ACIM owns 35% of the shares of Select High Yield ETF. Related parties do not invest in the funds for the purpose of exercising management or control.
ACIM has engaged Nomura Corporate Research and Asset Management Inc. (NCRAM) to serve as a subadvisor for Select High Yield ETF. NCRAM is responsible for making investment recommendations for the fund, subject to the oversight of the Board of Trustees and general supervision of the investment advisor and in accordance with the investment objective, polices and restrictions of the fund. ACIM pays all costs associated with retaining NCRAM as the subadvisor of the fund. A subsidiary of NCRAM’s parent company indirectly owns a non-controlling equity interest in ACC.
Management Fees — The trust has entered into a management agreement with ACIM, under which ACIM provides the funds with investment advisory and management services in exchange for a single, unified management fee (the fee). The agreement provides that ACIM will pay all expenses of managing and operating the funds, except brokerage and other transaction fees and expenses relating to the acquisition and disposition of portfolio securities, acquired fund fees and expenses, interest, taxes, litigation expenses and extraordinary expenses. The fee is computed and accrued daily based on the daily net assets of each fund and paid monthly in arrears.
93
The annual management fee for each fund is as follows:
| Annual Management Fee | |||||
| Diversified Corporate Bond ETF | 0.29% | ||||
| Diversified Municipal Bond ETF | 0.29% | ||||
| Emerging Markets Bond ETF | 0.39% | ||||
| Multisector Income ETF | 0.35% | ||||
| Select High Yield ETF | 0.45% | ||||
4. Investment Transactions
Purchases and sales of investment securities, excluding short-term investments and in kind transactions, for the period ended August 31, 2022 were as follows:
| Diversified Corporate Bond ETF | Diversified Municipal Bond ETF | Emerging Markets Bond ETF | Multisector Income ETF | Select High Yield ETF(1) | |||||||||||||
| Purchases of U.S. Treasury and Government Agency obligations | $19,961,098 | — | $1,924,293 | $52,296,859 | — | ||||||||||||
| Purchases of other investment securities | $244,975,438 | $154,812,985 | $13,682,861 | $123,687,444 | $4,046,429 | ||||||||||||
| Total Purchases | $264,936,536 | $154,812,985 | $15,607,154 | $175,984,303 | $4,046,429 | ||||||||||||
| Sales of U.S. Treasury and Government Agency obligations | $18,978,510 | — | $567,422 | $28,774,093 | — | ||||||||||||
| Sales of other investment securities | $246,596,876 | $94,880,934 | $16,449,028 | $130,987,546 | $3,559,741 | ||||||||||||
| Total Sales | $265,575,386 | $94,880,934 | $17,016,450 | $159,761,639 | $3,559,741 | ||||||||||||
(1)November 16, 2021 (fund inception) through August 31, 2022.
Securities received or delivered in kind through subscriptions and redemptions and in kind net realized gain (loss) for the period ended August 31, 2022 were as follows:
| In kind Subscriptions | In kind Redemptions | In kind Net Realized Gain/(Loss)* | |||||||||
| Diversified Corporate Bond ETF | $35,456,930 | $25,518,371 | $175,601 | ||||||||
| Diversified Municipal Bond ETF | $86,914,118 | $2,589,011 | $172,509 | ||||||||
| Emerging Markets Bond ETF | $10,441,993 | — | — | ||||||||
| Multisector Income ETF | $34,353,021 | $1,141,309 | $(49,978) | ||||||||
Select High Yield ETF(1) | $42,472,893 | $8,578,172 | $(504,553) | ||||||||
*Net realized gain (loss) on in kind transactions are not considered taxable for federal income tax purposes.
(1)November 16, 2021 (fund inception) through August 31, 2022.
5. Capital Share Transactions
Each fund’s shares may only be bought and sold in a secondary market through a broker-dealer at a market price. Because ETF shares trade at market prices rather than NAV, shares may trade at a price greater than NAV (a premium) or less than NAV (a discount). Each fund issues and redeems shares at their NAV only in aggregations of a specified number of shares (a creation unit) generally in exchange for a designated portfolio of securities and/or cash (including any portion of such securities for which cash may be substituted). Authorized participants may be required to pay an additional variable charge to cover certain brokerage, tax, foreign exchange, execution, market impact and other costs and expenses related to the execution of trades resulting from creation unit transactions. Such variable charges, if any, are included in other capital within the Statements of Changes in Net Assets.
94
6. Fair Value Measurements
The funds’ investment valuation process is based on several considerations and may use multiple inputs to determine the fair value of the investments held by the funds. In conformity with accounting principles generally accepted in the United States of America, the inputs used to determine a valuation are classified into three broad levels.
•Level 1 valuation inputs consist of unadjusted quoted prices in an active market for identical investments.
•Level 2 valuation inputs consist of direct or indirect observable market data (including quoted prices for comparable investments, evaluations of subsequent market events, interest rates, prepayment speeds, credit risk, etc.). These inputs also consist of quoted prices for identical investments initially expressed in local currencies that are adjusted through translation into U.S. dollars.
•Level 3 valuation inputs consist of unobservable data (including a fund’s own assumptions).
The level classification is based on the lowest level input that is significant to the fair valuation measurement. The valuation inputs are not necessarily an indication of the risks associated with investing in these securities or other financial instruments.
The following is a summary of the level classifications as of period end. The Schedules of Investments provide additional information on the funds’ portfolio holdings.
| Diversified Corporate Bond ETF | |||||||||||
| Level 1 | Level 2 | Level 3 | |||||||||
| Assets | |||||||||||
| Investment Securities | |||||||||||
| Corporate Bonds | — | $ | 136,991,428 | — | |||||||
| U.S. Treasury Securities | — | 2,953,860 | — | ||||||||
| Municipal Securities | — | 441,073 | — | ||||||||
| Short-Term Investments | $ | 6,197,063 | — | — | |||||||
| $ | 6,197,063 | $ | 140,386,361 | — | |||||||
| Other Financial Instruments | |||||||||||
| Futures Contracts | $ | 14,645 | — | — | |||||||
| Swap Agreements | — | $ | 6,227 | — | |||||||
| $ | 14,645 | $ | 6,227 | — | |||||||
| Liabilities | |||||||||||
| Other Financial Instruments | |||||||||||
| Futures Contracts | $ | 15,782 | — | — | |||||||
| Diversified Municipal Bond ETF | |||||||||||
| Level 1 | Level 2 | Level 3 | |||||||||
| Assets | |||||||||||
| Investment Securities | |||||||||||
| Municipal Securities | — | $ | 268,883,123 | — | |||||||
| Short-Term Investments | $ | 7,119,587 | — | — | |||||||
| $ | 7,119,587 | $ | 268,883,123 | — | |||||||
95
| Emerging Markets Bond ETF | |||||||||||
| Level 1 | Level 2 | Level 3 | |||||||||
| Assets | |||||||||||
| Investment Securities | |||||||||||
| Corporate Bonds | — | $ | 12,862,247 | — | |||||||
| Sovereign Governments and Agencies | — | 9,438,962 | — | ||||||||
| U.S. Treasury Securities | — | 1,453,680 | — | ||||||||
| Preferred Stocks | — | 557,379 | — | ||||||||
| Short-Term Investments | $ | 2,191,052 | — | — | |||||||
| $ | 2,191,052 | $ | 24,312,268 | — | |||||||
| Other Financial Instruments | |||||||||||
| Futures Contracts | $ | 2,586 | — | — | |||||||
| Swap Agreements | — | $ | 70,398 | — | |||||||
| $ | 2,586 | $ | 70,398 | — | |||||||
| Liabilities | |||||||||||
| Other Financial Instruments | |||||||||||
| Futures Contracts | $ | 4,055 | — | — | |||||||
| Swap Agreements | — | $ | 7,281 | — | |||||||
| $ | 4,055 | $ | 7,281 | — | |||||||
| Multisector Income ETF | |||||||||||
| Level 1 | Level 2 | Level 3 | |||||||||
| Assets | |||||||||||
| Investment Securities | |||||||||||
| Corporate Bonds | — | $ | 44,239,697 | — | |||||||
| U.S. Treasury Securities | — | 21,098,467 | — | ||||||||
| Asset-Backed Securities | — | 15,439,551 | — | ||||||||
| U.S. Government Agency Mortgage-Backed Securities | — | 7,716,834 | — | ||||||||
| Commercial Mortgage-Backed Securities | — | 6,237,490 | — | ||||||||
| Collateralized Mortgage Obligations | — | 6,020,183 | — | ||||||||
| Collateralized Loan Obligations | — | 5,935,110 | — | ||||||||
| Preferred Stocks | — | 4,778,071 | — | ||||||||
| Bank Loan Obligations | — | 1,451,917 | — | ||||||||
| Sovereign Governments and Agencies | — | 1,310,918 | — | ||||||||
| Short-Term Investments | $ | 5,321,975 | — | — | |||||||
| $ | 5,321,975 | $ | 114,228,238 | — | |||||||
| Other Financial Instruments | |||||||||||
| Futures Contracts | $ | 3,859 | — | — | |||||||
| Swap Agreements | — | $ | 4,939 | — | |||||||
| $ | 3,859 | $ | 4,939 | — | |||||||
| Liabilities | |||||||||||
| Other Financial Instruments | |||||||||||
| Futures Contracts | $ | 26,700 | — | — | |||||||
| Swap Agreements | — | $ | 27,544 | — | |||||||
| $ | 26,700 | $ | 27,544 | — | |||||||
96
| Select High Yield ETF | |||||||||||
| Level 1 | Level 2 | Level 3 | |||||||||
| Assets | |||||||||||
| Investment Securities | |||||||||||
| Corporate Bonds | — | $ | 28,902,651 | — | |||||||
| Preferred Stocks | — | 187,331 | — | ||||||||
| Short-Term Investments | $ | 3,007,380 | — | — | |||||||
| $ | 3,007,380 | $ | 29,089,982 | — | |||||||
7. Derivative Instruments
Credit Risk — The funds are subject to credit risk in the normal course of pursuing its investment objectives. The value of a bond generally declines as the credit quality of its issuer declines. Credit default swap agreements enable a fund to buy/sell protection against a credit event of a specific issuer or index. A fund may attempt to enhance returns by selling protection or attempt to mitigate credit risk by buying protection. The buyer/seller of credit protection against a security or basket of securities may pay/receive an up-front or periodic payment to compensate for/against potential default events. Changes in value, including the periodic amounts of interest to be paid or received on swap agreements, are recorded as unrealized appreciation (depreciation) on swap agreements. Upon entering into a centrally cleared swap, a fund is required to deposit cash or securities (initial margin) with a financial intermediary in an amount equal to a certain percentage of the notional amount. Subsequent payments (variation margin) are made or received daily, in cash, by a fund. The variation margin is equal to the daily change in the value and is a component of unrealized gains and losses. Realized gain or loss is recorded upon receipt or payment of a periodic settlement or termination of swap agreements. Net realized and unrealized gains or losses occurring during the holding period of swap agreements are a component of net realized gain (loss) on swap agreement transactions and change in net unrealized appreciation (depreciation) on swap agreements, respectively. The risks of entering into swap agreements include the possible lack of liquidity, failure of the counterparty to meet its obligations, and that there may be unfavorable changes in the underlying investments or instruments.
The funds' average notional amount to credit risk derivative instruments held during the period were as follows:
| Diversified Corporate Bond ETF | $4,261,833 | ||||
| Emerging Markets Bond ETF | $1,440,500 | ||||
| Multisector Income ETF | $11,654,736 | ||||
Interest Rate Risk — The funds are subject to interest rate risk in the normal course of pursuing its investment objectives. The value of bonds generally declines as interest rates rise. A fund may enter into futures contracts based on a bond index or a specific underlying security. A fund may purchase futures contracts to gain exposure to increases in market value or sell futures contracts to protect against a decline in market value. Upon entering into a futures contract, a fund will segregate cash, cash equivalents or other appropriate liquid securities on its records in amounts sufficient to meet requirements. Subsequent payments (variation margin) are made or received daily, in cash, by a fund. The variation margin is equal to the daily change in the contract value and is recorded as unrealized gains and losses. A fund recognizes a realized gain or loss when the futures contract is closed or expires. Net realized and unrealized gains or losses occurring during the holding period of futures contracts are a component of net realized gain (loss) on futures contract transactions and change in net unrealized appreciation (depreciation) on futures contracts, respectively. One of the risks of entering into futures contracts is the possibility that the change in value of the contract may not correlate with the changes in value of the underlying securities.
The funds' average notional exposure to interest rate risk derivative instruments held during the period were as follows:
| Futures Contracts Purchased | Futures Contracts Sold | |||||||
| Diversified Corporate Bond ETF | $17,466,572 | $17,651,391 | ||||||
| Emerging Markets Bond ETF | $1,848,884 | $3,943,736 | ||||||
| Multisector Income ETF | $20,097,535 | $9,345,696 | ||||||
97
Value of Derivative Instruments as of August 31, 2022
| Asset Derivatives | Liability Derivatives | |||||||||||||
| Fund / Type of Risk Exposure | Location on Statement of Assets and Liabilities | Value | Location on Statement of Assets and Liabilities | Value | ||||||||||
| Diversified Corporate Bond ETF | ||||||||||||||
| Credit Risk | Receivable for variation margin on swap agreements* | $ | 4,378 | Payable for variation margin on swap agreements* | — | |||||||||
| Interest Rate Risk | Receivable for variation margin on futures contracts* | — | Payable for variation margin on futures contracts* | $ | 4,855 | |||||||||
| $ | 4,378 | $ | 4,855 | |||||||||||
| Emerging Markets Bond ETF | ||||||||||||||
| Credit Risk | Swap agreements | $ | 70,398 | Swap agreements | $ | 7,281 | ||||||||
| Interest Rate Risk | Receivable for variation margin on futures contracts* | — | Payable for variation margin on futures contracts* | 11,578 | ||||||||||
| $ | 70,398 | $ | 18,859 | |||||||||||
| Multisector Income ETF | ||||||||||||||
| Credit Risk | Receivable for variation margin on swap agreements* | $ | 7,545 | Payable for variation margin on swap agreements* | — | |||||||||
| Interest Rate Risk | Receivable for variation margin on futures contracts* | 2,768 | Payable for variation margin on futures contracts* | — | ||||||||||
| $ | 10,313 | — | ||||||||||||
*Included in the unrealized appreciation (depreciation) on futures contracts or centrally cleared swap agreements, as applicable, as reported in the Schedule of Investments.
Effect of Derivative Instruments on the Statement of Operations for the Year Ended August 31, 2022
| Net Realized Gain (Loss) | Change in Net Unrealized Appreciation (Depreciation) | |||||||||||||
| Fund / Type of Risk Exposure | Location on Statement of Operations | Value | Location on Statement of Operations | Value | ||||||||||
| Diversified Corporate Bond ETF | ||||||||||||||
| Credit Risk | Net realized gain (loss) on swap agreement transactions | $ | 5,378 | Change in net unrealized appreciation (depreciation) on swap agreements | $ | (8,801) | ||||||||
| Interest Rate Risk | Net realized gain (loss) on futures contract transactions | 190,060 | Change in net unrealized appreciation (depreciation) on futures contracts | 14,387 | ||||||||||
| $ | 195,438 | $ | 5,586 | |||||||||||
| Emerging Markets Bond ETF | ||||||||||||||
| Credit Risk | Net realized gain (loss) on swap agreement transactions | $ | 471,342 | Change in net unrealized appreciation (depreciation) on swap agreements | $ | 16,732 | ||||||||
| Interest Rate Risk | Net realized gain (loss) on futures contract transactions | (215,641) | Change in net unrealized appreciation (depreciation) on futures contracts | 47 | ||||||||||
| $ | 255,701 | $ | 16,779 | |||||||||||
| Multisector Income ETF | ||||||||||||||
| Credit Risk | Net realized gain (loss) on swap agreement transactions | $ | 217,551 | Change in net unrealized appreciation (depreciation) on swap agreements | $ | 104,632 | ||||||||
| Interest Rate Risk | Net realized gain (loss) on futures contract transactions | 527,939 | Change in net unrealized appreciation (depreciation) on futures contracts | (34,076) | ||||||||||
| $ | 745,490 | $ | 70,556 | |||||||||||
98
8. Risk Factors
The value of the funds’ shares will go up and down, sometimes rapidly or unpredictably, based on the performance of the securities owned by the funds and other factors generally affecting the securities market. Market risks, including political, regulatory, economic and social developments, can affect the value of the funds’ investments. Natural disasters, public health emergencies, war, terrorism and other unforeseeable events may lead to increased market volatility and may have adverse long-term effects on world economies and markets generally.
The funds may invest in instruments that have variable or floating coupon rates based on the London Interbank Offered Rate (LIBOR). LIBOR is a benchmark interest rate intended to be representative of the rate at which certain major international banks lend to one another over short-terms. Financial institutions have started the process of phasing out LIBOR and the transition process to a replacement rate may lead to increased volatility or illiquidity in markets for instruments that rely on LIBOR. This could result in a change to the value of such instruments or a change in the cost of temporary borrowing for the fund.
There are certain risks involved in investing in foreign securities. These risks include those resulting from political events (such as civil unrest, national elections and imposition of exchange controls), social and economic events (such as labor strikes and rising inflation), and natural disasters. Securities of foreign issuers may be less liquid and more volatile. Investing in emerging markets or a significant portion of assets in one country or region may accentuate these risks.
The funds may invest in high-yield and lower-rated debt securities, which are subject to substantial risks including liquidity risk and credit risk.
The majority of Emerging Markets Bond ETF and Multisector Income ETF are owned by a relatively small number of shareholders. To the extent that a large shareholder (including a fund of funds) invests in the funds, the funds may experience relatively large redemptions as such shareholder reallocates its assets. In the event of a large shareholder redemption, the ongoing operations of the funds may be at risk.
A fund’s investment process may result in high portfolio turnover, which could mean high transaction costs, affecting both performance and capital gains tax liabilities to investors.
The novel coronavirus (COVID-19) pandemic has stressed the financial resources of many municipal issuers, which may impair a municipal issuer’s ability to meet its financial obligations when due and could adversely impact the value of its bonds, which could negatively impact the performance of the funds.
9. Federal Tax Information
The tax character of distributions paid during the years ended August 31, 2022 and August 31, 2021 (except as noted) were as follows:
| 2022 | 2021 | |||||||||||||||||||
| Distributions Paid From: | Distributions Paid From: | |||||||||||||||||||
| Exempt Income | Ordinary Income | Long-term Capital Gains | Exempt Income | Ordinary Income | Long-term Capital Gains | |||||||||||||||
| Diversified Corporate Bond ETF | — | $ | 2,951,390 | — | — | $ | 3,561,445 | $ | 549,535 | |||||||||||
| Diversified Municipal Bond ETF | $ | 3,278,595 | — | — | $ | 1,763,405 | — | — | ||||||||||||
Emerging Markets Bond ETF | — | $ | 1,194,630 | — | —(1) | $ 68,920(1) | —(1) | |||||||||||||
| Multisector Income ETF | — | $ | 3,577,090 | — | —(1) | $ 52,680(1) | —(1) | |||||||||||||
Select High Yield ETF(2) | — | $ | 1,026,610 | — | N/A | N/A | N/A | |||||||||||||
(1)June 29, 2021 (fund inception) through August 31, 2021.
(2)November 16, 2021 (fund inception) through August 31, 2022.
99
The book-basis character of distributions made during the year from net investment income or net realized gains may differ from their ultimate characterization for federal income tax purposes. These differences reflect the differing character of certain income items and net realized gains and losses for financial statement and tax purposes, and may result in reclassification among certain capital accounts on the financial statements.
The reclassifications, which are primarily due to in kind transactions, were as follows:
| Diversified Corporate Bond ETF | Diversified Municipal Bond ETF | Emerging Markets Bond ETF | Multisector Income ETF | Select High Yield ETF | |||||||||||||
| Capital paid in | $ | 175,601 | $ | 172,509 | — | $ | (54,171) | $ | (504,553) | ||||||||
| Distributable earnings | $ | (175,601) | $ | (172,509) | — | $ | 54,171 | $ | 504,553 | ||||||||
As of period end, the federal tax cost of investments and the components of distributable earnings on a tax-basis were as follows:
| Diversified Corporate Bond ETF | Diversified Municipal Bond ETF | Emerging Markets Bond ETF | Multisector Income ETF | Select High Yield ETF | |||||||||||||
| Federal tax cost of investments | $ | 155,237,298 | $ | 290,254,423 | $ | 30,556,872 | $ | 128,733,038 | $ | 36,182,252 | |||||||
| Gross tax appreciation of investments | $ | 21,686 | $ | 480,812 | $ | 47,000 | $ | 37,138 | $ | 8,653 | |||||||
| Gross tax depreciation of investments | (8,675,560) | (14,732,525) | (4,100,552) | (9,219,963) | (4,093,543) | ||||||||||||
| Net tax appreciation (depreciation) of investments | (8,653,874) | (14,251,713) | (4,053,552) | (9,182,825) | (4,084,890) | ||||||||||||
| Net tax appreciation (depreciation) on derivatives and translation of assets and liabilities in foreign currencies | 19,909 | — | 20,474 | 152,437 | — | ||||||||||||
| Net tax appreciation (depreciation) | $ | (8,633,965) | $ | (14,251,713) | $ | (4,033,078) | $ | (9,030,388) | $ | (4,084,890) | |||||||
| Undistributed ordinary income | $ | 395,860 | — | $ | 137,512 | $ | 569,947 | $ | 141,456 | ||||||||
| Undistributed exempt income | — | $ | 561,916 | — | — | — | |||||||||||
| Accumulated short-term capital losses | $ | (8,275,499) | $ | (4,713,606) | $ | (2,547,989) | $ | (6,715,554) | $ | (466,310) | |||||||
| Accumulated long-term capital losses | $ | (1,408,897) | $ | (1,176,877) | $ | (561,292) | — | — | |||||||||
For Diversified Corporate Bond ETF, Diversified Municipal Bond ETF, Emerging Markets Bond ETF and Multisector Income ETF, the difference between book-basis and tax-basis unrealized appreciation (depreciation) is attributable primarily to the tax deferral of losses on wash sales and the realization for tax purposes of unrealized gains (losses) on futures contracts and unsettled interest on swap agreements. The cost of investments for federal income tax purposes was the same as the cost for financial reporting purposes for Select High Yield ETF.
Accumulated capital losses represent net capital loss carryovers that may be used to offset future realized capital gains for federal income tax purposes. The capital loss carryovers may be carried forward for an unlimited period. Future capital loss carryover utilization in any given year may be subject to Internal Revenue Code limitations.
100
| Financial Highlights | ||
| For a Share Outstanding Throughout the Years Ended August 31 (except as noted) | ||||||||||||||||||||||||||||||||||||||||||||
| Per-Share Data | Ratios and Supplemental Data | |||||||||||||||||||||||||||||||||||||||||||
| Income From Investment Operations: | Distributions From: | Ratio to Average Net Assets of: | ||||||||||||||||||||||||||||||||||||||||||
| Net Asset Value, Beginning of Period | Net Investment Income (Loss)(1) | Net Realized and Unrealized Gain (Loss) | Total From Investment Operations | Net Investment Income | Net Realized Gains | Total Distributions | Other Capital(1) | Net Asset Value, End of Period | Total Return(2) | Operating Expenses | Net Investment Income (Loss) | Portfolio Turnover Rate(3) | Net Assets, End of Period (in thousands) | |||||||||||||||||||||||||||||||
| Diversified Corporate Bond ETF | ||||||||||||||||||||||||||||||||||||||||||||
| 2022 | $52.70 | 1.08 | (6.45) | (5.37) | (0.98) | — | (0.98) | 0.00(4) | $46.35 | (10.30)% | 0.29% | 2.18% | 181% | $143,685 | ||||||||||||||||||||||||||||||
| 2021 | $52.72 | 0.93 | 0.66 | 1.59 | (1.39) | (0.22) | (1.61) | 0.00(4) | $52.70 | 3.08% | 0.29% | 1.77% | 182% | $152,828 | ||||||||||||||||||||||||||||||
| 2020 | $51.38 | 1.28 | 1.47 | 2.75 | (1.40) | (0.03) | (1.43) | 0.02 | $52.72 | 5.48% | 0.29% | 2.50% | 174% | $121,260 | ||||||||||||||||||||||||||||||
| 2019 | $48.77 | 1.67 | 2.45 | 4.12 | (1.54) | — | (1.54) | 0.03 | $51.38 | 8.70% | 0.39% | 3.37% | 35% | $64,334 | ||||||||||||||||||||||||||||||
2018(5) | $50.00 | 0.96 | (1.41) | (0.45) | (0.82) | — | (0.82) | 0.04 | $48.77 | (0.77)% | 0.45%(6) | 3.09%(6) | 38% | $12,291 | ||||||||||||||||||||||||||||||
| Notes to Financial Highlights | ||
(1)Computed using average shares outstanding throughout the period.
(2)Total returns are calculated based on the net asset value of the last business day. Total returns for periods less than one year are not annualized.
(3)Excludes securities received or delivered in kind.
(4)Per-share amount was less than $0.005.
(5)January 11, 2018 (fund inception) through August 31, 2018.
(6)Annualized.
See Notes to Financial Statements.
| For a Share Outstanding Throughout the Years Ended August 31 (except as noted) | ||||||||||||||||||||||||||||||||||||||
| Per-Share Data | Ratios and Supplemental Data | |||||||||||||||||||||||||||||||||||||
| Income From Investment Operations: | Ratio to Average Net Assets of: | |||||||||||||||||||||||||||||||||||||
| Net Asset Value, Beginning of Period | Net Investment Income (Loss)(1) | Net Realized and Unrealized Gain (Loss) | Total From Investment Operations | Distributions From Net Investment Income | Other Capital(1) | Net Asset Value, End of Period | Total Return(2) | Operating Expenses | Net Investment Income (Loss) | Portfolio Turnover Rate(3) | Net Assets, End of Period (in thousands) | |||||||||||||||||||||||||||
| Diversified Municipal Bond ETF | ||||||||||||||||||||||||||||||||||||||
| 2022 | $55.48 | 0.89 | (5.76) | (4.87) | (0.82) | 0.02 | $49.81 | (8.82)% | 0.29% | 1.70% | 46% | $276,446 | ||||||||||||||||||||||||||
| 2021 | $53.61 | 1.00 | 1.83 | 2.83 | (1.05) | 0.09 | $55.48 | 5.50% | 0.29% | 1.82% | 14% | $163,663 | ||||||||||||||||||||||||||
| 2020 | $53.37 | 1.19 | 0.11 | 1.30 | (1.15) | 0.09 | $53.61 | 2.66% | 0.29% | 2.26% | 23% | $67,018 | ||||||||||||||||||||||||||
2019(4) | $50.00 | 1.36 | 3.16 | 4.52 | (1.25) | 0.10 | $53.37 | 9.42% | 0.29%(5) | 2.74%(5) | 19% | $26,684 | ||||||||||||||||||||||||||
| Notes to Financial Highlights | ||
(1)Computed using average shares outstanding throughout the period.
(2)Total returns are calculated based on the net asset value of the last business day. Total returns for periods less than one year are not annualized.
(3)Excludes securities received or delivered in kind.
(4)September 10, 2018 (fund inception) through August 31, 2019.
(5)Annualized.
See Notes to Financial Statements.
| For a Share Outstanding Throughout the Years Ended August 31 (except as noted) | ||||||||||||||||||||||||||||||||||||||
| Per-Share Data | Ratios and Supplemental Data | |||||||||||||||||||||||||||||||||||||
| Income From Investment Operations: | Ratio to Average Net Assets of: | |||||||||||||||||||||||||||||||||||||
| Net Asset Value, Beginning of Period | Net Investment Income (Loss)(1) | Net Realized and Unrealized Gain (Loss) | Total From Investment Operations | Distributions From Net Investment Income | Other Capital(1) | Net Asset Value, End of Period | Total Return(2) | Operating Expenses | Net Investment Income (Loss) | Portfolio Turnover Rate(3) | Net Assets, End of Period (in thousands) | |||||||||||||||||||||||||||
| Emerging Markets Bond ETF | ||||||||||||||||||||||||||||||||||||||
| 2022 | $50.30 | 2.13 | (12.25) | (10.12) | (2.05) | 0.00(4) | $38.13 | (20.60)% | 0.39% | 4.87% | 64% | $26,693 | ||||||||||||||||||||||||||
2021(5) | $50.00 | 0.36 | 0.11 | 0.47 | (0.17) | 0.00(4) | $50.30 | 0.95% | 0.39%(6) | 4.14%(6) | 7% | $22,636 | ||||||||||||||||||||||||||
| Notes to Financial Highlights | ||
(1)Computed using average shares outstanding throughout the period.
(2)Total returns are calculated based on the net asset value of the last business day. Total returns for periods less than one year are not annualized.
(3)Excludes securities received or delivered in kind.
(4)Per-share amount was less than $0.005.
(5)June 29, 2021 (fund inception) through August 31, 2021.
(6)Annualized.
See Notes to Financial Statements.
| For a Share Outstanding Throughout the Years Ended August 31 (except as noted) | ||||||||||||||||||||||||||||||||||||||
| Per-Share Data | Ratios and Supplemental Data | |||||||||||||||||||||||||||||||||||||
| Income From Investment Operations: | Ratio to Average Net Assets of: | |||||||||||||||||||||||||||||||||||||
| Net Asset Value, Beginning of Period | Net Investment Income (Loss)(1) | Net Realized and Unrealized Gain (Loss) | Total From Investment Operations | Distributions From Net Investment Income | Other Capital(1) | Net Asset Value, End of Period | Total Return(2) | Operating Expenses | Net Investment Income (Loss) | Portfolio Turnover Rate(3) | Net Assets, End of Period (in thousands) | |||||||||||||||||||||||||||
| Multisector Income ETF | ||||||||||||||||||||||||||||||||||||||
| 2022 | $50.24 | 1.67 | (6.41) | (4.74) | (1.53) | 0.02 | $43.99 | (9.60)% | 0.35% | 3.55% | 147% | $114,363 | ||||||||||||||||||||||||||
2021(4) | $50.00 | 0.27 | 0.02 | 0.29 | (0.13) | 0.08 | $50.24 | 0.75% | 0.35%(5) | 3.08%(5) | 75% | $82,904 | ||||||||||||||||||||||||||
| Notes to Financial Highlights | ||
(1)Computed using average shares outstanding throughout the period.
(2)Total returns are calculated based on the net asset value of the last business day. Total returns for periods less than one year are not annualized.
(3)Excludes securities received or delivered in kind.
(4)June 29, 2021 (fund inception) through August 31, 2021.
(5)Annualized.
See Notes to Financial Statements.
| For a Share Outstanding Throughout the Period Indicated | ||||||||||||||||||||||||||||||||||||||
| Per-Share Data | Ratios and Supplemental Data | |||||||||||||||||||||||||||||||||||||
| Income From Investment Operations: | Ratio to Average Net Assets of: | |||||||||||||||||||||||||||||||||||||
| Net Asset Value, Beginning of Period | Net Investment Income (Loss)(1) | Net Realized and Unrealized Gain (Loss) | Total From Investment Operations | Distributions From Net Investment Income | Other Capital(1) | Net Asset Value, End of Period | Total Return(2) | Operating Expenses | Net Investment Income (Loss) | Portfolio Turnover Rate(3) | Net Assets, End of Period (in thousands) | |||||||||||||||||||||||||||
| Select High Yield ETF | ||||||||||||||||||||||||||||||||||||||
2022(4) | $50.00 | 1.58 | (6.54) | (4.96) | (1.51) | 0.01 | $43.54 | (10.04)% | 0.45%(5) | 4.32%(5) | 12% | $30,481 | ||||||||||||||||||||||||||
| Notes to Financial Highlights | ||
(1)Computed using average shares outstanding throughout the period.
(2)Total returns are calculated based on the net asset value of the last business day. Total returns for periods less than one year are not annualized.
(3)Excludes securities received or delivered in kind.
(4)November 16, 2021 (fund inception) through August 31, 2022.
(5)Annualized.
See Notes to Financial Statements.
| Report of Independent Registered Public Accounting Firm | ||
To the Shareholders and the Board of Trustees of American Century ETF Trust:
Opinion on the Financial Statements and Financial Highlights
We have audited the accompanying statements of assets and liabilities, including the schedules of investments, of American Century Diversified Corporate Bond ETF, American Century Diversified Municipal Bond ETF, American Century Emerging Markets Bond ETF, American Century Multisector Income ETF, and American Century Select High Yield ETF (the “Funds”), five of the funds constituting the American Century ETF Trust, as of August 31, 2022, the related statements of operations, statements of changes in net assets, and financial highlights for the periods indicated in the table below; and the related notes. In our opinion, the financial statements and financial highlights present fairly, in all material respects, the financial position of each of the Funds constituting American Century ETF Trust as of August 31, 2022, and the results of their operations, the changes in their net assets, and the financial highlights for the periods listed in the table below, in conformity with accounting principles generally accepted in the United States of America.
| Individual Fund Constituting the American Century ETF Trust | Statement of Operations | Statements of Changes in Net Assets | Financial Highlights | ||||||||
| American Century Diversified Corporate Bond ETF | For the year ended August 31, 2022 | For the years ended August 31, 2022 and 2021 | For the years ended August 31, 2022, 2021, 2020, and 2019, and the period from January 11, 2018 (fund inception) through August 31, 2018 | ||||||||
| American Century Diversified Municipal Bond ETF | For the year ended August 31, 2022 | For the years ended August 31, 2022 and 2021 | For the years ended August 31, 2022, 2021 and 2020, and the period from September 10, 2018 (fund inception) through August 31, 2019 | ||||||||
| American Century Emerging Markets Bond ETF | For the year ended August 31, 2022 | For the year ended August 31, 2022 and the period from June 29, 2021 (fund inception) through August 31, 2021 | |||||||||
| American Century Multisector Income ETF | |||||||||||
| American Century Select High Yield ETF | For the period November 16, 2021 (fund inception) through August 31, 2022 | ||||||||||
Basis for Opinion
These financial statements and financial highlights are the responsibility of the Funds’ management. Our responsibility is to express an opinion on the Funds’ financial statements and financial highlights based on our audits. We are a public accounting firm registered with the Public Company Accounting Oversight Board (United States) (PCAOB) and are required to be independent with respect to the Funds in accordance with the U.S. federal securities laws and the applicable rules and regulations of the Securities and Exchange Commission and the PCAOB.
We conducted our audits in accordance with the standards of the PCAOB. Those standards require that we plan and perform the audit to obtain reasonable assurance about whether the financial statements and financial highlights are free of material misstatement, whether due to error or fraud. The Funds are not required to have, nor were we engaged to perform, an audit of their internal control over financial reporting. As part of our audits, we are required to obtain an understanding of internal control over financial reporting but not for the purpose of expressing an opinion on the effectiveness of the Funds’ internal control over financial reporting. Accordingly, we express no such opinion.
106
Our audits included performing procedures to assess the risks of material misstatement of the financial statements and financial highlights, whether due to error or fraud, and performing procedures that respond to those risks. Such procedures included examining, on a test basis, evidence regarding the amounts and disclosures in the financial statements and financial highlights. Our audits also included evaluating the accounting principles used and significant estimates made by management, as well as evaluating the overall presentation of the financial statements and financial highlights. Our procedures included confirmation of securities owned as of August 31, 2022, by correspondence with the custodian and brokers; when replies were not received from brokers, we performed other auditing procedures. We believe that our audits provide a reasonable basis for our opinion.
/s/ Deloitte & Touche LLP
Kansas City, Missouri
October 17, 2022
We have served as the auditor of one or more American Century investment companies since 1997.
107
| Management | ||
The Board of Trustees
The individuals listed below serve as trustees of the funds. Each trustee will continue to serve in this capacity until death, retirement, resignation or removal from office. The board has adopted a mandatory retirement age for trustees who are not “interested persons,” as that term is defined in the Investment Company Act (independent trustees). Trustees who are not also officers of the trust shall retire on December 31st of the year in which they reach their 75th birthday.
Jonathan S. Thomas is an “interested person” because he currently serves as President and Chief Executive Officer of American Century Companies, Inc. (ACC), the parent company of American Century Investment Management, Inc. (ACIM or the advisor). The other trustees are independent. They are not employees, directors or officers of, and have no financial interest in, ACC or any of its wholly owned, direct or indirect, subsidiaries, including ACIM and American Century Services, LLC (ACS), and they do not have any other affiliations, positions or relationships that would cause them to be considered “interested persons” under the Investment Company Act. The following trustees also serve in this capacity for a number of other registered investment companies in the American Century Investments family of funds: Jonathan S. Thomas, 15; Jeremy I. Bulow, 8; and Stephen E. Yates, 7.
The following table presents additional information about the trustees. The mailing address for each trustee other than Jonathan S. Thomas is 330 Madison Avenue, New York, New York 10017. The mailing address for Jonathan S. Thomas is 4500 Main Street, Kansas City, Missouri 64111.
| Name (Year of Birth) | Position(s) Held with Funds | Length of Time Served | Principal Occupation(s) During Past 5 Years | Number of American Century Portfolios Overseen by Trustee | Other Directorships Held During Past 5 Years | ||||||||||||
| Independent Trustees | |||||||||||||||||
| Reginald M. Browne (1968) | Trustee and Chairman of the Board | Since 2017 (Chairman since 2019) | Principal, GTS Securities (automated capital markets trading firm)(2019 to present); Senior Managing Director, Co Global Head-ETF Group, Cantor Fitzgerald (financial services firm)(2013 to 2019) | 41 | None | ||||||||||||
| Jeremy I. Bulow (1954) | Trustee | Since 2022 | Professor of Economics, Stanford University Graduate School of Business (1979 to present) | 75 | None | ||||||||||||
| Barry A. Mendelson (1958) | Trustee | Since 2017 | Retired | 41 | None | ||||||||||||
| Stephen E. Yates (1948) | Trustee | Since 2017 | Retired | 105 | None | ||||||||||||
| Interested Trustees | |||||||||||||||||
| Jonathan S. Thomas (1963) | Trustee | Since 2017 | President and Chief Executive Officer, ACC (2007 to present). Also serves as Chief Executive Officer, ACS; Director, ACC and other ACC subsidiaries | 139 | None | ||||||||||||
The Statement of Additional Information has additional information about the funds' trustees and is available without charge, upon request, by calling 1-800-345-6488.
108
Officers
The following table presents certain information about the executive officers of the funds. Each officer, except Cleo Chang and Edward Rosenberg, serves as an officer for each of the 16 investment companies in the American Century family of funds. No officer is compensated for his or her service as an officer of the funds. The listed officers are interested persons of the funds and are appointed or re-appointed on an annual basis. The mailing address for each officer listed below is 4500 Main Street, Kansas City, Missouri 64111.
| Name (Year of Birth) | Offices with the Funds | Principal Occupation(s) During the Past Five Years | ||||||
| Patrick Bannigan (1965) | President since 2019 | Executive Vice President and Director, ACC (2012 to present); Chief Financial Officer, Chief Accounting Officer and Treasurer, ACC (2015 to present). Also serves as President, ACS; Vice President, ACIM; Chief Financial Officer, Chief Accounting Officer and/or Director, ACIM, ACS and other ACC subsidiaries | ||||||
| R. Wes Campbell (1974) | Chief Financial Officer and Treasurer since 2018 | Vice President, ACS (2020 to present); Investment Operations and Investment Accounting, ACS (2000 to present) | ||||||
| Amy D. Shelton (1964) | Chief Compliance Officer and Vice President since 2017 | Chief Compliance Officer, American Century funds, (2014 to present); Chief Compliance Officer, ACIM (2014 to present); Chief Compliance Officer, ACIS (2009 to present). Also serves as Vice President, ACIS | ||||||
| John Pak (1968) | General Counsel and Vice President since 2021 | General Counsel and Senior Vice President, ACC (2021 to present). Also serves as General Counsel and Senior Vice President, ACIM, ACS and ACIS. Chief Legal Officer of Investment and Wealth Management,The Bank of New York Mellon (2014 to 2021) | ||||||
| Cleo Chang (1977) | Vice President since 2019 | Senior Vice President, ACIM (2015 to present) | ||||||
| David H. Reinmiller (1963) | Vice President since 2017 | Attorney, ACC (1994 to present). Also serves as Vice President, ACIM and ACS | ||||||
| Edward Rosenberg (1973) | Vice President since 2017 | Senior Vice President, ACIM (2017 to present); Senior Vice President, Flexshares Head of ETF Capital Markets, Northern Trust (2012 to 2017) | ||||||
| C. Jean Wade (1964) | Vice President since 2017 | Senior Vice President, ACS (2017 to present); Vice President, ACS (2000 to 2017) | ||||||
| Ward D. Stauffer (1960) | Secretary since 2019 | Attorney, ACS (2003 to present) | ||||||
109
| Approval of Management and Subadvisory Agreements | ||
American Century Diversified Corporate Bond ETF
American Century Diversified Municipal Bond ETF
American Century Emerging Markets Bond ETF
American Century Multisector Income ETF
At a meeting held on June 2, 2022, the Funds’ Board of Trustees (the "Board") unanimously approved the renewal of the management agreement pursuant to which American Century Investment Management, Inc. (the “Advisor”) acts as the investment advisor for each of the Funds. Under Section 15(c) of the Investment Company Act of 1940 (the “Investment Company Act”), contracts for investment advisory services are required to be reviewed, evaluated, and approved by a majority of a fund’s Trustees, including a majority of the independent Trustees, each year.
Prior to its consideration of the management agreement renewal, the Trustees requested and reviewed extensive data and information compiled by the Advisor and certain independent data providers concerning the Funds. This review was in addition to the oversight and evaluation undertaken by the Board and its Audit Committee on a continual basis and the information received was supplemental to the extensive information that the Board and its Audit Committee receive and consider throughout the year.
In connection with its consideration of the management agreement renewal, the Board’s review and evaluation of the services provided by the Advisor included, but was not limited to, the following:
•the nature, extent, and quality of investment management, shareholder services, and other services provided and to be provided to each Fund including without limitation portfolio management and trading services, shareholder and intermediary services, compliance and legal services, fund accounting and financial reporting, and fund share distribution;
•the wide range of other programs and services provided to each Fund and its shareholders on a routine and non-routine basis;
•the investment performance of each Fund, including data comparing each Fund's performance to an appropriate benchmark and/or a peer group of other funds with similar investment objectives and strategies;
•the cost of owning each Fund compared to the cost of owning similarly-managed funds;
•the compliance policies, procedures, and regulatory experience of the Advisor and the Funds’ service providers;
•the Advisor’s strategic plans, generally, and with respect to the ongoing impact of the COVID-19 pandemic response, heightened areas of interest in the mutual fund industry and recent geopolitical issues;
•the Advisor’s business continuity plans, vendor management practices, and cyber security practices;
•financial data showing the cost of services provided to each Fund, the profitability of each Fund to the Advisor, and the overall profitability of the Advisor;
•information regarding payments to intermediaries by the Advisor;
•possible economies of scale associated with the Advisor’s management of each Fund; and
•possible collateral benefits to the Advisor from the management of the Funds.
The independent Trustees met separately in private session to discuss the renewal and to review and discuss the information provided in response to their request. The independent Trustees also held active discussions with the Advisor regarding the renewal of the management agreement. The independent Trustees had the benefit of the advice of their independent counsel throughout the process.
110
Factors Considered
The Trustees considered all of the information provided by the Advisor, the independent data providers, and independent counsel in connection with the approval. They determined that the information was sufficient for them to evaluate the management agreement for the Funds. In connection with their review, the Trustees did not identify any single factor as being all-important or controlling, and each Trustee may have attributed different levels of importance to different factors. In deciding to renew the management agreement, the Board based its decision on a number of factors, including without limitation the following:
Nature, Extent and Quality of Services — Generally. Under each Fund’s management agreement, the Advisor is responsible for providing or arranging for all services necessary for the operation of each Fund. The Board noted that the Advisor provides or arranges at its own expense a wide variety of services which include the following:
•constructing and designing each Fund
•portfolio research and security selection
•initial capitalization/funding
•securities trading
•Fund administration
•custody of Fund assets
•daily valuation of each Fund’s portfolio
•liquidity monitoring and management
•risk management, including cyber security
•shareholder servicing and transfer agency, including shareholder confirmations, recordkeeping, and communications
•legal services (except the independent Trustees’ counsel)
•regulatory and portfolio compliance
•financial reporting
•marketing and distribution (except amounts paid by each Fund under Rule 12b-1 plans)
Investment Management Services. The nature of the investment management services provided to the Funds is quite complex and allows Fund shareholders access to professional money management, instant diversification of their investments within an asset class, and liquidity. In evaluating investment performance, the Board expects the Advisor to manage each Fund in accordance with its investment objectives and principal investment strategies. Further, the Trustees recognize that the Advisor has an obligation to monitor trading activities, and in particular to seek the best execution of fund trades, and to evaluate the use of and payment for research. In providing these services, the Advisor utilizes teams of investment professionals (portfolio managers, analysts, research assistants, and securities traders) who require extensive information technology, research, training, compliance, and other systems to conduct their business. The Board provides oversight of the investment performance process. It regularly reviews investment performance information for each Fund, together with comparative information for appropriate benchmarks over different time horizons. The Trustees also review investment performance information during the management agreement renewal process. If performance concerns are identified, the Board discusses with the Advisor the reasons for such results and any actions being taken to improve performance. The performance for American Century Diversified Corporate Bond ETF and American Century Diversified Municipal Bond ETF was above each Fund's respective benchmark for the one- and three-year periods reviewed by the Board. The Board found the investment management services provided by the Advisor to each Fund to be satisfactory and consistent with the management agreement.
Shareholder and Other Services. Under the management agreement, the Advisor provides or arranges for a comprehensive package of services to the Funds. The Board, directly and through its Audit Committee, regularly reviews reports and evaluations of such services at its regular meetings. These reports include, but are not limited to, information regarding the operational efficiency and accuracy of the shareholder and transfer agency services provided, staffing levels, shareholder satisfaction, technology support (including cyber security), new products and services
111
offered to Fund shareholders, securities trading activities, portfolio valuation services, auditing services, and legal and operational compliance activities. The Board found the services provided by the Advisor to each Fund under the management agreement to be competitive and of high quality.
Costs of Services and Profitability. The Advisor provides detailed information concerning its cost of providing various services to the Funds, its profitability in managing each Fund (pre- and post-distribution), its overall profitability, and its financial condition. The Trustees have reviewed with the Advisor the methodology used to prepare this financial information. This information is considered in evaluating the Advisor’s financial condition, its ability to continue to provide services under the management agreement, and the reasonableness of the current management fee. The Board concluded that the Advisor’s profits were reasonable in light of the services provided to the Funds.
Ethics. The Board generally considers the Advisor’s commitment to providing quality services to the Funds and to conducting its business ethically. They noted that the Advisor’s practices generally meet or exceed industry best practices.
Economies of Scale. The Board also reviewed information provided by the Advisor regarding the possible existence of economies of scale in connection with the management of each Fund. The Board concluded that economies of scale are difficult to measure and predict with precision, especially on a fund-by-fund basis. The Board concluded that the Advisor is sharing economies of scale, to the extent they exist, through its fee structure and through reinvestment in its business, infrastructure, investment capabilities and initiatives to provide shareholders additional content and services.
Comparison to Other Funds’ Fees. The management agreement provides that each Fund pays the Advisor a single, all-inclusive (or unified) management fee for providing all services necessary for the management and operation of the Fund, other than securities transaction expenses, taxes, interest, extraordinary expenses, and expenses incurred in connection with the provision of shareholder services and distribution services under a plan adopted pursuant to Rule 12b-1 under the Investment Company Act. Under the unified fee structure, the Advisor is responsible for providing all investment advisory, custody, audit, administrative, compliance, recordkeeping, marketing and shareholder services, or arranging and supervising third parties to provide such services. The Board believes the unified fee structure is a benefit to Fund shareholders because it clearly discloses to shareholders the cost of owning Fund shares, and, since the unified fee cannot be increased without a vote of Fund shareholders, it shifts to the Advisor the risk of increased costs of operating the Fund and provides a direct incentive to minimize administrative inefficiencies. Part of the Board’s analysis of fee levels involves reviewing certain evaluative data compiled by an independent provider comparing the Fund’s unified fee to the total expense ratios of its peers. The unified fee charged to shareholders of the American Century Diversified Corporate Bond ETF and American Century Multisector Income ETF was below the median of the total expense ratios of their respective peer expense universe and was within the range of their peer expense group. The unified fee charged to shareholders of the American Century Diversified Municipal Bond ETF was below the median of the total expense ratios of its peer expense universe and was the lowest of its peer expense group. The unified fee charged to shareholders of the American Century Emerging Markets Bond ETF was the lowest of the total expense ratios of its peer expense universe and was the lowest of its peer expense group. The Board concluded that the management fee paid by each Fund to the Advisor under its management agreement is reasonable in light of the services provided to the Fund.
Comparison to Fees and Services Provided to Other Clients of the Advisor. The Board also requested and received information from the Advisor concerning the nature of the services, fees, costs, and profitability of its advisory services to funds or other advisory clients managed similarly to the Funds. They observed that these varying types of client accounts require different services and involve different regulatory and entrepreneurial risks than the management of the Funds. The Board analyzed this information and concluded that the fees charged and services provided to the Funds were reasonable by comparison.
Payments to Intermediaries. The Trustees also requested and received a description of payments made to intermediaries by each Fund and the Advisor and services provided in response
112
thereto. These payments could include various payments made by each Fund or the Advisor to different types of intermediaries and recordkeepers for distribution and service activities provided for each Fund. The Trustees reviewed such information and received representations from the Advisor that all such payments by the Advisor were made from the Advisor’s resources and reasonable profits.
Collateral or “Fall-Out” Benefits Derived by the Advisor. The Board considered the possible existence of collateral benefits the Advisor may receive as a result of its relationship with the Funds. They concluded that the Advisor’s primary business is managing funds and it generally does not use fund or shareholder information to generate profits in other lines of business, and therefore does not derive any significant collateral benefits from them. The Board noted that additional assets from other clients may offer the Advisor some benefit from increased leverage with service providers and counterparties. The Board also determined that the Advisor is able to provide investment management services to certain clients other than the Funds, at least in part, due to its existing infrastructure built to serve the fund complex. The Board concluded that appropriate allocation methodologies had been employed to assign resources and the cost of those resources to these other clients.
Existing Relationship. The Board also considered whether there was any reason for not continuing the existing arrangement with the Advisor. In this regard, the Board was mindful of the potential disruptions of the Funds’ operations and various risks, uncertainties, and other effects that could occur as a result of a decision not to continue such relationship. In particular, the Board recognized that most shareholders have invested in each Fund on the strength of the Advisor’s industry standing and reputation and in the expectation that the Advisor will have a continuing role in providing advisory services to each Fund.
Conclusion of the Trustees. As a result of this process, the Board, including all of the independent Trustees, taking into account all of the factors discussed above and the information provided by the Advisor and others in connection with its review and throughout the year, determined that the terms of the management fee are fair and reasonable and that the management fee charged to each Fund is fair in light of the services provided and that the investment management agreement between each Fund and the Advisor should be renewed for an additional one-year period.
113
American Century Select High Yield ETF
At a meeting held on June 2, 2022, the Fund’s Board of Trustees (the "Board") unanimously approved the renewal of the management agreement pursuant to which American Century Investment Management, Inc. (the “Advisor”) acts as the investment advisor for the Fund. The Board also unanimously approved the renewal of the investment subadvisory agreement pursuant to which Nomura Corporate Research and Asset Management, Inc. (the “Subadvisor”) acts as subadvisor to the Fund. Under Section 15(c) of the Investment Company Act of 1940 (the “Investment Company Act”), contracts for investment advisory services are required to be reviewed, evaluated, and approved by a majority of a fund’s Trustees, including a majority of the independent Trustees, each year.
Prior to its consideration of the renewal of the management agreement and the subadvisory agreement, the Trustees requested and reviewed extensive data and information compiled by the Advisor, the Subadvisor and certain independent data providers concerning the Fund. This review was in addition to the oversight and evaluation undertaken by the Board and its Audit Committee on a continual basis and the information received was supplemental to the extensive information that the Board and its Audit Committee receive and consider throughout the year.
In connection with its consideration of the renewal of the management agreement and the subadvisory agreement, the Board’s review and evaluation of the services provided by the Advisor, the Advisor’s affiliates, and the Subadvisor included, but was not limited to, the following:
•the nature, extent, and quality of investment management, shareholder services, and other services provided and to be provided to the Fund including without limitation portfolio management and trading services, shareholder and intermediary services, compliance and legal services, fund accounting and financial reporting, and fund share distribution;
•the wide range of other programs and services provided to the Fund and its shareholders on a routine and non-routine basis;
•the Fund’s investment performance, including data comparing the Fund's performance to an appropriate benchmark and/or a peer group of other funds with similar investment objectives and strategies;
•the cost of owning the Fund compared to the cost of owning similarly-managed funds;
•the compliance policies, procedures, and regulatory experience of the Advisor and its affiliates, the Subadvisor and certain other Fund service providers;
•financial data showing the cost of services provided to the Fund, the profitability of the Fund to the Advisor, and the overall profitability of the Advisor;
•the Advisor’s strategic plans, generally, and with respect to the ongoing impact of the COVID-19 pandemic response, heightened areas of interest in the mutual fund industry and recent geopolitical issues;
•the Advisor’s business continuity plans, vendor management practices, and cyber security practices;
•information regarding payments to intermediaries by the Advisor;
•possible economies of scale associated with the Advisor’s management of the Fund; and
•possible collateral benefits to the Advisor from the management of the Fund.
The independent Trustees met separately in private session to discuss the renewal and to review and discuss the information provided in response to their request. The independent Trustees also held active discussions with the Advisor regarding the renewal of the management agreement and the subadvisory agreement. The independent Trustees had the benefit of the advice of their independent counsel throughout the process.
Factors Considered
The Trustees considered all of the information provided by the Advisor, the Subadvisor, the independent data providers, and independent counsel in connection with the approval. They
114
determined that the information was sufficient for them to evaluate the management agreement and the subadvisory agreement for the Fund. In connection with their review, the Trustees did not identify any single factor as being all-important or controlling, and each Trustee may have attributed different levels of importance to different factors. In deciding to renew the management agreement and subadvisory agreement, the Board based its decision on a number of factors, including without limitation the following:
Nature, Extent and Quality of Services — Generally. Under the management agreement, the Advisor is responsible for providing or arranging for all services necessary for the operation of the Fund. The Board noted that the Advisor provides or arranges at its own expense a wide variety of services which include the following:
•constructing and designing the Fund
•portfolio research and security selection
•initial capitalization/funding
•securities trading
•Fund administration
•custody of Fund assets
•daily valuation of the Fund’s portfolio
•liquidity monitoring and management
•risk management, including cyber security
•shareholder servicing and transfer agency, including shareholder confirmations, recordkeeping, and communications
•legal services (except the independent Trustees’ counsel)
•regulatory and portfolio compliance
•financial reporting
•marketing and distribution (except amounts paid by the Fund under Rule 12b-1 plans)
Investment Management Services. The nature of the investment management services provided to the Fund is quite complex and allows Fund shareholders access to professional money management, instant diversification of their investments within an asset class, and liquidity. In evaluating investment performance, the Board expects the Advisor and the Subadvisor to manage the Fund in accordance with its investment objectives and principal investment strategies. Further, the Trustees recognize that the Advisor and the Subadvisor have an obligation to monitor trading activities, and in particular to seek the best execution of fund trades, and to evaluate the use of and payment for research. In providing these services, the Advisor and the Subadvisor utilize teams of investment professionals (portfolio managers, analysts, research assistants, and securities traders) who require extensive information technology, research, training, compliance, and other systems to conduct their business. The Board provides oversight of the investment performance process. It regularly reviews investment performance information for the Fund, together with comparative information for appropriate benchmarks over different time horizons. The Trustees also review investment performance information during the management agreement renewal process. If performance concerns are identified, the Board discusses with the Advisor and/or the Subadvisor the reasons for such results and any actions being taken to improve performance. The Board found the investment management services provided by the Advisor and the Subadvisor to the Fund to be satisfactory and consistent with the management agreement.
Shareholder and Other Services. Under the management agreement, the Advisor provides or arranges for a comprehensive package of services to the Fund. The Board, directly and through its Audit Committee, regularly reviews reports and evaluations of such services at its regular meetings. These reports include, but are not limited to, information regarding the operational efficiency and accuracy of the shareholder and transfer agency services provided, staffing levels, shareholder satisfaction, technology support (including cyber security), new products and services offered to Fund shareholders, securities trading activities, portfolio valuation services, auditing services, and legal and operational compliance activities. The Board found the services provided by the Advisor to the Fund under the management agreement to be competitive and of high quality.
115
Costs of Services and Profitability. The Advisor provides detailed information concerning its cost of providing various services to the Fund, its profitability in managing the Fund (pre- and post-distribution), its overall profitability, and its financial condition. The Trustees have reviewed with the Advisor the methodology used to prepare this financial information. This information is considered in evaluating the Advisor’s financial condition, its ability to continue to provide services under the management agreement, and the reasonableness of the current management fee. The Board concluded that the Advisor’s profits were reasonable in light of the services provided to the Fund. The Board did not consider the profitability of the Subadvisor because the Subadvisor is paid from the unified management fee of the Advisor as a result of arms’ length negotiations.
Ethics. The Board generally considers the Advisor’s commitment to providing quality services to the Fund and to conducting its business ethically. They noted that the Advisor’s practices generally meet or exceed industry best practices.
Economies of Scale. The Board also reviewed information provided by the Advisor regarding the possible existence of economies of scale in connection with the management of the Fund. The Board concluded that economies of scale are difficult to measure and predict with precision, especially on a fund-by-fund basis. The Board concluded that the Advisor is sharing economies of scale, to the extent they exist, through its fee structure and through reinvestment in its business, infrastructure, investment capabilities and initiatives to provide shareholders additional content and services.
Comparison to Other Funds’ Fees. The management agreement provides that the Fund pays the Advisor a single, all-inclusive (or unified) management fee for providing all services necessary for the management and operation of the Fund, other than securities transaction expenses, taxes, interest, extraordinary expenses, and expenses incurred in connection with the provision of shareholder services and distribution services under a plan adopted pursuant to Rule 12b-1 under the Investment Company Act. The Board specifically noted that the subadvisory fee paid to the Subadvisor and the terms of the Subadvisory Agreement were subject to arms’ length negotiation between the Advisor and the Subadvisor and are paid by the Advisor out of its unified management fee. Under the unified fee structure, the Advisor is responsible for providing all investment advisory, custody, audit, administrative, compliance, recordkeeping, marketing and shareholder services, or arranging and supervising third parties to provide such services. The Board believes the unified fee structure is a benefit to Fund shareholders because it clearly discloses to shareholders the cost of owning Fund shares, and, since the unified fee cannot be increased without a vote of Fund shareholders, it shifts to the Advisor the risk of increased costs of operating the Fund and provides a direct incentive to minimize administrative inefficiencies. Part of the Board’s analysis of fee levels involves reviewing certain evaluative data compiled by an independent provider comparing the Fund’s unified fee to the total expense ratios of its peers. The unified fee charged to shareholders of the Fund was below the median of the total expense ratios of the Fund’s peer expense universe and was within the range of its peer expense group. The Board concluded that the management fee paid by the Fund to the Advisor under the management agreement is reasonable in light of the services provided to the Fund.
Comparison to Fees and Services Provided to Other Clients of the Advisor. The Board also requested and received information from the Advisor concerning the nature of the services, fees, costs, and profitability of its advisory services to funds or other advisory clients managed similarly to the Fund. They observed that these varying types of client accounts require different services and involve different regulatory and entrepreneurial risks than the management of the Fund. The Board analyzed this information and concluded that the fees charged and services provided to the Fund were reasonable by comparison.
Payments to Intermediaries. The Trustees also requested and received a description of payments made to intermediaries by the Fund and the Advisor and services provided in response thereto. These payments could include various payments made by the Fund or the Advisor to different types of intermediaries and recordkeepers for distribution and service activities provided for the Fund. The Trustees reviewed such information and received representations from the
116
Advisor that all such payments by the Advisor were made from the Advisor’s resources and reasonable profits.
Collateral or “Fall-Out” Benefits Derived by the Advisor. The Board considered the possible existence of collateral benefits the Advisor may receive as a result of its relationship with the Fund. They concluded that the Advisor’s primary business is managing funds and it generally does not use fund or shareholder information to generate profits in other lines of business, and therefore does not derive any significant collateral benefits from them. The Board noted that additional assets from other clients may offer the Advisor some benefit from increased leverage with service providers and counterparties. The Board also determined that the Advisor is able to provide investment management services to certain clients other than the Fund, at least in part, due to its existing infrastructure built to serve the fund complex. The Board concluded that appropriate allocation methodologies had been employed to assign resources and the cost of those resources to these other clients.
Existing Relationship. The Board also considered whether there was any reason for not continuing the existing arrangement with the Advisor. In this regard, the Board was mindful of the potential disruptions of the Fund’s operations and various risks, uncertainties, and other effects that could occur as a result of a decision not to continue such relationship. In particular, the Board recognized that most shareholders have invested in the Fund on the strength of the Advisor’s industry standing and reputation and in the expectation that the Advisor will have a continuing role in providing advisory services to the Fund.
Conclusion of the Trustees. As a result of this process, the Board, including all of the independent Trustees, taking into account all of the factors discussed above and the information provided by the Advisor and others in connection with its review and throughout the year, concluded that the terms of the management agreement and the subadvisory agreement are fair and reasonable and that the management fee charged to the Fund is reasonable in light of the services provided and that the management agreement and subadvisory agreement should be renewed for an additional one-year period.
117
| Liquidity Risk Management Program | ||
The Funds have adopted a liquidity risk management program (the “program”). The Funds' Board of Trustees (the "Board") has designated American Century Investment Management, Inc. (“ACIM”) as the administrator of the program. Personnel of ACIM or its affiliates conduct the day-to-day operation of the program pursuant to policies and procedures administered by the Program Administrator, including members of ACIM’s Investment Oversight Committee who are members of the ACIM’s Investment Management and Global Analytics departments.
Under the program, ACIM manages the Funds' liquidity risk, which is the risk that the Funds could not meet shareholder redemption requests without significant dilution of remaining shareholders’ interests in the Funds. This risk is managed by monitoring the degree of liquidity of the Funds' investments, limiting the amount of the Funds' illiquid investments, and utilizing various risk management tools and facilities available to the Funds for meeting shareholder redemptions, among other means. ACIM’s process of determining the degree of liquidity of certain Funds' investments is supported by a third-party liquidity assessment vendor.
The Board reviewed a report prepared by ACIM regarding the operation and effectiveness of the program for the period January 1, 2021 through December 31, 2021. No significant liquidity events impacting the Funds were noted in the report. In addition, ACIM provided its assessment that the program had been effective in managing the Funds' liquidity risk.
118
| Additional Information | ||
Retirement Account Information
As required by law, distributions you receive from certain retirement accounts are subject to federal income tax withholding, unless you elect not to have withholding apply*. Tax will be withheld on the total amount withdrawn even though you may be receiving amounts that are not subject to withholding, such as nondeductible contributions. In such case, excess amounts of withholding could occur. You may adjust your withholding election so that a greater or lesser amount will be withheld.
Remember, even if you elect not to have income tax withheld, you are liable for paying income tax on the taxable portion of your withdrawal. If you elect not to have income tax withheld or you don’t have enough income tax withheld, you may be responsible for payment of estimated tax. You may incur penalties under the estimated tax rules if your withholding and estimated tax payments are not sufficient. You can reduce or defer the income tax on a distribution by directly or indirectly rolling such distribution over to another IRA or eligible plan. You should consult your tax advisor for additional information.
State tax will be withheld if, at the time of your distribution, your address is within one of the mandatory withholding states and you have federal income tax withheld (or as otherwise required by state law). State taxes will be withheld from your distribution in accordance with the respective state rules.
*Some 403(b), 457 and qualified retirement plan distributions may be subject to 20% mandatory withholding, as they are subject to special tax and withholding rules. Your plan administrator or plan sponsor is required to provide you with a special tax notice explaining those rules at the time you request a distribution. If applicable, federal and/or state taxes may be withheld from your distribution amount.
Proxy Voting Policies
A description of the policies that the funds' investment advisor uses in exercising the voting rights associated with the securities purchased and/or held by the funds is available without charge, upon request, by calling 1-800-345-6488. It is also available on American Century Investments’ website at americancentury.com/proxy and on the Securities and Exchange Commission’s website at sec.gov. Information regarding how the investment advisor voted proxies relating to portfolio securities during the most recent 12-month period ended June 30 is available at americancentury.com/proxy. It is also available at sec.gov.
Quarterly Portfolio Disclosure
The funds file their complete schedule of portfolio holdings with the Securities and Exchange Commission (SEC) for the first and third quarters of each fiscal year as an exhibit to their reports on Form N-PORT. The funds' Form N-PORT reports are available on the SEC’s website at sec.gov.
119
Other Tax Information
The following information is provided pursuant to provisions of the Internal Revenue Code.
Diversified Municipal Bond ETF designates $3,278,595 as exempt interest dividends for the fiscal year ended August 31, 2022.
For nonresident alien shareholders, the funds hereby designate the following, or up to the maximum amount allowable, of ordinary income distributions as qualified interest income for the fiscal year ended August 31, 2022.
| Diversified Corporate Bond ETF | Diversified Municipal Bond ETF | Emerging Markets Bond ETF | Multisector Income ETF | Select High Yield ETF | ||||||||||
| $2,307,529 | — | $53,761 | $2,330,492 | $868,584 | ||||||||||
120
| ||||||||
| Contact Us | americancenturyetfs.com | |||||||
| American Century Sales Representatives, Financial Professionals, Broker Dealers, Insurance Companies, Banks and Trust Companies | 1-833-ACI-ETFS | |||||||
| Telecommunications Relay Service for the Deaf | 711 | |||||||
| American Century ETF Trust | ||||||||
Investment Advisor: American Century Investment Management, Inc. Kansas City, Missouri | ||||||||
Distributor: Foreside Fund Services, LLC - Distributor, not affiliated with American Century Investment Services, Inc. | ||||||||
| This report and the statements it contains are submitted for the general information of our shareholders. The report is not authorized for distribution to prospective investors unless preceded or accompanied by an effective prospectus. | ||||||||
| ©2022 American Century Proprietary Holdings, Inc. All rights reserved. CL-ANN-96946 2210 | ||||||||
| Annual Report | |||||
| August 31, 2022 | |||||
American Century® Focused Dynamic Growth ETF (FDG) | |||||
American Century® Focused Large Cap Value ETF (FLV) | |||||
| Table of Contents | ||
| President’s Letter | |||||
| Focused Dynamic Growth ETF | |||||
| Performance | |||||
| Portfolio Commentary | |||||
| Fund Characteristics | |||||
| Focused Large Cap Value ETF | |||||
| Performance | |||||
| Portfolio Commentary | |||||
| Fund Characteristics | |||||
| Shareholder Fee Examples | |||||
| Schedules of Investments | |||||
| Statements of Assets and Liabilities | |||||
| Statements of Operations | |||||
| Statements of Changes in Net Assets | |||||
| Notes to Financial Statements | |||||
| Financial Highlights | |||||
| Report of Independent Registered Public Accounting Firm | |||||
| Management | |||||
| Approval of Management Agreement | |||||
| Liquidity Risk Management Program | |||||
| Additional Information | |||||
Any opinions expressed in this report reflect those of the author as of the date of the report, and do not necessarily represent the opinions of American Century Investments® or any other person in the American Century Investments organization. Any such opinions are subject to change at any time based upon market or other conditions and American Century Investments disclaims any responsibility to update such opinions. These opinions may not be relied upon as investment advice and, because investment decisions made by American Century Investments funds are based on numerous factors, may not be relied upon as an indication of trading intent on behalf of any American Century Investments fund. Security examples are used for representational purposes only and are not intended as recommendations to purchase or sell securities. Performance information for comparative indices and securities is provided to American Century Investments by third party vendors. To the best of American Century Investments’ knowledge, such information is accurate at the time of printing.
The funds utilize the ActiveShares® methodology licensed from Precidian Investments, LLC (Precidian). Precidian’s products and services are protected by domestic and international intellectual property protections, including, without limitation, the following issued patents and pending patent applications: 7813987, 8285624, 7925562, 13011746, 14528658, 14208966, 16196560.
| President’s Letter | ||
Jonathan ThomasDear Investor:
Thank you for reviewing this annual report for the period ended August 31, 2022. Annual reports
help convey important information about fund returns, including market factors that affected
performance. For additional investment insights, please visit americancenturyetfs.com.
Mounting Market Challenges Hampered Performance
Asset class performance weakened dramatically during the funds’ fiscal year. In late 2021,
generally upbeat economic activity and corporate earnings supported gains for most U.S. and
global stock indices. Returns generally remained positive despite rapidly rising inflation and waning
central bank support—factors that had started to weigh on fixed-income indices.
By early 2022, the market climate shifted quickly. Inflation, which was already at multiyear highs,
rose to levels last seen in the early 1980s. Massive fiscal and monetary support unleashed during
the pandemic was partly to blame. In addition, escalating energy prices, supply chain breakdowns
and labor market shortages further aggravated inflation in the U.S. and other developed markets.
Russia’s invasion of Ukraine in February also exacerbated global inflationary pressures.
The Bank of England launched its inflation-fighting campaign in December and continued to lift
rates through period-end. The Federal Reserve responded to surging inflation in March, launching
an aggressive rate-hike campaign and ending its asset purchase program. Policymakers indicated
taming inflation remains their priority, even as the U.S. economy contracted in 2022’s first two
quarters. Facing record-high inflation in the eurozone, the European Central Bank in July embarked
on its first rate-hike effort in 11 years.
The combination of sharply elevated inflation, tighter monetary policy, geopolitical strife and weak
economies triggered sharp market volatility and fueled global recession fears. Against this
backdrop, most U.S. and global stock and bond indices declined sharply for the reporting period.
Staying Disciplined in Uncertain Times
We expect market volatility to linger as investors navigate a complex environment of high inflation,
rising interest rates and economic uncertainty. In addition, Russia’s invasion of Ukraine
complicates an increasingly tense geopolitical backdrop and threatens Europe’s winter energy
supply. We will continue to monitor the broad backdrop and its influence on financial markets.
We appreciate your confidence in us during these extraordinary times. Our firm has a long history
of helping clients weather unpredictable markets, and we’re confident we will continue to meet
today’s challenges.
Sincerely,
Jonathan Thomas
President and Chief Executive Officer
American Century Investments
2
| Performance | ||
| Focused Dynamic Growth ETF (FDG) | |||||||||||||||||||||||
| Total Returns as of August 31, 2022 | Average Annual Returns | ||||||||||||||||||||||
| 1 Year | Since Inception | Inception Date | |||||||||||||||||||||
| Net Asset Value | -33.49% | 16.42% | 3/31/2020 | ||||||||||||||||||||
| Market Price | -33.45% | 16.42% | 3/31/2020 | ||||||||||||||||||||
| Russell 1000 Growth Index | -19.06% | 20.82% | — | ||||||||||||||||||||
Market price is determined using the bid/ask midpoint at 4:00 p.m. Eastern time, when the net asset value (NAV) is typically calculated. Market performance does not represent the returns you would receive if you traded shares at other times. NAV prices are used to calculate market price performance prior to the date when the fund first traded on the Cboe BZX Exchange, Inc.
| Growth of $10,000 Over Life of Fund | ||
| $10,000 investment made March 31, 2020 | ||
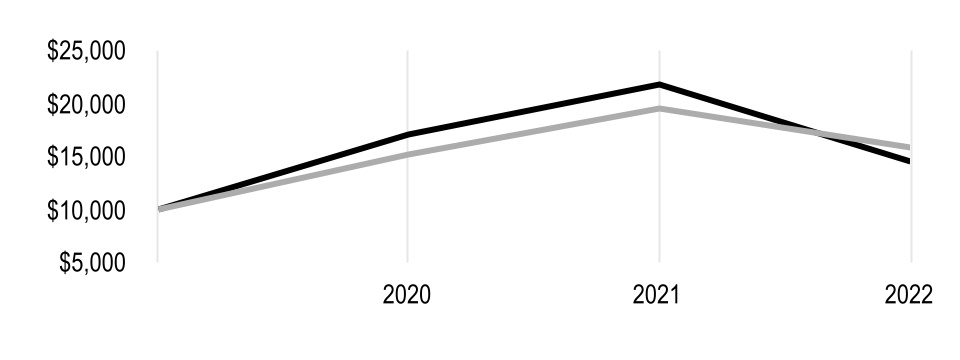
| Value on August 31, 2022 | |||||
| Net Asset Value — $14,439 | |||||
| Russell 1000 Growth Index — $15,801 | |||||
| Total Annual Fund Operating Expenses | |||||||||||||||||
| 0.45% | |||||||||||||||||
The total annual fund operating expenses shown is as stated in the fund’s prospectus current as of the date of this report. The prospectus may vary from the expense ratio shown elsewhere in this report because it is based on a different time period, includes acquired fund fees and expenses, and, if applicable, does not include fee waivers or expense reimbursements.
Data presented reflect past performance. Past performance is no guarantee of future results. Current performance may be higher or lower than the performance shown. Total returns for periods less than one year are not annualized. Investment return and principal value will fluctuate, and redemption value may be more or less than original cost. Data assumes reinvestment of dividends and capital gains, and none of the charts reflect the deduction of taxes that a shareholder would pay on fund distributions or the redemption of fund shares. To obtain performance data current to the most recent month end, please call 1-800-345-6488 or visit americancenturyetfs.com. For additional information about the funds, please consult the prospectus.
3
| Portfolio Commentary | ||
Portfolio Managers: Keith Lee, Michael Li, Henry He and Rene Casis.
Portfolio Manager Prabha Ram left American Century Investments after period-end.
Fund Strategy
American Century Focused Dynamic Growth ETF is an actively managed fund that seeks long-term capital growth. We look for liquid stocks of early and rapid stage growth companies we believe will increase in value over time. We make investment decisions based primarily on fundamental analysis of individual companies, rather than on broad economic forecasts. Management of the fund is based on the belief that, over the long term, stock price movements follow growth in earnings, revenues and/or cash flow. The fund invests primarily in securities of large-capitalization companies but may invest in companies of any market capitalization. The fund normally invests in a relatively limited number of companies, generally 30 to 45 securities, but may incorporate more securities to account for liquidity constraints.
Performance Review
The fund returned -33.45% on a market price basis for its fiscal year ended August 31, 2022. On a net asset value (NAV) basis, the fund returned -33.49%. For the same time period, the Russell 1000 Growth Index, the fund’s benchmark, returned -19.06%. The fund’s NAV and market price returns reflect fees and operating expenses, while the index return does not.
Information Technology Stocks Detracted From Relative Performance
Our holdings in the information technology sector dominated the fund’s underperformance amid the period’s growth sell-off, as investors sold the stocks of many companies that rose during the pandemic. DocuSign was a significant detractor. The stock of this developer of software for online signatures and document management had been a leading contributor to performance in recent years. It was a beneficiary of the pandemic-driven work-from-home environment but offered disappointing guidance as that tailwind subsided. Other sector detractors included Okta. The company provides cloud-based software for online identity verification, a rapidly growing market with scope for tremendous innovation. The stock fell sharply after Okta reported a third-party data breach potentially affecting a number of corporate clients that it had failed to notify in a timely manner. The small- and micro-merchant digital payments company Block (formerly Square), a darling during the pandemic, suffered during the growth sell-off as first rising interest rates and later recessionary fears weighed on the stock. Additionally, Block’s focus on blockchain technology—which enables cryptocurrencies—hurt as crypto prices fell.
Other Detractors
Elsewhere, the online education provider Chegg reported disappointing earnings and enrollment figures, precipitating a sharp decline. We eliminated our holding. Netflix hampered relative performance. The streaming video service announced layoffs amid weak subscriber growth. An expected renormalization of subscriber growth following the early gains of the pandemic has not materialized. Fund performance was also hurt by not owning some stocks that are benchmark components, including Apple. Despite supply chain struggles that have affected most electronics companies, Apple posted record sales and earnings, led by sales of the iPhone.
Consumer Staples Benefited Performance
Constellation Brands was a top contributor in the consumer staples sector. This innovative beer, wine and spirits beverage company reported quarterly revenue and earnings that beat expectations, driven by strength in its portfolio of beer brands.
Our positioning in the energy sector relative to the benchmark was helpful. Higher oil prices caused by rising demand benefited Cactus, which leases equipment to energy producers. The company is
4
gaining market share in niche capital equipment focused on shale oil well development by creating tools that are differentiated by their efficiency and safety.
Other top contributors came from a variety of sectors. The stock price of Tesla rose after the company reported better-than-expected quarterly earnings. The electric vehicle maker offered optimistic guidance but noted production headwinds due to supply chain disruptions and persistent lockdowns in China. We continue to view Tesla as an early stage growth company with significant competitive advantages relative to traditional automakers. Westinghouse Air Brake Technologies outperformed, aided by the strong results of its freight rail segment. The stock of Argenx, a Belgium-based biotechnology company, rose after it reported sales for Vyvgart that exceeded expectations. Vyvgart treats myasthenia gravis, a neuromuscular disorder. Our lack of exposure to PayPal Holdings benefited performance compared with the benchmark. The digital payment company’s stock price fell on slower growth, primarily due to losing its eBay account, but also because of difficult year-over-year comparisons as PayPal registered strong growth during the height of the pandemic.
Portfolio Positioning
The fund typically holds stakes in a relatively small number of companies in the early and rapid phases of growth. We seek companies that we believe are positioned for sustained, above-average growth over time driven by innovation. The fund’s sector allocations are primarily the result of this investment process emphasizing growth and individual security selection. The portfolio’s holdings are concentrated among companies that we see as having good management teams producing very strong earnings growth and that have demonstrated their unique value proposition for customers. We believe these companies are well-positioned competitively going forward.
While this has been a difficult period for growth equities, we want to reassure you that we retain high conviction in our investment process and portfolio holdings. We acknowledge the challenging environment and are closely monitoring the fundamentals of our investments. But our long-term focus also leads us to look through the short-term noise. Indeed, we believe many enduring secular growth trends will persist, such as a shift to electric vehicles; aging global demographics intersecting with advancements in health care; companies shifting more of their expenditures to technology; and increased digitization of transactions, among many others. As such, we believe this period can create attractive opportunities for long-term investors willing to be patient with companies that we believe are poised to grow over time.
5
| Fund Characteristics | ||
| AUGUST 31, 2022 | |||||
| Focused Dynamic Growth ETF | |||||
| Types of Investments in Portfolio | % of net assets | ||||
| Common Stocks | 98.8% | ||||
| Short-Term Investments | 1.3% | ||||
| Other Assets and Liabilities | (0.1)% | ||||
| Top Five Industries | % of net assets | ||||
| IT Services | 12.2% | ||||
| Software | 10.2% | ||||
| Internet and Direct Marketing Retail | 9.0% | ||||
| Automobiles | 8.9% | ||||
| Biotechnology | 8.9% | ||||
6
| Performance | ||
| Focused Large Cap Value ETF (FLV) | ||||||||||||||||||||
| Total Returns as of August 31, 2022 | Average Annual Returns | |||||||||||||||||||
| 1 year | Since Inception | Inception Date | ||||||||||||||||||
| Net Asset Value | -4.41% | 18.69% | 3/31/2020 | |||||||||||||||||
| Market Price | -4.48% | 18.69% | 3/31/2020 | |||||||||||||||||
| Russell 1000 Value Index | -6.23% | 20.91% | — | |||||||||||||||||
Market price is determined using the bid/ask midpoint at 4:00 p.m. Eastern time, when the net asset value (NAV) is typically calculated. Market performance does not represent the returns you would receive if you traded shares at other times. NAV prices are used to calculate market price performance prior to the date when the fund first traded on the Cboe BZX Exchange, Inc.
| Growth of $10,000 Over Life of Fund | ||
| $10,000 investment made March 31, 2020 | ||
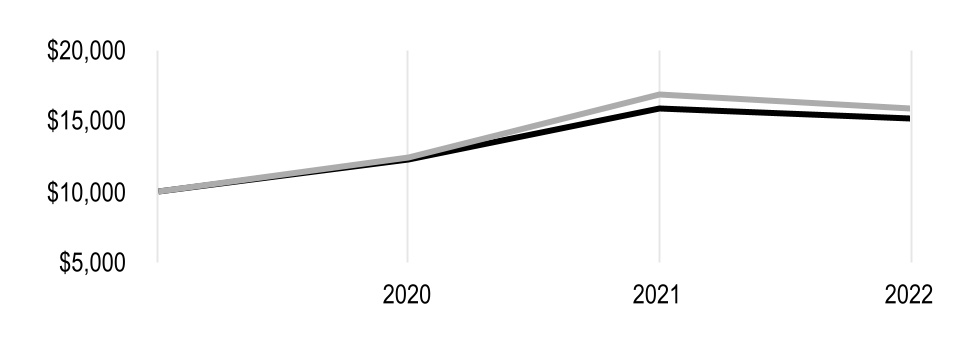
| Value on August 31, 2022 | |||||
| Net Asset Value — $15,131 | |||||
| Russell 1000 Value Index — $15,830 | |||||
| Total Annual Fund Operating Expenses | |||||||||||||||||
| 0.42% | |||||||||||||||||
The total annual fund operating expenses shown is as stated in the fund’s prospectus current as of the date of this report. The prospectus may vary from the expense ratio shown elsewhere in this report because it is based on a different time period, includes acquired fund fees and expenses, and, if applicable, does not include fee waivers or expense reimbursements.
Data presented reflect past performance. Past performance is no guarantee of future results. Current performance may be higher or lower than the performance shown. Total returns for periods less than one year are not annualized. Investment return and principal value will fluctuate, and redemption value may be more or less than original cost. Data assumes reinvestment of dividends and capital gains, and none of the charts reflect the deduction of taxes that a shareholder would pay on fund distributions or the redemption of fund shares. To obtain performance data current to the most recent month end, please call 1-800-345-6488 or visit americancenturyetfs.com. For additional information about the funds, please consult the prospectus.
7
| Portfolio Commentary | ||
Portfolio Managers: Phillip Davidson, Kevin Toney, Michael Liss, Brian Woglom, Adam Krenn, Philip Sundell and Rene Casis
Performance Summary
American Century Focused Large Cap Value ETF returned -4.48% on a market price basis over the 12-month period ending August 31, 2022. On a net asset value (NAV) basis, the fund returned -4.41%. The fund’s benchmark, the Russell 1000 Value Index, returned -6.23% during the same period. The fund’s market price and NAV returns reflect fees and operating expenses, but the index return does not.
The portfolio’s underweight and our choice of investments in the communication services sector positively impacted relative performance. In addition, several of our holdings in the financials sector helped drive the portfolio’s return relative to the benchmark, particularly in the insurance industry. On the other hand, security selection and an underweight in the energy sector detracted from results. Some of our positions in the health care sector also negatively impacted performance.
Communication Services and Financials Were Areas of Strength
During the reporting period, our bottom-up investment process resulted in an underweight to the communication services sector relative to the benchmark. This underweight, coupled with our security selection in the sector, positively impacted the portfolio’s relative performance. Notably, the portfolio’s underweight to The Walt Disney Co. was beneficial. Shares of this diversified global entertainment company experienced a sharp sell-off after the company reported Disney Plus subscriber numbers that came in below expectations. Later in the period, shares were pressured by a broad technology sell-off and investors’ concerns over direct-to-consumer business models. The portfolio also benefited from the lack of exposure to several of the benchmark’s names in the entertainment, media and interactive media and services industries. We avoided these names because they did not meet our investment criteria.
The financials sector was another area of strength, driven by the strong performance of several holdings in the insurance industry. Reinsurance Group of America was one of the portfolio’s top individual contributors. This global life and health reinsurance company reported strong financial results. Its core business performed well, and the impact from COVID-19 losses declined. Furthermore, investors expect earnings to rise over the next several years.
While the portfolio’s stock selection in the energy sector was negative overall, TotalEnergies (formerly named TOTAL), a large integrated energy company, was a key contributor to performance. Its shares rose as strong commodity prices increased the company’s free cash flow and earnings potential. Atmos Energy was another top contributor. This Texas-based utility company benefited from greater certainty about the recovery of costs stemming from extreme winter weather in 2021. Its shares were also buoyed by news of a peer being acquired at a significant premium to its market price.
Energy and Health Care Detracted
Rising commodity prices led to strong performance for many stocks in the energy sector. In turn, our lack of exposure to several of the benchmark’s energy names weighed on the portfolio’s relative results. More specifically, our avoidance of ConocoPhillips detracted. Shares of this oil and gas exploration and production company performed strongly after higher commodity prices led to financial results that were better than investors expected.
Security selection in the health care sector also detracted from results. Shares of Medtronic, a medical device company, were pressured by concerns about continued delays in elective procedures, a Food and Drug Administration warning letter regarding the company’s diabetes pumps and supply chain constraints. Zimmer Biomet Holdings, another medical device company,
8
was another key detractor. The pandemic weighed on its shares as patients deferred elective procedures.
Open Text and The Bank of New York Mellon were other key detractors. Shares of Open Text, an information technology company, declined after it provided 2023 earnings guidance that was slightly below expectations, driven by lower margins due to reinvestment in its cloud software. Also, investors became concerned that Open Text’s planned Micro Focus International acquisition may raise operational risk. Shares of The Bank of New York Mellon underperformed on concerns over reduced share repurchases. Furthermore, while we think rising interest rates should benefit this bank’s future earnings, rising rates acted as a near-term drag to capital levels due to higher unrealized losses on investment securities.
Portfolio Positioning
The portfolio seeks to invest in companies where we believe the valuation does not reflect the quality and normal earnings power of the company. Our process is based on individual security selection, but broad themes have emerged.
We have identified several opportunities in the consumer staples sector. Historically, many consumer staples companies have traded at a premium, but our analysis has led us to select companies in the sector that we believe are trading at a discount to the overall market. In addition, strong consumer demand for discretionary goods during the pandemic has shifted toward consumer staples due to soaring inflation and recession fears. In this uncertain environment, we believe companies that focus on consumer staples may hold up better than those focused on discretionary purchases.
Through our bottom-up process, we have also identified a number of companies in the health care sector that we believe offer attractive risk/reward profiles, particularly in the health care equipment and supplies and pharmaceuticals industries. We believe long-term demographic trends support demand for the health care companies that we hold in our portfolio. Additionally, we expect our medical device holdings to benefit from an increase in elective procedures.
On the other hand, as of August 31, 2022, the portfolio did not hold any positions in the consumer discretionary sector. It has been difficult for us to find higher-quality consumer discretionary companies with durable business models. The portfolio also ended the period with an underweight in communication services relative to the benchmark, as many companies in the sector have relatively volatile business models and more leveraged balance sheets.
9
| Fund Characteristics | ||
| AUGUST 31, 2022 | |||||
| Focused Large Cap Value ETF | |||||
| Types of Investments in Portfolio | % of net assets | ||||
| Common Stocks | 98.7% | ||||
| Short-Term Investments | 1.6% | ||||
| Other Assets and Liabilities | (0.3)% | ||||
| Top Five Industries | % of net assets | ||||
| Insurance | 12.1% | ||||
| Pharmaceuticals | 9.1% | ||||
| Health Care Equipment and Supplies | 9.0% | ||||
| Oil, Gas and Consumable Fuels | 6.9% | ||||
| Electrical Equipment | 4.8% | ||||
10
| Shareholder Fee Examples | ||
Fund shareholders may incur two types of costs: (1) transaction costs, including brokerage commissions paid on purchases and sales of fund shares; and (2) ongoing costs, including management fees and other fund expenses. This example is intended to help you understand your ongoing costs (in dollars) of investing in your fund and to compare these costs with the ongoing cost of investing in other funds.
The example is based on an investment of $1,000 made at the beginning of the period and held for the entire period from March 1, 2022 to August 31, 2022.
Actual Expenses
The table provides information about actual account values and actual expenses for each fund. You may use the information, together with the amount you invested, to estimate the expenses that you paid over the period. First, identify the fund you own. Then simply divide your account value by $1,000 (for example, an $8,600 account value divided by $1,000 = 8.6), then multiply the result by the number under the heading “Expenses Paid During Period” to estimate the expenses you paid on your account during this period.
Hypothetical Example for Comparison Purposes
The table also provides information about hypothetical account values and hypothetical expenses based on the actual expense ratio of your fund and an assumed rate of return of 5% per year before expenses, which is not the actual return of a fund. The hypothetical account values and expenses may not be used to estimate the actual ending account balance or expenses you paid for the period. You may use this information to compare the ongoing costs of investing in your fund and other funds. To do so, compare this 5% hypothetical example with the 5% hypothetical examples that appear in the shareholder reports of the other funds.
Please note that the expenses shown in the table are meant to highlight your ongoing costs only and do not reflect any transactional costs, such as brokerage commissions paid on purchases and sales of fund shares. Therefore, the table is useful in comparing ongoing costs only, and will not help you determine the relative total costs of owning different funds. In addition, if these transactional costs were included, your costs would have been higher.
| Beginning Account Value 3/1/22 | Ending Account Value 8/31/22 | Expenses Paid During Period(1) 3/1/22 - 8/31/22 | Annualized Expense Ratio(1) | |||||||||||
| Focused Dynamic Growth ETF | ||||||||||||||
| Actual | $1,000 | $835.70 | $2.08 | 0.45% | ||||||||||
| Hypothetical | $1,000 | $1,022.94 | $2.29 | 0.45% | ||||||||||
| Focused Large Cap Value ETF | ||||||||||||||
| Actual | $1,000 | $955.90 | $2.07 | 0.42% | ||||||||||
| Hypothetical | $1,000 | $1,023.09 | $2.14 | 0.42% | ||||||||||
(1)Expenses are equal to the fund's annualized expense ratio listed in the table above, multiplied by the average account value over the period, multiplied by 184, the number of days in the most recent fiscal half-year, divided by 365, to reflect the one-half year period. Annualized expense ratio reflects actual expenses, including any applicable fee waivers or expense reimbursements and excluding any acquired fund fees and expenses.
11
| Schedules of Investments | ||
AUGUST 31, 2022
| Focused Dynamic Growth ETF | ||||||||
| Shares | Value | |||||||
| COMMON STOCKS — 98.8% | ||||||||
| Aerospace and Defense — 0.6% | ||||||||
Rocket Lab USA, Inc.(1) | 155,058 | $ | 852,819 | |||||
| Automobiles — 8.9% | ||||||||
Tesla, Inc.(1) | 45,324 | 12,491,748 | ||||||
| Beverages — 7.5% | ||||||||
Boston Beer Co., Inc., Class A(1) | 5,363 | 1,807,760 | ||||||
| Constellation Brands, Inc., Class A | 35,630 | 8,766,761 | ||||||
| 10,574,521 | ||||||||
| Biotechnology — 8.9% | ||||||||
Alnylam Pharmaceuticals, Inc.(1) | 14,767 | 3,051,896 | ||||||
Argenx SE, ADR(1) | 7,208 | 2,723,687 | ||||||
Ascendis Pharma A/S, ADR(1) | 11,549 | 1,034,444 | ||||||
Blueprint Medicines Corp.(1) | 15,014 | 1,099,325 | ||||||
Regeneron Pharmaceuticals, Inc.(1) | 7,842 | 4,556,672 | ||||||
| 12,466,024 | ||||||||
| Capital Markets — 5.9% | ||||||||
| Intercontinental Exchange, Inc. | 37,185 | 3,750,107 | ||||||
| S&P Global, Inc. | 13,052 | 4,596,654 | ||||||
| 8,346,761 | ||||||||
| Electronic Equipment, Instruments and Components — 1.1% | ||||||||
| Cognex Corp. | 37,937 | 1,597,527 | ||||||
| Energy Equipment and Services — 1.4% | ||||||||
| Cactus, Inc., Class A | 48,339 | 1,931,143 | ||||||
| Entertainment — 0.4% | ||||||||
Netflix, Inc.(1) | 2,455 | 548,840 | ||||||
| Health Care Equipment and Supplies — 3.9% | ||||||||
Intuitive Surgical, Inc.(1) | 21,338 | 4,390,080 | ||||||
Silk Road Medical, Inc.(1) | 26,550 | 1,057,487 | ||||||
| 5,447,567 | ||||||||
| Hotels, Restaurants and Leisure — 3.2% | ||||||||
Chipotle Mexican Grill, Inc.(1) | 2,862 | 4,570,042 | ||||||
| Interactive Media and Services — 7.8% | ||||||||
Alphabet, Inc., Class C(1) | 99,880 | 10,901,902 | ||||||
| Internet and Direct Marketing Retail — 9.0% | ||||||||
Amazon.com, Inc.(1) | 99,361 | 12,595,994 | ||||||
| IT Services — 12.2% | ||||||||
Block, Inc.(1) | 32,273 | 2,223,932 | ||||||
| Mastercard, Inc., Class A | 16,301 | 5,287,555 | ||||||
Okta, Inc.(1) | 37,194 | 3,399,532 | ||||||
| Visa, Inc., Class A | 31,352 | 6,229,956 | ||||||
| 17,140,975 | ||||||||
| Machinery — 6.7% | ||||||||
| Graco, Inc. | 53,239 | 3,398,778 | ||||||
| Westinghouse Air Brake Technologies Corp. | 68,533 | 6,006,917 | ||||||
| 9,405,695 | ||||||||
12
| Focused Dynamic Growth ETF | ||||||||
| Shares | Value | |||||||
| Professional Services — 1.2% | ||||||||
| Verisk Analytics, Inc. | 9,094 | $ | 1,702,033 | |||||
| Semiconductors and Semiconductor Equipment — 7.1% | ||||||||
| Monolithic Power Systems, Inc. | 13,376 | 6,061,736 | ||||||
| NVIDIA Corp. | 25,493 | 3,847,913 | ||||||
| 9,909,649 | ||||||||
| Software — 10.2% | ||||||||
Bill.com Holdings, Inc.(1) | 24,747 | 4,006,044 | ||||||
DocuSign, Inc.(1) | 31,743 | 1,848,078 | ||||||
Paylocity Holding Corp.(1) | 23,982 | 5,779,662 | ||||||
Salesforce, Inc.(1) | 16,860 | 2,632,183 | ||||||
| 14,265,967 | ||||||||
| Textiles, Apparel and Luxury Goods — 2.8% | ||||||||
| NIKE, Inc., Class B | 36,760 | 3,913,102 | ||||||
TOTAL COMMON STOCKS (Cost $140,872,405) | 138,662,309 | |||||||
| SHORT-TERM INVESTMENTS — 1.3% | ||||||||
| Money Market Funds — 1.3% | ||||||||
State Street Institutional U.S. Government Money Market Fund, Premier Class (Cost $1,851,155) | 1,851,155 | 1,851,155 | ||||||
TOTAL INVESTMENT SECURITIES — 100.1% (Cost $142,723,560) | 140,513,464 | |||||||
| OTHER ASSETS AND LIABILITIES — (0.1)% | (180,560) | |||||||
| TOTAL NET ASSETS — 100.0% | $ | 140,332,904 | ||||||
| NOTES TO SCHEDULE OF INVESTMENTS | ||||||||
| ADR | - | American Depositary Receipt | ||||||
(1)Non-income producing.
See Notes to Financial Statements.
13
AUGUST 31, 2022
| Focused Large Cap Value ETF | ||||||||
| Shares | Value | |||||||
| COMMON STOCKS — 98.7% | ||||||||
| Aerospace and Defense — 2.3% | ||||||||
| Raytheon Technologies Corp. | 55,511 | $ | 4,982,112 | |||||
| Airlines — 1.1% | ||||||||
Southwest Airlines Co.(1) | 66,766 | 2,450,312 | ||||||
| Banks — 4.4% | ||||||||
| JPMorgan Chase & Co. | 52,370 | 5,956,040 | ||||||
| Truist Financial Corp. | 72,913 | 3,415,245 | ||||||
| 9,371,285 | ||||||||
| Beverages — 1.6% | ||||||||
| PepsiCo, Inc. | 20,027 | 3,450,051 | ||||||
| Capital Markets — 4.0% | ||||||||
| Bank of New York Mellon Corp. | 131,629 | 5,466,552 | ||||||
| BlackRock, Inc. | 4,507 | 3,003,420 | ||||||
| 8,469,972 | ||||||||
| Commercial Services and Supplies — 1.8% | ||||||||
| Republic Services, Inc. | 26,466 | 3,777,228 | ||||||
| Communications Equipment — 3.6% | ||||||||
| Cisco Systems, Inc. | 109,485 | 4,896,169 | ||||||
F5, Inc.(1) | 17,951 | 2,819,384 | ||||||
| 7,715,553 | ||||||||
| Containers and Packaging — 1.5% | ||||||||
| Packaging Corp. of America | 7,806 | 1,068,798 | ||||||
| Sonoco Products Co. | 34,248 | 2,158,309 | ||||||
| 3,227,107 | ||||||||
| Diversified Financial Services — 3.7% | ||||||||
Berkshire Hathaway, Inc., Class B(1) | 28,269 | 7,937,935 | ||||||
| Diversified Telecommunication Services — 3.0% | ||||||||
| Verizon Communications, Inc. | 155,246 | 6,490,835 | ||||||
| Electric Utilities — 3.1% | ||||||||
| Duke Energy Corp. | 31,116 | 3,326,611 | ||||||
| Pinnacle West Capital Corp. | 43,485 | 3,276,595 | ||||||
| 6,603,206 | ||||||||
| Electrical Equipment — 4.8% | ||||||||
ABB Ltd., ADR(2) | 58,665 | 1,617,394 | ||||||
| Emerson Electric Co. | 60,015 | 4,905,626 | ||||||
| Hubbell, Inc. | 9,600 | 1,980,480 | ||||||
| nVent Electric PLC | 50,765 | 1,673,215 | ||||||
| 10,176,715 | ||||||||
| Electronic Equipment, Instruments and Components — 0.9% | ||||||||
| TE Connectivity Ltd. | 14,441 | 1,822,599 | ||||||
| Entertainment — 0.9% | ||||||||
Walt Disney Co.(1) | 16,761 | 1,878,573 | ||||||
| Equity Real Estate Investment Trusts (REITs) — 1.3% | ||||||||
| Public Storage | 8,487 | 2,807,754 | ||||||
| Food and Staples Retailing — 2.4% | ||||||||
| Sysco Corp. | 30,946 | 2,544,380 | ||||||
| Walmart, Inc. | 20,299 | 2,690,633 | ||||||
| 5,235,013 | ||||||||
14
| Focused Large Cap Value ETF | ||||||||
| Shares | Value | |||||||
| Food Products — 3.9% | ||||||||
| Conagra Brands, Inc. | 122,381 | $ | 4,207,459 | |||||
| Mondelez International, Inc., Class A | 66,589 | 4,119,195 | ||||||
| 8,326,654 | ||||||||
| Gas Utilities — 3.2% | ||||||||
| Atmos Energy Corp. | 59,459 | 6,741,462 | ||||||
| Health Care Equipment and Supplies — 9.0% | ||||||||
| Becton Dickinson and Co. | 10,790 | 2,723,612 | ||||||
| Medtronic PLC | 120,515 | 10,595,679 | ||||||
| Zimmer Biomet Holdings, Inc. | 55,382 | 5,888,214 | ||||||
| 19,207,505 | ||||||||
| Health Care Providers and Services — 4.5% | ||||||||
Henry Schein, Inc.(1) | 26,907 | 1,975,243 | ||||||
| Humana, Inc. | 4,057 | 1,954,581 | ||||||
| Quest Diagnostics, Inc. | 14,179 | 1,776,771 | ||||||
| UnitedHealth Group, Inc. | 7,645 | 3,970,278 | ||||||
| 9,676,873 | ||||||||
| Household Products — 2.6% | ||||||||
| Colgate-Palmolive Co. | 9,065 | 708,974 | ||||||
| Kimberly-Clark Corp. | 38,064 | 4,853,921 | ||||||
| 5,562,895 | ||||||||
| Industrial Conglomerates — 0.4% | ||||||||
| Honeywell International, Inc. | 4,372 | 827,838 | ||||||
| Insurance — 12.1% | ||||||||
| Aflac, Inc. | 59,502 | 3,535,609 | ||||||
| Allstate Corp. | 56,275 | 6,781,137 | ||||||
| Chubb Ltd. | 23,897 | 4,517,728 | ||||||
| Marsh & McLennan Cos., Inc. | 35,109 | 5,665,539 | ||||||
| Reinsurance Group of America, Inc. | 42,266 | 5,298,466 | ||||||
| 25,798,479 | ||||||||
| Oil, Gas and Consumable Fuels — 6.9% | ||||||||
| Exxon Mobil Corp. | 80,910 | 7,734,187 | ||||||
| TotalEnergies SE, ADR | 140,787 | 7,111,151 | ||||||
| 14,845,338 | ||||||||
| Personal Products — 3.9% | ||||||||
Unilever PLC, ADR(2) | 181,408 | 8,234,109 | ||||||
| Pharmaceuticals — 9.1% | ||||||||
| Johnson & Johnson | 69,951 | 11,285,894 | ||||||
| Merck & Co., Inc. | 52,434 | 4,475,766 | ||||||
| Novartis AG, ADR | 46,722 | 3,762,056 | ||||||
| 19,523,716 | ||||||||
| Semiconductors and Semiconductor Equipment — 1.0% | ||||||||
| Texas Instruments, Inc. | 12,766 | 2,109,071 | ||||||
| Software — 1.7% | ||||||||
| Open Text Corp. | 71,374 | 2,246,853 | ||||||
| Oracle Corp. (New York) | 18,559 | 1,376,149 | ||||||
| 3,623,002 | ||||||||
TOTAL COMMON STOCKS (Cost $202,623,061) | 210,873,192 | |||||||
15
| Focused Large Cap Value ETF | ||||||||
| Shares | Value | |||||||
| SHORT-TERM INVESTMENTS — 1.6% | ||||||||
| Money Market Funds — 1.6% | ||||||||
| State Street Institutional U.S. Government Money Market Fund, Premier Class | 2,250,435 | $ | 2,250,435 | |||||
State Street Navigator Securities Lending Government Money Market Portfolio(3) | 1,242,944 | 1,242,944 | ||||||
TOTAL SHORT-TERM INVESTMENTS (Cost $3,493,379) | 3,493,379 | |||||||
TOTAL INVESTMENT SECURITIES — 100.3% (Cost $206,116,440) | 214,366,571 | |||||||
| OTHER ASSETS AND LIABILITIES — (0.3)% | (597,350) | |||||||
| TOTAL NET ASSETS — 100.0% | $ | 213,769,221 | ||||||
| NOTES TO SCHEDULE OF INVESTMENTS | ||||||||
| ADR | - | American Depositary Receipt | ||||||
(1)Non-income producing.
(2)Security, or a portion thereof, is on loan. At the period end, the aggregate value of securities on loan was $5,209,932. The amount of securities on loan indicated may not correspond with the securities on loan identified because securities with pending sales are in the process of recall from the brokers.
(3)Investment of cash collateral from securities on loan. At the period end, the aggregate value of the collateral held by the fund was $5,361,421, which includes securities collateral of $4,118,477.
See Notes to Financial Statements.
16
| Statements of Assets and Liabilities | ||
| AUGUST 31, 2022 | ||||||||
| Focused Dynamic Growth ETF | Focused Large Cap Value ETF | |||||||
| Assets | ||||||||
| Investment securities, at value (cost of $142,723,560 and $204,873,496, respectively) — including $— and $5,209,932, respectively of securities on loan | $ | 140,513,464 | $ | 213,123,627 | ||||
| Investment made with cash collateral received for securities on loan, at value (cost of $— and $1,242,944, respectively) | — | 1,242,944 | ||||||
| Total investment securities, at value (cost of $142,723,560 and $206,116,440, respectively) | 140,513,464 | 214,366,571 | ||||||
| Receivable for capital shares sold | 4,667,208 | — | ||||||
| Dividends and interest receivable | 32,529 | 723,337 | ||||||
| Securities lending receivable | — | 1,434 | ||||||
| 145,213,201 | 215,091,342 | |||||||
| Liabilities | ||||||||
| Payable for collateral received for securities on loan | — | 1,242,944 | ||||||
| Payable for investments purchased | 4,825,423 | — | ||||||
| Accrued management fees | 54,874 | 79,177 | ||||||
| 4,880,297 | 1,322,121 | |||||||
| Net Assets | $ | 140,332,904 | $ | 213,769,221 | ||||
| Shares outstanding (unlimited number of shares authorized) | 2,430,000 | 3,755,000 | ||||||
| Net Asset Value Per Share | $ | 57.75 | $ | 56.93 | ||||
| Net Assets Consist of: | ||||||||
| Capital paid in | $ | 162,332,336 | $ | 199,691,397 | ||||
| Distributable earnings | (21,999,432) | 14,077,824 | ||||||
| $ | 140,332,904 | $ | 213,769,221 | |||||
See Notes to Financial Statements.
17
| Statements of Operations | ||
| YEAR ENDED AUGUST 31, 2022 | ||||||||
| Focused Dynamic Growth ETF | Focused Large Cap Value ETF | |||||||
| Investment Income (Loss) | ||||||||
| Income: | ||||||||
| Dividends (net of foreign taxes withheld of $— and $132,307, respectively) | $ | 453,401 | $ | 5,670,941 | ||||
| Interest | 6,621 | 11,539 | ||||||
| Securities lending, net | 74 | 2,231 | ||||||
| 460,096 | 5,684,711 | |||||||
| Expenses: | ||||||||
| Management fees | 785,114 | 962,439 | ||||||
| Net investment income (loss) | (325,018) | 4,722,272 | ||||||
| Realized and Unrealized Gain (Loss) | ||||||||
| Net realized gain (loss) on investment transactions | (7,024,149) | 18,521,090 | ||||||
| Change in net unrealized appreciation (depreciation) on investments | (69,246,962) | (33,742,584) | ||||||
| Net realized and unrealized gain (loss) | (76,271,111) | (15,221,494) | ||||||
| Net Increase (Decrease) in Net Assets Resulting from Operations | $ | (76,596,129) | $ | (10,499,222) | ||||
See Notes to Financial Statements.
18
| Statements of Changes in Net Assets | ||
| YEARS ENDED AUGUST 31, 2022 AND AUGUST 31, 2021 | ||||||||||||||
| Focused Dynamic Growth ETF | Focused Large Cap Value ETF | |||||||||||||
| Increase (Decrease) in Net Assets | August 31, 2022 | August 31, 2021 | August 31, 2022 | August 31, 2021 | ||||||||||
| Operations | ||||||||||||||
| Net investment income (loss) | $ | (325,018) | $ | (370,443) | $ | 4,722,272 | $ | 3,728,184 | ||||||
| Net realized gain (loss) | (7,024,149) | 27,904,615 | 18,521,090 | 5,086,205 | ||||||||||
| Change in net unrealized appreciation (depreciation) | (69,246,962) | 23,407,498 | (33,742,584) | 37,043,077 | ||||||||||
| Net increase (decrease) in net assets resulting from operations | (76,596,129) | 50,941,670 | (10,499,222) | 45,857,466 | ||||||||||
| Distributions to Shareholders | ||||||||||||||
| From earnings | — | (21,840) | (9,716,163) | (2,991,009) | ||||||||||
| Capital Share Transactions | ||||||||||||||
| Proceeds from shares sold | 43,427,709 | 59,816,448 | 25,226,721 | 138,524,192 | ||||||||||
| Payments for shares redeemed | (57,885,327) | (88,569,594) | (55,367,369) | — | ||||||||||
| Other capital | 1,646 | 4,916 | 1,808 | 9,570 | ||||||||||
| Net increase (decrease) in net assets from capital share transactions | (14,455,972) | (28,748,230) | (30,138,840) | 138,533,762 | ||||||||||
| Net increase (decrease) in net assets | (91,052,101) | 22,171,600 | (50,354,225) | 181,400,219 | ||||||||||
| Net Assets | ||||||||||||||
| Beginning of period | 231,385,005 | 209,213,405 | 264,123,446 | 82,723,227 | ||||||||||
| End of period | $ | 140,332,904 | $ | 231,385,005 | $ | 213,769,221 | $ | 264,123,446 | ||||||
| Transactions in Shares of the Funds | ||||||||||||||
| Sold | 585,000 | 780,000 | 420,000 | 2,560,000 | ||||||||||
| Redeemed | (820,000) | (1,190,000) | (915,000) | — | ||||||||||
| Net increase (decrease) in shares of the funds | (235,000) | (410,000) | (495,000) | 2,560,000 | ||||||||||
See Notes to Financial Statements.
19
| Notes to Financial Statements | ||
AUGUST 31, 2022
1. Organization
American Century ETF Trust (the trust) was registered as a Delaware statutory trust in 2017 and is registered under the Investment Company Act of 1940, as amended (the 1940 Act), as an open-end management investment company. American Century Focused Dynamic Growth ETF (Focused Dynamic Growth ETF) and American Century Focused Large Cap Value ETF (Focused Large Cap Value ETF) (collectively, the funds) are two funds in a series issued by the trust. Each fund's investment objective is to seek long-term capital growth. Shares of each fund are listed for trading on the Cboe BZX Exchange, Inc.
2. Significant Accounting Policies
The following is a summary of significant accounting policies consistently followed by the funds in preparation of their financial statements. Each fund is an investment company and follows accounting and reporting guidance in accordance with accounting principles generally accepted in the United States of America. This may require management to make certain estimates and assumptions at the date of the financial statements. Actual results could differ from these estimates. Management evaluated the impact of events or transactions occurring through the date the financial statements were issued that would merit recognition or disclosure.
Investment Valuations — The funds determine the fair value of their investments and compute their net asset value (NAV) per share at the close of regular trading (usually 4 p.m. Eastern time) on the New York Stock Exchange (NYSE) on each day the NYSE is open. The Board of Trustees has adopted valuation policies and procedures to guide the investment advisor in the funds' investment valuation process and to provide methodologies for the oversight of the funds' pricing function.
Equity securities that are listed or traded on a domestic securities exchange are valued at the last reported sales price or at the official closing price as provided by the exchange. Equity securities traded on foreign securities exchanges are generally valued at the closing price of such securities on the exchange where primarily traded or at the close of the NYSE, if that is earlier. If no last sales price is reported, or if local convention or regulation so provides, the mean of the latest bid and asked prices may be used. Securities traded over-the-counter are valued at the mean of the latest bid and asked prices, the last sales price, or the official closing price.
Open-end management investment companies are valued at the reported NAV per share.
If the funds determine that the market price for an investment is not readily available or the valuation methods mentioned above do not reflect an investment’s fair value, such investment is valued as determined in good faith by the Board of Trustees or its delegate, in accordance with policies and procedures adopted by the Board of Trustees. In its determination of fair value, the funds may review several factors including, but not limited to, market information regarding the specific investment or comparable investments and correlation with other investment types, futures indices or general market indicators. Circumstances that may cause the funds to use these procedures to value an investment include, but are not limited to: an investment has been declared in default or is distressed; trading in a security has been suspended during the trading day or a security is not actively trading on its principal exchange; prices received from a regular pricing source are deemed unreliable; or there is a foreign market holiday and no trading occurred.
The funds monitor for significant events occurring after the close of an investment’s primary exchange but before each fund’s NAV per share is determined. Significant events may include, but are not limited to: corporate announcements and transactions; governmental action and political unrest that could impact a specific investment or an investment sector; or armed conflicts, natural disasters and similar events that could affect investments in a specific country or region. The funds also monitor for significant fluctuations between domestic and foreign markets, as evidenced by the U.S. market or such other indicators that the Board of Trustees, or its delegate, deems appropriate. The funds may apply a model-derived factor to the closing price of equity securities traded on foreign securities exchanges. The factor is based on observable market data as provided by an independent pricing service.
20
Security Transactions — Security transactions are accounted for as of the trade date. Net realized gains and losses are determined on the identified cost basis, which is also used for federal income tax purposes.
Investment Income — Dividend income less foreign taxes withheld, if any, is recorded as of the ex-dividend date. Distributions received on securities that represent a return of capital or long-term capital gain are recorded as a reduction of cost of investments and/or as a realized gain. The funds may estimate the components of distributions received that may be considered nontaxable distributions or long-term capital gain distributions for income tax purposes. Interest income is recorded on the accrual basis and includes accretion of discounts and amortization of premiums. Securities lending income is net of fees and rebates earned by the lending agent for its services.
Segregated Assets — In accordance with the 1940 Act, the funds segregate assets on their books and records to cover certain types of investment securities and other financial instruments. American Century Investment Management, Inc. (ACIM) (the investment advisor) monitors, on a daily basis, the securities segregated to ensure the funds designate a sufficient amount of liquid assets, marked-to-market daily. The funds may also receive assets or be required to pledge assets at the custodian bank or with a broker for collateral requirements.
Income Tax Status — It is each fund’s policy to distribute substantially all net investment income and net realized gains to shareholders and to otherwise qualify as a regulated investment company under provisions of the Internal Revenue Code. Accordingly, no provision has been made for income taxes. The funds file U.S. federal, state, local and non-U.S. tax returns as applicable. The funds' tax returns are subject to examination by the relevant taxing authority until expiration of the applicable statute of limitations, which is generally three years from the date of filing but can be longer in certain jurisdictions. At this time, management believes there are no uncertain tax positions which, based on their technical merit, would not be sustained upon examination and for which it is reasonably possible that the total amounts of unrecognized tax benefits will significantly change in the next twelve months.
Distributions to Shareholders — Distributions from net investment income, if any, are generally declared and paid quarterly. Distributions from net realized gains, if any, are generally declared and paid annually. Each fund may elect to treat a portion of its payment to a redeeming shareholder, which represents the pro rata share of undistributed net investment income and net realized gains, as a distribution for federal income tax purposes (tax equalization).
Indemnifications — Under the trust’s organizational documents, its officers and trustees are indemnified against certain liabilities arising out of the performance of their duties to the funds. In addition, in the normal course of business, the funds enter into contracts that provide general indemnifications. The maximum exposure under these arrangements is unknown as this would involve future claims that may be made against a fund. The risk of material loss from such claims is considered by management to be remote.
Securities Lending — Securities are lent to qualified financial institutions and brokers. State Street Bank & Trust Co. serves as securities lending agent to the funds pursuant to a Securities Lending Agreement. The lending of securities exposes the funds to risks such as: the borrowers may fail to return the loaned securities, the borrowers may not be able to provide additional collateral, the funds may experience delays in recovery of the loaned securities or delays in access to collateral, or the funds may experience losses related to the investment collateral. To minimize certain risks, loan counterparties pledge collateral in the form of cash and/or securities. The lending agent has agreed to indemnify the funds in the case of default of any securities borrowed. Cash collateral received is invested in the State Street Navigator Securities Lending Government Money Market Portfolio, a money market mutual fund registered under the 1940 Act. The loans may also be secured by U.S. government securities in an amount at least equal to the market value of the securities loaned, plus accrued interest and dividends, determined on a daily basis and adjusted accordingly. By lending securities, the funds seek to increase their net investment income through the receipt of interest and fees. Such income is reflected separately within the Statements of Operations. The value of loaned securities and related collateral outstanding at period end, if any, are shown on a gross basis within the Schedules of Investments and Statements of Assets and Liabilities.
21
The following table reflects a breakdown of transactions accounted for as secured borrowings, the gross obligation by the type of collateral pledged, and the remaining contractual maturity of those transactions as of August 31, 2022.
| Remaining Contractual Maturity of Agreements | |||||||||||||||||
Fund / Securities Lending Transactions(1) | Overnight and Continuous | <30 days | Between 30 & 90 days | >90 days | Total | ||||||||||||
| Focused Large Cap Value ETF | |||||||||||||||||
| Common Stocks | $ | 1,242,944 | — | — | — | $ | 1,242,944 | ||||||||||
| Gross amount of recognized liabilities for securities lending transactions | $ | 1,242,944 | |||||||||||||||
(1)Amount represents the payable for cash collateral received for securities on loan. This will generally be in the Overnight and Continuous column as the securities are typically callable on demand
3. Fees and Transactions with Related Parties
Certain officers and trustees of the trust are also officers and/or directors of American Century Companies, Inc. (ACC). The trust's investment advisor, ACIM, and the trust’s administrator, American Century Services, LLC, are wholly owned, directly or indirectly, by ACC. Various funds issued by American Century Strategic Asset Allocations, Inc. own, in aggregate, 39% and 35% of the shares of Focused Dynamic Growth ETF and Focused Large Cap Value ETF, respectively. Related parties do not invest in the funds for the purpose of exercising management or control.
Management Fees — The trust has entered into a management agreement with ACIM, under which ACIM provides the funds with investment advisory and management services in exchange for a single, unified management fee (the fee). The agreement provides that ACIM will pay all expenses of managing and operating the funds, except brokerage and other transaction fees and expenses relating to the acquisition and disposition of portfolio securities, acquired fund fees and expenses, interest, taxes, litigation expenses and extraordinary expenses. The fee is computed and accrued daily based on the daily net assets of each fund and paid monthly in arrears.
The annual management fee for each fund is as follows:
| Annual Management Fee | |||||
| Focused Dynamic Growth ETF | 0.45% | ||||
| Focused Large Cap Value ETF | 0.42% | ||||
4. Investment Transactions
Purchases and sales of investment securities, excluding short-term investments and in kind transactions, for the period ended August 31, 2022 were as follows:
| Focused Dynamic Growth ETF | Focused Large Cap Value ETF | |||||||
| Purchases | $74,325,153 | $65,689,361 | ||||||
| Sales | $73,190,199 | $50,887,391 | ||||||
Securities received or delivered in kind through subscriptions and redemptions and in kind net realized gain (loss) for the period ended August 31, 2022 were as follows:
| In kind Subscriptions | In kind Redemptions | In kind Net Realized Gain/(Loss)* | |||||||||
| Focused Dynamic Growth ETF | $31,582,883 | $46,995,605 | $12,731,524 | ||||||||
| Focused Large Cap Value ETF | $3,252,343 | $53,772,134 | $12,066,853 | ||||||||
*Net realized gain (loss) on in kind transactions are not considered taxable for federal income tax purposes.
22
5. Capital Share Transactions
Each fund’s shares may only be bought and sold in a secondary market through a broker-dealer at a market price. Because ETF shares trade at market prices rather than NAV, shares may trade at a price greater than NAV (a premium) or less than NAV (a discount). Each fund issues and redeems shares at their NAV only in aggregations of a specified number of shares (a creation unit) generally in exchange for a designated portfolio of securities and/or cash (including any portion of such securities for which cash may be substituted). Authorized participants may be required to pay an additional variable charge to cover certain brokerage, tax, foreign exchange, execution, market impact and other costs and expenses related to the execution of trades resulting from creation unit transactions. Such variable charges, if any, are included in other capital within the Statements of Changes in Net Assets.
6. Fair Value Measurements
The funds’ investment valuation process is based on several considerations and may use multiple inputs to determine the fair value of the investments held by the funds. In conformity with accounting principles generally accepted in the United States of America, the inputs used to determine a valuation are classified into three broad levels.
•Level 1 valuation inputs consist of unadjusted quoted prices in an active market for identical investments.
•Level 2 valuation inputs consist of direct or indirect observable market data (including quoted prices for comparable investments, evaluations of subsequent market events, interest rates, prepayment speeds, credit risk, etc.). These inputs also consist of quoted prices for identical investments initially expressed in local currencies that are adjusted through translation into U.S. dollars.
•Level 3 valuation inputs consist of unobservable data (including a fund’s own assumptions).
The level classification is based on the lowest level input that is significant to the fair valuation measurement. The valuation inputs are not necessarily an indication of the risks associated with investing in these securities or other financial instruments.
As of period end, the funds’ investment securities were classified as Level 1. The Schedules of Investments provide additional information on the funds’ portfolio holdings.
7. Risk Factors
The value of the funds’ shares will go up and down, sometimes rapidly or unpredictably, based on the performance of the securities owned by the funds and other factors generally affecting the securities market. Market risks, including political, regulatory, economic and social developments, can affect the value of the funds’ investments. Natural disasters, public health emergencies, war, terrorism and other unforeseeable events may lead to increased market volatility and may have adverse long-term effects on world economies and markets generally.
There are certain risks involved in investing in foreign securities. These risks include those resulting from political events (such as civil unrest, national elections and imposition of exchange controls), social and economic events (such as labor strikes and rising inflation), and natural disasters. Securities of foreign issuers may be less liquid and more volatile. Investing a significant portion of assets in one country or region may accentuate these risks.
8. Federal Tax Information
The tax character of distributions paid during the years ended August 31, 2022 and August 31, 2021 were as follows:
| 2022 | 2021 | |||||||||||||
| Distributions Paid From: | Distributions Paid From: | |||||||||||||
| Ordinary Income | Long-term Capital Gains | Ordinary Income | Long-term Capital Gains | |||||||||||
| Focused Dynamic Growth ETF | — | — | $ | 21,565 | $ | 275 | ||||||||
| Focused Large Cap Value ETF | $ | 9,198,604 | $ | 517,559 | $ | 2,991,009 | — | |||||||
23
The book-basis character of distributions made during the year from net investment income or net realized gains may differ from their ultimate characterization for federal income tax purposes. These differences reflect the differing character of certain income items and net realized gains and losses for financial statement and tax purposes, and may result in reclassification among certain capital accounts on the financial statements.
The reclassifications for Focused Dynamic Growth ETF and Focused Large Cap Value ETF, which are primarily due to in kind transactions, were made to capital paid in $11,960,914 and $13,706,266 and distributable earnings $(11,960,914) and $(13,706,266),respectively.
As of period end, the federal tax cost of investments and the components of distributable earnings on a tax-basis were as follows:
| Focused Dynamic Growth ETF | Focused Large Cap Value ETF | |||||||
| Federal tax cost of investments | $ | 143,897,499 | $ | 206,240,807 | ||||
| Gross tax appreciation of investments | $ | 15,522,153 | $ | 19,316,800 | ||||
| Gross tax depreciation of investments | (18,906,188) | (11,191,036) | ||||||
| Net tax appreciation (depreciation) of investments | $ | (3,384,035) | $ | 8,125,764 | ||||
| Undistributed ordinary income | — | $ | 1,156,030 | |||||
| Accumulated long-term gains | — | $ | 4,796,030 | |||||
| Accumulated short -term capital losses | $ | (10,714,374) | — | |||||
| Accumulated long-term capital losses | $ | (7,768,132) | — | |||||
| Late-year ordinary loss deferral | $ | (132,891) | — | |||||
The difference between book-basis and tax-basis unrealized appreciation (depreciation) is attributable primarily to the tax deferral of losses on wash sales.
Accumulated capital losses represent net capital loss carryovers that may be used to offset future realized capital gains for federal income tax purposes. The capital loss carryovers may be carried forward for an unlimited period. Future capital loss carryover utilization in any given year may be subject to Internal Revenue Code limitations.
Loss deferrals represent certain qualified losses that the funds have elected to treat as having been incurred in the following fiscal year for federal income tax purposes.
24
| Financial Highlights | ||
| For a Share Outstanding Throughout the Years Ended August 31 (except as noted) | ||||||||||||||||||||||||||||||||||||||
| Per-Share Data | Ratios and Supplemental Data | |||||||||||||||||||||||||||||||||||||
| Income From Investment Operations: | Ratio to Average Net Assets of: | |||||||||||||||||||||||||||||||||||||
| Net Asset Value, Beginning of Period | Net Investments Income (Loss)(1) | Net Realized and Unrealized Gain (Loss) | Total From Investment Operations | Distributions From Net Investment Income | Other Capital(1) | Net Asset Value, End of Period | Total Return(2) | Operating Expenses | Net Investment Income (Loss) | Portfolio Turnover Rate(3) | Net Assets, End of Period (in thousands) | |||||||||||||||||||||||||||
| Focused Dynamic Growth ETF | ||||||||||||||||||||||||||||||||||||||
| 2022 | $86.82 | (0.13) | (28.94) | (29.07) | — | 0.00(4) | $57.75 | (33.49)% | 0.45% | (0.19)% | 42% | $140,333 | ||||||||||||||||||||||||||
| 2021 | $68.04 | (0.13) | 18.92 | 18.79 | (0.01) | 0.00(4) | $86.82 | 27.61% | 0.45% | (0.17)% | 28% | $231,385 | ||||||||||||||||||||||||||
2020(5) | $40.00 | (0.04) | 28.07 | 28.03 | — | 0.01 | $68.04 | 70.11% | 0.45%(6) | (0.16)%(6) | 27% | $209,213 | ||||||||||||||||||||||||||
| Notes to Financial Highlights | ||
(1)Computed using average shares outstanding throughout the period.
(2)Total returns are calculated based on the net asset value of the last business day. Total returns for periods less than one year are not annualized.
(3)Excludes securities received or delivered in kind.
(4)Per-share amount was less than $0.005.
(5)March 31, 2020 (fund inception) through August 31, 2020.
(6)Annualized.
See Notes to Financial Statements.
| For a Share Outstanding Throughout the Years Ended August 31 (except as noted) | ||||||||||||||||||||||||||||||||||||||||||||
| Per-Share Data | Ratios and Supplemental Data | |||||||||||||||||||||||||||||||||||||||||||
| Income From Investment Operations: | Distributions From: | Ratio to Average Net Assets of: | ||||||||||||||||||||||||||||||||||||||||||
| Net Asset Value, Beginning of Period | Net Investments Income (Loss)(1) | Net Realized and Unrealized Gain (Loss) | Total From Investment Operations | Net Investment Income | Net Realized Gains | Total Distributions | Other Capital(1) | Net Asset Value, End of Period | Total Return(2) | Operating Expenses | Net Investment Income (Loss) | Portfolio Turnover Rate(3) | Net Assets, End of Period (in thousands) | |||||||||||||||||||||||||||||||
| Focused Large Cap Value ETF | ||||||||||||||||||||||||||||||||||||||||||||
| 2022 | $62.15 | 1.24 | (3.89) | (2.65) | (1.23) | (1.34) | (2.57) | 0.00(4) | $56.93 | (4.41)% | 0.42% | 2.06% | 22% | $213,769 | ||||||||||||||||||||||||||||||
| 2021 | $48.95 | 1.14 | 13.01 | 14.15 | (0.95) | — | (0.95) | 0.00(4) | $62.15 | 29.19% | 0.42% | 2.00% | 36% | $264,123 | ||||||||||||||||||||||||||||||
2020(5) | $40.00 | 0.41 | 8.59 | 9.00 | (0.06) | — | (0.06) | 0.01 | $48.95 | 22.53% | 0.42%(6) | 2.10%(6) | 73% | $82,723 | ||||||||||||||||||||||||||||||
| Notes to Financial Highlights | ||
(1)Computed using average shares outstanding throughout the period.
(2)Total returns are calculated based on the net asset value of the last business day. Total returns for periods less than one year are not annualized.
(3)Excludes securities received or delivered in kind.
(4)Per-share amount was less than $0.005.
(5)March 31, 2020 (fund inception) through August 31, 2020.
(6)Annualized.
See Notes to Financial Statements.
| Report of Independent Registered Public Accounting Firm | ||
To the Shareholders and the Board of Trustees of American Century ETF Trust:
Opinion on the Financial Statements and Financial Highlights
We have audited the accompanying statements of assets and liabilities, including the schedules of investments, of American Century Focused Dynamic Growth ETF and American Century Focused Large Cap Value ETF (the “Funds”), two of the funds constituting the American Century ETF Trust, as of August 31, 2022, the related statements of operations, statements of changes in net assets, and financial highlights for the periods indicated in the table below; and the related notes. In our opinion, the financial statements and financial highlights present fairly, in all material respects, the financial position of each of the Funds constituting American Century ETF Trust as of August 31, 2022, and the results of their operations, the changes in their net assets, and the financial highlights for the periods listed in the table below, in conformity with accounting principles generally accepted in the United States of America.
| Individual Fund Constituting the American Century ETF Trust | Statement of Operations | Statements of Changes in Net Assets | Financial Highlights | ||||||||
| American Century Focused Dynamic Growth ETF | For the year ended August 31, 2022 | For the years ended August 31, 2022 and 2021 | For the years ended August 31, 2022, 2021 and the period from March 31, 2020 (fund inception) through August 31, 2020 | ||||||||
| American Century Focused Large Cap Value ETF | |||||||||||
Basis for Opinion
These financial statements and financial highlights are the responsibility of the Funds’ management. Our responsibility is to express an opinion on the Funds’ financial statements and financial highlights based on our audits. We are a public accounting firm registered with the Public Company Accounting Oversight Board (United States) (PCAOB) and are required to be independent with respect to the Funds in accordance with the U.S. federal securities laws and the applicable rules and regulations of the Securities and Exchange Commission and the PCAOB.
We conducted our audits in accordance with the standards of the PCAOB. Those standards require that we plan and perform the audit to obtain reasonable assurance about whether the financial statements and financial highlights are free of material misstatement, whether due to error or fraud. The Funds are not required to have, nor were we engaged to perform, an audit of their internal control over financial reporting. As part of our audits, we are required to obtain an understanding of internal control over financial reporting but not for the purpose of expressing an opinion on the effectiveness of the Funds’ internal control over financial reporting. Accordingly, we express no such opinion.
27
Our audits included performing procedures to assess the risks of material misstatement of the financial statements and financial highlights, whether due to error or fraud, and performing procedures that respond to those risks. Such procedures included examining, on a test basis, evidence regarding the amounts and disclosures in the financial statements and financial highlights. Our audits also included evaluating the accounting principles used and significant estimates made by management, as well as evaluating the overall presentation of the financial statements and financial highlights. Our procedures included confirmation of securities owned as of August 31, 2022, by correspondence with the custodian and brokers; when replies were not received from brokers, we performed other auditing procedures. We believe that our audits provide a reasonable basis for our opinion.
/s/ Deloitte & Touche LLP
Kansas City, Missouri
October 17, 2022
We have served as the auditor of one or more American Century investment companies since 1997.
28
| Management | ||
The Board of Trustees
The individuals listed below serve as trustees of the funds. Each trustee will continue to serve in this capacity until death, retirement, resignation or removal from office. The board has adopted a mandatory retirement age for trustees who are not “interested persons,” as that term is defined in the Investment Company Act (independent trustees). Trustees who are not also officers of the trust shall retire on December 31st of the year in which they reach their 75th birthday.
Jonathan S. Thomas is an “interested person” because he currently serves as President and Chief Executive Officer of American Century Companies, Inc. (ACC), the parent company of American Century Investment Management, Inc. (ACIM or the advisor). The other trustees are independent. They are not employees, directors or officers of, and have no financial interest in, ACC or any of its wholly owned, direct or indirect, subsidiaries, including ACIM and American Century Services, LLC (ACS), and they do not have any other affiliations, positions or relationships that would cause them to be considered “interested persons” under the Investment Company Act. The following trustees also serve in this capacity for a number of other registered investment companies in the American Century Investments family of funds: Jonathan S. Thomas, 15; Jeremy I. Bulow, 8; and Stephen E. Yates, 7.
The following table presents additional information about the trustees. The mailing address for each trustee other than Jonathan S. Thomas is 330 Madison Avenue, New York, New York 10017. The mailing address for Jonathan S. Thomas is 4500 Main Street, Kansas City, Missouri 64111.
| Name (Year of Birth) | Position(s) Held with Funds | Length of Time Served | Principal Occupation(s) During Past 5 Years | Number of American Century Portfolios Overseen by Trustee | Other Directorships Held During Past 5 Years | ||||||||||||
| Independent Trustees | |||||||||||||||||
| Reginald M. Browne (1968) | Trustee and Chairman of the Board | Since 2017 (Chairman since 2019) | Principal, GTS Securities (automated capital markets trading firm)(2019 to present); Senior Managing Director, Co Global Head-ETF Group, Cantor Fitzgerald (financial services firm)(2013 to 2019) | 41 | None | ||||||||||||
| Jeremy I. Bulow (1954) | Trustee | Since 2022 | Professor of Economics, Stanford University Graduate School of Business (1979 to present) | 75 | None | ||||||||||||
| Barry A. Mendelson (1958) | Trustee | Since 2017 | Retired | 41 | None | ||||||||||||
| Stephen E. Yates (1948) | Trustee | Since 2017 | Retired | 105 | None | ||||||||||||
| Interested Trustees | |||||||||||||||||
| Jonathan S. Thomas (1963) | Trustee | Since 2017 | President and Chief Executive Officer, ACC (2007 to present). Also serves as Chief Executive Officer, ACS; Director, ACC and other ACC subsidiaries | 139 | None | ||||||||||||
The Statement of Additional Information has additional information about the funds' trustees and is available without charge, upon request, by calling 1-800-345-6488.
29
Officers
The following table presents certain information about the executive officers of the funds. Each officer, except Cleo Chang and Edward Rosenberg, serves as an officer for each of the 16 investment companies in the American Century family of funds. No officer is compensated for his or her service as an officer of the funds. The listed officers are interested persons of the funds and are appointed or re-appointed on an annual basis. The mailing address for each officer listed below is 4500 Main Street, Kansas City, Missouri 64111.
| Name (Year of Birth) | Offices with the Funds | Principal Occupation(s) During the Past Five Years | ||||||
| Patrick Bannigan (1965) | President since 2019 | Executive Vice President and Director, ACC (2012 to present); Chief Financial Officer, Chief Accounting Officer and Treasurer, ACC (2015 to present). Also serves as President, ACS; Vice President, ACIM; Chief Financial Officer, Chief Accounting Officer and/or Director, ACIM, ACS and other ACC subsidiaries | ||||||
| R. Wes Campbell (1974) | Chief Financial Officer and Treasurer since 2018 | Vice President, ACS (2020 to present); Investment Operations and Investment Accounting, ACS (2000 to present) | ||||||
| Amy D. Shelton (1964) | Chief Compliance Officer and Vice President since 2017 | Chief Compliance Officer, American Century funds, (2014 to present); Chief Compliance Officer, ACIM (2014 to present); Chief Compliance Officer, ACIS (2009 to present). Also serves as Vice President, ACIS | ||||||
| John Pak (1968) | General Counsel and Vice President since 2021 | General Counsel and Senior Vice President, ACC (2021 to present). Also serves as General Counsel and Senior Vice President, ACIM, ACS and ACIS. Chief Legal Officer of Investment and Wealth Management,The Bank of New York Mellon (2014 to 2021) | ||||||
| Cleo Chang (1977) | Vice President since 2019 | Senior Vice President, ACIM (2015 to present) | ||||||
| David H. Reinmiller (1963) | Vice President since 2017 | Attorney, ACC (1994 to present). Also serves as Vice President, ACIM and ACS | ||||||
| Edward Rosenberg (1973) | Vice President since 2017 | Senior Vice President, ACIM (2017 to present); Senior Vice President, Flexshares Head of ETF Capital Markets, Northern Trust (2012 to 2017) | ||||||
| C. Jean Wade (1964) | Vice President since 2017 | Senior Vice President, ACS (2017 to present); Vice President, ACS (2000 to 2017) | ||||||
| Ward D. Stauffer (1960) | Secretary since 2019 | Attorney, ACS (2003 to present) | ||||||
30
| Approval of Management Agreement | ||
At a meeting held on June 2, 2022, the Funds’ Board of Trustees (the "Board") unanimously approved the renewal of the management agreement pursuant to which American Century Investment Management, Inc. (the “Advisor”) acts as the investment advisor for each of the Funds. Under Section 15(c) of the Investment Company Act of 1940 (the “Investment Company Act”), contracts for investment advisory services are required to be reviewed, evaluated, and approved by a majority of a fund’s Trustees, including a majority of the independent Trustees, each year.
Prior to its consideration of the management agreement renewal, the Trustees requested and reviewed extensive data and information compiled by the Advisor and certain independent data providers concerning the Funds. This review was in addition to the oversight and evaluation undertaken by the Board and its Audit Committee on a continual basis and the information received was supplemental to the extensive information that the Board and its Audit Committee receive and consider throughout the year.
In connection with its consideration of the management agreement renewal, the Board’s review and evaluation of the services provided by the Advisor included, but was not limited to, the following:
•the nature, extent, and quality of investment management, shareholder services, and other services provided and to be provided to each Fund including without limitation portfolio management and trading services, shareholder and intermediary services, compliance and legal services, fund accounting and financial reporting, and fund share distribution;
•the wide range of other programs and services provided to each Fund and its shareholders on a routine and non-routine basis;
•the investment performance of each Fund, including data comparing each Fund's performance to an appropriate benchmark and/or a peer group of other funds with similar investment objectives and strategies;
•the cost of owning each Fund compared to the cost of owning similarly-managed funds;
•the compliance policies, procedures, and regulatory experience of the Advisor and the Funds’ service providers;
•the Advisor’s strategic plans, generally, and with respect to the ongoing impact of the COVID-19 pandemic response, heightened areas of interest in the mutual fund industry and recent geopolitical issues;
•the Advisor’s business continuity plans, vendor management practices, and cyber security practices;
•financial data showing the cost of services provided to each Fund, the profitability of each Fund to the Advisor, and the overall profitability of the Advisor;
•information regarding payments to intermediaries by the Advisor;
•possible economies of scale associated with the Advisor’s management of each Fund; and
•possible collateral benefits to the Advisor from the management of the Funds.
The independent Trustees met separately in private session to discuss the renewal and to review and discuss the information provided in response to their request. The independent Trustees also held active discussions with the Advisor regarding the renewal of the management agreement. The independent Trustees had the benefit of the advice of their independent counsel throughout the process.
Factors Considered
The Trustees considered all of the information provided by the Advisor, the independent data providers, and independent counsel in connection with the approval. They determined that the information was sufficient for them to evaluate the management agreement for the Funds. In
31
connection with their review, the Trustees did not identify any single factor as being all-important or controlling, and each Trustee may have attributed different levels of importance to different factors. In deciding to renew the management agreement, the Board based its decision on a number of factors, including without limitation the following:
Nature, Extent and Quality of Services — Generally. Under each Fund’s management agreement, the Advisor is responsible for providing or arranging for all services necessary for the operation of each Fund. The Board noted that the Advisor provides or arranges at its own expense a wide variety of services which include the following:
•constructing and designing each Fund
•portfolio research and security selection
•initial capitalization/funding
•securities trading
•Fund administration
•custody of Fund assets
•daily valuation of each Fund’s portfolio
•liquidity monitoring and management
•risk management, including cyber security
•shareholder servicing and transfer agency, including shareholder confirmations, recordkeeping, and communications
•legal services (except the independent Trustees’ counsel)
•regulatory and portfolio compliance
•financial reporting
•marketing and distribution (except amounts paid by each Fund under Rule 12b-1 plans)
Investment Management Services. The nature of the investment management services provided to the Funds is quite complex and allows Fund shareholders access to professional money management, instant diversification of their investments within an asset class, and liquidity. In evaluating investment performance, the Board expects the Advisor to manage each Fund in accordance with its investment objectives and principal investment strategies. Further, the Trustees recognize that the Advisor has an obligation to monitor trading activities, and in particular to seek the best execution of fund trades, and to evaluate the use of and payment for research. In providing these services, the Advisor utilizes teams of investment professionals (portfolio managers, analysts, research assistants, and securities traders) who require extensive information technology, research, training, compliance, and other systems to conduct their business. The Board provides oversight of the investment performance process. It regularly reviews investment performance information for each Fund, together with comparative information for appropriate benchmarks over different time horizons. The Trustees also review investment performance information during the management agreement renewal process. If performance concerns are identified, the Board discusses with the Advisor the reasons for such results and any actions being taken to improve performance. The performance for American Century Focused Dynamic Growth ETF and American Century Focused Large Cap Value ETF was below each Fund’s respective benchmark for the one-year period reviewed by the Board. The Board found the investment management services provided by the Advisor to each Fund to be satisfactory and consistent with the management agreement.
Shareholder and Other Services. Under the management agreement, the Advisor provides or arranges for a comprehensive package of services to the Funds. The Board, directly and through its Audit Committee, regularly reviews reports and evaluations of such services at its regular meetings. These reports include, but are not limited to, information regarding the operational efficiency and accuracy of the shareholder and transfer agency services provided, staffing levels, shareholder satisfaction, technology support (including cyber security), new products and services offered to Fund shareholders, securities trading activities, portfolio valuation services, auditing services, and legal and operational compliance activities. The Board found the services provided by the Advisor to each Fund under the management agreement to be competitive and of high quality.
32
Costs of Services and Profitability. The Advisor provides detailed information concerning its cost of providing various services to the Funds, its profitability in managing each Fund (pre- and post-distribution), its overall profitability, and its financial condition. The Trustees have reviewed with the Advisor the methodology used to prepare this financial information. This information is considered in evaluating the Advisor’s financial condition, its ability to continue to provide services under the management agreement, and the reasonableness of the current management fee. The Board concluded that the Advisor’s profits were reasonable in light of the services provided to the Funds.
Ethics. The Board generally considers the Advisor’s commitment to providing quality services to the Funds and to conducting its business ethically. They noted that the Advisor’s practices generally meet or exceed industry best practices.
Economies of Scale. The Board also reviewed information provided by the Advisor regarding the possible existence of economies of scale in connection with the management of each Fund. The Board concluded that economies of scale are difficult to measure and predict with precision, especially on a fund-by-fund basis. The Board concluded that the Advisor is sharing economies of scale, to the extent they exist, through its fee structure and through reinvestment in its business, infrastructure, investment capabilities and initiatives to provide shareholders additional content and services.
Comparison to Other Funds’ Fees. The management agreement provides that each Fund pays the Advisor a single, all-inclusive (or unified) management fee for providing all services necessary for the management and operation of the Fund, other than securities transaction expenses, taxes, interest, extraordinary expenses, and expenses incurred in connection with the provision of shareholder services and distribution services under a plan adopted pursuant to Rule 12b-1 under the Investment Company Act. Under the unified fee structure, the Advisor is responsible for providing all investment advisory, custody, audit, administrative, compliance, recordkeeping, marketing and shareholder services, or arranging and supervising third parties to provide such services. The Board believes the unified fee structure is a benefit to Fund shareholders because it clearly discloses to shareholders the cost of owning Fund shares, and, since the unified fee cannot be increased without a vote of Fund shareholders, it shifts to the Advisor the risk of increased costs of operating the Fund and provides a direct incentive to minimize administrative inefficiencies. Part of the Board’s analysis of fee levels involves reviewing certain evaluative data compiled by an independent provider comparing the Fund’s unified fee to the total expense ratios of its peers. The unified fee charged to shareholders of American Century Focused Dynamic Growth ETF was below the median of the total expense ratios of its peer expense universe and was the lowest of its peer expense group. The unified fee charged to shareholders of American Century Focused Large Cap Value ETF was below the median of the total expense ratios of its peer expense universe and was within the range of its peer expense group. The Board concluded that the management fee paid by each Fund to the Advisor under its management agreement is reasonable in light of the services provided to the Fund.
Comparison to Fees and Services Provided to Other Clients of the Advisor. The Board also requested and received information from the Advisor concerning the nature of the services, fees, costs, and profitability of its advisory services to funds or other advisory clients managed similarly to the Funds. They observed that these varying types of client accounts require different services and involve different regulatory and entrepreneurial risks than the management of the Funds. The Board analyzed this information and concluded that the fees charged and services provided to the Funds were reasonable by comparison.
Payments to Intermediaries. The Trustees also requested and received a description of payments made to intermediaries by each Fund and the Advisor and services provided in response thereto. These payments could include various payments made by each Fund or the Advisor to different types of intermediaries and recordkeepers for distribution and service activities provided for each Fund. The Trustees reviewed such information and received representations from the
33
Advisor that all such payments by the Advisor were made from the Advisor’s resources and reasonable profits.
Collateral or “Fall-Out” Benefits Derived by the Advisor. The Board considered the possible existence of collateral benefits the Advisor may receive as a result of its relationship with the Funds. They concluded that the Advisor’s primary business is managing funds and it generally does not use fund or shareholder information to generate profits in other lines of business, and therefore does not derive any significant collateral benefits from them. The Board noted that additional assets from other clients may offer the Advisor some benefit from increased leverage with service providers and counterparties. The Board also determined that the Advisor is able to provide investment management services to certain clients other than the Funds, at least in part, due to its existing infrastructure built to serve the fund complex. The Board concluded that appropriate allocation methodologies had been employed to assign resources and the cost of those resources to these other clients.
Existing Relationship. The Board also considered whether there was any reason for not continuing the existing arrangement with the Advisor. In this regard, the Board was mindful of the potential disruptions of the Funds’ operations and various risks, uncertainties, and other effects that could occur as a result of a decision not to continue such relationship. In particular, the Board recognized that most shareholders have invested in each Fund on the strength of the Advisor’s industry standing and reputation and in the expectation that the Advisor will have a continuing role in providing advisory services to each Fund.
Conclusion of the Trustees. As a result of this process, the Board, including all of the independent Trustees, taking into account all of the factors discussed above and the information provided by the Advisor and others in connection with its review and throughout the year, determined that the terms of the management fee are fair and reasonable and that the management fee charged to each Fund is fair in light of the services provided and that the investment management agreement between each Fund and the Advisor should be renewed for an additional one-year period.
34
| Liquidity Risk Management Program | ||
The Funds have adopted a liquidity risk management program (the “program”). The Funds' Board of Trustees (the "Board") has designated American Century Investment Management, Inc. (“ACIM”) as the administrator of the program. Personnel of ACIM or its affiliates conduct the day-to-day operation of the program pursuant to policies and procedures administered by the Program Administrator, including members of ACIM’s Investment Oversight Committee who are members of the ACIM’s Investment Management and Global Analytics departments.
Under the program, ACIM manages the Funds' liquidity risk, which is the risk that the Funds could not meet shareholder redemption requests without significant dilution of remaining shareholders’ interests in the Funds. This risk is managed by monitoring the degree of liquidity of the Funds' investments, limiting the amount of the Funds' illiquid investments, and utilizing various risk management tools and facilities available to the Funds for meeting shareholder redemptions, among other means. ACIM’s process of determining the degree of liquidity of certain Funds' investments is supported by a third-party liquidity assessment vendor.
The Board reviewed a report prepared by ACIM regarding the operation and effectiveness of the program for the period January 1, 2021 through December 31, 2021. No significant liquidity events impacting the Funds were noted in the report. In addition, ACIM provided its assessment that the program had been effective in managing the Funds' liquidity risk.
35
| Additional Information | ||
Retirement Account Information
As required by law, distributions you receive from certain retirement accounts are subject to federal income tax withholding, unless you elect not to have withholding apply*. Tax will be withheld on the total amount withdrawn even though you may be receiving amounts that are not subject to withholding, such as nondeductible contributions. In such case, excess amounts of withholding could occur. You may adjust your withholding election so that a greater or lesser amount will be withheld.
Remember, even if you elect not to have income tax withheld, you are liable for paying income tax on the taxable portion of your withdrawal. If you elect not to have income tax withheld or you don’t have enough income tax withheld, you may be responsible for payment of estimated tax. You may incur penalties under the estimated tax rules if your withholding and estimated tax payments are not sufficient. You can reduce or defer the income tax on a distribution by directly or indirectly rolling such distribution over to another IRA or eligible plan. You should consult your tax advisor for additional information.
State tax will be withheld if, at the time of your distribution, your address is within one of the mandatory withholding states and you have federal income tax withheld (or as otherwise required by state law). State taxes will be withheld from your distribution in accordance with the respective state rules.
*Some 403(b), 457 and qualified retirement plan distributions may be subject to 20% mandatory withholding, as they are subject to special tax and withholding rules. Your plan administrator or plan sponsor is required to provide you with a special tax notice explaining those rules at the time you request a distribution. If applicable, federal and/or state taxes may be withheld from your distribution amount.
Proxy Voting Policies
A description of the policies that the funds' investment advisor uses in exercising the voting rights associated with the securities purchased and/or held by the funds is available without charge, upon request, by calling 1-800-345-6488. It is also available on American Century Investments’ website at americancentury.com/proxy and on the Securities and Exchange Commission’s website at sec.gov. Information regarding how the investment advisor voted proxies relating to portfolio securities during the most recent 12-month period ended June 30 is available at americancentury.com/proxy. It is also available at sec.gov.
Quarterly Portfolio Disclosure
The funds file their complete schedule of portfolio holdings with the Securities and Exchange Commission (SEC) for the first and third quarters of each fiscal year as an exhibit to their reports on Form N-PORT. The funds' Form N-PORT reports are available on the SEC’s website at sec.gov.
36
Other Tax Information
The following information is provided pursuant to provisions of the Internal Revenue Code.
Focused Large Cap Value ETF hereby designates up to the maximum amount allowable as qualified dividend income for the fiscal year ended August 31, 2022.
For corporate taxpayers, Focused Large Cap Value ETF hereby designates $4,356,656, or up to the maximum amount allowable, of ordinary income distributions paid during the fiscal year ended August 31, 2022 as qualified for the corporate dividends received deduction.
Focused Large Cap Value ETF hereby designates $1,652,395, or up to the maximum amount allowable, as long-term capital gain distributions (20% rate gain distributions) for the fiscal year ended August 31, 2022.
Focused Large Cap Value ETF hereby designates $5,032,999 as qualified short-term capital gain distributions for purposes of Internal Revenue Code Section 871 for the fiscal year ended August 31, 2022.
Focused Large Cap Value ETF utilized earnings and profits of $1,663,723 distributed to shareholders on redemption of shares as part of the dividends paid deduction (tax equalization).
37
| Notes | ||||||||||||||
38
| Notes | ||||||||||||||
39
| Notes | ||||||||||||||
40
| ||||||||
| Contact Us | americancenturyetfs.com | |||||||
| American Century Sales Representatives, Financial Professionals, Broker Dealers, Insurance Companies, Banks and Trust Companies | 1-833-ACI-ETFS | |||||||
| Telecommunications Relay Service for the Deaf | 711 | |||||||
| American Century ETF Trust | ||||||||
Investment Advisor: American Century Investment Management, Inc. Kansas City, Missouri | ||||||||
Distributor: Foreside Fund Services, LLC - Distributor, not affiliated with American Century Investment Services, Inc. | ||||||||
| This report and the statements it contains are submitted for the general information of our shareholders. The report is not authorized for distribution to prospective investors unless preceded or accompanied by an effective prospectus. | ||||||||
| ©2022 American Century Proprietary Holdings, Inc. All rights reserved. CL-ANN-96952 2210 | ||||||||
| Annual Report | |||||
| August 31, 2022 | |||||
American Century® Mid Cap Growth Impact ETF (MID) | |||||
American Century® Sustainable Equity ETF (ESGA) | |||||
American Century® Sustainable Growth ETF (ESGY) | |||||
| Table of Contents | ||
| President’s Letter | |||||
| Mid Cap Growth Impact ETF | |||||
| Performance | |||||
| Portfolio Commentary | |||||
| Fund Characteristics | |||||
| Sustainable Equity ETF | |||||
| Performance | |||||
| Portfolio Commentary | |||||
| Fund Characteristics | |||||
| Sustainable Growth ETF | |||||
| Performance | |||||
| Portfolio Commentary | |||||
| Fund Characteristics | |||||
| Shareholder Fee Examples | |||||
| Schedules of Investments | |||||
| Statements of Assets and Liabilities | |||||
| Statements of Operations | |||||
| Statements of Changes in Net Assets | |||||
| Notes to Financial Statements | |||||
| Financial Highlights | |||||
| Report of Independent Registered Public Accounting Firm | |||||
| Management | |||||
| Approval of Management Agreement | |||||
| Liquidity Risk Management Program | |||||
| Additional Information | |||||
Any opinions expressed in this report reflect those of the author as of the date of the report, and do not necessarily represent the opinions of American Century Investments® or any other person in the American Century Investments organization. Any such opinions are subject to change at any time based upon market or other conditions and American Century Investments disclaims any responsibility to update such opinions. These opinions may not be relied upon as investment advice and, because investment decisions made by American Century Investments funds are based on numerous factors, may not be relied upon as an indication of trading intent on behalf of any American Century Investments fund. Security examples are used for representational purposes only and are not intended as recommendations to purchase or sell securities. Performance information for comparative indices and securities is provided to American Century Investments by third party vendors. To the best of American Century Investments’ knowledge, such information is accurate at the time of printing.
| President’s Letter | ||
Jonathan ThomasDear Investor:
Thank you for reviewing this annual report for the period ended August 31, 2022. Annual reports
help convey important information about fund returns, including market factors that affected
performance. For additional investment insights, please visit americancenturyetfs.com.
Mounting Market Challenges Hampered Performance
Asset class performance weakened dramatically during the funds’ fiscal year. In late 2021,
generally upbeat economic activity and corporate earnings supported gains for most U.S. and
global stock indices. Returns generally remained positive despite rapidly rising inflation and waning
central bank support—factors that had started to weigh on fixed-income indices.
By early 2022, the market climate shifted quickly. Inflation, which was already at multiyear highs,
rose to levels last seen in the early 1980s. Massive fiscal and monetary support unleashed during
the pandemic was partly to blame. In addition, escalating energy prices, supply chain breakdowns
and labor market shortages further aggravated inflation in the U.S. and other developed markets.
Russia’s invasion of Ukraine in February also exacerbated global inflationary pressures.
The Bank of England launched its inflation-fighting campaign in December and continued to lift
rates through period-end. The Federal Reserve responded to surging inflation in March, launching
an aggressive rate-hike campaign and ending its asset purchase program. Policymakers indicated
taming inflation remains their priority, even as the U.S. economy contracted in 2022’s first two
quarters. Facing record-high inflation in the eurozone, the European Central Bank in July embarked
on its first rate-hike effort in 11 years.
The combination of sharply elevated inflation, tighter monetary policy, geopolitical strife and weak
economies triggered sharp market volatility and fueled global recession fears. Against this
backdrop, most U.S. and global stock and bond indices declined sharply for the reporting period.
Staying Disciplined in Uncertain Times
We expect market volatility to linger as investors navigate a complex environment of high inflation,
rising interest rates and economic uncertainty. In addition, Russia’s invasion of Ukraine
complicates an increasingly tense geopolitical backdrop and threatens Europe’s winter energy
supply. We will continue to monitor the broad backdrop and its influence on financial markets.
We appreciate your confidence in us during these extraordinary times. Our firm has a long history
of helping clients weather unpredictable markets, and we’re confident we will continue to meet
today’s challenges.
Sincerely,
Jonathan Thomas
President and Chief Executive Officer
American Century Investments
2
| Performance | ||
| Mid Cap Growth Impact ETF (MID) | ||||||||||||||||||||
| Total Returns as of August 31, 2022 | Average Annual Returns | |||||||||||||||||||
| 1 year | Since Inception | Inception Date | ||||||||||||||||||
| Net Asset Value | -27.33% | 6.56% | 7/13/2020 | |||||||||||||||||
| Market Price | -27.39% | 6.55% | 7/13/2020 | |||||||||||||||||
| Russell Midcap Growth Index | -26.69% | 4.26% | — | |||||||||||||||||
Market price is determined using the bid/ask midpoint at 4:00 p.m. Eastern time, when the net asset value (NAV) is typically calculated. Market performance does not represent the returns you would receive if you traded shares at other times. NAV prices are used to calculate market price performance prior to the date when the fund first traded on the NYSE Arca, Inc.
| Growth of $10,000 Over Life of Fund | ||
| $10,000 investment made July 13, 2020 | ||
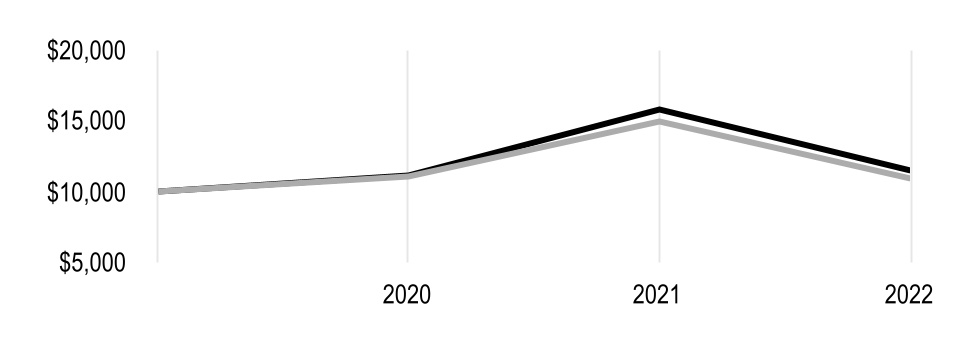
| Value on August 31, 2022 | |||||
| Net Asset Value — $11,451 | |||||
| Russell Midcap Growth Index — $10,931 | |||||
| Total Annual Fund Operating Expenses | |||||||||||||||||
| 0.45% | |||||||||||||||||
The total annual fund operating expenses shown is as stated in the fund’s prospectus current as of the date of this report. The prospectus may vary from the expense ratio shown elsewhere in this report because it is based on a different time period, includes acquired fund fees and expenses, and, if applicable, does not include fee waivers or expense reimbursements.
Data presented reflect past performance. Past performance is no guarantee of future results. Current performance may be higher or lower than the performance shown. Total returns for periods less than one year are not annualized. Investment return and principal value will fluctuate, and redemption value may be more or less than original cost. Data assumes reinvestment of dividends and capital gains, and none of the charts reflect the deduction of taxes that a shareholder would pay on fund distributions or the redemption of fund shares. To obtain performance data current to the most recent month end, please call 1-800-345-6488 or visit americancenturyetfs.com. For additional information about the funds, please consult the prospectus.
3
| Portfolio Commentary | ||
Portfolio Managers: Rob Brookby, Nalin Yogasundram and Rene Casis
Fund Strategy
American Century Mid Cap Growth Impact ETF is an actively managed fund that seeks long-term capital growth. The portfolio managers look for stocks of medium-capitalization companies they believe will increase in value over time, using proprietary fundamental research. The initial research process begins by analyzing themes aligned with the U.N. Sustainable Development Goals (SDG) to identify companies that generate, or could generate, social and environmental impact alongside a financial return. We make our investment decisions based primarily on our analysis of individual companies, rather than on broad economic forecasts. We generate an impact thesis to explain current or projected SDG alignment in combination with each security’s fundamental growth profile.
Performance Review
The fund returned -27.39% on a market price basis for the 12-month period ended August 31, 2022. On a net asset value (NAV) basis, the fund returned -27.33%. For the same time period, the Russell Midcap Growth Index, the fund’s benchmark, returned -26.69%. The fund’s NAV and market price returns reflect fees and operating expenses, while the index return does not.
Industrials Detracted
Road and rail stocks weighed on performance in the industrials sector, largely due to our position in Lyft. The ride-hailing company surprised investors with a significant reduction in the company’s profit margin forecast due to launching initiatives that deviated from plans communicated earlier in the year.
The portfolio was underweight energy relative to the benchmark. Our lighter exposure was a meaningful underperformer as sanctions on Russian oil purchases effectively removed several million barrels of oil and refined products from global markets. The resulting price increases boosted the sector.
Other detractors included DocuSign. The company develops software for online signatures and document management. DocuSign was a beneficiary of the pandemic-driven work-from-home environment but offered weak guidance as that tailwind subsides. We believe in the long-term adoption of e-signature and a more efficient document workflow that DocuSign offers. The small- and micro-merchant digital payments company Block (formerly Square) suffered during the growth sell-off as initially rising interest rates and later recessionary fears weighed on the stock. Additionally, Block’s focus on blockchain technology—which enables cryptocurrencies—hurt as crypto prices fell. Surging interest rates and investors’ move away from riskier assets because of the Russia-Ukraine war led fast-growth and expensive technology stocks such as IT services company Twilio to underperform. Block and Twilio were eliminated. Natera hampered performance. The stock of this genetic testing company fell amid allegations of marketing impropriety. We eliminated our position as Natera no longer aligned with our mandate for proper governance.
Information Technology Benefited Performance
Stock selection in the software industry led performance in information technology, driven by Palo Alto Networks. Over the past three years this cybersecurity software provider has transformed into a cloud-based platform of next-generation cybersecurity products. On top of a very strong environment for its products, Palo Alto said it expects greater free cash flow generation now that the heavy lift in its transformation is over. Cadence Design Systems sells software to help build semiconductor chips. Semiconductors have unprecedented tailwinds enabling themes like the cloud, 5G, internet of things and ultimately the metaverse. Cadence benefited from more customers and more usage.
4
Enphase Energy makes inverters to efficiently convert power from solar cells into usable electricity for the home. Demand for solar is high now that prices have been cut by 90% the past decade. After a period of revenue constrained by supply chain issues, Enphase experienced accelerating growth as the company addressed the supply challenges. Keysight Technologies sells measurement tools for high-frequency applications such as 5G and in automobiles. Keysight benefited from multiple tailwinds as complex communications capabilities are being added to an increasing set of applications from cars to consumer devices.
Elsewhere, Sarepta Therapeutics was a key contributor. This biopharmaceutical company benefited from investor enthusiasm about its pipeline of burgeoning gene therapies to treat rare diseases. Materials in general benefited from greater demand and firmer pricing due to global supply chain disruptions. Albemarle was a top contributor on demand for lithium, a key ingredient of batteries for electric vehicles.
Portfolio Positioning
Our process uses fundamental analysis aimed at identifying mid-capitalization companies producing attractive, sustained earnings growth. We seek to reduce unintended, nonfundamental risks and align the portfolio with fundamental, company-specific risks that we believe will be rewarded over time. As a result of this approach, our sector and industry allocations reflect where we are finding opportunities at a given time. We see longer-term opportunities in companies seeking to achieve the U.N. SDG with key impact themes of a greener planet; innovation, efficiency and education driven by technology; and improving health care outcomes across various sectors of our portfolio.
A strategy that considers the United Nations Sustainable Development Goals (SDG) criteria may limit the investment opportunities available to a portfolio. Therefore, the portfolio may underperform or perform differently than other portfolios that do not have an SDG investment focus. A portfolio’s SDG investment focus may also result in the portfolio investing in securities or industry sectors that perform differently or maintain a different risk profile than the market generally or compared to underlying holdings that are not screened for SDG standards.
5
| Fund Characteristics | ||
| AUGUST 31, 2022 | |||||
| Mid Cap Growth Impact ETF | |||||
| Types of Investments in Portfolio | % of net assets | ||||
| Common Stocks | 97.3% | ||||
| Short-Term Investments | 3.2% | ||||
| Other Assets and Liabilities | (0.5)% | ||||
| Top Five Industries | % of net assets | ||||
| Software | 17.9% | ||||
| Semiconductors and Semiconductor Equipment | 14.6% | ||||
| Hotels, Restaurants and Leisure | 9.2% | ||||
| Chemicals | 7.5% | ||||
| Biotechnology | 7.2% | ||||
6
| Performance | ||
| Sustainable Equity ETF (ESGA) | ||||||||||||||||||||
| Total Returns as of August 31, 2022 | Average Annual Returns | |||||||||||||||||||
| 1 year | Since Inception | Inception Date | ||||||||||||||||||
| Net Asset Value | -14.03% | 11.15% | 7/13/2020 | |||||||||||||||||
| Market Price | -14.10% | 11.14% | 7/13/2020 | |||||||||||||||||
| S&P 500 Index | -11.23% | 12.87% | — | |||||||||||||||||
Market price is determined using the bid/ask midpoint at 4:00 p.m. Eastern time, when the net asset value (NAV) is typically calculated. Market performance does not represent the returns you would receive if you traded shares at other times. NAV prices are used to calculate market price performance prior to the date when the fund first traded on the NYSE Arca, Inc.
| Growth of $10,000 Over Life of Fund | ||
| $10,000 investment made July 13, 2020 | ||
| Value on August 31, 2022 | |||||
| Net Asset Value — $12,531 | |||||
| S&P 500 Index — $12,948 | |||||
| Total Annual Fund Operating Expenses | |||||||||||||||||
| 0.39% | |||||||||||||||||
The total annual fund operating expenses shown is as stated in the fund’s prospectus current as of the date of this report. The prospectus may vary from the expense ratio shown elsewhere in this report because it is based on a different time period, includes acquired fund fees and expenses, and, if applicable, does not include fee waivers or expense reimbursements.
Data presented reflect past performance. Past performance is no guarantee of future results. Current performance may be higher or lower than the performance shown. Total returns for periods less than one year are not annualized. Investment return and principal value will fluctuate, and redemption value may be more or less than original cost. Data assumes reinvestment of dividends and capital gains, and none of the charts reflect the deduction of taxes that a shareholder would pay on fund distributions or the redemption of fund shares. To obtain performance data current to the most recent month end, please call 1-800-345-6488 or visit americancenturyetfs.com. For additional information about the funds, please consult the prospectus.
7
| Portfolio Commentary | ||
Portfolio Managers: Joe Reiland, Justin Brown, Rob Bove and Rene Casis
Fund Strategy
American Century Sustainable Equity ETF is an actively managed fund that seeks long-term capital growth. We seek to invest in larger U.S. companies demonstrating both improving business fundamentals and sustainable corporate behaviors in pursuit of long-term financial returns and a stronger environmental, social and governance (ESG) profile than the S&P 500 Index. As opposed to avoiding certain sectors entirely, we seek to invest in the most attractive companies within all sectors. A broad investment universe provides investors with both an attractive ESG profile and the potential for positive risk-adjusted returns over time. We construct our portfolio to intentionally acquire stock-specific risk aligned with our financial and sustainability research, while minimizing relative exposures related to sectors and common factor risks, such as market-capitalization size, volatility and momentum.
Performance Review
The fund returned -14.10% on a market price basis for its fiscal year ended August 31, 2022. On a net asset value (NAV) basis, the fund returned -14.03%. For the same time period, the S&P 500 Index, the fund’s benchmark, returned -11.23%. The fund’s NAV and market price returns reflect fees and operating expenses, while the index return does not.
Information Technology Detracted
Stock selection in the semiconductors and semiconductor equipment industry helped drive underperformance in information technology. Both chipmakers and semiconductor equipment manufacturers are being pressured by concerns that a slowdown in consumer spending will hamper demand for chips. ASML Holding, a Netherlands-based semiconductor capital equipment maker, was a significant industry detractor. Stock selection in the IT services industry also hurt performance in the sector. PayPal Holdings reported disappointing earnings largely due to declining eBay transactions. We eliminated PayPal. Underweighting Apple relative to the index hampered performance. The consumer electronics giant reported better-than-expected results, driven by iPhone sales.
Energy companies continued to benefit from rising oil and gas prices. Russia’s invasion of Ukraine, Europe’s energy supply concerns and slow production growth in the U.S. and from OPEC have kept energy markets volatile and in negative supply. We had lighter exposure to Exxon Mobil and Chevron than the benchmark, which hampered relative performance. Our underweight allocation to energy overall hampered relative performance, although a number of our holdings in the sector were top contributors, which helped offset some of the detraction. The portfolio was also underweight Tesla. The electric vehicle maker continued to outperform, exceeding production goals in the face of global supply chain disruptions and pandemic lockdowns in China.
Communication Services Was a Top Contributor
Positioning in the communication services sector benefited performance. We were underweight two laggards, Facebook’s parent Meta Platforms and streaming video company Netflix. Meta has been hurt more by both Apple iOS platform changes and TikTok competition than other digital advertising platforms. Our underweight reflects our elimination of Meta during the first quarter of 2022. Netflix announced layoffs amid weak subscriber growth. An expected renormalization of subscriber growth following the early gains of the pandemic has not materialized. We also eliminated Netflix.
8
Some of the leading individual contributors to performance compared with the benchmark were energy companies ConocoPhillips and Schlumberger. This is consistent with our process, which seeks to identify companies we believe are ESG leaders within all sectors, rather than exclude certain sectors entirely. Our approach led us to overweight positions in these companies, which we believe have relatively more attractive financial and ESG characteristics than other energy companies. ConocoPhilllips was the fund’s top contributor, benefiting from the jump in fossil fuel prices. Rising energy prices also boosted oil field services companies such as Schlumberger. The company also benefited from a multiyear growth dynamic leading to strong cash flow growth. Schlumberger’s new energy division is focused on transitioning toward lower carbon energy solutions: geothermal, hydrogen, carbon capture and sequestration.
Elsewhere, Cigna was a top performer. Managed care companies such as Cigna were perceived as being relatively insulated from the inflationary environment. We think Cigna’s pharmacy benefit management division should also benefit from new biosimilar pharmaceutical launches in the coming years. NextEra Energy received a boost from an executive order delaying implementation of solar panel tariffs, which helped ease concerns that NextEra’s plans for renewable capacity expansion would be slowed.
Portfolio Positioning
Our process uses fundamental analysis aimed at identifying growing, large-capitalization companies demonstrating sustainable corporate behaviors. Rather than screen out certain industries or sectors, we seek to identify companies with attractive fundamental growth and ESG characteristics in their respective sectors. As a result of this approach, our sector and industry allocations reflect where we are finding opportunities at a given time.
Using our bottom-up analysis, we have found what we think are attractive positions in the industrials sector, led by building products and electrical equipment. Consumer staples was also modestly overweight due to positions in food and staples retailing and household products. Utilities was the largest underweight sector because many of the companies in the sector do not fit our process well.
A strategy or emphasis on environmental, social and governance factors (ESG) may limit the investment opportunities available to a portfolio. Therefore, the portfolio may underperform or perform differently than other portfolios that do not have an ESG investment focus. A portfolio’s ESG investment focus may also result in the portfolio investing in securities or industry sectors that perform differently or maintain a different risk profile than the market generally or compared to underlying holdings that are not screened for ESG standards.
9
| Fund Characteristics | ||
| AUGUST 31, 2022 | |||||
| Sustainable Equity ETF | |||||
| Types of Investments in Portfolio | % of net assets | ||||
| Common Stocks | 99.5% | ||||
| Short-Term Investments | 0.4% | ||||
| Other Assets and Liabilities | 0.1% | ||||
| Top Five Industries | % of net assets | ||||
| Software | 10.0% | ||||
| Health Care Providers and Services | 5.2% | ||||
| Technology Hardware, Storage and Peripherals | 5.0% | ||||
| Interactive Media and Services | 4.9% | ||||
| Capital Markets | 4.7% | ||||
10
| Performance | ||
| Sustainable Growth ETF (ESGY) | |||||||||||||||||||||||
| Total Returns as of August 31, 2022 | Average Annual Returns | ||||||||||||||||||||||
| 1 year | Since Inception | Inception Date | |||||||||||||||||||||
| Net Asset Value | -19.93% | -12.00% | 6/29/2021 | ||||||||||||||||||||
| Market Price | -19.93% | -11.99% | 6/29/2021 | ||||||||||||||||||||
| Russell 1000 Growth Index | -19.06% | -11.59% | — | ||||||||||||||||||||
Market price is determined using the bid/ask midpoint at 4:00 p.m. Eastern time, when the net asset value (NAV) is typically calculated. Market performance does not represent the returns you would receive if you traded shares at other times. NAV prices are used to calculate market price performance prior to the date when the fund first traded on the NYSE Arca, Inc.
| Growth of $10,000 Over Life of Fund | ||
| $10,000 investment made June 29, 2021 | ||
| Value on August 31, 2022 | |||||
| Net Asset Value — $8,609 | |||||
| Russell 1000 Growth Index — $8,655 | |||||
| Total Annual Fund Operating Expenses | |||||||||||||||||
| 0.39% | |||||||||||||||||
The total annual fund operating expenses shown is as stated in the fund’s prospectus current as of the date of this report. The prospectus may vary from the expense ratio shown elsewhere in this report because it is based on a different time period, includes acquired fund fees and expenses, and, if applicable, does not include fee waivers or expense reimbursements.
Data presented reflect past performance. Past performance is no guarantee of future results. Current performance may be higher or lower than the performance shown. Total returns for periods less than one year are not annualized. Investment return and principal value will fluctuate, and redemption value may be more or less than original cost. Data assumes reinvestment of dividends and capital gains, and none of the charts reflect the deduction of taxes that a shareholder would pay on fund distributions or the redemption of fund shares. To obtain performance data current to the most recent month end, please call 1-800-345-6488 or visit americancenturyetfs.com. For additional information about the funds, please consult the prospectus.
11
| Portfolio Commentary | ||
Portfolio Managers: Joe Reiland, Rob Bove, Scott Marolf, David Cross and Rene Casis
David Cross joined the fund’s portfolio management team in February 2022.
Fund Strategy
American Century Sustainable Growth ETF is an actively managed fund that seeks capital appreciation. We seek to invest in larger U.S. companies demonstrating both improving business fundamentals and sustainable corporate behaviors in pursuit of long-term financial returns and a stronger environmental, social and governance (ESG) profile than the Russell 1000 Growth Index. As opposed to avoiding certain sectors entirely, we seek to invest in the most attractive companies within all sectors. A broad investment universe provides investors with both an attractive environmental, social and governance (ESG) profile and the potential for positive risk-adjusted returns over time. We construct our portfolio to intentionally acquire stock-specific risk aligned with our financial and sustainability research, while minimizing relative exposures related to sectors and common factor risks, such as market-capitalization size, volatility and momentum.
Performance Review
The fund returned -19.93% on a market price basis for the 12-month period ended August 31, 2022. On a net asset value (NAV) basis, the fund returned -19.93%. For the same period, the Russell 1000 Growth Index, the fund’s benchmark, returned -19.06%. The fund’s NAV and market price returns reflect fees and operating expenses, while the index return does not.
Information Technology Detracted
Stock selection in the semiconductors and semiconductor equipment industry helped drive underperformance in information technology. Both chipmakers and semiconductor equipment manufacturers are being pressured by concerns that a slowdown in consumer spending will hamper demand for chips. ASML Holding, a Netherlands-based semiconductor capital equipment maker, was a significant industry detractor. Stock selection in the IT services industry also hurt performance in the sector. PayPal Holdings reported disappointing earnings largely due to declining eBay transactions. We eliminated our holding. Software provider Adobe fell on expectations of slowing company spending on software as economic growth slows.
We were also hurt by lighter exposure than the benchmark in a trio of other stocks. Apple reported better-than-expected quarterly results, driven by iPhone sales. AbbVie, a large pharmaceutical company, benefited from investors looking for safer havens. We had no exposure to brick-and-mortar retailer Costco Wholesale, which recently reported membership renewals, its primary driver of profits, of more than 90%. Costco is also seen as recession-proof as consumers buy more bulk items to reduce costs.
Communication Services Benefited Performance
Stock choices in the interactive media and services industry led relative performance in communication services. We had less exposure to the lagging Meta Platforms than the benchmark. Facebook’s parent company has been hurt more by both Apple iOS platform changes and TikTok competition than other digital advertising platforms. Underweighting Netflix benefited relative performance. The streaming video service announced layoffs amid weak subscriber growth. An expected renormalization of subscriber growth following the early gains of the pandemic has not materialized. We eliminated Meta Platforms and Netflix.
Stock selection in health care was also helpful. UnitedHealth Group was a key contributor. The health insurer reported solid earnings and modestly increased its earnings guidance. However, the stock’s outperformance for much of the period was driven more by its defensive profile and being more insulated from the impact of inflation and a stronger U.S. dollar. Denmark-based pharmaceutical company Novo Nordisk continued to benefit from strong sales and demand for its obesity drug. Vertex Pharmaceuticals dominates the cystic fibrosis market with no real prospects of
12
competition on the horizon, giving it a strong cash flow position. Its emerging pipeline is beginning to show its strength, including its kidney drug, acute pain drug and Type 1 diabetes stem cell therapy.
Car rental provider Avis Budget Group benefited from improving travel trends and also rose significantly in November 2021 as the stock became part of the meme stock investing craze. We eliminated the position on the large stock price increase as we saw no additional upside.
Portfolio Positioning
Our process uses fundamental analysis aimed at identifying growing, large-capitalization companies demonstrating sustainable corporate behaviors. Rather than screen out certain industries or sectors, we seek to identify companies with attractive fundamental growth and ESG characteristics in their respective sectors. As a result of this approach, our sector and industry allocations reflect where we are finding opportunities at a given time.
Using our bottom-up analysis, we have found attractive positions in several sectors, notably information technology. In particular, we invested in attractive companies in the software, electronic equipment, instruments and components and semiconductors and semiconductor equipment industries. We have also found opportunities in health care, especially pharmaceuticals.
A strategy or emphasis on environmental, social and governance factors (ESG) may limit the investment opportunities available to a portfolio. Therefore, the portfolio may underperform or perform differently than other portfolios that do not have an ESG investment focus. A portfolio’s ESG investment focus may also result in the portfolio investing in securities or industry sectors that perform differently or maintain a different risk profile than the market generally or compared to underlying holdings that are not screened for ESG standards.
13
| Fund Characteristics | ||
| AUGUST 31, 2022 | |||||
| Sustainable Growth ETF | |||||
| Types of Investments in Portfolio | % of net assets | ||||
| Common Stocks | 99.6% | ||||
| Short-Term Investments | 0.3% | ||||
| Other Assets and Liabilities | 0.1% | ||||
| Top Five Industries | % of net assets | ||||
| Software | 19.7% | ||||
| Technology Hardware, Storage and Peripherals | 10.5% | ||||
| Semiconductors and Semiconductor Equipment | 7.6% | ||||
| Interactive Media and Services | 6.6% | ||||
| IT Services | 6.6% | ||||
14
| Shareholder Fee Examples | ||
Fund shareholders may incur two types of costs: (1) transaction costs, including brokerage commissions paid on purchases and sales of fund shares; and (2) ongoing costs, including management fees and other fund expenses. This example is intended to help you understand your ongoing costs (in dollars) of investing in your fund and to compare these costs with the ongoing cost of investing in other funds.
The example is based on an investment of $1,000 made at the beginning of the period and held for the entire period from March 1, 2022 to August 31, 2022.
Actual Expenses
The table provides information about actual account values and actual expenses for each fund. You may use the information, together with the amount you invested, to estimate the expenses that you paid over the period. First, identify the fund you own. Then simply divide your account value by $1,000 (for example, an $8,600 account value divided by $1,000 = 8.6), then multiply the result by the number under the heading “Expenses Paid During Period” to estimate the expenses you paid on your account during this period.
Hypothetical Example for Comparison Purposes
The table also provides information about hypothetical account values and hypothetical expenses based on the actual expense ratio of your fund and an assumed rate of return of 5% per year before expenses, which is not the actual return of a fund. The hypothetical account values and expenses may not be used to estimate the actual ending account balance or expenses you paid for the period. You may use this information to compare the ongoing costs of investing in your fund and other funds. To do so, compare this 5% hypothetical example with the 5% hypothetical examples that appear in the shareholder reports of the other funds.
Please note that the expenses shown in the table are meant to highlight your ongoing costs only and do not reflect any transactional costs, such as brokerage commissions paid on purchases and sales of fund shares. Therefore, the table is useful in comparing ongoing costs only, and will not help you determine the relative total costs of owning different funds. In addition, if these transactional costs were included, your costs would have been higher.
| Beginning Account Value 3/1/22 | Ending Account Value 8/31/22 | Expenses Paid During Period(1) 3/1/22 - 8/31/22 | Annualized Expense Ratio(1) | |||||||||||
| Mid Cap Growth Impact ETF | ||||||||||||||
| Actual | $1,000 | $907.90 | $2.16 | 0.45% | ||||||||||
| Hypothetical | $1,000 | $1,022.94 | $2.29 | 0.45% | ||||||||||
| Sustainable Equity ETF | ||||||||||||||
| Actual | $1,000 | $896.50 | $1.86 | 0.39% | ||||||||||
| Hypothetical | $1,000 | $1,023.24 | $1.99 | 0.39% | ||||||||||
| Sustainable Growth ETF | ||||||||||||||
| Actual | $1,000 | $860.00 | $1.83 | 0.39% | ||||||||||
| Hypothetical | $1,000 | $1,023.24 | $1.99 | 0.39% | ||||||||||
(1)Expenses are equal to the fund's annualized expense ratio listed in the table above, multiplied by the average account value over the period, multiplied by 184, the number of days in the most recent fiscal half-year, divided by 365, to reflect the one-half year period. Annualized expense ratio reflects actual expenses, including any applicable fee waivers or expense reimbursements and excluding any acquired fund fees and expenses.
15
| Schedules of Investments | ||
AUGUST 31, 2022
| Mid Cap Growth Impact ETF | ||||||||
| Shares | Value | |||||||
| COMMON STOCKS — 97.3% | ||||||||
| Aerospace and Defense — 1.2% | ||||||||
CAE, Inc.(1) | 15,358 | $ | 280,437 | |||||
| Auto Components — 3.4% | ||||||||
Aptiv PLC(1) | 8,784 | 820,689 | ||||||
| Biotechnology — 7.2% | ||||||||
Alnylam Pharmaceuticals, Inc.(1) | 894 | 184,763 | ||||||
Horizon Therapeutics PLC(1) | 6,376 | 377,523 | ||||||
Sarepta Therapeutics, Inc.(1) | 7,009 | 766,644 | ||||||
Seagen, Inc.(1) | 2,488 | 383,874 | ||||||
| 1,712,804 | ||||||||
| Building Products — 5.9% | ||||||||
| Trane Technologies PLC | 6,338 | 976,496 | ||||||
| Zurn Elkay Water Solutions Corp. | 15,490 | 427,214 | ||||||
| 1,403,710 | ||||||||
| Capital Markets — 3.6% | ||||||||
| MSCI, Inc. | 1,896 | 851,759 | ||||||
| Chemicals — 7.5% | ||||||||
| Albemarle Corp. | 818 | 219,192 | ||||||
| Avient Corp. | 14,012 | 614,146 | ||||||
| Element Solutions, Inc. | 50,439 | 941,696 | ||||||
| 1,775,034 | ||||||||
| Electrical Equipment — 3.4% | ||||||||
Generac Holdings, Inc.(1) | 2,524 | 556,315 | ||||||
Plug Power, Inc.(1)(2) | 8,609 | 241,396 | ||||||
| 797,711 | ||||||||
| Electronic Equipment, Instruments and Components — 5.1% | ||||||||
Keysight Technologies, Inc.(1) | 7,444 | 1,219,997 | ||||||
| Health Care Equipment and Supplies — 3.1% | ||||||||
DexCom, Inc.(1) | 8,858 | 728,216 | ||||||
| Health Care Technology — 3.2% | ||||||||
Veeva Systems, Inc., Class A(1) | 3,875 | 772,365 | ||||||
| Hotels, Restaurants and Leisure — 9.2% | ||||||||
Airbnb, Inc., Class A(1) | 7,866 | 889,802 | ||||||
Chipotle Mexican Grill, Inc.(1) | 814 | 1,299,795 | ||||||
| 2,189,597 | ||||||||
| Life Sciences Tools and Services — 5.4% | ||||||||
| Bio-Techne Corp. | 2,094 | 694,810 | ||||||
IQVIA Holdings, Inc.(1) | 2,816 | 598,851 | ||||||
| 1,293,661 | ||||||||
| Oil, Gas and Consumable Fuels — 2.4% | ||||||||
| Excelerate Energy, Inc., Class A | 22,237 | 571,046 | ||||||
| Professional Services — 3.3% | ||||||||
| Jacobs Solutions, Inc. | 6,246 | 778,127 | ||||||
| Road and Rail — 0.9% | ||||||||
Lyft, Inc., Class A(1) | 14,999 | 220,935 | ||||||
| Semiconductors and Semiconductor Equipment — 14.6% | ||||||||
Enphase Energy, Inc.(1) | 6,397 | 1,832,357 | ||||||
16
| Mid Cap Growth Impact ETF | ||||||||
| Shares | Value | |||||||
| Marvell Technology, Inc. | 18,045 | $ | 844,867 | |||||
| Monolithic Power Systems, Inc. | 1,745 | 790,799 | ||||||
| 3,468,023 | ||||||||
| Software — 17.9% | ||||||||
Cadence Design Systems, Inc.(1) | 9,305 | 1,616,930 | ||||||
DocuSign, Inc.(1) | 5,777 | 336,337 | ||||||
Manhattan Associates, Inc.(1) | 8,491 | 1,199,438 | ||||||
Palo Alto Networks, Inc.(1) | 1,975 | 1,099,700 | ||||||
| 4,252,405 | ||||||||
TOTAL COMMON STOCKS (Cost $25,515,834) | 23,136,516 | |||||||
| SHORT-TERM INVESTMENTS — 3.2% | ||||||||
| Money Market Funds — 3.2% | ||||||||
| State Street Institutional U.S. Government Money Market Fund, Premier Class | 645,638 | 645,638 | ||||||
State Street Navigator Securities Lending Government Money Market Portfolio(3) | 123,740 | 123,740 | ||||||
TOTAL SHORT-TERM INVESTMENTS (Cost $769,378) | 769,378 | |||||||
TOTAL INVESTMENT SECURITIES — 100.5% (Cost $26,285,212) | 23,905,894 | |||||||
| OTHER ASSETS AND LIABILITIES — (0.5)% | (126,566) | |||||||
| TOTAL NET ASSETS — 100.0% | $ | 23,779,328 | ||||||
| NOTES TO SCHEDULE OF INVESTMENTS | ||||||||
(1)Non-income producing.
(2)Security, or a portion thereof, is on loan. At the period end, the aggregate value of securities on loan was $120,684. The amount of securities on loan indicated may not correspond with the securities on loan identified because securities with pending sales are in the process of recall from the brokers.
(3)Investment of cash collateral from securities on loan. At the period end, the aggregate value of the collateral held by the fund was $123,740.
See Notes to Financial Statements.
17
AUGUST 31, 2022
| Sustainable Equity ETF | ||||||||
| Shares | Value | |||||||
| COMMON STOCKS — 99.5% | ||||||||
| Aerospace and Defense — 1.2% | ||||||||
| Lockheed Martin Corp. | 2,931 | $ | 1,231,342 | |||||
| Air Freight and Logistics — 1.3% | ||||||||
| United Parcel Service, Inc., Class B | 6,909 | 1,343,870 | ||||||
| Auto Components — 0.7% | ||||||||
Aptiv PLC(1) | 8,004 | 747,814 | ||||||
| Automobiles — 1.7% | ||||||||
Tesla, Inc.(1) | 6,434 | 1,773,275 | ||||||
| Banks — 3.1% | ||||||||
| Bank of America Corp. | 9,899 | 332,705 | ||||||
| JPMorgan Chase & Co. | 12,533 | 1,425,378 | ||||||
| Regions Financial Corp. | 67,559 | 1,464,004 | ||||||
| 3,222,087 | ||||||||
| Beverages — 1.8% | ||||||||
| PepsiCo, Inc. | 10,726 | 1,847,768 | ||||||
| Biotechnology — 2.0% | ||||||||
| AbbVie, Inc. | 8,834 | 1,187,820 | ||||||
| Amgen, Inc. | 1,724 | 414,277 | ||||||
Vertex Pharmaceuticals, Inc.(1) | 1,672 | 471,103 | ||||||
| 2,073,200 | ||||||||
| Building Products — 1.6% | ||||||||
| Johnson Controls International PLC | 20,334 | 1,100,883 | ||||||
| Masco Corp. | 10,435 | 530,828 | ||||||
| 1,631,711 | ||||||||
| Capital Markets — 4.7% | ||||||||
| Ameriprise Financial, Inc. | 2,645 | 708,886 | ||||||
| BlackRock, Inc. | 1,516 | 1,010,247 | ||||||
| Intercontinental Exchange, Inc. | 5,275 | 531,984 | ||||||
| Morgan Stanley | 20,130 | 1,715,479 | ||||||
| S&P Global, Inc. | 2,867 | 1,009,700 | ||||||
| 4,976,296 | ||||||||
| Chemicals — 2.3% | ||||||||
| Air Products and Chemicals, Inc. | 1,852 | 467,537 | ||||||
| Ecolab, Inc. | 2,973 | 487,066 | ||||||
| Linde PLC | 4,610 | 1,303,985 | ||||||
| Sherwin-Williams Co. | 696 | 161,542 | ||||||
| 2,420,130 | ||||||||
| Communications Equipment — 1.9% | ||||||||
| Cisco Systems, Inc. | 43,373 | 1,939,641 | ||||||
| Consumer Finance — 0.5% | ||||||||
| American Express Co. | 3,633 | 552,216 | ||||||
| Containers and Packaging — 0.6% | ||||||||
| Ball Corp. | 10,554 | 589,019 | ||||||
| Diversified Telecommunication Services — 1.1% | ||||||||
| Verizon Communications, Inc. | 27,885 | 1,165,872 | ||||||
| Electric Utilities — 2.2% | ||||||||
| NextEra Energy, Inc. | 27,182 | 2,312,101 | ||||||
| Electrical Equipment — 1.3% | ||||||||
| Eaton Corp. PLC | 5,358 | 732,117 | ||||||
18
| Sustainable Equity ETF | ||||||||
| Shares | Value | |||||||
Generac Holdings, Inc.(1) | 1,278 | $ | 281,684 | |||||
| Rockwell Automation, Inc. | 1,601 | 379,341 | ||||||
| 1,393,142 | ||||||||
| Electronic Equipment, Instruments and Components — 2.1% | ||||||||
| CDW Corp. | 5,806 | 991,084 | ||||||
| Cognex Corp. | 4,470 | 188,232 | ||||||
Keysight Technologies, Inc.(1) | 6,126 | 1,003,990 | ||||||
| 2,183,306 | ||||||||
| Energy Equipment and Services — 2.1% | ||||||||
| Schlumberger NV | 57,141 | 2,179,929 | ||||||
| Entertainment — 1.3% | ||||||||
| Electronic Arts, Inc. | 3,542 | 449,374 | ||||||
Walt Disney Co.(1) | 8,155 | 914,012 | ||||||
| 1,363,386 | ||||||||
| Equity Real Estate Investment Trusts (REITs) — 2.3% | ||||||||
| Prologis, Inc. | 19,453 | 2,422,093 | ||||||
| Food and Staples Retailing — 2.6% | ||||||||
| Costco Wholesale Corp. | 1,415 | 738,772 | ||||||
| Kroger Co. | 14,977 | 717,997 | ||||||
| Sysco Corp. | 15,554 | 1,278,850 | ||||||
| 2,735,619 | ||||||||
| Food Products — 0.8% | ||||||||
| Mondelez International, Inc., Class A | 13,533 | 837,151 | ||||||
Vital Farms, Inc.(1) | 3,757 | 48,653 | ||||||
| 885,804 | ||||||||
| Health Care Equipment and Supplies — 1.3% | ||||||||
Edwards Lifesciences Corp.(1) | 10,948 | 986,415 | ||||||
| Medtronic PLC | 1,819 | 159,926 | ||||||
| ResMed, Inc. | 1,023 | 224,978 | ||||||
| 1,371,319 | ||||||||
| Health Care Providers and Services — 5.2% | ||||||||
| Cigna Corp. | 5,909 | 1,674,906 | ||||||
| CVS Health Corp. | 12,726 | 1,249,057 | ||||||
| Humana, Inc. | 1,159 | 558,383 | ||||||
| UnitedHealth Group, Inc. | 3,811 | 1,979,167 | ||||||
| 5,461,513 | ||||||||
| Hotels, Restaurants and Leisure — 1.1% | ||||||||
Booking Holdings, Inc.(1) | 349 | 654,658 | ||||||
Chipotle Mexican Grill, Inc.(1) | 163 | 260,278 | ||||||
Expedia Group, Inc.(1) | 2,781 | 285,470 | ||||||
| 1,200,406 | ||||||||
| Household Products — 1.6% | ||||||||
| Colgate-Palmolive Co. | 6,348 | 496,477 | ||||||
| Procter & Gamble Co. | 8,789 | 1,212,355 | ||||||
| 1,708,832 | ||||||||
| Industrial Conglomerates — 0.9% | ||||||||
| Honeywell International, Inc. | 5,037 | 953,756 | ||||||
| Insurance — 2.1% | ||||||||
| Marsh & McLennan Cos., Inc. | 4,467 | 720,840 | ||||||
| Prudential Financial, Inc. | 7,964 | 762,553 | ||||||
| Travelers Cos., Inc. | 4,372 | 706,690 | ||||||
| 2,190,083 | ||||||||
19
| Sustainable Equity ETF | ||||||||
| Shares | Value | |||||||
| Interactive Media and Services — 4.9% | ||||||||
Alphabet, Inc., Class A(1) | 47,020 | $ | 5,088,504 | |||||
| Internet and Direct Marketing Retail — 3.2% | ||||||||
Amazon.com, Inc.(1) | 26,721 | 3,387,421 | ||||||
| IT Services — 4.2% | ||||||||
| Accenture PLC, Class A | 4,297 | 1,239,513 | ||||||
| Mastercard, Inc., Class A | 3,850 | 1,248,824 | ||||||
| Visa, Inc., Class A | 9,470 | 1,881,784 | ||||||
| 4,370,121 | ||||||||
| Life Sciences Tools and Services — 2.1% | ||||||||
| Agilent Technologies, Inc. | 8,167 | 1,047,418 | ||||||
| Thermo Fisher Scientific, Inc. | 2,114 | 1,152,806 | ||||||
| 2,200,224 | ||||||||
| Machinery — 2.0% | ||||||||
| Cummins, Inc. | 3,899 | 839,727 | ||||||
| Deere & Co. | 1,160 | 423,690 | ||||||
| Parker-Hannifin Corp. | 1,377 | 364,905 | ||||||
| Xylem, Inc. | 5,038 | 458,962 | ||||||
| 2,087,284 | ||||||||
| Media — 0.4% | ||||||||
| Comcast Corp., Class A | 11,249 | 407,101 | ||||||
| Multiline Retail — 0.4% | ||||||||
| Target Corp. | 2,673 | 428,589 | ||||||
| Oil, Gas and Consumable Fuels — 2.5% | ||||||||
| ConocoPhillips | 23,927 | 2,618,810 | ||||||
| Personal Products — 0.3% | ||||||||
| Estee Lauder Cos., Inc., Class A | 1,152 | 293,046 | ||||||
| Pharmaceuticals — 3.7% | ||||||||
| Bristol-Myers Squibb Co. | 18,902 | 1,274,184 | ||||||
| Merck & Co., Inc. | 13,195 | 1,126,325 | ||||||
| Novo Nordisk A/S, ADR | 6,202 | 658,032 | ||||||
| Zoetis, Inc. | 5,460 | 854,654 | ||||||
| 3,913,195 | ||||||||
| Road and Rail — 1.3% | ||||||||
| Norfolk Southern Corp. | 2,691 | 654,263 | ||||||
Uber Technologies, Inc.(1) | 6,880 | 197,868 | ||||||
| Union Pacific Corp. | 2,490 | 559,030 | ||||||
| 1,411,161 | ||||||||
| Semiconductors and Semiconductor Equipment — 4.3% | ||||||||
Advanced Micro Devices, Inc.(1) | 7,106 | 603,086 | ||||||
| Analog Devices, Inc. | 7,459 | 1,130,263 | ||||||
| Applied Materials, Inc. | 7,584 | 713,427 | ||||||
| ASML Holding NV, NY Shares | 1,232 | 603,606 | ||||||
| NVIDIA Corp. | 9,815 | 1,481,476 | ||||||
| 4,531,858 | ||||||||
| Software — 10.0% | ||||||||
Adobe, Inc.(1) | 1,471 | 549,330 | ||||||
Cadence Design Systems, Inc.(1) | 2,855 | 496,113 | ||||||
| Microsoft Corp. | 31,947 | 8,353,182 | ||||||
Salesforce, Inc.(1) | 4,105 | 640,873 | ||||||
ServiceNow, Inc.(1) | 621 | 269,899 | ||||||
20
| Sustainable Equity ETF | ||||||||
| Shares | Value | |||||||
Workday, Inc., Class A(1) | 1,260 | $ | 207,346 | |||||
| 10,516,743 | ||||||||
| Specialty Retail — 2.9% | ||||||||
| Home Depot, Inc. | 6,158 | 1,776,090 | ||||||
| TJX Cos., Inc. | 14,347 | 894,536 | ||||||
| Tractor Supply Co. | 1,776 | 328,826 | ||||||
| 2,999,452 | ||||||||
| Technology Hardware, Storage and Peripherals — 5.0% | ||||||||
| Apple, Inc. | 33,286 | 5,233,225 | ||||||
| Textiles, Apparel and Luxury Goods — 0.9% | ||||||||
Deckers Outdoor Corp.(1) | 1,086 | 349,225 | ||||||
| NIKE, Inc., Class B | 5,753 | 612,407 | ||||||
| 961,632 | ||||||||
TOTAL COMMON STOCKS (Cost $104,333,323) | 104,323,896 | |||||||
| SHORT-TERM INVESTMENTS — 0.4% | ||||||||
| Money Market Funds — 0.4% | ||||||||
State Street Institutional U.S. Government Money Market Fund, Premier Class (Cost $368,997) | 368,997 | 368,997 | ||||||
TOTAL INVESTMENT SECURITIES — 99.9% (Cost $104,702,320) | 104,692,893 | |||||||
| OTHER ASSETS AND LIABILITIES — 0.1% | 107,241 | |||||||
| TOTAL NET ASSETS — 100.0% | $ | 104,800,134 | ||||||
| NOTES TO SCHEDULE OF INVESTMENTS | ||||||||
| ADR | - | American Depositary Receipt | ||||||
(1)Non-income producing.
See Notes to Financial Statements.
21
AUGUST 31, 2022
| Sustainable Growth ETF | ||||||||
| Shares | Value | |||||||
| COMMON STOCKS — 99.6% | ||||||||
| Aerospace and Defense — 0.5% | ||||||||
| Lockheed Martin Corp. | 85 | $ | 35,709 | |||||
| Air Freight and Logistics — 0.9% | ||||||||
| United Parcel Service, Inc., Class B | 298 | 57,964 | ||||||
| Auto Components — 0.9% | ||||||||
Aptiv PLC(1) | 623 | 58,207 | ||||||
| Automobiles — 3.4% | ||||||||
Tesla, Inc.(1) | 801 | 220,764 | ||||||
| Beverages — 3.0% | ||||||||
| Coca-Cola Co. | 1,331 | 82,136 | ||||||
| PepsiCo, Inc. | 663 | 114,215 | ||||||
| 196,351 | ||||||||
| Biotechnology — 2.6% | ||||||||
| AbbVie, Inc. | 706 | 94,929 | ||||||
Vertex Pharmaceuticals, Inc.(1) | 268 | 75,511 | ||||||
| 170,440 | ||||||||
| Building Products — 2.1% | ||||||||
| Johnson Controls International PLC | 1,153 | 62,423 | ||||||
| Masco Corp. | 1,343 | 68,318 | ||||||
Trex Co., Inc.(1) | 216 | 10,107 | ||||||
| 140,848 | ||||||||
| Capital Markets — 0.6% | ||||||||
| S&P Global, Inc. | 108 | 38,035 | ||||||
| Chemicals — 1.2% | ||||||||
| Linde PLC | 278 | 78,635 | ||||||
| Commercial Services and Supplies — 0.2% | ||||||||
Copart, Inc.(1) | 133 | 15,913 | ||||||
| Communications Equipment — 0.4% | ||||||||
| Cisco Systems, Inc. | 660 | 29,515 | ||||||
| Distributors — 0.2% | ||||||||
| Pool Corp. | 45 | 15,264 | ||||||
| Electrical Equipment — 0.9% | ||||||||
Generac Holdings, Inc.(1) | 67 | 14,767 | ||||||
| Rockwell Automation, Inc. | 186 | 44,071 | ||||||
| 58,838 | ||||||||
| Electronic Equipment, Instruments and Components — 1.5% | ||||||||
| CDW Corp. | 199 | 33,969 | ||||||
| Cognex Corp. | 301 | 12,675 | ||||||
Keysight Technologies, Inc.(1) | 301 | 49,331 | ||||||
| 95,975 | ||||||||
| Energy Equipment and Services — 0.6% | ||||||||
| Schlumberger NV | 1,100 | 41,965 | ||||||
| Entertainment — 1.4% | ||||||||
| Electronic Arts, Inc. | 296 | 37,554 | ||||||
Walt Disney Co.(1) | 454 | 50,884 | ||||||
Warner Bros Discovery, Inc.(1) | 387 | 5,124 | ||||||
| 93,562 | ||||||||
| Equity Real Estate Investment Trusts (REITs) — 0.7% | ||||||||
| Prologis, Inc. | 381 | 47,438 | ||||||
22
| Sustainable Growth ETF | ||||||||
| Shares | Value | |||||||
| Food and Staples Retailing — 0.2% | ||||||||
| Kroger Co. | 237 | $ | 11,362 | |||||
| Food Products — 0.5% | ||||||||
| Mondelez International, Inc., Class A | 569 | 35,198 | ||||||
| Health Care Equipment and Supplies — 2.2% | ||||||||
Align Technology, Inc.(1) | 33 | 8,042 | ||||||
DexCom, Inc.(1) | 180 | 14,798 | ||||||
Edwards Lifesciences Corp.(1) | 617 | 55,592 | ||||||
IDEXX Laboratories, Inc.(1) | 88 | 30,591 | ||||||
Inari Medical, Inc.(1) | 53 | 3,675 | ||||||
Shockwave Medical, Inc.(1) | 91 | 27,014 | ||||||
Tandem Diabetes Care, Inc.(1) | 141 | 6,449 | ||||||
| 146,161 | ||||||||
| Health Care Providers and Services — 3.6% | ||||||||
| Cigna Corp. | 249 | 70,579 | ||||||
| UnitedHealth Group, Inc. | 314 | 163,070 | ||||||
| 233,649 | ||||||||
| Hotels, Restaurants and Leisure — 0.8% | ||||||||
Airbnb, Inc., Class A(1) | 61 | 6,900 | ||||||
Chipotle Mexican Grill, Inc.(1) | 16 | 25,549 | ||||||
Expedia Group, Inc.(1) | 185 | 18,990 | ||||||
| 51,439 | ||||||||
| Household Products — 1.1% | ||||||||
| Procter & Gamble Co. | 529 | 72,970 | ||||||
| Interactive Media and Services — 6.6% | ||||||||
Alphabet, Inc., Class A(1) | 3,980 | 430,716 | ||||||
| Internet and Direct Marketing Retail — 6.3% | ||||||||
Amazon.com, Inc.(1) | 3,094 | 392,226 | ||||||
| eBay, Inc. | 545 | 24,051 | ||||||
| 416,277 | ||||||||
| IT Services — 6.6% | ||||||||
| Accenture PLC, Class A | 183 | 52,788 | ||||||
| Mastercard, Inc., Class A | 525 | 170,294 | ||||||
Okta, Inc.(1) | 289 | 26,415 | ||||||
Snowflake, Inc., Class A(1) | 65 | 11,762 | ||||||
| Visa, Inc., Class A | 850 | 168,903 | ||||||
| 430,162 | ||||||||
| Leisure Products — 0.1% | ||||||||
YETI Holdings, Inc.(1) | 238 | 8,780 | ||||||
| Life Sciences Tools and Services — 1.5% | ||||||||
| Agilent Technologies, Inc. | 379 | 48,607 | ||||||
Illumina, Inc.(1) | 128 | 25,810 | ||||||
| West Pharmaceutical Services, Inc. | 78 | 23,142 | ||||||
| 97,559 | ||||||||
| Machinery — 1.3% | ||||||||
| Deere & Co. | 230 | 84,008 | ||||||
| Multiline Retail — 0.4% | ||||||||
| Nordstrom, Inc. | 341 | 5,835 | ||||||
| Target Corp. | 113 | 18,118 | ||||||
| 23,953 | ||||||||
23
| Sustainable Growth ETF | ||||||||
| Shares | Value | |||||||
| Oil, Gas and Consumable Fuels — 0.6% | ||||||||
| ConocoPhillips | 357 | $ | 39,074 | |||||
| Personal Products — 0.2% | ||||||||
| Estee Lauder Cos., Inc., Class A | 40 | 10,175 | ||||||
| Pharmaceuticals — 3.1% | ||||||||
| Eli Lilly & Co. | 120 | 36,148 | ||||||
| Novo Nordisk A/S, ADR | 1,100 | 116,710 | ||||||
| Zoetis, Inc. | 303 | 47,428 | ||||||
| 200,286 | ||||||||
| Road and Rail — 0.9% | ||||||||
Uber Technologies, Inc.(1) | 1,161 | 33,391 | ||||||
| Union Pacific Corp. | 118 | 26,492 | ||||||
| 59,883 | ||||||||
| Semiconductors and Semiconductor Equipment — 7.6% | ||||||||
Advanced Micro Devices, Inc.(1) | 893 | 75,789 | ||||||
| Analog Devices, Inc. | 125 | 18,941 | ||||||
| Applied Materials, Inc. | 499 | 46,941 | ||||||
| ASML Holding NV, NY Shares | 208 | 101,907 | ||||||
| Lam Research Corp. | 114 | 49,922 | ||||||
| NVIDIA Corp. | 1,335 | 201,505 | ||||||
| 495,005 | ||||||||
| Software — 19.7% | ||||||||
Adobe, Inc.(1) | 164 | 61,244 | ||||||
Cadence Design Systems, Inc.(1) | 374 | 64,990 | ||||||
Crowdstrike Holdings, Inc., Class A(1) | 167 | 30,496 | ||||||
Datadog, Inc., Class A(1) | 178 | 18,681 | ||||||
Fair Isaac Corp.(1) | 14 | 6,292 | ||||||
HubSpot, Inc.(1) | 36 | 12,133 | ||||||
| Intuit, Inc. | 43 | 18,567 | ||||||
| Microsoft Corp. | 3,367 | 880,369 | ||||||
PagerDuty, Inc.(1) | 633 | 16,483 | ||||||
Salesforce, Inc.(1) | 299 | 46,680 | ||||||
ServiceNow, Inc.(1) | 182 | 79,101 | ||||||
Splunk, Inc.(1) | 255 | 22,958 | ||||||
Workday, Inc., Class A(1) | 194 | 31,925 | ||||||
| 1,289,919 | ||||||||
| Specialty Retail — 3.4% | ||||||||
| Home Depot, Inc. | 384 | 110,753 | ||||||
| TJX Cos., Inc. | 1,080 | 67,338 | ||||||
Ulta Beauty, Inc.(1) | 85 | 35,689 | ||||||
| Williams-Sonoma, Inc. | 61 | 9,074 | ||||||
| 222,854 | ||||||||
| Technology Hardware, Storage and Peripherals — 10.5% | ||||||||
| Apple, Inc. | 4,367 | 686,580 | ||||||
| Textiles, Apparel and Luxury Goods — 1.3% | ||||||||
Deckers Outdoor Corp.(1) | 102 | 32,800 | ||||||
| NIKE, Inc., Class B | 515 | 54,822 | ||||||
| 87,622 | ||||||||
TOTAL COMMON STOCKS (Cost $7,287,618) | 6,529,055 | |||||||
24
| Sustainable Growth ETF | ||||||||
| Shares | Value | |||||||
| SHORT-TERM INVESTMENTS — 0.3% | ||||||||
| Money Market Funds — 0.3% | ||||||||
| State Street Institutional U.S. Government Money Market Fund, Premier Class (Cost $20,203) | 20,203 | $ | 20,203 | |||||
TOTAL INVESTMENT SECURITIES — 99.9% (Cost $7,307,821) | 6,549,258 | |||||||
| OTHER ASSETS AND LIABILITIES — 0.1% | 3,555 | |||||||
| TOTAL NET ASSETS — 100.0% | $ | 6,552,813 | ||||||
| NOTES TO SCHEDULE OF INVESTMENTS | ||||||||
| ADR | - | American Depositary Receipt | ||||||
(1)Non-income producing.
See Notes to Financial Statements.
25
| Statements of Assets and Liabilities | ||
| AUGUST 31, 2022 | ||||||||
| Mid Cap Growth Impact ETF | Sustainable Equity ETF | |||||||
| Assets | ||||||||
| Investment securities, at value (cost of $26,161,472 and $104,702,320, respectively) — including $120,684 and $—, respectively of securities on loan | $ | 23,782,154 | $ | 104,692,893 | ||||
| Investment made with cash collateral received for securities on loan, at value (cost of $123,740 and $—, respectively) | 123,740 | — | ||||||
| Total investment securities, at value (cost of $26,285,212 and $104,702,320, respectively) | 23,905,894 | 104,692,893 | ||||||
| Dividends and interest receivable | 6,956 | 143,756 | ||||||
| Securities lending receivable | 60 | — | ||||||
| 23,912,910 | 104,836,649 | |||||||
| Liabilities | ||||||||
| Payable for collateral received for securities on loan | 123,740 | — | ||||||
| Accrued management fees | 9,842 | 36,515 | ||||||
| 133,582 | 36,515 | |||||||
| Net Assets | $ | 23,779,328 | $ | 104,800,134 | ||||
| Shares outstanding (unlimited number of shares authorized) | 540,000 | 2,150,000 | ||||||
| Net Asset Value Per Share | $ | 44.04 | $ | 48.74 | ||||
| Net Assets Consist of: | ||||||||
| Capital paid in | $ | 29,041,230 | $ | 109,252,139 | ||||
| Distributable earnings | (5,261,902) | (4,452,005) | ||||||
| $ | 23,779,328 | $ | 104,800,134 | |||||
See Notes to Financial Statements.
26
| AUGUST 31, 2022 | |||||
| Sustainable Growth ETF | |||||
| Assets | |||||
| Investment securities, at value (cost of $7,307,821) | $ | 6,549,258 | |||
| Dividends and interest receivable | 5,878 | ||||
| 6,555,136 | |||||
| Liabilities | |||||
| Accrued management fees | 2,323 | ||||
| Net Assets | $ | 6,552,813 | |||
| Shares outstanding (unlimited number of shares authorized) | 190,000 | ||||
| Net Asset Value Per Share | $ | 34.49 | |||
| Net Assets Consist of: | |||||
| Capital paid in | $ | 7,703,059 | |||
| Distributable earnings | (1,150,246) | ||||
| $ | 6,552,813 | ||||
See Notes to Financial Statements.
27
| Statements of Operations | ||
| YEAR ENDED AUGUST 31, 2022 | ||||||||
| Mid Cap Growth Impact ETF | Sustainable Equity ETF | |||||||
| Investment Income (Loss) | ||||||||
| Income: | ||||||||
| Dividends (net of foreign taxes withheld of $— and $3,599, respectively) | $ | 67,118 | $ | 1,829,307 | ||||
| Interest | 2,754 | 1,683 | ||||||
| Securities lending, net | 143 | — | ||||||
| 70,015 | 1,830,990 | |||||||
| Expenses: | ||||||||
| Management fees | 108,165 | 542,552 | ||||||
| Net investment income (loss) | (38,150) | 1,288,438 | ||||||
| Realized and Unrealized Gain (Loss) | ||||||||
| Net realized gain (loss) on investment transactions | (1,116,341) | 12,237,994 | ||||||
| Change in net unrealized appreciation (depreciation) on investments | (6,850,129) | (34,780,883) | ||||||
| Net realized and unrealized gain (loss) | (7,966,470) | (22,542,889) | ||||||
| Net Increase (Decrease) in Net Assets Resulting from Operations | $ | (8,004,620) | $ | (21,254,451) | ||||
See Notes to Financial Statements.
28
| YEAR ENDED AUGUST 31, 2022 | |||||
| Sustainable Growth ETF | |||||
| Investment Income (Loss) | |||||
| Income: | |||||
| Dividends (net of foreign taxes withheld of $623) | $ | 44,202 | |||
| Interest | 92 | ||||
| 44,294 | |||||
| Expenses: | |||||
| Management fees | 25,380 | ||||
| Net investment income (loss) | 18,914 | ||||
| Realized and Unrealized Gain (Loss) | |||||
| Net realized gain (loss) on investment transactions | (409,268) | ||||
| Change in net unrealized appreciation (depreciation) on investments | (1,158,774) | ||||
| Net realized and unrealized gain (loss) | (1,568,042) | ||||
| Net Increase (Decrease) in Net Assets Resulting from Operations | $ | (1,549,128) | |||
See Notes to Financial Statements.
29
| Statements of Changes in Net Assets | ||
| YEARS ENDED AUGUST 31, 2022 AND AUGUST 31, 2021 | ||||||||||||||
| Mid Cap Growth Impact ETF | Sustainable Equity ETF | |||||||||||||
| Increase (Decrease) in Net Assets | August 31, 2022 | August 31, 2021 | August 31, 2022 | August 31, 2021 | ||||||||||
| Operations | ||||||||||||||
| Net investment income (loss) | $ | (38,150) | $ | (23,635) | $ | 1,288,438 | $ | 1,130,539 | ||||||
| Net realized gain (loss) | (1,116,341) | 184,057 | 12,237,994 | 5,728,347 | ||||||||||
| Change in net unrealized appreciation (depreciation) | (6,850,129) | 3,888,428 | (34,780,883) | 28,182,166 | ||||||||||
| Net increase (decrease) in net assets resulting from operations | (8,004,620) | 4,048,850 | (21,254,451) | 35,041,052 | ||||||||||
| Distributions to Shareholders | ||||||||||||||
| From earnings | — | — | (1,219,340) | (1,026,655) | ||||||||||
| Capital Share Transactions | ||||||||||||||
| Proceeds from shares sold | 17,585,267 | 13,522,367 | 52,262,088 | 56,555,628 | ||||||||||
| Payments for shares redeemed | (7,918,146) | (1,865,381) | (75,423,895) | (24,927,794) | ||||||||||
| Net increase (decrease) in net assets from capital share transactions | 9,667,121 | 11,656,986 | (23,161,807) | 31,627,834 | ||||||||||
| Net increase (decrease) in net assets | 1,662,501 | 15,705,836 | (45,635,598) | 65,642,231 | ||||||||||
| Net Assets | ||||||||||||||
| Beginning of period | 22,116,827 | 6,410,991 | 150,435,732 | 84,793,501 | ||||||||||
| End of period | $ | 23,779,328 | $ | 22,116,827 | $ | 104,800,134 | $ | 150,435,732 | ||||||
| Transactions in Shares of the Funds | ||||||||||||||
| Sold | 340,000 | 250,000 | 940,000 | 1,170,000 | ||||||||||
| Redeemed | (165,000) | (35,000) | (1,420,000) | (460,000) | ||||||||||
| Net increase (decrease) in shares of the funds | 175,000 | 215,000 | (480,000) | 710,000 | ||||||||||
See Notes to Financial Statements.
30
| YEAR ENDED AUGUST 31, 2022 AND PERIOD ENDED AUGUST 31, 2021 | ||||||||
| Sustainable Growth ETF | ||||||||
| Increase (Decrease) in Net Assets | August 31, 2022 | August 31, 2021(1) | ||||||
| Operations | ||||||||
| Net investment income (loss) | $ | 18,914 | $ | 1,272 | ||||
| Net realized gain (loss) | (409,268) | (9,099) | ||||||
| Change in net unrealized appreciation (depreciation) | (1,158,774) | 400,211 | ||||||
| Net increase (decrease) in net assets resulting from operations | (1,549,128) | 392,384 | ||||||
| Distributions to Shareholders | ||||||||
| From earnings | (13,482) | — | ||||||
| Capital Share Transactions | ||||||||
| Proceeds from shares sold | 2,444,496 | 5,651,186 | ||||||
| Payments for shares redeemed | (372,643) | — | ||||||
| Net increase (decrease) in net assets from capital share transactions | 2,071,853 | 5,651,186 | ||||||
| Net increase (decrease) in net assets | 509,243 | 6,043,570 | ||||||
| Net Assets | ||||||||
| Beginning of period | 6,043,570 | — | ||||||
| End of period | $ | 6,552,813 | $ | 6,043,570 | ||||
| Transactions in Shares of the Funds | ||||||||
| Sold | 60,000 | 140,000 | ||||||
| Redeemed | (10,000) | — | ||||||
| Net increase (decrease) in shares of the funds | 50,000 | 140,000 | ||||||
(1)June 29, 2021 (fund inception) through August 31, 2021.
See Notes to Financial Statements.
31
| Notes to Financial Statements | ||
AUGUST 31, 2022
1. Organization
American Century ETF Trust (the trust) was registered as a Delaware statutory trust in 2017 and is registered under the Investment Company Act of 1940, as amended (the 1940 Act), as an open-end management investment company. American Century Mid Cap Growth Impact ETF (Mid Cap Growth Impact ETF), American Century Sustainable Equity ETF (Sustainable Equity ETF) and American Century Sustainable Growth ETF (Sustainable Growth ETF) (collectively, the funds) are three funds in a series issued by the trust. The investment objective for Mid Cap Growth Impact ETF and Sustainable Equity ETF is to seek long-term capital growth. Sustainable Growth ETF's investment objective is to seek capital appreciation. Shares of each fund are listed for trading on the NYSE Arca, Inc. Sustainable Growth ETF incepted on June 29, 2021.
2. Significant Accounting Policies
The following is a summary of significant accounting policies consistently followed by the funds in preparation of their financial statements. Each fund is an investment company and follows accounting and reporting guidance in accordance with accounting principles generally accepted in the United States of America. This may require management to make certain estimates and assumptions at the date of the financial statements. Actual results could differ from these estimates. Management evaluated the impact of events or transactions occurring through the date the financial statements were issued that would merit recognition or disclosure.
Investment Valuations — The funds determine the fair value of their investments and compute their net asset value (NAV) per share at the close of regular trading (usually 4 p.m. Eastern time) on the New York Stock Exchange (NYSE) on each day the NYSE is open. The Board of Trustees has adopted valuation policies and procedures to guide the investment advisor in the funds' investment valuation process and to provide methodologies for the oversight of the funds' pricing function.
Equity securities that are listed or traded on a domestic securities exchange are valued at the last reported sales price or at the official closing price as provided by the exchange. Equity securities traded on foreign securities exchanges are generally valued at the closing price of such securities on the exchange where primarily traded or at the close of the NYSE, if that is earlier. If no last sales price is reported, or if local convention or regulation so provides, the mean of the latest bid and asked prices may be used. Securities traded over-the-counter are valued at the mean of the latest bid and asked prices, the last sales price, or the official closing price.
Open-end management investment companies are valued at the reported NAV per share.
If the funds determine that the market price for an investment is not readily available or the valuation methods mentioned above do not reflect an investment’s fair value, such investment is valued as determined in good faith by the Board of Trustees or its delegate, in accordance with policies and procedures adopted by the Board of Trustees. In its determination of fair value, the funds may review several factors including, but not limited to, market information regarding the specific investment or comparable investments and correlation with other investment types, futures indices or general market indicators. Circumstances that may cause the funds to use these procedures to value an investment include, but are not limited to: an investment has been declared in default or is distressed; trading in a security has been suspended during the trading day or a security is not actively trading on its principal exchange; prices received from a regular pricing source are deemed unreliable; or there is a foreign market holiday and no trading occurred.
The funds monitor for significant events occurring after the close of an investment’s primary exchange but before each fund’s NAV per share is determined. Significant events may include, but are not limited to: corporate announcements and transactions; governmental action and political unrest that could impact a specific investment or an investment sector; or armed conflicts, natural disasters and similar events that could affect investments in a specific country or region. The funds also monitor for significant fluctuations between domestic and foreign markets, as evidenced by the U.S. market or such other indicators that the Board of Trustees, or its delegate, deems appropriate. The funds may apply a model-derived factor to the closing price of equity securities traded on foreign securities exchanges. The factor is based on observable market data as provided by an independent pricing service.
32
Security Transactions — Security transactions are accounted for as of the trade date. Net realized gains and losses are determined on the identified cost basis, which is also used for federal income tax purposes.
Investment Income — Dividend income less foreign taxes withheld, if any, is recorded as of the ex-dividend date. Distributions received on securities that represent a return of capital or long-term capital gain are recorded as a reduction of cost of investments and/or as a realized gain. The funds may estimate the components of distributions received that may be considered nontaxable distributions or long-term capital gain distributions for income tax purposes. Interest income is recorded on the accrual basis and includes accretion of discounts and amortization of premiums. Securities lending income is net of fees and rebates earned by the lending agent for its services.
Segregated Assets — In accordance with the 1940 Act, the funds segregate assets on their books and records to cover certain types of investment securities and other financial instruments. American Century Investment Management, Inc. (ACIM) (the investment advisor) monitors, on a daily basis, the securities segregated to ensure the funds designate a sufficient amount of liquid assets, marked-to-market daily. The funds may also receive assets or be required to pledge assets at the custodian bank or with a broker for collateral requirements.
Income Tax Status — It is each fund’s policy to distribute substantially all net investment income and net realized gains to shareholders and to otherwise qualify as a regulated investment company under provisions of the Internal Revenue Code. Accordingly, no provision has been made for income taxes. The funds file U.S. federal, state, local and non-U.S. tax returns as applicable. The funds' tax returns are subject to examination by the relevant taxing authority until expiration of the applicable statute of limitations, which is generally three years from the date of filing but can be longer in certain jurisdictions. At this time, management believes there are no uncertain tax positions which, based on their technical merit, would not be sustained upon examination and for which it is reasonably possible that the total amounts of unrecognized tax benefits will significantly change in the next twelve months.
Distributions to Shareholders — Distributions from net investment income, if any, are generally declared and paid quarterly. Distributions from net realized gains, if any, are generally declared and paid annually. Each fund may elect to treat a portion of its payment to a redeeming shareholder, which represents the pro rata share of undistributed net investment income and net realized gains, as a distribution for federal income tax purposes (tax equalization).
Indemnifications — Under the trust’s organizational documents, its officers and trustees are indemnified against certain liabilities arising out of the performance of their duties to the funds. In addition, in the normal course of business, the funds enter into contracts that provide general indemnifications. The maximum exposure under these arrangements is unknown as this would involve future claims that may be made against a fund. The risk of material loss from such claims is considered by management to be remote.
Securities Lending — Securities are lent to qualified financial institutions and brokers. State Street Bank & Trust Co. serves as securities lending agent to the funds pursuant to a Securities Lending Agreement. The lending of securities exposes the funds to risks such as: the borrowers may fail to return the loaned securities, the borrowers may not be able to provide additional collateral, the funds may experience delays in recovery of the loaned securities or delays in access to collateral, or the funds may experience losses related to the investment collateral. To minimize certain risks, loan counterparties pledge collateral in the form of cash and/or securities. The lending agent has agreed to indemnify the funds in the case of default of any securities borrowed. Cash collateral received is invested in the State Street Navigator Securities Lending Government Money Market Portfolio, a money market mutual fund registered under the 1940 Act. The loans may also be secured by U.S. government securities in an amount at least equal to the market value of the securities loaned, plus accrued interest and dividends, determined on a daily basis and adjusted accordingly. By lending securities, the funds seek to increase their net investment income through the receipt of interest and fees. Such income is reflected separately within the Statements of Operations. The value of loaned securities and related collateral outstanding at period end, if any, are shown on a gross basis within the Schedules of
Investments and Statements of Assets and Liabilities.
33
The following table reflects a breakdown of transactions accounted for as secured borrowings, the gross obligation by the type of collateral pledged, and the remaining contractual maturity of those transactions as of August 31, 2022.
| Remaining Contractual Maturity of Agreements | |||||||||||||||||
Fund/Securities Lending Transactions(1) | Overnight and Continuous | <30 days | Between 30 & 90 days | >90 days | Total | ||||||||||||
| Mid Cap Growth Impact ETF | |||||||||||||||||
| Common Stocks | $ | 123,740 | — | — | — | $ | 123,740 | ||||||||||
| Gross amount of recognized liabilities for securities lending transactions | $ | 123,740 | |||||||||||||||
(1)Amount represents the payable for cash collateral received for securities on loan. This will generally be in the Overnight and Continuous column as the securities are typically callable on demand.
3. Fees and Transactions with Related Parties
Certain officers and trustees of the trust are also officers and/or directors of American Century Companies, Inc. (ACC). The trust's investment advisor, ACIM, and the trust’s administrator, American Century Services, LLC, are wholly owned, directly or indirectly, by ACC. ACIM owns 10% and 66% of the shares of Mid Cap Growth Impact ETF and Sustainable Growth ETF, respectively. Related parties do not invest in the funds for the purpose of exercising management or control.
Management Fees — The trust has entered into a management agreement with ACIM, under which ACIM provides the funds with investment advisory and management services in exchange for a single, unified management fee (the fee). The agreement provides that ACIM will pay all expenses of managing and operating the funds, except brokerage and other transaction fees and expenses relating to the acquisition and disposition of portfolio securities, acquired fund fees and expenses, interest, taxes, litigation expenses and extraordinary expenses. The fee is computed and accrued daily based on the daily net assets of each fund and paid monthly in arrears.
The annual management fee for each fund is as follows:
| Annual Management Fee | |||||
| Mid Cap Growth Impact ETF | 0.45% | ||||
| Sustainable Equity ETF | 0.39% | ||||
| Sustainable Growth ETF | 0.39% | ||||
Interfund Transactions — The funds may enter into security transactions with other American Century Investments funds and other client accounts of the investment advisor, in accordance with the 1940 Act rules and procedures adopted by the Board of Trustees. The rules and procedures require, among other things, that these transactions be effected at the independent current market price of the security. There were no interfund transactions during the period.
4. Investment Transactions
Purchases and sales of investment securities, excluding short-term investments and in kind transactions, for the period ended August 31, 2022 were as follows:
| Mid Cap Growth Impact ETF | Sustainable Equity ETF | Sustainable Growth ETF | |||||||||
| Purchases | $10,460,470 | $30,642,094 | $1,948,097 | ||||||||
| Sales | $10,285,647 | $28,855,996 | $1,904,369 | ||||||||
Securities received or delivered in kind through subscriptions and redemptions and in kind net realized gain (loss) for the period ended August 31, 2022 were as follows:
| In kind Subscriptions | In kind Redemptions | In kind Net Realized Gain/(Loss)* | |||||||||
| Mid Cap Growth Impact ETF | $16,899,888 | $7,602,890 | $1,592,068 | ||||||||
| Sustainable Equity ETF | $46,888,848 | $71,768,008 | $16,603,849 | ||||||||
| Sustainable Growth ETF | $2,384,602 | $362,134 | $7,010 | ||||||||
*Net realized gain (loss) on in kind transactions are not considered taxable for federal income tax purposes.
34
5. Capital Share Transactions
Each fund’s shares may only be bought and sold in a secondary market through a broker-dealer at a market price. Because ETF shares trade at market prices rather than NAV, shares may trade at a price greater than NAV (a premium) or less than NAV (a discount). Each fund issues and redeems shares at their NAV only in aggregations of a specified number of shares (a creation unit) generally in exchange for a designated portfolio of securities and/or cash (including any portion of such securities for which cash may be substituted). Authorized participants may be required to pay an additional variable charge to cover certain brokerage, tax, foreign exchange, execution, market impact and other costs and expenses related to the execution of trades resulting from creation unit transactions. Such variable charges, if any, are included in other capital within the Statements of Changes in Net Assets.
6. Fair Value Measurements
The funds’ investment valuation process is based on several considerations and may use multiple inputs to determine the fair value of the investments held by the funds. In conformity with accounting principles generally accepted in the United States of America, the inputs used to determine a valuation are classified into three broad levels.
•Level 1 valuation inputs consist of unadjusted quoted prices in an active market for identical investments.
•Level 2 valuation inputs consist of direct or indirect observable market data (including quoted prices for comparable investments, evaluations of subsequent market events, interest rates, prepayment speeds, credit risk, etc.). These inputs also consist of quoted prices for identical investments initially expressed in local currencies that are adjusted through translation into U.S. dollars.
•Level 3 valuation inputs consist of unobservable data (including a fund’s own assumptions).
The level classification is based on the lowest level input that is significant to the fair valuation measurement. The valuation inputs are not necessarily an indication of the risks associated with investing in these securities or other financial instruments.
As of period end, the funds’ investment securities were classified as Level 1. The Schedules of Investments provide additional information on the funds’ portfolio holdings.
7. Risk Factors
The value of the funds’ shares will go up and down, sometimes rapidly or unpredictably, based on the performance of the securities owned by the funds and other factors generally affecting the securities market. Market risks, including political, regulatory, economic and social developments, can affect the value of the funds’ investments. Natural disasters, public health emergencies, war, terrorism and other unforeseeable events may lead to increased market volatility and may have adverse long-term effects on world economies and markets generally.
35
8. Federal Tax Information
The tax character of distributions paid during the years ended August 31, 2022 and August 31, 2021 (except as noted) were as follows:
| 2022 | 2021 | |||||||||||||
| Distributions Paid From: | Distributions Paid From: | |||||||||||||
| Ordinary Income | Long-term Capital Gains | Ordinary Income | Long-term Capital Gains | |||||||||||
| Mid Cap Growth Impact ETF | — | — | — | — | ||||||||||
| Sustainable Equity ETF | $ | 1,219,340 | — | $ | 1,026,655 | — | ||||||||
Sustainable Growth ETF(1) | $ | 13,482 | — | — | — | |||||||||
(1)June 29, 2021 (fund inception) through August 31, 2021.
The book-basis character of distributions made during the year from net investment income or net realized gains may differ from their ultimate characterization for federal income tax purposes. These differences reflect the differing character of certain income items and net realized gains and losses for financial statement and tax purposes, and may result in reclassification among certain capital accounts on the financial statements.
The reclassifications, which are primarily due to in kind transactions, were as follows:
| Mid Cap Growth Impact ETF | Sustainable Equity ETF | Sustainable Growth ETF | |||||||||
| Capital paid in | $ | 1,483,139 | $ | 16,594,854 | (19,980) | ||||||
| Distributable earnings | $ | (1,483,139) | $ | (16,594,854) | 19,980 | ||||||
As of period end, the federal tax cost of investments and the components of distributable earnings on a tax-basis were as follows:
| Mid Cap Growth Impact ETF | Sustainable Equity ETF | Sustainable Growth ETF | |||||||||
| Federal tax cost of investments | $ | 26,371,870 | $ | 105,078,846 | $ | 7,332,280 | |||||
| Gross tax appreciation of investments | $ | 1,846,203 | $ | 6,016,523 | $ | 211,882 | |||||
| Gross tax depreciation of investments | (4,312,179) | (6,402,476) | (994,904) | ||||||||
| Net tax appreciation (depreciation) of investments | $ | (2,465,976) | $ | (385,953) | $ | (783,022) | |||||
| Undistributed ordinary income | — | $ | 142,411 | $ | 6,680 | ||||||
| Accumulated short-term capital losses | $ | (2,413,713) | $ | (3,055,556) | $ | (358,971) | |||||
| Accumulated long-term capital losses | $ | (339,568) | $ | (1,152,907) | $ | (14,933) | |||||
| Late-year ordinary loss deferral | $ | (42,645) | — | — | |||||||
The difference between book-basis and tax-basis unrealized appreciation (depreciation) is attributable primarily to the tax deferral of losses on wash sales.
Accumulated capital losses represent net capital loss carryovers that may be used to offset future realized capital gains for federal income tax purposes. The capital loss carryovers may be carried forward for an unlimited period. Future capital loss carryover utilization in any given year may be subject to Internal Revenue Code limitations.
Loss deferrals represent certain qualified losses that the fund has elected to treat as having been incurred in the following fiscal year for federal income tax purposes.
36
| Financial Highlights | ||
| For a Share Outstanding Throughout the Years Ended August 31 (except as noted) | ||||||||||||||||||||||||||||||||
| Per-Share Data | Ratios and Supplemental Data | |||||||||||||||||||||||||||||||
| Income From Investment Operations: | Ratio to Average Net Assets of: | |||||||||||||||||||||||||||||||
| Net Asset Value, Beginning of Period | Net Investment Income (Loss)(1) | Net Realized and Unrealized Gain (Loss) | Total From Investment Operations | Net Asset Value, End of Period | Total Return(2) | Operating Expenses | Net Investment Income (Loss) | Portfolio Turnover Rate(3) | Net Assets, End of Period (in thousands) | |||||||||||||||||||||||
| Mid Cap Growth Impact ETF | ||||||||||||||||||||||||||||||||
| 2022 | $60.59 | (0.08) | (16.47) | (16.55) | $44.04 | (27.33)% | 0.45% | (0.16)% | 44% | $23,779 | ||||||||||||||||||||||
| 2021 | $42.74 | (0.11) | 17.96 | 17.85 | $60.59 | 41.78% | 0.45% | (0.20)% | 48% | $22,117 | ||||||||||||||||||||||
2020(4) | $38.45 | (0.02) | 4.31 | 4.29 | $42.74 | 11.14% | 0.45%(5) | (0.29)%(5) | 2% | $6,411 | ||||||||||||||||||||||
| Notes to Financial Highlights | ||
(1)Computed using average shares outstanding throughout the period.
(2)Total returns are calculated based on the net asset value of the last business day. Total returns for periods less than one year are not annualized.
(3)Excludes securities received or delivered in kind.
(4)July 13, 2020 (fund inception) through August 31, 2020.
(5)Annualized.
See Notes to Financial Statements.
| For a Share Outstanding Throughout the Years Ended August 31 (except as noted) | |||||||||||||||||||||||||||||||||||
| Per-Share Data | Ratios and Supplemental Data | ||||||||||||||||||||||||||||||||||
| Income From Investment Operations: | Ratio to Average Net Assets of: | ||||||||||||||||||||||||||||||||||
| Net Asset Value, Beginning of Period | Net Investment Income (Loss)(1) | Net Realized and Unrealized Gain (Loss) | Total From Investment Operations | Distributions From Net Investment Income | Net Asset Value, End of Period | Total Return(2) | Operating Expenses | Net Investment Income (Loss) | Portfolio Turnover Rate(3) | Net Assets, End of Period (in thousands) | |||||||||||||||||||||||||
| Sustainable Equity ETF | |||||||||||||||||||||||||||||||||||
| 2022 | $57.20 | 0.50 | (8.49) | (7.99) | (0.47) | $48.74 | (14.03)% | 0.39% | 0.93% | 21% | $104,800 | ||||||||||||||||||||||||
| 2021 | $44.16 | 0.45 | 13.01 | 13.46 | (0.42) | $57.20 | 30.65% | 0.39% | 0.91% | 22% | $150,436 | ||||||||||||||||||||||||
2020(4) | $39.59 | 0.06 | 4.51 | 4.57 | — | $44.16 | 11.56% | 0.39%(5) | 1.13%(5) | 10% | $84,794 | ||||||||||||||||||||||||
| Notes to Financial Highlights | ||
(1)Computed using average shares outstanding throughout the period.
(2)Total returns are calculated based on the net asset value of the last business day. Total returns for periods less than one year are not annualized.
(3)Excludes securities received or delivered in kind.
(4)July 13, 2020 (fund inception) through August 31, 2020.
(5)Annualized.
See Notes to Financial Statements.
| For a Share Outstanding Throughout the Years Ended August 31 (except as noted) | |||||||||||||||||||||||||||||||||||
| Per-Share Data | Ratios and Supplemental Data | ||||||||||||||||||||||||||||||||||
| Income From Investment Operations: | Ratio to Average Net Assets of: | ||||||||||||||||||||||||||||||||||
| Net Asset Value, Beginning of Period | Net Investment Income (Loss)(1) | Net Realized and Unrealized Gain (Loss) | Total From Investment Operations | Distributions From Net Investment Income | Net Asset Value, End of Period | Total Return(2) | Operating Expenses | Net Investment Income (Loss) | Portfolio Turnover Rate(3) | Net Assets, End of Period (in thousands) | |||||||||||||||||||||||||
| Sustainable Growth ETF | |||||||||||||||||||||||||||||||||||
| 2022 | $43.17 | 0.12 | (8.72) | (8.60) | (0.08) | $34.49 | (19.93)% | 0.39% | 0.29% | 29% | $6,553 | ||||||||||||||||||||||||
2021(4) | $40.15 | 0.01 | 3.01 | 3.02 | — | $43.17 | 7.52% | 0.39%(5) | 0.14%(5) | 4% | $6,044 | ||||||||||||||||||||||||
| Notes to Financial Highlights | ||
(1)Computed using average shares outstanding throughout the period.
(2)Total returns are calculated based on the net asset value of the last business day. Total returns for periods less than one year are not annualized.
(3)Excludes securities received or delivered in kind.
(4)June 29, 2021 (fund inception) through August 31, 2021.
(5)Annualized.
See Notes to Financial Statements.
| Report of Independent Registered Public Accounting Firm | ||
To the Shareholders and the Board of Trustees of American Century ETF Trust:
Opinion on the Financial Statements and Financial Highlights
We have audited the accompanying statements of assets and liabilities, including the schedules of investments, of American Century Mid Cap Growth Impact ETF, American Century Sustainable Equity ETF, and American Century Sustainable Growth ETF (the “Funds”), three of the funds constituting the American Century ETF Trust, as of August 31, 2022, the related statements of operations, statements of changes in net assets, and financial highlights for the periods indicated in the table below; and the related notes. In our opinion, the financial statements and financial highlights present fairly, in all material respects, the financial position of each of the Funds constituting American Century ETF Trust as of August 31, 2022, and the results of their operations, the changes in their net assets, and the financial highlights for the periods listed in the table below, in conformity with accounting principles generally accepted in the United States of America.
| Individual Fund Constituting the American Century ETF Trust | Statement of Operations | Statements of Changes in Net Assets | Financial Highlights | ||||||||
| American Century Mid Cap Growth Impact ETF | For the year ended August 31, 2022 | For the years ended August 31, 2022 and 2021 | For the years ended August 31, 2022, 2021, and the period from July 13, 2020 (fund inception) through August 31, 2020 | ||||||||
| American Century Sustainable Equity ETF | |||||||||||
| American Century Sustainable Growth ETF | For the year ended August 31, 2022 | For the year ended August 31, 2022 and the period from June 29, 2021 (fund inception) through August 31, 2021 | |||||||||
Basis for Opinion
These financial statements and financial highlights are the responsibility of the Funds’ management. Our responsibility is to express an opinion on the Funds’ financial statements and financial highlights based on our audits. We are a public accounting firm registered with the Public Company Accounting Oversight Board (United States) (PCAOB) and are required to be independent with respect to the Funds in accordance with the U.S. federal securities laws and the applicable rules and regulations of the Securities and Exchange Commission and the PCAOB.
We conducted our audits in accordance with the standards of the PCAOB. Those standards require that we plan and perform the audit to obtain reasonable assurance about whether the financial statements and financial highlights are free of material misstatement, whether due to error or fraud. The Funds are not required to have, nor were we engaged to perform, an audit of their internal control over financial reporting. As part of our audits, we are required to obtain an understanding of internal control over financial reporting but not for the purpose of expressing an opinion on the effectiveness of the Funds’ internal control over financial reporting. Accordingly, we express no such opinion.
40
Our audits included performing procedures to assess the risks of material misstatement of the financial statements and financial highlights, whether due to error or fraud, and performing procedures that respond to those risks. Such procedures included examining, on a test basis, evidence regarding the amounts and disclosures in the financial statements and financial highlights. Our audits also included evaluating the accounting principles used and significant estimates made by management, as well as evaluating the overall presentation of the financial statements and financial highlights. Our procedures included confirmation of securities owned as of August 31, 2022, by correspondence with the custodian and brokers; when replies were not received from brokers, we performed other auditing procedures. We believe that our audits provide a reasonable basis for our opinion.
/s/ Deloitte & Touche LLP
Kansas City, Missouri
October 17, 2022
We have served as the auditor of one or more American Century investment companies since 1997.
41
| Management | ||
The Board of Trustees
The individuals listed below serve as trustees of the funds. Each trustee will continue to serve in this capacity until death, retirement, resignation or removal from office. The board has adopted a mandatory retirement age for trustees who are not “interested persons,” as that term is defined in the Investment Company Act (independent trustees). Trustees who are not also officers of the trust shall retire on December 31st of the year in which they reach their 75th birthday.
Jonathan S. Thomas is an “interested person” because he currently serves as President and Chief Executive Officer of American Century Companies, Inc. (ACC), the parent company of American Century Investment Management, Inc. (ACIM or the advisor). The other trustees are independent. They are not employees, directors or officers of, and have no financial interest in, ACC or any of its wholly owned, direct or indirect, subsidiaries, including ACIM and American Century Services, LLC (ACS), and they do not have any other affiliations, positions or relationships that would cause them to be considered “interested persons” under the Investment Company Act. The following trustees also serve in this capacity for a number of other registered investment companies in the American Century Investments family of funds: Jonathan S. Thomas, 15; Jeremy I. Bulow, 8; and Stephen E. Yates, 7.
The following table presents additional information about the trustees. The mailing address for each trustee other than Jonathan S. Thomas is 330 Madison Avenue, New York, New York 10017. The mailing address for Jonathan S. Thomas is 4500 Main Street, Kansas City, Missouri 64111.
| Name (Year of Birth) | Position(s) Held with Funds | Length of Time Served | Principal Occupation(s) During Past 5 Years | Number of American Century Portfolios Overseen by Trustee | Other Directorships Held During Past 5 Years | ||||||||||||
| Independent Trustees | |||||||||||||||||
| Reginald M. Browne (1968) | Trustee and Chairman of the Board | Since 2017 (Chairman since 2019) | Principal, GTS Securities (automated capital markets trading firm)(2019 to present); Senior Managing Director, Co Global Head-ETF Group, Cantor Fitzgerald (financial services firm)(2013 to 2019) | 41 | None | ||||||||||||
| Jeremy I. Bulow (1954) | Trustee | Since 2022 | Professor of Economics, Stanford University Graduate School of Business (1979 to present) | 75 | None | ||||||||||||
| Barry A. Mendelson (1958) | Trustee | Since 2017 | Retired | 41 | None | ||||||||||||
| Stephen E. Yates (1948) | Trustee | Since 2017 | Retired | 105 | None | ||||||||||||
| Interested Trustees | |||||||||||||||||
| Jonathan S. Thomas (1963) | Trustee | Since 2017 | President and Chief Executive Officer, ACC (2007 to present). Also serves as Chief Executive Officer, ACS; Director, ACC and other ACC subsidiaries | 139 | None | ||||||||||||
The Statement of Additional Information has additional information about the funds' trustees and is available without charge, upon request, by calling 1-800-345-6488.
42
Officers
The following table presents certain information about the executive officers of the funds. Each officer, except Cleo Chang and Edward Rosenberg, serves as an officer for each of the 16 investment companies in the American Century family of funds. No officer is compensated for his or her service as an officer of the funds. The listed officers are interested persons of the funds and are appointed or re-appointed on an annual basis. The mailing address for each officer listed below is 4500 Main Street, Kansas City, Missouri 64111.
| Name (Year of Birth) | Offices with the Funds | Principal Occupation(s) During the Past Five Years | ||||||
| Patrick Bannigan (1965) | President since 2019 | Executive Vice President and Director, ACC (2012 to present); Chief Financial Officer, Chief Accounting Officer and Treasurer, ACC (2015 to present). Also serves as President, ACS; Vice President, ACIM; Chief Financial Officer, Chief Accounting Officer and/or Director, ACIM, ACS and other ACC subsidiaries | ||||||
| R. Wes Campbell (1974) | Chief Financial Officer and Treasurer since 2018 | Vice President, ACS (2020 to present); Investment Operations and Investment Accounting, ACS (2000 to present) | ||||||
| Amy D. Shelton (1964) | Chief Compliance Officer and Vice President since 2017 | Chief Compliance Officer, American Century funds, (2014 to present); Chief Compliance Officer, ACIM (2014 to present); Chief Compliance Officer, ACIS (2009 to present). Also serves as Vice President, ACIS | ||||||
| John Pak (1968) | General Counsel and Vice President since 2021 | General Counsel and Senior Vice President, ACC (2021 to present). Also serves as General Counsel and Senior Vice President, ACIM, ACS and ACIS. Chief Legal Officer of Investment and Wealth Management,The Bank of New York Mellon (2014 to 2021) | ||||||
| Cleo Chang (1977) | Vice President since 2019 | Senior Vice President, ACIM (2015 to present) | ||||||
| David H. Reinmiller (1963) | Vice President since 2017 | Attorney, ACC (1994 to present). Also serves as Vice President, ACIM and ACS | ||||||
| Edward Rosenberg (1973) | Vice President since 2017 | Senior Vice President, ACIM (2017 to present); Senior Vice President, Flexshares Head of ETF Capital Markets, Northern Trust (2012 to 2017) | ||||||
| C. Jean Wade (1964) | Vice President since 2017 | Senior Vice President, ACS (2017 to present); Vice President, ACS (2000 to 2017) | ||||||
| Ward D. Stauffer (1960) | Secretary since 2019 | Attorney, ACS (2003 to present) | ||||||
43
| Approval of Management Agreement | ||
At a meeting held on June 2, 2022, the Funds’ Board of Trustees (the "Board") unanimously approved the renewal of the management agreement pursuant to which American Century Investment Management, Inc. (the “Advisor”) acts as the investment advisor for each of the Funds. Under Section 15(c) of the Investment Company Act of 1940 (the “Investment Company Act”), contracts for investment advisory services are required to be reviewed, evaluated, and approved by a majority of a fund’s Trustees, including a majority of the independent Trustees, each year.
Prior to its consideration of the management agreement renewal, the Trustees requested and reviewed extensive data and information compiled by the Advisor and certain independent data providers concerning the Funds. This review was in addition to the oversight and evaluation undertaken by the Board and its Audit Committee on a continual basis and the information received was supplemental to the extensive information that the Board and its Audit Committee receive and consider throughout the year.
In connection with its consideration of the management agreement renewal, the Board’s review and evaluation of the services provided by the Advisor included, but was not limited to, the following:
•the nature, extent, and quality of investment management, shareholder services, and other services provided and to be provided to each Fund including without limitation portfolio management and trading services, shareholder and intermediary services, compliance and legal services, fund accounting and financial reporting, and fund share distribution;
•the wide range of other programs and services provided to each Fund and its shareholders on a routine and non-routine basis;
•the investment performance of each Fund, including data comparing each Fund's performance to an appropriate benchmark and/or a peer group of other funds with similar investment objectives and strategies;
•the cost of owning each Fund compared to the cost of owning similarly-managed funds;
•the compliance policies, procedures, and regulatory experience of the Advisor and the Funds’ service providers;
•the Advisor’s strategic plans, generally, and with respect to the ongoing impact of the COVID-19 pandemic response, heightened areas of interest in the mutual fund industry and recent geopolitical issues;
•the Advisor’s business continuity plans, vendor management practices, and cyber security practices;
•financial data showing the cost of services provided to each Fund, the profitability of each Fund to the Advisor, and the overall profitability of the Advisor;
•information regarding payments to intermediaries by the Advisor;
•possible economies of scale associated with the Advisor’s management of each Fund; and
•possible collateral benefits to the Advisor from the management of the Funds.
The independent Trustees met separately in private session to discuss the renewal and to review and discuss the information provided in response to their request. The independent Trustees also held active discussions with the Advisor regarding the renewal of the management agreement. The independent Trustees had the benefit of the advice of their independent counsel throughout the process.
Factors Considered
The Trustees considered all of the information provided by the Advisor, the independent data providers, and independent counsel in connection with the approval. They determined that the
44
information was sufficient for them to evaluate the management agreement for the Funds. In connection with their review, the Trustees did not identify any single factor as being all-important or controlling, and each Trustee may have attributed different levels of importance to different factors. In deciding to renew the management agreement, the Board based its decision on a number of factors, including without limitation the following:
Nature, Extent and Quality of Services — Generally. Under each Fund’s management agreement, the Advisor is responsible for providing or arranging for all services necessary for the operation of each Fund. The Board noted that the Advisor provides or arranges at its own expense a wide variety of services which include the following:
•constructing and designing each Fund
•portfolio research and security selection
•initial capitalization/funding
•securities trading
•Fund administration
•custody of Fund assets
•daily valuation of each Fund’s portfolio
•liquidity monitoring and management
•risk management, including cyber security
•shareholder servicing and transfer agency, including shareholder confirmations, recordkeeping, and communications
•legal services (except the independent Trustees’ counsel)
•regulatory and portfolio compliance
•financial reporting
•marketing and distribution (except amounts paid by each Fund under Rule 12b-1 plans)
Investment Management Services. The nature of the investment management services provided to the Funds is quite complex and allows Fund shareholders access to professional money management, instant diversification of their investments within an asset class, and liquidity. In evaluating investment performance, the Board expects the Advisor to manage each Fund in accordance with its investment objectives and principal investment strategies. Further, the Trustees recognize that the Advisor has an obligation to monitor trading activities, and in particular to seek the best execution of fund trades, and to evaluate the use of and payment for research. In providing these services, the Advisor utilizes teams of investment professionals (portfolio managers, analysts, research assistants, and securities traders) who require extensive information technology, research, training, compliance, and other systems to conduct their business. The Board provides oversight of the investment performance process. It regularly reviews investment performance information for each Fund, together with comparative information for appropriate benchmarks over different time horizons. The Trustees also review investment performance information during the management agreement renewal process. If performance concerns are identified, the Board discusses with the Advisor the reasons for such results and any actions being taken to improve performance. The performance for American Century Sustainable Equity ETF was above its benchmark for the one-year period reviewed by the Board. The performance for American Century Mid Cap Growth Impact ETF was below its benchmark for the one-year period reviewed by the Board. The Board found the investment management services provided by the Advisor to each Fund to be satisfactory and consistent with the management agreement.
Shareholder and Other Services. Under the management agreement, the Advisor provides or arranges for a comprehensive package of services to the Funds. The Board, directly and through its Audit Committee, regularly reviews reports and evaluations of such services at its regular meetings. These reports include, but are not limited to, information regarding the operational efficiency and accuracy of the shareholder and transfer agency services provided, staffing levels, shareholder satisfaction, technology support (including cyber security), new products and services offered to Fund shareholders, securities trading activities, portfolio valuation services, auditing services, and legal and operational compliance activities. The Board found the services provided
45
by the Advisor to each Fund under the management agreement to be competitive and of high quality.
Costs of Services and Profitability. The Advisor provides detailed information concerning its cost of providing various services to the Funds, its profitability in managing each Fund (pre- and post-distribution), its overall profitability, and its financial condition. The Trustees have reviewed with the Advisor the methodology used to prepare this financial information. This information is considered in evaluating the Advisor’s financial condition, its ability to continue to provide services under the management agreement, and the reasonableness of the current management fee. The Board concluded that the Advisor’s profits were reasonable in light of the services provided to the Funds.
Ethics. The Board generally considers the Advisor’s commitment to providing quality services to the Funds and to conducting its business ethically. They noted that the Advisor’s practices generally meet or exceed industry best practices.
Economies of Scale. The Board also reviewed information provided by the Advisor regarding the possible existence of economies of scale in connection with the management of each Fund. The Board concluded that economies of scale are difficult to measure and predict with precision, especially on a fund-by-fund basis. The Board concluded that the Advisor is sharing economies of scale, to the extent they exist, through its fee structure and through reinvestment in its business, infrastructure, investment capabilities and initiatives to provide shareholders additional content and services.
Comparison to Other Funds’ Fees. The management agreement provides that each Fund pays the Advisor a single, all-inclusive (or unified) management fee for providing all services necessary for the management and operation of the Fund, other than securities transaction expenses, taxes, interest, extraordinary expenses, and expenses incurred in connection with the provision of shareholder services and distribution services under a plan adopted pursuant to Rule 12b-1 under the Investment Company Act. Under the unified fee structure, the Advisor is responsible for providing all investment advisory, custody, audit, administrative, compliance, recordkeeping, marketing and shareholder services, or arranging and supervising third parties to provide such services. The Board believes the unified fee structure is a benefit to Fund shareholders because it clearly discloses to shareholders the cost of owning Fund shares, and, since the unified fee cannot be increased without a vote of Fund shareholders, it shifts to the Advisor the risk of increased costs of operating the Fund and provides a direct incentive to minimize administrative inefficiencies. Part of the Board’s analysis of fee levels involves reviewing certain evaluative data compiled by an independent provider comparing the Fund’s unified fee to the total expense ratios of its peers. The unified fee charged to shareholders of American Century Sustainable Equity ETF and American Century Sustainable Growth ETF was below the median of the total expense ratios of their respective peer expense universe and was within the range of their peer expense group. The unified fee charged to shareholders of American Century Mid Cap Growth Impact ETF was below the median of the total expense ratio of its peer expense universe and was the lowest of its peer expense group. The Board concluded that the management fee paid by each Fund to the Advisor under its management agreement is reasonable in light of the services provided to the Fund.
Comparison to Fees and Services Provided to Other Clients of the Advisor. The Board also requested and received information from the Advisor concerning the nature of the services, fees, costs, and profitability of its advisory services to funds or other advisory clients managed similarly to the Funds. They observed that these varying types of client accounts require different services and involve different regulatory and entrepreneurial risks than the management of the Funds. The Board analyzed this information and concluded that the fees charged and services provided to the Funds were reasonable by comparison.
Payments to Intermediaries. The Trustees also requested and received a description of payments made to intermediaries by each Fund and the Advisor and services provided in response thereto. These payments could include various payments made by each Fund or the Advisor to
46
different types of intermediaries and recordkeepers for distribution and service activities provided for each Fund. The Trustees reviewed such information and received representations from the Advisor that all such payments by the Advisor were made from the Advisor’s resources and reasonable profits.
Collateral or “Fall-Out” Benefits Derived by the Advisor. The Board considered the possible existence of collateral benefits the Advisor may receive as a result of its relationship with the Funds. They concluded that the Advisor’s primary business is managing funds and it generally does not use fund or shareholder information to generate profits in other lines of business, and therefore does not derive any significant collateral benefits from them. The Board noted that additional assets from other clients may offer the Advisor some benefit from increased leverage with service providers and counterparties. The Board also determined that the Advisor is able to provide investment management services to certain clients other than the Funds, at least in part, due to its existing infrastructure built to serve the fund complex. The Board concluded that appropriate allocation methodologies had been employed to assign resources and the cost of those resources to these other clients.
Existing Relationship. The Board also considered whether there was any reason for not continuing the existing arrangement with the Advisor. In this regard, the Board was mindful of the potential disruptions of the Funds’ operations and various risks, uncertainties, and other effects that could occur as a result of a decision not to continue such relationship. In particular, the Board recognized that most shareholders have invested in each Fund on the strength of the Advisor’s industry standing and reputation and in the expectation that the Advisor will have a continuing role in providing advisory services to each Fund.
Conclusion of the Trustees. As a result of this process, the Board, including all of the independent Trustees, taking into account all of the factors discussed above and the information provided by the Advisor and others in connection with its review and throughout the year, determined that the terms of the management fee are fair and reasonable and that the management fee charged to each Fund is fair in light of the services provided and that the investment management agreement between each Fund and the Advisor should be renewed for an additional one-year period.
47
| Liquidity Risk Management Program | ||
The Funds have adopted a liquidity risk management program (the “program”). The Funds' Board of Trustees (the "Board") has designated American Century Investment Management, Inc. (“ACIM”) as the administrator of the program. Personnel of ACIM or its affiliates conduct the day-to-day operation of the program pursuant to policies and procedures administered by the Program Administrator, including members of ACIM’s Investment Oversight Committee who are members of the ACIM’s Investment Management and Global Analytics departments.
Under the program, ACIM manages the Funds' liquidity risk, which is the risk that the Funds could not meet shareholder redemption requests without significant dilution of remaining shareholders’ interests in the Funds. This risk is managed by monitoring the degree of liquidity of the Funds' investments, limiting the amount of the Funds' illiquid investments, and utilizing various risk management tools and facilities available to the Funds for meeting shareholder redemptions, among other means. ACIM’s process of determining the degree of liquidity of certain Funds' investments is supported by a third-party liquidity assessment vendor.
The Board reviewed a report prepared by ACIM regarding the operation and effectiveness of the program for the period January 1, 2021 through December 31, 2021. No significant liquidity events impacting the Funds were noted in the report. In addition, ACIM provided its assessment that the program had been effective in managing the Funds' liquidity risk.
48
| Additional Information | ||
Retirement Account Information
As required by law, distributions you receive from certain retirement accounts are subject to federal income tax withholding, unless you elect not to have withholding apply*. Tax will be withheld on the total amount withdrawn even though you may be receiving amounts that are not subject to withholding, such as nondeductible contributions. In such case, excess amounts of withholding could occur. You may adjust your withholding election so that a greater or lesser amount will be withheld.
Remember, even if you elect not to have income tax withheld, you are liable for paying income tax on the taxable portion of your withdrawal. If you elect not to have income tax withheld or you don’t have enough income tax withheld, you may be responsible for payment of estimated tax. You may incur penalties under the estimated tax rules if your withholding and estimated tax payments are not sufficient. You can reduce or defer the income tax on a distribution by directly or indirectly rolling such distribution over to another IRA or eligible plan. You should consult your tax advisor for additional information.
State tax will be withheld if, at the time of your distribution, your address is within one of the mandatory withholding states and you have federal income tax withheld (or as otherwise required by state law). State taxes will be withheld from your distribution in accordance with the respective state rules.
*Some 403(b), 457 and qualified retirement plan distributions may be subject to 20% mandatory withholding, as they are subject to special tax and withholding rules. Your plan administrator or plan sponsor is required to provide you with a special tax notice explaining those rules at the time you request a distribution. If applicable, federal and/or state taxes may be withheld from your distribution amount.
Proxy Voting Policies
A description of the policies that the funds' investment advisor uses in exercising the voting rights associated with the securities purchased and/or held by the funds is available without charge, upon request, by calling 1-800-345-6488. It is also available on American Century Investments’ website at americancentury.com/proxy and on the Securities and Exchange Commission’s website at sec.gov. Information regarding how the investment advisor voted proxies relating to portfolio securities during the most recent 12-month period ended June 30 is available at americancentury.com/proxy. It is also available at sec.gov.
Quarterly Portfolio Disclosure
The funds file their complete schedule of portfolio holdings with the Securities and Exchange Commission (SEC) for the first and third quarters of each fiscal year as an exhibit to their reports on Form N-PORT. The funds' Form N-PORT reports are available on the SEC’s website at sec.gov.
49
Other Tax Information
The following information is provided pursuant to provisions of the Internal Revenue Code.
Sustainable Equity ETF and Sustainable Growth ETF hereby designate up to the maximum amount allowable as qualified dividend income for the fiscal year ended August 31, 2022.
For corporate taxpayers, the funds hereby designate the following, or up to the maximum amount allowable, of ordinary income distributions paid during the fiscal year ended August 31, 2022 as qualified for the corporate dividends received deduction.
| Mid Cap Growth Impact ETF | Sustainable Equity ETF | Sustainable Growth ETF | ||||||
| — | $1,219,340 | $13,482 | ||||||
The funds hereby utilized earnings and profits distributed to shareholders on redemption of shares as part of the dividend paid deduction (tax equalization) for the fiscal year ended August 31, 2022.
| Mid Cap Growth Impact ETF | Sustainable Equity ETF | Sustainable Growth ETF | ||||||
| — | $128,845 | — | ||||||
50
| Notes | ||
51
| Notes | ||
52
| ||||||||
| Contact Us | americancenturyetfs.com | |||||||
| American Century Sales Representatives, Financial Professionals, Broker Dealers, Insurance Companies, Banks and Trust Companies | 1-833-ACI-ETFS | |||||||
| Telecommunications Relay Service for the Deaf | 711 | |||||||
| American Century ETF Trust | ||||||||
Investment Advisor: American Century Investment Management, Inc. Kansas City, Missouri | ||||||||
Distributor: Foreside Fund Services, LLC - Distributor, not affiliated with American Century Investment Services, Inc. | ||||||||
| This report and the statements it contains are submitted for the general information of our shareholders. The report is not authorized for distribution to prospective investors unless preceded or accompanied by an effective prospectus. | ||||||||
| ©2022 American Century Proprietary Holdings, Inc. All rights reserved. CL-ANN-96950 2210 | ||||||||
| Annual Report | |||||
| August 31, 2022 | |||||
American Century® Low Volatility ETF (LVOL) | |||||
American Century® Quality Convertible Securities ETF (QCON) | |||||
American Century® Quality Diversified International ETF (QINT) | |||||
American Century® Quality Preferred ETF (QPFF) | |||||
American Century® STOXX® U.S. Quality Growth ETF (QGRO) | |||||
American Century® STOXX® U.S. Quality Value ETF (VALQ) | |||||
| Table of Contents | ||
| President’s Letter | |||||
| Low Volatility ETF | |||||
| Performance | |||||
| Portfolio Commentary | |||||
| Fund Characteristics | |||||
| Quality Convertible Securities ETF | |||||
| Performance | |||||
| Portfolio Commentary | |||||
| Fund Characteristics | |||||
| Quality Diversified International ETF | |||||
| Performance | |||||
| Portfolio Commentary | |||||
| Fund Characteristics | |||||
| Quality Preferred ETF | |||||
| Performance | |||||
| Portfolio Commentary | |||||
| Fund Characteristics | |||||
STOXX® U.S. Quality Growth ETF | |||||
| Performance | |||||
| Portfolio Commentary | |||||
| Fund Characteristics | |||||
STOXX® U.S. Quality Value ETF | |||||
| Performance | |||||
| Portfolio Commentary | |||||
| Fund Characteristics | |||||
| Shareholder Fee Examples | |||||
| Schedules of Investments | |||||
| Statements of Assets and Liabilities | |||||
| Statements of Operations | |||||
| Statements of Changes in Net Assets | |||||
| Notes to Financial Statements | |||||
| Financial Highlights | |||||
| Report of Independent Registered Public Accounting Firm | |||||
| Management | |||||
| Approval of Management Agreement | |||||
| Liquidity Risk Management Program | |||||
| Additional Information | |||||
Any opinions expressed in this report reflect those of the author as of the date of the report, and do not necessarily represent the opinions of American Century Investments® or any other person in the American Century Investments organization. Any such opinions are subject to change at any time based upon market or other conditions and American Century Investments disclaims any responsibility to update such opinions. These opinions may not be relied upon as investment advice and, because investment decisions made by American Century Investments funds are based on numerous factors, may not be relied upon as an indication of trading intent on behalf of any American Century Investments fund. Security examples are used for representational purposes only and are not intended as recommendations to purchase or sell securities. Performance information for comparative indices and securities is provided to American Century Investments by third party vendors. To the best of American Century Investments’ knowledge, such information is accurate at the time of printing.
The STOXX® Index is the intellectual property (including registered trademarks) of STOXX Limited, Zurich, Switzerland ("STOXX"), Deutsche Börse Group or their licensors, which is used under license. The funds are neither sponsored nor promoted, distributed or in any other manner supported by STOXX, Deutsche Börse Group or their licensors, research partners or data providers and STOXX, Deutsche Börse Group and their licensors, research partners or data providers do not give any warranty, and exclude any liability (whether in negligence or otherwise) with respect thereto generally or specifically in relation to any errors, omissions or interruptions in the STOXX® Index or its data.
| President’s Letter | ||
Jonathan ThomasDear Investor:
Thank you for reviewing this annual report for the period ended August 31, 2022. Annual reports
help convey important information about fund returns, including market factors that affected
performance. For additional investment insights, please visit americancenturyetfs.com.
Mounting Market Challenges Hampered Performance
Asset class performance weakened dramatically during the funds’ fiscal year. In late 2021,
generally upbeat economic activity and corporate earnings supported gains for most U.S. and
global stock indices. Returns generally remained positive despite rapidly rising inflation and waning
central bank support—factors that had started to weigh on fixed-income indices.
By early 2022, the market climate shifted quickly. Inflation, which was already at multiyear highs,
rose to levels last seen in the early 1980s. Massive fiscal and monetary support unleashed during
the pandemic was partly to blame. In addition, escalating energy prices, supply chain breakdowns
and labor market shortages further aggravated inflation in the U.S. and other developed markets.
Russia’s invasion of Ukraine in February also exacerbated global inflationary pressures.
The Bank of England launched its inflation-fighting campaign in December and continued to lift
rates through period-end. The Federal Reserve responded to surging inflation in March, launching
an aggressive rate-hike campaign and ending its asset purchase program. Policymakers indicated
taming inflation remains their priority, even as the U.S. economy contracted in 2022’s first two
quarters. Facing record-high inflation in the eurozone, the European Central Bank in July embarked
on its first rate-hike effort in 11 years.
The combination of sharply elevated inflation, tighter monetary policy, geopolitical strife and weak
economies triggered sharp market volatility and fueled global recession fears. Against this
backdrop, most U.S. and global stock and bond indices declined sharply for the reporting period.
Staying Disciplined in Uncertain Times
We expect market volatility to linger as investors navigate a complex environment of high inflation,
rising interest rates and economic uncertainty. In addition, Russia’s invasion of Ukraine
complicates an increasingly tense geopolitical backdrop and threatens Europe’s winter energy
supply. We will continue to monitor the broad backdrop and its influence on financial markets.
We appreciate your confidence in us during these extraordinary times. Our firm has a long history
of helping clients weather unpredictable markets, and we’re confident we will continue to meet
today’s challenges.
Sincerely,
Jonathan Thomas
President and Chief Executive Officer
American Century Investments
2
| Performance | ||
| Low Volatility ETF (LVOL) | |||||||||||||||||||||||
| Total Returns as of August 31, 2022 | Average Annual Returns | ||||||||||||||||||||||
| 1 year | Since Inception | Inception Date | |||||||||||||||||||||
| Net Asset Value | -11.98% | 3.55% | 1/12/2021 | ||||||||||||||||||||
| Market Price | -11.99% | 3.55% | 1/12/2021 | ||||||||||||||||||||
| S&P 500 Index | -11.23% | 3.99% | — | ||||||||||||||||||||
Market price is determined using the bid/ask midpoint at 4:00 p.m. Eastern time, when the net asset value (NAV) is typically calculated. Market performance does not represent the returns you would receive if you traded shares at other times. NAV prices are used to calculate market price performance prior to the date when the fund first traded on the NYSE Arca, Inc.
| Growth of $10,000 Over Life of Fund | ||
| $10,000 investment made January 12, 2021 | ||
| Value on August 31, 2022 | |||||
| Net Asset Value — $10,586 | |||||
| S&P 500 Index — $10,659 | |||||
| Total Annual Fund Operating Expenses | |||||||||||||||||
| 0.29% | |||||||||||||||||
The total annual fund operating expenses shown is as stated in the fund’s prospectus current as of the date of this report. The prospectus may vary from the expense ratio shown elsewhere in this report because it is based on a different time period, includes acquired fund fees and expenses, and, if applicable, does not include fee waivers or expense reimbursements.
Data presented reflect past performance. Past performance is no guarantee of future results. Current performance may be higher or lower than the performance shown. Total returns for periods less than one year are not annualized. Investment return and principal value will fluctuate, and redemption value may be more or less than original cost. Data assumes reinvestment of dividends and capital gains, and none of the charts reflect the deduction of taxes that a shareholder would pay on fund distributions or the redemption of fund shares. To obtain performance data current to the most recent month end, please call 1-800-345-6488 or visit americancenturyetfs.com. For additional information about the funds, please consult the prospectus.
3
| Portfolio Commentary | ||
Portfolio Managers: Steve Rossi and Rene Casis
During the period, Tsuyoshi Ozaki left the fund’s management team.
Fund Strategy
American Century Low Volatility ETF is an actively managed fund that seeks to deliver long-term market returns while realizing less volatility, particularly in downturns. We seek to achieve the long-term growth of equities, while minimizing the variability of returns by emphasizing strong fundamentals to limit potential risk of speculative companies with questionable profits. We utilize proprietary models to screen and rank companies based on fundamental metrics typically derived from financial statement data and market information but may include other sources. The fund seeks to deliver a lower realized portfolio volatility than its benchmark, the S&P 500 Index, by utilizing a stock selection process that expands on traditional measures of price volatility by including measures of asymmetric (e.g., downside) volatility and seeking securities of businesses that demonstrate consistent cash flows, stable operations and strong balance sheets.
Performance Review
The fund returned -11.99% on a market price basis for its fiscal year ended August 31, 2022. On a net asset value (NAV) basis, the fund returned -11.98%. For the same period, the S&P 500 Index, the fund’s benchmark, returned -11.23%. The fund’s NAV and market price returns reflect fees and operating expenses, while the index return does not.
Materials and Health Care Weighed on Relative Performance
Stock choices and an underweight allocation meant materials stocks detracted the most from relative performance. Chemical companies LyondellBasell Industries and Linde were leading detractors amid weakening demand and poor pricing for plastic.
In the health care sector, stock choices among health care equipment and supplies companies detracted. Medical device makers Stryker and Medtronic underperformed amid production challenges resulting from supply chain disruptions and ongoing pandemic-related disruptions to medical procedures.
Other Detractors
Other significant detractors from performance compared with the benchmark were Apple, Amazon and Tesla. These were stocks that held up relatively well during a difficult period for equities, and to which the portfolio had less exposure than the benchmark, or in the case of Tesla, no exposure. The stocks tend to be volatile and comparatively unappealing based on our multipronged approach to limiting volatility.
Industrials and Information Technology Stocks Benefited Relative Performance
The leading contributions to performance compared with the benchmark came from commercial services and supplies companies Waste Management and Republic Services. These companies produced solid results and raised future guidance amid strong demand for environmental, recycling and sustainability services. Elsewhere in the sector, aerospace and defense firm General Dynamics performed well amid strong defense spending given the ongoing war in Ukraine.
4
Several information technology holdings were top contributors to relative performance. It was beneficial to have less exposure than the benchmark to semiconductors and semiconductor equipment companies NVIDIA and Intel. Chipmakers were vulnerable to declines after performing well at the height of the pandemic, when demand for chips used in gaming, cryptocurrencies and cloud computing surged. But semiconductor demand fell during the period as the pandemic eased and the threat of recession loomed. We had no exposure to Intel and eliminated our stake in NVIDIA during the period.
Portfolio Positioning
We manage the portfolio by allocating to one or more investment sleeves: Stand-alone strategies designed to generate alpha from distinct market segments. Each sleeve emphasizes domain-specific, fundamental drivers of investment performance, validated through empirical research. In contrast with more naïve approaches, which typically rely on only a single, backward-looking measure of risk, the low-volatility strategy utilizes a three-pronged approach focused specifically on downside volatility. The approach incorporates fundamental business risks (balance sheet and earnings quality), trailing stock volatility measures (downside beta) and traditional risk measures (price volatility).
As a result of this process, our largest overweight positions at period-end were in the consumer staples, financials and industrials sectors. We also maintained sizable absolute weighting in the information technology sector, reflecting this segment’s significant representation in the index. The consumer discretionary and communication services sectors were our largest underweights.
5
| Fund Characteristics | ||
| AUGUST 31, 2022 | |||||
| Low Volatility ETF | |||||
| Types of Investments in Portfolio | % of net assets | ||||
| Common Stocks | 99.3% | ||||
| Short-Term Investments | 0.6% | ||||
| Other Assets and Liabilities | 0.1% | ||||
| Top Five Industries | % of net assets | ||||
| Insurance | 7.4% | ||||
| Health Care Equipment and Supplies | 7.2% | ||||
| Commercial Services and Supplies | 5.5% | ||||
| Household Products | 5.4% | ||||
| Technology Hardware, Storage and Peripherals | 5.1% | ||||
6
| Performance | ||
| Quality Convertible Securities ETF (QCON) | |||||||||||||||||
| Total Returns as of August 31, 2022 | Average Annual Returns | ||||||||||||||||
| 1 year | Since Inception | Inception Date | |||||||||||||||
| Net Asset Value | -13.13% | -10.55% | 2/16/2021 | ||||||||||||||
| Market Price | -12.85% | -10.49% | 2/16/2021 | ||||||||||||||
| ICE BofA Convertible Index | -16.35% | -12.15% | — | ||||||||||||||
Market price is determined using the bid/ask midpoint at 4:00 p.m. Eastern time, when the net asset value (NAV) is typically calculated. Market performance does not represent the returns you would receive if you traded shares at other times. NAV prices are used to calculate market price performance prior to the date when the fund first traded on the Cboe BZX Exchange, Inc.
| Growth of $10,000 Over Life of Fund | ||
| $10,000 investment made February 16, 2021 | ||
| Value on August 31, 2022 | |||||
| Net Asset Value — $8,424 | |||||
| ICE BofA Convertible Index — $8,195 | |||||
| Total Annual Fund Operating Expenses | |||||||||||||||||
| 0.32% | |||||||||||||||||
The total annual fund operating expenses shown is as stated in the fund’s prospectus current as of the date of this report. The prospectus may vary from the expense ratio shown elsewhere in this report because it is based on a different time period, includes acquired fund fees and expenses, and, if applicable, does not include fee waivers or expense reimbursements.
Data presented reflect past performance. Past performance is no guarantee of future results. Current performance may be higher or lower than the performance shown. Total returns for periods less than one year are not annualized. Investment return and principal value will fluctuate, and redemption value may be more or less than original cost. Data assumes reinvestment of dividends and capital gains, and none of the charts reflect the deduction of taxes that a shareholder would pay on fund distributions or the redemption of fund shares. To obtain performance data current to the most recent month end, please call 1-800-345-6488 or visit americancenturyetfs.com. For additional information about the funds, please consult the prospectus.
7
| Portfolio Commentary | ||
Portfolio Managers: Rene Casis and Hitesh Patel
Fund Strategy
American Century Quality Convertible Securities ETF seeks to offer enhanced return potential versus passive capitalization-weighted convertible bond portfolios. The fund seeks to capitalize on the deficiencies inherent in passive indices, which ignore various fundamental and market risks, to deliver potential outperformance and downside protection.
We employ a holistic approach, emphasizing high-quality, growth-oriented names through a series of quantitative screens and fundamental oversight. We enhance the investment process via fundamental and technical measures. These include sales or earnings growth, profitability, leverage, balance sheet strength, price momentum relative to peers and valuation and yield relative to other convertible securities.
We seek to integrate fundamental and quantitative analysis to develop a diversified portfolio with an optimal balance between risk and return. We consider each portfolio security’s fundamental scores, structural features, benchmark weight and equity sensitivity.
The fund is an actively managed exchange-traded fund (ETF) that combines quantitative and fundamental insights implemented with ETF portfolio management expertise to seek maximize tax efficiency. The fund actively manages beta exposure, seeking an optimal mix of bond- and equity-sensitive securities. We have the flexibility to act in response to corporate actions, market dislocations and changes to regulatory, tax and monetary policy and other macroeconomic considerations.
Performance Review
The American Century Quality Convertible Securities ETF returned -12.85% on a market price basis for the 12-month period ended August 31, 2022. On a net asset value (NAV) basis, the fund returned -13.13%. For the same period, the ICE BofA Convertible Index, the fund’s benchmark index, returned -16.35%. The fund’s NAV and market price returns reflect fees and operating expenses, while the index return does not.
Market Overview
The U.S. equity and credit markets experienced a tumultuous 12-month period, declining sharply amid mounting inflationary pressures and increasingly hawkish Federal Reserve (Fed) policy. Additionally, Russia’s invasion of Ukraine in February and the spread of the omicron variant of COVID-19 disrupted global supply chains and led to surging oil and commodity prices. These factors exacerbated economic concerns and triggered bouts of market volatility.
The entire U.S. Treasury yield curve shifted higher over the period, and several segments along the curve inverted, a potential harbinger of future recession. For example, the two- to 10-year segment declined 140 basis points (bps) in the last 12 months, as two-year Treasury yields rose 328 bps and 10-year Treasury yields climbed 188 bps. The sharp rise in rates hampered credit markets, and investment-grade and high-yield bonds posted double-digit declines.
Broad U.S. equity indices also posted precipitous losses. Larger-capitalization (larger-cap) stocks weathered the stress better than small-cap stocks, and value stocks generally fared better than growth stocks.
8
The convertible bond market was not immune to the broader market stress, and it also declined. Although convertibles have a high degree of correlation with the underlying equity, they generally fared better due to their bond profiles providing some downside risk mitigation. Smaller-cap growth companies, which tend to be the dominant issuers of convertibles, suffered sharp losses for the period.
Defensive Positioning, Quality Focus Drove Fund’s Relative Outperformance
Our more actively managed risk-balanced positioning relative to the benchmark primarily accounted for the fund’s outperformance versus the index.
Investors’ expectations for rising costs to curb consumer demand and weigh on company profit margins led to broad-based selling and negative returns across most sectors. However, stocks in the energy sector benefited from rising oil and natural gas prices. Additionally, as investors sought more defensive positioning, the utilities and consumer staples sectors generated slightly positive returns. Meanwhile, growth sectors, such as technology, telecommunications and consumer discretionary, were among the weakest. Rising rates in the first half of 2022 weighed on valuations of their underlying equities.
The fund’s underweight position versus the index in convertibles from growth sectors aided relative results. Moreover, the fund’s overweight position in consumer staples, utilities and health care convertibles boosted performance. These defensive sectors were more resilient than cyclical and growth sectors. The fund also benefited from an opportunistic overweight to convertibles in the energy sector.
Security selection, particularly in the technology, health care and telecommunications sectors, was also a key driver of the fund’s relative outperformance. We focused on convertibles from profitable companies with reasonable valuations. These securities experienced less volatility than growth companies that were not profitable or trading at more expensive multiples. The fund also had less exposure to convertibles with higher sensitivity to the underlying equity of the issuer, which helped reduce exposure to market volatility.
Portfolio Positioning
U.S. economic growth is slowing, and recession risk is rising. While we expect headline inflation to decline from peak levels, core inflation may stay elevated. Goods-related inflation may fade as supply chain issues improve, but we expect services-related inflation to stay elevated as rents and wages remain high.
Sustained high inflation likely will keep the Fed on a persistent tightening path. While earnings generally have held up so far, we expect higher costs will eventually dampen corporate earnings for many firms. This dynamic likely will spur continued market volatility and potentially trigger further weakness in equity and credit markets through year-end.
We are focusing on higher-quality issuers with profitable businesses and stronger balance sheets. We believe these qualities should enable issuers to better manage this period of expected elevated volatility. We also believe valuations of certain growth companies have become more attractive, and we are adding to positions we expect to benefit from strong, persistent secular trends.
9
| Fund Characteristics | ||
| AUGUST 31, 2022 | |||||
| Quality Convertible Securities ETF | |||||
| Types of Investments in Portfolio | % of net assets | ||||
| Convertible Bonds | 72.3% | ||||
| Convertible Preferred Stocks | 19.4% | ||||
| Common Stocks | 5.1% | ||||
| Short-Term Investments | 2.9% | ||||
| Other Assets and Liabilities | 0.3% | ||||
| Top Five Industries | % of net assets | ||||
| Software | 15.8% | ||||
| Health Care Equipment and Supplies | 7.4% | ||||
| Semiconductors and Semiconductor Equipment | 5.7% | ||||
| Hotels, Restaurants and Leisure | 4.7% | ||||
| IT Services | 4.1% | ||||
10
| Performance | ||
| Quality Diversified International ETF (QINT) | |||||||||||||||||||||||
| Total Returns as of August 31, 2022 | Average Annual Returns | ||||||||||||||||||||||
| 1 year | Since Inception | Inception Date | |||||||||||||||||||||
| Net Asset Value | -24.82% | 1.22% | 9/10/2018 | ||||||||||||||||||||
| Market Price | -24.80% | 1.23% | 9/10/2018 | ||||||||||||||||||||
| Alpha Vee American Century Diversified International Equity Index | -24.05% | 2.04% | — | ||||||||||||||||||||
Market price is determined using the bid/ask midpoint at 4:00 p.m. Eastern time, when the net asset value (NAV) is typically calculated. Market performance does not represent the returns you would receive if you traded shares at other times. NAV prices are used to calculate market price performance prior to the date when the fund first traded on the NYSE Arca, Inc.
| Growth of $10,000 Over Life of Fund | ||
| $10,000 investment made September 10, 2018 | ||
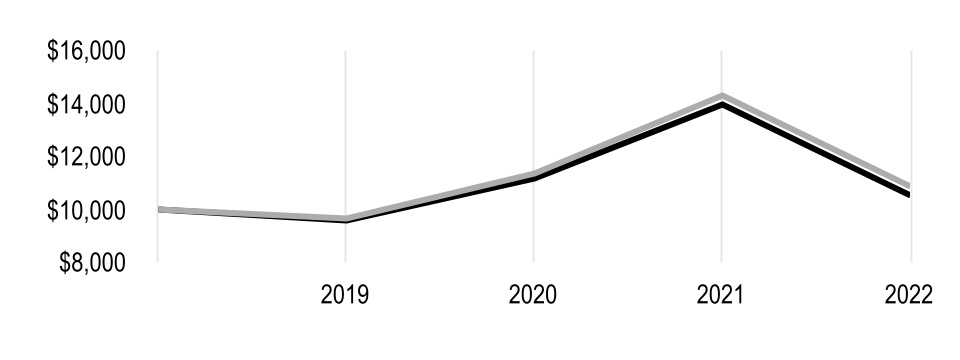
| Value on August 31, 2022 | |||||
| Net Asset Value — $10,493 | |||||
| Alpha Vee American Century Diversified International Equity Index — $10,837 | |||||
| Total Annual Fund Operating Expenses | |||||||||||||||||
| 0.39% | |||||||||||||||||
The total annual fund operating expenses shown is as stated in the fund’s prospectus current as of the date of this report. The prospectus may vary from the expense ratio shown elsewhere in this report because it is based on a different time period, includes acquired fund fees and expenses, and, if applicable, does not include fee waivers or expense reimbursements.
Data presented reflect past performance. Past performance is no guarantee of future results. Current performance may be higher or lower than the performance shown. Total returns for periods less than one year are not annualized. Investment return and principal value will fluctuate, and redemption value may be more or less than original cost. Data assumes reinvestment of dividends and capital gains, and none of the charts reflect the deduction of taxes that a shareholder would pay on fund distributions or the redemption of fund shares. To obtain performance data current to the most recent month end, please call 1-800-345-6488 or visit americancenturyetfs.com. For additional information about the funds, please consult the prospectus.
11
| Portfolio Commentary | ||
Portfolio Managers: Peruvemba Satish, Rene Casis, Will Enderle and Paul Jo
In August 2022, Will Enderle and Paul Jo joined the management team.
Effective September 9, 2022, Peruvemba Satish will no longer serve as a portfolio manager for American Century Quality Diversified International ETF.
Fund Strategy
American Century Quality Diversified International ETF seeks to deliver investment results that closely correspond, before fees and expenses, to the performance of the Alpha Vee American Century Diversified International Equity Index* (the underlying index). The fund invests in a representative sample of securities included in the underlying index that collectively has an investment profile similar to the underlying index. Under normal market conditions, the fund invests at least 80% of its assets, exclusive of collateral held from securities lending, in the component securities of the underlying index.
The underlying index is designed to select securities with attractive growth, valuation and quality fundamentals. The universe of the index is comprised of large- and mid-capitalization (mid-cap) equity securities of global issuers in developed and emerging markets, excluding the U.S.
Performance Review
For the 12 months ended August 31, 2022, the fund returned -24.80% on a market price basis. On a net asset value (NAV) basis, the fund returned -24.82%. For the same time period, the underlying index returned -24.05%. The fund’s NAV and market price returns reflect fees and operating expenses, while the index return does not.
Non-U.S. equities, as measured by the MSCI World ex USA Index** (world index), declined during the reporting period. The world index, which is an unmanaged index generally representative of the performance of large- and mid-cap non-U.S. equities, returned -18.56%. The fund’s underperformance versus the world index was largely due to the different compositions of the fund and the world index. The fund tracks the Alpha Vee American Century Diversified International Equity Index, which is designed to distinguish between high-quality value and growth companies, primarily in developed markets, and dynamically allocates to each category depending on the market environment.
Significant disparities between the performance of growth and value stocks in non-U.S. developed markets weighed on performance. Rising inflation and aggressive central bank policy responses led investors to suddenly turn away from higher-multiple growth stocks early in 2022. Value stocks continued to benefit as concerns about a global economic slowdown mounted, particularly in the wake of Russia’s invasion of Ukraine. However, growth stocks rebounded in early summer. The fund’s dynamic allocation adjusted accordingly, but the monthly rebalancing somewhat lagged the market’s rapid style rotations.
From a sector perspective, the industrials, consumer discretionary, health care, materials and financials sectors detracted from performance versus the world index. Conversely, information technology holdings boosted relative performance, with modest additional contribution from the real estate and consumer staples sectors.
*On September 9, 2022, the American Century Quality Diversified International ETF began to track the American Century Quality Diversified International Equity Index.
**The MSCI World ex USA Index returns for the one-year and since-inception periods ended August 31, 2022, were -18.56% and 2.13%, respectively.
12
Within industrials, concerns about the slowing global economy weighed on machinery stocks. Companies in the professional services industry, such as merger and acquisition specialists and staffing agencies, also declined amid growing economic uncertainty. Consumer discretionary stocks further detracted, led by names in the hotels, restaurants and leisure industry and household durables. Within health care, not owning AstraZeneca had a negative effect on relative performance as the pharmaceuticals stock advanced strongly as part of the world index. The materials sector also detracted, particularly mining and steel manufacturing company Evraz, which declined sharply amid sanctions following Russia’s invasion of Ukraine. Among financials, an underweight to banks weighed on relative returns.
On the upside, the information technology sector proved beneficial. Not owning several stocks that underperformed notably as part of the world index, such as Shopify in the IT services industry and SAP in the software industry, contributed to relative performance.
Dynamic allocation began the reporting period with growth at the maximum allocation level, however, late in 2021, a shift began amid a market rotation toward value stocks. By February 2022, value attained the maximum allocation level, where it remained for six months. Toward the end of the period, the growth allocation began to rise. The fund’s allocation ended the reporting period with an approximately 51% allocation to value and 49% allocation to growth. Allocations are rebalanced monthly, based on a strategy informed by recent risk-adjusted performance.
13
| Fund Characteristics | ||
| AUGUST 31, 2022 | |||||
| Quality Diversified International ETF | |||||
| Types of Investments in Portfolio | % of net assets | ||||
| Common Stocks | 98.9% | ||||
| Short-Term Investments | 1.4% | ||||
| Other Assets and Liabilities | (0.3)% | ||||
| Top Five Countries | % of net assets | ||||
| Japan | 19.8% | ||||
| United Kingdom | 11.8% | ||||
| France | 11.0% | ||||
| Canada | 8.7% | ||||
| Australia | 5.6% | ||||
14
| Performance | ||
| Quality Preferred ETF (QPFF) | |||||||||||||||||
| Total Returns as of August 31, 2022 | Average Annual Returns | ||||||||||||||||
| 1 year | Since Inception | Inception Date | |||||||||||||||
| Net Asset Value | -8.58% | -1.81% | 2/16/2021 | ||||||||||||||
| Market Price | -8.35% | -1.70% | 2/16/2021 | ||||||||||||||
| ICE Exchange-Listed Preferred & Hybrid Securities Index | -11.34% | -3.51% | — | ||||||||||||||
Market price is determined using the bid/ask midpoint at 4:00 p.m. Eastern time, when the net asset value (NAV) is typically calculated. Market performance does not represent the returns you would receive if you traded shares at other times. NAV prices are used to calculate market price performance prior to the date when the fund first traded on the Cboe BZX Exchange, Inc.
| Growth of $10,000 Over Life of Fund | ||
| $10,000 investment made February 16, 2021 | ||
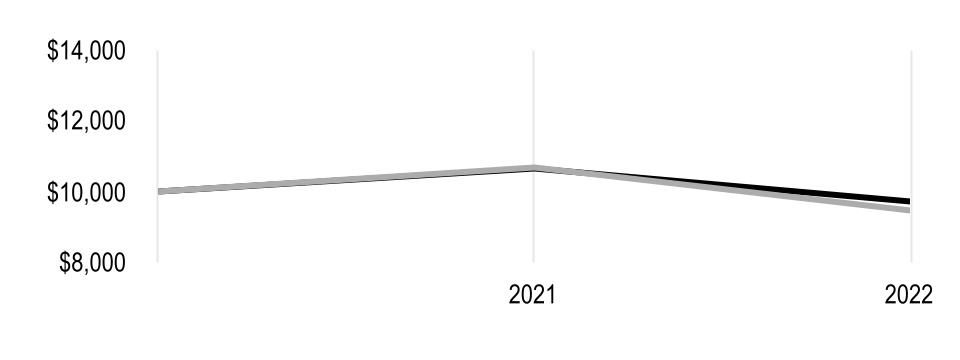
| Value on August 31, 2022 | |||||
| Net Asset Value — $9,723 | |||||
| ICE Exchange-Listed Preferred & Hybrid Securities Index — $9,465 | |||||
| Total Annual Fund Operating Expenses | |||||||||||||||||
| 0.32% | |||||||||||||||||
The total annual fund operating expenses shown is as stated in the fund’s prospectus current as of the date of this report. The prospectus may vary from the expense ratio shown elsewhere in this report because it is based on a different time period, includes acquired fund fees and expenses, and, if applicable, does not include fee waivers or expense reimbursements.
Data presented reflect past performance. Past performance is no guarantee of future results. Current performance may be higher or lower than the performance shown. Total returns for periods less than one year are not annualized. Investment return and principal value will fluctuate, and redemption value may be more or less than original cost. Data assumes reinvestment of dividends and capital gains, and none of the charts reflect the deduction of taxes that a shareholder would pay on fund distributions or the redemption of fund shares. To obtain performance data current to the most recent month end, please call 1-800-345-6488 or visit americancenturyetfs.com. For additional information about the funds, please consult the prospectus.
15
| Portfolio Commentary | ||
Portfolio Managers: Rene Casis and Hitesh Patel
Fund Strategy
American Century Quality Preferred ETF seeks to offer high sustainable income and attractive risk-adjusted returns compared with passive capitalization-weighted preferred securities portfolios. The fund seeks to capitalize on the deficiencies inherent in passive indices, which ignore various fundamental and market risks, to deliver potential outperformance.
We employ a holistic approach, emphasizing issuers we believe can sustain dividends throughout the market cycle by focusing on earnings quality and profitability. Through quantitative screens and fundamental oversight, we seek to avoid highly levered issuers with poor credit quality. We enhance the investment process with fundamental and technical measures. These include earnings quality, profitability, leverage, balance sheet strength, valuation and yield relative to other preferred securities.
We seek to integrate fundamental and quantitative analysis to develop a diversified portfolio with an optimal balance between risk and return. We consider each portfolio security’s fundamental scores, structural features, benchmark weight and equity sensitivity.
The fund is an actively managed exchange-traded fund (ETF) that combines quantitative and fundamental insights implemented with ETF portfolio management expertise to seek to maximize tax efficiency.
Performance Review
The American Century Quality Preferred ETF returned -8.35% on a market price basis for the 12-month period ended August 31, 2022. On a net asset value (NAV) basis, the fund returned -8.58%. For the same period, the ICE Exchange-Listed Preferred & Hybrid Securities Index, the fund’s benchmark, returned -11.34%. The fund’s NAV and market price returns reflect fees and operating expenses, while the index return does not.
Market Overview
The U.S. equity and credit markets experienced a tumultuous 12-month period, declining sharply amid mounting inflationary pressures and increasingly hawkish Federal Reserve (Fed) policy. Additionally, Russia’s invasion of Ukraine in February and the spread of the omicron variant of COVID-19 disrupted global supply chains and led to surging oil and commodity prices. These factors exacerbated economic concerns and triggered bouts of market volatility.
The entire U.S. Treasury yield curve shifted higher over the period, and several segments along the curve inverted, a potential harbinger of future recession. For example, the two- to 10-year segment declined 140 basis points (bps) in the last 12 months, as two-year Treasury yields rose 328 bps and 10-year Treasury yields climbed 188 bps. The sharp rise in rates hampered credit markets, and investment-grade and high-yield bonds posted double-digit declines.
Broad U.S. equity indices also posted precipitous losses. Larger-capitalization (larger-cap) stocks weathered the stress better than small-cap stocks, and value stocks generally fared better than growth stocks.
Tracking the broad decline among risk assets, the preferred securities market also declined. Rising interest rates and widening credit spreads combined with the market’s correlation with the equity market drove valuations of preferred securities lower.
16
Defensive Positioning, Duration Management Drove Fund’s Relative Outperformance
Our more actively managed risk-balanced positioning relative to the benchmark primarily accounted for the fund’s outperformance versus the index.
We positioned the fund for a fairly constructive macroeconomic environment for most of 2021. However, in late 2021, we shifted tactically to a more defensive posture amid stretched equity valuations and historically tight credit spreads. The prospect of Fed tightening loomed as inflation expectations rose and elevated prices appeared more persistent than transitory. Overall, the fund entered 2022 positioned for a more volatile market environment.
Several active and defensive measures helped the fund outperform the index in the subsequent rising-rate period and for the entire fiscal year. In particular, we maintained a much shorter duration than the index, which aided relative results. We also reduced the fund’s exposure to broad market volatility. Additionally, we shifted the fund’s sector allocations to reduce cyclical exposure in favor of a more defensive and value orientation.
Portfolio Positioning
U.S. economic growth is slowing, and recession risk is rising. While we expect headline inflation to decline from peak levels, core inflation may stay elevated. Markets have now priced in higher rates, followed by subsequent cuts once inflation and growth have abated. Credit spreads have widened on slowing growth concerns, and we expect defaults to rise over the next 12 months.
We believe preferred securities still appear attractive relative to other fixed-income investments. These predominately high-quality securities currently offer yields that are slightly lower than lower-quality high-yield corporate credit. We also believe preferreds offer value relative to investment-grade bonds, potentially offering yield advantages and less duration risk.
We have maintained a lower duration than the index. Recently, we have been adding duration exposure due to the market pricing in significant rate hikes and due to the increased risk of recession. We continue to favor higher-quality issues, focusing on higher-coupon preferreds as credit concerns are rising. We also remain overweight to value-oriented sectors, including banks that are well capitalized and have maintained core capital ratios. We believe these issuers may benefit from higher margins amid rising rates and loan growth.
17
| Fund Characteristics | ||
| AUGUST 31, 2022 | |||||
| Quality Preferred ETF | |||||
| Types of Investments in Portfolio | % of net assets | ||||
| Preferred Stocks | 83.9% | ||||
| Convertible Preferred Stocks | 7.1% | ||||
| Corporate Bonds | 2.3% | ||||
| Common Stocks | 2.0% | ||||
| Short-Term Investments | 4.0% | ||||
| Other Assets and Liabilities | 0.7% | ||||
| Top Five Industries | % of net assets | ||||
| Banks | 26.4% | ||||
| Capital Markets | 15.2% | ||||
| Insurance | 14.5% | ||||
| Multi-Utilities | 7.0% | ||||
| Mortgage Real Estate Investment Trusts (REITs) | 5.6% | ||||
18
| Performance | ||
STOXX® U.S. Quality Growth ETF (QGRO) | |||||||||||||||||||||||
| Total Returns as of August 31, 2022 | Average Annual Returns | ||||||||||||||||||||||
| 1 year | Since Inception | Inception Date | |||||||||||||||||||||
| Net Asset Value | -19.83% | 11.15% | 9/10/2018 | ||||||||||||||||||||
| Market Price | -19.83% | 11.15% | 9/10/2018 | ||||||||||||||||||||
iSTOXX® American Century USA Quality Growth Index | -19.68% | 11.53% | — | ||||||||||||||||||||
Market price is determined using the bid/ask midpoint at 4:00 p.m. Eastern time, when the net asset value (NAV) is typically calculated. Market performance does not represent the returns you would receive if you traded shares at other times. NAV prices are used to calculate market price performance prior to the date when the fund first traded on the NYSE Arca, Inc.
| Growth of $10,000 Over Life of Fund | ||
| $10,000 investment made September 10, 2018 | ||
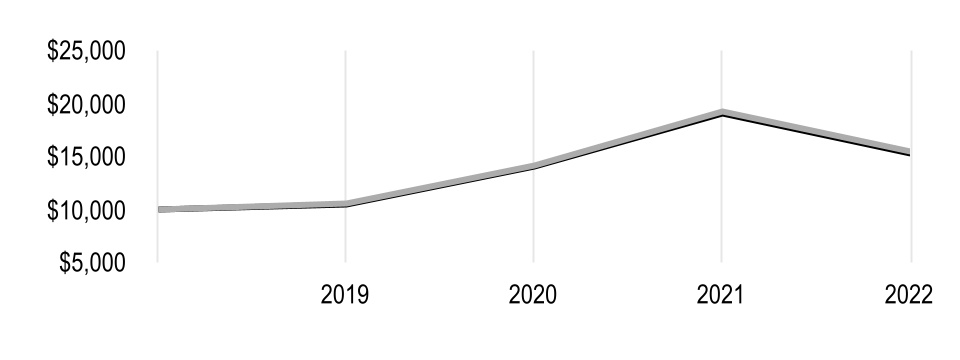
| Value on August 31, 2022 | |||||
| Net Asset Value — $15,222 | |||||
iSTOXX® American Century USA Quality Growth Index — $15,429 | |||||
| Total Annual Fund Operating Expenses | |||||||||||||||||
| 0.29% | |||||||||||||||||
The total annual fund operating expenses shown is as stated in the fund’s prospectus current as of the date of this report. The prospectus may vary from the expense ratio shown elsewhere in this report because it is based on a different time period, includes acquired fund fees and expenses, and, if applicable, does not include fee waivers or expense reimbursements.
Data presented reflect past performance. Past performance is no guarantee of future results. Current performance may be higher or lower than the performance shown. Total returns for periods less than one year are not annualized. Investment return and principal value will fluctuate, and redemption value may be more or less than original cost. Data assumes reinvestment of dividends and capital gains, and none of the charts reflect the deduction of taxes that a shareholder would pay on fund distributions or the redemption of fund shares. To obtain performance data current to the most recent month end, please call 1-800-345-6488 or visit americancenturyetfs.com. For additional information about the funds, please consult the prospectus.
19
| Portfolio Commentary | ||
Portfolio Managers: Peruvemba Satish, Rene Casis, Will Enderle and Paul Jo
Will Enderle and Paul Jo joined the investment management team in August 2022.
Fund Strategy
American Century STOXX® U.S. Quality Growth ETF seeks to provide investment results that closely correspond, before fees and expenses, to the performance of the iSTOXX® American Century USA Quality Growth Index (the underlying index). Under normal market conditions, the fund invests at least 80% of its assets in the component securities of the underlying index.
The STOXX® USA 900 Index, which consists of the 900 largest publicly traded U.S. equity securities, defines the universe we use to create the underlying index. The index is designed to measure the performance of securities in the universe and identify those that exhibit higher growth and quality characteristics relative to their peers. Though component securities of the underlying index may change from time to time, the index typically consists of 150 to 250 securities.
Performance Review
The fund returned -19.83% on a market price basis for the 12 months ended August 31, 2022. On a net asset value (NAV) basis, the fund returned -19.83%. For the same time period, the underlying index returned -19.68%. The fund fully replicated the underlying index’s components during the reporting period. The fund’s NAV and market price performance differed from the underlying index’s return due to fees and operating expenses associated with the fund.
For the same time period, the fund lagged market-capitalization-weighted growth strategies, as measured by the Russell 1000 Growth Index* (growth index). The growth index is an unmanaged index generally representative of the performance of U.S. large-capitalization growth stocks. The fund’s underperformance versus the growth index was largely due to the different compositions of the fund and the growth index. Specifically, the fund tracks the underlying index, which is designed to identify securities within the investment universe that exhibit higher growth and quality characteristics as well as securities that offer high-quality growth with attractive profitability and valuation relative to their peers. This approach led to underperformance versus the growth index, which selects and weights growth stocks based on market capitalization.
From a broad perspective, stock selection in the information technology sector helped drive underperformance versus the growth index. Within information technology, an underweight allocation to computers and peripherals stocks hampered performance. Underweighting communication services benefited relative performance, led by interactive media and services stocks.
The fund’s allocation began and closed the fiscal year with a bias toward high growth with a 65% weight in high growth and 35% weight in stable growth. However, during the year the fund’s allocations were tilted more toward stable growth, on average. Allocations are rebalanced monthly, based on a strategy informed by recent risk-adjusted performance.
*The Russell 1000 Growth Index returns for the one-year and since-inception periods ended August 31, 2022, were -19.06% and 12.32%, respectively.
20
| Fund Characteristics | ||
| AUGUST 31, 2022 | |||||
STOXX® U.S. Quality Growth ETF | |||||
| Types of Investments in Portfolio | % of net assets | ||||
| Common Stocks | 99.7% | ||||
| Short-Term Investments | 0.3% | ||||
| Other Assets and Liabilities | —* | ||||
| *Category is less than 0.05% of total net assets. | |||||
| Top Five Industries | % of net assets | ||||
| Software | 21.6% | ||||
| Semiconductors and Semiconductor Equipment | 10.6% | ||||
| Hotels, Restaurants and Leisure | 6.1% | ||||
| IT Services | 5.1% | ||||
| Biotechnology | 4.8% | ||||
21
| Performance | ||
STOXX® U.S. Quality Value ETF (VALQ) | ||||||||||||||||||||
| Total Returns as of August 31, 2022 | Average Annual Returns | |||||||||||||||||||
| 1 year | Since Inception | Inception Date | ||||||||||||||||||
| Net Asset Value | -7.70% | 5.49% | 1/11/2018 | |||||||||||||||||
| Market Price | -7.69% | 5.50% | 1/11/2018 | |||||||||||||||||
iSTOXX® American Century USA Quality Value Index | -7.41% | 5.79% | — | |||||||||||||||||
Market price is determined using the bid/ask midpoint at 4:00 p.m. Eastern time, when the net asset value (NAV) is typically calculated. Market performance does not represent the returns you would receive if you traded shares at other times. NAV prices are used to calculate market price performance prior to the date when the fund first traded on the NYSE Arca, Inc.
| Growth of $10,000 Over Life of Fund | ||
| $10,000 investment made January 11, 2018 | ||
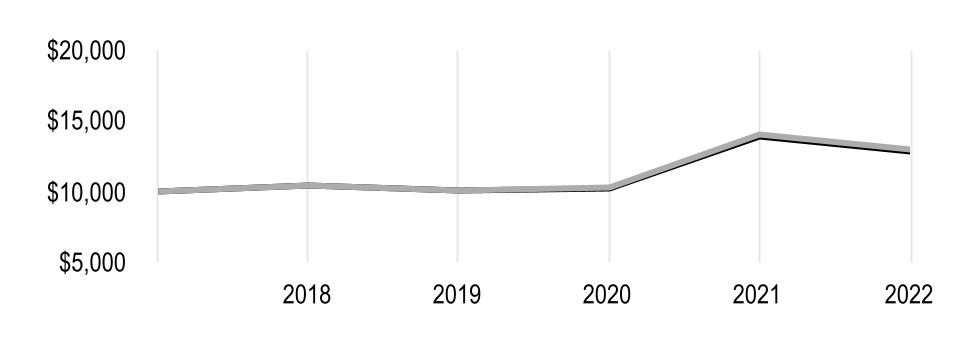
| Value on August 31, 2022 | |||||
| Net Asset Value — $12,815 | |||||
iSTOXX® American Century USA Quality Value Index — $12,985 | |||||
| Total Annual Fund Operating Expenses | |||||||||||||||||
| 0.29% | |||||||||||||||||
The total annual fund operating expenses shown is as stated in the fund’s prospectus current as of the date of this report. The prospectus may vary from the expense ratio shown elsewhere in this report because it is based on a different time period, includes acquired fund fees and expenses, and, if applicable, does not include fee waivers or expense reimbursements.
Data presented reflect past performance. Past performance is no guarantee of future results. Current performance may be higher or lower than the performance shown. Total returns for periods less than one year are not annualized. Investment return and principal value will fluctuate, and redemption value may be more or less than original cost. Data assumes reinvestment of dividends and capital gains, and none of the charts reflect the deduction of taxes that a shareholder would pay on fund distributions or the redemption of fund shares. To obtain performance data current to the most recent month end, please call 1-800-345-6488 or visit americancenturyetfs.com. For additional information about the funds, please consult the prospectus.
22
| Portfolio Commentary | ||
Portfolio Managers: Peruvemba Satish, Rene Casis, Will Enderle and Paul Jo
Will Enderle and Paul Jo joined the investment management team in August 2022.
Fund Strategy
American Century STOXX® U.S. Quality Value ETF seeks to track the investment results (before fees and expenses) of the iSTOXX® American Century USA Quality Value Index (the underlying index). Under normal market conditions, the fund invests at least 80% of its assets in the component securities of the underlying index.
The STOXX® USA 900 Index, which consists of the 900 largest publicly traded U.S. equity securities, defines the universe we use to create the underlying index. From that universe, we use a rules-based methodology that screens and weights stocks based on fundamental measures of quality, value and income. The resulting underlying index is designed to include high-quality securities of large- and mid-capitalization companies that are undervalued or have sustainable income. Although component securities of the underlying index may change from time to time, the index typically consists of 200 to 300 securities.
Performance Review
The fund returned -7.69% on a market price basis for the 12-month period ended August 31, 2022. On a net asset value (NAV) basis, the fund returned -7.70%. For the same time period, the underlying index returned -7.41%. The fund fully replicated the underlying index’s components during the reporting period. The fund’s NAV and market price returns reflect fees and operating expenses, while the index return does not.
For the same time period, the Russell 1000 Value Index* (value index), a market-capitalization index, returned -6.23%. The value index is an unmanaged index generally representative of the performance of U.S. large-capitalization value stocks. The fund’s performance versus the value index was largely attributable to the different compositions of the fund and the value index. Specifically, the fund tracks the underlying index, which pursues risk-adjusted returns by dynamically allocating among high-quality, attractively valued companies and companies offering sustainable income.
From a broad perspective, the fund’s stock selection in the consumer discretionary sector detracted from performance relative to the value index, especially in the specialty retail industry. Health care also detracted due to stock selection, led by weakness in the biotechnology and health care providers and services industries. Stock choices in industrials and an underweight allocation to financials were top positive contributors to performance.
The fund’s allocation closed the 12-month period with a 65% allocation to value and a 35% allocation to income. Over the course of the year, the allocation to value was as high as 80% and as low as 35%. Allocations are rebalanced monthly, based on a strategy informed by recent risk-adjusted performance.
*The Russell 1000 Value Index returns for the one-year and since-inception periods ended August 31, 2022, were -6.23% and 6.00%, respectively.
23
| Fund Characteristics | ||
| AUGUST 31, 2022 | |||||
STOXX® U.S. Quality Value ETF | |||||
| Types of Investments in Portfolio | % of net assets | ||||
| Common Stocks | 99.6% | ||||
| Short-Term Investments | 0.5% | ||||
| Other Assets and Liabilities | (0.1)% | ||||
| Top Five Industries | % of net assets | ||||
| Oil, Gas and Consumable Fuels | 6.8% | ||||
| Semiconductors and Semiconductor Equipment | 5.6% | ||||
| Health Care Providers and Services | 5.4% | ||||
| Biotechnology | 5.1% | ||||
| Equity Real Estate Investment Trusts (REITs) | 5.0% | ||||
24
| Shareholder Fee Examples | ||
Fund shareholders may incur two types of costs: (1) transaction costs, including brokerage commissions paid on purchases and sales of fund shares; and (2) ongoing costs, including management fees and other fund expenses. This example is intended to help you understand your ongoing costs (in dollars) of investing in your fund and to compare these costs with the ongoing cost of investing in other funds.
The example is based on an investment of $1,000 made at the beginning of the period and held for the entire period from March 1, 2022 to August 31, 2022.
Actual Expenses
The table provides information about actual account values and actual expenses for each fund. You may use the information, together with the amount you invested, to estimate the expenses that you paid over the period. First, identify the fund you own. Then simply divide your account value by $1,000 (for example, an $8,600 account value divided by $1,000 = 8.6), then multiply the result by the number under the heading “Expenses Paid During Period” to estimate the expenses you paid on your account during this period.
Hypothetical Example for Comparison Purposes
The table also provides information about hypothetical account values and hypothetical expenses based on the actual expense ratio of your fund and an assumed rate of return of 5% per year before expenses, which is not the actual return of a fund. The hypothetical account values and expenses may not be used to estimate the actual ending account balance or expenses you paid for the period. You may use this information to compare the ongoing costs of investing in your fund and other funds. To do so, compare this 5% hypothetical example with the 5% hypothetical examples that appear in the shareholder reports of the other funds.
Please note that the expenses shown in the table are meant to highlight your ongoing costs only and do not reflect any transactional costs, such as brokerage commissions paid on purchases and sales of fund shares. Therefore, the table is useful in comparing ongoing costs only, and will not help you determine the relative total costs of owning different funds. In addition, if these transactional costs were included, your costs would have been higher.
25
| Beginning Account Value 3/1/22 | Ending Account Value 8/31/22 | Expenses Paid During Period(1) 3/1/22 - 8/31/22 | Annualized Expense Ratio(1) | |||||||||||
| Low Volatility ETF | ||||||||||||||
| Actual | $1,000 | $925.40 | $1.41 | 0.29% | ||||||||||
| Hypothetical | $1,000 | $1,023.74 | $1.48 | 0.29% | ||||||||||
| Quality Convertible Securities ETF | ||||||||||||||
| Actual | $1,000 | $908.30 | $1.54 | 0.32% | ||||||||||
| Hypothetical | $1,000 | $1,023.59 | $1.63 | 0.32% | ||||||||||
| Quality Diversified International ETF | ||||||||||||||
| Actual | $1,000 | $846.40 | $1.82 | 0.39% | ||||||||||
| Hypothetical | $1,000 | $1,023.24 | $1.99 | 0.39% | ||||||||||
| Quality Preferred ETF | ||||||||||||||
| Actual | $1,000 | $960.50 | $1.58 | 0.32% | ||||||||||
| Hypothetical | $1,000 | $1,023.59 | $1.63 | 0.32% | ||||||||||
STOXX® U.S. Quality Growth ETF | ||||||||||||||
| Actual | $1,000 | $902.30 | $1.39 | 0.29% | ||||||||||
| Hypothetical | $1,000 | $1,023.74 | $1.48 | 0.29% | ||||||||||
STOXX® U.S. Quality Value ETF | ||||||||||||||
| Actual | $1,000 | $937.00 | $1.42 | 0.29% | ||||||||||
| Hypothetical | $1,000 | $1,023.74 | $1.48 | 0.29% | ||||||||||
(1)Expenses are equal to the fund's annualized expense ratio listed in the table above, multiplied by the average account value over the period, multiplied by 184, the number of days in the most recent fiscal half-year, divided by 365, to reflect the one-half year period. Annualized expense ratio reflects actual expenses, including any applicable fee waivers or expense reimbursements and excluding any acquired fund fees and expenses.
26
| Schedules of Investments | ||
AUGUST 31, 2022
| Low Volatility ETF | ||||||||
| Shares | Value | |||||||
| COMMON STOCKS — 99.3% | ||||||||
| Aerospace and Defense — 3.4% | ||||||||
| General Dynamics Corp. | 1,090 | $ | 249,534 | |||||
| Banks — 2.8% | ||||||||
| F.N.B. Corp. | 2,007 | 23,923 | ||||||
| JPMorgan Chase & Co. | 187 | 21,268 | ||||||
| Truist Financial Corp. | 385 | 18,033 | ||||||
| U.S. Bancorp | 3,134 | 142,942 | ||||||
| 206,166 | ||||||||
| Beverages — 5.0% | ||||||||
| Coca-Cola Co. | 4,940 | 304,847 | ||||||
| PepsiCo, Inc. | 384 | 66,152 | ||||||
| 370,999 | ||||||||
| Biotechnology — 0.4% | ||||||||
| Gilead Sciences, Inc. | 443 | 28,117 | ||||||
| Capital Markets — 4.7% | ||||||||
| FactSet Research Systems, Inc. | 52 | 22,534 | ||||||
| Moody's Corp. | 195 | 55,481 | ||||||
| MSCI, Inc. | 62 | 27,853 | ||||||
| Raymond James Financial, Inc. | 188 | 19,622 | ||||||
| S&P Global, Inc. | 57 | 20,074 | ||||||
| SEI Investments Co. | 2,860 | 156,442 | ||||||
| T. Rowe Price Group, Inc. | 377 | 45,240 | ||||||
| 347,246 | ||||||||
| Chemicals — 4.4% | ||||||||
| Dow, Inc. | 619 | 31,569 | ||||||
| Linde PLC | 803 | 227,136 | ||||||
| LyondellBasell Industries NV, Class A | 614 | 50,962 | ||||||
| Sherwin-Williams Co. | 87 | 20,193 | ||||||
| 329,860 | ||||||||
| Commercial Services and Supplies — 5.5% | ||||||||
| Cintas Corp. | 201 | 81,775 | ||||||
Copart, Inc.(1) | 148 | 17,708 | ||||||
| Republic Services, Inc. | 1,052 | 150,141 | ||||||
| Waste Management, Inc. | 934 | 157,874 | ||||||
| 407,498 | ||||||||
| Communications Equipment — 3.7% | ||||||||
| Cisco Systems, Inc. | 6,106 | 273,060 | ||||||
| Diversified Financial Services — 1.8% | ||||||||
Berkshire Hathaway, Inc., Class B(1) | 466 | 130,853 | ||||||
| Diversified Telecommunication Services — 0.7% | ||||||||
| AT&T, Inc. | 1,199 | 21,031 | ||||||
| Verizon Communications, Inc. | 809 | 33,824 | ||||||
| 54,855 | ||||||||
| Electronic Equipment, Instruments and Components — 4.4% | ||||||||
| Amphenol Corp., Class A | 1,627 | 119,633 | ||||||
Keysight Technologies, Inc.(1) | 204 | 33,433 | ||||||
27
| Low Volatility ETF | ||||||||
| Shares | Value | |||||||
| TE Connectivity Ltd. | 1,384 | $ | 174,675 | |||||
| 327,741 | ||||||||
| Equity Real Estate Investment Trusts (REITs) — 2.3% | ||||||||
| Mid-America Apartment Communities, Inc. | 665 | 110,170 | ||||||
| Public Storage | 128 | 42,346 | ||||||
| WP Carey, Inc. | 254 | 21,344 | ||||||
| 173,860 | ||||||||
| Food and Staples Retailing — 1.8% | ||||||||
| Costco Wholesale Corp. | 262 | 136,790 | ||||||
| Food Products — 1.3% | ||||||||
| Mondelez International, Inc., Class A | 1,195 | 73,923 | ||||||
| Tyson Foods, Inc., Class A | 264 | 19,900 | ||||||
| 93,823 | ||||||||
| Health Care Equipment and Supplies — 7.2% | ||||||||
| Abbott Laboratories | 1,488 | 152,743 | ||||||
Edwards Lifesciences Corp.(1) | 146 | 13,155 | ||||||
Intuitive Surgical, Inc.(1) | 79 | 16,253 | ||||||
| Medtronic PLC | 1,980 | 174,082 | ||||||
| Stryker Corp. | 879 | 180,371 | ||||||
| 536,604 | ||||||||
| Hotels, Restaurants and Leisure — 2.8% | ||||||||
| McDonald's Corp. | 762 | 192,237 | ||||||
| Starbucks Corp. | 197 | 16,562 | ||||||
| 208,799 | ||||||||
| Household Products — 5.4% | ||||||||
| Colgate-Palmolive Co. | 1,704 | 133,270 | ||||||
| Procter & Gamble Co. | 1,950 | 268,983 | ||||||
| 402,253 | ||||||||
| Industrial Conglomerates — 0.3% | ||||||||
| 3M Co. | 155 | 19,274 | ||||||
| Insurance — 7.4% | ||||||||
| Aflac, Inc. | 1,370 | 81,405 | ||||||
Arch Capital Group Ltd.(1) | 1,539 | 70,363 | ||||||
| Brown & Brown, Inc. | 473 | 29,818 | ||||||
| Chubb Ltd. | 208 | 39,322 | ||||||
| Everest Re Group Ltd. | 66 | 17,757 | ||||||
| Hanover Insurance Group, Inc. | 152 | 19,667 | ||||||
| Hartford Financial Services Group, Inc. | 354 | 22,766 | ||||||
| Marsh & McLennan Cos., Inc. | 737 | 118,930 | ||||||
| Travelers Cos., Inc. | 732 | 118,321 | ||||||
| WR Berkley Corp. | 561 | 36,353 | ||||||
| 554,702 | ||||||||
| Interactive Media and Services — 1.0% | ||||||||
Alphabet, Inc., Class A(1) | 656 | 70,992 | ||||||
| Internet and Direct Marketing Retail — 0.5% | ||||||||
Amazon.com, Inc.(1) | 296 | 37,524 | ||||||
| IT Services — 4.8% | ||||||||
| Accenture PLC, Class A | 372 | 107,307 | ||||||
| Amdocs Ltd. | 842 | 71,966 | ||||||
| Visa, Inc., Class A | 915 | 181,819 | ||||||
| 361,092 | ||||||||
28
| Low Volatility ETF | ||||||||
| Shares | Value | |||||||
| Life Sciences Tools and Services — 1.2% | ||||||||
| Danaher Corp. | 332 | $ | 89,610 | |||||
| Machinery — 3.7% | ||||||||
| Dover Corp. | 858 | 107,216 | ||||||
| IDEX Corp. | 281 | 56,540 | ||||||
| Illinois Tool Works, Inc. | 352 | 68,580 | ||||||
| Parker-Hannifin Corp. | 66 | 17,490 | ||||||
| Snap-on, Inc. | 114 | 24,836 | ||||||
| 274,662 | ||||||||
| Media — 1.1% | ||||||||
| Comcast Corp., Class A | 2,362 | 85,481 | ||||||
| Multi-Utilities — 1.0% | ||||||||
| Brookfield Infrastructure Partners LP | 704 | 29,561 | ||||||
| NiSource, Inc. | 1,451 | 42,819 | ||||||
| 72,380 | ||||||||
| Oil, Gas and Consumable Fuels — 3.4% | ||||||||
| Devon Energy Corp. | 338 | 23,870 | ||||||
| Exxon Mobil Corp. | 2,207 | 210,967 | ||||||
| Marathon Petroleum Corp. | 200 | 20,150 | ||||||
| 254,987 | ||||||||
| Pharmaceuticals — 3.0% | ||||||||
| Bristol-Myers Squibb Co. | 629 | 42,401 | ||||||
| Johnson & Johnson | 854 | 137,785 | ||||||
| Zoetis, Inc. | 295 | 46,176 | ||||||
| 226,362 | ||||||||
| Semiconductors and Semiconductor Equipment — 2.5% | ||||||||
Advanced Micro Devices, Inc.(1) | 191 | 16,210 | ||||||
| Analog Devices, Inc. | 219 | 33,185 | ||||||
| Broadcom, Inc. | 173 | 86,346 | ||||||
| KLA Corp. | 49 | 16,863 | ||||||
ON Semiconductor Corp.(1) | 286 | 19,668 | ||||||
| QUALCOMM, Inc. | 129 | 17,063 | ||||||
| 189,335 | ||||||||
| Software — 4.8% | ||||||||
Adobe, Inc.(1) | 38 | 14,191 | ||||||
| Microsoft Corp. | 895 | 234,016 | ||||||
| Roper Technologies, Inc. | 194 | 78,100 | ||||||
Synopsys, Inc.(1) | 99 | 34,256 | ||||||
| 360,563 | ||||||||
| Specialty Retail — 1.2% | ||||||||
| Home Depot, Inc. | 195 | 56,242 | ||||||
O'Reilly Automotive, Inc.(1) | 43 | 29,976 | ||||||
| 86,218 | ||||||||
| Technology Hardware, Storage and Peripherals — 5.1% | ||||||||
| Apple, Inc. | 2,427 | 381,573 | ||||||
| Textiles, Apparel and Luxury Goods — 0.2% | ||||||||
| NIKE, Inc., Class B | 171 | 18,203 | ||||||
| Trading Companies and Distributors — 0.5% | ||||||||
| Fastenal Co. | 702 | 35,332 | ||||||
TOTAL COMMON STOCKS (Cost $7,465,448) | 7,396,348 | |||||||
29
| Low Volatility ETF | ||||||||
| Shares | Value | |||||||
| SHORT-TERM INVESTMENTS — 0.6% | ||||||||
| Money Market Funds — 0.6% | ||||||||
State Street Institutional U.S. Government Money Market Fund, Premier Class (Cost $45,362) | 45,362 | $ | 45,362 | |||||
TOTAL INVESTMENT SECURITIES — 99.9% (Cost $7,510,810) | 7,441,710 | |||||||
| OTHER ASSETS AND LIABILITIES — 0.1% | 8,602 | |||||||
| TOTAL NET ASSETS — 100.0% | $ | 7,450,312 | ||||||
| NOTES TO SCHEDULE OF INVESTMENTS | ||||||||
(1)Non-income producing.
See Notes to Financial Statements.
30
AUGUST 31, 2022
| Quality Convertible Securities ETF | ||||||||
| Principal Amount/Shares | Value | |||||||
| CONVERTIBLE BONDS — 72.3% | ||||||||
| Aerospace and Defense — 0.7% | ||||||||
| Parsons Corp., 0.25%, 8/15/25 | $ | 170,000 | $ | 181,815 | ||||
| Air Freight and Logistics — 0.7% | ||||||||
| Air Transport Services Group, Inc., 1.125%, 10/15/24 | 148,000 | 164,798 | ||||||
| Airlines — 1.0% | ||||||||
| American Airlines Group, Inc., 6.50%, 7/1/25 | 98,000 | 106,526 | ||||||
| Southwest Airlines Co., 1.25%, 5/1/25 | 122,000 | 152,896 | ||||||
| 259,422 | ||||||||
| Automobiles — 1.3% | ||||||||
Ford Motor Co., 0.00%, 3/15/26(1) | 204,000 | 222,972 | ||||||
| Tesla, Inc., 2.00%, 5/15/24 | 7,000 | 93,121 | ||||||
| 316,093 | ||||||||
| Beverages — 1.4% | ||||||||
MGP Ingredients, Inc., 1.875%, 11/15/41(2) | 271,000 | 348,751 | ||||||
| Biotechnology — 3.3% | ||||||||
Ascendis Pharma A/S, 2.25%, 4/1/28(2) | 96,000 | 87,080 | ||||||
| Exact Sciences Corp., 0.375%, 3/1/28 | 102,000 | 70,176 | ||||||
| Halozyme Therapeutics, Inc., 0.25%, 3/1/27 | 261,000 | 233,921 | ||||||
| Insmed, Inc., 0.75%, 6/1/28 | 94,000 | 93,389 | ||||||
| Intercept Pharmaceuticals, Inc., 3.50%, 2/15/26 | 72,000 | 81,630 | ||||||
| Neurocrine Biosciences, Inc., 2.25%, 5/15/24 | 71,000 | 98,786 | ||||||
| Sarepta Therapeutics, Inc., 1.50%, 11/15/24 | 96,000 | 160,200 | ||||||
| 825,182 | ||||||||
| Communications Equipment — 2.1% | ||||||||
| Lumentum Holdings, Inc., 0.50%, 12/15/26 | 208,000 | 219,440 | ||||||
Lumentum Holdings, Inc., 0.50%, 6/15/28(2) | 188,000 | 168,636 | ||||||
| Viavi Solutions, Inc., 1.00%, 3/1/24 | 120,000 | 140,250 | ||||||
| 528,326 | ||||||||
| Electrical Equipment — 1.0% | ||||||||
| Plug Power, Inc., 3.75%, 6/1/25 | 20,000 | 111,950 | ||||||
| SunPower Corp., 4.00%, 1/15/23 | 117,000 | 133,673 | ||||||
| 245,623 | ||||||||
| Electronic Equipment, Instruments and Components — 2.1% | ||||||||
| Insight Enterprises, Inc., 0.75%, 2/15/25 | 256,000 | 356,608 | ||||||
| Vishay Intertechnology, Inc., 2.25%, 6/15/25 | 178,000 | 169,611 | ||||||
| 526,219 | ||||||||
| Entertainment — 3.0% | ||||||||
| iQIYI, Inc., 2.00%, 4/1/25 | 132,000 | 120,120 | ||||||
| Live Nation Entertainment, Inc., 2.50%, 3/15/23 | 68,000 | 93,975 | ||||||
| Pandora Media LLC, 1.75%, 12/1/23 | 65,000 | 70,980 | ||||||
| Sea Ltd., 0.25%, 9/15/26 | 239,000 | 176,027 | ||||||
| World Wrestling Entertainment, Inc., 3.375%, 12/15/23 | 35,000 | 96,740 | ||||||
| Zynga, Inc., 0.25%, 6/1/24 | 157,000 | 176,668 | ||||||
| 734,510 | ||||||||
| Equity Real Estate Investment Trusts (REITs) — 0.4% | ||||||||
IIP Operating Partnership LP, 3.75%, 2/21/24(2) | 17,000 | 24,407 | ||||||
31
| Quality Convertible Securities ETF | ||||||||
| Principal Amount/Shares | Value | |||||||
| Summit Hotel Properties, Inc., 1.50%, 2/15/26 | $ | 83,000 | $ | 74,077 | ||||
| 98,484 | ||||||||
| Health Care Equipment and Supplies — 4.5% | ||||||||
| CONMED Corp., 2.625%, 2/1/24 | 132,000 | 152,460 | ||||||
| Dexcom, Inc., 0.25%, 11/15/25 | 243,000 | 233,128 | ||||||
| Envista Holdings Corp., 2.375%, 6/1/25 | 78,000 | 143,949 | ||||||
Haemonetics Corp., 0.00%, 3/1/26(1) | 119,000 | 99,777 | ||||||
| Insulet Corp., 0.375%, 9/1/26 | 110,000 | 140,635 | ||||||
| Integra LifeSciences Holdings Corp., 0.50%, 8/15/25 | 240,000 | 222,405 | ||||||
| Mesa Laboratories, Inc., 1.375%, 8/15/25 | 63,000 | 55,861 | ||||||
| Omnicell, Inc., 0.25%, 9/15/25 | 60,000 | 71,100 | ||||||
| 1,119,315 | ||||||||
| Health Care Providers and Services — 3.1% | ||||||||
| Elevance Health, Inc., 2.75%, 10/15/42 | 86,000 | 592,755 | ||||||
Guardant Health, Inc., 0.00%, 11/15/27(1) | 215,000 | 160,262 | ||||||
| 753,017 | ||||||||
| Hotels, Restaurants and Leisure — 3.8% | ||||||||
Airbnb, Inc., 0.00%, 3/15/26(1) | 243,000 | 209,587 | ||||||
| Booking Holdings, Inc., 0.75%, 5/1/25 | 352,000 | 458,267 | ||||||
Marriott Vacations Worldwide Corp., 0.00%, 1/15/26(1) | 97,000 | 99,134 | ||||||
| Royal Caribbean Cruises Ltd., 4.25%, 6/15/23 | 172,000 | 169,877 | ||||||
| 936,865 | ||||||||
| Interactive Media and Services — 1.9% | ||||||||
| Snap, Inc., 0.75%, 8/1/26 | 79,000 | 72,186 | ||||||
| Twitter, Inc., 0.25%, 6/15/24 | 185,000 | 185,093 | ||||||
Ziff Davis, Inc., 1.75%, 11/1/26(2) | 204,000 | 202,062 | ||||||
| 459,341 | ||||||||
| Internet and Direct Marketing Retail — 2.4% | ||||||||
| Etsy, Inc., 0.25%, 6/15/28 | 149,000 | 124,713 | ||||||
Match Group Financeco 2, Inc., 0.875%, 6/15/26(2) | 150,000 | 145,875 | ||||||
Match Group Financeco 3, Inc., 2.00%, 1/15/30(2) | 137,000 | 136,700 | ||||||
Pinduoduo, Inc., 0.00%, 12/1/25(1) | 203,000 | 186,557 | ||||||
| 593,845 | ||||||||
| IT Services — 4.1% | ||||||||
| Akamai Technologies, Inc., 0.375%, 9/1/27 | 411,000 | 414,493 | ||||||
| Block, Inc., 0.25%, 11/1/27 | 143,000 | 111,124 | ||||||
| Cloudflare, Inc., 0.75%, 5/15/25 | 32,000 | 57,540 | ||||||
| MongoDB, Inc., 0.25%, 1/15/26 | 53,000 | 87,357 | ||||||
| Okta, Inc., 0.375%, 6/15/26 | 100,000 | 84,800 | ||||||
| Perficient, Inc., 1.25%, 8/1/25 | 35,000 | 56,943 | ||||||
Perficient, Inc., 0.125%, 11/15/26(2) | 113,000 | 90,909 | ||||||
| Shift4 Payments, Inc., 0.50%, 8/1/27 | 127,000 | 101,282 | ||||||
| 1,004,448 | ||||||||
| Leisure Products — 0.4% | ||||||||
| Callaway Golf Co., 2.75%, 5/1/26 | 62,000 | 89,319 | ||||||
| Machinery — 2.0% | ||||||||
Chart Industries, Inc., 1.00%, 11/15/24(2) | 53,000 | 175,600 | ||||||
| John Bean Technologies Corp., 0.25%, 5/15/26 | 136,000 | 123,420 | ||||||
| Middleby Corp., 1.00%, 9/1/25 | 147,000 | 183,088 | ||||||
| 482,108 | ||||||||
32
| Quality Convertible Securities ETF | ||||||||
| Principal Amount/Shares | Value | |||||||
| Media — 1.8% | ||||||||
| Cable One, Inc., 1.125%, 3/15/28 | $ | 92,000 | $ | 74,980 | ||||
Liberty Broadband Corp., 2.75%, 9/30/50(2) | 130,000 | 126,225 | ||||||
Liberty Media Corp., 2.75%, 12/1/49(2) | 259,000 | 239,187 | ||||||
| 440,392 | ||||||||
| Mortgage Real Estate Investment Trusts (REITs) — 2.5% | ||||||||
| Apollo Commercial Real Estate Finance, Inc., 5.375%, 10/15/23 | 171,000 | 170,038 | ||||||
| Arbor Realty Trust, Inc., 4.75%, 11/1/22 | 105,000 | 105,945 | ||||||
| Blackstone Mortgage Trust, Inc., 5.50%, 3/15/27 | 184,000 | 170,430 | ||||||
| PennyMac Corp., 5.50%, 3/15/26 | 195,000 | 174,623 | ||||||
| 621,036 | ||||||||
| Oil, Gas and Consumable Fuels — 2.9% | ||||||||
| EQT Corp., 1.75%, 5/1/26 | 51,000 | 165,138 | ||||||
| Green Plains, Inc., 2.25%, 3/15/27 | 50,000 | 68,475 | ||||||
| Pioneer Natural Resources Co., 0.25%, 5/15/25 | 197,000 | 484,324 | ||||||
| 717,937 | ||||||||
| Personal Products — 0.4% | ||||||||
| Herbalife Nutrition Ltd., 2.625%, 3/15/24 | 98,000 | 90,503 | ||||||
| Pharmaceuticals — 2.2% | ||||||||
| Jazz Investments I Ltd., 2.00%, 6/15/26 | 339,000 | 402,139 | ||||||
| Pacira BioSciences, Inc., 0.75%, 8/1/25 | 71,000 | 70,112 | ||||||
| Revance Therapeutics, Inc., 1.75%, 2/15/27 | 91,000 | 82,526 | ||||||
| 554,777 | ||||||||
| Professional Services — 1.6% | ||||||||
| FTI Consulting, Inc., 2.00%, 8/15/23 | 99,000 | 158,984 | ||||||
| KBR, Inc., 2.50%, 11/1/23 | 117,000 | 226,395 | ||||||
| 385,379 | ||||||||
| Real Estate Management and Development — 0.5% | ||||||||
| Zillow Group, Inc., 2.75%, 5/15/25 | 140,000 | 136,500 | ||||||
| Semiconductors and Semiconductor Equipment — 3.8% | ||||||||
Enphase Energy, Inc., 0.00%, 3/1/26(1) | 303,000 | 358,752 | ||||||
| Microchip Technology, Inc., 0.125%, 11/15/24 | 130,000 | 136,338 | ||||||
ON Semiconductor Corp., 0.00%, 5/1/27(1) | 114,000 | 163,818 | ||||||
| Silicon Laboratories, Inc., 0.625%, 6/15/25 | 63,000 | 75,739 | ||||||
| SMART Global Holdings, Inc., 2.25%, 2/15/26 | 94,000 | 105,468 | ||||||
Wolfspeed, Inc., 0.25%, 2/15/28(2) | 78,000 | 88,530 | ||||||
| 928,645 | ||||||||
| Software — 15.5% | ||||||||
Alarm.com Holdings, Inc., 0.00%, 1/15/26(1) | 131,000 | 110,106 | ||||||
| Bentley Systems, Inc., 0.125%, 1/15/26 | 291,000 | 265,549 | ||||||
Bill.com Holdings, Inc., 0.00%, 4/1/27(1)(2) | 150,000 | 128,344 | ||||||
CyberArk Software Ltd., 0.00%, 11/15/24(1) | 138,000 | 155,626 | ||||||
| Datadog, Inc., 0.125%, 6/15/25 | 88,000 | 118,089 | ||||||
Dropbox, Inc., 0.00%, 3/1/28(1) | 156,000 | 138,645 | ||||||
| Envestnet, Inc., 1.75%, 6/1/23 | 68,000 | 69,360 | ||||||
| Five9, Inc., 0.50%, 6/1/25 | 90,000 | 91,395 | ||||||
| HubSpot, Inc., 0.375%, 6/1/25 | 66,000 | 90,387 | ||||||
| InterDigital, Inc., 2.00%, 6/1/24 | 84,000 | 80,535 | ||||||
| Mandiant, Inc., 0.875%, 6/1/24 | 387,000 | 435,955 | ||||||
| Mitek Systems, Inc., 0.75%, 2/1/26 | 260,000 | 220,534 | ||||||
33
| Quality Convertible Securities ETF | ||||||||
| Principal Amount/Shares | Value | |||||||
| Palo Alto Networks, Inc., 0.375%, 6/1/25 | $ | 290,000 | $ | 551,870 | ||||
| Pegasystems, Inc., 0.75%, 3/1/25 | 129,000 | 107,634 | ||||||
| Progress Software Corp., 1.00%, 4/15/26 | 241,000 | 244,133 | ||||||
| Rapid7, Inc., 0.25%, 3/15/27 | 173,000 | 149,645 | ||||||
| Splunk, Inc., 1.125%, 9/15/25 | 169,000 | 161,142 | ||||||
| Tyler Technologies, Inc., 0.25%, 3/15/26 | 159,000 | 159,159 | ||||||
| Varonis Systems, Inc., 1.25%, 8/15/25 | 174,000 | 196,968 | ||||||
| Workday, Inc., 0.25%, 10/1/22 | 86,000 | 96,234 | ||||||
| Workiva, Inc., 1.125%, 8/15/26 | 149,000 | 164,049 | ||||||
| Zscaler, Inc., 0.125%, 7/1/25 | 65,000 | 81,933 | ||||||
| 3,817,292 | ||||||||
| Specialty Retail — 0.6% | ||||||||
| Burlington Stores, Inc., 2.25%, 4/15/25 | 136,000 | 141,610 | ||||||
| Technology Hardware, Storage and Peripherals — 1.3% | ||||||||
| Pure Storage, Inc., 0.125%, 4/15/23 | 268,000 | 318,920 | ||||||
TOTAL CONVERTIBLE BONDS (Cost $18,996,007) | 17,820,472 | |||||||
| CONVERTIBLE PREFERRED STOCKS — 19.4% | ||||||||
| Banks — 2.4% | ||||||||
| Bank of America Corp., 7.25% | 237 | 291,294 | ||||||
| Wells Fargo & Co., 7.50% | 233 | 290,668 | ||||||
| 581,962 | ||||||||
| Capital Markets — 1.8% | ||||||||
| AMG Capital Trust II, 5.15%, 10/15/37 | 2,974 | 149,057 | ||||||
| KKR & Co. Inc., 6.00%, 9/15/23 | 4,568 | 286,265 | ||||||
| 435,322 | ||||||||
| Electric Utilities — 2.2% | ||||||||
| American Electric Power Co., Inc., 6.125%, 8/15/23 | 4,799 | 263,513 | ||||||
| NextEra Energy, Inc., 6.22%, 9/1/23 | 5,125 | 268,678 | ||||||
| 532,191 | ||||||||
| Electronic Equipment, Instruments and Components — 0.5% | ||||||||
| II-VI, Inc., 6.00%, 7/1/23 | 580 | 118,094 | ||||||
| Equity Real Estate Investment Trusts (REITs) — 0.6% | ||||||||
| LXP Industrial Trust, 6.50% | 2,949 | 152,700 | ||||||
| Gas Utilities — 0.7% | ||||||||
| Spire, Inc., 7.50%, 3/1/24 | 3,300 | 165,396 | ||||||
| Health Care Equipment and Supplies — 2.9% | ||||||||
| Becton Dickinson & Co., 6.00%, 6/1/23 | 6,960 | 351,480 | ||||||
| Boston Scientific Corp., 5.50%, 6/1/23 | 3,436 | 363,278 | ||||||
| 714,758 | ||||||||
| Life Sciences Tools and Services — 1.8% | ||||||||
| Danaher Corp., 5.00%, 4/15/23 | 323 | 454,999 | ||||||
| Metals and Mining — 0.4% | ||||||||
| ArcelorMittal SA, 5.50%, 5/18/23 | 1,687 | 95,585 | ||||||
| Multi-Utilities — 1.7% | ||||||||
| DTE Energy Co., 6.25%, 11/1/22 | 4,839 | 248,386 | ||||||
| NiSource, Inc., 7.75%, 3/1/24 | 1,578 | 178,140 | ||||||
| 426,526 | ||||||||
34
| Quality Convertible Securities ETF | ||||||||
| Principal Amount/Shares | Value | |||||||
| Semiconductors and Semiconductor Equipment — 1.9% | ||||||||
| Broadcom, Inc., 8.00%, 9/30/22 | 294 | $ | 459,872 | |||||
| Wireless Telecommunication Services — 2.5% | ||||||||
2020 Cash Mandatory Exchangeable Trust, 5.25%, 6/1/23(2) | 528 | 630,474 | ||||||
TOTAL CONVERTIBLE PREFERRED STOCKS (Cost $5,009,184) | 4,767,879 | |||||||
| COMMON STOCKS — 5.1% | ||||||||
| Biotechnology — 0.2% | ||||||||
PTC Therapeutics, Inc.(3) | 975 | 48,691 | ||||||
| Communications Equipment — 0.2% | ||||||||
Viavi Solutions, Inc.(3) | 3,469 | 48,843 | ||||||
| Consumer Finance — 1.0% | ||||||||
Encore Capital Group, Inc.(3) | 4,270 | 233,484 | ||||||
| Electric Utilities — 1.0% | ||||||||
| Southern Co. | 3,287 | 253,329 | ||||||
| Electrical Equipment — 0.1% | ||||||||
SunPower Corp.(3) | 1,041 | 24,984 | ||||||
| Equity Real Estate Investment Trusts (REITs) — 0.4% | ||||||||
| Invitation Homes, Inc. | 2,603 | 94,437 | ||||||
| Food Products — 1.0% | ||||||||
| Bunge Ltd. | 2,370 | 235,033 | ||||||
| Hotels, Restaurants and Leisure — 0.9% | ||||||||
| Bloomin' Brands, Inc. | 11,335 | 229,194 | ||||||
| Software — 0.3% | ||||||||
Alteryx, Inc., Class A(3) | 927 | 57,771 | ||||||
Avalara, Inc.(3) | 256 | 23,447 | ||||||
| 81,218 | ||||||||
TOTAL COMMON STOCKS (Cost $1,252,395) | 1,249,213 | |||||||
| SHORT-TERM INVESTMENTS — 2.9% | ||||||||
| Money Market Funds — 2.9% | ||||||||
State Street Institutional U.S. Government Money Market Fund, Premier Class (Cost $723,066) | 723,066 | 723,066 | ||||||
TOTAL INVESTMENT SECURITIES — 99.7% (Cost $25,980,652) | 24,560,630 | |||||||
| OTHER ASSETS AND LIABILITIES — 0.3% | 77,555 | |||||||
| TOTAL NET ASSETS — 100.0% | $ | 24,638,185 | ||||||
| NOTES TO SCHEDULE OF INVESTMENTS | ||||||||
(1)Security is a zero-coupon bond. Zero-coupon securities may be issued at a substantial discount from their value at maturity.
(2)Security was purchased pursuant to Rule 144A or Section 4(2) under the Securities Act of 1933 and may be sold in transactions exempt from registration, normally to qualified institutional investors. The aggregate value of these securities at the period end was $2,592,780, which represented 10.5% of total net assets.
(3)Non-income producing.
See Notes to Financial Statements.
35
AUGUST 31, 2022
| Quality Diversified International ETF | ||||||||
| Shares | Value | |||||||
| COMMON STOCKS — 98.9% | ||||||||
| Australia — 5.6% | ||||||||
| Aristocrat Leisure Ltd. | 13,291 | $ | 320,797 | |||||
| ASX Ltd. | 26,763 | 1,424,655 | ||||||
| Australia & New Zealand Banking Group Ltd. | 15,377 | 237,706 | ||||||
| BlueScope Steel Ltd. | 37,625 | 422,146 | ||||||
| Computershare Ltd. | 16,624 | 277,250 | ||||||
| CSL Ltd. | 1,098 | 219,619 | ||||||
| Fortescue Metals Group Ltd. | 192,924 | 2,397,577 | ||||||
| Goodman Group | 14,865 | 197,675 | ||||||
| IGO Ltd. | 47,826 | 428,008 | ||||||
| Incitec Pivot Ltd. | 132,955 | 351,354 | ||||||
| James Hardie Industries PLC | 29,036 | 658,112 | ||||||
Lynas Rare Earths Ltd.(1) | 60,801 | 363,229 | ||||||
| Macquarie Group Ltd. | 1,605 | 192,043 | ||||||
| Medibank Pvt Ltd. | 106,736 | 268,865 | ||||||
| REA Group Ltd. | 2,664 | 229,739 | ||||||
| Sonic Healthcare Ltd. | 68,399 | 1,581,726 | ||||||
| South32 Ltd. | 145,511 | 400,695 | ||||||
| WiseTech Global Ltd. | 9,113 | 359,959 | ||||||
| Woodside Energy Group Ltd. | 12,924 | 300,205 | ||||||
| 10,631,360 | ||||||||
| Austria — 1.0% | ||||||||
| ANDRITZ AG | 5,990 | 275,877 | ||||||
| OMV AG | 30,499 | 1,228,874 | ||||||
| Verbund AG | 3,353 | 320,405 | ||||||
| voestalpine AG | 9,471 | 190,580 | ||||||
| 2,015,736 | ||||||||
| Belgium — 0.6% | ||||||||
| D'ieteren Group | 1,435 | 216,328 | ||||||
| KBC Group NV | 4,445 | 211,993 | ||||||
| Proximus SADP | 16,072 | 204,581 | ||||||
| Solvay SA | 2,835 | 228,859 | ||||||
| UCB SA | 3,143 | 220,849 | ||||||
| 1,082,610 | ||||||||
| Canada — 8.7% | ||||||||
| Alimentation Couche-Tard, Inc. | 4,771 | 205,029 | ||||||
| ARC Resources Ltd. | 18,975 | 261,938 | ||||||
| Canadian Natural Resources Ltd. | 7,935 | 435,010 | ||||||
| Canadian Tire Corp. Ltd., Class A | 13,059 | 1,535,938 | ||||||
CGI, Inc.(1) | 3,270 | 258,941 | ||||||
| Constellation Software, Inc. | 1,514 | 2,279,064 | ||||||
| Dollarama, Inc. | 6,805 | 414,409 | ||||||
| Empire Co. Ltd., Class A | 10,059 | 286,525 | ||||||
| Fairfax Financial Holdings Ltd. | 482 | 240,290 | ||||||
| George Weston Ltd. | 5,054 | 577,803 | ||||||
Gildan Activewear, Inc.(2) | 7,221 | 213,548 | ||||||
Great-West Lifeco, Inc.(2) | 10,183 | 239,194 | ||||||
| Imperial Oil Ltd. | 5,223 | 256,348 | ||||||
| Loblaw Cos. Ltd. | 17,234 | 1,523,090 | ||||||
36
| Quality Diversified International ETF | ||||||||
| Shares | Value | |||||||
| Lundin Mining Corp. | 31,370 | $ | 163,138 | |||||
| Manulife Financial Corp. | 181,033 | 3,131,739 | ||||||
Metro, Inc.(2) | 5,523 | 290,500 | ||||||
| Nutrien Ltd. | 2,724 | 250,072 | ||||||
Open Text Corp.(2) | 7,369 | 232,121 | ||||||
| Pembina Pipeline Corp. | 5,377 | 189,885 | ||||||
Shaw Communications, Inc., B Shares(2) | 7,649 | 196,154 | ||||||
Suncor Energy, Inc.(2) | 14,610 | 472,668 | ||||||
| Teck Resources Ltd., Class B | 6,738 | 228,200 | ||||||
| TFI International, Inc. | 2,639 | 263,287 | ||||||
| Toromont Industries Ltd. | 3,301 | 255,514 | ||||||
| Tourmaline Oil Corp. | 17,213 | 1,017,695 | ||||||
| West Fraser Timber Co. Ltd. | 10,077 | 901,548 | ||||||
Wheaton Precious Metals Corp.(2) | 5,936 | 181,196 | ||||||
| 16,500,844 | ||||||||
| China — 5.0% | ||||||||
| ANTA Sports Products Ltd. | 77,200 | 929,676 | ||||||
| BYD Co. Ltd., H Shares | 30,500 | 939,867 | ||||||
| China Coal Energy Co. Ltd., H Shares | 602,000 | 535,339 | ||||||
| China Shenhua Energy Co. Ltd., H Shares | 495,500 | 1,554,022 | ||||||
| COSCO SHIPPING Holdings Co. Ltd., Class H | 623,500 | 930,798 | ||||||
| CSPC Pharmaceutical Group Ltd. | 884,000 | 896,751 | ||||||
| JD.com, Inc., ADR | 820 | 52,062 | ||||||
| Li Ning Co. Ltd. | 70,500 | 642,136 | ||||||
| NetEase, Inc., ADR | 10,655 | 943,074 | ||||||
| Orient Overseas International Ltd. | 18,000 | 501,749 | ||||||
| Want Want China Holdings Ltd. | 1,095,000 | 771,341 | ||||||
Yankuang Energy Group Co. Ltd., H Shares(2) | 166,000 | 657,096 | ||||||
| Zhongsheng Group Holdings Ltd. | 33,000 | 156,036 | ||||||
| 9,509,947 | ||||||||
| Denmark — 2.2% | ||||||||
| AP Moller - Maersk A/S, B Shares | 457 | 1,096,413 | ||||||
| Carlsberg A/S, B Shares | 2,176 | 282,554 | ||||||
| Danske Bank A/S | 17,344 | 231,593 | ||||||
| Novo Nordisk A/S, B Shares | 19,424 | 2,076,693 | ||||||
| Novozymes A/S, B Shares | 3,389 | 194,507 | ||||||
| Pandora A/S | 6,096 | 366,227 | ||||||
| 4,247,987 | ||||||||
| Finland — 1.9% | ||||||||
| Elisa Oyj | 4,169 | 222,951 | ||||||
| Fortum Oyj | 15,021 | 154,513 | ||||||
| Kesko Oyj, B Shares | 8,626 | 181,471 | ||||||
| Nokia Oyj | 188,044 | 947,622 | ||||||
| Orion Oyj, Class B | 10,496 | 475,890 | ||||||
| Stora Enso Oyj, R Shares | 26,200 | 390,012 | ||||||
| Valmet Oyj | 24,965 | 632,797 | ||||||
| Wartsila Oyj Abp | 65,527 | 540,286 | ||||||
| 3,545,542 | ||||||||
| France — 11.0% | ||||||||
| ArcelorMittal SA | 9,341 | 221,700 | ||||||
| AXA SA | 10,990 | 258,832 | ||||||
37
| Quality Diversified International ETF | ||||||||
| Shares | Value | |||||||
| BNP Paribas SA | 4,864 | $ | 226,031 | |||||
| Bouygues SA | 43,512 | 1,278,164 | ||||||
| Bureau Veritas SA | 7,460 | 185,157 | ||||||
| Capgemini SE | 1,430 | 247,072 | ||||||
| Carrefour SA | 86,756 | 1,448,000 | ||||||
| Cie de Saint-Gobain | 33,797 | 1,361,267 | ||||||
| Cie Generale des Etablissements Michelin SCA | 1,652 | 40,179 | ||||||
| Eiffage SA | 5,332 | 468,976 | ||||||
Electricite de France SA(2) | 31,834 | 380,615 | ||||||
| Engie SA | 21,503 | 255,393 | ||||||
| Eurofins Scientific SE | 2,308 | 159,686 | ||||||
| Hermes International | 1,624 | 2,079,963 | ||||||
| Ipsen SA | 5,516 | 528,637 | ||||||
| Kering SA | 1,936 | 971,393 | ||||||
Klepierre SA(1) | 12,174 | 249,716 | ||||||
| L'Oreal SA | 6,711 | 2,304,854 | ||||||
| Legrand SA | 2,488 | 180,018 | ||||||
| LVMH Moet Hennessy Louis Vuitton SE | 1,399 | 902,728 | ||||||
| Orange SA | 78,678 | 796,802 | ||||||
| Pernod Ricard SA | 1,139 | 208,993 | ||||||
| Publicis Groupe SA | 6,363 | 310,675 | ||||||
| Remy Cointreau SA | 1,393 | 258,350 | ||||||
Rexel SA(1) | 27,395 | 444,948 | ||||||
| Sanofi | 33,418 | 2,731,915 | ||||||
| Sartorius Stedim Biotech | 2,548 | 931,960 | ||||||
| Societe Generale SA | 10,332 | 227,773 | ||||||
| STMicroelectronics NV | 6,166 | 214,886 | ||||||
| Teleperformance | 828 | 235,820 | ||||||
| Thales SA | 2,273 | 274,035 | ||||||
TotalEnergies SE(2) | 4,646 | 235,226 | ||||||
Unibail-Rodamco-Westfield(1) | 3,944 | 202,759 | ||||||
| Vivendi SE | 23,277 | 210,993 | ||||||
| 21,033,516 | ||||||||
| Germany — 5.1% | ||||||||
| Bayerische Motoren Werke AG | 13,312 | 980,810 | ||||||
| Brenntag SE | 2,784 | 182,540 | ||||||
| Carl Zeiss Meditec AG | 1,612 | 200,628 | ||||||
| Covestro AG | 30,397 | 916,528 | ||||||
CTS Eventim AG & Co. KGaA(1) | 3,354 | 180,324 | ||||||
| Evonik Industries AG | 108,730 | 2,027,284 | ||||||
| GEA Group AG | 41,728 | 1,451,584 | ||||||
| Hannover Rueck SE | 1,407 | 207,372 | ||||||
| HeidelbergCement AG | 19,136 | 864,133 | ||||||
| K+S AG | 9,887 | 225,241 | ||||||
| Knorr-Bremse AG | 4,062 | 196,865 | ||||||
| Merck KGaA | 1,161 | 199,437 | ||||||
| Muenchener Rueckversicherungs-Gesellschaft AG | 1,133 | 270,697 | ||||||
| Nemetschek SE | 3,015 | 177,614 | ||||||
| Rational AG | 330 | 177,989 | ||||||
| Rheinmetall AG | 1,063 | 168,746 | ||||||
| RWE AG | 4,889 | 186,649 | ||||||
38
| Quality Diversified International ETF | ||||||||
| Shares | Value | |||||||
| Siemens Healthineers AG | 4,623 | $ | 225,908 | |||||
| Symrise AG | 1,949 | 203,932 | ||||||
| Uniper SE | 10,748 | 58,156 | ||||||
| Volkswagen AG, Preference Shares | 1,668 | 237,255 | ||||||
| Wacker Chemie AG | 2,753 | 391,526 | ||||||
| 9,731,218 | ||||||||
| Hong Kong — 0.7% | ||||||||
| Chow Tai Fook Jewellery Group Ltd. | 262,400 | 528,134 | ||||||
| SITC International Holdings Co. Ltd. | 146,000 | 370,232 | ||||||
| Xinyi Glass Holdings Ltd. | 217,000 | 400,775 | ||||||
| 1,299,141 | ||||||||
| Ireland — 0.1% | ||||||||
| Bank of Ireland Group PLC | 47,996 | 295,730 | ||||||
| Israel — 1.2% | ||||||||
| Bank Hapoalim BM | 23,202 | 240,546 | ||||||
| Bank Leumi Le-Israel BM | 49,482 | 523,085 | ||||||
| ICL Group Ltd. | 96,262 | 919,175 | ||||||
| Israel Discount Bank Ltd., A Shares | 46,822 | 286,253 | ||||||
| Mizrahi Tefahot Bank Ltd. | 6,538 | 265,905 | ||||||
| 2,234,964 | ||||||||
| Italy — 2.4% | ||||||||
| A2A SpA | 165,365 | 185,298 | ||||||
| Assicurazioni Generali SpA | 15,242 | 223,551 | ||||||
| CNH Industrial NV | 20,180 | 245,693 | ||||||
| Eni SpA | 21,705 | 256,400 | ||||||
| Ferrari NV | 1,264 | 244,006 | ||||||
| Italgas SpA | 33,358 | 171,583 | ||||||
| Leonardo SpA | 32,351 | 264,754 | ||||||
| Mediobanca Banca di Credito Finanziario SpA | 27,753 | 219,690 | ||||||
| Moncler SpA | 4,794 | 213,293 | ||||||
| Recordati Industria Chimica e Farmaceutica SpA | 4,808 | 196,166 | ||||||
| Stellantis NV | 142,431 | 1,897,256 | ||||||
| UniCredit SpA | 41,061 | 401,818 | ||||||
| 4,519,508 | ||||||||
| Japan — 19.8% | ||||||||
| Advantest Corp. | 3,100 | 175,570 | ||||||
| AGC, Inc. | 7,300 | 247,754 | ||||||
| Ajinomoto Co., Inc. | 8,700 | 240,467 | ||||||
| Astellas Pharma, Inc. | 30,700 | 435,258 | ||||||
| Bandai Namco Holdings, Inc. | 2,800 | 210,102 | ||||||
| BayCurrent Consulting, Inc. | 1,300 | 382,031 | ||||||
| Brother Industries Ltd. | 44,900 | 859,274 | ||||||
Canon, Inc.(2) | 11,000 | 263,442 | ||||||
| Capcom Co. Ltd. | 9,500 | 259,300 | ||||||
| Chugai Pharmaceutical Co. Ltd. | 7,900 | 203,884 | ||||||
| CyberAgent, Inc. | 39,700 | 387,046 | ||||||
| Daiichi Sankyo Co. Ltd. | 8,000 | 240,414 | ||||||
| Daito Trust Construction Co. Ltd. | 2,400 | 236,106 | ||||||
| Dentsu Group, Inc. | 8,200 | 264,081 | ||||||
| Eisai Co. Ltd. | 6,700 | 273,180 | ||||||
| Fuji Electric Co. Ltd. | 4,500 | 194,410 | ||||||
39
| Quality Diversified International ETF | ||||||||
| Shares | Value | |||||||
| FUJIFILM Holdings Corp. | 5,000 | $ | 253,834 | |||||
| Fujitsu Ltd. | 1,800 | 211,812 | ||||||
| Hirose Electric Co. Ltd. | 1,500 | 212,546 | ||||||
| Hitachi Ltd. | 5,200 | 259,803 | ||||||
| Honda Motor Co. Ltd. | 11,200 | 298,169 | ||||||
| Hoya Corp. | 2,000 | 203,954 | ||||||
| INPEX Corp. | 52,700 | 605,767 | ||||||
| ITOCHU Corp. | 9,500 | 261,447 | ||||||
| Itochu Techno-Solutions Corp. | 11,100 | 280,132 | ||||||
| Japan Tobacco, Inc. | 159,400 | 2,700,780 | ||||||
| Kao Corp. | 59,200 | 2,563,376 | ||||||
Kawasaki Kisen Kaisha Ltd.(2) | 2,700 | 170,824 | ||||||
| KDDI Corp. | 7,000 | 214,208 | ||||||
| Keyence Corp. | 4,800 | 1,802,274 | ||||||
| Kirin Holdings Co. Ltd. | 45,500 | 749,010 | ||||||
| Komatsu Ltd. | 12,600 | 263,576 | ||||||
| Konami Group Corp. | 7,100 | 360,323 | ||||||
| Kyocera Corp. | 4,800 | 266,802 | ||||||
| Marubeni Corp. | 38,600 | 402,300 | ||||||
| Mazda Motor Corp. | 32,600 | 288,709 | ||||||
| MEIJI Holdings Co. Ltd. | 5,600 | 266,778 | ||||||
| MISUMI Group, Inc. | 9,400 | 230,734 | ||||||
| Mitsubishi Corp. | 9,400 | 307,762 | ||||||
| Mitsubishi Electric Corp. | 25,100 | 253,764 | ||||||
| Mitsubishi Heavy Industries Ltd. | 7,200 | 277,564 | ||||||
| Mitsui & Co. Ltd. | 22,800 | 535,096 | ||||||
Mitsui OSK Lines Ltd.(2) | 10,300 | 268,352 | ||||||
| Mizuho Financial Group, Inc. | 23,400 | 267,939 | ||||||
| Murata Manufacturing Co. Ltd. | 3,400 | 183,078 | ||||||
| NEC Corp. | 20,300 | 740,375 | ||||||
| Nintendo Co. Ltd. | 500 | 204,673 | ||||||
| NIPPON EXPRESS HOLDINGS, Inc. | 4,700 | 258,607 | ||||||
| Nippon Steel Corp. | 18,900 | 298,546 | ||||||
| Nippon Telegraph & Telephone Corp. | 22,100 | 599,004 | ||||||
Nippon Yusen KK(2) | 5,800 | 442,390 | ||||||
| Nissan Chemical Corp. | 5,500 | 277,104 | ||||||
| Nissin Foods Holdings Co. Ltd. | 3,200 | 228,948 | ||||||
| Nitto Denko Corp. | 3,200 | 197,225 | ||||||
| NTT Data Corp. | 17,500 | 246,266 | ||||||
| Obayashi Corp. | 38,900 | 269,055 | ||||||
| Olympus Corp. | 61,600 | 1,311,910 | ||||||
| Ono Pharmaceutical Co. Ltd. | 11,800 | 281,668 | ||||||
| Open House Group Co. Ltd. | 10,300 | 403,121 | ||||||
| Otsuka Corp. | 8,600 | 277,986 | ||||||
| Otsuka Holdings Co. Ltd. | 8,400 | 274,366 | ||||||
| Recruit Holdings Co. Ltd. | 15,400 | 489,575 | ||||||
| Ricoh Co. Ltd. | 98,500 | 774,156 | ||||||
| Rohm Co. Ltd. | 3,300 | 246,899 | ||||||
| SCSK Corp. | 68,300 | 1,112,149 | ||||||
Seiko Epson Corp.(2) | 56,900 | 894,116 | ||||||
| Sekisui Chemical Co. Ltd. | 19,200 | 261,760 | ||||||
40
| Quality Diversified International ETF | ||||||||
| Shares | Value | |||||||
| Sekisui House Ltd. | 80,400 | $ | 1,367,172 | |||||
| Shimano, Inc. | 1,200 | 212,291 | ||||||
| Shin-Etsu Chemical Co. Ltd. | 1,500 | 174,199 | ||||||
| Shinko Electric Industries Co. Ltd. | 5,800 | 161,447 | ||||||
| Shionogi & Co. Ltd. | 4,000 | 195,299 | ||||||
| SMC Corp. | 400 | 189,772 | ||||||
| Sompo Holdings, Inc. | 4,700 | 201,518 | ||||||
| SUMCO Corp. | 16,900 | 229,382 | ||||||
| Sumitomo Metal Mining Co. Ltd. | 5,000 | 157,333 | ||||||
Sumitomo Mitsui Financial Group, Inc.(2) | 9,000 | 271,469 | ||||||
| Sumitomo Mitsui Trust Holdings, Inc. | 9,100 | 283,039 | ||||||
| Suntory Beverage & Food Ltd. | 13,100 | 478,499 | ||||||
| T&D Holdings, Inc. | 24,100 | 263,201 | ||||||
| Taisei Corp. | 9,700 | 294,099 | ||||||
| TIS, Inc. | 10,500 | 299,006 | ||||||
| Tokio Marine Holdings, Inc. | 3,700 | 205,052 | ||||||
| Tokyo Electron Ltd. | 2,800 | 878,183 | ||||||
| Toppan, Inc. | 14,600 | 229,288 | ||||||
| Toray Industries, Inc. | 53,400 | 304,724 | ||||||
| Trend Micro, Inc. | 4,700 | 289,370 | ||||||
| Yakult Honsha Co. Ltd. | 3,900 | 230,668 | ||||||
| Yamaha Motor Co. Ltd. | 10,600 | 219,677 | ||||||
| ZOZO, Inc. | 24,600 | 543,739 | ||||||
| 37,601,358 | ||||||||
| Netherlands — 3.8% | ||||||||
| Aalberts NV | 9,926 | 363,986 | ||||||
Adyen NV(1) | 255 | 393,502 | ||||||
| ASM International NV | 1,378 | 374,663 | ||||||
| ASML Holding NV | 3,097 | 1,511,693 | ||||||
| BE Semiconductor Industries NV | 3,519 | 167,166 | ||||||
| Heineken Holding NV | 6,395 | 453,649 | ||||||
| Heineken NV | 2,136 | 191,982 | ||||||
| IMCD NV | 1,434 | 197,829 | ||||||
| ING Groep NV | 24,655 | 216,087 | ||||||
| Koninklijke Ahold Delhaize NV | 16,734 | 460,299 | ||||||
| Koninklijke Philips NV | 66,659 | 1,107,072 | ||||||
| Randstad NV | 26,192 | 1,219,781 | ||||||
| Signify NV | 6,948 | 197,503 | ||||||
| Wolters Kluwer NV | 3,505 | 342,764 | ||||||
| 7,197,976 | ||||||||
| Norway — 1.8% | ||||||||
| Aker BP ASA | 33,503 | 1,173,638 | ||||||
| DNB Bank ASA | 13,808 | 262,545 | ||||||
| Equinor ASA | 17,165 | 666,184 | ||||||
Mowi ASA(2) | 8,326 | 170,697 | ||||||
| Norsk Hydro ASA | 34,925 | 239,973 | ||||||
| Salmar ASA | 2,927 | 193,555 | ||||||
| Telenor ASA | 20,270 | 221,815 | ||||||
| TOMRA Systems ASA | 10,663 | 242,974 | ||||||
| Yara International ASA | 6,957 | 294,264 | ||||||
| 3,465,645 | ||||||||
41
| Quality Diversified International ETF | ||||||||
| Shares | Value | |||||||
| Portugal — 0.2% | ||||||||
| Galp Energia SGPS SA | 21,073 | $ | 227,567 | |||||
| Jeronimo Martins SGPS SA | 10,513 | 233,091 | ||||||
| 460,658 | ||||||||
| Singapore — 1.4% | ||||||||
| DBS Group Holdings Ltd. | 9,500 | 221,193 | ||||||
| Oversea-Chinese Banking Corp. Ltd. | 32,200 | 277,536 | ||||||
| Singapore Exchange Ltd. | 248,700 | 1,687,681 | ||||||
| Singapore Technologies Engineering Ltd. | 110,300 | 293,922 | ||||||
| United Overseas Bank Ltd. | 12,900 | 251,543 | ||||||
| 2,731,875 | ||||||||
| South Korea — 1.0% | ||||||||
| Celltrion, Inc. | 1,760 | 247,733 | ||||||
| HMM Co. Ltd. | 21,067 | 347,186 | ||||||
| KT Corp. | 7,731 | 214,251 | ||||||
| LG Innotek Co. Ltd. | 1,774 | 451,586 | ||||||
| NCSoft Corp. | 379 | 106,504 | ||||||
| SK Hynix, Inc. | 7,797 | 548,191 | ||||||
| 1,915,451 | ||||||||
| Spain — 2.3% | ||||||||
ACS Actividades de Construccion y Servicios SA(2) | 11,860 | 264,236 | ||||||
| Banco Bilbao Vizcaya Argentaria SA | 97,359 | 436,869 | ||||||
| Banco Santander SA | 153,226 | 370,914 | ||||||
| Bankinter SA | 67,758 | 347,245 | ||||||
| Fluidra SA | 8,136 | 130,133 | ||||||
| Repsol SA | 80,708 | 1,048,242 | ||||||
| Telefonica SA | 437,954 | 1,807,442 | ||||||
| 4,405,081 | ||||||||
| Sweden — 3.9% | ||||||||
Alleima AB(1) | 2,703 | 10,854 | ||||||
| Assa Abloy AB, Class B | 8,732 | 176,858 | ||||||
| Atlas Copco AB, A Shares | 19,184 | 194,737 | ||||||
| Epiroc AB, A Shares | 11,104 | 169,900 | ||||||
| Evolution AB | 8,213 | 657,067 | ||||||
| Getinge AB, B Shares | 9,549 | 176,862 | ||||||
H & M Hennes & Mauritz AB, B Shares(2) | 34,226 | 355,448 | ||||||
| Industrivarden AB, A Shares | 22,344 | 495,186 | ||||||
| Indutrade AB | 9,518 | 176,235 | ||||||
| Lifco AB, B Shares | 10,440 | 162,166 | ||||||
Orron Energy AB(2) | 17,799 | 33,854 | ||||||
| Sandvik AB | 13,517 | 210,737 | ||||||
| Skanska AB, B Shares | 16,055 | 237,175 | ||||||
| SKF AB, B Shares | 15,686 | 235,174 | ||||||
| SSAB AB, A Shares | 124,633 | 599,453 | ||||||
| Svenska Handelsbanken AB, A Shares | 28,145 | 230,512 | ||||||
| Swedbank AB, A Shares | 18,320 | 236,784 | ||||||
| Swedish Match AB | 83,213 | 835,387 | ||||||
Swedish Orphan Biovitrum AB(1) | 13,776 | 304,199 | ||||||
| Telefonaktiebolaget LM Ericsson, B Shares | 139,309 | 1,041,812 | ||||||
| Trelleborg AB, B Shares | 11,875 | 246,765 | ||||||
| Volvo AB, B Shares | 38,983 | 617,502 | ||||||
| 7,404,667 | ||||||||
42
| Quality Diversified International ETF | ||||||||
| Shares | Value | |||||||
| Switzerland — 5.4% | ||||||||
| Baloise Holding AG | 1,629 | $ | 235,095 | |||||
| Cie Financiere Richemont SA, Class A | 1,938 | 216,723 | ||||||
| DKSH Holding AG | 3,321 | 247,091 | ||||||
| EMS-Chemie Holding AG | 1,428 | 1,002,794 | ||||||
| Geberit AG | 391 | 180,660 | ||||||
Holcim AG(1) | 5,596 | 248,046 | ||||||
| Kuehne + Nagel International AG | 6,525 | 1,507,999 | ||||||
| Novartis AG | 25,740 | 2,082,058 | ||||||
| Partners Group Holding AG | 1,601 | 1,545,371 | ||||||
| Roche Holding AG | 1,442 | 464,672 | ||||||
| Sika AG | 775 | 174,371 | ||||||
| Sonova Holding AG | 607 | 159,928 | ||||||
| Straumann Holding AG | 4,434 | 485,890 | ||||||
| Swatch Group AG, Bearer Shares | 1,077 | 261,167 | ||||||
| Swiss Re AG | 9,506 | 739,145 | ||||||
VAT Group AG(1) | 2,176 | 520,296 | ||||||
| Zurich Insurance Group AG | 469 | 208,189 | ||||||
| 10,279,495 | ||||||||
| Taiwan — 1.5% | ||||||||
| Evergreen Marine Corp. Taiwan Ltd. | 114,000 | 326,692 | ||||||
| Globalwafers Co. Ltd. | 21,000 | 332,238 | ||||||
| MediaTek, Inc. | 33,000 | 714,012 | ||||||
| momo.com, Inc. | 8,800 | 208,670 | ||||||
| Taiwan Semiconductor Manufacturing Co. Ltd. | 30,000 | 491,093 | ||||||
| Unimicron Technology Corp. | 74,000 | 362,580 | ||||||
| Wan Hai Lines Ltd. | 16,100 | 45,376 | ||||||
| Yang Ming Marine Transport Corp. | 128,000 | 327,907 | ||||||
| 2,808,568 | ||||||||
| United Kingdom — 11.8% | ||||||||
| Anglo American PLC | 10,100 | 324,558 | ||||||
| Ashtead Group PLC | 19,026 | 934,706 | ||||||
| Associated British Foods PLC | 12,785 | 225,796 | ||||||
| Auto Trader Group PLC | 31,915 | 240,980 | ||||||
| Avast PLC | 45,545 | 373,818 | ||||||
| Aviva PLC | 51,426 | 249,480 | ||||||
| B&M European Value Retail SA | 56,720 | 243,226 | ||||||
| BAE Systems PLC | 62,191 | 560,098 | ||||||
| Barratt Developments PLC | 74,135 | 367,027 | ||||||
| Berkeley Group Holdings PLC | 5,264 | 222,841 | ||||||
| BP PLC | 66,481 | 339,713 | ||||||
| Bunzl PLC | 6,200 | 205,618 | ||||||
| Burberry Group PLC | 10,017 | 202,631 | ||||||
Coca-Cola HBC AG(1) | 37,960 | 866,222 | ||||||
| Compass Group PLC | 9,653 | 207,646 | ||||||
| DCC PLC | 3,940 | 226,764 | ||||||
| Dechra Pharmaceuticals PLC | 5,037 | 203,711 | ||||||
| Diageo PLC | 16,508 | 717,213 | ||||||
Evraz PLC(3) | 199,959 | 23 | ||||||
| Experian PLC | 13,451 | 408,177 | ||||||
| Ferguson PLC | 1,910 | 221,193 | ||||||
43
| Quality Diversified International ETF | ||||||||
| Shares | Value | |||||||
Glencore PLC(1) | 42,350 | $ | 231,551 | |||||
| GSK PLC | 150,616 | 2,407,599 | ||||||
| Hargreaves Lansdown PLC | 60,059 | 568,589 | ||||||
| HomeServe PLC | 33,751 | 464,631 | ||||||
| Howden Joinery Group PLC | 51,681 | 341,708 | ||||||
| Imperial Brands PLC | 102,334 | 2,250,513 | ||||||
| InterContinental Hotels Group PLC | 3,478 | 188,807 | ||||||
| Intertek Group PLC | 3,701 | 169,871 | ||||||
| Investec PLC | 98,831 | 475,055 | ||||||
| Kingfisher PLC | 336,087 | 902,820 | ||||||
| Lloyds Banking Group PLC | 479,873 | 243,178 | ||||||
| Mondi PLC | 25,527 | 433,331 | ||||||
| NatWest Group PLC | 89,991 | 256,804 | ||||||
| Next PLC | 2,647 | 178,254 | ||||||
| Pearson PLC | 29,311 | 293,344 | ||||||
| Persimmon PLC | 10,156 | 173,780 | ||||||
| RELX PLC | 7,581 | 198,813 | ||||||
| Rightmove PLC | 72,359 | 508,612 | ||||||
| Rio Tinto PLC | 6,850 | 378,191 | ||||||
| RS GROUP PLC | 17,708 | 222,760 | ||||||
| Sage Group PLC | 33,649 | 278,906 | ||||||
| Shell PLC | 16,416 | 434,648 | ||||||
| Taylor Wimpey PLC | 681,170 | 854,551 | ||||||
| Tesco PLC | 91,055 | 262,991 | ||||||
| Unilever PLC | 5,769 | 261,695 | ||||||
| Vodafone Group PLC | 1,402,692 | 1,877,997 | ||||||
| WPP PLC | 24,013 | 206,825 | ||||||
| 22,407,265 | ||||||||
| United States — 0.5% | ||||||||
| Ovintiv, Inc. | 16,591 | 881,754 | ||||||
TOTAL COMMON STOCKS (Cost $210,097,941) | 188,207,896 | |||||||
| SHORT-TERM INVESTMENTS — 1.4% | ||||||||
| Money Market Funds — 1.4% | ||||||||
| State Street Institutional U.S. Government Money Market Fund, Premier Class | 1,178,830 | 1,178,830 | ||||||
State Street Navigator Securities Lending Government Money Market Portfolio(4) | 1,364,843 | 1,364,843 | ||||||
TOTAL SHORT-TERM INVESTMENTS (Cost $2,543,673) | 2,543,673 | |||||||
TOTAL INVESTMENT SECURITIES — 100.3% (Cost $212,641,614) | 190,751,569 | |||||||
| OTHER ASSETS AND LIABILITIES — (0.3)% | (502,194) | |||||||
| TOTAL NET ASSETS — 100.0% | $ | 190,249,375 | ||||||
44
Quality Diversified International ETF
| MARKET SECTOR DIVERSIFICATION | |||||
| (as a % of net assets) | |||||
| Industrials | 16.6% | ||||
| Information Technology | 12.1% | ||||
| Consumer Discretionary | 12.0% | ||||
| Consumer Staples | 12.0% | ||||
| Health Care | 11.8% | ||||
| Financials | 10.4% | ||||
| Materials | 10.2% | ||||
| Energy | 6.8% | ||||
| Communication Services | 5.7% | ||||
| Utilities | 0.9% | ||||
| Real Estate | 0.4% | ||||
| Short-Term Investments | 1.4% | ||||
| Other Assets and Liabilities | (0.3)% | ||||
| NOTES TO SCHEDULE OF INVESTMENTS | ||||||||
| ADR | - | American Depositary Receipt | ||||||
(1)Non-income producing.
(2)Security, or a portion thereof, is on loan. At the period end, the aggregate value of securities on loan was $3,558,796. The amount of securities on loan indicated may not correspond with the securities on loan identified because securities with pending sales are in the process of recall from the brokers.
(3)Security may be subject to resale, redemption or transferability restrictions.
(4)Investment of cash collateral from securities on loan. At the period end, the aggregate value of the collateral held by the fund was $3,842,885, which includes securities collateral of $2,478,042.
See Notes to Financial Statements.
45
AUGUST 31, 2022
| Quality Preferred ETF | ||||||||
| Shares/Principal Amount | Value | |||||||
| PREFERRED STOCKS — 83.9% | ||||||||
| Automobiles — 0.4% | ||||||||
| Ford Motor Co., 6.00% | 4,200 | $ | 100,044 | |||||
| Banks — 25.5% | ||||||||
| Bank of America Corp., 3.69% | 4,892 | 90,796 | ||||||
| Bank of America Corp., 5.875% | 242,000 | 219,615 | ||||||
| Bank of America Corp., 5.875% | 4,331 | 108,405 | ||||||
| Bank of America Corp., 6.00% | 8,202 | 205,296 | ||||||
| Bank of America Corp., 6.25% | 169,000 | 167,450 | ||||||
| Citigroup, Inc., 6.30% | 183,000 | 177,281 | ||||||
| Citigroup, Inc., 6.875% | 15,296 | 387,754 | ||||||
| Citigroup, Inc., 7.125% | 15,120 | 388,433 | ||||||
| Citizens Financial Group, Inc., 6.35% | 8,200 | 203,770 | ||||||
| Fifth Third Bancorp, 6.00% | 4,440 | 109,979 | ||||||
| First Citizens BancShares, Inc., 5.375% | 2,680 | 59,040 | ||||||
| First Republic Bank, 4.00% | 3,480 | 59,682 | ||||||
| First Republic Bank, 5.125% | 12,065 | 268,084 | ||||||
| JPMorgan Chase & Co., 5.75% | 6,672 | 164,865 | ||||||
| JPMorgan Chase & Co., 6.75% | 319,000 | 321,138 | ||||||
| JPMorgan Chase & Co., Series EE, 6.00% | 6,598 | 166,599 | ||||||
| JPMorgan Chase & Co., Series R, 6.00% | 334,000 | 327,504 | ||||||
| KeyCorp, 5.65% | 9,193 | 219,713 | ||||||
| Old National Bancorp., 7.00% | 4,154 | 107,173 | ||||||
| PNC Financial Services Group, Inc., 6.85% | 10,617 | 267,761 | ||||||
| Regions Financial Corp., 5.70% | 3,960 | 91,753 | ||||||
| Synovus Financial Corp., 6.30% | 8,200 | 195,980 | ||||||
| Truist Financial Corp., 4.00% | 4,243 | 81,890 | ||||||
| Truist Financial Corp., 4.80% | 164,000 | 152,757 | ||||||
| U.S. Bancorp, 3.50% | 4,400 | 86,504 | ||||||
| USB Capital IX, 3.53% | 179,000 | 136,765 | ||||||
| Wells Fargo & Co., 5.85% | 19,723 | 473,549 | ||||||
| Wells Fargo & Co., 5.90% | 490,000 | 462,193 | ||||||
| 5,701,729 | ||||||||
| Capital Markets — 15.2% | ||||||||
| Affiliated Managers Group, Inc., 4.20% | 4,320 | 74,606 | ||||||
| Affiliated Managers Group, Inc., 5.875% | 14,803 | 345,206 | ||||||
| Goldman Sachs Group, Inc., 4.00% | 5,243 | 100,980 | ||||||
| Goldman Sachs Group, Inc., 5.50% | 13,730 | 336,111 | ||||||
| Goldman Sachs Group, Inc., 6.375% | 6,360 | 160,526 | ||||||
| Morgan Stanley, 6.375% | 5,960 | 151,801 | ||||||
| Morgan Stanley, 6.875% | 11,600 | 294,640 | ||||||
| Morgan Stanley, 7.125% | 15,440 | 394,801 | ||||||
| Oaktree Capital Group LLC, 6.55% | 15,918 | 385,057 | ||||||
| Oaktree Capital Group LLC, 6.625% | 15,739 | 380,884 | ||||||
| State Street Corp., 5.625% | 392,000 | 365,540 | ||||||
| State Street Corp., 5.90% | 13,490 | 333,203 | ||||||
| Stifel Financial Corp., 6.25% | 3,457 | 86,079 | ||||||
| 3,409,434 | ||||||||
46
| Quality Preferred ETF | ||||||||
| Shares/Principal Amount | Value | |||||||
| Consumer Finance — 0.6% | ||||||||
| Capital One Financial Corp., 4.375% | 7,399 | $ | 130,888 | |||||
| Diversified Financial Services — 3.1% | ||||||||
| Apollo Asset Management, Inc., 6.375% | 22,720 | 550,960 | ||||||
| Equitable Holdings, Inc., 5.25% | 6,900 | 146,073 | ||||||
| 697,033 | ||||||||
| Diversified Telecommunication Services — 1.1% | ||||||||
| AT&T, Inc., 5.00% | 4,800 | 101,472 | ||||||
| Qwest Corp., 6.75% | 6,280 | 145,382 | ||||||
| 246,854 | ||||||||
| Electric Utilities — 2.8% | ||||||||
| Duke Energy Corp., 5.625% | 10,400 | 257,400 | ||||||
| NextEra Energy Capital Holdings, Inc., 5.65% | 4,880 | 118,926 | ||||||
| SCE Trust VI, 5.00% | 9,337 | 179,737 | ||||||
| Southern Co., 4.20% | 3,106 | 59,262 | ||||||
| 615,325 | ||||||||
| Equity Real Estate Investment Trusts (REITs) — 2.0% | ||||||||
| Digital Realty Trust, Inc., 5.25% | 3,440 | 80,530 | ||||||
| Kimco Realty Corp., 5.25% | 4,201 | 101,118 | ||||||
| Public Storage, 5.05% | 4,440 | 107,937 | ||||||
| Public Storage, 5.15% | 6,680 | 162,257 | ||||||
| 451,842 | ||||||||
| Food Products — 1.0% | ||||||||
| CHS, Inc., 6.75% | 4,200 | 108,066 | ||||||
| CHS, Inc., 7.10% | 4,160 | 107,619 | ||||||
| 215,685 | ||||||||
| Industrial Conglomerates — 1.8% | ||||||||
| General Electric Co., 5.16% | 426,000 | 404,487 | ||||||
| Insurance — 13.6% | ||||||||
| Allstate Corp., 5.10% | 4,755 | 105,228 | ||||||
| Allstate Corp., 5.10% | 4,631 | 111,561 | ||||||
| Allstate Corp., 5.625% | 2,920 | 71,657 | ||||||
| American Equity Investment Life Holding Co., 5.95% | 5,104 | 119,025 | ||||||
| American Equity Investment Life Holding Co., 6.625% | 2,360 | 58,032 | ||||||
| Arch Capital Group Ltd., 5.45% | 4,826 | 109,502 | ||||||
| Aspen Insurance Holdings Ltd., 5.625% | 4,832 | 102,245 | ||||||
| Athene Holding Ltd., 4.875% | 3,564 | 66,968 | ||||||
| Athene Holding Ltd., 5.625% | 8,762 | 192,326 | ||||||
| Athene Holding Ltd., 6.35% | 3,493 | 85,404 | ||||||
| Athene Holding Ltd., 6.375% | 3,760 | 96,482 | ||||||
| Axis Capital Holdings Ltd., 5.50% | 4,925 | 107,759 | ||||||
| Brighthouse Financial, Inc., 5.375% | 5,335 | 106,113 | ||||||
| Brighthouse Financial, Inc., 6.60% | 7,080 | 175,159 | ||||||
| Enstar Group Ltd., 7.00% | 8,332 | 204,800 | ||||||
| Hartford Financial Services Group, Inc., 6.00% | 13,485 | 336,586 | ||||||
| MetLife, Inc., 4.10% | 2,600 | 53,508 | ||||||
| MetLife, Inc., 5.625% | 3,560 | 87,362 | ||||||
| Progressive Corp., 5.375% | 179,000 | 166,470 | ||||||
| Reinsurance Group of America, Inc., 6.20% | 9,400 | 235,282 | ||||||
| RenaissanceRe Holdings Ltd., 5.75% | 14,319 | 329,480 | ||||||
47
| Quality Preferred ETF | ||||||||
| Shares/Principal Amount | Value | |||||||
| W R Berkley Corp., 5.10% | 2,800 | $ | 60,844 | |||||
| W R Berkley Corp., 5.70% | 2,760 | 64,336 | ||||||
| 3,046,129 | ||||||||
| Leisure Products — 1.1% | ||||||||
| Brunswick Corp., 6.50% | 5,080 | 127,102 | ||||||
| Brunswick Corp., 6.625% | 4,441 | 115,910 | ||||||
| 243,012 | ||||||||
| Mortgage Real Estate Investment Trusts (REITs) — 5.6% | ||||||||
| AGNC Investment Corp., 6.125% | 9,637 | 206,810 | ||||||
| AGNC Investment Corp., 6.50% | 9,080 | 201,848 | ||||||
| Annaly Capital Management, Inc., 6.50% | 7,080 | 158,875 | ||||||
| Chimera Investment Corp., 7.75% | 4,560 | 93,298 | ||||||
| Chimera Investment Corp., 8.00% | 8,160 | 175,277 | ||||||
| MFA Financial, Inc., 6.50% | 8,120 | 158,259 | ||||||
| Rithm Capital Corp., 6.375% | 13,809 | 269,690 | ||||||
| 1,264,057 | ||||||||
| Multi-Utilities — 4.4% | ||||||||
| Algonquin Power & Utilities Corp., 6.20% | 3,541 | 85,905 | ||||||
| Algonquin Power & Utilities Corp., 6.875% | 6,920 | 171,477 | ||||||
| CMS Energy Corp., 5.875% | 6,240 | 149,760 | ||||||
| CMS Energy Corp., 5.875% | 4,360 | 106,646 | ||||||
| DTE Energy Co., 4.375% | 4,530 | 86,115 | ||||||
| NiSource, Inc., 6.50% | 7,160 | 181,148 | ||||||
| Sempra Energy, 4.875% | 213,000 | 206,284 | ||||||
| 987,335 | ||||||||
| Oil, Gas and Consumable Fuels — 2.6% | ||||||||
| DCP Midstream LP, 7.875% | 11,308 | 282,135 | ||||||
| Enbridge, Inc., 6.375% | 12,056 | 296,095 | ||||||
| 578,230 | ||||||||
| Real Estate Management and Development — 1.1% | ||||||||
| Brookfield Property Partners LP, 5.75% | 13,716 | 245,516 | ||||||
| Trading Companies and Distributors — 1.3% | ||||||||
| Triton International Ltd., 6.875% | 7,337 | 179,023 | ||||||
| WESCO International, Inc., 10.625% | 3,640 | 101,265 | ||||||
| 280,288 | ||||||||
| Wireless Telecommunication Services — 0.7% | ||||||||
| United States Cellular Corp., 6.25% | 7,336 | 158,824 | ||||||
TOTAL PREFERRED STOCKS (Cost $20,615,887) | 18,776,712 | |||||||
| CONVERTIBLE PREFERRED STOCKS — 7.1% | ||||||||
| Banks — 0.9% | ||||||||
| Bank of America Corp., 7.25% | 91 | 111,847 | ||||||
| Wells Fargo & Co., 7.50% | 80 | 99,800 | ||||||
| 211,647 | ||||||||
| Electric Utilities — 1.1% | ||||||||
| American Electric Power Co., Inc., 6.125%, 8/15/23 | 2,513 | 137,989 | ||||||
| NextEra Energy, Inc., 6.22%, 9/1/23 | 1,978 | 103,696 | ||||||
| 241,685 | ||||||||
| Health Care Equipment and Supplies — 1.8% | ||||||||
| Becton Dickinson & Co., 6.00%, 6/1/23 | 4,448 | 224,624 | ||||||
48
| Quality Preferred ETF | ||||||||
| Shares/Principal Amount | Value | |||||||
| Boston Scientific Corp., 5.50%, 6/1/23 | 1,680 | $ | 177,621 | |||||
| 402,245 | ||||||||
| Independent Power and Renewable Electricity Producers — 0.6% | ||||||||
| AES Corp., 6.875%, 2/15/24 | 1,342 | 130,550 | ||||||
| Life Sciences Tools and Services — 0.7% | ||||||||
| Danaher Corp., 5.00%, 4/15/23 | 111 | 156,362 | ||||||
| Multi-Utilities — 1.6% | ||||||||
| DTE Energy Co., 6.25%, 11/1/22 | 3,910 | 200,700 | ||||||
| NiSource, Inc., 7.75%, 3/1/24 | 1,315 | 148,451 | ||||||
| 349,151 | ||||||||
| Thrifts and Mortgage Finance — 0.4% | ||||||||
| New York Community Capital Trust V, 6.00%, 11/1/51 | 1,900 | 86,673 | ||||||
TOTAL CONVERTIBLE PREFERRED STOCKS (Cost $1,652,548) | 1,578,313 | |||||||
| CORPORATE BONDS — 2.3% | ||||||||
| Insurance — 0.9% | ||||||||
| Allstate Corp., VRN, 5.75%, 8/15/53 | $ | 231,000 | 212,231 | |||||
| Oil, Gas and Consumable Fuels — 1.4% | ||||||||
| Enbridge, Inc., VRN, 5.50%, 7/15/77 | 91,000 | 83,322 | ||||||
| Transcanada Trust, VRN, 5.30%, 3/15/77 | 248,000 | 230,022 | ||||||
| 313,344 | ||||||||
TOTAL CORPORATE BONDS (Cost $556,878) | 525,575 | |||||||
| COMMON STOCKS — 2.0% | ||||||||
| Electric Utilities — 1.0% | ||||||||
| Southern Co. | 2,786 | 214,717 | ||||||
| Multi-Utilities — 1.0% | ||||||||
| Dominion Energy, Inc. | 2,853 | 233,376 | ||||||
TOTAL COMMON STOCKS (Cost $454,162) | 448,093 | |||||||
| SHORT-TERM INVESTMENTS — 4.0% | ||||||||
| Money Market Funds — 4.0% | ||||||||
State Street Institutional U.S. Government Money Market Fund, Premier Class (Cost $904,709) | 904,709 | 904,709 | ||||||
TOTAL INVESTMENT SECURITIES — 99.3% (Cost $24,184,184) | 22,233,402 | |||||||
| OTHER ASSETS AND LIABILITIES — 0.7% | 160,404 | |||||||
| TOTAL NET ASSETS — 100.0% | $ | 22,393,806 | ||||||
| NOTES TO SCHEDULE OF INVESTMENTS | ||||||||
| VRN | - | Variable Rate Note. The rate adjusts periodically based upon the terms set forth in the security’s offering documents. The rate shown is effective at the period end and the reference rate and spread, if any, is indicated. The security's effective maturity date may be shorter than the final maturity date shown. | ||||||
See Notes to Financial Statements.
49
AUGUST 31, 2022
STOXX® U.S. Quality Growth ETF | ||||||||
| Shares | Value | |||||||
| COMMON STOCKS — 99.7% | ||||||||
| Aerospace and Defense — 0.2% | ||||||||
| Howmet Aerospace, Inc. | 11,849 | $ | 419,810 | |||||
| Air Freight and Logistics — 1.3% | ||||||||
| Expeditors International of Washington, Inc. | 2,235 | 229,959 | ||||||
| United Parcel Service, Inc., Class B | 16,462 | 3,202,024 | ||||||
| 3,431,983 | ||||||||
| Auto Components — 0.2% | ||||||||
| Autoliv, Inc. | 5,481 | 426,367 | ||||||
| Automobiles — 1.7% | ||||||||
Tesla, Inc.(1) | 15,934 | 4,391,570 | ||||||
| Beverages — 0.5% | ||||||||
| Brown-Forman Corp., Class B | 5,772 | 419,625 | ||||||
| Constellation Brands, Inc., Class A | 1,737 | 427,389 | ||||||
Monster Beverage Corp.(1) | 4,910 | 436,155 | ||||||
| 1,283,169 | ||||||||
| Biotechnology — 4.8% | ||||||||
| AbbVie, Inc. | 1,730 | 232,616 | ||||||
Exelixis, Inc.(1) | 75,060 | 1,331,565 | ||||||
Incyte Corp.(1) | 3,317 | 233,616 | ||||||
Neurocrine Biosciences, Inc.(1) | 34,337 | 3,592,680 | ||||||
Regeneron Pharmaceuticals, Inc.(1) | 5,589 | 3,247,544 | ||||||
Vertex Pharmaceuticals, Inc.(1) | 13,125 | 3,698,100 | ||||||
| 12,336,121 | ||||||||
| Building Products — 0.8% | ||||||||
| Masco Corp. | 36,187 | 1,840,833 | ||||||
| Owens Corning | 2,689 | 219,772 | ||||||
| 2,060,605 | ||||||||
| Capital Markets — 3.9% | ||||||||
| Ameriprise Financial, Inc. | 2,428 | 650,728 | ||||||
| Blackstone, Inc. | 6,532 | 613,616 | ||||||
| FactSet Research Systems, Inc. | 5,251 | 2,275,468 | ||||||
| LPL Financial Holdings, Inc. | 3,014 | 667,089 | ||||||
| MarketAxess Holdings, Inc. | 2,690 | 668,707 | ||||||
| Moody's Corp. | 788 | 224,202 | ||||||
| MSCI, Inc. | 9,916 | 4,454,664 | ||||||
| Raymond James Financial, Inc. | 2,217 | 231,388 | ||||||
| Tradeweb Markets, Inc., Class A | 6,171 | 429,440 | ||||||
| 10,215,302 | ||||||||
| Chemicals — 1.2% | ||||||||
| Air Products and Chemicals, Inc. | 1,679 | 423,864 | ||||||
| CF Industries Holdings, Inc. | 12,320 | 1,274,627 | ||||||
| Chemours Co. | 20,576 | 694,028 | ||||||
| Corteva, Inc. | 7,079 | 434,863 | ||||||
| Mosaic Co. | 3,892 | 209,662 | ||||||
| 3,037,044 | ||||||||
| Commercial Services and Supplies — 1.5% | ||||||||
| Cintas Corp. | 1,033 | 420,266 | ||||||
| Republic Services, Inc. | 3,034 | 433,012 | ||||||
| Waste Management, Inc. | 18,716 | 3,163,566 | ||||||
| 4,016,844 | ||||||||
50
STOXX® U.S. Quality Growth ETF | ||||||||
| Shares | Value | |||||||
| Communications Equipment — 1.4% | ||||||||
Arista Networks, Inc.(1) | 30,219 | $ | 3,622,654 | |||||
| Construction and Engineering — 0.2% | ||||||||
WillScot Mobile Mini Holdings Corp.(1) | 10,518 | 422,192 | ||||||
| Construction Materials — 0.1% | ||||||||
| Eagle Materials, Inc. | 1,881 | 225,005 | ||||||
| Diversified Consumer Services — 0.3% | ||||||||
| H&R Block, Inc. | 20,589 | 926,505 | ||||||
| Electrical Equipment — 0.1% | ||||||||
Generac Holdings, Inc.(1) | 1,795 | 395,636 | ||||||
| Electronic Equipment, Instruments and Components — 0.5% | ||||||||
| CDW Corp. | 3,665 | 625,616 | ||||||
Keysight Technologies, Inc.(1) | 3,990 | 653,921 | ||||||
| 1,279,537 | ||||||||
| Equity Real Estate Investment Trusts (REITs) — 1.4% | ||||||||
| Camden Property Trust | 3,239 | 416,244 | ||||||
| Equinix, Inc. | 649 | 426,633 | ||||||
| Gaming and Leisure Properties, Inc. | 8,684 | 419,177 | ||||||
| National Retail Properties, Inc. | 9,634 | 432,567 | ||||||
| SBA Communications Corp. | 3,685 | 1,198,546 | ||||||
| Weyerhaeuser Co. | 20,235 | 691,227 | ||||||
| 3,584,394 | ||||||||
| Food and Staples Retailing — 2.3% | ||||||||
| Casey's General Stores, Inc. | 1,102 | 235,575 | ||||||
| Costco Wholesale Corp. | 9,754 | 5,092,563 | ||||||
| Sysco Corp. | 7,972 | 655,458 | ||||||
| 5,983,596 | ||||||||
| Food Products — 1.3% | ||||||||
| Archer-Daniels-Midland Co. | 7,576 | 665,855 | ||||||
| Hershey Co. | 2,951 | 663,001 | ||||||
| Lamb Weston Holdings, Inc. | 25,050 | 1,992,226 | ||||||
| 3,321,082 | ||||||||
| Gas Utilities — 0.1% | ||||||||
| National Fuel Gas Co. | 3,248 | 231,485 | ||||||
| Health Care Equipment and Supplies — 2.2% | ||||||||
ABIOMED, Inc.(1) | 1,631 | 422,886 | ||||||
DexCom, Inc.(1) | 40,527 | 3,331,724 | ||||||
Edwards Lifesciences Corp.(1) | 7,126 | 642,052 | ||||||
Hologic, Inc.(1) | 3,387 | 228,826 | ||||||
IDEXX Laboratories, Inc.(1) | 1,855 | 644,835 | ||||||
| ResMed, Inc. | 1,953 | 429,504 | ||||||
| 5,699,827 | ||||||||
| Health Care Providers and Services — 0.7% | ||||||||
| AmerisourceBergen Corp. | 1,603 | 234,936 | ||||||
| Chemed Corp. | 500 | 238,095 | ||||||
| HCA Healthcare, Inc. | 1,129 | 223,395 | ||||||
| Humana, Inc. | 904 | 435,529 | ||||||
Molina Healthcare, Inc.(1) | 736 | 248,304 | ||||||
| UnitedHealth Group, Inc. | 827 | 429,486 | ||||||
| 1,809,745 | ||||||||
51
STOXX® U.S. Quality Growth ETF | ||||||||
| Shares | Value | |||||||
| Health Care Technology — 0.9% | ||||||||
Veeva Systems, Inc., Class A(1) | 12,314 | $ | 2,454,426 | |||||
| Hotels, Restaurants and Leisure — 6.1% | ||||||||
Chipotle Mexican Grill, Inc.(1) | 2,836 | 4,528,525 | ||||||
| Choice Hotels International, Inc. | 1,992 | 228,502 | ||||||
| Churchill Downs, Inc. | 2,099 | 413,692 | ||||||
| Marriott International, Inc., Class A | 42,338 | 6,509,044 | ||||||
| Texas Roadhouse, Inc. | 14,861 | 1,319,063 | ||||||
| Vail Resorts, Inc. | 12,278 | 2,758,621 | ||||||
| 15,757,447 | ||||||||
| Household Durables — 0.1% | ||||||||
| Tempur Sealy International, Inc. | 8,895 | 222,464 | ||||||
| Household Products — 0.2% | ||||||||
| Colgate-Palmolive Co. | 2,979 | 232,988 | ||||||
| Kimberly-Clark Corp. | 1,814 | 231,321 | ||||||
| 464,309 | ||||||||
| Insurance — 0.7% | ||||||||
| Arthur J. Gallagher & Co. | 2,343 | 425,418 | ||||||
| Kinsale Capital Group, Inc. | 1,663 | 421,704 | ||||||
| Progressive Corp. | 3,541 | 434,304 | ||||||
| WR Berkley Corp. | 6,634 | 429,883 | ||||||
| 1,711,309 | ||||||||
| Interactive Media and Services — 2.7% | ||||||||
Alphabet, Inc., Class C(1) | 24,576 | 2,682,470 | ||||||
Meta Platforms, Inc., Class A(1) | 14,282 | 2,326,966 | ||||||
ZoomInfo Technologies, Inc.(1) | 42,478 | 1,929,351 | ||||||
| 6,938,787 | ||||||||
| Internet and Direct Marketing Retail — 1.2% | ||||||||
Etsy, Inc.(1) | 4,133 | 436,486 | ||||||
MercadoLibre, Inc.(1) | 3,184 | 2,723,466 | ||||||
| 3,159,952 | ||||||||
| IT Services — 5.1% | ||||||||
| Accenture PLC, Class A | 1,445 | 416,825 | ||||||
| Automatic Data Processing, Inc. | 1,734 | 423,807 | ||||||
| Cognizant Technology Solutions Corp., Class A | 3,596 | 227,159 | ||||||
EPAM Systems, Inc.(1) | 4,554 | 1,942,281 | ||||||
Gartner, Inc.(1) | 9,370 | 2,673,449 | ||||||
Globant SA(1) | 1,960 | 413,109 | ||||||
GoDaddy, Inc., Class A(1) | 8,538 | 647,351 | ||||||
| Mastercard, Inc., Class A | 18,883 | 6,125,079 | ||||||
| Visa, Inc., Class A | 2,134 | 424,047 | ||||||
| 13,293,107 | ||||||||
| Life Sciences Tools and Services — 3.2% | ||||||||
| Agilent Technologies, Inc. | 3,292 | 422,199 | ||||||
| Bio-Techne Corp. | 1,249 | 414,431 | ||||||
| Bruker Corp. | 7,358 | 412,048 | ||||||
IQVIA Holdings, Inc.(1) | 1,907 | 405,543 | ||||||
Mettler-Toledo International, Inc.(1) | 520 | 630,479 | ||||||
Repligen Corp.(1) | 7,535 | 1,652,953 | ||||||
| West Pharmaceutical Services, Inc. | 14,992 | 4,447,976 | ||||||
| 8,385,629 | ||||||||
52
STOXX® U.S. Quality Growth ETF | ||||||||
| Shares | Value | |||||||
| Machinery — 0.4% | ||||||||
Chart Industries, Inc.(1) | 4,404 | $ | 853,760 | |||||
| Lincoln Electric Holdings, Inc. | 1,654 | 226,085 | ||||||
| 1,079,845 | ||||||||
| Media — 0.1% | ||||||||
| Nexstar Media Group, Inc., Class A | 1,237 | 236,663 | ||||||
| Metals and Mining — 0.1% | ||||||||
| Nucor Corp. | 2,554 | 339,529 | ||||||
| Oil, Gas and Consumable Fuels — 3.4% | ||||||||
| Chesapeake Energy Corp. | 9,289 | 933,452 | ||||||
| ConocoPhillips | 6,145 | 672,570 | ||||||
| Coterra Energy, Inc. | 7,711 | 238,347 | ||||||
| Devon Energy Corp. | 32,231 | 2,276,153 | ||||||
| Diamondback Energy, Inc. | 1,769 | 235,772 | ||||||
| HF Sinclair Corp. | 12,479 | 656,770 | ||||||
| Marathon Oil Corp. | 9,141 | 233,918 | ||||||
| Marathon Petroleum Corp. | 6,470 | 651,853 | ||||||
| Matador Resources Co. | 3,843 | 229,043 | ||||||
| Occidental Petroleum Corp. | 9,247 | 656,537 | ||||||
| Pioneer Natural Resources Co. | 2,650 | 671,033 | ||||||
| SM Energy Co. | 10,422 | 459,298 | ||||||
| Texas Pacific Land Corp. | 385 | 708,577 | ||||||
| Valero Energy Corp. | 1,954 | 228,852 | ||||||
| 8,852,175 | ||||||||
| Personal Products — 0.1% | ||||||||
| Estee Lauder Cos., Inc., Class A | 1,614 | 410,569 | ||||||
| Pharmaceuticals — 2.4% | ||||||||
| Eli Lilly & Co. | 1,385 | 417,204 | ||||||
| Merck & Co., Inc. | 37,385 | 3,191,184 | ||||||
| Pfizer, Inc. | 46,389 | 2,098,174 | ||||||
| Zoetis, Inc. | 2,704 | 423,257 | ||||||
| 6,129,819 | ||||||||
| Professional Services — 0.5% | ||||||||
| Robert Half International, Inc. | 17,891 | 1,377,070 | ||||||
| Real Estate Management and Development — 0.1% | ||||||||
CBRE Group, Inc., Class A(1) | 2,888 | 228,036 | ||||||
| Road and Rail — 3.7% | ||||||||
| J.B. Hunt Transport Services, Inc. | 18,913 | 3,291,240 | ||||||
| Landstar System, Inc. | 1,558 | 228,450 | ||||||
| Old Dominion Freight Line, Inc. | 18,310 | 4,969,517 | ||||||
Saia, Inc.(1) | 3,995 | 826,286 | ||||||
XPO Logistics, Inc.(1) | 4,233 | 221,894 | ||||||
| 9,537,387 | ||||||||
| Semiconductors and Semiconductor Equipment — 10.6% | ||||||||
Advanced Micro Devices, Inc.(1) | 36,853 | 3,127,714 | ||||||
| Applied Materials, Inc. | 22,957 | 2,159,565 | ||||||
Enphase Energy, Inc.(1) | 9,763 | 2,796,514 | ||||||
| KLA Corp. | 6,399 | 2,202,088 | ||||||
| Lam Research Corp. | 504 | 220,707 | ||||||
Lattice Semiconductor Corp.(1) | 22,588 | 1,217,493 | ||||||
| Microchip Technology, Inc. | 3,415 | 222,829 | ||||||
53
STOXX® U.S. Quality Growth ETF | ||||||||
| Shares | Value | |||||||
| Micron Technology, Inc. | 3,939 | $ | 222,672 | |||||
| Monolithic Power Systems, Inc. | 8,033 | 3,640,395 | ||||||
| NVIDIA Corp. | 38,448 | 5,803,341 | ||||||
ON Semiconductor Corp.(1) | 24,690 | 1,697,931 | ||||||
| Power Integrations, Inc. | 6,009 | 429,824 | ||||||
| QUALCOMM, Inc. | 16,482 | 2,180,074 | ||||||
SolarEdge Technologies, Inc.(1) | 1,488 | 410,643 | ||||||
| Teradyne, Inc. | 2,502 | 211,769 | ||||||
| Texas Instruments, Inc. | 1,360 | 224,685 | ||||||
| Universal Display Corp. | 5,771 | 644,794 | ||||||
| 27,413,038 | ||||||||
| Software — 21.6% | ||||||||
Adobe, Inc.(1) | 8,270 | 3,088,349 | ||||||
Aspen Technology, Inc.(1) | 3,179 | 669,497 | ||||||
Atlassian Corp. PLC, Class A(1) | 1,681 | 416,317 | ||||||
Autodesk, Inc.(1) | 25,027 | 5,048,947 | ||||||
Cadence Design Systems, Inc.(1) | 37,268 | 6,476,060 | ||||||
Crowdstrike Holdings, Inc., Class A(1) | 13,236 | 2,417,026 | ||||||
Datadog, Inc., Class A(1) | 24,334 | 2,553,853 | ||||||
Fair Isaac Corp.(1) | 1,418 | 637,249 | ||||||
Five9, Inc.(1) | 4,284 | 420,303 | ||||||
Fortinet, Inc.(1) | 81,233 | 3,955,235 | ||||||
HubSpot, Inc.(1) | 5,087 | 1,714,523 | ||||||
| Intuit, Inc. | 10,127 | 4,372,636 | ||||||
| Microsoft Corp. | 13,708 | 3,584,231 | ||||||
Palantir Technologies, Inc., Class A(1) | 212,668 | 1,641,797 | ||||||
Palo Alto Networks, Inc.(1) | 6,222 | 3,464,472 | ||||||
Paycom Software, Inc.(1) | 7,179 | 2,521,265 | ||||||
Paylocity Holding Corp.(1) | 1,792 | 431,872 | ||||||
PTC, Inc.(1) | 5,772 | 663,145 | ||||||
Salesforce, Inc.(1) | 2,574 | 401,853 | ||||||
ServiceNow, Inc.(1) | 8,202 | 3,564,753 | ||||||
Synopsys, Inc.(1) | 13,407 | 4,639,090 | ||||||
Trade Desk, Inc., Class A(1) | 40,556 | 2,542,861 | ||||||
Workday, Inc., Class A(1) | 2,757 | 453,692 | ||||||
Zoom Video Communications, Inc., Class A(1) | 2,812 | 226,085 | ||||||
| 55,905,111 | ||||||||
| Specialty Retail — 2.3% | ||||||||
AutoNation, Inc.(1) | 3,733 | 465,132 | ||||||
| Dick's Sporting Goods, Inc. | 4,374 | 465,262 | ||||||
Floor & Decor Holdings, Inc., Class A(1) | 5,016 | 408,102 | ||||||
| Lowe's Cos., Inc. | 1,143 | 221,902 | ||||||
| Murphy USA, Inc. | 810 | 235,037 | ||||||
O'Reilly Automotive, Inc.(1) | 1,290 | 899,285 | ||||||
Ulta Beauty, Inc.(1) | 5,667 | 2,379,403 | ||||||
| Williams-Sonoma, Inc. | 5,809 | 864,089 | ||||||
| 5,938,212 | ||||||||
| Technology Hardware, Storage and Peripherals — 2.2% | ||||||||
| Apple, Inc. | 22,481 | 3,534,463 | ||||||
| NetApp, Inc. | 3,068 | 221,295 | ||||||
Pure Storage, Inc., Class A(1) | 65,434 | 1,895,623 | ||||||
| 5,651,381 | ||||||||
54
STOXX® U.S. Quality Growth ETF | ||||||||
| Shares | Value | |||||||
| Textiles, Apparel and Luxury Goods — 2.7% | ||||||||
lululemon athletica, Inc.(1) | 11,821 | $ | 3,545,827 | |||||
| NIKE, Inc., Class B | 23,926 | 2,546,923 | ||||||
| Tapestry, Inc. | 26,223 | 910,725 | ||||||
| 7,003,475 | ||||||||
| Trading Companies and Distributors — 0.2% | ||||||||
Univar Solutions, Inc.(1) | 16,636 | 419,560 | ||||||
| W.W. Grainger, Inc. | 413 | 229,190 | ||||||
| 648,750 | ||||||||
| Wireless Telecommunication Services — 2.4% | ||||||||
T-Mobile US, Inc.(1) | 42,615 | 6,134,855 | ||||||
TOTAL COMMON STOCKS (Cost $259,113,977) | 258,393,818 | |||||||
| SHORT-TERM INVESTMENTS — 0.3% | ||||||||
| Money Market Funds — 0.3% | ||||||||
State Street Institutional U.S. Government Money Market Fund, Premier Class (Cost $692,303) | 692,303 | 692,303 | ||||||
TOTAL INVESTMENT SECURITIES — 100.0% (Cost $259,806,280) | 259,086,121 | |||||||
OTHER ASSETS AND LIABILITIES† | 46,842 | |||||||
| TOTAL NET ASSETS — 100.0% | $ | 259,132,963 | ||||||
| NOTES TO SCHEDULE OF INVESTMENTS | ||||||||
†Category is less than 0.05% of total net assets.
(1)Non-income producing.
See Notes to Financial Statements.
55
AUGUST 31, 2022
STOXX® U.S. Quality Value ETF | ||||||||
| Shares | Value | |||||||
| COMMON STOCKS — 99.6% | ||||||||
| Aerospace and Defense — 2.4% | ||||||||
| General Dynamics Corp. | 1,469 | $ | 336,298 | |||||
| Huntington Ingalls Industries, Inc. | 1,447 | 333,186 | ||||||
| Lockheed Martin Corp. | 8,400 | 3,528,924 | ||||||
| Raytheon Technologies Corp. | 3,637 | 326,421 | ||||||
| Textron, Inc. | 5,221 | 325,686 | ||||||
| 4,850,515 | ||||||||
| Air Freight and Logistics — 1.7% | ||||||||
| FedEx Corp. | 12,266 | 2,585,796 | ||||||
| United Parcel Service, Inc., Class B | 4,571 | 889,105 | ||||||
| 3,474,901 | ||||||||
| Airlines — 0.3% | ||||||||
Alaska Air Group, Inc.(1) | 7,568 | 329,662 | ||||||
Southwest Airlines Co.(1) | 9,069 | 332,832 | ||||||
| 662,494 | ||||||||
| Auto Components — 0.2% | ||||||||
| BorgWarner, Inc. | 8,992 | 338,998 | ||||||
| Automobiles — 1.2% | ||||||||
| Ford Motor Co. | 93,428 | 1,423,843 | ||||||
| Harley-Davidson, Inc. | 8,445 | 325,724 | ||||||
| Thor Industries, Inc. | 7,847 | 635,685 | ||||||
| 2,385,252 | ||||||||
| Banks — 2.9% | ||||||||
| Citigroup, Inc. | 36,162 | 1,765,067 | ||||||
| Citizens Financial Group, Inc. | 47,951 | 1,758,843 | ||||||
| Comerica, Inc. | 8,122 | 652,197 | ||||||
| KeyCorp | 79,018 | 1,397,828 | ||||||
| Popular, Inc. | 4,316 | 333,282 | ||||||
| 5,907,217 | ||||||||
| Beverages — 0.3% | ||||||||
| Molson Coors Beverage Co., Class B | 6,280 | 324,488 | ||||||
| PepsiCo, Inc. | 1,950 | 335,926 | ||||||
| 660,414 | ||||||||
| Biotechnology — 5.1% | ||||||||
| AbbVie, Inc. | 18,724 | 2,517,629 | ||||||
| Amgen, Inc. | 10,619 | 2,551,746 | ||||||
Biogen, Inc.(1) | 1,707 | 333,514 | ||||||
| Gilead Sciences, Inc. | 41,025 | 2,603,857 | ||||||
Moderna, Inc.(1) | 12,306 | 1,627,714 | ||||||
Regeneron Pharmaceuticals, Inc.(1) | 579 | 336,434 | ||||||
United Therapeutics Corp.(1) | 1,584 | 358,966 | ||||||
| 10,329,860 | ||||||||
| Building Products — 0.3% | ||||||||
| Johnson Controls International PLC | 6,132 | 331,986 | ||||||
| Owens Corning | 4,464 | 364,843 | ||||||
| 696,829 | ||||||||
| Capital Markets — 1.6% | ||||||||
| Bank of New York Mellon Corp. | 8,037 | 333,777 | ||||||
| Franklin Resources, Inc. | 27,513 | 717,264 | ||||||
56
STOXX® U.S. Quality Value ETF | ||||||||
| Shares | Value | |||||||
| Morgan Stanley | 6,195 | $ | 527,938 | |||||
| State Street Corp. | 4,878 | 333,411 | ||||||
| T. Rowe Price Group, Inc. | 11,916 | 1,429,920 | ||||||
| 3,342,310 | ||||||||
| Chemicals — 3.3% | ||||||||
| CF Industries Holdings, Inc. | 3,140 | 324,864 | ||||||
| Dow, Inc. | 46,785 | 2,386,035 | ||||||
| DuPont de Nemours, Inc. | 5,770 | 321,043 | ||||||
| Huntsman Corp. | 11,493 | 322,034 | ||||||
| LyondellBasell Industries NV, Class A | 20,455 | 1,697,765 | ||||||
| Mosaic Co. | 22,578 | 1,216,277 | ||||||
| Olin Corp. | 9,842 | 537,964 | ||||||
| 6,805,982 | ||||||||
| Communications Equipment — 0.2% | ||||||||
F5, Inc.(1) | 2,088 | 327,941 | ||||||
| Construction and Engineering — 0.2% | ||||||||
| EMCOR Group, Inc. | 2,819 | 335,236 | ||||||
| Consumer Finance — 0.2% | ||||||||
| American Express Co. | 2,155 | 327,560 | ||||||
| Containers and Packaging — 0.4% | ||||||||
| Packaging Corp. of America | 4,010 | 549,049 | ||||||
| Sealed Air Corp. | 6,057 | 325,927 | ||||||
| 874,976 | ||||||||
| Diversified Financial Services — 0.2% | ||||||||
Berkshire Hathaway, Inc., Class B(1) | 1,173 | 329,378 | ||||||
| Diversified Telecommunication Services — 3.1% | ||||||||
| AT&T, Inc. | 193,271 | 3,389,973 | ||||||
| Verizon Communications, Inc. | 70,302 | 2,939,327 | ||||||
| 6,329,300 | ||||||||
| Electric Utilities — 4.7% | ||||||||
| Alliant Energy Corp. | 4,422 | 269,919 | ||||||
| American Electric Power Co., Inc. | 6,730 | 674,346 | ||||||
| Duke Energy Corp. | 3,158 | 337,622 | ||||||
| Entergy Corp. | 17,542 | 2,022,593 | ||||||
| FirstEnergy Corp. | 4,777 | 188,930 | ||||||
| NRG Energy, Inc. | 75,299 | 3,108,343 | ||||||
| OGE Energy Corp. | 17,904 | 725,828 | ||||||
| Pinnacle West Capital Corp. | 24,434 | 1,841,102 | ||||||
| Southern Co. | 2,379 | 183,349 | ||||||
| Xcel Energy, Inc. | 2,475 | 183,769 | ||||||
| 9,535,801 | ||||||||
| Electrical Equipment — 0.2% | ||||||||
| Emerson Electric Co. | 3,974 | 324,835 | ||||||
| Electronic Equipment, Instruments and Components — 0.9% | ||||||||
| Corning, Inc. | 15,004 | 514,937 | ||||||
Flex Ltd.(1) | 21,647 | 385,533 | ||||||
II-VI, Inc.(1) | 6,426 | 303,500 | ||||||
| Jabil, Inc. | 5,928 | 357,459 | ||||||
| TE Connectivity Ltd. | 2,640 | 333,194 | ||||||
| 1,894,623 | ||||||||
57
STOXX® U.S. Quality Value ETF | ||||||||
| Shares | Value | |||||||
| Equity Real Estate Investment Trusts (REITs) — 5.0% | ||||||||
| Apartment Income REIT Corp. | 4,361 | $ | 178,147 | |||||
| Brixmor Property Group, Inc. | 29,552 | 634,777 | ||||||
| Crown Castle, Inc. | 1,089 | 186,034 | ||||||
| CubeSmart | 3,809 | 175,404 | ||||||
| Essex Property Trust, Inc. | 664 | 176,000 | ||||||
| Extra Space Storage, Inc. | 1,088 | 216,218 | ||||||
| Federal Realty Investment Trust | 8,848 | 896,037 | ||||||
| Gaming and Leisure Properties, Inc. | 36,520 | 1,762,820 | ||||||
| Host Hotels & Resorts, Inc. | 18,276 | 324,764 | ||||||
| Kimco Realty Corp. | 9,094 | 191,702 | ||||||
| Lamar Advertising Co., Class A | 14,749 | 1,384,784 | ||||||
| Life Storage, Inc. | 1,672 | 212,762 | ||||||
| National Retail Properties, Inc. | 40,512 | 1,818,989 | ||||||
| Omega Healthcare Investors, Inc. | 10,585 | 345,706 | ||||||
| STORE Capital Corp. | 54,117 | 1,460,077 | ||||||
| Weyerhaeuser Co. | 9,547 | 326,125 | ||||||
| 10,290,346 | ||||||||
| Food and Staples Retailing — 4.4% | ||||||||
| Kroger Co. | 56,712 | 2,718,774 | ||||||
| Walgreens Boots Alliance, Inc. | 106,565 | 3,736,169 | ||||||
| Walmart, Inc. | 19,355 | 2,565,505 | ||||||
| 9,020,448 | ||||||||
| Food Products — 4.5% | ||||||||
| Archer-Daniels-Midland Co. | 3,846 | 338,025 | ||||||
| Campbell Soup Co. | 38,793 | 1,954,391 | ||||||
| General Mills, Inc. | 26,891 | 2,065,229 | ||||||
| J.M. Smucker Co. | 4,024 | 563,320 | ||||||
| Kellogg Co. | 2,482 | 180,541 | ||||||
| Kraft Heinz Co. | 31,474 | 1,177,127 | ||||||
| Tyson Foods, Inc., Class A | 39,026 | 2,941,780 | ||||||
| 9,220,413 | ||||||||
| Gas Utilities — 0.1% | ||||||||
| UGI Corp. | 4,650 | 183,675 | ||||||
| Health Care Equipment and Supplies — 0.5% | ||||||||
| Becton Dickinson and Co. | 1,345 | 339,505 | ||||||
| DENTSPLY SIRONA, Inc. | 10,058 | 329,601 | ||||||
| Medtronic PLC | 3,795 | 333,656 | ||||||
| 1,002,762 | ||||||||
| Health Care Providers and Services — 5.4% | ||||||||
| Cardinal Health, Inc. | 5,060 | 357,843 | ||||||
Centene Corp.(1) | 32,870 | 2,949,754 | ||||||
| Cigna Corp. | 1,774 | 502,840 | ||||||
| CVS Health Corp. | 3,423 | 335,967 | ||||||
DaVita, Inc.(1) | 11,381 | 970,686 | ||||||
| Elevance Health, Inc. | 710 | 344,428 | ||||||
| HCA Healthcare, Inc. | 9,823 | 1,943,677 | ||||||
Henry Schein, Inc.(1) | 4,655 | 341,724 | ||||||
| Humana, Inc. | 706 | 340,137 | ||||||
| Laboratory Corp. of America Holdings | 1,475 | 332,273 | ||||||
Molina Healthcare, Inc.(1) | 1,068 | 360,311 | ||||||
58
STOXX® U.S. Quality Value ETF | ||||||||
| Shares | Value | |||||||
| Quest Diagnostics, Inc. | 2,677 | $ | 335,455 | |||||
Tenet Healthcare Corp.(1) | 16,570 | 936,205 | ||||||
| UnitedHealth Group, Inc. | 646 | 335,487 | ||||||
| Universal Health Services, Inc., Class B | 5,984 | 585,475 | ||||||
| 10,972,262 | ||||||||
| Hotels, Restaurants and Leisure — 1.0% | ||||||||
| Boyd Gaming Corp. | 6,109 | 332,513 | ||||||
| Darden Restaurants, Inc. | 10,638 | 1,316,027 | ||||||
Expedia Group, Inc.(1) | 3,225 | 331,046 | ||||||
| 1,979,586 | ||||||||
| Household Durables — 1.7% | ||||||||
| Leggett & Platt, Inc. | 18,803 | 718,651 | ||||||
| Lennar Corp., Class A | 4,118 | 318,939 | ||||||
Mohawk Industries, Inc.(1) | 9,061 | 999,972 | ||||||
| PulteGroup, Inc. | 8,121 | 330,200 | ||||||
| Whirlpool Corp. | 6,554 | 1,026,356 | ||||||
| 3,394,118 | ||||||||
| Household Products — 1.2% | ||||||||
| Colgate-Palmolive Co. | 2,327 | 181,995 | ||||||
| Kimberly-Clark Corp. | 15,777 | 2,011,883 | ||||||
| Procter & Gamble Co. | 1,334 | 184,012 | ||||||
| 2,377,890 | ||||||||
| Industrial Conglomerates — 1.0% | ||||||||
| 3M Co. | 16,312 | 2,028,397 | ||||||
| Insurance — 1.7% | ||||||||
Alleghany Corp.(1) | 415 | 349,090 | ||||||
| First American Financial Corp. | 3,252 | 173,982 | ||||||
| MetLife, Inc. | 5,197 | 334,323 | ||||||
| Principal Financial Group, Inc. | 2,661 | 198,936 | ||||||
| Reinsurance Group of America, Inc. | 2,708 | 339,475 | ||||||
| Unum Group | 53,708 | 2,032,848 | ||||||
| 3,428,654 | ||||||||
| Interactive Media and Services — 2.6% | ||||||||
Alphabet, Inc., Class C(1) | 26,734 | 2,918,016 | ||||||
Meta Platforms, Inc., Class A(1) | 14,500 | 2,362,485 | ||||||
| 5,280,501 | ||||||||
| Internet and Direct Marketing Retail — 0.2% | ||||||||
| eBay, Inc. | 7,504 | 331,152 | ||||||
| IT Services — 4.9% | ||||||||
| Accenture PLC, Class A | 1,129 | 325,671 | ||||||
Akamai Technologies, Inc.(1) | 3,695 | 333,585 | ||||||
| Amdocs Ltd. | 3,975 | 339,743 | ||||||
| Cognizant Technology Solutions Corp., Class A | 41,728 | 2,635,958 | ||||||
| Concentrix Corp. | 7,842 | 986,367 | ||||||
| Genpact Ltd. | 7,327 | 344,222 | ||||||
| International Business Machines Corp. | 26,095 | 3,351,903 | ||||||
PayPal Holdings, Inc.(1) | 3,615 | 337,785 | ||||||
| Visa, Inc., Class A | 1,666 | 331,051 | ||||||
| Western Union Co. | 70,413 | 1,043,521 | ||||||
| 10,029,806 | ||||||||
59
STOXX® U.S. Quality Value ETF | ||||||||
| Shares | Value | |||||||
| Leisure Products — 0.2% | ||||||||
| Brunswick Corp. | 4,259 | $ | 318,190 | |||||
| Machinery — 0.8% | ||||||||
| AGCO Corp. | 3,033 | 329,718 | ||||||
| Caterpillar, Inc. | 1,758 | 324,720 | ||||||
| Cummins, Inc. | 1,527 | 328,870 | ||||||
| Dover Corp. | 2,590 | 323,646 | ||||||
| Parker-Hannifin Corp. | 1,196 | 316,940 | ||||||
| 1,623,894 | ||||||||
| Media — 2.1% | ||||||||
Altice USA, Inc., Class A(1) | 67,042 | 670,420 | ||||||
Charter Communications, Inc., Class A(1) | 797 | 328,866 | ||||||
| Comcast Corp., Class A | 9,299 | 336,531 | ||||||
| Fox Corp., Class A | 9,995 | 341,629 | ||||||
| Interpublic Group of Cos., Inc. | 43,922 | 1,214,004 | ||||||
| Omnicom Group, Inc. | 21,500 | 1,438,350 | ||||||
| 4,329,800 | ||||||||
| Metals and Mining — 0.7% | ||||||||
| Alcoa Corp. | 16,996 | 840,962 | ||||||
| Nucor Corp. | 2,424 | 322,246 | ||||||
| Steel Dynamics, Inc. | 4,030 | 325,302 | ||||||
| 1,488,510 | ||||||||
| Multi-Utilities — 0.2% | ||||||||
| Ameren Corp. | 1,955 | 181,072 | ||||||
| WEC Energy Group, Inc. | 2,126 | 219,276 | ||||||
| 400,348 | ||||||||
| Multiline Retail — 1.2% | ||||||||
| Macy's, Inc. | 36,687 | 635,419 | ||||||
| Target Corp. | 11,722 | 1,879,505 | ||||||
| 2,514,924 | ||||||||
| Oil, Gas and Consumable Fuels — 6.8% | ||||||||
Antero Resources Corp.(1) | 8,244 | 330,419 | ||||||
| APA Corp. | 25,962 | 1,015,374 | ||||||
Chesapeake Energy Corp.(2) | 3,368 | 338,450 | ||||||
| Chevron Corp. | 13,560 | 2,143,294 | ||||||
| Exxon Mobil Corp. | 22,527 | 2,153,356 | ||||||
| HF Sinclair Corp. | 9,746 | 512,932 | ||||||
| Marathon Oil Corp. | 13,258 | 339,272 | ||||||
| Marathon Petroleum Corp. | 3,299 | 332,374 | ||||||
| Murphy Oil Corp. | 8,949 | 348,743 | ||||||
| Occidental Petroleum Corp. | 4,694 | 333,274 | ||||||
| Ovintiv, Inc. | 19,299 | 1,025,549 | ||||||
| PDC Energy, Inc. | 10,210 | 693,361 | ||||||
| Phillips 66 | 19,782 | 1,769,698 | ||||||
| SM Energy Co. | 15,116 | 666,162 | ||||||
| Valero Energy Corp. | 15,043 | 1,761,836 | ||||||
| 13,764,094 | ||||||||
| Paper and Forest Products — 0.3% | ||||||||
| Louisiana-Pacific Corp. | 11,945 | 647,777 | ||||||
| Pharmaceuticals — 4.9% | ||||||||
| Bristol-Myers Squibb Co. | 4,890 | 329,635 | ||||||
60
STOXX® U.S. Quality Value ETF | ||||||||
| Shares | Value | |||||||
| Johnson & Johnson | 13,194 | $ | 2,128,720 | |||||
| Merck & Co., Inc. | 28,470 | 2,430,199 | ||||||
| Organon & Co. | 11,524 | 328,780 | ||||||
| Perrigo Co. PLC | 8,678 | 324,731 | ||||||
| Pfizer, Inc. | 99,071 | 4,480,981 | ||||||
| 10,023,046 | ||||||||
| Professional Services — 1.1% | ||||||||
CACI International, Inc., Class A(1) | 1,244 | 349,402 | ||||||
| Leidos Holdings, Inc. | 3,505 | 333,150 | ||||||
| ManpowerGroup, Inc. | 11,355 | 832,549 | ||||||
| Nielsen Holdings PLC | 12,558 | 349,615 | ||||||
| Robert Half International, Inc. | 4,325 | 332,895 | ||||||
| 2,197,611 | ||||||||
| Real Estate Management and Development — 0.3% | ||||||||
CBRE Group, Inc., Class A(1) | 4,190 | 330,842 | ||||||
Jones Lang LaSalle, Inc.(1) | 1,933 | 334,409 | ||||||
| 665,251 | ||||||||
| Road and Rail — 0.8% | ||||||||
| CSX Corp. | 10,289 | 325,647 | ||||||
| Norfolk Southern Corp. | 1,329 | 323,120 | ||||||
| Union Pacific Corp. | 1,462 | 328,233 | ||||||
XPO Logistics, Inc.(1) | 12,278 | 643,613 | ||||||
| 1,620,613 | ||||||||
| Semiconductors and Semiconductor Equipment — 5.6% | ||||||||
| Analog Devices, Inc. | 2,093 | 317,152 | ||||||
| Applied Materials, Inc. | 3,330 | 313,253 | ||||||
| Broadcom, Inc. | 978 | 488,130 | ||||||
| Intel Corp. | 90,188 | 2,878,801 | ||||||
| Microchip Technology, Inc. | 4,954 | 323,248 | ||||||
| Micron Technology, Inc. | 39,990 | 2,260,635 | ||||||
| MKS Instruments, Inc. | 3,199 | 318,652 | ||||||
ON Semiconductor Corp.(1) | 22,789 | 1,567,199 | ||||||
Qorvo, Inc.(1) | 3,429 | 307,856 | ||||||
| QUALCOMM, Inc. | 2,632 | 348,135 | ||||||
| Skyworks Solutions, Inc. | 14,039 | 1,383,543 | ||||||
Synaptics, Inc.(1) | 2,611 | 301,858 | ||||||
| Teradyne, Inc. | 3,629 | 307,159 | ||||||
| Texas Instruments, Inc. | 1,972 | 325,794 | ||||||
| 11,441,415 | ||||||||
| Software — 1.1% | ||||||||
Check Point Software Technologies Ltd.(1) | 2,850 | 342,684 | ||||||
| Microsoft Corp. | 1,254 | 327,883 | ||||||
| NortonLifeLock, Inc. | 14,954 | 337,811 | ||||||
| Oracle Corp. (New York) | 4,547 | 337,160 | ||||||
Salesforce, Inc.(1) | 2,010 | 313,801 | ||||||
| VMware, Inc., Class A | 2,873 | 333,354 | ||||||
Zoom Video Communications, Inc., Class A(1) | 4,079 | 327,952 | ||||||
| 2,320,645 | ||||||||
| Specialty Retail — 3.2% | ||||||||
| Advance Auto Parts, Inc. | 1,932 | 325,813 | ||||||
AutoNation, Inc.(1) | 5,415 | 674,709 | ||||||
61
STOXX® U.S. Quality Value ETF | ||||||||
| Shares | Value | |||||||
| Bath & Body Works, Inc. | 9,218 | $ | 344,108 | |||||
| Best Buy Co., Inc. | 36,804 | 2,601,675 | ||||||
Dick's Sporting Goods, Inc.(2) | 6,344 | 674,811 | ||||||
| Home Depot, Inc. | 1,129 | 325,626 | ||||||
| Lowe's Cos., Inc. | 1,657 | 321,690 | ||||||
| Murphy USA, Inc. | 1,176 | 341,240 | ||||||
| Williams-Sonoma, Inc. | 6,319 | 939,951 | ||||||
| 6,549,623 | ||||||||
| Technology Hardware, Storage and Peripherals — 4.3% | ||||||||
| Apple, Inc. | 12,572 | 1,976,570 | ||||||
| Dell Technologies, Inc., Class C | 7,299 | 279,479 | ||||||
| Hewlett Packard Enterprise Co. | 163,594 | 2,224,878 | ||||||
| HP, Inc. | 103,696 | 2,977,112 | ||||||
| NetApp, Inc. | 4,450 | 320,978 | ||||||
| Seagate Technology Holdings PLC | 15,131 | 1,013,172 | ||||||
| 8,792,189 | ||||||||
| Textiles, Apparel and Luxury Goods — 0.8% | ||||||||
Capri Holdings Ltd.(1) | 6,746 | 318,276 | ||||||
| PVH Corp. | 10,326 | 580,837 | ||||||
| Ralph Lauren Corp. | 5,475 | 500,032 | ||||||
| Tapestry, Inc. | 9,508 | 330,213 | ||||||
| 1,729,358 | ||||||||
| Tobacco — 1.4% | ||||||||
| Altria Group, Inc. | 7,537 | 340,070 | ||||||
| Philip Morris International, Inc. | 26,568 | 2,536,978 | ||||||
| 2,877,048 | ||||||||
| Trading Companies and Distributors — 0.2% | ||||||||
United Rentals, Inc.(1) | 1,094 | 319,492 | ||||||
TOTAL COMMON STOCKS (Cost $207,115,471) | 202,898,260 | |||||||
| SHORT-TERM INVESTMENTS — 0.5% | ||||||||
| Money Market Funds — 0.5% | ||||||||
| State Street Institutional U.S. Government Money Market Fund, Premier Class | 340,212 | 340,212 | ||||||
State Street Navigator Securities Lending Government Money Market Portfolio(3) | 600,005 | 600,005 | ||||||
TOTAL SHORT-TERM INVESTMENTS (Cost $940,217) | 940,217 | |||||||
TOTAL INVESTMENT SECURITIES — 100.1% (Cost $208,055,688) | 203,838,477 | |||||||
| OTHER ASSETS AND LIABILITIES — (0.1)% | (193,924) | |||||||
| TOTAL NET ASSETS — 100.0% | $ | 203,644,553 | ||||||
| NOTES TO SCHEDULE OF INVESTMENTS | ||||||||
(1)Non-income producing.
(2)Security, or a portion thereof, is on loan. At the period end, the aggregate value of securities on loan was $790,512. The amount of securities on loan indicated may not correspond with the securities on loan identified because securities with pending sales are in the process of recall from the brokers.
(3)Investment of cash collateral from securities on loan. At the period end, the aggregate value of the collateral held by the fund was $801,453, which includes securities collateral of $201,448.
See Notes to Financial Statements.
62
| Statements of Assets and Liabilities | ||
| AUGUST 31, 2022 | ||||||||
| Low Volatility ETF | Quality Convertible Securities ETF | |||||||
| Assets | ||||||||
| Investment securities, at value (cost of $7,510,810 and $25,980,652, respectively) | $ | 7,441,710 | $ | 24,560,630 | ||||
| Dividends and interest receivable | 10,525 | 84,411 | ||||||
| 7,452,235 | 24,645,041 | |||||||
| Liabilities | ||||||||
| Accrued management fees | 1,923 | 6,856 | ||||||
| Net Assets | $ | 7,450,312 | $ | 24,638,185 | ||||
| Shares outstanding (unlimited number of shares authorized) | 180,000 | 600,000 | ||||||
| Net Asset Value Per Share | $ | 41.39 | $ | 41.06 | ||||
| Net Assets Consist of: | ||||||||
| Capital paid in | $ | 8,069,394 | $ | 28,660,267 | ||||
| Distributable earnings | (619,082) | (4,022,082) | ||||||
| $ | 7,450,312 | $ | 24,638,185 | |||||
See Notes to Financial Statements.
63
| AUGUST 31, 2022 | ||||||||
| Quality Diversified International ETF | Quality Preferred ETF | |||||||
| Assets | ||||||||
| Investment securities, at value (cost of $211,276,771 and $24,184,184, respectively) — including $3,558,796 and $—, respectively of securities on loan | $ | 189,386,726 | $ | 22,233,402 | ||||
| Investment made with cash collateral received for securities on loan, at value (cost of $1,364,843 and $—, respectively) | 1,364,843 | — | ||||||
| Total investment securities, at value (cost of $212,641,614 and $24,184,184, respectively) | 190,751,569 | 22,233,402 | ||||||
| Foreign currency holdings, at value (cost of $12,286 and $—, respectively) | 12,253 | — | ||||||
| Dividends and interest receivable | 912,624 | 166,659 | ||||||
| Securities lending receivable | 3,744 | — | ||||||
| 191,680,190 | 22,400,061 | |||||||
| Liabilities | ||||||||
| Payable for collateral received for securities on loan | 1,364,843 | — | ||||||
| Accrued management fees | 65,972 | 6,255 | ||||||
| 1,430,815 | 6,255 | |||||||
| Net Assets | $ | 190,249,375 | $ | 22,393,806 | ||||
| Shares outstanding (unlimited number of shares authorized) | 4,950,000 | 615,000 | ||||||
| Net Asset Value Per Share | $ | 38.43 | $ | 36.41 | ||||
| Net Assets Consist of: | ||||||||
| Capital paid in | $ | 238,417,263 | $ | 24,932,402 | ||||
| Distributable earnings | (48,167,888) | (2,538,596) | ||||||
| $ | 190,249,375 | $ | 22,393,806 | |||||
See Notes to Financial Statements.
64
| AUGUST 31, 2022 | ||||||||
STOXX® U.S. Quality Growth ETF | STOXX® U.S. Quality Value ETF | |||||||
| Assets | ||||||||
| Investment securities, at value (cost of $259,806,280 and $207,455,683, respectively) — including $— and $790,512, respectively of securities on loan | $ | 259,086,121 | $ | 203,238,472 | ||||
| Investment made with cash collateral received for securities on loan, at value (cost of $— and $600,005, respectively) | — | 600,005 | ||||||
| Total investment securities, at value (cost of $259,806,280 and $208,055,688, respectively) | 259,086,121 | 203,838,477 | ||||||
| Receivable for investments sold | 79,636,065 | 54,241,945 | ||||||
| Receivable for capital shares sold | — | 5,984,300 | ||||||
| Dividends and interest receivable | 515,259 | 722,495 | ||||||
| Securities lending receivable | — | 70 | ||||||
| 339,237,445 | 264,787,287 | |||||||
| Liabilities | ||||||||
| Payable for collateral received for securities on loan | — | 600,005 | ||||||
| Payable for investments purchased | 80,041,719 | 54,637,433 | ||||||
| Payable for capital shares redeemed | — | 5,852,425 | ||||||
| Accrued management fees | 62,763 | 52,871 | ||||||
| 80,104,482 | 61,142,734 | |||||||
| Net Assets | $ | 259,132,963 | $ | 203,644,553 | ||||
| Shares outstanding (unlimited number of shares authorized) | 4,300,000 | 4,350,000 | ||||||
| Net Asset Value Per Share | $ | 60.26 | $ | 46.81 | ||||
| Net Assets Consist of: | ||||||||
| Capital paid in | $ | 307,835,086 | $ | 229,515,611 | ||||
| Distributable earnings | (48,702,123) | (25,871,058) | ||||||
| $ | 259,132,963 | $ | 203,644,553 | |||||
See Notes to Financial Statements.
65
| Statements of Operations | ||
| YEAR ENDED AUGUST 31, 2022 | ||||||||
| Low Volatility ETF | Quality Convertible Securities ETF | |||||||
| Investment Income (Loss) | ||||||||
| Income: | ||||||||
| Dividends (net of foreign taxes withheld of $105 and $—, respectively) | $ | 134,229 | $ | 317,603 | ||||
| Interest | 163 | 187,658 | ||||||
| 134,392 | 505,261 | |||||||
| Expenses: | ||||||||
| Management fees | 21,528 | 76,593 | ||||||
| Net investment income (loss) | 112,864 | 428,668 | ||||||
| Realized and Unrealized Gain (Loss) | ||||||||
| Net realized gain (loss) on investment transactions | (184,372) | (1,495,888) | ||||||
| Change in net unrealized appreciation (depreciation) on investments | (853,772) | (2,374,184) | ||||||
| Net realized and unrealized gain (loss) | (1,038,144) | (3,870,072) | ||||||
| Net Increase (Decrease) in Net Assets Resulting from Operations | $ | (925,280) | $ | (3,441,404) | ||||
See Notes to Financial Statements.
66
| YEAR ENDED AUGUST 31, 2022 | ||||||||
| Quality Diversified International ETF | Quality Preferred ETF | |||||||
| Investment Income (Loss) | ||||||||
| Income: | ||||||||
| Dividends (net of foreign taxes withheld of $813,572 and $83, respectively) | $ | 7,394,818 | $ | 915,771 | ||||
| Interest | 3,461 | 102,226 | ||||||
| Securities lending, net | 54,338 | — | ||||||
| 7,452,617 | 1,017,997 | |||||||
| Expenses: | ||||||||
| Management fees | 820,589 | 66,377 | ||||||
| Other expenses | 449 | — | ||||||
| 821,038 | 66,377 | |||||||
| Net investment income (loss) | 6,631,579 | 951,620 | ||||||
| Realized and Unrealized Gain (Loss) | ||||||||
| Net realized gain (loss) on: | ||||||||
| Investment transactions | (20,714,345) | (562,701) | ||||||
| Foreign currency translation transactions | (26,135) | — | ||||||
| (20,740,480) | (562,701) | |||||||
| Change in net unrealized appreciation (depreciation) on: | ||||||||
| Investments | (46,361,540) | (2,353,989) | ||||||
| Translation of assets and liabilities in foreign currencies | (37,897) | — | ||||||
| (46,399,437) | (2,353,989) | |||||||
| Net realized and unrealized gain (loss) | (67,139,917) | (2,916,690) | ||||||
| Net Increase (Decrease) in Net Assets Resulting from Operations | $ | (60,508,338) | $ | (1,965,070) | ||||
See Notes to Financial Statements.
67
| YEAR ENDED AUGUST 31, 2022 | ||||||||
STOXX® U.S. Quality Growth ETF | STOXX® U.S. Quality Value ETF | |||||||
| Investment Income (Loss) | ||||||||
| Income: | ||||||||
| Dividends (net of foreign taxes withheld of $— and $751, respectively) | $ | 1,704,112 | $ | 5,713,152 | ||||
| Securities lending, net | 6,175 | 1,889 | ||||||
| Interest | 2,853 | 2,350 | ||||||
| 1,713,140 | 5,717,391 | |||||||
| Expenses: | ||||||||
| Management fees | 670,267 | 624,809 | ||||||
| Other expenses | — | 475 | ||||||
| 670,267 | 625,284 | |||||||
| Net investment income (loss) | 1,042,873 | 5,092,107 | ||||||
| Realized and Unrealized Gain (Loss) | ||||||||
| Net realized gain (loss) on investment transactions | (22,578,679) | 14,286,072 | ||||||
| Change in net unrealized appreciation (depreciation) on investments | (33,328,949) | (37,284,433) | ||||||
| Net realized and unrealized gain (loss) | (55,907,628) | (22,998,361) | ||||||
| Net Increase (Decrease) in Net Assets Resulting from Operations | $ | (54,864,755) | $ | (17,906,254) | ||||
See Notes to Financial Statements.
68
| Statements of Changes in Net Assets | ||
| YEAR ENDED AUGUST 31, 2022 AND PERIOD ENDED AUGUST 31, 2021 | |||||||||||||||||
| Low Volatility ETF | Quality Convertible Securities ETF | ||||||||||||||||
| Increase (Decrease) in Net Assets | August 31, 2022 | August 31, 2021(1) | August 31, 2022 | August 31, 2021(2) | |||||||||||||
| Operations | |||||||||||||||||
| Net investment income (loss) | $ | 112,864 | $ | 40,657 | $ | 428,668 | $ | 147,026 | |||||||||
| Net realized gain (loss) | (184,372) | 165,605 | (1,495,888) | (523,605) | |||||||||||||
| Change in net unrealized appreciation (depreciation) | (853,772) | 784,672 | (2,374,184) | 954,162 | |||||||||||||
| Net increase (decrease) in net assets resulting from operations | (925,280) | 990,934 | (3,441,404) | 577,583 | |||||||||||||
| Distributions to Shareholders | |||||||||||||||||
| From earnings | (98,904) | (27,228) | (478,670) | (104,616) | |||||||||||||
| Capital Share Transactions | |||||||||||||||||
| Proceeds from shares sold | 4,872,033 | 6,851,065 | 10,241,059 | 25,554,072 | |||||||||||||
| Payments for shares redeemed | (2,830,681) | (1,381,627) | (7,753,296) | — | |||||||||||||
| Other capital | — | — | 26,490 | 16,967 | |||||||||||||
| Net increase (decrease) in net assets from capital share transactions | 2,041,352 | 5,469,438 | 2,514,253 | 25,571,039 | |||||||||||||
| Net increase (decrease) in net assets | 1,017,168 | 6,433,144 | (1,405,821) | 26,044,006 | |||||||||||||
| Net Assets | |||||||||||||||||
| Beginning of period | 6,433,144 | — | 26,044,006 | — | |||||||||||||
| End of period | $ | 7,450,312 | $ | 6,433,144 | $ | 24,638,185 | $ | 26,044,006 | |||||||||
| Transactions in Shares of the Funds | |||||||||||||||||
| Sold | 105,000 | 165,000 | 220,000 | 540,000 | |||||||||||||
| Redeemed | (60,000) | (30,000) | (160,000) | — | |||||||||||||
| Net increase (decrease) in shares of the funds | 45,000 | 135,000 | 60,000 | 540,000 | |||||||||||||
(1)January 12, 2021 (fund inception) through August 31, 2021.
(2)February 16, 2021 (fund inception) through August 31, 2021.
See Notes to Financial Statements.
69
| YEARS ENDED AUGUST 31, 2022 AND AUGUST 31, 2021 (EXCEPT AS NOTED) | ||||||||||||||
| Quality Diversified International ETF | Quality Preferred ETF | |||||||||||||
| Increase (Decrease) in Net Assets | August 31, 2022 | August 31, 2021 | August 31, 2022 | August 31, 2021(1) | ||||||||||
| Operations | ||||||||||||||
| Net investment income (loss) | $ | 6,631,579 | $ | 3,487,829 | $ | 951,620 | $ | 344,799 | ||||||
| Net realized gain (loss) | (20,740,480) | 13,029,182 | (562,701) | 175,516 | ||||||||||
| Change in net unrealized appreciation (depreciation) | (46,399,437) | 13,883,259 | (2,353,989) | 403,207 | ||||||||||
| Net increase (decrease) in net assets resulting from operations | (60,508,338) | 30,400,270 | (1,965,070) | 923,522 | ||||||||||
| Distributions to Shareholders | ||||||||||||||
| From earnings | (6,315,055) | (3,209,185) | (961,361) | (292,191) | ||||||||||
| Capital Share Transactions | ||||||||||||||
| Proceeds from shares sold | 69,646,490 | 129,800,116 | 11,206,587 | 26,206,795 | ||||||||||
| Payments for shares redeemed | (20,994,370) | (49,841,406) | (8,412,358) | (4,335,252) | ||||||||||
| Other capital | — | — | 11,268 | 11,866 | ||||||||||
| Net increase (decrease) in net assets from capital share transactions | 48,652,120 | 79,958,710 | 2,805,497 | 21,883,409 | ||||||||||
| Net increase (decrease) in net assets | (18,171,273) | 107,149,795 | (120,934) | 22,514,740 | ||||||||||
| Net Assets | ||||||||||||||
| Beginning of period | 208,420,648 | 101,270,853 | 22,514,740 | — | ||||||||||
| End of period | $ | 190,249,375 | $ | 208,420,648 | $ | 22,393,806 | $ | 22,514,740 | ||||||
| Transactions in Shares of the Funds | ||||||||||||||
| Sold | 1,400,000 | 2,600,000 | 285,000 | 645,000 | ||||||||||
| Redeemed | (400,000) | (1,000,000) | (210,000) | (105,000) | ||||||||||
| Net increase (decrease) in shares of the funds | 1,000,000 | 1,600,000 | 75,000 | 540,000 | ||||||||||
(1)February 16, 2021 (fund inception) through August 31, 2021.
See Notes to Financial Statements.
70
| YEARS ENDED AUGUST 31, 2022 AND AUGUST 31, 2021 | ||||||||||||||
STOXX® U.S. Quality Growth ETF | STOXX® U.S. Quality Value ETF | |||||||||||||
| Increase (Decrease) in Net Assets | August 31, 2022 | August 31, 2021 | August 31, 2022 | August 31, 2021 | ||||||||||
| Operations | ||||||||||||||
| Net investment income (loss) | $ | 1,042,873 | $ | 841,343 | $ | 5,092,107 | $ | 3,562,962 | ||||||
| Net realized gain (loss) | (22,578,679) | 68,950,979 | 14,286,072 | 33,367,852 | ||||||||||
| Change in net unrealized appreciation (depreciation) | (33,328,949) | 1,940,684 | (37,284,433) | 21,953,183 | ||||||||||
| Net increase (decrease) in net assets resulting from operations | (54,864,755) | 71,733,006 | (17,906,254) | 58,883,997 | ||||||||||
| Distributions to Shareholders | ||||||||||||||
| From earnings | (911,250) | (546,618) | (4,592,625) | (3,277,478) | ||||||||||
| Capital Share Transactions | ||||||||||||||
| Proceeds from shares sold | 145,371,800 | 250,557,892 | 91,853,363 | 171,502,978 | ||||||||||
| Payments for shares redeemed | (88,984,655) | (278,660,990) | (120,929,370) | (109,488,315) | ||||||||||
| Net increase (decrease) in net assets from capital share transactions | 56,387,145 | (28,103,098) | (29,076,007) | 62,014,663 | ||||||||||
| Net increase (decrease) in net assets | 611,140 | 43,083,290 | (51,574,886) | 117,621,182 | ||||||||||
| Net Assets | ||||||||||||||
| Beginning of period | 258,521,823 | 215,438,533 | 255,219,439 | 137,598,257 | ||||||||||
| End of period | $ | 259,132,963 | $ | 258,521,823 | $ | 203,644,553 | $ | 255,219,439 | ||||||
| Transactions in Shares of the Funds | ||||||||||||||
| Sold | 2,125,000 | 3,800,000 | 1,825,000 | 3,625,000 | ||||||||||
| Redeemed | (1,250,000) | (4,225,000) | (2,400,000) | (2,250,000) | ||||||||||
| Net increase (decrease) in shares of the funds | 875,000 | (425,000) | (575,000) | 1,375,000 | ||||||||||
See Notes to Financial Statements.
71
| Notes to Financial Statements | ||
AUGUST 31, 2022
1. Organization
American Century ETF Trust (the trust) was registered as a Delaware statutory trust in 2017 and is registered under the Investment Company Act of 1940, as amended (the 1940 Act), as an open-end management investment company. American Century Low Volatility ETF (Low Volatility ETF), American Century Quality Convertible Securities ETF (Quality Convertible Securities ETF), American Century Quality Diversified International ETF (Quality Diversified International ETF), American Century Quality Preferred ETF (Quality Preferred ETF), American Century STOXX® U.S. Quality Growth ETF (STOXX® U.S. Quality Growth ETF) and American Century STOXX® U.S. Quality Value ETF (STOXX® U.S. Quality Value ETF) are six funds in a series issued by the trust. Low Volatility ETF’s investment objective is to seek capital appreciation. Quality Convertible Securities ETF’s investment objective is to seek total return. Quality Preferred ETF’s investment objective is to seek current income and capital appreciation. Quality Diversified International ETF, STOXX® U.S. Quality Growth ETF and STOXX® U.S. Quality Value ETF's investment objectives are to seek to provide investment results that closely correspond, before fees and expenses, to the performance of each fund's underlying index. Shares of Low Volatility ETF, Quality Diversified International ETF, STOXX® U.S. Quality Growth ETF and STOXX® U.S. Quality Value ETF are listed for trading on the NYSE Arca, Inc. Shares of Quality Convertible Securities ETF and Quality Preferred ETF are listed for trading on the Cboe BZX Exchange, Inc. Low Volatility ETF incepted on January 12, 2021. Quality Convertible Securities ETF and Quality Preferred ETF incepted on February 16, 2021.
2. Significant Accounting Policies
The following is a summary of significant accounting policies consistently followed by the funds in preparation of their financial statements. Each fund is an investment company and follows accounting and reporting guidance in accordance with accounting principles generally accepted in the United States of America. This may require management to make certain estimates and assumptions at the date of the financial statements. Actual results could differ from these estimates. Management evaluated the impact of events or transactions occurring through the date the financial statements were issued that would merit recognition or disclosure.
Investment Valuations — The funds determine the fair value of their investments and compute their net asset value (NAV) per share at the close of regular trading (usually 4 p.m. Eastern time) on the New York Stock Exchange (NYSE) on each day the NYSE is open. The Board of Trustees has adopted valuation policies and procedures to guide the investment advisor in the funds' investment valuation process and to provide methodologies for the oversight of the funds' pricing function.
Equity securities that are listed or traded on a domestic securities exchange are valued at the last reported sales price or at the official closing price as provided by the exchange. Equity securities traded on foreign securities exchanges are generally valued at the closing price of such securities on the exchange where primarily traded or at the close of the NYSE, if that is earlier. If no last sales price is reported, or if local convention or regulation so provides, the mean of the latest bid and asked prices may be used. Securities traded over-the-counter are valued at the mean of the latest bid and asked prices, the last sales price, or the official closing price. Equity securities initially expressed in local currencies are translated into U.S. dollars at the mean of the appropriate currency exchange rate at the close of the NYSE as provided by an independent pricing service.
Fixed income securities are valued at the evaluated mean as provided by independent pricing services or at the mean of the most recent bid and asked prices as provided by investment dealers. Corporate bonds and convertible bonds are valued using market models that consider trade data, quotations from dealers and active market makers, relevant yield curve and spread data, creditworthiness, trade data or market information on comparable securities, and other relevant security specific information.
Hybrid securities are valued at the evaluated mean as provided by independent pricing services or at the mean of the most recent bid and asked prices as provided by investment dealers. Preferred stocks and convertible preferred stocks with perpetual maturities are valued using market models that consider trade data, quotations from dealers and active market makers, relevant yield curve and spread data, creditworthiness, trade data or market information on comparable securities, and other relevant security specific information.
72
Open-end management investment companies are valued at the reported NAV per share.
If the funds determine that the market price for an investment is not readily available or the valuation methods mentioned above do not reflect an investment’s fair value, such investment is valued as determined in good faith by the Board of Trustees or its delegate, in accordance with policies and procedures adopted by the Board of Trustees. In its determination of fair value, the funds may review several factors including, but not limited to, market information regarding the specific investment or comparable investments and correlation with other investment types, futures indices or general market indicators. Circumstances that may cause the funds to use these procedures to value an investment include, but are not limited to: an investment has been declared in default or is distressed; trading in a security has been suspended during the trading day or a security is not actively trading on its principal exchange; prices received from a regular pricing source are deemed unreliable; or there is a foreign market holiday and no trading occurred.
The funds monitor for significant events occurring after the close of an investment’s primary exchange but before each fund’s NAV per share is determined. Significant events may include, but are not limited to: corporate announcements and transactions; governmental action and political unrest that could impact a specific investment or an investment sector; or armed conflicts, natural disasters and similar events that could affect investments in a specific country or region. The funds also monitor for significant fluctuations between domestic and foreign markets, as evidenced by the U.S. market or such other indicators that the Board of Trustees, or its delegate, deems appropriate. The funds may apply a model-derived factor to the closing price of equity securities traded on foreign securities exchanges. The factor is based on observable market data as provided by an independent pricing service.
Security Transactions — Security transactions are accounted for as of the trade date. Net realized gains and losses are determined on the identified cost basis, which is also used for federal income tax purposes.
Investment Income — Dividend income less foreign taxes withheld, if any, is recorded as of the ex-dividend date. Distributions received on securities that represent a return of capital or long-term capital gain are recorded as a reduction of cost of investments and/or as a realized gain. The funds may estimate the components of distributions received that may be considered nontaxable distributions or long-term capital gain distributions for income tax purposes. Interest income is recorded on the accrual basis and includes accretion of discounts and amortization of premiums. For convertible bonds, the premiums attributable only to the debt instrument are amortized. Securities lending income is net of fees and rebates earned by the lending agent for its services.
Foreign Currency Translations — All assets and liabilities initially expressed in foreign currencies are translated into U.S. dollars at prevailing exchange rates at period end. The funds may enter into spot foreign currency exchange contracts to facilitate transactions denominated in a foreign currency. Purchases and sales of investment securities, dividend and interest income, spot foreign currency exchange contracts, and expenses are translated at the rates of exchange prevailing on the respective dates of such transactions. Net realized and unrealized foreign currency exchange gains or losses related to investment securities are a component of net realized gain (loss) on investment transactions and change in net unrealized appreciation (depreciation) on investments, respectively.
Segregated Assets — In accordance with the 1940 Act, the funds segregate assets on their books and records to cover certain types of investment securities and other financial instruments. American Century Investment Management, Inc. (ACIM) (the investment advisor) monitors, on a daily basis, the securities segregated to ensure the funds designate a sufficient amount of liquid assets, marked-to-market daily. The funds may also receive assets or be required to pledge assets at the custodian bank or with a broker for collateral requirements.
Income Tax Status — It is each fund’s policy to distribute substantially all net investment income and net realized gains to shareholders and to otherwise qualify as a regulated investment company under provisions of the Internal Revenue Code. Accordingly, no provision has been made for income taxes. The funds file U.S. federal, state, local and non-U.S. tax returns as applicable. The funds' tax returns are subject to examination by the relevant taxing authority until expiration of the applicable statute of limitations, which is generally three years from the date of filing but can be longer in certain jurisdictions. At this time, management believes there are no uncertain tax positions which, based on their technical merit, would not be sustained upon examination and for which it is reasonably possible that the total amounts of unrecognized tax benefits will significantly change in the next twelve months.
73
Distributions to Shareholders — Distributions from net investment income, if any, are generally declared and paid monthly for Quality Convertible Securities ETF and Quality Preferred ETF. Distributions from net investment income, if any, are generally declared and paid quarterly for Low Volatility ETF, STOXX® U.S. Quality Growth ETF and STOXX® U.S. Quality Value ETF. Distributions from net investment income, if any, are generally declared and paid semiannually for Quality Diversified International ETF. Distributions from net realized gains, if any, are generally declared and paid annually for all funds. Each fund may elect to treat a portion of its payment to a redeeming shareholder, which represents the pro rata share of undistributed net investment income and net realized gains, as a distribution for federal income tax purposes (tax equalization).
Indemnifications — Under the trust’s organizational documents, its officers and trustees are indemnified against certain liabilities arising out of the performance of their duties to the funds. In addition, in the normal course of business, the funds enter into contracts that provide general indemnifications. The maximum exposure under these arrangements is unknown as this would involve future claims that may be made against a fund. The risk of material loss from such claims is considered by management to be remote.
Securities Lending — Securities are lent to qualified financial institutions and brokers. State Street Bank & Trust Co. serves as securities lending agent to the funds pursuant to a Securities Lending Agreement. The lending of securities exposes the funds to risks such as: the borrowers may fail to return the loaned securities, the borrowers may not be able to provide additional collateral, the funds may experience delays in recovery of the loaned securities or delays in access to collateral, or the funds may experience losses related to the investment collateral. To minimize certain risks, loan counterparties pledge collateral in the form of cash and/or securities. The lending agent has agreed to indemnify the funds in the case of default of any securities borrowed. Cash collateral received is invested in the State Street Navigator Securities Lending Government Money Market Portfolio, a money market mutual fund registered under the 1940 Act. The loans may also be secured by U.S. government securities in an amount at least equal to the market value of the securities loaned, plus accrued interest and dividends, determined on a daily basis and adjusted accordingly. By lending securities, the funds seek to increase their net investment income through the receipt of interest and fees. Such income is reflected separately within the Statements of Operations. The value of loaned securities and related collateral outstanding at period end, if any, are shown on a gross basis within the Schedules of Investments and Statements of Assets and Liabilities.
The following table reflects a breakdown of transactions accounted for as secured borrowings, the gross obligation by the type of collateral pledged, and the remaining contractual maturity of those transactions as of August 31, 2022.
| Remaining Contractual Maturity of Agreements | |||||||||||||||||
Fund / Securities Lending Transactions(1) | Overnight and Continuous | <30 days | Between 30 & 90 days | >90 days | Total | ||||||||||||
| Quality Diversified International ETF | |||||||||||||||||
| Common Stocks | $ | 1,364,843 | — | — | — | $ | 1,364,843 | ||||||||||
| Gross amount of recognized liabilities for securities lending transactions | $ | 1,364,843 | |||||||||||||||
STOXX® U.S. Quality Value ETF | |||||||||||||||||
| Common Stocks | $ | 600,005 | — | — | — | $ | 600,005 | ||||||||||
| Gross amount of recognized liabilities for securities lending transactions | $ | 600,005 | |||||||||||||||
(1)Amount represents the payable for cash collateral received for securities on loan. This will generally be in the Overnight and Continuous column as the securities are typically callable on demand.
3. Fees and Transactions with Related Parties
Certain officers and trustees of the trust are also officers and/or directors of American Century Companies, Inc. (ACC). The trust's investment advisor, ACIM, and the trust’s administrator, American Century Services, LLC, are wholly owned, directly or indirectly, by ACC. Various funds issued by American Century Strategic Asset Allocations, Inc. own, in aggregate, 33%, 29% and 50% of the shares of Quality Diversified International ETF , STOXX® U.S. Quality Growth ETF and STOXX® U.S. Quality Value ETF, respectively. Various funds issued by American Century Asset Allocation Portfolios, Inc. own, in aggregate, 28% of the shares of Low Volatility ETF. ACIM owns 56% of the shares of Low Volatility ETF. Related parties do not invest in the funds for the purpose of exercising management or control.
74
Management Fees — The trust has entered into a management agreement with ACIM, under which ACIM provides the funds with investment advisory and management services in exchange for a single, unified management fee (the fee). The agreement provides that ACIM will pay all expenses of managing and operating the funds, except brokerage and other transaction fees and expenses relating to the acquisition and disposition of portfolio securities, acquired fund fees and expenses, interest, taxes, litigation expenses and extraordinary expenses. The fee is computed and accrued daily based on the daily net assets of each fund and paid monthly in arrears.
The annual management fee for each fund is as follows:
| Annual Management Fee | |||||
| Low Volatility ETF | 0.29% | ||||
| Quality Convertible Securities ETF | 0.32% | ||||
| Quality Diversified International ETF | 0.39% | ||||
| Quality Preferred ETF | 0.32% | ||||
STOXX® U.S. Quality Growth ETF | 0.29% | ||||
STOXX® U.S. Quality Value ETF | 0.29% | ||||
Interfund Transactions — The funds may enter into security transactions with other American Century Investments funds and other client accounts of the investment advisor, in accordance with the 1940 Act rules and procedures adopted by the Board of Trustees. The rules and procedures require, among other things, that these transactions be effected at the independent current market price of the security. There were no interfund transactions during the period.
4. Investment Transactions
Purchases and sales of investment securities, excluding short-term investments and in kind transactions, for the period ended August 31, 2022 were as follows:
| Low Volatility ETF | Quality Convertible Securities ETF | Quality Diversified International ETF | Quality Preferred ETF | STOXX® U.S. Quality Growth ETF | STOXX® U.S. Quality Value ETF | |||||||||||||||
| Purchases | $12,251,359 | $19,441,852 | $243,674,955 | $10,673,005 | $355,965,698 | $254,650,658 | ||||||||||||||
| Sales | $12,420,675 | $14,271,836 | $224,291,655 | $10,026,302 | $353,091,972 | $253,603,879 | ||||||||||||||
Securities received or delivered in kind through subscriptions and redemptions and in kind net realized gain (loss) for the period ended August 31, 2022 were as follows:
| In kind Subscriptions | In kind Redemptions | In kind Net Realized Gain/(Loss)* | |||||||||
| Low Volatility ETF | $4,787,173 | $2,577,803 | $371,508 | ||||||||
| Quality Convertible Securities ETF | $4,859,721 | $7,436,970 | $585,502 | ||||||||
| Quality Diversified International ETF | $49,446,769 | $20,530,312 | $3,791,238 | ||||||||
| Quality Preferred ETF | $9,328,371 | $7,489,105 | $80,601 | ||||||||
STOXX® U.S. Quality Growth ETF | $142,635,735 | $87,724,212 | $20,081,510 | ||||||||
STOXX® U.S. Quality Value ETF | $89,166,023 | $118,311,256 | $25,188,025 | ||||||||
*Net realized gain (loss) on in kind transactions are not considered taxable for federal income tax purposes.
5. Capital Share Transactions
Each fund’s shares may only be bought and sold in a secondary market through a broker-dealer at a market price. Because ETF shares trade at market prices rather than NAV, shares may trade at a price greater than NAV (a premium) or less than NAV (a discount). Each fund issues and redeems shares at their NAV only in aggregations of a specified number of shares (a creation unit) generally in exchange for a designated portfolio of securities and/or cash (including any portion of such securities for which cash may be substituted). Authorized participants may be required to pay an additional variable charge to cover certain brokerage, tax, foreign exchange, execution, market impact and other costs and expenses related to the execution of trades resulting from creation unit transactions. Such variable charges, if any, are included in other capital within the Statements of Changes in Net Assets.
75
6. Fair Value Measurements
The funds’ investment valuation process is based on several considerations and may use multiple inputs to determine the fair value of the investments held by the funds. In conformity with accounting principles generally accepted in the United States of America, the inputs used to determine a valuation are classified into three broad levels.
•Level 1 valuation inputs consist of unadjusted quoted prices in an active market for identical investments.
•Level 2 valuation inputs consist of direct or indirect observable market data (including quoted prices for comparable investments, evaluations of subsequent market events, interest rates, prepayment speeds, credit risk, etc.). These inputs also consist of quoted prices for identical investments initially expressed in local currencies that are adjusted through translation into U.S. dollars.
•Level 3 valuation inputs consist of unobservable data (including a fund’s own assumptions).
The level classification is based on the lowest level input that is significant to the fair valuation measurement. The valuation inputs are not necessarily an indication of the risks associated with investing in these securities or other financial instruments.
The following is a summary of the level classifications as of period end. The Schedules of Investments provide additional information on the funds’ portfolio holdings.
| Low Volatility ETF | |||||||||||
| Level 1 | Level 2 | Level 3 | |||||||||
| Assets | |||||||||||
| Investment Securities | |||||||||||
| Common Stocks | $ | 7,396,348 | — | — | |||||||
| Short-Term Investments | 45,362 | — | — | ||||||||
| $ | 7,441,710 | — | — | ||||||||
| Quality Convertible Securities ETF | |||||||||||
| Level 1 | Level 2 | Level 3 | |||||||||
| Assets | |||||||||||
| Investment Securities | |||||||||||
| Convertible Bonds | — | $ | 17,820,472 | — | |||||||
| Convertible Preferred Stocks | $ | 351,480 | 4,416,399 | — | |||||||
| Common Stocks | 1,249,213 | — | — | ||||||||
| Short-Term Investments | 723,066 | — | — | ||||||||
| $ | 2,323,759 | $ | 22,236,871 | — | |||||||
| Quality Diversified International ETF | |||||||||||
| Level 1 | Level 2 | Level 3 | |||||||||
| Assets | |||||||||||
| Investment Securities | |||||||||||
| Common Stocks | $ | 995,136 | $ | 187,212,760 | — | ||||||
| Short-Term Investments | 2,543,673 | — | — | ||||||||
| $ | 3,538,809 | $ | 187,212,760 | — | |||||||
76
| Quality Preferred ETF | |||||||||||
| Level 1 | Level 2 | Level 3 | |||||||||
| Assets | |||||||||||
| Investment Securities | |||||||||||
| Preferred Stocks | $ | 15,669,228 | $ | 3,107,484 | — | ||||||
| Convertible Preferred Stocks | 224,624 | 1,353,689 | — | ||||||||
| Corporate Bonds | — | 525,575 | — | ||||||||
| Common Stocks | 448,093 | — | — | ||||||||
| Short-Term Investments | 904,709 | — | — | ||||||||
| $ | 17,246,654 | $ | 4,986,748 | — | |||||||
STOXX® U.S. Quality Growth ETF | |||||||||||
| Level 1 | Level 2 | Level 3 | |||||||||
| Assets | |||||||||||
| Investment Securities | |||||||||||
| Common Stocks | $ | 258,393,818 | — | — | |||||||
| Short-Term Investments | 692,303 | — | — | ||||||||
| $ | 259,086,121 | — | — | ||||||||
STOXX® U.S. Quality Value ETF | |||||||||||
| Level 1 | Level 2 | Level 3 | |||||||||
| Assets | |||||||||||
| Investment Securities | |||||||||||
| Common Stocks | $ | 202,898,260 | — | — | |||||||
| Short-Term Investments | 940,217 | — | — | ||||||||
| $ | 203,838,477 | — | — | ||||||||
7. Risk Factors
The value of the funds’ shares will go up and down, sometimes rapidly or unpredictably, based on the performance of the securities owned by the funds and other factors generally affecting the securities market. Market risks, including political, regulatory, economic and social developments, can affect the value of the funds’ investments. Natural disasters, public health emergencies, war, terrorism and other unforeseeable events may lead to increased market volatility and may have adverse long-term effects on world economies and markets generally.
Quality Diversified International ETF, STOXX® U.S. Quality Growth ETF and STOXX® U.S. Quality Value ETF are not actively managed and do not attempt to take defensive positions under any market conditions, including declining markets. Therefore, the funds generally will not buy or sell securities unless they are added or removed from their respective indexes, even if the security is underperforming. If the funds' respective indexes have high portfolio turnover, the funds may also have high portfolio turnover.
A fund’s investment process may result in high portfolio turnover, which could mean high transaction costs, affecting both performance and capital gains tax liabilities to investors.
There are certain risks involved in investing in foreign securities. These risks include those resulting from political events (such as civil unrest, national elections and imposition of exchange controls), social and economic events (such as labor strikes and rising inflation), and natural disasters. Securities of foreign issuers may be less liquid and more volatile. Investing in emerging markets or a significant portion of assets in one country or region may accentuate these risks.
77
8. Federal Tax Information
The tax character of distributions paid during the years ended August 31, 2022 and August 31, 2021 (except as noted) were as follows:
| 2022 | 2021 | |||||||||||||
| Distributions Paid From: | Distributions Paid From: | |||||||||||||
| Ordinary Income | Long-term Capital Gains | Ordinary Income | Long-term Capital Gains | |||||||||||
Low Volatility ETF(1) | $ | 98,904 | — | $ | 27,228 | — | ||||||||
Quality Convertible Securities ETF(2) | $ | 478,670 | — | $ | 104,616 | — | ||||||||
| Quality Diversified International ETF | $ | 6,315,055 | — | $ | 3,209,185 | — | ||||||||
Quality Preferred ETF(2) | $ | 961,361 | — | $ | 292,191 | — | ||||||||
STOXX® U.S. Quality Growth ETF | $ | 911,250 | — | $ | 546,618 | — | ||||||||
STOXX® U.S. Quality Value ETF | $ | 4,592,625 | — | $ | 3,277,478 | — | ||||||||
(1)January 12, 2021 (fund inception) through August 31, 2021.
(2)February 16, 2021 (fund inception) through August 31, 2021.
The book-basis character of distributions made during the year from net investment income or net realized gains may differ from their ultimate characterization for federal income tax purposes. These differences reflect the differing character of certain income items and net realized gains and losses for financial statement and tax purposes, and may result in reclassification among certain capital accounts on the financial statements.
The reclassifications, which are primarily due to in kind transactions, were as follows:
| Low Volatility ETF | Quality Convertible Securities ETF | Quality Diversified International ETF | Quality Preferred ETF | STOXX® U.S. Quality Growth ETF | STOXX® U.S. Quality Value ETF | |||||||||||||||
| Capital paid in | $ | 376,002 | $ | 574,975 | $ | 3,828,624 | $ | 94,063 | $ | 20,050,908 | $ | 25,040,370 | ||||||||
| Distributable earnings | $ | (376,002) | $ | (574,975) | $ | (3,828,624) | $ | (94,063) | $ | (20,050,908) | $ | (25,040,370) | ||||||||
78
As of period end, the federal tax cost of investments and the components of distributable earnings on a tax-basis were as follows:
| Low Volatility ETF | Quality Convertible Securities ETF | Quality Diversified International ETF | |||||||||
| Federal tax cost of investments | $ | 7,541,719 | $ | 26,101,126 | $ | 213,787,716 | |||||
| Gross tax appreciation of investments | $ | 275,753 | $ | 937,851 | $ | 7,501,079 | |||||
| Gross tax depreciation of investments | (375,762) | (2,478,347) | (30,537,226) | ||||||||
| Net tax appreciation (depreciation) of investments | (100,009) | (1,540,496) | (23,036,147) | ||||||||
| Net tax appreciation (depreciation) on translation of assets and liabilities in foreign currencies | — | — | $ | (35,997) | |||||||
| Net tax appreciation (depreciation) | $ | (100,009) | $ | (1,540,496) | $ | (23,072,144) | |||||
| Undistributed ordinary income | $ | 16,001 | $ | 87,677 | $ | 1,328,397 | |||||
| Accumulated long-term capital losses | — | $ | (375,354) | $ | (2,425,958) | ||||||
| Accumulated short-term capital losses | $ | (535,074) | $ | (2,193,909) | $ | (23,998,183) | |||||
| Quality Preferred ETF | STOXX® U.S. Quality Growth ETF | STOXX® U.S. Quality Value ETF | |||||||||
| Federal tax cost of investments | $ | 24,125,881 | $ | 261,283,766 | $ | 209,819,547 | |||||
| Gross tax appreciation of investments | $ | 13,044 | $ | 9,226,611 | $ | 8,060,393 | |||||
| Gross tax depreciation of investments | (1,905,523) | (11,424,256) | (14,041,463) | ||||||||
| Net tax appreciation (depreciation) of investments | $ | (1,892,479) | $ | (2,197,645) | $ | (5,981,070) | |||||
| Undistributed ordinary income | $ | 123,232 | $ | 51,900 | $ | 806,810 | |||||
| Accumulated long-term capital losses | $ | (60,171) | $ | (3,532,154) | $ | (1,378,509) | |||||
| Accumulated short-term capital losses | $ | (709,178) | $ | (43,024,224) | $ | (19,318,289) | |||||
The difference between book-basis and tax-basis unrealized appreciation (depreciation) is attributable primarily to the tax deferral of losses on wash sales, return of capital dividends received and to the timing and recognition of partnership income.
Accumulated capital losses represent net capital loss carryovers that may be used to offset future realized capital gains for federal income tax purposes. The capital loss carryovers may be carried forward for an unlimited period. Future capital loss carryover utilization in any given year may be subject to Internal Revenue Code limitations.
79
| Financial Highlights | ||
| For a Share Outstanding Throughout the Years Ended August 31 (except as noted) | |||||||||||||||||||||||||||||||||||
| Per-Share Data | Ratios and Supplemental Data | ||||||||||||||||||||||||||||||||||
| Income From Investment Operations: | Ratio to Average Net Assets of: | ||||||||||||||||||||||||||||||||||
| Net Asset Value, Beginning of Period | Net Investment Income (Loss)(1) | Net Realized and Unrealized Gain (Loss) | Total From Investment Operations | Distributions From Net Investment Income | Net Asset Value, End of Period | Total Return(2) | Operating Expenses | Net Investment Income (Loss) | Portfolio Turnover Rate(3) | Net Assets, End of Period (in thousands) | |||||||||||||||||||||||||
| Low Volatility ETF | |||||||||||||||||||||||||||||||||||
| 2022 | $47.65 | 0.68 | (6.35) | (5.67) | (0.59) | $41.39 | (11.98)% | 0.29% | 1.52% | 167% | $7,450 | ||||||||||||||||||||||||
2021(4) | $39.84 | 0.34 | 7.70 | 8.04 | (0.23) | $47.65 | 20.26% | 0.29%(5) | 1.24%(5) | 61% | $6,433 | ||||||||||||||||||||||||
| Notes to Financial Highlights | ||
(1)Computed using average shares outstanding throughout the period.
(2)Total returns are calculated based on the net asset value of the last business day. Total returns for periods less than one year are not annualized.
(3)Excludes securities received or delivered in kind.
(4)January 12, 2021 (fund inception) through August 31, 2021.
(5)Annualized.
See Notes to Financial Statements.
| For a Share Outstanding Throughout the Years Ended August 31 (except as noted) | ||||||||||||||||||||||||||||||||||||||
| Per-Share Data | Ratios and Supplemental Data | |||||||||||||||||||||||||||||||||||||
| Income From Investment Operations: | Ratio to Average Net Assets of: | |||||||||||||||||||||||||||||||||||||
| Net Asset Value, Beginning of Period | Net Investment Income (Loss)(1) | Net Realized and Unrealized Gain (Loss) | Total From Investment Operations | Distributions From Net Investment Income | Other Capital(1) | Net Asset Value, End of Period | Total Return(2) | Operating Expenses | Net Investment Income (Loss) | Portfolio Turnover Rate(3) | Net Assets, End of Period (in thousands) | |||||||||||||||||||||||||||
| Quality Convertible Securities ETF | ||||||||||||||||||||||||||||||||||||||
| 2022 | $48.23 | 0.80 | (7.10) | (6.30) | (0.92) | 0.05 | $41.06 | (13.13)% | 0.32% | 1.79% | 64% | $24,638 | ||||||||||||||||||||||||||
2021(4) | $50.00 | 0.39 | (1.95) | (1.56) | (0.25) | 0.04 | $48.23 | (3.03)% | 0.32%(5) | 1.53%(5) | 110% | $26,044 | ||||||||||||||||||||||||||
| Notes to Financial Highlights | ||
(1)Computed using average shares outstanding throughout the period.
(2)Total returns are calculated based on the net asset value of the last business day. Total returns for periods less than one year are not annualized.
(3)Excludes securities received or delivered in kind.
(4)February 16, 2021 (fund inception) through August 31, 2021.
(5)Annualized.
See Notes to Financial Statements.
| For a Share Outstanding Throughout the Years Ended August 31 (except as noted) | |||||||||||||||||||||||||||||||||||
| Per-Share Data | Ratios and Supplemental Data | ||||||||||||||||||||||||||||||||||
| Income From Investment Operations: | Ratio to Average Net Assets of: | ||||||||||||||||||||||||||||||||||
| Net Asset Value, Beginning of Period | Net Investment Income (Loss)(1) | Net Realized and Unrealized Gain (Loss) | Total From Investment Operations | Distributions From Net Investment Income | Net Asset Value, End of Period | Total Return(2) | Operating Expenses | Net Investment Income (Loss) | Portfolio Turnover Rate(3) | Net Assets, End of Period (in thousands) | |||||||||||||||||||||||||
| Quality Diversified International ETF | |||||||||||||||||||||||||||||||||||
| 2022 | $52.76 | 1.45 | (14.40) | (12.95) | (1.38) | $38.43 | (24.82)% | 0.39% | 3.15% | 108% | $190,249 | ||||||||||||||||||||||||
| 2021 | $43.09 | 1.17 | 9.56 | 10.73 | (1.06) | $52.76 | 25.04% | 0.39% | 2.37% | 107% | $208,421 | ||||||||||||||||||||||||
| 2020 | $37.44 | 0.78 | 5.42 | 6.20 | (0.55) | $43.09 | 16.67% | 0.39% | 2.00% | 118% | $101,271 | ||||||||||||||||||||||||
2019(4) | $39.85 | 0.98 | (2.69) | (1.71) | (0.70) | $37.44 | (4.32)% | 0.39%(5) | 2.67%(5) | 119% | $18,719 | ||||||||||||||||||||||||
| Notes to Financial Highlights | ||
(1)Computed using average shares outstanding throughout the period.
(2)Total returns are calculated based on the net asset value of the last business day. Total returns for periods less than one year are not annualized.
(3)Excludes securities received or delivered in kind.
(4)September 10, 2018 (fund inception) through August 31, 2019.
(5)Annualized.
See Notes to Financial Statements.
| For a Share Outstanding Throughout the Years Ended August 31 (except as noted) | ||||||||||||||||||||||||||||||||||||||
| Per-Share Data | Ratios and Supplemental Data | |||||||||||||||||||||||||||||||||||||
| Income From Investment Operations: | Ratio to Average Net Assets of: | |||||||||||||||||||||||||||||||||||||
| Net Asset Value, Beginning of Period | Net Investment Income (Loss)(1) | Net Realized and Unrealized Gain (Loss) | Total From Investment Operations | Distributions From Net Investment Income | Other Capital(1) | Net Asset Value, End of Period | Total Return(2) | Operating Expenses | Net Investment Income (Loss) | Portfolio Turnover Rate(3) | Net Assets, End of Period (in thousands) | |||||||||||||||||||||||||||
| Quality Preferred ETF | ||||||||||||||||||||||||||||||||||||||
| 2022 | $41.69 | 1.78 | (5.29) | (3.51) | (1.79) | 0.02 | $36.41 | (8.58)% | 0.32% | 4.59% | 51% | $22,394 | ||||||||||||||||||||||||||
2021(4) | $40.00 | 1.01 | 1.48 | 2.49 | (0.83) | 0.03 | $41.69 | 6.35% | 0.32%(5) | 4.59%(5) | 61% | $22,515 | ||||||||||||||||||||||||||
| Notes to Financial Highlights | ||
(1)Computed using average shares outstanding throughout the period.
(2)Total returns are calculated based on the net asset value of the last business day. Total returns for periods less than one year are not annualized.
(3)Excludes securities received or delivered in kind.
(4)February 16, 2021 (fund inception) through August 31, 2021.
(5)Annualized.
See Notes to Financial Statements.
| For a Share Outstanding Throughout the Years Ended August 31 (except as noted) | |||||||||||||||||||||||||||||||||||
| Per-Share Data | Ratios and Supplemental Data | ||||||||||||||||||||||||||||||||||
| Income From Investment Operations: | Ratio to Average Net Assets of: | ||||||||||||||||||||||||||||||||||
| Net Asset Value, Beginning of Period | Net Investment Income (Loss)(1) | Net Realized and Unrealized Gain (Loss) | Total From Investment Operations | Distributions From Net Investment Income | Net Asset Value, End of Period | Total Return(2) | Operating Expenses | Net Investment Income (Loss) | Portfolio Turnover Rate(3) | Net Assets, End of Period (in thousands) | |||||||||||||||||||||||||
STOXX® U.S. Quality Growth ETF | |||||||||||||||||||||||||||||||||||
| 2022 | $75.48 | 0.30 | (15.26) | (14.96) | (0.26) | $60.26 | (19.83)% | 0.29% | 0.45% | 153% | $259,133 | ||||||||||||||||||||||||
| 2021 | $55.96 | 0.23 | 19.44 | 19.67 | (0.15) | $75.48 | 35.20% | 0.29% | 0.36% | 162% | $258,522 | ||||||||||||||||||||||||
| 2020 | $41.84 | 0.18 | 14.11 | 14.29 | (0.17) | $55.96 | 34.30% | 0.29% | 0.39% | 180% | $215,439 | ||||||||||||||||||||||||
2019(4) | $40.15 | 0.18 | 1.64 | 1.82 | (0.13) | $41.84 | 4.57% | 0.29%(5) | 0.48%(5) | 191% | $21,964 | ||||||||||||||||||||||||
| Notes to Financial Highlights | ||
(1)Computed using average shares outstanding throughout the period.
(2)Total returns are calculated based on the net asset value of the last business day. Total returns for periods less than one year are not annualized.
(3)Excludes securities received or delivered in kind.
(4)September 10, 2018 (fund inception) through August 31, 2019.
(5)Annualized.
See Notes to Financial Statements.
| For a Share Outstanding Throughout the Years Ended August 31 (except as noted) | |||||||||||||||||||||||||||||||||||
| Per-Share Data | Ratios and Supplemental Data | ||||||||||||||||||||||||||||||||||
| Income From Investment Operations: | Ratio to Average Net Assets of: | ||||||||||||||||||||||||||||||||||
| Net Asset Value, Beginning of Period | Net Investment Income (Loss)(1) | Net Realized and Unrealized Gain (Loss) | Total From Investment Operations | Distributions From Net Investment Income | Net Asset Value, End of Period | Total Return(2) | Operating Expenses | Net Investment Income (Loss) | Portfolio Turnover Rate(3) | Net Assets, End of Period (in thousands) | |||||||||||||||||||||||||
STOXX® U.S. Quality Value ETF | |||||||||||||||||||||||||||||||||||
| 2022 | $51.82 | 1.19 | (5.14) | (3.95) | (1.06) | $46.81 | (7.70)% | 0.29% | 2.36% | 118% | $203,645 | ||||||||||||||||||||||||
| 2021 | $38.76 | 0.83 | 13.02 | 13.85 | (0.79) | $51.82 | 36.16% | 0.29% | 1.81% | 147% | $255,219 | ||||||||||||||||||||||||
| 2020 | $39.21 | 1.02 | (0.47) | 0.55 | (1.00) | $38.76 | 1.55% | 0.29% | 2.66% | 178% | $137,598 | ||||||||||||||||||||||||
| 2019 | $41.66 | 1.15 | (2.68) | (1.53) | (0.92) | $39.21 | (3.60)% | 0.29% | 2.94% | 190% | $30,391 | ||||||||||||||||||||||||
2018(4) | $40.37 | 0.55 | 1.11 | 1.66 | (0.37) | $41.66 | 4.16% | 0.29%(5) | 2.17%(5) | 77% | $7,291 | ||||||||||||||||||||||||
| Notes to Financial Highlights | ||
(1)Computed using average shares outstanding throughout the period.
(2)Total returns are calculated based on the net asset value of the last business day. Total returns for periods less than one year are not annualized.
(3)Excludes securities received or delivered in kind.
(4)January 11, 2018 (fund inception) through August 31, 2018.
(5)Annualized.
See Notes to Financial Statements.
| Report of Independent Registered Public Accounting Firm | ||
To the Shareholders and the Board of Trustees of American Century ETF Trust:
Opinion on the Financial Statements and Financial Highlights
We have audited the accompanying statements of assets and liabilities, including the schedules of investments, of American Century Low Volatility ETF, American Century Quality Convertible Securities ETF, American Century Quality Diversified International ETF, American Century Quality Preferred ETF, American Century STOXX® U.S. Quality Growth ETF, and American Century STOXX® U.S. Quality Value ETF (the “Funds”), six of the funds constituting the American Century ETF Trust, as of August 31, 2022, the related statements of operations, statements of changes in net assets, and financial highlights for the periods indicated in the table below; and the related notes. In our opinion, the financial statements and financial highlights present fairly, in all material respects, the financial position of each of the Funds constituting American Century ETF Trust as of August 31, 2022, and the results of their operations, the changes in their net assets, and the financial highlights for the periods listed in the table below, in conformity with accounting principles generally accepted in the United States of America.
| Individual Fund Constituting the American Century ETF Trust | Statement of Operations | Statements of Changes in Net Assets | Financial Highlights | ||||||||
| American Century Low Volatility ETF | For the year ended August 31, 2022 | For the year ended August 31, 2022 and the period from January 12, 2021 (fund inception) through August 31, 2021 | |||||||||
| American Century Quality Convertible Securities ETF | For the year ended August 31, 2022 | For the year ended August 31, 2022 and the period from February 16, 2021 (fund inception) through August 31, 2021 | |||||||||
| American Century Quality Diversified International ETF | For the year ended August 31, 2022 | For the years ended August 31, 2022 and 2021 | For the years ended August 31, 2022, 2021 and 2020, and the period from September 10, 2018 (fund inception) through August 31, 2019 | ||||||||
| American Century Quality Preferred ETF | For the year ended August 31, 2022 | For the year ended August 31, 2022 and the period from February 16, 2021 (fund inception) through August 31, 2021 | |||||||||
American Century STOXX® U.S. Quality Growth ETF | For the year ended August 31, 2022 | For the years ended August 31, 2022 and 2021 | For the years ended August 31, 2022, 2021 and 2020, and the period from September 10, 2018 (fund inception) through August 31, 2019 | ||||||||
American Century STOXX® U.S. Quality Value ETF | For the year ended August 31, 2022 | For the years ended August 31, 2022 and 2021 | For the years ended August 31, 2022, 2021, 2020, and 2019, and the period from January 11, 2018 (fund inception) through August 31, 2018 | ||||||||
86
Basis for Opinion
These financial statements and financial highlights are the responsibility of the Funds’ management. Our responsibility is to express an opinion on the Funds’ financial statements and financial highlights based on our audits. We are a public accounting firm registered with the Public Company Accounting Oversight Board (United States) (PCAOB) and are required to be independent with respect to the Funds in accordance with the U.S. federal securities laws and the applicable rules and regulations of the Securities and Exchange Commission and the PCAOB.
We conducted our audits in accordance with the standards of the PCAOB. Those standards require that we plan and perform the audit to obtain reasonable assurance about whether the financial statements and financial highlights are free of material misstatement, whether due to error or fraud. The Funds are not required to have, nor were we engaged to perform, an audit of their internal control over financial reporting. As part of our audits, we are required to obtain an understanding of internal control over financial reporting but not for the purpose of expressing an opinion on the effectiveness of the Funds’ internal control over financial reporting. Accordingly, we express no such opinion.
Our audits included performing procedures to assess the risks of material misstatement of the financial statements and financial highlights, whether due to error or fraud, and performing procedures that respond to those risks. Such procedures included examining, on a test basis, evidence regarding the amounts and disclosures in the financial statements and financial highlights. Our audits also included evaluating the accounting principles used and significant estimates made by management, as well as evaluating the overall presentation of the financial statements and financial highlights. Our procedures included confirmation of securities owned as of August 31, 2022, by correspondence with the custodian and brokers; when replies were not received from brokers, we performed other auditing procedures. We believe that our audits provide a reasonable basis for our opinion.
/s/ Deloitte & Touche LLP
Kansas City, Missouri
October 17, 2022
We have served as the auditor of one or more American Century investment companies since 1997.
87
| Management | ||
The Board of Trustees
The individuals listed below serve as trustees of the funds. Each trustee will continue to serve in this capacity until death, retirement, resignation or removal from office. The board has adopted a mandatory retirement age for trustees who are not “interested persons,” as that term is defined in the Investment Company Act (independent trustees). Trustees who are not also officers of the trust shall retire on December 31st of the year in which they reach their 75th birthday.
Jonathan S. Thomas is an “interested person” because he currently serves as President and Chief Executive Officer of American Century Companies, Inc. (ACC), the parent company of American Century Investment Management, Inc. (ACIM or the advisor). The other trustees are independent. They are not employees, directors or officers of, and have no financial interest in, ACC or any of its wholly owned, direct or indirect, subsidiaries, including ACIM and American Century Services, LLC (ACS), and they do not have any other affiliations, positions or relationships that would cause them to be considered “interested persons” under the Investment Company Act. The following trustees also serve in this capacity for a number of other registered investment companies in the American Century Investments family of funds: Jonathan S. Thomas, 15; Jeremy I. Bulow, 8; and Stephen E. Yates, 7.
The following table presents additional information about the trustees. The mailing address for each trustee other than Jonathan S. Thomas is 330 Madison Avenue, New York, New York 10017. The mailing address for Jonathan S. Thomas is 4500 Main Street, Kansas City, Missouri 64111.
| Name (Year of Birth) | Position(s) Held with Funds | Length of Time Served | Principal Occupation(s) During Past 5 Years | Number of American Century Portfolios Overseen by Trustee | Other Directorships Held During Past 5 Years | ||||||||||||
| Independent Trustees | |||||||||||||||||
| Reginald M. Browne (1968) | Trustee and Chairman of the Board | Since 2017 (Chairman since 2019) | Principal, GTS Securities (automated capital markets trading firm)(2019 to present); Senior Managing Director, Co Global Head-ETF Group, Cantor Fitzgerald (financial services firm)(2013 to 2019) | 41 | None | ||||||||||||
| Jeremy I. Bulow (1954) | Trustee | Since 2022 | Professor of Economics, Stanford University Graduate School of Business (1979 to present) | 75 | None | ||||||||||||
| Barry A. Mendelson (1958) | Trustee | Since 2017 | Retired | 41 | None | ||||||||||||
| Stephen E. Yates (1948) | Trustee | Since 2017 | Retired | 105 | None | ||||||||||||
| Interested Trustees | |||||||||||||||||
| Jonathan S. Thomas (1963) | Trustee | Since 2017 | President and Chief Executive Officer, ACC (2007 to present). Also serves as Chief Executive Officer, ACS; Director, ACC and other ACC subsidiaries | 139 | None | ||||||||||||
The Statement of Additional Information has additional information about the funds' trustees and is available without charge, upon request, by calling 1-800-345-6488.
88
Officers
The following table presents certain information about the executive officers of the funds. Each officer, except Cleo Chang and Edward Rosenberg, serves as an officer for each of the 16 investment companies in the American Century family of funds. No officer is compensated for his or her service as an officer of the funds. The listed officers are interested persons of the funds and are appointed or re-appointed on an annual basis. The mailing address for each officer listed below is 4500 Main Street, Kansas City, Missouri 64111.
| Name (Year of Birth) | Offices with the Funds | Principal Occupation(s) During the Past Five Years | ||||||
| Patrick Bannigan (1965) | President since 2019 | Executive Vice President and Director, ACC (2012 to present); Chief Financial Officer, Chief Accounting Officer and Treasurer, ACC (2015 to present). Also serves as President, ACS; Vice President, ACIM; Chief Financial Officer, Chief Accounting Officer and/or Director, ACIM, ACS and other ACC subsidiaries | ||||||
| R. Wes Campbell (1974) | Chief Financial Officer and Treasurer since 2018 | Vice President, ACS (2020 to present); Investment Operations and Investment Accounting, ACS (2000 to present) | ||||||
| Amy D. Shelton (1964) | Chief Compliance Officer and Vice President since 2017 | Chief Compliance Officer, American Century funds, (2014 to present); Chief Compliance Officer, ACIM (2014 to present); Chief Compliance Officer, ACIS (2009 to present). Also serves as Vice President, ACIS | ||||||
| John Pak (1968) | General Counsel and Vice President since 2021 | General Counsel and Senior Vice President, ACC (2021 to present). Also serves as General Counsel and Senior Vice President, ACIM, ACS and ACIS. Chief Legal Officer of Investment and Wealth Management,The Bank of New York Mellon (2014 to 2021) | ||||||
| Cleo Chang (1977) | Vice President since 2019 | Senior Vice President, ACIM (2015 to present) | ||||||
| David H. Reinmiller (1963) | Vice President since 2017 | Attorney, ACC (1994 to present). Also serves as Vice President, ACIM and ACS | ||||||
| Edward Rosenberg (1973) | Vice President since 2017 | Senior Vice President, ACIM (2017 to present); Senior Vice President, Flexshares Head of ETF Capital Markets, Northern Trust (2012 to 2017) | ||||||
| C. Jean Wade (1964) | Vice President since 2017 | Senior Vice President, ACS (2017 to present); Vice President, ACS (2000 to 2017) | ||||||
| Ward D. Stauffer (1960) | Secretary since 2019 | Attorney, ACS (2003 to present) | ||||||
89
| Approval of Management Agreement | ||
At a meeting held on June 2, 2022, the Funds’ Board of Trustees (the "Board") unanimously approved the renewal of the management agreement pursuant to which American Century Investment Management, Inc. (the “Advisor”) acts as the investment advisor for each of the Funds. Under Section 15(c) of the Investment Company Act of 1940 (the “Investment Company Act”), contracts for investment advisory services are required to be reviewed, evaluated, and approved by a majority of a fund’s Trustees, including a majority of the independent Trustees, each year.
Prior to its consideration of the management agreement renewal, the Trustees requested and reviewed extensive data and information compiled by the Advisor and certain independent data providers concerning the Funds. This review was in addition to the oversight and evaluation undertaken by the Board and its Audit Committee on a continual basis and the information received was supplemental to the extensive information that the Board and its Audit Committee receive and consider throughout the year.
In connection with its consideration of the management agreement renewal, the Board’s review and evaluation of the services provided by the Advisor included, but was not limited to, the following:
•the nature, extent, and quality of investment management, shareholder services, and other services provided and to be provided to each Fund including without limitation portfolio management and trading services, shareholder and intermediary services, compliance and legal services, fund accounting and financial reporting, and fund share distribution;
•the wide range of other programs and services provided to each Fund and its shareholders on a routine and non-routine basis;
•the investment performance of each Fund, including data comparing each Fund's performance to an appropriate benchmark and/or a peer group of other funds with similar investment objectives and strategies;
•the cost of owning each Fund compared to the cost of owning similarly-managed funds;
•the compliance policies, procedures, and regulatory experience of the Advisor and the Funds’ service providers;
•the Advisor’s strategic plans, generally, and with respect to the ongoing impact of the COVID-19 pandemic response, heightened areas of interest in the mutual fund industry and recent geopolitical issues;
•the Advisor’s business continuity plans, vendor management practices, and cyber security practices;
•financial data showing the cost of services provided to each Fund, the profitability of each Fund to the Advisor, and the overall profitability of the Advisor;
•information regarding payments to intermediaries by the Advisor;
•possible economies of scale associated with the Advisor’s management of each Fund; and
•possible collateral benefits to the Advisor from the management of the Funds.
The independent Trustees met separately in private session to discuss the renewal and to review and discuss the information provided in response to their request. The independent Trustees also held active discussions with the Advisor regarding the renewal of the management agreement. The independent Trustees had the benefit of the advice of their independent counsel throughout the process.
Factors Considered
The Trustees considered all of the information provided by the Advisor, the independent data providers, and independent counsel in connection with the approval. They determined that the
90
information was sufficient for them to evaluate the management agreement for the Funds. In connection with their review, the Trustees did not identify any single factor as being all-important or controlling, and each Trustee may have attributed different levels of importance to different factors. In deciding to renew the management agreement, the Board based its decision on a number of factors, including without limitation the following:
Nature, Extent and Quality of Services — Generally. Under each Fund’s management agreement, the Advisor is responsible for providing or arranging for all services necessary for the operation of each Fund. The Board noted that the Advisor provides or arranges at its own expense a wide variety of services which include the following:
•constructing and designing each Fund
•portfolio research and security selection
•initial capitalization/funding
•securities trading
•Fund administration
•custody of Fund assets
•daily valuation of each Fund’s portfolio
•liquidity monitoring and management
•risk management, including cyber security
•shareholder servicing and transfer agency, including shareholder confirmations, recordkeeping, and communications
•legal services (except the independent Trustees’ counsel)
•regulatory and portfolio compliance
•financial reporting
•marketing and distribution (except amounts paid by each Fund under Rule 12b-1 plans)
Investment Management Services. The nature of the investment management services provided to the Funds is quite complex and allows Fund shareholders access to professional money management, instant diversification of their investments within an asset class, and liquidity. In evaluating investment performance, the Board expects the Advisor to manage each Fund in accordance with its investment objectives and principal investment strategies. Further, the Trustees recognize that the Advisor has an obligation to monitor trading activities, and in particular to seek the best execution of fund trades, and to evaluate the use of and payment for research. In providing these services, the Advisor utilizes teams of investment professionals (portfolio managers, analysts, research assistants, and securities traders) who require extensive information technology, research, training, compliance, and other systems to conduct their business. The Board provides oversight of the investment performance process. It regularly reviews investment performance information for each Fund, together with comparative information for appropriate benchmarks over different time horizons. The Trustees also review investment performance information during the management agreement renewal process. If performance concerns are identified, the Board discusses with the Advisor the reasons for such results and any actions being taken to improve performance. The performance for American Century STOXX® U.S. Quality Growth ETF, American Century STOXX® U.S. Quality Value ETF, and American Century Quality Diversified International ETF was below each Fund’s respective benchmark for the one- and three-year periods reviewed by the Board. The Board found the investment management services provided by the Advisor to each Fund to be satisfactory and consistent with the management agreement.
Shareholder and Other Services. Under the management agreement, the Advisor provides or arranges for a comprehensive package of services to the Funds. The Board, directly and through its Audit Committee, regularly reviews reports and evaluations of such services at its regular meetings. These reports include, but are not limited to, information regarding the operational efficiency and accuracy of the shareholder and transfer agency services provided, staffing levels, shareholder satisfaction, technology support (including cyber security), new products and services offered to Fund shareholders, securities trading activities, portfolio valuation services, auditing services, and legal and operational compliance activities. The Board found the services provided
91
by the Advisor to each Fund under the management agreement to be competitive and of high quality.
Costs of Services and Profitability. The Advisor provides detailed information concerning its cost of providing various services to the Funds, its profitability in managing each Fund (pre- and post-distribution), its overall profitability, and its financial condition. The Trustees have reviewed with the Advisor the methodology used to prepare this financial information. This information is considered in evaluating the Advisor’s financial condition, its ability to continue to provide services under the management agreement, and the reasonableness of the current management fee. The Board concluded that the Advisor’s profits were reasonable in light of the services provided to the Funds.
Ethics. The Board generally considers the Advisor’s commitment to providing quality services to the Funds and to conducting its business ethically. They noted that the Advisor’s practices generally meet or exceed industry best practices.
Economies of Scale. The Board also reviewed information provided by the Advisor regarding the possible existence of economies of scale in connection with the management of each Fund. The Board concluded that economies of scale are difficult to measure and predict with precision, especially on a fund-by-fund basis. The Board concluded that the Advisor is sharing economies of scale, to the extent they exist, through its fee structure and through reinvestment in its business, infrastructure, investment capabilities and initiatives to provide shareholders additional content and services.
Comparison to Other Funds’ Fees. The management agreement provides that each Fund pays the Advisor a single, all-inclusive (or unified) management fee for providing all services necessary for the management and operation of the Fund, other than securities transaction expenses, taxes, interest, extraordinary expenses, and expenses incurred in connection with the provision of shareholder services and distribution services under a plan adopted pursuant to Rule 12b-1 under the Investment Company Act. Under the unified fee structure, the Advisor is responsible for providing all investment advisory, custody, audit, administrative, compliance, recordkeeping, marketing and shareholder services, or arranging and supervising third parties to provide such services. The Board believes the unified fee structure is a benefit to Fund shareholders because it clearly discloses to shareholders the cost of owning Fund shares, and, since the unified fee cannot be increased without a vote of Fund shareholders, it shifts to the Advisor the risk of increased costs of operating the Fund and provides a direct incentive to minimize administrative inefficiencies. Part of the Board’s analysis of fee levels involves reviewing certain evaluative data compiled by an independent provider comparing the Fund’s unified fee to the total expense ratios of its peers. The unified fee charged to shareholders of American Century STOXX® U.S. Quality Growth ETF, American Century STOXX® U.S. Quality Value ETF, and American Century Quality Diversified International ETF was below the median of the total expense ratios of their respective peer expense universe and was within the range of their peer expense group. The unified fee charged to shareholders of American Century Low Volatility ETF was below the median of the total expense ratios of its peer expense universe and was the lowest of its peer expense group. The unified fee charged to shareholders of American Century Quality Convertible Securities ETF and American Century Quality Preferred ETF was the lowest of the total expense ratios of their respective peer expense universe and was the lowest of their peer expense group. The Board concluded that the management fee paid by each Fund to the Advisor under its management agreement is reasonable in light of the services provided to the Fund.
Comparison to Fees and Services Provided to Other Clients of the Advisor. The Board also requested and received information from the Advisor concerning the nature of the services, fees, costs, and profitability of its advisory services to funds or other advisory clients managed similarly to the Funds. They observed that these varying types of client accounts require different services and involve different regulatory and entrepreneurial risks than the management of the Funds. The Board analyzed this information and concluded that the fees charged and services provided to the Funds were reasonable by comparison.
92
Payments to Intermediaries. The Trustees also requested and received a description of payments made to intermediaries by each Fund and the Advisor and services provided in response thereto. These payments could include various payments made by each Fund or the Advisor to different types of intermediaries and recordkeepers for distribution and service activities provided for each Fund. The Trustees reviewed such information and received representations from the Advisor that all such payments by the Advisor were made from the Advisor’s resources and reasonable profits.
Collateral or “Fall-Out” Benefits Derived by the Advisor. The Board considered the possible existence of collateral benefits the Advisor may receive as a result of its relationship with the Funds. They concluded that the Advisor’s primary business is managing funds and it generally does not use fund or shareholder information to generate profits in other lines of business, and therefore does not derive any significant collateral benefits from them. The Board noted that additional assets from other clients may offer the Advisor some benefit from increased leverage with service providers and counterparties. The Board also determined that the Advisor is able to provide investment management services to certain clients other than the Funds, at least in part, due to its existing infrastructure built to serve the fund complex. The Board concluded that appropriate allocation methodologies had been employed to assign resources and the cost of those resources to these other clients.
Existing Relationship. The Board also considered whether there was any reason for not continuing the existing arrangement with the Advisor. In this regard, the Board was mindful of the potential disruptions of the Funds’ operations and various risks, uncertainties, and other effects that could occur as a result of a decision not to continue such relationship. In particular, the Board recognized that most shareholders have invested in each Fund on the strength of the Advisor’s industry standing and reputation and in the expectation that the Advisor will have a continuing role in providing advisory services to each Fund.
Conclusion of the Trustees. As a result of this process, the Board, including all of the independent Trustees, taking into account all of the factors discussed above and the information provided by the Advisor and others in connection with its review and throughout the year, determined that the terms of the management fee are fair and reasonable and that the management fee charged to each Fund is fair in light of the services provided and that the investment management agreement between each Fund and the Advisor should be renewed for an additional one-year period.
93
| Liquidity Risk Management Program | ||
The Funds have adopted a liquidity risk management program (the “program”). The Funds' Board of Trustees (the "Board") has designated American Century Investment Management, Inc. (“ACIM”) as the administrator of the program. Personnel of ACIM or its affiliates conduct the day-to-day operation of the program pursuant to policies and procedures administered by the Program Administrator, including members of ACIM’s Investment Oversight Committee who are members of the ACIM’s Investment Management and Global Analytics departments.
Under the program, ACIM manages the Funds' liquidity risk, which is the risk that the Funds could not meet shareholder redemption requests without significant dilution of remaining shareholders’ interests in the Funds. This risk is managed by monitoring the degree of liquidity of the Funds' investments, limiting the amount of the Funds' illiquid investments, and utilizing various risk management tools and facilities available to the Funds for meeting shareholder redemptions, among other means. ACIM’s process of determining the degree of liquidity of certain Funds' investments is supported by a third-party liquidity assessment vendor.
The Board reviewed a report prepared by ACIM regarding the operation and effectiveness of the program for the period January 1, 2021 through December 31, 2021. No significant liquidity events impacting the Funds were noted in the report. In addition, ACIM provided its assessment that the program had been effective in managing the Funds' liquidity risk.
94
| Additional Information | ||
Retirement Account Information
As required by law, distributions you receive from certain retirement accounts are subject to federal income tax withholding, unless you elect not to have withholding apply*. Tax will be withheld on the total amount withdrawn even though you may be receiving amounts that are not subject to withholding, such as nondeductible contributions. In such case, excess amounts of withholding could occur. You may adjust your withholding election so that a greater or lesser amount will be withheld.
Remember, even if you elect not to have income tax withheld, you are liable for paying income tax on the taxable portion of your withdrawal. If you elect not to have income tax withheld or you don’t have enough income tax withheld, you may be responsible for payment of estimated tax. You may incur penalties under the estimated tax rules if your withholding and estimated tax payments are not sufficient. You can reduce or defer the income tax on a distribution by directly or indirectly rolling such distribution over to another IRA or eligible plan. You should consult your tax advisor for additional information.
State tax will be withheld if, at the time of your distribution, your address is within one of the mandatory withholding states and you have federal income tax withheld (or as otherwise required by state law). State taxes will be withheld from your distribution in accordance with the respective state rules.
*Some 403(b), 457 and qualified retirement plan distributions may be subject to 20% mandatory withholding, as they are subject to special tax and withholding rules. Your plan administrator or plan sponsor is required to provide you with a special tax notice explaining those rules at the time you request a distribution. If applicable, federal and/or state taxes may be withheld from your distribution amount.
Proxy Voting Policies
A description of the policies that the funds' investment advisor uses in exercising the voting rights associated with the securities purchased and/or held by the funds is available without charge, upon request, by calling 1-800-345-6488. It is also available on American Century Investments’ website at americancentury.com/proxy and on the Securities and Exchange Commission’s website at sec.gov. Information regarding how the investment advisor voted proxies relating to portfolio securities during the most recent 12-month period ended June 30 is available at americancentury.com/proxy. It is also available at sec.gov.
Quarterly Portfolio Disclosure
The funds file their complete schedule of portfolio holdings with the Securities and Exchange Commission (SEC) for the first and third quarters of each fiscal year as an exhibit to their reports on Form N-PORT. The funds' Form N-PORT reports are available on the SEC’s website at sec.gov.
95
Other Tax Information
The following information is provided pursuant to provisions of the Internal Revenue Code.
The funds hereby designate up to the maximum amount allowable as qualified dividend income
for the fiscal year ended August 31, 2022.
For corporate taxpayers, the funds hereby designate the following, or up to the maximum amount allowable, of ordinary income distributions paid during the fiscal year ended August 31, 2022 as qualified for the corporate dividends received deduction.
| Low Volatility ETF | Quality Convertible Securities ETF | Quality Diversified International ETF | Quality Preferred ETF | STOXX® U.S. Quality Growth ETF | STOXX® U.S. Quality Value ETF | ||||||||||||
| $98,904 | $326,651 | $11,565 | $716,290 | $911,250 | $4,592,625 | ||||||||||||
For nonresident alien shareholders, the funds hereby designate the following, or up to the maximum amount allowable, of ordinary income distributions as qualified interest income for the fiscal year ended August 31, 2022.
| Low Volatility ETF | Quality Convertible Securities ETF | Quality Diversified International ETF | Quality Preferred ETF | STOXX® U.S. Quality Growth ETF | STOXX® U.S. Quality Value ETF | ||||||||||||
| — | $160,953 | — | $101,725 | — | — | ||||||||||||
The funds hereby utilized earnings and profits distributed to shareholders on redemption of shares as part of the dividend paid deduction (tax equalization) for the fiscal year ended August 31, 2022.
| Low Volatility ETF | Quality Convertible Securities ETF | Quality Diversified International ETF | Quality Preferred ETF | STOXX® U.S. Quality Growth ETF | STOXX® U.S. Quality Value ETF | ||||||||||||
| $11,276 | — | — | — | $102,168 | $509,912 | ||||||||||||
For the fiscal year ended August 31, 2022, Quality Diversified International ETF intends to pass through to shareholders foreign source income of $6,866,938 and foreign taxes paid of $617,422, or up to the maximum amount allowable, as a foreign tax credit. Foreign source income and foreign tax expense per outstanding share on August 31, 2022 are $1.3873 and $0.1247, respectively.
96
| ||||||||
| Contact Us | americancenturyetfs.com | |||||||
| American Century Sales Representatives, Financial Professionals, Broker Dealers, Insurance Companies, Banks and Trust Companies | 1-833-ACI-ETFS | |||||||
| Telecommunications Relay Service for the Deaf | 711 | |||||||
| American Century ETF Trust | ||||||||
Investment Advisor: American Century Investment Management, Inc. Kansas City, Missouri | ||||||||
Distributor: Foreside Fund Services, LLC - Distributor, not affiliated with American Century Investment Services, Inc. | ||||||||
| This report and the statements it contains are submitted for the general information of our shareholders. The report is not authorized for distribution to prospective investors unless preceded or accompanied by an effective prospectus. | ||||||||
| ©2022 American Century Proprietary Holdings, Inc. All rights reserved. CL-ANN-96948 2210 | ||||||||
| Annual Report | |||||
| August 31, 2022 | |||||
Avantis® Real Estate ETF (AVRE) | |||||
Avantis® U.S. Equity ETF (AVUS) | |||||
Avantis® U.S. Large Cap Value ETF (AVLV) | |||||
Avantis® U.S. Small Cap Equity ETF (AVSC) | |||||
Avantis® U.S. Small Cap Value ETF (AVUV) | |||||
| Table of Contents | ||
| Chairman’s Letter | |||||
| Avantis Real Estate ETF | |||||
| Performance | |||||
| Portfolio Commentary | |||||
| Fund Characteristics | |||||
| Avantis U.S. Equity ETF | |||||
| Performance | |||||
| Portfolio Commentary | |||||
| Fund Characteristics | |||||
| Avantis U.S. Large Cap Value ETF | |||||
| Performance | |||||
| Portfolio Commentary | |||||
| Fund Characteristics | |||||
| Avantis U.S. Small Cap Equity ETF | |||||
| Performance | |||||
| Portfolio Commentary | |||||
| Fund Characteristics | |||||
| Avantis U.S. Small Cap Value ETF | |||||
| Performance | |||||
| Portfolio Commentary | |||||
| Fund Characteristics | |||||
| Shareholder Fee Examples | |||||
| Schedules of Investments | |||||
| Statements of Assets and Liabilities | |||||
| Statements of Operations | |||||
| Statements of Changes in Net Assets | |||||
| Notes to Financial Statements | |||||
| Financial Highlights | |||||
| Report of Independent Registered Public Accounting Firm | |||||
| Management | |||||
| Approval of Management Agreements | |||||
| Liquidity Risk Management Program | |||||
| Additional Information | |||||
Any opinions expressed in this report reflect those of the author as of the date of the report, and do not necessarily represent the opinions of American Century Investments® or any other person in the American Century Investments organization. Any such opinions are subject to change at any time based upon market or other conditions and American Century Investments disclaims any responsibility to update such opinions. These opinions may not be relied upon as investment advice and, because investment decisions made by American Century Investments funds are based on numerous factors, may not be relied upon as an indication of trading intent on behalf of any American Century Investments fund. Security examples are used for representational purposes only and are not intended as recommendations to purchase or sell securities. Performance information for comparative indices and securities is provided to American Century Investments by third party vendors. To the best of American Century Investments’ knowledge, such information is accurate at the time of printing.
| Chairman's Letter | ||
Jonathan ThomasDear Investor:
Thank you for reviewing this annual report for the period ended August 31, 2022. Annual reports
help convey important information about fund returns, including market factors that affected
performance. For additional investment insights, please visit avantisinvestors.com.
Mounting Market Challenges Hampered Performance
Asset class performance weakened dramatically during the funds’ fiscal year. In late 2021,
generally upbeat economic activity and corporate earnings supported gains for most U.S. and
global stock indices. Returns generally remained positive despite rapidly rising inflation and waning
central bank support—factors that had started to weigh on fixed-income indices.
By early 2022, the market climate shifted quickly. Inflation, which was already at multiyear highs,
rose to levels last seen in the early 1980s. Massive fiscal and monetary support unleashed during
the pandemic was partly to blame. In addition, escalating energy prices, supply chain breakdowns
and labor market shortages further aggravated inflation in the U.S. and other developed markets.
Russia’s invasion of Ukraine in February also exacerbated global inflationary pressures.
The Bank of England launched its inflation-fighting campaign in December and continued to lift
rates through period-end. The Federal Reserve responded to surging inflation in March, launching
an aggressive rate-hike campaign and ending its asset purchase program. Policymakers indicated
taming inflation remains their priority, even as the U.S. economy contracted in 2022’s first two
quarters. Facing record-high inflation in the eurozone, the European Central Bank in July embarked
on its first rate-hike effort in 11 years.
The combination of sharply elevated inflation, tighter monetary policy, geopolitical strife and weak
economies triggered sharp market volatility and fueled global recession fears. Against this
backdrop, most U.S. and global stock and bond indices declined sharply for the reporting period.
Staying Disciplined in Uncertain Times
We expect market volatility to linger as investors navigate a complex environment of high inflation,
rising interest rates and economic uncertainty. In addition, Russia’s invasion of Ukraine
complicates an increasingly tense geopolitical backdrop and threatens Europe’s winter energy
supply. We will continue to monitor the broad backdrop and its influence on financial markets.
We appreciate your confidence in us during these extraordinary times. Our firm has a long history
of helping clients weather unpredictable markets, and we’re confident we will continue to meet
today’s challenges.
Sincerely,
Jonathan Thomas
Chairman
Avantis Investors
2
| Performance | ||
| Avantis Real Estate ETF (AVRE) | ||||||||||||||||||||||||||
| Total Returns as of August 31, 2022 | ||||||||||||||||||||||||||
| Since Inception | Inception Date | |||||||||||||||||||||||||
| Net Asset Value | -8.86% | 9/28/2021 | ||||||||||||||||||||||||
| Market Price | -8.76% | 9/28/2021 | ||||||||||||||||||||||||
| S&P Global REIT Index | -9.78% | — | ||||||||||||||||||||||||
| MSCI World IMI Index | -12.77% | — | ||||||||||||||||||||||||
Market price is determined using the bid/ask midpoint at 4:00 p.m. Eastern time, when the net asset value (NAV) is typically calculated. Market performance does not represent the returns you would receive if you traded shares at other times. NAV prices are used to calculate market price performance prior to the date when the fund first traded on the NYSE Arca, Inc.
| Growth of $10,000 Over Life of Fund | ||
| $10,000 investment made September 28, 2021 | ||
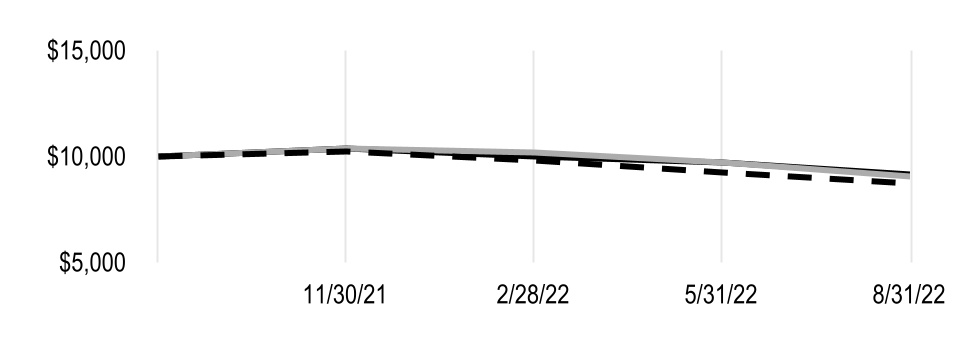
| Value on August 31, 2022 | |||||
| Net Asset Value — $9,114 | |||||
| S&P Global REIT Index — $9,022 | |||||
| MSCI World IMI Index — $8,723 | |||||
| Total Annual Fund Operating Expenses | |||||||||||||||||
| 0.17% | |||||||||||||||||
The total annual fund operating expenses shown is as stated in the fund’s prospectus current as of the date of this report. The prospectus may vary from the expense ratio shown elsewhere in this report because it is based on a different time period, includes acquired fund fees and expenses, and, if applicable, does not include fee waivers or expense reimbursements.
Data presented reflect past performance. Past performance is no guarantee of future results. Current performance may be higher or lower than the performance shown. Total returns for periods less than one year are not annualized. Investment return and principal value will fluctuate, and redemption value may be more or less than original cost. Data assumes reinvestment of dividends and capital gains, and none of the charts reflect the deduction of taxes that a shareholder would pay on fund distributions or the redemption of fund shares. To obtain performance data current to the most recent month end, please call 1-833-928-2684 or visit avantisinvestors.com. For additional information about the funds, please consult the prospectus.
3
| Portfolio Commentary | ||
Portfolio Managers: Eduardo Repetto, Mitch Firestein, Daniel Ong and Ted Randall
Fund Strategy
Avantis Real Estate ETF seeks long-term capital appreciation by investing in a diverse group of global real estate securities, including real estate investment trusts (REITs) and REIT-like entities across property sectors.
The fund seeks securities of companies that it expects to have higher returns and attractive risk characteristics. It places an enhanced emphasis on securities of companies with lower levels of leverage. Conversely, the fund seeks to underweight or exclude securities with high levels of leverage, with the goal of achieving a better risk/return profile. Under normal market conditions, the fund will invest at least 80% of its assets in securities issued by REITs and other companies engaged in the real estate industry. The fund generally invests in companies located in countries included in the fund’s benchmark, the S&P Global REIT Index.
The fund is an actively managed exchange-traded fund (ETF) that does not seek to replicate the performance of a specified index. The portfolio managers continually analyze market and financial data to make buy, sell and hold decisions. When buying or selling a security, the portfolio managers may consider the trade-off between expected returns of the security and implementation or tax costs of the trade. They do this in an attempt to gain trading efficiencies, avoid unnecessary risk and enhance portfolio performance.
Performance Review
For the period from the fund’s inception on September 28, 2021, through August 31, 2022, Avantis Real Estate ETF returned -8.76%* on a market price basis. On a net asset value (NAV) basis, the fund returned -8.86%. NAV and market price returns reflect fees and operating expenses, while index returns do not.
The fund outperformed the global REIT market, as measured by the S&P Global REIT Index, which returned -9.78% for the reporting period. The S&P Global REIT Index is an unmanaged index generally representative of publicly traded equity REITs in developed and emerging markets.
The fund’s outperformance versus the index was in part due to an underweight position in REITs with the highest leverage (total debt to capitalization) versus the index, which underperformed. The fund also had an overweight in specialized REITs, which outperformed.
*Total returns for periods less than one year are not annualized.
4
| Fund Characteristics | ||
| AUGUST 31, 2022 | |||||
| Avantis Real Estate ETF | |||||
| Types of Investments in Portfolio | % of net assets | ||||
| Common Stocks | 99.6% | ||||
| Short-Term Investments | 0.2% | ||||
| Other Assets and Liabilities | 0.2% | ||||
| Top Five Sectors | % of net assets | ||||
| Specialized REITs | 28.4% | ||||
| Industrial REITs | 16.5% | ||||
| Retail REITs | 16.2% | ||||
| Residential REITs | 14.4% | ||||
| Diversified REITs | 8.1% | ||||
5
| Performance | ||
| Avantis U.S. Equity ETF (AVUS) | ||||||||||||||||||||||||||
| Total Returns as of August 31, 2022 | Average Annual Returns | |||||||||||||||||||||||||
| 1 year | Since Inception | Inception Date | ||||||||||||||||||||||||
| Net Asset Value | -9.21% | 12.89% | 9/24/2019 | |||||||||||||||||||||||
| Market Price | -9.23% | 12.89% | 9/24/2019 | |||||||||||||||||||||||
| Russell 3000 Index | -13.28% | 11.61% | — | |||||||||||||||||||||||
Market price is determined using the bid/ask midpoint at 4:00 p.m. Eastern time, when the net asset value (NAV) is typically calculated. Market performance does not represent the returns you would receive if you traded shares at other times. NAV prices are used to calculate market price performance prior to the date when the fund first traded on the NYSE Arca, Inc.
| Growth of $10,000 Over Life of Fund | ||
| $10,000 investment made September 24, 2019 | ||
| Value on August 31, 2022 | |||||
| Net Asset Value — $14,278 | |||||
| Russell 3000 Index — $13,806 | |||||
| Total Annual Fund Operating Expenses | |||||||||||||||||
| 0.15% | |||||||||||||||||
The total annual fund operating expenses shown is as stated in the fund’s prospectus current as of the date of this report. The prospectus may vary from the expense ratio shown elsewhere in this report because it is based on a different time period, includes acquired fund fees and expenses, and, if applicable, does not include fee waivers or expense reimbursements.
Data presented reflect past performance. Past performance is no guarantee of future results. Current performance may be higher or lower than the performance shown. Total returns for periods less than one year are not annualized. Investment return and principal value will fluctuate, and redemption value may be more or less than original cost. Data assumes reinvestment of dividends and capital gains, and none of the charts reflect the deduction of taxes that a shareholder would pay on fund distributions or the redemption of fund shares. To obtain performance data current to the most recent month end, please call 1-833-928-2684 or visit avantisinvestors.com. For additional information about the funds, please consult the prospectus.
6
| Portfolio Commentary | ||
Portfolio Managers: Eduardo Repetto, Mitch Firestein, Daniel Ong and Ted Randall
Fund Strategy
Avantis U.S. Equity ETF seeks long-term capital appreciation by investing in a diverse group of U.S. companies across market sectors, industry groups and market capitalizations.
The fund seeks securities of companies that it expects to have higher returns. It places an enhanced emphasis on securities of companies with smaller market capitalizations and securities of companies it defines as high profitability or value companies. Conversely, the fund seeks to underweight or exclude securities it expects to have lower returns. This includes securities of large companies with lower levels of profitability and higher prices relative to their book values or other financial metrics. Under normal market conditions, the fund will invest at least 80% of its assets in equity securities of U.S. companies.
The fund is an actively managed exchange-traded fund (ETF) that does not seek to replicate the performance of a specified index. The portfolio managers continually analyze market and financial data to make buy, sell and hold decisions. When buying or selling a security, the portfolio managers may consider the trade-off between expected returns of the security and implementation or tax costs of the trade. They do this in an attempt to gain trading efficiencies, avoid unnecessary risk and enhance portfolio performance.
Performance Review
For the 12-month period ended August 31, 2022, Avantis U.S. Equity ETF returned -9.23% on a market price basis. On a net asset value (NAV) basis, the fund returned -9.21%. NAV and market price returns reflect fees and operating expenses, while index returns do not.
The fund outperformed the total U.S. stock market, as measured by the Russell 3000 Index, which returned -13.28% for the reporting period. The Russell 3000 Index is an unmanaged index generally representative of the performance of the broad U.S. stock market, including all capitalization categories.
The fund’s outperformance versus the index was largely due to the fund’s emphasis on value-oriented stocks. Specifically, the fund was overweight versus the index in stocks with the highest book-to-market and profitability characteristics and underweight in stocks with the lowest book-to-market and profitability traits.
Value stocks, as measured by the Russell 3000 Value Index, returned -6.49% for the 12-month period. Growth stocks, as measured by the Russell 3000 Growth Index, returned -19.44% for the 12 months.
7
| Fund Characteristics | ||
| AUGUST 31, 2022 | |||||
| Avantis U.S. Equity ETF | |||||
| Types of Investments in Portfolio | % of net assets | ||||
| Common Stocks | 99.8% | ||||
| Short-Term Investments | 0.4% | ||||
| Other Assets and Liabilities | (0.2)% | ||||
| Top Five Industries | % of net assets | ||||
| Oil, Gas and Consumable Fuels | 8.9% | ||||
| Software | 5.9% | ||||
| Banks | 5.7% | ||||
| Technology Hardware, Storage and Peripherals | 5.1% | ||||
| Semiconductors and Semiconductor Equipment | 4.4% | ||||
8
| Performance | ||
| Avantis U.S. Large Cap Value ETF (AVLV) | ||||||||||||||||||||||||||
| Total Returns as of August 31, 2022 | ||||||||||||||||||||||||||
| Since Inception | Inception Date | |||||||||||||||||||||||||
| Net Asset Value | -1.03% | 9/21/2021 | ||||||||||||||||||||||||
| Market Price | -1.04% | 9/21/2021 | ||||||||||||||||||||||||
| Russell 1000 Value Index | -2.42% | — | ||||||||||||||||||||||||
Market price is determined using the bid/ask midpoint at 4:00 p.m. Eastern time, when the net asset value (NAV) is typically calculated. Market performance does not represent the returns you would receive if you traded shares at other times. NAV prices are used to calculate market price performance prior to the date when the fund first traded on the NYSE Arca, Inc.
| Growth of $10,000 Over Life of Fund | ||
| $10,000 investment made September 21, 2021 | ||
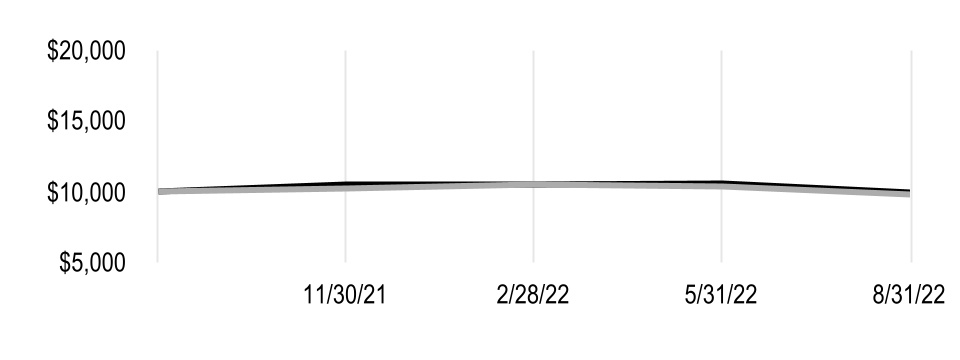
| Value on August 31, 2022 | |||||
| Net Asset Value — $9,897 | |||||
| Russell 1000 Value Index — $9,758 | |||||
| Total Annual Fund Operating Expenses | |||||||||||||||||
| 0.15% | |||||||||||||||||
The total annual fund operating expenses shown is as stated in the fund’s prospectus current as of the date of this report. The prospectus may vary from the expense ratio shown elsewhere in this report because it is based on a different time period, includes acquired fund fees and expenses, and, if applicable, does not include fee waivers or expense reimbursements.
Data presented reflect past performance. Past performance is no guarantee of future results. Current performance may be higher or lower than the performance shown. Total returns for periods less than one year are not annualized. Investment return and principal value will fluctuate, and redemption value may be more or less than original cost. Data assumes reinvestment of dividends and capital gains, and none of the charts reflect the deduction of taxes that a shareholder would pay on fund distributions or the redemption of fund shares. To obtain performance data current to the most recent month end, please call 1-833-928-2684 or visit avantisinvestors.com. For additional information about the funds, please consult the prospectus.
9
| Portfolio Commentary | ||
Portfolio Managers: Eduardo Repetto, Mitch Firestein, Daniel Ong and Ted Randall
Fund Strategy
Avantis U.S. Large Cap Value ETF seeks long-term capital appreciation by investing in a diverse group of U.S. companies across market sectors and industry groups.
The fund seeks securities of companies that it expects to have higher returns. It places an enhanced emphasis on securities of companies with higher profitability and value characteristics. Conversely, the fund seeks to underweight or exclude securities it expects to have lower returns. These include securities of companies with lower levels of profitability and less attractive value characteristics. Under normal market conditions, the fund will invest at least 80% of its assets in securities of large-capitalization (large-cap) U.S. companies.
The fund is an actively managed exchange-traded fund (ETF) that does not seek to replicate the performance of a specified index. The portfolio managers continually analyze market and financial data to make buy, sell and hold decisions. When buying or selling a security, the portfolio managers may consider the trade-off between expected returns of the security and implementation or tax costs of the trade. They do this in an attempt to gain trading efficiencies, avoid unnecessary risk and enhance fund performance.
Performance Review
For the period from the portfolio’s inception on September 21, 2021, through August 31, 2022, Avantis U.S. Large Cap Value ETF returned -1.04%* on a market price basis. On a net asset value (NAV) basis, the fund returned -1.03%. NAV and market price returns reflect fees and operating expenses, while index returns do not.
The fund outperformed the broad U.S. large-cap value universe, as measured by the Russell 1000 Value Index, which returned -2.42% for the reporting period. The Russell 1000 Value Index is an unmanaged index generally representative of the performance of U.S. large-cap companies with lower price-to-book ratios and lower forecasted growth values.
The outperformance was largely due to the fund’s overweight versus the index in companies with the highest profitability and book-to-market characteristics, which outperformed. A corresponding underweight in companies with the lowest profitability and book-to-market characteristics, which underperformed, also aided relative results. Additionally, the exclusion of real estate investment trusts (REITs) boosted the fund’s relative performance, as REITs underperformed for the reporting period.
*Total returns for periods less than one year are not annualized.
10
| Fund Characteristics | ||
| AUGUST 31, 2022 | |||||
| Avantis U.S. Large Cap Value ETF | |||||
| Types of Investments in Portfolio | % of net assets | ||||
| Common Stocks | 99.6% | ||||
| Short-Term Investments | 0.3% | ||||
| Other Assets and Liabilities | 0.1% | ||||
| Top Five Industries | % of net assets | ||||
| Oil, Gas and Consumable Fuels | 18.4% | ||||
| Pharmaceuticals | 8.3% | ||||
| Semiconductors and Semiconductor Equipment | 5.9% | ||||
| Specialty Retail | 5.0% | ||||
| Road and Rail | 5.0% | ||||
11
| Performance | ||
| Avantis U.S. Small Cap Equity ETF (AVSC) | ||||||||||||||||||||||||||
| Total Returns as of August 31, 2022 | ||||||||||||||||||||||||||
| Since Inception | Inception Date | |||||||||||||||||||||||||
| Net Asset Value | -11.95% | 1/11/2022 | ||||||||||||||||||||||||
| Market Price | -11.94% | 1/11/2022 | ||||||||||||||||||||||||
| Russell 2000 Index | -15.24% | — | ||||||||||||||||||||||||
Market price is determined using the bid/ask midpoint at 4:00 p.m. Eastern time, when the net asset value (NAV) is typically calculated. Market performance does not represent the returns you would receive if you traded shares at other times. NAV prices are used to calculate market price performance prior to the date when the fund first traded on the NYSE Arca, Inc.
| Growth of $10,000 Over Life of Fund | ||
| $10,000 investment made January 11, 2022 | ||
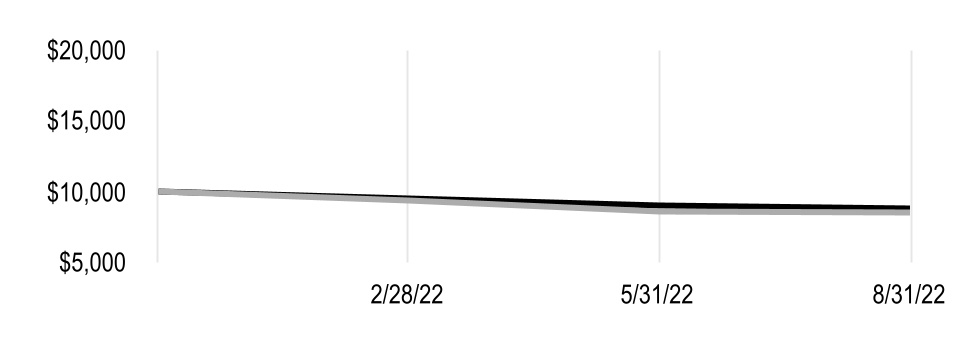
| Value on August 31, 2022 | |||||
| Net Asset Value — $8,805 | |||||
| Russell 2000 Index — $8,476 | |||||
| Total Annual Fund Operating Expenses | |||||||||||||||||
| 0.25% | |||||||||||||||||
The total annual fund operating expenses shown is as stated in the fund’s prospectus current as of the date of this report. The prospectus may vary from the expense ratio shown elsewhere in this report because it is based on a different time period, includes acquired fund fees and expenses, and, if applicable, does not include fee waivers or expense reimbursements.
Data presented reflect past performance. Past performance is no guarantee of future results. Current performance may be higher or lower than the performance shown. Total returns for periods less than one year are not annualized. Investment return and principal value will fluctuate, and redemption value may be more or less than original cost. Data assumes reinvestment of dividends and capital gains, and none of the charts reflect the deduction of taxes that a shareholder would pay on fund distributions or the redemption of fund shares. To obtain performance data current to the most recent month end, please call 1-833-928-2684 or visit avantisinvestors.com. For additional information about the funds, please consult the prospectus.
12
| Portfolio Commentary | ||
Portfolio Managers: Eduardo Repetto, Mitch Firestein, Daniel Ong and Ted Randall
Fund Strategy
Avantis U.S. Small Cap Equity ETF seeks long-term capital appreciation by investing in a diverse group of U.S. companies across market sectors, industry groups and market capitalizations.
The fund seeks securities of companies that it expects to have higher returns. It places an enhanced emphasis on securities of companies with smaller market capitalizations and securities of companies it defines as high profitability or value companies. Conversely, the fund seeks to underweight or exclude securities it expects to have lower returns. This includes securities of larger companies with lower levels of profitability and less attractive value characteristics. Under normal market conditions, the fund will invest at least 80% of its assets in small-capitalization (small-cap) equity securities of U.S. companies.
The fund is an actively managed exchange-traded fund (ETF) that does not seek to replicate the performance of a specified index. The portfolio managers continually analyze market and financial data to make buy, sell and hold decisions. When buying or selling a security, the portfolio managers may consider the trade-off between expected returns of the security and implementation or tax costs of the trade. They do this in an attempt to gain trading efficiencies, avoid unnecessary risk and enhance portfolio performance.
Performance Review
For the period from the portfolio’s inception on January 11, 2022, through August 31, 2022, Avantis U.S. Small Cap Equity ETF returned -11.94%* on a market price basis. On a net asset value (NAV) basis, the fund returned -11.95%. NAV and market price returns reflect fees and operating expenses, while index returns do not.
The fund outperformed the broad small-cap U.S. stock market, as measured by the Russell 2000 Index, which returned -15.24% for the reporting period. The Russell 2000 Index is an unmanaged index generally representative of the performance of U.S. small-cap stocks.
The outperformance was largely due to the fund’s underweight in companies with the lowest profitability and book-to-market characteristics, which underperformed. Additionally, the exclusion of real estate investment trusts (REITs) boosted the fund’s relative performance, as REITs underperformed for the reporting period.
*Total returns for periods less than one year are not annualized.
13
| Fund Characteristics | ||
| AUGUST 31, 2022 | |||||
| Avantis U.S. Small Cap Equity ETF | |||||
| Types of Investments in Portfolio | % of net assets | ||||
| Common Stocks | 99.7% | ||||
| Short-Term Investments | 0.2% | ||||
| Other Assets and Liabilities | 0.1% | ||||
| Top Five Industries | % of net assets | ||||
| Banks | 14.6% | ||||
| Oil, Gas and Consumable Fuels | 6.0% | ||||
| Biotechnology | 4.8% | ||||
| Specialty Retail | 4.3% | ||||
| Machinery | 4.1% | ||||
14
| Performance | ||
| Avantis U.S. Small Cap Value ETF (AVUV) | ||||||||||||||||||||||||||
| Total Returns as of August 31, 2022 | Average Annual Returns | |||||||||||||||||||||||||
| 1 year | Since Inception | Inception Date | ||||||||||||||||||||||||
| Net Asset Value | -0.47% | 15.87% | 9/24/2019 | |||||||||||||||||||||||
| Market Price | -0.45% | 15.87% | 9/24/2019 | |||||||||||||||||||||||
| Russell 2000 Value Index | -10.18% | 8.71% | — | |||||||||||||||||||||||
Market price is determined using the bid/ask midpoint at 4:00 p.m. Eastern time, when the net asset value (NAV) is typically calculated. Market performance does not represent the returns you would receive if you traded shares at other times. NAV prices are used to calculate market price performance prior to the date when the fund first traded on the NYSE Arca, Inc.
| Growth of $10,000 Over Life of Fund | ||
| $10,000 investment made September 24, 2019 | ||
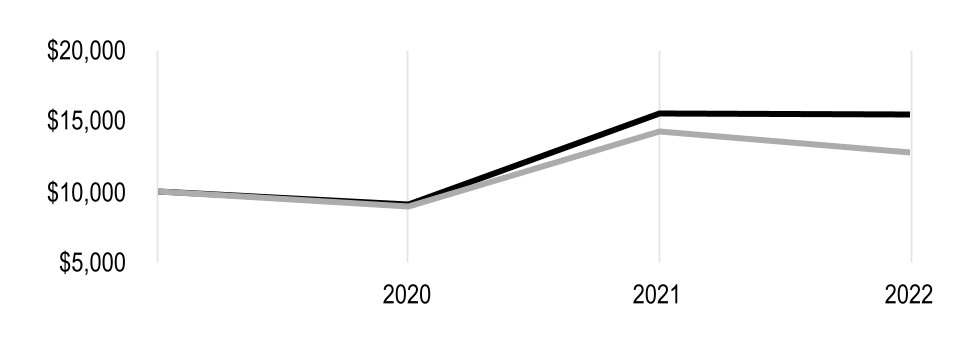
| Value on August 31, 2022 | |||||
| Net Asset Value — $15,412 | |||||
| Russell 2000 Value Index — $12,779 | |||||
| Total Annual Fund Operating Expenses | |||||||||||||||||
| 0.25% | |||||||||||||||||
The total annual fund operating expenses shown is as stated in the fund’s prospectus current as of the date of this report. The prospectus may vary from the expense ratio shown elsewhere in this report because it is based on a different time period, includes acquired fund fees and expenses, and, if applicable, does not include fee waivers or expense reimbursements.
Data presented reflect past performance. Past performance is no guarantee of future results. Current performance may be higher or lower than the performance shown. Total returns for periods less than one year are not annualized. Investment return and principal value will fluctuate, and redemption value may be more or less than original cost. Data assumes reinvestment of dividends and capital gains, and none of the charts reflect the deduction of taxes that a shareholder would pay on fund distributions or the redemption of fund shares. To obtain performance data current to the most recent month end, please call 1-833-928-2684 or visit avantisinvestors.com. For additional information about the funds, please consult the prospectus.
15
| Portfolio Commentary | ||
Portfolio Managers: Eduardo Repetto, Mitch Firestein, Daniel Ong and Ted Randall
Fund Strategy
Avantis U.S. Small Cap Value ETF seeks long-term capital appreciation by investing in a diverse group of U.S. small-capitalization (small-cap) companies across market sectors and industry groups.
The fund seeks securities of companies that it expects to have higher returns. It places an enhanced emphasis on securities of companies with smaller market capitalizations and securities of companies it defines as high profitability or value companies. Conversely, the fund seeks to underweight or exclude securities it expects to have lower returns. These include securities of larger companies with lower levels of profitability and higher prices relative to their book values or other financial metrics. Under normal market conditions, the fund will invest at least 80% of its assets in securities of small-cap companies located in the U.S.
The fund is an actively managed exchange-traded fund (ETF) that does not seek to replicate the performance of a specified index. The portfolio managers continually analyze market and financial data to make buy, sell and hold decisions. When buying or selling a security, the portfolio managers may consider the trade-off between expected returns of the security and implementation or tax costs of the trade. They do this in an attempt to gain trading efficiencies, avoid unnecessary risk and enhance fund performance.
Performance Review
For the 12-month period ended August 31, 2022, Avantis U.S. Small Cap Value ETF returned -0.45% on a market price basis. On a net asset value (NAV) basis, the fund returned -0.47%. NAV and market price returns reflect fees and operating expenses, while index returns do not.
The fund significantly outperformed the broad U.S. small-cap value universe, as measured by the Russell 2000 Value Index, which returned -10.18% for the reporting period. The Russell 2000 Value Index is an unmanaged index generally representative of the performance of U.S. small-cap companies with lower price-to-book ratios and lower forecasted growth values.
The outperformance was largely due to the fund’s overweight versus the index in companies with the highest profitability and book-to-market characteristics. A corresponding underweight in companies with the lowest profitability and book-to-market characteristics also aided relative results. Additionally, the exclusion of real estate investment trusts (REITs) boosted the fund’s relative performance, as REITs underperformed for the reporting period.
16
| Fund Characteristics | ||
| AUGUST 31, 2022 | |||||
| Avantis U.S. Small Cap Value ETF | |||||
| Types of Investments in Portfolio | % of net assets | ||||
| Common Stocks | 99.8% | ||||
| Short-Term Investments | 0.7% | ||||
| Other Assets and Liabilities | (0.5)% | ||||
| Top Five Industries | % of net assets | ||||
| Banks | 16.7% | ||||
| Oil, Gas and Consumable Fuels | 13.1% | ||||
| Specialty Retail | 7.4% | ||||
| Trading Companies and Distributors | 5.0% | ||||
| Thrifts and Mortgage Finance | 5.0% | ||||
17
| Shareholder Fee Examples | ||
Fund shareholders may incur two types of costs: (1) transaction costs, including brokerage commissions paid on purchases and sales of fund shares; and (2) ongoing costs, including management fees and other fund expenses. This example is intended to help you understand your ongoing costs (in dollars) of investing in your fund and to compare these costs with the ongoing cost of investing in other funds.
The example is based on an investment of $1,000 made at the beginning of the period and held for the entire period from March 1, 2022 to August 31, 2022.
Actual Expenses
The table provides information about actual account values and actual expenses for each fund. You may use the information, together with the amount you invested, to estimate the expenses that you paid over the period. First, identify the fund you own. Then simply divide your account value by $1,000 (for example, an $8,600 account value divided by $1,000 = 8.6), then multiply the result by the number under the heading “Expenses Paid During Period” to estimate the expenses you paid on your account during this period.
Hypothetical Example for Comparison Purposes
The table also provides information about hypothetical account values and hypothetical expenses based on the actual expense ratio of your fund and an assumed rate of return of 5% per year before expenses, which is not the actual return of a fund. The hypothetical account values and expenses may not be used to estimate the actual ending account balance or expenses you paid for the period. You may use this information to compare the ongoing costs of investing in your fund and other funds. To do so, compare this 5% hypothetical example with the 5% hypothetical examples that appear in the shareholder reports of the other funds.
Please note that the expenses shown in the table are meant to highlight your ongoing costs only and do not reflect any transactional costs, such as brokerage commissions paid on purchases and sales of fund shares. Therefore, the table is useful in comparing ongoing costs only, and will not help you determine the relative total costs of owning different funds. In addition, if these transactional costs were included, your costs would have been higher.
18
| Beginning Account Value 3/1/22 | Ending Account Value 8/31/22 | Expenses Paid During Period(1) 3/1/22 - 8/31/22 | Annualized Expense Ratio(1) | |||||||||||
| Avantis Real Estate ETF | ||||||||||||||
| Actual | $1,000 | $911.90 | $0.82 | 0.17% | ||||||||||
| Hypothetical | $1,000 | $1,024.35 | $0.87 | 0.17% | ||||||||||
| Avantis U.S. Equity ETF | ||||||||||||||
| Actual | $1,000 | $921.20 | $0.73 | 0.15% | ||||||||||
| Hypothetical | $1,000 | $1,024.45 | $0.77 | 0.15% | ||||||||||
| Avantis U.S. Large Cap Value ETF | ||||||||||||||
| Actual | $1,000 | $946.00 | $0.74 | 0.15% | ||||||||||
| Hypothetical | $1,000 | $1,024.45 | $0.77 | 0.15% | ||||||||||
| Avantis U.S. Small Cap Equity ETF | ||||||||||||||
| Actual | $1,000 | $925.80 | $1.21 | 0.25% | ||||||||||
| Hypothetical | $1,000 | $1,023.95 | $1.28 | 0.25% | ||||||||||
| Avantis U.S. Small Cap Value ETF | ||||||||||||||
| Actual | $1,000 | $946.40 | $1.23 | 0.25% | ||||||||||
| Hypothetical | $1,000 | $1,023.95 | $1.28 | 0.25% | ||||||||||
(1)Expenses are equal to the fund's annualized expense ratio listed in the table above, multiplied by the average account value over the period, multiplied by 184, the number of days in the most recent fiscal half-year, divided by 365, to reflect the one-half year period. Annualized expense ratio reflects actual expenses, including any applicable fee waivers or expense reimbursements and excluding any acquired fund fees and expenses.
19
| Schedules of Investments | ||
AUGUST 31, 2022
| Avantis Real Estate ETF | ||||||||
| Shares | Value | |||||||
| COMMON STOCKS — 99.6% | ||||||||
| Diversified REITs — 8.1% | ||||||||
| Abacus Property Group | 60,900 | $ | 112,254 | |||||
| Abrdn Property Income Trust Ltd. | 34,455 | 30,592 | ||||||
| Activia Properties, Inc. | 12 | 37,277 | ||||||
| AEW UK REIT PLC | 17,434 | 22,582 | ||||||
| Alarko Gayrimenkul Yatirim Ortakligi AS | 13,704 | 28,847 | ||||||
| Alexander & Baldwin, Inc. | 4,168 | 78,067 | ||||||
| Argosy Property Ltd. | 50,135 | 40,668 | ||||||
| Balanced Commercial Property Trust Ltd. | 85,754 | 105,918 | ||||||
| British Land Co. PLC | 120,198 | 599,573 | ||||||
| Broadstone Net Lease, Inc. | 10,127 | 193,831 | ||||||
| Centuria Capital Group | 31,116 | 38,587 | ||||||
| Charter Hall Group | 31,669 | 288,819 | ||||||
| Charter Hall Long Wale REIT | 57,241 | 173,535 | ||||||
| Cromwell European Real Estate Investment Trust | 20,500 | 42,459 | ||||||
| Custodian Reit PLC | 38,396 | 45,631 | ||||||
| D&D Platform REIT Co. Ltd. | 4,878 | 16,920 | ||||||
| Daiwa House REIT Investment Corp. | 215 | 497,036 | ||||||
| ESCON Japan Reit Investment Corp. | 7 | 6,074 | ||||||
| Essential Properties Realty Trust, Inc. | 8,191 | 185,444 | ||||||
| Fibra Uno Administracion SA de CV | 326,401 | 340,229 | ||||||
| Fortress REIT Ltd., A Shares | 147,520 | 89,671 | ||||||
Fortress REIT Ltd., B Shares(1) | 117,422 | 27,964 | ||||||
| GPT Group | 269,279 | 767,311 | ||||||
| Growthpoint Properties Australia Ltd. | 29,745 | 71,151 | ||||||
| Growthpoint Properties Ltd. | 533,717 | 396,995 | ||||||
| H&R Real Estate Investment Trust | 19,861 | 191,752 | ||||||
| Hankyu Hanshin REIT, Inc. | 66 | 73,758 | ||||||
| Heiwa Real Estate REIT, Inc. | 71 | 80,578 | ||||||
| Hulic Reit, Inc. | 125 | 149,064 | ||||||
| Industrials REIT Ltd. | 10,778 | 20,912 | ||||||
Is Gayrimenkul Yatirim Ortakligi AS(1)(2) | 150,603 | 149,753 | ||||||
| Land Securities Group PLC | 72,915 | 549,955 | ||||||
| LXI REIT PLC | 177,985 | 304,171 | ||||||
| Marimo Regional Revitalization REIT, Inc. | 5 | 4,799 | ||||||
| Menivim- The New REIT Ltd. | 49,307 | 29,717 | ||||||
| Merlin Properties Socimi SA | 30,567 | 279,722 | ||||||
| Mirvac Group | 485,471 | 691,375 | ||||||
| Nomura Real Estate Master Fund, Inc. | 390 | 476,994 | ||||||
| NTT UD REIT Investment Corp. | 201 | 217,267 | ||||||
Ozak Gayrimenkul Yatirim Ortakligi(1) | 97,896 | 43,452 | ||||||
| PRO Real Estate Investment Trust | 2,637 | 12,790 | ||||||
| Redefine Properties Ltd. | 826,646 | 183,058 | ||||||
| Reit 1 Ltd. | 25,165 | 160,013 | ||||||
| SA Corporate Real Estate Ltd. | 173,837 | 21,331 | ||||||
| Schroder Real Estate Investment Trust Ltd. | 57,173 | 35,346 | ||||||
20
| Avantis Real Estate ETF | ||||||||
| Shares | Value | |||||||
| Sekisui House Reit, Inc. | 285 | $ | 172,718 | |||||
| Sella Capital Real Estate Ltd. | 22,035 | 70,289 | ||||||
| Shinhan Seobu T&D REIT Co. Ltd. | 3,900 | 13,869 | ||||||
| SK REITs Co. Ltd. | 7,587 | 32,158 | ||||||
| Stockland | 401,770 | 988,300 | ||||||
| STORE Capital Corp. | 18,181 | 490,523 | ||||||
| Stride Property Group | 22,533 | 24,777 | ||||||
| Takara Leben Real Estate Investment Corp. | 63 | 48,494 | ||||||
| Tokaido REIT, Inc. | 10 | 8,821 | ||||||
| Tokyu REIT, Inc. | 123 | 175,360 | ||||||
| United Urban Investment Corp. | 334 | 355,354 | ||||||
| WP Carey, Inc. | 16,574 | 1,392,713 | ||||||
| XYMAX REIT Investment Corp. | 19 | 17,205 | ||||||
| Ziraat Gayrimenkul Yatirim Ortakligi AS | 101,747 | 19,150 | ||||||
| 11,722,973 | ||||||||
| Health Care REITs — 6.7% | ||||||||
| Aedifica SA | 3,985 | 377,036 | ||||||
| Assura PLC | 386,112 | 292,044 | ||||||
| CareTrust REIT, Inc. | 7,966 | 171,588 | ||||||
| Cofinimmo SA | 4,847 | 491,706 | ||||||
| Community Healthcare Trust, Inc. | 1,523 | 56,183 | ||||||
| First Real Estate Investment Trust | 152,500 | 29,948 | ||||||
| Global Medical REIT, Inc. | 901 | 9,767 | ||||||
| Health Care & Medical Investment Corp. | 53 | 70,290 | ||||||
| Healthcare Realty Trust, Inc., Class A | 27,840 | 677,069 | ||||||
| Healthpeak Properties, Inc. | 60,542 | 1,589,227 | ||||||
| Impact Healthcare Reit PLC | 37,285 | 49,615 | ||||||
| LTC Properties, Inc. | 5,515 | 247,568 | ||||||
| National Health Investors, Inc. | 6,452 | 422,670 | ||||||
| NorthWest Healthcare Properties Real Estate Investment Trust | 10,927 | 104,332 | ||||||
| Parkway Life Real Estate Investment Trust | 41,400 | 142,178 | ||||||
| Physicians Realty Trust | 14,969 | 249,384 | ||||||
| Primary Health Properties PLC | 42,764 | 67,771 | ||||||
| Universal Health Realty Income Trust | 1,438 | 73,180 | ||||||
| Ventas, Inc. | 41,389 | 1,980,878 | ||||||
| Vital Healthcare Property Trust | 51,426 | 85,528 | ||||||
| Welltower, Inc. | 32,348 | 2,479,474 | ||||||
| 9,667,436 | ||||||||
| Hotel & Resort REITs — 2.3% | ||||||||
| Apple Hospitality REIT, Inc. | 15,527 | 247,035 | ||||||
| Ascott Residence Trust | 256,600 | 199,935 | ||||||
| CDL Hospitality Trusts | 116,600 | 103,308 | ||||||
DiamondRock Hospitality Co.(1) | 14,750 | 128,768 | ||||||
| Far East Hospitality Trust | 116,400 | 51,599 | ||||||
| Frasers Hospitality Trust | 73,700 | 36,899 | ||||||
| Hoshino Resorts REIT, Inc. | 16 | 74,620 | ||||||
| Host Hotels & Resorts, Inc. | 88,998 | 1,581,494 | ||||||
| Japan Hotel REIT Investment Corp. | 522 | 257,345 | ||||||
| Pebblebrook Hotel Trust | 2,300 | 40,526 | ||||||
Ryman Hospitality Properties, Inc.(1) | 4,456 | 366,372 | ||||||
Sunstone Hotel Investors, Inc.(1) | 16,458 | 179,228 | ||||||
| 3,267,129 | ||||||||
21
| Avantis Real Estate ETF | ||||||||
| Shares | Value | |||||||
| Industrial REITs — 16.5% | ||||||||
| AIMS APAC REIT | 56,900 | $ | 55,709 | |||||
| Americold Realty Trust, Inc. | 23,694 | 697,078 | ||||||
| Ascendas Real Estate Investment Trust | 437,400 | 881,539 | ||||||
| Centuria Industrial REIT | 54,045 | 113,551 | ||||||
| CRE Logistics REIT, Inc. | 55 | 84,518 | ||||||
| Dexus Industria REIT | 17,648 | 33,001 | ||||||
| Dream Industrial Real Estate Investment Trust | 10,506 | 97,593 | ||||||
| Duke Realty Corp. | 51,796 | 3,048,195 | ||||||
| EastGroup Properties, Inc. | 4,437 | 732,238 | ||||||
| Equites Property Fund Ltd. | 74,137 | 77,562 | ||||||
| ESR Kendall Square REIT Co. Ltd. | 16,081 | 66,359 | ||||||
| ESR-LOGOS REIT | 409,127 | 119,897 | ||||||
| FIBRA Macquarie Mexico | 95,593 | 120,378 | ||||||
| First Industrial Realty Trust, Inc. | 11,218 | 568,528 | ||||||
| Frasers Logistics & Commercial Trust | 246,600 | 239,594 | ||||||
| GLP J-Reit | 386 | 470,220 | ||||||
| Goodman Group | 160,528 | 2,134,699 | ||||||
| Goodman Property Trust | 103,551 | 137,604 | ||||||
| Granite Real Estate Investment Trust | 3,126 | 177,561 | ||||||
| Industrial & Infrastructure Fund Investment Corp. | 132 | 174,187 | ||||||
| Innovative Industrial Properties, Inc. | 956 | 87,684 | ||||||
| Intervest Offices & Warehouses NV | 1,754 | 43,870 | ||||||
| Japan Logistics Fund, Inc. | 74 | 175,628 | ||||||
| LaSalle Logiport REIT | 137 | 169,281 | ||||||
| LondonMetric Property PLC | 106,703 | 269,358 | ||||||
| LXP Industrial Trust | 27,674 | 278,400 | ||||||
| Mapletree Industrial Trust | 238,500 | 431,106 | ||||||
| Mapletree Logistics Trust | 378,900 | 451,969 | ||||||
| Mitsubishi Estate Logistics REIT Investment Corp. | 32 | 109,987 | ||||||
| Mitsui Fudosan Logistics Park, Inc. | 40 | 156,692 | ||||||
| Montea NV | 799 | 71,988 | ||||||
| Nexus Industrial REIT | 1,250 | 9,670 | ||||||
| Nippon Prologis REIT, Inc. | 191 | 480,505 | ||||||
| PLA Administradora Industrial S de RL de CV | 71,222 | 94,991 | ||||||
| Prologis Property Mexico SA de CV | 44,200 | 114,062 | ||||||
| Prologis, Inc. | 56,698 | 7,059,468 | ||||||
| Rexford Industrial Realty, Inc. | 11,818 | 735,198 | ||||||
| Segro PLC | 107,989 | 1,178,481 | ||||||
| SOSiLA Logistics REIT, Inc. | 62 | 70,246 | ||||||
| STAG Industrial, Inc. | 9,493 | 292,384 | ||||||
| Summit Industrial Income REIT | 9,850 | 138,148 | ||||||
| Terreno Realty Corp. | 4,854 | 296,045 | ||||||
| Tritax Big Box REIT PLC | 179,249 | 345,816 | ||||||
| Urban Logistics REIT PLC | 52,071 | 102,732 | ||||||
| Warehouse Reit PLC | 33,623 | 60,416 | ||||||
| Warehouses De Pauw | 14,818 | 450,868 | ||||||
| 23,705,004 | ||||||||
| Office REITs — 7.0% | ||||||||
| Alexandria Real Estate Equities, Inc. | 10,513 | 1,612,694 | ||||||
| Allied Properties Real Estate Investment Trust | 6,091 | 145,533 | ||||||
22
| Avantis Real Estate ETF | ||||||||
| Shares | Value | |||||||
| alstria office REIT AG | 9,250 | $ | 117,759 | |||||
| AREIT, Inc. | 108,510 | 74,232 | ||||||
| Centuria Office REIT | 28,136 | 31,369 | ||||||
| Cousins Properties, Inc. | 14,747 | 395,957 | ||||||
| Daiwa Office Investment Corp. | 55 | 277,917 | ||||||
| Derwent London PLC | 16,737 | 472,179 | ||||||
| Dexus | 134,025 | 792,754 | ||||||
| Dream Office Real Estate Investment Trust | 3,733 | 51,930 | ||||||
| Easterly Government Properties, Inc. | 3,167 | 56,848 | ||||||
| Embassy Office Parks REIT | 50,319 | 229,142 | ||||||
| GDI Property Group Partnership | 50,200 | 30,979 | ||||||
| Gecina SA | 12,562 | 1,117,992 | ||||||
| Great Portland Estates PLC | 32,409 | 187,041 | ||||||
| Inmobiliaria Colonial Socimi SA | 29,752 | 176,232 | ||||||
| Japan Excellent, Inc. | 132 | 124,451 | ||||||
| Japan Prime Realty Investment Corp. | 81 | 239,916 | ||||||
| Japan Real Estate Investment Corp. | 156 | 722,526 | ||||||
| JBG SMITH Properties | 2,614 | 57,430 | ||||||
| JR Global Reit | 17,524 | 61,532 | ||||||
| Kenedix Office Investment Corp. | 61 | 315,141 | ||||||
| Keppel Pacific Oak US REIT | 64,500 | 42,869 | ||||||
| Keppel REIT | 222,600 | 171,880 | ||||||
| Kilroy Realty Corp. | 9,068 | 442,246 | ||||||
| Mindspace Business Parks REIT | 15,172 | 70,274 | ||||||
| Mori Hills REIT Investment Corp. | 160 | 179,748 | ||||||
| Nippon Building Fund, Inc. | 197 | 981,249 | ||||||
| NSI NV | 1,720 | 51,885 | ||||||
| Orion Office REIT, Inc. | 1,806 | 17,825 | ||||||
| Orix JREIT, Inc. | 264 | 363,080 | ||||||
| Postal Realty Trust, Inc., Class A | 1,103 | 16,379 | ||||||
| Precinct Properties New Zealand Ltd. | 173,288 | 141,812 | ||||||
| Prime US REIT | 50,100 | 31,287 | ||||||
| Prosperity REIT | 8,000 | 2,304 | ||||||
| RL Commercial REIT, Inc. | 326,700 | 35,698 | ||||||
Vakif Gayrimenkul Yatirim Ortakligi AS(1) | 82,194 | 12,806 | ||||||
Veris Residential, Inc.(1) | 5,534 | 74,377 | ||||||
| Workspace Group PLC | 15,922 | 96,391 | ||||||
| 10,023,664 | ||||||||
Real Estate Operating Companies† | ||||||||
| Lighthouse Properties PLC | 69,479 | 25,872 | ||||||
| Residential REITs — 14.4% | ||||||||
| Advance Residence Investment Corp. | 138 | 364,909 | ||||||
| Altarea SCA | 770 | 100,853 | ||||||
| American Homes 4 Rent, Class A | 19,720 | 701,243 | ||||||
| Apartment Income REIT Corp. | 9,029 | 368,835 | ||||||
| AvalonBay Communities, Inc. | 12,038 | 2,418,555 | ||||||
| Boardwalk Real Estate Investment Trust | 2,864 | 105,327 | ||||||
| BRT Apartments Corp. | 1,393 | 33,251 | ||||||
| BSR Real Estate Investment Trust | 198 | 3,202 | ||||||
| Camden Property Trust | 10,525 | 1,352,568 | ||||||
| Canadian Apartment Properties REIT | 9,247 | 314,511 | ||||||
23
| Avantis Real Estate ETF | ||||||||
| Shares | Value | |||||||
Care Property Invest NV(2) | 4,282 | $ | 92,405 | |||||
| Centerspace | 913 | 68,822 | ||||||
| Civitas Social Housing PLC | 53,391 | 44,079 | ||||||
| Comforia Residential REIT, Inc. | 53 | 130,054 | ||||||
| Daiwa Securities Living Investments Corp. | 231 | 206,278 | ||||||
| Emlak Konut Gayrimenkul Yatirim Ortakligi AS | 105,296 | 23,176 | ||||||
| Empiric Student Property PLC | 59,132 | 66,175 | ||||||
| Equity LifeStyle Properties, Inc. | 18,972 | 1,329,937 | ||||||
| Equity Residential | 36,480 | 2,669,606 | ||||||
| Essex Property Trust, Inc. | 5,564 | 1,474,794 | ||||||
| Flagship Communities REIT | 294 | 4,795 | ||||||
| Independence Realty Trust, Inc. | 13,886 | 270,083 | ||||||
| Ingenia Communities Group | 48,442 | 139,710 | ||||||
| InterRent Real Estate Investment Trust | 7,519 | 70,189 | ||||||
| Invitation Homes, Inc. | 41,054 | 1,489,439 | ||||||
| Irish Residential Properties REIT PLC | 106,234 | 135,450 | ||||||
| Kenedix Residential Next Investment Corp. | 102 | 165,694 | ||||||
| Killam Apartment Real Estate Investment Trust | 5,971 | 76,652 | ||||||
| Mid-America Apartment Communities, Inc. | 10,857 | 1,798,679 | ||||||
| Minto Apartment Real Estate Investment Trust | 1,605 | 18,356 | ||||||
| Nippon Accommodations Fund, Inc. | 61 | 299,413 | ||||||
| PRS REIT PLC | 51,343 | 61,174 | ||||||
| Samty Residential Investment Corp. | 14 | 12,790 | ||||||
Sinpas Gayrimenkul Yatirim Ortakligi AS(1) | 2,473 | 579 | ||||||
| Starts Proceed Investment Corp. | 7 | 12,901 | ||||||
| Sun Communities, Inc. | 12,896 | 1,982,244 | ||||||
| UDR, Inc. | 33,510 | 1,503,594 | ||||||
| UMH Properties, Inc. | 1,160 | 20,926 | ||||||
| UNITE Group PLC | 46,190 | 563,151 | ||||||
| Washington Real Estate Investment Trust | 9,799 | 192,158 | ||||||
| Xior Student Housing NV | 2,288 | 92,473 | ||||||
| 20,779,030 | ||||||||
| Retail REITs — 16.2% | ||||||||
| AEON REIT Investment Corp. | 138 | 155,813 | ||||||
| Agree Realty Corp. | 9,661 | 727,666 | ||||||
| BWP Trust | 83,174 | 225,059 | ||||||
| Capital & Counties Properties PLC | 78,867 | 109,602 | ||||||
| CapitaLand Integrated Commercial Trust | 835,900 | 1,236,315 | ||||||
| Carmila SA | 12,321 | 196,227 | ||||||
| Charter Hall Retail REIT | 90,536 | 251,720 | ||||||
| Choice Properties Real Estate Investment Trust | 14,845 | 153,610 | ||||||
| Crombie Real Estate Investment Trust | 5,221 | 61,816 | ||||||
| CT Real Estate Investment Trust | 4,970 | 61,077 | ||||||
| Eurocommercial Properties NV | 5,298 | 110,880 | ||||||
| Federal Realty Investment Trust | 10,280 | 1,041,056 | ||||||
| First Capital Real Estate Investment Trust | 10,486 | 120,720 | ||||||
| Fortune Real Estate Investment Trust | 144,000 | 117,079 | ||||||
| Frasers Centrepoint Trust | 108,900 | 175,781 | ||||||
| Frontier Real Estate Investment Corp. | 64 | 244,972 | ||||||
| Fukuoka REIT Corp. | 73 | 89,298 | ||||||
| Getty Realty Corp. | 2,944 | 88,555 | ||||||
24
| Avantis Real Estate ETF | ||||||||
| Shares | Value | |||||||
| Hamborner REIT AG | 11,025 | $ | 90,395 | |||||
| HomeCo Daily Needs REIT | 142,278 | 125,055 | ||||||
| Hyprop Investments Ltd. | 58,147 | 120,406 | ||||||
| InvenTrust Properties Corp. | 5,146 | 135,134 | ||||||
| Japan Metropolitan Fund Invest | 1,034 | 821,179 | ||||||
| Kenedix Retail REIT Corp. | 56 | 114,652 | ||||||
| Kimco Realty Corp. | 75,399 | 1,589,411 | ||||||
| Kite Realty Group Trust | 9,182 | 177,763 | ||||||
| Kiwi Property Group Ltd. | 12,883 | 8,022 | ||||||
Klepierre SA(1) | 43,950 | 901,514 | ||||||
| Lendlease Global Commercial REIT | 156,754 | 92,367 | ||||||
| Link REIT | 183,600 | 1,420,884 | ||||||
| LOTTE Reit Co. Ltd. | 23,539 | 90,062 | ||||||
| Mapletree Pan Asia Commercial Trust | 247,600 | 325,593 | ||||||
| National Retail Properties, Inc. | 22,072 | 991,033 | ||||||
NETSTREIT Corp.(2) | 3,739 | 73,509 | ||||||
| Phillips Edison & Co., Inc. | 8,983 | 293,475 | ||||||
| Primaris Real Estate Investment Trust | 4,549 | 46,205 | ||||||
| Realty Income Corp. | 62,008 | 4,233,906 | ||||||
| Regency Centers Corp. | 18,211 | 1,107,957 | ||||||
| Resilient REIT Ltd. | 41,188 | 130,069 | ||||||
| Retail Opportunity Investments Corp. | 6,737 | 112,845 | ||||||
| RioCan Real Estate Investment Trust | 23,149 | 354,810 | ||||||
| Sasseur Real Estate Investment Trust | 54,400 | 30,148 | ||||||
Shaftesbury PLC(2) | 26,736 | 127,852 | ||||||
| Shopping Centres Australasia Property Group | 120,711 | 222,950 | ||||||
| Simon Property Group, Inc. | 23,355 | 2,381,743 | ||||||
| SITE Centers Corp. | 19,883 | 257,684 | ||||||
| SmartCentres Real Estate Investment Trust | 7,735 | 164,730 | ||||||
| SPH REIT | 201,000 | 134,425 | ||||||
| Spirit Realty Capital, Inc. | 8,492 | 346,898 | ||||||
| Starhill Global REIT | 108,900 | 45,131 | ||||||
| Supermarket Income REIT PLC | 130,046 | 182,813 | ||||||
| Urstadt Biddle Properties, Inc., Class A | 3,378 | 56,480 | ||||||
| Vastned Retail NV | 1,035 | 22,970 | ||||||
| Vicinity Centres | 429,611 | 562,451 | ||||||
| Vukile Property Fund Ltd. | 116,910 | 91,753 | ||||||
| Waypoint REIT Ltd. | 68,502 | 122,553 | ||||||
| Wereldhave NV | 3,893 | 52,690 | ||||||
| 23,326,763 | ||||||||
| Specialized REITs — 28.4% | ||||||||
| American Tower Corp. | 38,779 | 9,851,805 | ||||||
| Arena REIT | 34,214 | 97,421 | ||||||
| Automotive Properties Real Estate Investment Trust | 1,936 | 18,986 | ||||||
| Big Yellow Group PLC | 21,616 | 332,974 | ||||||
| Charter Hall Social Infrastructure REIT | 51,367 | 128,826 | ||||||
| Crown Castle, Inc. | 33,897 | 5,790,625 | ||||||
| CubeSmart | 16,438 | 756,970 | ||||||
| Digital Realty Trust, Inc. | 20,813 | 2,573,111 | ||||||
| Equinix, Inc. | 6,799 | 4,469,459 | ||||||
| Extra Space Storage, Inc. | 9,708 | 1,929,271 | ||||||
25
| Avantis Real Estate ETF | ||||||||
| Shares | Value | |||||||
| Farmland Partners, Inc. | 947 | $ | 13,741 | |||||
| Four Corners Property Trust, Inc. | 6,128 | 164,782 | ||||||
| Gaming and Leisure Properties, Inc. | 20,019 | 966,317 | ||||||
| Gladstone Land Corp. | 548 | 12,883 | ||||||
| Hotel Property Investments | 20,255 | 45,907 | ||||||
| Keppel DC REIT | 104,800 | 145,400 | ||||||
| Koramco Energy Plus Reit | 7,888 | 31,465 | ||||||
| Lamar Advertising Co., Class A | 8,227 | 772,433 | ||||||
| Life Storage, Inc. | 8,021 | 1,020,672 | ||||||
| National Storage Affiliates Trust | 5,774 | 291,703 | ||||||
| National Storage REIT | 106,625 | 175,136 | ||||||
Power REIT(1) | 153 | 2,601 | ||||||
| Public Storage | 18,091 | 5,985,046 | ||||||
| Rural Funds Group | 39,014 | 69,466 | ||||||
| Safestore Holdings PLC | 17,840 | 228,382 | ||||||
| SBA Communications Corp. | 8,408 | 2,734,702 | ||||||
| Stor-Age Property REIT Ltd. | 32,780 | 25,154 | ||||||
| VICI Properties, Inc. | 67,070 | 2,212,639 | ||||||
| 40,847,877 | ||||||||
TOTAL COMMON STOCKS (Cost $152,532,174) | 143,365,748 | |||||||
| SHORT-TERM INVESTMENTS — 0.2% | ||||||||
| Money Market Funds — 0.2% | ||||||||
| State Street Institutional U.S. Government Money Market Fund, Premier Class | 180,152 | 180,152 | ||||||
State Street Navigator Securities Lending Government Money Market Portfolio(3) | 155,811 | 155,811 | ||||||
TOTAL SHORT-TERM INVESTMENTS (Cost $335,963) | 335,963 | |||||||
TOTAL INVESTMENT SECURITIES — 99.8% (Cost $152,868,137) | 143,701,711 | |||||||
| OTHER ASSETS AND LIABILITIES — 0.2% | 264,378 | |||||||
| TOTAL NET ASSETS — 100.0% | $ | 143,966,089 | ||||||
| NOTES TO SCHEDULE OF INVESTMENTS | ||||||||
†Category is less than 0.05% of total net assets.
(1)Non-income producing.
(2)Security, or a portion thereof, is on loan. At the period end, the aggregate value of securities on loan was $279,377. The amount of securities on loan indicated may not correspond with the securities on loan identified because securities with pending sales are in the process of recall from the brokers.
(3)Investment of cash collateral from securities on loan. At the period end, the aggregate value of the collateral held by the fund was $297,161, which includes securities collateral of $141,350.
See Notes to Financial Statements.
26
AUGUST 31, 2022
| Avantis U.S. Equity ETF | ||||||||
| Shares | Value | |||||||
| COMMON STOCKS — 99.8% | ||||||||
| Aerospace and Defense — 1.1% | ||||||||
AAR Corp.(1) | 4,892 | $ | 209,769 | |||||
Aerojet Rocketdyne Holdings, Inc.(1) | 12,505 | 538,590 | ||||||
AerSale Corp.(1) | 1,958 | 37,750 | ||||||
Archer Aviation, Inc., Class A(1)(2) | 8,098 | 28,667 | ||||||
Astronics Corp.(1) | 2,546 | 23,449 | ||||||
Axon Enterprise, Inc.(1) | 3,224 | 376,176 | ||||||
Boeing Co.(1) | 10,703 | 1,715,156 | ||||||
| BWX Technologies, Inc. | 25,635 | 1,336,353 | ||||||
| Curtiss-Wright Corp. | 4,641 | 683,109 | ||||||
Ducommun, Inc.(1) | 892 | 39,248 | ||||||
| General Dynamics Corp. | 6,588 | 1,508,191 | ||||||
| HEICO Corp. | 1,000 | 152,300 | ||||||
| HEICO Corp., Class A | 2,068 | 253,495 | ||||||
| Hexcel Corp. | 13,537 | 794,216 | ||||||
| Howmet Aerospace, Inc. | 20,407 | 723,020 | ||||||
| Huntington Ingalls Industries, Inc. | 3,746 | 862,554 | ||||||
| Kaman Corp. | 2,893 | 91,766 | ||||||
Kratos Defense & Security Solutions, Inc.(1) | 4,717 | 59,151 | ||||||
| L3Harris Technologies, Inc. | 5,501 | 1,255,273 | ||||||
| Lockheed Martin Corp. | 15,078 | 6,334,419 | ||||||
| Maxar Technologies, Inc. | 1,356 | 32,314 | ||||||
Mercury Systems, Inc.(1) | 663 | 31,910 | ||||||
| Moog, Inc., Class A | 7,671 | 575,172 | ||||||
| National Presto Industries, Inc. | 452 | 30,835 | ||||||
| Northrop Grumman Corp. | 4,035 | 1,928,690 | ||||||
| Park Aerospace Corp. | 228 | 2,624 | ||||||
Parsons Corp.(1) | 2,119 | 87,684 | ||||||
| Raytheon Technologies Corp. | 56,077 | 5,032,911 | ||||||
Spirit AeroSystems Holdings, Inc., Class A(2) | 384 | 11,558 | ||||||
| Textron, Inc. | 32,606 | 2,033,962 | ||||||
| TransDigm Group, Inc. | 1,447 | 868,764 | ||||||
Triumph Group, Inc.(1) | 936 | 12,159 | ||||||
V2X, Inc.(1) | 491 | 17,018 | ||||||
Virgin Galactic Holdings, Inc.(1) | 9,216 | 54,467 | ||||||
| Woodward, Inc. | 6,504 | 605,327 | ||||||
| 28,348,047 | ||||||||
| Air Freight and Logistics — 1.0% | ||||||||
Air Transport Services Group, Inc.(1) | 24,458 | 736,920 | ||||||
Atlas Air Worldwide Holdings, Inc.(1) | 9,204 | 919,664 | ||||||
| CH Robinson Worldwide, Inc. | 10,045 | 1,146,637 | ||||||
| Expeditors International of Washington, Inc. | 26,910 | 2,768,770 | ||||||
| FedEx Corp. | 29,020 | 6,117,706 | ||||||
| Forward Air Corp. | 6,501 | 630,857 | ||||||
GXO Logistics, Inc.(1) | 5,143 | 228,246 | ||||||
Hub Group, Inc., Class A(1) | 8,510 | 679,183 | ||||||
Radiant Logistics, Inc.(1) | 4,371 | 30,597 | ||||||
| United Parcel Service, Inc., Class B | 60,781 | 11,822,512 | ||||||
| 25,081,092 | ||||||||
27
| Avantis U.S. Equity ETF | ||||||||
| Shares | Value | |||||||
| Airlines — 0.3% | ||||||||
Alaska Air Group, Inc.(1) | 18,829 | $ | 820,191 | |||||
Allegiant Travel Co.(1) | 4,274 | 412,441 | ||||||
American Airlines Group, Inc.(1) | 32,567 | 423,045 | ||||||
Blade Air Mobility, Inc.(1) | 1,626 | 8,390 | ||||||
Delta Air Lines, Inc.(1) | 31,113 | 966,681 | ||||||
Frontier Group Holdings, Inc.(1)(2) | 2,424 | 31,270 | ||||||
Hawaiian Holdings, Inc.(1) | 13,923 | 208,706 | ||||||
JetBlue Airways Corp.(1) | 46,041 | 358,659 | ||||||
Joby Aviation, Inc.(1)(2) | 15,320 | 81,196 | ||||||
Mesa Air Group, Inc.(1) | 29 | 71 | ||||||
SkyWest, Inc.(1) | 11,182 | 238,065 | ||||||
Southwest Airlines Co.(1) | 49,514 | 1,817,164 | ||||||
Spirit Airlines, Inc.(1) | 20,815 | 472,084 | ||||||
Sun Country Airlines Holdings, Inc.(1) | 3,484 | 69,401 | ||||||
United Airlines Holdings, Inc.(1) | 21,975 | 769,345 | ||||||
Wheels Up Experience, Inc.(1) | 5,100 | 9,537 | ||||||
| 6,686,246 | ||||||||
| Auto Components — 0.4% | ||||||||
American Axle & Manufacturing Holdings, Inc.(1) | 66,709 | 690,438 | ||||||
Aptiv PLC(1) | 17,580 | 1,642,499 | ||||||
| Autoliv, Inc. | 15,143 | 1,177,974 | ||||||
| BorgWarner, Inc. | 41,409 | 1,561,119 | ||||||
| Dana, Inc. | 27,951 | 432,402 | ||||||
Dorman Products, Inc.(1) | 4,503 | 408,197 | ||||||
Garrett Motion, Inc.(1) | 1,509 | 10,397 | ||||||
| Gentex Corp. | 46,729 | 1,275,234 | ||||||
Gentherm, Inc.(1) | 7,923 | 474,588 | ||||||
Goodyear Tire & Rubber Co.(1) | 65,737 | 922,290 | ||||||
| LCI Industries | 1,163 | 134,757 | ||||||
| Lear Corp. | 9,111 | 1,263,149 | ||||||
Modine Manufacturing Co.(1) | 7,758 | 116,215 | ||||||
Motorcar Parts of America, Inc.(1) | 753 | 11,190 | ||||||
| Patrick Industries, Inc. | 3,643 | 192,970 | ||||||
QuantumScape Corp.(1)(2) | 4,621 | 50,970 | ||||||
Solid Power, Inc.(1) | 7,256 | 47,744 | ||||||
| Standard Motor Products, Inc. | 2,277 | 83,566 | ||||||
Stoneridge, Inc.(1) | 2,616 | 49,704 | ||||||
Visteon Corp.(1) | 2,384 | 285,675 | ||||||
XPEL, Inc.(1) | 618 | 42,351 | ||||||
| 10,873,429 | ||||||||
| Automobiles — 1.3% | ||||||||
Canoo, Inc.(1) | 2,099 | 6,696 | ||||||
Fisker, Inc.(1)(2) | 1,704 | 15,387 | ||||||
| Ford Motor Co. | 331,984 | 5,059,436 | ||||||
| General Motors Co. | 123,676 | 4,725,660 | ||||||
| Harley-Davidson, Inc. | 31,364 | 1,209,709 | ||||||
Lordstown Motors Corp., Class A(1) | 8,008 | 17,137 | ||||||
Lucid Group, Inc.(1)(2) | 7,374 | 113,117 | ||||||
Rivian Automotive, Inc., Class A(1)(2) | 13,295 | 434,879 | ||||||
Tesla, Inc.(1) | 72,197 | 19,898,215 | ||||||
28
| Avantis U.S. Equity ETF | ||||||||
| Shares | Value | |||||||
| Thor Industries, Inc. | 10,753 | $ | 871,101 | |||||
| Winnebago Industries, Inc. | 9,622 | 554,035 | ||||||
Workhorse Group, Inc.(1)(2) | 28,859 | 90,329 | ||||||
| 32,995,701 | ||||||||
| Banks — 5.7% | ||||||||
| 1st Source Corp. | 879 | 41,480 | ||||||
ACNB Corp.(2) | 607 | 21,585 | ||||||
| Allegiance Bancshares, Inc. | 3,173 | 134,408 | ||||||
| Amalgamated Financial Corp. | 1,882 | 42,345 | ||||||
| Amerant Bancorp, Inc. | 5,032 | 131,788 | ||||||
| American National Bankshares, Inc. | 154 | 5,071 | ||||||
| Ameris Bancorp | 13,031 | 608,287 | ||||||
| Arrow Financial Corp. | 2,252 | 72,312 | ||||||
| Associated Banc-Corp. | 29,179 | 584,747 | ||||||
| Atlantic Union Bankshares Corp. | 12,753 | 413,835 | ||||||
| Banc of California, Inc. | 10,178 | 171,805 | ||||||
| BancFirst Corp. | 2,563 | 276,445 | ||||||
Bancorp, Inc.(1) | 23,879 | 566,410 | ||||||
Bank First Corp.(2) | 1,208 | 98,174 | ||||||
| Bank of America Corp. | 294,019 | 9,881,979 | ||||||
| Bank of Hawaii Corp. | 8,346 | 651,155 | ||||||
| Bank of Marin Bancorp | 1,618 | 49,996 | ||||||
| Bank OZK | 20,312 | 823,245 | ||||||
| BankUnited, Inc. | 16,960 | 628,368 | ||||||
| Bankwell Financial Group, Inc. | 390 | 12,293 | ||||||
| Banner Corp. | 6,757 | 410,555 | ||||||
| Bar Harbor Bankshares | 1,386 | 39,265 | ||||||
| Baycom Corp. | 535 | 9,956 | ||||||
| BCB Bancorp, Inc. | 3,151 | 56,718 | ||||||
| Berkshire Hills Bancorp, Inc. | 7,977 | 225,031 | ||||||
| Blue Ridge Bankshares, Inc. | 1,176 | 17,252 | ||||||
| BOK Financial Corp. | 2,869 | 254,968 | ||||||
| Brookline Bancorp., Inc. | 14,184 | 176,874 | ||||||
| Business First Bancshares, Inc. | 2,302 | 54,304 | ||||||
| Byline Bancorp, Inc. | 4,125 | 89,966 | ||||||
| Cadence Bank | 36,260 | 923,905 | ||||||
| Cambridge Bancorp | 976 | 80,256 | ||||||
| Camden National Corp. | 2,488 | 112,532 | ||||||
| Capital City Bank Group, Inc. | 1,758 | 56,133 | ||||||
| Capstar Financial Holdings, Inc. | 2,332 | 46,990 | ||||||
Carter Bankshares, Inc.(1) | 2,725 | 44,881 | ||||||
| Cathay General Bancorp. | 14,807 | 621,006 | ||||||
| CBTX, Inc. | 2,246 | 66,931 | ||||||
| Central Pacific Financial Corp. | 6,548 | 142,681 | ||||||
| Central Valley Community Bancorp | 21 | 374 | ||||||
| Citigroup, Inc. | 136,534 | 6,664,225 | ||||||
| Citizens & Northern Corp. | 155 | 3,720 | ||||||
| Citizens Financial Group, Inc. | 57,203 | 2,098,206 | ||||||
| City Holding Co. | 2,660 | 226,127 | ||||||
| Civista Bancshares, Inc. | 849 | 17,956 | ||||||
| CNB Financial Corp. | 3,102 | 81,645 | ||||||
29
| Avantis U.S. Equity ETF | ||||||||
| Shares | Value | |||||||
Coastal Financial Corp.(1) | 861 | $ | 34,612 | |||||
| Codorus Valley Bancorp, Inc. | 16 | 320 | ||||||
| Columbia Banking System, Inc. | 12,336 | 369,463 | ||||||
| Comerica, Inc. | 21,876 | 1,756,643 | ||||||
| Commerce Bancshares, Inc. | 15,413 | 1,059,952 | ||||||
| Community Bank System, Inc. | 6,934 | 453,345 | ||||||
| Community Trust Bancorp, Inc. | 3,028 | 127,933 | ||||||
| ConnectOne Bancorp, Inc. | 6,543 | 163,771 | ||||||
CrossFirst Bankshares, Inc.(1) | 6,677 | 88,003 | ||||||
| Cullen/Frost Bankers, Inc. | 6,516 | 846,819 | ||||||
Customers Bancorp, Inc.(1) | 7,949 | 275,751 | ||||||
| CVB Financial Corp. | 18,200 | 477,568 | ||||||
| Dime Community Bancshares, Inc. | 9,508 | 297,220 | ||||||
| Eagle Bancorp, Inc. | 11,234 | 545,186 | ||||||
| East West Bancorp, Inc. | 22,654 | 1,634,939 | ||||||
| Eastern Bankshares, Inc. | 35,518 | 689,049 | ||||||
| Enterprise Bancorp, Inc. | 600 | 19,308 | ||||||
| Enterprise Financial Services Corp. | 6,713 | 306,918 | ||||||
| Equity Bancshares, Inc., Class A | 2,764 | 86,320 | ||||||
| Esquire Financial Holdings, Inc. | 310 | 11,588 | ||||||
| F.N.B. Corp. | 68,839 | 820,561 | ||||||
| Farmers & Merchants Bancorp, Inc. | 647 | 18,478 | ||||||
| Farmers National Banc Corp. | 3,803 | 54,345 | ||||||
| FB Financial Corp. | 6,574 | 260,462 | ||||||
| Fifth Third Bancorp | 81,662 | 2,788,757 | ||||||
| Financial Institutions, Inc. | 2,812 | 73,196 | ||||||
| First BanCorp | 53,643 | 767,095 | ||||||
| First Bancorp, Inc. | 582 | 16,878 | ||||||
| First Bancorp/Southern Pines NC | 5,756 | 209,576 | ||||||
| First Bancshares, Inc. | 3,315 | 99,119 | ||||||
| First Busey Corp. | 9,506 | 218,638 | ||||||
| First Business Financial Services, Inc. | 806 | 26,824 | ||||||
| First Citizens BancShares, Inc., Class A | 2,078 | 1,687,253 | ||||||
| First Commonwealth Financial Corp. | 14,363 | 193,613 | ||||||
| First Community Bankshares, Inc. | 2,112 | 66,591 | ||||||
| First Financial Bancorp | 26,735 | 576,941 | ||||||
| First Financial Bankshares, Inc. | 16,586 | 705,071 | ||||||
| First Financial Corp. | 1,812 | 84,258 | ||||||
| First Foundation, Inc. | 9,105 | 172,631 | ||||||
| First Hawaiian, Inc. | 21,920 | 563,563 | ||||||
| First Horizon Corp. | 57,687 | 1,304,880 | ||||||
| First Internet Bancorp | 1,280 | 46,938 | ||||||
| First Interstate Bancsystem, Inc., Class A | 16,740 | 673,952 | ||||||
| First Merchants Corp. | 14,647 | 583,244 | ||||||
| First Mid Bancshares, Inc. | 3,037 | 107,358 | ||||||
| First of Long Island Corp. | 2,567 | 47,258 | ||||||
| First Republic Bank | 14,565 | 2,211,404 | ||||||
| Flushing Financial Corp. | 5,686 | 117,416 | ||||||
| Fulton Financial Corp. | 38,080 | 618,038 | ||||||
| German American Bancorp, Inc. | 3,840 | 144,230 | ||||||
| Glacier Bancorp, Inc. | 13,902 | 704,553 | ||||||
30
| Avantis U.S. Equity ETF | ||||||||
| Shares | Value | |||||||
| Great Southern Bancorp, Inc. | 2,104 | $ | 123,673 | |||||
| Guaranty Bancshares, Inc. | 883 | 30,596 | ||||||
| Hancock Whitney Corp. | 16,167 | 779,734 | ||||||
| Hanmi Financial Corp. | 8,993 | 222,307 | ||||||
| HarborOne Bancorp, Inc. | 6,589 | 89,874 | ||||||
| Heartland Financial USA, Inc. | 12,518 | 559,179 | ||||||
| Heritage Commerce Corp. | 9,127 | 103,044 | ||||||
| Heritage Financial Corp. | 6,202 | 161,190 | ||||||
| Hilltop Holdings, Inc. | 18,880 | 498,432 | ||||||
| Home BancShares, Inc. | 23,712 | 557,943 | ||||||
| HomeStreet, Inc. | 4,609 | 160,439 | ||||||
| HomeTrust Bancshares, Inc. | 894 | 20,759 | ||||||
| Hope Bancorp, Inc. | 39,434 | 570,610 | ||||||
| Horizon Bancorp, Inc. | 6,529 | 123,529 | ||||||
| Huntington Bancshares, Inc. | 195,081 | 2,614,085 | ||||||
| Independent Bank Corp. (Massachusetts) | 7,996 | 625,527 | ||||||
| Independent Bank Corp. (Michigan) | 3,937 | 80,787 | ||||||
| Independent Bank Group, Inc. | 3,421 | 230,439 | ||||||
| International Bancshares Corp. | 14,685 | 612,805 | ||||||
| Investar Holding Corp. | 198 | 4,277 | ||||||
| JPMorgan Chase & Co. | 153,624 | 17,471,658 | ||||||
| KeyCorp | 123,340 | 2,181,885 | ||||||
| Lakeland Bancorp, Inc. | 9,990 | 162,737 | ||||||
| Lakeland Financial Corp. | 4,042 | 304,524 | ||||||
| Live Oak Bancshares, Inc. | 7,693 | 278,794 | ||||||
| M&T Bank Corp. | 16,371 | 2,975,920 | ||||||
| Macatawa Bank Corp. | 2,744 | 26,123 | ||||||
| MainStreet Bancshares, Inc. | 72 | 1,744 | ||||||
| Mercantile Bank Corp. | 2,588 | 85,611 | ||||||
| Metrocity Bankshares, Inc. | 4,302 | 85,997 | ||||||
Metropolitan Bank Holding Corp.(1) | 1,189 | 85,121 | ||||||
| Mid Penn Bancorp, Inc. | 1,010 | 29,381 | ||||||
| Midland States Bancorp, Inc. | 4,225 | 106,005 | ||||||
| MidWestOne Financial Group, Inc. | 1,178 | 35,929 | ||||||
| MVB Financial Corp. | 1,299 | 41,542 | ||||||
| National Bank Holdings Corp., Class A | 5,360 | 215,097 | ||||||
| NBT Bancorp, Inc. | 7,325 | 284,064 | ||||||
Nicolet Bankshares, Inc.(1) | 1,402 | 107,365 | ||||||
| Northeast Bank | 1,166 | 45,206 | ||||||
| Northrim BanCorp, Inc. | 414 | 16,788 | ||||||
| Northwest Bancshares, Inc. | 21,204 | 298,340 | ||||||
| OceanFirst Financial Corp. | 8,245 | 160,283 | ||||||
| OFG Bancorp | 14,801 | 402,587 | ||||||
| Old National Bancorp. | 48,783 | 814,188 | ||||||
| Old Second Bancorp, Inc. | 6,728 | 92,308 | ||||||
| Origin Bancorp, Inc. | 5,011 | 204,699 | ||||||
| Orrstown Financial Services, Inc. | 1,015 | 26,116 | ||||||
| Pacific Premier Bancorp, Inc. | 11,781 | 385,946 | ||||||
| PacWest Bancorp | 17,768 | 467,831 | ||||||
| Park National Corp. | 4,381 | 577,547 | ||||||
| Parke Bancorp, Inc. | 1,098 | 24,354 | ||||||
31
| Avantis U.S. Equity ETF | ||||||||
| Shares | Value | |||||||
| Pathward Financial, Inc. | 11,805 | $ | 389,093 | |||||
| PCB Bancorp. | 1,175 | 22,067 | ||||||
| PCSB Financial Corp. | 315 | 5,831 | ||||||
| Peapack-Gladstone Financial Corp. | 2,271 | 76,465 | ||||||
| Peoples Bancorp, Inc. | 4,596 | 137,374 | ||||||
| Pinnacle Financial Partners, Inc. | 8,088 | 652,783 | ||||||
| PNC Financial Services Group, Inc. | 30,096 | 4,755,168 | ||||||
| Popular, Inc. | 18,214 | 1,406,485 | ||||||
| Preferred Bank | 3,541 | 240,221 | ||||||
| Premier Financial Corp. | 6,454 | 174,387 | ||||||
| Primis Financial Corp. | 1,437 | 18,839 | ||||||
Professional Holding Corp., Class A(1) | 763 | 21,333 | ||||||
| Prosperity Bancshares, Inc. | 10,598 | 751,186 | ||||||
| QCR Holdings, Inc. | 4,146 | 231,554 | ||||||
| RBB Bancorp | 2,767 | 61,151 | ||||||
| Regions Financial Corp. | 122,578 | 2,656,265 | ||||||
| Renasant Corp. | 8,940 | 298,060 | ||||||
| Republic Bancorp, Inc., Class A | 1,027 | 43,648 | ||||||
| S&T Bancorp, Inc. | 5,344 | 158,396 | ||||||
| Sandy Spring Bancorp, Inc. | 13,314 | 512,855 | ||||||
| Seacoast Banking Corp. of Florida | 17,250 | 557,520 | ||||||
| ServisFirst Bancshares, Inc. | 8,771 | 739,922 | ||||||
| Shore Bancshares, Inc. | 1,102 | 20,993 | ||||||
| Sierra Bancorp | 1,242 | 25,734 | ||||||
| Signature Bank | 6,588 | 1,148,684 | ||||||
Silvergate Capital Corp., Class A(1) | 1,566 | 142,694 | ||||||
| Simmons First National Corp., Class A | 15,907 | 375,246 | ||||||
| SmartFinancial, Inc. | 1,143 | 28,678 | ||||||
| South Plains Financial, Inc. | 841 | 22,816 | ||||||
Southern First Bancshares, Inc.(1) | 753 | 32,462 | ||||||
| Southside Bancshares, Inc. | 4,581 | 172,612 | ||||||
| SouthState Corp. | 10,123 | 789,999 | ||||||
| Stock Yards Bancorp, Inc. | 2,784 | 184,468 | ||||||
| Summit Financial Group, Inc. | 829 | 23,643 | ||||||
SVB Financial Group(1) | 7,040 | 2,861,901 | ||||||
| Synovus Financial Corp. | 28,633 | 1,149,901 | ||||||
Texas Capital Bancshares, Inc.(1) | 9,030 | 533,041 | ||||||
| Tompkins Financial Corp. | 2,065 | 147,937 | ||||||
| Towne Bank | 20,779 | 591,994 | ||||||
| Trico Bancshares | 6,340 | 299,185 | ||||||
Triumph Bancorp, Inc.(1) | 7,035 | 435,537 | ||||||
| Truist Financial Corp. | 91,357 | 4,279,162 | ||||||
| Trustmark Corp. | 19,668 | 620,329 | ||||||
| U.S. Bancorp | 99,923 | 4,557,488 | ||||||
| UMB Financial Corp. | 7,893 | 706,187 | ||||||
| Umpqua Holdings Corp. | 48,879 | 867,113 | ||||||
| United Bankshares, Inc. | 17,280 | 641,088 | ||||||
| United Community Banks, Inc. | 19,656 | 659,066 | ||||||
| United Security Bancshares | 415 | 2,947 | ||||||
| Unity Bancorp, Inc. | 959 | 26,881 | ||||||
| Univest Financial Corp. | 4,517 | 112,022 | ||||||
32
| Avantis U.S. Equity ETF | ||||||||
| Shares | Value | |||||||
| Valley National Bancorp | 60,050 | $ | 697,781 | |||||
| Veritex Holdings, Inc. | 7,603 | 228,926 | ||||||
| Washington Federal, Inc. | 18,368 | 587,960 | ||||||
| Washington Trust Bancorp, Inc. | 2,999 | 151,839 | ||||||
| Webster Financial Corp. | 23,690 | 1,114,615 | ||||||
| Wells Fargo & Co. | 250,257 | 10,938,733 | ||||||
| WesBanco, Inc. | 17,707 | 605,756 | ||||||
| West BanCorp, Inc. | 1,287 | 31,673 | ||||||
| Westamerica Bancorporation | 3,919 | 219,268 | ||||||
| Western Alliance Bancorp | 17,156 | 1,316,208 | ||||||
| Wintrust Financial Corp. | 10,667 | 899,655 | ||||||
| Zions Bancorp NA | 25,735 | 1,416,197 | ||||||
| 142,689,955 | ||||||||
| Beverages — 1.1% | ||||||||
Boston Beer Co., Inc., Class A(1) | 740 | 249,439 | ||||||
| Brown-Forman Corp., Class A | 3,038 | 214,392 | ||||||
| Brown-Forman Corp., Class B | 29,032 | 2,110,626 | ||||||
Celsius Holdings, Inc.(1) | 939 | 97,177 | ||||||
| Coca-Cola Co. | 142,135 | 8,771,151 | ||||||
| Coca-Cola Consolidated, Inc. | 1,361 | 645,563 | ||||||
| Constellation Brands, Inc., Class A | 7,277 | 1,790,506 | ||||||
Duckhorn Portfolio, Inc.(1) | 2,145 | 39,125 | ||||||
| Keurig Dr Pepper, Inc. | 27,967 | 1,066,102 | ||||||
| MGP Ingredients, Inc. | 185 | 20,250 | ||||||
| Molson Coors Beverage Co., Class B | 25,808 | 1,333,499 | ||||||
Monster Beverage Corp.(1) | 21,302 | 1,892,257 | ||||||
| National Beverage Corp. | 6,864 | 380,678 | ||||||
| PepsiCo, Inc. | 58,759 | 10,122,413 | ||||||
Vintage Wine Estates, Inc.(1)(2) | 1,800 | 10,638 | ||||||
| 28,743,816 | ||||||||
| Biotechnology — 3.1% | ||||||||
2seventy bio, Inc.(1) | 3,479 | 51,246 | ||||||
| AbbVie, Inc. | 85,839 | 11,541,912 | ||||||
Adagio Therapeutics, Inc.(1) | 1,749 | 7,975 | ||||||
Adicet Bio, Inc.(1) | 2,017 | 28,561 | ||||||
ADMA Biologics, Inc.(1) | 5,354 | 14,456 | ||||||
Agenus, Inc.(1) | 4,971 | 13,422 | ||||||
Agios Pharmaceuticals, Inc.(1) | 4,516 | 115,158 | ||||||
Albireo Pharma, Inc.(1) | 1,606 | 28,105 | ||||||
Aldeyra Therapeutics, Inc.(1) | 5,236 | 36,861 | ||||||
Alector, Inc.(1) | 12,490 | 129,272 | ||||||
Alkermes PLC(1) | 11,615 | 274,927 | ||||||
Allogene Therapeutics, Inc.(1)(2) | 13,536 | 185,579 | ||||||
Alnylam Pharmaceuticals, Inc.(1) | 3,899 | 805,806 | ||||||
Altimmune, Inc.(1) | 4,810 | 106,205 | ||||||
| Amgen, Inc. | 35,376 | 8,500,853 | ||||||
AnaptysBio, Inc.(1) | 790 | 18,344 | ||||||
Anavex Life Sciences Corp.(1) | 1,024 | 9,820 | ||||||
Anika Therapeutics, Inc.(1) | 686 | 15,504 | ||||||
Apellis Pharmaceuticals, Inc.(1) | 2,435 | 147,342 | ||||||
Arcellx, Inc.(1) | 1,188 | 21,348 | ||||||
33
| Avantis U.S. Equity ETF | ||||||||
| Shares | Value | |||||||
Arcus Biosciences, Inc.(1) | 16,414 | $ | 395,249 | |||||
Arcutis Biotherapeutics, Inc.(1) | 2,806 | 75,622 | ||||||
Arrowhead Pharmaceuticals, Inc.(1) | 1,983 | 78,745 | ||||||
Atara Biotherapeutics, Inc.(1) | 2,178 | 8,734 | ||||||
Atreca, Inc., Class A(1) | 18 | 33 | ||||||
Avid Bioservices, Inc.(1) | 3,202 | 55,138 | ||||||
Beam Therapeutics, Inc.(1) | 260 | 14,196 | ||||||
BioCryst Pharmaceuticals, Inc.(1) | 6,896 | 95,854 | ||||||
Biogen, Inc.(1) | 18,170 | 3,550,055 | ||||||
Biohaven Pharmaceutical Holding Co. Ltd.(1) | 4,822 | 720,166 | ||||||
BioMarin Pharmaceutical, Inc.(1) | 11,412 | 1,017,950 | ||||||
Biomea Fusion, Inc.(1) | 889 | 10,224 | ||||||
Bluebird Bio, Inc.(1)(2) | 1,541 | 8,999 | ||||||
Blueprint Medicines Corp.(1) | 7,158 | 524,109 | ||||||
Bridgebio Pharma, Inc.(1)(2) | 3,088 | 32,424 | ||||||
C4 Therapeutics, Inc.(1) | 872 | 8,790 | ||||||
CareDx, Inc.(1) | 1,571 | 30,776 | ||||||
Caribou Biosciences, Inc.(1) | 425 | 4,195 | ||||||
Catalyst Pharmaceuticals, Inc.(1) | 22,268 | 301,509 | ||||||
Cerevel Therapeutics Holdings, Inc.(1) | 294 | 8,555 | ||||||
ChemoCentryx, Inc.(1) | 3,341 | 170,324 | ||||||
Chinook Therapeutics, Inc.(1) | 6,926 | 144,061 | ||||||
Cogent Biosciences, Inc.(1) | 3,613 | 59,578 | ||||||
Concert Pharmaceuticals, Inc.(1) | 181 | 1,191 | ||||||
Crinetics Pharmaceuticals, Inc.(1) | 241 | 4,550 | ||||||
CRISPR Therapeutics AG(1)(2) | 7,014 | 456,541 | ||||||
CTI BioPharma Corp.(1) | 4,815 | 30,238 | ||||||
Cullinan Oncology, Inc.(1) | 3,636 | 49,013 | ||||||
CytomX Therapeutics, Inc.(1) | 9 | 14 | ||||||
Day One Biopharmaceuticals, Inc.(1) | 8,018 | 188,343 | ||||||
Deciphera Pharmaceuticals, Inc.(1) | 4,637 | 75,259 | ||||||
Denali Therapeutics, Inc.(1) | 7,149 | 197,813 | ||||||
Design Therapeutics, Inc.(1) | 167 | 3,383 | ||||||
Dynavax Technologies Corp.(1) | 33,564 | 384,979 | ||||||
Dyne Therapeutics, Inc.(1) | 1,566 | 15,347 | ||||||
Eagle Pharmaceuticals, Inc.(1) | 1,170 | 38,341 | ||||||
Editas Medicine, Inc.(1) | 5,061 | 74,397 | ||||||
Eiger BioPharmaceuticals, Inc.(1) | 2 | 17 | ||||||
Emergent BioSolutions, Inc.(1) | 9,931 | 238,543 | ||||||
Enanta Pharmaceuticals, Inc.(1) | 1,062 | 64,655 | ||||||
Entrada Therapeutics, Inc.(1) | 2,872 | 36,273 | ||||||
EQRx, Inc.(1)(2) | 42,524 | 207,942 | ||||||
Evelo Biosciences, Inc.(1) | 99 | 217 | ||||||
Exact Sciences Corp.(1) | 4,780 | 169,929 | ||||||
Exelixis, Inc.(1) | 44,268 | 785,314 | ||||||
Fate Therapeutics, Inc.(1) | 3,184 | 83,230 | ||||||
Foghorn Therapeutics, Inc.(1) | 1,354 | 13,459 | ||||||
Forma Therapeutics Holdings, Inc.(1) | 975 | 13,065 | ||||||
Generation Bio Co.(1) | 2,942 | 15,063 | ||||||
Geron Corp.(1)(2) | 25,830 | 68,191 | ||||||
| Gilead Sciences, Inc. | 143,720 | 9,121,908 | ||||||
34
| Avantis U.S. Equity ETF | ||||||||
| Shares | Value | |||||||
Gossamer Bio, Inc.(1)(2) | 1,430 | $ | 19,949 | |||||
Halozyme Therapeutics, Inc.(1) | 38,533 | 1,569,449 | ||||||
Horizon Therapeutics PLC(1) | 20,387 | 1,207,114 | ||||||
Humanigen, Inc.(1) | 1,377 | 307 | ||||||
Ideaya Biosciences, Inc.(1) | 3,647 | 35,850 | ||||||
Imago Biosciences, Inc.(1) | 189 | 2,746 | ||||||
ImmunityBio, Inc.(1)(2) | 1,718 | 6,872 | ||||||
ImmunoGen, Inc.(1) | 2,876 | 16,710 | ||||||
Incyte Corp.(1) | 15,315 | 1,078,635 | ||||||
Inovio Pharmaceuticals, Inc.(1) | 4,201 | 9,620 | ||||||
Intellia Therapeutics, Inc.(1) | 1,880 | 112,913 | ||||||
Intercept Pharmaceuticals, Inc.(1) | 985 | 17,109 | ||||||
Ionis Pharmaceuticals, Inc.(1) | 7,366 | 313,202 | ||||||
Iovance Biotherapeutics, Inc.(1) | 7,081 | 75,908 | ||||||
Ironwood Pharmaceuticals, Inc.(1) | 52,595 | 565,922 | ||||||
iTeos Therapeutics, Inc.(1) | 4,335 | 96,150 | ||||||
KalVista Pharmaceuticals, Inc.(1) | 1,313 | 21,625 | ||||||
Karuna Therapeutics, Inc.(1) | 138 | 35,198 | ||||||
Karyopharm Therapeutics, Inc.(1) | 2,879 | 14,568 | ||||||
Keros Therapeutics, Inc.(1) | 1,005 | 35,547 | ||||||
Kezar Life Sciences, Inc.(1) | 2,073 | 21,310 | ||||||
Kinnate Biopharma, Inc.(1)(2) | 1,222 | 17,695 | ||||||
Kodiak Sciences, Inc.(1) | 479 | 4,795 | ||||||
Krystal Biotech, Inc.(1) | 1,128 | 79,084 | ||||||
Kura Oncology, Inc.(1) | 6,683 | 92,626 | ||||||
Kymera Therapeutics, Inc.(1) | 596 | 16,849 | ||||||
Ligand Pharmaceuticals, Inc.(1) | 1,609 | 148,656 | ||||||
Lyell Immunopharma, Inc.(1) | 14,815 | 99,261 | ||||||
MannKind Corp.(1)(2) | 11,800 | 43,070 | ||||||
Mersana Therapeutics, Inc.(1) | 5,475 | 41,063 | ||||||
Merus NV(1)(2) | 468 | 11,082 | ||||||
MiMedx Group, Inc.(1) | 1,944 | 6,862 | ||||||
Mirati Therapeutics, Inc.(1) | 1,829 | 148,204 | ||||||
Mirum Pharmaceuticals, Inc.(1) | 198 | 4,946 | ||||||
Moderna, Inc.(1) | 41,794 | 5,528,092 | ||||||
Morphic Holding, Inc.(1) | 721 | 19,842 | ||||||
Myovant Sciences Ltd.(1) | 847 | 14,475 | ||||||
Myriad Genetics, Inc.(1) | 21,316 | 476,199 | ||||||
Natera, Inc.(1) | 502 | 24,729 | ||||||
Neurocrine Biosciences, Inc.(1) | 7,536 | 788,492 | ||||||
Nkarta, Inc.(1) | 1,085 | 15,613 | ||||||
Novavax, Inc.(1)(2) | 377 | 12,456 | ||||||
Nurix Therapeutics, Inc.(1) | 2,656 | 41,779 | ||||||
Nuvalent, Inc., Class A(1) | 2,052 | 34,638 | ||||||
Ocugen, Inc.(1) | 457 | 1,179 | ||||||
Organogenesis Holdings, Inc.(1) | 6,078 | 21,820 | ||||||
PDL BioPharma, Inc.(1) | 1,937 | 4,959 | ||||||
PMV Pharmaceuticals, Inc.(1)(2) | 2,279 | 31,724 | ||||||
Point Biopharma Global, Inc.(1)(2) | 3,894 | 37,967 | ||||||
Prometheus Biosciences, Inc.(1) | 726 | 37,977 | ||||||
Protagonist Therapeutics, Inc.(1) | 979 | 8,537 | ||||||
35
| Avantis U.S. Equity ETF | ||||||||
| Shares | Value | |||||||
PTC Therapeutics, Inc.(1) | 3,800 | $ | 189,772 | |||||
Radius Health, Inc.(1) | 996 | 10 | ||||||
RAPT Therapeutics, Inc.(1) | 813 | 21,715 | ||||||
Recursion Pharmaceuticals, Inc., Class A(1) | 4,672 | 49,103 | ||||||
Regeneron Pharmaceuticals, Inc.(1) | 13,262 | 7,706,018 | ||||||
REGENXBIO, Inc.(1) | 8,268 | 243,906 | ||||||
Relay Therapeutics, Inc.(1) | 1,888 | 43,367 | ||||||
Repare Therapeutics, Inc.(1)(2) | 1,152 | 13,732 | ||||||
Replimune Group, Inc.(1) | 3,439 | 65,547 | ||||||
REVOLUTION Medicines, Inc.(1) | 4,712 | 98,151 | ||||||
Rhythm Pharmaceuticals, Inc.(1) | 2,979 | 67,325 | ||||||
Rigel Pharmaceuticals, Inc.(1) | 5,348 | 7,594 | ||||||
Rocket Pharmaceuticals, Inc.(1) | 3,752 | 57,818 | ||||||
Roivant Sciences Ltd.(1)(2) | 13,886 | 49,434 | ||||||
Sage Therapeutics, Inc.(1) | 15,478 | 582,901 | ||||||
Sana Biotechnology, Inc.(1)(2) | 5,954 | 40,547 | ||||||
Sangamo Therapeutics, Inc.(1) | 32,370 | 174,798 | ||||||
Sarepta Therapeutics, Inc.(1) | 2,762 | 302,108 | ||||||
Seagen, Inc.(1) | 5,903 | 910,774 | ||||||
Stoke Therapeutics, Inc.(1) | 64 | 964 | ||||||
Syndax Pharmaceuticals, Inc.(1) | 3,090 | 72,955 | ||||||
Tango Therapeutics, Inc.(1) | 3,500 | 14,350 | ||||||
TCR2 Therapeutics, Inc.(1) | 2 | 5 | ||||||
Travere Therapeutics, Inc.(1) | 1,018 | 27,242 | ||||||
Twist Bioscience Corp.(1) | 1,937 | 77,712 | ||||||
Ultragenyx Pharmaceutical, Inc.(1) | 2,831 | 135,010 | ||||||
uniQure NV(1) | 10,358 | 202,395 | ||||||
United Therapeutics Corp.(1) | 9,720 | 2,202,746 | ||||||
Vanda Pharmaceuticals, Inc.(1) | 6,611 | 69,944 | ||||||
Vaxart, Inc.(1)(2) | 2,744 | 8,506 | ||||||
Vaxcyte, Inc.(1) | 3,376 | 88,316 | ||||||
Veracyte, Inc.(1) | 4,325 | 88,230 | ||||||
Vericel Corp.(1) | 8 | 200 | ||||||
Vertex Pharmaceuticals, Inc.(1) | 29,202 | 8,227,956 | ||||||
Verve Therapeutics, Inc.(1) | 1,113 | 42,695 | ||||||
Vir Biotechnology, Inc.(1) | 25,354 | 602,158 | ||||||
Xencor, Inc.(1) | 5,756 | 151,901 | ||||||
Xenon Pharmaceuticals, Inc.(1) | 2,708 | 105,097 | ||||||
XOMA Corp.(1) | 135 | 2,684 | ||||||
Y-mAbs Therapeutics, Inc.(1) | 2,512 | 40,393 | ||||||
Zentalis Pharmaceuticals, Inc.(1) | 246 | 6,595 | ||||||
Zymeworks, Inc.(1) | 2,081 | 13,339 | ||||||
| 77,582,585 | ||||||||
| Building Products — 0.7% | ||||||||
| Advanced Drainage Systems, Inc. | 7,804 | 1,059,003 | ||||||
| Allegion PLC | 7,627 | 725,328 | ||||||
Alpha Pro Tech Ltd.(1) | 26 | 107 | ||||||
| AO Smith Corp. | 18,774 | 1,059,792 | ||||||
| Apogee Enterprises, Inc. | 6,213 | 253,739 | ||||||
| Armstrong World Industries, Inc. | 10,820 | 908,772 | ||||||
Builders FirstSource, Inc.(1) | 38,297 | 2,244,587 | ||||||
36
| Avantis U.S. Equity ETF | ||||||||
| Shares | Value | |||||||
| Carlisle Cos., Inc. | 5,505 | $ | 1,627,608 | |||||
| Carrier Global Corp. | 27,237 | 1,065,511 | ||||||
| CSW Industrials, Inc. | 1,598 | 202,307 | ||||||
| Fortune Brands Home & Security, Inc. | 7,040 | 432,467 | ||||||
Gibraltar Industries, Inc.(1) | 2,489 | 104,165 | ||||||
Hayward Holdings, Inc.(1) | 7,594 | 79,813 | ||||||
| Insteel Industries, Inc. | 2,774 | 80,169 | ||||||
Janus International Group, Inc.(1) | 2,408 | 24,875 | ||||||
JELD-WEN Holding, Inc.(1) | 20,972 | 233,838 | ||||||
| Johnson Controls International PLC | 17,338 | 938,679 | ||||||
| Lennox International, Inc. | 592 | 142,151 | ||||||
| Masco Corp. | 11,324 | 576,052 | ||||||
Masonite International Corp.(1) | 6,454 | 528,066 | ||||||
| Owens Corning | 23,553 | 1,924,987 | ||||||
PGT Innovations, Inc.(1) | 1,029 | 21,527 | ||||||
| Quanex Building Products Corp. | 5,105 | 113,841 | ||||||
Resideo Technologies, Inc.(1) | 1,537 | 32,000 | ||||||
| Simpson Manufacturing Co., Inc. | 6,839 | 633,565 | ||||||
| Trane Technologies PLC | 7,672 | 1,182,025 | ||||||
Trex Co., Inc.(1) | 20,209 | 945,579 | ||||||
| UFP Industries, Inc. | 11,474 | 910,921 | ||||||
| Zurn Elkay Water Solutions Corp. | 10,163 | 280,296 | ||||||
| 18,331,770 | ||||||||
| Capital Markets — 3.7% | ||||||||
| Affiliated Managers Group, Inc. | 2,322 | 295,730 | ||||||
| Ameriprise Financial, Inc. | 18,803 | 5,039,392 | ||||||
| Ares Management Corp., Class A | 4,949 | 366,919 | ||||||
| Artisan Partners Asset Management, Inc., Class A | 19,087 | 644,377 | ||||||
Assetmark Financial Holdings, Inc.(1) | 872 | 16,864 | ||||||
B. Riley Financial, Inc.(2) | 9,561 | 475,851 | ||||||
| Bank of New York Mellon Corp. | 60,617 | 2,517,424 | ||||||
| BGC Partners, Inc., Class A | 39,402 | 158,396 | ||||||
| BlackRock, Inc. | 6,371 | 4,245,571 | ||||||
| Blackstone, Inc. | 46,842 | 4,400,338 | ||||||
Blucora, Inc.(1) | 1,232 | 24,739 | ||||||
Blue Owl Capital, Inc.(2) | 4,041 | 44,855 | ||||||
| Brightsphere Investment Group, Inc. | 24,798 | 423,798 | ||||||
| Carlyle Group, Inc. | 41,916 | 1,363,528 | ||||||
| Cboe Global Markets, Inc. | 6,267 | 739,318 | ||||||
| Charles Schwab Corp. | 84,924 | 6,025,358 | ||||||
| CME Group, Inc. | 16,548 | 3,236,954 | ||||||
| Cohen & Steers, Inc. | 7,124 | 508,511 | ||||||
Coinbase Global, Inc., Class A(1)(2) | 15,230 | 1,017,364 | ||||||
| Cowen, Inc., Class A | 5,072 | 195,018 | ||||||
| Diamond Hill Investment Group, Inc. | 901 | 154,116 | ||||||
Donnelley Financial Solutions, Inc.(1) | 1,272 | 53,996 | ||||||
| Evercore, Inc., Class A | 9,192 | 861,199 | ||||||
| FactSet Research Systems, Inc. | 2,879 | 1,247,586 | ||||||
| Federated Hermes, Inc. | 19,955 | 679,667 | ||||||
Focus Financial Partners, Inc., Class A(1) | 1,152 | 45,101 | ||||||
| Franklin Resources, Inc. | 30,417 | 792,971 | ||||||
37
| Avantis U.S. Equity ETF | ||||||||
| Shares | Value | |||||||
| Goldman Sachs Group, Inc. | 30,679 | $ | 10,205,983 | |||||
| Hamilton Lane, Inc., Class A | 5,147 | 358,128 | ||||||
| Houlihan Lokey, Inc. | 12,694 | 996,479 | ||||||
| Interactive Brokers Group, Inc., Class A | 6,878 | 423,616 | ||||||
| Intercontinental Exchange, Inc. | 13,208 | 1,332,027 | ||||||
| Invesco Ltd. | 58,187 | 958,340 | ||||||
| Janus Henderson Group PLC | 35,306 | 826,160 | ||||||
| Jefferies Financial Group, Inc. | 37,869 | 1,215,216 | ||||||
| KKR & Co., Inc. | 64,558 | 3,264,053 | ||||||
| Lazard Ltd., Class A | 26,623 | 967,746 | ||||||
| LPL Financial Holdings, Inc. | 6,848 | 1,515,668 | ||||||
| Manning & Napier, Inc. | 2,881 | 36,675 | ||||||
| MarketAxess Holdings, Inc. | 2,324 | 577,723 | ||||||
| Moelis & Co., Class A | 16,661 | 694,097 | ||||||
| Moody's Corp. | 9,615 | 2,735,660 | ||||||
| Morgan Stanley | 111,068 | 9,465,215 | ||||||
| Morningstar, Inc. | 827 | 188,548 | ||||||
| MSCI, Inc. | 2,387 | 1,072,336 | ||||||
| Nasdaq, Inc. | 6,659 | 396,410 | ||||||
| Northern Trust Corp. | 25,489 | 2,423,749 | ||||||
Open Lending Corp., Class A(1) | 15,089 | 146,514 | ||||||
| Oppenheimer Holdings, Inc., Class A | 986 | 35,792 | ||||||
| Piper Sandler Cos. | 5,379 | 616,272 | ||||||
| PJT Partners, Inc., Class A | 729 | 50,461 | ||||||
| Pzena Investment Management, Inc., Class A | 14 | 133 | ||||||
| Raymond James Financial, Inc. | 26,636 | 2,779,999 | ||||||
| S&P Global, Inc. | 12,859 | 4,528,683 | ||||||
| SEI Investments Co. | 23,871 | 1,305,744 | ||||||
| State Street Corp. | 29,109 | 1,989,600 | ||||||
| StepStone Group, Inc., Class A | 9,943 | 271,344 | ||||||
| Stifel Financial Corp. | 19,397 | 1,150,436 | ||||||
StoneX Group, Inc.(1) | 4,796 | 445,261 | ||||||
| T. Rowe Price Group, Inc. | 29,963 | 3,595,560 | ||||||
| TPG, Inc. | 8,692 | 255,197 | ||||||
| Tradeweb Markets, Inc., Class A | 2,766 | 192,486 | ||||||
| Victory Capital Holdings, Inc., Class A | 4,889 | 130,927 | ||||||
| Virtu Financial, Inc., Class A | 24,762 | 568,536 | ||||||
| Virtus Investment Partners, Inc. | 1,731 | 331,054 | ||||||
| WisdomTree Investments, Inc. | 14,737 | 73,832 | ||||||
| 93,696,601 | ||||||||
| Chemicals — 2.7% | ||||||||
| AdvanSix, Inc. | 10,951 | 397,083 | ||||||
| Air Products and Chemicals, Inc. | 15,322 | 3,868,039 | ||||||
| Albemarle Corp. | 13,472 | 3,609,957 | ||||||
| American Vanguard Corp. | 7,257 | 144,632 | ||||||
Amyris, Inc.(1)(2) | 4,476 | 13,159 | ||||||
| Ashland, Inc. | 7,864 | 800,241 | ||||||
| Avient Corp. | 12,194 | 534,463 | ||||||
Axalta Coating Systems Ltd.(1) | 21,375 | 550,406 | ||||||
| Balchem Corp. | 981 | 129,315 | ||||||
| Cabot Corp. | 18,607 | 1,339,146 | ||||||
38
| Avantis U.S. Equity ETF | ||||||||
| Shares | Value | |||||||
| Celanese Corp. | 18,760 | $ | 2,079,734 | |||||
| CF Industries Holdings, Inc. | 45,686 | 4,726,674 | ||||||
| Chase Corp. | 827 | 72,908 | ||||||
| Chemours Co. | 47,053 | 1,587,098 | ||||||
| Corteva, Inc. | 66,345 | 4,075,573 | ||||||
Danimer Scientific, Inc.(1) | 8,628 | 38,395 | ||||||
| Dow, Inc. | 117,964 | 6,016,164 | ||||||
| DuPont de Nemours, Inc. | 36,613 | 2,037,147 | ||||||
| Eastman Chemical Co. | 21,600 | 1,965,600 | ||||||
| Ecolab, Inc. | 6,930 | 1,135,342 | ||||||
Ecovyst, Inc.(1) | 9,600 | 88,704 | ||||||
| Element Solutions, Inc. | 3,498 | 65,308 | ||||||
| FMC Corp. | 17,616 | 1,903,937 | ||||||
| FutureFuel Corp. | 3,000 | 21,870 | ||||||
GCP Applied Technologies, Inc.(1) | 3,819 | 119,993 | ||||||
Ginkgo Bioworks Holdings, Inc.(1) | 22,691 | 61,039 | ||||||
| H.B. Fuller Co. | 1,538 | 99,755 | ||||||
| Hawkins, Inc. | 2,975 | 114,002 | ||||||
| Huntsman Corp. | 43,684 | 1,224,026 | ||||||
Ingevity Corp.(1) | 10,403 | 729,666 | ||||||
| Innospec, Inc. | 6,407 | 598,798 | ||||||
| International Flavors & Fragrances, Inc. | 9,130 | 1,008,682 | ||||||
Intrepid Potash, Inc.(1) | 1,937 | 90,516 | ||||||
| Koppers Holdings, Inc. | 3,363 | 76,777 | ||||||
| Kronos Worldwide, Inc. | 4,375 | 56,350 | ||||||
| Linde PLC | 22,048 | 6,236,497 | ||||||
Livent Corp.(1) | 19,900 | 640,382 | ||||||
LSB Industries, Inc.(1) | 10,038 | 158,400 | ||||||
| LyondellBasell Industries NV, Class A | 53,353 | 4,428,299 | ||||||
| Minerals Technologies, Inc. | 8,814 | 513,504 | ||||||
| Mosaic Co. | 72,220 | 3,890,491 | ||||||
| NewMarket Corp. | 1,942 | 557,762 | ||||||
| Olin Corp. | 40,781 | 2,229,090 | ||||||
Origin Materials, Inc.(1) | 5,785 | 36,156 | ||||||
| Orion Engineered Carbons SA | 10,055 | 169,527 | ||||||
| PPG Industries, Inc. | 8,532 | 1,083,393 | ||||||
PureCycle Technologies, Inc.(1) | 9,764 | 89,145 | ||||||
| Quaker Chemical Corp. | 653 | 113,831 | ||||||
Rayonier Advanced Materials, Inc.(1) | 3,390 | 15,323 | ||||||
| RPM International, Inc. | 7,628 | 710,625 | ||||||
| Scotts Miracle-Gro Co. | 3,975 | 266,126 | ||||||
| Sensient Technologies Corp. | 7,628 | 607,723 | ||||||
| Sherwin-Williams Co. | 11,526 | 2,675,185 | ||||||
| Stepan Co. | 5,201 | 542,100 | ||||||
| Tredegar Corp. | 3,893 | 39,748 | ||||||
| Trinseo PLC | 7,782 | 206,456 | ||||||
| Tronox Holdings PLC, Class A | 36,080 | 527,850 | ||||||
| Valvoline, Inc. | 15,652 | 455,004 | ||||||
| Westlake Corp. | 7,147 | 704,909 | ||||||
| 68,278,025 | ||||||||
39
| Avantis U.S. Equity ETF | ||||||||
| Shares | Value | |||||||
| Commercial Services and Supplies — 0.6% | ||||||||
| ABM Industries, Inc. | 609 | $ | 28,258 | |||||
| Aris Water Solution, Inc., Class A | 532 | 9,044 | ||||||
| Brady Corp., Class A | 4,387 | 204,171 | ||||||
| Brink's Co. | 9,511 | 525,768 | ||||||
Casella Waste Systems, Inc., Class A(1) | 3,897 | 319,281 | ||||||
Cimpress PLC(1) | 4,681 | 157,188 | ||||||
| Cintas Corp. | 4,407 | 1,792,944 | ||||||
Civeo Corp.(1) | 3,500 | 103,810 | ||||||
Clean Harbors, Inc.(1) | 8,841 | 1,038,110 | ||||||
Copart, Inc.(1) | 22,447 | 2,685,784 | ||||||
| Deluxe Corp. | 2,787 | 53,622 | ||||||
| Ennis, Inc. | 3,748 | 79,570 | ||||||
| Healthcare Services Group, Inc. | 20,858 | 293,472 | ||||||
Heritage-Crystal Clean, Inc.(1) | 4,659 | 151,744 | ||||||
| HNI Corp. | 15,676 | 501,632 | ||||||
IAA, Inc.(1) | 11,831 | 440,823 | ||||||
| Interface, Inc. | 8,923 | 99,670 | ||||||
KAR Auction Services, Inc.(1) | 18,063 | 263,720 | ||||||
| Kimball International, Inc., Class B | 2,800 | 21,420 | ||||||
Li-Cycle Holdings Corp.(1)(2) | 7,930 | 57,175 | ||||||
| MSA Safety, Inc. | 1,023 | 121,594 | ||||||
| Pitney Bowes, Inc. | 14,248 | 41,177 | ||||||
Quad/Graphics, Inc.(1) | 695 | 2,196 | ||||||
| Republic Services, Inc. | 4,174 | 595,713 | ||||||
| Rollins, Inc. | 18,897 | 637,963 | ||||||
SP Plus Corp.(1) | 1,336 | 44,275 | ||||||
| Steelcase, Inc., Class A | 10,432 | 116,630 | ||||||
Stericycle, Inc.(1) | 933 | 46,734 | ||||||
Team, Inc.(1) | 25 | 32 | ||||||
| Tetra Tech, Inc. | 3,303 | 448,580 | ||||||
| UniFirst Corp. | 2,759 | 497,337 | ||||||
| VSE Corp. | 354 | 14,815 | ||||||
| Waste Connections, Inc. | 7,887 | 1,097,713 | ||||||
| Waste Management, Inc. | 23,346 | 3,946,174 | ||||||
| 16,438,139 | ||||||||
| Communications Equipment — 0.5% | ||||||||
| ADTRAN Holdings, Inc. | 2,297 | 53,382 | ||||||
Arista Networks, Inc.(1) | 14,450 | 1,732,266 | ||||||
Aviat Networks, Inc.(1) | 72 | 2,254 | ||||||
Ciena Corp.(1) | 17,132 | 869,278 | ||||||
| Cisco Systems, Inc. | 103,386 | 4,623,422 | ||||||
CommScope Holding Co., Inc.(1) | 15,572 | 175,964 | ||||||
Extreme Networks, Inc.(1) | 8,633 | 123,711 | ||||||
F5, Inc.(1) | 3,592 | 564,160 | ||||||
Harmonic, Inc.(1) | 1,105 | 12,442 | ||||||
| Juniper Networks, Inc. | 11,340 | 322,283 | ||||||
Lumentum Holdings, Inc.(1) | 10,057 | 840,262 | ||||||
| Motorola Solutions, Inc. | 4,879 | 1,187,597 | ||||||
NETGEAR, Inc.(1) | 2,159 | 50,931 | ||||||
NetScout Systems, Inc.(1) | 4,957 | 157,335 | ||||||
40
| Avantis U.S. Equity ETF | ||||||||
| Shares | Value | |||||||
Ubiquiti, Inc.(2) | 195 | $ | 60,526 | |||||
ViaSat, Inc.(1) | 15,587 | 591,994 | ||||||
Viavi Solutions, Inc.(1) | 16,691 | 235,009 | ||||||
| 11,602,816 | ||||||||
| Construction and Engineering — 0.5% | ||||||||
| AECOM | 2,577 | 188,508 | ||||||
Ameresco, Inc., Class A(1) | 2,793 | 192,298 | ||||||
| Arcosa, Inc. | 10,830 | 633,014 | ||||||
| Argan, Inc. | 1,177 | 40,712 | ||||||
| Comfort Systems USA, Inc. | 4,038 | 405,173 | ||||||
Dycom Industries, Inc.(1) | 7,351 | 824,194 | ||||||
| EMCOR Group, Inc. | 8,197 | 974,787 | ||||||
Fluor Corp.(1) | 31,245 | 826,118 | ||||||
| Granite Construction, Inc. | 6,936 | 207,941 | ||||||
Great Lakes Dredge & Dock Corp.(1) | 12,481 | 119,443 | ||||||
IES Holdings, Inc.(1) | 284 | 8,631 | ||||||
Infrastructure and Energy Alternatives, Inc.(1) | 975 | 13,855 | ||||||
INNOVATE Corp.(1) | 1,669 | 2,554 | ||||||
MasTec, Inc.(1) | 11,543 | 929,211 | ||||||
Matrix Service Co.(1) | 30 | 170 | ||||||
| MDU Resources Group, Inc. | 27,143 | 818,361 | ||||||
MYR Group, Inc.(1) | 6,996 | 650,208 | ||||||
Northwest Pipe Co.(1) | 457 | 14,469 | ||||||
NV5 Global, Inc.(1) | 732 | 103,036 | ||||||
| Primoris Services Corp. | 19,523 | 395,731 | ||||||
| Quanta Services, Inc. | 20,823 | 2,942,290 | ||||||
Sterling Infrastructure, Inc.(1) | 5,109 | 129,207 | ||||||
Tutor Perini Corp.(1) | 3,734 | 25,317 | ||||||
| Valmont Industries, Inc. | 1,840 | 509,349 | ||||||
WillScot Mobile Mini Holdings Corp.(1) | 19,094 | 766,433 | ||||||
| 11,721,010 | ||||||||
| Construction Materials — 0.2% | ||||||||
| Eagle Materials, Inc. | 10,183 | 1,218,090 | ||||||
| Martin Marietta Materials, Inc. | 4,568 | 1,588,339 | ||||||
Summit Materials, Inc., Class A(1) | 8,380 | 238,160 | ||||||
| United States Lime & Minerals, Inc. | 107 | 10,999 | ||||||
| Vulcan Materials Co. | 8,810 | 1,466,777 | ||||||
| 4,522,365 | ||||||||
| Consumer Finance — 1.0% | ||||||||
| Ally Financial, Inc. | 67,301 | 2,234,393 | ||||||
| American Express Co. | 26,541 | 4,034,232 | ||||||
Atlanticus Holdings Corp.(1) | 921 | 26,221 | ||||||
| Bread Financial Holdings, Inc. | 13,931 | 535,368 | ||||||
| Capital One Financial Corp. | 48,810 | 5,165,074 | ||||||
Consumer Portfolio Services, Inc.(1) | 1,811 | 21,080 | ||||||
Credit Acceptance Corp.(1)(2) | 1,581 | 841,218 | ||||||
| Discover Financial Services | 49,887 | 5,013,145 | ||||||
Encore Capital Group, Inc.(1) | 8,977 | 490,862 | ||||||
Enova International, Inc.(1) | 13,160 | 459,810 | ||||||
EZCORP, Inc., Class A(1) | 6,490 | 56,788 | ||||||
| FirstCash Holdings, Inc. | 587 | 45,763 | ||||||
41
| Avantis U.S. Equity ETF | ||||||||
| Shares | Value | |||||||
Green Dot Corp., Class A(1) | 12,887 | $ | 261,477 | |||||
LendingClub Corp.(1) | 10,858 | 141,914 | ||||||
| Navient Corp. | 44,036 | 677,714 | ||||||
| Nelnet, Inc., Class A | 4,823 | 406,290 | ||||||
| OneMain Holdings, Inc. | 29,616 | 1,034,487 | ||||||
PRA Group, Inc.(1) | 5,507 | 203,429 | ||||||
PROG Holdings, Inc.(1) | 11,339 | 210,225 | ||||||
| Regional Management Corp. | 1,642 | 55,319 | ||||||
| SLM Corp. | 85,494 | 1,306,348 | ||||||
SoFi Technologies, Inc.(1) | 25,626 | 151,706 | ||||||
| Synchrony Financial | 87,166 | 2,854,686 | ||||||
World Acceptance Corp.(1) | 562 | 65,327 | ||||||
| 26,292,876 | ||||||||
| Containers and Packaging — 0.6% | ||||||||
| Amcor PLC | 65,110 | 781,971 | ||||||
| AptarGroup, Inc. | 8,022 | 824,742 | ||||||
Ardagh Metal Packaging SA(2) | 6,691 | 41,150 | ||||||
| Avery Dennison Corp. | 8,499 | 1,560,586 | ||||||
| Ball Corp. | 14,628 | 816,389 | ||||||
Berry Global Group, Inc.(1) | 11,310 | 614,472 | ||||||
| Crown Holdings, Inc. | 7,685 | 696,184 | ||||||
| Graphic Packaging Holding Co. | 38,669 | 861,159 | ||||||
| Greif, Inc., Class A | 3,018 | 202,357 | ||||||
| Greif, Inc., Class B | 579 | 37,791 | ||||||
| International Paper Co. | 46,942 | 1,953,726 | ||||||
| Myers Industries, Inc. | 7,324 | 141,500 | ||||||
O-I Glass, Inc.(1) | 12,177 | 158,423 | ||||||
| Packaging Corp. of America | 19,256 | 2,636,532 | ||||||
| Sealed Air Corp. | 13,048 | 702,113 | ||||||
| Silgan Holdings, Inc. | 2,950 | 134,372 | ||||||
| Sonoco Products Co. | 21,315 | 1,343,271 | ||||||
| TriMas Corp. | 6,496 | 178,770 | ||||||
| WestRock Co. | 41,977 | 1,703,846 | ||||||
| 15,389,354 | ||||||||
| Distributors — 0.3% | ||||||||
Funko, Inc., Class A(1) | 2 | 45 | ||||||
| Genuine Parts Co. | 22,747 | 3,548,759 | ||||||
| LKQ Corp. | 27,232 | 1,449,287 | ||||||
| Pool Corp. | 4,059 | 1,376,772 | ||||||
| 6,374,863 | ||||||||
| Diversified Consumer Services — 0.2% | ||||||||
| ADT, Inc. | 8,893 | 64,830 | ||||||
Adtalem Global Education, Inc.(1) | 15,711 | 592,148 | ||||||
American Public Education, Inc.(1) | 1,168 | 12,065 | ||||||
Bright Horizons Family Solutions, Inc.(1) | 1,672 | 114,030 | ||||||
| Carriage Services, Inc. | 255 | 9,029 | ||||||
Chegg, Inc.(1) | 3,251 | 63,980 | ||||||
Coursera, Inc.(1) | 1,108 | 12,742 | ||||||
frontdoor, Inc.(1) | 6,672 | 156,659 | ||||||
| Graham Holdings Co., Class B | 393 | 222,214 | ||||||
Grand Canyon Education, Inc.(1) | 9,187 | 747,638 | ||||||
42
| Avantis U.S. Equity ETF | ||||||||
| Shares | Value | |||||||
| H&R Block, Inc. | 15,097 | $ | 679,365 | |||||
| Laureate Education, Inc., Class A | 13,106 | 144,428 | ||||||
OneSpaWorld Holdings Ltd.(1) | 2,875 | 25,329 | ||||||
Perdoceo Education Corp.(1) | 14,541 | 168,385 | ||||||
| Service Corp. International | 14,784 | 912,321 | ||||||
| Strategic Education, Inc. | 1,682 | 108,825 | ||||||
Stride, Inc.(1) | 4,771 | 181,966 | ||||||
Terminix Global Holdings, Inc.(1) | 623 | 26,571 | ||||||
Universal Technical Institute, Inc.(1) | 6,254 | 42,902 | ||||||
| 4,285,427 | ||||||||
| Diversified Financial Services — 0.8% | ||||||||
| A-Mark Precious Metals, Inc. | 2,185 | 67,538 | ||||||
Acacia Research Corp.(1) | 1,942 | 8,720 | ||||||
| Alerus Financial Corp. | 2,014 | 47,853 | ||||||
| Apollo Global Management, Inc. | 29,563 | 1,643,112 | ||||||
Berkshire Hathaway, Inc., Class B(1) | 51,207 | 14,378,926 | ||||||
Cannae Holdings, Inc.(1) | 6,857 | 148,180 | ||||||
| Equitable Holdings, Inc. | 88,214 | 2,624,366 | ||||||
| Jackson Financial, Inc., Class A | 23,759 | 742,706 | ||||||
| Voya Financial, Inc. | 25,895 | 1,593,319 | ||||||
| 21,254,720 | ||||||||
| Diversified Telecommunication Services — 1.0% | ||||||||
Anterix, Inc.(1) | 417 | 17,702 | ||||||
| AT&T, Inc. | 519,420 | 9,110,627 | ||||||
| ATN International, Inc. | 3,694 | 173,064 | ||||||
| Cogent Communications Holdings, Inc. | 1,813 | 96,542 | ||||||
Consolidated Communications Holdings, Inc.(1) | 5,433 | 31,185 | ||||||
EchoStar Corp., Class A(1) | 5,703 | 104,992 | ||||||
Frontier Communications Parent, Inc.(1) | 28,245 | 727,591 | ||||||
Globalstar, Inc.(1)(2) | 11,249 | 22,498 | ||||||
IDT Corp., Class B(1) | 3,911 | 100,004 | ||||||
Iridium Communications, Inc.(1) | 24,562 | 1,090,307 | ||||||
Liberty Latin America Ltd., Class C(1) | 1,731 | 12,065 | ||||||
Lumen Technologies, Inc.(2) | 67,736 | 674,651 | ||||||
Radius Global Infrastructure, Inc., Class A(1) | 5,645 | 77,732 | ||||||
| Verizon Communications, Inc. | 327,374 | 13,687,507 | ||||||
| 25,926,467 | ||||||||
| Electric Utilities — 2.1% | ||||||||
| ALLETE, Inc. | 4,114 | 243,466 | ||||||
| Alliant Energy Corp. | 22,624 | 1,380,969 | ||||||
| American Electric Power Co., Inc. | 46,784 | 4,687,757 | ||||||
Avangrid, Inc.(2) | 3,332 | 164,601 | ||||||
| Constellation Energy Corp. | 31,036 | 2,532,227 | ||||||
| Duke Energy Corp. | 26,399 | 2,822,317 | ||||||
| Edison International | 45,659 | 3,094,310 | ||||||
| Entergy Corp. | 26,267 | 3,028,585 | ||||||
| Evergy, Inc. | 27,614 | 1,892,387 | ||||||
| Eversource Energy | 30,233 | 2,711,598 | ||||||
| Exelon Corp. | 100,482 | 4,412,165 | ||||||
| FirstEnergy Corp. | 32,336 | 1,278,889 | ||||||
| Genie Energy Ltd., Class B | 1,970 | 20,567 | ||||||
43
| Avantis U.S. Equity ETF | ||||||||
| Shares | Value | |||||||
| Hawaiian Electric Industries, Inc. | 19,618 | $ | 767,456 | |||||
| IDACORP, Inc. | 6,052 | 661,120 | ||||||
| MGE Energy, Inc. | 688 | 52,990 | ||||||
| NextEra Energy, Inc. | 42,373 | 3,604,247 | ||||||
| NRG Energy, Inc. | 35,622 | 1,470,476 | ||||||
| OGE Energy Corp. | 30,666 | 1,243,200 | ||||||
| Otter Tail Corp. | 7,857 | 593,518 | ||||||
PG&E Corp.(1) | 211,609 | 2,609,139 | ||||||
| Pinnacle West Capital Corp. | 18,842 | 1,419,745 | ||||||
| PNM Resources, Inc. | 2,183 | 103,540 | ||||||
| Portland General Electric Co. | 16,991 | 877,925 | ||||||
| PPL Corp. | 90,164 | 2,621,969 | ||||||
| Southern Co. | 61,352 | 4,728,399 | ||||||
| Via Renewables, Inc. | 2 | 17 | ||||||
| Xcel Energy, Inc. | 48,534 | 3,603,649 | ||||||
| 52,627,228 | ||||||||
| Electrical Equipment — 0.6% | ||||||||
| Acuity Brands, Inc. | 4,665 | 764,733 | ||||||
| AMETEK, Inc. | 9,922 | 1,192,228 | ||||||
Array Technologies, Inc.(1) | 6,891 | 144,022 | ||||||
Atkore, Inc.(1) | 13,265 | 1,119,699 | ||||||
| AZZ, Inc. | 10,430 | 444,422 | ||||||
Babcock & Wilcox Enterprises, Inc.(1) | 1,361 | 10,861 | ||||||
Blink Charging Co.(1)(2) | 1,434 | 30,645 | ||||||
Bloom Energy Corp., Class A(1) | 8,599 | 218,501 | ||||||
ChargePoint Holdings, Inc.(1)(2) | 4,254 | 69,213 | ||||||
| Eaton Corp. PLC | 9,771 | 1,335,109 | ||||||
| Emerson Electric Co. | 32,857 | 2,685,731 | ||||||
| Encore Wire Corp. | 6,435 | 837,193 | ||||||
| EnerSys | 1,995 | 124,428 | ||||||
FREYR Battery SA(1)(2) | 9,793 | 139,452 | ||||||
FuelCell Energy, Inc.(1)(2) | 14,615 | 61,237 | ||||||
Generac Holdings, Inc.(1) | 3,166 | 697,818 | ||||||
| GrafTech International Ltd. | 15,715 | 92,404 | ||||||
| Hubbell, Inc. | 3,371 | 695,437 | ||||||
| LSI Industries, Inc. | 925 | 7,160 | ||||||
| nVent Electric PLC | 6,618 | 218,129 | ||||||
Orion Energy Systems, Inc.(1) | 35 | 59 | ||||||
Plug Power, Inc.(1)(2) | 21,817 | 611,749 | ||||||
| Powell Industries, Inc. | 406 | 10,012 | ||||||
| Regal Rexnord Corp. | 4,860 | 668,687 | ||||||
| Rockwell Automation, Inc. | 5,782 | 1,369,987 | ||||||
| Sensata Technologies Holding PLC | 2,411 | 97,115 | ||||||
Sunrun, Inc.(1) | 15,255 | 503,873 | ||||||
Thermon Group Holdings, Inc.(1) | 1,797 | 31,537 | ||||||
TPI Composites, Inc.(1) | 9,343 | 173,686 | ||||||
| 14,355,127 | ||||||||
| Electronic Equipment, Instruments and Components — 1.2% | ||||||||
908 Devices, Inc.(1) | 1,596 | 32,159 | ||||||
| Advanced Energy Industries, Inc. | 7,997 | 718,051 | ||||||
Aeva Technologies, Inc.(1) | 2,203 | 6,785 | ||||||
44
| Avantis U.S. Equity ETF | ||||||||
| Shares | Value | |||||||
AEye, Inc.(1)(2) | 1,934 | $ | 2,978 | |||||
| Amphenol Corp., Class A | 16,317 | 1,199,789 | ||||||
Arrow Electronics, Inc.(1) | 10,961 | 1,148,822 | ||||||
| Avnet, Inc. | 17,522 | 769,041 | ||||||
| Badger Meter, Inc. | 7,042 | 666,807 | ||||||
| Bel Fuse, Inc., Class B | 733 | 20,832 | ||||||
| Belden, Inc. | 2,846 | 186,356 | ||||||
| Benchmark Electronics, Inc. | 8,401 | 230,607 | ||||||
| CDW Corp. | 9,996 | 1,706,317 | ||||||
| Cognex Corp. | 7,406 | 311,867 | ||||||
| Corning, Inc. | 116,824 | 4,009,400 | ||||||
| CTS Corp. | 4,378 | 185,277 | ||||||
ePlus, Inc.(1) | 9,073 | 427,520 | ||||||
Fabrinet(1) | 3,304 | 339,783 | ||||||
FARO Technologies, Inc.(1) | 666 | 22,344 | ||||||
Flex Ltd.(1) | 89,169 | 1,588,100 | ||||||
II-VI, Inc.(1) | 11,837 | 559,062 | ||||||
Insight Enterprises, Inc.(1) | 7,619 | 694,243 | ||||||
IPG Photonics Corp.(1) | 2,605 | 235,987 | ||||||
Itron, Inc.(1) | 1,437 | 68,372 | ||||||
| Jabil, Inc. | 33,526 | 2,021,618 | ||||||
Keysight Technologies, Inc.(1) | 14,826 | 2,429,833 | ||||||
Kimball Electronics, Inc.(1) | 3,734 | 80,430 | ||||||
Knowles Corp.(1) | 10,136 | 153,560 | ||||||
| Littelfuse, Inc. | 1,898 | 450,244 | ||||||
| Methode Electronics, Inc. | 3,782 | 153,020 | ||||||
| National Instruments Corp. | 1,474 | 58,606 | ||||||
nLight, Inc.(1) | 1,434 | 17,911 | ||||||
Novanta, Inc.(1) | 765 | 102,273 | ||||||
OSI Systems, Inc.(1) | 3,737 | 311,367 | ||||||
| PC Connection, Inc. | 1,080 | 53,654 | ||||||
Plexus Corp.(1) | 7,193 | 674,200 | ||||||
Rogers Corp.(1) | 2,500 | 626,300 | ||||||
Sanmina Corp.(1) | 17,959 | 871,371 | ||||||
ScanSource, Inc.(1) | 3,507 | 101,598 | ||||||
SmartRent, Inc.(1) | 2,260 | 7,300 | ||||||
| TD SYNNEX Corp. | 9,909 | 954,039 | ||||||
| TE Connectivity Ltd. | 22,997 | 2,902,451 | ||||||
Teledyne Technologies, Inc.(1) | 1,984 | 730,826 | ||||||
Trimble, Inc.(1) | 7,638 | 483,104 | ||||||
TTM Technologies, Inc.(1) | 20,460 | 321,836 | ||||||
| Vishay Intertechnology, Inc. | 39,495 | 776,867 | ||||||
Vishay Precision Group, Inc.(1) | 1,127 | 38,667 | ||||||
| Vontier Corp. | 8,993 | 197,127 | ||||||
Zebra Technologies Corp., Class A(1) | 1,846 | 556,827 | ||||||
| 30,205,528 | ||||||||
| Energy Equipment and Services — 0.7% | ||||||||
| Archrock, Inc. | 69,294 | 512,083 | ||||||
| Baker Hughes Co. | 76,293 | 1,927,161 | ||||||
Bristow Group, Inc.(1) | 3,493 | 101,332 | ||||||
| Cactus, Inc., Class A | 10,888 | 434,976 | ||||||
45
| Avantis U.S. Equity ETF | ||||||||
| Shares | Value | |||||||
| ChampionX Corp. | 21,957 | $ | 478,882 | |||||
| Core Laboratories NV | 382 | 6,169 | ||||||
Diamond Offshore Drilling, Inc.(1)(2) | 9,801 | 69,685 | ||||||
DMC Global, Inc.(1) | 932 | 20,802 | ||||||
Dril-Quip, Inc.(1) | 7,904 | 174,916 | ||||||
Expro Group Holdings NV(1) | 6,851 | 92,626 | ||||||
Exterran Corp.(1) | 1,701 | 8,352 | ||||||
| Halliburton Co. | 149,647 | 4,508,864 | ||||||
Helix Energy Solutions Group, Inc.(1) | 17,270 | 74,606 | ||||||
| Helmerich & Payne, Inc. | 17,554 | 750,433 | ||||||
Liberty Energy, Inc., Class A(1) | 19,517 | 292,755 | ||||||
Nabors Industries Ltd.(1) | 3,052 | 404,420 | ||||||
National Energy Services Reunited Corp.(1) | 1,433 | 10,060 | ||||||
Newpark Resources, Inc.(1) | 2,273 | 6,546 | ||||||
NexTier Oilfield Solutions, Inc.(1) | 29,556 | 276,940 | ||||||
Noble Corp.(1) | 9,400 | 285,290 | ||||||
| NOV, Inc. | 71,178 | 1,257,715 | ||||||
Oceaneering International, Inc.(1) | 47,211 | 417,817 | ||||||
Oil States International, Inc.(1) | 2,864 | 14,034 | ||||||
| Patterson-UTI Energy, Inc. | 61,061 | 909,809 | ||||||
ProPetro Holding Corp.(1) | 21,776 | 199,468 | ||||||
| RPC, Inc. | 4,496 | 35,743 | ||||||
| Schlumberger NV | 53,475 | 2,040,071 | ||||||
SEACOR Marine Holdings, Inc.(1) | 90 | 585 | ||||||
Select Energy Services, Inc., Class A(1) | 6,207 | 44,132 | ||||||
| Solaris Oilfield Infrastructure, Inc., Class A | 1,898 | 20,309 | ||||||
TechnipFMC PLC(1) | 79,176 | 647,660 | ||||||
TETRA Technologies Inc(1) | 19,656 | 78,231 | ||||||
Tidewater, Inc.(1) | 7,131 | 158,023 | ||||||
Transocean Ltd.(1) | 115,547 | 418,280 | ||||||
US Silica Holdings, Inc.(1) | 24,214 | 339,722 | ||||||
Valaris Ltd.(1) | 4,898 | 249,700 | ||||||
Weatherford International PLC(1) | 23,126 | 650,766 | ||||||
| 17,918,963 | ||||||||
| Entertainment — 0.7% | ||||||||
| Activision Blizzard, Inc. | 18,578 | 1,458,187 | ||||||
AMC Entertainment Holdings, Inc., Class A(1) | 20,504 | 186,997 | ||||||
Cinemark Holdings, Inc.(1) | 1,358 | 19,121 | ||||||
| Electronic Arts, Inc. | 13,952 | 1,770,090 | ||||||
IMAX Corp.(1) | 3,850 | 60,368 | ||||||
Liberty Media Corp.-Liberty Braves, Class C(1) | 1,819 | 49,732 | ||||||
Liberty Media Corp.-Liberty Formula One, Class A(1) | 763 | 44,353 | ||||||
Liberty Media Corp.-Liberty Formula One, Class C(1) | 13,601 | 866,112 | ||||||
Live Nation Entertainment, Inc.(1) | 5,040 | 455,414 | ||||||
Madison Square Garden Entertainment Corp.(1) | 3,806 | 211,461 | ||||||
Madison Square Garden Sports Corp.(1) | 554 | 88,790 | ||||||
Marcus Corp.(2) | 2,297 | 36,959 | ||||||
Netflix, Inc.(1) | 17,542 | 3,921,690 | ||||||
Playstudios, Inc.(1) | 6,205 | 22,462 | ||||||
Playtika Holding Corp.(1) | 3,114 | 32,790 | ||||||
ROBLOX Corp., Class A(1) | 8,176 | 319,763 | ||||||
46
| Avantis U.S. Equity ETF | ||||||||
| Shares | Value | |||||||
Roku, Inc.(1) | 3,373 | $ | 229,364 | |||||
Take-Two Interactive Software, Inc.(1) | 15,855 | 1,943,189 | ||||||
Walt Disney Co.(1) | 31,693 | 3,552,151 | ||||||
Warner Bros Discovery, Inc.(1) | 74,426 | 985,400 | ||||||
| World Wrestling Entertainment, Inc., Class A | 13,330 | 906,573 | ||||||
| 17,160,966 | ||||||||
| Food and Staples Retailing — 1.9% | ||||||||
| Albertsons Cos., Inc., Class A | 19,487 | 536,087 | ||||||
| Andersons, Inc. | 3,851 | 142,603 | ||||||
BJ's Wholesale Club Holdings, Inc.(1) | 13,465 | 1,003,008 | ||||||
| Casey's General Stores, Inc. | 8,249 | 1,763,389 | ||||||
| Costco Wholesale Corp. | 33,435 | 17,456,414 | ||||||
Grocery Outlet Holding Corp.(1) | 3,257 | 130,671 | ||||||
HF Foods Group, Inc.(1) | 3 | 15 | ||||||
| Ingles Markets, Inc., Class A | 5,563 | 486,929 | ||||||
| Kroger Co. | 126,560 | 6,067,286 | ||||||
| Natural Grocers by Vitamin Cottage, Inc. | 1,404 | 20,161 | ||||||
Performance Food Group Co.(1) | 30,180 | 1,508,396 | ||||||
| PriceSmart, Inc. | 7,105 | 449,533 | ||||||
Rite Aid Corp.(1)(2) | 3,599 | 25,841 | ||||||
| SpartanNash Co. | 9,866 | 300,222 | ||||||
Sprouts Farmers Market, Inc.(1) | 35,102 | 1,014,448 | ||||||
| Sysco Corp. | 31,943 | 2,626,354 | ||||||
United Natural Foods, Inc.(1) | 17,141 | 755,575 | ||||||
US Foods Holding Corp.(1) | 2,951 | 90,360 | ||||||
| Village Super Market, Inc., Class A | 964 | 21,189 | ||||||
| Walgreens Boots Alliance, Inc. | 51,034 | 1,789,252 | ||||||
| Walmart, Inc. | 89,341 | 11,842,150 | ||||||
| Weis Markets, Inc. | 4,427 | 344,022 | ||||||
| 48,373,905 | ||||||||
| Food Products — 1.2% | ||||||||
| Alico, Inc. | 400 | 13,580 | ||||||
AppHarvest, Inc.(1) | 8,724 | 25,125 | ||||||
| Archer-Daniels-Midland Co. | 38,049 | 3,344,127 | ||||||
| B&G Foods, Inc. | 23,005 | 498,288 | ||||||
Benson Hill, Inc.(1) | 725 | 2,574 | ||||||
Beyond Meat, Inc.(1)(2) | 233 | 5,685 | ||||||
BRC, Inc., Class A(1) | 1,643 | 16,019 | ||||||
| Bunge Ltd. | 21,831 | 2,164,980 | ||||||
| Cal-Maine Foods, Inc. | 3,502 | 187,742 | ||||||
| Calavo Growers, Inc. | 2,655 | 111,616 | ||||||
| Campbell Soup Co. | 14,177 | 714,237 | ||||||
| Conagra Brands, Inc. | 6,529 | 224,467 | ||||||
Darling Ingredients, Inc.(1) | 26,159 | 1,989,653 | ||||||
Farmer Bros Co.(1) | 1,836 | 10,300 | ||||||
| Flowers Foods, Inc. | 32,947 | 899,453 | ||||||
| Fresh Del Monte Produce, Inc. | 6,637 | 181,456 | ||||||
| General Mills, Inc. | 14,820 | 1,138,176 | ||||||
Hain Celestial Group, Inc.(1) | 11,015 | 223,164 | ||||||
| Hershey Co. | 13,983 | 3,141,561 | ||||||
| Hormel Foods Corp. | 14,967 | 752,541 | ||||||
47
| Avantis U.S. Equity ETF | ||||||||
| Shares | Value | |||||||
Hostess Brands, Inc.(1) | 13,870 | $ | 321,507 | |||||
| Ingredion, Inc. | 11,413 | 993,730 | ||||||
| J&J Snack Foods Corp. | 907 | 135,170 | ||||||
| J.M. Smucker Co. | 10,326 | 1,445,537 | ||||||
| John B Sanfilippo & Son, Inc. | 1,089 | 87,915 | ||||||
| Kellogg Co. | 12,453 | 905,831 | ||||||
| Kraft Heinz Co. | 42,513 | 1,589,986 | ||||||
| Lamb Weston Holdings, Inc. | 20,976 | 1,668,221 | ||||||
| Lancaster Colony Corp. | 1,509 | 254,342 | ||||||
Landec Corp.(1) | 471 | 4,945 | ||||||
| McCormick & Co., Inc. | 5,745 | 482,982 | ||||||
Mission Produce, Inc.(1) | 3,648 | 58,733 | ||||||
| Mondelez International, Inc., Class A | 47,518 | 2,939,463 | ||||||
Pilgrim's Pride Corp.(1) | 11,243 | 320,088 | ||||||
Post Holdings, Inc.(1) | 1,439 | 127,726 | ||||||
| Seaboard Corp. | 34 | 131,320 | ||||||
Seneca Foods Corp., Class A(1) | 779 | 41,155 | ||||||
Simply Good Foods Co.(1) | 6,608 | 201,874 | ||||||
| Tootsie Roll Industries, Inc. | 1,066 | 38,195 | ||||||
TreeHouse Foods, Inc.(1) | 751 | 34,997 | ||||||
| Tyson Foods, Inc., Class A | 37,079 | 2,795,015 | ||||||
| 30,223,476 | ||||||||
| Gas Utilities — 0.2% | ||||||||
| Atmos Energy Corp. | 8,757 | 992,869 | ||||||
| Chesapeake Utilities Corp. | 584 | 73,759 | ||||||
| National Fuel Gas Co. | 14,260 | 1,016,310 | ||||||
| New Jersey Resources Corp. | 18,744 | 827,360 | ||||||
| Northwest Natural Holding Co. | 7,630 | 363,264 | ||||||
| ONE Gas, Inc. | 4,021 | 314,724 | ||||||
| South Jersey Industries, Inc. | 3,882 | 131,406 | ||||||
| Southwest Gas Holdings, Inc. | 1,238 | 96,378 | ||||||
| Spire, Inc. | 345 | 24,112 | ||||||
| Star Group LP | 906 | 8,326 | ||||||
| UGI Corp. | 21,261 | 839,810 | ||||||
| 4,688,318 | ||||||||
| Health Care Equipment and Supplies — 1.8% | ||||||||
| Abbott Laboratories | 64,677 | 6,639,094 | ||||||
ABIOMED, Inc.(1) | 2,666 | 691,240 | ||||||
Align Technology, Inc.(1) | 4,826 | 1,176,096 | ||||||
AngioDynamics, Inc.(1) | 2,566 | 56,811 | ||||||
Apyx Medical Corp.(1) | 34 | 195 | ||||||
| Atrion Corp. | 182 | 109,919 | ||||||
Avanos Medical, Inc.(1) | 4,066 | 100,146 | ||||||
Axogen, Inc.(1) | 60 | 562 | ||||||
| Baxter International, Inc. | 15,267 | 877,242 | ||||||
| Becton Dickinson and Co. | 6,112 | 1,542,791 | ||||||
BioLife Solutions, Inc.(1) | 1,379 | 32,558 | ||||||
Boston Scientific Corp.(1) | 48,849 | 1,969,103 | ||||||
Butterfly Network, Inc.(1) | 6,096 | 37,978 | ||||||
Cardiovascular Systems, Inc.(1) | 1,836 | 24,254 | ||||||
Co-Diagnostics, Inc.(1)(2) | 4,362 | 14,744 | ||||||
48
| Avantis U.S. Equity ETF | ||||||||
| Shares | Value | |||||||
| CONMED Corp. | 552 | $ | 48,891 | |||||
| Cooper Cos., Inc. | 3,096 | 889,914 | ||||||
CryoPort, Inc.(1) | 2,105 | 68,749 | ||||||
Cue Health, Inc.(1) | 1,307 | 4,352 | ||||||
| DENTSPLY SIRONA, Inc. | 11,911 | 390,323 | ||||||
DexCom, Inc.(1) | 9,281 | 762,991 | ||||||
Edwards Lifesciences Corp.(1) | 29,822 | 2,686,962 | ||||||
| Embecta Corp. | 2,919 | 93,174 | ||||||
Enovis Corp.(1) | 3,578 | 181,226 | ||||||
Envista Holdings Corp.(1) | 6,142 | 227,807 | ||||||
Glaukos Corp.(1) | 3,641 | 176,771 | ||||||
Globus Medical, Inc., Class A(1) | 6,438 | 381,065 | ||||||
Haemonetics Corp.(1) | 7,881 | 591,311 | ||||||
Heska Corp.(1) | 481 | 43,805 | ||||||
Hologic, Inc.(1) | 46,230 | 3,123,299 | ||||||
IDEXX Laboratories, Inc.(1) | 7,628 | 2,651,645 | ||||||
Inogen, Inc.(1) | 2,072 | 59,321 | ||||||
Inspire Medical Systems, Inc.(1) | 446 | 85,405 | ||||||
Insulet Corp.(1) | 1,914 | 488,970 | ||||||
Integer Holdings Corp.(1) | 5,955 | 375,582 | ||||||
Integra LifeSciences Holdings Corp.(1) | 6,105 | 291,270 | ||||||
Intuitive Surgical, Inc.(1) | 11,774 | 2,422,383 | ||||||
Lantheus Holdings, Inc.(1) | 18,902 | 1,489,478 | ||||||
| LeMaitre Vascular, Inc. | 2,208 | 109,031 | ||||||
LENSAR, Inc.(1) | 146 | 787 | ||||||
Masimo Corp.(1) | 2,888 | 424,218 | ||||||
| Medtronic PLC | 42,330 | 3,721,654 | ||||||
Meridian Bioscience, Inc.(1) | 15,240 | 496,672 | ||||||
Merit Medical Systems, Inc.(1) | 9,929 | 588,095 | ||||||
Neogen Corp.(1) | 6,340 | 132,506 | ||||||
Novocure Ltd.(1) | 2,027 | 166,477 | ||||||
NuVasive, Inc.(1) | 11,690 | 496,942 | ||||||
Omnicell, Inc.(1) | 1,395 | 142,695 | ||||||
OraSure Technologies, Inc.(1) | 69 | 282 | ||||||
Orthofix Medical, Inc.(1) | 1,659 | 33,014 | ||||||
Outset Medical, Inc.(1) | 982 | 17,961 | ||||||
Penumbra, Inc.(1) | 865 | 142,007 | ||||||
PROCEPT BioRobotics Corp.(1) | 440 | 17,811 | ||||||
Pulmonx Corp.(1) | 305 | 5,603 | ||||||
QuidelOrtho Corp.(1) | 12,395 | 982,428 | ||||||
| ResMed, Inc. | 6,385 | 1,404,189 | ||||||
Shockwave Medical, Inc.(1) | 576 | 170,991 | ||||||
SI-BONE, Inc.(1) | 1,456 | 24,024 | ||||||
STAAR Surgical Co.(1) | 156 | 14,756 | ||||||
| STERIS PLC | 4,280 | 861,906 | ||||||
| Stryker Corp. | 8,040 | 1,649,808 | ||||||
Surmodics, Inc.(1) | 184 | 6,199 | ||||||
| Teleflex, Inc. | 2,216 | 501,392 | ||||||
| Utah Medical Products, Inc. | 303 | 27,846 | ||||||
Varex Imaging Corp.(1) | 3,668 | 77,358 | ||||||
| Zimmer Biomet Holdings, Inc. | 11,620 | 1,235,438 | ||||||
49
| Avantis U.S. Equity ETF | ||||||||
| Shares | Value | |||||||
Zimvie, Inc.(1) | 3,747 | $ | 57,029 | |||||
| 44,316,546 | ||||||||
| Health Care Providers and Services — 2.5% | ||||||||
23andMe Holding Co., Class A(1)(2) | 18,394 | 61,988 | ||||||
Acadia Healthcare Co., Inc.(1) | 4,746 | 388,840 | ||||||
Accolade, Inc.(1) | 1,759 | 17,907 | ||||||
AdaptHealth Corp.(1) | 1,164 | 20,917 | ||||||
Addus HomeCare Corp.(1) | 318 | 28,372 | ||||||
agilon health, Inc.(1) | 6,671 | 138,623 | ||||||
Alignment Healthcare, Inc.(1) | 2,819 | 42,877 | ||||||
Amedisys, Inc.(1) | 594 | 70,359 | ||||||
| AmerisourceBergen Corp. | 12,941 | 1,896,633 | ||||||
AMN Healthcare Services, Inc.(1) | 8,644 | 887,220 | ||||||
Apollo Medical Holdings, Inc.(1)(2) | 2,627 | 113,303 | ||||||
Brookdale Senior Living, Inc.(1) | 97,084 | 427,170 | ||||||
| Cardinal Health, Inc. | 15,392 | 1,088,522 | ||||||
Castle Biosciences, Inc.(1) | 1,093 | 31,697 | ||||||
Centene Corp.(1) | 66,343 | 5,953,621 | ||||||
| Chemed Corp. | 1,614 | 768,571 | ||||||
| Cigna Corp. | 10,343 | 2,931,723 | ||||||
Clover Health Investments Corp.(1) | 18,695 | 48,794 | ||||||
Community Health Systems, Inc.(1) | 3,206 | 8,528 | ||||||
CorVel Corp.(1) | 1,182 | 183,659 | ||||||
Cross Country Healthcare, Inc.(1) | 482 | 12,233 | ||||||
| CVS Health Corp. | 26,771 | 2,627,574 | ||||||
DaVita, Inc.(1) | 3,190 | 272,075 | ||||||
DocGo, Inc.(1) | 416 | 4,243 | ||||||
| Elevance Health, Inc. | 18,056 | 8,759,146 | ||||||
| Encompass Health Corp. | 2,756 | 133,859 | ||||||
Enhabit, Inc.(1) | 1,164 | 19,322 | ||||||
| Ensign Group, Inc. | 12,799 | 1,091,755 | ||||||
Fulgent Genetics, Inc.(1) | 7,944 | 345,326 | ||||||
Guardant Health, Inc.(1) | 1,305 | 65,328 | ||||||
Hanger, Inc.(1) | 1,813 | 33,776 | ||||||
| HCA Healthcare, Inc. | 8,200 | 1,622,534 | ||||||
HealthEquity, Inc.(1) | 1,656 | 109,429 | ||||||
Henry Schein, Inc.(1) | 8,481 | 622,590 | ||||||
Hims & Hers Health, Inc.(1) | 7,222 | 45,932 | ||||||
| Humana, Inc. | 12,991 | 6,258,804 | ||||||
Invitae Corp.(1)(2) | 3,886 | 11,813 | ||||||
Joint Corp.(1) | 250 | 4,560 | ||||||
| Laboratory Corp. of America Holdings | 10,048 | 2,263,513 | ||||||
LHC Group, Inc.(1) | 377 | 60,874 | ||||||
| McKesson Corp. | 5,332 | 1,956,844 | ||||||
ModivCare, Inc.(1) | 4,962 | 537,484 | ||||||
Molina Healthcare, Inc.(1) | 11,958 | 4,034,270 | ||||||
| National Healthcare Corp. | 2,291 | 159,110 | ||||||
| National Research Corp. | 2,840 | 96,872 | ||||||
Oak Street Health, Inc.(1) | 2,330 | 61,046 | ||||||
OPKO Health, Inc.(1) | 34,966 | 76,226 | ||||||
Option Care Health, Inc.(1) | 2,717 | 84,118 | ||||||
50
| Avantis U.S. Equity ETF | ||||||||
| Shares | Value | |||||||
| Owens & Minor, Inc. | 19,414 | $ | 572,907 | |||||
| Patterson Cos., Inc. | 20,120 | 561,147 | ||||||
Pediatrix Medical Group, Inc.(1) | 408 | 7,271 | ||||||
| Premier, Inc., Class A | 19,823 | 698,563 | ||||||
| Quest Diagnostics, Inc. | 5,049 | 632,690 | ||||||
R1 RCM, Inc.(1) | 24,423 | 533,643 | ||||||
RadNet, Inc.(1) | 2,713 | 54,504 | ||||||
| Select Medical Holdings Corp. | 1,934 | 49,588 | ||||||
Signify Health, Inc., Class A(1) | 436 | 12,164 | ||||||
Tenet Healthcare Corp.(1) | 8,902 | 502,963 | ||||||
| UnitedHealth Group, Inc. | 24,671 | 12,812,390 | ||||||
| Universal Health Services, Inc., Class B | 11,036 | 1,079,762 | ||||||
| 63,997,572 | ||||||||
| Health Care Technology — 0.1% | ||||||||
Allscripts Healthcare Solutions, Inc.(1) | 34,123 | 580,091 | ||||||
American Well Corp., Class A(1) | 27,080 | 123,214 | ||||||
Change Healthcare, Inc.(1) | 27,001 | 663,415 | ||||||
Doximity, Inc., Class A(1)(2) | 2,017 | 66,944 | ||||||
Evolent Health, Inc., Class A(1) | 18,647 | 685,277 | ||||||
HealthStream, Inc.(1) | 1,147 | 25,383 | ||||||
Multiplan Corp.(1) | 3,646 | 12,834 | ||||||
NextGen Healthcare, Inc.(1) | 3,200 | 54,848 | ||||||
OptimizeRx Corp.(1) | 792 | 12,569 | ||||||
Phreesia, Inc.(1) | 1,042 | 26,738 | ||||||
Schrodinger, Inc.(1) | 2,566 | 70,411 | ||||||
Sharecare, Inc.(1) | 7,165 | 13,112 | ||||||
| Simulations Plus, Inc. | 670 | 40,234 | ||||||
Teladoc Health, Inc.(1) | 3,851 | 119,612 | ||||||
Veeva Systems, Inc., Class A(1) | 5,613 | 1,118,783 | ||||||
| 3,613,465 | ||||||||
| Hotels, Restaurants and Leisure — 1.5% | ||||||||
Accel Entertainment, Inc.(1) | 5,685 | 53,496 | ||||||
Airbnb, Inc., Class A(1) | 6,804 | 769,668 | ||||||
| Aramark | 8,716 | 311,248 | ||||||
BJ's Restaurants, Inc.(1) | 2,996 | 75,140 | ||||||
| Bloomin' Brands, Inc. | 19,658 | 397,485 | ||||||
Booking Holdings, Inc.(1) | 2,136 | 4,006,730 | ||||||
Bowlero Corp.(1) | 1,353 | 15,992 | ||||||
| Boyd Gaming Corp. | 16,465 | 896,190 | ||||||
Brinker International, Inc.(1) | 1,123 | 27,525 | ||||||
Caesars Entertainment, Inc.(1) | 10,014 | 431,804 | ||||||
Carnival Corp.(1) | 39,494 | 373,613 | ||||||
Carrols Restaurant Group, Inc.(1) | 62 | 136 | ||||||
Century Casinos, Inc.(1) | 2,996 | 22,081 | ||||||
Cheesecake Factory, Inc.(2) | 15,941 | 488,113 | ||||||
Chipotle Mexican Grill, Inc.(1) | 2,108 | 3,366,054 | ||||||
| Choice Hotels International, Inc. | 3,806 | 436,586 | ||||||
| Churchill Downs, Inc. | 3,620 | 713,466 | ||||||
Chuy's Holdings, Inc.(1) | 2,590 | 57,835 | ||||||
Cracker Barrel Old Country Store, Inc.(2) | 5,062 | 546,392 | ||||||
| Darden Restaurants, Inc. | 21,226 | 2,625,868 | ||||||
51
| Avantis U.S. Equity ETF | ||||||||
| Shares | Value | |||||||
Dave & Buster's Entertainment, Inc.(1) | 4,237 | $ | 175,158 | |||||
Denny's Corp.(1) | 344 | 3,251 | ||||||
| Dine Brands Global, Inc. | 739 | 49,217 | ||||||
| Domino's Pizza, Inc. | 1,293 | 480,815 | ||||||
DraftKings, Inc., Class A(1) | 3,001 | 48,196 | ||||||
Everi Holdings, Inc.(1) | 5,752 | 106,412 | ||||||
Expedia Group, Inc.(1) | 5,405 | 554,823 | ||||||
Fiesta Restaurant Group, Inc.(1) | 103 | 687 | ||||||
Golden Entertainment, Inc.(1) | 4,821 | 184,451 | ||||||
Hilton Grand Vacations, Inc.(1) | 14,878 | 606,725 | ||||||
| Hilton Worldwide Holdings, Inc. | 8,356 | 1,064,220 | ||||||
Hyatt Hotels Corp., Class A(1) | 7,988 | 715,885 | ||||||
| International Game Technology PLC | 4,798 | 86,076 | ||||||
| Jack in the Box, Inc. | 718 | 57,339 | ||||||
| Krispy Kreme, Inc. | 4,174 | 49,045 | ||||||
Las Vegas Sands Corp.(1) | 17,424 | 655,665 | ||||||
Life Time Group Holdings, Inc.(1)(2) | 2,409 | 28,547 | ||||||
Lindblad Expeditions Holdings, Inc.(1) | 902 | 6,972 | ||||||
| Marriott International, Inc., Class A | 10,824 | 1,664,082 | ||||||
| Marriott Vacations Worldwide Corp. | 885 | 126,042 | ||||||
| McDonald's Corp. | 17,635 | 4,448,958 | ||||||
| MGM Resorts International | 24,547 | 801,214 | ||||||
Monarch Casino & Resort, Inc.(1) | 2,813 | 169,877 | ||||||
Noodles & Co.(1) | 6,097 | 28,961 | ||||||
Norwegian Cruise Line Holdings Ltd.(1) | 31,403 | 410,751 | ||||||
ONE Group Hospitality, Inc.(1) | 112 | 800 | ||||||
| Papa John's International, Inc. | 855 | 69,110 | ||||||
Penn Entertainment, Inc.(1) | 18,528 | 578,629 | ||||||
Planet Fitness, Inc., Class A(1) | 2,296 | 155,554 | ||||||
Playa Hotels & Resorts NV(1) | 21,029 | 137,950 | ||||||
| RCI Hospitality Holdings, Inc. | 1,205 | 78,578 | ||||||
Red Robin Gourmet Burgers, Inc.(1) | 318 | 2,363 | ||||||
| Red Rock Resorts, Inc., Class A | 11,667 | 445,913 | ||||||
Royal Caribbean Cruises Ltd.(1) | 10,599 | 432,969 | ||||||
| Ruth's Hospitality Group, Inc. | 5,749 | 104,747 | ||||||
Scientific Games Corp., Class A(1) | 2,912 | 143,358 | ||||||
SeaWorld Entertainment, Inc.(1) | 11,698 | 587,824 | ||||||
Shake Shack, Inc., Class A(1) | 1,451 | 69,155 | ||||||
Six Flags Entertainment Corp.(1) | 1,413 | 31,298 | ||||||
| Starbucks Corp. | 28,329 | 2,381,619 | ||||||
Target Hospitality Corp.(1)(2) | 4,204 | 55,871 | ||||||
| Texas Roadhouse, Inc. | 15,280 | 1,356,253 | ||||||
| Travel + Leisure Co. | 8,543 | 362,223 | ||||||
| Vail Resorts, Inc. | 1,823 | 409,592 | ||||||
| Wendy's Co. | 30,120 | 577,702 | ||||||
| Wingstop, Inc. | 532 | 60,574 | ||||||
| Wyndham Hotels & Resorts, Inc. | 3,445 | 225,096 | ||||||
Wynn Resorts Ltd.(1) | 11,105 | 672,852 | ||||||
| Yum! Brands, Inc. | 9,045 | 1,006,166 | ||||||
| 38,084,987 | ||||||||
52
| Avantis U.S. Equity ETF | ||||||||
| Shares | Value | |||||||
| Household Durables — 0.8% | ||||||||
| Bassett Furniture Industries, Inc. | 340 | $ | 6,480 | |||||
Beazer Homes USA, Inc.(1) | 3,691 | 52,560 | ||||||
Cavco Industries, Inc.(1) | 1,845 | 431,748 | ||||||
| Century Communities, Inc. | 10,534 | 491,832 | ||||||
| D.R. Horton, Inc. | 27,217 | 1,936,490 | ||||||
| Ethan Allen Interiors, Inc. | 5,840 | 138,817 | ||||||
| Garmin Ltd. | 11,031 | 976,133 | ||||||
GoPro, Inc., Class A(1) | 15,431 | 93,975 | ||||||
Green Brick Partners, Inc.(1) | 3,432 | 83,604 | ||||||
| Hooker Furnishings Corp. | 1,278 | 20,282 | ||||||
| Installed Building Products, Inc. | 2,302 | 208,469 | ||||||
iRobot Corp.(1) | 3,512 | 206,787 | ||||||
| KB Home | 11,970 | 342,941 | ||||||
| La-Z-Boy, Inc. | 18,755 | 494,944 | ||||||
Legacy Housing Corp.(1) | 63 | 1,077 | ||||||
| Leggett & Platt, Inc. | 5,392 | 206,082 | ||||||
| Lennar Corp., B Shares | 731 | 45,088 | ||||||
| Lennar Corp., Class A | 28,604 | 2,215,380 | ||||||
LGI Homes, Inc.(1) | 1,820 | 172,736 | ||||||
| Lifetime Brands, Inc. | 86 | 767 | ||||||
| M.D.C. Holdings, Inc. | 5,224 | 162,362 | ||||||
M/I Homes, Inc.(1) | 10,905 | 471,532 | ||||||
Meritage Homes Corp.(1) | 7,408 | 580,417 | ||||||
Mohawk Industries, Inc.(1) | 10,669 | 1,177,431 | ||||||
| Newell Brands, Inc. | 60,315 | 1,076,623 | ||||||
NVR, Inc.(1) | 422 | 1,747,105 | ||||||
| PulteGroup, Inc. | 46,196 | 1,878,329 | ||||||
Skyline Champion Corp.(1) | 9,909 | 561,543 | ||||||
Sonos, Inc.(1) | 27,212 | 409,268 | ||||||
Taylor Morrison Home Corp.(1) | 27,850 | 699,314 | ||||||
| Tempur Sealy International, Inc. | 20,248 | 506,402 | ||||||
| Toll Brothers, Inc. | 21,803 | 954,753 | ||||||
TopBuild Corp.(1) | 380 | 69,829 | ||||||
Tri Pointe Homes, Inc.(1) | 30,130 | 522,153 | ||||||
Universal Electronics, Inc.(1) | 1,055 | 23,453 | ||||||
Vuzix Corp.(1)(2) | 3,281 | 24,640 | ||||||
| Whirlpool Corp. | 11,731 | 1,837,075 | ||||||
| 20,828,421 | ||||||||
| Household Products — 0.8% | ||||||||
Central Garden & Pet Co.(1) | 35 | 1,397 | ||||||
Central Garden & Pet Co., Class A(1) | 14,690 | 554,694 | ||||||
| Church & Dwight Co., Inc. | 13,962 | 1,168,759 | ||||||
| Clorox Co. | 9,651 | 1,393,025 | ||||||
| Colgate-Palmolive Co. | 53,717 | 4,201,207 | ||||||
| Energizer Holdings, Inc. | 1,905 | 53,530 | ||||||
| Kimberly-Clark Corp. | 25,251 | 3,220,008 | ||||||
| Oil-Dri Corp. of America | 506 | 13,961 | ||||||
| Procter & Gamble Co. | 68,605 | 9,463,374 | ||||||
| Spectrum Brands Holdings, Inc. | 10,895 | 686,276 | ||||||
| WD-40 Co. | 969 | 183,296 | ||||||
| 20,939,527 | ||||||||
53
| Avantis U.S. Equity ETF | ||||||||
| Shares | Value | |||||||
| Independent Power and Renewable Electricity Producers — 0.4% | ||||||||
| AES Corp. | 131,635 | $ | 3,350,111 | |||||
| Brookfield Renewable Corp., Class A | 7,149 | 274,450 | ||||||
| Clearway Energy, Inc., Class A | 7,120 | 245,497 | ||||||
| Clearway Energy, Inc., Class C | 17,698 | 656,596 | ||||||
Montauk Renewables, Inc.(1) | 4,235 | 75,171 | ||||||
| NextEra Energy Partners LP | 9,645 | 791,758 | ||||||
Ormat Technologies, Inc.(2) | 8,046 | 752,140 | ||||||
Sunnova Energy International, Inc.(1)(2) | 15,327 | 386,547 | ||||||
| Vistra Corp. | 103,785 | 2,568,679 | ||||||
| 9,100,949 | ||||||||
| Industrial Conglomerates — 0.3% | ||||||||
| 3M Co. | 23,226 | 2,888,153 | ||||||
| General Electric Co. | 28,095 | 2,063,297 | ||||||
| Honeywell International, Inc. | 19,978 | 3,782,834 | ||||||
| 8,734,284 | ||||||||
| Insurance — 3.7% | ||||||||
| Aflac, Inc. | 65,038 | 3,864,558 | ||||||
Alleghany Corp.(1) | 889 | 747,809 | ||||||
| Allstate Corp. | 38,728 | 4,666,724 | ||||||
Ambac Financial Group, Inc.(1) | 4,370 | 65,943 | ||||||
| American Equity Investment Life Holding Co. | 16,402 | 623,276 | ||||||
| American Financial Group, Inc. | 15,841 | 2,022,579 | ||||||
| American International Group, Inc. | 98,895 | 5,117,816 | ||||||
| AMERISAFE, Inc. | 2,734 | 130,740 | ||||||
| Aon PLC, Class A | 12,903 | 3,603,292 | ||||||
Arch Capital Group Ltd.(1) | 46,938 | 2,146,005 | ||||||
| Argo Group International Holdings Ltd. | 8,704 | 170,860 | ||||||
| Arthur J. Gallagher & Co. | 16,296 | 2,958,865 | ||||||
| Assurant, Inc. | 7,688 | 1,218,471 | ||||||
| Assured Guaranty Ltd. | 12,507 | 638,732 | ||||||
| Axis Capital Holdings Ltd. | 23,251 | 1,235,791 | ||||||
Brighthouse Financial, Inc.(1) | 15,322 | 728,561 | ||||||
| Brown & Brown, Inc. | 3,508 | 221,144 | ||||||
| Chubb Ltd. | 27,295 | 5,160,120 | ||||||
| Cincinnati Financial Corp. | 16,910 | 1,639,594 | ||||||
| CNA Financial Corp. | 2,425 | 93,266 | ||||||
| CNO Financial Group, Inc. | 27,228 | 501,267 | ||||||
| Employers Holdings, Inc. | 5,275 | 206,569 | ||||||
Enstar Group Ltd.(1) | 1,112 | 210,446 | ||||||
| Erie Indemnity Co., Class A | 2,673 | 574,508 | ||||||
| Everest Re Group Ltd. | 5,066 | 1,363,007 | ||||||
| Fidelity National Financial, Inc. | 59,824 | 2,339,118 | ||||||
| First American Financial Corp. | 20,988 | 1,122,858 | ||||||
Genworth Financial, Inc., Class A(1) | 153,947 | 649,656 | ||||||
| Globe Life, Inc. | 13,471 | 1,309,246 | ||||||
Greenlight Capital Re Ltd., A Shares(1) | 438 | 3,456 | ||||||
Hallmark Financial Services, Inc.(1) | 138 | 175 | ||||||
| Hanover Insurance Group, Inc. | 6,152 | 796,007 | ||||||
| Hartford Financial Services Group, Inc. | 63,797 | 4,102,785 | ||||||
HCI Group, Inc.(2) | 626 | 29,917 | ||||||
54
| Avantis U.S. Equity ETF | ||||||||
| Shares | Value | |||||||
| Horace Mann Educators Corp. | 14,988 | $ | 536,121 | |||||
| James River Group Holdings Ltd. | 3,137 | 74,535 | ||||||
| Kemper Corp. | 8,125 | 373,750 | ||||||
| Kinsale Capital Group, Inc. | 2,621 | 664,633 | ||||||
Lemonade, Inc.(1) | 2,080 | 46,010 | ||||||
| Lincoln National Corp. | 19,080 | 878,825 | ||||||
| Loews Corp. | 25,248 | 1,396,467 | ||||||
Markel Corp.(1) | 1,191 | 1,422,185 | ||||||
| Marsh & McLennan Cos., Inc. | 13,659 | 2,204,153 | ||||||
MBIA, Inc.(1) | 2,999 | 35,358 | ||||||
| Mercury General Corp. | 3,646 | 116,307 | ||||||
| MetLife, Inc. | 62,141 | 3,997,531 | ||||||
| National Western Life Group, Inc., Class A | 206 | 39,204 | ||||||
| Old Republic International Corp. | 52,968 | 1,156,821 | ||||||
Oscar Health, Inc., Class A(1) | 11,260 | 74,654 | ||||||
Palomar Holdings, Inc.(1) | 4,070 | 322,710 | ||||||
| Primerica, Inc. | 9,881 | 1,252,417 | ||||||
| Principal Financial Group, Inc. | 34,666 | 2,591,630 | ||||||
| ProAssurance Corp. | 9,411 | 201,301 | ||||||
| Progressive Corp. | 50,914 | 6,244,602 | ||||||
| Prudential Financial, Inc. | 38,255 | 3,662,916 | ||||||
| Reinsurance Group of America, Inc. | 9,776 | 1,225,519 | ||||||
| RenaissanceRe Holdings Ltd. | 6,723 | 909,353 | ||||||
| RLI Corp. | 4,685 | 514,226 | ||||||
Ryan Specialty Holdings, Inc.(1) | 2,302 | 97,513 | ||||||
| Safety Insurance Group, Inc. | 3,304 | 297,525 | ||||||
| Selective Insurance Group, Inc. | 10,893 | 865,122 | ||||||
SiriusPoint Ltd.(1) | 5,795 | 25,904 | ||||||
| Stewart Information Services Corp. | 10,224 | 517,743 | ||||||
| Tiptree, Inc. | 1,990 | 23,781 | ||||||
| Travelers Cos., Inc. | 38,045 | 6,149,594 | ||||||
Trupanion, Inc.(1) | 1,128 | 79,614 | ||||||
| United Fire Group, Inc. | 4,532 | 133,377 | ||||||
| Universal Insurance Holdings, Inc. | 1,959 | 23,390 | ||||||
| Unum Group | 32,566 | 1,232,623 | ||||||
| White Mountains Insurance Group Ltd. | 557 | 763,090 | ||||||
| Willis Towers Watson PLC | 3,379 | 698,879 | ||||||
| WR Berkley Corp. | 25,382 | 1,644,754 | ||||||
| 92,757,298 | ||||||||
| Interactive Media and Services — 3.1% | ||||||||
Alphabet, Inc., Class A(1) | 268,839 | 29,093,757 | ||||||
Alphabet, Inc., Class C(1) | 243,224 | 26,547,900 | ||||||
Bumble, Inc., Class A(1) | 440 | 11,022 | ||||||
Cargurus, Inc.(1) | 167 | 3,123 | ||||||
Cars.com, Inc.(1) | 18,061 | 230,278 | ||||||
Eventbrite, Inc., Class A(1) | 2,547 | 18,109 | ||||||
IAC, Inc.(1) | 4,568 | 293,585 | ||||||
Match Group, Inc.(1) | 7,719 | 436,355 | ||||||
Meta Platforms, Inc., Class A(1) | 109,448 | 17,832,363 | ||||||
Nextdoor Holdings, Inc.(1)(2) | 6,500 | 20,670 | ||||||
Pinterest, Inc., Class A(1) | 16,173 | 372,626 | ||||||
55
| Avantis U.S. Equity ETF | ||||||||
| Shares | Value | |||||||
QuinStreet, Inc.(1) | 2,396 | $ | 28,776 | |||||
| Shutterstock, Inc. | 5,416 | 300,101 | ||||||
Snap, Inc., Class A(1) | 25,165 | 273,795 | ||||||
TripAdvisor, Inc.(1) | 516 | 12,281 | ||||||
TrueCar, Inc.(1) | 11,316 | 24,669 | ||||||
Twitter, Inc.(1) | 34,298 | 1,329,047 | ||||||
Yelp, Inc.(1) | 6,267 | 214,143 | ||||||
Ziff Davis, Inc.(1) | 2,369 | 183,076 | ||||||
ZipRecruiter, Inc., Class A(1) | 881 | 14,695 | ||||||
ZoomInfo Technologies, Inc.(1) | 2,420 | 109,916 | ||||||
| 77,350,287 | ||||||||
| Internet and Direct Marketing Retail — 1.9% | ||||||||
1-800-Flowers.com, Inc., Class A(1) | 3,337 | 28,965 | ||||||
Amazon.com, Inc.(1) | 339,345 | 43,018,765 | ||||||
Chewy, Inc., Class A(1) | 5,328 | 182,910 | ||||||
ContextLogic, Inc., Class A(1)(2) | 7,999 | 10,399 | ||||||
DoorDash, Inc., Class A(1) | 6,941 | 415,766 | ||||||
Duluth Holdings, Inc., Class B(1) | 133 | 1,180 | ||||||
| eBay, Inc. | 40,576 | 1,790,619 | ||||||
Etsy, Inc.(1) | 5,403 | 570,611 | ||||||
Lands' End, Inc.(1) | 338 | 4,671 | ||||||
Liquidity Services, Inc.(1) | 5,958 | 104,205 | ||||||
MercadoLibre, Inc.(1) | 1,041 | 890,430 | ||||||
| PetMed Express, Inc. | 1,769 | 36,388 | ||||||
Poshmark, Inc., Class A(1) | 1,072 | 11,599 | ||||||
Revolve Group, Inc.(1) | 7,624 | 179,088 | ||||||
Stitch Fix, Inc., Class A(1) | 1,184 | 5,944 | ||||||
Wayfair, Inc., Class A(1) | 1,930 | 101,730 | ||||||
| 47,353,270 | ||||||||
| IT Services — 3.2% | ||||||||
| Accenture PLC, Class A | 31,023 | 8,948,895 | ||||||
Affirm Holdings, Inc.(1)(2) | 1,866 | 43,720 | ||||||
Akamai Technologies, Inc.(1) | 15,186 | 1,370,992 | ||||||
| Amdocs Ltd. | 13,844 | 1,183,247 | ||||||
| Automatic Data Processing, Inc. | 30,983 | 7,572,555 | ||||||
AvidXchange Holdings, Inc.(1) | 1,562 | 12,168 | ||||||
Block, Inc.(1) | 10,614 | 731,411 | ||||||
Brightcove, Inc.(1) | 3,022 | 20,066 | ||||||
| Broadridge Financial Solutions, Inc., ADR | 8,295 | 1,419,855 | ||||||
| Cass Information Systems, Inc. | 1,956 | 71,746 | ||||||
Cloudflare, Inc., Class A(1) | 1,622 | 101,488 | ||||||
| Cognizant Technology Solutions Corp., Class A | 46,246 | 2,921,360 | ||||||
Computer Task Group, Inc.(1) | 51 | 402 | ||||||
| Concentrix Corp. | 6,212 | 781,345 | ||||||
Conduent, Inc.(1) | 4,885 | 19,980 | ||||||
| CSG Systems International, Inc. | 11,456 | 662,730 | ||||||
Cyxtera Technologies, Inc.(1)(2) | 2,886 | 18,297 | ||||||
DigitalOcean Holdings, Inc.(1) | 570 | 23,991 | ||||||
DXC Technology Co.(1) | 57,180 | 1,416,920 | ||||||
EPAM Systems, Inc.(1) | 3,074 | 1,311,061 | ||||||
Euronet Worldwide, Inc.(1) | 5,323 | 471,937 | ||||||
56
| Avantis U.S. Equity ETF | ||||||||
| Shares | Value | |||||||
| EVERTEC, Inc. | 7,015 | $ | 235,704 | |||||
Evo Payments, Inc., Class A(1) | 1,973 | 65,740 | ||||||
ExlService Holdings, Inc.(1) | 2,080 | 348,837 | ||||||
Fastly, Inc., Class A(1) | 3,633 | 33,968 | ||||||
| Fidelity National Information Services, Inc. | 12,025 | 1,098,724 | ||||||
Fiserv, Inc.(1) | 11,232 | 1,136,566 | ||||||
FleetCor Technologies, Inc.(1) | 3,383 | 718,989 | ||||||
Gartner, Inc.(1) | 6,421 | 1,832,040 | ||||||
| Genpact Ltd. | 6,127 | 287,846 | ||||||
| Global Payments, Inc. | 6,330 | 786,376 | ||||||
Globant SA(1) | 1,279 | 269,575 | ||||||
GoDaddy, Inc., Class A(1) | 8,685 | 658,497 | ||||||
| Hackett Group, Inc. | 2,792 | 57,320 | ||||||
| Information Services Group, Inc. | 3,447 | 19,889 | ||||||
| International Business Machines Corp. | 30,728 | 3,947,012 | ||||||
International Money Express, Inc.(1) | 13,317 | 298,301 | ||||||
| Jack Henry & Associates, Inc. | 8,509 | 1,635,430 | ||||||
Kyndryl Holdings, Inc.(1) | 31,900 | 332,398 | ||||||
Marqeta, Inc., Class A(1) | 13,002 | 101,286 | ||||||
| Mastercard, Inc., Class A | 36,913 | 11,973,470 | ||||||
| MAXIMUS, Inc. | 8,237 | 499,080 | ||||||
MongoDB, Inc.(1) | 796 | 256,996 | ||||||
Okta, Inc.(1) | 1,627 | 148,708 | ||||||
Paya Holdings, Inc.(1) | 3,711 | 23,268 | ||||||
| Paychex, Inc. | 29,399 | 3,626,073 | ||||||
Payoneer Global, Inc.(1) | 16,459 | 108,959 | ||||||
PayPal Holdings, Inc.(1) | 30,255 | 2,827,027 | ||||||
Paysafe Ltd.(1)(2) | 8,658 | 14,286 | ||||||
Perficient, Inc.(1) | 768 | 59,981 | ||||||
PFSweb, Inc.(1) | 66 | 624 | ||||||
Remitly Global, Inc.(1) | 1,084 | 11,924 | ||||||
Repay Holdings Corp.(1) | 1,763 | 16,378 | ||||||
Sabre Corp.(1) | 13,115 | 94,297 | ||||||
Shift4 Payments, Inc., Class A(1) | 613 | 27,763 | ||||||
Snowflake, Inc., Class A(1) | 2,676 | 484,222 | ||||||
Squarespace, Inc., Class A(1) | 214 | 4,494 | ||||||
| SS&C Technologies Holdings, Inc. | 4,672 | 260,511 | ||||||
| Switch, Inc., Class A | 2,302 | 78,153 | ||||||
Toast, Inc., Class A(1) | 3,393 | 64,229 | ||||||
| TTEC Holdings, Inc. | 2,518 | 131,817 | ||||||
Twilio, Inc., Class A(1) | 5,172 | 359,868 | ||||||
Unisys Corp.(1) | 1,565 | 14,570 | ||||||
VeriSign, Inc.(1) | 3,001 | 546,842 | ||||||
Verra Mobility Corp.(1) | 9,352 | 149,071 | ||||||
| Visa, Inc., Class A | 76,360 | 15,173,496 | ||||||
| Western Union Co. | 45,297 | 671,301 | ||||||
WEX, Inc.(1) | 2,433 | 375,290 | ||||||
| 80,971,362 | ||||||||
| Leisure Products — 0.2% | ||||||||
| Acushnet Holdings Corp. | 4,327 | 206,182 | ||||||
American Outdoor Brands, Inc.(1) | 141 | 1,211 | ||||||
57
| Avantis U.S. Equity ETF | ||||||||
| Shares | Value | |||||||
AMMO, Inc.(1)(2) | 4,246 | $ | 16,177 | |||||
| Brunswick Corp. | 15,568 | 1,163,085 | ||||||
Callaway Golf Co.(1) | 8,673 | 191,934 | ||||||
Clarus Corp.(2) | 1,481 | 22,467 | ||||||
| Hasbro, Inc. | 7,409 | 583,977 | ||||||
JAKKS Pacific, Inc.(1) | 608 | 13,619 | ||||||
| Johnson Outdoors, Inc., Class A | 466 | 28,491 | ||||||
Malibu Boats, Inc., Class A(1) | 9,476 | 568,844 | ||||||
| Marine Products Corp. | 2 | 20 | ||||||
MasterCraft Boat Holdings, Inc.(1) | 4,086 | 98,432 | ||||||
Mattel, Inc.(1) | 14,498 | 320,696 | ||||||
Peloton Interactive, Inc., Class A(1)(2) | 9,526 | 97,070 | ||||||
| Polaris, Inc. | 11,853 | 1,342,589 | ||||||
| Smith & Wesson Brands, Inc. | 13,781 | 183,287 | ||||||
| Sturm Ruger & Co., Inc. | 7,750 | 404,938 | ||||||
Vista Outdoor, Inc.(1) | 17,321 | 487,067 | ||||||
YETI Holdings, Inc.(1) | 15,034 | 554,604 | ||||||
| 6,284,690 | ||||||||
| Life Sciences Tools and Services — 1.0% | ||||||||
10X Genomics, Inc., Class A(1) | 535 | 17,650 | ||||||
AbCellera Biologics, Inc.(1) | 17,609 | 188,064 | ||||||
Adaptive Biotechnologies Corp.(1) | 4,298 | 38,338 | ||||||
| Agilent Technologies, Inc. | 11,225 | 1,439,606 | ||||||
Avantor, Inc.(1) | 10,174 | 253,434 | ||||||
| Azenta, Inc. | 7,239 | 381,568 | ||||||
Bio-Rad Laboratories, Inc., Class A(1) | 1,773 | 859,976 | ||||||
| Bio-Techne Corp. | 1,747 | 579,672 | ||||||
Bionano Genomics, Inc.(1) | 14,024 | 34,780 | ||||||
| Bruker Corp. | 13,492 | 755,552 | ||||||
Charles River Laboratories International, Inc.(1) | 2,436 | 499,989 | ||||||
Cytek Biosciences, Inc.(1) | 165 | 1,922 | ||||||
| Danaher Corp. | 14,615 | 3,944,735 | ||||||
Illumina, Inc.(1) | 4,059 | 818,457 | ||||||
IQVIA Holdings, Inc.(1) | 6,249 | 1,328,912 | ||||||
Maravai LifeSciences Holdings, Inc., Class A(1) | 7,882 | 164,497 | ||||||
MaxCyte, Inc.(1) | 6,827 | 35,500 | ||||||
Medpace Holdings, Inc.(1) | 1,291 | 190,565 | ||||||
Mettler-Toledo International, Inc.(1) | 2,203 | 2,671,049 | ||||||
NeoGenomics, Inc.(1) | 5,328 | 53,546 | ||||||
| PerkinElmer, Inc. | 2,282 | 308,207 | ||||||
Quanterix Corp.(1) | 730 | 6,826 | ||||||
Repligen Corp.(1) | 2,885 | 632,882 | ||||||
Seer, Inc.(1) | 2,551 | 25,765 | ||||||
SomaLogic, Inc.(1)(2) | 5,131 | 18,882 | ||||||
Sotera Health Co.(1) | 4,745 | 80,238 | ||||||
Syneos Health, Inc.(1) | 1,232 | 74,056 | ||||||
| Thermo Fisher Scientific, Inc. | 11,056 | 6,029,058 | ||||||
Waters Corp.(1) | 7,736 | 2,309,970 | ||||||
| West Pharmaceutical Services, Inc. | 5,965 | 1,769,756 | ||||||
| 25,513,452 | ||||||||
58
| Avantis U.S. Equity ETF | ||||||||
| Shares | Value | |||||||
| Machinery — 2.1% | ||||||||
| AGCO Corp. | 9,782 | $ | 1,063,401 | |||||
| Alamo Group, Inc. | 1,958 | 256,028 | ||||||
| Albany International Corp., Class A | 7,251 | 639,466 | ||||||
| Allison Transmission Holdings, Inc. | 7,043 | 255,379 | ||||||
| Altra Industrial Motion Corp. | 3,818 | 144,893 | ||||||
| Astec Industries, Inc. | 5,646 | 215,564 | ||||||
| Barnes Group, Inc. | 3,716 | 115,382 | ||||||
| Caterpillar, Inc. | 37,967 | 7,012,885 | ||||||
Chart Industries, Inc.(1) | 1,362 | 264,037 | ||||||
CIRCOR International, Inc.(1) | 1,274 | 20,766 | ||||||
Commercial Vehicle Group, Inc.(1) | 656 | 4,284 | ||||||
| Crane Holdings Co. | 2,781 | 262,415 | ||||||
| Cummins, Inc. | 18,859 | 4,061,663 | ||||||
| Deere & Co. | 26,110 | 9,536,677 | ||||||
Desktop Metal, Inc., Class A(1) | 1,364 | 4,338 | ||||||
| Donaldson Co., Inc. | 18,780 | 964,353 | ||||||
| Douglas Dynamics, Inc. | 2,123 | 61,779 | ||||||
| Dover Corp. | 4,574 | 571,567 | ||||||
Energy Recovery, Inc.(1) | 2,454 | 56,295 | ||||||
| Enerpac Tool Group Corp. | 2,806 | 54,436 | ||||||
| Esab Corp. | 4,270 | 175,454 | ||||||
| ESCO Technologies, Inc. | 725 | 59,037 | ||||||
Evoqua Water Technologies Corp.(1) | 4,036 | 141,583 | ||||||
| Federal Signal Corp. | 9,256 | 369,037 | ||||||
| Flowserve Corp. | 14,857 | 452,693 | ||||||
| Fortive Corp. | 4,829 | 305,821 | ||||||
| Franklin Electric Co., Inc. | 2,203 | 191,331 | ||||||
Gates Industrial Corp. PLC(1) | 6,029 | 64,631 | ||||||
| Gorman-Rupp Co. | 1,605 | 42,388 | ||||||
| Graco, Inc. | 22,442 | 1,432,697 | ||||||
| Greenbrier Cos., Inc. | 14,571 | 415,419 | ||||||
| Helios Technologies, Inc. | 2,493 | 136,168 | ||||||
| Hillenbrand, Inc. | 2,858 | 119,093 | ||||||
Hyliion Holdings Corp.(1)(2) | 11,328 | 39,761 | ||||||
| Hyster-Yale Materials Handling, Inc. | 921 | 26,829 | ||||||
| IDEX Corp. | 3,399 | 683,913 | ||||||
| Illinois Tool Works, Inc. | 15,505 | 3,020,839 | ||||||
| Ingersoll Rand, Inc. | 19,628 | 929,778 | ||||||
| ITT, Inc. | 9,163 | 664,592 | ||||||
| John Bean Technologies Corp. | 1,642 | 169,553 | ||||||
| Kadant, Inc. | 750 | 134,572 | ||||||
| Kennametal, Inc. | 17,006 | 398,621 | ||||||
| Lincoln Electric Holdings, Inc. | 10,302 | 1,408,180 | ||||||
| Lindsay Corp. | 809 | 129,731 | ||||||
Manitowoc Co., Inc.(1) | 2,026 | 19,348 | ||||||
Mayville Engineering Co., Inc.(1) | 3 | 21 | ||||||
Middleby Corp.(1) | 722 | 103,838 | ||||||
| Miller Industries, Inc. | 912 | 21,441 | ||||||
| Mueller Industries, Inc. | 16,595 | 1,048,306 | ||||||
| Mueller Water Products, Inc., Class A | 46,629 | 525,975 | ||||||
59
| Avantis U.S. Equity ETF | ||||||||
| Shares | Value | |||||||
Nikola Corp.(1) | 5,549 | $ | 29,743 | |||||
| Nordson Corp. | 1,805 | 410,042 | ||||||
| Omega Flex, Inc. | 231 | 23,336 | ||||||
| Oshkosh Corp. | 10,937 | 872,335 | ||||||
| Otis Worldwide Corp. | 11,763 | 849,524 | ||||||
| PACCAR, Inc. | 32,781 | 2,868,665 | ||||||
| Park-Ohio Holdings Corp. | 42 | 697 | ||||||
| Parker-Hannifin Corp. | 2,655 | 703,575 | ||||||
| Pentair PLC | 3,467 | 154,281 | ||||||
Proterra, Inc.(1) | 9,921 | 59,923 | ||||||
Proto Labs, Inc.(1) | 2,685 | 103,104 | ||||||
RBC Bearings, Inc.(1) | 2,996 | 721,077 | ||||||
| REV Group, Inc. | 5,713 | 65,814 | ||||||
| Shyft Group, Inc. | 12,508 | 299,567 | ||||||
| Snap-on, Inc. | 7,995 | 1,741,791 | ||||||
SPX Technologies, Inc.(1) | 2,716 | 154,975 | ||||||
| Standex International Corp. | 1,524 | 137,785 | ||||||
| Stanley Black & Decker, Inc. | 2,961 | 260,864 | ||||||
| Tennant Co. | 2,016 | 121,666 | ||||||
| Terex Corp. | 17,066 | 566,932 | ||||||
| Timken Co. | 11,139 | 701,646 | ||||||
Titan International, Inc.(1) | 10,384 | 145,688 | ||||||
| Toro Co. | 15,950 | 1,322,733 | ||||||
| Trinity Industries, Inc. | 22,045 | 537,457 | ||||||
Velo3D, Inc.(1)(2) | 833 | 3,590 | ||||||
| Wabash National Corp. | 3,881 | 63,842 | ||||||
| Watts Water Technologies, Inc., Class A | 4,817 | 667,251 | ||||||
| Westinghouse Air Brake Technologies Corp. | 10,723 | 939,871 | ||||||
| Xylem, Inc. | 5,066 | 461,513 | ||||||
| 53,785,545 | ||||||||
| Marine — 0.1% | ||||||||
| Costamare, Inc. | 13,290 | 149,911 | ||||||
| Eagle Bulk Shipping, Inc. | 3,028 | 131,536 | ||||||
| Genco Shipping & Trading Ltd. | 13,257 | 181,754 | ||||||
Kirby Corp.(1) | 6,066 | 406,786 | ||||||
| Matson, Inc. | 12,137 | 894,011 | ||||||
| Pangaea Logistics Solutions Ltd. | 1,520 | 7,615 | ||||||
| Safe Bulkers, Inc. | 15,972 | 50,951 | ||||||
| 1,822,564 | ||||||||
| Media — 0.9% | ||||||||
Altice USA, Inc., Class A(1) | 21,980 | 219,800 | ||||||
AMC Networks, Inc., Class A(1) | 8,961 | 240,065 | ||||||
Audacy, Inc.(1) | 1,679 | 926 | ||||||
Boston Omaha Corp., Class A(1) | 2,163 | 58,033 | ||||||
| Cable One, Inc. | 742 | 842,170 | ||||||
Charter Communications, Inc., Class A(1) | 3,863 | 1,593,990 | ||||||
| Comcast Corp., Class A | 250,408 | 9,062,266 | ||||||
Cumulus Media, Inc., Class A(1) | 747 | 6,962 | ||||||
DISH Network Corp., Class A(1) | 33,044 | 573,313 | ||||||
Emerald Holding, Inc.(1) | 896 | 3,432 | ||||||
| Entravision Communications Corp., Class A | 9,735 | 49,454 | ||||||
60
| Avantis U.S. Equity ETF | ||||||||
| Shares | Value | |||||||
| Fox Corp., Class A | 46,840 | $ | 1,600,991 | |||||
| Fox Corp., Class B | 21,411 | 677,016 | ||||||
| Gray Television, Inc. | 25,583 | 488,635 | ||||||
iHeartMedia, Inc., Class A(1) | 124 | 1,097 | ||||||
| Interpublic Group of Cos., Inc. | 19,251 | 532,098 | ||||||
| John Wiley & Sons, Inc., Class A | 739 | 34,016 | ||||||
Liberty Broadband Corp., Class A(1) | 895 | 90,234 | ||||||
Liberty Broadband Corp., Class C(1) | 10,712 | 1,089,410 | ||||||
Liberty Media Corp.-Liberty SiriusXM, Class A(1) | 2,119 | 88,023 | ||||||
Liberty Media Corp.-Liberty SiriusXM, Class C(1) | 7,256 | 300,108 | ||||||
Loyalty Ventures, Inc.(1) | 43 | 91 | ||||||
Magnite, Inc.(1) | 2,469 | 18,592 | ||||||
| New York Times Co., Class A | 18,653 | 568,730 | ||||||
| News Corp., Class A | 36,897 | 624,297 | ||||||
| News Corp., Class B | 16,699 | 287,891 | ||||||
| Nexstar Media Group, Inc., Class A | 2,152 | 411,721 | ||||||
| Omnicom Group, Inc. | 11,052 | 739,379 | ||||||
Paramount Global, Class B(2) | 40,052 | 936,816 | ||||||
PubMatic, Inc., Class A(1) | 6,054 | 118,477 | ||||||
| Scholastic Corp. | 4,084 | 187,496 | ||||||
| Sinclair Broadcast Group, Inc., Class A | 3,662 | 80,894 | ||||||
Sirius XM Holdings, Inc.(2) | 19,316 | 117,634 | ||||||
TechTarget, Inc.(1) | 969 | 62,888 | ||||||
| TEGNA, Inc. | 24 | 514 | ||||||
Thryv Holdings, Inc.(1) | 710 | 18,162 | ||||||
WideOpenWest, Inc.(1) | 18,018 | 320,720 | ||||||
| 22,046,341 | ||||||||
| Metals and Mining — 1.4% | ||||||||
| Alcoa Corp. | 42,419 | 2,098,892 | ||||||
| Alpha Metallurgical Resources, Inc. | 6,083 | 955,943 | ||||||
Arconic Corp.(1) | 23,211 | 585,149 | ||||||
ATI, Inc.(1) | 21,496 | 643,375 | ||||||
| Carpenter Technology Corp. | 8,713 | 295,981 | ||||||
Century Aluminum Co.(1) | 4,487 | 34,640 | ||||||
Cleveland-Cliffs, Inc.(1) | 122,006 | 2,107,044 | ||||||
Coeur Mining, Inc.(1) | 53,471 | 147,580 | ||||||
| Commercial Metals Co. | 28,784 | 1,166,040 | ||||||
| Fortitude Gold Corp. | 744 | 4,486 | ||||||
| Freeport-McMoRan, Inc. | 199,964 | 5,918,934 | ||||||
Gatos Silver, Inc.(1) | 5,078 | 15,437 | ||||||
| Gold Resource Corp. | 5,263 | 8,947 | ||||||
| Haynes International, Inc. | 992 | 39,372 | ||||||
| Hecla Mining Co. | 61,236 | 241,270 | ||||||
| Kaiser Aluminum Corp. | 5,738 | 411,759 | ||||||
MP Materials Corp.(1) | 8,224 | 287,758 | ||||||
| Newmont Corp. | 82,268 | 3,402,605 | ||||||
| Nucor Corp. | 49,000 | 6,514,060 | ||||||
| Olympic Steel, Inc. | 1,419 | 37,348 | ||||||
| Ramaco Resources, Inc. | 4,948 | 52,152 | ||||||
| Reliance Steel & Aluminum Co. | 10,846 | 2,038,831 | ||||||
| Royal Gold, Inc. | 8,556 | 786,296 | ||||||
61
| Avantis U.S. Equity ETF | ||||||||
| Shares | Value | |||||||
| Ryerson Holding Corp. | 6,996 | $ | 199,386 | |||||
| Schnitzer Steel Industries, Inc., Class A | 6,797 | 224,573 | ||||||
| Steel Dynamics, Inc. | 46,316 | 3,738,628 | ||||||
| SunCoke Energy, Inc. | 26,823 | 176,764 | ||||||
TimkenSteel Corp.(1) | 16,443 | 252,236 | ||||||
| United States Steel Corp. | 63,129 | 1,443,760 | ||||||
| Warrior Met Coal, Inc. | 24,424 | 795,001 | ||||||
| Worthington Industries, Inc. | 9,411 | 479,867 | ||||||
| 35,104,114 | ||||||||
| Multi-Utilities — 1.0% | ||||||||
| Ameren Corp. | 26,949 | 2,496,016 | ||||||
| Avista Corp. | 14,212 | 577,434 | ||||||
| Black Hills Corp. | 1,295 | 97,747 | ||||||
| CenterPoint Energy, Inc. | 33,806 | 1,065,903 | ||||||
| CMS Energy Corp. | 26,683 | 1,802,170 | ||||||
| Consolidated Edison, Inc. | 39,784 | 3,888,488 | ||||||
| Dominion Energy, Inc. | 34,523 | 2,823,981 | ||||||
| DTE Energy Co. | 15,468 | 2,016,099 | ||||||
| NiSource, Inc. | 54,277 | 1,601,714 | ||||||
| NorthWestern Corp. | 4,152 | 219,973 | ||||||
| Public Service Enterprise Group, Inc. | 31,858 | 2,050,381 | ||||||
| Sempra Energy | 28,949 | 4,775,717 | ||||||
| Unitil Corp. | 3,441 | 179,242 | ||||||
| WEC Energy Group, Inc. | 15,074 | 1,554,732 | ||||||
| 25,149,597 | ||||||||
| Multiline Retail — 0.8% | ||||||||
Big Lots, Inc.(2) | 11,708 | 240,834 | ||||||
Dillard's, Inc., Class A(2) | 1,046 | 309,867 | ||||||
| Dollar General Corp. | 19,003 | 4,511,692 | ||||||
Dollar Tree, Inc.(1) | 26,943 | 3,655,626 | ||||||
| Kohl's Corp. | 35,202 | 1,000,441 | ||||||
| Macy's, Inc. | 77,681 | 1,345,435 | ||||||
Nordstrom, Inc.(2) | 32,142 | 549,950 | ||||||
Ollie's Bargain Outlet Holdings, Inc.(1) | 3,837 | 212,224 | ||||||
| Target Corp. | 48,630 | 7,797,334 | ||||||
| 19,623,403 | ||||||||
| Oil, Gas and Consumable Fuels — 8.9% | ||||||||
Aemetis, Inc.(1) | 1,036 | 9,448 | ||||||
Alto Ingredients, Inc.(1) | 4,759 | 20,559 | ||||||
Amplify Energy Corp.(1) | 1,985 | 14,788 | ||||||
| Antero Midstream Corp. | 76,794 | 773,316 | ||||||
Antero Resources Corp.(1) | 61,135 | 2,450,291 | ||||||
| APA Corp. | 63,231 | 2,472,964 | ||||||
| Arch Resources, Inc. | 6,847 | 996,786 | ||||||
Archaea Energy, Inc.(1) | 4,045 | 79,929 | ||||||
Ardmore Shipping Corp.(1) | 2,984 | 28,766 | ||||||
Battalion Oil Corp.(1) | 400 | 5,296 | ||||||
| Berry Corp. | 22,548 | 206,314 | ||||||
| Brigham Minerals, Inc., Class A | 6,313 | 187,812 | ||||||
| California Resources Corp. | 5,857 | 292,616 | ||||||
Callon Petroleum Co.(1) | 19,035 | 810,130 | ||||||
62
| Avantis U.S. Equity ETF | ||||||||
| Shares | Value | |||||||
Centrus Energy Corp., Class A(1) | 279 | $ | 13,897 | |||||
| Cheniere Energy, Inc. | 8,724 | 1,397,410 | ||||||
Chesapeake Energy Corp.(2) | 26,434 | 2,656,353 | ||||||
| Chevron Corp. | 138,559 | 21,900,636 | ||||||
| Chord Energy Corp. | 10,797 | 1,528,315 | ||||||
| Civitas Resources, Inc. | 16,502 | 1,108,769 | ||||||
Clean Energy Fuels Corp.(1) | 16,568 | 111,337 | ||||||
CNX Resources Corp.(1) | 56,008 | 989,661 | ||||||
Comstock Resources, Inc.(1) | 35,636 | 698,466 | ||||||
| ConocoPhillips | 149,758 | 16,391,013 | ||||||
| CONSOL Energy, Inc. | 11,394 | 817,861 | ||||||
| Continental Resources, Inc. | 13,681 | 955,344 | ||||||
| Coterra Energy, Inc. | 177,223 | 5,477,963 | ||||||
Crescent Energy Co., Class A(2) | 8,885 | 152,200 | ||||||
| CVR Energy, Inc. | 11,089 | 362,167 | ||||||
| Delek US Holdings, Inc. | 25,599 | 723,172 | ||||||
Denbury, Inc.(1) | 13,080 | 1,163,204 | ||||||
| Devon Energy Corp. | 138,019 | 9,746,902 | ||||||
| DHT Holdings, Inc. | 26,250 | 205,013 | ||||||
| Diamondback Energy, Inc. | 36,667 | 4,886,988 | ||||||
| Dorian LPG Ltd. | 7,148 | 104,003 | ||||||
DTE Midstream LLC(1) | 11,964 | 660,532 | ||||||
Earthstone Energy, Inc., Class A(1) | 21,658 | 329,202 | ||||||
EnLink Midstream LLC(1) | 106,546 | 1,082,507 | ||||||
| Enviva, Inc. | 57 | 3,963 | ||||||
| EOG Resources, Inc. | 90,904 | 11,026,655 | ||||||
| EQT Corp. | 71,931 | 3,438,302 | ||||||
| Equitrans Midstream Corp. | 127,117 | 1,178,375 | ||||||
| Evolution Petroleum Corp. | 5,367 | 37,247 | ||||||
| Excelerate Energy, Inc., Class A | 1,305 | 33,512 | ||||||
| Exxon Mobil Corp. | 312,196 | 29,842,816 | ||||||
Gevo, Inc.(1)(2) | 20,816 | 65,154 | ||||||
Green Plains, Inc.(1) | 18,694 | 684,761 | ||||||
Gulfport Energy Corp.(1) | 1,733 | 169,418 | ||||||
Hallador Energy Co.(1) | 2,647 | 17,258 | ||||||
| Hess Corp. | 55,285 | 6,677,322 | ||||||
| Hess Midstream LP, Class A | 5,313 | 150,411 | ||||||
| HF Sinclair Corp. | 22,550 | 1,186,807 | ||||||
| HighPeak Energy, Inc. | 5,135 | 130,018 | ||||||
| International Seaways, Inc. | 7,117 | 210,165 | ||||||
| Kimbell Royalty Partners LP | 12,840 | 227,782 | ||||||
| Kinder Morgan, Inc. | 127,473 | 2,335,305 | ||||||
Kosmos Energy Ltd.(1) | 174,997 | 1,237,229 | ||||||
Laredo Petroleum, Inc.(1) | 6,044 | 469,075 | ||||||
| Magnolia Oil & Gas Corp., Class A | 57,039 | 1,361,521 | ||||||
| Marathon Oil Corp. | 171,519 | 4,389,171 | ||||||
| Marathon Petroleum Corp. | 78,113 | 7,869,885 | ||||||
| Matador Resources Co. | 35,349 | 2,106,800 | ||||||
| Murphy Oil Corp. | 44,922 | 1,750,610 | ||||||
| NACCO Industries, Inc., Class A | 181 | 8,140 | ||||||
New Fortress Energy, Inc.(2) | 2,956 | 169,527 | ||||||
63
| Avantis U.S. Equity ETF | ||||||||
| Shares | Value | |||||||
NextDecade Corp.(1)(2) | 153 | $ | 1,128 | |||||
Nordic American Tankers Ltd.(2) | 26,921 | 69,995 | ||||||
| Northern Oil & Gas, Inc. | 3,481 | 110,139 | ||||||
| Occidental Petroleum Corp. | 139,497 | 9,904,287 | ||||||
| ONEOK, Inc. | 77,125 | 4,722,364 | ||||||
Overseas Shipholding Group, Inc., Class A(1) | 821 | 2,553 | ||||||
| Ovintiv, Inc. | 62,405 | 3,316,202 | ||||||
Par Pacific Holdings, Inc.(1) | 1,765 | 33,182 | ||||||
PBF Energy, Inc., Class A(1) | 34,812 | 1,189,178 | ||||||
| PDC Energy, Inc. | 31,062 | 2,109,420 | ||||||
Peabody Energy Corp.(1) | 26,439 | 651,986 | ||||||
Permian Resources Corp.(1) | 57,364 | 472,106 | ||||||
| Phillips 66 | 75,679 | 6,770,243 | ||||||
| PHX Minerals, Inc. | 28 | 92 | ||||||
| Pioneer Natural Resources Co. | 32,406 | 8,205,847 | ||||||
Plains GP Holdings LP, Class A(1) | 34,739 | 416,173 | ||||||
Range Resources Corp.(1) | 83,203 | 2,734,051 | ||||||
| Ranger Oil Corp., Class A | 7,655 | 298,468 | ||||||
REX American Resources Corp.(1) | 3,294 | 99,808 | ||||||
Ring Energy, Inc.(1) | 13,056 | 42,301 | ||||||
SandRidge Energy, Inc.(1) | 12,837 | 269,320 | ||||||
| Scorpio Tankers, Inc. | 8,867 | 368,867 | ||||||
| SFL Corp. Ltd. | 31,998 | 342,379 | ||||||
SilverBow Resources, Inc.(1)(2) | 3,156 | 125,483 | ||||||
| Sitio Royalties Corp. | 762 | 19,385 | ||||||
| SM Energy Co. | 41,949 | 1,848,692 | ||||||
Southwestern Energy Co.(1) | 230,873 | 1,729,239 | ||||||
Talos Energy, Inc.(1) | 22,219 | 460,600 | ||||||
| Targa Resources Corp. | 55,438 | 3,782,535 | ||||||
Teekay Corp.(1) | 317 | 1,106 | ||||||
Teekay Tankers Ltd., Class A(1) | 3,861 | 94,981 | ||||||
| Texas Pacific Land Corp. | 1,391 | 2,560,080 | ||||||
| VAALCO Energy, Inc. | 20,449 | 102,450 | ||||||
| Valero Energy Corp. | 60,461 | 7,081,192 | ||||||
| Viper Energy Partners LP | 2,450 | 74,774 | ||||||
W&T Offshore, Inc.(1) | 5,246 | 34,099 | ||||||
| Williams Cos., Inc. | 135,573 | 4,613,549 | ||||||
| World Fuel Services Corp. | 20,394 | 526,165 | ||||||
| 223,773,578 | ||||||||
| Paper and Forest Products — 0.1% | ||||||||
Clearwater Paper Corp.(1) | 6,341 | 269,746 | ||||||
| Glatfelter Corp. | 2,820 | 13,733 | ||||||
| Louisiana-Pacific Corp. | 24,295 | 1,317,518 | ||||||
| Mercer International, Inc. | 15,489 | 251,232 | ||||||
| Sylvamo Corp. | 11,996 | 533,102 | ||||||
| 2,385,331 | ||||||||
| Personal Products — 0.2% | ||||||||
BellRing Brands, Inc.(1) | 389 | 9,215 | ||||||
Coty, Inc., Class A(1) | 3,823 | 28,711 | ||||||
| Edgewell Personal Care Co. | 11,811 | 460,157 | ||||||
| Estee Lauder Cos., Inc., Class A | 12,591 | 3,202,899 | ||||||
64
| Avantis U.S. Equity ETF | ||||||||
| Shares | Value | |||||||
Herbalife Nutrition Ltd.(1) | 2,711 | $ | 70,730 | |||||
| Inter Parfums, Inc. | 628 | 49,311 | ||||||
| Lifevantage Corp. | 15 | 60 | ||||||
| Medifast, Inc. | 3,721 | 466,911 | ||||||
Nature's Sunshine Products, Inc.(1) | 2 | 19 | ||||||
NewAge, Inc.(1) | 63 | 14 | ||||||
| Nu Skin Enterprises, Inc., Class A | 14,574 | 596,659 | ||||||
Olaplex Holdings, Inc.(1) | 5,434 | 72,381 | ||||||
Thorne HealthTech, Inc.(1) | 1,462 | 6,842 | ||||||
USANA Health Sciences, Inc.(1) | 2,586 | 166,849 | ||||||
Veru, Inc.(1) | 5,135 | 78,565 | ||||||
| 5,209,323 | ||||||||
| Pharmaceuticals — 4.2% | ||||||||
Aclaris Therapeutics, Inc.(1) | 1,836 | 29,211 | ||||||
Aerie Pharmaceuticals, Inc.(1) | 1,310 | 19,781 | ||||||
Amneal Pharmaceuticals, Inc.(1) | 3,268 | 7,092 | ||||||
Amphastar Pharmaceuticals, Inc.(1) | 3,941 | 116,654 | ||||||
Amylyx Pharmaceuticals, Inc.(1) | 7,441 | 187,811 | ||||||
ANI Pharmaceuticals, Inc.(1) | 656 | 24,200 | ||||||
Arvinas, Inc.(1) | 9,431 | 399,309 | ||||||
Assertio Holdings, Inc.(1)(2) | 3,356 | 8,558 | ||||||
| AstraZeneca PLC, ADR | 16,803 | 1,048,171 | ||||||
ATAI Life Sciences NV(1) | 5,176 | 23,292 | ||||||
Atea Pharmaceuticals, Inc.(1) | 10,199 | 76,493 | ||||||
| Bristol-Myers Squibb Co. | 199,520 | 13,449,643 | ||||||
Cassava Sciences, Inc.(1)(2) | 1,285 | 33,063 | ||||||
Catalent, Inc.(1) | 8,939 | 786,632 | ||||||
CinCor Pharma, Inc.(1) | 1,088 | 36,742 | ||||||
Collegium Pharmaceutical, Inc.(1) | 887 | 15,593 | ||||||
Corcept Therapeutics, Inc.(1) | 29,738 | 767,835 | ||||||
Cymabay Therapeutics, Inc.(1) | 297 | 1,051 | ||||||
DICE Therapeutics, Inc.(1) | 3,665 | 57,541 | ||||||
Edgewise Therapeutics, Inc.(1) | 239 | 2,409 | ||||||
Elanco Animal Health, Inc.(1) | 34,443 | 521,123 | ||||||
| Eli Lilly & Co. | 47,166 | 14,207,814 | ||||||
Endo International PLC(1) | 30 | 3 | ||||||
Esperion Therapeutics, Inc.(1) | 1,615 | 12,048 | ||||||
Harmony Biosciences Holdings, Inc.(1) | 9,202 | 404,060 | ||||||
Innoviva, Inc.(1) | 19,241 | 253,212 | ||||||
Intra-Cellular Therapies, Inc.(1) | 11,472 | 576,583 | ||||||
Jazz Pharmaceuticals PLC(1) | 8,114 | 1,259,455 | ||||||
| Johnson & Johnson | 161,330 | 26,028,982 | ||||||
| Merck & Co., Inc. | 206,240 | 17,604,646 | ||||||
Nektar Therapeutics(1) | 8,235 | 32,446 | ||||||
NGM Biopharmaceuticals, Inc.(1) | 841 | 11,867 | ||||||
Nuvation Bio, Inc.(1) | 13,618 | 38,130 | ||||||
Ocular Therapeutix, Inc.(1) | 5,603 | 28,463 | ||||||
Omeros Corp.(1)(2) | 1,336 | 5,384 | ||||||
Oramed Pharmaceuticals, Inc.(1) | 470 | 4,023 | ||||||
| Organon & Co. | 12,312 | 351,261 | ||||||
Paratek Pharmaceuticals, Inc.(1)(2) | 1,588 | 3,986 | ||||||
65
| Avantis U.S. Equity ETF | ||||||||
| Shares | Value | |||||||
| Perrigo Co. PLC | 17,786 | $ | 665,552 | |||||
| Pfizer, Inc. | 416,529 | 18,839,607 | ||||||
| Phibro Animal Health Corp., Class A | 1,151 | 17,046 | ||||||
Pliant Therapeutics, Inc.(1) | 2,546 | 49,087 | ||||||
Prestige Consumer Healthcare, Inc.(1) | 11,557 | 584,553 | ||||||
ProPhase Labs, Inc.(2) | 872 | 10,560 | ||||||
Relmada Therapeutics, Inc.(1) | 509 | 14,832 | ||||||
Revance Therapeutics, Inc.(1) | 647 | 12,875 | ||||||
| Royalty Pharma PLC, Class A | 15,056 | 629,491 | ||||||
| SIGA Technologies, Inc. | 16,753 | 252,635 | ||||||
Strongbridge LLC(1) | 1,036 | 188 | ||||||
Supernus Pharmaceuticals, Inc.(1) | 20,389 | 697,915 | ||||||
TherapeuticsMD, Inc.(1) | 303 | 3,003 | ||||||
Theravance Biopharma, Inc.(1) | 2,554 | 23,012 | ||||||
Tricida, Inc.(1)(2) | 1,665 | 20,846 | ||||||
Ventyx Biosciences, Inc.(1) | 1,100 | 22,440 | ||||||
| Viatris, Inc. | 199,920 | 1,909,236 | ||||||
Xeris Biopharma Holdings, Inc.(1)(2) | 8 | 13 | ||||||
| Zoetis, Inc. | 26,517 | 4,150,706 | ||||||
| 106,338,164 | ||||||||
| Professional Services — 0.6% | ||||||||
ASGN, Inc.(1) | 1,736 | 167,871 | ||||||
| Barrett Business Services, Inc. | 1,313 | 105,880 | ||||||
| BGSF, Inc. | 7 | 85 | ||||||
| Booz Allen Hamilton Holding Corp. | 11,355 | 1,086,673 | ||||||
CACI International, Inc., Class A(1) | 444 | 124,706 | ||||||
CBIZ, Inc.(1) | 4,900 | 213,934 | ||||||
Clarivate PLC(1) | 18,662 | 217,786 | ||||||
CoStar Group, Inc.(1) | 16,449 | 1,145,508 | ||||||
| CRA International, Inc. | 1,265 | 115,634 | ||||||
| Dun & Bradstreet Holdings, Inc. | 3,414 | 48,650 | ||||||
| Equifax, Inc. | 4,848 | 915,060 | ||||||
| Exponent, Inc. | 6,939 | 651,295 | ||||||
First Advantage Corp.(1) | 687 | 9,508 | ||||||
Franklin Covey Co.(1) | 3,647 | 173,488 | ||||||
FTI Consulting, Inc.(1) | 1,294 | 207,816 | ||||||
| Heidrick & Struggles International, Inc. | 4,579 | 130,318 | ||||||
| ICF International, Inc. | 301 | 30,570 | ||||||
| Insperity, Inc. | 6,968 | 759,651 | ||||||
| Jacobs Solutions, Inc. | 5,025 | 626,015 | ||||||
| KBR, Inc. | 14,835 | 716,530 | ||||||
| Kelly Services, Inc., Class A | 5,460 | 87,961 | ||||||
| Kforce, Inc. | 6,299 | 344,681 | ||||||
| Korn Ferry | 13,601 | 828,573 | ||||||
| Leidos Holdings, Inc. | 6,138 | 583,417 | ||||||
| ManpowerGroup, Inc. | 9,020 | 661,346 | ||||||
| ManTech International Corp., Class A | 336 | 32,226 | ||||||
| Nielsen Holdings PLC | 7,418 | 206,517 | ||||||
Planet Labs PBC(1) | 16,681 | 91,412 | ||||||
RCM Technologies, Inc.(1) | 565 | 9,865 | ||||||
| Resources Connection, Inc. | 3,193 | 62,391 | ||||||
66
| Avantis U.S. Equity ETF | ||||||||
| Shares | Value | |||||||
| Robert Half International, Inc. | 22,140 | $ | 1,704,116 | |||||
| Science Applications International Corp. | 1,784 | 162,469 | ||||||
| TransUnion | 6,839 | 505,197 | ||||||
TriNet Group, Inc.(1) | 8,420 | 693,808 | ||||||
TrueBlue, Inc.(1) | 6,362 | 130,675 | ||||||
| Verisk Analytics, Inc. | 6,626 | 1,240,122 | ||||||
| 14,791,754 | ||||||||
| Real Estate Management and Development — 0.2% | ||||||||
CBRE Group, Inc., Class A(1) | 30,637 | 2,419,098 | ||||||
Cushman & Wakefield PLC(1) | 6,981 | 104,436 | ||||||
| Douglas Elliman, Inc. | 6,602 | 30,435 | ||||||
Five Point Holdings LLC, Class A(1) | 2,053 | 7,493 | ||||||
Forestar Group, Inc.(1) | 1,457 | 18,125 | ||||||
FRP Holdings, Inc.(1) | 435 | 25,021 | ||||||
Howard Hughes Corp.(1) | 6,310 | 401,505 | ||||||
Jones Lang LaSalle, Inc.(1) | 8,380 | 1,449,740 | ||||||
| Kennedy-Wilson Holdings, Inc. | 18,741 | 329,092 | ||||||
| Marcus & Millichap, Inc. | 4,614 | 172,471 | ||||||
| Newmark Group, Inc., Class A | 2,016 | 20,664 | ||||||
Opendoor Technologies, Inc.(1)(2) | 18,117 | 78,447 | ||||||
| RE/MAX Holdings, Inc., Class A | 4,152 | 94,500 | ||||||
| RMR Group, Inc., Class A | 1,714 | 44,633 | ||||||
Seritage Growth Properties, Class A(1) | 949 | 11,900 | ||||||
| St. Joe Co. | 5,335 | 203,797 | ||||||
Tejon Ranch Co.(1) | 586 | 9,235 | ||||||
WeWork, Inc., Class A(1)(2) | 5,457 | 22,374 | ||||||
Zillow Group, Inc., Class A(1) | 3,564 | 119,038 | ||||||
Zillow Group, Inc., Class C(1) | 7,164 | 239,707 | ||||||
| 5,801,711 | ||||||||
| Road and Rail — 1.8% | ||||||||
| AMERCO | 1,600 | 841,072 | ||||||
| ArcBest Corp. | 7,880�� | 634,576 | ||||||
Avis Budget Group, Inc.(1) | 772 | 129,217 | ||||||
| Canadian Pacific Railway Ltd. | 12,665 | 948,102 | ||||||
| Covenant Logistics Group, Inc. | 1,851 | 52,050 | ||||||
| CSX Corp. | 258,579 | 8,184,025 | ||||||
Daseke, Inc.(1) | 1,429 | 8,660 | ||||||
| Heartland Express, Inc. | 8,114 | 122,927 | ||||||
Hertz Global Holdings, Inc.(1) | 28,055 | 517,895 | ||||||
| J.B. Hunt Transport Services, Inc. | 16,477 | 2,867,328 | ||||||
| Knight-Swift Transportation Holdings, Inc. | 21,421 | 1,081,975 | ||||||
| Landstar System, Inc. | 8,137 | 1,193,128 | ||||||
Lyft, Inc., Class A(1) | 2,735 | 40,287 | ||||||
| Marten Transport Ltd. | 12,260 | 242,871 | ||||||
| Norfolk Southern Corp. | 27,846 | 6,770,198 | ||||||
| Old Dominion Freight Line, Inc. | 15,594 | 4,232,368 | ||||||
PAM Transportation Services, Inc.(1) | 495 | 14,706 | ||||||
| Ryder System, Inc. | 14,758 | 1,128,101 | ||||||
Saia, Inc.(1) | 5,367 | 1,110,057 | ||||||
| Schneider National, Inc., Class B | 7,539 | 172,342 | ||||||
TuSimple Holdings, Inc., Class A(1) | 6,948 | 49,956 | ||||||
67
| Avantis U.S. Equity ETF | ||||||||
| Shares | Value | |||||||
Uber Technologies, Inc.(1) | 19,004 | $ | 546,555 | |||||
| Union Pacific Corp. | 59,412 | 13,338,588 | ||||||
| Universal Logistics Holdings, Inc. | 1,509 | 55,094 | ||||||
| Werner Enterprises, Inc. | 16,003 | 636,759 | ||||||
XPO Logistics, Inc.(1) | 5,316 | 278,665 | ||||||
| 45,197,502 | ||||||||
| Semiconductors and Semiconductor Equipment — 4.4% | ||||||||
ACM Research, Inc., Class A(1) | 1,519 | 25,656 | ||||||
Advanced Micro Devices, Inc.(1) | 73,251 | 6,216,812 | ||||||
Allegro MicroSystems, Inc.(1) | 4,506 | 105,080 | ||||||
Alpha & Omega Semiconductor Ltd.(1) | 5,153 | 199,215 | ||||||
| Amkor Technology, Inc. | 27,647 | 556,534 | ||||||
| Analog Devices, Inc. | 20,403 | 3,091,667 | ||||||
| Applied Materials, Inc. | 77,344 | 7,275,750 | ||||||
Axcelis Technologies, Inc.(1) | 7,128 | 477,148 | ||||||
AXT, Inc.(1) | 1,500 | 12,885 | ||||||
| Broadcom, Inc. | 13,169 | 6,572,780 | ||||||
CEVA, Inc.(1) | 1,171 | 34,275 | ||||||
Cirrus Logic, Inc.(1) | 9,960 | 763,832 | ||||||
Cohu, Inc.(1) | 17,407 | 467,030 | ||||||
Diodes, Inc.(1) | 8,717 | 620,389 | ||||||
Enphase Energy, Inc.(1) | 9,429 | 2,700,843 | ||||||
| Entegris, Inc. | 9,222 | 874,983 | ||||||
First Solar, Inc.(1) | 11,503 | 1,467,208 | ||||||
Formfactor, Inc.(1) | 14,774 | 432,583 | ||||||
GLOBALFOUNDRIES, Inc.(1)(2) | 6,130 | 366,697 | ||||||
Impinj, Inc.(1) | 837 | 74,727 | ||||||
| Intel Corp. | 263,642 | 8,415,453 | ||||||
| KLA Corp. | 16,865 | 5,803,752 | ||||||
| Kulicke & Soffa Industries, Inc. | 15,136 | 636,317 | ||||||
| Lam Research Corp. | 13,974 | 6,119,354 | ||||||
Lattice Semiconductor Corp.(1) | 11,240 | 605,836 | ||||||
MACOM Technology Solutions Holdings, Inc.(1) | 1,812 | 99,932 | ||||||
MagnaChip Semiconductor Corp.(1) | 5,631 | 65,883 | ||||||
| Marvell Technology, Inc. | 23,315 | 1,091,608 | ||||||
MaxLinear, Inc.(1) | 7,964 | 286,147 | ||||||
| Microchip Technology, Inc. | 20,814 | 1,358,114 | ||||||
| Micron Technology, Inc. | 117,300 | 6,630,969 | ||||||
| MKS Instruments, Inc. | 5,047 | 502,732 | ||||||
| Monolithic Power Systems, Inc. | 2,132 | 966,180 | ||||||
Navitas Semiconductor Corp.(1) | 3,767 | 22,263 | ||||||
| NVE Corp. | 234 | 11,869 | ||||||
| NVIDIA Corp. | 66,662 | 10,061,962 | ||||||
| NXP Semiconductors NV | 7,537 | 1,240,439 | ||||||
ON Semiconductor Corp.(1) | 63,311 | 4,353,897 | ||||||
Onto Innovation, Inc.(1) | 4,902 | 347,993 | ||||||
PDF Solutions, Inc.(1) | 1,548 | 40,836 | ||||||
Photronics, Inc.(1) | 17,169 | 288,439 | ||||||
| Power Integrations, Inc. | 6,473 | 463,014 | ||||||
Qorvo, Inc.(1) | 11,874 | 1,066,048 | ||||||
| QUALCOMM, Inc. | 65,641 | 8,682,335 | ||||||
68
| Avantis U.S. Equity ETF | ||||||||
| Shares | Value | |||||||
Rambus, Inc.(1) | 8,646 | $ | 222,980 | |||||
Semtech Corp.(1) | 3,227 | 149,055 | ||||||
Silicon Laboratories, Inc.(1) | 2,549 | 319,466 | ||||||
SiTime Corp.(1) | 259 | 27,560 | ||||||
| Skyworks Solutions, Inc. | 18,384 | 1,811,743 | ||||||
SMART Global Holdings, Inc.(1) | 5,645 | 103,586 | ||||||
SolarEdge Technologies, Inc.(1) | 3,675 | 1,014,190 | ||||||
Synaptics, Inc.(1) | 5,205 | 601,750 | ||||||
| Teradyne, Inc. | 28,824 | 2,439,663 | ||||||
| Texas Instruments, Inc. | 74,458 | 12,301,206 | ||||||
Ultra Clean Holdings, Inc.(1) | 11,551 | 338,098 | ||||||
| Universal Display Corp. | 3,301 | 368,821 | ||||||
Veeco Instruments, Inc.(1) | 3,186 | 67,352 | ||||||
Wolfspeed, Inc.(1) | 6,574 | 745,952 | ||||||
| 112,008,888 | ||||||||
| Software — 5.9% | ||||||||
| A10 Networks, Inc. | 12,728 | 176,919 | ||||||
ACI Worldwide, Inc.(1) | 15,653 | 370,976 | ||||||
Adobe, Inc.(1) | 13,871 | 5,179,986 | ||||||
Agilysys, Inc.(1) | 1,242 | 64,298 | ||||||
Altair Engineering, Inc., Class A(1) | 234 | 12,170 | ||||||
| American Software, Inc., Class A | 2,265 | 38,346 | ||||||
ANSYS, Inc.(1) | 2,424 | 601,879 | ||||||
AppLovin Corp., Class A(1)(2) | 752 | 18,522 | ||||||
Aspen Technology, Inc.(1) | 2,658 | 559,775 | ||||||
Autodesk, Inc.(1) | 12,375 | 2,496,533 | ||||||
Avalara, Inc.(1) | 1,494 | 136,835 | ||||||
| Bentley Systems, Inc., Class B | 6,069 | 223,157 | ||||||
Bill.com Holdings, Inc.(1) | 4,020 | 650,758 | ||||||
Black Knight, Inc.(1) | 3,650 | 241,484 | ||||||
Blackbaud, Inc.(1) | 6,763 | 353,705 | ||||||
Box, Inc., Class A(1) | 6,725 | 173,169 | ||||||
BTRS Holdings, Inc., Class A(1) | 4,472 | 30,231 | ||||||
C3.ai, Inc., Class A(1) | 6,859 | 123,462 | ||||||
Cadence Design Systems, Inc.(1) | 17,458 | 3,033,677 | ||||||
Cerence, Inc.(1) | 7 | 140 | ||||||
Ceridian HCM Holding, Inc.(1) | 896 | 53,437 | ||||||
ChannelAdvisor Corp.(1) | 87 | 1,313 | ||||||
| Citrix Systems, Inc. | 5,254 | 539,954 | ||||||
CommVault Systems, Inc.(1) | 4,026 | 218,572 | ||||||
Confluent, Inc., Class A(1)(2) | 583 | 15,951 | ||||||
Consensus Cloud Solutions, Inc.(1) | 784 | 39,474 | ||||||
Crowdstrike Holdings, Inc., Class A(1) | 8,693 | 1,587,429 | ||||||
Datadog, Inc., Class A(1) | 3,982 | 417,911 | ||||||
Digital Turbine, Inc.(1) | 5,822 | 107,532 | ||||||
DocuSign, Inc.(1) | 7,778 | 452,835 | ||||||
| Dolby Laboratories, Inc., Class A | 7,446 | 545,345 | ||||||
Domo, Inc., Class B(1) | 393 | 7,569 | ||||||
Dropbox, Inc., Class A(1) | 11,043 | 236,210 | ||||||
Duck Creek Technologies, Inc.(1) | 6,715 | 79,909 | ||||||
Dynatrace, Inc.(1) | 2,654 | 101,330 | ||||||
69
| Avantis U.S. Equity ETF | ||||||||
| Shares | Value | |||||||
Ebix, Inc.(2) | 864 | $ | 22,481 | |||||
eGain Corp.(1) | 2,058 | 18,954 | ||||||
Elastic NV(1) | 685 | 57,478 | ||||||
Envestnet, Inc.(1) | 781 | 40,901 | ||||||
Fair Isaac Corp.(1) | 1,556 | 699,266 | ||||||
Five9, Inc.(1) | 898 | 88,103 | ||||||
Fortinet, Inc.(1) | 78,469 | 3,820,656 | ||||||
Gitlab, Inc., Class A(1)(2) | 946 | 56,637 | ||||||
Guidewire Software, Inc.(1) | 3,482 | 249,694 | ||||||
HubSpot, Inc.(1) | 1,330 | 448,263 | ||||||
| InterDigital, Inc. | 9,545 | 478,777 | ||||||
| Intuit, Inc. | 6,975 | 3,011,666 | ||||||
JFrog Ltd.(1) | 2,363 | 49,977 | ||||||
KnowBe4, Inc., Class A(1) | 538 | 10,340 | ||||||
LiveRamp Holdings, Inc.(1) | 3,077 | 61,078 | ||||||
Manhattan Associates, Inc.(1) | 9,193 | 1,298,603 | ||||||
Marathon Digital Holdings, Inc.(1)(2) | 3,908 | 46,310 | ||||||
Matterport, Inc.(1) | 2,267 | 10,451 | ||||||
| Microsoft Corp. | 343,909 | 89,921,886 | ||||||
MicroStrategy, Inc., Class A(1)(2) | 136 | 31,492 | ||||||
Mitek Systems, Inc.(1) | 2,761 | 28,217 | ||||||
NCR Corp.(1) | 15,837 | 491,739 | ||||||
| NortonLifeLock, Inc. | 41,269 | 932,267 | ||||||
Nutanix, Inc., Class A(1) | 6,002 | 103,835 | ||||||
| Oracle Corp. (New York) | 57,820 | 4,287,353 | ||||||
Palantir Technologies, Inc., Class A(1) | 60,538 | 467,353 | ||||||
Palo Alto Networks, Inc.(1) | 7,163 | 3,988,430 | ||||||
Paycom Software, Inc.(1) | 5,093 | 1,788,662 | ||||||
Paycor HCM, Inc.(1) | 1,072 | 31,763 | ||||||
Paylocity Holding Corp.(1) | 2,886 | 695,526 | ||||||
| Pegasystems, Inc. | 5,131 | 187,846 | ||||||
Procore Technologies, Inc.(1) | 1,239 | 67,649 | ||||||
| Progress Software Corp. | 2,551 | 122,780 | ||||||
PROS Holdings, Inc.(1) | 1,704 | 35,528 | ||||||
PTC, Inc.(1) | 3,141 | 360,869 | ||||||
Qualys, Inc.(1) | 7,678 | 1,166,288 | ||||||
Rapid7, Inc.(1) | 1,494 | 85,905 | ||||||
Rimini Street, Inc.(1) | 2,500 | 12,600 | ||||||
RingCentral, Inc., Class A(1) | 625 | 26,900 | ||||||
Riot Blockchain, Inc.(1)(2) | 6,275 | 44,992 | ||||||
| Roper Technologies, Inc. | 1,960 | 789,057 | ||||||
Salesforce, Inc.(1) | 19,387 | 3,026,698 | ||||||
Samsara, Inc., Class A(1) | 487 | 7,242 | ||||||
SentinelOne, Inc., Class A(1) | 3,235 | 88,348 | ||||||
ServiceNow, Inc.(1) | 6,409 | 2,785,480 | ||||||
ShotSpotter, Inc.(1) | 385 | 12,563 | ||||||
Splunk, Inc.(1) | 1,993 | 179,430 | ||||||
SPS Commerce, Inc.(1) | 2,014 | 245,950 | ||||||
Synopsys, Inc.(1) | 5,565 | 1,925,601 | ||||||
Tenable Holdings, Inc.(1) | 1,290 | 51,097 | ||||||
Teradata Corp.(1) | 15,700 | 516,530 | ||||||
70
| Avantis U.S. Equity ETF | ||||||||
| Shares | Value | |||||||
Trade Desk, Inc., Class A(1) | 8,095 | $ | 507,557 | |||||
Tyler Technologies, Inc.(1) | 1,462 | 543,148 | ||||||
UiPath, Inc., Class A(1) | 4,644 | 76,394 | ||||||
Unity Software, Inc.(1) | 1,629 | 69,591 | ||||||
Verint Systems, Inc.(1) | 509 | 24,681 | ||||||
Vertex, Inc., Class A(1) | 2,086 | 28,536 | ||||||
| VMware, Inc., Class A | 6,717 | 779,374 | ||||||
Workday, Inc., Class A(1) | 3,215 | 529,060 | ||||||
| Xperi Holding Corp. | 6,161 | 98,022 | ||||||
Zendesk, Inc.(1) | 1,463 | 112,315 | ||||||
Zoom Video Communications, Inc., Class A(1) | 11,241 | 903,776 | ||||||
Zscaler, Inc.(1) | 700 | 111,468 | ||||||
| 147,652,226 | ||||||||
| Specialty Retail — 2.7% | ||||||||
| Aaron's Co., Inc. | 5,617 | 66,842 | ||||||
Abercrombie & Fitch Co., Class A(1) | 19,651 | 282,778 | ||||||
| Academy Sports & Outdoors, Inc. | 24,664 | 1,062,525 | ||||||
| Advance Auto Parts, Inc. | 11,297 | 1,905,126 | ||||||
America's Car-Mart, Inc.(1) | 744 | 59,974 | ||||||
| American Eagle Outfitters, Inc. | 23,978 | 269,992 | ||||||
| Arko Corp. | 15,674 | 149,373 | ||||||
Asbury Automotive Group, Inc.(1) | 4,564 | 796,327 | ||||||
AutoNation, Inc.(1) | 15,252 | 1,900,399 | ||||||
AutoZone, Inc.(1) | 580 | 1,229,142 | ||||||
| Bath & Body Works, Inc. | 11,064 | 413,019 | ||||||
Bed Bath & Beyond, Inc.(1)(2) | 21,548 | 205,352 | ||||||
| Best Buy Co., Inc. | 35,669 | 2,521,442 | ||||||
| Big 5 Sporting Goods Corp. | 3,884 | 47,540 | ||||||
Boot Barn Holdings, Inc.(1) | 6,803 | 453,216 | ||||||
| Buckle, Inc. | 16,422 | 530,102 | ||||||
| Build-A-Bear Workshop, Inc. | 2,133 | 32,678 | ||||||
Burlington Stores, Inc.(1) | 8,194 | 1,148,717 | ||||||
| Caleres, Inc. | 11,754 | 299,962 | ||||||
| Camping World Holdings, Inc., Class A | 475 | 14,307 | ||||||
CarMax, Inc.(1) | 20,994 | 1,856,709 | ||||||
| Cato Corp., Class A | 1,679 | 18,150 | ||||||
Chico's FAS, Inc.(1) | 26,387 | 149,878 | ||||||
Children's Place, Inc.(1) | 1,932 | 81,492 | ||||||
Citi Trends, Inc.(1) | 1,443 | 29,149 | ||||||
Conn's, Inc.(1) | 549 | 5,276 | ||||||
Container Store Group, Inc.(1) | 5,121 | 34,720 | ||||||
| Designer Brands, Inc., Class A | 13,701 | 233,739 | ||||||
Destination XL Group, Inc.(1) | 8,008 | 44,124 | ||||||
Dick's Sporting Goods, Inc.(2) | 13,865 | 1,474,820 | ||||||
EVgo, Inc.(1) | 1,349 | 12,802 | ||||||
Five Below, Inc.(1) | 5,572 | 712,547 | ||||||
Floor & Decor Holdings, Inc., Class A(1) | 9,034 | 735,006 | ||||||
| Foot Locker, Inc. | 24,663 | 908,585 | ||||||
GameStop Corp., Class A(1)(2) | 1,176 | 33,681 | ||||||
| Gap, Inc. | 58,135 | 531,354 | ||||||
Genesco, Inc.(1) | 3,014 | 170,532 | ||||||
71
| Avantis U.S. Equity ETF | ||||||||
| Shares | Value | |||||||
| Group 1 Automotive, Inc. | 4,655 | $ | 831,337 | |||||
| Guess?, Inc. | 9,243 | 161,475 | ||||||
| Haverty Furniture Cos., Inc. | 3,957 | 106,127 | ||||||
| Hibbett, Inc. | 5,714 | 334,840 | ||||||
| Home Depot, Inc. | 22,350 | 6,446,187 | ||||||
Leslie's, Inc.(1) | 5,958 | 84,484 | ||||||
| Lithia Motors, Inc. | 6,395 | 1,697,489 | ||||||
LL Flooring Holdings, Inc.(1) | 2,757 | 22,442 | ||||||
| Lowe's Cos., Inc. | 25,925 | 5,033,080 | ||||||
MarineMax, Inc.(1) | 8,894 | 323,208 | ||||||
| Monro, Inc. | 98 | 4,538 | ||||||
| Murphy USA, Inc. | 6,848 | 1,987,084 | ||||||
National Vision Holdings, Inc.(1) | 3,443 | 114,411 | ||||||
O'Reilly Automotive, Inc.(1) | 3,485 | 2,429,463 | ||||||
ODP Corp.(1) | 14,432 | 515,944 | ||||||
| Penske Automotive Group, Inc. | 8,000 | 943,280 | ||||||
| Rent-A-Center, Inc. | 9,223 | 238,322 | ||||||
RH(1) | 2,371 | 606,763 | ||||||
| Ross Stores, Inc. | 51,710 | 4,461,022 | ||||||
Sally Beauty Holdings, Inc.(1) | 9,904 | 147,372 | ||||||
| Shoe Carnival, Inc. | 2,170 | 51,624 | ||||||
| Signet Jewelers Ltd. | 14,269 | 932,765 | ||||||
Sleep Number Corp.(1) | 263 | 10,896 | ||||||
| Sonic Automotive, Inc., Class A | 5,158 | 274,354 | ||||||
Sportsman's Warehouse Holdings, Inc.(1) | 3,818 | 30,391 | ||||||
| Tilly's, Inc., Class A | 1,024 | 7,680 | ||||||
| TJX Cos., Inc. | 115,632 | 7,209,655 | ||||||
| Tractor Supply Co. | 20,675 | 3,827,976 | ||||||
TravelCenters of America, Inc.(1) | 3,568 | 192,957 | ||||||
Ulta Beauty, Inc.(1) | 10,593 | 4,447,683 | ||||||
Urban Outfitters, Inc.(1) | 15,030 | 302,554 | ||||||
Victoria's Secret & Co.(1) | 19,662 | 657,497 | ||||||
| Williams-Sonoma, Inc. | 16,714 | 2,486,208 | ||||||
| Winmark Corp. | 91 | 18,780 | ||||||
Zumiez, Inc.(1) | 6,325 | 164,197 | ||||||
| 67,525,462 | ||||||||
| Technology Hardware, Storage and Peripherals — 5.1% | ||||||||
| Apple, Inc. | 771,093 | 121,231,242 | ||||||
Avid Technology, Inc.(1) | 1,549 | 42,365 | ||||||
Contra Zagg, Inc.(1) | 2 | — | ||||||
| Dell Technologies, Inc., Class C | 7,676 | 293,914 | ||||||
Eastman Kodak Co.(1) | 6,666 | 36,063 | ||||||
| Hewlett Packard Enterprise Co. | 62,964 | 856,310 | ||||||
| HP, Inc. | 33,590 | 964,369 | ||||||
Immersion Corp.(1) | 4,066 | 24,233 | ||||||
IonQ, Inc.(1)(2) | 2,370 | 14,078 | ||||||
| NetApp, Inc. | 17,396 | 1,254,774 | ||||||
Pure Storage, Inc., Class A(1) | 7,963 | 230,688 | ||||||
| Seagate Technology Holdings PLC | 27,067 | 1,812,406 | ||||||
Stratasys Ltd.(1) | 556 | 9,597 | ||||||
Super Micro Computer, Inc.(1) | 14,297 | 930,449 | ||||||
72
| Avantis U.S. Equity ETF | ||||||||
| Shares | Value | |||||||
Turtle Beach Corp.(1) | 89 | $ | 836 | |||||
Western Digital Corp.(1) | 22,513 | 951,399 | ||||||
| Xerox Holdings Corp. | 34,094 | 566,642 | ||||||
| 129,219,365 | ||||||||
| Textiles, Apparel and Luxury Goods — 1.0% | ||||||||
Allbirds, Inc., Class A(1)(2) | 2,473 | 10,164 | ||||||
Capri Holdings Ltd.(1) | 32,156 | 1,517,120 | ||||||
| Carter's, Inc. | 8,809 | 650,545 | ||||||
| Columbia Sportswear Co. | 4,837 | 344,588 | ||||||
Crocs, Inc.(1) | 15,771 | 1,162,323 | ||||||
Deckers Outdoor Corp.(1) | 5,250 | 1,688,243 | ||||||
| Ermenegildo Zegna NV | 5,235 | 53,606 | ||||||
Fossil Group, Inc.(1) | 3,467 | 14,665 | ||||||
G-III Apparel Group Ltd.(1) | 20,457 | 431,029 | ||||||
| Hanesbrands, Inc. | 37,039 | 322,610 | ||||||
| Kontoor Brands, Inc. | 3,228 | 120,178 | ||||||
| Levi Strauss & Co., Class A | 24,693 | 417,065 | ||||||
lululemon athletica, Inc.(1) | 13,438 | 4,030,863 | ||||||
| Movado Group, Inc. | 3,968 | 126,540 | ||||||
| NIKE, Inc., Class B | 74,734 | 7,955,434 | ||||||
| Oxford Industries, Inc. | 6,676 | 712,530 | ||||||
| PVH Corp. | 9,897 | 556,706 | ||||||
| Ralph Lauren Corp. | 8,465 | 773,108 | ||||||
| Rocky Brands, Inc. | 280 | 7,316 | ||||||
Skechers USA, Inc., Class A(1) | 17,252 | 652,126 | ||||||
| Steven Madden Ltd. | 15,576 | 453,417 | ||||||
| Tapestry, Inc. | 63,026 | 2,188,893 | ||||||
Under Armour, Inc., Class A(1) | 21,810 | 183,640 | ||||||
Under Armour, Inc., Class C(1) | 19,783 | 150,153 | ||||||
Unifi, Inc.(1) | 1,684 | 19,130 | ||||||
Vera Bradley, Inc.(1) | 320 | 1,267 | ||||||
| VF Corp. | 24,740 | 1,025,473 | ||||||
| Wolverine World Wide, Inc. | 15,298 | 298,923 | ||||||
| 25,867,655 | ||||||||
| Thrifts and Mortgage Finance — 0.4% | ||||||||
Axos Financial, Inc.(1) | 14,560 | 608,317 | ||||||
Blue Foundry Bancorp(1) | 470 | 5,344 | ||||||
Bridgewater Bancshares, Inc.(1) | 3,516 | 60,405 | ||||||
Columbia Financial, Inc.(1) | 4,823 | 102,875 | ||||||
| Enact Holdings, Inc. | 4,868 | 123,647 | ||||||
| Essent Group Ltd. | 26,071 | 1,042,579 | ||||||
| Federal Agricultural Mortgage Corp., Class C | 1,700 | 185,708 | ||||||
| Flagstar Bancorp, Inc. | 14,975 | 576,987 | ||||||
| FS Bancorp, Inc. | 826 | 24,540 | ||||||
| Hingham Institution For Savings | 252 | 74,819 | ||||||
| Home Bancorp, Inc. | 153 | 5,973 | ||||||
| Kearny Financial Corp. | 9,597 | 109,022 | ||||||
| Merchants Bancorp | 2,718 | 73,304 | ||||||
| MGIC Investment Corp. | 75,021 | 1,072,050 | ||||||
Mr. Cooper Group, Inc.(1) | 19,399 | 820,578 | ||||||
New York Community Bancorp, Inc.(2) | 70,392 | 689,138 | ||||||
73
| Avantis U.S. Equity ETF | ||||||||
| Shares | Value | |||||||
NMI Holdings, Inc., Class A(1) | 27,765 | $ | 570,015 | |||||
| Northfield Bancorp, Inc. | 6,269 | 92,405 | ||||||
| OP Bancorp | 18 | 218 | ||||||
| PennyMac Financial Services, Inc. | 10,548 | 560,310 | ||||||
| Provident Financial Services, Inc. | 13,319 | 309,400 | ||||||
| Radian Group, Inc. | 40,905 | 863,504 | ||||||
| Southern Missouri Bancorp, Inc. | 1,063 | 56,052 | ||||||
Sterling Bancorp, Inc.(1) | 3 | 18 | ||||||
| Territorial Bancorp, Inc. | 41 | 853 | ||||||
| TFS Financial Corp. | 2,590 | 37,037 | ||||||
| TrustCo Bank Corp. NY | 3,584 | 119,490 | ||||||
| Walker & Dunlop, Inc. | 7,647 | 768,218 | ||||||
| Waterstone Financial, Inc. | 2,638 | 45,611 | ||||||
| Western New England Bancorp, Inc. | 90 | 750 | ||||||
| WSFS Financial Corp. | 13,899 | 672,017 | ||||||
| 9,671,184 | ||||||||
| Trading Companies and Distributors — 0.8% | ||||||||
| Air Lease Corp. | 26,706 | 971,030 | ||||||
| Applied Industrial Technologies, Inc. | 6,879 | 729,312 | ||||||
Beacon Roofing Supply, Inc.(1) | 676 | 37,119 | ||||||
BlueLinx Holdings, Inc.(1) | 3,095 | 216,959 | ||||||
| Boise Cascade Co. | 12,760 | 795,331 | ||||||
| Fastenal Co. | 63,654 | 3,203,706 | ||||||
| GATX Corp. | 9,403 | 908,424 | ||||||
| Global Industrial Co. | 1,501 | 45,150 | ||||||
| H&E Equipment Services, Inc. | 12,345 | 390,843 | ||||||
| Herc Holdings, Inc. | 7,073 | 795,925 | ||||||
Hudson Technologies, Inc.(1) | 966 | 8,018 | ||||||
| McGrath RentCorp | 7,621 | 644,127 | ||||||
MRC Global, Inc.(1) | 7,555 | 73,510 | ||||||
| MSC Industrial Direct Co., Inc., Class A | 7,626 | 604,055 | ||||||
NOW, Inc.(1) | 17,726 | 214,839 | ||||||
| Rush Enterprises, Inc., Class A | 12,080 | 568,485 | ||||||
| Rush Enterprises, Inc., Class B | 820 | 41,525 | ||||||
SiteOne Landscape Supply, Inc.(1) | 5,239 | 655,713 | ||||||
| Textainer Group Holdings Ltd. | 16,848 | 511,842 | ||||||
Titan Machinery, Inc.(1) | 5,491 | 169,013 | ||||||
| Triton International Ltd. | 19,742 | 1,176,426 | ||||||
United Rentals, Inc.(1) | 5,888 | 1,719,531 | ||||||
Univar Solutions, Inc.(1) | 4,131 | 104,184 | ||||||
Veritiv Corp.(1) | 4,886 | 582,362 | ||||||
| W.W. Grainger, Inc. | 7,206 | 3,998,898 | ||||||
| Watsco, Inc. | 2,391 | 650,424 | ||||||
WESCO International, Inc.(1) | 2,067 | 272,182 | ||||||
| 20,088,933 | ||||||||
| Water Utilities — 0.1% | ||||||||
| American States Water Co. | 3,548 | 294,378 | ||||||
| American Water Works Co., Inc. | 9,652 | 1,432,839 | ||||||
| Artesian Resources Corp., Class A | 731 | 39,935 | ||||||
| California Water Service Group | 3,393 | 198,592 | ||||||
| Essential Utilities, Inc. | 11,807 | 580,314 | ||||||
74
| Avantis U.S. Equity ETF | ||||||||
| Shares | Value | |||||||
| Global Water Resources, Inc. | 7 | $ | 95 | |||||
| 2,546,153 | ||||||||
| Wireless Telecommunication Services — 0.4% | ||||||||
Gogo, Inc.(1) | 3,495 | 51,936 | ||||||
| Shenandoah Telecommunications Co. | 17,411 | 388,091 | ||||||
T-Mobile US, Inc.(1) | 56,525 | 8,137,339 | ||||||
| Telephone and Data Systems, Inc. | 32,429 | 527,620 | ||||||
United States Cellular Corp.(1) | 2,811 | 80,366 | ||||||
| 9,185,352 | ||||||||
TOTAL COMMON STOCKS (Cost $2,497,670,567) | 2,517,309,070 | |||||||
| SHORT-TERM INVESTMENTS — 0.4% | ||||||||
| Money Market Funds — 0.4% | ||||||||
| State Street Institutional U.S. Government Money Market Fund, Premier Class | 2,787,830 | 2,787,830 | ||||||
State Street Navigator Securities Lending Government Money Market Portfolio(3) | 7,532,352 | 7,532,352 | ||||||
TOTAL SHORT-TERM INVESTMENTS (Cost $10,320,182) | 10,320,182 | |||||||
TOTAL INVESTMENT SECURITIES — 100.2% (Cost $2,507,990,749) | 2,527,629,252 | |||||||
| OTHER ASSETS AND LIABILITIES — (0.2)% | (4,892,136) | |||||||
| TOTAL NET ASSETS — 100.0% | $ | 2,522,737,116 | ||||||
| NOTES TO SCHEDULE OF INVESTMENTS | ||||||||
| ADR | - | American Depositary Receipt | ||||||
(1)Non-income producing.
(2)Security, or a portion thereof, is on loan. At the period end, the aggregate value of securities on loan was $10,593,875. The amount of securities on loan indicated may not correspond with the securities on loan identified because securities with pending sales are in the process of recall from the brokers.
(3)Investment of cash collateral from securities on loan. At the period end, the aggregate value of the collateral held by the fund was $10,877,160, which includes securities collateral of $3,344,808.
See Notes to Financial Statements.
75
AUGUST 31, 2022
| Avantis U.S. Large Cap Value ETF | ||||||||
| Shares | Value | |||||||
| COMMON STOCKS — 99.6% | ||||||||
| Aerospace and Defense — 0.2% | ||||||||
| BWX Technologies, Inc. | 16,626 | $ | 866,713 | |||||
| Air Freight and Logistics — 2.6% | ||||||||
| Expeditors International of Washington, Inc. | 15,699 | 1,615,270 | ||||||
| FedEx Corp. | 16,287 | 3,433,463 | ||||||
| United Parcel Service, Inc., Class B | 40,334 | 7,845,366 | ||||||
| 12,894,099 | ||||||||
| Airlines — 0.1% | ||||||||
Alaska Air Group, Inc.(1) | 14,238 | 620,207 | ||||||
Auto Components† | ||||||||
| Gentex Corp. | 15 | 409 | ||||||
| Automobiles — 1.0% | ||||||||
| Ford Motor Co. | 185,368 | 2,825,008 | ||||||
| General Motors Co. | 43,609 | 1,666,300 | ||||||
| Harley-Davidson, Inc. | 14,610 | 563,508 | ||||||
| 5,054,816 | ||||||||
| Banks — 4.6% | ||||||||
| Citigroup, Inc. | 77,155 | 3,765,935 | ||||||
| Comerica, Inc. | 29 | 2,329 | ||||||
| JPMorgan Chase & Co. | 85,675 | 9,743,818 | ||||||
| KeyCorp | 59,838 | 1,058,534 | ||||||
| PacWest Bancorp | 5,670 | 149,291 | ||||||
| Popular, Inc. | 10,465 | 808,107 | ||||||
| Regions Financial Corp. | 125 | 2,709 | ||||||
| Synovus Financial Corp. | 26,729 | 1,073,437 | ||||||
| Wells Fargo & Co. | 138,585 | 6,057,550 | ||||||
| 22,661,710 | ||||||||
Beverages† | ||||||||
| National Beverage Corp. | 215 | 11,924 | ||||||
| Biotechnology — 4.4% | ||||||||
Biogen, Inc.(1) | 7,658 | 1,496,220 | ||||||
| Gilead Sciences, Inc. | 92,928 | 5,898,140 | ||||||
Halozyme Therapeutics, Inc.(1) | 4,677 | 190,494 | ||||||
Moderna, Inc.(1) | 28,358 | 3,750,913 | ||||||
Regeneron Pharmaceuticals, Inc.(1) | 8,335 | 4,843,135 | ||||||
United Therapeutics Corp.(1) | 5,200 | 1,178,424 | ||||||
Vertex Pharmaceuticals, Inc.(1) | 15,148 | 4,268,101 | ||||||
| 21,625,427 | ||||||||
| Building Products — 0.8% | ||||||||
Builders FirstSource, Inc.(1) | 24,878 | 1,458,100 | ||||||
| Owens Corning | 18,025 | 1,473,183 | ||||||
| UFP Industries, Inc. | 10,962 | 870,273 | ||||||
| 3,801,556 | ||||||||
| Capital Markets — 4.5% | ||||||||
| Ameriprise Financial, Inc. | 11,437 | 3,065,230 | ||||||
| Blackstone, Inc. | 11,014 | 1,034,655 | ||||||
| Carlyle Group, Inc. | 41,920 | 1,363,658 | ||||||
| Goldman Sachs Group, Inc. | 20,671 | 6,876,622 | ||||||
| Houlihan Lokey, Inc. | 15,075 | 1,183,387 | ||||||
76
| Avantis U.S. Large Cap Value ETF | ||||||||
| Shares | Value | |||||||
| Morgan Stanley | 52,813 | $ | 4,500,724 | |||||
| Raymond James Financial, Inc. | 102 | 10,646 | ||||||
| SEI Investments Co. | 14,070 | 769,629 | ||||||
| Stifel Financial Corp. | 13,255 | 786,154 | ||||||
| T. Rowe Price Group, Inc. | 23,372 | 2,804,640 | ||||||
| 22,395,345 | ||||||||
| Chemicals — 3.5% | ||||||||
| Celanese Corp. | 11,366 | 1,260,035 | ||||||
| CF Industries Holdings, Inc. | 25,461 | 2,634,195 | ||||||
| Chemours Co. | 23,809 | 803,077 | ||||||
| Dow, Inc. | 69,486 | 3,543,786 | ||||||
| Eastman Chemical Co. | 4,841 | 440,531 | ||||||
| Huntsman Corp. | 25,437 | 712,745 | ||||||
| LyondellBasell Industries NV, Class A | 30,138 | 2,501,454 | ||||||
| Mosaic Co. | 56,113 | 3,022,807 | ||||||
| Olin Corp. | 30,792 | 1,683,091 | ||||||
| Westlake Corp. | 6,720 | 662,794 | ||||||
| 17,264,515 | ||||||||
Construction Materials† | ||||||||
| Eagle Materials, Inc. | 1,692 | 202,397 | ||||||
| Consumer Finance — 2.5% | ||||||||
| Ally Financial, Inc. | 50,765 | 1,685,398 | ||||||
| Capital One Financial Corp. | 33,943 | 3,591,848 | ||||||
Credit Acceptance Corp.(1)(2) | 1,378 | 733,206 | ||||||
| Discover Financial Services | 32,555 | 3,271,452 | ||||||
| OneMain Holdings, Inc. | 20,363 | 711,280 | ||||||
| Synchrony Financial | 70,087 | 2,295,349 | ||||||
| 12,288,533 | ||||||||
| Containers and Packaging — 0.4% | ||||||||
| Packaging Corp. of America | 14,115 | 1,932,626 | ||||||
| Diversified Financial Services — 0.8% | ||||||||
| Apollo Global Management, Inc. | 2,223 | 123,554 | ||||||
| Equitable Holdings, Inc. | 71,995 | 2,141,851 | ||||||
| Voya Financial, Inc. | 24,554 | 1,510,808 | ||||||
| 3,776,213 | ||||||||
| Diversified Telecommunication Services — 1.8% | ||||||||
Iridium Communications, Inc.(1) | 16,909 | 750,591 | ||||||
| Verizon Communications, Inc. | 194,303 | 8,123,808 | ||||||
| 8,874,399 | ||||||||
| Electronic Equipment, Instruments and Components — 1.2% | ||||||||
| Corning, Inc. | 84,577 | 2,902,683 | ||||||
Flex Ltd.(1) | 67,678 | 1,205,345 | ||||||
| Jabil, Inc. | 28,283 | 1,705,465 | ||||||
| 5,813,493 | ||||||||
| Energy Equipment and Services — 0.1% | ||||||||
| Halliburton Co. | 9,190 | 276,895 | ||||||
| Entertainment — 0.1% | ||||||||
| World Wrestling Entertainment, Inc., Class A | 8,649 | 588,219 | ||||||
| Food and Staples Retailing — 4.5% | ||||||||
| Albertsons Cos., Inc., Class A | 22,324 | 614,133 | ||||||
| Casey's General Stores, Inc. | 6,312 | 1,349,316 | ||||||
77
| Avantis U.S. Large Cap Value ETF | ||||||||
| Shares | Value | |||||||
| Costco Wholesale Corp. | 15,822 | $ | 8,260,666 | |||||
| Kroger Co. | 82,325 | 3,946,661 | ||||||
| Walmart, Inc. | 63,193 | 8,376,232 | ||||||
| 22,547,008 | ||||||||
| Food Products — 0.2% | ||||||||
Darling Ingredients, Inc.(1) | 950 | 72,257 | ||||||
Pilgrim's Pride Corp.(1) | 27,060 | 770,398 | ||||||
| Tyson Foods, Inc., Class A | 32 | 2,412 | ||||||
| 845,067 | ||||||||
| Health Care Equipment and Supplies — 0.5% | ||||||||
Hologic, Inc.(1) | 31,632 | 2,137,058 | ||||||
QuidelOrtho Corp.(1) | 5,185 | 410,963 | ||||||
| 2,548,021 | ||||||||
| Health Care Providers and Services — 1.4% | ||||||||
Centene Corp.(1) | 33,427 | 2,999,739 | ||||||
| Ensign Group, Inc. | 6,375 | 543,788 | ||||||
| Humana, Inc. | 823 | 396,505 | ||||||
Molina Healthcare, Inc.(1) | 8,836 | 2,981,001 | ||||||
| 6,921,033 | ||||||||
| Hotels, Restaurants and Leisure — 0.5% | ||||||||
| Boyd Gaming Corp. | 16,820 | 915,513 | ||||||
| Choice Hotels International, Inc. | 4,665 | 535,122 | ||||||
| Texas Roadhouse, Inc. | 12,615 | 1,119,707 | ||||||
| 2,570,342 | ||||||||
| Household Durables — 0.7% | ||||||||
NVR, Inc.(1) | 136 | 563,048 | ||||||
| PulteGroup, Inc. | 28,338 | 1,152,223 | ||||||
| Toll Brothers, Inc. | 8,293 | 363,151 | ||||||
| Whirlpool Corp. | 9,614 | 1,505,552 | ||||||
| 3,583,974 | ||||||||
| Independent Power and Renewable Electricity Producers — 0.5% | ||||||||
| AES Corp. | 38,712 | 985,221 | ||||||
| Clearway Energy, Inc., Class A | 6,884 | 237,360 | ||||||
| Clearway Energy, Inc., Class C | 11,452 | 424,869 | ||||||
| Vistra Corp. | 28,245 | 699,064 | ||||||
| 2,346,514 | ||||||||
| Insurance — 3.8% | ||||||||
| Allstate Corp. | 14,082 | 1,696,881 | ||||||
| American Financial Group, Inc. | 7,920 | 1,011,225 | ||||||
| American International Group, Inc. | 45,096 | 2,333,718 | ||||||
| Fidelity National Financial, Inc. | 46,350 | 1,812,285 | ||||||
| First American Financial Corp. | 19,322 | 1,033,727 | ||||||
| Hartford Financial Services Group, Inc. | 46,806 | 3,010,094 | ||||||
| MetLife, Inc. | 24,800 | 1,595,384 | ||||||
| Old Republic International Corp. | 34,465 | 752,716 | ||||||
| Primerica, Inc. | 9,011 | 1,142,144 | ||||||
| RenaissanceRe Holdings Ltd. | 60 | 8,116 | ||||||
| Selective Insurance Group, Inc. | 2,377 | 188,781 | ||||||
| Travelers Cos., Inc. | 26,908 | 4,349,409 | ||||||
| 18,934,480 | ||||||||
78
| Avantis U.S. Large Cap Value ETF | ||||||||
| Shares | Value | |||||||
| Interactive Media and Services — 1.9% | ||||||||
Meta Platforms, Inc., Class A(1) | 56,402 | $ | 9,189,578 | |||||
| Internet and Direct Marketing Retail — 0.5% | ||||||||
| eBay, Inc. | 57,579 | 2,540,961 | ||||||
| IT Services — 0.3% | ||||||||
| Automatic Data Processing, Inc. | 872 | 213,125 | ||||||
DXC Technology Co.(1) | 42,319 | 1,048,665 | ||||||
| Jack Henry & Associates, Inc. | 869 | 167,022 | ||||||
| 1,428,812 | ||||||||
Leisure Products† | ||||||||
| Brunswick Corp. | 2,713 | 202,688 | ||||||
| Machinery — 1.5% | ||||||||
| Cummins, Inc. | 8,987 | 1,935,530 | ||||||
| Deere & Co. | 14,602 | 5,333,381 | ||||||
| Lincoln Electric Holdings, Inc. | 2,570 | 351,293 | ||||||
| Snap-on, Inc. | 214 | 46,622 | ||||||
| 7,666,826 | ||||||||
| Media — 0.1% | ||||||||
DISH Network Corp., Class A(1) | 26,675 | 462,811 | ||||||
| Metals and Mining — 2.9% | ||||||||
Cleveland-Cliffs, Inc.(1) | 67,763 | 1,170,267 | ||||||
| Commercial Metals Co. | 4,573 | 185,252 | ||||||
| Freeport-McMoRan, Inc. | 137,847 | 4,080,271 | ||||||
| Nucor Corp. | 34,356 | 4,567,287 | ||||||
| Reliance Steel & Aluminum Co. | 1,862 | 350,019 | ||||||
| Steel Dynamics, Inc. | 32,686 | 2,638,414 | ||||||
| United States Steel Corp. | 55,595 | 1,271,458 | ||||||
| 14,262,968 | ||||||||
| Multiline Retail — 1.6% | ||||||||
| Kohl's Corp. | 25,689 | 730,082 | ||||||
| Macy's, Inc. | 67,488 | 1,168,892 | ||||||
| Target Corp. | 36,856 | 5,909,491 | ||||||
| 7,808,465 | ||||||||
| Oil, Gas and Consumable Fuels — 18.4% | ||||||||
Antero Resources Corp.(1) | 25,354 | 1,016,188 | ||||||
| Chevron Corp. | 87,126 | 13,771,135 | ||||||
| ConocoPhillips | 94,480 | 10,340,836 | ||||||
| Continental Resources, Inc. | 13,536 | 945,219 | ||||||
| Coterra Energy, Inc. | 81,252 | 2,511,499 | ||||||
| Devon Energy Corp. | 99,809 | 7,048,512 | ||||||
| Diamondback Energy, Inc. | 24,557 | 3,272,957 | ||||||
| EOG Resources, Inc. | 55,063 | 6,679,142 | ||||||
| EQT Corp. | 28,619 | 1,367,988 | ||||||
| Exxon Mobil Corp. | 176,533 | 16,874,789 | ||||||
| Hess Corp. | 27,498 | 3,321,208 | ||||||
| Marathon Oil Corp. | 117,735 | 3,012,839 | ||||||
| Marathon Petroleum Corp. | 40,841 | 4,114,731 | ||||||
| Murphy Oil Corp. | 29,767 | 1,160,020 | ||||||
| Occidental Petroleum Corp. | 74,880 | 5,316,480 | ||||||
| ONEOK, Inc. | 59,299 | 3,630,878 | ||||||
| Ovintiv, Inc. | 18,321 | 973,578 | ||||||
79
| Avantis U.S. Large Cap Value ETF | ||||||||
| Shares | Value | |||||||
| PDC Energy, Inc. | 8,370 | $ | 568,407 | |||||
| Phillips 66 | 33,913 | 3,033,857 | ||||||
Range Resources Corp.(1) | 44,717 | 1,469,401 | ||||||
| Texas Pacific Land Corp. | 455 | 837,409 | ||||||
| 91,267,073 | ||||||||
| Paper and Forest Products — 0.2% | ||||||||
| Louisiana-Pacific Corp. | 19,702 | 1,068,440 | ||||||
| Pharmaceuticals — 8.3% | ||||||||
| Bristol-Myers Squibb Co. | 77,805 | 5,244,835 | ||||||
Jazz Pharmaceuticals PLC(1) | 10,313 | 1,600,784 | ||||||
| Johnson & Johnson | 76,337 | 12,316,212 | ||||||
| Merck & Co., Inc. | 114,643 | 9,785,926 | ||||||
| Pfizer, Inc. | 243,303 | 11,004,595 | ||||||
| Viatris, Inc. | 103,060 | 984,223 | ||||||
| 40,936,575 | ||||||||
| Professional Services — 0.5% | ||||||||
| Robert Half International, Inc. | 22,098 | 1,700,883 | ||||||
TriNet Group, Inc.(1) | 12,624 | 1,040,218 | ||||||
| 2,741,101 | ||||||||
| Road and Rail — 5.0% | ||||||||
| AMERCO | 1,567 | 823,725 | ||||||
| CSX Corp. | 157,527 | 4,985,730 | ||||||
Hertz Global Holdings, Inc.(1) | 799 | 14,750 | ||||||
| J.B. Hunt Transport Services, Inc. | 12,986 | 2,259,824 | ||||||
| Knight-Swift Transportation Holdings, Inc. | 19,612 | 990,602 | ||||||
| Landstar System, Inc. | 3,480 | 510,272 | ||||||
| Norfolk Southern Corp. | 12,921 | 3,141,483 | ||||||
| Old Dominion Freight Line, Inc. | 6,657 | 1,806,776 | ||||||
Saia, Inc.(1) | 5,240 | 1,083,789 | ||||||
| Union Pacific Corp. | 40,054 | 8,992,523 | ||||||
| 24,609,474 | ||||||||
| Semiconductors and Semiconductor Equipment — 5.9% | ||||||||
| Amkor Technology, Inc. | 18,015 | 362,642 | ||||||
| Applied Materials, Inc. | 47,700 | 4,487,139 | ||||||
GLOBALFOUNDRIES, Inc.(1)(2) | 4,245 | 253,936 | ||||||
| KLA Corp. | 6,446 | 2,218,262 | ||||||
| Lam Research Corp. | 9,671 | 4,235,028 | ||||||
| Micron Technology, Inc. | 50,098 | 2,832,040 | ||||||
ON Semiconductor Corp.(1) | 6,112 | 420,322 | ||||||
| QUALCOMM, Inc. | 28,415 | 3,758,452 | ||||||
| Teradyne, Inc. | 22,145 | 1,874,353 | ||||||
| Texas Instruments, Inc. | 51,977 | 8,587,120 | ||||||
| 29,029,294 | ||||||||
| Software — 1.1% | ||||||||
Aspen Technology, Inc.(1) | 41 | 8,635 | ||||||
| Microsoft Corp. | 18,443 | 4,822,291 | ||||||
Qualys, Inc.(1) | 3,095 | 470,130 | ||||||
| 5,301,056 | ||||||||
| Specialty Retail — 5.0% | ||||||||
AutoNation, Inc.(1) | 11,747 | 1,463,676 | ||||||
| Best Buy Co., Inc. | 30,003 | 2,120,912 | ||||||
80
| Avantis U.S. Large Cap Value ETF | ||||||||
| Shares | Value | |||||||
Burlington Stores, Inc.(1) | 6,781 | $ | 950,628 | |||||
Dick's Sporting Goods, Inc.(2) | 15,334 | 1,631,078 | ||||||
| Gap, Inc. | 17,382 | 158,871 | ||||||
| Lithia Motors, Inc. | 2,763 | 733,411 | ||||||
| Penske Automotive Group, Inc. | 7,859 | 926,655 | ||||||
RH(1) | 2,721 | 696,331 | ||||||
| Ross Stores, Inc. | 35,262 | 3,042,053 | ||||||
| TJX Cos., Inc. | 80,134 | 4,996,355 | ||||||
| Tractor Supply Co. | 16,597 | 3,072,934 | ||||||
Ulta Beauty, Inc.(1) | 7,464 | 3,133,910 | ||||||
| Williams-Sonoma, Inc. | 14,000 | 2,082,500 | ||||||
| 25,009,314 | ||||||||
| Technology Hardware, Storage and Peripherals — 2.8% | ||||||||
| Apple, Inc. | 87,429 | 13,745,587 | ||||||
| Textiles, Apparel and Luxury Goods — 1.4% | ||||||||
Capri Holdings Ltd.(1) | 29,539 | 1,393,650 | ||||||
| Levi Strauss & Co., Class A | 31,523 | 532,423 | ||||||
lululemon athletica, Inc.(1) | 5,974 | 1,791,961 | ||||||
| NIKE, Inc., Class B | 9,572 | 1,018,939 | ||||||
| Ralph Lauren Corp. | 3,601 | 328,879 | ||||||
| Tapestry, Inc. | 51,189 | 1,777,794 | ||||||
Under Armour, Inc., Class A(1) | 7,706 | 64,885 | ||||||
Under Armour, Inc., Class C(1) | 9,435 | 71,612 | ||||||
| 6,980,143 | ||||||||
| Trading Companies and Distributors — 0.6% | ||||||||
| W.W. Grainger, Inc. | 5,591 | 3,102,670 | ||||||
| Wireless Telecommunication Services — 0.9% | ||||||||
T-Mobile US, Inc.(1) | 31,720 | 4,566,411 | ||||||
TOTAL COMMON STOCKS (Cost $506,729,159) | 493,166,182 | |||||||
| SHORT-TERM INVESTMENTS — 0.3% | ||||||||
| Money Market Funds — 0.3% | ||||||||
| State Street Institutional U.S. Government Money Market Fund, Premier Class | 183,451 | 183,451 | ||||||
State Street Navigator Securities Lending Government Money Market Portfolio(3) | 1,262,664 | 1,262,664 | ||||||
TOTAL SHORT-TERM INVESTMENTS (Cost $1,446,115) | 1,446,115 | |||||||
TOTAL INVESTMENT SECURITIES — 99.9% (Cost $508,175,274) | 494,612,297 | |||||||
| OTHER ASSETS AND LIABILITIES — 0.1% | 342,308 | |||||||
| TOTAL NET ASSETS — 100.0% | $ | 494,954,605 | ||||||
| NOTES TO SCHEDULE OF INVESTMENTS | ||||||||
†Category is less than 0.05% of total net assets.
(1)Non-income producing.
(2)Security, or a portion thereof, is on loan. At the period end, the aggregate value of securities on loan was $1,714,564. The amount of securities on loan indicated may not correspond with the securities on loan identified because securities with pending sales are in the process of recall from the brokers.
(3)Investment of cash collateral from securities on loan. At the period end, the aggregate value of the collateral held by the fund was $1,764,108, which includes securities collateral of $501,444.
See Notes to Financial Statements.
81
AUGUST 31, 2022
| Avantis U.S. Small Cap Equity ETF | ||||||||
| Shares | Value | |||||||
| COMMON STOCKS — 99.7% | ||||||||
| Aerospace and Defense — 1.0% | ||||||||
AAR Corp.(1) | 1,040 | $ | 44,595 | |||||
AerSale Corp.(1) | 560 | 10,797 | ||||||
Archer Aviation, Inc., Class A(1) | 2,708 | 9,586 | ||||||
Astronics Corp.(1) | 560 | 5,158 | ||||||
Ducommun, Inc.(1) | 300 | 13,200 | ||||||
| Kaman Corp. | 740 | 23,473 | ||||||
Kratos Defense & Security Solutions, Inc.(1) | 901 | 11,299 | ||||||
| Maxar Technologies, Inc. | 2,080 | 49,566 | ||||||
Momentus, Inc.(1) | 885 | 1,566 | ||||||
| Moog, Inc., Class A | 882 | 66,132 | ||||||
| National Presto Industries, Inc. | 140 | 9,551 | ||||||
| Park Aerospace Corp. | 500 | 5,755 | ||||||
V2X, Inc.(1) | 300 | 10,398 | ||||||
| 261,076 | ||||||||
| Air Freight and Logistics — 1.3% | ||||||||
Air Transport Services Group, Inc.(1) | 2,044 | 61,586 | ||||||
Atlas Air Worldwide Holdings, Inc.(1) | 940 | 93,925 | ||||||
| Forward Air Corp. | 860 | 83,454 | ||||||
Hub Group, Inc., Class A(1) | 1,040 | 83,002 | ||||||
Radiant Logistics, Inc.(1) | 1,400 | 9,800 | ||||||
| 331,767 | ||||||||
| Airlines — 0.7% | ||||||||
Allegiant Travel Co.(1) | 420 | 40,530 | ||||||
Frontier Group Holdings, Inc.(1) | 1,041 | 13,429 | ||||||
Hawaiian Holdings, Inc.(1) | 1,340 | 20,087 | ||||||
Mesa Air Group, Inc.(1) | 780 | 1,895 | ||||||
SkyWest, Inc.(1) | 1,340 | 28,529 | ||||||
Spirit Airlines, Inc.(1) | 3,041 | 68,970 | ||||||
Sun Country Airlines Holdings, Inc.(1) | 910 | 18,127 | ||||||
| 191,567 | ||||||||
| Auto Components — 1.4% | ||||||||
American Axle & Manufacturing Holdings, Inc.(1) | 3,120 | 32,292 | ||||||
Cooper-Standard Holdings, Inc.(1) | 480 | 3,758 | ||||||
| Dana, Inc. | 3,320 | 51,360 | ||||||
Dorman Products, Inc.(1) | 760 | 68,894 | ||||||
Gentherm, Inc.(1) | 1,000 | 59,900 | ||||||
Modine Manufacturing Co.(1) | 1,608 | 24,088 | ||||||
Motorcar Parts of America, Inc.(1) | 500 | 7,430 | ||||||
| Patrick Industries, Inc. | 600 | 31,782 | ||||||
| Standard Motor Products, Inc. | 600 | 22,020 | ||||||
Stoneridge, Inc.(1) | 640 | 12,160 | ||||||
Visteon Corp.(1) | 490 | 58,717 | ||||||
XPEL, Inc.(1) | 84 | 5,757 | ||||||
| 378,158 | ||||||||
| Automobiles — 0.2% | ||||||||
| Winnebago Industries, Inc. | 880 | 50,670 | ||||||
Workhorse Group, Inc.(1) | 2,020 | 6,323 | ||||||
| 56,993 | ||||||||
82
| Avantis U.S. Small Cap Equity ETF | ||||||||
| Shares | Value | |||||||
| Banks — 14.6% | ||||||||
| 1st Source Corp. | 240 | $ | 11,326 | |||||
| ACNB Corp. | 282 | 10,028 | ||||||
| Allegiance Bancshares, Inc. | 640 | 27,110 | ||||||
| Amalgamated Financial Corp. | 380 | 8,550 | ||||||
| Amerant Bancorp, Inc. | 980 | 25,666 | ||||||
| American National Bankshares, Inc. | 300 | 9,879 | ||||||
| Ameris Bancorp | 840 | 39,211 | ||||||
| Ames National Corp. | 268 | 5,858 | ||||||
| Arrow Financial Corp. | 380 | 12,202 | ||||||
| Atlantic Union Bankshares Corp. | 2,287 | 74,213 | ||||||
| Banc of California, Inc. | 1,420 | 23,970 | ||||||
| BancFirst Corp. | 540 | 58,244 | ||||||
Bancorp, Inc.(1) | 1,440 | 34,157 | ||||||
| Bank First Corp. | 200 | 16,254 | ||||||
| Bank of Marin Bancorp | 440 | 13,596 | ||||||
| Bank7 Corp. | 120 | 2,857 | ||||||
| Bankwell Financial Group, Inc. | 184 | 5,800 | ||||||
| Banner Corp. | 940 | 57,114 | ||||||
| Bar Harbor Bankshares | 380 | 10,765 | ||||||
| Baycom Corp. | 441 | 8,207 | ||||||
| BCB Bancorp, Inc. | 548 | 9,864 | ||||||
| Berkshire Hills Bancorp, Inc. | 1,240 | 34,980 | ||||||
| Blue Ridge Bankshares, Inc. | 460 | 6,748 | ||||||
| Brookline Bancorp., Inc. | 2,100 | 26,187 | ||||||
| Business First Bancshares, Inc. | 540 | 12,739 | ||||||
| Byline Bancorp, Inc. | 660 | 14,395 | ||||||
| Cambridge Bancorp | 180 | 14,801 | ||||||
| Camden National Corp. | 380 | 17,187 | ||||||
| Capital Bancorp, Inc. | 260 | 6,440 | ||||||
| Capital City Bank Group, Inc. | 340 | 10,856 | ||||||
| Capstar Financial Holdings, Inc. | 460 | 9,269 | ||||||
Carter Bankshares, Inc.(1) | 747 | 12,303 | ||||||
| CBTX, Inc. | 461 | 13,738 | ||||||
| Central Pacific Financial Corp. | 780 | 16,996 | ||||||
| Central Valley Community Bancorp | 280 | 4,984 | ||||||
| Citizens & Northern Corp. | 400 | 9,600 | ||||||
| City Holding Co. | 400 | 34,004 | ||||||
| Civista Bancshares, Inc. | 400 | 8,460 | ||||||
| CNB Financial Corp. | 480 | 12,634 | ||||||
Coastal Financial Corp.(1) | 320 | 12,864 | ||||||
| Colony Bankcorp, Inc. | 465 | 6,566 | ||||||
| Columbia Banking System, Inc. | 2,205 | 66,040 | ||||||
| Community Trust Bancorp, Inc. | 420 | 17,745 | ||||||
| ConnectOne Bancorp, Inc. | 1,120 | 28,034 | ||||||
CrossFirst Bankshares, Inc.(1) | 1,140 | 15,025 | ||||||
Customers Bancorp, Inc.(1) | 960 | 33,302 | ||||||
| Dime Community Bancshares, Inc. | 840 | 26,258 | ||||||
| Eagle Bancorp, Inc. | 840 | 40,765 | ||||||
| Enterprise Bancorp, Inc. | 280 | 9,010 | ||||||
| Enterprise Financial Services Corp. | 960 | 43,891 | ||||||
83
| Avantis U.S. Small Cap Equity ETF | ||||||||
| Shares | Value | |||||||
| Equity Bancshares, Inc., Class A | 440 | $ | 13,741 | |||||
| Esquire Financial Holdings, Inc. | 220 | 8,224 | ||||||
| Farmers & Merchants Bancorp, Inc. | 421 | 12,024 | ||||||
| Farmers National Banc Corp. | 960 | 13,718 | ||||||
| FB Financial Corp. | 1,060 | 41,997 | ||||||
| Financial Institutions, Inc. | 440 | 11,453 | ||||||
| First BanCorp | 5,705 | 81,581 | ||||||
| First Bancorp, Inc. | 260 | 7,540 | ||||||
| First Bancorp/Southern Pines NC | 900 | 32,769 | ||||||
| First Bancshares, Inc. | 540 | 16,146 | ||||||
| First Bank/Hamilton NJ | 542 | 8,125 | ||||||
| First Busey Corp. | 1,460 | 33,580 | ||||||
| First Business Financial Services, Inc. | 249 | 8,287 | ||||||
| First Commonwealth Financial Corp. | 2,940 | 39,631 | ||||||
| First Community Bankshares, Inc. | 440 | 13,873 | ||||||
| First Financial Bancorp | 2,540 | 54,813 | ||||||
| First Financial Corp. | 300 | 13,950 | ||||||
| First Foundation, Inc. | 1,480 | 28,061 | ||||||
| First Internet Bancorp | 300 | 11,001 | ||||||
| First Merchants Corp. | 1,785 | 71,079 | ||||||
| First Mid Bancshares, Inc. | 460 | 16,261 | ||||||
| First of Long Island Corp. | 600 | 11,046 | ||||||
First Western Financial, Inc.(1) | 243 | 6,447 | ||||||
| Five Star Bancorp | 300 | 7,629 | ||||||
| Flushing Financial Corp. | 860 | 17,759 | ||||||
| Fulton Financial Corp. | 4,520 | 73,360 | ||||||
| German American Bancorp, Inc. | 760 | 28,546 | ||||||
| Great Southern Bancorp, Inc. | 300 | 17,634 | ||||||
| Guaranty Bancshares, Inc. | 220 | 7,623 | ||||||
| Hanmi Financial Corp. | 940 | 23,237 | ||||||
| HarborOne Bancorp, Inc. | 1,280 | 17,459 | ||||||
| Heartland Financial USA, Inc. | 1,060 | 47,350 | ||||||
| Heritage Commerce Corp. | 1,560 | 17,612 | ||||||
| Heritage Financial Corp. | 940 | 24,431 | ||||||
| Hilltop Holdings, Inc. | 1,626 | 42,926 | ||||||
| HomeStreet, Inc. | 600 | 20,886 | ||||||
| HomeTrust Bancshares, Inc. | 440 | 10,217 | ||||||
| Hope Bancorp, Inc. | 3,240 | 46,883 | ||||||
| Horizon Bancorp, Inc. | 1,100 | 20,812 | ||||||
| Independent Bank Corp. (Michigan) | 600 | 12,312 | ||||||
| International Bancshares Corp. | 1,520 | 63,430 | ||||||
| Lakeland Bancorp, Inc. | 1,860 | 30,299 | ||||||
| Lakeland Financial Corp. | 700 | 52,738 | ||||||
| Live Oak Bancshares, Inc. | 1,060 | 38,414 | ||||||
| Macatawa Bank Corp. | 860 | 8,187 | ||||||
| Mercantile Bank Corp. | 420 | 13,894 | ||||||
| Metrocity Bankshares, Inc. | 600 | 11,994 | ||||||
Metropolitan Bank Holding Corp.(1) | 340 | 24,341 | ||||||
| Mid Penn Bancorp, Inc. | 420 | 12,218 | ||||||
| Midland States Bancorp, Inc. | 560 | 14,050 | ||||||
| MidWestOne Financial Group, Inc. | 280 | 8,540 | ||||||
84
| Avantis U.S. Small Cap Equity ETF | ||||||||
| Shares | Value | |||||||
| MVB Financial Corp. | 280 | $ | 8,954 | |||||
| National Bank Holdings Corp., Class A | 940 | 37,722 | ||||||
| NBT Bancorp, Inc. | 1,269 | 49,212 | ||||||
Nicolet Bankshares, Inc.(1) | 360 | 27,569 | ||||||
| Northeast Bank | 200 | 7,754 | ||||||
| Northrim BanCorp, Inc. | 160 | 6,488 | ||||||
| Northwest Bancshares, Inc. | 3,320 | 46,712 | ||||||
| OceanFirst Financial Corp. | 1,660 | 32,270 | ||||||
| OFG Bancorp | 1,440 | 39,168 | ||||||
| Old Second Bancorp, Inc. | 1,140 | 15,641 | ||||||
| Origin Bancorp, Inc. | 580 | 23,693 | ||||||
| Orrstown Financial Services, Inc. | 326 | 8,388 | ||||||
| Park National Corp. | 420 | 55,369 | ||||||
| Parke Bancorp, Inc. | 342 | 7,586 | ||||||
| Pathward Financial, Inc. | 900 | 29,664 | ||||||
| PCB Bancorp. | 340 | 6,385 | ||||||
| PCSB Financial Corp. | 401 | 7,423 | ||||||
| Peapack-Gladstone Financial Corp. | 480 | 16,162 | ||||||
| Peoples Bancorp, Inc. | 720 | 21,521 | ||||||
| Peoples Financial Services Corp. | 200 | 9,736 | ||||||
| Preferred Bank | 427 | 28,968 | ||||||
| Premier Financial Corp. | 1,040 | 28,101 | ||||||
| Primis Financial Corp. | 620 | 8,128 | ||||||
Professional Holding Corp., Class A(1) | 420 | 11,743 | ||||||
| QCR Holdings, Inc. | 440 | 24,574 | ||||||
| RBB Bancorp | 420 | 9,282 | ||||||
| Renasant Corp. | 1,440 | 48,010 | ||||||
| Republic Bancorp, Inc., Class A | 400 | 17,000 | ||||||
Republic First Bancorp, Inc.(1) | 1,380 | 4,388 | ||||||
| S&T Bancorp, Inc. | 1,020 | 30,233 | ||||||
| Sandy Spring Bancorp, Inc. | 1,280 | 49,306 | ||||||
| Seacoast Banking Corp. of Florida | 1,809 | 58,467 | ||||||
| Shore Bancshares, Inc. | 520 | 9,906 | ||||||
| Sierra Bancorp | 380 | 7,874 | ||||||
Silvergate Capital Corp., Class A(1) | 623 | 56,768 | ||||||
| SmartFinancial, Inc. | 400 | 10,036 | ||||||
| South Plains Financial, Inc. | 280 | 7,596 | ||||||
Southern First Bancshares, Inc.(1) | 220 | 9,484 | ||||||
| Southside Bancshares, Inc. | 920 | 34,666 | ||||||
| Stock Yards Bancorp, Inc. | 800 | 53,008 | ||||||
| Summit Financial Group, Inc. | 320 | 9,126 | ||||||
Texas Capital Bancshares, Inc.(1) | 1,425 | 84,118 | ||||||
Third Coast Bancshares, Inc.(1) | 328 | 5,970 | ||||||
| Tompkins Financial Corp. | 340 | 24,358 | ||||||
| Towne Bank | 1,949 | 55,527 | ||||||
| Trico Bancshares | 907 | 42,801 | ||||||
Triumph Bancorp, Inc.(1) | 780 | 48,290 | ||||||
| Trustmark Corp. | 1,540 | 48,572 | ||||||
| Unity Bancorp, Inc. | 200 | 5,606 | ||||||
| Univest Financial Corp. | 820 | 20,336 | ||||||
| Veritex Holdings, Inc. | 1,300 | 39,143 | ||||||
85
| Avantis U.S. Small Cap Equity ETF | ||||||||
| Shares | Value | |||||||
| Washington Federal, Inc. | 1,780 | $ | 56,978 | |||||
| Washington Trust Bancorp, Inc. | 440 | 22,277 | ||||||
| WesBanco, Inc. | 1,640 | 56,104 | ||||||
| West BanCorp, Inc. | 420 | 10,336 | ||||||
| Westamerica Bancorporation | 801 | 44,816 | ||||||
| 3,840,133 | ||||||||
| Beverages — 0.1% | ||||||||
| MGP Ingredients, Inc. | 85 | 9,304 | ||||||
Vita Coco Co., Inc.(1) | 265 | 3,972 | ||||||
| 13,276 | ||||||||
| Biotechnology — 4.8% | ||||||||
89bio, Inc.(1) | 300 | 1,338 | ||||||
Aadi Bioscience, Inc.(1) | 400 | 5,420 | ||||||
Actinium Pharmaceuticals, Inc.(1) | 580 | 4,077 | ||||||
Adicet Bio, Inc.(1) | 800 | 11,328 | ||||||
Agios Pharmaceuticals, Inc.(1) | 1,040 | 26,520 | ||||||
Akero Therapeutics, Inc.(1) | 600 | 7,050 | ||||||
Akouos, Inc.(1) | 380 | 1,273 | ||||||
Aldeyra Therapeutics, Inc.(1) | 1,140 | 8,026 | ||||||
Alector, Inc.(1) | 900 | 9,315 | ||||||
Allogene Therapeutics, Inc.(1) | 1,700 | 23,307 | ||||||
Allovir, Inc.(1) | 800 | 6,008 | ||||||
Alpine Immune Sciences, Inc.(1) | 520 | 3,905 | ||||||
Altimmune, Inc.(1) | 1,040 | 22,963 | ||||||
AnaptysBio, Inc.(1) | 640 | 14,861 | ||||||
Anika Therapeutics, Inc.(1) | 380 | 8,588 | ||||||
Annexon, Inc.(1) | 360 | 2,117 | ||||||
AquaBounty Technologies, Inc.(1) | 1,000 | 1,200 | ||||||
Arcus Biosciences, Inc.(1) | 1,580 | 38,046 | ||||||
Arcutis Biotherapeutics, Inc.(1) | 580 | 15,631 | ||||||
Assembly Biosciences, Inc.(1) | 960 | 1,795 | ||||||
Atreca, Inc., Class A(1) | 780 | 1,451 | ||||||
aTyr Pharma, Inc.(1) | 840 | 2,873 | ||||||
Bioxcel Therapeutics, Inc.(1) | 500 | 6,840 | ||||||
Bluebird Bio, Inc.(1) | 1,100 | 6,424 | ||||||
BrainStorm Cell Therapeutics, Inc.(1) | 22 | 80 | ||||||
Cardiff Oncology, Inc.(1) | 1,020 | 2,744 | ||||||
Catalyst Pharmaceuticals, Inc.(1) | 3,000 | 40,620 | ||||||
Chinook Therapeutics, Inc.(1) | 960 | 19,968 | ||||||
Cogent Biosciences, Inc.(1) | 905 | 14,923 | ||||||
Cullinan Oncology, Inc.(1) | 939 | 12,658 | ||||||
CytomX Therapeutics, Inc.(1) | 1,542 | 2,313 | ||||||
Deciphera Pharmaceuticals, Inc.(1) | 1,464 | 23,761 | ||||||
Dynavax Technologies Corp.(1) | 3,660 | 41,980 | ||||||
Dyne Therapeutics, Inc.(1) | 520 | 5,096 | ||||||
Eagle Pharmaceuticals, Inc.(1) | 320 | 10,486 | ||||||
Editas Medicine, Inc.(1) | 1,065 | 15,655 | ||||||
Eiger BioPharmaceuticals, Inc.(1) | 700 | 5,782 | ||||||
Emergent BioSolutions, Inc.(1) | 940 | 22,579 | ||||||
Enanta Pharmaceuticals, Inc.(1) | 466 | 28,370 | ||||||
Enochian Biosciences, Inc.(1) | 640 | 1,581 | ||||||
86
| Avantis U.S. Small Cap Equity ETF | ||||||||
| Shares | Value | |||||||
Essa Pharma, Inc.(1) | 660 | $ | 1,703 | |||||
F-star Therapeutics, Inc.(1) | 420 | 2,818 | ||||||
Forma Therapeutics Holdings, Inc.(1) | 560 | 7,504 | ||||||
Frequency Therapeutics, Inc.(1) | 480 | 989 | ||||||
G1 Therapeutics, Inc.(1) | 560 | 8,126 | ||||||
Generation Bio Co.(1) | 680 | 3,482 | ||||||
Genprex, Inc.(1) | 920 | 1,472 | ||||||
Gritstone bio, Inc.(1) | 621 | 2,043 | ||||||
Harpoon Therapeutics, Inc.(1) | 380 | 631 | ||||||
Homology Medicines, Inc.(1) | 820 | 1,919 | ||||||
Ideaya Biosciences, Inc.(1) | 820 | 8,061 | ||||||
Immunic, Inc.(1) | 420 | 1,869 | ||||||
Immunovant, Inc.(1) | 1,120 | 5,768 | ||||||
Inmune Bio, Inc.(1) | 240 | 1,937 | ||||||
Inovio Pharmaceuticals, Inc.(1) | 5,020 | 11,496 | ||||||
Iovance Biotherapeutics, Inc.(1) | 260 | 2,787 | ||||||
Ironwood Pharmaceuticals, Inc.(1) | 3,860 | 41,533 | ||||||
iTeos Therapeutics, Inc.(1) | 760 | 16,857 | ||||||
Jounce Therapeutics, Inc.(1) | 1,020 | 3,733 | ||||||
KalVista Pharmaceuticals, Inc.(1) | 380 | 6,259 | ||||||
Kiniksa Pharmaceuticals Ltd., Class A(1) | 740 | 8,673 | ||||||
Kinnate Biopharma, Inc.(1) | 580 | 8,398 | ||||||
Kronos Bio, Inc.(1) | 620 | 2,480 | ||||||
Krystal Biotech, Inc.(1) | 540 | 37,859 | ||||||
Kura Oncology, Inc.(1) | 1,200 | 16,632 | ||||||
Larimar Therapeutics, Inc.(1) | 300 | 816 | ||||||
Ligand Pharmaceuticals, Inc.(1) | 480 | 44,347 | ||||||
Lineage Cell Therapeutics, Inc.(1) | 2,282 | 3,218 | ||||||
Lyell Immunopharma, Inc.(1) | 2,786 | 18,666 | ||||||
MacroGenics, Inc.(1) | 1,060 | 4,208 | ||||||
MediciNova, Inc.(1) | 1,180 | 2,513 | ||||||
MeiraGTx Holdings PLC(1) | 820 | 6,806 | ||||||
Mersana Therapeutics, Inc.(1) | 960 | 7,200 | ||||||
Myriad Genetics, Inc.(1) | 1,920 | 42,893 | ||||||
NextCure, Inc.(1) | 360 | 1,476 | ||||||
NightHawk Biosciences, Inc.(1) | 660 | 1,426 | ||||||
Nkarta, Inc.(1) | 220 | 3,166 | ||||||
Nurix Therapeutics, Inc.(1) | 1,200 | 18,876 | ||||||
Olema Pharmaceuticals, Inc.(1) | 440 | 1,738 | ||||||
Organogenesis Holdings, Inc.(1) | 1,140 | 4,093 | ||||||
ORIC Pharmaceuticals, Inc.(1) | 860 | 2,976 | ||||||
Ovid therapeutics, Inc.(1) | 1,460 | 2,935 | ||||||
Oyster Point Pharma, Inc.(1) | 120 | 750 | ||||||
Passage Bio, Inc.(1) | 720 | 1,454 | ||||||
PMV Pharmaceuticals, Inc.(1) | 620 | 8,630 | ||||||
Point Biopharma Global, Inc.(1) | 2,241 | 21,850 | ||||||
Poseida Therapeutics, Inc.(1) | 700 | 2,317 | ||||||
Praxis Precision Medicines, Inc.(1) | 960 | 2,995 | ||||||
Prothena Corp. PLC(1) | 960 | 26,467 | ||||||
Quince Therapeutics, Inc.(1) | 280 | 493 | ||||||
REGENXBIO, Inc.(1) | 1,020 | 30,090 | ||||||
87
| Avantis U.S. Small Cap Equity ETF | ||||||||
| Shares | Value | |||||||
Repare Therapeutics, Inc.(1) | 560 | $ | 6,675 | |||||
Replimune Group, Inc.(1) | 800 | 15,248 | ||||||
REVOLUTION Medicines, Inc.(1) | 1,860 | 38,744 | ||||||
Rhythm Pharmaceuticals, Inc.(1) | 700 | 15,820 | ||||||
Rocket Pharmaceuticals, Inc.(1) | 500 | 7,705 | ||||||
Roivant Sciences Ltd.(1) | 2,923 | 10,406 | ||||||
Sage Therapeutics, Inc.(1) | 1,366 | 51,443 | ||||||
Sangamo Therapeutics, Inc.(1) | 2,749 | 14,845 | ||||||
Shattuck Labs, Inc.(1) | 400 | 1,300 | ||||||
Silverback Therapeutics, Inc.(1) | 380 | 2,067 | ||||||
SQZ Biotechnologies Co.(1) | 560 | 1,680 | ||||||
Stoke Therapeutics, Inc.(1) | 360 | 5,422 | ||||||
Surface Oncology, Inc.(1) | 740 | 1,006 | ||||||
Sutro Biopharma, Inc.(1) | 1,000 | 5,660 | ||||||
TCR2 Therapeutics, Inc.(1) | 500 | 1,360 | ||||||
Twist Bioscience Corp.(1) | 969 | 38,876 | ||||||
uniQure NV(1) | 1,040 | 20,321 | ||||||
Vanda Pharmaceuticals, Inc.(1) | 1,320 | 13,966 | ||||||
Viking Therapeutics, Inc.(1) | 1,880 | 5,978 | ||||||
Viracta Therapeutics, Inc.(1) | 620 | 2,511 | ||||||
Voyager Therapeutics, Inc.(1) | 720 | 4,298 | ||||||
XBiotech, Inc.(1) | 460 | 1,845 | ||||||
Xencor, Inc.(1) | 1,820 | 48,030 | ||||||
Zymeworks, Inc.(1) | 620 | 3,974 | ||||||
| 1,265,560 | ||||||||
| Building Products — 1.1% | ||||||||
Alpha Pro Tech Ltd.(1) | 340 | 1,404 | ||||||
| Apogee Enterprises, Inc. | 740 | 30,222 | ||||||
| CSW Industrials, Inc. | 421 | 53,299 | ||||||
| Griffon Corp. | 987 | 30,942 | ||||||
| Insteel Industries, Inc. | 580 | 16,762 | ||||||
Janus International Group, Inc.(1) | 1,809 | 18,687 | ||||||
JELD-WEN Holding, Inc.(1) | 2,420 | 26,983 | ||||||
Masonite International Corp.(1) | 660 | 54,001 | ||||||
PGT Innovations, Inc.(1) | 1,568 | 32,803 | ||||||
| Quanex Building Products Corp. | 880 | 19,624 | ||||||
| 284,727 | ||||||||
| Capital Markets — 2.1% | ||||||||
| Artisan Partners Asset Management, Inc., Class A | 1,564 | 52,801 | ||||||
Assetmark Financial Holdings, Inc.(1) | 520 | 10,057 | ||||||
| B. Riley Financial, Inc. | 540 | 26,876 | ||||||
| BGC Partners, Inc., Class A | 8,560 | 34,411 | ||||||
Blucora, Inc.(1) | 1,280 | 25,702 | ||||||
| Bridge Investment Group Holdings, Inc., Class A | 242 | 3,947 | ||||||
| Cowen, Inc., Class A | 680 | 26,146 | ||||||
| Diamond Hill Investment Group, Inc. | 100 | 17,105 | ||||||
Donnelley Financial Solutions, Inc.(1) | 920 | 39,054 | ||||||
| Federated Hermes, Inc. | 1,606 | 54,700 | ||||||
| Greenhill & Co., Inc. | 340 | 2,659 | ||||||
| Manning & Napier, Inc. | 298 | 3,793 | ||||||
Open Lending Corp., Class A(1) | 2,482 | 24,100 | ||||||
88
| Avantis U.S. Small Cap Equity ETF | ||||||||
| Shares | Value | |||||||
| Oppenheimer Holdings, Inc., Class A | 200 | $ | 7,260 | |||||
| Piper Sandler Cos. | 560 | 64,159 | ||||||
| PJT Partners, Inc., Class A | 543 | 37,586 | ||||||
| Pzena Investment Management, Inc., Class A | 440 | 4,189 | ||||||
StoneX Group, Inc.(1) | 440 | 40,850 | ||||||
| Victory Capital Holdings, Inc., Class A | 620 | 16,604 | ||||||
| Virtus Investment Partners, Inc. | 180 | 34,425 | ||||||
| WisdomTree Investments, Inc. | 3,280 | 16,433 | ||||||
| 542,857 | ||||||||
| Chemicals — 2.1% | ||||||||
| AdvanSix, Inc. | 900 | 32,634 | ||||||
| American Vanguard Corp. | 720 | 14,350 | ||||||
| Chase Corp. | 200 | 17,632 | ||||||
Danimer Scientific, Inc.(1) | 1,810 | 8,054 | ||||||
Ecovyst, Inc.(1) | 1,541 | 14,239 | ||||||
| FutureFuel Corp. | 700 | 5,103 | ||||||
| Hawkins, Inc. | 540 | 20,693 | ||||||
Ingevity Corp.(1) | 1,028 | 72,104 | ||||||
| Innospec, Inc. | 680 | 63,553 | ||||||
Intrepid Potash, Inc.(1) | 320 | 14,954 | ||||||
| Koppers Holdings, Inc. | 540 | 12,328 | ||||||
| Kronos Worldwide, Inc. | 600 | 7,728 | ||||||
LSB Industries, Inc.(1) | 1,040 | 16,411 | ||||||
| Mativ Holdings, Inc. | 644 | 15,211 | ||||||
| Minerals Technologies, Inc. | 880 | 51,269 | ||||||
Origin Materials, Inc.(1) | 3,720 | 23,250 | ||||||
| Orion Engineered Carbons SA | 1,640 | 27,650 | ||||||
PureCycle Technologies, Inc.(1) | 2,570 | 23,464 | ||||||
Rayonier Advanced Materials, Inc.(1) | 1,580 | 7,142 | ||||||
| Stepan Co. | 604 | 62,955 | ||||||
| Tredegar Corp. | 760 | 7,760 | ||||||
| Trinseo PLC | 741 | 19,659 | ||||||
| Tronox Holdings PLC, Class A | 166 | 2,428 | ||||||
| 540,571 | ||||||||
| Commercial Services and Supplies — 1.6% | ||||||||
| ABM Industries, Inc. | 162 | 7,517 | ||||||
| ACCO Brands Corp. | 2,500 | 14,825 | ||||||
| ARC Document Solutions, Inc. | 1,140 | 3,363 | ||||||
| Brady Corp., Class A | 1,240 | 57,709 | ||||||
BrightView Holdings, Inc.(1) | 1,028 | 10,403 | ||||||
Civeo Corp.(1) | 320 | 9,491 | ||||||
| Deluxe Corp. | 1,040 | 20,010 | ||||||
| Ennis, Inc. | 680 | 14,436 | ||||||
Harsco Corp.(1) | 2,180 | 12,361 | ||||||
| Healthcare Services Group, Inc. | 1,540 | 21,668 | ||||||
Heritage-Crystal Clean, Inc.(1) | 500 | 16,285 | ||||||
| HNI Corp. | 1,200 | 38,400 | ||||||
| Interface, Inc. | 1,660 | 18,542 | ||||||
KAR Auction Services, Inc.(1) | 3,630 | 52,998 | ||||||
| Kimball International, Inc., Class B | 980 | 7,497 | ||||||
Li-Cycle Holdings Corp.(1) | 2,944 | 21,226 | ||||||
89
| Avantis U.S. Small Cap Equity ETF | ||||||||
| Shares | Value | |||||||
| Matthews International Corp., Class A | 840 | $ | 21,008 | |||||
| Pitney Bowes, Inc. | 4,640 | 13,410 | ||||||
Quad/Graphics, Inc.(1) | 860 | 2,718 | ||||||
SP Plus Corp.(1) | 620 | 20,547 | ||||||
| Steelcase, Inc., Class A | 2,748 | 30,723 | ||||||
| VSE Corp. | 300 | 12,555 | ||||||
| 427,692 | ||||||||
| Communications Equipment — 1.2% | ||||||||
| ADTRAN Holdings, Inc. | 1,300 | 30,212 | ||||||
Applied Optoelectronics, Inc.(1) | 500 | 1,205 | ||||||
Aviat Networks, Inc.(1) | 280 | 8,764 | ||||||
Cambium Networks Corp.(1) | 180 | 3,503 | ||||||
| Comtech Telecommunications Corp. | 720 | 8,129 | ||||||
Digi International, Inc.(1) | 621 | 20,561 | ||||||
DZS, Inc.(1) | 480 | 6,389 | ||||||
EMCORE Corp.(1) | 780 | 1,856 | ||||||
Extreme Networks, Inc.(1) | 4,160 | 59,613 | ||||||
KVH Industries, Inc.(1) | 420 | 4,116 | ||||||
NETGEAR, Inc.(1) | 820 | 19,344 | ||||||
NetScout Systems, Inc.(1) | 1,940 | 61,576 | ||||||
Ribbon Communications, Inc.(1) | 1,540 | 5,405 | ||||||
ViaSat, Inc.(1) | 2,044 | 77,631 | ||||||
| 308,304 | ||||||||
| Construction and Engineering — 1.9% | ||||||||
| Arcosa, Inc. | 1,320 | 77,154 | ||||||
| Argan, Inc. | 400 | 13,836 | ||||||
Concrete Pumping Holdings, Inc.(1) | 700 | 4,690 | ||||||
Dycom Industries, Inc.(1) | 940 | 105,393 | ||||||
Fluor Corp.(1) | 2,084 | 55,101 | ||||||
| Granite Construction, Inc. | 1,240 | 37,175 | ||||||
Great Lakes Dredge & Dock Corp.(1) | 1,720 | 16,460 | ||||||
IES Holdings, Inc.(1) | 28 | 851 | ||||||
Infrastructure and Energy Alternatives, Inc.(1) | 660 | 9,379 | ||||||
Matrix Service Co.(1) | 640 | 3,635 | ||||||
MYR Group, Inc.(1) | 420 | 39,035 | ||||||
Northwest Pipe Co.(1) | 260 | 8,232 | ||||||
NV5 Global, Inc.(1) | 440 | 61,934 | ||||||
| Primoris Services Corp. | 1,420 | 28,783 | ||||||
Sterling Infrastructure, Inc.(1) | 860 | 21,749 | ||||||
Tutor Perini Corp.(1) | 1,120 | 7,594 | ||||||
| 491,001 | ||||||||
Construction Materials† | ||||||||
| United States Lime & Minerals, Inc. | 60 | 6,167 | ||||||
| Consumer Finance — 1.4% | ||||||||
Atlanticus Holdings Corp.(1) | 180 | 5,125 | ||||||
| Bread Financial Holdings, Inc. | 1,448 | 55,647 | ||||||
Consumer Portfolio Services, Inc.(1) | 480 | 5,587 | ||||||
Elevate Credit, Inc.(1) | 680 | 1,006 | ||||||
Encore Capital Group, Inc.(1) | 720 | 39,369 | ||||||
Enova International, Inc.(1) | 1,020 | 35,639 | ||||||
EZCORP, Inc., Class A(1) | 1,520 | 13,300 | ||||||
90
| Avantis U.S. Small Cap Equity ETF | ||||||||
| Shares | Value | |||||||
Green Dot Corp., Class A(1) | 1,240 | $ | 25,160 | |||||
LendingClub Corp.(1) | 1,885 | 24,637 | ||||||
| Medallion Financial Corp. | 380 | 3,025 | ||||||
| Navient Corp. | 4,140 | 63,714 | ||||||
Oportun Financial Corp.(1) | 740 | 3,781 | ||||||
PRA Group, Inc.(1) | 1,340 | 49,499 | ||||||
PROG Holdings, Inc.(1) | 1,740 | 32,260 | ||||||
| Regional Management Corp. | 220 | 7,412 | ||||||
World Acceptance Corp.(1) | 140 | 16,274 | ||||||
| 381,435 | ||||||||
| Containers and Packaging — 0.7% | ||||||||
| Greif, Inc., Class A | 720 | 48,276 | ||||||
| Greif, Inc., Class B | 181 | 11,814 | ||||||
| Myers Industries, Inc. | 1,189 | 22,971 | ||||||
O-I Glass, Inc.(1) | 4,800 | 62,448 | ||||||
| Pactiv Evergreen, Inc. | 1,000 | 11,100 | ||||||
| TriMas Corp. | 1,080 | 29,722 | ||||||
| 186,331 | ||||||||
| Distributors — 0.1% | ||||||||
Funko, Inc., Class A(1) | 629 | 14,008 | ||||||
| Diversified Consumer Services — 1.1% | ||||||||
Adtalem Global Education, Inc.(1) | 1,220 | 45,982 | ||||||
American Public Education, Inc.(1) | 420 | 4,339 | ||||||
| Carriage Services, Inc. | 500 | 17,705 | ||||||
Chegg, Inc.(1) | 1,620 | 31,882 | ||||||
| Graham Holdings Co., Class B | 88 | 49,758 | ||||||
| Laureate Education, Inc., Class A | 648 | 7,141 | ||||||
Lincoln Educational Services Corp.(1) | 640 | 4,160 | ||||||
OneSpaWorld Holdings Ltd.(1) | 1,800 | 15,858 | ||||||
Perdoceo Education Corp.(1) | 1,840 | 21,307 | ||||||
| Strategic Education, Inc. | 500 | 32,350 | ||||||
Stride, Inc.(1) | 1,140 | 43,479 | ||||||
Universal Technical Institute, Inc.(1) | 920 | 6,311 | ||||||
| 280,272 | ||||||||
| Diversified Financial Services — 0.5% | ||||||||
| Alerus Financial Corp. | 340 | 8,079 | ||||||
Cannae Holdings, Inc.(1) | 2,100 | 45,381 | ||||||
| Jackson Financial, Inc., Class A | 2,309 | 72,179 | ||||||
| 125,639 | ||||||||
| Diversified Telecommunication Services — 0.3% | ||||||||
| ATN International, Inc. | 280 | 13,118 | ||||||
Consolidated Communications Holdings, Inc.(1) | 1,540 | 8,840 | ||||||
EchoStar Corp., Class A(1) | 1,040 | 19,146 | ||||||
IDT Corp., Class B(1) | 600 | 15,342 | ||||||
Liberty Latin America Ltd., Class A(1) | 106 | 742 | ||||||
Liberty Latin America Ltd., Class C(1) | 422 | 2,941 | ||||||
Radius Global Infrastructure, Inc., Class A(1) | 2,044 | 28,146 | ||||||
| 88,275 | ||||||||
| Electric Utilities — 0.7% | ||||||||
| MGE Energy, Inc. | 1,000 | 77,020 | ||||||
| Otter Tail Corp. | 1,300 | 98,202 | ||||||
91
| Avantis U.S. Small Cap Equity ETF | ||||||||
| Shares | Value | |||||||
| Via Renewables, Inc. | 320 | $ | 2,730 | |||||
| 177,952 | ||||||||
| Electrical Equipment — 1.1% | ||||||||
| AZZ, Inc. | 660 | 28,123 | ||||||
| Encore Wire Corp. | 680 | 88,468 | ||||||
| EnerSys | 1,060 | 66,112 | ||||||
FREYR Battery SA(1) | 2,780 | 39,587 | ||||||
FuelCell Energy, Inc.(1) | 1,088 | 4,559 | ||||||
| GrafTech International Ltd. | 5,488 | 32,270 | ||||||
Orion Energy Systems, Inc.(1) | 540 | 907 | ||||||
| Powell Industries, Inc. | 240 | 5,918 | ||||||
| Preformed Line Products Co. | 40 | 3,112 | ||||||
Thermon Group Holdings, Inc.(1) | 880 | 15,444 | ||||||
TPI Composites, Inc.(1) | 480 | 8,923 | ||||||
| 293,423 | ||||||||
| Electronic Equipment, Instruments and Components — 3.5% | ||||||||
| Advanced Energy Industries, Inc. | 931 | 83,594 | ||||||
Aeva Technologies, Inc.(1) | 1,762 | 5,427 | ||||||
Airgain, Inc.(1) | 200 | 1,550 | ||||||
Akoustis Technologies, Inc.(1) | 960 | 4,205 | ||||||
| Badger Meter, Inc. | 820 | 77,646 | ||||||
| Bel Fuse, Inc., Class B | 280 | 7,958 | ||||||
| Belden, Inc. | 1,360 | 89,053 | ||||||
| Benchmark Electronics, Inc. | 1,000 | 27,450 | ||||||
| CTS Corp. | 880 | 37,242 | ||||||
Daktronics, Inc.(1) | 1,000 | 3,200 | ||||||
ePlus, Inc.(1) | 840 | 39,581 | ||||||
Evolv Technologies Holdings, Inc.(1) | 1,160 | 2,633 | ||||||
Itron, Inc.(1) | 1,004 | 47,770 | ||||||
Kimball Electronics, Inc.(1) | 660 | 14,216 | ||||||
Knowles Corp.(1) | 2,620 | 39,693 | ||||||
| Methode Electronics, Inc. | 980 | 39,651 | ||||||
Napco Security Technologies, Inc.(1) | 980 | 29,067 | ||||||
nLight, Inc.(1) | 821 | 10,254 | ||||||
OSI Systems, Inc.(1) | 400 | 33,328 | ||||||
| PC Connection, Inc. | 280 | 13,910 | ||||||
Plexus Corp.(1) | 680 | 63,736 | ||||||
| Richardson Electronics Ltd. | 360 | 5,843 | ||||||
Sanmina Corp.(1) | 1,925 | 93,401 | ||||||
ScanSource, Inc.(1) | 800 | 23,176 | ||||||
TTM Technologies, Inc.(1) | 2,640 | 41,527 | ||||||
| Vishay Intertechnology, Inc. | 3,483 | 68,511 | ||||||
Vishay Precision Group, Inc.(1) | 320 | 10,979 | ||||||
Wrap Technologies, Inc.(1) | 500 | 1,000 | ||||||
| 915,601 | ||||||||
| Energy Equipment and Services — 3.0% | ||||||||
| Archrock, Inc. | 4,080 | 30,151 | ||||||
Bristow Group, Inc.(1) | 700 | 20,307 | ||||||
| Core Laboratories NV | 1,470 | 23,741 | ||||||
Diamond Offshore Drilling, Inc.(1) | 542 | 3,854 | ||||||
DMC Global, Inc.(1) | 520 | 11,606 | ||||||
92
| Avantis U.S. Small Cap Equity ETF | ||||||||
| Shares | Value | |||||||
Dril-Quip, Inc.(1) | 820 | $ | 18,147 | |||||
Expro Group Holdings NV(1) | 2,060 | 27,851 | ||||||
Exterran Corp.(1) | 580 | 2,848 | ||||||
Forum Energy Technologies, Inc.(1) | 120 | 3,226 | ||||||
Helix Energy Solutions Group, Inc.(1) | 3,800 | 16,416 | ||||||
Liberty Energy, Inc., Class A(1) | 5,204 | 78,060 | ||||||
Nabors Industries Ltd.(1) | 220 | 29,152 | ||||||
National Energy Services Reunited Corp.(1) | 760 | 5,335 | ||||||
Newpark Resources, Inc.(1) | 2,700 | 7,776 | ||||||
NexTier Oilfield Solutions, Inc.(1) | 7,161 | 67,099 | ||||||
Noble Corp.(1) | 1,362 | 41,337 | ||||||
Oceaneering International, Inc.(1) | 2,740 | 24,249 | ||||||
Oil States International, Inc.(1) | 1,680 | 8,232 | ||||||
| Patterson-UTI Energy, Inc. | 4,810 | 71,669 | ||||||
ProPetro Holding Corp.(1) | 2,780 | 25,465 | ||||||
| RPC, Inc. | 2,500 | 19,875 | ||||||
Select Energy Services, Inc., Class A(1) | 1,940 | 13,793 | ||||||
| Solaris Oilfield Infrastructure, Inc., Class A | 840 | 8,988 | ||||||
TechnipFMC PLC(1) | 7,027 | 57,481 | ||||||
TETRA Technologies Inc(1) | 3,990 | 15,880 | ||||||
Tidewater, Inc.(1) | 1,040 | 23,046 | ||||||
Transocean Ltd.(1) | 14,741 | 53,362 | ||||||
US Silica Holdings, Inc.(1) | 1,940 | 27,218 | ||||||
Weatherford International PLC(1) | 2,260 | 63,596 | ||||||
| 799,760 | ||||||||
| Entertainment — 0.4% | ||||||||
CuriosityStream, Inc.(1) | 440 | 748 | ||||||
IMAX Corp.(1) | 1,480 | 23,206 | ||||||
Madison Square Garden Entertainment Corp.(1) | 829 | 46,059 | ||||||
| Marcus Corp. | 680 | 10,941 | ||||||
Playstudios, Inc.(1) | 2,643 | 9,568 | ||||||
Sciplay Corp., Class A(1) | 640 | 7,802 | ||||||
| 98,324 | ||||||||
| Food and Staples Retailing — 1.7% | ||||||||
| Andersons, Inc. | 1,020 | 37,771 | ||||||
Blue Apron Holdings, Inc., Class A(1) | 565 | 3,283 | ||||||
Grocery Outlet Holding Corp.(1) | 2,260 | 90,671 | ||||||
HF Foods Group, Inc.(1) | 1,300 | 6,617 | ||||||
| Ingles Markets, Inc., Class A | 480 | 42,014 | ||||||
| Natural Grocers by Vitamin Cottage, Inc. | 360 | 5,170 | ||||||
| PriceSmart, Inc. | 660 | 41,758 | ||||||
Rite Aid Corp.(1) | 1,480 | 10,626 | ||||||
| SpartanNash Co. | 1,120 | 34,082 | ||||||
Sprouts Farmers Market, Inc.(1) | 1,610 | 46,529 | ||||||
United Natural Foods, Inc.(1) | 1,900 | 83,752 | ||||||
| Village Super Market, Inc., Class A | 200 | 4,396 | ||||||
| Weis Markets, Inc. | 500 | 38,855 | ||||||
| 445,524 | ||||||||
| Food Products — 1.4% | ||||||||
| Alico, Inc. | 120 | 4,074 | ||||||
AppHarvest, Inc.(1) | 900 | 2,592 | ||||||
93
| Avantis U.S. Small Cap Equity ETF | ||||||||
| Shares | Value | |||||||
| B&G Foods, Inc. | 1,700 | $ | 36,822 | |||||
| Cal-Maine Foods, Inc. | 1,322 | 70,872 | ||||||
| Calavo Growers, Inc. | 420 | 17,657 | ||||||
Farmer Bros Co.(1) | 300 | 1,683 | ||||||
| Fresh Del Monte Produce, Inc. | 1,020 | 27,887 | ||||||
Hain Celestial Group, Inc.(1) | 421 | 8,529 | ||||||
Hostess Brands, Inc.(1) | 2,344 | 54,334 | ||||||
| J&J Snack Foods Corp. | 186 | 27,720 | ||||||
Landec Corp.(1) | 700 | 7,350 | ||||||
| Limoneira Co. | 420 | 5,149 | ||||||
Mission Produce, Inc.(1) | 920 | 14,812 | ||||||
Seneca Foods Corp., Class A(1) | 160 | 8,453 | ||||||
| Tootsie Roll Industries, Inc. | 423 | 15,156 | ||||||
TreeHouse Foods, Inc.(1) | 1,480 | 68,968 | ||||||
Vital Farms, Inc.(1) | 500 | 6,475 | ||||||
| 378,533 | ||||||||
| Gas Utilities — 0.5% | ||||||||
| Chesapeake Utilities Corp. | 240 | 30,312 | ||||||
| Northwest Natural Holding Co. | 820 | 39,040 | ||||||
| South Jersey Industries, Inc. | 2,206 | 74,673 | ||||||
| Star Group LP | 29 | 267 | ||||||
| 144,292 | ||||||||
| Health Care Equipment and Supplies — 2.4% | ||||||||
Accuray, Inc.(1) | 2,400 | 5,712 | ||||||
AngioDynamics, Inc.(1) | 1,020 | 22,583 | ||||||
| Atrion Corp. | 40 | 24,158 | ||||||
Avanos Medical, Inc.(1) | 1,340 | 33,004 | ||||||
Axogen, Inc.(1) | 460 | 4,310 | ||||||
Butterfly Network, Inc.(1) | 1,722 | 10,728 | ||||||
Cardiovascular Systems, Inc.(1) | 580 | 7,662 | ||||||
Co-Diagnostics, Inc.(1) | 920 | 3,110 | ||||||
CytoSorbents Corp.(1) | 740 | 1,406 | ||||||
Glaukos Corp.(1) | 442 | 21,459 | ||||||
Haemonetics Corp.(1) | 1,360 | 102,041 | ||||||
Inogen, Inc.(1) | 320 | 9,162 | ||||||
Integer Holdings Corp.(1) | 920 | 58,024 | ||||||
iRhythm Technologies, Inc.(1) | 104 | 15,335 | ||||||
Lantheus Holdings, Inc.(1) | 1,610 | 126,868 | ||||||
| LeMaitre Vascular, Inc. | 540 | 26,665 | ||||||
Meridian Bioscience, Inc.(1) | 1,160 | 37,804 | ||||||
Merit Medical Systems, Inc.(1) | 4 | 237 | ||||||
Neuronetics, Inc.(1) | 540 | 1,928 | ||||||
NuVasive, Inc.(1) | 1,460 | 62,065 | ||||||
OraSure Technologies, Inc.(1) | 1,900 | 7,771 | ||||||
Orthofix Medical, Inc.(1) | 460 | 9,154 | ||||||
Retractable Technologies, Inc.(1) | 320 | 746 | ||||||
SeaSpine Holdings Corp.(1) | 720 | 4,608 | ||||||
Sensus Healthcare, Inc.(1) | 105 | 1,307 | ||||||
UFP Technologies, Inc.(1) | 61 | 5,672 | ||||||
| Utah Medical Products, Inc. | 100 | 9,190 | ||||||
Varex Imaging Corp.(1) | 1,060 | 22,355 | ||||||
| 635,064 | ||||||||
94
| Avantis U.S. Small Cap Equity ETF | ||||||||
| Shares | Value | |||||||
| Health Care Providers and Services — 1.9% | ||||||||
Addus HomeCare Corp.(1) | 403 | $ | 35,956 | |||||
Apollo Medical Holdings, Inc.(1) | 880 | 37,955 | ||||||
Brookdale Senior Living, Inc.(1) | 3,960 | 17,424 | ||||||
Clover Health Investments Corp.(1) | 7,441 | 19,421 | ||||||
CorVel Corp.(1) | 300 | 46,614 | ||||||
Fulgent Genetics, Inc.(1) | 540 | 23,474 | ||||||
Hanger, Inc.(1) | 1,008 | 18,779 | ||||||
InfuSystem Holdings, Inc.(1) | 400 | 3,084 | ||||||
Joint Corp.(1) | 380 | 6,931 | ||||||
ModivCare, Inc.(1) | 340 | 36,829 | ||||||
| National Healthcare Corp. | 340 | 23,613 | ||||||
| National Research Corp. | 520 | 17,737 | ||||||
OPKO Health, Inc.(1) | 11,740 | 25,593 | ||||||
| Owens & Minor, Inc. | 2,020 | 59,610 | ||||||
| Patterson Cos., Inc. | 1,324 | 36,926 | ||||||
Privia Health Group, Inc.(1) | 486 | 19,338 | ||||||
RadNet, Inc.(1) | 1,120 | 22,501 | ||||||
| Select Medical Holdings Corp. | 1,210 | 31,024 | ||||||
| U.S. Physical Therapy, Inc. | 340 | 28,087 | ||||||
| 510,896 | ||||||||
| Health Care Technology — 0.6% | ||||||||
Allscripts Healthcare Solutions, Inc.(1) | 3,300 | 56,100 | ||||||
American Well Corp., Class A(1) | 3,941 | 17,932 | ||||||
Computer Programs and Systems, Inc.(1) | 380 | 11,594 | ||||||
HealthStream, Inc.(1) | 680 | 15,048 | ||||||
Multiplan Corp.(1) | 3,721 | 13,098 | ||||||
NextGen Healthcare, Inc.(1) | 1,500 | 25,710 | ||||||
| Simulations Plus, Inc. | 420 | 25,221 | ||||||
| 164,703 | ||||||||
| Hotels, Restaurants and Leisure — 1.7% | ||||||||
Accel Entertainment, Inc.(1) | 602 | 5,665 | ||||||
Bally's Corp.(1) | 762 | 18,052 | ||||||
BJ's Restaurants, Inc.(1) | 600 | 15,048 | ||||||
| Bloomin' Brands, Inc. | 2,665 | 53,886 | ||||||
BurgerFi International, Inc.(1) | 100 | 301 | ||||||
Carrols Restaurant Group, Inc.(1) | 700 | 1,540 | ||||||
Century Casinos, Inc.(1) | 740 | 5,454 | ||||||
| Cheesecake Factory, Inc. | 1,300 | 39,806 | ||||||
Chuy's Holdings, Inc.(1) | 540 | 12,058 | ||||||
| Cracker Barrel Old Country Store, Inc. | 640 | 69,082 | ||||||
Dave & Buster's Entertainment, Inc.(1) | 1,261 | 52,130 | ||||||
El Pollo Loco Holdings, Inc.(1) | 400 | 3,620 | ||||||
Everi Holdings, Inc.(1) | 2,420 | 44,770 | ||||||
Fiesta Restaurant Group, Inc.(1) | 360 | 2,401 | ||||||
Golden Entertainment, Inc.(1) | 520 | 19,895 | ||||||
Monarch Casino & Resort, Inc.(1) | 360 | 21,740 | ||||||
Noodles & Co.(1) | 1,120 | 5,320 | ||||||
ONE Group Hospitality, Inc.(1) | 780 | 5,569 | ||||||
Playa Hotels & Resorts NV(1) | 3,780 | 24,797 | ||||||
PlayAGS, Inc.(1) | 640 | 4,710 | ||||||
95
| Avantis U.S. Small Cap Equity ETF | ||||||||
| Shares | Value | |||||||
| RCI Hospitality Holdings, Inc. | 260 | $ | 16,955 | |||||
Red Robin Gourmet Burgers, Inc.(1) | 240 | 1,783 | ||||||
| Ruth's Hospitality Group, Inc. | 860 | 15,669 | ||||||
| 440,251 | ||||||||
| Household Durables — 2.3% | ||||||||
Aterian, Inc.(1) | 1,767 | 4,029 | ||||||
| Bassett Furniture Industries, Inc. | 180 | 3,431 | ||||||
Beazer Homes USA, Inc.(1) | 960 | 13,670 | ||||||
Cavco Industries, Inc.(1) | 280 | 65,523 | ||||||
| Century Communities, Inc. | 940 | 43,889 | ||||||
| Ethan Allen Interiors, Inc. | 700 | 16,639 | ||||||
| Flexsteel Industries, Inc. | 160 | 2,798 | ||||||
GoPro, Inc., Class A(1) | 3,400 | 20,706 | ||||||
Green Brick Partners, Inc.(1) | 980 | 23,873 | ||||||
| Hooker Furnishings Corp. | 240 | 3,809 | ||||||
Hovnanian Enterprises, Inc., Class A(1) | 140 | 5,613 | ||||||
iRobot Corp.(1) | 680 | 40,038 | ||||||
| KB Home | 802 | 22,977 | ||||||
| La-Z-Boy, Inc. | 1,220 | 32,196 | ||||||
Legacy Housing Corp.(1) | 280 | 4,785 | ||||||
LGI Homes, Inc.(1) | 580 | 55,048 | ||||||
| Lifetime Brands, Inc. | 380 | 3,390 | ||||||
| M.D.C. Holdings, Inc. | 1,588 | 49,355 | ||||||
M/I Homes, Inc.(1) | 820 | 35,457 | ||||||
Meritage Homes Corp.(1) | 748 | 58,606 | ||||||
Skyline Champion Corp.(1) | 206 | 11,674 | ||||||
Sonos, Inc.(1) | 1,224 | 18,409 | ||||||
Tri Pointe Homes, Inc.(1) | 3,420 | 59,268 | ||||||
Universal Electronics, Inc.(1) | 280 | 6,224 | ||||||
VOXX International Corp.(1) | 380 | 3,663 | ||||||
| 605,070 | ||||||||
| Household Products — 0.7% | ||||||||
Central Garden & Pet Co.(1) | 280 | 11,178 | ||||||
Central Garden & Pet Co., Class A(1) | 1,100 | 41,536 | ||||||
| Energizer Holdings, Inc. | 1,780 | 50,018 | ||||||
| Oil-Dri Corp. of America | 140 | 3,863 | ||||||
| WD-40 Co. | 360 | 68,097 | ||||||
| 174,692 | ||||||||
| Independent Power and Renewable Electricity Producers — 0.3% | ||||||||
Sunnova Energy International, Inc.(1) | 2,720 | 68,598 | ||||||
| Insurance — 2.4% | ||||||||
Ambac Financial Group, Inc.(1) | 1,220 | 18,410 | ||||||
| AMERISAFE, Inc. | 520 | 24,866 | ||||||
| Argo Group International Holdings Ltd. | 940 | 18,452 | ||||||
Bright Health Group, Inc.(1) | 4,166 | 6,291 | ||||||
| CNO Financial Group, Inc. | 3,280 | 60,385 | ||||||
| Donegal Group, Inc., Class A | 465 | 6,752 | ||||||
eHealth, Inc.(1) | 340 | 2,176 | ||||||
| Employers Holdings, Inc. | 760 | 29,762 | ||||||
Genworth Financial, Inc., Class A(1) | 15,140 | 63,891 | ||||||
Greenlight Capital Re Ltd., A Shares(1) | 560 | 4,418 | ||||||
96
| Avantis U.S. Small Cap Equity ETF | ||||||||
| Shares | Value | |||||||
| HCI Group, Inc. | 225 | $ | 10,753 | |||||
| Heritage Insurance Holdings, Inc. | 580 | 1,531 | ||||||
| Horace Mann Educators Corp. | 1,268 | 45,356 | ||||||
| Investors Title Co. | 40 | 5,894 | ||||||
| James River Group Holdings Ltd. | 900 | 21,384 | ||||||
Lemonade, Inc.(1) | 540 | 11,945 | ||||||
| Mercury General Corp. | 784 | 25,010 | ||||||
| National Western Life Group, Inc., Class A | 60 | 11,419 | ||||||
Oscar Health, Inc., Class A(1) | 1,861 | 12,338 | ||||||
| ProAssurance Corp. | 1,620 | 34,652 | ||||||
| Safety Insurance Group, Inc. | 466 | 41,963 | ||||||
SelectQuote, Inc.(1) | 1,920 | 2,131 | ||||||
SiriusPoint Ltd.(1) | 2,160 | 9,655 | ||||||
| Stewart Information Services Corp. | 840 | 42,537 | ||||||
| Tiptree, Inc. | 700 | 8,365 | ||||||
| United Fire Group, Inc. | 700 | 20,601 | ||||||
| Universal Insurance Holdings, Inc. | 820 | 9,791 | ||||||
| White Mountains Insurance Group Ltd. | 67 | 91,790 | ||||||
| 642,518 | ||||||||
| Interactive Media and Services — 0.7% | ||||||||
Cars.com, Inc.(1) | 2,200 | 28,050 | ||||||
DHI Group, Inc.(1) | 1,460 | 7,446 | ||||||
Eventbrite, Inc., Class A(1) | 2,100 | 14,931 | ||||||
QuinStreet, Inc.(1) | 1,340 | 16,093 | ||||||
TripAdvisor, Inc.(1) | 2,365 | 56,287 | ||||||
TrueCar, Inc.(1) | 1,720 | 3,750 | ||||||
Yelp, Inc.(1) | 1,940 | 66,290 | ||||||
Zedge, Inc., Class B(1) | 240 | 679 | ||||||
| 193,526 | ||||||||
| Internet and Direct Marketing Retail — 0.3% | ||||||||
1-800-Flowers.com, Inc., Class A(1) | 700 | 6,076 | ||||||
ContextLogic, Inc., Class A(1) | 6,860 | 8,918 | ||||||
Duluth Holdings, Inc., Class B(1) | 280 | 2,483 | ||||||
Lands' End, Inc.(1) | 240 | 3,317 | ||||||
Liquidity Services, Inc.(1) | 720 | 12,593 | ||||||
| PetMed Express, Inc. | 540 | 11,108 | ||||||
| Qurate Retail, Inc., Series A | 8,280 | 25,668 | ||||||
Stitch Fix, Inc., Class A(1) | 1,241 | 6,230 | ||||||
| 76,393 | ||||||||
| IT Services — 1.4% | ||||||||
Brightcove, Inc.(1) | 1,080 | 7,171 | ||||||
| Cass Information Systems, Inc. | 380 | 13,938 | ||||||
Conduent, Inc.(1) | 4,460 | 18,241 | ||||||
| CSG Systems International, Inc. | 1,000 | 57,850 | ||||||
| EVERTEC, Inc. | 1,868 | 62,765 | ||||||
| Hackett Group, Inc. | 740 | 15,192 | ||||||
| Information Services Group, Inc. | 1,240 | 7,155 | ||||||
Innodata, Inc.(1) | 680 | 2,292 | ||||||
International Money Express, Inc.(1) | 860 | 19,264 | ||||||
Kyndryl Holdings, Inc.(1) | 5,720 | 59,602 | ||||||
Paya Holdings, Inc.(1) | 1,400 | 8,778 | ||||||
97
| Avantis U.S. Small Cap Equity ETF | ||||||||
| Shares | Value | |||||||
Paysafe Ltd.(1) | 9,888 | $ | 16,315 | |||||
PFSweb, Inc.(1) | 601 | 5,686 | ||||||
Rackspace Technology, Inc.(1) | 1,108 | 4,942 | ||||||
SolarWinds Corp.(1) | 1,007 | 9,134 | ||||||
Verra Mobility Corp.(1) | 4,080 | 65,035 | ||||||
| 373,360 | ||||||||
| Leisure Products — 0.6% | ||||||||
American Outdoor Brands, Inc.(1) | 260 | 2,233 | ||||||
AMMO, Inc.(1) | 1,840 | 7,010 | ||||||
JAKKS Pacific, Inc.(1) | 220 | 4,928 | ||||||
| Johnson Outdoors, Inc., Class A | 140 | 8,560 | ||||||
Malibu Boats, Inc., Class A(1) | 560 | 33,617 | ||||||
MasterCraft Boat Holdings, Inc.(1) | 520 | 12,527 | ||||||
Nautilus, Inc.(1) | 440 | 889 | ||||||
| Smith & Wesson Brands, Inc. | 1,000 | 13,300 | ||||||
| Sturm Ruger & Co., Inc. | 480 | 25,080 | ||||||
Vista Outdoor, Inc.(1) | 1,640 | 46,117 | ||||||
| 154,261 | ||||||||
| Life Sciences Tools and Services — 0.1% | ||||||||
Harvard Bioscience, Inc.(1) | 860 | 2,838 | ||||||
Personalis, Inc.(1) | 620 | 2,052 | ||||||
Quanterix Corp.(1) | 607 | 5,676 | ||||||
SomaLogic, Inc.(1) | 2,422 | 8,913 | ||||||
| 19,479 | ||||||||
| Machinery — 4.1% | ||||||||
| Alamo Group, Inc. | 320 | 41,843 | ||||||
| Albany International Corp., Class A | 900 | 79,371 | ||||||
| Altra Industrial Motion Corp. | 1,740 | 66,033 | ||||||
| Astec Industries, Inc. | 640 | 24,435 | ||||||
| Barnes Group, Inc. | 1,300 | 40,365 | ||||||
CIRCOR International, Inc.(1) | 540 | 8,802 | ||||||
Commercial Vehicle Group, Inc.(1) | 820 | 5,355 | ||||||
Desktop Metal, Inc., Class A(1) | 5,404 | 17,185 | ||||||
| Douglas Dynamics, Inc. | 640 | 18,624 | ||||||
| Enerpac Tool Group Corp. | 1,580 | 30,652 | ||||||
| EnPro Industries, Inc. | 1 | 90 | ||||||
| Federal Signal Corp. | 1,700 | 67,779 | ||||||
| Gorman-Rupp Co. | 680 | 17,959 | ||||||
| Greenbrier Cos., Inc. | 840 | 23,948 | ||||||
| Helios Technologies, Inc. | 940 | 51,343 | ||||||
| Hurco Cos., Inc. | 160 | 3,883 | ||||||
Hyliion Holdings Corp.(1) | 2,340 | 8,213 | ||||||
| Hyster-Yale Materials Handling, Inc. | 200 | 5,826 | ||||||
| Kadant, Inc. | 360 | 64,595 | ||||||
| Kennametal, Inc. | 2,300 | 53,912 | ||||||
Manitowoc Co., Inc.(1) | 920 | 8,786 | ||||||
Mayville Engineering Co., Inc.(1) | 140 | 974 | ||||||
| Miller Industries, Inc. | 300 | 7,053 | ||||||
| Mueller Industries, Inc. | 428 | 27,037 | ||||||
| Mueller Water Products, Inc., Class A | 4,260 | 48,053 | ||||||
NN, Inc.(1) | 740 | 1,584 | ||||||
98
| Avantis U.S. Small Cap Equity ETF | ||||||||
| Shares | Value | |||||||
| Omega Flex, Inc. | 80 | $ | 8,082 | |||||
| Park-Ohio Holdings Corp. | 240 | 3,982 | ||||||
Proterra, Inc.(1) | 3,769 | 22,765 | ||||||
Proto Labs, Inc.(1) | 741 | 28,454 | ||||||
| REV Group, Inc. | 900 | 10,368 | ||||||
| Shyft Group, Inc. | 960 | 22,992 | ||||||
SPX Technologies, Inc.(1) | 1,130 | 64,478 | ||||||
| Standex International Corp. | 340 | 30,739 | ||||||
| Tennant Co. | 480 | 28,968 | ||||||
| Terex Corp. | 1,840 | 61,125 | ||||||
Titan International, Inc.(1) | 1,660 | 23,290 | ||||||
| Trinity Industries, Inc. | 2,580 | 62,900 | ||||||
| 1,091,843 | ||||||||
| Marine — 0.2% | ||||||||
| Costamare, Inc. | 1,120 | 12,634 | ||||||
| Eagle Bulk Shipping, Inc. | 260 | 11,294 | ||||||
| Genco Shipping & Trading Ltd. | 980 | 13,436 | ||||||
| Pangaea Logistics Solutions Ltd. | 680 | 3,407 | ||||||
| Safe Bulkers, Inc. | 1,780 | 5,678 | ||||||
| 46,449 | ||||||||
| Media — 1.6% | ||||||||
AMC Networks, Inc., Class A(1) | 640 | 17,146 | ||||||
Boston Omaha Corp., Class A(1) | 520 | 13,952 | ||||||
Cardlytics, Inc.(1) | 640 | 8,474 | ||||||
comScore, Inc.(1) | 329 | 717 | ||||||
Cumulus Media, Inc., Class A(1) | 608 | 5,666 | ||||||
Daily Journal Corp.(1) | 20 | 5,224 | ||||||
E.W. Scripps Co., Class A(1) | 1,600 | 23,920 | ||||||
| Entravision Communications Corp., Class A | 1,660 | 8,433 | ||||||
Gannett Co., Inc.(1) | 3,720 | 8,630 | ||||||
| Gray Television, Inc. | 2,300 | 43,930 | ||||||
iHeartMedia, Inc., Class A(1) | 2,563 | 22,682 | ||||||
| John Wiley & Sons, Inc., Class A | 1,087 | 50,035 | ||||||
Lee Enterprises, Inc.(1) | 180 | 3,582 | ||||||
Magnite, Inc.(1) | 2,967 | 22,341 | ||||||
PubMatic, Inc., Class A(1) | 840 | 16,439 | ||||||
Salem Media Group, Inc.(1) | 640 | 1,536 | ||||||
| Scholastic Corp. | 560 | 25,710 | ||||||
| Sinclair Broadcast Group, Inc., Class A | 1,161 | 25,646 | ||||||
Stagwell, Inc.(1) | 1,242 | 8,421 | ||||||
TechTarget, Inc.(1) | 840 | 54,516 | ||||||
Thryv Holdings, Inc.(1) | 640 | 16,371 | ||||||
Urban One, Inc.(1) | 721 | 3,021 | ||||||
Urban One, Inc., Class A(1) | 260 | 1,420 | ||||||
WideOpenWest, Inc.(1) | 1,480 | 26,344 | ||||||
| 414,156 | ||||||||
| Metals and Mining — 2.1% | ||||||||
| Alpha Metallurgical Resources, Inc. | 483 | 75,904 | ||||||
Arconic Corp.(1) | 2,209 | 55,689 | ||||||
Ascent Industries Co.(1) | 260 | 4,352 | ||||||
ATI, Inc.(1) | 230 | 6,884 | ||||||
99
| Avantis U.S. Small Cap Equity ETF | ||||||||
| Shares | Value | |||||||
| Carpenter Technology Corp. | 1,583 | $ | 53,775 | |||||
Century Aluminum Co.(1) | 1,340 | 10,345 | ||||||
Coeur Mining, Inc.(1) | 4,740 | 13,082 | ||||||
| Compass Minerals International, Inc. | 844 | 34,174 | ||||||
| Haynes International, Inc. | 360 | 14,288 | ||||||
| Hecla Mining Co. | 15,087 | 59,443 | ||||||
| Kaiser Aluminum Corp. | 380 | 27,269 | ||||||
| Materion Corp. | 24 | 2,071 | ||||||
| Olympic Steel, Inc. | 220 | 5,790 | ||||||
| Ramaco Resources, Inc. | 305 | 3,215 | ||||||
| Ryerson Holding Corp. | 540 | 15,390 | ||||||
| Schnitzer Steel Industries, Inc., Class A | 720 | 23,789 | ||||||
| SunCoke Energy, Inc. | 2,260 | 14,893 | ||||||
TimkenSteel Corp.(1) | 1,260 | 19,328 | ||||||
| Warrior Met Coal, Inc. | 1,680 | 54,684 | ||||||
| Worthington Industries, Inc. | 900 | 45,891 | ||||||
| 540,256 | ||||||||
| Multi-Utilities — 0.4% | ||||||||
| Avista Corp. | 1,143 | 46,440 | ||||||
| NorthWestern Corp. | 825 | 43,708 | ||||||
| Unitil Corp. | 420 | 21,878 | ||||||
| 112,026 | ||||||||
| Multiline Retail — 0.3% | ||||||||
| Big Lots, Inc. | 860 | 17,690 | ||||||
Ollie's Bargain Outlet Holdings, Inc.(1) | 905 | 50,056 | ||||||
| 67,746 | ||||||||
| Oil, Gas and Consumable Fuels — 6.0% | ||||||||
Alto Ingredients, Inc.(1) | 1,880 | 8,122 | ||||||
| Arch Resources, Inc. | 382 | 55,611 | ||||||
| Berry Corp. | 2,360 | 21,594 | ||||||
| Brigham Minerals, Inc., Class A | 1,440 | 42,840 | ||||||
Callon Petroleum Co.(1) | 2,046 | 87,078 | ||||||
| Chord Energy Corp. | 887 | 125,555 | ||||||
Clean Energy Fuels Corp.(1) | 4,406 | 29,608 | ||||||
CNX Resources Corp.(1) | 2,783 | 49,176 | ||||||
Comstock Resources, Inc.(1) | 1,562 | 30,615 | ||||||
| CONSOL Energy, Inc. | 760 | 54,553 | ||||||
| Crescent Energy Co., Class A | 1,030 | 17,644 | ||||||
| CVR Energy, Inc. | 960 | 31,354 | ||||||
| Delek US Holdings, Inc. | 2,367 | 66,868 | ||||||
| DHT Holdings, Inc. | 3,760 | 29,366 | ||||||
| Diamondback Energy, Inc. | 142 | 18,991 | ||||||
| Dorian LPG Ltd. | 820 | 11,931 | ||||||
Earthstone Energy, Inc., Class A(1) | 2,448 | 37,210 | ||||||
| Evolution Petroleum Corp. | 820 | 5,691 | ||||||
Gevo, Inc.(1) | 5,260 | 16,464 | ||||||
Green Plains, Inc.(1) | 1,540 | 56,410 | ||||||
| International Seaways, Inc. | 1,240 | 36,617 | ||||||
| Kimbell Royalty Partners LP | 1,400 | 24,836 | ||||||
Kosmos Energy Ltd.(1) | 7,681 | 54,305 | ||||||
Laredo Petroleum, Inc.(1) | 560 | 43,461 | ||||||
100
| Avantis U.S. Small Cap Equity ETF | ||||||||
| Shares | Value | |||||||
| Nordic American Tankers Ltd. | 3,080 | $ | 8,008 | |||||
PBF Energy, Inc., Class A(1) | 3,080 | 105,213 | ||||||
Peabody Energy Corp.(1) | 2,349 | 57,926 | ||||||
Permian Resources Corp.(1) | 6,580 | 54,153 | ||||||
Plains GP Holdings LP, Class A(1) | 6,281 | 75,246 | ||||||
| Ranger Oil Corp., Class A | 800 | 31,192 | ||||||
REX American Resources Corp.(1) | 540 | 16,362 | ||||||
| Riley Exploration Permian, Inc. | 240 | 6,034 | ||||||
Ring Energy, Inc.(1) | 1,880 | 6,091 | ||||||
SandRidge Energy, Inc.(1) | 1,040 | 21,819 | ||||||
| Scorpio Tankers, Inc. | 1,768 | 73,549 | ||||||
| SFL Corp. Ltd. | 3,340 | 35,738 | ||||||
SilverBow Resources, Inc.(1) | 300 | 11,928 | ||||||
| Sitio Royalties Corp. | 365 | 9,286 | ||||||
Talos Energy, Inc.(1) | 2,080 | 43,118 | ||||||
Teekay Corp.(1) | 1,880 | 6,561 | ||||||
Teekay Tankers Ltd., Class A(1) | 600 | 14,760 | ||||||
| VAALCO Energy, Inc. | 1,540 | 7,715 | ||||||
Vertex Energy, Inc.(1) | 366 | 3,111 | ||||||
| World Fuel Services Corp. | 1,700 | 43,860 | ||||||
| 1,587,570 | ||||||||
| Paper and Forest Products — 0.4% | ||||||||
Clearwater Paper Corp.(1) | 540 | 22,971 | ||||||
| Glatfelter Corp. | 1,360 | 6,623 | ||||||
| Mercer International, Inc. | 1,080 | 17,518 | ||||||
| Sylvamo Corp. | 1,120 | 49,773 | ||||||
| 96,885 | ||||||||
| Personal Products — 0.9% | ||||||||
| Edgewell Personal Care Co. | 1,460 | 56,882 | ||||||
elf Beauty, Inc.(1) | 1,288 | 49,111 | ||||||
| Inter Parfums, Inc. | 206 | 16,175 | ||||||
| Medifast, Inc. | 240 | 30,115 | ||||||
Nature's Sunshine Products, Inc.(1) | 340 | 3,298 | ||||||
| Nu Skin Enterprises, Inc., Class A | 1,340 | 54,860 | ||||||
USANA Health Sciences, Inc.(1) | 320 | 20,646 | ||||||
| 231,087 | ||||||||
| Pharmaceuticals — 1.5% | ||||||||
Amneal Pharmaceuticals, Inc.(1) | 3,680 | 7,986 | ||||||
Amphastar Pharmaceuticals, Inc.(1) | 980 | 29,008 | ||||||
ANI Pharmaceuticals, Inc.(1) | 380 | 14,018 | ||||||
Arvinas, Inc.(1) | 107 | 4,530 | ||||||
Assertio Holdings, Inc.(1) | 1,180 | 3,009 | ||||||
Atea Pharmaceuticals, Inc.(1) | 880 | 6,600 | ||||||
Athira Pharma, Inc.(1) | 1,000 | 3,380 | ||||||
Collegium Pharmaceutical, Inc.(1) | 429 | 7,542 | ||||||
Contra Zogenix, Inc.(1) | 118 | 80 | ||||||
Corcept Therapeutics, Inc.(1) | 2,900 | 74,878 | ||||||
CorMedix, Inc.(1) | 528 | 1,864 | ||||||
Cymabay Therapeutics, Inc.(1) | 2,180 | 7,717 | ||||||
Evolus, Inc.(1) | 267 | 2,566 | ||||||
Harmony Biosciences Holdings, Inc.(1) | 842 | 36,972 | ||||||
101
| Avantis U.S. Small Cap Equity ETF | ||||||||
| Shares | Value | |||||||
Harrow Health, Inc.(1) | 680 | $ | 6,113 | |||||
Innoviva, Inc.(1) | 1,880 | 24,741 | ||||||
KemPharm, Inc.(1) | 820 | 4,477 | ||||||
Nektar Therapeutics(1) | 4,567 | 17,994 | ||||||
| Phibro Animal Health Corp., Class A | 500 | 7,405 | ||||||
Pliant Therapeutics, Inc.(1) | 380 | 7,326 | ||||||
Prestige Consumer Healthcare, Inc.(1) | 1,046 | 52,907 | ||||||
| SIGA Technologies, Inc. | 1,340 | 20,207 | ||||||
Supernus Pharmaceuticals, Inc.(1) | 1,420 | 48,607 | ||||||
TFF Pharmaceuticals, Inc.(1) | 304 | 1,402 | ||||||
Ventyx Biosciences, Inc.(1) | 566 | 11,546 | ||||||
| 402,875 | ||||||||
| Professional Services — 1.2% | ||||||||
| Barrett Business Services, Inc. | 200 | 16,128 | ||||||
CBIZ, Inc.(1) | 1,420 | 61,997 | ||||||
| CRA International, Inc. | 200 | 18,282 | ||||||
DLH Holdings Corp.(1) | 200 | 3,274 | ||||||
First Advantage Corp.(1) | 1,385 | 19,168 | ||||||
Forrester Research, Inc.(1) | 360 | 14,972 | ||||||
Franklin Covey Co.(1) | 380 | 18,077 | ||||||
| Heidrick & Struggles International, Inc. | 540 | 15,368 | ||||||
HireRight Holdings Corp.(1) | 220 | 3,577 | ||||||
Hudson Global, Inc.(1) | 80 | 2,822 | ||||||
| ICF International, Inc. | 540 | 54,843 | ||||||
| Kelly Services, Inc., Class A | 860 | 13,855 | ||||||
| Kforce, Inc. | 620 | 33,927 | ||||||
Mistras Group, Inc.(1) | 480 | 2,654 | ||||||
| Resources Connection, Inc. | 940 | 18,368 | ||||||
TrueBlue, Inc.(1) | 1,000 | 20,540 | ||||||
| 317,852 | ||||||||
| Real Estate Management and Development — 0.8% | ||||||||
Anywhere Real Estate, Inc.(1) | 3,146 | 30,736 | ||||||
Five Point Holdings LLC, Class A(1) | 1,400 | 5,110 | ||||||
Forestar Group, Inc.(1) | 500 | 6,220 | ||||||
FRP Holdings, Inc.(1) | 22 | 1,266 | ||||||
| Kennedy-Wilson Holdings, Inc. | 3,285 | 57,685 | ||||||
| Marcus & Millichap, Inc. | 780 | 29,156 | ||||||
Rafael Holdings, Inc., Class B(1) | 440 | 955 | ||||||
| RE/MAX Holdings, Inc., Class A | 500 | 11,380 | ||||||
| RMR Group, Inc., Class A | 420 | 10,937 | ||||||
Seritage Growth Properties, Class A(1) | 809 | 10,145 | ||||||
| St. Joe Co. | 501 | 19,138 | ||||||
Stratus Properties, Inc.(1) | 226 | 8,048 | ||||||
Tejon Ranch Co.(1) | 620 | 9,771 | ||||||
| 200,547 | ||||||||
| Road and Rail — 0.9% | ||||||||
| ArcBest Corp. | 900 | 72,477 | ||||||
| Covenant Logistics Group, Inc. | 320 | 8,998 | ||||||
Daseke, Inc.(1) | 1,400 | 8,484 | ||||||
| Heartland Express, Inc. | 1,240 | 18,786 | ||||||
| Marten Transport Ltd. | 1,800 | 35,658 | ||||||
102
| Avantis U.S. Small Cap Equity ETF | ||||||||
| Shares | Value | |||||||
PAM Transportation Services, Inc.(1) | 200 | $ | 5,942 | |||||
TuSimple Holdings, Inc., Class A(1) | 401 | 2,883 | ||||||
| Universal Logistics Holdings, Inc. | 180 | 6,572 | ||||||
US Xpress Enterprises, Inc., Class A(1) | 560 | 1,378 | ||||||
USA Truck, Inc.(1) | 220 | 6,899 | ||||||
| Werner Enterprises, Inc. | 1,660 | 66,052 | ||||||
| 234,129 | ||||||||
| Semiconductors and Semiconductor Equipment — 1.6% | ||||||||
ACM Research, Inc., Class A(1) | 828 | 13,985 | ||||||
Alpha & Omega Semiconductor Ltd.(1) | 720 | 27,835 | ||||||
Amtech Systems, Inc.(1) | 260 | 2,886 | ||||||
Axcelis Technologies, Inc.(1) | 1,000 | 66,940 | ||||||
AXT, Inc.(1) | 1,060 | 9,105 | ||||||
CEVA, Inc.(1) | 210 | 6,147 | ||||||
Cohu, Inc.(1) | 1,300 | 34,879 | ||||||
CyberOptics Corp.(1) | 180 | 9,583 | ||||||
Formfactor, Inc.(1) | 738 | 21,609 | ||||||
inTEST Corp.(1) | 200 | 1,776 | ||||||
| Kulicke & Soffa Industries, Inc. | 183 | 7,693 | ||||||
MagnaChip Semiconductor Corp.(1) | 1,260 | 14,742 | ||||||
| NVE Corp. | 120 | 6,086 | ||||||
Photronics, Inc.(1) | 1,960 | 32,928 | ||||||
Rambus, Inc.(1) | 3,260 | 84,076 | ||||||
SMART Global Holdings, Inc.(1) | 1,540 | 28,259 | ||||||
Ultra Clean Holdings, Inc.(1) | 1,220 | 35,709 | ||||||
Veeco Instruments, Inc.(1) | 1,341 | 28,349 | ||||||
| 432,587 | ||||||||
| Software — 1.5% | ||||||||
| A10 Networks, Inc. | 1,980 | 27,522 | ||||||
Agilysys, Inc.(1) | 406 | 21,019 | ||||||
Avaya Holdings Corp.(1) | 2,103 | 3,344 | ||||||
C3.ai, Inc., Class A(1) | 2,478 | 44,604 | ||||||
ChannelAdvisor Corp.(1) | 121 | 1,826 | ||||||
Cleanspark, Inc.(1) | 1,060 | 4,537 | ||||||
CommVault Systems, Inc.(1) | 842 | 45,712 | ||||||
CoreCard Corp.(1) | 180 | 4,365 | ||||||
Digital Turbine, Inc.(1) | 1,465 | 27,058 | ||||||
| Ebix, Inc. | 660 | 17,173 | ||||||
eGain Corp.(1) | 210 | 1,934 | ||||||
| InterDigital, Inc. | 840 | 42,134 | ||||||
LiveRamp Holdings, Inc.(1) | 1,780 | 35,333 | ||||||
Mitek Systems, Inc.(1) | 1,160 | 11,855 | ||||||
N-able, Inc.(1) | 1,369 | 13,635 | ||||||
OneSpan, Inc.(1) | 680 | 7,827 | ||||||
| Progress Software Corp. | 1,200 | 57,756 | ||||||
SRAX, Inc.(1) | 600 | 1,422 | ||||||
Upland Software, Inc.(1) | 400 | 4,188 | ||||||
Vertex, Inc., Class A(1) | 720 | 9,850 | ||||||
Yext, Inc.(1) | 2,129 | 9,474 | ||||||
| 392,568 | ||||||||
| Specialty Retail — 4.3% | ||||||||
| Aaron's Co., Inc. | 840 | 9,996 | ||||||
103
| Avantis U.S. Small Cap Equity ETF | ||||||||
| Shares | Value | |||||||
Abercrombie & Fitch Co., Class A(1) | 1,500 | $ | 21,585 | |||||
| Academy Sports & Outdoors, Inc. | 1,290 | 55,573 | ||||||
America's Car-Mart, Inc.(1) | 160 | 12,898 | ||||||
| American Eagle Outfitters, Inc. | 2,985 | 33,611 | ||||||
| Arko Corp. | 2,480 | 23,634 | ||||||
Barnes & Noble Education, Inc.(1) | 1,000 | 2,560 | ||||||
Bed Bath & Beyond, Inc.(1) | 1,660 | 15,820 | ||||||
| Big 5 Sporting Goods Corp. | 560 | 6,854 | ||||||
Boot Barn Holdings, Inc.(1) | 1,020 | 67,952 | ||||||
| Buckle, Inc. | 840 | 27,115 | ||||||
| Build-A-Bear Workshop, Inc. | 440 | 6,741 | ||||||
| Caleres, Inc. | 980 | 25,010 | ||||||
| Cato Corp., Class A | 500 | 5,405 | ||||||
Chico's FAS, Inc.(1) | 3,120 | 17,722 | ||||||
Children's Place, Inc.(1) | 360 | 15,185 | ||||||
Citi Trends, Inc.(1) | 220 | 4,444 | ||||||
Conn's, Inc.(1) | 500 | 4,805 | ||||||
Container Store Group, Inc.(1) | 820 | 5,560 | ||||||
| Designer Brands, Inc., Class A | 1,620 | 27,637 | ||||||
Express, Inc.(1) | 1,884 | 2,864 | ||||||
| Foot Locker, Inc. | 2,746 | 101,163 | ||||||
Genesco, Inc.(1) | 380 | 21,500 | ||||||
| Group 1 Automotive, Inc. | 370 | 66,078 | ||||||
| Guess?, Inc. | 1,100 | 19,217 | ||||||
| Haverty Furniture Cos., Inc. | 420 | 11,264 | ||||||
| Hibbett, Inc. | 320 | 18,752 | ||||||
Kirkland's, Inc.(1) | 240 | 979 | ||||||
Lazydays Holdings, Inc.(1) | 240 | 3,950 | ||||||
LL Flooring Holdings, Inc.(1) | 700 | 5,698 | ||||||
MarineMax, Inc.(1) | 640 | 23,258 | ||||||
| Monro, Inc. | 880 | 40,753 | ||||||
National Vision Holdings, Inc.(1) | 803 | 26,684 | ||||||
ODP Corp.(1) | 1,441 | 51,516 | ||||||
OneWater Marine, Inc., Class A(1) | 280 | 11,158 | ||||||
Party City Holdco, Inc.(1) | 2,260 | 4,452 | ||||||
Sally Beauty Holdings, Inc.(1) | 3,020 | 44,938 | ||||||
| Shoe Carnival, Inc. | 480 | 11,419 | ||||||
| Signet Jewelers Ltd. | 1,307 | 85,438 | ||||||
| Sonic Automotive, Inc., Class A | 580 | 30,850 | ||||||
Sportsman's Warehouse Holdings, Inc.(1) | 1,201 | 9,560 | ||||||
| Tile Shop Holdings, Inc. | 980 | 3,842 | ||||||
| Tilly's, Inc., Class A | 620 | 4,650 | ||||||
TravelCenters of America, Inc.(1) | 400 | 21,632 | ||||||
Urban Outfitters, Inc.(1) | 1,600 | 32,208 | ||||||
Victoria's Secret & Co.(1) | 2,124 | 71,026 | ||||||
Zumiez, Inc.(1) | 580 | 15,057 | ||||||
| 1,130,013 | ||||||||
| Technology Hardware, Storage and Peripherals — 0.5% | ||||||||
Eastman Kodak Co.(1) | 1,380 | 7,466 | ||||||
Immersion Corp.(1) | 620 | 3,695 | ||||||
Intevac, Inc.(1) | 660 | 3,294 | ||||||
104
| Avantis U.S. Small Cap Equity ETF | ||||||||
| Shares | Value | |||||||
Super Micro Computer, Inc.(1) | 1,360 | $ | 88,509 | |||||
Turtle Beach Corp.(1) | 380 | 3,568 | ||||||
| Xerox Holdings Corp. | 1,605 | 26,675 | ||||||
| 133,207 | ||||||||
| Textiles, Apparel and Luxury Goods — 1.0% | ||||||||
Allbirds, Inc., Class A(1) | 1,106 | 4,545 | ||||||
Delta Apparel, Inc.(1) | 160 | 3,005 | ||||||
Fossil Group, Inc.(1) | 1,260 | 5,330 | ||||||
G-III Apparel Group Ltd.(1) | 1,200 | 25,284 | ||||||
| Kontoor Brands, Inc. | 1,460 | 54,356 | ||||||
Lakeland Industries, Inc.(1) | 200 | 2,700 | ||||||
| Movado Group, Inc. | 500 | 15,945 | ||||||
| Oxford Industries, Inc. | 460 | 49,096 | ||||||
| Rocky Brands, Inc. | 160 | 4,181 | ||||||
| Steven Madden Ltd. | 1,580 | 45,994 | ||||||
| Superior Group of Cos., Inc. | 300 | 3,333 | ||||||
Unifi, Inc.(1) | 400 | 4,544 | ||||||
Vera Bradley, Inc.(1) | 660 | 2,613 | ||||||
| Wolverine World Wide, Inc. | 2,180 | 42,597 | ||||||
| 263,523 | ||||||||
| Thrifts and Mortgage Finance — 2.2% | ||||||||
Axos Financial, Inc.(1) | 1,309 | 54,690 | ||||||
Blue Foundry Bancorp(1) | 725 | 8,243 | ||||||
Bridgewater Bancshares, Inc.(1) | 580 | 9,964 | ||||||
Columbia Financial, Inc.(1) | 1,243 | 26,513 | ||||||
| Federal Agricultural Mortgage Corp., Class C | 280 | 30,587 | ||||||
| Flagstar Bancorp, Inc. | 1,460 | 56,254 | ||||||
| FS Bancorp, Inc. | 188 | 5,585 | ||||||
| Hingham Institution For Savings | 42 | 12,470 | ||||||
| Home Bancorp, Inc. | 200 | 7,808 | ||||||
| Kearny Financial Corp. | 1,880 | 21,357 | ||||||
| Merchants Bancorp | 440 | 11,867 | ||||||
Mr. Cooper Group, Inc.(1) | 1,066 | 45,092 | ||||||
NMI Holdings, Inc., Class A(1) | 2,280 | 46,808 | ||||||
| Northfield Bancorp, Inc. | 1,180 | 17,393 | ||||||
Ocwen Financial Corp.(1) | 220 | 5,760 | ||||||
| PennyMac Financial Services, Inc. | 766 | 40,690 | ||||||
| Provident Financial Services, Inc. | 2,040 | 47,389 | ||||||
| Southern Missouri Bancorp, Inc. | 220 | 11,601 | ||||||
| TrustCo Bank Corp. NY | 500 | 16,670 | ||||||
| Waterstone Financial, Inc. | 600 | 10,374 | ||||||
| WSFS Financial Corp. | 1,800 | 87,030 | ||||||
| 574,145 | ||||||||
| Trading Companies and Distributors — 1.5% | ||||||||
| Alta Equipment Group, Inc. | 560 | 6,591 | ||||||
BlueLinx Holdings, Inc.(1) | 320 | 22,432 | ||||||
| Boise Cascade Co. | 885 | 55,162 | ||||||
Distribution Solutions Group, Inc.(1) | 90 | 3,577 | ||||||
| Global Industrial Co. | 440 | 13,235 | ||||||
| H&E Equipment Services, Inc. | 920 | 29,127 | ||||||
| McGrath RentCorp | 660 | 55,783 | ||||||
105
| Avantis U.S. Small Cap Equity ETF | ||||||||
| Shares | Value | |||||||
MRC Global, Inc.(1) | 2,064 | $ | 20,083 | |||||
NOW, Inc.(1) | 3,648 | 44,214 | ||||||
| Rush Enterprises, Inc., Class A | 1,149 | 54,072 | ||||||
| Rush Enterprises, Inc., Class B | 227 | 11,495 | ||||||
Titan Machinery, Inc.(1) | 640 | 19,699 | ||||||
Transcat, Inc.(1) | 240 | 17,782 | ||||||
Veritiv Corp.(1) | 460 | 54,827 | ||||||
| 408,079 | ||||||||
| Water Utilities — 0.5% | ||||||||
| American States Water Co. | 610 | 50,612 | ||||||
| Artesian Resources Corp., Class A | 220 | 12,019 | ||||||
| California Water Service Group | 948 | 55,486 | ||||||
| Consolidated Water Co. Ltd. | 380 | 6,156 | ||||||
| York Water Co. | 221 | 9,717 | ||||||
| 133,990 | ||||||||
| Wireless Telecommunication Services — 0.3% | ||||||||
| Shenandoah Telecommunications Co. | 1,300 | 28,977 | ||||||
| Spok Holdings, Inc. | 440 | 3,168 | ||||||
| Telephone and Data Systems, Inc. | 2,860 | 46,532 | ||||||
United States Cellular Corp.(1) | 426 | 12,180 | ||||||
| 90,857 | ||||||||
TOTAL COMMON STOCKS (Cost $26,022,464) | 26,230,419 | |||||||
| SHORT-TERM INVESTMENTS — 0.2% | ||||||||
| Money Market Funds — 0.2% | ||||||||
State Street Institutional U.S. Government Money Market Fund, Premier Class (Cost $66,159) | 66,159 | 66,159 | ||||||
TOTAL INVESTMENT SECURITIES — 99.9% (Cost $26,088,623) | 26,296,578 | |||||||
| OTHER ASSETS AND LIABILITIES — 0.1% | 18,418 | |||||||
| TOTAL NET ASSETS — 100.0% | $ | 26,314,996 | ||||||
| NOTES TO SCHEDULE OF INVESTMENTS | ||||||||
†Category is less than 0.05% of total net assets.
(1)Non-income producing.
See Notes to Financial Statements.
106
AUGUST 31, 2022
| Avantis U.S. Small Cap Value ETF | ||||||||
| Shares | Value | |||||||
| COMMON STOCKS — 99.8% | ||||||||
| Aerospace and Defense — 0.2% | ||||||||
AAR Corp.(1) | 48,254 | $ | 2,069,132 | |||||
AerSale Corp.(1) | 38,048 | 733,565 | ||||||
| Kaman Corp. | 30,580 | 969,998 | ||||||
| Moog, Inc., Class A | 36,844 | 2,762,563 | ||||||
| 6,535,258 | ||||||||
| Air Freight and Logistics — 1.4% | ||||||||
Air Transport Services Group, Inc.(1) | 549,436 | 16,554,507 | ||||||
Atlas Air Worldwide Holdings, Inc.(1) | 237,766 | 23,757,579 | ||||||
Hub Group, Inc., Class A(1) | 160,555 | 12,813,894 | ||||||
| 53,125,980 | ||||||||
| Airlines — 0.8% | ||||||||
Allegiant Travel Co.(1) | 103,489 | 9,986,688 | ||||||
Hawaiian Holdings, Inc.(1) | 261,637 | 3,921,939 | ||||||
JetBlue Airways Corp.(1) | 1,216,425 | 9,475,951 | ||||||
Mesa Air Group, Inc.(1) | 22,440 | 54,529 | ||||||
SkyWest, Inc.(1) | 330,663 | 7,039,815 | ||||||
Wheels Up Experience, Inc.(1) | 272,156 | 508,932 | ||||||
| 30,987,854 | ||||||||
| Auto Components — 1.2% | ||||||||
American Axle & Manufacturing Holdings, Inc.(1) | 724,038 | 7,493,793 | ||||||
Dorman Products, Inc.(1) | 57,290 | 5,193,339 | ||||||
Goodyear Tire & Rubber Co.(1) | 1,629,696 | 22,864,635 | ||||||
| LCI Industries | 43,731 | 5,067,111 | ||||||
Motorcar Parts of America, Inc.(1) | 83,587 | 1,242,103 | ||||||
| Standard Motor Products, Inc. | 34,446 | 1,264,168 | ||||||
| 43,125,149 | ||||||||
| Automobiles — 1.2% | ||||||||
| Harley-Davidson, Inc. | 142,386 | 5,491,828 | ||||||
| Thor Industries, Inc. | 293,844 | 23,804,302 | ||||||
| Winnebago Industries, Inc. | 213,446 | 12,290,221 | ||||||
Workhorse Group, Inc.(1)(2) | 468,256 | 1,465,641 | ||||||
| 43,051,992 | ||||||||
| Banks — 16.7% | ||||||||
| 1st Source Corp. | 40,580 | 1,914,970 | ||||||
ACNB Corp.(2) | 39,875 | 1,417,955 | ||||||
| Allegiance Bancshares, Inc. | 31,254 | 1,323,919 | ||||||
| Amalgamated Financial Corp. | 90,564 | 2,037,690 | ||||||
| Amerant Bancorp, Inc. | 126,278 | 3,307,221 | ||||||
| American National Bankshares, Inc. | 3,000 | 98,790 | ||||||
| Ameris Bancorp | 265,259 | 12,382,290 | ||||||
| Arrow Financial Corp. | 71,978 | 2,311,214 | ||||||
| Associated Banc-Corp. | 603,378 | 12,091,695 | ||||||
| Atlantic Union Bankshares Corp. | 72,233 | 2,343,961 | ||||||
| Banc of California, Inc. | 154,877 | 2,614,324 | ||||||
| BancFirst Corp. | 72,469 | 7,816,506 | ||||||
Bancorp, Inc.(1) | 216,294 | 5,130,494 | ||||||
Bank First Corp.(2) | 16,236 | 1,319,500 | ||||||
| Bank of Hawaii Corp. | 187,209 | 14,606,046 | ||||||
107
| Avantis U.S. Small Cap Value ETF | ||||||||
| Shares | Value | |||||||
| Bank of Marin Bancorp | 20,867 | $ | 644,790 | |||||
| Bank OZK | 194,477 | 7,882,153 | ||||||
| Bank7 Corp. | 2,336 | 55,620 | ||||||
| BankFinancial Corp. | 55,406 | 551,290 | ||||||
| BankUnited, Inc. | 382,143 | 14,158,398 | ||||||
| Bankwell Financial Group, Inc. | 27,668 | 872,095 | ||||||
| Banner Corp. | 153,019 | 9,297,434 | ||||||
| Bar Harbor Bankshares | 13,444 | 380,869 | ||||||
| Baycom Corp. | 18,670 | 347,449 | ||||||
| BCB Bancorp, Inc. | 87,024 | 1,566,432 | ||||||
| Berkshire Hills Bancorp, Inc. | 60,483 | 1,706,225 | ||||||
| Brookline Bancorp., Inc. | 256,015 | 3,192,507 | ||||||
| Business First Bancshares, Inc. | 31,246 | 737,093 | ||||||
| Byline Bancorp, Inc. | 129,252 | 2,818,986 | ||||||
| Cadence Bank | 54,697 | 1,393,680 | ||||||
| Cambridge Bancorp | 11,370 | 934,955 | ||||||
| Camden National Corp. | 34,114 | 1,542,976 | ||||||
| Capital City Bank Group, Inc. | 14,734 | 470,457 | ||||||
| Capstar Financial Holdings, Inc. | 28,306 | 570,366 | ||||||
Carter Bankshares, Inc.(1) | 34,169 | 562,763 | ||||||
| Cathay General Bancorp. | 354,329 | 14,860,558 | ||||||
| CB Financial Services, Inc. | 19,701 | 429,482 | ||||||
| Central Pacific Financial Corp. | 165,896 | 3,614,874 | ||||||
| Central Valley Community Bancorp | 59,229 | 1,054,276 | ||||||
| City Holding Co. | 57,089 | 4,853,136 | ||||||
| Civista Bancshares, Inc. | 14,616 | 309,128 | ||||||
| CNB Financial Corp. | 83,466 | 2,196,825 | ||||||
Coastal Financial Corp.(1) | 1,350 | 54,270 | ||||||
| Codorus Valley Bancorp, Inc. | 46,003 | 920,520 | ||||||
| Colony Bankcorp, Inc. | 23,343 | 329,603 | ||||||
| Columbia Banking System, Inc. | 73,917 | 2,213,814 | ||||||
| Community Trust Bancorp, Inc. | 55,607 | 2,349,396 | ||||||
| ConnectOne Bancorp, Inc. | 166,074 | 4,156,832 | ||||||
CrossFirst Bankshares, Inc.(1) | 85,719 | 1,129,776 | ||||||
Customers Bancorp, Inc.(1) | 167,940 | 5,825,839 | ||||||
| Dime Community Bancshares, Inc. | 128,863 | 4,028,257 | ||||||
| Eagle Bancorp, Inc. | 163,407 | 7,930,142 | ||||||
| Enterprise Financial Services Corp. | 106,394 | 4,864,334 | ||||||
| Equity Bancshares, Inc., Class A | 30,515 | 952,983 | ||||||
| Esquire Financial Holdings, Inc. | 10,698 | 399,891 | ||||||
| F.N.B. Corp. | 928,574 | 11,068,602 | ||||||
| Farmers National Banc Corp. | 148,593 | 2,123,394 | ||||||
| FB Financial Corp. | 99,621 | 3,946,984 | ||||||
| Fidelity D&D Bancorp, Inc. | 1,144 | 45,760 | ||||||
| Financial Institutions, Inc. | 86,598 | 2,254,146 | ||||||
| First BanCorp | 979,230 | 14,002,989 | ||||||
| First Bancorp, Inc. | 19,768 | 573,272 | ||||||
| First Bancorp/Southern Pines NC | 50,397 | 1,834,955 | ||||||
| First Bancshares, Inc. | 40,206 | 1,202,159 | ||||||
| First Busey Corp. | 176,157 | 4,051,611 | ||||||
| First Business Financial Services, Inc. | 41,068 | 1,366,743 | ||||||
108
| Avantis U.S. Small Cap Value ETF | ||||||||
| Shares | Value | |||||||
| First Commonwealth Financial Corp. | 260,456 | $ | 3,510,947 | |||||
| First Community Bankshares, Inc. | 26,357 | 831,036 | ||||||
| First Financial Corp. | 40,501 | 1,883,296 | ||||||
| First Foundation, Inc. | 222,085 | 4,210,732 | ||||||
| First Guaranty Bancshares, Inc. | 3,820 | 85,110 | ||||||
| First Internet Bancorp | 46,391 | 1,701,158 | ||||||
| First Interstate Bancsystem, Inc., Class A | 224 | 9,018 | ||||||
| First Mid Bancshares, Inc. | 74,320 | 2,627,212 | ||||||
| First of Long Island Corp. | 114,949 | 2,116,211 | ||||||
| First United Corp. | 34,807 | 609,123 | ||||||
First Western Financial, Inc.(1) | 3,364 | 89,247 | ||||||
| Five Star Bancorp | 1,698 | 43,180 | ||||||
| Flushing Financial Corp. | 80,510 | 1,662,532 | ||||||
| Franklin Financial Services Corp. | 19,608 | 627,064 | ||||||
| Fulton Financial Corp. | 642,683 | 10,430,745 | ||||||
FVCBankcorp, Inc.(1)(2) | 16,706 | 321,758 | ||||||
| Great Southern Bancorp, Inc. | 68,733 | 4,040,126 | ||||||
| Guaranty Bancshares, Inc. | 3,094 | 107,207 | ||||||
| Hancock Whitney Corp. | 376,899 | 18,177,839 | ||||||
| Hanmi Financial Corp. | 181,544 | 4,487,768 | ||||||
| HarborOne Bancorp, Inc. | 159,152 | 2,170,833 | ||||||
| Hawthorn Bancshares, Inc. | 29,892 | 714,718 | ||||||
| Heartland Financial USA, Inc. | 137,851 | 6,157,804 | ||||||
| Heritage Commerce Corp. | 38,115 | 430,318 | ||||||
| Hilltop Holdings, Inc. | 289,666 | 7,647,182 | ||||||
| HomeStreet, Inc. | 128,600 | 4,476,566 | ||||||
| HomeTrust Bancshares, Inc. | 36,547 | 848,621 | ||||||
| Hope Bancorp, Inc. | 506,329 | 7,326,581 | ||||||
| Horizon Bancorp, Inc. | 118,120 | 2,234,830 | ||||||
| Independent Bank Corp. (Massachusetts) | 237 | 18,541 | ||||||
| Independent Bank Corp. (Michigan) | 122,548 | 2,514,685 | ||||||
| International Bancshares Corp. | 261,980 | 10,932,425 | ||||||
| Investar Holding Corp. | 4,779 | 103,226 | ||||||
| Lakeland Bancorp, Inc. | 266,752 | 4,345,390 | ||||||
| Lakeland Financial Corp. | 89,137 | 6,715,582 | ||||||
| Live Oak Bancshares, Inc. | 70,671 | 2,561,117 | ||||||
| Macatawa Bank Corp. | 151,804 | 1,445,174 | ||||||
| Mercantile Bank Corp. | 87,913 | 2,908,162 | ||||||
| Metrocity Bankshares, Inc. | 17,092 | 341,669 | ||||||
Metropolitan Bank Holding Corp.(1) | 31,219 | 2,234,968 | ||||||
| Mid Penn Bancorp, Inc. | 8,475 | 246,538 | ||||||
| Midland States Bancorp, Inc. | 129,308 | 3,244,338 | ||||||
| MidWestOne Financial Group, Inc. | 70,815 | 2,159,857 | ||||||
| MVB Financial Corp. | 75,247 | 2,406,399 | ||||||
| National Bank Holdings Corp., Class A | 87,914 | 3,527,989 | ||||||
| NBT Bancorp, Inc. | 156,760 | 6,079,153 | ||||||
Nicolet Bankshares, Inc.(1) | 9,316 | 713,419 | ||||||
| Northeast Bank | 50,135 | 1,943,734 | ||||||
| Northrim BanCorp, Inc. | 31,680 | 1,284,624 | ||||||
| OceanFirst Financial Corp. | 105,763 | 2,056,033 | ||||||
| OFG Bancorp | 265,307 | 7,216,350 | ||||||
109
| Avantis U.S. Small Cap Value ETF | ||||||||
| Shares | Value | |||||||
| Old Second Bancorp, Inc. | 193,731 | $ | 2,657,989 | |||||
| Origin Bancorp, Inc. | 69,148 | 2,824,696 | ||||||
| Orrstown Financial Services, Inc. | 56,127 | 1,444,148 | ||||||
| Pacific Premier Bancorp, Inc. | 289,352 | 9,479,172 | ||||||
| PacWest Bancorp | 545,634 | 14,366,543 | ||||||
| Park National Corp. | 39,491 | 5,206,099 | ||||||
| Parke Bancorp, Inc. | 56,871 | 1,261,399 | ||||||
| Pathward Financial, Inc. | 122,930 | 4,051,773 | ||||||
| PCB Bancorp. | 72,568 | 1,362,827 | ||||||
| PCSB Financial Corp. | 4,055 | 75,058 | ||||||
| Peapack-Gladstone Financial Corp. | 90,277 | 3,039,627 | ||||||
| Peoples Bancorp, Inc. | 62,783 | 1,876,584 | ||||||
| Popular, Inc. | 137,682 | 10,631,804 | ||||||
| Preferred Bank | 45,367 | 3,077,697 | ||||||
| Premier Financial Corp. | 109,720 | 2,964,634 | ||||||
| Primis Financial Corp. | 106,546 | 1,396,818 | ||||||
| QCR Holdings, Inc. | 79,256 | 4,426,448 | ||||||
| RBB Bancorp | 88,909 | 1,964,889 | ||||||
| Red River Bancshares, Inc. | 2,518 | 128,695 | ||||||
| Republic Bancorp, Inc., Class A | 60,455 | 2,569,337 | ||||||
Republic First Bancorp, Inc.(1) | 46,793 | 148,802 | ||||||
| Riverview Bancorp, Inc. | 119,597 | 843,159 | ||||||
| Sandy Spring Bancorp, Inc. | 175,314 | 6,753,095 | ||||||
| ServisFirst Bancshares, Inc. | 105,537 | 8,903,101 | ||||||
| Shore Bancshares, Inc. | 36,817 | 701,364 | ||||||
| Sierra Bancorp | 74,957 | 1,553,109 | ||||||
| Simmons First National Corp., Class A | 149,574 | 3,528,451 | ||||||
| SmartFinancial, Inc. | 58,952 | 1,479,106 | ||||||
| South Plains Financial, Inc. | 6,379 | 173,062 | ||||||
Southern First Bancshares, Inc.(1) | 37,854 | 1,631,886 | ||||||
| Southside Bancshares, Inc. | 30,902 | 1,164,387 | ||||||
| SouthState Corp. | 18,263 | 1,425,245 | ||||||
| Stock Yards Bancorp, Inc. | 425 | 28,161 | ||||||
| Summit Financial Group, Inc. | 57,645 | 1,644,035 | ||||||
| Synovus Financial Corp. | 194,118 | 7,795,779 | ||||||
Texas Capital Bancshares, Inc.(1) | 193,060 | 11,396,332 | ||||||
| Tompkins Financial Corp. | 30,088 | 2,155,504 | ||||||
| Towne Bank | 246,121 | 7,011,987 | ||||||
| Trico Bancshares | 80,296 | 3,789,168 | ||||||
Triumph Bancorp, Inc.(1) | 106,477 | 6,591,991 | ||||||
| Trustmark Corp. | 232,110 | 7,320,749 | ||||||
| UMB Financial Corp. | 171,127 | 15,310,733 | ||||||
| Umpqua Holdings Corp. | 965,874 | 17,134,605 | ||||||
| United Community Banks, Inc. | 210,494 | 7,057,864 | ||||||
| United Security Bancshares | 83,262 | 591,160 | ||||||
| Unity Bancorp, Inc. | 41,154 | 1,153,547 | ||||||
| Univest Financial Corp. | 78,190 | 1,939,112 | ||||||
| Valley National Bancorp | 645,230 | 7,497,573 | ||||||
| Washington Federal, Inc. | 304,009 | 9,731,328 | ||||||
| Washington Trust Bancorp, Inc. | 78,139 | 3,956,178 | ||||||
| West BanCorp, Inc. | 78,905 | 1,941,852 | ||||||
110
| Avantis U.S. Small Cap Value ETF | ||||||||
| Shares | Value | |||||||
| Wintrust Financial Corp. | 198,566 | $ | 16,747,056 | |||||
| 613,831,517 | ||||||||
| Beverages — 0.2% | ||||||||
| Coca-Cola Consolidated, Inc. | 18,611 | 8,827,756 | ||||||
| Biotechnology — 1.7% | ||||||||
Alector, Inc.(1) | 203,782 | 2,109,144 | ||||||
Capricor Therapeutics, Inc.(1) | 2,254 | 13,118 | ||||||
Catalyst Pharmaceuticals, Inc.(1) | 609,720 | 8,255,609 | ||||||
Cullinan Oncology, Inc.(1) | 39,769 | 536,086 | ||||||
Dynavax Technologies Corp.(1) | 581,949 | 6,674,955 | ||||||
Emergent BioSolutions, Inc.(1) | 297,547 | 7,147,079 | ||||||
Ironwood Pharmaceuticals, Inc.(1) | 1,003,611 | 10,798,854 | ||||||
iTeos Therapeutics, Inc.(1) | 164,483 | 3,648,233 | ||||||
Ligand Pharmaceuticals, Inc.(1) | 22,751 | 2,101,965 | ||||||
Organogenesis Holdings, Inc.(1) | 136,305 | 489,335 | ||||||
Ovid therapeutics, Inc.(1)(2) | 18,086 | 36,353 | ||||||
REGENXBIO, Inc.(1) | 246,712 | 7,278,004 | ||||||
Tango Therapeutics, Inc.(1) | 41,807 | 171,409 | ||||||
uniQure NV(1) | 193,755 | 3,785,973 | ||||||
Vir Biotechnology, Inc.(1) | 354,775 | 8,425,906 | ||||||
XBiotech, Inc.(1) | 852 | 3,416 | ||||||
XOMA Corp.(1) | 18,806 | 373,863 | ||||||
| 61,849,302 | ||||||||
| Building Products — 0.7% | ||||||||
| Apogee Enterprises, Inc. | 146,097 | 5,966,602 | ||||||
| Insteel Industries, Inc. | 92,028 | 2,659,609 | ||||||
Masonite International Corp.(1) | 144,132 | 11,792,880 | ||||||
| Quanex Building Products Corp. | 163,620 | 3,648,726 | ||||||
| UFP Industries, Inc. | 2,739 | 217,449 | ||||||
| 24,285,266 | ||||||||
| Capital Markets — 1.8% | ||||||||
| Artisan Partners Asset Management, Inc., Class A | 13,646 | 460,689 | ||||||
| B. Riley Financial, Inc. | 68,417 | 3,405,114 | ||||||
| Cowen, Inc., Class A | 137,831 | 5,299,602 | ||||||
| Diamond Hill Investment Group, Inc. | 15,852 | 2,711,485 | ||||||
| Evercore, Inc., Class A | 132,490 | 12,412,988 | ||||||
| Janus Henderson Group PLC | 309,742 | 7,247,963 | ||||||
| Manning & Napier, Inc. | 26,797 | 341,126 | ||||||
| Moelis & Co., Class A | 132,817 | 5,533,156 | ||||||
| Oppenheimer Holdings, Inc., Class A | 43,892 | 1,593,280 | ||||||
| Piper Sandler Cos. | 82,116 | 9,408,030 | ||||||
| Stifel Financial Corp. | 126,847 | 7,523,295 | ||||||
StoneX Group, Inc.(1) | 76,405 | 7,093,440 | ||||||
| Victory Capital Holdings, Inc., Class A | 6 | 161 | ||||||
| Virtus Investment Partners, Inc. | 19,914 | 3,808,552 | ||||||
| 66,838,881 | ||||||||
| Chemicals — 2.9% | ||||||||
| AdvanSix, Inc. | 210,957 | 7,649,301 | ||||||
AgroFresh Solutions, Inc.(1) | 125,141 | 200,851 | ||||||
| American Vanguard Corp. | 203,078 | 4,047,345 | ||||||
| Cabot Corp. | 353,597 | 25,448,376 | ||||||
111
| Avantis U.S. Small Cap Value ETF | ||||||||
| Shares | Value | |||||||
| Chemours Co. | 734,173 | $ | 24,763,655 | |||||
Ecovyst, Inc.(1) | 87,418 | 807,742 | ||||||
| FutureFuel Corp. | 27,557 | 200,890 | ||||||
| Hawkins, Inc. | 70,240 | 2,691,597 | ||||||
Intrepid Potash, Inc.(1) | 60,419 | 2,823,380 | ||||||
| Kronos Worldwide, Inc. | 110,521 | 1,423,510 | ||||||
LSB Industries, Inc.(1) | 283,229 | 4,469,354 | ||||||
| NewMarket Corp. | 12,595 | 3,617,410 | ||||||
| Orion Engineered Carbons SA | 226,436 | 3,817,711 | ||||||
Rayonier Advanced Materials, Inc.(1) | 462,796 | 2,091,838 | ||||||
| Sensient Technologies Corp. | 98 | 7,808 | ||||||
| Stepan Co. | 88,563 | 9,230,921 | ||||||
| Tredegar Corp. | 71,477 | 729,780 | ||||||
| Trinseo PLC | 68,122 | 1,807,277 | ||||||
| Tronox Holdings PLC, Class A | 820,143 | 11,998,692 | ||||||
| Valhi, Inc. | 7,238 | 252,896 | ||||||
| 108,080,334 | ||||||||
| Commercial Services and Supplies — 0.3% | ||||||||
Civeo Corp.(1) | 46,257 | 1,371,983 | ||||||
| Ennis, Inc. | 145,530 | 3,089,602 | ||||||
Heritage-Crystal Clean, Inc.(1) | 86,011 | 2,801,378 | ||||||
| HNI Corp. | 37,499 | 1,199,968 | ||||||
| Interface, Inc. | 271,564 | 3,033,370 | ||||||
Quad/Graphics, Inc.(1) | 158,491 | 500,831 | ||||||
| 11,997,132 | ||||||||
| Communications Equipment — 0.4% | ||||||||
Aviat Networks, Inc.(1) | 2,363 | 73,962 | ||||||
EMCORE Corp.(1) | 65,691 | 156,344 | ||||||
ViaSat, Inc.(1) | 424,669 | 16,128,929 | ||||||
| 16,359,235 | ||||||||
| Construction and Engineering — 0.6% | ||||||||
Ameresco, Inc., Class A(1) | 27,892 | 1,920,364 | ||||||
| Argan, Inc. | 10,528 | 364,164 | ||||||
Fluor Corp.(1) | 6,426 | 169,903 | ||||||
| Granite Construction, Inc. | 109,038 | 3,268,959 | ||||||
Great Lakes Dredge & Dock Corp.(1) | 159,345 | 1,524,932 | ||||||
MYR Group, Inc.(1) | 111,495 | 10,362,345 | ||||||
Northwest Pipe Co.(1) | 29,871 | 945,716 | ||||||
| Primoris Services Corp. | 107,400 | 2,176,998 | ||||||
Sterling Infrastructure, Inc.(1) | 35,833 | 906,217 | ||||||
Tutor Perini Corp.(1) | 200,371 | 1,358,515 | ||||||
| 22,998,113 | ||||||||
| Construction Materials — 0.1% | ||||||||
| Eagle Materials, Inc. | 42,886 | 5,130,023 | ||||||
| Consumer Finance — 2.2% | ||||||||
Atlanticus Holdings Corp.(1) | 12,827 | 365,185 | ||||||
| Bread Financial Holdings, Inc. | 322,940 | 12,410,584 | ||||||
Consumer Portfolio Services, Inc.(1) | 27,834 | 323,988 | ||||||
Elevate Credit, Inc.(1) | 797 | 1,180 | ||||||
Encore Capital Group, Inc.(1) | 112,712 | 6,163,092 | ||||||
Green Dot Corp., Class A(1) | 199,293 | 4,043,655 | ||||||
112
| Avantis U.S. Small Cap Value ETF | ||||||||
| Shares | Value | |||||||
LendingClub Corp.(1) | 90,258 | $ | 1,179,672 | |||||
| Navient Corp. | 672,528 | 10,350,206 | ||||||
| Nelnet, Inc., Class A | 90,213 | 7,599,543 | ||||||
| OneMain Holdings, Inc. | 160,395 | 5,602,597 | ||||||
Oportun Financial Corp.(1) | 19,856 | 101,464 | ||||||
PRA Group, Inc.(1) | 121,965 | 4,505,387 | ||||||
PROG Holdings, Inc.(1) | 234,710 | 4,351,523 | ||||||
| Regional Management Corp. | 50,358 | 1,696,561 | ||||||
| SLM Corp. | 1,366,767 | 20,884,200 | ||||||
World Acceptance Corp.(1)(2) | 9,967 | 1,158,564 | ||||||
| 80,737,401 | ||||||||
Containers and Packaging† | ||||||||
| TriMas Corp. | 927 | 25,511 | ||||||
| Diversified Consumer Services — 0.9% | ||||||||
Adtalem Global Education, Inc.(1) | 257,645 | 9,710,640 | ||||||
American Public Education, Inc.(1) | 22,143 | 228,737 | ||||||
| Graham Holdings Co., Class B | 3 | 1,696 | ||||||
Grand Canyon Education, Inc.(1) | 162,027 | 13,185,757 | ||||||
Lincoln Educational Services Corp.(1) | 24,562 | 159,653 | ||||||
Perdoceo Education Corp.(1) | 485,372 | 5,620,608 | ||||||
Stride, Inc.(1) | 62,467 | 2,382,492 | ||||||
Universal Technical Institute, Inc.(1) | 139,935 | 959,954 | ||||||
| 32,249,537 | ||||||||
| Diversified Financial Services — 0.2% | ||||||||
| Alerus Financial Corp. | 51,047 | 1,212,877 | ||||||
| Jackson Financial, Inc., Class A | 176,662 | 5,522,454 | ||||||
| 6,735,331 | ||||||||
| Diversified Telecommunication Services — 0.8% | ||||||||
| ATN International, Inc. | 59,500 | 2,787,575 | ||||||
EchoStar Corp., Class A(1) | 220,896 | 4,066,695 | ||||||
Iridium Communications, Inc.(1) | 466,004 | 20,685,918 | ||||||
| 27,540,188 | ||||||||
| Electrical Equipment — 1.2% | ||||||||
Atkore, Inc.(1) | 277,746 | 23,444,540 | ||||||
| Encore Wire Corp. | 158,427 | 20,611,353 | ||||||
| LSI Industries, Inc. | 6,383 | 49,404 | ||||||
| Powell Industries, Inc. | 3 | 74 | ||||||
TPI Composites, Inc.(1) | 1,218 | 22,643 | ||||||
| 44,128,014 | ||||||||
| Electronic Equipment, Instruments and Components — 1.6% | ||||||||
| Avnet, Inc. | 32,286 | 1,417,033 | ||||||
| Bel Fuse, Inc., Class B | 14,765 | 419,621 | ||||||
| Benchmark Electronics, Inc. | 45,323 | 1,244,116 | ||||||
| CTS Corp. | 33,707 | 1,426,480 | ||||||
Daktronics, Inc.(1) | 46,859 | 149,949 | ||||||
Kimball Electronics, Inc.(1) | 47,504 | 1,023,236 | ||||||
| Methode Electronics, Inc. | 50,758 | 2,053,669 | ||||||
Plexus Corp.(1) | 22,655 | 2,123,453 | ||||||
Sanmina Corp.(1) | 447,019 | 21,689,362 | ||||||
ScanSource, Inc.(1) | 38 | 1,101 | ||||||
TTM Technologies, Inc.(1) | 542,038 | 8,526,258 | ||||||
113
| Avantis U.S. Small Cap Value ETF | ||||||||
| Shares | Value | |||||||
| Vishay Intertechnology, Inc. | 924,853 | $ | 18,191,858 | |||||
Vishay Precision Group, Inc.(1) | 11,413 | 391,580 | ||||||
| 58,657,716 | ||||||||
| Energy Equipment and Services — 2.5% | ||||||||
| Archrock, Inc. | 1,042,380 | 7,703,188 | ||||||
Bristow Group, Inc.(1) | 137,824 | 3,998,274 | ||||||
| ChampionX Corp. | 414,802 | 9,046,832 | ||||||
Diamond Offshore Drilling, Inc.(1) | 21,360 | 151,870 | ||||||
Dril-Quip, Inc.(1) | 125,756 | 2,782,980 | ||||||
Exterran Corp.(1) | 220,918 | 1,084,707 | ||||||
Helix Energy Solutions Group, Inc.(1) | 665,350 | 2,874,312 | ||||||
| Helmerich & Payne, Inc. | 275,090 | 11,760,098 | ||||||
Liberty Energy, Inc., Class A(1) | 207,377 | 3,110,655 | ||||||
Nabors Industries Ltd.(1) | 59,554 | 7,891,501 | ||||||
National Energy Services Reunited Corp.(1) | 65,500 | 459,810 | ||||||
Natural Gas Services Group, Inc.(1) | 765 | 8,514 | ||||||
Newpark Resources, Inc.(1) | 209,427 | 603,150 | ||||||
Oceaneering International, Inc.(1) | 573,866 | 5,078,714 | ||||||
Oil States International, Inc.(1) | 32,414 | 158,829 | ||||||
| Patterson-UTI Energy, Inc. | 41,716 | 621,568 | ||||||
ProPetro Holding Corp.(1) | 526,115 | 4,819,213 | ||||||
Select Energy Services, Inc., Class A(1) | 51 | 363 | ||||||
TechnipFMC PLC(1) | 716,593 | 5,861,731 | ||||||
TETRA Technologies Inc(1) | 189,529 | 754,325 | ||||||
Transocean Ltd.(1) | 2,248,119 | 8,138,191 | ||||||
US Silica Holdings, Inc.(1) | 500,468 | 7,021,566 | ||||||
Valaris Ltd.(1) | 25,909 | 1,320,841 | ||||||
Weatherford International PLC(1) | 181,716 | 5,113,488 | ||||||
| 90,364,720 | ||||||||
| Entertainment — 0.2% | ||||||||
Gaia, Inc.(1) | 771 | 2,544 | ||||||
Marcus Corp.(2) | 30,651 | 493,175 | ||||||
| World Wrestling Entertainment, Inc., Class A | 92,585 | 6,296,706 | ||||||
| 6,792,425 | ||||||||
| Food and Staples Retailing — 2.0% | ||||||||
| Ingles Markets, Inc., Class A | 135,049 | 11,820,839 | ||||||
| Natural Grocers by Vitamin Cottage, Inc. | 75,995 | 1,091,288 | ||||||
| PriceSmart, Inc. | 54,733 | 3,462,957 | ||||||
| SpartanNash Co. | 284,359 | 8,653,044 | ||||||
Sprouts Farmers Market, Inc.(1) | 676,706 | 19,556,803 | ||||||
United Natural Foods, Inc.(1) | 456,086 | 20,104,271 | ||||||
| Village Super Market, Inc., Class A | 56,177 | 1,234,771 | ||||||
| Weis Markets, Inc. | 114,344 | 8,885,672 | ||||||
| 74,809,645 | ||||||||
| Food Products — 0.4% | ||||||||
| Flowers Foods, Inc. | 160,980 | 4,394,754 | ||||||
| Fresh Del Monte Produce, Inc. | 135,884 | 3,715,069 | ||||||
Hostess Brands, Inc.(1) | 15,680 | 363,462 | ||||||
| John B Sanfilippo & Son, Inc. | 2,695 | 217,567 | ||||||
Pilgrim's Pride Corp.(1) | 118,018 | 3,359,973 | ||||||
| Seaboard Corp. | 9 | 34,761 | ||||||
114
| Avantis U.S. Small Cap Value ETF | ||||||||
| Shares | Value | |||||||
Seneca Foods Corp., Class A(1) | 28,192 | $ | 1,489,383 | |||||
| 13,574,969 | ||||||||
| Health Care Equipment and Supplies — 0.5% | ||||||||
Co-Diagnostics, Inc.(1)(2) | 153,564 | 519,046 | ||||||
FONAR Corp.(1) | 29,522 | 416,260 | ||||||
Meridian Bioscience, Inc.(1) | 23,255 | 757,881 | ||||||
QuidelOrtho Corp.(1) | 192,050 | 15,221,883 | ||||||
Retractable Technologies, Inc.(1) | 6,054 | 14,106 | ||||||
| 16,929,176 | ||||||||
| Health Care Providers and Services — 0.4% | ||||||||
| Ensign Group, Inc. | 3,508 | 299,232 | ||||||
Fulgent Genetics, Inc.(1) | 150,924 | 6,560,666 | ||||||
Innovage Holding Corp.(1)(2) | 338 | 1,241 | ||||||
| National Healthcare Corp. | 4,859 | 337,458 | ||||||
| Patterson Cos., Inc. | 199,057 | 5,551,700 | ||||||
| Premier, Inc., Class A | 10,388 | 366,073 | ||||||
| 13,116,370 | ||||||||
| Health Care Technology — 0.2% | ||||||||
Allscripts Healthcare Solutions, Inc.(1) | 531,391 | 9,033,647 | ||||||
| Hotels, Restaurants and Leisure — 0.8% | ||||||||
BJ's Restaurants, Inc.(1) | 92,034 | 2,308,213 | ||||||
| Bluegreen Vacations Holding Corp. | 1 | 21 | ||||||
| Canterbury Park Holding Corp. | 249 | 5,478 | ||||||
Carrols Restaurant Group, Inc.(1) | 115,369 | 253,812 | ||||||
Century Casinos, Inc.(1) | 73,211 | 539,565 | ||||||
Cheesecake Factory, Inc.(2) | 254,499 | 7,792,759 | ||||||
Chuy's Holdings, Inc.(1) | 95,580 | 2,134,301 | ||||||
| Cracker Barrel Old Country Store, Inc. | 98,757 | 10,659,831 | ||||||
Golden Entertainment, Inc.(1) | 348 | 13,315 | ||||||
Monarch Casino & Resort, Inc.(1) | 87,157 | 5,263,411 | ||||||
ONE Group Hospitality, Inc.(1) | 32,122 | 229,351 | ||||||
Playa Hotels & Resorts NV(1) | 151,259 | 992,259 | ||||||
| RCI Hospitality Holdings, Inc. | 1,677 | 109,357 | ||||||
Red Robin Gourmet Burgers, Inc.(1) | 38,724 | 287,719 | ||||||
Target Hospitality Corp.(1) | 7,277 | 96,711 | ||||||
| 30,686,103 | ||||||||
| Household Durables — 1.6% | ||||||||
| Bassett Furniture Industries, Inc. | 40,798 | 777,610 | ||||||
Beazer Homes USA, Inc.(1) | 24,624 | 350,646 | ||||||
| Ethan Allen Interiors, Inc. | 163,397 | 3,883,947 | ||||||
GoPro, Inc., Class A(1) | 821,120 | 5,000,621 | ||||||
Green Brick Partners, Inc.(1) | 38,849 | 946,362 | ||||||
| Hamilton Beach Brands Holding Co., Class A | 724 | 8,941 | ||||||
| Hooker Furnishings Corp. | 26,580 | 421,824 | ||||||
Hovnanian Enterprises, Inc., Class A(1) | 8,080 | 323,927 | ||||||
| La-Z-Boy, Inc. | 221,605 | 5,848,156 | ||||||
Legacy Housing Corp.(1) | 24,910 | 425,712 | ||||||
M/I Homes, Inc.(1) | 49,090 | 2,122,651 | ||||||
Skyline Champion Corp.(1) | 49,603 | 2,811,002 | ||||||
Taylor Morrison Home Corp.(1) | 879,696 | 22,089,166 | ||||||
Tri Pointe Homes, Inc.(1) | 673,496 | 11,671,686 | ||||||
115
| Avantis U.S. Small Cap Value ETF | ||||||||
| Shares | Value | |||||||
Universal Electronics, Inc.(1) | 76,009 | $ | 1,689,680 | |||||
VOXX International Corp.(1) | 20,501 | 197,630 | ||||||
| 58,569,561 | ||||||||
Household Products† | ||||||||
Central Garden & Pet Co.(1) | 336 | 13,413 | ||||||
| Independent Power and Renewable Electricity Producers — 0.1% | ||||||||
Ormat Technologies, Inc.(2) | 32,284 | 3,017,908 | ||||||
| Insurance — 4.2% | ||||||||
Ambac Financial Group, Inc.(1) | 5,425 | 81,863 | ||||||
| American Equity Investment Life Holding Co. | 25,761 | 978,918 | ||||||
| AMERISAFE, Inc. | 68,138 | 3,258,359 | ||||||
| Argo Group International Holdings Ltd. | 152,171 | 2,987,117 | ||||||
| Assured Guaranty Ltd. | 186,662 | 9,532,828 | ||||||
| Axis Capital Holdings Ltd. | 396,599 | 21,079,237 | ||||||
Brighthouse Financial, Inc.(1) | 383,722 | 18,245,981 | ||||||
| CNO Financial Group, Inc. | 564,552 | 10,393,402 | ||||||
| Crawford & Co., Class A | 39,553 | 240,482 | ||||||
| Donegal Group, Inc., Class A | 13,581 | 197,196 | ||||||
| Employers Holdings, Inc. | 125,652 | 4,920,532 | ||||||
Genworth Financial, Inc., Class A(1) | 2,379,005 | 10,039,401 | ||||||
Greenlight Capital Re Ltd., A Shares(1) | 15,315 | 120,836 | ||||||
| Hanover Insurance Group, Inc. | 87,514 | 11,323,437 | ||||||
| Horace Mann Educators Corp. | 141,201 | 5,050,760 | ||||||
| Investors Title Co. | 301 | 44,352 | ||||||
| National Western Life Group, Inc., Class A | 4,196 | 798,541 | ||||||
Oscar Health, Inc., Class A(1) | 66,467 | 440,676 | ||||||
| Primerica, Inc. | 9,664 | 1,224,912 | ||||||
| ProAssurance Corp. | 128,425 | 2,747,011 | ||||||
| Safety Insurance Group, Inc. | 58,505 | 5,268,375 | ||||||
| Selective Insurance Group, Inc. | 229,702 | 18,242,933 | ||||||
SiriusPoint Ltd.(1) | 315,046 | 1,408,256 | ||||||
| Stewart Information Services Corp. | 104,852 | 5,309,705 | ||||||
| United Fire Group, Inc. | 53,616 | 1,577,919 | ||||||
| Unum Group | 286,088 | 10,828,431 | ||||||
| White Mountains Insurance Group Ltd. | 5,437 | 7,448,690 | ||||||
| 153,790,150 | ||||||||
| Interactive Media and Services — 0.1% | ||||||||
Cars.com, Inc.(1) | 423,599 | 5,400,887 | ||||||
Internet and Direct Marketing Retail† | ||||||||
Duluth Holdings, Inc., Class B(1) | 34,347 | 304,658 | ||||||
Lands' End, Inc.(1) | 30,871 | 426,637 | ||||||
| PetMed Express, Inc. | 72 | 1,481 | ||||||
| 732,776 | ||||||||
| IT Services — 0.3% | ||||||||
| Cass Information Systems, Inc. | 32,063 | 1,176,071 | ||||||
International Money Express, Inc.(1) | 125,658 | 2,814,739 | ||||||
Kyndryl Holdings, Inc.(1) | 533,569 | 5,559,789 | ||||||
| 9,550,599 | ||||||||
| Leisure Products — 0.9% | ||||||||
| Acushnet Holdings Corp. | 43,547 | 2,075,015 | ||||||
American Outdoor Brands, Inc.(1) | 2,466 | 21,183 | ||||||
116
| Avantis U.S. Small Cap Value ETF | ||||||||
| Shares | Value | |||||||
JAKKS Pacific, Inc.(1) | 6,536 | $ | 146,406 | |||||
Malibu Boats, Inc., Class A(1) | 122,852 | 7,374,806 | ||||||
MasterCraft Boat Holdings, Inc.(1) | 67,184 | 1,618,463 | ||||||
Nautilus, Inc.(1) | 2,437 | 4,923 | ||||||
| Smith & Wesson Brands, Inc. | 343,931 | 4,574,282 | ||||||
| Sturm Ruger & Co., Inc. | 113,482 | 5,929,434 | ||||||
Vista Outdoor, Inc.(1) | 370,485 | 10,418,038 | ||||||
| 32,162,550 | ||||||||
| Life Sciences Tools and Services — 0.1% | ||||||||
AbCellera Biologics, Inc.(1)(2) | 306,359 | 3,271,914 | ||||||
| Machinery — 1.4% | ||||||||
| Albany International Corp., Class A | 134,142 | 11,829,983 | ||||||
Commercial Vehicle Group, Inc.(1) | 26,106 | 170,472 | ||||||
| Hurco Cos., Inc. | 471 | 11,431 | ||||||
| Kennametal, Inc. | 486,603 | 11,405,974 | ||||||
Mayville Engineering Co., Inc.(1) | 3,596 | 25,028 | ||||||
| Miller Industries, Inc. | 34,855 | 819,441 | ||||||
| Mueller Industries, Inc. | 400,251 | 25,283,856 | ||||||
| REV Group, Inc. | 168,540 | 1,941,581 | ||||||
Titan International, Inc.(1) | 99,517 | 1,396,224 | ||||||
| 52,883,990 | ||||||||
| Marine — 1.0% | ||||||||
| Costamare, Inc. | 405,908 | 4,578,642 | ||||||
| Eagle Bulk Shipping, Inc. | 97,729 | 4,245,348 | ||||||
| Genco Shipping & Trading Ltd. | 322,897 | 4,426,918 | ||||||
| Matson, Inc. | 303,807 | 22,378,423 | ||||||
| Pangaea Logistics Solutions Ltd. | 157,192 | 787,532 | ||||||
| Safe Bulkers, Inc. | 399,200 | 1,273,448 | ||||||
| 37,690,311 | ||||||||
| Media — 0.4% | ||||||||
Audacy, Inc.(1) | 712,449 | 392,987 | ||||||
Cumulus Media, Inc., Class A(1) | 70,460 | 656,687 | ||||||
| Entravision Communications Corp., Class A | 384,232 | 1,951,899 | ||||||
Gambling.com Group Ltd.(1) | 1,804 | 14,252 | ||||||
PubMatic, Inc., Class A(1) | 26,115 | 511,070 | ||||||
| Scholastic Corp. | 101,648 | 4,666,660 | ||||||
WideOpenWest, Inc.(1) | 308,253 | 5,486,903 | ||||||
| 13,680,458 | ||||||||
| Metals and Mining — 3.0% | ||||||||
| Alpha Metallurgical Resources, Inc. | 136,391 | 21,433,846 | ||||||
Arconic Corp.(1) | 114,625 | 2,889,696 | ||||||
| Carpenter Technology Corp. | 103,051 | 3,500,642 | ||||||
Century Aluminum Co.(1) | 26,335 | 203,306 | ||||||
Coeur Mining, Inc.(1) | 1,265,135 | 3,491,773 | ||||||
| Commercial Metals Co. | 605,227 | 24,517,746 | ||||||
| Gold Resource Corp. | 220,629 | 375,069 | ||||||
| Haynes International, Inc. | 346 | 13,733 | ||||||
| Hecla Mining Co. | 2,393,336 | 9,429,744 | ||||||
| Kaiser Aluminum Corp. | 83,560 | 5,996,265 | ||||||
| Olympic Steel, Inc. | 11,917 | 313,655 | ||||||
| Ramaco Resources, Inc. | 133,398 | 1,406,015 | ||||||
117
| Avantis U.S. Small Cap Value ETF | ||||||||
| Shares | Value | |||||||
| Ryerson Holding Corp. | 151,528 | $ | 4,318,548 | |||||
| Schnitzer Steel Industries, Inc., Class A | 165,792 | 5,477,768 | ||||||
| SunCoke Energy, Inc. | 707,063 | 4,659,545 | ||||||
TimkenSteel Corp.(1) | 382,903 | 5,873,732 | ||||||
| United States Steel Corp. | 5,533 | 126,540 | ||||||
| Warrior Met Coal, Inc. | 495,391 | 16,124,977 | ||||||
| Worthington Industries, Inc. | 31 | 1,581 | ||||||
| 110,154,181 | ||||||||
| Multiline Retail — 1.3% | ||||||||
Big Lots, Inc.(2) | 186,347 | 3,833,158 | ||||||
Dillard's, Inc., Class A(2) | 30,715 | 9,099,012 | ||||||
| Kohl's Corp. | 564,241 | 16,035,729 | ||||||
| Macy's, Inc. | 1,144,563 | 19,823,831 | ||||||
| 48,791,730 | ||||||||
| Oil, Gas and Consumable Fuels — 13.1% | ||||||||
| Antero Midstream Corp. | 1,723,480 | 17,355,444 | ||||||
Antero Resources Corp.(1) | 78 | 3,126 | ||||||
| Arch Resources, Inc. | 134,872 | 19,634,666 | ||||||
| Berry Corp. | 498,659 | 4,562,730 | ||||||
| Brigham Minerals, Inc., Class A | 193,705 | 5,762,724 | ||||||
| California Resources Corp. | 90,009 | 4,496,850 | ||||||
Callon Petroleum Co.(1) | 391,549 | 16,664,325 | ||||||
| Chord Energy Corp. | 170,893 | 24,189,904 | ||||||
| Civitas Resources, Inc. | 336,275 | 22,594,317 | ||||||
CNX Resources Corp.(1) | 270,876 | 4,786,379 | ||||||
Comstock Resources, Inc.(1) | 632,807 | 12,403,017 | ||||||
| CONSOL Energy, Inc. | 219,128 | 15,729,008 | ||||||
| Crescent Energy Co., Class A | 1,127 | 19,306 | ||||||
| CVR Energy, Inc. | 194,371 | 6,348,157 | ||||||
| Delek US Holdings, Inc. | 112,649 | 3,182,334 | ||||||
Denbury, Inc.(1) | 203,245 | 18,074,578 | ||||||
| DHT Holdings, Inc. | 599,889 | 4,685,133 | ||||||
| Dorian LPG Ltd. | 203,773 | 2,964,897 | ||||||
Earthstone Energy, Inc., Class A(1) | 329,263 | 5,004,798 | ||||||
EnLink Midstream LLC(1) | 1,254,853 | 12,749,307 | ||||||
| Epsilon Energy Ltd. | 29,172 | 210,038 | ||||||
| Equitrans Midstream Corp. | 2,425,914 | 22,488,223 | ||||||
| Evolution Petroleum Corp. | 121,946 | 846,305 | ||||||
Hallador Energy Co.(1)(2) | 72,257 | 471,116 | ||||||
| HF Sinclair Corp. | 55,926 | 2,943,385 | ||||||
| HighPeak Energy, Inc. | 15,668 | 396,714 | ||||||
| International Seaways, Inc. | 4,965 | 146,616 | ||||||
| Kimbell Royalty Partners LP | 168,730 | 2,993,270 | ||||||
Kosmos Energy Ltd.(1) | 3,213,163 | 22,717,062 | ||||||
Laredo Petroleum, Inc.(1) | 106,209 | 8,242,881 | ||||||
| Magnolia Oil & Gas Corp., Class A | 570,851 | 13,626,213 | ||||||
| Matador Resources Co. | 404,770 | 24,124,292 | ||||||
| Murphy Oil Corp. | 652,708 | 25,436,031 | ||||||
| NACCO Industries, Inc., Class A | 25,822 | 1,161,215 | ||||||
Overseas Shipholding Group, Inc., Class A(1) | 263,793 | 820,396 | ||||||
PBF Energy, Inc., Class A(1) | 663,712 | 22,672,402 | ||||||
118
| Avantis U.S. Small Cap Value ETF | ||||||||
| Shares | Value | |||||||
| PDC Energy, Inc. | 316,746 | $ | 21,510,221 | |||||
Peabody Energy Corp.(1) | 407,426 | 10,047,125 | ||||||
Permian Resources Corp.(1) | 1,349,872 | 11,109,447 | ||||||
Plains GP Holdings LP, Class A(1) | 608,517 | 7,290,034 | ||||||
PrimeEnergy Resources Corp.(1) | 366 | 34,389 | ||||||
Range Resources Corp.(1) | 494,789 | 16,258,767 | ||||||
| Ranger Oil Corp., Class A | 146,262 | 5,702,755 | ||||||
REX American Resources Corp.(1) | 37,337 | 1,131,311 | ||||||
| Riley Exploration Permian, Inc. | 6,010 | 151,091 | ||||||
Ring Energy, Inc.(1) | 491,383 | 1,592,081 | ||||||
SandRidge Energy, Inc.(1) | 240,387 | 5,043,319 | ||||||
| SFL Corp. Ltd. | 775,128 | 8,293,870 | ||||||
SilverBow Resources, Inc.(1)(2) | 89,291 | 3,550,210 | ||||||
| Sitio Royalties Corp. | 11,246 | 286,098 | ||||||
| SM Energy Co. | 564,988 | 24,899,021 | ||||||
Talos Energy, Inc.(1) | 499,100 | 10,346,343 | ||||||
Teekay Corp.(1) | 162,857 | 568,371 | ||||||
| VAALCO Energy, Inc. | 251,307 | 1,259,048 | ||||||
| 479,580,660 | ||||||||
| Paper and Forest Products — 1.0% | ||||||||
Clearwater Paper Corp.(1) | 125,619 | 5,343,833 | ||||||
| Louisiana-Pacific Corp. | 462,344 | 25,072,915 | ||||||
| Mercer International, Inc. | 333,064 | 5,402,298 | ||||||
| Sylvamo Corp. | 43,196 | 1,919,630 | ||||||
| 37,738,676 | ||||||||
| Personal Products — 0.5% | ||||||||
| Inter Parfums, Inc. | 42 | 3,298 | ||||||
| Lifevantage Corp. | 58,539 | 232,985 | ||||||
Nature's Sunshine Products, Inc.(1) | 16,674 | 161,738 | ||||||
| Nu Skin Enterprises, Inc., Class A | 313,205 | 12,822,613 | ||||||
USANA Health Sciences, Inc.(1) | 64,171 | 4,140,313 | ||||||
| 17,360,947 | ||||||||
| Pharmaceuticals — 1.0% | ||||||||
Amphastar Pharmaceuticals, Inc.(1) | 30,915 | 915,084 | ||||||
Arvinas, Inc.(1) | 243,254 | 10,299,374 | ||||||
Assertio Holdings, Inc.(1)(2) | 207,719 | 529,683 | ||||||
Collegium Pharmaceutical, Inc.(1) | 45,646 | 802,457 | ||||||
Corcept Therapeutics, Inc.(1) | 16,062 | 414,721 | ||||||
Innoviva, Inc.(1) | 464,555 | 6,113,544 | ||||||
Prestige Consumer Healthcare, Inc.(1) | 231,640 | 11,716,351 | ||||||
ProPhase Labs, Inc.(2) | 43,917 | 531,835 | ||||||
| SIGA Technologies, Inc. | 347,695 | 5,243,241 | ||||||
Supernus Pharmaceuticals, Inc.(1) | 10,884 | 372,559 | ||||||
| 36,938,849 | ||||||||
| Professional Services — 0.9% | ||||||||
| Barrett Business Services, Inc. | 7,072 | 570,286 | ||||||
| BGSF, Inc. | 200 | 2,420 | ||||||
CBIZ, Inc.(1) | 84,195 | 3,675,954 | ||||||
| CRA International, Inc. | 7,747 | 708,153 | ||||||
| Heidrick & Struggles International, Inc. | 113,381 | 3,226,823 | ||||||
| Kelly Services, Inc., Class A | 77,646 | 1,250,877 | ||||||
119
| Avantis U.S. Small Cap Value ETF | ||||||||
| Shares | Value | |||||||
| Kforce, Inc. | 97,161 | $ | 5,316,650 | |||||
| Korn Ferry | 232,520 | 14,165,118 | ||||||
RCM Technologies, Inc.(1) | 2,109 | 36,823 | ||||||
TrueBlue, Inc.(1) | 162,081 | 3,329,144 | ||||||
| 32,282,248 | ||||||||
| Real Estate Management and Development — 0.6% | ||||||||
| Douglas Elliman, Inc. | 268,594 | 1,238,218 | ||||||
Five Point Holdings LLC, Class A(1) | 19,374 | 70,715 | ||||||
Forestar Group, Inc.(1) | 83,521 | 1,039,001 | ||||||
Howard Hughes Corp.(1) | 38,852 | 2,472,153 | ||||||
| Kennedy-Wilson Holdings, Inc. | 499,627 | 8,773,450 | ||||||
| Marcus & Millichap, Inc. | 181,991 | 6,802,824 | ||||||
| RE/MAX Holdings, Inc., Class A | 128,260 | 2,919,198 | ||||||
| 23,315,559 | ||||||||
| Road and Rail — 2.7% | ||||||||
| ArcBest Corp. | 187,865 | 15,128,768 | ||||||
| Covenant Logistics Group, Inc. | 67,613 | 1,901,278 | ||||||
| Heartland Express, Inc. | 277,729 | 4,207,594 | ||||||
| Landstar System, Inc. | 3,335 | 489,011 | ||||||
| Marten Transport Ltd. | 446,219 | 8,839,598 | ||||||
PAM Transportation Services, Inc.(1) | 23,304 | 692,362 | ||||||
| Ryder System, Inc. | 395,667 | 30,244,786 | ||||||
Saia, Inc.(1) | 79,351 | 16,412,167 | ||||||
| Schneider National, Inc., Class B | 270,225 | 6,177,344 | ||||||
| Universal Logistics Holdings, Inc. | 20,860 | 761,599 | ||||||
US Xpress Enterprises, Inc., Class A(1) | 109,942 | 270,457 | ||||||
USA Truck, Inc.(1) | 11,196 | 351,107 | ||||||
| Werner Enterprises, Inc. | 358,685 | 14,272,076 | ||||||
| 99,748,147 | ||||||||
| Semiconductors and Semiconductor Equipment — 1.9% | ||||||||
Alpha & Omega Semiconductor Ltd.(1) | 162,350 | 6,276,451 | ||||||
| Amkor Technology, Inc. | 586,819 | 11,812,666 | ||||||
Axcelis Technologies, Inc.(1) | 63,167 | 4,228,399 | ||||||
Cirrus Logic, Inc.(1) | 86,928 | 6,666,508 | ||||||
Diodes, Inc.(1) | 223,618 | 15,914,893 | ||||||
Everspin Technologies, Inc.(1) | 2,705 | 19,747 | ||||||
| Kulicke & Soffa Industries, Inc. | 395,387 | 16,622,070 | ||||||
Photronics, Inc.(1) | 481,097 | 8,082,430 | ||||||
Ultra Clean Holdings, Inc.(1) | 53,635 | 1,569,896 | ||||||
| 71,193,060 | ||||||||
| Software — 0.2% | ||||||||
Cleanspark, Inc.(1)(2) | 28,682 | 122,759 | ||||||
CoreCard Corp.(1) | 1,461 | 35,429 | ||||||
Greenidge Generation Holdings, Inc.(1)(2) | 16,917 | 41,109 | ||||||
| InterDigital, Inc. | 154,370 | 7,743,199 | ||||||
| 7,942,496 | ||||||||
| Specialty Retail — 7.4% | ||||||||
| Aaron's Co., Inc. | 228,561 | 2,719,876 | ||||||
Abercrombie & Fitch Co., Class A(1) | 378,497 | 5,446,572 | ||||||
| Academy Sports & Outdoors, Inc. | 530,387 | 22,849,072 | ||||||
| American Eagle Outfitters, Inc. | 850,021 | 9,571,236 | ||||||
120
| Avantis U.S. Small Cap Value ETF | ||||||||
| Shares | Value | |||||||
Asbury Automotive Group, Inc.(1) | 39,249 | $ | 6,848,166 | |||||
AutoNation, Inc.(1) | 183,637 | 22,881,170 | ||||||
Barnes & Noble Education, Inc.(1) | 21,541 | 55,145 | ||||||
Bed Bath & Beyond, Inc.(1)(2) | 249,656 | 2,379,222 | ||||||
| Big 5 Sporting Goods Corp. | 170,771 | 2,090,237 | ||||||
| Buckle, Inc. | 201,464 | 6,503,258 | ||||||
| Build-A-Bear Workshop, Inc. | 70,029 | 1,072,844 | ||||||
| Caleres, Inc. | 298,249 | 7,611,314 | ||||||
| Cato Corp., Class A | 70,239 | 759,284 | ||||||
Chico's FAS, Inc.(1) | 796,757 | 4,525,580 | ||||||
Children's Place, Inc.(1) | 60,160 | 2,537,549 | ||||||
Citi Trends, Inc.(1) | 62,482 | 1,262,136 | ||||||
Conn's, Inc.(1) | 83,602 | 803,415 | ||||||
Container Store Group, Inc.(1) | 146,521 | 993,412 | ||||||
| Designer Brands, Inc., Class A | 437,169 | 7,458,103 | ||||||
Destination XL Group, Inc.(1) | 138,650 | 763,962 | ||||||
Dick's Sporting Goods, Inc.(2) | 438 | 46,590 | ||||||
| Foot Locker, Inc. | 558,848 | 20,587,960 | ||||||
| Gap, Inc. | 1,599,734 | 14,621,569 | ||||||
Genesco, Inc.(1) | 106,531 | 6,027,524 | ||||||
| Group 1 Automotive, Inc. | 75,196 | 13,429,254 | ||||||
| Guess?, Inc. | 241,903 | 4,226,045 | ||||||
| Haverty Furniture Cos., Inc. | 91,597 | 2,456,632 | ||||||
| Hibbett, Inc. | 102,642 | 6,014,821 | ||||||
LL Flooring Holdings, Inc.(1) | 42,389 | 345,046 | ||||||
MarineMax, Inc.(1) | 156,202 | 5,676,381 | ||||||
| Murphy USA, Inc. | 100,033 | 29,026,576 | ||||||
ODP Corp.(1) | 239,554 | 8,564,055 | ||||||
| Rent-A-Center, Inc. | 174,822 | 4,517,400 | ||||||
| Shoe Carnival, Inc. | 91,622 | 2,179,687 | ||||||
| Signet Jewelers Ltd. | 308,737 | 20,182,138 | ||||||
| Sonic Automotive, Inc., Class A | 132,393 | 7,041,984 | ||||||
| Tilly's, Inc., Class A | 123,241 | 924,308 | ||||||
TravelCenters of America, Inc.(1) | 92,084 | 4,979,903 | ||||||
Urban Outfitters, Inc.(1) | 403,217 | 8,116,758 | ||||||
Zumiez, Inc.(1) | 129,449 | 3,360,496 | ||||||
| 271,456,680 | ||||||||
Technology Hardware, Storage and Peripherals† | ||||||||
Immersion Corp.(1) | 100,470 | 598,801 | ||||||
| Textiles, Apparel and Luxury Goods — 1.6% | ||||||||
| Carter's, Inc. | 177,786 | 13,129,496 | ||||||
| Culp, Inc. | 24,583 | 113,082 | ||||||
Delta Apparel, Inc.(1) | 696 | 13,071 | ||||||
G-III Apparel Group Ltd.(1) | 274,520 | 5,784,136 | ||||||
Lakeland Industries, Inc.(1) | 16,300 | 220,050 | ||||||
| Movado Group, Inc. | 98,257 | 3,133,416 | ||||||
| Oxford Industries, Inc. | 117,026 | 12,490,185 | ||||||
| PVH Corp. | 277,146 | 15,589,462 | ||||||
| Superior Group of Cos., Inc. | 278 | 3,089 | ||||||
Under Armour, Inc., Class A(1) | 397,774 | 3,349,257 | ||||||
Under Armour, Inc., Class C(1) | 356,146 | 2,703,148 | ||||||
121
| Avantis U.S. Small Cap Value ETF | ||||||||
| Shares | Value | |||||||
Unifi, Inc.(1) | 19,035 | $ | 216,238 | |||||
Vera Bradley, Inc.(1) | 45,375 | 179,685 | ||||||
| 56,924,315 | ||||||||
| Thrifts and Mortgage Finance — 5.0% | ||||||||
Axos Financial, Inc.(1) | 257,077 | 10,740,677 | ||||||
Bridgewater Bancshares, Inc.(1) | 116,814 | 2,006,865 | ||||||
| Enact Holdings, Inc. | 55,201 | 1,402,105 | ||||||
| Essent Group Ltd. | 491,545 | 19,656,885 | ||||||
| Federal Agricultural Mortgage Corp., Class C | 56,158 | 6,134,700 | ||||||
| Flagstar Bancorp, Inc. | 287,346 | 11,071,441 | ||||||
| FS Bancorp, Inc. | 45,287 | 1,345,477 | ||||||
| Greene County Bancorp, Inc. | 1,987 | 105,708 | ||||||
| Hingham Institution For Savings | 2,025 | 601,223 | ||||||
| Home Bancorp, Inc. | 33,249 | 1,298,041 | ||||||
| Kearny Financial Corp. | 107,403 | 1,220,098 | ||||||
loanDepot, Inc., Class A(2) | 2,306 | 3,805 | ||||||
| Luther Burbank Corp. | 74,720 | 979,579 | ||||||
| Merchants Bancorp | 119,067 | 3,211,237 | ||||||
| MGIC Investment Corp. | 1,566,998 | 22,392,401 | ||||||
Mr. Cooper Group, Inc.(1) | 393,954 | 16,664,254 | ||||||
New York Community Bancorp, Inc.(2) | 1,303,916 | 12,765,338 | ||||||
NMI Holdings, Inc., Class A(1) | 425,709 | 8,739,806 | ||||||
| Northfield Bancorp, Inc. | 112,484 | 1,658,014 | ||||||
Ocwen Financial Corp.(1) | 8,097 | 211,980 | ||||||
| OP Bancorp | 69,617 | 841,670 | ||||||
| PennyMac Financial Services, Inc. | 171,290 | 9,098,925 | ||||||
Ponce Financial Group, Inc.(1)(2) | 879 | 8,271 | ||||||
| Provident Financial Services, Inc. | 261,441 | 6,073,274 | ||||||
| Radian Group, Inc. | 820,097 | 17,312,248 | ||||||
| Southern Missouri Bancorp, Inc. | 38,744 | 2,042,971 | ||||||
Sterling Bancorp, Inc.(1) | 27,983 | 164,820 | ||||||
| Territorial Bancorp, Inc. | 37,690 | 784,329 | ||||||
| TrustCo Bank Corp. NY | 99,271 | 3,309,695 | ||||||
| Walker & Dunlop, Inc. | 109,300 | 10,980,278 | ||||||
| Waterstone Financial, Inc. | 119,662 | 2,068,956 | ||||||
| WSFS Financial Corp. | 157,261 | 7,603,569 | ||||||
| 182,498,640 | ||||||||
| Trading Companies and Distributors — 5.0% | ||||||||
| Air Lease Corp. | 736,486 | 26,778,631 | ||||||
| Alta Equipment Group, Inc. | 8,370 | 98,515 | ||||||
BlueLinx Holdings, Inc.(1) | 76,707 | 5,377,161 | ||||||
| Boise Cascade Co. | 307,686 | 19,178,068 | ||||||
| GATX Corp. | 261,343 | 25,248,347 | ||||||
| Global Industrial Co. | 1,651 | 49,662 | ||||||
| H&E Equipment Services, Inc. | 203,773 | 6,451,453 | ||||||
| Herc Holdings, Inc. | 157,045 | 17,672,274 | ||||||
| McGrath RentCorp | 167,296 | 14,139,858 | ||||||
NOW, Inc.(1) | 319,300 | 3,869,916 | ||||||
| Rush Enterprises, Inc., Class A | 161,436 | 7,597,178 | ||||||
| Rush Enterprises, Inc., Class B | 17,798 | 901,291 | ||||||
| Textainer Group Holdings Ltd. | 296,120 | 8,996,125 | ||||||
122
| Avantis U.S. Small Cap Value ETF | ||||||||
| Shares | Value | |||||||
Titan Machinery, Inc.(1) | 136,727 | $ | 4,208,457 | |||||
| Triton International Ltd. | 532,259 | 31,717,314 | ||||||
Veritiv Corp.(1) | 107,619 | 12,827,109 | ||||||
| 185,111,359 | ||||||||
| Wireless Telecommunication Services — 0.4% | ||||||||
| Telephone and Data Systems, Inc. | 712,031 | 11,584,745 | ||||||
United States Cellular Corp.(1) | 100,766 | 2,880,900 | ||||||
| 14,465,645 | ||||||||
TOTAL COMMON STOCKS (Cost $3,776,117,290) | 3,669,271,055 | |||||||
| SHORT-TERM INVESTMENTS — 0.7% | ||||||||
| Money Market Funds — 0.7% | ||||||||
| State Street Institutional U.S. Government Money Market Fund, Premier Class | 3,512,891 | 3,512,891 | ||||||
State Street Navigator Securities Lending Government Money Market Portfolio(3) | 22,491,144 | 22,491,144 | ||||||
TOTAL SHORT-TERM INVESTMENTS (Cost $26,004,035) | 26,004,035 | |||||||
TOTAL INVESTMENT SECURITIES — 100.5% (Cost $3,802,121,325) | 3,695,275,090 | |||||||
| OTHER ASSETS AND LIABILITIES — (0.5)% | (19,984,760) | |||||||
| TOTAL NET ASSETS — 100.0% | $ | 3,675,290,330 | ||||||
| NOTES TO SCHEDULE OF INVESTMENTS | ||||||||
†Category is less than 0.05% of total net assets.
(1)Non-income producing.
(2)Security, or a portion thereof, is on loan. At the period end, the aggregate value of securities on loan was $24,916,226. The amount of securities on loan indicated may not correspond with the securities on loan identified because securities with pending sales are in the process of recall from the brokers.
(3)Investment of cash collateral from securities on loan. At the period end, the aggregate value of the collateral held by the fund was $25,657,289, which includes securities collateral of $3,166,145.
See Notes to Financial Statements.
123
| Statements of Assets and Liabilities | ||
| AUGUST 31, 2022 | ||||||||
| Avantis Real Estate ETF | Avantis U.S. Equity ETF | |||||||
| Assets | ||||||||
| Investment securities, at value (cost of $152,712,326 and $2,500,458,397, respectively) — including $279,377 and $10,593,875, respectively of securities on loan | $ | 143,545,900 | $ | 2,520,096,900 | ||||
| Investment made with cash collateral received for securities on loan, at value (cost of $155,811 and $7,532,352, respectively) | 155,811 | 7,532,352 | ||||||
| Total investment securities, at value (cost of $152,868,137 and $2,507,990,749, respectively) | 143,701,711 | 2,527,629,252 | ||||||
| Foreign currency holdings, at value (cost of $106,492 and $—, respectively) | 106,447 | — | ||||||
| Receivable for investments sold | 23,868 | — | ||||||
| Receivable for capital shares sold | 6,877 | 4,144,293 | ||||||
| Dividends and interest receivable | 303,996 | 4,444,626 | ||||||
| Securities lending receivable | 450 | 14,017 | ||||||
| 144,143,349 | 2,536,232,188 | |||||||
| Liabilities | ||||||||
| Disbursements in excess of demand deposit cash | — | 1,521 | ||||||
| Payable for collateral received for securities on loan | 155,811 | 7,532,352 | ||||||
| Payable for investments purchased | — | 5,632,911 | ||||||
| Accrued management fees | 21,449 | 328,288 | ||||||
| 177,260 | 13,495,072 | |||||||
| Net Assets | $ | 143,966,089 | $ | 2,522,737,116 | ||||
| Shares outstanding (unlimited number of shares authorized) | 3,200,000 | 36,660,000 | ||||||
| Net Asset Value Per Share | $ | 44.99 | $ | 68.81 | ||||
| Net Assets Consist of: | ||||||||
| Capital paid in | $ | 152,409,130 | $ | 2,505,319,288 | ||||
| Distributable earnings | (8,443,041) | 17,417,828 | ||||||
| $ | 143,966,089 | $ | 2,522,737,116 | |||||
See Notes to Financial Statements.
124
| AUGUST 31, 2022 | ||||||||
| Avantis U.S. Large Cap Value ETF | Avantis U.S. Small Cap Equity ETF | |||||||
| Assets | ||||||||
| Investment securities, at value (cost of $506,912,610 and $26,088,623, respectively) — including $1,714,564 and $—, respectively of securities on loan | $ | 493,349,633 | $ | 26,296,578 | ||||
| Investment made with cash collateral received for securities on loan, at value (cost of $1,262,664 and $—, respectively) | 1,262,664 | — | ||||||
| Total investment securities, at value (cost of $508,175,274 and $26,088,623, respectively) | 494,612,297 | 26,296,578 | ||||||
| Receivable for capital shares sold | 10,773,878 | — | ||||||
| Dividends and interest receivable | 1,319,354 | 24,292 | ||||||
| Securities lending receivable | 1,095 | — | ||||||
| 506,706,624 | 26,320,870 | |||||||
| Liabilities | ||||||||
| Payable for collateral received for securities on loan | 1,262,664 | — | ||||||
| Payable for investments purchased | 10,428,558 | — | ||||||
| Accrued management fees | 60,797 | 5,874 | ||||||
| 11,752,019 | 5,874 | |||||||
| Net Assets | $ | 494,954,605 | $ | 26,314,996 | ||||
| Shares outstanding (unlimited number of shares authorized) | 10,120,000 | 600,000 | ||||||
| Net Asset Value Per Share | $ | 48.91 | $ | 43.86 | ||||
| Net Assets Consist of: | ||||||||
| Capital paid in | $ | 514,696,003 | $ | 26,179,605 | ||||
| Distributable earnings | (19,741,398) | 135,391 | ||||||
| $ | 494,954,605 | $ | 26,314,996 | |||||
See Notes to Financial Statements.
125
| AUGUST 31, 2022 | |||||
| Avantis U.S. Small Cap Value ETF | |||||
| Assets | |||||
| Investment securities, at value (cost of $3,779,630,181) — including $24,916,226 of securities on loan | $ | 3,672,783,946 | |||
| Investment made with cash collateral received for securities on loan, at value (cost of $22,491,144) | 22,491,144 | ||||
| Total investment securities, at value (cost of $3,802,121,325) | 3,695,275,090 | ||||
| Cash | 129,288 | ||||
| Receivable for capital shares sold | 44,423,340 | ||||
| Dividends and interest receivable | 4,804,936 | ||||
| Securities lending receivable | 26,121 | ||||
| 3,744,658,775 | |||||
| Liabilities | |||||
| Payable for collateral received for securities on loan | 22,491,144 | ||||
| Payable for investments purchased | 46,090,358 | ||||
| Accrued management fees | 786,943 | ||||
| 69,368,445 | |||||
| Net Assets | $ | 3,675,290,330 | |||
| Shares outstanding (unlimited number of shares authorized) | 49,640,000 | ||||
| Net Asset Value Per Share | $ | 74.04 | |||
| Net Assets Consist of: | |||||
| Capital paid in | $ | 3,864,704,778 | |||
| Distributable earnings | (189,414,448) | ||||
| $ | 3,675,290,330 | ||||
See Notes to Financial Statements.
126
| Statements of Operations | ||
| YEAR ENDED AUGUST 31, 2022 (EXCEPT AS NOTED) | ||||||||
Avantis Real Estate ETF(1) | Avantis U.S. Equity ETF | |||||||
| Investment Income (Loss) | ||||||||
| Income: | ||||||||
| Dividends (net of foreign taxes withheld of $126,903 and $7,950, respectively) | $ | 1,764,383 | $ | 32,368,718 | ||||
| Securities lending, net | 766 | 67,117 | ||||||
| Interest | 2,822 | 9,586 | ||||||
| 1,767,971 | 32,445,421 | |||||||
| Expenses: | ||||||||
| Management fees | 89,911 | 2,912,073 | ||||||
| Net investment income (loss) | 1,678,060 | 29,533,348 | ||||||
| Realized and Unrealized Gain (Loss) | ||||||||
| Net realized gain (loss) on: | ||||||||
| Investment transactions | (310,340) | 67,299,634 | ||||||
| Foreign currency translation transactions | (1,820) | (30) | ||||||
| (312,160) | 67,299,604 | |||||||
| Change in net unrealized appreciation (depreciation) on: | ||||||||
| Investments | (9,166,426) | (294,173,080) | ||||||
| Translation of assets and liabilities in foreign currencies | (5,055) | (26) | ||||||
| (9,171,481) | (294,173,106) | |||||||
| Net realized and unrealized gain (loss) | (9,483,641) | (226,873,502) | ||||||
| Net Increase (Decrease) in Net Assets Resulting from Operations | $ | (7,805,581) | $ | (197,340,154) | ||||
(1)September 28, 2021 (fund inception) through August 31, 2022.
See Notes to Financial Statements.
127
| PERIOD ENDED AUGUST 31, 2022 | ||||||||
Avantis U.S. Large Cap Value ETF(1) | Avantis U.S. Small Cap Equity ETF(2) | |||||||
| Investment Income (Loss) | ||||||||
| Income: | ||||||||
| Dividends (net of foreign taxes withheld of $517 and $130, respectively) | $ | 4,766,113 | $ | 120,563 | ||||
| Securities lending, net | 2,512 | — | ||||||
| Interest | 1,690 | 148 | ||||||
| 4,770,315 | 120,711 | |||||||
| Expenses: | ||||||||
| Management fees | 276,288 | 17,281 | ||||||
| Other expenses | 516 | — | ||||||
| 276,804 | 17,281 | |||||||
| Net investment income (loss) | 4,493,511 | 103,430 | ||||||
| Realized and Unrealized Gain (Loss) | ||||||||
| Net realized gain (loss) on investment transactions | (6,821,509) | (143,600) | ||||||
| Change in net unrealized appreciation (depreciation) on investments | (13,562,977) | 207,955 | ||||||
| Net realized and unrealized gain (loss) | (20,384,486) | 64,355 | ||||||
| Net Increase (Decrease) in Net Assets Resulting from Operations | $ | (15,890,975) | $ | 167,785 | ||||
(1)September 21, 2021 (fund inception) through August 31, 2022.
(2)January 11, 2022 (fund inception) through August 31, 2022.
See Notes to Financial Statements.
128
| YEAR ENDED AUGUST 31, 2022 | |||||
| Avantis U.S. Small Cap Value ETF | |||||
| Investment Income (Loss) | |||||
| Income: | |||||
| Dividends (net of foreign taxes withheld of $67,030) | $ | 53,041,491 | |||
| Securities lending, net | 77,048 | ||||
| Interest | 25,771 | ||||
| 53,144,310 | |||||
| Expenses: | |||||
| Management fees | 6,593,208 | ||||
| Net investment income (loss) | 46,551,102 | ||||
| Realized and Unrealized Gain (Loss) | |||||
| Net realized gain (loss) on investment transactions | 235,537,603 | ||||
| Change in net unrealized appreciation (depreciation) on investments | (376,259,387) | ||||
| Net realized and unrealized gain (loss) | (140,721,784) | ||||
| Net Increase (Decrease) in Net Assets Resulting from Operations | $ | (94,170,682) | |||
See Notes to Financial Statements.
129
| Statements of Changes in Net Assets | ||
| YEARS ENDED AUGUST 31, 2022 AND AUGUST 31, 2021 (EXCEPT AS NOTED) | |||||||||||
| Avantis Real Estate ETF | Avantis U.S. Equity ETF | ||||||||||
| Increase (Decrease) in Net Assets | August 31, 2022(1) | August 31, 2022 | August 31, 2021 | ||||||||
| Operations | |||||||||||
| Net investment income (loss) | $ | 1,678,060 | $ | 29,533,348 | $ | 11,940,979 | |||||
| Net realized gain (loss) | (312,160) | 67,299,604 | 7,906,935 | ||||||||
| Change in net unrealized appreciation (depreciation) | (9,171,481) | (294,173,106) | 243,650,591 | ||||||||
| Net increase (decrease) in net assets resulting from operations | (7,805,581) | (197,340,154) | 263,498,505 | ||||||||
| Distributions to Shareholders | |||||||||||
| From earnings | (637,460) | (24,641,184) | (9,363,483) | ||||||||
| Capital Share Transactions | |||||||||||
| Proceeds from shares sold | 152,347,682 | 1,439,756,772 | 819,649,560 | ||||||||
| Payments for shares redeemed | — | (181,495,905) | (23,425,992) | ||||||||
| Other capital | 61,448 | — | — | ||||||||
| Net increase (decrease) in net assets from capital share transactions | 152,409,130 | 1,258,260,867 | 796,223,568 | ||||||||
| Net increase (decrease) in net assets | 143,966,089 | 1,036,279,529 | 1,050,358,590 | ||||||||
| Net Assets | |||||||||||
| Beginning of period | — | 1,486,457,587 | 436,098,997 | ||||||||
| End of period | $ | 143,966,089 | $ | 2,522,737,116 | $ | 1,486,457,587 | |||||
| Transactions in Shares of the Funds | |||||||||||
| Sold | 3,200,000 | 19,830,000 | 11,940,000 | ||||||||
| Redeemed | — | (2,520,000) | (360,000) | ||||||||
| Net increase (decrease) in shares of the funds | 3,200,000 | 17,310,000 | 11,580,000 | ||||||||
(1)September 28, 2021 (fund inception) through August 31, 2022.
See Notes to Financial Statements.
130
| PERIOD ENDED AUGUST 31, 2022 | ||||||||
| Avantis U.S. Large Cap Value ETF | Avantis U.S. Small Cap Equity ETF | |||||||
| Increase (Decrease) in Net Assets | August 31, 2022(1) | August 31, 2022(2) | ||||||
| Operations | ||||||||
| Net investment income (loss) | $ | 4,493,511 | $ | 103,430 | ||||
| Net realized gain (loss) | (6,821,509) | (143,600) | ||||||
| Change in net unrealized appreciation (depreciation) | (13,562,977) | 207,955 | ||||||
| Net increase (decrease) in net assets resulting from operations | (15,890,975) | 167,785 | ||||||
| Distributions to Shareholders | ||||||||
| From earnings | (2,368,608) | (32,394) | ||||||
| Capital Share Transactions | ||||||||
| Proceeds from shares sold | 522,133,836 | 26,179,605 | ||||||
| Payments for shares redeemed | (8,919,648) | — | ||||||
| Net increase (decrease) in net assets from capital share transactions | 513,214,188 | 26,179,605 | ||||||
| Net increase (decrease) in net assets | 494,954,605 | 26,314,996 | ||||||
| Net Assets | ||||||||
| End of period | $ | 494,954,605 | $ | 26,314,996 | ||||
| Transactions in Shares of the Funds | ||||||||
| Sold | 10,300,000 | 600,000 | ||||||
| Redeemed | (180,000) | — | ||||||
| Net increase (decrease) in shares of the funds | 10,120,000 | 600,000 | ||||||
(1)September 21, 2021 (fund inception) through August 31, 2022.
(2)January 11, 2022 (fund inception) through August 31, 2022.
See Notes to Financial Statements.
131
| YEARS ENDED AUGUST 31, 2022 AND AUGUST 31, 2021 | ||||||||
| Avantis U.S. Small Cap Value ETF | ||||||||
| Increase (Decrease) in Net Assets | August 31, 2022 | August 31, 2021 | ||||||
| Operations | ||||||||
| Net investment income (loss) | $ | 46,551,102 | $ | 14,994,902 | ||||
| Net realized gain (loss) | 235,537,603 | 88,689,568 | ||||||
| Change in net unrealized appreciation (depreciation) | (376,259,387) | 222,948,763 | ||||||
| Net increase (decrease) in net assets resulting from operations | (94,170,682) | 326,633,233 | ||||||
| Distributions to Shareholders | ||||||||
| From earnings | (36,861,258) | (10,315,324) | ||||||
| Capital Share Transactions | ||||||||
| Proceeds from shares sold | 3,146,383,598 | 1,112,455,368 | ||||||
| Payments for shares redeemed | (910,204,464) | (213,928,626) | ||||||
| Net increase (decrease) in net assets from capital share transactions | 2,236,179,134 | 898,526,742 | ||||||
| Net increase (decrease) in net assets | 2,105,147,194 | 1,214,844,651 | ||||||
| Net Assets | ||||||||
| Beginning of period | 1,570,143,136 | 355,298,485 | ||||||
| End of period | $ | 3,675,290,330 | $ | 1,570,143,136 | ||||
| Transactions in Shares of the Funds | ||||||||
| Sold | 40,460,000 | 16,280,000 | ||||||
| Redeemed | (11,620,000) | (3,380,000) | ||||||
| Net increase (decrease) in shares of the funds | 28,840,000 | 12,900,000 | ||||||
See Notes to Financial Statements.
132
| Notes to Financial Statements | ||
AUGUST 31, 2022
1. Organization
American Century ETF Trust (the trust) was registered as a Delaware statutory trust in 2017 and is registered under the Investment Company Act of 1940, as amended (the 1940 Act), as an open-end management investment company. Avantis Real Estate ETF, Avantis U.S. Equity ETF, Avantis U.S. Large Cap Value ETF, Avantis U.S. Small Cap Equity ETF and Avantis U.S. Small Cap Value ETF (collectively, the funds) are five funds in a series issued by the trust. Each of the funds’ investment objective is to seek long-term capital appreciation. Shares of the funds are listed for trading on the NYSE Arca, Inc. Avantis Real Estate ETF incepted on September 28, 2021. Avantis U.S. Large Cap Value ETF incepted on September 21, 2021. Avantis U.S. Small Cap Equity ETF incepted on January 11, 2022.
2. Significant Accounting Policies
The following is a summary of significant accounting policies consistently followed by the funds in preparation of their financial statements. Each fund is an investment company and follows accounting and reporting guidance in accordance with accounting principles generally accepted in the United States of America. This may require management to make certain estimates and assumptions at the date of the financial statements. Actual results could differ from these estimates. Management evaluated the impact of events or transactions occurring through the date the financial statements were issued that would merit recognition or disclosure.
Investment Valuations — The funds determine the fair value of their investments and compute their net asset value (NAV) per share at the close of regular trading (usually 4 p.m. Eastern time) on the New York Stock Exchange (NYSE) on each day the NYSE is open. The Board of Trustees has adopted valuation policies and procedures to guide the investment advisor in the funds' investment valuation process and to provide methodologies for the oversight of the funds' pricing function.
Equity securities that are listed or traded on a domestic securities exchange are valued at the last reported sales price or at the official closing price as provided by the exchange. Equity securities traded on foreign securities exchanges are generally valued at the closing price of such securities on the exchange where primarily traded or at the close of the NYSE, if that is earlier. If no last sales price is reported, or if local convention or regulation so provides, the mean of the latest bid and asked prices may be used. Securities traded over-the-counter are valued at the mean of the latest bid and asked prices, the last sales price, or the official closing price. Equity securities initially expressed in local currencies are translated into U.S. dollars at the mean of the appropriate currency exchange rate at the close of the NYSE as provided by an independent pricing service.
Open-end management investment companies are valued at the reported NAV per share.
If the funds determine that the market price for an investment is not readily available or the valuation methods mentioned above do not reflect an investment’s fair value, such investment is valued as determined in good faith by the Board of Trustees or its delegate, in accordance with policies and procedures adopted by the Board of Trustees. In its determination of fair value, the funds may review several factors including, but not limited to, market information regarding the specific investment or comparable investments and correlation with other investment types, futures indices or general market indicators. Circumstances that may cause the funds to use these procedures to value an investment include, but are not limited to: an investment has been declared in default or is distressed; trading in a security has been suspended during the trading day or a security is not actively trading on its principal exchange; prices received from a regular pricing source are deemed unreliable; or there is a foreign market holiday and no trading occurred.
133
The funds monitor for significant events occurring after the close of an investment’s primary exchange but before each fund’s NAV per share is determined. Significant events may include, but are not limited to: corporate announcements and transactions; governmental action and political unrest that could impact a specific investment or an investment sector; or armed conflicts, natural disasters and similar events that could affect investments in a specific country or region. The funds also monitor for significant fluctuations between domestic and foreign markets, as evidenced by the U.S. market or such other indicators that the Board of Trustees, or its delegate, deems appropriate. The funds may apply a model-derived factor to the closing price of equity securities traded on foreign securities exchanges. The factor is based on observable market data as provided by an independent pricing service.
Security Transactions — Security transactions are accounted for as of the trade date. Net realized gains and losses are determined on the identified cost basis, which is also used for federal income tax purposes.
Investment Income — Dividend income less foreign taxes withheld, if any, is recorded as of the ex-dividend date. Distributions received on securities that represent a return of capital or long-term capital gain are recorded as a reduction of cost of investments and/or as a realized gain. The funds may estimate the components of distributions received that may be considered nontaxable distributions or long-term capital gain distributions for income tax purposes. Interest income is recorded on the accrual basis and includes accretion of discounts and amortization of premiums. Securities lending income is net of fees and rebates earned by the lending agent for its services.
Foreign Currency Translations — All assets and liabilities initially expressed in foreign currencies are translated into U.S. dollars at prevailing exchange rates at period end. The funds may enter into spot foreign currency exchange contracts to facilitate transactions denominated in a foreign currency. Purchases and sales of investment securities, dividend and interest income, spot foreign currency exchange contracts, and expenses are translated at the rates of exchange prevailing on the respective dates of such transactions. Net realized and unrealized foreign currency exchange gains or losses related to investment securities are a component of net realized gain (loss) on investment transactions and change in net unrealized appreciation (depreciation) on investments, respectively.
Segregated Assets — In accordance with the 1940 Act, the funds segregate assets on their books and records to cover certain types of investment securities and other financial instruments. American Century Investment Management, Inc. (ACIM) (the investment advisor) monitors, on a daily basis, the securities segregated to ensure the funds designate a sufficient amount of liquid assets, marked-to-market daily. The funds may also receive assets or be required to pledge assets at the custodian bank or with a broker for collateral requirements.
Income Tax Status — It is each fund’s policy to distribute substantially all net investment income and net realized gains to shareholders and to otherwise qualify as a regulated investment company under provisions of the Internal Revenue Code. Accordingly, no provision has been made for income taxes. The funds file U.S. federal, state, local and non-U.S. tax returns as applicable. The funds' tax returns are subject to examination by the relevant taxing authority until expiration of the applicable statute of limitations, which is generally three years from the date of filing but can be longer in certain jurisdictions. At this time, management believes there are no uncertain tax positions which, based on their technical merit, would not be sustained upon examination and for which it is reasonably possible that the total amounts of unrecognized tax benefits will significantly change in the next twelve months.
Distributions to Shareholders — Distributions from net investment income, if any, are generally declared and paid quarterly. Distributions from net realized gains, if any, are generally declared and paid annually.
Indemnifications — Under the trust’s organizational documents, its officers and trustees are indemnified against certain liabilities arising out of the performance of their duties to the funds. In addition, in the normal course of business, the funds enter into contracts that provide general indemnifications. The maximum exposure under these arrangements is unknown as this would involve future claims that may be made against a fund. The risk of material loss from such claims is considered by management to be remote.
134
Securities Lending — Securities are lent to qualified financial institutions and brokers. State Street Bank & Trust Co. serves as securities lending agent to the funds pursuant to a Securities Lending Agreement. The lending of securities exposes the funds to risks such as: the borrowers may fail to return the loaned securities, the borrowers may not be able to provide additional collateral, the funds may experience delays in recovery of the loaned securities or delays in access to collateral, or the funds may experience losses related to the investment collateral. To minimize certain risks, loan counterparties pledge collateral in the form of cash and/or securities. The lending agent has agreed to indemnify the funds in the case of default of any securities borrowed. Cash collateral received is invested in the State Street Navigator Securities Lending Government Money Market Portfolio, a money market mutual fund registered under the 1940 Act. The loans may also be secured by U.S. government securities in an amount at least equal to the market value of the securities loaned, plus accrued interest and dividends, determined on a daily basis and adjusted accordingly. By lending securities, the funds seek to increase their net investment income through the receipt of interest and fees. Such income is reflected separately within the Statements of Operations. The value of loaned securities and related collateral outstanding at period end, if any, are shown on a gross basis within the Schedules of Investments and Statements of Assets and Liabilities.
The following table reflects a breakdown of transactions accounted for as secured borrowings, the gross obligation by the type of collateral pledged, and the remaining contractual maturity of those transactions as of August 31, 2022.
| Remaining Contractual Maturity of Agreements | |||||||||||||||||
Fund / Securities Lending Transactions(1) | Overnight and Continuous | <30 days | Between 30 & 90 days | >90 days | Total | ||||||||||||
| Avantis Real Estate ETF | |||||||||||||||||
| Common Stocks | $ | 155,811 | — | — | — | $ | 155,811 | ||||||||||
| Gross amount of recognized liabilities for securities lending transactions | $ | 155,811 | |||||||||||||||
| Avantis U.S. Equity ETF | |||||||||||||||||
| Common Stocks | $ | 7,532,352 | — | — | — | $ | 7,532,352 | ||||||||||
| Gross amount of recognized liabilities for securities lending transactions | $ | 7,532,352 | |||||||||||||||
| Avantis U.S. Large Cap Value ETF | |||||||||||||||||
| Common Stocks | $ | 1,262,664 | — | — | — | $ | 1,262,664 | ||||||||||
| Gross amount of recognized liabilities for securities lending transactions | $ | 1,262,664 | |||||||||||||||
| Avantis U.S. Small Cap Value ETF | |||||||||||||||||
| Common Stocks | $ | 22,491,144 | — | — | — | $ | 22,491,144 | ||||||||||
| Gross amount of recognized liabilities for securities lending transactions | $ | 22,491,144 | |||||||||||||||
(1)Amount represents the payable for cash collateral received for securities on loan. This will generally be in the Overnight and Continuous column as the securities are typically callable on demand.
3. Fees and Transactions with Related Parties
Certain officers and trustees of the trust are also officers and/or directors of American Century Companies, Inc. (ACC). The trust's investment advisor, ACIM, and the trust’s administrator, American Century Services, LLC, are wholly owned, directly or indirectly, by ACC.
Management Fees — The trust has entered into a management agreement with ACIM, under which ACIM provides the funds with investment advisory and management services in exchange for a single, unified management fee (the fee). The agreement provides that ACIM will pay all expenses of managing and operating the funds, except brokerage and other transaction fees and expenses relating to the acquisition and disposition of portfolio securities, acquired fund fees and expenses, interest, taxes, litigation expenses and extraordinary expenses. The fee is computed and accrued daily based on the daily net assets of each fund and paid monthly in arrears.
135
The annual management fee for each fund is as follows:
| Annual Management Fee | |||||
| Avantis Real Estate ETF | 0.17% | ||||
| Avantis U.S. Equity ETF | 0.15% | ||||
| Avantis U.S. Large Cap Value ETF | 0.15% | ||||
| Avantis U.S. Small Cap Equity ETF | 0.25% | ||||
| Avantis U.S. Small Cap Value ETF | 0.25% | ||||
Interfund Transactions — The funds may enter into security transactions with other American Century Investments funds and other client accounts of the investment advisor, in accordance with the 1940 Act rules and procedures adopted by the Board of Trustees. The rules and procedures require, among other things, that these transactions be effected at the independent current market price of the security. There were no interfund transactions during the period.
4. Investment Transactions
Purchases and sales of investment securities, excluding short-term investments and in kind transactions, for the period ended August 31, 2022 were as follows:
Avantis Real Estate ETF(1) | Avantis U.S. Equity ETF | Avantis U.S. Large Cap Value ETF(2) | Avantis U.S. Small Cap Equity ETF(3) | Avantis U.S. Small Cap Value ETF | |||||||||||||
| Purchases | $76,206,213 | $143,384,891 | $55,700,229 | $1,812,040 | $849,226,680 | ||||||||||||
| Sales | $3,826,990 | $77,451,574 | $44,582,450 | $1,422,876 | $625,867,645 | ||||||||||||
(1)September 28, 2021 (fund inception) through August 31, 2022.
(2)September 21, 2021 (fund inception) through August 31, 2022.
(3)January 11, 2022 (fund inception) through August 31, 2022.
Securities received or delivered in kind through subscriptions and redemptions and in kind net realized gain (loss) for the period ended August 31, 2022 were as follows:
| In kind Subscriptions | In kind Redemptions | In kind Net Realized Gain/(Loss)* | |||||||||
Avantis Real Estate ETF(1) | $81,485,813 | — | — | ||||||||
| Avantis U.S. Equity ETF | $1,376,533,386 | $170,308,638 | $76,279,709 | ||||||||
Avantis U.S. Large Cap Value ETF(2) | $511,405,771 | $8,854,617 | $1,482,300 | ||||||||
Avantis U.S. Small Cap Equity ETF(3) | $26,032,230 | — | — | ||||||||
| Avantis U.S. Small Cap Value ETF | $2,933,887,062 | $847,884,078 | $322,686,850 | ||||||||
*Net realized gain (loss) on in kind transactions are not considered taxable for federal income tax purposes.
(1)September 28, 2021 (fund inception) through August 31, 2022.
(2)September 21, 2021 (fund inception) through August 31, 2022.
(3)January 11, 2022 (fund inception) through August 31, 2022.
5. Capital Share Transactions
Each fund’s shares may only be bought and sold in a secondary market through a broker-dealer at a market price. Because ETF shares trade at market prices rather than NAV, shares may trade at a price greater than NAV (a premium) or less than NAV (a discount). Each fund issues and redeems shares at their NAV only in aggregations of a specified number of shares (a creation unit) generally in exchange for a designated portfolio of securities and/or cash (including any portion of such securities for which cash may be substituted). Authorized participants may be required to pay an additional variable charge to cover certain brokerage, tax, foreign exchange, execution, market impact and other costs and expenses related to the execution of trades resulting from creation unit transactions. Such variable charges, if any, are included in other capital within the Statements of Changes in Net Assets.
136
6. Fair Value Measurements
The funds’ investment valuation process is based on several considerations and may use multiple inputs to determine the fair value of the investments held by the funds. In conformity with accounting principles generally accepted in the United States of America, the inputs used to determine a valuation are classified into three broad levels.
•Level 1 valuation inputs consist of unadjusted quoted prices in an active market for identical investments.
•Level 2 valuation inputs consist of direct or indirect observable market data (including quoted prices for comparable investments, evaluations of subsequent market events, interest rates, prepayment speeds, credit risk, etc.). These inputs also consist of quoted prices for identical investments initially expressed in local currencies that are adjusted through translation into U.S. dollars.
•Level 3 valuation inputs consist of unobservable data (including a fund’s own assumptions).
The level classification is based on the lowest level input that is significant to the fair valuation measurement. The valuation inputs are not necessarily an indication of the risks associated with investing in these securities or other financial instruments.
The following is a summary of the level classifications as of period end. The Schedules of Investments provide additional information on the funds’ portfolio holdings.
Avantis Real Estate ETF
| Level 1 | Level 2 | Level 3 | |||||||||
| Assets | |||||||||||
| Investment Securities | |||||||||||
| Common Stocks | |||||||||||
| Diversified REITs | $ | 2,340,578 | $ | 9,382,395 | — | ||||||
| Health Care REITs | 7,956,988 | 1,710,448 | — | ||||||||
| Hotel and Resort REITs | 2,543,423 | 723,706 | — | ||||||||
| Industrial REITs | 13,795,218 | 9,909,786 | — | ||||||||
| Office REITs | 2,673,756 | 7,349,908 | — | ||||||||
| Real Estate Operating Companies | — | 25,872 | — | ||||||||
| Residential REITs | 17,674,734 | 3,104,296 | — | ||||||||
| Retail REITs | 13,615,115 | 9,711,648 | — | ||||||||
| Specialized REITs | 39,548,760 | 1,299,117 | — | ||||||||
| Short-Term Investments | 335,963 | — | — | ||||||||
| $ | 100,484,535 | $ | 43,217,176 | — | |||||||
Avantis U.S. Equity ETF
| Level 1 | Level 2 | Level 3 | |||||||||
| Assets | |||||||||||
| Investment Securities | |||||||||||
| Common Stocks | $ | 2,517,309,070 | — | — | |||||||
| Short-Term Investments | 10,320,182 | — | — | ||||||||
| $ | 2,527,629,252 | — | — | ||||||||
Avantis U.S. Large Cap Value ETF
| Level 1 | Level 2 | Level 3 | |||||||||
| Assets | |||||||||||
| Investment Securities | |||||||||||
| Common Stocks | $ | 493,166,182 | — | — | |||||||
| Short-Term Investments | 1,446,115 | — | — | ||||||||
| $ | 494,612,297 | — | — | ||||||||
137
Avantis U.S. Small Cap Equity ETF
| Level 1 | Level 2 | Level 3 | |||||||||
| Assets | |||||||||||
| Investment Securities | |||||||||||
| Common Stocks | $ | 26,230,419 | — | — | |||||||
| Short-Term Investments | 66,159 | — | — | ||||||||
| $ | 26,296,578 | — | — | ||||||||
Avantis U.S. Small Cap Value ETF
| Level 1 | Level 2 | Level 3 | |||||||||
| Assets | |||||||||||
| Investment Securities | |||||||||||
| Common Stocks | $ | 3,669,271,055 | — | — | |||||||
| Short-Term Investments | 26,004,035 | — | — | ||||||||
| $ | 3,695,275,090 | — | — | ||||||||
7. Risk Factors
The value of the funds’ shares will go up and down, sometimes rapidly or unpredictably, based on the performance of the securities owned by the funds and other factors generally affecting the securities market. Market risks, including political, regulatory, economic and social developments, can affect the value of the funds’ investments. Natural disasters, public health emergencies, war, terrorism and other unforeseeable events may lead to increased market volatility and may have adverse long-term effects on world economies and markets generally.
Avantis Real Estate ETF concentrates its investments in a narrow segment of the total market. Because of this, the fund is subject to certain additional risks as compared to investing in a more diversified portfolio of investments. The fund may be subject to certain risks similar to those associated with direct investment in real estate including but not limited to: local or regional economic conditions, changes in zoning laws, changes in property values, property tax increases, overbuilding, increased competition, environmental contamination, natural disasters, and interest rate risk.
There are certain risks involved in investing in foreign securities. These risks include those resulting from political events (such as civil unrest, national elections and imposition of exchange controls), social and economic events (such as labor strikes and rising inflation), and natural disasters. Securities of foreign issuers may be less liquid and more volatile. Investing in emerging markets or a significant portion of assets in one country or region may accentuate these risks.
Avantis U.S. Small Cap Equity ETF and Avantis U.S. Small Cap Value ETF invest in common stocks of small companies. Because of this, the funds may be subject to greater risk and market fluctuations than funds investing in larger, more established companies.
138
8. Federal Tax Information
The tax character of distributions paid during the years ended August 31, 2022 (except as noted) and August 31, 2021 were as follows:
| 2022 | 2021 | |||||||||||||
| Distributions Paid From: | Distributions Paid From: | |||||||||||||
| Ordinary Income | Long-term Capital Gains | Ordinary Income | Long-term Capital Gains | |||||||||||
Avantis Real Estate ETF(1) | $ | 637,460 | — | N/A | N/A | |||||||||
| Avantis U.S. Equity ETF | $ | 24,641,184 | — | $ | 9,363,483 | — | ||||||||
Avantis U.S. Large Cap Value ETF(2) | $ | 2,368,608 | — | N/A | N/A | |||||||||
Avantis U.S. Small Cap Equity ETF(3) | $ | 32,394 | — | N/A | N/A | |||||||||
| Avantis U.S. Small Cap Value ETF | $ | 36,861,258 | — | $ | 10,315,324 | — | ||||||||
(1)September 28, 2021 (fund inception) through August 31, 2022.
(2)September 21, 2021 (fund inception) through August 31, 2022.
(3)January 11, 2022 (fund inception) through August 31, 2022.
The book-basis character of distributions made during the year from net investment income or net realized gains may differ from their ultimate characterization for federal income tax purposes. These differences reflect the differing character of certain income items and net realized gains and losses for financial statement and tax purposes, and may result in reclassification among certain capital accounts on the financial statements.
The reclassifications, which are primarily due to in kind transactions, were as follows:
| Avantis Real Estate ETF | Avantis U.S. Equity ETF | Avantis U.S. Large Cap Value ETF | Avantis U.S. Small Cap Equity ETF | Avantis U.S. Small Cap Value ETF | |||||||||||||
| Capital paid in | — | $ | 76,372,847 | $ | 1,481,815 | — | $ | 322,785,617 | |||||||||
| Distributable earnings | — | $ | (76,372,847) | $ | (1,481,815) | — | $ | (322,785,617) | |||||||||
139
As of period end, the federal tax cost of investments and the components of distributable earnings on a tax-basis were as follows:
| Avantis Real Estate ETF | Avantis U.S. Equity ETF | Avantis U.S. Large Cap Value ETF | Avantis U.S. Small Cap Equity ETF | Avantis U.S. Small Cap Value ETF | |||||||||||||
| Federal tax cost of investments | $ | 152,960,384 | $ | 2,507,628,318 | $ | 508,174,753 | $ | 26,105,789 | $ | 3,803,333,596 | |||||||
| Gross tax appreciation of investments | $ | 1,260,727 | $ | 194,491,760 | $ | 16,638,143 | $ | 1,626,576 | $ | 217,214,480 | |||||||
| Gross tax depreciation of investments | (10,519,400) | (174,490,826) | (30,200,599) | (1,435,787) | (325,272,986) | ||||||||||||
| Net tax appreciation (depreciation) of investments | (9,258,673) | 20,000,934 | (13,562,456) | 190,789 | (108,058,506) | ||||||||||||
| Net tax appreciation (depreciation) on derivatives and translation of assets and liabilities in foreign currencies | (5,055) | (26) | — | — | — | ||||||||||||
| Net tax appreciation (depreciation) | $ | (9,263,728) | $ | 20,000,908 | $ | (13,562,456) | $ | 190,789 | $ | (108,058,506) | |||||||
| Undistributed ordinary income | $ | 1,193,946 | $ | 8,181,360 | $ | 2,124,540 | $ | 87,379 | $ | 13,270,949 | |||||||
| Accumulated short-term capital losses | $ | (373,259) | $ | (10,686,670) | $ | (8,303,482) | $ | (142,777) | $ | (90,058,892) | |||||||
| Accumulated long-term capital losses | — | $ | (77,770) | — | — | (4,567,999) | |||||||||||
The difference between book-basis and tax-basis unrealized appreciation (depreciation) is attributable primarily to the realization to ordinary income for tax purposes of unrealized gains on investments in passive
foreign investment companies, return of capital dividends received and tax deferral of losses on wash sales.
Accumulated capital losses represent net capital loss carryovers that may be used to offset future realized
capital gains for federal income tax purposes. The capital loss carryovers may be carried forward for an
unlimited period. Future capital loss carryover utilization in any given year may be subject to Internal Revenue
Code limitations.
140
| Financial Highlights | ||
| For a Share Outstanding Throughout the Period Indicated | ||||||||||||||||||||||||||||||||||||||
| Per-Share Data | Ratios and Supplemental Data | |||||||||||||||||||||||||||||||||||||
| Income From Investment Operations: | Ratio to Average Net Assets of: | |||||||||||||||||||||||||||||||||||||
| Net Asset Value, Beginning of Period | Net Investment Income (Loss)(1) | Net Realized and Unrealized Gain (Loss) | Total From Investment Operations | Distributions From Net Investment Income | Other Capital(1) | Net Asset Value, End of Period | Total Return(2) | Operating Expenses | Net Investment Income (Loss) | Portfolio Turnover Rate(3) | Net Assets, End of Period (in thousands) | |||||||||||||||||||||||||||
| Avantis Real Estate ETF | ||||||||||||||||||||||||||||||||||||||
2022(4) | $50.00 | 1.40 | (5.82) | (4.42) | (0.64) | 0.05 | $44.99 | (8.86)% | 0.17%(5) | 3.17%(5) | 7% | $143,966 | ||||||||||||||||||||||||||
| Notes to Financial Highlights | ||
(1)Computed using average shares outstanding throughout the period.
(2)Total returns are calculated based on the net asset value of the last business day. Total returns for periods less than one year are not annualized.
(3)Excludes securities received or delivered in kind.
(4)September 28, 2021 (fund inception) through August 31, 2022.
(5)Annualized.
See Notes to Financial Statements.
| For a Share Outstanding Throughout the Years Ended August 31 (except as noted) | |||||||||||||||||||||||||||||||||||
| Per-Share Data | Ratios and Supplemental Data | ||||||||||||||||||||||||||||||||||
| Income From Investment Operations: | Ratio to Average Net Assets of: | ||||||||||||||||||||||||||||||||||
| Net Asset Value, Beginning of Period | Net Investment Income (Loss)(1) | Net Realized and Unrealized Gain (Loss) | Total From Investment Operations | Distributions From Net Investment Income | Net Asset Value, End of Period | Total Return(2) | Operating Expenses | Net Investment Income (Loss) | Portfolio Turnover Rate(3) | Net Assets, End of Period (in thousands) | |||||||||||||||||||||||||
| Avantis U.S. Equity ETF | |||||||||||||||||||||||||||||||||||
| 2022 | $76.82 | 1.12 | (8.15) | (7.03) | (0.98) | $68.81 | (9.21)% | 0.15% | 1.52% | 4% | $2,522,737 | ||||||||||||||||||||||||
| 2021 | $56.13 | 0.93 | 20.54 | 21.47 | (0.78) | $76.82 | 38.56% | 0.15% | 1.36% | 4% | $1,486,458 | ||||||||||||||||||||||||
2020(4) | $50.00 | 0.82 | 5.84 | 6.66 | (0.53) | $56.13 | 13.50% | 0.15%(5) | 1.76%(5) | 3% | $436,099 | ||||||||||||||||||||||||
| Notes to Financial Highlights | ||
(1)Computed using average shares outstanding throughout the period.
(2)Total returns are calculated based on the net asset value of the last business day. Total returns for periods less than one year are not annualized.
(3)Excludes securities received or delivered in kind.
(4)September 24, 2019 (fund inception) through August 31, 2020.
(5)Annualized.
See Notes to Financial Statements.
| For a Share Outstanding Throughout the Period Indicated | |||||||||||||||||||||||||||||||||||
| Per-Share Data | Ratios and Supplemental Data | ||||||||||||||||||||||||||||||||||
| Income From Investment Operations: | Ratio to Average Net Assets of: | ||||||||||||||||||||||||||||||||||
| Net Asset Value, Beginning of Period | Net Investment Income (Loss)(1) | Net Realized and Unrealized Gain (Loss) | Total From Investment Operations | Distributions From Net Investment Income | Net Asset Value, End of Period | Total Return(2) | Operating Expenses | Net Investment Income (Loss) | Portfolio Turnover Rate(3) | Net Assets, End of Period (in thousands) | |||||||||||||||||||||||||
| Avantis U.S. Large Cap Value ETF | |||||||||||||||||||||||||||||||||||
2022(4) | $50.00 | 1.16 | (1.65) | (0.49) | (0.60) | $48.91 | (1.03)% | 0.15%(5) | 2.44%(5) | 23% | $494,955 | ||||||||||||||||||||||||
| Notes to Financial Highlights | ||
(1)Computed using average shares outstanding throughout the period.
(2)Total returns are calculated based on the net asset value of the last business day. Total returns for periods less than one year are not annualized.
(3)Excludes securities received or delivered in kind.
(4)September 21, 2021 (fund inception) through August 31, 2022.
(5)Annualized.
See Notes to Financial Statements.
| For a Share Outstanding Throughout the Period Indicated | |||||||||||||||||||||||||||||||||||
| Per-Share Data | Ratios and Supplemental Data | ||||||||||||||||||||||||||||||||||
| Income From Investment Operations: | Ratio to Average Net Assets of: | ||||||||||||||||||||||||||||||||||
| Net Asset Value, Beginning of Period | Net Investment Income (Loss)(1) | Net Realized and Unrealized Gain (Loss) | Total From Investment Operations | Distributions From Net Investment Income | Net Asset Value, End of Period | Total Return(2) | Operating Expenses | Net Investment Income (Loss) | Portfolio Turnover Rate(3) | Net Assets, End of Period (in thousands) | |||||||||||||||||||||||||
| Avantis U.S. Small Cap Equity ETF | |||||||||||||||||||||||||||||||||||
2022(4) | $50.00 | 0.42 | (6.39) | (5.97) | (0.17) | $43.86 | (11.95)% | 0.25%(5) | 1.50%(5) | 14% | $26,315 | ||||||||||||||||||||||||
| Notes to Financial Highlights | ||
(1)Computed using average shares outstanding throughout the period.
(2)Total returns are calculated based on the net asset value of the last business day. Total returns for periods less than one year are not annualized.
(3)Excludes securities received or delivered in kind.
(4)January 11, 2022 (fund inception) through August 31, 2022.
(5)Annualized.
See Notes to Financial Statements.
| For a Share Outstanding Throughout the Years Ended August 31 (except as noted) | |||||||||||||||||||||||||||||||||||
| Per-Share Data | Ratios and Supplemental Data | ||||||||||||||||||||||||||||||||||
| Income From Investment Operations: | Ratio to Average Net Assets of: | ||||||||||||||||||||||||||||||||||
| Net Asset Value, Beginning of Period | Net Investment Income (Loss)(1) | Net Realized and Unrealized Gain (Loss) | Total From Investment Operations | Distributions From Net Investment Income | Net Asset Value, End of Period | Total Return(2) | Operating Expenses | Net Investment Income (Loss) | Portfolio Turnover Rate(3) | Net Assets, End of Period (in thousands) | |||||||||||||||||||||||||
| Avantis U.S. Small Cap Value ETF | |||||||||||||||||||||||||||||||||||
| 2022 | $75.49 | 1.36 | (1.70) | (0.34) | (1.11) | $74.04 | (0.47)% | 0.25% | 1.77% | 24% | $3,675,290 | ||||||||||||||||||||||||
| 2021 | $44.97 | 1.16 | 30.24 | 31.40 | (0.88) | $75.49 | 70.34% | 0.25% | 1.72% | 22% | $1,570,143 | ||||||||||||||||||||||||
2020(4) | $50.00 | 0.72 | (5.30) | (4.58) | (0.45) | $44.97 | (9.09)% | 0.25%(5) | 1.87%(5) | 20% | $355,298 | ||||||||||||||||||||||||
| Notes to Financial Highlights | ||
(1)Computed using average shares outstanding throughout the period.
(2)Total returns are calculated based on the net asset value of the last business day. Total returns for periods less than one year are not annualized.
(3)Excludes securities received or delivered in kind.
(4)September 24, 2019 (fund inception) through August 31, 2020.
(5)Annualized.
See Notes to Financial Statements.
| Report of Independent Registered Public Accounting Firm | ||
To the Shareholders and the Board of Trustees of American Century ETF Trust:
Opinion on the Financial Statements and Financial Highlights
We have audited the accompanying statements of assets and liabilities, including the schedules of investments, of Avantis® Real Estate ETF, Avantis® U.S. Equity ETF, Avantis® U.S. Large Cap Value ETF, Avantis® U.S. Small Cap Equity ETF, and Avantis® U.S. Small Cap Value ETF (the “Funds”), five of the funds constituting the American Century ETF Trust, as of August 31, 2022, the related statements of operations, statements of changes in net assets, and financial highlights for the periods indicated in the table below; and the related notes. In our opinion, the financial statements and financial highlights present fairly, in all material respects, the financial position of each of the Funds constituting American Century ETF Trust as of August 31, 2022, and the results of their operations, the changes in their net assets, and the financial highlights for the periods listed in the table below, in conformity with accounting principles generally accepted in the United States of America.
| Individual Fund Constituting the American Century ETF Trust | Statement of Operations | Statements of Changes in Net Assets | Financial Highlights | |||||||||||
Avantis® Real Estate ETF | For the period September 28, 2021 (fund inception) through August 31, 2022 | |||||||||||||
Avantis® U.S. Equity ETF | For the year ended August 31, 2022 | For the years ended August 31, 2022 and 2021 | For the years ended August 31, 2022, 2021 and the period from September 24, 2019 (fund inception) through August 31, 2020 | |||||||||||
Avantis® U.S. Large Cap Value ETF | For the period September 21, 2021 (fund inception) through August 31, 2022 | |||||||||||||
Avantis® U.S. Small Cap Equity ETF | For the period January 11, 2022 (fund inception) through August 31, 2022 | |||||||||||||
Avantis® U.S. Small Cap Value ETF | For the year ended August 31, 2022 | For the years ended August 31, 2022 and 2021 | For the years ended August 31, 2022, 2021 and the period from September 24, 2019 (fund inception) through August 31, 2020 | |||||||||||
Basis for Opinion
These financial statements and financial highlights are the responsibility of the Funds’ management. Our responsibility is to express an opinion on the Funds’ financial statements and financial highlights based on our audits. We are a public accounting firm registered with the Public Company Accounting Oversight Board (United States) (PCAOB) and are required to be independent with respect to the Funds in accordance with the U.S. federal securities laws and the applicable rules and regulations of the Securities and Exchange Commission and the PCAOB.
We conducted our audits in accordance with the standards of the PCAOB. Those standards require that we plan and perform the audit to obtain reasonable assurance about whether the financial statements and financial highlights are free of material misstatement, whether due to error or fraud. The Funds are not required to have, nor were we engaged to perform, an audit of their internal control over financial reporting. As part of our audits, we are required to obtain an understanding of internal control over financial reporting but not for the purpose of expressing an opinion on the effectiveness of the Funds’ internal control over financial reporting. Accordingly, we express no such opinion.
146
Our audits included performing procedures to assess the risks of material misstatement of the financial statements and financial highlights, whether due to error or fraud, and performing procedures that respond to those risks. Such procedures included examining, on a test basis, evidence regarding the amounts and disclosures in the financial statements and financial highlights. Our audits also included evaluating the accounting principles used and significant estimates made by management, as well as evaluating the overall presentation of the financial statements and financial highlights. Our procedures included confirmation of securities owned as of August 31, 2022, by correspondence with the custodian and brokers; when replies were not received from brokers, we performed other auditing procedures. We believe that our audits provide a reasonable basis for our opinion.
/s/ Deloitte & Touche LLP
Kansas City, Missouri
October 17, 2022
We have served as the auditor of one or more American Century investment companies since 1997.
147
| Management | ||
The Board of Trustees
The individuals listed below serve as trustees of the funds. Each trustee will continue to serve in this capacity until death, retirement, resignation or removal from office. The board has adopted a mandatory retirement age for trustees who are not “interested persons,” as that term is defined in the Investment Company Act (independent trustees). Trustees who are not also officers of the trust shall retire on December 31st of the year in which they reach their 75th birthday.
Jonathan S. Thomas is an “interested person” because he currently serves as President and Chief Executive Officer of American Century Companies, Inc. (ACC), the parent company of American Century Investment Management, Inc. (ACIM or the advisor). The other trustees are independent. They are not employees, directors or officers of, and have no financial interest in, ACC or any of its wholly owned, direct or indirect, subsidiaries, including ACIM and American Century Services, LLC (ACS), and they do not have any other affiliations, positions or relationships that would cause them to be considered “interested persons” under the Investment Company Act. The following trustees also serve in this capacity for a number of other registered investment companies in the American Century Investments family of funds: Jonathan S. Thomas, 15; Jeremy I. Bulow, 8; and Stephen E. Yates, 7.
The following table presents additional information about the trustees. The mailing address for each trustee other than Jonathan S. Thomas is 330 Madison Avenue, New York, New York 10017. The mailing address for Jonathan S. Thomas is 4500 Main Street, Kansas City, Missouri 64111.
| Name (Year of Birth) | Position(s) Held with Funds | Length of Time Served | Principal Occupation(s) During Past 5 Years | Number of American Century Portfolios Overseen by Trustee | Other Directorships Held During Past 5 Years | ||||||||||||
| Independent Trustees | |||||||||||||||||
| Reginald M. Browne (1968) | Trustee and Chairman of the Board | Since 2017 (Chairman since 2019) | Principal, GTS Securities (automated capital markets trading firm)(2019 to present); Senior Managing Director, Co Global Head-ETF Group, Cantor Fitzgerald (financial services firm)(2013 to 2019) | 41 | None | ||||||||||||
| Jeremy I. Bulow (1954) | Trustee | Since 2022 | Professor of Economics, Stanford University Graduate School of Business (1979 to present) | 75 | None | ||||||||||||
| Barry A. Mendelson (1958) | Trustee | Since 2017 | Retired | 41 | None | ||||||||||||
| Stephen E. Yates (1948) | Trustee | Since 2017 | Retired | 105 | None | ||||||||||||
| Interested Trustees | |||||||||||||||||
| Jonathan S. Thomas (1963) | Trustee | Since 2017 | President and Chief Executive Officer, ACC (2007 to present). Also serves as Chief Executive Officer, ACS; Director, ACC and other ACC subsidiaries | 139 | None | ||||||||||||
The Statement of Additional Information has additional information about the funds' trustees and is available without charge, upon request, by calling 1-800-345-6488.
148
Officers
The following table presents certain information about the executive officers of the funds. Each officer, except Cleo Chang and Edward Rosenberg, serves as an officer for each of the 16 investment companies in the American Century family of funds. No officer is compensated for his or her service as an officer of the funds. The listed officers are interested persons of the funds and are appointed or re-appointed on an annual basis. The mailing address for each officer listed below is 4500 Main Street, Kansas City, Missouri 64111.
| Name (Year of Birth) | Offices with the Funds | Principal Occupation(s) During the Past Five Years | ||||||
| Patrick Bannigan (1965) | President since 2019 | Executive Vice President and Director, ACC (2012 to present); Chief Financial Officer, Chief Accounting Officer and Treasurer, ACC (2015 to present). Also serves as President, ACS; Vice President, ACIM; Chief Financial Officer, Chief Accounting Officer and/or Director, ACIM, ACS and other ACC subsidiaries | ||||||
| R. Wes Campbell (1974) | Chief Financial Officer and Treasurer since 2018 | Vice President, ACS (2020 to present); Investment Operations and Investment Accounting, ACS (2000 to present) | ||||||
| Amy D. Shelton (1964) | Chief Compliance Officer and Vice President since 2017 | Chief Compliance Officer, American Century funds, (2014 to present); Chief Compliance Officer, ACIM (2014 to present); Chief Compliance Officer, ACIS (2009 to present). Also serves as Vice President, ACIS | ||||||
| John Pak (1968) | General Counsel and Vice President since 2021 | General Counsel and Senior Vice President, ACC (2021 to present). Also serves as General Counsel and Senior Vice President, ACIM, ACS and ACIS. Chief Legal Officer of Investment and Wealth Management,The Bank of New York Mellon (2014 to 2021) | ||||||
| Cleo Chang (1977) | Vice President since 2019 | Senior Vice President, ACIM (2015 to present) | ||||||
| David H. Reinmiller (1963) | Vice President since 2017 | Attorney, ACC (1994 to present). Also serves as Vice President, ACIM and ACS | ||||||
| Edward Rosenberg (1973) | Vice President since 2017 | Senior Vice President, ACIM (2017 to present); Senior Vice President, Flexshares Head of ETF Capital Markets, Northern Trust (2012 to 2017) | ||||||
| C. Jean Wade (1964) | Vice President since 2017 | Senior Vice President, ACS (2017 to present); Vice President, ACS (2000 to 2017) | ||||||
| Ward D. Stauffer (1960) | Secretary since 2019 | Attorney, ACS (2003 to present) | ||||||
149
| Approval of Management Agreements | ||
Avantis U.S. Small Cap Equity ETF
At a meeting held on December 8, 2021, the Fund's Board of Trustees (the "Board") unanimously approved the initial management agreement pursuant to which American Century Investment Management, Inc. (the “Advisor”) acts as the investment advisor for the Avantis U.S. Small Cap Equity ETF (the "New Fund"). Under Section 15(c) of the of the Investment Company Act of 1940, new contracts for investment advisory services are required to be approved by a majority of a fund’s independent Trustees and to be evaluated on an annual basis thereafter.
In advance of the Board’s consideration, the Advisor provided information concerning the New Fund. The materials circulated and the discussions held detailed the investment objective and strategy proposed to be utilized by the Advisor, the New Fund's characteristics and key attributes, the rationale for launching the New Fund, the experience of the staff designated to manage the New Fund, the proposed pricing, and the markets in which the New Fund would be sold. The information considered and the discussions held included, but were not limited to:
•the nature, extent, and quality of investment management and other services to be provided to the New Fund;
•the wide range of other programs and services the Advisor would provide to the New Fund and its shareholders on a routine and non-routine basis;
•the New Fund’s proposed investment objective and strategy, including a discussion of its anticipated investment performance and proposed benchmark;
•the cost of owning the New Fund compared to the cost of owning similarly-managed funds;
•the Advisor’s compliance policies, procedures, and regulatory experience; and
•any collateral benefits derived by the Advisor from the management of the New Fund.
Part of the Board’s analysis of fee levels involves reviewing certain evaluative data compiled by an independent data provider and comparing the New Fund’s fee to the total expense ratio of expected peer funds. The annual management fees charged to shareholders of the New Fund was anticipated to be below the median of the total expense ratios of it's respective peer universe.
When considering the approval of the management agreement for the New Fund, the independent Trustees considered the entrepreneurial risk that the Advisor assumes in launching a new fund. In particular, they considered the fact that the Advisor will assume a substantial part of the start-up costs of the New Fund and the risk that the New Fund will not grow to a level that will become profitable to the Advisor. The Board considered the position that the New Fund would take in the lineup of the American Century Investments’ family of funds and the benefits to shareholders of existing funds of the broadened product offering. Finally, while not specifically discussed, but important in the decision to approve the management agreement, is the Trustees’ familiarity with the Advisor. A majority of the Board oversees and evaluates on a continuous basis the nature and quality of all services the Advisor performs for other funds within the American Century Investments’ complex. As such, the Trustees have confidence in the Advisor’s integrity and competence in providing services to the New Fund.
The independent Trustees considered all of the information provided by the Advisor and the independent Trustees’ independent counsel in connection with the approval, and evaluated such information for the New Fund. In connection with their review, the Trustees did not identify any single factor as being all-important or controlling, and each Trustee may have attributed different levels of importance to different factors. The independent Trustees concluded that the overall arrangements between the New Fund and the Advisor, as provided in the management agreement, were fair and reasonable in light of the services to be provided and should be approved.
150
Avantis Real Estate ETF
Avantis U.S. Equity ETF
Avantis U.S. Large Cap Value ETF
Avantis U.S. Small Cap Value ETF
Avantis U.S. Equity ETF
Avantis U.S. Large Cap Value ETF
Avantis U.S. Small Cap Value ETF
At a meeting held on June 2, 2022, the Funds’ Board of Trustees (the "Board") unanimously approved the renewal of the management agreement pursuant to which American Century Investment Management, Inc. (the “Advisor”) acts as the investment advisor for Avantis Real Estate ETF, Avantis U.S. Equity ETF, Avantis U.S. Large Cap Value ETF, and Avantis U.S. Small Cap Value ETF (collectively the "Existing Funds"). Under Section 15(c) of the Investment Company Act of 1940 (the “Investment Company Act”), contracts for investment advisory services are required to be reviewed, evaluated, and approved by a majority of a fund’s Trustees, including a majority of the independent Trustees, each year.
Prior to its consideration of the management agreement renewal, the Trustees requested and reviewed extensive data and information compiled by the Advisor and certain independent data providers concerning the Existing Funds. This review was in addition to the oversight and evaluation undertaken by the Board and its Audit Committee on a continual basis and the information received was supplemental to the extensive information that the Board and its Audit Committee receive and consider throughout the year.
In connection with its consideration of the management agreement renewal, the Board’s review and evaluation of the services provided by the Advisor included, but was not limited to, the following:
•the nature, extent, and quality of investment management, shareholder services, and other services provided and to be provided to each Existing Fund including without limitation portfolio management and trading services, shareholder and intermediary services, compliance and legal services, fund accounting and financial reporting, and fund share distribution;
•the wide range of other programs and services provided to each Existing Fund and its shareholders on a routine and non-routine basis;
•the investment performance of each Fund, including data comparing each Existing Fund's performance to an appropriate benchmark and/or a peer group of other funds with similar investment objectives and strategies;
•the cost of owning each Existing Fund compared to the cost of owning similarly-managed funds;
•the compliance policies, procedures, and regulatory experience of the Advisor and the Existing Funds’ service providers;
•the Advisor’s strategic plans, generally, and with respect to the ongoing impact of the COVID-19 pandemic response, heightened areas of interest in the mutual fund industry and recent geopolitical issues;
•the Advisor’s business continuity plans, vendor management practices, and cyber security practices;
•financial data showing the cost of services provided to each Existing Fund, the profitability of each Existing Fund to the Advisor, and the overall profitability of the Advisor;
•information regarding payments to intermediaries by the Advisor;
•possible economies of scale associated with the Advisor’s management of each Existing Fund; and
•possible collateral benefits to the Advisor from the management of the Existing Funds.
The independent Trustees met separately in private session to discuss the renewal and to review and discuss the information provided in response to their request. The independent Trustees also held active discussions with the Advisor regarding the renewal of the management agreement. The independent Trustees had the benefit of the advice of their independent counsel throughout the process.
151
Factors Considered
The Trustees considered all of the information provided by the Advisor, the independent data providers, and independent counsel in connection with the approval. They determined that the information was sufficient for them to evaluate the management agreement for the Existing Funds. In connection with their review, the Trustees did not identify any single factor as being all-important or controlling, and each Trustee may have attributed different levels of importance to different factors. In deciding to renew the management agreement, the Board based its decision on a number of factors, including without limitation the following:
Nature, Extent and Quality of Services — Generally. Under each Existing Fund’s management agreement, the Advisor is responsible for providing or arranging for all services necessary for the operation of each Existing Fund. The Board noted that the Advisor provides or arranges at its own expense a wide variety of services which include the following:
•constructing and designing each Existing Fund
•portfolio research and security selection
•initial capitalization/funding
•securities trading
•Existing Fund administration
•custody of Fund assets
•daily valuation of each Existing Fund’s portfolio
•liquidity monitoring and management
•risk management, including cyber security
•shareholder servicing and transfer agency, including shareholder confirmations, recordkeeping, and communications
•legal services (except the independent Trustees’ counsel)
•regulatory and portfolio compliance
•financial reporting
•marketing and distribution (except amounts paid by each Existing Fund under Rule 12b-1 plans)
Investment Management Services. The nature of the investment management services provided to the Existing Funds is quite complex and allows Existing Fund shareholders access to professional money management, instant diversification of their investments within an asset class, and liquidity. In evaluating investment performance, the Board expects the Advisor to manage each Existing Fund in accordance with its investment objectives and principal investment strategies. Further, the Trustees recognize that the Advisor has an obligation to monitor trading activities, and in particular to seek the best execution of fund trades, and to evaluate the use of and payment for research. In providing these services, the Advisor utilizes teams of investment professionals (portfolio managers, analysts, research assistants, and securities traders) who require extensive information technology, research, training, compliance, and other systems to conduct their business. The Board provides oversight of the investment performance process. It regularly reviews investment performance information for each Existing Fund, together with comparative information for appropriate benchmarks over different time horizons. The Trustees also review investment performance information during the management agreement renewal process. If performance concerns are identified, the Board discusses with the Advisor the reasons for such results and any actions being taken to improve performance. The performance for each of Avantis U.S. Equity ETF and Avantis U.S. Small Cap Value ETF was above their respective benchmark for the one-year period reviewed by the Board. The Board found the investment management services provided by the Advisor to each Existing Fund to be satisfactory and consistent with the management agreement.
Shareholder and Other Services. Under the management agreement, the Advisor provides or arranges for a comprehensive package of services to the Existing Funds. The Board, directly and through its Audit Committee, regularly reviews reports and evaluations of such services at its regular meetings. These reports include, but are not limited to, information regarding the
152
operational efficiency and accuracy of the shareholder and transfer agency services provided, staffing levels, shareholder satisfaction, technology support (including cyber security), new products and services offered to Existing Fund shareholders, securities trading activities, portfolio valuation services, auditing services, and legal and operational compliance activities. The Board found the services provided by the Advisor to each Existing Fund under the management agreement to be competitive and of high quality.
Costs of Services and Profitability. The Advisor provides detailed information concerning its cost of providing various services to the Existing Funds, its profitability in managing each Existing Fund (pre- and post-distribution), its overall profitability, and its financial condition. The Trustees have reviewed with the Advisor the methodology used to prepare this financial information. This information is considered in evaluating the Advisor’s financial condition, its ability to continue to provide services under the management agreement, and the reasonableness of the current management fee. The Board concluded that the Advisor’s profits were reasonable in light of the services provided to the Existing Funds.
Ethics. The Board generally considers the Advisor’s commitment to providing quality services to the Existing Funds and to conducting its business ethically. They noted that the Advisor’s practices generally meet or exceed industry best practices.
Economies of Scale. The Board also reviewed information provided by the Advisor regarding the possible existence of economies of scale in connection with the management of each Existing Fund. The Board concluded that economies of scale are difficult to measure and predict with precision, especially on a fund-by-fund basis. The Board concluded that the Advisor is sharing economies of scale, to the extent they exist, through its fee structure and through reinvestment in its business, infrastructure, investment capabilities and initiatives to provide shareholders additional content and services.
Comparison to Other Funds’ Fees. The management agreement provides that each Existing Fund pays the Advisor a single, all-inclusive (or unified) management fee for providing all services necessary for the management and operation of the Existing Fund, other than securities transaction expenses, taxes, interest, extraordinary expenses, and expenses incurred in connection with the provision of shareholder services and distribution services under a plan adopted pursuant to Rule 12b-1 under the Investment Company Act. Under the unified fee structure, the Advisor is responsible for providing all investment advisory, custody, audit, administrative, compliance, recordkeeping, marketing and shareholder services, or arranging and supervising third parties to provide such services. The Board believes the unified fee structure is a benefit to Existing Fund shareholders because it clearly discloses to shareholders the cost of owning Existing Fund shares, and, since the unified fee cannot be increased without a vote of Existing Fund shareholders, it shifts to the Advisor the risk of increased costs of operating the Existing Fund and provides a direct incentive to minimize administrative inefficiencies. Part of the Board’s analysis of fee levels involves reviewing certain evaluative data compiled by an independent provider comparing the Existing Fund’s unified fee to the total expense ratios of its peers. The unified fee charged to shareholders of Avantis U.S. Equity ETF was below the median of the total expense ratios of its peer expense universe and was within the range of its peer expense group. The unified fee charged to shareholders of Avantis Real Estate ETF, Avantis U.S. Large Cap Value ETF, and Avantis U.S. Small Cap Value ETF was the lowest of the total expense ratios of their respective peer expense universe and was the lowest of their peer expense group. The Board concluded that the management fee paid by each Existing Fund to the Advisor under its management agreement is reasonable in light of the services provided to the Existing Fund.
Comparison to Fees and Services Provided to Other Clients of the Advisor. The Board also requested and received information from the Advisor concerning the nature of the services, fees, costs, and profitability of its advisory services to funds or other advisory clients managed similarly to the Existing Funds. They observed that these varying types of client accounts require different services and involve different regulatory and entrepreneurial risks than the management of the
153
Existing Funds. The Board analyzed this information and concluded that the fees charged and services provided to the Existing Funds were reasonable by comparison.
Payments to Intermediaries. The Trustees also requested and received a description of payments made to intermediaries by each Existing Fund and the Advisor and services provided in response thereto. These payments could include various payments made by each Existing Fund or the Advisor to different types of intermediaries and recordkeepers for distribution and service activities provided for each Existing Fund. The Trustees reviewed such information and received representations from the Advisor that all such payments by the Advisor were made from the Advisor’s resources and reasonable profits.
Collateral or “Fall-Out” Benefits Derived by the Advisor. The Board considered the possible existence of collateral benefits the Advisor may receive as a result of its relationship with the Existing Funds. They concluded that the Advisor’s primary business is managing funds and it generally does not use fund or shareholder information to generate profits in other lines of business, and therefore does not derive any significant collateral benefits from them. The Board noted that additional assets from other clients may offer the Advisor some benefit from increased leverage with service providers and counterparties. The Board also determined that the Advisor is able to provide investment management services to certain clients other than the Existing Funds, at least in part, due to its existing infrastructure built to serve the fund complex. The Board concluded that appropriate allocation methodologies had been employed to assign resources and the cost of those resources to these other clients.
Existing Relationship. The Board also considered whether there was any reason for not continuing the existing arrangement with the Advisor. In this regard, the Board was mindful of the potential disruptions of the Existing Funds’ operations and various risks, uncertainties, and other effects that could occur as a result of a decision not to continue such relationship. In particular, the Board recognized that most shareholders have invested in each Existing Fund on the strength of the Advisor’s industry standing and reputation and in the expectation that the Advisor will have a continuing role in providing advisory services to each Existing Fund.
Conclusion of the Trustees. As a result of this process, the Board, including all of the independent Trustees, taking into account all of the factors discussed above and the information provided by the Advisor and others in connection with its review and throughout the year, determined that the terms of the management fee are fair and reasonable and that the management fee charged to each Existing Fund is fair in light of the services provided and that the investment management agreement between each Existing Fund and the Advisor should be renewed for an additional one-year period.
154
| Liquidity Risk Management Program | ||
The Funds have adopted a liquidity risk management program (the “program”). The Funds' Board of Trustees (the "Board") has designated American Century Investment Management, Inc. (“ACIM”) as the administrator of the program. Personnel of ACIM or its affiliates conduct the day-to-day operation of the program pursuant to policies and procedures administered by the Program Administrator, including members of ACIM’s Investment Oversight Committee who are members of the ACIM’s Investment Management and Global Analytics departments.
Under the program, ACIM manages the Funds' liquidity risk, which is the risk that the Funds could not meet shareholder redemption requests without significant dilution of remaining shareholders’ interests in the Funds. This risk is managed by monitoring the degree of liquidity of the Funds' investments, limiting the amount of the Funds' illiquid investments, and utilizing various risk management tools and facilities available to the Funds for meeting shareholder redemptions, among other means. ACIM’s process of determining the degree of liquidity of certain Funds' investments is supported by a third-party liquidity assessment vendor.
The Board reviewed a report prepared by ACIM regarding the operation and effectiveness of the program for the period January 1, 2021 through December 31, 2021. No significant liquidity events impacting the Funds were noted in the report. In addition, ACIM provided its assessment that the program had been effective in managing the Funds' liquidity risk.
155
| Additional Information | ||
Retirement Account Information
As required by law, distributions you receive from certain retirement accounts are subject to federal income tax withholding, unless you elect not to have withholding apply*. Tax will be withheld on the total amount withdrawn even though you may be receiving amounts that are not subject to withholding, such as nondeductible contributions. In such case, excess amounts of withholding could occur. You may adjust your withholding election so that a greater or lesser amount will be withheld.
Remember, even if you elect not to have income tax withheld, you are liable for paying income tax on the taxable portion of your withdrawal. If you elect not to have income tax withheld or you don’t have enough income tax withheld, you may be responsible for payment of estimated tax. You may incur penalties under the estimated tax rules if your withholding and estimated tax payments are not sufficient. You can reduce or defer the income tax on a distribution by directly or indirectly rolling such distribution over to another IRA or eligible plan. You should consult your tax advisor for additional information.
State tax will be withheld if, at the time of your distribution, your address is within one of the mandatory withholding states and you have federal income tax withheld (or as otherwise required by state law). State taxes will be withheld from your distribution in accordance with the respective state rules.
*Some 403(b), 457 and qualified retirement plan distributions may be subject to 20% mandatory withholding, as they are subject to special tax and withholding rules. Your plan administrator or plan sponsor is required to provide you with a special tax notice explaining those rules at the time you request a distribution. If applicable, federal and/or state taxes may be withheld from your distribution amount.
Proxy Voting Policies
A description of the policies that the funds' investment advisor uses in exercising the voting rights associated with the securities purchased and/or held by the funds is available without charge, upon request, by calling 1-800-345-6488. It is also available on American Century Investments’ website at americancentury.com/proxy and on the Securities and Exchange Commission’s website at sec.gov. Information regarding how the investment advisor voted proxies relating to portfolio securities during the most recent 12-month period ended June 30 is available at americancentury.com/proxy. It is also available at sec.gov.
Quarterly Portfolio Disclosure
The funds file their complete schedule of portfolio holdings with the Securities and Exchange Commission (SEC) for the first and third quarters of each fiscal year as an exhibit to their reports on Form N-PORT. The funds' Form N-PORT reports are available on the SEC’s website at sec.gov.
156
Other Tax Information
The following information is provided pursuant to provisions of the Internal Revenue Code.
The funds hereby designate up to the maximum amount allowable as qualified dividend income for the fiscal year ended August 31, 2022.
For corporate taxpayers, the funds hereby designate the following, or up to the maximum amount allowable, of ordinary income distributions paid during the fiscal year ended August 31, 2022 as qualified for the corporate dividends received deduction.
| Avantis Real Estate ETF | Avantis U.S. Equity ETF | Avantis U.S. Large Cap Value ETF | Avantis U.S. Small Cap Equity ETF | Avantis U.S. Small Cap Value ETF | ||||||||||
| — | $24,641,184 | $2,368,608 | $32,394 | $36,861,258 | ||||||||||
157
| Notes | ||||||||||||||
158
| ||||||||
| Contact Us | avantisinvestors.com | |||||||
| American Century Sales Representatives, Financial Professionals, Broker Dealers, Insurance Companies, Banks and Trust Companies | 1-833-928-2684 | |||||||
| Telecommunications Relay Service for the Deaf | 711 | |||||||
| American Century ETF Trust | ||||||||
Investment Advisor: American Century Investment Management, Inc. Kansas City, Missouri | ||||||||
Distributor: Foreside Fund Services, LLC - Distributor, not affiliated with American Century Investment Services, Inc. | ||||||||
| This report and the statements it contains are submitted for the general information of our shareholders. The report is not authorized for distribution to prospective investors unless preceded or accompanied by an effective prospectus. | ||||||||
| ©2022 American Century Proprietary Holdings, Inc. All rights reserved. CL-ANN-97504 2210 | ||||||||
| Annual Report | |||||
| August 31, 2022 | |||||
Avantis® Emerging Markets Equity ETF (AVEM) | |||||
Avantis® Emerging Markets Value ETF (AVES) | |||||
Avantis® International Equity ETF (AVDE) | |||||
Avantis® International Large Cap Value ETF (AVIV) | |||||
Avantis® International Small Cap Value ETF (AVDV) | |||||
| Table of Contents | ||
| Chairman’s Letter | |||||
| Avantis Emerging Markets Equity ETF | |||||
| Performance | |||||
| Portfolio Commentary | |||||
| Fund Characteristics | |||||
| Avantis Emerging Markets Value ETF | |||||
| Performance | |||||
| Portfolio Commentary | |||||
| Fund Characteristics | |||||
| Avantis International Equity ETF | |||||
| Performance | |||||
| Portfolio Commentary | |||||
| Fund Characteristics | |||||
| Avantis International Large Cap Value ETF | |||||
| Performance | |||||
| Portfolio Commentary | |||||
| Fund Characteristics | |||||
| Avantis International Small Cap Value ETF | |||||
| Performance | |||||
| Portfolio Commentary | |||||
| Fund Characteristics | |||||
| Shareholder Fee Examples | |||||
| Schedules of Investments | |||||
| Statements of Assets and Liabilities | |||||
| Statements of Operations | |||||
| Statements of Changes in Net Assets | |||||
| Notes to Financial Statements | |||||
| Financial Highlights | |||||
| Report of Independent Registered Public Accounting Firm | |||||
| Management | |||||
| Approval of Management Agreement | |||||
| Liquidity Risk Management Program | |||||
| Additional Information | |||||
Any opinions expressed in this report reflect those of the author as of the date of the report, and do not necessarily represent the opinions of American Century Investments® or any other person in the American Century Investments organization. Any such opinions are subject to change at any time based upon market or other conditions and American Century Investments disclaims any responsibility to update such opinions. These opinions may not be relied upon as investment advice and, because investment decisions made by American Century Investments funds are based on numerous factors, may not be relied upon as an indication of trading intent on behalf of any American Century Investments fund. Security examples are used for representational purposes only and are not intended as recommendations to purchase or sell securities. Performance information for comparative indices and securities is provided to American Century Investments by third party vendors. To the best of American Century Investments’ knowledge, such information is accurate at the time of printing.
| Chairman's Letter | ||
Jonathan ThomasDear Investor:
Thank you for reviewing this annual report for the period ended August 31, 2022. Annual reports
help convey important information about fund returns, including market factors that affected
performance. For additional investment insights, please visit avantisinvestors.com.
Mounting Market Challenges Hampered Performance
Asset class performance weakened dramatically during the funds’ fiscal year. In late 2021,
generally upbeat economic activity and corporate earnings supported gains for most U.S. and
global stock indices. Returns generally remained positive despite rapidly rising inflation and waning
central bank support—factors that had started to weigh on fixed-income indices.
By early 2022, the market climate shifted quickly. Inflation, which was already at multiyear highs,
rose to levels last seen in the early 1980s. Massive fiscal and monetary support unleashed during
the pandemic was partly to blame. In addition, escalating energy prices, supply chain breakdowns
and labor market shortages further aggravated inflation in the U.S. and other developed markets.
Russia’s invasion of Ukraine in February also exacerbated global inflationary pressures.
The Bank of England launched its inflation-fighting campaign in December and continued to lift
rates through period-end. The Federal Reserve responded to surging inflation in March, launching
an aggressive rate-hike campaign and ending its asset purchase program. Policymakers indicated
taming inflation remains their priority, even as the U.S. economy contracted in 2022’s first two
quarters. Facing record-high inflation in the eurozone, the European Central Bank in July embarked
on its first rate-hike effort in 11 years.
The combination of sharply elevated inflation, tighter monetary policy, geopolitical strife and weak
economies triggered sharp market volatility and fueled global recession fears. Against this
backdrop, most U.S. and global stock and bond indices declined sharply for the reporting period.
Staying Disciplined in Uncertain Times
We expect market volatility to linger as investors navigate a complex environment of high inflation,
rising interest rates and economic uncertainty. In addition, Russia’s invasion of Ukraine
complicates an increasingly tense geopolitical backdrop and threatens Europe’s winter energy
supply. We will continue to monitor the broad backdrop and its influence on financial markets.
We appreciate your confidence in us during these extraordinary times. Our firm has a long history
of helping clients weather unpredictable markets, and we’re confident we will continue to meet
today’s challenges.
Sincerely,
Jonathan Thomas
Chairman
Avantis Investors
2
| Performance | ||
| Avantis Emerging Markets Equity ETF (AVEM) | ||||||||||||||||||||||||||
| Total Returns as of August 31, 2022 | Average Annual Returns | |||||||||||||||||||||||||
| 1 year | Since Inception | Inception Date | ||||||||||||||||||||||||
| Net Asset Value | -20.36% | 3.08% | 9/17/2019 | |||||||||||||||||||||||
| Market Price | -20.82% | 2.97% | 9/17/2019 | |||||||||||||||||||||||
| MSCI Emerging Markets IMI Index | -21.15% | 2.41% | — | |||||||||||||||||||||||
Market price is determined using the bid/ask midpoint at 4:00 p.m. Eastern time, when the net asset value (NAV) is typically calculated. Market performance does not represent the returns you would receive if you traded shares at other times. NAV prices are used to calculate market price performance prior to the date when the fund first traded on the NYSE Arca, Inc.
| Growth of $10,000 Over Life of Fund | ||
| $10,000 investment made September 17, 2019 | ||
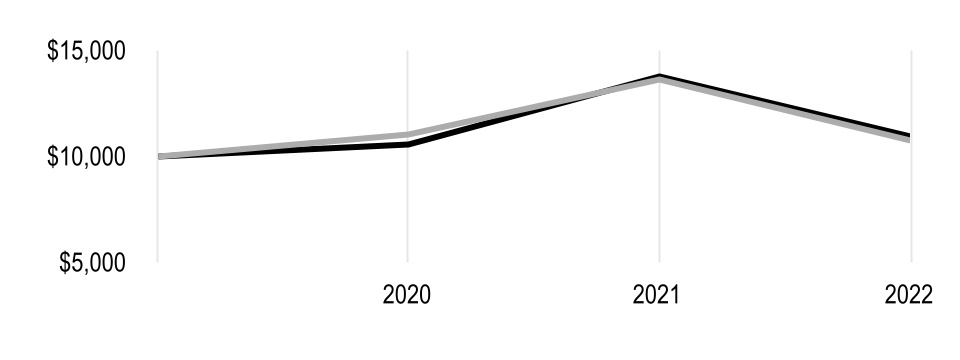
| Value on August 31, 2022 | |||||
| Net Asset Value — $10,937 | |||||
| MSCI Emerging Markets IMI Index — $10,730 | |||||
| Total Annual Fund Operating Expenses | |||||||||||||||||
| 0.33% | |||||||||||||||||
The total annual fund operating expenses shown is as stated in the fund’s prospectus current as of the date of this report. The prospectus may vary from the expense ratio shown elsewhere in this report because it is based on a different time period, includes acquired fund fees and expenses, and, if applicable, does not include fee waivers or expense reimbursements.
Data presented reflect past performance. Past performance is no guarantee of future results. Current performance may be higher or lower than the performance shown. Total returns for periods less than one year are not annualized. Investment return and principal value will fluctuate, and redemption value may be more or less than original cost. Data assumes reinvestment of dividends and capital gains, and none of the charts reflect the deduction of taxes that a shareholder would pay on fund distributions or the redemption of fund shares. To obtain performance data current to the most recent month end, please call 1-833-928-2684 or visit avantisinvestors.com. For additional information about the funds, please consult the prospectus.
3
| Portfolio Commentary | ||
Portfolio Managers: Eduardo Repetto, Mitch Firestein, Daniel Ong and Ted Randall
Fund Strategy
Avantis Emerging Markets Equity ETF seeks long-term capital appreciation by investing in a diverse group of companies related to emerging markets across market sectors, industry groups, countries and market capitalizations.
The fund seeks securities of companies that it expects to have higher returns. It places an enhanced emphasis on securities of companies with smaller market capitalizations and securities of companies it defines as high profitability or value companies. Conversely, the fund seeks to underweight or exclude securities it expects to have lower returns. These include securities of large companies with lower levels of profitability and higher prices relative to their book values or other financial metrics. Under normal market conditions, the fund will invest at least 80% of its assets in equity securities of companies related to emerging markets countries.
The fund is an actively managed exchange-traded fund (ETF) that does not seek to replicate the performance of a specified index. The portfolio managers continually analyze market and financial data to make buy, sell and hold decisions. When buying or selling a security, the portfolio managers may consider the trade-off between expected returns of the security and implementation or tax costs of the trade. They do this in an attempt to gain trading efficiencies, avoid unnecessary risk and enhance fund performance.
Performance Review
For the 12-month period ended August 31, 2022, Avantis Emerging Markets Equity ETF returned -20.82% on a market price basis. On a net asset value (NAV) basis, the fund returned -20.36%. NAV and market price returns reflect fees and operating expenses, while index returns do not.
The fund outperformed the broad emerging markets stock universe, as measured by the MSCI Emerging Markets IMI Index, which returned -21.15% for the reporting period. The MSCI Emerging Markets IMI Index is an unmanaged index generally representative of the performance of emerging markets stocks across capitalization categories.
The outperformance versus the index was largely due to the fund’s emphasis on companies with higher levels of profitability and lower prices relative to their book values. These value-oriented companies generally outperformed companies with lower levels of profitability and higher prices relative to their book values, or more growth-oriented firms. The fund’s underweight to growth-oriented companies versus the index also aided results.
Value stocks, as measured by the MSCI Emerging Markets IMI Value Index, returned -16.99% for the period. Growth stocks, as measured by the MSCI Emerging Markets IMI Growth Index, lagged their value-style counterparts, returning -24.94%.
4
| Fund Characteristics | ||
| AUGUST 31, 2022 | |||||
| Avantis Emerging Markets Equity ETF | |||||
| Types of Investments in Portfolio | % of net assets | ||||
| Common Stocks | 99.6% | ||||
| Warrants | —* | ||||
| Corporate Bonds | —* | ||||
| Rights | —* | ||||
| Short-Term Investments | 1.7% | ||||
| Other Assets and Liabilities | (1.3)% | ||||
| *Category is less than 0.05% of total net assets. | |||||
| Top Five Countries | % of net assets | ||||
| China | 28.8% | ||||
| Taiwan | 17.2% | ||||
| India | 17.2% | ||||
| South Korea | 13.1% | ||||
| Brazil | 6.1% | ||||
5
| Performance | ||
| Avantis Emerging Markets Value ETF (AVES) | |||||||||||||||||||||||||||||
| Total Returns as of August 31, 2022 | |||||||||||||||||||||||||||||
| Since Inception | Inception Date | ||||||||||||||||||||||||||||
| Net Asset Value | -14.38% | 9/28/2021 | |||||||||||||||||||||||||||
| Market Price | -14.34% | 9/28/2021 | |||||||||||||||||||||||||||
| MSCI Emerging Markets IMI Value Index | -14.71% | — | |||||||||||||||||||||||||||
Market price is determined using the bid/ask midpoint at 4:00 p.m. Eastern time, when the net asset value (NAV) is typically calculated. Market performance does not represent the returns you would receive if you traded shares at other times. NAV prices are used to calculate market price performance prior to the date when the fund first traded on the NYSE Arca, Inc.
| Growth of $10,000 Over Life of Fund | ||
| $10,000 investment made September 28, 2021 | ||
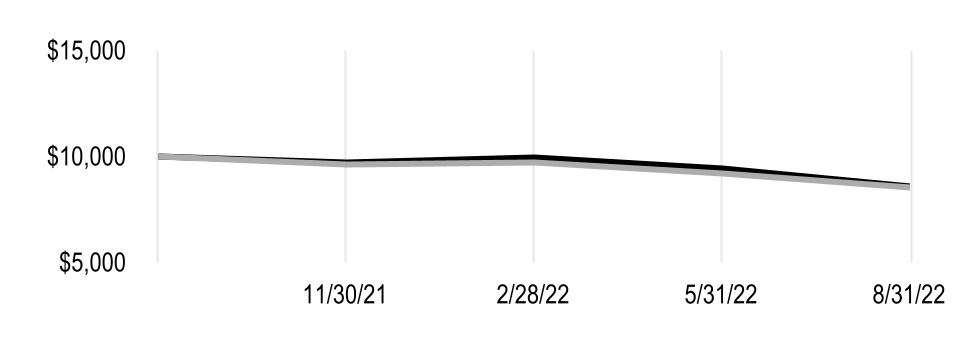
| Value on August 31, 2022 | |||||
| Net Asset Value — $8,562 | |||||
| MSCI Emerging Markets IMI Value Index — $8,529 | |||||
| Total Annual Fund Operating Expenses | |||||||||||||||||
| 0.36% | |||||||||||||||||
The total annual fund operating expenses shown is as stated in the fund’s prospectus current as of the date of this report. The prospectus may vary from the expense ratio shown elsewhere in this report because it is based on a different time period, includes acquired fund fees and expenses, and, if applicable, does not include fee waivers or expense reimbursements.
Data presented reflect past performance. Past performance is no guarantee of future results. Current performance may be higher or lower than the performance shown. Total returns for periods less than one year are not annualized. Investment return and principal value will fluctuate, and redemption value may be more or less than original cost. Data assumes reinvestment of dividends and capital gains, and none of the charts reflect the deduction of taxes that a shareholder would pay on fund distributions or the redemption of fund shares. To obtain performance data current to the most recent month end, please call 1-833-928-2684 or visit avantisinvestors.com. For additional information about the funds, please consult the prospectus.
6
| Portfolio Commentary | ||
Portfolio Managers: Eduardo Repetto, Mitch Firestein, Daniel Ong and Ted Randall
Fund Strategy
Avantis Emerging Markets Value ETF seeks long-term capital appreciation by investing in a diverse group of companies related to emerging markets across market sectors, industry groups, countries and market capitalizations.
The fund seeks securities of companies that it expects to have higher returns. It places an enhanced emphasis on securities of companies with smaller market capitalizations and securities of companies with higher profitability and value characteristics. Conversely, the fund seeks to underweight or exclude securities it expects to have lower returns. These include securities of larger companies with lower levels of profitability and less attractive value characteristics. Under normal market conditions, the fund will invest at least 80% of its assets in equity securities of companies related to emerging markets countries.
The fund is an actively managed exchange-traded fund (ETF) that does not seek to replicate the performance of a specified index. The portfolio managers continually analyze market and financial data to make buy, sell and hold decisions. When buying or selling a security, the portfolio managers may consider the trade-off between expected returns of the security and implementation or tax costs of the trade. They do this in an attempt to gain trading efficiencies, avoid unnecessary risk and enhance fund performance.
Performance Review
For the period from the portfolio’s inception on September 28, 2021, through August 31, 2022, Avantis Emerging Markets Value ETF returned -14.34%* on a market price basis. On a net asset value (NAV) basis, the fund returned -14.38%. NAV and market price returns reflect fees and operating expenses, while index returns do not.
The fund outperformed the broad emerging markets value stock universe, as measured by the MSCI Emerging Markets IMI Value Index, which returned -14.71% for the reporting period. The MSCI Emerging Markets IMI Value Index is an unmanaged index generally representative of the performance of emerging markets stocks with lower price-to-book ratios and lower forecasted growth values across capitalization categories.
The outperformance versus the index was largely due to the fund’s emphasis on companies with higher levels of profitability and lower prices relative to their book values. These companies generally outperformed companies with lower levels of profitability and higher prices relative to their book values.
*Total returns for periods less than one year are not annualized.
7
| Fund Characteristics | ||
| AUGUST 31, 2022 | |||||
| Avantis Emerging Markets Value ETF | |||||
| Types of Investments in Portfolio | % of net assets | ||||
| Common Stocks | 99.4% | ||||
| Warrants | —* | ||||
| Rights | —* | ||||
| Short-Term Investments | 1.8% | ||||
| Other Assets and Liabilities | (1.2)% | ||||
| *Category is less than 0.05% of total net assets. | |||||
| Top Five Countries | % of net assets | ||||
| China | 28.3% | ||||
| India | 17.5% | ||||
| Taiwan | 17.0% | ||||
| South Korea | 13.7% | ||||
| Brazil | 6.3% | ||||
8
| Performance | ||
| Avantis International Equity ETF (AVDE) | ||||||||||||||||||||||||||
| Total Returns as of August 31, 2022 | Average Annual Returns | |||||||||||||||||||||||||
| 1 year | Since Inception | Inception Date | ||||||||||||||||||||||||
| Net Asset Value | -18.85% | 2.59% | 9/24/2019 | |||||||||||||||||||||||
| Market Price | -18.95% | 2.62% | 9/24/2019 | |||||||||||||||||||||||
| MSCI World ex-USA IMI Index | -19.49% | 1.95% | — | |||||||||||||||||||||||
Market price is determined using the bid/ask midpoint at 4:00 p.m. Eastern time, when the net asset value (NAV) is typically calculated. Market performance does not represent the returns you would receive if you traded shares at other times. NAV prices are used to calculate market price performance prior to the date when the fund first traded on the NYSE Arca, Inc.
| Growth of $10,000 Over Life of Fund | ||
| $10,000 investment made September 24, 2019 | ||
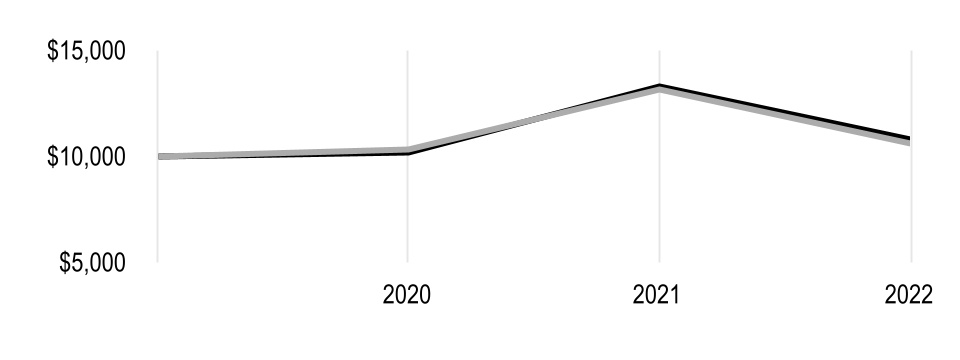
| Value on August 31, 2022 | |||||
| Net Asset Value — $10,781 | |||||
| MSCI World ex-USA IMI Index — $10,584 | |||||
| Total Annual Fund Operating Expenses | |||||||||||||||||
| 0.23% | |||||||||||||||||
The total annual fund operating expenses shown is as stated in the fund’s prospectus current as of the date of this report. The prospectus may vary from the expense ratio shown elsewhere in this report because it is based on a different time period, includes acquired fund fees and expenses, and, if applicable, does not include fee waivers or expense reimbursements.
Data presented reflect past performance. Past performance is no guarantee of future results. Current performance may be higher or lower than the performance shown. Total returns for periods less than one year are not annualized. Investment return and principal value will fluctuate, and redemption value may be more or less than original cost. Data assumes reinvestment of dividends and capital gains, and none of the charts reflect the deduction of taxes that a shareholder would pay on fund distributions or the redemption of fund shares. To obtain performance data current to the most recent month end, please call 1-833-928-2684 or visit avantisinvestors.com. For additional information about the funds, please consult the prospectus.
9
| Portfolio Commentary | ||
Portfolio Managers: Eduardo Repetto, Mitch Firestein, Daniel Ong and Ted Randall
Fund Strategy
Avantis International Equity ETF seeks long-term capital appreciation by investing in a diverse group of non-U.S. companies across countries, market sectors, industry groups and market capitalizations.
The fund seeks securities of companies that it expects to have higher returns. It places an emphasis on the securities of companies with smaller market capitalizations and securities of companies it defines as high profitability or value companies. Conversely, the fund seeks to underweight or exclude securities it expects to have lower returns. These include securities of large companies with lower levels of profitability and higher prices relative to their book values or other financial metrics. Under normal market conditions, the fund will invest at least 80% of its assets in equity securities.
The fund is an actively managed exchange-traded fund (ETF) that does not seek to replicate the performance of a specified index. The portfolio managers continually analyze market and financial data to make buy, sell and hold decisions. When buying or selling a security, the portfolio managers may consider the trade-off between expected returns of the security and implementation or tax costs of the trade. They do this in an attempt to gain trading efficiencies, avoid unnecessary risk and enhance fund performance.
Performance Review
For the 12-month period ended August 31, 2022, Avantis International Equity ETF returned -18.95% on a market price basis. On a net asset value (NAV) basis, the portfolio returned -18.85%. NAV and market price returns reflect fees and operating expenses, while index returns do not.
The fund outperformed the total non-U.S. developed markets stock universe, as measured by the MSCI World ex-USA IMI Index, which returned -19.49% for the reporting period. The MSCI World ex-USA IMI Index is an unmanaged index generally representative of the performance of non-U.S. developed markets stocks across capitalization categories.
The outperformance versus the index was largely due to the fund’s emphasis on companies with higher levels of profitability and lower prices relative to their book values. These value-oriented companies generally outperformed companies with lower levels of profitability and higher prices relative to their book values. The fund’s underweight to companies with the lowest levels of profitability and book-to-market values also aided results.
Value stocks, as measured by the MSCI World ex-USA IMI Value Index, returned -13.09% for the reporting period. These securities outperformed growth stocks, which returned -25.91%, according to the MSCI World ex-USA IMI Growth Index.
10
| Fund Characteristics | ||
| AUGUST 31, 2022 | |||||
| Avantis International Equity ETF | |||||
| Types of Investments in Portfolio | % of net assets | ||||
| Common Stocks | 99.5% | ||||
| Warrants | —* | ||||
| Rights | —* | ||||
| Short-Term Investments | 3.5% | ||||
| Other Assets and Liabilities | (3.0)% | ||||
| *Category is less than 0.05% of total net assets. | |||||
| Top Five Countries | % of net assets | ||||
| Japan | 21.1% | ||||
| United Kingdom | 13.6% | ||||
| Canada | 11.4% | ||||
| France | 8.8% | ||||
| Switzerland | 8.4% | ||||
11
| Performance | ||
| Avantis International Large Cap Value ETF (AVIV) | ||||||||||||||||||||||||||
| Total Returns as of August 31, 2022 | ||||||||||||||||||||||||||
| Since Inception | Inception Date | |||||||||||||||||||||||||
| Net Asset Value | -13.93% | 9/28/2021 | ||||||||||||||||||||||||
| Market Price | -13.82% | 9/28/2021 | ||||||||||||||||||||||||
| MSCI World ex-USA Value Index | -10.95% | — | ||||||||||||||||||||||||
Market price is determined using the bid/ask midpoint at 4:00 p.m. Eastern time, when the net asset value (NAV) is typically calculated. Market performance does not represent the returns you would receive if you traded shares at other times. NAV prices are used to calculate market price performance prior to the date when the fund first traded on the NYSE Arca, Inc.
| Growth of $10,000 Over Life of Fund | ||
| $10,000 investment made September 28, 2021 | ||
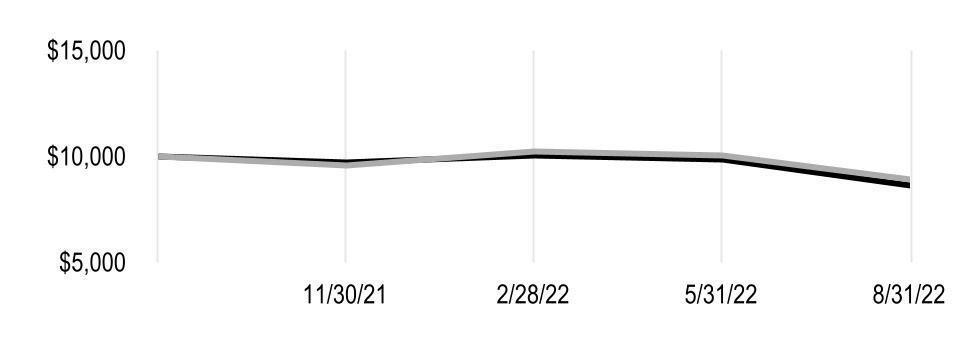
| Value on August 31, 2022 | |||||
| Net Asset Value — $8,607 | |||||
| MSCI World ex-USA Value Index — $8,905 | |||||
| Total Annual Fund Operating Expenses | |||||||||||||||||
| 0.25% | |||||||||||||||||
The total annual fund operating expenses shown is as stated in the fund’s prospectus current as of the date of this report. The prospectus may vary from the expense ratio shown elsewhere in this report because it is based on a different time period, includes acquired fund fees and expenses, and, if applicable, does not include fee waivers or expense reimbursements.
Data presented reflect past performance. Past performance is no guarantee of future results. Current performance may be higher or lower than the performance shown. Total returns for periods less than one year are not annualized. Investment return and principal value will fluctuate, and redemption value may be more or less than original cost. Data assumes reinvestment of dividends and capital gains, and none of the charts reflect the deduction of taxes that a shareholder would pay on fund distributions or the redemption of fund shares. To obtain performance data current to the most recent month end, please call 1-833-928-2684 or visit avantisinvestors.com. For additional information about the funds, please consult the prospectus.
12
| Portfolio Commentary | ||
Portfolio Managers: Eduardo Repetto, Mitch Firestein, Daniel Ong and Ted Randall
Fund Strategy
Avantis International Large Cap Value ETF seeks long-term capital appreciation by investing in a diverse group of non-U.S. companies across countries, market sectors and industry groups.
The fund seeks securities of companies that it expects to have higher returns. It places an enhanced emphasis on securities of companies with higher profitability and value characteristics. Conversely, the fund seeks to underweight or exclude securities it expects to have lower returns. These include securities of companies with lower levels of profitability and less attractive value characteristics. Under normal market conditions, the fund will invest at least 80% of its assets in securities of large-capitalization (large-cap) companies.
The fund is an actively managed exchange-traded fund (ETF) that does not seek to replicate the performance of a specified index. The portfolio managers continually analyze market and financial data to make buy, sell and hold decisions. When buying or selling a security, the portfolio managers may consider the trade-off between expected returns of the security and implementation or tax costs of the trade. They do this in an attempt to gain trading efficiencies, avoid unnecessary risk and enhance fund performance.
Performance Review
For the period from the portfolio’s inception on September 28, 2021, through August 31, 2022, Avantis International Large Cap Value ETF returned -13.82%* on a market price basis. On a net asset value (NAV) basis, the fund returned -13.93%. NAV and market price returns reflect fees and operating expenses, while index returns do not.
The fund underperformed the total non-U.S. developed markets value stock universe, as measured by the MSCI World ex-USA Value Index, which returned -10.95% for the reporting period. The MSCI World ex-USA Value Index is an unmanaged index generally representative of the performance of non-U.S. developed markets stocks with lower price-to-book ratios and lower forecasted growth values.
The underperformance versus the index was largely due to the fund’s overweight versus the index in large- and mid-cap companies with high book-to-market and profitability characteristics. Stocks of these companies underperformed mega caps for the reporting period.
*Total returns for periods less than one year are not annualized.
13
| Fund Characteristics | ||
| AUGUST 31, 2022 | |||||
| Avantis International Large Cap Value ETF | |||||
| Types of Investments in Portfolio | % of net assets | ||||
| Common Stocks | 99.5% | ||||
| Short-Term Investments | 8.3% | ||||
| Other Assets and Liabilities | (7.8)% | ||||
| Top Five Countries | % of net assets | ||||
| Japan | 20.3% | ||||
| United Kingdom | 19.1% | ||||
| Canada | 11.8% | ||||
| Germany | 8.8% | ||||
| France | 7.4% | ||||
14
| Performance | ||
| Avantis International Small Cap Value ETF (AVDV) | ||||||||||||||||||||||||||
| Total Returns as of August 31, 2022 | Average Annual Returns | |||||||||||||||||||||||||
| 1 year | Since Inception | Inception Date | ||||||||||||||||||||||||
| Net Asset Value | -16.92% | 4.34% | 9/24/2019 | |||||||||||||||||||||||
| Market Price | -17.05% | 4.37% | 9/24/2019 | |||||||||||||||||||||||
| MSCI World ex-USA Small Cap Index | -24.53% | 2.51% | — | |||||||||||||||||||||||
Market price is determined using the bid/ask midpoint at 4:00 p.m. Eastern time, when the net asset value (NAV) is typically calculated. Market performance does not represent the returns you would receive if you traded shares at other times. NAV prices are used to calculate market price performance prior to the date when the fund first traded on the NYSE Arca, Inc.
| Growth of $10,000 Over Life of Fund | ||
| $10,000 investment made September 24, 2019 | ||
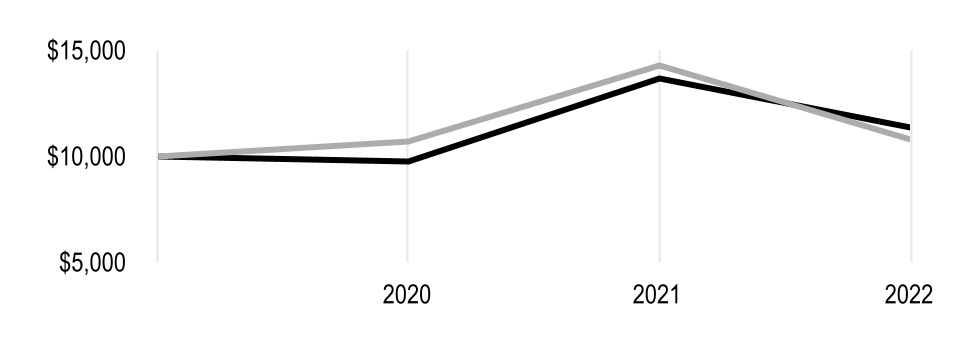
| Value on August 31, 2022 | |||||
| Net Asset Value — $11,330 | |||||
| MSCI World ex-USA Small Cap Index — $10,756 | |||||
| Total Annual Fund Operating Expenses | |||||||||||||||||
| 0.36% | |||||||||||||||||
The total annual fund operating expenses shown is as stated in the fund’s prospectus current as of the date of this report. The prospectus may vary from the expense ratio shown elsewhere in this report because it is based on a different time period, includes acquired fund fees and expenses, and, if applicable, does not include fee waivers or expense reimbursements.
Data presented reflect past performance. Past performance is no guarantee of future results. Current performance may be higher or lower than the performance shown. Total returns for periods less than one year are not annualized. Investment return and principal value will fluctuate, and redemption value may be more or less than original cost. Data assumes reinvestment of dividends and capital gains, and none of the charts reflect the deduction of taxes that a shareholder would pay on fund distributions or the redemption of fund shares. To obtain performance data current to the most recent month end, please call 1-833-928-2684 or visit avantisinvestors.com. For additional information about the funds, please consult the prospectus.
15
| Portfolio Commentary | ||
Portfolio Managers: Eduardo Repetto, Mitch Firestein, Daniel Ong and Ted Randall
Fund Strategy
Avantis International Small Cap Value ETF seeks long-term capital appreciation by investing in a diverse group of non-U.S. small-capitalization (small-cap) value companies across countries, market sectors and industry groups.
The fund seeks securities of companies that it expects to have higher returns. It places an enhanced emphasis on securities of companies with smaller market capitalizations and securities of companies with higher profitability and value characteristics. Conversely, the fund seeks to underweight or exclude securities it expects to have lower returns. These include securities of larger companies with lower levels of profitability and less attractive value characteristics. Under normal market conditions, the fund will invest at least 80% of its assets in securities of small-cap companies.
The fund is an actively managed exchange-traded fund (ETF) that does not seek to replicate the performance of a specified index. The portfolio managers continually analyze market and financial data to make buy, sell and hold decisions. When buying or selling a security, the portfolio managers may consider the trade-off between expected returns of the security and implementation or tax costs of the trade. They do this in an attempt to gain trading efficiencies, avoid unnecessary risk and enhance fund performance.
Performance Review
For the 12-month period ended August 31, 2022, Avantis International Small Cap Value ETF returned -17.05% on a market price basis. On a net asset value (NAV) basis, the fund returned -16.92%. NAV and market price returns reflect fees and operating expenses, while index returns do not.
The fund outperformed the total non-U.S. developed markets small-cap stock universe, as measured by the MSCI World ex-USA Small Cap Index, which returned -24.53% for the reporting period. The MSCI World ex-USA Small Cap Index is an unmanaged index generally representative of the performance of non-U.S. developed markets small-cap stocks.
The outperformance versus the index was largely due to the fund’s emphasis on small-cap companies with higher levels of profitability and lower prices relative to their book values. These value-oriented companies generally outperformed companies with lower levels of profitability and higher prices relative to their book values, or more growth-oriented stocks.
Small-cap value stocks, as measured by the MSCI World ex-USA Small Cap Value Index, returned -19.00% for the reporting period. Small-cap growth stocks, as measured by the MSCI World ex-USA Small Cap Growth Index, lagged their value-style peers, returning -29.98%.
16
| Fund Characteristics | ||
| AUGUST 31, 2022 | |||||
| Avantis International Small Cap Value ETF | |||||
| Types of Investments in Portfolio | % of net assets | ||||
| Common Stocks | 99.6% | ||||
| Rights | —* | ||||
| Warrants | —* | ||||
| Short-Term Investments | 3.6% | ||||
| Other Assets and Liabilities | (3.2)% | ||||
| *Category is less than 0.05% of total net assets. | |||||
| Top Five Countries | % of net assets | ||||
| Japan | 27.0% | ||||
| United Kingdom | 14.3% | ||||
| Canada | 10.6% | ||||
| Australia | 9.7% | ||||
| Sweden | 5.1% | ||||
17
| Shareholder Fee Examples | ||
Fund shareholders may incur two types of costs: (1) transaction costs, including brokerage commissions paid on purchases and sales of fund shares; and (2) ongoing costs, including management fees and other fund expenses. This example is intended to help you understand your ongoing costs (in dollars) of investing in your fund and to compare these costs with the ongoing cost of investing in other funds.
The example is based on an investment of $1,000 made at the beginning of the period and held for the entire period from March 1, 2022 to August 31, 2022.
Actual Expenses
The table provides information about actual account values and actual expenses for each fund. You may use the information, together with the amount you invested, to estimate the expenses that you paid over the period. First, identify the fund you own. Then simply divide your account value by $1,000 (for example, an $8,600 account value divided by $1,000 = 8.6), then multiply the result by the number under the heading “Expenses Paid During Period” to estimate the expenses you paid on your account during this period.
Hypothetical Example for Comparison Purposes
The table also provides information about hypothetical account values and hypothetical expenses based on the actual expense ratio of your fund and an assumed rate of return of 5% per year before expenses, which is not the actual return of a fund. The hypothetical account values and expenses may not be used to estimate the actual ending account balance or expenses you paid for the period. You may use this information to compare the ongoing costs of investing in your fund and other funds. To do so, compare this 5% hypothetical example with the 5% hypothetical examples that appear in the shareholder reports of the other funds.
Please note that the expenses shown in the table are meant to highlight your ongoing costs only and do not reflect any transactional costs, such as brokerage commissions paid on purchases and sales of fund shares. Therefore, the table is useful in comparing ongoing costs only, and will not help you determine the relative total costs of owning different funds. In addition, if these transactional costs were included, your costs would have been higher.
18
| Beginning Account Value 3/1/22 | Ending Account Value 8/31/22 | Expenses Paid During Period(1) 3/1/22 - 8/31/22 | Annualized Expense Ratio(1) | |||||||||||
| Avantis Emerging Markets Equity ETF | ||||||||||||||
| Actual | $1,000 | $865.40 | $1.55 | 0.33% | ||||||||||
| Hypothetical | $1,000 | $1,023.54 | $1.68 | 0.33% | ||||||||||
| Avantis Emerging Markets Value ETF | ||||||||||||||
| Actual | $1,000 | $862.30 | $1.69 | 0.36% | ||||||||||
| Hypothetical | $1,000 | $1,023.39 | $1.84 | 0.36% | ||||||||||
| Avantis International Equity ETF | ||||||||||||||
| Actual | $1,000 | $858.50 | $1.08 | 0.23% | ||||||||||
| Hypothetical | $1,000 | $1,024.05 | $1.17 | 0.23% | ||||||||||
| Avantis International Large Cap Value ETF | ||||||||||||||
| Actual | $1,000 | $857.50 | $1.17 | 0.25% | ||||||||||
| Hypothetical | $1,000 | $1,023.95 | $1.28 | 0.25% | ||||||||||
| Avantis International Small Cap Value ETF | ||||||||||||||
| Actual | $1,000 | $867.10 | $1.69 | 0.36% | ||||||||||
| Hypothetical | $1,000 | $1,023.39 | $1.84 | 0.36% | ||||||||||
(1)Expenses are equal to the fund's annualized expense ratio listed in the table above, multiplied by the average account value over the period, multiplied by 184, the number of days in the most recent fiscal half-year, divided by 365, to reflect the one-half year period. Annualized expense ratio reflects actual expenses, including any applicable fee waivers or expense reimbursements and excluding any acquired fund fees and expenses.
19
| Schedules of Investments | ||
AUGUST 31, 2022
| Avantis Emerging Markets Equity ETF | |||||||||||
| Shares | Value | ||||||||||
| COMMON STOCKS — 99.6% | |||||||||||
| Brazil — 6.1% | |||||||||||
3R Petroleum Oleo E Gas SA(1) | 92,066 | $ | 659,915 | ||||||||
| Aeris Industria E Comercio De Equipamentos Para Geracao De Energia SA | 36,000 | 15,916 | |||||||||
| AES Brasil Energia SA | 100,200 | 186,440 | |||||||||
| Aliansce Sonae Shopping Centers SA | 54,530 | 183,639 | |||||||||
Alliar Medicos A Frente SA(1) | 10,800 | 41,561 | |||||||||
| Alpargatas SA, Preference Shares | 48,400 | 194,627 | |||||||||
| Alupar Investimento SA | 19,700 | 107,921 | |||||||||
| Ambev SA, ADR | 531,661 | 1,541,817 | |||||||||
| Americanas SA | 24,743 | 77,239 | |||||||||
| Arezzo Industria e Comercio SA | 7,300 | 129,571 | |||||||||
| Atacadao SA | 54,300 | 207,810 | |||||||||
| Auren Energia SA | 105,283 | 310,037 | |||||||||
Azul SA, ADR(1)(2) | 11,628 | 108,722 | |||||||||
| B3 SA - Brasil Bolsa Balcao | 609,200 | 1,399,343 | |||||||||
| Banco ABC Brasil SA, Preference Shares | 39,110 | 142,986 | |||||||||
| Banco BMG SA, Preference Shares | 46,900 | 23,710 | |||||||||
| Banco Bradesco SA | 213,798 | 649,317 | |||||||||
| Banco Bradesco SA, ADR | 852,581 | 3,094,869 | |||||||||
| Banco BTG Pactual SA | 167,600 | 824,727 | |||||||||
| Banco do Brasil SA | 160,190 | 1,286,163 | |||||||||
| Banco do Estado do Rio Grande do Sul SA, Class B Preference Shares | 122,800 | 264,134 | |||||||||
| Banco Pan SA, Preference Shares | 40,800 | 57,721 | |||||||||
Banco Santander Brasil SA, ADR(2) | 77,459 | 443,065 | |||||||||
| BB Seguridade Participacoes SA | 101,100 | 552,684 | |||||||||
| Bemobi Mobile Tech SA | 19,600 | 52,933 | |||||||||
| Boa Vista Servicos SA | 20,600 | 27,124 | |||||||||
| BR Malls Participacoes SA | 399,400 | 635,674 | |||||||||
| BR Properties SA | 107,100 | 170,046 | |||||||||
| BrasilAgro - Co. Brasileira de Propriedades Agricolas | 36,000 | 198,947 | |||||||||
Braskem SA, ADR(2) | 30,441 | 359,813 | |||||||||
BRF SA, ADR(1)(2) | 218,181 | 652,361 | |||||||||
C&A MODAS SA(1) | 27,000 | 16,763 | |||||||||
| Camil Alimentos SA | 43,500 | 83,782 | |||||||||
| CCR SA | 389,300 | 1,040,149 | |||||||||
Centrais Eletricas Brasileiras SA, ADR(2) | 73,658 | 658,502 | |||||||||
| Centrais Eletricas Brasileiras SA, Class B Preference Shares | 45,200 | 417,907 | |||||||||
| Cia Brasileira de Aluminio | 30,800 | 76,372 | |||||||||
Cia Brasileira de Distribuicao, ADR(2) | 131,366 | 535,973 | |||||||||
| Cia de Saneamento Basico do Estado de Sao Paulo, ADR | 80,360 | 752,170 | |||||||||
| Cia de Saneamento de Minas Gerais-COPASA | 99,100 | 257,541 | |||||||||
| Cia de Saneamento do Parana | 55,100 | 182,911 | |||||||||
| Cia de Saneamento do Parana, Preference Shares | 450,200 | 304,610 | |||||||||
| Cia de Transmissao de Energia Eletrica Paulista, Preference Shares | 43,900 | 202,016 | |||||||||
20
| Avantis Emerging Markets Equity ETF | |||||||||||
| Shares | Value | ||||||||||
| Cia Energetica de Minas Gerais, ADR | 366,946 | $ | 865,993 | ||||||||
| Cia Ferro Ligas da Bahia - FERBASA, Preference Shares | 19,200 | 195,159 | |||||||||
| Cia Paranaense de Energia, ADR | 79,808 | 523,540 | |||||||||
| Cia Paranaense de Energia, Preference Shares | 573,000 | 766,585 | |||||||||
Cia Siderurgica Nacional SA, ADR(2) | 317,208 | 856,462 | |||||||||
| Cielo SA | 460,200 | 487,410 | |||||||||
Clear Sale SA(1) | 38,200 | 41,193 | |||||||||
Construtora Tenda SA(1) | 33,700 | 38,154 | |||||||||
| Cosan SA | 94,996 | 366,296 | |||||||||
| CPFL Energia SA | 39,000 | 264,103 | |||||||||
| Cristal Pigmentos do Brasil SA, Preference Shares | 1,700 | 9,150 | |||||||||
| Cury Construtora e Incorporadora SA | 44,100 | 75,529 | |||||||||
| Cyrela Brazil Realty SA Empreendimentos e Participacoes | 89,200 | 244,844 | |||||||||
| Desktop - Sigmanet Comunicacao Multimidia S.A | 17,400 | 36,021 | |||||||||
| Dexco SA | 135,610 | 259,625 | |||||||||
| Dexxos Participacoes SA | 17,400 | 23,379 | |||||||||
| Direcional Engenharia SA | 14,000 | 34,769 | |||||||||
EcoRodovias Infraestrutura e Logistica SA(1) | 124,200 | 139,422 | |||||||||
| EDP - Energias do Brasil SA | 52,100 | 227,131 | |||||||||
Embraer SA, ADR(1) | 79,025 | 842,406 | |||||||||
| Enauta Participacoes SA | 80,400 | 257,007 | |||||||||
| Energisa SA | 88,200 | 720,194 | |||||||||
Eneva SA(1) | 127,600 | 379,190 | |||||||||
| Engie Brasil Energia SA | 61,800 | 483,599 | |||||||||
| Equatorial Energia SA | 140,900 | 656,237 | |||||||||
| Eternit SA | 36,400 | 90,258 | |||||||||
| Eucatex SA Industria e Comercio, Preference Shares | 16,500 | 26,261 | |||||||||
| Even Construtora e Incorporadora SA | 47,100 | 53,778 | |||||||||
| Ez Tec Empreendimentos e Participacoes SA | 49,900 | 172,363 | |||||||||
| Fleury SA | 43,200 | 130,537 | |||||||||
| Fras-Le SA | 25,137 | 61,606 | |||||||||
Gafisa SA(1) | 76,300 | 17,600 | |||||||||
| Gerdau SA, ADR | 367,016 | 1,655,242 | |||||||||
| Getnet Adquirencia e Servicos para Meios de Pagamento SA, ADR | 2,647 | 4,632 | |||||||||
Gol Linhas Aereas Inteligentes SA, ADR(2) | 11,371 | 43,437 | |||||||||
Gol Linhas Aereas Inteligentes SA, Preference Shares(1) | 22,120 | 42,944 | |||||||||
| GPS Participacoes e Empreendimentos SA | 5,200 | 13,594 | |||||||||
| Grendene SA | 44,600 | 64,897 | |||||||||
| Grupo SBF SA | 7,300 | 30,912 | |||||||||
| Guararapes Confeccoes SA | 29,400 | 52,161 | |||||||||
| Hapvida Participacoes e Investimentos SA | 203,685 | 286,202 | |||||||||
Hidrovias do Brasil SA(1) | 35,200 | 16,577 | |||||||||
| Hypera SA | 12,800 | 106,019 | |||||||||
| Iguatemi SA | 55,980 | 210,797 | |||||||||
| Iguatemi SA | 100,000 | 46,709 | |||||||||
| Instituto Hermes Pardini SA | 14,100 | 53,691 | |||||||||
| Inter & Co., Inc. | 5,966 | 24,244 | |||||||||
International Meal Co. Alimentacao SA, Class A(1) | 63,300 | 24,457 | |||||||||
| Iochpe Maxion SA | 64,800 | 170,271 | |||||||||
| Irani Papel e Embalagem SA | 27,700 | 40,732 | |||||||||
21
| Avantis Emerging Markets Equity ETF | |||||||||||
| Shares | Value | ||||||||||
IRB Brasil Resseguros S/A(1) | 194,096 | $ | 61,933 | ||||||||
| Itau Unibanco Holding SA, ADR | 867,942 | 4,287,633 | |||||||||
| Jalles Machado SA | 74,200 | 106,970 | |||||||||
| JBS SA | 156,100 | 887,859 | |||||||||
| JHSF Participacoes SA | 125,400 | 149,928 | |||||||||
| Kepler Weber SA | 29,400 | 119,354 | |||||||||
| Klabin SA | 263,100 | 958,861 | |||||||||
| Lavvi Empreendimentos Imobiliarios Ltda | 44,580 | 48,673 | |||||||||
| Light SA | 71,000 | 77,791 | |||||||||
| Localiza Rent a Car SA | 140,693 | 1,649,945 | |||||||||
| LOG Commercial Properties e Participacoes SA | 29,400 | 148,854 | |||||||||
Log-in Logistica Intermodal SA(1) | 27,967 | 212,451 | |||||||||
| Lojas Renner SA | 92,400 | 472,799 | |||||||||
| LPS Brasil Consultoria de Imoveis SA | 47,300 | 26,367 | |||||||||
| M Dias Branco SA | 16,700 | 137,005 | |||||||||
Magazine Luiza SA(1) | 135,700 | 112,162 | |||||||||
| Mahle-Metal Leve SA | 10,400 | 48,797 | |||||||||
| Marcopolo SA, Preference Shares | 182,300 | 91,809 | |||||||||
| Marfrig Global Foods SA | 131,800 | 334,415 | |||||||||
Marisa Lojas SA(1) | 43,087 | 20,954 | |||||||||
| Metalurgica Gerdau SA, Preference Shares | 303,800 | 581,041 | |||||||||
| Mills Estruturas e Servicos de Engenharia SA | 105,400 | 201,586 | |||||||||
| Minerva SA | 77,600 | 230,008 | |||||||||
| Mitre Realty Empreendimentos E Participacoes LTDA | 16,000 | 16,946 | |||||||||
| Movida Participacoes SA | 107,300 | 286,070 | |||||||||
| MRV Engenharia e Participacoes SA | 113,900 | 223,316 | |||||||||
| Multilaser Industrial SA | 57,100 | 52,903 | |||||||||
| Multiplan Empreendimentos Imobiliarios SA | 109,100 | 509,178 | |||||||||
| Natura & Co. Holding SA | 51,756 | 144,353 | |||||||||
| Odontoprev SA | 85,140 | 149,908 | |||||||||
Omega Energia SA(1) | 63,009 | 135,770 | |||||||||
Petro Rio SA(1) | 239,400 | 1,258,571 | |||||||||
| Petroleo Brasileiro SA, ADR | 406,451 | 5,808,185 | |||||||||
| Petroleo Brasileiro SA, ADR Preference Shares | 520,250 | 6,627,985 | |||||||||
| Petroreconcavo SA | 44,200 | 231,603 | |||||||||
| Porto Seguro SA | 25,400 | 103,750 | |||||||||
| Portobello SA | 24,300 | 46,616 | |||||||||
| Positivo Tecnologia SA | 60,400 | 137,695 | |||||||||
| Qualicorp Consultoria e Corretora de Seguros SA | 50,200 | 92,248 | |||||||||
| Raia Drogasil SA | 88,000 | 370,444 | |||||||||
| Randon SA Implementos e Participacoes, Preference Shares | 53,400 | 98,231 | |||||||||
| Rede D'Or Sao Luiz SA | 15,900 | 101,774 | |||||||||
| Romi SA | 10,966 | 28,414 | |||||||||
| Rumo SA | 181,600 | 705,121 | |||||||||
| Santos Brasil Participacoes SA | 122,100 | 189,637 | |||||||||
| Sao Martinho SA | 91,000 | 559,217 | |||||||||
Sendas Distribuidora SA, ADR(2) | 68,000 | 1,198,160 | |||||||||
| Ser Educacional SA | 19,800 | 23,635 | |||||||||
| SIMPAR SA | 94,900 | 195,367 | |||||||||
| SLC Agricola SA | 33,880 | 316,632 | |||||||||
StoneCo Ltd., A Shares(1) | 72,084 | 683,356 | |||||||||
22
| Avantis Emerging Markets Equity ETF | |||||||||||
| Shares | Value | ||||||||||
| Sul America SA | 155,527 | $ | 729,145 | ||||||||
| Suzano SA, ADR | 170,040 | 1,460,644 | |||||||||
| SYN prop e tech SA | 61,800 | 53,931 | |||||||||
| Taurus Armas SA, Preference Shares | 31,600 | 105,690 | |||||||||
Telefonica Brasil SA, ADR(2) | 36,836 | 299,108 | |||||||||
| TIM SA, ADR | 62,534 | 709,136 | |||||||||
| TOTVS SA | 112,000 | 611,841 | |||||||||
| Transmissora Alianca de Energia Eletrica SA | 105,200 | 845,256 | |||||||||
| Trisul SA | 18,100 | 16,248 | |||||||||
| Tupy SA | 23,900 | 122,523 | |||||||||
Ultrapar Participacoes SA, ADR(2) | 198,880 | 529,021 | |||||||||
| Unipar Carbocloro SA, Class B Preference Shares | 36,160 | 704,030 | |||||||||
| Usinas Siderurgicas de Minas Gerais SA Usiminas, Class A Preference Shares | 285,200 | 440,211 | |||||||||
| Vale SA, ADR | 749,216 | 9,305,263 | |||||||||
| Valid Solucoes e Servicos de Seguranca em Meios de Pagamento e Identificacao SA | 30,600 | 62,113 | |||||||||
| Vamos Locacao de Caminhoes Maquinas e Equipamentos SA | 18,000 | 49,270 | |||||||||
Via S/A(1) | 711,300 | 438,888 | |||||||||
| Vibra Energia SA | 217,700 | 774,571 | |||||||||
| Vivara Participacoes SA | 8,900 | 43,350 | |||||||||
| Vulcabras Azaleia SA | 16,100 | 44,564 | |||||||||
| WEG SA | 119,800 | 651,688 | |||||||||
| Wiz Solucoes e Corretagem de Seguros SA | 29,400 | 45,945 | |||||||||
XP, Inc., Class A(1) | 8,935 | 171,909 | |||||||||
| YDUQS Participacoes SA | 48,300 | 114,752 | |||||||||
Zamp SA(1) | 84,400 | 126,542 | |||||||||
| 81,080,766 | |||||||||||
| Chile — 0.7% | |||||||||||
| Aguas Andinas SA, A Shares | 872,574 | 194,717 | |||||||||
| Banco de Chile | 5,359,986 | 508,518 | |||||||||
| Banco de Credito e Inversiones SA | 8,861 | 261,010 | |||||||||
| Banco Santander Chile, ADR | 28,694 | 460,252 | |||||||||
| Besalco SA | 44,236 | 16,781 | |||||||||
| CAP SA | 45,324 | 365,682 | |||||||||
| Cencosud SA | 592,777 | 828,730 | |||||||||
| Cencosud Shopping SA | 90,907 | 125,267 | |||||||||
| Cia Cervecerias Unidas SA, ADR | 20,801 | 227,355 | |||||||||
| Cia Sud Americana de Vapores SA | 3,138,368 | 287,872 | |||||||||
| Colbun SA | 3,301,713 | 314,680 | |||||||||
| Embotelladora Andina SA, Class B Preference Shares | 198,039 | 405,469 | |||||||||
| Empresa Nacional de Telecomunicaciones SA | 74,959 | 236,992 | |||||||||
| Empresas CMPC SA | 426,276 | 808,557 | |||||||||
| Empresas COPEC SA | 86,594 | 762,800 | |||||||||
| Enel Americas SA | 2,107,179 | 232,618 | |||||||||
| Enel Chile SA | 9,954,322 | 340,641 | |||||||||
Engie Energia Chile SA(1) | 182,950 | 103,085 | |||||||||
| Falabella SA | 59,522 | 140,263 | |||||||||
| Forus SA | 124 | 165 | |||||||||
| Grupo Security SA | 164,860 | 26,138 | |||||||||
| Inversiones Aguas Metropolitanas SA | 44,542 | 22,513 | |||||||||
23
| Avantis Emerging Markets Equity ETF | |||||||||||
| Shares | Value | ||||||||||
| Itau CorpBanca Chile SA | 44,740,341 | $ | 102,335 | ||||||||
| Parque Arauco SA | 247,310 | 261,466 | |||||||||
| Ripley Corp. SA | 828,763 | 151,651 | |||||||||
| Sociedad Quimica y Minera de Chile SA, ADR | 18,058 | 1,800,021 | |||||||||
| Vina Concha y Toro SA | 25,279 | 30,885 | |||||||||
| 9,016,463 | |||||||||||
| China — 28.8% | |||||||||||
| 360 DigiTech, Inc., ADR | 76,958 | 1,229,789 | |||||||||
361 Degrees International Ltd.(1) | 396,000 | 202,348 | |||||||||
| 3SBio, Inc. | 815,000 | 541,860 | |||||||||
| A-Living Smart City Services Co. Ltd. | 63,500 | 65,410 | |||||||||
AAC Technologies Holdings, Inc.(2) | 329,000 | 609,513 | |||||||||
AAG Energy Holdings Ltd.(2) | 1,110,000 | 209,539 | |||||||||
Agile Group Holdings Ltd.(2) | 588,000 | 205,918 | |||||||||
| Agricultural Bank of China Ltd., H Shares | 4,741,000 | 1,549,177 | |||||||||
Air China Ltd., H Shares(1) | 54,000 | 43,257 | |||||||||
| AK Medical Holdings Ltd. | 106,000 | 91,904 | |||||||||
Alibaba Group Holding Ltd., ADR(1) | 199,308 | 19,015,976 | |||||||||
Alibaba Pictures Group Ltd.(1) | 1,390,000 | 109,347 | |||||||||
| Aluminum Corp. of China Ltd., H Shares | 1,386,000 | 512,141 | |||||||||
| Anhui Conch Cement Co. Ltd., H Shares | 451,500 | 1,720,600 | |||||||||
| Anhui Expressway Co. Ltd., H Shares | 268,000 | 194,547 | |||||||||
| ANTA Sports Products Ltd. | 240,000 | 2,890,184 | |||||||||
Antengene Corp. Ltd.(1) | 32,500 | 17,146 | |||||||||
Anton Oilfield Services Group(1) | 330,000 | 19,537 | |||||||||
Ascletis Pharma, Inc.(1) | 64,000 | 26,936 | |||||||||
| Asia Cement China Holdings Corp. | 188,500 | 94,254 | |||||||||
| Autohome, Inc., ADR | 35,409 | 1,260,914 | |||||||||
| BAIC Motor Corp. Ltd., H Shares | 266,000 | 73,224 | |||||||||
Baidu, Inc., ADR(1) | 33,737 | 4,857,116 | |||||||||
| BAIOO Family Interactive Ltd. | 448,000 | 23,064 | |||||||||
| Bank of China Ltd., H Shares | 18,727,000 | 6,535,126 | |||||||||
| Bank of Chongqing Co. Ltd., H Shares | 216,000 | 111,764 | |||||||||
| Bank of Communications Co. Ltd., H Shares | 2,193,000 | 1,249,503 | |||||||||
| BBMG Corp., H Shares | 181,000 | 24,395 | |||||||||
BeiGene Ltd., ADR(1) | 5,906 | 1,013,824 | |||||||||
Beijing Capital International Airport Co. Ltd., H Shares(1) | 870,000 | 546,061 | |||||||||
| Beijing Chunlizhengda Medical Instruments Co. Ltd., H Shares | 7,500 | 10,907 | |||||||||
Beijing Energy International Holding Co. Ltd.(1) | 70,000 | 2,150 | |||||||||
| Beijing Enterprises Holdings Ltd. | 268,000 | 797,146 | |||||||||
| Beijing Enterprises Water Group Ltd. | 1,826,000 | 469,062 | |||||||||
| Beijing Jingneng Clean Energy Co. Ltd., H Shares | 584,000 | 122,470 | |||||||||
| Beijing North Star Co. Ltd., H Shares | 4,000 | 468 | |||||||||
| Beijing Tong Ren Tang Chinese Medicine Co. Ltd. | 221,000 | 274,983 | |||||||||
Bilibili, Inc., ADR(1)(2) | 815 | 20,342 | |||||||||
| Binjiang Service Group Co. Ltd. | 45,000 | 124,420 | |||||||||
| BOC Aviation Ltd. | 151,100 | 1,209,477 | |||||||||
| BOE Varitronix Ltd. | 362,000 | 825,756 | |||||||||
| Bosideng International Holdings Ltd. | 1,866,000 | 1,047,742 | |||||||||
| BYD Co. Ltd., H Shares | 144,000 | 4,437,406 | |||||||||
24
| Avantis Emerging Markets Equity ETF | |||||||||||
| Shares | Value | ||||||||||
BYD Electronic International Co. Ltd.(2) | 511,500 | $ | 1,351,449 | ||||||||
| C&D International Investment Group Ltd. | 23,980 | 47,959 | |||||||||
| C&D Property Management Group Co. Ltd. | 132,000 | 60,238 | |||||||||
| Cabbeen Fashion Ltd. | 102,000 | 17,626 | |||||||||
Canaan, Inc., ADR(1)(2) | 100,097 | 351,340 | |||||||||
Canadian Solar, Inc.(1)(2) | 29,188 | 1,318,422 | |||||||||
Cango, Inc., ADR(2) | 4,407 | 10,665 | |||||||||
CanSino Biologics, Inc., H Shares(2) | 12,200 | 76,147 | |||||||||
| Canvest Environmental Protection Group Co. Ltd. | 204,000 | 122,295 | |||||||||
Cathay Media And Education Group, Inc.(2) | 96,000 | 14,744 | |||||||||
| Central China Management Co. Ltd. | 117,000 | 11,459 | |||||||||
| Central China New Life Ltd. | 135,000 | 58,284 | |||||||||
Central China Real Estate Ltd.(2) | 218,000 | 14,402 | |||||||||
CGN Mining Co. Ltd.(1)(2) | 1,105,000 | 143,966 | |||||||||
Changsha Broad Homes Industrial Group Co. Ltd., H Shares(1)(2) | 53,400 | 54,833 | |||||||||
| Chaowei Power Holdings Ltd. | 168,000 | 38,815 | |||||||||
| Cheerwin Group Ltd. | 115,000 | 29,226 | |||||||||
Chen Lin Education Group Holdings Ltd.(1) | 16,000 | 4,282 | |||||||||
China Automotive Systems, Inc.(1) | 5,187 | 21,682 | |||||||||
| China BlueChemical Ltd., H Shares | 1,242,000 | 323,401 | |||||||||
| China Bohai Bank Co. Ltd., H Shares | 1,012,500 | 167,697 | |||||||||
| China Cinda Asset Management Co. Ltd., H Shares | 4,857,000 | 666,977 | |||||||||
| China CITIC Bank Corp. Ltd., H Shares | 3,098,000 | 1,328,144 | |||||||||
| China Coal Energy Co. Ltd., H Shares | 1,208,000 | 1,074,235 | |||||||||
| China Communications Services Corp. Ltd., H Shares | 1,748,000 | 750,585 | |||||||||
China Conch Environment Protection Holdings Ltd.(1) | 378,500 | 337,840 | |||||||||
| China Conch Venture Holdings Ltd. | 741,500 | 1,513,243 | |||||||||
| China Construction Bank Corp., H Shares | 20,401,000 | 12,611,549 | |||||||||
| China Datang Corp. Renewable Power Co. Ltd., H Shares | 1,708,000 | 427,730 | |||||||||
China Dongxiang Group Co. Ltd.(1) | 1,053,000 | 46,828 | |||||||||
China East Education Holdings Ltd.(2) | 489,000 | 206,643 | |||||||||
China Eastern Airlines Corp. Ltd., H Shares(1)(2) | 116,000 | 39,932 | |||||||||
| China Education Group Holdings Ltd. | 470,000 | 409,453 | |||||||||
China Energy Development Holdings Ltd.(1) | 4,000 | 82 | |||||||||
| China Everbright Bank Co. Ltd., H Shares | 1,101,000 | 337,525 | |||||||||
| China Everbright Environment Group Ltd. | 2,639,000 | 1,304,359 | |||||||||
China Everbright Greentech Ltd.(2) | 198,000 | 41,307 | |||||||||
| China Everbright Ltd. | 590,000 | 430,894 | |||||||||
China Everbright Water Ltd. (Singapore)(2) | 138,500 | 27,232 | |||||||||
| China Feihe Ltd. | 1,582,000 | 1,309,352 | |||||||||
| China Foods Ltd. | 282,000 | 89,765 | |||||||||
| China Galaxy Securities Co. Ltd., H Shares | 1,546,000 | 845,221 | |||||||||
| China Gas Holdings Ltd. | 862,800 | 1,220,950 | |||||||||
China General Education Group Ltd.(1) | 60,000 | 31,392 | |||||||||
China Glass Holdings Ltd.(2) | 622,000 | 88,374 | |||||||||
| China Hanking Holdings Ltd. | 175,000 | 18,692 | |||||||||
| China Harmony Auto Holding Ltd. | 269,500 | 70,804 | |||||||||
China High Speed Transmission Equipment Group Co. Ltd.(1) | 195,000 | 110,242 | |||||||||
| China Hongqiao Group Ltd. | 1,105,000 | 1,071,476 | |||||||||
| China International Capital Corp. Ltd., H Shares | 575,600 | 1,012,654 | |||||||||
25
| Avantis Emerging Markets Equity ETF | |||||||||||
| Shares | Value | ||||||||||
| China Kepei Education Group Ltd. | 130,000 | $ | 33,385 | ||||||||
| China Lesso Group Holdings Ltd. | 699,000 | 830,833 | |||||||||
| China Life Insurance Co. Ltd., ADR | 229,573 | 1,632,264 | |||||||||
| China Lilang Ltd. | 164,000 | 80,085 | |||||||||
China Literature Ltd.(1) | 62,600 | 253,675 | |||||||||
| China Longyuan Power Group Corp. Ltd., H Shares | 1,590,000 | 2,568,112 | |||||||||
China Maple Leaf Educational Systems Ltd.(1) | 230,000 | 10,403 | |||||||||
| China Medical System Holdings Ltd. | 1,072,000 | 1,586,538 | |||||||||
| China Meidong Auto Holdings Ltd. | 204,000 | 414,845 | |||||||||
China Mengniu Dairy Co. Ltd.(1) | 984,000 | 4,455,825 | |||||||||
| China Merchants Bank Co. Ltd., H Shares | 776,500 | 3,971,107 | |||||||||
China Merchants Land Ltd.(1) | 148,000 | 11,660 | |||||||||
| China Merchants Port Holdings Co. Ltd. | 881,545 | 1,323,435 | |||||||||
China Minsheng Banking Corp. Ltd., H Shares(2) | 1,799,000 | 572,259 | |||||||||
China Modern Dairy Holdings Ltd.(2) | 1,978,000 | 261,669 | |||||||||
| China National Building Material Co. Ltd., H Shares | 2,880,000 | 2,719,497 | |||||||||
| China New Higher Education Group Ltd. | 612,000 | 191,743 | |||||||||
China Oil & Gas Group Ltd.(1) | 280,000 | 11,411 | |||||||||
| China Oriental Group Co. Ltd. | 530,000 | 97,641 | |||||||||
| China Pacific Insurance Group Co. Ltd., H Shares | 667,600 | 1,414,188 | |||||||||
| China Petroleum & Chemical Corp., ADR | 60,403 | 2,809,948 | |||||||||
| China Pioneer Pharma Holdings Ltd. | 123,000 | 35,202 | |||||||||
| China Power International Development Ltd. | 1,476,000 | 823,981 | |||||||||
| China Railway Group Ltd., H Shares | 1,417,000 | 811,223 | |||||||||
| China Railway Signal & Communication Corp. Ltd., H Shares | 141,000 | 44,334 | |||||||||
China Rare Earth Holdings Ltd.(1) | 604,000 | 36,081 | |||||||||
| China Reinsurance Group Corp., H Shares | 302,000 | 22,250 | |||||||||
China Renaissance Holdings Ltd.(1) | 100,700 | 113,923 | |||||||||
| China Resources Beer Holdings Co. Ltd. | 294,000 | 2,049,479 | |||||||||
| China Resources Cement Holdings Ltd. | 1,748,000 | 1,077,483 | |||||||||
| China Resources Gas Group Ltd. | 162,900 | 634,236 | |||||||||
| China Resources Land Ltd. | 1,112,000 | 4,552,802 | |||||||||
| China Resources Medical Holdings Co. Ltd. | 527,500 | 312,938 | |||||||||
| China Resources Mixc Lifestyle Services Ltd. | 151,400 | 686,564 | |||||||||
| China Resources Pharmaceutical Group Ltd. | 433,500 | 297,013 | |||||||||
| China Resources Power Holdings Co. Ltd. | 1,234,000 | 2,453,611 | |||||||||
| China Risun Group Ltd. | 1,009,000 | 395,561 | |||||||||
| China Sanjiang Fine Chemicals Co. Ltd. | 248,000 | 50,707 | |||||||||
| China SCE Group Holdings Ltd. | 496,000 | 41,525 | |||||||||
China Shengmu Organic Milk Ltd.(1) | 82,000 | 3,759 | |||||||||
| China Shenhua Energy Co. Ltd., H Shares | 1,086,500 | 3,407,558 | |||||||||
| China Shineway Pharmaceutical Group Ltd. | 171,000 | 131,171 | |||||||||
China Shuifa Singyes Energy Holdings Ltd.(2) | 434,000 | 56,695 | |||||||||
China Silver Group Ltd.(1) | 376,000 | 17,699 | |||||||||
China South City Holdings Ltd.(2) | 1,568,000 | 98,582 | |||||||||
China Southern Airlines Co. Ltd., H Shares(1) | 282,000 | 152,212 | |||||||||
| China Starch Holdings Ltd. | 1,320,000 | 43,569 | |||||||||
| China Sunshine Paper Holdings Co. Ltd. | 645,500 | 151,576 | |||||||||
| China Suntien Green Energy Corp. Ltd., H Shares | 958,000 | 429,659 | |||||||||
| China Taiping Insurance Holdings Co. Ltd. | 1,017,200 | 1,038,536 | |||||||||
China Tobacco International HK Co. Ltd.(2) | 6,000 | 8,854 | |||||||||
26
| Avantis Emerging Markets Equity ETF | |||||||||||
| Shares | Value | ||||||||||
| China Tower Corp. Ltd., H Shares | 23,554,000 | $ | 2,937,133 | ||||||||
| China Traditional Chinese Medicine Holdings Co. Ltd. | 1,572,000 | 677,899 | |||||||||
China Travel International Investment Hong Kong Ltd.(1) | 842,000 | 152,961 | |||||||||
| China Vanke Co. Ltd., H Shares | 415,900 | 811,932 | |||||||||
| China Vast Industrial Urban Development Co. Ltd. | 5,000 | 1,516 | |||||||||
| China Water Affairs Group Ltd. | 376,000 | 342,490 | |||||||||
China Wood Optimization Holding Ltd.(1) | 8,000 | 917 | |||||||||
| China Xinhua Education Group Ltd. | 42,000 | 5,891 | |||||||||
| China XLX Fertiliser Ltd. | 556,000 | 316,836 | |||||||||
| China Yongda Automobiles Services Holdings Ltd. | 731,000 | 515,554 | |||||||||
China Youran Dairy Group Ltd.(1) | 201,000 | 60,853 | |||||||||
| China Yuchai International Ltd. | 4,954 | 41,267 | |||||||||
China Yuhua Education Corp. Ltd.(1)(2) | 1,390,000 | 218,417 | |||||||||
China ZhengTong Auto Services Holdings Ltd.(1)(2) | 518,000 | 32,757 | |||||||||
Chindata Group Holdings Ltd., ADR(1) | 81,044 | 684,011 | |||||||||
| Chongqing Rural Commercial Bank Co. Ltd., H Shares | 683,000 | 236,395 | |||||||||
| CIFI Ever Sunshine Services Group Ltd. | 368,000 | 226,169 | |||||||||
CIFI Holdings Group Co. Ltd.(2) | 1,689,616 | 427,633 | |||||||||
CIMC Enric Holdings Ltd.(2) | 82,000 | 87,585 | |||||||||
| CIMC Vehicles Group Co. Ltd., Class H | 20,000 | 12,467 | |||||||||
| CITIC Ltd. | 2,000,000 | 2,061,757 | |||||||||
| CITIC Securities Co. Ltd., H Shares | 683,950 | 1,386,255 | |||||||||
CMGE Technology Group Ltd.(1) | 646,000 | 159,387 | |||||||||
| CMOC Group Ltd., H Shares | 345,000 | 153,841 | |||||||||
CNFinance Holdings Ltd., ADR(1)(2) | 5,468 | 14,818 | |||||||||
COFCO Joycome Foods Ltd.(1) | 2,307,000 | 883,142 | |||||||||
| Concord New Energy Group Ltd. | 3,080,000 | 282,211 | |||||||||
| Consun Pharmaceutical Group Ltd. | 108,000 | 55,429 | |||||||||
Coolpad Group Ltd.(1) | 1,854,000 | 28,745 | |||||||||
COSCO SHIPPING Energy Transportation Co. Ltd., Class H(1) | 136,000 | 103,017 | |||||||||
| COSCO SHIPPING Holdings Co. Ltd., Class H | 1,157,249 | 1,727,611 | |||||||||
| COSCO SHIPPING International Hong Kong Co. Ltd. | 86,000 | 24,312 | |||||||||
| COSCO SHIPPING Ports Ltd. | 729,118 | 471,796 | |||||||||
Country Garden Holdings Co. Ltd.(2) | 2,007,339 | 592,558 | |||||||||
| Country Garden Services Holdings Co. Ltd. | 225,000 | 442,162 | |||||||||
| CPMC Holdings Ltd. | 165,000 | 70,590 | |||||||||
Crazy Sports Group Ltd.(1)(2) | 902,000 | 26,259 | |||||||||
| CSPC Pharmaceutical Group Ltd. | 4,899,760 | 4,970,432 | |||||||||
CSSC Hong Kong Shipping Co. Ltd.(2) | 620,000 | 104,799 | |||||||||
| Dali Foods Group Co. Ltd. | 827,500 | 378,293 | |||||||||
Daqo New Energy Corp., ADR(1) | 59,833 | 3,989,066 | |||||||||
| Datang International Power Generation Co. Ltd., H Shares | 184,000 | 37,915 | |||||||||
| Dexin China Holdings Co. Ltd. | 50,000 | 12,679 | |||||||||
Differ Group Auto Ltd.(1)(2) | 1,958,000 | 493,550 | |||||||||
| Digital China Holdings Ltd. | 356,000 | 158,803 | |||||||||
| Dongfeng Motor Group Co. Ltd., Class H | 1,468,000 | 930,782 | |||||||||
| Dongyue Group Ltd. | 958,000 | 1,075,204 | |||||||||
DouYu International Holdings Ltd., ADR(1) | 16,143 | 24,215 | |||||||||
Duiba Group Ltd.(1) | 119,600 | 12,161 | |||||||||
| Dynagreen Environmental Protection Group Co. Ltd., H Shares | 11,000 | 4,037 | |||||||||
27
| Avantis Emerging Markets Equity ETF | |||||||||||
| Shares | Value | ||||||||||
E-House China Enterprise Holdings Ltd.(1)(2) | 622,200 | $ | 54,399 | ||||||||
| ENN Energy Holdings Ltd. | 142,200 | 2,065,799 | |||||||||
EVA Precision Industrial Holdings Ltd.(2) | 1,018,000 | 194,749 | |||||||||
Everest Medicines Ltd.(1) | 26,000 | 39,323 | |||||||||
| Excellence Commercial Property & Facilities Management Group Ltd. | 72,000 | 29,935 | |||||||||
Fanhua, Inc., ADR(2) | 23,222 | 129,579 | |||||||||
FIH Mobile Ltd.(1) | 1,321,000 | 171,112 | |||||||||
| FinVolution Group, ADR | 126,902 | 624,358 | |||||||||
Fire Rock Holdings Ltd.(1)(2) | 186,000 | 13,271 | |||||||||
First Tractor Co. Ltd., H Shares(2) | 202,000 | 80,906 | |||||||||
Flat Glass Group Co. Ltd., H Shares(1)(2) | 39,000 | 128,454 | |||||||||
| Fosun International Ltd. | 783,500 | 578,326 | |||||||||
| Fountain SET Holdings Ltd. | 26,000 | 3,310 | |||||||||
| Fu Shou Yuan International Group Ltd. | 801,000 | 511,772 | |||||||||
| Fufeng Group Ltd. | 1,044,000 | 586,634 | |||||||||
| Fuyao Glass Industry Group Co. Ltd., H Shares | 175,200 | 836,026 | |||||||||
Ganfeng Lithium Co. Ltd., H Shares(2) | 35,880 | 315,222 | |||||||||
GCL New Energy Holdings Ltd.(1)(2) | 5,662,000 | 63,276 | |||||||||
GCL-Poly Energy Holdings Ltd.(1)(2) | 3,342,000 | 1,192,851 | |||||||||
GDS Holdings Ltd., Class A(1) | 205,100 | 700,474 | |||||||||
| Geely Automobile Holdings Ltd. | 3,059,000 | 6,146,197 | |||||||||
| Gemdale Properties & Investment Corp. Ltd. | 2,372,000 | 202,115 | |||||||||
| Genertec Universal Medical Group Co. Ltd. | 330,500 | 186,025 | |||||||||
| GF Securities Co. Ltd., H Shares | 379,200 | 495,351 | |||||||||
Global Bio-Chem Technology Group Co. Ltd.(1) | 40,000 | 918 | |||||||||
Global Cord Blood Corp.(1) | 18,571 | 42,899 | |||||||||
Glorious Property Holdings Ltd.(1) | 130,000 | 2,391 | |||||||||
Glory Health Industry Ltd.(1) | 17,000 | 366 | |||||||||
Glory Sun Financial Group Ltd.(1)(2) | 5,680,000 | 25,945 | |||||||||
GOME Retail Holdings Ltd.(1) | 1,947,000 | 60,691 | |||||||||
Goodbaby International Holdings Ltd.(1) | 338,000 | 34,360 | |||||||||
Grand Baoxin Auto Group Ltd.(1) | 22,000 | 1,364 | |||||||||
| Grand Pharmaceutical Group Ltd. | 778,000 | 415,360 | |||||||||
| Great Wall Motor Co. Ltd., H Shares | 298,000 | 447,099 | |||||||||
| Greatview Aseptic Packaging Co. Ltd. | 139,000 | 26,544 | |||||||||
| Greenland Hong Kong Holdings Ltd. | 321,000 | 33,408 | |||||||||
| Greentown China Holdings Ltd. | 244,500 | 461,319 | |||||||||
| Greentown Management Holdings Co. Ltd. | 60,000 | 50,770 | |||||||||
GreenTree Hospitality Group Ltd., ADR(2) | 1,515 | 6,378 | |||||||||
| Guangzhou Automobile Group Co. Ltd., H Shares | 370,000 | 318,130 | |||||||||
Guangzhou R&F Properties Co. Ltd., H Shares(2) | 984,800 | 203,695 | |||||||||
| Guotai Junan Securities Co. Ltd., H Shares | 69,200 | 81,990 | |||||||||
| H World Group Ltd., ADR | 44,282 | 1,666,332 | |||||||||
Haidilao International Holding Ltd.(1)(2) | 374,000 | 880,059 | |||||||||
| Haier Smart Home Co. Ltd., H Shares | 498,600 | 1,628,925 | |||||||||
Hainan Meilan International Airport Co. Ltd., H Shares(1) | 132,000 | 310,799 | |||||||||
| Haitian International Holdings Ltd. | 378,000 | 926,083 | |||||||||
| Haitong Securities Co. Ltd., H Shares | 1,103,600 | 722,549 | |||||||||
| Hangzhou Tigermed Consulting Co. Ltd., H Shares | 10,900 | 107,919 | |||||||||
| Hansoh Pharmaceutical Group Co. Ltd. | 102,000 | 203,504 | |||||||||
28
| Avantis Emerging Markets Equity ETF | |||||||||||
| Shares | Value | ||||||||||
Harbin Electric Co. Ltd., H Shares(1) | 416,000 | $ | 113,056 | ||||||||
Hebei Construction Group Corp. Ltd., H Shares(1) | 31,500 | 4,039 | |||||||||
| Hello Group, Inc., ADR | 109,713 | 565,022 | |||||||||
| Hengan International Group Co. Ltd. | 408,000 | 1,952,488 | |||||||||
Hi Sun Technology China Ltd.(1)(2) | 363,000 | 40,158 | |||||||||
Hilong Holding Ltd.(1) | 968,000 | 76,313 | |||||||||
| Hisense Home Appliances Group Co. Ltd., H Shares | 111,000 | 119,594 | |||||||||
| Hollysys Automation Technologies Ltd. | 45,726 | 778,714 | |||||||||
Homeland Interactive Technology Ltd.(1)(2) | 142,000 | 27,017 | |||||||||
Honworld Group Ltd.(1) | 7,500 | 2,934 | |||||||||
Hope Education Group Co. Ltd.(2) | 1,860,000 | 160,335 | |||||||||
Hopson Development Holdings Ltd.(2) | 224,949 | 309,302 | |||||||||
Hua Hong Semiconductor Ltd.(1)(2) | 277,000 | 813,124 | |||||||||
Huabao International Holdings Ltd.(2) | 172,000 | 87,952 | |||||||||
Huadian Power International Corp. Ltd., H Shares(2) | 132,000 | 54,251 | |||||||||
Huaneng Power International, Inc., H Shares(1) | 970,000 | 495,733 | |||||||||
| Huatai Securities Co. Ltd., H Shares | 763,200 | 1,020,110 | |||||||||
| Huaxi Holdings Co. Ltd. | 4,000 | 611 | |||||||||
Huazhong In-Vehicle Holdings Co. Ltd.(2) | 248,000 | 78,991 | |||||||||
Huijing Holdings Co. Ltd.(2) | 516,000 | 10,047 | |||||||||
HUYA, Inc., ADR(1) | 25,529 | 83,990 | |||||||||
Hygeia Healthcare Holdings Co. Ltd.(1)(2) | 68,400 | 369,187 | |||||||||
I-Mab, ADR(1) | 2,742 | 16,808 | |||||||||
iDreamSky Technology Holdings Ltd.(1) | 158,000 | 106,176 | |||||||||
| Industrial & Commercial Bank of China Ltd., H Shares | 11,761,000 | 5,975,092 | |||||||||
Ingdan, Inc.(1)(2) | 198,000 | 45,488 | |||||||||
Inkeverse Group Ltd.(1) | 436,000 | 71,318 | |||||||||
International Alliance Financial Leasing Co. Ltd.(1)(2) | 141,000 | 74,450 | |||||||||
iQIYI, Inc., ADR(1)(2) | 154,415 | 565,159 | |||||||||
| IVD Medical Holding Ltd. | 3,000 | 911 | |||||||||
JD Health International, Inc.(1) | 117,600 | 810,102 | |||||||||
| JD.com, Inc., ADR | 65,273 | 4,144,183 | |||||||||
| JD.com, Inc., Class A | 36,345 | 1,150,506 | |||||||||
JH Educational Technology, Inc.(1) | 102,000 | 41,399 | |||||||||
| Jiangsu Expressway Co. Ltd., H Shares | 514,000 | 440,244 | |||||||||
| Jiangxi Copper Co. Ltd., H Shares | 528,000 | 648,475 | |||||||||
Jiayuan International Group Ltd.(1)(2) | 674,000 | 18,550 | |||||||||
Jinchuan Group International Resources Co. Ltd.(2) | 2,216,000 | 239,139 | |||||||||
Jingrui Holdings Ltd.(1) | 10,000 | 752 | |||||||||
JinkoSolar Holding Co. Ltd., ADR(1)(2) | 12,774 | 777,553 | |||||||||
| Jinxin Fertility Group Ltd. | 565,500 | 368,240 | |||||||||
Jiumaojiu International Holdings Ltd.(2) | 387,000 | 761,379 | |||||||||
| JNBY Design Ltd. | 93,500 | 101,746 | |||||||||
| JOYY, Inc., ADR | 39,943 | 1,211,072 | |||||||||
Jutal Offshore Oil Services Ltd.(1) | 186,000 | 13,956 | |||||||||
JW Cayman Therapeutics Co. Ltd.(1)(2) | 36,000 | 27,953 | |||||||||
Kandi Technologies Group, Inc.(1)(2) | 17,258 | 37,795 | |||||||||
Kangji Medical Holdings Ltd.(2) | 185,000 | 147,467 | |||||||||
Kanzhun Ltd., ADR(1) | 3,060 | 71,879 | |||||||||
Kasen International Holdings Ltd.(1) | 143,000 | 8,105 | |||||||||
KE Holdings, Inc., ADR(1) | 79,292 | 1,430,428 | |||||||||
29
| Avantis Emerging Markets Equity ETF | |||||||||||
| Shares | Value | ||||||||||
| Kingboard Holdings Ltd. | 444,500 | $ | 1,403,597 | ||||||||
| Kingboard Laminates Holdings Ltd. | 646,500 | 616,705 | |||||||||
| Kingsoft Corp. Ltd. | 321,800 | 978,042 | |||||||||
Koolearn Technology Holding Ltd.(1)(2) | 6,000 | 22,713 | |||||||||
Kuaishou Technology(1) | 108,100 | 936,631 | |||||||||
| Kunlun Energy Co. Ltd. | 1,002,000 | 872,468 | |||||||||
| KWG Group Holdings Ltd. | 388,500 | 69,895 | |||||||||
| KWG Living Group Holdings Ltd. | 255,249 | 45,278 | |||||||||
| Lee & Man Paper Manufacturing Ltd. | 494,000 | 177,331 | |||||||||
| Lenovo Group Ltd. | 2,024,000 | 1,666,990 | |||||||||
Leoch International Technology Ltd.(1) | 122,000 | 9,914 | |||||||||
LexinFintech Holdings Ltd., ADR(1) | 64,339 | 131,252 | |||||||||
Li Auto, Inc., ADR(1) | 179,176 | 5,154,894 | |||||||||
| Li Ning Co. Ltd. | 613,000 | 5,583,392 | |||||||||
Lifetech Scientific Corp.(1) | 1,122,000 | 365,899 | |||||||||
Logan Group Co. Ltd.(2) | 211,000 | 23,015 | |||||||||
| Longfor Group Holdings Ltd. | 533,500 | 1,731,615 | |||||||||
| Lonking Holdings Ltd. | 1,310,000 | 221,812 | |||||||||
| Lufax Holding Ltd., ADR | 81,752 | 357,256 | |||||||||
Luokung Technology Corp.(1) | 475 | 97 | |||||||||
Luoyang Glass Co. Ltd., H Shares(1)(2) | 30,000 | 41,705 | |||||||||
Luye Pharma Group Ltd.(1)(2) | 644,000 | 185,884 | |||||||||
LVGEM China Real Estate Investment Co. Ltd.(1)(2) | 466,000 | 56,161 | |||||||||
| Maanshan Iron & Steel Co. Ltd., H Shares | 60,000 | 15,626 | |||||||||
Maoyan Entertainment(1)(2) | 173,200 | 145,450 | |||||||||
Meitu, Inc.(1)(2) | 1,750,000 | 186,047 | |||||||||
Meituan, Class B(1) | 276,000 | 6,628,749 | |||||||||
| Metallurgical Corp. of China Ltd., H Shares | 198,000 | 37,501 | |||||||||
Midea Real Estate Holding Ltd.(2) | 174,000 | 185,653 | |||||||||
| Minsheng Education Group Co. Ltd. | 254,000 | 19,368 | |||||||||
| Minth Group Ltd. | 406,000 | 1,148,848 | |||||||||
MMG Ltd.(1) | 2,440,000 | 667,488 | |||||||||
Mobvista, Inc.(1) | 109,000 | 65,711 | |||||||||
Mulsanne Group Holding Ltd.(1)(2) | 87,500 | 42,998 | |||||||||
Nam Tai Property, Inc.(1) | 9,475 | 39,937 | |||||||||
| NetDragon Websoft Holdings Ltd. | 229,500 | 499,339 | |||||||||
| NetEase, Inc., ADR | 106,588 | 9,434,104 | |||||||||
| New China Life Insurance Co. Ltd., H Shares | 267,400 | 629,375 | |||||||||
New Oriental Education & Technology Group, Inc., ADR(1) | 97,665 | 2,773,686 | |||||||||
| Nexteer Automotive Group Ltd. | 681,000 | 506,075 | |||||||||
| Nine Dragons Paper Holdings Ltd. | 859,000 | 674,032 | |||||||||
NIO, Inc., ADR(1) | 132,130 | 2,630,708 | |||||||||
Noah Holdings Ltd., ADR(1) | 23,231 | 411,421 | |||||||||
Nongfu Spring Co. Ltd., H Shares(2) | 413,000 | 2,455,636 | |||||||||
OneConnect Financial Technology Co. Ltd., ADR(1) | 51,874 | 56,024 | |||||||||
| Orient Overseas International Ltd. | 63,500 | 1,770,059 | |||||||||
Peijia Medical Ltd.(1) | 48,000 | 38,217 | |||||||||
| People's Insurance Co. Group of China Ltd., H Shares | 2,411,000 | 745,152 | |||||||||
| Perennial Energy Holdings Ltd. | 320,000 | 43,897 | |||||||||
PetroChina Co. Ltd., ADR(2) | 53,262 | 2,462,302 | |||||||||
| Pharmaron Beijing Co. Ltd., H Shares | 18,450 | 122,041 | |||||||||
30
| Avantis Emerging Markets Equity ETF | |||||||||||
| Shares | Value | ||||||||||
| PICC Property & Casualty Co. Ltd., H Shares | 2,666,000 | $ | 2,883,626 | ||||||||
Pinduoduo, Inc., ADR(1) | 67,433 | 4,807,973 | |||||||||
| Ping An Insurance Group Co. of China Ltd., H Shares | 1,532,782 | 9,015,277 | |||||||||
| Poly Property Group Co. Ltd. | 1,247,844 | 253,632 | |||||||||
| Poly Property Services Co. Ltd., Class H | 49,200 | 288,177 | |||||||||
Postal Savings Bank of China Co. Ltd., H Shares(2) | 1,774,000 | 1,059,027 | |||||||||
| Pou Sheng International Holdings Ltd. | 171,000 | 17,190 | |||||||||
| Powerlong Commercial Management Holdings Ltd. | 96,000 | 51,933 | |||||||||
| Powerlong Real Estate Holdings Ltd. | 327,000 | 41,007 | |||||||||
| Prinx Chengshan Holdings Ltd. | 1,000 | 891 | |||||||||
Q Technology Group Co. Ltd.(1) | 220,000 | 120,890 | |||||||||
Qudian, Inc., ADR(1)(2) | 69,556 | 66,078 | |||||||||
| Radiance Holdings Group Co. Ltd. | 329,000 | 159,002 | |||||||||
Redco Properties Group Ltd.(1)(2) | 44,000 | 9,974 | |||||||||
Redsun Properties Group Ltd.(1)(2) | 396,000 | 56,995 | |||||||||
ReneSola Ltd., ADR(1) | 12,150 | 70,956 | |||||||||
| Road King Infrastructure Ltd. | 27,000 | 14,121 | |||||||||
Ronshine China Holdings Ltd.(1)(2) | 202,500 | 19,347 | |||||||||
| Sany Heavy Equipment International Holdings Co. Ltd. | 451,000 | 467,175 | |||||||||
SCE Intelligent Commercial Management Holdings Ltd.(2) | 165,000 | 37,093 | |||||||||
Seazen Group Ltd.(1) | 774,000 | 256,924 | |||||||||
Shandong Gold Mining Co. Ltd., H Shares(2) | 140,500 | 238,183 | |||||||||
Shandong Hi-Speed New Energy Group Ltd.(1)(2) | 7,260,000 | 70,123 | |||||||||
| Shandong Weigao Group Medical Polymer Co. Ltd., H Shares | 950,000 | 1,288,740 | |||||||||
Shanghai Electric Group Co. Ltd., H Shares(1) | 208,000 | 49,709 | |||||||||
| Shanghai Fosun Pharmaceutical Group Co. Ltd., H Shares | 42,500 | 136,723 | |||||||||
| Shanghai Fudan Microelectronics Group Co. Ltd., H Shares | 60,000 | 279,585 | |||||||||
| Shanghai Industrial Holdings Ltd. | 239,000 | 332,238 | |||||||||
| Shanghai Industrial Urban Development Group Ltd. | 403,600 | 32,382 | |||||||||
| Shanghai Pharmaceuticals Holding Co. Ltd., H Shares | 311,400 | 452,711 | |||||||||
| Shenzhen Expressway Corp. Ltd., H Shares | 352,000 | 308,182 | |||||||||
| Shenzhen International Holdings Ltd. | 856,500 | 738,309 | |||||||||
| Shenzhen Investment Ltd. | 1,130,000 | 206,928 | |||||||||
| Shenzhou International Group Holdings Ltd. | 161,500 | 1,687,886 | |||||||||
Shimao Group Holdings Ltd.(2) | 245,000 | 137,972 | |||||||||
Shimao Services Holdings Ltd.(1)(2) | 148,000 | 37,911 | |||||||||
| Shoucheng Holdings Ltd. | 232,800 | 39,579 | |||||||||
| Shougang Fushan Resources Group Ltd. | 1,949,249 | 618,278 | |||||||||
| Shui On Land Ltd. | 2,733,000 | 343,774 | |||||||||
Sihuan Pharmaceutical Holdings Group Ltd.(2) | 2,368,000 | 300,296 | |||||||||
| Simcere Pharmaceutical Group Ltd. | 470,000 | 469,815 | |||||||||
| Sino Biopharmaceutical Ltd. | 3,548,500 | 1,863,728 | |||||||||
| Sino-Ocean Group Holding Ltd. | 2,162,500 | 315,633 | |||||||||
Sinolink Worldwide Holdings Ltd.(1) | 116,000 | 3,247 | |||||||||
| Sinopec Engineering Group Co. Ltd., H Shares | 628,500 | 280,795 | |||||||||
| Sinopec Kantons Holdings Ltd. | 356,000 | 108,653 | |||||||||
Sinopec Shanghai Petrochemical Co. Ltd., ADR(2) | 3,184 | 49,193 | |||||||||
| Sinopharm Group Co. Ltd., H Shares | 608,800 | 1,356,280 | |||||||||
| Sinotrans Ltd., H Shares | 138,000 | 39,433 | |||||||||
| Sinotruk Hong Kong Ltd. | 265,000 | 264,214 | |||||||||
| Skyworth Group Ltd. | 1,148,924 | 570,827 | |||||||||
31
| Avantis Emerging Markets Equity ETF | |||||||||||
| Shares | Value | ||||||||||
SOHO China Ltd.(1)(2) | 645,500 | $ | 114,952 | ||||||||
Sohu.com Ltd., ADR(1)(2) | 19,155 | 341,342 | |||||||||
South Manganese Investment Ltd.(1)(2) | 1,045,000 | 116,604 | |||||||||
| SSY Group Ltd. | 992,000 | 467,135 | |||||||||
Sun King Technology Group Ltd.(1) | 628,000 | 178,239 | |||||||||
| Sunny Optical Technology Group Co. Ltd. | 199,500 | 2,723,664 | |||||||||
Sunpower Group Ltd.(1) | 104,600 | 28,400 | |||||||||
SY Holdings Group Ltd.(2) | 48,000 | 32,116 | |||||||||
TAL Education Group, ADR(1) | 53,685 | 310,299 | |||||||||
| TCL Electronics Holdings Ltd. | 417,000 | 199,216 | |||||||||
| Tencent Holdings Ltd. | 597,200 | 24,682,721 | |||||||||
Tencent Music Entertainment Group, ADR(1) | 151,194 | 772,601 | |||||||||
Tian Ge Interactive Holdings Ltd.(1) | 9,000 | 1,087 | |||||||||
| Tian Lun Gas Holdings Ltd. | 187,500 | 84,678 | |||||||||
Tiangong International Co. Ltd.(2) | 890,000 | 298,477 | |||||||||
Tianneng Power International Ltd.(2) | 488,000 | 519,182 | |||||||||
Tibet Water Resources Ltd.(1) | 19,000 | 1,257 | |||||||||
Times China Holdings Ltd.(2) | 341,000 | 50,612 | |||||||||
| Tingyi Cayman Islands Holding Corp. | 1,072,000 | 1,903,577 | |||||||||
| Tong Ren Tang Technologies Co. Ltd., H Shares | 373,000 | 263,668 | |||||||||
Tongcheng Travel Holdings Ltd.(1) | 620,400 | 1,270,679 | |||||||||
Tongda Group Holdings Ltd.(1) | 2,745,000 | 41,812 | |||||||||
| Topsports International Holdings Ltd. | 1,025,000 | 809,027 | |||||||||
Towngas Smart Energy Co. Ltd.(1) | 365,000 | 160,124 | |||||||||
| TravelSky Technology Ltd., H Shares | 389,000 | 677,981 | |||||||||
Trigiant Group Ltd.(1) | 28,000 | 2,099 | |||||||||
Trip.com Group Ltd., ADR(1) | 110,711 | 2,847,487 | |||||||||
| Truly International Holdings Ltd. | 1,558,000 | 341,313 | |||||||||
| Tsaker New Energy Tech Co. Ltd. | 123,500 | 22,119 | |||||||||
| Tsingtao Brewery Co. Ltd., H Shares | 90,000 | 873,987 | |||||||||
Tuya, Inc., ADR(1)(2) | 16,113 | 21,269 | |||||||||
| Uni-President China Holdings Ltd. | 952,000 | 819,622 | |||||||||
| United Strength Power Holdings Ltd. | 21,000 | 29,932 | |||||||||
Venus MedTech Hangzhou, Inc., H Shares(1) | 36,500 | 63,526 | |||||||||
Vinda International Holdings Ltd.(2) | 226,000 | 631,686 | |||||||||
Vipshop Holdings Ltd., ADR(1) | 226,479 | 2,629,421 | |||||||||
Viva Biotech Holdings(1) | 93,500 | 22,031 | |||||||||
VNET Group, Inc., ADR(1) | 37,403 | 200,106 | |||||||||
| Want Want China Holdings Ltd. | 2,917,000 | 2,054,797 | |||||||||
| Wasion Holdings Ltd. | 82,000 | 27,588 | |||||||||
Weibo Corp., ADR(1) | 31,970 | 661,459 | |||||||||
| Weichai Power Co. Ltd., H Shares | 447,000 | 597,198 | |||||||||
| Weiqiao Textile Co., H Shares | 80,000 | 15,094 | |||||||||
| West China Cement Ltd. | 2,090,000 | 257,805 | |||||||||
| Wharf Holdings Ltd. | 464,000 | 1,747,406 | |||||||||
Wison Engineering Services Co. Ltd.(1) | 19,000 | 663 | |||||||||
Wuling Motors Holdings Ltd.(2) | 800,000 | 105,500 | |||||||||
| WuXi AppTec Co. Ltd., H Shares | 37,404 | 422,254 | |||||||||
Wuxi Biologics Cayman, Inc.(1) | 415,500 | 3,665,582 | |||||||||
X Financial, ADR(1) | 464 | 1,211 | |||||||||
Xiabuxiabu Catering Management China Holdings Co. Ltd.(1) | 474,500 | 223,415 | |||||||||
32
| Avantis Emerging Markets Equity ETF | |||||||||||
| Shares | Value | ||||||||||
| Xiamen International Port Co. Ltd., H Shares | 1,016,000 | $ | 287,937 | ||||||||
Ximei Resources Holding Ltd.(1) | 35,000 | 21,837 | |||||||||
Xin Point Holdings Ltd.(2) | 57,000 | 16,650 | |||||||||
| Xingda International Holdings Ltd. | 154,482 | 31,634 | |||||||||
| Xinhua Winshare Publishing and Media Co. Ltd., H Shares | 146,000 | 102,701 | |||||||||
| Xinjiang Goldwind Science & Technology Co. Ltd., H Shares | 367,400 | 547,486 | |||||||||
Xinjiang Xinxin Mining Industry Co. Ltd., H Shares(1) | 256,000 | 38,284 | |||||||||
| Xinte Energy Co. Ltd., H Shares | 202,400 | 528,203 | |||||||||
| Xinyi Energy Holdings Ltd. | 158,000 | 63,811 | |||||||||
| Xinyi Solar Holdings Ltd. | 1,580,976 | 2,174,188 | |||||||||
XPeng, Inc., Class A, ADR(1) | 29,867 | 553,137 | |||||||||
| XTEP International Holdings Ltd. | 727,500 | 1,009,541 | |||||||||
| Yadea Group Holdings Ltd. | 686,000 | 1,308,474 | |||||||||
Yankuang Energy Group Co. Ltd., H Shares(2) | 894,000 | 3,538,818 | |||||||||
YiChang HEC ChangJiang Pharmaceutical Co. Ltd., H Shares(1) | 71,000 | 45,074 | |||||||||
Yihai International Holding Ltd.(1)(2) | 126,000 | 317,318 | |||||||||
YuanShengTai Dairy Farm Ltd.(1) | 190,000 | 5,200 | |||||||||
| Yuexiu Property Co. Ltd. | 838,400 | 1,048,647 | |||||||||
| Yuexiu Transport Infrastructure Ltd. | 784,000 | 375,133 | |||||||||
| Yum China Holdings, Inc. | 161,922 | 8,113,911 | |||||||||
Yuzhou Group Holdings Co. Ltd.(2) | 782,955 | 33,819 | |||||||||
Zengame Technology Holding Ltd.(1) | 150,000 | 28,784 | |||||||||
| Zepp Health Corp., ADR | 1,207 | 2,305 | |||||||||
Zhaojin Mining Industry Co. Ltd., H Shares(1) | 902,000 | 763,754 | |||||||||
| Zhejiang Expressway Co. Ltd., H Shares | 1,016,000 | 773,297 | |||||||||
| Zhengzhou Coal Mining Machinery Group Co. Ltd., H Shares | 119,600 | 138,668 | |||||||||
Zhenro Properties Group Ltd.(1) | 482,000 | 22,315 | |||||||||
Zhong An Group Ltd.(1) | 415,000 | 12,820 | |||||||||
ZhongAn Online P&C Insurance Co. Ltd., H Shares(1)(2) | 400 | 1,172 | |||||||||
Zhongliang Holdings Group Co. Ltd.(2) | 269,500 | 22,658 | |||||||||
| Zhongsheng Group Holdings Ltd. | 215,500 | 1,018,963 | |||||||||
| Zhongyu Energy Holdings Ltd. | 175,000 | 143,643 | |||||||||
Zhou Hei Ya International Holdings Co. Ltd.(1) | 849,000 | 424,150 | |||||||||
Zhuguang Holdings Group Co. Ltd.(1) | 616,000 | 78,380 | |||||||||
| Zijin Mining Group Co. Ltd., H Shares | 1,834,000 | 2,072,370 | |||||||||
| Zoomlion Heavy Industry Science and Technology Co. Ltd., Class H | 447,200 | 201,596 | |||||||||
| ZTO Express Cayman, Inc., ADR | 127,680 | 3,326,064 | |||||||||
| 381,156,851 | |||||||||||
| Colombia — 0.2% | |||||||||||
| Banco Davivienda SA, Preference Shares | 24,226 | 169,565 | |||||||||
| Bancolombia SA | 37,189 | 287,167 | |||||||||
| Bancolombia SA, ADR | 19,013 | 521,907 | |||||||||
| Cementos Argos SA | 6,574 | 5,179 | |||||||||
Corp. Financiera Colombiana SA(1) | 24,838 | 109,357 | |||||||||
Ecopetrol SA, ADR(2) | 55,344 | 570,597 | |||||||||
Empresa de Telecomunicaciones de Bogota(1) | 18,600 | 622 | |||||||||
| Grupo Argos SA | 159,091 | 350,223 | |||||||||
| Interconexion Electrica SA ESP | 78,459 | 339,593 | |||||||||
| 2,354,210 | |||||||||||
33
| Avantis Emerging Markets Equity ETF | |||||||||||
| Shares | Value | ||||||||||
| Czech Republic — 0.2% | |||||||||||
| CEZ AS | 34,377 | $ | 1,392,682 | ||||||||
| Komercni banka AS | 13,292 | 311,312 | |||||||||
| Moneta Money Bank AS | 136,632 | 433,502 | |||||||||
| 2,137,496 | |||||||||||
| Egypt — 0.1% | |||||||||||
| Commercial International Bank Egypt S.A.E., GDR | 442,157 | 776,417 | |||||||||
| Greece — 0.3% | |||||||||||
Alpha Services & Holdings SA(1) | 456,912 | 421,960 | |||||||||
| Athens Water Supply & Sewage Co. SA | 3,091 | 24,123 | |||||||||
Eurobank Ergasias Services and Holdings SA, Class A(1) | 669,765 | 621,413 | |||||||||
| Fourlis Holdings SA | 364 | 1,095 | |||||||||
GEK Terna Holding Real Estate Construction SA(1) | 10,321 | 99,945 | |||||||||
| Hellenic Exchanges - Athens Stock Exchange SA | 8,827 | 29,241 | |||||||||
| Hellenic Petroleum Holdings SA | 15,901 | 109,410 | |||||||||
| Hellenic Telecommunications Organization SA | 24,439 | 388,796 | |||||||||
Intracom Holdings SA(1) | 19,243 | 33,657 | |||||||||
| JUMBO SA | 38,086 | 544,468 | |||||||||
LAMDA Development SA(1) | 8,171 | 48,517 | |||||||||
| Motor Oil Hellas Corinth Refineries SA | 13,501 | 254,543 | |||||||||
| Mytilineos SA | 11,184 | 174,892 | |||||||||
National Bank of Greece SA(1) | 141,333 | 456,114 | |||||||||
| OPAP SA | 25,054 | 330,009 | |||||||||
Piraeus Financial Holdings SA(1) | 169,308 | 177,199 | |||||||||
Public Power Corp. SA(1) | 42,251 | 220,567 | |||||||||
| Terna Energy SA | 12,145 | 216,610 | |||||||||
Titan Cement International SA(1) | 16,364 | 194,691 | |||||||||
| Viohalco SA | 30,134 | 103,761 | |||||||||
| 4,451,011 | |||||||||||
Hong Kong† | |||||||||||
Beijing Gas Blue Sky Holdings Ltd.(1) | 88,000 | 1,345 | |||||||||
Brilliance China Automotive Holdings Ltd.(1) | 338,000 | 154,171 | |||||||||
| China Isotope & Radiation Corp. | 14,400 | 32,448 | |||||||||
China Zhongwang Holdings Ltd.(1) | 525,200 | 112,418 | |||||||||
| Edvantage Group Holdings Ltd. | 144,000 | 42,854 | |||||||||
| Essex Bio-technology Ltd. | 120,000 | 63,349 | |||||||||
| IMAX China Holding, Inc. | 32,000 | 23,980 | |||||||||
Tianyun International Holdings Ltd.(1) | 84,000 | 16,375 | |||||||||
| 446,940 | |||||||||||
| Hungary — 0.2% | |||||||||||
| Magyar Telekom Telecommunications PLC | 79,956 | 67,888 | |||||||||
| MOL Hungarian Oil & Gas PLC | 187,146 | 1,289,502 | |||||||||
| OTP Bank Nyrt | 33,713 | 716,974 | |||||||||
| Richter Gedeon Nyrt | 12,974 | 261,583 | |||||||||
| 2,335,947 | |||||||||||
| India — 17.2% | |||||||||||
| 63 Moons Technologies Ltd. | 6,904 | 15,444 | |||||||||
| Aarti Drugs Ltd. | 9,663 | 52,131 | |||||||||
| Aarti Industries Ltd. | 7,452 | 76,901 | |||||||||
| ACC Ltd. | 26,254 | 752,292 | |||||||||
| Accelya Solutions India Ltd. | 1,465 | 20,485 | |||||||||
34
| Avantis Emerging Markets Equity ETF | |||||||||||
| Shares | Value | ||||||||||
| Action Construction Equipment Ltd. | 9,606 | $ | 30,135 | ||||||||
| Adani Enterprises Ltd. | 39,537 | 1,568,976 | |||||||||
Adani Green Energy Ltd.(1) | 33,383 | 1,008,695 | |||||||||
| Adani Ports & Special Economic Zone Ltd. | 104,567 | 1,094,032 | |||||||||
Adani Power Ltd.(1) | 51,167 | 261,292 | |||||||||
| Adani Total Gas Ltd. | 38,259 | 1,784,302 | |||||||||
Adani Transmission Ltd.(1) | 85,509 | 4,193,234 | |||||||||
Aditya Birla Capital Ltd.(1) | 239,350 | 338,063 | |||||||||
| Advanced Enzyme Technologies Ltd. | 16,916 | 56,654 | |||||||||
| Aegis Logistics Ltd. | 94,747 | 346,462 | |||||||||
Affle India Ltd.(1) | 3,390 | 54,553 | |||||||||
| AGI Greenpac Ltd. | 34,439 | 134,186 | |||||||||
| AIA Engineering Ltd. | 9,387 | 305,244 | |||||||||
| Ajanta Pharma Ltd. | 11,947 | 204,890 | |||||||||
| Akzo Nobel India Ltd. | 1,400 | 33,962 | |||||||||
| Alembic Ltd. | 8,551 | 7,804 | |||||||||
| Alembic Pharmaceuticals Ltd. | 35,995 | 291,284 | |||||||||
| Alkyl Amines Chemicals | 4,913 | 181,363 | |||||||||
| Allcargo Logistics Ltd. | 46,735 | 207,630 | |||||||||
Alok Industries Ltd.(1) | 45,160 | 10,843 | |||||||||
| Amara Raja Batteries Ltd. | 63,768 | 404,533 | |||||||||
| Ambika Cotton Mills Ltd. | 1,427 | 31,611 | |||||||||
| Ambuja Cements Ltd. | 141,561 | 725,902 | |||||||||
| Amrutanjan Health Care Ltd. | 2,916 | 27,566 | |||||||||
| Anant Raj Ltd. | 59,615 | 64,359 | |||||||||
| Andhra Sugars Ltd. | 26,768 | 48,623 | |||||||||
| Apar Industries Ltd. | 6,218 | 103,606 | |||||||||
| Apcotex Industries Ltd. | 6,865 | 50,422 | |||||||||
APL Apollo Tubes Ltd.(1) | 57,999 | 682,057 | |||||||||
| Apollo Hospitals Enterprise Ltd. | 31,815 | 1,709,368 | |||||||||
| Apollo Tyres Ltd. | 196,636 | 613,481 | |||||||||
| Aptech Ltd. | 7,681 | 24,021 | |||||||||
Arvind Ltd.(1) | 83,750 | 101,726 | |||||||||
| Ashok Leyland Ltd. | 387,965 | 742,073 | |||||||||
Ashoka Buildcon Ltd.(1) | 37,620 | 37,481 | |||||||||
| Asian Paints Ltd. | 28,362 | 1,194,007 | |||||||||
| Astec Lifesciences Ltd. | 1,514 | 36,315 | |||||||||
Aster DM Healthcare Ltd.(1) | 81,019 | 223,416 | |||||||||
| Astra Microwave Products Ltd. | 27,941 | 122,732 | |||||||||
| Astral Ltd. | 10,504 | 273,126 | |||||||||
| AstraZeneca Pharma India Ltd. | 328 | 12,654 | |||||||||
| Atul Ltd. | 2,495 | 285,359 | |||||||||
| AU Small Finance Bank Ltd. | 57,466 | 451,926 | |||||||||
| Aurobindo Pharma Ltd. | 111,130 | 756,598 | |||||||||
| Avadh Sugar & Energy Ltd. | 7,220 | 48,142 | |||||||||
| Avanti Feeds Ltd. | 12,625 | 72,963 | |||||||||
Avenue Supermarts Ltd.(1) | 7,242 | 407,089 | |||||||||
| Axis Bank Ltd., GDR | 37,051 | 1,755,371 | |||||||||
| Bajaj Auto Ltd. | 8,785 | 447,454 | |||||||||
| Bajaj Consumer Care Ltd. | 68,195 | 137,312 | |||||||||
| Bajaj Electricals Ltd. | 11,447 | 176,509 | |||||||||
35
| Avantis Emerging Markets Equity ETF | |||||||||||
| Shares | Value | ||||||||||
| Bajaj Finance Ltd. | 22,822 | $ | 2,059,715 | ||||||||
| Bajaj Finserv Ltd. | 3,898 | 817,197 | |||||||||
Bajaj Hindusthan Sugar Ltd.(1) | 570,901 | 70,959 | |||||||||
| Balaji Amines Ltd. | 3,447 | 147,932 | |||||||||
| Balkrishna Industries Ltd. | 19,897 | 505,445 | |||||||||
| Balmer Lawrie & Co. Ltd. | 12,135 | 18,816 | |||||||||
| Balrampur Chini Mills Ltd. | 101,388 | 442,165 | |||||||||
Bandhan Bank Ltd.(1) | 252,788 | 872,416 | |||||||||
| BASF India Ltd. | 3,328 | 137,512 | |||||||||
| Bata India Ltd. | 12,210 | 295,183 | |||||||||
| Bayer CropScience Ltd. | 2,143 | 146,117 | |||||||||
| BEML Ltd. | 1,894 | 43,471 | |||||||||
| Berger Paints India Ltd. | 18,465 | 154,429 | |||||||||
| Bhansali Engineering Polymers Ltd. | 11,499 | 18,129 | |||||||||
| Bharat Electronics Ltd. | 516,961 | 1,975,299 | |||||||||
| Bharat Forge Ltd. | 39,007 | 359,086 | |||||||||
Bharat Heavy Electricals Ltd.(1) | 304,098 | 222,158 | |||||||||
| Bharat Petroleum Corp. Ltd. | 317,728 | 1,301,537 | |||||||||
| Bharat Rasayan Ltd. | 356 | 53,695 | |||||||||
| Bharti Airtel Ltd. | 16,614 | 71,574 | |||||||||
| Bharti Airtel Ltd. | 232,596 | 2,106,957 | |||||||||
| Biocon Ltd. | 44,815 | 173,399 | |||||||||
| Birla Corp. Ltd. | 10,916 | 132,037 | |||||||||
| Birlasoft Ltd. | 75,089 | 297,067 | |||||||||
| Blue Dart Express Ltd. | 1,832 | 195,494 | |||||||||
| Blue Star Ltd. | 26,553 | 364,269 | |||||||||
| Bombay Burmah Trading Co. | 7,835 | 88,701 | |||||||||
Bombay Dyeing & Manufacturing Co. Ltd.(1) | 1,774 | 2,202 | |||||||||
Borosil Renewables Ltd.(1) | 2,629 | 18,386 | |||||||||
| Bosch Ltd. | 489 | 106,690 | |||||||||
| Brigade Enterprises Ltd. | 77,497 | 492,157 | |||||||||
| Brightcom Group Ltd. | 274,527 | 139,153 | |||||||||
| Britannia Industries Ltd. | 22,802 | 1,066,937 | |||||||||
| BSE Ltd. | 54,275 | 439,210 | |||||||||
| Butterfly Gandhimathi Appliances Ltd. | 136 | 2,583 | |||||||||
| Can Fin Homes Ltd. | 42,938 | 337,783 | |||||||||
| Canara Bank | 145,617 | 434,253 | |||||||||
Capacit'e Infraprojects Ltd.(1) | 19,339 | 39,670 | |||||||||
| Caplin Point Laboratories Ltd. | 7,672 | 74,694 | |||||||||
| Capri Global Capital Ltd. | 100 | 899 | |||||||||
| Carborundum Universal Ltd. | 26,856 | 282,649 | |||||||||
| Care Ratings Ltd. | 15,230 | 95,858 | |||||||||
| Castrol India Ltd. | 157,671 | 224,516 | |||||||||
| CCL Products India Ltd. | 48,413 | 289,621 | |||||||||
| Ceat Ltd. | 11,847 | 205,231 | |||||||||
| Central Depository Services India Ltd. | 5,186 | 80,075 | |||||||||
| Century Enka Ltd. | 6,013 | 34,572 | |||||||||
| Century Plyboards India Ltd. | 23,590 | 196,973 | |||||||||
| Century Textiles & Industries Ltd. | 18,862 | 201,932 | |||||||||
| Cera Sanitaryware Ltd. | 2,532 | 157,785 | |||||||||
| CESC Ltd. | 127,560 | 129,476 | |||||||||
36
| Avantis Emerging Markets Equity ETF | |||||||||||
| Shares | Value | ||||||||||
CG Power & Industrial Solutions Ltd.(1) | 26,937 | $ | 75,005 | ||||||||
Chalet Hotels Ltd.(1) | 8,387 | 33,651 | |||||||||
| Chambal Fertilisers and Chemicals Ltd. | 141,267 | 615,243 | |||||||||
| Chennai Petroleum Corp. Ltd. | 46,465 | 169,102 | |||||||||
| Cholamandalam Financial Holdings Ltd. | 3,258 | 27,204 | |||||||||
| Cholamandalam Investment and Finance Co. Ltd. | 155,729 | 1,525,694 | |||||||||
| Cigniti Technologies Ltd. | 3,206 | 23,315 | |||||||||
| Cipla Ltd. | 124,345 | 1,611,304 | |||||||||
| City Union Bank Ltd. | 296,272 | 663,018 | |||||||||
| Coal India Ltd. | 466,429 | 1,362,899 | |||||||||
| Cochin Shipyard Ltd. | 24,665 | 115,995 | |||||||||
| Coforge Ltd. | 4,049 | 178,466 | |||||||||
| Colgate-Palmolive India Ltd. | 31,764 | 666,947 | |||||||||
| Computer Age Management Services Ltd. | 7,758 | 221,835 | |||||||||
| Confidence Petroleum India Ltd. | 38,839 | 31,609 | |||||||||
| Container Corp. of India Ltd. | 73,677 | 639,110 | |||||||||
| Coromandel International Ltd. | 62,152 | 816,009 | |||||||||
| Cosmo Films Ltd. | 13,104 | 149,633 | |||||||||
CreditAccess Grameen Ltd.(1) | 40,856 | 505,728 | |||||||||
| CRISIL Ltd. | 3,327 | 136,027 | |||||||||
| Crompton Greaves Consumer Electricals Ltd. | 73,110 | 372,010 | |||||||||
| Cummins India Ltd. | 29,478 | 437,784 | |||||||||
| Cyient Ltd. | 34,182 | 357,931 | |||||||||
| Dabur India Ltd. | 64,578 | 470,858 | |||||||||
| Dalmia Bharat Ltd. | 22,527 | 431,070 | |||||||||
| Dalmia Bharat Sugar & Industries Ltd. | 13,724 | 59,224 | |||||||||
| DB Corp. Ltd. | 18,592 | 24,338 | |||||||||
| DCB Bank Ltd. | 121,786 | 142,871 | |||||||||
| DCM Shriram Ltd. | 34,620 | 451,859 | |||||||||
| Deccan Cements Ltd. | 2,682 | 17,400 | |||||||||
| Deepak Fertilisers & Petrochemicals Corp. Ltd. | 54,143 | 611,974 | |||||||||
| Deepak Nitrite Ltd. | 28,082 | 689,114 | |||||||||
| Delta Corp. Ltd. | 21,685 | 56,657 | |||||||||
DEN Networks Ltd.(1) | 50,404 | 23,079 | |||||||||
| DFM Foods Ltd. | 4,696 | 20,656 | |||||||||
Dhampur Bio Organics Ltd.(1) | 14,248 | 4,698 | |||||||||
| Dhampur Sugar Mills Ltd. | 14,248 | 41,147 | |||||||||
Dhani Services Ltd.(1) | 48,019 | 38,780 | |||||||||
| Dhanuka Agritech Ltd. | 3,413 | 30,269 | |||||||||
| Dilip Buildcon Ltd. | 11,891 | 35,591 | |||||||||
Dish TV India Ltd.(1) | 427,132 | 63,899 | |||||||||
Dishman Carbogen Amcis Ltd.(1) | 16,627 | 24,130 | |||||||||
| Divi's Laboratories Ltd. | 14,183 | 640,345 | |||||||||
| Dixon Technologies India Ltd. | 4,584 | 233,098 | |||||||||
| DLF Ltd. | 70,353 | 339,842 | |||||||||
| Dolat Algotech Ltd. | 16,966 | 14,436 | |||||||||
| Dollar Industries Ltd. | 6,412 | 37,717 | |||||||||
| Dr Lal PathLabs Ltd. | 1,949 | 62,092 | |||||||||
| Dr Reddy's Laboratories Ltd., ADR | 39,157 | 2,047,520 | |||||||||
| Dwarikesh Sugar Industries Ltd. | 128,758 | 155,231 | |||||||||
| eClerx Services Ltd. | 5,636 | 147,963 | |||||||||
37
| Avantis Emerging Markets Equity ETF | |||||||||||
| Shares | Value | ||||||||||
| Edelweiss Financial Services Ltd. | 146,943 | $ | 111,297 | ||||||||
| Eicher Motors Ltd. | 35,195 | 1,468,872 | |||||||||
| EID Parry India Ltd. | 63,545 | 420,371 | |||||||||
EIH Ltd.(1) | 32,352 | 64,430 | |||||||||
| Elecon Engineering Co. Ltd. | 37,000 | 172,234 | |||||||||
| Electrosteel Castings Ltd. | 150,505 | 68,851 | |||||||||
| Emami Ltd. | 74,951 | 453,716 | |||||||||
| Endurance Technologies Ltd. | 8,816 | 164,571 | |||||||||
| Engineers India Ltd. | 181,197 | 153,503 | |||||||||
| EPL Ltd. | 50,090 | 106,460 | |||||||||
Equitas Holdings Ltd.(1) | 122,426 | 152,113 | |||||||||
| Eris Lifesciences Ltd. | 8,852 | 76,469 | |||||||||
| Escorts Kubota Ltd. | 32,530 | 810,983 | |||||||||
| Ester Industries Ltd. | 21,161 | 42,632 | |||||||||
Eveready Industries India Ltd.(1) | 17,861 | 79,242 | |||||||||
| Everest Industries Ltd. | 6,868 | 60,306 | |||||||||
| Everest Kanto Cylinder Ltd. | 14,324 | 20,786 | |||||||||
| Excel Industries Ltd. | 2,396 | 43,462 | |||||||||
| Exide Industries Ltd. | 231,066 | 461,416 | |||||||||
FDC Ltd.(1) | 11,851 | 39,006 | |||||||||
| Federal Bank Ltd. | 855,830 | 1,241,138 | |||||||||
| FIEM Industries Ltd. | 2,287 | 42,519 | |||||||||
| Filatex India Ltd. | 19,510 | 27,327 | |||||||||
| Fine Organic Industries Ltd. | 1,757 | 135,365 | |||||||||
| Finolex Cables Ltd. | 22,911 | 131,551 | |||||||||
| Finolex Industries Ltd. | 89,019 | 168,182 | |||||||||
| Firstsource Solutions Ltd. | 31,653 | 42,090 | |||||||||
| Force Motors Ltd. | 1,685 | 27,229 | |||||||||
Fortis Healthcare Ltd.(1) | 6,563 | 24,070 | |||||||||
Future Consumer Ltd.(1) | 738,951 | 15,651 | |||||||||
| Gabriel India Ltd. | 15,306 | 30,018 | |||||||||
| GAIL India Ltd. | 416,859 | 708,088 | |||||||||
| Galaxy Surfactants Ltd. | 3,257 | 133,132 | |||||||||
| Ganesha Ecosphere Ltd. | 2,544 | 20,512 | |||||||||
| Garden Reach Shipbuilders & Engineers Ltd. | 26,723 | 99,856 | |||||||||
| Gateway Rail Freight Ltd. | 127,972 | 108,771 | |||||||||
| General Insurance Corp. of India | 46,922 | 72,637 | |||||||||
| Genus Power Infrastructures Ltd. | 50,411 | 52,790 | |||||||||
| Geojit Financial Services Ltd. | 18,976 | 10,827 | |||||||||
| GHCL Ltd. | 63,552 | 472,658 | |||||||||
| GIC Housing Finance Ltd. | 9,147 | 16,742 | |||||||||
| GlaxoSmithKline Pharmaceuticals Ltd. | 2,479 | 45,227 | |||||||||
| Glenmark Pharmaceuticals Ltd. | 85,518 | 396,081 | |||||||||
| Globus Spirits Ltd. | 6,451 | 69,884 | |||||||||
GMR Infrastructure Ltd.(1) | 141,365 | 63,130 | |||||||||
| Godawari Power and Ispat Ltd. | 41,518 | 152,046 | |||||||||
| Godrej Agrovet Ltd. | 886 | 5,777 | |||||||||
Godrej Consumer Products Ltd.(1) | 21,348 | 245,905 | |||||||||
Godrej Properties Ltd.(1) | 299 | 5,215 | |||||||||
Gokaldas Exports Ltd.(1) | 19,364 | 86,773 | |||||||||
| Granules India Ltd. | 91,156 | 347,054 | |||||||||
38
| Avantis Emerging Markets Equity ETF | |||||||||||
| Shares | Value | ||||||||||
| Graphite India Ltd. | 33,367 | $ | 170,845 | ||||||||
| Grasim Industries Ltd. | 71,891 | 1,498,312 | |||||||||
| Great Eastern Shipping Co. Ltd. | 86,605 | 616,063 | |||||||||
| Greaves Cotton Ltd. | 63,140 | 133,051 | |||||||||
| Greenpanel Industries Ltd. | 36,834 | 205,541 | |||||||||
| Greenply Industries Ltd. | 47,311 | 110,709 | |||||||||
| Gufic Biosciences Ltd. | 21,615 | 56,632 | |||||||||
| Gujarat Alkalies & Chemicals Ltd. | 15,153 | 167,132 | |||||||||
| Gujarat Ambuja Exports Ltd. | 63,680 | 216,944 | |||||||||
| Gujarat Fluorochemicals Ltd. | 5,413 | 224,430 | |||||||||
| Gujarat Gas Ltd. | 41,449 | 243,907 | |||||||||
| Gujarat Industries Power Co. Ltd. | 24,476 | 28,149 | |||||||||
| Gujarat Mineral Development Corp. Ltd. | 53,625 | 110,508 | |||||||||
| Gujarat Narmada Valley Fertilizers & Chemicals Ltd. | 63,798 | 593,712 | |||||||||
| Gujarat Pipavav Port Ltd. | 190,970 | 207,374 | |||||||||
| Gujarat State Fertilizers & Chemicals Ltd. | 185,622 | 363,965 | |||||||||
| Gujarat State Petronet Ltd. | 107,329 | 323,464 | |||||||||
| Happiest Minds Technologies Ltd. | 3,847 | 48,895 | |||||||||
Hathway Cable & Datacom Ltd.(1) | 327,684 | 72,881 | |||||||||
| Havells India Ltd. | 11,875 | 205,576 | |||||||||
| HBL Power Systems Ltd. | 108,784 | 109,632 | |||||||||
| HCL Technologies Ltd. | 189,141 | 2,200,057 | |||||||||
| HDFC Asset Management Co. Ltd. | 12,935 | 333,710 | |||||||||
| HDFC Life Insurance Co. Ltd. | 60,548 | 433,899 | |||||||||
| HEG Ltd. | 4,763 | 74,506 | |||||||||
| HeidelbergCement India Ltd. | 21,787 | 51,954 | |||||||||
| Heritage Foods Ltd. | 4,758 | 19,286 | |||||||||
| Hero MotoCorp Ltd. | 21,434 | 755,017 | |||||||||
| HFCL Ltd. | 373,176 | 342,658 | |||||||||
| HG Infra Engineering Ltd. | 7,905 | 59,018 | |||||||||
| Hikal Ltd. | 13,702 | 58,306 | |||||||||
| HIL Ltd. | 1,459 | 67,291 | |||||||||
| Himadri Speciality Chemical Ltd., ADR | 38,530 | 47,150 | |||||||||
Himatsingka Seide Ltd.(1) | 11,317 | 14,816 | |||||||||
| Hindalco Industries Ltd. | 565,092 | 3,064,833 | |||||||||
| Hinduja Global Solutions Ltd. | 6,962 | 129,678 | |||||||||
| Hindustan Copper Ltd. | 17,442 | 25,586 | |||||||||
Hindustan Oil Exploration Co. Ltd.(1) | 16,740 | 33,981 | |||||||||
| Hindustan Petroleum Corp. Ltd. | 237,554 | 721,034 | |||||||||
| Hindustan Unilever Ltd. | 50,492 | 1,671,586 | |||||||||
| Hindware Home Innovation Ltd. | 6,689 | 27,123 | |||||||||
| Housing Development Finance Corp. Ltd. | 221,709 | 6,712,332 | |||||||||
| I G Petrochemicals Ltd. | 7,893 | 58,272 | |||||||||
| ICICI Bank Ltd., ADR | 186,857 | 4,080,957 | |||||||||
| ICICI Lombard General Insurance Co. Ltd. | 35,064 | 563,251 | |||||||||
| ICICI Prudential Life Insurance Co. Ltd. | 29,126 | 215,020 | |||||||||
IDFC First Bank Ltd.(1) | 867,361 | 527,968 | |||||||||
| IDFC Ltd. | 903,171 | 769,383 | |||||||||
IFB Industries Ltd.(1) | 1,596 | 20,367 | |||||||||
IFCI Ltd.(1) | 361,243 | 49,155 | |||||||||
| IIFL Finance Ltd. | 114,341 | 489,764 | |||||||||
39
| Avantis Emerging Markets Equity ETF | |||||||||||
| Shares | Value | ||||||||||
| IIFL Securities Ltd. | 68,787 | $ | 61,362 | ||||||||
| IIFL Wealth Management Ltd. | 11,129 | 232,374 | |||||||||
| India Cements Ltd. | 103,508 | 293,087 | |||||||||
| India Glycols Ltd. | 6,368 | 70,607 | |||||||||
Indiabulls Housing Finance Ltd.(1) | 157,708 | 265,989 | |||||||||
Indiabulls Real Estate Ltd.(1) | 215,530 | 231,691 | |||||||||
| Indian Bank | 156,661 | 376,989 | |||||||||
| Indian Energy Exchange Ltd. | 152,162 | 303,251 | |||||||||
| Indian Hotels Co. Ltd. | 68,826 | 243,548 | |||||||||
| Indian Metals & Ferro Alloys Ltd. | 12,770 | 43,909 | |||||||||
| Indian Oil Corp. Ltd. | 648,004 | 578,220 | |||||||||
Indian Overseas Bank(1) | 35,971 | 8,006 | |||||||||
| Indian Railway Catering & Tourism Corp. Ltd. | 14,485 | 127,053 | |||||||||
| Indo Count Industries Ltd. | 24,311 | 49,459 | |||||||||
Indraprastha Medical Corp. Ltd.(1) | 21,721 | 18,887 | |||||||||
| Indus Towers Ltd. | 311,562 | 774,778 | |||||||||
| INEOS Styrolution India Ltd. | 1,561 | 18,016 | |||||||||
| Infibeam Avenues Ltd. | 30,456 | 5,998 | |||||||||
| Info Edge India Ltd. | 10,032 | 539,651 | |||||||||
| Infosys Ltd., ADR | 495,950 | 9,075,885 | |||||||||
Inox Leisure Ltd.(1) | 22,946 | 143,715 | |||||||||
Inox Wind Ltd.(1) | 24,296 | 33,717 | |||||||||
Insecticides India Ltd.(1) | 2,026 | 25,584 | |||||||||
| Intellect Design Arena Ltd. | 24,958 | 183,193 | |||||||||
InterGlobe Aviation Ltd.(1) | 8,303 | 207,346 | |||||||||
| IOL Chemicals and Pharmaceuticals Ltd. | 17,417 | 77,886 | |||||||||
| Ipca Laboratories Ltd. | 51,413 | 581,770 | |||||||||
| IRB Infrastructure Developers Ltd. | 55,466 | 162,881 | |||||||||
| IRCON International Ltd. | 98,906 | 50,484 | |||||||||
| ISGEC Heavy Engineering Ltd. | 2,727 | 16,260 | |||||||||
| ITD Cementation India Ltd. | 21,419 | 28,293 | |||||||||
| J Kumar Infraprojects Ltd. | 42,128 | 156,258 | |||||||||
| Jagran Prakashan Ltd. | 44,477 | 34,997 | |||||||||
| Jai Corp. Ltd. | 25,985 | 42,390 | |||||||||
Jain Irrigation Systems Ltd.(1) | 235,143 | 118,350 | |||||||||
Jaiprakash Associates Ltd.(1) | 521,016 | 53,182 | |||||||||
Jaiprakash Power Ventures Ltd.(1) | 1,605,118 | 150,112 | |||||||||
Jammu & Kashmir Bank Ltd.(1) | 221,834 | 87,210 | |||||||||
| Jamna Auto Industries Ltd. | 36,500 | 52,945 | |||||||||
| JB Chemicals & Pharmaceuticals Ltd. | 4,634 | 103,125 | |||||||||
| JBM Auto Ltd. | 13,780 | 68,754 | |||||||||
| Jindal Poly Films Ltd. | 9,031 | 118,207 | |||||||||
| Jindal Saw Ltd. | 75,959 | 81,994 | |||||||||
Jindal Stainless Hisar Ltd.(1) | 71,738 | 217,831 | |||||||||
Jindal Stainless Ltd.(1) | 124,030 | 197,319 | |||||||||
| Jindal Steel & Power Ltd. | 193,157 | 1,039,324 | |||||||||
| JK Cement Ltd. | 15,080 | 509,073 | |||||||||
| JK Lakshmi Cement Ltd. | 24,614 | 144,641 | |||||||||
| JK Paper Ltd. | 49,726 | 258,380 | |||||||||
| JK Tyre & Industries Ltd. | 96,052 | 166,436 | |||||||||
| JM Financial Ltd. | 265,915 | 211,158 | |||||||||
40
| Avantis Emerging Markets Equity ETF | |||||||||||
| Shares | Value | ||||||||||
Johnson Controls-Hitachi Air Conditioning India Ltd.(1) | 497 | $ | 9,887 | ||||||||
| JSW Energy Ltd. | 101,564 | 431,606 | |||||||||
| JSW Steel Ltd. | 249,402 | 2,068,325 | |||||||||
| Jubilant Foodworks Ltd. | 67,115 | 511,231 | |||||||||
| Jubilant Ingrevia Ltd. | 11,999 | 69,671 | |||||||||
| Jubilant Pharmova Ltd. | 18,288 | 80,039 | |||||||||
Just Dial Ltd.(1) | 6,866 | 50,340 | |||||||||
| Kajaria Ceramics Ltd. | 19,394 | 281,230 | |||||||||
| Kalpataru Power Transmission Ltd. | 27,696 | 141,141 | |||||||||
| Kalyani Steels Ltd. | 4,946 | 19,721 | |||||||||
| Karnataka Bank Ltd. | 117,924 | 109,808 | |||||||||
| Karur Vysya Bank Ltd. | 353,013 | 299,912 | |||||||||
| Kaveri Seed Co. Ltd. | 17,663 | 100,587 | |||||||||
| KCP Ltd. | 13,450 | 19,347 | |||||||||
| KEC International Ltd. | 67,848 | 344,431 | |||||||||
| KEI Industries Ltd. | 5,386 | 98,149 | |||||||||
| Kellton Tech Solutions Ltd. | 21,339 | 18,273 | |||||||||
Kiri Industries Ltd.(1) | 6,687 | 40,871 | |||||||||
| Kirloskar Ferrous Industries Ltd. | 53,234 | 168,169 | |||||||||
| Kitex Garments Ltd. | 19,681 | 56,133 | |||||||||
| KNR Constructions Ltd. | 85,833 | 278,438 | |||||||||
| Kolte-Patil Developers Ltd. | 12,134 | 46,495 | |||||||||
| Kotak Mahindra Bank Ltd. | 76,098 | 1,805,362 | |||||||||
| KPIT Technologies Ltd. | 80,575 | 556,691 | |||||||||
| KPR Mill Ltd. | 33,605 | 252,734 | |||||||||
| KRBL Ltd. | 41,605 | 163,152 | |||||||||
| L&T Finance Holdings Ltd. | 521,748 | 512,438 | |||||||||
| L&T Technology Services Ltd. | 5,165 | 236,548 | |||||||||
| Larsen & Toubro Infotech Ltd. | 9,662 | 552,892 | |||||||||
| Larsen & Toubro Ltd. | 162,769 | 3,884,846 | |||||||||
| Laurus Labs Ltd. | 88,140 | 634,468 | |||||||||
| LG Balakrishnan & Bros Ltd. | 6,278 | 54,458 | |||||||||
| LIC Housing Finance Ltd. | 177,489 | 901,846 | |||||||||
| Lincoln Pharmaceuticals Ltd. | 6,400 | 22,933 | |||||||||
| Linde India Ltd. | 2,410 | 102,866 | |||||||||
| LT Foods Ltd. | 88,028 | 104,330 | |||||||||
| Lupin Ltd. | 73,268 | 612,260 | |||||||||
| LUX Industries Ltd. | 1,865 | 42,218 | |||||||||
| Mahanagar Gas Ltd. | 15,906 | 172,830 | |||||||||
| Maharashtra Scooters Ltd. | 500 | 26,065 | |||||||||
| Maharashtra Seamless Ltd. | 15,828 | 165,347 | |||||||||
| Mahindra & Mahindra Financial Services Ltd. | 354,517 | 902,915 | |||||||||
| Mahindra & Mahindra Ltd. | 248,552 | 4,034,155 | |||||||||
| Mahindra CIE Automotive Ltd. | 20,725 | 70,805 | |||||||||
Mahindra Holidays & Resorts India Ltd.(1) | 7,144 | 23,374 | |||||||||
| Mahindra Lifespace Developers Ltd. | 5,296 | 34,220 | |||||||||
| Mahindra Logistics Ltd. | 11,828 | 71,079 | |||||||||
| Maithan Alloys Ltd. | 5,265 | 67,758 | |||||||||
| Man Infraconstruction Ltd. | 41,698 | 47,067 | |||||||||
| Manali Petrochemicals Ltd. | 80,005 | 91,911 | |||||||||
| Manappuram Finance Ltd. | 307,314 | 403,738 | |||||||||
41
| Avantis Emerging Markets Equity ETF | |||||||||||
| Shares | Value | ||||||||||
| Mangalam Cement Ltd. | 7,000 | $ | 29,892 | ||||||||
| Marico Ltd. | 121,947 | 800,565 | |||||||||
| Marksans Pharma Ltd. | 72,230 | 46,931 | |||||||||
| Maruti Suzuki India Ltd. | 21,313 | 2,404,051 | |||||||||
| MAS Financial Services Ltd. | 10,285 | 96,247 | |||||||||
| Mastek Ltd. | 4,905 | 114,937 | |||||||||
| Mayur Uniquoters Ltd. | 3,977 | 24,044 | |||||||||
| Mazagon Dock Shipbuilders Ltd. | 14,877 | 72,419 | |||||||||
Meghmani Finechem Ltd.(1) | 9,434 | 167,153 | |||||||||
| Meghmani Organics Ltd. | 109,721 | 166,582 | |||||||||
| Metropolis Healthcare Ltd. | 5,896 | 105,082 | |||||||||
| Minda Corp. Ltd. | 25,905 | 72,431 | |||||||||
| Mindtree Ltd. | 16,262 | 661,700 | |||||||||
Mirza International Ltd.(1) | 16,051 | 63,695 | |||||||||
| Mishra Dhatu Nigam Ltd. | 22,478 | 55,884 | |||||||||
| MOIL Ltd. | 40,373 | 82,595 | |||||||||
| Mold-Tek Packaging Ltd. | 2,551 | 29,872 | |||||||||
| Motherson Sumi Wiring India Ltd. | 196,201 | 199,336 | |||||||||
| Motilal Oswal Financial Services Ltd. | 28,303 | 271,280 | |||||||||
| Mphasis Ltd. | 22,200 | 584,026 | |||||||||
| MRF Ltd. | 771 | 821,825 | |||||||||
| Mrs Bectors Food Specialities Ltd. | 5,977 | 25,934 | |||||||||
| MSTC Ltd. | 10,973 | 37,247 | |||||||||
| Multi Commodity Exchange of India Ltd. | 9,338 | 149,607 | |||||||||
| Muthoot Finance Ltd. | 41,507 | 543,794 | |||||||||
| Narayana Hrudayalaya Ltd. | 13,965 | 122,097 | |||||||||
| Natco Pharma Ltd. | 30,624 | 235,510 | |||||||||
| National Aluminium Co. Ltd. | 671,550 | 668,736 | |||||||||
National Fertilizers Ltd.(1) | 53,307 | 33,281 | |||||||||
| Nava Ltd. | 72,134 | 203,164 | |||||||||
| Navneet Education Ltd. | 18,910 | 33,437 | |||||||||
| NBCC India Ltd. | 494,783 | 211,691 | |||||||||
| NCC Ltd. | 253,673 | 220,248 | |||||||||
| NCL Industries Ltd. | 7,144 | 16,315 | |||||||||
| NELCO Ltd. | 5,720 | 69,914 | |||||||||
| Neogen Chemicals Ltd. | 3,235 | 59,681 | |||||||||
| NESCO Ltd. | 6,909 | 49,607 | |||||||||
| Nestle India Ltd. | 5,523 | 1,375,110 | |||||||||
| Neuland Laboratories Ltd. | 2,794 | 44,157 | |||||||||
| Newgen Software Technologies Ltd. | 4,838 | 23,604 | |||||||||
| NIIT Ltd. | 47,453 | 204,175 | |||||||||
| Nilkamal Ltd. | 800 | 20,532 | |||||||||
| Nippon Life India Asset Management Ltd. | 63,034 | 237,034 | |||||||||
| NLC India Ltd. | 136,872 | 129,919 | |||||||||
| NOCIL Ltd. | 13,492 | 44,261 | |||||||||
| NTPC Ltd. | 1,199,170 | 2,458,128 | |||||||||
| Oberoi Realty Ltd. | 33,204 | 415,031 | |||||||||
| Oil & Natural Gas Corp. Ltd. | 621,580 | 1,076,026 | |||||||||
| Oil India Ltd. | 107,677 | 259,274 | |||||||||
Olectra Greentech Ltd.(1) | 18,741 | 144,057 | |||||||||
| OnMobile Global Ltd. | 15,331 | 23,616 | |||||||||
42
| Avantis Emerging Markets Equity ETF | |||||||||||
| Shares | Value | ||||||||||
| Oracle Financial Services Software Ltd. | 10,630 | $ | 419,957 | ||||||||
| Orient Cement Ltd. | 111,521 | 166,410 | |||||||||
| Orient Electric Ltd. | 45,372 | 147,065 | |||||||||
| Page Industries Ltd. | 902 | 574,680 | |||||||||
| Paisalo Digital Ltd. | 28,560 | 26,724 | |||||||||
| Panama Petrochem Ltd. | 12,000 | 48,448 | |||||||||
| Parag Milk Foods Ltd. | 1,585 | 2,192 | |||||||||
| PCBL Ltd. | 122,208 | 208,875 | |||||||||
| Persistent Systems Ltd. | 15,516 | 674,791 | |||||||||
| Petronet LNG Ltd. | 301,952 | 833,013 | |||||||||
| Phoenix Mills Ltd. | 5,274 | 92,236 | |||||||||
| PI Industries Ltd. | 8,448 | 361,230 | |||||||||
| Pidilite Industries Ltd. | 13,424 | 458,235 | |||||||||
| Piramal Enterprises Ltd. | 27,760 | 366,290 | |||||||||
Piramal Pharma Ltd.(1) | 111,040 | 304,455 | |||||||||
| PNB Gilts Ltd. | 22,203 | 17,683 | |||||||||
PNB Housing Finance Ltd.(1) | 36,647 | 158,951 | |||||||||
| PNC Infratech Ltd. | 46,836 | 165,224 | |||||||||
| Pokarna Ltd. | 6,924 | 47,549 | |||||||||
| Poly Medicure Ltd. | 2,282 | 24,239 | |||||||||
| Polycab India Ltd. | 8,365 | 256,575 | |||||||||
| Polyplex Corp. Ltd. | 16,298 | 435,967 | |||||||||
| Poonawalla Fincorp Ltd. | 59,543 | 225,127 | |||||||||
| Power Finance Corp. Ltd. | 70,033 | 104,393 | |||||||||
| Power Grid Corp. of India Ltd. | 893,685 | 2,558,684 | |||||||||
Power Mech Projects Ltd.(1) | 2,490 | 43,760 | |||||||||
| Praj Industries Ltd. | 66,164 | 344,126 | |||||||||
Prakash Industries Ltd.(1) | 19,502 | 13,608 | |||||||||
| Prestige Estates Projects Ltd. | 39,944 | 226,838 | |||||||||
Pricol Ltd.(1) | 50,806 | 109,285 | |||||||||
| Prince Pipes & Fittings Ltd. | 12,478 | 90,952 | |||||||||
Prism Johnson Ltd.(1) | 51,053 | 80,176 | |||||||||
| Privi Speciality Chemicals Ltd. | 2,600 | 44,963 | |||||||||
| Procter & Gamble Health Ltd. | 55 | 2,901 | |||||||||
| PSP Projects Ltd. | 3,816 | 28,805 | |||||||||
| PTC India Ltd. | 120,717 | 127,438 | |||||||||
| Quess Corp. Ltd. | 9,082 | 64,632 | |||||||||
| Radico Khaitan Ltd. | 19,433 | 253,029 | |||||||||
| Rain Industries Ltd. | 3,155 | 7,768 | |||||||||
| Rajesh Exports Ltd. | 19,058 | 140,427 | |||||||||
| Rallis India Ltd. | 30,724 | 86,407 | |||||||||
| Ramco Cements Ltd. | 51,015 | 481,360 | |||||||||
| Ramco Industries Ltd. | 7,096 | 18,689 | |||||||||
| Ramkrishna Forgings Ltd. | 20,160 | 50,115 | |||||||||
Ramky Infrastructure Ltd.(1) | 7,149 | 17,247 | |||||||||
| Rashtriya Chemicals & Fertilizers Ltd. | 132,601 | 163,109 | |||||||||
| Raymond Ltd. | 29,993 | 357,333 | |||||||||
RBL Bank Ltd.(1) | 133,725 | 201,855 | |||||||||
| REC Ltd. | 691,432 | 938,835 | |||||||||
| Redington India Ltd. | 330,156 | 616,029 | |||||||||
| Relaxo Footwears Ltd. | 4,267 | 53,235 | |||||||||
43
| Avantis Emerging Markets Equity ETF | |||||||||||
| Shares | Value | ||||||||||
| Reliance Industrial Infrastructure Ltd. | 1,798 | $ | 22,799 | ||||||||
| Reliance Industries Ltd., GDR | 147,285 | 9,675,556 | |||||||||
Reliance Infrastructure Ltd.(1) | 73,282 | 147,253 | |||||||||
Reliance Power Ltd.(1) | 1,967,209 | 408,670 | |||||||||
| Repco Home Finance Ltd. | 16,729 | 51,360 | |||||||||
| Rhi Magnesita India Ltd. | 18,440 | 135,586 | |||||||||
| Route Mobile Ltd. | 1,407 | 26,422 | |||||||||
| RSWM Ltd. | 4,000 | 19,231 | |||||||||
| Rupa & Co. Ltd. | 8,000 | 34,101 | |||||||||
| Sagar Cements Ltd. | 9,772 | 24,916 | |||||||||
| Samvardhana Motherson International Ltd. | 385,316 | 587,711 | |||||||||
Sanghi Industries Ltd.(1) | 10,104 | 6,930 | |||||||||
| Sanofi India Ltd. | 4,227 | 327,715 | |||||||||
| Sarda Energy & Minerals Ltd. | 8,082 | 92,240 | |||||||||
| Saregama India Ltd. | 5,611 | 28,064 | |||||||||
| Satia Industries Ltd. | 20,542 | 29,567 | |||||||||
| SBI Cards & Payment Services Ltd. | 17,809 | 204,203 | |||||||||
| SBI Life Insurance Co. Ltd. | 40,013 | 661,244 | |||||||||
| Schaeffler India Ltd. | 5,445 | 206,078 | |||||||||
SEAMEC Ltd.(1) | 1,917 | 26,054 | |||||||||
| Sequent Scientific Ltd. | 4,729 | 6,642 | |||||||||
| SH Kelkar & Co. Ltd. | 10,925 | 19,664 | |||||||||
| Shankara Building Products Ltd. | 4,974 | 47,273 | |||||||||
| Sharda Cropchem Ltd. | 16,930 | 109,310 | |||||||||
| Share India Securities Ltd. | 11,524 | 160,900 | |||||||||
| Shilpa Medicare Ltd. | 9,817 | 48,129 | |||||||||
| Shipping Corp. of India Ltd. | 62,678 | 92,055 | |||||||||
| Shree Cement Ltd. | 1,472 | 404,094 | |||||||||
| Shree Digvijay Cement Co. Ltd. | 24,457 | 20,766 | |||||||||
Shree Renuka Sugars Ltd.(1) | 59,409 | 34,490 | |||||||||
| Shriram City Union Finance Ltd. | 13,662 | 324,753 | |||||||||
| Shriram Transport Finance Co. Ltd. | 84,886 | 1,424,753 | |||||||||
| Siemens Ltd. | 8,514 | 305,691 | |||||||||
| Siyaram Silk Mills Ltd. | 4,811 | 30,113 | |||||||||
| SKF India Ltd. | 3,745 | 227,256 | |||||||||
| Sobha Ltd. | 29,353 | 254,180 | |||||||||
| Solar Industries India Ltd. | 3,514 | 146,149 | |||||||||
Somany Ceramics Ltd.(1) | 5,124 | 41,106 | |||||||||
| Sonata Software Ltd. | 39,554 | 350,220 | |||||||||
South Indian Bank Ltd.(1) | 293,008 | 30,021 | |||||||||
Southern Petrochemical Industries Corp. Ltd.(1) | 114,672 | 87,183 | |||||||||
Spandana Sphoorty Financial Ltd.(1) | 16,835 | 114,722 | |||||||||
| SRF Ltd. | 25,875 | 816,558 | |||||||||
Star Cement Ltd.(1) | 22,000 | 26,081 | |||||||||
| State Bank of India, GDR | 31,180 | 2,059,707 | |||||||||
Sterling and Wilson Renewable(1) | 27,192 | 100,354 | |||||||||
| Sterlite Technologies Ltd. | 54,881 | 117,021 | |||||||||
Strides Pharma Science Ltd.(1) | 29,009 | 119,338 | |||||||||
| Sudarshan Chemical Industries Ltd. | 20,068 | 114,859 | |||||||||
| Sumitomo Chemical India Ltd. | 29,259 | 178,649 | |||||||||
Sun Pharma Advanced Research Co. Ltd.(1) | 5,387 | 15,381 | |||||||||
44
| Avantis Emerging Markets Equity ETF | |||||||||||
| Shares | Value | ||||||||||
| Sun Pharmaceutical Industries Ltd. | 195,650 | $ | 2,183,496 | ||||||||
| Sun TV Network Ltd. | 44,030 | 275,012 | |||||||||
| Sundaram Finance Ltd. | 5,399 | 141,492 | |||||||||
| Sundram Fasteners Ltd. | 8,949 | 93,321 | |||||||||
Sunflag Iron & Steel Co.(1) | 32,298 | 35,455 | |||||||||
| Sunteck Realty Ltd. | 17,217 | 101,936 | |||||||||
| Suprajit Engineering Ltd. | 30,007 | 126,937 | |||||||||
| Supreme Industries Ltd. | 27,378 | 671,973 | |||||||||
| Supreme Petrochem Ltd. | 14,289 | 139,095 | |||||||||
| Surya Roshni Ltd. | 4,130 | 25,331 | |||||||||
| Suven Pharmaceuticals Ltd. | 29,490 | 180,620 | |||||||||
Suzlon Energy Ltd.(1) | 537,185 | 54,531 | |||||||||
| Swaraj Engines Ltd. | 1,157 | 23,138 | |||||||||
| Tamil Nadu Newsprint & Papers Ltd. | 42,975 | 136,677 | |||||||||
| Tamilnadu Petroproducts Ltd. | 58,751 | 74,171 | |||||||||
| Tanla Platforms Ltd. | 51,746 | 458,048 | |||||||||
TARC Ltd.(1) | 31,587 | 16,981 | |||||||||
| Tata Chemicals Ltd. | 75,652 | 1,063,103 | |||||||||
| Tata Communications Ltd. | 49,195 | 735,715 | |||||||||
| Tata Consultancy Services Ltd. | 120,853 | 4,819,809 | |||||||||
| Tata Consumer Products Ltd. | 21,954 | 221,890 | |||||||||
| Tata Elxsi Ltd. | 6,087 | 678,968 | |||||||||
| Tata Investment Corp. Ltd. | 5,111 | 102,206 | |||||||||
| Tata Metaliks Ltd. | 6,955 | 67,143 | |||||||||
Tata Motors Ltd., ADR(1)(2) | 102,123 | 2,961,567 | |||||||||
| Tata Power Co. Ltd. | 389,194 | 1,141,259 | |||||||||
| Tata Steel Long Products Ltd. | 8,116 | 62,936 | |||||||||
| Tata Steel Ltd. | 2,554,822 | 3,430,110 | |||||||||
Tata Teleservices Maharashtra Ltd.(1) | 42,691 | 57,856 | |||||||||
| TCI Express Ltd. | 2,703 | 59,504 | |||||||||
TeamLease Services Ltd.(1) | 2,705 | 114,596 | |||||||||
| Tech Mahindra Ltd. | 158,234 | 2,108,235 | |||||||||
Tejas Networks Ltd.(1) | 8,477 | 64,408 | |||||||||
| Texmaco Rail & Engineering Ltd. | 136,529 | 84,942 | |||||||||
| Thermax Ltd. | 21,660 | 652,026 | |||||||||
| Thirumalai Chemicals Ltd. | 53,644 | 156,163 | |||||||||
Thomas Cook India Ltd.(1) | 31,992 | 28,909 | |||||||||
| Thyrocare Technologies Ltd. | 4,641 | 35,843 | |||||||||
| Tide Water Oil Co. India Ltd. | 3,215 | 45,707 | |||||||||
| Time Technoplast Ltd. | 81,039 | 120,081 | |||||||||
| Timken India Ltd. | 3,048 | 114,795 | |||||||||
| Tinplate Co. of India Ltd. | 23,219 | 91,182 | |||||||||
Titagarh Wagons Ltd.(1) | 33,440 | 71,164 | |||||||||
| Titan Co. Ltd. | 18,943 | 613,834 | |||||||||
| Torrent Pharmaceuticals Ltd. | 30,325 | 585,963 | |||||||||
| Torrent Power Ltd. | 53,993 | 391,879 | |||||||||
| Transport Corp. of India Ltd. | 10,925 | 97,187 | |||||||||
| Trent Ltd. | 11,770 | 205,858 | |||||||||
| Trident Ltd. | 506,689 | 229,554 | |||||||||
| Triveni Engineering & Industries Ltd. | 52,908 | 154,743 | |||||||||
| Triveni Turbine Ltd. | 30,164 | 76,814 | |||||||||
45
| Avantis Emerging Markets Equity ETF | |||||||||||
| Shares | Value | ||||||||||
| TTK Prestige Ltd. | 2,550 | $ | 30,516 | ||||||||
| Tube Investments of India Ltd. | 27,683 | 780,542 | |||||||||
| TV Today Network Ltd. | 12,283 | 43,306 | |||||||||
TV18 Broadcast Ltd.(1) | 217,536 | 109,963 | |||||||||
| Uflex Ltd. | 36,177 | 352,686 | |||||||||
Ujjivan Financial Services Ltd.(1) | 8,440 | 20,531 | |||||||||
| UltraTech Cement Ltd. | 11,982 | 996,122 | |||||||||
United Spirits Ltd.(1) | 74,872 | 756,797 | |||||||||
| UPL Ltd. | 49,277 | 471,978 | |||||||||
| Usha Martin Ltd. | 59,005 | 104,010 | |||||||||
| UTI Asset Management Co. Ltd. | 25,595 | 262,376 | |||||||||
| V-Guard Industries Ltd. | 1,107 | 3,130 | |||||||||
VA Tech Wabag Ltd.(1) | 19,467 | 63,897 | |||||||||
| Vaibhav Global Ltd. | 7,950 | 34,333 | |||||||||
| Vakrangee Ltd. | 175,114 | 60,408 | |||||||||
Valiant Organics Ltd.(1) | 6,994 | 51,756 | |||||||||
| Vardhman Textiles Ltd. | 40,505 | 167,217 | |||||||||
| Varun Beverages Ltd. | 58,057 | 748,773 | |||||||||
| Vedanta Ltd. | 404,628 | 1,356,074 | |||||||||
| Venky's India Ltd. | 3,565 | 93,017 | |||||||||
| Vidhi Specialty Food Ingredients Ltd. | 7,127 | 34,719 | |||||||||
Vinati Organics Ltd.(1) | 4,973 | 136,474 | |||||||||
| VIP Industries Ltd. | 4,143 | 30,578 | |||||||||
| Visaka Industries Ltd. | 4,647 | 35,147 | |||||||||
Vodafone Idea Ltd.(1) | 1,680,095 | 188,388 | |||||||||
| Voltas Ltd. | 10,398 | 129,472 | |||||||||
| VRL Logistics Ltd. | 22,001 | 169,923 | |||||||||
| VST Tillers Tractors Ltd. | 1,038 | 32,717 | |||||||||
| Welspun Corp. Ltd. | 104,612 | 293,322 | |||||||||
| Welspun India Ltd. | 93,718 | 89,853 | |||||||||
| West Coast Paper Mills Ltd. | 12,238 | 95,969 | |||||||||
Westlife Development Ltd.(1) | 4,792 | 38,588 | |||||||||
| Wipro Ltd., ADR | 199,396 | 998,974 | |||||||||
Wockhardt Ltd.(1) | 8,602 | 25,720 | |||||||||
Yes Bank Ltd.(1) | 4,261,677 | 873,496 | |||||||||
| Zee Entertainment Enterprises Ltd. | 404,697 | 1,289,345 | |||||||||
Zee Media Corp. Ltd.(1) | 136,836 | 31,741 | |||||||||
| Zen Technologies Ltd. | 11,632 | 30,195 | |||||||||
| Zensar Technologies Ltd. | 56,416 | 160,286 | |||||||||
| 227,472,699 | |||||||||||
| Indonesia — 2.4% | |||||||||||
| Ace Hardware Indonesia Tbk PT | 576,500 | 27,973 | |||||||||
| Adaro Energy Indonesia Tbk PT | 6,679,400 | 1,592,347 | |||||||||
Adhi Karya Persero Tbk PT(1) | 661,700 | 36,090 | |||||||||
Adi Sarana Armada Tbk PT(1) | 488,400 | 47,975 | |||||||||
| AKR Corporindo Tbk PT | 5,702,500 | 460,875 | |||||||||
Alam Sutera Realty Tbk PT(1) | 486,000 | 5,889 | |||||||||
| Aneka Gas Industri Tbk PT | 170,800 | 24,045 | |||||||||
| Aneka Tambang Tbk | 4,068,900 | 544,080 | |||||||||
| Astra Agro Lestari Tbk PT | 175,900 | 108,421 | |||||||||
| Astra International Tbk PT | 4,575,100 | 2,146,724 | |||||||||
46
| Avantis Emerging Markets Equity ETF | |||||||||||
| Shares | Value | ||||||||||
| Bank BTPN Syariah Tbk PT | 472,400 | $ | 94,139 | ||||||||
Bank Bukopin Tbk PT(1) | 3,742,897 | 46,120 | |||||||||
| Bank Central Asia Tbk PT | 4,451,500 | 2,458,220 | |||||||||
Bank Jago Tbk PT(1) | 151,100 | 85,619 | |||||||||
| Bank Mandiri Persero Tbk PT | 4,232,800 | 2,518,875 | |||||||||
| Bank Negara Indonesia Persero Tbk PT | 1,621,700 | 930,152 | |||||||||
| Bank Pan Indonesia Tbk PT | 1,152,900 | 154,993 | |||||||||
| Bank Pembangunan Daerah Jawa Barat Dan Banten Tbk PT | 833,874 | 78,084 | |||||||||
| Bank Pembangunan Daerah Jawa Timur Tbk PT | 862,000 | 41,811 | |||||||||
| Bank Rakyat Indonesia Persero Tbk PT | 6,479,918 | 1,892,324 | |||||||||
| Bank Syariah Indonesia Tbk PT | 155,400 | 15,885 | |||||||||
| Bank Tabungan Negara Persero Tbk PT | 2,889,100 | 292,707 | |||||||||
| Barito Pacific Tbk PT | 957,200 | 52,840 | |||||||||
| BFI Finance Indonesia Tbk PT | 2,358,100 | 198,414 | |||||||||
Buana Lintas Lautan Tbk PT(1) | 4,340,500 | 49,424 | |||||||||
| Bukit Asam Tbk PT | 1,928,100 | 551,687 | |||||||||
Bumi Resources Tbk PT(1) | 452,000 | 5,121 | |||||||||
Bumi Serpong Damai Tbk PT(1) | 1,713,500 | 106,067 | |||||||||
| Charoen Pokphand Indonesia Tbk PT | 1,591,400 | 629,895 | |||||||||
| Ciputra Development Tbk PT | 6,235,500 | 398,879 | |||||||||
Delta Dunia Makmur Tbk PT(1) | 4,766,600 | 120,651 | |||||||||
| Dharma Satya Nusantara Tbk PT | 1,939,500 | 65,903 | |||||||||
| Elnusa Tbk PT | 1,459,800 | 31,290 | |||||||||
| Erajaya Swasembada Tbk PT | 3,010,100 | 98,891 | |||||||||
Gajah Tunggal Tbk PT(1) | 531,100 | 24,501 | |||||||||
Global Mediacom Tbk PT(1) | 976,100 | 23,665 | |||||||||
Hanson International Tbk PT(1) | 1,531,500 | 5,159 | |||||||||
| Indah Kiat Pulp & Paper Tbk PT | 1,283,600 | 719,007 | |||||||||
| Indika Energy Tbk PT | 1,315,600 | 254,157 | |||||||||
| Indo Tambangraya Megah Tbk PT | 247,800 | 656,367 | |||||||||
| Indocement Tunggal Prakarsa Tbk PT | 397,100 | 252,537 | |||||||||
| Indofood CBP Sukses Makmur Tbk PT | 236,100 | 132,144 | |||||||||
| Indofood Sukses Makmur Tbk PT | 1,258,600 | 528,002 | |||||||||
| Indomobil Sukses Internasional Tbk PT | 19,800 | 1,133 | |||||||||
| Indosat Tbk PT | 514,600 | 248,433 | |||||||||
| Industri Jamu Dan Farmasi Sido Muncul Tbk PT | 439,030 | 20,982 | |||||||||
| Integra Indocabinet Tbk PT | 481,500 | 16,702 | |||||||||
| Jaccs Mitra Pinasthika Mustika Tbk PT | 309,400 | 21,262 | |||||||||
| Japfa Comfeed Indonesia Tbk PT | 1,745,900 | 186,312 | |||||||||
Jasa Marga Persero Tbk PT(1) | 940,300 | 217,791 | |||||||||
| Kalbe Farma Tbk PT | 6,333,600 | 716,197 | |||||||||
| Kino Indonesia Tbk PT | 52,400 | 8,369 | |||||||||
Link Net Tbk PT(1) | 366,800 | 117,369 | |||||||||
Lippo Karawaci Tbk PT(1) | 5,989,600 | 46,383 | |||||||||
| Matahari Department Store Tbk PT | 1,171,600 | 302,663 | |||||||||
Matahari Putra Prima Tbk PT(1) | 1,186,000 | 14,869 | |||||||||
| Medco Energi Internasional Tbk PT | 4,898,020 | 283,909 | |||||||||
| Media Nusantara Citra Tbk PT | 2,569,600 | 158,251 | |||||||||
Merdeka Copper Gold Tbk PT(1) | 1,926,158 | 553,906 | |||||||||
Mitra Adiperkasa Tbk PT(1) | 9,138,700 | 620,930 | |||||||||
| Mitra Keluarga Karyasehat Tbk PT | 1,364,000 | 244,342 | |||||||||
47
| Avantis Emerging Markets Equity ETF | |||||||||||
| Shares | Value | ||||||||||
MNC Kapital Indonesia Tbk PT(1) | 6,385,800 | $ | 49,545 | ||||||||
| MNC Studios International Tbk PT | 434,500 | 167,649 | |||||||||
MNC Vision Networks Tbk PT(1) | 5,403,500 | 33,882 | |||||||||
| Pabrik Kertas Tjiwi Kimia Tbk PT | 305,600 | 139,355 | |||||||||
Pacific Strategic Financial Tbk PT(1) | 828,800 | 66,730 | |||||||||
| Pakuwon Jati Tbk PT | 3,204,800 | 104,460 | |||||||||
| Panin Financial Tbk PT | 4,121,600 | 106,034 | |||||||||
| Perusahaan Gas Negara Tbk PT | 3,854,000 | 476,805 | |||||||||
| Perusahaan Perkebunan London Sumatra Indonesia Tbk PT | 1,913,200 | 152,034 | |||||||||
PP Persero Tbk PT(1) | 1,481,700 | 100,682 | |||||||||
| PT Medikaloka Hermina Tbk | 2,312,900 | 232,450 | |||||||||
| PT Temas Tbk | 475,200 | 77,865 | |||||||||
| Puradelta Lestari Tbk PT | 976,100 | 11,573 | |||||||||
| Ramayana Lestari Sentosa Tbk PT | 547,700 | 21,755 | |||||||||
| Salim Ivomas Pratama Tbk PT | 183,800 | 5,644 | |||||||||
| Samudera Indonesia Tbk PT | 724,600 | 126,062 | |||||||||
| Sarana Menara Nusantara Tbk PT | 4,071,900 | 340,420 | |||||||||
| Semen Indonesia Persero Tbk PT | 1,035,300 | 459,736 | |||||||||
Sentul City Tbk PT(1) | 1,197,800 | 4,512 | |||||||||
| Siloam International Hospitals Tbk PT | 9,600 | 673 | |||||||||
Smartfren Telecom Tbk PT(1) | 39,123,800 | 260,980 | |||||||||
Sri Rejeki Isman Tbk PT(1) | 918,200 | 9,032 | |||||||||
| Summarecon Agung Tbk PT | 2,844,978 | 114,765 | |||||||||
| Surya Citra Media Tbk PT | 3,277,000 | 49,865 | |||||||||
Surya Semesta Internusa Tbk PT(1) | 423,900 | 10,446 | |||||||||
Telkom Indonesia Persero Tbk PT, ADR(2) | 101,772 | 3,060,284 | |||||||||
| Timah Tbk PT | 1,423,400 | 143,068 | |||||||||
| Tower Bersama Infrastructure Tbk PT | 3,145,700 | 597,227 | |||||||||
| Transcoal Pacific Tbk PT | 87,900 | 49,152 | |||||||||
| Tunas Baru Lampung Tbk PT | 339,100 | 17,582 | |||||||||
| Unilever Indonesia Tbk PT | 970,700 | 299,972 | |||||||||
| United Tractors Tbk PT | 612,100 | 1,393,793 | |||||||||
Vale Indonesia Tbk PT(1) | 256,900 | 105,296 | |||||||||
Waskita Beton Precast Tbk PT(1) | 238,300 | 1,525 | |||||||||
Waskita Karya Persero Tbk PT(1) | 3,601,745 | 136,856 | |||||||||
Wijaya Karya Persero Tbk PT(1) | 1,052,600 | 75,794 | |||||||||
| XL Axiata Tbk PT | 1,130,000 | 200,085 | |||||||||
| 31,491,340 | |||||||||||
| Malaysia — 1.9% | |||||||||||
| 7-Eleven Malaysia Holdings Bhd, Class B | 21,600 | 7,547 | |||||||||
| Aeon Co. M Bhd | 267,700 | 87,587 | |||||||||
| AEON Credit Service M Bhd | 4,800 | 15,092 | |||||||||
| Alliance Bank Malaysia Bhd | 595,000 | 467,861 | |||||||||
| AMMB Holdings Bhd | 756,500 | 703,126 | |||||||||
| Ann Joo Resources Bhd | 103,300 | 24,013 | |||||||||
Astro Malaysia Holdings Bhd(2) | 96,000 | 17,866 | |||||||||
| ATA IMS Bhd | 11,300 | 706 | |||||||||
| Axiata Group Bhd | 318,400 | 215,918 | |||||||||
| Bank Islam Malaysia Bhd | 287,000 | 166,981 | |||||||||
Berjaya Corp. Bhd(1) | 1,458,268 | 78,007 | |||||||||
Berjaya Land Bhd(1) | 2,900 | 149 | |||||||||
48
| Avantis Emerging Markets Equity ETF | |||||||||||
| Shares | Value | ||||||||||
| Bermaz Auto Bhd | 148,900 | $ | 60,432 | ||||||||
Boustead Holdings Bhd(1) | 572,700 | 83,180 | |||||||||
| Boustead Plantations Bhd | 491,100 | 84,773 | |||||||||
Bumi Armada Bhd(1) | 1,873,000 | 172,142 | |||||||||
| Bursa Malaysia Bhd | 179,900 | 257,105 | |||||||||
| Cahya Mata Sarawak Bhd | 204,700 | 42,941 | |||||||||
Capital A Bhd(1) | 140,600 | 18,895 | |||||||||
| Carlsberg Brewery Malaysia Bhd | 16,900 | 87,248 | |||||||||
Chin Hin Group Bhd(2) | 82,400 | 47,524 | |||||||||
| CIMB Group Holdings Bhd | 866,790 | 1,036,567 | |||||||||
| CSC Steel Holdings Bhd | 75,000 | 19,895 | |||||||||
| CTOS Digital Bhd | 109,100 | 34,835 | |||||||||
| D&O Green Technologies Bhd | 80,000 | 68,267 | |||||||||
Dagang NeXchange Bhd(2) | 1,759,400 | 331,899 | |||||||||
| Dayang Enterprise Holdings Bhd | 114,920 | 27,758 | |||||||||
| Dialog Group Bhd | 392,200 | 212,164 | |||||||||
| DiGi.Com Bhd | 412,900 | 344,619 | |||||||||
| DRB-Hicom Bhd | 107,800 | 34,589 | |||||||||
| Dufu Technology Corp. Bhd | 13,600 | 8,563 | |||||||||
| Duopharma Biotech Bhd | 10,630 | 2,937 | |||||||||
| Eco World Development Group Bhd | 601,900 | 89,604 | |||||||||
Eco World International Bhd(1) | 194,300 | 14,901 | |||||||||
Ekovest Bhd(1) | 1,008,300 | 86,207 | |||||||||
| Evergreen Fibreboard Bhd | 239,000 | 27,272 | |||||||||
| Formosa Prosonic Industries Bhd | 28,500 | 19,764 | |||||||||
| Fraser & Neave Holdings Bhd | 18,300 | 91,248 | |||||||||
| Frontken Corp. Bhd | 227,250 | 137,740 | |||||||||
| Gamuda Bhd | 582,323 | 496,173 | |||||||||
| Genting Bhd | 667,200 | 697,348 | |||||||||
| Genting Malaysia Bhd | 314,300 | 208,624 | |||||||||
| Genting Plantations Bhd | 105,000 | 157,053 | |||||||||
| Globetronics Technology Bhd | 102,800 | 28,654 | |||||||||
Greatech Technology Bhd(1) | 94,500 | 74,677 | |||||||||
| HAP Seng Consolidated Bhd | 65,700 | 101,944 | |||||||||
| Hap Seng Plantations Holdings Bhd | 58,900 | 29,701 | |||||||||
| Hartalega Holdings Bhd | 487,700 | 180,565 | |||||||||
| Heineken Malaysia Bhd | 29,500 | 155,086 | |||||||||
Hengyuan Refining Co. Bhd(1) | 57,800 | 68,386 | |||||||||
| Hextar Global Bhd | 58,320 | 20,865 | |||||||||
| Hiap Teck Venture Bhd | 691,900 | 42,780 | |||||||||
| Hibiscus Petroleum Bhd | 1,440,600 | 337,512 | |||||||||
| Hong Leong Bank Bhd | 78,200 | 363,985 | |||||||||
| Hong Leong Capital Bhd | 24,300 | 34,228 | |||||||||
| Hong Leong Financial Group Bhd | 45,900 | 198,412 | |||||||||
Hong Seng Consolidated Bhd(1) | 180,800 | 18,804 | |||||||||
| Hup Seng Industries Bhd | 9,000 | 1,467 | |||||||||
| IHH Healthcare Bhd | 133,200 | 183,839 | |||||||||
| IJM Corp. Bhd | 1,365,600 | 519,773 | |||||||||
| Inari Amertron Bhd | 462,900 | 275,504 | |||||||||
| Innoprise Plantations Bhd | 67,500 | 23,761 | |||||||||
| IOI Corp. Bhd | 234,200 | 220,933 | |||||||||
49
| Avantis Emerging Markets Equity ETF | |||||||||||
| Shares | Value | ||||||||||
| IOI Properties Group Bhd | 130,000 | $ | 28,654 | ||||||||
Jaya Tiasa Holdings Bhd(1) | 590,500 | 80,652 | |||||||||
KNM Group Bhd(1) | 595,500 | 15,270 | |||||||||
| Kossan Rubber Industries Bhd | 653,800 | 147,119 | |||||||||
| KPJ Healthcare Bhd | 353,700 | 69,007 | |||||||||
| Kuala Lumpur Kepong Bhd | 54,900 | 283,666 | |||||||||
| Kumpulan Perangsang Selangor Bhd | 6,000 | 960 | |||||||||
Leong Hup International Bhd(1) | 10,100 | 1,099 | |||||||||
| Lotte Chemical Titan Holding Bhd | 179,600 | 68,548 | |||||||||
| Mah Sing Group Bhd | 235,900 | 32,051 | |||||||||
| Malakoff Corp. Bhd | 157,200 | 24,315 | |||||||||
| Malayan Banking Bhd | 753,496 | 1,507,367 | |||||||||
| Malayan Flour Mills Bhd | 212,300 | 28,075 | |||||||||
Malaysia Airports Holdings Bhd(1) | 178,300 | 232,986 | |||||||||
Malaysia Building Society Bhd(2) | 1,018,892 | 131,338 | |||||||||
Malaysia Marine and Heavy Engineering Holdings Bhd(1) | 10,900 | 948 | |||||||||
Malaysian Bulk Carriers Bhd(1) | 163,800 | 15,101 | |||||||||
| Malaysian Pacific Industries Bhd | 20,000 | 134,286 | |||||||||
| Malaysian Resources Corp. Bhd | 259,300 | 20,137 | |||||||||
| Matrix Concepts Holdings Bhd | 77,400 | 39,175 | |||||||||
Maxis Bhd(2) | 245,800 | 210,705 | |||||||||
| Media Prima Bhd | 407,400 | 42,630 | |||||||||
| Mega First Corp. Bhd | 26,400 | 21,357 | |||||||||
| MISC Bhd | 290,300 | 459,325 | |||||||||
| MNRB Holdings Bhd | 10,700 | 2,329 | |||||||||
| Muda Holdings Bhd | 27,400 | 10,942 | |||||||||
| My EG Services Bhd | 756,914 | 134,211 | |||||||||
| Nestle Malaysia Bhd | 7,800 | 231,452 | |||||||||
| OSK Holdings Bhd | 20,000 | 4,149 | |||||||||
| Padini Holdings Bhd | 3,200 | 2,383 | |||||||||
| Pantech Group Holdings Bhd | 203,100 | 30,049 | |||||||||
| PESTECH International Bhd | 186,625 | 15,115 | |||||||||
| Petron Malaysia Refining & Marketing Bhd | 26,800 | 32,258 | |||||||||
| Petronas Chemicals Group Bhd | 453,100 | 888,742 | |||||||||
| Petronas Dagangan Bhd | 34,300 | 179,657 | |||||||||
| Petronas Gas Bhd | 118,500 | 457,945 | |||||||||
Pos Malaysia Bhd(1) | 5,700 | 809 | |||||||||
| Power Root Bhd | 5,800 | 2,376 | |||||||||
| PPB Group Bhd | 64,500 | 253,549 | |||||||||
| Press Metal Aluminium Holdings Bhd | 219,300 | 232,435 | |||||||||
| Public Bank Bhd | 2,710,000 | 2,845,608 | |||||||||
| QL Resources Bhd | 90,000 | 102,570 | |||||||||
Ranhill Utilities Bhd(1) | 299 | 28 | |||||||||
| RHB Bank Bhd | 576,942 | 737,205 | |||||||||
Rubberex Corp. M Bhd(1) | 196,500 | 17,727 | |||||||||
| Sam Engineering & Equipment M Bhd | 50,800 | 49,066 | |||||||||
| Sarawak Oil Palms Bhd | 168,750 | 103,797 | |||||||||
| Sarawak Plantation Bhd | 45,200 | 21,862 | |||||||||
| Scientex Bhd | 194,100 | 152,554 | |||||||||
| SEG International Bhd | 12,300 | 1,746 | |||||||||
| Sime Darby Bhd | 722,800 | 368,266 | |||||||||
50
| Avantis Emerging Markets Equity ETF | |||||||||||
| Shares | Value | ||||||||||
| Sime Darby Plantation Bhd | 547,357 | $ | 544,074 | ||||||||
| Sime Darby Property Bhd | 367,700 | 39,288 | |||||||||
| SKP Resources Bhd | 118,000 | 44,379 | |||||||||
| SP Setia Bhd Group | 409,900 | 68,349 | |||||||||
| Sports Toto Bhd | 61,307 | 24,729 | |||||||||
| Sunway Bhd | 502,448 | 183,530 | |||||||||
| Sunway Construction Group Bhd | 55,900 | 19,303 | |||||||||
| Supermax Corp. Bhd | 681,422 | 110,856 | |||||||||
| Syarikat Takaful Malaysia Keluarga Bhd | 79,874 | 59,332 | |||||||||
| Ta Ann Holdings Bhd | 165,600 | 147,376 | |||||||||
| TASCO Bhd | 91,000 | 19,109 | |||||||||
| TDM Bhd | 278,600 | 13,064 | |||||||||
| Telekom Malaysia Bhd | 318,700 | 423,672 | |||||||||
| Tenaga Nasional Bhd | 484,100 | 971,798 | |||||||||
| Thong Guan Industries Bhd | 44,400 | 25,240 | |||||||||
| TIME dotCom Bhd | 172,800 | 183,759 | |||||||||
Tiong NAM Logistics Holdings(1) | 95,600 | 13,216 | |||||||||
| Top Glove Corp. Bhd | 1,251,500 | 224,075 | |||||||||
Tropicana Corp. Bhd(1) | 20,482 | 5,303 | |||||||||
| TSH Resources Bhd | 488,400 | 120,706 | |||||||||
| Uchi Technologies Bhd | 42,900 | 31,937 | |||||||||
UEM Sunrise Bhd(1) | 10,800 | 706 | |||||||||
| UMW Holdings Bhd | 36,100 | 24,738 | |||||||||
| Unisem M Bhd | 172,200 | 104,292 | |||||||||
| United Plantations Bhd | 31,000 | 102,366 | |||||||||
| UOA Development Bhd | 1,700 | 652 | |||||||||
| UWC Bhd | 43,100 | 37,145 | |||||||||
Velesto Energy Bhd(1) | 2,752,500 | 51,732 | |||||||||
| ViTrox Corp. Bhd | 6,000 | 9,536 | |||||||||
VS Industry Bhd(2) | 949,200 | 212,403 | |||||||||
Wah Seong Corp. Bhd(1) | 136,000 | 20,292 | |||||||||
| Westports Holdings Bhd | 222,600 | 172,633 | |||||||||
| Yinson Holdings Bhd | 726,600 | 341,116 | |||||||||
| YTL Corp. Bhd | 775,813 | 101,937 | |||||||||
| 24,594,240 | |||||||||||
| Mexico — 2.3% | |||||||||||
| Alfa SAB de CV, Class A | 1,474,748 | 931,851 | |||||||||
| Alpek SAB de CV | 35,137 | 48,293 | |||||||||
Alsea SAB de CV(1) | 396,698 | 718,709 | |||||||||
America Movil SAB de CV, Class L ADR(2) | 231,409 | 3,933,953 | |||||||||
| Arca Continental SAB de CV | 83,983 | 568,432 | |||||||||
| Banco del Bajio SA | 344,462 | 721,701 | |||||||||
| Becle SAB de CV | 38,227 | 77,909 | |||||||||
| Bolsa Mexicana de Valores SAB de CV | 117,102 | 210,936 | |||||||||
Cemex SAB de CV, ADR(1) | 109,607 | 409,930 | |||||||||
| Coca-Cola Femsa SAB de CV | 151,389 | 924,197 | |||||||||
| Consorcio ARA SAB de CV | 34,198 | 5,568 | |||||||||
Controladora Vuela Cia de Aviacion SAB de CV, ADR(1)(2) | 41,350 | 367,188 | |||||||||
| Corp. Inmobiliaria Vesta SAB de CV | 159,668 | 295,219 | |||||||||
El Puerto de Liverpool SAB de CV, Class C1(2) | 7,605 | 33,891 | |||||||||
| Fomento Economico Mexicano SAB de CV, ADR | 17,132 | 1,074,348 | |||||||||
51
| Avantis Emerging Markets Equity ETF | |||||||||||
| Shares | Value | ||||||||||
| GCC SAB de CV | 54,498 | $ | 313,168 | ||||||||
| Genomma Lab Internacional SAB de CV, Class B | 522,396 | 426,806 | |||||||||
| Gentera SAB de CV | 787,672 | 617,345 | |||||||||
| Gruma SAB de CV, B Shares | 110,666 | 1,209,847 | |||||||||
| Grupo Aeroportuario del Centro Norte SAB de CV, ADR | 8,761 | 457,938 | |||||||||
| Grupo Aeroportuario del Pacifico SAB de CV, ADR | 7,133 | 1,016,952 | |||||||||
| Grupo Aeroportuario del Sureste SAB de CV, ADR | 4,069 | 860,471 | |||||||||
| Grupo Bimbo SAB de CV, Series A | 228,837 | 770,911 | |||||||||
| Grupo Carso SAB de CV, Series A1 | 70,857 | 243,207 | |||||||||
| Grupo Comercial Chedraui SA de CV | 100,512 | 285,224 | |||||||||
| Grupo Financiero Banorte SAB de CV, Class O | 482,713 | 2,851,257 | |||||||||
Grupo Financiero Inbursa SAB de CV, Class O(1)(2) | 610,417 | 956,234 | |||||||||
Grupo GICSA SAB de CV(1) | 21,090 | 1,958 | |||||||||
| Grupo Industrial Saltillo SAB de CV | 26,514 | 39,482 | |||||||||
| Grupo Mexico SAB de CV, Series B | 599,340 | 2,257,956 | |||||||||
Grupo Rotoplas SAB de CV(1) | 4,698 | 6,417 | |||||||||
| Grupo Televisa SAB, ADR | 212,861 | 1,347,410 | |||||||||
Grupo Traxion SAB de CV(1)(2) | 124,800 | 138,078 | |||||||||
Hoteles City Express SAB de CV(1) | 9,494 | 1,734 | |||||||||
| Industrias Bachoco SAB de CV | 13,371 | 52,856 | |||||||||
| Industrias Penoles SAB de CV | 78,632 | 650,124 | |||||||||
Kimberly-Clark de Mexico SAB de CV, A Shares(2) | 207,002 | 281,017 | |||||||||
La Comer SAB de CV(2) | 170,365 | 287,768 | |||||||||
| Megacable Holdings SAB de CV | 358,749 | 752,524 | |||||||||
Nemak SAB de CV(1) | 896,695 | 189,162 | |||||||||
| Operadora de Sites Mexicanos SA de CV | 128,052 | 127,439 | |||||||||
| Orbia Advance Corp. SAB de CV | 310,820 | 586,264 | |||||||||
| Promotora y Operadora de Infraestructura SAB de CV | 61,602 | 433,429 | |||||||||
| Qualitas Controladora SAB de CV | 117,498 | 514,690 | |||||||||
| Regional SAB de CV | 111,888 | 604,911 | |||||||||
Unifin Financiera SAB de CV(1)(2) | 17,710 | 1,530 | |||||||||
| Wal-Mart de Mexico SAB de CV | 445,796 | 1,460,872 | |||||||||
| 30,067,106 | |||||||||||
| Peru — 0.2% | |||||||||||
| Cia de Minas Buenaventura SAA, ADR | 169,790 | 903,283 | |||||||||
| Credicorp Ltd. | 8,384 | 1,080,614 | |||||||||
| Intercorp Financial Services, Inc. | 19,042 | 410,545 | |||||||||
| Southern Copper Corp. | 10,357 | 487,504 | |||||||||
| 2,881,946 | |||||||||||
| Philippines — 0.9% | |||||||||||
| Aboitiz Equity Ventures, Inc. | 585,770 | 584,239 | |||||||||
| Aboitiz Power Corp. | 60,500 | 33,688 | |||||||||
| ACEN Corp. | 835,520 | 111,268 | |||||||||
| Alliance Global Group, Inc. | 1,108,600 | 197,975 | |||||||||
| Ayala Corp. | 46,790 | 583,074 | |||||||||
| Ayala Land, Inc. | 712,600 | 361,739 | |||||||||
Ayalaland Logistics Holdings Corp.(1) | 28,000 | 1,806 | |||||||||
| Bank of the Philippine Islands | 434,110 | 732,946 | |||||||||
| BDO Unibank, Inc. | 400,540 | 915,893 | |||||||||
Cebu Air, Inc.(1) | 19,350 | 14,169 | |||||||||
| Century Pacific Food, Inc. | 256,200 | 113,157 | |||||||||
52
| Avantis Emerging Markets Equity ETF | |||||||||||
| Shares | Value | ||||||||||
Converge Information and Communications Technology Solutions, Inc.(1) | 643,700 | $ | 198,486 | ||||||||
| Cosco Capital, Inc. | 227,200 | 17,450 | |||||||||
DITO CME Holdings Corp.(1) | 425,200 | 28,588 | |||||||||
| DMCI Holdings, Inc. | 2,846,800 | 480,976 | |||||||||
| East West Banking Corp. | 65,600 | 7,992 | |||||||||
| Filinvest Land, Inc. | 519,000 | 8,219 | |||||||||
| Ginebra San Miguel, Inc. | 7,600 | 14,361 | |||||||||
| Global Ferronickel Holdings, Inc. | 757,000 | 31,639 | |||||||||
| Globe Telecom, Inc. | 7,670 | 286,179 | |||||||||
| GT Capital Holdings, Inc. | 39,760 | 340,540 | |||||||||
| International Container Terminal Services, Inc. | 172,240 | 554,727 | |||||||||
| JG Summit Holdings, Inc. | 415,834 | 378,141 | |||||||||
| Jollibee Foods Corp. | 102,430 | 436,585 | |||||||||
| LT Group, Inc. | 183,600 | 28,824 | |||||||||
| Manila Electric Co. | 52,080 | 278,922 | |||||||||
| Manila Water Co., Inc. | 265,100 | 73,048 | |||||||||
Max's Group, Inc.(1) | 15,000 | 1,496 | |||||||||
| Megaworld Corp. | 3,128,800 | 138,891 | |||||||||
| Metro Pacific Investments Corp. | 4,116,000 | 273,116 | |||||||||
| Metropolitan Bank & Trust Co. | 857,140 | 801,108 | |||||||||
Monde Nissin Corp.(1) | 647,800 | 190,119 | |||||||||
| Nickel Asia Corp. | 1,572,800 | 159,355 | |||||||||
Petron Corp.(1) | 137,700 | 7,521 | |||||||||
| Pilipinas Shell Petroleum Corp. | 7,000 | 2,610 | |||||||||
PLDT, Inc., ADR(2) | 17,924 | 521,230 | |||||||||
| Puregold Price Club, Inc. | 289,500 | 176,294 | |||||||||
| Robinsons Land Corp. | 742,200 | 247,825 | |||||||||
| Robinsons Retail Holdings, Inc. | 128,010 | 136,599 | |||||||||
| Security Bank Corp. | 307,900 | 492,181 | |||||||||
| Semirara Mining & Power Corp. | 478,300 | 349,843 | |||||||||
| SM Investments Corp. | 25,075 | 370,131 | |||||||||
| SM Prime Holdings, Inc. | 744,500 | 500,469 | |||||||||
| Universal Robina Corp. | 186,550 | 404,901 | |||||||||
| Vista Land & Lifescapes, Inc. | 266,100 | 9,539 | |||||||||
| Wilcon Depot, Inc. | 279,300 | 148,893 | |||||||||
| 11,746,752 | |||||||||||
| Poland — 0.7% | |||||||||||
Alior Bank SA(1) | 50,816 | 280,588 | |||||||||
Allegro.eu SA(1) | 24,626 | 129,168 | |||||||||
AmRest Holdings SE(1) | 9,743 | 41,095 | |||||||||
| Asseco Poland SA | 5,620 | 85,677 | |||||||||
| Bank Handlowy w Warszawie SA | 1,500 | 18,930 | |||||||||
Bank Millennium SA(1) | 269,763 | 216,808 | |||||||||
| Bank Polska Kasa Opieki SA | 35,859 | 496,077 | |||||||||
| Budimex SA | 1,528 | 82,109 | |||||||||
CCC SA(1) | 276 | 2,213 | |||||||||
| CD Projekt SA | 22,721 | 405,185 | |||||||||
Ciech SA(1) | 8,081 | 54,997 | |||||||||
| Cyfrowy Polsat SA | 30,113 | 124,194 | |||||||||
Dino Polska SA(1) | 7,626 | 556,344 | |||||||||
53
| Avantis Emerging Markets Equity ETF | |||||||||||
| Shares | Value | ||||||||||
Enea SA(1) | 78,670 | $ | 126,579 | ||||||||
Eurocash SA(1) | 19,678 | 48,174 | |||||||||
Famur SA(1) | 28,812 | 17,971 | |||||||||
Grupa Azoty SA(1) | 20,814 | 144,063 | |||||||||
Jastrzebska Spolka Weglowa SA(1) | 45,345 | 458,052 | |||||||||
| KGHM Polska Miedz SA | 30,381 | 569,321 | |||||||||
| KRUK SA | 4,763 | 306,244 | |||||||||
| LPP SA | 329 | 592,405 | |||||||||
| Lubelski Wegiel Bogdanka SA | 857 | 9,010 | |||||||||
mBank SA(1) | 3,942 | 181,100 | |||||||||
| Orange Polska SA | 282,077 | 359,465 | |||||||||
PGE Polska Grupa Energetyczna SA(1) | 68,057 | 103,743 | |||||||||
| Polski Koncern Naftowy ORLEN SA | 121,876 | 1,578,564 | |||||||||
Polskie Gornictwo Naftowe i Gazownictwo SA(1) | 325,856 | 387,094 | |||||||||
| Powszechna Kasa Oszczednosci Bank Polski SA | 65,141 | 324,959 | |||||||||
| Powszechny Zaklad Ubezpieczen SA | 99,967 | 598,385 | |||||||||
| Santander Bank Polska SA | 6,676 | 303,355 | |||||||||
Tauron Polska Energia SA(1) | 366,781 | 179,702 | |||||||||
| TEN Square Games SA | 1,102 | 22,761 | |||||||||
| Warsaw Stock Exchange | 5,163 | 37,759 | |||||||||
| XTB SA | 11,743 | 54,491 | |||||||||
| 8,896,582 | |||||||||||
Romania† | |||||||||||
| MAS PLC | 71,323 | 84,401 | |||||||||
Russia(3)† | |||||||||||
Gazprom PJSC, ADR(1) | 13,735 | 1 | |||||||||
Gazprom PJSC(1) | 1,738,516 | 3 | |||||||||
| Globaltrans Investment PLC, GDR | 112,592 | 11 | |||||||||
| LUKOIL PJSC | 69,112 | — | |||||||||
| LUKOIL PJSC, ADR | 2,950 | — | |||||||||
| Magnit PJSC | 9,702 | — | |||||||||
Magnit PJSC, GDR(1) | 3 | — | |||||||||
Mechel PJSC(1) | 22,684 | — | |||||||||
| MMC Norilsk Nickel PJSC | 6,947 | — | |||||||||
| MMC Norilsk Nickel PJSC, ADR | 5,465 | 1 | |||||||||
Mobile TeleSystems PJSC, ADR(1) | 58,032 | 6 | |||||||||
| Novatek PJSC LI, GDR | 215 | — | |||||||||
| Novatek PJSC, GDR | 36,400 | — | |||||||||
| Novolipetsk Steel PJSC | 405,900 | 1 | |||||||||
PhosAgro PJSC(1) | 275 | — | |||||||||
| PhosAgro PJSC LI, GDR | 2 | — | |||||||||
| PhosAgro PJSC RX | 14,221 | — | |||||||||
| Ros Agro PLC, GDR | 2,060 | — | |||||||||
| Rosneft Oil Co. PJSC | 192,337 | — | |||||||||
Severstal PAO, GDR(1) | 53,821 | 6 | |||||||||
| Tatneft PJSC, ADR | 37,246 | 4 | |||||||||
VTB Bank PJSC(1) | 1,439,642,000 | 2,360 | |||||||||
| X5 Retail Group NV, GDR | 13,628 | 1 | |||||||||
| 2,394 | |||||||||||
| South Africa — 4.0% | |||||||||||
| Absa Group Ltd. | 191,075 | 1,978,993 | |||||||||
54
| Avantis Emerging Markets Equity ETF | |||||||||||
| Shares | Value | ||||||||||
| Adcock Ingram Holdings Ltd. | 1,014 | $ | 2,922 | ||||||||
| Advtech Ltd. | 35,578 | 33,912 | |||||||||
AECI Ltd.(2) | 73,859 | 357,619 | |||||||||
| African Rainbow Minerals Ltd. | 61,838 | 851,676 | |||||||||
| Afrimat Ltd. | 9,681 | 28,172 | |||||||||
| Alexander Forbes Group Holdings Ltd. | 85,796 | 23,566 | |||||||||
| Anglo American Platinum Ltd. | 5,079 | 354,563 | |||||||||
| AngloGold Ashanti Ltd., ADR | 112,449 | 1,515,813 | |||||||||
ArcelorMittal South Africa Ltd.(1) | 60,938 | 18,102 | |||||||||
| Aspen Pharmacare Holdings Ltd. | 106,892 | 917,325 | |||||||||
| Astral Foods Ltd. | 25,588 | 308,552 | |||||||||
| AVI Ltd. | 113,632 | 488,075 | |||||||||
| Barloworld Ltd. | 113,243 | 576,404 | |||||||||
| Bid Corp. Ltd. | 38,888 | 736,582 | |||||||||
| Bidvest Group Ltd. | 55,899 | 700,232 | |||||||||
Brait PLC(1)(2) | 36,591 | 8,322 | |||||||||
| Capitec Bank Holdings Ltd. | 9,487 | 1,128,055 | |||||||||
| Cashbuild Ltd. | 1,658 | 22,001 | |||||||||
City Lodge Hotels Ltd.(1) | 91,493 | 22,757 | |||||||||
| Clicks Group Ltd. | 38,264 | 665,285 | |||||||||
| Coronation Fund Managers Ltd. | 64,473 | 118,691 | |||||||||
| DataTec Ltd. | 25,021 | 61,972 | |||||||||
| Dis-Chem Pharmacies Ltd. | 72,041 | 149,111 | |||||||||
Discovery Ltd.(1)(2) | 76,460 | 547,831 | |||||||||
Distell Group Holdings Ltd.(1) | 12,494 | 125,540 | |||||||||
| DRDGOLD Ltd. | 84,738 | 45,917 | |||||||||
| Exxaro Resources Ltd. | 56,532 | 720,231 | |||||||||
| Famous Brands Ltd. | 3,093 | 10,268 | |||||||||
| FirstRand Ltd. | 571,505 | 2,134,633 | |||||||||
| Foschini Group Ltd. | 123,881 | 917,109 | |||||||||
| Gold Fields Ltd., ADR | 219,789 | 1,778,093 | |||||||||
| Grindrod Shipping Holdings Ltd. | 9,223 | 217,039 | |||||||||
| Harmony Gold Mining Co. Ltd., ADR | 312,802 | 816,413 | |||||||||
| Impala Platinum Holdings Ltd. | 207,671 | 2,176,049 | |||||||||
| Investec Ltd. | 95,945 | 450,507 | |||||||||
| Kaap Agri Ltd. | 1,532 | 3,418 | |||||||||
| KAP Industrial Holdings Ltd. | 1,324,375 | 350,840 | |||||||||
Kumba Iron Ore Ltd.(2) | 9,172 | 203,062 | |||||||||
| Life Healthcare Group Holdings Ltd. | 285,953 | 335,073 | |||||||||
Massmart Holdings Ltd.(1) | 20,403 | 69,223 | |||||||||
| Metair Investments Ltd. | 41,971 | 64,742 | |||||||||
| MiX Telematics Ltd., ADR | 5,715 | 45,720 | |||||||||
| Momentum Metropolitan Holdings | 555,143 | 538,502 | |||||||||
| Motus Holdings Ltd. | 104,328 | 706,984 | |||||||||
| Mr Price Group Ltd. | 54,724 | 592,814 | |||||||||
| MTN Group Ltd. | 310,736 | 2,249,121 | |||||||||
| MultiChoice Group | 94,615 | 638,954 | |||||||||
Murray & Roberts Holdings Ltd.(1) | 20,297 | 10,558 | |||||||||
Nampak Ltd.(1) | 136,616 | 18,862 | |||||||||
| Naspers Ltd.,, N Shares | 18,039 | 2,543,615 | |||||||||
Nedbank Group Ltd.(2) | 120,136 | 1,418,021 | |||||||||
55
| Avantis Emerging Markets Equity ETF | |||||||||||
| Shares | Value | ||||||||||
| NEPI Rockcastle SA | 148,256 | $ | 789,989 | ||||||||
| Netcare Ltd. | 458,595 | 392,925 | |||||||||
| Ninety One Ltd. | 49,468 | 111,477 | |||||||||
Northam Platinum Holdings Ltd.(1) | 52,637 | 495,905 | |||||||||
Oceana Group Ltd.(2) | 2,532 | 8,101 | |||||||||
| Old Mutual Ltd. | 1,947,317 | 1,153,634 | |||||||||
| Omnia Holdings Ltd. | 125,590 | 452,805 | |||||||||
Pick n Pay Stores Ltd.(2) | 138,734 | 500,669 | |||||||||
PPC Ltd.(1) | 754,515 | 112,168 | |||||||||
| Rand Merchant Investment Holdings Ltd. | 173,970 | 274,624 | |||||||||
| Raubex Group Ltd. | 14,747 | 30,031 | |||||||||
| Reinet Investments SCA | 56,046 | 918,007 | |||||||||
| Remgro Ltd. | 130,866 | 970,428 | |||||||||
| Reunert Ltd. | 43,189 | 113,282 | |||||||||
| RFG Holdings Ltd. | 19,543 | 11,503 | |||||||||
RMB Holdings Ltd.(1) | 124,786 | 13,128 | |||||||||
Royal Bafokeng Platinum Ltd.(2) | 95,967 | 813,523 | |||||||||
| Sanlam Ltd. | 232,988 | 724,324 | |||||||||
| Santam Ltd. | 9,542 | 135,441 | |||||||||
Sappi Ltd.(1)(2) | 350,200 | 933,493 | |||||||||
Sasol Ltd., ADR(1)(2) | 133,734 | 2,581,066 | |||||||||
| Shoprite Holdings Ltd. | 104,789 | 1,420,941 | |||||||||
Sibanye Stillwater Ltd., ADR(2) | 201,335 | 1,807,988 | |||||||||
| SPAR Group Ltd. | 61,760 | 563,635 | |||||||||
| Standard Bank Group Ltd. | 202,927 | 1,810,830 | |||||||||
Steinhoff International Holdings NV(1) | 540,745 | 73,520 | |||||||||
| Super Group Ltd. | 69,845 | 118,401 | |||||||||
Telkom SA SOC Ltd.(1) | 224,397 | 575,895 | |||||||||
Thungela Resources Ltd.(2) | 113,385 | 2,161,144 | |||||||||
Tiger Brands Ltd.(2) | 39,159 | 381,015 | |||||||||
| Transaction Capital Ltd. | 16,857 | 37,065 | |||||||||
| Truworths International Ltd. | 151,183 | 504,164 | |||||||||
Tsogo Sun Gaming Ltd.(1) | 11,283 | 8,282 | |||||||||
| Vodacom Group Ltd. | 88,590 | 652,081 | |||||||||
| Wilson Bayly Holmes-Ovcon Ltd. | 9,429 | 48,534 | |||||||||
| Woolworths Holdings Ltd. | 160,005 | 521,998 | |||||||||
Zeder Investments Ltd.(2) | 120,266 | 12,690 | |||||||||
| 53,032,547 | |||||||||||
| South Korea — 13.1% | |||||||||||
ABLBio, Inc.(1) | 10,483 | 177,422 | |||||||||
Able C&C Co. Ltd.(1) | 610 | 2,558 | |||||||||
| Advanced Process Systems Corp. | 4,807 | 69,393 | |||||||||
| Aekyung Industrial Co. Ltd. | 63 | 657 | |||||||||
| AfreecaTV Co. Ltd. | 1,874 | 106,359 | |||||||||
| Ahnlab, Inc. | 1,317 | 81,964 | |||||||||
Alteogen, Inc.(1) | 960 | 45,262 | |||||||||
| Amorepacific Corp. | 4,608 | 419,978 | |||||||||
| AMOREPACIFIC Group | 5,619 | 145,455 | |||||||||
Ananti, Inc.(1) | 42,423 | 214,700 | |||||||||
| APTC Co. Ltd. | 1,177 | 14,782 | |||||||||
Asiana Airlines, Inc.(1) | 22,930 | 257,983 | |||||||||
56
| Avantis Emerging Markets Equity ETF | |||||||||||
| Shares | Value | ||||||||||
| BGF Co. Ltd. | 12,496 | $ | 37,593 | ||||||||
| BGF retail Co. Ltd. | 3,194 | 382,573 | |||||||||
| BH Co. Ltd. | 2,474 | 57,853 | |||||||||
| Binggrae Co. Ltd. | 3,060 | 104,336 | |||||||||
Bioneer Corp.(1) | 7,543 | 168,333 | |||||||||
| BNK Financial Group, Inc. | 142,413 | 710,115 | |||||||||
| Boditech Med, Inc. | 3,086 | 24,958 | |||||||||
| Boryung | 4,172 | 31,463 | |||||||||
| Bukwang Pharmaceutical Co. Ltd. | 6,484 | 43,413 | |||||||||
| Byucksan Corp. | 12,984 | 25,120 | |||||||||
| Caregen Co. Ltd. | 654 | 61,920 | |||||||||
| Celltrion Healthcare Co. Ltd. | 3,341 | 178,791 | |||||||||
Celltrion Pharm, Inc.(1) | 1,561 | 90,796 | |||||||||
| Celltrion, Inc. | 15,550 | 2,188,779 | |||||||||
Chabiotech Co. Ltd.(1) | 5,918 | 75,020 | |||||||||
| Cheil Worldwide, Inc. | 13,859 | 225,950 | |||||||||
| Chong Kun Dang Pharmaceutical Corp. | 1,087 | 69,508 | |||||||||
| Chongkundang Holdings Corp. | 112 | 4,992 | |||||||||
| Chunbo Co. Ltd. | 124 | 20,792 | |||||||||
| CJ CheilJedang Corp. | 2,210 | 670,376 | |||||||||
| CJ Corp. | 6,881 | 400,354 | |||||||||
| CJ ENM Co. Ltd. | 7,159 | 521,796 | |||||||||
CJ Logistics Corp.(1) | 3,862 | 340,404 | |||||||||
| Classys, Inc. | 3,850 | 40,685 | |||||||||
CMG Pharmaceutical Co. Ltd.(1) | 9,916 | 20,747 | |||||||||
| Com2uSCorp | 1,096 | 65,703 | |||||||||
| Cosmax, Inc. | 4,069 | 189,378 | |||||||||
| Coway Co. Ltd. | 23,095 | 1,095,729 | |||||||||
| COWELL FASHION Co. Ltd. | 16,647 | 81,581 | |||||||||
CrystalGenomics, Inc.(1) | 11,842 | 32,118 | |||||||||
| CS Wind Corp. | 1,378 | 70,206 | |||||||||
| Cuckoo Holdings Co. Ltd. | 2,944 | 38,967 | |||||||||
| Cuckoo Homesys Co. Ltd. | 4,724 | 111,629 | |||||||||
| Dae Han Flour Mills Co. Ltd. | 490 | 53,456 | |||||||||
| Daeduck Electronics Co. Ltd. | 27,026 | 592,646 | |||||||||
| Daesang Corp. | 7,824 | 131,699 | |||||||||
| Daewon Pharmaceutical Co. Ltd. | 2,047 | 24,934 | |||||||||
Daewoo Engineering & Construction Co. Ltd.(1) | 124,142 | 478,749 | |||||||||
Daewoo Shipbuilding & Marine Engineering Co. Ltd.(1) | 3,806 | 56,783 | |||||||||
| Daewoong Co. Ltd. | 2,717 | 49,023 | |||||||||
| Daewoong Pharmaceutical Co. Ltd. | 881 | 114,899 | |||||||||
| Daishin Securities Co. Ltd. | 21,905 | 250,905 | |||||||||
| Daol Investment & Securities Co. Ltd. | 28,641 | 97,731 | |||||||||
| Daou Data Corp. | 10,233 | 92,274 | |||||||||
| Daou Technology, Inc. | 16,706 | 233,592 | |||||||||
| DB Financial Investment Co. Ltd. | 13,706 | 50,787 | |||||||||
| DB HiTek Co. Ltd. | 18,112 | 621,689 | |||||||||
| DB Insurance Co. Ltd. | 27,421 | 1,221,161 | |||||||||
| Dentium Co. Ltd. | 4,690 | 305,046 | |||||||||
| DGB Financial Group, Inc. | 97,412 | 539,905 | |||||||||
| DI Dong Il Corp. | 2,393 | 31,431 | |||||||||
57
| Avantis Emerging Markets Equity ETF | |||||||||||
| Shares | Value | ||||||||||
DIO Corp.(1) | 879 | $ | 17,519 | ||||||||
| DL E&C Co. Ltd. | 17,573 | 533,379 | |||||||||
| DL Holdings Co. Ltd. | 11,024 | 547,116 | |||||||||
| Dong-A Socio Holdings Co. Ltd. | 783 | 63,358 | |||||||||
| Dong-A ST Co. Ltd. | 975 | 40,935 | |||||||||
| Dongjin Semichem Co. Ltd. | 16,489 | 420,719 | |||||||||
| DongKook Pharmaceutical Co. Ltd. | 3,539 | 48,765 | |||||||||
| Dongkuk Steel Mill Co. Ltd. | 43,318 | 424,354 | |||||||||
| Dongsuh Cos., Inc. | 2,441 | 44,437 | |||||||||
Dongwha Enterprise Co. Ltd.(1) | 633 | 31,833 | |||||||||
| Dongwha Pharm Co. Ltd. | 4,407 | 32,874 | |||||||||
| Dongwon Development Co. Ltd. | 10,306 | 28,575 | |||||||||
| Dongwon F&B Co. Ltd. | 482 | 55,693 | |||||||||
| Dongwon Industries Co. Ltd. | 505 | 85,076 | |||||||||
| Dongwon Systems Corp. | 602 | 24,194 | |||||||||
| Doosan Bobcat, Inc. | 5,255 | 135,108 | |||||||||
| Doosan Co. Ltd. | 327 | 20,012 | |||||||||
Doosan Enerbility Co. Ltd.(1) | 37,028 | 556,481 | |||||||||
Doosan Fuel Cell Co. Ltd.(1) | 1,092 | 30,892 | |||||||||
| Doosan Tesna, Inc. | 10,320 | 219,812 | |||||||||
| DoubleUGames Co. Ltd. | 1,703 | 54,324 | |||||||||
| Douzone Bizon Co. Ltd. | 2,938 | 78,740 | |||||||||
| Dreamtech Co. Ltd. | 3,895 | 27,279 | |||||||||
Duk San Neolux Co. Ltd.(1) | 1,519 | 40,584 | |||||||||
| E-MART, Inc. | 7,328 | 531,999 | |||||||||
| Easy Bio, Inc. | 465 | 1,694 | |||||||||
| Easy Holdings Co. Ltd. | 1 | 3 | |||||||||
| Echo Marketing, Inc. | 2,946 | 35,362 | |||||||||
| Ecopro BM Co. Ltd. | 4,048 | 334,943 | |||||||||
| Ecopro Co. Ltd. | 1,228 | 104,080 | |||||||||
| Ecopro HN Co. Ltd. | 984 | 38,872 | |||||||||
| ENF Technology Co. Ltd. | 2,415 | 52,085 | |||||||||
| Eo Technics Co. Ltd. | 907 | 50,534 | |||||||||
| Eugene Corp. | 22,122 | 63,907 | |||||||||
| Eugene Investment & Securities Co. Ltd. | 25,011 | 53,100 | |||||||||
| Eugene Technology Co. Ltd. | 2,922 | 59,258 | |||||||||
| F&F Co. Ltd. / New | 4,805 | 506,997 | |||||||||
| Fila Holdings Corp. | 25,928 | 598,880 | |||||||||
| Foosung Co. Ltd. | 7,703 | 92,148 | |||||||||
Genexine, Inc.(1) | 1,193 | 26,913 | |||||||||
| GOLFZON Co. Ltd. | 2,207 | 216,922 | |||||||||
| Gradiant Corp. | 2,065 | 28,596 | |||||||||
Grand Korea Leisure Co. Ltd.(1) | 3,996 | 47,409 | |||||||||
| Green Cross Corp. | 247 | 30,152 | |||||||||
| Green Cross Holdings Corp. | 2,440 | 34,143 | |||||||||
| GS Engineering & Construction Corp. | 39,009 | 872,567 | |||||||||
| GS Holdings Corp. | 24,652 | 846,353 | |||||||||
| GS Retail Co. Ltd. | 24,660 | 466,161 | |||||||||
| HAESUNG DS Co. Ltd. | 7,830 | 340,509 | |||||||||
| Halla Holdings Corp. | 3,576 | 102,198 | |||||||||
| Hana Financial Group, Inc. | 106,694 | 3,109,773 | |||||||||
58
| Avantis Emerging Markets Equity ETF | |||||||||||
| Shares | Value | ||||||||||
| Hana Materials, Inc. | 3,691 | $ | 103,753 | ||||||||
Hana Micron, Inc.(1) | 23,684 | 224,434 | |||||||||
| Handsome Co. Ltd. | 10,538 | 222,200 | |||||||||
| Hanil Cement Co. Ltd. | 4,810 | 54,532 | |||||||||
Hanjin Kal Corp.(1) | 674 | 26,525 | |||||||||
| Hanjin Transportation Co. Ltd. | 3,382 | 64,782 | |||||||||
| Hankook Shell Oil Co. Ltd. | 114 | 21,615 | |||||||||
| Hankook Tire & Technology Co. Ltd. | 27,046 | 762,476 | |||||||||
| Hanmi Pharm Co. Ltd. | 1,949 | 446,633 | |||||||||
| Hanmi Semiconductor Co. Ltd. | 7,590 | 67,430 | |||||||||
| Hanon Systems | 40,772 | 311,791 | |||||||||
| Hansae Co. Ltd. | 9,679 | 113,530 | |||||||||
| Hansol Chemical Co. Ltd. | 1,235 | 199,458 | |||||||||
| Hansol Paper Co. Ltd. | 4,250 | 49,636 | |||||||||
Hansol Technics Co. Ltd.(1) | 26,009 | 117,115 | |||||||||
| Hanssem Co. Ltd. | 2,979 | 119,135 | |||||||||
| Hanwha Aerospace Co. Ltd. | 20,175 | 1,220,533 | |||||||||
| Hanwha Corp., Preference Shares | 1,663 | 19,743 | |||||||||
| Hanwha Corp. | 31,349 | 741,344 | |||||||||
Hanwha General Insurance Co. Ltd.(1) | 2,720 | 9,517 | |||||||||
| Hanwha Investment & Securities Co. Ltd. | 57,162 | 131,686 | |||||||||
Hanwha Life Insurance Co. Ltd.(1) | 155,428 | 266,646 | |||||||||
Hanwha Solutions Corp.(1) | 27,331 | 1,065,687 | |||||||||
| Hanwha Systems Co. Ltd. | 15,137 | 174,668 | |||||||||
| Harim Holdings Co. Ltd. | 28,774 | 178,916 | |||||||||
| HD Hyundai Co. Ltd. | 14,887 | 698,994 | |||||||||
| HDC Holdings Co. Ltd. | 3,073 | 15,935 | |||||||||
| HDC Hyundai Development Co-Engineering & Construction, E Shares | 16,660 | 153,941 | |||||||||
Helixmith Co. Ltd.(1) | 5,398 | 66,407 | |||||||||
| Hite Jinro Co. Ltd. | 10,838 | 246,014 | |||||||||
HJ Shipbuilding & Construction Co. Ltd.(1) | 15,718 | 70,582 | |||||||||
HLB, Inc.(1) | 4,391 | 160,313 | |||||||||
| HMM Co. Ltd. | 113,246 | 1,866,306 | |||||||||
| Hotel Shilla Co. Ltd. | 9,577 | 524,620 | |||||||||
| HS Industries Co. Ltd. | 11,046 | 41,010 | |||||||||
| Huchems Fine Chemical Corp. | 7,190 | 113,620 | |||||||||
Hugel, Inc.(1) | 981 | 88,783 | |||||||||
Humax Co. Ltd.(1) | 14,003 | 41,598 | |||||||||
| Humedix Co. Ltd. | 4,107 | 72,454 | |||||||||
| Huons Co. Ltd. | 1,038 | 27,548 | |||||||||
| Huons Global Co. Ltd. | 1,022 | 16,351 | |||||||||
| Hwaseung Enterprise Co. Ltd. | 1,558 | 15,323 | |||||||||
HYBE Co. Ltd.(1) | 763 | 102,246 | |||||||||
| Hyosung Advanced Materials Corp. | 1,021 | 320,056 | |||||||||
Hyosung Chemical Corp.(1) | 1,063 | 136,505 | |||||||||
| Hyosung Corp. | 740 | 41,120 | |||||||||
Hyosung Heavy Industries Corp.(1) | 1,843 | 101,052 | |||||||||
| Hyosung TNC Corp. | 1,751 | 407,210 | |||||||||
| Hyundai Autoever Corp. | 926 | 82,585 | |||||||||
| Hyundai Construction Equipment Co. Ltd. | 4,697 | 141,809 | |||||||||
59
| Avantis Emerging Markets Equity ETF | |||||||||||
| Shares | Value | ||||||||||
| Hyundai Corp. | 3,168 | $ | 43,079 | ||||||||
| Hyundai Department Store Co. Ltd. | 7,000 | 322,027 | |||||||||
Hyundai Doosan Infracore Co. Ltd.(1) | 66,273 | 303,207 | |||||||||
Hyundai Electric & Energy System Co. Ltd.(1) | 19,118 | 452,621 | |||||||||
| Hyundai Elevator Co. Ltd. | 9,493 | 206,416 | |||||||||
| Hyundai Engineering & Construction Co. Ltd. | 28,444 | 1,017,096 | |||||||||
| Hyundai Glovis Co. Ltd. | 8,075 | 1,058,043 | |||||||||
| Hyundai Greenfood Co. Ltd. | 11,576 | 66,291 | |||||||||
Hyundai Heavy Industries Co. Ltd.(1) | 4,332 | 460,972 | |||||||||
| Hyundai Home Shopping Network Corp. | 2,978 | 110,931 | |||||||||
| Hyundai Marine & Fire Insurance Co. Ltd. | 39,765 | 932,805 | |||||||||
Hyundai Mipo Dockyard Co. Ltd.(1) | 5,532 | 439,162 | |||||||||
| Hyundai Mobis Co. Ltd. | 8,565 | 1,365,888 | |||||||||
| Hyundai Motor Co. | 31,050 | 4,511,013 | |||||||||
Hyundai Rotem Co. Ltd.(1) | 8,502 | 190,924 | |||||||||
| Hyundai Steel Co. | 36,693 | 894,748 | |||||||||
| Hyundai Wia Corp. | 6,286 | 353,782 | |||||||||
| i-SENS, Inc. | 1,013 | 28,241 | |||||||||
| ICD Co. Ltd. | 6,931 | 48,792 | |||||||||
Il Dong Pharmaceutical Co. Ltd.(1) | 137 | 3,783 | |||||||||
| Iljin Materials Co. Ltd. | 1,375 | 75,350 | |||||||||
| Ilyang Pharmaceutical Co. Ltd. | 8,045 | 130,299 | |||||||||
| iMarketKorea, Inc. | 7,862 | 60,793 | |||||||||
| Industrial Bank of Korea | 114,889 | 818,047 | |||||||||
| Innocean Worldwide, Inc. | 4,112 | 130,020 | |||||||||
| Innox Advanced Materials Co. Ltd. | 5,202 | 133,174 | |||||||||
Insun ENT Co. Ltd.(1) | 9,908 | 79,411 | |||||||||
Interflex Co. Ltd.(1) | 344 | 3,176 | |||||||||
| INTOPS Co. Ltd. | 5,066 | 112,978 | |||||||||
iNtRON Biotechnology, Inc.(1) | 11,031 | 93,877 | |||||||||
| IS Dongseo Co. Ltd. | 9,892 | 271,678 | |||||||||
| JB Financial Group Co. Ltd. | 74,751 | 422,318 | |||||||||
| Jusung Engineering Co. Ltd. | 21,793 | 256,267 | |||||||||
| JW Holdings Corp. | 1 | 2 | |||||||||
| JW Pharmaceutical Corp. | 9,269 | 150,655 | |||||||||
| JYP Entertainment Corp. | 4,858 | 219,938 | |||||||||
| Kakao Corp. | 22,306 | 1,211,297 | |||||||||
Kakao Games Corp.(1) | 2,446 | 95,405 | |||||||||
KakaoBank Corp.(1) | 5,416 | 109,667 | |||||||||
Kangwon Land, Inc.(1) | 13,067 | 257,636 | |||||||||
KB Financial Group, Inc., ADR(2) | 107,267 | 3,923,827 | |||||||||
| KC Co. Ltd. | 5,885 | 78,771 | |||||||||
| KC Tech Co. Ltd. | 6,554 | 79,043 | |||||||||
| KCC Corp. | 638 | 139,313 | |||||||||
| KCC Glass Corp. | 8,405 | 314,850 | |||||||||
| KEPCO Engineering & Construction Co., Inc. | 1,249 | 67,988 | |||||||||
| KEPCO Plant Service & Engineering Co. Ltd. | 10,471 | 321,359 | |||||||||
| KG Dongbu Steel Co. Ltd. | 1,377 | 12,822 | |||||||||
| Kginicis Co. Ltd. | 12,487 | 124,116 | |||||||||
| KH Vatec Co. Ltd. | 9,846 | 138,633 | |||||||||
| Kia Corp. | 63,633 | 3,814,024 | |||||||||
60
| Avantis Emerging Markets Equity ETF | |||||||||||
| Shares | Value | ||||||||||
| KISCO Corp. | 15,701 | $ | 80,720 | ||||||||
| KISWIRE Ltd. | 1,961 | 29,841 | |||||||||
| KIWOOM Securities Co. Ltd. | 9,227 | 586,316 | |||||||||
KMW Co. Ltd.(1) | 675 | 16,030 | |||||||||
| Koentec Co. Ltd. | 3,932 | 26,712 | |||||||||
| Koh Young Technology, Inc. | 7,227 | 75,667 | |||||||||
| Kolmar BNH Co. Ltd. | 1,408 | 27,090 | |||||||||
| Kolmar Korea Holdings Co. Ltd. | 1,580 | 19,464 | |||||||||
| Kolon Corp. | 1,460 | 27,545 | |||||||||
| Kolon Industries, Inc. | 7,471 | 290,397 | |||||||||
| KoMiCo Ltd. | 4,670 | 161,607 | |||||||||
KONA I Co. Ltd.(1) | 3,110 | 37,403 | |||||||||
| Korea Aerospace Industries Ltd. | 30,242 | 1,372,254 | |||||||||
| Korea District Heating Corp. | 758 | 17,936 | |||||||||
Korea Electric Power Corp., ADR(1)(2) | 61,715 | 470,885 | |||||||||
| Korea Electric Terminal Co. Ltd. | 2,213 | 109,606 | |||||||||
| Korea Gas Corp. | 4,476 | 144,997 | |||||||||
| Korea Investment Holdings Co. Ltd. | 22,974 | 968,700 | |||||||||
Korea Line Corp.(1) | 109,777 | 185,538 | |||||||||
| Korea Petrochemical Ind Co. Ltd. | 2,079 | 187,797 | |||||||||
| Korea Real Estate Investment & Trust Co. Ltd. | 45,582 | 55,236 | |||||||||
Korea Shipbuilding & Offshore Engineering Co. Ltd.(1) | 13,212 | 953,522 | |||||||||
| Korea United Pharm, Inc. | 1,469 | 26,915 | |||||||||
| Korea Zinc Co. Ltd. | 1,556 | 778,353 | |||||||||
Korean Air Lines Co. Ltd.(1) | 73,608 | 1,462,965 | |||||||||
| Korean Reinsurance Co. | 29,667 | 184,552 | |||||||||
Krafton, Inc.(1) | 1,161 | 212,086 | |||||||||
| KT Skylife Co. Ltd. | 12,012 | 76,497 | |||||||||
| Kumho Petrochemical Co. Ltd. | 8,732 | 842,262 | |||||||||
Kumho Tire Co., Inc.(1) | 23,830 | 61,542 | |||||||||
| KUMHOE & C Co. Ltd. | 253 | 1,560 | |||||||||
| Kyung Dong Navien Co. Ltd. | 926 | 29,800 | |||||||||
L&F Co. Ltd.(1) | 822 | 139,413 | |||||||||
| LB Semicon, Inc. | 11,772 | 80,700 | |||||||||
| LEENO Industrial, Inc. | 2,858 | 304,180 | |||||||||
| LF Corp. | 10,203 | 128,537 | |||||||||
| LG Chem Ltd. | 4,948 | 2,316,140 | |||||||||
| LG Corp. | 19,630 | 1,197,842 | |||||||||
LG Display Co. Ltd., ADR(2) | 183,787 | 1,051,262 | |||||||||
| LG Electronics, Inc. | 25,250 | 1,889,458 | |||||||||
LG Energy Solution Ltd.(1) | 1,253 | 429,425 | |||||||||
| LG H&H Co. Ltd. | 1,125 | 595,734 | |||||||||
| LG HelloVision Co. Ltd. | 6,071 | 23,146 | |||||||||
| LG Innotek Co. Ltd. | 5,644 | 1,436,725 | |||||||||
| LG Uplus Corp. | 103,809 | 889,019 | |||||||||
| LIG Nex1 Co. Ltd. | 8,823 | 695,918 | |||||||||
Lock&Lock Co. Ltd.(1) | 3,706 | 21,417 | |||||||||
| Lotte Chemical Corp. | 2,936 | 381,223 | |||||||||
| Lotte Chilsung Beverage Co. Ltd. | 2,538 | 292,031 | |||||||||
| Lotte Confectionery Co. Ltd. | 930 | 86,633 | |||||||||
| Lotte Corp. | 1,759 | 54,265 | |||||||||
61
| Avantis Emerging Markets Equity ETF | |||||||||||
| Shares | Value | ||||||||||
| Lotte Data Communication Co. | 2,619 | $ | 52,422 | ||||||||
| LOTTE Fine Chemical Co. Ltd. | 5,710 | 298,761 | |||||||||
| LOTTE Himart Co. Ltd. | 1,460 | 17,082 | |||||||||
| Lotte Rental Co. Ltd. | 12,038 | 319,745 | |||||||||
| Lotte Shopping Co. Ltd. | 6,832 | 501,481 | |||||||||
| LS Corp. | 5,518 | 274,971 | |||||||||
| LS Electric Co. Ltd. | 5,011 | 207,838 | |||||||||
| Lutronic Corp. | 9,910 | 138,700 | |||||||||
LVMC Holdings(1) | 7,813 | 17,498 | |||||||||
| LX Hausys Ltd. | 4,181 | 139,757 | |||||||||
LX Holdings Corp.(1) | 27,968 | 174,501 | |||||||||
| LX INTERNATIONAL Corp. | 12,326 | 396,948 | |||||||||
| LX Semicon Co. Ltd. | 6,261 | 440,520 | |||||||||
| Maeil Dairies Co. Ltd. | 2,084 | 89,083 | |||||||||
| Mando Corp. | 21,393 | 855,041 | |||||||||
| Mcnex Co. Ltd. | 2,570 | 70,461 | |||||||||
Medytox, Inc.(1) | 1,165 | 106,098 | |||||||||
| MegaStudyEdu Co. Ltd. | 5,732 | 333,434 | |||||||||
| Meritz Financial Group, Inc. | 18,139 | 415,750 | |||||||||
| Meritz Fire & Marine Insurance Co. Ltd. | 21,883 | 624,770 | |||||||||
| Meritz Securities Co. Ltd. | 166,006 | 598,293 | |||||||||
| Mirae Asset Life Insurance Co. Ltd. | 22,028 | 49,800 | |||||||||
| Mirae Asset Securities Co. Ltd. | 111,560 | 544,060 | |||||||||
| Miwon Commercial Co. Ltd. | 112 | 14,729 | |||||||||
| Namhae Chemical Corp. | 4,357 | 34,880 | |||||||||
Namsun Aluminum Co. Ltd.(1) | 7,959 | 13,268 | |||||||||
| NAVER Corp. | 10,078 | 1,788,307 | |||||||||
| NCSoft Corp. | 1,708 | 479,969 | |||||||||
Neowiz(1) | 2,115 | 61,711 | |||||||||
NEPES Corp.(1) | 5,225 | 84,466 | |||||||||
| Netmarble Corp. | 1,805 | 85,099 | |||||||||
| Nexen Tire Corp. | 14,849 | 73,465 | |||||||||
| NEXTIN, Inc. | 1,041 | 43,760 | |||||||||
| NH Investment & Securities Co. Ltd. | 72,012 | 533,092 | |||||||||
NHN Corp.(1) | 3,656 | 68,661 | |||||||||
NHN KCP Corp.(1) | 4,752 | 44,669 | |||||||||
| NICE Holdings Co. Ltd. | 8,854 | 90,161 | |||||||||
| NICE Information Service Co. Ltd. | 6,796 | 72,664 | |||||||||
| NongShim Co. Ltd. | 751 | 167,894 | |||||||||
| OCI Co. Ltd. | 3,129 | 272,262 | |||||||||
| OptoElectronics Solutions Co. Ltd. | 901 | 14,979 | |||||||||
| Orion Corp./Republic of Korea | 7,821 | 572,924 | |||||||||
| Orion Holdings Corp. | 8,594 | 93,455 | |||||||||
Oscotec, Inc.(1) | 168 | 2,532 | |||||||||
| Osstem Implant Co. Ltd. | 3,438 | 329,175 | |||||||||
| Ottogi Corp. | 414 | 148,139 | |||||||||
| Pan Ocean Co. Ltd. | 160,186 | 612,930 | |||||||||
Paradise Co. Ltd.(1) | 7,371 | 87,406 | |||||||||
| Partron Co. Ltd. | 30,167 | 194,389 | |||||||||
Pearl Abyss Corp.(1) | 3,308 | 139,105 | |||||||||
| PharmaResearch Co. Ltd. | 879 | 44,038 | |||||||||
62
| Avantis Emerging Markets Equity ETF | |||||||||||
| Shares | Value | ||||||||||
| PI Advanced Materials Co. Ltd. | 4,893 | $ | 135,140 | ||||||||
| Poongsan Corp. | 6,690 | 154,503 | |||||||||
| POSCO Chemical Co. Ltd. | 1,482 | 184,233 | |||||||||
| POSCO Holdings, Inc., ADR | 63,718 | 2,996,020 | |||||||||
| Posco ICT Co. Ltd. | 8,297 | 40,897 | |||||||||
| Posco International Corp. | 14,979 | 299,004 | |||||||||
| PSK, Inc. | 7,357 | 186,389 | |||||||||
| Pulmuone Co. Ltd. | 3,081 | 31,580 | |||||||||
| S&S Tech Corp. | 1,373 | 22,516 | |||||||||
| S-1 Corp. | 4,672 | 202,858 | |||||||||
| S-Oil Corp. | 15,324 | 1,162,325 | |||||||||
SAM KANG M&T Co. Ltd.(1) | 2,424 | 48,591 | |||||||||
| Sam Young Electronics Co. Ltd. | 3,086 | 25,066 | |||||||||
| Samjin Pharmaceutical Co. Ltd. | 1,819 | 33,600 | |||||||||
Samsung Biologics Co. Ltd.(1) | 2,089 | 1,299,272 | |||||||||
| Samsung C&T Corp. | 12,231 | 1,095,125 | |||||||||
| Samsung Card Co. Ltd. | 2,438 | 56,992 | |||||||||
| Samsung Electro-Mechanics Co. Ltd. | 20,379 | 2,109,972 | |||||||||
| Samsung Electronics Co. Ltd., GDR | 24,832 | 27,155,496 | |||||||||
Samsung Engineering Co. Ltd.(1) | 73,508 | 1,278,087 | |||||||||
| Samsung Fire & Marine Insurance Co. Ltd. | 12,151 | 1,765,954 | |||||||||
Samsung Heavy Industries Co. Ltd.(1) | 303,186 | 1,345,188 | |||||||||
| Samsung Life Insurance Co. Ltd. | 23,900 | 1,103,082 | |||||||||
| Samsung SDI Co. Ltd. | 5,755 | 2,544,294 | |||||||||
| Samsung SDS Co. Ltd. | 5,090 | 485,782 | |||||||||
| Samsung Securities Co. Ltd. | 29,725 | 748,331 | |||||||||
| Samwha Capacitor Co. Ltd. | 1,445 | 44,887 | |||||||||
| Samyang Corp. | 1,845 | 55,818 | |||||||||
| Samyang Foods Co. Ltd. | 1,666 | 138,370 | |||||||||
| Samyang Holdings Corp. | 1,825 | 93,295 | |||||||||
| Sangsangin Co. Ltd. | 30,631 | 194,881 | |||||||||
| SD Biosensor, Inc. | 18,118 | 473,687 | |||||||||
| Seah Besteel Holdings Corp. | 5,807 | 80,350 | |||||||||
| SeAH Steel Corp. | 1,232 | 174,927 | |||||||||
| SeAH Steel Holdings Corp. | 810 | 109,869 | |||||||||
| Sebang Global Battery Co. Ltd. | 1,882 | 72,742 | |||||||||
Seegene, Inc.(2) | 23,364 | 547,370 | |||||||||
| Sejong Telecom, Inc. | 2,388 | 1,069 | |||||||||
| Seobu T&D | 9,588 | 57,067 | |||||||||
| Seoul Semiconductor Co. Ltd. | 10,199 | 87,244 | |||||||||
| SFA Engineering Corp. | 2,392 | 73,025 | |||||||||
SFA Semicon Co. Ltd.(1) | 26,556 | 101,211 | |||||||||
| SGC Energy Co. Ltd. | 1,008 | 28,006 | |||||||||
Shinhan Financial Group Co. Ltd., ADR(2) | 122,126 | 3,261,985 | |||||||||
| Shinsegae International, Inc. | 7,481 | 155,097 | |||||||||
| Shinsegae, Inc. | 4,364 | 723,269 | |||||||||
Shinsung E&G Co. Ltd.(1) | 13,081 | 23,707 | |||||||||
| Shinyoung Securities Co. Ltd. | 714 | 30,322 | |||||||||
SillaJen, Inc.(1) | 626 | 1,498 | |||||||||
SIMMTECH Co. Ltd.(2) | 13,157 | 377,128 | |||||||||
SK Biopharmaceuticals Co. Ltd.(1) | 5,777 | 307,146 | |||||||||
63
| Avantis Emerging Markets Equity ETF | |||||||||||
| Shares | Value | ||||||||||
SK Bioscience Co. Ltd.(1) | 1,712 | $ | 143,327 | ||||||||
| SK Chemicals Co. Ltd. | 7,887 | 571,751 | |||||||||
| SK D&D Co. Ltd. | 2,714 | 54,096 | |||||||||
| SK Discovery Co. Ltd. | 5,267 | 142,225 | |||||||||
| SK Gas Ltd. | 666 | 57,729 | |||||||||
| SK Hynix, Inc. | 127,312 | 8,951,043 | |||||||||
SK IE Technology Co. Ltd.(1) | 1,480 | 91,038 | |||||||||
SK Innovation Co. Ltd.(1) | 7,408 | 1,042,863 | |||||||||
| SK Networks Co. Ltd. | 98,738 | 333,850 | |||||||||
| SK Securities Co. Ltd. | 132,330 | 74,202 | |||||||||
SK Telecom Co. Ltd., ADR(2) | 38,585 | 823,790 | |||||||||
| SK, Inc. | 6,566 | 1,135,714 | |||||||||
| SKC Co. Ltd. | 4,860 | 436,720 | |||||||||
| SL Corp. | 6,588 | 187,803 | |||||||||
| SM Entertainment Co. Ltd. | 3,478 | 178,492 | |||||||||
| SNT Dynamics Co. Ltd. | 3,850 | 32,495 | |||||||||
| SNT Motiv Co. Ltd. | 2,927 | 105,345 | |||||||||
| Songwon Industrial Co. Ltd. | 5,948 | 83,694 | |||||||||
| Soulbrain Co. Ltd. | 1,205 | 193,578 | |||||||||
| Soulbrain Holdings Co. Ltd. | 1,229 | 20,648 | |||||||||
| SPC Samlip Co. Ltd. | 1,750 | 105,353 | |||||||||
Ssangyong Motor Co.(1) | 2,905 | 6,016 | |||||||||
| STIC Investments, Inc. | 2,476 | 13,778 | |||||||||
Studio Dragon Corp.(1) | 2,038 | 114,758 | |||||||||
| Sungwoo Hitech Co. Ltd. | 2,998 | 11,659 | |||||||||
| Taekwang Industrial Co. Ltd. | 59 | 36,280 | |||||||||
Taewoong Co. Ltd.(1) | 329 | 3,353 | |||||||||
| Taeyoung Engineering & Construction Co. Ltd. | 8,091 | 38,462 | |||||||||
Taihan Electric Wire Co. Ltd.(1) | 39,071 | 54,273 | |||||||||
| TES Co. Ltd. | 10,262 | 151,373 | |||||||||
| TK Corp. | 3,134 | 45,190 | |||||||||
| Tokai Carbon Korea Co. Ltd. | 1,898 | 157,714 | |||||||||
| Tongyang Life Insurance Co. Ltd. | 24,322 | 101,956 | |||||||||
| Tongyang, Inc. | 2,830 | 2,372 | |||||||||
Toptec Co. Ltd.(1) | 329 | 1,978 | |||||||||
| TSE Co. Ltd. | 1,752 | 75,223 | |||||||||
TY Holdings Co. Ltd.(1) | 1,589 | 19,977 | |||||||||
| Unid Co. Ltd. | 2,924 | 225,807 | |||||||||
| Value Added Technology Co. Ltd. | 3,454 | 86,175 | |||||||||
| Vieworks Co. Ltd. | 968 | 28,522 | |||||||||
Webzen, Inc.(1) | 3,108 | 42,796 | |||||||||
| Wemade Co. Ltd. | 4,044 | 185,093 | |||||||||
| Whanin Pharmaceutical Co. Ltd. | 148 | 1,886 | |||||||||
| Winix, Inc. | 1,433 | 13,206 | |||||||||
| WiSoL Co. Ltd. | 6,266 | 40,693 | |||||||||
Wonik Holdings Co. Ltd.(1) | 5,541 | 15,593 | |||||||||
| WONIK IPS Co. Ltd. | 7,578 | 156,821 | |||||||||
| Wonik Materials Co. Ltd. | 745 | 16,836 | |||||||||
| Wonik QnC Corp. | 11,018 | 223,398 | |||||||||
| Woongjin Thinkbig Co. Ltd. | 11,642 | 22,317 | |||||||||
| Woori Financial Group, Inc. | 223,588 | 2,022,560 | |||||||||
64
| Avantis Emerging Markets Equity ETF | |||||||||||
| Shares | Value | ||||||||||
| Woori Investment Bank Co. Ltd. | 215,741 | $ | 141,973 | ||||||||
Woori Technology Investment Co. Ltd.(1) | 43,283 | 187,922 | |||||||||
| Y G-1 Co. Ltd. | 6 | 31 | |||||||||
| YG Entertainment, Inc. | 1,052 | 47,247 | |||||||||
| Youlchon Chemical Co. Ltd. | 1,157 | 27,080 | |||||||||
| Young Poong Corp. | 116 | 60,278 | |||||||||
| Youngone Corp. | 8,401 | 278,151 | |||||||||
| Youngone Holdings Co. Ltd. | 4,116 | 162,176 | |||||||||
| Yuanta Securities Korea Co. Ltd. | 39,133 | 83,190 | |||||||||
| Yuhan Corp. | 5,667 | 239,663 | |||||||||
| Zinus, Inc. | 2,151 | 69,377 | |||||||||
| 173,668,722 | |||||||||||
| Taiwan — 17.2% | |||||||||||
| Aaeon Technology, Inc. | 1,000 | 2,902 | |||||||||
| Abico Avy Co. Ltd. | 38,060 | 28,440 | |||||||||
Ability Enterprise Co. Ltd.(2) | 102,000 | 77,882 | |||||||||
| AcBel Polytech, Inc. | 95,000 | 93,702 | |||||||||
| Accton Technology Corp. | 65,000 | 598,559 | |||||||||
Acer, Inc.(2) | 1,085,000 | 779,271 | |||||||||
| ACES Electronic Co. Ltd. | 39,720 | 48,323 | |||||||||
| Acter Group Corp. Ltd. | 30,207 | 209,903 | |||||||||
| ADATA Technology Co. Ltd. | 66,000 | 131,443 | |||||||||
| Advanced Ceramic X Corp. | 9,000 | 55,740 | |||||||||
| Advanced International Multitech Co. Ltd. | 42,000 | 139,354 | |||||||||
Advanced Optoelectronic Technology, Inc.(1) | 23,000 | 14,951 | |||||||||
| Advanced Power Electronics Corp. | 25,000 | 94,323 | |||||||||
| Advantech Co. Ltd. | 65,199 | 695,543 | |||||||||
| AGV Products Corp. | 183,000 | 59,646 | |||||||||
Airtac International Group(1) | 4,185 | 112,216 | |||||||||
Alexander Marine Co. Ltd.(2) | 13,000 | 132,251 | |||||||||
| Allied Circuit Co. Ltd. | 10,000 | 40,311 | |||||||||
| Allied Supreme Corp. | 13,000 | 167,468 | |||||||||
Alltek Technology Corp.(2) | 59,529 | 73,603 | |||||||||
| Alltop Technology Co. Ltd. | 18,252 | 91,493 | |||||||||
| Alpha Networks, Inc. | 35,772 | 36,704 | |||||||||
| Altek Corp. | 31,000 | 37,840 | |||||||||
| Amazing Microelectronic Corp. | 33,000 | 117,934 | |||||||||
| Ampire Co. Ltd. | 33,000 | 27,791 | |||||||||
| AMPOC Far-East Co. Ltd. | 22,000 | 30,357 | |||||||||
| AmTRAN Technology Co. Ltd. | 186,973 | 78,052 | |||||||||
Anji Technology Co. Ltd.(2) | 20,000 | 37,678 | |||||||||
Anpec Electronics Corp.(2) | 26,000 | 118,892 | |||||||||
Apacer Technology, Inc.(2) | 53,000 | 70,201 | |||||||||
| APAQ Technology Co. Ltd. | 12,000 | 15,702 | |||||||||
| Apex International Co. Ltd. | 19,000 | 38,258 | |||||||||
| Arcadyan Technology Corp. | 43,061 | 161,966 | |||||||||
Ardentec Corp.(2) | 264,000 | 394,186 | |||||||||
| Argosy Research, Inc. | 28,545 | 69,269 | |||||||||
| ASE Technology Holding Co. Ltd., ADR | 358,547 | 2,065,231 | |||||||||
| Asia Cement Corp. | 781,000 | 1,105,606 | |||||||||
| Asia Optical Co., Inc. | 2,000 | 4,292 | |||||||||
65
| Avantis Emerging Markets Equity ETF | |||||||||||
| Shares | Value | ||||||||||
Asia Pacific Telecom Co. Ltd.(1) | 7,209 | $ | 1,656 | ||||||||
| Asia Polymer Corp. | 193,007 | 172,979 | |||||||||
| Asia Vital Components Co. Ltd. | 123,000 | 433,274 | |||||||||
| ASIX Electronics Corp. | 11,000 | 43,942 | |||||||||
| ASMedia Technology, Inc. | 1,000 | 30,184 | |||||||||
| ASolid Technology Co. Ltd. | 13,000 | 35,987 | |||||||||
ASPEED Technology, Inc.(2) | 4,400 | 289,587 | |||||||||
| ASROCK, Inc. | 3,000 | 9,407 | |||||||||
Asustek Computer, Inc.(2) | 177,000 | 1,472,824 | |||||||||
| Aten International Co. Ltd. | 9,000 | 23,080 | |||||||||
| Audix Corp. | 19,000 | 31,414 | |||||||||
AUO Corp.(2) | 3,070,200 | 1,676,419 | |||||||||
AURAS Technology Co. Ltd.(2) | 36,000 | 181,575 | |||||||||
| AVer Information, Inc. | 14,000 | 21,811 | |||||||||
| Avermedia Technologies | 24,000 | 19,006 | |||||||||
Azurewave Technologies, Inc.(1) | 12,000 | 8,442 | |||||||||
| Bafang Yunji International Co. Ltd. | 19,000 | 102,245 | |||||||||
| Bank of Kaohsiung Co. Ltd. | 138,318 | 63,052 | |||||||||
| Baolong International Co. Ltd. | 34,000 | 22,682 | |||||||||
| Basso Industry Corp. | 26,000 | 36,051 | |||||||||
BenQ Materials Corp.(2) | 108,000 | 112,265 | |||||||||
| BenQ Medical Technology Corp. | 23,000 | 57,554 | |||||||||
| BES Engineering Corp. | 1,076,000 | 329,709 | |||||||||
| Bin Chuan Enterprise Co. Ltd. | 23,000 | 20,792 | |||||||||
| Bioteque Corp. | 6,000 | 22,019 | |||||||||
| Bizlink Holding, Inc. | 14,000 | 155,112 | |||||||||
| Bora Pharmaceuticals Co. Ltd. | 5,502 | 61,150 | |||||||||
Brighton-Best International Taiwan, Inc.(2) | 206,000 | 232,012 | |||||||||
| C Sun Manufacturing Ltd. | 40,976 | 63,081 | |||||||||
| Capital Futures Corp. | 19,000 | 22,501 | |||||||||
| Capital Securities Corp. | 799,000 | 311,963 | |||||||||
Career Technology MFG. Co. Ltd.(1) | 148,100 | 127,764 | |||||||||
Catcher Technology Co. Ltd.(1) | 269,000 | 1,630,621 | |||||||||
Cathay Financial Holding Co. Ltd.(2) | 1,825,000 | 2,655,058 | |||||||||
| Cayman Engley Industrial Co. Ltd. | 7,000 | 17,288 | |||||||||
| Center Laboratories, Inc. | 51,738 | 106,516 | |||||||||
| Central Reinsurance Co. Ltd. | 111,000 | 77,556 | |||||||||
Century Iron & Steel Industrial Co. Ltd.(2) | 62,000 | 176,853 | |||||||||
| Chailease Holding Co. Ltd. | 69,783 | 448,056 | |||||||||
| Champion Building Materials Co. Ltd. | 91,000 | 28,008 | |||||||||
| Champion Microelectronic Corp. | 19,000 | 31,424 | |||||||||
| Chang Hwa Commercial Bank Ltd. | 1,406,864 | 812,620 | |||||||||
| Chang Wah Electromaterials, Inc. | 174,000 | 197,706 | |||||||||
| Chang Wah Technology Co. Ltd. | 17,500 | 20,836 | |||||||||
| Channel Well Technology Co. Ltd. | 20,000 | 20,090 | |||||||||
| Charoen Pokphand Enterprise | 61,600 | 162,758 | |||||||||
| CHC Healthcare Group | 41,000 | 62,427 | |||||||||
Chen Full International Co. Ltd.(1) | 16,000 | 20,437 | |||||||||
| Cheng Loong Corp. | 298,000 | 276,076 | |||||||||
Cheng Mei Materials Technology Corp.(1) | 321,000 | 113,173 | |||||||||
| Cheng Shin Rubber Industry Co. Ltd. | 376,000 | 435,575 | |||||||||
66
| Avantis Emerging Markets Equity ETF | |||||||||||
| Shares | Value | ||||||||||
| Cheng Uei Precision Industry Co. Ltd. | 133,000 | $ | 162,168 | ||||||||
| Chia Chang Co. Ltd. | 30,000 | 36,962 | |||||||||
| Chia Hsin Cement Corp. | 126,000 | 74,868 | |||||||||
| Chicony Electronics Co. Ltd. | 96,000 | 256,293 | |||||||||
| Chicony Power Technology Co. Ltd. | 42,000 | 97,557 | |||||||||
| Chieftek Precision Co. Ltd. | 1,100 | 2,676 | |||||||||
| Chin-Poon Industrial Co. Ltd. | 186,000 | 189,493 | |||||||||
China Airlines Ltd.(2) | 1,211,000 | 895,807 | |||||||||
| China Bills Finance Corp. | 117,000 | 62,344 | |||||||||
| China Chemical & Pharmaceutical Co. Ltd. | 152,000 | 113,946 | |||||||||
| China Container Terminal Corp. | 38,000 | 31,521 | |||||||||
| China Development Financial Holding Corp., Preference Shares | 402,360 | 111,990 | |||||||||
China Development Financial Holding Corp.(2) | 3,288,943 | 1,436,916 | |||||||||
| China Electric Manufacturing Corp. | 28,000 | 15,767 | |||||||||
| China General Plastics Corp. | 157,722 | 121,892 | |||||||||
| China Man-Made Fiber Corp. | 430,320 | 115,496 | |||||||||
| China Metal Products | 115,000 | 112,136 | |||||||||
| China Motor Corp. | 122,800 | 186,826 | |||||||||
China Petrochemical Development Corp.(2) | 1,190,980 | 398,824 | |||||||||
| China Steel Corp. | 2,912,000 | 2,757,857 | |||||||||
| China Steel Structure Co. Ltd. | 18,000 | 33,925 | |||||||||
| China Wire & Cable Co. Ltd. | 37,000 | 31,967 | |||||||||
Chinese Maritime Transport Ltd.(2) | 61,000 | 77,078 | |||||||||
Chipbond Technology Corp.(2) | 343,000 | 640,179 | |||||||||
ChipMOS Technologies, Inc.(2) | 388,000 | 452,126 | |||||||||
| Chlitina Holding Ltd. | 21,000 | 118,388 | |||||||||
| Chong Hong Construction Co. Ltd. | 1,000 | 2,435 | |||||||||
Chroma ATE, Inc.(2) | 147,000 | 902,070 | |||||||||
Chun Yuan Steel Industry Co. Ltd.(2) | 229,000 | 124,833 | |||||||||
Chung Hung Steel Corp.(2) | 180,000 | 151,882 | |||||||||
| Chung Hwa Pulp Corp. | 96,000 | 57,463 | |||||||||
Chung-Hsin Electric & Machinery Manufacturing Corp.(2) | 258,000 | 557,509 | |||||||||
| Chunghwa Precision Test Tech Co. Ltd. | 7,000 | 105,439 | |||||||||
| Chunghwa Telecom Co. Ltd., ADR | 56,585 | 2,247,556 | |||||||||
| Cleanaway Co. Ltd. | 64,000 | 370,917 | |||||||||
| Clevo Co. | 82,000 | 92,711 | |||||||||
CMC Magnetics Corp.(1) | 593,685 | 155,648 | |||||||||
| Co-Tech Development Corp. | 56,000 | 78,461 | |||||||||
Compal Electronics, Inc.(2) | 1,598,000 | 1,189,815 | |||||||||
| Compeq Manufacturing Co. Ltd. | 575,000 | 986,015 | |||||||||
| Concord International Securities Co. Ltd. | 79,775 | 30,263 | |||||||||
Concord Securities Co. Ltd.(2) | 197,000 | 70,197 | |||||||||
| Concraft Holding Co. Ltd. | 6,899 | 3,474 | |||||||||
| Continental Holdings Corp. | 204,000 | 199,887 | |||||||||
| Contrel Technology Co. Ltd. | 79,000 | 40,852 | |||||||||
| Coremax Corp. | 10,325 | 44,779 | |||||||||
| Coretronic Corp. | 125,000 | 256,333 | |||||||||
| Creative Sensor, Inc. | 35,000 | 25,183 | |||||||||
| CTBC Financial Holding Co. Ltd. | 4,869,000 | 3,729,440 | |||||||||
| CTCI Corp. | 324,000 | 477,929 | |||||||||
67
| Avantis Emerging Markets Equity ETF | |||||||||||
| Shares | Value | ||||||||||
| CviLux Corp. | 19,000 | $ | 24,181 | ||||||||
| CX Technology Co. Ltd. | 18,000 | 16,895 | |||||||||
CyberTAN Technology, Inc.(2) | 61,000 | 59,348 | |||||||||
D-Link Corp.(1) | 4,600 | 2,515 | |||||||||
| DA CIN Construction Co. Ltd. | 53,000 | 53,466 | |||||||||
| Da-Li Development Co. Ltd. | 2,242 | 2,086 | |||||||||
| Dafeng TV Ltd. | 4,000 | 6,365 | |||||||||
| Darfon Electronics Corp. | 100,000 | 134,951 | |||||||||
Darwin Precisions Corp.(1)(2) | 172,000 | 57,778 | |||||||||
| Daxin Materials Corp. | 31,000 | 74,349 | |||||||||
| Delta Electronics, Inc. | 259,000 | 2,217,467 | |||||||||
| Depo Auto Parts Ind Co. Ltd. | 81,000 | 219,747 | |||||||||
Dimerco Express Corp.(2) | 50,160 | 132,129 | |||||||||
| Double Bond Chemical Industry Co. Ltd. | 1,134 | 1,995 | |||||||||
| Dr Wu Skincare Co. Ltd. | 8,000 | 25,344 | |||||||||
| Dynamic Holding Co. Ltd. | 139,147 | 92,117 | |||||||||
| Dynapack International Technology Corp. | 63,000 | 164,143 | |||||||||
| E Ink Holdings, Inc. | 17,000 | 132,189 | |||||||||
| E-LIFE MALL Corp. | 4,000 | 10,969 | |||||||||
| E.Sun Financial Holding Co. Ltd. | 1,384,918 | 1,276,076 | |||||||||
| Eastern Media International Corp. | 79,515 | 63,250 | |||||||||
| Eclat Textile Co. Ltd. | 9,000 | 130,351 | |||||||||
| ECOVE Environment Corp. | 1,000 | 8,699 | |||||||||
Edison Opto Corp.(1) | 38,911 | 21,250 | |||||||||
| Edom Technology Co. Ltd. | 68,200 | 65,066 | |||||||||
| eGalax_eMPIA Technology, Inc. | 21,174 | 43,803 | |||||||||
| Egis Technology, Inc. | 20,000 | 52,673 | |||||||||
| Elan Microelectronics Corp. | 158,000 | 499,689 | |||||||||
| Elite Advanced Laser Corp. | 55,000 | 82,844 | |||||||||
| Elite Material Co. Ltd. | 155,000 | 815,861 | |||||||||
Elite Semiconductor Microelectronics Technology, Inc.(2) | 154,000 | 396,198 | |||||||||
| Elitegroup Computer Systems Co. Ltd. | 44,000 | 37,673 | |||||||||
| eMemory Technology, Inc. | 4,000 | 178,897 | |||||||||
| Emerging Display Technologies Corp. | 39,000 | 29,287 | |||||||||
| ENNOSTAR, Inc. | 244,375 | 410,508 | |||||||||
| Eson Precision Ind Co. Ltd. | 15,000 | 30,795 | |||||||||
| Eternal Materials Co. Ltd. | 176,000 | 195,165 | |||||||||
| Eurocharm Holdings Co. Ltd. | 6,000 | 32,999 | |||||||||
Eva Airways Corp.(2) | 889,000 | 972,894 | |||||||||
Everest Textile Co. Ltd.(1) | 2,322 | 599 | |||||||||
| Evergreen International Storage & Transport Corp. | 225,000 | 218,615 | |||||||||
| Evergreen Marine Corp. Taiwan Ltd. | 664,190 | 1,903,380 | |||||||||
| EVERGREEN Steel Corp. | 21,000 | 42,235 | |||||||||
| Everlight Chemical Industrial Corp. | 130,000 | 89,583 | |||||||||
| Everlight Electronics Co. Ltd. | 297,000 | 381,578 | |||||||||
| Excelliance Mos Corp. | 14,000 | 58,973 | |||||||||
| Excelsior Medical Co. Ltd. | 58,800 | 130,715 | |||||||||
| Far Eastern Department Stores Ltd. | 167,000 | 111,026 | |||||||||
| Far Eastern International Bank | 884,761 | 356,095 | |||||||||
| Far Eastern New Century Corp. | 878,000 | 940,829 | |||||||||
| Far EasTone Telecommunications Co. Ltd. | 632,000 | 1,550,015 | |||||||||
68
| Avantis Emerging Markets Equity ETF | |||||||||||
| Shares | Value | ||||||||||
Faraday Technology Corp.(2) | 70,000 | $ | 422,645 | ||||||||
| Farglory F T Z Investment Holding Co. Ltd. | 17,000 | 29,077 | |||||||||
| Farglory Land Development Co. Ltd. | 103,000 | 215,325 | |||||||||
Federal Corp.(1) | 89,000 | 62,445 | |||||||||
| Feedback Technology Corp. | 20,000 | 54,643 | |||||||||
| Feng Hsin Steel Co. Ltd. | 101,000 | 221,246 | |||||||||
| Feng TAY Enterprise Co. Ltd. | 54,800 | 307,448 | |||||||||
| Firich Enterprises Co. Ltd. | 61,228 | 69,243 | |||||||||
| First Financial Holding Co. Ltd. | 2,506,997 | 2,175,017 | |||||||||
| First Hi-Tec Enterprise Co. Ltd. | 3,793 | 5,584 | |||||||||
First Steamship Co. Ltd.(1)(2) | 391,210 | 122,944 | |||||||||
FIT Holding Co. Ltd.(2) | 75,000 | 70,434 | |||||||||
| Fitipower Integrated Technology, Inc. | 35,361 | 146,143 | |||||||||
| Fittech Co. Ltd. | 26,223 | 105,197 | |||||||||
FLEXium Interconnect, Inc.(1) | 126,000 | 385,006 | |||||||||
Flytech Technology Co. Ltd.(2) | 72,000 | 200,647 | |||||||||
FocalTech Systems Co. Ltd.(2) | 53,804 | 134,412 | |||||||||
| Forcecon Tech Co. Ltd. | 2,595 | 5,255 | |||||||||
| Forest Water Environment Engineering Co. Ltd. | 70 | 72 | |||||||||
| Formosa Advanced Technologies Co. Ltd. | 41,000 | 51,961 | |||||||||
| Formosa Chemicals & Fibre Corp. | 626,000 | 1,406,370 | |||||||||
| Formosa International Hotels Corp. | 24,000 | 136,383 | |||||||||
Formosa Laboratories, Inc.(2) | 36,000 | 70,524 | |||||||||
| Formosa Oilseed Processing Co. Ltd. | 49,000 | 86,029 | |||||||||
| Formosa Petrochemical Corp. | 50,000 | 137,056 | |||||||||
| Formosa Plastics Corp. | 805,000 | 2,400,183 | |||||||||
| Formosa Sumco Technology Corp. | 7,000 | 41,434 | |||||||||
Formosa Taffeta Co. Ltd.(2) | 170,000 | 153,648 | |||||||||
| Formosan Rubber Group, Inc. | 87,000 | 63,087 | |||||||||
| Formosan Union Chemical | 237,650 | 192,248 | |||||||||
| Fortune Electric Co. Ltd. | 1,000 | 1,329 | |||||||||
Foxconn Technology Co. Ltd.(2) | 343,000 | 567,084 | |||||||||
| Foxsemicon Integrated Technology, Inc. | 25,000 | 166,674 | |||||||||
Franbo Lines Corp.(2) | 99,957 | 64,499 | |||||||||
Froch Enterprise Co. Ltd.(2) | 45,000 | 36,616 | |||||||||
| FSP Technology, Inc. | 20,000 | 25,868 | |||||||||
| Fubon Financial Holding Co. Ltd. | 1,715,115 | 3,215,924 | |||||||||
| Fulgent Sun International Holding Co. Ltd. | 12,000 | 74,249 | |||||||||
| Fulltech Fiber Glass Corp. | 94,759 | 44,565 | |||||||||
| Fusheng Precision Co. Ltd. | 26,000 | 168,009 | |||||||||
| G Shank Enterprise Co. Ltd. | 32,000 | 61,778 | |||||||||
| Gamania Digital Entertainment Co. Ltd. | 95,000 | 188,541 | |||||||||
| GEM Services, Inc. | 9,000 | 22,863 | |||||||||
| Gemtek Technology Corp. | 224,000 | 231,899 | |||||||||
| General Interface Solution Holding Ltd. | 125,000 | 328,560 | |||||||||
| Generalplus Technology, Inc. | 27,000 | 50,406 | |||||||||
| GeneReach Biotechnology Corp. | 13,206 | 39,446 | |||||||||
| Genesys Logic, Inc. | 12,000 | 48,005 | |||||||||
Genius Electronic Optical Co. Ltd.(2) | 19,079 | 277,954 | |||||||||
| Getac Holdings Corp. | 94,000 | 146,304 | |||||||||
| GFC Ltd. | 1,000 | 2,471 | |||||||||
69
| Avantis Emerging Markets Equity ETF | |||||||||||
| Shares | Value | ||||||||||
| Giant Manufacturing Co. Ltd. | 52,000 | $ | 406,193 | ||||||||
Giantplus Technology Co. Ltd.(1) | 55,000 | 24,808 | |||||||||
Gigabyte Technology Co. Ltd.(2) | 261,000 | 727,961 | |||||||||
Global Brands Manufacture Ltd.(2) | 174,280 | 165,411 | |||||||||
| Global Lighting Technologies, Inc. | 26,000 | 50,193 | |||||||||
| Global Mixed Mode Technology, Inc. | 29,000 | 140,887 | |||||||||
| Global PMX Co. Ltd. | 14,000 | 71,926 | |||||||||
Global Unichip Corp.(2) | 30,000 | 525,994 | |||||||||
| Globalwafers Co. Ltd. | 11,000 | 174,030 | |||||||||
| Gloria Material Technology Corp. | 191,000 | 177,440 | |||||||||
| GMI Technology, Inc. | 44,767 | 28,470 | |||||||||
| Gold Circuit Electronics Ltd. | 104,000 | 282,815 | |||||||||
| Goldsun Building Materials Co. Ltd. | 481,674 | 399,405 | |||||||||
| Gourmet Master Co. Ltd. | 75,000 | 248,700 | |||||||||
Grand Fortune Securities Co. Ltd.(2) | 108,000 | 56,086 | |||||||||
| Grand Ocean Retail Group Ltd. | 1,000 | 484 | |||||||||
Grand Pacific Petrochemical(2) | 418,000 | 256,720 | |||||||||
| Grand Process Technology Corp. | 5,000 | 46,596 | |||||||||
| Grape King Bio Ltd. | 47,000 | 229,497 | |||||||||
| Great China Metal Industry | 9,000 | 7,498 | |||||||||
| Great Tree Pharmacy Co. Ltd. | 8,151 | 82,379 | |||||||||
| Great Wall Enterprise Co. Ltd. | 84,220 | 135,870 | |||||||||
Greatek Electronics, Inc.(2) | 123,000 | 238,493 | |||||||||
| Group Up Industrial Co. Ltd. | 8,000 | 23,745 | |||||||||
| Gudeng Precision Industrial Co. Ltd. | 3,346 | 31,007 | |||||||||
Hai Kwang Enterprise Corp.(2) | 76,000 | 55,143 | |||||||||
| Hannstar Board Corp. | 182,927 | 195,557 | |||||||||
HannStar Display Corp.(2) | 743,000 | 288,878 | |||||||||
| HannsTouch Solution, Inc. | 238,000 | 85,032 | |||||||||
| Harmony Electronics Corp. | 17,000 | 20,785 | |||||||||
| Harvatek Corp. | 35,000 | 22,680 | |||||||||
| Heran Co. Ltd. | 7,000 | 25,575 | |||||||||
| Highlight Tech Corp. | 16,000 | 28,786 | |||||||||
| Highwealth Construction Corp. | 6,600 | 10,465 | |||||||||
| Hiroca Holdings Ltd. | 47,000 | 85,834 | |||||||||
| Hitron Technology, Inc. | 42,000 | 40,124 | |||||||||
| Hiwin Technologies Corp. | 123,451 | 833,239 | |||||||||
| Ho Tung Chemical Corp. | 506,000 | 154,999 | |||||||||
| Hocheng Corp. | 126,000 | 45,253 | |||||||||
| Hold-Key Electric Wire & Cable Co. Ltd. | 44,800 | 19,126 | |||||||||
| Holiday Entertainment Co. Ltd. | 13,000 | 23,371 | |||||||||
Holtek Semiconductor, Inc.(2) | 78,000 | 188,420 | |||||||||
| Holy Stone Enterprise Co. Ltd. | 78,000 | 227,704 | |||||||||
| Hon Hai Precision Industry Co. Ltd. | 2,268,000 | 8,075,847 | |||||||||
Hong Pu Real Estate Development Co. Ltd.(1) | 5,000 | 3,789 | |||||||||
| Hong TAI Electric Industrial | 36,000 | 19,932 | |||||||||
Horizon Securities Co. Ltd.(2) | 161,120 | 59,959 | |||||||||
| Hota Industrial Manufacturing Co. Ltd. | 3,000 | 8,604 | |||||||||
| Hotai Finance Co. Ltd. | 72,000 | 246,860 | |||||||||
| Hotai Motor Co. Ltd. | 38,000 | 761,433 | |||||||||
| Hsin Kuang Steel Co. Ltd. | 2,000 | 2,492 | |||||||||
70
| Avantis Emerging Markets Equity ETF | |||||||||||
| Shares | Value | ||||||||||
| Hsin Yung Chien Co. Ltd. | 9,900 | $ | 36,474 | ||||||||
| Hsing TA Cement Co. | 62,000 | 36,371 | |||||||||
HTC Corp.(1) | 48,000 | 96,794 | |||||||||
Hu Lane Associate, Inc.(2) | 35,225 | 190,451 | |||||||||
| Hua Nan Financial Holdings Co. Ltd. | 1,968,987 | 1,494,487 | |||||||||
| Huaku Development Co. Ltd. | 51,000 | 155,287 | |||||||||
| Huang Hsiang Construction Corp. | 31,000 | 46,617 | |||||||||
| Hung Ching Development & Construction Co. Ltd. | 31,000 | 22,541 | |||||||||
| Hung Sheng Construction Ltd. | 185,880 | 157,466 | |||||||||
| Huxen Corp. | 2,000 | 3,234 | |||||||||
| Hycon Technology Corp. | 351 | 822 | |||||||||
| I-Sheng Electric Wire & Cable Co. Ltd. | 10,000 | 13,915 | |||||||||
| IBF Financial Holdings Co. Ltd. | 642,396 | 281,176 | |||||||||
| IC Plus Corp. | 16,000 | 25,574 | |||||||||
| Ichia Technologies, Inc. | 57,000 | 28,776 | |||||||||
| IEI Integration Corp. | 42,000 | 103,033 | |||||||||
| Info-Tek Corp. | 19,000 | 41,355 | |||||||||
| Infortrend Technology, Inc. | 92,000 | 49,614 | |||||||||
| Innodisk Corp. | 8,401 | 47,093 | |||||||||
Innolux Corp.(2) | 3,207,000 | 1,263,213 | |||||||||
| Inpaq Technology Co. Ltd. | 30,000 | 52,520 | |||||||||
| Insyde Software Corp. | 18,000 | 44,997 | |||||||||
Integrated Service Technology, Inc.(1) | 39,000 | 86,074 | |||||||||
| Interactive Digital Technologies, Inc. | 3,000 | 6,236 | |||||||||
International CSRC Investment Holdings Co.(2) | 444,000 | 302,486 | |||||||||
| International Games System Co. Ltd. | 59,000 | 719,379 | |||||||||
| Inventec Corp. | 784,000 | 593,542 | |||||||||
ITE Technology, Inc.(2) | 72,000 | 164,620 | |||||||||
| ITEQ Corp. | 65,000 | 143,908 | |||||||||
| Jarllytec Co. Ltd. | 27,000 | 59,491 | |||||||||
| Jentech Precision Industrial Co. Ltd. | 3,000 | 38,937 | |||||||||
| Jess-Link Products Co. Ltd. | 39,000 | 50,208 | |||||||||
| Jih Lin Technology Co. Ltd. | 11,000 | 30,624 | |||||||||
| Jiin Yeeh Ding Enterprise Co. Ltd. | 33,000 | 32,974 | |||||||||
| K Laser Technology, Inc. | 38,000 | 23,509 | |||||||||
| Kaimei Electronic Corp. | 49,000 | 92,899 | |||||||||
| Kaori Heat Treatment Co. Ltd. | 53,000 | 197,090 | |||||||||
| KEE TAI Properties Co. Ltd. | 181,000 | 85,810 | |||||||||
| Kenda Rubber Industrial Co. Ltd. | 124,800 | 142,378 | |||||||||
Kerry TJ Logistics Co. Ltd.(2) | 94,000 | 126,143 | |||||||||
| Kindom Development Co. Ltd. | 164,200 | 152,004 | |||||||||
| King Slide Works Co. Ltd. | 3,000 | 44,743 | |||||||||
King Yuan Electronics Co. Ltd.(2) | 578,000 | 704,084 | |||||||||
| King's Town Bank Co. Ltd. | 318,000 | 366,815 | |||||||||
Kinik Co.(2) | 64,000 | 330,071 | |||||||||
| Kinpo Electronics | 279,000 | 122,819 | |||||||||
Kinsus Interconnect Technology Corp.(2) | 205,000 | 814,289 | |||||||||
| KMC Kuei Meng International, Inc. | 14,000 | 74,942 | |||||||||
KNH Enterprise Co. Ltd.(2) | 99,000 | 61,549 | |||||||||
| KS Terminals, Inc. | 16,000 | 43,560 | |||||||||
| Kung Long Batteries Industrial Co. Ltd. | 48,000 | 221,879 | |||||||||
71
| Avantis Emerging Markets Equity ETF | |||||||||||
| Shares | Value | ||||||||||
| Kung Sing Engineering Corp. | 70,400 | $ | 16,158 | ||||||||
| Kuo Toong International Co. Ltd. | 67,000 | 51,097 | |||||||||
| Kuo Yang Construction Co. Ltd. | 49,727 | 32,113 | |||||||||
| L&K Engineering Co. Ltd. | 44,000 | 46,723 | |||||||||
| LandMark Optoelectronics Corp. | 15,000 | 86,633 | |||||||||
| Lanner Electronics, Inc. | 18,000 | 40,658 | |||||||||
| Largan Precision Co. Ltd. | 26,000 | 1,653,864 | |||||||||
| Leadtrend Technology Corp. | 20,330 | 42,912 | |||||||||
| Lealea Enterprise Co. Ltd. | 101,000 | 37,932 | |||||||||
| Lelon Electronics Corp. | 12,138 | 23,132 | |||||||||
Li Cheng Enterprise Co. Ltd.(1) | 1,071 | 1,139 | |||||||||
Li Peng Enterprise Co. Ltd.(1) | 391,000 | 118,217 | |||||||||
| Lian HWA Food Corp. | 47,408 | 117,056 | |||||||||
| Lien Hwa Industrial Holdings Corp. | 8,038 | 14,990 | |||||||||
Lingsen Precision Industries Ltd.(2) | 239,000 | 124,163 | |||||||||
Lion Travel Service Co. Ltd.(1) | 1,000 | 3,024 | |||||||||
| Lite-On Technology Corp. | 550,000 | 1,183,616 | |||||||||
| Liton Technology Corp. | 1,000 | 1,071 | |||||||||
Long Bon International Co. Ltd.(1) | 1,800 | 1,001 | |||||||||
Longchen Paper & Packaging Co. Ltd.(2) | 288,587 | 155,941 | |||||||||
| Longwell Co. | 17,000 | 31,586 | |||||||||
| Lotes Co. Ltd. | 20,251 | 480,113 | |||||||||
Lotus Pharmaceutical Co. Ltd.(1) | 28,000 | 158,509 | |||||||||
| Lucky Cement Corp. | 60,000 | 21,404 | |||||||||
| Lumax International Corp. Ltd. | 10,000 | 22,732 | |||||||||
| Lung Yen Life Service Corp. | 18,000 | 24,665 | |||||||||
| Macauto Industrial Co. Ltd. | 11,000 | 24,331 | |||||||||
| Machvision, Inc. | 17,039 | 85,410 | |||||||||
| Macroblock, Inc. | 19,000 | 73,003 | |||||||||
Macronix International Co. Ltd.(2) | 921,000 | 988,571 | |||||||||
| Makalot Industrial Co. Ltd. | 40,825 | 239,879 | |||||||||
| Marketech International Corp. | 38,000 | 153,437 | |||||||||
| Materials Analysis Technology, Inc. | 20,000 | 80,788 | |||||||||
| Mechema Chemicals International Corp. | 2,000 | 8,896 | |||||||||
| MediaTek, Inc. | 101,000 | 2,185,309 | |||||||||
| Mega Financial Holding Co. Ltd. | 1,208,475 | 1,417,452 | |||||||||
| Mercuries & Associates Holding Ltd. | 55,000 | 32,684 | |||||||||
Mercuries Life Insurance Co. Ltd.(1)(2) | 533,211 | 124,386 | |||||||||
| Merry Electronics Co. Ltd. | 6,000 | 16,571 | |||||||||
| Micro-Star International Co. Ltd. | 103,000 | 385,593 | |||||||||
| Microbio Co. Ltd. | 7,221 | 18,537 | |||||||||
| MIN AIK Technology Co. Ltd. | 35,000 | 22,715 | |||||||||
| Mirle Automation Corp. | 41,000 | 53,936 | |||||||||
Mitac Holdings Corp.(2) | 350,560 | 322,300 | |||||||||
momo.com, Inc.(2) | 9,000 | 213,412 | |||||||||
| MOSA Industrial Corp. | 48,000 | 47,928 | |||||||||
| Mosel Vitelic, Inc. | 30,000 | 40,175 | |||||||||
Motech Industries, Inc.(2) | 36,451 | 33,960 | |||||||||
| MPI Corp. | 42,000 | 132,976 | |||||||||
| Nak Sealing Technologies Corp. | 15,000 | 49,006 | |||||||||
| Namchow Holdings Co. Ltd. | 33,000 | 49,659 | |||||||||
72
| Avantis Emerging Markets Equity ETF | |||||||||||
| Shares | Value | ||||||||||
Nan Kang Rubber Tire Co. Ltd.(1) | 1,000 | $ | 1,269 | ||||||||
| Nan Liu Enterprise Co. Ltd. | 6,000 | 16,880 | |||||||||
| Nan Pao Resins Chemical Co. Ltd. | 11,000 | 50,980 | |||||||||
| Nan Ya Plastics Corp. | 985,000 | 2,212,503 | |||||||||
Nan Ya Printed Circuit Board Corp.(2) | 55,000 | 479,832 | |||||||||
Nantex Industry Co. Ltd.(2) | 136,000 | 190,031 | |||||||||
| Nanya Technology Corp. | 293,000 | 508,879 | |||||||||
| Nichidenbo Corp. | 36,000 | 61,097 | |||||||||
| Nien Made Enterprise Co. Ltd. | 39,000 | 360,154 | |||||||||
| Niko Semiconductor Co. Ltd. | 29,000 | 61,006 | |||||||||
| Nishoku Technology, Inc. | 6,000 | 17,186 | |||||||||
Novatek Microelectronics Corp.(2) | 146,000 | 1,249,074 | |||||||||
Nuvoton Technology Corp.(2) | 50,428 | 204,699 | |||||||||
| Nyquest Technology Co. Ltd. | 14,000 | 37,007 | |||||||||
| O-Bank Co. Ltd. | 642,430 | 182,332 | |||||||||
| O-TA Precision Industry Co. Ltd. | 37,000 | 150,087 | |||||||||
| Ocean Plastics Co. Ltd. | 30,000 | 36,411 | |||||||||
Orient Semiconductor Electronics Ltd.(2) | 356,000 | 215,325 | |||||||||
| Oriental Union Chemical Corp. | 218,000 | 130,366 | |||||||||
| P-Duke Technology Co. Ltd. | 1,105 | 2,995 | |||||||||
| Pacific Hospital Supply Co. Ltd. | 11,099 | 25,036 | |||||||||
Pan Jit International, Inc.(2) | 401,000 | 908,671 | |||||||||
| Pan-International Industrial Corp. | 112,000 | 126,261 | |||||||||
| Parade Technologies Ltd. | 2,000 | 55,987 | |||||||||
| Pegatron Corp. | 825,000 | 1,715,855 | |||||||||
| Pegavision Corp. | 8,000 | 110,698 | |||||||||
PharmaEngine, Inc.(2) | 52,000 | 218,230 | |||||||||
Pharmally International Holding Co. Ltd.(1) | 1,282 | 2,384 | |||||||||
Phihong Technology Co. Ltd.(1) | 67,000 | 84,947 | |||||||||
| Phison Electronics Corp. | 17,000 | 172,812 | |||||||||
Phoenix Silicon International Corp.(2) | 82,280 | 187,436 | |||||||||
Pixart Imaging, Inc.(2) | 42,000 | 129,484 | |||||||||
| Pou Chen Corp. | 569,000 | 539,009 | |||||||||
Power Wind Health Industry, Inc.(1) | 4,252 | 17,237 | |||||||||
| Powerchip Semiconductor Manufacturing Corp. | 653,000 | 732,236 | |||||||||
| Powertech Technology, Inc. | 369,000 | 1,029,669 | |||||||||
| Poya International Co. Ltd. | 31,301 | 437,768 | |||||||||
| President Chain Store Corp. | 206,000 | 1,810,238 | |||||||||
| President Securities Corp. | 264,929 | 145,187 | |||||||||
| Primax Electronics Ltd. | 83,000 | 181,595 | |||||||||
| Prince Housing & Development Corp. | 361,000 | 141,643 | |||||||||
| Promate Electronic Co. Ltd. | 22,000 | 28,157 | |||||||||
| Prosperity Dielectrics Co. Ltd. | 34,000 | 46,013 | |||||||||
| Qisda Corp. | 251,000 | 240,350 | |||||||||
| QST International Corp. | 9,000 | 21,773 | |||||||||
| Quang Viet Enterprise Co. Ltd. | 6,000 | 25,785 | |||||||||
| Quanta Computer, Inc. | 540,000 | 1,399,901 | |||||||||
| Quanta Storage, Inc. | 115,000 | 166,462 | |||||||||
| Radiant Opto-Electronics Corp. | 160,000 | 525,779 | |||||||||
| Radium Life Tech Co. Ltd. | 134,000 | 42,469 | |||||||||
| Raydium Semiconductor Corp. | 19,000 | 170,955 | |||||||||
73
| Avantis Emerging Markets Equity ETF | |||||||||||
| Shares | Value | ||||||||||
| Realtek Semiconductor Corp. | 111,000 | $ | 1,247,273 | ||||||||
| Rechi Precision Co. Ltd. | 41,000 | 25,918 | |||||||||
Rexon Industrial Corp. Ltd.(2) | 49,000 | 54,946 | |||||||||
| Rich Development Co. Ltd. | 92,000 | 27,667 | |||||||||
Ritek Corp.(1) | 64,281 | 17,842 | |||||||||
Roo Hsing Co. Ltd.(1) | 170,000 | 16,309 | |||||||||
| Ruentex Development Co. Ltd. | 430,600 | 887,919 | |||||||||
| Ruentex Engineering & Construction Co. | 23,290 | 68,951 | |||||||||
Ruentex Industries Ltd.(2) | 189,800 | 404,276 | |||||||||
| Sampo Corp. | 50,000 | 46,285 | |||||||||
| San Fang Chemical Industry Co. Ltd. | 5,000 | 3,500 | |||||||||
| San Shing Fastech Corp. | 17,000 | 29,612 | |||||||||
Sanyang Motor Co. Ltd.(2) | 328,000 | 390,446 | |||||||||
SCI Pharmtech, Inc.(1) | 5,600 | 16,095 | |||||||||
| Scientech Corp. | 24,000 | 65,735 | |||||||||
| ScinoPharm Taiwan Ltd. | 2,000 | 1,858 | |||||||||
| SDI Corp. | 15,000 | 57,822 | |||||||||
| Senao International Co. Ltd. | 1,000 | 1,053 | |||||||||
Senao Networks, Inc.(2) | 7,000 | 52,281 | |||||||||
| Sensortek Technology Corp. | 6,000 | 59,717 | |||||||||
Sesoda Corp.(2) | 111,997 | 176,148 | |||||||||
| Shanghai Commercial & Savings Bank Ltd. | 1,074,000 | 1,748,157 | |||||||||
| Sheng Yu Steel Co. Ltd. | 51,000 | 42,802 | |||||||||
| ShenMao Technology, Inc. | 17,000 | 28,625 | |||||||||
| Shih Her Technologies, Inc. | 24,000 | 45,918 | |||||||||
Shih Wei Navigation Co. Ltd.(2) | 97,875 | 89,967 | |||||||||
Shihlin Paper Corp.(1) | 30,000 | 55,743 | |||||||||
Shin Foong Specialty & Applied Materials Co. Ltd.(2) | 18,000 | 41,130 | |||||||||
| Shin Kong Financial Holding Co. Ltd. | 4,623,740 | 1,328,314 | |||||||||
| Shin Zu Shing Co. Ltd. | 51,536 | 148,418 | |||||||||
Shining Building Business Co. Ltd.(1) | 125,000 | 37,908 | |||||||||
| Shinkong Insurance Co. Ltd. | 66,000 | 124,915 | |||||||||
| Shinkong Synthetic Fibers Corp. | 389,000 | 230,368 | |||||||||
| Shiny Chemical Industrial Co. Ltd. | 39,582 | 173,446 | |||||||||
| ShunSin Technology Holding Ltd. | 12,000 | 33,132 | |||||||||
Shuttle, Inc.(1)(2) | 124,000 | 64,177 | |||||||||
| Sigurd Microelectronics Corp. | 275,063 | 458,613 | |||||||||
Silergy Corp.(2) | 12,000 | 205,722 | |||||||||
Silicon Integrated Systems Corp.(2) | 283,404 | 185,815 | |||||||||
| Simplo Technology Co. Ltd. | 85,000 | 802,047 | |||||||||
| Sinbon Electronics Co. Ltd. | 4,000 | 36,964 | |||||||||
Sincere Navigation Corp.(2) | 79,060 | 55,197 | |||||||||
| Singatron Enterprise Co. Ltd. | 48,000 | 37,732 | |||||||||
| Sinher Technology, Inc. | 15,000 | 19,520 | |||||||||
| Sinkang Industries Co. Ltd. | 3,000 | 1,932 | |||||||||
| Sinmag Equipment Corp. | 9,000 | 28,617 | |||||||||
| Sino-American Silicon Products, Inc. | 207,000 | 1,128,525 | |||||||||
| Sinon Corp. | 264,000 | 391,604 | |||||||||
| SinoPac Financial Holdings Co. Ltd. | 3,540,050 | 2,006,898 | |||||||||
| Sinopower Semiconductor, Inc. | 6,000 | 23,822 | |||||||||
| Sinyi Realty, Inc. | 34,000 | 34,636 | |||||||||
74
| Avantis Emerging Markets Equity ETF | |||||||||||
| Shares | Value | ||||||||||
Sitronix Technology Corp.(2) | 75,000 | $ | 463,713 | ||||||||
| Siward Crystal Technology Co. Ltd. | 72,000 | 97,261 | |||||||||
| Softstar Entertainment, Inc. | 1,000 | 2,705 | |||||||||
Solar Applied Materials Technology Corp.(2) | 264,670 | 334,953 | |||||||||
| Solomon Technology Corp. | 54,000 | 48,445 | |||||||||
| Solteam, Inc. | 28,000 | 56,947 | |||||||||
Sonix Technology Co. Ltd.(2) | 66,000 | 127,934 | |||||||||
| Speed Tech Corp. | 1,000 | 1,906 | |||||||||
| Sporton International, Inc. | 10,000 | 75,279 | |||||||||
| St Shine Optical Co. Ltd. | 21,000 | 184,332 | |||||||||
| Standard Chemical & Pharmaceutical Co. Ltd. | 16,000 | 26,037 | |||||||||
| Standard Foods Corp. | 59,000 | 79,391 | |||||||||
| Stark Technology, Inc. | 35,000 | 96,806 | |||||||||
| Sunjuice Holdings Co. Ltd. | 3,000 | 22,377 | |||||||||
| Sunny Friend Environmental Technology Co. Ltd. | 10,000 | 59,525 | |||||||||
| Sunonwealth Electric Machine Industry Co. Ltd. | 32,000 | 43,905 | |||||||||
| Sunplus Technology Co. Ltd. | 25,000 | 21,403 | |||||||||
| Sunrex Technology Corp. | 24,000 | 30,259 | |||||||||
| Supreme Electronics Co. Ltd. | 49,755 | 61,217 | |||||||||
Swancor Holding Co. Ltd.(2) | 10,000 | 33,272 | |||||||||
| Sweeten Real Estate Development Co. Ltd. | 4,320 | 3,391 | |||||||||
| Symtek Automation Asia Co. Ltd. | 29,000 | 85,909 | |||||||||
| Syncmold Enterprise Corp. | 32,000 | 71,246 | |||||||||
| Synnex Technology International Corp. | 393,000 | 716,353 | |||||||||
| Systex Corp. | 17,000 | 40,804 | |||||||||
T3EX Global Holdings Corp.(2) | 57,213 | 146,665 | |||||||||
TA Chen Stainless Pipe(2) | 611,184 | 787,906 | |||||||||
Ta Ya Electric Wire & Cable(2) | 127,363 | 90,868 | |||||||||
| TA-I Technology Co. Ltd. | 31,750 | 47,080 | |||||||||
| TAI Roun Products Co. Ltd. | 23,000 | 11,994 | |||||||||
Tai Tung Communication Co. Ltd.(1) | 42,000 | 22,295 | |||||||||
| Tai-Saw Technology Co. Ltd. | 75,000 | 87,679 | |||||||||
| Taichung Commercial Bank Co. Ltd. | 1,504,625 | 671,805 | |||||||||
TaiDoc Technology Corp.(2) | 32,000 | 233,711 | |||||||||
| Taiflex Scientific Co. Ltd. | 22,000 | 29,463 | |||||||||
Taigen Biopharmaceuticals Holdings Ltd.(1) | 68,000 | 42,145 | |||||||||
| Taimide Tech, Inc. | 55,000 | 70,960 | |||||||||
| Tainan Spinning Co. Ltd. | 189,000 | 116,460 | |||||||||
| Taishin Financial Holding Co. Ltd. | 3,445,841 | 1,710,263 | |||||||||
| Taisun Enterprise Co. Ltd. | 4,000 | 4,527 | |||||||||
| Taita Chemical Co. Ltd. | 80,850 | 59,708 | |||||||||
| Taiwan Business Bank | 2,689,825 | 1,127,395 | |||||||||
Taiwan Cement Corp.(2) | 757,853 | 975,575 | |||||||||
| Taiwan Cogeneration Corp. | 48,000 | 58,513 | |||||||||
| Taiwan Cooperative Financial Holding Co. Ltd. | 1,989,263 | 1,796,484 | |||||||||
| Taiwan Fertilizer Co. Ltd. | 284,000 | 584,012 | |||||||||
| Taiwan Fire & Marine Insurance Co. Ltd. | 41,000 | 27,095 | |||||||||
| Taiwan FU Hsing Industrial Co. Ltd. | 29,000 | 40,180 | |||||||||
| Taiwan Glass Industry Corp. | 412,000 | 236,447 | |||||||||
| Taiwan High Speed Rail Corp. | 513,000 | 490,462 | |||||||||
| Taiwan Hon Chuan Enterprise Co. Ltd. | 256,000 | 627,676 | |||||||||
75
| Avantis Emerging Markets Equity ETF | |||||||||||
| Shares | Value | ||||||||||
| Taiwan Hopax Chemicals Manufacturing Co. Ltd. | 41,000 | $ | 58,405 | ||||||||
Taiwan IC Packaging Corp.(1) | 32,000 | 15,803 | |||||||||
| Taiwan Mask Corp. | 24,000 | 58,785 | |||||||||
| Taiwan Mobile Co. Ltd. | 420,000 | 1,372,829 | |||||||||
Taiwan Navigation Co. Ltd.(2) | 126,000 | 111,502 | |||||||||
| Taiwan Paiho Ltd. | 92,000 | 191,009 | |||||||||
| Taiwan PCB Techvest Co. Ltd. | 238,000 | 298,759 | |||||||||
| Taiwan Sakura Corp. | 4,000 | 8,447 | |||||||||
| Taiwan Secom Co. Ltd. | 62,000 | 208,223 | |||||||||
| Taiwan Semiconductor Co. Ltd. | 76,000 | 236,165 | |||||||||
| Taiwan Semiconductor Manufacturing Co. Ltd., ADR | 465,132 | 38,768,752 | |||||||||
| Taiwan Shin Kong Security Co. Ltd. | 7,070 | 9,329 | |||||||||
| Taiwan Steel Union Co. Ltd. | 22,000 | 66,004 | |||||||||
| Taiwan Styrene Monomer | 72,000 | 34,536 | |||||||||
| Taiwan Surface Mounting Technology Corp. | 147,000 | 489,905 | |||||||||
Taiwan TEA Corp.(1) | 173,000 | 112,796 | |||||||||
| Taiwan Union Technology Corp. | 70,000 | 131,401 | |||||||||
Taiwan-Asia Semiconductor Corp.(2) | 200,000 | 255,260 | |||||||||
| Taiyen Biotech Co. Ltd. | 24,000 | 25,941 | |||||||||
Tatung Co. Ltd.(1)(2) | 483,000 | 544,765 | |||||||||
| Tatung System Technologies, Inc. | 21,000 | 26,736 | |||||||||
| TCI Co. Ltd. | 19,000 | 91,116 | |||||||||
| Teco Electric and Machinery Co. Ltd. | 605,000 | 585,218 | |||||||||
| Test Research, Inc. | 20,000 | 39,085 | |||||||||
| Test Rite International Co. Ltd. | 33,000 | 23,100 | |||||||||
| Thermaltake Technology Co. Ltd. | 97 | 84 | |||||||||
| Thinking Electronic Industrial Co. Ltd. | 26,000 | 121,477 | |||||||||
Thye Ming Industrial Co. Ltd.(2) | 77,400 | 109,168 | |||||||||
| Ton Yi Industrial Corp. | 421,000 | 279,318 | |||||||||
Tong Hsing Electronic Industries Ltd.(1) | 49,472 | 342,977 | |||||||||
| Tong Yang Industry Co. Ltd. | 258,000 | 459,906 | |||||||||
| Top Bright Holding Co. Ltd. | 8,000 | 29,579 | |||||||||
| Topco Scientific Co. Ltd. | 95,000 | 507,397 | |||||||||
| Topkey Corp. | 3,000 | 17,440 | |||||||||
| Topoint Technology Co. Ltd. | 51,000 | 48,761 | |||||||||
| TPK Holding Co. Ltd. | 157,000 | 186,066 | |||||||||
| Trade-Van Information Services Co. | 2,000 | 4,623 | |||||||||
| Transcend Information, Inc. | 49,000 | 106,167 | |||||||||
| Tripod Technology Corp. | 126,000 | 413,695 | |||||||||
| Tsann Kuen Enterprise Co. Ltd. | 38,589 | 59,229 | |||||||||
| TSC Auto ID Technology Co. Ltd. | 8,000 | 51,246 | |||||||||
| TSRC Corp. | 329,000 | 302,766 | |||||||||
| Ttet Union Corp. | 6,000 | 31,003 | |||||||||
| TTY Biopharm Co. Ltd. | 74,000 | 184,176 | |||||||||
| Tul Corp. | 18,000 | 36,140 | |||||||||
Tung Ho Steel Enterprise Corp.(2) | 389,760 | 689,097 | |||||||||
| Tung Thih Electronic Co. Ltd. | 12,000 | 71,184 | |||||||||
TXC Corp.(2) | 184,000 | 520,785 | |||||||||
TYC Brother Industrial Co. Ltd.(2) | 136,000 | 136,045 | |||||||||
Tycoons Group Enterprise(1) | 66,000 | 18,812 | |||||||||
| U-Ming Marine Transport Corp. | 207,000 | 257,450 | |||||||||
76
| Avantis Emerging Markets Equity ETF | |||||||||||
| Shares | Value | ||||||||||
| UDE Corp. | 31,000 | $ | 39,090 | ||||||||
Ultra Chip, Inc.(2) | 20,000 | 85,800 | |||||||||
| Uni-President Enterprises Corp. | 804,000 | 1,737,494 | |||||||||
| Unimicron Technology Corp. | 496,000 | 2,430,264 | |||||||||
| Union Bank of Taiwan | 796,129 | 429,253 | |||||||||
| Unitech Computer Co. Ltd. | 46,000 | 48,333 | |||||||||
Unitech Printed Circuit Board Corp.(1) | 100,000 | 75,581 | |||||||||
| United Integrated Services Co. Ltd. | 82,000 | 424,641 | |||||||||
United Microelectronics Corp.(1)(2) | 2,880,000 | 3,831,744 | |||||||||
United Renewable Energy Co. Ltd.(1) | 225,085 | 169,517 | |||||||||
| Universal Cement Corp. | 107,000 | 78,739 | |||||||||
| Universal Vision Biotechnology Co. Ltd. | 14,700 | 153,066 | |||||||||
| Universal, Inc. | 17,000 | 15,646 | |||||||||
Unizyx Holding Corp.(2) | 147,000 | 133,859 | |||||||||
| UPC Technology Corp. | 209,000 | 95,941 | |||||||||
| Userjoy Technology Co. Ltd. | 15,350 | 35,816 | |||||||||
| USI Corp. | 262,000 | 203,156 | |||||||||
| Utechzone Co. Ltd. | 26,000 | 78,140 | |||||||||
Vanguard International Semiconductor Corp.(2) | 353,000 | 853,386 | |||||||||
| Ventec International Group Co. Ltd. | 17,000 | 41,107 | |||||||||
| VIA Labs, Inc. | 2,000 | 16,426 | |||||||||
| Visual Photonics Epitaxy Co. Ltd. | 44,000 | 108,896 | |||||||||
| Voltronic Power Technology Corp. | 9,100 | 513,500 | |||||||||
Wafer Works Corp.(2) | 41,000 | 69,569 | |||||||||
| Wah Hong Industrial Corp. | 19,000 | 17,669 | |||||||||
| Wah Lee Industrial Corp. | 37,740 | 112,538 | |||||||||
Walsin Lihwa Corp.(2) | 988,553 | 1,276,650 | |||||||||
Walsin Technology Corp.(2) | 95,000 | 287,086 | |||||||||
| Walton Advanced Engineering, Inc. | 88,000 | 38,670 | |||||||||
Wan Hai Lines Ltd.(2) | 176,640 | 497,841 | |||||||||
WEI Chih Steel Industrial Co. Ltd.(2) | 76,000 | 65,971 | |||||||||
| Wei Chuan Foods Corp. | 82,000 | 54,651 | |||||||||
| Weikeng Industrial Co. Ltd. | 147,000 | 129,439 | |||||||||
| Well Shin Technology Co. Ltd. | 16,000 | 23,595 | |||||||||
| Wholetech System Hitech Ltd. | 33,000 | 51,342 | |||||||||
Win Semiconductors Corp.(2) | 99,000 | 575,025 | |||||||||
Winbond Electronics Corp.(2) | 1,330,000 | 958,270 | |||||||||
Winstek Semiconductor Co. Ltd.(2) | 54,000 | 87,429 | |||||||||
| WinWay Technology Co. Ltd. | 10,000 | 130,690 | |||||||||
Wisdom Marine Lines Co. Ltd.(2) | 239,378 | 451,096 | |||||||||
| Wisechip Semiconductor, Inc. | 12,000 | 26,764 | |||||||||
| Wistron Corp. | 715,000 | 648,216 | |||||||||
| Wistron Information Technology & Services Corp. | 8,000 | 23,113 | |||||||||
| Wistron NeWeb Corp. | 330,000 | 915,123 | |||||||||
Wiwynn Corp.(2) | 5,000 | 125,168 | |||||||||
Wowprime Corp.(1) | 45,000 | 183,730 | |||||||||
| WPG Holdings Ltd. | 271,000 | 455,748 | |||||||||
| WT Microelectronics Co. Ltd. | 195,000 | 411,230 | |||||||||
| XinTec, Inc. | 39,000 | 166,966 | |||||||||
| Xxentria Technology Materials Corp. | 16,000 | 34,192 | |||||||||
| Yageo Corp. | 85,212 | 911,361 | |||||||||
77
| Avantis Emerging Markets Equity ETF | |||||||||||
| Shares | Value | ||||||||||
Yang Ming Marine Transport Corp.(2) | 563,000 | $ | 1,442,278 | ||||||||
| YC INOX Co. Ltd. | 47,486 | 47,826 | |||||||||
| Yea Shin International Development Co. Ltd. | 38,106 | 27,884 | |||||||||
| Yem Chio Co. Ltd. | 99,579 | 46,090 | |||||||||
Yeong Guan Energy Technology Group Co. Ltd.(2) | 24,000 | 43,796 | |||||||||
| YFY, Inc. | 403,000 | 326,003 | |||||||||
Yieh Hsing Enterprise Co. Ltd.(1) | 41,000 | 15,941 | |||||||||
Yieh Phui Enterprise Co. Ltd.(2) | 172,200 | 88,053 | |||||||||
| Young Fast Optoelectronics Co. Ltd. | 39,000 | 38,459 | |||||||||
| Youngtek Electronics Corp. | 50,000 | 106,579 | |||||||||
| Yuanta Financial Holding Co. Ltd. | 2,653,733 | 1,761,535 | |||||||||
| Yulon Finance Corp. | 100,900 | 533,509 | |||||||||
| Yulon Motor Co. Ltd. | 330,397 | 445,158 | |||||||||
| YungShin Global Holding Corp. | 1,000 | 1,356 | |||||||||
| Zeng Hsing Industrial Co. Ltd. | 15,000 | 65,686 | |||||||||
| Zenitron Corp. | 50,000 | 48,434 | |||||||||
| Zero One Technology Co. Ltd. | 33,526 | 46,322 | |||||||||
| Zhen Ding Technology Holding Ltd. | 234,000 | 868,416 | |||||||||
Zinwell Corp.(1) | 75,000 | 43,699 | |||||||||
| Zippy Technology Corp. | 3,000 | 4,055 | |||||||||
| ZongTai Real Estate Development Co. Ltd. | 71,496 | 76,126 | |||||||||
| 228,054,528 | |||||||||||
| Thailand — 2.5% | |||||||||||
| AAPICO Hitech PCL, NVDR | 99,800 | 68,979 | |||||||||
| Advanced Info Service PCL, NVDR | 156,500 | 823,364 | |||||||||
| Advanced Information Technology PCL, NVDR | 219,700 | 37,296 | |||||||||
| AEON Thana Sinsap Thailand PCL, NVDR | 34,200 | 155,137 | |||||||||
Airports of Thailand PCL, NVDR(1) | 318,900 | 635,489 | |||||||||
| AJ Plast PCL, NVDR | 39,300 | 16,048 | |||||||||
| Amanah Leasing PCL, NVDR | 318,700 | 38,538 | |||||||||
| Amata Corp. PCL, NVDR | 263,000 | 150,593 | |||||||||
Ananda Development PCL, NVDR(1) | 53,000 | 1,856 | |||||||||
| AP Thailand PCL, NVDR | 1,678,200 | 459,503 | |||||||||
Aqua Corp. PCL, NVDR(1) | 1,757,300 | 28,971 | |||||||||
Asia Aviation PCL, NVDR(1) | 50,344 | 3,911 | |||||||||
| Asia Plus Group Holdings PCL, NVDR | 561,700 | 47,364 | |||||||||
| Asia Sermkij Leasing PCL, NVDR | 35,700 | 34,961 | |||||||||
| Asian Sea Corp. PCL, NVDR | 72,150 | 35,212 | |||||||||
| Asset World Corp. PCL, NVDR | 529,200 | 81,053 | |||||||||
| B Grimm Power PCL, NVDR | 143,400 | 145,263 | |||||||||
| Bangchak Corp. PCL, NVDR | 600,800 | 580,298 | |||||||||
Bangkok Airways PCL, NVDR(1) | 59,900 | 17,388 | |||||||||
| Bangkok Bank PCL, NVDR | 74,200 | 278,188 | |||||||||
| Bangkok Chain Hospital PCL, NVDR | 880,200 | 450,518 | |||||||||
| Bangkok Dusit Medical Services PCL, NVDR | 1,549,300 | 1,241,687 | |||||||||
| Bangkok Expressway & Metro PCL, NVDR | 478,300 | 114,686 | |||||||||
| Bangkok Land PCL, NVDR | 2,403,600 | 66,506 | |||||||||
| Bangkok Life Assurance PCL, NVDR | 625,200 | 608,025 | |||||||||
| Banpu PCL, NVDR | 2,491,566 | 989,168 | |||||||||
| Banpu Power PCL, NVDR | 69,100 | 29,926 | |||||||||
| BCPG PCL, NVDR | 117,700 | 34,816 | |||||||||
78
| Avantis Emerging Markets Equity ETF | |||||||||||
| Shares | Value | ||||||||||
Beauty Community PCL, NVDR(1) | 64,400 | $ | 2,575 | ||||||||
| BEC World PCL, NVDR | 687,000 | 263,365 | |||||||||
| Berli Jucker PCL, NVDR | 66,300 | 60,928 | |||||||||
Better World Green PCL, NVDR(1) | 3,280,900 | 73,597 | |||||||||
| BG Container Glass PCL, NVDR | 56,100 | 15,844 | |||||||||
| BTS Group Holdings PCL, NVDR | 520,100 | 119,723 | |||||||||
| Bumrungrad Hospital PCL, NVDR | 108,700 | 643,640 | |||||||||
| Cal-Comp Electronics Thailand PCL, NVDR | 476,838 | 32,082 | |||||||||
| Carabao Group PCL, NVDR | 10,500 | 29,051 | |||||||||
| Central Pattana PCL, NVDR | 228,900 | 434,088 | |||||||||
| Central Retail Corp. PCL, NVDR | 193,866 | 214,892 | |||||||||
| CH Karnchang PCL, NVDR | 368,600 | 212,140 | |||||||||
| Charoen Pokphand Foods PCL, NVDR | 798,200 | 568,722 | |||||||||
| Chularat Hospital PCL, NVDR | 1,181,300 | 118,542 | |||||||||
| CK Power PCL, NVDR | 296,300 | 41,401 | |||||||||
| Com7 PCL, NVDR | 603,800 | 569,177 | |||||||||
Country Group Development PCL, NVDR(1) | 979,000 | 11,807 | |||||||||
| CP ALL PCL, NVDR | 506,800 | 854,239 | |||||||||
| Delta Electronics Thailand PCL, NVDR | 13,400 | 192,010 | |||||||||
| Dhipaya Group Holdings PCL, NVDR | 48,200 | 82,266 | |||||||||
| Diamond Building Products PCL, NVDR | 51,200 | 11,015 | |||||||||
| Ditto Thailand PCL, NVDR | 48,000 | 75,979 | |||||||||
| Dynasty Ceramic PCL, NVDR | 1,977,800 | 146,382 | |||||||||
| Eastern Polymer Group PCL, NVDR | 295,500 | 77,726 | |||||||||
| Ekachai Medical Care PCL, NVDR | 156,000 | 32,062 | |||||||||
| Electricity Generating PCL, NVDR | 89,600 | 449,261 | |||||||||
| Energy Absolute PCL, NVDR | 283,100 | 660,952 | |||||||||
Erawan Group PCL, NVDR(1) | 77,040 | 7,633 | |||||||||
Esso Thailand PCL, NVDR(1) | 308,100 | 119,007 | |||||||||
| Forth Corp. PCL, NVDR | 129,100 | 204,938 | |||||||||
G J Steel PCL, NVDR(1) | 6,403,900 | 68,415 | |||||||||
| GFPT PCL, NVDR | 188,400 | 86,690 | |||||||||
| Global Power Synergy PCL, NVDR | 115,800 | 215,557 | |||||||||
| Gulf Energy Development PCL, NVDR | 164,020 | 230,161 | |||||||||
| Gunkul Engineering PCL, NVDR | 1,181,800 | 161,133 | |||||||||
| Haad Thip PCL, NVDR | 13,900 | 12,188 | |||||||||
| Hana Microelectronics PCL, NVDR | 94,800 | 110,694 | |||||||||
| Home Product Center PCL, NVDR | 1,121,200 | 427,117 | |||||||||
| Ichitan Group PCL, NVDR | 86,500 | 21,567 | |||||||||
| Indorama Ventures PCL, NVDR | 352,600 | 417,588 | |||||||||
| IRPC PCL, NVDR | 3,488,700 | 326,583 | |||||||||
Italian-Thai Development PCL, NVDR(1) | 1,929,200 | 101,473 | |||||||||
Jasmine International PCL, NVDR(1) | 3,889,400 | 272,547 | |||||||||
| Jay Mart PCL, NVDR | 68,641 | 97,706 | |||||||||
| JMT Network Services PCL, NVDR | 71,668 | 153,116 | |||||||||
| JWD Infologistics PCL, NVDR | 210,600 | 98,578 | |||||||||
| KCE Electronics PCL, NVDR | 316,000 | 468,347 | |||||||||
| KGI Securities Thailand PCL, NVDR | 805,200 | 109,872 | |||||||||
| Khon Kaen Sugar Industry PCL, NVDR | 380,000 | 37,467 | |||||||||
| Kiatnakin Phatra Bank PCL, NVDR | 99,300 | 197,100 | |||||||||
| Krung Thai Bank PCL, NVDR | 899,400 | 415,857 | |||||||||
79
| Avantis Emerging Markets Equity ETF | |||||||||||
| Shares | Value | ||||||||||
| Krungthai Card PCL, NVDR | 200,500 | $ | 330,590 | ||||||||
| Land & Houses PCL, NVDR | 2,661,700 | 649,351 | |||||||||
| Lanna Resources PCL, NVDR | 86,300 | 56,549 | |||||||||
| LPN Development PCL, NVDR | 441,700 | 54,713 | |||||||||
| Major Cineplex Group PCL, NVDR | 59,700 | 31,071 | |||||||||
Master Ad PCL, NVDR(1) | 1,993,300 | 30,521 | |||||||||
MBK PCL, NVDR(1) | 180,600 | 80,586 | |||||||||
| MC Group PCL, NVDR | 20,300 | 5,560 | |||||||||
| MCS Steel PCL, NVDR | 184,800 | 52,135 | |||||||||
| Mega Lifesciences PCL, NVDR | 88,500 | 119,330 | |||||||||
| MFEC PCL, NVDR | 71,500 | 18,303 | |||||||||
Minor International PCL, NVDR(1) | 543,100 | 486,345 | |||||||||
| MK Restaurants Group PCL, NVDR | 9,300 | 15,027 | |||||||||
| Muangthai Capital PCL, NVDR | 132,000 | 153,568 | |||||||||
| Namyong Terminal PCL, NVDR | 30,600 | 3,053 | |||||||||
| Noble Development PCL, Class C, NVDR | 205,200 | 27,672 | |||||||||
Nusasiri PCL, NVDR(1) | 2,794,300 | 78,016 | |||||||||
| Origin Property PCL, NVDR | 292,000 | 82,316 | |||||||||
| Osotspa PCL, NVDR | 229,800 | 196,755 | |||||||||
Plan B Media PCL, NVDR(1) | 739,800 | 133,675 | |||||||||
| Polyplex Thailand PCL, NVDR | 98,600 | 61,876 | |||||||||
| POSCO-Thainox PCL, NVDR | 576,900 | 18,805 | |||||||||
| Precious Shipping PCL, NVDR | 651,100 | 253,037 | |||||||||
| Premier Marketing PCL, NVDR | 72,700 | 17,532 | |||||||||
| Prima Marine PCL, NVDR | 477,300 | 81,099 | |||||||||
| Property Perfect PCL, NVDR | 2,307,910 | 25,859 | |||||||||
| Pruksa Holding PCL, NVDR | 89,200 | 31,486 | |||||||||
| PTG Energy PCL, NVDR | 269,800 | 112,951 | |||||||||
| PTT Exploration & Production PCL, NVDR | 275,400 | 1,273,734 | |||||||||
| PTT Global Chemical PCL, NVDR | 440,100 | 572,230 | |||||||||
| PTT Oil & Retail Business PCL, NVDR | 369,300 | 275,695 | |||||||||
| PTT PCL, NVDR | 1,466,000 | 1,506,201 | |||||||||
| Quality Houses PCL, NVDR | 6,104,100 | 361,385 | |||||||||
| R&B Food Supply PCL, NVDR | 29,500 | 11,393 | |||||||||
Raimon Land PCL, NVDR(1) | 1,000,000 | 21,382 | |||||||||
| Rajthanee Hospital PCL, NVDR | 65,600 | 64,772 | |||||||||
| Ratch Group PCL, NVDR | 87,750 | 105,852 | |||||||||
| Ratchthani Leasing PCL, NVDR | 998,700 | 130,176 | |||||||||
| Regional Container Lines PCL, NVDR | 443,600 | 394,595 | |||||||||
| Rojana Industrial Park PCL, NVDR | 239,200 | 38,973 | |||||||||
| RS PCL, NVDR | 189,100 | 79,734 | |||||||||
S Hotels & Resorts PCL, NVDR(1) | 289,200 | 32,311 | |||||||||
| S Kijchai Enterprise PCL, R Shares, NVDR | 189,900 | 29,350 | |||||||||
| Sabina PCL, NVDR | 40,300 | 29,265 | |||||||||
Samart Corp. PCL, NVDR(1) | 72,200 | 12,461 | |||||||||
| Sansiri PCL, NVDR | 5,153,500 | 155,273 | |||||||||
| Sappe PCL, NVDR | 43,800 | 53,375 | |||||||||
| SC Asset Corp. PCL, NVDR | 869,800 | 83,809 | |||||||||
| SCB X PCL, NVDR | 122,700 | 370,904 | |||||||||
SEAFCO PCL, NVDR(1) | 16,100 | 1,686 | |||||||||
| Sermsang Power Corp. Co. Ltd., NVDR | 206,668 | 54,344 | |||||||||
80
| Avantis Emerging Markets Equity ETF | |||||||||||
| Shares | Value | ||||||||||
| Siam Cement PCL, NVDR | 78,500 | $ | 770,083 | ||||||||
| Siam City Cement PCL, NVDR | 19,500 | 84,706 | |||||||||
| Siam Global House PCL, NVDR | 418,301 | 224,813 | |||||||||
| Siam Makro PCL, NVDR | 20,337 | 19,215 | |||||||||
| Siamgas & Petrochemicals PCL, NVDR | 124,500 | 38,193 | |||||||||
| Sikarin PCL, NVDR | 21,100 | 7,517 | |||||||||
Singha Estate PCL, NVDR(1) | 1,000,000 | 52,680 | |||||||||
| Sino-Thai Engineering & Construction PCL, NVDR | 676,800 | 227,916 | |||||||||
| SNC Former PCL, NVDR | 107,500 | 50,055 | |||||||||
| Somboon Advance Technology PCL, NVDR | 113,400 | 60,558 | |||||||||
| SPCG PCL, NVDR | 87,000 | 37,670 | |||||||||
| Sri Trang Agro-Industry PCL, NVDR | 222,500 | 137,714 | |||||||||
| Srisawad Corp. PCL, NVDR | 274,100 | 365,541 | |||||||||
| Srisawad Finance PCL, NVDR | 45,700 | 37,545 | |||||||||
| Srivichai Vejvivat PCL, NVDR | 93,400 | 24,558 | |||||||||
| Star Petroleum Refining PCL, NVDR | 459,000 | 162,179 | |||||||||
STP & I PCL, NVDR(1) | 367,800 | 36,453 | |||||||||
| Supalai PCL, NVDR | 440,800 | 235,595 | |||||||||
| Super Energy Corp. PCL, NVDR | 6,494,800 | 135,306 | |||||||||
| Synnex Thailand PCL, NVDR | 47,100 | 26,790 | |||||||||
| Taokaenoi Food & Marketing PCL, Class R NVDR | 221,400 | 46,708 | |||||||||
| Tata Steel Thailand PCL, NVDR | 498,600 | 13,930 | |||||||||
Thai Airways International PCL, NVDR(1) | 20,500 | 1,867 | |||||||||
| Thai Oil PCL, NVDR | 348,500 | 579,831 | |||||||||
| Thai Solar Energy PCL, NVDR | 212,200 | 12,328 | |||||||||
| Thai Union Group PCL, NVDR | 1,417,500 | 679,711 | |||||||||
| Thai Vegetable Oil PCL, NVDR | 244,200 | 204,361 | |||||||||
| Thaicom PCL, NVDR | 154,300 | 43,915 | |||||||||
| Thaifoods Group PCL, NVDR | 145,600 | 24,952 | |||||||||
| Thanachart Capital PCL, NVDR | 70,900 | 78,641 | |||||||||
| Thonburi Healthcare Group PCL, NVDR | 289,600 | 541,674 | |||||||||
| Thoresen Thai Agencies PCL, NVDR | 784,800 | 178,353 | |||||||||
| Tipco Asphalt PCL, NVDR | 270,600 | 123,857 | |||||||||
| Tisco Financial Group PCL, NVDR | 63,900 | 164,151 | |||||||||
| TMBThanachart Bank PCL, NVDR | 1,642,100 | 57,074 | |||||||||
| TOA Paint Thailand PCL, NVDR | 71,800 | 60,525 | |||||||||
| Total Access Communication PCL, NVDR | 54,400 | 64,161 | |||||||||
| TPI Polene PCL, NVDR | 1,342,100 | 62,526 | |||||||||
| TPI Polene Power PCL, NVDR | 537,300 | 55,069 | |||||||||
| TQM Alpha PCL, NVDR | 96,100 | 112,660 | |||||||||
| True Corp. PCL, NVDR | 4,802,500 | 600,255 | |||||||||
| TTW PCL, NVDR | 157,600 | 45,387 | |||||||||
U City PCL, NVDR(1) | 3,088,800 | 114,106 | |||||||||
Unique Engineering & Construction PCL, NVDR(1) | 129,200 | 17,207 | |||||||||
| United Paper PCL, NVDR | 45,600 | 21,108 | |||||||||
| Univentures PCL, NVDR | 191,000 | 15,389 | |||||||||
| Vanachai Group PCL, NVDR | 117,200 | 20,871 | |||||||||
| VGI PCL, NVDR | 194,070 | 23,279 | |||||||||
| WHA Corp. PCL, NVDR | 441,900 | 42,360 | |||||||||
| Workpoint Entertainment PCL, NVDR | 45,500 | 24,040 | |||||||||
| 33,161,608 | |||||||||||
81
| Avantis Emerging Markets Equity ETF | |||||||||||
| Shares | Value | ||||||||||
| Turkey — 0.6% | |||||||||||
| AG Anadolu Grubu Holding AS | 7,413 | $ | 30,183 | ||||||||
| Akbank TAS | 786,529 | 505,174 | |||||||||
| Aksa Akrilik Kimya Sanayii AS | 43,628 | 132,001 | |||||||||
| Aksa Enerji Uretim AS | 67,604 | 105,456 | |||||||||
| Alarko Holding AS | 3,511 | 9,513 | |||||||||
Albaraka Turk Katilim Bankasi AS(1) | 199,590 | 26,915 | |||||||||
Anadolu Anonim Turk Sigorta Sirketi(1) | 49,944 | 22,226 | |||||||||
| Anadolu Efes Biracilik Ve Malt Sanayii AS | 14,148 | 31,968 | |||||||||
| Aselsan Elektronik Sanayi Ve Ticaret AS | 54,650 | 78,179 | |||||||||
| Aygaz AS | 17,880 | 44,986 | |||||||||
Bagfas Bandirma Gubre Fabrikalari AS(1) | 24,987 | 30,144 | |||||||||
| Bera Holding AS | 134,336 | 131,143 | |||||||||
| BIM Birlesik Magazalar AS | 50,124 | 300,716 | |||||||||
Borusan Mannesmann Boru Sanayi ve Ticaret AS(1) | 2,241 | 5,270 | |||||||||
| Brisa Bridgestone Sabanci Sanayi ve Ticaret AS | 2,541 | 5,155 | |||||||||
| Cimsa Cimento Sanayi VE Ticaret AS | 2,951 | 8,590 | |||||||||
| Coca-Cola Icecek AS | 22,819 | 200,176 | |||||||||
| Dogan Sirketler Grubu Holding AS | 93,300 | 27,061 | |||||||||
| Dogus Otomotiv Servis ve Ticaret AS | 10,857 | 59,540 | |||||||||
| EIS Eczacibasi Ilac ve Sinai ve Finansal Yatirimlar Sanayi ve Ticaret AS | 5,143 | 3,908 | |||||||||
| Enerjisa Enerji AS | 111,018 | 104,149 | |||||||||
| Eregli Demir ve Celik Fabrikalari TAS | 184,379 | 291,349 | |||||||||
| Ford Otomotiv Sanayi AS | 4,847 | 88,070 | |||||||||
Goodyear Lastikleri TAS(1) | 456 | 272 | |||||||||
Gozde Girisim Sermayesi Yatirim Ortakligi AS(1) | 35,254 | 18,289 | |||||||||
| GSD Holding AS | 143,314 | 34,386 | |||||||||
Gubre Fabrikalari TAS(1) | 5,436 | 34,861 | |||||||||
| Haci Omer Sabanci Holding AS | 216,220 | 302,048 | |||||||||
Ipek Dogal Enerji Kaynaklari Arastirma Ve Uretim AS(1) | 33,311 | 32,742 | |||||||||
Is Finansal Kiralama AS(1) | 128,833 | 58,146 | |||||||||
| Is Yatirim Menkul Degerler AS | 27,641 | 43,155 | |||||||||
Kardemir Karabuk Demir Celik Sanayi ve Ticaret AS, Class D(2) | 382,092 | 247,519 | |||||||||
| KOC Holding AS | 147,079 | 366,948 | |||||||||
| Koza Altin Isletmeleri AS | 7,429 | 64,705 | |||||||||
Koza Anadolu Metal Madencilik Isletmeleri AS(1) | 64,168 | 95,427 | |||||||||
| Logo Yazilim Sanayi Ve Ticaret AS | 1,540 | 4,020 | |||||||||
| Mavi Giyim Sanayi Ve Ticaret AS, B Shares | 9,064 | 34,836 | |||||||||
Migros Ticaret AS(1) | 28,022 | 125,741 | |||||||||
MLP Saglik Hizmetleri AS(1) | 23,137 | 51,406 | |||||||||
NET Holding AS(1) | 41,981 | 27,169 | |||||||||
| Nuh Cimento Sanayi AS | 8,333 | 34,817 | |||||||||
ODAS Elektrik Uretim ve Sanayi Ticaret AS(1) | 226,375 | 56,043 | |||||||||
| Otokar Otomotiv Ve Savunma Sanayi AS | 1,892 | 49,602 | |||||||||
Pegasus Hava Tasimaciligi AS(1) | 8,451 | 96,831 | |||||||||
Petkim Petrokimya Holding AS(1) | 208,304 | 165,431 | |||||||||
Sasa Polyester Sanayi AS(1) | 18,108 | 53,021 | |||||||||
Sekerbank Turk AS(1) | 6,054 | 1,243 | |||||||||
| Selcuk Ecza Deposu Ticaret ve Sanayi AS | 14,657 | 16,076 | |||||||||
Sok Marketler Ticaret AS(1) | 77,870 | 72,142 | |||||||||
82
| Avantis Emerging Markets Equity ETF | |||||||||||
| Shares | Value | ||||||||||
TAV Havalimanlari Holding AS(1) | 84,976 | $ | 290,028 | ||||||||
| Tekfen Holding AS | 23,085 | 37,749 | |||||||||
| Tofas Turk Otomobil Fabrikasi AS | 13,715 | 66,171 | |||||||||
Turk Hava Yollari AO(1) | 203,802 | 817,379 | |||||||||
| Turk Traktor ve Ziraat Makineleri AS | 5,674 | 76,172 | |||||||||
| Turkcell Iletisim Hizmetleri AS, ADR | 117,278 | 348,316 | |||||||||
Turkiye Halk Bankasi AS(1) | 139,732 | 65,835 | |||||||||
| Turkiye Is Bankasi AS, C Shares | 1,240,843 | 537,501 | |||||||||
Turkiye Petrol Rafinerileri AS(1) | 37,542 | 740,172 | |||||||||
Turkiye Sinai Kalkinma Bankasi AS(1) | 616,866 | 166,526 | |||||||||
| Turkiye Sise ve Cam Fabrikalari AS | 128,771 | 174,326 | |||||||||
Turkiye Vakiflar Bankasi TAO, D Shares(1) | 179,737 | 72,071 | |||||||||
Ulusoy Elektrik Imalat Taahhut Ve Ticaret AS(1) | 777 | 5,505 | |||||||||
| Vestel Elektronik Sanayi ve Ticaret AS | 11,329 | 18,537 | |||||||||
Yapi ve Kredi Bankasi AS(2) | 571,144 | 220,691 | |||||||||
| Yatas Yatak ve Yorgan Sanayi ve Ticaret AS | 30,757 | 27,232 | |||||||||
Zorlu Enerji Elektrik Uretim AS(1) | 3,170 | 509 | |||||||||
| 7,993,468 | |||||||||||
TOTAL COMMON STOCKS (Cost $1,443,050,588) | 1,316,904,434 | ||||||||||
RIGHTS† | |||||||||||
Brazil† | |||||||||||
AES Brasil Energia SA(1) | 23,663 | 364 | |||||||||
China† | |||||||||||
Zhong An Group Ltd.(1) | 2,207 | 3 | |||||||||
Thailand† | |||||||||||
Thai Oil PCL, NVDR(1) | 28,755 | 8 | |||||||||
TOTAL RIGHTS (Cost $—) | 375 | ||||||||||
WARRANTS† | |||||||||||
Malaysia† | |||||||||||
Eco World Development Group Bhd(1) | 120,380 | 2,555 | |||||||||
PESTECH International Bhd(1) | 18,662 | 646 | |||||||||
Yinson Holdings Bhd(1) | 88,971 | 11,332 | |||||||||
| 14,533 | |||||||||||
Thailand† | |||||||||||
Aqua Corp. PCL(1) | 878,650 | 1,687 | |||||||||
Maco Pharma(1) | 498,325 | 136 | |||||||||
MBK PCL(1) | 7,224 | 2,556 | |||||||||
Minor International PCL, NVDR(1) | 1 | — | |||||||||
VGI PCL(1) | 44,070 | 204 | |||||||||
| 4,583 | |||||||||||
TOTAL WARRANTS (Cost $—) | 19,116 | ||||||||||
CORPORATE BONDS† | |||||||||||
India† | |||||||||||
Britannia Industries Ltd., 5.50%, 6/3/24 (Acquired 5/25/21, Cost $1,668)(4) (Cost $1,668) | INR | 121,365 | 1,490 | ||||||||
| SHORT-TERM INVESTMENTS — 1.7% | |||||||||||
| Money Market Funds — 1.7% | |||||||||||
| State Street Institutional U.S. Government Money Market Fund, Premier Class | 998,676 | 998,676 | |||||||||
83
| Avantis Emerging Markets Equity ETF | |||||||||||
| Shares | Value | ||||||||||
State Street Navigator Securities Lending Government Money Market Portfolio(5) | 22,098,803 | $ | 22,098,803 | ||||||||
TOTAL SHORT-TERM INVESTMENTS (Cost $23,097,479) | 23,097,479 | ||||||||||
TOTAL INVESTMENT SECURITIES — 101.3% (Cost $1,466,149,735) | 1,340,022,894 | ||||||||||
| OTHER ASSETS AND LIABILITIES — (1.3)% | (17,627,033) | ||||||||||
| TOTAL NET ASSETS — 100.0% | $ | 1,322,395,861 | |||||||||
| MARKET SECTOR DIVERSIFICATION | |||||
| (as a % of net assets) | |||||
| Financials | 20.0% | ||||
| Information Technology | 18.2% | ||||
| Consumer Discretionary | 13.4% | ||||
| Materials | 10.5% | ||||
| Industrials | 9.0% | ||||
| Communication Services | 7.6% | ||||
| Energy | 5.8% | ||||
| Consumer Staples | 5.7% | ||||
| Health Care | 3.8% | ||||
| Utilities | 3.8% | ||||
| Real Estate | 1.8% | ||||
| Short-Term Investments | 1.7% | ||||
| Other Assets and Liabilities | (1.3)% | ||||
| NOTES TO SCHEDULE OF INVESTMENTS | ||||||||
| ADR | - | American Depositary Receipt | ||||||
| GDR | - | Global Depositary Receipt | ||||||
| INR | - | Indian Rupee | ||||||
| NVDR | - | Non-Voting Depositary Receipt | ||||||
†Category is less than 0.05% of total net assets.
(1)Non-income producing.
(2)Security, or a portion thereof, is on loan. At the period end, the aggregate value of securities on loan was $71,542,673. The amount of securities on loan indicated may not correspond with the securities on loan identified because securities with pending sales are in the process of recall from the brokers.
(3)Securities may be subject to resale, redemption or transferability restrictions.
(4)Restricted security that may not be offered for public sale without being registered with the Securities and Exchange Commission and/or may be subject to resale, redemption or transferability restrictions. The aggregate value of these securities at the period end was $1,490, which represented less than 0.05% of total net assets.
(5)Investment of cash collateral from securities on loan. At the period end, the aggregate value of the collateral held by the fund was $79,323,096, which includes securities collateral of $57,224,293.
See Notes to Financial Statements.
84
AUGUST 31, 2022
| Avantis Emerging Markets Value ETF | ||||||||
| Shares | Value | |||||||
| COMMON STOCKS — 99.4% | ||||||||
| Brazil — 6.3% | ||||||||
3R Petroleum Oleo E Gas SA(1) | 8,500 | $ | 60,927 | |||||
| Aliansce Sonae Shopping Centers SA | 9,500 | 31,993 | ||||||
| Alpargatas SA, Preference Shares | 12,000 | 48,255 | ||||||
| Auren Energia SA | 772 | 2,273 | ||||||
| Banco ABC Brasil SA, Preference Shares | 15,900 | 58,131 | ||||||
| Banco BMG SA, Preference Shares | 400 | 202 | ||||||
| Banco Bradesco SA | 47,680 | 144,807 | ||||||
| Banco Bradesco SA, ADR | 178,782 | 648,979 | ||||||
| Banco do Brasil SA | 56,100 | 450,426 | ||||||
| Banco do Estado do Rio Grande do Sul SA, Class B Preference Shares | 33,700 | 72,486 | ||||||
| Banco Santander Brasil SA, ADR | 14,731 | 84,261 | ||||||
| BR Malls Participacoes SA | 58,700 | 93,425 | ||||||
| BR Properties SA | 14,800 | 23,498 | ||||||
| BrasilAgro - Co. Brasileira de Propriedades Agricolas | 4,200 | 23,210 | ||||||
Braskem SA, ADR(2) | 11,270 | 133,211 | ||||||
C&A MODAS SA(1) | 8,800 | 5,464 | ||||||
| Camil Alimentos SA | 11,700 | 22,535 | ||||||
| CCR SA | 50,600 | 135,195 | ||||||
Cia Brasileira de Distribuicao, ADR(2) | 18,964 | 77,373 | ||||||
| Cia Ferro Ligas da Bahia - FERBASA, Preference Shares | 3,400 | 34,559 | ||||||
| Cia Siderurgica Nacional SA, ADR | 76,432 | 206,366 | ||||||
Construtora Tenda SA(1) | 8,300 | 9,397 | ||||||
| Cury Construtora e Incorporadora SA | 7,200 | 12,331 | ||||||
| Desktop - Sigmanet Comunicacao Multimidia S.A | 3,000 | 6,211 | ||||||
| Dexco SA | 20,040 | 38,367 | ||||||
EcoRodovias Infraestrutura e Logistica SA(1) | 23,200 | 26,043 | ||||||
Embraer SA, ADR(1) | 18,152 | 193,500 | ||||||
| Enauta Participacoes SA | 16,000 | 51,146 | ||||||
| Engie Brasil Energia SA | 10,200 | 79,817 | ||||||
| Even Construtora e Incorporadora SA | 6,600 | 7,536 | ||||||
Gafisa SA(1) | 22,900 | 5,282 | ||||||
| Gerdau SA, ADR | 71,429 | 322,145 | ||||||
| Getnet Adquirencia e Servicos para Meios de Pagamento SA, ADR | 359 | 628 | ||||||
Infracommerce CXAAS SA(1) | 4,400 | 4,728 | ||||||
| Iochpe Maxion SA | 23,000 | 60,436 | ||||||
IRB Brasil Resseguros S/A(1) | 72,900 | 23,261 | ||||||
| Itau Unibanco Holding SA, ADR | 207,044 | 1,022,797 | ||||||
| JBS SA | 1,300 | 7,394 | ||||||
| JHSF Participacoes SA | 19,500 | 23,314 | ||||||
| Kepler Weber SA | 3,000 | 12,179 | ||||||
| Klabin SA | 45,200 | 164,730 | ||||||
| Localiza Rent a Car SA | 14,300 | 167,700 | ||||||
| LOG Commercial Properties e Participacoes SA | 4,200 | 21,265 | ||||||
Log-in Logistica Intermodal SA(1) | 3,700 | 28,107 | ||||||
| Lojas Quero Quero S/A | 16,100 | 21,416 | ||||||
| LPS Brasil Consultoria de Imoveis SA | 9,300 | 5,184 | ||||||
| Marfrig Global Foods SA | 24,300 | 61,656 | ||||||
85
| Avantis Emerging Markets Value ETF | ||||||||
| Shares | Value | |||||||
| Minerva SA | 10,700 | $ | 31,715 | |||||
| Movida Participacoes SA | 14,000 | 37,325 | ||||||
| MRV Engenharia e Participacoes SA | 600 | 1,176 | ||||||
Petro Rio SA(1) | 78,100 | 410,587 | ||||||
| Petroleo Brasileiro SA, ADR | 28,350 | 405,122 | ||||||
| Petroleo Brasileiro SA, ADR Preference Shares | 36,485 | 464,819 | ||||||
| Petroreconcavo SA | 3,200 | 16,768 | ||||||
| Randon SA Implementos e Participacoes, Preference Shares | 11,600 | 21,339 | ||||||
| Sao Martinho SA | 7,300 | 44,860 | ||||||
Sendas Distribuidora SA, ADR(2) | 13,420 | 236,460 | ||||||
| Ser Educacional SA | 4,300 | 5,133 | ||||||
StoneCo Ltd., A Shares(1) | 17,428 | 165,217 | ||||||
| Sul America SA | 14,900 | 69,855 | ||||||
| Suzano SA, ADR | 53,657 | 460,914 | ||||||
| SYN prop e tech SA | 11,300 | 9,861 | ||||||
| Taurus Armas SA, Preference Shares | 8,000 | 26,757 | ||||||
| TIM SA, ADR | 21,811 | 247,337 | ||||||
| Tupy SA | 3,700 | 18,968 | ||||||
| Unipar Carbocloro SA, Class B Preference Shares | 5,500 | 107,084 | ||||||
| Usinas Siderurgicas de Minas Gerais SA Usiminas, Class A Preference Shares | 31,700 | 48,930 | ||||||
| Vale SA, ADR | 41,428 | 514,536 | ||||||
Via S/A(1) | 108,800 | 67,132 | ||||||
| Wilson Sons Holdings Brasil SA | 6,000 | 10,207 | ||||||
| 8,156,248 | ||||||||
| Chile — 0.7% | ||||||||
| Banco de Chile | 583,267 | 55,336 | ||||||
| Banco de Credito e Inversiones SA | 459 | 13,520 | ||||||
| Banco Santander Chile, ADR | 120 | 1,925 | ||||||
| CAP SA | 5,932 | 47,860 | ||||||
| Cencosud SA | 63,224 | 88,390 | ||||||
| Colbun SA | 586,420 | 55,891 | ||||||
| Embotelladora Andina SA, Class B Preference Shares | 23,280 | 47,664 | ||||||
| Empresa Nacional de Telecomunicaciones SA | 10,496 | 33,184 | ||||||
| Empresas CMPC SA | 52,032 | 98,694 | ||||||
| Empresas COPEC SA | 13,368 | 117,758 | ||||||
| Itau CorpBanca Chile SA | 17,011,041 | 38,910 | ||||||
| Parque Arauco SA | 26,153 | 27,650 | ||||||
| Sociedad Quimica y Minera de Chile SA, ADR | 2,607 | 259,866 | ||||||
| Vina Concha y Toro SA | 5,557 | 6,789 | ||||||
| 893,437 | ||||||||
| China — 28.3% | ||||||||
| 360 DigiTech, Inc., ADR | 5,213 | 83,304 | ||||||
A-Living Smart City Services Co. Ltd.(2) | 34,250 | 35,280 | ||||||
| AAC Technologies Holdings, Inc. | 53,000 | 98,189 | ||||||
| AAG Energy Holdings Ltd. | 236,000 | 44,551 | ||||||
Agile Group Holdings Ltd.(2) | 78,000 | 27,316 | ||||||
| Aluminum Corp. of China Ltd., H Shares | 432,000 | 159,628 | ||||||
| Anhui Conch Cement Co. Ltd., H Shares | 141,000 | 537,330 | ||||||
| Anhui Expressway Co. Ltd., H Shares | 30,000 | 21,778 | ||||||
Anton Oilfield Services Group(1) | 34,000 | 2,013 | ||||||
86
| Avantis Emerging Markets Value ETF | ||||||||
| Shares | Value | |||||||
| Asia Cement China Holdings Corp. | 21,500 | $ | 10,750 | |||||
AsiaInfo Technologies Ltd.(2) | 14,000 | 20,076 | ||||||
| Autohome, Inc., ADR | 9,066 | 322,840 | ||||||
| Bank of Communications Co. Ltd., H Shares | 1,052,000 | 599,397 | ||||||
| Beijing Chunlizhengda Medical Instruments Co. Ltd., H Shares | 2,750 | 3,999 | ||||||
| Beijing Tong Ren Tang Chinese Medicine Co. Ltd. | 14,000 | 17,420 | ||||||
| BOC Aviation Ltd. | 48,100 | 385,016 | ||||||
| BOE Varitronix Ltd. | 55,000 | 125,460 | ||||||
| Bosideng International Holdings Ltd. | 204,000 | 114,544 | ||||||
| BYD Electronic International Co. Ltd. | 17,000 | 44,916 | ||||||
Canaan, Inc., ADR(1)(2) | 18,893 | 66,314 | ||||||
Canadian Solar, Inc.(1) | 446 | 20,146 | ||||||
Canvest Environmental Protection Group Co. Ltd.(2) | 41,000 | 24,579 | ||||||
CGN Mining Co. Ltd.(1)(2) | 310,000 | 40,389 | ||||||
Changsha Broad Homes Industrial Group Co. Ltd., H Shares(1) | 8,700 | 8,933 | ||||||
| China BlueChemical Ltd., H Shares | 302,000 | 78,637 | ||||||
China Bohai Bank Co. Ltd., H Shares(2) | 182,000 | 30,144 | ||||||
| China Cinda Asset Management Co. Ltd., H Shares | 1,149,000 | 157,784 | ||||||
| China CITIC Bank Corp. Ltd., H Shares | 876,000 | 375,550 | ||||||
| China Coal Energy Co. Ltd., H Shares | 216,000 | 192,082 | ||||||
| China Communications Services Corp. Ltd., H Shares | 386,000 | 165,747 | ||||||
| China Conch Venture Holdings Ltd. | 181,000 | 369,382 | ||||||
| China Datang Corp. Renewable Power Co. Ltd., H Shares | 294,000 | 73,626 | ||||||
| China East Education Holdings Ltd. | 68,500 | 28,947 | ||||||
| China Education Group Holdings Ltd. | 60,000 | 52,271 | ||||||
| China Everbright Bank Co. Ltd., H Shares | 211,000 | 64,685 | ||||||
| China Everbright Environment Group Ltd. | 757,000 | 374,157 | ||||||
China Everbright Greentech Ltd.(2) | 40,000 | 8,345 | ||||||
China Everbright Ltd.(2) | 140,000 | 102,246 | ||||||
| China Feihe Ltd. | 465,000 | 384,860 | ||||||
| China Foods Ltd. | 70,000 | 22,282 | ||||||
| China Galaxy Securities Co. Ltd., H Shares | 319,000 | 174,402 | ||||||
China Glass Holdings Ltd.(2) | 114,000 | 16,197 | ||||||
| China Hanking Holdings Ltd. | 11,000 | 1,175 | ||||||
China High Speed Transmission Equipment Group Co. Ltd.(1) | 63,000 | 35,617 | ||||||
| China Hongqiao Group Ltd. | 424,500 | 411,621 | ||||||
| China International Capital Corp. Ltd., H Shares | 187,200 | 329,341 | ||||||
| China Kepei Education Group Ltd. | 30,000 | 7,704 | ||||||
| China Lesso Group Holdings Ltd. | 119,000 | 141,444 | ||||||
| China Longyuan Power Group Corp. Ltd., H Shares | 375,000 | 605,687 | ||||||
| China Medical System Holdings Ltd. | 159,000 | 235,317 | ||||||
China Mengniu Dairy Co. Ltd.(1) | 180,000 | 815,090 | ||||||
China Minsheng Banking Corp. Ltd., H Shares(2) | 365,000 | 116,106 | ||||||
China Modern Dairy Holdings Ltd.(2) | 199,000 | 26,326 | ||||||
| China National Building Material Co. Ltd., H Shares | 722,000 | 681,763 | ||||||
| China New Higher Education Group Ltd. | 85,000 | 26,631 | ||||||
China Nuclear Energy Technology Corp. Ltd.(1) | 40,000 | 3,356 | ||||||
| China Oriental Group Co. Ltd. | 136,000 | 25,055 | ||||||
| China Pacific Insurance Group Co. Ltd., H Shares | 187,400 | 396,972 | ||||||
| China Petroleum & Chemical Corp., ADR | 2,460 | 114,439 | ||||||
| China Railway Group Ltd., H Shares | 374,000 | 214,112 | ||||||
87
| Avantis Emerging Markets Value ETF | ||||||||
| Shares | Value | |||||||
China Renaissance Holdings Ltd.(1) | 20,500 | $ | 23,192 | |||||
| China Resources Cement Holdings Ltd. | 338,000 | 208,346 | ||||||
| China Resources Land Ltd. | 288,000 | 1,179,143 | ||||||
| China Resources Power Holdings Co. Ltd. | 306,000 | 608,432 | ||||||
China Risun Group Ltd.(2) | 169,000 | 66,254 | ||||||
| China Sanjiang Fine Chemicals Co. Ltd. | 16,000 | 3,271 | ||||||
| China Shenhua Energy Co. Ltd., H Shares | 226,000 | 708,797 | ||||||
| China Shineway Pharmaceutical Group Ltd. | 7,000 | 5,370 | ||||||
| China Shuifa Singyes Energy Holdings Ltd. | 71,000 | 9,275 | ||||||
| China Sunshine Paper Holdings Co. Ltd. | 110,000 | 25,830 | ||||||
| China Suntien Green Energy Corp. Ltd., H Shares | 138,000 | 61,892 | ||||||
| China Taiping Insurance Holdings Co. Ltd. | 278,600 | 284,444 | ||||||
| China Tower Corp. Ltd., H Shares | 5,296,000 | 660,400 | ||||||
| China Vanke Co. Ltd., H Shares | 1,400 | 2,733 | ||||||
| China XLX Fertiliser Ltd. | 129,000 | 73,510 | ||||||
| China Yongda Automobiles Services Holdings Ltd. | 144,000 | 101,559 | ||||||
China Youran Dairy Group Ltd.(1) | 89,000 | 26,945 | ||||||
China Yuhua Education Corp. Ltd.(1) | 184,000 | 28,913 | ||||||
China ZhengTong Auto Services Holdings Ltd.(1) | 8,000 | 506 | ||||||
| Chongqing Rural Commercial Bank Co. Ltd., H Shares | 94,000 | 32,535 | ||||||
CIMC Enric Holdings Ltd.(2) | 68,000 | 72,632 | ||||||
| CITIC Ltd. | 706,000 | 727,800 | ||||||
| CITIC Resources Holdings Ltd. | 426,000 | 26,682 | ||||||
| CITIC Securities Co. Ltd., H Shares | 277,600 | 562,650 | ||||||
| CMOC Group Ltd., H Shares | 315,000 | 140,464 | ||||||
CNFinance Holdings Ltd., ADR(1) | 998 | 2,705 | ||||||
COFCO Joycome Foods Ltd.(1) | 482,000 | 184,514 | ||||||
COSCO SHIPPING Holdings Co. Ltd., Class H(2) | 436,500 | 651,633 | ||||||
| COSCO SHIPPING Ports Ltd. | 76,000 | 49,178 | ||||||
Country Garden Holdings Co. Ltd.(2) | 311,000 | 91,806 | ||||||
| CSPC Pharmaceutical Group Ltd. | 1,122,000 | 1,138,183 | ||||||
| CSSC Hong Kong Shipping Co. Ltd. | 132,000 | 22,312 | ||||||
| Dali Foods Group Co. Ltd. | 248,500 | 113,602 | ||||||
Daqo New Energy Corp., ADR(1) | 10,149 | 676,634 | ||||||
Differ Group Auto Ltd.(1)(2) | 304,000 | 76,629 | ||||||
| Digital China Holdings Ltd. | 80,000 | 35,686 | ||||||
| Dongfeng Motor Group Co. Ltd., Class H | 372,000 | 235,866 | ||||||
| Dongyue Group Ltd. | 137,000 | 153,761 | ||||||
E-House China Enterprise Holdings Ltd.(1)(2) | 153,000 | 13,377 | ||||||
Ebang International Holdings, Inc., A Shares(1) | 2,529 | 1,182 | ||||||
EVA Precision Industrial Holdings Ltd.(2) | 174,000 | 33,287 | ||||||
Fanhua, Inc., ADR(2) | 4,238 | 23,648 | ||||||
FIH Mobile Ltd.(1) | 466,000 | 60,362 | ||||||
| FinVolution Group, ADR | 24,288 | 119,497 | ||||||
First Tractor Co. Ltd., H Shares(2) | 32,000 | 12,817 | ||||||
| Fu Shou Yuan International Group Ltd. | 110,000 | 70,281 | ||||||
| Fufeng Group Ltd. | 260,000 | 146,097 | ||||||
| Fuyao Glass Industry Group Co. Ltd., H Shares | 9,200 | 43,901 | ||||||
GDS Holdings Ltd., Class A(1) | 69,100 | 235,996 | ||||||
| Geely Automobile Holdings Ltd. | 441,000 | 886,065 | ||||||
| GF Securities Co. Ltd., H Shares | 134,200 | 175,306 | ||||||
88
| Avantis Emerging Markets Value ETF | ||||||||
| Shares | Value | |||||||
| Grand Pharmaceutical Group Ltd. | 121,000 | $ | 64,600 | |||||
| Great Wall Motor Co. Ltd., H Shares | 21,000 | 31,507 | ||||||
| Greentown Management Holdings Co. Ltd. | 35,000 | 29,616 | ||||||
GreenTree Hospitality Group Ltd., ADR(2) | 414 | 1,743 | ||||||
Guangzhou R&F Properties Co. Ltd., H Shares(2) | 183,600 | 37,976 | ||||||
Hainan Meilan International Airport Co. Ltd., H Shares(1) | 26,000 | 61,218 | ||||||
| Haitian International Holdings Ltd. | 56,000 | 137,197 | ||||||
| Haitong Securities Co. Ltd., H Shares | 245,600 | 160,799 | ||||||
Harbin Electric Co. Ltd., H Shares(1) | 16,000 | 4,348 | ||||||
| Hello Group, Inc., ADR | 22,577 | 116,272 | ||||||
| Henan Jinma Energy Co. Ltd., H Shares | 4,000 | 1,613 | ||||||
| Hengan International Group Co. Ltd. | 116,500 | 557,512 | ||||||
Hilong Holding Ltd.(1) | 199,000 | 15,688 | ||||||
| Hisense Home Appliances Group Co. Ltd., H Shares | 28,000 | 30,168 | ||||||
| Hollysys Automation Technologies Ltd. | 1,174 | 19,993 | ||||||
Hope Education Group Co. Ltd.(2) | 368,000 | 31,722 | ||||||
Hua Hong Semiconductor Ltd.(1) | 59,000 | 173,193 | ||||||
| Huatai Securities Co. Ltd., H Shares | 198,200 | 264,918 | ||||||
Huazhong In-Vehicle Holdings Co. Ltd.(2) | 80,000 | 25,481 | ||||||
Huijing Holdings Co. Ltd.(2) | 116,000 | 2,259 | ||||||
Ingdan, Inc.(1) | 44,000 | 10,108 | ||||||
Inkeverse Group Ltd.(1) | 165,000 | 26,990 | ||||||
International Alliance Financial Leasing Co. Ltd.(1) | 159,000 | 83,955 | ||||||
| Jiangsu Expressway Co. Ltd., H Shares | 86,000 | 73,659 | ||||||
| Jiangxi Copper Co. Ltd., H Shares | 199,000 | 244,406 | ||||||
Jinchuan Group International Resources Co. Ltd.(2) | 460,000 | 49,641 | ||||||
| Jinxin Fertility Group Ltd. | 86,000 | 56,001 | ||||||
Jiumaojiu International Holdings Ltd.(2) | 33,000 | 64,924 | ||||||
| JNBY Design Ltd. | 12,000 | 13,058 | ||||||
| Kingboard Holdings Ltd. | 99,500 | 314,191 | ||||||
| Kingboard Laminates Holdings Ltd. | 64,500 | 61,527 | ||||||
| Lee & Man Paper Manufacturing Ltd. | 55,000 | 19,743 | ||||||
LexinFintech Holdings Ltd., ADR(1) | 14,536 | 29,653 | ||||||
Li Auto, Inc., ADR(1) | 5,461 | 157,113 | ||||||
| Longfor Group Holdings Ltd. | 194,000 | 629,678 | ||||||
| Lonking Holdings Ltd. | 339,000 | 57,400 | ||||||
Maoyan Entertainment(1)(2) | 25,800 | 21,666 | ||||||
Meitu, Inc.(1)(2) | 303,000 | 32,213 | ||||||
Midea Real Estate Holding Ltd.(2) | 35,200 | 37,557 | ||||||
| Minth Group Ltd. | 38,000 | 107,528 | ||||||
MMG Ltd.(1) | 348,000 | 95,199 | ||||||
| NetDragon Websoft Holdings Ltd. | 38,500 | 83,767 | ||||||
| NetEase, Inc., ADR | 11,958 | 1,058,403 | ||||||
| New China Life Insurance Co. Ltd., H Shares | 76,300 | 179,586 | ||||||
New Oriental Education & Technology Group, Inc., ADR(1) | 8,404 | 238,674 | ||||||
| Nexteer Automotive Group Ltd. | 85,000 | 63,166 | ||||||
| Nine Dragons Paper Holdings Ltd. | 98,000 | 76,898 | ||||||
NiSun International Enterprise Development Group Co. Ltd.(1) | 836 | 602 | ||||||
Noah Holdings Ltd., ADR(1) | 4,076 | 72,186 | ||||||
OneConnect Financial Technology Co. Ltd., ADR(1) | 13,145 | 14,197 | ||||||
| People's Insurance Co. Group of China Ltd., H Shares | 250,000 | 77,266 | ||||||
89
| Avantis Emerging Markets Value ETF | ||||||||
| Shares | Value | |||||||
| Perennial Energy Holdings Ltd. | 130,000 | $ | 17,833 | |||||
| PICC Property & Casualty Co. Ltd., H Shares | 740,000 | 800,406 | ||||||
| Poly Property Group Co. Ltd. | 17,681 | 3,594 | ||||||
| Poly Property Services Co. Ltd., Class H | 3,800 | 22,258 | ||||||
Postal Savings Bank of China Co. Ltd., H Shares(2) | 75,000 | 44,773 | ||||||
| Powerlong Commercial Management Holdings Ltd. | 20,500 | 11,090 | ||||||
Q Technology Group Co. Ltd.(1) | 44,000 | 24,178 | ||||||
Qudian, Inc., ADR(1)(2) | 6,009 | 5,709 | ||||||
Redsun Properties Group Ltd.(1)(2) | 61,000 | 8,780 | ||||||
| Sany Heavy Equipment International Holdings Co. Ltd. | 55,000 | 56,973 | ||||||
| Shanghai Industrial Holdings Ltd. | 65,000 | 90,357 | ||||||
| Shenzhen International Holdings Ltd. | 166,000 | 143,093 | ||||||
Shimao Services Holdings Ltd.(1)(2) | 68,000 | 17,419 | ||||||
| Shougang Fushan Resources Group Ltd. | 214,000 | 67,878 | ||||||
| Shui On Land Ltd. | 551,000 | 69,308 | ||||||
| Sino Biopharmaceutical Ltd. | 1,376,000 | 722,697 | ||||||
| Sino-Ocean Group Holding Ltd. | 376,000 | 54,880 | ||||||
| Sinopec Engineering Group Co. Ltd., H Shares | 99,000 | 44,230 | ||||||
| Skyworth Group Ltd. | 222,000 | 110,298 | ||||||
South Manganese Investment Ltd.(1) | 240,000 | 26,780 | ||||||
| SSY Group Ltd. | 184,000 | 86,646 | ||||||
Sun King Technology Group Ltd.(1)(2) | 108,000 | 30,653 | ||||||
| SY Holdings Group Ltd. | 27,500 | 18,400 | ||||||
Tiangong International Co. Ltd.(2) | 188,000 | 63,049 | ||||||
| Tingyi Cayman Islands Holding Corp. | 310,000 | 550,475 | ||||||
| Tong Ren Tang Technologies Co. Ltd., H Shares | 19,000 | 13,431 | ||||||
Tongcheng Travel Holdings Ltd.(1) | 52,800 | 108,143 | ||||||
Tongda Group Holdings Ltd.(1) | 190,000 | 2,894 | ||||||
| Topsports International Holdings Ltd. | 146,000 | 115,237 | ||||||
| TravelSky Technology Ltd., H Shares | 86,000 | 149,888 | ||||||
| Truly International Holdings Ltd. | 340,000 | 74,484 | ||||||
| Tsaker New Energy Tech Co. Ltd. | 55,000 | 9,851 | ||||||
| Tsingtao Brewery Co. Ltd., H Shares | 20,000 | 194,219 | ||||||
| Uni-President China Holdings Ltd. | 197,000 | 169,607 | ||||||
Vinda International Holdings Ltd.(2) | 2,000 | 5,590 | ||||||
Vipshop Holdings Ltd., ADR(1) | 43,799 | 508,506 | ||||||
VNET Group, Inc., ADR(1) | 11,141 | 59,604 | ||||||
| Want Want China Holdings Ltd. | 759,000 | 534,656 | ||||||
| Wasion Holdings Ltd. | 74,000 | 24,896 | ||||||
Weibo Corp., ADR(1) | 2,954 | 61,118 | ||||||
| West China Cement Ltd. | 422,000 | 52,054 | ||||||
Xiabuxiabu Catering Management China Holdings Co. Ltd.(1) | 76,000 | 35,784 | ||||||
| Xiamen International Port Co. Ltd., H Shares | 204,000 | 57,814 | ||||||
Xinchen China Power Holdings Ltd.(1) | 46,000 | 2,775 | ||||||
| Xinhua Winshare Publishing and Media Co. Ltd., H Shares | 31,000 | 21,806 | ||||||
| Xinjiang Goldwind Science & Technology Co. Ltd., H Shares | 70,200 | 104,609 | ||||||
Xinjiang Xinxin Mining Industry Co. Ltd., H Shares(1) | 47,000 | 7,029 | ||||||
| Xinte Energy Co. Ltd., H Shares | 39,600 | 103,344 | ||||||
| Xinyi Solar Holdings Ltd. | 54,000 | 74,262 | ||||||
| XTEP International Holdings Ltd. | 174,000 | 241,457 | ||||||
| Yadea Group Holdings Ltd. | 100,000 | 190,740 | ||||||
90
| Avantis Emerging Markets Value ETF | ||||||||
| Shares | Value | |||||||
Yankuang Energy Group Co. Ltd., H Shares(2) | 274,000 | $ | 1,084,604 | |||||
| Yuexiu Property Co. Ltd. | 79,000 | 98,811 | ||||||
| Yuexiu Transport Infrastructure Ltd. | 182,000 | 87,084 | ||||||
| Yum China Holdings, Inc. | 29,767 | 1,491,624 | ||||||
Zengame Technology Holding Ltd.(1) | 106,000 | 20,341 | ||||||
Zhaojin Mining Industry Co. Ltd., H Shares(1) | 231,500 | 196,019 | ||||||
| Zhejiang Expressway Co. Ltd., H Shares | 192,000 | 146,135 | ||||||
| Zhongsheng Group Holdings Ltd. | 78,000 | 368,813 | ||||||
Zhou Hei Ya International Holdings Co. Ltd.(1) | 115,500 | 57,702 | ||||||
| Zijin Mining Group Co. Ltd., H Shares | 592,000 | 668,944 | ||||||
| 36,623,578 | ||||||||
| Greece — 0.3% | ||||||||
Aegean Airlines SA(1) | 2,605 | 12,776 | ||||||
Eurobank Ergasias Services and Holdings SA, Class A(1) | 134,827 | 125,093 | ||||||
| Hellenic Petroleum Holdings SA | 3,094 | 21,289 | ||||||
| JUMBO SA | 5,506 | 78,712 | ||||||
| Motor Oil Hellas Corinth Refineries SA | 3,430 | 64,668 | ||||||
| Mytilineos SA | 1,224 | 19,141 | ||||||
National Bank of Greece SA(1) | 25,056 | 80,862 | ||||||
Titan Cement International SA(1) | 3,052 | 36,311 | ||||||
| Viohalco SA | 4,626 | 15,929 | ||||||
| 454,781 | ||||||||
Hong Kong† | ||||||||
| Edvantage Group Holdings Ltd. | 18,000 | 5,357 | ||||||
| Hungary — 0.2% | ||||||||
| MOL Hungarian Oil & Gas PLC | 16,810 | 115,827 | ||||||
| OTP Bank Nyrt | 4,173 | 88,747 | ||||||
| 204,574 | ||||||||
| India — 17.5% | ||||||||
| ACC Ltd. | 6,914 | 198,116 | ||||||
Aditya Birla Capital Ltd.(1) | 32,637 | 46,097 | ||||||
| AGI Greenpac Ltd. | 4,780 | 18,624 | ||||||
| Alembic Pharmaceuticals Ltd. | 6,262 | 50,674 | ||||||
| Allcargo Logistics Ltd. | 9,396 | 41,744 | ||||||
| Amara Raja Batteries Ltd. | 9,793 | 62,125 | ||||||
| Ambika Cotton Mills Ltd. | 311 | 6,889 | ||||||
| Andhra Sugars Ltd. | 4,689 | 8,517 | ||||||
| Apar Industries Ltd. | 3,493 | 58,201 | ||||||
APL Apollo Tubes Ltd.(1) | 7,577 | 89,104 | ||||||
| Apollo Hospitals Enterprise Ltd. | 8,609 | 462,548 | ||||||
| Apollo Tyres Ltd. | 43,125 | 134,545 | ||||||
| Aptech Ltd. | 1,562 | 4,885 | ||||||
Arvind Ltd.(1) | 11,995 | 14,570 | ||||||
Ashoka Buildcon Ltd.(1) | 7,902 | 7,873 | ||||||
Aster DM Healthcare Ltd.(1) | 9,036 | 24,917 | ||||||
| Astra Microwave Products Ltd. | 7,929 | 34,829 | ||||||
| Aurobindo Pharma Ltd. | 11,511 | 78,370 | ||||||
| Avadh Sugar & Energy Ltd. | 1,300 | 8,668 | ||||||
| Avanti Feeds Ltd. | 3,159 | 18,257 | ||||||
| Bajaj Consumer Care Ltd. | 11,479 | 23,113 | ||||||
| Bajaj Electricals Ltd. | 4,060 | 62,604 | ||||||
91
| Avantis Emerging Markets Value ETF | ||||||||
| Shares | Value | |||||||
Bajaj Hindusthan Sugar Ltd.(1) | 90,255 | $ | 11,218 | |||||
| Balrampur Chini Mills Ltd. | 15,901 | 69,346 | ||||||
Bandhan Bank Ltd.(1) | 37,768 | 130,344 | ||||||
| BASF India Ltd. | 963 | 39,791 | ||||||
| Bayer CropScience Ltd. | 650 | 44,319 | ||||||
| Bhansali Engineering Polymers Ltd. | 2,536 | 3,998 | ||||||
| Bharat Electronics Ltd. | 131,430 | 502,192 | ||||||
| Bharat Petroleum Corp. Ltd. | 53,006 | 217,133 | ||||||
| Birla Corp. Ltd. | 1,882 | 22,764 | ||||||
| Birlasoft Ltd. | 7,836 | 31,001 | ||||||
| Bombay Burmah Trading Co. | 1,001 | 11,332 | ||||||
| Brigade Enterprises Ltd. | 11,926 | 75,738 | ||||||
| Brightcom Group Ltd. | 43,823 | 22,213 | ||||||
| BSE Ltd. | 8,899 | 72,013 | ||||||
| Butterfly Gandhimathi Appliances Ltd. | 68 | 1,292 | ||||||
| Can Fin Homes Ltd. | 8,482 | 66,726 | ||||||
| Canara Bank | 23,689 | 70,644 | ||||||
| Caplin Point Laboratories Ltd. | 1,154 | 11,235 | ||||||
| Castrol India Ltd. | 58,341 | 83,075 | ||||||
| CCL Products India Ltd. | 7,880 | 47,141 | ||||||
| Ceat Ltd. | 1,017 | 17,618 | ||||||
| Century Enka Ltd. | 2,034 | 11,695 | ||||||
| Cera Sanitaryware Ltd. | 575 | 35,832 | ||||||
| Chambal Fertilisers and Chemicals Ltd. | 20,837 | 90,749 | ||||||
| Chennai Petroleum Corp. Ltd. | 5,140 | 18,706 | ||||||
| Cholamandalam Investment and Finance Co. Ltd. | 40,789 | 399,614 | ||||||
| Cipla Ltd. | 12,189 | 157,949 | ||||||
| City Union Bank Ltd. | 60,116 | 134,532 | ||||||
| Coal India Ltd. | 94,945 | 277,428 | ||||||
| Cochin Shipyard Ltd. | 4,351 | 20,462 | ||||||
| Coromandel International Ltd. | 11,165 | 146,588 | ||||||
| Cosmo Films Ltd. | 2,175 | 24,836 | ||||||
CreditAccess Grameen Ltd.(1) | 6,079 | 75,248 | ||||||
| Cyient Ltd. | 12,216 | 127,918 | ||||||
| Dalmia Bharat Ltd. | 3,919 | 74,993 | ||||||
| Dalmia Bharat Sugar & Industries Ltd. | 1,821 | 7,858 | ||||||
| DCB Bank Ltd. | 12,132 | 14,232 | ||||||
| DCM Shriram Ltd. | 5,890 | 76,876 | ||||||
| Deepak Fertilisers & Petrochemicals Corp. Ltd. | 8,499 | 96,063 | ||||||
| Deepak Nitrite Ltd. | 6,989 | 171,506 | ||||||
Dhampur Bio Organics Ltd.(1) | 1,877 | 619 | ||||||
| Dhampur Sugar Mills Ltd. | 1,877 | 5,421 | ||||||
Dish TV India Ltd.(1) | 67,412 | 10,085 | ||||||
| Dr Reddy's Laboratories Ltd., ADR | 6,543 | 342,133 | ||||||
| Edelweiss Financial Services Ltd. | 20,010 | 15,156 | ||||||
| Eicher Motors Ltd. | 6,288 | 262,431 | ||||||
| EID Parry India Ltd. | 15,380 | 101,744 | ||||||
| Elecon Engineering Co. Ltd. | 7,188 | 33,460 | ||||||
| Emami Ltd. | 17,089 | 103,448 | ||||||
| Endurance Technologies Ltd. | 2,695 | 50,309 | ||||||
| Engineers India Ltd. | 31,749 | 26,897 | ||||||
92
| Avantis Emerging Markets Value ETF | ||||||||
| Shares | Value | |||||||
| EPL Ltd. | 7,795 | $ | 16,567 | |||||
Equitas Holdings Ltd.(1) | 11,956 | 14,855 | ||||||
| Escorts Kubota Ltd. | 5,261 | 131,158 | ||||||
| Ester Industries Ltd. | 4,313 | 8,689 | ||||||
Eveready Industries India Ltd.(1) | 3,482 | 15,448 | ||||||
| Everest Industries Ltd. | 1,179 | 10,352 | ||||||
| Excel Industries Ltd. | 459 | 8,326 | ||||||
| Exide Industries Ltd. | 29,700 | 59,308 | ||||||
| Federal Bank Ltd. | 187,370 | 271,727 | ||||||
| Filatex India Ltd. | 3,577 | 5,010 | ||||||
| Finolex Industries Ltd. | 20,683 | 39,076 | ||||||
Future Consumer Ltd.(1) | 106,536 | 2,256 | ||||||
| Galaxy Surfactants Ltd. | 518 | 21,174 | ||||||
| Garden Reach Shipbuilders & Engineers Ltd. | 4,895 | 18,291 | ||||||
| GHCL Ltd. | 13,434 | 99,913 | ||||||
| Glenmark Pharmaceuticals Ltd. | 11,707 | 54,222 | ||||||
| Globus Spirits Ltd. | 932 | 10,096 | ||||||
| Godawari Power and Ispat Ltd. | 6,540 | 23,951 | ||||||
| Granules India Ltd. | 14,599 | 55,582 | ||||||
| Graphite India Ltd. | 5,696 | 29,165 | ||||||
| Grasim Industries Ltd. | 18,011 | 375,375 | ||||||
| Great Eastern Shipping Co. Ltd. | 13,363 | 95,057 | ||||||
| Greaves Cotton Ltd. | 10,870 | 22,906 | ||||||
| Greenpanel Industries Ltd. | 5,555 | 30,998 | ||||||
| Greenply Industries Ltd. | 10,648 | 24,917 | ||||||
| Gufic Biosciences Ltd. | 5,829 | 15,272 | ||||||
| Gujarat Alkalies & Chemicals Ltd. | 1,811 | 19,975 | ||||||
| Gujarat Ambuja Exports Ltd. | 9,501 | 32,368 | ||||||
| Gujarat Mineral Development Corp. Ltd. | 5,151 | 10,615 | ||||||
| Gujarat Narmada Valley Fertilizers & Chemicals Ltd. | 14,672 | 136,540 | ||||||
| Gujarat Pipavav Port Ltd. | 31,211 | 33,892 | ||||||
| Gujarat State Fertilizers & Chemicals Ltd. | 39,672 | 77,788 | ||||||
Hathway Cable & Datacom Ltd.(1) | 37,648 | 8,373 | ||||||
| HBL Power Systems Ltd. | 17,551 | 17,688 | ||||||
| HCL Technologies Ltd. | 56,520 | 657,431 | ||||||
| HDFC Asset Management Co. Ltd. | 2,510 | 64,756 | ||||||
| HEG Ltd. | 358 | 5,600 | ||||||
| Hero MotoCorp Ltd. | 6,914 | 243,547 | ||||||
| HFCL Ltd. | 66,004 | 60,606 | ||||||
| HIL Ltd. | 511 | 23,568 | ||||||
Himatsingka Seide Ltd.(1) | 4,246 | 5,559 | ||||||
| Hindalco Industries Ltd. | 133,423 | 723,633 | ||||||
| Hinduja Global Solutions Ltd. | 950 | 17,695 | ||||||
| Hindustan Petroleum Corp. Ltd. | 47,489 | 144,141 | ||||||
| Hindware Home Innovation Ltd. | 2,624 | 10,640 | ||||||
| I G Petrochemicals Ltd. | 1,051 | 7,759 | ||||||
| IIFL Finance Ltd. | 23,048 | 98,723 | ||||||
| IIFL Securities Ltd. | 8,473 | 7,558 | ||||||
| India Cements Ltd. | 17,803 | 50,410 | ||||||
| India Glycols Ltd. | 1,274 | 14,126 | ||||||
Indiabulls Housing Finance Ltd.(1) | 20,046 | 33,809 | ||||||
Indiabulls Real Estate Ltd.(1) | 15,634 | 16,806 | ||||||
93
| Avantis Emerging Markets Value ETF | ||||||||
| Shares | Value | |||||||
| Indian Bank | 32,022 | $ | 77,058 | |||||
| Indian Metals & Ferro Alloys Ltd. | 1,190 | 4,092 | ||||||
| Indian Oil Corp. Ltd. | 151,794 | 135,447 | ||||||
| Indus Towers Ltd. | 32,025 | 79,638 | ||||||
| Intellect Design Arena Ltd. | 6,555 | 48,114 | ||||||
| IOL Chemicals and Pharmaceuticals Ltd. | 972 | 4,347 | ||||||
| ISGEC Heavy Engineering Ltd. | 1,198 | 7,143 | ||||||
| J Kumar Infraprojects Ltd. | 6,591 | 24,447 | ||||||
Jaiprakash Power Ventures Ltd.(1) | 285,099 | 26,663 | ||||||
Jammu & Kashmir Bank Ltd.(1) | 25,685 | 10,098 | ||||||
| Jamna Auto Industries Ltd. | 7,499 | 10,878 | ||||||
| JBM Auto Ltd. | 1,877 | 9,365 | ||||||
| Jindal Poly Films Ltd. | 1,238 | 16,204 | ||||||
| Jindal Saw Ltd. | 10,436 | 11,265 | ||||||
Jindal Stainless Hisar Ltd.(1) | 11,655 | 35,390 | ||||||
Jindal Stainless Ltd.(1) | 21,756 | 34,612 | ||||||
| Jindal Steel & Power Ltd. | 47,733 | 256,838 | ||||||
| JK Cement Ltd. | 2,454 | 82,843 | ||||||
| JK Lakshmi Cement Ltd. | 7,677 | 45,113 | ||||||
| JK Paper Ltd. | 14,385 | 74,745 | ||||||
| JK Tyre & Industries Ltd. | 6,818 | 11,814 | ||||||
| JM Financial Ltd. | 46,248 | 36,725 | ||||||
| JSW Steel Ltd. | 59,880 | 496,593 | ||||||
| Jubilant Pharmova Ltd. | 4,145 | 18,141 | ||||||
| Kalpataru Power Transmission Ltd. | 4,836 | 24,645 | ||||||
| Karnataka Bank Ltd. | 11,225 | 10,452 | ||||||
| Karur Vysya Bank Ltd. | 73,299 | 62,273 | ||||||
| Kaveri Seed Co. Ltd. | 3,211 | 18,286 | ||||||
| KEC International Ltd. | 20,257 | 102,835 | ||||||
| Kirloskar Ferrous Industries Ltd. | 8,130 | 25,683 | ||||||
| KNR Constructions Ltd. | 14,489 | 47,002 | ||||||
| Kolte-Patil Developers Ltd. | 2,489 | 9,537 | ||||||
| KPIT Technologies Ltd. | 13,137 | 90,763 | ||||||
| KPR Mill Ltd. | 5,212 | 39,198 | ||||||
| KRBL Ltd. | 4,023 | 15,776 | ||||||
| L&T Finance Holdings Ltd. | 56,321 | 55,316 | ||||||
| Larsen & Toubro Ltd. | 43,487 | 1,037,914 | ||||||
| LG Balakrishnan & Bros Ltd. | 1,108 | 9,611 | ||||||
| LIC Housing Finance Ltd. | 46,510 | 236,324 | ||||||
| LT Foods Ltd. | 11,320 | 13,416 | ||||||
| LUX Industries Ltd. | 271 | 6,135 | ||||||
| Maharashtra Seamless Ltd. | 2,931 | 30,619 | ||||||
| Mahindra & Mahindra Financial Services Ltd. | 79,619 | 202,781 | ||||||
| Mahindra & Mahindra Ltd. | 56,425 | 915,813 | ||||||
| Mahindra Logistics Ltd. | 1,585 | 9,525 | ||||||
| Maithan Alloys Ltd. | 648 | 8,339 | ||||||
| Manali Petrochemicals Ltd. | 13,942 | 16,017 | ||||||
| Manappuram Finance Ltd. | 39,472 | 51,857 | ||||||
| Marksans Pharma Ltd. | 6,924 | 4,499 | ||||||
| Mazagon Dock Shipbuilders Ltd. | 2,533 | 12,330 | ||||||
Meghmani Finechem Ltd.(1) | 1,230 | 21,793 | ||||||
94
| Avantis Emerging Markets Value ETF | ||||||||
| Shares | Value | |||||||
| Meghmani Organics Ltd. | 7,596 | $ | 11,532 | |||||
| MOIL Ltd. | 8,159 | 16,692 | ||||||
| Motherson Sumi Wiring India Ltd. | 33,346 | 33,879 | ||||||
| Motilal Oswal Financial Services Ltd. | 3,345 | 32,061 | ||||||
| MRF Ltd. | 157 | 167,350 | ||||||
| Mrs Bectors Food Specialities Ltd. | 1,317 | 5,714 | ||||||
| MSTC Ltd. | 2,242 | 7,610 | ||||||
| Muthoot Finance Ltd. | 8,353 | 109,435 | ||||||
| National Aluminium Co. Ltd. | 69,427 | 69,136 | ||||||
National Fertilizers Ltd.(1) | 11,767 | 7,346 | ||||||
| Nava Ltd. | 8,151 | 22,957 | ||||||
| NBCC India Ltd. | 85,191 | 36,449 | ||||||
| NCC Ltd. | 42,057 | 36,515 | ||||||
| Neuland Laboratories Ltd. | 654 | 10,336 | ||||||
| NIIT Ltd. | 6,404 | 27,554 | ||||||
| Nippon Life India Asset Management Ltd. | 16,510 | 62,084 | ||||||
| NLC India Ltd. | 23,997 | 22,778 | ||||||
| NTPC Ltd. | 302,296 | 619,664 | ||||||
| Oil & Natural Gas Corp. Ltd. | 174,781 | 302,566 | ||||||
| Oil India Ltd. | 15,344 | 36,947 | ||||||
Olectra Greentech Ltd.(1) | 5,472 | 42,062 | ||||||
| Oracle Financial Services Software Ltd. | 711 | 28,089 | ||||||
| Orient Cement Ltd. | 18,137 | 27,064 | ||||||
| Orient Electric Ltd. | 8,736 | 28,316 | ||||||
| PCBL Ltd. | 14,507 | 24,795 | ||||||
| Petronet LNG Ltd. | 61,967 | 170,952 | ||||||
PNB Housing Finance Ltd.(1) | 6,311 | 27,373 | ||||||
| PNC Infratech Ltd. | 11,889 | 41,941 | ||||||
| Polyplex Corp. Ltd. | 3,109 | 83,165 | ||||||
| Praj Industries Ltd. | 18,823 | 97,901 | ||||||
| Prince Pipes & Fittings Ltd. | 2,142 | 15,613 | ||||||
Prism Johnson Ltd.(1) | 6,637 | 10,423 | ||||||
| Ramco Cements Ltd. | 11,690 | 110,303 | ||||||
| Rashtriya Chemicals & Fertilizers Ltd. | 21,021 | 25,857 | ||||||
| Raymond Ltd. | 3,996 | 47,608 | ||||||
RBL Bank Ltd.(1) | 18,154 | 27,403 | ||||||
| REC Ltd. | 125,696 | 170,672 | ||||||
| Redington India Ltd. | 55,731 | 103,987 | ||||||
Reliance Power Ltd.(1) | 315,988 | 65,644 | ||||||
| Rhi Magnesita India Ltd. | 3,248 | 23,882 | ||||||
| Rupa & Co. Ltd. | 1,880 | 8,014 | ||||||
| Samvardhana Motherson International Ltd. | 58,816 | 89,710 | ||||||
| Sanofi India Ltd. | 743 | 57,604 | ||||||
| Sarda Energy & Minerals Ltd. | 1,500 | 17,119 | ||||||
| Satia Industries Ltd. | 7,648 | 11,008 | ||||||
| Shankara Building Products Ltd. | 882 | 8,383 | ||||||
| Sharda Cropchem Ltd. | 3,884 | 25,077 | ||||||
| Share India Securities Ltd. | 1,267 | 17,690 | ||||||
| Shipping Corp. of India Ltd. | 12,981 | 19,065 | ||||||
| Shree Cement Ltd. | 396 | 108,710 | ||||||
| Shriram City Union Finance Ltd. | 3,294 | 78,300 | ||||||
95
| Avantis Emerging Markets Value ETF | ||||||||
| Shares | Value | |||||||
| Shriram Transport Finance Co. Ltd. | 26,352 | $ | 442,300 | |||||
| Siyaram Silk Mills Ltd. | 1,138 | 7,123 | ||||||
| Sobha Ltd. | 3,521 | 30,490 | ||||||
| Sonata Software Ltd. | 7,854 | 69,541 | ||||||
Southern Petrochemical Industries Corp. Ltd.(1) | 13,120 | 9,975 | ||||||
| State Bank of India, GDR | 8,634 | 570,350 | ||||||
Sterling and Wilson Renewable(1) | 3,352 | 12,371 | ||||||
| Sterlite Technologies Ltd. | 10,152 | 21,647 | ||||||
Strides Pharma Science Ltd.(1) | 1,933 | 7,952 | ||||||
| Sudarshan Chemical Industries Ltd. | 3,760 | 21,520 | ||||||
| Sun TV Network Ltd. | 7,999 | 49,962 | ||||||
Sunflag Iron & Steel Co.(1) | 6,209 | 6,816 | ||||||
| Suprajit Engineering Ltd. | 8,027 | 33,956 | ||||||
| Supreme Industries Ltd. | 4,391 | 107,774 | ||||||
| Supreme Petrochem Ltd. | 2,168 | 21,104 | ||||||
| Surya Roshni Ltd. | 1,022 | 6,268 | ||||||
| Tamil Nadu Newsprint & Papers Ltd. | 6,047 | 19,232 | ||||||
| Tamilnadu Petroproducts Ltd. | 8,337 | 10,525 | ||||||
| Tanla Platforms Ltd. | 3,889 | 34,425 | ||||||
| Tata Chemicals Ltd. | 12,586 | 176,865 | ||||||
| Tata Metaliks Ltd. | 1,355 | 13,081 | ||||||
Tata Motors Ltd., ADR(1)(2) | 10,990 | 318,710 | ||||||
| Tata Steel Long Products Ltd. | 1,015 | 7,871 | ||||||
| Tata Steel Ltd. | 543,032 | 729,076 | ||||||
| Tech Mahindra Ltd. | 40,280 | 536,672 | ||||||
| Thermax Ltd. | 3,891 | 117,130 | ||||||
| Thirumalai Chemicals Ltd. | 8,400 | 24,453 | ||||||
| Time Technoplast Ltd. | 12,711 | 18,835 | ||||||
| Tinplate Co. of India Ltd. | 3,877 | 15,225 | ||||||
| Transport Corp. of India Ltd. | 1,955 | 17,391 | ||||||
| Triveni Engineering & Industries Ltd. | 9,853 | 28,818 | ||||||
| Triveni Turbine Ltd. | 7,053 | 17,961 | ||||||
| Tube Investments of India Ltd. | 4,947 | 139,484 | ||||||
| TV Today Network Ltd. | 1,420 | 5,007 | ||||||
TV18 Broadcast Ltd.(1) | 31,080 | 15,711 | ||||||
| Uflex Ltd. | 5,946 | 57,967 | ||||||
| UltraTech Cement Ltd. | 4,628 | 384,748 | ||||||
| Usha Martin Ltd. | 8,471 | 14,932 | ||||||
| UTI Asset Management Co. Ltd. | 3,984 | 40,840 | ||||||
| Vaibhav Global Ltd. | 1,922 | 8,300 | ||||||
Valiant Organics Ltd.(1) | 1,468 | 10,863 | ||||||
Varroc Engineering Ltd.(1) | 4,313 | 18,435 | ||||||
| Vedanta Ltd. | 68,657 | 230,098 | ||||||
| Venky's India Ltd. | 511 | 13,333 | ||||||
| VRL Logistics Ltd. | 3,797 | 29,326 | ||||||
| Welspun Corp. Ltd. | 24,093 | 67,554 | ||||||
| West Coast Paper Mills Ltd. | 2,171 | 17,025 | ||||||
| Wipro Ltd., ADR | 7,595 | 38,051 | ||||||
Yes Bank Ltd.(1) | 257,765 | 52,833 | ||||||
| Zee Entertainment Enterprises Ltd. | 79,870 | 254,462 | ||||||
| 22,697,523 | ||||||||
96
| Avantis Emerging Markets Value ETF | ||||||||
| Shares | Value | |||||||
| Indonesia — 2.5% | ||||||||
| Adaro Energy Indonesia Tbk PT | 1,051,700 | $ | 250,722 | |||||
| AKR Corporindo Tbk PT | 556,300 | 44,960 | ||||||
| Aneka Tambang Tbk | 615,600 | 82,316 | ||||||
| Astra Agro Lestari Tbk PT | 37,100 | 22,868 | ||||||
| Astra International Tbk PT | 731,000 | 342,999 | ||||||
| Bank BTPN Syariah Tbk PT | 145,700 | 29,035 | ||||||
| Bank Mandiri Persero Tbk PT | 755,900 | 449,825 | ||||||
| Bank Pembangunan Daerah Jawa Barat Dan Banten Tbk PT | 233,300 | 21,846 | ||||||
| Bank Tabungan Negara Persero Tbk PT | 290,700 | 29,452 | ||||||
| BFI Finance Indonesia Tbk PT | 733,300 | 61,701 | ||||||
Buana Lintas Lautan Tbk PT(1) | 564,800 | 6,431 | ||||||
| Bukit Asam Tbk PT | 378,600 | 108,329 | ||||||
| Charoen Pokphand Indonesia Tbk PT | 1,200 | 475 | ||||||
| Ciputra Development Tbk PT | 870,400 | 55,679 | ||||||
Delta Dunia Makmur Tbk PT(1) | 184,000 | 4,657 | ||||||
| Dharma Satya Nusantara Tbk PT | 556,300 | 18,903 | ||||||
| Elnusa Tbk PT | 137,700 | 2,951 | ||||||
| Erajaya Swasembada Tbk PT | 364,200 | 11,965 | ||||||
| Indah Kiat Pulp & Paper Tbk PT | 46,500 | 26,047 | ||||||
| Indo Tambangraya Megah Tbk PT | 41,300 | 109,395 | ||||||
| Indosat Tbk PT | 59,500 | 28,725 | ||||||
| Jaccs Mitra Pinasthika Mustika Tbk PT | 229,100 | 15,744 | ||||||
Jasa Marga Persero Tbk PT(1) | 123,900 | 28,697 | ||||||
Link Net Tbk PT(1) | 97,700 | 31,262 | ||||||
Lippo Karawaci Tbk PT(1) | 403,300 | 3,123 | ||||||
| Matahari Department Store Tbk PT | 80,500 | 20,796 | ||||||
| Medco Energi Internasional Tbk PT | 640,600 | 37,132 | ||||||
| Media Nusantara Citra Tbk PT | 580,100 | 35,726 | ||||||
| Metrodata Electronics Tbk PT | 129,900 | 6,126 | ||||||
Mitra Adiperkasa Tbk PT(1) | 706,600 | 48,010 | ||||||
MNC Vision Networks Tbk PT(1) | 1,568,700 | 9,836 | ||||||
Multipolar Tbk PT(1) | 500,200 | 5,124 | ||||||
| Pabrik Kertas Tjiwi Kimia Tbk PT | 4,800 | 2,189 | ||||||
| Pakuwon Jati Tbk PT | 50,800 | 1,656 | ||||||
| Perusahaan Perkebunan London Sumatra Indonesia Tbk PT | 340,600 | 27,066 | ||||||
PP Persero Tbk PT(1) | 294,500 | 20,011 | ||||||
| Samudera Indonesia Tbk PT | 164,800 | 28,671 | ||||||
| Sawit Sumbermas Sarana Tbk PT | 417,100 | 39,501 | ||||||
| Semen Indonesia Persero Tbk PT | 18,800 | 8,348 | ||||||
Smartfren Telecom Tbk PT(1) | 1,831,700 | 12,218 | ||||||
| Summarecon Agung Tbk PT | 592,500 | 23,901 | ||||||
| Telkom Indonesia Persero Tbk PT, ADR | 26,252 | 789,398 | ||||||
| Timah Tbk PT | 302,800 | 30,435 | ||||||
| United Tractors Tbk PT | 97,700 | 222,469 | ||||||
| XL Axiata Tbk PT | 184,000 | 32,580 | ||||||
| 3,189,300 | ||||||||
| Malaysia — 1.9% | ||||||||
| Aeon Co. M Bhd | 66,900 | 21,889 | ||||||
| Alliance Bank Malaysia Bhd | 78,400 | 61,648 | ||||||
| AMMB Holdings Bhd | 93,200 | 86,624 | ||||||
97
| Avantis Emerging Markets Value ETF | ||||||||
| Shares | Value | |||||||
| Ann Joo Resources Bhd | 5,900 | $ | 1,371 | |||||
| Bank Islam Malaysia Bhd | 36,800 | 21,411 | ||||||
Boustead Holdings Bhd(1) | 85,400 | 12,404 | ||||||
| Boustead Plantations Bhd | 53,700 | 9,270 | ||||||
Bumi Armada Bhd(1) | 227,500 | 20,909 | ||||||
| Bursa Malaysia Bhd | 43,700 | 62,454 | ||||||
Chin Hin Group Bhd(2) | 26,200 | 15,111 | ||||||
| Dagang NeXchange Bhd | 236,600 | 44,633 | ||||||
| Eco World Development Group Bhd | 70,100 | 10,436 | ||||||
| Evergreen Fibreboard Bhd | 31,000 | 3,537 | ||||||
| Gamuda Bhd | 125,809 | 107,197 | ||||||
| Genting Bhd | 44,000 | 45,988 | ||||||
| Genting Plantations Bhd | 17,900 | 26,774 | ||||||
| Hartalega Holdings Bhd | 57,700 | 21,363 | ||||||
| Hiap Teck Venture Bhd | 109,800 | 6,789 | ||||||
| Hibiscus Petroleum Bhd | 117,300 | 27,482 | ||||||
| IJM Corp. Bhd | 162,500 | 61,851 | ||||||
Jaya Tiasa Holdings Bhd(1) | 66,000 | 9,014 | ||||||
| Kossan Rubber Industries Bhd | 48,500 | 10,913 | ||||||
| Lingkaran Trans Kota Holdings Bhd | 10,000 | 10,897 | ||||||
| Lotte Chemical Titan Holding Bhd | 29,100 | 11,107 | ||||||
| Malayan Banking Bhd | 153,703 | 307,482 | ||||||
| Malaysia Building Society Bhd | 179,400 | 23,125 | ||||||
Malaysian Bulk Carriers Bhd(1) | 25,900 | 2,388 | ||||||
| MISC Bhd | 41,800 | 66,138 | ||||||
| PESTECH International Bhd | 17,000 | 1,377 | ||||||
| Petronas Chemicals Group Bhd | 88,600 | 173,786 | ||||||
| Petronas Dagangan Bhd | 4,800 | 25,141 | ||||||
| Public Bank Bhd | 621,600 | 652,705 | ||||||
| RHB Bank Bhd | 69,000 | 88,167 | ||||||
Rubberex Corp. M Bhd(1) | 1,400 | 126 | ||||||
Sapura Energy Bhd(1) | 62,700 | 697 | ||||||
| Sarawak Oil Palms Bhd | 22,350 | 13,747 | ||||||
Serba Dinamik Holdings Bhd(1) | 21,300 | 141 | ||||||
| Sime Darby Bhd | 87,900 | 44,785 | ||||||
| Sime Darby Plantation Bhd | 124,300 | 123,554 | ||||||
| Sunway Bhd | 101,900 | 37,221 | ||||||
| Supermax Corp. Bhd | 44,020 | 7,161 | ||||||
| Syarikat Takaful Malaysia Keluarga Bhd | 14,000 | 10,399 | ||||||
| Ta Ann Holdings Bhd | 19,100 | 16,998 | ||||||
| TASCO Bhd | 6,400 | 1,344 | ||||||
| Telekom Malaysia Bhd | 46,600 | 61,949 | ||||||
| Top Glove Corp. Bhd | 124,800 | 22,345 | ||||||
| TSH Resources Bhd | 95,200 | 23,528 | ||||||
| Unisem M Bhd | 11,800 | 7,147 | ||||||
| Westports Holdings Bhd | 23,600 | 18,302 | ||||||
| Yinson Holdings Bhd | 78,400 | 36,806 | ||||||
| 2,477,631 | ||||||||
| Mexico — 2.3% | ||||||||
| Alfa SAB de CV, Class A | 183,951 | 116,233 | ||||||
| Alpek SAB de CV | 15,151 | 20,824 | ||||||
98
| Avantis Emerging Markets Value ETF | ||||||||
| Shares | Value | |||||||
| America Movil SAB de CV, Class L ADR | 43,404 | $ | 737,868 | |||||
| Banco del Bajio SA | 48,809 | 102,262 | ||||||
| Coca-Cola Femsa SAB de CV | 19,304 | 117,847 | ||||||
Controladora Vuela Cia de Aviacion SAB de CV, ADR(1) | 6,602 | 58,626 | ||||||
| GCC SAB de CV | 6,884 | 39,558 | ||||||
| Genomma Lab Internacional SAB de CV, Class B | 63,376 | 51,779 | ||||||
| Gentera SAB de CV | 101,654 | 79,672 | ||||||
| Gruma SAB de CV, B Shares | 5,651 | 61,779 | ||||||
| Grupo Aeroportuario del Centro Norte SAB de CV, ADR | 1,837 | 96,020 | ||||||
| Grupo Comercial Chedraui SA de CV | 13,100 | 37,174 | ||||||
| Grupo Financiero Banorte SAB de CV, Class O | 22,415 | 132,400 | ||||||
Grupo Financiero Inbursa SAB de CV, Class O(1) | 132,120 | 206,969 | ||||||
| Grupo Mexico SAB de CV, Series B | 134,609 | 507,127 | ||||||
| Grupo Televisa SAB, ADR | 31,627 | 200,199 | ||||||
| Industrias Penoles SAB de CV | 10,925 | 90,327 | ||||||
| Megacable Holdings SAB de CV | 63,376 | 132,940 | ||||||
Nemak SAB de CV(1) | 242,172 | 51,087 | ||||||
| Qualitas Controladora SAB de CV | 15,315 | 67,086 | ||||||
| Regional SAB de CV | 18,422 | 99,597 | ||||||
| 3,007,374 | ||||||||
| Philippines — 0.9% | ||||||||
| ACEN Corp. | 25,880 | 3,446 | ||||||
| Alliance Global Group, Inc. | 169,500 | 30,270 | ||||||
| Ayala Corp. | 12,350 | 153,900 | ||||||
| Bank of the Philippine Islands | 93,090 | 157,172 | ||||||
| BDO Unibank, Inc. | 103,940 | 237,674 | ||||||
| DMCI Holdings, Inc. | 446,300 | 75,404 | ||||||
| First Gen Corp. | 7,800 | 2,564 | ||||||
| Globe Telecom, Inc. | 940 | 35,073 | ||||||
| GT Capital Holdings, Inc. | 6,270 | 53,702 | ||||||
| LT Group, Inc. | 153,600 | 24,114 | ||||||
| Metropolitan Bank & Trust Co. | 157,450 | 147,157 | ||||||
| Nickel Asia Corp. | 238,600 | 24,175 | ||||||
PLDT, Inc., ADR(2) | 490 | 14,249 | ||||||
| Puregold Price Club, Inc. | 45,000 | 27,403 | ||||||
| Robinsons Land Corp. | 41,000 | 13,690 | ||||||
| Robinsons Retail Holdings, Inc. | 13,960 | 14,897 | ||||||
| Security Bank Corp. | 48,190 | 77,032 | ||||||
| Semirara Mining & Power Corp. | 78,400 | 57,344 | ||||||
| Universal Robina Corp. | 700 | 1,519 | ||||||
| 1,150,785 | ||||||||
| Poland — 0.7% | ||||||||
Alior Bank SA(1) | 7,649 | 42,235 | ||||||
| Bank Handlowy w Warszawie SA | 1,053 | 13,289 | ||||||
Bank Millennium SA(1) | 44,803 | 36,008 | ||||||
| Budimex SA | 61 | 3,278 | ||||||
| CD Projekt SA | 1,740 | 31,030 | ||||||
Ciech SA(1) | 4,184 | 28,475 | ||||||
Grupa Azoty SA(1) | 994 | 6,880 | ||||||
Jastrzebska Spolka Weglowa SA(1) | 6,455 | 65,205 | ||||||
| KGHM Polska Miedz SA | 6,525 | 122,274 | ||||||
99
| Avantis Emerging Markets Value ETF | ||||||||
| Shares | Value | |||||||
| KRUK SA | 769 | $ | 49,444 | |||||
| LPP SA | 54 | 97,234 | ||||||
Mercator Medical SA(1) | 130 | 1,446 | ||||||
| Orange Polska SA | 47,679 | 60,760 | ||||||
| Polski Koncern Naftowy ORLEN SA | 21,855 | 283,071 | ||||||
Polskie Gornictwo Naftowe i Gazownictwo SA(1) | 64,265 | 76,342 | ||||||
| 916,971 | ||||||||
Russia(3)† | ||||||||
| Globaltrans Investment PLC, GDR | 15,648 | 2 | ||||||
| LUKOIL PJSC | 7,931 | — | ||||||
| Novolipetsk Steel PJSC | 70,860 | — | ||||||
VTB Bank PJSC(1) | 152,598,000 | 250 | ||||||
| 252 | ||||||||
| South Africa — 3.9% | ||||||||
| Absa Group Ltd. | 51,261 | 530,918 | ||||||
AECI Ltd.(2) | 625 | 3,026 | ||||||
| African Rainbow Minerals Ltd. | 12,628 | 173,922 | ||||||
| Anglo American Platinum Ltd. | 2,283 | 159,375 | ||||||
| AngloGold Ashanti Ltd., ADR | 8,478 | 114,283 | ||||||
ArcelorMittal South Africa Ltd.(1) | 29,771 | 8,844 | ||||||
| Aspen Pharmacare Holdings Ltd. | 6,618 | 56,794 | ||||||
| Astral Foods Ltd. | 5,672 | 68,396 | ||||||
Aveng Ltd.(1) | 13,159 | 12,388 | ||||||
| Barloworld Ltd. | 16,454 | 83,751 | ||||||
| Gold Fields Ltd., ADR | 4,784 | 38,703 | ||||||
| Grindrod Shipping Holdings Ltd. | 1,560 | 36,710 | ||||||
| Harmony Gold Mining Co. Ltd., ADR | 105 | 274 | ||||||
| Impala Platinum Holdings Ltd. | 44,458 | 465,846 | ||||||
| Investec Ltd. | 11,949 | 56,106 | ||||||
| KAP Industrial Holdings Ltd. | 227,253 | 60,202 | ||||||
| Kumba Iron Ore Ltd. | 2,288 | 50,655 | ||||||
| Merafe Resources Ltd. | 218,751 | 16,574 | ||||||
| Momentum Metropolitan Holdings | 137,859 | 133,727 | ||||||
| Motus Holdings Ltd. | 17,253 | 116,916 | ||||||
| MTN Group Ltd. | 66,712 | 482,864 | ||||||
Murray & Roberts Holdings Ltd.(1) | 4,081 | 2,123 | ||||||
Nedbank Group Ltd.(2) | 9,333 | 110,162 | ||||||
| Ninety One Ltd. | 2,262 | 5,097 | ||||||
| Old Mutual Ltd. | 394,116 | 233,483 | ||||||
| Omnia Holdings Ltd. | 19,384 | 69,888 | ||||||
PPC Ltd.(1) | 98,041 | 14,575 | ||||||
| Raubex Group Ltd. | 9,646 | 19,643 | ||||||
| Reinet Investments SCA | 8,295 | 135,868 | ||||||
| Remgro Ltd. | 12,057 | 89,408 | ||||||
| Royal Bafokeng Platinum Ltd. | 15,691 | 133,014 | ||||||
Sappi Ltd.(1) | 89,427 | 238,376 | ||||||
Sasol Ltd., ADR(1) | 33,217 | 641,088 | ||||||
| Shoprite Holdings Ltd. | 2,603 | 35,297 | ||||||
| Sibanye Stillwater Ltd., ADR | 43,563 | 391,196 | ||||||
| Standard Bank Group Ltd. | 1,490 | 13,296 | ||||||
Telkom SA SOC Ltd.(1) | 36,834 | 94,531 | ||||||
100
| Avantis Emerging Markets Value ETF | ||||||||
| Shares | Value | |||||||
| Thungela Resources Ltd. | 11,965 | $ | 228,056 | |||||
| 5,125,375 | ||||||||
| South Korea — 13.7% | ||||||||
| Advanced Process Systems Corp. | 564 | 8,142 | ||||||
Ananti, Inc.(1) | 5,988 | 30,305 | ||||||
Asiana Airlines, Inc.(1) | 4,077 | 45,870 | ||||||
| BGF retail Co. Ltd. | 557 | 66,717 | ||||||
| Binggrae Co. Ltd. | 448 | 15,275 | ||||||
Bioneer Corp.(1) | 59 | 1,317 | ||||||
| BNK Financial Group, Inc. | 21,836 | 108,881 | ||||||
| Boditech Med, Inc. | 749 | 6,058 | ||||||
| CJ CheilJedang Corp. | 584 | 177,149 | ||||||
| CJ Corp. | 1,350 | 78,546 | ||||||
| CJ ENM Co. Ltd. | 581 | 42,347 | ||||||
CJ Logistics Corp.(1) | 946 | 83,382 | ||||||
| Cosmax, Inc. | 357 | 16,615 | ||||||
| Coway Co. Ltd. | 3,564 | 169,092 | ||||||
| Cuckoo Homesys Co. Ltd. | 777 | 18,361 | ||||||
| Daeduck Electronics Co. Ltd. | 4,341 | 95,193 | ||||||
Daewoo Engineering & Construction Co. Ltd.(1) | 17,714 | 68,313 | ||||||
| Daishin Securities Co. Ltd. | 3,023 | 34,626 | ||||||
| Daol Investment & Securities Co. Ltd. | 6,177 | 21,078 | ||||||
| Daou Data Corp. | 2,131 | 19,216 | ||||||
| Daou Technology, Inc. | 2,282 | 31,908 | ||||||
| DB Financial Investment Co. Ltd. | 1,187 | 4,398 | ||||||
| DB HiTek Co. Ltd. | 2,943 | 101,018 | ||||||
| DB Insurance Co. Ltd. | 6,161 | 274,373 | ||||||
| Dentium Co. Ltd. | 245 | 15,935 | ||||||
| DGB Financial Group, Inc. | 17,075 | 94,638 | ||||||
| DL E&C Co. Ltd. | 3,159 | 95,883 | ||||||
| DL Holdings Co. Ltd. | 1,522 | 75,536 | ||||||
| Dongjin Semichem Co. Ltd. | 209 | 5,333 | ||||||
| Dongkuk Steel Mill Co. Ltd. | 7,136 | 69,906 | ||||||
| Dongwon F&B Co. Ltd. | 47 | 5,431 | ||||||
| Dongwon Industries Co. Ltd. | 77 | 12,972 | ||||||
| Doosan Tesna, Inc. | 1,825 | 38,872 | ||||||
| Dreamtech Co. Ltd. | 1,784 | 12,494 | ||||||
| E-MART, Inc. | 1,160 | 84,214 | ||||||
| Eugene Investment & Securities Co. Ltd. | 4,137 | 8,783 | ||||||
| Fila Holdings Corp. | 4,451 | 102,808 | ||||||
| GOLFZON Co. Ltd. | 111 | 10,910 | ||||||
| GS Engineering & Construction Corp. | 6,311 | 141,167 | ||||||
| GS Holdings Corp. | 5,635 | 193,461 | ||||||
| GS Retail Co. Ltd. | 3,511 | 66,370 | ||||||
| Halla Holdings Corp. | 774 | 22,120 | ||||||
| Hana Financial Group, Inc. | 23,799 | 693,661 | ||||||
| Handsome Co. Ltd. | 1,100 | 23,194 | ||||||
| Hankook Tire & Technology Co. Ltd. | 3,080 | 86,831 | ||||||
| Hansae Co. Ltd. | 752 | 8,821 | ||||||
| Hanwha Aerospace Co. Ltd. | 3,848 | 232,794 | ||||||
| Hanwha Corp., Preference Shares | 1,870 | 22,201 | ||||||
101
| Avantis Emerging Markets Value ETF | ||||||||
| Shares | Value | |||||||
| Hanwha Corp. | 3,666 | $ | 86,694 | |||||
Hanwha Life Insurance Co. Ltd.(1) | 17,681 | 30,333 | ||||||
| Harim Holdings Co. Ltd. | 5,206 | 32,371 | ||||||
| HD Hyundai Co. Ltd. | 4,606 | 216,267 | ||||||
| HDC Holdings Co. Ltd. | 1,104 | 5,725 | ||||||
| HDC Hyundai Development Co-Engineering & Construction, E Shares | 2,113 | 19,524 | ||||||
| Hite Jinro Co. Ltd. | 1,082 | 24,561 | ||||||
HJ Shipbuilding & Construction Co. Ltd.(1) | 1,200 | 5,389 | ||||||
| HMM Co. Ltd. | 25,341 | 417,622 | ||||||
Humax Co. Ltd.(1) | 1,427 | 4,239 | ||||||
Hyosung Chemical Corp.(1) | 138 | 17,721 | ||||||
Hyosung Heavy Industries Corp.(1) | 208 | 11,405 | ||||||
| Hyosung TNC Corp. | 256 | 59,535 | ||||||
Hyundai Doosan Infracore Co. Ltd.(1) | 17,900 | 81,895 | ||||||
Hyundai Electric & Energy System Co. Ltd.(1) | 3,112 | 73,677 | ||||||
| Hyundai Elevator Co. Ltd. | 1,174 | 25,527 | ||||||
| Hyundai Engineering & Construction Co. Ltd. | 6,796 | 243,010 | ||||||
| Hyundai Glovis Co. Ltd. | 1,219 | 159,722 | ||||||
| Hyundai Home Shopping Network Corp. | 151 | 5,625 | ||||||
| Hyundai Marine & Fire Insurance Co. Ltd. | 7,354 | 172,510 | ||||||
| Hyundai Motor Co. | 7,134 | 1,036,443 | ||||||
| Hyundai Steel Co. | 5,550 | 135,335 | ||||||
| Hyundai Wia Corp. | 780 | 43,899 | ||||||
| ICD Co. Ltd. | 881 | 6,202 | ||||||
| iMarketKorea, Inc. | 1,069 | 8,266 | ||||||
| Industrial Bank of Korea | 17,231 | 122,690 | ||||||
| Innocean Worldwide, Inc. | 188 | 5,944 | ||||||
| IS Dongseo Co. Ltd. | 1,792 | 49,216 | ||||||
| JB Financial Group Co. Ltd. | 13,452 | 75,999 | ||||||
| Jusung Engineering Co. Ltd. | 2,401 | 28,234 | ||||||
KB Financial Group, Inc., ADR(2) | 25,253 | 923,755 | ||||||
| KCC Glass Corp. | 1,027 | 38,471 | ||||||
| KEPCO Plant Service & Engineering Co. Ltd. | 848 | 26,025 | ||||||
| Kginicis Co. Ltd. | 1,936 | 19,243 | ||||||
| KH Vatec Co. Ltd. | 1,317 | 18,543 | ||||||
| Kia Corp. | 17,411 | 1,043,577 | ||||||
| KISCO Corp. | 2,176 | 11,187 | ||||||
| KIWOOM Securities Co. Ltd. | 1,033 | 65,640 | ||||||
| Kolon Industries, Inc. | 1,006 | 39,103 | ||||||
| KoMiCo Ltd. | 713 | 24,674 | ||||||
| Korea Aerospace Industries Ltd. | 5,621 | 255,057 | ||||||
| Korea Electric Terminal Co. Ltd. | 348 | 17,236 | ||||||
| Korea Investment Holdings Co. Ltd. | 3,701 | 156,053 | ||||||
Korea Line Corp.(1) | 12,529 | 21,176 | ||||||
| Korea Petrochemical Ind Co. Ltd. | 320 | 28,906 | ||||||
Korea Shipbuilding & Offshore Engineering Co. Ltd.(1) | 2,988 | 215,647 | ||||||
Korean Air Lines Co. Ltd.(1) | 13,109 | 260,542 | ||||||
| Kumho Petrochemical Co. Ltd. | 1,668 | 160,890 | ||||||
| LF Corp. | 2,876 | 36,232 | ||||||
LG Display Co. Ltd., ADR(2) | 34,807 | 199,096 | ||||||
102
| Avantis Emerging Markets Value ETF | ||||||||
| Shares | Value | |||||||
| LG Electronics, Inc. | 7,652 | $ | 572,599 | |||||
| LG Innotek Co. Ltd. | 1,313 | 334,235 | ||||||
| LG Uplus Corp. | 14,269 | 122,199 | ||||||
| LIG Nex1 Co. Ltd. | 1,447 | 114,133 | ||||||
| Lotte Chilsung Beverage Co. Ltd. | 354 | 40,733 | ||||||
| Lotte Confectionery Co. Ltd. | 174 | 16,209 | ||||||
| Lotte Rental Co. Ltd. | 2,150 | 57,107 | ||||||
| Lotte Shopping Co. Ltd. | 775 | 56,886 | ||||||
| LS Electric Co. Ltd. | 779 | 32,310 | ||||||
| Lutronic Corp. | 1,374 | 19,230 | ||||||
| LX Hausys Ltd. | 663 | 22,162 | ||||||
| LX INTERNATIONAL Corp. | 3,949 | 127,174 | ||||||
| LX Semicon Co. Ltd. | 1,349 | 94,915 | ||||||
| Maeil Dairies Co. Ltd. | 404 | 17,269 | ||||||
| Mando Corp. | 1,729 | 69,105 | ||||||
| Mcnex Co. Ltd. | 1,178 | 32,297 | ||||||
| MegaStudyEdu Co. Ltd. | 881 | 51,248 | ||||||
| Meritz Financial Group, Inc. | 3,220 | 73,803 | ||||||
| Meritz Fire & Marine Insurance Co. Ltd. | 3,987 | 113,831 | ||||||
| Meritz Securities Co. Ltd. | 23,671 | 85,311 | ||||||
| Mirae Asset Life Insurance Co. Ltd. | 707 | 1,598 | ||||||
| Mirae Asset Securities Co. Ltd. | 17,749 | 86,559 | ||||||
| NH Investment & Securities Co. Ltd. | 10,825 | 80,136 | ||||||
| NICE Holdings Co. Ltd. | 1,180 | 12,016 | ||||||
| Pan Ocean Co. Ltd. | 20,766 | 79,458 | ||||||
| Partron Co. Ltd. | 5,577 | 35,937 | ||||||
| POSCO Holdings, Inc., ADR | 11,280 | 530,386 | ||||||
| S-Oil Corp. | 334 | 25,334 | ||||||
| Samsung Electro-Mechanics Co. Ltd. | 3,667 | 379,669 | ||||||
Samsung Engineering Co. Ltd.(1) | 14,949 | 259,919 | ||||||
| Samsung Fire & Marine Insurance Co. Ltd. | 2,929 | 425,684 | ||||||
Samsung Heavy Industries Co. Ltd.(1) | 60,090 | 266,610 | ||||||
| Samsung Life Insurance Co. Ltd. | 2,264 | 104,493 | ||||||
| Samsung Securities Co. Ltd. | 4,903 | 123,434 | ||||||
| Samyang Foods Co. Ltd. | 173 | 14,369 | ||||||
| Sangsangin Co. Ltd. | 4,231 | 26,919 | ||||||
| SD Biosensor, Inc. | 2,389 | 62,459 | ||||||
| SeAH Steel Holdings Corp. | 50 | 6,782 | ||||||
| Seegene, Inc. | 1,665 | 39,007 | ||||||
Shinhan Financial Group Co. Ltd., ADR(2) | 29,945 | 799,831 | ||||||
| Shinsegae International, Inc. | 1,263 | 26,185 | ||||||
| Shinsegae, Inc. | 732 | 121,318 | ||||||
| SIMMTECH Co. Ltd. | 1,741 | 49,903 | ||||||
| SK Chemicals Co. Ltd. | 1,160 | 84,092 | ||||||
| SK Hynix, Inc. | 8,916 | 626,865 | ||||||
| SK Networks Co. Ltd. | 15,598 | 52,739 | ||||||
| SK Telecom Co. Ltd., ADR | 4,095 | 87,428 | ||||||
| SK, Inc. | 711 | 122,981 | ||||||
| SL Corp. | 178 | 5,074 | ||||||
| Soulbrain Co. Ltd. | 80 | 12,852 | ||||||
| TES Co. Ltd. | 1,004 | 14,810 | ||||||
103
| Avantis Emerging Markets Value ETF | ||||||||
| Shares | Value | |||||||
| Tongyang Life Insurance Co. Ltd. | 3,404 | $ | 14,269 | |||||
| Unid Co. Ltd. | 317 | 24,480 | ||||||
| Value Added Technology Co. Ltd. | 652 | 16,267 | ||||||
| WONIK IPS Co. Ltd. | 1,028 | 21,274 | ||||||
| Woori Financial Group, Inc. | 54,424 | 492,315 | ||||||
| Woori Investment Bank Co. Ltd. | 38,774 | 25,516 | ||||||
Woori Technology Investment Co. Ltd.(1) | 6,976 | 30,288 | ||||||
| Youngone Corp. | 883 | 29,235 | ||||||
| Youngone Holdings Co. Ltd. | 734 | 28,921 | ||||||
| Yuanta Securities Korea Co. Ltd. | 5,679 | 12,073 | ||||||
| 17,721,389 | ||||||||
| Taiwan — 17.0% | ||||||||
| AcBel Polytech, Inc. | 15,000 | 14,795 | ||||||
| Acer, Inc. | 132,000 | 94,805 | ||||||
| Acter Group Corp. Ltd. | 7,000 | 48,642 | ||||||
| Advanced International Multitech Co. Ltd. | 5,000 | 16,590 | ||||||
| Advanced Power Electronics Corp. | 4,000 | 15,092 | ||||||
Alexander Marine Co. Ltd.(2) | 4,000 | 40,693 | ||||||
| Allied Circuit Co. Ltd. | 2,000 | 8,062 | ||||||
| Alltek Technology Corp. | 10,800 | 13,353 | ||||||
| Alltop Technology Co. Ltd. | 3,000 | 15,038 | ||||||
| Amazing Microelectronic Corp. | 4,000 | 14,295 | ||||||
| Anji Technology Co. Ltd. | 3,000 | 5,652 | ||||||
| Apex International Co. Ltd. | 13,000 | 26,177 | ||||||
| Arcadyan Technology Corp. | 4,000 | 15,045 | ||||||
| Ardentec Corp. | 36,000 | 53,753 | ||||||
| ASE Technology Holding Co. Ltd., ADR | 62,512 | 360,069 | ||||||
| Asia Cement Corp. | 218,000 | 308,607 | ||||||
| Asia Polymer Corp. | 31,000 | 27,783 | ||||||
| Asia Vital Components Co. Ltd. | 19,000 | 66,929 | ||||||
| ASolid Technology Co. Ltd. | 2,000 | 5,536 | ||||||
| ASROCK, Inc. | 1,000 | 3,136 | ||||||
AUO Corp.(2) | 605,000 | 330,348 | ||||||
| AURAS Technology Co. Ltd. | 5,000 | 25,219 | ||||||
| Avermedia Technologies | 2,000 | 1,584 | ||||||
| Bafang Yunji International Co. Ltd. | 6,000 | 32,288 | ||||||
| BenQ Materials Corp. | 13,000 | 13,513 | ||||||
| Bioteque Corp. | 5,000 | 18,349 | ||||||
| Brighton-Best International Taiwan, Inc. | 35,000 | 39,419 | ||||||
| Capital Securities Corp. | 138,000 | 53,881 | ||||||
Career Technology MFG. Co. Ltd.(1) | 34,000 | 29,331 | ||||||
Catcher Technology Co. Ltd.(1) | 65,000 | 394,016 | ||||||
| Cathay Financial Holding Co. Ltd. | 507,000 | 737,597 | ||||||
| Central Reinsurance Co. Ltd. | 19,000 | 13,275 | ||||||
| Cheng Loong Corp. | 89,000 | 82,452 | ||||||
Cheng Mei Materials Technology Corp.(1) | 67,000 | 23,622 | ||||||
| Cheng Shin Rubber Industry Co. Ltd. | 134,000 | 155,232 | ||||||
| Chia Chang Co. Ltd. | 7,000 | 8,624 | ||||||
| Chicony Electronics Co. Ltd. | 28,000 | 74,752 | ||||||
| Chicony Power Technology Co. Ltd. | 7,000 | 16,260 | ||||||
China Airlines Ltd.(2) | 245,000 | 181,233 | ||||||
104
| Avantis Emerging Markets Value ETF | ||||||||
| Shares | Value | |||||||
| China Bills Finance Corp. | 27,000 | $ | 14,387 | |||||
| China Container Terminal Corp. | 12,000 | 9,954 | ||||||
| China Development Financial Holding Corp., Preference Shares | 59,976 | 16,693 | ||||||
| China Development Financial Holding Corp. | 1,085,728 | 474,347 | ||||||
| China Metal Products | 24,000 | 23,402 | ||||||
| China Motor Corp. | 9,000 | 13,692 | ||||||
| Chinese Maritime Transport Ltd. | 9,000 | 11,372 | ||||||
| Chipbond Technology Corp. | 70,000 | 130,649 | ||||||
| ChipMOS Technologies, Inc. | 60,000 | 69,916 | ||||||
| Chlitina Holding Ltd. | 3,000 | 16,913 | ||||||
| Chung-Hsin Electric & Machinery Manufacturing Corp. | 50,000 | 108,044 | ||||||
CMC Magnetics Corp.(1) | 34,000 | 8,914 | ||||||
| Co-Tech Development Corp. | 15,000 | 21,016 | ||||||
| Compal Electronics, Inc. | 294,000 | 218,902 | ||||||
| Compeq Manufacturing Co. Ltd. | 120,000 | 205,777 | ||||||
| Concord Securities Co. Ltd. | 46,000 | 16,391 | ||||||
| Continental Holdings Corp. | 43,000 | 42,133 | ||||||
| Contrel Technology Co. Ltd. | 7,000 | 3,620 | ||||||
| CTBC Financial Holding Co. Ltd. | 849,000 | 650,297 | ||||||
| CTCI Corp. | 65,000 | 95,881 | ||||||
| CX Technology Co. Ltd. | 2,250 | 2,112 | ||||||
| DA CIN Construction Co. Ltd. | 30,000 | 30,264 | ||||||
| Darfon Electronics Corp. | 14,000 | 18,893 | ||||||
| Daxin Materials Corp. | 3,000 | 7,195 | ||||||
| Dimerco Express Corp. | 15,000 | 39,512 | ||||||
| Dynamic Holding Co. Ltd. | 22,000 | 14,564 | ||||||
| Dynapack International Technology Corp. | 8,000 | 20,844 | ||||||
| Edom Technology Co. Ltd. | 12,000 | 11,449 | ||||||
| Elan Microelectronics Corp. | 13,000 | 41,114 | ||||||
| Elite Advanced Laser Corp. | 9,000 | 13,556 | ||||||
| Elite Material Co. Ltd. | 16,000 | 84,218 | ||||||
| Elite Semiconductor Microelectronics Technology, Inc. | 18,000 | 46,309 | ||||||
| ENNOSTAR, Inc. | 57,000 | 95,750 | ||||||
Eva Airways Corp.(2) | 126,000 | 137,891 | ||||||
| Evergreen Marine Corp. Taiwan Ltd. | 182,000 | 521,560 | ||||||
| Everlight Electronics Co. Ltd. | 45,000 | 57,815 | ||||||
| Excelliance Mos Corp. | 2,000 | 8,425 | ||||||
| Excelsior Medical Co. Ltd. | 10,500 | 23,342 | ||||||
| Far Eastern International Bank | 153,000 | 61,579 | ||||||
| Far Eastern New Century Corp. | 130,000 | 139,303 | ||||||
| Far EasTone Telecommunications Co. Ltd. | 146,000 | 358,073 | ||||||
| Farglory Land Development Co. Ltd. | 19,000 | 39,720 | ||||||
First Steamship Co. Ltd.(1) | 67,000 | 21,056 | ||||||
| Fitipower Integrated Technology, Inc. | 4,000 | 16,532 | ||||||
| Fittech Co. Ltd. | 4,000 | 16,046 | ||||||
FLEXium Interconnect, Inc.(1) | 37,000 | 113,057 | ||||||
FocalTech Systems Co. Ltd.(2) | 6,000 | 14,989 | ||||||
| Formosa International Hotels Corp. | 3,000 | 17,048 | ||||||
| Formosa Plastics Corp. | 119,000 | 354,810 | ||||||
| Formosan Union Chemical | 17,000 | 13,752 | ||||||
Foxconn Technology Co. Ltd.(2) | 42,000 | 69,439 | ||||||
105
| Avantis Emerging Markets Value ETF | ||||||||
| Shares | Value | |||||||
| Foxsemicon Integrated Technology, Inc. | 4,000 | $ | 26,668 | |||||
| Franbo Lines Corp. | 23,028 | 14,859 | ||||||
| Fu Chun Shin Machinery Manufacture Co. Ltd. | 6,120 | 3,569 | ||||||
| Fubon Financial Holding Co. Ltd. | 465,000 | 871,898 | ||||||
| Full Wang International Development Co. Ltd. | 5,000 | 2,032 | ||||||
| G Shank Enterprise Co. Ltd. | 15,000 | 28,958 | ||||||
| Gamania Digital Entertainment Co. Ltd. | 14,000 | 27,785 | ||||||
| GEM Services, Inc. | 1,000 | 2,540 | ||||||
| General Interface Solution Holding Ltd. | 30,000 | 78,854 | ||||||
| Generalplus Technology, Inc. | 4,000 | 7,468 | ||||||
| Global Brands Manufacture Ltd. | 19,760 | 18,754 | ||||||
| Global Lighting Technologies, Inc. | 3,000 | 5,791 | ||||||
| Global PMX Co. Ltd. | 1,000 | 5,138 | ||||||
| Gold Circuit Electronics Ltd. | 9,000 | 24,474 | ||||||
| Goldsun Building Materials Co. Ltd. | 113,000 | 93,700 | ||||||
| Gourmet Master Co. Ltd. | 4,000 | 13,264 | ||||||
| Grand Fortune Securities Co. Ltd. | 18,000 | 9,348 | ||||||
| Grand Pacific Petrochemical | 76,000 | 46,676 | ||||||
| Great Tree Pharmacy Co. Ltd. | 1,257 | 12,704 | ||||||
| Greatek Electronics, Inc. | 19,000 | 36,840 | ||||||
| Group Up Industrial Co. Ltd. | 4,000 | 11,873 | ||||||
| Hai Kwang Enterprise Corp. | 4,000 | 2,902 | ||||||
| Hannstar Board Corp. | 21,000 | 22,450 | ||||||
| HannStar Display Corp. | 85,000 | 33,048 | ||||||
| HannsTouch Solution, Inc. | 44,000 | 15,720 | ||||||
| Ho Tung Chemical Corp. | 88,000 | 26,956 | ||||||
| Hocheng Corp. | 3,000 | 1,077 | ||||||
| Holy Stone Enterprise Co. Ltd. | 15,000 | 43,789 | ||||||
| Hon Hai Precision Industry Co. Ltd. | 200,000 | 712,156 | ||||||
| Horizon Securities Co. Ltd. | 7,420 | 2,761 | ||||||
| Hotai Finance Co. Ltd. | 10,000 | 34,286 | ||||||
| Hotel Holiday Garden | 14,850 | 13,523 | ||||||
| Hung Ching Development & Construction Co. Ltd. | 4,000 | 2,909 | ||||||
| Hung Sheng Construction Ltd. | 34,000 | 28,803 | ||||||
| Hycon Technology Corp. | 3,000 | 7,026 | ||||||
| IEI Integration Corp. | 16,000 | 39,251 | ||||||
| Innolux Corp. | 953,000 | 375,380 | ||||||
Integrated Service Technology, Inc.(1) | 11,000 | 24,277 | ||||||
| International CSRC Investment Holdings Co. | 82,000 | 55,865 | ||||||
| International Games System Co. Ltd. | 6,000 | 73,157 | ||||||
| Inventec Corp. | 102,000 | 77,221 | ||||||
| ITE Technology, Inc. | 5,000 | 11,432 | ||||||
| Jiin Yeeh Ding Enterprise Co. Ltd. | 5,000 | 4,996 | ||||||
| Kaimei Electronic Corp. | 10,000 | 18,959 | ||||||
| Kaori Heat Treatment Co. Ltd. | 7,000 | 26,031 | ||||||
Kenmec Mechanical Engineering Co. Ltd.(1) | 19,000 | 20,702 | ||||||
| Kerry TJ Logistics Co. Ltd. | 18,000 | 24,155 | ||||||
| Kindom Development Co. Ltd. | 24,000 | 22,217 | ||||||
| King Yuan Electronics Co. Ltd. | 128,000 | 155,922 | ||||||
| King's Town Bank Co. Ltd. | 73,000 | 84,206 | ||||||
| Kinik Co. | 12,000 | 61,888 | ||||||
106
| Avantis Emerging Markets Value ETF | ||||||||
| Shares | Value | |||||||
Kinsus Interconnect Technology Corp.(2) | 10,000 | $ | 39,721 | |||||
| KNH Enterprise Co. Ltd. | 2,000 | 1,243 | ||||||
| L&K Engineering Co. Ltd. | 14,000 | 14,866 | ||||||
| Largan Precision Co. Ltd. | 1,000 | 63,610 | ||||||
Leadtek Research, Inc.(1) | 3,000 | 3,722 | ||||||
| Lingsen Precision Industries Ltd. | 28,000 | 14,546 | ||||||
| Macronix International Co. Ltd. | 182,000 | 195,353 | ||||||
| Marketech International Corp. | 3,000 | 12,113 | ||||||
| Materials Analysis Technology, Inc. | 4,000 | 16,158 | ||||||
| Megaforce Co. Ltd. | 3,000 | 2,143 | ||||||
| Micro-Star International Co. Ltd. | 14,000 | 52,411 | ||||||
| MIN AIK Technology Co. Ltd. | 1,000 | 649 | ||||||
| Mirle Automation Corp. | 15,000 | 19,733 | ||||||
| MPI Corp. | 3,000 | 9,498 | ||||||
| Namchow Holdings Co. Ltd. | 4,000 | 6,019 | ||||||
| Nan Liu Enterprise Co. Ltd. | 1,000 | 2,813 | ||||||
| Nan Ya Plastics Corp. | 321,000 | 721,029 | ||||||
Nan Ya Printed Circuit Board Corp.(2) | 6,000 | 52,345 | ||||||
| Nantex Industry Co. Ltd. | 25,000 | 34,932 | ||||||
| Nanya Technology Corp. | 81,000 | 140,680 | ||||||
| Netronix, Inc. | 3,000 | 5,781 | ||||||
| Nien Made Enterprise Co. Ltd. | 4,000 | 36,939 | ||||||
| Novatek Microelectronics Corp. | 58,000 | 496,208 | ||||||
| Nyquest Technology Co. Ltd. | 2,000 | 5,287 | ||||||
| O-Bank Co. Ltd. | 103,000 | 29,233 | ||||||
| Orient Semiconductor Electronics Ltd. | 36,000 | 21,774 | ||||||
| Pacific Hospital Supply Co. Ltd. | 1,000 | 2,256 | ||||||
| Pegatron Corp. | 156,000 | 324,453 | ||||||
| Pegavision Corp. | 1,000 | 13,837 | ||||||
| PharmaEngine, Inc. | 9,000 | 37,771 | ||||||
| Pou Chen Corp. | 64,000 | 60,627 | ||||||
| Powertech Technology, Inc. | 81,000 | 226,025 | ||||||
| Poya International Co. Ltd. | 3,030 | 42,377 | ||||||
| President Chain Store Corp. | 7,000 | 61,513 | ||||||
| President Securities Corp. | 62,000 | 33,977 | ||||||
| Prince Housing & Development Corp. | 83,000 | 32,566 | ||||||
| Prosperity Dielectrics Co. Ltd. | 4,000 | 5,413 | ||||||
| Radiant Opto-Electronics Corp. | 18,000 | 59,150 | ||||||
| Raydium Semiconductor Corp. | 6,000 | 53,986 | ||||||
| Realtek Semiconductor Corp. | 54,000 | 606,781 | ||||||
| Rexon Industrial Corp. Ltd. | 4,000 | 4,485 | ||||||
Roo Hsing Co. Ltd.(1) | 30,000 | 2,878 | ||||||
| Scientech Corp. | 4,000 | 10,956 | ||||||
| Sea & Land Integrated Corp. | 10,400 | 10,489 | ||||||
| Sensortek Technology Corp. | 1,000 | 9,953 | ||||||
| Sesoda Corp. | 22,000 | 34,601 | ||||||
| Shih Her Technologies, Inc. | 2,000 | 3,826 | ||||||
| Shih Wei Navigation Co. Ltd. | 18,000 | 16,546 | ||||||
| Shin Foong Specialty & Applied Materials Co. Ltd. | 3,000 | 6,855 | ||||||
| Shin Kong Financial Holding Co. Ltd. | 821,000 | 235,858 | ||||||
| Shin Zu Shing Co. Ltd. | 17,000 | 48,958 | ||||||
107
| Avantis Emerging Markets Value ETF | ||||||||
| Shares | Value | |||||||
| Shinkong Insurance Co. Ltd. | 9,000 | $ | 17,034 | |||||
| Sigurd Microelectronics Corp. | 47,000 | 78,363 | ||||||
| Simplo Technology Co. Ltd. | 16,000 | 150,974 | ||||||
| Sincere Navigation Corp. | 25,000 | 17,454 | ||||||
| Sino-American Silicon Products, Inc. | 53,000 | 288,946 | ||||||
| Sinon Corp. | 37,000 | 54,884 | ||||||
| SinoPac Financial Holdings Co. Ltd. | 996,090 | 564,696 | ||||||
| Sinopower Semiconductor, Inc. | 1,000 | 3,970 | ||||||
| Sinyi Realty, Inc. | 22,000 | 22,412 | ||||||
| Sitronix Technology Corp. | 13,000 | 80,377 | ||||||
| Siward Crystal Technology Co. Ltd. | 23,000 | 31,070 | ||||||
| Soft-World International Corp. | 4,000 | 10,126 | ||||||
| Softstar Entertainment, Inc. | 4,000 | 10,821 | ||||||
| Solteam, Inc. | 7,000 | 14,237 | ||||||
| Sonix Technology Co. Ltd. | 12,000 | 23,261 | ||||||
| Symtek Automation Asia Co. Ltd. | 7,000 | 20,737 | ||||||
| T3EX Global Holdings Corp. | 11,000 | 28,198 | ||||||
| TA-I Technology Co. Ltd. | 4,000 | 5,931 | ||||||
Tai Tung Communication Co. Ltd.(1) | 5,000 | 2,654 | ||||||
| Taichung Commercial Bank Co. Ltd. | 337,709 | 150,785 | ||||||
| TaiDoc Technology Corp. | 3,000 | 21,910 | ||||||
| Taimide Tech, Inc. | 6,000 | 7,741 | ||||||
| Taishin Financial Holding Co. Ltd. | 997,362 | 495,017 | ||||||
| Taita Chemical Co. Ltd. | 10,500 | 7,754 | ||||||
| Taiwan Business Bank | 376,431 | 157,775 | ||||||
| Taiwan Cogeneration Corp. | 13,000 | 15,847 | ||||||
| Taiwan Glass Industry Corp. | 91,000 | 52,225 | ||||||
| Taiwan High Speed Rail Corp. | 107,000 | 102,299 | ||||||
| Taiwan Hon Chuan Enterprise Co. Ltd. | 30,000 | 73,556 | ||||||
| Taiwan Mobile Co. Ltd. | 41,000 | 134,014 | ||||||
| Taiwan Navigation Co. Ltd. | 23,000 | 20,354 | ||||||
| Taiwan Paiho Ltd. | 6,000 | 12,457 | ||||||
| Taiwan PCB Techvest Co. Ltd. | 23,000 | 28,872 | ||||||
| Taiwan Surface Mounting Technology Corp. | 26,000 | 86,650 | ||||||
| Taiwan-Asia Semiconductor Corp. | 34,000 | 43,394 | ||||||
| Tex-Ray Industrial Co. Ltd. | 4,000 | 1,561 | ||||||
| Thye Ming Industrial Co. Ltd. | 16,000 | 22,567 | ||||||
| Ton Yi Industrial Corp. | 112,000 | 74,308 | ||||||
| Tong Yang Industry Co. Ltd. | 41,000 | 73,086 | ||||||
| Topco Scientific Co. Ltd. | 13,000 | 69,433 | ||||||
| Topkey Corp. | 1,000 | 5,813 | ||||||
| TPK Holding Co. Ltd. | 13,000 | 15,407 | ||||||
| Tripod Technology Corp. | 29,000 | 95,216 | ||||||
| Tsann Kuen Enterprise Co. Ltd. | 13,331 | 20,461 | ||||||
| TSRC Corp. | 43,000 | 39,571 | ||||||
| TTY Biopharm Co. Ltd. | 9,000 | 22,400 | ||||||
| Tung Ho Steel Enterprise Corp. | 47,340 | 83,697 | ||||||
| TXC Corp. | 32,000 | 90,571 | ||||||
| TZE Shin International Co. Ltd. | 14,300 | 7,852 | ||||||
| U-Ming Marine Transport Corp. | 33,000 | 41,043 | ||||||
| UDE Corp. | 2,000 | 2,522 | ||||||
108
| Avantis Emerging Markets Value ETF | ||||||||
| Shares | Value | |||||||
| Unimicron Technology Corp. | 131,000 | $ | 641,864 | |||||
| Union Bank of Taiwan | 206,815 | 111,509 | ||||||
| Unitech Computer Co. Ltd. | 5,000 | 5,254 | ||||||
| United Integrated Services Co. Ltd. | 18,000 | 93,214 | ||||||
United Microelectronics Corp.(1)(2) | 305,000 | 405,792 | ||||||
| Universal, Inc. | 2,000 | 1,841 | ||||||
| Unizyx Holding Corp. | 24,000 | 21,855 | ||||||
| USI Corp. | 68,000 | 52,728 | ||||||
| Utechzone Co. Ltd. | 3,000 | 9,016 | ||||||
| Vanguard International Semiconductor Corp. | 44,000 | 106,371 | ||||||
| Walsin Technology Corp. | 11,000 | 33,242 | ||||||
| Wan Hai Lines Ltd. | 21,850 | 61,582 | ||||||
| Wei Chuan Foods Corp. | 14,000 | 9,331 | ||||||
| Weikeng Industrial Co. Ltd. | 16,000 | 14,089 | ||||||
Wha Yu Industrial Co. Ltd.(1) | 9,000 | 5,571 | ||||||
| Wholetech System Hitech Ltd. | 5,000 | 7,779 | ||||||
| Winbond Electronics Corp. | 265,000 | 190,934 | ||||||
| Wisdom Marine Lines Co. Ltd. | 47,000 | 88,569 | ||||||
Wistron Corp.(2) | 366,000 | 331,814 | ||||||
| Wistron NeWeb Corp. | 18,000 | 49,916 | ||||||
Wowprime Corp.(1) | 5,000 | 20,414 | ||||||
| WT Microelectronics Co. Ltd. | 32,000 | 67,484 | ||||||
| XinTec, Inc. | 8,000 | 34,249 | ||||||
| Yang Ming Marine Transport Corp. | 162,000 | 415,007 | ||||||
| Yeong Guan Energy Technology Group Co. Ltd. | 9,000 | 16,423 | ||||||
| YFY, Inc. | 98,000 | 79,276 | ||||||
| Youngtek Electronics Corp. | 16,000 | 34,105 | ||||||
| Yuanta Financial Holding Co. Ltd. | 61,800 | 41,023 | ||||||
| Yulon Finance Corp. | 16,288 | 86,123 | ||||||
| Yulon Motor Co. Ltd. | 46,000 | 61,978 | ||||||
| Zhen Ding Technology Holding Ltd. | 29,000 | 107,624 | ||||||
Zinwell Corp.(1) | 9,000 | 5,244 | ||||||
| Zippy Technology Corp. | 8,000 | 10,813 | ||||||
| ZongTai Real Estate Development Co. Ltd. | 12,288 | 13,084 | ||||||
| 21,996,186 | ||||||||
| Thailand — 2.6% | ||||||||
| AAPICO Hitech PCL, NVDR | 16,100 | 11,128 | ||||||
| Advanced Info Service PCL, NVDR | 44,200 | 232,541 | ||||||
| Advanced Information Technology PCL, NVDR | 62,200 | 10,559 | ||||||
| AEON Thana Sinsap Thailand PCL, NVDR | 6,900 | 31,300 | ||||||
| Amanah Leasing PCL, NVDR | 6,400 | 774 | ||||||
| AP Thailand PCL, NVDR | 225,800 | 61,826 | ||||||
| Asia Plus Group Holdings PCL, NVDR | 140,300 | 11,830 | ||||||
| Bangchak Corp. PCL, NVDR | 92,400 | 89,247 | ||||||
| Bangkok Chain Hospital PCL, NVDR | 66,800 | 34,191 | ||||||
| Banpu PCL, NVDR | 395,800 | 157,135 | ||||||
| BCPG PCL, NVDR | 55,500 | 16,417 | ||||||
| BEC World PCL, NVDR | 93,200 | 35,729 | ||||||
Better World Green PCL, NVDR(1) | 395,300 | 8,867 | ||||||
| BG Container Glass PCL, NVDR | 13,600 | 3,841 | ||||||
| Bumrungrad Hospital PCL, NVDR | 21,400 | 126,715 | ||||||
109
| Avantis Emerging Markets Value ETF | ||||||||
| Shares | Value | |||||||
| CH Karnchang PCL, NVDR | 10,500 | $ | 6,043 | |||||
| Chularat Hospital PCL, NVDR | 246,000 | 24,686 | ||||||
| Dynasty Ceramic PCL, NVDR | 199,500 | 14,765 | ||||||
| Ekachai Medical Care PCL, NVDR | 9,084 | 1,867 | ||||||
| Electricity Generating PCL, NVDR | 16,300 | 81,729 | ||||||
G J Steel PCL, NVDR(1) | 1,470,300 | 15,708 | ||||||
| GFPT PCL, NVDR | 7,900 | 3,635 | ||||||
| Gunkul Engineering PCL, NVDR | 35,700 | 4,868 | ||||||
| Ichitan Group PCL, NVDR | 2,000 | 499 | ||||||
| Indorama Ventures PCL, NVDR | 75,200 | 89,060 | ||||||
| Interlink Communication PCL, NVDR | 6,900 | 1,586 | ||||||
| IRPC PCL, NVDR | 364,500 | 34,121 | ||||||
Italian-Thai Development PCL, NVDR(1) | 382,400 | 20,114 | ||||||
Jasmine International PCL, NVDR(1) | 332,400 | 23,293 | ||||||
| JWD Infologistics PCL, NVDR | 25,100 | 11,749 | ||||||
| Karmarts PCL, NVDR | 71,000 | 8,940 | ||||||
| KGI Securities Thailand PCL, NVDR | 147,200 | 20,086 | ||||||
| Kiatnakin Phatra Bank PCL, NVDR | 20,300 | 40,293 | ||||||
| Krung Thai Bank PCL, NVDR | 114,900 | 53,126 | ||||||
| Krungthai Card PCL, NVDR | 32,100 | 52,927 | ||||||
| Land & Houses PCL, NVDR | 323,400 | 78,897 | ||||||
| Lanna Resources PCL, NVDR | 8,300 | 5,439 | ||||||
| MCS Steel PCL, NVDR | 47,600 | 13,429 | ||||||
| Mega Lifesciences PCL, NVDR | 21,800 | 29,394 | ||||||
| MFEC PCL, NVDR | 28,500 | 7,296 | ||||||
Minor International PCL, NVDR(1) | 2,000 | 1,791 | ||||||
Mono Next PCL, NVDR(1) | 69,600 | 2,946 | ||||||
| Muangthai Capital PCL, NVDR | 27,900 | 32,459 | ||||||
| Noble Development PCL, Class C, NVDR | 21,200 | 2,859 | ||||||
| Origin Property PCL, NVDR | 61,700 | 17,393 | ||||||
Plan B Media PCL, NVDR(1) | 195,688 | 35,359 | ||||||
| Polyplex Thailand PCL, NVDR | 7,500 | 4,707 | ||||||
| Precious Shipping PCL, NVDR | 82,400 | 32,023 | ||||||
| Premier Marketing PCL, NVDR | 6,800 | 1,640 | ||||||
| Prima Marine PCL, NVDR | 25,100 | 4,265 | ||||||
| Pruksa Holding PCL, NVDR | 94,900 | 33,498 | ||||||
| PTG Energy PCL, NVDR | 59,000 | 24,700 | ||||||
| PTT Exploration & Production PCL, NVDR | 65,100 | 301,089 | ||||||
| PTT Global Chemical PCL, NVDR | 85,200 | 110,779 | ||||||
| PTT Oil & Retail Business PCL, NVDR | 127,900 | 95,482 | ||||||
| PTT PCL, NVDR | 315,300 | 323,946 | ||||||
| Quality Houses PCL, NVDR | 718,900 | 42,561 | ||||||
| Ratchthani Leasing PCL, NVDR | 52,700 | 6,869 | ||||||
| Regional Container Lines PCL, NVDR | 33,900 | 30,155 | ||||||
| Sansiri PCL, NVDR | 1,199,500 | 36,140 | ||||||
| Sappe PCL, NVDR | 8,200 | 9,993 | ||||||
| SC Asset Corp. PCL, NVDR | 291,600 | 28,097 | ||||||
| SCB X PCL, NVDR | 29,200 | 88,267 | ||||||
| Sermsang Power Corp. Co. Ltd., NVDR | 89,590 | 23,558 | ||||||
| Siamgas & Petrochemicals PCL, NVDR | 28,300 | 8,681 | ||||||
| Sino-Thai Engineering & Construction PCL, NVDR | 102,900 | 34,652 | ||||||
110
| Avantis Emerging Markets Value ETF | ||||||||
| Shares | Value | |||||||
| SNC Former PCL, NVDR | 15,900 | $ | 7,404 | |||||
| Somboon Advance Technology PCL, NVDR | 22,000 | 11,748 | ||||||
| SPCG PCL, NVDR | 29,200 | 12,643 | ||||||
| Sri Trang Agro-Industry PCL, NVDR | 63,500 | 39,303 | ||||||
| Srisawad Corp. PCL, NVDR | 32,600 | 43,476 | ||||||
| Srivichai Vejvivat PCL, NVDR | 5,900 | 1,551 | ||||||
| Super Energy Corp. PCL, NVDR | 1,200,900 | 25,018 | ||||||
| SVI PCL, NVDR | 16,100 | 3,298 | ||||||
| Synnex Thailand PCL, NVDR | 14,800 | 8,418 | ||||||
| Taokaenoi Food & Marketing PCL, Class R NVDR | 5,800 | 1,224 | ||||||
| Thai Oil PCL, NVDR | 61,800 | 102,822 | ||||||
| Thai Vegetable Oil PCL, NVDR | 49,260 | 41,224 | ||||||
| Thaicom PCL, NVDR | 40,700 | 11,584 | ||||||
| Thanachart Capital PCL, NVDR | 18,100 | 20,076 | ||||||
| Thonburi Healthcare Group PCL, NVDR | 45,100 | 84,356 | ||||||
| Thoresen Thai Agencies PCL, NVDR | 99,800 | 22,680 | ||||||
| Tisco Financial Group PCL, NVDR | 13,300 | 34,166 | ||||||
| TPI Polene PCL, NVDR | 438,500 | 20,429 | ||||||
| TPI Polene Power PCL, NVDR | 75,300 | 7,718 | ||||||
| True Corp. PCL, NVDR | 324,300 | 40,534 | ||||||
U City PCL, NVDR(1) | 318,200 | 11,755 | ||||||
| 3,360,986 | ||||||||
| Turkey — 0.6% | ||||||||
| Akbank TAS | 152,796 | 98,138 | ||||||
| Aksa Akrilik Kimya Sanayii AS | 8,877 | 26,858 | ||||||
| Bera Holding AS | 17,265 | 16,855 | ||||||
| Dogus Otomotiv Servis ve Ticaret AS | 1,558 | 8,544 | ||||||
Dyo Boya Fabrikalari Sanayi ve Ticaret AS(1) | 394 | 410 | ||||||
| GSD Holding AS | 29,753 | 7,139 | ||||||
| Haci Omer Sabanci Holding AS | 55,981 | 78,202 | ||||||
Is Finansal Kiralama AS(1) | 2,489 | 1,123 | ||||||
| Kardemir Karabuk Demir Celik Sanayi ve Ticaret AS, Class A | 12,237 | 6,135 | ||||||
| Kardemir Karabuk Demir Celik Sanayi ve Ticaret AS, Class B | 12,677 | 6,364 | ||||||
| Kardemir Karabuk Demir Celik Sanayi ve Ticaret AS, Class D | 52,990 | 34,327 | ||||||
| KOC Holding AS | 27,360 | 68,261 | ||||||
Koza Anadolu Metal Madencilik Isletmeleri AS(1) | 5,860 | 8,715 | ||||||
| Tekfen Holding AS | 12,371 | 20,229 | ||||||
Turk Hava Yollari AO(1) | 30,978 | 124,242 | ||||||
| Turkcell Iletisim Hizmetleri AS, ADR | 12,764 | 37,909 | ||||||
Turkiye Halk Bankasi AS(1) | 3,872 | 1,824 | ||||||
| Turkiye Is Bankasi AS, C Shares | 140,040 | 60,662 | ||||||
Turkiye Petrol Rafinerileri AS(1) | 5,215 | 102,818 | ||||||
Turkiye Sinai Kalkinma Bankasi AS(1) | 103,194 | 27,858 | ||||||
Turkiye Vakiflar Bankasi TAO, D Shares(1) | 60,726 | 24,350 | ||||||
| Vakko Tekstil ve Hazir Giyim Sanayi Isletmeleri AS | 15,556 | 17,625 | ||||||
| Vestel Elektronik Sanayi ve Ticaret AS | 5,055 | 8,271 | ||||||
| Yapi ve Kredi Bankasi AS | 141,892 | 54,827 | ||||||
Yesil Yapi Endustrisi AS(1) | 17,827 | 1,194 | ||||||
| 842,880 | ||||||||
TOTAL COMMON STOCKS (Cost $148,528,493) | 128,824,627 | |||||||
111
| Avantis Emerging Markets Value ETF | ||||||||
| Shares | Value | |||||||
WARRANTS† | ||||||||
Malaysia† | ||||||||
Eco World Development Group Bhd(1) | 14,020 | $ | 297 | |||||
PESTECH International Bhd(1) | 1,700 | 59 | ||||||
Yinson Holdings Bhd(1) | 9,600 | 1,223 | ||||||
TOTAL WARRANTS (Cost $—) | 1,579 | |||||||
RIGHTS† | ||||||||
Brazil† | ||||||||
Infracommerce CXAAS SA(1) | 1,248 | 125 | ||||||
Thailand† | ||||||||
Thai Oil PCL, NVDR(1) | 4,843 | 1 | ||||||
TOTAL RIGHTS (Cost $—) | 126 | |||||||
| SHORT-TERM INVESTMENTS — 1.8% | ||||||||
| Money Market Funds — 1.8% | ||||||||
| State Street Institutional U.S. Government Money Market Fund, Premier Class | 372,842 | 372,842 | ||||||
State Street Navigator Securities Lending Government Money Market Portfolio(4) | 1,884,533 | 1,884,533 | ||||||
TOTAL SHORT-TERM INVESTMENTS (Cost $2,257,375) | 2,257,375 | |||||||
TOTAL INVESTMENT SECURITIES — 101.2% (Cost $150,785,868) | 131,083,707 | |||||||
| OTHER ASSETS AND LIABILITIES — (1.2)% | (1,527,937) | |||||||
| TOTAL NET ASSETS — 100.0% | $ | 129,555,770 | ||||||
| MARKET SECTOR DIVERSIFICATION | |||||
| (as a % of net assets) | |||||
| Financials | 22.8% | ||||
| Materials | 16.3% | ||||
| Information Technology | 13.2% | ||||
| Industrials | 12.1% | ||||
| Consumer Discretionary | 10.6% | ||||
| Energy | 6.6% | ||||
| Communication Services | 5.7% | ||||
| Consumer Staples | 4.3% | ||||
| Health Care | 3.5% | ||||
| Real Estate | 2.3% | ||||
| Utilities | 2.0% | ||||
| Short-Term Investments | 1.8% | ||||
| Other Assets and Liabilities | (1.2)% | ||||
112
| NOTES TO SCHEDULE OF INVESTMENTS | ||||||||
| ADR | - | American Depositary Receipt | ||||||
| GDR | - | Global Depositary Receipt | ||||||
| NVDR | - | Non-Voting Depositary Receipt | ||||||
†Category is less than 0.05% of total net assets.
(1)Non-income producing.
(2)Security, or a portion thereof, is on loan. At the period end, the aggregate value of securities on loan was $3,952,104. The amount of securities on loan indicated may not correspond with the securities on loan identified because securities with pending sales are in the process of recall from the brokers.
(3)Securities may be subject to resale, redemption or transferability restrictions.
(4)Investment of cash collateral from securities on loan. At the period end, the aggregate value of the collateral held by the fund was $4,323,744, which includes securities collateral of $2,439,211.
See Notes to Financial Statements.
113
AUGUST 31, 2022
| Avantis International Equity ETF | ||||||||
| Shares | Value | |||||||
| COMMON STOCKS — 99.5% | ||||||||
| Australia — 7.6% | ||||||||
29Metals Ltd.(1)(2) | 53,312 | $ | 72,218 | |||||
| Accent Group Ltd. | 64,983 | 66,078 | ||||||
Adairs Ltd.(1) | 18,374 | 28,313 | ||||||
| Adbri Ltd. | 52,893 | 79,194 | ||||||
Aeris Resources Ltd.(2) | 58,594 | 17,183 | ||||||
| AGL Energy Ltd. | 72,498 | 377,586 | ||||||
Alkane Resources Ltd.(2) | 119,313 | 59,197 | ||||||
Alliance Aviation Services Ltd.(2) | 12,349 | 30,018 | ||||||
Allkem Ltd.(2) | 14,401 | 133,497 | ||||||
| ALS Ltd. | 28,620 | 230,311 | ||||||
| Altium Ltd. | 7,451 | 183,752 | ||||||
| Alumina Ltd. | 137,794 | 140,636 | ||||||
AMA Group Ltd.(1)(2) | 2,514 | 274 | ||||||
AMP Ltd.(2) | 474,977 | 374,364 | ||||||
| Ampol Ltd. | 14,563 | 342,294 | ||||||
| Ansell Ltd. | 3,610 | 65,269 | ||||||
| APA Group | 98,691 | 744,211 | ||||||
| ARB Corp. Ltd. | 6,279 | 128,488 | ||||||
| Ardent Leisure Group Ltd. | 17,658 | 7,389 | ||||||
| Aristocrat Leisure Ltd. | 28,088 | 677,944 | ||||||
| ASX Ltd. | 30,768 | 1,637,850 | ||||||
| Atlas Arteria Ltd. | 19,479 | 105,970 | ||||||
Atlassian Corp. PLC, Class A(2) | 9,277 | 2,297,542 | ||||||
| AUB Group Ltd. | 3,110 | 46,517 | ||||||
Aurelia Metals Ltd.(1)(2) | 469,362 | 85,397 | ||||||
| Aurizon Holdings Ltd. | 505,537 | 1,278,569 | ||||||
| Austal Ltd. | 109,424 | 191,392 | ||||||
| Australia & New Zealand Banking Group Ltd. | 274,442 | 4,242,474 | ||||||
Australian Agricultural Co. Ltd.(2) | 49,709 | 61,259 | ||||||
| Australian Clinical Labs Ltd. | 19,027 | 57,213 | ||||||
| Australian Ethical Investment Ltd. | 12,659 | 55,491 | ||||||
| Australian Finance Group Ltd. | 53,619 | 69,760 | ||||||
| Baby Bunting Group Ltd. | 10,182 | 30,236 | ||||||
Bank of Queensland Ltd.(1) | 82,567 | 393,959 | ||||||
| Bapcor Ltd. | 17,603 | 79,783 | ||||||
| Beach Energy Ltd. | 715,659 | 827,178 | ||||||
| Bega Cheese Ltd. | 62,433 | 169,503 | ||||||
Bendigo & Adelaide Bank Ltd.(1) | 177,053 | 1,086,843 | ||||||
BHP Group Ltd., ADR(1) | 187,393 | 10,286,002 | ||||||
| Blackmores Ltd. | 634 | 29,631 | ||||||
| BlueScope Steel Ltd. | 124,360 | 1,395,297 | ||||||
Boss Energy Ltd.(2) | 36,842 | 66,859 | ||||||
| Brambles Ltd. | 190,515 | 1,603,417 | ||||||
| Bravura Solutions Ltd. | 16,149 | 17,330 | ||||||
| Brickworks Ltd. | 10,394 | 143,882 | ||||||
| carsales.com Ltd. | 15,214 | 231,947 | ||||||
| Cedar Woods Properties Ltd. | 11,527 | 35,679 | ||||||
| Challenger Ltd. | 199,482 | 860,005 | ||||||
114
| Avantis International Equity ETF | ||||||||
| Shares | Value | |||||||
| Champion Iron Ltd. | 88,158 | $ | 304,167 | |||||
| Cleanaway Waste Management Ltd. | 262,221 | 498,038 | ||||||
| Cochlear Ltd. | 3,489 | 507,918 | ||||||
Codan Ltd.(1) | 7,802 | 38,337 | ||||||
| Coles Group Ltd. | 145,949 | 1,746,889 | ||||||
| Collins Foods Ltd. | 8,619 | 57,445 | ||||||
| Commonwealth Bank of Australia | 95,983 | 6,342,768 | ||||||
| Computershare Ltd. | 11,334 | 189,025 | ||||||
Cooper Energy Ltd.(2) | 248,098 | 45,604 | ||||||
| Coronado Global Resources, Inc. | 165,950 | 181,553 | ||||||
| Costa Group Holdings Ltd. | 105,412 | 192,368 | ||||||
Credit Corp. Group Ltd.(1) | 11,629 | 160,211 | ||||||
| CSL Ltd. | 20,730 | 4,146,365 | ||||||
| CSR Ltd. | 83,413 | 255,919 | ||||||
| Data#3 Ltd. | 8,013 | 33,429 | ||||||
| Deterra Royalties Ltd. | 65,767 | 185,782 | ||||||
Domino's Pizza Enterprises Ltd.(1) | 3,067 | 132,194 | ||||||
| Downer EDI Ltd. | 52,490 | 179,511 | ||||||
| Eagers Automotive Ltd. | 9,937 | 89,453 | ||||||
Eclipx Group Ltd.(2) | 67,605 | 109,458 | ||||||
| Elders Ltd. | 9,295 | 73,221 | ||||||
| Emeco Holdings Ltd. | 118,990 | 73,904 | ||||||
| Endeavour Group Ltd. | 142,703 | 706,211 | ||||||
EVENT Hospitality and Entertainment Ltd.(2) | 5,230 | 52,532 | ||||||
| Evolution Mining Ltd. | 479,884 | 771,199 | ||||||
| Fortescue Metals Group Ltd. | 230,859 | 2,869,016 | ||||||
| Genworth Mortgage Insurance Australia Ltd. | 149,328 | 287,305 | ||||||
| Gold Road Resources Ltd. | 148,243 | 127,032 | ||||||
| GrainCorp Ltd., A Shares | 49,237 | 278,483 | ||||||
| Grange Resources Ltd. | 240,025 | 141,915 | ||||||
| GUD Holdings Ltd. | 9,367 | 52,649 | ||||||
| Hansen Technologies Ltd. | 11,367 | 37,943 | ||||||
| Harvey Norman Holdings Ltd. | 96,860 | 278,135 | ||||||
| Healius Ltd. | 13,318 | 33,659 | ||||||
| HT&E Ltd. | 31,735 | 31,782 | ||||||
| HUB24 Ltd. | 1,118 | 18,012 | ||||||
Humm Group Ltd.(1) | 52,623 | 19,172 | ||||||
IDP Education Ltd.(1) | 4,268 | 84,022 | ||||||
| IGO Ltd. | 134,694 | 1,205,414 | ||||||
| Iluka Resources Ltd. | 158,656 | 1,115,427 | ||||||
| Imdex Ltd. | 56,137 | 76,204 | ||||||
| Incitec Pivot Ltd. | 227,710 | 601,759 | ||||||
| Infomedia Ltd. | 19,353 | 18,953 | ||||||
| Inghams Group Ltd. | 65,857 | 116,371 | ||||||
| Insignia Financial Ltd. | 21,881 | 51,475 | ||||||
| Insurance Australia Group Ltd. | 56,692 | 179,141 | ||||||
| Integral Diagnostics Ltd. | 7,011 | 14,144 | ||||||
| InvoCare Ltd. | 27,025 | 202,866 | ||||||
| IPH Ltd. | 12,111 | 78,502 | ||||||
| IRESS Ltd. | 3,284 | 25,114 | ||||||
| James Hardie Industries PLC | 58,093 | 1,316,700 | ||||||
115
| Avantis International Equity ETF | ||||||||
| Shares | Value | |||||||
JB Hi-Fi Ltd.(1) | 19,369 | $ | 534,192 | |||||
Judo Capital Holdings Ltd.(1)(2) | 34,715 | 28,312 | ||||||
| Jumbo Interactive Ltd. | 3,168 | 30,380 | ||||||
| Jupiter Mines Ltd. | 132,283 | 18,098 | ||||||
Karoon Energy Ltd.(2) | 156,794 | 227,040 | ||||||
Kelsian Group Ltd.(1) | 5,450 | 20,059 | ||||||
| Lendlease Corp. Ltd. | 107,098 | 746,314 | ||||||
| Link Administration Holdings Ltd. | 33,767 | 98,969 | ||||||
Lovisa Holdings Ltd.(1) | 11,366 | 177,310 | ||||||
Lynas Rare Earths Ltd.(2) | 57,605 | 344,136 | ||||||
| MA Financial Group Ltd. | 6,842 | 25,519 | ||||||
| MACA Ltd. | 7,344 | 5,323 | ||||||
| Macmahon Holdings Ltd. | 38,005 | 4,386 | ||||||
| Macquarie Group Ltd. | 15,091 | 1,805,687 | ||||||
Magellan Financial Group Ltd.(1) | 23,683 | 207,901 | ||||||
Mayne Pharma Group Ltd.(2) | 440,581 | 89,599 | ||||||
| McMillan Shakespeare Ltd. | 11,056 | 107,722 | ||||||
| Medibank Pvt Ltd. | 384,104 | 967,545 | ||||||
| Metcash Ltd. | 514,675 | 1,440,261 | ||||||
| Mineral Resources Ltd. | 35,986 | 1,533,271 | ||||||
| Monadelphous Group Ltd. | 33,742 | 301,153 | ||||||
| Money3 Corp. Ltd. | 24,619 | 38,430 | ||||||
Mount Gibson Iron Ltd.(1) | 124,105 | 35,987 | ||||||
| Myer Holdings Ltd. | 134,614 | 46,165 | ||||||
| MyState Ltd. | 2,727 | 7,118 | ||||||
| National Australia Bank Ltd. | 240,853 | 4,994,359 | ||||||
| Netwealth Group Ltd. | 8,102 | 71,920 | ||||||
New Hope Corp. Ltd.(1) | 206,948 | 683,883 | ||||||
| Newcrest Mining Ltd. | 15,255 | 178,644 | ||||||
| Newcrest Mining Ltd. (Sydney) | 89,916 | 1,080,939 | ||||||
NEXTDC Ltd.(2) | 17,985 | 127,108 | ||||||
| nib holdings Ltd. | 54,902 | 305,627 | ||||||
Nick Scali Ltd.(1) | 14,783 | 110,416 | ||||||
| Nickel Industries Ltd. | 72,721 | 48,288 | ||||||
| Nine Entertainment Co. Holdings Ltd. | 132,302 | 196,369 | ||||||
| Northern Star Resources Ltd. | 214,087 | 1,131,501 | ||||||
| NRW Holdings Ltd. | 184,500 | 306,713 | ||||||
| Nufarm Ltd. | 105,036 | 379,235 | ||||||
OFX Group Ltd.(2) | 22,626 | 40,697 | ||||||
Omni Bridgeway Ltd.(2) | 8,695 | 26,912 | ||||||
| oOh!media Ltd. | 26,761 | 25,032 | ||||||
| Orica Ltd. | 112,611 | 1,177,927 | ||||||
| Origin Energy Ltd. | 257,986 | 1,098,777 | ||||||
| Orora Ltd. | 185,472 | 417,752 | ||||||
| OZ Minerals Ltd. | 63,762 | 1,098,867 | ||||||
| Pacific Current Group Ltd. | 6,132 | 37,886 | ||||||
| Pact Group Holdings Ltd. | 18,243 | 18,893 | ||||||
| Peet Ltd. | 34,647 | 26,718 | ||||||
| Pendal Group Ltd. | 49,618 | 174,200 | ||||||
| Perenti Global Ltd. | 164,573 | 87,296 | ||||||
Perpetual Ltd.(1) | 3,506 | 65,210 | ||||||
116
| Avantis International Equity ETF | ||||||||
| Shares | Value | |||||||
| Perseus Mining Ltd. | 441,460 | $ | 466,920 | |||||
PEXA Group Ltd.(1)(2) | 3,527 | 34,565 | ||||||
Pilbara Minerals Ltd.(2) | 28,929 | 70,157 | ||||||
| Platinum Asset Management Ltd. | 71,163 | 85,838 | ||||||
| Premier Investments Ltd. | 9,227 | 132,674 | ||||||
Pro Medicus Ltd.(1) | 2,137 | 78,550 | ||||||
| PWR Holdings Ltd. | 4,541 | 29,277 | ||||||
Qantas Airways Ltd.(2) | 55,594 | 199,790 | ||||||
| QBE Insurance Group Ltd. | 121,113 | 992,976 | ||||||
| Qube Holdings Ltd. | 174,401 | 341,433 | ||||||
| Ramelius Resources Ltd. | 237,352 | 129,255 | ||||||
| Ramsay Health Care Ltd. | 5,641 | 274,919 | ||||||
| REA Group Ltd. | 2,692 | 232,154 | ||||||
Red 5 Ltd.(2) | 66,325 | 11,409 | ||||||
| Reece Ltd. | 7,131 | 77,203 | ||||||
| Regis Resources Ltd. | 310,042 | 325,245 | ||||||
| Reliance Worldwide Corp. Ltd. | 59,045 | 155,126 | ||||||
Resolute Mining Ltd.(1)(2) | 192,523 | 36,870 | ||||||
| Rio Tinto Ltd. | 31,516 | 2,001,687 | ||||||
| Sandfire Resources Ltd. | 124,040 | 383,078 | ||||||
| Santos Ltd. | 531,874 | 2,839,294 | ||||||
| SEEK Ltd. | 8,278 | 116,792 | ||||||
Select Harvests Ltd.(1) | 17,604 | 59,451 | ||||||
| Servcorp Ltd. | 9,505 | 24,188 | ||||||
Service Stream Ltd.(1)(2) | 70,192 | 34,788 | ||||||
| Seven Group Holdings Ltd. | 15,447 | 194,288 | ||||||
Seven West Media Ltd.(1)(2) | 267,372 | 94,073 | ||||||
Sierra Rutile Holdings Ltd.(1)(2) | 144,997 | 29,764 | ||||||
Sigma Healthcare Ltd.(1) | 160,963 | 75,194 | ||||||
Silver Lake Resources Ltd.(2) | 308,282 | 276,542 | ||||||
| Sims Ltd. | 35,411 | 365,350 | ||||||
| SmartGroup Corp. Ltd. | 3,284 | 13,263 | ||||||
| Sonic Healthcare Ltd. | 18,284 | 422,817 | ||||||
| South32 Ltd. | 808,773 | 2,227,124 | ||||||
| Southern Cross Media Group Ltd. | 67,219 | 49,112 | ||||||
| St. Barbara Ltd. | 115,871 | 71,485 | ||||||
Star Entertainment Group Ltd.(2) | 61,102 | 115,057 | ||||||
| Steadfast Group Ltd. | 25,669 | 87,853 | ||||||
| Suncorp Group Ltd. | 121,038 | 893,896 | ||||||
Super Retail Group Ltd.(1) | 28,909 | 206,503 | ||||||
Superloop Ltd.(2) | 34,972 | 17,580 | ||||||
| Symbio Holdings Ltd. | 38 | 102 | ||||||
Syrah Resources Ltd.(1)(2) | 67,553 | 84,390 | ||||||
| Tassal Group Ltd. | 46,221 | 163,080 | ||||||
| Technology One Ltd. | 19,749 | 158,156 | ||||||
| Telstra Corp. Ltd. | 449,111 | 1,214,505 | ||||||
| TPG Telecom Ltd. | 5,094 | 18,513 | ||||||
| Transurban Group | 110,463 | 1,048,014 | ||||||
| Treasury Wine Estates Ltd. | 84,560 | 758,526 | ||||||
Tuas Ltd.(2) | 2,799 | 2,838 | ||||||
| United Malt Group Ltd. | 62,862 | 152,225 | ||||||
117
| Avantis International Equity ETF | ||||||||
| Shares | Value | |||||||
| Ventia Services Group Pty Ltd. | 23,158 | $ | 43,533 | |||||
| Viva Energy Group Ltd. | 236,299 | 477,853 | ||||||
| Vulcan Steel Ltd. | 7,025 | 37,733 | ||||||
Washington H Soul Pattinson & Co. Ltd.(1) | 21,744 | 378,957 | ||||||
| Wesfarmers Ltd. | 67,466 | 2,158,166 | ||||||
West African Resources Ltd.(2) | 442,166 | 376,495 | ||||||
| Westgold Resources Ltd. | 90,799 | 57,085 | ||||||
| Westpac Banking Corp. | 242,938 | 3,565,727 | ||||||
| Whitehaven Coal Ltd. | 362,943 | 1,933,255 | ||||||
| WiseTech Global Ltd. | 2,362 | 93,298 | ||||||
| Woodside Energy Group Ltd. | 134,924 | 3,134,084 | ||||||
Woodside Energy Group Ltd., ADR(1) | 59,682 | 1,361,346 | ||||||
| Woolworths Group Ltd. | 93,484 | 2,304,636 | ||||||
| Worley Ltd. | 7,793 | 76,330 | ||||||
Xero Ltd.(2) | 2,298 | 135,189 | ||||||
| 114,239,519 | ||||||||
| Austria — 0.3% | ||||||||
| ANDRITZ AG | 4,138 | 190,581 | ||||||
| AT&S Austria Technologie & Systemtechnik AG | 5,163 | 229,804 | ||||||
BAWAG Group AG(2) | 5,496 | 247,969 | ||||||
| CA Immobilien Anlagen AG | 677 | 21,562 | ||||||
DO & CO. AG(2) | 1,008 | 79,745 | ||||||
| Erste Group Bank AG | 14,166 | 318,561 | ||||||
| EVN AG | 7,023 | 136,240 | ||||||
FACC AG(1)(2) | 162 | 1,146 | ||||||
IMMOFINANZ AG(2) | 10,076 | 149,786 | ||||||
Lenzing AG(1) | 1,205 | 89,123 | ||||||
Oesterreichische Post AG(1) | 4,175 | 116,559 | ||||||
| OMV AG | 11,957 | 481,775 | ||||||
POLYTEC Holding AG(1) | 3,258 | 18,716 | ||||||
| Porr AG | 2,511 | 28,749 | ||||||
| Raiffeisen Bank International AG | 11,405 | 144,018 | ||||||
| S IMMO AG | 1,763 | 40,285 | ||||||
| Schoeller-Bleckmann Oilfield Equipment AG | 233 | 14,091 | ||||||
Semperit AG Holding(1) | 3,930 | 71,414 | ||||||
| Strabag SE | 933 | 35,852 | ||||||
Telekom Austria AG(2) | 14,883 | 92,932 | ||||||
| UNIQA Insurance Group AG | 22,170 | 146,552 | ||||||
| Verbund AG | 6,726 | 642,721 | ||||||
| Vienna Insurance Group AG Wiener Versicherung Gruppe | 6,986 | 165,618 | ||||||
| voestalpine AG | 10,973 | 220,804 | ||||||
| Wienerberger AG | 9,946 | 232,571 | ||||||
| 3,917,174 | ||||||||
| Belgium — 0.9% | ||||||||
Ackermans & van Haaren NV(1) | 5,351 | 782,279 | ||||||
| Ageas SA/NV | 26,628 | 1,080,445 | ||||||
AGFA-Gevaert NV(2) | 25,959 | 93,861 | ||||||
Anheuser-Busch InBev SA, ADR(1) | 32,287 | 1,561,399 | ||||||
Argenx SE, ADR(2) | 1,160 | 438,329 | ||||||
| Atenor | 123 | 6,327 | ||||||
| Barco NV | 9,728 | 216,790 | ||||||
118
| Avantis International Equity ETF | ||||||||
| Shares | Value | |||||||
| Bekaert SA | 10,194 | $ | 312,680 | |||||
| bpost SA | 22,304 | 135,489 | ||||||
Cie d'Entreprises CFE(1)(2) | 1,744 | 17,358 | ||||||
| D'ieteren Group | 3,211 | 484,063 | ||||||
| Deceuninck NV | 12,057 | 27,837 | ||||||
Deme Group NV(2) | 1,744 | 199,590 | ||||||
| Econocom Group SA | 16,489 | 51,393 | ||||||
| Elia Group SA | 3,183 | 462,399 | ||||||
| Etablissements Franz Colruyt NV | 10,222 | 284,100 | ||||||
| Euronav NV | 50,525 | 814,676 | ||||||
| Exmar NV | 7,468 | 65,068 | ||||||
| Fagron | 14,061 | 180,521 | ||||||
Galapagos NV, ADR(2) | 8,129 | 406,938 | ||||||
| Gimv NV | 6,351 | 324,931 | ||||||
Greenyard NV(2) | 2,093 | 17,657 | ||||||
| Immobel SA | 61 | 3,686 | ||||||
| Ion Beam Applications | 4,505 | 80,048 | ||||||
| KBC Ancora | 8,027 | 264,258 | ||||||
| KBC Group NV | 23,590 | 1,125,066 | ||||||
Kinepolis Group NV(2) | 3,103 | 136,046 | ||||||
| Melexis NV | 3,970 | 299,364 | ||||||
Ontex Group NV(2) | 8,093 | 46,469 | ||||||
| Proximus SADP | 29,080 | 370,160 | ||||||
| Recticel SA | 6,667 | 92,900 | ||||||
| Shurgard Self Storage SA | 2,002 | 96,645 | ||||||
| Solvay SA | 12,494 | 1,008,593 | ||||||
| Telenet Group Holding NV | 1,521 | 21,598 | ||||||
Tessenderlo Group SA(2) | 5,098 | 165,524 | ||||||
| UCB SA | 16,305 | 1,145,700 | ||||||
Umicore SA(1) | 29,603 | 940,963 | ||||||
| VGP NV | 477 | 69,351 | ||||||
| 13,830,501 | ||||||||
| Canada — 11.4% | ||||||||
5N Plus, Inc.(1)(2) | 16,500 | 21,106 | ||||||
Absolute Software Corp.(1) | 11,661 | 125,990 | ||||||
Advantage Energy Ltd.(2) | 70,477 | 602,088 | ||||||
Aecon Group, Inc.(1) | 10,217 | 84,639 | ||||||
| AG Growth International, Inc. | 3,004 | 89,822 | ||||||
AGF Management Ltd., Class B(1) | 10,400 | 48,858 | ||||||
| Agnico Eagle Mines Ltd. | 48,971 | 2,019,469 | ||||||
Aimia, Inc.(1)(2) | 8,705 | 27,109 | ||||||
Air Canada(1)(2) | 1,722 | 23,194 | ||||||
| Alamos Gold, Inc., Class A | 48,653 | 350,816 | ||||||
| Alaris Equity Partners Income | 2,635 | 34,669 | ||||||
Algonquin Power & Utilities Corp.(1) | 14,947 | 205,310 | ||||||
| Alimentation Couche-Tard, Inc. | 59,123 | 2,540,756 | ||||||
AltaGas Ltd.(1) | 12,042 | 259,664 | ||||||
| Altius Minerals Corp. | 661 | 9,215 | ||||||
| Amerigo Resources Ltd. | 28,700 | 23,164 | ||||||
| ARC Resources Ltd. | 136,200 | 1,880,158 | ||||||
Argonaut Gold, Inc.(2) | 54,995 | 19,471 | ||||||
119
| Avantis International Equity ETF | ||||||||
| Shares | Value | |||||||
Aritzia, Inc.(2) | 11,254 | $ | 366,065 | |||||
| Atco Ltd., Class I | 19,106 | 676,460 | ||||||
Athabasca Oil Corp.(1)(2) | 258,593 | 509,960 | ||||||
Atrium Mortgage Investment Corp.(1) | 5,535 | 50,194 | ||||||
ATS Automation Tooling Systems, Inc.(2) | 6,334 | 193,490 | ||||||
AutoCanada, Inc.(2) | 4,808 | 108,984 | ||||||
| B2Gold Corp. | 341,342 | 1,047,404 | ||||||
| Badger Infrastructure Solutions Ltd. | 4,729 | 111,370 | ||||||
Ballard Power Systems, Inc.(1)(2) | 8,100 | 63,216 | ||||||
| Bank of Montreal | 49,477 | 4,567,774 | ||||||
| Bank of Nova Scotia | 73,141 | 4,044,238 | ||||||
| Barrick Gold Corp. (Toronto) | 148,613 | 2,206,536 | ||||||
Bausch Health Cos., Inc.(2) | 16,016 | 96,095 | ||||||
Baytex Energy Corp.(1)(2) | 201,726 | 1,045,992 | ||||||
BCE, Inc.(1) | 3,817 | 184,202 | ||||||
BELLUS Health, Inc.(2) | 3,600 | 41,061 | ||||||
| Birchcliff Energy Ltd. | 110,243 | 971,189 | ||||||
Bird Construction, Inc.(1) | 10,205 | 51,516 | ||||||
Bombardier, Inc., Class B(2) | 2,663 | 66,263 | ||||||
Bonterra Energy Corp.(2) | 6,800 | 45,563 | ||||||
| Boralex, Inc., A Shares | 21,072 | 794,201 | ||||||
| Boyd Group Services, Inc. | 1,000 | 137,816 | ||||||
| Brookfield Asset Management, Inc., Class A | 40,669 | 1,956,422 | ||||||
Brookfield Business Corp., Class A(1) | 2,833 | 68,899 | ||||||
Brookfield Infrastructure Corp., A Shares(1) | 19,396 | 924,646 | ||||||
| Brookfield Infrastructure Corp., Class A | 1,005 | 47,838 | ||||||
| Brookfield Renewable Corp., Class A | 2,200 | 84,543 | ||||||
| BRP, Inc. | 861 | 59,716 | ||||||
CAE, Inc.(2) | 21,268 | 388,325 | ||||||
Calian Group Ltd.(1) | 2,200 | 100,774 | ||||||
Calibre Mining Corp.(2) | 20,300 | 14,684 | ||||||
| Cameco Corp. | 28,151 | 820,513 | ||||||
| Canaccord Genuity Group, Inc. | 20,833 | 124,521 | ||||||
Canacol Energy Ltd.(1) | 27,002 | 51,605 | ||||||
Canada Goose Holdings, Inc.(1)(2) | 5,500 | 99,083 | ||||||
| Canadian Imperial Bank of Commerce | 66,963 | 3,166,766 | ||||||
| Canadian National Railway Co. | 34,671 | 4,123,245 | ||||||
Canadian Natural Resources Ltd.(1) | 117,786 | 6,457,222 | ||||||
| Canadian Pacific Railway Ltd. | 23,658 | 1,771,085 | ||||||
| Canadian Tire Corp. Ltd., Class A | 6,076 | 714,630 | ||||||
| Canadian Utilities Ltd., A Shares | 14,825 | 453,549 | ||||||
| Canadian Western Bank | 21,760 | 405,758 | ||||||
Canfor Corp.(2) | 18,575 | 364,471 | ||||||
Canfor Pulp Products, Inc.(2) | 1,114 | 4,699 | ||||||
| Capital Power Corp. | 37,138 | 1,440,729 | ||||||
Capstone Mining Corp.(2) | 72,738 | 163,382 | ||||||
| Cardinal Energy Ltd. | 52,098 | 331,625 | ||||||
| Cargojet, Inc. | 1,100 | 115,733 | ||||||
Cascades, Inc.(1) | 13,743 | 93,654 | ||||||
| CCL Industries, Inc., Class B | 8,412 | 412,610 | ||||||
Celestica, Inc.(2) | 22,716 | 234,364 | ||||||
120
| Avantis International Equity ETF | ||||||||
| Shares | Value | |||||||
| Cenovus Energy, Inc. | 192,130 | $ | 3,604,586 | |||||
| Centerra Gold, Inc. | 95,117 | 430,918 | ||||||
CES Energy Solutions Corp.(1) | 52,900 | 99,891 | ||||||
CGI, Inc.(2) | 12,168 | 963,545 | ||||||
China Gold International Resources Corp. Ltd.(1) | 43,700 | 124,444 | ||||||
Chorus Aviation, Inc.(1)(2) | 12,046 | 25,773 | ||||||
| CI Financial Corp. | 13,110 | 143,742 | ||||||
Cineplex, Inc.(1)(2) | 2,300 | 15,779 | ||||||
| Cogeco Communications, Inc. | 2,300 | 140,818 | ||||||
Cogeco, Inc.(1) | 400 | 19,239 | ||||||
| Colliers International Group, Inc. (Toronto) | 2,900 | 337,816 | ||||||
| Computer Modelling Group Ltd. | 6,000 | 21,015 | ||||||
| Constellation Software, Inc. | 1,386 | 2,086,382 | ||||||
Copper Mountain Mining Corp.(1)(2) | 35,300 | 39,242 | ||||||
| Corus Entertainment, Inc., B Shares | 37,973 | 106,978 | ||||||
| Crescent Point Energy Corp. | 168,432 | 1,279,896 | ||||||
Crew Energy, Inc.(2) | 49,000 | 242,510 | ||||||
Descartes Systems Group, Inc.(2) | 3,100 | 218,382 | ||||||
| Dollarama, Inc. | 20,982 | 1,277,756 | ||||||
Dorel Industries, Inc., Class B(1) | 8,200 | 42,394 | ||||||
| DREAM Unlimited Corp., Class A | 3,222 | 69,158 | ||||||
| Dundee Precious Metals, Inc. | 41,236 | 187,758 | ||||||
Eldorado Gold Corp. (Toronto)(2) | 30,653 | 168,978 | ||||||
| Element Fleet Management Corp. | 62,933 | 792,562 | ||||||
| Emera, Inc. | 27,499 | 1,272,406 | ||||||
| Empire Co. Ltd., Class A | 26,193 | 746,092 | ||||||
| Enbridge, Inc. | 66,746 | 2,752,475 | ||||||
| Endeavour Mining PLC | 19,822 | 385,769 | ||||||
Enerflex Ltd.(1) | 21,246 | 106,606 | ||||||
| Enerplus Corp. | 63,964 | 985,747 | ||||||
Enghouse Systems Ltd.(1) | 5,435 | 132,673 | ||||||
Ensign Energy Services, Inc.(2) | 33,400 | 79,091 | ||||||
| EQB, Inc. | 4,200 | 168,403 | ||||||
Equinox Gold Corp.(1)(2) | 32,087 | 112,629 | ||||||
ERO Copper Corp.(2) | 7,643 | 72,511 | ||||||
| Evertz Technologies Ltd. | 2,936 | 33,085 | ||||||
Exchange Income Corp.(1) | 4,051 | 142,966 | ||||||
Extendicare, Inc.(1) | 18,746 | 102,626 | ||||||
| Fairfax Financial Holdings Ltd. | 2,512 | 1,252,299 | ||||||
Fiera Capital Corp.(1) | 6,753 | 46,945 | ||||||
| Finning International, Inc. | 31,710 | 683,286 | ||||||
Firm Capital Mortgage Investment Corp.(1) | 4,935 | 46,068 | ||||||
First National Financial Corp.(1) | 2,786 | 78,891 | ||||||
| First Quantum Minerals Ltd. | 109,742 | 1,941,907 | ||||||
| FirstService Corp. | 1,000 | 125,092 | ||||||
| Fortis, Inc. | 42,818 | 1,888,967 | ||||||
Fortuna Silver Mines, Inc.(1)(2) | 46,685 | 108,061 | ||||||
| Franco-Nevada Corp. | 6,292 | 756,468 | ||||||
Freehold Royalties Ltd.(1) | 32,275 | 352,399 | ||||||
Frontera Energy Corp.(2) | 24,368 | 205,765 | ||||||
Galiano Gold, Inc.(1)(2) | 36,800 | 17,653 | ||||||
121
| Avantis International Equity ETF | ||||||||
| Shares | Value | |||||||
| GCM Mining Corp. | 27,668 | $ | 68,888 | |||||
| Gear Energy Ltd. | 54,000 | 50,984 | ||||||
| George Weston Ltd. | 7,512 | 858,817 | ||||||
| GFL Environmental, Inc. | 8,668 | 244,197 | ||||||
| Gibson Energy, Inc. | 17,885 | 337,586 | ||||||
| Gildan Activewear, Inc. | 40,508 | 1,197,952 | ||||||
| goeasy Ltd. | 2,735 | 249,604 | ||||||
Great-West Lifeco, Inc.(1) | 33,927 | 796,930 | ||||||
Headwater Exploration, Inc.(2) | 52,600 | 239,901 | ||||||
Heroux-Devtek, Inc.(2) | 4,400 | 43,787 | ||||||
High Liner Foods, Inc.(1) | 5,446 | 55,689 | ||||||
| HLS Therapeutics, Inc. | 88 | 754 | ||||||
Home Capital Group, Inc.(1) | 11,152 | 237,246 | ||||||
| Hudbay Minerals, Inc. | 78,485 | 346,605 | ||||||
| Hydro One Ltd. | 44,280 | 1,198,916 | ||||||
i-80 Gold Corp.(2) | 11,800 | 21,114 | ||||||
| iA Financial Corp., Inc. | 13,944 | 749,038 | ||||||
IAMGOLD Corp.(1)(2) | 82,625 | 98,771 | ||||||
IBI Group, Inc.(2) | 2,400 | 35,360 | ||||||
| IGM Financial, Inc. | 4,421 | 120,342 | ||||||
Imperial Oil Ltd.(1) | 23,550 | 1,155,848 | ||||||
| Intact Financial Corp. | 7,142 | 1,034,580 | ||||||
Interfor Corp.(2) | 34,985 | 860,673 | ||||||
International Petroleum Corp.(1)(2) | 1,380 | 13,586 | ||||||
Ivanhoe Mines Ltd., Class A(2) | 17,544 | 112,743 | ||||||
Jamieson Wellness, Inc.(1) | 3,000 | 83,900 | ||||||
K-Bro Linen, Inc.(1) | 1,200 | 27,913 | ||||||
K92 Mining, Inc.(2) | 7,700 | 39,692 | ||||||
Karora Resources, Inc.(2) | 34,900 | 76,000 | ||||||
Kelt Exploration Ltd.(2) | 47,272 | 226,399 | ||||||
Keyera Corp.(1) | 34,451 | 848,848 | ||||||
| Kinross Gold Corp. | 222,869 | 731,386 | ||||||
Kiwetinohk Energy Corp.(2) | 2,000 | 23,863 | ||||||
Knight Therapeutics, Inc.(2) | 20,346 | 88,303 | ||||||
Labrador Iron Ore Royalty Corp.(1) | 9,099 | 202,231 | ||||||
Lassonde Industries, Inc., Class A(1) | 400 | 34,720 | ||||||
| Laurentian Bank of Canada | 5,817 | 159,360 | ||||||
| LifeWorks, Inc. | 3,205 | 77,920 | ||||||
| Linamar Corp. | 9,296 | 439,478 | ||||||
| Loblaw Cos. Ltd. | 20,494 | 1,811,199 | ||||||
| Lundin Gold, Inc. | 12,846 | 85,780 | ||||||
Lundin Mining Corp.(1) | 127,407 | 662,573 | ||||||
| Magna International, Inc. | 28,261 | 1,632,590 | ||||||
Major Drilling Group International, Inc.(2) | 6,258 | 42,408 | ||||||
| Manulife Financial Corp. | 179,173 | 3,099,563 | ||||||
| Maple Leaf Foods, Inc. | 7,500 | 132,314 | ||||||
| Martinrea International, Inc. | 14,140 | 111,432 | ||||||
MCAN Mortgage Corp.(1) | 4,620 | 56,284 | ||||||
MDA Ltd.(2) | 2,800 | 15,883 | ||||||
MEG Energy Corp.(2) | 82,231 | 1,149,550 | ||||||
| Methanex Corp. | 13,780 | 498,067 | ||||||
122
| Avantis International Equity ETF | ||||||||
| Shares | Value | |||||||
Metro, Inc.(1) | 35,001 | $ | 1,840,994 | |||||
| Morguard Corp. | 200 | 17,436 | ||||||
| MTY Food Group, Inc. | 1,461 | 65,321 | ||||||
| Mullen Group Ltd. | 15,714 | 168,225 | ||||||
| National Bank of Canada | 42,701 | 2,825,058 | ||||||
| Neo Performance Materials, Inc. | 1,800 | 19,832 | ||||||
New Gold, Inc. (Toronto)(2) | 203,910 | 131,971 | ||||||
North American Construction Group Ltd.(1) | 7,735 | 88,932 | ||||||
| North West Co., Inc. | 10,640 | 275,853 | ||||||
| Northland Power, Inc. | 44,165 | 1,511,903 | ||||||
Novagold Resources, Inc.(2) | 26,087 | 115,565 | ||||||
| Nutrien Ltd. | 35,330 | 3,243,414 | ||||||
Nuvei Corp.(2) | 2,394 | 73,259 | ||||||
NuVista Energy Ltd.(2) | 69,124 | 568,424 | ||||||
Obsidian Energy Ltd.(2) | 20,900 | 188,098 | ||||||
OceanaGold Corp.(2) | 246,089 | 363,508 | ||||||
| Onex Corp. | 13,069 | 646,310 | ||||||
| Open Text Corp. | 14,163 | 446,129 | ||||||
| Osisko Gold Royalties Ltd. (Toronto) | 14,023 | 135,708 | ||||||
Osisko Mining, Inc.(2) | 6,500 | 12,521 | ||||||
| Pan American Silver Corp. | 35,265 | 524,672 | ||||||
| Paramount Resources Ltd., A Shares | 11,250 | 256,463 | ||||||
| Parex Resources, Inc. | 52,800 | 844,655 | ||||||
Parkland Corp.(1) | 4,041 | 99,198 | ||||||
| Pason Systems, Inc. | 12,235 | 129,491 | ||||||
Pembina Pipeline Corp.(1) | 65,053 | 2,297,299 | ||||||
| Pet Valu Holdings Ltd. | 1,700 | 43,427 | ||||||
| Peyto Exploration & Development Corp. | 65,217 | 608,298 | ||||||
| Pine Cliff Energy Ltd. | 71,200 | 102,462 | ||||||
Pipestone Energy Corp.(2) | 23,900 | 88,805 | ||||||
Pizza Pizza Royalty Corp.(1) | 1,800 | 18,036 | ||||||
Polaris Renewable Energy, Inc.(1) | 5,700 | 83,676 | ||||||
| Power Corp. of Canada | 38,113 | 979,995 | ||||||
| PrairieSky Royalty Ltd. | 12,337 | 168,144 | ||||||
Precision Drilling Corp.(1)(2) | 3,189 | 196,000 | ||||||
| Primo Water Corp. | 2,635 | 34,609 | ||||||
Quebecor, Inc., Class B(1) | 22,474 | 485,466 | ||||||
Real Matters, Inc.(2) | 8,188 | 36,097 | ||||||
Recipe UnLtd. Corp.(2) | 1,658 | 24,832 | ||||||
Resolute Forest Products, Inc.(2) | 12,122 | 245,329 | ||||||
| Restaurant Brands International, Inc. | 10,063 | 594,042 | ||||||
| Richelieu Hardware Ltd. | 1,054 | 28,177 | ||||||
| Ritchie Bros Auctioneers, Inc. | 12,510 | 866,608 | ||||||
| Rogers Communications, Inc., Class B | 15,068 | 648,795 | ||||||
| Royal Bank of Canada | 67,885 | 6,312,708 | ||||||
| Russel Metals, Inc. | 12,378 | 267,663 | ||||||
Sabina Gold & Silver Corp.(2) | 28,165 | 22,732 | ||||||
| Sandstorm Gold Ltd. | 11,571 | 65,813 | ||||||
| Saputo, Inc. | 15,137 | 384,375 | ||||||
| Shaw Communications, Inc., B Shares | 36,681 | 940,660 | ||||||
Shawcor Ltd.(2) | 22,500 | 134,656 | ||||||
123
| Avantis International Equity ETF | ||||||||
| Shares | Value | |||||||
Shopify, Inc., Class A(2) | 19,036 | $ | 602,670 | |||||
Sierra Metals, Inc.(1) | 5,095 | 2,289 | ||||||
| Silvercorp Metals, Inc. | 18,355 | 41,787 | ||||||
| Sleep Country Canada Holdings, Inc. | 7,786 | 157,101 | ||||||
| Softchoice Corp. | 5,200 | 72,733 | ||||||
Spartan Delta Corp.(2) | 46,196 | 466,058 | ||||||
Spin Master Corp., VTG Shares(2) | 5,900 | 207,096 | ||||||
| Sprott, Inc. | 2,300 | 86,984 | ||||||
SSR Mining, Inc.(1) | 52,785 | 712,588 | ||||||
| SSR Mining, Inc. (NASDAQ) | 34,666 | 467,644 | ||||||
| Stantec, Inc. | 9,879 | 468,845 | ||||||
| Stelco Holdings, Inc. | 9,800 | 265,268 | ||||||
Stella-Jones, Inc.(1) | 7,823 | 238,201 | ||||||
STEP Energy Services Ltd.(2) | 7,400 | 36,342 | ||||||
| StorageVault Canada, Inc. | 7,000 | 32,512 | ||||||
Sun Life Financial, Inc.(1) | 43,219 | 1,904,025 | ||||||
Suncor Energy, Inc.(1) | 183,862 | 5,948,374 | ||||||
SunOpta, Inc.(1)(2) | 12,400 | 123,306 | ||||||
| Surge Energy, Inc. | 22,000 | 168,851 | ||||||
Tamarack Valley Energy Ltd.(1) | 153,645 | 490,176 | ||||||
Taseko Mines Ltd.(1)(2) | 73,100 | 76,253 | ||||||
| TC Energy Corp. | 45,946 | 2,214,126 | ||||||
| Teck Resources Ltd., Class B | 87,757 | 2,972,118 | ||||||
TELUS Corp.(1) | 37,040 | 834,236 | ||||||
| TFI International, Inc. | 6,635 | 661,959 | ||||||
| Thomson Reuters Corp. | 5,754 | 633,604 | ||||||
| Tidewater Midstream and Infrastructure Ltd. | 58,530 | 53,924 | ||||||
Timbercreek Financial Corp.(1) | 17,146 | 105,616 | ||||||
| TMX Group Ltd. | 2,178 | 218,737 | ||||||
| Topaz Energy Corp. | 6,176 | 97,247 | ||||||
Torex Gold Resources, Inc.(2) | 19,816 | 147,109 | ||||||
| Toromont Industries Ltd. | 10,088 | 780,863 | ||||||
| Toronto-Dominion Bank | 82,682 | 5,319,071 | ||||||
| Total Energy Services, Inc. | 4,100 | 22,695 | ||||||
| Tourmaline Oil Corp. | 54,277 | 3,209,052 | ||||||
TransAlta Corp.(1) | 46,002 | 431,876 | ||||||
TransAlta Renewables, Inc.(1) | 4,535 | 60,013 | ||||||
| Transcontinental, Inc., Class A | 9,035 | 113,922 | ||||||
TransGlobe Energy Corp.(1) | 14,400 | 47,804 | ||||||
Trican Well Service Ltd.(2) | 49,819 | 131,627 | ||||||
| Tricon Residential, Inc. (Toronto) | 36,012 | 375,928 | ||||||
Trisura Group Ltd.(1)(2) | 3,700 | 97,983 | ||||||
Turquoise Hill Resources Ltd.(2) | 12,004 | 330,136 | ||||||
Uni-Select, Inc.(2) | 7,700 | 217,806 | ||||||
| Vermilion Energy, Inc. | 56,790 | 1,516,879 | ||||||
| VersaBank | 1,400 | 10,500 | ||||||
Victoria Gold Corp.(2) | 4,900 | 29,027 | ||||||
Viemed Healthcare, Inc.(2) | 5,446 | 32,551 | ||||||
| Wajax Corp. | 5,600 | 90,480 | ||||||
Wesdome Gold Mines Ltd.(2) | 30,225 | 176,745 | ||||||
| West Fraser Timber Co. Ltd. | 30,224 | 2,704,016 | ||||||
124
| Avantis International Equity ETF | ||||||||
| Shares | Value | |||||||
| Western Forest Products, Inc. | 81,042 | $ | 95,028 | |||||
Westshore Terminals Investment Corp.(1) | 6,610 | 153,907 | ||||||
Wheaton Precious Metals Corp.(1) | 20,510 | 626,068 | ||||||
| Whitecap Resources, Inc. | 217,001 | 1,581,223 | ||||||
WildBrain Ltd.(1)(2) | 9,000 | 18,365 | ||||||
| Winpak Ltd. | 2,500 | 82,670 | ||||||
| WSP Global, Inc. | 5,717 | 681,287 | ||||||
| Yamana Gold, Inc. | 226,629 | 1,000,836 | ||||||
| 170,981,968 | ||||||||
China† | ||||||||
Fullshare Holdings Ltd.(1)(2) | 100,000 | 1,552 | ||||||
| Truly International Holdings Ltd. | 374,000 | 81,932 | ||||||
| 83,484 | ||||||||
| Denmark — 2.3% | ||||||||
ALK-Abello A/S(2) | 14,465 | 268,931 | ||||||
| Alm Brand A/S | 536,946 | 786,761 | ||||||
| AP Moller - Maersk A/S, A Shares | 416 | 971,821 | ||||||
| AP Moller - Maersk A/S, B Shares | 697 | 1,672,210 | ||||||
Bang & Olufsen A/S(2) | 24,799 | 42,957 | ||||||
Bavarian Nordic A/S(2) | 5,002 | 188,455 | ||||||
| Carlsberg A/S, B Shares | 3,959 | 514,077 | ||||||
| Chemometec A/S | 1,745 | 186,679 | ||||||
| Chr Hansen Holding A/S | 1,962 | 114,320 | ||||||
| Coloplast A/S, B Shares | 6,998 | 799,388 | ||||||
| D/S Norden A/S | 16,507 | 769,626 | ||||||
| Danske Andelskassers Bank A/S | 9,479 | 13,571 | ||||||
| Danske Bank A/S | 80,261 | 1,071,717 | ||||||
Demant A/S(2) | 4,308 | 132,705 | ||||||
| Dfds A/S | 8,763 | 303,225 | ||||||
Drilling Co. of 1972 A/S(2) | 5,076 | 240,873 | ||||||
| DSV A/S | 7,146 | 1,055,950 | ||||||
| FLSmidth & Co. A/S | 6,208 | 171,838 | ||||||
Genmab A/S, ADR(2) | 49,498 | 1,756,684 | ||||||
| GN Store Nord A/S | 4,760 | 134,625 | ||||||
| H Lundbeck A/S | 47,040 | 184,740 | ||||||
H Lundbeck A/S, A Shares(2) | 11,760 | 45,033 | ||||||
H+H International A/S, B Shares(2) | 4,897 | 78,702 | ||||||
ISS A/S(2) | 6,692 | 117,173 | ||||||
Jyske Bank A/S(2) | 7,385 | 369,655 | ||||||
Nilfisk Holding A/S(2) | 2,826 | 63,211 | ||||||
NKT A/S(2) | 3,517 | 179,533 | ||||||
NNIT A/S(2) | 133 | 1,202 | ||||||
| Novo Nordisk A/S, ADR | 115,211 | 12,223,887 | ||||||
| Novozymes A/S, B Shares | 24,954 | 1,432,200 | ||||||
| Orsted A/S | 20,414 | 1,992,457 | ||||||
| Pandora A/S | 16,305 | 979,549 | ||||||
| Per Aarsleff Holding A/S | 3,846 | 110,601 | ||||||
| Ringkjoebing Landbobank A/S | 6,495 | 693,472 | ||||||
| ROCKWOOL A/S, B Shares | 868 | 178,664 | ||||||
| Royal Unibrew A/S | 8,142 | 609,997 | ||||||
| Schouw & Co. A/S | 1,181 | 86,115 | ||||||
125
| Avantis International Equity ETF | ||||||||
| Shares | Value | |||||||
| SimCorp A/S | 6,205 | $ | 453,128 | |||||
| Solar A/S, B Shares | 1,529 | 123,618 | ||||||
| Spar Nord Bank A/S | 13,853 | 156,851 | ||||||
| Sparekassen Sjaelland-Fyn A/S | 2,040 | 44,465 | ||||||
| Sydbank A/S | 9,044 | 261,334 | ||||||
| Topdanmark A/S | 6,575 | 344,793 | ||||||
| TORM PLC | 4,729 | 91,698 | ||||||
Trifork Holding AG(1) | 1,154 | 27,323 | ||||||
| Tryg A/S | 27,250 | 615,735 | ||||||
| Vestas Wind Systems A/S | 107,354 | 2,686,115 | ||||||
| 35,347,664 | ||||||||
| Finland — 1.0% | ||||||||
| Aktia Bank Oyj | 8,317 | 85,840 | ||||||
| Alandsbanken Abp, B Shares | 230 | 6,950 | ||||||
| Anora Group Oyj | 660 | 5,378 | ||||||
| Atria Oyj | 267 | 2,619 | ||||||
| CapMan Oyj, B Shares | 6,695 | 18,583 | ||||||
| Cargotec Oyj, B Shares | 1,485 | 50,503 | ||||||
| Caverion OYJ | 8,415 | 41,166 | ||||||
Citycon Oyj(2) | 15,919 | 112,807 | ||||||
| Elisa Oyj | 9,124 | 487,936 | ||||||
Finnair Oyj(1)(2) | 78,370 | 32,122 | ||||||
| Fortum Oyj | 21,713 | 223,350 | ||||||
| Huhtamaki Oyj | 6,102 | 213,675 | ||||||
| Kemira Oyj | 19,081 | 229,674 | ||||||
| Kesko Oyj, B Shares | 61,279 | 1,289,164 | ||||||
| Kojamo Oyj | 17,923 | 300,076 | ||||||
| Kone Oyj, B Shares | 23,871 | 954,661 | ||||||
| Konecranes Oyj | 2,058 | 48,382 | ||||||
| Marimekko Oyj | 8,300 | 81,851 | ||||||
| Metsa Board Oyj | 59,746 | 513,648 | ||||||
| Metso Outotec Oyj | 33,984 | 265,794 | ||||||
Musti Group Oyj(2) | 1,325 | 26,198 | ||||||
| Neste Oyj | 18,429 | 909,228 | ||||||
| Nokia Oyj, ADR | 274,531 | 1,386,382 | ||||||
| Nokian Renkaat Oyj | 20,478 | 212,526 | ||||||
| Oma Saastopankki Oyj | 1,110 | 20,623 | ||||||
| Orion Oyj, Class B | 13,839 | 627,462 | ||||||
| Outokumpu Oyj | 77,026 | 308,871 | ||||||
Puuilo Oyj(1) | 10,225 | 48,768 | ||||||
QT Group Oyj(1)(2) | 326 | 16,528 | ||||||
| Revenio Group Oyj | 2,340 | 105,852 | ||||||
| Rovio Entertainment Oyj | 6,099 | 36,705 | ||||||
| Sampo Oyj, A Shares | 30,200 | 1,366,258 | ||||||
| Sanoma Oyj | 5,288 | 72,124 | ||||||
| Scanfil Oyj | 1,113 | 7,333 | ||||||
| Stora Enso Oyj, R Shares | 81,482 | 1,212,939 | ||||||
Suominen Oyj(1) | 1,851 | 5,382 | ||||||
| Taaleri Oyj | 3,323 | 32,434 | ||||||
| Talenom Oyj | 3,448 | 37,603 | ||||||
| TietoEVRY Oyj | 759 | 19,422 | ||||||
126
| Avantis International Equity ETF | ||||||||
| Shares | Value | |||||||
| Tokmanni Group Corp. | 9,938 | $ | 118,649 | |||||
| UPM-Kymmene Oyj | 47,295 | 1,606,814 | ||||||
| Uponor Oyj | 10,543 | 157,979 | ||||||
| Valmet Oyj | 29,073 | 736,924 | ||||||
| Wartsila Oyj Abp | 36,200 | 298,478 | ||||||
| YIT Oyj | 23,118 | 75,648 | ||||||
| 14,411,309 | ||||||||
| France — 8.8% | ||||||||
| ABC arbitrage | 5,497 | 38,836 | ||||||
Accor SA(2) | 13,536 | 322,849 | ||||||
Aeroports de Paris(2) | 2,721 | 372,587 | ||||||
Air France-KLM(2) | 101,348 | 147,957 | ||||||
| Air Liquide SA | 28,758 | 3,603,747 | ||||||
| Airbus SE | 33,050 | 3,238,672 | ||||||
| AKWEL | 1,895 | 34,259 | ||||||
ALD SA(1) | 26,666 | 290,243 | ||||||
Alstom SA(1) | 26,270 | 538,357 | ||||||
| Alten SA | 7,710 | 947,951 | ||||||
| Amundi SA | 3,977 | 201,649 | ||||||
| APERAM SA | 10,505 | 283,544 | ||||||
ArcelorMittal SA(1) | 102,504 | 2,418,069 | ||||||
| Arkema SA | 17,077 | 1,441,668 | ||||||
Atos SE(2) | 3,078 | 31,056 | ||||||
| Aubay | 553 | 27,073 | ||||||
| AXA SA | 177,511 | 4,180,672 | ||||||
Believe SA(2) | 1,680 | 13,844 | ||||||
| Beneteau SA | 5,548 | 59,148 | ||||||
| Bigben Interactive | 1,821 | 22,273 | ||||||
| BioMerieux | 16,303 | 1,490,904 | ||||||
| Biosynex | 1,048 | 15,397 | ||||||
| BNP Paribas SA | 77,400 | 3,596,793 | ||||||
| Bollore SE | 13,081 | 62,511 | ||||||
| Bonduelle SCA | 2,923 | 37,748 | ||||||
| Bouygues SA | 49,679 | 1,459,319 | ||||||
| Bureau Veritas SA | 38,005 | 943,281 | ||||||
| Caisse Regionale de Credit Agricole Mutuel Brie Picardie | 269 | 5,619 | ||||||
| Caisse Regionale de Credit Agricole Mutuel Nord de France | 123 | 2,164 | ||||||
| Capgemini SE | 6,621 | 1,143,963 | ||||||
| Carrefour SA | 128,475 | 2,144,310 | ||||||
Casino Guichard Perrachon SA(1)(2) | 817 | 10,587 | ||||||
| Catana Group | 7,681 | 47,472 | ||||||
Cellectis SA, ADR(2) | 48 | 159 | ||||||
| Chargeurs SA | 3,479 | 52,134 | ||||||
| Cie de Saint-Gobain | 83,200 | 3,351,108 | ||||||
Cie des Alpes(2) | 4,974 | 78,688 | ||||||
| Cie Generale des Etablissements Michelin SCA | 121,313 | 2,950,486 | ||||||
| Cie Plastic Omnium SA | 17,000 | 315,215 | ||||||
Claranova SE(2) | 434 | 1,383 | ||||||
Coface SA(2) | 23,635 | 236,338 | ||||||
| Credit Agricole SA | 90,553 | 833,420 | ||||||
| Danone SA | 23,837 | 1,254,310 | ||||||
127
| Avantis International Equity ETF | ||||||||
| Shares | Value | |||||||
| Dassault Aviation SA | 6,094 | $ | 836,887 | |||||
| Dassault Systemes SE | 14,576 | 562,097 | ||||||
| Derichebourg SA | 33,022 | 185,765 | ||||||
| Edenred | 12,133 | 613,680 | ||||||
| Eiffage SA | 23,967 | 2,108,015 | ||||||
| Electricite de France SA | 52,326 | 625,622 | ||||||
| Elis SA | 4,189 | 53,569 | ||||||
| Engie SA | 219,939 | 2,612,237 | ||||||
| Eramet SA | 3,158 | 267,747 | ||||||
| Esker SA | 659 | 85,441 | ||||||
| EssilorLuxottica SA | 10,511 | 1,565,481 | ||||||
Esso SA Francaise(2) | 1,073 | 66,020 | ||||||
| Etablissements Maurel et Prom SA | 22,643 | 114,598 | ||||||
| Eurazeo SE | 10,042 | 599,709 | ||||||
Euroapi SA(2) | 2,655 | 41,389 | ||||||
Eurobio Scientific SA(2) | 3,806 | 70,175 | ||||||
| Eurofins Scientific SE | 14,945 | 1,034,018 | ||||||
| Euronext NV | 7,555 | 558,337 | ||||||
| Eutelsat Communications SA | 62,189 | 562,500 | ||||||
Faurecia SE(2) | 67,929 | 974,160 | ||||||
FIGEAC-AERO(2) | 98 | 580 | ||||||
| Fnac Darty SA | 1,627 | 54,778 | ||||||
Focus Entertainment(2) | 642 | 29,037 | ||||||
| Fountaine Pajot SA | 5 | 512 | ||||||
| Gaztransport Et Technigaz SA | 10,456 | 1,331,095 | ||||||
Genfit(2) | 10,161 | 43,021 | ||||||
| Getlink SE | 28,796 | 542,258 | ||||||
| Groupe LDLC | 10 | 273 | ||||||
| Groupe SFPI | 119 | 301 | ||||||
| Hermes International | 1,917 | 2,455,227 | ||||||
ID Logistics Group(2) | 699 | 195,569 | ||||||
| Imerys SA | 5,617 | 162,534 | ||||||
Innate Pharma SA(1)(2) | 12,029 | 32,147 | ||||||
| Ipsen SA | 13,631 | 1,306,356 | ||||||
| IPSOS | 1,571 | 71,372 | ||||||
| Jacquet Metals SACA | 2,585 | 40,930 | ||||||
JCDecaux SA(2) | 13,512 | 187,364 | ||||||
| Kaufman & Broad SA | 2,490 | 58,971 | ||||||
| Kering SA | 6,227 | 3,124,413 | ||||||
| L'Oreal SA | 7,592 | 2,607,428 | ||||||
| La Francaise des Jeux SAEM | 28,973 | 939,716 | ||||||
| Legrand SA | 11,212 | 811,241 | ||||||
| LISI | 2,849 | 60,334 | ||||||
Lumibird(2) | 68 | 1,408 | ||||||
| LVMH Moet Hennessy Louis Vuitton SE | 14,073 | 9,080,839 | ||||||
Maisons du Monde SA(1) | 9,602 | 91,907 | ||||||
| Manitou BF SA | 1,848 | 30,427 | ||||||
McPhy Energy SA(1)(2) | 2,028 | 25,719 | ||||||
| Mersen SA | 3,800 | 112,379 | ||||||
| Metropole Television SA | 7,347 | 90,693 | ||||||
MGI Digital Graphic Technology(2) | 376 | 13,070 | ||||||
128
| Avantis International Equity ETF | ||||||||
| Shares | Value | |||||||
Nacon SA(1)(2) | 4,588 | $ | 22,176 | |||||
| Neoen SA | 5,514 | 227,754 | ||||||
| Nexans SA | 7,770 | 709,918 | ||||||
| Nexity SA | 8,366 | 187,322 | ||||||
Novacyt SA(2) | 33,332 | 39,617 | ||||||
Orange SA, ADR(1) | 355,461 | 3,586,601 | ||||||
Orpea SA(1)(2) | 2,494 | 54,261 | ||||||
| Pernod Ricard SA | 10,710 | 1,965,161 | ||||||
| Publicis Groupe SA | 8,981 | 438,500 | ||||||
| Quadient SA | 4,719 | 79,935 | ||||||
| Remy Cointreau SA | 1,940 | 359,798 | ||||||
Renault SA(2) | 53,678 | 1,528,909 | ||||||
ReWorld Media SA(2) | 8,722 | 55,299 | ||||||
Rexel SA(2) | 41,619 | 675,974 | ||||||
| Rubis SCA | 8,436 | 198,867 | ||||||
| Safran SA | 18,043 | 1,839,565 | ||||||
| Sanofi, ADR | 102,452 | 4,203,606 | ||||||
| Sartorius Stedim Biotech | 1,461 | 534,377 | ||||||
| Schneider Electric SE | 12,337 | 1,466,343 | ||||||
| SCOR SE | 32,969 | 545,580 | ||||||
| SEB SA | 4,193 | 310,555 | ||||||
| SES SA | 146,614 | 1,029,281 | ||||||
SES-imagotag SA(2) | 1,530 | 152,913 | ||||||
SMCP SA(2) | 8,367 | 45,821 | ||||||
| Societe BIC SA | 4,971 | 282,782 | ||||||
| Societe Generale SA | 109,829 | 2,421,225 | ||||||
| Sodexo SA | 3,662 | 280,069 | ||||||
SOITEC(2) | 2,190 | 309,307 | ||||||
Solutions 30 SE(1)(2) | 20,776 | 60,643 | ||||||
| Sopra Steria Group SACA | 1,362 | 188,004 | ||||||
| SPIE SA | 6,057 | 131,869 | ||||||
| STMicroelectronics NV, NY Shares | 151,927 | 5,302,252 | ||||||
| Sword Group | 534 | 21,424 | ||||||
Technicolor SA(2) | 12,860 | 39,977 | ||||||
| Technip Energies NV | 18,807 | 235,138 | ||||||
| Teleperformance | 8,213 | 2,339,121 | ||||||
| Television Francaise 1 | 13,708 | 86,933 | ||||||
| Thales SA | 18,298 | 2,206,021 | ||||||
| TotalEnergies SE, ADR | 207,239 | 10,467,642 | ||||||
| Trigano SA | 2,148 | 185,962 | ||||||
Ubisoft Entertainment SA(2) | 36,216 | 1,670,103 | ||||||
| Valeo | 74,847 | 1,429,705 | ||||||
Vallourec SA(2) | 45,182 | 470,353 | ||||||
| Veolia Environnement SA | 60,747 | 1,353,893 | ||||||
| Verallia SA | 18,552 | 425,327 | ||||||
| Vicat SA | 3,183 | 80,548 | ||||||
| Vilmorin & Cie SA | 1,210 | 51,993 | ||||||
| Vinci SA | 56,929 | 5,251,895 | ||||||
| Virbac SA | 696 | 258,031 | ||||||
| Vivendi SE | 117,031 | 1,060,822 | ||||||
| Wavestone | 362 | 16,859 | ||||||
129
| Avantis International Equity ETF | ||||||||
| Shares | Value | |||||||
Worldline SA(2) | 1,638 | $ | 70,176 | |||||
X-Fab Silicon Foundries SE(2) | 16,819 | 104,428 | ||||||
Xilam Animation SA(2) | 155 | 5,882 | ||||||
| 132,353,626 | ||||||||
| Germany — 6.2% | ||||||||
| 1&1 AG | 1,516 | 24,366 | ||||||
| 2G Energy AG | 451 | 10,728 | ||||||
| 7C Solarparken AG | 20,776 | 111,820 | ||||||
Aareal Bank AG(2) | 8,072 | 257,834 | ||||||
| ABO Wind AG | 286 | 17,235 | ||||||
| Adesso SE | 643 | 77,911 | ||||||
| adidas AG | 13,962 | 2,070,329 | ||||||
ADLER Group SA(2) | 6,494 | 18,215 | ||||||
| Allianz SE | 21,900 | 3,701,897 | ||||||
| Amadeus Fire AG | 678 | 67,637 | ||||||
| Aroundtown SA | 167,530 | 488,616 | ||||||
| Atoss Software AG | 790 | 104,797 | ||||||
| Aumann AG | 1,364 | 20,957 | ||||||
| AURELIUS Equity Opportunities SE & Co. KGaA | 7,906 | 183,582 | ||||||
| Aurubis AG | 10,874 | 658,382 | ||||||
| Baader Bank AG | 2,534 | 9,494 | ||||||
| BASF SE | 75,308 | 3,185,442 | ||||||
| Basler AG | 9 | 222 | ||||||
Bauer AG(2) | 2,186 | 19,187 | ||||||
| Bayer AG | 44,367 | 2,346,481 | ||||||
| Bayerische Motoren Werke AG | 34,922 | 2,573,006 | ||||||
| Bayerische Motoren Werke AG, Preference Shares | 4,575 | 318,073 | ||||||
| BayWa AG | 2,633 | 113,911 | ||||||
| Bechtle AG | 4,935 | 189,058 | ||||||
| Beiersdorf AG | 10,453 | 1,055,126 | ||||||
| Bertrandt AG | 464 | 15,837 | ||||||
| Bilfinger SE | 3,404 | 101,069 | ||||||
Borussia Dortmund GmbH & Co. KGaA(2) | 5,456 | 21,376 | ||||||
| Brenntag SE | 11,690 | 766,484 | ||||||
| CANCOM SE | 3,189 | 89,308 | ||||||
| Carl Zeiss Meditec AG | 2,825 | 351,597 | ||||||
| CECONOMY AG | 33,307 | 48,189 | ||||||
| Cewe Stiftung & Co. KGAA | 1,242 | 98,207 | ||||||
| Cliq Digital AG | 1,221 | 31,960 | ||||||
Commerzbank AG(2) | 208,120 | 1,384,815 | ||||||
| CompuGroup Medical SE & Co. KgaA | 3,719 | 139,872 | ||||||
| Continental AG | 4,994 | 287,526 | ||||||
| Covestro AG | 46,674 | 1,407,311 | ||||||
| CropEnergies AG | 6,201 | 101,589 | ||||||
CTS Eventim AG & Co. KGaA(2) | 11,356 | 610,541 | ||||||
Daimler Truck Holding AG(2) | 67,080 | 1,715,158 | ||||||
| Datagroup SE | 578 | 37,945 | ||||||
Delivery Hero SE(2) | 2,650 | 109,978 | ||||||
| Dermapharm Holding SE | 128 | 5,937 | ||||||
| Deutsche Bank AG | 215,752 | 1,792,899 | ||||||
| Deutsche Beteiligungs AG | 3,029 | 84,716 | ||||||
130
| Avantis International Equity ETF | ||||||||
| Shares | Value | |||||||
| Deutsche Boerse AG | 18,889 | $ | 3,193,648 | |||||
Deutsche Lufthansa AG(1)(2) | 143,154 | 851,092 | ||||||
| Deutsche Pfandbriefbank AG | 28,558 | 246,460 | ||||||
| Deutsche Post AG | 84,312 | 3,077,315 | ||||||
| Deutsche Rohstoff AG | 1,280 | 34,894 | ||||||
| Deutsche Telekom AG | 214,386 | 4,040,582 | ||||||
| Deutz AG | 29,067 | 109,458 | ||||||
| DIC Asset AG | 4,477 | 45,829 | ||||||
| Draegerwerk AG & Co. KGaA | 502 | 20,292 | ||||||
| Draegerwerk AG & Co. KGaA, Preference Shares | 2,646 | 125,190 | ||||||
| Duerr AG | 9,844 | 216,832 | ||||||
| E.ON SE | 169,988 | 1,449,928 | ||||||
| Eckert & Ziegler Strahlen- und Medizintechnik AG | 1,537 | 60,567 | ||||||
| Einhell Germany AG, Preference Shares | 58 | 8,248 | ||||||
| Elmos Semiconductor SE | 1,403 | 59,518 | ||||||
| ElringKlinger AG | 6,440 | 45,198 | ||||||
| Encavis AG | 33,924 | 725,001 | ||||||
| Energiekontor AG | 1,216 | 106,818 | ||||||
| Envitec Biogas AG | 183 | 9,916 | ||||||
| Evonik Industries AG | 34,799 | 648,831 | ||||||
Evotec SE(2) | 1,344 | 29,546 | ||||||
| Fielmann AG | 2,048 | 76,107 | ||||||
flatexDEGIRO AG(2) | 16,472 | 158,511 | ||||||
Fraport AG Frankfurt Airport Services Worldwide(2) | 1,701 | 73,549 | ||||||
| Freenet AG | 24,611 | 536,427 | ||||||
| Fresenius Medical Care AG & Co. KGaA, ADR | 13,329 | 227,926 | ||||||
| Fresenius SE & Co. KGaA | 11,089 | 274,323 | ||||||
| FUCHS PETROLUB SE, Preference Shares | 6,898 | 186,685 | ||||||
| GEA Group AG | 28,819 | 1,002,521 | ||||||
| Gerresheimer AG | 6,702 | 350,575 | ||||||
| GFT Technologies SE | 2,706 | 89,955 | ||||||
| Grand City Properties SA | 15,745 | 186,806 | ||||||
| GRENKE AG | 5,644 | 135,704 | ||||||
| Hamburger Hafen und Logistik AG | 7,308 | 89,377 | ||||||
| Hannover Rueck SE | 3,697 | 544,886 | ||||||
| HeidelbergCement AG | 23,296 | 1,051,988 | ||||||
Heidelberger Druckmaschinen AG(2) | 55,945 | 81,584 | ||||||
HelloFresh SE(2) | 50,398 | 1,203,301 | ||||||
| Henkel AG & Co. KGaA | 2,144 | 134,084 | ||||||
| Henkel AG & Co. KGaA, Preference Shares | 5,615 | 362,356 | ||||||
| Hensoldt AG | 2,635 | 58,598 | ||||||
| HOCHTIEF AG | 2,939 | 145,106 | ||||||
| Hornbach Holding AG & Co. KGaA | 1,507 | 106,298 | ||||||
| HUGO BOSS AG | 24,672 | 1,344,678 | ||||||
Hypoport SE(2) | 257 | 50,186 | ||||||
| Indus Holding AG | 3,842 | 85,767 | ||||||
| Infineon Technologies AG | 82,216 | 2,011,732 | ||||||
| Instone Real Estate Group SE | 11,568 | 102,401 | ||||||
| Jenoptik AG | 5,068 | 107,250 | ||||||
| JOST Werke AG | 3,780 | 140,092 | ||||||
| Jungheinrich AG, Preference Shares | 9,461 | 230,978 | ||||||
131
| Avantis International Equity ETF | ||||||||
| Shares | Value | |||||||
| K+S AG | 42,438 | $ | 966,805 | |||||
| KION Group AG | 7,460 | 298,078 | ||||||
| Kloeckner & Co. SE | 16,800 | 151,610 | ||||||
| Knorr-Bremse AG | 14,640 | 709,526 | ||||||
Koenig & Bauer AG(2) | 2,590 | 30,192 | ||||||
| Kontron AG | 12,365 | 188,123 | ||||||
| Krones AG | 2,792 | 229,933 | ||||||
| KSB SE & Co. KGaA | 17 | 6,560 | ||||||
| KSB SE & Co. KGaA, Preference Shares | 67 | 20,704 | ||||||
| KWS Saat SE & Co. KGaA | 1,413 | 85,976 | ||||||
| Lang & Schwarz AG | 1,638 | 23,339 | ||||||
| Lanxess AG | 18,241 | 615,479 | ||||||
| LEG Immobilien SE | 11,024 | 833,125 | ||||||
Leoni AG(2) | 7,189 | 50,385 | ||||||
| MBB SE | 132 | 12,785 | ||||||
Medios AG(2) | 1,294 | 31,718 | ||||||
| Mercedes-Benz Group AG | 61,129 | 3,427,239 | ||||||
| Merck KGaA | 5,505 | 945,649 | ||||||
METRO AG(2) | 9,856 | 78,465 | ||||||
| MLP SE | 5,074 | 28,023 | ||||||
MorphoSys AG(2) | 1,781 | 31,029 | ||||||
MPH Health Care AG(2) | 17 | 285 | ||||||
| MTU Aero Engines AG | 8,439 | 1,488,322 | ||||||
| Muenchener Rueckversicherungs-Gesellschaft AG | 11,549 | 2,759,296 | ||||||
| Mutares SE & Co. KGaA | 2,739 | 44,207 | ||||||
| Nabaltec AG | 291 | 7,953 | ||||||
Nagarro SE(2) | 1,730 | 173,850 | ||||||
| Nemetschek SE | 6,129 | 361,060 | ||||||
| New Work SE | 663 | 79,033 | ||||||
Nordex SE(2) | 1,802 | 17,327 | ||||||
| Norma Group SE | 4,199 | 66,024 | ||||||
| Patrizia SE | 1,333 | 16,854 | ||||||
| Pfeiffer Vacuum Technology AG | 154 | 20,324 | ||||||
| Porsche Automobil Holding SE, Preference Shares | 16,225 | 1,144,017 | ||||||
| ProSiebenSat.1 Media SE | 13,178 | 101,865 | ||||||
| Puma SE | 6,056 | 370,164 | ||||||
PVA TePla AG(2) | 3,677 | 61,762 | ||||||
QIAGEN NV(2) | 20,134 | 914,688 | ||||||
| Rational AG | 334 | 180,147 | ||||||
| Rheinmetall AG | 9,743 | 1,546,652 | ||||||
| RTL Group SA | 593 | 22,033 | ||||||
| RWE AG | 97,653 | 3,728,137 | ||||||
| SAF-Holland SE | 8,108 | 64,521 | ||||||
| Salzgitter AG | 6,881 | 169,166 | ||||||
| SAP SE, ADR | 24,681 | 2,103,315 | ||||||
| Sartorius AG, Preference Shares | 2,363 | 984,485 | ||||||
| Schaeffler AG, Preference Shares | 28,279 | 147,331 | ||||||
| Scout24 SE | 4,541 | 261,621 | ||||||
| Secunet Security Networks AG | 211 | 45,913 | ||||||
SGL Carbon SE(2) | 12,264 | 83,347 | ||||||
| Siemens AG | 27,557 | 2,791,362 | ||||||
132
| Avantis International Equity ETF | ||||||||
| Shares | Value | |||||||
Siemens Energy AG(2) | 38,926 | $ | 572,574 | |||||
| Siemens Healthineers AG | 18,389 | 898,599 | ||||||
| Siltronic AG | 3,112 | 213,257 | ||||||
| Sixt SE | 1,906 | 186,383 | ||||||
| Sixt SE, Preference Shares | 2,216 | 132,451 | ||||||
SMA Solar Technology AG(2) | 134 | 6,742 | ||||||
| Software AG | 298 | 8,106 | ||||||
| Stabilus SA | 4,968 | 254,106 | ||||||
| Steico SE | 1,178 | 90,554 | ||||||
| STO SE & Co. KGaA, Preference Shares | 497 | 77,735 | ||||||
| STRATEC SE | 1,501 | 127,939 | ||||||
| Stroeer SE & Co. KGaA | 3,977 | 169,015 | ||||||
| Suedzucker AG | 10,333 | 141,698 | ||||||
| SUESS MicroTec SE | 3,511 | 43,479 | ||||||
| Symrise AG | 10,407 | 1,088,928 | ||||||
| TAG Immobilien AG | 30,520 | 281,562 | ||||||
TeamViewer AG(2) | 24,430 | 244,470 | ||||||
| Technotrans SE | 448 | 12,162 | ||||||
| Telefonica Deutschland Holding AG | 472,423 | 1,226,383 | ||||||
ThyssenKrupp AG(2) | 126,700 | 706,716 | ||||||
| Uniper SE | 3,325 | 17,991 | ||||||
| United Internet AG | 11,304 | 255,703 | ||||||
| Varta AG | 2,459 | 172,516 | ||||||
| VERBIO Vereinigte BioEnergie AG | 3,962 | 254,292 | ||||||
| Villeroy & Boch AG, Preference Shares | 748 | 14,121 | ||||||
Vitesco Technologies Group AG, Class A(2) | 2,779 | 135,714 | ||||||
| Volkswagen AG | 1,703 | 315,005 | ||||||
| Volkswagen AG, Preference Shares | 13,068 | 1,858,781 | ||||||
| Vonovia SE | 65,618 | 1,776,379 | ||||||
| Vossloh AG | 720 | 24,618 | ||||||
| Wacker Chemie AG | 2,956 | 420,396 | ||||||
| Wacker Neuson SE | 6,179 | 102,298 | ||||||
| Washtec AG | 1,313 | 52,657 | ||||||
| Wuestenrot & Wuerttembergische AG | 2,845 | 46,330 | ||||||
Zalando SE(2) | 9,249 | 214,141 | ||||||
| 93,745,139 | ||||||||
| Hong Kong — 2.6% | ||||||||
| AIA Group Ltd. | 719,464 | 6,922,133 | ||||||
| ASMPT Ltd. | 83,200 | 644,418 | ||||||
Atlas Corp.(1) | 30,546 | 438,335 | ||||||
| Bank of East Asia Ltd. | 418,411 | 527,157 | ||||||
| BOC Hong Kong Holdings Ltd. | 455,500 | 1,567,740 | ||||||
Bossini International Holdings Ltd.(2) | 40,000 | 2,358 | ||||||
| Bright Smart Securities & Commodities Group Ltd. | 8,000 | 1,281 | ||||||
| Budweiser Brewing Co. APAC Ltd. | 64,100 | 188,418 | ||||||
| Cafe de Coral Holdings Ltd. | 54,000 | 77,311 | ||||||
China Tonghai International Financial Ltd.(2) | 20,000 | 429 | ||||||
| Chow Sang Sang Holdings International Ltd. | 81,000 | 91,192 | ||||||
| Chow Tai Fook Jewellery Group Ltd. | 53,800 | 108,284 | ||||||
| Chuang's Consortium International Ltd. | 4,000 | 535 | ||||||
Citychamp Watch & Jewellery Group Ltd.(2) | 156,000 | 24,046 | ||||||
133
| Avantis International Equity ETF | ||||||||
| Shares | Value | |||||||
| CK Asset Holdings Ltd. | 256,186 | $ | 1,729,195 | |||||
| CK Hutchison Holdings Ltd. | 115,000 | 742,630 | ||||||
| CK Infrastructure Holdings Ltd. | 69,000 | 419,590 | ||||||
| CLP Holdings Ltd. | 226,500 | 1,951,590 | ||||||
CMBC Capital Holdings Ltd.(1) | 73,000 | 15,782 | ||||||
Cowell e Holdings, Inc.(1)(2) | 60,000 | 121,620 | ||||||
| Dah Sing Banking Group Ltd. | 49,200 | 38,205 | ||||||
| Dah Sing Financial Holdings Ltd. | 28,400 | 75,609 | ||||||
| DFI Retail Group Holdings Ltd. | 18,700 | 50,772 | ||||||
| Dickson Concepts International Ltd. | 15,500 | 7,363 | ||||||
| E-Commodities Holdings Ltd. | 518,000 | 115,689 | ||||||
| EC Healthcare | 57,000 | 40,055 | ||||||
Esprit Holdings Ltd.(1)(2) | 152,500 | 18,946 | ||||||
ESR Group Ltd.(2) | 36,000 | 100,804 | ||||||
| Far East Consortium International Ltd. | 17,000 | 5,388 | ||||||
| First Pacific Co. Ltd. | 254,000 | 97,951 | ||||||
Fosun Tourism Group(1)(2) | 28,000 | 39,084 | ||||||
| FSE Lifestyle Services Ltd. | 3,000 | 1,913 | ||||||
Futu Holdings Ltd., ADR(1)(2) | 4,006 | 196,655 | ||||||
| Galaxy Entertainment Group Ltd. | 53,000 | 296,253 | ||||||
| Giordano International Ltd. | 250,000 | 58,173 | ||||||
Green Future Food Hydrocolloid Marine Science Co. Ltd.(2) | 96,000 | 42,839 | ||||||
| Guotai Junan International Holdings Ltd. | 520,000 | 52,172 | ||||||
Haitong International Securities Group Ltd.(1) | 470,800 | 52,088 | ||||||
| Hang Lung Group Ltd. | 165,000 | 279,073 | ||||||
| Hang Lung Properties Ltd. | 436,000 | 725,072 | ||||||
| Hang Seng Bank Ltd. | 53,300 | 834,498 | ||||||
| Henderson Land Development Co. Ltd. | 184,000 | 615,502 | ||||||
| HK Electric Investments & HK Electric Investments Ltd. | 250,000 | 208,591 | ||||||
| HKT Trust & HKT Ltd. | 190,000 | 254,900 | ||||||
| Hong Kong & China Gas Co. Ltd. | 514,990 | 507,719 | ||||||
| Hong Kong Exchanges & Clearing Ltd. | 58,188 | 2,344,658 | ||||||
Hong Kong Technology Venture Co. Ltd.(1) | 39,000 | 29,486 | ||||||
Hongkong & Shanghai Hotels Ltd.(2) | 20,000 | 17,917 | ||||||
| Hongkong Land Holdings Ltd. | 200,200 | 967,785 | ||||||
| Hysan Development Co. Ltd. | 112,000 | 315,643 | ||||||
| IGG, Inc. | 137,000 | 58,896 | ||||||
| International Housewares Retail Co. Ltd. | 24,000 | 8,860 | ||||||
IRC Ltd.(1)(2) | 1,018,000 | 17,464 | ||||||
| Jardine Matheson Holdings Ltd. | 12,100 | 641,683 | ||||||
JBM Healthcare Ltd.(2) | 1,000 | 102 | ||||||
| Johnson Electric Holdings Ltd. | 64,500 | 76,179 | ||||||
| K Wah International Holdings Ltd. | 171,000 | 64,489 | ||||||
| Karrie International Holdings Ltd. | 96,000 | 16,843 | ||||||
| Kerry Logistics Network Ltd. | 9,566 | 21,031 | ||||||
| Kerry Properties Ltd. | 160,500 | 370,039 | ||||||
Kwoon Chung Bus Holdings Ltd.(2) | 4,000 | 947 | ||||||
Lifestyle International Holdings Ltd.(2) | 18,000 | 10,535 | ||||||
LK Technology Holdings Ltd.(1) | 82,250 | 120,205 | ||||||
| Luk Fook Holdings International Ltd. | 81,000 | 207,058 | ||||||
| Man Wah Holdings Ltd. | 172,400 | 136,239 | ||||||
134
| Avantis International Equity ETF | ||||||||
| Shares | Value | |||||||
Melco Resorts & Entertainment Ltd., ADR(2) | 12,986 | $ | 74,799 | |||||
| Modern Dental Group Ltd. | 48,000 | 13,674 | ||||||
| MTR Corp. Ltd. | 70,286 | 359,957 | ||||||
| Multifield International Holdings Ltd. | 6,400 | 774 | ||||||
| New World Development Co. Ltd. | 436,750 | 1,423,185 | ||||||
| NWS Holdings Ltd. | 251,000 | 241,463 | ||||||
| Oriental Watch Holdings | 122,000 | 69,667 | ||||||
| Pacific Basin Shipping Ltd. | 2,155,000 | 764,874 | ||||||
| Pacific Textiles Holdings Ltd. | 190,000 | 71,352 | ||||||
Paliburg Holdings Ltd.(2) | 4,000 | 952 | ||||||
| PAX Global Technology Ltd. | 82,000 | 78,379 | ||||||
PC Partner Group Ltd.(1) | 54,000 | 51,338 | ||||||
| PCCW Ltd. | 326,357 | 163,377 | ||||||
| Perfect Medical Health Management Ltd. | 64,000 | 32,727 | ||||||
| Power Assets Holdings Ltd. | 141,000 | 843,350 | ||||||
Sa Sa International Holdings Ltd.(2) | 194,000 | 31,547 | ||||||
Sands China Ltd.(2) | 60,800 | 135,955 | ||||||
| SAS Dragon Holdings Ltd. | 4,000 | 1,936 | ||||||
Shangri-La Asia Ltd.(2) | 40,000 | 31,908 | ||||||
Shun Tak Holdings Ltd.(2) | 104,000 | 17,319 | ||||||
| Singamas Container Holdings Ltd. | 614,000 | 56,877 | ||||||
| Sino Land Co. Ltd. | 818,094 | 1,196,319 | ||||||
| SITC International Holdings Co. Ltd. | 270,000 | 684,674 | ||||||
SJM Holdings Ltd.(1)(2) | 108,000 | 37,660 | ||||||
| SmarTone Telecommunications Holdings Ltd. | 36,500 | 19,533 | ||||||
Solargiga Energy Holdings Ltd.(2) | 355,000 | 13,941 | ||||||
| Stella International Holdings Ltd. | 30,000 | 34,996 | ||||||
| Sun Hung Kai & Co. Ltd. | 33,000 | 15,209 | ||||||
| Sun Hung Kai Properties Ltd. | 59,500 | 699,019 | ||||||
| SUNeVision Holdings Ltd. | 107,000 | 70,101 | ||||||
| Swire Pacific Ltd., Class A | 145,500 | 1,006,391 | ||||||
| Swire Properties Ltd. | 159,000 | 366,451 | ||||||
| Symphony Holdings Ltd. | 10,000 | 1,260 | ||||||
| Techtronic Industries Co. Ltd. | 49,000 | 577,917 | ||||||
| Ten Pao Group Holdings Ltd. | 68,000 | 12,436 | ||||||
| Texhong Textile Group Ltd. | 52,500 | 49,326 | ||||||
| Texwinca Holdings Ltd. | 26,000 | 4,622 | ||||||
Theme International Holdings Ltd.(1)(2) | 620,000 | 73,301 | ||||||
Time Interconnect Technology Ltd.(1) | 184,000 | 53,248 | ||||||
| United Energy Group Ltd. | 2,374,000 | 292,939 | ||||||
| United Laboratories International Holdings Ltd. | 176,000 | 85,199 | ||||||
| Upbest Group Ltd. | 6,000 | 531 | ||||||
Value Partners Group Ltd.(1) | 204,000 | 59,834 | ||||||
Vitasoy International Holdings Ltd.(2) | 62,000 | 97,093 | ||||||
| VSTECS Holdings Ltd. | 144,000 | 95,201 | ||||||
| VTech Holdings Ltd. | 29,000 | 197,212 | ||||||
| WH Group Ltd. | 2,020,478 | 1,376,598 | ||||||
| Wharf Real Estate Investment Co. Ltd. | 111,000 | 505,071 | ||||||
Wynn Macau Ltd.(1)(2) | 48,800 | 29,340 | ||||||
Xinyi Electric Storage Holdings Ltd.(2) | 52,800 | 39,163 | ||||||
| Xinyi Glass Holdings Ltd. | 409,000 | 755,378 | ||||||
135
| Avantis International Equity ETF | ||||||||
| Shares | Value | |||||||
| Yue Yuen Industrial Holdings Ltd. | 139,500 | $ | 207,998 | |||||
Zensun Enterprises Ltd.(2) | 25,000 | 7,893 | ||||||
| 38,846,681 | ||||||||
| Ireland — 0.5% | ||||||||
AIB Group PLC(1) | 124,050 | 281,398 | ||||||
| Bank of Ireland Group PLC | 212,309 | 1,308,152 | ||||||
| Cairn Homes PLC | 92,984 | 92,737 | ||||||
| CRH PLC | 53,807 | 1,986,963 | ||||||
Dalata Hotel Group PLC(2) | 37,001 | 129,602 | ||||||
| FBD Holdings PLC | 1,492 | 15,225 | ||||||
| Glanbia PLC | 63,158 | 803,754 | ||||||
Glenveagh Properties PLC(2) | 145,981 | 148,583 | ||||||
| Kerry Group PLC, A Shares | 9,433 | 972,747 | ||||||
| Kingspan Group PLC | 4,634 | 262,372 | ||||||
| Origin Enterprises PLC | 27,398 | 102,706 | ||||||
Permanent TSB Group Holdings PLC(2) | 426 | 653 | ||||||
| Smurfit Kappa Group PLC | 48,775 | 1,635,405 | ||||||
Uniphar PLC(2) | 32,134 | 109,693 | ||||||
| 7,849,990 | ||||||||
| Israel — 1.1% | ||||||||
| Adgar Investment and Development Ltd. | 1,776 | 3,907 | ||||||
| AFI Properties Ltd. | 610 | 30,147 | ||||||
Airport City Ltd.(2) | 6,471 | 135,417 | ||||||
| Alony Hetz Properties & Investments Ltd. | 10,272 | 165,653 | ||||||
| Altshuler Shaham Penn Ltd. | 9,392 | 28,741 | ||||||
| Amot Investments Ltd. | 10,164 | 72,641 | ||||||
| Arad Investment & Industrial Development Ltd. | 146 | 20,582 | ||||||
| Arad Ltd. | 793 | 11,597 | ||||||
| Ashtrom Group Ltd. | 3,049 | 77,601 | ||||||
| AudioCodes Ltd. | 1,060 | 23,585 | ||||||
| Azorim-Investment Development & Construction Co. Ltd. | 10,263 | 41,953 | ||||||
| Azrieli Group Ltd. | 1,582 | 131,237 | ||||||
| Bank Hapoalim BM | 128,808 | 1,335,410 | ||||||
| Bank Leumi Le-Israel BM | 116,307 | 1,229,507 | ||||||
| Bezeq The Israeli Telecommunication Corp. Ltd. | 351,303 | 592,265 | ||||||
| Big Shopping Centers Ltd. | 574 | 82,075 | ||||||
| Blue Square Real Estate Ltd. | 749 | 64,733 | ||||||
| Caesarstone Ltd. | 3,402 | 34,666 | ||||||
Camtek Ltd.(2) | 4,223 | 113,330 | ||||||
| Carasso Motors Ltd. | 1,574 | 9,977 | ||||||
Cellcom Israel Ltd.(2) | 14,231 | 89,026 | ||||||
Ceragon Networks Ltd.(1)(2) | 817 | 1,806 | ||||||
Check Point Software Technologies Ltd.(2) | 5,978 | 718,795 | ||||||
Clal Insurance Enterprises Holdings Ltd.(2) | 10,976 | 237,009 | ||||||
Cognyte Software Ltd.(2) | 9,975 | 52,070 | ||||||
CyberArk Software Ltd.(2) | 901 | 129,996 | ||||||
| Danel Adir Yeoshua Ltd. | 474 | 57,898 | ||||||
| Delek Automotive Systems Ltd. | 6,943 | 107,066 | ||||||
Delek Group Ltd.(2) | 1,498 | 260,182 | ||||||
| Delta Galil Industries Ltd. | 1,972 | 104,617 | ||||||
| Elbit Systems Ltd. | 1,295 | 276,465 | ||||||
136
| Avantis International Equity ETF | ||||||||
| Shares | Value | |||||||
| Elco Ltd. | 589 | $ | 41,389 | |||||
| Electra Consumer Products 1970 Ltd. | 1,594 | 73,692 | ||||||
| Electra Ltd. | 168 | 106,633 | ||||||
Equital Ltd.(2) | 2,203 | 81,822 | ||||||
Fattal Holdings 1998 Ltd.(2) | 775 | 95,433 | ||||||
| FIBI Holdings Ltd. | 2,134 | 112,172 | ||||||
| First International Bank of Israel Ltd. | 6,306 | 293,455 | ||||||
| Formula Systems 1985 Ltd. | 165 | 16,389 | ||||||
| Fox Wizel Ltd. | 923 | 133,981 | ||||||
| Gav-Yam Lands Corp. Ltd. | 4,677 | 47,617 | ||||||
| Gazit-Globe Ltd. | 7,325 | 47,680 | ||||||
Gilat Satellite Networks Ltd.(2) | 3,128 | 20,328 | ||||||
Hagag Group Real Estate Development(2) | 921 | 6,390 | ||||||
| Harel Insurance Investments & Financial Services Ltd. | 20,663 | 234,938 | ||||||
| Hilan Ltd. | 1,433 | 87,192 | ||||||
| ICL Group Ltd. | 52,490 | 501,210 | ||||||
| IDI Insurance Co. Ltd. | 759 | 24,772 | ||||||
| Ilex Medical Ltd. | 429 | 10,157 | ||||||
| Infinya Ltd. | 146 | 14,812 | ||||||
Inmode Ltd.(2) | 3,377 | 107,861 | ||||||
| Inrom Construction Industries Ltd. | 17,244 | 80,368 | ||||||
| Isracard Ltd. | 42,940 | 142,936 | ||||||
Israel Corp. Ltd.(2) | 371 | 179,325 | ||||||
| Israel Discount Bank Ltd., A Shares | 199,817 | 1,221,611 | ||||||
| Israel Land Development - Urban Renewal Ltd. | 1,768 | 31,507 | ||||||
| Isras Investment Co. Ltd. | 161 | 38,562 | ||||||
| Ituran Location and Control Ltd. | 2,962 | 73,635 | ||||||
Kamada Ltd.(2) | 543 | 2,692 | ||||||
| Kenon Holdings Ltd. | 1,670 | 67,843 | ||||||
| M Yochananof & Sons Ltd. | 742 | 46,674 | ||||||
| Magic Software Enterprises Ltd. | 2,798 | 48,044 | ||||||
| Malam - Team Ltd. | 872 | 20,907 | ||||||
| Matrix IT Ltd. | 2,263 | 59,389 | ||||||
| Maytronics Ltd. | 1,809 | 25,987 | ||||||
| Mediterranean Towers Ltd. | 6,613 | 21,425 | ||||||
| Mega Or Holdings Ltd. | 1,423 | 49,218 | ||||||
| Melisron Ltd. | 1,050 | 85,746 | ||||||
Menora Mivtachim Holdings Ltd.(2) | 3,436 | 79,144 | ||||||
| Migdal Insurance & Financial Holdings Ltd. | 41,156 | 68,000 | ||||||
| Mivne Real Estate KD Ltd. | 43,225 | 158,639 | ||||||
| Mizrahi Tefahot Bank Ltd. | 10,231 | 416,090 | ||||||
Nano Dimension Ltd., ADR(1)(2) | 13,394 | 39,780 | ||||||
Naphtha Israel Petroleum Corp. Ltd.(2) | 1,311 | 7,893 | ||||||
| Nawi Brothers Ltd. | 1,423 | 12,573 | ||||||
Neto Malinda Trading Ltd.(2) | 518 | 20,060 | ||||||
Nice Ltd., ADR(1)(2) | 2,084 | 444,663 | ||||||
| Norstar Holdings, Inc. | 4,992 | 47,947 | ||||||
Nova Ltd.(2) | 1,909 | 187,329 | ||||||
| Oil Refineries Ltd. | 342,881 | 147,232 | ||||||
| One Software Technologies Ltd. | 4,313 | 79,514 | ||||||
OPC Energy Ltd.(2) | — | 5 | ||||||
137
| Avantis International Equity ETF | ||||||||
| Shares | Value | |||||||
Partner Communications Co. Ltd.(2) | 34,501 | $ | 298,404 | |||||
Paz Oil Co. Ltd.(2) | 2,369 | 310,570 | ||||||
Perion Network Ltd.(2) | 5,009 | 101,910 | ||||||
| Phoenix Holdings Ltd. | 23,029 | 277,792 | ||||||
| Prashkovsky Investments and Construction Ltd. | 500 | 16,714 | ||||||
Radware Ltd.(2) | 1,044 | 22,404 | ||||||
| Rami Levy Chain Stores Hashikma Marketing 2006 Ltd. | 1,156 | 89,464 | ||||||
| Raval Ics Ltd. | 1,209 | 1,690 | ||||||
| Sapiens International Corp. NV | 1,050 | 23,608 | ||||||
| Scope Metals Group Ltd. | 1,450 | 72,686 | ||||||
| Shapir Engineering and Industry Ltd. | 10,541 | 100,690 | ||||||
Shikun & Binui Ltd.(2) | 11,988 | 54,202 | ||||||
| Shufersal Ltd. | 103,288 | 707,383 | ||||||
Silicom Ltd.(2) | 230 | 9,287 | ||||||
| Strauss Group Ltd. | 3,660 | 95,711 | ||||||
| Summit Real Estate Holdings Ltd. | 3,162 | 59,613 | ||||||
| Tamar Petroleum Ltd. | 11,193 | 36,197 | ||||||
Taro Pharmaceutical Industries Ltd.(2) | 711 | 23,932 | ||||||
| Tel Aviv Stock Exchange Ltd. | 8,957 | 42,595 | ||||||
Tera Light Ltd.(2) | 1,179 | 2,253 | ||||||
Teva Pharmaceutical Industries Ltd., ADR(2) | 45,177 | 408,400 | ||||||
Tower Semiconductor Ltd.(2) | 9,975 | 467,565 | ||||||
Victory Supermarket Chain Ltd.(2) | 392 | 6,093 | ||||||
Wix.com Ltd.(2) | 1,032 | 65,315 | ||||||
| YH Dimri Construction & Development Ltd. | 818 | 64,848 | ||||||
ZIM Integrated Shipping Services Ltd.(1) | 18,621 | 672,032 | ||||||
| ZUR Shamir Holdings Ltd. | 917 | 3,585 | ||||||
| 16,237,558 | ||||||||
| Italy — 2.0% | ||||||||
| A2A SpA | 325,731 | 364,995 | ||||||
| ACEA SpA | 10,837 | 129,770 | ||||||
| Amplifon SpA | 11,893 | 309,943 | ||||||
| Aquafil SpA | 3,718 | 22,734 | ||||||
| Arnoldo Mondadori Editore SpA | 34,065 | 55,614 | ||||||
| Ascopiave SpA | 16,797 | 43,509 | ||||||
| Assicurazioni Generali SpA | 66,664 | 977,744 | ||||||
| Atlantia SpA | 52,992 | 1,213,435 | ||||||
Autogrill SpA(2) | 19,777 | 129,713 | ||||||
Avio SpA(1) | 486 | 6,702 | ||||||
| Azimut Holding SpA | 30,969 | 493,338 | ||||||
| Banca Generali SpA | 10,388 | 274,611 | ||||||
| Banca IFIS SpA | 7,262 | 86,713 | ||||||
| Banca Mediolanum SpA | 28,932 | 184,360 | ||||||
| Banca Popolare di Sondrio SCPA | 116,760 | 373,899 | ||||||
| Banco BPM SpA | 356,680 | 885,577 | ||||||
Banco di Desio e della Brianza SpA(1) | 1,492 | 4,555 | ||||||
| BFF Bank SpA | 32,161 | 203,578 | ||||||
| Biesse SpA | 2,461 | 31,247 | ||||||
| BPER Banca | 185,711 | 279,244 | ||||||
| Brembo SpA | 19,714 | 180,799 | ||||||
| Brunello Cucinelli SpA | 6,919 | 358,347 | ||||||
138
| Avantis International Equity ETF | ||||||||
| Shares | Value | |||||||
| Buzzi Unicem SpA | 8,576 | $ | 143,440 | |||||
| Cairo Communication SpA | 8,514 | 13,234 | ||||||
| Carel Industries SpA | 3,267 | 70,014 | ||||||
| Cementir Holding NV | 4,280 | 24,791 | ||||||
CIR SpA-Compagnie Industriali(2) | 75,799 | 31,814 | ||||||
| CNH Industrial NV | 117,925 | 1,435,745 | ||||||
| Credito Emiliano SpA | 13,483 | 77,948 | ||||||
d'Amico International Shipping SA(2) | 528,777 | 127,008 | ||||||
| Danieli & C Officine Meccaniche SpA | 2,036 | 37,426 | ||||||
| Danieli & C Officine Meccaniche SpA, Preference Shares | 7,286 | 92,588 | ||||||
| Davide Campari-Milano NV | 4,788 | 46,974 | ||||||
| De' Longhi SpA | 513 | 8,960 | ||||||
| DiaSorin SpA | 963 | 126,330 | ||||||
Digital Bros SpA(1) | 1,147 | 28,289 | ||||||
Digital Value SpA(2) | 772 | 51,490 | ||||||
| doValue SpA | 10,061 | 57,629 | ||||||
Enav SpA(2) | 36,812 | 152,185 | ||||||
| Enel SpA | 303,870 | 1,427,907 | ||||||
Eni SpA, ADR(1) | 99,990 | 2,361,764 | ||||||
| ERG SpA | 9,964 | 315,786 | ||||||
| Esprinet SpA | 2,865 | 19,488 | ||||||
| Ferrari NV | 5,193 | 1,002,469 | ||||||
| Fila SpA | 2,851 | 21,512 | ||||||
Fincantieri SpA(1)(2) | 120,808 | 60,564 | ||||||
| FinecoBank Banca Fineco SpA | 82,872 | 896,036 | ||||||
| Gruppo MutuiOnline SpA | 711 | 17,544 | ||||||
Hera SpA(1) | 241,038 | 603,769 | ||||||
| Infrastrutture Wireless Italiane SpA | 3,592 | 33,290 | ||||||
Intek Group SpA(2) | 23,351 | 13,263 | ||||||
| Interpump Group SpA | 1,856 | 65,500 | ||||||
| Intesa Sanpaolo SpA | 967,908 | 1,666,244 | ||||||
| Iren SpA | 238,529 | 359,456 | ||||||
| Italgas SpA | 160,687 | 826,523 | ||||||
Iveco Group NV(2) | 58,910 | 297,873 | ||||||
Juventus Football Club SpA(1)(2) | 47,074 | 17,024 | ||||||
| Leonardo SpA | 93,353 | 763,982 | ||||||
Maire Tecnimont SpA(1) | 27,880 | 70,754 | ||||||
| MARR SpA | 4,760 | 55,900 | ||||||
| Mediobanca Banca di Credito Finanziario SpA | 42,382 | 335,491 | ||||||
MFE-MediaForEurope NV, Class A(2) | 209,805 | 88,999 | ||||||
MFE-MediaForEurope NV, Class B(2) | 43,310 | 25,194 | ||||||
| Moncler SpA | 14,538 | 646,821 | ||||||
Nexi SpA(2) | 13,406 | 109,989 | ||||||
| OVS SpA | 78,160 | 118,185 | ||||||
| Pharmanutra SpA | 424 | 28,737 | ||||||
| Piaggio & C SpA | 14,394 | 35,161 | ||||||
| Poste Italiane SpA | 64,004 | 511,519 | ||||||
| Prysmian SpA | 16,073 | 493,164 | ||||||
| RAI Way SpA | 19,720 | 95,384 | ||||||
| Recordati Industria Chimica e Farmaceutica SpA | 7,622 | 310,977 | ||||||
| Reply SpA | 1,488 | 175,165 | ||||||
139
| Avantis International Equity ETF | ||||||||
| Shares | Value | |||||||
Safilo Group SpA(2) | 13,716 | $ | 19,215 | |||||
Saipem SpA(1)(2) | 135,168 | 94,823 | ||||||
Salvatore Ferragamo SpA(1) | 9,920 | 159,555 | ||||||
| Sanlorenzo SpA/Ameglia | 1,000 | 31,418 | ||||||
Saras SpA(2) | 226,969 | 274,921 | ||||||
| Sesa SpA | 1,467 | 179,320 | ||||||
| Snam SpA | 215,447 | 1,023,999 | ||||||
| SOL SpA | 2,502 | 44,691 | ||||||
| Stellantis NV | 165,698 | 2,207,185 | ||||||
| Technogym SpA | 16,948 | 116,218 | ||||||
Telecom Italia SpA/Milano(2) | 743,208 | 153,293 | ||||||
| Tenaris SA, ADR | 6,871 | 187,716 | ||||||
| Terna - Rete Elettrica Nazionale | 110,963 | 788,859 | ||||||
| Tinexta Spa | 922 | 20,392 | ||||||
Tod's SpA(2) | 1,049 | 42,387 | ||||||
| UniCredit SpA | 194,532 | 1,903,668 | ||||||
Unieuro SpA(1) | 3,508 | 39,889 | ||||||
| Unipol Gruppo SpA | 52,115 | 218,236 | ||||||
Webuild SpA(1) | 86,058 | 120,858 | ||||||
| Zignago Vetro SpA | 2,366 | 26,931 | ||||||
| 30,661,300 | ||||||||
| Japan — 21.1% | ||||||||
| 77 Bank Ltd. | 11,800 | 150,526 | ||||||
| A&D HOLON Holdings Co. Ltd. | 4,300 | 29,440 | ||||||
ABC-Mart, Inc.(1) | 700 | 28,159 | ||||||
| Acom Co. Ltd. | 24,300 | 57,792 | ||||||
Adastria Co. Ltd.(1) | 1,200 | 17,372 | ||||||
| ADEKA Corp. | 11,700 | 197,430 | ||||||
| Advantest Corp. | 13,300 | 753,250 | ||||||
| Adventure, Inc. | 600 | 45,655 | ||||||
| Adways, Inc. | 7,600 | 40,740 | ||||||
Aeon Co. Ltd.(1) | 26,200 | 511,050 | ||||||
Aeon Delight Co. Ltd.(1) | 3,100 | 63,369 | ||||||
Aeon Fantasy Co. Ltd.(1) | 2,400 | 61,556 | ||||||
AEON Financial Service Co. Ltd.(1) | 28,900 | 296,814 | ||||||
Aeon Mall Co. Ltd.(1) | 19,200 | 229,005 | ||||||
| AFC-HD AMS Life Science Co. Ltd. | 2,500 | 13,846 | ||||||
| AGC, Inc. | 47,400 | 1,608,706 | ||||||
| Ai Holdings Corp. | 3,600 | 55,064 | ||||||
| Aichi Bank Ltd. | 1,700 | 70,706 | ||||||
| Aichi Steel Corp. | 1,300 | 19,278 | ||||||
| Aida Engineering Ltd. | 3,300 | 20,333 | ||||||
| Aiful Corp. | 51,800 | 146,146 | ||||||
| Ain Holdings, Inc. | 4,600 | 262,903 | ||||||
| Air Water, Inc. | 28,200 | 352,783 | ||||||
| Airport Facilities Co. Ltd. | 1,300 | 5,206 | ||||||
Airtrip Corp.(1) | 800 | 15,040 | ||||||
| Aisan Industry Co. Ltd. | 6,000 | 31,422 | ||||||
| Aisin Corp. | 16,800 | 499,542 | ||||||
| Aizawa Securities Group Co. Ltd. | 300 | 1,392 | ||||||
| Ajinomoto Co., Inc. | 52,200 | 1,442,800 | ||||||
140
| Avantis International Equity ETF | ||||||||
| Shares | Value | |||||||
| Akatsuki, Inc. | 1,900 | $ | 32,296 | |||||
Akebono Brake Industry Co. Ltd.(2) | 15,900 | 19,369 | ||||||
| Alconix Corp. | 4,500 | 45,775 | ||||||
Alfresa Holdings Corp.(1) | 22,400 | 268,048 | ||||||
Alpen Co. Ltd.(1) | 3,500 | 52,681 | ||||||
Alps Alpine Co. Ltd.(1) | 44,100 | 394,511 | ||||||
| Altech Corp. | 1,500 | 20,102 | ||||||
| Amada Co. Ltd. | 49,500 | 387,311 | ||||||
| Amano Corp. | 9,500 | 175,738 | ||||||
ANA Holdings, Inc.(2) | 5,000 | 96,132 | ||||||
| Anritsu Corp. | 21,100 | 248,722 | ||||||
| AOKI Holdings, Inc. | 7,300 | 36,905 | ||||||
| Aoyama Trading Co. Ltd. | 13,000 | 86,251 | ||||||
| Aozora Bank Ltd. | 23,400 | 451,677 | ||||||
Arakawa Chemical Industries Ltd.(1) | 3,500 | 25,721 | ||||||
| Arata Corp. | 10,500 | 311,108 | ||||||
Arcland Sakamoto Co. Ltd.(1) | 8,500 | 91,144 | ||||||
Arcland Service Holdings Co. Ltd.(1) | 3,200 | 47,611 | ||||||
Arcs Co. Ltd.(1) | 7,400 | 108,203 | ||||||
| Arealink Co. Ltd. | 100 | 1,367 | ||||||
| Argo Graphics, Inc. | 4,100 | 114,102 | ||||||
| Arisawa Manufacturing Co. Ltd. | 6,100 | 58,219 | ||||||
| ARTERIA Networks Corp. | 5,700 | 53,302 | ||||||
| ArtSpark Holdings, Inc. | 6,300 | 42,137 | ||||||
| AS One Corp. | 600 | 27,518 | ||||||
| Asahi Diamond Industrial Co. Ltd. | 12,200 | 68,074 | ||||||
| Asahi Group Holdings Ltd. | 13,100 | 439,220 | ||||||
Asahi Holdings, Inc.(1) | 5,400 | 80,487 | ||||||
| Asahi Intecc Co. Ltd. | 2,500 | 44,469 | ||||||
| Asahi Kasei Corp. | 181,800 | 1,328,556 | ||||||
| ASAHI YUKIZAI Corp. | 4,100 | 67,480 | ||||||
| Asanuma Corp. | 2,000 | 40,526 | ||||||
| Asia Pile Holdings Corp. | 6,000 | 21,700 | ||||||
| Asics Corp. | 24,700 | 451,618 | ||||||
| ASKA Pharmaceutical Holdings Co. Ltd. | 3,500 | 29,739 | ||||||
| ASKUL Corp. | 4,200 | 55,485 | ||||||
| Astellas Pharma, Inc. | 77,900 | 1,104,449 | ||||||
| Astena Holdings Co. Ltd. | 6,000 | 19,260 | ||||||
Aucnet, Inc.(1) | 3,500 | 54,280 | ||||||
| Autobacs Seven Co. Ltd. | 8,300 | 85,080 | ||||||
| Avant Corp. | 1,700 | 18,387 | ||||||
Awa Bank Ltd.(1) | 5,100 | 69,519 | ||||||
| Axial Retailing, Inc. | 3,200 | 79,868 | ||||||
| Azbil Corp. | 2,500 | 71,233 | ||||||
| Bandai Namco Holdings, Inc. | 15,400 | 1,155,564 | ||||||
| Bando Chemical Industries Ltd. | 2,900 | 21,017 | ||||||
Bank of Iwate Ltd.(1) | 1,100 | 14,732 | ||||||
| Bank of Kyoto Ltd. | 4,300 | 167,601 | ||||||
| Bank of Nagoya Ltd. | 2,100 | 46,708 | ||||||
| Bank of Saga Ltd. | 200 | 2,155 | ||||||
Bank of the Ryukyus Ltd.(1) | 5,400 | 30,084 | ||||||
141
| Avantis International Equity ETF | ||||||||
| Shares | Value | |||||||
| BayCurrent Consulting, Inc. | 1,100 | $ | 323,257 | |||||
| Belc Co. Ltd. | 2,600 | 104,238 | ||||||
Bell System24 Holdings, Inc.(1) | 2,900 | 30,926 | ||||||
| Belluna Co. Ltd. | 9,800 | 51,935 | ||||||
| Benefit One, Inc. | 5,900 | 87,342 | ||||||
| Benesse Holdings, Inc. | 12,500 | 196,472 | ||||||
Bic Camera, Inc.(1) | 26,900 | 220,198 | ||||||
| BIPROGY Inc | 12,300 | 272,403 | ||||||
| BML, Inc. | 6,400 | 163,774 | ||||||
| Bourbon Corp. | 200 | 3,070 | ||||||
| Bridgestone Corp. | 50,400 | 1,934,059 | ||||||
| Brother Industries Ltd. | 39,200 | 750,190 | ||||||
| Bunka Shutter Co. Ltd. | 8,400 | 64,423 | ||||||
| C Uyemura & Co. Ltd. | 2,600 | 121,677 | ||||||
| Calbee, Inc. | 6,600 | 130,968 | ||||||
| Canon Electronics, Inc. | 1,400 | 16,321 | ||||||
| Canon Marketing Japan, Inc. | 4,700 | 106,581 | ||||||
Canon, Inc., ADR(1) | 59,437 | 1,419,356 | ||||||
| Capcom Co. Ltd. | 24,700 | 674,179 | ||||||
| Carenet, Inc. | 3,600 | 30,829 | ||||||
Carta Holdings, Inc.(1) | 1,900 | 23,843 | ||||||
Casio Computer Co. Ltd.(1) | 8,700 | 82,169 | ||||||
| Cawachi Ltd. | 2,200 | 33,402 | ||||||
| Central Automotive Products Ltd. | 700 | 11,463 | ||||||
| Central Glass Co. Ltd. | 10,600 | 255,748 | ||||||
| Central Japan Railway Co. | 4,200 | 494,466 | ||||||
| Central Security Patrols Co. Ltd. | 1,000 | 18,073 | ||||||
| Central Sports Co. Ltd. | 1,100 | 19,975 | ||||||
| Charm Care Corp. KK | 3,900 | 34,894 | ||||||
| Chiba Bank Ltd. | 42,300 | 228,498 | ||||||
| Chilled & Frozen Logistics Holdings Co. Ltd. | 100 | 886 | ||||||
Chiyoda Corp.(2) | 7,800 | 22,221 | ||||||
| Chofu Seisakusho Co. Ltd. | 1,200 | 17,142 | ||||||
| Chubu Electric Power Co., Inc. | 24,500 | 249,136 | ||||||
| Chudenko Corp. | 3,900 | 59,582 | ||||||
| Chugai Pharmaceutical Co. Ltd. | 41,900 | 1,081,358 | ||||||
Chugoku Bank Ltd.(1) | 24,600 | 164,757 | ||||||
Chugoku Electric Power Co., Inc.(1) | 3,500 | 20,990 | ||||||
Chugoku Marine Paints Ltd.(1) | 3,500 | 22,192 | ||||||
| CI Takiron Corp. | 5,800 | 22,788 | ||||||
Citizen Watch Co. Ltd.(1) | 64,000 | 273,448 | ||||||
| CKD Corp. | 8,700 | 114,459 | ||||||
| CMIC Holdings Co. Ltd. | 1,200 | 14,251 | ||||||
| CMK Corp. | 10,700 | 35,974 | ||||||
| Coca-Cola Bottlers Japan Holdings, Inc. | 30,000 | 306,812 | ||||||
| COLOPL, Inc. | 5,100 | 25,770 | ||||||
| Colowide Co. Ltd. | 10,200 | 137,120 | ||||||
| Computer Engineering & Consulting Ltd. | 1,600 | 14,783 | ||||||
COMSYS Holdings Corp.(1) | 9,100 | 169,005 | ||||||
| Comture Corp. | 1,800 | 31,352 | ||||||
| Concordia Financial Group Ltd. | 120,600 | 382,452 | ||||||
142
| Avantis International Equity ETF | ||||||||
| Shares | Value | |||||||
| Core Corp. | 100 | $ | 1,062 | |||||
| Cosmo Energy Holdings Co. Ltd. | 17,400 | 520,969 | ||||||
| Cosmos Pharmaceutical Corp. | 1,600 | 168,518 | ||||||
Create Restaurants Holdings, Inc.(1) | 19,400 | 126,994 | ||||||
| Create SD Holdings Co. Ltd. | 4,500 | 100,915 | ||||||
| Credit Saison Co. Ltd. | 56,400 | 709,562 | ||||||
| Creek & River Co. Ltd. | 2,300 | 39,805 | ||||||
Cresco Ltd.(1) | 1,000 | 13,202 | ||||||
| CTI Engineering Co. Ltd. | 1,500 | 28,062 | ||||||
Curves Holdings Co. Ltd.(1) | 600 | 3,557 | ||||||
| CyberAgent, Inc. | 58,000 | 565,458 | ||||||
| Cybozu, Inc. | 2,000 | 19,293 | ||||||
| Dai Nippon Printing Co. Ltd. | 18,100 | 380,984 | ||||||
| Dai Nippon Toryo Co. Ltd. | 4,100 | 21,913 | ||||||
| Dai-ichi Life Holdings, Inc. | 120,800 | 2,087,183 | ||||||
Daicel Corp.(1) | 60,200 | 378,069 | ||||||
Daido Metal Co. Ltd.(1) | 7,200 | 27,281 | ||||||
Daido Steel Co. Ltd.(1) | 2,200 | 61,715 | ||||||
| Daifuku Co. Ltd. | 400 | 23,335 | ||||||
| Daiho Corp. | 1,800 | 52,376 | ||||||
| Daiichi Jitsugyo Co. Ltd. | 700 | 19,238 | ||||||
| Daiichi Kigenso Kagaku-Kogyo Co. Ltd. | 3,900 | 37,049 | ||||||
| Daiichi Sankyo Co. Ltd. | 68,700 | 2,064,558 | ||||||
| Daiken Corp. | 2,400 | 33,534 | ||||||
| Daikin Industries Ltd. | 7,400 | 1,291,796 | ||||||
| Daikokutenbussan Co. Ltd. | 1,300 | 55,203 | ||||||
Daikyonishikawa Corp.(1) | 5,500 | 23,070 | ||||||
| Dainichiseika Color & Chemicals Manufacturing Co. Ltd. | 1,200 | 15,432 | ||||||
Daio Paper Corp.(1) | 13,400 | 125,255 | ||||||
| Daiseki Co. Ltd. | 3,480 | 104,356 | ||||||
| Daishi Hokuetsu Financial Group, Inc. | 12,900 | 242,712 | ||||||
Daishinku Corp.(1) | 7,400 | 52,091 | ||||||
| Daito Pharmaceutical Co. Ltd. | 1,100 | 20,986 | ||||||
| Daito Trust Construction Co. Ltd. | 22,800 | 2,243,007 | ||||||
| Daiwa House Industry Co. Ltd. | 30,500 | 681,895 | ||||||
| Daiwa Industries Ltd. | 2,200 | 17,635 | ||||||
Daiwa Securities Group, Inc.(1) | 265,400 | 1,158,531 | ||||||
| Daiwabo Holdings Co. Ltd. | 15,600 | 219,604 | ||||||
DCM Holdings Co. Ltd.(1) | 18,000 | 133,488 | ||||||
| DeNA Co. Ltd. | 5,200 | 71,161 | ||||||
| Denka Co. Ltd. | 21,800 | 522,242 | ||||||
| Denso Corp. | 11,900 | 649,510 | ||||||
| Dentsu Group, Inc. | 35,700 | 1,149,719 | ||||||
| Dexerials Corp. | 24,500 | 681,188 | ||||||
| DIC Corp. | 15,700 | 281,513 | ||||||
| Digital Arts, Inc. | 1,600 | 74,358 | ||||||
| Digital Garage, Inc. | 6,900 | 192,338 | ||||||
| Digital Hearts Holdings Co. Ltd. | 700 | 9,234 | ||||||
Dip Corp.(1) | 4,200 | 108,632 | ||||||
| Direct Marketing MiX, Inc. | 2,100 | 27,808 | ||||||
| Disco Corp. | 3,000 | 728,429 | ||||||
143
| Avantis International Equity ETF | ||||||||
| Shares | Value | |||||||
| DKK Co. Ltd. | 1,000 | $ | 18,099 | |||||
| DKS Co. Ltd. | 1,400 | 22,221 | ||||||
| DMG Mori Co. Ltd. | 13,600 | 176,507 | ||||||
| Doshisha Co. Ltd. | 3,100 | 33,892 | ||||||
| Doutor Nichires Holdings Co. Ltd. | 1,100 | 12,722 | ||||||
| Dowa Holdings Co. Ltd. | 9,400 | 354,324 | ||||||
Dream Incubator, Inc.(2) | 2,100 | 30,137 | ||||||
| DTS Corp. | 5,100 | 131,398 | ||||||
| Duskin Co. Ltd. | 5,600 | 115,441 | ||||||
| DyDo Group Holdings, Inc. | 1,600 | 53,382 | ||||||
| E-Guardian, Inc. | 1,800 | 38,741 | ||||||
| Eagle Industry Co. Ltd. | 4,000 | 33,608 | ||||||
| Earth Corp. | 2,400 | 93,889 | ||||||
| East Japan Railway Co. | 7,500 | 388,475 | ||||||
| Ebara Corp. | 17,900 | 678,081 | ||||||
| Ebara Jitsugyo Co. Ltd. | 700 | 11,192 | ||||||
Eco's Co. Ltd.(1) | 1,500 | 20,230 | ||||||
EDION Corp.(1) | 21,600 | 185,808 | ||||||
| Eiken Chemical Co. Ltd. | 4,400 | 60,135 | ||||||
| Eisai Co. Ltd. | 17,000 | 693,144 | ||||||
| Eizo Corp. | 3,500 | 95,268 | ||||||
| EJ Holdings, Inc. | 2,400 | 22,372 | ||||||
| Elan Corp. | 4,400 | 35,726 | ||||||
Electric Power Development Co. Ltd.(1) | 34,900 | 537,607 | ||||||
| Elematec Corp. | 2,300 | 22,430 | ||||||
| en Japan, Inc. | 3,000 | 51,269 | ||||||
| ENEOS Holdings, Inc. | 478,500 | 1,808,215 | ||||||
| Enplas Corp. | 800 | 24,248 | ||||||
| ESPEC Corp. | 1,100 | 14,377 | ||||||
| Exedy Corp. | 5,400 | 69,577 | ||||||
| EXEO Group, Inc. | 21,700 | 332,930 | ||||||
| Ezaki Glico Co. Ltd. | 5,400 | 140,506 | ||||||
| F.C.C. Co. Ltd. | 6,000 | 62,098 | ||||||
| Fancl Corp. | 1,400 | 28,306 | ||||||
| FANUC Corp. | 1,500 | 241,649 | ||||||
Fast Retailing Co. Ltd.(1) | 1,100 | 643,205 | ||||||
| Feed One Co. Ltd. | 6,420 | 32,349 | ||||||
| Ferrotec Holdings Corp. | 15,100 | 343,701 | ||||||
FIDEA Holdings Co. Ltd.(1) | 4,040 | 38,345 | ||||||
| Fields Corp. | 2,100 | 20,349 | ||||||
| Financial Products Group Co. Ltd. | 11,700 | 105,046 | ||||||
| Fixstars Corp. | 3,500 | 30,670 | ||||||
| FJ Next Holdings Co. Ltd. | 4,300 | 31,805 | ||||||
| Food & Life Cos. Ltd. | 10,600 | 166,810 | ||||||
| FP Corp. | 6,800 | 159,627 | ||||||
| France Bed Holdings Co. Ltd. | 3,000 | 21,265 | ||||||
Fronteo, Inc.(1) | 2,600 | 15,040 | ||||||
| Fudo Tetra Corp. | 2,600 | 29,285 | ||||||
| Fuji Corp./Miyagi | 1,800 | 16,193 | ||||||
| Fuji Electric Co. Ltd. | 48,200 | 2,082,343 | ||||||
| Fuji Kyuko Co. Ltd. | 1,000 | 29,419 | ||||||
144
| Avantis International Equity ETF | ||||||||
| Shares | Value | |||||||
| Fuji Media Holdings, Inc. | 5,800 | $ | 45,900 | |||||
| Fuji Seal International, Inc. | 6,600 | 73,214 | ||||||
| Fuji Soft, Inc. | 3,300 | 192,673 | ||||||
| Fujibo Holdings, Inc. | 1,400 | 36,327 | ||||||
| Fujicco Co. Ltd. | 1,300 | 18,212 | ||||||
| FUJIFILM Holdings Corp. | 10,900 | 553,358 | ||||||
| Fujikura Composites, Inc. | 3,700 | 27,169 | ||||||
| Fujikura Ltd. | 85,700 | 608,581 | ||||||
| Fujimi, Inc. | 1,600 | 76,587 | ||||||
| Fujimori Kogyo Co. Ltd. | 3,200 | 80,964 | ||||||
| Fujitec Co. Ltd. | 4,300 | 86,656 | ||||||
| Fujitsu Ltd. | 10,900 | 1,282,638 | ||||||
| Fujiya Co. Ltd. | 2,100 | 35,876 | ||||||
| Fukuda Corp. | 500 | 17,649 | ||||||
Fukui Bank Ltd.(1) | 200 | 1,987 | ||||||
| Fukui Computer Holdings, Inc. | 2,200 | 56,034 | ||||||
| Fukuoka Financial Group, Inc. | 21,500 | 384,198 | ||||||
| Fukushima Galilei Co. Ltd. | 1,200 | 31,301 | ||||||
| Fukuyama Transporting Co. Ltd. | 3,600 | 81,764 | ||||||
| FULLCAST Holdings Co. Ltd. | 3,500 | 61,239 | ||||||
| Funai Soken Holdings, Inc. | 5,700 | 97,643 | ||||||
| Furukawa Battery Co. Ltd. | 2,000 | 16,620 | ||||||
| Furukawa Co. Ltd. | 2,100 | 19,039 | ||||||
| Furukawa Electric Co. Ltd. | 9,200 | 161,168 | ||||||
| Furuno Electric Co. Ltd. | 4,100 | 33,009 | ||||||
| Furyu Corp. | 2,500 | 18,234 | ||||||
| Fuso Chemical Co. Ltd. | 3,300 | 83,368 | ||||||
| Futaba Industrial Co. Ltd. | 7,600 | 19,651 | ||||||
| Future Corp. | 3,800 | 46,230 | ||||||
| Fuyo General Lease Co. Ltd. | 4,000 | 236,209 | ||||||
| G-7 Holdings, Inc. | 5,800 | 62,188 | ||||||
G-Tekt Corp.(1) | 4,300 | 43,007 | ||||||
| Gakken Holdings Co. Ltd. | 4,800 | 33,824 | ||||||
| Gakkyusha Co. Ltd. | 2,100 | 24,656 | ||||||
Genky DrugStores Co. Ltd.(1) | 2,500 | 65,742 | ||||||
| Geo Holdings Corp. | 3,500 | 41,480 | ||||||
| Giken Ltd. | 3,100 | 72,163 | ||||||
| GLOBERIDE, Inc. | 8,100 | 158,747 | ||||||
| Glory Ltd. | 10,700 | 168,940 | ||||||
GMO Financial Holdings, Inc.(1) | 7,400 | 40,260 | ||||||
| GMO Payment Gateway, Inc. | 2,100 | 166,539 | ||||||
| Goldcrest Co. Ltd. | 4,400 | 54,824 | ||||||
| Goldwin, Inc. | 2,800 | 166,739 | ||||||
| Golf Digest Online, Inc. | 3,400 | 51,526 | ||||||
Gree, Inc.(1) | 1,800 | 10,995 | ||||||
| gremz, Inc. | 400 | 5,222 | ||||||
| GS Yuasa Corp. | 8,000 | 145,169 | ||||||
| GungHo Online Entertainment, Inc. | 10,500 | 173,393 | ||||||
Gunma Bank Ltd.(1) | 69,600 | 194,635 | ||||||
| Gunze Ltd. | 3,600 | 101,747 | ||||||
| H-One Co. Ltd. | 800 | 3,483 | ||||||
145
| Avantis International Equity ETF | ||||||||
| Shares | Value | |||||||
| H.U. Group Holdings, Inc. | 15,200 | $ | 308,730 | |||||
| H2O Retailing Corp. | 19,700 | 138,794 | ||||||
| Hachijuni Bank Ltd. | 60,400 | 207,126 | ||||||
| Hakudo Co. Ltd. | 1,300 | 25,203 | ||||||
| Hakuhodo DY Holdings, Inc. | 33,900 | 302,439 | ||||||
| Hakuto Co. Ltd. | 5,500 | 130,668 | ||||||
Halows Co. Ltd.(1) | 700 | 15,373 | ||||||
| Hamakyorex Co. Ltd. | 1,800 | 40,987 | ||||||
| Hamamatsu Photonics KK | 12,600 | 534,223 | ||||||
| Hankyu Hanshin Holdings, Inc. | 31,800 | 953,635 | ||||||
| Hanwa Co. Ltd. | 14,400 | 356,237 | ||||||
| Happinet Corp. | 4,000 | 46,346 | ||||||
| Haseko Corp. | 24,200 | 277,314 | ||||||
| Hazama Ando Corp. | 24,000 | 148,846 | ||||||
| Heiwa Corp. | 13,600 | 206,886 | ||||||
| Heiwa Real Estate Co. Ltd. | 8,400 | 236,868 | ||||||
Heiwado Co. Ltd.(1) | 7,300 | 104,342 | ||||||
| HI-LEX Corp. | 1,900 | 14,650 | ||||||
| Hibiya Engineering Ltd. | 2,000 | 26,741 | ||||||
| Hikari Tsushin, Inc. | 2,000 | 252,851 | ||||||
| Hino Motors Ltd. | 36,000 | 164,241 | ||||||
| Hioki EE Corp. | 800 | 38,847 | ||||||
Hirano Tecseed Co. Ltd.(1) | 2,700 | 35,950 | ||||||
| Hirata Corp. | 700 | 22,821 | ||||||
Hirogin Holdings, Inc.(1) | 45,400 | 199,776 | ||||||
| Hirose Electric Co. Ltd. | 1,900 | 269,225 | ||||||
Hisamitsu Pharmaceutical Co., Inc.(1) | 1,500 | 36,325 | ||||||
| Hitachi Construction Machinery Co. Ltd. | 14,400 | 296,030 | ||||||
| Hitachi Ltd. | 57,200 | 2,857,829 | ||||||
Hitachi Metals Ltd.(2) | 14,100 | 212,159 | ||||||
| Hitachi Transport System Ltd. | 3,300 | 208,336 | ||||||
| Hitachi Zosen Corp. | 80,600 | 508,788 | ||||||
| Hochiki Corp. | 300 | 2,892 | ||||||
| Hodogaya Chemical Co. Ltd. | 1,100 | 25,624 | ||||||
| Hogy Medical Co. Ltd. | 2,000 | 50,021 | ||||||
| Hokkaido Electric Power Co., Inc. | 41,300 | 151,592 | ||||||
| Hokkoku Financial Holdings, Inc. | 16,300 | 576,678 | ||||||
| Hokuetsu Corp. | 27,300 | 146,918 | ||||||
| Hokuhoku Financial Group, Inc. | 23,500 | 139,639 | ||||||
| Hokuriku Electric Power Co. | 23,800 | 87,258 | ||||||
| Hokuto Corp. | 2,300 | 31,811 | ||||||
| Honda Motor Co. Ltd., ADR | 97,252 | 2,579,123 | ||||||
| Honeys Holdings Co. Ltd. | 3,400 | 30,149 | ||||||
| Hoosiers Holdings Co. Ltd. | 4,500 | 26,108 | ||||||
| Horiba Ltd. | 8,300 | 378,096 | ||||||
| Hoshizaki Corp. | 3,800 | 112,892 | ||||||
| Hosiden Corp. | 8,200 | 93,166 | ||||||
| Hosokawa Micron Corp. | 2,300 | 43,419 | ||||||
| House Foods Group, Inc. | 2,300 | 48,797 | ||||||
| Hoya Corp. | 12,556 | 1,280,420 | ||||||
| HS Holdings Co. Ltd. | 7,600 | 63,591 | ||||||
146
| Avantis International Equity ETF | ||||||||
| Shares | Value | |||||||
| Hulic Co. Ltd. | 63,800 | $ | 483,474 | |||||
| Hyakugo Bank Ltd. | 37,300 | 85,361 | ||||||
| Hyakujushi Bank Ltd. | 4,000 | 48,803 | ||||||
| i-mobile Co. Ltd. | 2,300 | 23,585 | ||||||
| I-PEX, Inc. | 1,900 | 18,695 | ||||||
| Ibiden Co. Ltd. | 16,000 | 507,825 | ||||||
| Ichigo, Inc. | 5,900 | 12,894 | ||||||
| Ichinen Holdings Co. Ltd. | 100 | 912 | ||||||
| Ichiyoshi Securities Co. Ltd. | 2,700 | 12,303 | ||||||
| Idec Corp. | 9,600 | 200,561 | ||||||
Idemitsu Kosan Co. Ltd.(1) | 59,000 | 1,555,668 | ||||||
IDOM, Inc.(1) | 14,400 | 85,224 | ||||||
| IHI Corp. | 34,300 | 916,026 | ||||||
Iida Group Holdings Co. Ltd.(1) | 16,100 | 245,249 | ||||||
| Iino Kaiun Kaisha Ltd. | 17,500 | 102,834 | ||||||
| IMAGICA GROUP, Inc. | 5,500 | 35,589 | ||||||
| Inaba Denki Sangyo Co. Ltd. | 11,300 | 222,845 | ||||||
| Inabata & Co. Ltd. | 7,700 | 134,738 | ||||||
| Ines Corp. | 1,400 | 15,628 | ||||||
| Infocom Corp. | 3,600 | 52,154 | ||||||
| Information Services International-Dentsu Ltd. | 1,000 | 32,460 | ||||||
| INFRONEER Holdings, Inc. | 31,148 | 222,648 | ||||||
| Innotech Corp. | 2,900 | 28,337 | ||||||
| INPEX Corp. | 171,800 | 1,974,777 | ||||||
| Insource Co. Ltd. | 3,200 | 64,217 | ||||||
| Intage Holdings, Inc. | 6,100 | 70,048 | ||||||
| Internet Initiative Japan, Inc. | 9,000 | 325,042 | ||||||
| Inui Global Logistics Co. Ltd. | 2,800 | 42,893 | ||||||
| Iseki & Co. Ltd. | 3,800 | 34,570 | ||||||
| Isetan Mitsukoshi Holdings Ltd. | 28,100 | 222,045 | ||||||
| Ishihara Sangyo Kaisha Ltd. | 7,300 | 58,666 | ||||||
| Isuzu Motors Ltd. | 144,000 | 1,788,434 | ||||||
| Itfor, Inc. | 100 | 567 | ||||||
| ITmedia, Inc. | 1,600 | 20,742 | ||||||
| Ito En Ltd. | 1,800 | 78,997 | ||||||
| ITOCHU Corp. | 49,400 | 1,359,524 | ||||||
| Itochu Enex Co. Ltd. | 15,600 | 122,392 | ||||||
| Itochu Techno-Solutions Corp. | 4,500 | 113,567 | ||||||
| Itoham Yonekyu Holdings, Inc. | 18,000 | 87,048 | ||||||
| IwaiCosmo Holdings, Inc. | 2,500 | 22,555 | ||||||
| Iwatani Corp. | 6,500 | 265,215 | ||||||
| Iyo Bank Ltd. | 39,500 | 183,683 | ||||||
Izumi Co. Ltd.(1) | 5,700 | 123,013 | ||||||
J Front Retailing Co. Ltd.(1) | 82,000 | 649,890 | ||||||
J-Oil Mills, Inc.(1) | 1,700 | 19,541 | ||||||
| JAC Recruitment Co. Ltd. | 1,100 | 15,570 | ||||||
| Jaccs Co. Ltd. | 6,100 | 167,751 | ||||||
| JAFCO Group Co. Ltd. | 17,500 | 253,265 | ||||||
Japan Airlines Co. Ltd.(2) | 5,000 | 91,452 | ||||||
Japan Airport Terminal Co. Ltd.(2) | 1,100 | 45,394 | ||||||
| Japan Aviation Electronics Industry Ltd. | 8,600 | 143,819 | ||||||
147
| Avantis International Equity ETF | ||||||||
| Shares | Value | |||||||
Japan Display, Inc.(2) | 54,200 | $ | 24,413 | |||||
Japan Electronic Materials Corp.(1) | 2,800 | 31,437 | ||||||
| Japan Elevator Service Holdings Co. Ltd. | 5,500 | 73,340 | ||||||
| Japan Exchange Group, Inc. | 47,500 | 707,855 | ||||||
| Japan Investment Adviser Co. Ltd. | 3,700 | 35,817 | ||||||
| Japan Lifeline Co. Ltd. | 14,500 | 105,264 | ||||||
| Japan Material Co. Ltd. | 7,800 | 107,954 | ||||||
| Japan Petroleum Exploration Co. Ltd. | 9,500 | 270,659 | ||||||
| Japan Post Bank Co. Ltd. | 19,400 | 141,415 | ||||||
| Japan Post Holdings Co. Ltd. | 272,800 | 1,881,988 | ||||||
| Japan Post Insurance Co. Ltd. | 40,000 | 612,704 | ||||||
| Japan Pulp & Paper Co. Ltd. | 700 | 21,957 | ||||||
| Japan Securities Finance Co. Ltd. | 11,800 | 70,486 | ||||||
| Japan Steel Works Ltd. | 9,100 | 194,290 | ||||||
| Japan Wool Textile Co. Ltd. | 9,700 | 71,291 | ||||||
| JCR Pharmaceuticals Co. Ltd. | 3,800 | 58,912 | ||||||
| JCU Corp. | 1,900 | 44,791 | ||||||
| Jeol Ltd. | 1,100 | 44,056 | ||||||
JFE Holdings, Inc.(1) | 124,800 | 1,340,795 | ||||||
| JGC Holdings Corp. | 35,600 | 479,687 | ||||||
| JINS Holdings, Inc. | 1,000 | 30,503 | ||||||
| JINUSHI Co. Ltd. | 3,500 | 50,362 | ||||||
| JM Holdings Co. Ltd. | 2,400 | 27,474 | ||||||
| JMDC, Inc. | 700 | 33,256 | ||||||
| Joshin Denki Co. Ltd. | 3,900 | 53,725 | ||||||
| Joyful Honda Co. Ltd. | 10,400 | 129,729 | ||||||
| JSB Co. Ltd. | 1,300 | 32,398 | ||||||
| JSP Corp. | 2,500 | 25,951 | ||||||
| JSR Corp. | 50,800 | 1,133,187 | ||||||
| JTEKT Corp. | 22,000 | 154,868 | ||||||
| Juki Corp. | 7,200 | 36,466 | ||||||
| Juroku Financial Group, Inc. | 5,900 | 104,398 | ||||||
| Justsystems Corp. | 2,200 | 55,236 | ||||||
| JVCKenwood Corp. | 32,600 | 47,855 | ||||||
| K's Holdings Corp. | 43,800 | 403,548 | ||||||
| Kadokawa Corp. | 3,800 | 82,362 | ||||||
| Kaga Electronics Co. Ltd. | 3,500 | 103,605 | ||||||
| Kagome Co. Ltd. | 7,100 | 156,598 | ||||||
| Kajima Corp. | 116,100 | 1,221,666 | ||||||
| Kakaku.com, Inc. | 12,100 | 222,735 | ||||||
| Kakiyasu Honten Co. Ltd. | 1,700 | 28,587 | ||||||
| Kameda Seika Co. Ltd. | 800 | 26,134 | ||||||
| Kamei Corp. | 200 | 1,573 | ||||||
| Kamigumi Co. Ltd. | 13,700 | 268,094 | ||||||
| Kanamoto Co. Ltd. | 7,100 | 109,299 | ||||||
| Kandenko Co. Ltd. | 8,500 | 51,149 | ||||||
| Kaneka Corp. | 7,800 | 209,210 | ||||||
| Kanematsu Corp. | 40,200 | 434,883 | ||||||
| Kanematsu Electronics Ltd. | 700 | 21,355 | ||||||
| Kansai Electric Power Co., Inc. | 61,300 | 594,098 | ||||||
| Kansai Paint Co. Ltd. | 7,000 | 107,285 | ||||||
148
| Avantis International Equity ETF | ||||||||
| Shares | Value | |||||||
| Kanto Denka Kogyo Co. Ltd. | 11,800 | $ | 84,778 | |||||
| Kao Corp. | 22,000 | 952,606 | ||||||
| Katakura Industries Co. Ltd. | 1,400 | 20,425 | ||||||
| Kato Sangyo Co. Ltd. | 5,800 | 142,640 | ||||||
| Kawai Musical Instruments Manufacturing Co. Ltd. | 800 | 15,702 | ||||||
| Kawasaki Heavy Industries Ltd. | 18,800 | 364,871 | ||||||
Kawasaki Kisen Kaisha Ltd.(1) | 21,600 | 1,366,590 | ||||||
| KDDI Corp. | 130,500 | 3,993,447 | ||||||
| KeePer Technical Laboratory Co. Ltd. | 1,500 | 44,029 | ||||||
| Keihan Holdings Co. Ltd. | 2,900 | 73,530 | ||||||
| Keihanshin Building Co. Ltd. | 1,700 | 15,345 | ||||||
| Keikyu Corp. | 9,000 | 92,485 | ||||||
| Keio Corp. | 1,800 | 68,491 | ||||||
| Keisei Electric Railway Co. Ltd. | 3,400 | 94,847 | ||||||
| KEIWA, Inc. | 1,200 | 37,864 | ||||||
| Keiyo Bank Ltd. | 14,300 | 49,727 | ||||||
Keiyo Co. Ltd.(1) | 1,300 | 8,514 | ||||||
| Kewpie Corp. | 9,500 | 156,077 | ||||||
| Keyence Corp. | 3,300 | 1,239,064 | ||||||
| KFC Holdings Japan Ltd. | 600 | 12,069 | ||||||
| KH Neochem Co. Ltd. | 10,900 | 200,582 | ||||||
| Kibun Foods, Inc. | 3,400 | 24,153 | ||||||
| Kikkoman Corp. | 6,900 | 421,925 | ||||||
| Kinden Corp. | 8,500 | 89,694 | ||||||
| Kintetsu Group Holdings Co. Ltd. | 7,000 | 237,697 | ||||||
| Kirin Holdings Co. Ltd. | 27,200 | 447,760 | ||||||
| Kissei Pharmaceutical Co. Ltd. | 3,100 | 55,196 | ||||||
| Kito Corp. | 1,600 | 31,035 | ||||||
| Kitz Corp. | 10,200 | 59,473 | ||||||
| Kiyo Bank Ltd. | 13,400 | 143,995 | ||||||
| Koa Corp. | 8,900 | 150,493 | ||||||
| Kobayashi Pharmaceutical Co. Ltd. | 600 | 34,003 | ||||||
| Kobe Bussan Co. Ltd. | 6,600 | 168,072 | ||||||
| Kobe Steel Ltd. | 117,300 | 533,709 | ||||||
Koei Tecmo Holdings Co. Ltd.(1) | 2,100 | 70,405 | ||||||
Kohnan Shoji Co. Ltd.(1) | 24,200 | 599,862 | ||||||
| Koito Manufacturing Co. Ltd. | 4,300 | 146,907 | ||||||
Kojima Co. Ltd.(1) | 8,100 | 37,138 | ||||||
| Kokusai Pulp & Paper Co. Ltd. | 100 | 510 | ||||||
| Kokuyo Co. Ltd. | 11,300 | 145,534 | ||||||
| Komatsu Ltd. | 71,000 | 1,485,230 | ||||||
| Komatsu Matere Co. Ltd. | 200 | 1,317 | ||||||
KOMEDA Holdings Co. Ltd.(1) | 7,000 | 115,501 | ||||||
| Komeri Co. Ltd. | 7,500 | 140,860 | ||||||
| Konami Group Corp. | 10,800 | 548,096 | ||||||
| Kondotec, Inc. | 300 | 2,205 | ||||||
Konica Minolta, Inc.(1) | 77,200 | 267,304 | ||||||
| Konishi Co. Ltd. | 5,300 | 62,004 | ||||||
| Konoike Transport Co. Ltd. | 2,700 | 25,623 | ||||||
| Kose Corp. | 500 | 47,087 | ||||||
| Kotobuki Spirits Co. Ltd. | 200 | 11,516 | ||||||
149
| Avantis International Equity ETF | ||||||||
| Shares | Value | |||||||
| Krosaki Harima Corp. | 600 | $ | 20,317 | |||||
| Kubota Corp. | 35,500 | 551,323 | ||||||
| Kumagai Gumi Co. Ltd. | 18,900 | 361,572 | ||||||
| Kumiai Chemical Industry Co. Ltd. | 7,800 | 60,773 | ||||||
| Kurabo Industries Ltd. | 2,700 | 41,194 | ||||||
| Kuraray Co. Ltd. | 49,400 | 375,234 | ||||||
| Kureha Corp. | 3,800 | 255,182 | ||||||
| Kurita Water Industries Ltd. | 17,900 | 696,442 | ||||||
| Kuriyama Holdings Corp. | 3,800 | 24,328 | ||||||
| Kusuri no Aoki Holdings Co. Ltd. | 3,000 | 132,333 | ||||||
| KYB Corp. | 8,100 | 191,583 | ||||||
| Kyocera Corp. | 12,800 | 711,472 | ||||||
Kyoden Co. Ltd.(1) | 4,600 | 20,709 | ||||||
| Kyoei Steel Ltd. | 2,900 | 31,903 | ||||||
| Kyokuto Boeki Kaisha Ltd. | 2,400 | 23,024 | ||||||
| Kyokuto Kaihatsu Kogyo Co. Ltd. | 7,100 | 69,674 | ||||||
| Kyokuyo Co. Ltd. | 1,200 | 31,407 | ||||||
| KYORIN Holdings, Inc. | 900 | 11,314 | ||||||
| Kyowa Kirin Co. Ltd. | 10,900 | 244,320 | ||||||
| Kyudenko Corp. | 4,800 | 96,629 | ||||||
| Kyushu Electric Power Co., Inc. | 44,400 | 266,843 | ||||||
| Kyushu Financial Group, Inc. | 47,400 | 129,463 | ||||||
| Kyushu Railway Co. | 10,700 | 225,081 | ||||||
| Lasertec Corp. | 4,600 | 636,858 | ||||||
Lawson, Inc.(1) | 7,600 | 251,870 | ||||||
| LEC, Inc. | 4,100 | 22,362 | ||||||
Leopalace21 Corp.(2) | 200 | 475 | ||||||
| LIKE, Inc. | 1,200 | 19,343 | ||||||
| Link & Motivation, Inc. | 4,500 | 20,599 | ||||||
| Lintec Corp. | 6,500 | 108,332 | ||||||
| Lion Corp. | 11,600 | 135,438 | ||||||
| LITALICO, Inc. | 1,900 | 39,696 | ||||||
Lixil Corp.(1) | 27,400 | 476,471 | ||||||
| Loadstar Capital KK | 2,400 | 32,025 | ||||||
M&A Capital Partners Co. Ltd.(2) | 700 | 17,274 | ||||||
| m-up Holdings, Inc. | 6,500 | 67,247 | ||||||
| M3, Inc. | 18,600 | 595,792 | ||||||
| Mabuchi Motor Co. Ltd. | 2,600 | 73,818 | ||||||
| Macnica Holdings, Inc. | 10,700 | 229,584 | ||||||
| Maeda Kosen Co. Ltd. | 2,500 | 58,043 | ||||||
| Makino Milling Machine Co. Ltd. | 18,100 | 571,150 | ||||||
| Makita Corp. | 4,300 | 101,109 | ||||||
Management Solutions Co. Ltd.(1)(2) | 1,700 | 33,958 | ||||||
| Mandom Corp. | 1,300 | 13,983 | ||||||
| MarkLines Co. Ltd. | 1,900 | 30,534 | ||||||
| Marubeni Corp. | 197,700 | 2,060,485 | ||||||
| Marudai Food Co. Ltd. | 1,500 | 17,008 | ||||||
| Maruha Nichiro Corp. | 8,900 | 159,138 | ||||||
Marui Group Co. Ltd.(1) | 11,100 | 199,086 | ||||||
| Maruichi Steel Tube Ltd. | 4,700 | 100,194 | ||||||
| MARUKA FURUSATO Corp. | 4,800 | 116,981 | ||||||
150
| Avantis International Equity ETF | ||||||||
| Shares | Value | |||||||
Marumae Co. Ltd.(1) | 1,200 | $ | 17,723 | |||||
Marusan Securities Co. Ltd.(1) | 7,700 | 26,404 | ||||||
Maruwa Co. Ltd.(1) | 1,400 | 176,115 | ||||||
Maruwa Unyu Kikan Co. Ltd.(1) | 3,700 | 44,493 | ||||||
| Maruzen Showa Unyu Co. Ltd. | 800 | 18,268 | ||||||
| Marvelous, Inc. | 3,600 | 17,540 | ||||||
| Matsuda Sangyo Co. Ltd. | 700 | 12,162 | ||||||
| Matsui Securities Co. Ltd. | 19,000 | 108,238 | ||||||
| MatsukiyoCocokara & Co. | 5,220 | 207,118 | ||||||
| Max Co. Ltd. | 2,400 | 34,499 | ||||||
| Maxell Ltd. | 11,900 | 126,217 | ||||||
| Maxvalu Tokai Co. Ltd. | 800 | 15,563 | ||||||
| Mazda Motor Corp. | 126,800 | 1,122,954 | ||||||
| McDonald's Holdings Co. Japan Ltd. | 8,600 | 307,388 | ||||||
| Mebuki Financial Group, Inc. | 323,200 | 619,435 | ||||||
| MEC Co. Ltd. | 1,300 | 23,151 | ||||||
| Media Do Co. Ltd. | 1,400 | 20,593 | ||||||
| Medical Data Vision Co. Ltd. | 4,400 | 35,244 | ||||||
| Medipal Holdings Corp. | 21,400 | 292,790 | ||||||
MedPeer, Inc.(2) | 100 | 1,137 | ||||||
| Megmilk Snow Brand Co. Ltd. | 12,700 | 156,528 | ||||||
| Meidensha Corp. | 6,400 | 91,738 | ||||||
| MEIJI Holdings Co. Ltd. | 35,700 | 1,700,708 | ||||||
Meiji Shipping Co. Ltd.(1) | 1,900 | 11,163 | ||||||
Meiko Electronics Co. Ltd.(1) | 17,400 | 404,236 | ||||||
| Meisei Industrial Co. Ltd. | 2,800 | 15,059 | ||||||
| Meitec Corp. | 12,300 | 216,258 | ||||||
Meiwa Corp.(1) | 5,300 | 30,272 | ||||||
| Members Co. Ltd. | 1,400 | 27,275 | ||||||
| Menicon Co. Ltd. | 3,700 | 88,831 | ||||||
Mercari, Inc.(2) | 2,300 | 37,040 | ||||||
| METAWATER Co. Ltd. | 400 | 5,884 | ||||||
| Micronics Japan Co. Ltd. | 6,800 | 69,657 | ||||||
| Mie Kotsu Group Holdings, Inc. | 100 | 347 | ||||||
| Milbon Co. Ltd. | 1,400 | 58,964 | ||||||
| Mimasu Semiconductor Industry Co. Ltd. | 3,700 | 56,268 | ||||||
| MINEBEA MITSUMI, Inc. | 65,700 | 1,129,191 | ||||||
Ministop Co. Ltd.(1) | 1,900 | 19,283 | ||||||
| Mirait One Corp. | 20,400 | 229,277 | ||||||
| Miroku Jyoho Service Co. Ltd. | 1,400 | 15,500 | ||||||
| MISUMI Group, Inc. | 9,100 | 223,370 | ||||||
| Mito Securities Co. Ltd. | 2,600 | 4,952 | ||||||
| Mitsuba Corp. | 6,200 | 19,705 | ||||||
| Mitsubishi Chemical Group Corp. | 218,800 | 1,148,691 | ||||||
| Mitsubishi Corp. | 104,700 | 3,427,944 | ||||||
| Mitsubishi Electric Corp. | 79,700 | 805,778 | ||||||
| Mitsubishi Estate Co. Ltd. | 27,300 | 367,645 | ||||||
| Mitsubishi Gas Chemical Co., Inc. | 14,500 | 215,525 | ||||||
| Mitsubishi HC Capital, Inc. | 131,040 | 635,055 | ||||||
| Mitsubishi Heavy Industries Ltd. | 55,900 | 2,154,979 | ||||||
| Mitsubishi Logisnext Co. Ltd. | 2,600 | 15,573 | ||||||
151
| Avantis International Equity ETF | ||||||||
| Shares | Value | |||||||
Mitsubishi Logistics Corp.(1) | 13,600 | $ | 353,384 | |||||
| Mitsubishi Materials Corp. | 14,800 | 220,890 | ||||||
Mitsubishi Motors Corp.(2) | 83,500 | 334,014 | ||||||
| Mitsubishi Pencil Co. Ltd. | 3,700 | 37,099 | ||||||
| Mitsubishi Research Institute, Inc. | 3,300 | 98,791 | ||||||
| Mitsubishi Shokuhin Co. Ltd. | 3,400 | 83,456 | ||||||
| Mitsubishi Steel Manufacturing Co. Ltd. | 2,900 | 21,534 | ||||||
Mitsubishi UFJ Financial Group, Inc., ADR(1) | 717,569 | 3,695,480 | ||||||
Mitsuboshi Belting Ltd.(1) | 6,000 | 137,932 | ||||||
| Mitsui & Co. Ltd. | 97,900 | 2,297,627 | ||||||
| Mitsui Chemicals, Inc. | 51,100 | 1,147,988 | ||||||
| Mitsui Fudosan Co. Ltd. | 60,700 | 1,228,605 | ||||||
| Mitsui High-Tec, Inc. | 2,500 | 154,618 | ||||||
Mitsui Matsushima Holdings Co. Ltd.(1) | 2,800 | 73,312 | ||||||
| Mitsui Mining & Smelting Co. Ltd. | 19,300 | 455,781 | ||||||
Mitsui OSK Lines Ltd.(1) | 44,200 | 1,151,569 | ||||||
| Mitsui-Soko Holdings Co. Ltd. | 9,200 | 222,365 | ||||||
| Miura Co. Ltd. | 2,400 | 50,912 | ||||||
| Mixi, Inc. | 5,000 | 85,847 | ||||||
| Miyaji Engineering Group, Inc. | 700 | 15,972 | ||||||
| Miyazaki Bank Ltd. | 1,900 | 30,367 | ||||||
Mizuho Financial Group, Inc., ADR(1) | 718,518 | 1,645,406 | ||||||
| Mizuho Leasing Co. Ltd. | 5,300 | 128,015 | ||||||
| Mizuho Medy Co. Ltd. | 1,900 | 40,728 | ||||||
| Mizuno Corp. | 4,200 | 80,808 | ||||||
| Mochida Pharmaceutical Co. Ltd. | 2,300 | 56,624 | ||||||
Monex Group, Inc.(1) | 28,900 | 103,066 | ||||||
| Monogatari Corp. | 1,600 | 81,138 | ||||||
| MonotaRO Co. Ltd. | 10,400 | 186,600 | ||||||
| Morinaga & Co. Ltd. | 7,200 | 205,655 | ||||||
| Morinaga Milk Industry Co. Ltd. | 6,600 | 201,797 | ||||||
| Morita Holdings Corp. | 2,300 | 20,926 | ||||||
| MOS Food Services, Inc. | 3,000 | 68,480 | ||||||
| MS&AD Insurance Group Holdings, Inc. | 50,600 | 1,509,698 | ||||||
| Murata Manufacturing Co. Ltd. | 36,000 | 1,938,471 | ||||||
Musashi Seimitsu Industry Co. Ltd.(1) | 5,300 | 64,208 | ||||||
| Musashino Bank Ltd. | 3,800 | 46,319 | ||||||
| Nabtesco Corp. | 14,300 | 338,633 | ||||||
| Nachi-Fujikoshi Corp. | 2,900 | 78,683 | ||||||
Nafco Co. Ltd.(1) | 2,100 | 24,364 | ||||||
Nagano Keiki Co. Ltd.(1) | 3,200 | 25,193 | ||||||
| Nagase & Co. Ltd. | 13,000 | 186,561 | ||||||
| Nagoya Railroad Co. Ltd. | 2,400 | 37,129 | ||||||
| Nakanishi, Inc. | 9,100 | 176,458 | ||||||
| Nankai Electric Railway Co. Ltd. | 7,900 | 157,138 | ||||||
| Nanto Bank Ltd. | 5,600 | 78,923 | ||||||
| Natori Co. Ltd. | 1,000 | 15,063 | ||||||
| NEC Capital Solutions Ltd. | 2,200 | 33,957 | ||||||
| NEC Corp. | 20,400 | 744,022 | ||||||
| NEC Networks & System Integration Corp. | 4,200 | 52,339 | ||||||
| Neturen Co. Ltd. | 4,800 | 23,654 | ||||||
152
| Avantis International Equity ETF | ||||||||
| Shares | Value | |||||||
| Nexon Co. Ltd. | 7,800 | $ | 155,314 | |||||
| Nextage Co. Ltd. | 5,900 | 128,095 | ||||||
| NGK Insulators Ltd. | 43,400 | 619,642 | ||||||
| NGK Spark Plug Co. Ltd. | 26,700 | 547,821 | ||||||
| NH Foods Ltd. | 20,700 | 592,542 | ||||||
| NHK Spring Co. Ltd. | 38,100 | 257,327 | ||||||
| Nichias Corp. | 8,700 | 150,244 | ||||||
| Nichicon Corp. | 9,000 | 94,663 | ||||||
| Nichiha Corp. | 8,500 | 169,386 | ||||||
| Nichirei Corp. | 15,700 | 280,670 | ||||||
| Nichireki Co. Ltd. | 1,600 | 15,639 | ||||||
| Nidec Corp. | 5,618 | 373,215 | ||||||
| Nifco, Inc. | 15,000 | 338,548 | ||||||
| Nihon Chouzai Co. Ltd. | 1,900 | 18,278 | ||||||
| Nihon Dempa Kogyo Co. Ltd. | 6,300 | 68,459 | ||||||
| Nihon Kohden Corp. | 10,400 | 237,511 | ||||||
| Nihon M&A Center Holdings, Inc. | 7,100 | 87,992 | ||||||
| Nihon Nohyaku Co. Ltd. | 4,900 | 30,139 | ||||||
| Nihon Parkerizing Co. Ltd. | 7,500 | 51,622 | ||||||
| Nikkon Holdings Co. Ltd. | 6,300 | 106,640 | ||||||
| Nikon Corp. | 17,700 | 202,049 | ||||||
| Nintendo Co. Ltd. | 5,100 | 2,087,668 | ||||||
| Nippn Corp. | 6,000 | 67,672 | ||||||
| Nippon Carbon Co. Ltd. | 1,600 | 47,075 | ||||||
Nippon Chemi-Con Corp.(2) | 4,300 | 56,356 | ||||||
| Nippon Chemical Industrial Co. Ltd. | 1,300 | 19,676 | ||||||
| Nippon Coke & Engineering Co. Ltd. | 46,500 | 33,649 | ||||||
| Nippon Denko Co. Ltd. | 30,600 | 81,223 | ||||||
| Nippon Densetsu Kogyo Co. Ltd. | 7,700 | 99,076 | ||||||
| Nippon Electric Glass Co. Ltd. | 26,300 | 495,306 | ||||||
| NIPPON EXPRESS HOLDINGS, Inc. | 15,000 | 825,341 | ||||||
| Nippon Fine Chemical Co. Ltd. | 400 | 5,583 | ||||||
| Nippon Gas Co. Ltd. | 11,000 | 175,099 | ||||||
| Nippon Kanzai Co. Ltd. | 800 | 15,257 | ||||||
| Nippon Kayaku Co. Ltd. | 14,800 | 128,583 | ||||||
| Nippon Koei Co. Ltd. | 2,300 | 58,898 | ||||||
| Nippon Light Metal Holdings Co. Ltd. | 10,120 | 116,446 | ||||||
| Nippon Paint Holdings Co. Ltd. | 3,500 | 26,993 | ||||||
| Nippon Paper Industries Co. Ltd. | 23,500 | 153,335 | ||||||
| Nippon Parking Development Co. Ltd. | 50,500 | 58,368 | ||||||
| Nippon Pillar Packing Co. Ltd. | 8,100 | 150,768 | ||||||
Nippon Road Co. Ltd.(1) | 700 | 31,162 | ||||||
| Nippon Sanso Holdings Corp. | 5,000 | 90,936 | ||||||
| Nippon Seiki Co. Ltd. | 6,500 | 38,425 | ||||||
Nippon Seisen Co. Ltd.(1) | 700 | 23,486 | ||||||
Nippon Sheet Glass Co. Ltd.(2) | 17,100 | 65,199 | ||||||
| Nippon Shinyaku Co. Ltd. | 2,100 | 114,869 | ||||||
| Nippon Shokubai Co. Ltd. | 5,200 | 206,199 | ||||||
| Nippon Signal Co. Ltd. | 3,600 | 24,063 | ||||||
| Nippon Soda Co. Ltd. | 6,800 | 224,860 | ||||||
| Nippon Steel Corp. | 136,500 | 2,156,168 | ||||||
153
| Avantis International Equity ETF | ||||||||
| Shares | Value | |||||||
| Nippon Steel Trading Corp. | 2,600 | $ | 100,034 | |||||
| Nippon Suisan Kaisha Ltd. | 72,600 | 297,083 | ||||||
| Nippon Telegraph & Telephone Corp. | 92,600 | 2,509,856 | ||||||
| Nippon Television Holdings, Inc. | 7,000 | 59,483 | ||||||
| Nippon Thompson Co. Ltd. | 12,000 | 49,283 | ||||||
Nippon Yakin Kogyo Co. Ltd.(1) | 3,400 | 70,196 | ||||||
Nippon Yusen KK(1) | 29,100 | 2,219,578 | ||||||
| Nipro Corp. | 42,000 | 341,933 | ||||||
| Nishi-Nippon Financial Holdings, Inc. | 19,200 | 101,867 | ||||||
| Nishi-Nippon Railroad Co. Ltd. | 12,400 | 256,579 | ||||||
Nishimatsu Construction Co. Ltd.(1) | 5,600 | 162,619 | ||||||
| Nishimatsuya Chain Co. Ltd. | 9,700 | 113,615 | ||||||
| Nishio Rent All Co. Ltd. | 8,400 | 175,248 | ||||||
| Nissan Chemical Corp. | 14,100 | 710,394 | ||||||
| Nissan Motor Co. Ltd. | 185,000 | 727,826 | ||||||
| Nissha Co. Ltd. | 8,500 | 110,533 | ||||||
| Nisshin Oillio Group Ltd. | 4,200 | 98,296 | ||||||
| Nisshin Seifun Group, Inc. | 12,700 | 142,925 | ||||||
| Nisshinbo Holdings, Inc. | 35,900 | 277,812 | ||||||
| Nissin Electric Co. Ltd. | 6,200 | 66,072 | ||||||
| Nissin Foods Holdings Co. Ltd. | 2,900 | 207,485 | ||||||
| Nisso Corp. | 4,400 | 17,990 | ||||||
| Nitori Holdings Co. Ltd. | 2,900 | 277,244 | ||||||
| Nitta Corp. | 1,600 | 33,627 | ||||||
| Nittetsu Mining Co. Ltd. | 1,000 | 44,284 | ||||||
| Nitto Denko Corp. | 27,700 | 1,707,228 | ||||||
Nitto Kogyo Corp.(1) | 5,500 | 101,464 | ||||||
| Noevir Holdings Co. Ltd. | 800 | 33,145 | ||||||
| NOF Corp. | 3,800 | 144,006 | ||||||
| Nohmi Bosai Ltd. | 3,100 | 36,688 | ||||||
| Nojima Corp. | 9,800 | 197,442 | ||||||
NOK Corp.(1) | 15,700 | 139,537 | ||||||
Nomura Micro Science Co. Ltd.(1) | 1,300 | 34,285 | ||||||
| Noritake Co. Ltd./Nagoya Japan | 1,000 | 30,057 | ||||||
| Noritsu Koki Co. Ltd. | 2,600 | 48,325 | ||||||
| Noritz Corp. | 4,200 | 46,577 | ||||||
| North Pacific Bank Ltd. | 40,000 | 66,209 | ||||||
| NS Solutions Corp. | 300 | 8,161 | ||||||
NS Tool Co. Ltd.(1) | 1,800 | 14,461 | ||||||
| NS United Kaiun Kaisha Ltd. | 2,100 | 72,420 | ||||||
| NSD Co. Ltd. | 2,200 | 39,541 | ||||||
NSK Ltd.(1) | 44,800 | 242,854 | ||||||
NTN Corp.(2) | 64,800 | 122,664 | ||||||
| NTT Data Corp. | 74,900 | 1,054,020 | ||||||
Obara Group, Inc.(1) | 900 | 21,300 | ||||||
| Obayashi Corp. | 128,300 | 887,398 | ||||||
| Obic Co. Ltd. | 1,800 | 266,218 | ||||||
| Odakyu Electric Railway Co. Ltd. | 5,400 | 73,770 | ||||||
| Ogaki Kyoritsu Bank Ltd. | 4,800 | 59,537 | ||||||
| Ohsho Food Service Corp. | 400 | 18,657 | ||||||
| Oiles Corp. | 1,800 | 19,483 | ||||||
154
| Avantis International Equity ETF | ||||||||
| Shares | Value | |||||||
Oisix ra daichi, Inc.(1)(2) | 3,400 | $ | 46,254 | |||||
| Oji Holdings Corp. | 143,100 | 570,951 | ||||||
| Okamoto Industries, Inc. | 900 | 25,152 | ||||||
| Okamoto Machine Tool Works Ltd. | 700 | 20,180 | ||||||
| Okamura Corp. | 8,100 | 77,344 | ||||||
| Okasan Securities Group, Inc. | 20,100 | 48,197 | ||||||
| Oki Electric Industry Co. Ltd. | 13,600 | 73,390 | ||||||
| Okinawa Cellular Telephone Co. | 1,800 | 67,378 | ||||||
Okinawa Electric Power Co., Inc.(1) | 9,175 | 74,813 | ||||||
| Okinawa Financial Group, Inc. | 2,600 | 39,913 | ||||||
| OKUMA Corp. | 3,700 | 139,840 | ||||||
| Okumura Corp. | 22,100 | 465,491 | ||||||
Okura Industrial Co. Ltd.(1) | 1,700 | 22,608 | ||||||
| Olympus Corp. | 65,900 | 1,403,488 | ||||||
| Omron Corp. | 2,600 | 136,828 | ||||||
| Ono Pharmaceutical Co. Ltd. | 18,000 | 429,663 | ||||||
| Onoken Co. Ltd. | 2,600 | 27,748 | ||||||
| Onward Holdings Co. Ltd. | 23,400 | 46,150 | ||||||
| Open House Group Co. Ltd. | 15,400 | 602,724 | ||||||
| Oracle Corp. (Tokyo) | 2,200 | 131,057 | ||||||
| Organo Corp. | 1,600 | 106,425 | ||||||
| Orient Corp. | 75,200 | 65,763 | ||||||
| Oriental Land Co. Ltd. | 1,300 | 193,814 | ||||||
| Oriental Shiraishi Corp. | 8,200 | 14,832 | ||||||
| ORIX Corp., ADR | 25,727 | 2,118,618 | ||||||
| Osaka Gas Co. Ltd. | 9,300 | 156,644 | ||||||
| Osaka Organic Chemical Industry Ltd. | 1,300 | 23,934 | ||||||
Osaka Soda Co. Ltd.(1) | 3,200 | 86,854 | ||||||
| Osaka Steel Co. Ltd. | 2,100 | 19,191 | ||||||
OSAKA Titanium Technologies Co. Ltd.(2) | 12,000 | 273,594 | ||||||
| Osaki Electric Co. Ltd. | 4,600 | 17,368 | ||||||
| OSG Corp. | 11,500 | 158,370 | ||||||
| Otsuka Corp. | 8,100 | 261,824 | ||||||
| Otsuka Holdings Co. Ltd. | 13,200 | 431,146 | ||||||
| Outsourcing, Inc. | 14,100 | 122,391 | ||||||
| Oyo Corp. | 2,100 | 27,897 | ||||||
| Pacific Industrial Co. Ltd. | 8,100 | 63,068 | ||||||
| Pacific Metals Co. Ltd. | 600 | 10,461 | ||||||
| Pack Corp. | 2,400 | 39,592 | ||||||
| PALTAC Corp. | 1,300 | 37,394 | ||||||
| Pan Pacific International Holdings Corp. | 46,000 | 825,958 | ||||||
| Panasonic Holdings Corp. | 198,500 | 1,610,705 | ||||||
| Paramount Bed Holdings Co. Ltd. | 10,300 | 194,069 | ||||||
Park24 Co. Ltd.(2) | 9,600 | 136,789 | ||||||
PCA Corp.(1) | 300 | 2,244 | ||||||
| Penta-Ocean Construction Co. Ltd. | 167,600 | 884,479 | ||||||
PeptiDream, Inc.(2) | 6,600 | 78,699 | ||||||
| Persol Holdings Co. Ltd. | 18,200 | 365,350 | ||||||
Pharma Foods International Co. Ltd.(1) | 2,200 | 23,610 | ||||||
| Pigeon Corp. | 1,300 | 19,363 | ||||||
| Pilot Corp. | 6,400 | 229,071 | ||||||
155
| Avantis International Equity ETF | ||||||||
| Shares | Value | |||||||
| Piolax, Inc. | 3,900 | $ | 56,421 | |||||
Plenus Co. Ltd.(1) | 3,900 | 53,528 | ||||||
| Pola Orbis Holdings, Inc. | 1,700 | 18,752 | ||||||
| Pole To Win Holdings Inc | 5,600 | 40,725 | ||||||
| Premium Group Co. Ltd. | 5,100 | 63,263 | ||||||
| Press Kogyo Co. Ltd. | 21,300 | 67,371 | ||||||
| Pressance Corp. | 1,900 | 20,545 | ||||||
| Prestige International, Inc. | 21,900 | 105,193 | ||||||
| Prima Meat Packers Ltd. | 7,100 | 110,821 | ||||||
| Procrea Holdings, Inc. | 1,400 | 21,760 | ||||||
| PS Mitsubishi Construction Co. Ltd. | 4,400 | 20,546 | ||||||
| Qol Holdings Co. Ltd. | 1,800 | 16,325 | ||||||
Raccoon Holdings, Inc.(1) | 3,300 | 32,858 | ||||||
| Raito Kogyo Co. Ltd. | 7,600 | 100,927 | ||||||
| Raiznext Corp. | 3,800 | 32,810 | ||||||
| Rakus Co. Ltd. | 5,200 | 61,202 | ||||||
| Rakuten Group, Inc. | 58,100 | 281,974 | ||||||
| Raysum Co. Ltd. | 2,000 | 22,925 | ||||||
| Recruit Holdings Co. Ltd. | 51,500 | 1,637,216 | ||||||
| Relia, Inc. | 3,800 | 27,571 | ||||||
| Relo Group, Inc. | 15,700 | 252,370 | ||||||
Renesas Electronics Corp.(2) | 73,700 | 697,832 | ||||||
| Rengo Co. Ltd. | 32,600 | 192,063 | ||||||
RENOVA, Inc.(1)(2) | 1,900 | 41,277 | ||||||
| Resona Holdings, Inc. | 298,156 | 1,097,585 | ||||||
| Resorttrust, Inc. | 24,000 | 385,131 | ||||||
| Restar Holdings Corp. | 3,300 | 48,624 | ||||||
Retail Partners Co. Ltd.(1) | 2,200 | 16,931 | ||||||
| Ricoh Co. Ltd. | 88,500 | 695,561 | ||||||
| Ricoh Leasing Co. Ltd. | 4,700 | 120,982 | ||||||
| Riken Corp. | 1,500 | 25,929 | ||||||
| Riken Keiki Co. Ltd. | 3,000 | 94,272 | ||||||
| Riken Technos Corp. | 5,400 | 20,167 | ||||||
| Riken Vitamin Co. Ltd. | 2,800 | 34,491 | ||||||
| Rinnai Corp. | 2,600 | 199,117 | ||||||
| Riso Kagaku Corp. | 1,500 | 26,638 | ||||||
| Riso Kyoiku Co. Ltd. | 18,700 | 41,934 | ||||||
| Rohm Co. Ltd. | 7,200 | 538,689 | ||||||
| Rohto Pharmaceutical Co. Ltd. | 22,100 | 665,224 | ||||||
| Rokko Butter Co. Ltd. | 300 | 3,115 | ||||||
| Roland DG Corp. | 2,400 | 56,292 | ||||||
| Rorze Corp. | 1,300 | 78,882 | ||||||
| Round One Corp. | 22,100 | 318,002 | ||||||
RPA Holdings, Inc.(2) | 100 | 221 | ||||||
| RS Technologies Co. Ltd. | 1,000 | 48,888 | ||||||
| Ryobi Ltd. | 3,000 | 27,861 | ||||||
| Ryoden Corp. | 1,800 | 21,202 | ||||||
Ryohin Keikaku Co. Ltd.(1) | 30,600 | 283,799 | ||||||
| Ryosan Co. Ltd. | 3,700 | 59,180 | ||||||
| S Foods, Inc. | 2,900 | 62,013 | ||||||
| S-Pool, Inc. | 13,100 | 101,035 | ||||||
156
| Avantis International Equity ETF | ||||||||
| Shares | Value | |||||||
| Sakai Chemical Industry Co. Ltd. | 2,500 | $ | 35,284 | |||||
Sakai Moving Service Co. Ltd.(1) | 900 | 29,700 | ||||||
| Sakata INX Corp. | 6,000 | 42,054 | ||||||
| Sala Corp. | 11,800 | 68,943 | ||||||
| San Holdings, Inc. | 800 | 10,284 | ||||||
| San ju San Financial Group, Inc. | 1,900 | 20,241 | ||||||
| San-A Co. Ltd. | 1,200 | 35,836 | ||||||
| San-Ai Obbli Co. Ltd. | 12,800 | 101,284 | ||||||
| San-In Godo Bank Ltd. | 24,400 | 119,967 | ||||||
| Sangetsu Corp. | 7,000 | 81,763 | ||||||
| Sanken Electric Co. Ltd. | 5,800 | 203,793 | ||||||
| Sanki Engineering Co. Ltd. | 8,600 | 101,583 | ||||||
| Sankyo Co. Ltd. | 12,300 | 360,422 | ||||||
| Sankyu, Inc. | 10,300 | 316,800 | ||||||
| Sanoh Industrial Co. Ltd. | 3,200 | 17,295 | ||||||
| Santen Pharmaceutical Co. Ltd. | 30,000 | 215,535 | ||||||
| Sanwa Holdings Corp. | 33,800 | 334,449 | ||||||
Sanyo Chemical Industries Ltd.(1) | 1,800 | 61,501 | ||||||
| Sanyo Denki Co. Ltd. | 1,700 | 66,158 | ||||||
| Sanyo Electric Railway Co. Ltd. | 1,800 | 29,415 | ||||||
| Sanyo Special Steel Co. Ltd. | 3,900 | 58,621 | ||||||
| Sanyo Trading Co. Ltd. | 2,200 | 16,101 | ||||||
| Sapporo Holdings Ltd. | 14,400 | 315,625 | ||||||
| Sato Holdings Corp. | 3,800 | 52,199 | ||||||
| Sawai Group Holdings Co. Ltd. | 7,900 | 233,467 | ||||||
| SB Technology Corp. | 1,000 | 17,800 | ||||||
| SBI Holdings, Inc. | 62,900 | 1,235,995 | ||||||
| SBS Holdings, Inc. | 15,700 | 325,009 | ||||||
| SCREEN Holdings Co. Ltd. | 8,400 | 557,953 | ||||||
Scroll Corp.(1) | 5,700 | 32,116 | ||||||
| SCSK Corp. | 20,400 | 332,179 | ||||||
| Secom Co. Ltd. | 12,000 | 764,511 | ||||||
| Sega Sammy Holdings, Inc. | 13,800 | 204,858 | ||||||
| Seibu Holdings, Inc. | 9,400 | 95,229 | ||||||
| Seikagaku Corp. | 4,800 | 30,432 | ||||||
| Seikitokyu Kogyo Co. Ltd. | 3,600 | 19,624 | ||||||
| Seiko Epson Corp. | 46,100 | 724,407 | ||||||
| Seiko Holdings Corp. | 9,900 | 203,999 | ||||||
| Seino Holdings Co. Ltd. | 23,300 | 185,022 | ||||||
Seiren Co. Ltd.(1) | 3,000 | 45,561 | ||||||
| Sekisui Chemical Co. Ltd. | 73,100 | 996,595 | ||||||
| Sekisui House Ltd. | 23,500 | 399,609 | ||||||
| Sekisui Jushi Corp. | 1,400 | 17,311 | ||||||
| Senko Group Holdings Co. Ltd. | 20,900 | 142,790 | ||||||
| Senshu Electric Co. Ltd. | 1,100 | 44,103 | ||||||
| Senshu Ikeda Holdings, Inc. | 40,600 | 64,476 | ||||||
Septeni Holdings Co. Ltd.(1) | 19,800 | 70,562 | ||||||
| Seria Co. Ltd. | 10,400 | 202,846 | ||||||
Seven & i Holdings Co. Ltd.(1) | 58,800 | 2,335,859 | ||||||
| Seven Bank Ltd. | 104,500 | 198,505 | ||||||
| SG Holdings Co. Ltd. | 25,100 | 416,327 | ||||||
157
| Avantis International Equity ETF | ||||||||
| Shares | Value | |||||||
Sharp Corp.(1) | 19,200 | $ | 137,444 | |||||
| Shibaura Mechatronics Corp. | 900 | 74,228 | ||||||
SHIFT, Inc.(2) | 300 | 42,988 | ||||||
Shiga Bank Ltd.(1) | 8,500 | 156,816 | ||||||
| Shikoku Bank Ltd. | 3,300 | 20,336 | ||||||
| Shikoku Chemicals Corp. | 3,300 | 29,454 | ||||||
| Shikoku Electric Power Co., Inc. | 5,400 | 31,496 | ||||||
| Shima Seiki Manufacturing Ltd. | 1,600 | 25,382 | ||||||
| Shimadzu Corp. | 13,300 | 388,441 | ||||||
| Shimamura Co. Ltd. | 2,000 | 181,280 | ||||||
| Shimano, Inc. | 2,400 | 424,583 | ||||||
| Shimizu Corp. | 59,800 | 327,911 | ||||||
| Shin Nippon Air Technologies Co. Ltd. | 300 | 4,011 | ||||||
Shin Nippon Biomedical Laboratories Ltd.(1) | 5,500 | 93,786 | ||||||
| Shin-Etsu Chemical Co. Ltd. | 26,100 | 3,031,064 | ||||||
| Shin-Etsu Polymer Co. Ltd. | 7,300 | 69,845 | ||||||
| Shinagawa Refractories Co. Ltd. | 1,200 | 32,733 | ||||||
| Shindengen Electric Manufacturing Co. Ltd. | 1,500 | 39,279 | ||||||
| Shinko Electric Industries Co. Ltd. | 10,600 | 295,058 | ||||||
| Shinmaywa Industries Ltd. | 11,000 | 83,832 | ||||||
Shinoken Group Co. Ltd.(1) | 3,400 | 38,931 | ||||||
Shinsei Bank Ltd.(1) | 10,900 | 153,496 | ||||||
| Shinsho Corp. | 700 | 20,947 | ||||||
| Shionogi & Co. Ltd. | 10,100 | 493,131 | ||||||
| Ship Healthcare Holdings, Inc. | 11,400 | 213,127 | ||||||
| Shiseido Co. Ltd. | 17,332 | 654,696 | ||||||
| Shizuoka Bank Ltd. | 35,000 | 202,540 | ||||||
| SHO-BOND Holdings Co. Ltd. | 2,300 | 99,272 | ||||||
| Shoei Co. Ltd. | 3,800 | 150,576 | ||||||
| Showa Denko KK | 19,700 | 302,859 | ||||||
| Showa Sangyo Co. Ltd. | 2,000 | 37,175 | ||||||
| SIGMAXYZ Holdings, Inc. | 6,200 | 54,634 | ||||||
| Siix Corp. | 5,300 | 42,177 | ||||||
| Sinanen Holdings Co. Ltd. | 1,300 | 35,765 | ||||||
| Sinfonia Technology Co. Ltd. | 2,800 | 30,343 | ||||||
| Sinko Industries Ltd. | 1,300 | 15,045 | ||||||
| SKY Perfect JSAT Holdings, Inc. | 45,500 | 180,827 | ||||||
Skylark Holdings Co. Ltd.(1)(2) | 4,100 | 45,103 | ||||||
| SMC Corp. | 495 | 234,842 | ||||||
| SMS Co. Ltd. | 4,400 | 100,181 | ||||||
Snow Peak, Inc.(1) | 4,600 | 71,732 | ||||||
| Sodick Co. Ltd. | 6,700 | 38,795 | ||||||
| Softbank Corp. | 155,200 | 1,701,493 | ||||||
| SoftBank Group Corp. | 62,000 | 2,455,915 | ||||||
| Softcreate Holdings Corp. | 2,000 | 54,758 | ||||||
| Sohgo Security Services Co. Ltd. | 6,800 | 176,176 | ||||||
Sojitz Corp.(1) | 101,880 | 1,714,226 | ||||||
| Soken Chemical & Engineering Co. Ltd. | 1,100 | 15,303 | ||||||
| Solasto Corp. | 4,800 | 30,752 | ||||||
| Soliton Systems KK | 200 | 1,724 | ||||||
| Sompo Holdings, Inc. | 43,700 | 1,873,691 | ||||||
158
| Avantis International Equity ETF | ||||||||
| Shares | Value | |||||||
| Sony Group Corp., ADR | 79,460 | $ | 6,305,151 | |||||
Sosei Group Corp.(2) | 6,600 | 81,896 | ||||||
| Sparx Group Co. Ltd. | 17,200 | 37,025 | ||||||
| Square Enix Holdings Co. Ltd. | 5,500 | 238,816 | ||||||
| SRA Holdings | 700 | 14,884 | ||||||
| Stanley Electric Co. Ltd. | 6,900 | 127,368 | ||||||
| Star Micronics Co. Ltd. | 10,500 | 138,073 | ||||||
| Starts Corp., Inc. | 7,400 | 142,159 | ||||||
| Starzen Co. Ltd. | 1,600 | 24,318 | ||||||
| Stella Chemifa Corp. | 1,100 | 22,310 | ||||||
Studio Alice Co. Ltd.(1) | 2,000 | 31,962 | ||||||
| Subaru Corp. | 31,000 | 563,499 | ||||||
Sugi Holdings Co. Ltd.(1) | 2,100 | 89,111 | ||||||
| SUMCO Corp. | 53,800 | 730,220 | ||||||
| Sumitomo Bakelite Co. Ltd. | 4,900 | 154,458 | ||||||
| Sumitomo Chemical Co. Ltd. | 331,600 | 1,305,285 | ||||||
| Sumitomo Corp. | 152,800 | 2,149,223 | ||||||
| Sumitomo Dainippon Pharma Co. Ltd. | 15,200 | 113,224 | ||||||
| Sumitomo Densetsu Co. Ltd. | 2,700 | 50,988 | ||||||
| Sumitomo Electric Industries Ltd. | 66,200 | 758,294 | ||||||
| Sumitomo Forestry Co. Ltd. | 15,800 | 267,138 | ||||||
| Sumitomo Heavy Industries Ltd. | 18,900 | 396,730 | ||||||
| Sumitomo Metal Mining Co. Ltd. | 21,600 | 679,679 | ||||||
| Sumitomo Mitsui Construction Co. Ltd. | 31,400 | 104,607 | ||||||
Sumitomo Mitsui Financial Group, Inc., ADR(1) | 441,462 | 2,670,845 | ||||||
| Sumitomo Mitsui Trust Holdings, Inc. | 31,200 | 970,419 | ||||||
Sumitomo Osaka Cement Co. Ltd.(1) | 20,200 | 511,671 | ||||||
| Sumitomo Realty & Development Co. Ltd. | 33,400 | 816,827 | ||||||
| Sumitomo Riko Co. Ltd. | 7,400 | 30,909 | ||||||
| Sumitomo Rubber Industries Ltd. | 24,400 | 209,378 | ||||||
| Sumitomo Seika Chemicals Co. Ltd. | 2,100 | 47,012 | ||||||
| Sumitomo Warehouse Co. Ltd. | 11,200 | 175,753 | ||||||
| Sun Frontier Fudousan Co. Ltd. | 9,400 | 81,096 | ||||||
| Sun-Wa Technos Corp. | 2,500 | 25,331 | ||||||
| Sundrug Co. Ltd. | 15,900 | 389,020 | ||||||
| Suntory Beverage & Food Ltd. | 10,400 | 379,877 | ||||||
| Suruga Bank Ltd. | 40,900 | 110,233 | ||||||
| Suzuken Co. Ltd. | 11,100 | 266,015 | ||||||
| Suzuki Motor Corp. | 22,300 | 779,410 | ||||||
| SWCC Showa Holdings Co. Ltd. | 4,900 | 64,194 | ||||||
| Sysmex Corp. | 5,600 | 342,311 | ||||||
| Systena Corp. | 26,100 | 79,967 | ||||||
| Syuppin Co. Ltd. | 4,200 | 37,369 | ||||||
| T Hasegawa Co. Ltd. | 2,500 | 53,966 | ||||||
| T RAD Co. Ltd. | 1,400 | 28,031 | ||||||
| T&D Holdings, Inc. | 89,000 | 971,988 | ||||||
| T-Gaia Corp. | 4,500 | 53,504 | ||||||
| Tachi-S Co. Ltd. | 5,000 | 43,925 | ||||||
| Tadano Ltd. | 17,200 | 117,508 | ||||||
| Taihei Dengyo Kaisha Ltd. | 1,900 | 48,525 | ||||||
| Taiheiyo Cement Corp. | 25,300 | 378,777 | ||||||
159
| Avantis International Equity ETF | ||||||||
| Shares | Value | |||||||
| Taikisha Ltd. | 1,600 | $ | 36,710 | |||||
| Taisei Corp. | 29,600 | 897,458 | ||||||
| Taisei Lamick Co. Ltd. | 200 | 4,072 | ||||||
| Taisho Pharmaceutical Holdings Co. Ltd. | 1,300 | 48,337 | ||||||
Taiyo Holdings Co. Ltd.(1) | 6,400 | 125,466 | ||||||
| Taiyo Yuden Co. Ltd. | 31,100 | 961,170 | ||||||
| Takamatsu Construction Group Co. Ltd. | 1,800 | 24,741 | ||||||
| Takaoka Toko Co. Ltd. | 1,100 | 15,205 | ||||||
| Takara & Co. Ltd. | 2,300 | 34,411 | ||||||
| Takara Bio, Inc. | 5,800 | 81,236 | ||||||
| Takara Holdings, Inc. | 1,700 | 12,899 | ||||||
| Takara Leben Co. Ltd. | 16,000 | 43,522 | ||||||
| Takara Standard Co. Ltd. | 3,700 | 35,158 | ||||||
| Takasago International Corp. | 2,500 | 49,766 | ||||||
| Takasago Thermal Engineering Co. Ltd. | 9,600 | 113,426 | ||||||
Takashimaya Co. Ltd.(1) | 20,000 | 221,247 | ||||||
Take & Give Needs Co. Ltd.(2) | 2,800 | 31,862 | ||||||
Takeda Pharmaceutical Co. Ltd., ADR(1) | 103,845 | 1,427,869 | ||||||
| Takuma Co. Ltd. | 6,600 | 66,310 | ||||||
| Tama Home Co. Ltd. | 3,400 | 57,323 | ||||||
| Tamron Co. Ltd. | 2,400 | 52,437 | ||||||
| Tanseisha Co. Ltd. | 1,100 | 6,275 | ||||||
| Tayca Corp. | 200 | 1,891 | ||||||
| TBS Holdings, Inc. | 3,700 | 42,853 | ||||||
| TDC Soft, Inc. | 200 | 1,703 | ||||||
| TDK Corp. | 39,200 | 1,370,519 | ||||||
| TechMatrix Corp. | 8,500 | 104,730 | ||||||
| TECHNO ASSOCIE Co. Ltd. | 200 | 1,690 | ||||||
| TechnoPro Holdings, Inc. | 11,100 | 249,681 | ||||||
| Teijin Ltd. | 74,100 | 783,421 | ||||||
| Teikoku Electric Manufacturing Co. Ltd. | 900 | 12,566 | ||||||
| Teikoku Sen-I Co. Ltd. | 300 | 3,523 | ||||||
| Tenma Corp. | 1,800 | 29,025 | ||||||
| Terumo Corp. | 8,100 | 260,023 | ||||||
| THK Co. Ltd. | 5,800 | 117,731 | ||||||
| TIS, Inc. | 47,800 | 1,361,187 | ||||||
| TKC Corp. | 1,900 | 47,487 | ||||||
| Toa Corp. (Tokyo) | 2,500 | 43,867 | ||||||
| Toa Oil Co. Ltd. | 100 | 1,636 | ||||||
| TOA ROAD Corp. | 300 | 12,696 | ||||||
| Toagosei Co. Ltd. | 15,500 | 120,766 | ||||||
| Tobu Railway Co. Ltd. | 26,000 | 614,279 | ||||||
| TOC Co. Ltd. | 3,500 | 18,532 | ||||||
| Tocalo Co. Ltd. | 11,900 | 109,660 | ||||||
Tochigi Bank Ltd.(1) | 18,200 | 37,666 | ||||||
Toda Corp.(1) | 27,900 | 137,633 | ||||||
| Toei Animation Co. Ltd. | 200 | 18,245 | ||||||
| Toho Bank Ltd. | 24,600 | 36,039 | ||||||
| Toho Co. Ltd. | 2,400 | 91,149 | ||||||
| Toho Gas Co. Ltd. | 700 | 15,661 | ||||||
| Toho Holdings Co. Ltd. | 13,700 | 181,454 | ||||||
160
| Avantis International Equity ETF | ||||||||
| Shares | Value | |||||||
Toho Titanium Co. Ltd.(1) | 6,700 | $ | 106,132 | |||||
| Toho Zinc Co. Ltd. | 2,000 | 34,898 | ||||||
| Tohoku Electric Power Co., Inc. | 41,900 | 208,371 | ||||||
| Tokai Carbon Co. Ltd. | 20,300 | 148,185 | ||||||
| Tokai Corp/Gifu | 1,400 | 18,528 | ||||||
| TOKAI Holdings Corp. | 21,500 | 137,409 | ||||||
| Tokai Rika Co. Ltd. | 10,300 | 110,572 | ||||||
| Tokai Tokyo Financial Holdings, Inc. | 29,500 | 79,928 | ||||||
| Token Corp. | 1,000 | 63,694 | ||||||
| Tokio Marine Holdings, Inc. | 63,700 | 3,530,213 | ||||||
| Tokushu Tokai Paper Co. Ltd. | 900 | 20,489 | ||||||
| Tokuyama Corp. | 17,500 | 230,494 | ||||||
Tokyo Century Corp.(1) | 4,400 | 157,146 | ||||||
Tokyo Electric Power Co. Holdings, Inc.(2) | 222,400 | 868,576 | ||||||
| Tokyo Electron Device Ltd. | 1,700 | 71,803 | ||||||
| Tokyo Electron Ltd. | 6,700 | 2,101,367 | ||||||
| Tokyo Gas Co. Ltd. | 22,500 | 422,127 | ||||||
| Tokyo Kiraboshi Financial Group, Inc. | 6,000 | 96,761 | ||||||
| Tokyo Ohka Kogyo Co. Ltd. | 2,100 | 102,968 | ||||||
Tokyo Rope Manufacturing Co. Ltd.(1) | 2,600 | 18,795 | ||||||
| Tokyo Seimitsu Co. Ltd. | 9,700 | 323,119 | ||||||
| Tokyo Steel Manufacturing Co. Ltd. | 23,400 | 247,927 | ||||||
| Tokyo Tatemono Co. Ltd. | 38,400 | 575,607 | ||||||
| Tokyotokeiba Co. Ltd. | 3,100 | 93,758 | ||||||
| Tokyu Construction Co. Ltd. | 18,400 | 86,550 | ||||||
| Tokyu Corp. | 15,900 | 189,015 | ||||||
| Tokyu Fudosan Holdings Corp. | 83,300 | 447,636 | ||||||
| TOMONY Holdings, Inc. | 24,600 | 55,752 | ||||||
| Tomy Co. Ltd. | 32,800 | 310,938 | ||||||
| Topcon Corp. | 24,800 | 334,533 | ||||||
| Toppan, Inc. | 29,100 | 457,005 | ||||||
| Topre Corp. | 8,300 | 73,936 | ||||||
| Topy Industries Ltd. | 2,100 | 21,287 | ||||||
| Toray Industries, Inc. | 308,400 | 1,759,865 | ||||||
| Torex Semiconductor Ltd. | 1,100 | 23,019 | ||||||
| Toridoll Holdings Corp. | 7,700 | 164,217 | ||||||
| Torii Pharmaceutical Co. Ltd. | 1,300 | 27,943 | ||||||
| Torishima Pump Manufacturing Co. Ltd. | 2,100 | 22,125 | ||||||
| Tosei Corp. | 6,900 | 68,925 | ||||||
| Toshiba Corp. | 10,800 | 399,967 | ||||||
| Toshiba TEC Corp. | 4,100 | 122,017 | ||||||
| Tosho Co. Ltd. | 3,700 | 30,576 | ||||||
| Tosoh Corp. | 49,600 | 641,320 | ||||||
| Totetsu Kogyo Co. Ltd. | 2,100 | 35,011 | ||||||
| TOTO Ltd. | 4,200 | 144,769 | ||||||
| Towa Corp. | 6,100 | 81,452 | ||||||
| Towa Pharmaceutical Co. Ltd. | 5,300 | 84,052 | ||||||
| Toyo Construction Co. Ltd. | 15,800 | 97,475 | ||||||
| Toyo Corp. | 1,900 | 18,072 | ||||||
Toyo Engineering Corp.(2) | 7,700 | 38,140 | ||||||
| Toyo Gosei Co. Ltd. | 800 | 47,060 | ||||||
161
| Avantis International Equity ETF | ||||||||
| Shares | Value | |||||||
| Toyo Ink SC Holdings Co. Ltd. | 6,800 | $ | 93,250 | |||||
| Toyo Kanetsu KK | 2,800 | 52,536 | ||||||
| Toyo Seikan Group Holdings Ltd. | 56,000 | 662,698 | ||||||
| Toyo Suisan Kaisha Ltd. | 3,100 | 127,160 | ||||||
| Toyo Tanso Co. Ltd. | 3,100 | 75,119 | ||||||
| Toyo Tire Corp. | 24,100 | 292,086 | ||||||
| Toyobo Co. Ltd. | 20,100 | 152,296 | ||||||
| Toyoda Gosei Co. Ltd. | 10,600 | 184,414 | ||||||
| Toyota Boshoku Corp. | 7,700 | 111,824 | ||||||
| Toyota Industries Corp. | 7,200 | 402,428 | ||||||
Toyota Motor Corp., ADR(1) | 55,637 | 8,310,499 | ||||||
| Toyota Tsusho Corp. | 23,800 | 833,193 | ||||||
| TPR Co. Ltd. | 4,300 | 39,374 | ||||||
| Trancom Co. Ltd. | 1,100 | 60,133 | ||||||
| Transcosmos, Inc. | 5,200 | 143,434 | ||||||
| TRE Holdings Corp. | 7,496 | 91,806 | ||||||
| Trend Micro, Inc. | 9,500 | 584,896 | ||||||
| Trusco Nakayama Corp. | 8,500 | 118,872 | ||||||
| TS Tech Co. Ltd. | 7,400 | 82,782 | ||||||
| TSI Holdings Co. Ltd. | 8,500 | 23,666 | ||||||
| Tsubakimoto Chain Co. | 6,600 | 152,510 | ||||||
| Tsugami Corp. | 7,400 | 66,215 | ||||||
| Tsukuba Bank Ltd. | 15,100 | 21,208 | ||||||
| Tsumura & Co. | 4,100 | 93,855 | ||||||
| Tsuruha Holdings, Inc. | 2,000 | 111,013 | ||||||
| Tsuzuki Denki Co. Ltd. | 100 | 974 | ||||||
| TV Asahi Holdings Corp. | 4,100 | 42,724 | ||||||
| UACJ Corp. | 7,900 | 136,400 | ||||||
Ube Industries Ltd.(1) | 26,100 | 384,568 | ||||||
| Uchida Yoko Co. Ltd. | 1,600 | 57,313 | ||||||
| Ulvac, Inc. | 9,000 | 348,985 | ||||||
| Unicharm Corp. | 9,500 | 330,141 | ||||||
| Union Tool Co. | 800 | 20,427 | ||||||
| Unipres Corp. | 8,500 | 58,562 | ||||||
| United Arrows Ltd. | 5,300 | 69,579 | ||||||
United Super Markets Holdings, Inc.(1) | 6,600 | 50,096 | ||||||
UNITED, Inc.(1) | 1,200 | 13,051 | ||||||
Unitika Ltd.(2) | 8,800 | 16,367 | ||||||
Universal Entertainment Corp.(2) | 3,800 | 43,444 | ||||||
| Ushio, Inc. | 6,100 | 74,055 | ||||||
| USS Co. Ltd. | 40,500 | 714,698 | ||||||
| UT Group Co. Ltd. | 2,700 | 53,778 | ||||||
UUUM Co. Ltd.(1)(2) | 3,000 | 23,374 | ||||||
| V Technology Co. Ltd. | 1,700 | 36,586 | ||||||
| Valor Holdings Co. Ltd. | 8,200 | 104,534 | ||||||
| Valqua Ltd. | 6,100 | 118,514 | ||||||
| Value HR Co. Ltd. | 500 | 5,417 | ||||||
| ValueCommerce Co. Ltd. | 2,400 | 43,831 | ||||||
| Vector, Inc. | 8,100 | 67,677 | ||||||
Vertex Corp.(1) | 4,200 | 40,538 | ||||||
| Vital KSK Holdings, Inc. | 3,300 | 15,867 | ||||||
162
| Avantis International Equity ETF | ||||||||
| Shares | Value | |||||||
| VT Holdings Co. Ltd. | 18,200 | $ | 63,020 | |||||
| Wacoal Holdings Corp. | 5,800 | 92,692 | ||||||
| Wacom Co. Ltd. | 39,500 | 237,040 | ||||||
| Wakachiku Construction Co. Ltd. | 2,200 | 39,199 | ||||||
| Wakita & Co. Ltd. | 3,600 | 28,955 | ||||||
| Warabeya Nichiyo Holdings Co. Ltd. | 3,900 | 63,483 | ||||||
WDB Holdings Co. Ltd.(1) | 1,400 | 25,863 | ||||||
| Weathernews, Inc. | 300 | 17,250 | ||||||
Welcia Holdings Co. Ltd.(1) | 4,800 | 100,528 | ||||||
| West Holdings Corp. | 1,300 | 41,084 | ||||||
| West Japan Railway Co. | 7,300 | 284,104 | ||||||
| Will Group, Inc. | 200 | 1,927 | ||||||
World Co. Ltd.(1) | 2,800 | 27,215 | ||||||
| Xebio Holdings Co. Ltd. | 4,500 | 31,199 | ||||||
YA-MAN Ltd.(1) | 2,000 | 23,126 | ||||||
| Yakult Honsha Co. Ltd. | 12,600 | 745,236 | ||||||
| YAKUODO Holdings Co. Ltd. | 1,000 | 17,181 | ||||||
| YAMABIKO Corp. | 5,600 | 45,716 | ||||||
| Yamada Holdings Co. Ltd. | 137,200 | 474,855 | ||||||
| Yamae Group Holdings Co. Ltd. | 1,300 | 15,862 | ||||||
| Yamagata Bank Ltd. | 2,500 | 16,693 | ||||||
Yamaguchi Financial Group, Inc.(1) | 32,700 | 179,415 | ||||||
| Yamaha Corp. | 3,900 | 152,135 | ||||||
| Yamaha Motor Co. Ltd. | 63,900 | 1,324,282 | ||||||
| Yamaichi Electronics Co. Ltd. | 5,800 | 85,845 | ||||||
| Yamato Holdings Co. Ltd. | 25,200 | 392,844 | ||||||
| Yamato Kogyo Co. Ltd. | 3,900 | 138,063 | ||||||
| Yamazaki Baking Co. Ltd. | 15,500 | 182,547 | ||||||
| Yamazen Corp. | 12,200 | 81,696 | ||||||
| Yaoko Co. Ltd. | 3,100 | 143,841 | ||||||
Yaskawa Electric Corp.(1) | 14,100 | 459,137 | ||||||
| Yellow Hat Ltd. | 6,000 | 77,465 | ||||||
| Yodogawa Steel Works Ltd. | 2,600 | 46,758 | ||||||
| Yokogawa Bridge Holdings Corp. | 6,400 | 89,489 | ||||||
| Yokogawa Electric Corp. | 11,700 | 204,204 | ||||||
| Yokohama Rubber Co. Ltd. | 20,500 | 335,271 | ||||||
| Yokorei Co. Ltd. | 11,800 | 78,251 | ||||||
Yondoshi Holdings, Inc.(1) | 2,200 | 28,184 | ||||||
| Yonex Co. Ltd. | 15,400 | 174,120 | ||||||
| Yotai Refractories Co. Ltd. | 1,900 | 19,042 | ||||||
| Yuasa Trading Co. Ltd. | 5,900 | 148,644 | ||||||
| Yukiguni Maitake Co. Ltd. | 3,000 | 22,374 | ||||||
| Z Holdings Corp. | 61,700 | 181,390 | ||||||
| Zenkoku Hosho Co. Ltd. | 8,200 | 270,960 | ||||||
| Zenrin Co. Ltd. | 7,500 | 51,305 | ||||||
| Zensho Holdings Co. Ltd. | 13,667 | 358,310 | ||||||
| Zeon Corp. | 26,400 | 253,289 | ||||||
| ZERIA Pharmaceutical Co. Ltd. | 2,800 | 41,822 | ||||||
| ZIGExN Co. Ltd. | 7,900 | 19,132 | ||||||
| ZOZO, Inc. | 8,400 | 185,667 | ||||||
| 317,460,348 | ||||||||
163
| Avantis International Equity ETF | ||||||||
| Shares | Value | |||||||
| Netherlands — 3.4% | ||||||||
Aalberts NV(1) | 25,555 | $ | 937,102 | |||||
| ABN AMRO Bank NV, CVA | 75,072 | 721,208 | ||||||
Adyen NV(2) | 1,815 | 2,800,807 | ||||||
Aegon NV, NY Shares(1) | 554,137 | 2,488,075 | ||||||
AerCap Holdings NV(2) | 38,793 | 1,708,832 | ||||||
| Akzo Nobel NV | 23,391 | 1,473,665 | ||||||
| AMG Advanced Metallurgical Group NV | 7,080 | 180,768 | ||||||
| Arcadis NV | 10,266 | 327,273 | ||||||
| ASM International NV | 5,198 | 1,413,280 | ||||||
| ASML Holding NV, NY Shares | 20,936 | 10,257,384 | ||||||
| ASR Nederland NV | 47,252 | 1,928,554 | ||||||
| BE Semiconductor Industries NV | 17,639 | 837,918 | ||||||
Beter Bed Holding NV(1) | 3,753 | 13,548 | ||||||
| Boskalis Westminster | 14,656 | 486,124 | ||||||
| Brunel International NV | 4,395 | 41,150 | ||||||
| Coca-Cola Europacific Partners PLC | 23,816 | 1,171,033 | ||||||
Constellium SE(2) | 12,014 | 160,026 | ||||||
| Corbion NV | 3,487 | 99,011 | ||||||
| Flow Traders | 10,254 | 205,190 | ||||||
ForFarmers NV(1) | 6,503 | 18,327 | ||||||
Fugro NV(2) | 33,653 | 428,659 | ||||||
| Heijmans NV, CVA | 5,110 | 53,049 | ||||||
| Heineken Holding NV | 1,152 | 81,721 | ||||||
| Heineken NV | 14,759 | 1,326,525 | ||||||
| IMCD NV | 2,751 | 379,516 | ||||||
ING Groep NV, ADR(1) | 387,652 | 3,403,585 | ||||||
InPost SA(2) | 11,074 | 56,973 | ||||||
Just Eat Takeaway.com NV(2) | 9,390 | 156,207 | ||||||
| Kendrion NV | 1,780 | 27,632 | ||||||
| Koninklijke Ahold Delhaize NV | 154,249 | 4,242,898 | ||||||
Koninklijke BAM Groep NV(2) | 91,934 | 245,051 | ||||||
| Koninklijke DSM NV | 10,565 | 1,347,204 | ||||||
| Koninklijke KPN NV | 957,946 | 3,048,276 | ||||||
| Koninklijke Philips NV, NY Shares | 27,968 | 463,709 | ||||||
| Koninklijke Vopak NV | 22,955 | 505,274 | ||||||
| NN Group NV | 52,871 | 2,172,890 | ||||||
| OCI NV | 31,851 | 1,195,777 | ||||||
| Ordina NV | 8,994 | 35,489 | ||||||
Pharming Group NV(1)(2) | 184,523 | 221,875 | ||||||
PostNL NV(1) | 166,586 | 354,972 | ||||||
Prosus NV(2) | 22,002 | 1,359,931 | ||||||
| Randstad NV | 7,044 | 328,044 | ||||||
| SBM Offshore NV | 14,903 | 208,118 | ||||||
| SIF Holding NV | 604 | 6,170 | ||||||
| Signify NV | 8,321 | 236,532 | ||||||
Sligro Food Group NV(2) | 7,515 | 124,484 | ||||||
| TKH Group NV | 8,914 | 310,988 | ||||||
TomTom NV(2) | 4,565 | 36,747 | ||||||
| Universal Music Group NV | 26,768 | 531,558 | ||||||
| Van Lanschot Kempen NV | 4,210 | 88,699 | ||||||
164
| Avantis International Equity ETF | ||||||||
| Shares | Value | |||||||
| Wolters Kluwer NV | 11,248 | $ | 1,099,974 | |||||
| 51,347,802 | ||||||||
| New Zealand — 0.3% | ||||||||
a2 Milk Co. Ltd.(1)(2) | 57,922 | 220,332 | ||||||
Air New Zealand Ltd.(2) | 324,471 | 134,081 | ||||||
| Arvida Group Ltd. | 63,083 | 58,171 | ||||||
Auckland International Airport Ltd.(2) | 71,171 | 328,224 | ||||||
Channel Infrastructure NZ Ltd.(2) | 2,544 | 2,101 | ||||||
| Chorus Ltd. | 97,619 | 478,078 | ||||||
| Contact Energy Ltd. | 74,668 | 358,761 | ||||||
| Fisher & Paykel Healthcare Corp. Ltd. | 17,791 | 212,988 | ||||||
| Fletcher Building Ltd. | 75,150 | 256,544 | ||||||
| Genesis Energy Ltd. | 53,599 | 96,865 | ||||||
| Hallenstein Glasson Holdings Ltd. | 3,630 | 11,803 | ||||||
Heartland Group Holdings Ltd.(1) | 48,998 | 54,101 | ||||||
| Infratil Ltd. | 46,257 | 255,458 | ||||||
| KMD Brands Ltd. | 94,852 | 62,453 | ||||||
| Mercury NZ Ltd. | 40,890 | 144,709 | ||||||
| Meridian Energy Ltd. | 37,261 | 113,676 | ||||||
| NZX Ltd. | 4,193 | 3,324 | ||||||
| Oceania Healthcare Ltd. | 83,326 | 50,351 | ||||||
Pushpay Holdings Ltd.(2) | 55,414 | 43,147 | ||||||
Restaurant Brands New Zealand Ltd.(1) | 933 | 4,632 | ||||||
| Ryman Healthcare Ltd. | 13,809 | 77,275 | ||||||
| Skellerup Holdings Ltd. | 11,000 | 37,224 | ||||||
| SKYCITY Entertainment Group Ltd. | 75,887 | 132,013 | ||||||
| Spark New Zealand Ltd. | 380,537 | 1,258,784 | ||||||
| Summerset Group Holdings Ltd. | 22,373 | 150,800 | ||||||
Tourism Holdings Ltd.(2) | 3,514 | 5,837 | ||||||
| TOWER Ltd. | 29,792 | 11,192 | ||||||
Vista Group International Ltd.(2) | 6 | 7 | ||||||
| 4,562,931 | ||||||||
| Norway — 1.0% | ||||||||
| ABG Sundal Collier Holding ASA | 59,246 | 34,758 | ||||||
Adevinta ASA(2) | 6,703 | 54,232 | ||||||
| Aker BP ASA | 15,510 | 543,328 | ||||||
Aker Horizons ASA(1)(2) | 143 | 256 | ||||||
| Aker Solutions ASA | 26,621 | 104,402 | ||||||
American Shipping Co. ASA(2) | 2,356 | 9,525 | ||||||
ArcticZymes Technologies ASA(2) | 2,740 | 20,325 | ||||||
Atea ASA(2) | 1,331 | 14,656 | ||||||
| Austevoll Seafood ASA | 4,629 | 49,618 | ||||||
Axactor SE(1)(2) | 598 | 386 | ||||||
| B2Holding ASA | 18,817 | 16,989 | ||||||
| Bakkafrost P/F | 1,289 | 75,427 | ||||||
| Belships ASA | 16,794 | 25,145 | ||||||
| Bonheur ASA | 2,543 | 95,194 | ||||||
Borr Drilling Ltd.(1)(2) | 27,304 | 106,389 | ||||||
| Borregaard ASA | 9,187 | 140,117 | ||||||
BW Energy Ltd.(2) | 15,935 | 39,737 | ||||||
| BW LPG Ltd. | 27,500 | 178,758 | ||||||
165
| Avantis International Equity ETF | ||||||||
| Shares | Value | |||||||
| BW Offshore Ltd. | 23,808 | $ | 64,509 | |||||
Crayon Group Holding ASA(2) | 1,419 | 15,357 | ||||||
| DNB Bank ASA | 58,231 | 1,107,204 | ||||||
| DNO ASA | 141,033 | 200,382 | ||||||
| Entra ASA | 8,571 | 111,451 | ||||||
| Equinor ASA, ADR | 80,853 | 3,136,288 | ||||||
| Europris ASA | 16,840 | 101,028 | ||||||
| FLEX LNG Ltd. | 8,993 | 297,226 | ||||||
Frontline Ltd.(1)(2) | 13,650 | 161,889 | ||||||
| Gjensidige Forsikring ASA | 5,511 | 111,832 | ||||||
| Golden Ocean Group Ltd. | 39,604 | 373,269 | ||||||
| Grieg Seafood ASA | 4,635 | 56,079 | ||||||
| Hafnia Ltd. | 34,419 | 153,687 | ||||||
Hexagon Composites ASA(1)(2) | 22 | 62 | ||||||
Hexagon Purus ASA(1)(2) | 4 | 10 | ||||||
Hunter Group ASA(2) | 48,000 | 10,133 | ||||||
| Kid ASA | 3,728 | 33,525 | ||||||
| Kitron ASA | 6,243 | 12,503 | ||||||
Kongsberg Automotive ASA(1)(2) | 138,092 | 35,166 | ||||||
| Kongsberg Gruppen ASA | 11,378 | 388,907 | ||||||
| Leroy Seafood Group ASA | 10,584 | 70,719 | ||||||
Magseis Fairfield ASA(2) | 54,333 | 46,587 | ||||||
Mowi ASA(1) | 22,549 | 462,294 | ||||||
| MPC Container Ships ASA | 39,352 | 81,130 | ||||||
| Multiconsult ASA | 1,108 | 15,200 | ||||||
Nordic Semiconductor ASA(2) | 7,952 | 121,571 | ||||||
| Norsk Hydro ASA | 153,598 | 1,055,387 | ||||||
Norske Skog ASA(2) | 11,693 | 81,286 | ||||||
Norwegian Energy Co. ASA(2) | 6,842 | 245,543 | ||||||
Odfjell Drilling Ltd.(2) | 26,851 | 72,934 | ||||||
Odfjell Technology Ltd.(2) | 2,866 | 7,180 | ||||||
| Orkla ASA | 20,154 | 168,768 | ||||||
| Otello Corp ASA | 1,983 | 1,653 | ||||||
Panoro Energy ASA(2) | 14,083 | 41,781 | ||||||
| Pareto Bank ASA | 2,473 | 11,995 | ||||||
Petronor E&P ASA(2) | 8,972 | 777 | ||||||
PGS ASA(1)(2) | 179,549 | 146,136 | ||||||
| Protector Forsikring ASA | 11,708 | 140,160 | ||||||
| Rana Gruber ASA | 8,236 | 35,792 | ||||||
| Salmar ASA | 1,424 | 94,165 | ||||||
| Schibsted ASA, B Shares | 4,746 | 81,399 | ||||||
| Schibsted ASA, Class A | 3,105 | 56,824 | ||||||
| SpareBank 1 Nord Norge | 17,847 | 160,864 | ||||||
| Sparebank 1 Oestlandet | 4,121 | 46,959 | ||||||
| SpareBank 1 SMN | 19,539 | 237,898 | ||||||
| SpareBank 1 Sorost-Norge | 2,242 | 12,244 | ||||||
| SpareBank 1 SR-Bank ASA | 8,851 | 101,244 | ||||||
| Sparebanken Vest | 6,101 | 54,283 | ||||||
| Stolt-Nielsen Ltd. | 2,348 | 50,176 | ||||||
| Storebrand ASA | 148,060 | 1,185,082 | ||||||
| Subsea 7 SA | 29,339 | 263,373 | ||||||
166
| Avantis International Equity ETF | ||||||||
| Shares | Value | |||||||
| Telenor ASA | 37,667 | $ | 412,190 | |||||
| TGS ASA | 18,667 | 284,075 | ||||||
| TOMRA Systems ASA | 9,286 | 211,597 | ||||||
| Veidekke ASA | 13,219 | 135,002 | ||||||
| Wallenius Wilhelmsen ASA | 21,001 | 118,234 | ||||||
| Yara International ASA | 13,941 | 589,669 | ||||||
| 14,781,920 | ||||||||
| Portugal — 0.2% | ||||||||
| Altri SGPS SA | 22,911 | 129,274 | ||||||
| Banco Comercial Portugues SA, R Shares | 1,163,873 | 169,330 | ||||||
| Corticeira Amorim SGPS SA | 3,340 | 33,730 | ||||||
| CTT-Correios de Portugal SA | 6,666 | 21,713 | ||||||
| EDP - Energias de Portugal SA | 176,999 | 845,276 | ||||||
| EDP Renovaveis SA | 7,020 | 170,250 | ||||||
| Galp Energia SGPS SA | 97,423 | 1,052,069 | ||||||
Greenvolt-Energias Renovaveis SA(2) | 1,590 | 15,360 | ||||||
| Jeronimo Martins SGPS SA | 14,203 | 314,905 | ||||||
| Navigator Co. SA | 4,889 | 19,399 | ||||||
| NOS SGPS SA | 16,900 | 62,294 | ||||||
| REN - Redes Energeticas Nacionais SGPS SA | 128,562 | 340,816 | ||||||
| Sonae SGPS SA | 124,809 | 125,451 | ||||||
| 3,299,867 | ||||||||
| Singapore — 1.5% | ||||||||
| Ascendas India Trust | 198,400 | 161,410 | ||||||
Avarga Ltd.(2) | 100,800 | 15,876 | ||||||
| Boustead Singapore Ltd. | 1,000 | 647 | ||||||
| Bumitama Agri Ltd. | 141,800 | 63,350 | ||||||
| Capitaland Investment Ltd. | 225,200 | 592,901 | ||||||
| Centurion Corp. Ltd. | 1,800 | 490 | ||||||
| China Sunsine Chemical Holdings Ltd. | 56,900 | 19,561 | ||||||
| Chip Eng Seng Corp. Ltd. | 30,100 | 14,310 | ||||||
| City Developments Ltd. | 91,200 | 529,526 | ||||||
| ComfortDelGro Corp. Ltd. | 325,900 | 328,456 | ||||||
| DBS Group Holdings Ltd. | 126,385 | 2,942,683 | ||||||
| Delfi Ltd. | 14,200 | 7,768 | ||||||
| Far East Orchard Ltd. | 10,200 | 7,878 | ||||||
| First Resources Ltd. | 189,800 | 204,586 | ||||||
Frencken Group Ltd.(1) | 59,900 | 49,047 | ||||||
Geo Energy Resources Ltd.(1) | 254,900 | 70,003 | ||||||
| Golden Agri-Resources Ltd. | 3,289,200 | 659,382 | ||||||
Grab Holdings Ltd., Class A(2) | 29,392 | 83,767 | ||||||
GuocoLand Ltd.(1) | 16,800 | 20,166 | ||||||
| Haw Par Corp. Ltd. | 2,900 | 22,679 | ||||||
Hong Fok Corp. Ltd.(1) | 75,300 | 57,003 | ||||||
| Hong Leong Asia Ltd. | 13,900 | 7,454 | ||||||
| Hour Glass Ltd. | 52,500 | 87,037 | ||||||
| Hutchison Port Holdings Trust, U Shares | 1,497,200 | 321,265 | ||||||
iFAST Corp. Ltd.(1) | 12,900 | 41,237 | ||||||
| Indofood Agri Resources Ltd. | 80,500 | 18,130 | ||||||
| ISDN Holdings Ltd. | 85,200 | 28,858 | ||||||
| Japfa Ltd. | 93,000 | 39,899 | ||||||
167
| Avantis International Equity ETF | ||||||||
| Shares | Value | |||||||
| Jardine Cycle & Carriage Ltd. | 3,900 | $ | 91,557 | |||||
| Jiutian Chemical Group Ltd. | 505,900 | 33,549 | ||||||
| Keppel Corp. Ltd. | 262,600 | 1,363,818 | ||||||
Keppel Infrastructure Trust(1) | 445,300 | 181,342 | ||||||
Mandarin Oriental International Ltd.(2) | 14,400 | 29,522 | ||||||
Maxeon Solar Technologies Ltd.(1)(2) | 3,598 | 71,420 | ||||||
| Mewah International, Inc. | 26,100 | 6,415 | ||||||
| Micro-Mechanics Holdings Ltd. | 5,300 | 11,903 | ||||||
| Netlink Nbn Management Pte. Ltd. | 174,600 | 116,715 | ||||||
| Olam Group Ltd. | 123,300 | 129,498 | ||||||
OUE Ltd.(1) | 21,900 | 21,462 | ||||||
| Oversea-Chinese Banking Corp. Ltd. | 346,631 | 2,987,662 | ||||||
| Oxley Holdings Ltd. | 19,100 | 2,184 | ||||||
| QAF Ltd. | 19,700 | 12,053 | ||||||
| Raffles Medical Group Ltd. | 220,100 | 219,004 | ||||||
Rex International Holding Ltd.(1)(2) | 148,100 | 29,142 | ||||||
Riverstone Holdings Ltd.(1) | 188,700 | 97,281 | ||||||
| Samudera Shipping Line Ltd. | 80,000 | 57,035 | ||||||
SATS Ltd.(1)(2) | 35,600 | 102,808 | ||||||
Sea Ltd., ADR(2) | 7,999 | 495,938 | ||||||
| Sembcorp Industries Ltd. | 157,100 | 380,614 | ||||||
| Sheng Siong Group Ltd. | 186,800 | 216,515 | ||||||
| Sing Investments & Finance Ltd. | 1,000 | 1,066 | ||||||
Singapore Airlines Ltd.(1)(2) | 282,650 | 1,073,180 | ||||||
| Singapore Exchange Ltd. | 139,400 | 945,970 | ||||||
| Singapore Post Ltd. | 439,900 | 182,349 | ||||||
| Singapore Technologies Engineering Ltd. | 175,600 | 467,930 | ||||||
| Singapore Telecommunications Ltd. | 848,800 | 1,593,501 | ||||||
| Stamford Land Corp. Ltd. | 52,700 | 14,514 | ||||||
| StarHub Ltd. | 79,000 | 69,453 | ||||||
| Straits Trading Co. Ltd. | 14,200 | 33,095 | ||||||
| Tuan Sing Holdings Ltd. | 136,993 | 36,186 | ||||||
| United Overseas Bank Ltd. | 112,700 | 2,197,589 | ||||||
| UOL Group Ltd. | 165,200 | 817,375 | ||||||
| Venture Corp. Ltd. | 42,200 | 551,336 | ||||||
| Wilmar International Ltd. | 120,500 | 347,811 | ||||||
| Wing Tai Holdings Ltd. | 15,500 | 18,499 | ||||||
Yangzijiang Financial Holding Ltd.(2) | 397,300 | 106,287 | ||||||
| Yangzijiang Shipbuilding Holdings Ltd. | 795,000 | 550,964 | ||||||
| Yanlord Land Group Ltd. | 232,400 | 171,036 | ||||||
Yoma Strategic Holdings Ltd.(1)(2) | 578,700 | 53,710 | ||||||
| 22,284,657 | ||||||||
| Spain — 2.0% | ||||||||
| Acciona SA | 5,031 | 985,403 | ||||||
| Acerinox SA | 76,045 | 688,042 | ||||||
ACS Actividades de Construccion y Servicios SA(1) | 19,996 | 445,502 | ||||||
Aena SME SA(2) | 5,980 | 734,474 | ||||||
| Almirall SA | 14,176 | 127,883 | ||||||
Amadeus IT Group SA(2) | 26,840 | 1,416,867 | ||||||
Amper SA(2) | 83,093 | 14,738 | ||||||
| Applus Services SA | 13,771 | 92,127 | ||||||
168
| Avantis International Equity ETF | ||||||||
| Shares | Value | |||||||
| Atresmedia Corp. de Medios de Comunicacion SA | 15,793 | $ | 43,251 | |||||
| Banco Bilbao Vizcaya Argentaria SA, ADR | 435,571 | 1,933,935 | ||||||
| Banco de Sabadell SA | 1,387,322 | 954,108 | ||||||
| Banco Santander SA, ADR | 1,141,572 | 2,751,189 | ||||||
| Bankinter SA | 72,313 | 370,589 | ||||||
| CaixaBank SA | 419,158 | 1,265,648 | ||||||
| Cellnex Telecom SA | 20,987 | 817,291 | ||||||
| Cia de Distribucion Integral Logista Holdings SA | 6,004 | 116,695 | ||||||
| CIE Automotive SA | 5,093 | 124,896 | ||||||
| Construcciones y Auxiliar de Ferrocarriles SA | 4,085 | 118,205 | ||||||
| Ebro Foods SA | 6,389 | 100,979 | ||||||
| Enagas SA | 42,321 | 772,786 | ||||||
| Ence Energia y Celulosa SA | 19,662 | 69,598 | ||||||
| Endesa SA | 33,890 | 581,282 | ||||||
| Ercros SA | 15,264 | 46,882 | ||||||
| Faes Farma SA | 31,342 | 124,481 | ||||||
| Ferrovial SA (Madrid) | 10,167 | 254,936 | ||||||
| Fluidra SA | 7,732 | 123,671 | ||||||
| Fomento de Construcciones y Contratas SA | 8,611 | 77,317 | ||||||
| Gestamp Automocion SA | 41,472 | 151,843 | ||||||
| Global Dominion Access SA | 11,687 | 45,247 | ||||||
Grifols SA(1)(2) | 10,449 | 126,313 | ||||||
| Grupo Catalana Occidente SA | 3,270 | 96,153 | ||||||
| Iberdrola SA | 422,964 | 4,403,773 | ||||||
| Indra Sistemas SA | 5,048 | 39,689 | ||||||
| Industria de Diseno Textil SA | 55,571 | 1,199,857 | ||||||
| Laboratorios Farmaceuticos Rovi SA | 2,940 | 144,325 | ||||||
| Linea Directa Aseguradora SA Cia de Seguros y Reaseguros | 38,597 | 41,707 | ||||||
| Mapfre SA | 155,169 | 257,416 | ||||||
Melia Hotels International SA(2) | 22,151 | 134,337 | ||||||
| Metrovacesa SA | 5,539 | 38,051 | ||||||
| Miquel y Costas & Miquel SA | 638 | 8,241 | ||||||
Naturgy Energy Group SA(1) | 10,976 | 302,659 | ||||||
Neinor Homes SA(1) | 11,637 | 119,378 | ||||||
Obrascon Huarte Lain SA(1)(2) | 79,625 | 45,582 | ||||||
Prosegur Cash SA(1) | 27,680 | 18,937 | ||||||
| Prosegur Cia de Seguridad SA | 35,269 | 64,944 | ||||||
| Red Electrica Corp. SA | 49,363 | 902,493 | ||||||
| Repsol SA | 290,289 | 3,770,297 | ||||||
| Sacyr SA | 135,193 | 302,412 | ||||||
Siemens Gamesa Renewable Energy SA(2) | 14,118 | 254,377 | ||||||
Solaria Energia y Medio Ambiente SA(2) | 9,769 | 207,430 | ||||||
Talgo SA (Madrid)(1) | 920 | 2,444 | ||||||
Telefonica SA, ADR(1) | 493,580 | 2,013,806 | ||||||
Tubacex SA(2) | 7,139 | 15,895 | ||||||
| Unicaja Banco SA | 241,769 | 217,704 | ||||||
| Viscofan SA | 8,155 | 458,836 | ||||||
| 30,536,921 | ||||||||
| Sweden — 3.3% | ||||||||
| AAK AB | 18,328 | 280,744 | ||||||
| AcadeMedia AB | 13,381 | 58,631 | ||||||
169
| Avantis International Equity ETF | ||||||||
| Shares | Value | |||||||
| AddLife AB, B Shares | 6,029 | $ | 78,029 | |||||
| AddTech AB, B Shares | 33,034 | 463,421 | ||||||
Africa Oil Corp.(1) | 39,500 | 77,295 | ||||||
| AFRY AB | 900 | 11,864 | ||||||
| Alfa Laval AB | 23,107 | 616,204 | ||||||
| Alimak Group AB | 2,814 | 20,700 | ||||||
Alleima AB(2) | 8,488 | 34,080 | ||||||
| Alligo AB, Class B | 945 | 8,626 | ||||||
| Ambea AB | 3,055 | 12,387 | ||||||
| AQ Group AB | 798 | 17,737 | ||||||
| Arjo AB, B Shares | 30,587 | 137,373 | ||||||
| Assa Abloy AB, Class B | 39,945 | 809,045 | ||||||
| Atlas Copco AB, A Shares | 156,374 | 1,587,356 | ||||||
| Atlas Copco AB, B Shares | 117,408 | 1,069,092 | ||||||
| Atrium Ljungberg AB, B Shares | 5,093 | 73,819 | ||||||
Avanza Bank Holding AB(1) | 64,188 | 1,028,870 | ||||||
| Axfood AB | 25,364 | 764,537 | ||||||
| Beijer Alma AB | 1,369 | 20,853 | ||||||
| Beijer Ref AB | 21,339 | 276,256 | ||||||
Better Collective A/S(2) | 7,120 | 97,563 | ||||||
| Bilia AB, A Shares | 28,770 | 357,927 | ||||||
| BillerudKorsnas AB | 41,767 | 543,079 | ||||||
| BioGaia AB, B Shares | 12,584 | 101,560 | ||||||
| Biotage AB | 11,375 | 191,354 | ||||||
Bjorn Borg AB(2) | 934 | 2,388 | ||||||
| Boliden AB | 45,944 | 1,471,226 | ||||||
| Bonava AB, B Shares | 13,106 | 46,911 | ||||||
Boozt AB(1)(2) | 8,909 | 52,229 | ||||||
| Bravida Holding AB | 3,576 | 32,361 | ||||||
| Bufab AB | 973 | 22,566 | ||||||
| Bure Equity AB | 11,805 | 233,174 | ||||||
| Byggmax Group AB | 17,111 | 70,303 | ||||||
Castellum AB(1) | 52,962 | 743,292 | ||||||
| Catena AB | 3,571 | 146,786 | ||||||
Catena Media PLC(2) | 24,219 | 72,782 | ||||||
| Cellavision AB | 694 | 21,770 | ||||||
| Cibus Nordic Real Estate AB | 7,338 | 116,855 | ||||||
| Clas Ohlson AB, B Shares | 18,520 | 167,055 | ||||||
| Cloetta AB, B Shares | 80,256 | 140,303 | ||||||
Collector Bank AB(2) | 13,975 | 44,573 | ||||||
| Coor Service Management Holding AB | 8,924 | 69,098 | ||||||
| Corem Property Group AB, B Shares | 77,997 | 90,960 | ||||||
| Dios Fastigheter AB | 13,771 | 101,932 | ||||||
Duni AB(1)(2) | 2,761 | 22,510 | ||||||
| Elanders AB, B Shares | 2,304 | 32,635 | ||||||
| Electrolux AB, B Shares | 40,800 | 515,918 | ||||||
| Electrolux Professional AB, B Shares | 39,549 | 196,474 | ||||||
| Elekta AB, B Shares | 39,889 | 228,660 | ||||||
Embracer Group AB(1)(2) | 13,464 | 83,537 | ||||||
| Eolus Vind AB, B Shares | 3,678 | 47,557 | ||||||
| Epiroc AB, A Shares | 67,610 | 1,034,488 | ||||||
170
| Avantis International Equity ETF | ||||||||
| Shares | Value | |||||||
| Epiroc AB, B Shares | 29,680 | $ | 404,059 | |||||
| EQT AB | 7,225 | 161,824 | ||||||
| Essity AB, B Shares | 54,791 | 1,215,443 | ||||||
| Evolution AB | 4,085 | 326,813 | ||||||
| Fabege AB | 35,896 | 317,268 | ||||||
| Fagerhult AB | 716 | 3,066 | ||||||
Fastighets AB Balder, B Shares(2) | 45,738 | 252,575 | ||||||
Fingerprint Cards AB, B Shares(1)(2) | 1,440 | 958 | ||||||
| Fortnox AB | 51,665 | 228,630 | ||||||
G5 Entertainment AB(1) | 1,269 | 20,937 | ||||||
| GARO AB | 7,008 | 76,178 | ||||||
| Getinge AB, B Shares | 37,441 | 693,465 | ||||||
| Granges AB | 13,052 | 101,175 | ||||||
H & M Hennes & Mauritz AB, B Shares(1) | 76,064 | 789,950 | ||||||
| Hemnet Group AB | 5,791 | 76,814 | ||||||
| Hexagon AB, B Shares | 75,575 | 772,304 | ||||||
| Hexpol AB | 23,043 | 204,578 | ||||||
| HMS Networks AB | 2,435 | 88,482 | ||||||
Hoist Finance AB(2) | 12,496 | 37,833 | ||||||
| Holmen AB, B Shares | 9,972 | 427,844 | ||||||
| Hufvudstaden AB, A Shares | 13,708 | 163,306 | ||||||
| Husqvarna AB, B Shares | 35,664 | 239,963 | ||||||
| Industrivarden AB, A Shares | 10,140 | 224,722 | ||||||
| Indutrade AB | 29,971 | 554,943 | ||||||
| Instalco AB | 23,927 | 119,431 | ||||||
| Intrum AB | 8,076 | 145,049 | ||||||
| Investment AB Latour, B Shares | 3,154 | 62,132 | ||||||
INVISIO AB(1) | 2,959 | 41,124 | ||||||
| Inwido AB | 6,499 | 63,556 | ||||||
| JM AB | 12,160 | 209,061 | ||||||
| Kabe Group AB, Class B | 255 | 5,012 | ||||||
Karnov Group AB(2) | 4,021 | 21,584 | ||||||
Karo Pharma AB(1)(2) | 4,396 | 24,717 | ||||||
| Kopparbergs Bryggeri AB, B Shares | 1,831 | 25,902 | ||||||
| Lifco AB, B Shares | 11,946 | 185,558 | ||||||
Lime Technologies AB(1) | 752 | 21,559 | ||||||
| Lindab International AB | 13,006 | 186,289 | ||||||
| Loomis AB | 22,382 | 604,617 | ||||||
Maha Energy AB(2) | 43,382 | 49,974 | ||||||
| MEKO AB | 10,576 | 96,592 | ||||||
Millicom International Cellular SA, SDR(2) | 25,739 | 368,290 | ||||||
| MIPS AB | 3,739 | 168,486 | ||||||
Modern Times Group MTG AB, B Shares(2) | 13,190 | 115,500 | ||||||
Momentum Group AB(2) | 945 | 4,472 | ||||||
| Munters Group AB | 2,707 | 19,442 | ||||||
| Mycronic AB | 11,030 | 130,804 | ||||||
| NCC AB, B Shares | 17,143 | 161,355 | ||||||
Net Insight AB, B Shares(2) | 86,165 | 42,102 | ||||||
| New Wave Group AB, B Shares | 12,792 | 205,753 | ||||||
| Nibe Industrier AB, B Shares | 57,451 | 538,014 | ||||||
| Nilorngruppen AB, B Shares | 1,058 | 11,262 | ||||||
171
| Avantis International Equity ETF | ||||||||
| Shares | Value | |||||||
| Nobia AB | 34,226 | $ | 88,149 | |||||
| Nolato AB, B Shares | 34,043 | 176,710 | ||||||
| Nordea Bank Abp | 261,565 | 2,425,190 | ||||||
| Nordic Paper Holding AB | 1,595 | 5,367 | ||||||
| Nordic Waterproofing Holding AB | 800 | 12,941 | ||||||
| Nordnet AB publ | 15,342 | 183,670 | ||||||
| Nyfosa AB | 18,905 | 158,814 | ||||||
Orron Energy AB(1) | 8,113 | 15,431 | ||||||
Ovzon AB(2) | 906 | 4,046 | ||||||
OX2 AB(2) | 1,531 | 13,652 | ||||||
Pandox AB(2) | 11,646 | 143,977 | ||||||
| Paradox Interactive AB | 10,718 | 168,494 | ||||||
| Peab AB, Class B | 37,358 | 230,017 | ||||||
| Platzer Fastigheter Holding AB, B Shares | 4,333 | 33,586 | ||||||
| Profoto Holding AB | 290 | 2,651 | ||||||
RaySearch Laboratories AB(2) | 4,477 | 20,957 | ||||||
| Resurs Holding AB | 27,184 | 57,920 | ||||||
| Saab AB, B Shares | 20,393 | 681,271 | ||||||
| Sagax AB, D Shares | 2,138 | 5,570 | ||||||
| Sagax AB, B Shares | 3,456 | 74,328 | ||||||
Samhallsbyggnadsbolaget i Norden AB(1) | 67,346 | 108,129 | ||||||
| Samhallsbyggnadsbolaget i Norden AB, D Shares | 10,330 | 20,331 | ||||||
| Sandvik AB | 42,441 | 661,676 | ||||||
Scandi Standard AB(2) | 9,597 | 42,329 | ||||||
Scandic Hotels Group AB(2) | 23,624 | 83,890 | ||||||
Sectra AB, B Shares(2) | 7,948 | 118,360 | ||||||
Securitas AB, B Shares(1) | 29,117 | 254,969 | ||||||
Sinch AB(1)(2) | 22,860 | 44,197 | ||||||
| Skandinaviska Enskilda Banken AB, A Shares | 147,084 | 1,466,235 | ||||||
| Skanska AB, B Shares | 85,434 | 1,262,089 | ||||||
| SKF AB, B Shares | 55,839 | 837,170 | ||||||
| SkiStar AB | 16,243 | 209,012 | ||||||
Solid Forsakring AB(2) | 1,553 | 6,757 | ||||||
Spotify Technology SA(2) | 1,786 | 193,156 | ||||||
| SSAB AB, B Shares | 171,242 | 799,524 | ||||||
| SSAB AB, A Shares | 38,295 | 184,189 | ||||||
Stillfront Group AB(2) | 26,698 | 56,816 | ||||||
| Svenska Cellulosa AB SCA, B Shares | 65,994 | 988,821 | ||||||
| Svenska Handelsbanken AB, A Shares | 170,533 | 1,396,694 | ||||||
| Sweco AB, B Shares | 19,273 | 181,689 | ||||||
| Swedbank AB, A Shares | 109,600 | 1,416,569 | ||||||
Swedish Orphan Biovitrum AB(2) | 8,535 | 188,468 | ||||||
| Synsam AB | 2,551 | 12,215 | ||||||
| Tele2 AB, B Shares | 77,661 | 827,071 | ||||||
Telefonaktiebolaget LM Ericsson, ADR(1) | 283,428 | 2,105,870 | ||||||
| Telia Co. AB | 358,324 | 1,261,205 | ||||||
| Tethys Oil AB | 11,171 | 66,851 | ||||||
| TF Bank AB | 1,188 | 17,724 | ||||||
| Thule Group AB | 9,143 | 223,021 | ||||||
Tobii AB(2) | 777 | 1,739 | ||||||
Tobii Dynavox AB(2) | 920 | 1,954 | ||||||
172
| Avantis International Equity ETF | ||||||||
| Shares | Value | |||||||
Transtema Group AB(2) | 1,153 | $ | 3,217 | |||||
| Trelleborg AB, B Shares | 52,764 | 1,096,446 | ||||||
| Troax Group AB | 6,954 | 112,512 | ||||||
Truecaller AB, B Shares(2) | 14,523 | 76,350 | ||||||
Viaplay Group AB, B Shares(2) | 3,268 | 83,139 | ||||||
| Vitec Software Group AB, B Shares | 2,711 | 101,130 | ||||||
| Vitrolife AB | 3,780 | 90,135 | ||||||
| Volvo AB, B Shares | 119,305 | 1,889,826 | ||||||
| Volvo AB, A Shares | 14,188 | 236,125 | ||||||
Volvo Car AB, Class B(1)(2) | 61,731 | 376,029 | ||||||
| Wallenstam AB, B Shares | 27,044 | 121,364 | ||||||
| Wihlborgs Fastigheter AB | 39,052 | 279,758 | ||||||
| 49,565,004 | ||||||||
| Switzerland — 8.4% | ||||||||
ABB Ltd., ADR(1) | 61,439 | 1,693,873 | ||||||
| Adecco Group AG | 6,966 | 220,826 | ||||||
| Alcon, Inc. | 29,299 | 1,929,132 | ||||||
| Allreal Holding AG | 792 | 124,170 | ||||||
ALSO Holding AG(2) | 776 | 129,005 | ||||||
ams-OSRAM AG(2) | 18,505 | 135,412 | ||||||
| Arbonia AG | 14,274 | 187,098 | ||||||
| Ascom Holding AG | 5,835 | 37,635 | ||||||
| Autoneum Holding AG | 850 | 95,291 | ||||||
| Bachem Holding AG, Class B | 1,455 | 100,754 | ||||||
| Baloise Holding AG | 11,489 | 1,658,078 | ||||||
Banque Cantonale Vaudoise(1) | 2,377 | 225,553 | ||||||
| Barry Callebaut AG | 506 | 1,035,344 | ||||||
| Basellandschaftliche Kantonalbank | 14 | 13,151 | ||||||
Basilea Pharmaceutica AG(2) | 706 | 28,042 | ||||||
| Belimo Holding AG | 1,172 | 444,581 | ||||||
| Bell Food Group AG | 256 | 67,071 | ||||||
| Bellevue Group AG | 1,552 | 50,549 | ||||||
| BKW AG | 1,541 | 186,676 | ||||||
| Bobst Group SA | 2,200 | 177,260 | ||||||
| Bucher Industries AG | 1,432 | 510,210 | ||||||
| Burckhardt Compression Holding AG | 2,173 | 909,985 | ||||||
| Burkhalter Holding AG | 284 | 24,460 | ||||||
| Bystronic AG | 158 | 100,256 | ||||||
| Calida Holding AG | 583 | 25,433 | ||||||
| Cembra Money Bank AG | 7,289 | 491,591 | ||||||
| Chocoladefabriken Lindt & Spruengli AG | 7 | 762,257 | ||||||
| Chocoladefabriken Lindt & Spruengli AG, Participation Ceritificate | 73 | 772,075 | ||||||
| Cie Financiere Richemont SA, Class A | 37,879 | 4,235,949 | ||||||
Clariant AG(2) | 43,535 | 803,801 | ||||||
Coltene Holding AG(2) | 899 | 76,876 | ||||||
| Comet Holding AG | 2,276 | 395,810 | ||||||
COSMO Pharmaceuticals NV(1) | 520 | 27,484 | ||||||
| CPH Chemie & Papier Holding AG | 46 | 3,494 | ||||||
Credit Suisse Group AG, ADR(1) | 408,246 | 2,106,549 | ||||||
| Daetwyler Holding AG, Bearer Shares | 790 | 157,601 | ||||||
| DKSH Holding AG | 14,880 | 1,107,112 | ||||||
173
| Avantis International Equity ETF | ||||||||
| Shares | Value | |||||||
| dormakaba Holding AG | 637 | $ | 267,131 | |||||
Dufry AG(2) | 7,380 | 275,366 | ||||||
EFG International AG(2) | 20,976 | 176,272 | ||||||
| Emmi AG | 1,588 | 1,398,820 | ||||||
| EMS-Chemie Holding AG | 1,547 | 1,086,361 | ||||||
Feintool International Holding AG(1) | 1,020 | 21,963 | ||||||
Flughafen Zurich AG(2) | 1,868 | 314,542 | ||||||
| Forbo Holding AG | 216 | 269,534 | ||||||
| Galenica AG | 9,516 | 669,159 | ||||||
GAM Holding AG(2) | 27,635 | 27,438 | ||||||
| Geberit AG | 2,435 | 1,125,080 | ||||||
| Georg Fischer AG | 23,542 | 1,275,570 | ||||||
| Givaudan SA | 155 | 494,539 | ||||||
Gurit Holding AG, Bearer Shares(1) | 530 | 55,484 | ||||||
| Helvetia Holding AG | 10,274 | 1,132,414 | ||||||
Holcim AG(2) | 35,964 | 1,594,122 | ||||||
| Huber + Suhner AG | 3,468 | 288,847 | ||||||
| Hypothekarbank Lenzburg AG | 1 | 4,383 | ||||||
Idorsia Ltd.(1)(2) | 5,174 | 80,967 | ||||||
Implenia AG(2) | 1,904 | 56,232 | ||||||
Ina Invest Holding AG(2) | 225 | 4,522 | ||||||
| Inficon Holding AG | 386 | 269,090 | ||||||
| Interroll Holding AG | 61 | 139,470 | ||||||
| Intershop Holding AG | 107 | 69,716 | ||||||
Julius Baer Group Ltd.(2) | 33,769 | 1,631,707 | ||||||
| Kardex Holding AG | 2,098 | 367,850 | ||||||
| Komax Holding AG | 553 | 144,076 | ||||||
| Kuehne + Nagel International AG | 9,026 | 2,086,007 | ||||||
Landis & Gyr Group AG(2) | 12 | 702 | ||||||
| LEM Holding SA | 91 | 149,865 | ||||||
| Leonteq AG | 1,571 | 89,208 | ||||||
| Liechtensteinische Landesbank AG | 1,502 | 85,758 | ||||||
Logitech International SA(1) | 34,892 | 1,736,084 | ||||||
| Lonza Group AG | 2,586 | 1,379,165 | ||||||
| Medacta Group SA | 1,387 | 122,139 | ||||||
| Metall Zug AG, B Shares | 20 | 40,652 | ||||||
| Mobilezone Holding AG | 19,778 | 327,427 | ||||||
| Mobimo Holding AG | 1,185 | 290,907 | ||||||
Molecular Partners AG(2) | 12 | 68 | ||||||
Montana Aerospace AG(2) | 1,696 | 26,235 | ||||||
| Nestle SA | 99,845 | 11,684,154 | ||||||
| Novartis AG, ADR | 199,753 | 16,084,112 | ||||||
| OC Oerlikon Corp. AG | 31,229 | 228,112 | ||||||
| Orior AG | 1,857 | 145,130 | ||||||
| Partners Group Holding AG | 2,953 | 2,850,393 | ||||||
Peach Property Group AG(2) | 2,341 | 72,768 | ||||||
PolyPeptide Group AG(2) | 355 | 13,047 | ||||||
| PSP Swiss Property AG | 11,489 | 1,299,785 | ||||||
| Rieter Holding AG | 583 | 59,524 | ||||||
| Roche Holding AG | 46,822 | 15,087,985 | ||||||
| Roche Holding AG, Bearer Shares | 1,900 | 725,721 | ||||||
174
| Avantis International Equity ETF | ||||||||
| Shares | Value | |||||||
| Schindler Holding AG | 3,016 | $ | 509,374 | |||||
| Schindler Holding AG, Bearer Participation Certificate | 6,957 | 1,211,956 | ||||||
Schweiter Technologies AG, Bearer Shares(1) | 84 | 88,129 | ||||||
Schweizerische Nationalbank(1) | 8 | 45,230 | ||||||
Sensirion Holding AG(2) | 2,773 | 257,327 | ||||||
| SFS Group AG | 4,194 | 391,968 | ||||||
| SGS SA | 691 | 1,521,709 | ||||||
Siegfried Holding AG(2) | 485 | 387,038 | ||||||
SIG Group AG(2) | 19,460 | 456,281 | ||||||
| Sika AG | 5,153 | 1,159,398 | ||||||
Softwareone Holding AG(2) | 9,842 | 129,394 | ||||||
| Sonova Holding AG | 1,196 | 315,114 | ||||||
| St Galler Kantonalbank AG | 331 | 155,672 | ||||||
Stadler Rail AG(1) | 15,760 | 480,986 | ||||||
| Straumann Holding AG | 8,459 | 926,960 | ||||||
| Sulzer AG | 3,698 | 220,692 | ||||||
| Swatch Group AG | 6,774 | 308,073 | ||||||
| Swatch Group AG, Bearer Shares | 4,299 | 1,042,487 | ||||||
| Swiss Life Holding AG | 6,580 | 3,439,214 | ||||||
| Swiss Prime Site AG | 12,478 | 1,073,133 | ||||||
| Swiss Re AG | 26,666 | 2,073,432 | ||||||
| Swisscom AG | 6,511 | 3,366,381 | ||||||
| Swissquote Group Holding SA | 2,390 | 265,158 | ||||||
| Tecan Group AG | 839 | 308,718 | ||||||
| Temenos AG | 11,087 | 907,960 | ||||||
| TX Group AG | 361 | 55,489 | ||||||
u-blox Holding AG(2) | 2,694 | 373,383 | ||||||
UBS Group AG(1)(2) | 394,717 | 6,256,264 | ||||||
V-ZUG Holding AG(2) | 478 | 37,616 | ||||||
| Valiant Holding AG | 3,115 | 295,143 | ||||||
| Valora Holding AG | 1,108 | 293,525 | ||||||
VAT Group AG(2) | 4,058 | 970,294 | ||||||
| Vetropack Holding AG | 438 | 15,355 | ||||||
| Vontobel Holding AG | 9,564 | 588,425 | ||||||
| VZ Holding AG | 2,239 | 179,107 | ||||||
| Ypsomed Holding AG | 277 | 42,325 | ||||||
| Zehnder Group AG | 2,291 | 135,344 | ||||||
| Zurich Insurance Group AG | 17,082 | 7,582,688 | ||||||
| 126,742,789 | ||||||||
| United Kingdom — 13.6% | ||||||||
| 3i Group PLC | 183,144 | 2,577,988 | ||||||
| abrdn PLC | 189,225 | 321,579 | ||||||
| Admiral Group PLC | 28,521 | 701,582 | ||||||
| AG Barr PLC | 6,893 | 40,359 | ||||||
| Airtel Africa PLC | 120,897 | 185,603 | ||||||
| AJ Bell PLC | 36,519 | 124,555 | ||||||
| Alliance Pharma PLC | 70,006 | 77,164 | ||||||
| Anglo American PLC | 153,772 | 4,941,381 | ||||||
| Anglo Asian Mining PLC | 29,191 | 27,112 | ||||||
| Anglo Pacific Group PLC | 40,206 | 76,975 | ||||||
| Antofagasta PLC | 54,225 | 689,953 | ||||||
175
| Avantis International Equity ETF | ||||||||
| Shares | Value | |||||||
Arix Bioscience PLC(2) | 2,941 | $ | 4,015 | |||||
| Ashmore Group PLC | 37,441 | 88,220 | ||||||
| Ashtead Group PLC | 57,630 | 2,831,237 | ||||||
ASOS PLC(2) | 10,347 | 83,244 | ||||||
| Associated British Foods PLC | 25,740 | 454,594 | ||||||
Aston Martin Lagonda Global Holdings PLC(1)(2) | 10,082 | 52,050 | ||||||
| AstraZeneca PLC, ADR | 120,246 | 7,500,945 | ||||||
| Atalaya Mining PLC | 43,214 | 111,631 | ||||||
| Auto Trader Group PLC | 103,971 | 785,052 | ||||||
Avast PLC(1) | 14,881 | 122,138 | ||||||
| AVEVA Group PLC | 1,723 | 55,874 | ||||||
| Aviva PLC | 351,088 | 1,703,213 | ||||||
| Avon Rubber PLC | 180 | 1,681 | ||||||
| B&M European Value Retail SA | 168,403 | 722,144 | ||||||
Babcock International Group PLC(2) | 44,076 | 168,103 | ||||||
| BAE Systems PLC | 314,320 | 2,830,797 | ||||||
| Balfour Beatty PLC | 36,045 | 131,858 | ||||||
| Bank of Georgia Group PLC | 15,241 | 353,954 | ||||||
| Barclays PLC, ADR | 448,914 | 3,497,040 | ||||||
| Barratt Developments PLC | 89,486 | 443,026 | ||||||
| Beazley PLC | 92,660 | 625,239 | ||||||
| Begbies Traynor Group PLC | 21,662 | 36,971 | ||||||
| Bellway PLC | 26,511 | 626,837 | ||||||
| Berkeley Group Holdings PLC | 21,735 | 920,109 | ||||||
| Biffa PLC | 74,193 | 346,317 | ||||||
| Bloomsbury Publishing PLC | 3,451 | 16,844 | ||||||
| Bodycote PLC | 43,833 | 279,497 | ||||||
boohoo Group PLC(1)(2) | 417 | 202 | ||||||
| BP PLC, ADR | 269,145 | 8,300,432 | ||||||
| Breedon Group PLC | 89,631 | 62,059 | ||||||
| Brewin Dolphin Holdings PLC | 80,202 | 476,896 | ||||||
| Britvic PLC | 13,015 | 118,283 | ||||||
| BT Group PLC | 1,619,758 | 2,833,443 | ||||||
| Bunzl PLC | 18,206 | 603,787 | ||||||
| Burberry Group PLC | 74,830 | 1,513,713 | ||||||
| Burford Capital Ltd. | 32,227 | 301,470 | ||||||
| Bytes Technology Group PLC | 64,779 | 312,613 | ||||||
Capita PLC(2) | 457 | 137 | ||||||
| Capital Ltd. | 24,003 | 23,146 | ||||||
Capricorn Energy PLC(2) | 213,145 | 574,503 | ||||||
Carnival PLC, ADR(1)(2) | 3,002 | 25,427 | ||||||
| Centamin PLC | 375,324 | 393,608 | ||||||
| Central Asia Metals PLC | 59,380 | 158,101 | ||||||
Centrica PLC(2) | 1,256,060 | 1,101,648 | ||||||
| Cerillion PLC | 1,284 | 13,419 | ||||||
| Chemring Group PLC | 52,055 | 188,616 | ||||||
| Close Brothers Group PLC | 35,379 | 418,551 | ||||||
| CMC Markets PLC | 46,776 | 124,755 | ||||||
| Coats Group PLC | 382,014 | 266,252 | ||||||
Coca-Cola HBC AG(2) | 14,895 | 339,894 | ||||||
| Compass Group PLC | 66,759 | 1,436,056 | ||||||
176
| Avantis International Equity ETF | ||||||||
| Shares | Value | |||||||
| Computacenter PLC | 18,587 | $ | 532,458 | |||||
| ContourGlobal PLC | 41,671 | 124,563 | ||||||
| ConvaTec Group PLC | 36,119 | 91,126 | ||||||
Costain Group PLC(2) | 396 | 183 | ||||||
Countryside Partnerships PLC(2) | 44,394 | 124,322 | ||||||
| Cranswick PLC | 7,686 | 275,016 | ||||||
| Crest Nicholson Holdings PLC | 77,921 | 211,767 | ||||||
| Croda International PLC | 7,529 | 586,847 | ||||||
| CVS Group PLC | 12,484 | 263,029 | ||||||
| DCC PLC | 8,427 | 485,011 | ||||||
De La Rue PLC(1)(2) | 23,012 | 22,965 | ||||||
| Dechra Pharmaceuticals PLC | 2,991 | 120,965 | ||||||
| Devro PLC | 55,884 | 120,868 | ||||||
| Diageo PLC, ADR | 30,100 | 5,309,339 | ||||||
| Direct Line Insurance Group PLC | 269,431 | 641,719 | ||||||
| Diversified Energy Co. PLC | 105,683 | 162,182 | ||||||
| Domino's Pizza Group PLC | 18,620 | 50,962 | ||||||
| dotdigital group PLC | 41,597 | 41,972 | ||||||
| Dr. Martens PLC | 138,136 | 376,588 | ||||||
| Drax Group PLC | 105,165 | 775,756 | ||||||
| DS Smith PLC | 96,192 | 298,097 | ||||||
| Dunelm Group PLC | 32,164 | 256,703 | ||||||
DX Group PLC(2) | 62,822 | 21,894 | ||||||
easyJet PLC(2) | 32,447 | 134,814 | ||||||
Elementis PLC(2) | 31,520 | 40,467 | ||||||
| EMIS Group PLC | 14,128 | 309,042 | ||||||
EnQuest PLC(2) | 813,049 | 282,117 | ||||||
Ergomed PLC(2) | 6,908 | 89,499 | ||||||
| Essentra PLC | 8,994 | 20,703 | ||||||
| Experian PLC | 45,338 | 1,375,803 | ||||||
| Ferguson PLC | 18,078 | 2,093,579 | ||||||
| Ferrexpo PLC | 84,688 | 145,673 | ||||||
Firstgroup PLC(1) | 209,836 | 279,473 | ||||||
| Forterra PLC | 51,498 | 158,017 | ||||||
| Foxtons Group PLC | 38,162 | 16,484 | ||||||
Frasers Group PLC(2) | 57,099 | 531,656 | ||||||
| Fresnillo PLC | 5,578 | 44,427 | ||||||
Frontier Developments PLC(1)(2) | 3,584 | 60,739 | ||||||
| Games Workshop Group PLC | 6,510 | 536,060 | ||||||
| Gamma Communications PLC | 4,078 | 51,008 | ||||||
| Gateley Holdings PLC | 12,343 | 27,592 | ||||||
| Genel Energy PLC | 42,725 | 70,429 | ||||||
| Genus PLC | 390 | 11,373 | ||||||
Georgia Capital PLC(2) | 14,285 | 113,341 | ||||||
| Glencore PLC | 1,222,663 | 6,684,983 | ||||||
Go-Ahead Group PLC(2) | 17,442 | 312,889 | ||||||
Golar LNG Ltd.(2) | 12,093 | 329,776 | ||||||
| Grafton Group PLC | 62,929 | 528,226 | ||||||
| Grainger PLC | 79,986 | 249,043 | ||||||
Greencore Group PLC(2) | 5,834 | 5,765 | ||||||
| Greggs PLC | 36,024 | 770,034 | ||||||
177
| Avantis International Equity ETF | ||||||||
| Shares | Value | |||||||
| GSK PLC, ADR | 164,776 | $ | 5,351,924 | |||||
| Gulf Keystone Petroleum Ltd. | 72,894 | 204,087 | ||||||
Gym Group PLC(2) | 16,812 | 28,180 | ||||||
Haleon PLC, ADR(2) | 165,809 | 991,538 | ||||||
| Halfords Group PLC | 72,950 | 110,281 | ||||||
| Halma PLC | 23,314 | 560,817 | ||||||
| Harbour Energy PLC | 113,994 | 628,960 | ||||||
| Hargreaves Lansdown PLC | 55,211 | 522,692 | ||||||
| Hays PLC | 138,428 | 187,691 | ||||||
| Helical PLC | 11,050 | 49,996 | ||||||
Helios Towers PLC(2) | 140,295 | 201,052 | ||||||
| Hikma Pharmaceuticals PLC | 25,075 | 382,160 | ||||||
| Hill & Smith Holdings PLC | 19,487 | 235,421 | ||||||
| Hiscox Ltd. | 5,392 | 56,183 | ||||||
| Hochschild Mining PLC | 110,243 | 83,003 | ||||||
| HomeServe PLC | 6,457 | 88,890 | ||||||
Hotel Chocolat Group PLC(2) | 2,721 | 4,298 | ||||||
| Howden Joinery Group PLC | 134,643 | 890,241 | ||||||
HSBC Holdings PLC, ADR(1) | 239,151 | 7,373,025 | ||||||
| Hunting PLC | 42,329 | 141,577 | ||||||
Hurricane Energy PLC(2) | 454,791 | 38,788 | ||||||
| Ibstock PLC | 118,324 | 260,069 | ||||||
| IG Group Holdings PLC | 93,108 | 883,593 | ||||||
| IMI PLC | 39,815 | 529,550 | ||||||
| Impax Asset Management Group PLC | 25,999 | 188,713 | ||||||
| Inchcape PLC | 79,022 | 693,905 | ||||||
Indivior PLC(2) | 256,610 | 859,824 | ||||||
| Informa PLC | 14,968 | 94,697 | ||||||
| IntegraFin Holdings PLC | 649 | 2,023 | ||||||
| InterContinental Hotels Group PLC | 7,224 | 392,163 | ||||||
| Intermediate Capital Group PLC | 51,875 | 820,028 | ||||||
| International Personal Finance PLC | 68,141 | 79,198 | ||||||
| Intertek Group PLC | 24,978 | 1,146,455 | ||||||
| Investec PLC | 117,440 | 564,503 | ||||||
IOG PLC(2) | 48,616 | 16,101 | ||||||
| IP Group PLC | 297,811 | 241,706 | ||||||
IQE PLC(2) | 3,759 | 1,487 | ||||||
| ITV PLC | 229,320 | 170,655 | ||||||
IWG PLC(2) | 139,542 | 260,097 | ||||||
J D Wetherspoon PLC(2) | 11,618 | 65,066 | ||||||
| J Sainsbury PLC | 388,874 | 917,882 | ||||||
| Jadestone Energy PLC | 21,557 | 21,785 | ||||||
| JD Sports Fashion PLC | 471,508 | 616,747 | ||||||
JET2 PLC(2) | 19,161 | 189,752 | ||||||
| Johnson Matthey PLC | 46,276 | 1,079,657 | ||||||
Johnson Service Group PLC(2) | 20,787 | 23,227 | ||||||
Jubilee Metals Group PLC(2) | 540,980 | 74,164 | ||||||
| Jupiter Fund Management PLC | 103,845 | 117,099 | ||||||
| Just Group PLC | 297,841 | 248,709 | ||||||
| Kainos Group PLC | 14,199 | 224,017 | ||||||
| Keller Group PLC | 26,157 | 212,903 | ||||||
178
| Avantis International Equity ETF | ||||||||
| Shares | Value | |||||||
| Kingfisher PLC | 229,433 | $ | 616,318 | |||||
| Lancashire Holdings Ltd. | 7,276 | 41,749 | ||||||
| Legal & General Group PLC | 867,094 | 2,539,779 | ||||||
Liberty Global PLC, Class A(2) | 17,082 | 345,056 | ||||||
Liberty Global PLC, Class C(2) | 37,357 | 796,078 | ||||||
| Liontrust Asset Management PLC | 15,989 | 169,815 | ||||||
| Lloyds Banking Group PLC, ADR | 1,717,833 | 3,435,666 | ||||||
| London Stock Exchange Group PLC | 8,084 | 758,292 | ||||||
| Lookers PLC | 41,443 | 39,248 | ||||||
| Luceco PLC | 16,679 | 15,176 | ||||||
| Luxfer Holdings PLC | 7,575 | 124,609 | ||||||
M&C Saatchi PLC(2) | 15,294 | 28,556 | ||||||
| M&G PLC | 389,753 | 884,519 | ||||||
| Man Group PLC | 292,809 | 827,439 | ||||||
Marks & Spencer Group PLC(2) | 552,292 | 780,446 | ||||||
| Marshalls PLC | 20,546 | 79,681 | ||||||
Marston's PLC(2) | 216,269 | 91,164 | ||||||
| Mediclinic International PLC | 102,982 | 598,420 | ||||||
Meggitt PLC(2) | 34,240 | 317,338 | ||||||
Metro Bank PLC(2) | 28,972 | 27,225 | ||||||
Mitchells & Butlers PLC(2) | 41,484 | 74,192 | ||||||
| Mitie Group PLC | 205,964 | 172,977 | ||||||
Molten Ventures PLC(2) | 38,006 | 164,098 | ||||||
| Mondi PLC | 55,405 | 940,523 | ||||||
| Moneysupermarket.com Group PLC | 52,177 | 119,273 | ||||||
| Morgan Advanced Materials PLC | 67,098 | 206,855 | ||||||
| Morgan Sindall Group PLC | 11,270 | 225,003 | ||||||
| Mortgage Advice Bureau Holdings Ltd. | 7,743 | 85,515 | ||||||
Motorpoint group PLC(2) | 12,494 | 28,657 | ||||||
| National Grid PLC, ADR | 59,850 | 3,781,922 | ||||||
NatWest Group PLC, ADR(1) | 231,705 | 1,281,331 | ||||||
| Next PLC | 24,735 | 1,665,700 | ||||||
| Ninety One PLC | 140,672 | 322,272 | ||||||
| Norcros PLC | 2,909 | 7,141 | ||||||
| Numis Corp. PLC | 7,246 | 20,564 | ||||||
Ocado Group PLC(2) | 10,337 | 86,873 | ||||||
On the Beach Group PLC(2) | 1,503 | 2,231 | ||||||
| OSB Group PLC | 62,243 | 396,843 | ||||||
| Pagegroup PLC | 88,941 | 446,730 | ||||||
| Pan African Resources PLC | 767,835 | 163,096 | ||||||
Pantheon Resources PLC(1)(2) | 1,134 | 1,755 | ||||||
| Paragon Banking Group PLC | 62,496 | 388,463 | ||||||
Pearson PLC, ADR(1) | 39,232 | 393,889 | ||||||
| Pennon Group PLC | 47,209 | 511,150 | ||||||
| Persimmon PLC | 55,179 | 944,174 | ||||||
Petra Diamonds Ltd.(2) | 66,090 | 75,461 | ||||||
Petrofac Ltd.(2) | 512 | 708 | ||||||
| Phoenix Group Holdings PLC | 61,029 | 426,262 | ||||||
| Phoenix Spree Deutschland Ltd. | 4,901 | 17,029 | ||||||
Playtech PLC(2) | 43,998 | 228,387 | ||||||
| Plus500 Ltd. | 42,067 | 828,974 | ||||||
179
| Avantis International Equity ETF | ||||||||
| Shares | Value | |||||||
| Polar Capital Holdings PLC | 3,013 | $ | 16,014 | |||||
| Premier Foods PLC | 128,941 | 161,351 | ||||||
| Premier Miton Group PLC | 1,579 | 1,963 | ||||||
| Provident Financial PLC | 112,382 | 224,882 | ||||||
Prudential PLC, ADR(1) | 61,910 | 1,306,920 | ||||||
| PZ Cussons PLC | 55,773 | 125,764 | ||||||
| QinetiQ Group PLC | 84,373 | 340,919 | ||||||
| Quilter PLC | 320,252 | 390,712 | ||||||
| Rathbones Group PLC | 13,437 | 280,891 | ||||||
| Reach PLC | 80,817 | 69,474 | ||||||
| Reckitt Benckiser Group PLC | 46,761 | 3,608,153 | ||||||
| Redde Northgate PLC | 77,698 | 308,402 | ||||||
| Redrow PLC | 65,124 | 382,568 | ||||||
| RELX PLC, ADR | 138,873 | 3,635,695 | ||||||
| Renew Holdings PLC | 4,532 | 33,797 | ||||||
Renewi PLC(2) | 9,806 | 88,291 | ||||||
| Renishaw PLC | 2,383 | 101,928 | ||||||
| Rentokil Initial PLC | 56,297 | 340,004 | ||||||
| Restore PLC | 20,599 | 104,601 | ||||||
| Rhi Magnesita NV | 7,444 | 155,992 | ||||||
| Ricardo PLC | 6,212 | 33,291 | ||||||
| Rightmove PLC | 191,050 | 1,342,891 | ||||||
Rio Tinto PLC, ADR(1) | 121,758 | 6,853,758 | ||||||
Rolls-Royce Holdings PLC(2) | 370,359 | 330,071 | ||||||
| Rotork PLC | 143,914 | 412,862 | ||||||
| Royal Mail PLC | 164,264 | 524,107 | ||||||
| RS GROUP PLC | 59,652 | 750,400 | ||||||
| RWS Holdings PLC | 213 | 851 | ||||||
| Sabre Insurance Group PLC | 1,153 | 1,538 | ||||||
| Sage Group PLC | 23,242 | 192,646 | ||||||
Savannah Energy PLC(2) | 122,479 | 47,001 | ||||||
| Savills PLC | 33,798 | 371,185 | ||||||
| Schroders PLC | 15,674 | 487,558 | ||||||
| Secure Trust Bank PLC | 1,207 | 12,853 | ||||||
Senior PLC(2) | 90,863 | 137,003 | ||||||
| Serco Group PLC | 30,707 | 62,283 | ||||||
| Serica Energy PLC | 98,999 | 428,564 | ||||||
| Severn Trent PLC | 10,381 | 335,323 | ||||||
| Shell PLC, ADR | 294,520 | 15,603,670 | ||||||
SIG PLC(2) | 73,322 | 28,491 | ||||||
| Sirius Real Estate Ltd. | 142,432 | 134,361 | ||||||
| Smart Metering Systems PLC | 17,725 | 187,055 | ||||||
| Smith & Nephew PLC, ADR | 40,245 | 959,441 | ||||||
| Smiths Group PLC | 14,998 | 259,103 | ||||||
| Softcat PLC | 26,361 | 395,299 | ||||||
| Spectris PLC | 16,446 | 531,753 | ||||||
| Speedy Hire PLC | 159,701 | 75,807 | ||||||
| Spirax-Sarco Engineering PLC | 4,347 | 530,666 | ||||||
Spire Healthcare Group PLC(2) | 48,745 | 131,327 | ||||||
| Spirent Communications PLC | 79,464 | 237,697 | ||||||
| SSE PLC | 125,328 | 2,401,625 | ||||||
180
| Avantis International Equity ETF | ||||||||
| Shares | Value | |||||||
SSP Group PLC(2) | 93,351 | $ | 228,750 | |||||
| St. James's Place PLC | 110,363 | 1,412,640 | ||||||
| Standard Chartered PLC (London) | 319,393 | 2,212,164 | ||||||
| SThree PLC | 39,848 | 162,665 | ||||||
Strix Group PLC(1) | 60,456 | 103,938 | ||||||
Superdry PLC(2) | 21,844 | 31,754 | ||||||
| Synthomer PLC | 40,459 | 92,375 | ||||||
| Tate & Lyle PLC | 109,470 | 969,382 | ||||||
| Taylor Wimpey PLC | 331,706 | 416,137 | ||||||
| TBC Bank Group PLC | 17,271 | 355,588 | ||||||
| Telecom Plus PLC | 1,052 | 23,766 | ||||||
| Tesco PLC | 591,020 | 1,707,025 | ||||||
| TI Fluid Systems PLC | 36,012 | 61,035 | ||||||
| TP ICAP Group PLC | 86,013 | 153,393 | ||||||
Trainline PLC(2) | 263 | 1,055 | ||||||
| Travis Perkins PLC | 40,407 | 397,393 | ||||||
Tremor International Ltd.(1)(2) | 3,098 | 11,832 | ||||||
TUI AG(2) | 47,537 | 72,891 | ||||||
Tullow Oil PLC(1)(2) | 139,516 | 78,352 | ||||||
Unilever PLC, ADR(1) | 109,456 | 4,968,208 | ||||||
| United Utilities Group PLC | 138,438 | 1,696,737 | ||||||
| Vertu Motors PLC | 153,897 | 86,694 | ||||||
| Vesuvius PLC | 14,283 | 57,466 | ||||||
Victoria PLC(1)(2) | 161 | 643 | ||||||
| Victrex PLC | 12,480 | 253,149 | ||||||
| Virgin Money UK PLC | 311,364 | 538,376 | ||||||
| Vistry Group PLC | 60,080 | 538,062 | ||||||
| Vodafone Group PLC, ADR | 307,887 | 4,131,844 | ||||||
| Watkin Jones PLC | 56,946 | 125,141 | ||||||
| Weir Group PLC | 22,301 | 375,584 | ||||||
WH Smith PLC(2) | 15,485 | 256,691 | ||||||
| Whitbread PLC | 6,718 | 194,710 | ||||||
| Wickes Group PLC | 112,235 | 155,597 | ||||||
| Wincanton PLC | 23,673 | 92,894 | ||||||
WPP PLC, ADR(1) | 16,331 | 700,763 | ||||||
Yellow Cake PLC(2) | 58,617 | 285,788 | ||||||
| 204,391,720 | ||||||||
United States† | ||||||||
| ADTRAN Holdings, Inc. | 7,443 | 172,036 | ||||||
Block, Inc.(2) | 681 | 46,641 | ||||||
GXO Logistics, Inc.(2) | 604 | 26,806 | ||||||
| 245,483 | ||||||||
TOTAL COMMON STOCKS (Cost $1,626,825,551) | 1,497,725,355 | |||||||
WARRANTS† | ||||||||
Australia† | ||||||||
Magellan Financial Group Ltd.(2) | 1,432 | 681 | ||||||
Italy† | ||||||||
Webuild SpA(1)(2) | 3,662 | 5,171 | ||||||
TOTAL WARRANTS (Cost $—) | 5,852 | |||||||
181
| Avantis International Equity ETF | ||||||||
| Shares | Value | |||||||
RIGHTS† | ||||||||
Austria† | ||||||||
IMMOFINANZ AG(1)(2) | 5,298 | $ | 53 | |||||
Germany† | ||||||||
7C Solarparken AG(2) | 20,776 | 380 | ||||||
Hong Kong† | ||||||||
SJM Holdings Ltd.(1)(2) | 27,000 | 2,305 | ||||||
Xinyi Electric Storage Holdings Ltd.(2) | 5,280 | 215 | ||||||
| 2,520 | ||||||||
TOTAL RIGHTS (Cost $—) | 2,953 | |||||||
| SHORT-TERM INVESTMENTS — 3.5% | ||||||||
| Money Market Funds — 3.5% | ||||||||
| State Street Institutional U.S. Government Money Market Fund, Premier Class | 1,150,294 | 1,150,294 | ||||||
State Street Navigator Securities Lending Government Money Market Portfolio(3) | 51,033,501 | 51,033,501 | ||||||
TOTAL SHORT-TERM INVESTMENTS (Cost $52,183,795) | 52,183,795 | |||||||
TOTAL INVESTMENT SECURITIES — 103.0% (Cost $1,679,009,346) | 1,549,917,955 | |||||||
| OTHER ASSETS AND LIABILITIES — (3.0)% | (45,316,639) | |||||||
| TOTAL NET ASSETS — 100.0% | $ | 1,504,601,316 | ||||||
| MARKET SECTOR DIVERSIFICATION | |||||
| (as a % of net assets) | |||||
| Financials | 20.1% | ||||
| Industrials | 16.1% | ||||
| Materials | 11.9% | ||||
| Consumer Discretionary | 9.1% | ||||
| Energy | 8.5% | ||||
| Health Care | 7.7% | ||||
| Consumer Staples | 7.3% | ||||
| Information Technology | 6.7% | ||||
| Communication Services | 5.1% | ||||
| Utilities | 4.7% | ||||
| Real Estate | 2.3% | ||||
| Short-Term Investments | 3.5% | ||||
| Other Assets and Liabilities | (3.0)% | ||||
182
| NOTES TO SCHEDULE OF INVESTMENTS | ||||||||
| ADR | - | American Depositary Receipt | ||||||
| CVA | - | Certificaten Van Aandelen | ||||||
| SDR | - | Swedish Depositary Receipt | ||||||
†Category is less than 0.05% of total net assets.
(1)Security, or a portion thereof, is on loan. At the period end, the aggregate value of securities on loan was $98,429,673. The amount of securities on loan indicated may not correspond with the securities on loan identified because securities with pending sales are in the process of recall from the brokers.
(2)Non-income producing.
(3)Investment of cash collateral from securities on loan. At the period end, the aggregate value of the collateral held by the fund was $103,659,070, which includes securities collateral of $52,625,569.
See Notes to Financial Statements.
183
AUGUST 31, 2022
| Avantis International Large Cap Value ETF | ||||||||
| Shares | Value | |||||||
| COMMON STOCKS — 99.5% | ||||||||
| Australia — 7.1% | ||||||||
| ASX Ltd. | 1,230 | $ | 65,476 | |||||
| Aurizon Holdings Ltd. | 51,020 | 129,036 | ||||||
| Australia & New Zealand Banking Group Ltd. | 19,900 | 307,625 | ||||||
| Bank of Queensland Ltd. | 7,740 | 36,931 | ||||||
| Bendigo & Adelaide Bank Ltd. | 10,218 | 62,723 | ||||||
BHP Group Ltd., ADR(1) | 15,726 | 863,200 | ||||||
| BlueScope Steel Ltd. | 8,685 | 97,444 | ||||||
| Brambles Ltd. | 19,195 | 161,550 | ||||||
| Challenger Ltd. | 18,110 | 78,076 | ||||||
| Coles Group Ltd. | 10,332 | 123,666 | ||||||
| Evolution Mining Ltd. | 35,406 | 56,899 | ||||||
| Fortescue Metals Group Ltd. | 21,560 | 267,938 | ||||||
| Harvey Norman Holdings Ltd. | 13,158 | 37,783 | ||||||
| National Australia Bank Ltd. | 11,067 | 229,487 | ||||||
| Newcrest Mining Ltd. (Sydney) | 6,918 | 83,166 | ||||||
| Northern Star Resources Ltd. | 16,275 | 86,017 | ||||||
| Orica Ltd. | 917 | 9,592 | ||||||
| OZ Minerals Ltd. | 6,106 | 105,230 | ||||||
| Rio Tinto Ltd. | 2,632 | 167,167 | ||||||
| Santos Ltd. | 54,810 | 292,591 | ||||||
| Seven Group Holdings Ltd. | 72 | 906 | ||||||
| Sonic Healthcare Ltd. | 5,473 | 126,563 | ||||||
| South32 Ltd. | 89,644 | 246,853 | ||||||
| Telstra Corp. Ltd. | 22,555 | 60,994 | ||||||
| Viva Energy Group Ltd. | 5,957 | 12,047 | ||||||
| Whitehaven Coal Ltd. | 31,164 | 165,998 | ||||||
| Woodside Energy Group Ltd. | 11,760 | 273,167 | ||||||
Woodside Energy Group Ltd., ADR(1) | 5,350 | 122,034 | ||||||
| 4,270,159 | ||||||||
| Austria — 0.2% | ||||||||
| Erste Group Bank AG | 216 | 4,857 | ||||||
| OMV AG | 1,196 | 48,190 | ||||||
| Raiffeisen Bank International AG | 1,473 | 18,600 | ||||||
| Strabag SE | 223 | 8,569 | ||||||
| Vienna Insurance Group AG Wiener Versicherung Gruppe | 105 | 2,489 | ||||||
| voestalpine AG | 1,959 | 39,420 | ||||||
| 122,125 | ||||||||
| Belgium — 0.8% | ||||||||
| Ageas SA/NV | 1,839 | 74,618 | ||||||
| Bekaert SA | 438 | 13,435 | ||||||
Cie d'Entreprises CFE(1)(2) | 160 | 1,593 | ||||||
Deme Group NV(2) | 160 | 18,311 | ||||||
| Etablissements Franz Colruyt NV | 763 | 21,206 | ||||||
| Euronav NV | 712 | 11,480 | ||||||
| KBC Ancora | 875 | 28,806 | ||||||
| KBC Group NV | 1,505 | 71,777 | ||||||
| Melexis NV | 188 | 14,176 | ||||||
| Proximus SADP | 2,350 | 29,913 | ||||||
184
| Avantis International Large Cap Value ETF | ||||||||
| Shares | Value | |||||||
| Solvay SA | 718 | $ | 57,961 | |||||
| UCB SA | 1,089 | 76,521 | ||||||
| Umicore SA | 2,162 | 68,722 | ||||||
| 488,519 | ||||||||
| Canada — 11.8% | ||||||||
| ARC Resources Ltd. | 17,035 | 235,158 | ||||||
| Bank of Montreal | 5,775 | 533,155 | ||||||
| Bank of Nova Scotia | 8,444 | 466,900 | ||||||
| Brookfield Renewable Corp., Class A | 327 | 12,566 | ||||||
| Canadian Imperial Bank of Commerce | 7,474 | 353,455 | ||||||
| Canadian Natural Resources Ltd. | 10,323 | 565,924 | ||||||
| Canadian Tire Corp. Ltd., Class A | 883 | 103,854 | ||||||
| Cenovus Energy, Inc. | 19,101 | 358,357 | ||||||
| Empire Co. Ltd., Class A | 1,994 | 56,798 | ||||||
| First Quantum Minerals Ltd. | 3,141 | 55,581 | ||||||
| Great-West Lifeco, Inc. | 4,116 | 96,683 | ||||||
| iA Financial Corp., Inc. | 3,009 | 161,636 | ||||||
| Imperial Oil Ltd. | 3,248 | 159,414 | ||||||
| Keyera Corp. | 5,947 | 146,530 | ||||||
| Kinross Gold Corp. | 15,558 | 51,056 | ||||||
| Loblaw Cos. Ltd. | 1,660 | 146,706 | ||||||
| Lundin Mining Corp. | 9,783 | 50,876 | ||||||
| Magna International, Inc. | 4,384 | 253,256 | ||||||
| Manulife Financial Corp. | 28,856 | 499,188 | ||||||
| National Bank of Canada | 5,311 | 351,371 | ||||||
| Northland Power, Inc. | 3,212 | 109,957 | ||||||
| Onex Corp. | 1,003 | 49,602 | ||||||
| Rogers Communications, Inc., Class B | 732 | 31,518 | ||||||
| Royal Bank of Canada | 8,561 | 796,098 | ||||||
| Suncor Energy, Inc. | 18,869 | 610,457 | ||||||
| Teck Resources Ltd., Class B | 8,383 | 283,912 | ||||||
| Tourmaline Oil Corp. | 6,815 | 402,927 | ||||||
| West Fraser Timber Co. Ltd. | 1,756 | 157,102 | ||||||
| 7,100,037 | ||||||||
| Denmark — 0.6% | ||||||||
| AP Moller - Maersk A/S, A Shares | 2 | 4,672 | ||||||
| AP Moller - Maersk A/S, B Shares | 23 | 55,181 | ||||||
| Novo Nordisk A/S, ADR | 3,062 | 324,878 | ||||||
| Vestas Wind Systems A/S | 142 | 3,553 | ||||||
| 388,284 | ||||||||
| Finland — 1.1% | ||||||||
| Kesko Oyj, B Shares | 2,477 | 52,110 | ||||||
| Kone Oyj, B Shares | 2,298 | 91,903 | ||||||
| Metsa Board Oyj | 1,453 | 12,492 | ||||||
| Metso Outotec Oyj | 6,943 | 54,302 | ||||||
| Neste Oyj | 2,861 | 141,153 | ||||||
| Nokia Oyj, ADR | 20,423 | 103,136 | ||||||
| Sampo Oyj, A Shares | 1,500 | 67,860 | ||||||
| Stora Enso Oyj, R Shares | 6,903 | 102,758 | ||||||
| Wartsila Oyj Abp | 3,904 | 32,189 | ||||||
| 657,903 | ||||||||
185
| Avantis International Large Cap Value ETF | ||||||||
| Shares | Value | |||||||
| France — 7.4% | ||||||||
Aeroports de Paris(2) | 183 | $ | 25,058 | |||||
ALD SA(1) | 1,987 | 21,627 | ||||||
| Arkema SA | 979 | 82,649 | ||||||
| AXA SA | 13,068 | 307,773 | ||||||
| BioMerieux | 545 | 49,840 | ||||||
| Bouygues SA | 4,729 | 138,914 | ||||||
| Carrefour SA | 8,024 | 133,924 | ||||||
| Cie de Saint-Gobain | 4,598 | 185,197 | ||||||
| Cie Generale des Etablissements Michelin SCA | 7,709 | 187,493 | ||||||
| Dassault Aviation SA | 630 | 86,518 | ||||||
| Eiffage SA | 1,817 | 159,814 | ||||||
| Eramet SA | 76 | 6,444 | ||||||
| Eurazeo SE | 939 | 56,077 | ||||||
Faurecia SE(2) | 2,903 | 41,631 | ||||||
| Gaztransport Et Technigaz SA | 579 | 73,709 | ||||||
| Hermes International | 146 | 186,992 | ||||||
| Ipsen SA | 909 | 87,116 | ||||||
| Kering SA | 370 | 185,648 | ||||||
| La Francaise des Jeux SAEM | 2,599 | 84,296 | ||||||
| LVMH Moet Hennessy Louis Vuitton SE | 302 | 194,871 | ||||||
Neoen SA(1) | 809 | 33,416 | ||||||
| Nexans SA | 565 | 51,622 | ||||||
Orange SA, ADR(1) | 21,025 | 212,142 | ||||||
Renault SA(2) | 1,714 | 48,820 | ||||||
| Safran SA | 2,867 | 292,303 | ||||||
| SES SA | 9,397 | 65,970 | ||||||
| Societe Generale SA | 4,570 | 100,748 | ||||||
| STMicroelectronics NV, NY Shares | 6,360 | 221,964 | ||||||
| Teleperformance | 2 | 570 | ||||||
| Thales SA | 1,385 | 166,977 | ||||||
| TotalEnergies SE, ADR | 10,384 | 524,496 | ||||||
Ubisoft Entertainment SA(2) | 2,257 | 104,082 | ||||||
| Valeo | 3,849 | 73,522 | ||||||
| Vinci SA | 3,122 | 288,015 | ||||||
| 4,480,238 | ||||||||
| Germany — 8.8% | ||||||||
| adidas AG | 1,092 | 161,925 | ||||||
| Aurubis AG | 882 | 53,402 | ||||||
| BASF SE | 7,667 | 324,305 | ||||||
| Bayerische Motoren Werke AG | 3,435 | 253,086 | ||||||
| Bayerische Motoren Werke AG, Preference Shares | 549 | 38,169 | ||||||
Commerzbank AG(2) | 21,157 | 140,777 | ||||||
| Continental AG | 253 | 14,566 | ||||||
| Covestro AG | 3,995 | 120,457 | ||||||
Daimler Truck Holding AG(2) | 8,518 | 217,795 | ||||||
| Deutsche Bank AG | 22,148 | 184,050 | ||||||
| Deutsche Boerse AG | 283 | 47,848 | ||||||
Deutsche Lufthansa AG(2) | 22,906 | 136,183 | ||||||
| Deutsche Post AG | 11,644 | 424,996 | ||||||
| Deutsche Telekom AG | 26,480 | 499,075 | ||||||
186
| Avantis International Large Cap Value ETF | ||||||||
| Shares | Value | |||||||
| Encavis AG | 5,253 | $ | 112,264 | |||||
| Fielmann AG | 640 | 23,783 | ||||||
| HeidelbergCement AG | 4,122 | 186,139 | ||||||
HelloFresh SE(2) | 2,511 | 59,952 | ||||||
| HUGO BOSS AG | 2,615 | 142,523 | ||||||
| KION Group AG | 819 | 32,725 | ||||||
| Knorr-Bremse AG | 1,340 | 64,943 | ||||||
| Mercedes-Benz Group AG | 6,099 | 341,945 | ||||||
| MTU Aero Engines AG | 1,533 | 270,363 | ||||||
| Rheinmetall AG | 1,193 | 189,383 | ||||||
| RWE AG | 12,913 | 492,985 | ||||||
| Schaeffler AG, Preference Shares | 4,574 | 23,830 | ||||||
| Sixt SE | 568 | 55,543 | ||||||
| Sixt SE, Preference Shares | 415 | 24,805 | ||||||
| Telefonica Deutschland Holding AG | 39,107 | 101,519 | ||||||
| VERBIO Vereinigte BioEnergie AG | 879 | 56,417 | ||||||
| Volkswagen AG | 265 | 49,017 | ||||||
| Volkswagen AG, Preference Shares | 1,513 | 215,208 | ||||||
| Vonovia SE | 7,042 | 190,638 | ||||||
| Wacker Chemie AG | 433 | 61,580 | ||||||
| 5,312,196 | ||||||||
| Hong Kong — 2.6% | ||||||||
| AIA Group Ltd. | 54,400 | 523,395 | ||||||
| ASMPT Ltd. | 5,600 | 43,374 | ||||||
Atlas Corp.(1) | 1,491 | 21,396 | ||||||
| Bank of East Asia Ltd. | 17,600 | 22,174 | ||||||
| BOC Hong Kong Holdings Ltd. | 28,500 | 98,092 | ||||||
| CK Asset Holdings Ltd. | 16,500 | 111,371 | ||||||
| Hang Lung Group Ltd. | 13,000 | 21,988 | ||||||
| Hang Lung Properties Ltd. | 27,000 | 44,901 | ||||||
| Henderson Land Development Co. Ltd. | 10,000 | 33,451 | ||||||
| Hongkong Land Holdings Ltd. | 300 | 1,450 | ||||||
| Jardine Matheson Holdings Ltd. | 1,000 | 53,032 | ||||||
| Kerry Properties Ltd. | 10,500 | 24,208 | ||||||
| Luk Fook Holdings International Ltd. | 1,000 | 2,556 | ||||||
| Man Wah Holdings Ltd. | 13,600 | 10,748 | ||||||
| New World Development Co. Ltd. | 21,000 | 68,430 | ||||||
| NWS Holdings Ltd. | 29,000 | 27,898 | ||||||
| Pacific Basin Shipping Ltd. | 126,000 | 44,721 | ||||||
| Sino Land Co. Ltd. | 44,000 | 64,342 | ||||||
| SITC International Holdings Co. Ltd. | 5,000 | 12,679 | ||||||
| Sun Hung Kai Properties Ltd. | 2,000 | 23,497 | ||||||
| Swire Pacific Ltd., Class A | 13,000 | 89,918 | ||||||
| Swire Properties Ltd. | 5,000 | 11,524 | ||||||
| United Energy Group Ltd. | 174,000 | 21,471 | ||||||
| WH Group Ltd. | 169,500 | 115,484 | ||||||
| Xinyi Glass Holdings Ltd. | 26,000 | 48,019 | ||||||
| Yue Yuen Industrial Holdings Ltd. | 13,500 | 20,129 | ||||||
| 1,560,248 | ||||||||
| Ireland — 0.5% | ||||||||
| Bank of Ireland Group PLC | 12,266 | 75,578 | ||||||
187
| Avantis International Large Cap Value ETF | ||||||||
| Shares | Value | |||||||
| CRH PLC | 6,113 | $ | 225,738 | |||||
| Glanbia PLC | 431 | 5,485 | ||||||
| 306,801 | ||||||||
| Israel — 0.8% | ||||||||
| Bank Hapoalim BM | 10,122 | 104,939 | ||||||
| Bank Leumi Le-Israel BM | 10,579 | 111,833 | ||||||
Check Point Software Technologies Ltd.(2) | 161 | 19,359 | ||||||
| First International Bank of Israel Ltd. | 512 | 23,826 | ||||||
| ICL Group Ltd. | 4,542 | 43,370 | ||||||
Israel Corp. Ltd.(2) | 37 | 17,884 | ||||||
| Israel Discount Bank Ltd., A Shares | 10,663 | 65,190 | ||||||
| Mizrahi Tefahot Bank Ltd. | 1,575 | 64,056 | ||||||
| Strauss Group Ltd. | 53 | 1,386 | ||||||
ZIM Integrated Shipping Services Ltd.(1) | 1,053 | 38,003 | ||||||
| 489,846 | ||||||||
| Italy — 2.8% | ||||||||
| Atlantia SpA | 1,413 | 32,355 | ||||||
| Azimut Holding SpA | 5,766 | 91,853 | ||||||
| Banca Popolare di Sondrio SCPA | 13,803 | 44,201 | ||||||
| BPER Banca | 31,431 | 47,261 | ||||||
| Brembo SpA | 68 | 624 | ||||||
| Brunello Cucinelli SpA | 1,471 | 76,186 | ||||||
| Buzzi Unicem SpA | 2,432 | 40,677 | ||||||
| CNH Industrial NV | 16,135 | 196,445 | ||||||
| De' Longhi SpA | 6 | 105 | ||||||
| Eni SpA, ADR | 13,413 | 316,815 | ||||||
| ERG SpA | 3,101 | 98,279 | ||||||
| Leonardo SpA | 5,962 | 48,792 | ||||||
| Poste Italiane SpA | 12,583 | 100,563 | ||||||
| Salvatore Ferragamo SpA | 1,043 | 16,776 | ||||||
| Sesa SpA | 234 | 28,603 | ||||||
| Stellantis NV | 25,014 | 333,200 | ||||||
| UniCredit SpA | 25,017 | 244,813 | ||||||
| 1,717,548 | ||||||||
| Japan — 20.3% | ||||||||
Aeon Co. Ltd.(1) | 1,200 | 23,407 | ||||||
| Aeon Mall Co. Ltd. | 2,400 | 28,626 | ||||||
| AGC, Inc. | 3,400 | 115,392 | ||||||
| Air Water, Inc. | 3,400 | 42,534 | ||||||
| Aisin Corp. | 2,600 | 77,310 | ||||||
| Amada Co. Ltd. | 6,700 | 52,424 | ||||||
| Aozora Bank Ltd. | 700 | 13,512 | ||||||
| Asahi Kasei Corp. | 18,300 | 133,732 | ||||||
| Asics Corp. | 600 | 10,970 | ||||||
| BIPROGY Inc | 400 | 8,859 | ||||||
| Bridgestone Corp. | 5,400 | 207,221 | ||||||
| Brother Industries Ltd. | 3,800 | 72,723 | ||||||
| Canon Marketing Japan, Inc. | 700 | 15,874 | ||||||
| Capcom Co. Ltd. | 2,500 | 68,237 | ||||||
| Chugai Pharmaceutical Co. Ltd. | 3,800 | 98,071 | ||||||
| CyberAgent, Inc. | 2,800 | 27,298 | ||||||
188
| Avantis International Large Cap Value ETF | ||||||||
| Shares | Value | |||||||
| Dai-ichi Life Holdings, Inc. | 11,000 | $ | 190,058 | |||||
| Daito Trust Construction Co. Ltd. | 1,200 | 118,053 | ||||||
| Disco Corp. | 300 | 72,843 | ||||||
| Ebara Corp. | 1,700 | 64,399 | ||||||
| Electric Power Development Co. Ltd. | 5,400 | 83,183 | ||||||
| ENEOS Holdings, Inc. | 52,800 | 199,527 | ||||||
| FP Corp. | 100 | 2,347 | ||||||
| Fuji Electric Co. Ltd. | 2,100 | 90,724 | ||||||
| Fujitsu Ltd. | 1,700 | 200,044 | ||||||
| Fukuoka Financial Group, Inc. | 2,500 | 44,674 | ||||||
| Hakuhodo DY Holdings, Inc. | 4,900 | 43,715 | ||||||
| Haseko Corp. | 6,800 | 77,923 | ||||||
| Hino Motors Ltd. | 4,300 | 19,618 | ||||||
| Hitachi Construction Machinery Co. Ltd. | 1,800 | 37,004 | ||||||
| Honda Motor Co. Ltd., ADR | 8,927 | 236,744 | ||||||
| Hulic Co. Ltd. | 6,500 | 49,257 | ||||||
| Ibiden Co. Ltd. | 2,100 | 66,652 | ||||||
| Idemitsu Kosan Co. Ltd. | 4,500 | 118,653 | ||||||
| IHI Corp. | 4,000 | 106,825 | ||||||
| INPEX Corp. | 18,500 | 212,651 | ||||||
| Internet Initiative Japan, Inc. | 100 | 3,612 | ||||||
| Isuzu Motors Ltd. | 8,000 | 99,357 | ||||||
| Iwatani Corp. | 200 | 8,160 | ||||||
| Japan Post Insurance Co. Ltd. | 4,200 | 64,334 | ||||||
| JFE Holdings, Inc. | 7,700 | 82,725 | ||||||
| JGC Holdings Corp. | 4,900 | 66,024 | ||||||
| JSR Corp. | 3,200 | 71,382 | ||||||
| JTEKT Corp. | 200 | 1,408 | ||||||
| Kajima Corp. | 7,500 | 78,919 | ||||||
| Kawasaki Heavy Industries Ltd. | 5,100 | 98,981 | ||||||
| KDDI Corp. | 11,000 | 336,612 | ||||||
| Konami Group Corp. | 100 | 5,075 | ||||||
| Kuraray Co. Ltd. | 8,000 | 60,767 | ||||||
| Kurita Water Industries Ltd. | 1,600 | 62,252 | ||||||
| Lawson, Inc. | 1,300 | 43,083 | ||||||
| Lixil Corp. | 2,600 | 45,213 | ||||||
Marui Group Co. Ltd.(1) | 4,200 | 75,330 | ||||||
| Mazda Motor Corp. | 15,400 | 136,384 | ||||||
| MEIJI Holdings Co. Ltd. | 2,200 | 104,806 | ||||||
| MINEBEA MITSUMI, Inc. | 5,500 | 94,529 | ||||||
| Mitsubishi Chemical Group Corp. | 16,100 | 84,524 | ||||||
| Mitsubishi Corp. | 9,600 | 314,310 | ||||||
| Mitsubishi HC Capital, Inc. | 13,800 | 66,878 | ||||||
| Mitsubishi Heavy Industries Ltd. | 4,900 | 188,898 | ||||||
| Mitsubishi UFJ Financial Group, Inc., ADR | 54,185 | 279,053 | ||||||
| Mitsui & Co. Ltd. | 10,300 | 241,732 | ||||||
| Mitsui Chemicals, Inc. | 4,500 | 101,095 | ||||||
| MS&AD Insurance Group Holdings, Inc. | 5,400 | 161,114 | ||||||
| Nabtesco Corp. | 3,200 | 75,778 | ||||||
| NEC Corp. | 4,100 | 149,534 | ||||||
| NGK Insulators Ltd. | 4,100 | 58,538 | ||||||
189
| Avantis International Large Cap Value ETF | ||||||||
| Shares | Value | |||||||
| NGK Spark Plug Co. Ltd. | 1,700 | $ | 34,880 | |||||
| NH Foods Ltd. | 2,300 | 65,838 | ||||||
| NIPPON EXPRESS HOLDINGS, Inc. | 1,700 | 93,539 | ||||||
| Nippon Steel Corp. | 10,100 | 159,541 | ||||||
| Nippon Telegraph & Telephone Corp. | 5,700 | 154,494 | ||||||
Nippon Yusen KK(1) | 2,500 | 190,685 | ||||||
| Nissan Motor Co. Ltd. | 600 | 2,361 | ||||||
| Nitto Denko Corp. | 2,100 | 129,429 | ||||||
| NTT Data Corp. | 4,900 | 68,955 | ||||||
| Obayashi Corp. | 13,300 | 91,991 | ||||||
| Oji Holdings Corp. | 14,600 | 58,252 | ||||||
| ORIX Corp., ADR | 2,307 | 189,981 | ||||||
| Panasonic Holdings Corp. | 1,000 | 8,114 | ||||||
| Persol Holdings Co. Ltd. | 2,600 | 52,193 | ||||||
| Rakuten Group, Inc. | 7,200 | 34,943 | ||||||
| Resona Holdings, Inc. | 26,600 | 97,921 | ||||||
| Rohto Pharmaceutical Co. Ltd. | 1,000 | 30,101 | ||||||
| Santen Pharmaceutical Co. Ltd. | 5,400 | 38,796 | ||||||
| Sanwa Holdings Corp. | 2,600 | 25,727 | ||||||
| SBI Holdings, Inc. | 4,400 | 86,461 | ||||||
| SCREEN Holdings Co. Ltd. | 800 | 53,138 | ||||||
| Seiko Epson Corp. | 5,800 | 91,140 | ||||||
| Sekisui Chemical Co. Ltd. | 7,500 | 102,250 | ||||||
| SG Holdings Co. Ltd. | 3,200 | 53,078 | ||||||
| Sharp Corp. | 6,000 | 42,951 | ||||||
| Shimizu Corp. | 14,000 | 76,768 | ||||||
| Shin-Etsu Chemical Co. Ltd. | 2,200 | 255,492 | ||||||
| Shinko Electric Industries Co. Ltd. | 800 | 22,269 | ||||||
| Showa Denko KK | 3,000 | 46,121 | ||||||
| SoftBank Group Corp. | 4,400 | 174,291 | ||||||
| Sohgo Security Services Co. Ltd. | 700 | 18,136 | ||||||
| Sojitz Corp. | 4,720 | 79,418 | ||||||
| Sompo Holdings, Inc. | 5,000 | 214,381 | ||||||
| Sony Group Corp., ADR | 4,410 | 349,933 | ||||||
| Subaru Corp. | 10,800 | 196,316 | ||||||
| SUMCO Corp. | 8,500 | 115,369 | ||||||
| Sumitomo Chemical Co. Ltd. | 27,900 | 109,823 | ||||||
| Sumitomo Corp. | 13,700 | 192,699 | ||||||
| Sumitomo Heavy Industries Ltd. | 2,600 | 54,577 | ||||||
| Sumitomo Mitsui Financial Group, Inc., ADR | 40,323 | 243,954 | ||||||
| Sumitomo Realty & Development Co. Ltd. | 2,500 | 61,140 | ||||||
| Sumitomo Rubber Industries Ltd. | 2,600 | 22,311 | ||||||
| Sundrug Co. Ltd. | 1,800 | 44,040 | ||||||
| Suntory Beverage & Food Ltd. | 1,800 | 65,748 | ||||||
| Suzuken Co. Ltd. | 300 | 7,190 | ||||||
| Taisei Corp. | 3,800 | 115,214 | ||||||
| Taiyo Yuden Co. Ltd. | 2,100 | 64,902 | ||||||
| Takara Bio, Inc. | 200 | 2,801 | ||||||
| TDK Corp. | 3,800 | 132,856 | ||||||
| TIS, Inc. | 2,500 | 71,192 | ||||||
| Tobu Railway Co. Ltd. | 4,500 | 106,317 | ||||||
190
| Avantis International Large Cap Value ETF | ||||||||
| Shares | Value | |||||||
| Tokio Marine Holdings, Inc. | 5,600 | $ | 310,348 | |||||
Tokyo Century Corp.(1) | 1,100 | 39,287 | ||||||
| Tokyo Tatemono Co. Ltd. | 5,400 | 80,945 | ||||||
| Toray Industries, Inc. | 21,000 | 119,835 | ||||||
| Tosoh Corp. | 4,700 | 60,770 | ||||||
| Toyota Boshoku Corp. | 1,000 | 14,523 | ||||||
| Toyota Tsusho Corp. | 2,600 | 91,021 | ||||||
| Trend Micro, Inc. | 2,300 | 141,606 | ||||||
| USS Co. Ltd. | 2,200 | 38,823 | ||||||
| Yamada Holdings Co. Ltd. | 21,900 | 75,797 | ||||||
| Yamaha Motor Co. Ltd. | 3,600 | 74,607 | ||||||
| Yamato Holdings Co. Ltd. | 3,700 | 57,679 | ||||||
| Zenkoku Hosho Co. Ltd. | 300 | 9,913 | ||||||
| Zensho Holdings Co. Ltd. | 1,100 | 28,839 | ||||||
| 12,235,501 | ||||||||
| Netherlands — 1.6% | ||||||||
| ABN AMRO Bank NV, CVA | 3,760 | 36,122 | ||||||
Adyen NV(2) | 67 | 103,391 | ||||||
| Aegon NV, NY Shares | 15,512 | 69,649 | ||||||
AerCap Holdings NV(2) | 1,187 | 52,287 | ||||||
| ASML Holding NV, NY Shares | 624 | 305,723 | ||||||
| ASR Nederland NV | 512 | 20,897 | ||||||
| BE Semiconductor Industries NV | 12 | 570 | ||||||
ING Groep NV, ADR(1) | 10,134 | 88,976�� | ||||||
| Koninklijke Ahold Delhaize NV | 3,506 | 96,439 | ||||||
| Koninklijke DSM NV | 146 | 18,617 | ||||||
| Koninklijke KPN NV | 20,789 | 66,153 | ||||||
NN Group NV(1) | 1,414 | 58,112 | ||||||
| OCI NV | 1,295 | 48,618 | ||||||
| 965,554 | ||||||||
| New Zealand — 0.2% | ||||||||
| Chorus Ltd. | 4,529 | 22,180 | ||||||
| Fletcher Building Ltd. | 6,111 | 20,862 | ||||||
| Ryman Healthcare Ltd. | 1,646 | 9,211 | ||||||
| Spark New Zealand Ltd. | 9,752 | 32,259 | ||||||
| Summerset Group Holdings Ltd. | 2,171 | 14,633 | ||||||
| 99,145 | ||||||||
| Norway — 1.2% | ||||||||
| DNB Bank ASA | 3,919 | 74,516 | ||||||
| Equinor ASA, ADR | 11,557 | 448,296 | ||||||
| Norsk Hydro ASA | 17,351 | 119,220 | ||||||
| Schibsted ASA, B Shares | 1,613 | 27,665 | ||||||
| Schibsted ASA, Class A | 1,212 | 22,181 | ||||||
| Wallenius Wilhelmsen ASA | 3,536 | 19,907 | ||||||
| 711,785 | ||||||||
| Portugal — 0.3% | ||||||||
| Banco Comercial Portugues SA, R Shares | 114,737 | 16,693 | ||||||
| EDP Renovaveis SA | 1,116 | 27,065 | ||||||
| Galp Energia SGPS SA | 9,947 | 107,418 | ||||||
| Jeronimo Martins SGPS SA | 320 | 7,095 | ||||||
| Sonae SGPS SA | 32,924 | 33,093 | ||||||
| 191,364 | ||||||||
191
| Avantis International Large Cap Value ETF | ||||||||
| Shares | Value | |||||||
| Singapore — 1.4% | ||||||||
| City Developments Ltd. | 5,400 | $ | 31,353 | |||||
| DBS Group Holdings Ltd. | 9,400 | 218,865 | ||||||
| Golden Agri-Resources Ltd. | 65,700 | 13,171 | ||||||
| Keppel Corp. Ltd. | 26,200 | 136,070 | ||||||
| Olam Group Ltd. | 20,700 | 21,740 | ||||||
| Oversea-Chinese Banking Corp. Ltd. | 22,100 | 190,483 | ||||||
Singapore Airlines Ltd.(1)(2) | 24,900 | 94,542 | ||||||
| Singapore Exchange Ltd. | 1,000 | 6,786 | ||||||
| Singapore Technologies Engineering Ltd. | 5,900 | 15,722 | ||||||
| Singapore Telecommunications Ltd. | 29,000 | 54,443 | ||||||
| United Overseas Bank Ltd. | 600 | 11,700 | ||||||
| UOL Group Ltd. | 9,200 | 45,520 | ||||||
Yangzijiang Financial Holding Ltd.(2) | 4,500 | 1,204 | ||||||
| Yangzijiang Shipbuilding Holdings Ltd. | 21,800 | 15,108 | ||||||
| 856,707 | ||||||||
| Spain — 2.9% | ||||||||
| ACS Actividades de Construccion y Servicios SA | 87 | 1,938 | ||||||
| Banco Bilbao Vizcaya Argentaria SA, ADR | 22,223 | 98,670 | ||||||
| Banco Santander SA, ADR | 195,385 | 470,878 | ||||||
| Industria de Diseno Textil SA | 12,551 | 270,994 | ||||||
| Repsol SA | 63,108 | 819,652 | ||||||
Telefonica SA, ADR(1) | 26,421 | 107,798 | ||||||
| 1,769,930 | ||||||||
| Sweden — 2.2% | ||||||||
| Atlas Copco AB, A Shares | 5,983 | 60,733 | ||||||
| Atlas Copco AB, B Shares | 3,484 | 31,725 | ||||||
| Avanza Bank Holding AB | 1,640 | 26,288 | ||||||
| Axfood AB | 640 | 19,291 | ||||||
| BillerudKorsnas AB | 357 | 4,642 | ||||||
| Boliden AB | 3,101 | 99,301 | ||||||
| Bure Equity AB | 105 | 2,074 | ||||||
Electrolux AB, B Shares(1) | 2,297 | 29,046 | ||||||
| Epiroc AB, A Shares | 4,000 | 61,203 | ||||||
| Epiroc AB, B Shares | 2,366 | 32,210 | ||||||
H & M Hennes & Mauritz AB, B Shares(1) | 4,785 | 49,694 | ||||||
| Nordea Bank Abp | 17,017 | 157,779 | ||||||
| Nordnet AB publ | 2,199 | 26,326 | ||||||
| Saab AB, B Shares | 193 | 6,448 | ||||||
| Skandinaviska Enskilda Banken AB, A Shares | 6,676 | 66,551 | ||||||
| Skanska AB, B Shares | 4,036 | 59,622 | ||||||
| SSAB AB, A Shares | 3,498 | 16,824 | ||||||
| SSAB AB, B Shares | 12,429 | 58,031 | ||||||
| Svenska Handelsbanken AB, A Shares | 4,597 | 37,650 | ||||||
| Swedbank AB, A Shares | 7,766 | 100,375 | ||||||
Telefonaktiebolaget LM Ericsson, ADR(1) | 12,913 | 95,944 | ||||||
| Telia Co. AB | 20,400 | 71,802 | ||||||
| Trelleborg AB, B Shares | 3,443 | 71,546 | ||||||
| Volvo AB, A Shares | 854 | 14,213 | ||||||
| Volvo AB, B Shares | 7,210 | 114,208 | ||||||
Volvo Car AB, Class B(1)(2) | 6,004 | 36,573 | ||||||
| 1,350,099 | ||||||||
192
| Avantis International Large Cap Value ETF | ||||||||
| Shares | Value | |||||||
| Switzerland — 5.8% | ||||||||
| Adecco Group AG | 335 | $ | 10,620 | |||||
ALSO Holding AG(2) | 21 | 3,491 | ||||||
| Baloise Holding AG | 693 | 100,013 | ||||||
| Barry Callebaut AG | 6 | 12,277 | ||||||
| Bucher Industries AG | 73 | 26,009 | ||||||
Clariant AG(2) | 249 | 4,597 | ||||||
Credit Suisse Group AG, ADR(1) | 3,378 | 17,431 | ||||||
| DKSH Holding AG | 484 | 36,011 | ||||||
| Emmi AG | 46 | 40,520 | ||||||
| EMS-Chemie Holding AG | 73 | 51,263 | ||||||
| Forbo Holding AG | 6 | 7,487 | ||||||
| Geberit AG | 309 | 142,772 | ||||||
| Georg Fischer AG | 926 | 50,173 | ||||||
Holcim AG(2) | 2,377 | 105,362 | ||||||
| Inficon Holding AG | 27 | 18,822 | ||||||
Julius Baer Group Ltd.(2) | 2,466 | 119,156 | ||||||
| Kuehne + Nagel International AG | 328 | 75,804 | ||||||
| Novartis AG, ADR | 8,376 | 674,436 | ||||||
| OC Oerlikon Corp. AG | 842 | 6,150 | ||||||
| Partners Group Holding AG | 135 | 130,309 | ||||||
| Roche Holding AG | 2,621 | 844,595 | ||||||
| Roche Holding AG, Bearer Shares | 99 | 37,814 | ||||||
| Schindler Holding AG | 161 | 27,191 | ||||||
| Schindler Holding AG, Bearer Participation Certificate | 291 | 50,694 | ||||||
| SFS Group AG | 53 | 4,953 | ||||||
| Stadler Rail AG | 558 | 17,030 | ||||||
| Straumann Holding AG | 326 | 35,724 | ||||||
| Sulzer AG | 205 | 12,234 | ||||||
| Swatch Group AG | 191 | 8,687 | ||||||
| Swatch Group AG, Bearer Shares | 115 | 27,887 | ||||||
| Swisscom AG | 305 | 157,694 | ||||||
UBS Group AG(2) | 16,048 | 254,361 | ||||||
VAT Group AG(2) | 109 | 26,063 | ||||||
| Vontobel Holding AG | 539 | 33,162 | ||||||
| Zurich Insurance Group AG | 778 | 345,354 | ||||||
| 3,516,146 | ||||||||
| United Kingdom — 19.1% | ||||||||
| 3i Group PLC | 37,011 | 520,977 | ||||||
| Admiral Group PLC | 4,349 | 106,980 | ||||||
| Anglo American PLC | 29,935 | 961,945 | ||||||
| Antofagasta PLC | 12,786 | 162,688 | ||||||
| Ashtead Group PLC | 11,646 | 572,143 | ||||||
| AstraZeneca PLC, ADR | 3,245 | 202,423 | ||||||
| Barclays PLC, ADR | 59,641 | 464,603 | ||||||
| BP PLC, ADR | 44,150 | 1,361,586 | ||||||
| BT Group PLC | 215,784 | 377,471 | ||||||
| Burberry Group PLC | 14,668 | 296,714 | ||||||
Coca-Cola HBC AG(2) | 7,939 | 181,163 | ||||||
| Glencore PLC | 182,204 | 996,211 | ||||||
| GSK PLC, ADR | 37,150 | 1,206,632 | ||||||
193
| Avantis International Large Cap Value ETF | ||||||||
| Shares | Value | |||||||
Haleon PLC, ADR(2) | 618 | $ | 3,696 | |||||
| Hargreaves Lansdown PLC | 4,518 | 42,773 | ||||||
| Howden Joinery Group PLC | 14,032 | 92,778 | ||||||
| JD Sports Fashion PLC | 77,265 | 101,065 | ||||||
| Johnson Matthey PLC | 2,295 | 53,544 | ||||||
| Legal & General Group PLC | 16,282 | 47,691 | ||||||
| Lloyds Banking Group PLC, ADR | 208,408 | 416,816 | ||||||
Marks & Spencer Group PLC(2) | 34,205 | 48,335 | ||||||
| Rightmove PLC | 20,548 | 144,432 | ||||||
Rio Tinto PLC, ADR(1) | 17,483 | 984,118 | ||||||
| Royal Mail PLC | 18,337 | 58,507 | ||||||
| Shell PLC, ADR | 25,101 | 1,329,851 | ||||||
| St. James's Place PLC | 14,808 | 189,542 | ||||||
| Taylor Wimpey PLC | 937 | 1,176 | ||||||
| Vodafone Group PLC, ADR | 43,186 | 579,556 | ||||||
| 11,505,416 | ||||||||
TOTAL COMMON STOCKS (Cost $65,412,259) | 60,095,551 | |||||||
| SHORT-TERM INVESTMENTS — 8.3% | ||||||||
| Money Market Funds — 8.3% | ||||||||
| State Street Institutional U.S. Government Money Market Fund, Premier Class | 3,955,020 | 3,955,020 | ||||||
State Street Navigator Securities Lending Government Money Market Portfolio(3) | 1,069,229 | 1,069,229 | ||||||
TOTAL SHORT-TERM INVESTMENTS (Cost $5,024,249) | 5,024,249 | |||||||
TOTAL INVESTMENT SECURITIES — 107.8% (Cost $70,436,508) | 65,119,800 | |||||||
| OTHER ASSETS AND LIABILITIES — (7.8)% | (4,727,986) | |||||||
| TOTAL NET ASSETS — 100.0% | $ | 60,391,814 | ||||||
| MARKET SECTOR DIVERSIFICATION | |||||
| (as a % of net assets) | |||||
| Financials | 22.5% | ||||
| Materials | 15.2% | ||||
| Energy | 15.2% | ||||
| Industrials | 14.9% | ||||
| Consumer Discretionary | 9.5% | ||||
| Health Care | 6.3% | ||||
| Communication Services | 6.3% | ||||
| Information Technology | 3.5% | ||||
| Consumer Staples | 2.7% | ||||
| Real Estate | 1.8% | ||||
| Utilities | 1.6% | ||||
| Short-Term Investments | 8.3% | ||||
| Other Assets and Liabilities | (7.8)% | ||||
194
| NOTES TO SCHEDULE OF INVESTMENTS | ||||||||
| ADR | - | American Depositary Receipt | ||||||
| CVA | - | Certificaten Van Aandelen | ||||||
(1)Security, or a portion thereof, is on loan. At the period end, the aggregate value of securities on loan was $1,331,726. The amount of securities on loan indicated may not correspond with the securities on loan identified because securities with pending sales are in the process of recall from the brokers.
(2)Non-income producing.
(3)Investment of cash collateral from securities on loan. At the period end, the aggregate value of the collateral held by the fund was $1,375,342, which includes securities collateral of $306,113.
See Notes to Financial Statements.
195
AUGUST 31, 2022
| Avantis International Small Cap Value ETF | ||||||||
| Shares | Value | |||||||
| COMMON STOCKS — 99.6% | ||||||||
| Australia — 9.7% | ||||||||
29Metals Ltd.(1)(2) | 388,736 | $ | 526,591 | |||||
| Accent Group Ltd. | 170,492 | 173,365 | ||||||
Adairs Ltd.(1) | 8,436 | 12,999 | ||||||
| Adbri Ltd. | 915,846 | 1,371,245 | ||||||
Aeris Resources Ltd.(2) | 219,927 | 64,495 | ||||||
Alkane Resources Ltd.(2) | 662,962 | 328,928 | ||||||
Alliance Aviation Services Ltd.(2) | 50,306 | 122,282 | ||||||
Allkem Ltd.(2) | 1,887 | 17,492 | ||||||
AMP Ltd.(2) | 1,001,558 | 789,401 | ||||||
Aurelia Metals Ltd.(1)(2) | 4,106,478 | 747,144 | ||||||
| Austal Ltd. | 1,143,303 | 1,999,732 | ||||||
Australian Agricultural Co. Ltd.(2) | 144,316 | 177,849 | ||||||
| Australian Finance Group Ltd. | 418,030 | 543,871 | ||||||
Bank of Queensland Ltd.(1) | 934,211 | 4,457,486 | ||||||
| Beach Energy Ltd. | 6,062,205 | 7,006,864 | ||||||
| Bega Cheese Ltd. | 604,424 | 1,640,983 | ||||||
Bendigo & Adelaide Bank Ltd.(1) | 918,964 | 5,641,076 | ||||||
Boral Ltd.(1) | 282,604 | 565,121 | ||||||
| Bravura Solutions Ltd. | 401,752 | 431,123 | ||||||
| Brickworks Ltd. | 36,303 | 502,536 | ||||||
| Cedar Woods Properties Ltd. | 9,800 | 30,333 | ||||||
| Challenger Ltd. | 1,170,338 | 5,045,551 | ||||||
| Champion Iron Ltd. | 1,194,236 | 4,120,411 | ||||||
| Coronado Global Resources, Inc. | 2,653,873 | 2,903,396 | ||||||
| Costa Group Holdings Ltd. | 516,623 | 942,793 | ||||||
Credit Corp. Group Ltd.(1) | 80,038 | 1,102,671 | ||||||
| CSR Ltd. | 1,527,470 | 4,686,418 | ||||||
Dacian Gold Ltd.(2) | 129,467 | 8,756 | ||||||
Eclipx Group Ltd.(2) | 1,063,775 | 1,722,341 | ||||||
| Emeco Holdings Ltd. | 600,927 | 373,234 | ||||||
| Evolution Mining Ltd. | 2,670,714 | 4,291,977 | ||||||
| Genworth Mortgage Insurance Australia Ltd. | 1,271,937 | 2,447,185 | ||||||
| Gold Road Resources Ltd. | 1,093,183 | 936,769 | ||||||
| Grange Resources Ltd. | 2,101,628 | 1,242,585 | ||||||
| GWA Group Ltd. | 154,726 | 211,424 | ||||||
| HT&E Ltd. | 1,042 | 1,044 | ||||||
Humm Group Ltd.(1) | 498,202 | 181,506 | ||||||
| Iluka Resources Ltd. | 1,328,445 | 9,339,601 | ||||||
| Infomedia Ltd. | 542,757 | 531,540 | ||||||
| Inghams Group Ltd. | 1,047,164 | 1,850,373 | ||||||
| InvoCare Ltd. | 229,514 | 1,722,874 | ||||||
| JB Hi-Fi Ltd. | 84,211 | 2,322,516 | ||||||
Karoon Energy Ltd.(2) | 387,929 | 561,727 | ||||||
| MACA Ltd. | 207,538 | 150,415 | ||||||
| Macmahon Holdings Ltd. | 354,016 | 40,858 | ||||||
Magellan Financial Group Ltd.(1) | 335,827 | 2,948,060 | ||||||
Mayne Pharma Group Ltd.(2) | 2,506,596 | 509,756 | ||||||
| McMillan Shakespeare Ltd. | 238,894 | 2,327,614 | ||||||
196
| Avantis International Small Cap Value ETF | ||||||||
| Shares | Value | |||||||
| Metcash Ltd. | 1,189,177 | $ | 3,327,781 | |||||
| Monadelphous Group Ltd. | 88,466 | 789,575 | ||||||
| Money3 Corp. Ltd. | 84,557 | 131,993 | ||||||
Mount Gibson Iron Ltd.(1) | 292,213 | 84,733 | ||||||
| Myer Holdings Ltd. | 133,683 | 45,846 | ||||||
| MyState Ltd. | 57,388 | 149,801 | ||||||
New Hope Corp. Ltd.(1) | 1,672,651 | 5,527,462 | ||||||
| Newcrest Mining Ltd. | 2,886 | 33,797 | ||||||
| nib holdings Ltd. | 920,332 | 5,123,284 | ||||||
| Nine Entertainment Co. Holdings Ltd. | 1,256,732 | 1,865,304 | ||||||
| NRW Holdings Ltd. | 1,616,782 | 2,687,743 | ||||||
| Nufarm Ltd. | 872,925 | 3,151,713 | ||||||
Nuix Ltd.(2) | 36,978 | 17,028 | ||||||
OFX Group Ltd.(2) | 82,787 | 148,906 | ||||||
| Orica Ltd. | 250,230 | 2,617,442 | ||||||
| Orora Ltd. | 1,490,950 | 3,358,176 | ||||||
| Pacific Current Group Ltd. | 33,854 | 209,165 | ||||||
| Pendal Group Ltd. | 691,898 | 2,429,125 | ||||||
| Perenti Global Ltd. | 3,496,199 | 1,854,515 | ||||||
| Perseus Mining Ltd. | 4,142,233 | 4,381,124 | ||||||
| Platinum Asset Management Ltd. | 1,152,930 | 1,390,683 | ||||||
| Premier Investments Ltd. | 214,938 | 3,090,563 | ||||||
| Ramelius Resources Ltd. | 2,844,137 | 1,548,830 | ||||||
| Regis Resources Ltd. | 1,885,539 | 1,977,996 | ||||||
Resimac Group Ltd.(1) | 18,160 | 15,946 | ||||||
Resolute Mining Ltd.(1)(2) | 1,617,172 | 309,703 | ||||||
| Ridley Corp. Ltd. | 233,228 | 330,056 | ||||||
| Sandfire Resources Ltd. | 1,253,519 | 3,871,297 | ||||||
Select Harvests Ltd.(1) | 111,217 | 375,594 | ||||||
| Servcorp Ltd. | 22,553 | 57,392 | ||||||
Service Stream Ltd.(1)(2) | 422,893 | 209,594 | ||||||
Seven West Media Ltd.(1)(2) | 1,494,140 | 525,703 | ||||||
Sierra Rutile Holdings Ltd.(1)(2) | 865,486 | 177,663 | ||||||
| Sigma Healthcare Ltd. | 452,187 | 211,241 | ||||||
Silver Lake Resources Ltd.(2) | 3,077,255 | 2,760,430 | ||||||
| Sims Ltd. | 160,141 | 1,652,243 | ||||||
| Southern Cross Media Group Ltd. | 637,416 | 465,717 | ||||||
Super Retail Group Ltd.(1) | 483,550 | 3,454,097 | ||||||
| Symbio Holdings Ltd. | 3,813 | 10,210 | ||||||
| Tassal Group Ltd. | 603,988 | 2,131,032 | ||||||
| United Malt Group Ltd. | 31,284 | 75,757 | ||||||
| Viva Energy Group Ltd. | 2,368,085 | 4,788,838 | ||||||
West African Resources Ltd.(2) | 3,194,736 | 2,720,252 | ||||||
| Westgold Resources Ltd. | 484,525 | 304,619 | ||||||
| Whitehaven Coal Ltd. | 2,225,507 | 11,854,404 | ||||||
| 161,918,684 | ||||||||
| Austria — 0.9% | ||||||||
| AT&S Austria Technologie & Systemtechnik AG | 176,317 | 7,847,825 | ||||||
DO & CO. AG(1)(2) | 410 | 32,436 | ||||||
FACC AG(1)(2) | 15,577 | 110,216 | ||||||
POLYTEC Holding AG(1) | 25,087 | 144,116 | ||||||
197
| Avantis International Small Cap Value ETF | ||||||||
| Shares | Value | |||||||
| Porr AG | 53,641 | $ | 614,141 | |||||
| S IMMO AG | 242 | 5,530 | ||||||
Semperit AG Holding(1) | 100,872 | 1,833,002 | ||||||
| UNIQA Insurance Group AG | 609,742 | 4,030,626 | ||||||
| Vienna Insurance Group AG Wiener Versicherung Gruppe | 10,205 | 241,932 | ||||||
| 14,859,824 | ||||||||
| Belgium — 1.1% | ||||||||
AGFA-Gevaert NV(2) | 877 | 3,171 | ||||||
| Bekaert SA | 157,383 | 4,827,394 | ||||||
| bpost SA | 197,526 | 1,199,901 | ||||||
Cie d'Entreprises CFE(1)(2) | 27,899 | 277,676 | ||||||
Deceuninck NV(1) | 136,003 | 313,999 | ||||||
Deme Group NV(2) | 9,927 | 1,136,083 | ||||||
| Gimv NV | 36,485 | 1,866,650 | ||||||
| Ion Beam Applications | 46,200 | 820,918 | ||||||
KBC Ancora(1) | 124,325 | 4,092,915 | ||||||
Tessenderlo Group SA(2) | 94,046 | 3,053,523 | ||||||
| 17,592,230 | ||||||||
| Canada — 10.6% | ||||||||
5N Plus, Inc.(1)(2) | 13,540 | 17,320 | ||||||
Advantage Energy Ltd.(2) | 435,548 | 3,720,903 | ||||||
Algoma Steel Group, Inc.(1) | 192,389 | 1,757,847 | ||||||
| Amerigo Resources Ltd. | 26,000 | 20,985 | ||||||
Argonaut Gold, Inc.(2) | 642,224 | 227,384 | ||||||
Athabasca Oil Corp.(1)(2) | 1,454,477 | 2,868,310 | ||||||
Badger Infrastructure Solutions Ltd.(1) | 53 | 1,248 | ||||||
Baytex Energy Corp.(1)(2) | 1,551,872 | 8,046,787 | ||||||
| Birchcliff Energy Ltd. | 688,955 | 6,069,372 | ||||||
Bird Construction, Inc.(1) | 18,294 | 92,351 | ||||||
Bonterra Energy Corp.(2) | 7,772 | 52,076 | ||||||
Calian Group Ltd.(1) | 3,400 | 155,742 | ||||||
Calibre Mining Corp.(2) | 207,000 | 149,732 | ||||||
| Canaccord Genuity Group, Inc. | 127,870 | 764,289 | ||||||
Canacol Energy Ltd.(1) | 93,418 | 178,535 | ||||||
| Canadian Western Bank | 118,049 | 2,201,256 | ||||||
Canfor Corp.(2) | 157,941 | 3,099,052 | ||||||
| Capital Power Corp. | 262,309 | 10,175,995 | ||||||
Cardinal Energy Ltd.(1) | 296,508 | 1,887,392 | ||||||
Cascades, Inc.(1) | 32,421 | 220,937 | ||||||
| Centerra Gold, Inc. | 498,291 | 2,257,457 | ||||||
China Gold International Resources Corp. Ltd.(1) | 231,678 | 659,745 | ||||||
Chorus Aviation, Inc.(1)(2) | 214,100 | 458,081 | ||||||
Copper Mountain Mining Corp.(1)(2) | 379,405 | 421,770 | ||||||
| Corus Entertainment, Inc., B Shares | 395,346 | 1,113,778 | ||||||
| Crescent Point Energy Corp. | 1,508,946 | 11,466,312 | ||||||
Crew Energy, Inc.(2) | 299,200 | 1,480,793 | ||||||
Dorel Industries, Inc., Class B(1) | 76,575 | 395,892 | ||||||
| Dundee Precious Metals, Inc. | 384,815 | 1,752,156 | ||||||
Eldorado Gold Corp. (Toronto)(2) | 109,542 | 603,863 | ||||||
| Endeavour Mining PLC | 27,094 | 527,295 | ||||||
Enerflex Ltd.(1) | 68,309 | 342,754 | ||||||
198
| Avantis International Small Cap Value ETF | ||||||||
| Shares | Value | |||||||
| Enerplus Corp. | 453,951 | $ | 6,995,826 | |||||
| EQB, Inc. | 32,749 | 1,313,102 | ||||||
ERO Copper Corp.(2) | 125,119 | 1,187,028 | ||||||
| Evertz Technologies Ltd. | 3,800 | 42,822 | ||||||
Exchange Income Corp.(1) | 871 | 30,739 | ||||||
First National Financial Corp.(1) | 12,548 | 355,320 | ||||||
Fortuna Silver Mines, Inc.(1)(2) | 501,083 | 1,159,853 | ||||||
Frontera Energy Corp.(2) | 109,081 | 921,086 | ||||||
| GCM Mining Corp. | 113,257 | 281,989 | ||||||
| Gear Energy Ltd. | 167,200 | 157,862 | ||||||
| Hardwoods Distribution, Inc. | 7 | 157 | ||||||
High Liner Foods, Inc.(1) | 4 | 41 | ||||||
| HLS Therapeutics, Inc. | 2 | 17 | ||||||
Home Capital Group, Inc.(1) | 86,531 | 1,840,847 | ||||||
Hudbay Minerals, Inc.(1) | 400,997 | 1,770,878 | ||||||
| iA Financial Corp., Inc. | 66,563 | 3,575,604 | ||||||
IAMGOLD Corp.(1)(2) | 801,414 | 958,023 | ||||||
Interfor Corp.(2) | 162,414 | 3,995,581 | ||||||
International Petroleum Corp.(1)(2) | 9,413 | 92,671 | ||||||
Kelt Exploration Ltd.(2) | 351,761 | 1,684,682 | ||||||
| Kinross Gold Corp. | 1,027,293 | 3,371,251 | ||||||
Largo, Inc.(1)(2) | 1,825 | 12,423 | ||||||
| Laurentian Bank of Canada | 52,144 | 1,428,516 | ||||||
| Linamar Corp. | 88,219 | 4,170,646 | ||||||
| Lundin Gold, Inc. | 102,280 | 682,983 | ||||||
Lundin Mining Corp.(1) | 1,094,870 | 5,693,808 | ||||||
| Martinrea International, Inc. | 229,920 | 1,811,910 | ||||||
MEG Energy Corp.(2) | 431,826 | 6,036,719 | ||||||
| Methanex Corp. | 121,819 | 4,403,052 | ||||||
New Gold, Inc. (Toronto)(2) | 1,364,313 | 882,983 | ||||||
North American Construction Group Ltd.(1) | 25,781 | 296,412 | ||||||
| North West Co., Inc. | 14 | 363 | ||||||
NuVista Energy Ltd.(2) | 417,650 | 3,434,439 | ||||||
Obsidian Energy Ltd.(2) | 201,907 | 1,817,140 | ||||||
OceanaGold Corp.(2) | 1,186,573 | 1,752,733 | ||||||
| Onex Corp. | 127,125 | 6,286,800 | ||||||
| Parex Resources, Inc. | 240,467 | 3,846,813 | ||||||
Peyto Exploration & Development Corp.(1) | 376,681 | 3,513,414 | ||||||
Pine Cliff Energy Ltd.(1) | 138,356 | 199,104 | ||||||
Pipestone Energy Corp.(2) | 134,864 | 501,113 | ||||||
Polaris Renewable Energy, Inc.(1) | 2,900 | 42,572 | ||||||
Precision Drilling Corp.(2) | 35 | 2,151 | ||||||
Real Matters, Inc.(1)(2) | 119,739 | 527,878 | ||||||
Resolute Forest Products, Inc.(2) | 133,077 | 2,693,255 | ||||||
| Russel Metals, Inc. | 142,339 | 3,077,952 | ||||||
| Secure Energy Services, Inc. | 7,039 | 30,603 | ||||||
Sierra Metals, Inc.(1) | 3,100 | 1,393 | ||||||
Spartan Delta Corp.(2) | 206,520 | 2,083,519 | ||||||
SSR Mining, Inc.(1) | 120,138 | 1,621,842 | ||||||
| Stelco Holdings, Inc. | 105,729 | 2,861,892 | ||||||
STEP Energy Services Ltd.(2) | 8,300 | 40,762 | ||||||
199
| Avantis International Small Cap Value ETF | ||||||||
| Shares | Value | |||||||
SunOpta, Inc.(1)(2) | 2,722 | $ | 27,068 | |||||
| Surge Energy, Inc. | 110,349 | 846,932 | ||||||
Tamarack Valley Energy Ltd.(1) | 791,157 | 2,524,040 | ||||||
Taseko Mines Ltd.(1)(2) | 422,528 | 440,753 | ||||||
| Tidewater Midstream and Infrastructure Ltd. | 71,511 | 65,884 | ||||||
Torex Gold Resources, Inc.(2) | 210,007 | 1,559,042 | ||||||
| Total Energy Services, Inc. | 4,600 | 25,463 | ||||||
| Transcontinental, Inc., Class A | 17 | 214 | ||||||
TransGlobe Energy Corp.(1) | 62,926 | 208,899 | ||||||
Turquoise Hill Resources Ltd.(2) | 69,764 | 1,918,663 | ||||||
| Vermilion Energy, Inc. | 451,427 | 12,057,760 | ||||||
Wajax Corp.(1) | 42,171 | 681,363 | ||||||
| West Fraser Timber Co. Ltd. | 11,631 | 1,040,578 | ||||||
| Western Forest Products, Inc. | 1,171,541 | 1,373,718 | ||||||
| Yamana Gold, Inc. | 461,753 | 2,039,188 | ||||||
Yangarra Resources Ltd.(2) | 16,400 | 35,214 | ||||||
| 177,522,757 | ||||||||
| Denmark — 1.7% | ||||||||
Bang & Olufsen A/S(2) | 24,456 | 42,363 | ||||||
| D/S Norden A/S | 118,509 | 5,525,391 | ||||||
| Dfds A/S | 86,366 | 2,988,508 | ||||||
Drilling Co. of 1972 A/S(2) | 29,320 | 1,391,329 | ||||||
| FLSmidth & Co. A/S | 114,434 | 3,167,548 | ||||||
| H Lundbeck A/S | 3,256 | 12,787 | ||||||
H Lundbeck A/S, A Shares(2) | 3,984 | 15,256 | ||||||
H+H International A/S, B Shares(2) | 19,433 | 312,317 | ||||||
Jyske Bank A/S(2) | 139,746 | 6,994,972 | ||||||
NNIT A/S(2) | 47,672 | 430,823 | ||||||
| Per Aarsleff Holding A/S | 27,470 | 789,963 | ||||||
| Schouw & Co. A/S | 246 | 17,938 | ||||||
| Solar A/S, B Shares | 7,936 | 641,615 | ||||||
| Spar Nord Bank A/S | 101,339 | 1,147,417 | ||||||
| Sparekassen Sjaelland-Fyn A/S | 5,583 | 121,689 | ||||||
| Sydbank A/S | 159,316 | 4,603,570 | ||||||
| TORM PLC | 26,192 | 507,876 | ||||||
| 28,711,362 | ||||||||
| Finland — 1.5% | ||||||||
Admicom Oyj(1) | 98 | 5,708 | ||||||
| Anora Group Oyj | 36,645 | 298,623 | ||||||
| CapMan Oyj, B Shares | 9,067 | 25,167 | ||||||
Finnair Oyj(1)(2) | 805,706 | 330,237 | ||||||
HKScan Oyj, A Shares(1) | 81,827 | 94,206 | ||||||
| Kamux Corp. | 19,625 | 119,783 | ||||||
| Kemira Oyj | 217,501 | 2,618,009 | ||||||
Lassila & Tikanoja Oyj(1) | 1,259 | 13,531 | ||||||
| Marimekko Oyj | 107,690 | 1,061,997 | ||||||
| Metsa Board Oyj | 379,742 | 3,264,715 | ||||||
| Nokian Renkaat Oyj | 253,358 | 2,629,411 | ||||||
| Outokumpu Oyj | 1,575,444 | 6,317,466 | ||||||
Puuilo Oyj(1) | 160,514 | 765,576 | ||||||
QT Group Oyj(1)(2) | 7,811 | 396,022 | ||||||
200
| Avantis International Small Cap Value ETF | ||||||||
| Shares | Value | |||||||
| Rovio Entertainment Oyj | 64,029 | $ | 385,340 | |||||
| Sanoma Oyj | 18,203 | 248,273 | ||||||
Suominen Oyj(1) | 39,346 | 114,409 | ||||||
| Talenom Oyj | 4,970 | 54,201 | ||||||
| Tokmanni Group Corp. | 191,430 | 2,285,460 | ||||||
| Uponor Oyj | 130,782 | 1,959,675 | ||||||
Verkkokauppa.com Oyj(1) | 53,826 | 200,369 | ||||||
WithSecure Oyj(2) | 9,318 | 15,647 | ||||||
YIT Oyj(1) | 560,254 | 1,833,305 | ||||||
| 25,037,130 | ||||||||
| France — 3.2% | ||||||||
| AKWEL | 4,039 | 73,020 | ||||||
ALD SA(1) | 129,561 | 1,410,191 | ||||||
| Biosynex | 12,193 | 179,143 | ||||||
| Bonduelle SCA | 1,607 | 20,753 | ||||||
| Catana Group | 30,598 | 189,108 | ||||||
Cie des Alpes(2) | 12,302 | 194,616 | ||||||
| Cie Plastic Omnium SA | 139,538 | 2,587,326 | ||||||
Coface SA(2) | 144,623 | 1,446,154 | ||||||
| Derichebourg SA | 345,326 | 1,942,627 | ||||||
| Eramet SA | 38,089 | 3,229,321 | ||||||
Esso SA Francaise(2) | 1,045 | 64,297 | ||||||
| Etablissements Maurel et Prom SA | 93,902 | 475,245 | ||||||
Eurobio Scientific SA(2) | 27,648 | 509,772 | ||||||
| Eutelsat Communications SA | 608,861 | 5,507,156 | ||||||
Faurecia SE(2) | 182,526 | 2,617,578 | ||||||
Focus Entertainment(2) | 2,042 | 92,358 | ||||||
| Gaztransport Et Technigaz SA | 17,558 | 2,235,210 | ||||||
Genfit(2) | 22,555 | 95,497 | ||||||
Groupe LDLC(1) | 6,031 | 164,356 | ||||||
| Guillemot Corp. | 1,314 | 18,326 | ||||||
ID Logistics Group(2) | 422 | 118,069 | ||||||
Innate Pharma SA(1)(2) | 90,846 | 242,782 | ||||||
Jacquet Metals SACA(1) | 34,099 | 539,915 | ||||||
JCDecaux SA(2) | 53,776 | 745,685 | ||||||
Kaufman & Broad SA(1) | 15,062 | 356,715 | ||||||
| LISI | 4,404 | 93,265 | ||||||
Maisons du Monde SA(1) | 89,228 | 854,055 | ||||||
| Manitou BF SA | 4,308 | 70,930 | ||||||
| Mersen SA | 30,936 | 914,887 | ||||||
| Metropole Television SA | 95,403 | 1,177,673 | ||||||
| Nexans SA | 55,512 | 5,071,937 | ||||||
Novacyt SA(1)(2) | 242,631 | 288,384 | ||||||
Orpea SA(2) | 61,871 | 1,346,112 | ||||||
ReWorld Media SA(2) | 6,000 | 38,041 | ||||||
| SES SA | 1,093,132 | 7,674,165 | ||||||
SMCP SA(2) | 75,957 | 415,972 | ||||||
| Societe BIC SA | 39,139 | 2,226,476 | ||||||
| Television Francaise 1 | 213,653 | 1,354,946 | ||||||
Vallourec SA(2) | 368,320 | 3,834,281 | ||||||
| Verallia SA | 95,316 | 2,185,235 | ||||||
201
| Avantis International Small Cap Value ETF | ||||||||
| Shares | Value | |||||||
| Vicat SA | 11,675 | $ | 295,445 | |||||
| Vilmorin & Cie SA | 196 | 8,422 | ||||||
X-Fab Silicon Foundries SE(2) | 35,763 | 222,049 | ||||||
| 53,127,495 | ||||||||
| Germany — 3.6% | ||||||||
| 7C Solarparken AG | 46,830 | 252,047 | ||||||
Aareal Bank AG(2) | 1,499 | 47,881 | ||||||
| AURELIUS Equity Opportunities SE & Co. KGaA | 19,301 | 448,182 | ||||||
| Aurubis AG | 60,885 | 3,686,372 | ||||||
| Baader Bank AG | 7,342 | 27,509 | ||||||
Bauer AG(2) | 8,713 | 76,476 | ||||||
| Bertrandt AG | 1,999 | 68,231 | ||||||
| CECONOMY AG | 24,947 | 36,094 | ||||||
| Cewe Stiftung & Co. KGAA | 6,217 | 491,589 | ||||||
| CropEnergies AG | 37,925 | 621,310 | ||||||
| Deutsche Beteiligungs AG | 12,982 | 363,085 | ||||||
| Deutsche Pfandbriefbank AG | 270,958 | 2,338,413 | ||||||
| Deutz AG | 373,799 | 1,407,617 | ||||||
| Draegerwerk AG & Co. KGaA | 875 | 35,370 | ||||||
| Draegerwerk AG & Co. KGaA, Preference Shares | 18,405 | 870,797 | ||||||
| Duerr AG | 51,052 | 1,124,513 | ||||||
| Elmos Semiconductor SE | 10,498 | 445,348 | ||||||
| ElringKlinger AG | 30,458 | 213,763 | ||||||
| Encavis AG | 251,955 | 5,384,612 | ||||||
| Energiekontor AG | 318 | 27,934 | ||||||
flatexDEGIRO AG(2) | 115,324 | 1,109,772 | ||||||
| GRENKE AG | 10,080 | 242,363 | ||||||
| Hamburger Hafen und Logistik AG | 103,424 | 1,264,882 | ||||||
| Hornbach Holding AG & Co. KGaA | 19,752 | 1,393,227 | ||||||
| HUGO BOSS AG | 143,435 | 7,817,520 | ||||||
| Instone Real Estate Group SE | 78,683 | 696,507 | ||||||
| JOST Werke AG | 41,016 | 1,520,107 | ||||||
| Jungheinrich AG, Preference Shares | 141,794 | 3,461,718 | ||||||
| Kloeckner & Co. SE | 7,498 | 67,665 | ||||||
| Kontron AG | 34,547 | 525,604 | ||||||
| Krones AG | 37,638 | 3,099,649 | ||||||
| Lang & Schwarz AG | 30,420 | 433,443 | ||||||
| Lanxess AG | 191,634 | 6,466,026 | ||||||
Leoni AG(2) | 21,600 | 151,385 | ||||||
METRO AG(2) | 161,704 | 1,287,349 | ||||||
| Mutares SE & Co. KGaA | 15,517 | 250,439 | ||||||
PVA TePla AG(2) | 24,855 | 417,484 | ||||||
| SAF-Holland SE | 65,617 | 522,157 | ||||||
SGL Carbon SE(2) | 268,651 | 1,825,779 | ||||||
| Siltronic AG | 31,355 | 2,148,679 | ||||||
| STO SE & Co. KGaA, Preference Shares | 7,533 | 1,178,225 | ||||||
| Suedzucker AG | 68,022 | 932,798 | ||||||
| TAG Immobilien AG | 245,253 | 2,262,578 | ||||||
Vitesco Technologies Group AG, Class A(2) | 39,485 | 1,928,270 | ||||||
| Wacker Neuson SE | 50,499 | 836,053 | ||||||
| Wuestenrot & Wuerttembergische AG | 33,661 | 548,156 | ||||||
| 60,354,978 | ||||||||
202
| Avantis International Small Cap Value ETF | ||||||||
| Shares | Value | |||||||
| Hong Kong — 1.8% | ||||||||
| BOCOM International Holdings Co. Ltd. | 50,000 | $ | 3,312 | |||||
| Bright Smart Securities & Commodities Group Ltd. | 1,576,000 | 252,361 | ||||||
| Cafe de Coral Holdings Ltd. | 184,000 | 263,430 | ||||||
China Strategic Holdings Ltd.(2) | 56,655,000 | 222,839 | ||||||
| Chow Sang Sang Holdings International Ltd. | 445,000 | 500,996 | ||||||
CMBC Capital Holdings Ltd.(1) | 1,387,000 | 299,857 | ||||||
| Crystal International Group Ltd. | 34,500 | 11,584 | ||||||
| CSI Properties Ltd. | 80,000 | 1,781 | ||||||
| Dah Sing Banking Group Ltd. | 349,200 | 271,163 | ||||||
| Dah Sing Financial Holdings Ltd. | 193,200 | 514,356 | ||||||
| E-Commodities Holdings Ltd. | 11,394,000 | 2,544,706 | ||||||
| First Pacific Co. Ltd. | 20,000 | 7,713 | ||||||
| FSE Lifestyle Services Ltd. | 27,000 | 17,218 | ||||||
| Guotai Junan International Holdings Ltd. | 5,767,000 | 578,610 | ||||||
Haitong International Securities Group Ltd.(1) | 2,010,699 | 222,459 | ||||||
| Hang Lung Group Ltd. | 138,000 | 233,407 | ||||||
Hengdeli Holdings Ltd.(2) | 12,000 | 364 | ||||||
| IGG, Inc. | 2,915,000 | 1,253,143 | ||||||
IRC Ltd.(1)(2) | 4,792,000 | 82,206 | ||||||
| Jinhui Shipping & Transportation Ltd. | 15,000 | 12,588 | ||||||
| Johnson Electric Holdings Ltd. | 1,193,000 | 1,409,019 | ||||||
| K Wah International Holdings Ltd. | 2,713,000 | 1,023,143 | ||||||
| Ka Shui International Holdings Ltd. | 1,174,000 | 71,541 | ||||||
Lifestyle International Holdings Ltd.(2) | 1,000 | 585 | ||||||
| Luk Fook Holdings International Ltd. | 107,000 | 273,521 | ||||||
| Oriental Watch Holdings | 890,000 | 508,226 | ||||||
| Pacific Basin Shipping Ltd. | 32,260,000 | 11,450,041 | ||||||
| PAX Global Technology Ltd. | 55,000 | 52,572 | ||||||
PC Partner Group Ltd.(1) | 1,550,000 | 1,473,583 | ||||||
| Regina Miracle International Holdings Ltd. | 195,000 | 120,677 | ||||||
Sa Sa International Holdings Ltd.(2) | 946,000 | 153,832 | ||||||
Shun Tak Holdings Ltd.(2) | 3,190,000 | 531,238 | ||||||
| Singamas Container Holdings Ltd. | 3,476,000 | 321,994 | ||||||
| SmarTone Telecommunications Holdings Ltd. | 33,500 | 17,927 | ||||||
Solargiga Energy Holdings Ltd.(2) | 2,281,000 | 89,579 | ||||||
| Soundwill Holdings Ltd. | 2,500 | 2,288 | ||||||
| Sun Hung Kai & Co. Ltd. | 866,000 | 399,125 | ||||||
| Tai Hing Group Holdings Ltd. | 245,000 | 31,454 | ||||||
| Tam Jai International Co. Ltd. | 84,000 | 27,962 | ||||||
| Ten Pao Group Holdings Ltd. | 412,000 | 75,347 | ||||||
| Texhong Textile Group Ltd. | 1,353,000 | 1,271,206 | ||||||
| Texwinca Holdings Ltd. | 440,000 | 78,222 | ||||||
Time Interconnect Technology Ltd.(1) | 424,000 | 122,702 | ||||||
| United Laboratories International Holdings Ltd. | 4,442,000 | 2,150,295 | ||||||
Value Partners Group Ltd.(1) | 1,576,000 | 462,245 | ||||||
| VSTECS Holdings Ltd. | 1,348,000 | 891,187 | ||||||
| VTech Holdings Ltd. | 1,000 | 6,800 | ||||||
| 30,310,404 | ||||||||
| Ireland — 0.4% | ||||||||
Dalata Hotel Group PLC(2) | 226,737 | 794,183 | ||||||
203
| Avantis International Small Cap Value ETF | ||||||||
| Shares | Value | |||||||
| FBD Holdings PLC | 6,291 | $ | 64,198 | |||||
Glenveagh Properties PLC(2) | 5,617,775 | 5,717,911 | ||||||
| Origin Enterprises PLC | 140,699 | 527,431 | ||||||
| 7,103,723 | ||||||||
| Israel — 3.1% | ||||||||
| Adgar Investment and Development Ltd. | 13,419 | 29,523 | ||||||
| AFI Properties Ltd. | 546 | 26,984 | ||||||
Airport City Ltd.(2) | 57,990 | 1,213,544 | ||||||
| Caesarstone Ltd. | 1,085 | 11,056 | ||||||
| Carasso Motors Ltd. | 19,452 | 123,294 | ||||||
Cellcom Israel Ltd.(2) | 80,659 | 504,584 | ||||||
Clal Insurance Enterprises Holdings Ltd.(2) | 212,865 | 4,596,473 | ||||||
| Delek Automotive Systems Ltd. | 89,099 | 1,373,974 | ||||||
Delek Group Ltd.(2) | 8,505 | 1,477,200 | ||||||
| Delta Galil Industries Ltd. | 8,381 | 444,622 | ||||||
Equital Ltd.(2) | 21,717 | 806,548 | ||||||
Fattal Holdings 1998 Ltd.(2) | 178 | 21,919 | ||||||
| FIBI Holdings Ltd. | 56,902 | 2,991,006 | ||||||
| First International Bank of Israel Ltd. | 36,753 | 1,710,332 | ||||||
| Gazit-Globe Ltd. | 93,940 | 611,475 | ||||||
| Harel Insurance Investments & Financial Services Ltd. | 367,739 | 4,181,180 | ||||||
| IDI Insurance Co. Ltd. | 2,066 | 67,430 | ||||||
| Infinya Ltd. | 3,142 | 318,766 | ||||||
| Inrom Construction Industries Ltd. | 8,916 | 41,554 | ||||||
| Isracard Ltd. | 688,739 | 2,292,617 | ||||||
Israel Corp. Ltd.(2) | 2,738 | 1,323,426 | ||||||
| Israel Land Development - Urban Renewal Ltd. | 8,422 | 150,083 | ||||||
| Isras Investment Co. Ltd. | 1,627 | 389,691 | ||||||
| Ituran Location and Control Ltd. | 495 | 12,306 | ||||||
| M Yochananof & Sons Ltd. | 4,089 | 257,210 | ||||||
Menora Mivtachim Holdings Ltd.(2) | 76,658 | 1,765,732 | ||||||
| Migdal Insurance & Financial Holdings Ltd. | 1,189,172 | 1,964,815 | ||||||
Naphtha Israel Petroleum Corp. Ltd.(2) | 10,798 | 65,011 | ||||||
| Nawi Brothers Ltd. | 9,923 | 87,672 | ||||||
| Oil Refineries Ltd. | 5,497,207 | 2,360,476 | ||||||
Partner Communications Co. Ltd.(2) | 440,988 | 3,814,169 | ||||||
Paz Oil Co. Ltd.(2) | 29,774 | 3,902,737 | ||||||
| Phoenix Holdings Ltd. | 451,686 | 5,448,551 | ||||||
| Prashkovsky Investments and Construction Ltd. | 4,864 | 162,595 | ||||||
| Rami Levy Chain Stores Hashikma Marketing 2006 Ltd. | 15,722 | 1,216,744 | ||||||
| Scope Metals Group Ltd. | 74 | 3,709 | ||||||
| Shapir Engineering and Industry Ltd. | 57,934 | 553,398 | ||||||
Shikun & Binui Ltd.(2) | 17,321 | 78,316 | ||||||
| Shufersal Ltd. | 689,636 | 4,723,071 | ||||||
Taro Pharmaceutical Industries Ltd.(2) | 3,625 | 122,017 | ||||||
Tera Light Ltd.(2) | 31,601 | 60,395 | ||||||
Tower Semiconductor Ltd.(2) | 342 | 16,031 | ||||||
Victory Supermarket Chain Ltd.(2) | 1,573 | 24,448 | ||||||
| YH Dimri Construction & Development Ltd. | 5,182 | 410,807 | ||||||
| 51,757,491 | ||||||||
| Italy — 2.3% | ||||||||
Aeffe SpA(2) | 47,952 | 68,494 | ||||||
204
| Avantis International Small Cap Value ETF | ||||||||
| Shares | Value | |||||||
| Arnoldo Mondadori Editore SpA | 244,950 | $ | 399,900 | |||||
| Banca IFIS SpA | 99,982 | 1,193,854 | ||||||
Banca Popolare di Sondrio SCPA(1) | 2,719,859 | 8,709,765 | ||||||
Banco di Desio e della Brianza SpA(1) | 118,022 | 360,341 | ||||||
| BFF Bank SpA | 54,749 | 346,559 | ||||||
| Biesse SpA | 72,713 | 923,238 | ||||||
| Cairo Communication SpA | 10,143 | 15,766 | ||||||
| Cementir Holding NV | 33,094 | 191,689 | ||||||
| Danieli & C Officine Meccaniche SpA | 5,483 | 100,790 | ||||||
| Danieli & C Officine Meccaniche SpA, Preference Shares | 53,298 | 677,289 | ||||||
Digital Bros SpA(1) | 61,158 | 1,508,365 | ||||||
Enav SpA(2) | 769 | 3,179 | ||||||
| Fila SpA | 23,357 | 176,239 | ||||||
Fincantieri SpA(1)(2) | 1,970,690 | 987,959 | ||||||
FNM SpA(2) | 66,723 | 28,633 | ||||||
Geox SpA(1)(2) | 68,174 | 52,914 | ||||||
Intek Group SpA(2) | 24,920 | 14,154 | ||||||
Iveco Group NV(2) | 942,671 | 4,766,532 | ||||||
Maire Tecnimont SpA(1) | 939,467 | 2,384,184 | ||||||
MFE-MediaForEurope NV, Class A(1)(2) | 3,017,628 | 1,280,080 | ||||||
MFE-MediaForEurope NV, Class B(1)(2) | 834,408 | 485,381 | ||||||
Newlat Food SpA(2) | 16,765 | 96,654 | ||||||
| Orsero SpA | 1,102 | 18,190 | ||||||
OVS SpA(1) | 2,254,121 | 3,408,437 | ||||||
| RAI Way SpA | 255,774 | 1,237,156 | ||||||
Safilo Group SpA(2) | 508,600 | 712,493 | ||||||
Saipem SpA(1)(2) | 3,274,801 | 2,297,328 | ||||||
| Sanlorenzo SpA/Ameglia | 25,548 | 802,656 | ||||||
Saras SpA(2) | 282,774 | 342,516 | ||||||
Tesmec SpA(1)(2) | 1,690,861 | 215,687 | ||||||
Webuild SpA(1) | 2,964,208 | 4,162,859 | ||||||
| 37,969,281 | ||||||||
| Japan — 27.0% | ||||||||
| 77 Bank Ltd. | 77,000 | 982,247 | ||||||
| A&D HOLON Holdings Co. Ltd. | 4,200 | 28,755 | ||||||
AEON Financial Service Co. Ltd.(1) | 397,700 | 4,084,528 | ||||||
Aeon Mall Co. Ltd.(1) | 179,700 | 2,143,344 | ||||||
| AFC-HD AMS Life Science Co. Ltd. | 30,300 | 167,808 | ||||||
| Aichi Steel Corp. | 14,800 | 219,475 | ||||||
| Air Water, Inc. | 161,200 | 2,016,620 | ||||||
| Airport Facilities Co. Ltd. | 3,500 | 14,017 | ||||||
| Aisan Industry Co. Ltd. | 51,400 | 269,181 | ||||||
| Akatsuki, Inc. | 13,100 | 222,674 | ||||||
Akebono Brake Industry Co. Ltd.(2) | 29,600 | 36,058 | ||||||
| Alleanza Holdings Co. Ltd. | 3,900 | 28,048 | ||||||
Alpen Co. Ltd.(1) | 4,100 | 61,712 | ||||||
Alps Alpine Co. Ltd.(1) | 35,200 | 314,893 | ||||||
| Amada Co. Ltd. | 118,300 | 925,633 | ||||||
| AOKI Holdings, Inc. | 26,400 | 133,465 | ||||||
| Aoyama Trading Co. Ltd. | 101,600 | 674,086 | ||||||
| Aozora Bank Ltd. | 15,300 | 295,327 | ||||||
205
| Avantis International Small Cap Value ETF | ||||||||
| Shares | Value | |||||||
| Arata Corp. | 29,700 | $ | 879,992 | |||||
Arcland Sakamoto Co. Ltd.(1) | 70,100 | 751,670 | ||||||
Arcs Co. Ltd.(1) | 45,500 | 665,300 | ||||||
| Asahi Diamond Industrial Co. Ltd. | 21,700 | 121,082 | ||||||
Asahi Holdings, Inc.(1) | 400 | 5,962 | ||||||
| ASAHI YUKIZAI Corp. | 22,200 | 365,378 | ||||||
| Asia Pile Holdings Corp. | 1,400 | 5,063 | ||||||
| Astena Holdings Co. Ltd. | 10,800 | 34,668 | ||||||
Aucnet, Inc.(1) | 7,500 | 116,315 | ||||||
| Bando Chemical Industries Ltd. | 12,700 | 92,038 | ||||||
| Bank of Nagoya Ltd. | 15,700 | 349,197 | ||||||
Bank of the Ryukyus Ltd.(1) | 11,200 | 62,397 | ||||||
| Belluna Co. Ltd. | 132,000 | 699,536 | ||||||
| Benesse Holdings, Inc. | 53,500 | 840,899 | ||||||
Bic Camera, Inc.(1) | 103,000 | 843,139 | ||||||
| BML, Inc. | 68,500 | 1,752,897 | ||||||
| Bunka Shutter Co. Ltd. | 147,000 | 1,127,398 | ||||||
| Careerlink Co. Ltd. | 9,100 | 151,254 | ||||||
| Central Glass Co. Ltd. | 86,300 | 2,082,176 | ||||||
| Chiba Kogyo Bank Ltd. | 2,000 | 3,770 | ||||||
| Chilled & Frozen Logistics Holdings Co. Ltd. | 1,900 | 16,833 | ||||||
| Chori Co. Ltd. | 1,200 | 17,544 | ||||||
| Chubu Shiryo Co. Ltd. | 9,200 | 71,015 | ||||||
Citizen Watch Co. Ltd.(1) | 886,600 | 3,788,105 | ||||||
| CKD Corp. | 55,200 | 726,222 | ||||||
| CMIC Holdings Co. Ltd. | 19,100 | 226,831 | ||||||
| Cosmo Energy Holdings Co. Ltd. | 397,900 | 11,913,428 | ||||||
| Credit Saison Co. Ltd. | 656,800 | 8,263,130 | ||||||
| CTI Engineering Co. Ltd. | 4,700 | 87,926 | ||||||
| Cybernet Systems Co. Ltd. | 18,600 | 128,568 | ||||||
Daicel Corp.(1) | 754,300 | 4,737,163 | ||||||
| Daiho Corp. | 2,700 | 78,564 | ||||||
| Daiichi Kigenso Kagaku-Kogyo Co. Ltd. | 300 | 2,850 | ||||||
| Daiken Corp. | 15,600 | 217,970 | ||||||
| Daikokutenbussan Co. Ltd. | 8,900 | 377,926 | ||||||
| Daikyonishikawa Corp. | 3,500 | 14,681 | ||||||
| Dainichiseika Color & Chemicals Manufacturing Co. Ltd. | 10,700 | 137,603 | ||||||
Daio Paper Corp.(1) | 182,600 | 1,706,830 | ||||||
| Daishi Hokuetsu Financial Group, Inc. | 17,900 | 336,786 | ||||||
Daishinku Corp.(1) | 54,500 | 383,646 | ||||||
| Daiwa Industries Ltd. | 2,500 | 20,039 | ||||||
| Daiwabo Holdings Co. Ltd. | 31,000 | 436,392 | ||||||
| Denka Co. Ltd. | 229,900 | 5,507,502 | ||||||
| Densan System Holdings Co. Ltd. | 900 | 15,519 | ||||||
| DIC Corp. | 32,700 | 586,337 | ||||||
| DKS Co. Ltd. | 2,800 | 44,442 | ||||||
| Dowa Holdings Co. Ltd. | 56,800 | 2,141,022 | ||||||
Dream Incubator, Inc.(2) | 8,400 | 120,548 | ||||||
| Eagle Industry Co. Ltd. | 47,000 | 394,898 | ||||||
| Ebara Jitsugyo Co. Ltd. | 200 | 3,198 | ||||||
Eco's Co. Ltd.(1) | 14,100 | 190,162 | ||||||
206
| Avantis International Small Cap Value ETF | ||||||||
| Shares | Value | |||||||
EDION Corp.(1) | 86,000 | $ | 739,790 | |||||
| EF-ON, Inc. | 12,800 | 62,258 | ||||||
Ehime Bank Ltd.(1) | 3,300 | 20,180 | ||||||
| Eizo Corp. | 21,300 | 579,772 | ||||||
| EJ Holdings, Inc. | 2,900 | 27,033 | ||||||
Electric Power Development Co. Ltd.(1) | 503,300 | 7,752,945 | ||||||
| Elematec Corp. | 21,800 | 212,594 | ||||||
Enomoto Co. Ltd.(1) | 3,000 | 33,284 | ||||||
| Exedy Corp. | 72,500 | 934,142 | ||||||
| EXEO Group, Inc. | 226,600 | 3,476,590 | ||||||
| F.C.C. Co. Ltd. | 87,100 | 901,459 | ||||||
| FALCO HOLDINGS Co. Ltd. | 2,000 | 26,012 | ||||||
| Feed One Co. Ltd. | 4,700 | 23,682 | ||||||
| Ferrotec Holdings Corp. | 148,300 | 3,375,551 | ||||||
FIDEA Holdings Co. Ltd.(1) | 7,810 | 74,127 | ||||||
| Fields Corp. | 41,500 | 402,144 | ||||||
| FJ Next Holdings Co. Ltd. | 15,100 | 111,686 | ||||||
| France Bed Holdings Co. Ltd. | 12,600 | 89,312 | ||||||
| Frontier International, Inc. | 5,900 | 171,298 | ||||||
Fuji Co. Ltd.(1) | 600 | 8,628 | ||||||
| Fuji Corp. Ltd. | 9,000 | 42,931 | ||||||
| Fuji Media Holdings, Inc. | 44,200 | 349,789 | ||||||
| Fuji Oil Co. Ltd. | 11,300 | 30,154 | ||||||
| Fuji Seal International, Inc. | 51,900 | 575,725 | ||||||
| Fujibo Holdings, Inc. | 1,800 | 46,706 | ||||||
| Fujikura Composites, Inc. | 31,200 | 229,097 | ||||||
| Fujikura Ltd. | 781,200 | 5,547,529 | ||||||
| Fujimori Kogyo Co. Ltd. | 6,200 | 156,867 | ||||||
| Furukawa Battery Co. Ltd. | 500 | 4,155 | ||||||
| Furukawa Co. Ltd. | 32,800 | 297,371 | ||||||
| Furuno Electric Co. Ltd. | 12,900 | 103,859 | ||||||
| Furyu Corp. | 16,900 | 123,263 | ||||||
| Futaba Industrial Co. Ltd. | 112,500 | 290,894 | ||||||
| Fuyo General Lease Co. Ltd. | 61,000 | 3,602,180 | ||||||
| G-7 Holdings, Inc. | 100 | 1,072 | ||||||
G-Tekt Corp.(1) | 16,400 | 164,026 | ||||||
| Gecoss Corp. | 2,200 | 12,936 | ||||||
Genky DrugStores Co. Ltd.(1) | 12,800 | 336,599 | ||||||
| GLOBERIDE, Inc. | 29,300 | 574,233 | ||||||
| Glory Ltd. | 28,900 | 456,297 | ||||||
GMO Financial Holdings, Inc.(1) | 8,800 | 47,877 | ||||||
| Goldcrest Co. Ltd. | 24,900 | 310,253 | ||||||
| Good Com Asset Co. Ltd. | 15,600 | 149,914 | ||||||
| GungHo Online Entertainment, Inc. | 13,500 | 222,933 | ||||||
Gunma Bank Ltd.(1) | 365,400 | 1,021,835 | ||||||
| H-One Co. Ltd. | 9,400 | 40,928 | ||||||
| H.U. Group Holdings, Inc. | 190,000 | 3,859,126 | ||||||
| H2O Retailing Corp. | 189,600 | 1,335,806 | ||||||
| Hagiwara Electric Holdings Co. Ltd. | 300 | 5,086 | ||||||
| Hakudo Co. Ltd. | 8,500 | 164,791 | ||||||
Halows Co. Ltd.(1) | 2,300 | 50,512 | ||||||
207
| Avantis International Small Cap Value ETF | ||||||||
| Shares | Value | |||||||
| Hamakyorex Co. Ltd. | 30,100 | $ | 685,392 | |||||
| Hanwa Co. Ltd. | 111,400 | 2,755,888 | ||||||
| Happinet Corp. | 10,200 | 118,182 | ||||||
| Hazama Ando Corp. | 3,700 | 22,947 | ||||||
| Heiwa Real Estate Co. Ltd. | 96,300 | 2,715,519 | ||||||
Heiwado Co. Ltd.(1) | 55,000 | 786,139 | ||||||
| Hino Motors Ltd. | 229,700 | 1,047,949 | ||||||
Hirano Tecseed Co. Ltd.(1) | 17,200 | 229,014 | ||||||
Hirogin Holdings, Inc.(1) | 73,400 | 322,986 | ||||||
| Hitachi Transport System Ltd. | 2,900 | 183,084 | ||||||
| Hitachi Zosen Corp. | 503,200 | 3,176,451 | ||||||
| Hodogaya Chemical Co. Ltd. | 1,500 | 34,942 | ||||||
| Hokkoku Financial Holdings, Inc. | 6,100 | 215,812 | ||||||
| Hokuetsu Corp. | 324,800 | 1,747,950 | ||||||
| Hokuhoku Financial Group, Inc. | 294,600 | 1,750,537 | ||||||
| Hokuto Corp. | 300 | 4,149 | ||||||
| Honeys Holdings Co. Ltd. | 2,400 | 21,282 | ||||||
| Hoosiers Holdings Co. Ltd. | 15,500 | 89,926 | ||||||
| Horiba Ltd. | 4,000 | 182,215 | ||||||
| Hosokawa Micron Corp. | 10,600 | 200,103 | ||||||
| HS Holdings Co. Ltd. | 61,800 | 517,098 | ||||||
| Hyakugo Bank Ltd. | 102,100 | 233,655 | ||||||
| i-mobile Co. Ltd. | 3,100 | 31,789 | ||||||
| I-Net Corp./Kanagawa | 1,400 | 13,544 | ||||||
| I-PEX, Inc. | 22,700 | 223,360 | ||||||
| Ichigo, Inc. | 4,000 | 8,742 | ||||||
Ichinen Holdings Co. Ltd.(1) | 7,200 | 65,662 | ||||||
| IDEA Consultants, Inc. | 200 | 2,494 | ||||||
IDOM, Inc.(1) | 160,200 | 948,118 | ||||||
| IHI Corp. | 285,500 | 7,624,650 | ||||||
| Iino Kaiun Kaisha Ltd. | 283,100 | 1,663,554 | ||||||
| IMAGICA GROUP, Inc. | 51,200 | 331,304 | ||||||
| Ines Corp. | 200 | 2,233 | ||||||
| INFRONEER Holdings, Inc. | 308,884 | 2,207,927 | ||||||
| Innotech Corp. | 7,400 | 72,309 | ||||||
| Internet Initiative Japan, Inc. | 3,600 | 130,017 | ||||||
| Inui Global Logistics Co. Ltd. | 24,000 | 367,656 | ||||||
| Iseki & Co. Ltd. | 29,800 | 271,101 | ||||||
| Ishihara Sangyo Kaisha Ltd. | 106,300 | 854,268 | ||||||
| Itochu Enex Co. Ltd. | 215,600 | 1,691,522 | ||||||
| IwaiCosmo Holdings, Inc. | 13,500 | 121,799 | ||||||
| Iyo Bank Ltd. | 28,300 | 131,601 | ||||||
Izumi Co. Ltd.(1) | 9,000 | 194,231 | ||||||
J Front Retailing Co. Ltd.(1) | 646,200 | 5,121,450 | ||||||
| Jaccs Co. Ltd. | 79,700 | 2,191,757 | ||||||
| JAFCO Group Co. Ltd. | 231,700 | 3,353,231 | ||||||
Jamco Corp.(2) | 12,300 | 115,753 | ||||||
| Japan Aviation Electronics Industry Ltd. | 102,800 | 1,719,142 | ||||||
Japan Electronic Materials Corp.(1) | 24,800 | 278,443 | ||||||
| Japan Investment Adviser Co. Ltd. | 14,500 | 140,363 | ||||||
| Japan Lifeline Co. Ltd. | 29,200 | 211,980 | ||||||
208
| Avantis International Small Cap Value ETF | ||||||||
| Shares | Value | |||||||
| Japan Pulp & Paper Co. Ltd. | 2,100 | $ | 65,870 | |||||
| Japan System Techniques Co. Ltd. | 3,700 | 70,845 | ||||||
| Japan Transcity Corp. | 4,400 | 16,101 | ||||||
| Japan Wool Textile Co. Ltd. | 78,700 | 578,416 | ||||||
| JINUSHI Co. Ltd. | 20,500 | 294,976 | ||||||
| JK Holdings Co. Ltd. | 3,700 | 27,088 | ||||||
| JM Holdings Co. Ltd. | 9,900 | 113,329 | ||||||
| Joshin Denki Co. Ltd. | 13,900 | 191,480 | ||||||
| JSB Co. Ltd. | 2,200 | 54,827 | ||||||
| JSP Corp. | 2,200 | 22,837 | ||||||
| JTEKT Corp. | 653,100 | 4,597,477 | ||||||
| Juroku Financial Group, Inc. | 42,600 | 753,789 | ||||||
| JVCKenwood Corp. | 1,093,200 | 1,604,746 | ||||||
| K's Holdings Corp. | 453,100 | 4,174,601 | ||||||
| Kamei Corp. | 6,800 | 53,498 | ||||||
| Kanamoto Co. Ltd. | 107,000 | 1,647,185 | ||||||
| Kaneka Corp. | 152,700 | 4,095,696 | ||||||
| Kanematsu Corp. | 246,900 | 2,670,961 | ||||||
| Kanto Denka Kogyo Co. Ltd. | 154,500 | 1,110,013 | ||||||
| Kato Sangyo Co. Ltd. | 22,400 | 550,886 | ||||||
| Kawai Musical Instruments Manufacturing Co. Ltd. | 900 | 17,664 | ||||||
| Kawasaki Heavy Industries Ltd. | 41,300 | 801,553 | ||||||
Keiyo Co. Ltd.(1) | 16,200 | 106,098 | ||||||
| KH Neochem Co. Ltd. | 75,500 | 1,389,350 | ||||||
| Kibun Foods, Inc. | 2,000 | 14,208 | ||||||
Kimura Chemical Plants Co. Ltd.(1) | 1,000 | 5,654 | ||||||
| Kito Corp. | 1,700 | 32,975 | ||||||
| Kitz Corp. | 140,700 | 820,381 | ||||||
| Kiyo Bank Ltd. | 175,300 | 1,883,750 | ||||||
| Kobe Steel Ltd. | 1,478,100 | 6,725,283 | ||||||
Kohnan Shoji Co. Ltd.(1) | 67,400 | 1,670,690 | ||||||
Kojima Co. Ltd.(1) | 42,100 | 193,025 | ||||||
| Kokusai Pulp & Paper Co. Ltd. | 98,500 | 502,080 | ||||||
| Komeri Co. Ltd. | 92,100 | 1,729,761 | ||||||
| Komori Corp. | 10,100 | 55,798 | ||||||
Konica Minolta, Inc.(1) | 461,800 | 1,598,975 | ||||||
| Konoike Transport Co. Ltd. | 21,300 | 202,140 | ||||||
| Konoshima Chemical Co. Ltd. | 2,100 | 21,442 | ||||||
Kosaido Holdings Co. Ltd.(1)(2) | 9,600 | 82,569 | ||||||
| Krosaki Harima Corp. | 200 | 6,772 | ||||||
| Kumagai Gumi Co. Ltd. | 72,300 | 1,383,158 | ||||||
| Kuraray Co. Ltd. | 822,100 | 6,244,530 | ||||||
| Kureha Corp. | 51,600 | 3,465,101 | ||||||
| Kurimoto Ltd. | 100 | 1,187 | ||||||
| Kuriyama Holdings Corp. | 5,800 | 37,133 | ||||||
| KYB Corp. | 65,400 | 1,546,856 | ||||||
Kyoden Co. Ltd.(1) | 45,100 | 203,042 | ||||||
| Kyodo Printing Co. Ltd. | 2,700 | 46,751 | ||||||
| Kyokuto Kaihatsu Kogyo Co. Ltd. | 16,400 | 160,938 | ||||||
Lawson, Inc.(1) | 1,800 | 59,654 | ||||||
| Macnica Holdings, Inc. | 54,200 | 1,162,940 | ||||||
209
| Avantis International Small Cap Value ETF | ||||||||
| Shares | Value | |||||||
| Makino Milling Machine Co. Ltd. | 76,300 | $ | 2,407,666 | |||||
| Maruha Nichiro Corp. | 117,000 | 2,092,045 | ||||||
| MARUKA FURUSATO Corp. | 27,000 | 658,020 | ||||||
Maruwa Co. Ltd.(1) | 200 | 25,159 | ||||||
| Maruzen Showa Unyu Co. Ltd. | 12,500 | 285,435 | ||||||
| Maxell Ltd. | 176,100 | 1,867,797 | ||||||
| Mazda Motor Corp. | 600 | 5,314 | ||||||
| Mebuki Financial Group, Inc. | 929,500 | 1,781,451 | ||||||
| Media Do Co. Ltd. | 4,100 | 60,308 | ||||||
| Megmilk Snow Brand Co. Ltd. | 138,700 | 1,709,478 | ||||||
| Meidensha Corp. | 4,100 | 58,770 | ||||||
Meiji Shipping Co. Ltd.(1) | 19,500 | 114,568 | ||||||
Meiko Electronics Co. Ltd.(1) | 52,400 | 1,217,353 | ||||||
| Meisei Industrial Co. Ltd. | 3,800 | 20,438 | ||||||
Meiwa Corp.(1) | 5,900 | 33,699 | ||||||
| Micronics Japan Co. Ltd. | 55,100 | 564,424 | ||||||
Mikuni Corp.(1) | 22,300 | 52,702 | ||||||
| Mimasu Semiconductor Industry Co. Ltd. | 44,900 | 682,819 | ||||||
Ministop Co. Ltd.(1) | 6,600 | 66,984 | ||||||
| Miraial Co. Ltd. | 17,900 | 251,776 | ||||||
| Mirait One Corp. | 140,800 | 1,582,461 | ||||||
| Mitsuba Corp. | 58,600 | 186,246 | ||||||
| Mitsubishi Research Institute, Inc. | 23,200 | 694,532 | ||||||
| Mitsubishi Shokuhin Co. Ltd. | 66,200 | 1,624,936 | ||||||
| Mitsubishi Steel Manufacturing Co. Ltd. | 26,000 | 193,063 | ||||||
| Mitsui Chemicals, Inc. | 60,100 | 1,350,178 | ||||||
Mitsui Matsushima Holdings Co. Ltd.(1) | 49,700 | 1,301,281 | ||||||
| Mitsui Mining & Smelting Co. Ltd. | 233,900 | 5,523,689 | ||||||
| Mitsui-Soko Holdings Co. Ltd. | 75,800 | 1,832,096 | ||||||
| Miyaji Engineering Group, Inc. | 700 | 15,972 | ||||||
| Miyazaki Bank Ltd. | 10,600 | 169,414 | ||||||
| Mizuho Leasing Co. Ltd. | 82,700 | 1,997,515 | ||||||
Mizuho Medy Co. Ltd.(1) | 19,300 | 413,709 | ||||||
| Mizuno Corp. | 38,500 | 740,740 | ||||||
Monex Group, Inc.(1) | 453,600 | 1,617,674 | ||||||
| Morinaga Milk Industry Co. Ltd. | 101,100 | 3,091,164 | ||||||
| MrMax Holdings Ltd. | 3,100 | 14,119 | ||||||
| Musashino Bank Ltd. | 17,300 | 210,871 | ||||||
| Nabtesco Corp. | 40,800 | 966,169 | ||||||
| Nachi-Fujikoshi Corp. | 55,500 | 1,505,831 | ||||||
Nafco Co. Ltd.(1) | 5,100 | 59,170 | ||||||
Nagano Keiki Co. Ltd.(1) | 7,300 | 57,471 | ||||||
| Nagase & Co. Ltd. | 4,200 | 60,273 | ||||||
| Nanto Bank Ltd. | 7,100 | 100,063 | ||||||
| NEC Capital Solutions Ltd. | 17,000 | 262,392 | ||||||
| Neturen Co. Ltd. | 10,700 | 52,728 | ||||||
| NHK Spring Co. Ltd. | 221,800 | 1,498,035 | ||||||
| Nichias Corp. | 119,200 | 2,058,521 | ||||||
| Nichiha Corp. | 45,900 | 914,684 | ||||||
| Nichireki Co. Ltd. | 33,200 | 324,515 | ||||||
| Nihon Chouzai Co. Ltd. | 14,700 | 141,418 | ||||||
210
| Avantis International Small Cap Value ETF | ||||||||
| Shares | Value | |||||||
| Nihon Dempa Kogyo Co. Ltd. | 68,000 | $ | 738,928 | |||||
| Nihon Flush Co. Ltd. | 3,600 | 24,541 | ||||||
| Nihon House Holdings Co. Ltd. | 33,600 | 102,510 | ||||||
| Nihon Tokushu Toryo Co. Ltd. | 1,200 | 8,153 | ||||||
| Nikkon Holdings Co. Ltd. | 104,200 | 1,763,786 | ||||||
| Nippn Corp. | 33,900 | 382,346 | ||||||
Nippon Chemi-Con Corp.(2) | 73,300 | 960,672 | ||||||
| Nippon Chemical Industrial Co. Ltd. | 8,000 | 121,084 | ||||||
| Nippon Coke & Engineering Co. Ltd. | 617,300 | 446,705 | ||||||
| Nippon Denko Co. Ltd. | 24,100 | 63,970 | ||||||
| Nippon Densetsu Kogyo Co. Ltd. | 70,200 | 903,263 | ||||||
| Nippon Electric Glass Co. Ltd. | 250,000 | 4,708,235 | ||||||
Nippon Kodoshi Corp.(1) | 6,600 | 103,308 | ||||||
| Nippon Koei Co. Ltd. | 26,100 | 668,365 | ||||||
| Nippon Light Metal Holdings Co. Ltd. | 83,410 | 959,759 | ||||||
| Nippon Paper Industries Co. Ltd. | 311,100 | 2,029,893 | ||||||
| Nippon Pillar Packing Co. Ltd. | 32,900 | 612,380 | ||||||
| Nippon Seiki Co. Ltd. | 2,100 | 12,414 | ||||||
Nippon Seisen Co. Ltd.(1) | 3,000 | 100,654 | ||||||
| Nippon Shokubai Co. Ltd. | 80,000 | 3,172,294 | ||||||
| Nippon Soda Co. Ltd. | 29,900 | 988,723 | ||||||
| Nippon Steel Trading Corp. | 17,600 | 677,154 | ||||||
| Nippon Suisan Kaisha Ltd. | 996,400 | 4,077,315 | ||||||
| Nippon Television Holdings, Inc. | 77,000 | 654,315 | ||||||
| Nippon Thompson Co. Ltd. | 97,400 | 400,010 | ||||||
Nippon Yakin Kogyo Co. Ltd.(1) | 27,510 | 567,969 | ||||||
| Nipro Corp. | 446,200 | 3,632,626 | ||||||
| Nishi-Nippon Financial Holdings, Inc. | 234,900 | 1,246,278 | ||||||
Nishimatsu Construction Co. Ltd.(1) | 42,900 | 1,245,781 | ||||||
| Nishio Rent All Co. Ltd. | 70,100 | 1,462,488 | ||||||
| Nissan Shatai Co. Ltd. | 18,000 | 99,467 | ||||||
| Nissha Co. Ltd. | 32,100 | 417,425 | ||||||
| Nisshinbo Holdings, Inc. | 381,500 | 2,952,234 | ||||||
| Nissin Electric Co. Ltd. | 24,600 | 262,158 | ||||||
| Nittetsu Mining Co. Ltd. | 10,000 | 442,840 | ||||||
Nitto Kogyo Corp.(1) | 13,600 | 250,892 | ||||||
| Nittoc Construction Co. Ltd. | 100 | 648 | ||||||
| Nojima Corp. | 96,200 | 1,938,157 | ||||||
| NOK Corp. | 237,400 | 2,109,945 | ||||||
| Noritake Co. Ltd./Nagoya Japan | 4,900 | 147,280 | ||||||
| North Pacific Bank Ltd. | 239,300 | 396,098 | ||||||
| NS United Kaiun Kaisha Ltd. | 31,600 | 1,089,749 | ||||||
NTN Corp.(2) | 216,700 | 410,204 | ||||||
| Ogaki Kyoritsu Bank Ltd. | 14,800 | 183,572 | ||||||
| Okamoto Machine Tool Works Ltd. | 2,800 | 80,721 | ||||||
| Okasan Securities Group, Inc. | 15,100 | 36,208 | ||||||
| Oki Electric Industry Co. Ltd. | 184,700 | 996,698 | ||||||
| Okumura Corp. | 84,100 | 1,771,393 | ||||||
Okuwa Co. Ltd.(1) | 26,100 | 170,629 | ||||||
| Olympic Group Corp. | 2,700 | 11,582 | ||||||
| Onoken Co. Ltd. | 28,300 | 302,030 | ||||||
211
| Avantis International Small Cap Value ETF | ||||||||
| Shares | Value | |||||||
| Organo Corp. | 11,700 | $ | 778,235 | |||||
| Orient Corp. | 1,911,400 | 1,671,538 | ||||||
| Oriental Shiraishi Corp. | 50,000 | 90,437 | ||||||
Osaka Soda Co. Ltd.(1) | 48,000 | 1,302,813 | ||||||
OSAKA Titanium Technologies Co. Ltd.(2) | 84,200 | 1,919,716 | ||||||
| Pacific Industrial Co. Ltd. | 204,900 | 1,595,384 | ||||||
| Pasco Corp. | 500 | 4,726 | ||||||
| Pegasus Sewing Machine Manufacturing Co. Ltd. | 5,800 | 36,189 | ||||||
| Penta-Ocean Construction Co. Ltd. | 227,600 | 1,201,119 | ||||||
| Press Kogyo Co. Ltd. | 408,400 | 1,291,752 | ||||||
| Pressance Corp. | 10,100 | 109,211 | ||||||
| Prima Meat Packers Ltd. | 53,500 | 835,061 | ||||||
| PS Mitsubishi Construction Co. Ltd. | 16,200 | 75,645 | ||||||
| Raiznext Corp. | 18,700 | 161,458 | ||||||
| Rasa Industries Ltd. | 6,300 | 107,991 | ||||||
| Raysum Co. Ltd. | 15,400 | 176,525 | ||||||
| Relia, Inc. | 27,600 | 200,250 | ||||||
| Rengo Co. Ltd. | 626,700 | 3,692,212 | ||||||
| Resorttrust, Inc. | 249,800 | 4,008,568 | ||||||
| Restar Holdings Corp. | 9,800 | 144,399 | ||||||
| Ricoh Leasing Co. Ltd. | 51,800 | 1,333,381 | ||||||
| Riken Corp. | 3,800 | 65,688 | ||||||
| Riken Technos Corp. | 14,500 | 54,153 | ||||||
| Roland DG Corp. | 800 | 18,764 | ||||||
| Ryobi Ltd. | 24,000 | 222,885 | ||||||
| Ryoden Corp. | 3,000 | 35,337 | ||||||
| Sakai Chemical Industry Co. Ltd. | 30,000 | 423,408 | ||||||
| Sakura Internet, Inc. | 500 | 2,079 | ||||||
| Sala Corp. | 19,300 | 112,763 | ||||||
| San-In Godo Bank Ltd. | 73,900 | 363,342 | ||||||
Sanei Architecture Planning Co. Ltd.(1) | 1,800 | 21,243 | ||||||
| Sankyu, Inc. | 89,500 | 2,752,776 | ||||||
| Sanwa Holdings Corp. | 399,300 | 3,951,052 | ||||||
Sanyo Chemical Industries Ltd.(1) | 13,700 | 468,093 | ||||||
| Sanyo Denki Co. Ltd. | 3,700 | 143,991 | ||||||
| Sanyo Special Steel Co. Ltd. | 16,700 | 251,017 | ||||||
| Sawai Group Holdings Co. Ltd. | 4,200 | 124,121 | ||||||
| SBS Holdings, Inc. | 19,300 | 399,533 | ||||||
Scroll Corp.(1) | 49,300 | 277,778 | ||||||
| Seed Co. Ltd. | 5,000 | 20,859 | ||||||
| Seikitokyu Kogyo Co. Ltd. | 6,400 | 34,887 | ||||||
| Seiko Holdings Corp. | 92,600 | 1,908,110 | ||||||
| Seino Holdings Co. Ltd. | 129,900 | 1,031,516 | ||||||
| Senko Group Holdings Co. Ltd. | 285,300 | 1,949,185 | ||||||
| Senshu Electric Co. Ltd. | 10,700 | 428,998 | ||||||
| Senshu Ikeda Holdings, Inc. | 384,900 | 611,255 | ||||||
| Shibaura Mechatronics Corp. | 12,200 | 1,006,205 | ||||||
| Shibuya Corp. | 4,700 | 84,520 | ||||||
| Shinagawa Refractories Co. Ltd. | 1,700 | 46,371 | ||||||
| Shindengen Electric Manufacturing Co. Ltd. | 6,200 | 162,353 | ||||||
| Shinmaywa Industries Ltd. | 185,900 | 1,416,753 | ||||||
212
| Avantis International Small Cap Value ETF | ||||||||
| Shares | Value | |||||||
| Shinnihon Corp. | 8,600 | $ | 45,207 | |||||
Shinoken Group Co. Ltd.(1) | 7,800 | 89,312 | ||||||
Shinsei Bank Ltd.(1) | 1,100 | 15,490 | ||||||
| Shinsho Corp. | 700 | 20,947 | ||||||
| Sinfonia Technology Co. Ltd. | 26,900 | 291,513 | ||||||
| SK-Electronics Co. Ltd. | 200 | 2,019 | ||||||
| SKY Perfect JSAT Holdings, Inc. | 641,900 | 2,551,055 | ||||||
| Sodick Co. Ltd. | 92,100 | 533,285 | ||||||
| Soken Chemical & Engineering Co. Ltd. | 1,300 | 18,086 | ||||||
| St-Care Holding Corp. | 12,200 | 76,913 | ||||||
| Star Micronics Co. Ltd. | 115,500 | 1,518,806 | ||||||
| Starts Corp., Inc. | 98,600 | 1,894,173 | ||||||
| Starzen Co. Ltd. | 8,100 | 123,112 | ||||||
| Stella Chemifa Corp. | 8,000 | 162,252 | ||||||
Studio Alice Co. Ltd.(1) | 10,800 | 172,593 | ||||||
| Sumida Corp. | 13,400 | 93,090 | ||||||
| Sumitomo Densetsu Co. Ltd. | 16,900 | 319,147 | ||||||
| Sumitomo Heavy Industries Ltd. | 333,300 | 6,996,310 | ||||||
| Sumitomo Mitsui Construction Co. Ltd. | 111,900 | 372,789 | ||||||
Sumitomo Osaka Cement Co. Ltd.(1) | 96,000 | 2,431,703 | ||||||
| Sumitomo Riko Co. Ltd. | 57,500 | 240,171 | ||||||
| Sumitomo Rubber Industries Ltd. | 452,100 | 3,879,499 | ||||||
| Sumitomo Seika Chemicals Co. Ltd. | 7,600 | 170,139 | ||||||
| Sumitomo Warehouse Co. Ltd. | 50,200 | 787,750 | ||||||
| Sun Frontier Fudousan Co. Ltd. | 91,300 | 787,663 | ||||||
| Sun-Wa Technos Corp. | 1,700 | 17,225 | ||||||
| Suncall Corp. | 18,200 | 95,318 | ||||||
| Suruga Bank Ltd. | 444,600 | 1,198,276 | ||||||
| Suzuken Co. Ltd. | 64,300 | 1,540,971 | ||||||
| SWCC Showa Holdings Co. Ltd. | 53,000 | 694,347 | ||||||
| T RAD Co. Ltd. | 4,600 | 92,102 | ||||||
| T-Gaia Corp. | 4,800 | 57,071 | ||||||
| Tachibana Eletech Co. Ltd. | 8,600 | 100,568 | ||||||
| Taihei Dengyo Kaisha Ltd. | 4,100 | 104,711 | ||||||
| Taiheiyo Cement Corp. | 385,300 | 5,768,494 | ||||||
| Taiho Kogyo Co. Ltd. | 22,800 | 115,114 | ||||||
| Takamatsu Construction Group Co. Ltd. | 5,400 | 74,222 | ||||||
| Takamiya Co. Ltd. | 1,600 | 4,850 | ||||||
| Takaoka Toko Co. Ltd. | 6,600 | 91,227 | ||||||
| Takara Leben Co. Ltd. | 107,600 | 292,685 | ||||||
| Takara Standard Co. Ltd. | 63,900 | 607,183 | ||||||
| Takasago International Corp. | 16,600 | 330,446 | ||||||
| Takasago Thermal Engineering Co. Ltd. | 46,900 | 554,132 | ||||||
Take & Give Needs Co. Ltd.(2) | 11,000 | 125,172 | ||||||
Tama Home Co. Ltd.(1) | 56,600 | 954,253 | ||||||
| Teijin Ltd. | 620,800 | 6,563,394 | ||||||
| Tera Probe, Inc. | 2,600 | 26,471 | ||||||
Tess Holdings Co. Ltd.(1) | 12,800 | 110,378 | ||||||
| Toa Corp. (Tokyo) | 55,100 | 966,818 | ||||||
| TOA ROAD Corp. | 500 | 21,160 | ||||||
| Toagosei Co. Ltd. | 8,800 | 68,564 | ||||||
213
| Avantis International Small Cap Value ETF | ||||||||
| Shares | Value | |||||||
Toda Corp.(1) | 1,800 | $ | 8,880 | |||||
Toho Titanium Co. Ltd.(1) | 2,400 | 38,017 | ||||||
| TOKAI Holdings Corp. | 268,300 | 1,714,742 | ||||||
| Tokai Rika Co. Ltd. | 1,400 | 15,029 | ||||||
| Tokuyama Corp. | 227,500 | 2,996,420 | ||||||
| Tokyo Electron Device Ltd. | 11,300 | 477,276 | ||||||
| Tokyo Kiraboshi Financial Group, Inc. | 57,200 | 922,457 | ||||||
Tokyo Rope Manufacturing Co. Ltd.(1) | 10,400 | 75,182 | ||||||
| Tokyo Seimitsu Co. Ltd. | 118,700 | 3,954,046 | ||||||
| Tokyo Steel Manufacturing Co. Ltd. | 221,200 | 2,343,651 | ||||||
| Tokyo Tatemono Co. Ltd. | 392,700 | 5,886,481 | ||||||
| Tokyu Construction Co. Ltd. | 303,600 | 1,428,083 | ||||||
| Tokyu Fudosan Holdings Corp. | 5,200 | 27,944 | ||||||
| Tomen Devices Corp. | 2,200 | 89,217 | ||||||
| TOMONY Holdings, Inc. | 16,700 | 37,848 | ||||||
| Tomy Co. Ltd. | 113,200 | 1,073,115 | ||||||
| Topre Corp. | 83,900 | 747,377 | ||||||
| Torishima Pump Manufacturing Co. Ltd. | 1,600 | 16,857 | ||||||
Totech Corp.(1) | 2,100 | 53,471 | ||||||
| Towa Bank Ltd. | 11,900 | 45,031 | ||||||
| Towa Corp. | 37,000 | 494,052 | ||||||
Toyo Engineering Corp.(2) | 38,200 | 189,214 | ||||||
| Toyo Ink SC Holdings Co. Ltd. | 24,100 | 330,490 | ||||||
| Toyo Kanetsu KK | 5,500 | 103,196 | ||||||
| Toyo Seikan Group Holdings Ltd. | 437,900 | 5,182,058 | ||||||
| Toyo Tire Corp. | 220,400 | 2,671,195 | ||||||
| Toyobo Co. Ltd. | 268,000 | 2,030,616 | ||||||
| Toyoda Gosei Co. Ltd. | 156,300 | 2,719,241 | ||||||
| Toyota Boshoku Corp. | 157,000 | 2,280,055 | ||||||
| TPR Co. Ltd. | 27,900 | 255,475 | ||||||
| Transcosmos, Inc. | 69,100 | 1,906,012 | ||||||
| TRE Holdings Corp. | 40 | 490 | ||||||
| Tsubakimoto Chain Co. | 72,900 | 1,684,544 | ||||||
| Tsugami Corp. | 110,800 | 991,432 | ||||||
| Tsukuba Bank Ltd. | 38,600 | 54,213 | ||||||
| Tsuzuki Denki Co. Ltd. | 200 | 1,948 | ||||||
| TV Asahi Holdings Corp. | 58,700 | 611,678 | ||||||
| Tv Tokyo Holdings Corp. | 6,600 | 93,044 | ||||||
| UACJ Corp. | 38,900 | 671,639 | ||||||
| Ube Industries Ltd. | 344,900 | 5,081,896 | ||||||
| Uchida Yoko Co. Ltd. | 5,500 | 197,015 | ||||||
| Ulvac, Inc. | 50,300 | 1,950,440 | ||||||
| Unipres Corp. | 71,400 | 491,918 | ||||||
Unitika Ltd.(2) | 43,200 | 80,347 | ||||||
Univance Corp.(1) | 29,200 | 84,927 | ||||||
| Valor Holdings Co. Ltd. | 117,500 | 1,497,896 | ||||||
| Valqua Ltd. | 2,300 | 44,686 | ||||||
| VINX Corp. | 1,500 | 16,166 | ||||||
| VT Holdings Co. Ltd. | 146,600 | 507,627 | ||||||
| Wakachiku Construction Co. Ltd. | 5,100 | 90,870 | ||||||
| Wakita & Co. Ltd. | 66,000 | 530,833 | ||||||
214
| Avantis International Small Cap Value ETF | ||||||||
| Shares | Value | |||||||
| Warabeya Nichiyo Holdings Co. Ltd. | 34,100 | $ | 555,065 | |||||
| YAMABIKO Corp. | 22,100 | 180,413 | ||||||
| Yamada Holdings Co. Ltd. | 13,640 | 47,209 | ||||||
Yamaguchi Financial Group, Inc.(1) | 111,800 | 613,412 | ||||||
| Yamaichi Electronics Co. Ltd. | 58,500 | 865,846 | ||||||
| Yamazen Corp. | 132,000 | 883,924 | ||||||
| Yellow Hat Ltd. | 6,500 | 83,920 | ||||||
| Yodogawa Steel Works Ltd. | 9,500 | 170,846 | ||||||
| Yokogawa Bridge Holdings Corp. | 70,800 | 989,969 | ||||||
| Yokohama Rubber Co. Ltd. | 345,200 | 5,645,644 | ||||||
| Yokorei Co. Ltd. | 79,500 | 527,198 | ||||||
| Yorozu Corp. | 4,500 | 28,853 | ||||||
| Yotai Refractories Co. Ltd. | 2,400 | 24,054 | ||||||
| Yuasa Trading Co. Ltd. | 49,800 | 1,254,657 | ||||||
| Yurtec Corp. | 7,400 | 39,816 | ||||||
| Zeon Corp. | 219,500 | 2,105,943 | ||||||
| 450,966,124 | ||||||||
| Netherlands — 1.9% | ||||||||
AerCap Holdings NV(2) | 159,883 | 7,042,846 | ||||||
| Arcadis NV | 806 | 25,695 | ||||||
| ASR Nederland NV | 218,541 | 8,919,584 | ||||||
| Boskalis Westminster | 89,583 | 2,971,375 | ||||||
| Flow Traders | 42,345 | 847,353 | ||||||
ForFarmers NV(1) | 33,946 | 95,669 | ||||||
| Heijmans NV, CVA | 108,545 | 1,126,848 | ||||||
Just Eat Takeaway.com NV(2) | 18,788 | 312,547 | ||||||
Koninklijke BAM Groep NV(2) | 802,873 | 2,140,065 | ||||||
| OCI NV | 150,269 | 5,641,524 | ||||||
PostNL NV(1) | 813,567 | 1,733,601 | ||||||
| SIF Holding NV | 285 | 2,911 | ||||||
Sligro Food Group NV(2) | 1,259 | 20,855 | ||||||
| TKH Group NV | 39,638 | 1,382,876 | ||||||
| 32,263,749 | ||||||||
| New Zealand — 0.8% | ||||||||
Air New Zealand Ltd.(2) | 13,671,732 | 5,649,552 | ||||||
Channel Infrastructure NZ Ltd.(2) | 201,543 | 166,462 | ||||||
| Heartland Group Holdings Ltd. | 6,172 | 6,815 | ||||||
| KMD Brands Ltd. | 813,699 | 535,762 | ||||||
| Oceania Healthcare Ltd. | 3,300,723 | 1,994,512 | ||||||
| SKYCITY Entertainment Group Ltd. | 2,581,167 | 4,490,213 | ||||||
| Warehouse Group Ltd. | 16,193 | 32,560 | ||||||
| 12,875,876 | ||||||||
| Norway — 2.1% | ||||||||
2020 Bulkers Ltd.(1)(2) | 30,242 | 269,258 | ||||||
| ABG Sundal Collier Holding ASA | 456,965 | 268,092 | ||||||
| Belships ASA | 96,422 | 144,369 | ||||||
| Bonheur ASA | 6,255 | 234,148 | ||||||
BW Energy Ltd.(2) | 142,484 | 355,315 | ||||||
| BW LPG Ltd. | 356,424 | 2,316,861 | ||||||
| BW Offshore Ltd. | 579,931 | 1,571,357 | ||||||
| DNO ASA | 2,010,345 | 2,856,332 | ||||||
215
| Avantis International Small Cap Value ETF | ||||||||
| Shares | Value | |||||||
| Golden Ocean Group Ltd. | 316,268 | $ | 2,980,838 | |||||
| Hafnia Ltd. | 54,716 | 244,316 | ||||||
| Kid ASA | 52,924 | 475,929 | ||||||
Komplett Bank ASA(2) | 51,670 | 30,734 | ||||||
Kongsberg Automotive ASA(1)(2) | 1,245,534 | 317,182 | ||||||
| MPC Container Ships ASA | 784,180 | 1,616,700 | ||||||
Norwegian Energy Co. ASA(2) | 13,725 | 492,558 | ||||||
Odfjell Drilling Ltd.(2) | 364,708 | 990,642 | ||||||
Odfjell Technology Ltd.(2) | 45 | 113 | ||||||
| OKEA ASA | 12,489 | 64,862 | ||||||
Panoro Energy ASA(2) | 13,512 | 40,087 | ||||||
Petronor E&P ASA(2) | 8,608 | 746 | ||||||
PGS ASA(1)(2) | 4,034,085 | 3,283,366 | ||||||
| Protector Forsikring ASA | 38,929 | 466,031 | ||||||
| Rana Gruber ASA | 6,421 | 27,904 | ||||||
| Scatec ASA | 62,591 | 634,897 | ||||||
| SpareBank 1 Nord Norge | 347,847 | 3,135,315 | ||||||
| SpareBank 1 SMN | 172,072 | 2,095,074 | ||||||
| Sparebanken Vest | 58,146 | 517,345 | ||||||
| Stolt-Nielsen Ltd. | 80,383 | 1,717,742 | ||||||
| Subsea 7 SA | 690,317 | 6,196,906 | ||||||
| Wallenius Wilhelmsen ASA | 363,960 | 2,049,072 | ||||||
| 35,394,091 | ||||||||
| Portugal — 0.3% | ||||||||
| Altri SGPS SA | 523,406 | 2,953,276 | ||||||
| Corticeira Amorim SGPS SA | 645 | 6,514 | ||||||
CTT-Correios de Portugal SA(1) | 255,358 | 831,768 | ||||||
Greenvolt-Energias Renovaveis SA(2) | 2,325 | 22,460 | ||||||
Mota-Engil SGPS SA(1) | 250,341 | 301,638 | ||||||
| NOS SGPS SA | 62,748 | 231,291 | ||||||
| Sonae SGPS SA | 12,843 | 12,909 | ||||||
| 4,359,856 | ||||||||
| Singapore — 2.1% | ||||||||
Aztech Global Ltd.(1) | 10,000 | 6,324 | ||||||
Banyan Tree Holdings Ltd.(2) | 67,500 | 14,213 | ||||||
| Boustead Singapore Ltd. | 18,200 | 11,784 | ||||||
| BRC Asia Ltd. | 7,900 | 9,604 | ||||||
| Bumitama Agri Ltd. | 1,717,200 | 767,165 | ||||||
| China Sunsine Chemical Holdings Ltd. | 1,435,600 | 493,537 | ||||||
| Chip Eng Seng Corp. Ltd. | 274,900 | 130,693 | ||||||
Dyna-Mac Holdings Ltd.(1)(2) | 717,900 | 101,301 | ||||||
| First Resources Ltd. | 1,560,400 | 1,681,958 | ||||||
| Food Empire Holdings Ltd. | 53,700 | 20,151 | ||||||
Geo Energy Resources Ltd.(1) | 4,567,500 | 1,254,377 | ||||||
| Golden Agri-Resources Ltd. | 41,800,800 | 8,379,752 | ||||||
Hong Fok Corp. Ltd.(1) | 104,800 | 79,334 | ||||||
Hong Leong Asia Ltd.(1) | 179,100 | 96,048 | ||||||
| Hour Glass Ltd. | 273,800 | 453,917 | ||||||
| Hutchison Port Holdings Trust, U Shares | 23,259,900 | 4,991,040 | ||||||
| Indofood Agri Resources Ltd. | 191,900 | 43,219 | ||||||
| InnoTek Ltd. | 91,000 | 31,244 | ||||||
216
| Avantis International Small Cap Value ETF | ||||||||
| Shares | Value | |||||||
ISDN Holdings Ltd.(1) | 2,016,400 | $ | 682,973 | |||||
Japfa Ltd.(1) | 2,065,800 | 886,280 | ||||||
Jiutian Chemical Group Ltd.(1) | 9,280,000 | 615,411 | ||||||
| Medtecs International Corp. Ltd. | 1,417,400 | 158,659 | ||||||
| Mewah International, Inc. | 120,500 | 29,616 | ||||||
| QAF Ltd. | 46,100 | 28,206 | ||||||
Riverstone Holdings Ltd.(1) | 3,181,800 | 1,640,319 | ||||||
| Samudera Shipping Line Ltd. | 648,700 | 462,482 | ||||||
| Singapore Post Ltd. | 2,063,100 | 855,205 | ||||||
Tuan Sing Holdings Ltd.(1) | 1,652,390 | 436,474 | ||||||
| UG Healthcare Corp. Ltd. | 356,100 | 53,427 | ||||||
Yangzijiang Financial Holding Ltd.(2) | 2,550,300 | 682,262 | ||||||
| Yangzijiang Shipbuilding Holdings Ltd. | 10,386,300 | 7,198,079 | ||||||
| Yanlord Land Group Ltd. | 3,645,600 | 2,683,005 | ||||||
| 34,978,059 | ||||||||
| Spain — 1.7% | ||||||||
| Acerinox SA | 506,176 | 4,579,790 | ||||||
| Almirall SA | 11,427 | 103,084 | ||||||
Amper SA(2) | 1,097,654 | 194,695 | ||||||
Atresmedia Corp. de Medios de Comunicacion SA(1) | 169,927 | 465,361 | ||||||
| Banco de Sabadell SA | 10,809,307 | 7,433,926 | ||||||
| Bankinter SA | 973,935 | 4,991,211 | ||||||
| Construcciones y Auxiliar de Ferrocarriles SA | 30,039 | 869,219 | ||||||
Deoleo SA(1)(2) | 356,161 | 102,097 | ||||||
| Ence Energia y Celulosa SA | 84,262 | 298,264 | ||||||
| Ercros SA | 82,553 | 253,555 | ||||||
| Fomento de Construcciones y Contratas SA | 15 | 135 | ||||||
| Gestamp Automocion SA | 566,903 | 2,075,625 | ||||||
| Laboratorios Farmaceuticos Rovi SA | 37,304 | 1,831,256 | ||||||
| Linea Directa Aseguradora SA Cia de Seguros y Reaseguros | 64,629 | 69,837 | ||||||
Mediaset Espana Comunicacion SA(2) | 77,153 | 214,610 | ||||||
Melia Hotels International SA(2) | 197,205 | 1,195,967 | ||||||
| Miquel y Costas & Miquel SA | 467 | 6,032 | ||||||
| Neinor Homes SA | 51,163 | 524,857 | ||||||
| Pharma Mar SA | 6,627 | 385,993 | ||||||
| Prosegur Cia de Seguridad SA | 396,671 | 730,431 | ||||||
Sacyr SA(1) | 708,033 | 1,583,795 | ||||||
| Unicaja Banco SA | 1 | 1 | ||||||
| 27,909,741 | ||||||||
| Sweden — 5.1% | ||||||||
Arise AB(2) | 16,414 | 117,239 | ||||||
| Atrium Ljungberg AB, B Shares | 23,263 | 337,179 | ||||||
Avanza Bank Holding AB(1) | 97,198 | 1,557,988 | ||||||
| Bahnhof AB, B Shares | 3,602 | 12,164 | ||||||
| BE Group AB | 13,128 | 125,361 | ||||||
Better Collective A/S(2) | 14,769 | 202,375 | ||||||
| Bilia AB, A Shares | 344,589 | 4,287,024 | ||||||
| BillerudKorsnas AB | 259,747 | 3,377,380 | ||||||
| Biotage AB | 22,939 | 385,887 | ||||||
| Bonava AB, B Shares | 219,962 | 787,328 | ||||||
Boozt AB(1)(2) | 300 | 1,759 | ||||||
217
| Avantis International Small Cap Value ETF | ||||||||
| Shares | Value | |||||||
| Bure Equity AB | 152,161 | $ | 3,005,503 | |||||
| Byggmax Group AB | 171,674 | 705,343 | ||||||
Camurus AB(2) | 3,636 | 75,667 | ||||||
Catena Media PLC(1)(2) | 353,519 | 1,062,377 | ||||||
| Cibus Nordic Real Estate AB | 140,335 | 2,234,781 | ||||||
| Clas Ohlson AB, B Shares | 236,552 | 2,133,756 | ||||||
| Cloetta AB, B Shares | 527,436 | 922,059 | ||||||
Collector Bank AB(2) | 222,047 | 708,217 | ||||||
| Corem Property Group AB, B Shares | 423,419 | 493,793 | ||||||
| Dios Fastigheter AB | 316,355 | 2,341,628 | ||||||
| Electrolux Professional AB, B Shares | 403,469 | 2,004,380 | ||||||
| Elekta AB, B Shares | 3,828 | 21,944 | ||||||
G5 Entertainment AB(1) | 23,843 | 393,387 | ||||||
| GARO AB | 14,419 | 156,736 | ||||||
Hoist Finance AB(1)(2) | 190,033 | 575,340 | ||||||
| Hufvudstaden AB, A Shares | 269,839 | 3,214,641 | ||||||
| JM AB | 137,094 | 2,356,988 | ||||||
| Kopparbergs Bryggeri AB, B Shares | 12,361 | 174,861 | ||||||
| Loomis AB | 309,629 | 8,364,172 | ||||||
Maha Energy AB(1)(2) | 107,389 | 123,708 | ||||||
| MEKO AB | 126,997 | 1,159,885 | ||||||
| MIPS AB | 22,650 | 1,020,651 | ||||||
Modern Times Group MTG AB, B Shares(2) | 163,207 | 1,429,143 | ||||||
| Mycronic AB | 106,156 | 1,258,901 | ||||||
| NCC AB, B Shares | 251,936 | 2,371,296 | ||||||
Net Insight AB, B Shares(2) | 206,751 | 101,023 | ||||||
| New Wave Group AB, B Shares | 151,712 | 2,440,210 | ||||||
| Nobia AB | 229,259 | 590,456 | ||||||
| NP3 Fastigheter AB | 231 | 5,054 | ||||||
| Nyfosa AB | 463,483 | 3,893,550 | ||||||
Pandox AB(2) | 317,403 | 3,923,998 | ||||||
Paradox Interactive AB(1) | 150,402 | 2,364,413 | ||||||
| Peab AB, Class B | 634,632 | 3,907,498 | ||||||
RaySearch Laboratories AB(2) | 37,992 | 177,843 | ||||||
| Resurs Holding AB | 614,496 | 1,309,293 | ||||||
| Saab AB, B Shares | 186,899 | 6,243,752 | ||||||
Scandi Standard AB(2) | 306,021 | 1,349,744 | ||||||
| SkiStar AB | 83,042 | 1,068,567 | ||||||
Storytel AB(2) | 4,814 | 20,880 | ||||||
| Tethys Oil AB | 68,999 | 412,914 | ||||||
| Troax Group AB | 4 | 65 | ||||||
Truecaller AB, B Shares(2) | 193,736 | 1,018,511 | ||||||
| Wihlborgs Fastigheter AB | 904,779 | 6,481,596 | ||||||
| 84,810,208 | ||||||||
| Switzerland — 4.3% | ||||||||
ALSO Holding AG(2) | 13,576 | 2,256,914 | ||||||
| Arbonia AG | 62,992 | 825,675 | ||||||
Autoneum Holding AG(1) | 22,650 | 2,539,228 | ||||||
| Bell Food Group AG | 4,474 | 1,172,165 | ||||||
| Bellevue Group AG | 547 | 17,816 | ||||||
| Bobst Group SA | 43,897 | 3,536,899 | ||||||
218
| Avantis International Small Cap Value ETF | ||||||||
| Shares | Value | |||||||
| Bucher Industries AG | 2,032 | $ | 723,986 | |||||
| Burckhardt Compression Holding AG | 13,354 | 5,592,238 | ||||||
| Cembra Money Bank AG | 148,977 | 10,047,429 | ||||||
Coltene Holding AG(2) | 5,166 | 441,760 | ||||||
| dormakaba Holding AG | 38 | 15,936 | ||||||
EFG International AG(2) | 490,560 | 4,122,435 | ||||||
| Forbo Holding AG | 1,075 | 1,341,429 | ||||||
GAM Holding AG(2) | 225,677 | 224,066 | ||||||
Gurit Holding AG, Bearer Shares(1) | 8,294 | 868,265 | ||||||
| Huber + Suhner AG | 34,655 | 2,886,389 | ||||||
Implenia AG(2) | 20,407 | 602,695 | ||||||
| Leonteq AG | 63,856 | 3,626,011 | ||||||
| Liechtensteinische Landesbank AG | 5,832 | 332,983 | ||||||
| Mobimo Holding AG | 7,077 | 1,737,339 | ||||||
| OC Oerlikon Corp. AG | 705,180 | 5,150,976 | ||||||
| Orior AG | 17,102 | 1,336,571 | ||||||
| Rieter Holding AG | 7,404 | 755,944 | ||||||
Schweizerische Nationalbank(1) | 3 | 16,961 | ||||||
| St Galler Kantonalbank AG | 3,040 | 1,429,738 | ||||||
| Sulzer AG | 52,708 | 3,145,553 | ||||||
Swiss Steel Holding AG(2) | 2,052,704 | 610,729 | ||||||
| Swissquote Group Holding SA | 56,290 | 6,245,092 | ||||||
u-blox Holding AG(2) | 18,949 | 2,626,292 | ||||||
V-ZUG Holding AG(2) | 762 | 59,966 | ||||||
| Valiant Holding AG | 42,541 | 4,030,711 | ||||||
| Valora Holding AG | 7,704 | 2,040,902 | ||||||
| Zehnder Group AG | 35,507 | 2,097,619 | ||||||
| 72,458,712 | ||||||||
| United Kingdom — 14.3% | ||||||||
| AG Barr PLC | 11,470 | 67,158 | ||||||
| Anglo Asian Mining PLC | 160,594 | 149,158 | ||||||
| Anglo Pacific Group PLC | 31,308 | 59,940 | ||||||
| Atalaya Mining PLC | 166,337 | 429,683 | ||||||
| Bank of Georgia Group PLC | 90,419 | 2,099,872 | ||||||
| Berkeley Group Holdings PLC | 177,308 | 7,505,992 | ||||||
| Biffa PLC | 79,689 | 371,971 | ||||||
| Brewin Dolphin Holdings PLC | 400,637 | 2,382,260 | ||||||
| Britvic PLC | 95,651 | 869,294 | ||||||
Capricorn Energy PLC(1)(2) | 330,167 | 889,920 | ||||||
| Centamin PLC | 3,004,370 | 3,150,731 | ||||||
| Central Asia Metals PLC | 434,307 | 1,156,355 | ||||||
| Close Brothers Group PLC | 372,177 | 4,403,033 | ||||||
| CMC Markets PLC | 363,520 | 969,537 | ||||||
| Coats Group PLC | 3,493,432 | 2,434,815 | ||||||
| Computacenter PLC | 169,154 | 4,845,716 | ||||||
| ContourGlobal PLC | 192,848 | 576,461 | ||||||
| Crest Nicholson Holdings PLC | 623,894 | 1,695,567 | ||||||
| Devro PLC | 322,494 | 697,502 | ||||||
| Direct Line Insurance Group PLC | 2,793,553 | 6,653,561 | ||||||
| Drax Group PLC | 1,040,318 | 7,673,972 | ||||||
| Dunelm Group PLC | 136,679 | 1,090,845 | ||||||
219
| Avantis International Small Cap Value ETF | ||||||||
| Shares | Value | |||||||
EnQuest PLC(2) | 4,704,729 | $ | 1,632,475 | |||||
| Essentra PLC | 12,262 | 28,225 | ||||||
| Ferrexpo PLC | 697,692 | 1,200,108 | ||||||
Firstgroup PLC(1) | 1,856,815 | 2,473,023 | ||||||
| Forterra PLC | 375,168 | 1,151,171 | ||||||
| Foxtons Group PLC | 91,059 | 39,334 | ||||||
Frasers Group PLC(2) | 483,368 | 4,500,698 | ||||||
| Genel Energy PLC | 77,741 | 128,151 | ||||||
Georgia Capital PLC(2) | 7,564 | 60,015 | ||||||
Go-Ahead Group PLC(2) | 86,720 | 1,555,655 | ||||||
| Grafton Group PLC | 315,635 | 2,649,442 | ||||||
| Greggs PLC | 228,479 | 4,883,869 | ||||||
| Gulf Keystone Petroleum Ltd. | 417,308 | 1,168,368 | ||||||
Gym Group PLC(2) | 37,455 | 62,781 | ||||||
| Halfords Group PLC | 381,593 | 576,869 | ||||||
| Hargreaves Lansdown PLC | 469,037 | 4,440,456 | ||||||
Helios Towers PLC(2) | 29,532 | 42,321 | ||||||
| Hikma Pharmaceuticals PLC | 335,193 | 5,108,570 | ||||||
| Hill & Smith Holdings PLC | 44,644 | 539,341 | ||||||
| Hochschild Mining PLC | 909,421 | 684,708 | ||||||
| Howden Joinery Group PLC | 1,313,322 | 8,683,507 | ||||||
| Hunting PLC | 128,039 | 428,249 | ||||||
Hurricane Energy PLC(2) | 1,022,797 | 87,233 | ||||||
| Ibstock PLC | 793,994 | 1,745,148 | ||||||
| IG Group Holdings PLC | 921,227 | 8,742,423 | ||||||
| Inchcape PLC | 827,722 | 7,268,359 | ||||||
Indivior PLC(2) | 1,024,496 | 3,432,783 | ||||||
| IntegraFin Holdings PLC | 49,423 | 154,066 | ||||||
| Intermediate Capital Group PLC | 475,600 | 7,518,172 | ||||||
| International Personal Finance PLC | 50,695 | 58,921 | ||||||
| Investec PLC | 1,067,118 | 5,129,358 | ||||||
| IP Group PLC | 2,156,004 | 1,749,828 | ||||||
| J Sainsbury PLC | 270,408 | 638,260 | ||||||
| Jadestone Energy PLC | 36,122 | 36,504 | ||||||
| Johnson Matthey PLC | 472,209 | 11,017,018 | ||||||
Jubilee Metals Group PLC(2) | 779,435 | 106,854 | ||||||
| Just Group PLC | 814,485 | 680,128 | ||||||
| Keller Group PLC | 155,110 | 1,262,504 | ||||||
| Lookers PLC | 276,034 | 261,416 | ||||||
| Luceco PLC | 2,439 | 2,219 | ||||||
| Luxfer Holdings PLC | 414 | 6,810 | ||||||
| M&G PLC | 2,281,037 | 5,176,664 | ||||||
| Man Group PLC | 2,513,505 | 7,102,831 | ||||||
Marks & Spencer Group PLC(2) | 5,261,691 | 7,435,312 | ||||||
| Mediclinic International PLC | 453,101 | 2,632,934 | ||||||
Mitchells & Butlers PLC(2) | 107,415 | 192,107 | ||||||
| Mitie Group PLC | 1,149,194 | 965,139 | ||||||
Molten Ventures PLC(2) | 235,011 | 1,014,704 | ||||||
| Morgan Sindall Group PLC | 26,848 | 536,013 | ||||||
| MP Evans Group PLC | 2,787 | 26,213 | ||||||
N Brown Group PLC(2) | 181,281 | 52,734 | ||||||
220
| Avantis International Small Cap Value ETF | ||||||||
| Shares | Value | |||||||
| Ninety One PLC | 880,883 | $ | 2,018,058 | |||||
| OSB Group PLC | 621,292 | 3,961,179 | ||||||
| Pagegroup PLC | 579,420 | 2,910,292 | ||||||
| Pan African Resources PLC | 3,481,329 | 739,469 | ||||||
| Paragon Banking Group PLC | 412,093 | 2,561,487 | ||||||
| PayPoint PLC | 19,404 | 144,509 | ||||||
Petra Diamonds Ltd.(2) | 25,308 | 28,896 | ||||||
| Plus500 Ltd. | 285,064 | 5,617,485 | ||||||
| Provident Financial PLC | 707,991 | 1,416,725 | ||||||
| PZ Cussons PLC | 493,679 | 1,113,207 | ||||||
| Rathbones Group PLC | 69,063 | 1,443,713 | ||||||
| Reach PLC | 527,385 | 453,362 | ||||||
| Redde Northgate PLC | 597,736 | 2,372,554 | ||||||
| Redrow PLC | 203,023 | 1,192,649 | ||||||
| Rhi Magnesita NV | 22,539 | 472,313 | ||||||
| Royal Mail PLC | 1,582,009 | 5,047,621 | ||||||
| Savills PLC | 258,980 | 2,844,234 | ||||||
Senior PLC(2) | 407,863 | 614,976 | ||||||
| Serica Energy PLC | 435,258 | 1,884,222 | ||||||
| Speedy Hire PLC | 1,235,865 | 586,643 | ||||||
Spire Healthcare Group PLC(2) | 445,008 | 1,198,922 | ||||||
| St. James's Place PLC | 428,859 | 5,489,371 | ||||||
| SThree PLC | 291,685 | 1,190,699 | ||||||
Superdry PLC(2) | 157,134 | 228,419 | ||||||
| Synthomer PLC | 250,027 | 570,855 | ||||||
| Tate & Lyle PLC | 1,139,021 | 10,086,290 | ||||||
| TBC Bank Group PLC | 73,777 | 1,518,976 | ||||||
| TI Fluid Systems PLC | 250,921 | 425,275 | ||||||
Tremor International Ltd.(1)(2) | 72,792 | 278,007 | ||||||
| Vertu Motors PLC | 555,720 | 313,050 | ||||||
| Virgin Money UK PLC | 2,792,805 | 4,829,012 | ||||||
| Vistry Group PLC | 420,995 | 3,770,332 | ||||||
| Wickes Group PLC | 499,885 | 693,017 | ||||||
Yellow Cake PLC(2) | 512,433 | 2,498,377 | ||||||
| 237,757,530 | ||||||||
| United States — 0.1% | ||||||||
| ADTRAN Holdings, Inc. | 79,452 | 1,836,442 | ||||||
Cazoo Group Ltd.(2) | 376 | 254 | ||||||
| 1,836,696 | ||||||||
TOTAL COMMON STOCKS (Cost $1,887,598,596) | 1,661,876,001 | |||||||
WARRANTS† | ||||||||
Australia† | ||||||||
Magellan Financial Group Ltd.(1)(2) | 7,122 | 3,387 | ||||||
Italy† | ||||||||
Webuild SpA(1)(2) | 35,053 | 49,493 | ||||||
TOTAL WARRANTS (Cost $—) | 52,880 | |||||||
RIGHTS† | ||||||||
Germany† | ||||||||
7C Solarparken AG(2) (Cost $—) | 26,014 | 475 | ||||||
221
| Avantis International Small Cap Value ETF | ||||||||
| Shares | Value | |||||||
| SHORT-TERM INVESTMENTS — 3.6% | ||||||||
| Money Market Funds — 3.6% | ||||||||
| State Street Institutional U.S. Government Money Market Fund, Premier Class | 16,863,247 | $ | 16,863,247 | |||||
State Street Navigator Securities Lending Government Money Market Portfolio(3) | 42,560,887 | 42,560,887 | ||||||
TOTAL SHORT-TERM INVESTMENTS (Cost $59,424,134) | 59,424,134 | |||||||
TOTAL INVESTMENT SECURITIES — 103.2% (Cost $1,947,022,730) | 1,721,353,490 | |||||||
| OTHER ASSETS AND LIABILITIES — (3.2)% | (52,845,043) | |||||||
| TOTAL NET ASSETS — 100.0% | $ | 1,668,508,447 | ||||||
| MARKET SECTOR DIVERSIFICATION | |||||
| (as a % of net assets) | |||||
| Industrials | 20.4% | ||||
| Financials | 19.2% | ||||
| Materials | 18.4% | ||||
| Consumer Discretionary | 12.8% | ||||
| Energy | 10.4% | ||||
| Consumer Staples | 4.8% | ||||
| Information Technology | 4.0% | ||||
| Real Estate | 3.1% | ||||
| Communication Services | 2.4% | ||||
| Health Care | 2.1% | ||||
| Utilities | 2.0% | ||||
| Short-Term Investments | 3.6% | ||||
| Other Assets and Liabilities | (3.2)% | ||||
| NOTES TO SCHEDULE OF INVESTMENTS | ||||||||
| CVA | - | Certificaten Van Aandelen | ||||||
†Category is less than 0.05% of total net assets.
(1)Security, or a portion thereof, is on loan. At the period end, the aggregate value of securities on loan was $86,011,273. The amount of securities on loan indicated may not correspond with the securities on loan identified because securities with pending sales are in the process of recall from the brokers.
(2)Non-income producing.
(3)Investment of cash collateral from securities on loan. At the period end, the aggregate value of the collateral held by the fund was $92,245,596, which includes securities collateral of $49,684,709.
See Notes to Financial Statements.
222
| Statements of Assets and Liabilities | ||
| AUGUST 31, 2022 | ||||||||
| Avantis Emerging Markets Equity ETF | Avantis Emerging Markets Value ETF | |||||||
| Assets | ||||||||
| Investment securities, at value (cost of $1,444,050,932 and $148,901,335, respectively) — including $71,542,673 and $3,952,104, respectively of securities on loan | $ | 1,317,924,091 | $ | 129,199,174 | ||||
| Investment made with cash collateral received for securities on loan, at value (cost of $22,098,803 and $1,884,533, respectively) | 22,098,803 | 1,884,533 | ||||||
| Total investment securities, at value (cost of $1,466,149,735 and $150,785,868, respectively) | 1,340,022,894 | 131,083,707 | ||||||
| Foreign currency holdings, at value (cost of $442,198 and $1,014,832, respectively) | 441,657 | 1,014,858 | ||||||
| Receivable for investments sold | 42,169 | 13,005 | ||||||
| Dividends and interest receivable | 7,936,286 | 653,545 | ||||||
| Securities lending receivable | 148,583 | 11,575 | ||||||
| 1,348,591,589 | 132,776,690 | |||||||
| Liabilities | ||||||||
| Payable for collateral received for securities on loan | 22,098,803 | 1,884,533 | ||||||
| Payable for investments purchased | 95,452 | 1,299,297 | ||||||
| Accrued management fees | 365,619 | 37,090 | ||||||
| Accrued foreign taxes | 3,635,854 | — | ||||||
| 26,195,728 | 3,220,920 | |||||||
| Net Assets | $ | 1,322,395,861 | $ | 129,555,770 | ||||
| Shares outstanding (unlimited number of shares authorized) | 25,600,000 | 3,080,000 | ||||||
| Net Asset Value Per Share | $ | 51.66 | $ | 42.06 | ||||
| Net Assets Consist of: | ||||||||
| Capital paid in | $ | 1,468,261,858 | $ | 148,327,804 | ||||
| Distributable earnings | (145,865,997) | (18,772,034) | ||||||
| $ | 1,322,395,861 | $ | 129,555,770 | |||||
See Notes to Financial Statements.
223
| AUGUST 31, 2022 | ||||||||
| Avantis International Equity ETF | Avantis International Large Cap Value ETF | |||||||
| Assets | ||||||||
| Investment securities, at value (cost of $1,627,975,845 and $69,367,279, respectively) — including $98,429,673 and $1,331,726, respectively of securities on loan | $ | 1,498,884,454 | $ | 64,050,571 | ||||
| Investment made with cash collateral received for securities on loan, at value (cost of $51,033,501 and $1,069,229, respectively) | 51,033,501 | 1,069,229 | ||||||
| Total investment securities, at value (cost of $1,679,009,346 and $70,436,508, respectively) | 1,549,917,955 | 65,119,800 | ||||||
| Cash | 3,805 | — | ||||||
| Foreign currency holdings, at value (cost of $218,186 and $7,682, respectively) | 216,490 | 7,675 | ||||||
| Receivable for investments sold | 10,189 | — | ||||||
| Dividends and interest receivable | 5,717,960 | 255,787 | ||||||
| Securities lending receivable | 75,578 | 1,295 | ||||||
| 1,555,941,977 | 65,384,557 | |||||||
| Liabilities | ||||||||
| Payable for collateral received for securities on loan | 51,033,501 | 1,069,229 | ||||||
| Payable for investments purchased | 6,185 | 3,911,987 | ||||||
| Accrued management fees | 300,975 | 11,527 | ||||||
| 51,340,661 | 4,992,743 | |||||||
| Net Assets | $ | 1,504,601,316 | $ | 60,391,814 | ||||
| Shares outstanding (unlimited number of shares authorized) | 29,750,000 | 1,440,000 | ||||||
| Net Asset Value Per Share | $ | 50.57 | $ | 41.94 | ||||
| Net Assets Consist of: | ||||||||
| Capital paid in | $ | 1,647,099,422 | $ | 67,122,856 | ||||
| Distributable earnings | (142,498,106) | (6,731,042) | ||||||
| $ | 1,504,601,316 | $ | 60,391,814 | |||||
See Notes to Financial Statements.
224
| AUGUST 31, 2022 | |||||
| Avantis International Small Cap Value ETF | |||||
| Assets | |||||
| Investment securities, at value (cost of $1,904,461,843) — including $86,011,273 of securities on loan | $ | 1,678,792,603 | |||
| Investment made with cash collateral received for securities on loan, at value (cost of $42,560,887) | 42,560,887 | ||||
| Total investment securities, at value (cost of $1,947,022,730) | 1,721,353,490 | ||||
| Foreign currency holdings, at value (cost of $194,574) | 199,841 | ||||
| Receivable for investments sold | 16,426 | ||||
| Receivable for capital shares sold | 17,619,876 | ||||
| Dividends and interest receivable | 5,327,101 | ||||
| Securities lending receivable | 118,189 | ||||
| 1,744,634,923 | |||||
| Liabilities | |||||
| Payable for collateral received for securities on loan | 42,560,887 | ||||
| Payable for investments purchased | 33,050,934 | ||||
| Accrued management fees | 514,655 | ||||
| 76,126,476 | |||||
| Net Assets | $ | 1,668,508,447 | |||
| Shares outstanding (unlimited number of shares authorized) | 31,410,000 | ||||
| Net Asset Value Per Share | $ | 53.12 | |||
| Net Assets Consist of: | |||||
| Capital paid in | $ | 1,984,444,031 | |||
| Distributable earnings | (315,935,584) | ||||
| $ | 1,668,508,447 | ||||
See Notes to Financial Statements.
225
| Statements of Operations | ||
| YEAR ENDED AUGUST 31, 2022 (EXCEPT AS NOTED) | ||||||||
| Avantis Emerging Markets Equity ETF | Avantis Emerging Markets Value ETF(1) | |||||||
| Investment Income (Loss) | ||||||||
| Income: | ||||||||
| Dividends (net of foreign taxes withheld of $5,672,517 and $581,477, respectively) | $ | 43,916,068 | $ | 4,053,556 | ||||
| Securities lending, net | 656,643 | 39,408 | ||||||
| Interest | 4,289 | 535 | ||||||
| 44,577,000 | 4,093,499 | |||||||
| Expenses: | ||||||||
| Management fees | 3,562,047 | 262,082 | ||||||
| Other expenses | 8,690 | 1,725 | ||||||
| 3,570,737 | 263,807 | |||||||
| Net investment income (loss) | 41,006,263 | 3,829,692 | ||||||
| Realized and Unrealized Gain (Loss) | ||||||||
| Net realized gain (loss) on: | ||||||||
| Investment transactions (net of foreign tax expenses paid (refunded) of $13,775 and $—, respectively) | (25,746,565) | (1,254,150) | ||||||
| Futures contract transactions | — | 559 | ||||||
| Foreign currency translation transactions | (507,796) | (95,213) | ||||||
| (26,254,361) | (1,348,804) | |||||||
| Change in net unrealized appreciation (depreciation) on: | ||||||||
| Investments (includes (increase) decrease in accrued foreign taxes of $(285,973) and $—, respectively) | (259,013,096) | (19,702,161) | ||||||
| Translation of assets and liabilities in foreign currencies | (86,131) | (12,416) | ||||||
| (259,099,227) | (19,714,577) | |||||||
| Net realized and unrealized gain (loss) | (285,353,588) | (21,063,381) | ||||||
| Net Increase (Decrease) in Net Assets Resulting from Operations | $ | (244,347,325) | $ | (17,233,689) | ||||
(1)September 28, 2021 (fund inception) through August 31, 2022.
See Notes to Financial Statements.
226
| YEAR ENDED AUGUST 31, 2022 (EXCEPT AS NOTED) | ||||||||
| Avantis International Equity ETF | Avantis International Large Cap Value ETF(1) | |||||||
| Investment Income (Loss) | ||||||||
| Income: | ||||||||
| Dividends (net of foreign taxes withheld of $4,302,953 and $115,881, respectively) | $ | 43,741,005 | $ | 1,270,624 | ||||
| Securities lending, net | 634,253 | 4,386 | ||||||
| Interest | 7,931 | 1,521 | ||||||
| 44,383,189 | 1,276,531 | |||||||
| Expenses: | ||||||||
| Management fees | 2,893,435 | 65,598 | ||||||
| Other expenses | 6,433 | 460 | ||||||
| 2,899,868 | 66,058 | |||||||
| Net investment income (loss) | 41,483,321 | 1,210,473 | ||||||
| Realized and Unrealized Gain (Loss) | ||||||||
| Net realized gain (loss) on: | ||||||||
| Investment transactions | (11,901,365) | (1,693,451) | ||||||
| Foreign currency translation transactions | (505,205) | (20,577) | ||||||
| (12,406,570) | (1,714,028) | |||||||
| Change in net unrealized appreciation (depreciation) on: | ||||||||
| Investments | (306,745,626) | (5,316,708) | ||||||
| Translation of assets and liabilities in foreign currencies | (150,021) | (6,432) | ||||||
| (306,895,647) | (5,323,140) | |||||||
| Net realized and unrealized gain (loss) | (319,302,217) | (7,037,168) | ||||||
| Net Increase (Decrease) in Net Assets Resulting from Operations | $ | (277,818,896) | $ | (5,826,695) | ||||
(1)September 28, 2021 (fund inception) through August 31, 2022.
See Notes to Financial Statements.
227
| YEAR ENDED AUGUST 31, 2022 | |||||
| Avantis International Small Cap Value ETF | |||||
| Investment Income (Loss) | |||||
| Income: | |||||
| Dividends (net of foreign taxes withheld of $4,918,435) | $ | 53,441,675 | |||
| Securities lending, net | 1,074,525 | ||||
| Interest | 13,341 | ||||
| 54,529,541 | |||||
| Expenses: | |||||
| Management fees | 5,061,317 | ||||
| Other expenses | 4,658 | ||||
| 5,065,975 | |||||
| Net investment income (loss) | 49,463,566 | ||||
| Realized and Unrealized Gain (Loss) | |||||
| Net realized gain (loss) on: | |||||
| Investment transactions | 11,908,309 | ||||
| Foreign currency translation transactions | (1,207,736) | ||||
| 10,700,573 | |||||
| Change in net unrealized appreciation (depreciation) on: | |||||
| Investments | (345,888,590) | ||||
| Translation of assets and liabilities in foreign currencies | (182,665) | ||||
| (346,071,255) | |||||
| Net realized and unrealized gain (loss) | (335,370,682) | ||||
| Net Increase (Decrease) in Net Assets Resulting from Operations | $ | (285,907,116) | |||
See Notes to Financial Statements.
228
| Statements of Changes in Net Assets | ||
| YEARS ENDED AUGUST 31, 2022 AND AUGUST 31, 2021 (EXCEPT AS NOTED) | |||||||||||
| Avantis Emerging Markets Equity ETF | Avantis Emerging Markets Value ETF | ||||||||||
| Increase (Decrease) in Net Assets | August 31, 2022 | August 31, 2021 | August 31, 2022(1) | ||||||||
| Operations | |||||||||||
| Net investment income (loss) | $ | 41,006,263 | $ | 13,439,376 | $ | 3,829,692 | |||||
| Net realized gain (loss) | (26,254,361) | (3,459,576) | (1,348,804) | ||||||||
| Change in net unrealized appreciation (depreciation) | (259,099,227) | 100,142,245 | (19,714,577) | ||||||||
| Net increase (decrease) in net assets resulting from operations | (244,347,325) | 110,122,045 | (17,233,689) | ||||||||
| Distributions to Shareholders | |||||||||||
| From earnings | (30,216,930) | (9,558,420) | (1,539,540) | ||||||||
| Capital Share Transactions | |||||||||||
| Proceeds from shares sold | 731,567,092 | 521,084,968 | 148,188,439 | ||||||||
| Payments for shares redeemed | — | (2,598,710) | — | ||||||||
| Other capital | 566,509 | 330,894 | 140,560 | ||||||||
| Net increase (decrease) in net assets from capital share transactions | 732,133,601 | 518,817,152 | 148,328,999 | ||||||||
| Net increase (decrease) in net assets | 457,569,346 | 619,380,777 | 129,555,770 | ||||||||
| Net Assets | |||||||||||
| Beginning of period | 864,826,515 | 245,445,738 | — | ||||||||
| End of period | $ | 1,322,395,861 | $ | 864,826,515 | $ | 129,555,770 | |||||
| Transactions in Shares of the Funds | |||||||||||
| Sold | 12,650,000 | 8,300,000 | 3,080,000 | ||||||||
| Redeemed | — | (50,000) | — | ||||||||
| Net increase (decrease) in shares of the funds | 12,650,000 | 8,250,000 | 3,080,000 | ||||||||
(1)September 28, 2021 (fund inception) through August 31, 2022.
See Notes to Financial Statements.
229
| YEARS ENDED AUGUST 31, 2022 AND AUGUST 31, 2021 (EXCEPT AS NOTED) | |||||||||||
| Avantis International Equity ETF | Avantis International Large Cap Value ETF | ||||||||||
| Increase (Decrease) in Net Assets | August 31, 2022 | August 31, 2021 | August 31, 2022(1) | ||||||||
| Operations | |||||||||||
| Net investment income (loss) | $ | 41,483,321 | $ | 15,824,875 | $ | 1,210,473 | |||||
| Net realized gain (loss) | (12,406,570) | (1,072,621) | (1,714,028) | ||||||||
| Change in net unrealized appreciation (depreciation) | (306,895,647) | 131,587,282 | (5,323,140) | ||||||||
| Net increase (decrease) in net assets resulting from operations | (277,818,896) | 146,339,536 | (5,826,695) | ||||||||
| Distributions to Shareholders | |||||||||||
| From earnings | (39,846,030) | (14,039,130) | (904,347) | ||||||||
| Capital Share Transactions | |||||||||||
| Proceeds from shares sold | 826,982,923 | 529,082,577 | 67,084,377 | ||||||||
| Payments for shares redeemed | (2,673,055) | (5,592,990) | — | ||||||||
| Other capital | 412,669 | 409,617 | 38,479 | ||||||||
| Net increase (decrease) in net assets from capital share transactions | 824,722,537 | 523,899,204 | 67,122,856 | ||||||||
| Net increase (decrease) in net assets | 507,057,611 | 656,199,610 | 60,391,814 | ||||||||
| Net Assets | |||||||||||
| Beginning of period | 997,543,705 | 341,344,095 | — | ||||||||
| End of period | $ | 1,504,601,316 | $ | 997,543,705 | $ | 60,391,814 | |||||
| Transactions in Shares of the Funds | |||||||||||
| Sold | 14,300,000 | 8,800,000 | 1,440,000 | ||||||||
| Redeemed | (50,000) | (100,000) | — | ||||||||
| Net increase (decrease) in shares of the funds | 14,250,000 | 8,700,000 | 1,440,000 | ||||||||
(1)September 28, 2021 (fund inception) through August 31, 2022.
See Notes to Financial Statements.
230
| YEARS ENDED AUGUST 31, 2022 AND AUGUST 31, 2021 | ||||||||
| Avantis International Small Cap Value ETF | ||||||||
| Increase (Decrease) in Net Assets | August 31, 2022 | August 31, 2021 | ||||||
| Operations | ||||||||
| Net investment income (loss) | $ | 49,463,566 | $ | 13,754,952 | ||||
| Net realized gain (loss) | 10,700,573 | 30,382,503 | ||||||
| Change in net unrealized appreciation (depreciation) | (346,071,255) | 104,166,255 | ||||||
| Net increase (decrease) in net assets resulting from operations | (285,907,116) | 148,303,710 | ||||||
| Distributions to Shareholders | ||||||||
| From earnings | (45,642,411) | (12,987,087) | ||||||
| Capital Share Transactions | ||||||||
| Proceeds from shares sold | 1,221,524,862 | 737,021,098 | ||||||
| Payments for shares redeemed | (278,542,155) | (90,624,702) | ||||||
| Other capital | 372,440 | 165,125 | ||||||
| Net increase (decrease) in net assets from capital share transactions | 943,355,147 | 646,561,521 | ||||||
| Net increase (decrease) in net assets | 611,805,620 | 781,878,144 | ||||||
| Net Assets | ||||||||
| Beginning of period | 1,056,702,827 | 274,824,683 | ||||||
| End of period | $ | 1,668,508,447 | $ | 1,056,702,827 | ||||
| Transactions in Shares of the Funds | ||||||||
| Sold | 20,010,000 | 11,760,000 | ||||||
| Redeemed | (4,590,000) | (1,470,000) | ||||||
| Net increase (decrease) in shares of the funds | 15,420,000 | 10,290,000 | ||||||
See Notes to Financial Statements.
231
| Notes to Financial Statements | ||
AUGUST 31, 2022
1. Organization
American Century ETF Trust (the trust) was registered as a Delaware statutory trust in 2017 and is registered under the Investment Company Act of 1940, as amended (the 1940 Act), as an open-end management investment company. Avantis Emerging Markets Equity ETF, Avantis Emerging Markets Value ETF, Avantis International Equity ETF, Avantis International Large Cap Value ETF and Avantis International Small Cap Value ETF (collectively, the funds) are five funds in a series issued by the trust. Each of the funds’ investment objective is to seek long-term capital appreciation. Shares of the funds are listed for trading on the NYSE Arca, Inc. Avantis Emerging Markets Value ETF and Avantis International Large Cap Value ETF incepted on September 28, 2021.
2. Significant Accounting Policies
The following is a summary of significant accounting policies consistently followed by the funds in preparation of their financial statements. Each fund is an investment company and follows accounting and reporting guidance in accordance with accounting principles generally accepted in the United States of America. This may require management to make certain estimates and assumptions at the date of the financial statements. Actual results could differ from these estimates. Management evaluated the impact of events or transactions occurring through the date the financial statements were issued that would merit recognition or disclosure.
Investment Valuations — The funds determine the fair value of their investments and compute their net asset value (NAV) per share at the close of regular trading (usually 4 p.m. Eastern time) on the New York Stock Exchange (NYSE) on each day the NYSE is open. The Board of Trustees has adopted valuation policies and procedures to guide the investment advisor in the funds' investment valuation process and to provide methodologies for the oversight of the funds' pricing function.
Equity securities that are listed or traded on a domestic securities exchange are valued at the last reported sales price or at the official closing price as provided by the exchange. Equity securities traded on foreign securities exchanges are generally valued at the closing price of such securities on the exchange where primarily traded or at the close of the NYSE, if that is earlier. If no last sales price is reported, or if local convention or regulation so provides, the mean of the latest bid and asked prices may be used. Securities traded over-the-counter are valued at the mean of the latest bid and asked prices, the last sales price, or the official closing price. Equity securities initially expressed in local currencies are translated into U.S. dollars at the mean of the appropriate currency exchange rate at the close of the NYSE as provided by an independent pricing service.
Fixed income securities are valued at the evaluated mean as provided by independent pricing services or at the mean of the most recent bid and asked prices as provided by investment dealers. Corporate bonds are valued using market models that consider trade data, quotations from dealers and active market makers, relevant yield curve and spread data, creditworthiness, trade data or market information on comparable securities, and other relevant security specific information. Fixed income securities initially expressed in local currencies are translated into U.S. dollars at the mean of the appropriate currency exchange rate at the close of the NYSE as provided by an independent pricing service.
Open-end management investment companies are valued at the reported NAV per share. Exchange-traded futures contracts are valued at the settlement price as provided by the appropriate exchange.
If the funds determine that the market price for an investment is not readily available or the valuation methods mentioned above do not reflect an investment’s fair value, such investment is valued as determined in good faith by the Board of Trustees or its delegate, in accordance with policies and procedures adopted by the Board of Trustees. In its determination of fair value, the funds may review several factors including, but not limited to, market information regarding the specific investment or comparable investments and correlation with other investment types, futures indices or general market indicators. Circumstances that may cause the funds to use these procedures to value an investment include, but are not limited to: an investment has been declared in default or is distressed; trading in a security has been suspended during the trading day or a security is not actively trading on its principal exchange; prices received from a regular pricing source are deemed unreliable; or there is a foreign market holiday and no trading occurred.
232
The funds monitor for significant events occurring after the close of an investment’s primary exchange but before each fund’s NAV per share is determined. Significant events may include, but are not limited to: corporate announcements and transactions; governmental action and political unrest that could impact a specific investment or an investment sector; or armed conflicts, natural disasters and similar events that could affect investments in a specific country or region. The funds also monitor for significant fluctuations between domestic and foreign markets, as evidenced by the U.S. market or such other indicators that the Board of Trustees, or its delegate, deems appropriate. The funds may apply a model-derived factor to the closing price of equity securities traded on foreign securities exchanges. The factor is based on observable market data as provided by an independent pricing service.
Security Transactions — Security transactions are accounted for as of the trade date. Net realized gains and losses are determined on the identified cost basis, which is also used for federal income tax purposes. Certain countries impose taxes on realized gains on the sale of securities registered in their country. The funds record the foreign tax expense, if any, on an accrual basis. The foreign tax expense on realized gains and unrealized appreciation reduces the net realized gain (loss) on investment transactions and net unrealized appreciation (depreciation) on investments, respectively.
Investment Income — Dividend income less foreign taxes withheld, if any, is recorded as of the ex-dividend date. Distributions received on securities that represent a return of capital or long-term capital gain are recorded as a reduction of cost of investments and/or as a realized gain. The funds may estimate the components of distributions received that may be considered nontaxable distributions or long-term capital gain distributions for income tax purposes. Interest income is recorded on the accrual basis and includes accretion of discounts and amortization of premiums. Securities lending income is net of fees and rebates earned by the lending agent for its services.
Foreign Currency Translations — All assets and liabilities initially expressed in foreign currencies are translated into U.S. dollars at prevailing exchange rates at period end. The funds may enter into spot foreign currency exchange contracts to facilitate transactions denominated in a foreign currency. Purchases and sales of investment securities, dividend and interest income, spot foreign currency exchange contracts, and expenses are translated at the rates of exchange prevailing on the respective dates of such transactions. Net realized and unrealized foreign currency exchange gains or losses related to investment securities are a component of net realized gain (loss) on investment transactions and change in net unrealized appreciation (depreciation) on investments, respectively.
Segregated Assets — In accordance with the 1940 Act, the funds segregate assets on their books and records to cover certain types of investment securities and other financial instruments. American Century Investment Management, Inc. (ACIM) (the investment advisor) monitors, on a daily basis, the securities segregated to ensure the funds designate a sufficient amount of liquid assets, marked-to-market daily. The funds may also receive assets or be required to pledge assets at the custodian bank or with a broker for collateral requirements.
Income Tax Status — It is each fund’s policy to distribute substantially all net investment income and net realized gains to shareholders and to otherwise qualify as a regulated investment company under provisions of the Internal Revenue Code. Accordingly, no provision has been made for income taxes. The funds file U.S. federal, state, local and non-U.S. tax returns as applicable. The funds' tax returns are subject to examination by the relevant taxing authority until expiration of the applicable statute of limitations, which is generally three years from the date of filing but can be longer in certain jurisdictions. At this time, management believes there are no uncertain tax positions which, based on their technical merit, would not be sustained upon examination and for which it is reasonably possible that the total amounts of unrecognized tax benefits will significantly change in the next twelve months.
Distributions to Shareholders — Distributions from net investment income, if any, are generally declared and paid semiannually. Distributions from net realized gains, if any, are generally declared and paid annually.
Indemnifications — Under the trust’s organizational documents, its officers and trustees are indemnified against certain liabilities arising out of the performance of their duties to the funds. In addition, in the normal course of business, the funds enter into contracts that provide general indemnifications. The maximum exposure under these arrangements is unknown as this would involve future claims that may be made against a fund. The risk of material loss from such claims is considered by management to be remote.
233
Securities Lending — Securities are lent to qualified financial institutions and brokers. State Street Bank & Trust Co. serves as securities lending agent to the funds pursuant to a Securities Lending Agreement. The lending of securities exposes the funds to risks such as: the borrowers may fail to return the loaned securities, the borrowers may not be able to provide additional collateral, the funds may experience delays in recovery of the loaned securities or delays in access to collateral, or the funds may experience losses related to the investment collateral. To minimize certain risks, loan counterparties pledge collateral in the form of cash and/or securities. The lending agent has agreed to indemnify the funds in the case of default of any securities borrowed. Cash collateral received is invested in the State Street Navigator Securities Lending Government Money Market Portfolio, a money market mutual fund registered under the 1940 Act. The loans may also be secured by U.S. government securities in an amount at least equal to the market value of the securities loaned, plus accrued interest and dividends, determined on a daily basis and adjusted accordingly. By lending securities, the funds seek to increase their net investment income through the receipt of interest and fees. Such income is reflected separately within the Statements of Operations. The value of loaned securities and related collateral outstanding at period end, if any, are shown on a gross basis within the Schedules of Investments and Statements of Assets and Liabilities.
The following table reflects a breakdown of transactions accounted for as secured borrowings, the gross obligation by the type of collateral pledged, and the remaining contractual maturity of those transactions as of August 31, 2022.
| Remaining Contractual Maturity of Agreements | |||||||||||||||||
Fund / Securities Lending Transactions(1) | Overnight and Continuous | <30 days | Between 30 & 90 days | >90 days | Total | ||||||||||||
| Avantis Emerging Markets Equity ETF | |||||||||||||||||
| Common Stocks | $ | 22,098,803 | — | — | — | $ | 22,098,803 | ||||||||||
| Gross amount of recognized liabilities for securities lending transactions | $ | 22,098,803 | |||||||||||||||
| Avantis Emerging Markets Value ETF | |||||||||||||||||
| Common Stocks | $ | 1,884,533 | — | — | — | $ | 1,884,533 | ||||||||||
| Gross amount of recognized liabilities for securities lending transactions | $ | 1,884,533 | |||||||||||||||
| Avantis International Equity ETF | |||||||||||||||||
| Common Stocks | $ | 51,030,433 | — | — | — | $ | 51,030,433 | ||||||||||
| Warrants | 3,068 | — | — | — | 3,068 | ||||||||||||
| Total Borrowings | $ | 51,033,501 | — | — | — | $ | 51,033,501 | ||||||||||
| Gross amount of recognized liabilities for securities lending transactions | $ | 51,033,501 | |||||||||||||||
| Avantis International Large Cap Value ETF | |||||||||||||||||
| Common Stocks | $ | 1,069,229 | — | — | — | $ | 1,069,229 | ||||||||||
| Gross amount of recognized liabilities for securities lending transactions | $ | 1,069,229 | |||||||||||||||
| Avantis International Small Cap Value ETF | |||||||||||||||||
| Common Stocks | $ | 42,532,484 | — | — | — | $ | 42,532,484 | ||||||||||
| Warrants | 28,403 | — | — | — | 28,403 | ||||||||||||
| Total Borrowings | $ | 42,560,887 | — | — | — | $ | 42,560,887 | ||||||||||
| Gross amount of recognized liabilities for securities lending transactions | $ | 42,560,887 | |||||||||||||||
(1)Amount represents the payable for cash collateral received for securities on loan. This will generally be in the Overnight and Continuous column as the securities are typically callable on demand.
3. Fees and Transactions with Related Parties
Certain officers and trustees of the trust are also officers and/or directors of American Century Companies, Inc. (ACC). The trust's investment advisor, ACIM, and the trust’s administrator, American Century Services, LLC, are wholly owned, directly or indirectly, by ACC. Various funds issued by American Century Strategic Asset Allocations, Inc. own, in aggregate, 5% of the shares of the Avantis Emerging Markets Equity ETF.
234
Management Fees — The trust has entered into a management agreement with ACIM, under which ACIM provides the funds with investment advisory and management services in exchange for a single, unified management fee (the fee). The agreement provides that ACIM will pay all expenses of managing and operating the funds, except brokerage and other transaction fees and expenses relating to the acquisition and disposition of portfolio securities, acquired fund fees and expenses, interest, taxes, litigation expenses and extraordinary expenses. The fee is computed and accrued daily based on the daily net assets of each fund and paid monthly in arrears.
The annual management fee for each fund is as follows:
| Annual Management Fee | |||||
| Avantis Emerging Markets Equity ETF | 0.33% | ||||
| Avantis Emerging Markets Value ETF | 0.36% | ||||
| Avantis International Equity ETF | 0.23% | ||||
| Avantis International Large Cap Value ETF | 0.25% | ||||
| Avantis International Small Cap Value ETF | 0.36% | ||||
Interfund Transactions — The funds may enter into security transactions with other American Century Investments funds and other client accounts of the investment advisor, in accordance with the 1940 Act rules and procedures adopted by the Board of Trustees. The rules and procedures require, among other things, that these transactions be effected at the independent current market price of the security. There were no interfund transactions during the period.
4. Investment Transactions
Purchases and sales of investment securities, excluding short-term investments and in kind transactions, for the period ended August 31, 2022 were as follows:
| Avantis Emerging Markets Equity ETF | Avantis Emerging Markets Value ETF(1) | Avantis International Equity ETF | Avantis International Large Cap Value ETF(1) | Avantis International Small Cap Value ETF | |||||||||||||
| Purchases | $ | 648,038,667 | $ | 139,374,441 | $ | 458,133,467 | $ | 43,434,013 | $ | 841,817,235 | |||||||
| Sales | $ | 35,475,886 | $ | 6,165,983 | $ | 91,247,475 | $ | 12,587,530 | $ | 291,100,122 | |||||||
(1)September 28, 2021 (fund inception) through August 31, 2022.
Securities received or delivered in kind through subscriptions and redemptions and in kind net realized gain (loss) for the period ended August 31, 2022 were as follows:
| In kind Subscriptions | In kind Redemptions | In kind Net Realized Gain/(Loss)* | |||||||||
| Avantis Emerging Markets Equity ETF | $ | 123,526,960 | — | — | |||||||
Avantis Emerging Markets Value ETF(1) | $ | 16,646,711 | — | — | |||||||
| Avantis International Equity ETF | $ | 462,321,047 | $ | 2,615,589 | $ | 1,506,426 | |||||
Avantis International Large Cap Value ETF(1) | $ | 36,258,493 | — | — | |||||||
| Avantis International Small Cap Value ETF | $ | 677,557,479 | $ | 275,243,521 | $ | 100,984,987 | |||||
*Net realized gain (loss) on in kind transactions are not considered taxable for federal income tax purposes.
(1)September 28, 2021 (fund inception) through August 31, 2022.
5. Capital Share Transactions
Each fund’s shares may only be bought and sold in a secondary market through a broker-dealer at a market price. Because ETF shares trade at market prices rather than NAV, shares may trade at a price greater than NAV (a premium) or less than NAV (a discount). Each fund issues and redeems shares at their NAV only in aggregations of a specified number of shares (a creation unit) generally in exchange for a designated portfolio of securities and/or cash (including any portion of such securities for which cash may be substituted). Authorized participants may be required to pay an additional variable charge to cover certain brokerage, tax, foreign exchange, execution, market impact and other costs and expenses related to the execution of trades resulting from creation unit transactions. Such variable charges, if any, are included in other capital within the Statements of Changes in Net Assets.
235
6. Fair Value Measurements
The funds’ investment valuation process is based on several considerations and may use multiple inputs to determine the fair value of the investments held by the funds. In conformity with accounting principles generally accepted in the United States of America, the inputs used to determine a valuation are classified into three broad levels.
•Level 1 valuation inputs consist of unadjusted quoted prices in an active market for identical investments.
•Level 2 valuation inputs consist of direct or indirect observable market data (including quoted prices for comparable investments, evaluations of subsequent market events, interest rates, prepayment speeds, credit risk, etc.). These inputs also consist of quoted prices for identical investments initially expressed in local currencies that are adjusted through translation into U.S. dollars.
•Level 3 valuation inputs consist of unobservable data (including a fund’s own assumptions).
The level classification is based on the lowest level input that is significant to the fair valuation measurement. The valuation inputs are not necessarily an indication of the risks associated with investing in these securities or other financial instruments.
The following is a summary of the level classifications as of period end. The Schedules of Investments provide additional information on the funds’ portfolio holdings.
Avantis Emerging Markets Equity ETF
| Level 1 | Level 2 | Level 3 | |||||||||
| Assets | |||||||||||
| Investment Securities | |||||||||||
| Common Stocks | |||||||||||
| Brazil | $ | 44,019,404 | $ | 37,061,362 | — | ||||||
| Chile | 2,487,628 | 6,528,835 | — | ||||||||
| China | 98,674,301 | 282,482,550 | — | ||||||||
| Colombia | 1,092,504 | 1,261,706 | — | ||||||||
| India | 19,164,903 | 208,307,796 | — | ||||||||
| Indonesia | 3,060,284 | 28,431,056 | — | ||||||||
| Mexico | 9,468,190 | 20,598,916 | — | ||||||||
| Peru | 2,881,946 | — | — | ||||||||
| Philippines | 521,230 | 11,225,522 | — | ||||||||
| Russia | — | 2,394 | — | ||||||||
| South Africa | 8,545,093 | 44,487,454 | — | ||||||||
| South Korea | 12,527,769 | 161,140,953 | — | ||||||||
| Taiwan | 43,081,539 | 184,972,989 | — | ||||||||
| Turkey | 348,316 | 7,645,152 | — | ||||||||
| Other Countries | — | 76,884,642 | — | ||||||||
| Rights | — | 375 | — | ||||||||
| Warrants | — | 19,116 | — | ||||||||
| Corporate Bonds | — | 1,490 | — | ||||||||
| Short-Term Investments | 23,097,479 | — | — | ||||||||
| $ | 268,970,586 | $ | 1,071,052,308 | — | |||||||
236
Avantis Emerging Markets Value ETF
| Level 1 | Level 2 | Level 3 | |||||||||
| Assets | |||||||||||
| Investment Securities | |||||||||||
| Common Stocks | |||||||||||
| Brazil | $ | 5,183,665 | $ | 2,972,583 | — | ||||||
| Chile | 261,791 | 631,646 | — | ||||||||
| China | 5,266,106 | 31,357,472 | — | ||||||||
| India | 698,894 | 21,998,629 | — | ||||||||
| Indonesia | 789,398 | 2,399,902 | — | ||||||||
| Mexico | 1,092,713 | 1,914,661 | — | ||||||||
| Philippines | 14,249 | 1,136,536 | — | ||||||||
| South Africa | 1,185,544 | 3,939,831 | — | ||||||||
| South Korea | 2,540,496 | 15,180,893 | — | ||||||||
| Taiwan | 360,069 | 21,636,117 | — | ||||||||
| Turkey | 37,909 | 804,971 | — | ||||||||
| Other Countries | — | 7,420,552 | — | ||||||||
| Warrants | — | 1,579 | — | ||||||||
| Rights | — | 126 | — | ||||||||
| Short-Term Investments | 2,257,375 | — | — | ||||||||
| $ | 19,688,209 | $ | 111,395,498 | — | |||||||
| Level 1 | Level 2 | Level 3 | |||||||||
| Assets | |||||||||||
| Investment Securities | |||||||||||
| Common Stocks | |||||||||||
| Australia | $ | 13,944,890 | $ | 100,294,629 | — | ||||||
| Belgium | 2,406,666 | 11,423,835 | — | ||||||||
| Canada | 699,946 | 170,282,022 | — | ||||||||
| Denmark | 13,980,571 | 21,367,093 | — | ||||||||
| Finland | 1,386,382 | 13,024,927 | — | ||||||||
| France | 25,978,329 | 106,375,297 | — | ||||||||
| Germany | 5,038,828 | 88,706,311 | — | ||||||||
| Hong Kong | 709,789 | 38,136,892 | — | ||||||||
| Israel | 2,828,227 | 13,409,331 | — | ||||||||
| Italy | 2,549,480 | 28,111,820 | — | ||||||||
| Japan | 30,172,347 | 287,288,001 | — | ||||||||
| Netherlands | 19,652,644 | 31,695,158 | — | ||||||||
| Norway | 3,298,177 | 11,483,743 | — | ||||||||
| Singapore | 651,125 | 21,633,532 | — | ||||||||
| Spain | 6,698,930 | 23,837,991 | — | ||||||||
| Sweden | 2,299,026 | 47,265,978 | — | ||||||||
| Switzerland | 26,140,798 | 100,601,991 | — | ||||||||
| United Kingdom | 86,998,296 | 117,393,424 | — | ||||||||
| Other Countries | — | 19,958,929 | — | ||||||||
| Warrants | — | 5,852 | — | ||||||||
| Rights | — | 2,953 | — | ||||||||
| Short-Term Investments | 52,183,795 | — | — | ||||||||
| $ | 297,618,246 | $ | 1,252,299,709 | — | |||||||
237
Avantis International Large Cap Value ETF
| Level 1 | Level 2 | Level 3 | |||||||||
| Assets | |||||||||||
| Investment Securities | |||||||||||
| Common Stocks | |||||||||||
| Australia | $ | 985,234 | $ | 3,284,925 | — | ||||||
| Denmark | 324,878 | 63,406 | — | ||||||||
| Finland | 103,136 | 554,767 | — | ||||||||
| France | 958,602 | 3,521,636 | — | ||||||||
| Germany | 184,050 | 5,128,146 | — | ||||||||
| Hong Kong | 21,396 | 1,538,852 | — | ||||||||
| Israel | 57,362 | 432,484 | — | ||||||||
| Italy | 316,815 | 1,400,733 | — | ||||||||
| Japan | 1,299,665 | 10,935,836 | — | ||||||||
| Netherlands | 516,635 | 448,919 | — | ||||||||
| Norway | 448,296 | 263,489 | — | ||||||||
| Spain | 677,346 | 1,092,584 | — | ||||||||
| Sweden | 95,944 | 1,254,155 | — | ||||||||
| Switzerland | 946,228 | 2,569,918 | — | ||||||||
| United Kingdom | 6,549,281 | 4,956,135 | — | ||||||||
| Other Countries | — | 9,164,698 | — | ||||||||
| Short-Term Investments | 5,024,249 | — | — | ||||||||
| $ | 18,509,117 | $ | 46,610,683 | — | |||||||
Avantis International Small Cap Value ETF
| Level 1 | Level 2 | Level 3 | |||||||||
| Assets | |||||||||||
| Investment Securities | |||||||||||
| Common Stocks | $ | 7,195,289 | $ | 1,654,680,712 | — | ||||||
| Warrants | — | 52,880 | — | ||||||||
| Rights | — | 475 | — | ||||||||
| Short-Term Investments | 59,424,134 | — | — | ||||||||
| $ | 66,619,423 | $ | 1,654,734,067 | — | |||||||
7. Derivative Instruments
Equity Price Risk — The funds are subject to equity price risk in the normal course of pursuing its investment objectives. A fund may enter into futures contracts based on an equity index in order to manage its exposure to changes in market conditions. A fund may purchase futures contracts to gain exposure to increases in market value or sell futures contracts to protect against a decline in market value. Upon entering into a futures contract, a fund is required to deposit either cash or securities in an amount equal to a certain percentage of the contract value (initial margin). Subsequent payments (variation margin) are made or received daily, in cash, by a fund. The variation margin is equal to the daily change in the contract value and is recorded as unrealized gains and losses. A fund recognizes a realized gain or loss when the contract is closed or expires. Net realized and unrealized gains or losses occurring during the holding period of futures contracts are a component of net realized gain (loss) on futures contract transactions and change in net unrealized appreciation (depreciation) on futures contracts, respectively. One of the risks of entering into futures contracts is the possibility that the change in value of the contract may not correlate with the changes in value of the underlying securities. During the period, Avantis Emerging Markets Value ETF participated in equity price risk derivative instruments for temporary investment purposes.
At period end, the funds did not have any derivative instruments disclosed on the Statement of Assets and Liabilities
238
Effect of Derivative Instruments on the Statement of Operations for the period September 28, 2021 (fund inception) through August 31, 2022
| Net Realized Gain (Loss) | Change in Net Unrealized Appreciation (Depreciation) | |||||||||||||
| Fund / Type of Risk Exposure | Location on Statement of Operations | Value | Location on Statement of Operations | Value | ||||||||||
| Avantis Emerging Markets Value ETF | ||||||||||||||
| Equity Price Risk | Net realized gain (loss) on futures contract transactions | $ | 559 | Change in net unrealized appreciation (depreciation) on futures contracts | — | |||||||||
8. Risk Factors
The value of the funds’ shares will go up and down, sometimes rapidly or unpredictably, based on the performance of the securities owned by the funds and other factors generally affecting the securities market. Market risks, including political, regulatory, economic and social developments, can affect the value of the funds’ investments. Natural disasters, public health emergencies, war, terrorism and other unforeseeable events may lead to increased market volatility and may have adverse long-term effects on world economies and markets generally.
There are certain risks involved in investing in foreign securities. These risks include those resulting from political events (such as civil unrest, national elections and imposition of exchange controls), social and economic events (such as labor strikes and rising inflation), and natural disasters. Securities of foreign issuers may be less liquid and more volatile. Investing in emerging markets or a significant portion of assets in one country or region may accentuate these risks.
Avantis International Small Cap Value ETF invests in common stocks of small companies. Because of this, the fund may be subject to greater risk and market fluctuations than funds investing in larger, more established companies.
9. Federal Tax Information
The tax character of distributions paid during the years ended August 31, 2022 (except as noted) and August 31, 2021 were as follows:
| 2022 | 2021 | |||||||||||||
| Distributions Paid From: | Distributions Paid From: | |||||||||||||
| Ordinary Income | Long-term Capital Gains | Ordinary Income | Long-term Capital Gains | |||||||||||
| Avantis Emerging Markets Equity ETF | $ | 30,216,930 | — | $ | 9,558,420 | — | ||||||||
Avantis Emerging Markets Value ETF(1) | $ | 1,539,540 | — | N/A | N/A | |||||||||
| Avantis International Equity ETF | $ | 39,846,030 | — | $ | 14,039,130 | — | ||||||||
Avantis International Large Cap Value ETF(1) | $ | 904,347 | — | N/A | N/A | |||||||||
| Avantis International Small Cap Value ETF | $ | 45,642,411 | — | $ | 12,987,087 | — | ||||||||
(1)September 28, 2021 (fund inception) through August 31, 2022.
The book-basis character of distributions made during the year from net investment income or net realized gains may differ from their ultimate characterization for federal income tax purposes. These differences reflect the differing character of certain income items and net realized gains and losses for financial statement and tax purposes, and may result in reclassification among certain capital accounts on the financial statements.
239
The reclassifications, which are primarily due to in kind transactions, were as follows:
| Avantis Emerging Markets Equity ETF | Avantis Emerging Markets Value ETF | Avantis International Equity ETF | Avantis International Large Cap Value ETF | Avantis International Small Cap Value ETF | |||||||||||||
| Capital paid in | $ | 22,235 | $ | (1,195) | $ | 2,595,240 | — | $ | 99,929,163 | ||||||||
| Distributable earnings | $ | (22,235) | $ | 1,195 | $ | (2,595,240) | — | $ | (99,929,163) | ||||||||
As of period end, the federal tax cost of investments and the components of distributable earnings on a tax-basis were as follows:
| Avantis Emerging Markets Equity ETF | Avantis Emerging Markets Value ETF | Avantis International Equity ETF | Avantis International Large Cap Value ETF | Avantis International Small Cap Value ETF | |||||||||||||
| Federal tax cost of investments | $ | 1,473,677,825 | $ | 150,993,652 | $ | 1,681,938,621 | $ | 70,488,098 | $ | 1,953,029,924 | |||||||
| Gross tax appreciation of investments | $ | 89,847,198 | $ | 4,551,907 | $ | 72,681,242 | $ | 974,675 | $ | 81,455,651 | |||||||
| Gross tax depreciation of investments | (223,502,129) | (24,461,852) | (204,701,908) | (6,342,973) | (313,132,085) | ||||||||||||
| Net tax appreciation (depreciation) of investments | (133,654,931) | (19,909,945) | (132,020,666) | (5,368,298) | (231,676,434) | ||||||||||||
| Net tax appreciation (depreciation) on derivatives and translation of assets and liabilities in foreign currencies | (3,710,949) | (12,416) | (147,156) | (6,432) | (184,358) | ||||||||||||
| Net tax appreciation (depreciation) | $ | (137,365,880) | $ | (19,922,361) | $ | (132,167,822) | $ | (5,374,730) | $ | (231,860,792) | |||||||
| Undistributed ordinary income | $ | 21,264,673 | $ | 2,385,150 | $ | 7,176,627 | $ | 305,318 | $ | 9,218,347 | |||||||
| Accumulated short-term capital losses | $ | (15,270,988) | $ | (1,234,823) | $ | (14,169,805) | $ | (1,661,630) | $ | (69,817,151) | |||||||
| Accumulated long-term capital losses | $ | (14,493,802) | — | $ | (3,337,106) | — | $ | (23,475,988) | |||||||||
The difference between book-basis and tax-basis unrealized appreciation (depreciation) is attributable primarily to the realization to ordinary income for tax purposes of unrealized gains on investments in passive
foreign investment companies and tax deferral of losses on wash sales.
Accumulated capital losses represent net capital loss carryovers that may be used to offset future realized
capital gains for federal income tax purposes. The capital loss carryovers may be carried forward for an
unlimited period. Future capital loss carryover utilization in any given year may be subject to Internal Revenue
Code limitations.
240
| Financial Highlights | ||
| For a Share Outstanding Throughout the Years Ended August 31 (except as noted) | ||||||||||||||||||||||||||||||||||||||
| Per-Share Data | Ratios and Supplemental Data | |||||||||||||||||||||||||||||||||||||
| Income From Investment Operations: | Ratio to Average Net Assets of: | |||||||||||||||||||||||||||||||||||||
| Net Asset Value, Beginning of Period | Net Investment Income (Loss)(1) | Net Realized and Unrealized Gain (Loss) | Total From Investment Operations | Distributions From Net Investment Income | Other Capital(1) | Net Asset Value, End of Period | Total Return(2) | Operating Expenses | Net Investment Income (Loss) | Portfolio Turnover Rate(3) | Net Assets, End of Period (in thousands) | |||||||||||||||||||||||||||
| Avantis Emerging Markets Equity ETF | ||||||||||||||||||||||||||||||||||||||
| 2022 | $66.78 | 2.21 | (15.63) | (13.42) | (1.73) | 0.03 | $51.66 | (20.36)% | 0.33% | 3.80% | 3% | $1,322,396 | ||||||||||||||||||||||||||
| 2021 | $52.22 | 1.51 | 14.10 | 15.61 | (1.09) | 0.04 | $66.78 | 30.08% | 0.33% | 2.34% | 5% | $864,827 | ||||||||||||||||||||||||||
2020(4) | $50.00 | 1.35 | 1.40 | 2.75 | (0.54) | 0.01 | $52.22 | 5.57% | 0.33%(5) | 2.95%(5) | 8% | $245,446 | ||||||||||||||||||||||||||
| Notes to Financial Highlights | ||
(1)Computed using average shares outstanding throughout the period.
(2)Total returns are calculated based on the net asset value of the last business day. Total returns for periods less than one year are not annualized.
(3)Excludes securities received or delivered in kind.
(4)September 17, 2019 (fund inception) through August 31, 2020.
(5)Annualized.
See Notes to Financial Statements.
| For a Share Outstanding Throughout the Period Indicated | ||||||||||||||||||||||||||||||||||||||
| Per-Share Data | Ratios and Supplemental Data | |||||||||||||||||||||||||||||||||||||
| Income From Investment Operations: | Ratio to Average Net Assets of: | |||||||||||||||||||||||||||||||||||||
| Net Asset Value, Beginning of Period | Net Investment Income (Loss)(1) | Net Realized and Unrealized Gain (Loss) | Total From Investment Operations | Distributions From Net Investment Income | Other Capital(1) | Net Asset Value, End of Period | Total Return(2) | Operating Expenses | Net Investment Income (Loss) | Portfolio Turnover Rate(3) | Net Assets, End of Period (in thousands) | |||||||||||||||||||||||||||
| Avantis Emerging Markets Value ETF | ||||||||||||||||||||||||||||||||||||||
2022(4) | $50.00 | 2.23 | (9.45) | (7.22) | (0.80) | 0.08 | $42.06 | (14.38)% | 0.36%(5) | 5.26%(5) | 8% | $129,556 | ||||||||||||||||||||||||||
| Notes to Financial Highlights | ||
(1)Computed using average shares outstanding throughout the period.
(2)Total returns are calculated based on the net asset value of the last business day. Total returns for periods less than one year are not annualized.
(3)Excludes securities received or delivered in kind.
(4)September 28, 2021 (fund inception) through August 31, 2022.
(5)Annualized.
See Notes to Financial Statements.
| For a Share Outstanding Throughout the Years Ended August 31 (except as noted) | ||||||||||||||||||||||||||||||||||||||
| Per-Share Data | Ratios and Supplemental Data | |||||||||||||||||||||||||||||||||||||
| Income From Investment Operations: | Ratio to Average Net Assets of: | |||||||||||||||||||||||||||||||||||||
| Net Asset Value, Beginning of Period | Net Investment Income (Loss)(1) | Net Realized and Unrealized Gain (Loss) | Total From Investment Operations | Distributions From Net Investment Income | Other Capital(1) | Net Asset Value, End of Period | Total Return(2) | Operating Expenses | Net Investment Income (Loss) | Portfolio Turnover Rate(3) | Net Assets, End of Period (in thousands) | |||||||||||||||||||||||||||
| Avantis International Equity ETF | ||||||||||||||||||||||||||||||||||||||
| 2022 | $64.36 | 1.92 | (13.92) | (12.00) | (1.81) | 0.02 | $50.57 | (18.85)% | 0.23% | 3.30% | 7% | $1,504,601 | ||||||||||||||||||||||||||
| 2021 | $50.20 | 1.50 | 13.86 | 15.36 | (1.24) | 0.04 | $64.36 | 30.86% | 0.23% | 2.51% | 7% | $997,544 | ||||||||||||||||||||||||||
2020(4) | $50.00 | 1.12 | (0.38) | 0.74 | (0.55) | 0.01 | $50.20 | 1.52% | 0.23%(5) | 2.57%(5) | 8% | $341,344 | ||||||||||||||||||||||||||
| Notes to Financial Highlights | ||
(1)Computed using average shares outstanding throughout the period.
(2)Total returns are calculated based on the net asset value of the last business day. Total returns for periods less than one year are not annualized.
(3)Excludes securities received or delivered in kind.
(4)September 24, 2019 (fund inception) through August 31, 2020.
(5)Annualized.
See Notes to Financial Statements.
| For a Share Outstanding Throughout the Period Indicated | ||||||||||||||||||||||||||||||||||||||
| Per-Share Data | Ratios and Supplemental Data | |||||||||||||||||||||||||||||||||||||
| Income From Investment Operations: | Ratio to Average Net Assets of: | |||||||||||||||||||||||||||||||||||||
| Net Asset Value, Beginning of Period | Net Investment Income (Loss)(1) | Net Realized and Unrealized Gain (Loss) | Total From Investment Operations | Distributions From Net Investment Income | Other Capital(1) | Net Asset Value, End of Period | Total Return(2) | Operating Expenses | Net Investment Income (Loss) | Portfolio Turnover Rate(3) | Net Assets, End of Period (in thousands) | |||||||||||||||||||||||||||
| Avantis International Large Cap Value ETF | ||||||||||||||||||||||||||||||||||||||
2022(4) | $50.00 | 1.98 | (8.93) | (6.95) | (1.17) | 0.06 | $41.94 | (13.93)% | 0.25%(5) | 4.61%(5) | 47% | $60,392 | ||||||||||||||||||||||||||
| Notes to Financial Highlights | ||
(1)Computed using average shares outstanding throughout the period.
(2)Total returns are calculated based on the net asset value of the last business day. Total returns for periods less than one year are not annualized.
(3)Excludes securities received or delivered in kind.
(4)September 28, 2021 (fund inception) through August 31, 2022.
(5)Annualized.
See Notes to Financial Statements.
| For a Share Outstanding Throughout the Years Ended August 31 (except as noted) | ||||||||||||||||||||||||||||||||||||||
| Per-Share Data | Ratios and Supplemental Data | |||||||||||||||||||||||||||||||||||||
| Income From Investment Operations: | Ratio to Average Net Assets of: | |||||||||||||||||||||||||||||||||||||
| Net Asset Value, Beginning of Period | Net Investment Income (Loss)(1) | Net Realized and Unrealized Gain (Loss) | Total From Investment Operations | Distributions From Net Investment Income | Other Capital(1) | Net Asset Value, End of Period | Total Return(2) | Operating Expenses | Net Investment Income (Loss) | Portfolio Turnover Rate(3) | Net Assets, End of Period (in thousands) | |||||||||||||||||||||||||||
| Avantis International Small Cap Value ETF | ||||||||||||||||||||||||||||||||||||||
| 2022 | $66.09 | 2.12 | (13.19) | (11.07) | (1.92) | 0.02 | $53.12 | (16.92)% | 0.36% | 3.52% | 21% | $1,668,508 | ||||||||||||||||||||||||||
| 2021 | $48.21 | 1.45 | 17.69 | 19.14 | (1.28) | 0.02 | $66.09 | 39.98% | 0.36% | 2.37% | 21% | $1,056,703 | ||||||||||||||||||||||||||
2020(4) | $50.00 | 0.93 | (2.25) | (1.32) | (0.50) | 0.03 | $48.21 | (2.58)% | 0.36%(5) | 2.20%(5) | 32% | $274,825 | ||||||||||||||||||||||||||
| Notes to Financial Highlights | ||
(1)Computed using average shares outstanding throughout the period.
(2)Total returns are calculated based on the net asset value of the last business day. Total returns for periods less than one year are not annualized.
(3)Excludes securities received or delivered in kind.
(4)September 24, 2019 (fund inception) through August 31, 2020.
(5)Annualized.
See Notes to Financial Statements.
| Report of Independent Registered Public Accounting Firm | ||
To the Shareholders and the Board of Trustees of American Century ETF Trust:
Opinion on the Financial Statements and Financial Highlights
We have audited the accompanying statements of assets and liabilities, including the schedules of investments, of Avantis® Emerging Markets Equity ETF, Avantis® Emerging Markets Value ETF, Avantis® International Equity ETF, Avantis® International Large Cap Value ETF, and Avantis® International Small Cap Value ETF (the “Funds”), five of the funds constituting the American Century ETF Trust, as of August 31, 2022, the related statements of operations, statements of changes in net assets, and financial highlights for the periods indicated in the table below; and the related notes. In our opinion, the financial statements and financial highlights present fairly, in all material respects, the financial position of each of the Funds constituting American Century ETF Trust as of August 31, 2022, and the results of their operations, the changes in their net assets, and the financial highlights for the periods listed in the table below, in conformity with accounting principles generally accepted in the United States of America.
| Individual Fund Constituting the American Century ETF Trust | Statement of Operations | Statements of Changes in Net Assets | Financial Highlights | |||||||||||
Avantis® Emerging Markets Equity ETF | For the year ended August 31, 2022 | For the years ended August 31, 2022 and 2021 | For the years ended August 31, 2022, 2021 and the period from September 17, 2019 (fund inception) through August 31, 2020 | |||||||||||
Avantis® Emerging Markets Value ETF | For the period September 28, 2021 (fund inception) through August 31, 2022 | |||||||||||||
Avantis® International Equity ETF | For the year ended August 31, 2022 | For the years ended August 31, 2022 and 2021 | For the years ended August 31, 2022, 2021 and the period from September 24, 2019 (fund inception) through August 31, 2020 | |||||||||||
Avantis® International Large Cap Value ETF | For the period September 28, 2021 (fund inception) through August 31, 2022 | |||||||||||||
Avantis® International Small Cap Value ETF | For the year ended August 31, 2022 | For the years ended August 31, 2022 and 2021 | For the years ended August 31, 2022, 2021 and the period from September 24, 2019 (fund inception) through August 31, 2020 | |||||||||||
Basis for Opinion
These financial statements and financial highlights are the responsibility of the Funds’ management. Our responsibility is to express an opinion on the Funds’ financial statements and financial highlights based on our audits. We are a public accounting firm registered with the Public Company Accounting Oversight Board (United States) (PCAOB) and are required to be independent with respect to the Funds in accordance with the U.S. federal securities laws and the applicable rules and regulations of the Securities and Exchange Commission and the PCAOB.
246
We conducted our audits in accordance with the standards of the PCAOB. Those standards require that we plan and perform the audit to obtain reasonable assurance about whether the financial statements and financial highlights are free of material misstatement, whether due to error or fraud. The Funds are not required to have, nor were we engaged to perform, an audit of their internal control over financial reporting. As part of our audits, we are required to obtain an understanding of internal control over financial reporting but not for the purpose of expressing an opinion on the effectiveness of the Funds’ internal control over financial reporting. Accordingly, we express no such opinion.
Our audits included performing procedures to assess the risks of material misstatement of the financial statements and financial highlights, whether due to error or fraud, and performing procedures that respond to those risks. Such procedures included examining, on a test basis, evidence regarding the amounts and disclosures in the financial statements and financial highlights. Our audits also included evaluating the accounting principles used and significant estimates made by management, as well as evaluating the overall presentation of the financial statements and financial highlights. Our procedures included confirmation of securities owned as of August 31, 2022, by correspondence with the custodian and brokers; when replies were not received from brokers, we performed other auditing procedures. We believe that our audits provide a reasonable basis for our opinion.
/s/ Deloitte & Touche LLP
Kansas City, Missouri
October 17, 2022
We have served as the auditor of one or more American Century investment companies since 1997.
247
| Management | ||
The Board of Trustees
The individuals listed below serve as trustees of the funds. Each trustee will continue to serve in this capacity until death, retirement, resignation or removal from office. The board has adopted a mandatory retirement age for trustees who are not “interested persons,” as that term is defined in the Investment Company Act (independent trustees). Trustees who are not also officers of the trust shall retire on December 31st of the year in which they reach their 75th birthday.
Jonathan S. Thomas is an “interested person” because he currently serves as President and Chief Executive Officer of American Century Companies, Inc. (ACC), the parent company of American Century Investment Management, Inc. (ACIM or the advisor). The other trustees are independent. They are not employees, directors or officers of, and have no financial interest in, ACC or any of its wholly owned, direct or indirect, subsidiaries, including ACIM and American Century Services, LLC (ACS), and they do not have any other affiliations, positions or relationships that would cause them to be considered “interested persons” under the Investment Company Act. The following trustees also serve in this capacity for a number of other registered investment companies in the American Century Investments family of funds: Jonathan S. Thomas, 15; Jeremy I. Bulow, 8; and Stephen E. Yates, 7.
The following table presents additional information about the trustees. The mailing address for each trustee other than Jonathan S. Thomas is 330 Madison Avenue, New York, New York 10017. The mailing address for Jonathan S. Thomas is 4500 Main Street, Kansas City, Missouri 64111.
| Name (Year of Birth) | Position(s) Held with Funds | Length of Time Served | Principal Occupation(s) During Past 5 Years | Number of American Century Portfolios Overseen by Trustee | Other Directorships Held During Past 5 Years | ||||||||||||
| Independent Trustees | |||||||||||||||||
| Reginald M. Browne (1968) | Trustee and Chairman of the Board | Since 2017 (Chairman since 2019) | Principal, GTS Securities (automated capital markets trading firm)(2019 to present); Senior Managing Director, Co Global Head-ETF Group, Cantor Fitzgerald (financial services firm)(2013 to 2019) | 41 | None | ||||||||||||
| Jeremy I. Bulow (1954) | Trustee | Since 2022 | Professor of Economics, Stanford University Graduate School of Business (1979 to present) | 75 | None | ||||||||||||
| Barry A. Mendelson (1958) | Trustee | Since 2017 | Retired | 41 | None | ||||||||||||
| Stephen E. Yates (1948) | Trustee | Since 2017 | Retired | 105 | None | ||||||||||||
| Interested Trustees | |||||||||||||||||
| Jonathan S. Thomas (1963) | Trustee | Since 2017 | President and Chief Executive Officer, ACC (2007 to present). Also serves as Chief Executive Officer, ACS; Director, ACC and other ACC subsidiaries | 139 | None | ||||||||||||
The Statement of Additional Information has additional information about the funds' trustees and is available without charge, upon request, by calling 1-800-345-6488.
248
Officers
The following table presents certain information about the executive officers of the funds. Each officer, except Cleo Chang and Edward Rosenberg, serves as an officer for each of the 16 investment companies in the American Century family of funds. No officer is compensated for his or her service as an officer of the funds. The listed officers are interested persons of the funds and are appointed or re-appointed on an annual basis. The mailing address for each officer listed below is 4500 Main Street, Kansas City, Missouri 64111.
| Name (Year of Birth) | Offices with the Funds | Principal Occupation(s) During the Past Five Years | ||||||
| Patrick Bannigan (1965) | President since 2019 | Executive Vice President and Director, ACC (2012 to present); Chief Financial Officer, Chief Accounting Officer and Treasurer, ACC (2015 to present). Also serves as President, ACS; Vice President, ACIM; Chief Financial Officer, Chief Accounting Officer and/or Director, ACIM, ACS and other ACC subsidiaries | ||||||
| R. Wes Campbell (1974) | Chief Financial Officer and Treasurer since 2018 | Vice President, ACS (2020 to present); Investment Operations and Investment Accounting, ACS (2000 to present) | ||||||
| Amy D. Shelton (1964) | Chief Compliance Officer and Vice President since 2017 | Chief Compliance Officer, American Century funds, (2014 to present); Chief Compliance Officer, ACIM (2014 to present); Chief Compliance Officer, ACIS (2009 to present). Also serves as Vice President, ACIS | ||||||
| John Pak (1968) | General Counsel and Vice President since 2021 | General Counsel and Senior Vice President, ACC (2021 to present). Also serves as General Counsel and Senior Vice President, ACIM, ACS and ACIS. Chief Legal Officer of Investment and Wealth Management,The Bank of New York Mellon (2014 to 2021) | ||||||
| Cleo Chang (1977) | Vice President since 2019 | Senior Vice President, ACIM (2015 to present) | ||||||
| David H. Reinmiller (1963) | Vice President since 2017 | Attorney, ACC (1994 to present). Also serves as Vice President, ACIM and ACS | ||||||
| Edward Rosenberg (1973) | Vice President since 2017 | Senior Vice President, ACIM (2017 to present); Senior Vice President, Flexshares Head of ETF Capital Markets, Northern Trust (2012 to 2017) | ||||||
| C. Jean Wade (1964) | Vice President since 2017 | Senior Vice President, ACS (2017 to present); Vice President, ACS (2000 to 2017) | ||||||
| Ward D. Stauffer (1960) | Secretary since 2019 | Attorney, ACS (2003 to present) | ||||||
249
| Approval of Management Agreement | ||
At a meeting held on June 2, 2022, the Funds’ Board of Trustees (the "Board") unanimously approved the renewal of the management agreement pursuant to which American Century Investment Management, Inc. (the “Advisor”) acts as the investment advisor for each of the Funds. Under Section 15(c) of the Investment Company Act of 1940 (the “Investment Company Act”), contracts for investment advisory services are required to be reviewed, evaluated, and approved by a majority of a fund’s Trustees, including a majority of the independent Trustees, each year.
Prior to its consideration of the management agreement renewal, the Trustees requested and reviewed extensive data and information compiled by the Advisor and certain independent data providers concerning the Funds. This review was in addition to the oversight and evaluation undertaken by the Board and its Audit Committee on a continual basis and the information received was supplemental to the extensive information that the Board and its Audit Committee receive and consider throughout the year.
In connection with its consideration of the management agreement renewal, the Board’s review and evaluation of the services provided by the Advisor included, but was not limited to, the following:
•the nature, extent, and quality of investment management, shareholder services, and other services provided and to be provided to each Fund including without limitation portfolio management and trading services, shareholder and intermediary services, compliance and legal services, fund accounting and financial reporting, and fund share distribution;
•the wide range of other programs and services provided to each Fund and its shareholders on a routine and non-routine basis;
•the investment performance of each Fund, including data comparing each Fund's performance to an appropriate benchmark and/or a peer group of other funds with similar investment objectives and strategies;
•the cost of owning each Fund compared to the cost of owning similarly-managed funds;
•the compliance policies, procedures, and regulatory experience of the Advisor and the Funds’ service providers;
•the Advisor’s strategic plans, generally, and with respect to the ongoing impact of the COVID-19 pandemic response, heightened areas of interest in the mutual fund industry and recent geopolitical issues;
•the Advisor’s business continuity plans, vendor management practices, and cyber security practices;
•financial data showing the cost of services provided to each Fund, the profitability of each Fund to the Advisor, and the overall profitability of the Advisor;
•information regarding payments to intermediaries by the Advisor;
•possible economies of scale associated with the Advisor’s management of each Fund; and
•possible collateral benefits to the Advisor from the management of the Funds.
The independent Trustees met separately in private session to discuss the renewal and to review and discuss the information provided in response to their request. The independent Trustees also held active discussions with the Advisor regarding the renewal of the management agreement. The independent Trustees had the benefit of the advice of their independent counsel throughout the process.
Factors Considered
The Trustees considered all of the information provided by the Advisor, the independent data providers, and independent counsel in connection with the approval. They determined that the
250
information was sufficient for them to evaluate the management agreement for the Funds. In connection with their review, the Trustees did not identify any single factor as being all-important or controlling, and each Trustee may have attributed different levels of importance to different factors. In deciding to renew the management agreement, the Board based its decision on a number of factors, including without limitation the following:
Nature, Extent and Quality of Services — Generally. Under each Fund’s management agreement, the Advisor is responsible for providing or arranging for all services necessary for the operation of each Fund. The Board noted that the Advisor provides or arranges at its own expense a wide variety of services which include the following:
•constructing and designing each Fund
•portfolio research and security selection
•initial capitalization/funding
•securities trading
•Fund administration
•custody of Fund assets
•daily valuation of each Fund’s portfolio
•liquidity monitoring and management
•risk management, including cyber security
•shareholder servicing and transfer agency, including shareholder confirmations, recordkeeping, and communications
•legal services (except the independent Trustees’ counsel)
•regulatory and portfolio compliance
•financial reporting
•marketing and distribution (except amounts paid by each Fund under Rule 12b-1 plans)
Investment Management Services. The nature of the investment management services provided to the Funds is quite complex and allows Fund shareholders access to professional money management, instant diversification of their investments within an asset class, and liquidity. In evaluating investment performance, the Board expects the Advisor to manage each Fund in accordance with its investment objectives and principal investment strategies. Further, the Trustees recognize that the Advisor has an obligation to monitor trading activities, and in particular to seek the best execution of fund trades, and to evaluate the use of and payment for research. In providing these services, the Advisor utilizes teams of investment professionals (portfolio managers, analysts, research assistants, and securities traders) who require extensive information technology, research, training, compliance, and other systems to conduct their business. The Board provides oversight of the investment performance process. It regularly reviews investment performance information for each Fund, together with comparative information for appropriate benchmarks over different time horizons. The Trustees also review investment performance information during the management agreement renewal process. If performance concerns are identified, the Board discusses with the Advisor the reasons for such results and any actions being taken to improve performance. The performance for Avantis Emerging Markets Equity ETF, Avantis International Equity ETF, and Avantis International Small Cap Value ETF was above each Fund’s respective benchmark for the one-year period reviewed by the Board. The Board found the investment management services provided by the Advisor to each Fund to be satisfactory and consistent with the management agreement.
Shareholder and Other Services. Under the management agreement, the Advisor provides or arranges for a comprehensive package of services to the Funds. The Board, directly and through its Audit Committee, regularly reviews reports and evaluations of such services at its regular meetings. These reports include, but are not limited to, information regarding the operational efficiency and accuracy of the shareholder and transfer agency services provided, staffing levels, shareholder satisfaction, technology support (including cyber security), new products and services offered to Fund shareholders, securities trading activities, portfolio valuation services, auditing services, and legal and operational compliance activities. The Board found the services provided
251
by the Advisor to each Fund under the management agreement to be competitive and of high quality.
Costs of Services and Profitability. The Advisor provides detailed information concerning its cost of providing various services to the Funds, its profitability in managing each Fund (pre- and post-distribution), its overall profitability, and its financial condition. The Trustees have reviewed with the Advisor the methodology used to prepare this financial information. This information is considered in evaluating the Advisor’s financial condition, its ability to continue to provide services under the management agreement, and the reasonableness of the current management fee. The Board concluded that the Advisor’s profits were reasonable in light of the services provided to the Funds.
Ethics. The Board generally considers the Advisor’s commitment to providing quality services to the Funds and to conducting its business ethically. They noted that the Advisor’s practices generally meet or exceed industry best practices.
Economies of Scale. The Board also reviewed information provided by the Advisor regarding the possible existence of economies of scale in connection with the management of each Fund. The Board concluded that economies of scale are difficult to measure and predict with precision, especially on a fund-by-fund basis. The Board concluded that the Advisor is sharing economies of scale, to the extent they exist, through its fee structure and through reinvestment in its business, infrastructure, investment capabilities and initiatives to provide shareholders additional content and services.
Comparison to Other Funds’ Fees. The management agreement provides that each Fund pays the Advisor a single, all-inclusive (or unified) management fee for providing all services necessary for the management and operation of the Fund, other than securities transaction expenses, taxes, interest, extraordinary expenses, and expenses incurred in connection with the provision of shareholder services and distribution services under a plan adopted pursuant to Rule 12b-1 under the Investment Company Act. Under the unified fee structure, the Advisor is responsible for providing all investment advisory, custody, audit, administrative, compliance, recordkeeping, marketing and shareholder services, or arranging and supervising third parties to provide such services. The Board believes the unified fee structure is a benefit to Fund shareholders because it clearly discloses to shareholders the cost of owning Fund shares, and, since the unified fee cannot be increased without a vote of Fund shareholders, it shifts to the Advisor the risk of increased costs of operating the Fund and provides a direct incentive to minimize administrative inefficiencies. Part of the Board’s analysis of fee levels involves reviewing certain evaluative data compiled by an independent provider comparing the Fund’s unified fee to the total expense ratios of its peers. The unified fee charged to shareholders of Avantis International Equity ETF and Avantis International Small Cap Value ETF was below the median of the total expense ratios of their respective peer expense universe and was within the range of their peer expense group. The unified fee charged to shareholders of Avantis Emerging Markets Equity ETF and Avantis Emerging Markets Value ETF was below the median of the total expense ratios of their respective peer expense universe and was the lowest of their peer expense group. The unified fee charged to shareholders of Avantis International Large Cap Value ETF was the lowest of the total expense ratios of its peer expense universe and was the lowest of its peer expense group. The Board concluded that the management fee paid by each Fund to the Advisor under its management agreement is reasonable in light of the services provided to the Fund.
Comparison to Fees and Services Provided to Other Clients of the Advisor. The Board also requested and received information from the Advisor concerning the nature of the services, fees, costs, and profitability of its advisory services to funds or other advisory clients managed similarly to the Funds. They observed that these varying types of client accounts require different services and involve different regulatory and entrepreneurial risks than the management of the Funds. The Board analyzed this information and concluded that the fees charged and services provided to the Funds were reasonable by comparison.
252
Payments to Intermediaries. The Trustees also requested and received a description of payments made to intermediaries by each Fund and the Advisor and services provided in response thereto. These payments could include various payments made by each Fund or the Advisor to different types of intermediaries and recordkeepers for distribution and service activities provided for each Fund. The Trustees reviewed such information and received representations from the Advisor that all such payments by the Advisor were made from the Advisor’s resources and reasonable profits.
Collateral or “Fall-Out” Benefits Derived by the Advisor. The Board considered the possible existence of collateral benefits the Advisor may receive as a result of its relationship with the Funds. They concluded that the Advisor’s primary business is managing funds and it generally does not use fund or shareholder information to generate profits in other lines of business, and therefore does not derive any significant collateral benefits from them. The Board noted that additional assets from other clients may offer the Advisor some benefit from increased leverage with service providers and counterparties. The Board also determined that the Advisor is able to provide investment management services to certain clients other than the Funds, at least in part, due to its existing infrastructure built to serve the fund complex. The Board concluded that appropriate allocation methodologies had been employed to assign resources and the cost of those resources to these other clients.
Existing Relationship. The Board also considered whether there was any reason for not continuing the existing arrangement with the Advisor. In this regard, the Board was mindful of the potential disruptions of the Funds’ operations and various risks, uncertainties, and other effects that could occur as a result of a decision not to continue such relationship. In particular, the Board recognized that most shareholders have invested in each Fund on the strength of the Advisor’s industry standing and reputation and in the expectation that the Advisor will have a continuing role in providing advisory services to each Fund.
Conclusion of the Trustees. As a result of this process, the Board, including all of the independent Trustees, taking into account all of the factors discussed above and the information provided by the Advisor and others in connection with its review and throughout the year, determined that the terms of the management fee are fair and reasonable and that the management fee charged to each Fund is fair in light of the services provided and that the investment management agreement between each Fund and the Advisor should be renewed for an additional one-year period.
253
| Liquidity Risk Management Program | ||
The Funds have adopted a liquidity risk management program (the “program”). The Funds' Board of Trustees (the "Board") has designated American Century Investment Management, Inc. (“ACIM”) as the administrator of the program. Personnel of ACIM or its affiliates conduct the day-to-day operation of the program pursuant to policies and procedures administered by the Program Administrator, including members of ACIM’s Investment Oversight Committee who are members of the ACIM’s Investment Management and Global Analytics departments.
Under the program, ACIM manages the Funds' liquidity risk, which is the risk that the Funds could not meet shareholder redemption requests without significant dilution of remaining shareholders’ interests in the Funds. This risk is managed by monitoring the degree of liquidity of the Funds' investments, limiting the amount of the Funds' illiquid investments, and utilizing various risk management tools and facilities available to the Funds for meeting shareholder redemptions, among other means. ACIM’s process of determining the degree of liquidity of certain Funds' investments is supported by a third-party liquidity assessment vendor.
The Board reviewed a report prepared by ACIM regarding the operation and effectiveness of the program for the period January 1, 2021 through December 31, 2021. No significant liquidity events impacting the Funds were noted in the report. In addition, ACIM provided its assessment that the program had been effective in managing the Funds' liquidity risk.
254
| Additional Information | ||
Retirement Account Information
As required by law, distributions you receive from certain retirement accounts are subject to federal income tax withholding, unless you elect not to have withholding apply*. Tax will be withheld on the total amount withdrawn even though you may be receiving amounts that are not subject to withholding, such as nondeductible contributions. In such case, excess amounts of withholding could occur. You may adjust your withholding election so that a greater or lesser amount will be withheld.
Remember, even if you elect not to have income tax withheld, you are liable for paying income tax on the taxable portion of your withdrawal. If you elect not to have income tax withheld or you don’t have enough income tax withheld, you may be responsible for payment of estimated tax. You may incur penalties under the estimated tax rules if your withholding and estimated tax payments are not sufficient. You can reduce or defer the income tax on a distribution by directly or indirectly rolling such distribution over to another IRA or eligible plan. You should consult your tax advisor for additional information.
State tax will be withheld if, at the time of your distribution, your address is within one of the mandatory withholding states and you have federal income tax withheld (or as otherwise required by state law). State taxes will be withheld from your distribution in accordance with the respective state rules.
*Some 403(b), 457 and qualified retirement plan distributions may be subject to 20% mandatory withholding, as they are subject to special tax and withholding rules. Your plan administrator or plan sponsor is required to provide you with a special tax notice explaining those rules at the time you request a distribution. If applicable, federal and/or state taxes may be withheld from your distribution amount.
Proxy Voting Policies
A description of the policies that the funds' investment advisor uses in exercising the voting rights associated with the securities purchased and/or held by the funds is available without charge, upon request, by calling 1-800-345-6488. It is also available on American Century Investments’ website at americancentury.com/proxy and on the Securities and Exchange Commission’s website at sec.gov. Information regarding how the investment advisor voted proxies relating to portfolio securities during the most recent 12-month period ended June 30 is available at americancentury.com/proxy. It is also available at sec.gov.
Quarterly Portfolio Disclosure
The funds file their complete schedule of portfolio holdings with the Securities and Exchange Commission (SEC) for the first and third quarters of each fiscal year as an exhibit to their reports on Form N-PORT. The funds' Form N-PORT reports are available on the SEC’s website at sec.gov.
255
Other Tax Information
The following information is provided pursuant to provisions of the Internal Revenue Code.
The funds hereby designate up to the maximum amount allowable as qualified dividend income for the fiscal year ended August 31, 2022.
For corporate taxpayers, the funds hereby designate the following, or up to the maximum amount allowable, of ordinary income distributions paid during the fiscal year ended August 31, 2022 as qualified for the corporate dividends received deduction.
| Avantis Emerging Markets Equity ETF | Avantis Emerging Markets Value ETF | Avantis International Equity ETF | Avantis International Large Cap Value ETF | Avantis International Small Cap Value ETF | ||||||||||
| $ | 90,726 | $ | 8,090 | $ | 48,176 | — | $ | 625,107 | ||||||
For the fiscal year ended August 31, 2022, the funds intend to pass through to shareholders the following foreign source income and foreign taxes paid, or up to the maximum amount allowable, as a foreign tax credit.
| Foreign Tax Credit | Foreign Source Income | |||||||||||||
| Amount | Per Outstanding Share | Amount | Per Outstanding Share | |||||||||||
| Avantis Emerging Markets Equity ETF | $ | 5,395,041 | $ | 0.2107 | $ | 46,902,415 | $ | 1.8321 | ||||||
| Avantis Emerging Markets Value ETF | $ | 573,288 | $ | 0.1861 | $ | 4,528,885 | $ | 1.4704 | ||||||
| Avantis International Equity ETF | $ | 3,401,651 | $ | 0.1143 | $ | 41,093,944 | $ | 1.3813 | ||||||
| Avantis International Large Cap Value ETF | $ | 103,188 | $ | 0.0717 | $ | 1,309,306 | $ | 0.9092 | ||||||
| Avantis International Small Cap Value ETF | $ | 4,205,951 | $ | 0.1339 | $ | 51,710,765 | $ | 1.6463 | ||||||
256
| ||||||||
| Contact Us | avantisinvestors.com | |||||||
| American Century Sales Representatives, Financial Professionals, Broker Dealers, Insurance Companies, Banks and Trust Companies | 1-833-928-2684 | |||||||
| Telecommunications Relay Service for the Deaf | 711 | |||||||
| American Century ETF Trust | ||||||||
Investment Advisor: American Century Investment Management, Inc. Kansas City, Missouri | ||||||||
Distributor: Foreside Fund Services, LLC - Distributor, not affiliated with American Century Investment Services, Inc. | ||||||||
| This report and the statements it contains are submitted for the general information of our shareholders. The report is not authorized for distribution to prospective investors unless preceded or accompanied by an effective prospectus. | ||||||||
| ©2022 American Century Proprietary Holdings, Inc. All rights reserved. CL-ANN-97506 2210 | ||||||||
| Annual Report | |||||
| August 31, 2022 | |||||
Avantis® Core Fixed Income ETF (AVIG) | |||||
Avantis® Core Municipal Fixed Income ETF (AVMU) | |||||
Avantis® Short-Term Fixed Income ETF (AVSF) | |||||
| Table of Contents | ||
| Chairman’s Letter | |||||
| Avantis Core Fixed Income ETF | |||||
| Performance | |||||
| Portfolio Commentary | |||||
| Fund Characteristics | |||||
| Avantis Core Municipal Fixed Income ETF | |||||
| Performance | |||||
| Portfolio Commentary | |||||
| Fund Characteristics | |||||
| Avantis Short-Term Fixed Income ETF | |||||
| Performance | |||||
| Portfolio Commentary | |||||
| Fund Characteristics | |||||
| Shareholder Fee Examples | |||||
| Schedules of Investments | |||||
| Statements of Assets and Liabilities | |||||
| Statements of Operations | |||||
| Statements of Changes in Net Assets | |||||
| Notes to Financial Statements | |||||
| Financial Highlights | |||||
| Report of Independent Registered Public Accounting Firm | |||||
| Management | |||||
| Approval of Management Agreement | |||||
| Liquidity Risk Management Program | |||||
| Additional Information | |||||
Any opinions expressed in this report reflect those of the author as of the date of the report, and do not necessarily represent the opinions of American Century Investments® or any other person in the American Century Investments organization. Any such opinions are subject to change at any time based upon market or other conditions and American Century Investments disclaims any responsibility to update such opinions. These opinions may not be relied upon as investment advice and, because investment decisions made by American Century Investments funds are based on numerous factors, may not be relied upon as an indication of trading intent on behalf of any American Century Investments fund. Security examples are used for representational purposes only and are not intended as recommendations to purchase or sell securities. Performance information for comparative indices and securities is provided to American Century Investments by third party vendors. To the best of American Century Investments’ knowledge, such information is accurate at the time of printing.
| Chairman's Letter | ||
Jonathan ThomasDear Investor:
Thank you for reviewing this annual report for the period ended August 31, 2022. Annual reports
help convey important information about fund returns, including market factors that affected
performance. For additional investment insights, please visit avantisinvestors.com.
Mounting Market Challenges Hampered Performance
Asset class performance weakened dramatically during the funds’ fiscal year. In late 2021,
generally upbeat economic activity and corporate earnings supported gains for most U.S. and
global stock indices. Returns generally remained positive despite rapidly rising inflation and waning
central bank support—factors that had started to weigh on fixed-income indices.
By early 2022, the market climate shifted quickly. Inflation, which was already at multiyear highs,
rose to levels last seen in the early 1980s. Massive fiscal and monetary support unleashed during
the pandemic was partly to blame. In addition, escalating energy prices, supply chain breakdowns
and labor market shortages further aggravated inflation in the U.S. and other developed markets.
Russia’s invasion of Ukraine in February also exacerbated global inflationary pressures.
The Bank of England launched its inflation-fighting campaign in December and continued to lift
rates through period-end. The Federal Reserve responded to surging inflation in March, launching
an aggressive rate-hike campaign and ending its asset purchase program. Policymakers indicated
taming inflation remains their priority, even as the U.S. economy contracted in 2022’s first two
quarters. Facing record-high inflation in the eurozone, the European Central Bank in July embarked
on its first rate-hike effort in 11 years.
The combination of sharply elevated inflation, tighter monetary policy, geopolitical strife and weak
economies triggered sharp market volatility and fueled global recession fears. Against this
backdrop, most U.S. and global stock and bond indices declined sharply for the reporting period.
Staying Disciplined in Uncertain Times
We expect market volatility to linger as investors navigate a complex environment of high inflation,
rising interest rates and economic uncertainty. In addition, Russia’s invasion of Ukraine
complicates an increasingly tense geopolitical backdrop and threatens Europe’s winter energy
supply. We will continue to monitor the broad backdrop and its influence on financial markets.
We appreciate your confidence in us during these extraordinary times. Our firm has a long history
of helping clients weather unpredictable markets, and we’re confident we will continue to meet
today’s challenges.
Sincerely,
Jonathan Thomas
Chairman
Avantis Investors
2
| Performance | ||
| Avantis Core Fixed Income ETF (AVIG) | |||||||||||||||||
| Total Returns as of August 31, 2022 | Average Annual Returns | ||||||||||||||||
| 1 year | Since Inception | Inception Date | |||||||||||||||
| Net Asset Value | -12.86% | -6.98% | 10/13/2020 | ||||||||||||||
| Market Price | -13.07% | -7.05% | 10/13/2020 | ||||||||||||||
| Bloomberg U.S. Aggregate Bond Index | -11.52% | -6.34% | — | ||||||||||||||
Market price is determined using the bid/ask midpoint at 4:00 p.m. Eastern time, when the net asset value (NAV) is typically calculated. Market performance does not represent the returns you would receive if you traded shares at other times. NAV prices are used to calculate market price performance prior to the date when the fund first traded on the NYSE Arca, Inc.
| Growth of $10,000 Over Life of Fund | ||
| $10,000 investment made October 13, 2020 | ||
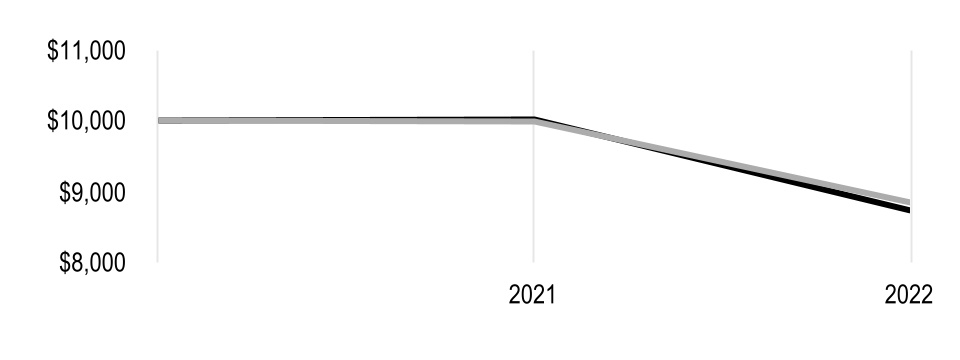
| Value on August 31, 2022 | |||||
| Net Asset Value — $8,727 | |||||
| Bloomberg U.S. Aggregate Bond Index — $8,841 | |||||
| Total Annual Fund Operating Expenses | |||||||||||||||||
| 0.15% | |||||||||||||||||
The total annual fund operating expenses shown is as stated in the fund’s prospectus current as of the date of this report. The prospectus may vary from the expense ratio shown elsewhere in this report because it is based on a different time period, includes acquired fund fees and expenses, and, if applicable, does not include fee waivers or expense reimbursements.
Data presented reflect past performance. Past performance is no guarantee of future results. Current performance may be higher or lower than the performance shown. Total returns for periods less than one year are not annualized. Investment return and principal value will fluctuate, and redemption value may be more or less than original cost. Data assumes reinvestment of dividends and capital gains, and none of the charts reflect the deduction of taxes that a shareholder would pay on fund distributions or the redemption of fund shares. To obtain performance data current to the most recent month end, please call 1-833-928-2684 or visit avantisinvestors.com. For additional information about the funds, please consult the prospectus.
3
| Portfolio Commentary | ||
Portfolio Managers: Eduardo Repetto, Hozef Arif, Mitchell Handa and Daniel Ong
Fund Strategy
Avantis Core Fixed Income ETF seeks to maximize total returns by investing primarily in investment-grade debt obligations across sectors, maturities and issuers.
In seeking securities with high expected returns, the portfolio managers use an analytical framework, which includes an assessment of securities’ expected income and capital appreciation. The portfolio managers categorize securities within the fund’s investment universe into component groups based on factors such as industry sector, credit rating, duration, country and currency. The portfolio managers then calculate the expected return implied by the yield curve of each component group. At the same time, they consider valuation metrics, such as yield, duration and option adjusted spreads. Finally, the portfolio managers adjust the weightings for each component group, with the goal of building a portfolio with enhanced expected return.
The fund is an actively managed exchange-traded fund (ETF) that does not seek to replicate the performance of a specified index. The portfolio managers continually analyze market and financial data to make buy, sell and hold decisions. When buying or selling a security, the portfolio managers may consider the trade-off between expected returns of the security and implementation or tax costs of the trade. They do this in an attempt to gain trading efficiencies, avoid unnecessary risk and enhance fund performance.
Performance Review
For the 12-month period ended August 31, 2022, Avantis Core Fixed Income ETF returned -13.07% on a market price basis. On a net asset value (NAV) basis, the fund returned -12.86%. NAV and market price returns reflect fees and operating expenses, while index returns do not.
The fund underperformed the Bloomberg U.S. Aggregate Bond Index, which returned -11.52% for the reporting period. The index is an unmanaged index generally representative of the performance of the broad U.S. taxable investment-grade bond market.
An overweight versus the index to corporates detracted from relative performance as spreads widened over the period. However, the fund’s yield curve positioning among corporate issuers helped mitigate relative underperformance.
4
| Fund Characteristics | ||
| AUGUST 31, 2022 | |||||
| Avantis Core Fixed Income ETF | |||||
| Types of Investments in Portfolio | % of net assets | ||||
| Corporate Bonds | 61.9% | ||||
| U.S. Treasury Securities | 25.1% | ||||
| U.S. Government Agency Mortgage-Backed Securities | 19.6% | ||||
| U.S. Government Agency Securities | 2.1% | ||||
| Sovereign Governments and Agencies | 0.2% | ||||
| Short-Term Investments | 10.2% | ||||
| Other Assets and Liabilities | (19.1)% | ||||
5
| Performance | ||
| Avantis Core Municipal Fixed Income ETF (AVMU) | |||||||||||||||||
| Total Returns as of August 31, 2022 | Average Annual Returns | ||||||||||||||||
| 1 year | Since Inception | Inception Date | |||||||||||||||
| Net Asset Value | -8.36% | -4.41% | 12/8/2020 | ||||||||||||||
| Market Price | -8.39% | -4.40% | 12/8/2020 | ||||||||||||||
| S&P National AMT-Free Municipal Bond Index | -8.34% | -3.90% | — | ||||||||||||||
Market price is determined using the bid/ask midpoint at 4:00 p.m. Eastern time, when the net asset value (NAV) is typically calculated. Market performance does not represent the returns you would receive if you traded shares at other times. NAV prices are used to calculate market price performance prior to the date when the fund first traded on the NYSE Arca, Inc.
| Growth of $10,000 Over Life of Fund | ||
| $10,000 investment made December 8, 2020 | ||
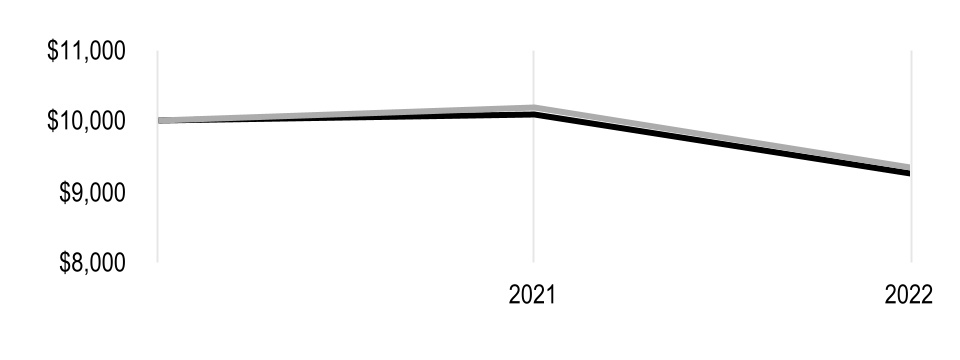
| Value on August 31, 2022 | |||||
| Net Asset Value — $9,249 | |||||
| S&P National AMT-Free Municipal Bond Index — $9,336 | |||||
| Total Annual Fund Operating Expenses | |||||||||||||||||
| 0.15% | |||||||||||||||||
The total annual fund operating expenses shown is as stated in the fund’s prospectus current as of the date of this report. The prospectus may vary from the expense ratio shown elsewhere in this report because it is based on a different time period, includes acquired fund fees and expenses, and, if applicable, does not include fee waivers or expense reimbursements.
Data presented reflect past performance. Past performance is no guarantee of future results. Current performance may be higher or lower than the performance shown. Total returns for periods less than one year are not annualized. Investment return and principal value will fluctuate, and redemption value may be more or less than original cost. Data assumes reinvestment of dividends and capital gains, and none of the charts reflect the deduction of taxes that a shareholder would pay on fund distributions or the redemption of fund shares. To obtain performance data current to the most recent month end, please call 1-833-928-2684 or visit avantisinvestors.com. For additional information about the funds, please consult the prospectus.
6
| Portfolio Commentary | ||
Portfolio Managers: Eduardo Repetto, Hozef Arif, Mitchell Handa and Daniel Ong
Fund Strategy
Avantis Core Municipal Fixed Income ETF seeks to generate current income exempt from federal income tax by investing primarily in municipal securities.
In seeking securities with high expected returns, the portfolio managers use an analytical framework, which includes an assessment of securities’ expected income and capital appreciation. The portfolio managers categorize securities within the fund’s investment universe into component groups based on factors such as industry sector, credit rating, duration, country and currency. The portfolio managers then calculate the expected return implied by the yield curve of each component group. At the same time, they consider valuation metrics, such as yield, duration and option adjusted spreads. Finally, the portfolio managers adjust the weightings for each component group, with the goal of building a portfolio with enhanced expected return.
The fund is an actively managed exchange-traded fund (ETF) that does not seek to replicate the performance of a specified index. The portfolio managers continually analyze market and financial data to make buy, sell and hold decisions. When buying or selling a security, the portfolio managers may consider the trade-off between expected returns of the security and implementation or tax costs of the trade. They do this in an attempt to gain trading efficiencies, avoid unnecessary risk and enhance fund performance.
Performance Review
For the 12-month period ended August 31, 2022, Avantis Core Municipal Fixed Income ETF returned -8.39% on a market price basis. On a net asset value (NAV) basis, the fund returned -8.36%. NAV and market price returns reflect fees and operating expenses, while index returns do not.
The fund performed in line with the S&P National AMT-Free Municipal Bond Index, which returned -8.34% for the reporting period. The index is a broad, comprehensive, market value-weighted index designed to measure the performance of the investment-grade tax-exempt U.S. municipal bond market.
The fund’s relative performance benefited from positioning on the yield curve (underweighting longer-dated bonds) and an underweight versus the index to issuers with BBB ratings. However, an overweight to issuers with AA ratings detracted and offset those positive effects.
7
| Fund Characteristics | ||
| AUGUST 31, 2022 | |||||
| Avantis Core Municipal Fixed Income ETF | |||||
| Types of Investments in Portfolio | % of net assets | ||||
| Municipal Securities | 98.6% | ||||
| Short-Term Investments | 0.3% | ||||
| Other Assets and Liabilities | 1.1% | ||||
| Top Five States and Territories | % of net assets | ||||
| California | 18.1% | ||||
| New York | 15.6% | ||||
| Texas | 7.6% | ||||
| Georgia | 4.1% | ||||
| Washington | 3.9% | ||||
| Top Five Sectors | % of fund investments | ||||
| Special Tax | 23% | ||||
| General Obligation (GO) - Local | 14% | ||||
| General Obligation (GO) - State | 12% | ||||
| Water & Sewer | 9% | ||||
| Public Power | 7% | ||||
8
| Performance | ||
| Avantis Short-Term Fixed Income ETF (AVSF) | |||||||||||||||||
| Total Returns as of August 31, 2022 | Average Annual Returns | ||||||||||||||||
| 1 year | Since Inception | Inception Date | |||||||||||||||
| Net Asset Value | -5.92% | -3.02% | 10/13/2020 | ||||||||||||||
| Market Price | -6.12% | -3.09% | 10/13/2020 | ||||||||||||||
| Bloomberg U.S. Aggregate Government/Credit 1-5 Year Index | -5.84% | -2.99% | — | ||||||||||||||
Market price is determined using the bid/ask midpoint at 4:00 p.m. Eastern time, when the net asset value (NAV) is typically calculated. Market performance does not represent the returns you would receive if you traded shares at other times. NAV prices are used to calculate market price performance prior to the date when the fund first traded on the NYSE Arca, Inc.
| Growth of $10,000 Over Life of Fund | ||
| $10,000 investment made October 13, 2020 | ||
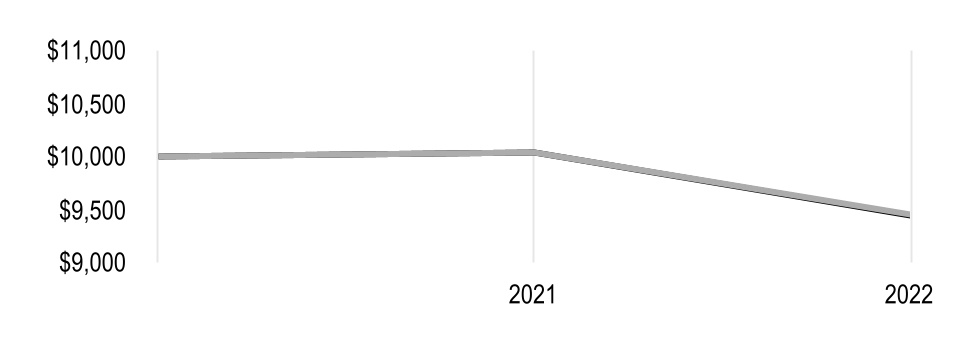
| Value on August 31, 2022 | |||||
| Net Asset Value — $9,439 | |||||
| Bloomberg U.S. Aggregate Government/Credit 1-5 Year Index — $9,444 | |||||
| Total Annual Fund Operating Expenses | |||||||||||||||||
| 0.15% | |||||||||||||||||
The total annual fund operating expenses shown is as stated in the fund’s prospectus current as of the date of this report. The prospectus may vary from the expense ratio shown elsewhere in this report because it is based on a different time period, includes acquired fund fees and expenses, and, if applicable, does not include fee waivers or expense reimbursements.
Data presented reflect past performance. Past performance is no guarantee of future results. Current performance may be higher or lower than the performance shown. Total returns for periods less than one year are not annualized. Investment return and principal value will fluctuate, and redemption value may be more or less than original cost. Data assumes reinvestment of dividends and capital gains, and none of the charts reflect the deduction of taxes that a shareholder would pay on fund distributions or the redemption of fund shares. To obtain performance data current to the most recent month end, please call 1-833-928-2684 or visit avantisinvestors.com. For additional information about the funds, please consult the prospectus.
9
| Portfolio Commentary | ||
Portfolio Managers: Eduardo Repetto, Hozef Arif, Mitchell Handa and Daniel Ong
Fund Strategy
Avantis Short-Term Fixed Income ETF seeks to maximize total returns by investing primarily in shorter-maturity investment-grade debt obligations across sectors, maturities and issuers.
In seeking securities with high expected returns, the portfolio managers use an analytical framework, which includes an assessment of securities’ expected income and capital appreciation. The portfolio managers categorize securities within the fund’s investment universe into component groups based on factors such as industry sector, credit rating, duration, country and currency. The portfolio managers then calculate the expected return implied by the yield curve of each component group. At the same time, they consider valuation metrics, such as yield, duration and option adjusted spreads. Finally, the portfolio managers adjust the weightings for each component group, with the goal of building a portfolio with enhanced expected return.
The fund is an actively managed exchange-traded fund (ETF) that does not seek to replicate the performance of a specified index. The portfolio managers continually analyze market and financial data to make buy, sell and hold decisions. When buying or selling a security, the portfolio managers may consider the trade-off between expected returns of the security and implementation or tax costs of the trade. They do this in an attempt to gain trading efficiencies, avoid unnecessary risk and enhance fund performance.
Performance Review
For the 12-month period ended August 31, 2022, Avantis Short-Term Fixed Income ETF returned -6.12% on a market price basis. On a net asset value (NAV) basis, the fund returned -5.92%. NAV and market price returns reflect fees and operating expenses, while index returns do not.
On a NAV basis, the fund performed in line with the Bloomberg U.S. Aggregate Government/Credit 1-5 Year Index, which returned -5.84% for the reporting period. The index is an unmanaged index generally representative of the performance of U.S. Treasury, government agency and corporate bonds with maturities between one and five years.
The fund’s overweight allocation versus the index to the corporate credit sector detracted from relative results. However, the fund’s yield curve positioning among corporate issuers added relative value.
10
| Fund Characteristics | ||
| AUGUST 31, 2022 | |||||
| Avantis Short-Term Fixed Income ETF | |||||
| Types of Investments in Portfolio | % of net assets | ||||
| Corporate Bonds | 66.7% | ||||
| U.S. Treasury Securities and Equivalents | 30.0% | ||||
| U.S. Government Agency Securities | 2.4% | ||||
| Other Assets and Liabilities | 0.9% | ||||
11
| Shareholder Fee Examples | ||
Fund shareholders may incur two types of costs: (1) transaction costs, including brokerage commissions paid on purchases and sales of fund shares; and (2) ongoing costs, including management fees and other fund expenses. This example is intended to help you understand your ongoing costs (in dollars) of investing in your fund and to compare these costs with the ongoing cost of investing in other funds.
The example is based on an investment of $1,000 made at the beginning of the period and held for the entire period from March 1, 2022 to August 31, 2022.
Actual Expenses
The table provides information about actual account values and actual expenses for each fund. You may use the information, together with the amount you invested, to estimate the expenses that you paid over the period. First, identify the fund you own. Then simply divide your account value by $1,000 (for example, an $8,600 account value divided by $1,000 = 8.6), then multiply the result by the number under the heading “Expenses Paid During Period” to estimate the expenses you paid on your account during this period.
Hypothetical Example for Comparison Purposes
The table also provides information about hypothetical account values and hypothetical expenses based on the actual expense ratio of your fund and an assumed rate of return of 5% per year before expenses, which is not the actual return of a fund. The hypothetical account values and expenses may not be used to estimate the actual ending account balance or expenses you paid for the period. You may use this information to compare the ongoing costs of investing in your fund and other funds. To do so, compare this 5% hypothetical example with the 5% hypothetical examples that appear in the shareholder reports of the other funds.
Please note that the expenses shown in the table are meant to highlight your ongoing costs only and do not reflect any transactional costs, such as brokerage commissions paid on purchases and sales of fund shares. Therefore, the table is useful in comparing ongoing costs only, and will not help you determine the relative total costs of owning different funds. In addition, if these transactional costs were included, your costs would have been higher.
| Beginning Account Value 3/1/22 | Ending Account Value 8/31/22 | Expenses Paid During Period(1) 3/1/22 - 8/31/22 | Annualized Expense Ratio(1) | |||||||||||
| Avantis Core Fixed Income ETF | ||||||||||||||
| Actual | $1,000 | $916.40 | $0.72 | 0.15% | ||||||||||
| Hypothetical | $1,000 | $1,024.45 | $0.77 | 0.15% | ||||||||||
| Avantis Core Municipal Fixed Income ETF | ||||||||||||||
| Actual | $1,000 | $947.80 | $0.74 | 0.15% | ||||||||||
| Hypothetical | $1,000 | $1,024.45 | $0.77 | 0.15% | ||||||||||
| Avantis Short-Term Fixed Income ETF | ||||||||||||||
| Actual | $1,000 | $966.80 | $0.74 | 0.15% | ||||||||||
| Hypothetical | $1,000 | $1,024.45 | $0.77 | 0.15% | ||||||||||
(1)Expenses are equal to the fund's annualized expense ratio listed in the table above, multiplied by the average account value over the period, multiplied by 184, the number of days in the most recent fiscal half-year, divided by 365, to reflect the one-half year period. Annualized expense ratio reflects actual expenses, including any applicable fee waivers or expense reimbursements and excluding any acquired fund fees and expenses.
12
| Schedules of Investments | ||
AUGUST 31, 2022
| Avantis Core Fixed Income ETF | ||||||||
| Principal Amount | Value | |||||||
| CORPORATE BONDS — 61.9% | ||||||||
| Aerospace and Defense — 1.4% | ||||||||
| Boeing Co., 2.20%, 2/4/26 | $ | 100,000 | $ | 91,548 | ||||
| Boeing Co., 2.80%, 3/1/27 | 25,000 | 22,782 | ||||||
| General Dynamics Corp., 3.625%, 4/1/30 | 307,000 | 296,208 | ||||||
| Huntington Ingalls Industries, Inc., 3.48%, 12/1/27 | 1,150,000 | 1,069,991 | ||||||
| Lockheed Martin Corp., 3.55%, 1/15/26 | 380,000 | 377,098 | ||||||
| Northrop Grumman Corp., 3.25%, 1/15/28 | 270,000 | 256,389 | ||||||
| Precision Castparts Corp., 3.25%, 6/15/25 | 393,000 | 388,714 | ||||||
| Raytheon Technologies Corp., 3.50%, 3/15/27 | 65,000 | 63,013 | ||||||
| Textron, Inc., 4.00%, 3/15/26 | 301,000 | 295,212 | ||||||
| Textron, Inc., 3.65%, 3/15/27 | 61,000 | 58,158 | ||||||
| Textron, Inc., 2.45%, 3/15/31 | 545,000 | 445,177 | ||||||
| 3,364,290 | ||||||||
| Air Freight and Logistics — 0.4% | ||||||||
| United Parcel Service, Inc., 3.90%, 4/1/25 | 1,023,000 | 1,024,813 | ||||||
| Airlines — 0.3% | ||||||||
| Southwest Airlines Co., 5.125%, 6/15/27 | 152,000 | 155,127 | ||||||
| Southwest Airlines Co., 2.625%, 2/10/30 | 761,000 | 640,666 | ||||||
| 795,793 | ||||||||
| Auto Components — 0.2% | ||||||||
| BorgWarner, Inc., 2.65%, 7/1/27 | 630,000 | 573,617 | ||||||
| Automobiles — 0.7% | ||||||||
| American Honda Finance Corp., 1.00%, 9/10/25 | 100,000 | 91,189 | ||||||
| American Honda Finance Corp., 2.35%, 1/8/27 | 330,000 | 306,079 | ||||||
| General Motors Co., 4.20%, 10/1/27 | 350,000 | 336,497 | ||||||
| General Motors Financial Co., Inc., 5.10%, 1/17/24 | 44,000 | 44,398 | ||||||
| Toyota Motor Credit Corp., 2.15%, 2/13/30 | 100,000 | 86,713 | ||||||
| Toyota Motor Credit Corp., 3.375%, 4/1/30 | 600,000 | 567,156 | ||||||
| Toyota Motor Credit Corp., 1.65%, 1/10/31 | 453,000 | 370,702 | ||||||
| 1,802,734 | ||||||||
| Banks — 8.0% | ||||||||
| African Development Bank, 0.75%, 4/3/23 | 110,000 | 108,282 | ||||||
| African Development Bank, 0.875%, 7/22/26 | 295,000 | 266,300 | ||||||
| Asian Development Bank, 2.625%, 1/30/24 | 125,000 | 123,451 | ||||||
| Asian Development Bank, 0.625%, 10/8/24 | 250,000 | 235,373 | ||||||
| Asian Development Bank, 0.375%, 9/3/25 | 851,000 | 773,650 | ||||||
| Asian Development Bank, 2.375%, 8/10/27 | 40,000 | 38,019 | ||||||
| Asian Infrastructure Investment Bank, 0.25%, 9/29/23 | 200,000 | 192,855 | ||||||
| Asian Infrastructure Investment Bank, 0.50%, 5/28/25 | 450,000 | 412,177 | ||||||
| Bank of Montreal, Series E, 3.30%, 2/5/24 | 235,000 | 232,877 | ||||||
| Bank of Nova Scotia, 3.40%, 2/11/24 | 163,000 | 161,663 | ||||||
| Citizens Financial Group, Inc., 2.50%, 2/6/30 | 200,000 | 168,581 | ||||||
| Council Of Europe Development Bank, 0.25%, 10/20/23 | 140,000 | 134,841 | ||||||
| Council Of Europe Development Bank, 2.50%, 2/27/24 | 135,000 | 133,057 | ||||||
| Discover Bank, 4.65%, 9/13/28 | 600,000 | 576,684 | ||||||
13
| Avantis Core Fixed Income ETF | ||||||||
| Principal Amount | Value | |||||||
| European Bank for Reconstruction & Development, 0.50%, 1/28/26 | $ | 100,000 | $ | 90,009 | ||||
| European Investment Bank, 3.125%, 12/14/23 | 100,000 | 99,501 | ||||||
| European Investment Bank, 0.625%, 7/25/25 | 770,000 | 708,238 | ||||||
| European Investment Bank, 1.375%, 3/15/27 | 342,000 | 312,128 | ||||||
| European Investment Bank, 4.875%, 2/15/36 | 130,000 | 148,529 | ||||||
| Fifth Third Bancorp, 3.65%, 1/25/24 | 243,000 | 241,562 | ||||||
| Fifth Third Bancorp, 2.55%, 5/5/27 | 955,000 | 880,334 | ||||||
| Inter-American Development Bank, 3.00%, 10/4/23 | 100,000 | 99,614 | ||||||
| Inter-American Development Bank, 0.625%, 7/15/25 | 460,000 | 422,807 | ||||||
| Inter-American Development Bank, 2.00%, 7/23/26 | 700,000 | 661,545 | ||||||
| Inter-American Development Bank, 2.375%, 7/7/27 | 255,000 | 242,548 | ||||||
| Inter-American Development Bank, 3.125%, 9/18/28 | 450,000 | 440,612 | ||||||
| Inter-American Development Bank, 1.125%, 1/13/31 | 585,000 | 490,000 | ||||||
| International Bank for Reconstruction & Development, 1.75%, 4/19/23 | 50,000 | 49,468 | ||||||
| International Bank for Reconstruction & Development, 0.875%, 7/15/26 | 239,000 | 216,135 | ||||||
| International Bank for Reconstruction & Development, 0.75%, 11/24/27 | 700,000 | 609,301 | ||||||
| International Bank for Reconstruction & Development, 0.875%, 5/14/30 | 480,000 | 398,153 | ||||||
| International Finance Corp., 2.875%, 7/31/23 | 50,000 | 49,650 | ||||||
| JPMorgan Chase & Co., 5.50%, 10/15/40 | 1,125,000 | 1,177,218 | ||||||
| Kreditanstalt fuer Wiederaufbau, 1.25%, 1/31/25 | 175,000 | 165,580 | ||||||
| Kreditanstalt fuer Wiederaufbau, 2.00%, 5/2/25 | 350,000 | 335,913 | ||||||
| Kreditanstalt fuer Wiederaufbau, 0.375%, 7/18/25 | 150,000 | 136,906 | ||||||
| Landwirtschaftliche Rentenbank, 2.00%, 1/13/25 | 415,000 | 399,985 | ||||||
| Landwirtschaftliche Rentenbank, 0.50%, 5/27/25 | 281,000 | 258,367 | ||||||
| Oesterreichische Kontrollbank AG, 2.875%, 3/13/23 | 75,000 | 74,785 | ||||||
| Oesterreichische Kontrollbank AG, 1.50%, 2/12/25 | 250,000 | 237,732 | ||||||
| PNC Financial Services Group, Inc., 3.15%, 5/19/27 | 1,237,000 | 1,185,099 | ||||||
| Santander Holdings USA, Inc., 3.45%, 6/2/25 | 360,000 | 344,332 | ||||||
| Santander Holdings USA, Inc., 4.40%, 7/13/27 | 685,000 | 660,156 | ||||||
| Sumitomo Mitsui Financial Group, Inc., 3.94%, 10/16/23 | 500,000 | 499,615 | ||||||
| Toronto-Dominion Bank, 0.75%, 1/6/26 | 350,000 | 312,915 | ||||||
| Toronto-Dominion Bank, 4.11%, 6/8/27 | 550,000 | 544,431 | ||||||
| Truist Financial Corp., 3.70%, 6/5/25 | 200,000 | 197,976 | ||||||
| US Bancorp, 3.95%, 11/17/25 | 710,000 | 710,718 | ||||||
| US Bancorp, 1.375%, 7/22/30 | 1,550,000 | 1,240,691 | ||||||
| Wells Fargo & Co., 3.55%, 9/29/25 | 885,000 | 870,179 | ||||||
| Wells Fargo & Co., 3.00%, 10/23/26 | 575,000 | 543,596 | ||||||
| Westpac Banking Corp., 3.40%, 1/25/28 | 240,000 | 229,610 | ||||||
| 19,843,748 | ||||||||
| Beverages — 1.3% | ||||||||
| Anheuser-Busch InBev Worldwide, Inc., 4.00%, 4/13/28 | 125,000 | 123,637 | ||||||
| Anheuser-Busch InBev Worldwide, Inc., 8.20%, 1/15/39 | 350,000 | 455,826 | ||||||
| Anheuser-Busch InBev Worldwide, Inc., 4.35%, 6/1/40 | 75,000 | 68,341 | ||||||
| Coca-Cola Co., 3.45%, 3/25/30 | 585,000 | 564,034 | ||||||
| Coca-Cola Co., 1.375%, 3/15/31 | 465,000 | 378,872 | ||||||
| Keurig Dr Pepper, Inc., 2.55%, 9/15/26 | 60,000 | 55,944 | ||||||
| Keurig Dr Pepper, Inc., 3.20%, 5/1/30 | 525,000 | 471,352 | ||||||
| Molson Coors Beverage Co., 3.00%, 7/15/26 | 256,000 | 239,965 | ||||||
14
| Avantis Core Fixed Income ETF | ||||||||
| Principal Amount | Value | |||||||
| PepsiCo, Inc., 3.00%, 10/15/27 | $ | 695,000 | $ | 672,637 | ||||
| PepsiCo, Inc., 1.625%, 5/1/30 | 270,000 | 228,184 | ||||||
| PepsiCo, Inc., 1.40%, 2/25/31 | 61,000 | 49,895 | ||||||
| 3,308,687 | ||||||||
| Biotechnology — 0.4% | ||||||||
| AbbVie, Inc., 3.20%, 11/21/29 | 300,000 | 274,237 | ||||||
| AbbVie, Inc., 4.50%, 5/14/35 | 735,000 | 699,968 | ||||||
| 974,205 | ||||||||
| Capital Markets — 3.7% | ||||||||
| Ameriprise Financial, Inc., 2.875%, 9/15/26 | 1,325,000 | 1,264,161 | ||||||
| BlackRock, Inc., 3.25%, 4/30/29 | 1,645,000 | 1,562,585 | ||||||
| Brookfield Finance, Inc., 3.90%, 1/25/28 | 1,360,000 | 1,286,658 | ||||||
| Charles Schwab Corp., 3.20%, 3/2/27 | 100,000 | 96,897 | ||||||
| Charles Schwab Corp., 2.75%, 10/1/29 | 1,216,000 | 1,096,430 | ||||||
| Charles Schwab Corp., 1.65%, 3/11/31 | 625,000 | 503,660 | ||||||
| Franklin Resources, Inc., 1.60%, 10/30/30 | 719,000 | 570,463 | ||||||
| Intercontinental Exchange, Inc., 4.35%, 6/15/29 | 50,000 | 49,379 | ||||||
| Lazard Group LLC, 4.375%, 3/11/29 | 1,018,000 | 976,250 | ||||||
| Morgan Stanley, 7.25%, 4/1/32 | 100,000 | 117,696 | ||||||
| Nasdaq, Inc., 3.85%, 6/30/26 | 1,000,000 | 986,436 | ||||||
| Nasdaq, Inc., 2.50%, 12/21/40 | 750,000 | 523,618 | ||||||
| S&P Global, Inc., 2.95%, 1/22/27 | 75,000 | 72,078 | ||||||
| 9,106,311 | ||||||||
| Chemicals — 2.8% | ||||||||
| Air Products and Chemicals, Inc., 1.50%, 10/15/25 | 720,000 | 671,620 | ||||||
| Dow Chemical Co., 4.80%, 11/30/28 | 1,000,000 | 1,007,904 | ||||||
| Eastman Chemical Co., 3.80%, 3/15/25 | 300,000 | 295,629 | ||||||
| EI du Pont de Nemours and Co., 2.30%, 7/15/30 | 850,000 | 734,878 | ||||||
| Linde, Inc., 3.20%, 1/30/26 | 80,000 | 78,493 | ||||||
| Mosaic Co., 4.05%, 11/15/27 | 25,000 | 24,270 | ||||||
| Mosaic Co., 5.45%, 11/15/33 | 1,265,000 | 1,279,997 | ||||||
| Nutrien Ltd., 2.95%, 5/13/30 | 735,000 | 652,216 | ||||||
| PPG Industries, Inc., 1.20%, 3/15/26 | 525,000 | 472,265 | ||||||
| RPM International, Inc., 4.55%, 3/1/29 | 956,000 | 915,254 | ||||||
| Westlake Corp., 3.60%, 8/15/26 | 120,000 | 116,277 | ||||||
| Westlake Corp., 3.375%, 6/15/30 | 755,000 | 677,759 | ||||||
| 6,926,562 | ||||||||
Commercial Services and Supplies† | ||||||||
| Waste Management, Inc., 1.15%, 3/15/28 | 50,000 | 42,438 | ||||||
| Construction and Engineering — 0.4% | ||||||||
| Quanta Services, Inc., 2.90%, 10/1/30 | 1,200,000 | 1,026,672 | ||||||
| Construction Materials — 0.1% | ||||||||
| Martin Marietta Materials, Inc., 3.50%, 12/15/27 | 298,000 | 284,851 | ||||||
| Consumer Finance — 0.2% | ||||||||
| Ally Financial, Inc., 2.20%, 11/2/28 | 600,000 | 495,940 | ||||||
| Synchrony Financial, 3.95%, 12/1/27 | 120,000 | 109,168 | ||||||
| 605,108 | ||||||||
| Containers and Packaging — 0.4% | ||||||||
| Sonoco Products Co., 2.85%, 2/1/32 | 550,000 | 460,404 | ||||||
| WRKCo, Inc., 3.375%, 9/15/27 | 68,000 | 64,111 | ||||||
| WRKCo, Inc., 4.90%, 3/15/29 | 400,000 | 399,616 | ||||||
| 924,131 | ||||||||
15
| Avantis Core Fixed Income ETF | ||||||||
| Principal Amount | Value | |||||||
| Diversified Financial Services — 0.5% | ||||||||
Corebridge Financial, Inc., 3.65%, 4/5/27(1) | $ | 100,000 | $ | 94,080 | ||||
| Equitable Holdings, Inc., 4.35%, 4/20/28 | 904,000 | 890,153 | ||||||
| National Rural Utilities Cooperative Finance Corp., 3.70%, 3/15/29 | 300,000 | 286,126 | ||||||
| 1,270,359 | ||||||||
| Electric Utilities — 4.2% | ||||||||
| Berkshire Hathaway Energy Co., 4.05%, 4/15/25 | 120,000 | 120,213 | ||||||
| Berkshire Hathaway Energy Co., 3.25%, 4/15/28 | 100,000 | 94,690 | ||||||
| DTE Electric Co., 2.25%, 3/1/30 | 950,000 | 826,641 | ||||||
| DTE Electric Co., Series C, 2.625%, 3/1/31 | 110,000 | 97,533 | ||||||
| Duke Energy Carolinas LLC, Series A, 6.00%, 12/1/28 | 1,157,000 | 1,240,818 | ||||||
| Duke Energy Florida LLC, 3.80%, 7/15/28 | 40,000 | 39,099 | ||||||
| Duke Energy Ohio, Inc., 2.125%, 6/1/30 | 210,000 | 177,201 | ||||||
| Entergy Arkansas LLC, 4.00%, 6/1/28 | 693,000 | 672,706 | ||||||
| Entergy Louisiana LLC, 2.40%, 10/1/26 | 200,000 | 185,454 | ||||||
| Entergy Louisiana LLC, 3.05%, 6/1/31 | 330,000 | 295,703 | ||||||
| Florida Power & Light Co., 3.125%, 12/1/25 | 65,000 | 64,148 | ||||||
| IPALCO Enterprises, Inc., 4.25%, 5/1/30 | 594,000 | 548,929 | ||||||
| MidAmerican Energy Co., 6.75%, 12/30/31 | 550,000 | 643,830 | ||||||
| PacifiCorp, 2.70%, 9/15/30 | 90,000 | 79,513 | ||||||
| PPL Electric Utilities Corp., 6.25%, 5/15/39 | 1,075,000 | 1,214,392 | ||||||
| Public Service Electric and Gas Co., 3.00%, 5/15/27 | 1,210,000 | 1,161,898 | ||||||
| Puget Energy, Inc., 2.38%, 6/15/28 | 545,000 | 474,735 | ||||||
| Puget Energy, Inc., 4.10%, 6/15/30 | 335,000 | 309,304 | ||||||
| Southwestern Electric Power Co., Series M, 4.10%, 9/15/28 | 510,000 | 493,404 | ||||||
| Union Electric Co., 2.95%, 3/15/30 | 1,312,000 | 1,194,787 | ||||||
| Wisconsin Power and Light Co., 3.00%, 7/1/29 | 464,000 | 425,309 | ||||||
| 10,360,307 | ||||||||
| Electronic Equipment, Instruments and Components — 0.8% | ||||||||
| Flex Ltd., 3.75%, 2/1/26 | 50,000 | 47,681 | ||||||
| Flex Ltd., 4.875%, 5/12/30 | 400,000 | 378,489 | ||||||
| Jabil, Inc., 3.00%, 1/15/31 | 940,000 | 785,332 | ||||||
| Trimble, Inc., 4.90%, 6/15/28 | 303,000 | 301,344 | ||||||
| Tyco Electronics Group SA, 3.125%, 8/15/27 | 425,000 | 404,272 | ||||||
| 1,917,118 | ||||||||
| Energy Equipment and Services — 0.3% | ||||||||
| Baker Hughes Holdings LLC / Baker Hughes Co.-Obligor, Inc., 3.34%, 12/15/27 | 245,000 | 229,427 | ||||||
| Schlumberger Investment SA, 2.65%, 6/26/30 | 459,000 | 405,174 | ||||||
| 634,601 | ||||||||
| Equity Real Estate Investment Trusts (REITs) — 6.4% | ||||||||
| Alexandria Real Estate Equities, Inc., 3.375%, 8/15/31 | 100,000 | 89,281 | ||||||
| American Homes 4 Rent LP, 4.25%, 2/15/28 | 859,000 | 821,622 | ||||||
| American Tower Corp., 3.60%, 1/15/28 | 210,000 | 195,245 | ||||||
| American Tower Corp., 2.90%, 1/15/30 | 1,400,000 | 1,210,395 | ||||||
| AvalonBay Communities, Inc., 3.20%, 1/15/28 | 810,000 | 758,321 | ||||||
| Boston Properties LP, 3.65%, 2/1/26 | 875,000 | 850,997 | ||||||
| Boston Properties LP, 3.25%, 1/30/31 | 425,000 | 366,708 | ||||||
| Brixmor Operating Partnership LP, 3.65%, 6/15/24 | 347,000 | 338,945 | ||||||
| Brixmor Operating Partnership LP, 3.90%, 3/15/27 | 695,000 | 659,375 | ||||||
| Camden Property Trust, 2.80%, 5/15/30 | 1,215,000 | 1,078,033 | ||||||
16
| Avantis Core Fixed Income ETF | ||||||||
| Principal Amount | Value | |||||||
| Corporate Office Properties LP, 2.25%, 3/15/26 | $ | 319,000 | $ | 286,190 | ||||
| Crown Castle, Inc., 2.10%, 4/1/31 | 1,146,000 | 914,122 | ||||||
| Digital Realty Trust LP, 3.60%, 7/1/29 | 1,400,000 | 1,291,061 | ||||||
| Equinix, Inc., 1.25%, 7/15/25 | 280,000 | 256,265 | ||||||
| Equinix, Inc., 2.00%, 5/15/28 | 662,000 | 569,415 | ||||||
| Highwoods Realty LP, 4.125%, 3/15/28 | 300,000 | 283,537 | ||||||
| Highwoods Realty LP, 2.60%, 2/1/31 | 329,000 | 262,933 | ||||||
| Kimco Realty Corp., 1.90%, 3/1/28 | 250,000 | 214,408 | ||||||
| Prologis LP, 3.25%, 10/1/26 | 400,000 | 386,256 | ||||||
| Prologis LP, 2.25%, 4/15/30 | 1,300,000 | 1,131,989 | ||||||
| Public Storage, 1.85%, 5/1/28 | 1,200,000 | 1,066,664 | ||||||
| Public Storage, 2.30%, 5/1/31 | 800,000 | 682,842 | ||||||
| Realty Income Corp., 3.65%, 1/15/28 | 260,000 | 249,481 | ||||||
| Realty Income Corp., 2.85%, 12/15/32 | 70,000 | 60,087 | ||||||
| Sun Communities Operating LP, 2.30%, 11/1/28 | 100,000 | 84,547 | ||||||
| UDR, Inc., 2.10%, 8/1/32 | 1,405,000 | 1,083,738 | ||||||
| Ventas Realty LP, 3.00%, 1/15/30 | 520,000 | 453,348 | ||||||
| Ventas Realty LP, 4.75%, 11/15/30 | 360,000 | 349,636 | ||||||
| 15,995,441 | ||||||||
| Food and Staples Retailing — 0.3% | ||||||||
| Walgreens Boots Alliance, Inc., 3.45%, 6/1/26 | 58,000 | 56,291 | ||||||
| Walgreens Boots Alliance, Inc., 3.20%, 4/15/30 | 375,000 | 334,671 | ||||||
| Walmart, Inc., 3.55%, 6/26/25 | 350,000 | 350,505 | ||||||
| 741,467 | ||||||||
| Food Products — 2.0% | ||||||||
| Archer-Daniels-Midland Co., 3.25%, 3/27/30 | 2,275,000 | 2,144,084 | ||||||
| Bunge Ltd. Finance Corp., 3.25%, 8/15/26 | 220,000 | 211,083 | ||||||
| Campbell Soup Co., 4.15%, 3/15/28 | 743,000 | 730,453 | ||||||
| General Mills, Inc., 3.20%, 2/10/27 | 325,000 | 313,385 | ||||||
| General Mills, Inc., 4.20%, 4/17/28 | 525,000 | 522,766 | ||||||
| Ingredion, Inc., 2.90%, 6/1/30 | 515,000 | 449,406 | ||||||
| Mondelez International, Inc., 1.50%, 2/4/31 | 919,000 | 725,674 | ||||||
| 5,096,851 | ||||||||
| Gas Utilities — 0.2% | ||||||||
| National Fuel Gas Co., 5.50%, 1/15/26 | 45,000 | 45,495 | ||||||
| Southern California Gas Co., 2.55%, 2/1/30 | 574,000 | 512,803 | ||||||
| 558,298 | ||||||||
| Health Care Equipment and Supplies — 0.6% | ||||||||
| Edwards Lifesciences Corp., 4.30%, 6/15/28 | 1,387,000 | 1,383,463 | ||||||
| Smith & Nephew PLC, 2.03%, 10/14/30 | 148,000 | 117,379 | ||||||
| 1,500,842 | ||||||||
| Health Care Providers and Services — 1.2% | ||||||||
| Cigna Corp., 3.20%, 3/15/40 | 1,050,000 | 826,202 | ||||||
| CVS Health Corp., 2.875%, 6/1/26 | 25,000 | 23,873 | ||||||
| HCA, Inc., 4.50%, 2/15/27 | 25,000 | 24,431 | ||||||
| HCA, Inc., 4.125%, 6/15/29 | 750,000 | 691,336 | ||||||
| UnitedHealth Group, Inc., 3.75%, 7/15/25 | 625,000 | 623,383 | ||||||
| UnitedHealth Group, Inc., 3.45%, 1/15/27 | 850,000 | 835,653 | ||||||
| 3,024,878 | ||||||||
| Hotels, Restaurants and Leisure — 0.7% | ||||||||
| Expedia Group, Inc., 3.25%, 2/15/30 | 350,000 | 303,162 | ||||||
17
| Avantis Core Fixed Income ETF | ||||||||
| Principal Amount | Value | |||||||
| Hyatt Hotels Corp., 4.85%, 3/15/26 | $ | 60,000 | $ | 60,397 | ||||
| McDonald's Corp., 4.70%, 12/9/35 | 50,000 | 49,691 | ||||||
| Starbucks Corp., 4.00%, 11/15/28 | 1,415,000 | 1,384,641 | ||||||
| 1,797,891 | ||||||||
| Household Durables — 0.1% | ||||||||
| Lennar Corp., 5.00%, 6/15/27 | 46,000 | 45,719 | ||||||
| Whirlpool Corp., 4.00%, 3/1/24 | 139,000 | 139,274 | ||||||
| 184,993 | ||||||||
| Industrial Conglomerates — 0.6% | ||||||||
| 3M Co., 5.70%, 3/15/37 | 1,380,000 | 1,467,779 | ||||||
| Insurance — 1.3% | ||||||||
| Athene Holding Ltd., 4.125%, 1/12/28 | 500,000 | 469,329 | ||||||
| Chubb INA Holdings, Inc., 3.15%, 3/15/25 | 525,000 | 516,712 | ||||||
| Chubb INA Holdings, Inc., 1.375%, 9/15/30 | 435,000 | 347,381 | ||||||
| First American Financial Corp., 4.00%, 5/15/30 | 66,000 | 59,204 | ||||||
| Hartford Financial Services Group, Inc., 2.80%, 8/19/29 | 105,000 | 93,113 | ||||||
| MetLife, Inc., 3.60%, 11/13/25 | 910,000 | 900,352 | ||||||
| Prudential PLC, 3.125%, 4/14/30 | 945,000 | 845,294 | ||||||
| Willis North America, Inc., 4.50%, 9/15/28 | 100,000 | 97,449 | ||||||
| 3,328,834 | ||||||||
| Interactive Media and Services — 0.4% | ||||||||
| Alphabet, Inc., 0.80%, 8/15/27 | 447,000 | 390,770 | ||||||
| Alphabet, Inc., 1.10%, 8/15/30 | 625,000 | 510,002 | ||||||
| 900,772 | ||||||||
| Internet and Direct Marketing Retail — 0.2% | ||||||||
| Amazon.com, Inc., 5.20%, 12/3/25 | 200,000 | 208,419 | ||||||
| Amazon.com, Inc., 1.20%, 6/3/27 | 276,000 | 245,501 | ||||||
| 453,920 | ||||||||
| IT Services — 1.4% | ||||||||
| Global Payments, Inc., 2.90%, 5/15/30 | 800,000 | 674,291 | ||||||
| International Business Machines Corp., 1.95%, 5/15/30 | 1,659,000 | 1,385,873 | ||||||
| Leidos, Inc., 4.375%, 5/15/30 | 1,090,000 | 1,007,870 | ||||||
| Western Union Co., 6.20%, 11/17/36 | 324,000 | 321,122 | ||||||
| 3,389,156 | ||||||||
| Leisure Products — 0.1% | ||||||||
| Hasbro, Inc., 3.50%, 9/15/27 | 286,000 | 271,115 | ||||||
| Machinery — 1.0% | ||||||||
| ABB Finance USA, Inc., 3.80%, 4/3/28 | 106,000 | 103,869 | ||||||
| Caterpillar Financial Services Corp., 3.65%, 12/7/23 | 140,000 | 140,196 | ||||||
| Caterpillar Financial Services Corp., 1.10%, 9/14/27 | 100,000 | 87,498 | ||||||
| IDEX Corp., 3.00%, 5/1/30 | 250,000 | 220,515 | ||||||
| John Deere Capital Corp., 3.05%, 1/6/28 | 468,000 | 450,045 | ||||||
| John Deere Capital Corp., 1.45%, 1/15/31 | 140,000 | 114,458 | ||||||
| Kennametal, Inc., 4.625%, 6/15/28 | 108,000 | 104,037 | ||||||
| Oshkosh Corp., 4.60%, 5/15/28 | 956,000 | 923,411 | ||||||
| Parker-Hannifin Corp., 4.20%, 11/21/34 | 425,000 | 398,025 | ||||||
| 2,542,054 | ||||||||
| Media — 1.1% | ||||||||
| Comcast Corp., 2.65%, 2/1/30 | 693,000 | 613,698 | ||||||
| Comcast Corp., 4.25%, 10/15/30 | 700,000 | 689,455 | ||||||
| Interpublic Group of Cos., Inc., 4.75%, 3/30/30 | 250,000 | 241,255 | ||||||
18
| Avantis Core Fixed Income ETF | ||||||||
| Principal Amount | Value | |||||||
| Walt Disney Co., 3.70%, 9/15/24 | $ | 750,000 | $ | 747,018 | ||||
| Walt Disney Co., 2.00%, 9/1/29 | 520,000 | 449,897 | ||||||
| Walt Disney Co., 6.55%, 3/15/33 | 45,000 | 51,886 | ||||||
| 2,793,209 | ||||||||
| Metals and Mining — 0.6% | ||||||||
| Kinross Gold Corp., 4.50%, 7/15/27 | 95,000 | 92,292 | ||||||
| Steel Dynamics, Inc., 3.25%, 1/15/31 | 1,540,000 | 1,332,573 | ||||||
| 1,424,865 | ||||||||
| Multi-Utilities — 0.2% | ||||||||
| Dominion Energy, Inc., 4.25%, 6/1/28 | 150,000 | 147,605 | ||||||
| San Diego Gas & Electric Co., 1.70%, 10/1/30 | 367,000 | 302,003 | ||||||
| 449,608 | ||||||||
| Multiline Retail — 0.8% | ||||||||
| Dollar Tree, Inc., 4.20%, 5/15/28 | 1,190,000 | 1,160,683 | ||||||
| Target Corp., 2.65%, 9/15/30 | 870,000 | 776,856 | ||||||
| 1,937,539 | ||||||||
| Oil, Gas and Consumable Fuels — 6.5% | ||||||||
| Boardwalk Pipelines LP, 4.80%, 5/3/29 | 700,000 | 671,748 | ||||||
| BP Capital Markets America, Inc., 3.63%, 4/6/30 | 1,060,000 | 1,005,113 | ||||||
| BP Capital Markets PLC, 3.28%, 9/19/27 | 90,000 | 86,238 | ||||||
| Burlington Resources LLC, 7.40%, 12/1/31 | 30,000 | 35,785 | ||||||
| Canadian Natural Resources Ltd., 2.95%, 7/15/30 | 563,000 | 491,189 | ||||||
| Cheniere Corpus Christi Holdings LLC, 5.125%, 6/30/27 | 894,000 | 893,285 | ||||||
| Chevron Corp., 1.55%, 5/11/25 | 545,000 | 514,491 | ||||||
| Chevron USA, Inc., 3.85%, 1/15/28 | 1,083,000 | 1,071,160 | ||||||
| Continental Resources, Inc., 4.375%, 1/15/28 | 600,000 | 565,932 | ||||||
| Devon Energy Corp., 4.50%, 1/15/30 | 600,000 | 569,767 | ||||||
| Enbridge, Inc., 3.125%, 11/15/29 | 320,000 | 289,652 | ||||||
| Energy Transfer LP, 4.95%, 5/15/28 | 600,000 | 587,318 | ||||||
| Enterprise Products Operating LLC, 3.35%, 3/15/23 | 220,000 | 219,645 | ||||||
| Enterprise Products Operating LLC, 3.70%, 2/15/26 | 80,000 | 79,065 | ||||||
| Equinor ASA, 3.70%, 3/1/24 | 70,000 | 70,011 | ||||||
| Equinor ASA, 2.875%, 4/6/25 | 450,000 | 437,960 | ||||||
| Exxon Mobil Corp., 3.04%, 3/1/26 | 375,000 | 365,369 | ||||||
| Exxon Mobil Corp., 2.44%, 8/16/29 | 665,000 | 600,266 | ||||||
| Exxon Mobil Corp., 2.61%, 10/15/30 | 512,000 | 458,027 | ||||||
| Kinder Morgan, Inc., 5.30%, 12/1/34 | 665,000 | 652,068 | ||||||
| Marathon Petroleum Corp., 4.70%, 5/1/25 | 40,000 | 40,274 | ||||||
| MPLX LP, 2.65%, 8/15/30 | 1,449,000 | 1,209,817 | ||||||
| Phillips 66, 3.90%, 3/15/28 | 540,000 | 518,134 | ||||||
| Pioneer Natural Resources Co., 1.90%, 8/15/30 | 1,075,000 | 877,357 | ||||||
| Shell International Finance BV, 3.25%, 5/11/25 | 305,000 | 300,063 | ||||||
| Shell International Finance BV, 2.50%, 9/12/26 | 460,000 | 436,138 | ||||||
| Shell International Finance BV, 2.75%, 4/6/30 | 1,025,000 | 921,113 | ||||||
| TotalEnergies Capital International SA, 2.43%, 1/10/25 | 247,000 | 238,946 | ||||||
| TransCanada PipeLines Ltd., 4.25%, 5/15/28 | 140,000 | 136,707 | ||||||
| Valero Energy Corp., 6.625%, 6/15/37 | 375,000 | 407,528 | ||||||
| Valero Energy Partners LP, 4.50%, 3/15/28 | 693,000 | 685,019 | ||||||
| Williams Cos., Inc., 4.00%, 9/15/25 | 855,000 | 846,257 | ||||||
| 16,281,442 | ||||||||
19
| Avantis Core Fixed Income ETF | ||||||||
| Principal Amount | Value | |||||||
| Pharmaceuticals — 2.1% | ||||||||
| Astrazeneca Finance LLC, 2.25%, 5/28/31 | $ | 350,000 | $ | 303,537 | ||||
| AstraZeneca PLC, 4.00%, 1/17/29 | 733,000 | 732,931 | ||||||
| Bristol-Myers Squibb Co., 1.45%, 11/13/30 | 426,000 | 348,277 | ||||||
| Eli Lilly & Co., 3.375%, 3/15/29 | 338,000 | 327,749 | ||||||
| Johnson & Johnson, 0.55%, 9/1/25 | 40,000 | 36,686 | ||||||
| Johnson & Johnson, 2.90%, 1/15/28 | 540,000 | 519,482 | ||||||
| Johnson & Johnson, 3.625%, 3/3/37 | 100,000 | 92,929 | ||||||
| Merck & Co., Inc., 0.75%, 2/24/26 | 420,000 | 379,984 | ||||||
| Merck & Co., Inc., 3.40%, 3/7/29 | 352,000 | 338,326 | ||||||
| Mylan, Inc., 4.55%, 4/15/28 | 100,000 | 93,985 | ||||||
| Novartis Capital Corp., 3.10%, 5/17/27 | 285,000 | 276,772 | ||||||
| Novartis Capital Corp., 2.20%, 8/14/30 | 175,000 | 154,052 | ||||||
| Royalty Pharma PLC, 2.20%, 9/2/30 | 1,000,000 | 812,176 | ||||||
| Sanofi, 3.625%, 6/19/28 | 835,000 | 811,634 | ||||||
| 5,228,520 | ||||||||
| Professional Services — 0.3% | ||||||||
| Verisk Analytics, Inc., 4.125%, 3/15/29 | 844,000 | 806,770 | ||||||
| Road and Rail — 0.1% | ||||||||
| Norfolk Southern Corp., 3.15%, 6/1/27 | 125,000 | 118,614 | ||||||
| Norfolk Southern Corp., 3.80%, 8/1/28 | 153,000 | 149,238 | ||||||
| 267,852 | ||||||||
| Semiconductors and Semiconductor Equipment — 2.6% | ||||||||
Broadcom, Inc., 2.60%, 2/15/33(1) | 825,000 | 635,014 | ||||||
Broadcom, Inc., 4.93%, 5/15/37(1) | 560,000 | 499,685 | ||||||
| Intel Corp., 4.60%, 3/25/40 | 473,000 | 453,340 | ||||||
| Lam Research Corp., 3.75%, 3/15/26 | 200,000 | 199,365 | ||||||
| Marvell Technology, Inc., 2.95%, 4/15/31 | 1,175,000 | 965,105 | ||||||
| Micron Technology, Inc., 4.19%, 2/15/27 | 325,000 | 316,655 | ||||||
| NVIDIA Corp., 2.85%, 4/1/30 | 749,000 | 676,903 | ||||||
| NVIDIA Corp., 2.00%, 6/15/31 | 400,000 | 338,098 | ||||||
| NXP BV / NXP Funding LLC, 5.55%, 12/1/28 | 560,000 | 570,378 | ||||||
| QUALCOMM, Inc., 3.25%, 5/20/27 | 1,835,000 | 1,791,722 | ||||||
| 6,446,265 | ||||||||
| Software — 1.2% | ||||||||
| Adobe, Inc., 2.30%, 2/1/30 | 583,000 | 519,203 | ||||||
| Autodesk, Inc., 2.85%, 1/15/30 | 1,000,000 | 888,717 | ||||||
| Microsoft Corp., 2.875%, 2/6/24 | 150,000 | 148,526 | ||||||
| Oracle Corp., 3.25%, 5/15/30 | 320,000 | 278,660 | ||||||
| Roper Technologies, Inc., 1.40%, 9/15/27 | 135,000 | 115,742 | ||||||
| VMware, Inc., 1.80%, 8/15/28 | 146,000 | 121,549 | ||||||
| VMware, Inc., 4.70%, 5/15/30 | 850,000 | 806,608 | ||||||
| 2,879,005 | ||||||||
| Specialty Retail — 1.4% | ||||||||
| AutoNation, Inc., 3.80%, 11/15/27 | 116,000 | 106,880 | ||||||
| AutoNation, Inc., 4.75%, 6/1/30 | 640,000 | 599,997 | ||||||
| Home Depot, Inc., 2.80%, 9/14/27 | 210,000 | 199,664 | ||||||
| Home Depot, Inc., 2.95%, 6/15/29 | 1,000,000 | 934,931 | ||||||
| Home Depot, Inc., 3.30%, 4/15/40 | 275,000 | 230,495 | ||||||
| O'Reilly Automotive, Inc., 4.35%, 6/1/28 | 175,000 | 173,502 | ||||||
| TJX Cos., Inc., 1.15%, 5/15/28 | 1,350,000 | 1,151,431 | ||||||
| 3,396,900 | ||||||||
20
| Avantis Core Fixed Income ETF | ||||||||
| Principal Amount | Value | |||||||
| Technology Hardware, Storage and Peripherals — 1.2% | ||||||||
| Apple, Inc., 3.25%, 2/23/26 | $ | 390,000 | $ | 383,412 | ||||
| Apple, Inc., 3.20%, 5/11/27 | 570,000 | 555,846 | ||||||
| Apple, Inc., 3.00%, 11/13/27 | 100,000 | 95,939 | ||||||
| Apple, Inc., 2.20%, 9/11/29 | 355,000 | 317,311 | ||||||
| Hewlett Packard Enterprise Co., 6.20%, 10/15/35 | 664,000 | 702,764 | ||||||
| HP, Inc., 3.40%, 6/17/30 | 1,210,000 | 1,052,993 | ||||||
| 3,108,265 | ||||||||
| Textiles, Apparel and Luxury Goods — 0.3% | ||||||||
| NIKE, Inc., 2.85%, 3/27/30 | 900,000 | 828,319 | ||||||
| Trading Companies and Distributors — 0.1% | ||||||||
| Air Lease Corp., 3.625%, 12/1/27 | 363,000 | 331,266 | ||||||
| Transportation Infrastructure — 0.3% | ||||||||
| FedEx Corp. 2020-1 Class AA Pass Through Trust, 1.875%, 8/20/35 | 895,734 | 782,879 | ||||||
| Wireless Telecommunication Services — 0.5% | ||||||||
| T-Mobile USA, Inc., 3.75%, 4/15/27 | 210,000 | 201,486 | ||||||
| T-Mobile USA, Inc., 2.55%, 2/15/31 | 374,000 | 311,599 | ||||||
| T-Mobile USA, Inc., 2.25%, 11/15/31 | 854,000 | 685,763 | ||||||
| 1,198,848 | ||||||||
TOTAL CORPORATE BONDS (Cost $167,723,907) | 154,202,188 | |||||||
| U.S. TREASURY SECURITIES — 25.1% | ||||||||
| U.S. Treasury Bonds, 1.125%, 8/15/40 | 2,136,000 | 1,441,758 | ||||||
| U.S. Treasury Bonds, 1.875%, 2/15/41 | 2,000,000 | 1,533,320 | ||||||
| U.S. Treasury Bonds, 2.25%, 5/15/41 | 1,585,000 | 1,293,013 | ||||||
| U.S. Treasury Bonds, 2.00%, 11/15/41 | 3,245,000 | 2,521,910 | ||||||
| U.S. Treasury Bonds, 2.75%, 8/15/42 | 5,025,000 | 4,418,859 | ||||||
| U.S. Treasury Bonds, 2.50%, 2/15/45 | 1,750,000 | 1,447,852 | ||||||
| U.S. Treasury Bonds, 2.875%, 8/15/45 | 2,400,000 | 2,123,719 | ||||||
| U.S. Treasury Notes, 0.875%, 1/31/24 | 3,450,000 | 3,325,881 | ||||||
| U.S. Treasury Notes, 2.25%, 3/31/24 | 4,150,000 | 4,071,053 | ||||||
| U.S. Treasury Notes, 0.375%, 4/15/24 | 3,350,000 | 3,186,426 | ||||||
| U.S. Treasury Notes, 1.50%, 11/30/24 | 4,950,000 | 4,740,785 | ||||||
U.S. Treasury Notes, 1.375%, 1/31/25(2) | 4,290,000 | 4,082,454 | ||||||
| U.S. Treasury Notes, 2.75%, 2/28/25 | 3,700,000 | 3,635,394 | ||||||
| U.S. Treasury Notes, 0.375%, 4/30/25 | 2,000,000 | 1,842,734 | ||||||
| U.S. Treasury Notes, 2.75%, 8/31/25 | 1,071,900 | 1,049,562 | ||||||
| U.S. Treasury Notes, 2.625%, 12/31/25 | 2,550,000 | 2,483,013 | ||||||
| U.S. Treasury Notes, 2.625%, 1/31/26 | 3,750,000 | 3,648,560 | ||||||
| U.S. Treasury Notes, 0.75%, 3/31/26 | 3,000,000 | 2,726,250 | ||||||
| U.S. Treasury Notes, 0.875%, 9/30/26 | 2,600,000 | 2,349,141 | ||||||
| U.S. Treasury Notes, 0.375%, 9/30/27 | 3,750,000 | 3,232,910 | ||||||
| U.S. Treasury Notes, 1.375%, 10/31/28 | 4,700,000 | 4,184,836 | ||||||
| U.S. Treasury Notes, 2.625%, 2/15/29 | 1,750,000 | 1,678,633 | ||||||
| U.S. Treasury Notes, 1.625%, 5/15/31 | 1,850,000 | 1,634,721 | ||||||
TOTAL U.S. TREASURY SECURITIES (Cost $66,307,501) | 62,652,784 | |||||||
| U.S. GOVERNMENT AGENCY MORTGAGE-BACKED SECURITIES — 19.6% | ||||||||
| Fixed-Rate U.S. Government Agency Mortgage-Backed Securities — 19.6% | ||||||||
| GNMA, 3.00%,TBA | 1,500,000 | 1,408,535 | ||||||
| GNMA, 3.50%,TBA | 6,000,000 | 5,786,953 | ||||||
21
| Avantis Core Fixed Income ETF | ||||||||
| Principal Amount | Value | |||||||
| GNMA, 4.50%,TBA | $ | 2,500,000 | $ | 2,501,172 | ||||
| GNMA, 3.50%,TBA | 4,500,000 | 4,335,821 | ||||||
| UMBS, 2.50%,TBA | 4,000,000 | 3,785,000 | ||||||
| UMBS, 3.00%,TBA | 3,000,000 | 2,906,133 | ||||||
| UMBS, 3.50%,TBA | 2,000,000 | 1,964,303 | ||||||
| UMBS, 3.00%,TBA | 3,000,000 | 2,903,203 | ||||||
| UMBS, 3.00%,TBA | 3,650,000 | 3,379,957 | ||||||
| UMBS, 3.50%,TBA | 2,500,000 | 2,382,617 | ||||||
| UMBS, 4.00%,TBA | 2,000,000 | 1,952,656 | ||||||
| UMBS, 4.50%,TBA | 3,000,000 | 2,982,656 | ||||||
| UMBS, 3.00%,TBA | 1,500,000 | 1,388,404 | ||||||
| UMBS, 3.50%,TBA | 7,900,000 | 7,524,473 | ||||||
| UMBS, 4.00%,TBA | 3,750,000 | 3,658,435 | ||||||
TOTAL U.S. GOVERNMENT AGENCY MORTGAGE-BACKED SECURITIES (Cost $49,449,290) | 48,860,318 | |||||||
| U.S. GOVERNMENT AGENCY SECURITIES — 2.1% | ||||||||
| Federal Farm Credit Banks Funding Corp., 1.125%, 1/6/25 | 100,000 | 94,685 | ||||||
| FHLB, 2.75%, 12/13/24 | 15,000 | 14,758 | ||||||
| FHLB, 2.375%, 3/14/25 | 50,000 | 48,653 | ||||||
| FHLB, 3.125%, 6/13/25 | 50,000 | 49,522 | ||||||
| FHLB, 0.375%, 9/4/25 | 125,000 | 113,940 | ||||||
| FHLB, 1.25%, 12/21/26 | 200,000 | 183,163 | ||||||
| FHLB, 3.00%, 3/12/27 | 50,000 | 49,146 | ||||||
| FHLB, 3.25%, 11/16/28 | 1,070,000 | 1,065,648 | ||||||
| FHLMC, 1.50%, 2/12/25 | 540,000 | 515,224 | ||||||
| FHLMC, 0.375%, 7/21/25 | 279,000 | 255,285 | ||||||
| FHLMC, 0.375%, 9/23/25 | 730,000 | 665,105 | ||||||
| FNMA, 2.50%, 2/5/24 | 30,000 | 29,616 | ||||||
| FNMA, 1.625%, 10/15/24 | 265,000 | 254,894 | ||||||
| FNMA, 0.625%, 4/22/25 | 125,000 | 115,771 | ||||||
| FNMA, 0.50%, 6/17/25 | 100,000 | 91,950 | ||||||
| FNMA, 0.375%, 8/25/25 | 100,000 | 91,241 | ||||||
| FNMA, 6.25%, 5/15/29 | 249,000 | 291,603 | ||||||
| FNMA, 7.125%, 1/15/30 | 105,000 | 130,649 | ||||||
| FNMA, 7.25%, 5/15/30 | 20,000 | 25,163 | ||||||
| FNMA, 6.625%, 11/15/30 | 125,000 | 153,064 | ||||||
| FNMA, 5.625%, 7/15/37 | 450,000 | 544,750 | ||||||
| Tennessee Valley Authority, 0.75%, 5/15/25 | 105,000 | 97,289 | ||||||
| Tennessee Valley Authority, 7.125%, 5/1/30 | 120,000 | 148,888 | ||||||
| Tennessee Valley Authority, 5.88%, 4/1/36 | 90,000 | 107,353 | ||||||
| Tennessee Valley Authority, Series A, 2.875%, 2/1/27 | 60,000 | 58,557 | ||||||
TOTAL U.S. GOVERNMENT AGENCY SECURITIES (Cost $5,535,967) | 5,195,917 | |||||||
| SOVEREIGN GOVERNMENTS AND AGENCIES — 0.2% | ||||||||
| Canada — 0.1% | ||||||||
| Export Development Canada, 2.625%, 2/21/24 | 300,000 | 295,824 | ||||||
| Sweden — 0.1% | ||||||||
| Svensk Exportkredit AB, 0.625%, 5/14/25 | 200,000 | 184,320 | ||||||
TOTAL SOVEREIGN GOVERNMENTS AND AGENCIES (Cost $497,115) | 480,144 | |||||||
22
| Avantis Core Fixed Income ETF | ||||||||
| Principal Amount | Value | |||||||
| SHORT-TERM INVESTMENTS — 10.2% | ||||||||
Treasury Bills(3) — 10.2% | ||||||||
| U.S. Treasury Bills, 1.69%, 9/6/22 | $ | 5,450,000 | $ | 5,448,484 | ||||
| U.S. Treasury Bills, 2.06%, 9/8/22 | 1,000,000 | 999,604 | ||||||
| U.S. Treasury Bills, 2.26%, 9/13/22 | 3,500,000 | 3,497,474 | ||||||
| U.S. Treasury Bills, 2.35%, 9/27/22 | 5,000,000 | 4,991,811 | ||||||
| U.S. Treasury Bills, 2.25%, 9/15/22 | 3,500,000 | 3,497,087 | ||||||
| U.S. Treasury Bills, 2.24%, 9/20/22 | 3,500,000 | 3,496,043 | ||||||
| U.S. Treasury Bills, 2.67%, 10/25/22 | 3,500,000 | 3,486,279 | ||||||
TOTAL SHORT-TERM INVESTMENTS (Cost $25,416,695) | 25,416,782 | |||||||
TOTAL INVESTMENT SECURITIES — 119.1% (Cost $314,930,475) | 296,808,133 | |||||||
| OTHER ASSETS AND LIABILITIES — (19.1)% | (47,676,466) | |||||||
| TOTAL NET ASSETS — 100.0% | $ | 249,131,667 | ||||||
| FUTURES CONTRACTS PURCHASED | ||||||||||||||
| Reference Entity | Contracts | Expiration Date | Notional Amount | Unrealized Appreciation (Depreciation)^ | ||||||||||
| U.S. Treasury Long Bonds | 35 | December 2022 | $ | 4,754,531 | $ | (27,732) | ||||||||
^Amount represents value and unrealized appreciation (depreciation).
| CENTRALLY CLEARED CREDIT DEFAULT SWAP AGREEMENTS | |||||||||||||||||||||||
| Reference Entity | Type‡ | Fixed Rate Received (Paid) Quarterly | Termination Date | Notional Amount | Premiums Paid (Received) | Unrealized Appreciation (Depreciation) | Value^ | ||||||||||||||||
| Markit CDX North America Investment Grade Index Series 38 | Sell | 1.00% | 6/20/27 | $ | 5,000,000 | $ | 38,289 | $ | (11,062) | $ | 27,227 | ||||||||||||
‡The maximum potential amount the fund could be required to deliver as a seller of credit protection if a credit event occurs as defined under the terms of the agreement is the notional amount. The maximum potential amount may be partially offset by any recovery values of the reference entities and upfront payments received upon entering into the agreement.
^The value for credit default swap agreements serves as an indicator of the current status of the payment/performance risk and represent the likelihood of an expected liability or profit at the period end. Increasing values in absolute terms when compared to the notional amount of the credit default swap agreement represent a deterioration of the referenced entity's credit soundness and an increased likelihood or risk of a credit event occurring as defined in the agreement.
23
| Avantis Core Fixed Income ETF | ||||||||
| NOTES TO SCHEDULE OF INVESTMENTS | ||||||||
| CDX | - | Credit Derivatives Indexes | ||||||
| FHLB | - | Federal Home Loan Bank | ||||||
| FHLMC | - | Federal Home Loan Mortgage Corporation | ||||||
| FNMA | - | Federal National Mortgage Association | ||||||
| GNMA | - | Government National Mortgage Association | ||||||
| TBA | - | To-Be-Announced. Security was purchased on a forward commitment basis with an approximate principal amount and maturity date. Actual principal amount and maturity date will be determined upon settlement. | ||||||
| UMBS | - | Uniform Mortgage-Backed Securities | ||||||
†Category is less than 0.05% of total net assets.
(1)Security was purchased pursuant to Rule 144A or Section 4(2) under the Securities Act of 1933 and may be sold in transactions exempt from registration, normally to qualified institutional investors. The aggregate value of these securities at the period end was $1,228,779, which represented 0.5% of total net assets.
(2)Security, or a portion thereof, has been pledged at the custodian bank or with a broker for collateral requirements on forward commitments, futures contracts and/or swap agreements. At the period end, the aggregate value of securities pledged was $385,407.
(3)The rate indicated is the yield to maturity at purchase for non-interest bearing securities. For interest bearing securities, the stated coupon rate is shown.
See Notes to Financial Statements.
24
AUGUST 31, 2022
| Avantis Core Municipal Fixed Income ETF | ||||||||
| Principal Amount | Value | |||||||
| MUNICIPAL SECURITIES — 98.6% | ||||||||
| Alabama — 2.4% | ||||||||
Alabama Federal Aid Highway Finance Authority Rev., 5.00%, 9/1/24(1) | $ | 100,000 | $ | 105,107 | ||||
Alabama Federal Aid Highway Finance Authority Rev., 4.00%, 9/1/27, Prerefunded at 100% of Par(1) | 50,000 | 53,658 | ||||||
| Alabama Public School and College Authority Rev., 5.00%, 11/1/37 | 200,000 | 224,171 | ||||||
| Alabama Public School and College Authority Rev., 5.00%, 11/1/39 | 250,000 | 278,752 | ||||||
| Alabama Public School and College Authority Rev., 4.00%, 11/1/40 | 200,000 | 198,947 | ||||||
| 860,635 | ||||||||
| Arizona — 1.8% | ||||||||
| Arizona Transportation Board Rev., 5.00%, 7/1/24 | 50,000 | 52,341 | ||||||
| Mesa Utility System Rev., 4.00%, 7/1/34 | 15,000 | 15,609 | ||||||
| Phoenix GO, 5.00%, 7/1/25 | 85,000 | 91,046 | ||||||
| Pima County Sewer System Rev., 5.00%, 7/1/24 | 25,000 | 26,148 | ||||||
| Pima County Sewer System Rev., 5.00%, 7/1/25 | 35,000 | 37,440 | ||||||
| Salt River Project Agricultural Improvement & Power District Rev., 5.00%, 1/1/31 | 30,000 | 32,918 | ||||||
| Salt River Project Agricultural Improvement & Power District Rev., 5.00%, 1/1/31 | 60,000 | 67,063 | ||||||
| Salt River Project Agricultural Improvement & Power District Rev., 5.00%, 1/1/38 | 40,000 | 43,125 | ||||||
| Salt River Project Agricultural Improvement & Power District Rev., 5.00%, 1/1/39 | 65,000 | 70,836 | ||||||
| Scottsdale Municipal Property Corp. Rev., 5.00%, 7/1/30 | 50,000 | 56,787 | ||||||
State of Arizona COP, 5.00%, 10/1/25(1) | 125,000 | 134,679 | ||||||
State of Arizona COP, 5.00%, 10/1/29(1) | 10,000 | 11,598 | ||||||
State of Arizona Lottery Rev., 5.00%, 7/1/29(1) | 30,000 | 34,570 | ||||||
| 674,160 | ||||||||
| California — 18.1% | ||||||||
| California Infrastructure & Economic Development Bank Rev., (University of California), 5.00%, 5/15/42 | 160,000 | 173,574 | ||||||
| California State Public Works Board Rev., 5.00%, 11/1/29 | 25,000 | 25,741 | ||||||
| California State Public Works Board Rev., (State of California Department of General Services), 5.00%, 5/1/25 | 40,000 | 42,653 | ||||||
| California State University Rev., 5.00%, 11/1/26 | 25,000 | 27,098 | ||||||
| California State University Rev., 5.00%, 11/1/36 | 200,000 | 215,105 | ||||||
| Chino Basin Regional Financing Authority Rev., (Inland Empire Utilities Agency), 4.00%, 11/1/25 | 25,000 | 26,199 | ||||||
Coast Community College District GO, 5.00%, 8/15/25, Prerefunded at 100% of Par(1) | 75,000 | 80,645 | ||||||
Coast Community College District GO, 5.00%, 8/15/25, Prerefunded at 100% of Par(1) | 40,000 | 43,011 | ||||||
Coast Community College District GO, Capital Appreciation, 0.00%, 8/1/27 (AGM)(2) | 50,000 | 43,604 | ||||||
| East Bay Municipal Utility District Water System Rev., 5.00%, 6/1/30 | 135,000 | 144,531 | ||||||
| East Bay Municipal Utility District Water System Rev., 5.00%, 6/1/33 | 30,000 | 33,431 | ||||||
| East Bay Municipal Utility District Water System Rev., 5.00%, 6/1/35 | 30,000 | 33,156 | ||||||
25
| Avantis Core Municipal Fixed Income ETF | ||||||||
| Principal Amount | Value | |||||||
| Eastern Municipal Water District Financing Authority Rev., 4.00%, 7/1/38 | $ | 60,000 | $ | 61,906 | ||||
| Los Angeles Community College District GO, 5.00%, 8/1/23 | 25,000 | 25,613 | ||||||
| Los Angeles Community College District GO, 5.00%, 8/1/24 | 10,000 | 10,498 | ||||||
| Los Angeles Community College District GO, 5.00%, 8/1/25 | 65,000 | 70,116 | ||||||
| Los Angeles Community College District GO, 5.00%, 6/1/26 | 60,000 | 66,001 | ||||||
| Los Angeles County Metropolitan Transportation Authority Sales Tax Revenue Rev., 5.00%, 7/1/37 | 60,000 | 65,785 | ||||||
| Los Angeles County Public Works Financing Authority Rev., (Los Angeles County), 5.00%, 12/1/39 | 650,000 | 677,022 | ||||||
| Los Angeles Department of Airports Rev., 5.00%, 5/15/36 | 35,000 | 38,788 | ||||||
| Los Angeles Department of Airports Rev., 5.00%, 5/15/37 | 200,000 | 220,972 | ||||||
| Los Angeles Department of Airports Rev., 4.00%, 5/15/39 | 10,000 | 10,082 | ||||||
| Los Angeles Department of Airports Rev., 5.00%, 5/15/39 | 200,000 | 219,935 | ||||||
| Los Angeles Department of Airports Rev., 4.00%, 5/15/40 | 75,000 | 75,438 | ||||||
| Los Angeles Department of Airports Rev., 5.00%, 5/15/40 | 65,000 | 71,110 | ||||||
| Los Angeles Department of Water & Power System Rev., 5.00%, 7/1/24 | 45,000 | 45,400 | ||||||
| Los Angeles Department of Water & Power System Rev., 5.00%, 7/1/24 | 25,000 | 26,217 | ||||||
| Los Angeles Department of Water & Power System Rev., 5.00%, 7/1/25 | 25,000 | 26,734 | ||||||
| Los Angeles Department of Water & Power System Rev., 5.00%, 7/1/27 | 50,000 | 52,341 | ||||||
| Los Angeles Department of Water & Power System Rev., 5.00%, 7/1/34 | 50,000 | 52,686 | ||||||
| Los Angeles Department of Water & Power System Rev., 5.00%, 7/1/40 | 75,000 | 83,127 | ||||||
| Los Angeles Unified School District GO, 3.00%, 7/1/35 | 45,000 | 41,279 | ||||||
| Los Angeles Unified School District GO, 3.00%, 7/1/45 | 150,000 | 116,642 | ||||||
| Los Rios Community College District GO, 3.00%, 8/1/25 | 15,000 | 15,250 | ||||||
| Municipal Improvement Corp. of Los Angeles Rev., 4.00%, 11/1/35 | 100,000 | 102,181 | ||||||
| Municipal Improvement Corp. of Los Angeles Rev., (Los Angeles), 5.00%, 11/1/24 | 80,000 | 84,465 | ||||||
| Municipal Improvement Corp. of Los Angeles Rev., (Los Angeles), 5.00%, 11/1/31 | 60,000 | 65,623 | ||||||
| Oakland Unified School District / Alameda County GO, 5.00%, 8/1/26 (AGM) | 120,000 | 128,746 | ||||||
| Peralta Community College District GO, 4.00%, 8/1/39 | 25,000 | 24,857 | ||||||
| Perris Union High School District GO, 4.00%, 9/1/43 (AGM) | 50,000 | 48,275 | ||||||
Riverside County Public Financing Authority Rev., (Riverside County), 4.125%, 11/1/25, Prerefunded at 100% of Par(1) | 10,000 | 10,545 | ||||||
| Sacramento City Financing Authority Rev., (Sacramento), 5.25%, 12/1/30 (Ambac) | 100,000 | 115,362 | ||||||
| Sacramento Municipal Utility District Rev., 5.00%, 8/15/23 | 25,000 | 25,626 | ||||||
| Sacramento Municipal Utility District Rev., 5.00%, 8/15/39 | 50,000 | 55,518 | ||||||
| San Diego Community College District GO, 5.00%, 8/1/27 | 10,000 | 10,983 | ||||||
| San Diego Community College District GO, 5.00%, 8/1/28 | 40,000 | 43,909 | ||||||
San Diego Community College District GO, 5.00%, 8/1/26, Prerefunded at 100% of Par(1) | 30,000 | 33,044 | ||||||
San Diego Community College District GO, 5.00%, 8/1/26, Prerefunded at 100% of Par(1) | 30,000 | 33,044 | ||||||
San Diego Community College District GO, 4.00%, 8/1/26, Prerefunded at 100% of Par(1) | 45,000 | 47,838 | ||||||
| San Diego Public Facilities Financing Authority Rev., (City of San Diego Water Utility Revenue), 5.00%, 8/1/28 | 60,000 | 65,770 | ||||||
26
| Avantis Core Municipal Fixed Income ETF | ||||||||
| Principal Amount | Value | |||||||
| San Diego Public Facilities Financing Authority Rev., (San Diego Sewer Utility Rev.), 5.00%, 5/15/29 | $ | 35,000 | $ | 38,247 | ||||
| San Diego Unified School District GO, 5.00%, 7/1/26 | 75,000 | 80,614 | ||||||
| San Diego Unified School District GO, 5.25%, 7/1/28 (AGM) | 35,000 | 40,404 | ||||||
San Diego Unified School District GO, Capital Appreciation, 0.00%, 7/1/30(2) | 40,000 | 31,566 | ||||||
| San Francisco City & County Airport Comm-San Francisco International Airport Rev., 5.00%, 5/1/32 | 20,000 | 22,433 | ||||||
| San Francisco City & County Airport Comm-San Francisco International Airport Rev., 5.00%, 5/1/35 | 40,000 | 44,127 | ||||||
| San Francisco Public Utilities Commission Water Rev., 5.00%, 11/1/24 | 25,000 | 26,439 | ||||||
| San Francisco Public Utilities Commission Water Rev., 5.00%, 11/1/34 | 85,000 | 92,594 | ||||||
| San Francisco Public Utilities Commission Water Rev., 4.00%, 11/1/35 | 10,000 | 10,170 | ||||||
| San Francisco Public Utilities Commission Water Rev., 5.00%, 11/1/36 | 35,000 | 36,957 | ||||||
San Jose Financing Authority Rev., (San Jose), 5.00%, 6/1/23, Prerefunded at 100% of Par(1) | 45,000 | 45,904 | ||||||
| Santa County Clara GO, 3.50%, 8/1/38 | 175,000 | 174,116 | ||||||
| Santa County Clara GO, 3.25%, 8/1/39 | 50,000 | 46,497 | ||||||
| State of California GO, 5.00%, 9/1/26 | 30,000 | 32,985 | ||||||
| State of California GO, 5.00%, 8/1/27 | 200,000 | 214,516 | ||||||
| State of California GO, 5.00%, 8/1/28 | 5,000 | 5,589 | ||||||
| State of California GO, 5.00%, 4/1/30 | 5,000 | 5,836 | ||||||
| State of California GO, 5.00%, 4/1/30 | 20,000 | 23,005 | ||||||
| State of California GO, 5.00%, 9/1/31 | 50,000 | 54,691 | ||||||
| State of California GO, 5.00%, 10/1/31 | 15,000 | 17,352 | ||||||
| State of California GO, 5.25%, 8/1/32 (AGM) | 230,000 | 279,395 | ||||||
| State of California GO, 4.00%, 9/1/33 | 60,000 | 62,305 | ||||||
| State of California GO, 4.00%, 10/1/34 | 40,000 | 41,765 | ||||||
| State of California GO, 5.00%, 3/1/35 | 70,000 | 79,098 | ||||||
| State of California GO, 3.00%, 10/1/35 | 300,000 | 285,885 | ||||||
| State of California GO, 4.00%, 10/1/35 | 200,000 | 209,662 | ||||||
| State of California GO, 4.00%, 3/1/36 | 145,000 | 149,848 | ||||||
| State of California GO, 4.00%, 10/1/36 | 50,000 | 51,527 | ||||||
| State of California GO, 4.00%, 11/1/36 | 50,000 | 51,738 | ||||||
| State of California GO, 3.00%, 10/1/37 | 90,000 | 81,820 | ||||||
State of California Department of Water Resources Rev., 5.00%, 6/1/23, Prerefunded at 100% of Par(1) | 25,000 | 25,511 | ||||||
State of California Department of Water Resources Rev., 5.00%, 12/1/24, Prerefunded at 100% of Par(1) | 145,000 | 153,622 | ||||||
| University of California Rev., 5.00%, 5/15/29 | 35,000 | 37,379 | ||||||
| University of California Rev., 5.00%, 5/15/34 | 50,000 | 55,928 | ||||||
| University of California Rev., 5.00%, 5/15/36 | 65,000 | 70,812 | ||||||
| University of California Rev., 5.00%, 5/15/38 | 30,000 | 32,922 | ||||||
| University of California Rev., 5.00%, 5/15/38 | 30,000 | 33,765 | ||||||
| 6,604,500 | ||||||||
| Colorado — 2.0% | ||||||||
| City & County of Denver GO, 5.00%, 8/1/30 | 325,000 | 380,890 | ||||||
| City & County of Denver Airport System Rev., 5.00%, 11/15/23 | 50,000 | 51,567 | ||||||
| City & County of Denver Airport System Rev., 5.00%, 11/15/24 | 30,000 | 31,630 | ||||||
E-470 Public Highway Authority Rev., Capital Appreciation, 0.00%, 9/1/24 (NATL)(2) | 55,000 | 51,716 | ||||||
27
| Avantis Core Municipal Fixed Income ETF | ||||||||
| Principal Amount | Value | |||||||
E-470 Public Highway Authority Rev., Capital Appreciation, 0.00%, 9/1/30 (NATL)(2) | $ | 80,000 | $ | 59,674 | ||||
| Regional Transportation District Sales Tax Rev., 5.00%, 11/1/28 | 30,000 | 34,233 | ||||||
| State of Colorado COP, 5.00%, 12/15/32 | 50,000 | 57,213 | ||||||
| State of Colorado COP, 4.00%, 12/15/37 | 40,000 | 40,288 | ||||||
| State of Colorado COP, 4.00%, 12/15/38 | 30,000 | 30,015 | ||||||
| 737,226 | ||||||||
| Connecticut — 1.6% | ||||||||
| Connecticut State Health & Educational Facilities Authority Rev., (Quinnipiac University), 4.125%, 7/1/41 | 75,000 | 72,988 | ||||||
| State of Connecticut GO, 5.00%, 10/15/22 | 25,000 | 25,080 | ||||||
| State of Connecticut GO, 5.00%, 5/15/24 | 30,000 | 31,250 | ||||||
| State of Connecticut GO, 5.00%, 4/15/25 | 25,000 | 26,560 | ||||||
| State of Connecticut GO, 5.00%, 1/15/26 | 35,000 | 37,774 | ||||||
| State of Connecticut GO, 5.00%, 11/15/31 | 30,000 | 32,138 | ||||||
| State of Connecticut GO, 3.00%, 1/15/32 | 20,000 | 19,349 | ||||||
| State of Connecticut Special Tax Rev., 5.00%, 9/1/29 | 40,000 | 43,535 | ||||||
| State of Connecticut Special Tax Rev., 5.00%, 8/1/31 | 25,000 | 26,643 | ||||||
| State of Connecticut Special Tax Rev., 5.00%, 5/1/33 | 25,000 | 28,590 | ||||||
| State of Connecticut Special Tax Rev., 5.00%, 5/1/37 | 75,000 | 82,881 | ||||||
| State of Connecticut Special Tax Rev., 3.125%, 5/1/40 | 75,000 | 64,356 | ||||||
| University of Connecticut Rev., 4.00%, 4/15/38 | 95,000 | 93,296 | ||||||
| 584,440 | ||||||||
| District of Columbia — 3.0% | ||||||||
| District of Columbia GO, 5.00%, 6/1/28 | 35,000 | 35,671 | ||||||
| District of Columbia GO, 5.00%, 10/15/30 | 100,000 | 114,308 | ||||||
| District of Columbia GO, 5.00%, 6/1/31 | 120,000 | 124,706 | ||||||
| District of Columbia GO, 5.00%, 6/1/33 | 60,000 | 62,103 | ||||||
| District of Columbia Rev., (Georgetown University), 5.00%, 4/1/32 | 10,000 | 10,731 | ||||||
| District of Columbia Rev., (Georgetown University), 5.00%, 4/1/33 | 25,000 | 26,747 | ||||||
| District of Columbia Rev., (Georgetown University), 5.00%, 4/1/34 | 100,000 | 106,681 | ||||||
| District of Columbia Rev., (Income Tax Revenue), 4.00%, 3/1/37 | 360,000 | 365,968 | ||||||
| District of Columbia Rev., (Income Tax Revenue), 5.00%, 3/1/38 | 100,000 | 111,128 | ||||||
| Washington Metropolitan Area Transit Authority Rev., 5.00%, 7/1/37 | 25,000 | 26,988 | ||||||
| Washington Metropolitan Area Transit Authority Rev., 5.00%, 7/15/37 | 85,000 | 94,141 | ||||||
| 1,079,172 | ||||||||
| Florida — 3.4% | ||||||||
Broward County Airport System Rev., 5.00%, 10/1/22, Prerefunded at 100% of Par(1) | 50,000 | 50,112 | ||||||
| Broward County Water & Sewer Utility Rev., 5.00%, 10/1/38 | 15,000 | 16,547 | ||||||
| Central Florida Expressway Authority Rev., 4.00%, 7/1/31 | 10,000 | 10,321 | ||||||
| Central Florida Expressway Authority Rev., 3.25%, 7/1/36 | 60,000 | 56,713 | ||||||
| Central Florida Expressway Authority Rev., 4.00%, 7/1/37 | 95,000 | 95,936 | ||||||
| Hillsborough County School Board COP, 5.00%, 7/1/26 | 105,000 | 111,608 | ||||||
| Miami-Dade County GO, 4.00%, 7/1/33 | 50,000 | 50,995 | ||||||
| Miami-Dade County Water & Sewer System Rev., 5.00%, 10/1/23 | 10,000 | 10,279 | ||||||
28
| Avantis Core Municipal Fixed Income ETF | ||||||||
| Principal Amount | Value | |||||||
| Miami-Dade County Water & Sewer System Rev., 5.00%, 10/1/24 | $ | 50,000 | $ | 52,614 | ||||
Miami-Dade County Water & Sewer System Rev., 5.00%, 10/1/23, Prerefunded at 100% of Par(1) | 80,000 | 82,270 | ||||||
| Miami-Dade County Water & Sewer System Rev., 3.125%, 10/1/39 | 25,000 | 21,819 | ||||||
| Orange County Convention Center/Orlando Rev., 5.00%, 10/1/24 | 80,000 | 83,900 | ||||||
| Orange County School Board COP, 5.00%, 8/1/34 | 90,000 | 96,995 | ||||||
| Palm Beach County School District COP, 5.00%, 8/1/29 | 130,000 | 145,562 | ||||||
| Palm Beach County School District COP, 5.00%, 8/1/31 | 50,000 | 52,789 | ||||||
| School Board of Miami-Dade County COP, 5.00%, 2/1/25 | 60,000 | 63,446 | ||||||
| School Board of Miami-Dade County COP, 5.00%, 2/1/27 | 80,000 | 85,743 | ||||||
| School Board of Miami-Dade County COP, 5.00%, 5/1/30 | 60,000 | 62,838 | ||||||
| School District of Broward County COP, 5.00%, 7/1/32 | 25,000 | 28,159 | ||||||
| Tampa Bay Water Rev., 5.50%, 10/1/24 (NATL) | 55,000 | 58,338 | ||||||
| 1,236,984 | ||||||||
| Georgia — 4.1% | ||||||||
| Atlanta Department of Aviation Rev., 5.00%, 7/1/27 | 10,000 | 11,095 | ||||||
| Atlanta Water & Wastewater Rev., 5.75%, 11/1/30 (AGM) | 10,000 | 12,136 | ||||||
| Atlanta Water & Wastewater Rev., 5.00%, 11/1/40 | 15,000 | 15,758 | ||||||
| DeKalb County Water & Sewerage Rev., 5.25%, 10/1/32 (AGM) | 75,000 | 82,333 | ||||||
| Fulton County Water & Sewerage Rev., 3.00%, 1/1/40 | 150,000 | 130,015 | ||||||
| Georgia State Road & Tollway Authority Rev., 5.00%, 6/1/30 | 80,000 | 92,596 | ||||||
| Gwinnett County School District GO, 4.00%, 2/1/37 | 200,000 | 207,989 | ||||||
| Metropolitan Atlanta Rapid Transit Authority Rev., 5.00%, 7/1/33 | 310,000 | 335,067 | ||||||
| Metropolitan Atlanta Rapid Transit Authority Rev., 3.25%, 7/1/37 | 45,000 | 41,902 | ||||||
| Metropolitan Atlanta Rapid Transit Authority Rev., 3.25%, 7/1/39 | 260,000 | 237,955 | ||||||
| Private Colleges & Universities Authority Rev., (Emory University), 5.00%, 9/1/29 | 20,000 | 23,129 | ||||||
| Private Colleges & Universities Authority Rev., (Emory University), 4.00%, 9/1/38 | 250,000 | 252,536 | ||||||
| Private Colleges & Universities Authority Rev., (Emory University), 4.00%, 9/1/39 | 50,000 | 50,162 | ||||||
| 1,492,673 | ||||||||
| Hawaii — 1.4% | ||||||||
| City & County Honolulu Wastewater System Rev., 3.00%, 7/1/41 | 90,000 | 74,357 | ||||||
| City & County of Honolulu GO, 5.00%, 3/1/25 | 45,000 | 47,840 | ||||||
| City & County of Honolulu GO, 5.00%, 9/1/30 | 185,000 | 209,297 | ||||||
| City & County of Honolulu GO, 5.00%, 3/1/31 | 45,000 | 52,036 | ||||||
| State of Hawaii GO, 5.00%, 1/1/36 | 35,000 | 38,555 | ||||||
| State of Hawaii GO, 3.00%, 4/1/36 | 30,000 | 27,179 | ||||||
| State of Hawaii GO, 4.00%, 5/1/36 | 10,000 | 10,195 | ||||||
| State of Hawaii Airports System Rev., 5.00%, 7/1/33 | 35,000 | 39,306 | ||||||
| 498,765 | ||||||||
| Illinois — 3.2% | ||||||||
| Chicago O'Hare International Airport Rev., 5.25%, 1/1/29 | 5,000 | 5,043 | ||||||
| Chicago O'Hare International Airport Rev., 5.00%, 1/1/30 | 45,000 | 47,228 | ||||||
| Chicago O'Hare International Airport Rev., 5.00%, 1/1/32 | 5,000 | 5,229 | ||||||
| Chicago O'Hare International Airport Rev., 5.00%, 1/1/32 | 25,000 | 26,556 | ||||||
| Chicago O'Hare International Airport Rev., 5.00%, 1/1/34 | 25,000 | 26,398 | ||||||
| Chicago O'Hare International Airport Rev., 5.00%, 1/1/35 | 90,000 | 96,080 | ||||||
| Cook County Sales Tax Rev., 4.00%, 11/15/40 | 105,000 | 101,521 | ||||||
29
| Avantis Core Municipal Fixed Income ETF | ||||||||
| Principal Amount | Value | |||||||
| Illinois Finance Authority Rev., (DePaul University), 4.00%, 10/1/40 | $ | 135,000 | $ | 126,646 | ||||
| Illinois Finance Authority Rev., (State of Illinois Water Revolving Fund - Clean Water Program), 5.00%, 7/1/35 | 25,000 | 26,983 | ||||||
| Illinois Finance Authority Rev., (State of Illinois Water Revolving Fund - Clean Water Program), 4.00%, 7/1/38 | 90,000 | 90,239 | ||||||
| Illinois State Toll Highway Authority Rev., 5.00%, 1/1/28 | 20,000 | 22,404 | ||||||
| Illinois State Toll Highway Authority Rev., 5.00%, 1/1/30 | 25,000 | 28,640 | ||||||
| Illinois State Toll Highway Authority Rev., 5.00%, 1/1/31 | 30,000 | 34,326 | ||||||
| Illinois State Toll Highway Authority Rev., 5.00%, 1/1/41 | 75,000 | 78,874 | ||||||
| Metropolitan Water Reclamation District of Greater Chicago GO, 5.00%, 12/1/25 | 100,000 | 107,136 | ||||||
| Sales Tax Securitization Corp. Rev., 5.50%, 1/1/32 | 10,000 | 11,216 | ||||||
| Sales Tax Securitization Corp. Rev., 5.00%, 1/1/37 (BAM) | 150,000 | 162,627 | ||||||
| Springfield Electric Rev., 4.00%, 3/1/40 (AGM) | 20,000 | 20,048 | ||||||
| State of Illinois GO, 5.00%, 2/1/26 | 40,000 | 42,052 | ||||||
| State of Illinois GO, 5.00%, 3/1/34 | 40,000 | 42,732 | ||||||
| State of Illinois GO, 5.00%, 5/1/35 | 35,000 | 35,726 | ||||||
| State of Illinois GO, 4.00%, 11/1/38 | 20,000 | 18,801 | ||||||
| State of Illinois GO, 5.50%, 5/1/39 | 15,000 | 16,297 | ||||||
| State of Illinois Rev., 5.00%, 6/15/26 | 15,000 | 15,228 | ||||||
| 1,188,030 | ||||||||
| Indiana — 1.1% | ||||||||
| Indiana Finance Authority Rev., (CWA Authority, Inc.), 4.00%, 10/1/36 | 390,000 | 393,308 | ||||||
| Kentucky — 1.5% | ||||||||
| Kentucky State Property & Building Commission Rev., (Kentucky Finance and Administration Cabinet), 5.00%, 11/1/25 | 50,000 | 53,356 | ||||||
| Louisville and Jefferson County Metropolitan Sewer District Rev., 4.00%, 5/15/36 | 500,000 | 501,976 | ||||||
| 555,332 | ||||||||
| Louisiana — 0.3% | ||||||||
East Baton Rouge Sewerage Commission Rev., 5.00%, 2/1/25, Prerefunded at 100% of Par(1) | 35,000 | 37,146 | ||||||
| State of Louisiana GO, 5.00%, 8/1/27 | 75,000 | 81,816 | ||||||
| 118,962 | ||||||||
| Maryland — 1.8% | ||||||||
| Montgomery County GO, 5.00%, 11/1/24 | 35,000 | 36,961 | ||||||
| Prince County George's GO, 5.00%, 7/15/31 | 100,000 | 113,351 | ||||||
| State of Maryland GO, 5.00%, 3/15/23 | 45,000 | 45,660 | ||||||
| State of Maryland GO, 5.00%, 3/15/25 | 25,000 | 26,633 | ||||||
| State of Maryland GO, 5.00%, 3/15/29 | 25,000 | 28,817 | ||||||
| State of Maryland GO, 5.00%, 8/1/30 | 15,000 | 17,615 | ||||||
| State of Maryland GO, 5.00%, 3/15/31 | 25,000 | 27,633 | ||||||
| State of Maryland GO, 3.25%, 3/15/32 | 25,000 | 25,247 | ||||||
| State of Maryland GO, 5.00%, 8/1/35 | 35,000 | 39,995 | ||||||
| State of Maryland GO, 5.00%, 6/1/36 | 150,000 | 175,043 | ||||||
| State of Maryland Department of Transportation Rev., 5.00%, 11/1/23 | 55,000 | 56,599 | ||||||
| State of Maryland Department of Transportation Rev., 2.125%, 10/1/31 | 70,000 | 62,265 | ||||||
| 655,819 | ||||||||
| Massachusetts — 3.2% | ||||||||
| Massachusetts GO, 5.50%, 8/1/30 (Ambac) | 150,000 | 178,531 | ||||||
30
| Avantis Core Municipal Fixed Income ETF | ||||||||
| Principal Amount | Value | |||||||
| Massachusetts GO, 5.00%, 9/1/30 | $ | 10,000 | $ | 11,499 | ||||
| Massachusetts GO, 5.00%, 2/1/35 | 50,000 | 54,094 | ||||||
| Massachusetts GO, 3.00%, 7/1/35 | 100,000 | 92,874 | ||||||
| Massachusetts GO, 5.00%, 9/1/37 | 50,000 | 54,737 | ||||||
| Massachusetts GO, 5.00%, 11/1/41 | 55,000 | 59,418 | ||||||
| Massachusetts GO, 5.00%, 11/1/45 | 75,000 | 82,151 | ||||||
| Massachusetts GO, 5.00%, 11/1/50 | 75,000 | 81,794 | ||||||
| Massachusetts Development Finance Agency Rev., (Northeastern University), 5.00%, 3/1/39 | 75,000 | 76,043 | ||||||
| Massachusetts Development Finance Agency Rev., (President and Fellows of Harvard College), 5.00%, 10/15/29 | 10,000 | 11,668 | ||||||
| Massachusetts School Building Authority Rev., 5.00%, 11/15/33 | 25,000 | 27,169 | ||||||
| Massachusetts School Building Authority Rev., 5.00%, 8/15/37 | 60,000 | 63,543 | ||||||
| Massachusetts Transportation Fund Rev., 5.00%, 6/1/25 | 150,000 | 160,368 | ||||||
| Massachusetts Transportation Trust Fund Metropolitan Highway System Rev., 5.00%, 1/1/33 | 155,000 | 172,636 | ||||||
| Massachusetts Water Resources Authority Rev., 5.00%, 8/1/23 | 60,000 | 61,472 | ||||||
| 1,187,997 | ||||||||
| Michigan — 0.9% | ||||||||
| Michigan Finance Authority Rev., (Detroit), 4.50%, 10/1/29 | 40,000 | 40,497 | ||||||
| Michigan Finance Authority Rev., (Great Lakes Water Authority Sewage Disposal System Rev.), 5.00%, 7/1/26 (AGM) | 25,000 | 26,139 | ||||||
| Michigan State Building Authority Rev., 5.00%, 4/15/30 | 30,000 | 32,095 | ||||||
| Michigan State Building Authority Rev., 5.00%, 10/15/30 | 10,000 | 10,883 | ||||||
| State of Michigan Trunk Line Rev., 5.00%, 11/15/29 | 75,000 | 87,016 | ||||||
| State of Michigan Trunk Line Rev., 4.00%, 11/15/37 | 25,000 | 25,278 | ||||||
| State of Michigan Trunk Line Rev., 4.00%, 11/15/37 | 75,000 | 75,918 | ||||||
University of Michigan Rev., 5.00%, 4/1/26, Prerefunded at 100% of Par(1) | 20,000 | 21,779 | ||||||
| 319,605 | ||||||||
| Minnesota — 2.9% | ||||||||
| Minneapolis-St. Paul Metropolitan Airports Commission Rev., 5.00%, 1/1/27 | 30,000 | 33,035 | ||||||
| Minneapolis-St. Paul Metropolitan Airports Commission Rev., 5.00%, 1/1/28 | 25,000 | 27,482 | ||||||
| Minneapolis-St. Paul Metropolitan Airports Commission Rev., 5.00%, 1/1/30 | 20,000 | 21,834 | ||||||
| Minneapolis-St. Paul Metropolitan Airports Commission Rev., 5.00%, 1/1/31 | 100,000 | 108,829 | ||||||
| State of Minnesota GO, 5.00%, 8/1/23 | 105,000 | 107,595 | ||||||
| State of Minnesota GO, 5.00%, 8/1/23 | 750,000 | 768,539 | ||||||
| 1,067,314 | ||||||||
| Mississippi — 0.1% | ||||||||
State of Mississippi GO, 5.00%, 10/1/27, Prerefunded at 100% of Par(1) | 25,000 | 28,078 | ||||||
| Missouri — 0.2% | ||||||||
| Missouri Joint Municipal Electric Utility Commission Rev., 5.00%, 12/1/40 | 25,000 | 26,446 | ||||||
| Springfield School District No. R-12 GO, 3.00%, 3/1/39 | 20,000 | 17,257 | ||||||
| St. Louis Airport Rev., 5.50%, 7/1/28 (NATL) | 25,000 | 28,541 | ||||||
| 72,244 | ||||||||
| Nebraska — 0.1% | ||||||||
| Omaha Public Power District Rev., 5.00%, 2/1/31 | 30,000 | 33,988 | ||||||
31
| Avantis Core Municipal Fixed Income ETF | ||||||||
| Principal Amount | Value | |||||||
| Nevada — 1.4% | ||||||||
| Clark County Passenger Facility Charge Rev., 5.00%, 7/1/33 | $ | 55,000 | $ | 60,993 | ||||
| Clark County School District GO, 5.00%, 6/15/26 | 15,000 | 16,151 | ||||||
| Clark County School District GO, 5.00%, 6/15/27 | 125,000 | 134,552 | ||||||
| State of Nevada Highway Improvement Rev., 5.00%, 12/1/25 | 50,000 | 53,972 | ||||||
| State of Nevada Highway Improvement Rev., 5.00%, 12/1/26 | 45,000 | 49,094 | ||||||
| State of Nevada Highway Improvement Rev., 5.00%, 12/1/27 | 50,000 | 54,511 | ||||||
| State of Nevada Highway Improvement Rev., 5.00%, 12/1/31 | 105,000 | 115,623 | ||||||
| Truckee Meadows Water Authority Rev., 5.00%, 7/1/34 | 25,000 | 26,848 | ||||||
| 511,744 | ||||||||
| New Jersey — 3.3% | ||||||||
| Garden State Preservation Trust Rev., 5.75%, 11/1/28 (AGM) | 25,000 | 27,950 | ||||||
Garden State Preservation Trust Rev., Capital Appreciation, 0.00%, 11/1/28 (AGM)(2) | 5,000 | 4,105 | ||||||
| Hudson County Improvement Authority Rev., (Hudson County), 4.00%, 10/1/46 | 100,000 | 92,406 | ||||||
| Hudson County Improvement Authority Rev., (Hudson County), 4.00%, 10/1/51 | 150,000 | 139,591 | ||||||
| New Jersey Economic Development Authority Rev., (New Jersey Transit Corp.), 4.00%, 11/1/25 | 30,000 | 30,829 | ||||||
| New Jersey Economic Development Authority Rev., (New Jersey Transit Corp.), 5.00%, 11/1/26 | 50,000 | 53,976 | ||||||
| New Jersey Economic Development Authority Rev., (New Jersey Transit Corp.), 4.00%, 11/1/27 | 25,000 | 25,743 | ||||||
| New Jersey Economic Development Authority Rev., (State of New Jersey Department of the Treasury), 4.25%, 6/15/26 | 35,000 | 36,003 | ||||||
| New Jersey Economic Development Authority Rev., (State of New Jersey Department of the Treasury), 4.375%, 6/15/27 | 25,000 | 25,696 | ||||||
New Jersey Economic Development Authority Rev., (State of New Jersey Department of the Treasury), 5.50%, 12/15/26, Prerefunded at 100% of Par(1) | 20,000 | 22,512 | ||||||
| New Jersey Economic Development Authority Rev., (State of New Jersey Department of the Treasury), 5.00%, 6/15/35 | 25,000 | 25,819 | ||||||
| New Jersey Economic Development Authority Rev., (State of New Jersey Department of the Treasury), 5.00%, 6/15/36 | 20,000 | 20,637 | ||||||
| New Jersey Economic Development Authority Rev., (State of New Jersey Department of the Treasury), 4.00%, 6/15/37 | 25,000 | 24,321 | ||||||
| New Jersey Economic Development Authority Rev., (State of New Jersey Department of the Treasury), 5.00%, 6/15/41 | 140,000 | 145,141 | ||||||
| New Jersey Educational Facilities Authority Rev., (Montclair State University, Inc.), 5.00%, 7/1/39 | 20,000 | 20,571 | ||||||
| New Jersey Educational Facilities Authority Rev., (State of New Jersey), 5.00%, 9/1/36 | 55,000 | 57,448 | ||||||
| New Jersey Transportation Trust Fund Authority Rev., 5.00%, 6/15/27 | 5,000 | 5,392 | ||||||
| New Jersey Transportation Trust Fund Authority Rev., 5.00%, 12/15/27 | 25,000 | 27,278 | ||||||
| New Jersey Transportation Trust Fund Authority Rev., 5.00%, 12/15/27 | 35,000 | 38,188 | ||||||
| New Jersey Transportation Trust Fund Authority Rev., 5.00%, 6/15/30 | 25,000 | 26,800 | ||||||
| New Jersey Turnpike Authority Rev., 5.00%, 1/1/31 | 20,000 | 22,092 | ||||||
| New Jersey Turnpike Authority Rev., 5.00%, 1/1/31 | 15,000 | 16,569 | ||||||
| New Jersey Turnpike Authority Rev., 5.00%, 1/1/32 | 10,000 | 10,993 | ||||||
| New Jersey Turnpike Authority Rev., 5.00%, 1/1/33 | 25,000 | 27,003 | ||||||
| New Jersey Turnpike Authority Rev., 4.00%, 1/1/34 | 25,000 | 25,627 | ||||||
| New Jersey Turnpike Authority Rev., 5.00%, 1/1/34 | 25,000 | 26,905 | ||||||
32
| Avantis Core Municipal Fixed Income ETF | ||||||||
| Principal Amount | Value | |||||||
| New Jersey Turnpike Authority Rev., 4.00%, 1/1/35 | $ | 20,000 | $ | 20,347 | ||||
| New Jersey Turnpike Authority Rev., 5.00%, 1/1/35 | 10,000 | 10,859 | ||||||
| New Jersey Turnpike Authority Rev., 5.00%, 1/1/36 | 10,000 | 10,831 | ||||||
| New Jersey Turnpike Authority Rev., 3.25%, 1/1/38 | 30,000 | 26,719 | ||||||
| New Jersey Turnpike Authority Rev., 5.00%, 1/1/40 | 15,000 | 16,047 | ||||||
| State of New Jersey GO, 5.00%, 6/1/28 | 50,000 | 55,935 | ||||||
| State of New Jersey GO, 4.00%, 6/1/31 | 25,000 | 26,700 | ||||||
| State of New Jersey GO, 4.00%, 6/1/33 | 40,000 | 40,216 | ||||||
| State of New Jersey GO, 4.00%, 6/1/34 | 20,000 | 20,286 | ||||||
| 1,207,535 | ||||||||
| New Mexico — 0.1% | ||||||||
| State of New Mexico Severance Tax Permanent Fund Rev., 5.00%, 7/1/31 | 45,000 | 53,030 | ||||||
| New York — 15.6% | ||||||||
| Dutchess County Local Development Corp. Rev., (Vassar College), 5.00%, 7/1/42 | 20,000 | 20,948 | ||||||
| Hudson Yards Infrastructure Corp. Rev., 5.00%, 2/15/28 | 25,000 | 27,454 | ||||||
| Hudson Yards Infrastructure Corp. Rev., 5.00%, 2/15/29 | 60,000 | 65,906 | ||||||
| Hudson Yards Infrastructure Corp. Rev., 5.00%, 2/15/32 | 20,000 | 21,830 | ||||||
| Hudson Yards Infrastructure Corp. Rev., 5.00%, 2/15/37 | 160,000 | 171,940 | ||||||
| Long Island Power Authority Rev., 5.00%, 9/1/33 | 55,000 | 60,829 | ||||||
| Long Island Power Authority Rev., 5.00%, 9/1/38 | 100,000 | 109,059 | ||||||
| Metropolitan Transportation Authority Rev., 4.00%, 11/15/36 | 40,000 | 39,051 | ||||||
| Metropolitan Transportation Authority Rev., 5.00%, 11/15/44 (AGM) | 25,000 | 26,586 | ||||||
| Metropolitan Transportation Authority Rev., (Metropolitan Transportation Authority Dedicated Tax Fund), 5.00%, 11/15/24 | 35,000 | 35,179 | ||||||
| Metropolitan Transportation Authority Rev., (Metropolitan Transportation Authority Dedicated Tax Fund), 5.25%, 11/15/33 | 25,000 | 27,800 | ||||||
| Metropolitan Transportation Authority Rev., (Metropolitan Transportation Authority Dedicated Tax Fund), 5.25%, 11/15/35 | 25,000 | 27,184 | ||||||
| Nassau County GO, 5.00%, 10/1/27 | 80,000 | 89,161 | ||||||
| New York City GO, 5.00%, 8/1/25 | 165,000 | 172,744 | ||||||
| New York City GO, 5.00%, 8/1/25 | 200,000 | 214,219 | ||||||
| New York City GO, 5.00%, 8/1/26 | 25,000 | 27,331 | ||||||
| New York City GO, 5.00%, 8/1/27 | 50,000 | 51,131 | ||||||
| New York City GO, 5.00%, 8/1/27 | 100,000 | 111,416 | ||||||
| New York City GO, 5.00%, 8/1/28 | 60,000 | 60,633 | ||||||
| New York City GO, 5.00%, 8/1/28 | 10,000 | 11,194 | ||||||
| New York City GO, 5.25%, 10/1/30 | 50,000 | 55,571 | ||||||
| New York City GO, 5.00%, 12/1/38 | 30,000 | 32,396 | ||||||
| New York City Industrial Development Agency Rev., (Yankee Stadium LLC), 4.00%, 3/1/45 (AGM) | 100,000 | 92,785 | ||||||
| New York City Transitional Finance Authority Building Aid Rev., 5.00%, 7/15/29 | 25,000 | 27,658 | ||||||
| New York City Transitional Finance Authority Building Aid Rev., 5.00%, 7/15/35 | 25,000 | 27,046 | ||||||
| New York Convention Center Development Corp. Rev., (New York City Hotel Unit Fee Rev.), 5.00%, 11/15/40 | 75,000 | 77,734 | ||||||
| New York State Dormitory Authority Rev., (New York University), 4.00%, 7/1/36 | 50,000 | 50,510 | ||||||
| New York State Dormitory Authority Rev., (New York University), 5.00%, 7/1/39 | 10,000 | 10,698 | ||||||
New York State Dormitory Authority Rev., (State of New York Personal Income Tax Rev.), 5.00%, 2/15/24(1) | 60,000 | 62,336 | ||||||
33
| Avantis Core Municipal Fixed Income ETF | ||||||||
| Principal Amount | Value | |||||||
| New York State Dormitory Authority Rev., (State of New York Personal Income Tax Rev.), 5.00%, 3/15/26 | $ | 35,000 | $ | 37,556 | ||||
| New York State Dormitory Authority Rev., (State of New York Personal Income Tax Rev.), 5.00%, 2/15/30 | 100,000 | 110,257 | ||||||
| New York State Dormitory Authority Rev., (State of New York Personal Income Tax Rev.), 5.00%, 3/15/30 | 35,000 | 36,993 | ||||||
| New York State Dormitory Authority Rev., (State of New York Personal Income Tax Rev.), 5.00%, 3/15/32 | 100,000 | 111,884 | ||||||
| New York State Dormitory Authority Rev., (State of New York Personal Income Tax Rev.), 5.00%, 3/15/32 | 40,000 | 44,515 | ||||||
| New York State Dormitory Authority Rev., (State of New York Personal Income Tax Rev.), 5.00%, 3/15/32 | 40,000 | 45,937 | ||||||
| New York State Dormitory Authority Rev., (State of New York Personal Income Tax Rev.), 4.00%, 2/15/37 | 25,000 | 24,787 | ||||||
| New York State Dormitory Authority Rev., (State of New York Personal Income Tax Rev.), 4.00%, 2/15/38 | 65,000 | 63,883 | ||||||
| New York State Dormitory Authority Rev., (State of New York Personal Income Tax Rev.), 4.00%, 2/15/39 | 200,000 | 195,376 | ||||||
| New York State Dormitory Authority Rev., (State of New York Personal Income Tax Rev.), 5.00%, 3/15/39 | 25,000 | 26,983 | ||||||
| New York State Dormitory Authority Rev., (State of New York Personal Income Tax Rev.), 4.00%, 3/15/40 | 100,000 | 97,161 | ||||||
| New York State Dormitory Authority Rev., (State of New York Personal Income Tax Rev.), 5.00%, 2/15/41 | 125,000 | 134,280 | ||||||
| New York State Dormitory Authority Rev., (State of New York Sales Tax Rev.), 5.00%, 3/15/33 | 60,000 | 64,397 | ||||||
| New York State Dormitory Authority Rev., (State of New York Sales Tax Rev.), 5.00%, 3/15/36 | 50,000 | 54,232 | ||||||
| New York State Dormitory Authority Rev., (State University of New York), 5.00%, 7/1/23 | 5,000 | 5,107 | ||||||
New York State Dormitory Authority Rev., (State University of New York), 5.00%, 7/1/23, Prerefunded at 100% of Par(1) | 50,000 | 51,111 | ||||||
| New York State Dormitory Authority Rev., (Trustees of Columbia University in the New York City), 5.00%, 10/1/38 | 10,000 | 11,014 | ||||||
| New York State Thruway Authority Rev., 5.00%, 1/1/23 | 40,000 | 40,346 | ||||||
| New York State Thruway Authority Rev., 5.00%, 1/1/26 | 40,000 | 41,179 | ||||||
| New York State Thruway Authority Rev., 5.00%, 1/1/29 | 100,000 | 104,972 | ||||||
| New York State Thruway Authority Rev., 4.00%, 1/1/40 | 35,000 | 33,819 | ||||||
| New York State Urban Development Corp. Rev., (State of New York Personal Income Tax Rev.), 5.00%, 3/15/23 | 40,000 | 40,580 | ||||||
| New York State Urban Development Corp. Rev., (State of New York Personal Income Tax Rev.), 5.00%, 3/15/25 | 30,000 | 31,167 | ||||||
| New York State Urban Development Corp. Rev., (State of New York Personal Income Tax Rev.), 5.00%, 3/15/26 | 55,000 | 59,583 | ||||||
| New York State Urban Development Corp. Rev., (State of New York Personal Income Tax Rev.), 5.00%, 3/15/27 | 115,000 | 124,340 | ||||||
| New York State Urban Development Corp. Rev., (State of New York Personal Income Tax Rev.), 5.00%, 3/15/31 | 110,000 | 113,873 | ||||||
| New York State Urban Development Corp. Rev., (State of New York Personal Income Tax Rev.), 5.00%, 3/15/31 | 25,000 | 27,595 | ||||||
| New York State Urban Development Corp. Rev., (State of New York Personal Income Tax Rev.), 5.00%, 3/15/32 | 25,000 | 28,480 | ||||||
| New York State Urban Development Corp. Rev., (State of New York Personal Income Tax Rev.), 5.00%, 3/15/34 | 60,000 | 62,067 | ||||||
| New York State Urban Development Corp. Rev., (State of New York Personal Income Tax Rev.), 5.00%, 3/15/35 | 25,000 | 27,645 | ||||||
| New York State Urban Development Corp. Rev., (State of New York Personal Income Tax Rev.), 5.00%, 3/15/36 | 50,000 | 54,635 | ||||||
34
| Avantis Core Municipal Fixed Income ETF | ||||||||
| Principal Amount | Value | |||||||
| New York State Urban Development Corp. Rev., (State of New York Personal Income Tax Rev.), 4.00%, 3/15/37 | $ | 30,000 | $ | 29,581 | ||||
| New York State Urban Development Corp. Rev., (State of New York Personal Income Tax Rev.), 5.00%, 3/15/38 | 200,000 | 217,905 | ||||||
| New York State Urban Development Corp. Rev., (State of New York Sales Tax Rev.), 5.00%, 3/15/36 | 140,000 | 156,449 | ||||||
| New York State Urban Development Corp. Rev., (State of New York Sales Tax Rev.), 5.00%, 3/15/36 | 15,000 | 16,546 | ||||||
| Port Authority of New York & New Jersey Rev., 5.00%, 7/15/29 | 10,000 | 11,202 | ||||||
| Port Authority of New York & New Jersey Rev., 5.00%, 10/15/31 | 5,000 | 5,359 | ||||||
| Port Authority of New York & New Jersey Rev., 5.00%, 7/15/33 | 15,000 | 16,906 | ||||||
| Port Authority of New York & New Jersey Rev., 5.00%, 7/15/34 | 425,000 | 467,760 | ||||||
| Port Authority of New York & New Jersey Rev., 5.00%, 7/15/35 | 40,000 | 44,438 | ||||||
| Port Authority of New York & New Jersey Rev., 4.00%, 7/15/37 | 100,000 | 99,704 | ||||||
Sales Tax Asset Receivable Corp. Rev., 5.00%, 10/15/24(1) | 50,000 | 52,725 | ||||||
Sales Tax Asset Receivable Corp. Rev., 5.00%, 10/15/24, Prerefunded at 100% of Par(1) | 10,000 | 10,545 | ||||||
| Suffolk County Water Authority Rev., 3.00%, 6/1/32 | 10,000 | 9,909 | ||||||
| Suffolk County Water Authority Rev., 3.25%, 6/1/43 | 15,000 | 13,025 | ||||||
| Triborough Bridge & Tunnel Authority Rev., 5.00%, 11/15/25 | 20,000 | 21,555 | ||||||
| Triborough Bridge & Tunnel Authority Rev., 5.00%, 11/15/27 | 60,000 | 66,177 | ||||||
| Triborough Bridge & Tunnel Authority Rev., 5.00%, 11/15/27 | 80,000 | 89,755 | ||||||
| Triborough Bridge & Tunnel Authority Rev., 5.00%, 11/15/28 | 50,000 | 56,965 | ||||||
| Triborough Bridge & Tunnel Authority Rev., 5.00%, 11/15/34 | 95,000 | 103,853 | ||||||
| Triborough Bridge & Tunnel Authority Rev., 5.00%, 11/15/37 | 25,000 | 27,110 | ||||||
| Triborough Bridge & Tunnel Authority Rev., 5.00%, 11/15/38 | 50,000 | 54,122 | ||||||
| Triborough Bridge & Tunnel Authority Rev., 5.00%, 11/15/41 | 100,000 | 106,438 | ||||||
| Utility Debt Securitization Authority Rev., 5.00%, 12/15/25 | 35,000 | 36,161 | ||||||
| Utility Debt Securitization Authority Rev., 5.00%, 6/15/27 | 40,000 | 42,624 | ||||||
| Utility Debt Securitization Authority Rev., 5.00%, 6/15/28 | 25,000 | 27,070 | ||||||
| Utility Debt Securitization Authority Rev., 5.00%, 12/15/30 | 55,000 | 56,824 | ||||||
| Utility Debt Securitization Authority Rev., 5.00%, 12/15/31 | 50,000 | 51,626 | ||||||
| Utility Debt Securitization Authority Rev., 5.00%, 12/15/33 | 25,000 | 26,707 | ||||||
| Utility Debt Securitization Authority Rev., 5.00%, 12/15/36 | 50,000 | 52,993 | ||||||
| 5,686,117 | ||||||||
| North Carolina — 1.4% | ||||||||
| Charlotte Water & Sewer System Rev., 5.00%, 7/1/40 | 25,000 | 26,569 | ||||||
| State of North Carolina GO, 5.00%, 6/1/23 | 250,000 | 254,983 | ||||||
| State of North Carolina GO, 5.00%, 6/1/29 | 60,000 | 69,380 | ||||||
| State of North Carolina Rev., 5.00%, 3/1/30 | 10,000 | 11,336 | ||||||
| State of North Carolina Rev., 5.00%, 3/1/33 | 115,000 | 127,880 | ||||||
| Wake County GO, 5.00%, 3/1/24 | 35,000 | 36,381 | ||||||
| 526,529 | ||||||||
| Ohio — 2.2% | ||||||||
| American Municipal Power, Inc. Rev., 5.00%, 2/15/33 | 90,000 | 101,163 | ||||||
| American Municipal Power, Inc. Rev., 5.00%, 2/15/35 | 100,000 | 110,410 | ||||||
| Cincinnati City School District GO, 5.25%, 12/1/29 (NATL) | 15,000 | 17,574 | ||||||
| Cincinnati City School District GO, 5.25%, 12/1/30 (NATL) | 30,000 | 35,593 | ||||||
| Cincinnati City School District GO, 5.25%, 12/1/31 (NATL) | 5,000 | 5,994 | ||||||
| Northeast Ohio Regional Sewer District Rev., 3.00%, 11/15/39 | 230,000 | 197,760 | ||||||
| Ohio Water Development Authority Water Pollution Control Loan Fund Rev., 5.00%, 12/1/36 | 75,000 | 83,573 | ||||||
35
| Avantis Core Municipal Fixed Income ETF | ||||||||
| Principal Amount | Value | |||||||
| Ohio Water Development Authority Water Pollution Control Loan Fund Rev., 5.00%, 12/1/39 | $ | 100,000 | $ | 110,914 | ||||
| Rickenbacker Port Authority Rev., 5.375%, 1/1/32 | 45,000 | 51,277 | ||||||
| State of Ohio GO, 5.00%, 8/1/24 | 30,000 | 31,494 | ||||||
| State of Ohio Rev., 5.00%, 12/15/23 | 55,000 | 56,803 | ||||||
| 802,555 | ||||||||
| Oklahoma — 1.3% | ||||||||
| Grand River Dam Authority Rev., 5.00%, 6/1/25 | 250,000 | 265,975 | ||||||
| Oklahoma Turnpike Authority Rev., 5.00%, 1/1/30 | 175,000 | 201,730 | ||||||
| 467,705 | ||||||||
| Oregon — 1.2% | ||||||||
| Deschutes Public Library District GO, 3.00%, 12/1/41 | 100,000 | 81,199 | ||||||
| Multnomah County School District No. 1 Portland GO, 5.00%, 6/15/24 (SCH BD GTY) | 25,000 | 26,166 | ||||||
| Oregon State Lottery Rev., 5.00%, 4/1/27 | 175,000 | 186,033 | ||||||
| State of Oregon Department of Transportation Rev., 5.00%, 11/15/23 | 30,000 | 30,958 | ||||||
State of Oregon Department of Transportation Rev., 5.00%, 11/15/24, Prerefunded at 100% of Par(1) | 65,000 | 68,648 | ||||||
Washington & Multnomah Counties School District No. 48J Beaverton GO, 5.00%, 6/15/24, Prerefunded at 100% of Par (SCH BD GTY)(1) | 35,000 | 36,621 | ||||||
| 429,625 | ||||||||
| Pennsylvania — 2.2% | ||||||||
| Delaware Valley Regional Finance Authority Rev., 5.50%, 8/1/28 (Ambac) | 25,000 | 28,582 | ||||||
| Delaware Valley Regional Finance Authority Rev., 5.75%, 7/1/32 | 25,000 | 30,001 | ||||||
| Montgomery County Higher Education and Health Authority Rev., (Thomas Jefferson University Obligated Group), 5.00%, 9/1/33 | 175,000 | 191,477 | ||||||
| Montgomery County Higher Education and Health Authority Rev., (Thomas Jefferson University Obligated Group), 4.00%, 9/1/34 | 100,000 | 99,444 | ||||||
| Pennsylvania GO, 4.00%, 7/1/23 | 25,000 | 25,351 | ||||||
| Pennsylvania GO, 5.00%, 1/1/24 | 25,000 | 25,870 | ||||||
| Pennsylvania GO, 5.00%, 1/1/28 | 5,000 | 5,523 | ||||||
Pennsylvania GO, 5.00%, 4/1/23, Prerefunded at 100% of Par(1) | 25,000 | 25,392 | ||||||
| Pennsylvania GO, 4.00%, 5/1/33 | 45,000 | 46,595 | ||||||
| Pennsylvania GO, 3.00%, 9/15/36 | 80,000 | 71,900 | ||||||
| Pennsylvania GO, 3.00%, 5/1/38 | 25,000 | 21,934 | ||||||
| Pennsylvania GO, 2.00%, 5/1/39 | 30,000 | 21,502 | ||||||
| Pennsylvania State Public School Building Authority Rev., (School District of Philadelphia), 5.00%, 6/1/29 (AGM) | 30,000 | 33,776 | ||||||
| Pennsylvania Turnpike Commission Rev., 5.00%, 12/1/23 | 30,000 | 30,947 | ||||||
| Pennsylvania Turnpike Commission Rev., 5.00%, 12/1/41 | 30,000 | 31,219 | ||||||
| Philadelphia GO, 4.00%, 8/1/35 | 20,000 | 20,139 | ||||||
| Philadelphia Gas Works Co Rev., 5.00%, 8/1/50 (AGM) | 100,000 | 108,108 | ||||||
| 817,760 | ||||||||
| Rhode Island — 0.1% | ||||||||
| Rhode Island Commerce Corp. Rev., 5.00%, 6/15/23 | 25,000 | 25,462 | ||||||
| South Carolina — 0.8% | ||||||||
Charleston Educational Excellence Finance Corp. Rev., (Charleston County School District), 5.00%, 12/1/23, Prerefunded at 100% of Par(1) | 30,000 | 30,958 | ||||||
| South Carolina Public Service Authority Rev., 5.00%, 12/1/26 | 50,000 | 52,102 | ||||||
36
| Avantis Core Municipal Fixed Income ETF | ||||||||
| Principal Amount | Value | |||||||
| South Carolina Public Service Authority Rev., 5.00%, 12/1/30 | $ | 70,000 | $ | 74,003 | ||||
| South Carolina Public Service Authority Rev., 5.00%, 12/1/36 | 25,000 | 25,871 | ||||||
| South Carolina Public Service Authority Rev., 3.00%, 12/1/41 | 50,000 | 39,910 | ||||||
| South Carolina Public Service Authority Rev., 4.00%, 12/1/42 | 60,000 | 55,535 | ||||||
| 278,379 | ||||||||
| Tennessee — 0.2% | ||||||||
| Memphis GO, 5.00%, 5/1/23 | 25,000 | 25,443 | ||||||
| Metropolitan Government of Nashville & Davidson County GO, 5.00%, 1/1/26 | 50,000 | 54,153 | ||||||
| 79,596 | ||||||||
| Texas — 7.6% | ||||||||
| Austin GO, 2.95%, 9/1/27 | 25,000 | 25,290 | ||||||
| Board of Regents of the University of Texas System Rev., 5.375%, 8/15/23 | 50,000 | 51,443 | ||||||
| Board of Regents of the University of Texas System Rev., 5.00%, 8/15/24 | 30,000 | 31,506 | ||||||
| Board of Regents of the University of Texas System Rev., 5.00%, 8/15/24 | 35,000 | 36,757 | ||||||
| Board of Regents of the University of Texas System Rev., 5.00%, 8/15/25 | 50,000 | 53,763 | ||||||
| Board of Regents of the University of Texas System Rev., 5.00%, 8/15/26 | 25,000 | 27,491 | ||||||
| Board of Regents of the University of Texas System Rev., 5.00%, 8/15/38 | 300,000 | 332,597 | ||||||
| Central Texas Regional Mobility Authority Rev., 3.375%, 1/1/41 | 35,000 | 29,749 | ||||||
| Central Texas Turnpike System Rev., 5.00%, 8/15/39 | 90,000 | 97,764 | ||||||
| Cypress-Fairbanks Independent School District GO, 5.00%, 2/15/24 (PSF-GTD) | 80,000 | 82,973 | ||||||
| Dallas GO, 5.00%, 2/15/23 | 60,000 | 60,708 | ||||||
| Dallas GO, 5.00%, 2/15/27 | 30,000 | 31,067 | ||||||
| Dallas Area Rapid Transit Rev., 5.00%, 12/1/29 | 35,000 | 40,381 | ||||||
| Dallas Area Rapid Transit Rev., 5.00%, 12/1/33 | 240,000 | 271,225 | ||||||
| Dallas Fort Worth International Airport Rev., 5.00%, 11/1/32 | 15,000 | 17,147 | ||||||
| Dallas Fort Worth International Airport Rev., 5.00%, 11/1/33 | 65,000 | 73,676 | ||||||
| Dallas Fort Worth International Airport Rev., 5.00%, 11/1/33 | 50,000 | 56,674 | ||||||
| Dallas Independent School District GO, 5.00%, 8/15/24 (PSF-GTD) | 35,000 | 36,770 | ||||||
Dallas Independent School District GO, 5.00%, 8/15/24, Prerefunded at 100% of Par (PSF-GTD)(1) | 40,000 | 41,962 | ||||||
| Dallas Waterworks & Sewer System Rev., 5.00%, 10/1/27 | 80,000 | 85,898 | ||||||
| Houston GO, 5.00%, 3/1/24 | 75,000 | 77,948 | ||||||
| Houston GO, 5.00%, 3/1/28 | 35,000 | 39,220 | ||||||
| Houston Independent School District GO, 5.00%, 2/15/27 (PSF-GTD) | 55,000 | 59,633 | ||||||
North Texas Tollway Authority Rev., (North Texas Tollway System), 5.00%, 1/1/23(1) | 15,000 | 15,134 | ||||||
| North Texas Tollway Authority Rev., (North Texas Tollway System), 5.00%, 1/1/23 | 20,000 | 20,177 | ||||||
| North Texas Tollway Authority Rev., (North Texas Tollway System), 5.00%, 1/1/28 | 10,000 | 10,747 | ||||||
| North Texas Tollway Authority Rev., (North Texas Tollway System), 4.00%, 1/1/36 | 20,000 | 20,183 | ||||||
| North Texas Tollway Authority Rev., (North Texas Tollway System), 4.00%, 1/1/38 | 30,000 | 29,710 | ||||||
| North Texas Tollway Authority Rev., (North Texas Tollway System), 5.00%, 1/1/38 | 25,000 | 27,065 | ||||||
37
| Avantis Core Municipal Fixed Income ETF | ||||||||
| Principal Amount | Value | |||||||
North Texas Tollway Authority Rev., (North Texas Tollway System), Capital Appreciation, 0.00%, 1/1/30 (AGC)(2) | $ | 100,000 | $ | 78,274 | ||||
| San Antonio Electric & Gas Systems Rev., 5.00%, 2/1/26 | 75,000 | 81,147 | ||||||
| San Antonio Electric & Gas Systems Rev., 5.00%, 2/1/29 | 40,000 | 43,629 | ||||||
| State of Texas GO, 5.00%, 10/1/28 | 40,000 | 42,986 | ||||||
State of Texas GO, 5.00%, 4/1/24, Prerefunded at 100% of Par(1) | 60,000 | 62,407 | ||||||
State of Texas GO, 5.00%, 10/1/24, Prerefunded at 100% of Par(1) | 50,000 | 52,500 | ||||||
| State of Texas GO, 5.00%, 10/1/30 | 55,000 | 61,169 | ||||||
State of Texas GO, 4.00%, 4/1/24, Prerefunded at 100% of Par(1) | 50,000 | 51,211 | ||||||
| State of Texas GO, 5.00%, 10/1/33 | 100,000 | 110,059 | ||||||
| Texas Transportation Commission State Highway Fund Rev., 5.00%, 4/1/24 | 5,000 | 5,205 | ||||||
| Texas Water Development Board Rev., (State Water Implementation Rev. Fund for Texas), 5.00%, 10/15/29 | 45,000 | 48,175 | ||||||
| Texas Water Development Board Rev., (State Water Implementation Rev. Fund for Texas), 4.00%, 10/15/34 | 105,000 | 107,964 | ||||||
| Texas Water Development Board Rev., (State Water Implementation Rev. Fund for Texas), 5.00%, 10/15/38 | 65,000 | 71,561 | ||||||
| Texas Water Development Board Rev., (State Water Implementation Rev. Fund for Texas), 5.00%, 10/15/40 | 75,000 | 79,921 | ||||||
| Trinity River Authority Central Regional Wastewater System Rev., 5.00%, 8/1/28 | 25,000 | 27,922 | ||||||
| University of Texas System Rev., 5.00%, 8/15/30 | 50,000 | 58,704 | ||||||
| 2,767,492 | ||||||||
| Utah — 1.1% | ||||||||
| State of Utah GO, 5.00%, 7/1/28 | 125,000 | 142,611 | ||||||
| State of Utah GO, 5.00%, 7/1/29 | 40,000 | 46,061 | ||||||
| Utah Transit Authority Rev., 5.00%, 6/15/25 | 110,000 | 117,706 | ||||||
Utah Transit Authority Rev., 5.00%, 6/15/25, Prerefunded at 100% of Par(1) | 30,000 | 32,068 | ||||||
| Utah Transit Authority Rev., 5.25%, 6/15/32 (AGM) | 40,000 | 46,988 | ||||||
| 385,434 | ||||||||
| Virginia — 2.9% | ||||||||
| Richmond Public Utility Rev., 5.00%, 1/15/28 | 25,000 | 26,948 | ||||||
| University of Virginia Rev., 5.00%, 4/1/38 | 25,000 | 26,978 | ||||||
| Virginia College Building Authority Rev., 5.00%, 2/1/30 | 75,000 | 83,930 | ||||||
| Virginia College Building Authority Rev., 5.00%, 2/1/31 | 70,000 | 76,850 | ||||||
| Virginia College Building Authority Rev., 4.00%, 2/1/33 | 40,000 | 40,804 | ||||||
| Virginia College Building Authority Rev., 3.00%, 2/1/35 | 80,000 | 71,902 | ||||||
| Virginia Commonwealth Transportation Board Rev., 5.00%, 5/15/24 | 50,000 | 52,229 | ||||||
| Virginia Commonwealth Transportation Board Rev., 5.00%, 3/15/25 | 25,000 | 26,658 | ||||||
| Virginia Commonwealth Transportation Board Rev., 5.00%, 9/15/26 | 50,000 | 55,122 | ||||||
| Virginia Commonwealth Transportation Board Rev., 5.00%, 9/15/27 | 60,000 | 67,546 | ||||||
| Virginia Commonwealth Transportation Board Rev., 5.00%, 5/15/32 | 10,000 | 11,070 | ||||||
| Virginia Commonwealth Transportation Board Rev., 5.00%, 5/15/33 | 50,000 | 55,237 | ||||||
38
| Avantis Core Municipal Fixed Income ETF | ||||||||
| Principal Amount/Shares | Value | |||||||
| Virginia Public Building Authority Rev., 5.00%, 8/1/27 | $ | 100,000 | $ | 111,760 | ||||
| Virginia Small Business Financing Authority Rev., (Hampton University), 4.00%, 10/1/38 | 360,000 | 361,684 | ||||||
| 1,068,718 | ||||||||
| Washington — 3.9% | ||||||||
Central Puget Sound Regional Transit Authority Rev., 5.00%, 11/1/25, Prerefunded at 100% of Par(1) | 50,000 | 54,034 | ||||||
| Central Puget Sound Regional Transit Authority Rev., (Sales Motor Vehicle & Rental Car Taxe), 5.00%, 11/1/26 | 50,000 | 55,147 | ||||||
| Energy Northwest Rev., (Bonneville Power Administration), 5.00%, 7/1/23 | 35,000 | 35,749 | ||||||
| Energy Northwest Rev., (Bonneville Power Administration), 5.00%, 7/1/25 | 25,000 | 26,743 | ||||||
| Energy Northwest Rev., (Bonneville Power Administration), 5.00%, 7/1/27 | 25,000 | 26,152 | ||||||
| Energy Northwest Rev., (Bonneville Power Administration), 5.00%, 7/1/27 | 65,000 | 72,335 | ||||||
| Energy Northwest Rev., (Bonneville Power Administration), 5.00%, 7/1/28 | 20,000 | 22,257 | ||||||
| Energy Northwest Rev., (Bonneville Power Administration), 5.00%, 7/1/30 | 25,000 | 28,130 | ||||||
| Energy Northwest Rev., (Bonneville Power Administration), 5.00%, 7/1/31 | 15,000 | 15,612 | ||||||
| Energy Northwest Rev., (Bonneville Power Administration), 5.00%, 7/1/32 | 50,000 | 52,936 | ||||||
| Energy Northwest Rev., (Bonneville Power Administration), 5.00%, 7/1/33 | 25,000 | 26,419 | ||||||
| Energy Northwest Rev., (Bonneville Power Administration), 5.00%, 7/1/35 | 50,000 | 56,114 | ||||||
| Energy Northwest Rev., (Bonneville Power Administration), 4.00%, 7/1/42 | 70,000 | 68,286 | ||||||
| King County Sewer Rev., 4.00%, 7/1/31 | 25,000 | 26,023 | ||||||
| State of Washington GO, 4.00%, 7/1/26 | 50,000 | 51,428 | ||||||
| State of Washington GO, 5.00%, 8/1/28 | 50,000 | 54,740 | ||||||
| State of Washington GO, 5.00%, 7/1/29 | 250,000 | 270,263 | ||||||
| State of Washington GO, 5.00%, 8/1/31 | 25,000 | 27,562 | ||||||
| State of Washington GO, 5.00%, 8/1/32 | 40,000 | 42,611 | ||||||
| State of Washington GO, 5.00%, 8/1/32 | 255,000 | 280,273 | ||||||
| State of Washington GO, 5.00%, 2/1/40 | 40,000 | 43,994 | ||||||
| State of Washington GO, 5.00%, 2/1/41 | 25,000 | 27,353 | ||||||
| State of Washington Rev., 5.00%, 9/1/23 | 35,000 | 35,846 | ||||||
| University of Washington Rev., 4.00%, 6/1/37 | 10,000 | 10,093 | ||||||
| 1,410,100 | ||||||||
| West Virginia — 0.2% | ||||||||
| State of West Virginia GO, 5.00%, 12/1/41 | 70,000 | 75,630 | ||||||
TOTAL MUNICIPAL SECURITIES (Cost $38,659,008) | 35,982,643 | |||||||
| SHORT-TERM INVESTMENTS — 0.3% | ||||||||
| Money Market Funds — 0.3% | ||||||||
| State Street Institutional U.S. Government Money Market Fund, Premier Class (Cost $122,323) | 122,323 | 122,323 | ||||||
TOTAL INVESTMENT SECURITIES — 98.9% (Cost $38,781,331) | 36,104,966 | |||||||
| OTHER ASSETS AND LIABILITIES — 1.1% | 393,947 | |||||||
| TOTAL NET ASSETS — 100.0% | $ | 36,498,913 | ||||||
39
| Avantis Core Municipal Fixed Income ETF | ||||||||
| NOTES TO SCHEDULE OF INVESTMENTS | ||||||||
| AGC | - | Assured Guaranty Corporation | ||||||
| AGM | - | Assured Guaranty Municipal Corporation | ||||||
| BAM | - | Build America Mutual Assurance Company | ||||||
| COP | - | Certificates of Participation | ||||||
| GO | - | General Obligation | ||||||
| NATL | - | National Public Finance Guarantee Corporation | ||||||
| PSF-GTD | - | Permanent School Fund Guaranteed | ||||||
| SCH BD GTY | - | School Bond Guaranty | ||||||
(1)Escrowed to maturity in U.S. government securities or state and local government securities.
(2)Security is a zero-coupon bond. Zero-coupon securities may be issued at a substantial discount from their value at maturity.
See Notes to Financial Statements.
40
AUGUST 31, 2022
| Avantis Short-Term Fixed Income ETF | ||||||||
| Principal Amount | Value | |||||||
| CORPORATE BONDS — 66.7% | ||||||||
| Aerospace and Defense — 0.8% | ||||||||
| General Dynamics Corp., 3.50%, 5/15/25 | $ | 506,000 | $ | 503,580 | ||||
| Lockheed Martin Corp., 3.55%, 1/15/26 | 235,000 | 233,205 | ||||||
| 736,785 | ||||||||
| Air Freight and Logistics — 0.5% | ||||||||
| United Parcel Service, Inc., 2.20%, 9/1/24 | 459,000 | 445,890 | ||||||
| Automobiles — 1.2% | ||||||||
| American Honda Finance Corp., 2.15%, 9/10/24 | 467,000 | 451,632 | ||||||
| American Honda Finance Corp., 1.00%, 9/10/25 | 229,000 | 208,824 | ||||||
| General Motors Financial Co., Inc., 4.25%, 5/15/23 | 95,000 | 95,067 | ||||||
| Toyota Motor Corp., 2.36%, 7/2/24 | 332,000 | 324,188 | ||||||
| 1,079,711 | ||||||||
| Banks — 14.2% | ||||||||
| African Development Bank, 3.00%, 9/20/23 | 306,000 | 304,085 | ||||||
| African Development Bank, 0.875%, 7/22/26 | 60,000 | 54,163 | ||||||
| Asian Development Bank, 0.25%, 10/6/23 | 439,000 | 423,511 | ||||||
| Asian Development Bank, 2.625%, 1/30/24 | 250,000 | 246,903 | ||||||
| Asian Development Bank, 1.50%, 1/20/27 | 120,000 | 110,324 | ||||||
| Asian Infrastructure Investment Bank, 0.25%, 9/29/23 | 234,000 | 225,641 | ||||||
| Asian Infrastructure Investment Bank, 0.50%, 10/30/24 | 545,000 | 509,629 | ||||||
| Asian Infrastructure Investment Bank, 0.50%, 1/27/26 | 250,000 | 223,829 | ||||||
| Australia & New Zealand Banking Group Ltd., 3.70%, 11/16/25 | 400,000 | 396,853 | ||||||
| Bank of Montreal, 1.25%, 9/15/26 | 250,000 | 223,142 | ||||||
| Bank of Nova Scotia, 1.30%, 6/11/25 | 269,000 | 248,944 | ||||||
| Bank of Nova Scotia, 2.70%, 8/3/26 | 59,000 | 55,584 | ||||||
| Barclays PLC, 3.65%, 3/16/25 | 200,000 | 194,796 | ||||||
| Barclays PLC, 4.375%, 1/12/26 | 200,000 | 196,142 | ||||||
| Citigroup, Inc., 3.30%, 4/27/25 | 538,000 | 525,116 | ||||||
| Council Of Europe Development Bank, 0.25%, 6/10/23 | 24,000 | 23,383 | ||||||
| Council Of Europe Development Bank, 1.375%, 2/27/25 | 214,000 | 202,892 | ||||||
| European Bank for Reconstruction & Development, 0.25%, 7/10/23 | 40,000 | 38,874 | ||||||
| European Bank for Reconstruction & Development, 0.50%, 5/19/25 | 250,000 | 230,051 | ||||||
| European Investment Bank, 1.375%, 3/15/27 | 205,000 | 187,094 | ||||||
| HSBC Holdings PLC, 3.90%, 5/25/26 | 300,000 | 292,125 | ||||||
| Huntington Bancshares, Inc., 4.00%, 5/15/25 | 269,000 | 266,867 | ||||||
| Inter-American Development Bank, 2.50%, 1/18/23 | 120,000 | 119,666 | ||||||
| Inter-American Development Bank, 3.00%, 10/4/23 | 106,000 | 105,591 | ||||||
| Inter-American Development Bank, 0.25%, 11/15/23 | 82,000 | 79,037 | ||||||
| International Bank for Reconstruction & Development, 1.50%, 8/28/24 | 475,000 | 456,571 | ||||||
| International Bank for Reconstruction & Development, 2.50%, 7/29/25 | 325,000 | 315,324 | ||||||
| International Bank for Reconstruction & Development, 0.875%, 7/15/26 | 40,000 | 36,173 | ||||||
| International Finance Corp., 2.875%, 7/31/23 | 152,000 | 150,937 | ||||||
| JPMorgan Chase & Co., 3.90%, 7/15/25 | 363,000 | 360,420 | ||||||
| KeyBank N.A., 3.30%, 6/1/25 | 375,000 | 365,719 | ||||||
| Kreditanstalt fuer Wiederaufbau, 0.25%, 3/8/24 | 450,000 | 428,292 | ||||||
41
| Avantis Short-Term Fixed Income ETF | ||||||||
| Principal Amount | Value | |||||||
| Kreditanstalt fuer Wiederaufbau, 1.25%, 1/31/25 | $ | 50,000 | $ | 47,308 | ||||
| Landwirtschaftliche Rentenbank, 0.50%, 5/27/25 | 200,000 | 183,891 | ||||||
| National Australia Bank Ltd., 2.50%, 7/12/26 | 550,000 | 516,932 | ||||||
| Nordic Investment Bank, 0.50%, 1/21/26 | 250,000 | 227,012 | ||||||
| Oesterreichische Kontrollbank AG, 2.875%, 3/13/23 | 50,000 | 49,857 | ||||||
| Oesterreichische Kontrollbank AG, 1.50%, 2/12/25 | 150,000 | 142,639 | ||||||
| PNC Financial Services Group, Inc., 3.50%, 1/23/24 | 500,000 | 498,689 | ||||||
| Royal Bank of Canada, 2.55%, 7/16/24 | 806,000 | 784,647 | ||||||
| Santander Holdings USA, Inc., 4.50%, 7/17/25 | 334,000 | 332,556 | ||||||
| Toronto-Dominion Bank, 1.25%, 9/10/26 | 395,000 | 351,070 | ||||||
| Toronto-Dominion Bank, 4.11%, 6/8/27 | 100,000 | 98,988 | ||||||
| Truist Financial Corp., 3.75%, 12/6/23 | 313,000 | 313,619 | ||||||
| US Bancorp, 3.95%, 11/17/25 | 512,000 | 512,518 | ||||||
| Wells Fargo & Co., 3.00%, 10/23/26 | 150,000 | 141,808 | ||||||
| Westpac Banking Corp., 2.85%, 5/13/26 | 450,000 | 431,125 | ||||||
| 12,230,337 | ||||||||
| Beverages — 0.2% | ||||||||
| Constellation Brands, Inc., 4.40%, 11/15/25 | 165,000 | 165,257 | ||||||
| Biotechnology — 0.5% | ||||||||
| AbbVie, Inc., 2.90%, 11/6/22 | 63,000 | 62,957 | ||||||
| AbbVie, Inc., 3.20%, 5/14/26 | 360,000 | 345,152 | ||||||
| 408,109 | ||||||||
| Capital Markets — 6.2% | ||||||||
| Ameriprise Financial, Inc., 3.00%, 4/2/25 | 327,000 | 318,628 | ||||||
| Bank of New York Mellon Corp., 2.20%, 8/16/23 | 311,000 | 306,822 | ||||||
| Cboe Global Markets, Inc., 3.65%, 1/12/27 | 575,000 | 561,930 | ||||||
| Charles Schwab Corp., 3.75%, 4/1/24 | 100,000 | 99,951 | ||||||
| Charles Schwab Corp., 3.85%, 5/21/25 | 413,000 | 413,909 | ||||||
| Charles Schwab Corp., 2.45%, 3/3/27 | 225,000 | 210,025 | ||||||
| CME Group, Inc., 3.00%, 3/15/25 | 600,000 | 589,047 | ||||||
| Goldman Sachs Group, Inc., 3.85%, 1/26/27 | 625,000 | 605,904 | ||||||
| Janus Henderson US Holdings, Inc., 4.875%, 8/1/25 | 230,000 | 231,209 | ||||||
| Jefferies Group LLC / Jefferies Group Capital Finance, Inc., 4.85%, 1/15/27 | 200,000 | 198,793 | ||||||
| Lazard Group LLC, 3.75%, 2/13/25 | 167,000 | 164,668 | ||||||
| Morgan Stanley, 3.625%, 1/20/27 | 525,000 | 510,382 | ||||||
| S&P Global, Inc., 2.95%, 1/22/27 | 450,000 | 432,466 | ||||||
| State Street Corp., 3.55%, 8/18/25 | 700,000 | 693,840 | ||||||
| 5,337,574 | ||||||||
| Chemicals — 0.4% | ||||||||
| Air Products and Chemicals, Inc., 3.35%, 7/31/24 | 227,000 | 225,351 | ||||||
| Mosaic Co., 4.25%, 11/15/23 | 140,000 | 140,185 | ||||||
| 365,536 | ||||||||
| Consumer Finance — 1.2% | ||||||||
| Capital One Financial Corp., 4.25%, 4/30/25 | 538,000 | 537,123 | ||||||
| Discover Financial Services, 4.50%, 1/30/26 | 437,000 | 428,201 | ||||||
| Synchrony Financial, 4.50%, 7/23/25 | 100,000 | 97,941 | ||||||
| 1,063,265 | ||||||||
Containers and Packaging† | ||||||||
| Packaging Corp. of America, 3.65%, 9/15/24 | 17,000 | 16,869 | ||||||
42
| Avantis Short-Term Fixed Income ETF | ||||||||
| Principal Amount | Value | |||||||
| Diversified Consumer Services — 0.2% | ||||||||
| Yale University, 0.87%, 4/15/25 | $ | 200,000 | $ | 185,593 | ||||
| Diversified Financial Services — 0.4% | ||||||||
| Ally Financial, Inc., 4.75%, 6/9/27 | 225,000 | 219,619 | ||||||
Corebridge Financial, Inc., 3.65%, 4/5/27(1) | 100,000 | 94,080 | ||||||
| 313,699 | ||||||||
| Electric Utilities — 2.4% | ||||||||
| Berkshire Hathaway Energy Co., 4.05%, 4/15/25 | 148,000 | 148,263 | ||||||
| Cleco Corporate Holdings LLC, 3.74%, 5/1/26 | 242,000 | 232,152 | ||||||
| Duke Energy Florida LLC, 3.20%, 1/15/27 | 750,000 | 726,997 | ||||||
| Entergy Louisiana LLC, 2.40%, 10/1/26 | 450,000 | 417,272 | ||||||
| Oklahoma Gas and Electric Co., 0.55%, 5/26/23 | 174,000 | 170,057 | ||||||
| Sierra Pacific Power Co., 2.60%, 5/1/26 | 375,000 | 355,573 | ||||||
| 2,050,314 | ||||||||
| Electronic Equipment, Instruments and Components — 0.9% | ||||||||
| Avnet, Inc., 4.625%, 4/15/26 | 285,000 | 282,245 | ||||||
| Flex Ltd., 3.75%, 2/1/26 | 293,000 | 279,410 | ||||||
| Jabil, Inc., 1.70%, 4/15/26 | 155,000 | 138,460 | ||||||
| Keysight Technologies, Inc., 4.55%, 10/30/24 | 48,000 | 48,299 | ||||||
| TD SYNNEX Corp., 1.75%, 8/9/26 | 75,000 | 65,743 | ||||||
| 814,157 | ||||||||
| Energy Equipment and Services — 0.7% | ||||||||
| Schlumberger Finance Canada Ltd., 1.40%, 9/17/25 | 275,000 | 257,393 | ||||||
| Schlumberger Investment SA, 3.65%, 12/1/23 | 313,000 | 312,912 | ||||||
| 570,305 | ||||||||
| Equity Real Estate Investment Trusts (REITs) — 6.6% | ||||||||
| AvalonBay Communities, Inc., 2.95%, 5/11/26 | 525,000 | 500,393 | ||||||
| Boston Properties LP, 2.75%, 10/1/26 | 450,000 | 419,349 | ||||||
| Corporate Office Properties LP, 2.25%, 3/15/26 | 68,000 | 61,006 | ||||||
| Crown Castle, Inc., 4.45%, 2/15/26 | 250,000 | 248,949 | ||||||
| Digital Realty Trust LP, 3.70%, 8/15/27 | 450,000 | 429,847 | ||||||
| ERP Operating LP, 3.375%, 6/1/25 | 463,000 | 451,656 | ||||||
| Federal Realty Investment Trust, 3.25%, 7/15/27 | 450,000 | 425,500 | ||||||
| Healthcare Realty Holdings LP, 3.50%, 8/1/26 | 250,000 | 238,676 | ||||||
| Host Hotels & Resorts LP, 4.50%, 2/1/26 | 200,000 | 195,353 | ||||||
| Kimco Realty Corp., 3.30%, 2/1/25 | 338,000 | 330,329 | ||||||
| Mid-America Apartments LP, 3.60%, 6/1/27 | 100,000 | 96,066 | ||||||
| Omega Healthcare Investors, Inc., 4.95%, 4/1/24 | 75,000 | 75,234 | ||||||
| Prologis LP, 3.25%, 10/1/26 | 625,000 | 603,524 | ||||||
| Spirit Realty LP, 4.45%, 9/15/26 | 322,000 | 315,606 | ||||||
| UDR, Inc., 3.50%, 7/1/27 | 450,000 | 427,224 | ||||||
| Ventas Realty LP, 3.85%, 4/1/27 | 450,000 | 432,229 | ||||||
| Vornado Realty LP, 2.15%, 6/1/26 | 100,000 | 88,089 | ||||||
| WP Carey, Inc., 4.00%, 2/1/25 | 388,000 | 384,436 | ||||||
| 5,723,466 | ||||||||
| Food and Staples Retailing — 0.9% | ||||||||
| Costco Wholesale Corp., 2.75%, 5/18/24 | 181,000 | 179,523 | ||||||
| Walmart, Inc., 3.30%, 4/22/24 | 115,000 | 114,547 | ||||||
| Walmart, Inc., 3.05%, 7/8/26 | 450,000 | 445,814 | ||||||
| 739,884 | ||||||||
43
| Avantis Short-Term Fixed Income ETF | ||||||||
| Principal Amount | Value | |||||||
| Food Products — 0.8% | ||||||||
| Archer-Daniels-Midland Co., 2.50%, 8/11/26 | $ | 150,000 | $ | 142,778 | ||||
| Bunge Ltd. Finance Corp., 1.63%, 8/17/25 | 459,000 | 426,439 | ||||||
| Hershey Co., 2.05%, 11/15/24 | 123,000 | 118,863 | ||||||
| 688,080 | ||||||||
| Gas Utilities — 0.2% | ||||||||
| Southern California Gas Co., 2.60%, 6/15/26 | 197,000 | 186,105 | ||||||
| Health Care Providers and Services — 1.5% | ||||||||
| Aetna, Inc., 3.50%, 11/15/24 | 440,000 | 434,453 | ||||||
| Cardinal Health, Inc., 3.50%, 11/15/24 | 137,000 | 136,108 | ||||||
| Cigna Corp., 3.05%, 11/30/22 | 38,000 | 38,000 | ||||||
| CVS Health Corp., 2.875%, 6/1/26 | 70,000 | 66,845 | ||||||
| HCA, Inc., 5.25%, 6/15/26 | 270,000 | 271,559 | ||||||
| Laboratory Corp. of America Holdings, 3.60%, 2/1/25 | 100,000 | 98,649 | ||||||
| Quest Diagnostics, Inc., 3.45%, 6/1/26 | 227,000 | 221,144 | ||||||
| 1,266,758 | ||||||||
| Hotels, Restaurants and Leisure — 0.4% | ||||||||
| Hyatt Hotels Corp., 4.85%, 3/15/26 | 65,000 | 65,431 | ||||||
| Starbucks Corp., 3.80%, 8/15/25 | 293,000 | 291,897 | ||||||
| 357,328 | ||||||||
| Household Durables — 0.5% | ||||||||
| DR Horton, Inc., 4.75%, 2/15/23 | 70,000 | 70,107 | ||||||
| Lennar Corp., 5.25%, 6/1/26 | 200,000 | 201,613 | ||||||
| PulteGroup, Inc., 5.00%, 1/15/27 | 200,000 | 200,691 | ||||||
| 472,411 | ||||||||
| Household Products — 0.5% | ||||||||
| Colgate-Palmolive Co., 3.25%, 3/15/24 | 134,000 | 133,399 | ||||||
| Procter & Gamble Co., 2.45%, 11/3/26 | 300,000 | 288,204 | ||||||
| 421,603 | ||||||||
| Industrial Conglomerates — 0.5% | ||||||||
| 3M Co., 2.25%, 9/19/26 | 450,000 | 420,109 | ||||||
| Insurance — 3.1% | ||||||||
| Aflac, Inc., 3.25%, 3/17/25 | 278,000 | 274,065 | ||||||
| Allstate Corp., 0.75%, 12/15/25 | 600,000 | 538,674 | ||||||
| Brighthouse Financial, Inc., 3.70%, 6/22/27 | 450,000 | 427,497 | ||||||
| Chubb INA Holdings, Inc., 3.35%, 5/3/26 | 821,000 | 803,786 | ||||||
| First American Financial Corp., 4.60%, 11/15/24 | 200,000 | 199,944 | ||||||
| MetLife, Inc., 4.37%, 9/15/23 | 274,000 | 275,535 | ||||||
| MetLife, Inc., 3.60%, 11/13/25 | 179,000 | 177,102 | ||||||
| 2,696,603 | ||||||||
| Interactive Media and Services — 0.5% | ||||||||
| Alphabet, Inc., 3.375%, 2/25/24 | 450,000 | 449,313 | ||||||
| Internet and Direct Marketing Retail — 0.5% | ||||||||
| Amazon.com, Inc., 2.80%, 8/22/24 | 468,000 | 462,326 | ||||||
| IT Services — 1.9% | ||||||||
| International Business Machines Corp., 1.70%, 5/15/27 | 500,000 | 449,485 | ||||||
| Mastercard, Inc., 2.95%, 11/21/26 | 250,000 | 242,040 | ||||||
| VeriSign, Inc., 5.25%, 4/1/25 | 750,000 | 762,094 | ||||||
| Western Union Co., 2.85%, 1/10/25 | 171,000 | 164,169 | ||||||
| 1,617,788 | ||||||||
44
| Avantis Short-Term Fixed Income ETF | ||||||||
| Principal Amount | Value | |||||||
| Machinery — 2.8% | ||||||||
| Caterpillar Financial Services Corp., 3.30%, 6/9/24 | $ | 240,000 | $ | 238,746 | ||||
| Caterpillar Financial Services Corp., 1.45%, 5/15/25 | 723,000 | 680,254 | ||||||
| Cummins, Inc., 3.65%, 10/1/23 | 106,000 | 106,272 | ||||||
| Cummins, Inc., 0.75%, 9/1/25 | 250,000 | 228,995 | ||||||
| Illinois Tool Works, Inc., 3.50%, 3/1/24 | 56,000 | 55,928 | ||||||
| John Deere Capital Corp., 3.45%, 1/10/24 | 242,000 | 241,460 | ||||||
| PACCAR Financial Corp., 2.15%, 8/15/24 | 351,000 | 340,494 | ||||||
| PACCAR Financial Corp., 1.10%, 5/11/26 | 600,000 | 544,570 | ||||||
| 2,436,719 | ||||||||
| Media — 0.9% | ||||||||
| Comcast Cable Communications Holdings, Inc., 9.46%, 11/15/22 | 32,000 | 32,378 | ||||||
| Comcast Corp., 3.375%, 8/15/25 | 506,000 | 497,835 | ||||||
| Discovery Communications LLC, 4.90%, 3/11/26 | 245,000 | 244,813 | ||||||
| 775,026 | ||||||||
| Metals and Mining — 0.3% | ||||||||
| ArcelorMittal SA, 4.55%, 3/11/26 | 70,000 | 68,659 | ||||||
| BHP Billiton Finance USA Ltd., 3.85%, 9/30/23 | 45,000 | 45,065 | ||||||
| Kinross Gold Corp., 5.95%, 3/15/24 | 106,000 | 107,937 | ||||||
| 221,661 | ||||||||
| Multi-Utilities — 0.1% | ||||||||
| Dominion Energy, Inc., 2.75%, 9/15/22 | 98,000 | 97,996 | ||||||
| Multiline Retail — 1.6% | ||||||||
| Dollar Tree, Inc., 4.00%, 5/15/25 | 318,000 | 315,181 | ||||||
| Target Corp., 2.25%, 4/15/25 | 1,120,000 | 1,076,476 | ||||||
| 1,391,657 | ||||||||
| Oil, Gas and Consumable Fuels — 5.6% | ||||||||
| Canadian Natural Resources Ltd., 2.05%, 7/15/25 | 398,000 | 370,805 | ||||||
| Chevron Corp., 2.90%, 3/3/24 | 66,000 | 65,340 | ||||||
| Chevron Corp., 2.95%, 5/16/26 | 385,000 | 373,114 | ||||||
| Enbridge, Inc., 2.50%, 1/15/25 | 296,000 | 283,796 | ||||||
| Energy Transfer LP, 4.75%, 1/15/26 | 438,000 | 434,547 | ||||||
| Enterprise Products Operating LLC, 3.35%, 3/15/23 | 146,000 | 145,764 | ||||||
| Equinor ASA, 2.45%, 1/17/23 | 66,000 | 65,801 | ||||||
| Equinor ASA, 3.70%, 3/1/24 | 391,000 | 391,060 | ||||||
| Exxon Mobil Corp., 2.71%, 3/6/25 | 221,000 | 215,137 | ||||||
| Exxon Mobil Corp., 2.99%, 3/19/25 | 815,000 | 797,637 | ||||||
Phillips 66 Co., 2.45%, 12/15/24(1) | 148,000 | 140,750 | ||||||
| Shell International Finance BV, 3.25%, 5/11/25 | 436,000 | 428,943 | ||||||
| TotalEnergies Capital Canada Ltd., 2.75%, 7/15/23 | 131,000 | 129,792 | ||||||
| TotalEnergies Capital International SA, 2.43%, 1/10/25 | 450,000 | 435,326 | ||||||
| Valero Energy Corp., 2.85%, 4/15/25 | 37,000 | 35,845 | ||||||
| Williams Cos., Inc., 4.00%, 9/15/25 | 488,000 | 483,010 | ||||||
| 4,796,667 | ||||||||
| Personal Products — 0.1% | ||||||||
| Estee Lauder Cos., Inc., 2.00%, 12/1/24 | 48,000 | 46,682 | ||||||
| Pharmaceuticals — 2.8% | ||||||||
| Astrazeneca Finance LLC, 1.20%, 5/28/26 | 274,000 | 247,524 | ||||||
| Bristol-Myers Squibb Co., 2.90%, 7/26/24 | 431,000 | 425,578 | ||||||
| GlaxoSmithKline Capital PLC, 3.00%, 6/1/24 | 287,000 | 284,175 | ||||||
45
| Avantis Short-Term Fixed Income ETF | ||||||||
| Principal Amount | Value | |||||||
| GlaxoSmithKline Capital, Inc., 3.625%, 5/15/25 | $ | 499,000 | $ | 496,540 | ||||
| Novartis Capital Corp., 1.75%, 2/14/25 | 63,000 | 60,324 | ||||||
| Novartis Capital Corp., 3.00%, 11/20/25 | 411,000 | 402,532 | ||||||
| Royalty Pharma PLC, 1.20%, 9/2/25 | 179,000 | 162,842 | ||||||
| Utah Acquisition Sub, Inc., 3.95%, 6/15/26 | 150,000 | 141,036 | ||||||
| Wyeth LLC, 6.45%, 2/1/24 | 172,000 | 178,480 | ||||||
| 2,399,031 | ||||||||
| Road and Rail — 0.7% | ||||||||
| Canadian National Railway Co., 2.75%, 3/1/26 | 325,000 | 311,436 | ||||||
| Ryder System, Inc., 2.50%, 9/1/24 | 48,000 | 46,442 | ||||||
| Ryder System, Inc., 3.35%, 9/1/25 | 224,000 | 216,035 | ||||||
| 573,913 | ||||||||
| Semiconductors and Semiconductor Equipment — 1.0% | ||||||||
| Broadcom Corp. / Broadcom Cayman Finance Ltd., 3.875%, 1/15/27 | 175,000 | 168,318 | ||||||
| Marvell Technology, Inc., 1.65%, 4/15/26 | 230,000 | 207,071 | ||||||
| Microchip Technology, Inc., 4.33%, 6/1/23 | 64,000 | 64,107 | ||||||
| Micron Technology, Inc., 4.98%, 2/6/26 | 295,000 | 296,250 | ||||||
| NXP BV / NXP Funding LLC, 4.875%, 3/1/24 | 100,000 | 100,460 | ||||||
| 836,206 | ||||||||
| Software — 1.0% | ||||||||
| Citrix Systems, Inc., 1.25%, 3/1/26 | 234,000 | 228,845 | ||||||
| Microsoft Corp., 2.875%, 2/6/24 | 200,000 | 198,035 | ||||||
| Microsoft Corp., 3.125%, 11/3/25 | 225,000 | 221,460 | ||||||
| Microsoft Corp., 2.40%, 8/8/26 | 200,000 | 191,010 | ||||||
| Oracle Corp., 2.40%, 9/15/23 | 40,000 | 39,310 | ||||||
| 878,660 | ||||||||
| Specialty Retail — 0.6% | ||||||||
| Home Depot, Inc., 3.00%, 4/1/26 | 300,000 | 291,464 | ||||||
| Ross Stores, Inc., 4.60%, 4/15/25 | 238,000 | 240,157 | ||||||
| 531,621 | ||||||||
| Technology Hardware, Storage and Peripherals — 1.4% | ||||||||
| Apple, Inc., 3.00%, 2/9/24 | 97,000 | 96,237 | ||||||
| Apple, Inc., 1.125%, 5/11/25 | 69,000 | 64,506 | ||||||
| Apple, Inc., 3.20%, 5/13/25 | 225,000 | 222,126 | ||||||
| Apple, Inc., 3.25%, 2/23/26 | 428,000 | 420,770 | ||||||
| Dell International LLC / EMC Corp., 6.02%, 6/15/26 | 358,000 | 372,018 | ||||||
| Hewlett Packard Enterprise Co., 4.90%, 10/15/25 | 48,000 | 48,787 | ||||||
| 1,224,444 | ||||||||
| Trading Companies and Distributors — 0.1% | ||||||||
| Air Lease Corp., 2.875%, 1/15/26 | 50,000 | 46,157 | ||||||
TOTAL CORPORATE BONDS (Cost $60,324,419) | 57,541,615 | |||||||
| U.S. TREASURY SECURITIES AND EQUIVALENTS — 30.0% | ||||||||
| Israel Government AID Bond, 5.50%, 9/18/23 | 32,000 | 32,623 | ||||||
| U.S. Treasury Notes, 0.125%, 8/31/23 | 500,000 | 483,422 | ||||||
| U.S. Treasury Notes, 0.125%, 10/15/23 | 900,000 | 867,270 | ||||||
| U.S. Treasury Notes, 2.75%, 11/15/23 | 776,000 | 769,604 | ||||||
| U.S. Treasury Notes, 0.125%, 12/15/23 | 1,000,000 | 958,516 | ||||||
U.S. Treasury Notes, 2.375%, 2/29/24(2) | 1,560,000 | 1,535,259 | ||||||
| U.S. Treasury Notes, 0.375%, 4/15/24 | 1,550,000 | 1,474,316 | ||||||
| U.S. Treasury Notes, 2.00%, 5/31/24 | 1,194,700 | 1,165,346 | ||||||
46
| Avantis Short-Term Fixed Income ETF | ||||||||
| Principal Amount | Value | |||||||
| U.S. Treasury Notes, 0.25%, 6/15/24 | $ | 2,025,000 | $ | 1,912,755 | ||||
| U.S. Treasury Notes, 0.375%, 7/15/24 | 1,375,000 | 1,298,945 | ||||||
| U.S. Treasury Notes, 2.375%, 8/15/24 | 1,900,000 | 1,861,406 | ||||||
| U.S. Treasury Notes, 1.50%, 10/31/24 | 2,150,000 | 2,063,076 | ||||||
| U.S. Treasury Notes, 1.50%, 11/30/24 | 2,220,000 | 2,126,170 | ||||||
| U.S. Treasury Notes, 1.50%, 2/15/25 | 2,000,000 | 1,906,797 | ||||||
| U.S. Treasury Notes, 2.75%, 2/28/25 | 500,000 | 491,270 | ||||||
| U.S. Treasury Notes, 2.00%, 8/15/25 | 1,100,000 | 1,054,238 | ||||||
| U.S. Treasury Notes, 0.25%, 10/31/25 | 2,100,000 | 1,897,875 | ||||||
| U.S. Treasury Notes, 0.375%, 11/30/25 | 1,795,200 | 1,624,446 | ||||||
| U.S. Treasury Notes, 0.75%, 5/31/26 | 1,400,000 | 1,267,438 | ||||||
| U.S. Treasury Notes, 1.125%, 10/31/26 | 900,000 | 820,160 | ||||||
| U.S. Treasury Notes, 0.50%, 6/30/27 | 250,000 | 218,369 | ||||||
TOTAL U.S. TREASURY SECURITIES AND EQUIVALENTS (Cost $26,922,655) | 25,829,301 | |||||||
| U.S. GOVERNMENT AGENCY SECURITIES — 2.4% | ||||||||
| Federal Farm Credit Banks Funding Corp., 0.125%, 5/10/23 | 150,000 | 146,490 | ||||||
| Federal Farm Credit Banks Funding Corp., 1.125%, 1/6/25 | 250,000 | 236,713 | ||||||
| FHLB, 0.125%, 6/2/23 | 100,000 | 97,513 | ||||||
| FHLB, 1.50%, 8/15/24 | 170,000 | 163,957 | ||||||
| FHLB, 2.75%, 12/13/24 | 120,000 | 118,060 | ||||||
| FHLB, 2.375%, 3/14/25 | 200,000 | 194,613 | ||||||
| FHLB, 3.125%, 6/13/25 | 25,000 | 24,761 | ||||||
| FHLMC, 0.125%, 10/16/23 | 104,000 | 100,152 | ||||||
| FHLMC, 0.25%, 11/6/23 | 104,000 | 100,091 | ||||||
| FHLMC, 0.25%, 12/4/23 | 100,000 | 95,946 | ||||||
| FHLMC, 0.375%, 7/21/25 | 115,000 | 105,225 | ||||||
| FNMA, 2.375%, 1/19/23 | 16,000 | 15,944 | ||||||
| FNMA, 0.25%, 7/10/23 | 152,000 | 147,861 | ||||||
| FNMA, 2.625%, 9/6/24 | 375,000 | 368,733 | ||||||
| FNMA, 1.625%, 10/15/24 | 25,000 | 24,047 | ||||||
| FNMA, 0.375%, 8/25/25 | 25,000 | 22,810 | ||||||
| Tennessee Valley Authority, 0.75%, 5/15/25 | 125,000 | 115,820 | ||||||
TOTAL U.S. GOVERNMENT AGENCY SECURITIES (Cost $2,168,614) | 2,078,736 | |||||||
TOTAL INVESTMENT SECURITIES — 99.1% (Cost $89,415,688) | 85,449,652 | |||||||
| OTHER ASSETS AND LIABILITIES — 0.9% | 752,222 | |||||||
| TOTAL NET ASSETS — 100.0% | $ | 86,201,874 | ||||||
47
| Avantis Short-Term Fixed Income ETF | ||||||||
| NOTES TO SCHEDULE OF INVESTMENTS | ||||||||
| AID | - | Agency for International Development | ||||||
| Equivalent | - | Security whose payments are secured by the U.S. Treasury | ||||||
| FHLB | - | Federal Home Loan Bank | ||||||
| FHLMC | - | Federal Home Loan Mortgage Corporation | ||||||
| FNMA | - | Federal National Mortgage Association | ||||||
†Category is less than 0.05% of total net assets.
(1)Security was purchased pursuant to Rule 144A or Section 4(2) under the Securities Act of 1933 and may be sold in transactions exempt from registration, normally to qualified institutional investors. The aggregate value of these securities at the period end was $234,830, which represented 0.3% of total net assets.
(2)Security, or a portion thereof, has been pledged at the custodian bank or with a broker for collateral requirements on futures contracts. At the period end, the aggregate value of securities pledged was $49,207.
See Notes to Financial Statements.
48
| Statements of Assets and Liabilities | ||
| AUGUST 31, 2022 | ||||||||
| Avantis Core Fixed Income ETF | Avantis Core Municipal Fixed Income ETF | |||||||
| Assets | ||||||||
| Investment securities, at value (cost of $314,930,475 and $38,781,331, respectively) | $ | 296,808,133 | $ | 36,104,966 | ||||
| Cash | 522,388 | — | ||||||
| Receivable for investments sold | 33,651,982 | — | ||||||
| Receivable for capital shares sold | — | 2,281,180 | ||||||
| Interest receivable | 1,838,138 | 398,034 | ||||||
| 332,820,641 | 38,784,180 | |||||||
| Liabilities | ||||||||
| Payable for investments purchased | 83,640,296 | 2,280,915 | ||||||
| Payable for variation margin on futures contracts | 14,219 | — | ||||||
| Payable for variation margin on swap agreements | 2,805 | — | ||||||
| Accrued management fees | 31,654 | 4,352 | ||||||
| 83,688,974 | 2,285,267 | |||||||
| Net Assets | $ | 249,131,667 | $ | 36,498,913 | ||||
| Shares outstanding (unlimited number of shares authorized) | 5,850,000 | 800,000 | ||||||
| Net Asset Value Per Share | $ | 42.59 | $ | 45.62 | ||||
| Net Assets Consist of: | ||||||||
| Capital paid in | $ | 271,984,790 | $ | 39,138,455 | ||||
| Distributable earnings | (22,853,123) | (2,639,542) | ||||||
| $ | 249,131,667 | $ | 36,498,913 | |||||
See Notes to Financial Statements.
49
| AUGUST 31, 2022 | |||||
| Avantis Short-Term Fixed Income ETF | |||||
| Assets | |||||
| Investment securities, at value (cost of $89,415,688) | $ | 85,449,652 | |||
| Cash | 550,839 | ||||
| Receivable for investments sold | 2,092,734 | ||||
| Interest receivable | 507,983 | ||||
| 88,601,208 | |||||
| Liabilities | |||||
| Payable for investments purchased | 2,388,283 | ||||
| Accrued management fees | 11,051 | ||||
| 2,399,334 | |||||
| Net Assets | $ | 86,201,874 | |||
| Shares outstanding (unlimited number of shares authorized) | 1,850,000 | ||||
| Net Asset Value Per Share | $ | 46.60 | |||
| Net Assets Consist of: | |||||
| Capital paid in | $ | 90,574,805 | |||
| Distributable earnings | (4,372,931) | ||||
| $ | 86,201,874 | ||||
See Notes to Financial Statements.
50
| Statements of Operations | ||
| YEAR ENDED AUGUST 31, 2022 | ||||||||
| Avantis Core Fixed Income ETF | Avantis Core Municipal Fixed Income ETF | |||||||
| Investment Income (Loss) | ||||||||
| Income: | ||||||||
| Interest | $ | 3,464,198 | $ | 339,323 | ||||
| Expenses: | ||||||||
| Management fees | 231,892 | 43,881 | ||||||
| Other expenses | 622 | — | ||||||
| 232,514 | 43,881 | |||||||
| Net investment income (loss) | 3,231,684 | 295,442 | ||||||
| Realized and Unrealized Gain (Loss) | ||||||||
| Net realized gain (loss) on: | ||||||||
| Investment transactions | (4,898,904) | 60 | ||||||
| Futures contract transactions | (352,749) | — | ||||||
| Swap agreement transactions | (13,722) | — | ||||||
| (5,265,375) | 60 | |||||||
| Change in net unrealized appreciation (depreciation) on: | ||||||||
| Investments | (18,512,153) | (2,780,081) | ||||||
| Futures contracts | (28,724) | — | ||||||
| Swap agreements | (15,109) | — | ||||||
| (18,555,986) | (2,780,081) | |||||||
| Net realized and unrealized gain (loss) | (23,821,361) | (2,780,021) | ||||||
| Net Increase (Decrease) in Net Assets Resulting from Operations | $ | (20,589,677) | $ | (2,484,579) | ||||
See Notes to Financial Statements.
51
| YEAR ENDED AUGUST 31, 2022 | |||||
| Avantis Short-Term Fixed Income ETF | |||||
| Investment Income (Loss) | |||||
| Income: | |||||
| Interest | $ | 823,232 | |||
| Expenses: | |||||
| Management fees | 92,552 | ||||
| Net investment income (loss) | 730,680 | ||||
| Realized and Unrealized Gain (Loss) | |||||
| Net realized gain (loss) on: | |||||
| Investment transactions | (516,482) | ||||
| Futures contract transactions | (10,957) | ||||
| (527,439) | |||||
| Change in net unrealized appreciation (depreciation) on investments | (3,976,581) | ||||
| Net realized and unrealized gain (loss) | (4,504,020) | ||||
| Net Increase (Decrease) in Net Assets Resulting from Operations | $ | (3,773,340) | |||
See Notes to Financial Statements.
52
| Statements of Changes in Net Assets | ||
| YEAR ENDED AUGUST 31, 2022 AND PERIOD ENDED AUGUST 31, 2021 | ||||||||||||||
| Avantis Core Fixed Income ETF | Avantis Core Municipal Fixed Income ETF | |||||||||||||
| Increase (Decrease) in Net Assets | August 31, 2022 | August 31, 2021(1) | August 31, 2022 | August 31, 2021(2) | ||||||||||
| Operations | ||||||||||||||
| Net investment income (loss) | $ | 3,231,684 | $ | 378,942 | $ | 295,442 | $ | 125,182 | ||||||
| Net realized gain (loss) | (5,265,375) | (47,233) | 60 | (5,086) | ||||||||||
| Change in net unrealized appreciation (depreciation) | (18,555,986) | 394,850 | (2,780,081) | 103,716 | ||||||||||
| Net increase (decrease) in net assets resulting from operations | (20,589,677) | 726,559 | (2,484,579) | 223,812 | ||||||||||
| Distributions to Shareholders | ||||||||||||||
| From earnings | (2,680,155) | (309,850) | (271,910) | (106,865) | ||||||||||
| Capital Share Transactions | ||||||||||||||
| Proceeds from shares sold | 202,856,185 | 69,116,150 | 11,608,180 | 27,507,410 | ||||||||||
| Other capital | 11,448 | 1,007 | 10,377 | 12,488 | ||||||||||
| Net increase (decrease) in net assets from capital share transactions | 202,867,633 | 69,117,157 | 11,618,557 | 27,519,898 | ||||||||||
| Net increase (decrease) in net assets | 179,597,801 | 69,533,866 | 8,862,068 | 27,636,845 | ||||||||||
| Net Assets | ||||||||||||||
| Beginning of period | 69,533,866 | — | 27,636,845 | — | ||||||||||
| End of period | $ | 249,131,667 | $ | 69,533,866 | $ | 36,498,913 | $ | 27,636,845 | ||||||
| Transactions in Shares of the Funds | ||||||||||||||
| Sold | 4,450,000 | 1,400,000 | 250,000 | 550,000 | ||||||||||
(1)October 13, 2020 (fund inception) through August 31, 2021.
(2)December 8, 2020 (fund inception) through August 31, 2021.
See Notes to Financial Statements.
53
| YEAR ENDED AUGUST 31, 2022 AND PERIOD ENDED AUGUST 31, 2021 | ||||||||
| Avantis Short-Term Fixed Income ETF | ||||||||
| Increase (Decrease) in Net Assets | August 31, 2022 | August 31, 2021(1) | ||||||
| Operations | ||||||||
| Net investment income (loss) | $ | 730,680 | $ | 80,480 | ||||
| Net realized gain (loss) | (527,439) | 5,514 | ||||||
| Change in net unrealized appreciation (depreciation) | (3,976,581) | 10,545 | ||||||
| Net increase (decrease) in net assets resulting from operations | (3,773,340) | 96,539 | ||||||
| Distributions to Shareholders | ||||||||
| From earnings | (622,910) | (73,220) | ||||||
| Capital Share Transactions | ||||||||
| Proceeds from shares sold | 58,095,084 | 32,473,925 | ||||||
| Other capital | 4,107 | 1,689 | ||||||
| Net increase (decrease) in net assets from capital share transactions | 58,099,191 | 32,475,614 | ||||||
| Net increase (decrease) in net assets | 53,702,941 | 32,498,933 | ||||||
| Net Assets | ||||||||
| Beginning of period | 32,498,933 | — | ||||||
| End of period | $ | 86,201,874 | $ | 32,498,933 | ||||
| Transactions in Shares of the Funds | ||||||||
| Sold | 1,200,000 | 650,000 | ||||||
(1)October 13, 2020 (fund inception) through August 31, 2021.
See Notes to Financial Statements.
54
| Notes to Financial Statements | ||
AUGUST 31, 2022
1. Organization
American Century ETF Trust (the trust) was registered as a Delaware statutory trust in 2017 and is registered under the Investment Company Act of 1940, as amended (the 1940 Act), as an open-end management investment company. Avantis Core Fixed Income ETF, Avantis Core Municipal Fixed Income ETF and Avantis Short-Term Fixed Income ETF (collectively, the funds) are three funds in a series issued by the trust. The investment objective for Avantis Core Fixed Income ETF and Avantis Short-Term Fixed Income ETF is to seek to maximize total return. Avantis Core Municipal Fixed Income ETF’s investment objective is to seek current income that is exempt from federal income tax. Shares of the funds are listed for trading on the NYSE Arca, Inc. Avantis Core Fixed Income ETF and Avantis Short-Term Fixed Income ETF incepted on October 13, 2020. Avantis Core Municipal Fixed Income ETF incepted on December 8, 2020.
2. Significant Accounting Policies
The following is a summary of significant accounting policies consistently followed by the funds in preparation of their financial statements. Each fund is an investment company and follows accounting and reporting guidance in accordance with accounting principles generally accepted in the United States of America. This may require management to make certain estimates and assumptions at the date of the financial statements. Actual results could differ from these estimates. Management evaluated the impact of events or transactions occurring through the date the financial statements were issued that would merit recognition or disclosure.
Investment Valuations — The funds determine the fair value of their investments and compute their net asset value (NAV) per share at the close of regular trading (usually 4 p.m. Eastern time) on the New York Stock Exchange (NYSE) on each day the NYSE is open. The Board of Trustees has adopted valuation policies and procedures to guide the investment advisor in the funds' investment valuation process and to provide methodologies for the oversight of the funds' pricing function.
Fixed income securities are valued at the evaluated mean as provided by independent pricing services or at the mean of the most recent bid and asked prices as provided by investment dealers. Corporate bonds, U.S. Treasury and Government Agency securities, municipal securities, and sovereign governments and agencies are valued using market models that consider trade data, quotations from dealers and active market makers, relevant yield curve and spread data, creditworthiness, trade data or market information on comparable securities, and other relevant security specific information. Mortgage-related and asset-backed securities are valued based on models that consider trade data, prepayment and default projections, benchmark yield and spread data and estimated cash flows of each tranche of the issuer. Commercial paper is valued using a curve-based approach that considers money market rates for specific instruments, programs, currencies and maturity points from a variety of active market makers.
Open-end management investment companies are valued at the reported NAV per share. Exchange-traded futures contracts are valued at the settlement price as provided by the appropriate exchange. Swap agreements are valued at an evaluated mean as provided by independent pricing services or independent brokers.
If the funds determine that the market price for an investment is not readily available or the valuation methods mentioned above do not reflect an investment’s fair value, such investment is valued as determined in good faith by the Board of Trustees or its delegate, in accordance with policies and procedures adopted by the Board of Trustees. In its determination of fair value, the funds may review several factors including, but not limited to, market information regarding the specific investment or comparable investments and correlation with other investment types, futures indices or general market indicators. Circumstances that may cause the funds to use these procedures to value an investment include, but are not limited to: an investment has been declared in default or is distressed; trading in a security has been suspended during the trading day or a security is not actively trading on its principal exchange; prices received from a regular pricing source are deemed unreliable; or there is a foreign market holiday and no trading occurred.
55
The funds monitor for significant events occurring after the close of an investment’s primary exchange but before each fund’s NAV per share is determined. Significant events may include, but are not limited to: corporate announcements and transactions; governmental action and political unrest that could impact a specific investment or an investment sector; or armed conflicts, natural disasters and similar events that could affect investments in a specific country or region.
Security Transactions — Security transactions are accounted for as of the trade date. Net realized gains and losses are determined on the identified cost basis, which is also used for federal income tax purposes.
Investment Income — Interest income is recorded on the accrual basis and includes accretion of discounts and amortization of premiums. Inflation adjustments related to inflation-linked debt securities are reflected as interest income.
Forward Commitments — The funds may engage in securities transactions on a forward commitment basis. In these transactions, the securities’ prices and yields are fixed on the date of the commitment. The funds may sell a to-be-announced (TBA) security and at the same time make a commitment to purchase the same security at a future date at a specified price. Conversely, the funds may purchase a TBA security and at the same time make a commitment to sell the same security at a future date at a specified price. These types of transactions are known as “TBA roll” transactions and are accounted for as purchases and sales. The funds will segregate cash, cash equivalents or other appropriate liquid securities on its records in amounts sufficient to meet the purchase price.
Segregated Assets — In accordance with the 1940 Act, the funds segregate assets on their books and records to cover certain types of investment securities and other financial instruments. American Century Investment Management, Inc. (ACIM) (the investment advisor) monitors, on a daily basis, the securities segregated to ensure the funds designate a sufficient amount of liquid assets, marked-to-market daily. The funds may also receive assets or be required to pledge assets at the custodian bank or with a broker for collateral requirements.
Income Tax Status — It is each fund’s policy to distribute substantially all net investment income and net realized gains to shareholders and to otherwise qualify as a regulated investment company under provisions of the Internal Revenue Code. Accordingly, no provision has been made for income taxes. The funds file U.S. federal, state, local and non-U.S. tax returns as applicable. The funds' tax returns are subject to examination by the relevant taxing authority until expiration of the applicable statute of limitations, which is generally three years from the date of filing but can be longer in certain jurisdictions. At this time, management believes there are no uncertain tax positions which, based on their technical merit, would not be sustained upon examination and for which it is reasonably possible that the total amounts of unrecognized tax benefits will significantly change in the next twelve months.
Distributions to Shareholders — Distributions from net investment income, if any, are generally declared and paid monthly. Distributions from net realized gains, if any, are generally declared and paid annually.
Indemnifications — Under the trust’s organizational documents, its officers and trustees are indemnified against certain liabilities arising out of the performance of their duties to the funds. In addition, in the normal course of business, the funds enter into contracts that provide general indemnifications. The maximum exposure under these arrangements is unknown as this would involve future claims that may be made against a fund. The risk of material loss from such claims is considered by management to be remote.
3. Fees and Transactions with Related Parties
Certain officers and trustees of the trust are also officers and/or directors of American Century Companies, Inc. (ACC). The trust's investment advisor, ACIM, and the trust’s administrator, American Century Services, LLC, are wholly owned, directly or indirectly, by ACC.
Management Fees — The trust has entered into a management agreement with ACIM, under which ACIM provides the funds with investment advisory and management services in exchange for a single, unified management fee (the fee). The agreement provides that ACIM will pay all expenses of managing and operating the funds, except brokerage and other transaction fees and expenses relating to the acquisition and disposition of portfolio securities, acquired fund fees and expenses, interest, taxes, litigation expenses and extraordinary expenses. The fee is computed and accrued daily based on the daily net assets of each fund and paid monthly in arrears.
56
The annual management fee for each fund is as follows:
| Annual Management Fee | |||||
| Avantis Core Fixed Income ETF | 0.15% | ||||
| Avantis Core Municipal Fixed Income ETF | 0.15% | ||||
| Avantis Short-Term Fixed Income ETF | 0.15% | ||||
4. Investment Transactions
Purchases and sales of investment securities, excluding short-term investments and in kind transactions, for the period ended August 31, 2022 were as follows:
| Avantis Core Fixed Income ETF | Avantis Core Municipal Fixed Income ETF | Avantis Short-Term Fixed Income ETF | |||||||||
| Purchases of U.S. Treasury and Government Agency obligations | $ | 680,521,153 | — | $ | 7,237,079 | ||||||
| Purchases of other investment securities | 11,797,957 | $ | 8,371,644 | 23,740,604 | |||||||
| Total Purchases | $ | 692,319,110 | $ | 8,371,644 | $ | 30,977,683 | |||||
| Sales of U.S. Treasury and Government Agency obligations | $ | 640,126,795 | — | $ | 8,896,622 | ||||||
| Sales of other investment securities | 10,991,300 | $ | 649,886 | 14,297,368 | |||||||
| Total Sales | $ | 651,118,095 | $ | 649,886 | $ | 23,193,990 | |||||
Securities received or delivered in kind through subscriptions and redemptions and in kind net realized gain (loss) for the period ended August 31, 2022 were as follows:
| In kind Subscriptions | In kind Redemptions | In kind Net Realized Gain/(Loss)* | |||||||||
| Avantis Core Fixed Income ETF | $178,753,151 | — | — | ||||||||
| Avantis Core Municipal Fixed Income ETF | $4,649,428 | — | — | ||||||||
| Avantis Short-Term Fixed Income ETF | $50,971,507 | — | — | ||||||||
*Net realized gain (loss) on in kind transactions are not considered taxable for federal income tax purposes.
5. Capital Share Transactions
Each fund’s shares may only be bought and sold in a secondary market through a broker-dealer at a market price. Because ETF shares trade at market prices rather than NAV, shares may trade at a price greater than NAV (a premium) or less than NAV (a discount). Each fund issues and redeems shares at their NAV only in aggregations of a specified number of shares (a creation unit) generally in exchange for a designated portfolio of securities and/or cash (including any portion of such securities for which cash may be substituted). Authorized participants may be required to pay an additional variable charge to cover certain brokerage, tax, foreign exchange, execution, market impact and other costs and expenses related to the execution of trades resulting from creation unit transactions. Such variable charges, if any, are included in other capital within the Statements of Changes in Net Assets.
57
6. Fair Value Measurements
The funds’ investment valuation process is based on several considerations and may use multiple inputs to determine the fair value of the investments held by the funds. In conformity with accounting principles generally accepted in the United States of America, the inputs used to determine a valuation are classified into three broad levels.
•Level 1 valuation inputs consist of unadjusted quoted prices in an active market for identical investments.
•Level 2 valuation inputs consist of direct or indirect observable market data (including quoted prices for comparable investments, evaluations of subsequent market events, interest rates, prepayment speeds, credit risk, etc.). These inputs also consist of quoted prices for identical investments initially expressed in local currencies that are adjusted through translation into U.S. dollars.
•Level 3 valuation inputs consist of unobservable data (including a fund’s own assumptions).
The level classification is based on the lowest level input that is significant to the fair valuation measurement. The valuation inputs are not necessarily an indication of the risks associated with investing in these securities or other financial instruments.
The following is a summary of the level classifications as of period end. The Schedules of Investments provide additional information on the funds’ portfolio holdings.
Avantis Core Fixed Income ETF
| Level 1 | Level 2 | Level 3 | |||||||||
| Assets | |||||||||||
| Investment Securities | |||||||||||
| Corporate Bonds | — | $ | 154,202,188 | — | |||||||
| U.S. Treasury Securities | — | 62,652,784 | — | ||||||||
| U.S. Government Agency Mortgage-Backed Securities | — | 48,860,318 | — | ||||||||
| U.S. Government Agency Securities | — | 5,195,917 | — | ||||||||
| Sovereign Governments and Agencies | — | 480,144 | — | ||||||||
| Short-Term Investments | — | 25,416,782 | — | ||||||||
| — | $ | 296,808,133 | — | ||||||||
| Other Financial Instruments | |||||||||||
| Swap Agreements | — | $ | 27,227 | — | |||||||
| Liabilities | |||||||||||
| Other Financial Instruments | |||||||||||
| Futures Contracts | $ | 27,732 | — | — | |||||||
Avantis Core Municipal Fixed Income ETF
| Level 1 | Level 2 | Level 3 | |||||||||
| Assets | |||||||||||
| Investment Securities | |||||||||||
| Municipal Securities | — | $ | 35,982,643 | — | |||||||
| Short-Term Investments | $ | 122,323 | — | — | |||||||
| $ | 122,323 | $ | 35,982,643 | — | |||||||
58
Avantis Short-Term Fixed Income ETF
| Level 1 | Level 2 | Level 3 | |||||||||
| Assets | |||||||||||
| Investment Securities | |||||||||||
| Corporate Bonds | — | $ | 57,541,615 | — | |||||||
| U.S. Treasury Securities and Equivalents | — | 25,829,301 | — | ||||||||
| U.S. Government Agency Securities | — | 2,078,736 | — | ||||||||
| — | $ | 85,449,652 | — | ||||||||
7. Derivative Instruments
Credit Risk — The funds are subject to credit risk in the normal course of pursuing its investment objectives. The value of a bond generally declines as the credit quality of its issuer declines. Credit default swap agreements enable a fund to buy/sell protection against a credit event of a specific issuer or index. A fund may attempt to enhance returns by selling protection or attempt to mitigate credit risk by buying protection. The buyer/seller of credit protection against a security or basket of securities may pay/receive an up-front or periodic payment to compensate for/against potential default events. Changes in value, including the periodic amounts of interest to be paid or received on swap agreements, are recorded as unrealized appreciation (depreciation) on swap agreements. Upon entering into a centrally cleared swap, a fund is required to deposit cash or securities (initial margin) with a financial intermediary in an amount equal to a certain percentage of the notional amount. Subsequent payments (variation margin) are made or received daily, in cash, by a fund. The variation margin is equal to the daily change in the value and is a component of unrealized gains and losses. Realized gain or loss is recorded upon receipt or payment of a periodic settlement or termination of swap agreements. Net realized and unrealized gains or losses occurring during the holding period of swap agreements are a component of net realized gain (loss) on swap agreement transactions and change in net unrealized appreciation (depreciation) on swap agreements, respectively. The risks of entering into swap agreements include the possible lack of liquidity, failure of the counterparty to meet its obligations, and that there may be unfavorable changes in the underlying investments or instruments.
The fund's average notional amount to credit risk derivative instruments held during the period was as follows:
| Avantis Core Fixed Income ETF | $2,895,833 | ||||
Interest Rate Risk — The funds are subject to interest rate risk in the normal course of pursuing its investment objectives. The value of bonds generally declines as interest rates rise. A fund may enter into futures contracts based on a bond index or a specific underlying security. A fund may purchase futures contracts to gain exposure to increases in market value or sell futures contracts to protect against a decline in market value. Upon entering into a futures contract, a fund will segregate cash, cash equivalents or other appropriate liquid securities on its records in amounts sufficient to meet requirements. Subsequent payments (variation margin) are made or received daily, in cash, by a fund. The variation margin is equal to the daily change in the contract value and is recorded as unrealized gains and losses. A fund recognizes a realized gain or loss when the futures contract is closed or expires. Net realized and unrealized gains or losses occurring during the holding period of futures contracts are a component of net realized gain (loss) on futures contract transactions and change in net unrealized appreciation (depreciation) on futures contracts, respectively. One of the risks of entering into futures contracts is the possibility that the change in value of the contract may not correlate with the changes in value of the underlying securities.
The funds' average notional exposure to interest rate risk derivative instruments held during the period were as follows:
| Futures Contracts Purchased | |||||
| Avantis Core Fixed Income ETF | $1,849,529 | ||||
| Avantis Short-Term Fixed Income ETF | $1,137,266 | ||||
59
Value of Derivative Instruments as of August 31, 2022
| Asset Derivatives | Liability Derivatives | |||||||||||||
| Fund / Type of Risk Exposure | Location on Statement of Assets and Liabilities | Value | Location on Statement of Assets and Liabilities | Value | ||||||||||
| Avantis Core Fixed Income ETF | ||||||||||||||
| Credit Risk | Receivable for variation margin on swap agreements* | — | Payable for variation margin on swap agreements* | $ | 2,805 | |||||||||
| Interest Rate Risk | Receivable for variation margin on futures contracts* | — | Payable for variation margin on futures contracts* | 14,219 | ||||||||||
| — | $ | 17,024 | ||||||||||||
*Included in the unrealized appreciation (depreciation) on futures contracts or centrally cleared swap agreements, as applicable, as reported in the Schedule of Investments.
At period end, Avantis Short-Term Fixed Income ETF did not have any derivative instruments disclosed on the Statement of Assets and Liabilities.
Effect of Derivative Instruments on the Statement of Operations for the Year Ended August 31, 2022
| Net Realized Gain (Loss) | Change in Net Unrealized Appreciation (Depreciation) | |||||||||||||
| Fund / Type of Risk Exposure | Location on Statement of Operations | Value | Location on Statement of Operations | Value | ||||||||||
| Avantis Core Fixed Income ETF | ||||||||||||||
| Credit Risk | Net realized gain (loss) on swap agreement transactions | $ | (13,722) | Change in net unrealized appreciation (depreciation) on swap agreements | $ | (15,109) | ||||||||
| Interest Rate Risk | Net realized gain (loss) on futures contract transactions | (352,749) | Change in net unrealized appreciation (depreciation) on futures contracts | (28,724) | ||||||||||
| $ | (366,471) | $ | (43,833) | |||||||||||
| Avantis Short-Term Fixed Income ETF | ||||||||||||||
| Interest Rate Risk | Net realized gain (loss) on futures contract transactions | $ | (10,957) | Change in net unrealized appreciation (depreciation) on futures contracts | — | |||||||||
8. Risk Factors
The value of the funds’ shares will go up and down, sometimes rapidly or unpredictably, based on the performance of the securities owned by the funds and other factors generally affecting the securities market. Market risks, including political, regulatory, economic and social developments, can affect the value of the funds’ investments. Natural disasters, public health emergencies, war, terrorism and other unforeseeable events may lead to increased market volatility and may have adverse long-term effects on world economies and markets generally.
The novel coronavirus (COVID-19) pandemic has stressed the financial resources of many municipal issuers, which may impair a municipal issuer’s ability to meet its financial obligations when due and could adversely impact the value of its bonds, which could negatively impact the performance of the funds.
A fund’s investment process may result in high portfolio turnover, which could mean high transaction costs, affecting both performance and capital gains tax liabilities to investors.
60
9. Federal Tax Information
The tax character of distributions paid during the year ended August 31, 2022 and period ended August 31, 2021 were as follows:
| 2022 | 2021 | |||||||||||||||||||
| Distributions Paid From: | Distributions Paid From: | |||||||||||||||||||
| Exempt Income | Ordinary Income | Long-term Capital Gains | Exempt Income | Ordinary Income | Long-term Capital Gains | |||||||||||||||
| Avantis Core Fixed Income ETF | — | $ | 2,680,155 | — | —(1) | $ 309,850(1) | —(1) | |||||||||||||
| Avantis Core Municipal Fixed Income ETF | $ | 271,910 | — | — | $106,865(2) | —(2) | —(2) | |||||||||||||
| Avantis Short-Term Fixed Income ETF | — | $ | 622,910 | — | —(1) | $73,220(1) | —(1) | |||||||||||||
(1)October 13, 2020 (fund inception) through August 31, 2021.
(2)December 8, 2020 (fund inception) through August 31, 2021.
The book-basis character of distributions made during the year from net investment income or net realized gains may differ from their ultimate characterization for federal income tax purposes. These differences reflect the differing character of certain income items and net realized gains and losses for financial statement and tax purposes, and may result in reclassification among certain capital accounts on the financial statements.
As of period end, the federal tax cost of investments and the components of distributable earnings on a tax-basis were as follows:
| Avantis Core Fixed Income ETF | Avantis Core Municipal Fixed Income ETF | Avantis Short-Term Fixed Income ETF | |||||||||
| Federal tax cost of investments | $ | 315,402,504 | $ | 38,781,331 | $ | 89,415,688 | |||||
| Gross tax appreciation of investments | $ | 8,504 | $ | 9,862 | $ | 79 | |||||
| Gross tax depreciation of investments | (18,602,875) | (2,686,227) | (3,966,115) | ||||||||
| Net tax appreciation (depreciation) of investments | (18,594,371) | (2,676,365) | (3,966,036) | ||||||||
| Net tax appreciation (depreciation) on derivatives | (1,062) | — | — | ||||||||
| Net tax appreciation (depreciation) | $ | (18,595,433) | $ | (2,676,365) | $ | (3,966,036) | |||||
| Undistributed ordinary income | $ | 642,889 | — | $ | 147,833 | ||||||
| Undistributed exempt income | — | $ | 41,849 | — | |||||||
| Accumulated short-term capital losses | $ | (3,858,395) | $ | (5,026) | $ | (423,360) | |||||
| Accumulated long-term capital losses | $ | (1,042,184) | — | $ | (131,368) | ||||||
For Avantis Core Fixed Income ETF, the difference between book-basis and tax-basis unrealized appreciation (depreciation) is attributable primarily to the tax deferral of losses on wash sales. The cost of investments for federal income tax purposes was the same as the cost for financial reporting purposes for Avantis Core Municipal Fixed Income ETF and Avantis Short-Term Fixed Income ETF.
Accumulated capital losses represent net capital loss carryovers that may be used to offset future realized capital gains for federal income tax purposes. The capital loss carryovers may be carried forward for an unlimited period. Future capital loss carryover utilization in any given year may be subject to Internal Revenue Code limitations.
61
| Financial Highlights | ||
| For a Share Outstanding Throughout the Years Ended August 31 (except as noted) | ||||||||||||||||||||||||||||||||||||||
| Per-Share Data | Ratios and Supplemental Data | |||||||||||||||||||||||||||||||||||||
| Income From Investment Operations: | Ratio to Average Net Assets of: | |||||||||||||||||||||||||||||||||||||
| Net Asset Value, Beginning of Period | Net Investment Income (Loss)(1) | Net Realized and Unrealized Gain (Loss) | Total From Investment Operations | Distributions From Net Investment Income | Other Capital(1) | Net Asset Value, End of Period | Total Return(2) | Operating Expenses | Net Investment Income (Loss) | Portfolio Turnover Rate(3) | Net Assets, End of Period (in thousands) | |||||||||||||||||||||||||||
| Avantis Core Fixed Income ETF | ||||||||||||||||||||||||||||||||||||||
| 2022 | $49.67 | 0.94 | (7.28) | (6.34) | (0.74) | 0.00(4) | $42.59 | (12.86)% | 0.15% | 2.09% | 382% | $249,132 | ||||||||||||||||||||||||||
2021(5) | $50.00 | 0.51 | (0.43) | 0.08 | (0.41) | 0.00(4) | $49.67 | 0.15% | 0.15%(6) | 1.17%(6) | 185% | $69,534 | ||||||||||||||||||||||||||
| Notes to Financial Highlights | ||
(1)Computed using average shares outstanding throughout the period.
(2)Total returns are calculated based on the net asset value of the last business day. Total returns for periods less than one year are not annualized.
(3)Excludes securities received or delivered in kind.
(4)Per-share amount was less than $0.005.
(5)October 13, 2020 (fund inception) through August 31, 2021.
(6)Annualized.
See Notes to Financial Statements.
| For a Share Outstanding Throughout the Years Ended August 31 (except as noted) | ||||||||||||||||||||||||||||||||||||||
| Per-Share Data | Ratios and Supplemental Data | |||||||||||||||||||||||||||||||||||||
| Income From Investment Operations: | Ratio to Average Net Assets of: | |||||||||||||||||||||||||||||||||||||
| Net Asset Value, Beginning of Period | Net Investment Income (Loss)(1) | Net Realized and Unrealized Gain (Loss) | Total From Investment Operations | Distributions From Net Investment Income | Other Capital(1) | Net Asset Value, End of Period | Total Return(2) | Operating Expenses | Net Investment Income (Loss) | Portfolio Turnover Rate(3) | Net Assets, End of Period (in thousands) | |||||||||||||||||||||||||||
| Avantis Core Municipal Fixed Income ETF | ||||||||||||||||||||||||||||||||||||||
| 2022 | $50.25 | 0.48 | (4.69) | (4.21) | (0.44) | $0.02 | $45.62 | (8.36)% | 0.15% | 1.01% | 2% | $36,499 | ||||||||||||||||||||||||||
2021(4) | $50.00 | 0.26 | 0.17 | 0.43 | (0.21) | $0.03 | $50.25 | 0.93% | 0.15%(5) | 0.70%(5) | 14% | $27,637 | ||||||||||||||||||||||||||
| Notes to Financial Highlights | ||
(1)Computed using average shares outstanding throughout the period.
(2)Total returns are calculated based on the net asset value of the last business day. Total returns for periods less than one year are not annualized.
(3)Excludes securities received or delivered in kind.
(4)December 8, 2020 (fund inception) through August 31, 2021.
(5)Annualized.
See Notes to Financial Statements.
| For a Share Outstanding Throughout the Years Ended August 31 (except as noted) | ||||||||||||||||||||||||||||||||||||||
| Per-Share Data | Ratios and Supplemental Data | |||||||||||||||||||||||||||||||||||||
| Income From Investment Operations: | Ratio to Average Net Assets of: | |||||||||||||||||||||||||||||||||||||
| Net Asset Value, Beginning of Period | Net Investment Income (Loss)(1) | Net Realized and Unrealized Gain (Loss) | Total From Investment Operations | Distributions From Net Investment Income | Other Capital(1) | Net Asset Value, End of Period | Total Return(2) | Operating Expenses | Net Investment Income (Loss) | Portfolio Turnover Rate(3) | Net Assets, End of Period (in thousands) | |||||||||||||||||||||||||||
| Avantis Short-Term Fixed Income ETF | ||||||||||||||||||||||||||||||||||||||
| 2022 | $50.00 | 0.57 | (3.52) | (2.95) | (0.45) | 0.00(4) | $46.60 | (5.92)% | 0.15% | 1.18% | 38% | $86,202 | ||||||||||||||||||||||||||
2021(5) | $50.00 | 0.18 | (0.02) | 0.16 | (0.16) | 0.00(4) | $50.00 | 0.33% | 0.15%(6) | 0.40%(6) | 49% | $32,499 | ||||||||||||||||||||||||||
| Notes to Financial Highlights | ||
(1)Computed using average shares outstanding throughout the period.
(2)Total returns are calculated based on the net asset value of the last business day. Total returns for periods less than one year are not annualized.
(3)Excludes securities received or delivered in kind.
(4)Per-share amount was less than $0.005.
(5)October 13, 2020 (fund inception) through August 31, 2021.
(6)Annualized.
See Notes to Financial Statements.
| Report of Independent Registered Public Accounting Firm | ||
To the Shareholders and the Board of Trustees of American Century ETF Trust:
Opinion on the Financial Statements and Financial Highlights
We have audited the accompanying statements of assets and liabilities, including the schedules of investments, of Avantis® Core Fixed Income ETF, Avantis® Core Municipal Fixed Income ETF, and Avantis® Short-Term Fixed Income ETF (the “Funds”), three of the funds constituting the American Century ETF Trust, as of August 31, 2022, the related statements of operations, statements of changes in net assets, and financial highlights for the periods indicated in the table below; and the related notes. In our opinion, the financial statements and financial highlights present fairly, in all material respects, the financial position of each of the Funds constituting American Century ETF Trust as of August 31, 2022, and the results of their operations, the changes in their net assets, and the financial highlights for the periods listed in the table below, in conformity with accounting principles generally accepted in the United States of America.
| Individual Fund Constituting the American Century ETF Trust | Statement of Operations | Statements of Changes in Net Assets | Financial Highlights | |||||||||||
Avantis® Core Fixed Income ETF | For the year ended August 31, 2022 | For the year ended August 31, 2022 and the period from October 13, 2020 (fund inception) through August 31, 2021 | ||||||||||||
Avantis® Core Municipal Fixed Income ETF | For the year ended August 31, 2022 | For the year ended August 31, 2022 and the period from December 8, 2020 (fund inception) through August 31, 2021 | ||||||||||||
Avantis® Short-Term Fixed Income ETF | For the year ended August 31, 2022 | For the year ended August 31, 2022 and the period from October 13, 2020 (fund inception) through August 31, 2021 | ||||||||||||
Basis for Opinion
These financial statements and financial highlights are the responsibility of the Funds’ management. Our responsibility is to express an opinion on the Funds’ financial statements and financial highlights based on our audits. We are a public accounting firm registered with the Public Company Accounting Oversight Board (United States) (PCAOB) and are required to be independent with respect to the Funds in accordance with the U.S. federal securities laws and the applicable rules and regulations of the Securities and Exchange Commission and the PCAOB.
We conducted our audits in accordance with the standards of the PCAOB. Those standards require that we plan and perform the audit to obtain reasonable assurance about whether the financial statements and financial highlights are free of material misstatement, whether due to error or fraud. The Funds are not required to have, nor were we engaged to perform, an audit of their internal control over financial reporting. As part of our audits, we are required to obtain an understanding of internal control over financial reporting but not for the purpose of expressing an opinion on the effectiveness of the Funds’ internal control over financial reporting. Accordingly, we express no such opinion.
65
Our audits included performing procedures to assess the risks of material misstatement of the financial statements and financial highlights, whether due to error or fraud, and performing procedures that respond to those risks. Such procedures included examining, on a test basis, evidence regarding the amounts and disclosures in the financial statements and financial highlights. Our audits also included evaluating the accounting principles used and significant estimates made by management, as well as evaluating the overall presentation of the financial statements and financial highlights. Our procedures included confirmation of securities owned as of August 31, 2022, by correspondence with the custodian and brokers; when replies were not received from brokers, we performed other auditing procedures. We believe that our audits provide a reasonable basis for our opinion.
/s/ Deloitte & Touche LLP
Kansas City, Missouri
October 17, 2022
We have served as the auditor of one or more American Century investment companies since 1997.
66
| Management | ||
The Board of Trustees
The individuals listed below serve as trustees of the funds. Each trustee will continue to serve in this capacity until death, retirement, resignation or removal from office. The board has adopted a mandatory retirement age for trustees who are not “interested persons,” as that term is defined in the Investment Company Act (independent trustees). Trustees who are not also officers of the trust shall retire on December 31st of the year in which they reach their 75th birthday.
Jonathan S. Thomas is an “interested person” because he currently serves as President and Chief Executive Officer of American Century Companies, Inc. (ACC), the parent company of American Century Investment Management, Inc. (ACIM or the advisor). The other trustees are independent. They are not employees, directors or officers of, and have no financial interest in, ACC or any of its wholly owned, direct or indirect, subsidiaries, including ACIM and American Century Services, LLC (ACS), and they do not have any other affiliations, positions or relationships that would cause them to be considered “interested persons” under the Investment Company Act. The following trustees also serve in this capacity for a number of other registered investment companies in the American Century Investments family of funds: Jonathan S. Thomas, 15; Jeremy I. Bulow, 8; and Stephen E. Yates, 7.
The following table presents additional information about the trustees. The mailing address for each trustee other than Jonathan S. Thomas is 330 Madison Avenue, New York, New York 10017. The mailing address for Jonathan S. Thomas is 4500 Main Street, Kansas City, Missouri 64111.
| Name (Year of Birth) | Position(s) Held with Funds | Length of Time Served | Principal Occupation(s) During Past 5 Years | Number of American Century Portfolios Overseen by Trustee | Other Directorships Held During Past 5 Years | ||||||||||||
| Independent Trustees | |||||||||||||||||
| Reginald M. Browne (1968) | Trustee and Chairman of the Board | Since 2017 (Chairman since 2019) | Principal, GTS Securities (automated capital markets trading firm)(2019 to present); Senior Managing Director, Co Global Head-ETF Group, Cantor Fitzgerald (financial services firm)(2013 to 2019) | 41 | None | ||||||||||||
| Jeremy I. Bulow (1954) | Trustee | Since 2022 | Professor of Economics, Stanford University Graduate School of Business (1979 to present) | 75 | None | ||||||||||||
| Barry A. Mendelson (1958) | Trustee | Since 2017 | Retired | 41 | None | ||||||||||||
| Stephen E. Yates (1948) | Trustee | Since 2017 | Retired | 105 | None | ||||||||||||
| Interested Trustees | |||||||||||||||||
| Jonathan S. Thomas (1963) | Trustee | Since 2017 | President and Chief Executive Officer, ACC (2007 to present). Also serves as Chief Executive Officer, ACS; Director, ACC and other ACC subsidiaries | 139 | None | ||||||||||||
The Statement of Additional Information has additional information about the funds' trustees and is available without charge, upon request, by calling 1-800-345-6488.
67
Officers
The following table presents certain information about the executive officers of the funds. Each officer, except Cleo Chang and Edward Rosenberg, serves as an officer for each of the 16 investment companies in the American Century family of funds. No officer is compensated for his or her service as an officer of the funds. The listed officers are interested persons of the funds and are appointed or re-appointed on an annual basis. The mailing address for each officer listed below is 4500 Main Street, Kansas City, Missouri 64111.
| Name (Year of Birth) | Offices with the Funds | Principal Occupation(s) During the Past Five Years | ||||||
| Patrick Bannigan (1965) | President since 2019 | Executive Vice President and Director, ACC (2012 to present); Chief Financial Officer, Chief Accounting Officer and Treasurer, ACC (2015 to present). Also serves as President, ACS; Vice President, ACIM; Chief Financial Officer, Chief Accounting Officer and/or Director, ACIM, ACS and other ACC subsidiaries | ||||||
| R. Wes Campbell (1974) | Chief Financial Officer and Treasurer since 2018 | Vice President, ACS (2020 to present); Investment Operations and Investment Accounting, ACS (2000 to present) | ||||||
| Amy D. Shelton (1964) | Chief Compliance Officer and Vice President since 2017 | Chief Compliance Officer, American Century funds, (2014 to present); Chief Compliance Officer, ACIM (2014 to present); Chief Compliance Officer, ACIS (2009 to present). Also serves as Vice President, ACIS | ||||||
| John Pak (1968) | General Counsel and Vice President since 2021 | General Counsel and Senior Vice President, ACC (2021 to present). Also serves as General Counsel and Senior Vice President, ACIM, ACS and ACIS. Chief Legal Officer of Investment and Wealth Management,The Bank of New York Mellon (2014 to 2021) | ||||||
| Cleo Chang (1977) | Vice President since 2019 | Senior Vice President, ACIM (2015 to present) | ||||||
| David H. Reinmiller (1963) | Vice President since 2017 | Attorney, ACC (1994 to present). Also serves as Vice President, ACIM and ACS | ||||||
| Edward Rosenberg (1973) | Vice President since 2017 | Senior Vice President, ACIM (2017 to present); Senior Vice President, Flexshares Head of ETF Capital Markets, Northern Trust (2012 to 2017) | ||||||
| C. Jean Wade (1964) | Vice President since 2017 | Senior Vice President, ACS (2017 to present); Vice President, ACS (2000 to 2017) | ||||||
| Ward D. Stauffer (1960) | Secretary since 2019 | Attorney, ACS (2003 to present) | ||||||
68
| Approval of Management Agreement | ||
At a meeting held on June 2, 2022, the Funds’ Board of Trustees (the "Board") unanimously approved the renewal of the management agreement pursuant to which American Century Investment Management, Inc. (the “Advisor”) acts as the investment advisor for each of the Funds. Under Section 15(c) of the Investment Company Act of 1940 (the “Investment Company Act”), contracts for investment advisory services are required to be reviewed, evaluated, and approved by a majority of a fund’s Trustees, including a majority of the independent Trustees, each year.
Prior to its consideration of the management agreement renewal, the Trustees requested and reviewed extensive data and information compiled by the Advisor and certain independent data providers concerning the Funds. This review was in addition to the oversight and evaluation undertaken by the Board and its Audit Committee on a continual basis and the information received was supplemental to the extensive information that the Board and its Audit Committee receive and consider throughout the year.
In connection with its consideration of the management agreement renewal, the Board’s review and evaluation of the services provided by the Advisor included, but was not limited to, the following:
•the nature, extent, and quality of investment management, shareholder services, and other services provided and to be provided to each Fund including without limitation portfolio management and trading services, shareholder and intermediary services, compliance and legal services, fund accounting and financial reporting, and fund share distribution;
•the wide range of other programs and services provided to each Fund and its shareholders on a routine and non-routine basis;
•the investment performance of each Fund, including data comparing each Fund's performance to an appropriate benchmark and/or a peer group of other funds with similar investment objectives and strategies;
•the cost of owning each Fund compared to the cost of owning similarly-managed funds;
•the compliance policies, procedures, and regulatory experience of the Advisor and the Funds’ service providers;
•the Advisor’s strategic plans, generally, and with respect to the ongoing impact of the COVID-19 pandemic response, heightened areas of interest in the mutual fund industry and recent geopolitical issues;
•the Advisor’s business continuity plans, vendor management practices, and cyber security practices;
•financial data showing the cost of services provided to each Fund, the profitability of each Fund to the Advisor, and the overall profitability of the Advisor;
•information regarding payments to intermediaries by the Advisor;
•possible economies of scale associated with the Advisor’s management of each Fund; and
•possible collateral benefits to the Advisor from the management of the Funds.
The independent Trustees met separately in private session to discuss the renewal and to review and discuss the information provided in response to their request. The independent Trustees also held active discussions with the Advisor regarding the renewal of the management agreement. The independent Trustees had the benefit of the advice of their independent counsel throughout the process.
Factors Considered
The Trustees considered all of the information provided by the Advisor, the independent data providers, and independent counsel in connection with the approval. They determined that the information was sufficient for them to evaluate the management agreement for the Funds. In
69
connection with their review, the Trustees did not identify any single factor as being all-important or controlling, and each Trustee may have attributed different levels of importance to different factors. In deciding to renew the management agreement, the Board based its decision on a number of factors, including without limitation the following:
Nature, Extent and Quality of Services — Generally. Under each Fund’s management agreement, the Advisor is responsible for providing or arranging for all services necessary for the operation of each Fund. The Board noted that the Advisor provides or arranges at its own expense a wide variety of services which include the following:
•constructing and designing each Fund
•portfolio research and security selection
•initial capitalization/funding
•securities trading
•Fund administration
•custody of Fund assets
•daily valuation of each Fund’s portfolio
•liquidity monitoring and management
•risk management, including cyber security
•shareholder servicing and transfer agency, including shareholder confirmations, recordkeeping, and communications
•legal services (except the independent Trustees’ counsel)
•regulatory and portfolio compliance
•financial reporting
•marketing and distribution (except amounts paid by each Fund under Rule 12b-1 plans)
Investment Management Services. The nature of the investment management services provided to the Funds is quite complex and allows Fund shareholders access to professional money management, instant diversification of their investments within an asset class, and liquidity. In evaluating investment performance, the Board expects the Advisor to manage each Fund in accordance with its investment objectives and principal investment strategies. Further, the Trustees recognize that the Advisor has an obligation to monitor trading activities, and in particular to seek the best execution of fund trades, and to evaluate the use of and payment for research. In providing these services, the Advisor utilizes teams of investment professionals (portfolio managers, analysts, research assistants, and securities traders) who require extensive information technology, research, training, compliance, and other systems to conduct their business. The Board provides oversight of the investment performance process. It regularly reviews investment performance information for each Fund, together with comparative information for appropriate benchmarks over different time horizons. The Trustees also review investment performance information during the management agreement renewal process. If performance concerns are identified, the Board discusses with the Advisor the reasons for such results and any actions being taken to improve performance. The performance for Avantis Core Fixed Income ETF, Avantis Core Municipal Fixed Income ETF, and Avantis Short-Term Fixed Income ETF was below each Fund’s respective benchmark for the one-year period reviewed by the Board. The Board found the investment management services provided by the Advisor to each Fund to be satisfactory and consistent with the management agreement.
Shareholder and Other Services. Under the management agreement, the Advisor provides or arranges for a comprehensive package of services to the Funds. The Board, directly and through its Audit Committee, regularly reviews reports and evaluations of such services at its regular meetings. These reports include, but are not limited to, information regarding the operational efficiency and accuracy of the shareholder and transfer agency services provided, staffing levels, shareholder satisfaction, technology support (including cyber security), new products and services offered to Fund shareholders, securities trading activities, portfolio valuation services, auditing services, and legal and operational compliance activities. The Board found the services provided by the Advisor to each Fund under the management agreement to be competitive and of high quality.
70
Costs of Services and Profitability. The Advisor provides detailed information concerning its cost of providing various services to the Funds, its profitability in managing each Fund (pre- and post-distribution), its overall profitability, and its financial condition. The Trustees have reviewed with the Advisor the methodology used to prepare this financial information. This information is considered in evaluating the Advisor’s financial condition, its ability to continue to provide services under the management agreement, and the reasonableness of the current management fee. The Board concluded that the Advisor’s profits were reasonable in light of the services provided to the Funds.
Ethics. The Board generally considers the Advisor’s commitment to providing quality services to the Funds and to conducting its business ethically. They noted that the Advisor’s practices generally meet or exceed industry best practices.
Economies of Scale. The Board also reviewed information provided by the Advisor regarding the possible existence of economies of scale in connection with the management of each Fund. The Board concluded that economies of scale are difficult to measure and predict with precision, especially on a fund-by-fund basis. The Board concluded that the Advisor is sharing economies of scale, to the extent they exist, through its fee structure and through reinvestment in its business, infrastructure, investment capabilities and initiatives to provide shareholders additional content and services.
Comparison to Other Funds’ Fees. The management agreement provides that each Fund pays the Advisor a single, all-inclusive (or unified) management fee for providing all services necessary for the management and operation of the Fund, other than securities transaction expenses, taxes, interest, extraordinary expenses, and expenses incurred in connection with the provision of shareholder services and distribution services under a plan adopted pursuant to Rule 12b-1 under the Investment Company Act. Under the unified fee structure, the Advisor is responsible for providing all investment advisory, custody, audit, administrative, compliance, recordkeeping, marketing and shareholder services, or arranging and supervising third parties to provide such services. The Board believes the unified fee structure is a benefit to Fund shareholders because it clearly discloses to shareholders the cost of owning Fund shares, and, since the unified fee cannot be increased without a vote of Fund shareholders, it shifts to the Advisor the risk of increased costs of operating the Fund and provides a direct incentive to minimize administrative inefficiencies. Part of the Board’s analysis of fee levels involves reviewing certain evaluative data compiled by an independent provider comparing the Fund’s unified fee to the total expense ratios of its peers. The unified fee charged to shareholders of Avantis Core Fixed Income ETF was below the median of the total expense ratios of its peer expense universe and the lowest of its peer expense group. The unified fee charged to shareholders of Avantis Core Municipal Fixed Income ETF and Avantis Short-Term Fixed Income ETF was the lowest of the total expense ratios of their respective peer expense universe and was the lowest of their peer expense group. The Board concluded that the management fee paid by each Fund to the Advisor under its management agreement is reasonable in light of the services provided to the Fund.
Comparison to Fees and Services Provided to Other Clients of the Advisor. The Board also requested and received information from the Advisor concerning the nature of the services, fees, costs, and profitability of its advisory services to funds or other advisory clients managed similarly to the Funds. They observed that these varying types of client accounts require different services and involve different regulatory and entrepreneurial risks than the management of the Funds. The Board analyzed this information and concluded that the fees charged and services provided to the Funds were reasonable by comparison.
Payments to Intermediaries. The Trustees also requested and received a description of payments made to intermediaries by each Fund and the Advisor and services provided in response thereto. These payments could include various payments made by each Fund or the Advisor to different types of intermediaries and recordkeepers for distribution and service activities provided for each Fund. The Trustees reviewed such information and received representations from the
71
Advisor that all such payments by the Advisor were made from the Advisor’s resources and reasonable profits.
Collateral or “Fall-Out” Benefits Derived by the Advisor. The Board considered the possible existence of collateral benefits the Advisor may receive as a result of its relationship with the Funds. They concluded that the Advisor’s primary business is managing funds and it generally does not use fund or shareholder information to generate profits in other lines of business, and therefore does not derive any significant collateral benefits from them. The Board noted that additional assets from other clients may offer the Advisor some benefit from increased leverage with service providers and counterparties. The Board also determined that the Advisor is able to provide investment management services to certain clients other than the Funds, at least in part, due to its existing infrastructure built to serve the fund complex. The Board concluded that appropriate allocation methodologies had been employed to assign resources and the cost of those resources to these other clients.
Existing Relationship. The Board also considered whether there was any reason for not continuing the existing arrangement with the Advisor. In this regard, the Board was mindful of the potential disruptions of the Funds’ operations and various risks, uncertainties, and other effects that could occur as a result of a decision not to continue such relationship. In particular, the Board recognized that most shareholders have invested in each Fund on the strength of the Advisor’s industry standing and reputation and in the expectation that the Advisor will have a continuing role in providing advisory services to each Fund.
Conclusion of the Trustees. As a result of this process, the Board, including all of the independent Trustees, taking into account all of the factors discussed above and the information provided by the Advisor and others in connection with its review and throughout the year, determined that the terms of the management fee are fair and reasonable and that the management fee charged to each Fund is fair in light of the services provided and that the investment management agreement between each Fund and the Advisor should be renewed for an additional one-year period.
72
| Liquidity Risk Management Program | ||
The Funds have adopted a liquidity risk management program (the “program”). The Funds' Board of Trustees (the "Board") has designated American Century Investment Management, Inc. (“ACIM”) as the administrator of the program. Personnel of ACIM or its affiliates conduct the day-to-day operation of the program pursuant to policies and procedures administered by the Program Administrator, including members of ACIM’s Investment Oversight Committee who are members of the ACIM’s Investment Management and Global Analytics departments.
Under the program, ACIM manages the Funds' liquidity risk, which is the risk that the Funds could not meet shareholder redemption requests without significant dilution of remaining shareholders’ interests in the Funds. This risk is managed by monitoring the degree of liquidity of the Funds' investments, limiting the amount of the Funds' illiquid investments, and utilizing various risk management tools and facilities available to the Funds for meeting shareholder redemptions, among other means. ACIM’s process of determining the degree of liquidity of certain Funds' investments is supported by a third-party liquidity assessment vendor.
The Board reviewed a report prepared by ACIM regarding the operation and effectiveness of the program for the period January 1, 2021 through December 31, 2021. No significant liquidity events impacting the Funds were noted in the report. In addition, ACIM provided its assessment that the program had been effective in managing the Funds' liquidity risk.
73
| Additional Information | ||
Retirement Account Information
As required by law, distributions you receive from certain retirement accounts are subject to federal income tax withholding, unless you elect not to have withholding apply*. Tax will be withheld on the total amount withdrawn even though you may be receiving amounts that are not subject to withholding, such as nondeductible contributions. In such case, excess amounts of withholding could occur. You may adjust your withholding election so that a greater or lesser amount will be withheld.
Remember, even if you elect not to have income tax withheld, you are liable for paying income tax on the taxable portion of your withdrawal. If you elect not to have income tax withheld or you don’t have enough income tax withheld, you may be responsible for payment of estimated tax. You may incur penalties under the estimated tax rules if your withholding and estimated tax payments are not sufficient. You can reduce or defer the income tax on a distribution by directly or indirectly rolling such distribution over to another IRA or eligible plan. You should consult your tax advisor for additional information.
State tax will be withheld if, at the time of your distribution, your address is within one of the mandatory withholding states and you have federal income tax withheld (or as otherwise required by state law). State taxes will be withheld from your distribution in accordance with the respective state rules.
*Some 403(b), 457 and qualified retirement plan distributions may be subject to 20% mandatory withholding, as they are subject to special tax and withholding rules. Your plan administrator or plan sponsor is required to provide you with a special tax notice explaining those rules at the time you request a distribution. If applicable, federal and/or state taxes may be withheld from your distribution amount.
Proxy Voting Policies
A description of the policies that the funds' investment advisor uses in exercising the voting rights associated with the securities purchased and/or held by the funds is available without charge, upon request, by calling 1-800-345-6488. It is also available on American Century Investments’ website at americancentury.com/proxy and on the Securities and Exchange Commission’s website at sec.gov. Information regarding how the investment advisor voted proxies relating to portfolio securities during the most recent 12-month period ended June 30 is available at americancentury.com/proxy. It is also available at sec.gov.
Quarterly Portfolio Disclosure
The funds file their complete schedule of portfolio holdings with the Securities and Exchange Commission (SEC) for the first and third quarters of each fiscal year as an exhibit to their reports on Form N-PORT. The funds' Form N-PORT reports are available on the SEC’s website at sec.gov.
74
Other Tax Information
The following information is provided pursuant to provisions of the Internal Revenue Code.
Avantis Core Municipal Fixed Income ETF designates $271,910 as exempt interest dividends for the fiscal year ended August 31, 2022.
For nonresident alien shareholders, the funds hereby designate the following, or up to the maximum amount allowable, of ordinary income distributions as qualified interest income for the fiscal year ended August 31, 2022.
| Avantis Core Fixed Income ETF | Avantis Core Municipal Fixed Income ETF | Avantis Short-Term Fixed Income ETF | ||||||
| $2,425,557 | — | $524,734 | ||||||
75
| Notes | ||
76
| ||||||||
| Contact Us | avantisinvestors.com | |||||||
| American Century Sales Representatives, Financial Professionals, Broker Dealers, Insurance Companies, Banks and Trust Companies | 1-833-928-2684 | |||||||
| Telecommunications Relay Service for the Deaf | 711 | |||||||
| American Century ETF Trust | ||||||||
Investment Advisor: American Century Investment Management, Inc. Kansas City, Missouri | ||||||||
Distributor: Foreside Fund Services, LLC - Distributor, not affiliated with American Century Investment Services, Inc. | ||||||||
| This report and the statements it contains are submitted for the general information of our shareholders. The report is not authorized for distribution to prospective investors unless preceded or accompanied by an effective prospectus. | ||||||||
| ©2022 American Century Proprietary Holdings, Inc. All rights reserved. CL-ANN-96956 2210 | ||||||||
| Annual Report | |||||
| August 31, 2022 | |||||
Avantis® U.S. Equity Fund | |||||
| Institutional Class (AVUSX) | |||||
| G Class (AVUNX) | |||||
Avantis® U.S. Large Cap Value Fund | |||||
| Institutional Class (ALCDX) | |||||
| G Class (ALCEX) | |||||
Avantis® U.S. Small Cap Value Fund | |||||
| Institutional Class (AVUVX) | |||||
| G Class (AVCNX) | |||||
| Table of Contents | ||
| Chairman’s Letter | |||||
| Avantis U.S. Equity Fund | |||||
| Performance | |||||
| Portfolio Commentary | |||||
| Fund Characteristics | |||||
| Avantis U.S. Large Cap Value Fund | |||||
| Performance | |||||
| Portfolio Commentary | |||||
| Fund Characteristics | |||||
| Avantis U.S. Small Cap Value Fund | |||||
| Performance | |||||
| Portfolio Commentary | |||||
| Fund Characteristics | |||||
| Shareholder Fee Examples | |||||
| Schedules of Investments | |||||
| Statements of Assets and Liabilities | |||||
| Statements of Operations | |||||
| Statements of Changes in Net Assets | |||||
| Notes to Financial Statements | |||||
| Financial Highlights | |||||
| Report of Independent Registered Public Accounting Firm | |||||
| Management | |||||
| Approval of Management Agreements | |||||
| Liquidity Risk Management Program | |||||
| Additional Information | |||||
Any opinions expressed in this report reflect those of the author as of the date of the report, and do not necessarily represent the opinions of American Century Investments® or any other person in the American Century Investments organization. Any such opinions are subject to change at any time based upon market or other conditions and American Century Investments disclaims any responsibility to update such opinions. These opinions may not be relied upon as investment advice and, because investment decisions made by American Century Investments funds are based on numerous factors, may not be relied upon as an indication of trading intent on behalf of any American Century Investments fund. Security examples are used for representational purposes only and are not intended as recommendations to purchase or sell securities. Performance information for comparative indices and securities is provided to American Century Investments by third party vendors. To the best of American Century Investments’ knowledge, such information is accurate at the time of printing.
| Chairman's Letter | ||
Jonathan ThomasDear Investor:
Thank you for reviewing this annual report for the period ended August 31, 2022. Annual reports
help convey important information about fund returns, including market factors that affected
performance. For additional investment insights, please visit avantisinvestors.com.
Mounting Market Challenges Hampered Performance
Asset class performance weakened dramatically during the funds’ fiscal year. In late 2021,
generally upbeat economic activity and corporate earnings supported gains for most U.S. and
global stock indices. Returns generally remained positive despite rapidly rising inflation and waning
central bank support—factors that had started to weigh on fixed-income indices.
By early 2022, the market climate shifted quickly. Inflation, which was already at multiyear highs,
rose to levels last seen in the early 1980s. Massive fiscal and monetary support unleashed during
the pandemic was partly to blame. In addition, escalating energy prices, supply chain breakdowns
and labor market shortages further aggravated inflation in the U.S. and other developed markets.
Russia’s invasion of Ukraine in February also exacerbated global inflationary pressures.
The Bank of England launched its inflation-fighting campaign in December and continued to lift
rates through period-end. The Federal Reserve responded to surging inflation in March, launching
an aggressive rate-hike campaign and ending its asset purchase program. Policymakers indicated
taming inflation remains their priority, even as the U.S. economy contracted in 2022’s first two
quarters. Facing record-high inflation in the eurozone, the European Central Bank in July embarked
on its first rate-hike effort in 11 years.
The combination of sharply elevated inflation, tighter monetary policy, geopolitical strife and weak
economies triggered sharp market volatility and fueled global recession fears. Against this
backdrop, most U.S. and global stock and bond indices declined sharply for the reporting period.
Staying Disciplined in Uncertain Times
We expect market volatility to linger as investors navigate a complex environment of high inflation,
rising interest rates and economic uncertainty. In addition, Russia’s invasion of Ukraine
complicates an increasingly tense geopolitical backdrop and threatens Europe’s winter energy
supply. We will continue to monitor the broad backdrop and its influence on financial markets.
We appreciate your confidence in us during these extraordinary times. Our firm has a long history
of helping clients weather unpredictable markets, and we’re confident we will continue to meet
today’s challenges.
Sincerely,
Jonathan Thomas
Chairman
Avantis Investors
2
| Performance | ||
| Avantis U.S. Equity Fund | ||||||||||||||||||||||||||
| Total Returns as of August 31, 2022 | Average Annual Returns | |||||||||||||||||||||||||
| Ticker Symbol | 1 year | Since Inception | Inception Date | |||||||||||||||||||||||
| Institutional Class | AVUSX | -10.57% | 11.57% | 12/4/2019 | ||||||||||||||||||||||
| Russell 3000 Index | — | -13.28% | 10.35% | — | ||||||||||||||||||||||
| G Class | AVUNX | -10.36% | 2.89% | 1/20/2021 | ||||||||||||||||||||||
G Class returns would have been lower if a portion of the fees had not been waived.
| Growth of $10,000 Over Life of Class | ||
| $10,000 investment made December 4, 2019 | ||
Performance for other share classes will vary due to differences in fee structure.
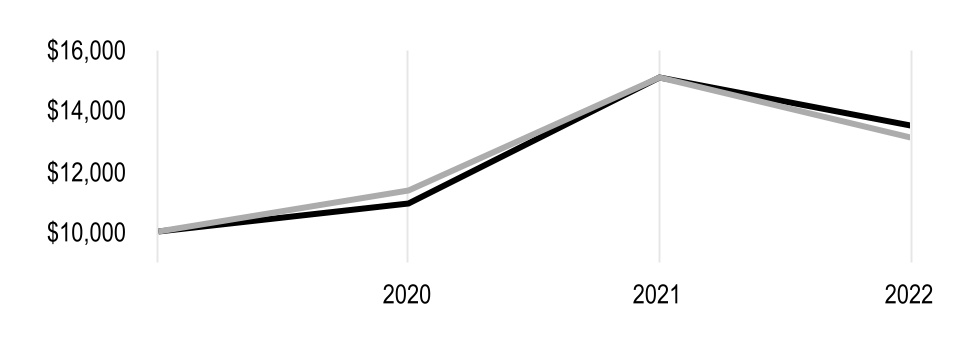
| Value on August 31, 2022 | |||||
| Institutional Class — $13,501 | |||||
| Russell 3000 Index — $13,101 | |||||
| Total Annual Fund Operating Expenses | |||||
| Institutional Class | G Class | ||||
| 0.15% | 0.15% | ||||
The total annual fund operating expenses shown is as stated in the fund’s prospectus current as of the date of this report. The prospectus may vary from the expense ratio shown elsewhere in this report because it is based on a different time period, includes acquired fund fees and expenses, and, if applicable, does not include fee waivers or expense reimbursements.
Data presented reflect past performance. Past performance is no guarantee of future results. Current performance may be higher or lower than the performance shown. Total returns for periods less than one year are not annualized. Investment return and principal value will fluctuate, and redemption value may be more or less than original cost. Data assumes reinvestment of dividends and capital gains, and none of the charts reflect the deduction of taxes that a shareholder would pay on fund distributions or the redemption of fund shares. To obtain performance data current to the most recent month end, please call 1-833-928-2684 or visit avantisinvestors.com. For additional information about the funds, please consult the prospectus.
3
| Portfolio Commentary | ||
Portfolio Managers: Eduardo Repetto, Mitch Firestein, Daniel Ong and Ted Randall
Fund Strategy
Avantis U.S. Equity seeks long-term capital appreciation by investing in a diverse group of U.S. companies across market sectors, industry groups and market capitalizations.
The fund seeks securities of companies that it expects to have higher returns. It places an enhanced emphasis on securities of companies with smaller market capitalizations and securities of companies it defines as high profitability or value companies. Conversely, the fund seeks to underweight or exclude securities it expects to have lower returns. These include securities of large companies with lower levels of profitability and higher prices relative to their book values or other financial metrics. Under normal market conditions, the fund will invest at least 80% of its assets in equity securities of U.S. companies.
The portfolio managers continually analyze market and financial data to make buy, sell and hold decisions. When buying or selling a security, the portfolio managers may consider the trade-off between expected returns of the security and implementation or tax costs of the trade in an attempt to gain trading efficiencies, avoid unnecessary risk and enhance fund performance.
Performance Review
For the 12-month period ended August 31, 2022, Avantis U.S. Equity returned -10.57%.* For the same period, the fund’s benchmark, the Russell 3000 Index, returned -13.28%. The index is an unmanaged portfolio generally representative of the performance of the broad U.S. stock market, including all capitalization categories. Fund returns reflect fees and operating expenses, while index returns do not.
The fund’s outperformance versus the index was largely due to the fund’s emphasis on value-oriented stocks. Specifically, the fund was overweight versus the index in stocks with the highest book-to-market and profitability characteristics and underweight in stocks with the lowest book-to-market and profitability traits.
Value stocks, as measured by the Russell 3000 Value Index, returned -6.49% for the 12-month period. Growth stocks, as measured by the Russell 3000 Growth Index, returned -19.44% for the same period.
*All fund returns referenced in this commentary are for Institutional Class shares. Performance for other share classes will vary due to differences in fee structure; when Institutional Class performance exceeds that of the fund’s benchmark, other share classes may not. See page 3 for returns for all share classes.
4
| Fund Characteristics | ||
| AUGUST 31, 2022 | |||||
| Avantis U.S. Equity Fund | |||||
| Types of Investments in Portfolio | % of net assets | ||||
| Common Stocks | 99.4% | ||||
| Short-Term Investments | 0.9% | ||||
| Other Assets and Liabilities | (0.3)% | ||||
| Top Five Industries | % of net assets | ||||
| Oil, Gas and Consumable Fuels | 9.0% | ||||
| Banks | 5.8% | ||||
| Software | 5.7% | ||||
| Technology Hardware, Storage and Peripherals | 4.7% | ||||
| Semiconductors and Semiconductor Equipment | 4.6% | ||||
5
| Performance | ||
| Avantis U.S. Large Cap Value Fund | ||||||||||||||||||||||||||
| Total Returns as of August 31, 2022 | ||||||||||||||||||||||||||
| Ticker Symbol | Since Inception | Inception Date | ||||||||||||||||||||||||
| Institutional Class | ALCDX | 4.80% | 6/21/2022 | |||||||||||||||||||||||
| Russell 1000 Value Index | — | 3.94% | — | |||||||||||||||||||||||
| G Class | ALCEX | 4.80% | 6/21/2022 | |||||||||||||||||||||||
G Class returns would have been lower if a portion of the fees had not been waived.
| Total Annual Fund Operating Expenses | |||||
| Institutional Class | G Class | ||||
| 0.15% | 0.15% | ||||
The total annual fund operating expenses shown is as stated in the fund’s prospectus current as of the date of this report. The prospectus may vary from the expense ratio shown elsewhere in this report because it is based on a different time period, includes acquired fund fees and expenses, and, if applicable, does not include fee waivers or expense reimbursements.
Data presented reflect past performance. Past performance is no guarantee of future results. Current performance may be higher or lower than the performance shown. Total returns for periods less than one year are not annualized. Investment return and principal value will fluctuate, and redemption value may be more or less than original cost. Data assumes reinvestment of dividends and capital gains, and none of the charts reflect the deduction of taxes that a shareholder would pay on fund distributions or the redemption of fund shares. To obtain performance data current to the most recent month end, please call 1-833-928-2684 or visit avantisinvestors.com. For additional information about the funds, please consult the prospectus.
6
| Portfolio Commentary | ||
Portfolio Managers: Eduardo Repetto, Mitch Firestein, Daniel Ong and Ted Randall
Fund Strategy
Avantis U.S. Large Cap Value seeks long-term capital appreciation by investing in a diverse group of U.S. large-capitalization (large-cap) companies across market sectors and industry groups.
The fund seeks securities of companies that it expects to have higher returns. It places an enhanced emphasis on securities of companies with higher profitability and value characteristics. Conversely, the fund seeks to underweight or exclude securities it expects to have lower returns. These include securities of companies with lower levels of profitability and less attractive value characteristics. Under normal market conditions, the fund will invest at least 80% of its assets in securities of large-cap U.S. companies.
The portfolio managers continually analyze market and financial data to make buy, sell and hold decisions. When buying or selling a security, the portfolio managers may consider the trade-off between expected returns of the security and implementation or tax costs of the trade. They do this in an attempt to gain trading efficiencies, avoid unnecessary risk and enhance fund performance.
Performance Review
For the period from the portfolio’s inception on June 21, 2022, through August 31, 2022, Avantis U.S. Large Cap Value returned 4.80%.* For the same period, the fund’s benchmark, the Russell 1000 Value Index, returned 3.94%. The index is an unmanaged portfolio generally representative of the performance of U.S. large-cap companies with lower price-to-book ratios and lower forecasted growth values. Fund returns reflect fees and operating expenses, while index returns do not.
The fund’s outperformance versus the index was largely due to the fund’s overweight to large- and mid-cap companies with higher levels of profitability and lower prices relative to their book values. An underweight position to mega-cap stocks also aided relative results.
Large-cap value stocks, as measured by the Russell 1000 Value Index, returned 3.94% for the reporting period. Mid-cap value stocks, according to the Russell Midcap Value Index, returned 5.60% for the same timeframe.
*All fund returns referenced in this commentary are for Institutional Class shares. Total returns for periods less
than one year are not annualized. Performance for other share classes will vary due to differences in fee structure; when Institutional Class performance exceeds that of the fund’s benchmark, other share classes may not. See page 6 for returns for all share classes.
7
| Fund Characteristics | ||
| AUGUST 31, 2022 | |||||
| Avantis U.S. Large Cap Value Fund | |||||
| Types of Investments in Portfolio | % of net assets | ||||
| Common Stocks | 99.7% | ||||
| Short-Term Investments | 0.2% | ||||
| Other Assets and Liabilities | 0.1% | ||||
| Top Five Industries | % of net assets | ||||
| Oil, Gas and Consumable Fuels | 17.9% | ||||
| Pharmaceuticals | 9.1% | ||||
| Road and Rail | 5.4% | ||||
| Biotechnology | 4.9% | ||||
| Specialty Retail | 4.7% | ||||
8
| Performance | ||
| Avantis U.S. Small Cap Value Fund | ||||||||||||||||||||||||||
| Total Returns as of August 31, 2022 | Average Annual Returns | |||||||||||||||||||||||||
| Ticker Symbol | 1 year | Since Inception | Inception Date | |||||||||||||||||||||||
| Institutional Class | AVUVX | -0.61% | 16.61% | 12/4/2019 | ||||||||||||||||||||||
| Russell 2000 Value Index | — | -10.18% | 7.83% | — | ||||||||||||||||||||||
| G Class | AVCNX | -0.37% | 10.98% | 1/20/2021 | ||||||||||||||||||||||
G Class returns would have been lower if a portion of the fees had not been waived.
| Growth of $10,000 Over Life of Class | ||
| $10,000 investment made December 4, 2019 | ||
Performance for other share classes will vary due to differences in fee structure.
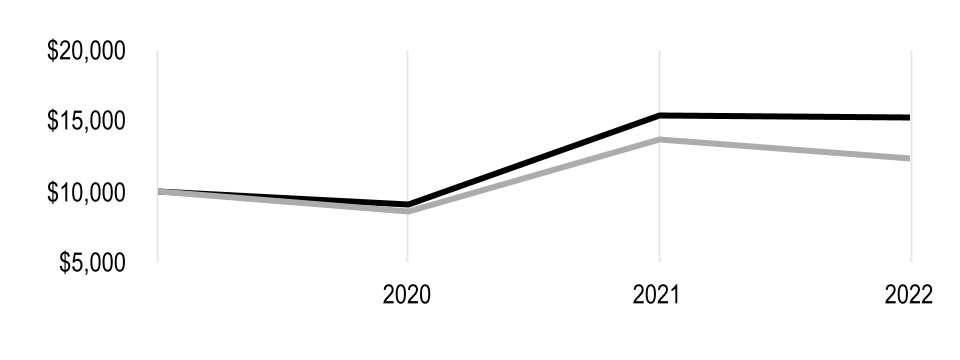
| Value on August 31, 2022 | |||||
| Institutional Class — $15,240 | |||||
| Russell 2000 Value Index — $12,297 | |||||
| Total Annual Fund Operating Expenses | |||||
| Institutional Class | G Class | ||||
| 0.25% | 0.25% | ||||
The total annual fund operating expenses shown is as stated in the fund’s prospectus current as of the date of this report. The prospectus may vary from the expense ratio shown elsewhere in this report because it is based on a different time period, includes acquired fund fees and expenses, and, if applicable, does not include fee waivers or expense reimbursements.
Data presented reflect past performance. Past performance is no guarantee of future results. Current performance may be higher or lower than the performance shown. Total returns for periods less than one year are not annualized. Investment return and principal value will fluctuate, and redemption value may be more or less than original cost. Data assumes reinvestment of dividends and capital gains, and none of the charts reflect the deduction of taxes that a shareholder would pay on fund distributions or the redemption of fund shares. To obtain performance data current to the most recent month end, please call 1-833-928-2684 or visit avantisinvestors.com. For additional information about the funds, please consult the prospectus.
9
| Portfolio Commentary | ||
Portfolio Managers: Eduardo Repetto, Mitch Firestein, Daniel Ong and Ted Randall
Fund Strategy
Avantis U.S. Small Cap Value seeks long-term capital appreciation by investing in a diverse group of U.S. small-capitalization (small-cap) companies across market sectors and industry groups.
The fund seeks securities of companies that it expects to have higher returns. It places an enhanced emphasis on securities of companies with smaller market capitalizations and securities of companies it defines as high profitability or value companies. Conversely, the fund seeks to underweight or exclude securities it expects to have lower returns. These include securities of large companies with lower levels of profitability and higher prices relative to their book values or other financial metrics. Under normal market conditions, the fund will invest at least 80% of its assets in securities of small-cap companies located in the U.S.
The portfolio managers continually analyze market and financial data to make buy, sell and hold decisions. When buying or selling a security, the portfolio managers may consider the trade-off between expected returns of the security and implementation or tax costs of the trade. They do this in an attempt to gain trading efficiencies, avoid unnecessary risk and enhance fund performance.
Performance Review
For the 12-month period ended August 31, 2022, Avantis U.S. Small Cap Value returned -0.61%.* For the same period, the fund’s benchmark, the Russell 2000 Value Index, returned -10.18%. The index is an unmanaged portfolio generally representative of the performance of U.S. small-cap companies with lower price-to-book ratios and lower forecasted growth values. Fund returns reflect fees and operating expenses, while index returns do not.
The fund’s significant outperformance was largely due to the portfolio’s overweight versus the index in companies with the highest profitability and book-to-market characteristics. A corresponding underweight in companies with the lowest profitability and book-to-market characteristics also aided relative results. Additionally, the exclusion of real estate investment trusts (REITs) boosted the fund’s relative performance, as REITs underperformed for the reporting period.
*All fund returns referenced in this commentary are for Institutional Class shares. Performance for other share classes will vary due to differences in fee structure; when Institutional Class performance exceeds that of the fund’s benchmark, other share classes may not. See page 9 for returns for all share classes.
10
| Fund Characteristics | ||
| AUGUST 31, 2022 | |||||
| Avantis U.S. Small Cap Value Fund | |||||
| Types of Investments in Portfolio | % of net assets | ||||
| Common Stocks | 99.5% | ||||
| Short-Term Investments | 2.1% | ||||
| Other Assets and Liabilities | (1.6)% | ||||
| Top Five Industries | % of net assets | ||||
| Banks | 15.1% | ||||
| Oil, Gas and Consumable Fuels | 13.3% | ||||
| Specialty Retail | 7.2% | ||||
| Trading Companies and Distributors | 5.3% | ||||
| Thrifts and Mortgage Finance | 5.1% | ||||
11
| Shareholder Fee Examples | ||
Fund shareholders may incur two types of costs: (1) transaction costs, including brokerage commissions paid on purchases and sales of fund shares; and (2) ongoing costs, including management fees and other fund expenses. This example is intended to help you understand your ongoing costs (in dollars) of investing in your fund and to compare these costs with the ongoing cost of investing in other funds.
The example is based on an investment of $1,000 made at the beginning of the period and held for the entire period from March 1, 2022 to August 31, 2022 (except as noted).
Actual Expenses
The table provides information about actual account values and actual expenses for each class. You may use the information, together with the amount you invested, to estimate the expenses that you paid over the period. First, identify the class you own. Then simply divide your account value by $1,000 (for example, an $8,600 account value divided by $1,000 = 8.6), then multiply the result by the number under the heading “Expenses Paid During Period” to estimate the expenses you paid on your account during this period.
Hypothetical Example for Comparison Purposes
The table also provides information about hypothetical account values and hypothetical expenses based on the actual expense ratio of each class of your fund and an assumed rate of return of 5% per year before expenses, which is not the actual return of a fund's share class's. The hypothetical account values and expenses may not be used to estimate the actual ending account balance or expenses you paid for the period. You may use this information to compare the ongoing costs of investing in your fund and other funds. To do so, compare this 5% hypothetical example with the 5% hypothetical examples that appear in the shareholder reports of the other funds.
Please note that the expenses shown in the table are meant to highlight your ongoing costs only and do not reflect any transactional costs, such as brokerage commissions paid on purchases and sales of fund shares. Therefore, the table is useful in comparing ongoing costs only, and will not help you determine the relative total costs of owning different funds. In addition, if these transactional costs were included, your costs would have been higher.
12
| Beginning Account Value 3/1/22 | Ending Account Value 8/31/22 | Expenses Paid During Period(1) 3/1/22 - 8/31/22 | Annualized Expense Ratio(1) | |||||||||||
| Avantis U.S. Equity Fund | ||||||||||||||
| Actual | ||||||||||||||
| Institutional Class | $1,000 | $919.40 | $0.73 | 0.15% | ||||||||||
| G Class | $1,000 | $920.20 | $0.00 | 0.00%(2) | ||||||||||
| Hypothetical | ||||||||||||||
| Institutional Class | $1,000 | $1,024.45 | $0.77 | 0.15% | ||||||||||
| G Class | $1,000 | $1,025.21 | $0.00 | 0.00%(2) | ||||||||||
| Avantis U.S. Large Cap Value Fund | ||||||||||||||
| Actual | ||||||||||||||
| Institutional Class | $1,000 | $1,048.00 | $0.30(3) | 0.15% | ||||||||||
| G Class | $1,000 | $1,048.00 | $0.00(3) | 0.00% | ||||||||||
| Hypothetical | ||||||||||||||
| Institutional Class | $1,000 | $1,024.45 | $0.77 | 0.15% | ||||||||||
| G Class | $1,000 | $1,025.21 | $0.00 | 0.00% | ||||||||||
| Avantis U.S. Small Cap Value Fund | ||||||||||||||
| Actual | ||||||||||||||
| Institutional Class | $1,000 | $941.30 | $1.22 | 0.25% | ||||||||||
| G Class | $1,000 | $942.60 | $0.00 | 0.00%(2) | ||||||||||
| Hypothetical | ||||||||||||||
| Institutional Class | $1,000 | $1,023.95 | $1.28 | 0.25% | ||||||||||
| G Class | $1,000 | $1,025.21 | $0.00 | 0.00%(2) | ||||||||||
(1)Expenses are equal to the class's annualized expense ratio listed in the table above, multiplied by the average account value over the period, multiplied by 184, the number of days in the most recent fiscal half-year, divided by 365, to reflect the one-half year period. Annualized expense ratio reflects actual expenses, including any applicable fee waivers or expense reimbursements and excluding any acquired fund fees and expenses.
(2)Other expenses did not exceed 0.005%.
(3)Expenses are equal to the class's annualized expense ratio listed in the table above, multiplied by the average account value over the period, multiplied by 72, the number of days in the period from June 21, 2022 (fund inception) through August 31, 2022, divided by 365, to reflect the period. Had the class been available for the full period, the expenses paid during the period would have been higher.
13
| Schedules of Investments | ||
AUGUST 31, 2022
| Avantis U.S. Equity Fund | ||||||||
| Shares | Value | |||||||
| COMMON STOCKS — 99.4% | ||||||||
| Aerospace and Defense — 1.1% | ||||||||
AAR Corp.(1) | 1,155 | $ | 49,526 | |||||
Aerojet Rocketdyne Holdings, Inc.(1) | 3,126 | 134,637 | ||||||
AerSale Corp.(1) | 635 | 12,243 | ||||||
Archer Aviation, Inc., Class A(1)(2) | 4,546 | 16,093 | ||||||
Axon Enterprise, Inc.(1) | 257 | 29,987 | ||||||
Boeing Co.(1) | 1,587 | 254,317 | ||||||
| BWX Technologies, Inc. | 3,560 | 185,583 | ||||||
| Curtiss-Wright Corp. | 281 | 41,360 | ||||||
Ducommun, Inc.(1) | 89 | 3,916 | ||||||
| General Dynamics Corp. | 1,113 | 254,799 | ||||||
| HEICO Corp. | 159 | 24,216 | ||||||
| HEICO Corp., Class A | 385 | 47,193 | ||||||
| Hexcel Corp. | 1,272 | 74,628 | ||||||
| Howmet Aerospace, Inc. | 1,262 | 44,713 | ||||||
| Huntington Ingalls Industries, Inc. | 493 | 113,518 | ||||||
| Kaman Corp. | 710 | 22,521 | ||||||
Kratos Defense & Security Solutions, Inc.(1) | 917 | 11,499 | ||||||
| L3Harris Technologies, Inc. | 689 | 157,223 | ||||||
| Lockheed Martin Corp. | 2,429 | 1,020,447 | ||||||
| Maxar Technologies, Inc. | 218 | 5,195 | ||||||
| Moog, Inc., Class A | 847 | 63,508 | ||||||
| National Presto Industries, Inc. | 103 | 7,027 | ||||||
| Northrop Grumman Corp. | 649 | 310,216 | ||||||
Parsons Corp.(1) | 30 | 1,241 | ||||||
| Raytheon Technologies Corp. | 8,595 | 771,401 | ||||||
| Textron, Inc. | 3,876 | 241,785 | ||||||
| TransDigm Group, Inc. | 207 | 124,281 | ||||||
Triumph Group, Inc.(1) | 528 | 6,859 | ||||||
Virgin Galactic Holdings, Inc.(1) | 1,367 | 8,079 | ||||||
| Woodward, Inc. | 1,377 | 128,157 | ||||||
| 4,166,168 | ||||||||
| Air Freight and Logistics — 1.0% | ||||||||
Air Transport Services Group, Inc.(1) | 3,671 | 110,607 | ||||||
Atlas Air Worldwide Holdings, Inc.(1) | 1,208 | 120,704 | ||||||
| CH Robinson Worldwide, Inc. | 502 | 57,303 | ||||||
| Expeditors International of Washington, Inc. | 3,378 | 347,563 | ||||||
| FedEx Corp. | 4,099 | 864,110 | ||||||
| Forward Air Corp. | 607 | 58,903 | ||||||
GXO Logistics, Inc.(1) | 748 | 33,196 | ||||||
Hub Group, Inc., Class A(1) | 987 | 78,773 | ||||||
| United Parcel Service, Inc., Class B | 9,683 | 1,883,440 | ||||||
| 3,554,599 | ||||||||
| Airlines — 0.2% | ||||||||
Alaska Air Group, Inc.(1) | 1,423 | 61,986 | ||||||
Allegiant Travel Co.(1) | 620 | 59,830 | ||||||
14
| Avantis U.S. Equity Fund | ||||||||
| Shares | Value | |||||||
American Airlines Group, Inc.(1) | 2,286 | $ | 29,695 | |||||
Delta Air Lines, Inc.(1) | 6,530 | 202,887 | ||||||
Frontier Group Holdings, Inc.(1) | 913 | 11,778 | ||||||
Hawaiian Holdings, Inc.(1) | 2,390 | 35,826 | ||||||
JetBlue Airways Corp.(1) | 4,739 | 36,917 | ||||||
Mesa Air Group, Inc.(1) | 522 | 1,268 | ||||||
SkyWest, Inc.(1) | 1,629 | 34,681 | ||||||
Southwest Airlines Co.(1) | 6,257 | 229,632 | ||||||
Spirit Airlines, Inc.(1) | 1,496 | 33,929 | ||||||
Sun Country Airlines Holdings, Inc.(1) | 1,302 | 25,936 | ||||||
United Airlines Holdings, Inc.(1) | 3,798 | 132,968 | ||||||
Wheels Up Experience, Inc.(1) | 4,550 | 8,509 | ||||||
| 905,842 | ||||||||
| Auto Components — 0.4% | ||||||||
American Axle & Manufacturing Holdings, Inc.(1) | 6,857 | 70,970 | ||||||
Aptiv PLC(1) | 2,035 | 190,130 | ||||||
| Autoliv, Inc. | 2,728 | 212,211 | ||||||
| BorgWarner, Inc. | 4,383 | 165,239 | ||||||
Cooper-Standard Holdings, Inc.(1) | 132 | 1,034 | ||||||
| Dana, Inc. | 2,357 | 36,463 | ||||||
Dorman Products, Inc.(1) | 700 | 63,455 | ||||||
| Gentex Corp. | 4,070 | 111,070 | ||||||
Gentherm, Inc.(1) | 778 | 46,602 | ||||||
Goodyear Tire & Rubber Co.(1) | 8,220 | 115,327 | ||||||
| LCI Industries | 1,159 | 134,293 | ||||||
| Lear Corp. | 944 | 130,876 | ||||||
Modine Manufacturing Co.(1) | 860 | 12,883 | ||||||
Motorcar Parts of America, Inc.(1) | 233 | 3,463 | ||||||
| Patrick Industries, Inc. | 464 | 24,578 | ||||||
QuantumScape Corp.(1)(2) | 2,508 | 27,663 | ||||||
| Standard Motor Products, Inc. | 341 | 12,515 | ||||||
Visteon Corp.(1) | 245 | 29,358 | ||||||
| 1,388,130 | ||||||||
| Automobiles — 1.2% | ||||||||
Canoo, Inc.(1)(2) | 2,240 | 7,146 | ||||||
| Ford Motor Co. | 36,419 | 555,026 | ||||||
| General Motors Co. | 15,250 | 582,702 | ||||||
| Harley-Davidson, Inc. | 3,640 | 140,395 | ||||||
Lordstown Motors Corp., Class A(1) | 2,733 | 5,849 | ||||||
Lucid Group, Inc.(1)(2) | 4,717 | 72,359 | ||||||
Rivian Automotive, Inc., Class A(1)(2) | 241 | 7,883 | ||||||
Tesla, Inc.(1) | 11,091 | 3,056,790 | ||||||
| Thor Industries, Inc. | 933 | 75,582 | ||||||
| Winnebago Industries, Inc. | 1,158 | 66,678 | ||||||
Workhorse Group, Inc.(1)(2) | 232 | 726 | ||||||
| 4,571,136 | ||||||||
| Banks — 5.8% | ||||||||
| 1st Source Corp. | 134 | 6,323 | ||||||
ACNB Corp.(2) | 274 | 9,743 | ||||||
| Allegiance Bancshares, Inc. | 505 | 21,392 | ||||||
| Amalgamated Financial Corp. | 479 | 10,777 | ||||||
15
| Avantis U.S. Equity Fund | ||||||||
| Shares | Value | |||||||
| Amerant Bancorp, Inc. | 864 | $ | 22,628 | |||||
| American National Bankshares, Inc. | 384 | 12,645 | ||||||
| Ameris Bancorp | 1,706 | 79,636 | ||||||
| Arrow Financial Corp. | 599 | 19,234 | ||||||
| Associated Banc-Corp. | 3,946 | 79,078 | ||||||
| Atlantic Union Bankshares Corp. | 1,701 | 55,197 | ||||||
| Banc of California, Inc. | 1,504 | 25,388 | ||||||
| BancFirst Corp. | 383 | 41,310 | ||||||
Bancorp, Inc.(1) | 1,686 | 39,992 | ||||||
Bank First Corp.(2) | 345 | 28,038 | ||||||
| Bank of America Corp. | 47,870 | 1,608,911 | ||||||
| Bank of Hawaii Corp. | 1,184 | 92,376 | ||||||
| Bank of Marin Bancorp | 324 | 10,012 | ||||||
| Bank OZK | 3,249 | 131,682 | ||||||
| BankUnited, Inc. | 2,500 | 92,625 | ||||||
| Banner Corp. | 954 | 57,965 | ||||||
| Bar Harbor Bankshares | 500 | 14,165 | ||||||
| Baycom Corp. | 385 | 7,165 | ||||||
| BCB Bancorp, Inc. | 593 | 10,674 | ||||||
| Berkshire Hills Bancorp, Inc. | 845 | 23,837 | ||||||
| Blue Ridge Bankshares, Inc. | 811 | 11,897 | ||||||
| BOK Financial Corp. | 625 | 55,544 | ||||||
| Brookline Bancorp., Inc. | 1,675 | 20,887 | ||||||
| Business First Bancshares, Inc. | 748 | 17,645 | ||||||
| Byline Bancorp, Inc. | 780 | 17,012 | ||||||
| Cadence Bank | 3,288 | 83,778 | ||||||
| Cambridge Bancorp | 192 | 15,788 | ||||||
| Camden National Corp. | 451 | 20,399 | ||||||
| Capital City Bank Group, Inc. | 175 | 5,588 | ||||||
| Capstar Financial Holdings, Inc. | 717 | 14,448 | ||||||
Carter Bankshares, Inc.(1) | 1,318 | 21,707 | ||||||
| Cathay General Bancorp. | 1,671 | 70,082 | ||||||
| CBTX, Inc. | 475 | 14,155 | ||||||
| Central Pacific Financial Corp. | 1,144 | 24,928 | ||||||
| Central Valley Community Bancorp | 384 | 6,835 | ||||||
| Citigroup, Inc. | 20,647 | 1,007,780 | ||||||
| Citizens & Northern Corp. | 211 | 5,064 | ||||||
| Citizens Financial Group, Inc. | 10,986 | 402,966 | ||||||
| City Holding Co. | 392 | 33,324 | ||||||
| Civista Bancshares, Inc. | 218 | 4,611 | ||||||
| CNB Financial Corp. | 770 | 20,266 | ||||||
Coastal Financial Corp.(1) | 338 | 13,588 | ||||||
| Columbia Banking System, Inc. | 1,767 | 52,922 | ||||||
| Comerica, Inc. | 3,572 | 286,832 | ||||||
| Commerce Bancshares, Inc. | 2,089 | 143,661 | ||||||
| Community Bank System, Inc. | 549 | 35,894 | ||||||
| Community Trust Bancorp, Inc. | 482 | 20,364 | ||||||
| ConnectOne Bancorp, Inc. | 1,113 | 27,858 | ||||||
CrossFirst Bankshares, Inc.(1) | 869 | 11,453 | ||||||
| Cullen/Frost Bankers, Inc. | 810 | 105,268 | ||||||
Customers Bancorp, Inc.(1) | 1,382 | 47,942 | ||||||
16
| Avantis U.S. Equity Fund | ||||||||
| Shares | Value | |||||||
| CVB Financial Corp. | 2,412 | $ | 63,291 | |||||
| Dime Community Bancshares, Inc. | 1,170 | 36,574 | ||||||
| Eagle Bancorp, Inc. | 926 | 44,939 | ||||||
| East West Bancorp, Inc. | 3,332 | 240,470 | ||||||
| Eastern Bankshares, Inc. | 2,790 | 54,126 | ||||||
| Enterprise Bancorp, Inc. | 150 | 4,827 | ||||||
| Enterprise Financial Services Corp. | 907 | 41,468 | ||||||
| Equity Bancshares, Inc., Class A | 592 | 18,488 | ||||||
| Esquire Financial Holdings, Inc. | 226 | 8,448 | ||||||
| F.N.B. Corp. | 7,606 | 90,663 | ||||||
| Farmers & Merchants Bancorp, Inc. | 511 | 14,594 | ||||||
| Farmers National Banc Corp. | 1,110 | 15,862 | ||||||
| FB Financial Corp. | 818 | 32,409 | ||||||
| Fifth Third Bancorp | 12,639 | 431,622 | ||||||
| Financial Institutions, Inc. | 648 | 16,867 | ||||||
| First BanCorp | 9,275 | 132,632 | ||||||
| First Bancorp, Inc. | 69 | 2,001 | ||||||
| First Bancorp/Southern Pines NC | 791 | 28,800 | ||||||
| First Bancshares, Inc. | 537 | 16,056 | ||||||
| First Busey Corp. | 1,592 | 36,616 | ||||||
| First Business Financial Services, Inc. | 296 | 9,851 | ||||||
| First Citizens BancShares, Inc., Class A | 259 | 210,298 | ||||||
| First Commonwealth Financial Corp. | 2,633 | 35,493 | ||||||
| First Community Bankshares, Inc. | 369 | 11,635 | ||||||
| First Financial Bancorp | 2,191 | 47,282 | ||||||
| First Financial Bankshares, Inc. | 1,917 | 81,492 | ||||||
| First Financial Corp. | 358 | 16,647 | ||||||
| First Foundation, Inc. | 1,202 | 22,790 | ||||||
| First Hawaiian, Inc. | 2,303 | 59,210 | ||||||
| First Horizon Corp. | 13,829 | 312,812 | ||||||
| First Internet Bancorp | 270 | 9,901 | ||||||
| First Interstate Bancsystem, Inc., Class A | 2,212 | 89,055 | ||||||
| First Merchants Corp. | 1,521 | 60,566 | ||||||
| First Mid Bancshares, Inc. | 445 | 15,731 | ||||||
| First of Long Island Corp. | 279 | 5,136 | ||||||
| First Republic Bank | 2,154 | 327,042 | ||||||
| Five Star Bancorp | 297 | 7,553 | ||||||
| Flushing Financial Corp. | 915 | 18,895 | ||||||
| Fulton Financial Corp. | 5,098 | 82,741 | ||||||
| German American Bancorp, Inc. | 515 | 19,343 | ||||||
| Glacier Bancorp, Inc. | 1,729 | 87,626 | ||||||
| Great Southern Bancorp, Inc. | 358 | 21,043 | ||||||
| Hancock Whitney Corp. | 2,758 | 133,018 | ||||||
| Hanmi Financial Corp. | 1,345 | 33,248 | ||||||
| HarborOne Bancorp, Inc. | 1,993 | 27,185 | ||||||
| Heartland Financial USA, Inc. | 932 | 41,632 | ||||||
| Heritage Commerce Corp. | 1,136 | 12,825 | ||||||
| Heritage Financial Corp. | 687 | 17,855 | ||||||
| Hilltop Holdings, Inc. | 1,799 | 47,494 | ||||||
| Home BancShares, Inc. | 3,454 | 81,273 | ||||||
| HomeStreet, Inc. | 686 | 23,880 | ||||||
17
| Avantis U.S. Equity Fund | ||||||||
| Shares | Value | |||||||
| HomeTrust Bancshares, Inc. | 196 | $ | 4,551 | |||||
| Hope Bancorp, Inc. | 3,253 | 47,071 | ||||||
| Horizon Bancorp, Inc. | 1,083 | 20,490 | ||||||
| Huntington Bancshares, Inc. | 23,895 | 320,193 | ||||||
| Independent Bank Corp. (Massachusetts) | 694 | 54,292 | ||||||
| Independent Bank Corp. (Michigan) | 653 | 13,400 | ||||||
| Independent Bank Group, Inc. | 668 | 44,996 | ||||||
| International Bancshares Corp. | 1,696 | 70,774 | ||||||
| JPMorgan Chase & Co. | 22,283 | 2,534,246 | ||||||
| KeyCorp | 21,881 | 387,075 | ||||||
| Lakeland Bancorp, Inc. | 1,178 | 19,190 | ||||||
| Lakeland Financial Corp. | 564 | 42,492 | ||||||
| Live Oak Bancshares, Inc. | 1,124 | 40,734 | ||||||
| M&T Bank Corp. | 2,638 | 479,536 | ||||||
| Macatawa Bank Corp. | 489 | 4,655 | ||||||
| Mercantile Bank Corp. | 568 | 18,789 | ||||||
| Metrocity Bankshares, Inc. | 562 | 11,234 | ||||||
Metropolitan Bank Holding Corp.(1) | 258 | 18,470 | ||||||
| Mid Penn Bancorp, Inc. | 311 | 9,047 | ||||||
| Midland States Bancorp, Inc. | 740 | 18,567 | ||||||
| MidWestOne Financial Group, Inc. | 190 | 5,795 | ||||||
| MVB Financial Corp. | 145 | 4,637 | ||||||
| National Bank Holdings Corp., Class A | 687 | 27,569 | ||||||
| NBT Bancorp, Inc. | 1,284 | 49,794 | ||||||
Nicolet Bankshares, Inc.(1) | 207 | 15,852 | ||||||
| Northeast Bank | 344 | 13,337 | ||||||
| Northrim BanCorp, Inc. | 88 | 3,568 | ||||||
| Northwest Bancshares, Inc. | 2,752 | 38,721 | ||||||
| OceanFirst Financial Corp. | 1,395 | 27,119 | ||||||
| OFG Bancorp | 2,093 | 56,930 | ||||||
| Old National Bancorp. | 5,628 | 93,931 | ||||||
| Old Second Bancorp, Inc. | 1,091 | 14,969 | ||||||
| Origin Bancorp, Inc. | 749 | 30,597 | ||||||
| Orrstown Financial Services, Inc. | 418 | 10,755 | ||||||
| Pacific Premier Bancorp, Inc. | 2,662 | 87,207 | ||||||
| PacWest Bancorp | 3,340 | 87,942 | ||||||
| Park National Corp. | 449 | 59,192 | ||||||
| Parke Bancorp, Inc. | 239 | 5,301 | ||||||
| Pathward Financial, Inc. | 714 | 23,533 | ||||||
| PCB Bancorp. | 619 | 11,625 | ||||||
| Peapack-Gladstone Financial Corp. | 200 | 6,734 | ||||||
| Peoples Bancorp, Inc. | 1,112 | 33,238 | ||||||
| Pinnacle Financial Partners, Inc. | 1,064 | 85,875 | ||||||
| PNC Financial Services Group, Inc. | 4,686 | 740,388 | ||||||
| Popular, Inc. | 2,764 | 213,436 | ||||||
| Preferred Bank | 443 | 30,053 | ||||||
| Premier Financial Corp. | 1,015 | 27,425 | ||||||
| Primis Financial Corp. | 314 | 4,117 | ||||||
Professional Holding Corp., Class A(1) | 371 | 10,373 | ||||||
| Prosperity Bancshares, Inc. | 1,463 | 103,697 | ||||||
| QCR Holdings, Inc. | 506 | 28,260 | ||||||
18
| Avantis U.S. Equity Fund | ||||||||
| Shares | Value | |||||||
| RBB Bancorp | 596 | $ | 13,172 | |||||
| Regions Financial Corp. | 20,692 | 448,396 | ||||||
| Renasant Corp. | 997 | 33,240 | ||||||
| Republic Bancorp, Inc., Class A | 412 | 17,510 | ||||||
| S&T Bancorp, Inc. | 1,341 | 39,747 | ||||||
| Sandy Spring Bancorp, Inc. | 1,151 | 44,337 | ||||||
| Seacoast Banking Corp. of Florida | 1,088 | 35,164 | ||||||
| ServisFirst Bancshares, Inc. | 1,192 | 100,557 | ||||||
| Shore Bancshares, Inc. | 441 | 8,401 | ||||||
| Sierra Bancorp | 568 | 11,769 | ||||||
| Signature Bank | 915 | 159,539 | ||||||
Silvergate Capital Corp., Class A(1) | 419 | 38,179 | ||||||
| Simmons First National Corp., Class A | 2,316 | 54,634 | ||||||
| SmartFinancial, Inc. | 229 | 5,746 | ||||||
Southern First Bancshares, Inc.(1) | 222 | 9,570 | ||||||
| Southside Bancshares, Inc. | 640 | 24,115 | ||||||
| SouthState Corp. | 1,540 | 120,182 | ||||||
| Stock Yards Bancorp, Inc. | 339 | 22,462 | ||||||
| Summit Financial Group, Inc. | 196 | 5,590 | ||||||
SVB Financial Group(1) | 789 | 320,744 | ||||||
| Synovus Financial Corp. | 4,240 | 170,278 | ||||||
Texas Capital Bancshares, Inc.(1) | 1,212 | 71,544 | ||||||
| Tompkins Financial Corp. | 301 | 21,564 | ||||||
| Towne Bank | 1,775 | 50,570 | ||||||
| Trico Bancshares | 1,187 | 56,015 | ||||||
Triumph Bancorp, Inc.(1) | 1,059 | 65,563 | ||||||
| Truist Financial Corp. | 14,115 | 661,147 | ||||||
| Trustmark Corp. | 1,692 | 53,366 | ||||||
| U.S. Bancorp | 15,054 | 686,613 | ||||||
| UMB Financial Corp. | 1,004 | 89,828 | ||||||
| Umpqua Holdings Corp. | 6,896 | 122,335 | ||||||
| United Bankshares, Inc. | 2,235 | 82,918 | ||||||
| United Community Banks, Inc. | 2,262 | 75,845 | ||||||
| Unity Bancorp, Inc. | 332 | 9,306 | ||||||
| Univest Financial Corp. | 963 | 23,882 | ||||||
| Valley National Bancorp | 8,148 | 94,680 | ||||||
| Veritex Holdings, Inc. | 933 | 28,093 | ||||||
| Washington Federal, Inc. | 1,697 | 54,321 | ||||||
| Washington Trust Bancorp, Inc. | 493 | 24,961 | ||||||
| Webster Financial Corp. | 3,147 | 148,066 | ||||||
| Wells Fargo & Co. | 41,460 | 1,812,217 | ||||||
| WesBanco, Inc. | 1,386 | 47,415 | ||||||
| West BanCorp, Inc. | 500 | 12,305 | ||||||
| Westamerica Bancorporation | 600 | 33,570 | ||||||
| Western Alliance Bancorp | 2,406 | 184,588 | ||||||
| Wintrust Financial Corp. | 1,545 | 130,305 | ||||||
| Zions Bancorp NA | 4,184 | 230,245 | ||||||
| 21,088,950 | ||||||||
| Beverages — 1.2% | ||||||||
Boston Beer Co., Inc., Class A(1) | 75 | 25,281 | ||||||
| Brown-Forman Corp., Class A | 472 | 33,309 | ||||||
19
| Avantis U.S. Equity Fund | ||||||||
| Shares | Value | |||||||
| Brown-Forman Corp., Class B | 4,463 | $ | 324,460 | |||||
Celsius Holdings, Inc.(1) | 207 | 21,422 | ||||||
| Coca-Cola Co. | 20,705 | 1,277,706 | ||||||
| Coca-Cola Consolidated, Inc. | 201 | 95,340 | ||||||
| Constellation Brands, Inc., Class A | 1,530 | 376,456 | ||||||
Duckhorn Portfolio, Inc.(1) | 503 | 9,175 | ||||||
| Keurig Dr Pepper, Inc. | 3,480 | 132,658 | ||||||
| Molson Coors Beverage Co., Class B | 4,236 | 218,874 | ||||||
Monster Beverage Corp.(1) | 2,753 | 244,549 | ||||||
| National Beverage Corp. | 860 | 47,696 | ||||||
| PepsiCo, Inc. | 8,721 | 1,502,367 | ||||||
| 4,309,293 | ||||||||
| Biotechnology — 3.0% | ||||||||
2seventy bio, Inc.(1) | 714 | 10,517 | ||||||
| AbbVie, Inc. | 12,122 | 1,629,924 | ||||||
Adicet Bio, Inc.(1) | 495 | 7,009 | ||||||
Adverum Biotechnologies, Inc.(1)(2) | 241 | 280 | ||||||
Agios Pharmaceuticals, Inc.(1) | 619 | 15,784 | ||||||
Alaunos Therapeutics, Inc.(1) | 600 | 1,476 | ||||||
Albireo Pharma, Inc.(1)(2) | 120 | 2,100 | ||||||
Aldeyra Therapeutics, Inc.(1) | 2,228 | 15,685 | ||||||
Alector, Inc.(1) | 2,399 | 24,830 | ||||||
Alkermes PLC(1) | 2,415 | 57,163 | ||||||
Allakos, Inc.(1)(2) | 54 | 262 | ||||||
Allogene Therapeutics, Inc.(1)(2) | 1,863 | 25,542 | ||||||
Alnylam Pharmaceuticals, Inc.(1) | 419 | 86,595 | ||||||
Altimmune, Inc.(1) | 915 | 20,203 | ||||||
ALX Oncology Holdings, Inc.(1)(2) | 72 | 936 | ||||||
| Amgen, Inc. | 3,763 | 904,249 | ||||||
AnaptysBio, Inc.(1) | 151 | 3,506 | ||||||
Anika Therapeutics, Inc.(1) | 17 | 384 | ||||||
Apellis Pharmaceuticals, Inc.(1) | 626 | 37,879 | ||||||
Arcturus Therapeutics Holdings, Inc.(1) | 69 | 969 | ||||||
Arcus Biosciences, Inc.(1) | 711 | 17,121 | ||||||
Arcutis Biotherapeutics, Inc.(1) | 494 | 13,313 | ||||||
Ardelyx, Inc.(1) | 348 | 330 | ||||||
Assembly Biosciences, Inc.(1)(2) | 133 | 249 | ||||||
Atara Biotherapeutics, Inc.(1) | 834 | 3,344 | ||||||
Avid Bioservices, Inc.(1) | 621 | 10,694 | ||||||
BioCryst Pharmaceuticals, Inc.(1) | 946 | 13,149 | ||||||
Biogen, Inc.(1) | 2,382 | 465,395 | ||||||
Biohaven Pharmaceutical Holding Co. Ltd.(1) | 428 | 63,922 | ||||||
BioMarin Pharmaceutical, Inc.(1) | 2,017 | 179,916 | ||||||
Bluebird Bio, Inc.(1)(2) | 123 | 718 | ||||||
Blueprint Medicines Corp.(1) | 609 | 44,591 | ||||||
Calithera Biosciences, Inc.(1) | 8 | 31 | ||||||
CareDx, Inc.(1) | 381 | 7,464 | ||||||
Catalyst Pharmaceuticals, Inc.(1) | 3,691 | 49,976 | ||||||
ChemoCentryx, Inc.(1) | 885 | 45,117 | ||||||
Chinook Therapeutics, Inc.(1) | 763 | 15,870 | ||||||
Cogent Biosciences, Inc.(1) | 1,769 | 29,171 | ||||||
20
| Avantis U.S. Equity Fund | ||||||||
| Shares | Value | |||||||
CRISPR Therapeutics AG(1)(2) | 1,163 | $ | 75,700 | |||||
CTI BioPharma Corp.(1)(2) | 1,427 | 8,962 | ||||||
Cullinan Oncology, Inc.(1) | 506 | 6,821 | ||||||
Day One Biopharmaceuticals, Inc.(1) | 822 | 19,309 | ||||||
Deciphera Pharmaceuticals, Inc.(1) | 674 | 10,939 | ||||||
Denali Therapeutics, Inc.(1) | 843 | 23,326 | ||||||
Dynavax Technologies Corp.(1) | 4,847 | 55,595 | ||||||
Editas Medicine, Inc.(1) | 1,447 | 21,271 | ||||||
Eiger BioPharmaceuticals, Inc.(1) | 1,162 | 9,598 | ||||||
Emergent BioSolutions, Inc.(1) | 873 | 20,969 | ||||||
Enanta Pharmaceuticals, Inc.(1) | 212 | 12,907 | ||||||
EQRx, Inc.(1)(2) | 9,167 | 44,827 | ||||||
Exact Sciences Corp.(1) | 920 | 32,706 | ||||||
Exelixis, Inc.(1) | 2,650 | 47,011 | ||||||
Frequency Therapeutics, Inc.(1) | 165 | 340 | ||||||
G1 Therapeutics, Inc.(1)(2) | 166 | 2,409 | ||||||
Generation Bio Co.(1) | 1,509 | 7,726 | ||||||
Geron Corp.(1)(2) | 2,825 | 7,458 | ||||||
| Gilead Sciences, Inc. | 20,055 | 1,272,891 | ||||||
Halozyme Therapeutics, Inc.(1) | 5,543 | 225,766 | ||||||
Harpoon Therapeutics, Inc.(1) | 487 | 808 | ||||||
Horizon Therapeutics PLC(1) | 3,218 | 190,538 | ||||||
Ideaya Biosciences, Inc.(1) | 273 | 2,684 | ||||||
Incyte Corp.(1) | 2,121 | 149,382 | ||||||
Ionis Pharmaceuticals, Inc.(1) | 1,383 | 58,805 | ||||||
Iovance Biotherapeutics, Inc.(1) | 1,053 | 11,288 | ||||||
Ironwood Pharmaceuticals, Inc.(1) | 6,854 | 73,749 | ||||||
iTeos Therapeutics, Inc.(1) | 1,269 | 28,146 | ||||||
Keros Therapeutics, Inc.(1) | 47 | 1,662 | ||||||
Kiniksa Pharmaceuticals Ltd., Class A(1) | 232 | 2,719 | ||||||
Kodiak Sciences, Inc.(1) | 87 | 871 | ||||||
Krystal Biotech, Inc.(1) | 343 | 24,048 | ||||||
Kura Oncology, Inc.(1) | 2,185 | 30,284 | ||||||
Kymera Therapeutics, Inc.(1) | 547 | 15,464 | ||||||
Ligand Pharmaceuticals, Inc.(1) | 249 | 23,005 | ||||||
Lyell Immunopharma, Inc.(1) | 4,561 | 30,559 | ||||||
MacroGenics, Inc.(1) | 152 | 603 | ||||||
MannKind Corp.(1)(2) | 2,305 | 8,413 | ||||||
Mirati Therapeutics, Inc.(1) | 383 | 31,034 | ||||||
Moderna, Inc.(1) | 5,818 | 769,547 | ||||||
Monte Rosa Therapeutics, Inc.(1)(2) | 439 | 3,477 | ||||||
Myriad Genetics, Inc.(1) | 693 | 15,482 | ||||||
Neurocrine Biosciences, Inc.(1) | 1,142 | 119,487 | ||||||
Nkarta, Inc.(1) | 785 | 11,296 | ||||||
Nurix Therapeutics, Inc.(1) | 334 | 5,254 | ||||||
Nuvalent, Inc., Class A(1) | 550 | 9,284 | ||||||
Olema Pharmaceuticals, Inc.(1) | 299 | 1,181 | ||||||
Organogenesis Holdings, Inc.(1) | 778 | 2,793 | ||||||
Passage Bio, Inc.(1) | 253 | 511 | ||||||
PDL BioPharma, Inc.(1) | 752 | 1,925 | ||||||
PMV Pharmaceuticals, Inc.(1) | 1,392 | 19,377 | ||||||
21
| Avantis U.S. Equity Fund | ||||||||
| Shares | Value | |||||||
Point Biopharma Global, Inc.(1)(2) | 2,767 | $ | 26,978 | |||||
PTC Therapeutics, Inc.(1) | 260 | 12,984 | ||||||
Quince Therapeutics, Inc.(1) | 256 | 451 | ||||||
Recursion Pharmaceuticals, Inc., Class A(1) | 1,117 | 11,740 | ||||||
Regeneron Pharmaceuticals, Inc.(1) | 2,013 | 1,169,674 | ||||||
REGENXBIO, Inc.(1) | 1,606 | 47,377 | ||||||
Relay Therapeutics, Inc.(1) | 247 | 5,674 | ||||||
Repare Therapeutics, Inc.(1)(2) | 136 | 1,621 | ||||||
Replimune Group, Inc.(1) | 1,200 | 22,872 | ||||||
REVOLUTION Medicines, Inc.(1) | 858 | 17,872 | ||||||
Rhythm Pharmaceuticals, Inc.(1) | 119 | 2,689 | ||||||
Rigel Pharmaceuticals, Inc.(1) | 10,153 | 14,417 | ||||||
Rocket Pharmaceuticals, Inc.(1) | 601 | 9,261 | ||||||
Sage Therapeutics, Inc.(1) | 1,513 | 56,980 | ||||||
Sana Biotechnology, Inc.(1)(2) | 1,133 | 7,716 | ||||||
Sangamo Therapeutics, Inc.(1) | 1,575 | 8,505 | ||||||
Sarepta Therapeutics, Inc.(1) | 749 | 81,926 | ||||||
Seagen, Inc.(1) | 1,087 | 167,713 | ||||||
Spectrum Pharmaceuticals, Inc.(1) | 83 | 94 | ||||||
Stoke Therapeutics, Inc.(1) | 72 | 1,084 | ||||||
Sutro Biopharma, Inc.(1) | 160 | 906 | ||||||
Syndax Pharmaceuticals, Inc.(1) | 280 | 6,611 | ||||||
Talaris Therapeutics, Inc.(1) | 221 | 731 | ||||||
Tango Therapeutics, Inc.(1) | 1,099 | 4,506 | ||||||
TCR2 Therapeutics, Inc.(1) | 110 | 299 | ||||||
Twist Bioscience Corp.(1) | 461 | 18,495 | ||||||
Ultragenyx Pharmaceutical, Inc.(1) | 172 | 8,203 | ||||||
uniQure NV(1) | 1,848 | 36,110 | ||||||
United Therapeutics Corp.(1) | 1,463 | 331,545 | ||||||
Vanda Pharmaceuticals, Inc.(1) | 982 | 10,390 | ||||||
Vaxcyte, Inc.(1) | 339 | 8,868 | ||||||
VBI Vaccines, Inc.(1) | 770 | 690 | ||||||
Veracyte, Inc.(1) | 948 | 19,339 | ||||||
Vertex Pharmaceuticals, Inc.(1) | 4,387 | 1,236,081 | ||||||
Viking Therapeutics, Inc.(1) | 399 | 1,269 | ||||||
Vir Biotechnology, Inc.(1) | 3,360 | 79,800 | ||||||
Voyager Therapeutics, Inc.(1) | 243 | 1,451 | ||||||
Xencor, Inc.(1) | 1,200 | 31,668 | ||||||
Xenon Pharmaceuticals, Inc.(1) | 995 | 38,616 | ||||||
Zymeworks, Inc.(1) | 83 | 532 | ||||||
| 10,859,609 | ||||||||
| Building Products — 0.7% | ||||||||
| Advanced Drainage Systems, Inc. | 484 | 65,679 | ||||||
| Allegion PLC | 925 | 87,968 | ||||||
American Woodmark Corp.(1) | 7 | 363 | ||||||
| AO Smith Corp. | 3,011 | 169,971 | ||||||
| Apogee Enterprises, Inc. | 875 | 35,735 | ||||||
| Armstrong World Industries, Inc. | 1,587 | 133,292 | ||||||
Builders FirstSource, Inc.(1) | 5,958 | 349,198 | ||||||
| Carlisle Cos., Inc. | 502 | 148,421 | ||||||
| Carrier Global Corp. | 4,462 | 174,554 | ||||||
22
| Avantis U.S. Equity Fund | ||||||||
| Shares | Value | |||||||
| CSW Industrials, Inc. | 243 | $ | 30,764 | |||||
| Fortune Brands Home & Security, Inc. | 926 | 56,884 | ||||||
Gibraltar Industries, Inc.(1) | 251 | 10,504 | ||||||
Hayward Holdings, Inc.(1) | 2,247 | 23,616 | ||||||
| Insteel Industries, Inc. | 667 | 19,276 | ||||||
JELD-WEN Holding, Inc.(1) | 331 | 3,691 | ||||||
| Johnson Controls International PLC | 2,010 | 108,821 | ||||||
| Lennox International, Inc. | 155 | 37,219 | ||||||
| Masco Corp. | 1,107 | 56,313 | ||||||
Masonite International Corp.(1) | 811 | 66,356 | ||||||
| Owens Corning | 3,626 | 296,353 | ||||||
| Quanex Building Products Corp. | 780 | 17,394 | ||||||
Resideo Technologies, Inc.(1) | 946 | 19,696 | ||||||
| Simpson Manufacturing Co., Inc. | 774 | 71,703 | ||||||
| Trane Technologies PLC | 863 | 132,962 | ||||||
Trex Co., Inc.(1) | 2,678 | 125,304 | ||||||
| UFP Industries, Inc. | 1,098 | 87,170 | ||||||
| Zurn Elkay Water Solutions Corp. | 2,517 | 69,419 | ||||||
| 2,398,626 | ||||||||
| Capital Markets — 3.6% | ||||||||
| Affiliated Managers Group, Inc. | 122 | 15,538 | ||||||
| Ameriprise Financial, Inc. | 2,783 | 745,872 | ||||||
| Ares Management Corp., Class A | 806 | 59,757 | ||||||
| Artisan Partners Asset Management, Inc., Class A | 2,740 | 92,502 | ||||||
| B. Riley Financial, Inc. | 781 | 38,870 | ||||||
| Bank of New York Mellon Corp. | 9,327 | 387,350 | ||||||
| BGC Partners, Inc., Class A | 5,615 | 22,572 | ||||||
| BlackRock, Inc. | 854 | 569,097 | ||||||
| Blackstone, Inc. | 9,082 | 853,163 | ||||||
| Brightsphere Investment Group, Inc. | 1,432 | 24,473 | ||||||
| Carlyle Group, Inc. | 6,168 | 200,645 | ||||||
| Cboe Global Markets, Inc. | 580 | 68,423 | ||||||
| Charles Schwab Corp. | 12,237 | 868,215 | ||||||
| CME Group, Inc. | 2,237 | 437,580 | ||||||
| Cohen & Steers, Inc. | 935 | 66,740 | ||||||
Coinbase Global, Inc., Class A(1) | 2,116 | 141,349 | ||||||
| Cowen, Inc., Class A | 748 | 28,761 | ||||||
| Diamond Hill Investment Group, Inc. | 95 | 16,250 | ||||||
Donnelley Financial Solutions, Inc.(1) | 603 | 25,597 | ||||||
| Evercore, Inc., Class A | 1,376 | 128,917 | ||||||
| FactSet Research Systems, Inc. | 543 | 235,304 | ||||||
| Federated Hermes, Inc. | 2,049 | 69,789 | ||||||
Focus Financial Partners, Inc., Class A(1) | 408 | 15,973 | ||||||
| Franklin Resources, Inc. | 4,032 | 105,114 | ||||||
| Goldman Sachs Group, Inc. | 4,355 | 1,448,778 | ||||||
| Hamilton Lane, Inc., Class A | 248 | 17,256 | ||||||
| Houlihan Lokey, Inc. | 2,001 | 157,078 | ||||||
| Interactive Brokers Group, Inc., Class A | 674 | 41,512 | ||||||
| Intercontinental Exchange, Inc. | 1,419 | 143,106 | ||||||
| Invesco Ltd. | 6,693 | 110,234 | ||||||
| Janus Henderson Group PLC | 4,060 | 95,004 | ||||||
23
| Avantis U.S. Equity Fund | ||||||||
| Shares | Value | |||||||
| Jefferies Financial Group, Inc. | 6,277 | $ | 201,429 | |||||
| KKR & Co., Inc. | 7,160 | 362,010 | ||||||
| Lazard Ltd., Class A | 4,175 | 151,761 | ||||||
| LPL Financial Holdings, Inc. | 1,198 | 265,153 | ||||||
| Manning & Napier, Inc. | 477 | 6,072 | ||||||
| MarketAxess Holdings, Inc. | 363 | 90,238 | ||||||
| Moelis & Co., Class A | 2,333 | 97,193 | ||||||
| Moody's Corp. | 1,104 | 314,110 | ||||||
| Morgan Stanley | 12,112 | 1,032,185 | ||||||
| Morningstar, Inc. | 190 | 43,318 | ||||||
| MSCI, Inc. | 339 | 152,292 | ||||||
| Nasdaq, Inc. | 1,113 | 66,257 | ||||||
| Northern Trust Corp. | 3,479 | 330,818 | ||||||
Open Lending Corp., Class A(1) | 2,157 | 20,944 | ||||||
| Oppenheimer Holdings, Inc., Class A | 408 | 14,810 | ||||||
Perella Weinberg Partners(2) | 1,054 | 7,578 | ||||||
| Piper Sandler Cos. | 766 | 87,761 | ||||||
| PJT Partners, Inc., Class A | 240 | 16,613 | ||||||
| Raymond James Financial, Inc. | 4,032 | 420,820 | ||||||
| S&P Global, Inc. | 1,631 | 574,406 | ||||||
| SEI Investments Co. | 3,084 | 168,695 | ||||||
| State Street Corp. | 5,421 | 370,525 | ||||||
| StepStone Group, Inc., Class A | 1,178 | 32,148 | ||||||
| Stifel Financial Corp. | 2,844 | 168,678 | ||||||
StoneX Group, Inc.(1) | 834 | 77,428 | ||||||
| T. Rowe Price Group, Inc. | 3,744 | 449,280 | ||||||
| TPG, Inc. | 727 | 21,345 | ||||||
| Tradeweb Markets, Inc., Class A | 632 | 43,981 | ||||||
| Victory Capital Holdings, Inc., Class A | 933 | 24,986 | ||||||
| Virtu Financial, Inc., Class A | 4,225 | 97,006 | ||||||
| Virtus Investment Partners, Inc. | 188 | 35,955 | ||||||
| WisdomTree Investments, Inc. | 2,210 | 11,072 | ||||||
| 12,987,686 | ||||||||
| Chemicals — 2.7% | ||||||||
| AdvanSix, Inc. | 1,154 | 41,844 | ||||||
| Air Products and Chemicals, Inc. | 2,140 | 540,243 | ||||||
| Albemarle Corp. | 2,047 | 548,514 | ||||||
| American Vanguard Corp. | 1,244 | 24,793 | ||||||
| Ashland, Inc. | 1,009 | 102,676 | ||||||
| Avient Corp. | 1,128 | 49,440 | ||||||
Axalta Coating Systems Ltd.(1) | 1,496 | 38,522 | ||||||
| Balchem Corp. | 144 | 18,982 | ||||||
| Cabot Corp. | 2,792 | 200,940 | ||||||
| Celanese Corp. | 2,609 | 289,234 | ||||||
| CF Industries Holdings, Inc. | 6,978 | 721,944 | ||||||
| Chase Corp. | 153 | 13,488 | ||||||
| Chemours Co. | 7,313 | 246,667 | ||||||
| Corteva, Inc. | 9,479 | 582,295 | ||||||
Danimer Scientific, Inc.(1) | 1,017 | 4,526 | ||||||
| Dow, Inc. | 18,472 | 942,072 | ||||||
| DuPont de Nemours, Inc. | 4,665 | 259,561 | ||||||
24
| Avantis U.S. Equity Fund | ||||||||
| Shares | Value | |||||||
| Eastman Chemical Co. | 3,371 | $ | 306,761 | |||||
| Ecolab, Inc. | 789 | 129,262 | ||||||
Ecovyst, Inc.(1) | 968 | 8,944 | ||||||
| Element Solutions, Inc. | 781 | 14,581 | ||||||
| FMC Corp. | 3,139 | 339,263 | ||||||
GCP Applied Technologies, Inc.(1) | 467 | 14,673 | ||||||
| H.B. Fuller Co. | 487 | 31,587 | ||||||
| Hawkins, Inc. | 610 | 23,375 | ||||||
| Huntsman Corp. | 5,297 | 148,422 | ||||||
Ingevity Corp.(1) | 1,528 | 107,174 | ||||||
| Innospec, Inc. | 430 | 40,188 | ||||||
| International Flavors & Fragrances, Inc. | 1,429 | 157,876 | ||||||
Intrepid Potash, Inc.(1) | 310 | 14,486 | ||||||
| Koppers Holdings, Inc. | 734 | 16,757 | ||||||
| Kronos Worldwide, Inc. | 903 | 11,631 | ||||||
| Linde PLC | 2,924 | 827,083 | ||||||
LSB Industries, Inc.(1) | 4,030 | 63,593 | ||||||
| LyondellBasell Industries NV, Class A | 8,097 | 672,051 | ||||||
| Mativ Holdings, Inc. | 1 | 24 | ||||||
| Minerals Technologies, Inc. | 580 | 33,791 | ||||||
| Mosaic Co. | 12,135 | 653,712 | ||||||
| NewMarket Corp. | 182 | 52,272 | ||||||
| Olin Corp. | 6,220 | 339,985 | ||||||
Origin Materials, Inc.(1) | 1,311 | 8,194 | ||||||
| Orion Engineered Carbons SA | 2,618 | 44,139 | ||||||
| PPG Industries, Inc. | 980 | 124,440 | ||||||
PureCycle Technologies, Inc.(1)(2) | 1,827 | 16,681 | ||||||
| Quaker Chemical Corp. | 152 | 26,497 | ||||||
| RPM International, Inc. | 949 | 88,409 | ||||||
| Sensient Technologies Corp. | 532 | 42,384 | ||||||
| Sherwin-Williams Co. | 1,835 | 425,903 | ||||||
| Stepan Co. | 372 | 38,774 | ||||||
| Tredegar Corp. | 1,180 | 12,048 | ||||||
| Trinseo PLC | 1,620 | 42,979 | ||||||
| Tronox Holdings PLC, Class A | 5,103 | 74,657 | ||||||
| Valhi, Inc. | 232 | 8,106 | ||||||
| Valvoline, Inc. | 2,780 | 80,815 | ||||||
| Westlake Corp. | 860 | 84,822 | ||||||
| 9,752,080 | ||||||||
| Commercial Services and Supplies — 0.6% | ||||||||
| Aris Water Solution, Inc., Class A | 400 | 6,800 | ||||||
| Brady Corp., Class A | 638 | 29,693 | ||||||
| Brink's Co. | 478 | 26,424 | ||||||
Casella Waste Systems, Inc., Class A(1) | 858 | 70,296 | ||||||
Cimpress PLC(1) | 8 | 269 | ||||||
| Cintas Corp. | 601 | 244,511 | ||||||
Civeo Corp.(1) | 1,036 | 30,728 | ||||||
Clean Harbors, Inc.(1) | 1,513 | 177,656 | ||||||
Copart, Inc.(1) | 3,436 | 411,117 | ||||||
| Deluxe Corp. | 592 | 11,390 | ||||||
| Ennis, Inc. | 1,194 | 25,349 | ||||||
25
| Avantis U.S. Equity Fund | ||||||||
| Shares | Value | |||||||
| Healthcare Services Group, Inc. | 1,523 | $ | 21,429 | |||||
Heritage-Crystal Clean, Inc.(1) | 610 | 19,868 | ||||||
| HNI Corp. | 1,019 | 32,608 | ||||||
IAA, Inc.(1) | 1,865 | 69,490 | ||||||
| Interface, Inc. | 1,955 | 21,837 | ||||||
KAR Auction Services, Inc.(1) | 1,998 | 29,171 | ||||||
Li-Cycle Holdings Corp.(1) | 1,720 | 12,401 | ||||||
| MSA Safety, Inc. | 191 | 22,702 | ||||||
| Pitney Bowes, Inc. | 1,109 | 3,205 | ||||||
Quad/Graphics, Inc.(1) | 1,703 | 5,381 | ||||||
| Republic Services, Inc. | 746 | 106,469 | ||||||
| Rollins, Inc. | 1,768 | 59,688 | ||||||
SP Plus Corp.(1) | 633 | 20,978 | ||||||
| Steelcase, Inc., Class A | 935 | 10,453 | ||||||
Stericycle, Inc.(1) | 75 | 3,757 | ||||||
| Tetra Tech, Inc. | 261 | 35,446 | ||||||
| UniFirst Corp. | 194 | 34,970 | ||||||
| VSE Corp. | 101 | 4,227 | ||||||
| Waste Connections, Inc. | 1,017 | 141,546 | ||||||
| Waste Management, Inc. | 2,970 | 502,019 | ||||||
| 2,191,878 | ||||||||
| Communications Equipment — 0.5% | ||||||||
| ADTRAN Holdings, Inc. | 351 | 8,157 | ||||||
Arista Networks, Inc.(1) | 2,598 | 311,448 | ||||||
Aviat Networks, Inc.(1) | 332 | 10,392 | ||||||
Cambium Networks Corp.(1) | 125 | 2,432 | ||||||
Ciena Corp.(1) | 2,194 | 111,324 | ||||||
| Cisco Systems, Inc. | 14,143 | 632,475 | ||||||
CommScope Holding Co., Inc.(1) | 2,063 | 23,312 | ||||||
| Comtech Telecommunications Corp. | 175 | 1,976 | ||||||
Extreme Networks, Inc.(1) | 2,001 | 28,674 | ||||||
F5, Inc.(1) | 259 | 40,678 | ||||||
| Juniper Networks, Inc. | 2,173 | 61,757 | ||||||
Lumentum Holdings, Inc.(1) | 1,326 | 110,787 | ||||||
| Motorola Solutions, Inc. | 734 | 178,663 | ||||||
NETGEAR, Inc.(1) | 326 | 7,690 | ||||||
NetScout Systems, Inc.(1) | 924 | 29,328 | ||||||
Ribbon Communications, Inc.(1) | 594 | 2,085 | ||||||
Ubiquiti, Inc.(2) | 105 | 32,591 | ||||||
ViaSat, Inc.(1) | 2,208 | 83,860 | ||||||
Viavi Solutions, Inc.(1) | 3,474 | 48,914 | ||||||
| 1,726,543 | ||||||||
| Construction and Engineering — 0.4% | ||||||||
| AECOM | 294 | 21,506 | ||||||
| Arcosa, Inc. | 788 | 46,059 | ||||||
| Argan, Inc. | 354 | 12,245 | ||||||
Dycom Industries, Inc.(1) | 713 | 79,941 | ||||||
| EMCOR Group, Inc. | 1,105 | 131,406 | ||||||
Fluor Corp.(1) | 1,904 | 50,342 | ||||||
| Granite Construction, Inc. | 1,638 | 49,107 | ||||||
Great Lakes Dredge & Dock Corp.(1) | 2,633 | 25,198 | ||||||
26
| Avantis U.S. Equity Fund | ||||||||
| Shares | Value | |||||||
MasTec, Inc.(1) | 1,366 | $ | 109,963 | |||||
Matrix Service Co.(1) | 1 | 6 | ||||||
| MDU Resources Group, Inc. | 3,472 | 104,681 | ||||||
MYR Group, Inc.(1) | 655 | 60,876 | ||||||
Northwest Pipe Co.(1) | 260 | 8,232 | ||||||
NV5 Global, Inc.(1) | 172 | 24,211 | ||||||
| Primoris Services Corp. | 1,447 | 29,331 | ||||||
| Quanta Services, Inc. | 2,414 | 341,098 | ||||||
Sterling Infrastructure, Inc.(1) | 1,283 | 32,447 | ||||||
Tutor Perini Corp.(1) | 1,023 | 6,936 | ||||||
| Valmont Industries, Inc. | 236 | 65,329 | ||||||
WillScot Mobile Mini Holdings Corp.(1) | 3,752 | 150,605 | ||||||
| 1,349,519 | ||||||||
| Construction Materials — 0.2% | ||||||||
| Eagle Materials, Inc. | 1,469 | 175,722 | ||||||
| Martin Marietta Materials, Inc. | 716 | 248,960 | ||||||
Summit Materials, Inc., Class A(1) | 1,702 | 48,371 | ||||||
| United States Lime & Minerals, Inc. | 34 | 3,495 | ||||||
| Vulcan Materials Co. | 1,269 | 211,276 | ||||||
| 687,824 | ||||||||
| Consumer Finance — 1.1% | ||||||||
| Ally Financial, Inc. | 10,154 | 337,113 | ||||||
| American Express Co. | 4,093 | 622,136 | ||||||
Atlanticus Holdings Corp.(1) | 173 | 4,925 | ||||||
| Bread Financial Holdings, Inc. | 2,394 | 92,001 | ||||||
| Capital One Financial Corp. | 7,635 | 807,936 | ||||||
Consumer Portfolio Services, Inc.(1) | 792 | 9,219 | ||||||
Credit Acceptance Corp.(1)(2) | 252 | 134,084 | ||||||
| Discover Financial Services | 7,449 | 748,550 | ||||||
Encore Capital Group, Inc.(1) | 1,178 | 64,413 | ||||||
Enova International, Inc.(1) | 991 | 34,626 | ||||||
EZCORP, Inc., Class A(1) | 1,486 | 13,002 | ||||||
Green Dot Corp., Class A(1) | 1,850 | 37,536 | ||||||
LendingClub Corp.(1) | 1,423 | 18,599 | ||||||
| Navient Corp. | 5,259 | 80,936 | ||||||
| Nelnet, Inc., Class A | 486 | 40,941 | ||||||
| OneMain Holdings, Inc. | 3,935 | 137,450 | ||||||
Oportun Financial Corp.(1) | 218 | 1,114 | ||||||
PRA Group, Inc.(1) | 1,218 | 44,993 | ||||||
PROG Holdings, Inc.(1) | 2,373 | 43,995 | ||||||
| Regional Management Corp. | 404 | 13,611 | ||||||
| SLM Corp. | 10,642 | 162,610 | ||||||
SoFi Technologies, Inc.(1) | 8,756 | 51,835 | ||||||
| Synchrony Financial | 15,059 | 493,182 | ||||||
World Acceptance Corp.(1) | 184 | 21,388 | ||||||
| 4,016,195 | ||||||||
| Containers and Packaging — 0.6% | ||||||||
| Amcor PLC | 6,192 | 74,366 | ||||||
| AptarGroup, Inc. | 741 | 76,182 | ||||||
Ardagh Metal Packaging SA(2) | 1,684 | 10,357 | ||||||
| Avery Dennison Corp. | 871 | 159,933 | ||||||
27
| Avantis U.S. Equity Fund | ||||||||
| Shares | Value | |||||||
| Ball Corp. | 2,728 | $ | 152,250 | |||||
Berry Global Group, Inc.(1) | 844 | 45,854 | ||||||
| Crown Holdings, Inc. | 857 | 77,636 | ||||||
| Graphic Packaging Holding Co. | 8,922 | 198,693 | ||||||
| Greif, Inc., Class A | 624 | 41,839 | ||||||
| Greif, Inc., Class B | 105 | 6,853 | ||||||
| International Paper Co. | 6,520 | 271,362 | ||||||
| Myers Industries, Inc. | 941 | 18,180 | ||||||
O-I Glass, Inc.(1) | 1,786 | 23,236 | ||||||
| Packaging Corp. of America | 2,966 | 406,105 | ||||||
| Sealed Air Corp. | 2,260 | 121,610 | ||||||
| Silgan Holdings, Inc. | 152 | 6,924 | ||||||
| Sonoco Products Co. | 2,935 | 184,964 | ||||||
| TriMas Corp. | 840 | 23,117 | ||||||
| WestRock Co. | 5,045 | 204,776 | ||||||
| 2,104,237 | ||||||||
| Distributors — 0.2% | ||||||||
| Genuine Parts Co. | 2,399 | 374,268 | ||||||
| LKQ Corp. | 4,458 | 237,255 | ||||||
| Pool Corp. | 480 | 162,811 | ||||||
| 774,334 | ||||||||
| Diversified Consumer Services — 0.2% | ||||||||
| ADT, Inc. | 1,747 | 12,736 | ||||||
Adtalem Global Education, Inc.(1) | 2,434 | 91,737 | ||||||
American Public Education, Inc.(1) | 77 | 795 | ||||||
Bright Horizons Family Solutions, Inc.(1) | 192 | 13,094 | ||||||
frontdoor, Inc.(1) | 841 | 19,747 | ||||||
| Graham Holdings Co., Class B | 49 | 27,706 | ||||||
Grand Canyon Education, Inc.(1) | 1,419 | 115,478 | ||||||
| H&R Block, Inc. | 2,819 | 126,855 | ||||||
| Laureate Education, Inc., Class A | 5,744 | 63,299 | ||||||
OneSpaWorld Holdings Ltd.(1) | 449 | 3,956 | ||||||
Perdoceo Education Corp.(1) | 2,416 | 27,977 | ||||||
| Service Corp. International | 2,235 | 137,922 | ||||||
| Strategic Education, Inc. | 354 | 22,904 | ||||||
Stride, Inc.(1) | 1,135 | 43,289 | ||||||
Terminix Global Holdings, Inc.(1) | 304 | 12,966 | ||||||
Universal Technical Institute, Inc.(1) | 1,620 | 11,113 | ||||||
WW International, Inc.(1) | 204 | 1,065 | ||||||
| 732,639 | ||||||||
| Diversified Financial Services — 0.9% | ||||||||
| A-Mark Precious Metals, Inc. | 612 | 18,917 | ||||||
Acacia Research Corp.(1) | 2,587 | 11,616 | ||||||
| Alerus Financial Corp. | 452 | 10,740 | ||||||
| Apollo Global Management, Inc. | 3,955 | 219,819 | ||||||
Berkshire Hathaway, Inc., Class B(1) | 7,563 | 2,123,690 | ||||||
Cannae Holdings, Inc.(1) | 1,598 | 34,533 | ||||||
| Equitable Holdings, Inc. | 13,663 | 406,474 | ||||||
| Jackson Financial, Inc., Class A | 3,977 | 124,321 | ||||||
| Voya Financial, Inc. | 3,706 | 228,030 | ||||||
| 3,178,140 | ||||||||
28
| Avantis U.S. Equity Fund | ||||||||
| Shares | Value | |||||||
| Diversified Telecommunication Services — 1.1% | ||||||||
Anterix, Inc.(1) | 60 | $ | 2,547 | |||||
| AT&T, Inc. | 75,494 | 1,324,165 | ||||||
| ATN International, Inc. | 438 | 20,520 | ||||||
| Cogent Communications Holdings, Inc. | 206 | 10,969 | ||||||
Consolidated Communications Holdings, Inc.(1) | 479 | 2,749 | ||||||
EchoStar Corp., Class A(1) | 780 | 14,360 | ||||||
Frontier Communications Parent, Inc.(1) | 7,854 | 202,319 | ||||||
IDT Corp., Class B(1) | 973 | 24,880 | ||||||
Iridium Communications, Inc.(1) | 3,543 | 157,274 | ||||||
Lumen Technologies, Inc.(2) | 10,454 | 104,122 | ||||||
Radius Global Infrastructure, Inc., Class A(1) | 1,899 | 26,149 | ||||||
| Verizon Communications, Inc. | 50,070 | 2,093,427 | ||||||
| 3,983,481 | ||||||||
| Electric Utilities — 2.0% | ||||||||
| ALLETE, Inc. | 973 | 57,582 | ||||||
| Alliant Energy Corp. | 2,670 | 162,977 | ||||||
| American Electric Power Co., Inc. | 5,430 | 544,086 | ||||||
Avangrid, Inc.(2) | 746 | 36,852 | ||||||
| Constellation Energy Corp. | 3,903 | 318,446 | ||||||
| Duke Energy Corp. | 3,795 | 405,723 | ||||||
| Edison International | 7,241 | 490,723 | ||||||
| Entergy Corp. | 4,121 | 475,151 | ||||||
| Evergy, Inc. | 2,308 | 158,167 | ||||||
| Eversource Energy | 3,567 | 319,924 | ||||||
| Exelon Corp. | 15,959 | 700,760 | ||||||
| FirstEnergy Corp. | 4,696 | 185,727 | ||||||
| Genie Energy Ltd., Class B | 711 | 7,423 | ||||||
| Hawaiian Electric Industries, Inc. | 2,880 | 112,666 | ||||||
| IDACORP, Inc. | 533 | 58,225 | ||||||
| NextEra Energy, Inc. | 5,012 | 426,321 | ||||||
| NRG Energy, Inc. | 5,712 | 235,791 | ||||||
| OGE Energy Corp. | 4,504 | 182,592 | ||||||
| Otter Tail Corp. | 1,073 | 81,054 | ||||||
PG&E Corp.(1) | 31,766 | 391,675 | ||||||
| Pinnacle West Capital Corp. | 2,614 | 196,965 | ||||||
| PNM Resources, Inc. | 273 | 12,948 | ||||||
| Portland General Electric Co. | 2,453 | 126,747 | ||||||
| PPL Corp. | 13,140 | 382,111 | ||||||
| Southern Co. | 8,773 | 676,135 | ||||||
| Xcel Energy, Inc. | 7,055 | 523,834 | ||||||
| 7,270,605 | ||||||||
| Electrical Equipment — 0.6% | ||||||||
| Acuity Brands, Inc. | 620 | 101,637 | ||||||
| Allied Motion Technologies, Inc. | 103 | 3,607 | ||||||
| AMETEK, Inc. | 981 | 117,877 | ||||||
Array Technologies, Inc.(1) | 950 | 19,855 | ||||||
Atkore, Inc.(1) | 2,058 | 173,716 | ||||||
| AZZ, Inc. | 720 | 30,679 | ||||||
Bloom Energy Corp., Class A(1) | 941 | 23,911 | ||||||
| Eaton Corp. PLC | 1,202 | 164,241 | ||||||
29
| Avantis U.S. Equity Fund | ||||||||
| Shares | Value | |||||||
| Emerson Electric Co. | 5,546 | $ | 453,330 | |||||
| Encore Wire Corp. | 1,004 | 130,620 | ||||||
| EnerSys | 620 | 38,669 | ||||||
FREYR Battery SA(1)(2) | 2,327 | 33,137 | ||||||
FuelCell Energy, Inc.(1)(2) | 5,831 | 24,432 | ||||||
Generac Holdings, Inc.(1) | 447 | 98,523 | ||||||
| GrafTech International Ltd. | 5,884 | 34,598 | ||||||
| Hubbell, Inc. | 309 | 63,747 | ||||||
| nVent Electric PLC | 1,051 | 34,641 | ||||||
Plug Power, Inc.(1) | 5,674 | 159,099 | ||||||
| Regal Rexnord Corp. | 660 | 90,809 | ||||||
| Rockwell Automation, Inc. | 1,035 | 245,233 | ||||||
| Sensata Technologies Holding PLC | 509 | 20,503 | ||||||
Sunrun, Inc.(1) | 2,181 | 72,038 | ||||||
Thermon Group Holdings, Inc.(1) | 1,263 | 22,166 | ||||||
TPI Composites, Inc.(1) | 537 | 9,983 | ||||||
Vicor Corp.(1) | 201 | 14,299 | ||||||
| 2,181,350 | ||||||||
| Electronic Equipment, Instruments and Components — 1.1% | ||||||||
908 Devices, Inc.(1) | 481 | 9,692 | ||||||
| Advanced Energy Industries, Inc. | 922 | 82,786 | ||||||
Aeva Technologies, Inc.(1) | 1,223 | 3,767 | ||||||
| Amphenol Corp., Class A | 2,070 | 152,207 | ||||||
Arrow Electronics, Inc.(1) | 998 | 104,600 | ||||||
| Avnet, Inc. | 2,011 | 88,263 | ||||||
| Badger Meter, Inc. | 447 | 42,326 | ||||||
| Bel Fuse, Inc., Class B | 256 | 7,276 | ||||||
| Belden, Inc. | 397 | 25,996 | ||||||
| Benchmark Electronics, Inc. | 796 | 21,850 | ||||||
| CDW Corp. | 1,292 | 220,544 | ||||||
| Cognex Corp. | 1,413 | 59,501 | ||||||
| Corning, Inc. | 16,969 | 582,376 | ||||||
| CTS Corp. | 953 | 40,331 | ||||||
Daktronics, Inc.(1) | 760 | 2,432 | ||||||
ePlus, Inc.(1) | 464 | 21,864 | ||||||
Fabrinet(1) | 572 | 58,824 | ||||||
Flex Ltd.(1) | 13,886 | 247,310 | ||||||
II-VI, Inc.(1) | 1,474 | 69,617 | ||||||
Insight Enterprises, Inc.(1) | 830 | 75,630 | ||||||
IPG Photonics Corp.(1) | 275 | 24,912 | ||||||
Itron, Inc.(1) | 11 | 523 | ||||||
| Jabil, Inc. | 4,661 | 281,058 | ||||||
Keysight Technologies, Inc.(1) | 2,497 | 409,233 | ||||||
Kimball Electronics, Inc.(1) | 789 | 16,995 | ||||||
Knowles Corp.(1) | 1,589 | 24,073 | ||||||
| Littelfuse, Inc. | 295 | 69,980 | ||||||
| Methode Electronics, Inc. | 659 | 26,663 | ||||||
Napco Security Technologies, Inc.(1) | 300 | 8,898 | ||||||
nLight, Inc.(1) | 132 | 1,649 | ||||||
Novanta, Inc.(1) | 194 | 25,936 | ||||||
OSI Systems, Inc.(1) | 313 | 26,079 | ||||||
30
| Avantis U.S. Equity Fund | ||||||||
| Shares | Value | |||||||
| PC Connection, Inc. | 108 | $ | 5,365 | |||||
Plexus Corp.(1) | 496 | 46,490 | ||||||
Rogers Corp.(1) | 301 | 75,407 | ||||||
Sanmina Corp.(1) | 2,496 | 121,106 | ||||||
ScanSource, Inc.(1) | 877 | 25,407 | ||||||
SmartRent, Inc.(1)(2) | 2,037 | 6,580 | ||||||
| TD SYNNEX Corp. | 1,631 | 157,033 | ||||||
| TE Connectivity Ltd. | 3,229 | 407,532 | ||||||
Teledyne Technologies, Inc.(1) | 182 | 67,042 | ||||||
Trimble, Inc.(1) | 742 | 46,932 | ||||||
TTM Technologies, Inc.(1) | 3,605 | 56,707 | ||||||
| Vishay Intertechnology, Inc. | 5,398 | 106,179 | ||||||
Vishay Precision Group, Inc.(1) | 149 | 5,112 | ||||||
| Vontier Corp. | 1,994 | 43,708 | ||||||
Zebra Technologies Corp., Class A(1) | 322 | 97,128 | ||||||
| 4,100,919 | ||||||||
| Energy Equipment and Services — 0.7% | ||||||||
| Archrock, Inc. | 6,912 | 51,080 | ||||||
| Baker Hughes Co. | 12,169 | 307,389 | ||||||
Bristow Group, Inc.(1) | 795 | 23,063 | ||||||
| Cactus, Inc., Class A | 582 | 23,251 | ||||||
| ChampionX Corp. | 4,393 | 95,811 | ||||||
| Core Laboratories NV | 695 | 11,224 | ||||||
Diamond Offshore Drilling, Inc.(1)(2) | 2,775 | 19,730 | ||||||
Dril-Quip, Inc.(1) | 967 | 21,400 | ||||||
Expro Group Holdings NV(1) | 1,949 | 26,351 | ||||||
Exterran Corp.(1) | 1,528 | 7,502 | ||||||
| Halliburton Co. | 18,925 | 570,210 | ||||||
Helix Energy Solutions Group, Inc.(1) | 4,373 | 18,891 | ||||||
| Helmerich & Payne, Inc. | 1,931 | 82,550 | ||||||
Liberty Energy, Inc., Class A(1) | 3,801 | 57,015 | ||||||
Nabors Industries Ltd.(1) | 439 | 58,172 | ||||||
Newpark Resources, Inc.(1) | 1,250 | 3,600 | ||||||
NexTier Oilfield Solutions, Inc.(1) | 4,622 | 43,308 | ||||||
Noble Corp.(1) | 1,535 | 46,587 | ||||||
| NOV, Inc. | 7,631 | 134,840 | ||||||
Oceaneering International, Inc.(1) | 4,305 | 38,099 | ||||||
Oil States International, Inc.(1) | 607 | 2,974 | ||||||
| Patterson-UTI Energy, Inc. | 4,703 | 70,075 | ||||||
ProPetro Holding Corp.(1) | 3,099 | 28,387 | ||||||
| RPC, Inc. | 1,445 | 11,488 | ||||||
| Schlumberger NV | 9,301 | 354,833 | ||||||
Select Energy Services, Inc., Class A(1) | 634 | 4,508 | ||||||
| Solaris Oilfield Infrastructure, Inc., Class A | 647 | 6,923 | ||||||
TechnipFMC PLC(1) | 5,104 | 41,751 | ||||||
TETRA Technologies Inc(1) | 3,876 | 15,427 | ||||||
Tidewater, Inc.(1) | 1,106 | 24,509 | ||||||
Transocean Ltd.(1) | 16,346 | 59,173 | ||||||
US Silica Holdings, Inc.(1) | 3,249 | 45,583 | ||||||
Valaris Ltd.(1) | 2,649 | 135,046 | ||||||
Weatherford International PLC(1) | 3,564 | 100,291 | ||||||
| 2,541,041 | ||||||||
31
| Avantis U.S. Equity Fund | ||||||||
| Shares | Value | |||||||
| Entertainment — 0.7% | ||||||||
| Activision Blizzard, Inc. | 3,036 | $ | 238,296 | |||||
AMC Entertainment Holdings, Inc., Class A(1) | 2,207 | 20,128 | ||||||
| Electronic Arts, Inc. | 1,795 | 227,732 | ||||||
IMAX Corp.(1) | 513 | 8,044 | ||||||
Liberty Media Corp.-Liberty Braves, Class C(1) | 731 | 19,986 | ||||||
Liberty Media Corp.-Liberty Formula One, Class A(1) | 216 | 12,556 | ||||||
Liberty Media Corp.-Liberty Formula One, Class C(1) | 2,009 | 127,933 | ||||||
Live Nation Entertainment, Inc.(1) | 402 | 36,325 | ||||||
Madison Square Garden Entertainment Corp.(1) | 519 | 28,836 | ||||||
Madison Square Garden Sports Corp.(1) | 133 | 21,316 | ||||||
Marcus Corp.(2) | 226 | 3,636 | ||||||
Netflix, Inc.(1) | 2,425 | 542,133 | ||||||
Playstudios, Inc.(1)(2) | 2,241 | 8,112 | ||||||
Playtika Holding Corp.(1) | 514 | 5,412 | ||||||
ROBLOX Corp., Class A(1) | 1,198 | 46,854 | ||||||
Roku, Inc.(1) | 475 | 32,300 | ||||||
Take-Two Interactive Software, Inc.(1) | 2,649 | 324,661 | ||||||
Walt Disney Co.(1) | 5,252 | 588,644 | ||||||
Warner Bros Discovery, Inc.(1) | 8,905 | 117,902 | ||||||
| World Wrestling Entertainment, Inc., Class A | 1,803 | 122,622 | ||||||
| 2,533,428 | ||||||||
| Food and Staples Retailing — 1.8% | ||||||||
| Albertsons Cos., Inc., Class A | 2,681 | 73,754 | ||||||
| Andersons, Inc. | 834 | 30,883 | ||||||
BJ's Wholesale Club Holdings, Inc.(1) | 2,011 | 149,799 | ||||||
| Casey's General Stores, Inc. | 1,047 | 223,817 | ||||||
| Costco Wholesale Corp. | 4,776 | 2,493,550 | ||||||
Grocery Outlet Holding Corp.(1) | 68 | 2,728 | ||||||
| Ingles Markets, Inc., Class A | 741 | 64,860 | ||||||
| Kroger Co. | 18,575 | 890,485 | ||||||
| Natural Grocers by Vitamin Cottage, Inc. | 593 | 8,515 | ||||||
Performance Food Group Co.(1) | 1,656 | 82,767 | ||||||
| PriceSmart, Inc. | 476 | 30,117 | ||||||
| SpartanNash Co. | 1,193 | 36,303 | ||||||
Sprouts Farmers Market, Inc.(1) | 4,995 | 144,356 | ||||||
| Sysco Corp. | 4,207 | 345,900 | ||||||
United Natural Foods, Inc.(1) | 2,370 | 104,470 | ||||||
US Foods Holding Corp.(1) | 249 | 7,624 | ||||||
| Walgreens Boots Alliance, Inc. | 5,900 | 206,854 | ||||||
| Walmart, Inc. | 12,991 | 1,721,957 | ||||||
| Weis Markets, Inc. | 703 | 54,630 | ||||||
| 6,673,369 | ||||||||
| Food Products — 1.1% | ||||||||
| Archer-Daniels-Midland Co. | 7,043 | 619,009 | ||||||
| B&G Foods, Inc. | 1,239 | 26,837 | ||||||
| Bunge Ltd. | 2,100 | 208,257 | ||||||
| Cal-Maine Foods, Inc. | 1,110 | 59,507 | ||||||
| Calavo Growers, Inc. | 128 | 5,381 | ||||||
| Campbell Soup Co. | 650 | 32,747 | ||||||
| Conagra Brands, Inc. | 997 | 34,277 | ||||||
32
| Avantis U.S. Equity Fund | ||||||||
| Shares | Value | |||||||
Darling Ingredients, Inc.(1) | 3,873 | $ | 294,580 | |||||
| Flowers Foods, Inc. | 5,736 | 156,593 | ||||||
| Fresh Del Monte Produce, Inc. | 779 | 21,298 | ||||||
| General Mills, Inc. | 1,563 | 120,038 | ||||||
Hain Celestial Group, Inc.(1) | 1,287 | 26,075 | ||||||
| Hershey Co. | 1,902 | 427,322 | ||||||
| Hormel Foods Corp. | 1,791 | 90,051 | ||||||
Hostess Brands, Inc.(1) | 2,775 | 64,325 | ||||||
| Ingredion, Inc. | 1,502 | 130,779 | ||||||
| J&J Snack Foods Corp. | 148 | 22,056 | ||||||
| J.M. Smucker Co. | 1,415 | 198,086 | ||||||
| John B Sanfilippo & Son, Inc. | 282 | 22,766 | ||||||
| Kellogg Co. | 805 | 58,556 | ||||||
| Kraft Heinz Co. | 5,846 | 218,640 | ||||||
| Lamb Weston Holdings, Inc. | 2,657 | 211,311 | ||||||
| Lancaster Colony Corp. | 177 | 29,833 | ||||||
| McCormick & Co., Inc. | 345 | 29,004 | ||||||
Mission Produce, Inc.(1) | 437 | 7,036 | ||||||
| Mondelez International, Inc., Class A | 6,301 | 389,780 | ||||||
Pilgrim's Pride Corp.(1) | 1,548 | 44,072 | ||||||
Post Holdings, Inc.(1) | 93 | 8,255 | ||||||
| Seaboard Corp. | 6 | 23,174 | ||||||
Seneca Foods Corp., Class A(1) | 387 | 20,445 | ||||||
Simply Good Foods Co.(1) | 1,298 | 39,654 | ||||||
| Tootsie Roll Industries, Inc. | 565 | 20,244 | ||||||
TreeHouse Foods, Inc.(1) | 20 | 932 | ||||||
| Tyson Foods, Inc., Class A | 5,324 | 401,323 | ||||||
Whole Earth Brands, Inc.(1) | 160 | 818 | ||||||
| 4,063,061 | ||||||||
| Gas Utilities — 0.2% | ||||||||
| Atmos Energy Corp. | 1,398 | 158,505 | ||||||
| Chesapeake Utilities Corp. | 179 | 22,608 | ||||||
| National Fuel Gas Co. | 2,283 | 162,709 | ||||||
| New Jersey Resources Corp. | 2,530 | 111,674 | ||||||
| Northwest Natural Holding Co. | 947 | 45,087 | ||||||
| ONE Gas, Inc. | 647 | 50,641 | ||||||
| Southwest Gas Holdings, Inc. | 305 | 23,744 | ||||||
| UGI Corp. | 1,849 | 73,036 | ||||||
| 648,004 | ||||||||
| Health Care Equipment and Supplies — 1.8% | ||||||||
| Abbott Laboratories | 9,989 | 1,025,371 | ||||||
ABIOMED, Inc.(1) | 305 | 79,080 | ||||||
Align Technology, Inc.(1) | 816 | 198,859 | ||||||
AngioDynamics, Inc.(1) | 722 | 15,985 | ||||||
Asensus Surgical, Inc.(1) | 792 | 428 | ||||||
| Atrion Corp. | 34 | 20,534 | ||||||
Avanos Medical, Inc.(1) | 657 | 16,182 | ||||||
| Baxter International, Inc. | 4,230 | 243,056 | ||||||
| Becton Dickinson and Co. | 864 | 218,091 | ||||||
Boston Scientific Corp.(1) | 6,529 | 263,184 | ||||||
Butterfly Network, Inc.(1) | 3,163 | 19,705 | ||||||
33
| Avantis U.S. Equity Fund | ||||||||
| Shares | Value | |||||||
Cardiovascular Systems, Inc.(1) | 759 | $ | 10,026 | |||||
Co-Diagnostics, Inc.(1)(2) | 798 | 2,697 | ||||||
| CONMED Corp. | 43 | 3,809 | ||||||
| Cooper Cos., Inc. | 485 | 139,408 | ||||||
CryoPort, Inc.(1) | 552 | 18,028 | ||||||
Cue Health, Inc.(1) | 1,815 | 6,044 | ||||||
| DENTSPLY SIRONA, Inc. | 1,323 | 43,355 | ||||||
DexCom, Inc.(1) | 1,624 | 133,509 | ||||||
Edwards Lifesciences Corp.(1) | 4,339 | 390,944 | ||||||
| Embecta Corp. | 489 | 15,609 | ||||||
Enovis Corp.(1) | 442 | 22,387 | ||||||
Envista Holdings Corp.(1) | 1,501 | 55,672 | ||||||
Glaukos Corp.(1) | 840 | 40,782 | ||||||
Globus Medical, Inc., Class A(1) | 1,092 | 64,635 | ||||||
Haemonetics Corp.(1) | 829 | 62,200 | ||||||
Heska Corp.(1) | 102 | 9,289 | ||||||
Hologic, Inc.(1) | 6,774 | 457,651 | ||||||
IDEXX Laboratories, Inc.(1) | 844 | 293,391 | ||||||
Inogen, Inc.(1) | 174 | 4,982 | ||||||
Inspire Medical Systems, Inc.(1) | 128 | 24,511 | ||||||
Insulet Corp.(1) | 144 | 36,788 | ||||||
Integer Holdings Corp.(1) | 444 | 28,003 | ||||||
Integra LifeSciences Holdings Corp.(1) | 697 | 33,254 | ||||||
Intuitive Surgical, Inc.(1) | 1,704 | 350,581 | ||||||
Lantheus Holdings, Inc.(1) | 701 | 55,239 | ||||||
| LeMaitre Vascular, Inc. | 560 | 27,653 | ||||||
LENSAR, Inc.(1) | 57 | 307 | ||||||
Masimo Corp.(1) | 338 | 49,649 | ||||||
| Medtronic PLC | 6,765 | 594,779 | ||||||
Meridian Bioscience, Inc.(1) | 1,361 | 44,355 | ||||||
Merit Medical Systems, Inc.(1) | 1,016 | 60,178 | ||||||
Neogen Corp.(1) | 919 | 19,207 | ||||||
Novocure Ltd.(1) | 563 | 46,239 | ||||||
NuVasive, Inc.(1) | 617 | 26,229 | ||||||
Omnicell, Inc.(1) | 37 | 3,785 | ||||||
OraSure Technologies, Inc.(1) | 1,749 | 7,153 | ||||||
Orthofix Medical, Inc.(1) | 268 | 5,333 | ||||||
OrthoPediatrics Corp.(1) | 107 | 5,253 | ||||||
Outset Medical, Inc.(1) | 537 | 9,822 | ||||||
Penumbra, Inc.(1) | 198 | 32,506 | ||||||
PROCEPT BioRobotics Corp.(1) | 698 | 28,255 | ||||||
QuidelOrtho Corp.(1) | 1,869 | 148,137 | ||||||
| ResMed, Inc. | 787 | 173,077 | ||||||
Shockwave Medical, Inc.(1) | 190 | 56,403 | ||||||
| STERIS PLC | 475 | 95,656 | ||||||
| Stryker Corp. | 1,181 | 242,341 | ||||||
| Teleflex, Inc. | 263 | 59,506 | ||||||
UFP Technologies, Inc.(1) | 50 | 4,650 | ||||||
| Utah Medical Products, Inc. | 113 | 10,385 | ||||||
Varex Imaging Corp.(1) | 658 | 13,877 | ||||||
ViewRay, Inc.(1) | 1,573 | 5,380 | ||||||
34
| Avantis U.S. Equity Fund | ||||||||
| Shares | Value | |||||||
| Zimmer Biomet Holdings, Inc. | 1,906 | $ | 202,646 | |||||
Zimvie, Inc.(1) | 1,329 | 20,227 | ||||||
| 6,396,257 | ||||||||
| Health Care Providers and Services — 2.6% | ||||||||
23andMe Holding Co., Class A(1)(2) | 6,785 | 22,865 | ||||||
Acadia Healthcare Co., Inc.(1) | 915 | 74,966 | ||||||
agilon health, Inc.(1) | 1,982 | 41,186 | ||||||
| AmerisourceBergen Corp. | 2,248 | 329,467 | ||||||
AMN Healthcare Services, Inc.(1) | 1,552 | 159,297 | ||||||
Apollo Medical Holdings, Inc.(1)(2) | 519 | 22,385 | ||||||
Brookdale Senior Living, Inc.(1) | 5,183 | 22,805 | ||||||
| Cardinal Health, Inc. | 3,790 | 268,029 | ||||||
Castle Biosciences, Inc.(1) | 388 | 11,252 | ||||||
Centene Corp.(1) | 10,562 | 947,834 | ||||||
| Chemed Corp. | 168 | 80,000 | ||||||
| Cigna Corp. | 1,217 | 344,959 | ||||||
Clover Health Investments Corp.(1) | 2,646 | 6,906 | ||||||
Community Health Systems, Inc.(1) | 542 | 1,442 | ||||||
CorVel Corp.(1) | 304 | 47,236 | ||||||
Cross Country Healthcare, Inc.(1) | 793 | 20,126 | ||||||
| CVS Health Corp. | 3,564 | 349,807 | ||||||
DaVita, Inc.(1) | 433 | 36,931 | ||||||
| Elevance Health, Inc. | 3,313 | 1,607,169 | ||||||
| Encompass Health Corp. | 544 | 26,422 | ||||||
Enhabit, Inc.(1) | 272 | 4,515 | ||||||
| Ensign Group, Inc. | 1,821 | 155,331 | ||||||
Fulgent Genetics, Inc.(1) | 945 | 41,079 | ||||||
| HCA Healthcare, Inc. | 1,258 | 248,921 | ||||||
HealthEquity, Inc.(1) | 492 | 32,511 | ||||||
Henry Schein, Inc.(1) | 1,095 | 80,384 | ||||||
Hims & Hers Health, Inc.(1) | 1,786 | 11,359 | ||||||
| Humana, Inc. | 1,682 | 810,354 | ||||||
InfuSystem Holdings, Inc.(1) | 278 | 2,143 | ||||||
Joint Corp.(1) | 325 | 5,928 | ||||||
| Laboratory Corp. of America Holdings | 1,478 | 332,949 | ||||||
LHC Group, Inc.(1) | 61 | 9,850 | ||||||
| McKesson Corp. | 392 | 143,864 | ||||||
ModivCare, Inc.(1) | 191 | 20,689 | ||||||
Molina Healthcare, Inc.(1) | 1,873 | 631,894 | ||||||
| National Healthcare Corp. | 378 | 26,252 | ||||||
| National Research Corp. | 717 | 24,457 | ||||||
Oak Street Health, Inc.(1) | 233 | 6,105 | ||||||
OPKO Health, Inc.(1) | 3,813 | 8,312 | ||||||
Option Care Health, Inc.(1) | 591 | 18,297 | ||||||
| Owens & Minor, Inc. | 2,443 | 72,093 | ||||||
| Patterson Cos., Inc. | 1,919 | 53,521 | ||||||
| Premier, Inc., Class A | 2,712 | 95,571 | ||||||
| Quest Diagnostics, Inc. | 575 | 72,053 | ||||||
R1 RCM, Inc.(1) | 2,179 | 47,611 | ||||||
RadNet, Inc.(1) | 227 | 4,560 | ||||||
| Select Medical Holdings Corp. | 625 | 16,025 | ||||||
35
| Avantis U.S. Equity Fund | ||||||||
| Shares | Value | |||||||
Tenet Healthcare Corp.(1) | 1,018 | $ | 57,517 | |||||
| UnitedHealth Group, Inc. | 3,655 | 1,898,151 | ||||||
| Universal Health Services, Inc., Class B | 846 | 82,773 | ||||||
| 9,436,153 | ||||||||
| Health Care Technology — 0.1% | ||||||||
Allscripts Healthcare Solutions, Inc.(1) | 5,340 | 90,780 | ||||||
American Well Corp., Class A(1) | 4,197 | 19,096 | ||||||
Change Healthcare, Inc.(1) | 1,093 | 26,855 | ||||||
Doximity, Inc., Class A(1)(2) | 387 | 12,845 | ||||||
HealthStream, Inc.(1) | 242 | 5,355 | ||||||
Multiplan Corp.(1)(2) | 1,051 | 3,699 | ||||||
NextGen Healthcare, Inc.(1) | 1,155 | 19,797 | ||||||
Schrodinger, Inc.(1) | 340 | 9,330 | ||||||
Teladoc Health, Inc.(1) | 531 | 16,493 | ||||||
Veeva Systems, Inc., Class A(1) | 600 | 119,592 | ||||||
| 323,842 | ||||||||
| Hotels, Restaurants and Leisure — 1.4% | ||||||||
Airbnb, Inc., Class A(1) | 1,900 | 214,928 | ||||||
| Aramark | 268 | 9,570 | ||||||
BJ's Restaurants, Inc.(1) | 123 | 3,085 | ||||||
| Bloomin' Brands, Inc. | 2,879 | 58,213 | ||||||
Booking Holdings, Inc.(1) | 316 | 592,756 | ||||||
| Boyd Gaming Corp. | 2,988 | 162,637 | ||||||
Caesars Entertainment, Inc.(1) | 1,838 | 79,255 | ||||||
Carnival Corp.(1) | 6,046 | 57,195 | ||||||
Century Casinos, Inc.(1) | 1,373 | 10,119 | ||||||
Cheesecake Factory, Inc.(2) | 2,161 | 66,170 | ||||||
Chipotle Mexican Grill, Inc.(1) | 411 | 656,285 | ||||||
| Choice Hotels International, Inc. | 864 | 99,109 | ||||||
| Churchill Downs, Inc. | 547 | 107,808 | ||||||
Chuy's Holdings, Inc.(1) | 150 | 3,350 | ||||||
Cracker Barrel Old Country Store, Inc.(2) | 915 | 98,765 | ||||||
| Darden Restaurants, Inc. | 1,717 | 212,410 | ||||||
Dave & Buster's Entertainment, Inc.(1) | 694 | 28,690 | ||||||
| Dine Brands Global, Inc. | 76 | 5,062 | ||||||
| Domino's Pizza, Inc. | 107 | 39,789 | ||||||
DraftKings, Inc., Class A(1) | 1,081 | 17,361 | ||||||
Everi Holdings, Inc.(1) | 1,846 | 34,151 | ||||||
Expedia Group, Inc.(1) | 973 | 99,878 | ||||||
Fiesta Restaurant Group, Inc.(1) | 301 | 2,008 | ||||||
GAN Ltd.(1) | 132 | 341 | ||||||
Golden Entertainment, Inc.(1) | 852 | 32,598 | ||||||
Hilton Grand Vacations, Inc.(1) | 2,206 | 89,961 | ||||||
| Hilton Worldwide Holdings, Inc. | 899 | 114,497 | ||||||
Hyatt Hotels Corp., Class A(1) | 1,710 | 153,250 | ||||||
| International Game Technology PLC | 277 | 4,969 | ||||||
| Jack in the Box, Inc. | 49 | 3,913 | ||||||
Las Vegas Sands Corp.(1) | 669 | 25,174 | ||||||
| Marriott International, Inc., Class A | 1,668 | 256,438 | ||||||
| Marriott Vacations Worldwide Corp. | 43 | 6,124 | ||||||
| McDonald's Corp. | 2,243 | 565,864 | ||||||
36
| Avantis U.S. Equity Fund | ||||||||
| Shares | Value | |||||||
| MGM Resorts International | 3,253 | $ | 106,178 | |||||
Monarch Casino & Resort, Inc.(1) | 574 | 34,664 | ||||||
Noodles & Co.(1) | 1,969 | 9,353 | ||||||
Norwegian Cruise Line Holdings Ltd.(1) | 4,367 | 57,120 | ||||||
ONE Group Hospitality, Inc.(1) | 584 | 4,170 | ||||||
| Papa John's International, Inc. | 227 | 18,348 | ||||||
Penn Entertainment, Inc.(1) | 3,016 | 94,190 | ||||||
Planet Fitness, Inc., Class A(1) | 490 | 33,197 | ||||||
Playa Hotels & Resorts NV(1) | 945 | 6,199 | ||||||
| RCI Hospitality Holdings, Inc. | 194 | 12,651 | ||||||
Red Robin Gourmet Burgers, Inc.(1) | 134 | 996 | ||||||
| Red Rock Resorts, Inc., Class A | 643 | 24,575 | ||||||
Royal Caribbean Cruises Ltd.(1) | 1,756 | 71,733 | ||||||
| Ruth's Hospitality Group, Inc. | 1,077 | 19,623 | ||||||
Scientific Games Corp., Class A(1) | 443 | 21,809 | ||||||
SeaWorld Entertainment, Inc.(1) | 1,367 | 68,692 | ||||||
Shake Shack, Inc., Class A(1) | 95 | 4,528 | ||||||
Six Flags Entertainment Corp.(1) | 511 | 11,319 | ||||||
| Starbucks Corp. | 3,302 | 277,599 | ||||||
Target Hospitality Corp.(1)(2) | 1,541 | 20,480 | ||||||
| Texas Roadhouse, Inc. | 2,483 | 220,391 | ||||||
| Travel + Leisure Co. | 327 | 13,865 | ||||||
| Vail Resorts, Inc. | 134 | 30,107 | ||||||
| Wendy's Co. | 1,933 | 37,075 | ||||||
| Wingstop, Inc. | 190 | 21,633 | ||||||
| Wyndham Hotels & Resorts, Inc. | 394 | 25,744 | ||||||
Wynn Resorts Ltd.(1) | 211 | 12,784 | ||||||
| Yum! Brands, Inc. | 810 | 90,104 | ||||||
| 5,260,850 | ||||||||
| Household Durables — 0.7% | ||||||||
| Bassett Furniture Industries, Inc. | 229 | 4,365 | ||||||
Beazer Homes USA, Inc.(1) | 466 | 6,636 | ||||||
Cavco Industries, Inc.(1) | 165 | 38,612 | ||||||
| Century Communities, Inc. | 837 | 39,080 | ||||||
| D.R. Horton, Inc. | 3,655 | 260,053 | ||||||
| Ethan Allen Interiors, Inc. | 868 | 20,632 | ||||||
| Garmin Ltd. | 1,702 | 150,610 | ||||||
GoPro, Inc., Class A(1) | 2,385 | 14,525 | ||||||
Green Brick Partners, Inc.(1) | 540 | 13,154 | ||||||
| Hooker Furnishings Corp. | 146 | 2,317 | ||||||
Hovnanian Enterprises, Inc., Class A(1) | 211 | 8,459 | ||||||
| Installed Building Products, Inc. | 370 | 33,507 | ||||||
iRobot Corp.(1) | 286 | 16,840 | ||||||
| KB Home | 1,452 | 41,600 | ||||||
| La-Z-Boy, Inc. | 995 | 26,258 | ||||||
| Leggett & Platt, Inc. | 589 | 22,512 | ||||||
| Lennar Corp., B Shares | 255 | 15,728 | ||||||
| Lennar Corp., Class A | 3,819 | 295,782 | ||||||
LGI Homes, Inc.(1) | 457 | 43,374 | ||||||
| Lifetime Brands, Inc. | 361 | 3,220 | ||||||
| M.D.C. Holdings, Inc. | 969 | 30,117 | ||||||
37
| Avantis U.S. Equity Fund | ||||||||
| Shares | Value | |||||||
M/I Homes, Inc.(1) | 727 | $ | 31,435 | |||||
Meritage Homes Corp.(1) | 629 | 49,282 | ||||||
Mohawk Industries, Inc.(1) | 835 | 92,151 | ||||||
| Newell Brands, Inc. | 3,563 | 63,600 | ||||||
NVR, Inc.(1) | 78 | 322,925 | ||||||
| PulteGroup, Inc. | 6,078 | 247,131 | ||||||
Skyline Champion Corp.(1) | 1,519 | 86,082 | ||||||
Sonos, Inc.(1) | 2,784 | 41,871 | ||||||
Taylor Morrison Home Corp.(1) | 3,148 | 79,046 | ||||||
| Tempur Sealy International, Inc. | 3,035 | 75,905 | ||||||
| Toll Brothers, Inc. | 3,705 | 162,242 | ||||||
TopBuild Corp.(1) | 165 | 30,320 | ||||||
Tri Pointe Homes, Inc.(1) | 3,868 | 67,032 | ||||||
Tupperware Brands Corp.(1) | 158 | 1,776 | ||||||
Universal Electronics, Inc.(1) | 86 | 1,912 | ||||||
VOXX International Corp.(1) | 219 | 2,111 | ||||||
| Whirlpool Corp. | 1,692 | 264,967 | ||||||
| 2,707,169 | ||||||||
| Household Products — 0.8% | ||||||||
Central Garden & Pet Co.(1) | 81 | 3,233 | ||||||
Central Garden & Pet Co., Class A(1) | 611 | 23,071 | ||||||
| Church & Dwight Co., Inc. | 2,321 | 194,291 | ||||||
| Clorox Co. | 1,371 | 197,890 | ||||||
| Colgate-Palmolive Co. | 8,395 | 656,573 | ||||||
| Energizer Holdings, Inc. | 489 | 13,741 | ||||||
| Kimberly-Clark Corp. | 4,417 | 563,256 | ||||||
| Procter & Gamble Co. | 9,641 | 1,329,880 | ||||||
| Reynolds Consumer Products, Inc. | 84 | 2,346 | ||||||
| Spectrum Brands Holdings, Inc. | 1,621 | 102,107 | ||||||
| WD-40 Co. | 119 | 22,510 | ||||||
| 3,108,898 | ||||||||
| Independent Power and Renewable Electricity Producers — 0.4% | ||||||||
| AES Corp. | 19,470 | 495,511 | ||||||
| Brookfield Renewable Corp., Class A | 2,666 | 102,348 | ||||||
| Clearway Energy, Inc., Class A | 894 | 30,825 | ||||||
| Clearway Energy, Inc., Class C | 2,406 | 89,263 | ||||||
Montauk Renewables, Inc.(1) | 1,924 | 34,151 | ||||||
| NextEra Energy Partners LP | 854 | 70,105 | ||||||
Ormat Technologies, Inc.(2) | 1,105 | 103,295 | ||||||
Sunnova Energy International, Inc.(1)(2) | 2,345 | 59,141 | ||||||
| Vistra Corp. | 15,545 | 384,739 | ||||||
| 1,369,378 | ||||||||
| Industrial Conglomerates — 0.4% | ||||||||
| 3M Co. | 4,014 | 499,141 | ||||||
| General Electric Co. | 5,710 | 419,342 | ||||||
| Honeywell International, Inc. | 2,180 | 412,783 | ||||||
| 1,331,266 | ||||||||
| Insurance — 3.7% | ||||||||
| Aflac, Inc. | 10,888 | 646,965 | ||||||
Alleghany Corp.(1) | 238 | 200,201 | ||||||
| Allstate Corp. | 5,821 | 701,430 | ||||||
38
| Avantis U.S. Equity Fund | ||||||||
| Shares | Value | |||||||
Ambac Financial Group, Inc.(1) | 1,189 | $ | 17,942 | |||||
| American Equity Investment Life Holding Co. | 1,706 | 64,828 | ||||||
| American Financial Group, Inc. | 1,855 | 236,846 | ||||||
| American International Group, Inc. | 13,662 | 707,008 | ||||||
| AMERISAFE, Inc. | 368 | 17,598 | ||||||
| Aon PLC, Class A | 1,958 | 546,791 | ||||||
Arch Capital Group Ltd.(1) | 7,325 | 334,899 | ||||||
| Argo Group International Holdings Ltd. | 1,368 | 26,854 | ||||||
| Arthur J. Gallagher & Co. | 2,841 | 515,840 | ||||||
| Assurant, Inc. | 894 | 141,690 | ||||||
| Assured Guaranty Ltd. | 1,731 | 88,402 | ||||||
| Axis Capital Holdings Ltd. | 3,241 | 172,259 | ||||||
Brighthouse Financial, Inc.(1) | 2,533 | 120,444 | ||||||
| Brown & Brown, Inc. | 809 | 50,999 | ||||||
| Chubb Ltd. | 4,049 | 765,463 | ||||||
| Cincinnati Financial Corp. | 2,676 | 259,465 | ||||||
| CNA Financial Corp. | 370 | 14,230 | ||||||
| CNO Financial Group, Inc. | 4,157 | 76,530 | ||||||
eHealth, Inc.(1) | 98 | 627 | ||||||
| Employers Holdings, Inc. | 581 | 22,752 | ||||||
Enstar Group Ltd.(1) | 198 | 37,472 | ||||||
| Erie Indemnity Co., Class A | 360 | 77,375 | ||||||
| Everest Re Group Ltd. | 820 | 220,621 | ||||||
| Fidelity National Financial, Inc. | 8,535 | 333,718 | ||||||
| First American Financial Corp. | 3,297 | 176,390 | ||||||
Genworth Financial, Inc., Class A(1) | 11,877 | 50,121 | ||||||
| Globe Life, Inc. | 2,529 | 245,794 | ||||||
Goosehead Insurance, Inc., Class A(1)(2) | 185 | 9,620 | ||||||
| Hanover Insurance Group, Inc. | 1,012 | 130,943 | ||||||
| Hartford Financial Services Group, Inc. | 9,417 | 605,607 | ||||||
HCI Group, Inc.(2) | 212 | 10,131 | ||||||
| Horace Mann Educators Corp. | 1,128 | 40,349 | ||||||
| Investors Title Co. | 48 | 7,073 | ||||||
| James River Group Holdings Ltd. | 743 | 17,654 | ||||||
| Kemper Corp. | 858 | 39,468 | ||||||
| Kinsale Capital Group, Inc. | 435 | 110,307 | ||||||
Lemonade, Inc.(1) | 288 | 6,371 | ||||||
| Lincoln National Corp. | 4,246 | 195,571 | ||||||
| Loews Corp. | 3,290 | 181,970 | ||||||
Markel Corp.(1) | 180 | 214,940 | ||||||
| Marsh & McLennan Cos., Inc. | 1,272 | 205,263 | ||||||
MBIA, Inc.(1) | 105 | 1,238 | ||||||
| Mercury General Corp. | 537 | 17,130 | ||||||
| MetLife, Inc. | 9,882 | 635,709 | ||||||
| National Western Life Group, Inc., Class A | 28 | 5,329 | ||||||
| Old Republic International Corp. | 7,881 | 172,121 | ||||||
Oscar Health, Inc., Class A(1) | 1,266 | 8,394 | ||||||
Palomar Holdings, Inc.(1) | 289 | 22,915 | ||||||
| Primerica, Inc. | 1,378 | 174,662 | ||||||
| Principal Financial Group, Inc. | 5,489 | 410,358 | ||||||
| ProAssurance Corp. | 1,341 | 28,684 | ||||||
39
| Avantis U.S. Equity Fund | ||||||||
| Shares | Value | |||||||
| Progressive Corp. | 6,505 | $ | 797,838 | |||||
| Prudential Financial, Inc. | 4,322 | 413,831 | ||||||
| Reinsurance Group of America, Inc. | 1,668 | 209,100 | ||||||
| RenaissanceRe Holdings Ltd. | 1,214 | 164,206 | ||||||
| RLI Corp. | 548 | 60,148 | ||||||
Ryan Specialty Holdings, Inc.(1) | 489 | 20,714 | ||||||
| Safety Insurance Group, Inc. | 413 | 37,191 | ||||||
| Selective Insurance Group, Inc. | 1,847 | 146,689 | ||||||
SelectQuote, Inc.(1) | 403 | 447 | ||||||
SiriusPoint Ltd.(1) | 1,818 | 8,126 | ||||||
| Stewart Information Services Corp. | 1,125 | 56,970 | ||||||
| Tiptree, Inc. | 1,010 | 12,070 | ||||||
| Travelers Cos., Inc. | 5,883 | 950,928 | ||||||
Trupanion, Inc.(1) | 330 | 23,291 | ||||||
| United Fire Group, Inc. | 765 | 22,514 | ||||||
| Universal Insurance Holdings, Inc. | 781 | 9,325 | ||||||
| Unum Group | 3,934 | 148,902 | ||||||
| White Mountains Insurance Group Ltd. | 86 | 117,820 | ||||||
| Willis Towers Watson PLC | 365 | 75,493 | ||||||
| WR Berkley Corp. | 3,546 | 229,781 | ||||||
| 13,628,745 | ||||||||
| Interactive Media and Services — 3.2% | ||||||||
Alphabet, Inc., Class A(1) | 40,097 | 4,339,297 | ||||||
Alphabet, Inc., Class C(1) | 35,068 | 3,827,672 | ||||||
Bumble, Inc., Class A(1) | 293 | 7,340 | ||||||
Cars.com, Inc.(1) | 3,040 | 38,760 | ||||||
IAC, Inc.(1) | 835 | 53,665 | ||||||
Match Group, Inc.(1) | 1,025 | 57,943 | ||||||
Meta Platforms, Inc., Class A(1) | 18,419 | 3,001,008 | ||||||
Pinterest, Inc., Class A(1) | 2,493 | 57,439 | ||||||
| Shutterstock, Inc. | 649 | 35,961 | ||||||
Snap, Inc., Class A(1) | 3,439 | 37,416 | ||||||
TrueCar, Inc.(1) | 1,846 | 4,024 | ||||||
Twitter, Inc.(1) | 6,222 | 241,103 | ||||||
Yelp, Inc.(1) | 1,410 | 48,180 | ||||||
Ziff Davis, Inc.(1) | 366 | 28,284 | ||||||
ZoomInfo Technologies, Inc.(1) | 847 | 38,471 | ||||||
| 11,816,563 | ||||||||
| Internet and Direct Marketing Retail — 2.1% | ||||||||
1-800-Flowers.com, Inc., Class A(1) | 849 | 7,369 | ||||||
Amazon.com, Inc.(1) | 54,559 | 6,916,444 | ||||||
Chewy, Inc., Class A(1)(2) | 788 | 27,052 | ||||||
ContextLogic, Inc., Class A(1)(2) | 3,664 | 4,763 | ||||||
DoorDash, Inc., Class A(1) | 839 | 50,256 | ||||||
| eBay, Inc. | 3,096 | 136,626 | ||||||
Etsy, Inc.(1) | 1,403 | 148,171 | ||||||
Lands' End, Inc.(1) | 165 | 2,280 | ||||||
Liquidity Services, Inc.(1) | 577 | 10,092 | ||||||
MercadoLibre, Inc.(1) | 280 | 239,501 | ||||||
PetMed Express, Inc.(2) | 282 | 5,801 | ||||||
Revolve Group, Inc.(1)(2) | 188 | 4,416 | ||||||
40
| Avantis U.S. Equity Fund | ||||||||
| Shares | Value | |||||||
Stitch Fix, Inc., Class A(1) | 127 | $ | 638 | |||||
Wayfair, Inc., Class A(1) | 187 | 9,857 | ||||||
| 7,563,266 | ||||||||
| IT Services — 3.2% | ||||||||
| Accenture PLC, Class A | 4,115 | 1,187,013 | ||||||
Akamai Technologies, Inc.(1) | 2,118 | 191,213 | ||||||
| Amdocs Ltd. | 953 | 81,453 | ||||||
| Automatic Data Processing, Inc. | 4,272 | 1,044,120 | ||||||
AvidXchange Holdings, Inc.(1) | 1,423 | 11,085 | ||||||
Block, Inc.(1) | 2,995 | 206,385 | ||||||
BM Technologies, Inc.(1) | 51 | 322 | ||||||
| Broadridge Financial Solutions, Inc., ADR | 933 | 159,702 | ||||||
| Cass Information Systems, Inc. | 420 | 15,406 | ||||||
Cloudflare, Inc., Class A(1) | 747 | 46,740 | ||||||
| Cognizant Technology Solutions Corp., Class A | 6,119 | 386,537 | ||||||
| Concentrix Corp. | 587 | 73,833 | ||||||
| CSG Systems International, Inc. | 812 | 46,974 | ||||||
DXC Technology Co.(1) | 8,968 | 222,227 | ||||||
EPAM Systems, Inc.(1) | 345 | 147,142 | ||||||
Euronet Worldwide, Inc.(1) | 413 | 36,617 | ||||||
| EVERTEC, Inc. | 1,120 | 37,632 | ||||||
Evo Payments, Inc., Class A(1) | 388 | 12,928 | ||||||
ExlService Holdings, Inc.(1) | 336 | 56,351 | ||||||
| Fidelity National Information Services, Inc. | 1,761 | 160,903 | ||||||
Fiserv, Inc.(1) | 1,452 | 146,928 | ||||||
FleetCor Technologies, Inc.(1) | 353 | 75,023 | ||||||
Gartner, Inc.(1) | 1,103 | 314,708 | ||||||
| Genpact Ltd. | 1,411 | 66,289 | ||||||
| Global Payments, Inc. | 532 | 66,090 | ||||||
Globant SA(1) | 350 | 73,769 | ||||||
GoDaddy, Inc., Class A(1) | 2,664 | 201,984 | ||||||
| Hackett Group, Inc. | 243 | 4,989 | ||||||
| International Business Machines Corp. | 4,448 | 571,346 | ||||||
International Money Express, Inc.(1) | 1,660 | 37,184 | ||||||
| Jack Henry & Associates, Inc. | 1,379 | 265,044 | ||||||
Kyndryl Holdings, Inc.(1) | 6,639 | 69,178 | ||||||
| Mastercard, Inc., Class A | 5,747 | 1,864,154 | ||||||
| MAXIMUS, Inc. | 765 | 46,351 | ||||||
MongoDB, Inc.(1) | 196 | 63,281 | ||||||
Okta, Inc.(1) | 363 | 33,178 | ||||||
| Paychex, Inc. | 4,521 | 557,620 | ||||||
Payoneer Global, Inc.(1) | 6,475 | 42,865 | ||||||
PayPal Holdings, Inc.(1) | 4,654 | 434,870 | ||||||
Perficient, Inc.(1) | 80 | 6,248 | ||||||
Sabre Corp.(1) | 2,132 | 15,329 | ||||||
Snowflake, Inc., Class A(1) | 815 | 147,474 | ||||||
| SS&C Technologies Holdings, Inc. | 517 | 28,828 | ||||||
| Switch, Inc., Class A | 1,413 | 47,971 | ||||||
| TTEC Holdings, Inc. | 119 | 6,230 | ||||||
Tucows, Inc., Class A(1)(2) | 51 | 2,396 | ||||||
Twilio, Inc., Class A(1) | 724 | 50,376 | ||||||
41
| Avantis U.S. Equity Fund | ||||||||
| Shares | Value | |||||||
VeriSign, Inc.(1) | 430 | $ | 78,355 | |||||
Verra Mobility Corp.(1) | 2,671 | 42,576 | ||||||
| Visa, Inc., Class A | 10,888 | 2,163,554 | ||||||
| Western Union Co. | 3,196 | 47,365 | ||||||
WEX, Inc.(1) | 80 | 12,340 | ||||||
| 11,708,476 | ||||||||
| Leisure Products — 0.2% | ||||||||
| Acushnet Holdings Corp. | 918 | 43,743 | ||||||
American Outdoor Brands, Inc.(1) | 305 | 2,620 | ||||||
| Brunswick Corp. | 2,281 | 170,413 | ||||||
Callaway Golf Co.(1) | 2,038 | 45,101 | ||||||
Clarus Corp.(2) | 253 | 3,838 | ||||||
| Hasbro, Inc. | 534 | 42,090 | ||||||
Malibu Boats, Inc., Class A(1) | 1,042 | 62,551 | ||||||
MasterCraft Boat Holdings, Inc.(1) | 673 | 16,213 | ||||||
Mattel, Inc.(1) | 2,007 | 44,395 | ||||||
Nautilus, Inc.(1) | 588 | 1,188 | ||||||
Peloton Interactive, Inc., Class A(1)(2) | 878 | 8,947 | ||||||
| Polaris, Inc. | 1,594 | 180,552 | ||||||
| Smith & Wesson Brands, Inc. | 2,127 | 28,289 | ||||||
| Sturm Ruger & Co., Inc. | 1,010 | 52,772 | ||||||
Vista Outdoor, Inc.(1) | 1,946 | 54,721 | ||||||
YETI Holdings, Inc.(1) | 2,166 | 79,904 | ||||||
| 837,337 | ||||||||
| Life Sciences Tools and Services — 1.1% | ||||||||
AbCellera Biologics, Inc.(1) | 2,519 | 26,903 | ||||||
Adaptive Biotechnologies Corp.(1) | 962 | 8,581 | ||||||
| Agilent Technologies, Inc. | 1,724 | 221,103 | ||||||
Avantor, Inc.(1) | 2,394 | 59,635 | ||||||
| Azenta, Inc. | 823 | 43,380 | ||||||
Berkeley Lights, Inc.(1) | 64 | 235 | ||||||
Bio-Rad Laboratories, Inc., Class A(1) | 331 | 160,548 | ||||||
| Bio-Techne Corp. | 204 | 67,689 | ||||||
Bionano Genomics, Inc.(1) | 2,464 | 6,111 | ||||||
| Bruker Corp. | 2,063 | 115,528 | ||||||
Charles River Laboratories International, Inc.(1) | 183 | 37,561 | ||||||
| Danaher Corp. | 2,405 | 649,134 | ||||||
Illumina, Inc.(1) | 539 | 108,684 | ||||||
IQVIA Holdings, Inc.(1) | 1,293 | 274,969 | ||||||
Maravai LifeSciences Holdings, Inc., Class A(1) | 1,771 | 36,961 | ||||||
MaxCyte, Inc.(1)(2) | 1,890 | 9,828 | ||||||
Medpace Holdings, Inc.(1) | 254 | 37,493 | ||||||
Mettler-Toledo International, Inc.(1) | 330 | 400,112 | ||||||
NeoGenomics, Inc.(1) | 2,110 | 21,205 | ||||||
| PerkinElmer, Inc. | 582 | 78,605 | ||||||
Quanterix Corp.(1) | 542 | 5,068 | ||||||
Repligen Corp.(1) | 303 | 66,469 | ||||||
SomaLogic, Inc.(1)(2) | 1,931 | 7,106 | ||||||
Sotera Health Co.(1) | 1,121 | 18,956 | ||||||
Syneos Health, Inc.(1) | 186 | 11,180 | ||||||
| Thermo Fisher Scientific, Inc. | 1,455 | 793,441 | ||||||
42
| Avantis U.S. Equity Fund | ||||||||
| Shares | Value | |||||||
Waters Corp.(1) | 1,124 | $ | 335,626 | |||||
| West Pharmaceutical Services, Inc. | 983 | 291,646 | ||||||
| 3,893,757 | ||||||||
| Machinery — 2.0% | ||||||||
| AGCO Corp. | 1,087 | 118,168 | ||||||
| Alamo Group, Inc. | 139 | 18,176 | ||||||
| Albany International Corp., Class A | 898 | 79,195 | ||||||
| Allison Transmission Holdings, Inc. | 745 | 27,014 | ||||||
| Altra Industrial Motion Corp. | 1,132 | 42,959 | ||||||
| Astec Industries, Inc. | 209 | 7,980 | ||||||
| Barnes Group, Inc. | 798 | 24,778 | ||||||
| Caterpillar, Inc. | 4,867 | 898,984 | ||||||
Chart Industries, Inc.(1) | 355 | 68,820 | ||||||
CIRCOR International, Inc.(1) | 209 | 3,407 | ||||||
| Crane Holdings Co. | 898 | 84,735 | ||||||
| Cummins, Inc. | 2,392 | 515,165 | ||||||
| Deere & Co. | 3,752 | 1,370,418 | ||||||
Desktop Metal, Inc., Class A(1)(2) | 2,197 | 6,986 | ||||||
| Donaldson Co., Inc. | 2,606 | 133,818 | ||||||
| Dover Corp. | 549 | 68,603 | ||||||
Energy Recovery, Inc.(1) | 341 | 7,822 | ||||||
| Enerpac Tool Group Corp. | 189 | 3,667 | ||||||
| Esab Corp. | 1,198 | 49,226 | ||||||
| ESCO Technologies, Inc. | 315 | 25,650 | ||||||
Evoqua Water Technologies Corp.(1) | 1,789 | 62,758 | ||||||
| Federal Signal Corp. | 688 | 27,430 | ||||||
| Flowserve Corp. | 558 | 17,002 | ||||||
| Fortive Corp. | 1,371 | 86,825 | ||||||
| Graco, Inc. | 2,614 | 166,878 | ||||||
| Greenbrier Cos., Inc. | 795 | 22,665 | ||||||
| Helios Technologies, Inc. | 388 | 21,193 | ||||||
| Hillenbrand, Inc. | 929 | 38,711 | ||||||
| Hyster-Yale Materials Handling, Inc. | 139 | 4,049 | ||||||
Ideanomics, Inc.(1)(2) | 1,009 | 598 | ||||||
| IDEX Corp. | 266 | 53,522 | ||||||
| Illinois Tool Works, Inc. | 2,019 | 393,362 | ||||||
| Ingersoll Rand, Inc. | 3,083 | 146,042 | ||||||
| ITT, Inc. | 1,098 | 79,638 | ||||||
| John Bean Technologies Corp. | 284 | 29,326 | ||||||
| Kadant, Inc. | 246 | 44,140 | ||||||
| Kennametal, Inc. | 1,693 | 39,684 | ||||||
| Lincoln Electric Holdings, Inc. | 1,652 | 225,812 | ||||||
| Lindsay Corp. | 224 | 35,921 | ||||||
Manitowoc Co., Inc.(1) | 304 | 2,903 | ||||||
Microvast Holdings, Inc.(1)(2) | 1,335 | 3,284 | ||||||
Middleby Corp.(1) | 205 | 29,483 | ||||||
| Miller Industries, Inc. | 151 | 3,550 | ||||||
| Mueller Industries, Inc. | 2,547 | 160,894 | ||||||
| Mueller Water Products, Inc., Class A | 2,715 | 30,625 | ||||||
Nikola Corp.(1) | 820 | 4,395 | ||||||
NN, Inc.(1) | 691 | 1,479 | ||||||
43
| Avantis U.S. Equity Fund | ||||||||
| Shares | Value | |||||||
| Nordson Corp. | 313 | $ | 71,104 | |||||
| Omega Flex, Inc. | 78 | 7,880 | ||||||
| Oshkosh Corp. | 2,158 | 172,122 | ||||||
| Otis Worldwide Corp. | 1,694 | 122,341 | ||||||
| PACCAR, Inc. | 5,405 | 472,991 | ||||||
| Park-Ohio Holdings Corp. | 125 | 2,074 | ||||||
| Parker-Hannifin Corp. | 321 | 85,065 | ||||||
| Pentair PLC | 444 | 19,758 | ||||||
Proterra, Inc.(1)(2) | 1,940 | 11,718 | ||||||
Proto Labs, Inc.(1) | 403 | 15,475 | ||||||
RBC Bearings, Inc.(1) | 319 | 76,777 | ||||||
| REV Group, Inc. | 628 | 7,235 | ||||||
| Shyft Group, Inc. | 1,440 | 34,488 | ||||||
| Snap-on, Inc. | 977 | 212,849 | ||||||
| SPX Technologies, Inc. | 581 | 33,152 | ||||||
| Standex International Corp. | 289 | 26,128 | ||||||
| Stanley Black & Decker, Inc. | 381 | 33,566 | ||||||
| Tennant Co. | 589 | 35,546 | ||||||
| Terex Corp. | 1,789 | 59,431 | ||||||
| Timken Co. | 1,073 | 67,588 | ||||||
Titan International, Inc.(1) | 2,080 | 29,182 | ||||||
| Toro Co. | 2,572 | 213,296 | ||||||
| Trinity Industries, Inc. | 1,464 | 35,692 | ||||||
| Wabash National Corp. | 397 | 6,531 | ||||||
| Watts Water Technologies, Inc., Class A | 388 | 53,746 | ||||||
| Westinghouse Air Brake Technologies Corp. | 1,175 | 102,989 | ||||||
| Xylem, Inc. | 671 | 61,128 | ||||||
| 7,357,592 | ||||||||
| Marine — 0.1% | ||||||||
| Costamare, Inc. | 2,623 | 29,587 | ||||||
| Eagle Bulk Shipping, Inc. | 484 | 21,025 | ||||||
| Genco Shipping & Trading Ltd. | 1,967 | 26,968 | ||||||
Kirby Corp.(1) | 1,123 | 75,308 | ||||||
| Matson, Inc. | 1,929 | 142,090 | ||||||
| Pangaea Logistics Solutions Ltd. | 2,021 | 10,125 | ||||||
| Safe Bulkers, Inc. | 2,798 | 8,926 | ||||||
| 314,029 | ||||||||
| Media — 0.8% | ||||||||
Altice USA, Inc., Class A(1) | 842 | 8,420 | ||||||
AMC Networks, Inc., Class A(1) | 1,331 | 35,658 | ||||||
Boston Omaha Corp., Class A(1) | 279 | 7,486 | ||||||
| Cable One, Inc. | 143 | 162,305 | ||||||
Charter Communications, Inc., Class A(1) | 680 | 280,588 | ||||||
| Comcast Corp., Class A | 31,078 | 1,124,713 | ||||||
Cumulus Media, Inc., Class A(1) | 504 | 4,697 | ||||||
DISH Network Corp., Class A(1) | 7,941 | 137,776 | ||||||
| Entravision Communications Corp., Class A | 2,377 | 12,075 | ||||||
| Fox Corp., Class A | 5,126 | 175,207 | ||||||
| Fox Corp., Class B | 2,394 | 75,698 | ||||||
| Gray Television, Inc. | 1,992 | 38,047 | ||||||
| Interpublic Group of Cos., Inc. | 3,801 | 105,060 | ||||||
44
| Avantis U.S. Equity Fund | ||||||||
| Shares | Value | |||||||
| John Wiley & Sons, Inc., Class A | 69 | $ | 3,176 | |||||
Liberty Broadband Corp., Class A(1) | 212 | 21,374 | ||||||
Liberty Broadband Corp., Class C(1) | 1,146 | 116,548 | ||||||
Liberty Media Corp.-Liberty SiriusXM, Class A(1) | 173 | 7,186 | ||||||
Liberty Media Corp.-Liberty SiriusXM, Class C(1) | 297 | 12,284 | ||||||
Loyalty Ventures, Inc.(1) | 1 | 2 | ||||||
| New York Times Co., Class A | 3,092 | 94,275 | ||||||
| News Corp., Class A | 4,508 | 76,275 | ||||||
| News Corp., Class B | 1,406 | 24,239 | ||||||
| Nexstar Media Group, Inc., Class A | 400 | 76,528 | ||||||
| Omnicom Group, Inc. | 1,905 | 127,445 | ||||||
Paramount Global, Class B(2) | 7,418 | 173,507 | ||||||
PubMatic, Inc., Class A(1) | 1,125 | 22,016 | ||||||
| Scholastic Corp. | 581 | 26,674 | ||||||
| Sinclair Broadcast Group, Inc., Class A | 563 | 12,437 | ||||||
Sirius XM Holdings, Inc.(2) | 2,311 | 14,074 | ||||||
TechTarget, Inc.(1) | 102 | 6,620 | ||||||
| TEGNA, Inc. | 439 | 9,395 | ||||||
WideOpenWest, Inc.(1) | 2,553 | 45,443 | ||||||
| 3,037,228 | ||||||||
| Metals and Mining — 1.4% | ||||||||
| Alcoa Corp. | 5,866 | 290,250 | ||||||
| Alpha Metallurgical Resources, Inc. | 876 | 137,663 | ||||||
Arconic Corp.(1) | 2,288 | 57,681 | ||||||
| Carpenter Technology Corp. | 1,064 | 36,144 | ||||||
Century Aluminum Co.(1) | 1,342 | 10,360 | ||||||
Cleveland-Cliffs, Inc.(1) | 18,770 | 324,158 | ||||||
Coeur Mining, Inc.(1) | 4,989 | 13,770 | ||||||
| Commercial Metals Co. | 4,284 | 173,545 | ||||||
| Freeport-McMoRan, Inc. | 29,865 | 884,004 | ||||||
| Gold Resource Corp. | 3,735 | 6,350 | ||||||
| Haynes International, Inc. | 157 | 6,231 | ||||||
| Hecla Mining Co. | 11,425 | 45,015 | ||||||
| Kaiser Aluminum Corp. | 498 | 35,736 | ||||||
MP Materials Corp.(1) | 1,504 | 52,625 | ||||||
| Newmont Corp. | 11,500 | 475,640 | ||||||
| Nucor Corp. | 8,009 | 1,064,716 | ||||||
| Olympic Steel, Inc. | 164 | 4,316 | ||||||
| Ramaco Resources, Inc. | 1,527 | 16,095 | ||||||
| Reliance Steel & Aluminum Co. | 985 | 185,160 | ||||||
| Royal Gold, Inc. | 942 | 86,570 | ||||||
| Ryerson Holding Corp. | 1,270 | 36,195 | ||||||
| Schnitzer Steel Industries, Inc., Class A | 1,280 | 42,291 | ||||||
| Steel Dynamics, Inc. | 6,503 | 524,922 | ||||||
| SunCoke Energy, Inc. | 3,751 | 24,719 | ||||||
TimkenSteel Corp.(1) | 2,117 | 32,475 | ||||||
| United States Steel Corp. | 10,901 | 249,306 | ||||||
| Warrior Met Coal, Inc. | 3,057 | 99,505 | ||||||
| Worthington Industries, Inc. | 425 | 21,671 | ||||||
| 4,937,113 | ||||||||
| Multi-Utilities — 1.0% | ||||||||
| Ameren Corp. | 3,397 | 314,630 | ||||||
45
| Avantis U.S. Equity Fund | ||||||||
| Shares | Value | |||||||
| Avista Corp. | 1,948 | $ | 79,147 | |||||
| Black Hills Corp. | 283 | 21,361 | ||||||
| CenterPoint Energy, Inc. | 6,606 | 208,287 | ||||||
| CMS Energy Corp. | 4,530 | 305,956 | ||||||
| Consolidated Edison, Inc. | 5,487 | 536,300 | ||||||
| Dominion Energy, Inc. | 3,716 | 303,969 | ||||||
| DTE Energy Co. | 1,992 | 259,637 | ||||||
| NiSource, Inc. | 8,926 | 263,406 | ||||||
| NorthWestern Corp. | 1,029 | 54,517 | ||||||
| Public Service Enterprise Group, Inc. | 3,563 | 229,315 | ||||||
| Sempra Energy | 4,171 | 688,090 | ||||||
| Unitil Corp. | 565 | 29,431 | ||||||
| WEC Energy Group, Inc. | 2,217 | 228,661 | ||||||
| 3,522,707 | ||||||||
| Multiline Retail — 0.8% | ||||||||
Big Lots, Inc.(2) | 932 | 19,171 | ||||||
| Dillard's, Inc., Class A | 218 | 64,580 | ||||||
| Dollar General Corp. | 2,922 | 693,741 | ||||||
Dollar Tree, Inc.(1) | 4,340 | 588,851 | ||||||
| Kohl's Corp. | 5,840 | 165,973 | ||||||
| Macy's, Inc. | 10,794 | 186,952 | ||||||
Nordstrom, Inc.(2) | 4,513 | 77,218 | ||||||
Ollie's Bargain Outlet Holdings, Inc.(1) | 379 | 20,963 | ||||||
| Target Corp. | 7,921 | 1,270,053 | ||||||
| 3,087,502 | ||||||||
| Oil, Gas and Consumable Fuels — 9.0% | ||||||||
Alto Ingredients, Inc.(1) | 755 | 3,262 | ||||||
| Antero Midstream Corp. | 11,707 | 117,889 | ||||||
Antero Resources Corp.(1) | 9,433 | 378,075 | ||||||
| APA Corp. | 2,072 | 81,036 | ||||||
| Arch Resources, Inc. | 972 | 141,504 | ||||||
Archaea Energy, Inc.(1) | 611 | 12,073 | ||||||
| Berry Corp. | 3,422 | 31,311 | ||||||
| Brigham Minerals, Inc., Class A | 1,200 | 35,700 | ||||||
| California Resources Corp. | 2,483 | 124,051 | ||||||
Callon Petroleum Co.(1) | 3,295 | 140,235 | ||||||
| Cheniere Energy, Inc. | 1,998 | 320,040 | ||||||
Chesapeake Energy Corp.(2) | 4,247 | 426,781 | ||||||
| Chevron Corp. | 19,633 | 3,103,192 | ||||||
| Chord Energy Corp. | 1,858 | 263,000 | ||||||
| Civitas Resources, Inc. | 2,406 | 161,659 | ||||||
Clean Energy Fuels Corp.(1) | 3,357 | 22,559 | ||||||
CNX Resources Corp.(1) | 8,153 | 144,063 | ||||||
Comstock Resources, Inc.(1) | 4,528 | 88,749 | ||||||
| ConocoPhillips | 20,765 | 2,272,729 | ||||||
| CONSOL Energy, Inc. | 1,572 | 112,838 | ||||||
| Continental Resources, Inc. | 2,500 | 174,575 | ||||||
| Coterra Energy, Inc. | 24,180 | 747,404 | ||||||
| Crescent Energy Co., Class A | 1,612 | 27,613 | ||||||
| CVR Energy, Inc. | 1,422 | 46,442 | ||||||
| Delek US Holdings, Inc. | 1,295 | 36,584 | ||||||
46
| Avantis U.S. Equity Fund | ||||||||
| Shares | Value | |||||||
Denbury, Inc.(1) | 1,876 | $ | 166,833 | |||||
| Devon Energy Corp. | 20,493 | 1,447,216 | ||||||
| DHT Holdings, Inc. | 4,534 | 35,410 | ||||||
| Diamondback Energy, Inc. | 6,200 | 826,343 | ||||||
| Dorian LPG Ltd. | 1,894 | 27,558 | ||||||
DTE Midstream LLC(1) | 2,211 | 122,069 | ||||||
Earthstone Energy, Inc., Class A(1) | 3,598 | 54,690 | ||||||
| EnLink Midstream LLC | 8,756 | 88,961 | ||||||
| EOG Resources, Inc. | 13,885 | 1,684,250 | ||||||
| EQT Corp. | 9,743 | 465,715 | ||||||
| Equitrans Midstream Corp. | 18,336 | 169,975 | ||||||
| Evolution Petroleum Corp. | 1,487 | 10,320 | ||||||
| Exxon Mobil Corp. | 45,321 | 4,332,234 | ||||||
Gevo, Inc.(1)(2) | 2,230 | 6,980 | ||||||
Green Plains, Inc.(1) | 925 | 33,883 | ||||||
Hallador Energy Co.(1)(2) | 1,673 | 10,908 | ||||||
| Hess Corp. | 7,723 | 932,784 | ||||||
| Hess Midstream LP, Class A | 276 | 7,813 | ||||||
| HF Sinclair Corp. | 4,254 | 223,888 | ||||||
| HighPeak Energy, Inc. | 808 | 20,458 | ||||||
| International Seaways, Inc. | 1,366 | 40,338 | ||||||
| Kimbell Royalty Partners LP | 2,153 | 38,194 | ||||||
| Kinder Morgan, Inc. | 19,417 | 355,719 | ||||||
Kosmos Energy Ltd.(1) | 24,330 | 172,013 | ||||||
Laredo Petroleum, Inc.(1) | 861 | 66,822 | ||||||
| Magnolia Oil & Gas Corp., Class A | 8,457 | 201,869 | ||||||
| Marathon Oil Corp. | 27,940 | 714,985 | ||||||
| Marathon Petroleum Corp. | 9,780 | 985,335 | ||||||
| Matador Resources Co. | 5,277 | 314,509 | ||||||
| Murphy Oil Corp. | 6,639 | 258,722 | ||||||
New Fortress Energy, Inc.(2) | 738 | 42,324 | ||||||
Nordic American Tankers Ltd.(2) | 8,182 | 21,273 | ||||||
| Northern Oil & Gas, Inc. | 531 | 16,801 | ||||||
| Occidental Petroleum Corp. | 22,369 | 1,588,199 | ||||||
| ONEOK, Inc. | 10,482 | 641,813 | ||||||
| Ovintiv, Inc. | 9,448 | 502,067 | ||||||
PBF Energy, Inc., Class A(1) | 4,544 | 155,223 | ||||||
| PDC Energy, Inc. | 4,658 | 316,325 | ||||||
Peabody Energy Corp.(1) | 3,252 | 80,194 | ||||||
Permian Resources Corp.(1) | 9,713 | 79,938 | ||||||
| Phillips 66 | 12,126 | 1,084,792 | ||||||
| Pioneer Natural Resources Co. | 5,272 | 1,334,976 | ||||||
| Plains GP Holdings LP, Class A | 5,616 | 67,280 | ||||||
Range Resources Corp.(1) | 12,205 | 401,056 | ||||||
| Ranger Oil Corp., Class A | 1,332 | 51,935 | ||||||
REX American Resources Corp.(1) | 564 | 17,089 | ||||||
Ring Energy, Inc.(1) | 4,287 | 13,890 | ||||||
SandRidge Energy, Inc.(1) | 2,068 | 43,387 | ||||||
| Scorpio Tankers, Inc. | 1,387 | 57,699 | ||||||
| SFL Corp. Ltd. | 4,194 | 44,876 | ||||||
SilverBow Resources, Inc.(1)(2) | 1,005 | 39,959 | ||||||
47
| Avantis U.S. Equity Fund | ||||||||
| Shares | Value | |||||||
| SM Energy Co. | 6,183 | $ | 272,485 | |||||
Southwestern Energy Co.(1) | 39,786 | 297,997 | ||||||
Talos Energy, Inc.(1) | 3,477 | 72,078 | ||||||
| Targa Resources Corp. | 7,349 | 501,422 | ||||||
Teekay Tankers Ltd., Class A(1) | 1,161 | 28,561 | ||||||
| Texas Pacific Land Corp. | 196 | 360,730 | ||||||
| VAALCO Energy, Inc. | 2,868 | 14,369 | ||||||
| Valero Energy Corp. | 8,475 | 992,592 | ||||||
| Viper Energy Partners LP | 1,359 | 41,477 | ||||||
| Williams Cos., Inc. | 19,802 | 673,862 | ||||||
| World Fuel Services Corp. | 1,606 | 41,435 | ||||||
| 32,728,262 | ||||||||
| Paper and Forest Products — 0.1% | ||||||||
Clearwater Paper Corp.(1) | 642 | 27,311 | ||||||
| Glatfelter Corp. | 1,507 | 7,339 | ||||||
| Louisiana-Pacific Corp. | 3,453 | 187,256 | ||||||
| Mercer International, Inc. | 2,526 | 40,972 | ||||||
| Sylvamo Corp. | 2,010 | 89,324 | ||||||
| 352,202 | ||||||||
| Personal Products — 0.2% | ||||||||
BellRing Brands, Inc.(1) | 203 | 4,809 | ||||||
Coty, Inc., Class A(1) | 226 | 1,697 | ||||||
| Edgewell Personal Care Co. | 654 | 25,480 | ||||||
elf Beauty, Inc.(1) | 178 | 6,787 | ||||||
| Estee Lauder Cos., Inc., Class A | 1,414 | 359,694 | ||||||
Herbalife Nutrition Ltd.(1) | 446 | 11,636 | ||||||
| Medifast, Inc. | 515 | 64,622 | ||||||
| Nu Skin Enterprises, Inc., Class A | 1,997 | 81,757 | ||||||
USANA Health Sciences, Inc.(1) | 442 | 28,518 | ||||||
Veru, Inc.(1) | 1,115 | 17,060 | ||||||
| 602,060 | ||||||||
| Pharmaceuticals — 4.2% | ||||||||
Amneal Pharmaceuticals, Inc.(1) | 658 | 1,428 | ||||||
Amphastar Pharmaceuticals, Inc.(1) | 912 | 26,995 | ||||||
Amylyx Pharmaceuticals, Inc.(1) | 1,495 | 37,734 | ||||||
Arvinas, Inc.(1) | 1,841 | 77,948 | ||||||
Assertio Holdings, Inc.(1)(2) | 2,974 | 7,584 | ||||||
| AstraZeneca PLC, ADR | 3,301 | 205,916 | ||||||
Atea Pharmaceuticals, Inc.(1) | 3,630 | 27,225 | ||||||
Athira Pharma, Inc.(1) | 865 | 2,924 | ||||||
| Bristol-Myers Squibb Co. | 29,989 | 2,021,558 | ||||||
Cassava Sciences, Inc.(1)(2) | 412 | 10,601 | ||||||
Catalent, Inc.(1) | 1,264 | 111,232 | ||||||
CinCor Pharma, Inc.(1) | 496 | 16,750 | ||||||
| Contra Zogenix, Inc. | 21 | 14 | ||||||
Corcept Therapeutics, Inc.(1) | 3,958 | 102,196 | ||||||
DICE Therapeutics, Inc.(1) | 549 | 8,619 | ||||||
Elanco Animal Health, Inc.(1) | 2,049 | 31,001 | ||||||
| Eli Lilly & Co. | 5,744 | 1,730,265 | ||||||
Endo International PLC(1) | 569 | 61 | ||||||
Harmony Biosciences Holdings, Inc.(1) | 1,234 | 54,185 | ||||||
48
| Avantis U.S. Equity Fund | ||||||||
| Shares | Value | |||||||
Harrow Health, Inc.(1) | 610 | $ | 5,484 | |||||
Innoviva, Inc.(1) | 2,990 | 39,348 | ||||||
Intra-Cellular Therapies, Inc.(1) | 875 | 43,977 | ||||||
Jazz Pharmaceuticals PLC(1) | 639 | 99,186 | ||||||
| Johnson & Johnson | 23,578 | 3,804,074 | ||||||
Lannett Co., Inc.(1)(2) | 110 | 55 | ||||||
| Merck & Co., Inc. | 31,880 | 2,721,277 | ||||||
Nektar Therapeutics(1) | 1,106 | 4,358 | ||||||
NGM Biopharmaceuticals, Inc.(1) | 636 | 8,974 | ||||||
Nuvation Bio, Inc.(1) | 2,146 | 6,009 | ||||||
Ocular Therapeutix, Inc.(1) | 278 | 1,412 | ||||||
| Organon & Co. | 1,514 | 43,194 | ||||||
| Perrigo Co. PLC | 1,973 | 73,830 | ||||||
| Pfizer, Inc. | 58,928 | 2,665,313 | ||||||
| Phibro Animal Health Corp., Class A | 349 | 5,169 | ||||||
Pliant Therapeutics, Inc.(1) | 173 | 3,335 | ||||||
Prestige Consumer Healthcare, Inc.(1) | 1,185 | 59,937 | ||||||
ProPhase Labs, Inc.(2) | 711 | 8,610 | ||||||
Reata Pharmaceuticals, Inc., Class A(1) | 1 | 24 | ||||||
| Royalty Pharma PLC, Class A | 3,276 | 136,970 | ||||||
| SIGA Technologies, Inc. | 2,227 | 33,583 | ||||||
Supernus Pharmaceuticals, Inc.(1) | 1,246 | 42,651 | ||||||
Theravance Biopharma, Inc.(1) | 88 | 793 | ||||||
Ventyx Biosciences, Inc.(1) | 719 | 14,668 | ||||||
| Viatris, Inc. | 27,643 | 263,991 | ||||||
| Zoetis, Inc. | 3,630 | 568,204 | ||||||
| 15,128,662 | ||||||||
| Professional Services — 0.6% | ||||||||
ASGN, Inc.(1) | 367 | 35,489 | ||||||
| Barrett Business Services, Inc. | 192 | 15,483 | ||||||
| Booz Allen Hamilton Holding Corp. | 1,263 | 120,869 | ||||||
CACI International, Inc., Class A(1) | 73 | 20,503 | ||||||
CBIZ, Inc.(1) | 1,427 | 62,303 | ||||||
Clarivate PLC(1) | 5,008 | 58,443 | ||||||
CoStar Group, Inc.(1) | 2,261 | 157,456 | ||||||
| CRA International, Inc. | 224 | 20,476 | ||||||
| Dun & Bradstreet Holdings, Inc. | 380 | 5,415 | ||||||
| Equifax, Inc. | 584 | 110,230 | ||||||
| Exponent, Inc. | 542 | 50,872 | ||||||
First Advantage Corp.(1) | 1,404 | 19,431 | ||||||
Franklin Covey Co.(1) | 585 | 27,828 | ||||||
FTI Consulting, Inc.(1) | 197 | 31,638 | ||||||
| Heidrick & Struggles International, Inc. | 865 | 24,618 | ||||||
| ICF International, Inc. | 43 | 4,367 | ||||||
| Insperity, Inc. | 1,312 | 143,034 | ||||||
| Jacobs Solutions, Inc. | 365 | 45,472 | ||||||
| KBR, Inc. | 1,649 | 79,647 | ||||||
| Kelly Services, Inc., Class A | 1,355 | 21,829 | ||||||
| Kforce, Inc. | 916 | 50,124 | ||||||
| Korn Ferry | 2,010 | 122,449 | ||||||
| Leidos Holdings, Inc. | 263 | 24,998 | ||||||
49
| Avantis U.S. Equity Fund | ||||||||
| Shares | Value | |||||||
| ManpowerGroup, Inc. | 1,108 | $ | 81,239 | |||||
| ManTech International Corp., Class A | 361 | 34,623 | ||||||
| Nielsen Holdings PLC | 1,070 | 29,789 | ||||||
Planet Labs PBC(1) | 2,816 | 15,432 | ||||||
RCM Technologies, Inc.(1) | 304 | 5,308 | ||||||
| Resources Connection, Inc. | 350 | 6,839 | ||||||
| Robert Half International, Inc. | 3,564 | 274,321 | ||||||
| Science Applications International Corp. | 224 | 20,400 | ||||||
| TransUnion | 796 | 58,801 | ||||||
TriNet Group, Inc.(1) | 1,299 | 107,038 | ||||||
TrueBlue, Inc.(1) | 1,245 | 25,572 | ||||||
| Verisk Analytics, Inc. | 840 | 157,214 | ||||||
| 2,069,550 | ||||||||
| Real Estate Management and Development — 0.2% | ||||||||
CBRE Group, Inc., Class A(1) | 3,938 | 310,945 | ||||||
Cushman & Wakefield PLC(1) | 257 | 3,845 | ||||||
| Douglas Elliman, Inc. | 2,917 | 13,447 | ||||||
Forestar Group, Inc.(1) | 454 | 5,648 | ||||||
FRP Holdings, Inc.(1) | 20 | 1,150 | ||||||
Howard Hughes Corp.(1) | 629 | 40,023 | ||||||
Jones Lang LaSalle, Inc.(1) | 937 | 162,101 | ||||||
| Kennedy-Wilson Holdings, Inc. | 3,861 | 67,799 | ||||||
| Marcus & Millichap, Inc. | 1,365 | 51,024 | ||||||
| RE/MAX Holdings, Inc., Class A | 648 | 14,748 | ||||||
| RMR Group, Inc., Class A | 296 | 7,708 | ||||||
| St. Joe Co. | 992 | 37,894 | ||||||
Zillow Group, Inc., Class A(1) | 82 | 2,739 | ||||||
Zillow Group, Inc., Class C(1) | 295 | 9,871 | ||||||
| 728,942 | ||||||||
| Road and Rail — 1.9% | ||||||||
| AMERCO | 273 | 143,508 | ||||||
| ArcBest Corp. | 962 | 77,470 | ||||||
Avis Budget Group, Inc.(1) | 172 | 28,789 | ||||||
| Canadian Pacific Railway Ltd. | 1,071 | 80,175 | ||||||
| Covenant Logistics Group, Inc. | 651 | 18,306 | ||||||
| CSX Corp. | 39,804 | 1,259,797 | ||||||
Daseke, Inc.(1) | 1,443 | 8,745 | ||||||
| Heartland Express, Inc. | 2,232 | 33,815 | ||||||
Hertz Global Holdings, Inc.(1) | 8,237 | 152,055 | ||||||
| J.B. Hunt Transport Services, Inc. | 2,706 | 470,898 | ||||||
| Knight-Swift Transportation Holdings, Inc. | 2,418 | 122,133 | ||||||
| Landstar System, Inc. | 1,247 | 182,848 | ||||||
Lyft, Inc., Class A(1) | 1,303 | 19,193 | ||||||
| Marten Transport Ltd. | 2,708 | 53,645 | ||||||
| Norfolk Southern Corp. | 4,148 | 1,008,503 | ||||||
| Old Dominion Freight Line, Inc. | 2,143 | 581,632 | ||||||
PAM Transportation Services, Inc.(1) | 436 | 12,954 | ||||||
| Ryder System, Inc. | 2,215 | 169,315 | ||||||
Saia, Inc.(1) | 798 | 165,050 | ||||||
| Schneider National, Inc., Class B | 1,675 | 38,290 | ||||||
TuSimple Holdings, Inc., Class A(1) | 2,225 | 15,998 | ||||||
50
| Avantis U.S. Equity Fund | ||||||||
| Shares | Value | |||||||
Uber Technologies, Inc.(1) | 5,594 | $ | 160,883 | |||||
| Union Pacific Corp. | 8,731 | 1,960,197 | ||||||
US Xpress Enterprises, Inc., Class A(1) | 274 | 674 | ||||||
USA Truck, Inc.(1) | 549 | 17,217 | ||||||
| Werner Enterprises, Inc. | 2,188 | 87,060 | ||||||
XPO Logistics, Inc.(1) | 879 | 46,077 | ||||||
| 6,915,227 | ||||||||
| Semiconductors and Semiconductor Equipment — 4.6% | ||||||||
Advanced Micro Devices, Inc.(1) | 9,637 | 817,892 | ||||||
Allegro MicroSystems, Inc.(1) | 1,211 | 28,241 | ||||||
Alpha & Omega Semiconductor Ltd.(1) | 643 | 24,858 | ||||||
| Amkor Technology, Inc. | 3,931 | 79,131 | ||||||
| Analog Devices, Inc. | 2,183 | 330,790 | ||||||
| Applied Materials, Inc. | 11,374 | 1,069,952 | ||||||
Axcelis Technologies, Inc.(1) | 904 | 60,514 | ||||||
| Broadcom, Inc. | 1,893 | 944,815 | ||||||
CEVA, Inc.(1) | 370 | 10,830 | ||||||
Cirrus Logic, Inc.(1) | 1,724 | 132,214 | ||||||
Cohu, Inc.(1) | 1,163 | 31,203 | ||||||
Diodes, Inc.(1) | 1,307 | 93,019 | ||||||
Enphase Energy, Inc.(1) | 1,372 | 392,996 | ||||||
| Entegris, Inc. | 1,443 | 136,912 | ||||||
First Solar, Inc.(1) | 1,628 | 207,651 | ||||||
Formfactor, Inc.(1) | 1,211 | 35,458 | ||||||
GLOBALFOUNDRIES, Inc.(1)(2) | 259 | 15,493 | ||||||
| Intel Corp. | 41,045 | 1,310,157 | ||||||
| KLA Corp. | 2,480 | 853,443 | ||||||
| Kulicke & Soffa Industries, Inc. | 2,255 | 94,800 | ||||||
| Lam Research Corp. | 2,190 | 959,023 | ||||||
Lattice Semiconductor Corp.(1) | 701 | 37,784 | ||||||
MACOM Technology Solutions Holdings, Inc.(1) | 105 | 5,791 | ||||||
MagnaChip Semiconductor Corp.(1) | 601 | 7,032 | ||||||
| Marvell Technology, Inc. | 4,008 | 187,655 | ||||||
MaxLinear, Inc.(1) | 1,244 | 44,697 | ||||||
| Microchip Technology, Inc. | 4,146 | 270,527 | ||||||
| Micron Technology, Inc. | 18,923 | 1,069,717 | ||||||
| MKS Instruments, Inc. | 885 | 88,155 | ||||||
| Monolithic Power Systems, Inc. | 313 | 141,845 | ||||||
| NVIDIA Corp. | 10,245 | 1,546,380 | ||||||
| NXP Semiconductors NV | 2,024 | 333,110 | ||||||
ON Semiconductor Corp.(1) | 9,681 | 665,762 | ||||||
Onto Innovation, Inc.(1) | 510 | 36,205 | ||||||
PDF Solutions, Inc.(1) | 768 | 20,260 | ||||||
Photronics, Inc.(1) | 2,470 | 41,496 | ||||||
| Power Integrations, Inc. | 962 | 68,812 | ||||||
Qorvo, Inc.(1) | 1,536 | 137,902 | ||||||
| QUALCOMM, Inc. | 11,362 | 1,502,852 | ||||||
Rambus, Inc.(1) | 1,432 | 36,931 | ||||||
Semtech Corp.(1) | 543 | 25,081 | ||||||
Silicon Laboratories, Inc.(1) | 54 | 6,768 | ||||||
| Skyworks Solutions, Inc. | 2,106 | 207,546 | ||||||
51
| Avantis U.S. Equity Fund | ||||||||
| Shares | Value | |||||||
SMART Global Holdings, Inc.(1) | 1,098 | $ | 20,148 | |||||
SolarEdge Technologies, Inc.(1) | 522 | 144,056 | ||||||
Synaptics, Inc.(1) | 920 | 106,361 | ||||||
| Teradyne, Inc. | 4,306 | 364,460 | ||||||
| Texas Instruments, Inc. | 10,796 | 1,783,607 | ||||||
Ultra Clean Holdings, Inc.(1) | 942 | 27,572 | ||||||
| Universal Display Corp. | 310 | 34,636 | ||||||
Veeco Instruments, Inc.(1) | 988 | 20,886 | ||||||
Wolfspeed, Inc.(1) | 646 | 73,302 | ||||||
| 16,686,728 | ||||||||
| Software — 5.7% | ||||||||
| A10 Networks, Inc. | 1,937 | 26,924 | ||||||
ACI Worldwide, Inc.(1) | 251 | 5,949 | ||||||
Adobe, Inc.(1) | 2,013 | 751,735 | ||||||
Agilysys, Inc.(1) | 407 | 21,070 | ||||||
| American Software, Inc., Class A | 628 | 10,632 | ||||||
ANSYS, Inc.(1) | 336 | 83,429 | ||||||
Aspen Technology, Inc.(1) | 270 | 56,862 | ||||||
Autodesk, Inc.(1) | 1,532 | 309,066 | ||||||
Avalara, Inc.(1) | 257 | 23,539 | ||||||
| Bentley Systems, Inc., Class B | 1,233 | 45,337 | ||||||
Bill.com Holdings, Inc.(1) | 547 | 88,548 | ||||||
Black Knight, Inc.(1) | 377 | 24,942 | ||||||
Blackbaud, Inc.(1) | 48 | 2,510 | ||||||
Box, Inc., Class A(1) | 1,329 | 34,222 | ||||||
C3.ai, Inc., Class A(1) | 799 | 14,382 | ||||||
Cadence Design Systems, Inc.(1) | 2,267 | 393,937 | ||||||
Ceridian HCM Holding, Inc.(1) | 388 | 23,140 | ||||||
| Citrix Systems, Inc. | 775 | 79,647 | ||||||
CommVault Systems, Inc.(1) | 646 | 35,071 | ||||||
Consensus Cloud Solutions, Inc.(1) | 294 | 14,803 | ||||||
Crowdstrike Holdings, Inc., Class A(1) | 1,352 | 246,889 | ||||||
Datadog, Inc., Class A(1) | 734 | 77,033 | ||||||
Digital Turbine, Inc.(1) | 1,458 | 26,929 | ||||||
DocuSign, Inc.(1) | 1,998 | 116,324 | ||||||
| Dolby Laboratories, Inc., Class A | 512 | 37,499 | ||||||
Dropbox, Inc., Class A(1) | 1,553 | 33,219 | ||||||
Duck Creek Technologies, Inc.(1) | 1,597 | 19,004 | ||||||
Dynatrace, Inc.(1) | 454 | 17,334 | ||||||
Elastic NV(1) | 232 | 19,467 | ||||||
Envestnet, Inc.(1) | 56 | 2,933 | ||||||
Fair Isaac Corp.(1) | 220 | 98,868 | ||||||
Five9, Inc.(1) | 84 | 8,241 | ||||||
Fortinet, Inc.(1) | 8,925 | 434,558 | ||||||
Guidewire Software, Inc.(1) | 731 | 52,420 | ||||||
HubSpot, Inc.(1) | 150 | 50,556 | ||||||
| InterDigital, Inc. | 969 | 48,605 | ||||||
| Intuit, Inc. | 1,093 | 471,936 | ||||||
LiveRamp Holdings, Inc.(1) | 716 | 14,213 | ||||||
Manhattan Associates, Inc.(1) | 966 | 136,457 | ||||||
| Microsoft Corp. | 48,922 | 12,791,635 | ||||||
52
| Avantis U.S. Equity Fund | ||||||||
| Shares | Value | |||||||
MicroStrategy, Inc., Class A(1)(2) | 6 | $ | 1,389 | |||||
NCR Corp.(1) | 943 | 29,280 | ||||||
| NortonLifeLock, Inc. | 2,630 | 59,412 | ||||||
Nutanix, Inc., Class A(1) | 878 | 15,189 | ||||||
OneSpan, Inc.(1) | 120 | 1,381 | ||||||
| Oracle Corp. (New York) | 6,108 | 452,908 | ||||||
Palantir Technologies, Inc., Class A(1) | 6,821 | 52,658 | ||||||
Palo Alto Networks, Inc.(1) | 1,134 | 631,423 | ||||||
Paycom Software, Inc.(1) | 360 | 126,432 | ||||||
Paylocity Holding Corp.(1) | 260 | 62,660 | ||||||
Procore Technologies, Inc.(1) | 234 | 12,776 | ||||||
| Progress Software Corp. | 642 | 30,899 | ||||||
PROS Holdings, Inc.(1) | 347 | 7,235 | ||||||
PTC, Inc.(1) | 165 | 18,957 | ||||||
Qualys, Inc.(1) | 1,191 | 180,913 | ||||||
Rapid7, Inc.(1) | 344 | 19,780 | ||||||
RingCentral, Inc., Class A(1) | 153 | 6,585 | ||||||
Riot Blockchain, Inc.(1)(2) | 1,138 | 8,159 | ||||||
| Roper Technologies, Inc. | 253 | 101,853 | ||||||
Salesforce, Inc.(1) | 3,465 | 540,956 | ||||||
SentinelOne, Inc., Class A(1) | 946 | 25,835 | ||||||
ServiceNow, Inc.(1) | 949 | 412,454 | ||||||
ShotSpotter, Inc.(1) | 335 | 10,931 | ||||||
Splunk, Inc.(1) | 446 | 40,153 | ||||||
SPS Commerce, Inc.(1) | 399 | 48,726 | ||||||
Synopsys, Inc.(1) | 845 | 292,387 | ||||||
Tenable Holdings, Inc.(1) | 482 | 19,092 | ||||||
Teradata Corp.(1) | 2,037 | 67,017 | ||||||
Trade Desk, Inc., Class A(1) | 1,746 | 109,474 | ||||||
Tyler Technologies, Inc.(1) | 156 | 57,956 | ||||||
UiPath, Inc., Class A(1) | 1,377 | 22,652 | ||||||
Unity Software, Inc.(1) | 612 | 26,145 | ||||||
Verint Systems, Inc.(1) | 99 | 4,801 | ||||||
VirnetX Holding Corp.(1) | 637 | 1,300 | ||||||
| VMware, Inc., Class A | 763 | 88,531 | ||||||
Workday, Inc., Class A(1) | 579 | 95,280 | ||||||
| Xperi Holding Corp. | 52 | 827 | ||||||
Zendesk, Inc.(1) | 119 | 9,136 | ||||||
Zoom Video Communications, Inc., Class A(1) | 2,543 | 204,457 | ||||||
Zscaler, Inc.(1) | 240 | 38,218 | ||||||
| 20,686,082 | ||||||||
| Specialty Retail — 2.8% | ||||||||
| Aaron's Co., Inc. | 1,139 | 13,554 | ||||||
Abercrombie & Fitch Co., Class A(1) | 2,006 | 28,866 | ||||||
| Academy Sports & Outdoors, Inc. | 3,368 | 145,093 | ||||||
| Advance Auto Parts, Inc. | 1,730 | 291,747 | ||||||
| American Eagle Outfitters, Inc. | 2,570 | 28,938 | ||||||
| Arko Corp. | 3,379 | 32,202 | ||||||
Asbury Automotive Group, Inc.(1) | 791 | 138,014 | ||||||
AutoNation, Inc.(1) | 1,703 | 212,194 | ||||||
AutoZone, Inc.(1) | 93 | 197,087 | ||||||
53
| Avantis U.S. Equity Fund | ||||||||
| Shares | Value | |||||||
| Bath & Body Works, Inc. | 773 | $ | 28,856 | |||||
Bed Bath & Beyond, Inc.(1)(2) | 1,677 | 15,982 | ||||||
| Best Buy Co., Inc. | 4,874 | 344,543 | ||||||
| Big 5 Sporting Goods Corp. | 321 | 3,929 | ||||||
Boot Barn Holdings, Inc.(1) | 1,085 | 72,283 | ||||||
| Buckle, Inc. | 1,139 | 36,767 | ||||||
| Build-A-Bear Workshop, Inc. | 1,114 | 17,067 | ||||||
Burlington Stores, Inc.(1) | 2,285 | 320,334 | ||||||
| Caleres, Inc. | 2,141 | 54,638 | ||||||
CarMax, Inc.(1) | 1,491 | 131,864 | ||||||
| Cato Corp., Class A | 608 | 6,573 | ||||||
Chico's FAS, Inc.(1) | 7,596 | 43,145 | ||||||
Children's Place, Inc.(1) | 496 | 20,921 | ||||||
Citi Trends, Inc.(1) | 310 | 6,262 | ||||||
Conn's, Inc.(1) | 1,071 | 10,292 | ||||||
Container Store Group, Inc.(1) | 332 | 2,251 | ||||||
| Designer Brands, Inc., Class A | 3,573 | 60,955 | ||||||
Dick's Sporting Goods, Inc.(2) | 2,161 | 229,866 | ||||||
Express, Inc.(1)(2) | 1,177 | 1,789 | ||||||
Five Below, Inc.(1) | 1,398 | 178,776 | ||||||
Floor & Decor Holdings, Inc., Class A(1) | 2,329 | 189,488 | ||||||
| Foot Locker, Inc. | 2,276 | 83,848 | ||||||
GameStop Corp., Class A(1)(2) | 144 | 4,124 | ||||||
| Gap, Inc. | 8,170 | 74,674 | ||||||
Genesco, Inc.(1) | 669 | 37,852 | ||||||
| Group 1 Automotive, Inc. | 719 | 128,406 | ||||||
| Guess?, Inc. | 1,409 | 24,615 | ||||||
| Haverty Furniture Cos., Inc. | 552 | 14,805 | ||||||
| Hibbett, Inc. | 424 | 24,846 | ||||||
| Home Depot, Inc. | 3,832 | 1,105,226 | ||||||
Kirkland's, Inc.(1) | 193 | 787 | ||||||
Leslie's, Inc.(1) | 228 | 3,233 | ||||||
| Lithia Motors, Inc. | 930 | 246,859 | ||||||
LL Flooring Holdings, Inc.(1) | 428 | 3,484 | ||||||
| Lowe's Cos., Inc. | 3,078 | 597,563 | ||||||
MarineMax, Inc.(1) | 860 | 31,252 | ||||||
| Monro, Inc. | 56 | 2,593 | ||||||
| Murphy USA, Inc. | 981 | 284,657 | ||||||
National Vision Holdings, Inc.(1) | 585 | 19,440 | ||||||
O'Reilly Automotive, Inc.(1) | 505 | 352,046 | ||||||
ODP Corp.(1) | 1,904 | 68,068 | ||||||
Party City Holdco, Inc.(1)(2) | 635 | 1,251 | ||||||
| Penske Automotive Group, Inc. | 1,020 | 120,268 | ||||||
| Rent-A-Center, Inc. | 1,267 | 32,739 | ||||||
RH(1) | 456 | 116,695 | ||||||
| Ross Stores, Inc. | 10,202 | 880,127 | ||||||
Sally Beauty Holdings, Inc.(1) | 1,334 | 19,850 | ||||||
| Shoe Carnival, Inc. | 492 | 11,705 | ||||||
| Signet Jewelers Ltd. | 2,014 | 131,655 | ||||||
| Sonic Automotive, Inc., Class A | 922 | 49,041 | ||||||
Sportsman's Warehouse Holdings, Inc.(1) | 796 | 6,336 | ||||||
54
| Avantis U.S. Equity Fund | ||||||||
| Shares | Value | |||||||
| Tilly's, Inc., Class A | 712 | $ | 5,340 | |||||
| TJX Cos., Inc. | 17,584 | 1,096,362 | ||||||
| Tractor Supply Co. | 2,936 | 543,600 | ||||||
TravelCenters of America, Inc.(1) | 734 | 39,695 | ||||||
Ulta Beauty, Inc.(1) | 1,432 | 601,254 | ||||||
Urban Outfitters, Inc.(1) | 1,183 | 23,814 | ||||||
Victoria's Secret & Co.(1) | 3,269 | 109,315 | ||||||
Vroom, Inc.(1) | 638 | 1,040 | ||||||
| Williams-Sonoma, Inc. | 2,325 | 345,844 | ||||||
Zumiez, Inc.(1) | 640 | 16,614 | ||||||
| 10,125,199 | ||||||||
| Technology Hardware, Storage and Peripherals — 4.7% | ||||||||
| Apple, Inc. | 101,906 | 16,021,661 | ||||||
Avid Technology, Inc.(1) | 259 | 7,084 | ||||||
| Dell Technologies, Inc., Class C | 2,087 | 79,911 | ||||||
Diebold Nixdorf, Inc.(1) | 309 | 1,075 | ||||||
Eastman Kodak Co.(1) | 2,017 | 10,912 | ||||||
| Hewlett Packard Enterprise Co. | 10,968 | 149,165 | ||||||
| HP, Inc. | 5,124 | 147,110 | ||||||
| NetApp, Inc. | 2,900 | 209,177 | ||||||
Pure Storage, Inc., Class A(1) | 1,885 | 54,609 | ||||||
| Seagate Technology Holdings PLC | 3,068 | 205,433 | ||||||
Stratasys Ltd.(1) | 65 | 1,122 | ||||||
Super Micro Computer, Inc.(1) | 867 | 56,424 | ||||||
Western Digital Corp.(1) | 4,088 | 172,759 | ||||||
| Xerox Holdings Corp. | 2,848 | 47,334 | ||||||
| 17,163,776 | ||||||||
| Textiles, Apparel and Luxury Goods — 1.0% | ||||||||
Capri Holdings Ltd.(1) | 4,929 | 232,550 | ||||||
| Carter's, Inc. | 1,203 | 88,842 | ||||||
| Columbia Sportswear Co. | 506 | 36,047 | ||||||
Crocs, Inc.(1) | 1,885 | 138,924 | ||||||
Deckers Outdoor Corp.(1) | 786 | 252,754 | ||||||
Fossil Group, Inc.(1) | 764 | 3,232 | ||||||
G-III Apparel Group Ltd.(1) | 1,426 | 30,046 | ||||||
| Hanesbrands, Inc. | 5,462 | 47,574 | ||||||
| Kontoor Brands, Inc. | 1,131 | 42,107 | ||||||
Lakeland Industries, Inc.(1) | 124 | 1,674 | ||||||
| Levi Strauss & Co., Class A | 2,442 | 41,245 | ||||||
lululemon athletica, Inc.(1) | 1,798 | 539,328 | ||||||
| Movado Group, Inc. | 613 | 19,549 | ||||||
| NIKE, Inc., Class B | 11,788 | 1,254,833 | ||||||
| Oxford Industries, Inc. | 701 | 74,818 | ||||||
| PVH Corp. | 2,090 | 117,562 | ||||||
| Ralph Lauren Corp. | 1,442 | 131,698 | ||||||
| Rocky Brands, Inc. | 110 | 2,874 | ||||||
Skechers USA, Inc., Class A(1) | 1,975 | 74,655 | ||||||
| Steven Madden Ltd. | 1,100 | 32,021 | ||||||
| Tapestry, Inc. | 7,898 | 274,298 | ||||||
Under Armour, Inc., Class A(1) | 4,094 | 34,471 | ||||||
Under Armour, Inc., Class C(1) | 4,805 | 36,470 | ||||||
55
| Avantis U.S. Equity Fund | ||||||||
| Shares | Value | |||||||
Unifi, Inc.(1) | 394 | $ | 4,476 | |||||
| VF Corp. | 3,131 | 129,780 | ||||||
| Wolverine World Wide, Inc. | 1,604 | 31,342 | ||||||
| 3,673,170 | ||||||||
| Thrifts and Mortgage Finance — 0.4% | ||||||||
Axos Financial, Inc.(1) | 1,381 | 57,698 | ||||||
Blue Foundry Bancorp(1) | 1,039 | 11,813 | ||||||
Bridgewater Bancshares, Inc.(1) | 809 | 13,899 | ||||||
Columbia Financial, Inc.(1) | 962 | 20,520 | ||||||
| Enact Holdings, Inc. | 915 | 23,241 | ||||||
| Essent Group Ltd. | 3,707 | 148,243 | ||||||
| Federal Agricultural Mortgage Corp., Class C | 285 | 31,133 | ||||||
| Flagstar Bancorp, Inc. | 1,880 | 72,436 | ||||||
| FS Bancorp, Inc. | 140 | 4,159 | ||||||
| Hingham Institution For Savings | 30 | 8,907 | ||||||
| Home Bancorp, Inc. | 231 | 9,018 | ||||||
| Kearny Financial Corp. | 2,765 | 31,410 | ||||||
| Merchants Bancorp | 397 | 10,707 | ||||||
| MGIC Investment Corp. | 10,563 | 150,945 | ||||||
Mr. Cooper Group, Inc.(1) | 2,696 | 114,041 | ||||||
New York Community Bancorp, Inc.(2) | 10,888 | 106,594 | ||||||
NMI Holdings, Inc., Class A(1) | 3,188 | 65,450 | ||||||
| Northfield Bancorp, Inc. | 1,268 | 18,690 | ||||||
| PennyMac Financial Services, Inc. | 1,046 | 55,564 | ||||||
| Provident Financial Services, Inc. | 1,634 | 37,958 | ||||||
| Radian Group, Inc. | 5,792 | 122,269 | ||||||
| Southern Missouri Bancorp, Inc. | 393 | 20,723 | ||||||
| TFS Financial Corp. | 577 | 8,251 | ||||||
| TrustCo Bank Corp. NY | 416 | 13,870 | ||||||
| Walker & Dunlop, Inc. | 1,358 | 136,425 | ||||||
| Waterstone Financial, Inc. | 1,058 | 18,293 | ||||||
| WSFS Financial Corp. | 1,578 | 76,296 | ||||||
| 1,388,553 | ||||||||
| Trading Companies and Distributors — 0.8% | ||||||||
| Air Lease Corp. | 3,834 | 139,404 | ||||||
| Alta Equipment Group, Inc. | 676 | 7,956 | ||||||
| Applied Industrial Technologies, Inc. | 796 | 84,392 | ||||||
BlueLinx Holdings, Inc.(1) | 434 | 30,423 | ||||||
| Boise Cascade Co. | 2,057 | 128,213 | ||||||
| Fastenal Co. | 8,539 | 429,768 | ||||||
| GATX Corp. | 1,504 | 145,301 | ||||||
| Global Industrial Co. | 136 | 4,091 | ||||||
| H&E Equipment Services, Inc. | 1,433 | 45,369 | ||||||
| Herc Holdings, Inc. | 1,057 | 118,944 | ||||||
| McGrath RentCorp | 715 | 60,432 | ||||||
MRC Global, Inc.(1) | 2,832 | 27,555 | ||||||
| MSC Industrial Direct Co., Inc., Class A | 722 | 57,190 | ||||||
NOW, Inc.(1) | 3,177 | 38,505 | ||||||
| Rush Enterprises, Inc., Class A | 1,829 | 86,073 | ||||||
| Rush Enterprises, Inc., Class B | 295 | 14,939 | ||||||
SiteOne Landscape Supply, Inc.(1) | 519 | 64,958 | ||||||
56
| Avantis U.S. Equity Fund | ||||||||
| Shares | Value | |||||||
| Textainer Group Holdings Ltd. | 1,559 | $ | 47,362 | |||||
Titan Machinery, Inc.(1) | 997 | 30,688 | ||||||
| Triton International Ltd. | 2,813 | 167,627 | ||||||
United Rentals, Inc.(1) | 989 | 288,827 | ||||||
Univar Solutions, Inc.(1) | 248 | 6,255 | ||||||
Veritiv Corp.(1) | 747 | 89,035 | ||||||
| W.W. Grainger, Inc. | 1,218 | 675,917 | ||||||
| Watsco, Inc. | 365 | 99,291 | ||||||
WESCO International, Inc.(1) | 504 | 66,367 | ||||||
| 2,954,882 | ||||||||
| Water Utilities — 0.1% | ||||||||
| American States Water Co. | 389 | 32,275 | ||||||
| American Water Works Co., Inc. | 2,135 | 316,941 | ||||||
| California Water Service Group | 1,285 | 75,211 | ||||||
| Essential Utilities, Inc. | 555 | 27,278 | ||||||
| 451,705 | ||||||||
| Wireless Telecommunication Services — 0.4% | ||||||||
Gogo, Inc.(1) | 445 | 6,613 | ||||||
| Shenandoah Telecommunications Co. | 1,063 | 23,694 | ||||||
T-Mobile US, Inc.(1) | 8,415 | 1,211,423 | ||||||
| Telephone and Data Systems, Inc. | 3,403 | 55,367 | ||||||
United States Cellular Corp.(1) | 828 | 23,673 | ||||||
| 1,320,770 | ||||||||
TOTAL COMMON STOCKS (Cost $370,804,029) | 361,352,584 | |||||||
| SHORT-TERM INVESTMENTS — 0.9% | ||||||||
| Money Market Funds — 0.9% | ||||||||
| State Street Institutional U.S. Government Money Market Fund, Premier Class | 1,352,588 | 1,352,588 | ||||||
State Street Navigator Securities Lending Government Money Market Portfolio(3) | 1,757,422 | 1,757,422 | ||||||
TOTAL SHORT-TERM INVESTMENTS (Cost $3,110,010) | 3,110,010 | |||||||
TOTAL INVESTMENT SECURITIES — 100.3% (Cost $373,914,039) | 364,462,594 | |||||||
| OTHER ASSETS AND LIABILITIES — (0.3)% | (984,805) | |||||||
| TOTAL NET ASSETS — 100.0% | $ | 363,477,789 | ||||||
| FUTURES CONTRACTS PURCHASED | |||||||||||||||||
| Reference Entity | Contracts | Expiration Date | Notional Amount | Unrealized Appreciation (Depreciation)^ | |||||||||||||
| S&P 500 E-Mini | 3 | September 2022 | $ | 593,475 | $ | 33,220 | |||||||||||
^Amount represents value and unrealized appreciation (depreciation).
| NOTES TO SCHEDULE OF INVESTMENTS | ||||||||
| ADR | - | American Depositary Receipt | ||||||
(1)Non-income producing.
(2)Security, or a portion thereof, is on loan. At the period end, the aggregate value of securities on loan was $2,505,935. The amount of securities on loan indicated may not correspond with the securities on loan identified because securities with pending sales are in the process of recall from the brokers.
(3)Investment of cash collateral from securities on loan. At the period end, the aggregate value of the collateral held by the fund was $2,559,974, which includes securities collateral of $802,552.
See Notes to Financial Statements.
57
AUGUST 31, 2022
| Avantis U.S. Large Cap Value Fund | ||||||||
| Shares | Value | |||||||
| COMMON STOCKS — 99.7% | ||||||||
Aerospace and Defense† | ||||||||
| BWX Technologies, Inc. | 15 | $ | 782 | |||||
| Air Freight and Logistics — 2.9% | ||||||||
| Expeditors International of Washington, Inc. | 3,844 | 395,509 | ||||||
| FedEx Corp. | 3,552 | 748,797 | ||||||
| United Parcel Service, Inc., Class B | 6,299 | 1,225,219 | ||||||
| 2,369,525 | ||||||||
| Airlines — 0.2% | ||||||||
Alaska Air Group, Inc.(1) | 2,974 | 129,547 | ||||||
| Automobiles — 1.2% | ||||||||
| Ford Motor Co. | 31,030 | 472,897 | ||||||
| General Motors Co. | 11,849 | 452,751 | ||||||
| Harley-Davidson, Inc. | 16 | 617 | ||||||
| 926,265 | ||||||||
| Banks — 4.1% | ||||||||
| Citigroup, Inc. | 92 | 4,490 | ||||||
| East West Bancorp, Inc. | 2,177 | 157,114 | ||||||
| JPMorgan Chase & Co. | 13,981 | 1,590,059 | ||||||
| KeyCorp | 11,463 | 202,780 | ||||||
| Popular, Inc. | 2,082 | 160,772 | ||||||
| Signature Bank | 735 | 128,155 | ||||||
| Synovus Financial Corp. | 2,430 | 97,589 | ||||||
| Wells Fargo & Co. | 18,322 | 800,855 | ||||||
| Western Alliance Bancorp | 2,051 | 157,353 | ||||||
| 3,299,167 | ||||||||
| Beverages — 0.1% | ||||||||
| National Beverage Corp. | 720 | 39,931 | ||||||
| Biotechnology — 4.9% | ||||||||
Biogen, Inc.(1) | 2,754 | 538,076 | ||||||
| Gilead Sciences, Inc. | 16,151 | 1,025,104 | ||||||
Halozyme Therapeutics, Inc.(1) | 24 | 977 | ||||||
Moderna, Inc.(1) | 5,310 | 702,354 | ||||||
Regeneron Pharmaceuticals, Inc.(1) | 1,410 | 819,295 | ||||||
United Therapeutics Corp.(1) | 5 | 1,133 | ||||||
Vertex Pharmaceuticals, Inc.(1) | 3,076 | 866,694 | ||||||
| 3,953,633 | ||||||||
| Building Products — 0.9% | ||||||||
Builders FirstSource, Inc.(1) | 4,201 | 246,221 | ||||||
| Owens Corning | 2,640 | 215,767 | ||||||
Trex Co., Inc.(1) | 1,882 | 88,059 | ||||||
| UFP Industries, Inc. | 1,792 | 142,267 | ||||||
| 692,314 | ||||||||
| Capital Markets — 3.9% | ||||||||
| Ameriprise Financial, Inc. | 1,715 | 459,637 | ||||||
| Blackstone, Inc. | 51 | 4,791 | ||||||
| Carlyle Group, Inc. | 4,012 | 130,510 | ||||||
| Goldman Sachs Group, Inc. | 3,056 | 1,016,640 | ||||||
| Houlihan Lokey, Inc. | 1,072 | 84,152 | ||||||
| Morgan Stanley | 8,438 | 719,086 | ||||||
58
| Avantis U.S. Large Cap Value Fund | ||||||||
| Shares | Value | |||||||
| Raymond James Financial, Inc. | 7 | $ | 731 | |||||
| SEI Investments Co. | 2,522 | 137,953 | ||||||
| Stifel Financial Corp. | 1,697 | 100,649 | ||||||
| T. Rowe Price Group, Inc. | 3,947 | 473,640 | ||||||
| TPG, Inc. | 1,571 | 46,125 | ||||||
| 3,173,914 | ||||||||
| Chemicals — 3.5% | ||||||||
| Celanese Corp. | 1,855 | 205,645 | ||||||
| CF Industries Holdings, Inc. | 5,273 | 545,545 | ||||||
| Chemours Co. | 5,572 | 187,943 | ||||||
| Dow, Inc. | 12,305 | 627,555 | ||||||
| Eastman Chemical Co. | 7 | 637 | ||||||
| Huntsman Corp. | 4,469 | 125,221 | ||||||
| LyondellBasell Industries NV, Class A | 5,255 | 436,165 | ||||||
| Mosaic Co. | 7,684 | 413,937 | ||||||
| Olin Corp. | 3,871 | 211,589 | ||||||
| Westlake Corp. | 809 | 79,792 | ||||||
| 2,834,029 | ||||||||
| Construction Materials — 0.2% | ||||||||
| Eagle Materials, Inc. | 1,130 | 135,171 | ||||||
| Consumer Finance — 1.8% | ||||||||
| Ally Financial, Inc. | 5,282 | 175,362 | ||||||
| Capital One Financial Corp. | 3,828 | 405,079 | ||||||
Credit Acceptance Corp.(1) | 186 | 98,967 | ||||||
| Discover Financial Services | 5,403 | 542,948 | ||||||
| OneMain Holdings, Inc. | 23 | 803 | ||||||
| Synchrony Financial | 7,865 | 257,579 | ||||||
| 1,480,738 | ||||||||
| Containers and Packaging — 0.7% | ||||||||
| International Paper Co. | 6,553 | 272,736 | ||||||
| Packaging Corp. of America | 2,204 | 301,772 | ||||||
| 574,508 | ||||||||
| Diversified Financial Services — 0.5% | ||||||||
| Equitable Holdings, Inc. | 8,665 | 257,784 | ||||||
| Voya Financial, Inc. | 2,720 | 167,361 | ||||||
| 425,145 | ||||||||
| Diversified Telecommunication Services — 3.4% | ||||||||
| AT&T, Inc. | 63,010 | 1,105,195 | ||||||
Iridium Communications, Inc.(1) | 3,657 | 162,334 | ||||||
| Verizon Communications, Inc. | 35,954 | 1,503,237 | ||||||
| 2,770,766 | ||||||||
| Electronic Equipment, Instruments and Components — 1.0% | ||||||||
| Corning, Inc. | 11,334 | 388,983 | ||||||
Flex Ltd.(1) | 11,187 | 199,240 | ||||||
| Jabil, Inc. | 3,670 | 221,301 | ||||||
| 809,524 | ||||||||
| Entertainment — 0.1% | ||||||||
| World Wrestling Entertainment, Inc., Class A | 1,514 | 102,967 | ||||||
| Food and Staples Retailing — 4.6% | ||||||||
| Albertsons Cos., Inc., Class A | 3,640 | 100,136 | ||||||
| Casey's General Stores, Inc. | 1,035 | 221,252 | ||||||
59
| Avantis U.S. Large Cap Value Fund | ||||||||
| Shares | Value | |||||||
| Costco Wholesale Corp. | 3,240 | $ | 1,691,604 | |||||
| Kroger Co. | 13,054 | 625,809 | ||||||
| Walmart, Inc. | 8,135 | 1,078,294 | ||||||
| 3,717,095 | ||||||||
Food Products† | ||||||||
Pilgrim's Pride Corp.(1) | 1,308 | 37,239 | ||||||
| Tyson Foods, Inc., Class A | 16 | 1,206 | ||||||
| 38,445 | ||||||||
| Health Care Equipment and Supplies — 0.4% | ||||||||
Hologic, Inc.(1) | 4,460 | 301,318 | ||||||
QuidelOrtho Corp.(1) | 6 | 475 | ||||||
| 301,793 | ||||||||
| Health Care Providers and Services — 1.6% | ||||||||
AMN Healthcare Services, Inc.(1) | 7 | 718 | ||||||
Centene Corp.(1) | 36 | 3,231 | ||||||
| Humana, Inc. | 1,726 | 831,552 | ||||||
Molina Healthcare, Inc.(1) | 1,286 | 433,858 | ||||||
| 1,269,359 | ||||||||
| Hotels, Restaurants and Leisure — 1.1% | ||||||||
| Boyd Gaming Corp. | 1,657 | 90,191 | ||||||
| Choice Hotels International, Inc. | 724 | 83,050 | ||||||
| Darden Restaurants, Inc. | 2,702 | 334,264 | ||||||
Hilton Grand Vacations, Inc.(1) | 2,060 | 84,007 | ||||||
Hyatt Hotels Corp., Class A(1) | 956 | 85,677 | ||||||
| Texas Roadhouse, Inc. | 1,895 | 168,200 | ||||||
| 845,389 | ||||||||
| Household Durables — 0.9% | ||||||||
NVR, Inc.(1) | 78 | 322,925 | ||||||
| PulteGroup, Inc. | 5,157 | 209,684 | ||||||
| Toll Brothers, Inc. | 8 | 350 | ||||||
| Whirlpool Corp. | 1,411 | 220,962 | ||||||
| 753,921 | ||||||||
| Independent Power and Renewable Electricity Producers — 0.5% | ||||||||
| AES Corp. | 15,506 | 394,628 | ||||||
| Clearway Energy, Inc., Class A | 7 | 241 | ||||||
| Clearway Energy, Inc., Class C | 13 | 482 | ||||||
| Vistra Corp. | 66 | 1,634 | ||||||
| 396,985 | ||||||||
| Insurance — 3.8% | ||||||||
| Allstate Corp. | 28 | 3,374 | ||||||
| American Financial Group, Inc. | 2,122 | 270,937 | ||||||
| American International Group, Inc. | 11,389 | 589,381 | ||||||
| Fidelity National Financial, Inc. | 6,420 | 251,022 | ||||||
| First American Financial Corp. | 2,001 | 107,054 | ||||||
| Hanover Insurance Group, Inc. | 3 | 388 | ||||||
| Hartford Financial Services Group, Inc. | 6,930 | 445,668 | ||||||
| MetLife, Inc. | 6,631 | 426,572 | ||||||
| Old Republic International Corp. | 6,151 | 134,338 | ||||||
| Primerica, Inc. | 1,008 | 127,764 | ||||||
| RenaissanceRe Holdings Ltd. | 3 | 406 | ||||||
| Travelers Cos., Inc. | 4,283 | 692,304 | ||||||
| 3,049,208 | ||||||||
60
| Avantis U.S. Large Cap Value Fund | ||||||||
| Shares | Value | |||||||
| Interactive Media and Services — 4.3% | ||||||||
Alphabet, Inc., Class A(1) | 9,030 | $ | 977,227 | |||||
Alphabet, Inc., Class C(1) | 7,930 | 865,559 | ||||||
Meta Platforms, Inc., Class A(1) | 9,813 | 1,598,832 | ||||||
| 3,441,618 | ||||||||
| Internet and Direct Marketing Retail — 0.5% | ||||||||
| eBay, Inc. | 8,466 | 373,605 | ||||||
| IT Services — 0.2% | ||||||||
DXC Technology Co.(1) | 5,295 | 131,210 | ||||||
| Machinery — 1.5% | ||||||||
| Cummins, Inc. | 2,039 | 439,140 | ||||||
| Deere & Co. | 2,088 | 762,642 | ||||||
| Lincoln Electric Holdings, Inc. | 3 | 410 | ||||||
| 1,202,192 | ||||||||
| Media — 0.1% | ||||||||
DISH Network Corp., Class A(1) | 3,001 | 52,067 | ||||||
| Metals and Mining — 2.7% | ||||||||
| Alcoa Corp. | 2,264 | 112,023 | ||||||
Cleveland-Cliffs, Inc.(1) | 11,624 | 200,746 | ||||||
| Commercial Metals Co. | 2,670 | 108,162 | ||||||
| Freeport-McMoRan, Inc. | 12,312 | 364,435 | ||||||
| Nucor Corp. | 4,765 | 633,459 | ||||||
| Reliance Steel & Aluminum Co. | 1,373 | 258,097 | ||||||
| Steel Dynamics, Inc. | 5,273 | 425,637 | ||||||
| United States Steel Corp. | 4,914 | 112,383 | ||||||
| 2,214,942 | ||||||||
| Multiline Retail — 0.9% | ||||||||
| Dillard's, Inc., Class A | 116 | 34,364 | ||||||
| Kohl's Corp. | 32 | 910 | ||||||
| Macy's, Inc. | 5,216 | 90,341 | ||||||
| Target Corp. | 3,704 | 593,899 | ||||||
| 719,514 | ||||||||
| Oil, Gas and Consumable Fuels — 17.9% | ||||||||
Antero Resources Corp.(1) | 5,677 | 227,534 | ||||||
| APA Corp. | 6,086 | 238,023 | ||||||
| Chesapeake Energy Corp. | 2,749 | 276,247 | ||||||
| Chevron Corp. | 9,955 | 1,573,487 | ||||||
| Chord Energy Corp. | 875 | 123,856 | ||||||
| Civitas Resources, Inc. | 1,169 | 78,545 | ||||||
| ConocoPhillips | 9,905 | 1,084,102 | ||||||
| Continental Resources, Inc. | 1,039 | 72,553 | ||||||
| Coterra Energy, Inc. | 14,033 | 433,760 | ||||||
| Devon Energy Corp. | 8,478 | 598,716 | ||||||
| Diamondback Energy, Inc. | 2,648 | 352,925 | ||||||
| EOG Resources, Inc. | 5,633 | 683,283 | ||||||
| EQT Corp. | 6,481 | 309,792 | ||||||
| Exxon Mobil Corp. | 18,894 | 1,806,078 | ||||||
| Hess Corp. | 3,931 | 474,786 | ||||||
| Hess Midstream LP, Class A | 706 | 19,987 | ||||||
| HF Sinclair Corp. | 3,385 | 178,153 | ||||||
| Magnolia Oil & Gas Corp., Class A | 3,813 | 91,016 | ||||||
61
| Avantis U.S. Large Cap Value Fund | ||||||||
| Shares | Value | |||||||
| Marathon Oil Corp. | 11,812 | $ | 302,269 | |||||
| Marathon Petroleum Corp. | 6,103 | 614,877 | ||||||
| Matador Resources Co. | 2,588 | 154,245 | ||||||
| Murphy Oil Corp. | 3,241 | 126,302 | ||||||
| Occidental Petroleum Corp. | 8,474 | 601,654 | ||||||
| ONEOK, Inc. | 5,758 | 352,562 | ||||||
| Ovintiv, Inc. | 4,994 | 265,381 | ||||||
| PDC Energy, Inc. | 2,204 | 149,674 | ||||||
| Phillips 66 | 5,654 | 505,807 | ||||||
| Pioneer Natural Resources Co. | 2,331 | 590,256 | ||||||
Range Resources Corp.(1) | 6,343 | 208,431 | ||||||
| SM Energy Co. | 2,774 | 122,250 | ||||||
Southwestern Energy Co.(1) | 28,397 | 212,694 | ||||||
| Targa Resources Corp. | 3,544 | 241,807 | ||||||
| Texas Pacific Land Corp. | 125 | 230,058 | ||||||
| Valero Energy Corp. | 5,282 | 618,628 | ||||||
| Williams Cos., Inc. | 14,593 | 496,600 | ||||||
| 14,416,338 | ||||||||
Paper and Forest Products† | ||||||||
| Louisiana-Pacific Corp. | 23 | 1,247 | ||||||
| Pharmaceuticals — 9.1% | ||||||||
| Bristol-Myers Squibb Co. | 19,426 | 1,309,507 | ||||||
Jazz Pharmaceuticals PLC(1) | 1,856 | 288,088 | ||||||
| Johnson & Johnson | 12,108 | 1,953,505 | ||||||
| Merck & Co., Inc. | 19,539 | 1,667,849 | ||||||
| Pfizer, Inc. | 41,907 | 1,895,453 | ||||||
| Viatris, Inc. | 18,825 | 179,779 | ||||||
| 7,294,181 | ||||||||
| Professional Services — 0.3% | ||||||||
| Robert Half International, Inc. | 1,694 | 130,387 | ||||||
TriNet Group, Inc.(1) | 1,045 | 86,108 | ||||||
| 216,495 | ||||||||
| Road and Rail — 5.4% | ||||||||
| AMERCO | 234 | 123,007 | ||||||
| CSX Corp. | 27,048 | 856,069 | ||||||
Hertz Global Holdings, Inc.(1) | 5,242 | 96,767 | ||||||
| J.B. Hunt Transport Services, Inc. | 1,817 | 316,195 | ||||||
| Knight-Swift Transportation Holdings, Inc. | 3,653 | 184,513 | ||||||
| Landstar System, Inc. | 1,067 | 156,454 | ||||||
| Norfolk Southern Corp. | 3,076 | 747,868 | ||||||
| Old Dominion Freight Line, Inc. | 1,752 | 475,510 | ||||||
Saia, Inc.(1) | 662 | 136,922 | ||||||
| Union Pacific Corp. | 5,724 | 1,285,095 | ||||||
| 4,378,400 | ||||||||
| Semiconductors and Semiconductor Equipment — 4.6% | ||||||||
| Amkor Technology, Inc. | 2,703 | 54,411 | ||||||
| Applied Materials, Inc. | 5,567 | 523,688 | ||||||
GLOBALFOUNDRIES, Inc.(1) | 1,040 | 62,213 | ||||||
| Intel Corp. | 151 | 4,820 | ||||||
| KLA Corp. | 10 | 3,441 | ||||||
| Lam Research Corp. | 1,308 | 572,786 | ||||||
62
| Avantis U.S. Large Cap Value Fund | ||||||||
| Shares | Value | |||||||
| Micron Technology, Inc. | 8,090 | $ | 457,328 | |||||
ON Semiconductor Corp.(1) | 7,491 | 515,156 | ||||||
| QUALCOMM, Inc. | 28 | 3,704 | ||||||
| Teradyne, Inc. | 3,096 | 262,045 | ||||||
| Texas Instruments, Inc. | 7,663 | 1,266,004 | ||||||
| 3,725,596 | ||||||||
| Software — 0.2% | ||||||||
Fortinet, Inc.(1) | 25 | 1,217 | ||||||
| Microsoft Corp. | 19 | 4,968 | ||||||
Qualys, Inc.(1) | 937 | 142,331 | ||||||
| 148,516 | ||||||||
| Specialty Retail — 4.7% | ||||||||
AutoNation, Inc.(1) | 1,623 | 202,226 | ||||||
| Best Buy Co., Inc. | 3,448 | 243,739 | ||||||
Burlington Stores, Inc.(1) | 934 | 130,938 | ||||||
| Dick's Sporting Goods, Inc. | 1,286 | 136,792 | ||||||
| Lithia Motors, Inc. | 696 | 184,746 | ||||||
| Murphy USA, Inc. | 776 | 225,172 | ||||||
| Penske Automotive Group, Inc. | 776 | 91,499 | ||||||
RH(1) | 334 | 85,474 | ||||||
| Ross Stores, Inc. | 6,037 | 520,812 | ||||||
| TJX Cos., Inc. | 12,398 | 773,015 | ||||||
| Tractor Supply Co. | 2,256 | 417,698 | ||||||
Ulta Beauty, Inc.(1) | 1,205 | 505,943 | ||||||
| Williams-Sonoma, Inc. | 1,872 | 278,460 | ||||||
| 3,796,514 | ||||||||
| Technology Hardware, Storage and Peripherals — 2.3% | ||||||||
| Apple, Inc. | 12,011 | 1,888,369 | ||||||
| Textiles, Apparel and Luxury Goods — 1.2% | ||||||||
Capri Holdings Ltd.(1) | 2,074 | 97,851 | ||||||
| Levi Strauss & Co., Class A | 1,927 | 32,547 | ||||||
lululemon athletica, Inc.(1) | 1,788 | 536,329 | ||||||
| NIKE, Inc., Class B | 42 | 4,471 | ||||||
| Ralph Lauren Corp. | 997 | 91,056 | ||||||
| Tapestry, Inc. | 6,752 | 234,497 | ||||||
| 996,751 | ||||||||
| Trading Companies and Distributors — 0.5% | ||||||||
| W.W. Grainger, Inc. | 759 | 421,199 | ||||||
| Wireless Telecommunication Services — 1.0% | ||||||||
T-Mobile US, Inc.(1) | 5,637 | 811,503 | ||||||
TOTAL COMMON STOCKS (Cost $84,706,350) | 80,320,378 | |||||||
| SHORT-TERM INVESTMENTS — 0.2% | ||||||||
| Money Market Funds — 0.2% | ||||||||
State Street Institutional U.S. Government Money Market Fund, Premier Class (Cost $176,629) | 176,629 | 176,629 | ||||||
TOTAL INVESTMENT SECURITIES — 99.9% (Cost $84,882,979) | 80,497,007 | |||||||
| OTHER ASSETS AND LIABILITIES — 0.1% | 89,614 | |||||||
| TOTAL NET ASSETS — 100.0% | $ | 80,586,621 | ||||||
63
Avantis U.S. Large Cap Value Fund
| NOTES TO SCHEDULE OF INVESTMENTS | ||||||||
†Category is less than 0.05% of total net assets.
(1)Non-income producing.
See Notes to Financial Statements.
64
AUGUST 31, 2022
| Avantis U.S. Small Cap Value Fund | ||||||||
| Shares | Value | |||||||
| COMMON STOCKS — 99.5% | ||||||||
| Aerospace and Defense — 0.3% | ||||||||
AAR Corp.(1) | 9,381 | $ | 402,257 | |||||
| Moog, Inc., Class A | 8,633 | 647,303 | ||||||
| 1,049,560 | ||||||||
| Air Freight and Logistics — 1.2% | ||||||||
Air Transport Services Group, Inc.(1) | 55,349 | 1,667,665 | ||||||
Atlas Air Worldwide Holdings, Inc.(1) | 22,531 | 2,251,298 | ||||||
Hub Group, Inc., Class A(1) | 8,840 | 705,520 | ||||||
| 4,624,483 | ||||||||
| Airlines — 0.9% | ||||||||
Allegiant Travel Co.(1) | 11,272 | 1,087,748 | ||||||
Hawaiian Holdings, Inc.(1) | 2,903 | 43,516 | ||||||
JetBlue Airways Corp.(1) | 210,569 | 1,640,333 | ||||||
SkyWest, Inc.(1) | 29,145 | 620,497 | ||||||
Wheels Up Experience, Inc.(1) | 63,614 | 118,958 | ||||||
| 3,511,052 | ||||||||
| Auto Components — 1.2% | ||||||||
American Axle & Manufacturing Holdings, Inc.(1) | 76,633 | 793,152 | ||||||
Dorman Products, Inc.(1) | 7,327 | 664,193 | ||||||
Goodyear Tire & Rubber Co.(1) | 165,471 | 2,321,558 | ||||||
| LCI Industries | 6,067 | 702,983 | ||||||
Modine Manufacturing Co.(1) | 38 | 569 | ||||||
Motorcar Parts of America, Inc.(1) | 5,397 | 80,199 | ||||||
Strattec Security Corp.(1) | 45 | 1,229 | ||||||
| 4,563,883 | ||||||||
| Automobiles — 1.2% | ||||||||
| Harley-Davidson, Inc. | 5,633 | 217,265 | ||||||
| Thor Industries, Inc. | 34,957 | 2,831,867 | ||||||
| Winnebago Industries, Inc. | 20,927 | 1,204,977 | ||||||
Workhorse Group, Inc.(1)(2) | 72,304 | 226,311 | ||||||
| 4,480,420 | ||||||||
| Banks — 15.1% | ||||||||
| 1st Source Corp. | 3,078 | 145,251 | ||||||
ACNB Corp.(2) | 923 | 32,822 | ||||||
| Allegiance Bancshares, Inc. | 2,998 | 126,995 | ||||||
| Amalgamated Financial Corp. | 4,591 | 103,298 | ||||||
| Amerant Bancorp, Inc. | 13,742 | 359,903 | ||||||
| American National Bankshares, Inc. | 1,409 | 46,398 | ||||||
| Ameris Bancorp | 29,639 | 1,383,549 | ||||||
| Ames National Corp. | 1,518 | 33,183 | ||||||
| Arrow Financial Corp. | 3,365 | 108,050 | ||||||
| Associated Banc-Corp. | 35,676 | 714,947 | ||||||
| Banc of California, Inc. | 25,830 | 436,010 | ||||||
| BancFirst Corp. | 4,390 | 473,505 | ||||||
Bancorp, Inc.(1) | 12,237 | 290,262 | ||||||
Bank First Corp.(2) | 423 | 34,377 | ||||||
| Bank of Hawaii Corp. | 15,983 | 1,246,994 | ||||||
| Bank OZK | 16,823 | 681,836 | ||||||
| BankFinancial Corp. | 377 | 3,751 | ||||||
65
| Avantis U.S. Small Cap Value Fund | ||||||||
| Shares | Value | |||||||
| BankUnited, Inc. | 37,259 | $ | 1,380,446 | |||||
| Banner Corp. | 17,031 | 1,034,804 | ||||||
| Bar Harbor Bankshares | 2,956 | 83,744 | ||||||
| Baycom Corp. | 1,850 | 34,429 | ||||||
| BCB Bancorp, Inc. | 3,352 | 60,336 | ||||||
| Berkshire Hills Bancorp, Inc. | 2,716 | 76,618 | ||||||
| Brookline Bancorp., Inc. | 37,017 | 461,602 | ||||||
| Business First Bancshares, Inc. | 3,317 | 78,248 | ||||||
| Byline Bancorp, Inc. | 9,248 | 201,699 | ||||||
| C&F Financial Corp. | 431 | 21,011 | ||||||
| Cambridge Bancorp | 1,125 | 92,509 | ||||||
| Camden National Corp. | 3,837 | 173,548 | ||||||
| Capital Bancorp, Inc. | 2,756 | 68,266 | ||||||
| Capital City Bank Group, Inc. | 2,809 | 89,691 | ||||||
| Capstar Financial Holdings, Inc. | 3,560 | 71,734 | ||||||
Carter Bankshares, Inc.(1) | 2,856 | 47,038 | ||||||
| Cathay General Bancorp. | 28,187 | 1,182,163 | ||||||
| CB Financial Services, Inc. | 235 | 5,123 | ||||||
| Central Pacific Financial Corp. | 12,145 | 264,640 | ||||||
| Central Valley Community Bancorp | 2,641 | 47,010 | ||||||
| Chemung Financial Corp. | 842 | 37,949 | ||||||
| City Holding Co. | 6,514 | 553,755 | ||||||
| Civista Bancshares, Inc. | 2,482 | 52,494 | ||||||
| CNB Financial Corp. | 3,804 | 100,121 | ||||||
Coastal Financial Corp.(1) | 250 | 10,050 | ||||||
| Colony Bankcorp, Inc. | 416 | 5,874 | ||||||
| Columbia Banking System, Inc. | 4,417 | 132,289 | ||||||
| Community Financial Corp. | 1,296 | 49,002 | ||||||
| Community Trust Bancorp, Inc. | 5,680 | 239,980 | ||||||
| ConnectOne Bancorp, Inc. | 15,019 | 375,926 | ||||||
CrossFirst Bankshares, Inc.(1) | 10,197 | 134,396 | ||||||
Customers Bancorp, Inc.(1) | 15,789 | 547,720 | ||||||
| Dime Community Bancshares, Inc. | 18,184 | 568,432 | ||||||
| Eagle Bancorp Montana, Inc. | 1,752 | 33,814 | ||||||
| Eagle Bancorp, Inc. | 15,914 | 772,306 | ||||||
| Enterprise Bancorp, Inc. | 1,329 | 42,767 | ||||||
| Enterprise Financial Services Corp. | 11,529 | 527,106 | ||||||
| Equity Bancshares, Inc., Class A | 3,501 | 109,336 | ||||||
| Esquire Financial Holdings, Inc. | 1,574 | 58,836 | ||||||
| Evans Bancorp, Inc. | 1,322 | 50,540 | ||||||
| F.N.B. Corp. | 73,674 | 878,194 | ||||||
| Farmers National Banc Corp. | 6,519 | 93,157 | ||||||
| FB Financial Corp. | 14,797 | 586,257 | ||||||
| Financial Institutions, Inc. | 3,877 | 100,918 | ||||||
| First BanCorp | 105,580 | 1,509,794 | ||||||
| First Bancorp, Inc. | 227 | 6,583 | ||||||
| First Bancorp/Southern Pines NC | 6,690 | 243,583 | ||||||
| First Bancshares, Inc. | 4,395 | 131,411 | ||||||
| First Bank/Hamilton NJ | 4,600 | 68,954 | ||||||
| First Busey Corp. | 22,561 | 518,903 | ||||||
| First Business Financial Services, Inc. | 977 | 32,515 | ||||||
66
| Avantis U.S. Small Cap Value Fund | ||||||||
| Shares | Value | |||||||
| First Commonwealth Financial Corp. | 30,821 | $ | 415,467 | |||||
| First Community Bankshares, Inc. | 2,500 | 78,825 | ||||||
| First Community Corp. | 85 | 1,530 | ||||||
| First Financial Corp. | 4,114 | 191,301 | ||||||
| First Foundation, Inc. | 24,626 | 466,909 | ||||||
| First Guaranty Bancshares, Inc. | 266 | 5,926 | ||||||
| First Internet Bancorp | 3,003 | 110,120 | ||||||
| First Merchants Corp. | 705 | 28,073 | ||||||
| First Mid Bancshares, Inc. | 4,108 | 145,218 | ||||||
| First of Long Island Corp. | 5,675 | 104,477 | ||||||
| First Savings Financial Group, Inc. | 1,383 | 31,560 | ||||||
| First United Corp. | 279 | 4,883 | ||||||
First Western Financial, Inc.(1) | 900 | 23,877 | ||||||
| Flushing Financial Corp. | 12,918 | 266,757 | ||||||
| FNCB Bancorp, Inc. | 206 | 1,629 | ||||||
| Franklin Financial Services Corp. | 146 | 4,669 | ||||||
| Fulton Financial Corp. | 61,870 | 1,004,150 | ||||||
FVCBankcorp, Inc.(1)(2) | 598 | 11,517 | ||||||
| Great Southern Bancorp, Inc. | 4,818 | 283,202 | ||||||
| Hancock Whitney Corp. | 35,648 | 1,719,303 | ||||||
| Hanmi Financial Corp. | 18,029 | 445,677 | ||||||
| HarborOne Bancorp, Inc. | 11,000 | 150,040 | ||||||
| Hawthorn Bancshares, Inc. | 792 | 18,937 | ||||||
| HBT Financial, Inc. | 2,201 | 39,794 | ||||||
| Heartland Financial USA, Inc. | 14,573 | 650,976 | ||||||
| Hilltop Holdings, Inc. | 23,313 | 615,463 | ||||||
| HomeStreet, Inc. | 8,098 | 281,891 | ||||||
| HomeTrust Bancshares, Inc. | 2,923 | 67,872 | ||||||
| Hope Bancorp, Inc. | 61,353 | 887,778 | ||||||
| Horizon Bancorp, Inc. | 13,036 | 246,641 | ||||||
| Independent Bank Corp. (Michigan) | 5,710 | 117,169 | ||||||
| International Bancshares Corp. | 21,985 | 917,434 | ||||||
| Investar Holding Corp. | 2,251 | 48,622 | ||||||
| Lakeland Bancorp, Inc. | 18,210 | 296,641 | ||||||
| Lakeland Financial Corp. | 3,035 | 228,657 | ||||||
| Landmark Bancorp, Inc. | 195 | 4,978 | ||||||
| LCNB Corp. | 1,807 | 28,840 | ||||||
| Limestone Bancorp, Inc. | 58 | 1,123 | ||||||
| Live Oak Bancshares, Inc. | 8,775 | 318,006 | ||||||
| Macatawa Bank Corp. | 7,793 | 74,189 | ||||||
| Mercantile Bank Corp. | 3,782 | 125,109 | ||||||
| Meridian Corp. | 1,533 | 46,481 | ||||||
| Metrocity Bankshares, Inc. | 3,750 | 74,963 | ||||||
Metropolitan Bank Holding Corp.(1) | 3,568 | 255,433 | ||||||
| Mid Penn Bancorp, Inc. | 1,366 | 39,737 | ||||||
| Midland States Bancorp, Inc. | 7,780 | 195,200 | ||||||
| MidWestOne Financial Group, Inc. | 3,723 | 113,552 | ||||||
| MVB Financial Corp. | 2,840 | 90,823 | ||||||
| National Bank Holdings Corp., Class A | 8,652 | 347,205 | ||||||
| National Bankshares, Inc. | 300 | 10,095 | ||||||
| NBT Bancorp, Inc. | 20,589 | 798,441 | ||||||
67
| Avantis U.S. Small Cap Value Fund | ||||||||
| Shares | Value | |||||||
| Northeast Bank | 1,928 | $ | 74,749 | |||||
| Northrim BanCorp, Inc. | 1,797 | 72,868 | ||||||
| Oak Valley Bancorp | 775 | 14,020 | ||||||
| OceanFirst Financial Corp. | 14,614 | 284,096 | ||||||
| OFG Bancorp | 29,609 | 805,365 | ||||||
| Old National Bancorp. | 1 | 17 | ||||||
| Old Second Bancorp, Inc. | 13,543 | 185,810 | ||||||
| Origin Bancorp, Inc. | 8,492 | 346,898 | ||||||
| Orrstown Financial Services, Inc. | 2,704 | 69,574 | ||||||
| Pacific Premier Bancorp, Inc. | 32,869 | 1,076,788 | ||||||
| PacWest Bancorp | 48,422 | 1,274,951 | ||||||
| Park National Corp. | 4,634 | 610,900 | ||||||
| Parke Bancorp, Inc. | 2,104 | 46,667 | ||||||
| Pathward Financial, Inc. | 10,015 | 330,094 | ||||||
| PCB Bancorp. | 1,436 | 26,968 | ||||||
| Peapack-Gladstone Financial Corp. | 4,207 | 141,650 | ||||||
| Peoples Bancorp of North Carolina, Inc. | 588 | 15,288 | ||||||
| Peoples Bancorp, Inc. | 5,085 | 151,991 | ||||||
| Plumas Bancorp | 642 | 19,119 | ||||||
| Popular, Inc. | 16,729 | 1,291,813 | ||||||
| Preferred Bank | 6,211 | 421,354 | ||||||
| Premier Financial Corp. | 12,362 | 334,021 | ||||||
| Primis Financial Corp. | 5,304 | 69,535 | ||||||
| QCR Holdings, Inc. | 9,206 | 514,155 | ||||||
| RBB Bancorp | 3,757 | 83,030 | ||||||
| Red River Bancshares, Inc. | 185 | 9,455 | ||||||
| Republic Bancorp, Inc., Class A | 3,166 | 134,555 | ||||||
Republic First Bancorp, Inc.(1) | 3,815 | 12,132 | ||||||
| Riverview Bancorp, Inc. | 2,994 | 21,108 | ||||||
| Salisbury Bancorp, Inc. | 62 | 1,466 | ||||||
| Sandy Spring Bancorp, Inc. | 21,346 | 822,248 | ||||||
| SB Financial Group, Inc. | 134 | 2,329 | ||||||
| ServisFirst Bancshares, Inc. | 7,912 | 667,456 | ||||||
| Shore Bancshares, Inc. | 1,205 | 22,955 | ||||||
| Sierra Bancorp | 3,475 | 72,002 | ||||||
| Simmons First National Corp., Class A | 25,507 | 601,710 | ||||||
| SmartFinancial, Inc. | 2,267 | 56,879 | ||||||
| South Plains Financial, Inc. | 2,649 | 71,867 | ||||||
Southern First Bancshares, Inc.(1) | 1,448 | 62,423 | ||||||
| Southside Bancshares, Inc. | 8,927 | 336,369 | ||||||
| SouthState Corp. | 840 | 65,554 | ||||||
| Stock Yards Bancorp, Inc. | 18 | 1,193 | ||||||
| Summit Financial Group, Inc. | 1,425 | 40,641 | ||||||
| Synovus Financial Corp. | 16,965 | 681,314 | ||||||
Texas Capital Bancshares, Inc.(1) | 19,250 | 1,136,328 | ||||||
| Tompkins Financial Corp. | 3,663 | 262,417 | ||||||
| Towne Bank | 26,674 | 759,942 | ||||||
| Trico Bancshares | 13,380 | 631,402 | ||||||
Triumph Bancorp, Inc.(1) | 9,789 | 606,037 | ||||||
| Trustmark Corp. | 18,782 | 592,384 | ||||||
| UMB Financial Corp. | 15,557 | 1,391,885 | ||||||
68
| Avantis U.S. Small Cap Value Fund | ||||||||
| Shares | Value | |||||||
| Umpqua Holdings Corp. | 111,265 | $ | 1,973,841 | |||||
| Union Bankshares, Inc. | 156 | 3,978 | ||||||
| United Community Banks, Inc. | 276 | 9,254 | ||||||
| United Security Bancshares | 700 | 4,970 | ||||||
| Unity Bancorp, Inc. | 1,160 | 32,515 | ||||||
| Univest Financial Corp. | 10,161 | 251,993 | ||||||
| Valley National Bancorp | 98,198 | 1,141,061 | ||||||
| Washington Federal, Inc. | 31,340 | 1,003,193 | ||||||
| Washington Trust Bancorp, Inc. | 6,452 | 326,665 | ||||||
| West BanCorp, Inc. | 3,824 | 94,109 | ||||||
| Wintrust Financial Corp. | 14,575 | 1,229,256 | ||||||
| 56,102,519 | ||||||||
| Beverages — 0.3% | ||||||||
| Coca-Cola Consolidated, Inc. | 2,476 | 1,174,441 | ||||||
| Biotechnology — 1.8% | ||||||||
Alector, Inc.(1) | 23,084 | 238,919 | ||||||
Catalyst Pharmaceuticals, Inc.(1) | 71,471 | 967,717 | ||||||
Dynavax Technologies Corp.(1)(2) | 67,405 | 773,135 | ||||||
Emergent BioSolutions, Inc.(1) | 26,140 | 627,883 | ||||||
Ironwood Pharmaceuticals, Inc.(1) | 97,746 | 1,051,747 | ||||||
iTeos Therapeutics, Inc.(1) | 16,121 | 357,564 | ||||||
Ligand Pharmaceuticals, Inc.(1) | 838 | 77,423 | ||||||
Organogenesis Holdings, Inc.(1) | 4,707 | 16,898 | ||||||
Ovid therapeutics, Inc.(1)(2) | 2,634 | 5,294 | ||||||
REGENXBIO, Inc.(1) | 26,570 | 783,815 | ||||||
Tango Therapeutics, Inc.(1) | 1,587 | 6,507 | ||||||
uniQure NV(1) | 3,474 | 67,882 | ||||||
Vir Biotechnology, Inc.(1) | 65,549 | 1,556,789 | ||||||
XOMA Corp.(1) | 1,119 | 22,246 | ||||||
| 6,553,819 | ||||||||
| Building Products — 0.6% | ||||||||
| Apogee Enterprises, Inc. | 13,170 | 537,863 | ||||||
| Insteel Industries, Inc. | 10,532 | 304,375 | ||||||
Masonite International Corp.(1) | 12,185 | 996,976 | ||||||
| Quanex Building Products Corp. | 14,314 | 319,202 | ||||||
| 2,158,416 | ||||||||
| Capital Markets — 2.1% | ||||||||
| B. Riley Financial, Inc. | 3,858 | 192,013 | ||||||
| Cowen, Inc., Class A | 13,043 | 501,503 | ||||||
| Diamond Hill Investment Group, Inc. | 855 | 146,248 | ||||||
| Evercore, Inc., Class A | 17,095 | 1,601,631 | ||||||
| GAMCO Investors, Inc., Class A | 544 | 11,005 | ||||||
| Hennessy Advisors, Inc. | 490 | 4,871 | ||||||
| Janus Henderson Group PLC | 58,255 | 1,363,167 | ||||||
| Manning & Napier, Inc. | 5,060 | 64,414 | ||||||
| Moelis & Co., Class A | 11,811 | 492,046 | ||||||
| Oppenheimer Holdings, Inc., Class A | 2,286 | 82,982 | ||||||
| Piper Sandler Cos. | 8,874 | 1,016,694 | ||||||
| Stifel Financial Corp. | 16,908 | 1,002,813 | ||||||
StoneX Group, Inc.(1) | 9,623 | 893,399 | ||||||
| Virtus Investment Partners, Inc. | 2,381 | 455,366 | ||||||
| 7,828,152 | ||||||||
69
| Avantis U.S. Small Cap Value Fund | ||||||||
| Shares | Value | |||||||
| Chemicals — 2.8% | ||||||||
| AdvanSix, Inc. | 20,486 | $ | 742,822 | |||||
| American Vanguard Corp. | 24,323 | 484,757 | ||||||
| Cabot Corp. | 38,614 | 2,779,050 | ||||||
| Chemours Co. | 85,000 | 2,867,050 | ||||||
| Hawkins, Inc. | 5,041 | 193,171 | ||||||
Intrepid Potash, Inc.(1) | 6,770 | 316,362 | ||||||
| Kronos Worldwide, Inc. | 15,640 | 201,443 | ||||||
LSB Industries, Inc.(1) | 21,847 | 344,746 | ||||||
| Orion Engineered Carbons SA | 21,130 | 356,252 | ||||||
Rayonier Advanced Materials, Inc.(1) | 27,861 | 125,932 | ||||||
| Stepan Co. | 385 | 40,128 | ||||||
| Tredegar Corp. | 9,795 | 100,007 | ||||||
| Trinseo PLC | 18,011 | 477,832 | ||||||
| Tronox Holdings PLC, Class A | 87,905 | 1,286,050 | ||||||
| Valhi, Inc. | 1,270 | 44,374 | ||||||
| 10,359,976 | ||||||||
| Commercial Services and Supplies — 0.2% | ||||||||
Civeo Corp.(1) | 5,607 | 166,304 | ||||||
| Ennis, Inc. | 4,672 | 99,186 | ||||||
Heritage-Crystal Clean, Inc.(1) | 8,227 | 267,953 | ||||||
| Interface, Inc. | 23,294 | 260,194 | ||||||
Quad/Graphics, Inc.(1) | 8,561 | 27,053 | ||||||
Team, Inc.(1) | 9 | 12 | ||||||
| 820,702 | ||||||||
| Communications Equipment — 0.5% | ||||||||
ViaSat, Inc.(1) | 46,759 | 1,775,907 | ||||||
| Construction and Engineering — 0.4% | ||||||||
Dycom Industries, Inc.(1) | 2,742 | 307,433 | ||||||
Great Lakes Dredge & Dock Corp.(1) | 12,115 | 115,940 | ||||||
MYR Group, Inc.(1) | 10,584 | 983,677 | ||||||
Northwest Pipe Co.(1) | 1,947 | 61,642 | ||||||
| Primoris Services Corp. | 1,340 | 27,162 | ||||||
Tutor Perini Corp.(1) | 18,365 | 124,515 | ||||||
| 1,620,369 | ||||||||
| Construction Materials — 0.1% | ||||||||
| Eagle Materials, Inc. | 3,974 | 475,370 | ||||||
| United States Lime & Minerals, Inc. | 69 | 7,092 | ||||||
| 482,462 | ||||||||
| Consumer Finance — 2.2% | ||||||||
Atlanticus Holdings Corp.(1) | 2,510 | 71,460 | ||||||
| Bread Financial Holdings, Inc. | 38,093 | 1,463,914 | ||||||
Consumer Portfolio Services, Inc.(1) | 6,386 | 74,333 | ||||||
Encore Capital Group, Inc.(1) | 12,475 | 682,133 | ||||||
EZCORP, Inc., Class A(1) | 8,933 | 78,164 | ||||||
Green Dot Corp., Class A(1) | 19,310 | 391,800 | ||||||
LendingClub Corp.(1) | 14,829 | 193,815 | ||||||
| Navient Corp. | 76,801 | 1,181,967 | ||||||
| Nelnet, Inc., Class A | 4,308 | 362,906 | ||||||
| OneMain Holdings, Inc. | 14,192 | 495,727 | ||||||
Oportun Financial Corp.(1) | 5,021 | 25,657 | ||||||
70
| Avantis U.S. Small Cap Value Fund | ||||||||
| Shares | Value | |||||||
PRA Group, Inc.(1) | 15,335 | $ | 566,475 | |||||
PROG Holdings, Inc.(1) | 10,698 | 198,341 | ||||||
| Regional Management Corp. | 2,426 | 81,732 | ||||||
| SLM Corp. | 126,000 | 1,925,280 | ||||||
World Acceptance Corp.(1) | 1,826 | 212,254 | ||||||
| 8,005,958 | ||||||||
Distributors† | ||||||||
Funko, Inc., Class A(1) | 17 | 379 | ||||||
| Diversified Consumer Services — 1.0% | ||||||||
Adtalem Global Education, Inc.(1) | 37,160 | 1,400,560 | ||||||
Grand Canyon Education, Inc.(1) | 17,498 | 1,423,987 | ||||||
| Laureate Education, Inc., Class A | 132 | 1,455 | ||||||
Perdoceo Education Corp.(1) | 49,829 | 577,020 | ||||||
Universal Technical Institute, Inc.(1) | 25,324 | 173,723 | ||||||
| 3,576,745 | ||||||||
| Diversified Financial Services — 0.5% | ||||||||
| Alerus Financial Corp. | 2,974 | 70,662 | ||||||
| Jackson Financial, Inc., Class A | 51,405 | 1,606,920 | ||||||
| 1,677,582 | ||||||||
| Diversified Telecommunication Services — 0.7% | ||||||||
| ATN International, Inc. | 6,433 | 301,386 | ||||||
EchoStar Corp., Class A(1) | 23,130 | 425,823 | ||||||
Iridium Communications, Inc.(1) | 41,945 | 1,861,939 | ||||||
| 2,589,148 | ||||||||
| Electrical Equipment — 1.1% | ||||||||
Atkore, Inc.(1) | 27,592 | 2,329,041 | ||||||
| Encore Wire Corp. | 13,062 | 1,699,366 | ||||||
| Preformed Line Products Co. | 32 | 2,489 | ||||||
| 4,030,896 | ||||||||
| Electronic Equipment, Instruments and Components — 1.6% | ||||||||
| Bel Fuse, Inc., Class B | 746 | 21,201 | ||||||
| CTS Corp. | 9,571 | 405,045 | ||||||
Daktronics, Inc.(1) | 6,059 | 19,389 | ||||||
Kimball Electronics, Inc.(1) | 4,447 | 95,788 | ||||||
Plexus Corp.(1) | 2 | 187 | ||||||
Sanmina Corp.(1) | 47,827 | 2,320,566 | ||||||
ScanSource, Inc.(1) | 3,964 | 114,837 | ||||||
TTM Technologies, Inc.(1) | 62,174 | 977,997 | ||||||
| Vishay Intertechnology, Inc. | 96,638 | 1,900,870 | ||||||
| 5,855,880 | ||||||||
| Energy Equipment and Services — 2.4% | ||||||||
| Archrock, Inc. | 112,363 | 830,363 | ||||||
Bristow Group, Inc.(1) | 12,875 | 373,504 | ||||||
Dril-Quip, Inc.(1) | 22,235 | 492,060 | ||||||
Exterran Corp.(1) | 14,245 | 69,943 | ||||||
| Helmerich & Payne, Inc. | 25,283 | 1,080,848 | ||||||
Nabors Industries Ltd.(1) | 6,518 | 863,700 | ||||||
National Energy Services Reunited Corp.(1) | 15,545 | 109,126 | ||||||
Natural Gas Services Group, Inc.(1) | 3,161 | 35,182 | ||||||
Newpark Resources, Inc.(1) | 37,589 | 108,256 | ||||||
Oceaneering International, Inc.(1) | 63,288 | 560,099 | ||||||
71
| Avantis U.S. Small Cap Value Fund | ||||||||
| Shares | Value | |||||||
Oil States International, Inc.(1) | 6,690 | $ | 32,781 | |||||
ProPetro Holding Corp.(1) | 58,748 | 538,132 | ||||||
Select Energy Services, Inc., Class A(1) | 2,624 | 18,657 | ||||||
TechnipFMC PLC(1) | 104,408 | 854,057 | ||||||
TETRA Technologies Inc(1) | 32,370 | 128,833 | ||||||
Transocean Ltd.(1) | 206,443 | 747,324 | ||||||
US Silica Holdings, Inc.(1) | 51,337 | 720,258 | ||||||
Valaris Ltd.(1) | 1,537 | 78,356 | ||||||
Weatherford International PLC(1) | 38,393 | 1,080,379 | ||||||
| 8,721,858 | ||||||||
| Food and Staples Retailing — 1.9% | ||||||||
| Andersons, Inc. | 8 | 296 | ||||||
HF Foods Group, Inc.(1) | 1,687 | 8,587 | ||||||
| Ingles Markets, Inc., Class A | 12,928 | 1,131,588 | ||||||
| Natural Grocers by Vitamin Cottage, Inc. | 4,681 | 67,219 | ||||||
| PriceSmart, Inc. | 385 | 24,359 | ||||||
| SpartanNash Co. | 30,562 | 930,002 | ||||||
Sprouts Farmers Market, Inc.(1) | 65,893 | 1,904,308 | ||||||
United Natural Foods, Inc.(1) | 41,532 | 1,830,730 | ||||||
| Village Super Market, Inc., Class A | 2,044 | 44,927 | ||||||
| Weis Markets, Inc. | 13,414 | 1,042,402 | ||||||
| 6,984,418 | ||||||||
| Food Products — 0.2% | ||||||||
| Fresh Del Monte Produce, Inc. | 16,780 | 458,765 | ||||||
Pilgrim's Pride Corp.(1) | 5 | 142 | ||||||
Seneca Foods Corp., Class A(1) | 2,432 | 128,483 | ||||||
| 587,390 | ||||||||
| Health Care Equipment and Supplies — 0.6% | ||||||||
Co-Diagnostics, Inc.(1)(2) | 13,905 | 46,999 | ||||||
FONAR Corp.(1) | 475 | 6,698 | ||||||
Meridian Bioscience, Inc.(1) | 21,524 | 701,467 | ||||||
QuidelOrtho Corp.(1) | 19,548 | 1,549,374 | ||||||
| Utah Medical Products, Inc. | 574 | 52,751 | ||||||
| 2,357,289 | ||||||||
| Health Care Providers and Services — 0.7% | ||||||||
| Ensign Group, Inc. | 2,000 | 170,600 | ||||||
Fulgent Genetics, Inc.(1) | 14,748 | 641,096 | ||||||
| National Healthcare Corp. | 502 | 34,864 | ||||||
| Patterson Cos., Inc. | 15,682 | 437,371 | ||||||
| Premier, Inc., Class A | 32,085 | 1,130,675 | ||||||
| 2,414,606 | ||||||||
| Health Care Technology — 0.3% | ||||||||
Allscripts Healthcare Solutions, Inc.(1) | 61,145 | 1,039,465 | ||||||
| Hotels, Restaurants and Leisure — 1.1% | ||||||||
BJ's Restaurants, Inc.(1) | 11,392 | 285,711 | ||||||
Carrols Restaurant Group, Inc.(1) | 3,216 | 7,075 | ||||||
Century Casinos, Inc.(1) | 7,973 | 58,761 | ||||||
Cheesecake Factory, Inc.(2) | 31,204 | 955,467 | ||||||
Chuy's Holdings, Inc.(1) | 12,506 | 279,259 | ||||||
| Cracker Barrel Old Country Store, Inc. | 11,748 | 1,268,079 | ||||||
Monarch Casino & Resort, Inc.(1) | 8,431 | 509,148 | ||||||
72
| Avantis U.S. Small Cap Value Fund | ||||||||
| Shares | Value | |||||||
ONE Group Hospitality, Inc.(1) | 10,666 | $ | 76,155 | |||||
Playa Hotels & Resorts NV(1) | 9,018 | 59,158 | ||||||
| RCI Hospitality Holdings, Inc. | 4,212 | 274,665 | ||||||
Red Robin Gourmet Burgers, Inc.(1) | 4,768 | 35,426 | ||||||
Target Hospitality Corp.(1)(2) | 7,103 | 94,399 | ||||||
| 3,903,303 | ||||||||
| Household Durables — 1.5% | ||||||||
| Bassett Furniture Industries, Inc. | 2,642 | 50,357 | ||||||
Beazer Homes USA, Inc.(1) | 151 | 2,150 | ||||||
| Ethan Allen Interiors, Inc. | 17,413 | 413,907 | ||||||
GoPro, Inc., Class A(1) | 69,441 | 422,896 | ||||||
Green Brick Partners, Inc.(1) | 6,280 | 152,981 | ||||||
| Hooker Furnishings Corp. | 1,512 | 23,995 | ||||||
Hovnanian Enterprises, Inc., Class A(1) | 1,596 | 63,984 | ||||||
| La-Z-Boy, Inc. | 12,057 | 318,184 | ||||||
Legacy Housing Corp.(1) | 241 | 4,119 | ||||||
| Lifetime Brands, Inc. | 559 | 4,986 | ||||||
M/I Homes, Inc.(1) | 9,599 | 415,061 | ||||||
Skyline Champion Corp.(1) | 3,951 | 223,903 | ||||||
Taylor Morrison Home Corp.(1) | 83,774 | 2,103,565 | ||||||
Tri Pointe Homes, Inc.(1) | 70,550 | 1,222,631 | ||||||
Universal Electronics, Inc.(1) | 4,678 | 103,992 | ||||||
VOXX International Corp.(1) | 3,636 | 35,051 | ||||||
| 5,561,762 | ||||||||
| Independent Power and Renewable Electricity Producers — 0.2% | ||||||||
Ormat Technologies, Inc.(2) | 7,348 | 686,891 | ||||||
| Insurance — 4.0% | ||||||||
Ambac Financial Group, Inc.(1) | 12,074 | 182,197 | ||||||
| AMERISAFE, Inc. | 3,786 | 181,046 | ||||||
| Argo Group International Holdings Ltd. | 19,751 | 387,712 | ||||||
| Assured Guaranty Ltd. | 31,027 | 1,584,549 | ||||||
| Axis Capital Holdings Ltd. | 36,618 | 1,946,247 | ||||||
Brighthouse Financial, Inc.(1) | 38,401 | 1,825,968 | ||||||
| CNO Financial Group, Inc. | 47,671 | 877,623 | ||||||
| Crawford & Co., Class A | 616 | 3,745 | ||||||
| Donegal Group, Inc., Class A | 3,433 | 49,847 | ||||||
| Employers Holdings, Inc. | 10,283 | 402,682 | ||||||
Genworth Financial, Inc., Class A(1) | 225,216 | 950,411 | ||||||
| Hanover Insurance Group, Inc. | 7,019 | 908,188 | ||||||
| Horace Mann Educators Corp. | 16,488 | 589,776 | ||||||
| Investors Title Co. | 100 | 14,735 | ||||||
NI Holdings, Inc.(1) | 1,243 | 16,321 | ||||||
Oscar Health, Inc., Class A(1) | 8,049 | 53,365 | ||||||
| Primerica, Inc. | 3,477 | 440,710 | ||||||
| ProAssurance Corp. | 11,387 | 243,568 | ||||||
| Safety Insurance Group, Inc. | 7,626 | 686,721 | ||||||
| Selective Insurance Group, Inc. | 16,785 | 1,333,065 | ||||||
SiriusPoint Ltd.(1) | 28,701 | 128,293 | ||||||
| Stewart Information Services Corp. | 10,742 | 543,975 | ||||||
| Tiptree, Inc. | 508 | 6,071 | ||||||
| United Fire Group, Inc. | 5,307 | 156,185 | ||||||
73
| Avantis U.S. Small Cap Value Fund | ||||||||
| Shares | Value | |||||||
| Unum Group | 35,628 | $ | 1,348,520 | |||||
| 14,861,520 | ||||||||
| Interactive Media and Services — 0.1% | ||||||||
Cars.com, Inc.(1) | 40,989 | 522,610 | ||||||
Internet and Direct Marketing Retail† | ||||||||
Duluth Holdings, Inc., Class B(1) | 5,416 | 48,040 | ||||||
Lands' End, Inc.(1) | 5,925 | 81,883 | ||||||
| 129,923 | ||||||||
| IT Services — 0.4% | ||||||||
| Cass Information Systems, Inc. | 1,244 | 45,630 | ||||||
Computer Task Group, Inc.(1) | 1,148 | 9,046 | ||||||
Innodata, Inc.(1) | 154 | 519 | ||||||
International Money Express, Inc.(1) | 11,900 | 266,560 | ||||||
Kyndryl Holdings, Inc.(1) | 99,459 | 1,036,363 | ||||||
| 1,358,118 | ||||||||
| Leisure Products — 0.9% | ||||||||
| Acushnet Holdings Corp. | 8 | 381 | ||||||
| Johnson Outdoors, Inc., Class A | 21 | 1,284 | ||||||
Malibu Boats, Inc., Class A(1) | 12,932 | 776,308 | ||||||
MasterCraft Boat Holdings, Inc.(1) | 8,678 | 209,053 | ||||||
| Smith & Wesson Brands, Inc. | 33,445 | 444,818 | ||||||
| Sturm Ruger & Co., Inc. | 13,179 | 688,603 | ||||||
Vista Outdoor, Inc.(1) | 40,197 | 1,130,340 | ||||||
| 3,250,787 | ||||||||
Life Sciences Tools and Services† | ||||||||
AbCellera Biologics, Inc.(1) | 16,661 | 177,939 | ||||||
| Machinery — 1.3% | ||||||||
| Albany International Corp., Class A | 14,081 | 1,241,803 | ||||||
| Greenbrier Cos., Inc. | 502 | 14,312 | ||||||
| Kennametal, Inc. | 52,388 | 1,227,975 | ||||||
L.B. Foster Co., Class A(1) | 1,249 | 16,362 | ||||||
| Miller Industries, Inc. | 57 | 1,340 | ||||||
| Mueller Industries, Inc. | 33,511 | 2,116,890 | ||||||
| REV Group, Inc. | 19,917 | 229,444 | ||||||
| Terex Corp. | 220 | 7,308 | ||||||
Titan International, Inc.(1) | 3,633 | 50,971 | ||||||
| 4,906,405 | ||||||||
| Marine — 1.1% | ||||||||
| Costamare, Inc. | 49,975 | 563,718 | ||||||
| Eagle Bulk Shipping, Inc. | 9,617 | 417,762 | ||||||
| Genco Shipping & Trading Ltd. | 36,123 | 495,246 | ||||||
| Matson, Inc. | 32,841 | 2,419,068 | ||||||
| Pangaea Logistics Solutions Ltd. | 20,109 | 100,746 | ||||||
| Safe Bulkers, Inc. | 44,161 | 140,874 | ||||||
| 4,137,414 | ||||||||
| Media — 0.5% | ||||||||
Audacy, Inc.(1) | 33,969 | 18,737 | ||||||
Cumulus Media, Inc., Class A(1) | 11,998 | 111,821 | ||||||
| Entravision Communications Corp., Class A | 30,218 | 153,507 | ||||||
PubMatic, Inc., Class A(1) | 5,040 | 98,633 | ||||||
| Scholastic Corp. | 15,305 | 702,653 | ||||||
74
| Avantis U.S. Small Cap Value Fund | ||||||||
| Shares | Value | |||||||
WideOpenWest, Inc.(1) | 36,081 | $ | 642,242 | |||||
| 1,727,593 | ||||||||
| Metals and Mining — 3.3% | ||||||||
| Alpha Metallurgical Resources, Inc. | 14,113 | 2,217,858 | ||||||
Arconic Corp.(1) | 132 | 3,328 | ||||||
Ascent Industries Co.(1) | 314 | 5,256 | ||||||
| Carpenter Technology Corp. | 11,645 | 395,581 | ||||||
Coeur Mining, Inc.(1) | 146,856 | 405,323 | ||||||
| Commercial Metals Co. | 85,335 | 3,456,921 | ||||||
| Haynes International, Inc. | 266 | 10,558 | ||||||
| Hecla Mining Co. | 300,627 | 1,184,470 | ||||||
| Kaiser Aluminum Corp. | 11,289 | 810,099 | ||||||
| Ramaco Resources, Inc. | 17,058 | 179,791 | ||||||
| Ryerson Holding Corp. | 18,104 | 515,964 | ||||||
| Schnitzer Steel Industries, Inc., Class A | 17,163 | 567,065 | ||||||
| SunCoke Energy, Inc. | 79,002 | 520,623 | ||||||
TimkenSteel Corp.(1) | 41,205 | 632,085 | ||||||
| Warrior Met Coal, Inc. | 45,948 | 1,495,607 | ||||||
| 12,400,529 | ||||||||
| Multiline Retail — 1.2% | ||||||||
Big Lots, Inc.(2) | 20,394 | 419,505 | ||||||
Dillard's, Inc., Class A(2) | 2,962 | 877,463 | ||||||
| Kohl's Corp. | 51,314 | 1,458,344 | ||||||
| Macy's, Inc. | 94,123 | 1,630,210 | ||||||
| 4,385,522 | ||||||||
| Oil, Gas and Consumable Fuels — 13.3% | ||||||||
| Antero Midstream Corp. | 123,631 | 1,244,964 | ||||||
| Arch Resources, Inc. | 10,926 | 1,590,607 | ||||||
Ardmore Shipping Corp.(1) | 3,480 | 33,547 | ||||||
| Berry Corp. | 57,138 | 522,813 | ||||||
| Brigham Minerals, Inc., Class A | 34,503 | 1,026,464 | ||||||
| California Resources Corp. | 5,686 | 284,073 | ||||||
Callon Petroleum Co.(1) | 29,950 | 1,274,672 | ||||||
| Chord Energy Corp. | 12,266 | 1,736,252 | ||||||
| Civitas Resources, Inc. | 23,874 | 1,604,094 | ||||||
CNX Resources Corp.(1) | 23,917 | 422,613 | ||||||
Comstock Resources, Inc.(1) | 56,462 | 1,106,655 | ||||||
| CONSOL Energy, Inc. | 20,813 | 1,493,957 | ||||||
| CVR Energy, Inc. | 20,034 | 654,310 | ||||||
Denbury, Inc.(1) | 21,188 | 1,884,249 | ||||||
| DHT Holdings, Inc. | 74,073 | 578,510 | ||||||
| Dorian LPG Ltd. | 31,002 | 451,079 | ||||||
Earthstone Energy, Inc., Class A(1) | 33,331 | 506,631 | ||||||
| EnLink Midstream LLC | 120,991 | 1,229,269 | ||||||
| Epsilon Energy Ltd. | 4,859 | 34,985 | ||||||
| Equitrans Midstream Corp. | 212,089 | 1,966,065 | ||||||
| Evolution Petroleum Corp. | 16,025 | 111,213 | ||||||
Hallador Energy Co.(1)(2) | 16,621 | 108,369 | ||||||
| Kimbell Royalty Partners LP | 37,600 | 667,024 | ||||||
Kosmos Energy Ltd.(1) | 291,453 | 2,060,573 | ||||||
Laredo Petroleum, Inc.(1) | 11,562 | 897,327 | ||||||
75
| Avantis U.S. Small Cap Value Fund | ||||||||
| Shares | Value | |||||||
| Magnolia Oil & Gas Corp., Class A | 76,325 | $ | 1,821,878 | |||||
| Matador Resources Co. | 47,256 | 2,816,458 | ||||||
| Murphy Oil Corp. | 67,305 | 2,622,876 | ||||||
| NACCO Industries, Inc., Class A | 2,354 | 105,859 | ||||||
Overseas Shipholding Group, Inc., Class A(1) | 20,289 | 63,099 | ||||||
PBF Energy, Inc., Class A(1) | 49,820 | 1,701,851 | ||||||
| PDC Energy, Inc. | 43,227 | 2,935,546 | ||||||
Peabody Energy Corp.(1) | 42,983 | 1,059,961 | ||||||
Permian Resources Corp.(1) | 148,599 | 1,222,970 | ||||||
| Plains GP Holdings LP, Class A | 98,281 | 1,177,406 | ||||||
Range Resources Corp.(1) | 66,188 | 2,174,938 | ||||||
| Ranger Oil Corp., Class A | 14,247 | 555,490 | ||||||
REX American Resources Corp.(1) | 8,244 | 249,793 | ||||||
| Riley Exploration Permian, Inc. | 1,613 | 40,551 | ||||||
Ring Energy, Inc.(1) | 66,787 | 216,390 | ||||||
SandRidge Energy, Inc.(1) | 25,724 | 539,689 | ||||||
| SFL Corp. Ltd. | 84,617 | 905,402 | ||||||
SilverBow Resources, Inc.(1) | 8,443 | 335,694 | ||||||
| SM Energy Co. | 71,541 | 3,152,812 | ||||||
Talos Energy, Inc.(1) | 55,708 | 1,154,827 | ||||||
Teekay Corp.(1) | 3,514 | 12,264 | ||||||
VAALCO Energy, Inc.(2) | 39,518 | 197,985 | ||||||
| World Fuel Services Corp. | 25,726 | 663,731 | ||||||
| 49,217,785 | ||||||||
| Paper and Forest Products — 1.3% | ||||||||
Clearwater Paper Corp.(1) | 12,171 | 517,754 | ||||||
| Louisiana-Pacific Corp. | 51,611 | 2,798,865 | ||||||
| Mercer International, Inc. | 36,581 | 593,344 | ||||||
| Sylvamo Corp. | 21,834 | 970,303 | ||||||
| 4,880,266 | ||||||||
| Personal Products — 0.4% | ||||||||
Nature's Sunshine Products, Inc.(1) | 4,126 | 40,022 | ||||||
| Nu Skin Enterprises, Inc., Class A | 29,331 | 1,200,811 | ||||||
USANA Health Sciences, Inc.(1) | 5,730 | 369,700 | ||||||
| 1,610,533 | ||||||||
| Pharmaceuticals — 0.8% | ||||||||
Arvinas, Inc.(1) | 24,127 | 1,021,537 | ||||||
Assertio Holdings, Inc.(1)(2) | 15,274 | 38,949 | ||||||
Innoviva, Inc.(1) | 45,675 | 601,083 | ||||||
| Phibro Animal Health Corp., Class A | 63 | 933 | ||||||
Prestige Consumer Healthcare, Inc.(1) | 18,987 | 960,362 | ||||||
ProPhase Labs, Inc.(2) | 2,333 | 28,253 | ||||||
| SIGA Technologies, Inc. | 31,011 | 467,646 | ||||||
Supernus Pharmaceuticals, Inc.(1) | 52 | 1,780 | ||||||
| 3,120,543 | ||||||||
| Professional Services — 1.2% | ||||||||
CBIZ, Inc.(1) | 30,307 | 1,323,204 | ||||||
| CRA International, Inc. | 1,551 | 141,777 | ||||||
| Heidrick & Struggles International, Inc. | 11,832 | 336,739 | ||||||
| Kelly Services, Inc., Class A | 7,404 | 119,278 | ||||||
| Kforce, Inc. | 4,885 | 267,307 | ||||||
76
| Avantis U.S. Small Cap Value Fund | ||||||||
| Shares | Value | |||||||
| Korn Ferry | 30,155 | $ | 1,837,042 | |||||
TrueBlue, Inc.(1) | 19,874 | 408,212 | ||||||
| 4,433,559 | ||||||||
| Real Estate Management and Development — 0.9% | ||||||||
| Douglas Elliman, Inc. | 41,064 | 189,305 | ||||||
Five Point Holdings LLC, Class A(1) | 14,515 | 52,980 | ||||||
Forestar Group, Inc.(1) | 10,190 | 126,764 | ||||||
Howard Hughes Corp.(1) | 9,738 | 619,629 | ||||||
| Kennedy-Wilson Holdings, Inc. | 78,106 | 1,371,541 | ||||||
| Marcus & Millichap, Inc. | 17,554 | 656,168 | ||||||
| RE/MAX Holdings, Inc., Class A | 12,693 | 288,893 | ||||||
| 3,305,280 | ||||||||
| Road and Rail — 2.5% | ||||||||
| ArcBest Corp. | 15,963 | 1,285,500 | ||||||
| Covenant Logistics Group, Inc. | 4,475 | 125,837 | ||||||
| Heartland Express, Inc. | 33,067 | 500,965 | ||||||
| Marten Transport Ltd. | 42,552 | 842,955 | ||||||
PAM Transportation Services, Inc.(1) | 3,478 | 103,331 | ||||||
| Ryder System, Inc. | 36,212 | 2,768,045 | ||||||
Saia, Inc.(1) | 5,869 | 1,213,885 | ||||||
| Schneider National, Inc., Class B | 30,754 | 703,037 | ||||||
| Universal Logistics Holdings, Inc. | 1,657 | 60,497 | ||||||
US Xpress Enterprises, Inc., Class A(1) | 5,048 | 12,418 | ||||||
USA Truck, Inc.(1) | 4,124 | 129,329 | ||||||
| Werner Enterprises, Inc. | 36,245 | 1,442,189 | ||||||
| 9,187,988 | ||||||||
| Semiconductors and Semiconductor Equipment — 1.8% | ||||||||
Alpha & Omega Semiconductor Ltd.(1) | 13,415 | 518,624 | ||||||
| Amkor Technology, Inc. | 52,529 | 1,057,409 | ||||||
Axcelis Technologies, Inc.(1) | 9,846 | 659,091 | ||||||
Diodes, Inc.(1) | 28,096 | 1,999,592 | ||||||
| Kulicke & Soffa Industries, Inc. | 39,586 | 1,664,195 | ||||||
Photronics, Inc.(1) | 46,191 | 776,009 | ||||||
| 6,674,920 | ||||||||
| Software — 0.3% | ||||||||
Cleanspark, Inc.(1)(2) | 13,052 | 55,863 | ||||||
| InterDigital, Inc. | 20,094 | 1,007,915 | ||||||
Marathon Digital Holdings, Inc.(1)(2) | 8,540 | 101,199 | ||||||
| 1,164,977 | ||||||||
| Specialty Retail — 7.2% | ||||||||
| Aaron's Co., Inc. | 23,207 | 276,163 | ||||||
Abercrombie & Fitch Co., Class A(1) | 37,746 | 543,165 | ||||||
| Academy Sports & Outdoors, Inc. | 60,865 | 2,622,064 | ||||||
| American Eagle Outfitters, Inc. | 74,711 | 841,246 | ||||||
AutoNation, Inc.(1) | 11,121 | 1,385,677 | ||||||
Bed Bath & Beyond, Inc.(1)(2) | 23,199 | 221,086 | ||||||
| Big 5 Sporting Goods Corp. | 10,404 | 127,345 | ||||||
| Buckle, Inc. | 18,874 | 609,253 | ||||||
| Build-A-Bear Workshop, Inc. | 9,659 | 147,976 | ||||||
| Caleres, Inc. | 30,168 | 769,887 | ||||||
| Cato Corp., Class A | 10,167 | 109,905 | ||||||
77
| Avantis U.S. Small Cap Value Fund | ||||||||
| Shares | Value | |||||||
Chico's FAS, Inc.(1) | 81,986 | $ | 465,681 | |||||
Children's Place, Inc.(1) | 6,298 | 265,650 | ||||||
Citi Trends, Inc.(1) | 4,400 | 88,880 | ||||||
Conn's, Inc.(1) | 10,875 | 104,509 | ||||||
Container Store Group, Inc.(1) | 13,676 | 92,723 | ||||||
| Designer Brands, Inc., Class A | 41,874 | 714,370 | ||||||
Destination XL Group, Inc.(1) | 23,632 | 130,212 | ||||||
Dick's Sporting Goods, Inc.(2) | 1,153 | 122,645 | ||||||
| Foot Locker, Inc. | 56,964 | 2,098,554 | ||||||
| Gap, Inc. | 189,432 | 1,731,409 | ||||||
Genesco, Inc.(1) | 10,031 | 567,554 | ||||||
| Group 1 Automotive, Inc. | 7,826 | 1,397,645 | ||||||
| Guess?, Inc. | 23,094 | 403,452 | ||||||
| Haverty Furniture Cos., Inc. | 11,215 | 300,786 | ||||||
| Hibbett, Inc. | 8,763 | 513,512 | ||||||
MarineMax, Inc.(1) | 15,373 | 558,655 | ||||||
| Murphy USA, Inc. | 10,749 | 3,119,037 | ||||||
ODP Corp.(1) | 27,928 | 998,426 | ||||||
| Rent-A-Center, Inc. | 27,958 | 722,435 | ||||||
| Shoe Carnival, Inc. | 11,530 | 274,299 | ||||||
| Signet Jewelers Ltd. | 30,487 | 1,992,935 | ||||||
| Sonic Automotive, Inc., Class A | 13,849 | 736,628 | ||||||
| Tilly's, Inc., Class A | 11,039 | 82,793 | ||||||
TravelCenters of America, Inc.(1) | 8,883 | 480,393 | ||||||
Urban Outfitters, Inc.(1) | 45,731 | 920,565 | ||||||
Zumiez, Inc.(1) | 11,140 | 289,194 | ||||||
| 26,826,709 | ||||||||
Technology Hardware, Storage and Peripherals† | ||||||||
Immersion Corp.(1) | 2,525 | 15,049 | ||||||
Super Micro Computer, Inc.(1) | 135 | 8,786 | ||||||
| 23,835 | ||||||||
| Textiles, Apparel and Luxury Goods — 1.5% | ||||||||
Capri Holdings Ltd.(1) | 4,003 | 188,862 | ||||||
| Crown Crafts, Inc. | 31 | 189 | ||||||
Delta Apparel, Inc.(1) | 1,000 | 18,780 | ||||||
G-III Apparel Group Ltd.(1) | 29,152 | 614,233 | ||||||
Lakeland Industries, Inc.(1) | 1,868 | 25,218 | ||||||
| Movado Group, Inc. | 9,896 | 315,583 | ||||||
| Oxford Industries, Inc. | 12,102 | 1,291,646 | ||||||
| PVH Corp. | 40,078 | 2,254,388 | ||||||
| Superior Group of Cos., Inc. | 233 | 2,589 | ||||||
Under Armour, Inc., Class A(1) | 48,749 | 410,467 | ||||||
Under Armour, Inc., Class C(1) | 30,676 | 232,831 | ||||||
Unifi, Inc.(1) | 4,426 | 50,279 | ||||||
Vera Bradley, Inc.(1) | 5,863 | 23,217 | ||||||
| 5,428,282 | ||||||||
| Thrifts and Mortgage Finance — 5.1% | ||||||||
Axos Financial, Inc.(1) | 22,120 | 924,174 | ||||||
Bridgewater Bancshares, Inc.(1) | 5,299 | 91,037 | ||||||
| Enact Holdings, Inc. | 9,161 | 232,689 | ||||||
| Essent Group Ltd. | 58,885 | 2,354,811 | ||||||
78
| Avantis U.S. Small Cap Value Fund | ||||||||
| Shares | Value | |||||||
| Federal Agricultural Mortgage Corp., Class C | 4,325 | $ | 472,463 | |||||
| Flagstar Bancorp, Inc. | 27,065 | 1,042,814 | ||||||
| FS Bancorp, Inc. | 2,126 | 63,163 | ||||||
| Greene County Bancorp, Inc. | 134 | 7,129 | ||||||
| Hingham Institution For Savings | 363 | 107,775 | ||||||
| Home Bancorp, Inc. | 1,338 | 52,235 | ||||||
| Kearny Financial Corp. | 17,555 | 199,425 | ||||||
| Luther Burbank Corp. | 2,236 | 29,314 | ||||||
| Merchants Bancorp | 8,404 | 226,656 | ||||||
| MGIC Investment Corp. | 164,333 | 2,348,318 | ||||||
Mr. Cooper Group, Inc.(1) | 41,366 | 1,749,782 | ||||||
New York Community Bancorp, Inc.(2) | 213,735 | 2,092,466 | ||||||
NMI Holdings, Inc., Class A(1) | 46,085 | 946,125 | ||||||
| Northfield Bancorp, Inc. | 9,630 | 141,946 | ||||||
| OP Bancorp | 1,343 | 16,237 | ||||||
| PennyMac Financial Services, Inc. | 13,369 | 710,161 | ||||||
| Provident Financial Services, Inc. | 33,500 | 778,205 | ||||||
| Radian Group, Inc. | 102,644 | 2,166,815 | ||||||
| Southern Missouri Bancorp, Inc. | 2,022 | 106,620 | ||||||
| Territorial Bancorp, Inc. | 886 | 18,438 | ||||||
| Timberland Bancorp, Inc. | 1,932 | 51,237 | ||||||
| TrustCo Bank Corp. NY | 7,964 | 265,520 | ||||||
| Walker & Dunlop, Inc. | 7,149 | 718,188 | ||||||
| Waterstone Financial, Inc. | 5,837 | 100,922 | ||||||
| WSFS Financial Corp. | 16,282 | 787,235 | ||||||
| 18,801,900 | ||||||||
| Trading Companies and Distributors — 5.3% | ||||||||
| Air Lease Corp. | 71,342 | 2,593,995 | ||||||
| Alta Equipment Group, Inc. | 1,728 | 20,339 | ||||||
BlueLinx Holdings, Inc.(1) | 8,216 | 575,942 | ||||||
| Boise Cascade Co. | 35,379 | 2,205,173 | ||||||
| GATX Corp. | 27,822 | 2,687,883 | ||||||
| Global Industrial Co. | 41 | 1,233 | ||||||
| H&E Equipment Services, Inc. | 19,829 | 627,786 | ||||||
| Herc Holdings, Inc. | 13,833 | 1,556,628 | ||||||
| McGrath RentCorp | 16,229 | 1,371,675 | ||||||
NOW, Inc.(1) | 55,237 | 669,472 | ||||||
| Rush Enterprises, Inc., Class A | 25,814 | 1,214,807 | ||||||
| Rush Enterprises, Inc., Class B | 3,706 | 187,672 | ||||||
| Textainer Group Holdings Ltd. | 27,393 | 832,199 | ||||||
Titan Machinery, Inc.(1) | 11,805 | 363,358 | ||||||
| Triton International Ltd. | 53,558 | 3,191,521 | ||||||
Veritiv Corp.(1) | 11,473 | 1,367,467 | ||||||
| 19,467,150 | ||||||||
| Wireless Telecommunication Services — 0.4% | ||||||||
| Telephone and Data Systems, Inc. | 74,189 | 1,207,055 | ||||||
United States Cellular Corp.(1) | 9,475 | 270,890 | ||||||
| 1,477,945 | ||||||||
TOTAL COMMON STOCKS (Cost $331,734,053) | 368,579,763 | |||||||
79
| Avantis U.S. Small Cap Value Fund | ||||||||
| Shares | Value | |||||||
| SHORT-TERM INVESTMENTS — 2.1% | ||||||||
| Money Market Funds — 2.1% | ||||||||
| State Street Institutional U.S. Government Money Market Fund, Premier Class | 1,990,085 | $ | 1,990,085 | |||||
State Street Navigator Securities Lending Government Money Market Portfolio(3) | 5,757,217 | 5,757,217 | ||||||
TOTAL SHORT-TERM INVESTMENTS (Cost $7,747,302) | 7,747,302 | |||||||
TOTAL INVESTMENT SECURITIES — 101.6% (Cost $339,481,355) | 376,327,065 | |||||||
| OTHER ASSETS AND LIABILITIES — (1.6)% | (5,825,001) | |||||||
| TOTAL NET ASSETS — 100.0% | $ | 370,502,064 | ||||||
| FUTURES CONTRACTS PURCHASED | ||||||||||||||
| Reference Entity | Contracts | Expiration Date | Notional Amount | Unrealized Appreciation (Depreciation)^ | ||||||||||
| Russell 2000 E-Mini Index | 9 | September 2022 | $ | 830,070 | $ | (7,628) | ||||||||
^Amount represents value and unrealized appreciation (depreciation).
| NOTES TO SCHEDULE OF INVESTMENTS | ||||||||
†Category is less than 0.05% of total net assets.
(1)Non-income producing.
(2)Security, or a portion thereof, is on loan. At the period end, the aggregate value of securities on loan was $6,252,098. The amount of securities on loan indicated may not correspond with the securities on loan identified because securities with pending sales are in the process of recall from the brokers.
(3)Investment of cash collateral from securities on loan. At the period end, the aggregate value of the collateral held by the fund was $6,456,302, which includes securities collateral of $699,085.
See Notes to Financial Statements.
80
| Statements of Assets and Liabilities | ||
| AUGUST 31, 2022 | ||||||||
| Avantis U.S. Equity Fund | Avantis U.S. Large Cap Value Fund | |||||||
| Assets | ||||||||
| Investment securities, at value (cost of $372,156,617 and $84,882,979, respectively) — including $2,505,935 and $—, respectively of securities on loan | $ | 362,705,172 | $ | 80,497,007 | ||||
| Investment made with cash collateral received for securities on loan, at value (cost of $1,757,422 and $—, respectively) | 1,757,422 | — | ||||||
| Total investment securities, at value (cost of $373,914,039 and $84,882,979, respectively) | 364,462,594 | 80,497,007 | ||||||
| Deposits with broker for futures contracts | 30,000 | — | ||||||
| Receivable for capital shares sold | 181,613 | — | ||||||
| Dividends and interest receivable | 655,171 | 139,057 | ||||||
| Securities lending receivable | 3,292 | — | ||||||
| 365,332,670 | 80,636,064 | |||||||
| Liabilities | ||||||||
| Disbursements in excess of demand deposit cash | 752 | — | ||||||
| Payable for collateral received for securities on loan | 1,757,422 | — | ||||||
| Payable for capital shares redeemed | 47,010 | 43,534 | ||||||
| Payable for variation margin on futures contracts | 4,650 | — | ||||||
| Accrued management fees | 45,047 | 5,909 | ||||||
| 1,854,881 | 49,443 | |||||||
| Net Assets | $ | 363,477,789 | $ | 80,586,621 | ||||
| Net Assets Consist of: | ||||||||
| Capital paid in | $ | 372,207,929 | $ | 84,829,272 | ||||
| Distributable earnings | (8,730,140) | (4,242,651) | ||||||
| $ | 363,477,789 | $ | 80,586,621 | |||||
| Fund/Class | Net Assets | Shares Outstanding | Net Asset Value Per Share | ||||||||
| Avantis U.S. Equity Fund | |||||||||||
| Institutional Class | $338,381,172 | 25,568,347 | $13.23 | ||||||||
| G Class | $25,096,617 | 1,893,196 | $13.26 | ||||||||
| Avantis U.S. Large Cap Value Fund | |||||||||||
| Institutional Class | $80,581,379 | 7,687,677 | $10.48 | ||||||||
| G Class | $5,242 | 500 | $10.48 | ||||||||
See Notes to Financial Statements.
81
| AUGUST 31, 2022 | |||||
| Avantis U.S. Small Cap Value Fund | |||||
| Assets | |||||
| Investment securities, at value (cost of $333,724,138) — including $6,252,098 of securities on loan | $ | 370,569,848 | |||
| Investment made with cash collateral received for securities on loan, at value (cost of $5,757,217) | 5,757,217 | ||||
| Total investment securities, at value (cost of $339,481,355) | 376,327,065 | ||||
| Deposits with broker for futures contracts | 49,500 | ||||
| Receivable for capital shares sold | 264,889 | ||||
| Dividends and interest receivable | 512,890 | ||||
| Securities lending receivable | 4,267 | ||||
| 377,158,611 | |||||
| Liabilities | |||||
| Payable for collateral received for securities on loan | 5,757,217 | ||||
| Payable for investments purchased | 767,261 | ||||
| Payable for capital shares redeemed | 44,883 | ||||
| Payable for variation margin on futures contracts | 5,265 | ||||
| Accrued management fees | 81,921 | ||||
| 6,656,547 | |||||
| Net Assets | $ | 370,502,064 | |||
| Net Assets Consist of: | |||||
| Capital paid in | $ | 308,792,718 | |||
| Distributable earnings | 61,709,346 | ||||
| $ | 370,502,064 | ||||
| Fund/Class | Net Assets | Shares Outstanding | Net Asset Value Per Share | ||||||||
| Avantis U.S. Small Cap Value Fund | |||||||||||
| Institutional Class | $368,198,416 | 25,806,345 | $14.27 | ||||||||
| G Class | $2,303,648 | 161,204 | $14.29 | ||||||||
See Notes to Financial Statements.
82
| Statements of Operations | ||
| YEAR ENDED AUGUST 31, 2022 (EXCEPT AS NOTED) | ||||||||
| Avantis U.S. Equity Fund | Avantis U.S. Large Cap Value Fund(1) | |||||||
| Investment Income (Loss) | ||||||||
| Income: | ||||||||
| Dividends (net of foreign taxes withheld of $2,059 and $—, respectively) | $ | 5,405,891 | $ | 144,060 | ||||
| Securities lending, net | 27,639 | — | ||||||
| Interest | 9,630 | 5,252 | ||||||
| 5,443,160 | 149,312 | |||||||
| Expenses: | ||||||||
| Management fees | 488,305 | 5,992 | ||||||
| Other expenses | 1,375 | — | ||||||
| 489,680 | 5,992 | |||||||
| Fees waived - G Class | (20,570) | (1) | ||||||
| 469,110 | 5,991 | |||||||
| Net investment income (loss) | 4,974,050 | 143,321 | ||||||
| Realized and Unrealized Gain (Loss) | ||||||||
| Net realized gain (loss) on: | ||||||||
| Investment transactions | (2,858,605) | — | ||||||
| Futures contract transactions | 15,092 | — | ||||||
| (2,843,513) | — | |||||||
| Change in net unrealized appreciation (depreciation) on: | ||||||||
| Investments | (46,189,572) | (4,385,972) | ||||||
| Futures contracts | 12,187 | — | ||||||
| (46,177,385) | (4,385,972) | |||||||
| Net realized and unrealized gain (loss) | (49,020,898) | (4,385,972) | ||||||
| Net Increase (Decrease) in Net Assets Resulting from Operations | $ | (44,046,848) | $ | (4,242,651) | ||||
(1)June 21, 2022 (fund inception) through August 31, 2022.
See Notes to Financial Statements.
83
| YEAR ENDED AUGUST 31, 2022 | |||||
| Avantis U.S. Small Cap Value Fund | |||||
| Investment Income (Loss) | |||||
| Income: | |||||
| Dividends (net of foreign taxes withheld of $7,760) | $ | 6,477,880 | |||
| Securities lending, net | 77,414 | ||||
| Interest | 9,036 | ||||
| 6,564,330 | |||||
| Expenses: | |||||
| Management fees | 841,839 | ||||
| Other expenses | 8,982 | ||||
| 850,821 | |||||
| Fees waived - G Class | (3,179) | ||||
| 847,642 | |||||
| Net investment income (loss) | 5,716,688 | ||||
| Realized and Unrealized Gain (Loss) | |||||
| Net realized gain (loss) on: | |||||
| Investment transactions | 24,700,405 | ||||
| Futures contract transactions | (17,620) | ||||
| 24,682,785 | |||||
| Change in net unrealized appreciation (depreciation) on: | |||||
| Investments | (36,284,756) | ||||
| Futures contracts | (55,295) | ||||
| (36,340,051) | |||||
| Net realized and unrealized gain (loss) | (11,657,266) | ||||
| Net Increase (Decrease) in Net Assets Resulting from Operations | $ | (5,940,578) | |||
See Notes to Financial Statements.
84
| Statements of Changes in Net Assets | ||
| YEARS ENDED AUGUST 31, 2022 AND AUGUST 31, 2021 (EXCEPT AS NOTED) | |||||||||||
| Avantis U.S. Equity Fund | Avantis U.S. Large Cap Value Fund | ||||||||||
| Increase (Decrease) in Net Assets | August 31, 2022 | August 31, 2021 | August 31, 2022(1) | ||||||||
| Operations | |||||||||||
| Net investment income (loss) | $ | 4,974,050 | $ | 1,353,507 | $ | 143,321 | |||||
| Net realized gain (loss) | (2,843,513) | 794,199 | — | ||||||||
| Change in net unrealized appreciation (depreciation) | (46,177,385) | 27,174,332 | (4,385,972) | ||||||||
| Net increase (decrease) in net assets resulting from operations | (44,046,848) | 29,322,038 | (4,242,651) | ||||||||
| Distributions to Shareholders | |||||||||||
| From earnings: | |||||||||||
| Institutional Class | (3,104,121) | (550,258) | — | ||||||||
| G Class | (24,544) | — | — | ||||||||
| Decrease in net assets from distributions | (3,128,665) | (550,258) | — | ||||||||
| Capital Share Transactions | |||||||||||
| Net increase (decrease) in net assets from capital share transactions (Note 5) | 196,915,104 | 133,435,192 | 84,829,272 | ||||||||
| Net increase (decrease) in net assets | 149,739,591 | 162,206,972 | 80,586,621 | ||||||||
| Net Assets | |||||||||||
| Beginning of period | 213,738,198 | 51,531,226 | — | ||||||||
| End of period | $ | 363,477,789 | $ | 213,738,198 | $ | 80,586,621 | |||||
(1)June 21, 2022 (fund inception) through August 31, 2022.
See Notes to Financial Statements.
85
| YEARS ENDED AUGUST 31, 2022 AND AUGUST 31, 2021 | ||||||||
| Avantis U.S. Small Cap Value Fund | ||||||||
| Increase (Decrease) in Net Assets | August 31, 2022 | August 31, 2021 | ||||||
| Operations | ||||||||
| Net investment income (loss) | $ | 5,716,688 | $ | 3,137,208 | ||||
| Net realized gain (loss) | 24,682,785 | 15,334,310 | ||||||
| Change in net unrealized appreciation (depreciation) | (36,340,051) | 60,204,107 | ||||||
| Net increase (decrease) in net assets resulting from operations | (5,940,578) | 78,675,625 | ||||||
| Distributions to Shareholders | ||||||||
| From earnings: | ||||||||
| Institutional Class | (18,793,908) | (948,448) | ||||||
| G Class | (13,000) | — | ||||||
| Decrease in net assets from distributions | (18,806,908) | (948,448) | ||||||
| Capital Share Transactions | ||||||||
| Net increase (decrease) in net assets from capital share transactions (Note 5) | 134,893,216 | 103,291,530 | ||||||
| Net increase (decrease) in net assets | 110,145,730 | 181,018,707 | ||||||
| Net Assets | ||||||||
| Beginning of period | 260,356,334 | 79,337,627 | ||||||
| End of period | $ | 370,502,064 | $ | 260,356,334 | ||||
See Notes to Financial Statements.
86
| Notes to Financial Statements | ||
AUGUST 31, 2022
1. Organization
American Century ETF Trust (the trust) was registered as a Delaware statutory trust in 2017 and is registered under the Investment Company Act of 1940, as amended (the 1940 Act), as an open-end management investment company. Avantis U.S. Equity Fund, Avantis U.S. Large Cap Value Fund and Avantis U.S. Small Cap Value Fund (collectively, the funds) are three funds in a series issued by the trust. Each of the funds' investment objective is to seek long-term capital appreciation. The funds offer the Institutional Class and G Class. The G Class for Avantis U.S. Equity Fund and Avantis U.S. Small Cap Value Fund commenced sale on January 20, 2021. All classes of Avantis U.S. Large Cap Value Fund commenced sale on June 21, 2022, the fund's inception date.
2. Significant Accounting Policies
The following is a summary of significant accounting policies consistently followed by the funds in preparation of their financial statements. Each fund is an investment company and follows accounting and reporting guidance in accordance with accounting principles generally accepted in the United States of America. This may require management to make certain estimates and assumptions at the date of the financial statements. Actual results could differ from these estimates. Management evaluated the impact of events or transactions occurring through the date the financial statements were issued that would merit recognition or disclosure.
Investment Valuations — The funds determine the fair value of their investments and compute their net asset value (NAV) per share at the close of regular trading (usually 4 p.m. Eastern time) on the New York Stock Exchange (NYSE) on each day the NYSE is open. The Board of Trustees has adopted valuation policies and procedures to guide the investment advisor in the funds' investment valuation process and to provide methodologies for the oversight of the funds' pricing function.
Equity securities that are listed or traded on a domestic securities exchange are valued at the last reported sales price or at the official closing price as provided by the exchange. Equity securities traded on foreign securities exchanges are generally valued at the closing price of such securities on the exchange where primarily traded or at the close of the NYSE, if that is earlier. If no last sales price is reported, or if local convention or regulation so provides, the mean of the latest bid and asked prices may be used. Securities traded over-the-counter are valued at the mean of the latest bid and asked prices, the last sales price, or the official closing price.
Fixed income securities are valued at the evaluated mean as provided by independent pricing services or at the mean of the most recent bid and asked prices as provided by investment dealers. Corporate bonds are valued using market models that consider trade data, quotations from dealers and active market makers, relevant yield curve and spread data, creditworthiness, trade data or market information on comparable securities, and other relevant security specific information.
Open-end management investment companies are valued at the reported NAV per share. Exchange-traded futures contracts are valued at the settlement price as provided by the appropriate exchange.
If the funds determine that the market price for an investment is not readily available or the valuation methods mentioned above do not reflect an investment’s fair value, such investment is valued as determined in good faith by the Board of Trustees or its delegate, in accordance with policies and procedures adopted by the Board of Trustees. In its determination of fair value, the funds may review several factors including, but not limited to, market information regarding the specific investment or comparable investments and correlation with other investment types, futures indices or general market indicators. Circumstances that may cause the funds to use these procedures to value an investment include, but are not limited to: an investment has been declared in default or is distressed; trading in a security has been suspended during the trading day or a security is not actively trading on its principal exchange; prices received from a regular pricing source are deemed unreliable; or there is a foreign market holiday and no trading occurred.
The funds monitor for significant events occurring after the close of an investment’s primary exchange but before each fund’s NAV per share is determined. Significant events may include, but are not limited to: corporate announcements and transactions; governmental action and political unrest that could impact a
87
specific investment or an investment sector; or armed conflicts, natural disasters and similar events that could affect investments in a specific country or region. The funds also monitor for significant fluctuations between domestic and foreign markets, as evidenced by the U.S. market or such other indicators that the Board of Trustees, or its delegate, deems appropriate. The funds may apply a model-derived factor to the closing price of equity securities traded on foreign securities exchanges. The factor is based on observable market data as provided by an independent pricing service.
Security Transactions — Security transactions are accounted for as of the trade date. Net realized gains and losses are determined on the identified cost basis, which is also used for federal income tax purposes.
Investment Income — Dividend income less foreign taxes withheld, if any, is recorded as of the ex-dividend date. Distributions received on securities that represent a return of capital or long-term capital gain are recorded as a reduction of cost of investments and/or as a realized gain. The funds may estimate the components of distributions received that may be considered nontaxable distributions or long-term capital gain distributions for income tax purposes. Interest income is recorded on the accrual basis and includes accretion of discounts and amortization of premiums. Securities lending income is net of fees and rebates earned by the lending agent for its services.
Segregated Assets — In accordance with the 1940 Act, the funds segregate assets on their books and records to cover certain types of investment securities and other financial instruments. American Century Investment Management, Inc. (ACIM) (the investment advisor) monitors, on a daily basis, the securities segregated to ensure the funds designate a sufficient amount of liquid assets, marked-to-market daily. The funds may also receive assets or be required to pledge assets at the custodian bank or with a broker for collateral requirements.
Income Tax Status — It is each fund’s policy to distribute substantially all net investment income and net realized gains to shareholders and to otherwise qualify as a regulated investment company under provisions of the Internal Revenue Code. Accordingly, no provision has been made for income taxes. The funds file U.S. federal, state, local and non-U.S. tax returns as applicable. The funds' tax returns are subject to examination by the relevant taxing authority until expiration of the applicable statute of limitations, which is generally three years from the date of filing but can be longer in certain jurisdictions. At this time, management believes there are no uncertain tax positions which, based on their technical merit, would not be sustained upon examination and for which it is reasonably possible that the total amounts of unrecognized tax benefits will significantly change in the next twelve months.
Multiple Class — All shares of each fund represent an equal pro rata interest in the net assets of the class to which such shares belong, and have identical voting, dividend, liquidation and other rights and the same terms and conditions, except for class specific expenses and exclusive rights to vote on matters affecting only individual classes. Income, non-class specific expenses, and realized and unrealized capital gains and losses of the funds are allocated to each class of shares based on their relative net assets.
Distributions to Shareholders — Distributions from net investment income and net realized gains, if any, are generally declared and paid annually. Each fund may elect to treat a portion of its payment to a redeeming shareholder, which represents the pro rata share of undistributed net investment income and net realized gains, as a distribution for federal income tax purposes (tax equalization).
Indemnifications — Under the trust’s organizational documents, its officers and trustees are indemnified against certain liabilities arising out of the performance of their duties to the funds. In addition, in the normal course of business, the funds enter into contracts that provide general indemnifications. The maximum exposure under these arrangements is unknown as this would involve future claims that may be made against a fund. The risk of material loss from such claims is considered by management to be remote.
Securities Lending — Securities are lent to qualified financial institutions and brokers. State Street Bank & Trust Co. serves as securities lending agent to the funds pursuant to a Securities Lending Agreement. The lending of securities exposes the funds to risks such as: the borrowers may fail to return the loaned securities, the borrowers may not be able to provide additional collateral, the funds may experience delays in recovery of the loaned securities or delays in access to collateral, or the funds may experience losses related to the investment collateral. To minimize certain risks, loan counterparties pledge collateral in the form of cash and/or securities. The lending agent has agreed to indemnify the funds in the case of default of any securities borrowed. Cash collateral received is invested in the State Street Navigator Securities Lending Government Money Market Portfolio, a money market mutual fund registered under the 1940 Act. The loans may also be secured by U.S. government securities in an amount at least equal to the market value of the securities
88
loaned, plus accrued interest and dividends, determined on a daily basis and adjusted accordingly. By lending securities, the funds seek to increase their net investment income through the receipt of interest and fees. Such income is reflected separately within the Statements of Operations. The value of loaned securities and related collateral outstanding at period end, if any, are shown on a gross basis within the Schedules of Investments and Statements of Assets and Liabilities.
The following table reflects a breakdown of transactions accounted for as secured borrowings, the gross obligation by the type of collateral pledged, and the remaining contractual maturity of those transactions as of August 31, 2022.
| Remaining Contractual Maturity of Agreements | |||||||||||||||||
Fund / Securities Lending Transactions(1) | Overnight and Continuous | <30 days | Between 30 & 90 days | >90 days | Total | ||||||||||||
| Avantis U.S. Equity Fund | |||||||||||||||||
| Common Stocks | $ | 1,757,422 | — | — | — | $ | 1,757,422 | ||||||||||
| Gross amount of recognized liabilities for securities lending transactions | $ | 1,757,422 | |||||||||||||||
| Avantis U.S. Small Cap Value Fund | |||||||||||||||||
| Common Stocks | $ | 5,757,217 | — | — | — | $ | 5,757,217 | ||||||||||
| Gross amount of recognized liabilities for securities lending transactions | $ | 5,757,217 | |||||||||||||||
(1)Amount represents the payable for cash collateral received for securities on loan. This will generally be in the Overnight and Continuous column as the securities are typically callable on demand.
3. Fees and Transactions with Related Parties
Certain officers and trustees of the trust are also officers and/or directors of American Century Companies, Inc. (ACC). The trust's investment advisor, ACIM, the funds' distributor, American Century Investment Services, Inc., and the trust’s transfer agent, American Century Services, LLC, are wholly owned, directly or indirectly, by ACC. Various funds issued by American Century Asset Allocation Portfolios, Inc. own, in aggregate, 7% of the shares of the Avantis U.S. Equity Fund.
Management Fees — The trust has entered into a management agreement with ACIM, under which ACIM provides the funds with investment advisory and management services in exchange for a single, unified management fee (the fee) per class. The agreement provides that ACIM will pay all expenses of managing and operating the funds, except brokerage and other transaction fees and expenses relating to the acquisition and disposition of portfolio securities, acquired fund fees and expenses, interest, taxes, litigation expenses and extraordinary expenses. The fee is computed and accrued daily based on each class's daily net assets and paid monthly in arrears. The investment advisor agreed to waive each fund's G Class management fee in its entirety. The investment advisor expects this waiver to remain in effect permanently and cannot terminate it without the approval of the Board of Trustees.
For the period ended August 31, 2022, the annual management fee for the Institutional Class and the annual management fee before and after waiver for G Class for each fund are as follows:
| Annual Management Fee | |||||||||||
| Institutional Class | G Class Before Waiver | G Class After Waiver | |||||||||
| Avantis U.S. Equity Fund | 0.15% | 0.15% | 0.00% | ||||||||
| Avantis U.S. Large Cap Value Fund | 0.15% | 0.15% | 0.00% | ||||||||
| Avantis U.S. Small Cap Value Fund | 0.25% | 0.25% | 0.00% | ||||||||
Interfund Transactions — The funds may enter into security transactions with other American Century Investments funds and other client accounts of the investment advisor, in accordance with the 1940 Act rules and procedures adopted by the Board of Trustees. The rules and procedures require, among other things, that these transactions be effected at the independent current market price of the security. There were no interfund transactions during the period.
89
4. Investment Transactions
Purchases and sales of investment securities, excluding short-term investments, for the period ended August 31, 2022 were as follows:
| Avantis U.S. Equity Fund | Avantis U.S. Large Cap Value Fund(1) | Avantis U.S. Small Cap Value Fund | |||||||||
| Purchases | $211,513,335 | $84,706,349 | $279,130,792 | ||||||||
| Sales | $11,626,601 | — | $149,657,301 | ||||||||
(1)June 21, 2022 (fund inception) through August 31, 2022.
5. Capital Share Transactions
Transactions in shares of the funds were as follows (unlimited number of shares authorized):
| Year ended August 31, 2022 | Year ended August 31, 2021 | |||||||||||||
| Shares | Amount | Shares | Amount | |||||||||||
Avantis U.S. Equity Fund(1) | ||||||||||||||
| Institutional Class | ||||||||||||||
| Sold | 14,744,175 | $ | 218,739,743 | 12,039,286 | $ | 163,599,924 | ||||||||
| Issued in reinvestment of distributions | 203,548 | 3,104,121 | 45,855 | 550,258 | ||||||||||
| Redeemed | (3,588,094) | (50,154,425) | (2,596,029) | (32,277,485) | ||||||||||
| 11,359,629 | 171,689,439 | 9,489,112 | 131,872,697 | |||||||||||
| G Class | ||||||||||||||
| Sold | 1,996,667 | 28,251,875 | 120,988 | 1,701,468 | ||||||||||
| Issued in reinvestment of distributions | 1,608 | 24,544 | — | — | ||||||||||
| Redeemed | (216,378) | (3,050,754) | (9,689) | (138,973) | ||||||||||
| 1,781,897 | 25,225,665 | 111,299 | 1,562,495 | |||||||||||
| Net increase (decrease) | 13,141,526 | $ | 196,915,104 | 9,600,411 | $ | 133,435,192 | ||||||||
Avantis U.S. Large Cap Value Fund(2) | ||||||||||||||
| Institutional Class | N/A | |||||||||||||
| Sold | 7,765,165 | $ | 85,673,025 | |||||||||||
| Redeemed | (77,488) | (848,753) | ||||||||||||
| 7,687,677 | 84,824,272 | |||||||||||||
| G Class | N/A | |||||||||||||
| Sold | 500 | 5,000 | ||||||||||||
| Net increase (decrease) | 7,688,177 | $ | 84,829,272 | |||||||||||
Avantis U.S. Small Cap Value Fund(1) | ||||||||||||||
| Institutional Class | ||||||||||||||
| Sold | 15,009,023 | $ | 228,803,472 | 12,018,509 | $ | 150,648,156 | ||||||||
| Issued in reinvestment of distributions | 1,238,456 | 18,774,999 | 83,637 | 948,448 | ||||||||||
| Redeemed | (7,563,465) | (114,898,447) | (3,763,099) | (48,461,598) | ||||||||||
| 8,684,014 | 132,680,024 | 8,339,047 | 103,135,006 | |||||||||||
| G Class | ||||||||||||||
| Sold | 167,351 | 2,462,224 | 11,337 | 168,264 | ||||||||||
| Issued in reinvestment of distributions | 858 | 13,000 | — | — | ||||||||||
| Redeemed | (17,562) | (262,032) | (780) | (11,740) | ||||||||||
| 150,647 | 2,213,192 | 10,557 | 156,524 | |||||||||||
| Net increase (decrease) | 8,834,661 | $ | 134,893,216 | 8,349,604 | $ | 103,291,530 | ||||||||
(1)January 20, 2021 (commencement of sale) through August 31, 2021 for the G Class.
(2)June 21, 2022 (fund inception) through August 31, 2022.
90
6. Fair Value Measurements
The funds’ investment valuation process is based on several considerations and may use multiple inputs to determine the fair value of the investments held by the funds. In conformity with accounting principles generally accepted in the United States of America, the inputs used to determine a valuation are classified into three broad levels.
•Level 1 valuation inputs consist of unadjusted quoted prices in an active market for identical investments.
•Level 2 valuation inputs consist of direct or indirect observable market data (including quoted prices for comparable investments, evaluations of subsequent market events, interest rates, prepayment speeds, credit risk, etc.). These inputs also consist of quoted prices for identical investments initially expressed in local currencies that are adjusted through translation into U.S. dollars.
•Level 3 valuation inputs consist of unobservable data (including a fund’s own assumptions).
The level classification is based on the lowest level input that is significant to the fair valuation measurement. The valuation inputs are not necessarily an indication of the risks associated with investing in these securities or other financial instruments.
As of period end, the funds’ investment securities and other financial instruments were classified as Level 1. The Schedules of Investments provide additional information on the funds’ portfolio holdings.
7. Derivative Instruments
Equity Price Risk — The funds are subject to equity price risk in the normal course of pursuing its investment objectives. A fund may enter into futures contracts based on an equity index in order to manage its exposure to changes in market conditions. A fund may purchase futures contracts to gain exposure to increases in market value or sell futures contracts to protect against a decline in market value. Upon entering into a futures contract, a fund is required to deposit either cash or securities in an amount equal to a certain percentage of the contract value (initial margin). Subsequent payments (variation margin) are made or received daily, in cash, by a fund. The variation margin is equal to the daily change in the contract value and is recorded as unrealized gains and losses. A fund recognizes a realized gain or loss when the contract is closed or expires. Net realized and unrealized gains or losses occurring during the holding period of futures contracts are a component of net realized gain (loss) on futures contract transactions and change in net unrealized appreciation (depreciation) on futures contracts, respectively. One of the risks of entering into futures contracts is the possibility that the change in value of the contract may not correlate with the changes in value of the underlying securities.
The funds' average notional exposure to equity price risk derivative instruments held during the period were as follows:
| Futures Contracts Purchased | |||||
| Avantis U.S. Equity Fund | $771,210 | ||||
| Avantis U.S. Small Cap Value Fund | $773,680 | ||||
Value of Derivative Instruments as of August 31, 2022
| Asset Derivatives | Liability Derivatives | |||||||||||||
| Fund / Type of Risk Exposure | Location on Statement of Assets and Liabilities | Value | Location on Statement of Assets and Liabilities | Value | ||||||||||
| Avantis U.S. Equity Fund | ||||||||||||||
| Equity Price Risk | Receivable for variation margin on futures contracts* | — | Payable for variation margin on futures contracts* | $ | 4,650 | |||||||||
| Avantis U.S. Small Cap Value Fund | ||||||||||||||
| Equity Price Risk | Receivable for variation margin on futures contracts* | — | Payable for variation margin on futures contracts* | $ | 5,265 | |||||||||
*Included in the unrealized appreciation (depreciation) on futures contracts, as reported in the Schedule of Investments.
91
Effect of Derivative Instruments on the Statement of Operations for the Year Ended August 31, 2022
| Net Realized Gain (Loss) | Change in Net Unrealized Appreciation (Depreciation) | |||||||||||||
| Fund / Type of Risk Exposure | Location on Statement of Operations | Value | Location on Statement of Operations | Value | ||||||||||
| Avantis U.S. Equity Fund | ||||||||||||||
| Equity Price Risk | Net realized gain (loss) on futures contract transactions | $ | 15,092 | Change in net unrealized appreciation (depreciation) on futures contracts | $ | 12,187 | ||||||||
| Avantis U.S. Small Cap Value Fund | ||||||||||||||
| Equity Price Risk | Net realized gain (loss) on futures contract transactions | $ | (17,620) | Change in net unrealized appreciation (depreciation) on futures contracts | $ | (55,295) | ||||||||
8. Risk Factors
The value of the funds’ shares will go up and down, sometimes rapidly or unpredictably, based on the performance of the securities owned by the funds and other factors generally affecting the securities market. Market risks, including political, regulatory, economic and social developments, can affect the value of the funds’ investments. Natural disasters, public health emergencies, war, terrorism and other unforeseeable events may lead to increased market volatility and may have adverse long-term effects on world economies and markets generally.
Avantis U.S. Small Cap Value Fund invests in common stocks of small companies. Because of this, the fund may be subject to greater risk and market fluctuations than a fund investing in larger, more established companies.
9. Federal Tax Information
The tax character of distributions paid during the years ended August 31, 2022 and August 31, 2021 (except as noted) were as follows:
| 2022 | 2021 | |||||||||||||
| Distributions Paid From: | Distributions Paid From: | |||||||||||||
| Ordinary Income | Long-term Capital Gains | Ordinary Income | Long-term Capital Gains | |||||||||||
| Avantis U.S. Equity Fund | $ | 2,686,577 | $ | 442,088 | $ | 410,184 | $ | 140,074 | ||||||
Avantis U.S. Large Cap Value Fund(1) | — | — | N/A | N/A | ||||||||||
| Avantis U.S. Small Cap Value Fund | $ | 13,674,239 | $ | 5,132,669 | $ | 923,459 | $ | 24,989 | ||||||
(1)June 21, 2022 (fund inception) through August 31, 2022.
The book-basis character of distributions made during the year from net investment income or net realized gains may differ from their ultimate characterization for federal income tax purposes. These differences reflect the differing character of certain income items and net realized gains and losses for financial statement and tax purposes, and may result in reclassification among certain capital accounts on the financial statements.
92
As of period end, the federal tax cost of investments and the components of distributable earnings on a tax-basis were as follows:
| Avantis U.S. Equity Fund | Avantis U.S. Large Cap Value Fund | Avantis U.S. Small Cap Value Fund | |||||||||
| Federal tax cost of investments | $ | 374,082,584 | $ | 84,882,979 | $ | 339,883,313 | |||||
| Gross tax appreciation of investments | $ | 30,245,259 | $ | 569,066 | $ | 59,957,900 | |||||
| Gross tax depreciation of investments | (39,865,249) | (4,955,038) | (23,514,148) | ||||||||
| Net tax appreciation (depreciation) of investments | $ | (9,619,990) | $ | (4,385,972) | $ | 36,443,752 | |||||
| Undistributed ordinary income | $ | 3,704,390 | $ | 143,321 | $ | 3,792,779 | |||||
| Accumulated long-term gains | — | — | $ | 21,472,815 | |||||||
| Accumulated short-term capital losses | $ | (2,814,540) | — | — | |||||||
The difference between book-basis and tax-basis unrealized appreciation (depreciation) is attributable primarily to the tax deferral of losses on wash sales. The cost of investments for federal income tax purposes was the same as the cost for financial reporting purposes for Avantis U.S. Large Cap Value Fund.
Accumulated capital losses represent net capital loss carryovers that may be used to offset future realized capital gains for federal income tax purposes. The capital loss carryovers may be carried forward for an unlimited period. Future capital loss carryover utilization in any given year may be subject to Internal Revenue Code limitations.
93
| Financial Highlights | ||
| For a Share Outstanding Throughout the Years Ended August 31 (except as noted) | |||||||||||||||||||||||||||||||||||||||||||||||
| Per-Share Data | Ratios and Supplemental Data | ||||||||||||||||||||||||||||||||||||||||||||||
| Income From Investment Operations: | Distributions From: | Ratio to Average Net Assets of: | |||||||||||||||||||||||||||||||||||||||||||||
| Net Asset Value, Beginning of Period | Net Investment Income (Loss)(1) | Net Realized and Unrealized Gain (Loss) | Total From Investment Operations | Net Investment Income | Net Realized Gains | Total Distributions | Net Asset Value, End of Period | Total Return(2) | Operating Expenses | Operating Expenses (before expense waiver) | Net Investment Income (Loss) | Net Investment Income (Loss) (before expense waiver) | Portfolio Turnover Rate | Net Assets, End of Period (in thousands) | |||||||||||||||||||||||||||||||||
| Avantis U.S. Equity Fund | |||||||||||||||||||||||||||||||||||||||||||||||
| Institutional Class | |||||||||||||||||||||||||||||||||||||||||||||||
| 2022 | $14.93 | 0.22 | (1.78) | (1.56) | (0.10) | (0.04) | (0.14) | $13.23 | (10.57)% | 0.15% | 0.15% | 1.52% | 1.52% | 4% | $338,381 | ||||||||||||||||||||||||||||||||
| 2021 | $10.92 | 0.18 | 3.95 | 4.13 | (0.09) | (0.03) | (0.12) | $14.93 | 38.03% | 0.15% | 0.15% | 1.37% | 1.37% | 3% | $212,075 | ||||||||||||||||||||||||||||||||
2020(3) | $10.00 | 0.12 | 0.82 | 0.94 | (0.02) | — | (0.02) | $10.92 | 9.37% | 0.15%(4) | 0.15%(4) | 1.62%(4) | 1.62%(4) | 3% | $51,531 | ||||||||||||||||||||||||||||||||
| G Class | |||||||||||||||||||||||||||||||||||||||||||||||
| 2022 | $14.95 | 0.25 | (1.78) | (1.53) | (0.12) | (0.04) | (0.16) | $13.26 | (10.36)% | 0.00%(5) | 0.15% | 1.67% | 1.52% | 4% | $25,097 | ||||||||||||||||||||||||||||||||
2021(6) | $12.80 | 0.14 | 2.01 | 2.15 | — | — | — | $14.95 | 16.80% | 0.00%(4)(5) | 0.15%(4) | 1.55%(4) | 1.40%(4) | 3%(7) | $1,663 | ||||||||||||||||||||||||||||||||
| Notes to Financial Highlights | ||
(1)Computed using average shares outstanding throughout the period.
(2)Total returns are calculated based on the net asset value of the last business day. Total returns for periods less than one year are not annualized.
(3)December 4, 2019 (fund inception) through August 31, 2020.
(4)Annualized.
(5)Ratio was less than 0.005%.
(6)January 20, 2021 (commencement of sale) through August 31, 2021.
(7)Portfolio turnover is calculated at the fund level. Percentage indicated was calculated for the year ended August 31, 2021.
See Notes to Financial Statements.
| For a Share Outstanding Throughout the Period Indicated | ||||||||||||||||||||||||||||||||||||||
| Per-Share Data | Ratios and Supplemental Data | |||||||||||||||||||||||||||||||||||||
| Income From Investment Operations: | Ratio to Average Net Assets of: | |||||||||||||||||||||||||||||||||||||
| Net Asset Value, Beginning of Period | Net Investment Income (Loss)(1) | Net Realized and Unrealized Gain (Loss) | Total From Investment Operations | Net Asset Value, End of Period | Total Return(2) | Operating Expenses | Operating Expenses (before expense waiver) | Net Investment Income (Loss) | Net Investment Income (Loss) (before expense waiver) | Portfolio Turnover Rate | Net Assets, End of Period (in thousands) | |||||||||||||||||||||||||||
| Avantis U.S. Large Cap Value Fund | ||||||||||||||||||||||||||||||||||||||
| Institutional Class | ||||||||||||||||||||||||||||||||||||||
2022(3) | $10.00 | 0.08 | 0.40 | 0.48 | $10.48 | 4.80% | 0.15%(4) | 0.15%(4) | 3.59%(4) | 3.59%(4) | 0% | $80,581 | ||||||||||||||||||||||||||
| G Class | ||||||||||||||||||||||||||||||||||||||
2022(3) | $10.00 | 0.05 | 0.43 | 0.48 | $10.48 | 4.80% | 0.00%(4) | 0.15%(4) | 3.74%(4) | 3.59%(4) | 0% | $5 | ||||||||||||||||||||||||||
| Notes to Financial Highlights | ||
(1)Computed using average shares outstanding throughout the period.
(2)Total returns are calculated based on the net asset value of the last business day. Total returns for periods less than one year are not annualized.
(3)June 21, 2022 (fund inception) through August 31, 2022.
(4)Annualized.
See Notes to Financial Statements.
| For a Share Outstanding Throughout the Years Ended August 31 (except as noted) | |||||||||||||||||||||||||||||||||||||||||||||||
| Per-Share Data | Ratios and Supplemental Data | ||||||||||||||||||||||||||||||||||||||||||||||
| Income From Investment Operations: | Distributions From: | Ratio to Average Net Assets of: | |||||||||||||||||||||||||||||||||||||||||||||
| Net Asset Value, Beginning of Period | Net Investment Income (Loss)(1) | Net Realized and Unrealized Gain (Loss) | Total From Investment Operations | Net Investment Income | Net Realized Gains | Total Distributions | Net Asset Value, End of Period | Total Return(2) | Operating Expenses | Operating Expenses (before expense waiver) | Net Investment Income (Loss) | Net Investment Income (Loss) (before expense waiver) | Portfolio Turnover Rate | Net Assets, End of Period (in thousands) | |||||||||||||||||||||||||||||||||
| Avantis U.S. Small Cap Value Fund | |||||||||||||||||||||||||||||||||||||||||||||||
| Institutional Class | |||||||||||||||||||||||||||||||||||||||||||||||
| 2022 | $15.20 | 0.25 | (0.29) | (0.04) | (0.19) | (0.70) | (0.89) | $14.27 | (0.61)% | 0.25% | 0.25% | 1.70% | 1.70% | 45% | $368,198 | ||||||||||||||||||||||||||||||||
| 2021 | $9.03 | 0.24 | 6.01 | 6.25 | (0.08) | —(3) | (0.08) | $15.20 | 69.57% | 0.25% | 0.25% | 1.81% | 1.81% | 37% | $260,196 | ||||||||||||||||||||||||||||||||
2020(4) | $10.00 | 0.11 | (1.07) | (0.96) | (0.01) | — | (0.01) | $9.03 | (9.57)% | 0.25%(5) | 0.25%(5) | 1.89%(5) | 1.89%(5) | 4% | $79,338 | ||||||||||||||||||||||||||||||||
| G Class | |||||||||||||||||||||||||||||||||||||||||||||||
| 2022 | $15.22 | 0.28 | (0.28) | — | (0.23) | (0.70) | (0.93) | $14.29 | (0.37)% | 0.00%(6) | 0.25% | 1.95% | 1.70% | 45% | $2,304 | ||||||||||||||||||||||||||||||||
2021(7) | $12.82 | 0.18 | 2.22 | 2.40 | — | — | — | $15.22 | 18.72% | 0.00%(5)(6) | 0.25%(5) | 2.00%(5) | 1.75%(5) | 37%(8) | $161 | ||||||||||||||||||||||||||||||||
| Notes to Financial Highlights | ||
(1)Computed using average shares outstanding throughout the period.
(2)Total returns are calculated based on the net asset value of the last business day. Total returns for periods less than one year are not annualized.
(3)Per-share amount was less than $0.005.
(4)December 4, 2019 (fund inception) through August 31, 2020.
(5)Annualized.
(6)Ratio was less than 0.005%.
(7)January 20, 2021 (commencement of sale) through August 31, 2021.
(8)Portfolio turnover is calculated at the fund level. Percentage indicated was calculated for the year ended August 31, 2021.
See Notes to Financial Statements.
| Report of Independent Registered Public Accounting Firm | ||
To the Shareholders and the Board of Trustees of American Century ETF Trust:
Opinion on the Financial Statements and Financial Highlights
We have audited the accompanying statements of assets and liabilities, including the schedules of investments, of Avantis® U.S. Equity Fund, Avantis® U.S. Large Cap Value Fund, and Avantis® U.S. Small Cap Value Fund (the “Funds”), three of the funds constituting the American Century ETF Trust, as of August 31, 2022, the related statements of operations, statements of changes in net assets, and financial highlights for the periods indicated in the table below; and the related notes. In our opinion, the financial statements and financial highlights present fairly, in all material respects, the financial position of each of the Funds constituting American Century ETF Trust as of August 31, 2022, and the results of their operations, the changes in their net assets, and the financial highlights for the periods listed in the table below, in conformity with accounting principles generally accepted in the United States of America.
| Individual Fund Constituting the American Century ETF Trust | Statement of Operations | Statements of Changes in Net Assets | Financial Highlights | ||||||||
Avantis® U.S. Equity Fund | For the year ended August 31, 2022 | For the years ended August 31, 2022 and 2021 | For the years ended August 31, 2022, 2021 and the period from December 4, 2019 (fund inception) through August 31, 2020 | ||||||||
Avantis® U.S. Large Cap Value Fund | For the period June 21, 2022 (fund inception) through August 31, 2022 | ||||||||||
Avantis® U.S. Small Cap Value Fund | For the year ended August 31, 2022 | For the years ended August 31, 2022 and 2021 | For the years ended August 31, 2022, 2021 and the period from December 4, 2019 (fund inception) through August 31, 2020 | ||||||||
Basis for Opinion
These financial statements and financial highlights are the responsibility of the Funds’ management. Our responsibility is to express an opinion on the Funds’ financial statements and financial highlights based on our audits. We are a public accounting firm registered with the Public Company Accounting Oversight Board (United States) (PCAOB) and are required to be independent with respect to the Funds in accordance with the U.S. federal securities laws and the applicable rules and regulations of the Securities and Exchange Commission and the PCAOB.
We conducted our audits in accordance with the standards of the PCAOB. Those standards require that we plan and perform the audit to obtain reasonable assurance about whether the financial statements and financial highlights are free of material misstatement, whether due to error or fraud. The Funds are not required to have, nor were we engaged to perform, an audit of their internal control over financial reporting. As part of our audits, we are required to obtain an understanding of internal control over financial reporting but not for the purpose of expressing an opinion on the effectiveness of the Funds’ internal control over financial reporting. Accordingly, we express no such opinion.
97
Our audits included performing procedures to assess the risks of material misstatement of the financial statements and financial highlights, whether due to error or fraud, and performing procedures that respond to those risks. Such procedures included examining, on a test basis, evidence regarding the amounts and disclosures in the financial statements and financial highlights. Our audits also included evaluating the accounting principles used and significant estimates made by management, as well as evaluating the overall presentation of the financial statements and financial highlights. Our procedures included confirmation of securities owned as of August 31, 2022, by correspondence with the custodian and brokers; when replies were not received from brokers, we performed other auditing procedures. We believe that our audits provide a reasonable basis for our opinion.
/s/ Deloitte & Touche LLP
Kansas City, Missouri
October 17, 2022
We have served as the auditor of one or more American Century investment companies since 1997.
98
| Management | ||
The Board of Trustees
The individuals listed below serve as trustees of the funds. Each trustee will continue to serve in this capacity until death, retirement, resignation or removal from office. The board has adopted a mandatory retirement age for trustees who are not “interested persons,” as that term is defined in the Investment Company Act (independent trustees). Trustees who are not also officers of the trust shall retire on December 31st of the year in which they reach their 75th birthday.
Jonathan S. Thomas is an “interested person” because he currently serves as President and Chief Executive Officer of American Century Companies, Inc. (ACC), the parent company of American Century Investment Management, Inc. (ACIM or the advisor). The other trustees are independent. They are not employees, directors or officers of, and have no financial interest in, ACC or any of its wholly owned, direct or indirect, subsidiaries, including ACIM and American Century Services, LLC (ACS), and they do not have any other affiliations, positions or relationships that would cause them to be considered “interested persons” under the Investment Company Act. The following trustees also serve in this capacity for a number of other registered investment companies in the American Century Investments family of funds: Jonathan S. Thomas, 15; Jeremy I. Bulow, 8; and Stephen E. Yates, 7.
The following table presents additional information about the trustees. The mailing address for each trustee other than Jonathan S. Thomas is 330 Madison Avenue, New York, New York 10017. The mailing address for Jonathan S. Thomas is 4500 Main Street, Kansas City, Missouri 64111.
| Name (Year of Birth) | Position(s) Held with Funds | Length of Time Served | Principal Occupation(s) During Past 5 Years | Number of American Century Portfolios Overseen by Trustee | Other Directorships Held During Past 5 Years | ||||||||||||
| Independent Trustees | |||||||||||||||||
| Reginald M. Browne (1968) | Trustee and Chairman of the Board | Since 2017 (Chairman since 2019) | Principal, GTS Securities (automated capital markets trading firm)(2019 to present); Senior Managing Director, Co Global Head-ETF Group, Cantor Fitzgerald (financial services firm)(2013 to 2019) | 41 | None | ||||||||||||
| Jeremy I. Bulow (1954) | Trustee | Since 2022 | Professor of Economics, Stanford University Graduate School of Business (1979 to present) | 75 | None | ||||||||||||
| Barry A. Mendelson (1958) | Trustee | Since 2017 | Retired | 41 | None | ||||||||||||
| Stephen E. Yates (1948) | Trustee | Since 2017 | Retired | 105 | None | ||||||||||||
| Interested Trustees | |||||||||||||||||
| Jonathan S. Thomas (1963) | Trustee | Since 2017 | President and Chief Executive Officer, ACC (2007 to present). Also serves as Chief Executive Officer, ACS; Director, ACC and other ACC subsidiaries | 139 | None | ||||||||||||
The Statement of Additional Information has additional information about the funds' trustees and is available without charge, upon request, by calling 1-800-345-6488.
99
Officers
The following table presents certain information about the executive officers of the funds. Each officer, except Cleo Chang and Edward Rosenberg, serves as an officer for each of the 16 investment companies in the American Century family of funds. No officer is compensated for his or her service as an officer of the funds. The listed officers are interested persons of the funds and are appointed or re-appointed on an annual basis. The mailing address for each officer listed below is 4500 Main Street, Kansas City, Missouri 64111.
| Name (Year of Birth) | Offices with the Funds | Principal Occupation(s) During the Past Five Years | ||||||
| Patrick Bannigan (1965) | President since 2019 | Executive Vice President and Director, ACC (2012 to present); Chief Financial Officer, Chief Accounting Officer and Treasurer, ACC (2015 to present). Also serves as President, ACS; Vice President, ACIM; Chief Financial Officer, Chief Accounting Officer and/or Director, ACIM, ACS and other ACC subsidiaries | ||||||
| R. Wes Campbell (1974) | Chief Financial Officer and Treasurer since 2018 | Vice President, ACS (2020 to present); Investment Operations and Investment Accounting, ACS (2000 to present) | ||||||
| Amy D. Shelton (1964) | Chief Compliance Officer and Vice President since 2017 | Chief Compliance Officer, American Century funds, (2014 to present); Chief Compliance Officer, ACIM (2014 to present); Chief Compliance Officer, ACIS (2009 to present). Also serves as Vice President, ACIS | ||||||
| John Pak (1968) | General Counsel and Vice President since 2021 | General Counsel and Senior Vice President, ACC (2021 to present). Also serves as General Counsel and Senior Vice President, ACIM, ACS and ACIS. Chief Legal Officer of Investment and Wealth Management,The Bank of New York Mellon (2014 to 2021) | ||||||
| Cleo Chang (1977) | Vice President since 2019 | Senior Vice President, ACIM (2015 to present) | ||||||
| David H. Reinmiller (1963) | Vice President since 2017 | Attorney, ACC (1994 to present). Also serves as Vice President, ACIM and ACS | ||||||
| Edward Rosenberg (1973) | Vice President since 2017 | Senior Vice President, ACIM (2017 to present); Senior Vice President, Flexshares Head of ETF Capital Markets, Northern Trust (2012 to 2017) | ||||||
| C. Jean Wade (1964) | Vice President since 2017 | Senior Vice President, ACS (2017 to present); Vice President, ACS (2000 to 2017) | ||||||
| Ward D. Stauffer (1960) | Secretary since 2019 | Attorney, ACS (2003 to present) | ||||||
100
| Approval of Management Agreements | ||
Avantis U.S. Large Cap Value Fund
At a meeting held on March 2, 2022, the Fund's Board of Trustees (the "Board") unanimously approved the initial management agreement pursuant to which American Century Investment Management, Inc. (the “Advisor”) acts as the investment advisor for the Avantis U.S. Large Cap Value Fund (the "New Fund"). Under Section 15(c) of the of the Investment Company Act of 1940, new contracts for investment advisory services are required to be approved by a majority of a fund’s independent Trustees and to be evaluated on an annual basis thereafter.
In advance of the Board’s consideration, the Advisor provided information concerning the New Fund. The materials circulated and the discussions held detailed the investment objective and strategy proposed to be utilized by the Advisor, the New Fund's characteristics and key attributes, the rationale for launching the New Fund, the experience of the staff designated to manage the New Fund, the proposed pricing, and the markets in which the New Fund would be sold. The information considered and the discussions held included, but were not limited to:
•the nature, extent, and quality of investment management and other services to be provided to the New Fund;
•the wide range of other programs and services the Advisor would provide to the New Fund and its shareholders on a routine and non-routine basis;
•the New Fund’s proposed investment objective and strategy, including a discussion of its anticipated investment performance and proposed benchmark;
•the cost of owning the New Fund compared to the cost of owning similarly-managed funds;
•the Advisor’s compliance policies, procedures, and regulatory experience; and
•any collateral benefits derived by the Advisor from the management of the New Fund.
Part of the Board’s analysis of fee levels involves reviewing certain evaluative data compiled by an independent data provider and comparing the New Fund’s fee to the total expense ratio of expected peer funds. The annual management fees charged to shareholders of the New Fund was anticipated to be below the median of the total expense ratios of it's respective peer universe.
When considering the approval of the management agreement for the New Fund, the independent Trustees considered the entrepreneurial risk that the Advisor assumes in launching a new fund. In particular, they considered the fact that the Advisor will assume a substantial part of the start-up costs of the New Fund and the risk that the New Fund will not grow to a level that will become profitable to the Advisor. The Board considered the position that the New Fund would take in the lineup of the American Century Investments’ family of funds and the benefits to shareholders of existing funds of the broadened product offering. Finally, while not specifically discussed, but important in the decision to approve the management agreement, is the Trustees’ familiarity with the Advisor. A majority of the Board oversees and evaluates on a continuous basis the nature and quality of all services the Advisor performs for other funds within the American Century Investments’ complex. As such, the Trustees have confidence in the Advisor’s integrity and competence in providing services to the New Fund.
The independent Trustees considered all of the information provided by the Advisor and the independent Trustees’ independent counsel in connection with the approval, and evaluated such information for the New Fund. In connection with their review, the Trustees did not identify any single factor as being all-important or controlling, and each Trustee may have attributed different levels of importance to different factors. The independent Trustees concluded that the overall arrangements between the New Fund and the Advisor, as provided in the management agreement, were fair and reasonable in light of the services to be provided and should be approved.
101
Avantis U.S. Equity Fund
Avantis U.S. Small Cap Value Fund
At a meeting held on June 2, 2022, the Funds’ Board of Trustees (the "Board") unanimously approved the renewal of the management agreement pursuant to which American Century Investment Management, Inc. (the “Advisor”) acts as the investment advisor for Avantis U.S. Equity Fund and Avantis U.S. Small Cap Value Fund (collectively the "Existing Funds"). Under Section 15(c) of the Investment Company Act of 1940 (the “Investment Company Act”), contracts for investment advisory services are required to be reviewed, evaluated, and approved by a majority of a fund’s Trustees, including a majority of the independent Trustees, each year.
Prior to its consideration of the management agreement renewal, the Trustees requested and reviewed extensive data and information compiled by the Advisor and certain independent data providers concerning the Existing Funds. This review was in addition to the oversight and evaluation undertaken by the Board and its Audit Committee on a continual basis and the information received was supplemental to the extensive information that the Board and its Audit Committee receive and consider throughout the year.
In connection with its consideration of the management agreement renewal, the Board’s review and evaluation of the services provided by the Advisor included, but was not limited to, the following:
•the nature, extent, and quality of investment management, shareholder services, and other services provided and to be provided to each Existing Fund including without limitation portfolio management and trading services, shareholder and intermediary services, compliance and legal services, fund accounting and financial reporting, and fund share distribution;
•the wide range of other programs and services provided to each Existing Fund and its shareholders on a routine and non-routine basis;
•the investment performance of each Existing Fund, including data comparing each Existing Fund's performance to an appropriate benchmark and/or a peer group of other funds with similar investment objectives and strategies;
•the cost of owning each Existing Fund compared to the cost of owning similarly-managed funds;
•the compliance policies, procedures, and regulatory experience of the Advisor and the Existing Funds’ service providers;
•the Advisor’s strategic plans, generally, and with respect to the ongoing impact of the COVID-19 pandemic response, heightened areas of interest in the mutual fund industry and recent geopolitical issues;
•the Advisor’s business continuity plans, vendor management practices, and cyber security practices;
•financial data showing the cost of services provided to each Existing Fund, the profitability of each Existing Fund to the Advisor, and the overall profitability of the Advisor;
•information regarding payments to intermediaries by the Advisor;
•possible economies of scale associated with the Advisor’s management of each Existing Fund; and
•possible collateral benefits to the Advisor from the management of the Existing Funds.
The independent Trustees met separately in private session to discuss the renewal and to review and discuss the information provided in response to their request. The independent Trustees also held active discussions with the Advisor regarding the renewal of the management agreement. The independent Trustees had the benefit of the advice of their independent counsel throughout the process.
102
Factors Considered
The Trustees considered all of the information provided by the Advisor, the independent data providers, and independent counsel in connection with the approval. They determined that the information was sufficient for them to evaluate the management agreement for the Existing Funds. In connection with their review, the Trustees did not identify any single factor as being all-important or controlling, and each Trustee may have attributed different levels of importance to different factors. In deciding to renew the management agreement, the Board based its decision on a number of factors, including without limitation the following:
Nature, Extent and Quality of Services — Generally. Under each Existing Fund’s management agreement, the Advisor is responsible for providing or arranging for all services necessary for the operation of each Existing Fund. The Board noted that the Advisor provides or arranges at its own expense a wide variety of services which include the following:
•constructing and designing each Existing Fund
•portfolio research and security selection
•initial capitalization/funding
•securities trading
•Existing Fund administration
•custody of Existing Fund assets
•daily valuation of each Existing Fund’s portfolio
•liquidity monitoring and management
•risk management, including cyber security
•shareholder servicing and transfer agency, including shareholder confirmations, recordkeeping, and communications
•legal services (except the independent Trustees’ counsel)
•regulatory and portfolio compliance
•financial reporting
•marketing and distribution (except amounts paid by each Existing Fund under Rule 12b-1 plans)
Investment Management Services. The nature of the investment management services provided to the Existing Funds is quite complex and allows Existing Fund shareholders access to professional money management, instant diversification of their investments within an asset class, and liquidity. In evaluating investment performance, the Board expects the Advisor to manage each Existing Fund in accordance with its investment objectives and principal investment strategies. Further, the Trustees recognize that the Advisor has an obligation to monitor trading activities, and in particular to seek the best execution of fund trades, and to evaluate the use of and payment for research. In providing these services, the Advisor utilizes teams of investment professionals (portfolio managers, analysts, research assistants, and securities traders) who require extensive information technology, research, training, compliance, and other systems to conduct their business. The Board provides oversight of the investment performance process. It regularly reviews investment performance information for each Existing Fund, together with comparative information for appropriate benchmarks over different time horizons. The Trustees also review investment performance information during the management agreement renewal process. If performance concerns are identified, the Board discusses with the Advisor the reasons for such results and any actions being taken to improve performance. The performance for Avantis U.S. Equity Fund and Avantis U.S. Small Cap Value Fund was above each Existing Fund’s respective benchmark for the one-year period reviewed by the Board. The Board found the investment management services provided by the Advisor to each Existing Fund to be satisfactory and consistent with the management agreement.
Shareholder and Other Services. Under the management agreement, the Advisor provides or arranges for a comprehensive package of services to the Existing Funds. The Board, directly and through its Audit Committee, regularly reviews reports and evaluations of such services at its regular meetings. These reports include, but are not limited to, information regarding the
103
operational efficiency and accuracy of the shareholder and transfer agency services provided, staffing levels, shareholder satisfaction, technology support (including cyber security), new products and services offered to Existing Fund shareholders, securities trading activities, portfolio valuation services, auditing services, and legal and operational compliance activities. The Board found the services provided by the Advisor to each Existing Fund under the management agreement to be competitive and of high quality.
Costs of Services and Profitability. The Advisor provides detailed information concerning its cost of providing various services to the Existing Funds, its profitability in managing each Existing Fund (pre- and post-distribution), its overall profitability, and its financial condition. The Trustees have reviewed with the Advisor the methodology used to prepare this financial information. This information is considered in evaluating the Advisor’s financial condition, its ability to continue to provide services under the management agreement, and the reasonableness of the current management fee. The Board concluded that the Advisor’s profits were reasonable in light of the services provided to the Existing Funds.
Ethics. The Board generally considers the Advisor’s commitment to providing quality services to the Existing Funds and to conducting its business ethically. They noted that the Advisor’s practices generally meet or exceed industry best practices.
Economies of Scale. The Board also reviewed information provided by the Advisor regarding the possible existence of economies of scale in connection with the management of each Existing Fund. The Board concluded that economies of scale are difficult to measure and predict with precision, especially on a fund-by-fund basis. The Board concluded that the Advisor is sharing economies of scale, to the extent they exist, through its fee structure and through reinvestment in its business, infrastructure, investment capabilities and initiatives to provide shareholders additional content and services.
Comparison to Other Funds’ Fees. The management agreement provides that each Existing Fund pays the Advisor a single, all-inclusive (or unified) management fee for providing all services necessary for the management and operation of the Existing Fund, other than securities transaction expenses, taxes, interest, extraordinary expenses, and expenses incurred in connection with the provision of shareholder services and distribution services under a plan adopted pursuant to Rule 12b-1 under the Investment Company Act. Under the unified fee structure, the Advisor is responsible for providing all investment advisory, custody, audit, administrative, compliance, recordkeeping, marketing and shareholder services, or arranging and supervising third parties to provide such services. The Board believes the unified fee structure is a benefit to Existing Fund shareholders because it clearly discloses to shareholders the cost of owning Existing Fund shares, and, since the unified fee cannot be increased without a vote of Existing Fund shareholders, it shifts to the Advisor the risk of increased costs of operating the Existing Fund and provides a direct incentive to minimize administrative inefficiencies. Part of the Board’s analysis of fee levels involves reviewing certain evaluative data compiled by an independent provider comparing the Existing Fund’s unified fee to the total expense ratios of its peers. The unified fee charged to shareholders of Avantis U.S. Equity Fund and Avantis U.S. Small Cap Value Fund was the lowest of the total expense ratios of their respective peer expense universe and was the lowest of their peer expense group. The Board concluded that the management fee paid by each Existing Fund to the Advisor under its management agreement is reasonable in light of the services provided to the Existing Fund.
Comparison to Fees and Services Provided to Other Clients of the Advisor. The Board also requested and received information from the Advisor concerning the nature of the services, fees, costs, and profitability of its advisory services to funds or other advisory clients managed similarly to the Existing Funds. They observed that these varying types of client accounts require different services and involve different regulatory and entrepreneurial risks than the management of the Existing Funds. The Board analyzed this information and concluded that the fees charged and services provided to the Existing Funds were reasonable by comparison.
104
Payments to Intermediaries. The Trustees also requested and received a description of payments made to intermediaries by each Existing Fund and the Advisor and services provided in response thereto. These payments could include various payments made by each Existing Fund or the Advisor to different types of intermediaries and recordkeepers for distribution and service activities provided for each Existing Fund. The Trustees reviewed such information and received representations from the Advisor that all such payments by the Advisor were made from the Advisor’s resources and reasonable profits.
Collateral or “Fall-Out” Benefits Derived by the Advisor. The Board considered the possible existence of collateral benefits the Advisor may receive as a result of its relationship with the Existing Funds. They concluded that the Advisor’s primary business is managing funds and it generally does not use fund or shareholder information to generate profits in other lines of business, and therefore does not derive any significant collateral benefits from them. The Board noted that additional assets from other clients may offer the Advisor some benefit from increased leverage with service providers and counterparties. The Board also determined that the Advisor is able to provide investment management services to certain clients other than the Existing Funds, at least in part, due to its existing infrastructure built to serve the fund complex. The Board concluded that appropriate allocation methodologies had been employed to assign resources and the cost of those resources to these other clients.
Existing Relationship. The Board also considered whether there was any reason for not continuing the existing arrangement with the Advisor. In this regard, the Board was mindful of the potential disruptions of the Existing Funds’ operations and various risks, uncertainties, and other effects that could occur as a result of a decision not to continue such relationship. In particular, the Board recognized that most shareholders have invested in each Existing Fund on the strength of the Advisor’s industry standing and reputation and in the expectation that the Advisor will have a continuing role in providing advisory services to each Existing Fund.
Conclusion of the Trustees. As a result of this process, the Board, including all of the independent Trustees, taking into account all of the factors discussed above and the information provided by the Advisor and others in connection with its review and throughout the year, determined that the terms of the management fee are fair and reasonable and that the management fee charged to each Existing Fund is fair in light of the services provided and that the investment management agreement between each Existing Fund and the Advisor should be renewed for an additional one-year period.
105
| Liquidity Risk Management Program | ||
The Funds have adopted a liquidity risk management program (the “program”). The Funds' Board of Trustees (the "Board") has designated American Century Investment Management, Inc. (“ACIM”) as the administrator of the program. Personnel of ACIM or its affiliates conduct the day-to-day operation of the program pursuant to policies and procedures administered by the Program Administrator, including members of ACIM’s Investment Oversight Committee who are members of the ACIM’s Investment Management and Global Analytics departments.
Under the program, ACIM manages the Funds' liquidity risk, which is the risk that the Funds could not meet shareholder redemption requests without significant dilution of remaining shareholders’ interests in the Funds. This risk is managed by monitoring the degree of liquidity of the Funds' investments, limiting the amount of the Funds' illiquid investments, and utilizing various risk management tools and facilities available to the Funds for meeting shareholder redemptions, among other means. ACIM’s process of determining the degree of liquidity of certain Funds' investments is supported by a third-party liquidity assessment vendor.
The Board reviewed a report prepared by ACIM regarding the operation and effectiveness of the program for the period January 1, 2021 through December 31, 2021. No significant liquidity events impacting the Funds were noted in the report. In addition, ACIM provided its assessment that the program had been effective in managing the Funds' liquidity risk.
106
| Additional Information | ||
Retirement Account Information
As required by law, distributions you receive from certain retirement accounts are subject to federal income tax withholding, unless you elect not to have withholding apply*. Tax will be withheld on the total amount withdrawn even though you may be receiving amounts that are not subject to withholding, such as nondeductible contributions. In such case, excess amounts of withholding could occur. You may adjust your withholding election so that a greater or lesser amount will be withheld.
If you don’t want us to withhold on this amount, you must notify us to not withhold the federal income tax. You may notify us in writing or in certain situations by telephone or through other electronic means. For systematic withdrawals, your withholding election will remain in effect until revoked or changed by filing a new election. You have the right to revoke your election at any time and change your withholding percentage for future distributions.
Remember, even if you elect not to have income tax withheld, you are liable for paying income tax on the taxable portion of your withdrawal. If you elect not to have income tax withheld or you don’t have enough income tax withheld, you may be responsible for payment of estimated tax. You may incur penalties under the estimated tax rules if your withholding and estimated tax payments are not sufficient. You can reduce or defer the income tax on a distribution by directly or indirectly rolling such distribution over to another IRA or eligible plan. You should consult your tax advisor for additional information.
State tax will be withheld if, at the time of your distribution, your address is within one of the mandatory withholding states and you have federal income tax withheld (or as otherwise required by state law). State taxes will be withheld from your distribution in accordance with the respective state rules.
*Some 403(b), 457 and qualified retirement plan distributions may be subject to 20% mandatory withholding, as they are subject to special tax and withholding rules. Your plan administrator or plan sponsor is required to provide you with a special tax notice explaining those rules at the time you request a distribution. If applicable, federal and/or state taxes may be withheld from your distribution amount.
Proxy Voting Policies
A description of the policies that the funds' investment advisor uses in exercising the voting rights associated with the securities purchased and/or held by the funds is available without charge, upon request, by calling 1-800-345-6488. It is also available on American Century Investments’ website at americancentury.com/proxy and on the Securities and Exchange Commission’s website at sec.gov. Information regarding how the investment advisor voted proxies relating to portfolio securities during the most recent 12-month period ended June 30 is available at americancentury.com/proxy. It is also available at sec.gov.
Quarterly Portfolio Disclosure
The funds file their complete schedule of portfolio holdings with the Securities and Exchange Commission (SEC) for the first and third quarters of each fiscal year as an exhibit to their reports on Form N-PORT. The funds' Form N-PORT reports are available on the SEC’s website at sec.gov.
107
Other Tax Information
The following information is provided pursuant to provisions of the Internal Revenue Code.
Avantis U.S. Equity Fund and Avantis U.S. Small Cap Value Fund hereby designate up to the maximum amount allowable as qualified dividend income for the fiscal year ended August 31, 2022.
For corporate taxpayers, the funds hereby designate the following, or up to the maximum amount allowable, of ordinary income distributions paid during the fiscal year ended August 31, 2022 as qualified for the corporate dividends received deduction.
| Avantis U.S. Equity Fund | Avantis U.S. Large Cap Value Fund | Avantis U.S. Small Cap Value Fund | ||||||
| $2,447,964 | — | $3,248,766 | ||||||
The funds hereby designate the following, or up to the maximum amount allowable, as long-term capital gain distributions (20% rate gain distributions) for the fiscal year ended August 31, 2022.
| Avantis U.S. Equity Fund | Avantis U.S. Large Cap Value Fund | Avantis U.S. Small Cap Value Fund | ||||||
| $442,088 | — | $7,483,465 | ||||||
The funds hereby designate the following as qualified short-term capital gain distributions for purposes of Internal Revenue Code Section 871 for the fiscal year ended August 31, 2022.
| Avantis U.S. Equity Fund | Avantis U.S. Large Cap Value Fund | Avantis U.S. Small Cap Value Fund | ||||||
| $317,269 | — | $9,626,779 | ||||||
The funds hereby utilized earnings and profits distributed to shareholders on redemption of shares as part of the dividend paid deduction (tax equalization) for the fiscal year ended August 31, 2022.
| Avantis U.S. Equity Fund | Avantis U.S. Large Cap Value Fund | Avantis U.S. Small Cap Value Fund | ||||||
| — | — | $2,939,930 | ||||||
108
| ||||||||
| Contact Us | avantisinvestors.com | |||||||
| American Century Sales Representatives, Financial Professionals, Broker Dealers, Insurance Companies, Banks and Trust Companies | 1-833-928-2684 | |||||||
| Telecommunications Relay Service for the Deaf | 711 | |||||||
| American Century ETF Trust | ||||||||
Investment Advisor: American Century Investment Management, Inc. Kansas City, Missouri | ||||||||
| This report and the statements it contains are submitted for the general information of our shareholders. The report is not authorized for distribution to prospective investors unless preceded or accompanied by an effective prospectus. | ||||||||
| ©2022 American Century Proprietary Holdings, Inc. All rights reserved. CL-ANN-97500 2210 | ||||||||
| Annual Report | |||||
| August 31, 2022 | |||||
Avantis® Emerging Markets Equity Fund | |||||
| Institutional Class (AVEEX) | |||||
| G Class (AVENX) | |||||
Avantis® International Equity Fund | |||||
| Institutional Class (AVDEX) | |||||
| G Class (AVDNX) | |||||
Avantis® International Small Cap Value Fund | |||||
| Institutional Class (AVDVX) | |||||
| G Class (AVANX) | |||||
| Table of Contents | ||
| Chairman’s Letter | |||||
| Avantis Emerging Markets Equity Fund | |||||
| Performance | |||||
| Portfolio Commentary | |||||
| Fund Characteristics | |||||
| Avantis International Equity Fund | |||||
| Performance | |||||
| Portfolio Commentary | |||||
| Fund Characteristics | |||||
| Avantis International Small Cap Value Fund | |||||
| Performance | |||||
| Portfolio Commentary | |||||
| Fund Characteristics | |||||
| Shareholder Fee Examples | |||||
| Schedules of Investments | |||||
| Statements of Assets and Liabilities | |||||
| Statements of Operations | |||||
| Statements of Changes in Net Assets | |||||
| Notes to Financial Statements | |||||
| Financial Highlights | |||||
| Report of Independent Registered Public Accounting Firm | |||||
| Management | |||||
| Approval of Management Agreement | |||||
| Liquidity Risk Management Program | |||||
| Additional Information | |||||
Any opinions expressed in this report reflect those of the author as of the date of the report, and do not necessarily represent the opinions of American Century Investments® or any other person in the American Century Investments organization. Any such opinions are subject to change at any time based upon market or other conditions and American Century Investments disclaims any responsibility to update such opinions. These opinions may not be relied upon as investment advice and, because investment decisions made by American Century Investments funds are based on numerous factors, may not be relied upon as an indication of trading intent on behalf of any American Century Investments fund. Security examples are used for representational purposes only and are not intended as recommendations to purchase or sell securities. Performance information for comparative indices and securities is provided to American Century Investments by third party vendors. To the best of American Century Investments’ knowledge, such information is accurate at the time of printing.
| Chairman's Letter | ||
Jonathan ThomasDear Investor:
Thank you for reviewing this annual report for the period ended August 31, 2022. Annual reports
help convey important information about fund returns, including market factors that affected
performance. For additional investment insights, please visit avantisinvestors.com.
Mounting Market Challenges Hampered Performance
Asset class performance weakened dramatically during the funds’ fiscal year. In late 2021,
generally upbeat economic activity and corporate earnings supported gains for most U.S. and
global stock indices. Returns generally remained positive despite rapidly rising inflation and waning
central bank support—factors that had started to weigh on fixed-income indices.
By early 2022, the market climate shifted quickly. Inflation, which was already at multiyear highs,
rose to levels last seen in the early 1980s. Massive fiscal and monetary support unleashed during
the pandemic was partly to blame. In addition, escalating energy prices, supply chain breakdowns
and labor market shortages further aggravated inflation in the U.S. and other developed markets.
Russia’s invasion of Ukraine in February also exacerbated global inflationary pressures.
The Bank of England launched its inflation-fighting campaign in December and continued to lift
rates through period-end. The Federal Reserve responded to surging inflation in March, launching
an aggressive rate-hike campaign and ending its asset purchase program. Policymakers indicated
taming inflation remains their priority, even as the U.S. economy contracted in 2022’s first two
quarters. Facing record-high inflation in the eurozone, the European Central Bank in July embarked
on its first rate-hike effort in 11 years.
The combination of sharply elevated inflation, tighter monetary policy, geopolitical strife and weak
economies triggered sharp market volatility and fueled global recession fears. Against this
backdrop, most U.S. and global stock and bond indices declined sharply for the reporting period.
Staying Disciplined in Uncertain Times
We expect market volatility to linger as investors navigate a complex environment of high inflation,
rising interest rates and economic uncertainty. In addition, Russia’s invasion of Ukraine
complicates an increasingly tense geopolitical backdrop and threatens Europe’s winter energy
supply. We will continue to monitor the broad backdrop and its influence on financial markets.
We appreciate your confidence in us during these extraordinary times. Our firm has a long history
of helping clients weather unpredictable markets, and we’re confident we will continue to meet
today’s challenges.
Sincerely,
Jonathan Thomas
Chairman
Avantis Investors
2
| Performance | ||
| Avantis Emerging Markets Equity Fund | ||||||||||||||||||||||||||
| Total Returns as of August 31, 2022 | Average Annual Returns | |||||||||||||||||||||||||
| Ticker Symbol | 1 year | Since Inception | Inception Date | |||||||||||||||||||||||
| Institutional Class | AVEEX | -20.98% | 2.65% | 12/4/2019 | ||||||||||||||||||||||
| MSCI Emerging Markets IMI Index | — | -21.15% | 1.85% | — | ||||||||||||||||||||||
| G Class | AVENX | -20.69% | -12.51% | 1/20/2021 | ||||||||||||||||||||||
G Class returns would have been lower if a portion of the fees had not been waived.
| Growth of $10,000 Over Life of Class | ||
| $10,000 investment made December 4, 2019 | ||
Performance for other share classes will vary due to differences in fee structure.
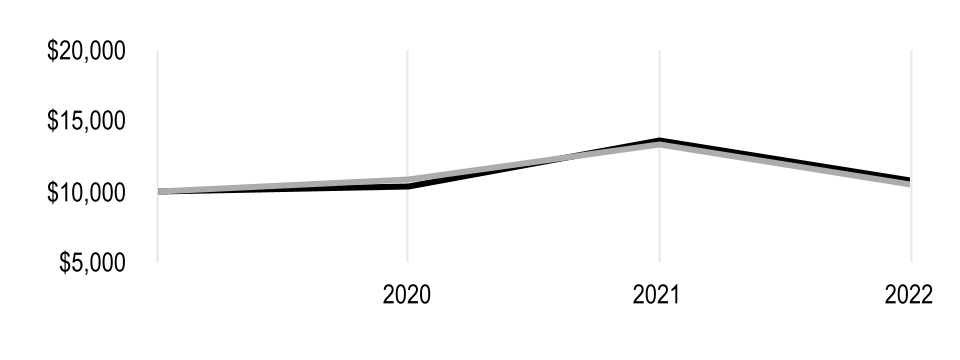
| Value on August 31, 2022 | |||||
| Institutional Class — $10,744 | |||||
| MSCI Emerging Markets IMI Index — $10,516 | |||||
| Total Annual Fund Operating Expenses | |||||
| Institutional Class | G Class | ||||
| 0.33% | 0.33% | ||||
The total annual fund operating expenses shown is as stated in the fund’s prospectus current as of the date of this report. The prospectus may vary from the expense ratio shown elsewhere in this report because it is based on a different time period, includes acquired fund fees and expenses, and, if applicable, does not include fee waivers or expense reimbursements.
Data presented reflect past performance. Past performance is no guarantee of future results. Current performance may be higher or lower than the performance shown. Total returns for periods less than one year are not annualized. Investment return and principal value will fluctuate, and redemption value may be more or less than original cost. Data assumes reinvestment of dividends and capital gains, and none of the charts reflect the deduction of taxes that a shareholder would pay on fund distributions or the redemption of fund shares. To obtain performance data current to the most recent month end, please call 1-833-928-2684 or visit avantisinvestors.com. For additional information about the funds, please consult the prospectus.
3
| Portfolio Commentary | ||
Portfolio Managers: Eduardo Repetto, Mitch Firestein, Daniel Ong and Ted Randall
Fund Strategy
Avantis Emerging Markets Equity seeks long-term capital appreciation by investing in a diverse group of companies related to emerging markets across market sectors, industry groups, countries and market capitalizations.
The fund seeks securities of companies that it expects to have higher returns. It places an enhanced emphasis on securities of companies with smaller market capitalizations and securities of companies it defines as high profitability or value companies. Conversely, the fund seeks to underweight or exclude securities it expects to have lower returns. These include securities of large companies with lower levels of profitability and higher prices relative to their book values or other financial metrics. Under normal market conditions, the fund will invest at least 80% of its assets in equity securities of companies related to emerging markets countries.
The portfolio managers continually analyze market and financial data to make buy, sell and hold decisions. When buying or selling a security, the portfolio managers may consider the trade-off between expected returns of the security and implementation or tax costs of the trade. They do this in an attempt to gain trading efficiencies, avoid unnecessary risk and enhance fund performance.
Performance Review
For the 12-month period ended August 31, 2022, Avantis Emerging Markets Equity returned -20.98%.* For the same period, the fund’s benchmark, the MSCI Emerging Markets IMI Index, returned -21.15%. The index is an unmanaged portfolio generally representative of the performance of emerging markets stocks across capitalization categories. Fund returns reflect fees and operating expenses, while index returns do not.
The fund’s outperformance versus the index was due to the fund’s emphasis on companies with higher levels of profitability and lower prices relative to their book values. These value-oriented companies generally outperformed companies with growth characteristics, including lower levels of profitability and higher prices relative to their book values. The fund’s underweight to growth-oriented companies also boosted relative performance.
Value stocks, as measured by the MSCI Emerging Markets IMI Value Index, returned -16.99% for the period. Growth stocks, as measured by the MSCI Emerging Markets IMI Growth Index, lagged their value-style counterparts, returning -24.94%.
*All fund returns referenced in this commentary are for Institutional Class shares. Performance for other share classes will vary due to differences in fee structure; when Institutional Class performance exceeds that of the fund’s benchmark, other share classes may not. See page 3 for returns for all share classes.
4
| Fund Characteristics | ||
| AUGUST 31, 2022 | |||||
| Avantis Emerging Markets Equity Fund | |||||
| Types of Investments in Portfolio | % of net assets | ||||
| Common Stocks | 99.4% | ||||
| Warrants | —* | ||||
| Corporate Bonds | —* | ||||
| Rights | —* | ||||
| Short-Term Investments | 2.6% | ||||
| Other Assets and Liabilities | (2.0)% | ||||
| *Category is less than 0.05% of total net assets. | |||||
| Top Five Countries | % of net assets | ||||
| China | 28.7% | ||||
| India | 17.4% | ||||
| Taiwan | 17.1% | ||||
| South Korea | 13.2% | ||||
| Brazil | 6.2% | ||||
5
| Performance | ||
| Avantis International Equity Fund | ||||||||||||||||||||||||||
| Total Returns as of August 31, 2022 | Average Annual Returns | |||||||||||||||||||||||||
| Ticker Symbol | 1 year | Since Inception | Inception Date | |||||||||||||||||||||||
| Institutional Class | AVDEX | -18.92% | 1.19% | 12/4/2019 | ||||||||||||||||||||||
| MSCI World ex-USA IMI Index | — | -19.49% | 0.71% | — | ||||||||||||||||||||||
| G Class | AVDNX | -18.72% | -6.55% | 1/20/2021 | ||||||||||||||||||||||
G Class returns would have been lower if a portion of the fees had not been waived.
| Growth of $10,000 Over Life of Class | ||
| $10,000 investment made December 4, 2019 | ||
Performance for other share classes will vary due to differences in fee structure.
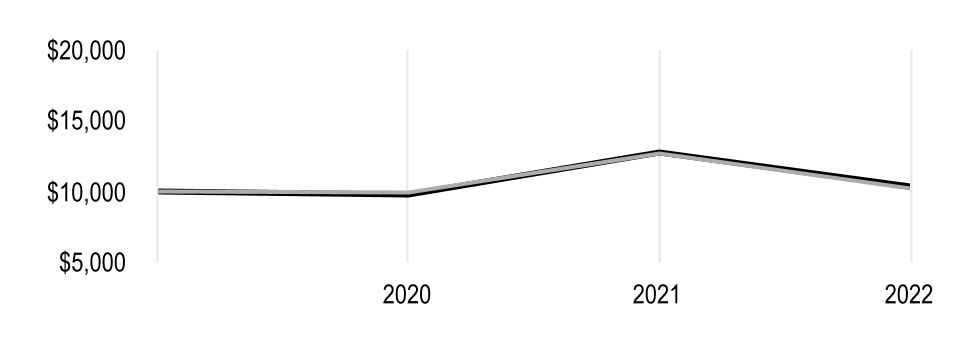
| Value on August 31, 2022 | |||||
| Institutional Class — $10,329 | |||||
| MSCI World ex-USA IMI Index — $10,197 | |||||
| Total Annual Fund Operating Expenses | |||||
| Institutional Class | G Class | ||||
| 0.23% | 0.23% | ||||
The total annual fund operating expenses shown is as stated in the fund’s prospectus current as of the date of this report. The prospectus may vary from the expense ratio shown elsewhere in this report because it is based on a different time period, includes acquired fund fees and expenses, and, if applicable, does not include fee waivers or expense reimbursements.
Data presented reflect past performance. Past performance is no guarantee of future results. Current performance may be higher or lower than the performance shown. Total returns for periods less than one year are not annualized. Investment return and principal value will fluctuate, and redemption value may be more or less than original cost. Data assumes reinvestment of dividends and capital gains, and none of the charts reflect the deduction of taxes that a shareholder would pay on fund distributions or the redemption of fund shares. To obtain performance data current to the most recent month end, please call 1-833-928-2684 or visit avantisinvestors.com. For additional information about the funds, please consult the prospectus.
6
| Portfolio Commentary | ||
Portfolio Managers: Eduardo Repetto, Mitch Firestein, Daniel Ong and Ted Randall
Fund Strategy
Avantis International Equity seeks long-term capital appreciation by investing in a diverse group of non-U.S. companies across countries, market sectors, industry groups and market capitalizations.
The fund seeks securities of companies that it expects to have higher returns. It places an emphasis on the security weights of companies with smaller market capitalizations and securities of companies it defines as high profitability or value companies. Conversely, the fund seeks to underweight or exclude securities it expects to have lower returns. These include securities of large companies with lower levels of profitability and higher prices relative to their book values or other financial metrics. Under normal market conditions, the fund will invest at least 80% of its assets in equity securities.
The portfolio managers continually analyze market and financial data to make buy, sell and hold decisions. When buying or selling a security, the portfolio managers may consider the trade-off between expected returns of the security and implementation or tax costs of the trade. They do this in an attempt to gain trading efficiencies, avoid unnecessary risk and enhance fund performance.
Performance Review
For the 12-month period ended August 31, 2022, Avantis International Equity returned -18.92%.* For the same period, the fund’s benchmark, the MSCI World ex-USA IMI Index, returned -19.49%. The index is an unmanaged portfolio generally representative of the performance of non-U.S. developed markets stocks across capitalization categories. Fund returns reflect fees and operating expenses, while index returns do not.
The fund’s outperformance versus the index was largely due to the fund’s emphasis on companies with higher levels of profitability and lower prices relative to their book values, or more value-oriented companies. These companies generally outperformed companies with lower levels of profitability and higher prices relative to their book value, or growth-oriented companies. The fund’s underweight to growth-oriented companies also aided relative results.
Value stocks, as measured by the MSCI World ex-USA IMI Value Index, returned -13.09% for the reporting period. These securities outperformed growth stocks, which returned -25.91%, according to the MSCI World ex-USA IMI Growth Index.
*All fund returns referenced in this commentary are for Institutional Class shares. Performance for other share classes will vary due to differences in fee structure; when Institutional Class performance exceeds that of the fund’s benchmark, other share classes may not. See page 6 for returns for all share classes.
7
| Fund Characteristics | ||
| AUGUST 31, 2022 | |||||
| Avantis International Equity Fund | |||||
| Types of Investments in Portfolio | % of net assets | ||||
| Common Stocks | 98.5% | ||||
| Rights | —* | ||||
| Warrants | —* | ||||
| Short-Term Investments | 6.4% | ||||
| Other Assets and Liabilities | (4.9)% | ||||
| *Category is less than 0.05% of total net assets. | |||||
| Top Five Countries | % of net assets | ||||
| Japan | 20.9% | ||||
| United Kingdom | 13.5% | ||||
| Canada | 11.2% | ||||
| France | 8.8% | ||||
| Switzerland | 8.4% | ||||
8
| Performance | ||||||||||||||||||||||||||
| Avantis International Small Cap Value Fund | ||||||||||||||||||||||||||
| Total Returns as of August 31, 2022 | Average Annual Returns | |||||||||||||||||||||||||
| Ticker Symbol | 1 year | Since Inception | Inception Date | |||||||||||||||||||||||
| Institutional Class | AVDVX | -16.31% | 3.06% | 12/4/2019 | ||||||||||||||||||||||
| MSCI World ex-USA Small Cap Index | — | -24.53% | 0.64% | — | ||||||||||||||||||||||
| G Class | AVANX | -15.92% | -3.17% | 1/20/2021 | ||||||||||||||||||||||
| Growth of $10,000 Over Life of Class | ||
| $10,000 investment made December 4, 2019 | ||
Performance for other share classes will vary due to differences in fee structure.
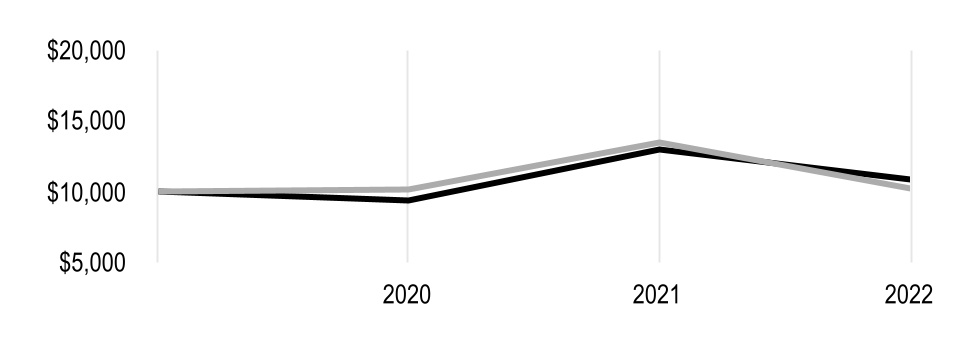
| Value on August 31, 2022 | |||||
| Institutional Class — $10,863 | |||||
| MSCI World ex-USA Small Cap Index — $10,175 | |||||
| Total Annual Fund Operating Expenses | |||||
| Institutional Class | G Class | ||||
| 0.36% | 0.36% | ||||
The total annual fund operating expenses shown is as stated in the fund’s prospectus current as of the date of this report. The prospectus may vary from the expense ratio shown elsewhere in this report because it is based on a different time period, includes acquired fund fees and expenses, and, if applicable, does not include fee waivers or expense reimbursements.
Data presented reflect past performance. Past performance is no guarantee of future results. Current performance may be higher or lower than the performance shown. Total returns for periods less than one year are not annualized. Investment return and principal value will fluctuate, and redemption value may be more or less than original cost. Data assumes reinvestment of dividends and capital gains, and none of the charts reflect the deduction of taxes that a shareholder would pay on fund distributions or the redemption of fund shares. To obtain performance data current to the most recent month end, please call 1-833-928-2684 or visit avantisinvestors.com. For additional information about the funds, please consult the prospectus.
9
| Portfolio Commentary | ||
Portfolio Managers: Eduardo Repetto, Mitch Firestein, Daniel Ong and Ted Randall
Fund Strategy
Avantis International Small Cap Value seeks long-term capital appreciation by investing in a diverse group of non-U.S. small-capitalization (small-cap) value companies across countries, market sectors and industry groups.
The fund seeks securities of companies that it expects to have higher returns. It places an enhanced emphasis on securities of companies with smaller market capitalizations and securities of companies it defines as high profitability or value companies. Conversely, the fund seeks to underweight or exclude securities it expects to have lower returns. These include securities of large companies with lower levels of profitability and higher prices relative to their book values or other financial metrics. Under normal market conditions, the portfolio will invest at least 80% of its assets in securities of small-cap companies.
The portfolio managers continually analyze market and financial data to make buy, sell and hold decisions. When buying or selling a security, the portfolio managers may consider the trade-off between expected returns of the security and implementation or tax costs of the trade. They do this in an attempt to gain trading efficiencies, avoid unnecessary risk and enhance fund performance.
Performance Review
For the 12-month period ended August 31, 2022, Avantis International Small Cap Value returned -16.31%.* For the same period, the fund’s benchmark, the MSCI World ex-USA Small Cap Index, returned -24.53%. The index is an unmanaged portfolio generally representative of the performance of non-U.S. developed markets small-cap stocks. Fund returns reflect fees and operating expenses, while index returns do not.
The fund’s outperformance versus the index was largely due to the fund’s overweight to small-cap companies with higher levels of profitability and lower prices relative to their book values. These companies generally outperformed companies with lower levels of profitability and higher prices relative to their book values, or growth-oriented companies. The fund’s underweight to growth-oriented companies also aided results.
Small-cap value stocks, as measured by the MSCI World ex-USA Small Cap Value Index, returned -19.00% for the reporting period. Small-cap growth stocks, according to the MSCI World ex-USA Small Cap Growth Index, lagged their value-style peers, returning -29.98%.
*All fund returns referenced in this commentary are for Institutional Class shares. Performance for other share classes will vary due to differences in fee structure; when Institutional Class performance exceeds that of the fund’s benchmark, other share classes may not. See page 9 for returns for all share classes.
10
| Fund Characteristics | ||
| AUGUST 31, 2022 | |||||
| Avantis International Small Cap Value Fund | |||||
| Types of Investments in Portfolio | % of net assets | ||||
| Common Stocks | 98.6% | ||||
| Warrants | —* | ||||
| Rights | —* | ||||
| Short-Term Investments | 6.2% | ||||
| Other Assets and Liabilities | (4.8)% | ||||
| *Category is less than 0.05% of total net assets. | |||||
| Top Five Countries | % of net assets | ||||
| Japan | 26.7% | ||||
| United Kingdom | 13.6% | ||||
| Canada | 10.0% | ||||
| Australia | 9.3% | ||||
| Sweden | 4.9% | ||||
11
| Shareholder Fee Examples | ||
Fund shareholders may incur two types of costs: (1) transaction costs, including brokerage commissions paid on purchases and sales of fund shares; and (2) ongoing costs, including management fees and other fund expenses. This example is intended to help you understand your ongoing costs (in dollars) of investing in your fund and to compare these costs with the ongoing cost of investing in other funds.
The example is based on an investment of $1,000 made at the beginning of the period and held for the entire period from March 1, 2022 to August 31, 2022.
Actual Expenses
The table provides information about actual account values and actual expenses for each class. You may use the information, together with the amount you invested, to estimate the expenses that you paid over the period. First, identify the class you own. Then simply divide your account value by $1,000 (for example, an $8,600 account value divided by $1,000 = 8.6), then multiply the result by the number under the heading “Expenses Paid During Period” to estimate the expenses you paid on your account during this period.
Hypothetical Example for Comparison Purposes
The table also provides information about hypothetical account values and hypothetical expenses based on the actual expense ratio of each class of your fund and an assumed rate of return of 5% per year before expenses, which is not the actual return of a fund's share class's. The hypothetical account values and expenses may not be used to estimate the actual ending account balance or expenses you paid for the period. You may use this information to compare the ongoing costs of investing in your fund and other funds. To do so, compare this 5% hypothetical example with the 5% hypothetical examples that appear in the shareholder reports of the other funds.
Please note that the expenses shown in the table are meant to highlight your ongoing costs only and do not reflect any transactional costs, such as brokerage commissions paid on purchases and sales of fund shares. Therefore, the table is useful in comparing ongoing costs only, and will not help you determine the relative total costs of owning different funds. In addition, if these transactional costs were included, your costs would have been higher.
12
| Beginning Account Value 3/1/22 | Ending Account Value 8/31/22 | Expenses Paid During Period(1) 3/1/22 - 8/31/22 | Annualized Expense Ratio(1) | |||||||||||
| Avantis Emerging Markets Equity Fund | ||||||||||||||
| Actual | ||||||||||||||
| Institutional Class | $1,000 | $862.50 | $1.55 | 0.33% | ||||||||||
| G Class | $1,000 | $864.30 | $0.00 | 0.00%(2) | ||||||||||
| Hypothetical | ||||||||||||||
| Institutional Class | $1,000 | $1,023.54 | $1.68 | 0.33% | ||||||||||
| G Class | $1,000 | $1,025.21 | $0.00 | 0.00%(2) | ||||||||||
| Avantis International Equity Fund | ||||||||||||||
| Actual | ||||||||||||||
| Institutional Class | $1,000 | $858.90 | $1.08 | 0.23% | ||||||||||
| G Class | $1,000 | $859.80 | $0.00 | 0.00%(2) | ||||||||||
| Hypothetical | ||||||||||||||
| Institutional Class | $1,000 | $1,024.05 | $1.17 | 0.23% | ||||||||||
| G Class | $1,000 | $1,025.21 | $0.00 | 0.00%(2) | ||||||||||
| Avantis International Small Cap Value Fund | ||||||||||||||
| Actual | ||||||||||||||
| Institutional Class | $1,000 | $872.10 | $1.70 | 0.36% | ||||||||||
| G Class | $1,000 | $874.70 | $0.00 | 0.00%(2) | ||||||||||
| Hypothetical | ||||||||||||||
| Institutional Class | $1,000 | $1,023.39 | $1.84 | 0.36% | ||||||||||
| G Class | $1,000 | $1,025.21 | $0.00 | 0.00%(2) | ||||||||||
(1)Expenses are equal to the class's annualized expense ratio listed in the table above, multiplied by the average account value over the period, multiplied by 184, the number of days in the most recent fiscal half-year, divided by 365, to reflect the one-half year period. Annualized expense ratio reflects actual expenses, including any applicable fee waivers or expense reimbursements and excluding any acquired fund fees and expenses.
(2)Other expenses did not exceed 0.005%.
13
| Schedules of Investments | ||
AUGUST 31, 2022
| Avantis Emerging Markets Equity Fund | ||||||||
| Shares | Value | |||||||
| COMMON STOCKS — 99.4% | ||||||||
| Brazil — 6.2% | ||||||||
3R Petroleum Oleo E Gas SA(1) | 18,200 | $ | 130,455 | |||||
| Aeris Industria E Comercio De Equipamentos Para Geracao De Energia SA | 2,800 | 1,238 | ||||||
| AES Brasil Energia SA | 16,800 | 31,259 | ||||||
| Aliansce Sonae Shopping Centers SA | 9,500 | 31,993 | ||||||
| Alpargatas SA, Preference Shares | 11,700 | 47,048 | ||||||
| Alupar Investimento SA | 16,700 | 91,487 | ||||||
| Ambev SA, ADR | 81,433 | 236,156 | ||||||
| Americanas SA | 19,717 | 61,549 | ||||||
Anima Holding SA(1) | 600 | 582 | ||||||
| Atacadao SA | 14,600 | 55,875 | ||||||
| Auren Energia SA | 17,602 | 51,834 | ||||||
Azul SA, ADR(1)(2) | 1,804 | 16,867 | ||||||
| B3 SA - Brasil Bolsa Balcao | 69,300 | 159,183 | ||||||
| Banco ABC Brasil SA, Preference Shares | 14,000 | 51,184 | ||||||
| Banco BMG SA, Preference Shares | 4,900 | 2,477 | ||||||
| Banco Bradesco SA | 43,559 | 132,291 | ||||||
| Banco Bradesco SA, ADR | 147,037 | 533,744 | ||||||
| Banco BTG Pactual SA | 34,700 | 170,752 | ||||||
| Banco do Brasil SA | 34,260 | 275,073 | ||||||
| Banco do Estado do Rio Grande do Sul SA, Class B Preference Shares | 19,000 | 40,868 | ||||||
| Banco Mercantil do Brasil SA, Preference Shares | 800 | 1,553 | ||||||
| Banco Pan SA, Preference Shares | 11,300 | 15,986 | ||||||
| Banco Santander Brasil SA, ADR | 12,690 | 72,587 | ||||||
| BB Seguridade Participacoes SA | 19,100 | 104,414 | ||||||
| Boa Vista Servicos SA | 11,700 | 15,405 | ||||||
| BR Malls Participacoes SA | 81,700 | 130,032 | ||||||
| BR Properties SA | 26,200 | 41,599 | ||||||
| BrasilAgro - Co. Brasileira de Propriedades Agricolas | 6,400 | 35,368 | ||||||
Braskem SA, ADR(2) | 3,958 | 46,784 | ||||||
BRF SA, ADR(1)(2) | 30,252 | 90,453 | ||||||
C&A MODAS SA(1) | 4,900 | 3,042 | ||||||
| Camil Alimentos SA | 13,900 | 26,772 | ||||||
| CCR SA | 101,500 | 271,192 | ||||||
Centrais Eletricas Brasileiras SA, ADR(2) | 12,652 | 113,109 | ||||||
| Centrais Eletricas Brasileiras SA, Class B Preference Shares | 7,300 | 67,494 | ||||||
Cia Brasileira de Distribuicao, ADR(2) | 14,446 | 58,940 | ||||||
| Cia de Saneamento Basico do Estado de Sao Paulo, ADR | 2,823 | 26,423 | ||||||
| Cia de Saneamento de Minas Gerais-COPASA | 14,600 | 37,943 | ||||||
| Cia de Saneamento do Parana | 7,500 | 24,897 | ||||||
| Cia de Saneamento do Parana, Preference Shares | 71,900 | 48,648 | ||||||
| Cia de Transmissao de Energia Eletrica Paulista, Preference Shares | 15,600 | 71,787 | ||||||
| Cia Energetica de Minas Gerais, ADR | 51,877 | 122,430 | ||||||
| Cia Ferro Ligas da Bahia - FERBASA, Preference Shares | 3,800 | 38,625 | ||||||
14
| Avantis Emerging Markets Equity Fund | ||||||||
| Shares | Value | |||||||
| Cia Paranaense de Energia | 23,700 | $ | 29,292 | |||||
| Cia Paranaense de Energia, ADR | 14,010 | 91,906 | ||||||
| Cia Paranaense de Energia, Preference Shares | 107,200 | 143,417 | ||||||
Cia Siderurgica Nacional SA, ADR(2) | 47,207 | 127,459 | ||||||
| Cielo SA | 112,100 | 118,728 | ||||||
Clear Sale SA(1) | 7,300 | 7,872 | ||||||
Cogna Educacao(1) | 5,800 | 2,776 | ||||||
Construtora Tenda SA(1) | 4,800 | 5,434 | ||||||
| Cosan SA | 15,144 | 58,394 | ||||||
| CPFL Energia SA | 7,800 | 52,821 | ||||||
| Cristal Pigmentos do Brasil SA, Preference Shares | 200 | 1,076 | ||||||
| Cury Construtora e Incorporadora SA | 25,400 | 43,502 | ||||||
CVC Brasil Operadora e Agencia de Viagens SA(1) | 23,914 | 35,027 | ||||||
| Cyrela Brazil Realty SA Empreendimentos e Participacoes | 27,500 | 75,484 | ||||||
| Dexco SA | 19,580 | 37,486 | ||||||
| Dexxos Participacoes SA | 3,600 | 4,837 | ||||||
| Direcional Engenharia SA | 2,300 | 5,712 | ||||||
Dommo Energia SA(1) | 1,400 | 433 | ||||||
EcoRodovias Infraestrutura e Logistica SA(1) | 24,600 | 27,615 | ||||||
| EDP - Energias do Brasil SA | 8,700 | 37,928 | ||||||
Embraer SA, ADR(1) | 12,244 | 130,521 | ||||||
| Enauta Participacoes SA | 14,600 | 46,670 | ||||||
| Energisa SA | 12,000 | 97,986 | ||||||
Eneva SA(1) | 31,400 | 93,312 | ||||||
| Engie Brasil Energia SA | 6,000 | 46,951 | ||||||
| Equatorial Energia SA | 36,900 | 171,861 | ||||||
| Eternit SA | 9,288 | 23,031 | ||||||
| Eucatex SA Industria e Comercio, Preference Shares | 3,000 | 4,775 | ||||||
| Even Construtora e Incorporadora SA | 7,000 | 7,992 | ||||||
| Ez Tec Empreendimentos e Participacoes SA | 11,900 | 41,105 | ||||||
| Fleury SA | 8,500 | 25,684 | ||||||
| Fras-Le SA | 1,000 | 2,451 | ||||||
Gafisa SA(1) | 10,749 | 2,479 | ||||||
| Gerdau SA, ADR | 52,356 | 236,126 | ||||||
| Getnet Adquirencia e Servicos para Meios de Pagamento SA, ADR | 766 | 1,341 | ||||||
Gol Linhas Aereas Inteligentes SA, ADR(2) | 2,473 | 9,447 | ||||||
Gol Linhas Aereas Inteligentes SA, Preference Shares(1) | 2,495 | 4,844 | ||||||
| GPS Participacoes e Empreendimentos SA | 4,300 | 11,241 | ||||||
| Grazziotin SA, Preference Shares | 200 | 1,315 | ||||||
| Grendene SA | 11,100 | 16,152 | ||||||
Grupo Mateus SA(1) | 4,100 | 5,012 | ||||||
| Grupo SBF SA | 1,700 | 7,199 | ||||||
| Guararapes Confeccoes SA | 4,800 | 8,516 | ||||||
| Hapvida Participacoes e Investimentos SA | 31,628 | 44,441 | ||||||
| Helbor Empreendimentos SA | 720 | 374 | ||||||
Hidrovias do Brasil SA(1) | 28,100 | 13,233 | ||||||
| Hypera SA | 10,000 | 82,827 | ||||||
| Iguatemi SA | 15,680 | 59,044 | ||||||
| Iguatemi SA | 13,000 | 6,072 | ||||||
Infracommerce CXAAS SA(1) | 6,800 | 7,307 | ||||||
| Instituto Hermes Pardini SA | 1,400 | 5,331 | ||||||
15
| Avantis Emerging Markets Equity Fund | ||||||||
| Shares | Value | |||||||
| Intelbras SA Industria de Telecomunicacao Eletronica Brasileira | 1,000 | $ | 5,334 | |||||
| Inter & Co., Inc. | 1,492 | 6,062 | ||||||
| Iochpe Maxion SA | 20,200 | 53,078 | ||||||
| Irani Papel e Embalagem SA | 5,300 | 7,794 | ||||||
IRB Brasil Resseguros S/A(1) | 50,114 | 15,991 | ||||||
| Itau Unibanco Holding SA, ADR | 164,187 | 811,084 | ||||||
| Jalles Machado SA | 17,600 | 25,373 | ||||||
| JBS SA | 21,800 | 123,993 | ||||||
| JHSF Participacoes SA | 26,500 | 31,683 | ||||||
| Kepler Weber SA | 4,200 | 17,051 | ||||||
| Klabin SA | 57,000 | 207,735 | ||||||
| Lavvi Empreendimentos Imobiliarios Ltda | 5,200 | 5,677 | ||||||
| Light SA | 15,600 | 17,092 | ||||||
| Localiza Rent a Car SA | 29,516 | 346,141 | ||||||
Locaweb Servicos de Internet SA(1) | 10,700 | 19,210 | ||||||
| LOG Commercial Properties e Participacoes SA | 4,900 | 24,809 | ||||||
Log-in Logistica Intermodal SA(1) | 5,558 | 42,221 | ||||||
| Lojas Quero Quero S/A | 15,600 | 20,750 | ||||||
| Lojas Renner SA | 23,570 | 120,605 | ||||||
| LPS Brasil Consultoria de Imoveis SA | 6,100 | 3,400 | ||||||
| M Dias Branco SA | 3,200 | 26,253 | ||||||
Magazine Luiza SA(1) | 22,100 | 18,267 | ||||||
| Mahle-Metal Leve SA | 4,400 | 20,645 | ||||||
| Marcopolo SA, Preference Shares | 53,500 | 26,943 | ||||||
| Marfrig Global Foods SA | 29,900 | 75,865 | ||||||
Marisa Lojas SA(1) | 12,448 | 6,054 | ||||||
Meliuz SA(1) | 4,800 | 1,199 | ||||||
| Metalurgica Gerdau SA, Preference Shares | 37,100 | 70,957 | ||||||
| Mills Estruturas e Servicos de Engenharia SA | 31,349 | 59,957 | ||||||
| Minerva SA | 34,400 | 101,962 | ||||||
| Mitre Realty Empreendimentos E Participacoes LTDA | 2,600 | 2,754 | ||||||
| Movida Participacoes SA | 15,400 | 41,058 | ||||||
| MPM Corporeos SA | 2,100 | 803 | ||||||
| MRV Engenharia e Participacoes SA | 14,400 | 28,233 | ||||||
| Multilaser Industrial SA | 10,400 | 9,636 | ||||||
| Multiplan Empreendimentos Imobiliarios SA | 11,500 | 53,671 | ||||||
| Natura & Co. Holding SA | 10,478 | 29,224 | ||||||
| Odontoprev SA | 17,160 | 30,214 | ||||||
Omega Energia SA(1) | 15,162 | 32,671 | ||||||
Paranapanema SA(1) | 200 | 291 | ||||||
Petro Rio SA(1) | 39,000 | 205,030 | ||||||
| Petroleo Brasileiro SA, ADR | 79,213 | 1,131,954 | ||||||
| Petroleo Brasileiro SA, ADR Preference Shares | 101,362 | 1,291,352 | ||||||
| Petroreconcavo SA | 8,800 | 46,111 | ||||||
| Porto Seguro SA | 3,800 | 15,522 | ||||||
| Portobello SA | 4,200 | 8,057 | ||||||
| Positivo Tecnologia SA | 2,800 | 6,383 | ||||||
| Profarma Distribuidora de Produtos Farmaceuticos SA | 1,200 | 851 | ||||||
| Qualicorp Consultoria e Corretora de Seguros SA | 5,900 | 10,842 | ||||||
| Raia Drogasil SA | 23,700 | 99,767 | ||||||
| Randon SA Implementos e Participacoes, Preference Shares | 8,700 | 16,004 | ||||||
16
| Avantis Emerging Markets Equity Fund | ||||||||
| Shares | Value | |||||||
| Rede D'Or Sao Luiz SA | 3,800 | $ | 24,323 | |||||
| Romi SA | 1,850 | 4,794 | ||||||
| Rumo SA | 38,900 | 151,042 | ||||||
| Santos Brasil Participacoes SA | 45,400 | 70,512 | ||||||
| Sao Carlos Empreendimentos e Participacoes SA | 100 | 500 | ||||||
| Sao Martinho SA | 11,400 | 70,056 | ||||||
| Sendas Distribuidora SA, ADR | 10,523 | 185,415 | ||||||
| Ser Educacional SA | 2,100 | 2,507 | ||||||
| SIMPAR SA | 19,700 | 40,556 | ||||||
| SLC Agricola SA | 5,000 | 46,728 | ||||||
StoneCo Ltd., A Shares(1) | 14,765 | 139,972 | ||||||
| Sul America SA | 24,973 | 117,079 | ||||||
| Suzano SA, ADR | 26,127 | 224,431 | ||||||
| SYN prop e tech SA | 7,800 | 6,807 | ||||||
| Taurus Armas SA, Preference Shares | 3,200 | 10,703 | ||||||
| Tegma Gestao Logistica SA | 400 | 1,356 | ||||||
Telefonica Brasil SA, ADR(2) | 6,442 | 52,309 | ||||||
| TIM SA, ADR | 12,723 | 144,279 | ||||||
| TOTVS SA | 7,000 | 38,240 | ||||||
| Transmissora Alianca de Energia Eletrica SA | 25,300 | 203,279 | ||||||
| Trisul SA | 300 | 269 | ||||||
| Tupy SA | 7,300 | 37,423 | ||||||
Ultrapar Participacoes SA, ADR(2) | 20,277 | 53,937 | ||||||
| Unipar Carbocloro SA, Class B Preference Shares | 5,660 | 110,199 | ||||||
| Usinas Siderurgicas de Minas Gerais SA Usiminas, Class A Preference Shares | 34,100 | 52,634 | ||||||
| Vale SA, ADR | 134,981 | 1,676,464 | ||||||
| Valid Solucoes e Servicos de Seguranca em Meios de Pagamento e Identificacao SA | 600 | 1,218 | ||||||
| Vamos Locacao de Caminhoes Maquinas e Equipamentos SA | 2,400 | 6,569 | ||||||
Via S/A(1) | 164,600 | 101,562 | ||||||
| Vibra Energia SA | 49,900 | 177,543 | ||||||
| Vivara Participacoes SA | 800 | 3,897 | ||||||
| Vulcabras Azaleia SA | 8,900 | 24,635 | ||||||
| WEG SA | 18,900 | 102,812 | ||||||
| Wilson Sons Holdings Brasil SA | 13,800 | 23,476 | ||||||
| Wiz Solucoes e Corretagem de Seguros SA | 4,600 | 7,189 | ||||||
XP, Inc., Class A(1) | 1,166 | 22,434 | ||||||
| YDUQS Participacoes SA | 13,000 | 30,886 | ||||||
Zamp SA(1) | 10,800 | 16,193 | ||||||
| 15,067,078 | ||||||||
| Chile — 0.7% | ||||||||
| Aguas Andinas SA, A Shares | 212,600 | 47,442 | ||||||
| Banco de Chile | 837,675 | 79,473 | ||||||
| Banco de Credito e Inversiones SA | 1,882 | 55,436 | ||||||
| Banco Santander Chile, ADR | 3,896 | 62,492 | ||||||
| Besalco SA | 2,057 | 780 | ||||||
| CAP SA | 9,814 | 79,181 | ||||||
| Cencosud SA | 82,384 | 115,177 | ||||||
| Cencosud Shopping SA | 6,154 | 8,480 | ||||||
| Cia Cervecerias Unidas SA, ADR | 3,272 | 35,763 | ||||||
| Cia Sud Americana de Vapores SA | 569,019 | 52,194 | ||||||
17
| Avantis Emerging Markets Equity Fund | ||||||||
| Shares | Value | |||||||
| Colbun SA | 910,018 | $ | 86,732 | |||||
| Embotelladora Andina SA, Class B Preference Shares | 38,716 | 79,268 | ||||||
| Empresa Nacional de Telecomunicaciones SA | 16,665 | 52,688 | ||||||
| Empresas CMPC SA | 100,943 | 191,468 | ||||||
| Empresas COPEC SA | 14,437 | 127,174 | ||||||
| Enel Chile SA | 1,085,633 | 37,151 | ||||||
Engie Energia Chile SA(1) | 14,725 | 8,297 | ||||||
| Falabella SA | 6,732 | 15,864 | ||||||
| Grupo Security SA | 30,991 | 4,914 | ||||||
| Inversiones Aguas Metropolitanas SA | 7,601 | 3,842 | ||||||
| Itau CorpBanca Chile SA | 21,331,050 | 48,791 | ||||||
| Parque Arauco SA | 46,629 | 49,298 | ||||||
| Ripley Corp. SA | 168,455 | 30,825 | ||||||
| Salfacorp SA | 2,048 | 731 | ||||||
| Sociedad Quimica y Minera de Chile SA, ADR | 3,544 | 353,266 | ||||||
| SONDA SA | 16,560 | 6,905 | ||||||
| 1,633,632 | ||||||||
| China — 28.7% | ||||||||
| 360 DigiTech, Inc., ADR | 11,101 | 177,394 | ||||||
361 Degrees International Ltd.(1) | 85,000 | 43,433 | ||||||
| 3SBio, Inc. | 140,000 | 93,080 | ||||||
AAC Technologies Holdings, Inc.(2) | 48,000 | 88,926 | ||||||
AAG Energy Holdings Ltd.(2) | 154,000 | 29,071 | ||||||
Agile Group Holdings Ltd.(2) | 144,000 | 50,429 | ||||||
Agora, Inc., ADR(1) | 4,604 | 19,061 | ||||||
| Agricultural Bank of China Ltd., H Shares | 1,126,000 | 367,934 | ||||||
Air China Ltd., H Shares(1) | 28,000 | 22,429 | ||||||
| Ajisen China Holdings Ltd. | 4,000 | 382 | ||||||
AK Medical Holdings Ltd.(2) | 58,000 | 50,287 | ||||||
Alibaba Group Holding Ltd., ADR(1) | 43,199 | 4,121,617 | ||||||
Alibaba Pictures Group Ltd.(1) | 330,000 | 25,960 | ||||||
Alphamab Oncology(1)(2) | 10,000 | 10,065 | ||||||
| Aluminum Corp. of China Ltd., H Shares | 398,000 | 147,065 | ||||||
| Angang Steel Co. Ltd., H Shares | 4,000 | 1,250 | ||||||
| Anhui Conch Cement Co. Ltd., H Shares | 94,500 | 360,126 | ||||||
| Anhui Expressway Co. Ltd., H Shares | 80,000 | 58,074 | ||||||
| ANTA Sports Products Ltd. | 60,200 | 724,955 | ||||||
Antengene Corp. Ltd.(1)(2) | 12,500 | 6,595 | ||||||
Ascentage Pharma Group International(1)(2) | 1,100 | 2,285 | ||||||
| Asia Cement China Holdings Corp. | 43,000 | 21,501 | ||||||
| AsiaInfo Technologies Ltd. | 10,800 | 15,488 | ||||||
| Autohome, Inc., ADR | 7,053 | 251,157 | ||||||
| BAIC Motor Corp. Ltd., H Shares | 47,000 | 12,938 | ||||||
Baidu, Inc., ADR(1) | 6,466 | 930,910 | ||||||
| BAIOO Family Interactive Ltd. | 74,000 | 3,810 | ||||||
Bairong, Inc.(1)(2) | 18,500 | 22,108 | ||||||
| Bank of China Ltd., H Shares | 3,717,000 | 1,297,114 | ||||||
| Bank of Chongqing Co. Ltd., H Shares | 27,000 | 13,971 | ||||||
| Bank of Communications Co. Ltd., H Shares | 490,000 | 279,187 | ||||||
Baozun, Inc., ADR(1) | 1,003 | 8,526 | ||||||
Baozun, Inc., Class A(1) | 1,700 | 4,735 | ||||||
18
| Avantis Emerging Markets Equity Fund | ||||||||
| Shares | Value | |||||||
| BBMG Corp., H Shares | 5,000 | $ | 674 | |||||
BeiGene Ltd., ADR(1) | 885 | 151,919 | ||||||
Beijing Capital International Airport Co. Ltd., H Shares(1) | 128,000 | 80,340 | ||||||
| Beijing Chunlizhengda Medical Instruments Co. Ltd., H Shares | 8,000 | 11,634 | ||||||
| Beijing Enterprises Holdings Ltd. | 45,500 | 135,336 | ||||||
| Beijing Enterprises Water Group Ltd. | 342,000 | 87,853 | ||||||
| Beijing Jingneng Clean Energy Co. Ltd., H Shares | 96,000 | 20,132 | ||||||
| Beijing North Star Co. Ltd., H Shares | 4,000 | 468 | ||||||
| Beijing Tong Ren Tang Chinese Medicine Co. Ltd. | 42,000 | 52,259 | ||||||
| Binjiang Service Group Co. Ltd. | 10,500 | 29,031 | ||||||
| BOC Aviation Ltd. | 30,500 | 244,137 | ||||||
| BOE Varitronix Ltd. | 45,000 | 102,649 | ||||||
| Bosideng International Holdings Ltd. | 420,000 | 235,826 | ||||||
| Bright Scholar Education Holdings Ltd., ADR | 27 | 88 | ||||||
Burning Rock Biotech Ltd., ADR(1)(2) | 365 | 1,431 | ||||||
| BYD Co. Ltd., H Shares | 29,500 | 909,052 | ||||||
BYD Electronic International Co. Ltd.(2) | 44,000 | 116,254 | ||||||
| C&D International Investment Group Ltd. | 26,990 | 53,979 | ||||||
C&D Property Management Group Co. Ltd.(2) | 19,000 | 8,671 | ||||||
| Cabbeen Fashion Ltd. | 11,000 | 1,901 | ||||||
Canaan, Inc., ADR(1)(2) | 17,159 | 60,228 | ||||||
Canadian Solar, Inc.(1) | 4,366 | 197,212 | ||||||
Cango, Inc., ADR(2) | 5,200 | 12,584 | ||||||
CanSino Biologics, Inc., H Shares(2) | 3,200 | 19,973 | ||||||
| Canvest Environmental Protection Group Co. Ltd. | 32,000 | 19,183 | ||||||
Cathay Media And Education Group, Inc.(2) | 12,000 | 1,843 | ||||||
Central China Management Co. Ltd.(2) | 18,000 | 1,763 | ||||||
| Central China New Life Ltd. | 5,000 | 2,159 | ||||||
Central China Real Estate Ltd.(2) | 18,000 | 1,189 | ||||||
Changsha Broad Homes Industrial Group Co. Ltd., H Shares(1)(2) | 14,700 | 15,095 | ||||||
| Chaowei Power Holdings Ltd. | 36,000 | 8,317 | ||||||
Cheetah Mobile, Inc., ADR(1)(2) | 309 | 214 | ||||||
| China Aircraft Leasing Group Holdings Ltd. | 1,000 | 661 | ||||||
China Automotive Systems, Inc.(1) | 741 | 3,097 | ||||||
| China BlueChemical Ltd., H Shares | 284,000 | 73,950 | ||||||
| China Bohai Bank Co. Ltd., H Shares | 215,000 | 35,610 | ||||||
| China Cinda Asset Management Co. Ltd., H Shares | 938,000 | 128,809 | ||||||
| China CITIC Bank Corp. Ltd., H Shares | 638,000 | 273,517 | ||||||
| China Coal Energy Co. Ltd., H Shares | 224,000 | 199,196 | ||||||
| China Communications Services Corp. Ltd., H Shares | 334,000 | 143,418 | ||||||
China Conch Environment Protection Holdings Ltd.(1) | 91,500 | 81,671 | ||||||
| China Conch Venture Holdings Ltd. | 153,500 | 313,261 | ||||||
| China Construction Bank Corp., H Shares | 3,667,000 | 2,266,877 | ||||||
| China Datang Corp. Renewable Power Co. Ltd., H Shares | 284,000 | 71,121 | ||||||
China Dongxiang Group Co. Ltd.(1) | 210,000 | 9,339 | ||||||
China East Education Holdings Ltd.(2) | 97,000 | 40,991 | ||||||
China Eastern Airlines Corp. Ltd., H Shares(1) | 14,000 | 4,819 | ||||||
| China Education Group Holdings Ltd. | 61,000 | 53,142 | ||||||
China Energy Development Holdings Ltd.(1) | 48,000 | 983 | ||||||
| China Everbright Bank Co. Ltd., H Shares | 257,000 | 78,787 | ||||||
| China Everbright Environment Group Ltd. | 496,000 | 245,154 | ||||||
19
| Avantis Emerging Markets Equity Fund | ||||||||
| Shares | Value | |||||||
China Everbright Greentech Ltd.(2) | 31,000 | $ | 6,467 | |||||
| China Everbright Ltd. | 98,000 | 71,572 | ||||||
| China Feihe Ltd. | 324,000 | 268,161 | ||||||
| China Foods Ltd. | 32,000 | 10,186 | ||||||
| China Galaxy Securities Co. Ltd., H Shares | 275,500 | 150,620 | ||||||
| China Gas Holdings Ltd. | 170,400 | 241,133 | ||||||
China Glass Holdings Ltd.(2) | 156,000 | 22,165 | ||||||
| China Harmony Auto Holding Ltd. | 31,500 | 8,276 | ||||||
China High Speed Transmission Equipment Group Co. Ltd.(1) | 51,000 | 28,833 | ||||||
| China Hongqiao Group Ltd. | 315,500 | 305,928 | ||||||
| China International Capital Corp. Ltd., H Shares | 92,400 | 162,559 | ||||||
| China Kepei Education Group Ltd. | 26,000 | 6,677 | ||||||
| China Lesso Group Holdings Ltd. | 136,000 | 161,650 | ||||||
| China Life Insurance Co. Ltd., ADR | 41,716 | 296,601 | ||||||
| China Lilang Ltd. | 24,000 | 11,720 | ||||||
China Literature Ltd.(1) | 3,200 | 12,967 | ||||||
| China Longyuan Power Group Corp. Ltd., H Shares | 249,000 | 402,176 | ||||||
China Maple Leaf Educational Systems Ltd.(1) | 42,000 | 1,900 | ||||||
| China Medical System Holdings Ltd. | 175,000 | 258,996 | ||||||
| China Meidong Auto Holdings Ltd. | 46,000 | 93,543 | ||||||
China Mengniu Dairy Co. Ltd.(1) | 180,000 | 815,090 | ||||||
| China Merchants Bank Co. Ltd., H Shares | 119,500 | 611,136 | ||||||
China Merchants Land Ltd.(1) | 40,000 | 3,151 | ||||||
| China Merchants Port Holdings Co. Ltd. | 128,756 | 193,297 | ||||||
| China Minsheng Banking Corp. Ltd., H Shares | 456,500 | 145,212 | ||||||
China Modern Dairy Holdings Ltd.(2) | 418,000 | 55,297 | ||||||
| China National Building Material Co. Ltd., H Shares | 484,000 | 457,027 | ||||||
| China New Higher Education Group Ltd. | 143,000 | 44,803 | ||||||
| China Nonferrous Mining Corp. Ltd. | 235,000 | 100,472 | ||||||
China Oil & Gas Group Ltd.(1) | 40,000 | 1,630 | ||||||
| China Oriental Group Co. Ltd. | 26,000 | 4,790 | ||||||
| China Pacific Insurance Group Co. Ltd., H Shares | 134,600 | 285,125 | ||||||
| China Petroleum & Chemical Corp., ADR | 14,803 | 688,636 | ||||||
| China Pioneer Pharma Holdings Ltd. | 22,000 | 6,296 | ||||||
| China Power International Development Ltd. | 235,000 | 131,189 | ||||||
| China Railway Group Ltd., H Shares | 339,000 | 194,075 | ||||||
| China Railway Signal & Communication Corp. Ltd., H Shares | 31,000 | 9,747 | ||||||
China Rare Earth Holdings Ltd.(1) | 68,000 | 4,062 | ||||||
| China Reinsurance Group Corp., H Shares | 43,000 | 3,168 | ||||||
China Renaissance Holdings Ltd.(1) | 18,900 | 21,382 | ||||||
| China Resources Beer Holdings Co. Ltd. | 54,000 | 376,435 | ||||||
| China Resources Cement Holdings Ltd. | 334,000 | 205,881 | ||||||
| China Resources Gas Group Ltd. | 26,000 | 101,229 | ||||||
| China Resources Land Ltd. | 178,000 | 728,776 | ||||||
| China Resources Medical Holdings Co. Ltd. | 94,000 | 55,765 | ||||||
| China Resources Mixc Lifestyle Services Ltd. | 3,800 | 17,232 | ||||||
| China Resources Pharmaceutical Group Ltd. | 64,500 | 44,192 | ||||||
| China Resources Power Holdings Co. Ltd. | 176,000 | 349,948 | ||||||
China Risun Group Ltd.(2) | 224,000 | 87,815 | ||||||
| China Sanjiang Fine Chemicals Co. Ltd. | 48,000 | 9,814 | ||||||
| China SCE Group Holdings Ltd. | 91,000 | 7,619 | ||||||
20
| Avantis Emerging Markets Equity Fund | ||||||||
| Shares | Value | |||||||
China Shengmu Organic Milk Ltd.(1) | 55,000 | $ | 2,521 | |||||
| China Shenhua Energy Co. Ltd., H Shares | 149,500 | 468,873 | ||||||
| China Shineway Pharmaceutical Group Ltd. | 48,000 | 36,820 | ||||||
China Shuifa Singyes Energy Holdings Ltd.(2) | 66,000 | 8,622 | ||||||
China South City Holdings Ltd.(2) | 148,000 | 9,305 | ||||||
China Southern Airlines Co. Ltd., H Shares(1)(2) | 18,000 | 9,716 | ||||||
| China Starch Holdings Ltd. | 515,000 | 16,999 | ||||||
| China Sunshine Paper Holdings Co. Ltd. | 69,000 | 16,203 | ||||||
| China Suntien Green Energy Corp. Ltd., H Shares | 162,000 | 72,656 | ||||||
| China Taiping Insurance Holdings Co. Ltd. | 158,000 | 161,314 | ||||||
China Tobacco International HK Co. Ltd.(2) | 12,000 | 17,709 | ||||||
| China Tower Corp. Ltd., H Shares | 4,190,000 | 522,484 | ||||||
| China Traditional Chinese Medicine Holdings Co. Ltd. | 314,000 | 135,407 | ||||||
China Travel International Investment Hong Kong Ltd.(1)(2) | 170,000 | 30,883 | ||||||
| China Vanke Co. Ltd., H Shares | 57,600 | 112,448 | ||||||
| China Water Affairs Group Ltd. | 98,000 | 89,266 | ||||||
| China Xinhua Education Group Ltd. | 17,000 | 2,384 | ||||||
| China XLX Fertiliser Ltd. | 112,000 | 63,823 | ||||||
| China Yongda Automobiles Services Holdings Ltd. | 118,000 | 83,222 | ||||||
China Youran Dairy Group Ltd.(1) | 98,000 | 29,670 | ||||||
China Youzan Ltd.(1)(2) | 80,000 | 1,276 | ||||||
| China Yuchai International Ltd. | 512 | 4,265 | ||||||
China Yuhua Education Corp. Ltd.(1)(2) | 328,000 | 51,540 | ||||||
China ZhengTong Auto Services Holdings Ltd.(1) | 80,000 | 5,059 | ||||||
Chindata Group Holdings Ltd., ADR(1) | 13,898 | 117,299 | ||||||
| Chongqing Rural Commercial Bank Co. Ltd., H Shares | 147,000 | 50,879 | ||||||
| CIFI Ever Sunshine Services Group Ltd. | 58,000 | 35,646 | ||||||
CIFI Holdings Group Co. Ltd.(2) | 282,880 | 71,595 | ||||||
| CITIC Ltd. | 419,000 | 431,938 | ||||||
| CITIC Securities Co. Ltd., H Shares | 119,325 | 241,852 | ||||||
CMGE Technology Group Ltd.(1)(2) | 60,000 | 14,804 | ||||||
| CMOC Group Ltd., H Shares | 102,000 | 45,483 | ||||||
CNFinance Holdings Ltd., ADR(1)(2) | 1,003 | 2,718 | ||||||
COFCO Joycome Foods Ltd.(1) | 445,000 | 170,350 | ||||||
| Concord New Energy Group Ltd. | 870,000 | 79,715 | ||||||
| Consun Pharmaceutical Group Ltd. | 29,000 | 14,884 | ||||||
Coolpad Group Ltd.(1) | 372,000 | 5,768 | ||||||
COSCO SHIPPING Energy Transportation Co. Ltd., Class H(1) | 20,000 | 15,150 | ||||||
COSCO SHIPPING Holdings Co. Ltd., Class H(2) | 227,549 | 339,699 | ||||||
COSCO SHIPPING International Hong Kong Co. Ltd.(2) | 16,000 | 4,523 | ||||||
| COSCO SHIPPING Ports Ltd. | 209,929 | 135,840 | ||||||
Country Garden Holdings Co. Ltd.(2) | 362,210 | 106,923 | ||||||
| Country Garden Services Holdings Co. Ltd. | 23,000 | 45,199 | ||||||
| CPMC Holdings Ltd. | 28,000 | 11,979 | ||||||
Crazy Sports Group Ltd.(1)(2) | 124,000 | 3,610 | ||||||
| CSPC Pharmaceutical Group Ltd. | 837,200 | 849,276 | ||||||
| CSSC Hong Kong Shipping Co. Ltd. | 248,000 | 41,919 | ||||||
Dada Nexus Ltd., ADR(1) | 1,333 | 8,625 | ||||||
| Dali Foods Group Co. Ltd. | 250,000 | 114,288 | ||||||
Daqo New Energy Corp., ADR(1) | 9,823 | 654,899 | ||||||
| Datang International Power Generation Co. Ltd., H Shares | 6,000 | 1,236 | ||||||
21
| Avantis Emerging Markets Equity Fund | ||||||||
| Shares | Value | |||||||
| Dawnrays Pharmaceutical Holdings Ltd. | 7,000 | $ | 1,076 | |||||
Dexin China Holdings Co. Ltd.(2) | 5,000 | 1,268 | ||||||
Differ Group Auto Ltd.(1)(2) | 306,000 | 77,133 | ||||||
| Digital China Holdings Ltd. | 116,000 | 51,745 | ||||||
| Dongfeng Motor Group Co. Ltd., Class H | 272,000 | 172,461 | ||||||
| Dongyue Group Ltd. | 194,000 | 217,734 | ||||||
DouYu International Holdings Ltd., ADR(1) | 1,695 | 2,543 | ||||||
Duiba Group Ltd.(1)(2) | 16,000 | 1,627 | ||||||
| Dynagreen Environmental Protection Group Co. Ltd., H Shares | 28,000 | 10,276 | ||||||
E-House China Enterprise Holdings Ltd.(1)(2) | 48,000 | 4,197 | ||||||
Ebang International Holdings, Inc., A Shares(1)(2) | 10,000 | 4,675 | ||||||
| ENN Energy Holdings Ltd. | 27,200 | 395,146 | ||||||
EVA Precision Industrial Holdings Ltd.(2) | 114,000 | 21,809 | ||||||
Everest Medicines Ltd.(1) | 3,500 | 5,293 | ||||||
Fanhua, Inc., ADR(2) | 4,262 | 23,782 | ||||||
FIH Mobile Ltd.(1) | 284,000 | 36,787 | ||||||
| FinVolution Group, ADR | 21,769 | 107,103 | ||||||
First Tractor Co. Ltd., H Shares(2) | 44,000 | 17,623 | ||||||
Flat Glass Group Co. Ltd., H Shares(1)(2) | 4,000 | 13,175 | ||||||
| Fosun International Ltd. | 194,000 | 143,198 | ||||||
| Fountain SET Holdings Ltd. | 6,000 | 764 | ||||||
| FriendTimes, Inc. | 28,000 | 4,218 | ||||||
| Fu Shou Yuan International Group Ltd. | 139,000 | 88,809 | ||||||
| Fufeng Group Ltd. | 295,000 | 165,763 | ||||||
| Fuyao Glass Industry Group Co. Ltd., H Shares | 38,400 | 183,239 | ||||||
Ganfeng Lithium Co. Ltd., H Shares(2) | 6,680 | 58,687 | ||||||
Ganglong China Property Group Ltd.(1) | 25,000 | 12,975 | ||||||
GCL New Energy Holdings Ltd.(1)(2) | 928,000 | 10,371 | ||||||
GCL-Poly Energy Holdings Ltd.(1)(2) | 555,000 | 198,095 | ||||||
GDS Holdings Ltd., Class A(1) | 45,300 | 154,712 | ||||||
| Geely Automobile Holdings Ltd. | 376,000 | 755,466 | ||||||
| Gemdale Properties & Investment Corp. Ltd. | 688,000 | 58,624 | ||||||
| Genertec Universal Medical Group Co. Ltd. | 137,000 | 77,112 | ||||||
Genor Biopharma Holdings Ltd.(1)(2) | 2,500 | 999 | ||||||
| GF Securities Co. Ltd., H Shares | 68,800 | 89,874 | ||||||
Global Cord Blood Corp.(1) | 2,020 | 4,666 | ||||||
Glory Health Industry Ltd.(1) | 29,000 | 624 | ||||||
Glory Sun Financial Group Ltd.(1)(2) | 140,000 | 639 | ||||||
GOME Retail Holdings Ltd.(1)(2) | 646,000 | 20,137 | ||||||
Goodbaby International Holdings Ltd.(1) | 58,000 | 5,896 | ||||||
| Grand Pharmaceutical Group Ltd. | 125,000 | 66,735 | ||||||
| Great Wall Motor Co. Ltd., H Shares | 85,500 | 128,278 | ||||||
| Greatview Aseptic Packaging Co. Ltd. | 30,000 | 5,729 | ||||||
| Greenland Hong Kong Holdings Ltd. | 22,000 | 2,290 | ||||||
| Greentown China Holdings Ltd. | 93,500 | 176,414 | ||||||
| Guangzhou Automobile Group Co. Ltd., H Shares | 152,000 | 130,691 | ||||||
Guangzhou R&F Properties Co. Ltd., H Shares(2) | 278,400 | 57,584 | ||||||
| Guotai Junan Securities Co. Ltd., H Shares | 4,400 | 5,213 | ||||||
| H World Group Ltd., ADR | 5,798 | 218,179 | ||||||
Haidilao International Holding Ltd.(1)(2) | 72,000 | 169,423 | ||||||
| Haier Smart Home Co. Ltd., H Shares | 40,800 | 133,294 | ||||||
22
| Avantis Emerging Markets Equity Fund | ||||||||
| Shares | Value | |||||||
Hainan Meilan International Airport Co. Ltd., H Shares(1) | 20,000 | $ | 47,091 | |||||
| Haitian International Holdings Ltd. | 80,000 | 195,996 | ||||||
| Haitong Securities Co. Ltd., H Shares | 198,000 | 129,635 | ||||||
| Hangzhou Tigermed Consulting Co. Ltd., H Shares | 1,700 | 16,831 | ||||||
| Hansoh Pharmaceutical Group Co. Ltd. | 64,000 | 127,689 | ||||||
Harbin Electric Co. Ltd., H Shares(1) | 92,000 | 25,003 | ||||||
Hebei Construction Group Corp. Ltd., H Shares(1) | 3,000 | 385 | ||||||
| Hello Group, Inc., ADR | 15,765 | 81,190 | ||||||
| Hengan International Group Co. Ltd. | 80,000 | 382,841 | ||||||
Hi Sun Technology China Ltd.(1)(2) | 57,000 | 6,306 | ||||||
Hilong Holding Ltd.(1) | 302,000 | 23,808 | ||||||
| Hisense Home Appliances Group Co. Ltd., H Shares | 34,000 | 36,632 | ||||||
| Hollysys Automation Technologies Ltd. | 7,446 | 126,805 | ||||||
Homeland Interactive Technology Ltd.(1)(2) | 24,000 | 4,566 | ||||||
Hope Education Group Co. Ltd.(2) | 368,000 | 31,722 | ||||||
Hopson Development Holdings Ltd.(2) | 29,040 | 39,930 | ||||||
Hua Hong Semiconductor Ltd.(1)(2) | 61,000 | 179,063 | ||||||
Hua Medicine(1) | 8,500 | 4,272 | ||||||
Huabao International Holdings Ltd.(2) | 29,000 | 14,829 | ||||||
Huadian Power International Corp. Ltd., H Shares(2) | 30,000 | 12,330 | ||||||
Huaneng Power International, Inc., H Shares(1) | 210,000 | 107,324 | ||||||
| Huatai Securities Co. Ltd., H Shares | 132,600 | 177,236 | ||||||
| Huaxi Holdings Co. Ltd. | 4,000 | 611 | ||||||
Huazhong In-Vehicle Holdings Co. Ltd.(2) | 40,000 | 12,740 | ||||||
HUYA, Inc., ADR(1) | 5,310 | 17,470 | ||||||
Hygeia Healthcare Holdings Co. Ltd.(1)(2) | 12,600 | 68,008 | ||||||
I-Mab, ADR(1) | 310 | 1,900 | ||||||
iDreamSky Technology Holdings Ltd.(1) | 9,600 | 6,451 | ||||||
| Industrial & Commercial Bank of China Ltd., H Shares | 2,149,000 | 1,091,784 | ||||||
Ingdan, Inc.(1)(2) | 66,000 | 15,163 | ||||||
Inkeverse Group Ltd.(1) | 38,000 | 6,216 | ||||||
International Alliance Financial Leasing Co. Ltd.(1)(2) | 93,000 | 49,106 | ||||||
iQIYI, Inc., ADR(1)(2) | 29,749 | 108,881 | ||||||
JD Health International, Inc.(1) | 12,750 | 87,830 | ||||||
| JD.com, Inc., ADR | 13,011 | 826,068 | ||||||
| JD.com, Inc., Class A | 4,138 | 130,989 | ||||||
JH Educational Technology, Inc.(1) | 14,000 | 5,682 | ||||||
| Jiangsu Expressway Co. Ltd., H Shares | 114,000 | 97,642 | ||||||
| Jiangxi Copper Co. Ltd., H Shares | 87,000 | 106,851 | ||||||
Jiayuan International Group Ltd.(1)(2) | 52,000 | 1,431 | ||||||
Jinchuan Group International Resources Co. Ltd.(2) | 430,000 | 46,403 | ||||||
Jingrui Holdings Ltd.(1) | 6,000 | 451 | ||||||
JinkoSolar Holding Co. Ltd., ADR(1)(2) | 1,540 | 93,740 | ||||||
| Jinxin Fertility Group Ltd. | 97,000 | 63,164 | ||||||
Jiumaojiu International Holdings Ltd.(2) | 84,000 | 165,261 | ||||||
| JNBY Design Ltd. | 11,500 | 12,514 | ||||||
| JOYY, Inc., ADR | 4,673 | 141,685 | ||||||
Jutal Offshore Oil Services Ltd.(1) | 46,000 | 3,452 | ||||||
Kandi Technologies Group, Inc.(1)(2) | 639 | 1,399 | ||||||
Kangji Medical Holdings Ltd.(2) | 33,500 | 26,703 | ||||||
Kanzhun Ltd., ADR(1) | 952 | 22,362 | ||||||
23
| Avantis Emerging Markets Equity Fund | ||||||||
| Shares | Value | |||||||
Kasen International Holdings Ltd.(1) | 37,000 | $ | 2,097 | |||||
KE Holdings, Inc., ADR(1) | 18,197 | 328,274 | ||||||
| Kingboard Holdings Ltd. | 89,500 | 282,614 | ||||||
| Kingboard Laminates Holdings Ltd. | 117,000 | 111,608 | ||||||
Kingsoft Cloud Holdings Ltd., ADR(1) | 5,650 | 19,436 | ||||||
| Kingsoft Corp. Ltd. | 54,800 | 166,553 | ||||||
Kuaishou Technology(1) | 24,100 | 208,814 | ||||||
| Kunlun Energy Co. Ltd. | 158,000 | 137,575 | ||||||
| KWG Group Holdings Ltd. | 86,000 | 15,472 | ||||||
| KWG Living Group Holdings Ltd. | 45,500 | 8,071 | ||||||
Lee & Man Chemical Co. Ltd.(2) | 4,000 | 3,313 | ||||||
| Lee & Man Paper Manufacturing Ltd. | 99,000 | 35,538 | ||||||
Legend Biotech Corp., ADR(1) | 353 | 16,411 | ||||||
| Lenovo Group Ltd. | 478,000 | 393,686 | ||||||
LexinFintech Holdings Ltd., ADR(1) | 13,176 | 26,879 | ||||||
Li Auto, Inc., ADR(1) | 20,455 | 588,490 | ||||||
| Li Ning Co. Ltd. | 90,000 | 819,748 | ||||||
Lifetech Scientific Corp.(1) | 248,000 | 80,876 | ||||||
LightInTheBox Holding Co. Ltd., ADR(1) | 2,012 | 1,992 | ||||||
Logan Group Co. Ltd.(2) | 30,000 | 3,272 | ||||||
| Longfor Group Holdings Ltd. | 103,000 | 334,314 | ||||||
| Lonking Holdings Ltd. | 202,000 | 34,203 | ||||||
| Lufax Holding Ltd., ADR | 16,968 | 74,150 | ||||||
Luokung Technology Corp.(1) | 3,718 | 758 | ||||||
Luoyang Glass Co. Ltd., H Shares(1) | 6,000 | 8,341 | ||||||
Luye Pharma Group Ltd.(1)(2) | 114,000 | 32,905 | ||||||
LVGEM China Real Estate Investment Co. Ltd.(1)(2) | 34,000 | 4,098 | ||||||
| Maanshan Iron & Steel Co. Ltd., H Shares | 4,000 | 1,042 | ||||||
Maoyan Entertainment(1)(2) | 27,400 | 23,010 | ||||||
Medlive Technology Co. Ltd.(2) | 7,000 | 11,128 | ||||||
Meitu, Inc.(1)(2) | 239,000 | 25,409 | ||||||
Meituan, Class B(1) | 42,400 | 1,018,330 | ||||||
| Metallurgical Corp. of China Ltd., H Shares | 5,000 | 947 | ||||||
Midea Real Estate Holding Ltd.(2) | 58,000 | 61,884 | ||||||
| Minsheng Education Group Co. Ltd. | 34,000 | 2,593 | ||||||
| Minth Group Ltd. | 52,000 | 147,143 | ||||||
MMG Ltd.(1) | 484,000 | 132,403 | ||||||
Mobvista, Inc.(1) | 25,000 | 15,071 | ||||||
Mulsanne Group Holding Ltd.(1)(2) | 12,500 | 6,143 | ||||||
Nam Tai Property, Inc.(1)(2) | 1,859 | 7,836 | ||||||
| NetDragon Websoft Holdings Ltd. | 48,000 | 104,437 | ||||||
| NetEase, Inc., ADR | 19,550 | 1,730,371 | ||||||
| New China Life Insurance Co. Ltd., H Shares | 65,600 | 154,402 | ||||||
New Oriental Education & Technology Group, Inc., ADR(1) | 7,116 | 202,094 | ||||||
New Sparkle Roll International Group Ltd.(1) | 136,000 | 1,628 | ||||||
Newborn Town, Inc.(1)(2) | 46,000 | 12,057 | ||||||
Nexteer Automotive Group Ltd.(2) | 84,000 | 62,423 | ||||||
| Nine Dragons Paper Holdings Ltd. | 161,000 | 126,332 | ||||||
NIO, Inc., ADR(1) | 21,956 | 437,144 | ||||||
NiSun International Enterprise Development Group Co. Ltd.(1) | 338 | 243 | ||||||
Noah Holdings Ltd., ADR(1) | 3,545 | 62,782 | ||||||
24
| Avantis Emerging Markets Equity Fund | ||||||||
| Shares | Value | |||||||
Nongfu Spring Co. Ltd., H Shares(2) | 59,400 | $ | 353,183 | |||||
Ocumension Therapeutics(1)(2) | 1,500 | 2,635 | ||||||
OneConnect Financial Technology Co. Ltd., ADR(1) | 10,438 | 11,273 | ||||||
| Orient Overseas International Ltd. | 12,500 | 348,437 | ||||||
| Pacific Millennium Packaging Group Corp. | 2,000 | 1,578 | ||||||
| People's Insurance Co. Group of China Ltd., H Shares | 484,000 | 149,587 | ||||||
Perennial Energy Holdings Ltd.(2) | 40,000 | 5,487 | ||||||
| PetroChina Co. Ltd., ADR | 9,644 | 445,842 | ||||||
| Pharmaron Beijing Co. Ltd., H Shares | 3,900 | 25,797 | ||||||
| PICC Property & Casualty Co. Ltd., H Shares | 478,000 | 517,019 | ||||||
Pinduoduo, Inc., ADR(1) | 15,553 | 1,108,929 | ||||||
Ping An Healthcare and Technology Co. Ltd.(1)(2) | 15,300 | 41,419 | ||||||
| Ping An Insurance Group Co. of China Ltd., H Shares | 267,006 | 1,570,434 | ||||||
| Poly Property Group Co. Ltd. | 213,362 | 43,367 | ||||||
| Poly Property Services Co. Ltd., Class H | 9,200 | 53,887 | ||||||
Postal Savings Bank of China Co. Ltd., H Shares(2) | 468,000 | 279,383 | ||||||
| Pou Sheng International Holdings Ltd. | 90,000 | 9,047 | ||||||
| Powerlong Commercial Management Holdings Ltd. | 8,500 | 4,598 | ||||||
Powerlong Real Estate Holdings Ltd.(2) | 62,000 | 7,775 | ||||||
| Prinx Chengshan Holdings Ltd. | 6,000 | 5,344 | ||||||
PW Medtech Group Ltd.(1) | 7,000 | 719 | ||||||
Q Technology Group Co. Ltd.(1) | 41,000 | 22,529 | ||||||
| Qingling Motors Co. Ltd., H Shares | 6,000 | 954 | ||||||
Qudian, Inc., ADR(1)(2) | 12,033 | 11,431 | ||||||
| Radiance Holdings Group Co. Ltd. | 106,000 | 51,229 | ||||||
Redco Properties Group Ltd.(1)(2) | 22,000 | 4,987 | ||||||
Redsun Properties Group Ltd.(1)(2) | 84,000 | 12,090 | ||||||
ReneSola Ltd., ADR(1) | 3,379 | 19,733 | ||||||
| Road King Infrastructure Ltd. | 5,000 | 2,615 | ||||||
Ronshine China Holdings Ltd.(1) | 27,500 | 2,627 | ||||||
| Sany Heavy Equipment International Holdings Co. Ltd. | 90,000 | 93,228 | ||||||
SCE Intelligent Commercial Management Holdings Ltd.(2) | 14,000 | 3,147 | ||||||
Seazen Group Ltd.(1) | 222,000 | 73,691 | ||||||
Shandong Gold Mining Co. Ltd., H Shares(2) | 13,250 | 22,462 | ||||||
Shandong Hi-Speed New Energy Group Ltd.(1)(2) | 1,000,000 | 9,659 | ||||||
Shandong Molong Petroleum Machinery Co. Ltd., H Shares(1) | 12,800 | 4,621 | ||||||
| Shandong Weigao Group Medical Polymer Co. Ltd., H Shares | 214,000 | 290,306 | ||||||
Shanghai Electric Group Co. Ltd., H Shares(1) | 40,000 | 9,559 | ||||||
| Shanghai Fosun Pharmaceutical Group Co. Ltd., H Shares | 6,000 | 19,302 | ||||||
| Shanghai Fudan Microelectronics Group Co. Ltd., H Shares | 4,000 | 18,639 | ||||||
| Shanghai Haohai Biological Technology Co. Ltd., H Shares | 200 | 702 | ||||||
| Shanghai Industrial Holdings Ltd. | 78,000 | 108,429 | ||||||
| Shanghai Industrial Urban Development Group Ltd. | 1,600 | 128 | ||||||
| Shanghai Pharmaceuticals Holding Co. Ltd., H Shares | 63,800 | 92,752 | ||||||
| Shenzhen Expressway Corp. Ltd., H Shares | 34,000 | 29,768 | ||||||
| Shenzhen International Holdings Ltd. | 193,500 | 166,798 | ||||||
| Shenzhen Investment Ltd. | 152,000 | 27,835 | ||||||
| Shenzhou International Group Holdings Ltd. | 22,200 | 232,019 | ||||||
Shimao Group Holdings Ltd.(2) | 35,500 | 19,992 | ||||||
Shimao Services Holdings Ltd.(1)(2) | 108,000 | 27,665 | ||||||
| Shoucheng Holdings Ltd. | 113,200 | 19,245 | ||||||
25
| Avantis Emerging Markets Equity Fund | ||||||||
| Shares | Value | |||||||
| Shougang Fushan Resources Group Ltd. | 322,000 | $ | 102,134 | |||||
| Shui On Land Ltd. | 355,500 | 44,717 | ||||||
Sihuan Pharmaceutical Holdings Group Ltd.(2) | 329,000 | 41,722 | ||||||
Silver Grant International Holdings Group Ltd.(1) | 8,000 | 506 | ||||||
| Simcere Pharmaceutical Group Ltd. | 71,000 | 70,972 | ||||||
| Sino Biopharmaceutical Ltd. | 567,000 | 297,797 | ||||||
| Sino-Ocean Group Holding Ltd. | 256,000 | 37,365 | ||||||
| Sinopec Engineering Group Co. Ltd., H Shares | 201,000 | 89,801 | ||||||
| Sinopec Kantons Holdings Ltd. | 30,000 | 9,156 | ||||||
| Sinopec Shanghai Petrochemical Co. Ltd., ADR | 365 | 5,639 | ||||||
| Sinopharm Group Co. Ltd., H Shares | 108,800 | 242,384 | ||||||
Sinosoft Technology Group Ltd.(1) | 22,000 | 1,102 | ||||||
| Sinotrans Ltd., H Shares | 4,000 | 1,143 | ||||||
| Sinotruk Hong Kong Ltd. | 53,000 | 52,843 | ||||||
| Skyworth Group Ltd. | 196,487 | 97,622 | ||||||
So-Young International, Inc., ADR(1) | 363 | 361 | ||||||
SOHO China Ltd.(1)(2) | 54,500 | 9,706 | ||||||
Sohu.com Ltd., ADR(1)(2) | 3,248 | 57,879 | ||||||
South Manganese Investment Ltd.(1)(2) | 210,000 | 23,432 | ||||||
| SSY Group Ltd. | 152,000 | 71,577 | ||||||
Sun King Technology Group Ltd.(1) | 42,000 | 11,920 | ||||||
Sunac Services Holdings Ltd.(2) | 15,386 | 4,639 | ||||||
| Sunny Optical Technology Group Co. Ltd. | 29,800 | 406,843 | ||||||
| SY Holdings Group Ltd. | 41,500 | 27,767 | ||||||
TAL Education Group, ADR(1) | 51,245 | 296,196 | ||||||
| TCL Electronics Holdings Ltd. | 67,000 | 32,008 | ||||||
| Tencent Holdings Ltd. | 100,100 | 4,137,208 | ||||||
Tencent Music Entertainment Group, ADR(1) | 37,505 | 191,651 | ||||||
Tian Ge Interactive Holdings Ltd.(1) | 5,000 | 604 | ||||||
| Tian Lun Gas Holdings Ltd. | 32,000 | 14,452 | ||||||
| Tiangong International Co. Ltd. | 126,000 | 42,256 | ||||||
| Tianjin Port Development Holdings Ltd. | 12,000 | 900 | ||||||
Tianneng Power International Ltd.(2) | 88,000 | 93,623 | ||||||
Times China Holdings Ltd.(2) | 11,000 | 1,633 | ||||||
| Tingyi Cayman Islands Holding Corp. | 190,000 | 337,388 | ||||||
| Tong Ren Tang Technologies Co. Ltd., H Shares | 95,000 | 67,154 | ||||||
Tongcheng Travel Holdings Ltd.(1) | 116,000 | 237,587 | ||||||
Tongda Group Holdings Ltd.(1) | 745,000 | 11,348 | ||||||
| Topsports International Holdings Ltd. | 193,000 | 152,334 | ||||||
Towngas Smart Energy Co. Ltd.(1) | 60,000 | 26,322 | ||||||
| TravelSky Technology Ltd., H Shares | 118,000 | 205,660 | ||||||
Trigiant Group Ltd.(1) | 6,000 | 450 | ||||||
Trip.com Group Ltd., ADR(1) | 15,189 | 390,661 | ||||||
| Truly International Holdings Ltd. | 256,000 | 56,082 | ||||||
| Tsaker New Energy Tech Co. Ltd. | 72,500 | 12,985 | ||||||
| Tsingtao Brewery Co. Ltd., H Shares | 16,000 | 155,376 | ||||||
| Uni-President China Holdings Ltd. | 154,000 | 132,586 | ||||||
| United Strength Power Holdings Ltd. | 2,000 | 2,851 | ||||||
Up Fintech Holding Ltd., ADR(1)(2) | 818 | 3,084 | ||||||
Uxin Ltd., ADR(1)(2) | 1,379 | 1,029 | ||||||
Venus MedTech Hangzhou, Inc., H Shares(1)(2) | 9,000 | 15,664 | ||||||
26
| Avantis Emerging Markets Equity Fund | ||||||||
| Shares | Value | |||||||
Vinda International Holdings Ltd.(2) | 50,000 | $ | 139,753 | |||||
Viomi Technology Co. Ltd., ADR(1) | 993 | 1,291 | ||||||
Vipshop Holdings Ltd., ADR(1) | 46,060 | 534,757 | ||||||
VNET Group, Inc., ADR(1) | 11,318 | 60,551 | ||||||
| Want Want China Holdings Ltd. | 427,000 | 300,788 | ||||||
| Wasion Holdings Ltd. | 28,000 | 9,420 | ||||||
Weibo Corp., ADR(1) | 7,800 | 161,382 | ||||||
| Weichai Power Co. Ltd., H Shares | 61,000 | 81,497 | ||||||
| Weiqiao Textile Co., H Shares | 25,500 | 4,811 | ||||||
| West China Cement Ltd. | 310,000 | 38,239 | ||||||
| Wharf Holdings Ltd. | 99,000 | 372,830 | ||||||
Wuling Motors Holdings Ltd.(2) | 160,000 | 21,100 | ||||||
WuXi AppTec Co. Ltd., H Shares(2) | 4,607 | 52,008 | ||||||
Wuxi Biologics Cayman, Inc.(1) | 55,000 | 485,215 | ||||||
Xiabuxiabu Catering Management China Holdings Co. Ltd.(1) | 82,000 | 38,609 | ||||||
| Xiamen International Port Co. Ltd., H Shares | 196,000 | 55,547 | ||||||
Xin Point Holdings Ltd.(2) | 12,000 | 3,505 | ||||||
| Xingda International Holdings Ltd. | 30,896 | 6,327 | ||||||
| Xinhua Winshare Publishing and Media Co. Ltd., H Shares | 16,000 | 11,255 | ||||||
| Xinjiang Goldwind Science & Technology Co. Ltd., H Shares | 73,400 | 109,378 | ||||||
| Xinte Energy Co. Ltd., H Shares | 36,400 | 94,993 | ||||||
| Xinyi Solar Holdings Ltd. | 182,541 | 251,034 | ||||||
XPeng, Inc., Class A, ADR(1) | 5,211 | 96,508 | ||||||
| XTEP International Holdings Ltd. | 150,500 | 208,847 | ||||||
Xunlei Ltd., ADR(1) | 887 | 1,428 | ||||||
| Yadea Group Holdings Ltd. | 112,000 | 213,628 | ||||||
Yankuang Energy Group Co. Ltd., H Shares(2) | 122,000 | 482,926 | ||||||
YiChang HEC ChangJiang Pharmaceutical Co. Ltd., H Shares(1) | 8,800 | 5,587 | ||||||
Yidu Tech, Inc.(1)(2) | 1,600 | 1,441 | ||||||
Yihai International Holding Ltd.(1)(2) | 19,000 | 47,850 | ||||||
Yincheng International Holding Co. Ltd.(1)(2) | 4,000 | 1,130 | ||||||
Youdao, Inc., ADR(1) | 285 | 1,528 | ||||||
YuanShengTai Dairy Farm Ltd.(1) | 41,000 | 1,122 | ||||||
| Yuexiu Property Co. Ltd. | 181,800 | 227,390 | ||||||
| Yuexiu Transport Infrastructure Ltd. | 156,000 | 74,644 | ||||||
| Yum China Holdings, Inc. | 29,319 | 1,469,175 | ||||||
Yuzhou Group Holdings Co. Ltd.(2) | 48,133 | 2,079 | ||||||
Zengame Technology Holding Ltd.(1) | 48,000 | 9,211 | ||||||
Zepp Health Corp., ADR(2) | 940 | 1,795 | ||||||
Zhaojin Mining Industry Co. Ltd., H Shares(1) | 174,000 | 147,332 | ||||||
| Zhejiang Expressway Co. Ltd., H Shares | 156,000 | 118,735 | ||||||
| Zhengzhou Coal Mining Machinery Group Co. Ltd., H Shares | 6,400 | 7,420 | ||||||
Zhenro Properties Group Ltd.(1) | 71,000 | 3,287 | ||||||
ZhongAn Online P&C Insurance Co. Ltd., H Shares(1)(2) | 2,200 | 6,447 | ||||||
Zhongliang Holdings Group Co. Ltd.(2) | 34,000 | 2,859 | ||||||
| Zhongsheng Group Holdings Ltd. | 54,000 | 255,332 | ||||||
| Zhongyu Energy Holdings Ltd. | 54,000 | 44,324 | ||||||
Zhou Hei Ya International Holdings Co. Ltd.(1)(2) | 150,000 | 74,938 | ||||||
Zhuguang Holdings Group Co. Ltd.(1) | 66,000 | 8,398 | ||||||
| Zijin Mining Group Co. Ltd., H Shares | 384,000 | 433,910 | ||||||
| Zoomlion Heavy Industry Science and Technology Co. Ltd., Class H | 114,200 | 51,481 | ||||||
27
| Avantis Emerging Markets Equity Fund | ||||||||
| Shares | Value | |||||||
| ZTO Express Cayman, Inc., ADR | 24,366 | $ | 634,734 | |||||
| 69,266,352 | ||||||||
| Colombia — 0.2% | ||||||||
BAC Holding International Corp.(1) | 3,792 | 193 | ||||||
| Banco Davivienda SA, Preference Shares | 3,823 | 26,758 | ||||||
| Bancolombia SA | 8,153 | 62,956 | ||||||
| Bancolombia SA, ADR | 3,240 | 88,938 | ||||||
| Cementos Argos SA | 12,288 | 9,680 | ||||||
Corp. Financiera Colombiana SA(1) | 3,119 | 13,732 | ||||||
Ecopetrol SA, ADR(2) | 7,732 | 79,717 | ||||||
| Grupo Argos SA | 24,875 | 54,760 | ||||||
| Grupo Aval Acciones y Valores SA, Preference Shares | 3,792 | 569 | ||||||
| Interconexion Electrica SA ESP | 19,829 | 85,826 | ||||||
| 423,129 | ||||||||
| Czech Republic — 0.1% | ||||||||
| CEZ AS | 5,531 | 224,072 | ||||||
| Komercni banka AS | 2,588 | 60,614 | ||||||
| Moneta Money Bank AS | 21,939 | 69,607 | ||||||
| 354,293 | ||||||||
| Egypt — 0.1% | ||||||||
| Commercial International Bank Egypt S.A.E., GDR | 82,243 | 144,417 | ||||||
| Greece — 0.3% | ||||||||
Alpha Services & Holdings SA(1) | 68,380 | 63,149 | ||||||
| Athens Water Supply & Sewage Co. SA | 574 | 4,480 | ||||||
Attica Bank SA(1) | 36 | 4 | ||||||
Eurobank Ergasias Services and Holdings SA, Class A(1) | 124,210 | 115,243 | ||||||
| Fourlis Holdings SA | 301 | 906 | ||||||
GEK Terna Holding Real Estate Construction SA(1) | 4,410 | 42,705 | ||||||
| Hellenic Exchanges - Athens Stock Exchange SA | 1,076 | 3,565 | ||||||
| Hellenic Petroleum Holdings SA | 215 | 1,479 | ||||||
| Hellenic Telecommunications Organization SA | 4,516 | 71,844 | ||||||
| JUMBO SA | 8,947 | 127,904 | ||||||
| Motor Oil Hellas Corinth Refineries SA | 1,617 | 30,486 | ||||||
| Mytilineos SA | 3,750 | 58,641 | ||||||
National Bank of Greece SA(1) | 26,488 | 85,483 | ||||||
| OPAP SA | 7,277 | 95,852 | ||||||
Piraeus Financial Holdings SA(1) | 29,614 | 30,994 | ||||||
Public Power Corp. SA(1) | 5,060 | 26,415 | ||||||
| Terna Energy SA | 969 | 17,283 | ||||||
Titan Cement International SA(1) | 2,169 | 25,806 | ||||||
| Viohalco SA | 2,419 | 8,329 | ||||||
| 810,568 | ||||||||
Hong Kong† | ||||||||
Brilliance China Automotive Holdings Ltd.(1) | 60,000 | 27,368 | ||||||
China Beststudy Education Group(1) | 17,000 | 831 | ||||||
China First Capital Group Ltd.(1) | 5,600 | 91 | ||||||
| China Isotope & Radiation Corp. | 2,200 | 4,957 | ||||||
China Zhongwang Holdings Ltd.(1)(2) | 86,400 | 18,494 | ||||||
| Edvantage Group Holdings Ltd. | 14,000 | 4,166 | ||||||
| Essex Bio-technology Ltd. | 21,000 | 11,086 | ||||||
| IMAX China Holding, Inc. | 4,700 | 3,522 | ||||||
28
| Avantis Emerging Markets Equity Fund | ||||||||
| Shares | Value | |||||||
| Scholar Education Group | 5,000 | $ | 521 | |||||
| 71,036 | ||||||||
| Hungary — 0.2% | ||||||||
| Magyar Telekom Telecommunications PLC | 10,305 | 8,750 | ||||||
| MOL Hungarian Oil & Gas PLC | 32,635 | 224,866 | ||||||
| OTP Bank Nyrt | 4,728 | 100,550 | ||||||
| Richter Gedeon Nyrt | 3,428 | 69,116 | ||||||
| 403,282 | ||||||||
| India — 17.4% | ||||||||
3M India Ltd.(1) | 18 | 5,236 | ||||||
| Aarti Drugs Ltd. | 1,000 | 5,395 | ||||||
| ACC Ltd. | 5,629 | 161,296 | ||||||
| Adani Enterprises Ltd. | 6,327 | 251,079 | ||||||
Adani Green Energy Ltd.(1) | 5,866 | 177,246 | ||||||
| Adani Ports & Special Economic Zone Ltd. | 16,908 | 176,900 | ||||||
Adani Power Ltd.(1) | 15,009 | 76,646 | ||||||
| Adani Total Gas Ltd. | 6,675 | 311,305 | ||||||
Adani Transmission Ltd.(1) | 17,822 | 873,964 | ||||||
Aditya Birla Capital Ltd.(1) | 37,897 | 53,527 | ||||||
| Aegis Logistics Ltd. | 10,892 | 39,829 | ||||||
| AGI Greenpac Ltd. | 5,613 | 21,870 | ||||||
| AIA Engineering Ltd. | 2,717 | 88,351 | ||||||
| Ajanta Pharma Ltd. | 3,028 | 51,930 | ||||||
| Akzo Nobel India Ltd. | 222 | 5,385 | ||||||
| Alembic Ltd. | 2,801 | 2,556 | ||||||
| Alembic Pharmaceuticals Ltd. | 8,197 | 66,333 | ||||||
| Alkyl Amines Chemicals | 545 | 20,119 | ||||||
| Allcargo Logistics Ltd. | 9,782 | 43,459 | ||||||
Alok Industries Ltd.(1) | 30,788 | 7,392 | ||||||
| Amara Raja Batteries Ltd. | 8,996 | 57,069 | ||||||
| Ambuja Cements Ltd. | 25,656 | 131,560 | ||||||
| Andhra Sugars Ltd. | 4,791 | 8,703 | ||||||
| Apar Industries Ltd. | 1,193 | 19,878 | ||||||
APL Apollo Tubes Ltd.(1) | 10,577 | 124,384 | ||||||
| Apollo Hospitals Enterprise Ltd. | 4,820 | 258,971 | ||||||
| Apollo Tyres Ltd. | 40,709 | 127,007 | ||||||
Arvind Ltd.(1) | 19,696 | 23,924 | ||||||
| Ashok Leyland Ltd. | 53,961 | 103,213 | ||||||
Ashoka Buildcon Ltd.(1) | 5,427 | 5,407 | ||||||
| Asian Paints Ltd. | 4,621 | 194,539 | ||||||
Aster DM Healthcare Ltd.(1) | 13,761 | 37,947 | ||||||
| Astral Ltd. | 1,639 | 42,617 | ||||||
| AstraZeneca Pharma India Ltd. | 87 | 3,356 | ||||||
| Atul Ltd. | 395 | 45,177 | ||||||
| AU Small Finance Bank Ltd. | 10,280 | 80,844 | ||||||
| Aurobindo Pharma Ltd. | 22,533 | 153,410 | ||||||
Aurum Proptech Ltd.(1) | 376 | 618 | ||||||
| Avanti Feeds Ltd. | 3,130 | 18,089 | ||||||
Avenue Supermarts Ltd.(1) | 1,289 | 72,458 | ||||||
| Axis Bank Ltd., GDR | 7,694 | 364,520 | ||||||
| Bajaj Auto Ltd. | 3,482 | 177,352 | ||||||
29
| Avantis Emerging Markets Equity Fund | ||||||||
| Shares | Value | |||||||
| Bajaj Consumer Care Ltd. | 4,232 | $ | 8,521 | |||||
| Bajaj Electricals Ltd. | 4,356 | 67,168 | ||||||
| Bajaj Finance Ltd. | 3,352 | 302,522 | ||||||
| Bajaj Finserv Ltd. | 731 | 153,251 | ||||||
Bajaj Hindusthan Sugar Ltd.(1) | 221,576 | 27,540 | ||||||
| Balaji Amines Ltd. | 521 | 22,359 | ||||||
| Balkrishna Industries Ltd. | 4,519 | 114,797 | ||||||
| Balrampur Chini Mills Ltd. | 18,717 | 81,627 | ||||||
Bandhan Bank Ltd.(1) | 45,128 | 155,745 | ||||||
| BASF India Ltd. | 868 | 35,866 | ||||||
| Bata India Ltd. | 1,352 | 32,685 | ||||||
| Bayer CropScience Ltd. | 493 | 33,614 | ||||||
| Berger Paints India Ltd. | 4,126 | 34,507 | ||||||
| Bhansali Engineering Polymers Ltd. | 2,839 | 4,476 | ||||||
| Bharat Electronics Ltd. | 101,170 | 386,569 | ||||||
| Bharat Forge Ltd. | 12,134 | 111,702 | ||||||
Bharat Heavy Electricals Ltd.(1) | 45,108 | 32,954 | ||||||
| Bharat Petroleum Corp. Ltd. | 62,811 | 257,298 | ||||||
| Bharat Rasayan Ltd. | 54 | 8,145 | ||||||
| Bharti Airtel Ltd. | 1,882 | 8,108 | ||||||
| Bharti Airtel Ltd. | 26,351 | 238,699 | ||||||
| Biocon Ltd. | 11,885 | 45,986 | ||||||
| Birla Corp. Ltd. | 2,240 | 27,094 | ||||||
| Birlasoft Ltd. | 11,057 | 43,744 | ||||||
| Blue Dart Express Ltd. | 342 | 36,495 | ||||||
| Blue Star Ltd. | 4,639 | 63,640 | ||||||
| Bombay Burmah Trading Co. | 1,082 | 12,249 | ||||||
| Bosch Ltd. | 97 | 21,163 | ||||||
| Brigade Enterprises Ltd. | 15,678 | 99,566 | ||||||
| Brightcom Group Ltd. | 106,495 | 53,980 | ||||||
| Britannia Industries Ltd. | 3,904 | 182,674 | ||||||
| BSE Ltd. | 9,680 | 78,334 | ||||||
| Can Fin Homes Ltd. | 5,036 | 39,617 | ||||||
| Canara Bank | 30,478 | 90,890 | ||||||
Capacit'e Infraprojects Ltd.(1) | 3,479 | 7,136 | ||||||
| Caplin Point Laboratories Ltd. | 1,037 | 10,096 | ||||||
| Capri Global Capital Ltd. | 800 | 7,189 | ||||||
| Carborundum Universal Ltd. | 5,975 | 62,885 | ||||||
| Care Ratings Ltd. | 1,529 | 9,624 | ||||||
| Castrol India Ltd. | 39,493 | 56,236 | ||||||
| CCL Products India Ltd. | 8,126 | 48,612 | ||||||
| Ceat Ltd. | 2,618 | 45,353 | ||||||
| Central Depository Services India Ltd. | 1,383 | 21,354 | ||||||
| Century Plyboards India Ltd. | 4,675 | 39,035 | ||||||
| Century Textiles & Industries Ltd. | 3,854 | 41,260 | ||||||
| Cera Sanitaryware Ltd. | 332 | 20,689 | ||||||
| CESC Ltd. | 31,367 | 31,838 | ||||||
CG Power & Industrial Solutions Ltd.(1) | 7,280 | 20,271 | ||||||
| Chambal Fertilisers and Chemicals Ltd. | 25,589 | 111,445 | ||||||
| Chennai Petroleum Corp. Ltd. | 12,992 | 47,282 | ||||||
| Cholamandalam Financial Holdings Ltd. | 962 | 8,033 | ||||||
30
| Avantis Emerging Markets Equity Fund | ||||||||
| Shares | Value | |||||||
| Cholamandalam Investment and Finance Co. Ltd. | 20,592 | $ | 201,742 | |||||
| Cipla Ltd. | 24,070 | 311,907 | ||||||
| City Union Bank Ltd. | 59,336 | 132,786 | ||||||
| Coal India Ltd. | 100,424 | 293,438 | ||||||
| Cochin Shipyard Ltd. | 5,312 | 24,981 | ||||||
| Coforge Ltd. | 586 | 25,829 | ||||||
| Colgate-Palmolive India Ltd. | 6,782 | 142,401 | ||||||
| Computer Age Management Services Ltd. | 1,311 | 37,487 | ||||||
| Container Corp. of India Ltd. | 8,549 | 74,158 | ||||||
| Coromandel International Ltd. | 13,464 | 176,772 | ||||||
| Cosmo Films Ltd. | 2,080 | 23,751 | ||||||
CreditAccess Grameen Ltd.(1) | 5,896 | 72,982 | ||||||
| CRISIL Ltd. | 880 | 35,979 | ||||||
| Crompton Greaves Consumer Electricals Ltd. | 25,183 | 128,140 | ||||||
| Cummins India Ltd. | 4,689 | 69,637 | ||||||
| Cyient Ltd. | 8,221 | 86,085 | ||||||
| Dabur India Ltd. | 17,811 | 129,866 | ||||||
| Dalmia Bharat Ltd. | 4,247 | 81,269 | ||||||
| Dalmia Bharat Sugar & Industries Ltd. | 1,638 | 7,069 | ||||||
| DCB Bank Ltd. | 7,572 | 8,883 | ||||||
| DCM Shriram Ltd. | 6,921 | 90,333 | ||||||
| Deepak Fertilisers & Petrochemicals Corp. Ltd. | 10,453 | 118,149 | ||||||
| Deepak Nitrite Ltd. | 5,774 | 141,690 | ||||||
| Delta Corp. Ltd. | 3,208 | 8,382 | ||||||
Dhani Services Ltd.(1) | 4,561 | 3,684 | ||||||
| Dilip Buildcon Ltd. | 1,435 | 4,295 | ||||||
Dish TV India Ltd.(1) | 128,989 | 19,297 | ||||||
Dishman Carbogen Amcis Ltd.(1) | 4,829 | 7,008 | ||||||
| Divi's Laboratories Ltd. | 3,604 | 162,716 | ||||||
| Dixon Technologies India Ltd. | 770 | 39,155 | ||||||
| DLF Ltd. | 17,606 | 85,046 | ||||||
| Dr Lal PathLabs Ltd. | 1,235 | 39,345 | ||||||
| Dr Reddy's Laboratories Ltd., ADR | 5,797 | 303,125 | ||||||
| Dwarikesh Sugar Industries Ltd. | 31,044 | 37,427 | ||||||
| eClerx Services Ltd. | 985 | 25,859 | ||||||
| Edelweiss Financial Services Ltd. | 21,252 | 16,097 | ||||||
| Eicher Motors Ltd. | 8,287 | 345,860 | ||||||
| EID Parry India Ltd. | 12,280 | 81,236 | ||||||
| Elecon Engineering Co. Ltd. | 8,207 | 38,203 | ||||||
| Electrosteel Castings Ltd. | 36,739 | 16,807 | ||||||
| Emami Ltd. | 17,752 | 107,462 | ||||||
| Endurance Technologies Ltd. | 938 | 17,510 | ||||||
| Engineers India Ltd. | 29,497 | 24,989 | ||||||
| EPL Ltd. | 9,271 | 19,704 | ||||||
Equitas Holdings Ltd.(1) | 15,078 | 18,734 | ||||||
| Eris Lifesciences Ltd. | 2,218 | 19,160 | ||||||
| Escorts Kubota Ltd. | 5,240 | 130,635 | ||||||
Eveready Industries India Ltd.(1) | 3,403 | 15,098 | ||||||
| Everest Industries Ltd. | 1,312 | 11,520 | ||||||
| Excel Industries Ltd. | 483 | 8,761 | ||||||
| Exide Industries Ltd. | 50,863 | 101,568 | ||||||
31
| Avantis Emerging Markets Equity Fund | ||||||||
| Shares | Value | |||||||
FDC Ltd.(1) | 1,453 | $ | 4,782 | |||||
| Federal Bank Ltd. | 178,579 | 258,978 | ||||||
| FIEM Industries Ltd. | 780 | 14,501 | ||||||
| Fine Organic Industries Ltd. | 202 | 15,563 | ||||||
| Finolex Cables Ltd. | 4,004 | 22,990 | ||||||
| Finolex Industries Ltd. | 24,605 | 46,486 | ||||||
| Force Motors Ltd. | 351 | 5,672 | ||||||
Future Lifestyle Fashions Ltd.(1) | 1,257 | 203 | ||||||
| GAIL India Ltd. | 59,436 | 100,960 | ||||||
| Galaxy Surfactants Ltd. | 1,001 | 40,916 | ||||||
| Garden Reach Shipbuilders & Engineers Ltd. | 5,677 | 21,213 | ||||||
| Garware Technical Fibres Ltd. | 298 | 12,976 | ||||||
| Genus Power Infrastructures Ltd. | 9,003 | 9,428 | ||||||
| GHCL Ltd. | 11,424 | 84,964 | ||||||
| Gillette India Ltd. | 152 | 10,468 | ||||||
| GlaxoSmithKline Pharmaceuticals Ltd. | 1,424 | 25,979 | ||||||
| Glenmark Pharmaceuticals Ltd. | 12,358 | 57,237 | ||||||
| Globus Spirits Ltd. | 1,282 | 13,888 | ||||||
GMR Infrastructure Ltd.(1) | 35,363 | 15,792 | ||||||
GMR Power and Urban Infra Ltd.(1) | 1,505 | 653 | ||||||
| GNA Axles Ltd. | 786 | 6,766 | ||||||
| Godawari Power and Ispat Ltd. | 8,189 | 29,989 | ||||||
Godrej Consumer Products Ltd.(1) | 6,465 | 74,470 | ||||||
Godrej Industries Ltd.(1) | 830 | 4,975 | ||||||
Gokaldas Exports Ltd.(1) | 4,153 | 18,610 | ||||||
| Granules India Ltd. | 14,660 | 55,814 | ||||||
| Graphite India Ltd. | 10,458 | 53,547 | ||||||
| Grasim Industries Ltd. | 14,586 | 303,993 | ||||||
| Great Eastern Shipping Co. Ltd. | 18,440 | 131,173 | ||||||
| Greaves Cotton Ltd. | 10,035 | 21,146 | ||||||
| Greenpanel Industries Ltd. | 7,398 | 41,282 | ||||||
| Greenply Industries Ltd. | 8,512 | 19,918 | ||||||
| Gufic Biosciences Ltd. | 3,500 | 9,170 | ||||||
| Gujarat Alkalies & Chemicals Ltd. | 1,841 | 20,306 | ||||||
| Gujarat Ambuja Exports Ltd. | 15,182 | 51,722 | ||||||
| Gujarat Fluorochemicals Ltd. | 757 | 31,386 | ||||||
| Gujarat Gas Ltd. | 11,469 | 67,489 | ||||||
| Gujarat Mineral Development Corp. Ltd. | 9,795 | 20,185 | ||||||
| Gujarat Narmada Valley Fertilizers & Chemicals Ltd. | 13,375 | 124,469 | ||||||
| Gujarat Pipavav Port Ltd. | 29,539 | 32,076 | ||||||
| Gujarat State Fertilizers & Chemicals Ltd. | 38,670 | 75,824 | ||||||
| Gujarat State Petronet Ltd. | 14,796 | 44,592 | ||||||
| Happiest Minds Technologies Ltd. | 520 | 6,609 | ||||||
Hathway Cable & Datacom Ltd.(1) | 53,179 | 11,828 | ||||||
| Havells India Ltd. | 8,068 | 139,670 | ||||||
| HBL Power Systems Ltd. | 15,215 | 15,334 | ||||||
| HCL Technologies Ltd. | 38,052 | 442,615 | ||||||
| HDFC Asset Management Co. Ltd. | 2,087 | 53,843 | ||||||
| HDFC Life Insurance Co. Ltd. | 10,253 | 73,475 | ||||||
| HEG Ltd. | 507 | 7,931 | ||||||
| HeidelbergCement India Ltd. | 3,441 | 8,205 | ||||||
32
| Avantis Emerging Markets Equity Fund | ||||||||
| Shares | Value | |||||||
| Hero MotoCorp Ltd. | 6,316 | $ | 222,482 | |||||
| HFCL Ltd. | 55,288 | 50,767 | ||||||
| HG Infra Engineering Ltd. | 1,319 | 9,848 | ||||||
| Hikal Ltd. | 2,164 | 9,209 | ||||||
| HIL Ltd. | 531 | 24,490 | ||||||
Himatsingka Seide Ltd.(1) | 1,947 | 2,549 | ||||||
| Hindalco Industries Ltd. | 81,114 | 439,930 | ||||||
| Hinduja Global Solutions Ltd. | 708 | 13,188 | ||||||
| Hindustan Copper Ltd. | 24,302 | 35,649 | ||||||
Hindustan Oil Exploration Co. Ltd.(1) | 4,116 | 8,355 | ||||||
| Hindustan Petroleum Corp. Ltd. | 62,661 | 190,191 | ||||||
| Hindustan Unilever Ltd. | 10,414 | 344,766 | ||||||
| Hitachi Energy India Ltd. | 241 | 11,224 | ||||||
Home First Finance Co. India Ltd.(1) | 1,412 | 17,014 | ||||||
| Housing Development Finance Corp. Ltd. | 43,013 | 1,302,236 | ||||||
| I G Petrochemicals Ltd. | 1,499 | 11,067 | ||||||
| ICICI Bank Ltd., ADR | 36,671 | 800,895 | ||||||
| ICICI Lombard General Insurance Co. Ltd. | 7,483 | 120,203 | ||||||
| ICICI Prudential Life Insurance Co. Ltd. | 7,787 | 57,487 | ||||||
IDFC First Bank Ltd.(1) | 74,379 | 45,275 | ||||||
| IDFC Ltd. | 86,995 | 74,108 | ||||||
IFB Industries Ltd.(1) | 268 | 3,420 | ||||||
IFCI Ltd.(1) | 32,831 | 4,467 | ||||||
| IIFL Finance Ltd. | 19,033 | 81,525 | ||||||
| IIFL Securities Ltd. | 5,318 | 4,744 | ||||||
| IIFL Wealth Management Ltd. | 1,793 | 37,438 | ||||||
| India Cements Ltd. | 15,074 | 42,683 | ||||||
| India Glycols Ltd. | 1,220 | 13,527 | ||||||
Indiabulls Housing Finance Ltd.(1) | 19,242 | 32,453 | ||||||
Indiabulls Real Estate Ltd.(1) | 22,587 | 24,281 | ||||||
| Indian Bank | 32,035 | 77,089 | ||||||
| Indian Energy Exchange Ltd. | 23,847 | 47,526 | ||||||
| Indian Metals & Ferro Alloys Ltd. | 3,462 | 11,904 | ||||||
| Indian Oil Corp. Ltd. | 196,969 | 175,757 | ||||||
| Indian Railway Catering & Tourism Corp. Ltd. | 2,155 | 18,902 | ||||||
| Indo Count Industries Ltd. | 3,348 | 6,811 | ||||||
| Indraprastha Gas Ltd. | 1,402 | 7,330 | ||||||
| Indus Towers Ltd. | 47,602 | 118,374 | ||||||
| Info Edge India Ltd. | 1,068 | 57,451 | ||||||
| Infosys Ltd., ADR | 93,352 | 1,708,342 | ||||||
Inox Wind Ltd.(1) | 5,788 | 8,032 | ||||||
| Intellect Design Arena Ltd. | 9,903 | 72,688 | ||||||
InterGlobe Aviation Ltd.(1) | 1,748 | 43,652 | ||||||
| IOL Chemicals and Pharmaceuticals Ltd. | 943 | 4,217 | ||||||
| Ipca Laboratories Ltd. | 11,799 | 133,513 | ||||||
| IRB Infrastructure Developers Ltd. | 9,082 | 26,670 | ||||||
| J Kumar Infraprojects Ltd. | 6,357 | 23,579 | ||||||
| Jagran Prakashan Ltd. | 9,956 | 7,834 | ||||||
| Jai Corp. Ltd. | 9,007 | 14,693 | ||||||
Jain Irrigation Systems Ltd.(1) | 33,922 | 17,073 | ||||||
Jaiprakash Associates Ltd.(1) | 47,432 | 4,842 | ||||||
33
| Avantis Emerging Markets Equity Fund | ||||||||
| Shares | Value | |||||||
Jaiprakash Power Ventures Ltd.(1) | 337,329 | $ | 31,547 | |||||
Jammu & Kashmir Bank Ltd.(1) | 42,258 | 16,613 | ||||||
| Jamna Auto Industries Ltd. | 30,124 | 43,696 | ||||||
| Jindal Poly Films Ltd. | 1,475 | 19,306 | ||||||
| Jindal Saw Ltd. | 15,519 | 16,752 | ||||||
Jindal Stainless Hisar Ltd.(1) | 11,911 | 36,168 | ||||||
Jindal Stainless Ltd.(1) | 17,129 | 27,250 | ||||||
| Jindal Steel & Power Ltd. | 42,987 | 231,301 | ||||||
| JK Cement Ltd. | 2,071 | 69,913 | ||||||
| JK Lakshmi Cement Ltd. | 6,614 | 38,866 | ||||||
| JK Paper Ltd. | 14,528 | 75,489 | ||||||
| JK Tyre & Industries Ltd. | 14,652 | 25,388 | ||||||
| JM Financial Ltd. | 38,923 | 30,908 | ||||||
| JSW Energy Ltd. | 10,448 | 44,400 | ||||||
| JSW Steel Ltd. | 38,502 | 319,302 | ||||||
| Jubilant Foodworks Ltd. | 13,800 | 105,118 | ||||||
| Jubilant Ingrevia Ltd. | 2,179 | 12,652 | ||||||
| Jubilant Pharmova Ltd. | 3,351 | 14,666 | ||||||
Just Dial Ltd.(1) | 979 | 7,178 | ||||||
| Jyothy Labs Ltd. | 4,782 | 11,273 | ||||||
| Kajaria Ceramics Ltd. | 4,758 | 68,995 | ||||||
| Kalpataru Power Transmission Ltd. | 3,140 | 16,002 | ||||||
| Kansai Nerolac Paints Ltd. | 2,339 | 14,762 | ||||||
| Karnataka Bank Ltd. | 15,165 | 14,121 | ||||||
| Karur Vysya Bank Ltd. | 40,236 | 34,184 | ||||||
| Kaveri Seed Co. Ltd. | 3,831 | 21,817 | ||||||
| KEC International Ltd. | 17,517 | 88,925 | ||||||
| KEI Industries Ltd. | 948 | 17,275 | ||||||
| Kirloskar Ferrous Industries Ltd. | 6,887 | 21,756 | ||||||
| Kirloskar Oil Engines Ltd. | 3,353 | 9,474 | ||||||
| KNR Constructions Ltd. | 12,064 | 39,135 | ||||||
| Kolte-Patil Developers Ltd. | 1,397 | 5,353 | ||||||
| Kopran Ltd. | 1,454 | 3,364 | ||||||
| Kotak Mahindra Bank Ltd. | 12,483 | 296,149 | ||||||
| KPIT Technologies Ltd. | 15,137 | 104,581 | ||||||
| KPR Mill Ltd. | 5,470 | 41,138 | ||||||
| KRBL Ltd. | 8,855 | 34,725 | ||||||
| L&T Finance Holdings Ltd. | 82,772 | 81,295 | ||||||
| L&T Technology Services Ltd. | 955 | 43,737 | ||||||
| Larsen & Toubro Infotech Ltd. | 1,594 | 91,214 | ||||||
| Larsen & Toubro Ltd. | 25,814 | 616,109 | ||||||
| Laurus Labs Ltd. | 27,240 | 196,085 | ||||||
| LIC Housing Finance Ltd. | 37,996 | 193,063 | ||||||
| Linde India Ltd. | 348 | 14,854 | ||||||
| LT Foods Ltd. | 7,047 | 8,352 | ||||||
| Lupin Ltd. | 8,269 | 69,099 | ||||||
| Mahanagar Gas Ltd. | 1,830 | 19,884 | ||||||
| Maharashtra Seamless Ltd. | 2,014 | 21,039 | ||||||
| Mahindra & Mahindra Financial Services Ltd. | 53,466 | 136,172 | ||||||
| Mahindra & Mahindra Ltd. | 50,680 | 822,568 | ||||||
| Mahindra CIE Automotive Ltd. | 11,971 | 40,898 | ||||||
34
| Avantis Emerging Markets Equity Fund | ||||||||
| Shares | Value | |||||||
| Mahindra Lifespace Developers Ltd. | 2,988 | $ | 19,307 | |||||
| Mahindra Logistics Ltd. | 3,262 | 19,603 | ||||||
| Maithan Alloys Ltd. | 1,132 | 14,568 | ||||||
| Manali Petrochemicals Ltd. | 9,199 | 10,568 | ||||||
| Manappuram Finance Ltd. | 40,753 | 53,540 | ||||||
| Marico Ltd. | 22,586 | 148,274 | ||||||
| Marksans Pharma Ltd. | 7,598 | 4,937 | ||||||
| Maruti Suzuki India Ltd. | 4,010 | 452,318 | ||||||
| MAS Financial Services Ltd. | 1,629 | 15,244 | ||||||
| Mastek Ltd. | 528 | 12,372 | ||||||
| Matrimony.com Ltd. | 690 | 6,136 | ||||||
| Mayur Uniquoters Ltd. | 698 | 4,220 | ||||||
| Mazagon Dock Shipbuilders Ltd. | 3,870 | 18,839 | ||||||
Meghmani Finechem Ltd.(1) | 1,763 | 31,237 | ||||||
| Meghmani Organics Ltd. | 14,945 | 22,690 | ||||||
| Metropolis Healthcare Ltd. | 1,019 | 18,161 | ||||||
| Minda Corp. Ltd. | 3,029 | 8,469 | ||||||
| Mindtree Ltd. | 2,532 | 103,027 | ||||||
Mirza International Ltd.(1) | 9,808 | 38,921 | ||||||
| MOIL Ltd. | 7,182 | 14,693 | ||||||
| Motherson Sumi Wiring India Ltd. | 33,006 | 33,533 | ||||||
| Motilal Oswal Financial Services Ltd. | 5,586 | 53,541 | ||||||
| Mphasis Ltd. | 4,694 | 123,487 | ||||||
| MRF Ltd. | 187 | 199,327 | ||||||
| MSTC Ltd. | 1,029 | 3,493 | ||||||
| Multi Commodity Exchange of India Ltd. | 1,228 | 19,674 | ||||||
| Muthoot Finance Ltd. | 5,694 | 74,599 | ||||||
| Narayana Hrudayalaya Ltd. | 3,375 | 29,508 | ||||||
| Natco Pharma Ltd. | 7,670 | 58,985 | ||||||
| National Aluminium Co. Ltd. | 92,483 | 92,095 | ||||||
| Nava Ltd. | 11,704 | 32,964 | ||||||
| NBCC India Ltd. | 65,976 | 28,228 | ||||||
| NCC Ltd. | 39,240 | 34,070 | ||||||
| NELCO Ltd. | 701 | 8,568 | ||||||
| Neogen Chemicals Ltd. | 823 | 15,183 | ||||||
| NESCO Ltd. | 711 | 5,105 | ||||||
| Nestle India Ltd. | 961 | 239,269 | ||||||
| Neuland Laboratories Ltd. | 579 | 9,151 | ||||||
| Newgen Software Technologies Ltd. | 1,964 | 9,582 | ||||||
| NIIT Ltd. | 9,326 | 40,127 | ||||||
| Nippon Life India Asset Management Ltd. | 6,940 | 26,097 | ||||||
| NOCIL Ltd. | 1,719 | 5,639 | ||||||
| NTPC Ltd. | 237,131 | 486,085 | ||||||
| Oberoi Realty Ltd. | 6,424 | 80,296 | ||||||
| Oil & Natural Gas Corp. Ltd. | 129,618 | 224,383 | ||||||
| Oil India Ltd. | 21,074 | 50,744 | ||||||
Olectra Greentech Ltd.(1) | 3,191 | 24,528 | ||||||
| OnMobile Global Ltd. | 3,493 | 5,381 | ||||||
| Oracle Financial Services Software Ltd. | 2,052 | 81,068 | ||||||
| Orient Cement Ltd. | 17,095 | 25,509 | ||||||
| Orient Electric Ltd. | 9,374 | 30,384 | ||||||
35
| Avantis Emerging Markets Equity Fund | ||||||||
| Shares | Value | |||||||
| Page Industries Ltd. | 239 | $ | 152,271 | |||||
| Paisalo Digital Ltd. | 11,790 | 11,032 | ||||||
PC Jeweller Ltd.(1) | 24,410 | 21,653 | ||||||
| PCBL Ltd. | 19,120 | 32,679 | ||||||
| Persistent Systems Ltd. | 2,477 | 107,725 | ||||||
| Petronet LNG Ltd. | 85,800 | 236,701 | ||||||
| Phoenix Mills Ltd. | 2,284 | 39,944 | ||||||
| PI Industries Ltd. | 1,641 | 70,168 | ||||||
| Pidilite Industries Ltd. | 3,031 | 103,465 | ||||||
| Piramal Enterprises Ltd. | 4,189 | 55,273 | ||||||
Piramal Pharma Ltd.(1) | 16,756 | 45,942 | ||||||
PNB Housing Finance Ltd.(1) | 6,414 | 27,820 | ||||||
| PNC Infratech Ltd. | 10,165 | 35,859 | ||||||
| Polycab India Ltd. | 446 | 13,680 | ||||||
| Polyplex Corp. Ltd. | 2,781 | 74,391 | ||||||
| Poonawalla Fincorp Ltd. | 2,566 | 9,702 | ||||||
| Power Finance Corp. Ltd. | 10,140 | 15,115 | ||||||
| Power Grid Corp. of India Ltd. | 173,073 | 495,520 | ||||||
| Praj Industries Ltd. | 9,934 | 51,668 | ||||||
| Prestige Estates Projects Ltd. | 8,021 | 45,550 | ||||||
Pricol Ltd.(1) | 15,569 | 33,489 | ||||||
| Prince Pipes & Fittings Ltd. | 1,925 | 14,031 | ||||||
Prism Johnson Ltd.(1) | 6,392 | 10,038 | ||||||
| Privi Speciality Chemicals Ltd. | 426 | 7,367 | ||||||
| Procter & Gamble Health Ltd. | 56 | 2,954 | ||||||
| PTC India Ltd. | 20,398 | 21,534 | ||||||
| Radico Khaitan Ltd. | 4,520 | 58,853 | ||||||
| Rain Industries Ltd. | 2,672 | 6,579 | ||||||
| Rajesh Exports Ltd. | 5,055 | 37,247 | ||||||
| Rallis India Ltd. | 2,331 | 6,556 | ||||||
| Ramco Cements Ltd. | 7,339 | 69,248 | ||||||
| Rashtriya Chemicals & Fertilizers Ltd. | 15,657 | 19,259 | ||||||
| Ratnamani Metals & Tubes Ltd. | 1,240 | 28,862 | ||||||
| Raymond Ltd. | 6,204 | 73,914 | ||||||
RBL Bank Ltd.(1) | 51,352 | 77,515 | ||||||
| REC Ltd. | 127,515 | 173,141 | ||||||
| Redington India Ltd. | 75,163 | 140,245 | ||||||
| Relaxo Footwears Ltd. | 2,718 | 33,910 | ||||||
| Reliance Industrial Infrastructure Ltd. | 626 | 7,938 | ||||||
| Reliance Industries Ltd., GDR | 27,300 | 1,793,412 | ||||||
Reliance Infrastructure Ltd.(1) | 17,976 | 36,121 | ||||||
Reliance Power Ltd.(1) | 326,382 | 67,803 | ||||||
| Repco Home Finance Ltd. | 1,964 | 6,030 | ||||||
| Rhi Magnesita India Ltd. | 2,629 | 19,331 | ||||||
| Rupa & Co. Ltd. | 2,495 | 10,635 | ||||||
| Samvardhana Motherson International Ltd. | 81,252 | 123,931 | ||||||
| Sanofi India Ltd. | 867 | 67,218 | ||||||
| Sarda Energy & Minerals Ltd. | 1,168 | 13,330 | ||||||
| Saregama India Ltd. | 1,980 | 9,903 | ||||||
| SBI Cards & Payment Services Ltd. | 2,749 | 31,521 | ||||||
| SBI Life Insurance Co. Ltd. | 8,184 | 135,247 | ||||||
36
| Avantis Emerging Markets Equity Fund | ||||||||
| Shares | Value | |||||||
| Schaeffler India Ltd. | 875 | $ | 33,116 | |||||
| Sharda Cropchem Ltd. | 3,173 | 20,487 | ||||||
| Share India Securities Ltd. | 1,816 | 25,355 | ||||||
| Shipping Corp. of India Ltd. | 5,563 | 8,170 | ||||||
| Shree Cement Ltd. | 650 | 178,438 | ||||||
Shree Renuka Sugars Ltd.(1) | 13,699 | 7,953 | ||||||
| Shriram City Union Finance Ltd. | 2,449 | 58,214 | ||||||
| Shriram Transport Finance Co. Ltd. | 19,066 | 320,010 | ||||||
| Siemens Ltd. | 1,247 | 44,773 | ||||||
| SKF India Ltd. | 1,718 | 104,253 | ||||||
| Sobha Ltd. | 3,140 | 27,191 | ||||||
| Sonata Software Ltd. | 7,907 | 70,010 | ||||||
South Indian Bank Ltd.(1) | 51,265 | 5,253 | ||||||
Southern Petrochemical Industries Corp. Ltd.(1) | 17,726 | 13,477 | ||||||
Spandana Sphoorty Financial Ltd.(1) | 2,425 | 16,525 | ||||||
| SRF Ltd. | 5,107 | 161,166 | ||||||
Star Cement Ltd.(1) | 7,215 | 8,553 | ||||||
| State Bank of India, GDR | 5,540 | 365,965 | ||||||
Sterling and Wilson Renewable(1) | 4,243 | 15,659 | ||||||
| Sterling Tools Ltd. | 2,980 | 7,931 | ||||||
| Sterlite Technologies Ltd. | 13,985 | 29,820 | ||||||
Stove Kraft Ltd.(1) | 1,472 | 11,197 | ||||||
Strides Pharma Science Ltd.(1) | 2,601 | 10,700 | ||||||
Subex Ltd.(1) | 6,461 | 2,991 | ||||||
| Sudarshan Chemical Industries Ltd. | 3,424 | 19,597 | ||||||
| Sumitomo Chemical India Ltd. | 4,396 | 26,841 | ||||||
Sun Pharma Advanced Research Co. Ltd.(1) | 1,889 | 5,393 | ||||||
| Sun Pharmaceutical Industries Ltd. | 38,001 | 424,099 | ||||||
| Sun TV Network Ltd. | 7,009 | 43,778 | ||||||
| Sundaram Finance Ltd. | 691 | 18,109 | ||||||
| Sundram Fasteners Ltd. | 4,294 | 44,778 | ||||||
Sunflag Iron & Steel Co.(1) | 6,118 | 6,716 | ||||||
| Sunteck Realty Ltd. | 3,995 | 23,653 | ||||||
| Suprajit Engineering Ltd. | 6,701 | 28,347 | ||||||
| Supreme Industries Ltd. | 4,071 | 99,920 | ||||||
| Supreme Petrochem Ltd. | 1,178 | 11,467 | ||||||
| Surya Roshni Ltd. | 797 | 4,888 | ||||||
| Suven Pharmaceuticals Ltd. | 9,498 | 58,173 | ||||||
Suzlon Energy Ltd.(1) | 104,836 | 10,642 | ||||||
| Tamil Nadu Newsprint & Papers Ltd. | 7,235 | 23,010 | ||||||
| Tamilnadu Petroproducts Ltd. | 7,021 | 8,864 | ||||||
| Tanla Platforms Ltd. | 5,252 | 46,490 | ||||||
| Tata Chemicals Ltd. | 13,140 | 184,651 | ||||||
| Tata Communications Ltd. | 4,299 | 64,292�� | ||||||
| Tata Consultancy Services Ltd. | 23,081 | 920,507 | ||||||
| Tata Consumer Products Ltd. | 5,037 | 50,909 | ||||||
| Tata Elxsi Ltd. | 1,108 | 123,591 | ||||||
| Tata Investment Corp. Ltd. | 995 | 19,897 | ||||||
Tata Motors Ltd., ADR(1)(2) | 16,305 | 472,845 | ||||||
| Tata Power Co. Ltd. | 75,964 | 222,754 | ||||||
| Tata Steel Long Products Ltd. | 1,631 | 12,648 | ||||||
37
| Avantis Emerging Markets Equity Fund | ||||||||
| Shares | Value | |||||||
| Tata Steel Ltd. | 417,150 | $ | 560,067 | |||||
| TCI Express Ltd. | 457 | 10,060 | ||||||
TeamLease Services Ltd.(1) | 553 | 23,428 | ||||||
| Tech Mahindra Ltd. | 25,268 | 336,659 | ||||||
Tejas Networks Ltd.(1) | 1,973 | 14,991 | ||||||
| Texmaco Rail & Engineering Ltd. | 26,769 | 16,655 | ||||||
| Thermax Ltd. | 4,851 | 146,028 | ||||||
| Thirumalai Chemicals Ltd. | 10,204 | 29,705 | ||||||
| Thyrocare Technologies Ltd. | 472 | 3,645 | ||||||
| Tide Water Oil Co. India Ltd. | 360 | 5,118 | ||||||
| Time Technoplast Ltd. | 12,032 | 17,829 | ||||||
| Tinplate Co. of India Ltd. | 3,598 | 14,129 | ||||||
Titagarh Wagons Ltd.(1) | 11,407 | 24,275 | ||||||
| Titan Co. Ltd. | 4,187 | 135,677 | ||||||
| Torrent Pharmaceuticals Ltd. | 8,544 | 165,094 | ||||||
| Torrent Power Ltd. | 13,079 | 94,927 | ||||||
| Transport Corp. of India Ltd. | 1,642 | 14,607 | ||||||
| Trident Ltd. | 68,002 | 30,808 | ||||||
| Triveni Engineering & Industries Ltd. | 12,778 | 37,372 | ||||||
| Triveni Turbine Ltd. | 9,259 | 23,578 | ||||||
| Tube Investments of India Ltd. | 6,219 | 175,349 | ||||||
| TV Today Network Ltd. | 2,282 | 8,046 | ||||||
TV18 Broadcast Ltd.(1) | 50,440 | 25,497 | ||||||
| Uflex Ltd. | 5,373 | 52,381 | ||||||
Ujjivan Financial Services Ltd.(1) | 1,463 | 3,559 | ||||||
| UltraTech Cement Ltd. | 3,651 | 303,525 | ||||||
| Union Bank of India Ltd. | 17,616 | 9,248 | ||||||
United Spirits Ltd.(1) | 12,264 | 123,963 | ||||||
| UPL Ltd. | 8,054 | 77,142 | ||||||
| Usha Martin Ltd. | 12,880 | 22,704 | ||||||
| UTI Asset Management Co. Ltd. | 2,788 | 28,580 | ||||||
| V-Guard Industries Ltd. | 2,008 | 5,678 | ||||||
VA Tech Wabag Ltd.(1) | 2,681 | 8,800 | ||||||
| Vaibhav Global Ltd. | 1,025 | 4,427 | ||||||
| Vakrangee Ltd. | 31,841 | 10,984 | ||||||
Valiant Organics Ltd.(1) | 1,671 | 12,365 | ||||||
| Vardhman Textiles Ltd. | 7,755 | 32,015 | ||||||
Varroc Engineering Ltd.(1) | 5,823 | 24,889 | ||||||
| Varun Beverages Ltd. | 7,731 | 99,708 | ||||||
| Vedanta Ltd. | 52,624 | 176,365 | ||||||
| Venky's India Ltd. | 238 | 6,210 | ||||||
| VIP Industries Ltd. | 1,621 | 11,964 | ||||||
Vodafone Idea Ltd.(1) | 232,783 | 26,102 | ||||||
| Voltas Ltd. | 1,275 | 15,876 | ||||||
| VRL Logistics Ltd. | 6,022 | 46,511 | ||||||
| Welspun Corp. Ltd. | 11,369 | 31,878 | ||||||
| Welspun India Ltd. | 20,423 | 19,581 | ||||||
| West Coast Paper Mills Ltd. | 2,196 | 17,221 | ||||||
Westlife Development Ltd.(1) | 808 | 6,507 | ||||||
| Whirlpool of India Ltd. | 1,552 | 35,284 | ||||||
| Wipro Ltd., ADR | 26,591 | 133,221 | ||||||
38
| Avantis Emerging Markets Equity Fund | ||||||||
| Shares | Value | |||||||
Wockhardt Ltd.(1) | 1,829 | $ | 5,469 | |||||
Yes Bank Ltd.(1) | 673,890 | 138,124 | ||||||
| Zee Entertainment Enterprises Ltd. | 65,242 | 207,858 | ||||||
| Zen Technologies Ltd. | 2,024 | 5,254 | ||||||
| Zensar Technologies Ltd. | 10,622 | 30,179 | ||||||
| 41,986,752 | ||||||||
| Indonesia — 2.3% | ||||||||
| Ace Hardware Indonesia Tbk PT | 107,700 | 5,226 | ||||||
| Adaro Energy Indonesia Tbk PT | 973,100 | 231,984 | ||||||
Adhi Karya Persero Tbk PT(1) | 82,400 | 4,494 | ||||||
Adi Sarana Armada Tbk PT(1) | 73,600 | 7,230 | ||||||
Agung Podomoro Land Tbk PT(1) | 80,200 | 643 | ||||||
| AKR Corporindo Tbk PT | 983,900 | 79,519 | ||||||
Alam Sutera Realty Tbk PT(1) | 534,300 | 6,475 | ||||||
| Aneka Gas Industri Tbk PT | 86,700 | 12,205 | ||||||
| Aneka Tambang Tbk | 398,100 | 53,233 | ||||||
| Astra Agro Lestari Tbk PT | 40,600 | 25,025 | ||||||
| Astra International Tbk PT | 755,200 | 354,354 | ||||||
| Bank BTPN Syariah Tbk PT | 164,600 | 32,801 | ||||||
Bank Bukopin Tbk PT(1) | 1,089,998 | 13,431 | ||||||
| Bank Central Asia Tbk PT | 684,800 | 378,162 | ||||||
Bank China Construction Bank Indonesia Tbk PT(1) | 357,900 | 2,292 | ||||||
Bank Jago Tbk PT(1) | 31,000 | 17,566 | ||||||
| Bank Mandiri Persero Tbk PT | 730,200 | 434,531 | ||||||
| Bank Negara Indonesia Persero Tbk PT | 270,200 | 154,977 | ||||||
| Bank Pan Indonesia Tbk PT | 266,100 | 35,774 | ||||||
| Bank Pembangunan Daerah Jawa Barat Dan Banten Tbk PT | 248,200 | 23,241 | ||||||
| Bank Pembangunan Daerah Jawa Timur Tbk PT | 113,500 | 5,505 | ||||||
| Bank Rakyat Indonesia Persero Tbk PT | 1,289,997 | 376,717 | ||||||
| Bank Syariah Indonesia Tbk PT | 61,200 | 6,256 | ||||||
| Bank Tabungan Negara Persero Tbk PT | 374,000 | 37,892 | ||||||
| Barito Pacific Tbk PT | 254,400 | 14,044 | ||||||
| BFI Finance Indonesia Tbk PT | 479,000 | 40,304 | ||||||
Buana Lintas Lautan Tbk PT(1) | 553,700 | 6,305 | ||||||
| Bukit Asam Tbk PT | 421,600 | 120,632 | ||||||
Bumi Serpong Damai Tbk PT(1) | 433,000 | 26,803 | ||||||
| Buyung Poetra Sembada PT | 68,000 | 600 | ||||||
| Charoen Pokphand Indonesia Tbk PT | 212,200 | 83,991 | ||||||
| Ciputra Development Tbk PT | 808,700 | 51,732 | ||||||
Delta Dunia Makmur Tbk PT(1) | 708,900 | 17,944 | ||||||
| Dharma Satya Nusantara Tbk PT | 370,800 | 12,600 | ||||||
| Elnusa Tbk PT | 183,200 | 3,927 | ||||||
| Erajaya Swasembada Tbk PT | 584,000 | 19,186 | ||||||
Gajah Tunggal Tbk PT(1) | 82,900 | 3,824 | ||||||
Global Mediacom Tbk PT(1) | 881,800 | 21,378 | ||||||
| Harum Energy Tbk PT | 81,000 | 9,265 | ||||||
| Indah Kiat Pulp & Paper Tbk PT | 174,200 | 97,578 | ||||||
| Indika Energy Tbk PT | 181,000 | 34,967 | ||||||
| Indo Tambangraya Megah Tbk PT | 50,300 | 133,234 | ||||||
| Indocement Tunggal Prakarsa Tbk PT | 60,200 | 38,284 | ||||||
| Indofood CBP Sukses Makmur Tbk PT | 49,400 | 27,649 | ||||||
39
| Avantis Emerging Markets Equity Fund | ||||||||
| Shares | Value | |||||||
| Indofood Sukses Makmur Tbk PT | 70,800 | $ | 29,702 | |||||
| Indosat Tbk PT | 103,000 | 49,725 | ||||||
| Industri Jamu Dan Farmasi Sido Muncul Tbk PT | 453,652 | 21,680 | ||||||
| Japfa Comfeed Indonesia Tbk PT | 274,200 | 29,261 | ||||||
Jasa Marga Persero Tbk PT(1) | 147,500 | 34,164 | ||||||
| Kalbe Farma Tbk PT | 769,000 | 86,958 | ||||||
Kresna Graha Investama Tbk PT(1) | 28,000 | 94 | ||||||
Link Net Tbk PT(1) | 124,500 | 39,838 | ||||||
Lippo Karawaci Tbk PT(1) | 765,000 | 5,924 | ||||||
Malindo Feedmill Tbk PT(1) | 13,400 | 550 | ||||||
| Matahari Department Store Tbk PT | 145,500 | 37,588 | ||||||
| Medco Energi Internasional Tbk PT | 1,203,840 | 69,779 | ||||||
| Media Nusantara Citra Tbk PT | 624,400 | 38,454 | ||||||
Merdeka Copper Gold Tbk PT(1) | 385,651 | 110,902 | ||||||
Mitra Adiperkasa Tbk PT(1) | 1,020,400 | 69,331 | ||||||
| Mitra Keluarga Karyasehat Tbk PT | 306,200 | 54,852 | ||||||
| Pabrik Kertas Tjiwi Kimia Tbk PT | 93,100 | 42,454 | ||||||
Pacific Strategic Financial Tbk PT(1) | 416,600 | 33,542 | ||||||
| Pakuwon Jati Tbk PT | 1,083,400 | 35,313 | ||||||
| Panin Financial Tbk PT | 1,013,700 | 26,079 | ||||||
| Perusahaan Gas Negara Tbk PT | 351,300 | 43,462 | ||||||
| Perusahaan Perkebunan London Sumatra Indonesia Tbk PT | 344,600 | 27,384 | ||||||
PP Persero Tbk PT(1) | 159,800 | 10,858 | ||||||
PT Adaro Minerals Indonesia Tbk(1) | 364,600 | 42,048 | ||||||
| PT Blue Bird Tbk | 139,500 | 13,011 | ||||||
| PT Medikaloka Hermina Tbk | 527,400 | 53,005 | ||||||
| PT Sumber Alfaria Trijaya Tbk | 938,300 | 137,707 | ||||||
| PT Temas Tbk | 125,900 | 20,630 | ||||||
| Puradelta Lestari Tbk PT | 105,100 | 1,246 | ||||||
Rimo International Lestari Tbk PT(1) | 329,900 | 1,111 | ||||||
| Salim Ivomas Pratama Tbk PT | 44,700 | 1,373 | ||||||
| Samudera Indonesia Tbk PT | 117,400 | 20,425 | ||||||
| Sarana Menara Nusantara Tbk PT | 1,238,500 | 103,541 | ||||||
| Sawit Sumbermas Sarana Tbk PT | 400,700 | 37,947 | ||||||
| Selamat Sempurna Tbk PT | 68,200 | 5,765 | ||||||
| Semen Indonesia Persero Tbk PT | 182,300 | 80,952 | ||||||
| Siloam International Hospitals Tbk PT | 16,000 | 1,121 | ||||||
Smartfren Telecom Tbk PT(1) | 3,336,600 | 22,257 | ||||||
Sri Rejeki Isman Tbk PT(1) | 54,600 | 537 | ||||||
| Steel Pipe Industry of Indonesia PT | 274,200 | 5,540 | ||||||
| Summarecon Agung Tbk PT | 747,358 | 30,148 | ||||||
| Surya Citra Media Tbk PT | 945,000 | 14,380 | ||||||
| Surya Esa Perkasa Tbk PT | 52,700 | 3,953 | ||||||
Surya Semesta Internusa Tbk PT(1) | 20,600 | 508 | ||||||
Telkom Indonesia Persero Tbk PT, ADR(2) | 15,291 | 459,800 | ||||||
| Timah Tbk PT | 278,200 | 27,962 | ||||||
| Tower Bersama Infrastructure Tbk PT | 253,700 | 48,166 | ||||||
| Transcoal Pacific Tbk PT | 29,600 | 16,552 | ||||||
| Tunas Baru Lampung Tbk PT | 24,900 | 1,291 | ||||||
| Unilever Indonesia Tbk PT | 262,600 | 81,150 | ||||||
| United Tractors Tbk PT | 107,300 | 244,329 | ||||||
40
| Avantis Emerging Markets Equity Fund | ||||||||
| Shares | Value | |||||||
Vale Indonesia Tbk PT(1) | 121,600 | $ | 49,840 | |||||
Waskita Beton Precast Tbk PT(1) | 48,300 | 309 | ||||||
Waskita Karya Persero Tbk PT(1) | 384,292 | 14,602 | ||||||
Wijaya Karya Persero Tbk PT(1) | 252,800 | 18,203 | ||||||
| XL Axiata Tbk PT | 243,300 | 43,080 | ||||||
| 5,564,163 | ||||||||
| Malaysia — 1.9% | ||||||||
| 7-Eleven Malaysia Holdings Bhd, Class B | 3,000 | 1,048 | ||||||
| Aeon Co. M Bhd | 118,600 | 38,804 | ||||||
| AEON Credit Service M Bhd | 500 | 1,572 | ||||||
| Alliance Bank Malaysia Bhd | 119,700 | 94,123 | ||||||
| AMMB Holdings Bhd | 108,800 | 101,124 | ||||||
| Ann Joo Resources Bhd | 16,600 | 3,859 | ||||||
| Astro Malaysia Holdings Bhd | 23,800 | 4,429 | ||||||
| ATA IMS Bhd | 14,300 | 893 | ||||||
| Axiata Group Bhd | 40,600 | 27,532 | ||||||
| Bank Islam Malaysia Bhd | 35,200 | 20,480 | ||||||
Berjaya Corp. Bhd(1) | 18,096 | 968 | ||||||
| Bermaz Auto Bhd | 63,500 | 25,772 | ||||||
| Beshom Holdings Bhd | 2,076 | 689 | ||||||
Boustead Holdings Bhd(1) | 112,300 | 16,311 | ||||||
| Boustead Plantations Bhd | 74,900 | 12,929 | ||||||
Bumi Armada Bhd(1) | 305,000 | 28,032 | ||||||
| Bursa Malaysia Bhd | 27,900 | 39,873 | ||||||
| Cahya Mata Sarawak Bhd | 32,700 | 6,860 | ||||||
Capital A Bhd(1) | 33,100 | 4,448 | ||||||
Careplus Group Bhd(1) | 13,500 | 887 | ||||||
| Carlsberg Brewery Malaysia Bhd | 2,500 | 12,907 | ||||||
| CIMB Group Holdings Bhd | 166,248 | 198,811 | ||||||
Coastal Contracts Bhd(1) | 3,400 | 1,395 | ||||||
| Comfort Glove Bhd | 6,800 | 712 | ||||||
| CSC Steel Holdings Bhd | 18,100 | 4,801 | ||||||
Cypark Resources Bhd(1) | 15,400 | 1,295 | ||||||
| Dagang NeXchange Bhd | 250,700 | 47,293 | ||||||
| Datasonic Group Bhd | 28,200 | 3,275 | ||||||
| Dayang Enterprise Holdings Bhd | 17,100 | 4,130 | ||||||
| Dialog Group Bhd | 69,000 | 37,326 | ||||||
| DiGi.Com Bhd | 85,000 | 70,944 | ||||||
| DRB-Hicom Bhd | 29,900 | 9,594 | ||||||
| Dufu Technology Corp. Bhd | 2,800 | 1,763 | ||||||
| Eco World Development Group Bhd | 95,100 | 14,157 | ||||||
Econpile Holdings Bhd(1) | 5,500 | 201 | ||||||
Ekovest Bhd(1) | 134,300 | 11,482 | ||||||
Focus Dynamics Group Bhd(1) | 55,800 | 246 | ||||||
| Fraser & Neave Holdings Bhd | 5,300 | 26,427 | ||||||
| Frontken Corp. Bhd | 31,000 | 18,790 | ||||||
| Gamuda Bhd | 152,015 | 129,526 | ||||||
| Genting Bhd | 118,100 | 123,436 | ||||||
| Genting Malaysia Bhd | 34,300 | 22,767 | ||||||
| Genting Plantations Bhd | 6,300 | 9,423 | ||||||
| Globetronics Technology Bhd | 12,200 | 3,401 | ||||||
41
| Avantis Emerging Markets Equity Fund | ||||||||
| Shares | Value | |||||||
Greatech Technology Bhd(1) | 15,100 | $ | 11,933 | |||||
| HAP Seng Consolidated Bhd | 16,900 | 26,223 | ||||||
| Hartalega Holdings Bhd | 108,100 | 40,023 | ||||||
| Heineken Malaysia Bhd | 9,800 | 51,520 | ||||||
Hengyuan Refining Co. Bhd(1) | 5,300 | 6,271 | ||||||
| Hextar Global Bhd | 4,440 | 1,589 | ||||||
| Hiap Teck Venture Bhd | 125,000 | 7,729 | ||||||
| Hibiscus Petroleum Bhd | 304,300 | 71,293 | ||||||
| Hong Leong Bank Bhd | 13,300 | 61,905 | ||||||
| Hong Leong Financial Group Bhd | 8,500 | 36,743 | ||||||
| Hong Leong Industries Bhd | 400 | 816 | ||||||
| IHH Healthcare Bhd | 14,000 | 19,322 | ||||||
| IJM Corp. Bhd | 261,800 | 99,646 | ||||||
| Inari Amertron Bhd | 72,300 | 43,031 | ||||||
| IOI Corp. Bhd | 39,200 | 36,979 | ||||||
| IOI Properties Group Bhd | 41,800 | 9,213 | ||||||
JAKS Resources Bhd(1) | 11,180 | 656 | ||||||
Jaya Tiasa Holdings Bhd(1) | 104,500 | 14,273 | ||||||
| Kossan Rubber Industries Bhd | 136,100 | 30,625 | ||||||
| KPJ Healthcare Bhd | 33,800 | 6,594 | ||||||
KSL Holdings Bhd(1) | 5,500 | 1,035 | ||||||
| Kuala Lumpur Kepong Bhd | 11,300 | 58,387 | ||||||
| Land & General Bhd | 29,900 | 697 | ||||||
| LBS Bina Group Bhd | 8,961 | 848 | ||||||
Leong Hup International Bhd(1) | 5,600 | 609 | ||||||
| Lii Hen Industries Bhd | 4,200 | 813 | ||||||
| Lotte Chemical Titan Holding Bhd | 20,000 | 7,633 | ||||||
| Luxchem Corp. Bhd | 20,900 | 2,629 | ||||||
| Mah Sing Group Bhd | 51,600 | 7,011 | ||||||
| Malakoff Corp. Bhd | 6,800 | 1,052 | ||||||
| Malayan Banking Bhd | 115,921 | 231,900 | ||||||
| Malayan Flour Mills Bhd | 26,300 | 3,478 | ||||||
Malaysia Airports Holdings Bhd(1) | 27,900 | 36,457 | ||||||
| Malaysia Building Society Bhd | 190,000 | 24,491 | ||||||
Malaysia Marine and Heavy Engineering Holdings Bhd(1) | 4,700 | 409 | ||||||
| Malaysian Pacific Industries Bhd | 2,600 | 17,457 | ||||||
| Malaysian Resources Corp. Bhd | 9,900 | 769 | ||||||
| Matrix Concepts Holdings Bhd | 12,200 | 6,175 | ||||||
| Maxis Bhd | 58,000 | 49,719 | ||||||
| Media Prima Bhd | 58,500 | 6,121 | ||||||
| Mega First Corp. Bhd | 4,200 | 3,398 | ||||||
| MISC Bhd | 64,900 | 102,687 | ||||||
| MKH Bhd | 2,900 | 814 | ||||||
| MR DIY Group M Bhd | 67,500 | 32,586 | ||||||
Muhibbah Engineering M Bhd(1) | 2,000 | 193 | ||||||
| My EG Services Bhd | 132,900 | 23,565 | ||||||
Naim Holdings Bhd(1) | 4,300 | 484 | ||||||
| Nestle Malaysia Bhd | 2,200 | 65,281 | ||||||
| OCK Group Bhd | 7,100 | 647 | ||||||
| OSK Holdings Bhd | 6,600 | 1,369 | ||||||
| Padini Holdings Bhd | 12,900 | 9,605 | ||||||
42
| Avantis Emerging Markets Equity Fund | ||||||||
| Shares | Value | |||||||
| Paramount Corp. Bhd | 3,400 | $ | 523 | |||||
| Perak Transit Bhd | 5,566 | 1,083 | ||||||
| PESTECH International Bhd | 29,625 | 2,399 | ||||||
| Petronas Chemicals Group Bhd | 95,500 | 187,320 | ||||||
| Petronas Dagangan Bhd | 10,200 | 53,426 | ||||||
| Petronas Gas Bhd | 29,500 | 114,003 | ||||||
| Poh Huat Resources Holdings Bhd | 2,800 | 835 | ||||||
| PPB Group Bhd | 15,500 | 60,930 | ||||||
| Press Metal Aluminium Holdings Bhd | 39,400 | 41,760 | ||||||
| Public Bank Bhd | 476,700 | 500,554 | ||||||
| QL Resources Bhd | 31,850 | 36,298 | ||||||
Ranhill Utilities Bhd(1) | 3,829 | 358 | ||||||
| RHB Bank Bhd | 94,085 | 120,220 | ||||||
Rubberex Corp. M Bhd(1) | 61,100 | 5,512 | ||||||
| Sam Engineering & Equipment M Bhd | 2,400 | 2,318 | ||||||
Sapura Energy Bhd(1) | 43,200 | 481 | ||||||
| Sarawak Oil Palms Bhd | 31,800 | 19,560 | ||||||
| Scientex Bhd | 22,400 | 17,605 | ||||||
Serba Dinamik Holdings Bhd(1) | 4,000 | 26 | ||||||
| Sime Darby Bhd | 142,000 | 72,349 | ||||||
| Sime Darby Plantation Bhd | 115,200 | 114,509 | ||||||
| Sime Darby Property Bhd | 33,900 | 3,622 | ||||||
| SP Setia Bhd Group | 120,300 | 20,060 | ||||||
| Sports Toto Bhd | 7,474 | 3,015 | ||||||
| Sunway Bhd | 82,300 | 30,062 | ||||||
| Sunway Construction Group Bhd | 11,200 | 3,868 | ||||||
| Supermax Corp. Bhd | 208,043 | 33,845 | ||||||
| Syarikat Takaful Malaysia Keluarga Bhd | 18,100 | 13,445 | ||||||
| Ta Ann Holdings Bhd | 26,400 | 23,495 | ||||||
| Telekom Malaysia Bhd | 84,600 | 112,465 | ||||||
| Tenaga Nasional Bhd | 78,100 | 156,781 | ||||||
| Thong Guan Industries Bhd | 2,400 | 1,364 | ||||||
| TIME dotCom Bhd | 58,200 | 61,891 | ||||||
Tiong NAM Logistics Holdings(1) | 26,900 | 3,719 | ||||||
| Top Glove Corp. Bhd | 238,700 | 42,738 | ||||||
Tropicana Corp. Bhd(1) | 4,807 | 1,245 | ||||||
| TSH Resources Bhd | 77,200 | 19,080 | ||||||
| Uchi Technologies Bhd | 7,500 | 5,583 | ||||||
UEM Sunrise Bhd(1) | 6,800 | 444 | ||||||
| UMW Holdings Bhd | 5,900 | 4,043 | ||||||
| Unisem M Bhd | 26,600 | 16,110 | ||||||
| United Plantations Bhd | 5,000 | 16,511 | ||||||
| UWC Bhd | 6,400 | 5,516 | ||||||
Velesto Energy Bhd(1) | 250,600 | 4,710 | ||||||
| ViTrox Corp. Bhd | 4,000 | 6,357 | ||||||
Vizione Holdings Bhd(1) | 5,100 | 68 | ||||||
| VS Industry Bhd | 66,800 | 14,948 | ||||||
Wah Seong Corp. Bhd(1) | 16,200 | 2,417 | ||||||
| WCT Holdings Bhd | 7,446 | 712 | ||||||
| Westports Holdings Bhd | 38,900 | 30,168 | ||||||
| Yinson Holdings Bhd | 131,320 | 61,651 | ||||||
43
| Avantis Emerging Markets Equity Fund | ||||||||
| Shares | Value | |||||||
| YTL Corp. Bhd | 27,796 | $ | 3,652 | |||||
| YTL Power International Bhd | 117,700 | 19,776 | ||||||
| 4,534,868 | ||||||||
| Mexico — 2.3% | ||||||||
| Alfa SAB de CV, Class A | 158,700 | 100,278 | ||||||
| Alpek SAB de CV | 45,690 | 62,798 | ||||||
Alsea SAB de CV(1) | 35,100 | 63,592 | ||||||
| America Movil SAB de CV, Class L ADR | 38,279 | 650,743 | ||||||
| Arca Continental SAB de CV | 12,800 | 86,636 | ||||||
| Banco del Bajio SA | 75,677 | 158,555 | ||||||
| Becle SAB de CV | 4,400 | 8,967 | ||||||
| Bolsa Mexicana de Valores SAB de CV | 10,700 | 19,274 | ||||||
Cemex SAB de CV, ADR(1) | 24,287 | 90,833 | ||||||
| Coca-Cola Femsa SAB de CV | 36,405 | 222,245 | ||||||
| Consorcio ARA SAB de CV | 4,900 | 798 | ||||||
Controladora Vuela Cia de Aviacion SAB de CV, ADR(1)(2) | 5,699 | 50,607 | ||||||
| Corp. Inmobiliaria Vesta SAB de CV | 45,700 | 84,497 | ||||||
| El Puerto de Liverpool SAB de CV, Class C1 | 600 | 2,674 | ||||||
| Fomento Economico Mexicano SAB de CV, ADR | 3,422 | 214,594 | ||||||
| GCC SAB de CV | 11,000 | 63,210 | ||||||
| Genomma Lab Internacional SAB de CV, Class B | 94,200 | 76,963 | ||||||
| Gentera SAB de CV | 175,200 | 137,315 | ||||||
| Gruma SAB de CV, B Shares | 13,190 | 144,199 | ||||||
| Grupo Aeroportuario del Centro Norte SAB de CV, ADR | 3,759 | 196,483 | ||||||
| Grupo Aeroportuario del Pacifico SAB de CV, ADR | 1,192 | 169,943 | ||||||
| Grupo Aeroportuario del Sureste SAB de CV, ADR | 817 | 172,771 | ||||||
| Grupo Bimbo SAB de CV, Series A | 35,600 | 119,930 | ||||||
| Grupo Carso SAB de CV, Series A1 | 13,100 | 44,964 | ||||||
| Grupo Comercial Chedraui SA de CV | 33,500 | 95,063 | ||||||
| Grupo Financiero Banorte SAB de CV, Class O | 94,796 | 559,935 | ||||||
Grupo Financiero Inbursa SAB de CV, Class O(1)(2) | 129,050 | 202,160 | ||||||
Grupo GICSA SAB de CV(1) | 8,000 | 743 | ||||||
| Grupo Industrial Saltillo SAB de CV | 1,800 | 2,680 | ||||||
| Grupo Mexico SAB de CV, Series B | 126,594 | 476,931 | ||||||
Grupo Rotoplas SAB de CV(1) | 1,969 | 2,690 | ||||||
| Grupo Televisa SAB, ADR | 36,065 | 228,291 | ||||||
Grupo Traxion SAB de CV(1) | 18,200 | 20,136 | ||||||
Hoteles City Express SAB de CV(1) | 1,300 | 237 | ||||||
| Industrias Bachoco SAB de CV | 700 | 2,767 | ||||||
| Industrias Penoles SAB de CV | 9,820 | 81,191 | ||||||
| Kimberly-Clark de Mexico SAB de CV, A Shares | 71,700 | 97,337 | ||||||
| La Comer SAB de CV | 32,900 | 55,572 | ||||||
| Megacable Holdings SAB de CV | 49,200 | 103,204 | ||||||
Nemak SAB de CV(1) | 231,440 | 48,823 | ||||||
| Orbia Advance Corp. SAB de CV | 49,300 | 92,989 | ||||||
| Promotora y Operadora de Infraestructura SAB de CV | 14,300 | 100,614 | ||||||
| Qualitas Controladora SAB de CV | 23,200 | 101,626 | ||||||
| Regional SAB de CV | 4,890 | 26,437 | ||||||
Unifin Financiera SAB de CV(1) | 222 | 19 | ||||||
| Wal-Mart de Mexico SAB de CV | 82,697 | 270,998 | ||||||
| 5,513,312 | ||||||||
44
| Avantis Emerging Markets Equity Fund | ||||||||
| Shares | Value | |||||||
| Peru — 0.2% | ||||||||
| Cia de Minas Buenaventura SAA, ADR | 27,211 | $ | 144,762 | |||||
| Credicorp Ltd. | 1,766 | 227,620 | ||||||
| Intercorp Financial Services, Inc. | 3,602 | 77,659 | ||||||
| Southern Copper Corp. | 1,674 | 78,795 | ||||||
| 528,836 | ||||||||
| Philippines — 0.9% | ||||||||
| Aboitiz Equity Ventures, Inc. | 79,690 | 79,482 | ||||||
| Aboitiz Power Corp. | 12,100 | 6,738 | ||||||
| ACEN Corp. | 112,530 | 14,986 | ||||||
| Alliance Global Group, Inc. | 166,000 | 29,644 | ||||||
| Ayala Corp. | 9,300 | 115,892 | ||||||
| Ayala Land, Inc. | 224,700 | 114,065 | ||||||
Ayalaland Logistics Holdings Corp.(1) | 17,000 | 1,096 | ||||||
| Bank of the Philippine Islands | 57,660 | 97,352 | ||||||
| BDO Unibank, Inc. | 80,300 | 183,618 | ||||||
Cebu Air, Inc.(1) | 6,390 | 4,679 | ||||||
| Century Pacific Food, Inc. | 41,200 | 18,197 | ||||||
Converge Information and Communications Technology Solutions, Inc.(1) | 156,800 | 48,350 | ||||||
| Cosco Capital, Inc. | 51,700 | 3,971 | ||||||
| DMCI Holdings, Inc. | 350,700 | 59,252 | ||||||
DoubleDragon Corp.(1) | 2,700 | 370 | ||||||
| East West Banking Corp. | 5,400 | 658 | ||||||
EEI Corp.(1) | 5,000 | 298 | ||||||
| Filinvest Land, Inc. | 41,000 | 649 | ||||||
| First Gen Corp. | 22,300 | 7,330 | ||||||
| Ginebra San Miguel, Inc. | 1,300 | 2,456 | ||||||
| Global Ferronickel Holdings, Inc. | 171,000 | 7,147 | ||||||
| Globe Telecom, Inc. | 1,195 | 44,587 | ||||||
| GT Capital Holdings, Inc. | 5,870 | 50,276 | ||||||
Integrated Micro-Electronics, Inc.(1) | 6,600 | 809 | ||||||
| International Container Terminal Services, Inc. | 35,900 | 115,622 | ||||||
| JG Summit Holdings, Inc. | 68,613 | 62,394 | ||||||
| Jollibee Foods Corp. | 19,830 | 84,521 | ||||||
| Manila Electric Co. | 5,510 | 29,510 | ||||||
| Manila Water Co., Inc. | 32,900 | 9,065 | ||||||
Max's Group, Inc.(1) | 4,100 | 409 | ||||||
| Megaworld Corp. | 712,000 | 31,607 | ||||||
| Metro Pacific Investments Corp. | 758,000 | 50,297 | ||||||
| Metropolitan Bank & Trust Co. | 152,030 | 142,092 | ||||||
Monde Nissin Corp.(1) | 229,500 | 67,355 | ||||||
| Nickel Asia Corp. | 273,100 | 27,670 | ||||||
Petron Corp.(1) | 75,000 | 4,096 | ||||||
| Pilipinas Shell Petroleum Corp. | 1,600 | 596 | ||||||
PLDT, Inc., ADR(2) | 4,443 | 129,202 | ||||||
| Puregold Price Club, Inc. | 65,600 | 39,948 | ||||||
| Robinsons Land Corp. | 91,300 | 30,486 | ||||||
| Robinsons Retail Holdings, Inc. | 34,190 | 36,484 | ||||||
| Security Bank Corp. | 57,680 | 92,202 | ||||||
| Semirara Mining & Power Corp. | 60,700 | 44,398 | ||||||
45
| Avantis Emerging Markets Equity Fund | ||||||||
| Shares | Value | |||||||
| SM Investments Corp. | 3,985 | $ | 58,822 | |||||
| SM Prime Holdings, Inc. | 134,900 | 90,683 | ||||||
| Universal Robina Corp. | 32,640 | 70,844 | ||||||
| Vista Land & Lifescapes, Inc. | 62,800 | 2,251 | ||||||
| Wilcon Depot, Inc. | 52,200 | 27,827 | ||||||
| 2,140,283 | ||||||||
| Poland — 0.7% | ||||||||
Alior Bank SA(1) | 7,262 | 40,098 | ||||||
Allegro.eu SA(1) | 1,485 | 7,789 | ||||||
AmRest Holdings SE(1) | 2,830 | 11,937 | ||||||
| Asseco Poland SA | 1,398 | 21,313 | ||||||
Bank Millennium SA(1) | 49,227 | 39,564 | ||||||
| Bank Polska Kasa Opieki SA | 5,325 | 73,667 | ||||||
CCC SA(1) | 861 | 6,905 | ||||||
| CD Projekt SA | 3,015 | 53,767 | ||||||
Ciech SA(1) | 2,368 | 16,116 | ||||||
| Cyfrowy Polsat SA | 4,067 | 16,773 | ||||||
Dino Polska SA(1) | 1,264 | 92,213 | ||||||
Enea SA(1) | 26,578 | 42,764 | ||||||
Eurocash SA(1) | 2,586 | 6,331 | ||||||
Famur SA(1) | 6,958 | 4,340 | ||||||
Grupa Azoty SA(1) | 3,462 | 23,962 | ||||||
Jastrzebska Spolka Weglowa SA(1) | 7,794 | 78,731 | ||||||
| KGHM Polska Miedz SA | 6,983 | 130,857 | ||||||
| KRUK SA | 388 | 24,947 | ||||||
| LiveChat Software SA | 1,024 | 22,707 | ||||||
| LPP SA | 45 | 81,028 | ||||||
| Lubelski Wegiel Bogdanka SA | 109 | 1,146 | ||||||
mBank SA(1) | 675 | 31,010 | ||||||
Mercator Medical SA(1) | 146 | 1,624 | ||||||
| Neuca SA | 24 | 3,767 | ||||||
| Orange Polska SA | 79,818 | 101,716 | ||||||
PGE Polska Grupa Energetyczna SA(1) | 20,198 | 30,789 | ||||||
PKP Cargo SA(1) | 196 | 546 | ||||||
| Polski Koncern Naftowy ORLEN SA | 20,956 | 271,427 | ||||||
Polskie Gornictwo Naftowe i Gazownictwo SA(1) | 68,823 | 81,757 | ||||||
| Powszechna Kasa Oszczednosci Bank Polski SA | 10,611 | 52,933 | ||||||
| Powszechny Zaklad Ubezpieczen SA | 14,313 | 85,675 | ||||||
| Santander Bank Polska SA | 1,263 | 57,390 | ||||||
Tauron Polska Energia SA(1) | 95,228 | 46,656 | ||||||
| TEN Square Games SA | 170 | 3,511 | ||||||
| Warsaw Stock Exchange | 783 | 5,726 | ||||||
| XTB SA | 4,908 | 22,775 | ||||||
| 1,594,257 | ||||||||
Russia(3)† | ||||||||
Gazprom PJSC(1) | 309,544 | 1 | ||||||
| Globaltrans Investment PLC, GDR | 19,562 | 2 | ||||||
| LUKOIL PJSC | 14,461 | — | ||||||
Magnit PJSC, GDR(1) | 3 | — | ||||||
| Magnit PJSC | 1,613 | — | ||||||
Mechel PJSC(1) | 7,372 | — | ||||||
46
| Avantis Emerging Markets Equity Fund | ||||||||
| Shares | Value | |||||||
| MMC Norilsk Nickel PJSC | 849 | — | ||||||
| MMC Norilsk Nickel PJSC, ADR | 3 | — | ||||||
Mobile TeleSystems PJSC, ADR(1) | 11,495 | $ | 1 | |||||
| Novatek PJSC, GDR | 8,700 | — | ||||||
| Novolipetsk Steel PJSC | 60,580 | — | ||||||
| O'Key Group SA, GDR | 1,578 | — | ||||||
PhosAgro PJSC(1) | 44 | — | ||||||
| PhosAgro PJSC LI, GDR | 2 | — | ||||||
| PhosAgro PJSC RX | 2,275 | — | ||||||
| Ros Agro PLC, GDR | 3,053 | — | ||||||
| Rosneft Oil Co. PJSC | 36,427 | — | ||||||
Severstal PAO, GDR(1) | 6,837 | 1 | ||||||
| Tatneft PJSC, ADR | 10,228 | 1 | ||||||
VK Co. Ltd., GDR(1) | 87 | — | ||||||
VTB Bank PJSC(1) | 386,396,000 | 634 | ||||||
| X5 Retail Group NV, GDR | 2,570 | — | ||||||
| 640 | ||||||||
| South Africa — 3.9% | ||||||||
| Absa Group Ltd. | 39,426 | 408,341 | ||||||
| Adcock Ingram Holdings Ltd. | 305 | 879 | ||||||
| Advtech Ltd. | 12,737 | 12,140 | ||||||
AECI Ltd.(2) | 8,701 | 42,130 | ||||||
| African Rainbow Minerals Ltd. | 10,125 | 139,449 | ||||||
| Afrimat Ltd. | 756 | 2,200 | ||||||
| Alexander Forbes Group Holdings Ltd. | 4,775 | 1,312 | ||||||
| Anglo American Platinum Ltd. | 1,400 | 97,733 | ||||||
| AngloGold Ashanti Ltd., ADR | 21,208 | 285,884 | ||||||
| Aspen Pharmacare Holdings Ltd. | 19,235 | 165,071 | ||||||
| Astral Foods Ltd. | 7,442 | 89,739 | ||||||
Aveng Ltd.(1) | 7,715 | 7,263 | ||||||
| AVI Ltd. | 22,005 | 94,516 | ||||||
| Balwin Properties Ltd. | 4,197 | 609 | ||||||
| Barloworld Ltd. | 16,801 | 85,517 | ||||||
| Bid Corp. Ltd. | 4,461 | 84,496 | ||||||
| Bidvest Group Ltd. | 8,951 | 112,127 | ||||||
Blue Label Telecoms Ltd.(1) | 5,048 | 1,839 | ||||||
Brait PLC(1) | 4,194 | 954 | ||||||
| Capitec Bank Holdings Ltd. | 1,630 | 193,816 | ||||||
| Cashbuild Ltd. | 488 | 6,476 | ||||||
City Lodge Hotels Ltd.(1) | 2,646 | 658 | ||||||
| Clicks Group Ltd. | 9,263 | 161,053 | ||||||
| Coronation Fund Managers Ltd. | 13,375 | 24,623 | ||||||
Curro Holdings Ltd.(2) | 896 | 559 | ||||||
| Dis-Chem Pharmacies Ltd. | 25,081 | 51,913 | ||||||
Discovery Ltd.(1)(2) | 12,431 | 89,067 | ||||||
Distell Group Holdings Ltd.(1) | 1,448 | 14,550 | ||||||
| DRDGOLD Ltd. | 20,138 | 10,912 | ||||||
EOH Holdings Ltd.(1) | 1,194 | 374 | ||||||
| Exxaro Resources Ltd. | 10,826 | 137,926 | ||||||
| Famous Brands Ltd. | 293 | 973 | ||||||
| FirstRand Ltd. | 141,744 | 529,429 | ||||||
47
| Avantis Emerging Markets Equity Fund | ||||||||
| Shares | Value | |||||||
| Foschini Group Ltd. | 12,120 | $ | 89,726 | |||||
| Gold Fields Ltd., ADR | 27,974 | 226,310 | ||||||
| Grindrod Shipping Holdings Ltd. | 2,188 | 51,489 | ||||||
| Harmony Gold Mining Co. Ltd., ADR | 38,478 | 100,428 | ||||||
| Impala Platinum Holdings Ltd. | 40,015 | 419,291 | ||||||
| Investec Ltd. | 14,076 | 66,093 | ||||||
| Kaap Agri Ltd. | 177 | 395 | ||||||
| KAP Industrial Holdings Ltd. | 178,079 | 47,175 | ||||||
| Kumba Iron Ore Ltd. | 2,452 | 54,286 | ||||||
| Lewis Group Ltd. | 508 | 1,417 | ||||||
| Life Healthcare Group Holdings Ltd. | 32,255 | 37,796 | ||||||
Massmart Holdings Ltd.(1) | 4,582 | 15,546 | ||||||
| Metair Investments Ltd. | 1,914 | 2,952 | ||||||
| MiX Telematics Ltd., ADR | 83 | 664 | ||||||
| Momentum Metropolitan Holdings | 129,392 | 125,513 | ||||||
| Motus Holdings Ltd. | 16,603 | 112,511 | ||||||
| Mpact Ltd. | 965 | 1,604 | ||||||
| Mr Price Group Ltd. | 12,571 | 136,179 | ||||||
| MTN Group Ltd. | 56,441 | 408,522 | ||||||
| MultiChoice Group | 21,390 | 144,451 | ||||||
Murray & Roberts Holdings Ltd.(1) | 1,453 | 756 | ||||||
Nampak Ltd.(1) | 4,076 | 563 | ||||||
| Naspers Ltd.,, N Shares | 1,386 | 195,435 | ||||||
Nedbank Group Ltd.(2) | 20,655 | 243,801 | ||||||
| NEPI Rockcastle SA | 24,508 | 130,592 | ||||||
| Netcare Ltd. | 121,001 | 103,674 | ||||||
| Ninety One Ltd. | 10,483 | 23,624 | ||||||
Northam Platinum Holdings Ltd.(1) | 12,388 | 116,710 | ||||||
Oceana Group Ltd.(2) | 464 | 1,485 | ||||||
Old Mutual Ltd.(2) | 368,121 | 218,083 | ||||||
| Omnia Holdings Ltd. | 30,120 | 108,595 | ||||||
| Pepkor Holdings Ltd. | 20,522 | 24,097 | ||||||
| Pick n Pay Stores Ltd. | 22,957 | 82,848 | ||||||
PPC Ltd.(1) | 125,428 | 18,646 | ||||||
| Rand Merchant Investment Holdings Ltd. | 43,611 | 68,843 | ||||||
| Raubex Group Ltd. | 5,921 | 12,058 | ||||||
| Reinet Investments SCA | 9,687 | 158,668 | ||||||
| Remgro Ltd. | 22,295 | 165,327 | ||||||
| Reunert Ltd. | 3,156 | 8,278 | ||||||
| RFG Holdings Ltd. | 1,040 | 612 | ||||||
RMB Holdings Ltd.(1) | 8,812 | 927 | ||||||
| Royal Bafokeng Platinum Ltd. | 15,814 | 134,057 | ||||||
| Sanlam Ltd. | 47,525 | 147,748 | ||||||
| Santam Ltd. | 2,838 | 40,283 | ||||||
Sappi Ltd.(1) | 75,826 | 202,122 | ||||||
Sasol Ltd., ADR(1)(2) | 26,634 | 514,036 | ||||||
| Shoprite Holdings Ltd. | 11,215 | 152,076 | ||||||
Sibanye Stillwater Ltd., ADR(2) | 36,825 | 330,689 | ||||||
| SPAR Group Ltd. | 7,714 | 70,400 | ||||||
| Standard Bank Group Ltd. | 39,718 | 354,427 | ||||||
Steinhoff International Holdings NV(1) | 112,095 | 15,240 | ||||||
48
| Avantis Emerging Markets Equity Fund | ||||||||
| Shares | Value | |||||||
Sun International Ltd.(1) | 488 | $ | 932 | |||||
Telkom SA SOC Ltd.(1) | 42,288 | 108,528 | ||||||
Thungela Resources Ltd.(2) | 21,640 | 412,463 | ||||||
Tiger Brands Ltd.(2) | 9,075 | 88,299 | ||||||
| Transaction Capital Ltd. | 9,016 | 19,824 | ||||||
Trencor Ltd.(1) | 1,689 | 541 | ||||||
| Truworths International Ltd. | 30,638 | 102,171 | ||||||
Tsogo Sun Gaming Ltd.(1) | 3,616 | 2,654 | ||||||
Tsogo Sun Hotels Ltd.(1) | 3,866 | 833 | ||||||
| Vodacom Group Ltd. | 14,702 | 108,216 | ||||||
| Wilson Bayly Holmes-Ovcon Ltd. | 1,556 | 8,009 | ||||||
| Woolworths Holdings Ltd. | 31,006 | 101,154 | ||||||
Zeder Investments Ltd.(2) | 8,750 | 923 | ||||||
| 9,496,123 | ||||||||
| South Korea — 13.2% | ||||||||
ABLBio, Inc.(1) | 1,967 | 33,291 | ||||||
Ace Technologies Corp.(1) | 775 | 4,062 | ||||||
| Advanced Process Systems Corp. | 1,624 | 23,444 | ||||||
| Aekyung Industrial Co. Ltd. | 349 | 3,639 | ||||||
| AfreecaTV Co. Ltd. | 388 | 22,021 | ||||||
Agabang&Company(1) | 2,113 | 6,632 | ||||||
| Ahnlab, Inc. | 230 | 14,314 | ||||||
Alteogen, Inc.(1) | 180 | 8,487 | ||||||
| Amorepacific Corp. | 322 | 29,347 | ||||||
| AMOREPACIFIC Group | 1,483 | 38,389 | ||||||
Ananti, Inc.(1) | 6,338 | 32,076 | ||||||
Aprogen pharmaceuticals, Inc.(1) | 1,383 | 624 | ||||||
Aprogen, Inc.(1) | 437 | 466 | ||||||
AptaBio Therapeutics, Inc.(1) | 502 | 6,521 | ||||||
Asiana Airlines, Inc.(1) | 3,845 | 43,260 | ||||||
| BGF Co. Ltd. | 616 | 1,853 | ||||||
| BGF retail Co. Ltd. | 779 | 93,308 | ||||||
| BH Co. Ltd. | 952 | 22,262 | ||||||
| Binggrae Co. Ltd. | 616 | 21,004 | ||||||
Bioneer Corp.(1) | 1,389 | 30,998 | ||||||
BNC Korea Co. Ltd.(1) | 1,241 | 10,142 | ||||||
| BNK Financial Group, Inc. | 28,603 | 142,623 | ||||||
| Boditech Med, Inc. | 953 | 7,707 | ||||||
| Boryung | 285 | 2,149 | ||||||
| Bukwang Pharmaceutical Co. Ltd. | 513 | 3,435 | ||||||
| Byucksan Corp. | 2,612 | 5,053 | ||||||
Cellid Co. Ltd.(1) | 65 | 1,011 | ||||||
| Celltrion Healthcare Co. Ltd. | 392 | 20,978 | ||||||
Celltrion Pharm, Inc.(1) | 252 | 14,658 | ||||||
| Celltrion, Inc. | 2,837 | 399,329 | ||||||
Chabiotech Co. Ltd.(1) | 516 | 6,541 | ||||||
| Cheil Worldwide, Inc. | 4,386 | 71,507 | ||||||
| Chong Kun Dang Pharmaceutical Corp. | 789 | 50,452 | ||||||
| Chongkundang Holdings Corp. | 42 | 1,872 | ||||||
| Chunbo Co. Ltd. | 75 | 12,576 | ||||||
CJ CGV Co. Ltd.(1) | 377 | 5,739 | ||||||
49
| Avantis Emerging Markets Equity Fund | ||||||||
| Shares | Value | |||||||
| CJ CheilJedang Corp. | 437 | $ | 132,559 | |||||
| CJ Corp. | 1,535 | 89,310 | ||||||
| CJ ENM Co. Ltd. | 760 | 55,394 | ||||||
CJ Logistics Corp.(1) | 623 | 54,912 | ||||||
| Classys, Inc. | 1,624 | 17,162 | ||||||
CMG Pharmaceutical Co. Ltd.(1) | 803 | 1,680 | ||||||
| Com2uSCorp | 114 | 6,834 | ||||||
| Cosmax, Inc. | 1,131 | 52,639 | ||||||
CosmoAM&T Co. Ltd.(1) | 253 | 12,082 | ||||||
COSON Co. Ltd.(1) | 1,078 | 2,120 | ||||||
| Coway Co. Ltd. | 4,140 | 196,420 | ||||||
| COWELL FASHION Co. Ltd. | 866 | 4,244 | ||||||
Creative & Innovative System(1) | 493 | 5,271 | ||||||
CrystalGenomics, Inc.(1) | 1,166 | 3,162 | ||||||
| CS Wind Corp. | 558 | 28,429 | ||||||
| Cuckoo Homesys Co. Ltd. | 704 | 16,636 | ||||||
Daea TI Co. Ltd.(1) | 824 | 2,214 | ||||||
| Daeduck Electronics Co. Ltd. | 4,805 | 105,368 | ||||||
| Daesang Corp. | 1,157 | 19,475 | ||||||
| Daewon Pharmaceutical Co. Ltd. | 395 | 4,811 | ||||||
Daewoo Engineering & Construction Co. Ltd.(1) | 26,080 | 100,576 | ||||||
Daewoo Shipbuilding & Marine Engineering Co. Ltd.(1) | 196 | 2,924 | ||||||
| Daewoong Co. Ltd. | 705 | 12,720 | ||||||
| Daewoong Pharmaceutical Co. Ltd. | 323 | 42,125 | ||||||
| Daishin Securities Co. Ltd. | 4,161 | 47,661 | ||||||
| Daol Investment & Securities Co. Ltd. | 5,885 | 20,081 | ||||||
| Daou Data Corp. | 2,016 | 18,179 | ||||||
| Daou Technology, Inc. | 2,270 | 31,740 | ||||||
| Dawonsys Co. Ltd. | 62 | 1,066 | ||||||
| DB Financial Investment Co. Ltd. | 1,678 | 6,218 | ||||||
| DB HiTek Co. Ltd. | 3,627 | 124,496 | ||||||
| DB Insurance Co. Ltd. | 5,455 | 242,932 | ||||||
| Dentium Co. Ltd. | 478 | 31,090 | ||||||
| Devsisters Co. Ltd. | 99 | 2,863 | ||||||
| DGB Financial Group, Inc. | 16,567 | 91,822 | ||||||
DIO Corp.(1) | 562 | 11,201 | ||||||
| DL E&C Co. Ltd. | 3,312 | 100,526 | ||||||
| DL Holdings Co. Ltd. | 1,379 | 68,439 | ||||||
| Dong-A Socio Holdings Co. Ltd. | 122 | 9,872 | ||||||
| Dong-A ST Co. Ltd. | 223 | 9,363 | ||||||
| Dongjin Semichem Co. Ltd. | 2,768 | 70,626 | ||||||
| DongKook Pharmaceutical Co. Ltd. | 415 | 5,718 | ||||||
| Dongkuk Steel Mill Co. Ltd. | 8,738 | 85,600 | ||||||
| Dongsuh Cos., Inc. | 282 | 5,134 | ||||||
Dongwha Enterprise Co. Ltd.(1) | 82 | 4,124 | ||||||
| Dongwha Pharm Co. Ltd. | 1,215 | 9,063 | ||||||
| Dongwon Development Co. Ltd. | 641 | 1,777 | ||||||
| Dongwon F&B Co. Ltd. | 93 | 10,746 | ||||||
| Dongwon Industries Co. Ltd. | 190 | 32,009 | ||||||
| Dongwon Systems Corp. | 217 | 8,721 | ||||||
| Doosan Bobcat, Inc. | 917 | 23,576 | ||||||
50
| Avantis Emerging Markets Equity Fund | ||||||||
| Shares | Value | |||||||
Doosan Enerbility Co. Ltd.(1) | 8,853 | $ | 133,049 | |||||
| Doosan Tesna, Inc. | 1,960 | 41,747 | ||||||
| DoubleUGames Co. Ltd. | 275 | 8,772 | ||||||
| Douzone Bizon Co. Ltd. | 812 | 21,762 | ||||||
Duk San Neolux Co. Ltd.(1) | 569 | 15,202 | ||||||
| E-MART, Inc. | 1,032 | 74,921 | ||||||
| Echo Marketing, Inc. | 366 | 4,393 | ||||||
| Ecopro BM Co. Ltd. | 496 | 41,040 | ||||||
| Ecopro Co. Ltd. | 169 | 14,324 | ||||||
| Ecopro HN Co. Ltd. | 136 | 5,373 | ||||||
| ENF Technology Co. Ltd. | 240 | 5,176 | ||||||
| Eo Technics Co. Ltd. | 129 | 7,187 | ||||||
Eoflow Co. Ltd.(1) | 486 | 6,930 | ||||||
| Eugene Corp. | 3,001 | 8,669 | ||||||
| Eugene Investment & Securities Co. Ltd. | 4,439 | 9,424 | ||||||
| Eugene Technology Co. Ltd. | 502 | 10,181 | ||||||
| F&F Co. Ltd. / New | 900 | 94,963 | ||||||
| F&F Holdings Co. Ltd. | 27 | 356 | ||||||
| Fila Holdings Corp. | 3,645 | 84,192 | ||||||
| Fine Semitech Corp. | 363 | 3,907 | ||||||
| Foosung Co. Ltd. | 1,807 | 21,616 | ||||||
GemVax & Kael Co. Ltd.(1) | 680 | 6,862 | ||||||
Genexine, Inc.(1) | 81 | 1,827 | ||||||
Giantstep, Inc.(1) | 170 | 2,998 | ||||||
| GOLFZON Co. Ltd. | 448 | 44,033 | ||||||
| Gradiant Corp. | 604 | 8,364 | ||||||
Grand Korea Leisure Co. Ltd.(1) | 242 | 2,871 | ||||||
| Green Cross Corp. | 41 | 5,005 | ||||||
| Green Cross Holdings Corp. | 435 | 6,087 | ||||||
| GS Engineering & Construction Corp. | 6,709 | 150,069 | ||||||
| GS Holdings Corp. | 5,649 | 193,942 | ||||||
| GS Retail Co. Ltd. | 4,711 | 89,054 | ||||||
| HAESUNG DS Co. Ltd. | 1,458 | 63,405 | ||||||
| Halla Holdings Corp. | 590 | 16,861 | ||||||
| Hana Financial Group, Inc. | 20,035 | 583,953 | ||||||
| Hana Materials, Inc. | 366 | 10,288 | ||||||
Hana Micron, Inc.(1) | 3,236 | 30,665 | ||||||
Hanall Biopharma Co. Ltd.(1) | 410 | 5,348 | ||||||
| Handsome Co. Ltd. | 2,251 | 47,464 | ||||||
| Hanil Cement Co. Ltd. | 730 | 8,276 | ||||||
Hanjin Kal Corp.(1) | 187 | 7,359 | ||||||
| Hanjin Transportation Co. Ltd. | 337 | 6,455 | ||||||
| Hankook Shell Oil Co. Ltd. | 40 | 7,584 | ||||||
| Hankook Tire & Technology Co. Ltd. | 5,407 | 152,433 | ||||||
| Hanmi Pharm Co. Ltd. | 378 | 86,623 | ||||||
| Hanmi Semiconductor Co. Ltd. | 3,377 | 30,001 | ||||||
| Hanon Systems | 8,178 | 62,539 | ||||||
| Hansae Co. Ltd. | 1,736 | 20,363 | ||||||
| Hansol Chemical Co. Ltd. | 375 | 60,564 | ||||||
| Hansol Paper Co. Ltd. | 1,067 | 12,462 | ||||||
Hansol Technics Co. Ltd.(1) | 1,045 | 4,705 | ||||||
51
| Avantis Emerging Markets Equity Fund | ||||||||
| Shares | Value | |||||||
| Hanssem Co. Ltd. | 322 | $ | 12,877 | |||||
| Hanwha Aerospace Co. Ltd. | 3,100 | 187,542 | ||||||
| Hanwha Corp. | 3,440 | 81,349 | ||||||
| Hanwha Corp., Preference Shares | 729 | 8,655 | ||||||
Hanwha General Insurance Co. Ltd.(1) | 2,607 | 9,122 | ||||||
| Hanwha Investment & Securities Co. Ltd. | 10,391 | 23,938 | ||||||
Hanwha Life Insurance Co. Ltd.(1) | 37,675 | 64,634 | ||||||
Hanwha Solutions Corp.(1) | 3,550 | 138,421 | ||||||
| Hanwha Systems Co. Ltd. | 2,295 | 26,482 | ||||||
| Harim Holdings Co. Ltd. | 7,758 | 48,239 | ||||||
| HD Hyundai Co. Ltd. | 5,366 | 251,951 | ||||||
| HDC Holdings Co. Ltd. | 1,750 | 9,075 | ||||||
| HDC Hyundai Development Co-Engineering & Construction, E Shares | 3,589 | 33,163 | ||||||
| Hite Jinro Co. Ltd. | 2,211 | 50,188 | ||||||
HJ Shipbuilding & Construction Co. Ltd.(1) | 2,594 | 11,648 | ||||||
| HK inno N Corp. | 227 | 6,826 | ||||||
HLB Global Co. Ltd.(1) | 807 | 4,911 | ||||||
HLB Life Science Co. Ltd.(1) | 1,360 | 14,857 | ||||||
HLB, Inc.(1) | 686 | 25,045 | ||||||
| HMM Co. Ltd. | 20,172 | 332,437 | ||||||
| Hotel Shilla Co. Ltd. | 1,180 | 64,639 | ||||||
| HS Industries Co. Ltd. | 1,315 | 4,882 | ||||||
| Huchems Fine Chemical Corp. | 1,424 | 22,503 | ||||||
Hugel, Inc.(1) | 170 | 15,385 | ||||||
Humax Co. Ltd.(1) | 1,601 | 4,756 | ||||||
| Humedix Co. Ltd. | 254 | 4,481 | ||||||
| Huons Co. Ltd. | 129 | 3,424 | ||||||
| Huons Global Co. Ltd. | 141 | 2,256 | ||||||
| Hwaseung Enterprise Co. Ltd. | 315 | 3,098 | ||||||
HYBE Co. Ltd.(1) | 162 | 21,709 | ||||||
| Hyosung Advanced Materials Corp. | 134 | 42,005 | ||||||
Hyosung Chemical Corp.(1) | 216 | 27,738 | ||||||
| Hyosung Corp. | 369 | 20,504 | ||||||
Hyosung Heavy Industries Corp.(1) | 224 | 12,282 | ||||||
| Hyosung TNC Corp. | 224 | 52,093 | ||||||
| Hyundai Autoever Corp. | 426 | 37,993 | ||||||
Hyundai Bioscience Co. Ltd.(1) | 581 | 14,892 | ||||||
| Hyundai Construction Equipment Co. Ltd. | 678 | 20,470 | ||||||
| Hyundai Corp. | 337 | 4,583 | ||||||
| Hyundai Department Store Co. Ltd. | 1,484 | 68,270 | ||||||
Hyundai Doosan Infracore Co. Ltd.(1) | 5,579 | 25,525 | ||||||
Hyundai Electric & Energy System Co. Ltd.(1) | 3,851 | 91,173 | ||||||
| Hyundai Elevator Co. Ltd. | 1,982 | 43,097 | ||||||
| Hyundai Engineering & Construction Co. Ltd. | 6,200 | 221,699 | ||||||
| Hyundai Futurenet Co. Ltd. | 2,521 | 5,052 | ||||||
| Hyundai Glovis Co. Ltd. | 1,796 | 235,324 | ||||||
| Hyundai Greenfood Co. Ltd. | 4,245 | 24,309 | ||||||
Hyundai Heavy Industries Co. Ltd.(1) | 1,149 | 122,266 | ||||||
| Hyundai Home Shopping Network Corp. | 644 | 23,989 | ||||||
| Hyundai Livart Furniture Co. Ltd. | 429 | 3,492 | ||||||
52
| Avantis Emerging Markets Equity Fund | ||||||||
| Shares | Value | |||||||
| Hyundai Marine & Fire Insurance Co. Ltd. | 8,078 | $ | 189,493 | |||||
Hyundai Mipo Dockyard Co. Ltd.(1) | 294 | 23,339 | ||||||
| Hyundai Mobis Co. Ltd. | 1,598 | 254,838 | ||||||
| Hyundai Motor Co. | 5,134 | 745,879 | ||||||
Hyundai Rotem Co. Ltd.(1) | 1,229 | 27,599 | ||||||
| Hyundai Steel Co. | 6,853 | 167,108 | ||||||
| Hyundai Wia Corp. | 564 | 31,742 | ||||||
| i-SENS, Inc. | 272 | 7,583 | ||||||
| ICD Co. Ltd. | 2,133 | 15,016 | ||||||
| Iljin Diamond Co. Ltd. | 93 | 1,537 | ||||||
| Iljin Materials Co. Ltd. | 319 | 17,481 | ||||||
| Ilyang Pharmaceutical Co. Ltd. | 2,125 | 34,417 | ||||||
| iMarketKorea, Inc. | 2,108 | 16,300 | ||||||
| Industrial Bank of Korea | 22,154 | 157,744 | ||||||
| Innocean Worldwide, Inc. | 782 | 24,727 | ||||||
| Innox Advanced Materials Co. Ltd. | 1,309 | 33,511 | ||||||
Inscobee, Inc.(1) | 756 | 1,127 | ||||||
Insun ENT Co. Ltd.(1) | 1,650 | 13,224 | ||||||
Interflex Co. Ltd.(1) | 276 | 2,548 | ||||||
| INTOPS Co. Ltd. | 1,921 | 42,841 | ||||||
iNtRON Biotechnology, Inc.(1) | 2,914 | 24,799 | ||||||
| IS Dongseo Co. Ltd. | 2,292 | 62,948 | ||||||
| JB Financial Group Co. Ltd. | 14,750 | 83,333 | ||||||
| Jeil Pharmaceutical Co. Ltd. | 24 | 377 | ||||||
Jeju Air Co. Ltd.(1) | 190 | 2,191 | ||||||
Jin Air Co. Ltd.(1) | 624 | 8,060 | ||||||
| Jusung Engineering Co. Ltd. | 4,806 | 56,515 | ||||||
| JW Holdings Corp. | 399 | 983 | ||||||
| JW Pharmaceutical Corp. | 2,377 | 38,635 | ||||||
| JYP Entertainment Corp. | 1,575 | 71,305 | ||||||
| Kakao Corp. | 4,437 | 240,945 | ||||||
Kakao Games Corp.(1) | 699 | 27,264 | ||||||
KakaoBank Corp.(1) | 897 | 18,163 | ||||||
Kangwon Land, Inc.(1) | 1,592 | 31,389 | ||||||
KB Financial Group, Inc., ADR(2) | 18,091 | 661,769 | ||||||
| KC Co. Ltd. | 435 | 5,822 | ||||||
| KC Tech Co. Ltd. | 493 | 5,946 | ||||||
| KCC Corp. | 306 | 66,818 | ||||||
| KCC Glass Corp. | 1,172 | 43,903 | ||||||
| KEPCO Engineering & Construction Co., Inc. | 229 | 12,465 | ||||||
| KEPCO Plant Service & Engineering Co. Ltd. | 1,281 | 39,314 | ||||||
| KG Dongbu Steel Co. Ltd. | 279 | 2,598 | ||||||
| Kginicis Co. Ltd. | 1,731 | 17,206 | ||||||
KH Feelux Co. Ltd.(1) | 8,049 | 8,202 | ||||||
| KH Vatec Co. Ltd. | 1,906 | 26,837 | ||||||
| Kia Corp. | 14,356 | 860,467 | ||||||
| KISCO Corp. | 1,358 | 6,982 | ||||||
| KIWOOM Securities Co. Ltd. | 1,873 | 119,017 | ||||||
KMW Co. Ltd.(1) | 276 | 6,555 | ||||||
| Koentec Co. Ltd. | 632 | 4,293 | ||||||
| Koh Young Technology, Inc. | 700 | 7,329 | ||||||
53
| Avantis Emerging Markets Equity Fund | ||||||||
| Shares | Value | |||||||
| Kolmar BNH Co. Ltd. | 169 | $ | 3,252 | |||||
| Kolmar Korea Co. Ltd. | 104 | 2,957 | ||||||
| Kolmar Korea Holdings Co. Ltd. | 244 | 3,006 | ||||||
| Kolon Industries, Inc. | 1,544 | 60,015 | ||||||
| KoMiCo Ltd. | 1,114 | 38,550 | ||||||
Komipharm International Co. Ltd.(1) | 185 | 975 | ||||||
KONA I Co. Ltd.(1) | 716 | 8,611 | ||||||
| Korea Aerospace Industries Ltd. | 5,012 | 227,423 | ||||||
Korea Electric Power Corp., ADR(1)(2) | 17,239 | 131,534 | ||||||
| Korea Electric Terminal Co. Ltd. | 609 | 30,163 | ||||||
| Korea Gas Corp. | 430 | 13,930 | ||||||
| Korea Investment Holdings Co. Ltd. | 4,226 | 178,189 | ||||||
Korea Line Corp.(1) | 17,992 | 30,409 | ||||||
| Korea Petrochemical Ind Co. Ltd. | 318 | 28,725 | ||||||
| Korea Real Estate Investment & Trust Co. Ltd. | 3,951 | 4,788 | ||||||
Korea Shipbuilding & Offshore Engineering Co. Ltd.(1) | 2,976 | 214,781 | ||||||
| Korea United Pharm, Inc. | 247 | 4,526 | ||||||
| Korea Zinc Co. Ltd. | 260 | 130,059 | ||||||
Korean Air Lines Co. Ltd.(1) | 13,827 | 274,813 | ||||||
| Korean Reinsurance Co. | 6,669 | 41,486 | ||||||
Krafton, Inc.(1) | 204 | 37,266 | ||||||
| KT Skylife Co. Ltd. | 1,686 | 10,737 | ||||||
| Kumho Petrochemical Co. Ltd. | 1,757 | 169,475 | ||||||
Kumho Tire Co., Inc.(1) | 3,469 | 8,959 | ||||||
| Kwang Dong Pharmaceutical Co. Ltd. | 671 | 3,328 | ||||||
| Kyobo Securities Co. Ltd. | 138 | 648 | ||||||
| Kyung Dong Navien Co. Ltd. | 141 | 4,538 | ||||||
| L&C Bio Co. Ltd. | 334 | 6,499 | ||||||
L&F Co. Ltd.(1) | 331 | 56,138 | ||||||
| LB Semicon, Inc. | 1,686 | 11,558 | ||||||
| LEENO Industrial, Inc. | 638 | 67,903 | ||||||
| LF Corp. | 3,890 | 49,006 | ||||||
| LG Chem Ltd. | 847 | 396,478 | ||||||
| LG Corp. | 1,880 | 114,719 | ||||||
LG Display Co. Ltd., ADR(2) | 37,882 | 216,685 | ||||||
| LG Electronics, Inc. | 4,246 | 317,728 | ||||||
LG Energy Solution Ltd.(1) | 188 | 64,431 | ||||||
| LG H&H Co. Ltd. | 251 | 132,915 | ||||||
| LG HelloVision Co. Ltd. | 1,238 | 4,720 | ||||||
| LG Innotek Co. Ltd. | 1,145 | 291,469 | ||||||
| LG Uplus Corp. | 16,787 | 143,764 | ||||||
| LIG Nex1 Co. Ltd. | 595 | 46,931 | ||||||
Lock&Lock Co. Ltd.(1) | 304 | 1,757 | ||||||
| Lotte Chemical Corp. | 703 | 91,281 | ||||||
| Lotte Chilsung Beverage Co. Ltd. | 381 | 43,839 | ||||||
| Lotte Confectionery Co. Ltd. | 165 | 15,370 | ||||||
| Lotte Corp. | 231 | 7,126 | ||||||
| Lotte Data Communication Co. | 464 | 9,287 | ||||||
| LOTTE Fine Chemical Co. Ltd. | 1,867 | 97,686 | ||||||
| LOTTE Himart Co. Ltd. | 116 | 1,357 | ||||||
| Lotte Rental Co. Ltd. | 1,895 | 50,334 | ||||||
54
| Avantis Emerging Markets Equity Fund | ||||||||
| Shares | Value | |||||||
| Lotte Shopping Co. Ltd. | 1,215 | $ | 89,183 | |||||
| LS Corp. | 813 | 40,513 | ||||||
| LS Electric Co. Ltd. | 817 | 33,886 | ||||||
| Lutronic Corp. | 1,474 | 20,630 | ||||||
LVMC Holdings(1) | 986 | 2,208 | ||||||
| LX Hausys Ltd. | 634 | 21,193 | ||||||
LX Holdings Corp.(1) | 3,787 | 23,628 | ||||||
| LX INTERNATIONAL Corp. | 1,786 | 57,517 | ||||||
| LX Semicon Co. Ltd. | 992 | 69,796 | ||||||
| Maeil Dairies Co. Ltd. | 252 | 10,772 | ||||||
| Mando Corp. | 3,492 | 139,569 | ||||||
Medytox, Inc.(1) | 163 | 14,845 | ||||||
| MegaStudyEdu Co. Ltd. | 837 | 48,689 | ||||||
| Meritz Financial Group, Inc. | 3,092 | 70,869 | ||||||
| Meritz Fire & Marine Insurance Co. Ltd. | 4,008 | 114,430 | ||||||
| Meritz Securities Co. Ltd. | 32,838 | 118,350 | ||||||
| Mirae Asset Life Insurance Co. Ltd. | 2,237 | 5,057 | ||||||
| Mirae Asset Securities Co. Ltd. | 19,540 | 95,293 | ||||||
| Miwon Commercial Co. Ltd. | 26 | 3,419 | ||||||
Myoung Shin Industrial Co. Ltd.(1) | 421 | 6,785 | ||||||
| Namhae Chemical Corp. | 960 | 7,685 | ||||||
Namsun Aluminum Co. Ltd.(1) | 4,341 | 7,236 | ||||||
Naturecell Co. Ltd.(1) | 342 | 6,711 | ||||||
| NAVER Corp. | 2,003 | 355,426 | ||||||
| NCSoft Corp. | 319 | 89,643 | ||||||
Neowiz(1) | 562 | 16,398 | ||||||
NEPES Corp.(1) | 2,001 | 32,348 | ||||||
| Netmarble Corp. | 181 | 8,534 | ||||||
| Nexen Tire Corp. | 3,291 | 16,282 | ||||||
| NEXTIN, Inc. | 591 | 24,843 | ||||||
| NH Investment & Securities Co. Ltd. | 11,541 | 85,436 | ||||||
NHN Corp.(1) | 938 | 17,616 | ||||||
NHN KCP Corp.(1) | 1,223 | 11,496 | ||||||
| NICE Holdings Co. Ltd. | 1,626 | 16,558 | ||||||
| NICE Information Service Co. Ltd. | 1,931 | 20,647 | ||||||
NKMax Co. Ltd.(1) | 576 | 7,925 | ||||||
| NongShim Co. Ltd. | 253 | 56,561 | ||||||
| OCI Co. Ltd. | 932 | 81,096 | ||||||
OliX Pharmaceuticals, Inc.(1) | 206 | 3,265 | ||||||
| OptoElectronics Solutions Co. Ltd. | 81 | 1,347 | ||||||
| Orion Corp./Republic of Korea | 2,105 | 154,201 | ||||||
| Orion Holdings Corp. | 2,268 | 24,663 | ||||||
| Osstem Implant Co. Ltd. | 576 | 55,150 | ||||||
| Ottogi Corp. | 144 | 51,527 | ||||||
| Pan Ocean Co. Ltd. | 34,063 | 130,337 | ||||||
Paradise Co. Ltd.(1) | 1,512 | 17,929 | ||||||
| Park Systems Corp. | 72 | 5,193 | ||||||
| Partron Co. Ltd. | 4,798 | 30,917 | ||||||
Pearl Abyss Corp.(1) | 642 | 26,997 | ||||||
| PharmaResearch Co. Ltd. | 223 | 11,172 | ||||||
| PI Advanced Materials Co. Ltd. | 961 | 26,542 | ||||||
55
| Avantis Emerging Markets Equity Fund | ||||||||
| Shares | Value | |||||||
| Poongsan Corp. | 487 | $ | 11,247 | |||||
| POSCO Chemical Co. Ltd. | 347 | 43,137 | ||||||
| POSCO Holdings, Inc., ADR | 12,950 | 608,909 | ||||||
| Posco ICT Co. Ltd. | 844 | 4,160 | ||||||
| Posco International Corp. | 2,436 | 48,626 | ||||||
| PSK, Inc. | 1,091 | 27,640 | ||||||
| Pulmuone Co. Ltd. | 627 | 6,427 | ||||||
| S&S Tech Corp. | 452 | 7,412 | ||||||
| S-1 Corp. | 691 | 30,003 | ||||||
| S-Oil Corp. | 2,420 | 183,557 | ||||||
| Samchully Co. Ltd. | 65 | 10,094 | ||||||
| Samjin Pharmaceutical Co. Ltd. | 249 | 4,599 | ||||||
Samsung Biologics Co. Ltd.(1) | 357 | 222,039 | ||||||
| Samsung C&T Corp. | 1,987 | 177,910 | ||||||
| Samsung Card Co. Ltd. | 448 | 10,473 | ||||||
| Samsung Electro-Mechanics Co. Ltd. | 3,411 | 353,163 | ||||||
| Samsung Electronics Co. Ltd., GDR | 4,442 | 4,857,632 | ||||||
Samsung Engineering Co. Ltd.(1) | 9,997 | 173,818 | ||||||
| Samsung Fire & Marine Insurance Co. Ltd. | 2,651 | 385,281 | ||||||
Samsung Heavy Industries Co. Ltd.(1) | 54,769 | 243,001 | ||||||
| Samsung Life Insurance Co. Ltd. | 4,435 | 204,693 | ||||||
Samsung Pharmaceutical Co. Ltd.(1) | 723 | 1,959 | ||||||
| Samsung SDI Co. Ltd. | 1,000 | 442,102 | ||||||
| Samsung SDS Co. Ltd. | 986 | 94,102 | ||||||
| Samsung Securities Co. Ltd. | 6,127 | 154,248 | ||||||
| Samwha Capacitor Co. Ltd. | 200 | 6,213 | ||||||
| Samyang Corp. | 176 | 5,325 | ||||||
| Samyang Foods Co. Ltd. | 395 | 32,807 | ||||||
| Samyang Holdings Corp. | 195 | 9,969 | ||||||
| Sangsangin Co. Ltd. | 4,184 | 26,620 | ||||||
| SD Biosensor, Inc. | 3,414 | 89,258 | ||||||
| Seah Besteel Holdings Corp. | 911 | 12,605 | ||||||
| SeAH Steel Corp. | 339 | 48,133 | ||||||
| SeAH Steel Holdings Corp. | 160 | 21,703 | ||||||
| Sebang Global Battery Co. Ltd. | 158 | 6,107 | ||||||
| Seegene, Inc. | 4,156 | 97,366 | ||||||
| Seobu T&D | 1,800 | 10,714 | ||||||
| Seojin System Co. Ltd. | 1,030 | 11,544 | ||||||
| Seoul Semiconductor Co. Ltd. | 5,788 | 49,512 | ||||||
| Seoul Viosys Co. Ltd. | 377 | 1,963 | ||||||
| SFA Engineering Corp. | 912 | 27,842 | ||||||
SFA Semicon Co. Ltd.(1) | 2,124 | 8,095 | ||||||
Shin Poong Pharmaceutical Co. Ltd.(1) | 78 | 1,618 | ||||||
Shinhan Financial Group Co. Ltd., ADR(2) | 23,091 | 616,761 | ||||||
| Shinsegae International, Inc. | 1,719 | 35,638 | ||||||
| Shinsegae, Inc. | 780 | 129,274 | ||||||
Shinsung E&G Co. Ltd.(1) | 2,421 | 4,388 | ||||||
| Shinyoung Securities Co. Ltd. | 132 | 5,606 | ||||||
| SIMMTECH Co. Ltd. | 2,906 | 83,297 | ||||||
SK Biopharmaceuticals Co. Ltd.(1) | 1,017 | 54,071 | ||||||
SK Bioscience Co. Ltd.(1) | 259 | 21,683 | ||||||
56
| Avantis Emerging Markets Equity Fund | ||||||||
| Shares | Value | |||||||
| SK Chemicals Co. Ltd. | 1,075 | $ | 77,930 | |||||
| SK D&D Co. Ltd. | 398 | 7,933 | ||||||
| SK Discovery Co. Ltd. | 345 | 9,316 | ||||||
| SK Gas Ltd. | 126 | 10,922 | ||||||
| SK Hynix, Inc. | 22,212 | 1,561,680 | ||||||
SK IE Technology Co. Ltd.(1) | 232 | 14,271 | ||||||
SK Innovation Co. Ltd.(1) | 1,073 | 151,052 | ||||||
| SK Networks Co. Ltd. | 21,603 | 73,043 | ||||||
| SK Securities Co. Ltd. | 31,975 | 17,929 | ||||||
| SK Telecom Co. Ltd., ADR | 5,221 | 111,468 | ||||||
| SK, Inc. | 1,039 | 179,715 | ||||||
| SKC Co. Ltd. | 731 | 65,688 | ||||||
| SL Corp. | 1,283 | 36,574 | ||||||
| SM Entertainment Co. Ltd. | 586 | 30,074 | ||||||
| SNT Motiv Co. Ltd. | 434 | 15,620 | ||||||
SOLUM Co. Ltd.(1) | 448 | 6,873 | ||||||
| Songwon Industrial Co. Ltd. | 1,219 | 17,153 | ||||||
| Soulbrain Co. Ltd. | 232 | 37,270 | ||||||
| Soulbrain Holdings Co. Ltd. | 101 | 1,697 | ||||||
| SPC Samlip Co. Ltd. | 100 | 6,020 | ||||||
| ST Pharm Co. Ltd. | 132 | 9,636 | ||||||
| STIC Investments, Inc. | 700 | 3,895 | ||||||
Studio Dragon Corp.(1) | 147 | 8,277 | ||||||
| Suheung Co. Ltd. | 280 | 7,281 | ||||||
| Taeyoung Engineering & Construction Co. Ltd. | 1,144 | 5,438 | ||||||
| TES Co. Ltd. | 1,403 | 20,695 | ||||||
| TK Corp. | 771 | 11,117 | ||||||
| Tokai Carbon Korea Co. Ltd. | 392 | 32,573 | ||||||
| Tongyang Life Insurance Co. Ltd. | 4,796 | 20,104 | ||||||
| Tongyang, Inc. | 3,527 | 2,956 | ||||||
Toptec Co. Ltd.(1) | 247 | 1,485 | ||||||
| TSE Co. Ltd. | 162 | 6,956 | ||||||
TY Holdings Co. Ltd.(1) | 1,322 | 16,620 | ||||||
| Unid Co. Ltd. | 507 | 39,153 | ||||||
Unison Co. Ltd.(1) | 4,003 | 8,093 | ||||||
UniTest, Inc.(1) | 329 | 4,737 | ||||||
| Value Added Technology Co. Ltd. | 1,055 | 26,322 | ||||||
Vaxcell-Bio Therapeutics Co. Ltd.(1) | 86 | 4,536 | ||||||
| Vieworks Co. Ltd. | 344 | 10,136 | ||||||
Webzen, Inc.(1) | 493 | 6,788 | ||||||
| Wemade Co. Ltd. | 705 | 32,268 | ||||||
| Winix, Inc. | 383 | 3,530 | ||||||
| WiSoL Co. Ltd. | 935 | 6,072 | ||||||
Wonik Holdings Co. Ltd.(1) | 908 | 2,555 | ||||||
| WONIK IPS Co. Ltd. | 1,371 | 28,372 | ||||||
| Wonik Materials Co. Ltd. | 174 | 3,932 | ||||||
| Wonik QnC Corp. | 1,985 | 40,247 | ||||||
| Woongjin Thinkbig Co. Ltd. | 2,317 | 4,442 | ||||||
| Woori Financial Group, Inc. | 41,559 | 375,940 | ||||||
| Woori Investment Bank Co. Ltd. | 18,555 | 12,211 | ||||||
Woori Technology Investment Co. Ltd.(1) | 6,780 | 29,437 | ||||||
57
| Avantis Emerging Markets Equity Fund | ||||||||
| Shares | Value | |||||||
| Youngone Corp. | 1,635 | $ | 54,134 | |||||
| Youngone Holdings Co. Ltd. | 707 | 27,857 | ||||||
| Yuanta Securities Korea Co. Ltd. | 8,160 | 17,347 | ||||||
| Yuhan Corp. | 728 | 30,788 | ||||||
| Zinus, Inc. | 287 | 9,257 | ||||||
| 31,905,053 | ||||||||
| Taiwan — 17.1% | ||||||||
| Abico Avy Co. Ltd. | 6,020 | 4,498 | ||||||
| Ability Enterprise Co. Ltd. | 22,000 | 16,798 | ||||||
| AcBel Polytech, Inc. | 24,000 | 23,672 | ||||||
| Accton Technology Corp. | 5,000 | 46,043 | ||||||
| Acer, Inc. | 220,000 | 158,009 | ||||||
| ACES Electronic Co. Ltd. | 7,514 | 9,141 | ||||||
Acon Holding, Inc.(1) | 30,465 | 17,291 | ||||||
| Acter Group Corp. Ltd. | 5,000 | 34,744 | ||||||
| Advanced Analog Technology, Inc. | 2,000 | 3,341 | ||||||
| Advanced International Multitech Co. Ltd. | 16,000 | 53,087 | ||||||
| Advanced Power Electronics Corp. | 6,000 | 22,638 | ||||||
| Advantech Co. Ltd. | 6,099 | 65,064 | ||||||
| AGV Products Corp. | 14,000 | 4,563 | ||||||
| Airmate Cayman International Co. Ltd. | 1,060 | 673 | ||||||
Airtac International Group(1) | 2,046 | 54,861 | ||||||
| Alcor Micro Corp. | 4,000 | 5,075 | ||||||
| Alexander Marine Co. Ltd. | 4,000 | 40,693 | ||||||
| Allied Circuit Co. Ltd. | 2,000 | 8,062 | ||||||
| Allied Supreme Corp. | 3,000 | 38,647 | ||||||
| Allis Electric Co. Ltd. | 2,315 | 2,567 | ||||||
| Alltek Technology Corp. | 8,013 | 9,907 | ||||||
| Alltop Technology Co. Ltd. | 3,500 | 17,545 | ||||||
| Alpha Networks, Inc. | 5,773 | 5,923 | ||||||
| Altek Corp. | 7,000 | 8,545 | ||||||
| Amazing Microelectronic Corp. | 7,000 | 25,016 | ||||||
| Ampire Co. Ltd. | 2,000 | 1,684 | ||||||
| AMPOC Far-East Co. Ltd. | 2,000 | 2,760 | ||||||
| AmTRAN Technology Co. Ltd. | 50,292 | 20,994 | ||||||
| Anji Technology Co. Ltd. | 5,000 | 9,420 | ||||||
| Anpec Electronics Corp. | 5,000 | 22,864 | ||||||
| Apacer Technology, Inc. | 1,000 | 1,325 | ||||||
| APAQ Technology Co. Ltd. | 3,000 | 3,925 | ||||||
| APCB, Inc. | 2,000 | 1,105 | ||||||
| Apex International Co. Ltd. | 14,000 | 28,190 | ||||||
| Arcadyan Technology Corp. | 7,000 | 26,329 | ||||||
| Ardentec Corp. | 40,000 | 59,725 | ||||||
| Argosy Research, Inc. | 4,155 | 10,083 | ||||||
| ASE Technology Holding Co. Ltd., ADR | 72,205 | 415,901 | ||||||
| Asia Cement Corp. | 167,000 | 236,410 | ||||||
| Asia Optical Co., Inc. | 2,000 | 4,292 | ||||||
Asia Pacific Telecom Co. Ltd.(1) | 28,621 | 6,575 | ||||||
| Asia Polymer Corp. | 47,353 | 42,439 | ||||||
| Asia Vital Components Co. Ltd. | 22,000 | 77,496 | ||||||
| ASolid Technology Co. Ltd. | 2,000 | 5,536 | ||||||
58
| Avantis Emerging Markets Equity Fund | ||||||||
| Shares | Value | |||||||
| ASROCK, Inc. | 2,000 | $ | 6,271 | |||||
| Asustek Computer, Inc. | 36,000 | 299,557 | ||||||
| Aten International Co. Ltd. | 2,000 | 5,129 | ||||||
| Audix Corp. | 1,000 | 1,653 | ||||||
AUO Corp.(2) | 620,800 | 338,975 | ||||||
| AURAS Technology Co. Ltd. | 5,000 | 25,219 | ||||||
| Avermedia Technologies | 8,800 | 6,969 | ||||||
| Bafang Yunji International Co. Ltd. | 5,000 | 26,907 | ||||||
| Bank of Kaohsiung Co. Ltd. | 51,814 | 23,619 | ||||||
| Basso Industry Corp. | 17,000 | 23,572 | ||||||
| BenQ Materials Corp. | 17,000 | 17,671 | ||||||
| BES Engineering Corp. | 164,000 | 50,253 | ||||||
| Bin Chuan Enterprise Co. Ltd. | 2,000 | 1,808 | ||||||
| Bora Pharmaceuticals Co. Ltd. | 3,301 | 36,688 | ||||||
| Brighton-Best International Taiwan, Inc. | 31,000 | 34,914 | ||||||
| C Sun Manufacturing Ltd. | 7,354 | 11,321 | ||||||
| Capital Securities Corp. | 136,000 | 53,100 | ||||||
Career Technology MFG. Co. Ltd.(1) | 52,020 | 44,877 | ||||||
Catcher Technology Co. Ltd.(1) | 54,000 | 327,337 | ||||||
| Cathay Financial Holding Co. Ltd. | 305,000 | 443,722 | ||||||
| Cayman Engley Industrial Co. Ltd. | 2,000 | 4,939 | ||||||
| Central Reinsurance Co. Ltd. | 21,000 | 14,673 | ||||||
| Century Iron & Steel Industrial Co. Ltd. | 7,000 | 19,967 | ||||||
| Chailease Holding Co. Ltd. | 15,146 | 97,248 | ||||||
ChainQui Construction Development Co. Ltd.(1) | 2,200 | 1,129 | ||||||
| Champion Building Materials Co. Ltd. | 25,000 | 7,695 | ||||||
| Champion Microelectronic Corp. | 4,000 | 6,616 | ||||||
| Chang Hwa Commercial Bank Ltd. | 281,236 | 162,445 | ||||||
| Chang Wah Electromaterials, Inc. | 39,000 | 44,313 | ||||||
| Chang Wah Technology Co. Ltd. | 2,500 | 2,977 | ||||||
| Channel Well Technology Co. Ltd. | 2,000 | 2,009 | ||||||
| Charoen Pokphand Enterprise | 12,100 | 31,970 | ||||||
| CHC Healthcare Group | 9,000 | 13,703 | ||||||
Chen Full International Co. Ltd.(1) | 4,000 | 5,109 | ||||||
| Cheng Loong Corp. | 55,000 | 50,954 | ||||||
Cheng Mei Materials Technology Corp.(1) | 48,000 | 16,923 | ||||||
| Cheng Shin Rubber Industry Co. Ltd. | 141,000 | 163,341 | ||||||
| Cheng Uei Precision Industry Co. Ltd. | 21,000 | 25,606 | ||||||
| Chia Chang Co. Ltd. | 5,000 | 6,160 | ||||||
| Chia Hsin Cement Corp. | 2,000 | 1,188 | ||||||
| Chicony Electronics Co. Ltd. | 28,000 | 74,752 | ||||||
| Chicony Power Technology Co. Ltd. | 4,000 | 9,291 | ||||||
| Chin-Poon Industrial Co. Ltd. | 44,000 | 44,826 | ||||||
China Airlines Ltd.(2) | 216,000 | 159,781 | ||||||
| China Bills Finance Corp. | 46,000 | 24,511 | ||||||
| China Chemical & Pharmaceutical Co. Ltd. | 29,000 | 21,740 | ||||||
| China Development Financial Holding Corp., Preference Shares | 80,081 | 22,289 | ||||||
| China Development Financial Holding Corp. | 676,760 | 295,672 | ||||||
| China Electric Manufacturing Corp. | 28,000 | 15,767 | ||||||
| China General Plastics Corp. | 26,805�� | 20,716 | ||||||
| China Man-Made Fiber Corp. | 82,000 | 22,008 | ||||||
59
| Avantis Emerging Markets Equity Fund | ||||||||
| Shares | Value | |||||||
| China Metal Products | 1,000 | $ | 975 | |||||
| China Motor Corp. | 17,000 | 25,864 | ||||||
| China Petrochemical Development Corp. | 262,690 | 87,967 | ||||||
| China Steel Chemical Corp. | 8,000 | 30,608 | ||||||
| China Steel Corp. | 418,000 | 395,874 | ||||||
| China Wire & Cable Co. Ltd. | 22,000 | 19,007 | ||||||
| Chinese Maritime Transport Ltd. | 7,000 | 8,845 | ||||||
| Ching Feng Home Fashions Co. Ltd. | 1,000 | 605 | ||||||
Chipbond Technology Corp.(2) | 74,000 | 138,114 | ||||||
| ChipMOS Technologies, Inc. | 76,000 | 88,561 | ||||||
| Chlitina Holding Ltd. | 4,000 | 22,550 | ||||||
| Chong Hong Construction Co. Ltd. | 2,000 | 4,870 | ||||||
| Chroma ATE, Inc. | 21,000 | 128,867 | ||||||
| Chun Yuan Steel Industry Co. Ltd. | 32,000 | 17,444 | ||||||
| Chung Hwa Chemical Industrial Works Ltd. | 6,000 | 6,412 | ||||||
| Chung Hwa Pulp Corp. | 19,000 | 11,373 | ||||||
| Chung-Hsin Electric & Machinery Manufacturing Corp. | 58,000 | 125,332 | ||||||
| Chunghwa Precision Test Tech Co. Ltd. | 2,000 | 30,126 | ||||||
| Chunghwa Telecom Co. Ltd., ADR | 9,721 | 386,118 | ||||||
| Cleanaway Co. Ltd. | 6,000 | 34,773 | ||||||
| Clevo Co. | 25,000 | 28,265 | ||||||
CMC Magnetics Corp.(1) | 62,000 | 16,255 | ||||||
| Co-Tech Development Corp. | 17,000 | 23,818 | ||||||
| Compal Electronics, Inc. | 306,000 | 227,837 | ||||||
| Compeq Manufacturing Co. Ltd. | 107,000 | 183,485 | ||||||
| Concord International Securities Co. Ltd. | 13,780 | 5,228 | ||||||
| Concord Securities Co. Ltd. | 40,028 | 14,263 | ||||||
| Concraft Holding Co. Ltd. | 3,000 | 1,511 | ||||||
| Continental Holdings Corp. | 56,000 | 54,871 | ||||||
| Contrel Technology Co. Ltd. | 13,000 | 6,723 | ||||||
| Coretronic Corp. | 21,000 | 43,064 | ||||||
| CTBC Financial Holding Co. Ltd. | 749,000 | 573,701 | ||||||
| CTCI Corp. | 62,000 | 91,456 | ||||||
| CviLux Corp. | 4,000 | 5,091 | ||||||
CyberTAN Technology, Inc.(2) | 25,000 | 24,323 | ||||||
| DA CIN Construction Co. Ltd. | 25,000 | 25,220 | ||||||
| Darfon Electronics Corp. | 12,000 | 16,194 | ||||||
Darwin Precisions Corp.(1) | 23,000 | 7,726 | ||||||
| Daxin Materials Corp. | 6,000 | 14,390 | ||||||
| Delta Electronics, Inc. | 17,000 | 145,548 | ||||||
| Depo Auto Parts Ind Co. Ltd. | 15,000 | 40,694 | ||||||
| Dimerco Express Corp. | 17,240 | 45,413 | ||||||
| DONPON PRECISION, Inc. | 10,000 | 6,931 | ||||||
| Dr Wu Skincare Co. Ltd. | 3,000 | 9,504 | ||||||
| Dyaco International, Inc. | 1,000 | 1,423 | ||||||
| Dynamic Holding Co. Ltd. | 27,274 | 18,056 | ||||||
| Dynapack International Technology Corp. | 9,000 | 23,449 | ||||||
| E Ink Holdings, Inc. | 5,000 | 38,879 | ||||||
| E-LIFE MALL Corp. | 1,000 | 2,742 | ||||||
| E.Sun Financial Holding Co. Ltd. | 225,300 | 207,593 | ||||||
| Eastern Media International Corp. | 12,825 | 10,202 | ||||||
60
| Avantis Emerging Markets Equity Fund | ||||||||
| Shares | Value | |||||||
| Eclat Textile Co. Ltd. | 1,000 | $ | 14,483 | |||||
| eGalax_eMPIA Technology, Inc. | 2,142 | 4,431 | ||||||
| Egis Technology, Inc. | 2,000 | 5,267 | ||||||
| Elan Microelectronics Corp. | 28,000 | 88,552 | ||||||
| Elite Advanced Laser Corp. | 8,000 | 12,050 | ||||||
| Elite Material Co. Ltd. | 17,000 | 89,482 | ||||||
| Elite Semiconductor Microelectronics Technology, Inc. | 18,000 | 46,309 | ||||||
| Elitegroup Computer Systems Co. Ltd. | 35,000 | 29,967 | ||||||
| eMemory Technology, Inc. | 2,000 | 89,449 | ||||||
| ENE Technology, Inc. | 5,000 | 5,276 | ||||||
| ENNOSTAR, Inc. | 59,325 | 99,656 | ||||||
| Eson Precision Ind Co. Ltd. | 1,000 | 2,053 | ||||||
| Eternal Materials Co. Ltd. | 18,000 | 19,960 | ||||||
Eva Airways Corp.(2) | 202,000 | 221,063 | ||||||
| Evergreen International Storage & Transport Corp. | 36,000 | 34,978 | ||||||
| Evergreen Marine Corp. Taiwan Ltd. | 122,000 | 349,617 | ||||||
| EVERGREEN Steel Corp. | 15,000 | 30,168 | ||||||
| Everlight Chemical Industrial Corp. | 26,000 | 17,917 | ||||||
| Everlight Electronics Co. Ltd. | 54,000 | 69,378 | ||||||
| Excellence Opto, Inc. | 2,000 | 1,622 | ||||||
| Excelliance Mos Corp. | 2,000 | 8,425 | ||||||
| Excelsior Medical Co. Ltd. | 12,600 | 28,010 | ||||||
| Far Eastern Department Stores Ltd. | 15,000 | 9,972 | ||||||
| Far Eastern International Bank | 189,883 | 76,423 | ||||||
| Far Eastern New Century Corp. | 239,000 | 256,103 | ||||||
| Far EasTone Telecommunications Co. Ltd. | 112,000 | 274,686 | ||||||
Faraday Technology Corp.(2) | 14,000 | 84,529 | ||||||
| Farglory F T Z Investment Holding Co. Ltd. | 12,000 | 20,525 | ||||||
| Farglory Land Development Co. Ltd. | 27,000 | 56,444 | ||||||
Federal Corp.(1) | 9,000 | 6,315 | ||||||
| Feedback Technology Corp. | 3,000 | 8,196 | ||||||
| Feng Hsin Steel Co. Ltd. | 12,000 | 26,287 | ||||||
| Feng TAY Enterprise Co. Ltd. | 1,200 | 6,732 | ||||||
| Firich Enterprises Co. Ltd. | 9,630 | 10,891 | ||||||
| First Financial Holding Co. Ltd. | 496,138 | 430,439 | ||||||
First Steamship Co. Ltd.(1) | 79,350 | 24,937 | ||||||
| FIT Holding Co. Ltd. | 9,000 | 8,452 | ||||||
| Fitipower Integrated Technology, Inc. | 5,451 | 22,528 | ||||||
| Fittech Co. Ltd. | 5,000 | 20,058 | ||||||
FLEXium Interconnect, Inc.(1) | 40,000 | 122,224 | ||||||
| Flytech Technology Co. Ltd. | 11,000 | 30,654 | ||||||
FocalTech Systems Co. Ltd.(2) | 8,900 | 22,234 | ||||||
| Forcecon Tech Co. Ltd. | 3,559 | 7,207 | ||||||
| Formosa Advanced Technologies Co. Ltd. | 5,000 | 6,337 | ||||||
| Formosa Chemicals & Fibre Corp. | 137,000 | 307,784 | ||||||
| Formosa International Hotels Corp. | 4,000 | 22,730 | ||||||
| Formosa Laboratories, Inc. | 4,000 | 7,836 | ||||||
| Formosa Optical Technology Co. Ltd. | 1,000 | 1,936 | ||||||
| Formosa Petrochemical Corp. | 10,000 | 27,411 | ||||||
| Formosa Plastics Corp. | 161,000 | 480,037 | ||||||
| Formosa Sumco Technology Corp. | 2,000 | 11,838 | ||||||
61
| Avantis Emerging Markets Equity Fund | ||||||||
| Shares | Value | |||||||
| Formosa Taffeta Co. Ltd. | 63,000 | $ | 56,940 | |||||
| Formosan Rubber Group, Inc. | 13,000 | 9,427 | ||||||
| Formosan Union Chemical | 30,000 | 24,269 | ||||||
| Founding Construction & Development Co. Ltd. | 2,000 | 1,252 | ||||||
| Foxconn Technology Co. Ltd. | 62,000 | 102,505 | ||||||
| Foxsemicon Integrated Technology, Inc. | 5,000 | 33,335 | ||||||
| Franbo Lines Corp. | 12,966 | 8,367 | ||||||
| FSP Technology, Inc. | 5,000 | 6,467 | ||||||
| Fubon Financial Holding Co. Ltd. | 274,364 | 514,446 | ||||||
| Fulgent Sun International Holding Co. Ltd. | 3,042 | 18,822 | ||||||
| Full Wang International Development Co. Ltd. | 2,000 | 813 | ||||||
| Fulltech Fiber Glass Corp. | 14,419 | 6,781 | ||||||
| Fusheng Precision Co. Ltd. | 2,000 | 12,924 | ||||||
| G Shank Enterprise Co. Ltd. | 9,000 | 17,375 | ||||||
| Gallant Precision Machining Co. Ltd. | 7,000 | 6,202 | ||||||
| Gamania Digital Entertainment Co. Ltd. | 16,000 | 31,754 | ||||||
| GEM Services, Inc. | 3,000 | 7,621 | ||||||
| Gemtek Technology Corp. | 45,000 | 46,587 | ||||||
| General Interface Solution Holding Ltd. | 30,000 | 78,855 | ||||||
| Generalplus Technology, Inc. | 4,000 | 7,468 | ||||||
| GeneReach Biotechnology Corp. | 4,000 | 11,948 | ||||||
| Genius Electronic Optical Co. Ltd. | 4,000 | 58,274 | ||||||
| Getac Holdings Corp. | 12,000 | 18,677 | ||||||
| Giant Manufacturing Co. Ltd. | 6,000 | 46,868 | ||||||
| Gigabyte Technology Co. Ltd. | 24,000 | 66,939 | ||||||
| Global Brands Manufacture Ltd. | 23,200 | 22,019 | ||||||
| Global Lighting Technologies, Inc. | 5,000 | 9,652 | ||||||
| Global Mixed Mode Technology, Inc. | 4,000 | 19,433 | ||||||
| Global PMX Co. Ltd. | 4,000 | 20,550 | ||||||
| Global Unichip Corp. | 5,000 | 87,666 | ||||||
| Globalwafers Co. Ltd. | 8,000 | 126,567 | ||||||
Globe Union Industrial Corp.(1) | 2,000 | 835 | ||||||
| Gloria Material Technology Corp. | 30,000 | 27,870 | ||||||
| Gold Circuit Electronics Ltd. | 29,000 | 78,862 | ||||||
| Goldsun Building Materials Co. Ltd. | 80,990 | 67,157 | ||||||
| Gourmet Master Co. Ltd. | 3,000 | 9,948 | ||||||
| Grand Fortune Securities Co. Ltd. | 9,391 | 4,877 | ||||||
| Grand Pacific Petrochemical | 76,000 | 46,676 | ||||||
| Grand Process Technology Corp. | 1,000 | 9,319 | ||||||
| Grape King Bio Ltd. | 6,000 | 29,298 | ||||||
| Great Tree Pharmacy Co. Ltd. | 3,260 | 32,947 | ||||||
| Great Wall Enterprise Co. Ltd. | 17,304 | 27,916 | ||||||
| Greatek Electronics, Inc. | 33,000 | 63,986 | ||||||
| Group Up Industrial Co. Ltd. | 3,000 | 8,905 | ||||||
| GTM Holdings Corp. | 2,000 | 1,650 | ||||||
| Hai Kwang Enterprise Corp. | 12,000 | 8,707 | ||||||
| Hannstar Board Corp. | 40,301 | 43,084 | ||||||
| HannStar Display Corp. | 163,000 | 63,374 | ||||||
| HannsTouch Solution, Inc. | 53,000 | 18,936 | ||||||
| Harmony Electronics Corp. | 5,000 | 6,113 | ||||||
| Harvatek Corp. | 11,000 | 7,128 | ||||||
62
| Avantis Emerging Markets Equity Fund | ||||||||
| Shares | Value | |||||||
| Heran Co. Ltd. | 2,000 | $ | 7,307 | |||||
| Highlight Tech Corp. | 7,000 | 12,594 | ||||||
| Highwealth Construction Corp. | 1,100 | 1,744 | ||||||
| Hiroca Holdings Ltd. | 4,000 | 7,305 | ||||||
| Hitron Technology, Inc. | 3,000 | 2,866 | ||||||
| Hiwin Technologies Corp. | 18,675 | 126,048 | ||||||
| Ho Tung Chemical Corp. | 81,000 | 24,812 | ||||||
| Hocheng Corp. | 27,000 | 9,697 | ||||||
| Hold-Key Electric Wire & Cable Co. Ltd. | 7,200 | 3,074 | ||||||
| Holiday Entertainment Co. Ltd. | 1,000 | 1,798 | ||||||
| Holtek Semiconductor, Inc. | 13,000 | 31,403 | ||||||
| Holy Stone Enterprise Co. Ltd. | 10,000 | 29,193 | ||||||
| Hon Hai Precision Industry Co. Ltd. | 519,000 | 1,848,044 | ||||||
Hong Pu Real Estate Development Co. Ltd.(1) | 2,000 | 1,516 | ||||||
| Hong TAI Electric Industrial | 19,000 | 10,520 | ||||||
| Hong YI Fiber Industry Co. | 2,000 | 1,238 | ||||||
| Horizon Securities Co. Ltd. | 19,080 | 7,100 | ||||||
| Hota Industrial Manufacturing Co. Ltd. | 2,147 | 6,158 | ||||||
| Hotai Finance Co. Ltd. | 18,000 | 61,715 | ||||||
| Hotai Motor Co. Ltd. | 9,000 | 180,339 | ||||||
| Hsing TA Cement Co. | 2,000 | 1,173 | ||||||
HTC Corp.(1) | 9,000 | 18,149 | ||||||
| Hu Lane Associate, Inc. | 4,025 | 21,762 | ||||||
| Hua Nan Financial Holdings Co. Ltd. | 371,572 | 282,028 | ||||||
| Huaku Development Co. Ltd. | 9,000 | 27,404 | ||||||
| Huang Hsiang Construction Corp. | 14,000 | 21,053 | ||||||
| Hung Ching Development & Construction Co. Ltd. | 2,000 | 1,454 | ||||||
| Hung Sheng Construction Ltd. | 16,920 | 14,334 | ||||||
| Hycon Technology Corp. | 2,100 | 4,918 | ||||||
| I-Sheng Electric Wire & Cable Co. Ltd. | 1,000 | 1,392 | ||||||
| IBF Financial Holdings Co. Ltd. | 162,839 | 71,275 | ||||||
| Ichia Technologies, Inc. | 16,000 | 8,077 | ||||||
| IEI Integration Corp. | 3,000 | 7,360 | ||||||
| Infortrend Technology, Inc. | 23,000 | 12,404 | ||||||
| Innolux Corp. | 780,000 | 307,236 | ||||||
| Inpaq Technology Co. Ltd. | 5,000 | 8,753 | ||||||
Integrated Service Technology, Inc.(1) | 5,000 | 11,035 | ||||||
| International CSRC Investment Holdings Co. | 60,000 | 40,877 | ||||||
| International Games System Co. Ltd. | 14,000 | 170,700 | ||||||
| Inventec Corp. | 157,000 | 118,860 | ||||||
| ITE Technology, Inc. | 18,000 | 41,155 | ||||||
| ITEQ Corp. | 15,000 | 33,210 | ||||||
| Jarllytec Co. Ltd. | 3,000 | 6,610 | ||||||
| Jess-Link Products Co. Ltd. | 10,000 | 12,874 | ||||||
| Jih Lin Technology Co. Ltd. | 2,000 | 5,568 | ||||||
| Jinan Acetate Chemical Co. Ltd. | 6,000 | 25,018 | ||||||
Joinsoon Electronics Manufacturing Co. Ltd.(1) | 10,000 | 7,628 | ||||||
| K Laser Technology, Inc. | 2,000 | 1,237 | ||||||
| Kaimei Electronic Corp. | 3,000 | 5,688 | ||||||
| Kaori Heat Treatment Co. Ltd. | 8,000 | 29,749 | ||||||
| KEE TAI Properties Co. Ltd. | 42,000 | 19,912 | ||||||
63
| Avantis Emerging Markets Equity Fund | ||||||||
| Shares | Value | |||||||
| Kenda Rubber Industrial Co. Ltd. | 17,040 | $ | 19,440 | |||||
Kenmec Mechanical Engineering Co. Ltd.(1) | 27,000 | 29,418 | ||||||
| Kerry TJ Logistics Co. Ltd. | 23,000 | 30,865 | ||||||
| Kindom Development Co. Ltd. | 26,400 | 24,439 | ||||||
| King Yuan Electronics Co. Ltd. | 118,000 | 143,740 | ||||||
| King's Town Bank Co. Ltd. | 77,000 | 88,820 | ||||||
| Kinik Co. | 12,000 | 61,888 | ||||||
| Kinpo Electronics | 53,000 | 23,331 | ||||||
Kinsus Interconnect Technology Corp.(2) | 17,000 | 67,526 | ||||||
| KMC Kuei Meng International, Inc. | 2,000 | 10,706 | ||||||
| KNH Enterprise Co. Ltd. | 4,000 | 2,487 | ||||||
| KS Terminals, Inc. | 1,000 | 2,723 | ||||||
| Kung Long Batteries Industrial Co. Ltd. | 2,000 | 9,245 | ||||||
| Kung Sing Engineering Corp. | 4,400 | 1,010 | ||||||
| Kuo Toong International Co. Ltd. | 13,000 | 9,914 | ||||||
| Kuo Yang Construction Co. Ltd. | 4,545 | 2,935 | ||||||
| L&K Engineering Co. Ltd. | 5,000 | 5,309 | ||||||
| LandMark Optoelectronics Corp. | 6,000 | 34,653 | ||||||
| Lanner Electronics, Inc. | 3,000 | 6,776 | ||||||
| Largan Precision Co. Ltd. | 5,000 | 318,051 | ||||||
Leadtek Research, Inc.(1) | 4,000 | 4,963 | ||||||
| Lealea Enterprise Co. Ltd. | 23,000 | 8,638 | ||||||
| Lelon Electronics Corp. | 2,000 | 3,812 | ||||||
| Lemtech Holdings Co. Ltd. | 2,299 | 7,563 | ||||||
Li Peng Enterprise Co. Ltd.(1) | 34,000 | 10,280 | ||||||
| Lian HWA Food Corp. | 4,884 | 12,059 | ||||||
| Lien Hwa Industrial Holdings Corp. | 1,339 | 2,497 | ||||||
| Lingsen Precision Industries Ltd. | 32,000 | 16,624 | ||||||
| Lite-On Technology Corp. | 55,000 | 118,362 | ||||||
| Long Da Construction & Development Corp. | 2,000 | 1,429 | ||||||
| Longchen Paper & Packaging Co. Ltd. | 27,591 | 14,909 | ||||||
| Lotes Co. Ltd. | 4,038 | 95,733 | ||||||
Lotus Pharmaceutical Co. Ltd.(1) | 9,000 | 50,949 | ||||||
| Lucky Cement Corp. | 9,000 | 3,211 | ||||||
| Lumax International Corp. Ltd. | 1,000 | 2,273 | ||||||
| Lung Yen Life Service Corp. | 23,000 | 31,517 | ||||||
| Macauto Industrial Co. Ltd. | 2,000 | 4,424 | ||||||
| Machvision, Inc. | 2,000 | 10,025 | ||||||
| Macroblock, Inc. | 3,000 | 11,527 | ||||||
Macronix International Co. Ltd.(2) | 175,000 | 187,839 | ||||||
| MacroWell OMG Digital Entertainment Co. Ltd. | 3,000 | 9,362 | ||||||
| Makalot Industrial Co. Ltd. | 10,000 | 58,758 | ||||||
| Marketech International Corp. | 6,000 | 24,227 | ||||||
| Materials Analysis Technology, Inc. | 3,000 | 12,118 | ||||||
| MediaTek, Inc. | 19,000 | 411,098 | ||||||
| Mega Financial Holding Co. Ltd. | 172,200 | 201,978 | ||||||
| Megaforce Co. Ltd. | 9,000 | 6,428 | ||||||
| Meiloon Industrial Co. | 2,000 | 1,372 | ||||||
| Mercuries & Associates Holding Ltd. | 10,400 | 6,180 | ||||||
Mercuries Life Insurance Co. Ltd.(1) | 159,052 | 37,103 | ||||||
| Merry Electronics Co. Ltd. | 3,000 | 8,286 | ||||||
64
| Avantis Emerging Markets Equity Fund | ||||||||
| Shares | Value | |||||||
| Micro-Star International Co. Ltd. | 17,000 | $ | 63,642 | |||||
| MIN AIK Technology Co. Ltd. | 12,000 | 7,788 | ||||||
| Mitac Holdings Corp. | 57,840 | 53,177 | ||||||
Mobiletron Electronics Co. Ltd.(1) | 1,000 | 2,043 | ||||||
| momo.com, Inc. | 1,560 | 36,991 | ||||||
| MOSA Industrial Corp. | 8,000 | 7,988 | ||||||
| Mosel Vitelic, Inc. | 18,000 | 24,105 | ||||||
| MPI Corp. | 4,000 | 12,664 | ||||||
| Namchow Holdings Co. Ltd. | 5,000 | 7,524 | ||||||
| Nan Liu Enterprise Co. Ltd. | 1,000 | 2,813 | ||||||
| Nan Pao Resins Chemical Co. Ltd. | 1,000 | 4,635 | ||||||
| Nan Ren Lake Leisure Amusement Co. Ltd. | 2,000 | 805 | ||||||
| Nan Ya Plastics Corp. | 176,000 | 395,331 | ||||||
| Nan Ya Printed Circuit Board Corp. | 8,000 | 69,794 | ||||||
| Nantex Industry Co. Ltd. | 11,000 | 15,370 | ||||||
| Nanya Technology Corp. | 79,000 | 137,206 | ||||||
| Nichidenbo Corp. | 7,000 | 11,880 | ||||||
| Nien Made Enterprise Co. Ltd. | 5,000 | 46,174 | ||||||
| Niko Semiconductor Co. Ltd. | 4,000 | 8,415 | ||||||
| Nishoku Technology, Inc. | 2,000 | 5,729 | ||||||
| Novatek Microelectronics Corp. | 26,000 | 222,438 | ||||||
Nuvoton Technology Corp.(2) | 14,000 | 56,829 | ||||||
| Nyquest Technology Co. Ltd. | 2,000 | 5,287 | ||||||
| O-Bank Co. Ltd. | 102,000 | 28,949 | ||||||
| O-TA Precision Industry Co. Ltd. | 10,000 | 40,564 | ||||||
| Ocean Plastics Co. Ltd. | 9,000 | 10,923 | ||||||
| Orient Semiconductor Electronics Ltd. | 52,000 | 31,452 | ||||||
| Oriental Union Chemical Corp. | 36,000 | 21,528 | ||||||
| P-Two Industries, Inc. | 5,000 | 4,890 | ||||||
| Pacific Hospital Supply Co. Ltd. | 3,000 | 6,767 | ||||||
| PADAUK Technology Co. Ltd. | 2,420 | 7,622 | ||||||
| Pan Jit International, Inc. | 16,000 | 36,256 | ||||||
| Pan-International Industrial Corp. | 21,000 | 23,674 | ||||||
| Parade Technologies Ltd. | 1,000 | 27,994 | ||||||
| Pegatron Corp. | 141,000 | 293,255 | ||||||
| Pegavision Corp. | 2,000 | 27,675 | ||||||
| PharmaEngine, Inc. | 8,000 | 33,574 | ||||||
| Phison Electronics Corp. | 1,000 | 10,165 | ||||||
| Phoenix Silicon International Corp. | 20,319 | 46,287 | ||||||
| Pixart Imaging, Inc. | 17,000 | 52,410 | ||||||
| Plotech Co. Ltd. | 1,800 | 1,391 | ||||||
| Pou Chen Corp. | 151,000 | 143,041 | ||||||
Power Wind Health Industry, Inc.(1) | 1,050 | 4,257 | ||||||
| Powerchip Semiconductor Manufacturing Corp. | 158,000 | 177,172 | ||||||
| Powertech Technology, Inc. | 61,000 | 170,216 | ||||||
| Powertip Technology Corp. | 14,000 | 6,957 | ||||||
| Poya International Co. Ltd. | 3,060 | 42,796 | ||||||
| President Chain Store Corp. | 33,000 | 289,990 | ||||||
| President Securities Corp. | 59,451 | 32,581 | ||||||
| Prince Housing & Development Corp. | 60,000 | 23,542 | ||||||
| Promate Electronic Co. Ltd. | 9,000 | 11,519 | ||||||
65
| Avantis Emerging Markets Equity Fund | ||||||||
| Shares | Value | |||||||
| Prosperity Dielectrics Co. Ltd. | 3,000 | $ | 4,060 | |||||
| Qisda Corp. | 59,000 | 56,497 | ||||||
| Qualipoly Chemical Corp. | 4,000 | 4,867 | ||||||
| Quang Viet Enterprise Co. Ltd. | 1,000 | 4,298 | ||||||
| Quanta Computer, Inc. | 63,000 | 163,322 | ||||||
| Quanta Storage, Inc. | 19,000 | 27,502 | ||||||
| Radiant Opto-Electronics Corp. | 34,000 | 111,728 | ||||||
| Radium Life Tech Co. Ltd. | 21,000 | 6,656 | ||||||
| Raydium Semiconductor Corp. | 7,000 | 62,983 | ||||||
| Realtek Semiconductor Corp. | 22,000 | 247,207 | ||||||
| Rechi Precision Co. Ltd. | 12,000 | 7,586 | ||||||
| Rexon Industrial Corp. Ltd. | 4,000 | 4,485 | ||||||
| Rich Development Co. Ltd. | 21,000 | 6,315 | ||||||
| RiTdisplay Corp. | 4,000 | 5,359 | ||||||
Ritek Corp.(1) | 16,000 | 4,441 | ||||||
Roo Hsing Co. Ltd.(1) | 3,000 | 288 | ||||||
| Ruentex Development Co. Ltd. | 55,800 | 115,062 | ||||||
| Ruentex Engineering & Construction Co. | 5,480 | 16,224 | ||||||
| Ruentex Industries Ltd. | 24,400 | 51,972 | ||||||
Ruentex Materials Co. Ltd.(1) | 1,000 | 663 | ||||||
| Sampo Corp. | 9,000 | 8,331 | ||||||
| San Fang Chemical Industry Co. Ltd. | 2,000 | 1,400 | ||||||
| San Far Property Ltd. | 2,316 | 988 | ||||||
| San Shing Fastech Corp. | 3,000 | 5,226 | ||||||
| Sanyang Motor Co. Ltd. | 39,000 | 46,425 | ||||||
SCI Pharmtech, Inc.(1) | 1,200 | 3,449 | ||||||
| Scientech Corp. | 5,000 | 13,695 | ||||||
| SDI Corp. | 1,000 | 3,855 | ||||||
| Sensortek Technology Corp. | 1,000 | 9,953 | ||||||
| Sesoda Corp. | 17,000 | 26,737 | ||||||
| Shan-Loong Transportation Co. Ltd. | 2,000 | 2,276 | ||||||
| Shanghai Commercial & Savings Bank Ltd. | 191,000 | 310,892 | ||||||
| Sheng Yu Steel Co. Ltd. | 2,000 | 1,679 | ||||||
| ShenMao Technology, Inc. | 2,000 | 3,368 | ||||||
| Shih Her Technologies, Inc. | 6,000 | 11,479 | ||||||
| Shih Wei Navigation Co. Ltd. | 15,000 | 13,788 | ||||||
| Shin Foong Specialty & Applied Materials Co. Ltd. | 3,000 | 6,855 | ||||||
| Shin Kong Financial Holding Co. Ltd. | 859,852 | 247,019 | ||||||
| Shin Zu Shing Co. Ltd. | 22,123 | 63,712 | ||||||
Shining Building Business Co. Ltd.(1) | 22,000 | 6,672 | ||||||
| Shinkong Insurance Co. Ltd. | 29,000 | 54,887 | ||||||
| Shinkong Synthetic Fibers Corp. | 67,000 | 39,678 | ||||||
| Shiny Chemical Industrial Co. Ltd. | 7,777 | 34,078 | ||||||
| ShunSin Technology Holding Ltd. | 2,000 | 5,522 | ||||||
Shuttle, Inc.(1) | 27,000 | 13,974 | ||||||
| Sigurd Microelectronics Corp. | 49,000 | 81,698 | ||||||
| Silergy Corp. | 4,000 | 68,574 | ||||||
Silicon Integrated Systems Corp.(2) | 47,960 | 31,445 | ||||||
| Simplo Technology Co. Ltd. | 16,000 | 150,974 | ||||||
| Sincere Navigation Corp. | 30,000 | 20,945 | ||||||
| Singatron Enterprise Co. Ltd. | 8,000 | 6,289 | ||||||
66
| Avantis Emerging Markets Equity Fund | ||||||||
| Shares | Value | |||||||
| Sino-American Silicon Products, Inc. | 16,000 | $ | 87,229 | |||||
| Sinon Corp. | 39,000 | 57,851 | ||||||
| SinoPac Financial Holdings Co. Ltd. | 569,640 | 322,936 | ||||||
| Sinyi Realty, Inc. | 6,000 | 6,112 | ||||||
| Sirtec International Co. Ltd. | 1,000 | 728 | ||||||
| Sitronix Technology Corp. | 16,000 | 98,926 | ||||||
| Siward Crystal Technology Co. Ltd. | 26,000 | 35,122 | ||||||
| Soft-World International Corp. | 2,000 | 5,063 | ||||||
| Solar Applied Materials Technology Corp. | 12,547 | 15,879 | ||||||
| Solomon Technology Corp. | 9,000 | 8,074 | ||||||
| Solteam, Inc. | 5,000 | 10,169 | ||||||
| Sonix Technology Co. Ltd. | 12,000 | 23,261 | ||||||
| Speed Tech Corp. | 7,000 | 13,343 | ||||||
| Sporton International, Inc. | 5,050 | 38,016 | ||||||
| Sports Gear Co. Ltd. | 9,000 | 25,157 | ||||||
| St Shine Optical Co. Ltd. | 5,000 | 43,889 | ||||||
| Standard Foods Corp. | 20,000 | 26,912 | ||||||
| Stark Technology, Inc. | 3,000 | 8,298 | ||||||
| Sunjuice Holdings Co. Ltd. | 1,000 | 7,459 | ||||||
| Sunny Friend Environmental Technology Co. Ltd. | 2,000 | 11,905 | ||||||
| Sunonwealth Electric Machine Industry Co. Ltd. | 1,000 | 1,372 | ||||||
| Sunrex Technology Corp. | 5,000 | 6,304 | ||||||
| Superior Plating Technology Co. Ltd. | 3,000 | 5,367 | ||||||
| Supreme Electronics Co. Ltd. | 7,739 | 9,522 | ||||||
| Sweeten Real Estate Development Co. Ltd. | 2,160 | 1,695 | ||||||
| Symtek Automation Asia Co. Ltd. | 8,000 | 23,699 | ||||||
| Syncmold Enterprise Corp. | 6,000 | 13,359 | ||||||
| Synnex Technology International Corp. | 23,000 | 41,924 | ||||||
| Systex Corp. | 4,000 | 9,601 | ||||||
| T3EX Global Holdings Corp. | 18,121 | 46,453 | ||||||
| TA Chen Stainless Pipe | 107,808 | 138,980 | ||||||
| TA-I Technology Co. Ltd. | 3,000 | 4,448 | ||||||
| Tah Hsin Industrial Corp. | 2,145 | 4,998 | ||||||
Tai Tung Communication Co. Ltd.(1) | 12,000 | 6,370 | ||||||
| Tai-Saw Technology Co. Ltd. | 20,000 | 23,381 | ||||||
| Taichung Commercial Bank Co. Ltd. | 310,314 | 138,553 | ||||||
| TaiDoc Technology Corp. | 9,000 | 65,731 | ||||||
| Taiflex Scientific Co. Ltd. | 4,000 | 5,357 | ||||||
Taigen Biopharmaceuticals Holdings Ltd.(1) | 21,000 | 13,015 | ||||||
| Taimide Tech, Inc. | 10,000 | 12,902 | ||||||
| Tainan Spinning Co. Ltd. | 33,000 | 20,334 | ||||||
| Taishin Financial Holding Co. Ltd. | 623,813 | 309,615 | ||||||
| Taisun Enterprise Co. Ltd. | 2,000 | 2,264 | ||||||
| Taita Chemical Co. Ltd. | 9,343 | 6,900 | ||||||
| Taitien Electronics Co. Ltd. | 5,000 | 6,375 | ||||||
| Taiwan Business Bank | 514,440 | 215,619 | ||||||
| Taiwan Cement Corp. | 106,858 | 137,557 | ||||||
| Taiwan Cogeneration Corp. | 19,000 | 23,161 | ||||||
| Taiwan Cooperative Financial Holding Co. Ltd. | 401,381 | 362,483 | ||||||
| Taiwan FamilyMart Co. Ltd. | 1,000 | 6,418 | ||||||
| Taiwan Fertilizer Co. Ltd. | 53,000 | 108,988 | ||||||
67
| Avantis Emerging Markets Equity Fund | ||||||||
| Shares | Value | |||||||
| Taiwan Fire & Marine Insurance Co. Ltd. | 2,000 | $ | 1,322 | |||||
| Taiwan FU Hsing Industrial Co. Ltd. | 4,000 | 5,542 | ||||||
| Taiwan Glass Industry Corp. | 103,000 | 59,112 | ||||||
| Taiwan High Speed Rail Corp. | 90,000 | 86,046 | ||||||
| Taiwan Hon Chuan Enterprise Co. Ltd. | 33,000 | 80,911 | ||||||
| Taiwan Hopax Chemicals Manufacturing Co. Ltd. | 2,000 | 2,849 | ||||||
Taiwan Land Development Corp.(1) | 21,000 | 1,849 | ||||||
| Taiwan Mobile Co. Ltd. | 44,000 | 143,820 | ||||||
| Taiwan Navigation Co. Ltd. | 37,000 | 32,743 | ||||||
| Taiwan Paiho Ltd. | 17,000 | 35,295 | ||||||
| Taiwan PCB Techvest Co. Ltd. | 38,000 | 47,701 | ||||||
| Taiwan Sakura Corp. | 4,000 | 8,447 | ||||||
| Taiwan Secom Co. Ltd. | 7,000 | 23,509 | ||||||
| Taiwan Semiconductor Co. Ltd. | 15,000 | 46,611 | ||||||
| Taiwan Semiconductor Manufacturing Co. Ltd., ADR | 86,672 | 7,224,111 | ||||||
| Taiwan Shin Kong Security Co. Ltd. | 1,010 | 1,333 | ||||||
| Taiwan Styrene Monomer | 2,000 | 959 | ||||||
| Taiwan Surface Mounting Technology Corp. | 24,000 | 79,984 | ||||||
Taiwan TEA Corp.(1) | 29,000 | 18,908 | ||||||
| Taiwan Union Technology Corp. | 9,000 | 16,894 | ||||||
| Taiwan-Asia Semiconductor Corp. | 38,000 | 48,499 | ||||||
| Taiyen Biotech Co. Ltd. | 6,000 | 6,485 | ||||||
Tatung Co. Ltd.(1) | 122,000 | 137,601 | ||||||
| TCI Co. Ltd. | 2,000 | 9,591 | ||||||
| Te Chang Construction Co. Ltd. | 1,000 | 984 | ||||||
| Teco Electric and Machinery Co. Ltd. | 121,000 | 117,044 | ||||||
| Tera Autotech Corp. | 1,081 | 679 | ||||||
| Test Research, Inc. | 13,000 | 25,405 | ||||||
| Test Rite International Co. Ltd. | 2,000 | 1,400 | ||||||
| Tex-Ray Industrial Co. Ltd. | 12,000 | 4,683 | ||||||
| Thinking Electronic Industrial Co. Ltd. | 9,000 | 42,050 | ||||||
| Thye Ming Industrial Co. Ltd. | 13,800 | 19,464 | ||||||
| Ton Yi Industrial Corp. | 112,000 | 74,308 | ||||||
Tong Hsing Electronic Industries Ltd.(1) | 7,000 | 48,529 | ||||||
| Tong Yang Industry Co. Ltd. | 45,000 | 80,216 | ||||||
| Tong-Tai Machine & Tool Co. Ltd. | 2,000 | 950 | ||||||
| Top Union Electronics Corp. | 8,552 | 7,853 | ||||||
| Topco Scientific Co. Ltd. | 20,000 | 106,820 | ||||||
| Topoint Technology Co. Ltd. | 7,000 | 6,693 | ||||||
| TPK Holding Co. Ltd. | 23,000 | 27,258 | ||||||
| Transcend Information, Inc. | 17,000 | 36,833 | ||||||
| Tripod Technology Corp. | 17,000 | 55,816 | ||||||
| Tsann Kuen Enterprise Co. Ltd. | 8,419 | 12,922 | ||||||
| TSC Auto ID Technology Co. Ltd. | 1,000 | 6,406 | ||||||
| TSRC Corp. | 59,000 | 54,295 | ||||||
| Ttet Union Corp. | 2,000 | 10,334 | ||||||
| TTY Biopharm Co. Ltd. | 10,000 | 24,889 | ||||||
| Tul Corp. | 3,000 | 6,023 | ||||||
| Tung Ho Steel Enterprise Corp. | 52,770 | 93,298 | ||||||
| TXC Corp. | 28,000 | 79,250 | ||||||
| TYC Brother Industrial Co. Ltd. | 31,000 | 31,010 | ||||||
68
| Avantis Emerging Markets Equity Fund | ||||||||
| Shares | Value | |||||||
| Tyntek Corp. | 3,000 | $ | 1,830 | |||||
| U-Ming Marine Transport Corp. | 27,000 | 33,580 | ||||||
| U-Tech Media Corp. | 13,000 | 6,875 | ||||||
| Ultra Chip, Inc. | 3,000 | 12,870 | ||||||
| Uni-President Enterprises Corp. | 193,000 | 417,085 | ||||||
Unimicron Technology Corp.(2) | 73,000 | 357,680 | ||||||
| Union Bank of Taiwan | 161,054 | 86,836 | ||||||
| Union Insurance Co. Ltd. | 2,100 | 1,111 | ||||||
| Unitech Computer Co. Ltd. | 10,000 | 10,507 | ||||||
Unitech Printed Circuit Board Corp.(1) | 12,000 | 9,070 | ||||||
| United Integrated Services Co. Ltd. | 20,000 | 103,571 | ||||||
United Microelectronics Corp.(1)(2) | 380,000 | 505,577 | ||||||
United Renewable Energy Co. Ltd.(1) | 76,285 | 57,452 | ||||||
| Univacco Technology, Inc. | 2,000 | 2,062 | ||||||
| Universal Cement Corp. | 15,000 | 11,038 | ||||||
| Universal Vision Biotechnology Co. Ltd. | 3,150 | 32,800 | ||||||
| Unizyx Holding Corp. | 30,000 | 27,318 | ||||||
| UPC Technology Corp. | 63,000 | 28,920 | ||||||
| Userjoy Technology Co. Ltd. | 4,000 | 9,333 | ||||||
| USI Corp. | 72,000 | 55,829 | ||||||
| Utechzone Co. Ltd. | 6,000 | 18,032 | ||||||
| Vanguard International Semiconductor Corp. | 46,000 | 111,206 | ||||||
| Ventec International Group Co. Ltd. | 2,000 | 4,836 | ||||||
| Visual Photonics Epitaxy Co. Ltd. | 9,000 | 22,274 | ||||||
| Voltronic Power Technology Corp. | 1,000 | 56,429 | ||||||
| Wafer Works Corp. | 8,000 | 13,574 | ||||||
| Wah Lee Industrial Corp. | 12,100 | 36,081 | ||||||
| Walsin Lihwa Corp. | 194,763 | 251,523 | ||||||
| Walsin Technology Corp. | 10,000 | 30,220 | ||||||
| Walton Advanced Engineering, Inc. | 12,000 | 5,273 | ||||||
| Wan Hai Lines Ltd. | 29,785 | 83,946 | ||||||
| WEI Chih Steel Industrial Co. Ltd. | 18,000 | 15,625 | ||||||
| Wei Chuan Foods Corp. | 9,000 | 5,998 | ||||||
| Weikeng Industrial Co. Ltd. | 36,000 | 31,699 | ||||||
| Well Shin Technology Co. Ltd. | 5,000 | 7,373 | ||||||
| Weltrend Semiconductor | 2,000 | 3,663 | ||||||
| Wholetech System Hitech Ltd. | 6,000 | 9,335 | ||||||
| Win Semiconductors Corp. | 13,000 | 75,508 | ||||||
| Winbond Electronics Corp. | 263,000 | 189,493 | ||||||
| Winstek Semiconductor Co. Ltd. | 9,000 | 14,572 | ||||||
| WinWay Technology Co. Ltd. | 2,000 | 26,138 | ||||||
| Wisdom Marine Lines Co. Ltd. | 52,047 | 98,080 | ||||||
Wistron Corp.(2) | 177,000 | 160,467 | ||||||
| Wistron Information Technology & Services Corp. | 2,000 | 5,778 | ||||||
| Wistron NeWeb Corp. | 25,000 | 69,328 | ||||||
| Wiwynn Corp. | 1,000 | 25,034 | ||||||
Wowprime Corp.(1) | 4,000 | 16,332 | ||||||
| WPG Holdings Ltd. | 46,000 | 77,360 | ||||||
| WT Microelectronics Co. Ltd. | 41,000 | 86,464 | ||||||
| WUS Printed Circuit Co. Ltd. | 10,800 | 9,894 | ||||||
Xander International Corp.(2) | 8,000 | 11,809 | ||||||
69
| Avantis Emerging Markets Equity Fund | ||||||||
| Shares | Value | |||||||
| XinTec, Inc. | 11,000 | $ | 47,093 | |||||
| Xxentria Technology Materials Corp. | 1,000 | 2,137 | ||||||
| Yageo Corp. | 19,801 | 211,776 | ||||||
| Yang Ming Marine Transport Corp. | 91,000 | 233,121 | ||||||
| YC INOX Co. Ltd. | 14,000 | 14,100 | ||||||
| YCC Parts Manufacturing Co. Ltd. | 1,000 | 1,455 | ||||||
| Yea Shin International Development Co. Ltd. | 5,443 | 3,983 | ||||||
| Yem Chio Co. Ltd. | 13,771 | 6,374 | ||||||
| Yeong Guan Energy Technology Group Co. Ltd. | 12,000 | 21,898 | ||||||
| YFY, Inc. | 82,000 | 66,333 | ||||||
| Yi Jinn Industrial Co. Ltd. | 7,000 | 4,188 | ||||||
| Yieh Phui Enterprise Co. Ltd. | 71,400 | 36,510 | ||||||
| Yonyu Plastics Co. Ltd. | 1,000 | 1,102 | ||||||
| Young Fast Optoelectronics Co. Ltd. | 4,000 | 3,944 | ||||||
| Youngtek Electronics Corp. | 9,000 | 19,184 | ||||||
| Yuanta Financial Holding Co. Ltd. | 491,928 | 326,539 | ||||||
| Yulon Finance Corp. | 21,131 | 111,730 | ||||||
| Yulon Motor Co. Ltd. | 43,357 | 58,417 | ||||||
| YungShin Global Holding Corp. | 1,000 | 1,356 | ||||||
| Zeng Hsing Industrial Co. Ltd. | 2,000 | 8,758 | ||||||
| Zenitron Corp. | 2,000 | 1,937 | ||||||
| Zero One Technology Co. Ltd. | 2,315 | 3,199 | ||||||
| Zhen Ding Technology Holding Ltd. | 44,000 | 163,292 | ||||||
| Zig Sheng Industrial Co. Ltd. | 22,000 | 7,776 | ||||||
Zinwell Corp.(1) | 18,000 | 10,488 | ||||||
| Zippy Technology Corp. | 11,000 | 14,868 | ||||||
| ZongTai Real Estate Development Co. Ltd. | 6,702 | 7,136 | ||||||
| 41,433,352 | ||||||||
| Thailand — 2.5% | ||||||||
| AAPICO Hitech PCL, NVDR | 10,890 | 7,527 | ||||||
| Advanced Info Service PCL, NVDR | 26,800 | 140,998 | ||||||
| Advanced Information Technology PCL, NVDR | 50,000 | 8,488 | ||||||
| AEON Thana Sinsap Thailand PCL, NVDR | 6,200 | 28,124 | ||||||
Airports of Thailand PCL, NVDR(1) | 44,700 | 89,076 | ||||||
| Amanah Leasing PCL, NVDR | 9,200 | 1,112 | ||||||
| Amata Corp. PCL, NVDR | 67,200 | 38,479 | ||||||
| AP Thailand PCL, NVDR | 222,000 | 60,785 | ||||||
Aqua Corp. PCL, NVDR(1) | 783,300 | 12,914 | ||||||
| Asia Plus Group Holdings PCL, NVDR | 240,200 | 20,254 | ||||||
| Asia Sermkij Leasing PCL, NVDR | 1,800 | 1,763 | ||||||
| Asian Sea Corp. PCL, NVDR | 9,900 | 4,832 | ||||||
| Asset World Corp. PCL, NVDR | 171,600 | 26,282 | ||||||
| B Grimm Power PCL, NVDR | 40,900 | 41,431 | ||||||
| Bangchak Corp. PCL, NVDR | 120,600 | 116,485 | ||||||
Bangkok Airways PCL, NVDR(1) | 31,300 | 9,086 | ||||||
Bangkok Aviation Fuel Services PCL, NVDR(1) | 1,000 | 781 | ||||||
| Bangkok Bank PCL, NVDR | 9,600 | 35,992 | ||||||
| Bangkok Chain Hospital PCL, NVDR | 154,200 | 78,925 | ||||||
| Bangkok Dusit Medical Services PCL, NVDR | 258,800 | 207,415 | ||||||
| Bangkok Expressway & Metro PCL, NVDR | 224,900 | 53,926 | ||||||
| Bangkok Land PCL, NVDR | 666,800 | 18,450 | ||||||
70
| Avantis Emerging Markets Equity Fund | ||||||||
| Shares | Value | |||||||
| Bangkok Life Assurance PCL, NVDR | 38,700 | $ | 37,637 | |||||
| Banpu PCL, NVDR | 548,066 | 217,586 | ||||||
| Banpu Power PCL, NVDR | 35,200 | 15,245 | ||||||
| BCPG PCL, NVDR | 106,600 | 31,532 | ||||||
| BEC World PCL, NVDR | 74,300 | 28,483 | ||||||
| Berli Jucker PCL, NVDR | 15,100 | 13,876 | ||||||
Better World Green PCL, NVDR(1) | 686,100 | 15,391 | ||||||
| BG Container Glass PCL, NVDR | 26,300 | 7,428 | ||||||
| BTS Group Holdings PCL, NVDR | 87,900 | 20,234 | ||||||
| Bumrungrad Hospital PCL, NVDR | 24,600 | 145,663 | ||||||
| Cal-Comp Electronics Thailand PCL, NVDR | 117,135 | 7,881 | ||||||
| Carabao Group PCL, NVDR | 13,600 | 37,628 | ||||||
| Central Pattana PCL, NVDR | 56,700 | 107,526 | ||||||
Central Plaza Hotel PCL, NVDR(1) | 20,400 | 23,862 | ||||||
| Central Retail Corp. PCL, NVDR | 64,441 | 71,430 | ||||||
| CH Karnchang PCL, NVDR | 87,000 | 50,071 | ||||||
| Charoen Pokphand Foods PCL, NVDR | 136,500 | 97,257 | ||||||
| Chularat Hospital PCL, NVDR | 556,200 | 55,814 | ||||||
| CK Power PCL, NVDR | 141,800 | 19,813 | ||||||
| Com7 PCL, NVDR | 36,200 | 34,124 | ||||||
| CP ALL PCL, NVDR | 78,000 | 131,473 | ||||||
| Delta Electronics Thailand PCL, NVDR | 1,500 | 21,494 | ||||||
| Dhipaya Group Holdings PCL, NVDR | 5,900 | 10,070 | ||||||
| Diamond Building Products PCL, NVDR | 5,000 | 1,076 | ||||||
| Dohome PCL, NVDR | 4,549 | 1,894 | ||||||
| Dynasty Ceramic PCL, NVDR | 269,300 | 19,932 | ||||||
| Eastern Polymer Group PCL, NVDR | 42,400 | 11,153 | ||||||
| Eastern Water Resources Development and Management PCL, NVDR | 2,900 | 513 | ||||||
| Ekachai Medical Care PCL, NVDR | 50,336 | 10,345 | ||||||
| Electricity Generating PCL, NVDR | 17,200 | 86,242 | ||||||
| Energy Absolute PCL, NVDR | 31,600 | 73,776 | ||||||
Erawan Group PCL, NVDR(1) | 15,660 | 1,551 | ||||||
Esso Thailand PCL, NVDR(1) | 67,300 | 25,995 | ||||||
| GFPT PCL, NVDR | 27,500 | 12,654 | ||||||
| Global Power Synergy PCL, NVDR | 23,400 | 43,558 | ||||||
| Gulf Energy Development PCL, NVDR | 42,000 | 58,937 | ||||||
| Gunkul Engineering PCL, NVDR | 340,500 | 46,426 | ||||||
| Haad Thip PCL, NVDR | 1,400 | 1,228 | ||||||
| Hana Microelectronics PCL, NVDR | 17,600 | 20,551 | ||||||
| Home Product Center PCL, NVDR | 166,100 | 63,275 | ||||||
| Humanica PCL, NVDR | 27,200 | 9,377 | ||||||
| Ichitan Group PCL, NVDR | 20,000 | 4,987 | ||||||
| Indorama Ventures PCL, NVDR | 77,100 | 91,310 | ||||||
| Interlink Communication PCL, NVDR | 21,100 | 4,850 | ||||||
| IRPC PCL, NVDR | 722,000 | 67,588 | ||||||
| IT City PCL (NVDR), NVDR | 50,100 | 8,559 | ||||||
Italian-Thai Development PCL, NVDR(1) | 149,800 | 7,879 | ||||||
Jasmine International PCL, NVDR(1) | 389,500 | 27,294 | ||||||
| Jay Mart PCL, NVDR | 13,800 | 19,643 | ||||||
| JMT Network Services PCL, NVDR | 16,697 | 35,672 | ||||||
71
| Avantis Emerging Markets Equity Fund | ||||||||
| Shares | Value | |||||||
| JWD Infologistics PCL, NVDR | 30,600 | $ | 14,323 | |||||
| KCE Electronics PCL, NVDR | 34,800 | 51,577 | ||||||
| KGI Securities Thailand PCL, NVDR | 97,400 | 13,291 | ||||||
| Khon Kaen Sugar Industry PCL, NVDR | 55,500 | 5,472 | ||||||
| Kiatnakin Phatra Bank PCL, NVDR | 16,500 | 32,751 | ||||||
| Krung Thai Bank PCL, NVDR | 192,100 | 88,822 | ||||||
| Krungthai Card PCL, NVDR | 46,000 | 75,846 | ||||||
| Land & Houses PCL, NVDR | 543,700 | 132,642 | ||||||
| Lanna Resources PCL, NVDR | 38,500 | 25,228 | ||||||
| LPN Development PCL, NVDR | 37,300 | 4,620 | ||||||
| Major Cineplex Group PCL, NVDR | 17,300 | 9,004 | ||||||
Master Ad PCL, NVDR(1) | 596,800 | 9,138 | ||||||
MBK PCL, NVDR(1) | 85,300 | 38,062 | ||||||
| MC Group PCL, NVDR | 4,300 | 1,178 | ||||||
| MCS Steel PCL, NVDR | 43,200 | 12,187 | ||||||
| Mega Lifesciences PCL, NVDR | 26,600 | 35,867 | ||||||
| MFEC PCL, NVDR | 43,100 | 11,033 | ||||||
Minor International PCL, NVDR(1) | 80,800 | 72,356 | ||||||
| MK Restaurants Group PCL, NVDR | 9,400 | 15,189 | ||||||
| Muangthai Capital PCL, NVDR | 21,600 | 25,129 | ||||||
Nex Point Parts PCL, NVDR(1) | 9,400 | 4,599 | ||||||
| Noble Development PCL, Class C, NVDR | 40,800 | 5,502 | ||||||
| Origin Property PCL, NVDR | 60,500 | 17,055 | ||||||
| Osotspa PCL, NVDR | 92,900 | 79,541 | ||||||
Plan B Media PCL, NVDR(1) | 261,604 | 47,269 | ||||||
| Polyplex Thailand PCL, NVDR | 13,000 | 8,158 | ||||||
| Praram 9 Hospital PCL, NVDR | 44,800 | 21,858 | ||||||
| Precious Shipping PCL, NVDR | 121,600 | 47,257 | ||||||
| Premier Marketing PCL, NVDR | 3,900 | 941 | ||||||
| Prima Marine PCL, NVDR | 39,800 | 6,763 | ||||||
| Property Perfect PCL, NVDR | 42,735 | 479 | ||||||
| Pruksa Holding PCL, NVDR | 61,600 | 21,744 | ||||||
| PTG Energy PCL, NVDR | 67,400 | 28,217 | ||||||
| PTT Exploration & Production PCL, NVDR | 47,800 | 221,076 | ||||||
| PTT Global Chemical PCL, NVDR | 78,900 | 102,588 | ||||||
| PTT Oil & Retail Business PCL, NVDR | 85,200 | 63,605 | ||||||
| PTT PCL, NVDR | 242,900 | 249,561 | ||||||
| Quality Houses PCL, NVDR | 618,800 | 36,635 | ||||||
| R&B Food Supply PCL, NVDR | 8,900 | 3,437 | ||||||
Raimon Land PCL, NVDR(1) | 40,600 | 868 | ||||||
| Rajthanee Hospital PCL, NVDR | 10,300 | 10,170 | ||||||
| Ratch Group PCL, NVDR | 51,900 | 62,606 | ||||||
| Ratchthani Leasing PCL, NVDR | 172,650 | 22,504 | ||||||
| Regional Container Lines PCL, NVDR | 31,100 | 27,664 | ||||||
| Rojana Industrial Park PCL, NVDR | 6,800 | 1,108 | ||||||
| RS PCL, NVDR | 38,900 | 16,402 | ||||||
| S 11 Group PCL, NVDR | 4,200 | 598 | ||||||
S Hotels & Resorts PCL, NVDR(1) | 188,700 | 21,082 | ||||||
| Sabina PCL, NVDR | 22,900 | 16,629 | ||||||
Samart Digital PCL, NVDR(1) | 296,000 | 2,513 | ||||||
| Sansiri PCL, NVDR | 1,174,700 | 35,393 | ||||||
72
| Avantis Emerging Markets Equity Fund | ||||||||
| Shares | Value | |||||||
| Sappe PCL, NVDR | 11,000 | $ | 13,405 | |||||
| SC Asset Corp. PCL, NVDR | 164,100 | 15,812 | ||||||
| SCB X PCL, NVDR | 21,200 | 64,085 | ||||||
SEAFCO PCL, NVDR(1) | 5,200 | 545 | ||||||
| Sermsang Power Corp. Co. Ltd., NVDR | 35,332 | 9,291 | ||||||
| Siam Cement PCL, NVDR | 12,500 | 122,625 | ||||||
| Siam City Cement PCL, NVDR | 1,800 | 7,819 | ||||||
| Siam Global House PCL, NVDR | 60,562 | 32,549 | ||||||
| Siam Makro PCL, NVDR | 5,200 | 4,913 | ||||||
| Siamgas & Petrochemicals PCL, NVDR | 27,100 | 8,313 | ||||||
Singha Estate PCL, NVDR(1) | 20,100 | 1,059 | ||||||
| Sino-Thai Engineering & Construction PCL, NVDR | 92,100 | 31,015 | ||||||
| SISB PCL, NVDR | 65,400 | 25,447 | ||||||
| SNC Former PCL, NVDR | 35,500 | 16,530 | ||||||
| Somboon Advance Technology PCL, NVDR | 2,000 | 1,068 | ||||||
| SPCG PCL, NVDR | 13,200 | 5,716 | ||||||
| Sri Trang Agro-Industry PCL, NVDR | 92,600 | 57,314 | ||||||
| Srisawad Corp. PCL, NVDR | 41,200 | 54,945 | ||||||
| Srisawad Finance PCL, NVDR | 4,400 | 3,615 | ||||||
| Srivichai Vejvivat PCL, NVDR | 25,600 | 6,731 | ||||||
| Star Petroleum Refining PCL, NVDR | 125,200 | 44,237 | ||||||
| Stars Microelectronics Thailand PCL, NVDR | 33,500 | 4,950 | ||||||
STP & I PCL, NVDR(1) | 59,900 | 5,937 | ||||||
| Supalai PCL, NVDR | 97,800 | 52,271 | ||||||
| Super Energy Corp. PCL, NVDR | 762,900 | 15,894 | ||||||
| Susco PCL, NVDR | 10,600 | 1,086 | ||||||
| Synnex Thailand PCL, NVDR | 11,700 | 6,655 | ||||||
| Taokaenoi Food & Marketing PCL, Class R NVDR | 16,200 | 3,418 | ||||||
Thai Airways International PCL, NVDR(1) | 6,800 | 619 | ||||||
| Thai Oil PCL, NVDR | 75,100 | 124,951 | ||||||
| Thai Union Group PCL, NVDR | 97,200 | 46,609 | ||||||
| Thai Vegetable Oil PCL, NVDR | 36,960 | 30,930 | ||||||
| Thaicom PCL, NVDR | 73,800 | 21,004 | ||||||
| Thaifoods Group PCL, NVDR | 70,100 | 12,013 | ||||||
| Thanachart Capital PCL, NVDR | 21,000 | 23,293 | ||||||
| Thonburi Healthcare Group PCL, NVDR | 35,700 | 66,774 | ||||||
| Thoresen Thai Agencies PCL, NVDR | 181,300 | 41,202 | ||||||
| Tipco Asphalt PCL, NVDR | 46,800 | 21,421 | ||||||
| Tisco Financial Group PCL, NVDR | 12,600 | 32,368 | ||||||
| TMBThanachart Bank PCL, NVDR | 219,700 | 7,636 | ||||||
| TOA Paint Thailand PCL, NVDR | 15,900 | 13,403 | ||||||
| Total Access Communication PCL, NVDR | 15,400 | 18,163 | ||||||
| TPI Polene PCL, NVDR | 156,800 | 7,305 | ||||||
| TPI Polene Power PCL, NVDR | 54,800 | 5,617 | ||||||
| TQM Alpha PCL, NVDR | 17,300 | 20,281 | ||||||
| Triple i Logistics PCL, NVDR | 53,000 | 19,042 | ||||||
| True Corp. PCL, NVDR | 593,900 | 74,230 | ||||||
| TTW PCL, NVDR | 14,400 | 4,147 | ||||||
U City PCL, NVDR(1) | 368,200 | 13,602 | ||||||
Unique Engineering & Construction PCL, NVDR(1) | 4,000 | 533 | ||||||
73
| Avantis Emerging Markets Equity Fund | ||||||||
| Shares | Value | |||||||
| Univanich Palm Oil PCL, NVDR | 80,500 | $ | 16,320 | |||||
| VGI PCL, NVDR | 28,860 | 3,462 | ||||||
| WHA Corp. PCL, NVDR | 287,300 | 27,540 | ||||||
| Workpoint Entertainment PCL, NVDR | 14,600 | 7,714 | ||||||
| WP Energy PCL, NVDR | 5,900 | 757 | ||||||
Xspring Capital PCL, NVDR(1) | 107,200 | 4,963 | ||||||
Zen Corp. Group PCL, NVDR(1) | 2,200 | 899 | ||||||
| 6,102,488 | ||||||||
| Turkey — 0.5% | ||||||||
| AG Anadolu Grubu Holding AS | 1,279 | 5,208 | ||||||
| Akbank TAS | 118,317 | 75,993 | ||||||
| Aksa Akrilik Kimya Sanayii AS | 7,202 | 21,790 | ||||||
| Aksa Enerji Uretim AS | 15,862 | 24,743 | ||||||
Aksigorta AS(1) | 9,932 | 2,039 | ||||||
| Alarko Holding AS | 3,317 | 8,987 | ||||||
Anadolu Anonim Turk Sigorta Sirketi(1) | 5,534 | 2,463 | ||||||
| Anadolu Efes Biracilik Ve Malt Sanayii AS | 10,760 | 24,313 | ||||||
| Arcelik AS | 470 | 1,811 | ||||||
| Aselsan Elektronik Sanayi Ve Ticaret AS | 8,801 | 12,590 | ||||||
Bagfas Bandirma Gubre Fabrikalari AS(1) | 3,765 | 4,542 | ||||||
Baticim Bati Anadolu Cimento Sanayii AS(1) | 2,996 | 5,332 | ||||||
| Bera Holding AS | 19,838 | 19,367 | ||||||
| BIM Birlesik Magazalar AS | 7,140 | 42,836 | ||||||
| Cemtas Celik Makina Sanayi Ve Ticaret AS | 729 | 1,276 | ||||||
| Cimsa Cimento Sanayi VE Ticaret AS | 1,448 | 4,215 | ||||||
| Coca-Cola Icecek AS | 1,377 | 12,080 | ||||||
| Dogan Sirketler Grubu Holding AS | 15,748 | 4,568 | ||||||
| Dogus Otomotiv Servis ve Ticaret AS | 3,638 | 19,951 | ||||||
| EGE Endustri VE Ticaret AS | 21 | 2,663 | ||||||
| Enerjisa Enerji AS | 9,053 | 8,493 | ||||||
| Eregli Demir ve Celik Fabrikalari TAS | 26,105 | 41,250 | ||||||
| Ford Otomotiv Sanayi AS | 1,168 | 21,223 | ||||||
| GSD Holding AS | 63,384 | 15,208 | ||||||
| Haci Omer Sabanci Holding AS | 62,822 | 87,759 | ||||||
Ipek Dogal Enerji Kaynaklari Arastirma Ve Uretim AS(1) | 8,190 | 8,050 | ||||||
Is Finansal Kiralama AS(1) | 5,787 | 2,612 | ||||||
| Is Yatirim Menkul Degerler AS | 1,327 | 2,072 | ||||||
| Kardemir Karabuk Demir Celik Sanayi ve Ticaret AS, Class A | 17,876 | 8,962 | ||||||
| Kardemir Karabuk Demir Celik Sanayi ve Ticaret AS, Class D | 52,809 | 34,210 | ||||||
| Kardemir Karabuk Demir Celik Sanayi ve Ticaret AS, Class B | 11,042 | 5,544 | ||||||
| Kartonsan Karton Sanayi ve Ticaret AS | 321 | 1,265 | ||||||
| KOC Holding AS | 17,503 | 43,668 | ||||||
| Koza Altin Isletmeleri AS | 720 | 6,271 | ||||||
Koza Anadolu Metal Madencilik Isletmeleri AS(1) | 12,688 | 18,869 | ||||||
| Logo Yazilim Sanayi Ve Ticaret AS | 1,020 | 2,663 | ||||||
| Mavi Giyim Sanayi Ve Ticaret AS, B Shares | 1,566 | 6,019 | ||||||
Migros Ticaret AS(1) | 3,677 | 16,500 | ||||||
MLP Saglik Hizmetleri AS(1) | 4,033 | 8,961 | ||||||
NET Holding AS(1) | 2,629 | 1,701 | ||||||
| Nuh Cimento Sanayi AS | 462 | 1,930 | ||||||
74
| Avantis Emerging Markets Equity Fund | ||||||||
| Shares | Value | |||||||
ODAS Elektrik Uretim ve Sanayi Ticaret AS(1) | 67,032 | $ | 16,595 | |||||
| Otokar Otomotiv Ve Savunma Sanayi AS | 392 | 10,277 | ||||||
Pegasus Hava Tasimaciligi AS(1) | 1,470 | 16,843 | ||||||
Petkim Petrokimya Holding AS(1) | 36,883 | 29,292 | ||||||
Qua Granite Hayal(1) | 7,606 | 12,895 | ||||||
Sasa Polyester Sanayi AS(1) | 4,584 | 13,422 | ||||||
| Selcuk Ecza Deposu Ticaret ve Sanayi AS | 1,189 | 1,304 | ||||||
Sok Marketler Ticaret AS(1) | 7,558 | 7,002 | ||||||
TAV Havalimanlari Holding AS(1) | 4,174 | 14,246 | ||||||
| Tekfen Holding AS | 4,089 | 6,686 | ||||||
| Tofas Turk Otomobil Fabrikasi AS | 4,881 | 23,550 | ||||||
Turk Hava Yollari AO(1) | 22,822 | 91,531 | ||||||
| Turk Traktor ve Ziraat Makineleri AS | 343 | 4,605 | ||||||
| Turkcell Iletisim Hizmetleri AS, ADR | 11,052 | 32,824 | ||||||
Turkiye Halk Bankasi AS(1) | 30,178 | 14,218 | ||||||
| Turkiye Is Bankasi AS, C Shares | 101,042 | 43,769 | ||||||
Turkiye Petrol Rafinerileri AS(1) | 3,354 | 66,127 | ||||||
| Turkiye Sigorta AS | 4,436 | 1,618 | ||||||
Turkiye Sinai Kalkinma Bankasi AS(1) | 119,810 | 32,343 | ||||||
| Turkiye Sise ve Cam Fabrikalari AS | 27,623 | 37,395 | ||||||
Turkiye Vakiflar Bankasi TAO, D Shares(1) | 69,538 | 27,883 | ||||||
| Vakko Tekstil ve Hazir Giyim Sanayi Isletmeleri AS | 20,568 | 23,303 | ||||||
| Vestel Elektronik Sanayi ve Ticaret AS | 9,811 | 16,053 | ||||||
| Yapi ve Kredi Bankasi AS | 205,561 | 79,429 | ||||||
| Yatas Yatak ve Yorgan Sanayi ve Ticaret AS | 2,668 | 2,362 | ||||||
Yesil Yapi Endustrisi AS(1) | 21,886 | 1,466 | ||||||
Zorlu Enerji Elektrik Uretim AS(1) | 5,104 | 820 | ||||||
| 1,267,855 | ||||||||
TOTAL COMMON STOCKS (Cost $267,089,722) | 240,241,769 | |||||||
WARRANTS† | ||||||||
Malaysia† | ||||||||
Eco World Development Group Bhd(1) | 19,020 | 404 | ||||||
Perak Transit Bhd(1) | 1,391 | 59 | ||||||
PESTECH International Bhd(1) | 2,962 | 103 | ||||||
Vizione Holdings Bhd(1) | 2,768 | 3 | ||||||
Yinson Holdings Bhd(1) | 16,080 | 2,048 | ||||||
| 2,617 | ||||||||
Thailand† | ||||||||
Aqua Corp. PCL(1) | 391,650 | 752 | ||||||
Erawan Group PCL(1) | 1,243 | 32 | ||||||
Maco Pharma(1) | 149,200 | 41 | ||||||
MBK PCL(1) | 912 | 322 | ||||||
Minor International PCL, NVDR(1) | 466 | 58 | ||||||
VGI PCL(1) | 6,660 | 31 | ||||||
| 1,236 | ||||||||
TOTAL WARRANTS (Cost $—) | 3,853 | |||||||
75
| Avantis Emerging Markets Equity Fund | |||||||||||
| Principal Amount/Shares | Value | ||||||||||
CORPORATE BONDS† | |||||||||||
India† | |||||||||||
Britannia Industries Ltd., 5.50%, 6/3/24 (Acquired 5/25/21, Cost $433)(4) (Cost $433) | INR | 31,523 | $ | 387 | |||||||
RIGHTS† | |||||||||||
Brazil† | |||||||||||
AES Brasil Energia SA(1) | 3,967 | 61 | |||||||||
| Infracommerce CXAAS SA(1) | 1,929 | 193 | |||||||||
| 254 | |||||||||||
Greece† | |||||||||||
Attica Bank SA(1) | 36 | 1 | |||||||||
Thailand† | |||||||||||
Thai Oil PCL, NVDR(1) | 6,381 | 2 | |||||||||
TOTAL RIGHTS (Cost $—) | 257 | ||||||||||
| SHORT-TERM INVESTMENTS — 2.6% | |||||||||||
| Money Market Funds — 2.6% | |||||||||||
| State Street Institutional U.S. Government Money Market Fund, Premier Class | 1,769,913 | 1,769,913 | |||||||||
State Street Navigator Securities Lending Government Money Market Portfolio(5) | 4,524,997 | 4,524,997 | |||||||||
TOTAL SHORT-TERM INVESTMENTS (Cost $6,294,910) | 6,294,910 | ||||||||||
TOTAL INVESTMENT SECURITIES — 102.0% (Cost $273,385,065) | 246,541,176 | ||||||||||
| OTHER ASSETS AND LIABILITIES — (2.0)% | (4,926,336) | ||||||||||
| TOTAL NET ASSETS — 100.0% | $ | 241,614,840 | |||||||||
| FUTURES CONTRACTS PURCHASED | ||||||||||||||
| Reference Entity | Contracts | Expiration Date | Notional Amount | Unrealized Appreciation (Depreciation)^ | ||||||||||
| S&P 500 E-Mini | 4 | September 2022 | $ | 791,300 | $ | 29,593 | ||||||||
^Amount represents value and unrealized appreciation (depreciation).
| MARKET SECTOR DIVERSIFICATION | |||||
(as a % of net assets) | |||||
| Financials | 19.5% | ||||
| Information Technology | 18.1% | ||||
| Consumer Discretionary | 13.3% | ||||
| Materials | 10.9% | ||||
| Industrials | 9.5% | ||||
| Communication Services | 7.0% | ||||
| Energy | 5.8% | ||||
| Consumer Staples | 5.7% | ||||
| Utilities | 4.2% | ||||
| Health Care | 3.4% | ||||
| Real Estate | 2.0% | ||||
| Short-Term Investments | 2.6% | ||||
| Other Assets and Liabilities | (2.0)% | ||||
76
| Avantis Emerging Markets Equity Fund | ||||||||
| NOTES TO SCHEDULE OF INVESTMENTS | ||||||||
| ADR | - | American Depositary Receipt | ||||||
| GDR | - | Global Depositary Receipt | ||||||
| INR | - | Indian Rupee | ||||||
| NVDR | - | Non-Voting Depositary Receipt | ||||||
†Category is less than 0.05% of total net assets.
(1)Non-income producing.
(2)Security, or a portion thereof, is on loan. At the period end, the aggregate value of securities on loan was $10,184,875. The amount of securities on loan indicated may not correspond with the securities on loan identified because securities with pending sales are in the process of recall from the brokers.
(3)Securities may be subject to resale, redemption or transferability restrictions.
(4)Restricted security that may not be offered for public sale without being registered with the Securities and Exchange Commission and/or may be subject to resale, redemption or transferability restrictions. The aggregate value of these securities at the period end was $387, which represented less than 0.05% of total net assets.
(5)Investment of cash collateral from securities on loan. At the period end, the aggregate value of the collateral held by the fund was $11,002,485, which includes securities collateral of $6,477,488.
See Notes to Financial Statements.
77
AUGUST 31, 2022
| Avantis International Equity Fund | ||||||||
| Shares | Value | |||||||
| COMMON STOCKS — 98.5% | ||||||||
| Australia — 7.5% | ||||||||
29Metals Ltd.(1)(2) | 7,709 | $ | 10,443 | |||||
| Accent Group Ltd. | 4,561 | 4,638 | ||||||
Adairs Ltd.(1) | 1,603 | 2,470 | ||||||
| Adbri Ltd. | 5,681 | 8,506 | ||||||
AGL Energy Ltd.(1) | 8,981 | 46,775 | ||||||
Alkane Resources Ltd.(2) | 15,781 | 7,830 | ||||||
Alliance Aviation Services Ltd.(2) | 1,918 | 4,662 | ||||||
Allkem Ltd.(2) | 5,630 | 52,190 | ||||||
| ALS Ltd. | 829 | 6,671 | ||||||
| Altium Ltd. | 1,435 | 35,389 | ||||||
| Alumina Ltd. | 14,872 | 15,179 | ||||||
AMP Ltd.(2) | 48,216 | 38,003 | ||||||
| Ampol Ltd. | 2,191 | 51,498 | ||||||
| Ansell Ltd. | 204 | 3,688 | ||||||
| APA Group | 12,621 | 95,173 | ||||||
Appen Ltd.(1) | 277 | 694 | ||||||
| ARB Corp. Ltd. | 367 | 7,510 | ||||||
Ardent Leisure Group Ltd.(2) | 1,272 | 532 | ||||||
| Aristocrat Leisure Ltd. | 2,745 | 66,255 | ||||||
| ASX Ltd. | 2,359 | 125,575 | ||||||
| Atlas Arteria Ltd. | 9,335 | 50,784 | ||||||
Atlassian Corp. PLC, Class A(2) | 677 | 167,666 | ||||||
Aurelia Metals Ltd.(1)(2) | 47,081 | 8,566 | ||||||
| Aurizon Holdings Ltd. | 40,513 | 102,463 | ||||||
| Austal Ltd. | 8,146 | 14,248 | ||||||
| Australia & New Zealand Banking Group Ltd. | 18,744 | 289,755 | ||||||
Australian Agricultural Co. Ltd.(2) | 2,182 | 2,689 | ||||||
| Australian Clinical Labs Ltd. | 1,433 | 4,309 | ||||||
| Australian Ethical Investment Ltd. | 906 | 3,971 | ||||||
| Australian Finance Group Ltd. | 3,111 | 4,048 | ||||||
| Baby Bunting Group Ltd. | 1,932 | 5,737 | ||||||
Bank of Queensland Ltd.(1) | 11,467 | 54,714 | ||||||
| Bapcor Ltd. | 1,574 | 7,134 | ||||||
| Beach Energy Ltd. | 48,464 | 56,016 | ||||||
| Bega Cheese Ltd. | 7,118 | 19,325 | ||||||
Bendigo & Adelaide Bank Ltd.(1) | 12,349 | 75,805 | ||||||
BHP Group Ltd., ADR(1) | 15,126 | 830,266 | ||||||
| Blackmores Ltd. | 116 | 5,421 | ||||||
| BlueScope Steel Ltd. | 8,231 | 92,350 | ||||||
Boral Ltd.(1) | 7,744 | 15,486 | ||||||
Boss Energy Ltd.(2) | 3,742 | 6,791 | ||||||
| Brambles Ltd. | 19,702 | 165,817 | ||||||
| Brickworks Ltd. | 1,087 | 15,047 | ||||||
| carsales.com Ltd. | 1,859 | 28,342 | ||||||
| Cedar Woods Properties Ltd. | 1,766 | 5,466 | ||||||
| Challenger Ltd. | 12,960 | 55,873 | ||||||
| Champion Iron Ltd. | 7,862 | 27,126 | ||||||
| Cleanaway Waste Management Ltd. | 4,609 | 8,754 | ||||||
78
| Avantis International Equity Fund | ||||||||
| Shares | Value | |||||||
| Cochlear Ltd. | 153 | $ | 22,273 | |||||
Codan Ltd.(1) | 230 | 1,130 | ||||||
| Coles Group Ltd. | 15,165 | 181,513 | ||||||
| Collins Foods Ltd. | 1,103 | 7,351 | ||||||
| Commonwealth Bank of Australia | 8,791 | 580,929 | ||||||
| Computershare Ltd. | 3,014 | 50,267 | ||||||
| Coronado Global Resources, Inc. | 22,324 | 24,423 | ||||||
| Costa Group Holdings Ltd. | 7,789 | 14,214 | ||||||
Credit Corp. Group Ltd.(1) | 1,437 | 19,797 | ||||||
| CSL Ltd. | 1,846 | 369,233 | ||||||
| CSR Ltd. | 10,391 | 31,881 | ||||||
| Data#3 Ltd. | 2,361 | 9,850 | ||||||
| Deterra Royalties Ltd. | 5,503 | 15,545 | ||||||
Domino's Pizza Enterprises Ltd.(1) | 338 | 14,569 | ||||||
| Downer EDI Ltd. | 3,856 | 13,187 | ||||||
| Eagers Automotive Ltd. | 1,928 | 17,356 | ||||||
Eclipx Group Ltd.(2) | 5,402 | 8,746 | ||||||
| Elders Ltd. | 290 | 2,284 | ||||||
| Emeco Holdings Ltd. | 5,966 | 3,705 | ||||||
| Endeavour Group Ltd. | 13,634 | 67,472 | ||||||
EVENT Hospitality and Entertainment Ltd.(2) | 724 | 7,272 | ||||||
| Evolution Mining Ltd. | 32,690 | 52,535 | ||||||
| Fortescue Metals Group Ltd. | 17,638 | 219,198 | ||||||
| Genworth Mortgage Insurance Australia Ltd. | 10,695 | 20,577 | ||||||
Gold Road Resources Ltd.(1) | 13,654 | 11,700 | ||||||
| GrainCorp Ltd., A Shares | 3,047 | 17,234 | ||||||
| Grange Resources Ltd. | 15,468 | 9,145 | ||||||
| GUD Holdings Ltd. | 929 | 5,222 | ||||||
| GWA Group Ltd. | 2,433 | 3,325 | ||||||
| Hansen Technologies Ltd. | 2,687 | 8,969 | ||||||
| Harvey Norman Holdings Ltd. | 11,163 | 32,055 | ||||||
| Healius Ltd. | 2,245 | 5,674 | ||||||
| HT&E Ltd. | 1,854 | 1,857 | ||||||
| HUB24 Ltd. | 60 | 967 | ||||||
Humm Group Ltd.(1) | 743 | 271 | ||||||
IDP Education Ltd.(1) | 1,098 | 21,616 | ||||||
| IGO Ltd. | 5,101 | 45,650 | ||||||
| Iluka Resources Ltd. | 11,247 | 79,072 | ||||||
| Imdex Ltd. | 5,249 | 7,125 | ||||||
| Incitec Pivot Ltd. | 21,682 | 57,298 | ||||||
| Infomedia Ltd. | 4,782 | 4,683 | ||||||
| Inghams Group Ltd. | 6,443 | 11,385 | ||||||
| Insurance Australia Group Ltd. | 3,293 | 10,406 | ||||||
InvoCare Ltd.(1) | 2,422 | 18,181 | ||||||
| IPH Ltd. | 2,732 | 17,708 | ||||||
| IRESS Ltd. | 889 | 6,798 | ||||||
| James Hardie Industries PLC | 2,954 | 66,954 | ||||||
JB Hi-Fi Ltd.(1) | 1,381 | 38,088 | ||||||
Jervois Global Ltd.(1)(2) | 8,940 | 3,232 | ||||||
Judo Capital Holdings Ltd.(2) | 5,674 | 4,627 | ||||||
| Jumbo Interactive Ltd. | 617 | 5,917 | ||||||
79
| Avantis International Equity Fund | ||||||||
| Shares | Value | |||||||
| Jupiter Mines Ltd. | 22,840 | $ | 3,125 | |||||
Karoon Energy Ltd.(2) | 10,001 | 14,482 | ||||||
Kelsian Group Ltd.(1) | 288 | 1,060 | ||||||
| Lendlease Corp. Ltd. | 8,029 | 55,950 | ||||||
| Lifestyle Communities Ltd. | 1,073 | 12,577 | ||||||
| Link Administration Holdings Ltd. | 2,543 | 7,453 | ||||||
Lovisa Holdings Ltd.(1) | 719 | 11,216 | ||||||
Lynas Rare Earths Ltd.(2) | 5,893 | 35,205 | ||||||
| Macmahon Holdings Ltd. | 6,093 | 703 | ||||||
| Macquarie Group Ltd. | 1,084 | 129,704 | ||||||
Magellan Financial Group Ltd.(1) | 1,869 | 16,407 | ||||||
Mayne Pharma Group Ltd.(2) | 42,422 | 8,627 | ||||||
| McMillan Shakespeare Ltd. | 968 | 9,432 | ||||||
| Medibank Pvt Ltd. | 25,963 | 65,400 | ||||||
Mesoblast Ltd.(2) | 10,158 | 5,908 | ||||||
| Metcash Ltd. | 11,982 | 33,530 | ||||||
| Mineral Resources Ltd. | 2,262 | 96,378 | ||||||
| Monadelphous Group Ltd. | 3,593 | 32,068 | ||||||
| Money3 Corp. Ltd. | 3,577 | 5,584 | ||||||
Mount Gibson Iron Ltd.(1) | 15,532 | 4,504 | ||||||
| Myer Holdings Ltd. | 19,906 | 6,827 | ||||||
| MyState Ltd. | 613 | 1,600 | ||||||
| National Australia Bank Ltd. | 18,785 | 389,528 | ||||||
Nearmap Ltd.(1)(2) | 4,535 | 6,380 | ||||||
| Netwealth Group Ltd. | 1,149 | 10,200 | ||||||
| New Energy Solar | 2,331 | 1,468 | ||||||
New Hope Corp. Ltd.(1) | 14,116 | 46,648 | ||||||
Newcrest Mining Ltd.(1) | 1,091 | 12,776 | ||||||
| Newcrest Mining Ltd. (Sydney) | 7,005 | 84,212 | ||||||
NEXTDC Ltd.(2) | 3,245 | 22,934 | ||||||
| nib holdings Ltd. | 6,938 | 38,622 | ||||||
Nick Scali Ltd.(1) | 1,075 | 8,029 | ||||||
| Nine Entertainment Co. Holdings Ltd. | 9,409 | 13,965 | ||||||
| Northern Star Resources Ltd. | 15,459 | 81,705 | ||||||
| NRW Holdings Ltd. | 12,761 | 21,214 | ||||||
| Nufarm Ltd. | 9,128 | 32,957 | ||||||
OFX Group Ltd.(2) | 3,710 | 6,673 | ||||||
Omni Bridgeway Ltd.(2) | 3,281 | 10,155 | ||||||
| oOh!media Ltd. | 5,524 | 5,167 | ||||||
| Orica Ltd. | 5,242 | 54,832 | ||||||
| Origin Energy Ltd. | 20,790 | 88,546 | ||||||
| Orora Ltd. | 15,560 | 35,047 | ||||||
| OZ Minerals Ltd. | 5,497 | 94,735 | ||||||
| Pacific Current Group Ltd. | 220 | 1,359 | ||||||
Paladin Energy Ltd.(2) | 44,959 | 25,301 | ||||||
| Peet Ltd. | 1,161 | 895 | ||||||
| Pendal Group Ltd. | 5,570 | 19,555 | ||||||
| Perenti Global Ltd. | 16,854 | 8,940 | ||||||
Perpetual Ltd.(1) | 1,371 | 25,500 | ||||||
| Perseus Mining Ltd. | 38,760 | 40,995 | ||||||
Pilbara Minerals Ltd.(2) | 28,029 | 67,974 | ||||||
80
| Avantis International Equity Fund | ||||||||
| Shares | Value | |||||||
| Platinum Asset Management Ltd. | 17,853 | $ | 21,535 | |||||
| Premier Investments Ltd. | 925 | 13,300 | ||||||
Pro Medicus Ltd.(1) | 239 | 8,785 | ||||||
| PWR Holdings Ltd. | 302 | 1,947 | ||||||
Qantas Airways Ltd.(2) | 10,546 | 37,899 | ||||||
| QBE Insurance Group Ltd. | 10,068 | 82,545 | ||||||
| Qube Holdings Ltd. | 16,040 | 31,402 | ||||||
| Ramelius Resources Ltd. | 15,930 | 8,675 | ||||||
| Ramsay Health Care Ltd. | 461 | 22,467 | ||||||
| REA Group Ltd. | 347 | 29,925 | ||||||
Red 5 Ltd.(2) | 29,625 | 5,096 | ||||||
| Reece Ltd. | 610 | 6,604 | ||||||
| Regis Resources Ltd. | 23,277 | 24,418 | ||||||
| Reliance Worldwide Corp. Ltd. | 3,953 | 10,386 | ||||||
Resimac Group Ltd.(1) | 2,359 | 2,071 | ||||||
Resolute Mining Ltd.(1)(2) | 13,533 | 2,592 | ||||||
| Ridley Corp. Ltd. | 9,738 | 13,781 | ||||||
| Rio Tinto Ltd. | 2,061 | 130,901 | ||||||
| Sandfire Resources Ltd. | 6,798 | 20,995 | ||||||
| Santos Ltd. | 47,680 | 254,529 | ||||||
Sayona Mining Ltd.(1)(2) | 125,229 | 24,278 | ||||||
| SEEK Ltd. | 519 | 7,322 | ||||||
Select Harvests Ltd.(1) | 1,691 | 5,711 | ||||||
Service Stream Ltd.(1)(2) | 13,882 | 6,880 | ||||||
| Seven Group Holdings Ltd. | 1,190 | 14,968 | ||||||
Seven West Media Ltd.(2) | 35,885 | 12,626 | ||||||
Sierra Rutile Holdings Ltd.(1)(2) | 7,537 | 1,547 | ||||||
Sigma Healthcare Ltd.(1) | 23,896 | 11,163 | ||||||
Silver Lake Resources Ltd.(2) | 22,909 | 20,550 | ||||||
| Sims Ltd. | 2,335 | 24,091 | ||||||
| SmartGroup Corp. Ltd. | 213 | 860 | ||||||
| Sonic Healthcare Ltd. | 6,900 | 159,562 | ||||||
| South32 Ltd. | 62,108 | 171,027 | ||||||
| Southern Cross Media Group Ltd. | 4,053 | 2,961 | ||||||
| St. Barbara Ltd. | 9,352 | 5,770 | ||||||
Star Entertainment Group Ltd.(2) | 10,436 | 19,651 | ||||||
| Steadfast Group Ltd. | 2,294 | 7,851 | ||||||
| Suncorp Group Ltd. | 11,943 | 88,202 | ||||||
Super Retail Group Ltd.(1) | 3,218 | 22,987 | ||||||
Syrah Resources Ltd.(1)(2) | 10,036 | 12,537 | ||||||
| Tassal Group Ltd. | 4,752 | 16,766 | ||||||
| Technology One Ltd. | 2,656 | 21,270 | ||||||
| Telstra Corp. Ltd. | 31,624 | 85,519 | ||||||
| TPG Telecom Ltd. | 527 | 1,915 | ||||||
| Transurban Group | 11,567 | 109,742 | ||||||
| Treasury Wine Estates Ltd. | 7,385 | 66,245 | ||||||
Tuas Ltd.(2) | 517 | 524 | ||||||
| United Malt Group Ltd. | 7,330 | 17,750 | ||||||
| Ventia Services Group Pty Ltd. | 4,120 | 7,745 | ||||||
| Viva Energy Group Ltd. | 23,658 | 47,842 | ||||||
Washington H Soul Pattinson & Co. Ltd.(1) | 3,107 | 54,149 | ||||||
81
| Avantis International Equity Fund | ||||||||
| Shares | Value | |||||||
| Wesfarmers Ltd. | 5,794 | $ | 185,344 | |||||
West African Resources Ltd.(2) | 32,437 | 27,619 | ||||||
| Westgold Resources Ltd. | 8,310 | 5,224 | ||||||
| Westpac Banking Corp. | 23,362 | 342,896 | ||||||
| Whitehaven Coal Ltd. | 26,056 | 138,790 | ||||||
| WiseTech Global Ltd. | 468 | 18,486 | ||||||
| Woodside Energy Group Ltd. | 14,051 | 326,384 | ||||||
Woodside Energy Group Ltd., ADR(1) | 5,413 | 123,471 | ||||||
| Woolworths Group Ltd. | 8,628 | 212,704 | ||||||
| Worley Ltd. | 123 | 1,205 | ||||||
Xero Ltd.(2) | 297 | 17,472 | ||||||
| 9,951,627 | ||||||||
| Austria — 0.2% | ||||||||
| ANDRITZ AG | 401 | 18,469 | ||||||
| AT&S Austria Technologie & Systemtechnik AG | 530 | 23,590 | ||||||
BAWAG Group AG(2) | 552 | 24,905 | ||||||
DO & CO. AG(2) | 67 | 5,300 | ||||||
| Erste Group Bank AG | 1,716 | 38,589 | ||||||
| EVN AG | 663 | 12,862 | ||||||
IMMOFINANZ AG(2) | 996 | 14,806 | ||||||
Lenzing AG(1) | 88 | 6,509 | ||||||
Oesterreichische Post AG(1) | 396 | 11,056 | ||||||
| OMV AG | 706 | 28,446 | ||||||
| Porr AG | 59 | 676 | ||||||
| Raiffeisen Bank International AG | 1,502 | 18,967 | ||||||
| S IMMO AG | 449 | 10,260 | ||||||
Semperit AG Holding(1) | 239 | 4,343 | ||||||
| Strabag SE | 242 | 9,299 | ||||||
Telekom Austria AG(2) | 1,177 | 7,349 | ||||||
| UNIQA Insurance Group AG | 1,663 | 10,993 | ||||||
| Verbund AG | 336 | 32,107 | ||||||
| Vienna Insurance Group AG Wiener Versicherung Gruppe | 237 | 5,619 | ||||||
| voestalpine AG | 1,471 | 29,600 | ||||||
| Wienerberger AG | 1,008 | 23,570 | ||||||
| 337,315 | ||||||||
| Belgium — 0.9% | ||||||||
| Ackermans & van Haaren NV | 287 | 41,957 | ||||||
| Ageas SA/NV | 1,809 | 73,401 | ||||||
AGFA-Gevaert NV(2) | 2,083 | 7,532 | ||||||
Anheuser-Busch InBev SA, ADR(1) | 3,058 | 147,885 | ||||||
Argenx SE, ADR(2) | 172 | 64,994 | ||||||
| Barco NV | 1,096 | 24,425 | ||||||
| Bekaert SA | 999 | 30,642 | ||||||
| bpost SA | 3,655 | 22,203 | ||||||
Cie d'Entreprises CFE(1)(2) | 208 | 2,070 | ||||||
| D'ieteren Group | 216 | 32,562 | ||||||
Deceuninck NV(1) | 1,645 | 3,798 | ||||||
Deme Group NV(2) | 208 | 23,804 | ||||||
| Econocom Group SA | 2,474�� | 7,711 | ||||||
| Elia Group SA | 297 | 43,146 | ||||||
| Etablissements Franz Colruyt NV | 1,025 | 28,488 | ||||||
82
| Avantis International Equity Fund | ||||||||
| Shares | Value | |||||||
| Euronav NV | 2,736 | $ | 44,116 | |||||
| EVS Broadcast Equipment SA | 45 | 997 | ||||||
| Fagron | 1,371 | 17,601 | ||||||
Galapagos NV, ADR(2) | 686 | 34,341 | ||||||
| Gimv NV | 622 | 31,823 | ||||||
| Ion Beam Applications | 379 | 6,734 | ||||||
| KBC Ancora | 509 | 16,757 | ||||||
| KBC Group NV | 1,654 | 78,883 | ||||||
Kinepolis Group NV(2) | 280 | 12,276 | ||||||
| Melexis NV | 418 | 31,520 | ||||||
Ontex Group NV(2) | 1,853 | 10,640 | ||||||
| Proximus SADP | 2,382 | 30,320 | ||||||
| Recticel SA | 374 | 5,211 | ||||||
| Shurgard Self Storage SA | 292 | 14,096 | ||||||
| Solvay SA | 961 | 77,578 | ||||||
| Telenet Group Holding NV | 98 | 1,392 | ||||||
Tessenderlo Group SA(2) | 527 | 17,111 | ||||||
| UCB SA | 1,303 | 91,558 | ||||||
Umicore SA(1) | 3,284 | 104,385 | ||||||
| VGP NV | 46 | 6,688 | ||||||
| 1,188,645 | ||||||||
| Canada — 11.2% | ||||||||
Absolute Software Corp.(1) | 2,000 | 21,609 | ||||||
Advantage Energy Ltd.(2) | 6,300 | 53,821 | ||||||
Aecon Group, Inc.(1) | 960 | 7,953 | ||||||
AGF Management Ltd., Class B(1) | 1,000 | 4,698 | ||||||
| Agnico Eagle Mines Ltd. | 2,794 | 115,219 | ||||||
Air Canada(1)(2) | 400 | 5,388 | ||||||
| Alamos Gold, Inc., Class A | 6,300 | 45,427 | ||||||
| Alaris Equity Partners Income | 100 | 1,316 | ||||||
Algoma Steel Group, Inc.(1) | 1,600 | 14,619 | ||||||
Algonquin Power & Utilities Corp.(1) | 3,400 | 46,702 | ||||||
| Alimentation Couche-Tard, Inc. | 4,900 | 210,573 | ||||||
AltaGas Ltd.(1) | 700 | 15,094 | ||||||
| Altius Minerals Corp. | 500 | 6,971 | ||||||
| ARC Resources Ltd. | 12,488 | 172,389 | ||||||
Argonaut Gold, Inc.(2) | 5,100 | 1,806 | ||||||
Aritzia, Inc.(2) | 1,000 | 32,528 | ||||||
| Atco Ltd., Class I | 1,700 | 60,190 | ||||||
Athabasca Oil Corp.(1)(2) | 18,000 | 35,497 | ||||||
Atrium Mortgage Investment Corp.(1) | 700 | 6,348 | ||||||
ATS Automation Tooling Systems, Inc.(2) | 500 | 15,274 | ||||||
AutoCanada, Inc.(2) | 400 | 9,067 | ||||||
| B2Gold Corp. | 15,200 | 46,641 | ||||||
| Badger Infrastructure Solutions Ltd. | 400 | 9,420 | ||||||
Ballard Power Systems, Inc.(1)(2) | 2,100 | 16,389 | ||||||
| Bank of Montreal | 4,788 | 442,034 | ||||||
| Bank of Nova Scotia | 7,000 | 387,056 | ||||||
| Barrick Gold Corp. (Toronto) | 11,900 | 176,686 | ||||||
Bausch Health Cos., Inc.(2) | 920 | 5,520 | ||||||
Baytex Energy Corp.(1)(2) | 15,850 | 82,186 | ||||||
83
| Avantis International Equity Fund | ||||||||
| Shares | Value | |||||||
BCE, Inc.(1) | 400 | $ | 19,303 | |||||
| Birchcliff Energy Ltd. | 7,400 | 65,191 | ||||||
| Bird Construction, Inc. | 300 | 1,514 | ||||||
Bombardier, Inc., Class B(2) | 284 | 7,067 | ||||||
Bonterra Energy Corp.(2) | 1,100 | 7,370 | ||||||
| Boralex, Inc., A Shares | 1,900 | 71,611 | ||||||
| Boyd Group Services, Inc. | 99 | 13,644 | ||||||
Brookfield Asset Management Reinsurance Partners Ltd., A Shares(2) | 211 | 10,179 | ||||||
| Brookfield Asset Management, Inc., Class A | 3,850 | 185,208 | ||||||
Brookfield Business Corp., Class A(1) | 519 | 12,622 | ||||||
| Brookfield Infrastructure Corp., A Shares | 1,312 | 62,546 | ||||||
| Brookfield Infrastructure Corp., Class A | 106 | 5,046 | ||||||
| Brookfield Renewable Corp., Class A | 700 | 26,900 | ||||||
| BRP, Inc. | 100 | 6,936 | ||||||
CAE, Inc.(2) | 1,300 | 23,736 | ||||||
Calian Group Ltd.(1) | 200 | 9,161 | ||||||
Calibre Mining Corp.(2) | 2,700 | 1,953 | ||||||
| Cameco Corp. | 2,200 | 64,123 | ||||||
| Canaccord Genuity Group, Inc. | 1,615 | 9,653 | ||||||
Canacol Energy Ltd.(1) | 2,100 | 4,013 | ||||||
Canada Goose Holdings, Inc.(2) | 600 | 10,809 | ||||||
| Canadian Imperial Bank of Commerce | 5,600 | 264,831 | ||||||
| Canadian National Railway Co. | 2,532 | 301,118 | ||||||
Canadian Natural Resources Ltd.(1) | 9,300 | 509,841 | ||||||
| Canadian Pacific Railway Ltd. | 1,700 | 127,265 | ||||||
| Canadian Tire Corp. Ltd., Class A | 800 | 94,092 | ||||||
Canadian Utilities Ltd., A Shares(1) | 2,200 | 67,306 | ||||||
Canadian Western Bank(1) | 1,100 | 20,512 | ||||||
Canfor Corp.(2) | 1,400 | 27,470 | ||||||
| Capital Power Corp. | 3,000 | 116,382 | ||||||
Capstone Mining Corp.(2) | 9,500 | 21,339 | ||||||
Cardinal Energy Ltd.(1) | 3,700 | 23,552 | ||||||
| Cargojet, Inc. | 100 | 10,521 | ||||||
| Cascades, Inc. | 2,300 | 15,674 | ||||||
| CCL Industries, Inc., Class B | 1,000 | 49,050 | ||||||
Celestica, Inc.(2) | 2,200 | 22,698 | ||||||
| Cenovus Energy, Inc. | 17,638 | 330,910 | ||||||
| Centerra Gold, Inc. | 4,400 | 19,934 | ||||||
| CES Energy Solutions Corp. | 4,300 | 8,120 | ||||||
CGI, Inc.(2) | 1,300 | 102,943 | ||||||
Chorus Aviation, Inc.(1)(2) | 1,800 | 3,851 | ||||||
| CI Financial Corp. | 800 | 8,771 | ||||||
| Cogeco Communications, Inc. | 300 | 18,368 | ||||||
Cogeco, Inc.(1) | 100 | 4,810 | ||||||
| Colliers International Group, Inc. (Toronto) | 400 | 46,595 | ||||||
| Computer Modelling Group Ltd. | 200 | 701 | ||||||
| Constellation Software, Inc. | 100 | 150,533 | ||||||
Copper Mountain Mining Corp.(1)(2) | 6,200 | 6,892 | ||||||
Corus Entertainment, Inc., B Shares(1) | 2,600 | 7,325 | ||||||
Crescent Point Energy Corp.(1) | 11,700 | 88,907 | ||||||
84
| Avantis International Equity Fund | ||||||||
| Shares | Value | |||||||
Crew Energy, Inc.(2) | 3,700 | $ | 18,312 | |||||
Definity Financial Corp.(1) | 1,800 | 50,984 | ||||||
Descartes Systems Group, Inc.(2) | 600 | 42,267 | ||||||
| Dollarama, Inc. | 1,300 | 79,167 | ||||||
Doman Building Materials Group Ltd.(1) | 1,200 | 5,491 | ||||||
Dorel Industries, Inc., Class B(1) | 500 | 2,585 | ||||||
| DREAM Unlimited Corp., Class A | 400 | 8,586 | ||||||
| Dundee Precious Metals, Inc. | 4,590 | 20,899 | ||||||
Eldorado Gold Corp. (Toronto)(2) | 1,200 | 6,615 | ||||||
| Element Fleet Management Corp. | 8,100 | 102,009 | ||||||
| Emera, Inc. | 1,300 | 60,152 | ||||||
| Empire Co. Ltd., Class A | 2,600 | 74,059 | ||||||
| Enbridge, Inc. | 4,400 | 181,447 | ||||||
| Endeavour Mining PLC | 1,938 | 37,717 | ||||||
Enerflex Ltd.(1) | 1,000 | 5,018 | ||||||
Enerplus Corp.(1) | 4,658 | 71,784 | ||||||
Enghouse Systems Ltd.(1) | 300 | 7,323 | ||||||
Ensign Energy Services, Inc.(2) | 2,800 | 6,630 | ||||||
| EQB, Inc. | 400 | 16,038 | ||||||
Equinox Gold Corp.(1)(2) | 3,893 | 13,665 | ||||||
ERO Copper Corp.(1)(2) | 600 | 5,692 | ||||||
| Evertz Technologies Ltd. | 400 | 4,508 | ||||||
Exchange Income Corp.(1) | 300 | 10,587 | ||||||
| Exco Technologies Ltd. | 200 | 1,331 | ||||||
Extendicare, Inc.(1) | 2,200 | 12,044 | ||||||
| Fairfax Financial Holdings Ltd. | 300 | 149,558 | ||||||
| Finning International, Inc. | 2,500 | 53,870 | ||||||
Firm Capital Mortgage Investment Corp.(1) | 600 | 5,601 | ||||||
First Majestic Silver Corp.(1) | 900 | 6,572 | ||||||
First Mining Gold Corp.(1)(2) | 9,000 | 1,508 | ||||||
First National Financial Corp.(1) | 400 | 11,327 | ||||||
| First Quantum Minerals Ltd. | 7,200 | 127,406 | ||||||
| FirstService Corp. | 200 | 25,018 | ||||||
| Fortis, Inc. | 3,700 | 163,230 | ||||||
Fortuna Silver Mines, Inc.(1)(2) | 3,699 | 8,562 | ||||||
| Franco-Nevada Corp. | 600 | 72,136 | ||||||
Freehold Royalties Ltd.(1) | 1,300 | 14,194 | ||||||
Frontera Energy Corp.(2) | 1,500 | 12,666 | ||||||
Galiano Gold, Inc.(1)(2) | 1,100 | 528 | ||||||
| GCM Mining Corp. | 2,600 | 6,474 | ||||||
| Gear Energy Ltd. | 16,300 | 15,390 | ||||||
| George Weston Ltd. | 800 | 91,461 | ||||||
| GFL Environmental, Inc. | 1,100 | 30,989 | ||||||
| Gibson Energy, Inc. | 1,000 | 18,875 | ||||||
| Gildan Activewear, Inc. | 1,700 | 50,274 | ||||||
| goeasy Ltd. | 200 | 18,253 | ||||||
Great-West Lifeco, Inc.(1) | 3,200 | 75,167 | ||||||
Headwater Exploration, Inc.(2) | 3,100 | 14,139 | ||||||
Heroux-Devtek, Inc.(2) | 600 | 5,971 | ||||||
High Liner Foods, Inc.(1) | 200 | 2,045 | ||||||
Home Capital Group, Inc.(1) | 941 | 20,019 | ||||||
85
| Avantis International Equity Fund | ||||||||
| Shares | Value | |||||||
Hudbay Minerals, Inc.(1) | 4,900 | $ | 21,639 | |||||
Hut 8 Mining Corp.(1)(2) | 2,300 | 4,746 | ||||||
| Hydro One Ltd. | 3,700 | 100,180 | ||||||
i-80 Gold Corp.(2) | 800 | 1,431 | ||||||
| iA Financial Corp., Inc. | 2,200 | 118,179 | ||||||
IAMGOLD Corp.(1)(2) | 5,900 | 7,053 | ||||||
| IGM Financial, Inc. | 600 | 16,332 | ||||||
Imperial Oil Ltd.(1) | 2,300 | 112,885 | ||||||
| Intact Financial Corp. | 1,100 | 159,344 | ||||||
Interfor Corp.(2) | 1,700 | 41,822 | ||||||
International Petroleum Corp.(1)(2) | 127 | 1,250 | ||||||
Ivanhoe Mines Ltd., Class A(1)(2) | 2,400 | 15,423 | ||||||
Jamieson Wellness, Inc.(1) | 600 | 16,780 | ||||||
K92 Mining, Inc.(2) | 2,600 | 13,402 | ||||||
Karora Resources, Inc.(2) | 1,900 | 4,138 | ||||||
Kelt Exploration Ltd.(2) | 4,300 | 20,594 | ||||||
Keyera Corp.(1) | 4,400 | 108,413 | ||||||
| Kinross Gold Corp. | 16,500 | 54,148 | ||||||
Knight Therapeutics, Inc.(2) | 2,400 | 10,416 | ||||||
Labrador Iron Ore Royalty Corp.(1) | 1,100 | 24,448 | ||||||
Largo, Inc.(1)(2) | 700 | 4,765 | ||||||
| Laurentian Bank of Canada | 1,000 | 27,396 | ||||||
| LifeWorks, Inc. | 300 | 7,294 | ||||||
| Linamar Corp. | 1,000 | 47,276 | ||||||
| Loblaw Cos. Ltd. | 1,500 | 132,566 | ||||||
| Lundin Gold, Inc. | 2,400 | 16,026 | ||||||
Lundin Mining Corp.(1) | 11,400 | 59,285 | ||||||
| Magna International, Inc. | 3,400 | 196,412 | ||||||
Major Drilling Group International, Inc.(2) | 3,271 | 22,166 | ||||||
| Manulife Financial Corp. | 21,900 | 378,854 | ||||||
Maple Leaf Foods, Inc.(1) | 400 | 7,057 | ||||||
Martinrea International, Inc.(1) | 1,900 | 14,973 | ||||||
MCAN Mortgage Corp.(1) | 400 | 4,873 | ||||||
| Medical Facilities Corp. | 700 | 5,362 | ||||||
MEG Energy Corp.(2) | 6,500 | 90,867 | ||||||
| Methanex Corp. | 1,400 | 50,602 | ||||||
Metro, Inc.(1) | 1,900 | 99,937 | ||||||
| MTY Food Group, Inc. | 200 | 8,942 | ||||||
| Mullen Group Ltd. | 2,800 | 29,975 | ||||||
| National Bank of Canada | 4,100 | 271,252 | ||||||
New Gold, Inc. (Toronto)(2) | 14,500 | 9,384 | ||||||
North American Construction Group Ltd.(1) | 700 | 8,048 | ||||||
| North West Co., Inc. | 700 | 18,148 | ||||||
| Northland Power, Inc. | 2,880 | 98,591 | ||||||
Novagold Resources, Inc.(2) | 9,601 | 42,532 | ||||||
| Nutrien Ltd. | 3,500 | 321,312 | ||||||
Nuvei Corp.(2) | 500 | 15,301 | ||||||
NuVista Energy Ltd.(2) | 4,900 | 40,294 | ||||||
Obsidian Energy Ltd.(2) | 2,300 | 20,700 | ||||||
OceanaGold Corp.(2) | 18,400 | 27,179 | ||||||
| Onex Corp. | 1,200 | 59,344 | ||||||
86
| Avantis International Equity Fund | ||||||||
| Shares | Value | |||||||
| Open Text Corp. | 2,300 | $ | 72,449 | |||||
| Osisko Gold Royalties Ltd. (Toronto) | 900 | 8,710 | ||||||
Osisko Mining, Inc.(2) | 1,400 | 2,697 | ||||||
Pan American Silver Corp.(1) | 3,270 | 48,651 | ||||||
Paramount Resources Ltd., A Shares(1) | 1,700 | 38,754 | ||||||
| Parex Resources, Inc. | 3,200 | 51,191 | ||||||
Parkland Corp.(1) | 400 | 9,819 | ||||||
| Pason Systems, Inc. | 1,100 | 11,642 | ||||||
Pembina Pipeline Corp.(1) | 3,900 | 137,726 | ||||||
| Pet Valu Holdings Ltd. | 200 | 5,109 | ||||||
Peyto Exploration & Development Corp.(1) | 5,900 | 55,031 | ||||||
Pine Cliff Energy Ltd.(1) | 6,700 | 9,642 | ||||||
Pipestone Energy Corp.(2) | 4,000 | 14,863 | ||||||
Pizza Pizza Royalty Corp.(1) | 200 | 2,004 | ||||||
Polaris Renewable Energy, Inc.(1) | 400 | 5,872 | ||||||
Pollard Banknote Ltd.(1) | 200 | 2,951 | ||||||
| Power Corp. of Canada | 1,805 | 46,412 | ||||||
| PrairieSky Royalty Ltd. | 2,400 | 32,710 | ||||||
Precision Drilling Corp.(1)(2) | 300 | 18,438 | ||||||
| Primo Water Corp. | 700 | 9,194 | ||||||
| Quarterhill, Inc. | 800 | 1,151 | ||||||
Quebecor, Inc., Class B(1) | 1,800 | 38,882 | ||||||
Real Matters, Inc.(1)(2) | 650 | 2,866 | ||||||
Recipe UnLtd. Corp.(2) | 330 | 4,942 | ||||||
Resolute Forest Products, Inc.(2) | 500 | 10,119 | ||||||
| Restaurant Brands International, Inc. | 2,300 | 135,774 | ||||||
| Richelieu Hardware Ltd. | 400 | 10,693 | ||||||
| Ritchie Bros Auctioneers, Inc. | 1,000 | 69,273 | ||||||
| Rogers Communications, Inc., Class B | 1,000 | 43,058 | ||||||
| Royal Bank of Canada | 7,283 | 677,255 | ||||||
| Russel Metals, Inc. | 1,500 | 32,436 | ||||||
Sabina Gold & Silver Corp.(2) | 3,500 | 2,825 | ||||||
| Sandstorm Gold Ltd. | 800 | 4,550 | ||||||
| Saputo, Inc. | 900 | 22,854 | ||||||
| Secure Energy Services, Inc. | 2,000 | 8,695 | ||||||
| Shaw Communications, Inc., B Shares | 2,900 | 74,369 | ||||||
Shawcor Ltd.(2) | 2,500 | 14,962 | ||||||
Shopify, Inc., Class A(2) | 2,000 | 63,319 | ||||||
Sienna Senior Living, Inc.(1) | 100 | 1,015 | ||||||
| Silvercorp Metals, Inc. | 800 | 1,821 | ||||||
| Sleep Country Canada Holdings, Inc. | 600 | 12,106 | ||||||
| Softchoice Corp. | 1,100 | 15,386 | ||||||
Spartan Delta Corp.(1)(2) | 3,800 | 38,337 | ||||||
Spin Master Corp., VTG Shares(2) | 600 | 21,061 | ||||||
SSR Mining, Inc.(1) | 2,809 | 37,921 | ||||||
| SSR Mining, Inc. (NASDAQ) | 1,697 | 22,893 | ||||||
| Stantec, Inc. | 700 | 33,221 | ||||||
| Stelco Holdings, Inc. | 1,300 | 35,189 | ||||||
Stella-Jones, Inc.(1) | 900 | 27,404 | ||||||
| StorageVault Canada, Inc. | 1,200 | 5,574 | ||||||
| Sun Life Financial, Inc. | 3,300 | 145,382 | ||||||
87
| Avantis International Equity Fund | ||||||||
| Shares | Value | |||||||
| Suncor Energy, Inc. | 15,666 | $ | 506,832 | |||||
SunOpta, Inc.(1)(2) | 900 | 8,950 | ||||||
| Surge Energy, Inc. | 2,500 | 19,188 | ||||||
Tamarack Valley Energy Ltd.(1) | 10,100 | 32,222 | ||||||
Taseko Mines Ltd.(1)(2) | 3,500 | 3,651 | ||||||
| TC Energy Corp. | 3,600 | 173,483 | ||||||
| Teck Resources Ltd., Class B | 6,700 | 226,913 | ||||||
| TELUS Corp. | 2,300 | 51,802 | ||||||
| TFI International, Inc. | 500 | 49,884 | ||||||
| Thomson Reuters Corp. | 400 | 44,046 | ||||||
| Tidewater Midstream and Infrastructure Ltd. | 8,200 | 7,555 | ||||||
Timbercreek Financial Corp.(1) | 1,500 | 9,240 | ||||||
| TMX Group Ltd. | 300 | 30,129 | ||||||
Torex Gold Resources, Inc.(2) | 1,738 | 12,903 | ||||||
| Toromont Industries Ltd. | 1,000 | 77,405 | ||||||
| Toronto-Dominion Bank | 6,290 | 404,646 | ||||||
| Total Energy Services, Inc. | 1,600 | 8,857 | ||||||
| Tourmaline Oil Corp. | 4,800 | 283,793 | ||||||
TransAlta Corp.(1) | 4,800 | 45,063 | ||||||
TransAlta Renewables, Inc.(1) | 500 | 6,617 | ||||||
| Transcontinental, Inc., Class A | 560 | 7,061 | ||||||
TransGlobe Energy Corp.(1) | 4,600 | 15,271 | ||||||
Treasury Metals, Inc.(1)(2) | 300 | 83 | ||||||
Trican Well Service Ltd.(1)(2) | 3,500 | 9,247 | ||||||
| Tricon Residential, Inc. (Toronto) | 1,930 | 20,147 | ||||||
Trisura Group Ltd.(1)(2) | 500 | 13,241 | ||||||
Turquoise Hill Resources Ltd.(2) | 1,400 | 38,503 | ||||||
Uni-Select, Inc.(2) | 800 | 22,629 | ||||||
| Vermilion Energy, Inc. | 4,233 | 113,065 | ||||||
Victoria Gold Corp.(2) | 1,300 | 7,701 | ||||||
Viemed Healthcare, Inc.(2) | 200 | 1,195 | ||||||
Viemed Healthcare, Inc. (Toronto)(2) | 474 | 2,811 | ||||||
| Wajax Corp. | 500 | 8,079 | ||||||
Wesdome Gold Mines Ltd.(2) | 2,200 | 12,865 | ||||||
| West Fraser Timber Co. Ltd. | 1,472 | 131,694 | ||||||
| Western Forest Products, Inc. | 5,500 | 6,449 | ||||||
Westshore Terminals Investment Corp.(1) | 600 | 13,970 | ||||||
Wheaton Precious Metals Corp.(1) | 1,700 | 51,893 | ||||||
Whitecap Resources, Inc.(1) | 10,796 | 78,667 | ||||||
| Winpak Ltd. | 200 | 6,614 | ||||||
| WSP Global, Inc. | 700 | 83,418 | ||||||
| Yamana Gold, Inc. | 15,200 | 67,126 | ||||||
Yangarra Resources Ltd.(2) | 4,100 | 8,803 | ||||||
| 14,895,705 | ||||||||
China† | ||||||||
Fullshare Holdings Ltd.(1)(2) | 167,500 | 2,599 | ||||||
| Truly International Holdings Ltd. | 24,000 | 5,258 | ||||||
| 7,857 | ||||||||
| Denmark — 2.3% | ||||||||
ALK-Abello A/S(2) | 1,597 | 29,691 | ||||||
| Alm Brand A/S | 21,735 | 31,847 | ||||||
88
| Avantis International Equity Fund | ||||||||
| Shares | Value | |||||||
| AP Moller - Maersk A/S, A Shares | 33 | $ | 77,092 | |||||
| AP Moller - Maersk A/S, B Shares | 58 | 139,151 | ||||||
Bang & Olufsen A/S(2) | 1,614 | 2,796 | ||||||
Bavarian Nordic A/S(2) | 1,131 | 42,612 | ||||||
| Carlsberg A/S, B Shares | 328 | 42,591 | ||||||
| Chemometec A/S | 181 | 19,363 | ||||||
| Chr Hansen Holding A/S | 468 | 27,269 | ||||||
| Coloplast A/S, B Shares | 598 | 68,310 | ||||||
| D/S Norden A/S | 947 | 44,153 | ||||||
| Danske Bank A/S | 6,414 | 85,646 | ||||||
Demant A/S(2) | 632 | 19,468 | ||||||
| Dfds A/S | 682 | 23,599 | ||||||
Drilling Co. of 1972 A/S(2) | 360 | 17,083 | ||||||
| DSV A/S | 611 | 90,286 | ||||||
| FLSmidth & Co. A/S | 362 | 10,020 | ||||||
Genmab A/S, ADR(2) | 4,871 | 172,872 | ||||||
| GN Store Nord A/S | 283 | 8,004 | ||||||
| H Lundbeck A/S | 3,924 | 15,411 | ||||||
H Lundbeck A/S, A Shares(2) | 981 | 3,757 | ||||||
H+H International A/S, B Shares(2) | 331 | 5,320 | ||||||
ISS A/S(2) | 46 | 805 | ||||||
Jyske Bank A/S(2) | 846 | 42,346 | ||||||
Nilfisk Holding A/S(2) | 257 | 5,748 | ||||||
NKT A/S(2) | 487 | 24,860 | ||||||
NNIT A/S(2) | 254 | 2,295 | ||||||
| Novo Nordisk A/S, ADR | 10,888 | 1,155,217 | ||||||
| Novozymes A/S, B Shares | 2,575 | 147,789 | ||||||
| Orsted A/S | 1,295 | 126,395 | ||||||
| Pandora A/S | 903 | 54,249 | ||||||
| Per Aarsleff Holding A/S | 341 | 9,806 | ||||||
| Ringkjoebing Landbobank A/S | 334 | 35,661 | ||||||
| ROCKWOOL A/S, B Shares | 68 | 13,997 | ||||||
| Royal Unibrew A/S | 310 | 23,225 | ||||||
| Schouw & Co. A/S | 57 | 4,156 | ||||||
| SimCorp A/S | 408 | 29,795 | ||||||
| Solar A/S, B Shares | 136 | 10,995 | ||||||
| SP Group A/S | 96 | 3,561 | ||||||
| Spar Nord Bank A/S | 1,639 | 18,558 | ||||||
| Sydbank A/S | 1,105 | 31,930 | ||||||
| Topdanmark A/S | 699 | 36,656 | ||||||
| TORM PLC | 676 | 13,108 | ||||||
| Tryg A/S | 2,333 | 52,716 | ||||||
| Vestas Wind Systems A/S | 8,337 | 208,601 | ||||||
| 3,028,810 | ||||||||
| Finland — 0.9% | ||||||||
| Aktia Bank Oyj | 500 | 5,161 | ||||||
| Anora Group Oyj | 109 | 888 | ||||||
| Cargotec Oyj, B Shares | 258 | 8,774 | ||||||
| Caverion OYJ | 704 | 3,444 | ||||||
Citycon Oyj(2) | 1,917 | 13,585 | ||||||
| Elisa Oyj | 863 | 46,152 | ||||||
89
| Avantis International Equity Fund | ||||||||
| Shares | Value | |||||||
| Fortum Oyj | 3,183 | $ | 32,742 | |||||
HKScan Oyj, A Shares(1) | 1,333 | 1,535 | ||||||
| Huhtamaki Oyj | 439 | 15,373 | ||||||
| Kemira Oyj | 1,934 | 23,279 | ||||||
| Kesko Oyj, B Shares | 3,922 | 82,510 | ||||||
| Kojamo Oyj | 1,599 | 26,771 | ||||||
| Kone Oyj, B Shares | 2,175 | 86,984 | ||||||
| Konecranes Oyj | 267 | 6,277 | ||||||
| Marimekko Oyj | 615 | 6,065 | ||||||
| Metsa Board Oyj | 3,411 | 29,325 | ||||||
| Metso Outotec Oyj | 5,171 | 40,443 | ||||||
Musti Group Oyj(2) | 248 | 4,904 | ||||||
| Neste Oyj | 1,987 | 98,032 | ||||||
| Nokia Oyj, ADR | 24,146 | 121,937 | ||||||
| Nokian Renkaat Oyj | 1,505 | 15,619 | ||||||
| Oriola Oyj, B Shares | 441 | 837 | ||||||
| Orion Oyj, Class B | 1,227 | 55,632 | ||||||
| Outokumpu Oyj | 4,900 | 19,649 | ||||||
Puuilo Oyj(1) | 1,119 | 5,337 | ||||||
QT Group Oyj(1)(2) | 196 | 9,937 | ||||||
| Revenio Group Oyj | 298 | 13,480 | ||||||
| Rovio Entertainment Oyj | 2,326 | 13,998 | ||||||
| Sampo Oyj, A Shares | 2,794 | 126,401 | ||||||
| Sanoma Oyj | 490 | 6,683 | ||||||
| Stora Enso Oyj, R Shares | 6,724 | 100,093 | ||||||
| TietoEVRY Oyj | 97 | 2,482 | ||||||
| Tokmanni Group Corp. | 974 | 11,628 | ||||||
| UPM-Kymmene Oyj | 3,325 | 112,965 | ||||||
| Uponor Oyj | 1,775 | 26,597 | ||||||
| Valmet Oyj | 1,568 | 39,745 | ||||||
| Wartsila Oyj Abp | 3,316 | 27,341 | ||||||
YIT Oyj(1) | 2,168 | 7,094 | ||||||
| 1,249,699 | ||||||||
| France — 8.8% | ||||||||
| ABC arbitrage | 396 | 2,798 | ||||||
Accor SA(2) | 1,260 | 30,052 | ||||||
Aeroports de Paris(2) | 289 | 39,573 | ||||||
Air France-KLM(2) | 8,044 | 11,743 | ||||||
| Air Liquide SA | 2,567 | 321,678 | ||||||
| Airbus SE | 3,000 | 293,979 | ||||||
| AKWEL | 46 | 832 | ||||||
| ALD SA | 2,285 | 24,871 | ||||||
Alstom SA(1) | 1,620 | 33,199 | ||||||
| Alten SA | 263 | 32,336 | ||||||
| Amundi SA | 513 | 26,011 | ||||||
| APERAM SA | 810 | 21,863 | ||||||
ArcelorMittal SA(1) | 6,560 | 154,750 | ||||||
| Arkema SA | 1,244 | 105,021 | ||||||
Atari SA(1)(2) | 7,088 | 903 | ||||||
Atos SE(2) | 526 | 5,307 | ||||||
| Aubay | 27 | 1,322 | ||||||
90
| Avantis International Equity Fund | ||||||||
| Shares | Value | |||||||
| AXA SA | 20,424 | $ | 481,018 | |||||
| Beneteau SA | 586 | 6,247 | ||||||
| Bigben Interactive | 62 | 758 | ||||||
| BioMerieux | 776 | 70,965 | ||||||
| BNP Paribas SA | 6,677 | 310,281 | ||||||
| Bollore SE | 8,843 | 42,259 | ||||||
| Bonduelle SCA | 188 | 2,428 | ||||||
| Bouygues SA | 4,907 | 144,143 | ||||||
| Bureau Veritas SA | 5,933 | 147,257 | ||||||
| Capgemini SE | 635 | 109,714 | ||||||
| Carrefour SA | 10,611 | 177,103 | ||||||
Casino Guichard Perrachon SA(1)(2) | 675 | 8,747 | ||||||
| Catana Group | 769 | 4,753 | ||||||
Cellectis SA, ADR(2) | 316 | 1,046 | ||||||
CGG SA(2) | 9,736 | 9,206 | ||||||
| Chargeurs SA | 243 | 3,641 | ||||||
| Cie de Saint-Gobain | 5,538 | 223,058 | ||||||
Cie des Alpes(2) | 439 | 6,945 | ||||||
| Cie Generale des Etablissements Michelin SCA | 9,523 | 231,611 | ||||||
| Cie Plastic Omnium SA | 1,492 | 27,665 | ||||||
Coface SA(2) | 2,961 | 29,608 | ||||||
| Credit Agricole SA | 8,811 | 81,094 | ||||||
| Danone SA | 1,399 | 73,616 | ||||||
| Dassault Aviation SA | 712 | 97,779 | ||||||
| Dassault Systemes SE | 3,545 | 136,706 | ||||||
| Derichebourg SA | 3,292 | 18,519 | ||||||
| Edenred | 1,271 | 64,286 | ||||||
| Eiffage SA | 2,283 | 200,801 | ||||||
| Electricite de France SA | 4,088 | 48,877 | ||||||
| Elis SA | 536 | 6,854 | ||||||
| Engie SA | 16,123 | 191,494 | ||||||
| Eramet SA | 355 | 30,098 | ||||||
| Esker SA | 37 | 4,797 | ||||||
| EssilorLuxottica SA | 830 | 123,618 | ||||||
Esso SA Francaise(2) | 168 | 10,337 | ||||||
| Etablissements Maurel et Prom SA | 1,540 | 7,794 | ||||||
| Eurazeo SE | 1,052 | 62,826 | ||||||
Euroapi SA(2) | 956 | 14,903 | ||||||
Eurobio Scientific SA(2) | 276 | 5,089 | ||||||
| Eurofins Scientific SE | 1,381 | 95,549 | ||||||
| Euronext NV | 633 | 46,781 | ||||||
| Eutelsat Communications SA | 4,418 | 39,961 | ||||||
Faurecia SE(2) | 3,229 | 46,307 | ||||||
| Fnac Darty SA | 114 | 3,838 | ||||||
Focus Entertainment(2) | 53 | 2,397 | ||||||
| Gaztransport Et Technigaz SA | 753 | 95,860 | ||||||
Genfit(2) | 1,825 | 7,727 | ||||||
| Getlink SE | 5,947 | 111,988 | ||||||
Groupe LDLC(1) | 99 | 2,698 | ||||||
| Hermes International | 210 | 268,961 | ||||||
ID Logistics Group(2) | 79 | 22,103 | ||||||
91
| Avantis International Equity Fund | ||||||||
| Shares | Value | |||||||
| Imerys SA | 604 | $ | 17,477 | |||||
| Infotel SA | 51 | 2,562 | ||||||
Innate Pharma SA(1)(2) | 719 | 1,922 | ||||||
| Ipsen SA | 1,009 | 96,700 | ||||||
| Jacquet Metals SACA | 231 | 3,658 | ||||||
JCDecaux SA(2) | 633 | 8,777 | ||||||
Kaufman & Broad SA(1) | 197 | 4,666 | ||||||
| Kering SA | 520 | 260,911 | ||||||
| L'Oreal SA | 828 | 284,372 | ||||||
| La Francaise des Jeux SAEM | 2,967 | 96,232 | ||||||
| Legrand SA | 737 | 53,325 | ||||||
| LISI | 253 | 5,358 | ||||||
| LVMH Moet Hennessy Louis Vuitton SE | 1,342 | 865,948 | ||||||
Maisons du Monde SA(1) | 672 | 6,432 | ||||||
| Manitou BF SA | 243 | 4,001 | ||||||
| Mersen SA | 475 | 14,047 | ||||||
| Metropole Television SA | 937 | 11,567 | ||||||
Nacon SA(1)(2) | 27 | 131 | ||||||
| Neoen SA | 875 | 36,142 | ||||||
| Nexans SA | 621 | 56,739 | ||||||
| Nexity SA | 557 | 12,472 | ||||||
Novacyt SA(2) | 1,610 | 1,914 | ||||||
Orange SA, ADR(1) | 29,450 | 297,151 | ||||||
Orpea SA(1)(2) | 451 | 9,812 | ||||||
| Pernod Ricard SA | 986 | 180,920 | ||||||
| Publicis Groupe SA | 982 | 47,946 | ||||||
| Quadient SA | 622 | 10,536 | ||||||
| Remy Cointreau SA | 170 | 31,529 | ||||||
Renault SA(2) | 3,115 | 88,724 | ||||||
ReWorld Media SA(2) | 641 | 4,064 | ||||||
Rexel SA(2) | 2,669 | 43,350 | ||||||
| Rubis SCA | 851 | 20,061 | ||||||
| Safran SA | 3,249 | 331,250 | ||||||
| Sanofi, ADR | 9,985 | 409,685 | ||||||
| Sartorius Stedim Biotech | 112 | 40,965 | ||||||
| Schneider Electric SE | 1,033 | 122,780 | ||||||
| SCOR SE | 3,011 | 49,827 | ||||||
| SEB SA | 387 | 28,663 | ||||||
| SES SA | 12,776 | 89,692 | ||||||
SES-imagotag SA(2) | 222 | 22,187 | ||||||
SMCP SA(2) | 707 | 3,872 | ||||||
| Societe BIC SA | 346 | 19,683 | ||||||
| Societe Generale SA | 9,650 | 212,738 | ||||||
| Sodexo SA | 422 | 32,275 | ||||||
SOITEC(2) | 372 | 52,540 | ||||||
Solutions 30 SE(1)(2) | 1,773 | 5,175 | ||||||
| Sopra Steria Group SACA | 213 | 29,401 | ||||||
| SPIE SA | 1,881 | 40,952 | ||||||
| STMicroelectronics NV, NY Shares | 10,472 | 365,473 | ||||||
| Technip Energies NV | 1,549 | 19,367 | ||||||
| Teleperformance | 503 | 143,258 | ||||||
92
| Avantis International Equity Fund | ||||||||
| Shares | Value | |||||||
| Television Francaise 1 | 741 | $ | 4,699 | |||||
| Thales SA | 1,885 | 227,257 | ||||||
| TotalEnergies SE, ADR | 17,336 | 875,641 | ||||||
| Trigano SA | 86 | 7,445 | ||||||
Ubisoft Entertainment SA(2) | 2,348 | 108,278 | ||||||
| Valeo | 4,638 | 88,594 | ||||||
Vallourec SA(2) | 2,861 | 29,784 | ||||||
| Veolia Environnement SA | 3,471 | 77,360 | ||||||
| Verallia SA | 2,032 | 46,586 | ||||||
| Vicat SA | 337 | 8,528 | ||||||
| Vilmorin & Cie SA | 141 | 6,059 | ||||||
| Vinci SA | 4,463 | 411,727 | ||||||
| Virbac SA | 55 | 20,390 | ||||||
| Vivendi SE | 7,547 | 68,409 | ||||||
| Wavestone | 105 | 4,890 | ||||||
Worldline SA(2) | 151 | 6,469 | ||||||
X-Fab Silicon Foundries SE(2) | 1,705 | 10,586 | ||||||
| 11,670,280 | ||||||||
| Germany — 6.1% | ||||||||
| 1&1 AG | 260 | 4,179 | ||||||
| 7C Solarparken AG | 2,864 | 15,415 | ||||||
Aareal Bank AG(2) | 477 | 15,236 | ||||||
| Adesso SE | 58 | 7,028 | ||||||
| adidas AG | 1,355 | 200,924 | ||||||
ADLER Group SA(2) | 223 | 625 | ||||||
| Allianz SE | 1,867 | 315,591 | ||||||
| Amadeus Fire AG | 60 | 5,986 | ||||||
| Aroundtown SA | 14,194 | 41,398 | ||||||
| Atoss Software AG | 106 | 14,061 | ||||||
| AURELIUS Equity Opportunities SE & Co. KGaA | 862 | 20,016 | ||||||
| Aurubis AG | 774 | 46,863 | ||||||
| BASF SE | 6,157 | 260,434 | ||||||
| Bayer AG | 4,528 | 239,477 | ||||||
| Bayerische Motoren Werke AG | 2,707 | 199,448 | ||||||
| Bayerische Motoren Werke AG, Preference Shares | 433 | 30,104 | ||||||
| BayWa AG | 138 | 5,970 | ||||||
| Bechtle AG | 696 | 26,663 | ||||||
| Befesa SA | 386 | 15,886 | ||||||
| Beiersdorf AG | 1,086 | 109,621 | ||||||
| Bertrandt AG | 99 | 3,379 | ||||||
Bijou Brigitte AG(2) | 20 | 657 | ||||||
| Bilfinger SE | 352 | 10,451 | ||||||
Borussia Dortmund GmbH & Co. KGaA(2) | 870 | 3,409 | ||||||
| Brenntag SE | 894 | 58,617 | ||||||
| CANCOM SE | 186 | 5,209 | ||||||
| Carl Zeiss Meditec AG | 316 | 39,329 | ||||||
| CECONOMY AG | 4,325 | 6,257 | ||||||
| Cewe Stiftung & Co. KGAA | 104 | 8,223 | ||||||
Commerzbank AG(2) | 16,189 | 107,720 | ||||||
| CompuGroup Medical SE & Co. KgaA | 280 | 10,531 | ||||||
| Continental AG | 736 | 42,375 | ||||||
93
| Avantis International Equity Fund | ||||||||
| Shares | Value | |||||||
| Covestro AG | 3,000 | $ | 90,456 | |||||
| CropEnergies AG | 109 | 1,786 | ||||||
CTS Eventim AG & Co. KGaA(2) | 848 | 45,592 | ||||||
Daimler Truck Holding AG(2) | 6,407 | 163,820 | ||||||
Delivery Hero SE(2) | 303 | 12,575 | ||||||
| Dermapharm Holding SE | 272 | 12,616 | ||||||
| Deutsche Bank AG | 19,454 | 161,663 | ||||||
| Deutsche Beteiligungs AG | 216 | 6,041 | ||||||
| Deutsche Boerse AG | 1,171 | 197,986 | ||||||
Deutsche Lufthansa AG(2) | 12,411 | 73,787 | ||||||
| Deutsche Pfandbriefbank AG | 2,973 | 25,657 | ||||||
| Deutsche Post AG | 6,123 | 223,484 | ||||||
| Deutsche Telekom AG | 21,751 | 409,946 | ||||||
| Deutz AG | 2,787 | 10,495 | ||||||
| DIC Asset AG | 312 | 3,194 | ||||||
| Draegerwerk AG & Co. KGaA | 78 | 3,153 | ||||||
| Draegerwerk AG & Co. KGaA, Preference Shares | 416 | 19,682 | ||||||
| Duerr AG | 958 | 21,102 | ||||||
| E.ON SE | 13,971 | 119,167 | ||||||
| Eckert & Ziegler Strahlen- und Medizintechnik AG | 152 | 5,990 | ||||||
| Elmos Semiconductor SE | 204 | 8,654 | ||||||
| ElringKlinger AG | 121 | 849 | ||||||
| Encavis AG | 2,548 | 54,454 | ||||||
| Energiekontor AG | 210 | 18,447 | ||||||
| Evonik Industries AG | 2,361 | 44,021 | ||||||
Evotec SE(2) | 1,401 | 30,799 | ||||||
| Fielmann AG | 598 | 22,223 | ||||||
flatexDEGIRO AG(2) | 1,036 | 9,969 | ||||||
Fraport AG Frankfurt Airport Services Worldwide(2) | 157 | 6,789 | ||||||
| Freenet AG | 1,139 | 24,826 | ||||||
| Fresenius Medical Care AG & Co. KGaA, ADR | 1,743 | 29,805 | ||||||
| Fresenius SE & Co. KGaA | 368 | 9,104 | ||||||
| FUCHS PETROLUB SE, Preference Shares | 646 | 17,483 | ||||||
| GEA Group AG | 2,145 | 74,618 | ||||||
| Gerresheimer AG | 696 | 36,407 | ||||||
| GFT Technologies SE | 224 | 7,446 | ||||||
| Grand City Properties SA | 1,116 | 13,241 | ||||||
| GRENKE AG | 380 | 9,137 | ||||||
| Hamburger Hafen und Logistik AG | 771 | 9,429 | ||||||
| Hannover Rueck SE | 505 | 74,430 | ||||||
| HeidelbergCement AG | 2,037 | 91,986 | ||||||
Heidelberger Druckmaschinen AG(2) | 3,633 | 5,298 | ||||||
HelloFresh SE(2) | 1,739 | 41,520 | ||||||
| Henkel AG & Co. KGaA | 460 | 28,768 | ||||||
| Henkel AG & Co. KGaA, Preference Shares | 789 | 50,917 | ||||||
| Hensoldt AG | 650 | 14,455 | ||||||
| HOCHTIEF AG | 490 | 24,193 | ||||||
| Hornbach Holding AG & Co. KGaA | 279 | 19,680 | ||||||
| HUGO BOSS AG | 1,494 | 81,426 | ||||||
Hypoport SE(2) | 22 | 4,296 | ||||||
| Indus Holding AG | 450 | 10,046 | ||||||
94
| Avantis International Equity Fund | ||||||||
| Shares | Value | |||||||
| Infineon Technologies AG | 5,657 | $ | 138,420 | |||||
| Instone Real Estate Group SE | 786 | 6,958 | ||||||
| Jenoptik AG | 553 | 11,703 | ||||||
| JOST Werke AG | 365 | 13,527 | ||||||
| Jungheinrich AG, Preference Shares | 1,272 | 31,054 | ||||||
| K+S AG | 3,931 | 89,554 | ||||||
| KION Group AG | 468 | 18,700 | ||||||
| Kloeckner & Co. SE | 1,094 | 9,873 | ||||||
| Knorr-Bremse AG | 959 | 46,478 | ||||||
Koenig & Bauer AG(2) | 246 | 2,868 | ||||||
| Kontron AG | 1,115 | 16,964 | ||||||
| Krones AG | 359 | 29,565 | ||||||
| KSB SE & Co. KGaA, Preference Shares | 15 | 4,635 | ||||||
| KWS Saat SE & Co. KGaA | 122 | 7,423 | ||||||
| Lang & Schwarz AG | 141 | 2,009 | ||||||
| Lanxess AG | 1,307 | 44,100 | ||||||
| LEG Immobilien SE | 610 | 46,100 | ||||||
| Leifheit AG | 4 | 62 | ||||||
Leoni AG(2) | 416 | 2,916 | ||||||
LPKF Laser & Electronics AG(2) | 302 | 2,611 | ||||||
| Mercedes-Benz Group AG | 5,288 | 296,475 | ||||||
| Merck KGaA | 375 | 64,417 | ||||||
METRO AG(2) | 2,732 | 21,750 | ||||||
| MLP SE | 786 | 4,341 | ||||||
| MTU Aero Engines AG | 938 | 165,428 | ||||||
| Muenchener Rueckversicherungs-Gesellschaft AG | 1,090 | 260,424 | ||||||
| Mutares SE & Co. KGaA | 412 | 6,650 | ||||||
Nagarro SE(2) | 105 | 10,552 | ||||||
| Nemetschek SE | 560 | 32,990 | ||||||
| New Work SE | 30 | 3,576 | ||||||
| Norma Group SE | 326 | 5,126 | ||||||
| OHB SE | 22 | 781 | ||||||
| PATRIZIA SE | 274 | 3,464 | ||||||
| Pfeiffer Vacuum Technology AG | 35 | 4,619 | ||||||
| Porsche Automobil Holding SE, Preference Shares | 1,458 | 102,803 | ||||||
| ProSiebenSat.1 Media SE | 1,049 | 8,109 | ||||||
publity AG(2) | 24 | 694 | ||||||
| Puma SE | 729 | 44,559 | ||||||
PVA TePla AG(2) | 186 | 3,124 | ||||||
QIAGEN NV(2) | 1,802 | 81,865 | ||||||
| Rational AG | 50 | 26,968 | ||||||
| Rheinmetall AG | 778 | 123,504 | ||||||
| RTL Group SA | 47 | 1,746 | ||||||
| RWE AG | 8,644 | 330,005 | ||||||
| SAF-Holland SE | 676 | 5,379 | ||||||
| Salzgitter AG | 583 | 14,333 | ||||||
| SAP SE, ADR | 1,936 | 164,986 | ||||||
| Sartorius AG, Preference Shares | 147 | 61,244 | ||||||
| Schaeffler AG, Preference Shares | 2,472 | 12,879 | ||||||
| Scout24 SE | 365 | 21,029 | ||||||
| Secunet Security Networks AG | 55 | 11,968 | ||||||
95
| Avantis International Equity Fund | ||||||||
| Shares | Value | |||||||
SGL Carbon SE(2) | 2,080 | $ | 14,136 | |||||
| Siemens AG | 2,474 | 250,602 | ||||||
Siemens Energy AG(2) | 2,395 | 35,229 | ||||||
| Siemens Healthineers AG | 1,686 | 82,388 | ||||||
| Siltronic AG | 314 | 21,518 | ||||||
| Sixt SE | 346 | 33,834 | ||||||
| Sixt SE, Preference Shares | 398 | 23,789 | ||||||
SMA Solar Technology AG(2) | 128 | 6,440 | ||||||
| Software AG | 120 | 3,264 | ||||||
| Stabilus SA | 504 | 25,779 | ||||||
| Steico SE | 77 | 5,919 | ||||||
| STO SE & Co. KGaA, Preference Shares | 45 | 7,038 | ||||||
| STRATEC SE | 85 | 7,245 | ||||||
| Stroeer SE & Co. KGaA | 379 | 16,107 | ||||||
| Suedzucker AG | 1,714 | 23,504 | ||||||
| SUESS MicroTec SE | 143 | 1,771 | ||||||
| Symrise AG | 665 | 69,582 | ||||||
| Synlab AG | 1,246 | 18,267 | ||||||
| TAG Immobilien AG | 2,539 | 23,423 | ||||||
TeamViewer AG(2) | 2,316 | 23,176 | ||||||
| Technotrans SE | 128 | 3,475 | ||||||
| Telefonica Deutschland Holding AG | 24,554 | 63,741 | ||||||
ThyssenKrupp AG(2) | 5,850 | 32,631 | ||||||
| Traffic Systems SE | 40 | 846 | ||||||
| UmweltBank AG | 260 | 3,657 | ||||||
| Uniper SE | 1,851 | 10,016 | ||||||
| United Internet AG | 1,451 | 32,822 | ||||||
| Varta AG | 394 | 27,642 | ||||||
| VERBIO Vereinigte BioEnergie AG | 509 | 32,669 | ||||||
| Villeroy & Boch AG, Preference Shares | 155 | 2,926 | ||||||
Vitesco Technologies Group AG, Class A(2) | 380 | 18,557 | ||||||
| Volkswagen AG | 236 | 43,653 | ||||||
| Volkswagen AG, Preference Shares | 1,269 | 180,501 | ||||||
| Vonovia SE | 6,207 | 168,033 | ||||||
| Vossloh AG | 187 | 6,394 | ||||||
| Wacker Chemie AG | 203 | 28,870 | ||||||
| Wacker Neuson SE | 447 | 7,400 | ||||||
| Washtec AG | 108 | 4,331 | ||||||
| Wuestenrot & Wuerttembergische AG | 218 | 3,550 | ||||||
Zalando SE(2) | 392 | 9,076 | ||||||
| 8,149,099 | ||||||||
| Hong Kong — 2.5% | ||||||||
| AIA Group Ltd. | 61,068 | 587,550 | ||||||
| ASMPT Ltd. | 6,200 | 48,022 | ||||||
Atlas Corp.(1) | 4,940 | 70,889 | ||||||
| Bank of East Asia Ltd. | 31,200 | 39,309 | ||||||
| BOC Hong Kong Holdings Ltd. | 29,000 | 99,812 | ||||||
| Bright Smart Securities & Commodities Group Ltd. | 14,000 | 2,242 | ||||||
| Budweiser Brewing Co. APAC Ltd. | 4,600 | 13,521 | ||||||
| Cafe de Coral Holdings Ltd. | 4,000 | 5,727 | ||||||
| Chow Sang Sang Holdings International Ltd. | 5,000 | 5,629 | ||||||
96
| Avantis International Equity Fund | ||||||||
| Shares | Value | |||||||
| Chow Tai Fook Jewellery Group Ltd. | 5,200 | $ | 10,466 | |||||
| CK Asset Holdings Ltd. | 25,906 | 174,859 | ||||||
| CK Hutchison Holdings Ltd. | 8,500 | 54,890 | ||||||
| CK Infrastructure Holdings Ltd. | 7,500 | 45,608 | ||||||
| CLP Holdings Ltd. | 16,000 | 137,861 | ||||||
Comba Telecom Systems Holdings Ltd.(1)(2) | 18,000 | 3,338 | ||||||
Cowell e Holdings, Inc.(1)(2) | 11,000 | 22,297 | ||||||
| Dah Sing Banking Group Ltd. | 16,800 | 13,046 | ||||||
| Dah Sing Financial Holdings Ltd. | 3,200 | 8,519 | ||||||
| DFI Retail Group Holdings Ltd. | 2,300 | 6,245 | ||||||
E-Commodities Holdings Ltd.(1) | 82,000 | 18,314 | ||||||
Esprit Holdings Ltd.(1)(2) | 5,100 | 634 | ||||||
ESR Group Ltd.(2) | 7,800 | 21,841 | ||||||
| Fairwood Holdings Ltd. | 2,000 | 3,311 | ||||||
| Far East Consortium International Ltd. | 15,000 | 4,754 | ||||||
| First Pacific Co. Ltd. | 24,000 | 9,255 | ||||||
Futu Holdings Ltd., ADR(1)(2) | 705 | 34,608 | ||||||
| Galaxy Entertainment Group Ltd. | 8,000 | 44,717 | ||||||
| Giordano International Ltd. | 52,000 | 12,100 | ||||||
| Guotai Junan International Holdings Ltd. | 40,000 | 4,013 | ||||||
Haitong International Securities Group Ltd.(1) | 34,100 | 3,773 | ||||||
| Hang Lung Group Ltd. | 17,000 | 28,753 | ||||||
| Hang Lung Properties Ltd. | 35,000 | 58,205 | ||||||
| Hang Seng Bank Ltd. | 5,000 | 78,283 | ||||||
| Henderson Land Development Co. Ltd. | 19,000 | 63,557 | ||||||
| HK Electric Investments & HK Electric Investments Ltd. | 28,500 | 23,779 | ||||||
| HKT Trust & HKT Ltd. | 16,000 | 21,465 | ||||||
| Hong Kong & China Gas Co. Ltd. | 29,332 | 28,918 | ||||||
| Hong Kong Exchanges & Clearing Ltd. | 4,900 | 197,443 | ||||||
Hongkong & Shanghai Hotels Ltd.(2) | 1,000 | 896 | ||||||
| Hongkong Land Holdings Ltd. | 12,600 | 60,910 | ||||||
| Hutchison Telecommunications Hong Kong Holdings Ltd. | 20,000 | 2,954 | ||||||
| Hysan Development Co. Ltd. | 11,000 | 31,001 | ||||||
| IGG, Inc. | 10,000 | 4,299 | ||||||
IRC Ltd.(1)(2) | 202,000 | 3,465 | ||||||
| Jardine Matheson Holdings Ltd. | 1,300 | 68,941 | ||||||
| Johnson Electric Holdings Ltd. | 4,000 | 4,724 | ||||||
| K Wah International Holdings Ltd. | 11,000 | 4,148 | ||||||
| Kerry Logistics Network Ltd. | 728 | 1,601 | ||||||
| Kerry Properties Ltd. | 10,000 | 23,055 | ||||||
Lifestyle International Holdings Ltd.(2) | 5,000 | 2,926 | ||||||
LK Technology Holdings Ltd.(1) | 10,000 | 14,615 | ||||||
| Luk Fook Holdings International Ltd. | 5,000 | 12,781 | ||||||
| Man Wah Holdings Ltd. | 16,800 | 13,276 | ||||||
Melco Resorts & Entertainment Ltd., ADR(2) | 529 | 3,047 | ||||||
MGM China Holdings Ltd.(1)(2) | 800 | 413 | ||||||
| Modern Dental Group Ltd. | 6,000 | 1,709 | ||||||
| MTR Corp. Ltd. | 5,000 | 25,607 | ||||||
| New World Development Co. Ltd. | 29,000 | 94,499 | ||||||
| NWS Holdings Ltd. | 38,000 | 36,556 | ||||||
Oriental Watch Holdings(1) | 24,828 | 14,178 | ||||||
97
| Avantis International Equity Fund | ||||||||
| Shares | Value | |||||||
| Pacific Basin Shipping Ltd. | 130,000 | $ | 46,141 | |||||
Pacific Century Premium Developments Ltd.(2) | 2,268 | 120 | ||||||
| Pacific Textiles Holdings Ltd. | 12,000 | 4,506 | ||||||
PC Partner Group Ltd.(1) | 8,000 | 7,606 | ||||||
| PCCW Ltd. | 27,024 | 13,528 | ||||||
| Perfect Medical Health Management Ltd. | 7,000 | 3,579 | ||||||
| Power Assets Holdings Ltd. | 11,000 | 65,793 | ||||||
Realord Group Holdings Ltd.(1)(2) | 6,000 | 7,552 | ||||||
| Regina Miracle International Holdings Ltd. | 2,000 | 1,238 | ||||||
Sa Sa International Holdings Ltd.(2) | 4,000 | 650 | ||||||
Sands China Ltd.(2) | 3,600 | 8,050 | ||||||
Shun Tak Holdings Ltd.(2) | 16,000 | 2,665 | ||||||
| Singamas Container Holdings Ltd. | 96,000 | 8,893 | ||||||
| Sino Land Co. Ltd. | 53,055 | 77,584 | ||||||
| SITC International Holdings Co. Ltd. | 20,000 | 50,717 | ||||||
SJM Holdings Ltd.(1)(2) | 14,000 | 4,882 | ||||||
| Sun Hung Kai & Co. Ltd. | 10,000 | 4,609 | ||||||
| Sun Hung Kai Properties Ltd. | 6,500 | 76,363 | ||||||
| SUNeVision Holdings Ltd. | 11,000 | 7,207 | ||||||
| Swire Pacific Ltd., Class A | 9,000 | 62,251 | ||||||
| Swire Properties Ltd. | 12,600 | 29,040 | ||||||
| Techtronic Industries Co. Ltd. | 5,500 | 64,868 | ||||||
| Texhong Textile Group Ltd. | 4,000 | 3,758 | ||||||
| Texwinca Holdings Ltd. | 4,000 | 711 | ||||||
| United Energy Group Ltd. | 212,000 | 26,160 | ||||||
| United Laboratories International Holdings Ltd. | 10,000 | 4,841 | ||||||
Value Partners Group Ltd.(1) | 10,000 | 2,933 | ||||||
Vitasoy International Holdings Ltd.(1)(2) | 6,000 | 9,396 | ||||||
| VSTECS Holdings Ltd. | 8,000 | 5,289 | ||||||
| VTech Holdings Ltd. | 3,700 | 25,162 | ||||||
| WH Group Ltd. | 229,423 | 156,311 | ||||||
| Wharf Real Estate Investment Co. Ltd. | 10,000 | 45,502 | ||||||
Wynn Macau Ltd.(1)(2) | 7,600 | 4,569 | ||||||
Xinyi Electric Storage Holdings Ltd.(2) | 16,000 | 11,868 | ||||||
| Xinyi Glass Holdings Ltd. | 31,000 | 57,254 | ||||||
| Yue Yuen Industrial Holdings Ltd. | 15,000 | 22,365 | ||||||
| 3,357,115 | ||||||||
| Ireland — 0.5% | ||||||||
AIB Group PLC(1) | 10,809 | 24,520 | ||||||
| Bank of Ireland Group PLC | 16,880 | 104,007 | ||||||
| Cairn Homes PLC | 7,836 | 7,815 | ||||||
| CRH PLC | 4,906 | 181,167 | ||||||
Dalata Hotel Group PLC(2) | 3,681 | 12,893 | ||||||
| FBD Holdings PLC | 510 | 5,204 | ||||||
| Glanbia PLC | 5,229 | 66,545 | ||||||
Glenveagh Properties PLC(2) | 13,592 | 13,834 | ||||||
| Kerry Group PLC, A Shares | 888 | 91,572 | ||||||
| Kingspan Group PLC | 681 | 38,557 | ||||||
| Origin Enterprises PLC | 6,048 | 22,672 | ||||||
| Smurfit Kappa Group PLC | 4,033 | 135,225 | ||||||
Uniphar PLC(2) | 1,590 | 5,428 | ||||||
| 709,439 | ||||||||
98
| Avantis International Equity Fund | ||||||||
| Shares | Value | |||||||
| Israel — 1.1% | ||||||||
| AFI Properties Ltd. | 174 | $ | 8,594 | |||||
Airport City Ltd.(2) | 717 | 15,004 | ||||||
| Alony Hetz Properties & Investments Ltd. | 1,125 | 18,142 | ||||||
| Amot Investments Ltd. | 2,002 | 14,308 | ||||||
| Ashtrom Group Ltd. | 80 | 2,036 | ||||||
| AudioCodes Ltd. | 183 | 4,072 | ||||||
| Azrieli Group Ltd. | 181 | 15,015 | ||||||
| Bank Hapoalim BM | 10,153 | 105,261 | ||||||
| Bank Leumi Le-Israel BM | 9,847 | 104,095 | ||||||
| Bezeq The Israeli Telecommunication Corp. Ltd. | 18,393 | 31,009 | ||||||
| Big Shopping Centers Ltd. | 98 | 14,013 | ||||||
| Caesarstone Ltd. | 67 | 683 | ||||||
Cellcom Israel Ltd.(2) | 759 | 4,748 | ||||||
Check Point Software Technologies Ltd.(2) | 509 | 61,202 | ||||||
Clal Insurance Enterprises Holdings Ltd.(2) | 1,225 | 26,452 | ||||||
Cognyte Software Ltd.(2) | 134 | 699 | ||||||
CyberArk Software Ltd.(2) | 90 | 12,985 | ||||||
| Danel Adir Yeoshua Ltd. | 47 | 5,741 | ||||||
| Delek Automotive Systems Ltd. | 1,513 | 23,332 | ||||||
Delek Group Ltd.(2) | 84 | 14,590 | ||||||
| Delta Galil Industries Ltd. | 164 | 8,700 | ||||||
| Elbit Systems Ltd. | 111 | 23,697 | ||||||
| Elco Ltd. | 83 | 5,832 | ||||||
| Electra Consumer Products 1970 Ltd. | 158 | 7,305 | ||||||
| Electra Ltd. | 11 | 6,982 | ||||||
| Energix-Renewable Energies Ltd. | 281 | 1,281 | ||||||
Equital Ltd.(2) | 507 | 18,830 | ||||||
Fattal Holdings 1998 Ltd.(2) | 45 | 5,541 | ||||||
| FIBI Holdings Ltd. | 173 | 9,094 | ||||||
| First International Bank of Israel Ltd. | 813 | 37,834 | ||||||
| FMS Enterprises Migun Ltd. | 27 | 920 | ||||||
| Fox Wizel Ltd. | 130 | 18,871 | ||||||
| Gav-Yam Lands Corp. Ltd. | 433 | 4,411 | ||||||
| Gazit-Globe Ltd. | 640 | 4,166 | ||||||
| Harel Insurance Investments & Financial Services Ltd. | 1,656 | 18,829 | ||||||
| Hilan Ltd. | 298 | 18,132 | ||||||
| ICL Group Ltd. | 5,218 | 49,825 | ||||||
| IDI Insurance Co. Ltd. | 30 | 979 | ||||||
Inmode Ltd.(2) | 506 | 16,162 | ||||||
| Inrom Construction Industries Ltd. | 1,146 | 5,341 | ||||||
| Isracard Ltd. | 4,656 | 15,497 | ||||||
Israel Corp. Ltd.(2) | 34 | 16,434 | ||||||
| Israel Discount Bank Ltd., A Shares | 8,848 | 54,094 | ||||||
| Israel Land Development - Urban Renewal Ltd. | 808 | 14,399 | ||||||
| Ituran Location and Control Ltd. | 393 | 9,770 | ||||||
Kamada Ltd.(2) | 160 | 793 | ||||||
| Kenon Holdings Ltd. | 115 | 4,672 | ||||||
Kornit Digital Ltd.(2) | 40 | 1,243 | ||||||
| M Yochananof & Sons Ltd. | 68 | 4,277 | ||||||
| Matrix IT Ltd. | 212 | 5,564 | ||||||
99
| Avantis International Equity Fund | ||||||||
| Shares | Value | |||||||
| Maytronics Ltd. | 330 | $ | 4,741 | |||||
| Mediterranean Towers Ltd. | 327 | 1,059 | ||||||
| Mega Or Holdings Ltd. | 162 | 5,603 | ||||||
| Melisron Ltd. | 83 | 6,778 | ||||||
Menora Mivtachim Holdings Ltd.(2) | 483 | 11,125 | ||||||
| Migdal Insurance & Financial Holdings Ltd. | 3,642 | 6,018 | ||||||
| Mivne Real Estate KD Ltd. | 3,933 | 14,434 | ||||||
| Mizrahi Tefahot Bank Ltd. | 1,239 | 50,391 | ||||||
Nano Dimension Ltd., ADR(2) | 1,645 | 4,886 | ||||||
Neto Malinda Trading Ltd.(2) | 370 | 14,328 | ||||||
Nice Ltd., ADR(1)(2) | 211 | 45,021 | ||||||
Nova Ltd.(2) | 180 | 17,663 | ||||||
| Novolog Ltd. | 5,599 | 5,401 | ||||||
| Oil Refineries Ltd. | 45,199 | 19,408 | ||||||
| One Software Technologies Ltd. | 600 | 11,062 | ||||||
OPC Energy Ltd.(2) | 1,847 | 22,022 | ||||||
Partner Communications Co. Ltd.(2) | 2,031 | 17,566 | ||||||
Paz Oil Co. Ltd.(2) | 218 | 28,575 | ||||||
Perion Network Ltd.(2) | 476 | 9,684 | ||||||
| Phoenix Holdings Ltd. | 2,948 | 35,561 | ||||||
Property & Building Corp. Ltd.(2) | 45 | 4,615 | ||||||
| Rami Levy Chain Stores Hashikma Marketing 2006 Ltd. | 98 | 7,584 | ||||||
| Sapiens International Corp. NV | 45 | 1,012 | ||||||
| Scope Metals Group Ltd. | 181 | 9,073 | ||||||
| Shapir Engineering and Industry Ltd. | 867 | 8,282 | ||||||
Shikun & Binui Ltd.(2) | 1,826 | 8,257 | ||||||
| Shufersal Ltd. | 3,883 | 26,593 | ||||||
| Strauss Group Ltd. | 509 | 13,311 | ||||||
| Summit Real Estate Holdings Ltd. | 420 | 7,918 | ||||||
Taro Pharmaceutical Industries Ltd.(2) | 51 | 1,717 | ||||||
| Tel Aviv Stock Exchange Ltd. | 917 | 4,361 | ||||||
Tera Light Ltd.(2) | 69 | 132 | ||||||
Teva Pharmaceutical Industries Ltd., ADR(2) | 5,571 | 50,362 | ||||||
Tower Semiconductor Ltd.(2) | 396 | 18,562 | ||||||
Wix.com Ltd.(2) | 145 | 9,177 | ||||||
| YH Dimri Construction & Development Ltd. | 124 | 9,830 | ||||||
ZIM Integrated Shipping Services Ltd.(1) | 1,085 | 39,158 | ||||||
| 1,422,726 | ||||||||
| Italy — 2.0% | ||||||||
| A2A SpA | 31,231 | 34,996 | ||||||
| ACEA SpA | 668 | 7,999 | ||||||
| Amplifon SpA | 1,006 | 26,217 | ||||||
| Arnoldo Mondadori Editore SpA | 2,193 | 3,580 | ||||||
| Ascopiave SpA | 1,761 | 4,561 | ||||||
| Assicurazioni Generali SpA | 4,497 | 65,956 | ||||||
| Atlantia SpA | 4,259 | 97,525 | ||||||
Autogrill SpA(2) | 2,820 | 18,496 | ||||||
| Azimut Holding SpA | 1,599 | 25,472 | ||||||
| Banca Generali SpA | 776 | 20,514 | ||||||
| Banca IFIS SpA | 489 | 5,839 | ||||||
| Banca Mediolanum SpA | 3,320 | 21,156 | ||||||
100
| Avantis International Equity Fund | ||||||||
| Shares | Value | |||||||
Banca Monte dei Paschi di Siena SpA(1)(2) | 639 | $ | 203 | |||||
| Banca Popolare di Sondrio SCPA | 10,739 | 34,389 | ||||||
| Banco BPM SpA | 19,755 | 49,048 | ||||||
| BFF Bank SpA | 3,275 | 20,731 | ||||||
| Biesse SpA | 223 | 2,831 | ||||||
| BPER Banca | 24,612 | 37,008 | ||||||
| Brembo SpA | 1,664 | 15,261 | ||||||
| Brunello Cucinelli SpA | 735 | 38,067 | ||||||
| Buzzi Unicem SpA | 2,170 | 36,295 | ||||||
| Carel Industries SpA | 333 | 7,136 | ||||||
| Cementir Holding NV | 699 | 4,049 | ||||||
CIR SpA-Compagnie Industriali(2) | 10,844 | 4,551 | ||||||
| CNH Industrial NV | 9,034 | 109,990 | ||||||
| Credito Emiliano SpA | 1,683 | 9,730 | ||||||
d'Amico International Shipping SA(2) | 45,275 | 10,875 | ||||||
| Danieli & C Officine Meccaniche SpA | 239 | 4,393 | ||||||
| Danieli & C Officine Meccaniche SpA, Preference Shares | 502 | 6,379 | ||||||
| Davide Campari-Milano NV | 589 | 5,779 | ||||||
De' Longhi SpA(1) | 340 | 5,939 | ||||||
| DiaSorin SpA | 42 | 5,510 | ||||||
Digital Value SpA(2) | 81 | 5,402 | ||||||
| doValue SpA | 489 | 2,801 | ||||||
Enav SpA(2) | 4,093 | 16,921 | ||||||
| Enel SpA | 34,142 | 160,436 | ||||||
Eni SpA, ADR(1) | 6,764 | 159,766 | ||||||
| ERG SpA | 1,116 | 35,369 | ||||||
| Ferrari NV | 449 | 86,676 | ||||||
| Fila SpA | 454 | 3,426 | ||||||
Fincantieri SpA(1)(2) | 30,410 | 15,245 | ||||||
| FinecoBank Banca Fineco SpA | 5,445 | 58,873 | ||||||
| Gruppo MutuiOnline SpA | 307 | 7,575 | ||||||
| Hera SpA | 14,182 | 35,524 | ||||||
| Infrastrutture Wireless Italiane SpA | 103 | 955 | ||||||
| Interpump Group SpA | 205 | 7,235 | ||||||
| Intesa Sanpaolo SpA | 83,357 | 143,498 | ||||||
| Iren SpA | 25,168 | 37,927 | ||||||
| Italgas SpA | 14,060 | 72,320 | ||||||
Iveco Group NV(2) | 5,228 | 26,435 | ||||||
| Leonardo SpA | 4,135 | 33,840 | ||||||
Maire Tecnimont SpA(1) | 2,273 | 5,768 | ||||||
| MARR SpA | 738 | 8,667 | ||||||
| Mediobanca Banca di Credito Finanziario SpA | 4,737 | 37,498 | ||||||
MFE-MediaForEurope NV, Class A(2) | 9,573 | 4,061 | ||||||
MFE-MediaForEurope NV, Class B(2) | 7,657 | 4,454 | ||||||
| Moncler SpA | 1,518 | 67,538 | ||||||
Nexi SpA(2) | 501 | 4,110 | ||||||
| OVS SpA | 5,412 | 8,183 | ||||||
| Piaggio & C SpA | 2,541 | 6,207 | ||||||
| Poste Italiane SpA | 7,286 | 58,230 | ||||||
| Prysmian SpA | 1,858 | 57,009 | ||||||
| RAI Way SpA | 2,481 | 12,000 | ||||||
101
| Avantis International Equity Fund | ||||||||
| Shares | Value | |||||||
| Recordati Industria Chimica e Farmaceutica SpA | 641 | $ | 26,153 | |||||
| Reply SpA | 152 | 17,893 | ||||||
Safilo Group SpA(2) | 2,082 | 2,917 | ||||||
Saipem SpA(1)(2) | 4,992 | 3,502 | ||||||
Salvatore Ferragamo SpA(1) | 973 | 15,650 | ||||||
| Sanlorenzo SpA/Ameglia | 180 | 5,655 | ||||||
Saras SpA(2) | 21,050 | 25,497 | ||||||
| Sesa SpA | 216 | 26,403 | ||||||
| Snam SpA | 28,121 | 133,656 | ||||||
| Stellantis NV | 15,665 | 208,666 | ||||||
| Technogym SpA | 1,602 | 10,986 | ||||||
Telecom Italia SpA/Milano(2) | 49,767 | 10,265 | ||||||
Telecom Italia SpA/Milano, Preference Shares(2) | 37,591 | 7,455 | ||||||
| Tenaris SA, ADR | 967 | 26,418 | ||||||
| Terna - Rete Elettrica Nazionale | 6,553 | 46,587 | ||||||
| UniCredit SpA | 14,864 | 145,457 | ||||||
Unieuro SpA(1) | 231 | 2,627 | ||||||
| Unipol Gruppo SpA | 5,271 | 22,073 | ||||||
Webuild SpA(1) | 6,794 | 9,541 | ||||||
| Zignago Vetro SpA | 498 | 5,668 | ||||||
| 2,677,493 | ||||||||
| Japan — 20.9% | ||||||||
| 77 Bank Ltd. | 900 | 11,481 | ||||||
| A&D HOLON Holdings Co. Ltd. | 200 | 1,369 | ||||||
| ABC-Mart, Inc. | 100 | 4,023 | ||||||
| Acom Co. Ltd. | 1,400 | 3,330 | ||||||
| ADEKA Corp. | 800 | 13,499 | ||||||
| Advantest Corp. | 1,300 | 73,626 | ||||||
Aeon Co. Ltd.(1) | 3,200 | 62,418 | ||||||
Aeon Delight Co. Ltd.(1) | 200 | 4,088 | ||||||
AEON Financial Service Co. Ltd.(1) | 2,700 | 27,730 | ||||||
Aeon Mall Co. Ltd.(1) | 2,500 | 29,818 | ||||||
| AGC, Inc. | 2,600 | 88,241 | ||||||
| Ai Holdings Corp. | 100 | 1,530 | ||||||
| Aichi Bank Ltd. | 200 | 8,318 | ||||||
| Aida Engineering Ltd. | 200 | 1,232 | ||||||
| Aiful Corp. | 3,700 | 10,439 | ||||||
| Ain Holdings, Inc. | 400 | 22,861 | ||||||
| Air Water, Inc. | 3,300 | 41,283 | ||||||
| Aisan Industry Co. Ltd. | 1,000 | 5,237 | ||||||
| Aisin Corp. | 2,000 | 59,469 | ||||||
| Ajinomoto Co., Inc. | 2,400 | 66,336 | ||||||
| Akatsuki, Inc. | 100 | 1,700 | ||||||
| Alconix Corp. | 100 | 1,017 | ||||||
Alfresa Holdings Corp.(1) | 2,100 | 25,130 | ||||||
Alpen Co. Ltd.(1) | 400 | 6,021 | ||||||
Alps Alpine Co. Ltd.(1) | 3,200 | 28,627 | ||||||
| Altech Corp. | 300 | 4,020 | ||||||
| Amada Co. Ltd. | 6,300 | 49,294 | ||||||
| Amano Corp. | 1,300 | 24,048 | ||||||
| Amvis Holdings, Inc. | 200 | 7,932 | ||||||
102
| Avantis International Equity Fund | ||||||||
| Shares | Value | |||||||
ANA Holdings, Inc.(2) | 700 | $ | 13,458 | |||||
| Anritsu Corp. | 2,300 | 27,112 | ||||||
| AOKI Holdings, Inc. | 100 | 506 | ||||||
| Aoyama Trading Co. Ltd. | 1,700 | 11,279 | ||||||
| Aozora Bank Ltd. | 1,900 | 36,675 | ||||||
| Arata Corp. | 400 | 11,852 | ||||||
Arcland Sakamoto Co. Ltd.(1) | 900 | 9,651 | ||||||
Arcs Co. Ltd.(1) | 800 | 11,698 | ||||||
| Argo Graphics, Inc. | 700 | 19,481 | ||||||
| Arisawa Manufacturing Co. Ltd. | 200 | 1,909 | ||||||
| ARTERIA Networks Corp. | 100 | 935 | ||||||
| ArtSpark Holdings, Inc. | 900 | 6,020 | ||||||
Aruhi Corp.(2) | 200 | 1,515 | ||||||
| AS One Corp. | 200 | 9,173 | ||||||
| Asahi Co. Ltd. | 300 | 2,865 | ||||||
| Asahi Diamond Industrial Co. Ltd. | 1,700 | 9,486 | ||||||
| Asahi Group Holdings Ltd. | 1,100 | 36,881 | ||||||
| Asahi Intecc Co. Ltd. | 200 | 3,558 | ||||||
| Asahi Kasei Corp. | 13,700 | 100,117 | ||||||
| ASAHI YUKIZAI Corp. | 500 | 8,229 | ||||||
| Asanuma Corp. | 200 | 4,053 | ||||||
| Asics Corp. | 1,600 | 29,255 | ||||||
| ASKA Pharmaceutical Holdings Co. Ltd. | 500 | 4,248 | ||||||
| ASKUL Corp. | 400 | 5,284 | ||||||
| Astellas Pharma, Inc. | 9,200 | 130,436 | ||||||
| Astena Holdings Co. Ltd. | 1,500 | 4,815 | ||||||
Aucnet, Inc.(1) | 1,000 | 15,509 | ||||||
| Autobacs Seven Co. Ltd. | 500 | 5,125 | ||||||
| Avant Corp. | 1,200 | 12,979 | ||||||
Awa Bank Ltd.(1) | 300 | 4,089 | ||||||
| Axial Retailing, Inc. | 600 | 14,975 | ||||||
| Azbil Corp. | 100 | 2,849 | ||||||
| Bandai Namco Holdings, Inc. | 1,700 | 127,562 | ||||||
| Bando Chemical Industries Ltd. | 200 | 1,449 | ||||||
Bank of Iwate Ltd.(1) | 200 | 2,678 | ||||||
| Bank of Kyoto Ltd. | 700 | 27,284 | ||||||
| Bank of Nagoya Ltd. | 200 | 4,448 | ||||||
Bank of the Ryukyus Ltd.(1) | 900 | 5,014 | ||||||
| BayCurrent Consulting, Inc. | 100 | 29,387 | ||||||
| Belc Co. Ltd. | 400 | 16,037 | ||||||
| Belluna Co. Ltd. | 800 | 4,240 | ||||||
| Benefit One, Inc. | 400 | 5,922 | ||||||
| Benesse Holdings, Inc. | 1,100 | 17,290 | ||||||
Bic Camera, Inc.(1) | 2,200 | 18,009 | ||||||
| BIPROGY, Inc | 1,200 | 26,576 | ||||||
| BML, Inc. | 400 | 10,236 | ||||||
| Bridgestone Corp. | 4,400 | 168,846 | ||||||
| Brother Industries Ltd. | 4,200 | 80,378 | ||||||
| Bunka Shutter Co. Ltd. | 700 | 5,369 | ||||||
| C Uyemura & Co. Ltd. | 400 | 18,720 | ||||||
| Calbee, Inc. | 1,300 | 25,797 | ||||||
103
| Avantis International Equity Fund | ||||||||
| Shares | Value | |||||||
| Canon Marketing Japan, Inc. | 400 | $ | 9,071 | |||||
Canon, Inc., ADR(1) | 2,778 | 66,339 | ||||||
| Capcom Co. Ltd. | 1,800 | 49,130 | ||||||
| Carenet, Inc. | 800 | 6,851 | ||||||
Casio Computer Co. Ltd.(1) | 700 | 6,611 | ||||||
| Cawachi Ltd. | 200 | 3,037 | ||||||
| Central Glass Co. Ltd. | 1,000 | 24,127 | ||||||
| Central Japan Railway Co. | 400 | 47,092 | ||||||
| Chiba Bank Ltd. | 5,400 | 29,170 | ||||||
| Chubu Electric Power Co., Inc. | 3,500 | 35,591 | ||||||
| Chubu Shiryo Co. Ltd. | 400 | 3,088 | ||||||
| Chudenko Corp. | 200 | 3,056 | ||||||
| Chugai Pharmaceutical Co. Ltd. | 4,000 | 103,232 | ||||||
Chugoku Bank Ltd.(1) | 3,300 | 22,102 | ||||||
Chugoku Electric Power Co., Inc.(1) | 300 | 1,799 | ||||||
Citizen Watch Co. Ltd.(1) | 6,900 | 29,481 | ||||||
| CKD Corp. | 1,200 | 15,787 | ||||||
| CMIC Holdings Co. Ltd. | 400 | 4,750 | ||||||
| CMK Corp. | 200 | 672 | ||||||
| Coca-Cola Bottlers Japan Holdings, Inc. | 2,400 | 24,545 | ||||||
| COLOPL, Inc. | 600 | 3,032 | ||||||
| Colowide Co. Ltd. | 500 | 6,722 | ||||||
| Computer Engineering & Consulting Ltd. | 300 | 2,772 | ||||||
COMSYS Holdings Corp.(1) | 1,500 | 27,858 | ||||||
| Comture Corp. | 200 | 3,484 | ||||||
| Concordia Financial Group Ltd. | 10,200 | 32,347 | ||||||
| Cosmo Energy Holdings Co. Ltd. | 2,100 | 62,876 | ||||||
| Cosmos Pharmaceutical Corp. | 200 | 21,065 | ||||||
Create Restaurants Holdings, Inc.(1) | 2,400 | 15,711 | ||||||
| Create SD Holdings Co. Ltd. | 200 | 4,485 | ||||||
| Credit Saison Co. Ltd. | 3,400 | 42,775 | ||||||
| CTI Engineering Co. Ltd. | 200 | 3,742 | ||||||
| CyberAgent, Inc. | 5,700 | 55,571 | ||||||
| Cybozu, Inc. | 200 | 1,929 | ||||||
| Dai Nippon Printing Co. Ltd. | 1,200 | 25,259 | ||||||
| Dai-Dan Co. Ltd. | 200 | 3,195 | ||||||
| Dai-ichi Life Holdings, Inc. | 8,400 | 145,135 | ||||||
Daicel Corp.(1) | 5,200 | 32,657 | ||||||
Daido Steel Co. Ltd.(1) | 200 | 5,610 | ||||||
| Daifuku Co. Ltd. | 500 | 29,169 | ||||||
| Daiho Corp. | 400 | 11,639 | ||||||
| Daiichi Jitsugyo Co. Ltd. | 200 | 5,497 | ||||||
| Daiichi Kigenso Kagaku-Kogyo Co. Ltd. | 200 | 1,900 | ||||||
| Daiichi Sankyo Co. Ltd. | 9,000 | 270,466 | ||||||
| Daikin Industries Ltd. | 800 | 139,654 | ||||||
| Daikokutenbussan Co. Ltd. | 200 | 8,493 | ||||||
| Dainichiseika Color & Chemicals Manufacturing Co. Ltd. | 400 | 5,144 | ||||||
Daio Paper Corp.(1) | 800 | 7,478 | ||||||
| Daiseki Co. Ltd. | 360 | 10,796 | ||||||
| Daishi Hokuetsu Financial Group, Inc. | 900 | 16,933 | ||||||
| Daito Pharmaceutical Co. Ltd. | 200 | 3,816 | ||||||
104
| Avantis International Equity Fund | ||||||||
| Shares | Value | |||||||
| Daito Trust Construction Co. Ltd. | 800 | $ | 78,702 | |||||
| Daiwa House Industry Co. Ltd. | 2,500 | 55,893 | ||||||
Daiwa Securities Group, Inc.(1) | 11,500 | 50,200 | ||||||
| Daiwabo Holdings Co. Ltd. | 1,000 | 14,077 | ||||||
DCM Holdings Co. Ltd.(1) | 1,000 | 7,416 | ||||||
| DeNA Co. Ltd. | 400 | 5,474 | ||||||
| Denka Co. Ltd. | 1,800 | 43,121 | ||||||
| Denso Corp. | 1,000 | 54,581 | ||||||
| Dentsu Group, Inc. | 1,900 | 61,190 | ||||||
| Denyo Co. Ltd. | 200 | 2,344 | ||||||
| Dexerials Corp. | 1,400 | 38,925 | ||||||
| DIC Corp. | 1,600 | 28,689 | ||||||
| Digital Arts, Inc. | 100 | 4,647 | ||||||
| Digital Garage, Inc. | 600 | 16,725 | ||||||
| Dip Corp. | 300 | 7,759 | ||||||
| Disco Corp. | 300 | 72,843 | ||||||
| DMG Mori Co. Ltd. | 1,700 | 22,063 | ||||||
| Doshisha Co. Ltd. | 400 | 4,373 | ||||||
| Doutor Nichires Holdings Co. Ltd. | 300 | 3,470 | ||||||
| Dowa Holdings Co. Ltd. | 900 | 33,925 | ||||||
Dream Incubator, Inc.(2) | 300 | 4,305 | ||||||
| DTS Corp. | 300 | 7,729 | ||||||
| Duskin Co. Ltd. | 1,000 | 20,614 | ||||||
| DyDo Group Holdings, Inc. | 200 | 6,673 | ||||||
| Eagle Industry Co. Ltd. | 200 | 1,680 | ||||||
| Earth Corp. | 100 | 3,912 | ||||||
| East Japan Railway Co. | 900 | 46,617 | ||||||
| Ebara Corp. | 1,600 | 60,611 | ||||||
EDION Corp.(1) | 2,400 | 20,645 | ||||||
| Eiken Chemical Co. Ltd. | 600 | 8,200 | ||||||
| Eisai Co. Ltd. | 3,100 | 126,397 | ||||||
| Eizo Corp. | 200 | 5,444 | ||||||
Electric Power Development Co. Ltd.(1) | 3,800 | 58,536 | ||||||
| en Japan, Inc. | 500 | 8,545 | ||||||
| ENEOS Holdings, Inc. | 37,900 | 143,221 | ||||||
| Enigmo, Inc. | 600 | 2,370 | ||||||
| eRex Co. Ltd. | 500 | 10,050 | ||||||
| ESPEC Corp. | 200 | 2,614 | ||||||
| Exedy Corp. | 500 | 6,442 | ||||||
| EXEO Group, Inc. | 1,400 | 21,479 | ||||||
| Ezaki Glico Co. Ltd. | 900 | 23,418 | ||||||
| F.C.C. Co. Ltd. | 1,500 | 15,525 | ||||||
| Fancl Corp. | 300 | 6,066 | ||||||
| FANUC Corp. | 200 | 32,220 | ||||||
Fast Retailing Co. Ltd.(1) | 300 | 175,419 | ||||||
| Ferrotec Holdings Corp. | 1,200 | 27,314 | ||||||
| Fields Corp. | 600 | 5,814 | ||||||
| Financial Products Group Co. Ltd. | 1,800 | 16,161 | ||||||
| Food & Life Cos. Ltd. | 800 | 12,589 | ||||||
| Foster Electric Co. Ltd. | 100 | 558 | ||||||
| FP Corp. | 800 | 18,780 | ||||||
105
| Avantis International Equity Fund | ||||||||
| Shares | Value | |||||||
| France Bed Holdings Co. Ltd. | 200 | $ | 1,418 | |||||
| Fudo Tetra Corp. | 100 | 1,126 | ||||||
| Fuji Electric Co. Ltd. | 1,500 | 64,803 | ||||||
| Fuji Kyuko Co. Ltd. | 200 | 5,884 | ||||||
| Fuji Media Holdings, Inc. | 600 | 4,748 | ||||||
| Fuji Seal International, Inc. | 800 | 8,874 | ||||||
| Fuji Soft, Inc. | 200 | 11,677 | ||||||
| Fujibo Holdings, Inc. | 100 | 2,595 | ||||||
| Fujicco Co. Ltd. | 200 | 2,802 | ||||||
| FUJIFILM Holdings Corp. | 1,100 | 55,843 | ||||||
| Fujikura Composites, Inc. | 700 | 5,140 | ||||||
| Fujikura Ltd. | 5,100 | 36,217 | ||||||
| Fujimi, Inc. | 200 | 9,573 | ||||||
| Fujimori Kogyo Co. Ltd. | 200 | 5,060 | ||||||
| Fujitec Co. Ltd. | 600 | 12,092 | ||||||
| Fujitsu Ltd. | 1,500 | 176,510 | ||||||
| Fujiya Co. Ltd. | 300 | 5,125 | ||||||
| Fukuda Corp. | 200 | 7,060 | ||||||
| Fukui Computer Holdings, Inc. | 100 | 2,547 | ||||||
| Fukuoka Financial Group, Inc. | 2,900 | 51,822 | ||||||
| Fukushima Galilei Co. Ltd. | 200 | 5,217 | ||||||
| Fukuyama Transporting Co. Ltd. | 200 | 4,542 | ||||||
| FULLCAST Holdings Co. Ltd. | 300 | 5,249 | ||||||
| Funai Soken Holdings, Inc. | 200 | 3,426 | ||||||
| Furukawa Co. Ltd. | 300 | 2,720 | ||||||
| Furukawa Electric Co. Ltd. | 300 | 5,255 | ||||||
| Furuno Electric Co. Ltd. | 100 | 805 | ||||||
| Furyu Corp. | 700 | 5,106 | ||||||
| Fuso Chemical Co. Ltd. | 200 | 5,053 | ||||||
| Futaba Industrial Co. Ltd. | 200 | 517 | ||||||
| Future Corp. | 600 | 7,300 | ||||||
| Fuyo General Lease Co. Ltd. | 300 | 17,716 | ||||||
| G-7 Holdings, Inc. | 200 | 2,144 | ||||||
| G-Tekt Corp. | 100 | 1,000 | ||||||
Genky DrugStores Co. Ltd.(1) | 200 | 5,259 | ||||||
| Geo Holdings Corp. | 500 | 5,926 | ||||||
| GLOBERIDE, Inc. | 400 | 7,839 | ||||||
| Glory Ltd. | 1,100 | 17,368 | ||||||
GMO Financial Holdings, Inc.(1) | 1,200 | 6,529 | ||||||
| GMO Internet, Inc. | 400 | 7,378 | ||||||
| GMO Payment Gateway, Inc. | 100 | 7,930 | ||||||
| Goldcrest Co. Ltd. | 500 | 6,230 | ||||||
| Goldwin, Inc. | 600 | 35,730 | ||||||
| GS Yuasa Corp. | 800 | 14,517 | ||||||
| GungHo Online Entertainment, Inc. | 1,400 | 23,119 | ||||||
Gunma Bank Ltd.(1) | 8,300 | 23,211 | ||||||
| Gunze Ltd. | 100 | 2,826 | ||||||
| H.U. Group Holdings, Inc. | 1,400 | 28,436 | ||||||
| H2O Retailing Corp. | 3,200 | 22,545 | ||||||
| Hachijuni Bank Ltd. | 8,200 | 28,120 | ||||||
| Hakuhodo DY Holdings, Inc. | 3,600 | 32,117 | ||||||
106
| Avantis International Equity Fund | ||||||||
| Shares | Value | |||||||
| Hakuto Co. Ltd. | 700 | $ | 16,630 | |||||
Halows Co. Ltd.(1) | 200 | 4,392 | ||||||
| Hamakyorex Co. Ltd. | 200 | 4,554 | ||||||
| Hamamatsu Photonics KK | 1,100 | 46,639 | ||||||
| Hankyu Hanshin Holdings, Inc. | 1,200 | 35,986 | ||||||
| Hanwa Co. Ltd. | 1,000 | 24,739 | ||||||
| Happinet Corp. | 600 | 6,952 | ||||||
| Haseko Corp. | 5,200 | 59,588 | ||||||
| Hazama Ando Corp. | 1,100 | 6,822 | ||||||
| Heiwa Corp. | 700 | 10,649 | ||||||
| Heiwa Real Estate Co. Ltd. | 800 | 22,559 | ||||||
Heiwado Co. Ltd.(1) | 400 | 5,717 | ||||||
| Hikari Tsushin, Inc. | 200 | 25,285 | ||||||
| Hino Motors Ltd. | 5,000 | 22,811 | ||||||
| Hirata Corp. | 100 | 3,260 | ||||||
Hirogin Holdings, Inc.(1) | 3,100 | 13,641 | ||||||
| Hirose Electric Co. Ltd. | 300 | 42,509 | ||||||
Hisamitsu Pharmaceutical Co., Inc.(1) | 200 | 4,843 | ||||||
| Hitachi Construction Machinery Co. Ltd. | 1,500 | 30,836 | ||||||
| Hitachi Ltd. | 2,800 | 139,894 | ||||||
Hitachi Metals Ltd.(2) | 400 | 6,019 | ||||||
| Hitachi Transport System Ltd. | 500 | 31,566 | ||||||
| Hitachi Zosen Corp. | 4,300 | 27,144 | ||||||
| Hogy Medical Co. Ltd. | 100 | 2,501 | ||||||
| Hokkaido Electric Power Co., Inc. | 5,900 | 21,656 | ||||||
| Hokko Chemical Industry Co. Ltd. | 200 | 1,519 | ||||||
| Hokkoku Financial Holdings, Inc. | 400 | 14,152 | ||||||
| Hokuetsu Corp. | 3,800 | 20,450 | ||||||
| Hokuetsu Industries Co. Ltd. | 100 | 691 | ||||||
| Hokuhoku Financial Group, Inc. | 3,100 | 18,420 | ||||||
| Hokuriku Electric Power Co. | 2,600 | 9,532 | ||||||
| Hokuto Corp. | 200 | 2,766 | ||||||
| Honda Motor Co. Ltd., ADR | 8,429 | 223,537 | ||||||
| Hoosiers Holdings Co. Ltd. | 200 | 1,160 | ||||||
| Horiba Ltd. | 900 | 40,998 | ||||||
| Hoshizaki Corp. | 600 | 17,825 | ||||||
| Hosiden Corp. | 800 | 9,089 | ||||||
| Hosokawa Micron Corp. | 200 | 3,776 | ||||||
House Foods Group, Inc.(1) | 200 | 4,243 | ||||||
| Hoya Corp. | 1,184 | 120,740 | ||||||
| HS Holdings Co. Ltd. | 200 | 1,673 | ||||||
| Hulic Co. Ltd. | 5,800 | 43,952 | ||||||
| Hyakugo Bank Ltd. | 3,700 | 8,467 | ||||||
| Hyakujushi Bank Ltd. | 200 | 2,440 | ||||||
| I'rom Group Co. Ltd. | 300 | 5,193 | ||||||
| I-Net Corp./Kanagawa | 100 | 967 | ||||||
| I-PEX, Inc. | 200 | 1,968 | ||||||
| Ibiden Co. Ltd. | 1,400 | 44,435 | ||||||
| Icom, Inc. | 200 | 3,816 | ||||||
| Idec Corp. | 800 | 16,713 | ||||||
Idemitsu Kosan Co. Ltd.(1) | 3,600 | 94,922 | ||||||
107
| Avantis International Equity Fund | ||||||||
| Shares | Value | |||||||
IDOM, Inc.(1) | 900 | $ | 5,327 | |||||
| IHI Corp. | 3,200 | 85,460 | ||||||
Iida Group Holdings Co. Ltd.(1) | 1,100 | 16,756 | ||||||
| Iino Kaiun Kaisha Ltd. | 1,700 | 9,990 | ||||||
| Inaba Denki Sangyo Co. Ltd. | 600 | 11,832 | ||||||
Inabata & Co. Ltd.(1) | 400 | 6,999 | ||||||
| Ines Corp. | 100 | 1,116 | ||||||
| Infocom Corp. | 200 | 2,897 | ||||||
| Infomart Corp. | 200 | 599 | ||||||
| Information Services International-Dentsu Ltd. | 400 | 12,984 | ||||||
| INFRONEER Holdings, Inc. | 2,484 | 17,756 | ||||||
| INPEX Corp. | 11,800 | 135,637 | ||||||
| Insource Co. Ltd. | 800 | 16,054 | ||||||
| Intage Holdings, Inc. | 600 | 6,890 | ||||||
| Internet Initiative Japan, Inc. | 1,000 | 36,116 | ||||||
| IR Japan Holdings Ltd. | 100 | 1,834 | ||||||
| Iseki & Co. Ltd. | 500 | 4,549 | ||||||
| Isetan Mitsukoshi Holdings Ltd. | 3,400 | 26,867 | ||||||
| Ishihara Sangyo Kaisha Ltd. | 900 | 7,233 | ||||||
| Isuzu Motors Ltd. | 8,000 | 99,357 | ||||||
| Ito En Ltd. | 500 | 21,944 | ||||||
| ITOCHU Corp. | 5,000 | 137,604 | ||||||
| Itochu Enex Co. Ltd. | 600 | 4,707 | ||||||
| Itochu Techno-Solutions Corp. | 500 | 12,619 | ||||||
| Itoham Yonekyu Holdings, Inc. | 900 | 4,352 | ||||||
| IwaiCosmo Holdings, Inc. | 100 | 902 | ||||||
| Iwatani Corp. | 1,000 | 40,802 | ||||||
| Iyo Bank Ltd. | 4,300 | 19,996 | ||||||
Izumi Co. Ltd.(1) | 500 | 10,791 | ||||||
J Front Retailing Co. Ltd.(1) | 5,800 | 45,968 | ||||||
| J Trust Co. Ltd. | 1,200 | 5,307 | ||||||
| JAC Recruitment Co. Ltd. | 300 | 4,246 | ||||||
| Jaccs Co. Ltd. | 500 | 13,750 | ||||||
| JAFCO Group Co. Ltd. | 2,100 | 30,392 | ||||||
Japan Airlines Co. Ltd.(2) | 200 | 3,658 | ||||||
Japan Airport Terminal Co. Ltd.(2) | 200 | 8,253 | ||||||
| Japan Aviation Electronics Industry Ltd. | 600 | 10,034 | ||||||
| Japan Elevator Service Holdings Co. Ltd. | 500 | 6,667 | ||||||
| Japan Exchange Group, Inc. | 3,200 | 47,687 | ||||||
| Japan Investment Adviser Co. Ltd. | 400 | 3,872 | ||||||
| Japan Lifeline Co. Ltd. | 1,300 | 9,437 | ||||||
| Japan Material Co. Ltd. | 500 | 6,920 | ||||||
| Japan Petroleum Exploration Co. Ltd. | 700 | 19,943 | ||||||
| Japan Post Bank Co. Ltd. | 700 | 5,103 | ||||||
| Japan Post Holdings Co. Ltd. | 15,400 | 106,241 | ||||||
| Japan Post Insurance Co. Ltd. | 3,400 | 52,080 | ||||||
| Japan Pulp & Paper Co. Ltd. | 200 | 6,273 | ||||||
Japan Securities Finance Co. Ltd.(1) | 700 | 4,181 | ||||||
| Japan Steel Works Ltd. | 600 | 12,810 | ||||||
| Japan Wool Textile Co. Ltd. | 700 | 5,145 | ||||||
| JCR Pharmaceuticals Co. Ltd. | 1,100 | 17,053 | ||||||
108
| Avantis International Equity Fund | ||||||||
| Shares | Value | |||||||
| JCU Corp. | 200 | $ | 4,715 | |||||
| JDC Corp. | 200 | 868 | ||||||
| Jeol Ltd. | 800 | 32,041 | ||||||
JFE Holdings, Inc.(1) | 6,200 | 66,610 | ||||||
| JGC Holdings Corp. | 3,100 | 41,771 | ||||||
| JINS Holdings, Inc. | 100 | 3,050 | ||||||
| JINUSHI Co. Ltd. | 300 | 4,317 | ||||||
| Joshin Denki Co. Ltd. | 300 | 4,133 | ||||||
| Joyful Honda Co. Ltd. | 900 | 11,227 | ||||||
| JSB Co. Ltd. | 200 | 4,984 | ||||||
| JSR Corp. | 2,500 | 55,767 | ||||||
| JTEKT Corp. | 3,900 | 27,454 | ||||||
| Juki Corp. | 1,000 | 5,065 | ||||||
| Juroku Financial Group, Inc. | 500 | 8,847 | ||||||
| Justsystems Corp. | 600 | 15,064 | ||||||
| JVCKenwood Corp. | 4,600 | 6,753 | ||||||
| K's Holdings Corp. | 2,800 | 25,798 | ||||||
| Kadokawa Corp. | 400 | 8,670 | ||||||
| Kaga Electronics Co. Ltd. | 100 | 2,960 | ||||||
| Kagome Co. Ltd. | 800 | 17,645 | ||||||
| Kajima Corp. | 6,100 | 64,187 | ||||||
| Kakaku.com, Inc. | 800 | 14,726 | ||||||
| Kameda Seika Co. Ltd. | 100 | 3,267 | ||||||
| Kamigumi Co. Ltd. | 900 | 17,612 | ||||||
| Kanamoto Co. Ltd. | 600 | 9,237 | ||||||
| Kandenko Co. Ltd. | 900 | 5,416 | ||||||
| Kaneka Corp. | 1,300 | 34,868 | ||||||
| Kanematsu Corp. | 1,600 | 17,309 | ||||||
| Kanematsu Electronics Ltd. | 200 | 6,101 | ||||||
| Kansai Electric Power Co., Inc. | 4,500 | 43,612 | ||||||
| Kansai Paint Co. Ltd. | 300 | 4,598 | ||||||
| Kanto Denka Kogyo Co. Ltd. | 1,200 | 8,621 | ||||||
| Kao Corp. | 2,500 | 108,251 | ||||||
Kasai Kogyo Co. Ltd.(2) | 200 | 342 | ||||||
| Kato Sangyo Co. Ltd. | 700 | 17,215 | ||||||
| Kawasaki Heavy Industries Ltd. | 3,300 | 64,047 | ||||||
Kawasaki Kisen Kaisha Ltd.(1) | 600 | 37,961 | ||||||
| KDDI Corp. | 10,800 | 330,492 | ||||||
| KeePer Technical Laboratory Co. Ltd. | 300 | 8,806 | ||||||
| Keihan Holdings Co. Ltd. | 600 | 15,213 | ||||||
| Keihanshin Building Co. Ltd. | 300 | 2,708 | ||||||
| Keikyu Corp. | 300 | 3,083 | ||||||
| Keio Corp. | 200 | 7,610 | ||||||
| Keisei Electric Railway Co. Ltd. | 500 | 13,948 | ||||||
| KEIWA, Inc. | 200 | 6,311 | ||||||
| Keiyo Bank Ltd. | 1,500 | 5,216 | ||||||
| Kewpie Corp. | 1,400 | 23,001 | ||||||
| Keyence Corp. | 200 | 75,095 | ||||||
| KFC Holdings Japan Ltd. | 700 | 14,080 | ||||||
| KH Neochem Co. Ltd. | 800 | 14,722 | ||||||
| Kikkoman Corp. | 300 | 18,345 | ||||||
109
| Avantis International Equity Fund | ||||||||
| Shares | Value | |||||||
| Kinden Corp. | 1,300 | $ | 13,718 | |||||
| Kintetsu Group Holdings Co. Ltd. | 600 | 20,374 | ||||||
| Kirin Holdings Co. Ltd. | 3,300 | 54,324 | ||||||
| Kissei Pharmaceutical Co. Ltd. | 400 | 7,122 | ||||||
Kitanotatsujin Corp.(1) | 200 | 341 | ||||||
| Kito Corp. | 100 | 1,940 | ||||||
| Kitz Corp. | 900 | 5,248 | ||||||
| Kiyo Bank Ltd. | 1,000 | 10,746 | ||||||
| Koa Corp. | 500 | 8,455 | ||||||
| Koatsu Gas Kogyo Co. Ltd. | 200 | 961 | ||||||
| Kobe Bussan Co. Ltd. | 1,200 | 30,558 | ||||||
| Kobe Steel Ltd. | 6,200 | 28,210 | ||||||
Koei Tecmo Holdings Co. Ltd.(1) | 260 | 8,717 | ||||||
Kohnan Shoji Co. Ltd.(1) | 500 | 12,394 | ||||||
| Koito Manufacturing Co. Ltd. | 500 | 17,082 | ||||||
| Kojima Co. Ltd. | 1,100 | 5,043 | ||||||
| Kokuyo Co. Ltd. | 500 | 6,440 | ||||||
| Komatsu Ltd. | 5,300 | 110,869 | ||||||
| KOMEDA Holdings Co. Ltd. | 800 | 13,200 | ||||||
| Komeri Co. Ltd. | 1,100 | 20,659 | ||||||
| Komori Corp. | 100 | 552 | ||||||
| Konami Group Corp. | 900 | 45,675 | ||||||
Konica Minolta, Inc.(1) | 10,200 | 35,317 | ||||||
| Konishi Co. Ltd. | 400 | 4,680 | ||||||
| Konoike Transport Co. Ltd. | 400 | 3,796 | ||||||
| Kotobuki Spirits Co. Ltd. | 100 | 5,758 | ||||||
| Kubota Corp. | 4,700 | 72,992 | ||||||
| Kumagai Gumi Co. Ltd. | 900 | 17,218 | ||||||
| Kumiai Chemical Industry Co. Ltd. | 2,900 | 22,595 | ||||||
| Kurabo Industries Ltd. | 200 | 3,051 | ||||||
| Kuraray Co. Ltd. | 7,000 | 53,171 | ||||||
| Kureha Corp. | 500 | 33,577 | ||||||
| Kurita Water Industries Ltd. | 1,100 | 42,798 | ||||||
| Kusuri no Aoki Holdings Co. Ltd. | 400 | 17,644 | ||||||
| KYB Corp. | 300 | 7,096 | ||||||
| Kyocera Corp. | 1,500 | 83,376 | ||||||
| Kyokuto Kaihatsu Kogyo Co. Ltd. | 400 | 3,925 | ||||||
| Kyokuyo Co. Ltd. | 200 | 5,234 | ||||||
| Kyowa Kirin Co. Ltd. | 1,500 | 33,622 | ||||||
| Kyudenko Corp. | 300 | 6,039 | ||||||
| Kyushu Electric Power Co., Inc. | 4,800 | 28,848 | ||||||
| Kyushu Financial Group, Inc. | 2,500 | 6,828 | ||||||
| Kyushu Railway Co. | 1,100 | 23,139 | ||||||
| Lasertec Corp. | 300 | 41,534 | ||||||
Lawson, Inc.(1) | 1,100 | 36,455 | ||||||
| LEC, Inc. | 400 | 2,182 | ||||||
| Lintec Corp. | 500 | 8,333 | ||||||
| Lion Corp. | 600 | 7,005 | ||||||
Lixil Corp.(1) | 4,200 | 73,036 | ||||||
M&A Capital Partners Co. Ltd.(2) | 100 | 2,468 | ||||||
| m-up Holdings, Inc. | 900 | 9,311 | ||||||
110
| Avantis International Equity Fund | ||||||||
| Shares | Value | |||||||
| M3, Inc. | 2,000 | $ | 64,064 | |||||
| Mabuchi Motor Co. Ltd. | 100 | 2,839 | ||||||
| Macnica Holdings, Inc. | 800 | 17,165 | ||||||
| Maeda Kosen Co. Ltd. | 400 | 9,287 | ||||||
| Makino Milling Machine Co. Ltd. | 600 | 18,933 | ||||||
| Makita Corp. | 800 | 18,811 | ||||||
Mani, Inc.(1) | 200 | 2,507 | ||||||
| Marubeni Corp. | 12,600 | 131,321 | ||||||
| Marudai Food Co. Ltd. | 200 | 2,268 | ||||||
| Maruha Nichiro Corp. | 800 | 14,305 | ||||||
Marui Group Co. Ltd.(1) | 2,200 | 39,458 | ||||||
| Maruichi Steel Tube Ltd. | 200 | 4,264 | ||||||
| MARUKA FURUSATO Corp. | 500 | 12,186 | ||||||
| Marusan Securities Co. Ltd. | 1,100 | 3,772 | ||||||
Maruwa Co. Ltd.(1) | 300 | 37,739 | ||||||
Maruwa Unyu Kikan Co. Ltd.(1) | 400 | 4,810 | ||||||
| Maruzen Showa Unyu Co. Ltd. | 200 | 4,567 | ||||||
| Marvelous, Inc. | 900 | 4,385 | ||||||
| Matsui Securities Co. Ltd. | 1,500 | 8,545 | ||||||
| MatsukiyoCocokara & Co. | 100 | 3,968 | ||||||
| Maxell Ltd. | 1,400 | 14,849 | ||||||
| Mazda Motor Corp. | 10,700 | 94,760 | ||||||
| McDonald's Holdings Co. Japan Ltd. | 700 | 25,020 | ||||||
| Mebuki Financial Group, Inc. | 11,100 | 21,274 | ||||||
| Media Do Co. Ltd. | 200 | 2,942 | ||||||
| Medipal Holdings Corp. | 1,500 | 20,523 | ||||||
MedPeer, Inc.(1)(2) | 200 | 2,274 | ||||||
| Megmilk Snow Brand Co. Ltd. | 800 | 9,860 | ||||||
| Meidensha Corp. | 400 | 5,734 | ||||||
| MEIJI Holdings Co. Ltd. | 1,400 | 66,694 | ||||||
Meiko Electronics Co. Ltd.(1) | 400 | 9,293 | ||||||
| Meitec Corp. | 1,500 | 26,373 | ||||||
| Menicon Co. Ltd. | 1,100 | 26,409 | ||||||
Mercari, Inc.(2) | 600 | 9,663 | ||||||
| Micronics Japan Co. Ltd. | 1,300 | 13,317 | ||||||
| Milbon Co. Ltd. | 100 | 4,212 | ||||||
| Mimasu Semiconductor Industry Co. Ltd. | 100 | 1,521 | ||||||
| MINEBEA MITSUMI, Inc. | 4,200 | 72,186 | ||||||
| MIRAIT ONE Corp. | 1,000 | 11,239 | ||||||
| Miroku Jyoho Service Co. Ltd. | 200 | 2,214 | ||||||
| MISUMI Group, Inc. | 1,500 | 36,819 | ||||||
| Mitsuba Corp. | 200 | 636 | ||||||
| Mitsubishi Chemical Group Corp. | 15,300 | 80,324 | ||||||
| Mitsubishi Corp. | 8,800 | 288,118 | ||||||
| Mitsubishi Electric Corp. | 7,100 | 71,782 | ||||||
| Mitsubishi Estate Co. Ltd. | 4,300 | 57,908 | ||||||
| Mitsubishi Gas Chemical Co., Inc. | 2,300 | 34,187 | ||||||
| Mitsubishi HC Capital, Inc. | 12,330 | 59,754 | ||||||
| Mitsubishi Heavy Industries Ltd. | 4,900 | 188,898 | ||||||
| Mitsubishi Logisnext Co. Ltd. | 400 | 2,396 | ||||||
Mitsubishi Logistics Corp.(1) | 1,000 | 25,984 | ||||||
111
| Avantis International Equity Fund | ||||||||
| Shares | Value | |||||||
| Mitsubishi Materials Corp. | 1,000 | $ | 14,925 | |||||
Mitsubishi Motors Corp.(2) | 5,700 | 22,801 | ||||||
| Mitsubishi Research Institute, Inc. | 400 | 11,975 | ||||||
| Mitsubishi Shokuhin Co. Ltd. | 400 | 9,818 | ||||||
Mitsubishi UFJ Financial Group, Inc., ADR(1) | 57,383 | 295,522 | ||||||
Mitsuboshi Belting Ltd.(1) | 1,000 | 22,989 | ||||||
| Mitsui & Co. Ltd. | 9,200 | 215,916 | ||||||
| Mitsui Chemicals, Inc. | 3,500 | 78,629 | ||||||
| Mitsui DM Sugar Holdings Co. Ltd. | 100 | 1,346 | ||||||
| Mitsui Fudosan Co. Ltd. | 4,100 | 82,986 | ||||||
| Mitsui High-Tec, Inc. | 300 | 18,554 | ||||||
Mitsui Matsushima Holdings Co. Ltd.(1) | 500 | 13,091 | ||||||
| Mitsui Mining & Smelting Co. Ltd. | 1,800 | 42,508 | ||||||
Mitsui OSK Lines Ltd.(1) | 3,000 | 78,161 | ||||||
| Mitsui-Soko Holdings Co. Ltd. | 1,000 | 24,170 | ||||||
| Mitsuuroko Group Holdings Co. Ltd. | 400 | 2,825 | ||||||
| Miura Co. Ltd. | 200 | 4,243 | ||||||
| Mixi, Inc. | 300 | 5,151 | ||||||
| Miyazaki Bank Ltd. | 300 | 4,795 | ||||||
Mizuho Financial Group, Inc., ADR(1) | 58,107 | 133,065 | ||||||
| Mizuho Leasing Co. Ltd. | 800 | 19,323 | ||||||
| Mizuho Medy Co. Ltd. | 300 | 6,431 | ||||||
| Mizuno Corp. | 400 | 7,696 | ||||||
| Mochida Pharmaceutical Co. Ltd. | 100 | 2,462 | ||||||
Modec, Inc.(2) | 100 | 1,037 | ||||||
Monex Group, Inc.(1) | 3,700 | 13,195 | ||||||
| Monogatari Corp. | 400 | 20,284 | ||||||
| MonotaRO Co. Ltd. | 800 | 14,354 | ||||||
| Morinaga & Co. Ltd. | 700 | 19,994 | ||||||
| Morinaga Milk Industry Co. Ltd. | 700 | 21,403 | ||||||
Moriroku Holdings Co. Ltd.(1) | 400 | 5,072 | ||||||
| Morita Holdings Corp. | 600 | 5,459 | ||||||
| MOS Food Services, Inc. | 800 | 18,261 | ||||||
| MrMax Holdings Ltd. | 400 | 1,822 | ||||||
| MS&AD Insurance Group Holdings, Inc. | 4,300 | 128,294 | ||||||
| Murata Manufacturing Co. Ltd. | 3,400 | 183,078 | ||||||
Musashi Seimitsu Industry Co. Ltd.(1) | 700 | 8,480 | ||||||
| Musashino Bank Ltd. | 400 | 4,876 | ||||||
| Nabtesco Corp. | 2,200 | 52,097 | ||||||
| Nachi-Fujikoshi Corp. | 200 | 5,426 | ||||||
| Nagase & Co. Ltd. | 1,100 | 15,786 | ||||||
| Nagoya Railroad Co. Ltd. | 1,500 | 23,206 | ||||||
| Nakanishi, Inc. | 1,100 | 21,330 | ||||||
| Nankai Electric Railway Co. Ltd. | 600 | 11,935 | ||||||
| Nanto Bank Ltd. | 500 | 7,047 | ||||||
| NEC Corp. | 3,300 | 120,356 | ||||||
| Nexon Co. Ltd. | 1,200 | 23,895 | ||||||
| Nextage Co. Ltd. | 900 | 19,540 | ||||||
| NGK Insulators Ltd. | 3,700 | 52,827 | ||||||
| NGK Spark Plug Co. Ltd. | 2,100 | 43,087 | ||||||
| NH Foods Ltd. | 1,500 | 42,938 | ||||||
112
| Avantis International Equity Fund | ||||||||
| Shares | Value | |||||||
| NHK Spring Co. Ltd. | 4,400 | $ | 29,718 | |||||
| Nichias Corp. | 1,000 | 17,269 | ||||||
| Nichicon Corp. | 1,400 | 14,725 | ||||||
| Nichiha Corp. | 1,300 | 25,906 | ||||||
| Nichirei Corp. | 1,800 | 32,179 | ||||||
| Nichireki Co. Ltd. | 100 | 977 | ||||||
| Nidec Corp. | 823 | 54,674 | ||||||
| Nifco, Inc. | 1,200 | 27,084 | ||||||
| Nihon Dempa Kogyo Co. Ltd. | 200 | 2,173 | ||||||
| Nihon Flush Co. Ltd. | 400 | 2,727 | ||||||
| Nihon Kohden Corp. | 1,300 | 29,689 | ||||||
| Nihon M&A Center Holdings, Inc. | 1,000 | 12,393 | ||||||
| Nihon Parkerizing Co. Ltd. | 2,300 | 15,831 | ||||||
| Nihon Plast Co. Ltd. | 200 | 650 | ||||||
| Nikkon Holdings Co. Ltd. | 1,400 | 23,698 | ||||||
| Nikon Corp. | 3,800 | 43,378 | ||||||
| Nintendo Co. Ltd. | 400 | 163,739 | ||||||
| Nippn Corp. | 700 | 7,895 | ||||||
| Nippon Carbon Co. Ltd. | 100 | 2,942 | ||||||
Nippon Chemi-Con Corp.(2) | 500 | 6,553 | ||||||
| Nippon Coke & Engineering Co. Ltd. | 7,500 | 5,427 | ||||||
| Nippon Denko Co. Ltd. | 2,400 | 6,370 | ||||||
| Nippon Densetsu Kogyo Co. Ltd. | 2,100 | 27,021 | ||||||
| Nippon Electric Glass Co. Ltd. | 1,600 | 30,133 | ||||||
| NIPPON EXPRESS HOLDINGS, Inc. | 1,400 | 77,032 | ||||||
| Nippon Gas Co. Ltd. | 600 | 9,551 | ||||||
| Nippon Kayaku Co. Ltd. | 1,500 | 13,032 | ||||||
| Nippon Koei Co. Ltd. | 200 | 5,122 | ||||||
| Nippon Light Metal Holdings Co. Ltd. | 1,160 | 13,348 | ||||||
| Nippon Paint Holdings Co. Ltd. | 2,500 | 19,281 | ||||||
| Nippon Paper Industries Co. Ltd. | 1,900 | 12,397 | ||||||
| Nippon Parking Development Co. Ltd. | 3,300 | 3,814 | ||||||
| Nippon Pillar Packing Co. Ltd. | 200 | 3,723 | ||||||
Nippon Road Co. Ltd.(1) | 200 | 8,903 | ||||||
| Nippon Sanso Holdings Corp. | 1,100 | 20,006 | ||||||
| Nippon Seiki Co. Ltd. | 400 | 2,365 | ||||||
Nippon Sheet Glass Co. Ltd.(2) | 1,300 | 4,957 | ||||||
| Nippon Shinyaku Co. Ltd. | 300 | 16,410 | ||||||
| Nippon Shokubai Co. Ltd. | 800 | 31,723 | ||||||
| Nippon Signal Co. Ltd. | 100 | 668 | ||||||
| Nippon Soda Co. Ltd. | 700 | 23,147 | ||||||
| Nippon Steel Corp. | 9,800 | 154,802 | ||||||
| Nippon Steel Trading Corp. | 200 | 7,695 | ||||||
| Nippon Suisan Kaisha Ltd. | 5,600 | 22,915 | ||||||
| Nippon Telegraph & Telephone Corp. | 8,600 | 233,097 | ||||||
| Nippon Television Holdings, Inc. | 800 | 6,798 | ||||||
| Nippon Yakin Kogyo Co. Ltd. | 200 | 4,129 | ||||||
Nippon Yusen KK(1) | 2,400 | 183,058 | ||||||
| Nipro Corp. | 3,400 | 27,680 | ||||||
| Nishi-Nippon Financial Holdings, Inc. | 1,800 | 9,550 | ||||||
| Nishi-Nippon Railroad Co. Ltd. | 1,000 | 20,692 | ||||||
113
| Avantis International Equity Fund | ||||||||
| Shares | Value | |||||||
Nishimatsu Construction Co. Ltd.(1) | 700 | $ | 20,327 | |||||
| Nishimatsuya Chain Co. Ltd. | 800 | 9,370 | ||||||
| Nishio Rent All Co. Ltd. | 300 | 6,259 | ||||||
| Nissan Chemical Corp. | 1,100 | 55,421 | ||||||
| Nissan Motor Co. Ltd. | 16,300 | 64,127 | ||||||
| Nissan Shatai Co. Ltd. | 1,400 | 7,736 | ||||||
| Nissha Co. Ltd. | 700 | 9,103 | ||||||
| Nisshin Oillio Group Ltd. | 300 | 7,021 | ||||||
Nisshin Seifun Group, Inc.(1) | 1,800 | 20,257 | ||||||
| Nisshinbo Holdings, Inc. | 3,200 | 24,763 | ||||||
| Nissin Electric Co. Ltd. | 500 | 5,328 | ||||||
| Nissin Foods Holdings Co. Ltd. | 300 | 21,464 | ||||||
| Nitori Holdings Co. Ltd. | 400 | 38,241 | ||||||
| Nittetsu Mining Co. Ltd. | 200 | 8,857 | ||||||
| Nitto Denko Corp. | 1,800 | 110,939 | ||||||
Nitto Kogyo Corp.(1) | 400 | 7,379 | ||||||
| Nittoc Construction Co. Ltd. | 200 | 1,297 | ||||||
| Noevir Holdings Co. Ltd. | 100 | 4,143 | ||||||
| NOF Corp. | 200 | 7,579 | ||||||
| Nohmi Bosai Ltd. | 800 | 9,468 | ||||||
| Nojima Corp. | 1,200 | 24,177 | ||||||
| NOK Corp. | 1,200 | 10,665 | ||||||
| Nomura Co. Ltd. | 100 | 677 | ||||||
Nomura Micro Science Co. Ltd.(1) | 200 | 5,275 | ||||||
| Noritake Co. Ltd./Nagoya Japan | 100 | 3,006 | ||||||
| Noritz Corp. | 300 | 3,327 | ||||||
| North Pacific Bank Ltd. | 3,000 | 4,966 | ||||||
| NS Solutions Corp. | 200 | 5,441 | ||||||
| NS United Kaiun Kaisha Ltd. | 400 | 13,794 | ||||||
| NSD Co. Ltd. | 300 | 5,392 | ||||||
NSK Ltd.(1) | 2,500 | 13,552 | ||||||
NTN Corp.(2) | 4,600 | 8,708 | ||||||
| NTT Data Corp. | 4,200 | 59,104 | ||||||
Obara Group, Inc.(1) | 200 | 4,733 | ||||||
| Obayashi Corp. | 9,600 | 66,399 | ||||||
| Obic Co. Ltd. | 100 | 14,790 | ||||||
| Odakyu Electric Railway Co. Ltd. | 700 | 9,563 | ||||||
| Ogaki Kyoritsu Bank Ltd. | 400 | 4,961 | ||||||
| Oiles Corp. | 400 | 4,329 | ||||||
Oisix ra daichi, Inc.(1)(2) | 300 | 4,081 | ||||||
| Oji Holdings Corp. | 15,300 | 61,045 | ||||||
| Okamoto Machine Tool Works Ltd. | 200 | 5,766 | ||||||
| Okamura Corp. | 1,600 | 15,278 | ||||||
| Okasan Securities Group, Inc. | 1,000 | 2,398 | ||||||
| Oki Electric Industry Co. Ltd. | 1,000 | 5,396 | ||||||
| Okinawa Cellular Telephone Co. | 300 | 11,230 | ||||||
Okinawa Electric Power Co., Inc.(1) | 915 | 7,461 | ||||||
| Okinawa Financial Group, Inc. | 400 | 6,140 | ||||||
| OKUMA Corp. | 400 | 15,118 | ||||||
| Okumura Corp. | 500 | 10,531 | ||||||
Okura Industrial Co. Ltd.(1) | 400 | 5,319 | ||||||
114
| Avantis International Equity Fund | ||||||||
| Shares | Value | |||||||
| Okuwa Co. Ltd. | 100 | $ | 654 | |||||
| Olympus Corp. | 7,100 | 151,210 | ||||||
| Omron Corp. | 300 | 15,788 | ||||||
| Ono Pharmaceutical Co. Ltd. | 3,500 | 83,546 | ||||||
Onward Holdings Co. Ltd.(1) | 1,000 | 1,972 | ||||||
| Open House Group Co. Ltd. | 600 | 23,483 | ||||||
Optim Corp.(2) | 200 | 1,265 | ||||||
| Oracle Corp. (Tokyo) | 400 | 23,829 | ||||||
| Organo Corp. | 300 | 19,955 | ||||||
| Orient Corp. | 15,400 | 13,467 | ||||||
| Oriental Land Co. Ltd. | 200 | 29,817 | ||||||
| Oriental Shiraishi Corp. | 1,400 | 2,532 | ||||||
| ORIX Corp., ADR | 1,839 | 151,442 | ||||||
| Osaka Gas Co. Ltd. | 800 | 13,475 | ||||||
| Osaka Organic Chemical Industry Ltd. | 200 | 3,682 | ||||||
Osaka Soda Co. Ltd.(1) | 200 | 5,428 | ||||||
OSAKA Titanium Technologies Co. Ltd.(1)(2) | 1,400 | 31,919 | ||||||
| OSG Corp. | 1,800 | 24,788 | ||||||
| Otsuka Corp. | 400 | 12,930 | ||||||
| Otsuka Holdings Co. Ltd. | 2,100 | 68,591 | ||||||
| Outsourcing, Inc. | 1,100 | 9,548 | ||||||
| Pacific Industrial Co. Ltd. | 700 | 5,450 | ||||||
| Pack Corp. | 100 | 1,650 | ||||||
| PALTAC Corp. | 200 | 5,753 | ||||||
| Pan Pacific International Holdings Corp. | 2,800 | 50,276 | ||||||
| Panasonic Holdings Corp. | 15,700 | 127,396 | ||||||
| Paramount Bed Holdings Co. Ltd. | 1,200 | 22,610 | ||||||
Park24 Co. Ltd.(2) | 1,700 | 24,223 | ||||||
| Penta-Ocean Construction Co. Ltd. | 4,700 | 24,803 | ||||||
PeptiDream, Inc.(2) | 300 | 3,577 | ||||||
| Persol Holdings Co. Ltd. | 1,300 | 26,096 | ||||||
Pharma Foods International Co. Ltd.(1) | 300 | 3,220 | ||||||
| Pigeon Corp. | 1,000 | 14,895 | ||||||
| Pilot Corp. | 700 | 25,055 | ||||||
| Piolax, Inc. | 700 | 10,127 | ||||||
Plenus Co. Ltd.(1) | 200 | 2,745 | ||||||
| Pola Orbis Holdings, Inc. | 300 | 3,309 | ||||||
| Pole To Win Holdings, Inc. | 100 | 727 | ||||||
| Premium Group Co. Ltd. | 600 | 7,443 | ||||||
| Press Kogyo Co. Ltd. | 2,300 | 7,275 | ||||||
| Prestige International, Inc. | 2,200 | 10,567 | ||||||
| Prima Meat Packers Ltd. | 500 | 7,804 | ||||||
Raccoon Holdings, Inc.(1) | 300 | 2,987 | ||||||
| Raito Kogyo Co. Ltd. | 1,300 | 17,264 | ||||||
| Raiznext Corp. | 700 | 6,044 | ||||||
| Rakus Co. Ltd. | 400 | 4,708 | ||||||
| Rakuten Group, Inc. | 5,200 | 25,237 | ||||||
| Recruit Holdings Co. Ltd. | 6,000 | 190,744 | ||||||
| Relia, Inc. | 500 | 3,628 | ||||||
| Relo Group, Inc. | 2,000 | 32,149 | ||||||
Renesas Electronics Corp.(2) | 5,700 | 53,971 | ||||||
115
| Avantis International Equity Fund | ||||||||
| Shares | Value | |||||||
Rengo Co. Ltd.(1) | 3,800 | $ | 22,388 | |||||
RENOVA, Inc.(1)(2) | 200 | 4,345 | ||||||
| Resona Holdings, Inc. | 25,784 | 94,917 | ||||||
| Resorttrust, Inc. | 2,100 | 33,699 | ||||||
| Restar Holdings Corp. | 500 | 7,367 | ||||||
Retail Partners Co. Ltd.(1) | 500 | 3,848 | ||||||
| Ricoh Co. Ltd. | 7,400 | 58,160 | ||||||
| Ricoh Leasing Co. Ltd. | 400 | 10,296 | ||||||
| Riken Keiki Co. Ltd. | 400 | 12,570 | ||||||
| Riken Vitamin Co. Ltd. | 500 | 6,159 | ||||||
| Rinnai Corp. | 300 | 22,975 | ||||||
| Riso Kyoiku Co. Ltd. | 1,600 | 3,588 | ||||||
| Rohm Co. Ltd. | 700 | 52,373 | ||||||
| Rohto Pharmaceutical Co. Ltd. | 1,600 | 48,161 | ||||||
| Roland DG Corp. | 300 | 7,037 | ||||||
| Rorze Corp. | 100 | 6,068 | ||||||
| Round One Corp. | 1,400 | 20,145 | ||||||
| RS Technologies Co. Ltd. | 200 | 9,778 | ||||||
| Ryobi Ltd. | 100 | 929 | ||||||
Ryohin Keikaku Co. Ltd.(1) | 2,100 | 19,476 | ||||||
Ryosan Co. Ltd.(1) | 200 | 3,199 | ||||||
| S Foods, Inc. | 200 | 4,277 | ||||||
| S-Pool, Inc. | 1,600 | 12,340 | ||||||
| Sakai Moving Service Co. Ltd. | 100 | 3,300 | ||||||
| Sakata INX Corp. | 900 | 6,308 | ||||||
| Sakata Seed Corp. | 200 | 7,425 | ||||||
| San-A Co. Ltd. | 100 | 2,986 | ||||||
| San-Ai Obbli Co. Ltd. | 700 | 5,539 | ||||||
| San-In Godo Bank Ltd. | 2,100 | 10,325 | ||||||
| Sangetsu Corp. | 300 | 3,504 | ||||||
| Sanken Electric Co. Ltd. | 600 | 21,082 | ||||||
| Sanki Engineering Co. Ltd. | 700 | 8,268 | ||||||
| Sankyo Co. Ltd. | 800 | 23,442 | ||||||
| Sankyu, Inc. | 500 | 15,379 | ||||||
| Sanoh Industrial Co. Ltd. | 100 | 540 | ||||||
| Santen Pharmaceutical Co. Ltd. | 5,300 | 38,078 | ||||||
| Sanwa Holdings Corp. | 3,200 | 31,664 | ||||||
| Sanyo Chemical Industries Ltd. | 100 | 3,417 | ||||||
| Sanyo Denki Co. Ltd. | 200 | 7,783 | ||||||
| Sanyo Special Steel Co. Ltd. | 800 | 12,025 | ||||||
| Sapporo Holdings Ltd. | 1,700 | 37,261 | ||||||
| Sato Holdings Corp. | 500 | 6,868 | ||||||
| Sawai Group Holdings Co. Ltd. | 500 | 14,776 | ||||||
| SB Technology Corp. | 200 | 3,560 | ||||||
| SBI Holdings, Inc. | 4,000 | 78,601 | ||||||
| SBS Holdings, Inc. | 400 | 8,280 | ||||||
| SCREEN Holdings Co. Ltd. | 600 | 39,854 | ||||||
Scroll Corp.(1) | 1,200 | 6,761 | ||||||
| SCSK Corp. | 1,800 | 29,310 | ||||||
| Secom Co. Ltd. | 900 | 57,338 | ||||||
| Sega Sammy Holdings, Inc. | 1,700 | 25,236 | ||||||
116
| Avantis International Equity Fund | ||||||||
| Shares | Value | |||||||
| Seibu Holdings, Inc. | 500 | $ | 5,065 | |||||
| Seikagaku Corp. | 700 | 4,438 | ||||||
| Seikitokyu Kogyo Co. Ltd. | 200 | 1,090 | ||||||
Seiko Epson Corp.(1) | 3,700 | 58,141 | ||||||
| Seiko Holdings Corp. | 900 | 18,545 | ||||||
| Seino Holdings Co. Ltd. | 2,500 | 19,852 | ||||||
Seiren Co. Ltd.(1) | 400 | 6,075 | ||||||
| Sekisui Chemical Co. Ltd. | 4,900 | 66,803 | ||||||
| Sekisui House Ltd. | 2,500 | 42,512 | ||||||
| Sekisui Jushi Corp. | 100 | 1,237 | ||||||
| Senko Group Holdings Co. Ltd. | 2,200 | 15,031 | ||||||
| Senshu Electric Co. Ltd. | 200 | 8,019 | ||||||
| Senshu Ikeda Holdings, Inc. | 2,000 | 3,176 | ||||||
Septeni Holdings Co. Ltd.(1) | 1,000 | 3,564 | ||||||
| Seria Co. Ltd. | 1,100 | 21,455 | ||||||
Seven & i Holdings Co. Ltd.(1) | 4,100 | 162,874 | ||||||
Seven Bank Ltd.(1) | 14,000 | 26,594 | ||||||
| SG Holdings Co. Ltd. | 2,500 | 41,467 | ||||||
Sharp Corp.(1) | 3,900 | 27,918 | ||||||
| Shibaura Electronics Co. Ltd. | 400 | 14,976 | ||||||
| Shibaura Mechatronics Corp. | 200 | 16,495 | ||||||
| Shibuya Corp. | 100 | 1,798 | ||||||
SHIFT, Inc.(2) | 100 | 14,329 | ||||||
Shiga Bank Ltd.(1) | 600 | 11,069 | ||||||
| Shikoku Bank Ltd. | 200 | 1,232 | ||||||
| Shikoku Chemicals Corp. | 100 | 893 | ||||||
| Shikoku Electric Power Co., Inc. | 900 | 5,249 | ||||||
| Shimadzu Corp. | 1,100 | 32,127 | ||||||
| Shimamura Co. Ltd. | 100 | 9,064 | ||||||
| Shimano, Inc. | 400 | 70,764 | ||||||
| Shimizu Corp. | 9,600 | 52,641 | ||||||
Shin Nippon Biomedical Laboratories Ltd.(1) | 600 | 10,231 | ||||||
| Shin-Etsu Chemical Co. Ltd. | 1,500 | 174,199 | ||||||
| Shin-Etsu Polymer Co. Ltd. | 200 | 1,914 | ||||||
| Shinko Electric Industries Co. Ltd. | 1,000 | 27,836 | ||||||
| Shinmaywa Industries Ltd. | 1,900 | 14,480 | ||||||
| Shinoken Group Co. Ltd. | 100 | 1,145 | ||||||
Shinsei Bank Ltd.(1) | 1,000 | 14,082 | ||||||
| Shionogi & Co. Ltd. | 900 | 43,942 | ||||||
| Ship Healthcare Holdings, Inc. | 1,000 | 18,695 | ||||||
| Shiseido Co. Ltd. | 2,000 | 75,548 | ||||||
| Shizuoka Bank Ltd. | 4,700 | 27,198 | ||||||
| Shoei Co. Ltd. | 200 | 7,925 | ||||||
| Showa Denko KK | 3,600 | 55,345 | ||||||
| Showa Sangyo Co. Ltd. | 200 | 3,718 | ||||||
| SIGMAXYZ Holdings, Inc. | 900 | 7,931 | ||||||
| Siix Corp. | 300 | 2,387 | ||||||
| Sinanen Holdings Co. Ltd. | 200 | 5,502 | ||||||
| Sinfonia Technology Co. Ltd. | 300 | 3,251 | ||||||
| Sinko Industries Ltd. | 200 | 2,315 | ||||||
| Sintokogio Ltd. | 200 | 1,019 | ||||||
117
| Avantis International Equity Fund | ||||||||
| Shares | Value | |||||||
| SKY Perfect JSAT Holdings, Inc. | 5,600 | $ | 22,256 | |||||
Skylark Holdings Co. Ltd.(1)(2) | 2,200 | 24,201 | ||||||
| SMC Corp. | 53 | 25,145 | ||||||
| SMS Co. Ltd. | 300 | 6,831 | ||||||
Snow Peak, Inc.(1) | 400 | 6,238 | ||||||
| Sodick Co. Ltd. | 2,100 | 12,160 | ||||||
| Softbank Corp. | 11,800 | 129,366 | ||||||
| SoftBank Group Corp. | 6,700 | 265,397 | ||||||
| Sohgo Security Services Co. Ltd. | 700 | 18,136 | ||||||
Sojitz Corp.(1) | 4,540 | 76,390 | ||||||
| Solasto Corp. | 100 | 641 | ||||||
| Sompo Holdings, Inc. | 3,400 | 145,779 | ||||||
| Sony Group Corp., ADR | 5,027 | 398,892 | ||||||
| Sparx Group Co. Ltd. | 2,100 | 4,520 | ||||||
| Square Enix Holdings Co. Ltd. | 900 | 39,079 | ||||||
| Stanley Electric Co. Ltd. | 500 | 9,230 | ||||||
| Star Micronics Co. Ltd. | 2,100 | 27,615 | ||||||
| Starts Corp., Inc. | 1,000 | 19,211 | ||||||
| Starzen Co. Ltd. | 200 | 3,040 | ||||||
| Stella Chemifa Corp. | 200 | 4,056 | ||||||
| Subaru Corp. | 8,800 | 159,961 | ||||||
Sugi Holdings Co. Ltd.(1) | 600 | 25,460 | ||||||
| SUMCO Corp. | 6,500 | 88,224 | ||||||
| Sumida Corp. | 700 | 4,863 | ||||||
| Sumitomo Bakelite Co. Ltd. | 500 | 15,761 | ||||||
| Sumitomo Chemical Co. Ltd. | 21,100 | 83,056 | ||||||
| Sumitomo Corp. | 10,800 | 151,908 | ||||||
| Sumitomo Densetsu Co. Ltd. | 900 | 16,996 | ||||||
| Sumitomo Electric Industries Ltd. | 5,600 | 64,146 | ||||||
| Sumitomo Forestry Co. Ltd. | 1,100 | 18,598 | ||||||
| Sumitomo Heavy Industries Ltd. | 1,900 | 39,883 | ||||||
| Sumitomo Metal Mining Co. Ltd. | 1,800 | 56,640 | ||||||
| Sumitomo Mitsui Construction Co. Ltd. | 6,400 | 21,321 | ||||||
Sumitomo Mitsui Financial Group, Inc., ADR(1) | 33,370 | 201,889 | ||||||
| Sumitomo Mitsui Trust Holdings, Inc. | 3,200 | 99,530 | ||||||
Sumitomo Osaka Cement Co. Ltd.(1) | 600 | 15,198 | ||||||
| Sumitomo Pharma Co. Ltd. | 800 | 5,959 | ||||||
| Sumitomo Realty & Development Co. Ltd. | 2,500 | 61,140 | ||||||
| Sumitomo Rubber Industries Ltd. | 3,200 | 27,459 | ||||||
| Sumitomo Seika Chemicals Co. Ltd. | 200 | 4,477 | ||||||
| Sumitomo Warehouse Co. Ltd. | 1,300 | 20,400 | ||||||
| Sun Frontier Fudousan Co. Ltd. | 500 | 4,314 | ||||||
| Sundrug Co. Ltd. | 1,000 | 24,467 | ||||||
| Suntory Beverage & Food Ltd. | 1,300 | 47,485 | ||||||
| Suruga Bank Ltd. | 2,600 | 7,007 | ||||||
| Suzuken Co. Ltd. | 1,000 | 23,965 | ||||||
| Suzuki Motor Corp. | 2,400 | 83,883 | ||||||
| SWCC Showa Holdings Co. Ltd. | 1,100 | 14,411 | ||||||
SymBio Pharmaceuticals Ltd.(2) | 1,000 | 5,063 | ||||||
| Sysmex Corp. | 600 | 36,676 | ||||||
| Systena Corp. | 2,000 | 6,128 | ||||||
118
| Avantis International Equity Fund | ||||||||
| Shares | Value | |||||||
| Syuppin Co. Ltd. | 600 | $ | 5,338 | |||||
| T Hasegawa Co. Ltd. | 200 | 4,317 | ||||||
| T&D Holdings, Inc. | 4,700 | 51,330 | ||||||
| T-Gaia Corp. | 100 | 1,189 | ||||||
| Tadano Ltd. | 2,200 | 15,030 | ||||||
| Taihei Dengyo Kaisha Ltd. | 100 | 2,554 | ||||||
| Taiheiyo Cement Corp. | 1,500 | 22,457 | ||||||
| Taikisha Ltd. | 200 | 4,589 | ||||||
| Taisei Corp. | 3,200 | 97,022 | ||||||
| Taisho Pharmaceutical Holdings Co. Ltd. | 400 | 14,873 | ||||||
Taiyo Holdings Co. Ltd.(1) | 600 | 11,762 | ||||||
| Taiyo Yuden Co. Ltd. | 1,800 | 55,630 | ||||||
| Takamatsu Construction Group Co. Ltd. | 100 | 1,374 | ||||||
| Takara Bio, Inc. | 1,000 | 14,006 | ||||||
| Takara Holdings, Inc. | 3,400 | 25,797 | ||||||
| Takara Leben Co. Ltd. | 1,500 | 4,080 | ||||||
| Takara Standard Co. Ltd. | 1,200 | 11,403 | ||||||
| Takasago International Corp. | 400 | 7,963 | ||||||
| Takasago Thermal Engineering Co. Ltd. | 600 | 7,089 | ||||||
Takashimaya Co. Ltd.(1) | 1,900 | 21,018 | ||||||
Takeda Pharmaceutical Co. Ltd., ADR(1) | 9,611 | 132,151 | ||||||
Takuma Co. Ltd.(1) | 500 | 5,023 | ||||||
| Tama Home Co. Ltd. | 500 | 8,430 | ||||||
| Tamron Co. Ltd. | 200 | 4,370 | ||||||
| Tanseisha Co. Ltd. | 800 | 4,563 | ||||||
Tatsuta Electric Wire and Cable Co. Ltd.(1) | 200 | 667 | ||||||
| TBS Holdings, Inc. | 600 | 6,949 | ||||||
| TDK Corp. | 5,500 | 192,292 | ||||||
| TechMatrix Corp. | 400 | 4,928 | ||||||
| TechnoPro Holdings, Inc. | 700 | 15,746 | ||||||
| Teijin Ltd. | 3,100 | 32,775 | ||||||
| Teikoku Electric Manufacturing Co. Ltd. | 400 | 5,585 | ||||||
| Teikoku Sen-I Co. Ltd. | 200 | 2,349 | ||||||
| Terumo Corp. | 1,500 | 48,152 | ||||||
| THK Co. Ltd. | 500 | 10,149 | ||||||
| TIS, Inc. | 2,400 | 68,344 | ||||||
| TKC Corp. | 200 | 4,999 | ||||||
| Toa Corp. (Tokyo) | 300 | 5,264 | ||||||
| Toagosei Co. Ltd. | 1,300 | 10,129 | ||||||
| Tobu Railway Co. Ltd. | 3,100 | 73,241 | ||||||
| Tocalo Co. Ltd. | 1,600 | 14,744 | ||||||
Toda Corp.(1) | 4,500 | 22,199 | ||||||
| Toho Bank Ltd. | 3,300 | 4,835 | ||||||
| Toho Co. Ltd. | 700 | 26,585 | ||||||
| Toho Gas Co. Ltd. | 100 | 2,237 | ||||||
| Toho Holdings Co. Ltd. | 1,300 | 17,218 | ||||||
Toho Titanium Co. Ltd.(1) | 600 | 9,504 | ||||||
| Toho Zinc Co. Ltd. | 200 | 3,490 | ||||||
| Tohoku Electric Power Co., Inc. | 5,300 | 26,357 | ||||||
| Tokai Carbon Co. Ltd. | 4,300 | 31,389 | ||||||
| Tokai Corp/Gifu | 200 | 2,647 | ||||||
119
| Avantis International Equity Fund | ||||||||
| Shares | Value | |||||||
| TOKAI Holdings Corp. | 2,800 | $ | 17,895 | |||||
| Tokai Rika Co. Ltd. | 500 | 5,368 | ||||||
| Tokai Tokyo Financial Holdings, Inc. | 1,400 | 3,793 | ||||||
| Token Corp. | 100 | 6,369 | ||||||
| Tokio Marine Holdings, Inc. | 4,400 | 243,845 | ||||||
| Tokushu Tokai Paper Co. Ltd. | 100 | 2,277 | ||||||
| Tokuyama Corp. | 1,700 | 22,391 | ||||||
Tokyo Century Corp.(1) | 500 | 17,858 | ||||||
Tokyo Electric Power Co. Holdings, Inc.(2) | 21,200 | 82,796 | ||||||
| Tokyo Electron Device Ltd. | 200 | 8,447 | ||||||
| Tokyo Electron Ltd. | 700 | 219,546 | ||||||
| Tokyo Gas Co. Ltd. | 3,300 | 61,912 | ||||||
| Tokyo Kiraboshi Financial Group, Inc. | 500 | 8,063 | ||||||
| Tokyo Ohka Kogyo Co. Ltd. | 500 | 24,516 | ||||||
| Tokyo Seimitsu Co. Ltd. | 1,000 | 33,311 | ||||||
| Tokyo Steel Manufacturing Co. Ltd. | 1,600 | 16,952 | ||||||
| Tokyo Tatemono Co. Ltd. | 3,100 | 46,468 | ||||||
| Tokyotokeiba Co. Ltd. | 400 | 12,098 | ||||||
| Tokyu Construction Co. Ltd. | 2,800 | 13,171 | ||||||
| Tokyu Corp. | 4,700 | 55,872 | ||||||
| Tokyu Fudosan Holdings Corp. | 5,600 | 30,093 | ||||||
| TOMONY Holdings, Inc. | 1,400 | 3,173 | ||||||
| Tomy Co. Ltd. | 2,800 | 26,543 | ||||||
| Topcon Corp. | 2,400 | 32,374 | ||||||
| Toppan, Inc. | 2,300 | 36,121 | ||||||
| Topre Corp. | 1,100 | 9,799 | ||||||
| Toray Industries, Inc. | 15,900 | 90,732 | ||||||
| Toridoll Holdings Corp. | 200 | 4,265 | ||||||
| Torii Pharmaceutical Co. Ltd. | 100 | 2,149 | ||||||
| Tosei Corp. | 500 | 4,995 | ||||||
| Toshiba Corp. | 4,000 | 148,136 | ||||||
| Toshiba TEC Corp. | 400 | 11,904 | ||||||
| Tosoh Corp. | 5,100 | 65,942 | ||||||
| Totetsu Kogyo Co. Ltd. | 300 | 5,002 | ||||||
| TOTO Ltd. | 500 | 17,234 | ||||||
| Towa Bank Ltd. | 200 | 757 | ||||||
| Towa Corp. | 500 | 6,676 | ||||||
| Towa Pharmaceutical Co. Ltd. | 600 | 9,515 | ||||||
| Toyo Construction Co. Ltd. | 2,000 | 12,339 | ||||||
Toyo Engineering Corp.(2) | 1,000 | 4,953 | ||||||
| Toyo Gosei Co. Ltd. | 100 | 5,883 | ||||||
| Toyo Ink SC Holdings Co. Ltd. | 200 | 2,743 | ||||||
| Toyo Kanetsu KK | 200 | 3,753 | ||||||
| Toyo Seikan Group Holdings Ltd. | 2,600 | 30,768 | ||||||
| Toyo Suisan Kaisha Ltd. | 700 | 28,714 | ||||||
| Toyo Tanso Co. Ltd. | 400 | 9,693 | ||||||
| Toyo Tire Corp. | 2,100 | 25,452 | ||||||
| Toyobo Co. Ltd. | 1,700 | 12,881 | ||||||
| Toyoda Gosei Co. Ltd. | 1,000 | 17,398 | ||||||
| Toyota Boshoku Corp. | 1,500 | 21,784 | ||||||
| Toyota Industries Corp. | 900 | 50,304 | ||||||
120
| Avantis International Equity Fund | ||||||||
| Shares | Value | |||||||
| Toyota Motor Corp., ADR | 3,973 | $ | 593,447 | |||||
| Toyota Tsusho Corp. | 2,500 | 87,520 | ||||||
| TPR Co. Ltd. | 200 | 1,831 | ||||||
| Trancom Co. Ltd. | 100 | 5,467 | ||||||
| Transcosmos, Inc. | 1,000 | 27,583 | ||||||
| TRE Holdings Corp. | 868 | 10,631 | ||||||
| Trend Micro, Inc. | 1,700 | 104,666 | ||||||
| Trusco Nakayama Corp. | 900 | 12,586 | ||||||
| TS Tech Co. Ltd. | 600 | 6,712 | ||||||
| Tsubakimoto Chain Co. | 400 | 9,243 | ||||||
Tsugami Corp.(1) | 500 | 4,474 | ||||||
| Tsukishima Kikai Co. Ltd. | 500 | 3,290 | ||||||
| Tsumura & Co. | 200 | 4,578 | ||||||
| Tsuruha Holdings, Inc. | 600 | 33,304 | ||||||
| TV Asahi Holdings Corp. | 400 | 4,168 | ||||||
| UACJ Corp. | 500 | 8,633 | ||||||
Ube Industries Ltd.(1) | 2,200 | 32,416 | ||||||
| Uchida Yoko Co. Ltd. | 200 | 7,164 | ||||||
| Ulvac, Inc. | 700 | 27,143 | ||||||
| Unicharm Corp. | 1,100 | 38,227 | ||||||
| Unipres Corp. | 1,100 | 7,579 | ||||||
| United Arrows Ltd. | 1,200 | 15,754 | ||||||
United Super Markets Holdings, Inc.(1) | 900 | 6,831 | ||||||
Universal Entertainment Corp.(2) | 100 | 1,143 | ||||||
| Ushio, Inc. | 500 | 6,070 | ||||||
| USS Co. Ltd. | 2,300 | 40,588 | ||||||
| UT Group Co. Ltd. | 200 | 3,984 | ||||||
| V Technology Co. Ltd. | 200 | 4,304 | ||||||
| Valor Holdings Co. Ltd. | 1,200 | 15,298 | ||||||
| Valqua Ltd. | 400 | 7,771 | ||||||
| ValueCommerce Co. Ltd. | 200 | 3,653 | ||||||
| Vector, Inc. | 600 | 5,013 | ||||||
Visional, Inc.(1)(2) | 300 | 15,987 | ||||||
| Vital KSK Holdings, Inc. | 400 | 1,923 | ||||||
| VT Holdings Co. Ltd. | 1,600 | 5,540 | ||||||
W-Scope Corp.(2) | 1,400 | 23,516 | ||||||
Wacoal Holdings Corp.(1) | 200 | 3,196 | ||||||
| Wacom Co. Ltd. | 1,800 | 10,802 | ||||||
| Wakita & Co. Ltd. | 600 | 4,826 | ||||||
| Warabeya Nichiyo Holdings Co. Ltd. | 1,200 | 19,533 | ||||||
Welcia Holdings Co. Ltd.(1) | 400 | 8,377 | ||||||
| West Japan Railway Co. | 700 | 27,243 | ||||||
| Xebio Holdings Co. Ltd. | 800 | 5,547 | ||||||
YA-MAN Ltd.(1) | 600 | 6,938 | ||||||
| Yahagi Construction Co. Ltd. | 400 | 2,205 | ||||||
| Yakult Honsha Co. Ltd. | 700 | 41,402 | ||||||
| YAKUODO Holdings Co. Ltd. | 200 | 3,436 | ||||||
| YAMABIKO Corp. | 500 | 4,082 | ||||||
| Yamada Holdings Co. Ltd. | 13,100 | 45,340 | ||||||
Yamaguchi Financial Group, Inc.(1) | 2,800 | 15,363 | ||||||
| Yamaha Corp. | 500 | 19,504 | ||||||
121
| Avantis International Equity Fund | ||||||||
| Shares | Value | |||||||
| Yamaha Motor Co. Ltd. | 3,200 | $ | 66,318 | |||||
| Yamaichi Electronics Co. Ltd. | 1,000 | 14,801 | ||||||
| Yamanashi Chuo Bank Ltd. | 1,000 | 8,212 | ||||||
| Yamato Holdings Co. Ltd. | 3,300 | 51,444 | ||||||
| Yamato Kogyo Co. Ltd. | 200 | 7,080 | ||||||
| Yamazaki Baking Co. Ltd. | 1,500 | 17,666 | ||||||
| Yamazen Corp. | 1,900 | 12,723 | ||||||
| Yaoko Co. Ltd. | 300 | 13,920 | ||||||
Yaskawa Electric Corp.(1) | 500 | 16,281 | ||||||
| Yellow Hat Ltd. | 500 | 6,455 | ||||||
| Yodogawa Steel Works Ltd. | 200 | 3,597 | ||||||
| Yokogawa Bridge Holdings Corp. | 500 | 6,991 | ||||||
| Yokogawa Electric Corp. | 3,600 | 62,832 | ||||||
| Yokohama Rubber Co. Ltd. | 2,700 | 44,158 | ||||||
| Yokorei Co. Ltd. | 700 | 4,642 | ||||||
| Yonex Co. Ltd. | 2,000 | 22,613 | ||||||
| Yotai Refractories Co. Ltd. | 200 | 2,004 | ||||||
| Yuasa Trading Co. Ltd. | 400 | 10,078 | ||||||
| Z Holdings Corp. | 7,600 | 22,343 | ||||||
| Zenkoku Hosho Co. Ltd. | 1,100 | 36,348 | ||||||
| Zenrin Co. Ltd. | 600 | 4,104 | ||||||
| Zensho Holdings Co. Ltd. | 1,100 | 28,839 | ||||||
| Zeon Corp. | 2,700 | 25,905 | ||||||
| ZERIA Pharmaceutical Co. Ltd. | 700 | 10,455 | ||||||
| ZOZO, Inc. | 400 | 8,841 | ||||||
| Zuken, Inc. | 800 | 20,119 | ||||||
| 27,754,535 | ||||||||
| Netherlands — 3.4% | ||||||||
| Aalberts NV | 1,597 | 58,562 | ||||||
| ABN AMRO Bank NV, CVA | 8,553 | 82,168 | ||||||
Adyen NV(2) | 206 | 317,888 | ||||||
Aegon NV, NY Shares(1) | 35,879 | 161,097 | ||||||
AerCap Holdings NV(2) | 3,634 | 160,078 | ||||||
| Akzo Nobel NV | 1,540 | 97,022 | ||||||
| AMG Advanced Metallurgical Group NV | 1,241 | 31,685 | ||||||
| Arcadis NV | 924 | 29,456 | ||||||
| ASM International NV | 339 | 92,170 | ||||||
| ASML Holding NV, NY Shares | 1,815 | 889,241 | ||||||
| ASR Nederland NV | 3,494 | 142,605 | ||||||
| B&S Group Sarl | 176 | 894 | ||||||
Basic-Fit NV(1)(2) | 224 | 8,550 | ||||||
| BE Semiconductor Industries NV | 854 | 40,568 | ||||||
| Boskalis Westminster | 1,596 | 52,938 | ||||||
| Brunel International NV | 841 | 7,874 | ||||||
| Coca-Cola Europacific Partners PLC | 1,661 | 81,671 | ||||||
Constellium SE(2) | 1,297 | 17,276 | ||||||
| Corbion NV | 413 | 11,727 | ||||||
| Flow Traders | 1,075 | 21,512 | ||||||
ForFarmers NV(1) | 632 | 1,781 | ||||||
Fugro NV(2) | 3,473 | 44,238 | ||||||
| Heijmans NV, CVA | 494 | 5,128 | ||||||
122
| Avantis International Equity Fund | ||||||||
| Shares | Value | |||||||
| Heineken Holding NV | 291 | $ | 20,643 | |||||
| Heineken NV | 1,028 | 92,396 | ||||||
| IMCD NV | 309 | 42,628 | ||||||
ING Groep NV, ADR(1) | 39,156 | 343,790 | ||||||
InPost SA(2) | 415 | 2,135 | ||||||
| JDE Peet's NV | 810 | 24,977 | ||||||
Just Eat Takeaway.com NV(2) | 1,120 | 18,632 | ||||||
| Kendrion NV | 45 | 699 | ||||||
| Koninklijke Ahold Delhaize NV | 11,923 | 327,964 | ||||||
Koninklijke BAM Groep NV(2) | 11,769 | 31,370 | ||||||
| Koninklijke DSM NV | 1,458 | 185,918 | ||||||
| Koninklijke KPN NV | 68,204 | 217,032 | ||||||
| Koninklijke Philips NV, NY Shares | 4,033 | 66,867 | ||||||
| Koninklijke Vopak NV | 1,453 | 31,983 | ||||||
| Nedap NV | 19 | 1,082 | ||||||
| NN Group NV | 4,393 | 180,543 | ||||||
| OCI NV | 2,356 | 88,451 | ||||||
Pharming Group NV(2) | 26,094 | 31,376 | ||||||
PostNL NV(1) | 13,712 | 29,218 | ||||||
Prosus NV(2) | 2,031 | 125,535 | ||||||
Randstad NV(1) | 1,178 | 54,860 | ||||||
| SBM Offshore NV | 1,193 | 16,660 | ||||||
SIF Holding NV(1) | 255 | 2,605 | ||||||
| Signify NV | 428 | 12,166 | ||||||
Sligro Food Group NV(2) | 705 | 11,678 | ||||||
TKH Group NV(1) | 995 | 34,713 | ||||||
TomTom NV(2) | 2,734 | 22,008 | ||||||
| Universal Music Group NV | 3,755 | 74,567 | ||||||
| Van Lanschot Kempen NV | 419 | 8,828 | ||||||
| Wolters Kluwer NV | 401 | 39,215 | ||||||
| 4,496,668 | ||||||||
| New Zealand — 0.3% | ||||||||
a2 Milk Co. Ltd.(1)(2) | 7,181 | 27,316 | ||||||
Air New Zealand Ltd.(2) | 28,413 | 11,741 | ||||||
| Arvida Group Ltd. | 960 | 885 | ||||||
Auckland International Airport Ltd.(2) | 7,581 | 34,962 | ||||||
| Chorus Ltd. | 6,898 | 33,782 | ||||||
| Contact Energy Ltd. | 8,525 | 40,960 | ||||||
| Fisher & Paykel Healthcare Corp. Ltd. | 1,195 | 14,306 | ||||||
| Fletcher Building Ltd. | 5,977 | 20,404 | ||||||
| Genesis Energy Ltd. | 11,169 | 20,185 | ||||||
| Hallenstein Glasson Holdings Ltd. | 237 | 771 | ||||||
| Infratil Ltd. | 3,807 | 21,024 | ||||||
| KMD Brands Ltd. | 10,227 | 6,734 | ||||||
| Mercury NZ Ltd. | 5,198 | 18,396 | ||||||
| Meridian Energy Ltd. | 2,645 | 8,069 | ||||||
| NZX Ltd. | 2,074 | 1,644 | ||||||
| Oceania Healthcare Ltd. | 10,328 | 6,241 | ||||||
Pushpay Holdings Ltd.(2) | 6,208 | 4,834 | ||||||
| Ryman Healthcare Ltd. | 3,156 | 17,661 | ||||||
Sanford Ltd.(2) | 585 | 1,573 | ||||||
123
| Avantis International Equity Fund | ||||||||
| Shares | Value | |||||||
| Scales Corp. Ltd. | 162 | $ | 468 | |||||
| SKYCITY Entertainment Group Ltd. | 17,623 | 30,657 | ||||||
| Spark New Zealand Ltd. | 12,261 | 40,558 | ||||||
| Summerset Group Holdings Ltd. | 3,170 | 21,367 | ||||||
Synlait Milk Ltd.(2) | 167 | 355 | ||||||
| 384,893 | ||||||||
| Norway — 1.0% | ||||||||
2020 Bulkers Ltd.(1)(2) | 909 | 8,093 | ||||||
| ABG Sundal Collier Holding ASA | 7,195 | 4,221 | ||||||
Adevinta ASA(2) | 508 | 4,110 | ||||||
| Aker BP ASA | 1,666 | 58,361 | ||||||
| Aker Solutions ASA | 3,184 | 12,487 | ||||||
Atea ASA(2) | 431 | 4,746 | ||||||
| Austevoll Seafood ASA | 1,103 | 11,823 | ||||||
| Bakkafrost P/F | 196 | 11,469 | ||||||
| Bonheur ASA | 230 | 8,610 | ||||||
Borr Drilling Ltd.(1)(2) | 3,895 | 15,177 | ||||||
| Borregaard ASA | 682 | 10,402 | ||||||
| Bouvet ASA | 260 | 1,554 | ||||||
BW Energy Ltd.(2) | 3,520 | 8,778 | ||||||
| BW LPG Ltd. | 2,550 | 16,576 | ||||||
| BW Offshore Ltd. | 1,603 | 4,344 | ||||||
| DNB Bank ASA | 4,824 | 91,724 | ||||||
| DNO ASA | 13,106 | 18,621 | ||||||
| Elmera Group ASA | 637 | 1,272 | ||||||
| Entra ASA | 613 | 7,971 | ||||||
Equinor ASA, ADR(1) | 6,268 | 243,136 | ||||||
| Europris ASA | 1,242 | 7,451 | ||||||
| FLEX LNG Ltd. | 624 | 20,624 | ||||||
FLEX LNG Ltd. (New York)(1) | 391 | 12,930 | ||||||
Frontline Ltd.(2) | 857 | 10,164 | ||||||
| Gjensidige Forsikring ASA | 310 | 6,291 | ||||||
| Golden Ocean Group Ltd. | 2,772 | 26,126 | ||||||
Golden Ocean Group Ltd. (NASDAQ)(1) | 2,193 | 21,031 | ||||||
| Grieg Seafood ASA | 515 | 6,231 | ||||||
| Hafnia Ltd. | 2,782 | 12,422 | ||||||
Kahoot! ASA(1)(2) | 1,016 | 2,017 | ||||||
Kitron ASA(1) | 2,712 | 5,432 | ||||||
Kongsberg Automotive ASA(1)(2) | 17,100 | 4,355 | ||||||
| Kongsberg Gruppen ASA | 668 | 22,833 | ||||||
| Leroy Seafood Group ASA | 712 | 4,757 | ||||||
Mowi ASA(1) | 2,207 | 45,247 | ||||||
| MPC Container Ships ASA | 6,362 | 13,116 | ||||||
NEL ASA(1)(2) | 3,897 | 5,719 | ||||||
Nordic Semiconductor ASA(2) | 634 | 9,693 | ||||||
| Norsk Hydro ASA | 8,743 | 60,074 | ||||||
Norske Skog ASA(2) | 1,236 | 8,592 | ||||||
Norwegian Energy Co. ASA(2) | 674 | 24,188 | ||||||
Odfjell Drilling Ltd.(2) | 3,213 | 8,727 | ||||||
Odfjell Technology Ltd.(2) | 535 | 1,340 | ||||||
| Orkla ASA | 3,095 | 25,917 | ||||||
124
| Avantis International Equity Fund | ||||||||
| Shares | Value | |||||||
Panoro Energy ASA(2) | 3,234 | $ | 9,595 | |||||
Petronor E&P ASA(2) | 2,060 | 178 | ||||||
PGS ASA(1)(2) | 27,702 | 22,547 | ||||||
| Protector Forsikring ASA | 851 | 10,188 | ||||||
| Salmar ASA | 167 | 11,043 | ||||||
| Scatec ASA | 510 | 5,173 | ||||||
| Schibsted ASA, B Shares | 1,357 | 23,274 | ||||||
| Schibsted ASA, Class A | 204 | 3,733 | ||||||
| SpareBank 1 Nord Norge | 1,780 | 16,044 | ||||||
| Sparebank 1 Oestlandet | 512 | 5,834 | ||||||
| SpareBank 1 SMN | 1,594 | 19,408 | ||||||
| SpareBank 1 SR-Bank ASA | 2,340 | 26,767 | ||||||
| Sparebanken More | 150 | 1,104 | ||||||
| Sparebanken Vest | 955 | 8,497 | ||||||
| Stolt-Nielsen Ltd. | 590 | 12,608 | ||||||
| Storebrand ASA | 3,174 | 25,405 | ||||||
| Subsea 7 SA | 2,413 | 21,661 | ||||||
| Telenor ASA | 1,943 | 21,262 | ||||||
| TGS ASA | 1,885 | 28,686 | ||||||
| TOMRA Systems ASA | 876 | 19,961 | ||||||
| Veidekke ASA | 669 | 6,832 | ||||||
| Wallenius Wilhelmsen ASA | 2,050 | 11,541 | ||||||
| Yara International ASA | 1,125 | 47,585 | ||||||
| 1,267,678 | ||||||||
| Portugal — 0.2% | ||||||||
| Altri SGPS SA | 2,306 | 13,011 | ||||||
| Banco Comercial Portugues SA, R Shares | 177,737 | 25,859 | ||||||
| Corticeira Amorim SGPS SA | 399 | 4,029 | ||||||
| CTT-Correios de Portugal SA | 1,350 | 4,397 | ||||||
| EDP - Energias de Portugal SA | 13,776 | 65,789 | ||||||
| EDP Renovaveis SA | 452 | 10,962 | ||||||
| Galp Energia SGPS SA | 4,926 | 53,196 | ||||||
Greenvolt-Energias Renovaveis SA(2) | 507 | 4,898 | ||||||
| Jeronimo Martins SGPS SA | 1,167 | 25,875 | ||||||
| NOS SGPS SA | 4,490 | 16,550 | ||||||
| REN - Redes Energeticas Nacionais SGPS SA | 13,744 | 36,435 | ||||||
| Sonae SGPS SA | 23,224 | 23,343 | ||||||
| 284,344 | ||||||||
| Singapore — 1.5% | ||||||||
| Ascendas India Trust | 17,800 | 14,481 | ||||||
| Bumitama Agri Ltd. | 8,900 | 3,976 | ||||||
| Capitaland Investment Ltd. | 15,400 | 40,545 | ||||||
| Chip Eng Seng Corp. Ltd. | 22,700 | 10,792 | ||||||
| City Developments Ltd. | 8,400 | 48,772 | ||||||
| ComfortDelGro Corp. Ltd. | 25,800 | 26,002 | ||||||
| DBS Group Holdings Ltd. | 9,252 | 215,419 | ||||||
| Far East Orchard Ltd. | 3,900 | 3,012 | ||||||
| First Resources Ltd. | 18,900 | 20,372 | ||||||
Frencken Group Ltd.(1) | 6,300 | 5,159 | ||||||
| Fu Yu Corp. Ltd. | 17,800 | 3,311 | ||||||
| Geo Energy Resources Ltd. | 28,300 | 7,772 | ||||||
125
| Avantis International Equity Fund | ||||||||
| Shares | Value | |||||||
| Golden Agri-Resources Ltd. | 230,700 | $ | 46,248 | |||||
Grab Holdings Ltd., Class A(2) | 6,419 | 18,294 | ||||||
| Haw Par Corp. Ltd. | 2,700 | 21,115 | ||||||
Hong Fok Corp. Ltd.(1) | 15,800 | 11,961 | ||||||
| Hour Glass Ltd. | 8,700 | 14,423 | ||||||
| Hutchison Port Holdings Trust, U Shares | 134,300 | 28,818 | ||||||
iFAST Corp. Ltd.(1) | 2,000 | 6,393 | ||||||
| Japfa Ltd. | 10,400 | 4,462 | ||||||
| Jardine Cycle & Carriage Ltd. | 500 | 11,738 | ||||||
| Keppel Corp. Ltd. | 26,800 | 139,186 | ||||||
| Keppel Infrastructure Trust | 46,100 | 18,774 | ||||||
Mandarin Oriental International Ltd.(2) | 3,400 | 6,971 | ||||||
Maxeon Solar Technologies Ltd.(1)(2) | 491 | 9,746 | ||||||
| Netlink NBN Management Pte. Ltd. | 19,400 | 12,968 | ||||||
| Olam Group Ltd. | 24,600 | 25,836 | ||||||
| Oversea-Chinese Banking Corp. Ltd. | 33,324 | 287,224 | ||||||
| QAF Ltd. | 5,200 | 3,182 | ||||||
| Raffles Medical Group Ltd. | 19,100 | 19,005 | ||||||
| Riverstone Holdings Ltd. | 13,900 | 7,166 | ||||||
SATS Ltd.(2) | 2,200 | 6,353 | ||||||
Sea Ltd., ADR(2) | 571 | 35,402 | ||||||
| Sembcorp Industries Ltd. | 17,500 | 42,398 | ||||||
| Sheng Siong Group Ltd. | 14,600 | 16,922 | ||||||
SIA Engineering Co. Ltd.(2) | 2,500 | 4,427 | ||||||
Singapore Airlines Ltd.(1)(2) | 23,000 | 87,328 | ||||||
| Singapore Exchange Ltd. | 8,600 | 58,360 | ||||||
| Singapore Post Ltd. | 64,500 | 26,737 | ||||||
| Singapore Technologies Engineering Ltd. | 17,000 | 45,301 | ||||||
| Singapore Telecommunications Ltd. | 53,600 | 100,626 | ||||||
| StarHub Ltd. | 4,500 | 3,956 | ||||||
| United Overseas Bank Ltd. | 9,200 | 179,395 | ||||||
| UOL Group Ltd. | 11,000 | 54,426 | ||||||
| Venture Corp. Ltd. | 2,600 | 33,969 | ||||||
| Wilmar International Ltd. | 17,300 | 49,935 | ||||||
| Wing Tai Holdings Ltd. | 4,300 | 5,132 | ||||||
Yangzijiang Financial Holding Ltd.(2) | 115,700 | 30,952 | ||||||
| Yangzijiang Shipbuilding Holdings Ltd. | 80,400 | 55,720 | ||||||
| Yanlord Land Group Ltd. | 14,700 | 10,819 | ||||||
| 1,941,281 | ||||||||
| Spain — 2.0% | ||||||||
| Acciona SA | 265 | 51,905 | ||||||
| Acerinox SA | 4,076 | 36,879 | ||||||
ACS Actividades de Construccion y Servicios SA(1) | 1,871 | 41,685 | ||||||
Aena SME SA(2) | 760 | 93,344 | ||||||
| Almirall SA | 2,037 | 18,376 | ||||||
Amadeus IT Group SA(2) | 1,697 | 89,584 | ||||||
| Applus Services SA | 1,497 | 10,015 | ||||||
Atresmedia Corp. de Medios de Comunicacion SA(1) | 1,279 | 3,503 | ||||||
| Banco Bilbao Vizcaya Argentaria SA, ADR | 29,781 | 132,228 | ||||||
| Banco de Sabadell SA | 96,960 | 66,683 | ||||||
| Banco Santander SA, ADR | 104,723 | 252,382 | ||||||
126
| Avantis International Equity Fund | ||||||||
| Shares | Value | |||||||
| Bankinter SA | 7,173 | $ | 36,760 | |||||
| CaixaBank SA | 26,387 | 79,676 | ||||||
| Cellnex Telecom SA | 1,167 | 45,446 | ||||||
| Cia de Distribucion Integral Logista Holdings SA | 1,274 | 24,762 | ||||||
| CIE Automotive SA | 454 | 11,133 | ||||||
| Construcciones y Auxiliar de Ferrocarriles SA | 289 | 8,363 | ||||||
| Ebro Foods SA | 526 | 8,313 | ||||||
| Enagas SA | 2,416 | 44,116 | ||||||
| Ence Energia y Celulosa SA | 1,443 | 5,108 | ||||||
| Endesa SA | 3,527 | 60,495 | ||||||
| Ercros SA | 5,101 | 15,667 | ||||||
Faes Farma SA(1) | 2,981 | 11,840 | ||||||
| Ferrovial SA (Madrid) | 1,762 | 44,182 | ||||||
| Fluidra SA | 1,104 | 17,658 | ||||||
| Fomento de Construcciones y Contratas SA | 501 | 4,498 | ||||||
| Gestamp Automocion SA | 6,053 | 22,162 | ||||||
| Global Dominion Access SA | 1,242 | 4,808 | ||||||
Grifols SA(1)(2) | 808 | 9,767 | ||||||
| Grupo Catalana Occidente SA | 464 | 13,644 | ||||||
| Iberdrola SA | 38,204 | 397,768 | ||||||
| Indra Sistemas SA | 855 | 6,722 | ||||||
| Industria de Diseno Textil SA | 5,595 | 120,804 | ||||||
| Laboratorios Farmaceuticos Rovi SA | 411 | 20,176 | ||||||
| Linea Directa Aseguradora SA Cia de Seguros y Reaseguros | 2,702 | 2,920 | ||||||
Mapfre SA(1) | 11,653 | 19,332 | ||||||
Mediaset Espana Comunicacion SA(2) | 4,452 | 12,384 | ||||||
Melia Hotels International SA(2) | 3,071 | 18,624 | ||||||
| Miquel y Costas & Miquel SA | 78 | 1,008 | ||||||
Naturgy Energy Group SA(1) | 2,010 | 55,425 | ||||||
Neinor Homes SA(1) | 540 | 5,540 | ||||||
Obrascon Huarte Lain SA(1)(2) | 23,193 | 13,277 | ||||||
| Pharma Mar SA | 281 | 16,367 | ||||||
Prosegur Cash SA(1) | 3,818 | 2,612 | ||||||
| Prosegur Cia de Seguridad SA | 2,790 | 5,137 | ||||||
| Red Electrica Corp. SA | 4,336 | 79,274 | ||||||
| Repsol SA | 21,429 | 278,322 | ||||||
| Sacyr SA | 11,825 | 26,451 | ||||||
Siemens Gamesa Renewable Energy SA(2) | 615 | 11,081 | ||||||
Solaria Energia y Medio Ambiente SA(2) | 1,101 | 23,378 | ||||||
Talgo SA (Madrid)(1) | 324 | 861 | ||||||
Telefonica SA, ADR(1) | 38,446 | 156,860 | ||||||
| Unicaja Banco SA | 20,803 | 18,732 | ||||||
| Viscofan SA | 691 | 38,879 | ||||||
| 2,596,916 | ||||||||
| Sweden — 3.3% | ||||||||
| AAK AB | 1,407 | 21,552 | ||||||
| AcadeMedia AB | 673 | 2,949 | ||||||
| AddLife AB, B Shares | 743 | 9,616 | ||||||
| AddTech AB, B Shares | 2,373 | 33,290 | ||||||
Africa Oil Corp.(1) | 2,600 | 5,088 | ||||||
| AFRY AB | 464 | 6,116 | ||||||
127
| Avantis International Equity Fund | ||||||||
| Shares | Value | |||||||
| Alfa Laval AB | 1,710 | $ | 45,601 | |||||
| Alimak Group AB | 274 | 2,015 | ||||||
Alleima AB(2) | 1,053 | 4,229 | ||||||
| Ambea AB | 451 | 1,829 | ||||||
Annehem Fastigheter AB, B Shares(2) | 151 | 419 | ||||||
Arise AB(2) | 907 | 6,478 | ||||||
| Arjo AB, B Shares | 2,424 | 10,887 | ||||||
| Assa Abloy AB, Class B | 2,571 | 52,073 | ||||||
| Atlas Copco AB, A Shares | 14,061 | 142,733 | ||||||
| Atlas Copco AB, B Shares | 8,304 | 75,614 | ||||||
| Atrium Ljungberg AB, B Shares | 320 | 4,638 | ||||||
Avanza Bank Holding AB(1) | 2,022 | 32,411 | ||||||
| Axfood AB | 1,616 | 48,710 | ||||||
| Beijer Alma AB | 144 | 2,193 | ||||||
| Beijer Ref AB | 2,350 | 30,423 | ||||||
Better Collective A/S(2) | 287 | 3,933 | ||||||
| Bilia AB, A Shares | 2,990 | 37,198 | ||||||
| BillerudKorsnas AB | 3,166 | 41,166 | ||||||
BioArctic AB(2) | 99 | 882 | ||||||
| BioGaia AB, B Shares | 2,701 | 21,799 | ||||||
| Biotage AB | 900 | 15,140 | ||||||
| Boliden AB | 3,817 | 122,229 | ||||||
| Bonava AB, B Shares | 824 | 2,949 | ||||||
| Bravida Holding AB | 1,751 | 15,845 | ||||||
| Bure Equity AB | 775 | 15,308 | ||||||
| Byggmax Group AB | 1,186 | 4,873 | ||||||
Camurus AB(2) | 951 | 19,791 | ||||||
Castellum AB(1) | 2,378 | 33,374 | ||||||
| Catena AB | 510 | 20,964 | ||||||
Catena Media PLC(2) | 1,233 | 3,705 | ||||||
| Cibus Nordic Real Estate AB | 949 | 15,112 | ||||||
| Clas Ohlson AB, B Shares | 1,811 | 16,336 | ||||||
| Cloetta AB, B Shares | 5,697 | 9,959 | ||||||
| Coor Service Management Holding AB | 784 | 6,070 | ||||||
| Corem Property Group AB, B Shares | 6,921 | 8,071 | ||||||
| Dios Fastigheter AB | 1,235 | 9,141 | ||||||
Electrolux AB, B Shares(1) | 3,258 | 41,198 | ||||||
| Electrolux Professional AB, B Shares | 5,210 | 25,883 | ||||||
Elekta AB, B Shares(1) | 5,352 | 30,680 | ||||||
Embracer Group AB(1)(2) | 4,233 | 26,263 | ||||||
| Eolus Vind AB, B Shares | 472 | 6,103 | ||||||
| Epiroc AB, A Shares | 5,604 | 85,746 | ||||||
| Epiroc AB, B Shares | 3,348 | 45,579 | ||||||
| EQT AB | 716 | 16,037 | ||||||
| Essity AB, B Shares | 3,527 | 78,240 | ||||||
| Evolution AB | 379 | 30,321 | ||||||
| Fabege AB | 3,431 | 30,325 | ||||||
Fastighets AB Balder, B Shares(2) | 4,260 | 23,525 | ||||||
Fingerprint Cards AB, B Shares(1)(2) | 1,176 | 783 | ||||||
| Fortnox AB | 6,605 | 29,229 | ||||||
G5 Entertainment AB(1) | 124 | 2,046 | ||||||
128
| Avantis International Equity Fund | ||||||||
| Shares | Value | |||||||
| GARO AB | 383 | $ | 4,163 | |||||
| Getinge AB, B Shares | 1,746 | 32,339 | ||||||
| Granges AB | 1,135 | 8,798 | ||||||
H & M Hennes & Mauritz AB, B Shares(1) | 6,612 | 68,668 | ||||||
| Hexagon AB, B Shares | 7,148 | 73,046 | ||||||
| Hexatronic Group AB | 2,920 | 28,442 | ||||||
| Hexpol AB | 3,584 | 31,819 | ||||||
| HMS Networks AB | 331 | 12,028 | ||||||
Hoist Finance AB(1)(2) | 1,730 | 5,238 | ||||||
| Holmen AB, B Shares | 924 | 39,644 | ||||||
| Hufvudstaden AB, A Shares | 1,835 | 21,861 | ||||||
| Husqvarna AB, B Shares | 5,584 | 37,572 | ||||||
| Industrivarden AB, A Shares | 1,066 | 23,625 | ||||||
| Indutrade AB | 1,857 | 34,384 | ||||||
| Instalco AB | 4,268 | 21,304 | ||||||
| Intrum AB | 284 | 5,101 | ||||||
| Investment AB Latour, B Shares | 184 | 3,625 | ||||||
INVISIO AB(1) | 463 | 6,435 | ||||||
| Inwido AB | 628 | 6,141 | ||||||
| JM AB | 1,250 | 21,491 | ||||||
Karo Pharma AB(1)(2) | 252 | 1,417 | ||||||
| Kopparbergs Bryggeri AB, B Shares | 454 | 6,422 | ||||||
| Lifco AB, B Shares | 1,571 | 24,402 | ||||||
Lime Technologies AB(1) | 93 | 2,666 | ||||||
| Lindab International AB | 778 | 11,144 | ||||||
| Loomis AB | 2,248 | 60,726 | ||||||
Maha Energy AB(1)(2) | 2,600 | 2,995 | ||||||
| MEKO AB | 513 | 4,685 | ||||||
Millicom International Cellular SA, SDR(2) | 1,700 | 24,325 | ||||||
| MIPS AB | 348 | 15,682 | ||||||
Modern Times Group MTG AB, B Shares(2) | 3,856 | 33,766 | ||||||
| Munters Group AB | 204 | 1,465 | ||||||
| Mycronic AB | 817 | 9,689 | ||||||
| NCC AB, B Shares | 1,971 | 18,552 | ||||||
| New Wave Group AB, B Shares | 885 | 14,235 | ||||||
| Nibe Industrier AB, B Shares | 4,052 | 37,946 | ||||||
| Nobia AB | 1,165 | 3,000 | ||||||
| Nolato AB, B Shares | 2,030 | 10,537 | ||||||
| Nordea Bank Abp | 22,308 | 206,836 | ||||||
| Nordic Waterproofing Holding AB | 311 | 5,031 | ||||||
| Nordnet AB publ | 4,118 | 49,300 | ||||||
| NP3 Fastigheter AB | 89 | 1,947 | ||||||
| Nyfosa AB | 1,109 | 9,316 | ||||||
Orron Energy AB(1) | 793 | 1,508 | ||||||
OX2 AB(2) | 1,721 | 15,346 | ||||||
Pandox AB(2) | 1,148 | 14,192 | ||||||
| Paradox Interactive AB | 1,018 | 16,004 | ||||||
| Peab AB, Class B | 4,080 | 25,121 | ||||||
| Platzer Fastigheter Holding AB, B Shares | 531 | 4,116 | ||||||
| Proact IT Group AB | 345 | 2,901 | ||||||
RaySearch Laboratories AB(2) | 89 | 417 | ||||||
129
| Avantis International Equity Fund | ||||||||
| Shares | Value | |||||||
| Rejlers AB | 199 | $ | 2,593 | |||||
| Resurs Holding AB | 1,899 | 4,046 | ||||||
| Saab AB, B Shares | 1,378 | 46,035 | ||||||
| Sagax AB, B Shares | 507 | 10,904 | ||||||
Samhallsbyggnadsbolaget i Norden AB(1) | 6,754 | 10,844 | ||||||
| Sandvik AB | 5,266 | 82,100 | ||||||
Scandi Standard AB(2) | 736 | 3,246 | ||||||
Scandic Hotels Group AB(1)(2) | 3,942 | 13,998 | ||||||
Sectra AB, B Shares(2) | 2,420 | 36,038 | ||||||
Securitas AB, B Shares(1) | 1,129 | 9,886 | ||||||
Sinch AB(1)(2) | 1,121 | 2,167 | ||||||
| Skandinaviska Enskilda Banken AB, A Shares | 12,577 | 125,376 | ||||||
| Skanska AB, B Shares | 5,643 | 83,362 | ||||||
SKF AB, B Shares(1) | 4,516 | 67,706 | ||||||
| SkiStar AB | 1,531 | 19,701 | ||||||
Solid Forsakring AB(2) | 189 | 822 | ||||||
Spotify Technology SA(2) | 155 | 16,763 | ||||||
| SSAB AB, A Shares | 4,621 | 22,226 | ||||||
| SSAB AB, B Shares | 14,976 | 69,923 | ||||||
Stillfront Group AB(2) | 2,051 | 4,365 | ||||||
| Svenska Cellulosa AB SCA, B Shares | 4,754 | 71,232 | ||||||
| Svenska Handelsbanken AB, A Shares | 10,754 | 88,077 | ||||||
Sweco AB, B Shares(1) | 1,505 | 14,188 | ||||||
| Swedbank AB, A Shares | 8,279 | 107,005 | ||||||
Swedish Orphan Biovitrum AB(2) | 1,017 | 22,457 | ||||||
| Tele2 AB, B Shares | 5,757 | 61,311 | ||||||
Telefonaktiebolaget LM Ericsson, ADR(1) | 22,432 | 166,670 | ||||||
| Telia Co. AB | 36,766 | 129,406 | ||||||
| Tethys Oil AB | 1,621 | 9,701 | ||||||
| TF Bank AB | 201 | 2,999 | ||||||
Thule Group AB(1) | 941 | 22,953 | ||||||
Transtema Group AB(2) | 301 | 840 | ||||||
| Trelleborg AB, B Shares | 4,859 | 100,971 | ||||||
| Troax Group AB | 724 | 11,714 | ||||||
Truecaller AB, B Shares(2) | 1,245 | 6,545 | ||||||
Viaplay Group AB, B Shares(2) | 422 | 10,736 | ||||||
| Vitec Software Group AB, B Shares | 386 | 14,399 | ||||||
| Vitrolife AB | 318 | 7,583 | ||||||
| Volvo AB, A Shares | 1,259 | 20,953 | ||||||
| Volvo AB, B Shares | 11,193 | 177,300 | ||||||
Volvo Car AB, Class B(1)(2) | 6,763 | 41,196 | ||||||
| Wallenstam AB, B Shares | 2,873 | 12,893 | ||||||
| Wihlborgs Fastigheter AB | 4,412 | 31,606 | ||||||
| 4,320,916 | ||||||||
| Switzerland — 8.4% | ||||||||
ABB Ltd., ADR(1) | 3,370 | 92,911 | ||||||
| Adecco Group AG | 733 | 23,237 | ||||||
| Alcon, Inc. | 1,862 | 122,600 | ||||||
| Allreal Holding AG | 221 | 34,648 | ||||||
ALSO Holding AG(2) | 84 | 13,964 | ||||||
ams-OSRAM AG(2) | 2,550 | 18,660 | ||||||
130
| Avantis International Equity Fund | ||||||||
| Shares | Value | |||||||
| Arbonia AG | 1,126 | $ | 14,759 | |||||
| Ascom Holding AG | 361 | 2,328 | ||||||
| Autoneum Holding AG | 85 | 9,529 | ||||||
| Bachem Holding AG, Class B | 180 | 12,464 | ||||||
| Baloise Holding AG | 1,168 | 168,564 | ||||||
Banque Cantonale Vaudoise(1) | 432 | 40,992 | ||||||
| Barry Callebaut AG | 42 | 85,938 | ||||||
Basilea Pharmaceutica AG(2) | 121 | 4,806 | ||||||
| Belimo Holding AG | 88 | 33,382 | ||||||
| Bell Food Group AG | 17 | 4,454 | ||||||
| Bellevue Group AG | 89 | 2,899 | ||||||
| BKW AG | 199 | 24,107 | ||||||
| Bobst Group SA | 202 | 16,276 | ||||||
| Bucher Industries AG | 127 | 45,249 | ||||||
| Burckhardt Compression Holding AG | 97 | 40,621 | ||||||
| Burkhalter Holding AG | 309 | 26,613 | ||||||
| Bystronic AG | 14 | 8,883 | ||||||
| Cembra Money Bank AG | 784 | 52,875 | ||||||
| Chocoladefabriken Lindt & Spruengli AG, Participation Ceritificate | 6 | 63,458 | ||||||
| Cie Financiere Richemont SA, Class A | 2,801 | 313,231 | ||||||
Clariant AG(2) | 3,245 | 59,914 | ||||||
Coltene Holding AG(2) | 73 | 6,242 | ||||||
| Comet Holding AG | 138 | 23,999 | ||||||
COSMO Pharmaceuticals NV(1) | 51 | 2,696 | ||||||
Credit Suisse Group AG, ADR(1) | 26,766 | 138,113 | ||||||
| Daetwyler Holding AG, Bearer Shares | 76 | 15,162 | ||||||
| DKSH Holding AG | 835 | 62,126 | ||||||
| dormakaba Holding AG | 51 | 21,387 | ||||||
Dufry AG(2) | 1,184 | 44,178 | ||||||
EFG International AG(2) | 2,307 | 19,387 | ||||||
| Emmi AG | 40 | 35,235 | ||||||
| EMS-Chemie Holding AG | 92 | 64,606 | ||||||
Flughafen Zurich AG(2) | 297 | 50,010 | ||||||
| Forbo Holding AG | 18 | 22,461 | ||||||
Fundamenta Real Estate AG(2) | 318 | 5,395 | ||||||
| Galenica AG | 548 | 38,535 | ||||||
GAM Holding AG(2) | 1,797 | 1,784 | ||||||
| Geberit AG | 217 | 100,264 | ||||||
| Georg Fischer AG | 1,691 | 91,623 | ||||||
| Givaudan SA | 14 | 44,668 | ||||||
Gurit Holding AG, Bearer Shares(1) | 60 | 6,281 | ||||||
| Helvetia Holding AG | 784 | 86,414 | ||||||
Holcim AG(2) | 6,031 | 267,327 | ||||||
| Huber + Suhner AG | 289 | 24,071 | ||||||
Idorsia Ltd.(1)(2) | 580 | 9,076 | ||||||
Implenia AG(2) | 101 | 2,983 | ||||||
Ina Invest Holding AG(2) | 20 | 402 | ||||||
| Inficon Holding AG | 27 | 18,822 | ||||||
| Intershop Holding AG | 7 | 4,561 | ||||||
Julius Baer Group Ltd.(2) | 3,551 | 171,583 | ||||||
| Kardex Holding AG | 96 | 16,832 | ||||||
131
| Avantis International Equity Fund | ||||||||
| Shares | Value | |||||||
| Komax Holding AG | 34 | $ | 8,858 | |||||
| Kuehne + Nagel International AG | 648 | 149,760 | ||||||
| LEM Holding SA | 15 | 24,703 | ||||||
| Leonteq AG | 202 | 11,470 | ||||||
| Liechtensteinische Landesbank AG | 79 | 4,511 | ||||||
| Logitech International SA | 1,805 | 89,809 | ||||||
| Lonza Group AG | 165 | 87,998 | ||||||
| Medacta Group SA | 105 | 9,246 | ||||||
| Metall Zug AG, B Shares | 4 | 8,130 | ||||||
| Mobilezone Holding AG | 1,771 | 29,319 | ||||||
Mobimo Holding AG(1) | 75 | 18,412 | ||||||
| Nestle SA | 9,209 | 1,077,664 | ||||||
| Novartis AG, ADR | 18,049 | 1,453,306 | ||||||
| OC Oerlikon Corp. AG | 4,799 | 35,054 | ||||||
| Orior AG | 174 | 13,599 | ||||||
| Partners Group Holding AG | 206 | 198,842 | ||||||
Peach Property Group AG(2) | 168 | 5,222 | ||||||
PolyPeptide Group AG(2) | 59 | 2,168 | ||||||
| PSP Swiss Property AG | 784 | 88,696 | ||||||
| Rieter Holding AG | 59 | 6,024 | ||||||
| Roche Holding AG | 4,203 | 1,354,380 | ||||||
| Roche Holding AG, Bearer Shares | 164 | 62,641 | ||||||
| Schindler Holding AG | 268 | 45,263 | ||||||
| Schindler Holding AG, Bearer Participation Certificate | 466 | 81,180 | ||||||
| Schweiter Technologies AG, Bearer Shares | 10 | 10,492 | ||||||
| Schweizerische Nationalbank | 2 | 11,308 | ||||||
Sensirion Holding AG(2) | 289 | 26,818 | ||||||
| SFS Group AG | 406 | 37,944 | ||||||
| SGS SA | 75 | 165,164 | ||||||
Siegfried Holding AG(2) | 35 | 27,931 | ||||||
SIG Group AG(2) | 1,594 | 37,375 | ||||||
| Sika AG | 252 | 56,699 | ||||||
Softwareone Holding AG(1)(2) | 836 | 10,991 | ||||||
| Sonova Holding AG | 196 | 51,641 | ||||||
| St Galler Kantonalbank AG | 94 | 44,209 | ||||||
Stadler Rail AG(1) | 1,396 | 42,605 | ||||||
| Straumann Holding AG | 1,293 | 141,691 | ||||||
| Sulzer AG | 561 | 33,480 | ||||||
| Swatch Group AG | 826 | 37,566 | ||||||
| Swatch Group AG, Bearer Shares | 454 | 110,093 | ||||||
| Swiss Life Holding AG | 506 | 264,475 | ||||||
| Swiss Prime Site AG | 1,317 | 113,265 | ||||||
| Swiss Re AG | 2,520 | 195,944 | ||||||
| Swisscom AG | 461 | 238,351 | ||||||
| Swissquote Group Holding SA | 270 | 29,955 | ||||||
| Tecan Group AG | 130 | 47,835 | ||||||
| Temenos AG | 442 | 36,197 | ||||||
| TX Group AG | 61 | 9,376 | ||||||
u-blox Holding AG(2) | 241 | 33,402 | ||||||
UBS Group AG(1)(2) | 45,046 | 713,979 | ||||||
V-ZUG Holding AG(2) | 38 | 2,990 | ||||||
132
| Avantis International Equity Fund | ||||||||
| Shares | Value | |||||||
| Valiant Holding AG | 325 | $ | 30,793 | |||||
| Valora Holding AG | 44 | 11,656 | ||||||
VAT Group AG(2) | 269 | 64,320 | ||||||
| Vetropack Holding AG | 50 | 1,753 | ||||||
| Vontobel Holding AG | 557 | 34,269 | ||||||
| VP Bank AG, Class A | 24 | 2,205 | ||||||
| VZ Holding AG | 197 | 15,759 | ||||||
| Ypsomed Holding AG | 8 | 1,222 | ||||||
| Zehnder Group AG | 255 | 15,064 | ||||||
| Zurich Insurance Group AG | 1,767 | 784,370 | ||||||
| 11,093,027 | ||||||||
| United Kingdom — 13.5% | ||||||||
| 3i Group PLC | 13,655 | 192,212 | ||||||
| abrdn PLC | 18,681 | 31,747 | ||||||
| Admiral Group PLC | 1,789 | 44,007 | ||||||
| AG Barr PLC | 685 | 4,011 | ||||||
| Airtel Africa PLC | 9,146 | 14,041 | ||||||
| AJ Bell PLC | 7,601 | 25,925 | ||||||
| Alliance Pharma PLC | 10,362 | 11,422 | ||||||
| Alpha FX Group PLC | 573 | 12,105 | ||||||
| Anglo American PLC | 14,543 | 467,332 | ||||||
| Anglo Pacific Group PLC | 13,738 | 26,302 | ||||||
| Antofagasta PLC | 5,859 | 74,549 | ||||||
| Ashmore Group PLC | 2,920 | 6,880 | ||||||
| Ashtead Group PLC | 6,135 | 301,399 | ||||||
ASOS PLC(2) | 317 | 2,550 | ||||||
| Associated British Foods PLC | 3,157 | 55,756 | ||||||
Aston Martin Lagonda Global Holdings PLC(1)(2) | 795 | 4,104 | ||||||
| AstraZeneca PLC, ADR | 11,902 | 742,447 | ||||||
| Atalaya Mining PLC | 1,621 | 4,187 | ||||||
| Auto Trader Group PLC | 11,436 | 86,350 | ||||||
| Avast PLC | 411 | 3,373 | ||||||
| Avation PLC | 285 | 260 | ||||||
| AVEVA Group PLC | 241 | 7,815 | ||||||
| Aviva PLC | 29,486 | 143,044 | ||||||
| B&M European Value Retail SA | 9,160 | 39,280 | ||||||
Babcock International Group PLC(2) | 4,076 | 15,546 | ||||||
| BAE Systems PLC | 28,041 | 252,540 | ||||||
| Balfour Beatty PLC | 9,906 | 36,238 | ||||||
| Bank of Georgia Group PLC | 924 | 21,459 | ||||||
| Barclays PLC, ADR | 38,700 | 301,473 | ||||||
| Barratt Developments PLC | 12,137 | 60,088 | ||||||
| Beazley PLC | 7,261 | 48,995 | ||||||
| Bellway PLC | 1,639 | 38,753 | ||||||
| Berkeley Group Holdings PLC | 1,710 | 72,390 | ||||||
| Biffa PLC | 7,883 | 36,796 | ||||||
| Bioventix PLC | 97 | 3,775 | ||||||
| Bloomsbury Publishing PLC | 1,593 | 7,775 | ||||||
| Bodycote PLC | 2,068 | 13,186 | ||||||
| BP PLC, ADR | 30,814 | 950,304 | ||||||
| Breedon Group PLC | 17,773 | 12,306 | ||||||
133
| Avantis International Equity Fund | ||||||||
| Shares | Value | |||||||
| Brewin Dolphin Holdings PLC | 5,938 | $ | 35,308 | |||||
| BT Group PLC | 92,200 | 161,286 | ||||||
| Bunzl PLC | 1,783 | 59,132 | ||||||
| Burberry Group PLC | 7,064 | 142,895 | ||||||
| Burford Capital Ltd. | 4,035 | 37,746 | ||||||
| Bytes Technology Group PLC | 4,598 | 22,189 | ||||||
Capricorn Energy PLC(2) | 12,461 | 33,587 | ||||||
Carnival PLC, ADR(1)(2) | 380 | 3,219 | ||||||
| Centamin PLC | 26,895 | 28,205 | ||||||
| Central Asia Metals PLC | 6,765 | 18,012 | ||||||
Centrica PLC(2) | 151,036 | 132,469 | ||||||
| Cerillion PLC | 701 | 7,326 | ||||||
| Chemring Group PLC | 1,059 | 3,837 | ||||||
| Chesnara PLC | 3,157 | 11,071 | ||||||
| Clarkson PLC | 447 | 15,623 | ||||||
| Close Brothers Group PLC | 3,281 | 38,816 | ||||||
CMC Markets PLC(1) | 4,009 | 10,692 | ||||||
| Coats Group PLC | 45,694 | 31,847 | ||||||
Coca-Cola HBC AG(2) | 3,453 | 78,795 | ||||||
| Compass Group PLC | 8,575 | 184,457 | ||||||
| Computacenter PLC | 1,736 | 49,731 | ||||||
| ContourGlobal PLC | 2,246 | 6,714 | ||||||
| ConvaTec Group PLC | 10,165 | 25,646 | ||||||
Countryside Partnerships PLC(2) | 4,785 | 13,400 | ||||||
| Cranswick PLC | 561 | 20,073 | ||||||
| Crest Nicholson Holdings PLC | 4,562 | 12,398 | ||||||
| Croda International PLC | 419 | 32,659 | ||||||
| CVS Group PLC | 810 | 17,066 | ||||||
Darktrace PLC(2) | 2,282 | 13,525 | ||||||
| DCC PLC | 698 | 40,173 | ||||||
De La Rue PLC(1)(2) | 2,261 | 2,256 | ||||||
| Dechra Pharmaceuticals PLC | 30 | 1,213 | ||||||
| Devro PLC | 2,672 | 5,779 | ||||||
| Diageo PLC, ADR | 2,454 | 432,861 | ||||||
| Direct Line Insurance Group PLC | 20,073 | 47,809 | ||||||
| Diversified Energy Co. PLC | 6,380 | 9,791 | ||||||
| Domino's Pizza Group PLC | 1,387 | 3,796 | ||||||
| Dr. Martens PLC | 10,699 | 29,168 | ||||||
| Drax Group PLC | 7,925 | 58,459 | ||||||
| DS Smith PLC | 8,550 | 26,496 | ||||||
| Dunelm Group PLC | 1,681 | 13,416 | ||||||
easyJet PLC(2) | 2,734 | 11,360 | ||||||
| EMIS Group PLC | 1,286 | 28,130 | ||||||
EnQuest PLC(2) | 45,716 | 15,863 | ||||||
Ergomed PLC(2) | 532 | 6,893 | ||||||
| Essentra PLC | 6,998 | 16,108 | ||||||
| Experian PLC | 3,886 | 117,923 | ||||||
| Ferguson PLC | 1,005 | 116,387 | ||||||
| Ferrexpo PLC | 15,137 | 26,037 | ||||||
Firstgroup PLC(1) | 25,619 | 34,121 | ||||||
| Forterra PLC | 7,139 | 21,905 | ||||||
134
| Avantis International Equity Fund | ||||||||
| Shares | Value | |||||||
Frasers Group PLC(2) | 4,573 | $ | 42,580 | |||||
| Fresnillo PLC | 497 | 3,958 | ||||||
Frontier Developments PLC(1)(2) | 65 | 1,102 | ||||||
| Games Workshop Group PLC | 586 | 48,254 | ||||||
| Gamma Communications PLC | 370 | 4,628 | ||||||
| Gateley Holdings PLC | 451 | 1,008 | ||||||
| Genel Energy PLC | 8,674 | 14,298 | ||||||
| Genus PLC | 152 | 4,433 | ||||||
Georgia Capital PLC(2) | 584 | 4,634 | ||||||
Glencore PLC(2) | 89,230 | 487,870 | ||||||
Go-Ahead Group PLC(2) | 2,145 | 38,479 | ||||||
Golar LNG Ltd.(2) | 1,158 | 31,579 | ||||||
| Grafton Group PLC | 4,069 | 34,155 | ||||||
| Grainger PLC | 8,530 | 26,559 | ||||||
| Greggs PLC | 1,975 | 42,217 | ||||||
| GSK PLC, ADR | 16,070 | 521,954 | ||||||
| Gulf Keystone Petroleum Ltd. | 10,676 | 29,890 | ||||||
Gym Group PLC(2) | 3,624 | 6,074 | ||||||
Haleon PLC, ADR(2) | 13,533 | 80,927 | ||||||
| Halfords Group PLC | 3,874 | 5,856 | ||||||
| Halma PLC | 1,280 | 30,790 | ||||||
| Harbour Energy PLC | 8,634 | 47,638 | ||||||
| Hargreaves Lansdown PLC | 3,944 | 37,339 | ||||||
| Hays PLC | 11,502 | 15,595 | ||||||
| Headlam Group PLC | 1,141 | 3,579 | ||||||
| Helical PLC | 1,145 | 5,181 | ||||||
Helios Towers PLC(2) | 19,955 | 28,597 | ||||||
| Hikma Pharmaceuticals PLC | 1,954 | 29,780 | ||||||
| Hill & Smith Holdings PLC | 1,870 | 22,591 | ||||||
| Hiscox Ltd. | 2,060 | 21,465 | ||||||
| Hochschild Mining PLC | 19,992 | 15,052 | ||||||
| HomeServe PLC | 887 | 12,211 | ||||||
Hotel Chocolat Group PLC(2) | 183 | 289 | ||||||
| Howden Joinery Group PLC | 10,956 | 72,440 | ||||||
HSBC Holdings PLC, ADR(1) | 21,146 | 651,931 | ||||||
| Hunting PLC | 2,569 | 8,592 | ||||||
Hurricane Energy PLC(2) | 154,073 | 13,141 | ||||||
| Ibstock PLC | 6,036 | 13,267 | ||||||
| IG Group Holdings PLC | 6,750 | 64,057 | ||||||
| IMI PLC | 2,241 | 29,806 | ||||||
| Impax Asset Management Group PLC | 1,397 | 10,140 | ||||||
| Inchcape PLC | 6,616 | 58,096 | ||||||
Indivior PLC(2) | 21,457 | 71,896 | ||||||
| Informa PLC | 300 | 1,898 | ||||||
| InterContinental Hotels Group PLC | 807 | 43,809 | ||||||
| Intermediate Capital Group PLC | 3,734 | 59,026 | ||||||
| International Personal Finance PLC | 4,374 | 5,084 | ||||||
| Intertek Group PLC | 1,307 | 59,989 | ||||||
| Investec PLC | 12,748 | 61,276 | ||||||
| IP Group PLC | 29,947 | 24,305 | ||||||
| ITV PLC | 51,947 | 38,658 | ||||||
135
| Avantis International Equity Fund | ||||||||
| Shares | Value | |||||||
IWG PLC(2) | 7,707 | $ | 14,365 | |||||
J D Wetherspoon PLC(2) | 378 | 2,117 | ||||||
| J Sainsbury PLC | 20,840 | 49,190 | ||||||
Jadestone Energy PLC(1) | 2,676 | 2,704 | ||||||
| JD Sports Fashion PLC | 52,807 | 69,073 | ||||||
JET2 PLC(2) | 1,045 | 10,349 | ||||||
| Johnson Matthey PLC | 3,740 | 87,257 | ||||||
Jubilee Metals Group PLC(2) | 28,078 | 3,849 | ||||||
| Judges Scientific PLC | 96 | 8,463 | ||||||
| Jupiter Fund Management PLC | 7,591 | 8,560 | ||||||
| Just Group PLC | 13,695 | 11,436 | ||||||
| Kainos Group PLC | 1,078 | 17,008 | ||||||
| Keller Group PLC | 1,301 | 10,589 | ||||||
| Kingfisher PLC | 21,062 | 56,578 | ||||||
| Knights Group Holdings PLC | 237 | 279 | ||||||
| Lancashire Holdings Ltd. | 652 | 3,741 | ||||||
| Legal & General Group PLC | 62,397 | 182,765 | ||||||
Liberty Global PLC, Class A(2) | 1,044 | 21,089 | ||||||
Liberty Global PLC, Class C(2) | 2,576 | 54,895 | ||||||
| Liontrust Asset Management PLC | 689 | 7,318 | ||||||
| Lloyds Banking Group PLC, ADR | 157,046 | 314,092 | ||||||
| London Stock Exchange Group PLC | 795 | 74,572 | ||||||
| Lookers PLC | 1,152 | 1,091 | ||||||
| Luxfer Holdings PLC | 635 | 10,446 | ||||||
| M&G PLC | 23,519 | 53,375 | ||||||
| Man Group PLC | 30,325 | 85,694 | ||||||
Marks & Spencer Group PLC(2) | 31,253 | 44,164 | ||||||
| Marshalls PLC | 1,809 | 7,016 | ||||||
Marston's PLC(2) | 6,983 | 2,944 | ||||||
McBride PLC(2) | 3,696 | 964 | ||||||
| ME Group International PLC | 14,615 | 14,873 | ||||||
| Mediclinic International PLC | 6,963 | 40,461 | ||||||
Meggitt PLC(2) | 3,447 | 31,947 | ||||||
| Micro Focus International PLC, ADR | 162 | 977 | ||||||
Mitchells & Butlers PLC(1)(2) | 2,602 | 4,654 | ||||||
| Mitie Group PLC | 62,804 | 52,745 | ||||||
Molten Ventures PLC(2) | 2,262 | 9,767 | ||||||
| Mondi PLC | 5,122 | 86,948 | ||||||
| Moneysupermarket.com Group PLC | 10,218 | 23,358 | ||||||
| Morgan Advanced Materials PLC | 7,472 | 23,035 | ||||||
| Morgan Sindall Group PLC | 493 | 9,843 | ||||||
| Mortgage Advice Bureau Holdings Ltd. | 524 | 5,787 | ||||||
Motorpoint group PLC(2) | 72 | 165 | ||||||
Naked Wines PLC(1)(2) | 964 | 1,493 | ||||||
| National Grid PLC, ADR | 4,077 | 257,626 | ||||||
NatWest Group PLC, ADR(1) | 24,252 | 134,116 | ||||||
Network International Holdings PLC(2) | 345 | 964 | ||||||
| Next Fifteen Communications Group PLC | 1,714 | 17,058 | ||||||
| Next PLC | 1,751 | 117,916 | ||||||
| Ninety One PLC | 11,109 | 25,450 | ||||||
| Norcros PLC | 2,404 | 5,901 | ||||||
136
| Avantis International Equity Fund | ||||||||
| Shares | Value | |||||||
Ocado Group PLC(2) | 886 | $ | 7,446 | |||||
| OSB Group PLC | 7,552 | 48,149 | ||||||
| Pagegroup PLC | 4,975 | 24,988 | ||||||
| Pan African Resources PLC | 35,963 | 7,639 | ||||||
| Paragon Banking Group PLC | 5,426 | 33,727 | ||||||
Pearson PLC, ADR(1) | 3,605 | 36,194 | ||||||
| Pennon Group PLC | 6,797 | 73,594 | ||||||
| Persimmon PLC | 3,579 | 61,241 | ||||||
Petra Diamonds Ltd.(1)(2) | 4,880 | 5,572 | ||||||
Petrofac Ltd.(2) | 3,277 | 4,533 | ||||||
| Phoenix Group Holdings PLC | 7,538 | 52,650 | ||||||
Playtech PLC(2) | 3,187 | 16,543 | ||||||
| Plus500 Ltd. | 2,854 | 56,241 | ||||||
| Premier Foods PLC | 10,225 | 12,795 | ||||||
| Provident Financial PLC | 9,000 | 18,009 | ||||||
Prudential PLC, ADR(1) | 5,306 | 112,010 | ||||||
| PZ Cussons PLC | 2,000 | 4,510 | ||||||
| QinetiQ Group PLC | 8,039 | 32,483 | ||||||
| Quilter PLC | 11,967 | 14,600 | ||||||
| Rathbones Group PLC | 909 | 19,002 | ||||||
| Reach PLC | 5,624 | 4,835 | ||||||
| Reckitt Benckiser Group PLC | 4,045 | 312,119 | ||||||
| Redde Northgate PLC | 5,962 | 23,665 | ||||||
| Redrow PLC | 4,467 | 26,241 | ||||||
| RELX PLC, ADR | 10,902 | 285,414 | ||||||
Renewi PLC(2) | 877 | 7,896 | ||||||
| Renishaw PLC | 107 | 4,577 | ||||||
| Rentokil Initial PLC | 6,769 | 40,881 | ||||||
| Rhi Magnesita NV | 334 | 6,999 | ||||||
| Rightmove PLC | 14,325 | 100,690 | ||||||
Rio Tinto PLC, ADR(1) | 10,349 | 582,545 | ||||||
Rolls-Royce Holdings PLC(2) | 23,152 | 20,634 | ||||||
| Rotork PLC | 7,216 | 20,701 | ||||||
| Royal Mail PLC | 8,658 | 27,625 | ||||||
| RPS Group PLC | 8,039 | 19,682 | ||||||
| RS GROUP PLC | 2,385 | 30,002 | ||||||
Saga PLC(2) | 108 | 189 | ||||||
| Sage Group PLC | 4,743 | 39,313 | ||||||
Savannah Energy PLC(2) | 44,665 | 17,140 | ||||||
| Savills PLC | 2,592 | 28,467 | ||||||
| Schroders PLC | 879 | 27,342 | ||||||
Senior PLC(2) | 6,285 | 9,477 | ||||||
| Serco Group PLC | 23,913 | 48,503 | ||||||
| Serica Energy PLC | 8,239 | 35,666 | ||||||
| Severn Trent PLC | 1,404 | 45,351 | ||||||
| Shanta Gold Ltd. | 16,512 | 1,813 | ||||||
| Shell PLC, ADR | 24,330 | 1,289,003 | ||||||
SIG PLC(2) | 1,703 | 662 | ||||||
| Sirius Real Estate Ltd. | 6,667 | 6,289 | ||||||
| Smart Metering Systems PLC | 1,076 | 11,355 | ||||||
| Smith & Nephew PLC, ADR | 3,049 | 72,688 | ||||||
137
| Avantis International Equity Fund | ||||||||
| Shares | Value | |||||||
| Smiths Group PLC | 1,674 | $ | 28,920 | |||||
| Softcat PLC | 2,481 | 37,204 | ||||||
| Spectris PLC | 924 | 29,876 | ||||||
| Speedy Hire PLC | 6,740 | 3,199 | ||||||
| Spirax-Sarco Engineering PLC | 349 | 42,605 | ||||||
Spire Healthcare Group PLC(2) | 642 | 1,730 | ||||||
| Spirent Communications PLC | 7,786 | 23,290 | ||||||
| SSE PLC | 5,822 | 111,565 | ||||||
SSP Group PLC(2) | 13,261 | 32,495 | ||||||
| St. James's Place PLC | 7,501 | 96,012 | ||||||
| Standard Chartered PLC (London) | 35,210 | 243,870 | ||||||
| SThree PLC | 2,722 | 11,112 | ||||||
Strix Group PLC(1) | 2,672 | 4,594 | ||||||
Studio Retail Group PLC(2) | 420 | 561 | ||||||
Superdry PLC(2) | 1,215 | 1,766 | ||||||
| Synthomer PLC | 2,700 | 6,165 | ||||||
| Tate & Lyle PLC | 10,912 | 96,628 | ||||||
Tatton Asset Management PLC(1) | 821 | 3,718 | ||||||
| Taylor Wimpey PLC | 50,329 | 63,139 | ||||||
| TBC Bank Group PLC | 854 | 17,583 | ||||||
| Tesco PLC | 75,124 | 216,978 | ||||||
| TI Fluid Systems PLC | 1,823 | 3,090 | ||||||
| Topps Tiles PLC | 1,038 | 583 | ||||||
| TP ICAP Group PLC | 4,487 | 8,002 | ||||||
Trainline PLC(2) | 174 | 698 | ||||||
| Travis Perkins PLC | 2,650 | 26,062 | ||||||
Tremor International Ltd.(1)(2) | 765 | 2,922 | ||||||
TUI AG(2) | 2,877 | 4,411 | ||||||
Tullow Oil PLC(1)(2) | 13,780 | 7,739 | ||||||
Unilever PLC, ADR(1) | 12,208 | 554,121 | ||||||
| United Utilities Group PLC | 13,795 | 169,076 | ||||||
| Vertu Motors PLC | 18,946 | 10,673 | ||||||
| Vesuvius PLC | 1,468 | 5,906 | ||||||
| Victrex PLC | 813 | 16,491 | ||||||
| Virgin Money UK PLC | 26,413 | 45,670 | ||||||
| Vistry Group PLC | 3,803 | 34,059 | ||||||
| Vodafone Group PLC, ADR | 29,215 | 392,065 | ||||||
| Vp PLC | 87 | 811 | ||||||
| Watkin Jones PLC | 3,373 | 7,412 | ||||||
| Weir Group PLC | 1,376 | 23,174 | ||||||
WH Smith PLC(2) | 1,292 | 21,417 | ||||||
| Whitbread PLC | 1,855 | 53,764 | ||||||
| Wickes Group PLC | 7,958 | 11,033 | ||||||
| Wincanton PLC | 1,138 | 4,466 | ||||||
WPP PLC, ADR(1) | 1,117 | 47,930 | ||||||
Yellow Cake PLC(2) | 5,262 | 25,655 | ||||||
| YouGov PLC | 1,701 | 19,732 | ||||||
| 17,915,092 | ||||||||
United States† | ||||||||
| ADTRAN Holdings, Inc. | 611 | 14,123 | ||||||
Block, Inc.(2) | 91 | 6,232 | ||||||
138
| Avantis International Equity Fund | ||||||||
| Shares | Value | |||||||
Cazoo Group Ltd.(2) | 548 | $ | 370 | |||||
GXO Logistics, Inc.(2) | 41 | 1,820 | ||||||
Regencell Bioscience Holdings Ltd.(2) | 100 | 2,930 | ||||||
| 25,475 | ||||||||
TOTAL COMMON STOCKS (Cost $136,099,773) | 130,726,635 | |||||||
RIGHTS† | ||||||||
Austria† | ||||||||
IMMOFINANZ AG(1)(2) | 530 | 5 | ||||||
Germany† | ||||||||
7C Solarparken AG(2) | 2,864 | 53 | ||||||
Hong Kong† | ||||||||
SJM Holdings Ltd.(1)(2) | 3,500 | 299 | ||||||
Xinyi Electric Storage Holdings Ltd.(2) | 1,600 | 65 | ||||||
| 364 | ||||||||
TOTAL RIGHTS (Cost $—) | 422 | |||||||
WARRANTS† | ||||||||
Australia† | ||||||||
Magellan Financial Group Ltd.(1)(2) (Cost $—) | 79 | 38 | ||||||
| SHORT-TERM INVESTMENTS — 6.4% | ||||||||
| Money Market Funds — 6.4% | ||||||||
| State Street Institutional U.S. Government Money Market Fund, Premier Class | 1,488,453 | 1,488,453 | ||||||
State Street Navigator Securities Lending Government Money Market Portfolio(3) | 7,033,882 | 7,033,882 | ||||||
TOTAL SHORT-TERM INVESTMENTS (Cost $8,522,335) | 8,522,335 | |||||||
TOTAL INVESTMENT SECURITIES — 104.9% (Cost $144,622,108) | 139,249,430 | |||||||
| OTHER ASSETS AND LIABILITIES — (4.9)% | (6,532,960) | |||||||
| TOTAL NET ASSETS — 100.0% | $ | 132,716,470 | ||||||
| FUTURES CONTRACTS PURCHASED | ||||||||||||||
| Reference Entity | Contracts | Expiration Date | Notional Amount | Unrealized Appreciation (Depreciation)^ | ||||||||||
| S&P 500 E-Mini | 4 | September 2022 | $ | 791,300 | $ | 18,394 | ||||||||
^Amount represents value and unrealized appreciation (depreciation).
139
| Avantis International Equity Fund | |||||
| MARKET SECTOR DIVERSIFICATION | |||||
(as a % of net assets) | |||||
| Financials | 20.3% | ||||
| Industrials | 15.6% | ||||
| Materials | 10.9% | ||||
| Consumer Discretionary | 10.0% | ||||
| Health Care | 8.5% | ||||
| Energy | 8.1% | ||||
| Consumer Staples | 7.0% | ||||
| Information Technology | 6.4% | ||||
| Utilities | 4.9% | ||||
| Communication Services | 4.6% | ||||
| Real Estate | 2.2% | ||||
| Short-Term Investments | 6.4% | ||||
| Other Assets and Liabilities | (4.9)% | ||||
| NOTES TO SCHEDULE OF INVESTMENTS | ||||||||
| ADR | - | American Depositary Receipt | ||||||
| CVA | - | Certificaten Van Aandelen | ||||||
| SDR | - | Swedish Depositary Receipt | ||||||
†Category is less than 0.05% of total net assets.
(1)Security, or a portion thereof, is on loan. At the period end, the aggregate value of securities on loan was $12,163,975. The amount of securities on loan indicated may not correspond with the securities on loan identified because securities with pending sales are in the process of recall from the brokers.
(2)Non-income producing.
(3)Investment of cash collateral from securities on loan. At the period end, the aggregate value of the collateral held by the fund was $12,775,591, which includes securities collateral of $5,741,709.
See Notes to Financial Statements.
140
AUGUST 31, 2022
| Avantis International Small Cap Value Fund | ||||||||
| Shares | Value | |||||||
| COMMON STOCKS — 98.6% | ||||||||
| Australia — 9.3% | ||||||||
29Metals Ltd.(1)(2) | 31,054 | $ | 42,067 | |||||
| Accent Group Ltd. | 37,961 | 38,601 | ||||||
Adairs Ltd.(1) | 10,087 | 15,543 | ||||||
| Adbri Ltd. | 41,613 | 62,305 | ||||||
Aeris Resources Ltd.(2) | 55,697 | 16,333 | ||||||
Alkane Resources Ltd.(2) | 84,644 | 41,996 | ||||||
Alliance Aviation Services Ltd.(2) | 9,551 | 23,216 | ||||||
AMP Ltd.(2) | 197,130 | 155,372 | ||||||
Aurelia Metals Ltd.(1)(2) | 329,886 | 60,020 | ||||||
| Austal Ltd. | 68,708 | 120,176 | ||||||
Australian Agricultural Co. Ltd.(2) | 38,261 | 47,151 | ||||||
| Australian Finance Group Ltd. | 51,743 | 67,319 | ||||||
Bank of Queensland Ltd.(1) | 91,135 | 434,841 | ||||||
| Beach Energy Ltd. | 483,396 | 558,722 | ||||||
| Bega Cheese Ltd. | 42,040 | 114,137 | ||||||
Bendigo & Adelaide Bank Ltd.(1) | 110,415 | 677,784 | ||||||
| Bravura Solutions Ltd. | 43,732 | 46,929 | ||||||
Byron Energy Ltd.(2) | 7,834 | 748 | ||||||
| Challenger Ltd. | 97,841 | 421,811 | ||||||
| Champion Iron Ltd. | 59,052 | 203,744 | ||||||
| Coronado Global Resources, Inc. | 257,710 | 281,940 | ||||||
| Costa Group Holdings Ltd. | 96,391 | 175,905 | ||||||
Credit Corp. Group Ltd.(1) | 10,307 | 141,998 | ||||||
| CSR Ltd. | 119,094 | 365,391 | ||||||
Dacian Gold Ltd.(2) | 57,096 | 3,861 | ||||||
Eclipx Group Ltd.(2) | 76,422 | 123,734 | ||||||
| Emeco Holdings Ltd. | 88,013 | 54,665 | ||||||
| Evolution Mining Ltd. | 349,758 | 562,079 | ||||||
| Genworth Mortgage Insurance Australia Ltd. | 88,696 | 170,650 | ||||||
| Grange Resources Ltd. | 129,405 | 76,511 | ||||||
| HUB24 Ltd. | 126 | 2,030 | ||||||
Humm Group Ltd.(1) | 50,226 | 18,298 | ||||||
| Iluka Resources Ltd. | 88,499 | 622,190 | ||||||
| Imdex Ltd. | 30,795 | 41,803 | ||||||
| Infomedia Ltd. | 58,370 | 57,164 | ||||||
| Inghams Group Ltd. | 78,223 | 138,223 | ||||||
| JB Hi-Fi Ltd. | 1,944 | 53,615 | ||||||
Lovisa Holdings Ltd.(1) | 6,765 | 105,535 | ||||||
| MACA Ltd. | 43,040 | 31,194 | ||||||
| Macmahon Holdings Ltd. | 111,757 | 12,898 | ||||||
Magellan Financial Group Ltd.(1) | 15,877 | 139,376 | ||||||
Mayne Pharma Group Ltd.(2) | 223,000 | 45,351 | ||||||
| McMillan Shakespeare Ltd. | 17,332 | 168,871 | ||||||
| Metcash Ltd. | 140,046 | 391,903 | ||||||
| Monadelphous Group Ltd. | 13,825 | 123,391 | ||||||
| Money3 Corp. Ltd. | 24,697 | 38,552 | ||||||
Mount Gibson Iron Ltd.(1) | 98,675 | 28,613 | ||||||
| Myer Holdings Ltd. | 187,519 | 64,309 | ||||||
141
| Avantis International Small Cap Value Fund | ||||||||
| Shares | Value | |||||||
| MyState Ltd. | 7,500 | $ | 19,577 | |||||
New Hope Corp. Ltd.(1) | 161,917 | 535,073 | ||||||
| nib holdings Ltd. | 74,771 | 416,234 | ||||||
Nick Scali Ltd.(1) | 4,199 | 31,363 | ||||||
| Nine Entertainment Co. Holdings Ltd. | 191,474 | 284,195 | ||||||
| NRW Holdings Ltd. | 136,556 | 227,011 | ||||||
| Nufarm Ltd. | 62,295 | 224,917 | ||||||
OFX Group Ltd.(2) | 32,997 | 59,350 | ||||||
| Orica Ltd. | 39,595 | 414,169 | ||||||
| Orora Ltd. | 138,357 | 311,632 | ||||||
| Pacific Current Group Ltd. | 868 | 5,363 | ||||||
| Pendal Group Ltd. | 76,178 | 267,447 | ||||||
| Perenti Global Ltd. | 163,178 | 86,556 | ||||||
| Perseus Mining Ltd. | 332,298 | 351,462 | ||||||
| Platinum Asset Management Ltd. | 77,029 | 92,914 | ||||||
| Premier Investments Ltd. | 19,428 | 279,353 | ||||||
| Ramelius Resources Ltd. | 204,754 | 111,503 | ||||||
Red 5 Ltd.(2) | 97,638 | 16,795 | ||||||
| Regis Resources Ltd. | 154,229 | 161,792 | ||||||
Reject Shop Ltd.(2) | 3,585 | 10,333 | ||||||
Resimac Group Ltd.(1) | 17,203 | 15,105 | ||||||
Resolute Mining Ltd.(1)(2) | 203,821 | 39,034 | ||||||
| Ridley Corp. Ltd. | 28,204 | 39,913 | ||||||
| Sandfire Resources Ltd. | 78,484 | 242,386 | ||||||
Service Stream Ltd.(1)(2) | 87,623 | 43,428 | ||||||
Seven West Media Ltd.(2) | 146,432 | 51,521 | ||||||
Sierra Rutile Holdings Ltd.(1)(2) | 88,499 | 18,167 | ||||||
Silver Lake Resources Ltd.(2) | 181,307 | 162,640 | ||||||
| Southern Cross Media Group Ltd. | 65,243 | 47,669 | ||||||
Super Retail Group Ltd.(1) | 41,304 | 295,043 | ||||||
| Tassal Group Ltd. | 30,862 | 108,889 | ||||||
| Ten Sixty Four Ltd. | 4,832 | 1,877 | ||||||
| Viva Energy Group Ltd. | 226,390 | 457,815 | ||||||
West African Resources Ltd.(2) | 274,129 | 233,415 | ||||||
| Whitehaven Coal Ltd. | 231,777 | 1,234,585 | ||||||
| 14,087,391 | ||||||||
| Austria — 0.9% | ||||||||
| AT&S Austria Technologie & Systemtechnik AG | 13,429 | 597,721 | ||||||
| POLYTEC Holding AG | 6,121 | 35,163 | ||||||
| Porr AG | 7,672 | 87,838 | ||||||
Semperit AG Holding(1) | 9,776 | 177,645 | ||||||
| UNIQA Insurance Group AG | 63,327 | 418,616 | ||||||
| 1,316,983 | ||||||||
| Belgium — 1.5% | ||||||||
| Bekaert SA | 14,676 | 450,156 | ||||||
Cie d'Entreprises CFE(1)(2) | 3,893 | 38,747 | ||||||
Deceuninck NV(1) | 6,823 | 15,753 | ||||||
Deme Group NV(2) | 3,893 | 445,529 | ||||||
| Euronav NV | 28,042 | 452,155 | ||||||
| Gimv NV | 6,180 | 316,182 | ||||||
| Ion Beam Applications | 2,467 | 43,835 | ||||||
142
| Avantis International Small Cap Value Fund | ||||||||
| Shares | Value | |||||||
| Jensen-Group NV | 250 | $ | 7,408 | |||||
| KBC Ancora | 11,370 | 374,313 | ||||||
Tessenderlo Group SA(2) | 6,832 | 221,824 | ||||||
| 2,365,902 | ||||||||
| Canada — 10.0% | ||||||||
Advantage Energy Ltd.(2) | 35,900 | 306,695 | ||||||
| Alaris Equity Partners Income | 1,400 | 18,420 | ||||||
| Algoma Central Corp. | 200 | 2,578 | ||||||
Algoma Steel Group, Inc.(1) | 17,200 | 157,155 | ||||||
Argonaut Gold, Inc.(2) | 34,000 | 12,038 | ||||||
Athabasca Oil Corp.(1)(2) | 114,700 | 226,195 | ||||||
Baytex Energy Corp.(1)(2) | 128,800 | 667,856 | ||||||
| Birchcliff Energy Ltd. | 50,015 | 440,609 | ||||||
Bird Construction, Inc.(1) | 7,100 | 35,842 | ||||||
Bonterra Energy Corp.(2) | 5,800 | 38,862 | ||||||
Calibre Mining Corp.(2) | 24,200 | 17,505 | ||||||
| Canaccord Genuity Group, Inc. | 8,679 | 51,875 | ||||||
Canacol Energy Ltd.(1) | 15,500 | 29,623 | ||||||
Canadian Western Bank(1) | 10,600 | 197,658 | ||||||
Canfor Corp.(2) | 12,800 | 251,156 | ||||||
| Capital Power Corp. | 22,700 | 880,622 | ||||||
Capstone Mining Corp.(2) | 4,000 | 8,985 | ||||||
Cardinal Energy Ltd.(1) | 25,400 | 161,681 | ||||||
| Centerra Gold, Inc. | 44,500 | 201,603 | ||||||
China Gold International Resources Corp. Ltd.(1) | 2,500 | 7,119 | ||||||
Chorus Aviation, Inc.(1)(2) | 12,431 | 26,597 | ||||||
Copper Mountain Mining Corp.(1)(2) | 21,000 | 23,345 | ||||||
Corus Entertainment, Inc., B Shares(1) | 23,366 | 65,827 | ||||||
| Crescent Point Energy Corp. | 79,130 | 601,300 | ||||||
Crew Energy, Inc.(2) | 20,800 | 102,943 | ||||||
Dorel Industries, Inc., Class B(1) | 3,777 | 19,527 | ||||||
| Dundee Precious Metals, Inc. | 34,500 | 157,087 | ||||||
| Element Fleet Management Corp. | 55,582 | 699,986 | ||||||
| Endeavour Mining PLC | 20 | 389 | ||||||
Enerflex Ltd.(1) | 11,500 | 57,704 | ||||||
| Enerplus Corp. | 43,700 | 673,459 | ||||||
| EQB, Inc. | 2,700 | 108,259 | ||||||
ERO Copper Corp.(1)(2) | 9,100 | 86,333 | ||||||
| Evertz Technologies Ltd. | 1,200 | 13,523 | ||||||
Extendicare, Inc.(1) | 5,700 | 31,205 | ||||||
First National Financial Corp.(1) | 1,700 | 48,139 | ||||||
Fortuna Silver Mines, Inc.(1)(2) | 33,300 | 77,079 | ||||||
Freehold Royalties Ltd.(1) | 7,600 | 82,982 | ||||||
Frontera Energy Corp.(2) | 9,445 | 79,754 | ||||||
Galiano Gold, Inc.(1)(2) | 66 | 32 | ||||||
| GCM Mining Corp. | 7,900 | 19,670 | ||||||
Home Capital Group, Inc.(1) | 5,153 | 109,624 | ||||||
Hudbay Minerals, Inc.(1) | 32,200 | 142,201 | ||||||
| iA Financial Corp., Inc. | 9,200 | 494,202 | ||||||
IAMGOLD Corp.(1)(2) | 37,500 | 44,828 | ||||||
Interfor Corp.(2) | 11,430 | 281,192 | ||||||
143
| Avantis International Small Cap Value Fund | ||||||||
| Shares | Value | |||||||
International Petroleum Corp.(1)(2) | 702 | $ | 6,911 | |||||
| Jaguar Mining, Inc. | 3,200 | 7,090 | ||||||
Karora Resources, Inc.(2) | 10,789 | 23,495 | ||||||
Kelt Exploration Ltd.(2) | 25,800 | 123,563 | ||||||
| Laurentian Bank of Canada | 4,700 | 128,759 | ||||||
| Linamar Corp. | 6,500 | 307,294 | ||||||
| Lundin Gold, Inc. | 2,400 | 16,026 | ||||||
Lundin Mining Corp.(1) | 115,500 | 600,651 | ||||||
Major Drilling Group International, Inc.(2) | 3,900 | 26,429 | ||||||
Martinrea International, Inc.(1) | 10,360 | 81,643 | ||||||
MEG Energy Corp.(2) | 39,200 | 547,997 | ||||||
| Methanex Corp. | 11,500 | 415,658 | ||||||
New Gold, Inc. (Toronto)(2) | 79,400 | 51,388 | ||||||
North American Construction Group Ltd.(1) | 3,549 | 40,804 | ||||||
NuVista Energy Ltd.(2) | 32,888 | 270,446 | ||||||
Obsidian Energy Ltd.(2) | 15,300 | 137,698 | ||||||
OceanaGold Corp.(2) | 128,200 | 189,369 | ||||||
| Onex Corp. | 12,000 | 593,444 | ||||||
Paramount Resources Ltd., A Shares(1) | 6,300 | 143,619 | ||||||
| Parex Resources, Inc. | 21,900 | 350,340 | ||||||
Peyto Exploration & Development Corp.(1) | 31,900 | 297,541 | ||||||
Pipestone Energy Corp.(2) | 21,400 | 79,516 | ||||||
Precision Drilling Corp.(1)(2) | 10 | 615 | ||||||
Real Matters, Inc.(1)(2) | 7,600 | 33,505 | ||||||
Resolute Forest Products, Inc.(2) | 10,100 | 204,407 | ||||||
| Russel Metals, Inc. | 10,682 | 230,989 | ||||||
Shawcor Ltd.(2) | 4,100 | 24,537 | ||||||
Sierra Metals, Inc.(1) | 6,600 | 2,965 | ||||||
Spartan Delta Corp.(1)(2) | 26,300 | 265,333 | ||||||
SSR Mining, Inc.(1) | 5,330 | 71,954 | ||||||
| Stelco Holdings, Inc. | 7,100 | 192,184 | ||||||
Tamarack Valley Energy Ltd.(1) | 69,200 | 220,770 | ||||||
Taseko Mines Ltd.(1)(2) | 22,300 | 23,262 | ||||||
| Tidewater Midstream and Infrastructure Ltd. | 23,900 | 22,019 | ||||||
Torex Gold Resources, Inc.(2) | 14,400 | 106,902 | ||||||
| Total Energy Services, Inc. | 3,600 | 19,928 | ||||||
TransGlobe Energy Corp.(1) | 11,900 | 39,505 | ||||||
Turquoise Hill Resources Ltd.(2) | 5,930 | 163,088 | ||||||
| Vermilion Energy, Inc. | 34,200 | 913,493 | ||||||
| Wajax Corp. | 4,075 | 65,840 | ||||||
| Western Forest Products, Inc. | 48,200 | 56,518 | ||||||
| Yamana Gold, Inc. | 64,000 | 282,636 | ||||||
Yangarra Resources Ltd.(2) | 14,800 | 31,778 | ||||||
| 15,173,173 | ||||||||
| China — 0.1% | ||||||||
Fullshare Holdings Ltd.(1)(2) | 2,015,000 | 31,270 | ||||||
| Truly International Holdings Ltd. | 218,000 | 47,758 | ||||||
| 79,028 | ||||||||
| Denmark — 1.7% | ||||||||
Brodrene Hartmann A/S(2) | 40 | 1,386 | ||||||
| D/S Norden A/S | 8,551 | 398,684 | ||||||
144
| Avantis International Small Cap Value Fund | ||||||||
| Shares | Value | |||||||
| Dfds A/S | 8,576 | $ | 296,754 | |||||
Drilling Co. of 1972 A/S(2) | 3,387 | 160,724 | ||||||
| FLSmidth & Co. A/S | 12,741 | 352,672 | ||||||
H+H International A/S, B Shares(2) | 3,080 | 49,500 | ||||||
Jyske Bank A/S(2) | 11,938 | 597,555 | ||||||
| Per Aarsleff Holding A/S | 3,849 | 110,687 | ||||||
| Solar A/S, B Shares | 1,529 | 123,618 | ||||||
| Sydbank A/S | 16,360 | 472,736 | ||||||
| TORM PLC | 3,973 | 77,038 | ||||||
| 2,641,354 | ||||||||
| Finland — 1.3% | ||||||||
| Aspo Oyj | 1,402 | 10,848 | ||||||
| Atria Oyj | 343 | 3,364 | ||||||
Finnair Oyj(1)(2) | 187,999 | 77,056 | ||||||
HKScan Oyj, A Shares(1) | 3,016 | 3,472 | ||||||
Lassila & Tikanoja Oyj(1) | 893 | 9,597 | ||||||
| Marimekko Oyj | 8,637 | 85,175 | ||||||
| Metsa Board Oyj | 41,800 | 359,362 | ||||||
| Nokian Renkaat Oyj | 18,942 | 196,585 | ||||||
| Outokumpu Oyj | 141,981 | 569,338 | ||||||
Puuilo Oyj(1) | 17,296 | 82,494 | ||||||
QT Group Oyj(1)(2) | 2,218 | 112,454 | ||||||
| Rovio Entertainment Oyj | 13,225 | 79,591 | ||||||
Talenom Oyj(1) | 3,181 | 34,691 | ||||||
| Tokmanni Group Corp. | 17,199 | 205,337 | ||||||
| Uponor Oyj | 899 | 13,471 | ||||||
Verkkokauppa.com Oyj(1) | 1,005 | 3,741 | ||||||
YIT Oyj(1) | 54,145 | 177,177 | ||||||
| 2,023,753 | ||||||||
| France — 3.1% | ||||||||
| AKWEL | 113 | 2,043 | ||||||
| ALD SA | 14,649 | 159,445 | ||||||
Biosynex(1) | 1,444 | 21,216 | ||||||
| Catana Group | 2,606 | 16,106 | ||||||
| Cie Plastic Omnium SA | 13,441 | 249,224 | ||||||
Coface SA(2) | 25,919 | 259,176 | ||||||
| Derichebourg SA | 25,674 | 144,429 | ||||||
| Eramet SA | 2,914 | 247,059 | ||||||
Esso SA Francaise(2) | 846 | 52,053 | ||||||
| Etablissements Maurel et Prom SA | 20,855 | 105,549 | ||||||
Eurobio Scientific SA(2) | 2,309 | 42,573 | ||||||
| Eutelsat Communications SA | 40,826 | 369,272 | ||||||
Faurecia SE(2) | 23,906 | 342,832 | ||||||
Focus Entertainment(2) | 483 | 21,846 | ||||||
| Gaztransport Et Technigaz SA | 1,652 | 210,307 | ||||||
Genfit(2) | 7,093 | 30,031 | ||||||
Groupe LDLC(1) | 755 | 20,575 | ||||||
| Guerbet | 63 | 1,221 | ||||||
ID Logistics Group(2) | 242 | 67,708 | ||||||
| Jacquet Metals SACA | 893 | 14,140 | ||||||
JCDecaux SA(2) | 5,303 | 73,534 | ||||||
145
| Avantis International Small Cap Value Fund | ||||||||
| Shares | Value | |||||||
| Maisons du Monde SA | 8,259 | $ | 79,052 | |||||
| Mersen SA | 228 | 6,743 | ||||||
| Metropole Television SA | 6,034 | 74,485 | ||||||
| Nexans SA | 4,565 | 417,088 | ||||||
Novacyt SA(2) | 19,950 | 23,712 | ||||||
ReWorld Media SA(2) | 1,855 | 11,761 | ||||||
| SES SA | 86,718 | 608,790 | ||||||
SES-imagotag SA(2) | 363 | 36,279 | ||||||
SMCP SA(2) | 10,769 | 58,976 | ||||||
| Societe BIC SA | 2,833 | 161,159 | ||||||
| Synergie SE | 96 | 2,641 | ||||||
| Television Francaise 1 | 11,044 | 70,039 | ||||||
| Valeo | 2,789 | 53,275 | ||||||
Vallourec SA(2) | 14,226 | 148,095 | ||||||
| Verallia SA | 16,123 | 369,639 | ||||||
| Vicat SA | 1,081 | 27,356 | ||||||
| Vilmorin & Cie SA | 697 | 29,950 | ||||||
X-Fab Silicon Foundries SE(2) | 11,204 | 69,565 | ||||||
Xilam Animation SA(2) | 33 | 1,252 | ||||||
| 4,700,196 | ||||||||
| Germany — 4.1% | ||||||||
| 7C Solarparken AG | 5,130 | 27,611 | ||||||
| AlzChem Group AG | 231 | 4,175 | ||||||
| Aumann AG | 430 | 6,607 | ||||||
| Aurubis AG | 2,019 | 122,243 | ||||||
| Baader Bank AG | 2,427 | 9,094 | ||||||
Bauer AG(2) | 749 | 6,574 | ||||||
| Bertrandt AG | 560 | 19,114 | ||||||
| Centrotec SE | 313 | 11,418 | ||||||
| Cewe Stiftung & Co. KGAA | 858 | 67,844 | ||||||
| CropEnergies AG | 6,419 | 105,160 | ||||||
| Deutsche Beteiligungs AG | 1,500 | 41,952 | ||||||
| Deutsche Pfandbriefbank AG | 30,839 | 266,146 | ||||||
| Deutz AG | 23,572 | 88,765 | ||||||
| Draegerwerk AG & Co. KGaA | 622 | 25,143 | ||||||
| Draegerwerk AG & Co. KGaA, Preference Shares | 2,357 | 111,517 | ||||||
| Elmos Semiconductor SE | 655 | 27,787 | ||||||
| Encavis AG | 11,840 | 253,036 | ||||||
flatexDEGIRO AG(2) | 13,726 | 132,086 | ||||||
| Gesco AG | 473 | 11,934 | ||||||
| GRENKE AG | 1,419 | 34,118 | ||||||
| Hamburger Hafen und Logistik AG | 5,162 | 63,132 | ||||||
| Hornbach Holding AG & Co. KGaA | 1,747 | 123,226 | ||||||
| HUGO BOSS AG | 12,976 | 707,220 | ||||||
| Instone Real Estate Group SE | 9,003 | 79,695 | ||||||
| JOST Werke AG | 1,973 | 73,122 | ||||||
| Jungheinrich AG, Preference Shares | 7,642 | 186,570 | ||||||
| K+S AG | 23,024 | 524,523 | ||||||
| Kloeckner & Co. SE | 4,828 | 43,570 | ||||||
Koenig & Bauer AG(2) | 2,154 | 25,109 | ||||||
| Krones AG | 3,584 | 295,158 | ||||||
146
| Avantis International Small Cap Value Fund | ||||||||
| Shares | Value | |||||||
| KSB SE & Co. KGaA | 1 | $ | 386 | |||||
| KSB SE & Co. KGaA, Preference Shares | 69 | 21,322 | ||||||
| Lang & Schwarz AG | 1,344 | 19,150 | ||||||
| Lanxess AG | 12,147 | 409,858 | ||||||
Leoni AG(2) | 3,260 | 22,848 | ||||||
METRO AG(2) | 19,194 | 152,806 | ||||||
Multitude SE(2) | 937 | 2,304 | ||||||
| Mutares SE & Co. KGaA | 2,051 | 33,102 | ||||||
PVA TePla AG(2) | 2,576 | 43,269 | ||||||
| Rheinmetall AG | 5,000 | 793,725 | ||||||
| Salzgitter AG | 3,211 | 78,941 | ||||||
SGL Carbon SE(2) | 13,987 | 95,057 | ||||||
| Siltronic AG | 2,930 | 200,785 | ||||||
| STO SE & Co. KGaA, Preference Shares | 488 | 76,327 | ||||||
| TAG Immobilien AG | 33,926 | 312,984 | ||||||
| Villeroy & Boch AG, Preference Shares | 1,357 | 25,617 | ||||||
Vitesco Technologies Group AG, Class A(2) | 4,933 | 240,906 | ||||||
| Wacker Chemie AG | 579 | 82,344 | ||||||
| Wacker Neuson SE | 6,370 | 105,461 | ||||||
| Wuestenrot & Wuerttembergische AG | 1,952 | 31,788 | ||||||
| 6,242,629 | ||||||||
| Hong Kong — 1.8% | ||||||||
| Analogue Holdings Ltd. | 12,000 | 2,095 | ||||||
| BOCOM International Holdings Co. Ltd. | 29,000 | 1,921 | ||||||
| Bright Smart Securities & Commodities Group Ltd. | 120,000 | 19,215 | ||||||
| Cafe de Coral Holdings Ltd. | 88,000 | 125,988 | ||||||
China Strategic Holdings Ltd.(2) | 1,810,000 | 7,119 | ||||||
| Chow Sang Sang Holdings International Ltd. | 6,000 | 6,755 | ||||||
CMBC Capital Holdings Ltd.(1) | 126,250 | 27,294 | ||||||
| Crystal International Group Ltd. | 15,500 | 5,204 | ||||||
| CSI Properties Ltd. | 350,000 | 7,791 | ||||||
| Dah Sing Banking Group Ltd. | 152,800 | 118,653 | ||||||
| Dah Sing Financial Holdings Ltd. | 15,600 | 41,532 | ||||||
| Dickson Concepts International Ltd. | 25,000 | 11,876 | ||||||
E-Commodities Holdings Ltd.(1) | 1,292,000 | 288,552 | ||||||
| Eagle Nice International Holdings Ltd. | 2,000 | 1,119 | ||||||
| Hang Lung Group Ltd. | 9,000 | 15,222 | ||||||
| IGG, Inc. | 317,000 | 136,277 | ||||||
| International Housewares Retail Co. Ltd. | 10,000 | 3,691 | ||||||
IRC Ltd.(1)(2) | 124,000 | 2,127 | ||||||
| Johnson Electric Holdings Ltd. | 130,500 | 154,130 | ||||||
| K Wah International Holdings Ltd. | 220,000 | 82,968 | ||||||
| Ka Shui International Holdings Ltd. | 82,000 | 4,997 | ||||||
| Karrie International Holdings Ltd. | 74,000 | 12,983 | ||||||
Lifestyle International Holdings Ltd.(2) | 28,000 | 16,388 | ||||||
LK Technology Holdings Ltd.(1) | 250 | 365 | ||||||
| Minmetals Land Ltd. | 4,000 | 326 | ||||||
| Oriental Watch Holdings | 66,000 | 37,689�� | ||||||
| Pacific Basin Shipping Ltd. | 2,240,000 | 795,043 | ||||||
PC Partner Group Ltd.(1) | 140,000 | 133,098 | ||||||
| Regina Miracle International Holdings Ltd. | 26,000 | 16,090 | ||||||
147
| Avantis International Small Cap Value Fund | ||||||||
| Shares | Value | |||||||
Shun Tak Holdings Ltd.(2) | 208,000 | $ | 34,639 | |||||
| Singamas Container Holdings Ltd. | 430,000 | 39,832 | ||||||
| SmarTone Telecommunications Holdings Ltd. | 69,000 | 36,925 | ||||||
Solargiga Energy Holdings Ltd.(2) | 480,000 | 18,850 | ||||||
| Sun Hung Kai & Co. Ltd. | 54,000 | 24,888 | ||||||
| Tai Hing Group Holdings Ltd. | 50,000 | 6,419 | ||||||
| Ten Pao Group Holdings Ltd. | 80,000 | 14,631 | ||||||
| Texhong Textile Group Ltd. | 143,500 | 134,825 | ||||||
| Texwinca Holdings Ltd. | 26,000 | 4,622 | ||||||
| United Laboratories International Holdings Ltd. | 376,000 | 182,015 | ||||||
Value Partners Group Ltd.(1) | 412,000 | 120,841 | ||||||
| VSTECS Holdings Ltd. | 28,000 | 18,511 | ||||||
| 2,713,506 | ||||||||
| Ireland — 0.5% | ||||||||
Dalata Hotel Group PLC(2) | 122,273 | 428,281 | ||||||
| FBD Holdings PLC | 2,442 | 24,920 | ||||||
Glenveagh Properties PLC(2) | 165,159 | 168,103 | ||||||
| Origin Enterprises PLC | 25,522 | 95,673 | ||||||
Permanent TSB Group Holdings PLC(2) | 4,574 | 7,013 | ||||||
| 723,990 | ||||||||
| Israel — 3.0% | ||||||||
| Adgar Investment and Development Ltd. | 786 | 1,729 | ||||||
Airport City Ltd.(2) | 7,779 | 162,789 | ||||||
| Arad Investment & Industrial Development Ltd. | 163 | 22,978 | ||||||
| Ashtrom Group Ltd. | 3,572 | 90,912 | ||||||
| Aspen Group Ltd. | 664 | 1,953 | ||||||
| Azorim-Investment Development & Construction Co. Ltd. | 8,901 | 36,385 | ||||||
| Caesarstone Ltd. | 611 | 6,226 | ||||||
| Carasso Motors Ltd. | 2,263 | 14,344 | ||||||
Cellcom Israel Ltd.(2) | 10,293 | 64,391 | ||||||
Clal Insurance Enterprises Holdings Ltd.(2) | 14,781 | 319,172 | ||||||
| Delta Galil Industries Ltd. | 1,864 | 98,887 | ||||||
| Dor Alon Energy in Israel 1988 Ltd. | 81 | 3,089 | ||||||
Equital Ltd.(2) | 2,202 | 81,794 | ||||||
Fattal Holdings 1998 Ltd.(2) | 266 | 32,755 | ||||||
| FIBI Holdings Ltd. | 3,410 | 179,244 | ||||||
| First International Bank of Israel Ltd. | 4,077 | 189,727 | ||||||
| Fox Wizel Ltd. | 963 | 139,787 | ||||||
| Gazit-Globe Ltd. | 8,946 | 58,231 | ||||||
| Harel Insurance Investments & Financial Services Ltd. | 23,818 | 270,810 | ||||||
| IDI Insurance Co. Ltd. | 228 | 7,441 | ||||||
| Infinya Ltd. | 120 | 12,174 | ||||||
| Inrom Construction Industries Ltd. | 6,953 | 32,405 | ||||||
| Isracard Ltd. | 39,799 | 132,480 | ||||||
Israel Corp. Ltd.(2) | 613 | 296,297 | ||||||
| Israel Land Development - Urban Renewal Ltd. | 937 | 16,698 | ||||||
| Isras Investment Co. Ltd. | 182 | 43,592 | ||||||
| M Yochananof & Sons Ltd. | 273 | 17,172 | ||||||
Mehadrin Ltd.(2) | 7 | 325 | ||||||
| Melisron Ltd. | 1,144 | 93,422 | ||||||
Menora Mivtachim Holdings Ltd.(2) | 5,658 | 130,326 | ||||||
148
| Avantis International Small Cap Value Fund | ||||||||
| Shares | Value | |||||||
| Migdal Insurance & Financial Holdings Ltd. | 98,590 | $ | 162,896 | |||||
Naphtha Israel Petroleum Corp. Ltd.(2) | 2,351 | 14,155 | ||||||
| Norstar Holdings, Inc. | 1,581 | 15,185 | ||||||
| Oil Refineries Ltd. | 354,376 | 152,167 | ||||||
Partner Communications Co. Ltd.(2) | 23,332 | 201,802 | ||||||
Paz Oil Co. Ltd.(2) | 2,059 | 269,891 | ||||||
Perion Network Ltd.(2) | 1,361 | 27,690 | ||||||
| Phoenix Holdings Ltd. | 33,799 | 407,707 | ||||||
Property & Building Corp. Ltd.(2) | 90 | 9,230 | ||||||
| Rami Levy Chain Stores Hashikma Marketing 2006 Ltd. | 92 | 7,120 | ||||||
| Scope Metals Group Ltd. | 511 | 25,616 | ||||||
| Shapir Engineering and Industry Ltd. | 15,181 | 145,012 | ||||||
| Shufersal Ltd. | 52,963 | 362,725 | ||||||
| Summit Real Estate Holdings Ltd. | 5,021 | 94,660 | ||||||
| Tadiran Group Ltd. | 102 | 17,194 | ||||||
| Tamar Petroleum Ltd. | 732 | 2,367 | ||||||
Taro Pharmaceutical Industries Ltd.(2) | 1,168 | 39,315 | ||||||
Tera Light Ltd.(2) | 2,240 | 4,281 | ||||||
Tower Semiconductor Ltd.(2) | 2,114 | 99,091 | ||||||
Victory Supermarket Chain Ltd.(2) | 265 | 4,119 | ||||||
| 4,619,758 | ||||||||
| Italy — 2.5% | ||||||||
Aeffe SpA(2) | 1,917 | 2,738 | ||||||
| Aquafil SpA | 8,245 | 50,415 | ||||||
Avio SpA(1) | 4,718 | 65,059 | ||||||
| Banca IFIS SpA | 10,740 | 128,243 | ||||||
| Banca Popolare di Sondrio SCPA | 195,157 | 624,949 | ||||||
| Banca Sistema SpA | 12,370 | 19,203 | ||||||
| Biesse SpA | 6,867 | 87,190 | ||||||
| Credito Emiliano SpA | 11,263 | 65,114 | ||||||
d'Amico International Shipping SA(2) | 460,655 | 110,646 | ||||||
| Danieli & C Officine Meccaniche SpA | 445 | 8,180 | ||||||
| Danieli & C Officine Meccaniche SpA, Preference Shares | 6,575 | 83,552 | ||||||
Digital Bros SpA(1) | 3,194 | 78,775 | ||||||
| Emak SpA | 6,148 | 6,887 | ||||||
| Fila SpA | 3,915 | 29,540 | ||||||
Fincantieri SpA(1)(2) | 100,777 | 50,522 | ||||||
| Gefran SpA | 300 | 2,662 | ||||||
Geox SpA(2) | 34,516 | 26,790 | ||||||
Iveco Group NV(2) | 98,797 | 499,558 | ||||||
Maire Tecnimont SpA(1) | 62,561 | 158,768 | ||||||
MFE-MediaForEurope NV, Class A(1)(2) | 212,559 | 90,168 | ||||||
MFE-MediaForEurope NV, Class B(1)(2) | 113,286 | 65,899 | ||||||
| OVS SpA | 149,027 | 225,343 | ||||||
| RAI Way SpA | 38,790 | 187,624 | ||||||
Saras SpA(2) | 527,251 | 638,643 | ||||||
Servizi Italia SpA(2) | 1,623 | 2,001 | ||||||
Tesmec SpA(1)(2) | 215,373 | 27,473 | ||||||
Webuild SpA(1) | 286,264 | 402,022 | ||||||
| 3,737,964 | ||||||||
149
| Avantis International Small Cap Value Fund | ||||||||
| Shares | Value | |||||||
| Japan — 26.7% | ||||||||
| 77 Bank Ltd. | 4,800 | $ | 61,231 | |||||
| A&D HOLON Holdings Co. Ltd. | 200 | 1,369 | ||||||
| ADEKA Corp. | 400 | 6,750 | ||||||
AEON Financial Service Co. Ltd.(1) | 30,600 | 314,273 | ||||||
| AFC-HD AMS Life Science Co. Ltd. | 1,900 | 10,523 | ||||||
| Ahresty Corp. | 3,200 | 9,353 | ||||||
| Aichi Steel Corp. | 1,200 | 17,795 | ||||||
| Air Water, Inc. | 22,700 | 283,978 | ||||||
| Airport Facilities Co. Ltd. | 400 | 1,602 | ||||||
| Aisan Industry Co. Ltd. | 5,400 | 28,280 | ||||||
| Akatsuki, Inc. | 1,300 | 22,097 | ||||||
Alinco, Inc.(1) | 200 | 1,295 | ||||||
| Amada Co. Ltd. | 15,400 | 120,497 | ||||||
| AOKI Holdings, Inc. | 5,700 | 28,816 | ||||||
| Aoyama Trading Co. Ltd. | 11,100 | 73,645 | ||||||
| Aozora Bank Ltd. | 10,100 | 194,954 | ||||||
| Applied Co. Ltd. | 200 | 3,161 | ||||||
Arakawa Chemical Industries Ltd.(1) | 1,500 | 11,023 | ||||||
| Arata Corp. | 3,100 | 91,851 | ||||||
Arcland Sakamoto Co. Ltd.(1) | 7,000 | 75,060 | ||||||
Asahi Holdings, Inc.(1) | 4,300 | 64,091 | ||||||
| ASAHI YUKIZAI Corp. | 4,000 | 65,834 | ||||||
| Asia Pile Holdings Corp. | 800 | 2,893 | ||||||
| Bando Chemical Industries Ltd. | 1,300 | 9,421 | ||||||
| Bank of Nagoya Ltd. | 1,600 | 35,587 | ||||||
Bank of the Ryukyus Ltd.(1) | 2,300 | 12,814 | ||||||
| Belluna Co. Ltd. | 5,800 | 30,737 | ||||||
| Benesse Holdings, Inc. | 1,300 | 20,433 | ||||||
Bic Camera, Inc.(1) | 24,600 | 201,371 | ||||||
| BML, Inc. | 5,700 | 145,862 | ||||||
| Bunka Shutter Co. Ltd. | 7,800 | 59,821 | ||||||
| Carlit Holdings Co. Ltd. | 1,800 | 8,800 | ||||||
| Central Glass Co. Ltd. | 10,800 | 260,574 | ||||||
| Chiba Kogyo Bank Ltd. | 4,000 | 7,541 | ||||||
| Chilled & Frozen Logistics Holdings Co. Ltd. | 500 | 4,430 | ||||||
| Chubu Shiryo Co. Ltd. | 1,600 | 12,350 | ||||||
Citizen Watch Co. Ltd.(1) | 59,800 | 255,503 | ||||||
| CKD Corp. | 9,000 | 118,406 | ||||||
| CMIC Holdings Co. Ltd. | 3,100 | 36,816 | ||||||
| Cosmo Energy Holdings Co. Ltd. | 27,300 | 817,383 | ||||||
| Credit Saison Co. Ltd. | 50,100 | 630,303 | ||||||
| CTI Engineering Co. Ltd. | 500 | 9,354 | ||||||
| Cybernet Systems Co. Ltd. | 4,200 | 29,204 | ||||||
Daicel Corp.(1) | 57,800 | 362,996 | ||||||
Daido Metal Co. Ltd.(1) | 3,000 | 11,367 | ||||||
| Daiichi Kigenso Kagaku-Kogyo Co. Ltd. | 200 | 1,900 | ||||||
| Daiken Corp. | 1,300 | 18,164 | ||||||
| Daikokutenbussan Co. Ltd. | 800 | 33,971 | ||||||
| Daikyonishikawa Corp. | 100 | 419 | ||||||
| Dainichiseika Color & Chemicals Manufacturing Co. Ltd. | 1,800 | 23,148 | ||||||
150
| Avantis International Small Cap Value Fund | ||||||||
| Shares | Value | |||||||
Daio Paper Corp.(1) | 11,900 | $ | 111,234 | |||||
| Daito Chemix Corp. | 1,100 | 4,752 | ||||||
| Daitron Co. Ltd. | 100 | 1,514 | ||||||
| Denka Co. Ltd. | 18,800 | 450,374 | ||||||
| Dowa Holdings Co. Ltd. | 11,800 | 444,790 | ||||||
Dream Incubator, Inc.(2) | 2,200 | 31,572 | ||||||
| Eagle Industry Co. Ltd. | 5,600 | 47,052 | ||||||
| Eco's Co. Ltd. | 100 | 1,349 | ||||||
EDION Corp.(1) | 5,900 | 50,753 | ||||||
| EF-ON, Inc. | 2,000 | 9,728 | ||||||
Ehime Bank Ltd.(1) | 1,800 | 11,007 | ||||||
| Eizo Corp. | 2,700 | 73,492 | ||||||
| EJ Holdings, Inc. | 1,100 | 10,254 | ||||||
Electric Power Development Co. Ltd.(1) | 43,500 | 670,084 | ||||||
| Endo Lighting Corp. | 2,800 | 15,657 | ||||||
Enomoto Co. Ltd.(1) | 700 | 7,766 | ||||||
| eRex Co. Ltd. | 5,200 | 104,517 | ||||||
| Exedy Corp. | 5,100 | 65,712 | ||||||
| EXEO Group, Inc. | 17,500 | 268,492 | ||||||
| F.C.C. Co. Ltd. | 7,200 | 74,518 | ||||||
| Feed One Co. Ltd. | 1,900 | 9,574 | ||||||
| Ferrotec Holdings Corp. | 9,900 | 225,340 | ||||||
FIDEA Holdings Co. Ltd.(1) | 1,620 | 15,376 | ||||||
| Fields Corp. | 6,600 | 63,955 | ||||||
| Financial Products Group Co. Ltd. | 9,800 | 87,987 | ||||||
| FJ Next Holdings Co. Ltd. | 1,700 | 12,574 | ||||||
| France Bed Holdings Co. Ltd. | 3,100 | 21,974 | ||||||
| Frontier International, Inc. | 700 | 20,323 | ||||||
Fuji Corp. Ltd.(1) | 3,300 | 15,742 | ||||||
| Fuji Corp./Miyagi | 800 | 7,197 | ||||||
| Fuji Seal International, Inc. | 3,000 | 33,279 | ||||||
| Fujikura Composites, Inc. | 3,600 | 26,434 | ||||||
| Fujikura Ltd. | 80,900 | 574,495 | ||||||
| Fujimori Kogyo Co. Ltd. | 1,100 | 27,831 | ||||||
| Fukuoka Financial Group, Inc. | 12,600 | 225,158 | ||||||
| Furukawa Co. Ltd. | 2,100 | 19,039 | ||||||
| Furyu Corp. | 3,000 | 21,881 | ||||||
| Futaba Industrial Co. Ltd. | 10,000 | 25,857 | ||||||
| Fuyo General Lease Co. Ltd. | 4,600 | 271,640 | ||||||
| G-7 Holdings, Inc. | 400 | 4,289 | ||||||
G-Tekt Corp.(1) | 2,800 | 28,004 | ||||||
| Gecoss Corp. | 400 | 2,352 | ||||||
Genky DrugStores Co. Ltd.(1) | 1,300 | 34,186 | ||||||
Geomatec Co. Ltd.(2) | 900 | 3,660 | ||||||
| GLOBERIDE, Inc. | 4,200 | 82,313 | ||||||
| Glory Ltd. | 4,200 | 66,313 | ||||||
| Goldcrest Co. Ltd. | 2,400 | 29,904 | ||||||
| GS Yuasa Corp. | 700 | 12,702 | ||||||
| GungHo Online Entertainment, Inc. | 1,000 | 16,514 | ||||||
Gunma Bank Ltd.(1) | 27,000 | 75,505 | ||||||
| H-One Co. Ltd. | 2,700 | 11,756 | ||||||
151
| Avantis International Small Cap Value Fund | ||||||||
| Shares | Value | |||||||
| H.U. Group Holdings, Inc. | 15,300 | $ | 310,761 | |||||
| H2O Retailing Corp. | 22,900 | 161,339 | ||||||
| Hakudo Co. Ltd. | 1,200 | 23,265 | ||||||
| Hakuto Co. Ltd. | 2,800 | 66,522 | ||||||
Halows Co. Ltd.(1) | 600 | 13,177 | ||||||
| Hamakyorex Co. Ltd. | 3,100 | 70,589 | ||||||
| Hanwa Co. Ltd. | 11,600 | 286,969 | ||||||
| Happinet Corp. | 1,500 | 17,380 | ||||||
| Heiwa Real Estate Co. Ltd. | 5,900 | 166,371 | ||||||
Heiwado Co. Ltd.(1) | 6,600 | 94,337 | ||||||
Hirano Tecseed Co. Ltd.(1) | 1,600 | 21,304 | ||||||
| Hitachi Zosen Corp. | 41,700 | 263,231 | ||||||
| Hokuetsu Corp. | 26,900 | 144,766 | ||||||
| Hokuhoku Financial Group, Inc. | 20,000 | 118,842 | ||||||
| Hoosiers Holdings Co. Ltd. | 3,200 | 18,565 | ||||||
| Horiba Ltd. | 2,700 | 122,995 | ||||||
| Hosokawa Micron Corp. | 800 | 15,102 | ||||||
| HS Holdings Co. Ltd. | 7,500 | 62,755 | ||||||
| Hyakugo Bank Ltd. | 18,300 | 41,879 | ||||||
| i-mobile Co. Ltd. | 1,900 | 19,483 | ||||||
| I-Net Corp./Kanagawa | 200 | 1,935 | ||||||
| I-PEX, Inc. | 2,000 | 19,679 | ||||||
Ichinen Holdings Co. Ltd.(1) | 1,300 | 11,856 | ||||||
IDOM, Inc.(1) | 4,700 | 27,816 | ||||||
| IHI Corp. | 26,900 | 718,400 | ||||||
| Iino Kaiun Kaisha Ltd. | 23,200 | 136,328 | ||||||
| IMAGICA GROUP, Inc. | 4,500 | 29,444 | ||||||
Inabata & Co. Ltd.(1) | 7,600 | 132,988 | ||||||
| INFRONEER Holdings, Inc. | 19,640 | 140,388 | ||||||
| Innotech Corp. | 1,800 | 17,589 | ||||||
| Internet Initiative Japan, Inc. | 7,700 | 278,091 | ||||||
| Inui Global Logistics Co. Ltd. | 2,000 | 30,638 | ||||||
| Iseki & Co. Ltd. | 3,600 | 32,750 | ||||||
| Ishihara Sangyo Kaisha Ltd. | 9,700 | 77,953 | ||||||
| Itochu Enex Co. Ltd. | 13,500 | 105,916 | ||||||
| IwaiCosmo Holdings, Inc. | 2,100 | 18,947 | ||||||
| Iwasaki Electric Co. Ltd. | 200 | 3,721 | ||||||
| Iwatani Corp. | 1,300 | 53,043 | ||||||
J Front Retailing Co. Ltd.(1) | 67,600 | 535,763 | ||||||
| Jaccs Co. Ltd. | 6,200 | 170,501 | ||||||
| JAFCO Group Co. Ltd. | 18,300 | 264,843 | ||||||
| Japan Aviation Electronics Industry Ltd. | 8,500 | 142,147 | ||||||
Japan Electronic Materials Corp.(1) | 2,200 | 24,701 | ||||||
| Japan Investment Adviser Co. Ltd. | 2,500 | 24,200 | ||||||
| Japan Lifeline Co. Ltd. | 1,500 | 10,970 | ||||||
| Japan Petroleum Exploration Co. Ltd. | 8,100 | 230,773 | ||||||
| Japan Pulp & Paper Co. Ltd. | 400 | 12,547 | ||||||
| Japan Transcity Corp. | 2,000 | 7,319 | ||||||
| Japan Wool Textile Co. Ltd. | 10,100 | 74,231 | ||||||
| JGC Holdings Corp. | 56,200 | 757,259 | ||||||
| JINUSHI Co. Ltd. | 2,800 | 40,289 | ||||||
152
| Avantis International Small Cap Value Fund | ||||||||
| Shares | Value | |||||||
| JSP Corp. | 1,200 | $ | 12,456 | |||||
| JTEKT Corp. | 43,400 | 305,513 | ||||||
| Juroku Financial Group, Inc. | 3,700 | 65,470 | ||||||
| JVCKenwood Corp. | 34,700 | 50,937 | ||||||
| K's Holdings Corp. | 43,300 | 398,941 | ||||||
| Kamei Corp. | 1,400 | 11,014 | ||||||
| Kanamoto Co. Ltd. | 8,700 | 133,930 | ||||||
| Kaneka Corp. | 11,700 | 313,816 | ||||||
| Kanematsu Corp. | 20,300 | 219,605 | ||||||
| Kanto Denka Kogyo Co. Ltd. | 9,000 | 64,661 | ||||||
| Kato Sangyo Co. Ltd. | 4,000 | 98,373 | ||||||
| Kawai Musical Instruments Manufacturing Co. Ltd. | 800 | 15,702 | ||||||
| Kawasaki Heavy Industries Ltd. | 3,300 | 64,047 | ||||||
| Keiyo Bank Ltd. | 8,200 | 28,627 | ||||||
| KFC Holdings Japan Ltd. | 100 | 2,011 | ||||||
| KH Neochem Co. Ltd. | 6,800 | 125,134 | ||||||
| Kimura Chemical Plants Co. Ltd. | 1,900 | 10,743 | ||||||
| Kito Corp. | 1,900 | 36,855 | ||||||
| Kitz Corp. | 8,700 | 50,727 | ||||||
| Kiyo Bank Ltd. | 13,000 | 139,696 | ||||||
| Kobe Steel Ltd. | 101,900 | 463,640 | ||||||
| Koei Chemical Co. Ltd. | 200 | 3,349 | ||||||
Kohnan Shoji Co. Ltd.(1) | 6,700 | 166,077 | ||||||
Kojima Co. Ltd.(1) | 8,800 | 40,347 | ||||||
| Kokusai Pulp & Paper Co. Ltd. | 10,500 | 53,521 | ||||||
| Komeri Co. Ltd. | 6,300 | 118,322 | ||||||
| Komori Corp. | 2,900 | 16,021 | ||||||
| Konoike Transport Co. Ltd. | 3,500 | 33,216 | ||||||
| Kumagai Gumi Co. Ltd. | 7,200 | 137,742 | ||||||
| Kurabo Industries Ltd. | 1,300 | 19,834 | ||||||
| Kuraray Co. Ltd. | 58,500 | 444,356 | ||||||
| Kureha Corp. | 4,200 | 282,043 | ||||||
| KYB Corp. | 5,500 | 130,087 | ||||||
Kyoden Co. Ltd.(1) | 3,400 | 15,307 | ||||||
| Kyokuyo Co. Ltd. | 200 | 5,234 | ||||||
Lawson, Inc.(1) | 300 | 9,942 | ||||||
| Macnica Holdings, Inc. | 4,200 | 90,117 | ||||||
| Makino Milling Machine Co. Ltd. | 7,200 | 227,198 | ||||||
| Maruha Nichiro Corp. | 10,500 | 187,748 | ||||||
| MARUKA FURUSATO Corp. | 3,200 | 77,988 | ||||||
| Maruzen Showa Unyu Co. Ltd. | 1,200 | 27,402 | ||||||
| Maxell Ltd. | 14,100 | 149,551 | ||||||
| Mebuki Financial Group, Inc. | 82,700 | 158,500 | ||||||
| Megmilk Snow Brand Co. Ltd. | 11,300 | 139,273 | ||||||
Meiko Electronics Co. Ltd.(1) | 5,100 | 118,483 | ||||||
| Micronics Japan Co. Ltd. | 6,300 | 64,535 | ||||||
| Mimasu Semiconductor Industry Co. Ltd. | 4,000 | 60,830 | ||||||
| Miraial Co. Ltd. | 1,700 | 24,119 | ||||||
| MIRAIT ONE Corp. | 17,400 | 195,560 | ||||||
| Mitsubishi Research Institute, Inc. | 2,100 | 62,867 | ||||||
| Mitsubishi Shokuhin Co. Ltd. | 5,100 | 125,184 | ||||||
153
| Avantis International Small Cap Value Fund | ||||||||
| Shares | Value | |||||||
| Mitsubishi Steel Manufacturing Co. Ltd. | 4,300 | $ | 31,930 | |||||
Mitsuboshi Belting Ltd.(1) | 1,300 | 29,885 | ||||||
Mitsui Matsushima Holdings Co. Ltd.(1) | 2,700 | 70,693 | ||||||
| Mitsui Mining & Smelting Co. Ltd. | 18,500 | 436,889 | ||||||
| Mitsui-Soko Holdings Co. Ltd. | 6,000 | 145,021 | ||||||
| Miyaji Engineering Group, Inc. | 800 | 18,253 | ||||||
| Miyazaki Bank Ltd. | 1,500 | 23,974 | ||||||
| Mizuho Leasing Co. Ltd. | 5,800 | 140,092 | ||||||
Mizuho Medy Co. Ltd.(1) | 1,400 | 30,010 | ||||||
| Mizuno Corp. | 3,800 | 73,112 | ||||||
Monex Group, Inc.(1) | 26,600 | 94,864 | ||||||
| Morinaga Milk Industry Co. Ltd. | 8,500 | 259,890 | ||||||
| Musashino Bank Ltd. | 1,600 | 19,503 | ||||||
| Nabtesco Corp. | 15,600 | 369,417 | ||||||
| Nachi-Fujikoshi Corp. | 3,800 | 103,102 | ||||||
| Naigai Tec Corp. | 300 | 5,648 | ||||||
| Nanto Bank Ltd. | 5,400 | 76,104 | ||||||
| Nasu Denki Tekko Co. Ltd. | 100 | 5,874 | ||||||
| NEC Capital Solutions Ltd. | 1,000 | 15,435 | ||||||
| New Japan Chemical Co. Ltd. | 5,000 | 8,841 | ||||||
| NGK Spark Plug Co. Ltd. | 11,100 | 227,746 | ||||||
| Nichias Corp. | 8,800 | 151,971 | ||||||
| Nichiha Corp. | 4,200 | 83,697 | ||||||
| Nichireki Co. Ltd. | 4,600 | 44,963 | ||||||
| Nihon Chouzai Co. Ltd. | 2,800 | 26,937 | ||||||
| Nihon Dempa Kogyo Co. Ltd. | 3,000 | 32,600 | ||||||
| Nihon Dengi Co. Ltd. | 100 | 2,347 | ||||||
| Nihon Flush Co. Ltd. | 400 | 2,727 | ||||||
| Nihon House Holdings Co. Ltd. | 7,900 | 24,102 | ||||||
| Nikkon Holdings Co. Ltd. | 9,700 | 164,191 | ||||||
| Nippn Corp. | 7,800 | 87,973 | ||||||
Nippon Avionics Co. Ltd.(2) | 300 | 6,010 | ||||||
Nippon Chemi-Con Corp.(2) | 5,200 | 68,151 | ||||||
| Nippon Chemical Industrial Co. Ltd. | 1,100 | 16,649 | ||||||
| Nippon Coke & Engineering Co. Ltd. | 53,600 | 38,787 | ||||||
| Nippon Concrete Industries Co. Ltd. | 4,300 | 8,330 | ||||||
| Nippon Denko Co. Ltd. | 10,100 | 26,809 | ||||||
| Nippon Densetsu Kogyo Co. Ltd. | 5,500 | 70,768 | ||||||
| Nippon Electric Glass Co. Ltd. | 19,800 | 372,892 | ||||||
| Nippon Kodoshi Corp. | 1,400 | 21,914 | ||||||
| Nippon Koei Co. Ltd. | 2,300 | 58,898 | ||||||
| Nippon Paper Industries Co. Ltd. | 26,600 | 173,562 | ||||||
| Nippon Pillar Packing Co. Ltd. | 1,900 | 35,365 | ||||||
| Nippon Seiki Co. Ltd. | 1,600 | 9,459 | ||||||
| Nippon Shokubai Co. Ltd. | 6,800 | 269,645 | ||||||
| Nippon Soda Co. Ltd. | 6,500 | 214,940 | ||||||
| Nippon Steel Trading Corp. | 2,000 | 76,949 | ||||||
| Nippon Suisan Kaisha Ltd. | 66,600 | 272,530 | ||||||
| Nippon Thompson Co. Ltd. | 12,200 | 50,104 | ||||||
Nippon Yakin Kogyo Co. Ltd.(1) | 4,500 | 92,907 | ||||||
| Nipro Corp. | 35,600 | 289,828 | ||||||
154
| Avantis International Small Cap Value Fund | ||||||||
| Shares | Value | |||||||
| Nishi-Nippon Financial Holdings, Inc. | 18,600 | $ | 98,684 | |||||
Nishimatsu Construction Co. Ltd.(1) | 2,300 | 66,790 | ||||||
| Nishio Rent All Co. Ltd. | 3,900 | 81,365 | ||||||
| Nissan Shatai Co. Ltd. | 2,100 | 11,604 | ||||||
| Nisshinbo Holdings, Inc. | 34,000 | 263,109 | ||||||
| Nissin Electric Co. Ltd. | 1,900 | 20,248 | ||||||
| Nittetsu Mining Co. Ltd. | 1,000 | 44,284 | ||||||
| Nojima Corp. | 8,600 | 173,266 | ||||||
NOK Corp.(1) | 17,800 | 158,201 | ||||||
Nomura Micro Science Co. Ltd.(1) | 600 | 15,824 | ||||||
| Noritake Co. Ltd./Nagoya Japan | 800 | 24,046 | ||||||
| NS United Kaiun Kaisha Ltd. | 2,400 | 82,766 | ||||||
| Oji Holdings Corp. | 11,700 | 46,682 | ||||||
| Okasan Securities Group, Inc. | 10,300 | 24,837 | ||||||
| Oki Electric Industry Co. Ltd. | 8,800 | 47,488 | ||||||
| Okumura Corp. | 5,900 | 124,271 | ||||||
Okura Industrial Co. Ltd.(1) | 900 | 11,969 | ||||||
Okuwa Co. Ltd.(1) | 2,200 | 14,383 | ||||||
| Olympic Group Corp. | 500 | 2,145 | ||||||
| Onoken Co. Ltd. | 2,900 | 30,950 | ||||||
| Organo Corp. | 1,500 | 99,774 | ||||||
| Orient Corp. | 124,700 | 109,051 | ||||||
| Oriental Shiraishi Corp. | 10,000 | 18,087 | ||||||
Osaka Soda Co. Ltd.(1) | 3,300 | 89,568 | ||||||
| Osaka Steel Co. Ltd. | 1,600 | 14,621 | ||||||
OSAKA Titanium Technologies Co. Ltd.(2) | 7,100 | 161,876 | ||||||
| Pacific Industrial Co. Ltd. | 7,400 | 57,618 | ||||||
Pasona Group, Inc.(1) | 1,000 | 14,969 | ||||||
| Penta-Ocean Construction Co. Ltd. | 4,700 | 24,803 | ||||||
| Press Kogyo Co. Ltd. | 24,800 | 78,441 | ||||||
| Pressance Corp. | 2,200 | 23,788 | ||||||
| Prima Meat Packers Ltd. | 5,900 | 92,091 | ||||||
| PS Mitsubishi Construction Co. Ltd. | 1,700 | 7,938 | ||||||
| Raiznext Corp. | 700 | 6,044 | ||||||
Rengo Co. Ltd.(1) | 44,000 | 259,227 | ||||||
| Resorttrust, Inc. | 21,800 | 349,827 | ||||||
| Ricoh Leasing Co. Ltd. | 3,500 | 90,093 | ||||||
| Riken Corp. | 1,400 | 24,201 | ||||||
| Riken Technos Corp. | 1,900 | 7,096 | ||||||
| Roland DG Corp. | 2,200 | 51,601 | ||||||
| Ryobi Ltd. | 2,500 | 23,217 | ||||||
| Sakai Chemical Industry Co. Ltd. | 2,000 | 28,227 | ||||||
| Sakura Internet, Inc. | 300 | 1,247 | ||||||
| Sala Corp. | 5,500 | 32,134 | ||||||
| San Holdings, Inc. | 400 | 5,142 | ||||||
| San-Ai Obbli Co. Ltd. | 5,600 | 44,312 | ||||||
| San-In Godo Bank Ltd. | 12,500 | 61,458 | ||||||
Sanix, Inc.(2) | 1,600 | 2,842 | ||||||
| Sanki Engineering Co. Ltd. | 3,500 | 41,342 | ||||||
| Sankyo Frontier Co. Ltd. | 200 | 5,539 | ||||||
| Sankyu, Inc. | 7,700 | 236,831 | ||||||
155
| Avantis International Small Cap Value Fund | ||||||||
| Shares | Value | |||||||
| Sanwa Holdings Corp. | 27,100 | $ | 268,153 | |||||
Sanyo Chemical Industries Ltd.(1) | 1,300 | 44,418 | ||||||
| Sanyo Denki Co. Ltd. | 800 | 31,133 | ||||||
| SBS Holdings, Inc. | 300 | 6,210 | ||||||
Scroll Corp.(1) | 5,900 | 33,243 | ||||||
| SEC Carbon Ltd. | 100 | 4,380 | ||||||
| Seed Co. Ltd. | 1,600 | 6,675 | ||||||
| Seikitokyu Kogyo Co. Ltd. | 1,800 | 9,812 | ||||||
| Seiko Holdings Corp. | 8,400 | 173,090 | ||||||
| Seino Holdings Co. Ltd. | 24,600 | 195,345 | ||||||
| Sekisui Kasei Co. Ltd. | 2,100 | 6,124 | ||||||
| SEMITEC Corp. | 200 | 13,835 | ||||||
| Senko Group Holdings Co. Ltd. | 23,800 | 162,603 | ||||||
| Senshu Electric Co. Ltd. | 1,500 | 60,140 | ||||||
| Senshu Ikeda Holdings, Inc. | 54,400 | 86,392 | ||||||
| Shibaura Mechatronics Corp. | 800 | 65,981 | ||||||
| Shibusawa Warehouse Co. Ltd. | 100 | 1,518 | ||||||
| Shikoku Bank Ltd. | 2,100 | 12,941 | ||||||
Shin Nippon Biomedical Laboratories Ltd.(1) | 1,000 | 17,052 | ||||||
| Shinagawa Refractories Co. Ltd. | 500 | 13,639 | ||||||
| Shinmaywa Industries Ltd. | 16,400 | 124,985 | ||||||
| Shinnihon Corp. | 400 | 2,103 | ||||||
Shinsei Bank Ltd.(1) | 13,200 | 185,885 | ||||||
| Sinfonia Technology Co. Ltd. | 2,300 | 24,925 | ||||||
| SK-Electronics Co. Ltd. | 100 | 1,009 | ||||||
| SKY Perfect JSAT Holdings, Inc. | 49,200 | 195,532 | ||||||
| Sodick Co. Ltd. | 10,000 | 57,903 | ||||||
| Soken Chemical & Engineering Co. Ltd. | 800 | 11,130 | ||||||
| St-Care Holding Corp. | 1,900 | 11,978 | ||||||
| Star Micronics Co. Ltd. | 10,200 | 134,128 | ||||||
| Starts Corp., Inc. | 7,400 | 142,159 | ||||||
Studio Alice Co. Ltd.(1) | 400 | 6,392 | ||||||
| Subaru Enterprise Co. Ltd. | 100 | 6,411 | ||||||
| Sumitomo Densetsu Co. Ltd. | 2,800 | 52,876 | ||||||
| Sumitomo Heavy Industries Ltd. | 28,200 | 591,947 | ||||||
Sumitomo Osaka Cement Co. Ltd.(1) | 8,400 | 212,774 | ||||||
| Sumitomo Riko Co. Ltd. | 6,000 | 25,061 | ||||||
| Sumitomo Rubber Industries Ltd. | 36,300 | 311,493 | ||||||
| Sumitomo Seika Chemicals Co. Ltd. | 900 | 20,148 | ||||||
| Sumitomo Warehouse Co. Ltd. | 8,800 | 138,092 | ||||||
| Sun Frontier Fudousan Co. Ltd. | 8,100 | 69,880 | ||||||
| Sun-Wa Technos Corp. | 1,500 | 15,199 | ||||||
| Suruga Bank Ltd. | 36,000 | 97,026 | ||||||
| Suzuken Co. Ltd. | 1,800 | 43,138 | ||||||
| SWCC Showa Holdings Co. Ltd. | 6,400 | 83,846 | ||||||
| T RAD Co. Ltd. | 1,600 | 32,035 | ||||||
| T-Gaia Corp. | 400 | 4,756 | ||||||
| Tachikawa Corp. | 400 | 3,057 | ||||||
| Taiheiyo Cement Corp. | 27,100 | 405,726 | ||||||
| Taiho Kogyo Co. Ltd. | 1,500 | 7,573 | ||||||
| Takamiya Co. Ltd. | 1,000 | 3,031 | ||||||
156
| Avantis International Small Cap Value Fund | ||||||||
| Shares | Value | |||||||
| Takara Standard Co. Ltd. | 4,600 | $ | 43,710 | |||||
| Takasago International Corp. | 1,900 | 37,822 | ||||||
| Takasago Thermal Engineering Co. Ltd. | 7,700 | 90,977 | ||||||
| Tama Home Co. Ltd. | 2,600 | 43,835 | ||||||
| Tamron Co. Ltd. | 1,000 | 21,849 | ||||||
| Teijin Ltd. | 48,300 | 510,651 | ||||||
| Tera Probe, Inc. | 500 | 5,091 | ||||||
| Toa Corp. (Tokyo) | 3,000 | 52,640 | ||||||
| TOA ROAD Corp. | 200 | 8,464 | ||||||
| Toagosei Co. Ltd. | 6,500 | 50,644 | ||||||
| Toenec Corp. | 100 | 2,640 | ||||||
Toho Titanium Co. Ltd.(1) | 8,300 | 131,476 | ||||||
| TOKAI Holdings Corp. | 19,400 | 123,988 | ||||||
| Tokuyama Corp. | 16,700 | 219,957 | ||||||
| Tokyo Electron Device Ltd. | 1,200 | 50,684 | ||||||
| Tokyo Kiraboshi Financial Group, Inc. | 5,500 | 88,698 | ||||||
| Tokyo Seimitsu Co. Ltd. | 8,500 | 283,146 | ||||||
| Tokyo Steel Manufacturing Co. Ltd. | 21,100 | 223,558 | ||||||
| Tokyo Tatemono Co. Ltd. | 35,600 | 533,636 | ||||||
| Tokyu Construction Co. Ltd. | 21,800 | 102,543 | ||||||
| TOMONY Holdings, Inc. | 900 | 2,040 | ||||||
| Tomy Co. Ltd. | 21,200 | 200,972 | ||||||
| Tonami Holdings Co. Ltd. | 300 | 7,951 | ||||||
| Topre Corp. | 9,100 | 81,062 | ||||||
| Towa Corp. | 5,200 | 69,434 | ||||||
| Toyo Construction Co. Ltd. | 13,700 | 84,520 | ||||||
Toyo Engineering Corp.(2) | 5,200 | 25,757 | ||||||
| Toyo Seikan Group Holdings Ltd. | 35,000 | 414,186 | ||||||
| Toyo Tire Corp. | 15,600 | 189,068 | ||||||
| Toyobo Co. Ltd. | 21,700 | 164,419 | ||||||
| Toyoda Gosei Co. Ltd. | 8,100 | 140,920 | ||||||
| Toyota Boshoku Corp. | 13,200 | 191,699 | ||||||
| TPR Co. Ltd. | 4,200 | 38,459 | ||||||
| Traders Holdings Co. Ltd. | 1,500 | 4,102 | ||||||
| Transcosmos, Inc. | 5,900 | 162,742 | ||||||
| TRE Holdings Corp. | 24 | 294 | ||||||
| Tsubakimoto Chain Co. | 5,900 | 136,335 | ||||||
Tsugami Corp.(1) | 8,600 | 76,952 | ||||||
| Tsukuba Bank Ltd. | 6,900 | 9,691 | ||||||
| TV Asahi Holdings Corp. | 5,400 | 56,270 | ||||||
| UACJ Corp. | 2,500 | 43,164 | ||||||
Ube Industries Ltd.(1) | 25,600 | 377,201 | ||||||
| Ulvac, Inc. | 7,600 | 294,699 | ||||||
| Unipres Corp. | 8,900 | 61,317 | ||||||
Unitika Ltd.(2) | 10,300 | 19,157 | ||||||
Univance Corp.(1) | 3,000 | 8,725 | ||||||
| Valor Holdings Co. Ltd. | 9,500 | 121,106 | ||||||
Vertex Corp.(1) | 3,000 | 28,955 | ||||||
| VT Holdings Co. Ltd. | 17,600 | 60,943 | ||||||
| Wakita & Co. Ltd. | 3,800 | 30,563 | ||||||
| Warabeya Nichiyo Holdings Co. Ltd. | 3,700 | 60,227 | ||||||
157
| Avantis International Small Cap Value Fund | ||||||||
| Shares | Value | |||||||
| Willplus Holdings Corp. | 900 | $ | 7,056 | |||||
| Wood One Co. Ltd. | 1,900 | 14,789 | ||||||
| Yachiyo Industry Co. Ltd. | 2,600 | 13,218 | ||||||
| YAMABIKO Corp. | 1,800 | 14,694 | ||||||
| Yamada Holdings Co. Ltd. | 3,100 | 10,729 | ||||||
| Yamaichi Electronics Co. Ltd. | 4,800 | 71,044 | ||||||
| Yamazen Corp. | 12,000 | 80,357 | ||||||
| Yokogawa Bridge Holdings Corp. | 7,400 | 103,471 | ||||||
| Yokohama Rubber Co. Ltd. | 26,600 | 435,035 | ||||||
| Yokorei Co. Ltd. | 9,800 | 64,988 | ||||||
| Yorozu Corp. | 1,600 | 10,259 | ||||||
| Yuasa Trading Co. Ltd. | 4,300 | 108,334 | ||||||
| Yurtec Corp. | 2,200 | 11,837 | ||||||
| Zeon Corp. | 8,300 | 79,632 | ||||||
| 40,583,594 | ||||||||
| Netherlands — 1.9% | ||||||||
AerCap Holdings NV(2) | 13,843 | 609,784 | ||||||
| AMG Advanced Metallurgical Group NV | 1,026 | 26,196 | ||||||
| ASR Nederland NV | 19,534 | 797,265 | ||||||
| Boskalis Westminster | 8,689 | 288,205 | ||||||
| Brunel International NV | 814 | 7,621 | ||||||
| Flow Traders | 6,272 | 125,507 | ||||||
ForFarmers NV(1) | 2,391 | 6,739 | ||||||
| Heijmans NV, CVA | 3,378 | 35,068 | ||||||
Koninklijke BAM Groep NV(2) | 42,608 | 113,572 | ||||||
| Nedap NV | 63 | 3,589 | ||||||
| OCI NV | 13,847 | 519,856 | ||||||
PostNL NV(1) | 69,773 | 148,677 | ||||||
| SIF Holding NV | 899 | 9,183 | ||||||
| TKH Group NV | 5,405 | 188,568 | ||||||
| 2,879,830 | ||||||||
| New Zealand — 1.0% | ||||||||
Air New Zealand Ltd.(2) | 1,097,140 | 453,370 | ||||||
Channel Infrastructure NZ Ltd.(2) | 5,917 | 4,887 | ||||||
| KMD Brands Ltd. | 92,097 | 60,639 | ||||||
| Oceania Healthcare Ltd. | 363,093 | 219,404 | ||||||
| PGG Wrightson Ltd. | 3,178 | 9,320 | ||||||
SKY Network Television Ltd.(2) | 12,857 | 19,374 | ||||||
| SKYCITY Entertainment Group Ltd. | 445,041 | 774,196 | ||||||
| Warehouse Group Ltd. | 4,116 | 8,276 | ||||||
| 1,549,466 | ||||||||
| Norway — 2.3% | ||||||||
2020 Bulkers Ltd.(1)(2) | 1,868 | 16,632 | ||||||
| ABG Sundal Collier Holding ASA | 106,475 | 62,467 | ||||||
| Aker Solutions ASA | 39,671 | 155,582 | ||||||
BW Energy Ltd.(2) | 17,996 | 44,877 | ||||||
| BW LPG Ltd. | 21,847 | 142,012 | ||||||
| BW Offshore Ltd. | 28,192 | 76,388 | ||||||
| DNO ASA | 149,189 | 211,970 | ||||||
| FLEX LNG Ltd. | 13,168 | 435,212 | ||||||
| Hafnia Ltd. | 11,755 | 52,488 | ||||||
158
| Avantis International Small Cap Value Fund | ||||||||
| Shares | Value | |||||||
| Kid ASA | 4,498 | $ | 40,449 | |||||
| Klaveness Combination Carriers ASA | 508 | 3,515 | ||||||
Kongsberg Automotive ASA(1)(2) | 5,303 | 1,350 | ||||||
Magseis Fairfield ASA(2) | 62,644 | 53,713 | ||||||
| MPC Container Ships ASA | 61,895 | 127,605 | ||||||
Norske Skog ASA(2) | 12,428 | 86,395 | ||||||
Norwegian Energy Co. ASA(2) | 7,184 | 257,817 | ||||||
Odfjell Drilling Ltd.(2) | 38,648 | 104,978 | ||||||
Odfjell Technology Ltd.(2) | 6,441 | 16,136 | ||||||
| OKEA ASA | 4,565 | 23,709 | ||||||
PGS ASA(1)(2) | 150,801 | 122,738 | ||||||
| Protector Forsikring ASA | 12,352 | 147,870 | ||||||
Rana Gruber ASA(1) | 6,299 | 27,374 | ||||||
Solstad Offshore ASA(1)(2) | 13,653 | 40,323 | ||||||
| SpareBank 1 Nord Norge | 28,395 | 255,938 | ||||||
| SpareBank 1 SMN | 3,077 | 37,464 | ||||||
| SpareBank 1 Sorost-Norge | 1,293 | 7,062 | ||||||
| Sparebanken More | 1,335 | 9,824 | ||||||
| Sparebanken Vest | 1,609 | 14,316 | ||||||
| Stolt-Nielsen Ltd. | 4,558 | 97,402 | ||||||
| Subsea 7 SA | 66,957 | 601,066 | ||||||
| Veidekke ASA | 2,764 | 28,228 | ||||||
| Wallenius Wilhelmsen ASA | 31,730 | 178,638 | ||||||
| 3,481,538 | ||||||||
| Portugal — 0.3% | ||||||||
| Altri SGPS SA | 47,120 | 265,871 | ||||||
| Corticeira Amorim SGPS SA | 2,594 | 26,196 | ||||||
Greenvolt-Energias Renovaveis SA(2) | 955 | 9,226 | ||||||
| Ibersol SGPS SA | 9 | 52 | ||||||
Mota-Engil SGPS SA(1) | 23,248 | 28,012 | ||||||
| NOS SGPS SA | 4,467 | 16,465 | ||||||
| Sonae SGPS SA | 53,840 | 54,117 | ||||||
| 399,939 | ||||||||
| Singapore — 2.1% | ||||||||
| BRC Asia Ltd. | 5,500 | 6,687 | ||||||
| Bumitama Agri Ltd. | 185,600 | 82,917 | ||||||
| Centurion Corp. Ltd. | 10,500 | 2,856 | ||||||
| China Sunsine Chemical Holdings Ltd. | 27,500 | 9,454 | ||||||
| First Resources Ltd. | 65,400 | 70,495 | ||||||
| Food Empire Holdings Ltd. | 800 | 300 | ||||||
| Fu Yu Corp. Ltd. | 20,700 | 3,850 | ||||||
Geo Energy Resources Ltd.(1) | 240,500 | 66,049 | ||||||
| GKE Corp. Ltd. | 228,600 | 16,506 | ||||||
| Golden Agri-Resources Ltd. | 3,600,800 | 721,848 | ||||||
Hong Fok Corp. Ltd.(1) | 81,600 | 61,772 | ||||||
| Hong Leong Asia Ltd. | 45,000 | 24,133 | ||||||
| Hour Glass Ltd. | 33,400 | 55,372 | ||||||
| Hutchison Port Holdings Trust, U Shares | 2,337,300 | 501,531 | ||||||
| InnoTek Ltd. | 9,200 | 3,159 | ||||||
| ISDN Holdings Ltd. | 69,200 | 23,439 | ||||||
| Japfa Ltd. | 27,900 | 11,970 | ||||||
159
| Avantis International Small Cap Value Fund | ||||||||
| Shares | Value | |||||||
| Jiutian Chemical Group Ltd. | 589,800 | $ | 39,113 | |||||
| Medtecs International Corp. Ltd. | 188,100 | 21,055 | ||||||
OUE Ltd.(1) | 26,100 | 25,578 | ||||||
Riverstone Holdings Ltd.(1) | 228,500 | 117,799 | ||||||
| Samudera Shipping Line Ltd. | 88,500 | 63,095 | ||||||
| Sing Holdings Ltd. | 11,800 | 3,251 | ||||||
| Singapore Post Ltd. | 105,500 | 43,732 | ||||||
| Tuan Sing Holdings Ltd. | 399,413 | 105,504 | ||||||
| Yangzijiang Shipbuilding Holdings Ltd. | 1,194,500 | 827,831 | ||||||
| Yanlord Land Group Ltd. | 332,100 | 244,411 | ||||||
Ying Li International Real Estate Ltd.(2) | 4,700 | 158 | ||||||
| 3,153,865 | ||||||||
| Spain — 1.6% | ||||||||
| Acerinox SA | 34,045 | 308,033 | ||||||
| Almirall SA | 5,387 | 48,597 | ||||||
Amper SA(2) | 121,002 | 21,463 | ||||||
Atresmedia Corp. de Medios de Comunicacion SA(1) | 17,202 | 47,109 | ||||||
| Banco de Sabadell SA | 961,848 | 661,495 | ||||||
| Bankinter SA | 124,938 | 640,281 | ||||||
Deoleo SA(1)(2) | 10,719 | 3,073 | ||||||
| Ence Energia y Celulosa SA | 18,325 | 64,865 | ||||||
| Ercros SA | 14,677 | 45,079 | ||||||
| Gestamp Automocion SA | 39,788 | 145,677 | ||||||
Mediaset Espana Comunicacion SA(2) | 2,672 | 7,433 | ||||||
Melia Hotels International SA(2) | 14,135 | 85,723 | ||||||
| Miquel y Costas & Miquel SA | 1,905 | 24,607 | ||||||
Neinor Homes SA(1) | 5,607 | 57,520 | ||||||
| Pharma Mar SA | 576 | 33,549 | ||||||
| Prosegur Cia de Seguridad SA | 21,375 | 39,360 | ||||||
| Sacyr SA | 67,098 | 150,091 | ||||||
| 2,383,955 | ||||||||
| Sweden — 4.9% | ||||||||
Annehem Fastigheter AB, B Shares(2) | 455 | 1,262 | ||||||
| AQ Group AB | 739 | 16,426 | ||||||
Avanza Bank Holding AB(1) | 11,533 | 184,863 | ||||||
Better Collective A/S(2) | 5,175 | 70,911 | ||||||
| Bilia AB, A Shares | 32,370 | 402,714 | ||||||
| BillerudKorsnas AB | 6,654 | 86,519 | ||||||
| Bonava AB, B Shares | 20,091 | 71,913 | ||||||
| Bulten AB | 2,640 | 15,752 | ||||||
| Bure Equity AB | 4,889 | 96,568 | ||||||
| Byggmax Group AB | 23,825 | 97,888 | ||||||
Catena Media PLC(2) | 25,029 | 75,216 | ||||||
| Cibus Nordic Real Estate AB | 14,337 | 228,311 | ||||||
| Clas Ohlson AB, B Shares | 18,451 | 166,432 | ||||||
| Cloetta AB, B Shares | 80,377 | 140,514 | ||||||
Collector Bank AB(2) | 18,091 | 57,701 | ||||||
| Corem Property Group AB, B Shares | 25,539 | 29,784 | ||||||
| Dios Fastigheter AB | 20,206 | 149,563 | ||||||
| Elanders AB, B Shares | 400 | 5,666 | ||||||
| Electrolux Professional AB, B Shares | 37,987 | 188,714 | ||||||
160
| Avantis International Small Cap Value Fund | ||||||||
| Shares | Value | |||||||
Elekta AB, B Shares(1) | 22,531 | $ | 129,157 | |||||
G5 Entertainment AB(1) | 2,128 | 35,110 | ||||||
| Granges AB | 2,384 | 18,480 | ||||||
| Hexatronic Group AB | 34,580 | 336,818 | ||||||
Hoist Finance AB(1)(2) | 24,202 | 73,273 | ||||||
| Hufvudstaden AB, A Shares | 10,826 | 128,972 | ||||||
| JM AB | 3,928 | 67,532 | ||||||
| Loomis AB | 22,214 | 600,079 | ||||||
Maha Energy AB(1)(2) | 17,201 | 19,815 | ||||||
| MEKO AB | 14,010 | 127,956 | ||||||
| MIPS AB | 5,708 | 257,213 | ||||||
Modern Times Group MTG AB, B Shares(2) | 29,603 | 259,223 | ||||||
| NCC AB, B Shares | 1,910 | 17,977 | ||||||
| New Wave Group AB, B Shares | 17,177 | 276,283 | ||||||
| Nyfosa AB | 52,439 | 440,521 | ||||||
Pandox AB(2) | 29,205 | 361,056 | ||||||
Paradox Interactive AB(1) | 14,394 | 226,283 | ||||||
| Peab AB, Class B | 44,681 | 275,106 | ||||||
RaySearch Laboratories AB(2) | 2,832 | 13,257 | ||||||
| Resurs Holding AB | 48,139 | 102,569 | ||||||
| Saab AB, B Shares | 18,853 | 629,824 | ||||||
Scandi Standard AB(2) | 20,927 | 92,301 | ||||||
| SkiStar AB | 18,795 | 241,850 | ||||||
Solid Forsakring AB(2) | 4,813 | 20,940 | ||||||
Stendorren Fastigheter AB(2) | 511 | 9,573 | ||||||
| Tethys Oil AB | 10,983 | 65,726 | ||||||
| TF Bank AB | 180 | 2,685 | ||||||
| Wihlborgs Fastigheter AB | 84,915 | 608,309 | ||||||
| 7,524,605 | ||||||||
| Switzerland — 4.3% | ||||||||
ALSO Holding AG(2) | 1,300 | 216,116 | ||||||
| Arbonia AG | 5,672 | 74,346 | ||||||
Autoneum Holding AG(1) | 1,094 | 122,645 | ||||||
| Bell Food Group AG | 548 | 143,573 | ||||||
| Bellevue Group AG | 642 | 20,910 | ||||||
| Bobst Group SA | 4,013 | 323,338 | ||||||
| Bucher Industries AG | 1,065 | 379,451 | ||||||
| Burckhardt Compression Holding AG | 1,182 | 494,985 | ||||||
| Burkhalter Holding AG | 341 | 29,369 | ||||||
| Cembra Money Bank AG | 13,725 | 925,653 | ||||||
Coltene Holding AG(2) | 353 | 30,186 | ||||||
EFG International AG(2) | 31,149 | 261,761 | ||||||
Feintool International Holding AG(1) | 531 | 11,434 | ||||||
| Forbo Holding AG | 66 | 82,358 | ||||||
| Huber + Suhner AG | 104 | 8,662 | ||||||
| Leonteq AG | 3,159 | 179,381 | ||||||
| Liechtensteinische Landesbank AG | 1,372 | 78,335 | ||||||
| OC Oerlikon Corp. AG | 54,199 | 395,896 | ||||||
| Orior AG | 1,860 | 145,364 | ||||||
| Phoenix Mecano AG | 43 | 15,802 | ||||||
| Rieter Holding AG | 462 | 47,170 | ||||||
161
| Avantis International Small Cap Value Fund | ||||||||
| Shares | Value | |||||||
Sensirion Holding AG(2) | 2,492 | $ | 231,251 | |||||
| St Galler Kantonalbank AG | 579 | 272,309 | ||||||
| Sulzer AG | 7,845 | 468,181 | ||||||
| Swissquote Group Holding SA | 3,715 | 412,161 | ||||||
u-blox Holding AG(2) | 3,379 | 468,322 | ||||||
V-ZUG Holding AG(2) | 209 | 16,447 | ||||||
| Valiant Holding AG | 3,533 | 334,748 | ||||||
| Valora Holding AG | 385 | 101,992 | ||||||
| Zehnder Group AG | 3,544 | 209,366 | ||||||
| 6,501,512 | ||||||||
| United Kingdom — 13.6% | ||||||||
| AG Barr PLC | 7,361 | 43,100 | ||||||
| Anglo Asian Mining PLC | 5,959 | 5,535 | ||||||
| Anglo Pacific Group PLC | 7,591 | 14,533 | ||||||
| Atalaya Mining PLC | 24,177 | 62,454 | ||||||
| Bank of Georgia Group PLC | 8,588 | 199,446 | ||||||
| Berkeley Group Holdings PLC | 16,222 | 686,727 | ||||||
| Biffa PLC | 28,021 | 130,796 | ||||||
| Brewin Dolphin Holdings PLC | 49,184 | 292,457 | ||||||
Capricorn Energy PLC(2) | 20,114 | 54,215 | ||||||
| Centamin PLC | 235,511 | 246,984 | ||||||
| Central Asia Metals PLC | 40,939 | 109,001 | ||||||
| Close Brothers Group PLC | 33,690 | 398,569 | ||||||
CMC Markets PLC(1) | 30,696 | 81,869 | ||||||
| Coats Group PLC | 349,940 | 243,897 | ||||||
| Computacenter PLC | 13,411 | 384,182 | ||||||
| ContourGlobal PLC | 25,921 | 77,483 | ||||||
| Crest Nicholson Holdings PLC | 54,990 | 149,447 | ||||||
| Devro PLC | 13,264 | 28,688 | ||||||
| Direct Line Insurance Group PLC | 266,749 | 635,331 | ||||||
| Drax Group PLC | 91,765 | 676,910 | ||||||
| Dunelm Group PLC | 15,171 | 121,081 | ||||||
EnQuest PLC(2) | 513,322 | 178,116 | ||||||
| Ferrexpo PLC | 48,113 | 82,760 | ||||||
Firstgroup PLC(1) | 207,710 | 276,641 | ||||||
| Forterra PLC | 43,803 | 134,406 | ||||||
Frasers Group PLC(2) | 38,605 | 359,456 | ||||||
| Games Workshop Group PLC | 267 | 21,986 | ||||||
| Genel Energy PLC | 36,022 | 59,380 | ||||||
Georgia Capital PLC(2) | 3,896 | 30,912 | ||||||
Go-Ahead Group PLC(2) | 6,462 | 115,921 | ||||||
Golar LNG Ltd.(2) | 1,248 | 34,033 | ||||||
| Greggs PLC | 17,706 | 378,476 | ||||||
| Gulf Keystone Petroleum Ltd. | 63,843 | 178,746 | ||||||
| Halfords Group PLC | 21,023 | 31,781 | ||||||
| Hargreaves Lansdown PLC | 35,902 | 339,890 | ||||||
| Hikma Pharmaceuticals PLC | 30,975 | 472,080 | ||||||
| Hill & Smith Holdings PLC | 10,982 | 132,673 | ||||||
| Hochschild Mining PLC | 68,105 | 51,277 | ||||||
| Howden Joinery Group PLC | 107,648 | 711,754 | ||||||
| Hunting PLC | 13,843 | 46,300 | ||||||
162
| Avantis International Small Cap Value Fund | ||||||||
| Shares | Value | |||||||
| Ibstock PLC | 81,092 | $ | 178,235 | |||||
| IG Group Holdings PLC | 83,740 | 794,691 | ||||||
| Inchcape PLC | 80,901 | 710,405 | ||||||
Indivior PLC(2) | 110,874 | 371,506 | ||||||
| Intermediate Capital Group PLC | 49,195 | 777,663 | ||||||
| International Personal Finance PLC | 32,615 | 37,907 | ||||||
| Investec PLC | 63,009 | 302,868 | ||||||
| IP Group PLC | 215,528 | 174,924 | ||||||
| J Sainsbury PLC | 101,488 | 239,548 | ||||||
| Jadestone Energy PLC | 15,089 | 15,249 | ||||||
| Johnson Matthey PLC | 35,225 | 821,828 | ||||||
Jubilee Metals Group PLC(2) | 2,770 | 380 | ||||||
| Jupiter Fund Management PLC | 28,556 | 32,200 | ||||||
| Just Group PLC | 19,926 | 16,639 | ||||||
| Keller Group PLC | 11,278 | 91,796 | ||||||
| Lookers PLC | 14,458 | 13,692 | ||||||
| M&G PLC | 266,917 | 605,751 | ||||||
| Man Group PLC | 248,568 | 702,420 | ||||||
Marks & Spencer Group PLC(2) | 397,293 | 561,416 | ||||||
McBride PLC(2) | 1,428 | 372 | ||||||
Mitchells & Butlers PLC(2) | 53,256 | 95,246 | ||||||
| Mitie Group PLC | 232,309 | 195,102 | ||||||
Molten Ventures PLC(2) | 35,249 | 152,194 | ||||||
Motorpoint group PLC(2) | 61 | 140 | ||||||
N Brown Group PLC(2) | 12,509 | 3,639 | ||||||
| Ninety One PLC | 70,025 | 160,424 | ||||||
| OSB Group PLC | 24,245 | 154,579 | ||||||
| Pagegroup PLC | 63,837 | 320,638 | ||||||
| Pan African Resources PLC | 412,906 | 87,705 | ||||||
| Paragon Banking Group PLC | 36,441 | 226,510 | ||||||
Petra Diamonds Ltd.(1)(2) | 46,129 | 52,670 | ||||||
| Plus500 Ltd. | 24,523 | 483,251 | ||||||
| Provident Financial PLC | 36,179 | 72,396 | ||||||
| PZ Cussons PLC | 42,187 | 95,128 | ||||||
| Rathbones Group PLC | 7,463 | 156,009 | ||||||
| Reach PLC | 60,293 | 51,830 | ||||||
| Redde Northgate PLC | 52,618 | 208,853 | ||||||
| Royal Mail PLC | 93,916 | 299,652 | ||||||
| Savills PLC | 29,073 | 319,293 | ||||||
| Secure Trust Bank PLC | 121 | 1,288 | ||||||
Senior PLC(2) | 47,232 | 71,216 | ||||||
| Serica Energy PLC | 45,322 | 196,198 | ||||||
| Shanta Gold Ltd. | 106,592 | 11,704 | ||||||
| Speedy Hire PLC | 93,197 | 44,239 | ||||||
Spire Healthcare Group PLC(2) | 29,420 | 79,262 | ||||||
| St. James's Place PLC | 9,449 | 120,947 | ||||||
| SThree PLC | 28,594 | 116,725 | ||||||
Superdry PLC(2) | 8,840 | 12,850 | ||||||
| Synthomer PLC | 62,378 | 142,420 | ||||||
| Tate & Lyle PLC | 99,879 | 884,451 | ||||||
| TBC Bank Group PLC | 9,590 | 197,446 | ||||||
163
| Avantis International Small Cap Value Fund | ||||||||
| Shares | Value | |||||||
| TI Fluid Systems PLC | 25,171 | $ | 42,661 | |||||
| Vertu Motors PLC | 50,582 | 28,494 | ||||||
| Virgin Money UK PLC | 265,220 | 458,589 | ||||||
| Vistry Group PLC | 17,211 | 154,138 | ||||||
| Vp PLC | 235 | 2,192 | ||||||
| Watkin Jones PLC | 4,934 | 10,843 | ||||||
| Wickes Group PLC | 49,645 | 68,825 | ||||||
Xaar PLC(2) | 533 | 1,282 | ||||||
Yellow Cake PLC(2) | 45,020 | 219,496 | ||||||
| 20,729,308 | ||||||||
| United States — 0.1% | ||||||||
| ADTRAN Holdings, Inc. | 4,877 | 112,726 | ||||||
TOTAL COMMON STOCKS (Cost $158,899,473) | 149,725,965 | |||||||
WARRANTS† | ||||||||
Italy† | ||||||||
Webuild SpA(1)(2) (Cost $—) | 6,684 | 9,438 | ||||||
RIGHTS† | ||||||||
Austria† | ||||||||
IMMOFINANZ AG(2) | 993 | 10 | ||||||
Germany† | ||||||||
7C Solarparken AG(2) | 5,130 | 94 | ||||||
TOTAL RIGHTS (Cost $—) | 104 | |||||||
| SHORT-TERM INVESTMENTS — 6.2% | ||||||||
| Money Market Funds — 6.2% | ||||||||
| State Street Institutional U.S. Government Money Market Fund, Premier Class | 1,553,087 | 1,553,087 | ||||||
State Street Navigator Securities Lending Government Money Market Portfolio(3) | 7,792,439 | 7,792,439 | ||||||
TOTAL SHORT-TERM INVESTMENTS (Cost $9,345,526) | 9,345,526 | |||||||
TOTAL INVESTMENT SECURITIES — 104.8% (Cost $168,244,999) | 159,081,033 | |||||||
| OTHER ASSETS AND LIABILITIES — (4.8)% | (7,263,033) | |||||||
| TOTAL NET ASSETS — 100.0% | $ | 151,818,000 | ||||||
| FUTURES CONTRACTS PURCHASED | ||||||||||||||
| Reference Entity | Contracts | Expiration Date | Notional Amount | Unrealized Appreciation (Depreciation)^ | ||||||||||
| Russell 2000 E-Mini Index | 9 | September 2022 | $ | 830,070 | $ | 58,316 | ||||||||
^Amount represents value and unrealized appreciation (depreciation).
164
| Avantis International Small Cap Value Fund | |||||
| MARKET SECTOR DIVERSIFICATION | |||||
(as a % of net assets) | |||||
| Industrials | 20.6% | ||||
| Financials | 19.7% | ||||
| Materials | 16.5% | ||||
| Consumer Discretionary | 12.2% | ||||
| Energy | 11.2% | ||||
| Consumer Staples | 4.8% | ||||
| Information Technology | 4.3% | ||||
| Real Estate | 3.2% | ||||
| Communication Services | 2.6% | ||||
| Utilities | 1.8% | ||||
| Health Care | 1.7% | ||||
| Short-Term Investments | 6.2% | ||||
| Other Assets and Liabilities | (4.8)% | ||||
| NOTES TO SCHEDULE OF INVESTMENTS | ||||||||
| CVA | - | Certificaten Van Aandelen | ||||||
†Category is less than 0.05% of total net assets.
(1)Security, or a portion thereof, is on loan. At the period end, the aggregate value of securities on loan was $14,127,401. The amount of securities on loan indicated may not correspond with the securities on loan identified because securities with pending sales are in the process of recall from the brokers.
(2)Non-income producing.
(3)Investment of cash collateral from securities on loan. At the period end, the aggregate value of the collateral held by the fund was $15,034,693, which includes securities collateral of $7,242,254.
See Notes to Financial Statements.
165
| Statements of Assets and Liabilities | ||
| AUGUST 31, 2022 | ||||||||
| Avantis Emerging Markets Equity Fund | Avantis International Equity Fund | |||||||
| Assets | ||||||||
| Investment securities, at value (cost of $268,860,068 and $137,588,226, respectively) — including $10,184,875 and $12,163,975, respectively of securities on loan | $ | 242,016,179 | $ | 132,215,548 | ||||
| Investment made with cash collateral received for securities on loan, at value (cost of $4,524,997 and $7,033,882, respectively) | 4,524,997 | 7,033,882 | ||||||
| Total investment securities, at value (cost of $273,385,065 and $144,622,108, respectively) | 246,541,176 | 139,249,430 | ||||||
| Cash | — | 271 | ||||||
| Foreign currency holdings, at value (cost of $329,517 and $14,076, respectively) | 329,259 | 14,041 | ||||||
| Deposits with broker for futures contracts | 40,000 | 40,000 | ||||||
| Receivable for investments sold | 2,112 | — | ||||||
| Receivable for capital shares sold | 585,421 | 674,249 | ||||||
| Dividends and interest receivable | 1,246,771 | 461,007 | ||||||
| Securities lending receivable | 19,883 | 8,463 | ||||||
| 248,764,622 | 140,447,461 | |||||||
| Liabilities | ||||||||
| Payable for collateral received for securities on loan | 4,524,997 | 7,033,882 | ||||||
| Payable for investments purchased | 223,855 | 662,169 | ||||||
| Payable for capital shares redeemed | 1,690,103 | 4,495 | ||||||
| Payable for variation margin on futures contracts | 6,200 | 6,200 | ||||||
| Accrued management fees | 67,406 | 24,245 | ||||||
| Accrued foreign taxes | 637,221 | — | ||||||
| 7,149,782 | 7,730,991 | |||||||
| Net Assets | $ | 241,614,840 | $ | 132,716,470 | ||||
| Net Assets Consist of: | ||||||||
| Capital paid in | $ | 267,459,529 | $ | 136,689,226 | ||||
| Distributable earnings | (25,844,689) | (3,972,756) | ||||||
| $ | 241,614,840 | $ | 132,716,470 | |||||
| Fund/Class | Net Assets | Shares Outstanding | Net Asset Value Per Share | ||||||||
| Avantis Emerging Markets Equity Fund | |||||||||||
| Institutional Class | $238,857,723 | 23,074,657 | $10.35 | ||||||||
| G Class | $2,757,117 | 265,630 | $10.38 | ||||||||
| Avantis International Equity Fund | |||||||||||
| Institutional Class | $122,849,895 | 12,537,801 | $9.80 | ||||||||
| G Class | $9,866,575 | 1,005,352 | $9.81 | ||||||||
See Notes to Financial Statements.
166
| AUGUST 31, 2022 | |||||
| Avantis International Small Cap Value Fund | |||||
| Assets | |||||
| Investment securities, at value (cost of $160,452,560) — including $14,127,401 of securities on loan | $ | 151,288,594 | |||
| Investment made with cash collateral received for securities on loan, at value (cost of $7,792,439) | 7,792,439 | ||||
| Total investment securities, at value (cost of $168,244,999) | 159,081,033 | ||||
| Foreign currency holdings, at value (cost of $14,999) | 14,960 | ||||
| Deposits with broker for futures contracts | 49,500 | ||||
| Receivable for investments sold | 5,571 | ||||
| Receivable for capital shares sold | 499,699 | ||||
| Dividends and interest receivable | 536,069 | ||||
| Securities lending receivable | 11,957 | ||||
| 160,198,789 | |||||
| Liabilities | |||||
| Payable for collateral received for securities on loan | 7,792,439 | ||||
| Payable for investments purchased | 490,504 | ||||
| Payable for capital shares redeemed | 44,583 | ||||
| Payable for variation margin on futures contracts | 5,265 | ||||
| Accrued management fees | 47,998 | ||||
| 8,380,789 | |||||
| Net Assets | $ | 151,818,000 | |||
| Net Assets Consist of: | |||||
| Capital paid in | $ | 160,049,758 | |||
| Distributable earnings | (8,231,758) | ||||
| $ | 151,818,000 | ||||
| Fund/Class | Net Assets | Shares Outstanding | Net Asset Value Per Share | ||||||||
| Avantis International Small Cap Value Fund | |||||||||||
| Institutional Class | $151,812,544 | 14,835,451 | $10.23 | ||||||||
| G Class | $5,456 | 532 | $10.26 | ||||||||
See Notes to Financial Statements.
167
| Statements of Operations | ||
| YEAR ENDED AUGUST 31, 2022 | ||||||||
| Avantis Emerging Markets Equity Fund | Avantis International Equity Fund | |||||||
| Investment Income (Loss) | ||||||||
| Income: | ||||||||
| Dividends (net of foreign taxes withheld of $1,019,949 and $367,632, respectively) | $ | 7,648,022 | $ | 3,624,659 | ||||
| Securities lending, net | 124,862 | 68,596 | ||||||
| Interest | 11,121 | 8,255 | ||||||
| 7,784,005 | 3,701,510 | |||||||
| Expenses: | ||||||||
| Management fees | 616,547 | 240,186 | ||||||
| Other expenses | 1,258 | 840 | ||||||
| 617,805 | 241,026 | |||||||
| Fees waived - G Class | (4,771) | (12,312) | ||||||
| 613,034 | 228,714 | |||||||
| Net investment income (loss) | 7,170,971 | 3,472,796 | ||||||
| Realized and Unrealized Gain (Loss) | ||||||||
| Net realized gain (loss) on: | ||||||||
| Investment transactions (net of foreign tax expenses paid (refunded) of $1,334 and $—, respectively) | (2,559,739) | (729,774) | ||||||
| Futures contract transactions | (177,628) | (71,245) | ||||||
| Foreign currency translation transactions | (138,837) | (12,945) | ||||||
| (2,876,204) | (813,964) | |||||||
| Change in net unrealized appreciation (depreciation) on: | ||||||||
| Investments (includes (increase) decrease in accrued foreign taxes of $(77,088) and $—, respectively) | (47,726,750) | (25,931,588) | ||||||
| Futures contracts | (31,748) | (24,186) | ||||||
| Translation of assets and liabilities in foreign currencies | (10,295) | (12,665) | ||||||
| (47,768,793) | (25,968,439) | |||||||
| Net realized and unrealized gain (loss) | (50,644,997) | (26,782,403) | ||||||
| Net Increase (Decrease) in Net Assets Resulting from Operations | $ | (43,474,026) | $ | (23,309,607) | ||||
See Notes to Financial Statements.
168
| YEAR ENDED AUGUST 31, 2022 | |||||
| Avantis International Small Cap Value Fund | |||||
| Investment Income (Loss) | |||||
| Income: | |||||
| Dividends (net of foreign taxes withheld of $512,297) | $ | 5,473,032 | |||
| Securities lending, net | 128,131 | ||||
| Interest | 7,085 | ||||
| 5,608,248 | |||||
| Expenses: | |||||
| Management fees | 550,281 | ||||
| Other expenses | 6,577 | ||||
| 556,858 | |||||
| Fees waived - G Class | (22) | ||||
| 556,836 | |||||
| Net investment income (loss) | 5,051,412 | ||||
| Realized and Unrealized Gain (Loss) | |||||
| Net realized gain (loss) on: | |||||
| Investment transactions | (1,215,543) | ||||
| Futures contract transactions | (248,694) | ||||
| Foreign currency translation transactions | (92,163) | ||||
| (1,556,400) | |||||
| Change in net unrealized appreciation (depreciation) on: | |||||
| Investments | (31,397,309) | ||||
| Futures contracts | 79,169 | ||||
| Translation of assets and liabilities in foreign currencies | (19,733) | ||||
| (31,337,873) | |||||
| Net realized and unrealized gain (loss) | (32,894,273) | ||||
| Net Increase (Decrease) in Net Assets Resulting from Operations | $ | (27,842,861) | |||
See Notes to Financial Statements.
169
| Statements of Changes in Net Assets | ||
| YEARS ENDED AUGUST 31, 2022 AND AUGUST 31, 2021 | ||||||||||||||
| Avantis Emerging Markets Equity Fund | Avantis International Equity Fund | |||||||||||||
| Increase (Decrease) in Net Assets | August 31, 2022 | August 31, 2021 | August 31, 2022 | August 31, 2021 | ||||||||||
| Operations | ||||||||||||||
| Net investment income (loss) | $ | 7,170,971 | $ | 1,975,710 | $ | 3,472,796 | $ | 1,485,331 | ||||||
| Net realized gain (loss) | (2,876,204) | (443,772) | (813,964) | 890,582 | ||||||||||
| Change in net unrealized appreciation (depreciation) | (47,768,793) | 15,145,633 | (25,968,439) | 13,410,567 | ||||||||||
| Net increase (decrease) in net assets resulting from operations | (43,474,026) | 16,677,571 | (23,309,607) | 15,786,480 | ||||||||||
| Distributions to Shareholders | ||||||||||||||
| From earnings: | ||||||||||||||
| Institutional Class | (3,595,649) | (961,367) | (3,058,961) | (945,667) | ||||||||||
| G Class | (5,179) | — | (34,017) | — | ||||||||||
| Decrease in net assets from distributions | (3,600,828) | (961,367) | (3,092,978) | (945,667) | ||||||||||
| Capital Share Transactions | ||||||||||||||
| Net increase (decrease) in net assets from capital share transactions (Note 5) | 169,634,805 | 66,800,095 | 81,040,548 | 12,339,585 | ||||||||||
| Net increase (decrease) in net assets | 122,559,951 | 82,516,299 | 54,637,963 | 27,180,398 | ||||||||||
| Net Assets | ||||||||||||||
| Beginning of period | 119,054,889 | 36,538,590 | 78,078,507 | 50,898,109 | ||||||||||
| End of period | $ | 241,614,840 | $ | 119,054,889 | $ | 132,716,470 | $ | 78,078,507 | ||||||
See Notes to Financial Statements.
170
| YEARS ENDED AUGUST 31, 2022 AND AUGUST 31, 2021 | ||||||||
| Avantis International Small Cap Value Fund | ||||||||
| Increase (Decrease) in Net Assets | August 31, 2022 | August 31, 2021 | ||||||
| Operations | ||||||||
| Net investment income (loss) | $ | 5,051,412 | $ | 1,990,491 | ||||
| Net realized gain (loss) | (1,556,400) | 3,293,883 | ||||||
| Change in net unrealized appreciation (depreciation) | (31,337,873) | 18,343,811 | ||||||
| Net increase (decrease) in net assets resulting from operations | (27,842,861) | 23,628,185 | ||||||
| Distributions to Shareholders | ||||||||
| From earnings: | ||||||||
| Institutional Class | (7,085,204) | (742,081) | ||||||
| G Class | (282) | — | ||||||
| Decrease in net assets from distributions | (7,085,486) | (742,081) | ||||||
| Capital Share Transactions | ||||||||
| Net increase (decrease) in net assets from capital share transactions (Note 5) | 55,037,524 | 66,559,222 | ||||||
| Net increase (decrease) in net assets | 20,109,177 | 89,445,326 | ||||||
| Net Assets | ||||||||
| Beginning of period | 131,708,823 | 42,263,497 | ||||||
| End of period | $ | 151,818,000 | $ | 131,708,823 | ||||
See Notes to Financial Statements.
171
| Notes to Financial Statements | ||
AUGUST 31, 2022
1. Organization
American Century ETF Trust (the trust) was registered as a Delaware statutory trust in 2017 and is registered under the Investment Company Act of 1940, as amended (the 1940 Act), as an open-end management investment company. Avantis Emerging Markets Equity Fund, Avantis International Equity Fund and Avantis International Small Cap Value Fund (collectively, the funds) are three funds in a series issued by the trust. Each of the funds' investment objective is to seek long-term capital appreciation. The funds offer the Institutional Class and G Class. The G Class of each fund commenced sale on January 20, 2021.
2. Significant Accounting Policies
The following is a summary of significant accounting policies consistently followed by the funds in preparation of their financial statements. Each fund is an investment company and follows accounting and reporting guidance in accordance with accounting principles generally accepted in the United States of America. This may require management to make certain estimates and assumptions at the date of the financial statements. Actual results could differ from these estimates. Management evaluated the impact of events or transactions occurring through the date the financial statements were issued that would merit recognition or disclosure.
Investment Valuations — The funds determine the fair value of their investments and compute their net asset value (NAV) per share at the close of regular trading (usually 4 p.m. Eastern time) on the New York Stock Exchange (NYSE) on each day the NYSE is open. The Board of Trustees has adopted valuation policies and procedures to guide the investment advisor in the funds' investment valuation process and to provide methodologies for the oversight of the funds' pricing function.
Equity securities that are listed or traded on a domestic securities exchange are valued at the last reported sales price or at the official closing price as provided by the exchange. Equity securities traded on foreign securities exchanges are generally valued at the closing price of such securities on the exchange where primarily traded or at the close of the NYSE, if that is earlier. If no last sales price is reported, or if local convention or regulation so provides, the mean of the latest bid and asked prices may be used. Securities traded over-the-counter are valued at the mean of the latest bid and asked prices, the last sales price, or the official closing price. Equity securities initially expressed in local currencies are translated into U.S. dollars at the mean of the appropriate currency exchange rate at the close of the NYSE as provided by an independent pricing service.
Fixed income securities are valued at the evaluated mean as provided by independent pricing services or at the mean of the most recent bid and asked prices as provided by investment dealers. Corporate bonds are valued using market models that consider trade data, quotations from dealers and active market makers, relevant yield curve and spread data, creditworthiness, trade data or market information on comparable securities, and other relevant security specific information. Fixed income securities initially expressed in local currencies are translated into U.S. dollars at the mean of the appropriate currency exchange rate at the close of the NYSE as provided by an independent pricing service.
Open-end management investment companies are valued at the reported NAV per share. Exchange-traded futures contracts are valued at the settlement price as provided by the appropriate exchange.
If the funds determine that the market price for an investment is not readily available or the valuation methods mentioned above do not reflect an investment’s fair value, such investment is valued as determined in good faith by the Board of Trustees or its delegate, in accordance with policies and procedures adopted by the Board of Trustees. In its determination of fair value, the funds may review several factors including, but not limited to, market information regarding the specific investment or comparable investments and correlation with other investment types, futures indices or general market indicators. Circumstances that may cause the funds to use these procedures to value an investment include, but are not limited to: an investment has been declared in default or is distressed; trading in a security has been suspended during the trading day or a security is not actively trading on its principal exchange; prices received from a regular pricing source are deemed unreliable; or there is a foreign market holiday and no trading occurred.
172
The funds monitor for significant events occurring after the close of an investment’s primary exchange but before each fund’s NAV per share is determined. Significant events may include, but are not limited to: corporate announcements and transactions; governmental action and political unrest that could impact a specific investment or an investment sector; or armed conflicts, natural disasters and similar events that could affect investments in a specific country or region. The funds also monitor for significant fluctuations between domestic and foreign markets, as evidenced by the U.S. market or such other indicators that the Board of Trustees, or its delegate, deems appropriate. The funds may apply a model-derived factor to the closing price of equity securities traded on foreign securities exchanges. The factor is based on observable market data as provided by an independent pricing service.
Security Transactions — Security transactions are accounted for as of the trade date. Net realized gains and losses are determined on the identified cost basis, which is also used for federal income tax purposes. Certain countries impose taxes on realized gains on the sale of securities registered in their country. The funds record the foreign tax expense, if any, on an accrual basis. The foreign tax expense on realized gains and unrealized appreciation reduces the net realized gain (loss) on investment transactions and net unrealized appreciation (depreciation) on investments, respectively.
Investment Income — Dividend income less foreign taxes withheld, if any, is recorded as of the ex-dividend date. Distributions received on securities that represent a return of capital or long-term capital gain are recorded as a reduction of cost of investments and/or as a realized gain. The funds may estimate the components of distributions received that may be considered nontaxable distributions or long-term capital gain distributions for income tax purposes. Interest income is recorded on the accrual basis and includes accretion of discounts and amortization of premiums. Securities lending income is net of fees and rebates earned by the lending agent for its services.
Foreign Currency Translations — All assets and liabilities initially expressed in foreign currencies are translated into U.S. dollars at prevailing exchange rates at period end. The funds may enter into spot foreign currency exchange contracts to facilitate transactions denominated in a foreign currency. Purchases and sales of investment securities, dividend and interest income, spot foreign currency exchange contracts, and expenses are translated at the rates of exchange prevailing on the respective dates of such transactions. Net realized and unrealized foreign currency exchange gains or losses related to investment securities are a component of net realized gain (loss) on investment transactions and change in net unrealized appreciation (depreciation) on investments, respectively.
Segregated Assets — In accordance with the 1940 Act, the funds segregate assets on their books and records to cover certain types of investment securities and other financial instruments. American Century Investment Management, Inc. (ACIM) (the investment advisor) monitors, on a daily basis, the securities segregated to ensure the funds designate a sufficient amount of liquid assets, marked-to-market daily. The funds may also receive assets or be required to pledge assets at the custodian bank or with a broker for collateral requirements.
Income Tax Status — It is each fund’s policy to distribute substantially all net investment income and net realized gains to shareholders and to otherwise qualify as a regulated investment company under provisions of the Internal Revenue Code. Accordingly, no provision has been made for income taxes. The funds file U.S. federal, state, local and non-U.S. tax returns as applicable. The funds' tax returns are subject to examination by the relevant taxing authority until expiration of the applicable statute of limitations, which is generally three years from the date of filing but can be longer in certain jurisdictions. At this time, management believes there are no uncertain tax positions which, based on their technical merit, would not be sustained upon examination and for which it is reasonably possible that the total amounts of unrecognized tax benefits will significantly change in the next twelve months.
Multiple Class — All shares of each fund represent an equal pro rata interest in the net assets of the class to which such shares belong, and have identical voting, dividend, liquidation and other rights and the same terms and conditions, except for class specific expenses and exclusive rights to vote on matters affecting only individual classes. Income, non-class specific expenses, and realized and unrealized capital gains and losses of the funds are allocated to each class of shares based on their relative net assets.
Distributions to Shareholders — Distributions from net investment income and net realized gains, if any, are generally declared and paid annually. Each fund may elect to treat a portion of its payment to a redeeming shareholder, which represents the pro rata share of undistributed net investment income and net realized gains, as a distribution for federal income tax purposes (tax equalization).
173
Indemnifications — Under the trust’s organizational documents, its officers and trustees are indemnified against certain liabilities arising out of the performance of their duties to the funds. In addition, in the normal course of business, the funds enter into contracts that provide general indemnifications. The maximum exposure under these arrangements is unknown as this would involve future claims that may be made against a fund. The risk of material loss from such claims is considered by management to be remote.
Securities Lending — Securities are lent to qualified financial institutions and brokers. State Street Bank & Trust Co. serves as securities lending agent to the funds pursuant to a Securities Lending Agreement. The lending of securities exposes the funds to risks such as: the borrowers may fail to return the loaned securities, the borrowers may not be able to provide additional collateral, the funds may experience delays in recovery of the loaned securities or delays in access to collateral, or the funds may experience losses related to the investment collateral. To minimize certain risks, loan counterparties pledge collateral in the form of cash and/or securities. The lending agent has agreed to indemnify the funds in the case of default of any securities borrowed. Cash collateral received is invested in the State Street Navigator Securities Lending Government Money Market Portfolio, a money market mutual fund registered under the 1940 Act. The loans may also be secured by U.S. government securities in an amount at least equal to the market value of the securities loaned, plus accrued interest and dividends, determined on a daily basis and adjusted accordingly. By lending securities, the funds seek to increase their net investment income through the receipt of interest and fees. Such income is reflected separately within the Statements of Operations. The value of loaned securities and related collateral outstanding at period end, if any, are shown on a gross basis within the Schedules of Investments and Statements of Assets and Liabilities.
The following table reflects a breakdown of transactions accounted for as secured borrowings, the gross obligation by the type of collateral pledged, and the remaining contractual maturity of those transactions as of August 31, 2022.
| Remaining Contractual Maturity of Agreements | |||||||||||||||||
Fund / Securities Lending Transactions(1) | Overnight and Continuous | <30 days | Between 30 & 90 days | >90 days | Total | ||||||||||||
| Avantis Emerging Markets Equity Fund | |||||||||||||||||
| Common Stocks | $ | 4,524,997 | — | — | — | $ | 4,524,997 | ||||||||||
| Gross amount of recognized liabilities for securities lending transactions | $ | 4,524,997 | |||||||||||||||
| Avantis International Equity Fund | |||||||||||||||||
| Common Stocks | $ | 7,033,879 | — | — | — | $ | 7,033,879 | ||||||||||
| Warrants | 3 | — | — | — | 3 | ||||||||||||
| Total Borrowings | $ | 7,033,882 | — | — | — | $ | 7,033,882 | ||||||||||
| Gross amount of recognized liabilities for securities lending transactions | $ | 7,033,882 | |||||||||||||||
| Avantis International Small Cap Value Fund | |||||||||||||||||
| Common Stocks | $ | 7,782,625 | — | — | — | $ | 7,782,625 | ||||||||||
| Warrants | 9,814 | — | — | — | 9,814 | ||||||||||||
| Total Borrowings | $ | 7,792,439 | — | — | — | $ | 7,792,439 | ||||||||||
| Gross amount of recognized liabilities for securities lending transactions | $ | 7,792,439 | |||||||||||||||
(1)Amount represents the payable for cash collateral received for securities on loan. This will generally be in the Overnight and Continuous column as the securities are typically callable on demand.
3. Fees and Transactions with Related Parties
Certain officers and trustees of the trust are also officers and/or directors of American Century Companies, Inc. (ACC). The trust's investment advisor, ACIM, the funds' distributor, American Century Investment Services, Inc., and the trust’s transfer agent, American Century Services, LLC, are wholly owned, directly or indirectly, by ACC. Various funds issued by American Century Asset Allocation Portfolios, Inc. own, in aggregate, 7% of the shares of Avantis International Equity Fund.
174
Management Fees — The trust has entered into a management agreement with ACIM, under which ACIM provides the funds with investment advisory and management services in exchange for a single, unified management fee (the fee) per class. The agreement provides that ACIM will pay all expenses of managing and operating the funds, except brokerage and other transaction fees and expenses relating to the acquisition and disposition of portfolio securities, acquired fund fees and expenses, interest, taxes, litigation expenses and extraordinary expenses. The fee is computed and accrued daily based on each class's daily net assets and paid monthly in arrears. The investment advisor agreed to waive each fund's G Class management fee in its entirety. The investment advisor expects this waiver to remain in effect permanently and cannot terminate it without the approval of the Board of Trustees.
For the period ended August 31, 2022, the annual management fee for the Institutional Class and the annual management fee before and after waiver for G Class for each fund are as follows:
| Annual Management Fee | |||||||||||
| Institutional Class | G Class Before Waiver | G Class After Waiver | |||||||||
| Avantis Emerging Markets Equity Fund | 0.33% | 0.33% | 0.00% | ||||||||
| Avantis International Equity Fund | 0.23% | 0.23% | 0.00% | ||||||||
| Avantis International Small Cap Value Fund | 0.36% | 0.36% | 0.00% | ||||||||
Interfund Transactions — The funds may enter into security transactions with other American Century Investments funds and other client accounts of the investment advisor, in accordance with the 1940 Act rules and procedures adopted by the Board of Trustees. The rules and procedures require, among other things, that these transactions be effected at the independent current market price of the security. There were no interfund transactions during the period.
4. Investment Transactions
Purchases and sales of investment securities, excluding short-term investments, for the period ended August 31, 2022 were as follows:
| Avantis Emerging Markets Equity Fund | Avantis International Equity Fund | Avantis International Small Cap Value Fund | |||||||||
| Purchases | $179,340,686 | $86,820,428 | $119,595,316 | ||||||||
| Sales | $6,936,372 | $5,725,229 | $65,356,116 | ||||||||
175
5. Capital Share Transactions
Transactions in shares of the funds were as follows (unlimited number of shares authorized):
| Year ended August 31, 2022 | Year ended August 31, 2021(1) | |||||||||||||
| Shares | Amount | Shares | Amount | |||||||||||
| Avantis Emerging Markets Equity Fund | ||||||||||||||
| Institutional Class | ||||||||||||||
| Sold | 18,214,805 | $ | 211,886,239 | 7,036,283 | $ | 85,129,263 | ||||||||
| Issued in reinvestment of distributions | 279,932 | 3,518,747 | 82,168 | 961,367 | ||||||||||
| Redeemed | (4,326,978) | (48,726,237) | (1,750,431) | (19,477,229) | ||||||||||
| 14,167,759 | 166,678,749 | 5,368,020 | 66,613,401 | |||||||||||
| G Class | ||||||||||||||
| Sold | 262,509 | 3,085,435 | 15,109 | 200,031 | ||||||||||
| Issued in reinvestment of distributions | 412 | 5,179 | — | — | ||||||||||
| Redeemed | (11,386) | (134,558) | (1,014) | (13,337) | ||||||||||
| 251,535 | 2,956,056 | 14,095 | 186,694 | |||||||||||
| Net increase (decrease) | 14,419,294 | $ | 169,634,805 | 5,382,115 | $ | 66,800,095 | ||||||||
| Avantis International Equity Fund | ||||||||||||||
| Institutional Class | ||||||||||||||
| Sold | 9,727,575 | $ | 106,017,213 | 2,528,683 | $ | 28,162,838 | ||||||||
| Issued in reinvestment of distributions | 257,056 | 3,058,961 | 88,298 | 945,667 | ||||||||||
| Redeemed | (3,637,313) | (38,696,269) | (1,631,782) | (17,402,937) | ||||||||||
| 6,347,318 | 70,379,905 | 985,199 | 11,705,568 | |||||||||||
| G Class | ||||||||||||||
| Sold | 1,026,201 | 11,458,538 | 56,777 | 687,665 | ||||||||||
| Issued in reinvestment of distributions | 2,861 | 34,017 | — | — | ||||||||||
| Redeemed | (76,106) | (831,912) | (4,381) | (53,648) | ||||||||||
| 952,956 | 10,660,643 | 52,396 | 634,017 | |||||||||||
| Net increase (decrease) | 7,300,274 | $ | 81,040,548 | 1,037,595 | $ | 12,339,585 | ||||||||
| Avantis International Small Cap Value Fund | ||||||||||||||
| Institutional Class | ||||||||||||||
| Sold | 9,036,277 | $ | 105,208,521 | 7,205,043 | $ | 81,466,015 | ||||||||
| Issued in reinvestment of distributions | 594,896 | 7,085,204 | 70,473 | 742,081 | ||||||||||
| Redeemed | (5,127,997) | (57,256,483) | (1,478,397) | (15,654,623) | ||||||||||
| 4,503,176 | 55,037,242 | 5,797,119 | 66,553,473 | |||||||||||
| G Class | ||||||||||||||
| Sold | — | — | 508 | 5,749 | ||||||||||
| Issued in reinvestment of distributions | 24 | 282 | — | — | ||||||||||
| 24 | 282 | 508 | 5,749 | |||||||||||
| Net increase (decrease) | 4,503,200 | $ | 55,037,524 | 5,797,627 | $ | 66,559,222 | ||||||||
(1)January 20, 2021 (commencement of sale) through August 31, 2021 for the G Class.
176
6. Fair Value Measurements
The funds’ investment valuation process is based on several considerations and may use multiple inputs to determine the fair value of the investments held by the funds. In conformity with accounting principles generally accepted in the United States of America, the inputs used to determine a valuation are classified into three broad levels.
•Level 1 valuation inputs consist of unadjusted quoted prices in an active market for identical investments.
•Level 2 valuation inputs consist of direct or indirect observable market data (including quoted prices for comparable investments, evaluations of subsequent market events, interest rates, prepayment speeds, credit risk, etc.). These inputs also consist of quoted prices for identical investments initially expressed in local currencies that are adjusted through translation into U.S. dollars.
•Level 3 valuation inputs consist of unobservable data (including a fund’s own assumptions).
The level classification is based on the lowest level input that is significant to the fair valuation measurement. The valuation inputs are not necessarily an indication of the risks associated with investing in these securities or other financial instruments.
The following is a summary of the level classifications as of period end. The Schedules of Investments provide additional information on the funds’ portfolio holdings.
| Avantis Emerging Markets Equity Fund | |||||||||||
| Level 1 | Level 2 | Level 3 | |||||||||
| Assets | |||||||||||
| Investment Securities | |||||||||||
| Common Stocks | |||||||||||
| Brazil | $ | 7,647,924 | $ | 7,419,154 | — | ||||||
| Chile | 451,521 | 1,182,111 | — | ||||||||
| China | 18,494,646 | 50,771,706 | — | ||||||||
| Colombia | 168,655 | 254,474 | — | ||||||||
| India | 3,418,428 | 38,568,324 | — | ||||||||
| Indonesia | 459,800 | 5,104,363 | — | ||||||||
| Mexico | 1,774,265 | 3,739,047 | — | ||||||||
| Peru | 528,836 | — | — | ||||||||
| Philippines | 129,202 | 2,011,081 | — | ||||||||
| Russia | — | 640 | — | ||||||||
| South Africa | 1,458,011 | 8,038,112 | — | ||||||||
| South Korea | 2,347,126 | 29,557,927 | — | ||||||||
| Taiwan | 8,026,130 | 33,407,222 | — | ||||||||
| Turkey | 32,824 | 1,235,031 | — | ||||||||
| Other Countries | — | 14,015,209 | — | ||||||||
| Warrants | — | 3,853 | — | ||||||||
| Corporate Bonds | — | 387 | — | ||||||||
| Rights | — | 257 | — | ||||||||
| Short-Term Investments | 6,294,910 | — | — | ||||||||
| $ | 51,232,278 | $ | 195,308,898 | — | |||||||
| Other Financial Instruments | |||||||||||
| Futures Contracts | $ | 29,593 | — | — | |||||||
177
| Avantis International Equity Fund | |||||||||||
| Level 1 | Level 2 | Level 3 | |||||||||
| Assets | |||||||||||
| Investment Securities | |||||||||||
| Common Stocks | |||||||||||
| Australia | $ | 1,121,403 | $ | 8,830,224 | — | ||||||
| Belgium | 247,220 | 941,425 | — | ||||||||
| Canada | 85,904 | 14,809,801 | — | ||||||||
| Denmark | 1,328,089 | 1,700,721 | — | ||||||||
| Finland | 121,937 | 1,127,762 | — | ||||||||
| France | 2,103,746 | 9,566,534 | — | ||||||||
| Germany | 438,319 | 7,710,780 | — | ||||||||
| Hong Kong | 108,544 | 3,248,571 | — | ||||||||
| Israel | 257,137 | 1,165,589 | — | ||||||||
| Italy | 186,184 | 2,491,309 | — | ||||||||
| Japan | 2,196,284 | 25,558,251 | — | ||||||||
| Netherlands | 1,720,020 | 2,776,648 | — | ||||||||
| Norway | 287,261 | 980,417 | — | ||||||||
| Singapore | 63,442 | 1,877,839 | — | ||||||||
| Spain | 541,470 | 2,055,446 | — | ||||||||
| Sweden | 183,433 | 4,137,483 | — | ||||||||
| Switzerland | 2,398,309 | 8,694,718 | — | ||||||||
| United Kingdom | 7,881,906 | 10,033,186 | — | ||||||||
| United States | 3,300 | 22,175 | — | ||||||||
| Other Countries | — | 1,723,848 | — | ||||||||
| Rights | — | 422 | — | ||||||||
| Warrants | — | 38 | — | ||||||||
| Short-Term Investments | 8,522,335 | — | — | ||||||||
| $ | 29,796,243 | $ | 109,453,187 | — | |||||||
| Other Financial Instruments | |||||||||||
| Futures Contracts | $ | 18,394 | — | — | |||||||
| Avantis International Small Cap Value Fund | |||||||||||
| Level 1 | Level 2 | Level 3 | |||||||||
| Assets | |||||||||||
| Investment Securities | |||||||||||
| Common Stocks | $ | 689,358 | $ | 149,036,607 | — | ||||||
| Warrants | — | 9,438 | — | ||||||||
| Rights | — | 104 | — | ||||||||
| Short-Term Investments | 9,345,526 | — | — | ||||||||
| $ | 10,034,884 | $ | 149,046,149 | — | |||||||
| Other Financial Instruments | |||||||||||
| Futures Contracts | $ | 58,316 | — | — | |||||||
178
7. Derivative Instruments
Equity Price Risk — The funds are subject to equity price risk in the normal course of pursuing its investment objectives. A fund may enter into futures contracts based on an equity index in order to manage its exposure to changes in market conditions. A fund may purchase futures contracts to gain exposure to increases in market value or sell futures contracts to protect against a decline in market value. Upon entering into a futures contract, a fund is required to deposit either cash or securities in an amount equal to a certain percentage of the contract value (initial margin). Subsequent payments (variation margin) are made or received daily, in cash, by a fund. The variation margin is equal to the daily change in the contract value and is recorded as unrealized gains and losses. A fund recognizes a realized gain or loss when the contract is closed or expires. Net realized and unrealized gains or losses occurring during the holding period of futures contracts are a component of net realized gain (loss) on futures contract transactions and change in net unrealized appreciation (depreciation) on futures contracts, respectively. One of the risks of entering into futures contracts is the possibility that the change in value of the contract may not correlate with the changes in value of the underlying securities.
The funds' average notional exposure to equity price risk derivative instruments held during the period were as follows:
| Futures Contracts Purchased | |||||
| Avantis Emerging Markets Equity Fund | $792,799 | ||||
| Avantis International Equity Fund | $633,428 | ||||
| Avantis International Small Cap Value Fund | $725,668 | ||||
Value of Derivative Instruments as of August 31, 2022
| Asset Derivatives | Liability Derivatives | |||||||||||||
| Fund / Type of Risk Exposure | Location on Statement of Assets and Liabilities | Value | Location on Statement of Assets and Liabilities | Value | ||||||||||
| Avantis Emerging Markets Equity Fund | ||||||||||||||
| Equity Price Risk | Receivable for variation margin on futures contracts* | — | Payable for variation margin on futures contracts* | $ | 6,200 | |||||||||
| Avantis International Equity Fund | ||||||||||||||
| Equity Price Risk | Receivable for variation margin on futures contracts* | — | Payable for variation margin on futures contracts* | $ | 6,200 | |||||||||
| Avantis International Small Cap Value Fund | ||||||||||||||
| Equity Price Risk | Receivable for variation margin on futures contracts* | — | Payable for variation margin on futures contracts* | $ | 5,265 | |||||||||
*Included in the unrealized appreciation (depreciation) on futures contracts, as reported in the Schedule of Investments.
179
Effect of Derivative Instruments on the Statement of Operations for the Year Ended August 31, 2022
| Net Realized Gain (Loss) | Change in Net Unrealized Appreciation (Depreciation) | |||||||||||||
| Fund / Type of Risk Exposure | Location on Statement of Operations | Value | Location on Statement of Operations | Value | ||||||||||
| Avantis Emerging Markets Equity Fund | ||||||||||||||
| Equity Price Risk | Net realized gain (loss) on futures contract transactions | $ | (177,628) | Change in net unrealized appreciation (depreciation) on futures contracts | $ | (31,748) | ||||||||
| Avantis International Equity Fund | ||||||||||||||
| Equity Price Risk | Net realized gain (loss) on futures contract transactions | $ | (71,245) | Change in net unrealized appreciation (depreciation) on futures contracts | $ | (24,186) | ||||||||
| Avantis International Small Cap Value Fund | ||||||||||||||
| Equity Price Risk | Net realized gain (loss) on futures contract transactions | $ | (248,694) | Change in net unrealized appreciation (depreciation) on futures contracts | $ | 79,169 | ||||||||
8. Risk Factors
The value of the funds’ shares will go up and down, sometimes rapidly or unpredictably, based on the performance of the securities owned by the funds and other factors generally affecting the securities market. Market risks, including political, regulatory, economic and social developments, can affect the value of the funds’ investments. Natural disasters, public health emergencies, war, terrorism and other unforeseeable events may lead to increased market volatility and may have adverse long-term effects on world economies and markets generally.
There are certain risks involved in investing in foreign securities. These risks include those resulting from political events (such as civil unrest, national elections and imposition of exchange controls), social and economic events (such as labor strikes and rising inflation), and natural disasters. Securities of foreign issuers may be less liquid and more volatile. Investing in emerging markets or a significant portion of assets in one country or region may accentuate these risks.
Avantis International Small Cap Value Fund invests in common stocks of small companies. Because of this, the fund may be subject to greater risk and market fluctuations than funds investing in larger, more established companies.
9. Federal Tax Information
The tax character of distributions paid during the years ended August 31, 2022 and August 31, 2021 were as follows:
| 2022 | 2021 | |||||||||||||
| Distributions Paid From: | Distributions Paid From: | |||||||||||||
| Ordinary Income | Long-term Capital Gains | Ordinary Income | Long-term Capital Gains | |||||||||||
| Avantis Emerging Markets Equity Fund | $ | 3,600,828 | — | $ | 961,367 | — | ||||||||
| Avantis International Equity Fund | $ | 2,458,445 | $ | 634,533 | $ | 945,667 | — | |||||||
| Avantis International Small Cap Value Fund | $ | 6,421,133 | $ | 664,353 | $ | 742,081 | — | |||||||
180
The book-basis character of distributions made during the year from net investment income or net realized gains may differ from their ultimate characterization for federal income tax purposes. These differences reflect the differing character of certain income items and net realized gains and losses for financial statement and tax purposes, and may result in reclassification among certain capital accounts on the financial statements.
As of period end, the federal tax cost of investments and the components of distributable earnings on a tax-basis were as follows:
| Avantis Emerging Markets Equity Fund | Avantis International Equity Fund | Avantis International Small Cap Value Fund | |||||||||
| Federal tax cost of investments | $ | 274,461,687 | $ | 145,038,273 | $ | 169,437,802 | |||||
| Gross tax appreciation of investments | $ | 14,228,120 | $ | 8,393,373 | $ | 13,929,781 | |||||
| Gross tax depreciation of investments | (42,148,631) | (14,182,216) | (24,286,550) | ||||||||
| Net tax appreciation (depreciation) of investments | (27,920,511) | (5,788,843) | (10,356,769) | ||||||||
| Net tax appreciation (depreciation) on derivatives and translation of assets and liabilities in foreign currencies | (646,975) | (11,989) | (19,538) | ||||||||
| Net tax appreciation (depreciation) | $ | (28,567,486) | $ | (5,800,832) | $ | (10,376,307) | |||||
| Undistributed ordinary income | $ | 5,862,113 | $ | 2,596,074 | $ | 3,809,855 | |||||
| Accumulated short-term capital losses | $ | (1,814,680) | $ | (767,998) | $ | (1,665,306) | |||||
| Accumulated long-term capital losses | $ | (1,324,636) | — | — | |||||||
The difference between book-basis and tax-basis unrealized appreciation (depreciation) is attributable primarily to the realization to ordinary income for tax purposes of unrealized gains on investments in passive foreign investment companies.
Accumulated capital losses represent net capital loss carryovers that may be used to offset future realized capital gains for federal income tax purposes. The capital loss carryovers may be carried forward for an unlimited period. Future capital loss carryover utilization in any given year may be subject to Internal Revenue Code limitations.
181
| Financial Highlights | ||
| For a Share Outstanding Throughout the Years Ended August 31 (except as noted) | |||||||||||||||||||||||||||||||||||||||||
| Per-Share Data | Ratios and Supplemental Data | ||||||||||||||||||||||||||||||||||||||||
| Income From Investment Operations: | Ratio to Average Net Assets of: | ||||||||||||||||||||||||||||||||||||||||
| Net Asset Value, Beginning of Period | Net Investment Income (Loss)(1) | Net Realized and Unrealized Gain (Loss) | Total From Investment Operations | Distributions From Net Investment Income | Net Asset Value, End of Period | Total Return(2) | Operating Expenses | Operating Expenses (before expense waiver) | Net Investment Income (Loss) | Net Investment Income (Loss) (before expense waiver) | Portfolio Turnover Rate | Net Assets, End of Period (in thousands) | |||||||||||||||||||||||||||||
| Avantis Emerging Markets Equity Fund | |||||||||||||||||||||||||||||||||||||||||
| Institutional Class | |||||||||||||||||||||||||||||||||||||||||
| 2022 | $13.35 | 0.44 | (3.20) | (2.76) | (0.24) | $10.35 | (20.98)% | 0.33% | 0.33% | 3.84% | 3.84% | 4% | $238,858 | ||||||||||||||||||||||||||||
| 2021 | $10.32 | 0.29 | 2.93 | 3.22 | (0.19) | $13.35 | 31.29% | 0.33% | 0.33% | 2.29% | 2.29% | 9% | $118,866 | ||||||||||||||||||||||||||||
2020(3) | $10.00 | 0.23 | 0.12 | 0.35 | (0.03) | $10.32 | 3.57% | 0.33%(4) | 0.33%(4) | 3.26%(4) | 3.26%(4) | 4% | $36,539 | ||||||||||||||||||||||||||||
| G Class | |||||||||||||||||||||||||||||||||||||||||
| 2022 | $13.38 | 0.53 | (3.25) | (2.72) | (0.28) | $10.38 | (20.69)% | 0.00%(5) | 0.33% | 4.17% | 3.84% | 4% | $2,757 | ||||||||||||||||||||||||||||
2021(6) | $13.16 | 0.31 | (0.09) | 0.22 | — | $13.38 | 1.67% | 0.00%(4)(5) | 0.33%(4) | 3.75%(4) | 3.42%(4) | 9%(7) | $189 | ||||||||||||||||||||||||||||
| Notes to Financial Highlights | ||
(1)Computed using average shares outstanding throughout the period.
(2)Total returns are calculated based on the net asset value of the last business day. Total returns for periods less than one year are not annualized.
(3)December 4, 2019 (fund inception) through August 31, 2020.
(4)Annualized.
(5)Ratio was less than 0.005%.
(6)January 20, 2021 (commencement of sale) through August 31, 2021.
(7)Portfolio turnover is calculated at the fund level. Percentage indicated was calculated for the year ended August 31, 2021.
See Notes to Financial Statements.
| For a Share Outstanding Throughout the Years Ended August 31 (except as noted) | |||||||||||||||||||||||||||||||||||||||||||||||
| Per-Share Data | Ratios and Supplemental Data | ||||||||||||||||||||||||||||||||||||||||||||||
| Income From Investment Operations: | Distributions From: | Ratio to Average Net Assets of: | |||||||||||||||||||||||||||||||||||||||||||||
| Net Asset Value, Beginning of Period | Net Investment Income (Loss)(1) | Net Realized and Unrealized Gain (Loss) | Total From Investment Operations | Net Investment Income | Net Realized Gains | Total Distributions | Net Asset Value, End of Period | Total Return(2) | Operating Expenses | Operating Expenses (before expense waiver) | Net Investment Income (Loss) | Net Investment Income (Loss) (before expense waiver) | Portfolio Turnover Rate | Net Assets, End of Period (in thousands) | |||||||||||||||||||||||||||||||||
| Avantis International Equity Fund | |||||||||||||||||||||||||||||||||||||||||||||||
| Institutional Class | |||||||||||||||||||||||||||||||||||||||||||||||
| 2022 | $12.51 | 0.37 | (2.66) | (2.29) | (0.30) | (0.12) | (0.42) | $9.80 | (18.92)% | 0.23% | 0.23% | 3.31% | 3.31% | 6% | $122,850 | ||||||||||||||||||||||||||||||||
| 2021 | $9.78 | 0.27 | 2.64 | 2.91 | (0.18) | — | (0.18) | $12.51 | 30.11% | 0.23% | 0.23% | 2.35% | 2.35% | 13% | $77,422 | ||||||||||||||||||||||||||||||||
2020(3) | $10.00 | 0.17 | (0.38) | (0.21) | (0.01) | — | (0.01) | $9.78 | (2.10)% | 0.23%(4) | 0.23%(4) | 2.54%(4) | 2.54%(4) | 2% | $50,898 | ||||||||||||||||||||||||||||||||
| G Class | |||||||||||||||||||||||||||||||||||||||||||||||
| 2022 | $12.52 | 0.44 | (2.71) | (2.27) | (0.32) | (0.12) | (0.44) | $9.81 | (18.72)% | 0.00%(5) | 0.23% | 3.54% | 3.31% | 6% | $9,867 | ||||||||||||||||||||||||||||||||
2021(6) | $11.35 | 0.21 | 0.96 | 1.17 | — | — | — | $12.52 | 10.31% | 0.00%(4)(5) | 0.23%(4) | 2.79%(4) | 2.56%(4) | 13%(7) | $656 | ||||||||||||||||||||||||||||||||
| Notes to Financial Highlights | ||
(1)Computed using average shares outstanding throughout the period.
(2)Total returns are calculated based on the net asset value of the last business day. Total returns for periods less than one year are not annualized.
(3)December 4, 2019 (fund inception) through August 31, 2020.
(4)Annualized.
(5)Ratio was less than 0.005%.
(6)January 20, 2021 (commencement of sale) through August 31, 2021.
(7)Portfolio turnover is calculated at the fund level. Percentage indicated was calculated for the year ended August 31, 2021.
See Notes to Financial Statements.
| For a Share Outstanding Throughout the Years Ended August 31 (except as noted) | |||||||||||||||||||||||||||||||||||||||||||||||
| Per-Share Data | Ratios and Supplemental Data | ||||||||||||||||||||||||||||||||||||||||||||||
| Income From Investment Operations: | Distributions From: | Ratio to Average Net Assets of: | |||||||||||||||||||||||||||||||||||||||||||||
| Net Asset Value, Beginning of Period | Net Investment Income (Loss)(1) | Net Realized and Unrealized Gain (Loss) | Total From Investment Operations | Net Investment Income | Net Realized Gains | Total Distributions | Net Asset Value, End of Period | Total Return(2) | Operating Expenses | Operating Expenses (before expense waiver) | Net Investment Income (Loss) | Net Investment Income (Loss) (before expense waiver) | Portfolio Turnover Rate | Net Assets, End of Period (in thousands) | |||||||||||||||||||||||||||||||||
| Avantis International Small Cap Value Fund | |||||||||||||||||||||||||||||||||||||||||||||||
| Institutional Class | |||||||||||||||||||||||||||||||||||||||||||||||
| 2022 | $12.75 | 0.38 | (2.39) | (2.01) | (0.30) | (0.21) | (0.51) | $10.23 | (16.31)% | 0.36% | 0.36% | 3.31% | 3.31% | 44% | $151,813 | ||||||||||||||||||||||||||||||||
| 2021 | $9.32 | 0.27 | 3.31 | 3.58 | (0.15) | — | — | $12.75 | 38.73% | 0.36% | 0.36% | 2.33% | 2.33% | 34% | $131,702 | ||||||||||||||||||||||||||||||||
2020(3) | $10.00 | 0.14 | (0.78) | (0.64) | (0.04) | — | (0.04) | $9.32 | (6.43)% | 0.36%(4) | 0.36%(4) | 2.18%(4) | 2.18%(4) | 12% | $42,263 | ||||||||||||||||||||||||||||||||
| G Class | |||||||||||||||||||||||||||||||||||||||||||||||
| 2022 | $12.77 | 0.42 | (2.38) | (1.96) | (0.34) | (0.21) | (0.55) | $10.26 | (15.92)% | 0.00%(5) | 0.36% | 3.67% | 3.31% | 44% | $5 | ||||||||||||||||||||||||||||||||
2021(6) | $11.31 | 0.21 | 1.25 | 1.46 | — | — | — | $12.77 | 12.91% | 0.00%(4)(5) | 0.36%(4) | 2.82%(4) | 2.46%(4) | 34%(7) | $6 | ||||||||||||||||||||||||||||||||
| Notes to Financial Highlights | ||
(1)Computed using average shares outstanding throughout the period.
(2)Total returns are calculated based on the net asset value of the last business day. Total returns for periods less than one year are not annualized.
(3)December 4, 2019 (fund inception) through August 31, 2020.
(4)Annualized.
(5)Ratio was less than 0.005%.
(6)January 20, 2021 (commencement of sale) through August 31, 2021.
(7)Portfolio turnover is calculated at the fund level. Percentage indicated was calculated for the year ended August 31, 2021.
See Notes to Financial Statements.
| Report of Independent Registered Public Accounting Firm | ||
To the Shareholders and the Board of Trustees of American Century ETF Trust:
Opinion on the Financial Statements and Financial Highlights
We have audited the accompanying statements of assets and liabilities, including the schedules of investments, of Avantis® Emerging Markets Equity Fund, Avantis® International Equity Fund, and Avantis® International Small Cap Value Fund (the “Funds”), three of the funds constituting the American Century ETF Trust, as of August 31, 2022, the related statements of operations, statements of changes in net assets, and financial highlights for the periods indicated in the table below; and the related notes. In our opinion, the financial statements and financial highlights present fairly, in all material respects, the financial position of each of the Funds constituting American Century ETF Trust as of August 31, 2022, and the results of their operations, the changes in their net assets, and the financial highlights for the periods listed in the table below, in conformity with accounting principles generally accepted in the United States of America.
| Individual Fund Constituting the American Century ETF Trust | Statement of Operations | Statements of Changes in Net Assets | Financial Highlights | ||||||||
Avantis® Emerging Markets Equity Fund | For the year ended August 31, 2022 | For the years ended August 31, 2022 and 2021 | For the years ended August 31, 2022, 2021 and the period from December 4, 2019 (fund inception) through August 31, 2020 | ||||||||
Avantis® International Equity Fund | |||||||||||
Avantis® International Small Cap Value Fund | |||||||||||
Basis for Opinion
These financial statements and financial highlights are the responsibility of the Funds’ management. Our responsibility is to express an opinion on the Funds’ financial statements and financial highlights based on our audits. We are a public accounting firm registered with the Public Company Accounting Oversight Board (United States) (PCAOB) and are required to be independent with respect to the Funds in accordance with the U.S. federal securities laws and the applicable rules and regulations of the Securities and Exchange Commission and the PCAOB.
We conducted our audits in accordance with the standards of the PCAOB. Those standards require that we plan and perform the audit to obtain reasonable assurance about whether the financial statements and financial highlights are free of material misstatement, whether due to error or fraud. The Funds are not required to have, nor were we engaged to perform, an audit of their internal control over financial reporting. As part of our audits we are required to obtain an understanding of internal control over financial reporting but not for the purpose of expressing an opinion on the effectiveness of the Funds’ internal control over financial reporting. Accordingly, we express no such opinion.
186
Our audits included performing procedures to assess the risks of material misstatement of the financial statements and financial highlights, whether due to error or fraud, and performing procedures that respond to those risks. Such procedures included examining, on a test basis, evidence regarding the amounts and disclosures in the financial statements and financial highlights. Our audits also included evaluating the accounting principles used and significant estimates made by management, as well as evaluating the overall presentation of the financial statements and financial highlights. Our procedures included confirmation of securities owned as of August 31, 2022, by correspondence with the custodian and brokers; when replies were not received from brokers, we performed other auditing procedures. We believe that our audits provide a reasonable basis for our opinion.
/s/ Deloitte & Touche LLP
Kansas City, Missouri
October 17, 2022
We have served as the auditor of one or more American Century investment companies since 1997.
187
| Management | ||
The Board of Trustees
The individuals listed below serve as trustees of the funds. Each trustee will continue to serve in this capacity until death, retirement, resignation or removal from office. The board has adopted a mandatory retirement age for trustees who are not “interested persons,” as that term is defined in the Investment Company Act (independent trustees). Trustees who are not also officers of the trust shall retire on December 31st of the year in which they reach their 75th birthday.
Jonathan S. Thomas is an “interested person” because he currently serves as President and Chief Executive Officer of American Century Companies, Inc. (ACC), the parent company of American Century Investment Management, Inc. (ACIM or the advisor). The other trustees are independent. They are not employees, directors or officers of, and have no financial interest in, ACC or any of its wholly owned, direct or indirect, subsidiaries, including ACIM and American Century Services, LLC (ACS), and they do not have any other affiliations, positions or relationships that would cause them to be considered “interested persons” under the Investment Company Act. The following trustees also serve in this capacity for a number of other registered investment companies in the American Century Investments family of funds: Jonathan S. Thomas, 15; Jeremy I. Bulow, 8; and Stephen E. Yates, 7.
The following table presents additional information about the trustees. The mailing address for each trustee other than Jonathan S. Thomas is 330 Madison Avenue, New York, New York 10017. The mailing address for Jonathan S. Thomas is 4500 Main Street, Kansas City, Missouri 64111.
| Name (Year of Birth) | Position(s) Held with Funds | Length of Time Served | Principal Occupation(s) During Past 5 Years | Number of American Century Portfolios Overseen by Trustee | Other Directorships Held During Past 5 Years | ||||||||||||
| Independent Trustees | |||||||||||||||||
| Reginald M. Browne (1968) | Trustee and Chairman of the Board | Since 2017 (Chairman since 2019) | Principal, GTS Securities (automated capital markets trading firm)(2019 to present); Senior Managing Director, Co Global Head-ETF Group, Cantor Fitzgerald (financial services firm)(2013 to 2019) | 41 | None | ||||||||||||
| Jeremy I. Bulow (1954) | Trustee | Since 2022 | Professor of Economics, Stanford University Graduate School of Business (1979 to present) | 75 | None | ||||||||||||
| Barry A. Mendelson (1958) | Trustee | Since 2017 | Retired | 41 | None | ||||||||||||
| Stephen E. Yates (1948) | Trustee | Since 2017 | Retired | 105 | None | ||||||||||||
| Interested Trustees | |||||||||||||||||
| Jonathan S. Thomas (1963) | Trustee | Since 2017 | President and Chief Executive Officer, ACC (2007 to present). Also serves as Chief Executive Officer, ACS; Director, ACC and other ACC subsidiaries | 139 | None | ||||||||||||
The Statement of Additional Information has additional information about the funds' trustees and is available without charge, upon request, by calling 1-800-345-6488.
188
Officers
The following table presents certain information about the executive officers of the funds. Each officer, except Cleo Chang and Edward Rosenberg, serves as an officer for each of the 16 investment companies in the American Century family of funds. No officer is compensated for his or her service as an officer of the funds. The listed officers are interested persons of the funds and are appointed or re-appointed on an annual basis. The mailing address for each officer listed below is 4500 Main Street, Kansas City, Missouri 64111.
| Name (Year of Birth) | Offices with the Funds | Principal Occupation(s) During the Past Five Years | ||||||
| Patrick Bannigan (1965) | President since 2019 | Executive Vice President and Director, ACC (2012 to present); Chief Financial Officer, Chief Accounting Officer and Treasurer, ACC (2015 to present). Also serves as President, ACS; Vice President, ACIM; Chief Financial Officer, Chief Accounting Officer and/or Director, ACIM, ACS and other ACC subsidiaries | ||||||
| R. Wes Campbell (1974) | Chief Financial Officer and Treasurer since 2018 | Vice President, ACS (2020 to present); Investment Operations and Investment Accounting, ACS (2000 to present) | ||||||
| Amy D. Shelton (1964) | Chief Compliance Officer and Vice President since 2017 | Chief Compliance Officer, American Century funds, (2014 to present); Chief Compliance Officer, ACIM (2014 to present); Chief Compliance Officer, ACIS (2009 to present). Also serves as Vice President, ACIS | ||||||
| John Pak (1968) | General Counsel and Vice President since 2021 | General Counsel and Senior Vice President, ACC (2021 to present). Also serves as General Counsel and Senior Vice President, ACIM, ACS and ACIS. Chief Legal Officer of Investment and Wealth Management,The Bank of New York Mellon (2014 to 2021) | ||||||
| Cleo Chang (1977) | Vice President since 2019 | Senior Vice President, ACIM (2015 to present) | ||||||
| David H. Reinmiller (1963) | Vice President since 2017 | Attorney, ACC (1994 to present). Also serves as Vice President, ACIM and ACS | ||||||
| Edward Rosenberg (1973) | Vice President since 2017 | Senior Vice President, ACIM (2017 to present); Senior Vice President, Flexshares Head of ETF Capital Markets, Northern Trust (2012 to 2017) | ||||||
| C. Jean Wade (1964) | Vice President since 2017 | Senior Vice President, ACS (2017 to present); Vice President, ACS (2000 to 2017) | ||||||
| Ward D. Stauffer (1960) | Secretary since 2019 | Attorney, ACS (2003 to present) | ||||||
189
| Approval of Management Agreement | ||
At a meeting held on June 2, 2022, the Funds’ Board of Trustees (the "Board") unanimously approved the renewal of the management agreement pursuant to which American Century Investment Management, Inc. (the “Advisor”) acts as the investment advisor for each of the Funds. Under Section 15(c) of the Investment Company Act of 1940 (the “Investment Company Act”), contracts for investment advisory services are required to be reviewed, evaluated, and approved by a majority of a fund’s Trustees, including a majority of the independent Trustees, each year.
Prior to its consideration of the management agreement renewal, the Trustees requested and reviewed extensive data and information compiled by the Advisor and certain independent data providers concerning the Funds. This review was in addition to the oversight and evaluation undertaken by the Board and its Audit Committee on a continual basis and the information received was supplemental to the extensive information that the Board and its Audit Committee receive and consider throughout the year.
In connection with its consideration of the management agreement renewal, the Board’s review and evaluation of the services provided by the Advisor included, but was not limited to, the following:
•the nature, extent, and quality of investment management, shareholder services, and other services provided and to be provided to each Fund including without limitation portfolio management and trading services, shareholder and intermediary services, compliance and legal services, fund accounting and financial reporting, and fund share distribution;
•the wide range of other programs and services provided to each Fund and its shareholders on a routine and non-routine basis;
•the investment performance of each Fund, including data comparing each Fund's performance to an appropriate benchmark and/or a peer group of other funds with similar investment objectives and strategies;
•the cost of owning each Fund compared to the cost of owning similarly-managed funds;
•the compliance policies, procedures, and regulatory experience of the Advisor and the Funds’ service providers;
•the Advisor’s strategic plans, generally, and with respect to the ongoing impact of the COVID-19 pandemic response, heightened areas of interest in the mutual fund industry and recent geopolitical issues;
•the Advisor’s business continuity plans, vendor management practices, and cyber security practices;
•financial data showing the cost of services provided to each Fund, the profitability of each Fund to the Advisor, and the overall profitability of the Advisor;
•information regarding payments to intermediaries by the Advisor;
•possible economies of scale associated with the Advisor’s management of each Fund; and
•possible collateral benefits to the Advisor from the management of the Funds.
The independent Trustees met separately in private session to discuss the renewal and to review and discuss the information provided in response to their request. The independent Trustees also held active discussions with the Advisor regarding the renewal of the management agreement. The independent Trustees had the benefit of the advice of their independent counsel throughout the process.
Factors Considered
The Trustees considered all of the information provided by the Advisor, the independent data providers, and independent counsel in connection with the approval. They determined that the
190
information was sufficient for them to evaluate the management agreement for the Funds. In connection with their review, the Trustees did not identify any single factor as being all-important or controlling, and each Trustee may have attributed different levels of importance to different factors. In deciding to renew the management agreement, the Board based its decision on a number of factors, including without limitation the following:
Nature, Extent and Quality of Services — Generally. Under each Fund’s management agreement, the Advisor is responsible for providing or arranging for all services necessary for the operation of each Fund. The Board noted that the Advisor provides or arranges at its own expense a wide variety of services which include the following:
•constructing and designing each Fund
•portfolio research and security selection
•initial capitalization/funding
•securities trading
•Fund administration
•custody of Fund assets
•daily valuation of each Fund’s portfolio
•liquidity monitoring and management
•risk management, including cyber security
•shareholder servicing and transfer agency, including shareholder confirmations, recordkeeping, and communications
•legal services (except the independent Trustees’ counsel)
•regulatory and portfolio compliance
•financial reporting
•marketing and distribution (except amounts paid by each Fund under Rule 12b-1 plans)
Investment Management Services. The nature of the investment management services provided to the Funds is quite complex and allows Fund shareholders access to professional money management, instant diversification of their investments within an asset class, and liquidity. In evaluating investment performance, the Board expects the Advisor to manage each Fund in accordance with its investment objectives and principal investment strategies. Further, the Trustees recognize that the Advisor has an obligation to monitor trading activities, and in particular to seek the best execution of fund trades, and to evaluate the use of and payment for research. In providing these services, the Advisor utilizes teams of investment professionals (portfolio managers, analysts, research assistants, and securities traders) who require extensive information technology, research, training, compliance, and other systems to conduct their business. The Board provides oversight of the investment performance process. It regularly reviews investment performance information for each Fund, together with comparative information for appropriate benchmarks over different time horizons. The Trustees also review investment performance information during the management agreement renewal process. If performance concerns are identified, the Board discusses with the Advisor the reasons for such results and any actions being taken to improve performance. The performance for Avantis Emerging Markets Equity Fund, Avantis International Equity Fund, and Avantis International Small Cap Value Fund was above each Fund’s respective benchmark for the one-year period reviewed by the Board. The Board found the investment management services provided by the Advisor to each Fund to be satisfactory and consistent with the management agreement.
Shareholder and Other Services. Under the management agreement, the Advisor provides or arranges for a comprehensive package of services to the Funds. The Board, directly and through its Audit Committee, regularly reviews reports and evaluations of such services at its regular meetings. These reports include, but are not limited to, information regarding the operational efficiency and accuracy of the shareholder and transfer agency services provided, staffing levels, shareholder satisfaction, technology support (including cyber security), new products and services offered to Fund shareholders, securities trading activities, portfolio valuation services, auditing services, and legal and operational compliance activities. The Board found the services provided
191
by the Advisor to each Fund under the management agreement to be competitive and of high quality.
Costs of Services and Profitability. The Advisor provides detailed information concerning its cost of providing various services to the Funds, its profitability in managing each Fund (pre- and post-distribution), its overall profitability, and its financial condition. The Trustees have reviewed with the Advisor the methodology used to prepare this financial information. This information is considered in evaluating the Advisor’s financial condition, its ability to continue to provide services under the management agreement, and the reasonableness of the current management fee. The Board concluded that the Advisor’s profits were reasonable in light of the services provided to the Funds.
Ethics. The Board generally considers the Advisor’s commitment to providing quality services to the Funds and to conducting its business ethically. They noted that the Advisor’s practices generally meet or exceed industry best practices.
Economies of Scale. The Board also reviewed information provided by the Advisor regarding the possible existence of economies of scale in connection with the management of each Fund. The Board concluded that economies of scale are difficult to measure and predict with precision, especially on a fund-by-fund basis. The Board concluded that the Advisor is sharing economies of scale, to the extent they exist, through its fee structure and through reinvestment in its business, infrastructure, investment capabilities and initiatives to provide shareholders additional content and services.
Comparison to Other Funds’ Fees. The management agreement provides that each Fund pays the Advisor a single, all-inclusive (or unified) management fee for providing all services necessary for the management and operation of the Fund, other than securities transaction expenses, taxes, interest, extraordinary expenses, and expenses incurred in connection with the provision of shareholder services and distribution services under a plan adopted pursuant to Rule 12b-1 under the Investment Company Act. Under the unified fee structure, the Advisor is responsible for providing all investment advisory, custody, audit, administrative, compliance, recordkeeping, marketing and shareholder services, or arranging and supervising third parties to provide such services. The Board believes the unified fee structure is a benefit to Fund shareholders because it clearly discloses to shareholders the cost of owning Fund shares, and, since the unified fee cannot be increased without a vote of Fund shareholders, it shifts to the Advisor the risk of increased costs of operating the Fund and provides a direct incentive to minimize administrative inefficiencies. Part of the Board’s analysis of fee levels involves reviewing certain evaluative data compiled by an independent provider comparing the Fund’s unified fee to the total expense ratios of its peers. The unified fee charged to shareholders of Avantis Emerging Markets Equity Fund, Avantis International Equity Fund, and Avantis International Small Cap Value Fund was the lowest of the total expense ratios of their respective peer expense universe and was the lowest of their peer expense group. The Board concluded that the management fee paid by each Fund to the Advisor under its management agreement is reasonable in light of the services provided to the Fund.
Comparison to Fees and Services Provided to Other Clients of the Advisor. The Board also requested and received information from the Advisor concerning the nature of the services, fees, costs, and profitability of its advisory services to funds or other advisory clients managed similarly to the Funds. They observed that these varying types of client accounts require different services and involve different regulatory and entrepreneurial risks than the management of the Funds. The Board analyzed this information and concluded that the fees charged and services provided to the Funds were reasonable by comparison.
Payments to Intermediaries. The Trustees also requested and received a description of payments made to intermediaries by each Fund and the Advisor and services provided in response thereto. These payments could include various payments made by each Fund or the Advisor to different types of intermediaries and recordkeepers for distribution and service activities provided for each Fund. The Trustees reviewed such information and received representations from the
192
Advisor that all such payments by the Advisor were made from the Advisor’s resources and reasonable profits.
Collateral or “Fall-Out” Benefits Derived by the Advisor. The Board considered the possible existence of collateral benefits the Advisor may receive as a result of its relationship with the Funds. They concluded that the Advisor’s primary business is managing funds and it generally does not use fund or shareholder information to generate profits in other lines of business, and therefore does not derive any significant collateral benefits from them. The Board noted that additional assets from other clients may offer the Advisor some benefit from increased leverage with service providers and counterparties. The Board also determined that the Advisor is able to provide investment management services to certain clients other than the Funds, at least in part, due to its existing infrastructure built to serve the fund complex. The Board concluded that appropriate allocation methodologies had been employed to assign resources and the cost of those resources to these other clients.
Existing Relationship. The Board also considered whether there was any reason for not continuing the existing arrangement with the Advisor. In this regard, the Board was mindful of the potential disruptions of the Funds’ operations and various risks, uncertainties, and other effects that could occur as a result of a decision not to continue such relationship. In particular, the Board recognized that most shareholders have invested in each Fund on the strength of the Advisor’s industry standing and reputation and in the expectation that the Advisor will have a continuing role in providing advisory services to each Fund.
Conclusion of the Trustees. As a result of this process, the Board, including all of the independent Trustees, taking into account all of the factors discussed above and the information provided by the Advisor and others in connection with its review and throughout the year, determined that the terms of the management fee are fair and reasonable and that the management fee charged to each Fund is fair in light of the services provided and that the investment management agreement between each Fund and the Advisor should be renewed for an additional one-year period.
193
| Liquidity Risk Management Program | ||
The Funds have adopted a liquidity risk management program (the “program”). The Funds' Board of Trustees (the "Board") has designated American Century Investment Management, Inc. (“ACIM”) as the administrator of the program. Personnel of ACIM or its affiliates conduct the day-to-day operation of the program pursuant to policies and procedures administered by the Program Administrator, including members of ACIM’s Investment Oversight Committee who are members of the ACIM’s Investment Management and Global Analytics departments.
Under the program, ACIM manages the Funds' liquidity risk, which is the risk that the Funds could not meet shareholder redemption requests without significant dilution of remaining shareholders’ interests in the Funds. This risk is managed by monitoring the degree of liquidity of the Funds' investments, limiting the amount of the Funds' illiquid investments, and utilizing various risk management tools and facilities available to the Funds for meeting shareholder redemptions, among other means. ACIM’s process of determining the degree of liquidity of certain Funds' investments is supported by a third-party liquidity assessment vendor.
The Board reviewed a report prepared by ACIM regarding the operation and effectiveness of the program for the period January 1, 2021 through December 31, 2021. No significant liquidity events impacting the Funds were noted in the report. In addition, ACIM provided its assessment that the program had been effective in managing the Funds' liquidity risk.
194
| Additional Information | ||
Retirement Account Information
As required by law, distributions you receive from certain retirement accounts are subject to federal income tax withholding, unless you elect not to have withholding apply*. Tax will be withheld on the total amount withdrawn even though you may be receiving amounts that are not subject to withholding, such as nondeductible contributions. In such case, excess amounts of withholding could occur. You may adjust your withholding election so that a greater or lesser amount will be withheld.
If you don’t want us to withhold on this amount, you must notify us to not withhold the federal income tax. You may notify us in writing or in certain situations by telephone or through other electronic means. For systematic withdrawals, your withholding election will remain in effect until revoked or changed by filing a new election. You have the right to revoke your election at any time and change your withholding percentage for future distributions.
Remember, even if you elect not to have income tax withheld, you are liable for paying income tax on the taxable portion of your withdrawal. If you elect not to have income tax withheld or you don’t have enough income tax withheld, you may be responsible for payment of estimated tax. You may incur penalties under the estimated tax rules if your withholding and estimated tax payments are not sufficient. You can reduce or defer the income tax on a distribution by directly or indirectly rolling such distribution over to another IRA or eligible plan. You should consult your tax advisor for additional information.
State tax will be withheld if, at the time of your distribution, your address is within one of the mandatory withholding states and you have federal income tax withheld (or as otherwise required by state law). State taxes will be withheld from your distribution in accordance with the respective state rules.
*Some 403(b), 457 and qualified retirement plan distributions may be subject to 20% mandatory withholding, as they are subject to special tax and withholding rules. Your plan administrator or plan sponsor is required to provide you with a special tax notice explaining those rules at the time you request a distribution. If applicable, federal and/or state taxes may be withheld from your distribution amount.
Proxy Voting Policies
A description of the policies that the funds' investment advisor uses in exercising the voting rights associated with the securities purchased and/or held by the funds is available without charge, upon request, by calling 1-800-345-6488. It is also available on American Century Investments’ website at americancentury.com/proxy and on the Securities and Exchange Commission’s website at sec.gov. Information regarding how the investment advisor voted proxies relating to portfolio securities during the most recent 12-month period ended June 30 is available at americancentury.com/proxy. It is also available at sec.gov.
Quarterly Portfolio Disclosure
The funds file their complete schedule of portfolio holdings with the Securities and Exchange Commission (SEC) for the first and third quarters of each fiscal year as an exhibit to their reports on Form N-PORT. The funds' Form N-PORT reports are available on the SEC’s website at sec.gov.
195
Other Tax Information
The following information is provided pursuant to provisions of the Internal Revenue Code.
The funds hereby designates up to the maximum amount allowable as qualified dividend income for the fiscal year ended August 31, 2022.
For corporate taxpayers, the funds hereby designate the following, or up to the maximum amount allowable, of ordinary income distributions paid during the fiscal year ended August 31, 2022 as qualified for the corporate dividends received deduction.
| Avantis Emerging Markets Equity Fund | Avantis International Equity Fund | Avantis International Small Cap Value Fund | ||||||
| $15,618 | $6,440 | $73,719 | ||||||
The funds hereby designate the following as qualified short-term capital gain distributions for purposes of Internal Revenue Code Section 871 for the fiscal year ended August 31, 2022.
| Avantis Emerging Markets Equity Fund | Avantis International Equity Fund | Avantis International Small Cap Value Fund | ||||||
| — | $188,946 | $2,293,947 | ||||||
The funds hereby designate the following, or up to the maximum amount allowable, as long-term capital gain distributions (20% rate gain distributions) for the fiscal year ended August 31, 2022.
| Avantis Emerging Markets Equity Fund | Avantis International Equity Fund | Avantis International Small Cap Value Fund | ||||||
| — | $634,533 | $664,353 | ||||||
The funds utilized the following earnings and profits distributed to shareholders on redemption of shares as part of the dividends paid deduction (tax equalization).
| Avantis Emerging Markets Equity Fund | Avantis International Equity Fund | Avantis International Small Cap Value Fund | ||||||
| $3,176 | $6,748 | — | ||||||
For the fiscal year ended August 31, 2022, the funds intend to pass through to shareholders the following foreign source income and foreign taxes paid, or up to the maximum amount allowable, as a foreign tax credit.
| Foreign Tax Credit | Foreign Source Income | |||||||||||||
| Amount | Per Outstanding Share | Amount | Per Outstanding Share | |||||||||||
| Avantis Emerging Markets Equity Fund | $994,070 | $0.0426 | $8,308,183 | $0.3560 | ||||||||||
| Avantis International Equity Fund | $263,476 | $0.0195 | $3,223,272 | $0.2380 | ||||||||||
| Avantis International Small Cap Value Fund | $435,156 | $0.0293 | $5,293,522 | $0.3568 | ||||||||||
196
| ||||||||
| Contact Us | avantisinvestors.com | |||||||
| American Century Sales Representatives, Financial Professionals, Broker Dealers, Insurance Companies, Banks and Trust Companies | 1-833-928-2684 | |||||||
| Telecommunications Relay Service for the Deaf | 711 | |||||||
| American Century ETF Trust | ||||||||
Investment Advisor: American Century Investment Management, Inc. Kansas City, Missouri | ||||||||
| This report and the statements it contains are submitted for the general information of our shareholders. The report is not authorized for distribution to prospective investors unless preceded or accompanied by an effective prospectus. | ||||||||
| ©2022 American Century Proprietary Holdings, Inc. All rights reserved. CL-ANN-97502 2210 | ||||||||
| Annual Report | |||||
| August 31, 2022 | |||||
Avantis® Core Fixed Income Fund | |||||
| Institutional Class (AVIGX) | |||||
| G Class (AVBNX) | |||||
Avantis® Core Municipal Fixed Income Fund | |||||
| Institutional Class (AVMUX) | |||||
| G Class (AVFNX) | |||||
Avantis® Short-Term Fixed Income Fund | |||||
| Institutional Class (AVSFX) | |||||
| G Class (AVGNX) | |||||
| Table of Contents | ||
| Chairman’s Letter | |||||
| Avantis Core Fixed Income Fund | |||||
| Performance | |||||
| Portfolio Commentary | |||||
| Fund Characteristics | |||||
| Avantis Core Municipal Fixed Income Fund | |||||
| Performance | |||||
| Portfolio Commentary | |||||
| Fund Characteristics | |||||
| Avantis Short-Term Fixed Income Fund | |||||
| Performance | |||||
| Portfolio Commentary | |||||
| Fund Characteristics | |||||
| Shareholder Fee Examples | |||||
| Schedules of Investments | |||||
| Statements of Assets and Liabilities | |||||
| Statements of Operations | |||||
| Statements of Changes in Net Assets | |||||
| Notes to Financial Statements | |||||
| Financial Highlights | |||||
| Report of Independent Registered Public Accounting Firm | |||||
| Management | |||||
| Approval of Management Agreement | |||||
| Liquidity Risk Management Program | |||||
| Additional Information | |||||
Any opinions expressed in this report reflect those of the author as of the date of the report, and do not necessarily represent the opinions of American Century Investments® or any other person in the American Century Investments organization. Any such opinions are subject to change at any time based upon market or other conditions and American Century Investments disclaims any responsibility to update such opinions. These opinions may not be relied upon as investment advice and, because investment decisions made by American Century Investments funds are based on numerous factors, may not be relied upon as an indication of trading intent on behalf of any American Century Investments fund. Security examples are used for representational purposes only and are not intended as recommendations to purchase or sell securities. Performance information for comparative indices and securities is provided to American Century Investments by third party vendors. To the best of American Century Investments’ knowledge, such information is accurate at the time of printing.
| Chairman's Letter | ||
Jonathan ThomasDear Investor:
Thank you for reviewing this annual report for the period ended August 31, 2022. Annual reports
help convey important information about fund returns, including market factors that affected
performance. For additional investment insights, please visit avantisinvestors.com.
Mounting Market Challenges Hampered Performance
Asset class performance weakened dramatically during the funds’ fiscal year. In late 2021,
generally upbeat economic activity and corporate earnings supported gains for most U.S. and
global stock indices. Returns generally remained positive despite rapidly rising inflation and waning
central bank support—factors that had started to weigh on fixed-income indices.
By early 2022, the market climate shifted quickly. Inflation, which was already at multiyear highs,
rose to levels last seen in the early 1980s. Massive fiscal and monetary support unleashed during
the pandemic was partly to blame. In addition, escalating energy prices, supply chain breakdowns
and labor market shortages further aggravated inflation in the U.S. and other developed markets.
Russia’s invasion of Ukraine in February also exacerbated global inflationary pressures.
The Bank of England launched its inflation-fighting campaign in December and continued to lift
rates through period-end. The Federal Reserve responded to surging inflation in March, launching
an aggressive rate-hike campaign and ending its asset purchase program. Policymakers indicated
taming inflation remains their priority, even as the U.S. economy contracted in 2022’s first two
quarters. Facing record-high inflation in the eurozone, the European Central Bank in July embarked
on its first rate-hike effort in 11 years.
The combination of sharply elevated inflation, tighter monetary policy, geopolitical strife and weak
economies triggered sharp market volatility and fueled global recession fears. Against this
backdrop, most U.S. and global stock and bond indices declined sharply for the reporting period.
Staying Disciplined in Uncertain Times
We expect market volatility to linger as investors navigate a complex environment of high inflation,
rising interest rates and economic uncertainty. In addition, Russia’s invasion of Ukraine
complicates an increasingly tense geopolitical backdrop and threatens Europe’s winter energy
supply. We will continue to monitor the broad backdrop and its influence on financial markets.
We appreciate your confidence in us during these extraordinary times. Our firm has a long history
of helping clients weather unpredictable markets, and we’re confident we will continue to meet
today’s challenges.
Sincerely,
Jonathan Thomas
Chairman
Avantis Investors
2
| Performance | ||
| Avantis Core Fixed Income Fund | ||||||||||||||||||||
| Total Returns as of August 31, 2022 | Average Annual Returns | |||||||||||||||||||
| Ticker Symbol | 1 year | Since Inception | Inception Date | |||||||||||||||||
| Institutional Class | AVIGX | -13.01% | -7.85% | 2/24/2021 | ||||||||||||||||
| Bloomberg U.S. Aggregate Bond Index | — | -11.52% | -6.82% | — | ||||||||||||||||
| G Class | AVBNX | -12.88% | -7.71% | 2/24/2021 | ||||||||||||||||
G Class returns would have been lower if a portion of the fees had not been waived.
| Growth of $10,000 Over Life of Class | ||
| $10,000 investment made February 24, 2021 | ||
Performance for other share classes will vary due to differences in fee structure.
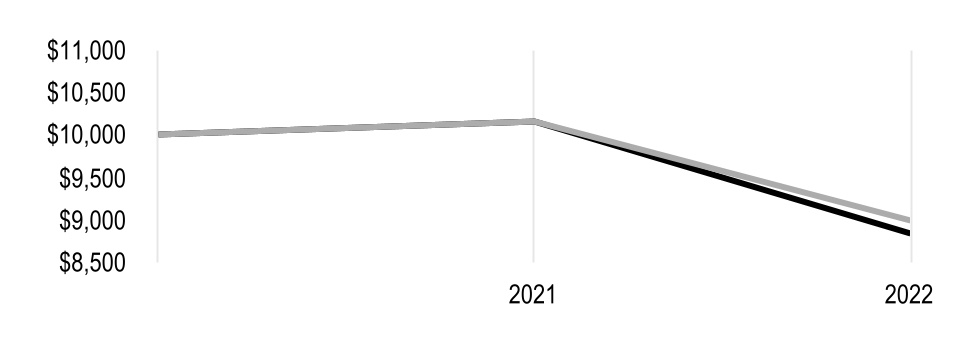
| Value on August 31, 2022 | |||||
| Institutional Class — $8,835 | |||||
| Bloomberg U.S. Aggregate Bond Index — $8,984 | |||||
| Total Annual Fund Operating Expenses | |||||
| Institutional Class | G Class | ||||
| 0.15% | 0.15% | ||||
The total annual fund operating expenses shown is as stated in the fund’s prospectus current as of the date of this report. The prospectus may vary from the expense ratio shown elsewhere in this report because it is based on a different time period, includes acquired fund fees and expenses, and, if applicable, does not include fee waivers or expense reimbursements.
Data presented reflect past performance. Past performance is no guarantee of future results. Current performance may be higher or lower than the performance shown. Total returns for periods less than one year are not annualized. Investment return and principal value will fluctuate, and redemption value may be more or less than original cost. Data assumes reinvestment of dividends and capital gains, and none of the charts reflect the deduction of taxes that a shareholder would pay on fund distributions or the redemption of fund shares. To obtain performance data current to the most recent month end, please call 1-833-928-2684 or visit avantisinvestors.com. For additional information about the funds, please consult the prospectus.
3
| Portfolio Commentary | ||
Portfolio Managers: Eduardo Repetto, Hozef Arif, Mitchell Handa and Daniel Ong
Fund Strategy
Avantis Core Fixed Income seeks to maximize total returns by investing primarily in investment-grade debt obligations across sectors, maturities and issuers.
In seeking securities with high expected returns, the portfolio managers use an analytical framework, which includes an assessment of securities’ expected income and capital appreciation. The portfolio managers categorize securities within the fund’s investment universe into component groups based on factors such as industry sector, credit rating, duration, country and currency. The portfolio managers then calculate the expected return implied by the yield curve of each component group. At the same time, they consider valuation metrics, such as yield, duration and option adjusted spreads. Finally, the portfolio managers adjust the weightings for each component group, with the goal of building a portfolio with enhanced expected return.
Performance Review
For the 12-month period ended August 31, 2022, Avantis Core Fixed Income returned -13.01%.* The fund underperformed the Bloomberg U.S. Aggregate Bond Index, which returned -11.52% for the period. The index is an unmanaged portfolio generally representative of the performance of the broad U.S. taxable investment-grade bond market. The fund’s return reflects fees and operating expenses, while the index return does not.
An overweight position versus the index to corporates detracted from relative performance as spreads widened over the period. However, the fund’s yield curve positioning among corporate issuers helped mitigate the relative underperformance.
*All fund returns referenced in this commentary are for Institutional Class shares. Performance for other share classes will vary due to differences in fee structure; when Institutional Class performance exceeds that of the fund’s benchmark, other share classes may not. See page 3 for returns for all share classes.
4
| Fund Characteristics | ||
| AUGUST 31, 2022 | |||||
| Avantis Core Fixed Income Fund | |||||
| Types of Investments in Portfolio | % of net assets | ||||
| Corporate Bonds | 61.2% | ||||
| U.S. Treasury Securities and Equivalents | 25.2% | ||||
| U.S. Government Agency Mortgage-Backed Securities | 19.3% | ||||
| U.S. Government Agency Securities | 1.9% | ||||
| Short-Term Investments | 11.6% | ||||
| Other Assets and Liabilities | (19.2)% | ||||
5
| Performance | ||
| Avantis Core Municipal Fixed Income Fund | ||||||||||||||||||||
| Total Returns as of August 31, 2022 | Average Annual Returns | |||||||||||||||||||
| Ticker Symbol | 1 year | Since Inception | Inception Date | |||||||||||||||||
| Institutional Class | AVMUX | -7.82% | -3.88% | 2/24/2021 | ||||||||||||||||
| S&P National AMT-Free Municipal Bond Index | — | -8.34% | -4.19% | — | ||||||||||||||||
| G Glass | AVFNX | -7.68% | -3.74% | 2/24/2021 | ||||||||||||||||
G Class returns would have been lower if a portion of the fees had not been waived.
| Growth of $10,000 Over Life of Class | ||
| $10,000 investment made February 24, 2021 | ||
Performance for other share classes will vary due to differences in fee structure.
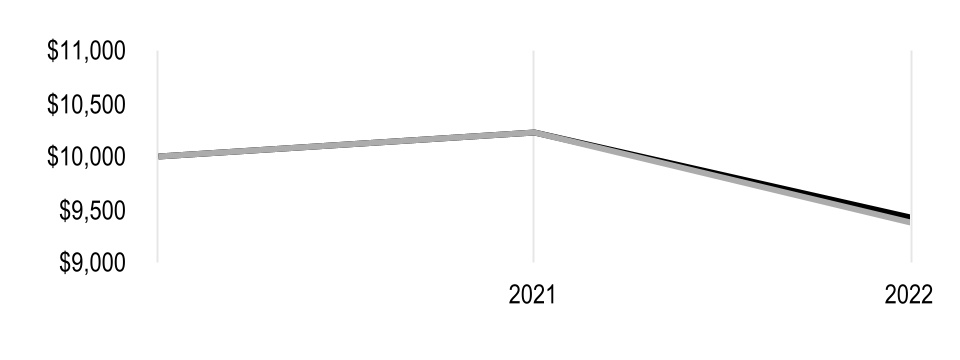
| Value on August 31, 2022 | |||||
| Institutional Class — $9,418 | |||||
| S&P National AMT-Free Municipal Bond Index — $9,372 | |||||
| Total Annual Fund Operating Expenses | |||||
| Institutional Class | G Class | ||||
| 0.15% | 0.15% | ||||
The total annual fund operating expenses shown is as stated in the fund’s prospectus current as of the date of this report. The prospectus may vary from the expense ratio shown elsewhere in this report because it is based on a different time period, includes acquired fund fees and expenses, and, if applicable, does not include fee waivers or expense reimbursements.
Data presented reflect past performance. Past performance is no guarantee of future results. Current performance may be higher or lower than the performance shown. Total returns for periods less than one year are not annualized. Investment return and principal value will fluctuate, and redemption value may be more or less than original cost. Data assumes reinvestment of dividends and capital gains, and none of the charts reflect the deduction of taxes that a shareholder would pay on fund distributions or the redemption of fund shares. To obtain performance data current to the most recent month end, please call 1-833-928-2684 or visit avantisinvestors.com. For additional information about the funds, please consult the prospectus.
6
| Portfolio Commentary | ||
Portfolio Managers: Eduardo Repetto, Hozef Arif, Mitchell Handa and Daniel Ong
Fund Strategy
Avantis Core Municipal Fixed Income seeks to generate current income exempt from federal income tax by investing primarily in municipal securities.
In seeking securities with high expected returns, the portfolio managers use an analytical framework, which includes an assessment of securities’ expected income and capital appreciation. The portfolio managers categorize securities within the fund’s investment universe into component groups based on factors such as industry sector, credit rating, duration, country and currency. The portfolio managers then calculate the expected return implied by the yield curve of each component group. At the same time, they consider valuation metrics, such as yield, duration and option adjusted spreads. Finally, the portfolio managers adjust the weightings for each component group, with the goal of building a portfolio with enhanced expected return.
Performance Review
For the 12-month period ended August 31, 2022, Avantis Core Municipal Fixed Income returned -7.82%.* The fund outperformed the S&P National AMT-Free Municipal Bond Index, which returned -8.34% for the same period. The index is a broad, comprehensive, market value-weighted index designed to measure the performance of the investment-grade tax-exempt U.S. municipal bond market. The fund’s return reflects fees and operating expenses, while the index return does not.
The fund’s outperformance versus the index was mainly due to positioning on the yield curve (underweighting longer-dated bonds). Underweighting duration compared with the benchmark also aided relative results. An underweight position to BBB-rated issuers also contributed to relative results. However, overweight positions in issuers with AA and A ratings detracted and offset the effects of the BBB underweight.
*All fund returns referenced in this commentary are for Institutional Class shares. Performance for other share classes will vary due to differences in fee structure; when Institutional Class performance exceeds that of the fund’s benchmark, other share classes may not. See page 6 for returns for all share classes.
7
| Fund Characteristics | ||
| AUGUST 31, 2022 | |||||
| Avantis Core Municipal Fixed Income Fund | |||||
| Types of Investments in Portfolio | % of net assets | ||||
| Municipal Securities | 98.7% | ||||
| Short-Term Investments | 0.2% | ||||
| Other Assets and Liabilities | 1.1% | ||||
| Top Five States and Territories | % of net assets | ||||
| California | 15.9% | ||||
| New York | 13.8% | ||||
| Florida | 6.6% | ||||
| Texas | 6.3% | ||||
| Illinois | 5.1% | ||||
| Top Five Sectors | % of fund investments | ||||
| Special Tax | 24% | ||||
| General Obligation (GO) - State | 19% | ||||
| General Obligation (GO) - Local | 13% | ||||
| Public Power | 9% | ||||
| Water & Sewer | 7% | ||||
8
| Performance | ||
| Avantis Short-Term Fixed Income Fund | ||||||||||||||||||||
| Total Returns as of August 31, 2022 | Average Annual Returns | |||||||||||||||||||
| Ticker Symbol | 1 year | Since Inception | Inception Date | |||||||||||||||||
| Institutional Class | AVSFX | -5.88% | -3.78% | 2/24/2021 | ||||||||||||||||
| Bloomberg U.S. Aggregate Government/Credit 1-5 Year Index | — | -5.84% | -3.78% | — | ||||||||||||||||
| G Class | AVGNX | -5.74% | -3.64% | 2/24/2021 | ||||||||||||||||
| Growth of $10,000 Over Life of Class | ||
| $10,000 investment made February 24, 2021 | ||
Performance for other share classes will vary due to differences in fee structure.
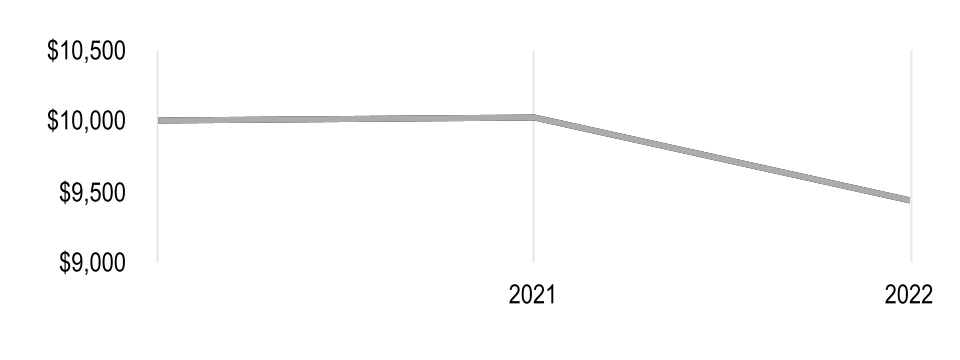
| Value on August 31, 2022 | |||||
| Institutional Class — $9,433 | |||||
| Bloomberg U.S. Aggregate Government/Credit 1-5 Year Index — $9,433 | |||||
| Total Annual Fund Operating Expenses | |||||
| Institutional Class | G Class | ||||
| 0.15% | 0.15% | ||||
The total annual fund operating expenses shown is as stated in the fund’s prospectus current as of the date of this report. The prospectus may vary from the expense ratio shown elsewhere in this report because it is based on a different time period, includes acquired fund fees and expenses, and, if applicable, does not include fee waivers or expense reimbursements.
Data presented reflect past performance. Past performance is no guarantee of future results. Current performance may be higher or lower than the performance shown. Total returns for periods less than one year are not annualized. Investment return and principal value will fluctuate, and redemption value may be more or less than original cost. Data assumes reinvestment of dividends and capital gains, and none of the charts reflect the deduction of taxes that a shareholder would pay on fund distributions or the redemption of fund shares. To obtain performance data current to the most recent month end, please call 1-833-928-2684 or visit avantisinvestors.com. For additional information about the funds, please consult the prospectus.
9
| Portfolio Commentary | ||
Portfolio Managers: Eduardo Repetto, Hozef Arif, Mitchell Handa and Daniel Ong
Fund Strategy
Avantis Short-Term Fixed Income seeks to maximize total returns by investing primarily in shorter-maturity investment-grade debt obligations across sectors, maturities and issuers.
In seeking securities with high expected returns, the portfolio managers use an analytical framework, which includes an assessment of securities’ expected income and capital appreciation. The portfolio managers categorize securities within the fund’s investment universe into component groups based on factors such as industry sector, credit rating, duration, country and currency. The portfolio managers then calculate the expected return implied by the yield curve of each component group. At the same time, they consider valuation metrics, such as yield, duration and option adjusted spreads. Finally, the portfolio managers adjust the weightings for each component group, with the goal of building a portfolio with enhanced expected return.
Performance Review
For the 12-month period ended August 31, 2022, Avantis Short-Term Fixed Income returned -5.88%.* The fund performed in line with the Bloomberg U.S. Aggregate Government/Credit 1-5 Year Index, which returned -5.84% for the same period. The index is an unmanaged portfolio generally representative of the performance of U.S. Treasury, government agency and corporate bonds with maturities between one and five years. The fund’s return reflects fees and operating expenses, while the index return does not.
The fund’s yield curve positioning among corporate issuers added relative value. The fund’s overweight position versus the index to the corporate credit sector detracted from relative results.
*All fund returns referenced in this commentary are for Institutional Class shares. Performance for other share classes will vary due to differences in fee structure; when Institutional Class performance exceeds that of the fund’s benchmark, other share classes may not. See page 9 for returns for all share classes.
10
| Fund Characteristics | ||
| AUGUST 31, 2022 | |||||
| Avantis Short-Term Fixed Income Fund | |||||
| Types of Investments in Portfolio | % of net assets | ||||
| Corporate Bonds | 63.9% | ||||
| U.S. Treasury Securities and Equivalents | 31.1% | ||||
| U.S. Government Agency Securities | 3.1% | ||||
| Short-Term Investments | 1.3% | ||||
| Other Assets and Liabilities | 0.6% | ||||
11
| Shareholder Fee Examples | ||
Fund shareholders may incur two types of costs: (1) transaction costs, including brokerage commissions paid on purchases and sales of fund shares; and (2) ongoing costs, including management fees and other fund expenses. This example is intended to help you understand your ongoing costs (in dollars) of investing in your fund and to compare these costs with the ongoing cost of investing in other funds.
The example is based on an investment of $1,000 made at the beginning of the period and held for the entire period from March 1, 2022 to August 31, 2022.
Actual Expenses
The table provides information about actual account values and actual expenses for each class. You may use the information, together with the amount you invested, to estimate the expenses that you paid over the period. First, identify the share class you own. Then simply divide your account value by $1,000 (for example, an $8,600 account value divided by $1,000 = 8.6), then multiply the result by the number under the heading “Expenses Paid During Period” to estimate the expenses you paid on your account during this period.
Hypothetical Example for Comparison Purposes
The table also provides information about hypothetical account values and hypothetical expenses based on the actual expense ratio of your fund and an assumed rate of return of 5% per year before expenses, which is not the actual return of a fund. The hypothetical account values and expenses may not be used to estimate the actual ending account balance or expenses you paid for the period. You may use this information to compare the ongoing costs of investing in your fund and other funds. To do so, compare this 5% hypothetical example with the 5% hypothetical examples that appear in the shareholder reports of the other funds.
Please note that the expenses shown in the table are meant to highlight your ongoing costs only and do not reflect any transactional costs, such as brokerage commissions paid on purchases and sales of fund shares. Therefore, the table is useful in comparing ongoing costs only, and will not help you determine the relative total costs of owning different funds. In addition, if these transactional costs were included, your costs would have been higher.
12
| Beginning Account Value 3/1/22 | Ending Account Value 8/31/22 | Expenses Paid During Period(1) 3/1/22 - 8/31/22 | Annualized Expense Ratio(1) | |||||||||||
| Avantis Core Fixed Income Fund | ||||||||||||||
| Actual | ||||||||||||||
| Institutional Class | $1,000 | $914.50 | $0.72 | 0.15% | ||||||||||
| G Class | $1,000 | $915.20 | $0.00 | 0.00%(2) | ||||||||||
| Hypothetical | ||||||||||||||
| Institutional Class | $1,000 | $1,024.45 | $0.77 | 0.15% | ||||||||||
| G Class | $1,000 | $1,025.21 | $0.00 | 0.00%(2) | ||||||||||
| Avantis Core Municipal Fixed Income Fund | ||||||||||||||
| Actual | ||||||||||||||
| Institutional Class | $1,000 | $955.70 | $0.74 | 0.15% | ||||||||||
| G Class | $1,000 | $956.40 | $0.00 | 0.00%(2) | ||||||||||
| Hypothetical | ||||||||||||||
| Institutional Class | $1,000 | $1,024.45 | $0.77 | 0.15% | ||||||||||
| G Class | $1,000 | $1,025.21 | $0.00 | 0.00%(2) | ||||||||||
| Avantis Short-Term Fixed Income Fund | ||||||||||||||
| Actual | ||||||||||||||
| Institutional Class | $1,000 | $967.20 | $0.74 | 0.15% | ||||||||||
| G Class | $1,000 | $967.90 | $0.00 | 0.00%(2) | ||||||||||
| Hypothetical | ||||||||||||||
| Institutional Class | $1,000 | $1,024.45 | $0.77 | 0.15% | ||||||||||
| G Class | $1,000 | $1,025.21 | $0.00 | 0.00%(2) | ||||||||||
(1)Expenses are equal to the class's annualized expense ratio listed in the table above, multiplied by the average account value over the period, multiplied by 184, the number of days in the most recent fiscal half-year, divided by 365, to reflect the one-half year period. Annualized expense ratio reflects actual expenses, including any applicable fee waivers or expense reimbursements and excluding any acquired fund fees and expenses.
(2)Other expenses did not exceed 0.005%.
13
| Schedules of Investments | ||
AUGUST 31, 2022
| Avantis Core Fixed Income Fund | ||||||||
| Principal Amount | Value | |||||||
| CORPORATE BONDS — 61.2% | ||||||||
| Aerospace and Defense — 1.4% | ||||||||
| General Dynamics Corp., 3.625%, 4/1/30 | $ | 184,000 | $ | 177,532 | ||||
| Huntington Ingalls Industries, Inc., 3.48%, 12/1/27 | 30,000 | 27,913 | ||||||
| Lockheed Martin Corp., 3.55%, 1/15/26 | 48,000 | 47,633 | ||||||
| Lockheed Martin Corp., 1.85%, 6/15/30 | 175,000 | 150,941 | ||||||
| Northrop Grumman Corp., 3.25%, 1/15/28 | 42,000 | 39,883 | ||||||
| Textron, Inc., 4.00%, 3/15/26 | 30,000 | 29,423 | ||||||
| 473,325 | ||||||||
| Air Freight and Logistics — 0.3% | ||||||||
| United Parcel Service, Inc., 3.90%, 4/1/25 | 100,000 | 100,177 | ||||||
| Airlines — 0.4% | ||||||||
| Southwest Airlines Co., 5.125%, 6/15/27 | 102,000 | 104,098 | ||||||
| Southwest Airlines Co., 2.625%, 2/10/30 | 37,000 | 31,150 | ||||||
| 135,248 | ||||||||
| Auto Components — 0.1% | ||||||||
| BorgWarner, Inc., 2.65%, 7/1/27 | 48,000 | 43,704 | ||||||
| Automobiles — 1.2% | ||||||||
| American Honda Finance Corp., 1.00%, 9/10/25 | 60,000 | 54,714 | ||||||
| American Honda Finance Corp., 2.35%, 1/8/27 | 48,000 | 44,520 | ||||||
| American Honda Finance Corp., 3.50%, 2/15/28 | 150,000 | 144,487 | ||||||
| General Motors Financial Co., Inc., 5.10%, 1/17/24 | 27,000 | 27,244 | ||||||
| General Motors Financial Co., Inc., 4.00%, 1/15/25 | 65,000 | 64,224 | ||||||
| Toyota Motor Credit Corp., 3.375%, 4/1/30 | 30,000 | 28,358 | ||||||
| Toyota Motor Credit Corp., 1.65%, 1/10/31 | 38,000 | 31,096 | ||||||
| 394,643 | ||||||||
| Banks — 5.7% | ||||||||
| African Development Bank, 0.875%, 7/22/26 | 100,000 | 90,271 | ||||||
| Asian Development Bank, 0.25%, 10/6/23 | 25,000 | 24,118 | ||||||
| Asian Development Bank, 0.375%, 9/3/25 | 50,000 | 45,455 | ||||||
| Asian Development Bank, 2.375%, 8/10/27 | 16,000 | 15,208 | ||||||
| Asian Infrastructure Investment Bank, 0.50%, 5/28/25 | 150,000 | 137,392 | ||||||
| Bank of Nova Scotia, 3.40%, 2/11/24 | 68,000 | 67,443 | ||||||
| Council Of Europe Development Bank, 2.50%, 2/27/24 | 25,000 | 24,640 | ||||||
| European Bank for Reconstruction & Development, 0.50%, 1/28/26 | 100,000 | 90,009 | ||||||
| European Investment Bank, 1.375%, 3/15/27 | 200,000 | 182,531 | ||||||
| Fifth Third Bancorp, 3.65%, 1/25/24 | 66,000 | 65,610 | ||||||
| Inter-American Development Bank, 0.625%, 7/15/25 | 150,000 | 137,872 | ||||||
| International Bank for Reconstruction & Development, 0.50%, 10/28/25 | 75,000 | 68,131 | ||||||
| International Bank for Reconstruction & Development, 0.875%, 7/15/26 | 25,000 | 22,608 | ||||||
| International Bank for Reconstruction & Development, 0.75%, 11/24/27 | 60,000 | 52,226 | ||||||
| Kreditanstalt fuer Wiederaufbau, 1.25%, 1/31/25 | 25,000 | 23,654 | ||||||
| Oesterreichische Kontrollbank AG, 1.50%, 2/12/25 | 125,000 | 118,866 | ||||||
| PNC Bank NA, 3.10%, 10/25/27 | 250,000 | 238,034 | ||||||
14
| Avantis Core Fixed Income Fund | ||||||||
| Principal Amount | Value | |||||||
| Santander Holdings USA, Inc., 3.45%, 6/2/25 | $ | 36,000 | $ | 34,433 | ||||
| Santander Holdings USA, Inc., 4.40%, 7/13/27 | 36,000 | 34,694 | ||||||
| Sumitomo Mitsui Financial Group, Inc., 3.94%, 10/16/23 | 30,000 | 29,977 | ||||||
| US Bancorp, 3.95%, 11/17/25 | 97,000 | 97,098 | ||||||
| Wells Fargo & Co., 3.55%, 9/29/25 | 66,000 | 64,895 | ||||||
| Westpac Banking Corp., 2.85%, 5/13/26 | 70,000 | 67,064 | ||||||
| Westpac Banking Corp., 3.35%, 3/8/27 | 145,000 | 139,999 | ||||||
| 1,872,228 | ||||||||
| Beverages — 1.0% | ||||||||
| Constellation Brands, Inc., 4.65%, 11/15/28 | 175,000 | 173,811 | ||||||
| Molson Coors Beverage Co., 3.00%, 7/15/26 | 73,000 | 68,427 | ||||||
| PepsiCo, Inc., 3.00%, 10/15/27 | 73,000 | 70,651 | ||||||
| 312,889 | ||||||||
| Biotechnology — 0.2% | ||||||||
| Biogen, Inc., 2.25%, 5/1/30 | 78,000 | 63,820 | ||||||
| Building Products — 0.4% | ||||||||
| Owens Corning, 3.875%, 6/1/30 | 150,000 | 137,798 | ||||||
| Capital Markets — 4.8% | ||||||||
| Bank of New York Mellon Corp., 3.85%, 4/26/29 | 250,000 | 241,186 | ||||||
| BlackRock, Inc., 3.25%, 4/30/29 | 12,000 | 11,399 | ||||||
| BlackRock, Inc., 2.10%, 2/25/32 | 75,000 | 62,420 | ||||||
| Brookfield Finance, Inc., 3.90%, 1/25/28 | 66,000 | 62,441 | ||||||
| Cboe Global Markets, Inc., 3.65%, 1/12/27 | 200,000 | 195,454 | ||||||
| Charles Schwab Corp., 3.20%, 3/2/27 | 30,000 | 29,069 | ||||||
| Charles Schwab Corp., 2.75%, 10/1/29 | 55,000 | 49,592 | ||||||
| Charles Schwab Corp., 1.95%, 12/1/31 | 120,000 | 97,902 | ||||||
| CME Group, Inc., 3.75%, 6/15/28 | 150,000 | 147,438 | ||||||
| Goldman Sachs Group, Inc., 3.80%, 3/15/30 | 150,000 | 138,468 | ||||||
| Intercontinental Exchange, Inc., 4.35%, 6/15/29 | 100,000 | 98,757 | ||||||
| Lazard Group LLC, 4.375%, 3/11/29 | 125,000 | 119,874 | ||||||
| Morgan Stanley, 3.875%, 1/27/26 | 150,000 | 148,391 | ||||||
| S&P Global, Inc., 2.95%, 1/22/27 | 25,000 | 24,026 | ||||||
S&P Global, Inc., 2.45%, 3/1/27(1) | 173,000 | 161,465 | ||||||
| 1,587,882 | ||||||||
| Chemicals — 1.5% | ||||||||
| CF Industries, Inc., 5.15%, 3/15/34 | 138,000 | 133,267 | ||||||
| Dow Chemical Co., 4.25%, 10/1/34 | 100,000 | 92,560 | ||||||
| EI du Pont de Nemours and Co., 2.30%, 7/15/30 | 30,000 | 25,937 | ||||||
| Linde, Inc., 3.20%, 1/30/26 | 48,000 | 47,096 | ||||||
| Mosaic Co., 5.45%, 11/15/33 | 60,000 | 60,711 | ||||||
| RPM International, Inc., 4.55%, 3/1/29 | 64,000 | 61,272 | ||||||
| Westlake Corp., 3.60%, 8/15/26 | 42,000 | 40,697 | ||||||
| Westlake Corp., 3.375%, 6/15/30 | 30,000 | 26,931 | ||||||
| 488,471 | ||||||||
| Communications Equipment — 0.3% | ||||||||
| Motorola Solutions, Inc., 4.60%, 5/23/29 | 100,000 | 96,444 | ||||||
| Construction and Engineering — 0.1% | ||||||||
| Quanta Services, Inc., 2.90%, 10/1/30 | 30,000 | 25,667 | ||||||
| Consumer Finance — 0.2% | ||||||||
| Ally Financial, Inc., 5.80%, 5/1/25 | 60,000 | 61,405 | ||||||
| Diversified Financial Services — 0.2% | ||||||||
Corebridge Financial, Inc., 3.65%, 4/5/27(1) | 50,000 | 47,040 | ||||||
15
| Avantis Core Fixed Income Fund | ||||||||
| Principal Amount | Value | |||||||
| Equitable Holdings, Inc., 4.35%, 4/20/28 | $ | 30,000 | $ | 29,540 | ||||
| 76,580 | ||||||||
| Diversified Telecommunication Services — 0.4% | ||||||||
| Verizon Communications, Inc., 5.85%, 9/15/35 | 125,000 | 134,267 | ||||||
| Electric Utilities — 3.8% | ||||||||
| Baltimore Gas and Electric Co., 2.25%, 6/15/31 | 140,000 | 118,796 | ||||||
| Berkshire Hathaway Energy Co., 4.05%, 4/15/25 | 12,000 | 12,021 | ||||||
| CenterPoint Energy Houston Electric LLC, 6.95%, 3/15/33 | 120,000 | 142,429 | ||||||
| DTE Electric Co., Series C, 2.625%, 3/1/31 | 66,000 | 58,520 | ||||||
| Duke Energy Carolinas LLC, Series A, 6.00%, 12/1/28 | 30,000 | 32,173 | ||||||
| Edison International, 3.55%, 11/15/24 | 65,000 | 63,576 | ||||||
| Entergy Arkansas LLC, 4.00%, 6/1/28 | 32,000 | 31,063 | ||||||
| Entergy Louisiana LLC, 3.05%, 6/1/31 | 33,000 | 29,570 | ||||||
| Entergy Mississippi LLC, 2.85%, 6/1/28 | 160,000 | 145,771 | ||||||
| IPALCO Enterprises, Inc., 4.25%, 5/1/30 | 57,000 | 52,675 | ||||||
| MidAmerican Energy Co., 6.75%, 12/30/31 | 70,000 | 81,942 | ||||||
| PacifiCorp, 2.70%, 9/15/30 | 54,000 | 47,707 | ||||||
| Public Service Co. of New Hampshire, 2.20%, 6/15/31 | 140,000 | 118,946 | ||||||
| Public Service Electric and Gas Co., 3.00%, 5/15/27 | 36,000 | 34,569 | ||||||
| Puget Energy, Inc., 4.10%, 6/15/30 | 66,000 | 60,938 | ||||||
| Southern Co., 3.70%, 4/30/30 | 150,000 | 140,544 | ||||||
| Union Electric Co., 2.95%, 3/15/30 | 68,000 | 61,925 | ||||||
| Wisconsin Power and Light Co., 3.00%, 7/1/29 | 24,000 | 21,999 | ||||||
| 1,255,164 | ||||||||
| Electronic Equipment, Instruments and Components — 0.6% | ||||||||
| Flex Ltd., 3.75%, 2/1/26 | 30,000 | 28,608 | ||||||
| Jabil, Inc., 3.00%, 1/15/31 | 30,000 | 25,064 | ||||||
| TD SYNNEX Corp., 2.65%, 8/9/31 | 100,000 | 79,068 | ||||||
| Trimble, Inc., 4.90%, 6/15/28 | 62,000 | 61,661 | ||||||
| 194,401 | ||||||||
| Energy Equipment and Services — 0.5% | ||||||||
| Baker Hughes Holdings LLC / Baker Hughes Co.-Obligor, Inc., 3.34%, 12/15/27 | 30,000 | 28,093 | ||||||
| Schlumberger Finance Canada Ltd., 1.40%, 9/17/25 | 70,000 | 65,518 | ||||||
| Schlumberger Investment SA, 2.65%, 6/26/30 | 66,000 | 58,261 | ||||||
| 151,872 | ||||||||
| Entertainment — 0.2% | ||||||||
| TWDC Enterprises 18 Corp., 7.00%, 3/1/32 | 45,000 | 53,172 | ||||||
| Equity Real Estate Investment Trusts (REITs) — 6.7% | ||||||||
| Alexandria Real Estate Equities, Inc., 3.375%, 8/15/31 | 50,000 | 44,641 | ||||||
| American Homes 4 Rent LP, 4.25%, 2/15/28 | 66,000 | 63,128 | ||||||
| American Tower Corp., 3.60%, 1/15/28 | 66,000 | 61,363 | ||||||
| American Tower Corp., 2.90%, 1/15/30 | 100,000 | 86,457 | ||||||
| AvalonBay Communities, Inc., 3.20%, 1/15/28 | 24,000 | 22,469 | ||||||
| AvalonBay Communities, Inc., 3.30%, 6/1/29 | 75,000 | 69,747 | ||||||
| Boston Properties LP, 3.65%, 2/1/26 | 250,000 | 243,142 | ||||||
| Brixmor Operating Partnership LP, 3.65%, 6/15/24 | 69,000 | 67,398 | ||||||
| Camden Property Trust, 3.15%, 7/1/29 | 85,000 | 77,985 | ||||||
| Corporate Office Properties LP, 2.25%, 3/15/26 | 72,000 | 64,595 | ||||||
| Crown Castle, Inc., 3.30%, 7/1/30 | 150,000 | 133,173 | ||||||
| Equinix, Inc., 2.00%, 5/15/28 | 125,000 | 107,518 | ||||||
16
| Avantis Core Fixed Income Fund | ||||||||
| Principal Amount | Value | |||||||
| ERP Operating LP, 3.25%, 8/1/27 | $ | 90,000 | $ | 84,840 | ||||
| Essex Portfolio LP, 4.00%, 3/1/29 | 150,000 | 142,443 | ||||||
| Highwoods Realty LP, 2.60%, 2/1/31 | 36,000 | 28,771 | ||||||
| Host Hotels & Resorts LP, 4.50%, 2/1/26 | 70,000 | 68,374 | ||||||
| Kilroy Realty LP, 2.50%, 11/15/32 | 79,000 | 61,222 | ||||||
| Prologis LP, 2.125%, 4/15/27 | 110,000 | 101,538 | ||||||
| Prologis LP, 2.25%, 4/15/30 | 115,000 | 100,137 | ||||||
| Realty Income Corp., 3.65%, 1/15/28 | 36,000 | 34,543 | ||||||
| Simon Property Group LP, 2.20%, 2/1/31 | 200,000 | 164,243 | ||||||
| Sun Communities Operating LP, 2.30%, 11/1/28 | 100,000 | 84,547 | ||||||
| Tanger Properties LP, 2.75%, 9/1/31 | 150,000 | 114,288 | ||||||
| UDR, Inc., 3.20%, 1/15/30 | 150,000 | 133,266 | ||||||
| Ventas Realty LP, 4.75%, 11/15/30 | 66,000 | 64,100 | ||||||
| 2,223,928 | ||||||||
| Food and Staples Retailing — 0.9% | ||||||||
| Costco Wholesale Corp., 3.00%, 5/18/27 | 125,000 | 121,850 | ||||||
| Sysco Corp., 5.375%, 9/21/35 | 125,000 | 129,682 | ||||||
| Walgreens Boots Alliance, Inc., 3.45%, 6/1/26 | 5,000 | 4,853 | ||||||
| Walgreens Boots Alliance, Inc., 3.20%, 4/15/30 | 30,000 | 26,774 | ||||||
| 283,159 | ||||||||
| Food Products — 1.1% | ||||||||
| Archer-Daniels-Midland Co., 3.25%, 3/27/30 | 66,000 | 62,202 | ||||||
| Bunge Ltd. Finance Corp., 3.25%, 8/15/26 | 73,000 | 70,042 | ||||||
| Bunge Ltd. Finance Corp., 2.75%, 5/14/31 | 100,000 | 84,091 | ||||||
| Campbell Soup Co., 4.15%, 3/15/28 | 64,000 | 62,919 | ||||||
| Conagra Brands, Inc., 4.85%, 11/1/28 | 75,000 | 74,306 | ||||||
| 353,560 | ||||||||
| Gas Utilities — 0.2% | ||||||||
| National Fuel Gas Co., 4.75%, 9/1/28 | 35,000 | 33,746 | ||||||
| Southern California Gas Co., 2.55%, 2/1/30 | 35,000 | 31,269 | ||||||
| 65,015 | ||||||||
| Health Care Equipment and Supplies — 0.6% | ||||||||
| Abbott Laboratories, 3.875%, 9/15/25 | 125,000 | 125,780 | ||||||
| Edwards Lifesciences Corp., 4.30%, 6/15/28 | 26,000 | 25,934 | ||||||
| Medtronic, Inc., 4.375%, 3/15/35 | 30,000 | 29,821 | ||||||
| 181,535 | ||||||||
| Health Care Providers and Services — 1.5% | ||||||||
| Adventist Health System, 2.95%, 3/1/29 | 67,000 | 60,780 | ||||||
| Cardinal Health, Inc., 3.08%, 6/15/24 | 30,000 | 29,429 | ||||||
| CVS Health Corp., 4.875%, 7/20/35 | 70,000 | 68,442 | ||||||
| Humana, Inc., 2.15%, 2/3/32 | 200,000 | 162,092 | ||||||
| UnitedHealth Group, Inc., 3.45%, 1/15/27 | 24,000 | 23,595 | ||||||
| UnitedHealth Group, Inc., 3.375%, 4/15/27 | 125,000 | 122,360 | ||||||
| UnitedHealth Group, Inc., 4.625%, 7/15/35 | 24,000 | 23,952 | ||||||
| 490,650 | ||||||||
| Hotels, Restaurants and Leisure — 0.2% | ||||||||
| Marriott International, Inc., 4.625%, 6/15/30 | 75,000 | 71,737 | ||||||
| Household Durables — 0.5% | ||||||||
| DR Horton, Inc., 1.40%, 10/15/27 | 150,000 | 125,766 | ||||||
| Whirlpool Corp., 4.00%, 3/1/24 | 54,000 | 54,107 | ||||||
| 179,873 | ||||||||
17
| Avantis Core Fixed Income Fund | ||||||||
| Principal Amount | Value | |||||||
| Household Products — 0.7% | ||||||||
| Kimberly-Clark Corp., 3.20%, 4/25/29 | $ | 250,000 | $ | 236,787 | ||||
| Industrial Conglomerates — 0.8% | ||||||||
| 3M Co., 3.375%, 3/1/29 | 250,000 | 232,118 | ||||||
| 3M Co., 5.70%, 3/15/37 | 18,000 | 19,145 | ||||||
| Honeywell International, Inc., 5.70%, 3/15/36 | 24,000 | 26,894 | ||||||
| 278,157 | ||||||||
| Insurance — 2.7% | ||||||||
| Aflac, Inc., 3.60%, 4/1/30 | 75,000 | 71,459 | ||||||
| Assurant, Inc., 3.70%, 2/22/30 | 100,000 | 88,763 | ||||||
| Athene Holding Ltd., 6.15%, 4/3/30 | 100,000 | 101,042 | ||||||
| Chubb INA Holdings, Inc., 1.375%, 9/15/30 | 36,000 | 28,749 | ||||||
| Chubb INA Holdings, Inc., 6.70%, 5/15/36 | 75,000 | 88,765 | ||||||
| Hartford Financial Services Group, Inc., 2.80%, 8/19/29 | 50,000 | 44,339 | ||||||
| MetLife, Inc., 3.60%, 11/13/25 | 97,000 | 95,972 | ||||||
| Prudential PLC, 3.625%, 3/24/32 | 250,000 | 226,118 | ||||||
| Willis North America, Inc., 4.50%, 9/15/28 | 150,000 | 146,173 | ||||||
| 891,380 | ||||||||
| Interactive Media and Services — 0.1% | ||||||||
| Alphabet, Inc., 0.80%, 8/15/27 | 48,000 | 41,962 | ||||||
| Internet and Direct Marketing Retail — 0.4% | ||||||||
| Amazon.com, Inc., 5.20%, 12/3/25 | 30,000 | 31,263 | ||||||
| Amazon.com, Inc., 4.80%, 12/5/34 | 100,000 | 105,629 | ||||||
| 136,892 | ||||||||
| IT Services — 1.1% | ||||||||
| Global Payments, Inc., 4.45%, 6/1/28 | 100,000 | 96,448 | ||||||
| International Business Machines Corp., 3.50%, 5/15/29 | 100,000 | 94,466 | ||||||
| VeriSign, Inc., 2.70%, 6/15/31 | 200,000 | 164,450 | ||||||
| 355,364 | ||||||||
| Leisure Products — 0.2% | ||||||||
| Hasbro, Inc., 3.50%, 9/15/27 | 67,000 | 63,513 | ||||||
| Machinery — 1.2% | ||||||||
| ABB Finance USA, Inc., 3.80%, 4/3/28 | 64,000 | 62,713 | ||||||
| Caterpillar Financial Services Corp., 1.10%, 9/14/27 | 30,000 | 26,249 | ||||||
| John Deere Capital Corp., 3.05%, 1/6/28 | 102,000 | 98,087 | ||||||
| Kennametal, Inc., 4.625%, 6/15/28 | 65,000 | 62,615 | ||||||
| Otis Worldwide Corp., 2.57%, 2/15/30 | 150,000 | 129,274 | ||||||
| 378,938 | ||||||||
| Media — 1.3% | ||||||||
| Comcast Corp., 4.25%, 10/15/30 | 210,000 | 206,836 | ||||||
| Fox Corp., 3.05%, 4/7/25 | 130,000 | 125,687 | ||||||
| Walt Disney Co., 2.00%, 9/1/29 | 42,000 | 36,338 | ||||||
| Walt Disney Co., 6.55%, 3/15/33 | 40,000 | 46,121 | ||||||
| 414,982 | ||||||||
| Metals and Mining — 0.7% | ||||||||
| Barrick Gold Corp., 6.45%, 10/15/35 | 100,000 | 109,653 | ||||||
| Kinross Gold Corp., 4.50%, 7/15/27 | 42,000 | 40,803 | ||||||
| Steel Dynamics, Inc., 3.25%, 1/15/31 | 100,000 | 86,531 | ||||||
| 236,987 | ||||||||
| Multi-Utilities — 0.4% | ||||||||
| Dominion Energy, Inc., 5.95%, 6/15/35 | 100,000 | 106,381 | ||||||
18
| Avantis Core Fixed Income Fund | ||||||||
| Principal Amount | Value | |||||||
| San Diego Gas & Electric Co., 1.70%, 10/1/30 | $ | 37,000 | $ | 30,447 | ||||
| 136,828 | ||||||||
| Multiline Retail — 0.4% | ||||||||
| Dollar Tree, Inc., 4.00%, 5/15/25 | 65,000 | 64,424 | ||||||
| Dollar Tree, Inc., 4.20%, 5/15/28 | 30,000 | 29,261 | ||||||
| Target Corp., 2.65%, 9/15/30 | 42,000 | 37,503 | ||||||
| 131,188 | ||||||||
| Oil, Gas and Consumable Fuels — 5.8% | ||||||||
| Boardwalk Pipelines LP, 4.80%, 5/3/29 | 50,000 | 47,982 | ||||||
| BP Capital Markets America, Inc., 3.12%, 5/4/26 | 250,000 | 242,149 | ||||||
| Burlington Resources LLC, 7.40%, 12/1/31 | 18,000 | 21,471 | ||||||
| Canadian Natural Resources Ltd., 2.95%, 7/15/30 | 29,000 | 25,301 | ||||||
| Canadian Natural Resources Ltd., 5.85%, 2/1/35 | 60,000 | 59,913 | ||||||
| Cheniere Corpus Christi Holdings LLC, 5.125%, 6/30/27 | 63,000 | 62,950 | ||||||
| Chevron Corp., 1.55%, 5/11/25 | 42,000 | 39,649 | ||||||
| Chevron USA, Inc., 3.85%, 1/15/28 | 26,000 | 25,716 | ||||||
| ConocoPhillips Co., 6.95%, 4/15/29 | 85,000 | 97,094 | ||||||
| Devon Energy Corp., 4.50%, 1/15/30 | 133,000 | 126,298 | ||||||
| Enbridge, Inc., 3.125%, 11/15/29 | 42,000 | 38,017 | ||||||
| Energy Transfer LP, 3.75%, 5/15/30 | 175,000 | 157,426 | ||||||
| Enterprise Products Operating LLC, 3.70%, 2/15/26 | 18,000 | 17,790 | ||||||
| EOG Resources, Inc., 4.15%, 1/15/26 | 200,000 | 200,335 | ||||||
| Equinor ASA, 2.875%, 4/6/25 | 44,000 | 42,823 | ||||||
| Equinor ASA, 1.75%, 1/22/26 | 70,000 | 64,992 | ||||||
| Exxon Mobil Corp., 2.44%, 8/16/29 | 54,000 | 48,743 | ||||||
| Halliburton Co., 2.92%, 3/1/30 | 175,000 | 154,903 | ||||||
| Kinder Morgan, Inc., 5.30%, 12/1/34 | 18,000 | 17,650 | ||||||
| Marathon Petroleum Corp., 4.70%, 5/1/25 | 24,000 | 24,164 | ||||||
| MPLX LP, 2.65%, 8/15/30 | 30,000 | 25,048 | ||||||
| ONEOK, Inc., 6.35%, 1/15/31 | 35,000 | 36,599 | ||||||
| ONEOK, Inc., 6.00%, 6/15/35 | 60,000 | 59,288 | ||||||
| Phillips 66, 3.90%, 3/15/28 | 24,000 | 23,028 | ||||||
| Pioneer Natural Resources Co., 1.90%, 8/15/30 | 30,000 | 24,484 | ||||||
| Sabine Pass Liquefaction LLC, 4.50%, 5/15/30 | 68,000 | 65,159 | ||||||
| Shell International Finance BV, 3.25%, 5/11/25 | 18,000 | 17,709 | ||||||
| Shell International Finance BV, 2.50%, 9/12/26 | 66,000 | 62,576 | ||||||
| Shell International Finance BV, 4.125%, 5/11/35 | 12,000 | 11,412 | ||||||
| Valero Energy Corp., 6.625%, 6/15/37 | 30,000 | 32,602 | ||||||
| Valero Energy Partners LP, 4.50%, 3/15/28 | 26,000 | 25,701 | ||||||
| Williams Cos., Inc., 4.00%, 9/15/25 | 18,000 | 17,816 | ||||||
| 1,916,788 | ||||||||
| Paper and Forest Products — 0.4% | ||||||||
| WestRock MWV LLC, 7.95%, 2/15/31 | 100,000 | 117,321 | ||||||
| Personal Products — 0.1% | ||||||||
| Estee Lauder Cos., Inc., 1.95%, 3/15/31 | 57,000 | 48,107 | ||||||
| Pharmaceuticals — 1.7% | ||||||||
| Astrazeneca Finance LLC, 2.25%, 5/28/31 | 50,000 | 43,362 | ||||||
| AstraZeneca PLC, 0.70%, 4/8/26 | 140,000 | 124,728 | ||||||
| Bristol-Myers Squibb Co., 1.45%, 11/13/30 | 46,000 | 37,607 | ||||||
| GlaxoSmithKline Capital, Inc., 6.375%, 5/15/38 | 36,000 | 42,251 | ||||||
| Johnson & Johnson, 0.55%, 9/1/25 | 24,000 | 22,012 | ||||||
19
| Avantis Core Fixed Income Fund | ||||||||
| Principal Amount | Value | |||||||
| Johnson & Johnson, 2.90%, 1/15/28 | $ | 54,000 | $ | 51,948 | ||||
| Merck & Co., Inc., 0.75%, 2/24/26 | 42,000 | 37,998 | ||||||
| Novartis Capital Corp., 3.10%, 5/17/27 | 66,000 | 64,095 | ||||||
| Royalty Pharma PLC, 2.20%, 9/2/30 | 73,000 | 59,289 | ||||||
| Sanofi, 3.625%, 6/19/28 | 65,000 | 63,181 | ||||||
| 546,471 | ||||||||
| Road and Rail — 0.7% | ||||||||
| CSX Corp., 6.15%, 5/1/37 | 75,000 | 84,006 | ||||||
| Union Pacific Corp., 3.375%, 2/1/35 | 175,000 | 155,473 | ||||||
| 239,479 | ||||||||
| Semiconductors and Semiconductor Equipment — 2.4% | ||||||||
| Applied Materials, Inc., 5.10%, 10/1/35 | 150,000 | 158,520 | ||||||
| Broadcom, Inc., 4.15%, 11/15/30 | 100,000 | 91,293 | ||||||
| Intel Corp., 3.90%, 3/25/30 | 60,000 | 57,822 | ||||||
| Lam Research Corp., 4.00%, 3/15/29 | 125,000 | 122,776 | ||||||
| Marvell Technology, Inc., 2.45%, 4/15/28 | 150,000 | 130,481 | ||||||
| Micron Technology, Inc., 4.66%, 2/15/30 | 150,000 | 140,698 | ||||||
| NXP BV / NXP Funding LLC, 5.55%, 12/1/28 | 24,000 | 24,445 | ||||||
| QUALCOMM, Inc., 3.25%, 5/20/27 | 66,000 | 64,443 | ||||||
| 790,478 | ||||||||
| Software — 1.2% | ||||||||
| Autodesk, Inc., 2.85%, 1/15/30 | 150,000 | 133,307 | ||||||
| Oracle Corp., 3.25%, 5/15/30 | 75,000 | 65,311 | ||||||
| Roper Technologies, Inc., 1.40%, 9/15/27 | 73,000 | 62,587 | ||||||
| VMware, Inc., 1.80%, 8/15/28 | 100,000 | 83,253 | ||||||
| VMware, Inc., 4.70%, 5/15/30 | 60,000 | 56,937 | ||||||
| 401,395 | ||||||||
| Specialty Retail — 1.7% | ||||||||
| Advance Auto Parts, Inc., 3.50%, 3/15/32 | 175,000 | 148,725 | ||||||
| AutoNation, Inc., 3.80%, 11/15/27 | 40,000 | 36,855 | ||||||
| AutoNation, Inc., 4.75%, 6/1/30 | 24,000 | 22,500 | ||||||
| AutoZone, Inc., 4.00%, 4/15/30 | 150,000 | 142,618 | ||||||
| Home Depot, Inc., 2.80%, 9/14/27 | 66,000 | 62,751 | ||||||
| Home Depot, Inc., 2.70%, 4/15/30 | 150,000 | 135,237 | ||||||
| TJX Cos., Inc., 1.15%, 5/15/28 | 30,000 | 25,587 | ||||||
| 574,273 | ||||||||
| Technology Hardware, Storage and Peripherals — 1.0% | ||||||||
| Apple, Inc., 3.20%, 5/11/27 | 12,000 | 11,702 | ||||||
| Apple, Inc., 2.20%, 9/11/29 | 18,000 | 16,089 | ||||||
| Apple, Inc., 1.65%, 5/11/30 | 48,000 | 40,785 | ||||||
| Apple, Inc., 1.70%, 8/5/31 | 100,000 | 84,547 | ||||||
| Apple, Inc., 4.50%, 2/23/36 | 150,000 | 154,952 | ||||||
| HP, Inc., 3.40%, 6/17/30 | 42,000 | 36,550 | ||||||
| 344,625 | ||||||||
| Textiles, Apparel and Luxury Goods — 0.4% | ||||||||
| NIKE, Inc., 2.85%, 3/27/30 | 150,000 | 138,053 | ||||||
| Transportation Infrastructure — 0.2% | ||||||||
| FedEx Corp. 2020-1 Class AA Pass Through Trust, 1.875%, 8/20/35 | 65,193 | 56,979 | ||||||
| Wireless Telecommunication Services — 0.6% | ||||||||
| T-Mobile USA, Inc., 3.875%, 4/15/30 | 100,000 | 92,499 | ||||||
20
| Avantis Core Fixed Income Fund | ||||||||
| Principal Amount | Value | |||||||
| Vodafone Group PLC, 6.25%, 11/30/32 | $ | 100,000 | $ | 107,837 | ||||
| 200,336 | ||||||||
TOTAL CORPORATE BONDS (Cost $21,781,769) | 20,185,897 | |||||||
| U.S. TREASURY SECURITIES AND EQUIVALENTS — 25.2% | ||||||||
| Israel Government AID Bond, 5.50%, 9/18/23 | 25,000 | 25,487 | ||||||
| U.S. Treasury Bonds, 7.625%, 2/15/25 | 245,000 | 268,715 | ||||||
| U.S. Treasury Bonds, 6.125%, 11/15/27 | 250,000 | 282,412 | ||||||
| U.S. Treasury Bonds, 5.50%, 8/15/28 | 85,000 | 94,715 | ||||||
| U.S. Treasury Bonds, 2.375%, 2/15/42 | 380,000 | 315,162 | ||||||
| U.S. Treasury Bonds, 3.00%, 5/15/42 | 650,000 | 597,873 | ||||||
| U.S. Treasury Bonds, 2.75%, 8/15/42 | 650,000 | 571,594 | ||||||
| U.S. Treasury Bonds, 2.875%, 5/15/43 | 250,000 | 223,027 | ||||||
| U.S. Treasury Bonds, 3.375%, 5/15/44 | 300,000 | 289,676 | ||||||
| U.S. Treasury Bonds, 3.125%, 8/15/44 | 350,000 | 323,982 | ||||||
| U.S. Treasury Bonds, 2.875%, 8/15/45 | 35,000 | 30,971 | ||||||
| U.S. Treasury Notes, 0.25%, 9/30/23 | 100,000 | 96,607 | ||||||
| U.S. Treasury Notes, 0.75%, 12/31/23 | 350,000 | 337,695 | ||||||
| U.S. Treasury Notes, 0.875%, 1/31/24 | 500,000 | 482,012 | ||||||
| U.S. Treasury Notes, 2.125%, 2/29/24 | 350,000 | 343,205 | ||||||
| U.S. Treasury Notes, 2.25%, 3/31/24 | 400,000 | 392,391 | ||||||
| U.S. Treasury Notes, 0.375%, 8/15/24 | 375,000 | 353,276 | ||||||
| U.S. Treasury Notes, 1.75%, 12/31/24 | 380,000 | 365,535 | ||||||
| U.S. Treasury Notes, 2.50%, 1/31/25 | 355,000 | 346,999 | ||||||
U.S. Treasury Notes, 1.50%, 2/15/25(2) | 320,000 | 305,087 | ||||||
| U.S. Treasury Notes, 2.75%, 2/28/25 | 375,000 | 368,452 | ||||||
| U.S. Treasury Notes, 0.50%, 3/31/25 | 375,000 | 347,622 | ||||||
| U.S. Treasury Notes, 0.375%, 1/31/26 | 105,000 | 94,545 | ||||||
| U.S. Treasury Notes, 1.50%, 8/15/26 | 135,000 | 125,350 | ||||||
| U.S. Treasury Notes, 2.25%, 8/15/27 | 150,000 | 142,477 | ||||||
| U.S. Treasury Notes, 1.25%, 3/31/28 | 125,000 | 111,602 | ||||||
| U.S. Treasury Notes, 1.375%, 10/31/28 | 570,000 | 507,523 | ||||||
| U.S. Treasury Notes, 2.375%, 5/15/29 | 215,000 | 202,780 | ||||||
| U.S. Treasury Notes, 1.875%, 2/15/32 | 395,000 | 353,216 | ||||||
TOTAL U.S. TREASURY SECURITIES AND EQUIVALENTS (Cost $8,609,444) | 8,299,988 | |||||||
| U.S. GOVERNMENT AGENCY MORTGAGE-BACKED SECURITIES — 19.3% | ||||||||
| Fixed-Rate U.S. Government Agency Mortgage-Backed Securities — 19.3% | ||||||||
| GNMA, 3.00%,TBA | 150,000 | 140,853 | ||||||
| GNMA, 3.50%,TBA | 700,000 | 675,145 | ||||||
| GNMA, 4.50%,TBA | 350,000 | 350,164 | ||||||
| GNMA, 3.50%,TBA | 550,000 | 529,934 | ||||||
| UMBS, 2.50%,TBA | 250,000 | 236,562 | ||||||
| UMBS, 3.00%,TBA | 350,000 | 339,049 | ||||||
| UMBS, 3.50%,TBA | 250,000 | 245,538 | ||||||
| UMBS, 3.00%,TBA | 600,000 | 580,641 | ||||||
| UMBS, 3.00%,TBA | 450,000 | 416,707 | ||||||
| UMBS, 3.50%,TBA | 307,482 | 293,044 | ||||||
| UMBS, 4.00%,TBA | 300,000 | 292,898 | ||||||
21
| Avantis Core Fixed Income Fund | ||||||||
| Principal Amount/Shares | Value | |||||||
| UMBS, 4.50%,TBA | $ | 400,000 | $ | 397,687 | ||||
| UMBS, 3.00%,TBA | 200,000 | 185,121 | ||||||
| UMBS, 3.50%,TBA | 1,000,000 | 952,465 | ||||||
| UMBS, 4.00%,TBA | 750,000 | 731,687 | ||||||
TOTAL U.S. GOVERNMENT AGENCY MORTGAGE-BACKED SECURITIES (Cost $6,438,470) | 6,367,495 | |||||||
| U.S. GOVERNMENT AGENCY SECURITIES — 1.9% | ||||||||
| FHLB, 3.25%, 11/16/28 | 100,000 | 99,593 | ||||||
| FNMA, 0.375%, 8/25/25 | 25,000 | 22,810 | ||||||
| FNMA, 7.125%, 1/15/30 | 150,000 | 186,641 | ||||||
| FNMA, 6.625%, 11/15/30 | 125,000 | 153,065 | ||||||
| Tennessee Valley Authority, 0.75%, 5/15/25 | 175,000 | 162,149 | ||||||
TOTAL U.S. GOVERNMENT AGENCY SECURITIES (Cost $647,357) | 624,258 | |||||||
| SHORT-TERM INVESTMENTS — 11.6% | ||||||||
| Money Market Funds — 1.3% | ||||||||
| State Street Institutional U.S. Government Money Market Fund, Premier Class | 446,011 | 446,011 | ||||||
Treasury Bills(3) — 10.3% | ||||||||
| U.S. Treasury Bills, 2.04%, 9/8/22 | $ | 150,000 | 149,941 | |||||
| U.S. Treasury Bills, 2.25%, 9/15/22 | 400,000 | 399,667 | ||||||
| U.S. Treasury Bills, 2.24%, 9/20/22 | 1,000,000 | 998,869 | ||||||
| U.S. Treasury Bills, 2.67%, 10/25/22 | 350,000 | 348,628 | ||||||
| U.S. Treasury Bills, 2.05%, 9/22/22 | 500,000 | 499,402 | ||||||
| U.S. Treasury Bills, 2.12%, 9/6/22 | 1,000,000 | 999,722 | ||||||
| 3,396,229 | ||||||||
TOTAL SHORT-TERM INVESTMENTS (Cost $3,842,205) | 3,842,240 | |||||||
TOTAL INVESTMENT SECURITIES — 119.2% (Cost $41,319,245) | 39,319,878 | |||||||
| OTHER ASSETS AND LIABILITIES — (19.2)% | (6,336,686) | |||||||
| TOTAL NET ASSETS — 100.0% | $ | 32,983,192 | ||||||
| FUTURES CONTRACTS PURCHASED | ||||||||||||||
| Reference Entity | Contracts | Expiration Date | Notional Amount | Unrealized Appreciation (Depreciation)^ | ||||||||||
| U.S. Treasury Long Bonds | 5 | December 2022 | $ | 679,219 | $ | (3,361) | ||||||||
^Amount represents value and unrealized appreciation (depreciation).
22
Avantis Core Fixed Income Fund
| CENTRALLY CLEARED CREDIT DEFAULT SWAP AGREEMENTS | |||||||||||||||||||||||
| Reference Entity | Type‡ | Fixed Rate Received (Paid) Quarterly | Termination Date | Notional Amount | Premiums Paid (Received) | Unrealized Appreciation (Depreciation) | Value^ | ||||||||||||||||
| Markit CDX North America Investment Grade Index Series 38 | Sell | 1.00% | 6/20/27 | $ | 700,000 | $ | 6,232 | $ | (2,420) | $ | 3,812 | ||||||||||||
‡The maximum potential amount the fund could be required to deliver as a seller of credit protection if a credit event occurs as defined under the terms of the agreement is the notional amount. The maximum potential amount may be partially offset by any recovery values of the reference entities and upfront payments received upon entering into the agreement.
^The value for credit default swap agreements serves as an indicator of the current status of the payment/performance risk and represent the likelihood of an expected liability or profit at the period end. Increasing values in absolute terms when compared to the notional amount of the credit default swap agreement represent a deterioration of the referenced entity's credit soundness and an increased likelihood or risk of a credit event occurring as defined in the agreement.
| NOTES TO SCHEDULE OF INVESTMENTS | ||||||||
| AID | - | Agency for International Development | ||||||
| CDX | - | Credit Derivatives Indexes | ||||||
| Equivalent | - | Security whose payments are secured by the U.S. Treasury | ||||||
| FHLB | - | Federal Home Loan Bank | ||||||
| FNMA | - | Federal National Mortgage Association | ||||||
| GNMA | - | Government National Mortgage Association | ||||||
| TBA | - | To-Be-Announced. Security was purchased on a forward commitment basis with an approximate principal amount and maturity date. Actual principal amount and maturity date will be determined upon settlement. | ||||||
| UMBS | - | Uniform Mortgage-Backed Securities | ||||||
(1)Security was purchased pursuant to Rule 144A or Section 4(2) under the Securities Act of 1933 and may be sold in transactions exempt from registration, normally to qualified institutional investors. The aggregate value of these securities at the period end was $208,505, which represented 0.6% of total net assets.
(2)Security, or a portion thereof, has been pledged at the custodian bank or with a broker for collateral requirements on forward commitments, futures contracts and/or swap agreements. At the period end, the aggregate value of securities pledged was $52,437.
(3)The rate indicated is the yield to maturity at purchase for non-interest bearing securities. For interest bearing securities, the stated coupon rate is shown.
See Notes to Financial Statements.
23
AUGUST 31, 2022
| Avantis Core Municipal Fixed Income Fund | ||||||||
| Principal Amount | Value | |||||||
| MUNICIPAL SECURITIES — 98.7% | ||||||||
| Alabama — 2.1% | ||||||||
Alabama Federal Aid Highway Finance Authority Rev., 5.00%, 9/1/24(1) | $ | 10,000 | $ | 10,511 | ||||
Alabama Federal Aid Highway Finance Authority Rev., 5.00%, 9/1/26, Prerefunded at 100% of Par(1) | 10,000 | 10,967 | ||||||
Alabama Federal Aid Highway Finance Authority Rev., 4.00%, 9/1/27, Prerefunded at 100% of Par(1) | 25,000 | 26,829 | ||||||
| Alabama Public School and College Authority Rev., 5.00%, 11/1/37 | 100,000 | 112,086 | ||||||
| State of Alabama GO, 5.00%, 8/1/27 | 60,000 | 65,781 | ||||||
| 226,174 | ||||||||
| Arizona — 2.5% | ||||||||
| Mesa Utility System Rev., 4.00%, 7/1/34 | 15,000 | 15,610 | ||||||
| Pima County Sewer System Rev., 5.00%, 7/1/25 | 20,000 | 21,394 | ||||||
| Salt River Project Agricultural Improvement & Power District Rev., 5.00%, 1/1/30 | 65,000 | 72,820 | ||||||
| Salt River Project Agricultural Improvement & Power District Rev., 5.00%, 1/1/31 | 55,000 | 61,474 | ||||||
| Scottsdale Municipal Property Corp. Rev., 5.00%, 7/1/30 | 30,000 | 34,072 | ||||||
State of Arizona COP, 5.00%, 10/1/25(1) | 10,000 | 10,774 | ||||||
State of Arizona COP, 5.00%, 10/1/27(1) | 40,000 | 44,925 | ||||||
State of Arizona Lottery Rev., 5.00%, 7/1/27(1) | 10,000 | 11,153 | ||||||
| 272,222 | ||||||||
| California — 15.9% | ||||||||
| California Infrastructure & Economic Development Bank Rev., 5.00%, 10/1/28 | 30,000 | 33,379 | ||||||
| California State Public Works Board Rev., (State of California Department of General Services), 5.00%, 5/1/25 | 25,000 | 26,658 | ||||||
| California State Public Works Board Rev., (State of California Department of General Services), 5.00%, 5/1/27 | 50,000 | 53,304 | ||||||
| California State University Rev., 5.00%, 11/1/26 | 10,000 | 10,839 | ||||||
| California State University Rev., 4.00%, 11/1/34 | 50,000 | 51,249 | ||||||
| California State University Rev., 5.00%, 11/1/37 | 25,000 | 26,780 | ||||||
| East Bay Municipal Utility District Water System Rev., 5.00%, 6/1/30 | 10,000 | 10,706 | ||||||
| East Bay Municipal Utility District Water System Rev., 5.00%, 6/1/33 | 20,000 | 22,287 | ||||||
| Eastern Municipal Water District Financing Authority Rev., 4.00%, 7/1/38 | 40,000 | 41,270 | ||||||
| Los Angeles Department of Airports Rev., 5.00%, 5/15/31 | 95,000 | 109,601 | ||||||
| Los Angeles Department of Airports Rev., 5.00%, 5/15/38 | 95,000 | 104,687 | ||||||
| Los Angeles Department of Water & Power Rev., 5.00%, 7/1/28 | 20,000 | 21,187 | ||||||
| Los Angeles Department of Water & Power Rev., 5.00%, 7/1/28 | 105,000 | 119,548 | ||||||
| Los Angeles Department of Water & Power System Rev., 5.00%, 7/1/34 | 15,000 | 15,806 | ||||||
| Los Angeles Unified School District GO, 5.00%, 7/1/29 | 25,000 | 28,134 | ||||||
| Municipal Improvement Corp. of Los Angeles Rev., (Los Angeles), 5.00%, 11/1/31 | 40,000 | 43,748 | ||||||
| Port of Los Angeles Rev., 5.00%, 8/1/26 | 25,000 | 27,272 | ||||||
| San Diego Public Facilities Financing Authority Rev., (San Diego Sewer Utility Rev.), 5.00%, 5/15/29 | 25,000 | 27,320 | ||||||
| San Diego Unified School District GO, 5.25%, 7/1/28 (AGM) | 25,000 | 28,860 | ||||||
| San Diego Unified School District GO, 5.00%, 7/1/29 | 20,000 | 21,888 | ||||||
24
| Avantis Core Municipal Fixed Income Fund | ||||||||
| Principal Amount | Value | |||||||
| San Diego Unified School District GO, 4.00%, 7/1/32 | $ | 40,000 | $ | 41,736 | ||||
San Diego Unified School District GO ,Capital Appreciation, 0.00%, 7/1/30(2) | 15,000 | 11,837 | ||||||
| San Francisco City & County Airport Comm-San Francisco International Airport Rev., 5.00%, 5/1/35 | 10,000 | 11,032 | ||||||
| San Francisco City & County Airport Comm-San Francisco International Airport Rev., 5.00%, 5/1/37 | 10,000 | 10,922 | ||||||
| San Francisco Public Utilities Commission Water Rev., 5.00%, 11/1/29 | 50,000 | 55,231 | ||||||
| San Francisco Public Utilities Commission Water Rev., 5.00%, 11/1/34 | 15,000 | 16,340 | ||||||
| San Jose Redevelopment Agency Successor Agency Tax Allocation, 5.00%, 8/1/34 | 10,000 | 10,882 | ||||||
| Southern California Public Power Authority Rev., 5.00%, 7/1/30 | 10,000 | 10,299 | ||||||
| State of California GO, 5.00%, 9/1/26 | 20,000 | 21,990 | ||||||
| State of California GO, 5.00%, 11/1/27 | 40,000 | 44,992 | ||||||
| State of California GO, 5.00%, 8/1/29 | 30,000 | 32,838 | ||||||
| State of California GO, 5.00%, 8/1/30 | 40,000 | 45,411 | ||||||
| State of California GO, 5.25%, 8/1/32 (AGM) | 10,000 | 12,148 | ||||||
| State of California GO, 4.00%, 9/1/33 | 70,000 | 72,689 | ||||||
| State of California GO, 5.00%, 9/1/35 | 40,000 | 43,217 | ||||||
| State of California GO, 3.00%, 10/1/35 | 165,000 | 157,237 | ||||||
| State of California GO, 3.00%, 10/1/37 | 40,000 | 36,364 | ||||||
State of California Department of Water Resources Rev., 5.00%, 12/1/26, Prerefunded at 100% of Par(1) | 25,000 | 27,760 | ||||||
| State of California Department of Water Resources Rev., 5.00%, 12/1/29 | 25,000 | 27,648 | ||||||
| State of California Department of Water Resources Rev., 5.00%, 12/1/34 | 25,000 | 28,789 | ||||||
| University of California Rev., 5.00%, 5/15/27 | 40,000 | 42,755 | ||||||
| University of California Rev., 5.00%, 5/15/32 | 50,000 | 55,217 | ||||||
| University of California Rev., 5.00%, 5/15/32 | 25,000 | 28,109 | ||||||
| University of California Rev., 5.00%, 5/15/36 | 50,000 | 54,470 | ||||||
| 1,724,436 | ||||||||
| Colorado — 1.0% | ||||||||
| City & County of Denver GO, 5.00%, 8/1/27 | 25,000 | 28,038 | ||||||
| City & County of Denver Airport System Rev., 4.00%, 11/15/31 | 25,000 | 25,044 | ||||||
| Regional Transportation District Sales Tax Rev., 5.00%, 11/1/28 | 20,000 | 22,822 | ||||||
| State of Colorado COP, 5.00%, 12/15/29 | 25,000 | 28,324 | ||||||
| State of Colorado COP, 4.00%, 12/15/37 | 10,000 | 10,072 | ||||||
| 114,300 | ||||||||
| Connecticut — 2.0% | ||||||||
| State of Connecticut GO, 5.00%, 11/15/26 | 60,000 | 64,515 | ||||||
| State of Connecticut GO, 5.00%, 6/15/28 | 25,000 | 28,211 | ||||||
| State of Connecticut GO, 5.00%, 1/15/31 | 25,000 | 28,652 | ||||||
| State of Connecticut, Special Tax Rev., 5.00%, 8/1/26 | 20,000 | 21,376 | ||||||
| State of Connecticut, Special Tax Rev., 5.00%, 9/1/27 | 20,000 | 20,958 | ||||||
| State of Connecticut, Special Tax Rev., 5.00%, 1/1/28 | 40,000 | 44,807 | ||||||
| State of Connecticut, Special Tax Rev., 5.00%, 1/1/31 | 10,000 | 11,093 | ||||||
| 219,612 | ||||||||
| District of Columbia — 1.9% | ||||||||
| District of Columbia GO, 5.00%, 10/15/27 | 10,000 | 11,239 | ||||||
| District of Columbia GO, 5.00%, 6/1/31 | 25,000 | 25,980 | ||||||
| District of Columbia GO, 5.00%, 6/1/33 | 35,000 | 36,227 | ||||||
25
| Avantis Core Municipal Fixed Income Fund | ||||||||
| Principal Amount | Value | |||||||
| District of Columbia GO, 5.00%, 10/15/34 | $ | 50,000 | $ | 55,918 | ||||
| District of Columbia GO, 5.00%, 10/15/36 | 30,000 | 33,342 | ||||||
| District of Columbia GO, 4.00%, 6/1/37 | 5,000 | 5,056 | ||||||
| District of Columbia Rev., (Georgetown University), 5.00%, 4/1/34 | 35,000 | 37,339 | ||||||
| 205,101 | ||||||||
| Florida — 6.6% | ||||||||
| Broward County Water & Sewer Utility Rev., 5.00%, 10/1/38 | 15,000 | 16,547 | ||||||
| Cape Coral Water & Sewer Rev., 5.00%, 10/1/39 | 10,000 | 10,738 | ||||||
| Central Florida Expressway Authority Rev., 4.00%, 7/1/31 | 5,000 | 5,160 | ||||||
| Central Florida Expressway Authority Rev., 4.00%, 7/1/37 | 70,000 | 70,690 | ||||||
| Central Florida Expressway Authority Rev., 4.00%, 7/1/38 | 15,000 | 15,110 | ||||||
| Florida Department of Management Services COP, 5.00%, 11/1/28 | 50,000 | 56,627 | ||||||
| Florida Municipal Power Agency Rev., 5.00%, 10/1/27 | 90,000 | 98,067 | ||||||
| Hillsborough County School Board COP, 5.00%, 7/1/26 | 45,000 | 47,832 | ||||||
| Hillsborough County School Board COP, 5.00%, 7/1/29 | 30,000 | 33,494 | ||||||
| Miami-Dade County Aviation Rev., 5.00%, 10/1/28 | 50,000 | 53,795 | ||||||
| Miami-Dade County Expressway Authority Rev., 5.00%, 7/1/25 | 10,000 | 10,424 | ||||||
| Miami-Dade County Expressway Authority Rev., 5.00%, 7/1/27 | 75,000 | 78,100 | ||||||
| Miami-Dade County Water & Sewer System Rev., 5.00%, 10/1/30 | 20,000 | 21,346 | ||||||
| Orange County School Board COP, 5.00%, 8/1/34 | 60,000 | 64,663 | ||||||
| Palm Beach County School District COP, 5.00%, 8/1/28 | 35,000 | 39,393 | ||||||
| Palm Beach County School District COP, 5.00%, 8/1/29 | 15,000 | 16,796 | ||||||
| School Board of Miami-Dade County COP, 5.00%, 5/1/26 | 70,000 | 73,862 | ||||||
| 712,644 | ||||||||
| Georgia — 1.1% | ||||||||
| Atlanta Water & Wastewater Rev., 5.00%, 11/1/31 | 25,000 | 26,541 | ||||||
| Georgia State Road & Tollway Authority Rev., 5.00%, 6/1/29 | 10,000 | 11,450 | ||||||
| Metropolitan Atlanta Rapid Transit Authority Rev., 3.25%, 7/1/37 | 10,000 | 9,311 | ||||||
| State of Georgia GO, 5.00%, 7/1/28 | 65,000 | 74,195 | ||||||
| 121,497 | ||||||||
| Hawaii — 2.7% | ||||||||
| City & County of Honolulu GO, 5.00%, 3/1/25 | 30,000 | 31,893 | ||||||
| City & County of Honolulu GO, 5.00%, 3/1/28 | 80,000 | 90,388 | ||||||
| City & County of Honolulu GO, 5.00%, 9/1/29 | 65,000 | 73,747 | ||||||
| State of Hawaii GO, 5.00%, 1/1/28 | 35,000 | 39,392 | ||||||
| State of Hawaii GO, 5.00%, 10/1/28 | 25,000 | 27,352 | ||||||
| State of Hawaii GO, 5.00%, 10/1/30 | 30,000 | 33,195 | ||||||
| 295,967 | ||||||||
| Idaho — 0.2% | ||||||||
| Idaho Housing & Finance Association Rev., 5.00%, 7/15/26 | 20,000 | 21,767 | ||||||
| Illinois — 5.1% | ||||||||
| Chicago Midway International Airport Rev., 5.00%, 1/1/41 | 35,000 | 36,251 | ||||||
| Chicago O'Hare International Airport Rev., 5.00%, 1/1/30 | 50,000 | 53,424 | ||||||
| Chicago O'Hare International Airport Rev., 5.00%, 1/1/32 | 15,000 | 15,933 | ||||||
| Chicago O'Hare International Airport Rev., 5.00%, 1/1/38 | 25,000 | 26,451 | ||||||
| Cook County GO, 5.00%, 11/15/31 | 20,000 | 21,317 | ||||||
| Illinois Finance Authority Rev., (DePaul University), 4.00%, 10/1/40 | 75,000 | 70,359 | ||||||
| Illinois State Toll Highway Authority Rev., 5.00%, 1/1/30 | 15,000 | 17,184 | ||||||
26
| Avantis Core Municipal Fixed Income Fund | ||||||||
| Principal Amount | Value | |||||||
| Illinois State Toll Highway Authority Rev., 5.00%, 1/1/30 | $ | 30,000 | $ | 34,367 | ||||
| Illinois State Toll Highway Authority Rev., 5.00%, 1/1/41 | 40,000 | 42,066 | ||||||
| Metropolitan Water Reclamation District of Greater Chicago GO, 5.00%, 12/1/29 | 95,000 | 103,716 | ||||||
| Metropolitan Water Reclamation District of Greater Chicago GO, 5.00%, 12/1/30 | 25,000 | 27,095 | ||||||
| State of Illinois GO, 4.00%, 10/1/32 | 10,000 | 9,893 | ||||||
| State of Illinois GO, 5.00%, 3/1/34 | 35,000 | 37,391 | ||||||
| State of Illinois GO, 4.25%, 12/1/37 | 35,000 | 34,102 | ||||||
| State of Illinois Rev., 5.00%, 6/15/26 | 20,000 | 20,305 | ||||||
| 549,854 | ||||||||
| Indiana — 1.4% | ||||||||
| Indiana Finance Authority Rev., (Indiana Department of Transportation), 5.00%, 6/1/28 | 105,000 | 115,253 | ||||||
| Indiana Finance Authority Rev., (Indiana Finance Authority State Revolving Fund), 5.00%, 2/1/37 | 10,000 | 11,043 | ||||||
| Indiana Finance Authority Rev., (Marion County Capital Improvement Board), 5.25%, 2/1/37 | 10,000 | 10,676 | ||||||
| Indiana Municipal Power Agency Rev., 5.00%, 1/1/35 | 10,000 | 10,679 | ||||||
| 147,651 | ||||||||
| Kansas — 0.7% | ||||||||
| State of Kansas Department of Transportation Rev., 5.00%, 9/1/26 | 50,000 | 53,743 | ||||||
| State of Kansas Department of Transportation Rev., 5.00%, 9/1/27 | 25,000 | 26,796 | ||||||
| 80,539 | ||||||||
| Kentucky — 0.4% | ||||||||
| Kentucky State Property & Building Commission Rev., (Kentucky Finance and Administration Cabinet), 5.00%, 11/1/26 | 40,000 | 43,422 | ||||||
| Louisiana — 0.9% | ||||||||
| State of Louisiana GO, 5.00%, 8/1/27 | 50,000 | 54,545 | ||||||
| State of Louisiana GO, 5.00%, 8/1/28 | 35,000 | 38,099 | ||||||
| 92,644 | ||||||||
| Maryland — 2.0% | ||||||||
| State of Maryland GO, 5.00%, 3/15/25 | 15,000 | 15,980 | ||||||
| State of Maryland GO, 5.00%, 3/15/27 | 10,000 | 11,129 | ||||||
| State of Maryland GO, 5.00%, 3/15/29 | 15,000 | 17,290 | ||||||
| State of Maryland GO, 5.00%, 3/15/30 | 45,000 | 50,869 | ||||||
| State of Maryland GO, 5.00%, 3/15/31 | 15,000 | 16,580 | ||||||
| State of Maryland GO, 5.00%, 3/15/31 | 95,000 | 108,639 | ||||||
| 220,487 | ||||||||
| Massachusetts — 4.9% | ||||||||
| Massachusetts GO, 5.00%, 7/1/27 | 25,000 | 27,930 | ||||||
| Massachusetts GO, 5.00%, 11/1/27 | 35,000 | 39,350 | ||||||
| Massachusetts GO, 5.00%, 3/1/28 | 20,000 | 22,619 | ||||||
| Massachusetts GO, 5.00%, 1/1/30 | 35,000 | 39,895 | ||||||
| Massachusetts GO, 5.00%, 9/1/30 | 30,000 | 34,498 | ||||||
| Massachusetts GO, 5.00%, 1/1/31 | 60,000 | 67,908 | ||||||
| Massachusetts GO, 3.00%, 7/1/35 | 15,000 | 13,931 | ||||||
| Massachusetts Bay Transportation Authority Rev., 5.00%, 7/1/28 | 110,000 | 125,177 | ||||||
| Massachusetts Bay Transportation Authority Rev., 5.00%, 7/1/29 | 45,000 | 52,008 | ||||||
| Massachusetts School Building Authority Rev., 5.00%, 8/15/37 | 40,000 | 42,362 | ||||||
| Massachusetts Transportation Trust Fund Metropolitan Highway System Rev., 5.00%, 1/1/27 | 30,000 | 33,022 | ||||||
27
| Avantis Core Municipal Fixed Income Fund | ||||||||
| Principal Amount | Value | |||||||
| Massachusetts Transportation Trust Fund Metropolitan Highway System Rev., 5.00%, 1/1/31 | $ | 25,000 | $ | 28,140 | ||||
| 526,840 | ||||||||
| Michigan — 1.1% | ||||||||
| Great Lakes Water Authority Sewage Disposal System Rev., 5.00%, 7/1/29 | 45,000 | 51,130 | ||||||
| Great Lakes Water Authority Sewage Disposal System Rev., 5.00%, 7/1/30 | 40,000 | 43,285 | ||||||
| Michigan State Building Authority Rev., 5.00%, 4/15/30 | 20,000 | 21,397 | ||||||
| 115,812 | ||||||||
| Minnesota — 0.9% | ||||||||
| Minneapolis-St. Paul Metropolitan Airports Commission Rev., 5.00%, 1/1/26 | 55,000 | 59,366 | ||||||
| Minneapolis-St. Paul Metropolitan Airports Commission Rev., 5.00%, 1/1/27 | 15,000 | 16,517 | ||||||
| Minneapolis-St. Paul Metropolitan Airports Commission Rev., 5.00%, 1/1/28 | 25,000 | 27,483 | ||||||
| 103,366 | ||||||||
| Mississippi — 1.0% | ||||||||
| State of Mississippi GO, 5.00%, 10/1/27 | 75,000 | 84,044 | ||||||
State of Mississippi GO, 5.00%, 10/1/27, Prerefunded at 100% of Par(1) | 25,000 | 28,078 | ||||||
| 112,122 | ||||||||
| Nevada — 2.4% | ||||||||
| Clark County School District GO, 5.00%, 6/15/25 | 40,000 | 42,690 | ||||||
| Clark County School District GO, 5.00%, 6/15/27 | 25,000 | 26,910 | ||||||
| State of Nevada GO, 5.00%, 4/1/27 | 20,000 | 21,261 | ||||||
| State of Nevada Highway Improvement Rev., 5.00%, 12/1/26 | 15,000 | 16,365 | ||||||
| State of Nevada Highway Improvement Rev., 5.00%, 12/1/27 | 35,000 | 38,158 | ||||||
| State of Nevada Highway Improvement Rev., 5.00%, 12/1/28 | 70,000 | 76,185 | ||||||
| State of Nevada Highway Improvement Rev., 5.00%, 12/1/31 | 35,000 | 38,541 | ||||||
| 260,110 | ||||||||
| New Jersey — 3.5% | ||||||||
| New Jersey Economic Development Authority Rev., (New Jersey Transit Corp.), 4.00%, 11/1/27 | 75,000 | 77,230 | ||||||
| New Jersey Economic Development Authority Rev., (State of New Jersey Department of the Treasury), 4.25%, 6/15/26 | 35,000 | 36,003 | ||||||
| New Jersey Economic Development Authority Rev., (State of New Jersey Department of the Treasury), 4.00%, 6/15/37 | 15,000 | 14,593 | ||||||
| New Jersey Economic Development Authority Rev., (State of New Jersey Department of the Treasury), 5.00%, 6/15/41 | 20,000 | 20,734 | ||||||
| New Jersey Educational Facilities Authority Rev., (State of New Jersey), 5.00%, 9/1/36 | 60,000 | 62,671 | ||||||
| New Jersey Turnpike Authority Rev., 5.00%, 1/1/32 | 45,000 | 49,469 | ||||||
| New Jersey Turnpike Authority Rev., 5.00%, 1/1/33 | 20,000 | 21,602 | ||||||
| New Jersey Turnpike Authority Rev., 5.00%, 1/1/34 | 10,000 | 10,762 | ||||||
| New Jersey Turnpike Authority Rev., 3.25%, 1/1/38 | 20,000 | 17,813 | ||||||
| State of New Jersey GO, 5.00%, 6/1/27 | 30,000 | 31,893 | ||||||
| State of New Jersey GO, 5.00%, 6/1/28 | 35,000 | 39,155 | ||||||
| 381,925 | ||||||||
| New Mexico — 0.3% | ||||||||
| State of New Mexico Severance Tax Permanent Fund Rev., 5.00%, 7/1/31 | 25,000 | 29,461 | ||||||
| New York — 13.8% | ||||||||
| Hudson Yards Infrastructure Corp. Rev., 5.00%, 2/15/24 | 20,000 | 20,737 | ||||||
28
| Avantis Core Municipal Fixed Income Fund | ||||||||
| Principal Amount | Value | |||||||
| Hudson Yards Infrastructure Corp. Rev., 5.00%, 2/15/28 | $ | 15,000 | $ | 16,472 | ||||
| Hudson Yards Infrastructure Corp. Rev., 5.00%, 2/15/32 | 15,000 | 16,373 | ||||||
| Hudson Yards Infrastructure Corp. Rev., 5.00%, 2/15/37 | 105,000 | 112,835 | ||||||
| Long Island Power Authority Rev., 5.00%, 9/1/29 | 20,000 | 22,561 | ||||||
| Metropolitan Transportation Authority Rev., (Dedicated Tax Fund), 5.25%, 11/15/29 | 50,000 | 55,041 | ||||||
| Metropolitan Transportation Authority Rev., (Metropolitan Transportation Authority Dedicated Tax Fund), 5.25%, 11/15/33 | 15,000 | 16,680 | ||||||
| Nassau County GO, 5.00%, 10/1/27 | 95,000 | 105,879 | ||||||
| New York City GO, 5.00%, 8/1/26 | 15,000 | 16,398 | ||||||
| New York City GO, 5.00%, 8/1/27 | 60,000 | 66,850 | ||||||
| New York City GO, 5.00%, 12/1/33 | 25,000 | 27,053 | ||||||
| New York City GO, 4.00%, 3/1/42 | 20,000 | 19,429 | ||||||
| New York City Transitional Finance Authority Building Aid Rev., 5.00%, 7/15/30 | 50,000 | 55,117 | ||||||
| New York City Transitional Finance Authority Building Aid Rev., 4.00%, 7/15/36 | 25,000 | 25,129 | ||||||
| New York Convention Center Development Corp. Rev., (New York City Hotel Unit Fee Rev.), 5.00%, 11/15/40 | 25,000 | 25,912 | ||||||
| New York State Dormitory Authority Rev., (State of New York Personal Income Tax Rev.), 5.00%, 2/15/30 | 50,000 | 55,128 | ||||||
| New York State Dormitory Authority Rev., (State of New York Personal Income Tax Rev.), 5.00%, 3/15/32 | 25,000 | 27,971 | ||||||
| New York State Dormitory Authority Rev., (State of New York Personal Income Tax Rev.), 5.00%, 3/15/32 | 20,000 | 22,258 | ||||||
| New York State Dormitory Authority Rev., (State of New York Personal Income Tax Rev.), 5.00%, 3/15/32 | 60,000 | 68,905 | ||||||
| New York State Dormitory Authority Rev., (State of New York Personal Income Tax Rev.), 4.00%, 3/15/34 | 20,000 | 20,374 | ||||||
| New York State Dormitory Authority Rev., (State of New York Personal Income Tax Rev.), 5.00%, 3/15/39 | 15,000 | 16,190 | ||||||
| New York State Dormitory Authority Rev., (State University of New York), 5.00%, 7/1/26 | 50,000 | 54,224 | ||||||
| New York State Thruway Authority Rev., 5.00%, 1/1/32 | 10,000 | 10,467 | ||||||
| New York State Thruway Authority Rev., 3.50%, 1/1/37 | 25,000 | 23,055 | ||||||
| New York State Urban Development Corp. Rev., (State of New York Personal Income Tax Rev.), 5.00%, 3/15/26 | 35,000 | 37,917 | ||||||
| New York State Urban Development Corp. Rev., (State of New York Personal Income Tax Rev.), 5.00%, 3/15/31 | 15,000 | 16,557 | ||||||
| New York State Urban Development Corp. Rev., (State of New York Personal Income Tax Rev.), 5.00%, 3/15/32 | 30,000 | 34,176 | ||||||
| New York State Urban Development Corp. Rev., (State of New York Personal Income Tax Rev.), 4.00%, 3/15/37 | 35,000 | 34,511 | ||||||
| New York State Urban Development Corp. Rev., (State of New York Personal Income Tax Rev.), 4.00%, 3/15/37 | 10,000 | 9,860 | ||||||
| New York State Urban Development Corp. Rev., (State of New York Personal Income Tax Rev.), 5.00%, 3/15/39 | 45,000 | 48,618 | ||||||
| New York State Urban Development Corp. Rev., (State of New York Personal Income Tax Rev.), 5.00%, 3/15/39 | 30,000 | 32,504 | ||||||
| Port Authority of New York & New Jersey Rev., 5.00%, 10/15/34 | 15,000 | 16,054 | ||||||
| Port Authority of New York & New Jersey Rev., 4.00%, 7/15/37 | 65,000 | 64,808 | ||||||
| Port Authority of New York & New Jersey Rev., 4.00%, 9/1/37 | 20,000 | 19,935 | ||||||
| Suffolk County Water Authority Rev., 3.00%, 6/1/32 | 10,000 | 9,909 | ||||||
| Triborough Bridge & Tunnel Authority Rev., 5.00%, 11/15/25 | 15,000 | 16,167 | ||||||
| Triborough Bridge & Tunnel Authority Rev., 5.00%, 11/15/29 | 45,000 | 51,922 | ||||||
| Triborough Bridge & Tunnel Authority Rev., 5.00%, 11/15/30 | 40,000 | 46,606 | ||||||
| Triborough Bridge & Tunnel Authority Rev., 5.00%, 11/15/38 | 15,000 | 16,236 | ||||||
29
| Avantis Core Municipal Fixed Income Fund | ||||||||
| Principal Amount | Value | |||||||
| Utility Debt Securitization Authority Rev., 5.00%, 6/15/25 | $ | 15,000 | $ | 15,310 | ||||
| Utility Debt Securitization Authority Rev., 5.00%, 12/15/25 | 25,000 | 25,829 | ||||||
| Utility Debt Securitization Authority Rev., 5.00%, 12/15/26 | 10,000 | 10,556 | ||||||
| Utility Debt Securitization Authority Rev., 5.00%, 12/15/35 | 50,000 | 53,074 | ||||||
| Utility Debt Securitization Authority Rev., 5.00%, 12/15/36 | 35,000 | 37,095 | ||||||
| 1,498,682 | ||||||||
| North Carolina — 1.0% | ||||||||
| State of North Carolina Rev., 5.00%, 3/1/27 | 20,000 | 22,087 | ||||||
| State of North Carolina Rev., 5.00%, 3/1/29 | 45,000 | 51,232 | ||||||
| State of North Carolina Rev., 5.00%, 3/1/33 | 30,000 | 33,360 | ||||||
| 106,679 | ||||||||
| Ohio — 1.3% | ||||||||
| Ohio Water Development Authority Rev., (Ohio Water Development Authority Drinking Water Assistance Fund), 5.00%, 12/1/29 | 30,000 | 34,613 | ||||||
| Ohio Water Development Authority Water Pollution Control Loan Fund Rev., 5.00%, 6/1/29 | 15,000 | 17,188 | ||||||
| Ohio Water Development Authority Water Pollution Control Loan Fund Rev., 5.00%, 6/1/33 | 15,000 | 17,111 | ||||||
| Ohio Water Development Authority Water Pollution Control Loan Fund Rev., 5.00%, 12/1/38 | 20,000 | 22,173 | ||||||
| Ohio Water Development Authority Water Pollution Control Loan Fund Rev., 5.00%, 12/1/39 | 30,000 | 33,274 | ||||||
| State of Ohio Rev., 5.00%, 12/15/25 | 20,000 | 21,614 | ||||||
| 145,973 | ||||||||
| Oregon — 0.6% | ||||||||
| Multnomah County GO, 5.00%, 6/15/29 | 20,000 | 23,072 | ||||||
| Oregon State Lottery Rev., 5.00%, 4/1/27 | 35,000 | 37,207 | ||||||
| 60,279 | ||||||||
| Pennsylvania — 2.2% | ||||||||
| Delaware Valley Regional Finance Authority Rev., 5.50%, 8/1/28 (Ambac) | 20,000 | 22,865 | ||||||
| Montgomery County Higher Education and Health Authority Rev., (Thomas Jefferson University Obligated Group), 5.00%, 9/1/33 | 20,000 | 21,883 | ||||||
| Montgomery County Higher Education and Health Authority Rev., (Thomas Jefferson University Obligated Group), 4.00%, 9/1/34 | 55,000 | 54,694 | ||||||
| Pennsylvania GO, 5.00%, 7/15/27 | 75,000 | 83,418 | ||||||
| Pennsylvania GO, 5.00%, 7/15/29 | 35,000 | 40,070 | ||||||
Philadelphia Water & Wastewater Rev., 5.00%, 7/1/24, Prerefunded at 100% of Par(1) | 15,000 | 15,705 | ||||||
| 238,635 | ||||||||
| South Carolina — 0.7% | ||||||||
| South Carolina Public Service Authority Rev., 5.00%, 12/1/30 | 75,000 | 79,289 | ||||||
| Tennessee — 1.6% | ||||||||
| Metropolitan Government of Nashville & Davidson County GO, 5.00%, 1/1/26 | 10,000 | 10,831 | ||||||
| Metropolitan Government of Nashville & Davidson County GO, 5.00%, 7/1/27 | 25,000 | 27,942 | ||||||
| Metropolitan Government of Nashville & Davidson County GO, 4.00%, 7/1/28 | 125,000 | 133,326 | ||||||
| 172,099 | ||||||||
| Texas — 6.3% | ||||||||
| Central Texas Turnpike System Rev., 5.00%, 8/15/37 | 20,000 | 20,730 | ||||||
| Dallas Area Rapid Transit Rev., 5.00%, 12/1/29 | 15,000 | 17,306 | ||||||
30
| Avantis Core Municipal Fixed Income Fund | ||||||||
| Principal Amount | Value | |||||||
| Dallas County Utility & Reclamation District GO, 5.00%, 2/15/28 | $ | 85,000 | $ | 94,403 | ||||
| Dallas Fort Worth International Airport Rev., 5.00%, 11/1/32 | 50,000 | 57,157 | ||||||
| Dallas Waterworks & Sewer System Rev., 5.00%, 10/1/27 | 45,000 | 48,318 | ||||||
| Houston GO, 5.00%, 3/1/28 | 25,000 | 28,014 | ||||||
| Houston GO, 5.00%, 3/1/28 | 20,000 | 21,998 | ||||||
| Houston GO, 5.00%, 3/1/30 | 30,000 | 33,930 | ||||||
| North Texas Tollway Authority Rev., 5.00%, 1/1/33 | 50,000 | 52,288 | ||||||
| San Antonio Electric & Gas Systems Rev., 3.125%, 2/1/28 | 20,000 | 20,254 | ||||||
| San Antonio Electric & Gas Systems Rev., 5.00%, 2/1/30 | 45,000 | 48,931 | ||||||
State of Texas GO, 5.00%, 10/1/24, Prerefunded at 100% of Par(1) | 50,000 | 52,500 | ||||||
| Texas State University System Rev., 5.00%, 3/15/31 | 80,000 | 87,636 | ||||||
| Texas Water Development Board Rev., (State Water Implementation Rev. Fund for Texas), 5.00%, 4/15/29 | 20,000 | 22,468 | ||||||
| Texas Water Development Board Rev., (State Water Implementation Rev. Fund for Texas), 4.00%, 10/15/36 | 30,000 | 30,931 | ||||||
| Texas Water Development Board Rev., (State Water Implementation Rev. Fund for Texas), 4.00%, 10/15/37 | 25,000 | 25,595 | ||||||
| Trinity River Authority Central Regional Wastewater System Rev., 5.00%, 8/1/28 | 15,000 | 16,753 | ||||||
| 679,212 | ||||||||
| Utah — 0.3% | ||||||||
| Utah Transit Authority Rev., 5.25%, 6/15/32 (AGM) | 25,000 | 29,368 | ||||||
| Virginia — 4.0% | ||||||||
| Richmond Public Utility Rev., 5.00%, 1/15/28 | 20,000 | 21,558 | ||||||
| Virginia College Building Authority Rev., 5.00%, 2/1/30 | 185,000 | 207,978 | ||||||
| Virginia College Building Authority Rev., 5.00%, 2/1/30 | 20,000 | 22,381 | ||||||
| Virginia College Building Authority Rev., 3.00%, 2/1/35 | 20,000 | 17,976 | ||||||
| Virginia Commonwealth Transportation Board Rev., 5.00%, 9/15/26 | 35,000 | 38,585 | ||||||
| Virginia Commonwealth Transportation Board Rev., 5.00%, 5/15/27 | 20,000 | 22,372 | ||||||
| Virginia Commonwealth Transportation Board Rev., 5.00%, 5/15/29 | 25,000 | 28,034 | ||||||
| Virginia Public Building Authority Rev., 5.00%, 8/1/27 | 65,000 | 72,644 | ||||||
| 431,528 | ||||||||
| Washington — 4.5% | ||||||||
Central Puget Sound Regional Transit Authority Rev., 5.00%, 11/1/25, Prerefunded at 100% of Par(1) | 35,000 | 37,824 | ||||||
Central Puget Sound Regional Transit Authority Rev., 5.00%, 11/1/25, Prerefunded at 100% of Par(1) | 25,000 | 27,017 | ||||||
| Energy Northwest Rev., (Bonneville Power Administration), 5.00%, 7/1/25 | 10,000 | 10,697 | ||||||
| Energy Northwest Rev., (Bonneville Power Administration), 5.00%, 7/1/27 | 65,000 | 72,335 | ||||||
| Energy Northwest Rev., (Bonneville Power Administration), 5.00%, 7/1/28 | 40,000 | 45,286 | ||||||
| Energy Northwest Rev., (Bonneville Power Administration), 5.00%, 7/1/28 | 10,000 | 11,129 | ||||||
| Energy Northwest Rev., (Bonneville Power Administration), 5.00%, 7/1/30 | 20,000 | 22,504 | ||||||
| Energy Northwest Rev., (Bonneville Power Administration), 5.00%, 7/1/33 | 35,000 | 38,797 | ||||||
| State of Washington GO, 5.00%, 8/1/27 | 40,000 | 44,763 | ||||||
31
| Avantis Core Municipal Fixed Income Fund | ||||||||
| Principal Amount/Shares | Value | |||||||
| State of Washington GO, 5.00%, 7/1/29 | $ | 10,000 | $ | 10,810 | ||||
| State of Washington GO, 5.00%, 7/1/32 | 145,000 | 155,167 | ||||||
| State of Washington GO, 5.00%, 8/1/32 | 10,000 | 10,816 | ||||||
| 487,145 | ||||||||
| Wisconsin — 1.8% | ||||||||
| State of Wisconsin GO, 5.00%, 5/1/27 | 10,000 | 10,541 | ||||||
| State of Wisconsin GO, 5.00%, 11/1/29 | 25,000 | 27,610 | ||||||
| State of Wisconsin Rev., 5.00%, 5/1/27 | 125,000 | 138,657 | ||||||
| Wisconsin Department of Transportation Rev., 5.00%, 7/1/27 | 15,000 | 16,780 | ||||||
| 193,588 | ||||||||
TOTAL MUNICIPAL SECURITIES (Cost $11,539,965) | 10,700,430 | |||||||
| SHORT-TERM INVESTMENTS — 0.2% | ||||||||
| Money Market Funds — 0.2% | ||||||||
State Street Institutional U.S. Government Money Market Fund, Premier Class (Cost $21,406) | 21,406 | 21,406 | ||||||
TOTAL INVESTMENT SECURITIES — 98.9% (Cost $11,561,371) | 10,721,836 | |||||||
| OTHER ASSETS AND LIABILITIES — 1.1% | 123,734 | |||||||
| TOTAL NET ASSETS — 100.0% | $ | 10,845,570 | ||||||
| NOTES TO SCHEDULE OF INVESTMENTS | ||||||||
| AGM | - | Assured Guaranty Municipal Corporation | ||||||
| COP | - | Certificates of Participation | ||||||
| GO | - | General Obligation | ||||||
(1)Escrowed to maturity in U.S. government securities or state and local government securities.
(2)Security is a zero-coupon bond. Zero-coupon securities may be issued at a substantial discount from their value at maturity.
See Notes to Financial Statements.
32
AUGUST 31, 2022
| Avantis Short-Term Fixed Income Fund | ||||||||
| Principal Amount | Value | |||||||
| CORPORATE BONDS — 63.9% | ||||||||
| Aerospace and Defense — 0.6% | ||||||||
| General Dynamics Corp., 3.50%, 5/15/25 | $ | 42,000 | $ | 41,799 | ||||
| Huntington Ingalls Industries, Inc., 3.84%, 5/1/25 | 36,000 | 35,242 | ||||||
| 77,041 | ||||||||
| Air Freight and Logistics — 0.8% | ||||||||
| United Parcel Service, Inc., 2.20%, 9/1/24 | 101,000 | 98,115 | ||||||
| Automobiles — 1.1% | ||||||||
| American Honda Finance Corp., 1.00%, 9/10/25 | 78,000 | 71,128 | ||||||
| General Motors Financial Co., Inc., 4.25%, 5/15/23 | 20,000 | 20,014 | ||||||
| General Motors Financial Co., Inc., 5.25%, 3/1/26 | 45,000 | 45,336 | ||||||
| 136,478 | ||||||||
| Banks — 11.9% | ||||||||
| Asian Development Bank, 0.50%, 2/4/26 | 100,000 | 90,087 | ||||||
| Bank of Montreal, 0.625%, 7/9/24 | 60,000 | 56,514 | ||||||
| Bank of Montreal, 1.85%, 5/1/25 | 72,000 | 67,911 | ||||||
| Bank of Nova Scotia, 1.30%, 6/11/25 | 108,000 | 99,948 | ||||||
| Citigroup, Inc., 3.30%, 4/27/25 | 66,000 | 64,420 | ||||||
| Council Of Europe Development Bank, 2.50%, 2/27/24 | 25,000 | 24,640 | ||||||
| European Bank for Reconstruction & Development, 0.25%, 7/10/23 | 50,000 | 48,593 | ||||||
| European Investment Bank, 1.375%, 3/15/27 | 150,000 | 136,898 | ||||||
| Inter-American Development Bank, 2.625%, 1/16/24 | 150,000 | 148,110 | ||||||
| Inter-American Development Bank, 3.00%, 2/21/24 | 140,000 | 138,898 | ||||||
| International Bank for Reconstruction & Development, 0.875%, 7/15/26 | 10,000 | 9,043 | ||||||
| PNC Financial Services Group, Inc., 2.20%, 11/1/24 | 90,000 | 87,068 | ||||||
| Royal Bank of Canada, 2.55%, 7/16/24 | 42,000 | 40,887 | ||||||
| Royal Bank of Canada, 1.15%, 7/14/26 | 60,000 | 53,542 | ||||||
| Santander Holdings USA, Inc., 4.50%, 7/17/25 | 66,000 | 65,715 | ||||||
| Santander Holdings USA, Inc., 3.24%, 10/5/26 | 70,000 | 65,152 | ||||||
| Toronto-Dominion Bank, 1.20%, 6/3/26 | 105,000 | 94,089 | ||||||
| US Bancorp, 3.15%, 4/27/27 | 100,000 | 96,437 | ||||||
| Wells Fargo & Co., 3.55%, 9/29/25 | 36,000 | 35,397 | ||||||
| Wells Fargo & Co., 3.00%, 10/23/26 | 25,000 | 23,635 | ||||||
| Westpac Banking Corp., 3.35%, 3/8/27 | 100,000 | 96,551 | ||||||
| 1,543,535 | ||||||||
| Beverages — 0.8% | ||||||||
| Coca-Cola Co., 1.75%, 9/6/24 | 101,000 | 97,962 | ||||||
| Biotechnology — 0.2% | ||||||||
| AbbVie, Inc., 2.90%, 11/6/22 | 29,000 | 28,980 | ||||||
| Building Products — 0.2% | ||||||||
| Owens Corning, 3.40%, 8/15/26 | 28,000 | 26,729 | ||||||
| Capital Markets — 6.1% | ||||||||
| Ameriprise Financial, Inc., 2.875%, 9/15/26 | 98,000 | 93,500 | ||||||
| Bank of New York Mellon Corp., 3.25%, 9/11/24 | 98,000 | 97,341 | ||||||
| BlackRock, Inc., 3.50%, 3/18/24 | 70,000 | 69,851 | ||||||
| Brookfield Finance, Inc., 4.00%, 4/1/24 | 66,000 | 65,791 | ||||||
| Cboe Global Markets, Inc., 3.65%, 1/12/27 | 100,000 | 97,727 | ||||||
| Charles Schwab Corp., 3.85%, 5/21/25 | 66,000 | 66,145 | ||||||
33
| Avantis Short-Term Fixed Income Fund | ||||||||
| Principal Amount | Value | |||||||
| CME Group, Inc., 3.00%, 3/15/25 | $ | 35,000 | $ | 34,361 | ||||
| Goldman Sachs Group, Inc., 3.75%, 5/22/25 | 66,000 | 64,860 | ||||||
| Janus Henderson US Holdings, Inc., 4.875%, 8/1/25 | 30,000 | 30,158 | ||||||
| Lazard Group LLC, 3.75%, 2/13/25 | 66,000 | 65,078 | ||||||
| S&P Global, Inc., 2.95%, 1/22/27 | 25,000 | 24,026 | ||||||
| State Street Corp., 3.55%, 8/18/25 | 86,000 | 85,243 | ||||||
| 794,081 | ||||||||
| Chemicals — 0.9% | ||||||||
| Ecolab, Inc., 2.70%, 11/1/26 | 95,000 | 91,629 | ||||||
| Mosaic Co., 4.25%, 11/15/23 | 30,000 | 30,040 | ||||||
| 121,669 | ||||||||
| Consumer Finance — 1.2% | ||||||||
| Capital One Financial Corp., 4.25%, 4/30/25 | 66,000 | 65,893 | ||||||
| Discover Financial Services, 4.50%, 1/30/26 | 65,000 | 63,691 | ||||||
| Synchrony Financial, 4.50%, 7/23/25 | 30,000 | 29,382 | ||||||
| 158,966 | ||||||||
| Containers and Packaging — 0.1% | ||||||||
| Packaging Corp. of America, 3.65%, 9/15/24 | 13,000 | 12,900 | ||||||
| Diversified Financial Services — 0.4% | ||||||||
Corebridge Financial, Inc., 3.65%, 4/5/27(1) | 50,000 | 47,040 | ||||||
| Electric Utilities — 2.8% | ||||||||
| Baltimore Gas & Electric Co., 2.40%, 8/15/26 | 64,000 | 60,013 | ||||||
| Berkshire Hathaway Energy Co., 4.05%, 4/15/25 | 36,000 | 36,064 | ||||||
| Cleco Corporate Holdings LLC, 3.74%, 5/1/26 | 61,000 | 58,518 | ||||||
| Duke Energy Progress LLC, 3.25%, 8/15/25 | 24,000 | 23,669 | ||||||
| Emera US Finance LP, 3.55%, 6/15/26 | 62,000 | 59,446 | ||||||
| Entergy Gulf States Louisiana LLC, 5.59%, 10/1/24 | 58,000 | 59,687 | ||||||
| Public Service Electric and Gas Co., 2.25%, 9/15/26 | 64,000 | 59,799 | ||||||
| 357,196 | ||||||||
| Electronic Equipment, Instruments and Components — 0.8% | ||||||||
| Flex Ltd., 3.75%, 2/1/26 | 47,000 | 44,820 | ||||||
| Keysight Technologies, Inc., 4.55%, 10/30/24 | 36,000 | 36,224 | ||||||
| TD SYNNEX Corp., 1.75%, 8/9/26 | 25,000 | 21,914 | ||||||
| 102,958 | ||||||||
| Energy Equipment and Services — 0.7% | ||||||||
| Schlumberger Finance Canada Ltd., 1.40%, 9/17/25 | 104,000 | 97,341 | ||||||
| Equity Real Estate Investment Trusts (REITs) — 4.4% | ||||||||
| Corporate Office Properties LP, 2.25%, 3/15/26 | 29,000 | 26,017 | ||||||
| ERP Operating LP, 3.375%, 6/1/25 | 105,000 | 102,427 | ||||||
| Healthcare Realty Holdings LP, 3.50%, 8/1/26 | 75,000 | 71,603 | ||||||
| Host Hotels & Resorts LP, 4.50%, 2/1/26 | 30,000 | 29,303 | ||||||
| Kimco Realty Corp., 3.30%, 2/1/25 | 66,000 | 64,502 | ||||||
| Mid-America Apartments LP, 3.60%, 6/1/27 | 50,000 | 48,033 | ||||||
| Omega Healthcare Investors, Inc., 4.95%, 4/1/24 | 15,000 | 15,047 | ||||||
| Prologis LP, 3.25%, 10/1/26 | 100,000 | 96,564 | ||||||
| Simon Property Group LP, 3.375%, 6/15/27 | 65,000 | 62,362 | ||||||
| Spirit Realty LP, 4.45%, 9/15/26 | 42,000 | 41,166 | ||||||
| Vornado Realty LP, 2.15%, 6/1/26 | 20,000 | 17,618 | ||||||
| 574,642 | ||||||||
| Food and Staples Retailing — 0.7% | ||||||||
| Costco Wholesale Corp., 2.75%, 5/18/24 | 42,000 | 41,657 | ||||||
34
| Avantis Short-Term Fixed Income Fund | ||||||||
| Principal Amount | Value | |||||||
| Sysco Corp., 3.30%, 7/15/26 | $ | 45,000 | $ | 43,588 | ||||
| 85,245 | ||||||||
| Food Products — 1.3% | ||||||||
| Bunge Ltd. Finance Corp., 1.63%, 8/17/25 | 29,000 | 26,943 | ||||||
| Hershey Co., 2.05%, 11/15/24 | 36,000 | 34,789 | ||||||
| Hormel Foods Corp., 0.65%, 6/3/24 | 60,000 | 57,044 | ||||||
| Tyson Foods, Inc., 4.00%, 3/1/26 | 45,000 | 44,527 | ||||||
| 163,303 | ||||||||
| Gas Utilities — 0.5% | ||||||||
| Southern California Gas Co., 3.15%, 9/15/24 | 63,000 | 62,404 | ||||||
| Health Care Providers and Services — 3.4% | ||||||||
| Cardinal Health, Inc., 3.50%, 11/15/24 | 69,000 | 68,551 | ||||||
| Cigna Corp., 3.05%, 11/30/22 | 29,000 | 29,000 | ||||||
| CommonSpirit Health, 2.76%, 10/1/24 | 36,000 | 34,893 | ||||||
| Elevance Health, Inc., 2.375%, 1/15/25 | 60,000 | 57,584 | ||||||
| HCA, Inc., 5.00%, 3/15/24 | 66,000 | 66,469 | ||||||
| Humana, Inc., 4.50%, 4/1/25 | 66,000 | 66,558 | ||||||
| UnitedHealth Group, Inc., 2.375%, 8/15/24 | 100,000 | 97,821 | ||||||
Universal Health Services, Inc., 1.65%, 9/1/26(1) | 30,000 | 25,937 | ||||||
| 446,813 | ||||||||
| Hotels, Restaurants and Leisure — 1.1% | ||||||||
| Booking Holdings, Inc., 3.65%, 3/15/25 | 97,000 | 96,552 | ||||||
| Hyatt Hotels Corp., 4.85%, 3/15/26 | 45,000 | 45,298 | ||||||
| 141,850 | ||||||||
| Household Durables — 0.2% | ||||||||
| DR Horton, Inc., 4.75%, 2/15/23 | 30,000 | 30,046 | ||||||
| Household Products — 0.2% | ||||||||
| Colgate-Palmolive Co., 3.25%, 3/15/24 | 20,000 | 19,910 | ||||||
| Insurance — 3.7% | ||||||||
| Aflac, Inc., 3.625%, 11/15/24 | 96,000 | 95,744 | ||||||
| Aon Global Ltd., 3.875%, 12/15/25 | 50,000 | 49,512 | ||||||
| Brighthouse Financial, Inc., 3.70%, 6/22/27 | 65,000 | 61,750 | ||||||
| First American Financial Corp., 4.60%, 11/15/24 | 50,000 | 49,986 | ||||||
| MetLife, Inc., 4.37%, 9/15/23 | 50,000 | 50,280 | ||||||
| MetLife, Inc., 3.60%, 11/13/25 | 34,000 | 33,640 | ||||||
| Principal Financial Group, Inc., 3.40%, 5/15/25 | 66,000 | 64,588 | ||||||
| Prudential Financial, Inc., 1.50%, 3/10/26 | 75,000 | 68,729 | ||||||
| 474,229 | ||||||||
| IT Services — 1.3% | ||||||||
| International Business Machines Corp., 3.00%, 5/15/24 | 100,000 | 98,830 | ||||||
| Western Union Co., 2.85%, 1/10/25 | 72,000 | 69,124 | ||||||
| 167,954 | ||||||||
| Machinery — 2.7% | ||||||||
| Caterpillar Financial Services Corp., 3.30%, 6/9/24 | 69,000 | 68,639 | ||||||
| Caterpillar Financial Services Corp., 1.45%, 5/15/25 | 36,000 | 33,872 | ||||||
| Cummins, Inc., 3.65%, 10/1/23 | 42,000 | 42,108 | ||||||
| Illinois Tool Works, Inc., 3.50%, 3/1/24 | 42,000 | 41,946 | ||||||
| John Deere Capital Corp., 3.45%, 1/10/24 | 69,000 | 68,846 | ||||||
| PACCAR Financial Corp., 2.15%, 8/15/24 | 101,000 | 97,977 | ||||||
| 353,388 | ||||||||
35
| Avantis Short-Term Fixed Income Fund | ||||||||
| Principal Amount | Value | |||||||
| Media — 1.0% | ||||||||
| Comcast Cable Communications Holdings, Inc., 9.46%, 11/15/22 | $ | 24,000 | $ | 24,283 | ||||
| Comcast Corp., 3.375%, 8/15/25 | 42,000 | 41,323 | ||||||
| Discovery Communications LLC, 4.90%, 3/11/26 | 60,000 | 59,954 | ||||||
| 125,560 | ||||||||
| Metals and Mining — 0.7% | ||||||||
| ArcelorMittal SA, 4.55%, 3/11/26 | 20,000 | 19,617 | ||||||
| BHP Billiton Finance USA Ltd., 3.85%, 9/30/23 | 34,000 | 34,049 | ||||||
| Kinross Gold Corp., 5.95%, 3/15/24 | 42,000 | 42,768 | ||||||
| 96,434 | ||||||||
| Multi-Utilities — 0.3% | ||||||||
| Dominion Energy, Inc., 2.75%, 9/15/22 | 36,000 | 35,999 | ||||||
| Multiline Retail — 0.5% | ||||||||
| Dollar Tree, Inc., 4.00%, 5/15/25 | 66,000 | 65,415 | ||||||
| Oil, Gas and Consumable Fuels — 5.3% | ||||||||
| Canadian Natural Resources Ltd., 2.05%, 7/15/25 | 36,000 | 33,540 | ||||||
| Chevron Corp., 1.55%, 5/11/25 | 102,000 | 96,290 | ||||||
| Enbridge, Inc., 2.50%, 1/15/25 | 72,000 | 69,031 | ||||||
| Energy Transfer LP, 3.90%, 7/15/26 | 70,000 | 67,010 | ||||||
| Enterprise Products Operating LLC, 3.35%, 3/15/23 | 72,000 | 71,884 | ||||||
| Equinor ASA, 2.875%, 4/6/25 | 35,000 | 34,064 | ||||||
| Exxon Mobil Corp., 2.71%, 3/6/25 | 72,000 | 70,090 | ||||||
Phillips 66 Co., 2.45%, 12/15/24(1) | 36,000 | 34,236 | ||||||
| Shell International Finance BV, 3.25%, 5/11/25 | 66,000 | 64,932 | ||||||
| TotalEnergies Capital Canada Ltd., 2.75%, 7/15/23 | 72,000 | 71,336 | ||||||
| Valero Energy Corp., 2.85%, 4/15/25 | 9,000 | 8,719 | ||||||
| Williams Cos., Inc., 4.00%, 9/15/25 | 66,000 | 65,325 | ||||||
| 686,457 | ||||||||
| Personal Products — 0.3% | ||||||||
| Estee Lauder Cos., Inc., 2.00%, 12/1/24 | 36,000 | 35,011 | ||||||
| Pharmaceuticals — 2.7% | ||||||||
| GlaxoSmithKline Capital PLC, 3.00%, 6/1/24 | 84,000 | 83,173 | ||||||
| GlaxoSmithKline Capital, Inc., 3.625%, 5/15/25 | 18,000 | 17,911 | ||||||
| Novartis Capital Corp., 1.75%, 2/14/25 | 29,000 | 27,768 | ||||||
| Novartis Capital Corp., 3.00%, 11/20/25 | 27,000 | 26,444 | ||||||
| Pfizer, Inc., 3.40%, 5/15/24 | 97,000 | 96,709 | ||||||
| Royalty Pharma PLC, 1.20%, 9/2/25 | 78,000 | 70,959 | ||||||
| Utah Acquisition Sub, Inc., 3.95%, 6/15/26 | 30,000 | 28,208 | ||||||
| 351,172 | ||||||||
| Road and Rail — 0.4% | ||||||||
| Ryder System, Inc., 2.50%, 9/1/24 | 36,000 | 34,832 | ||||||
| Ryder System, Inc., 3.35%, 9/1/25 | 18,000 | 17,360 | ||||||
| 52,192 | ||||||||
| Semiconductors and Semiconductor Equipment — 0.9% | ||||||||
| Marvell Technology, Inc., 1.65%, 4/15/26 | 67,000 | 60,321 | ||||||
| Microchip Technology, Inc., 4.33%, 6/1/23 | 48,000 | 48,080 | ||||||
| NXP BV / NXP Funding LLC, 4.875%, 3/1/24 | 15,000 | 15,069 | ||||||
| 123,470 | ||||||||
36
| Avantis Short-Term Fixed Income Fund | ||||||||
| Principal Amount | Value | |||||||
| Software — 1.5% | ||||||||
| Citrix Systems, Inc., 1.25%, 3/1/26 | $ | 69,000 | $ | 67,480 | ||||
| Intuit, Inc., 0.95%, 7/15/25 | 42,000 | 38,661 | ||||||
| Microsoft Corp., 2.875%, 2/6/24 | 84,000 | 83,174 | ||||||
| 189,315 | ||||||||
| Specialty Retail — 1.0% | ||||||||
| Home Depot, Inc., 3.75%, 2/15/24 | 66,000 | 66,187 | ||||||
| Ross Stores, Inc., 4.60%, 4/15/25 | 66,000 | 66,598 | ||||||
| 132,785 | ||||||||
| Technology Hardware, Storage and Peripherals — 1.1% | ||||||||
| Apple, Inc., 3.00%, 2/9/24 | 35,000 | 34,725 | ||||||
| Apple, Inc., 2.45%, 8/4/26 | 71,000 | 67,579 | ||||||
| Hewlett Packard Enterprise Co., 4.90%, 10/15/25 | 36,000 | 36,590 | ||||||
| 138,894 | ||||||||
| Trading Companies and Distributors — 0.1% | ||||||||
| Air Lease Corp., 2.875%, 1/15/26 | 20,000 | 18,463 | ||||||
TOTAL CORPORATE BONDS (Cost $8,830,980) | 8,271,942 | |||||||
| U.S. TREASURY SECURITIES AND EQUIVALENTS — 31.1% | ||||||||
| Israel Government AID Bond, 5.50%, 9/18/23 | 100,000 | 101,946 | ||||||
| U.S. Treasury Notes, 2.125%, 2/29/24 | 225,000 | 220,632 | ||||||
U.S. Treasury Notes, 2.375%, 2/29/24(2) | 400,000 | 393,656 | ||||||
| U.S. Treasury Notes, 0.375%, 4/15/24 | 350,000 | 332,910 | ||||||
| U.S. Treasury Notes, 0.375%, 7/15/24 | 450,000 | 425,109 | ||||||
| U.S. Treasury Notes, 0.375%, 8/15/24 | 440,000 | 414,511 | ||||||
| U.S. Treasury Notes, 1.50%, 10/31/24 | 450,000 | 431,807 | ||||||
| U.S. Treasury Notes, 0.25%, 7/31/25 | 298,000 | 271,459 | ||||||
| U.S. Treasury Notes, 2.00%, 8/15/25 | 325,000 | 311,480 | ||||||
| U.S. Treasury Notes, 0.375%, 1/31/26 | 513,000 | 461,920 | ||||||
| U.S. Treasury Notes, 1.625%, 2/15/26 | 285,000 | 267,778 | ||||||
| U.S. Treasury Notes, 0.625%, 7/31/26 | 30,000 | 26,923 | ||||||
| U.S. Treasury Notes, 1.25%, 12/31/26 | 300,000 | 274,172 | ||||||
| U.S. Treasury Notes, 2.25%, 8/15/27 | 100,000 | 94,984 | ||||||
TOTAL U.S. TREASURY SECURITIES AND EQUIVALENTS (Cost $4,281,257) | 4,029,287 | |||||||
| U.S. GOVERNMENT AGENCY SECURITIES — 3.1% | ||||||||
| FHLB, 2.375%, 3/14/25 | 50,000 | 48,653 | ||||||
| FHLB, 0.375%, 9/4/25 | 25,000 | 22,788 | ||||||
| FHLB, 1.25%, 12/21/26 | 100,000 | 91,582 | ||||||
| FNMA, 1.625%, 10/15/24 | 75,000 | 72,140 | ||||||
| FNMA, 0.375%, 8/25/25 | 25,000 | 22,810 | ||||||
| FNMA, 1.875%, 9/24/26 | 100,000 | 94,126 | ||||||
| Tennessee Valley Authority, 0.75%, 5/15/25 | 48,000 | 44,475 | ||||||
TOTAL U.S. GOVERNMENT AGENCY SECURITIES (Cost $412,930) | 396,574 | |||||||
37
| Avantis Short-Term Fixed Income Fund | ||||||||
| Shares | Value | |||||||
| SHORT-TERM INVESTMENTS — 1.3% | ||||||||
| Money Market Funds — 1.3% | ||||||||
State Street Institutional U.S. Government Money Market Fund, Premier Class (Cost $167,770) | 167,770 | $ | 167,770 | |||||
TOTAL INVESTMENT SECURITIES — 99.4% (Cost $13,692,937) | 12,865,573 | |||||||
| OTHER ASSETS AND LIABILITIES — 0.6% | 82,432 | |||||||
| TOTAL NET ASSETS — 100.0% | $ | 12,948,005 | ||||||
| NOTES TO SCHEDULE OF INVESTMENTS | ||||||||
| AID | - | Agency for International Development | ||||||
| Equivalent | - | Security whose payments are secured by the U.S. Treasury | ||||||
| FHLB | - | Federal Home Loan Bank | ||||||
| FNMA | - | Federal National Mortgage Association | ||||||
(1)Security was purchased pursuant to Rule 144A or Section 4(2) under the Securities Act of 1933 and may be sold in transactions exempt from registration, normally to qualified institutional investors. The aggregate value of these securities at the period end was $107,213, which represented 0.8% of total net assets.
(2)Security, or a portion thereof, has been pledged at the custodian bank or with a broker for collateral requirements on futures contracts. At the period end, the aggregate value of securities pledged was $19,683.
See Notes to Financial Statements.
38
| Statements of Assets and Liabilities | ||
| AUGUST 31, 2022 | ||||||||
| Avantis Core Fixed Income Fund | Avantis Core Municipal Fixed Income Fund | |||||||
| Assets | ||||||||
| Investment securities, at value (cost of $41,319,245 and $11,561,371, respectively) | $ | 39,319,878 | $ | 10,721,836 | ||||
| Receivable for investments sold | 5,210,330 | — | ||||||
| Interest receivable | 258,181 | 127,039 | ||||||
| 44,788,389 | 10,848,875 | |||||||
| Liabilities | ||||||||
| Payable for investments purchased | 11,707,604 | — | ||||||
| Payable for capital shares redeemed | 94,517 | 1,974 | ||||||
| Payable for variation margin on futures contracts | 2,031 | — | ||||||
| Payable for variation margin on swap agreements | 361 | — | ||||||
| Accrued management fees | 684 | 1,331 | ||||||
| 11,805,197 | 3,305 | |||||||
| Net Assets | $ | 32,983,192 | $ | 10,845,570 | ||||
| Net Assets Consist of: | ||||||||
| Capital paid in | $ | 37,236,001 | $ | 11,886,128 | ||||
| Distributable earnings | (4,252,809) | (1,040,558) | ||||||
| $ | 32,983,192 | $ | 10,845,570 | |||||
| Fund/Class | Net Assets | Shares Outstanding | Net Asset Value Per Share | ||||||||
| Avantis Core Fixed Income Fund | |||||||||||
| Institutional Class | $5,090,142 | 591,913 | $8.60 | ||||||||
| G Class | $27,893,050 | 3,242,679 | $8.60 | ||||||||
| Avantis Core Municipal Fixed Income Fund | |||||||||||
| Institutional Class | $9,902,009 | 1,067,394 | $9.28 | ||||||||
| G Class | $943,561 | 101,717 | $9.28 | ||||||||
See Notes to Financial Statements.
39
| AUGUST 31, 2022 | |||||
| Avantis Short-Term Fixed Income Fund | |||||
| Assets | |||||
| Investment securities, at value (cost of $13,692,937) | $ | 12,865,573 | |||
| Interest receivable | 84,729 | ||||
| 12,950,302 | |||||
| Liabilities | |||||
| Payable for capital shares redeemed | 527 | ||||
| Accrued management fees | 1,348 | ||||
| Dividends payable | 422 | ||||
| 2,297 | |||||
| Net Assets | $ | 12,948,005 | |||
| Net Assets Consist of: | |||||
| Capital paid in | $ | 13,911,512 | |||
| Distributable earnings | (963,507) | ||||
| $ | 12,948,005 | ||||
| Fund/Class | Net Assets | Shares Outstanding | Net Asset Value Per Share | ||||||||
| Avantis Short-Term Fixed Income Fund | |||||||||||
| Institutional Class | $10,458,764 | 1,119,617 | $9.34 | ||||||||
| G Class | $2,489,241 | 266,477 | $9.34 | ||||||||
See Notes to Financial Statements.
40
| Statements of Operations | ||
| YEAR ENDED AUGUST 31, 2022 | ||||||||
| Avantis Core Fixed Income Fund | Avantis Core Municipal Fixed Income Fund | |||||||
| Investment Income (Loss) | ||||||||
| Income: | ||||||||
| Interest | $ | 585,259 | $ | 157,671 | ||||
| Expenses: | ||||||||
| Management fees | 39,441 | 20,294 | ||||||
| Other expenses | 1,054 | 501 | ||||||
| 40,495 | 20,795 | |||||||
| Fees waived - G Class | (23,121) | (1,469) | ||||||
| 17,374 | 19,326 | |||||||
| Net investment income (loss) | 567,885 | 138,345 | ||||||
| Realized and Unrealized Gain (Loss) | ||||||||
| Net realized gain (loss) on: | ||||||||
| Investment transactions | (2,192,378) | (200,903) | ||||||
| Futures contract transactions | (44,294) | — | ||||||
| Swap agreement transactions | (5,529) | — | ||||||
| (2,242,201) | (200,903) | |||||||
| Change in net unrealized appreciation (depreciation) on: | ||||||||
| Investments | (2,133,766) | (1,099,348) | ||||||
| Futures contracts | (3,609) | — | ||||||
| Swap agreements | (3,353) | — | ||||||
| (2,140,728) | (1,099,348) | |||||||
| Net realized and unrealized gain (loss) | (4,382,929) | (1,300,251) | ||||||
| Net Increase (Decrease) in Net Assets Resulting from Operations | $ | (3,815,044) | $ | (1,161,906) | ||||
See Notes to Financial Statements.
41
| YEAR ENDED AUGUST 31, 2022 | |||||
| Avantis Short-Term Fixed Income Fund | |||||
| Investment Income (Loss) | |||||
| Income: | |||||
| Interest | $ | 127,921 | |||
| Expenses: | |||||
| Management fees | 21,081 | ||||
| Other expenses | 28 | ||||
| 21,109 | |||||
| Fees waived - G Class | (2,693) | ||||
| 18,416 | |||||
| Net investment income (loss) | 109,505 | ||||
| Realized and Unrealized Gain (Loss) | |||||
| Net realized gain (loss) on: | |||||
| Investment transactions | (126,077) | ||||
| Futures contract transactions | (4,711) | ||||
| (130,788) | |||||
| Change in net unrealized appreciation (depreciation) on investments | (827,585) | ||||
| Net realized and unrealized gain (loss) | (958,373) | ||||
| Net Increase (Decrease) in Net Assets Resulting from Operations | $ | (848,868) | |||
See Notes to Financial Statements.
42
| Statements of Changes in Net Assets | ||
| YEAR ENDED AUGUST 31, 2022 AND PERIOD ENDED AUGUST 31, 2021 | |||||||||||||||||
| Avantis Core Fixed Income Fund | Avantis Core Municipal Fixed Income Fund | ||||||||||||||||
| Increase (Decrease) in Net Assets | August 31, 2022 | August 31, 2021(1) | August 31, 2022 | August 31, 2021(1) | |||||||||||||
| Operations | |||||||||||||||||
| Net investment income (loss) | $ | 567,885 | $ | 105,070 | $ | 138,345 | $ | 70,766 | |||||||||
| Net realized gain (loss) | (2,242,201) | 22,346 | (200,903) | (120) | |||||||||||||
| Change in net unrealized appreciation (depreciation) | (2,140,728) | 135,580 | (1,099,348) | 259,813 | |||||||||||||
| Net increase (decrease) in net assets resulting from operations | (3,815,044) | 262,996 | (1,161,906) | 330,459 | |||||||||||||
| Distributions to Shareholders | |||||||||||||||||
| From earnings: | |||||||||||||||||
| Institutional Class | (224,439) | (91,575) | (126,953) | (65,321) | |||||||||||||
| G Class | (370,366) | (14,426) | (11,392) | (5,445) | |||||||||||||
| Decrease in net assets from distributions | (594,805) | (106,001) | (138,345) | (70,766) | |||||||||||||
| Capital Share Transactions | |||||||||||||||||
| Net increase (decrease) in net assets from capital share transactions (Note 5) | 20,526,590 | 16,709,456 | (3,234,628) | 15,120,756 | |||||||||||||
| Net increase (decrease) in net assets | 16,116,741 | 16,866,451 | (4,534,879) | 15,380,449 | |||||||||||||
| Net Assets | |||||||||||||||||
| Beginning of period | 16,866,451 | — | 15,380,449 | — | |||||||||||||
| End of period | $ | 32,983,192 | $ | 16,866,451 | $ | 10,845,570 | $ | 15,380,449 | |||||||||
(1)February 24, 2021 (fund inception) through August 31, 2021.
See Notes to Financial Statements.
43
| YEAR ENDED AUGUST 31, 2022 AND PERIOD ENDED AUGUST 31, 2021 | |||||||||||
| Avantis Short-Term Fixed Income Fund | |||||||||||
| Increase (Decrease) in Net Assets | August 31, 2022 | August 31, 2021(1) | |||||||||
| Operations | |||||||||||
| Net investment income (loss) | $ | 109,505 | $ | 32,896 | |||||||
| Net realized gain (loss) | (130,788) | (5,108) | |||||||||
| Change in net unrealized appreciation (depreciation) | (827,585) | 221 | |||||||||
| Net increase (decrease) in net assets resulting from operations | (848,868) | 28,009 | |||||||||
| Distributions to Shareholders | |||||||||||
| From earnings: | |||||||||||
| Institutional Class | (92,513) | (29,858) | |||||||||
| G Class | (17,239) | (3,038) | |||||||||
| Decrease in net assets from distributions | (109,752) | (32,896) | |||||||||
| Capital Share Transactions | |||||||||||
| Net increase (decrease) in net assets from capital share transactions (Note 5) | (1,098,579) | 15,010,091 | |||||||||
| Net increase (decrease) in net assets | (2,057,199) | 15,005,204 | |||||||||
| Net Assets | |||||||||||
| Beginning of period | 15,005,204 | — | |||||||||
| End of period | $ | 12,948,005 | $ | 15,005,204 | |||||||
(1)February 24, 2021 (fund inception) through August 31, 2021.
See Notes to Financial Statements.
44
| Notes to Financial Statements | ||
AUGUST 31, 2022
1. Organization
American Century ETF Trust (the trust) was registered as a Delaware statutory trust in 2017 and is registered under the Investment Company Act of 1940, as amended (the 1940 Act), as an open-end management investment company. Avantis Core Fixed Income Fund, Avantis Core Municipal Fixed Income Fund and Avantis Short-Term Fixed Income Fund (collectively, the funds) are three funds in a series issued by the trust. The investment objective for Avantis Core Fixed Income Fund and Avantis Short-Term Fixed Income Fund is to seek to maximize total return. Avantis Core Municipal Fixed Income Fund’s investment objective is to seek current income that is exempt from federal income tax. The funds offer the Institutional Class and G Class. All classes of the funds commenced sale on February 24, 2021, the funds’ inception date.
2. Significant Accounting Policies
The following is a summary of significant accounting policies consistently followed by the funds in preparation of their financial statements. Each fund is an investment company and follows accounting and reporting guidance in accordance with accounting principles generally accepted in the United States of America. This may require management to make certain estimates and assumptions at the date of the financial statements. Actual results could differ from these estimates. Management evaluated the impact of events or transactions occurring through the date the financial statements were issued that would merit recognition or disclosure.
Investment Valuations — The funds determine the fair value of their investments and compute their net asset value (NAV) per share at the close of regular trading (usually 4 p.m. Eastern time) on the New York Stock Exchange (NYSE) on each day the NYSE is open. The Board of Trustees has adopted valuation policies and procedures to guide the investment advisor in the funds' investment valuation process and to provide methodologies for the oversight of the funds' pricing function.
Fixed income securities are valued at the evaluated mean as provided by independent pricing services or at the mean of the most recent bid and asked prices as provided by investment dealers. Corporate bonds, U.S. Treasury and Government Agency securities, municipal securities, and sovereign governments and agencies are valued using market models that consider trade data, quotations from dealers and active market makers, relevant yield curve and spread data, creditworthiness, trade data or market information on comparable securities, and other relevant security specific information. Mortgage-related and asset-backed securities are valued based on models that consider trade data, prepayment and default projections, benchmark yield and spread data and estimated cash flows of each tranche of the issuer. Commercial paper is valued using a curve-based approach that considers money market rates for specific instruments, programs, currencies and maturity points from a variety of active market makers.
Open-end management investment companies are valued at the reported NAV per share. Exchange-traded futures contracts are valued at the settlement price as provided by the appropriate exchange. Swap agreements are valued at an evaluated mean as provided by independent pricing services or independent brokers.
If the funds determine that the market price for an investment is not readily available or the valuation methods mentioned above do not reflect an investment’s fair value, such investment is valued as determined in good faith by the Board of Trustees or its delegate, in accordance with policies and procedures adopted by the Board of Trustees. In its determination of fair value, the funds may review several factors including, but not limited to, market information regarding the specific investment or comparable investments and correlation with other investment types, futures indices or general market indicators. Circumstances that may cause the funds to use these procedures to value an investment include, but are not limited to: an investment has been declared in default or is distressed; trading in a security has been suspended during the trading day or a security is not actively trading on its principal exchange; prices received from a regular pricing source are deemed unreliable; or there is a foreign market holiday and no trading occurred.
45
The funds monitor for significant events occurring after the close of an investment’s primary exchange but before each fund’s NAV per share is determined. Significant events may include, but are not limited to: corporate announcements and transactions; governmental action and political unrest that could impact a specific investment or an investment sector; or armed conflicts, natural disasters and similar events that could affect investments in a specific country or region.
Security Transactions — Security transactions are accounted for as of the trade date. Net realized gains and losses are determined on the identified cost basis, which is also used for federal income tax purposes.
Investment Income — Interest income is recorded on the accrual basis and includes accretion of discounts and amortization of premiums. Inflation adjustments related to inflation-linked debt securities are reflected as interest income.
Forward Commitments — The funds may engage in securities transactions on a forward commitment basis. In these transactions, the securities’ prices and yields are fixed on the date of the commitment. The funds may sell a to-be-announced (TBA) security and at the same time make a commitment to purchase the same security at a future date at a specified price. Conversely, the funds may purchase a TBA security and at the same time make a commitment to sell the same security at a future date at a specified price. These types of transactions are known as “TBA roll” transactions and are accounted for as purchases and sales. The funds will segregate cash, cash equivalents or other appropriate liquid securities on its records in amounts sufficient to meet the purchase price.
Segregated Assets — In accordance with the 1940 Act, the funds segregate assets on their books and records to cover certain types of investment securities and other financial instruments. American Century Investment Management, Inc. (ACIM) (the investment advisor) monitors, on a daily basis, the securities segregated to ensure the funds designate a sufficient amount of liquid assets, marked-to-market daily. The funds may also receive assets or be required to pledge assets at the custodian bank or with a broker for collateral requirements.
Income Tax Status — It is each fund’s policy to distribute substantially all net investment income and net realized gains to shareholders and to otherwise qualify as a regulated investment company under provisions of the Internal Revenue Code. Accordingly, no provision has been made for income taxes. The funds file U.S. federal, state, local and non-U.S. tax returns as applicable. The funds' tax returns are subject to examination by the relevant taxing authority until expiration of the applicable statute of limitations, which is generally three years from the date of filing but can be longer in certain jurisdictions. At this time, management believes there are no uncertain tax positions which, based on their technical merit, would not be sustained upon examination and for which it is reasonably possible that the total amounts of unrecognized tax benefits will significantly change in the next twelve months.
Multiple Class — All shares of each fund represent an equal pro rata interest in the net assets of the class to which such shares belong, and have identical voting, dividend, liquidation and other rights and the same terms and conditions, except for class specific expenses and exclusive rights to vote on matters affecting only individual classes. Income, non-class specific expenses, and realized and unrealized capital gains and losses of the funds are allocated to each class of shares based on their relative net assets.
Distributions to Shareholders — Distributions from net investment income, if any, are declared daily and paid monthly. Distributions from net realized gains, if any, are generally declared and paid annually.
Indemnifications — Under the trust’s organizational documents, its officers and trustees are indemnified against certain liabilities arising out of the performance of their duties to the funds. In addition, in the normal course of business, the funds enter into contracts that provide general indemnifications. The maximum exposure under these arrangements is unknown as this would involve future claims that may be made against a fund. The risk of material loss from such claims is considered by management to be remote.
46
3. Fees and Transactions with Related Parties
Certain officers and trustees of the trust are also officers and/or directors of American Century Companies, Inc. (ACC). The trust's investment advisor, ACIM, the funds' distributor, American Century Investment Services, Inc., and the trust’s transfer agent, American Century Services, LLC, are wholly owned, directly or indirectly, by ACC. Various funds issued by American Century Asset Allocation Portfolios, Inc. own, in aggregate, 82% and 12% of the shares of the Avantis Core Fixed Income Fund and Avantis Short-Term Fixed Income Fund, respectively. ACIM owns 60% and 60% of the shares of the Avantis Core Municipal Fixed Income Fund and Avantis Short-Term Fixed Income Fund, respectively. Related parties do not invest in the funds for the purpose of exercising management or control.
Management Fees — The trust has entered into a management agreement with ACIM, under which ACIM provides the funds with investment advisory and management services in exchange for a single, unified management fee (the fee) per class. The agreement provides that ACIM will pay all expenses of managing and operating the funds, except brokerage and other transaction fees and expenses relating to the acquisition and disposition of portfolio securities, acquired fund fees and expenses, interest, taxes, litigation expenses and extraordinary expenses. The fee is computed and accrued daily based on each class's daily net assets and paid monthly in arrears. The investment advisor agreed to waive each fund's G Class management fee in its entirety. The investment advisor expects this waiver to remain in effect permanently and cannot terminate it without the approval of the Board of Trustees.
For the period ended August 31, 2022, the annual management fee for the Institutional Class and the annual management fee before and after waiver for G Class for each fund are as follows:
| Annual Management Fee | |||||||||||
| Institutional Class | G Class Before Waiver | G Class After Waiver | |||||||||
| Avantis Core Fixed Income Fund | 0.15% | 0.15% | 0.00% | ||||||||
| Avantis Core Municipal Fixed Income Fund | 0.15% | 0.15% | 0.00% | ||||||||
| Avantis Short-Term Fixed Income Fund | 0.15% | 0.15% | 0.00% | ||||||||
4. Investment Transactions
Purchases and sales of investment securities, excluding short-term investments, for the period ended August 31, 2022 were as follows:
| Avantis Core Fixed Income Fund | Avantis Core Municipal Fixed Income Fund | Avantis Short-Term Fixed Income Fund | |||||||||
| Purchases of U.S. Treasury and Government Agency obligations | $130,751,779 | — | $1,920,829 | ||||||||
| Purchases of other investment securities | 29,545,876 | $237,798 | 4,659,193 | ||||||||
| Total Purchases | $160,297,655 | $237,798 | $6,580,022 | ||||||||
| Sales of U.S. Treasury and Government Agency obligations | $121,801,747 | — | $3,853,556 | ||||||||
| Sales of other investment securities | 17,015,791 | $3,071,386 | 3,658,728 | ||||||||
| Total Sales | $138,817,538 | $3,071,386 | $7,512,284 | ||||||||
47
5. Capital Share Transactions
Transactions in shares of the funds were as follows (unlimited number of shares authorized):
| Year ended August 31, 2022 | Period ended August 31, 2021(1) | |||||||||||||
| Shares | Amount | Shares | Amount | |||||||||||
| Avantis Core Fixed Income Fund | ||||||||||||||
| Institutional Class | ||||||||||||||
| Sold | 5,099,931 | $ | 45,722,365 | 1,551,182 | $ | 15,497,766 | ||||||||
| Issued in reinvestment of distributions | 24,385 | 224,431 | 9,172 | 91,575 | ||||||||||
| Redeemed | (5,917,471) | (53,229,219) | (175,286) | (1,740,476) | ||||||||||
| (793,155) | (7,282,423) | 1,385,068 | 13,848,865 | |||||||||||
| G Class | ||||||||||||||
| Sold | 3,382,690 | 31,653,010 | 302,966 | 3,022,315 | ||||||||||
| Issued in reinvestment of distributions | 41,477 | 370,366 | 1,441 | 14,426 | ||||||||||
| Redeemed | (468,280) | (4,214,363) | (17,615) | (176,150) | ||||||||||
| 2,955,887 | 27,809,013 | 286,792 | 2,860,591 | |||||||||||
| Net increase (decrease) | 2,162,732 | $ | 20,526,590 | 1,671,860 | $ | 16,709,456 | ||||||||
| Avantis Core Municipal Fixed Income Fund | ||||||||||||||
| Institutional Class | ||||||||||||||
| Sold | 846,714 | $ | 8,102,970 | 1,404,925 | $ | 14,049,990 | ||||||||
| Issued in reinvestment of distributions | 13,099 | 126,855 | 6,445 | 65,321 | ||||||||||
| Redeemed | (1,203,789) | (11,475,845) | — | — | ||||||||||
| (343,976) | (3,246,020) | 1,411,370 | 14,115,311 | |||||||||||
| G Class | ||||||||||||||
| Sold | — | — | 100,000 | 1,000,000 | ||||||||||
| Issued in reinvestment of distributions | 1,180 | 11,392 | 537 | 5,445 | ||||||||||
| 1,180 | 11,392 | 100,537 | 1,005,445 | |||||||||||
| Net increase (decrease) | (342,796) | $ | (3,234,628) | 1,511,907 | $ | 15,120,756 | ||||||||
| Avantis Short-Term Fixed Income Fund | ||||||||||||||
| Institutional Class | ||||||||||||||
| Sold | 599,839 | $ | 5,842,256 | 1,421,448 | $ | 14,214,166 | ||||||||
| Issued in reinvestment of distributions | 9,439 | 90,799 | 2,990 | 29,858 | ||||||||||
| Redeemed | (881,557) | (8,556,323) | (32,542) | (325,176) | ||||||||||
| (272,279) | (2,623,268) | 1,391,896 | 13,918,848 | |||||||||||
| G Class | ||||||||||||||
| Sold | 176,706 | 1,708,621 | 109,983 | 1,099,661 | ||||||||||
| Issued in reinvestment of distributions | 1,806 | 17,239 | 304 | 3,038 | ||||||||||
| Redeemed | (21,174) | (201,171) | (1,148) | (11,456) | ||||||||||
| 157,338 | 1,524,689 | 109,139 | 1,091,243 | |||||||||||
| Net increase (decrease) | (114,941) | $ | (1,098,579) | 1,501,035 | $ | 15,010,091 | ||||||||
(1)February 24, 2021 (fund inception) through August 31, 2021.
48
6. Fair Value Measurements
The funds’ investment valuation process is based on several considerations and may use multiple inputs to determine the fair value of the investments held by the funds. In conformity with accounting principles generally accepted in the United States of America, the inputs used to determine a valuation are classified into three broad levels.
•Level 1 valuation inputs consist of unadjusted quoted prices in an active market for identical investments.
•Level 2 valuation inputs consist of direct or indirect observable market data (including quoted prices for comparable investments, evaluations of subsequent market events, interest rates, prepayment speeds, credit risk, etc.). These inputs also consist of quoted prices for identical investments initially expressed in local currencies that are adjusted through translation into U.S. dollars.
•Level 3 valuation inputs consist of unobservable data (including a fund’s own assumptions).
The level classification is based on the lowest level input that is significant to the fair valuation measurement. The valuation inputs are not necessarily an indication of the risks associated with investing in these securities or other financial instruments.
The following is a summary of the level classifications as of period end. The Schedules of Investments provide additional information on the funds’ portfolio holdings.
Avantis Core Fixed Income Fund
| Level 1 | Level 2 | Level 3 | |||||||||
| Assets | |||||||||||
| Investment Securities | |||||||||||
| Corporate Bonds | — | $ | 20,185,897 | — | |||||||
| U.S. Treasury Securities and Equivalents | — | 8,299,988 | — | ||||||||
| U.S. Government Agency Mortgage-Backed Securities | — | 6,367,495 | — | ||||||||
| U.S. Government Agency Securities | — | 624,258 | — | ||||||||
| Short-Term Investments | $ | 446,011 | 3,396,229 | — | |||||||
| $ | 446,011 | $ | 38,873,867 | — | |||||||
| Other Financial Instruments | |||||||||||
| Swap Agreements | — | $ | 3,812 | — | |||||||
| Liabilities | |||||||||||
| Other Financial Instruments | |||||||||||
| Futures Contracts | $ | 3,361 | — | — | |||||||
Avantis Core Municipal Fixed Income Fund
| Level 1 | Level 2 | Level 3 | |||||||||
| Assets | |||||||||||
| Investment Securities | |||||||||||
| Municipal Securities | — | $ | 10,700,430 | — | |||||||
| Short-Term Investments | $ | 21,406 | — | — | |||||||
| $ | 21,406 | $ | 10,700,430 | — | |||||||
49
Avantis Short-Term Fixed Income Fund
| Level 1 | Level 2 | Level 3 | |||||||||
| Assets | |||||||||||
| Investment Securities | |||||||||||
| Corporate Bonds | — | $ | 8,271,942 | — | |||||||
| U.S. Treasury Securities and Equivalents | — | 4,029,287 | — | ||||||||
| U.S. Government Agency Securities | — | 396,574 | — | ||||||||
| Short-Term Investments | $ | 167,770 | — | — | |||||||
| $ | 167,770 | $ | 12,697,803 | — | |||||||
7. Derivative Instruments
Credit Risk — The funds are subject to credit risk in the normal course of pursuing its investment objectives. The value of a bond generally declines as the credit quality of its issuer declines. Credit default swap agreements enable a fund to buy/sell protection against a credit event of a specific issuer or index. A fund may attempt to enhance returns by selling protection or attempt to mitigate credit risk by buying protection. The buyer/seller of credit protection against a security or basket of securities may pay/receive an up-front or periodic payment to compensate for/against potential default events. Changes in value, including the periodic amounts of interest to be paid or received on swap agreements, are recorded as unrealized appreciation (depreciation) on swap agreements. Upon entering into a centrally cleared swap, a fund is required to deposit cash or securities (initial margin) with a financial intermediary in an amount equal to a certain percentage of the notional amount. Subsequent payments (variation margin) are made or received daily, in cash, by a fund. The variation margin is equal to the daily change in the value and is a component of unrealized gains and losses. Realized gain or loss is recorded upon receipt or payment of a periodic settlement or termination of swap agreements. Net realized and unrealized gains or losses occurring during the holding period of swap agreements are a component of net realized gain (loss) on swap agreement transactions and change in net unrealized appreciation (depreciation) on swap agreements, respectively. The risks of entering into swap agreements include the possible lack of liquidity, failure of the counterparty to meet its obligations, and that there may be unfavorable changes in the underlying investments or instruments.
The fund's average notional amount to credit risk derivative instruments held during the period was as follows:
| Avantis Core Fixed Income Fund | $ | 575,000 | |||
Interest Rate Risk — The funds are subject to interest rate risk in the normal course of pursuing its investment objectives. The value of bonds generally declines as interest rates rise. A fund may enter into futures contracts based on a bond index or a specific underlying security. A fund may purchase futures contracts to gain exposure to increases in market value or sell futures contracts to protect against a decline in market value. Upon entering into a futures contract, a fund will segregate cash, cash equivalents or other appropriate liquid securities on its records in amounts sufficient to meet requirements. Subsequent payments (variation margin) are made or received daily, in cash, by a fund. The variation margin is equal to the daily change in the contract value and is recorded as unrealized gains and losses. A fund recognizes a realized gain or loss when the futures contract is closed or expires. Net realized and unrealized gains or losses occurring during the holding period of futures contracts are a component of net realized gain (loss) on futures contract transactions and change in net unrealized appreciation (depreciation) on futures contracts, respectively. One of the risks of entering into futures contracts is the possibility that the change in value of the contract may not correlate with the changes in value of the underlying securities.
The funds' average notional exposure to interest rate risk derivative instruments held during the period were as follows:
| Futures Contracts Purchased | |||||
| Avantis Core Fixed Income Fund | $471,919 | ||||
| Avantis Short-Term Fixed Income Fund | $568,633 | ||||
50
Value of Derivative Instruments as of August 31, 2022
| Asset Derivatives | Liability Derivatives | |||||||||||||
| Fund / Type of Risk Exposure | Location on Statement of Assets and Liabilities | Value | Location on Statement of Assets and Liabilities | Value | ||||||||||
| Avantis Core Fixed Income Fund | ||||||||||||||
| Credit Risk | Receivable for variation margin on swap agreements* | — | Payable for variation margin on swap agreements* | $ | 361 | |||||||||
| Interest Rate Risk | Receivable for variation margin on futures contracts* | — | Payable for variation margin on futures contracts* | 2,031 | ||||||||||
| — | $ | 2,392 | ||||||||||||
*Included in the unrealized appreciation (depreciation) on futures contracts or centrally cleared swap agreements, as applicable, as reported in the Schedule of Investments.
At period end, Avantis Short-Term Fixed Income Fund did not have any derivative instruments disclosed on the Statement of Assets and Liabilities
Effect of Derivative Instruments on the Statement of Operations for the Year Ended August 31, 2022
| Net Realized Gain (Loss) | Change in Net Unrealized Appreciation (Depreciation) | |||||||||||||
| Fund / Type of Risk Exposure | Location on Statement of Operations | Value | Location on Statement of Operations | Value | ||||||||||
| Avantis Core Fixed Income Fund | ||||||||||||||
| Credit Risk | Net realized gain (loss) on swap agreement transactions | $ | (5,529) | Change in net unrealized appreciation (depreciation) on swap agreements | $ | (3,353) | ||||||||
| Interest Rate Risk | Net realized gain (loss) on futures contract transactions | (44,294) | Change in net unrealized appreciation (depreciation) on futures contracts | (3,609) | ||||||||||
| $ | (49,823) | $ | (6,962) | |||||||||||
| Avantis Short-Term Fixed Income Fund | ||||||||||||||
| Interest Rate Risk | Net realized gain (loss) on futures contract transactions | $ | (4,711) | Change in net unrealized appreciation (depreciation) on futures contracts | — | |||||||||
8. Risk Factors
The value of the funds’ shares will go up and down, sometimes rapidly or unpredictably, based on the performance of the securities owned by the funds and other factors generally affecting the securities market. Market risks, including political, regulatory, economic and social developments, can affect the value of the funds’ investments. Natural disasters, public health emergencies, war, terrorism and other unforeseeable events may lead to increased market volatility and may have adverse long-term effects on world economies and markets generally.
The novel coronavirus (COVID-19) pandemic has stressed the financial resources of many municipal issuers, which may impair a municipal issuer’s ability to meet its financial obligations when due and could adversely impact the value of its bonds, which could negatively impact the performance of the funds.
A fund’s investment process may result in high portfolio turnover, which could mean high transaction costs, affecting both performance and capital gains tax liabilities to investors.
51
9. Federal Tax Information
The tax character of distributions paid during the year ended August 31, 2022 and period ended August 31, 2021 were as follows:
| 2022 | 2021(1) | |||||||||||||||||||
| Distributions Paid From: | Distributions Paid From: | |||||||||||||||||||
| Exempt Income | Ordinary Income | Long-term Capital Gains | Exempt Income | Ordinary Income | Long-term Capital Gains | |||||||||||||||
| Avantis Core Fixed Income Fund | — | $ | 594,805 | — | — | $ | 106,001 | — | ||||||||||||
| Avantis Core Municipal Fixed Income Fund | $ | 138,345 | — | — | $ | 70,766 | — | — | ||||||||||||
| Avantis Short-Term Fixed Income Fund | — | $ | 109,752 | — | — | $ | 32,896 | — | ||||||||||||
(1)February 24, 2021 (fund inception) through August 31, 2021.
The book-basis character of distributions made during the year from net investment income or net realized gains may differ from their ultimate characterization for federal income tax purposes. These differences reflect the differing character of certain income items and net realized gains and losses for financial statement and tax purposes, and may result in reclassification among certain capital accounts on the financial statements.
As of period end, the federal tax cost of investments and the components of distributable earnings on a tax-basis were as follows:
| Avantis Core Fixed Income Fund | Avantis Core Municipal Fixed Income Fund | Avantis Short-Term Fixed Income Fund | |||||||||
| Federal tax cost of investments | $ | 41,454,285 | $ | 11,561,371 | $ | 13,692,937 | |||||
| Gross tax appreciation of investments | $ | 2,025 | — | — | |||||||
| Gross tax depreciation of investments | (2,136,432) | (839,535) | (827,364) | ||||||||
| Net tax appreciation (depreciation) of investments | (2,134,407) | (839,535) | (827,364) | ||||||||
| Net tax appreciation (depreciation) on derivatives | (3,820) | — | — | ||||||||
| Net tax appreciation (depreciation) | $ | (2,138,227) | $ | (839,535) | $ | (827,364) | |||||
| Undistributed tax exempt income | — | $ | 502 | — | |||||||
| Accumulated short-term capital losses | $ | (1,475,590) | $ | (17,799) | $ | (79,802) | |||||
| Accumulated long-term capital losses | $ | (638,992) | $ | (183,726) | $ | (56,341) | |||||
For Avantis Core Fixed Income Fund, the difference between book-basis and tax-basis unrealized appreciation (depreciation) is attributable primarily to the tax deferral of losses on wash sales. The cost of investments for federal income tax purposes was the same as the cost for financial reporting purposes for Avantis Core Municipal Fixed Income Fund and Avantis Short-Term Fixed Income Fund.
Accumulated capital losses represent net capital loss carryovers that may be used to offset future realized capital gains for federal income tax purposes. The capital loss carryovers may be carried forward for an unlimited period. Future capital loss carryover utilization in any given year may be subject to Internal Revenue Code limitations.
52
| Financial Highlights | ||
| For a Share Outstanding Throughout the Years Ended August 31 (except as noted) | |||||||||||||||||||||||||||||||||||||||||||||||
| Per-Share Data | Ratios and Supplemental Data | ||||||||||||||||||||||||||||||||||||||||||||||
| Income From Investment Operations: | Distributions From: | Ratio to Average Net Assets of: | |||||||||||||||||||||||||||||||||||||||||||||
| Net Asset Value, Beginning of Period | Net Investment Income (Loss)(1) | Net Realized and Unrealized Gain (Loss) | Total From Investment Operations | Net Investment Income | Net Realized Gains | Total Distributions | Net Asset Value, End of Period | Total Return(2) | Operating Expenses | Operating Expenses (before expense waiver) | Net Investment Income (Loss) | Net Investment Income (Loss) (before expense waiver) | Portfolio Turnover Rate | Net Assets, End of Period (in thousands) | |||||||||||||||||||||||||||||||||
| Avantis Core Fixed Income Fund | |||||||||||||||||||||||||||||||||||||||||||||||
| Institutional Class | |||||||||||||||||||||||||||||||||||||||||||||||
| 2022 | $10.09 | 0.18 | (1.49) | (1.31) | (0.17) | (0.01) | (0.18) | $8.60 | (13.01)% | 0.15% | 0.15% | 2.08% | 2.08% | 481% | $5,090 | ||||||||||||||||||||||||||||||||
2021(3) | $10.00 | 0.06 | 0.10 | 0.16 | (0.07) | — | (0.07) | $10.09 | 1.56% | 0.15%(4) | 0.15%(4) | 1.26%(4) | 1.26%(4) | 113% | $13,973 | ||||||||||||||||||||||||||||||||
| G Class | |||||||||||||||||||||||||||||||||||||||||||||||
| 2022 | $10.09 | 0.21 | (1.50) | (1.29) | (0.19) | (0.01) | (0.20) | $8.60 | (12.88)% | 0.00%(5) | 0.15% | 2.23% | 2.08% | 481% | $27,893 | ||||||||||||||||||||||||||||||||
2021(3) | $10.00 | 0.07 | 0.09 | 0.16 | (0.07) | — | (0.07) | $10.09 | 1.64% | 0.00%(4)(5) | 0.15%(4) | 1.41%(4) | 1.26%(4) | 113% | $2,893 | ||||||||||||||||||||||||||||||||
| Notes to Financial Highlights | ||
(1)Computed using average shares outstanding throughout the period.
(2)Total returns are calculated based on the net asset value of the last business day. Total returns for periods less than one year are not annualized.
(3)February 24, 2021 (fund inception) through August 31, 2021.
(4)Annualized
(5)Ratio was less than 0.005%.
See Notes to Financial Statements.
| For a Share Outstanding Throughout the Years Ended August 31 (except as noted) | |||||||||||||||||||||||||||||||||||||||||
| Per-Share Data | Ratios and Supplemental Data | ||||||||||||||||||||||||||||||||||||||||
| Income From Investment Operations: | Ratio to Average Net Assets of: | ||||||||||||||||||||||||||||||||||||||||
| Net Asset Value, Beginning of Period | Net Investment Income (Loss)(1) | Net Realized and Unrealized Gain (Loss) | Total From Investment Operations | Distributions From Net Investment Income | Net Asset Value, End of Period | Total Return(2) | Operating Expenses | Operating Expenses (before expense waiver) | Net Investment Income (Loss) | Net Investment Income (Loss) (before expense waiver) | Portfolio Turnover Rate | Net Assets, End of Period (in thousands) | |||||||||||||||||||||||||||||
| Avantis Core Municipal Fixed Income Fund | |||||||||||||||||||||||||||||||||||||||||
| Institutional Class | |||||||||||||||||||||||||||||||||||||||||
| 2022 | $10.17 | 0.10 | (0.89) | (0.79) | (0.10) | $9.28 | (7.82)% | 0.15% | 0.15% | 1.02% | 1.02% | 2% | $9,902 | ||||||||||||||||||||||||||||
2021(3) | $10.00 | 0.05 | 0.17 | 0.22 | (0.05) | $10.17 | 2.17% | 0.15%(4) | 0.15%(4) | 0.89%(4) | 0.89%(4) | 2% | $14,358 | ||||||||||||||||||||||||||||
| G Class | |||||||||||||||||||||||||||||||||||||||||
| 2022 | $10.17 | 0.11 | (0.89) | (0.78) | (0.11) | $9.28 | (7.68)% | 0.00%(5) | 0.15% | 1.17% | 1.02% | 2% | $944 | ||||||||||||||||||||||||||||
2021(3) | $10.00 | 0.05 | 0.17 | 0.22 | (0.05) | $10.17 | 2.25% | 0.00%(4) | 0.15%(4) | 1.04%(4) | 0.89%(4) | 2% | $1,023 | ||||||||||||||||||||||||||||
| Notes to Financial Highlights | ||
(1)Computed using average shares outstanding throughout the period.
(2)Total returns are calculated based on the net asset value of the last business day. Total returns for periods less than one year are not annualized.
(3)February 24, 2021 (fund inception) through August 31, 2021.
(4)Annualized.
(5)Ratio was less than 0.005%.
See Notes to Financial Statements.
| For a Share Outstanding Throughout the Years Ended August 31 (except as noted) | |||||||||||||||||||||||||||||||||||||||||
| Per-Share Data | Ratios and Supplemental Data | ||||||||||||||||||||||||||||||||||||||||
| Income From Investment Operations: | Ratio to Average Net Assets of: | ||||||||||||||||||||||||||||||||||||||||
| Net Asset Value, Beginning of Period | Net Investment Income (Loss)(1) | Net Realized and Unrealized Gain (Loss) | Total From Investment Operations | Distributions From Net Investment Income | Net Asset Value, End of Period | Total Return(2) | Operating Expenses | Operating Expenses (before expense waiver) | Net Investment Income (Loss) | Net Investment Income (Loss) (before expense waiver) | Portfolio Turnover Rate | Net Assets, End of Period (in thousands) | |||||||||||||||||||||||||||||
| Avantis Short-Term Fixed Income Fund | |||||||||||||||||||||||||||||||||||||||||
| Institutional Class | |||||||||||||||||||||||||||||||||||||||||
| 2022 | $10.00 | 0.07 | (0.66) | (0.59) | (0.07) | $9.34 | (5.88)% | 0.15% | 0.15% | 0.76% | 0.76% | 48% | $10,459 | ||||||||||||||||||||||||||||
2021(3) | $10.00 | 0.02 | —(4) | 0.02 | (0.02) | $10.00 | 0.21% | 0.15%(5) | 0.15%(5) | 0.42%(5) | 0.42%(5) | 29% | $13,914 | ||||||||||||||||||||||||||||
| G Class | |||||||||||||||||||||||||||||||||||||||||
| 2022 | $10.00 | 0.09 | (0.66) | (0.57) | (0.09) | $9.34 | (5.74)% | 0.00%(6) | 0.15% | 0.91% | 0.76% | 48% | $2,489 | ||||||||||||||||||||||||||||
2021(3) | $10.00 | 0.03 | —(4) | 0.03 | (0.03) | $10.00 | 0.29% | 0.00%(5) | 0.15%(5) | 0.57%(5) | 0.42%(5) | 29% | $1,091 | ||||||||||||||||||||||||||||
| Notes to Financial Highlights | ||
(1)Computed using average shares outstanding throughout the period.
(2)Total returns are calculated based on the net asset value of the last business day. Total returns for periods less than one year are not annualized.
(3)February 24, 2021 (fund inception) through August 31, 2021.
(4)Per-share amount was less than $0.005.
(5)Annualized.
(6)Ratio was less than 0.005%.
See Notes to Financial Statements.
| Report of Independent Registered Public Accounting Firm | ||
To the Shareholders and the Board of Trustees of American Century ETF Trust:
Opinion on the Financial Statements and Financial Highlights
We have audited the accompanying statements of assets and liabilities, including the schedules of investments, of Avantis® Core Fixed Income Fund, Avantis® Core Municipal Fixed Income Fund, and Avantis® Short-Term Fixed Income Fund (the “Funds”), three of the funds constituting the American Century ETF Trust, as of August 31, 2022, the related statements of operations, statements of changes in net assets, and financial highlights for the periods indicated in the table below; and the related notes. In our opinion, the financial statements and financial highlights present fairly, in all material respects, the financial position of each of the Funds constituting American Century ETF Trust as of August 31, 2022, and the results of their operations, the changes in their net assets, and the financial highlights for the periods listed in the table below, in conformity with accounting principles generally accepted in the United States of America.
| Individual Fund Constituting the American Century ETF Trust | Statement of Operations | Statements of Changes in Net Assets | Financial Highlights | ||||||||
Avantis® Core Fixed Income Fund | For the year ended August 31, 2022 | For the year ended August 31, 2022 and the period from February 24, 2021 (fund inception) through August 31, 2021 | |||||||||
Avantis® Core Municipal Fixed Income Fund | |||||||||||
Avantis® Short-Term Fixed Income Fund | |||||||||||
Basis for Opinion
These financial statements and financial highlights are the responsibility of the Funds’ management. Our responsibility is to express an opinion on the Funds’ financial statements and financial highlights based on our audits. We are a public accounting firm registered with the Public Company Accounting Oversight Board (United States) (PCAOB) and are required to be independent with respect to the Funds in accordance with the U.S. federal securities laws and the applicable rules and regulations of the Securities and Exchange Commission and the PCAOB.
We conducted our audits in accordance with the standards of the PCAOB. Those standards require that we plan and perform the audit to obtain reasonable assurance about whether the financial statements and financial highlights are free of material misstatement, whether due to error or fraud. The Funds are not required to have, nor were we engaged to perform, an audit of their internal control over financial reporting. As part of our audits, we are required to obtain an understanding of internal control over financial reporting but not for the purpose of expressing an opinion on the effectiveness of the Funds’ internal control over financial reporting. Accordingly, we express no such opinion.
56
Our audits included performing procedures to assess the risks of material misstatement of the financial statements and financial highlights, whether due to error or fraud, and performing procedures that respond to those risks. Such procedures included examining, on a test basis, evidence regarding the amounts and disclosures in the financial statements and financial highlights. Our audits also included evaluating the accounting principles used and significant estimates made by management, as well as evaluating the overall presentation of the financial statements and financial highlights. Our procedures included confirmation of securities owned as of August 31, 2022, by correspondence with the custodian and brokers; when replies were not received from brokers, we performed other auditing procedures. We believe that our audits provide a reasonable basis for our opinion.
/s/ Deloitte & Touche LLP
Kansas City, Missouri
October 17, 2022
We have served as the auditor of one or more American Century investment companies since 1997.
57
| Management | ||
The Board of Trustees
The individuals listed below serve as trustees of the funds. Each trustee will continue to serve in this capacity until death, retirement, resignation or removal from office. The board has adopted a mandatory retirement age for trustees who are not “interested persons,” as that term is defined in the Investment Company Act (independent trustees). Trustees who are not also officers of the trust shall retire on December 31st of the year in which they reach their 75th birthday.
Jonathan S. Thomas is an “interested person” because he currently serves as President and Chief Executive Officer of American Century Companies, Inc. (ACC), the parent company of American Century Investment Management, Inc. (ACIM or the advisor). The other trustees are independent. They are not employees, directors or officers of, and have no financial interest in, ACC or any of its wholly owned, direct or indirect, subsidiaries, including ACIM and American Century Services, LLC (ACS), and they do not have any other affiliations, positions or relationships that would cause them to be considered “interested persons” under the Investment Company Act. The following trustees also serve in this capacity for a number of other registered investment companies in the American Century Investments family of funds: Jonathan S. Thomas, 15; Jeremy I. Bulow, 8; and Stephen E. Yates, 7.
The following table presents additional information about the trustees. The mailing address for each trustee other than Jonathan S. Thomas is 330 Madison Avenue, New York, New York 10017. The mailing address for Jonathan S. Thomas is 4500 Main Street, Kansas City, Missouri 64111.
| Name (Year of Birth) | Position(s) Held with Funds | Length of Time Served | Principal Occupation(s) During Past 5 Years | Number of American Century Portfolios Overseen by Trustee | Other Directorships Held During Past 5 Years | ||||||||||||
| Independent Trustees | |||||||||||||||||
| Reginald M. Browne (1968) | Trustee and Chairman of the Board | Since 2017 (Chairman since 2019) | Principal, GTS Securities (automated capital markets trading firm)(2019 to present); Senior Managing Director, Co Global Head-ETF Group, Cantor Fitzgerald (financial services firm)(2013 to 2019) | 41 | None | ||||||||||||
| Jeremy I. Bulow (1954) | Trustee | Since 2022 | Professor of Economics, Stanford University Graduate School of Business (1979 to present) | 75 | None | ||||||||||||
| Barry A. Mendelson (1958) | Trustee | Since 2017 | Retired | 41 | None | ||||||||||||
| Stephen E. Yates (1948) | Trustee | Since 2017 | Retired | 105 | None | ||||||||||||
| Interested Trustees | |||||||||||||||||
| Jonathan S. Thomas (1963) | Trustee | Since 2017 | President and Chief Executive Officer, ACC (2007 to present). Also serves as Chief Executive Officer, ACS; Director, ACC and other ACC subsidiaries | 139 | None | ||||||||||||
The Statement of Additional Information has additional information about the funds' trustees and is available without charge, upon request, by calling 1-800-345-6488.
58
Officers
The following table presents certain information about the executive officers of the funds. Each officer, except Cleo Chang and Edward Rosenberg, serves as an officer for each of the 16 investment companies in the American Century family of funds. No officer is compensated for his or her service as an officer of the funds. The listed officers are interested persons of the funds and are appointed or re-appointed on an annual basis. The mailing address for each officer listed below is 4500 Main Street, Kansas City, Missouri 64111.
| Name (Year of Birth) | Offices with the Funds | Principal Occupation(s) During the Past Five Years | ||||||
| Patrick Bannigan (1965) | President since 2019 | Executive Vice President and Director, ACC (2012 to present); Chief Financial Officer, Chief Accounting Officer and Treasurer, ACC (2015 to present). Also serves as President, ACS; Vice President, ACIM; Chief Financial Officer, Chief Accounting Officer and/or Director, ACIM, ACS and other ACC subsidiaries | ||||||
| R. Wes Campbell (1974) | Chief Financial Officer and Treasurer since 2018 | Vice President, ACS (2020 to present); Investment Operations and Investment Accounting, ACS (2000 to present) | ||||||
| Amy D. Shelton (1964) | Chief Compliance Officer and Vice President since 2017 | Chief Compliance Officer, American Century funds, (2014 to present); Chief Compliance Officer, ACIM (2014 to present); Chief Compliance Officer, ACIS (2009 to present). Also serves as Vice President, ACIS | ||||||
| John Pak (1968) | General Counsel and Vice President since 2021 | General Counsel and Senior Vice President, ACC (2021 to present). Also serves as General Counsel and Senior Vice President, ACIM, ACS and ACIS. Chief Legal Officer of Investment and Wealth Management,The Bank of New York Mellon (2014 to 2021) | ||||||
| Cleo Chang (1977) | Vice President since 2019 | Senior Vice President, ACIM (2015 to present) | ||||||
| David H. Reinmiller (1963) | Vice President since 2017 | Attorney, ACC (1994 to present). Also serves as Vice President, ACIM and ACS | ||||||
| Edward Rosenberg (1973) | Vice President since 2017 | Senior Vice President, ACIM (2017 to present); Senior Vice President, Flexshares Head of ETF Capital Markets, Northern Trust (2012 to 2017) | ||||||
| C. Jean Wade (1964) | Vice President since 2017 | Senior Vice President, ACS (2017 to present); Vice President, ACS (2000 to 2017) | ||||||
| Ward D. Stauffer (1960) | Secretary since 2019 | Attorney, ACS (2003 to present) | ||||||
59
| Approval of Management Agreement | ||
At a meeting held on June 2, 2022, the Funds’ Board of Trustees (the "Board") unanimously approved the renewal of the management agreement pursuant to which American Century Investment Management, Inc. (the “Advisor”) acts as the investment advisor for each of the Funds. Under Section 15(c) of the Investment Company Act of 1940 (the “Investment Company Act”), contracts for investment advisory services are required to be reviewed, evaluated, and approved by a majority of a fund’s Trustees, including a majority of the independent Trustees, each year.
Prior to its consideration of the management agreement renewal, the Trustees requested and reviewed extensive data and information compiled by the Advisor and certain independent data providers concerning the Funds. This review was in addition to the oversight and evaluation undertaken by the Board and its Audit Committee on a continual basis and the information received was supplemental to the extensive information that the Board and its Audit Committee receive and consider throughout the year.
In connection with its consideration of the management agreement renewal, the Board’s review and evaluation of the services provided by the Advisor included, but was not limited to, the following:
•the nature, extent, and quality of investment management, shareholder services, and other services provided and to be provided to each Fund including without limitation portfolio management and trading services, shareholder and intermediary services, compliance and legal services, fund accounting and financial reporting, and fund share distribution;
•the wide range of other programs and services provided to each Fund and its shareholders on a routine and non-routine basis;
•the investment performance of each Fund, including data comparing each Fund's performance to an appropriate benchmark and/or a peer group of other funds with similar investment objectives and strategies;
•the cost of owning each Fund compared to the cost of owning similarly-managed funds;
•the compliance policies, procedures, and regulatory experience of the Advisor and the Funds’ service providers;
•the Advisor’s strategic plans, generally, and with respect to the ongoing impact of the COVID-19 pandemic response, heightened areas of interest in the mutual fund industry and recent geopolitical issues;
•the Advisor’s business continuity plans, vendor management practices, and cyber security practices;
•financial data showing the cost of services provided to each Fund, the profitability of each Fund to the Advisor, and the overall profitability of the Advisor;
•information regarding payments to intermediaries by the Advisor;
•possible economies of scale associated with the Advisor’s management of each Fund; and
•possible collateral benefits to the Advisor from the management of the Funds.
The independent Trustees met separately in private session to discuss the renewal and to review and discuss the information provided in response to their request. The independent Trustees also held active discussions with the Advisor regarding the renewal of the management agreement. The independent Trustees had the benefit of the advice of their independent counsel throughout the process.
Factors Considered
The Trustees considered all of the information provided by the Advisor, the independent data providers, and independent counsel in connection with the approval. They determined that the information was sufficient for them to evaluate the management agreement for the Funds. In
60
connection with their review, the Trustees did not identify any single factor as being all-important or controlling, and each Trustee may have attributed different levels of importance to different factors. In deciding to renew the management agreement, the Board based its decision on a number of factors, including without limitation the following:
Nature, Extent and Quality of Services — Generally. Under each Fund’s management agreement, the Advisor is responsible for providing or arranging for all services necessary for the operation of each Fund. The Board noted that the Advisor provides or arranges at its own expense a wide variety of services which include the following:
•constructing and designing each Fund
•portfolio research and security selection
•initial capitalization/funding
•securities trading
•Fund administration
•custody of Fund assets
•daily valuation of each Fund’s portfolio
•liquidity monitoring and management
•risk management, including cyber security
•shareholder servicing and transfer agency, including shareholder confirmations, recordkeeping, and communications
•legal services (except the independent Trustees’ counsel)
•regulatory and portfolio compliance
•financial reporting
•marketing and distribution (except amounts paid by each Fund under Rule 12b-1 plans)
Investment Management Services. The nature of the investment management services provided to the Funds is quite complex and allows Fund shareholders access to professional money management, instant diversification of their investments within an asset class, and liquidity. In evaluating investment performance, the Board expects the Advisor to manage each Fund in accordance with its investment objectives and principal investment strategies. Further, the Trustees recognize that the Advisor has an obligation to monitor trading activities, and in particular to seek the best execution of fund trades, and to evaluate the use of and payment for research. In providing these services, the Advisor utilizes teams of investment professionals (portfolio managers, analysts, research assistants, and securities traders) who require extensive information technology, research, training, compliance, and other systems to conduct their business. The Board provides oversight of the investment performance process. It regularly reviews investment performance information for each Fund, together with comparative information for appropriate benchmarks over different time horizons. The Trustees also review investment performance information during the management agreement renewal process. If performance concerns are identified, the Board discusses with the Advisor the reasons for such results and any actions being taken to improve performance. The Board found the investment management services provided by the Advisor to each Fund to be satisfactory and consistent with the management agreement.
Shareholder and Other Services. Under the management agreement, the Advisor provides or arranges for a comprehensive package of services to the Funds. The Board, directly and through its Audit Committee, regularly reviews reports and evaluations of such services at its regular meetings. These reports include, but are not limited to, information regarding the operational efficiency and accuracy of the shareholder and transfer agency services provided, staffing levels, shareholder satisfaction, technology support (including cyber security), new products and services offered to Fund shareholders, securities trading activities, portfolio valuation services, auditing services, and legal and operational compliance activities. The Board found the services provided by the Advisor to each Fund under the management agreement to be competitive and of high quality.
Costs of Services and Profitability. The Advisor provides detailed information concerning its cost of providing various services to the Funds, its profitability in managing each Fund (pre- and
61
post-distribution), its overall profitability, and its financial condition. The Trustees have reviewed with the Advisor the methodology used to prepare this financial information. This information is considered in evaluating the Advisor’s financial condition, its ability to continue to provide services under the management agreement, and the reasonableness of the current management fee. The Board concluded that the Advisor’s profits were reasonable in light of the services provided to the Funds.
Ethics. The Board generally considers the Advisor’s commitment to providing quality services to the Funds and to conducting its business ethically. They noted that the Advisor’s practices generally meet or exceed industry best practices.
Economies of Scale. The Board also reviewed information provided by the Advisor regarding the possible existence of economies of scale in connection with the management of each Fund. The Board concluded that economies of scale are difficult to measure and predict with precision, especially on a fund-by-fund basis. The Board concluded that the Advisor is sharing economies of scale, to the extent they exist, through its fee structure and through reinvestment in its business, infrastructure, investment capabilities and initiatives to provide shareholders additional content and services.
Comparison to Other Funds’ Fees. The management agreement provides that each Fund pays the Advisor a single, all-inclusive (or unified) management fee for providing all services necessary for the management and operation of the Fund, other than securities transaction expenses, taxes, interest, extraordinary expenses, and expenses incurred in connection with the provision of shareholder services and distribution services under a plan adopted pursuant to Rule 12b-1 under the Investment Company Act. Under the unified fee structure, the Advisor is responsible for providing all investment advisory, custody, audit, administrative, compliance, recordkeeping, marketing and shareholder services, or arranging and supervising third parties to provide such services. The Board believes the unified fee structure is a benefit to Fund shareholders because it clearly discloses to shareholders the cost of owning Fund shares, and, since the unified fee cannot be increased without a vote of Fund shareholders, it shifts to the Advisor the risk of increased costs of operating the Fund and provides a direct incentive to minimize administrative inefficiencies. Part of the Board’s analysis of fee levels involves reviewing certain evaluative data compiled by an independent provider comparing the Fund’s unified fee to the total expense ratios of its peers. The unified fee charged to shareholders of Avantis Core Fixed Income Fund and Avantis Short-Term Fixed Income Fund was below the median of the total expense ratios of their respective peer expense universe and was the lowest of their peer expense group. The unified fee charged to shareholders of Avantis Core Municipal Fixed Income Fund was the lowest of the total expense ratios of its peer expense universe and was the lowest of its peer expense group. The Board concluded that the management fee paid by each Fund to the Advisor under its management agreement is reasonable in light of the services provided to the Fund.
Comparison to Fees and Services Provided to Other Clients of the Advisor. The Board also requested and received information from the Advisor concerning the nature of the services, fees, costs, and profitability of its advisory services to funds or other advisory clients managed similarly to the Funds. They observed that these varying types of client accounts require different services and involve different regulatory and entrepreneurial risks than the management of the Funds. The Board analyzed this information and concluded that the fees charged and services provided to the Funds were reasonable by comparison.
Payments to Intermediaries. The Trustees also requested and received a description of payments made to intermediaries by each Fund and the Advisor and services provided in response thereto. These payments could include various payments made by each Fund or the Advisor to different types of intermediaries and recordkeepers for distribution and service activities provided for each Fund. The Trustees reviewed such information and received representations from the Advisor that all such payments by the Advisor were made from the Advisor’s resources and reasonable profits.
62
Collateral or “Fall-Out” Benefits Derived by the Advisor. The Board considered the possible existence of collateral benefits the Advisor may receive as a result of its relationship with the Funds. They concluded that the Advisor’s primary business is managing funds and it generally does not use fund or shareholder information to generate profits in other lines of business, and therefore does not derive any significant collateral benefits from them. The Board noted that additional assets from other clients may offer the Advisor some benefit from increased leverage with service providers and counterparties. The Board also determined that the Advisor is able to provide investment management services to certain clients other than the Funds, at least in part, due to its existing infrastructure built to serve the fund complex. The Board concluded that appropriate allocation methodologies had been employed to assign resources and the cost of those resources to these other clients.
Existing Relationship. The Board also considered whether there was any reason for not continuing the existing arrangement with the Advisor. In this regard, the Board was mindful of the potential disruptions of the Funds’ operations and various risks, uncertainties, and other effects that could occur as a result of a decision not to continue such relationship. In particular, the Board recognized that most shareholders have invested in each Fund on the strength of the Advisor’s industry standing and reputation and in the expectation that the Advisor will have a continuing role in providing advisory services to each Fund.
Conclusion of the Trustees. As a result of this process, the Board, including all of the independent Trustees, taking into account all of the factors discussed above and the information provided by the Advisor and others in connection with its review and throughout the year, determined that the terms of the management fee are fair and reasonable and that the management fee charged to each Fund is fair in light of the services provided and that the investment management agreement between each Fund and the Advisor should be renewed for an additional one-year period.
63
| Liquidity Risk Management Program | ||
The Funds have adopted a liquidity risk management program (the “program”). The Funds' Board of Trustees (the "Board") has designated American Century Investment Management, Inc. (“ACIM”) as the administrator of the program. Personnel of ACIM or its affiliates conduct the day-to-day operation of the program pursuant to policies and procedures administered by the Program Administrator, including members of ACIM’s Investment Oversight Committee who are members of the ACIM’s Investment Management and Global Analytics departments.
Under the program, ACIM manages the Funds' liquidity risk, which is the risk that the Funds could not meet shareholder redemption requests without significant dilution of remaining shareholders’ interests in the Funds. This risk is managed by monitoring the degree of liquidity of the Funds' investments, limiting the amount of the Funds' illiquid investments, and utilizing various risk management tools and facilities available to the Funds for meeting shareholder redemptions, among other means. ACIM’s process of determining the degree of liquidity of certain Funds' investments is supported by a third-party liquidity assessment vendor.
The Board reviewed a report prepared by ACIM regarding the operation and effectiveness of the program for the period January 1, 2021 through December 31, 2021. No significant liquidity events impacting the Funds were noted in the report. In addition, ACIM provided its assessment that the program had been effective in managing the Funds' liquidity risk.
64
| Additional Information | ||
Retirement Account Information
As required by law, distributions you receive from certain retirement accounts are subject to federal income tax withholding, unless you elect not to have withholding apply*. Tax will be withheld on the total amount withdrawn even though you may be receiving amounts that are not subject to withholding, such as nondeductible contributions. In such case, excess amounts of withholding could occur. You may adjust your withholding election so that a greater or lesser amount will be withheld.
If you don’t want us to withhold on this amount, you must notify us to not withhold the federal income tax. You may notify us in writing or in certain situations by telephone or through other electronic means. For systematic withdrawals, your withholding election will remain in effect until revoked or changed by filing a new election. You have the right to revoke your election at any time and change your withholding percentage for future distributions.
Remember, even if you elect not to have income tax withheld, you are liable for paying income tax on the taxable portion of your withdrawal. If you elect not to have income tax withheld or you don’t have enough income tax withheld, you may be responsible for payment of estimated tax. You may incur penalties under the estimated tax rules if your withholding and estimated tax payments are not sufficient. You can reduce or defer the income tax on a distribution by directly or indirectly rolling such distribution over to another IRA or eligible plan. You should consult your tax advisor for additional information.
State tax will be withheld if, at the time of your distribution, your address is within one of the mandatory withholding states and you have federal income tax withheld (or as otherwise required by state law). State taxes will be withheld from your distribution in accordance with the respective state rules.
*Some 403(b), 457 and qualified retirement plan distributions may be subject to 20% mandatory withholding, as they are subject to special tax and withholding rules. Your plan administrator or plan sponsor is required to provide you with a special tax notice explaining those rules at the time you request a distribution. If applicable, federal and/or state taxes may be withheld from your distribution amount.
Proxy Voting Policies
A description of the policies that the funds' investment advisor uses in exercising the voting rights associated with the securities purchased and/or held by the funds is available without charge, upon request, by calling 1-800-345-6488. It is also available on American Century Investments’ website at americancentury.com/proxy and on the Securities and Exchange Commission’s website at sec.gov. Information regarding how the investment advisor voted proxies relating to portfolio securities during the most recent 12-month period ended June 30 is available at americancentury.com/proxy. It is also available at sec.gov.
Quarterly Portfolio Disclosure
The funds file their complete schedule of portfolio holdings with the Securities and Exchange Commission (SEC) for the first and third quarters of each fiscal year as an exhibit to their reports on Form N-PORT. The funds' Form N-PORT reports are available on the SEC’s website at sec.gov.
65
Other Tax Information
The following information is provided pursuant to provisions of the Internal Revenue Code.
Avantis Core Fixed Income Fund hereby designates up to the maximum amount allowable as qualified dividend income for the fiscal year ended August 31, 2022.
Avantis Core Municipal Fixed Income Fund designates $138,345 as exempt interest dividends for the fiscal year ended August 31, 2022.
For nonresident alien shareholders, the funds hereby designate the following, or up to the maximum amount allowable, of ordinary income distributions as qualified interest income for the fiscal year ended August 31, 2022.
| Avantis Core Fixed Income Fund | Avantis Core Municipal Fixed Income Fund | Avantis Short-Term Fixed Income Fund | ||||||
| $ | 531,963 | — | $ | 92,912 | ||||
66
| Notes | ||
67
| Notes | ||
68
| ||||||||
| Contact Us | avantisinvestors.com | |||||||
| American Century Sales Representatives, Financial Professionals, Broker Dealers, Insurance Companies, Banks and Trust Companies | 1-833-928-2684 | |||||||
| Telecommunications Relay Service for the Deaf | 711 | |||||||
| American Century ETF Trust | ||||||||
Investment Advisor: American Century Investment Management, Inc. Kansas City, Missouri | ||||||||
| This report and the statements it contains are submitted for the general information of our shareholders. The report is not authorized for distribution to prospective investors unless preceded or accompanied by an effective prospectus. | ||||||||
| ©2022 American Century Proprietary Holdings, Inc. All rights reserved. CL-ANN-96960 2210 | ||||||||
| Annual Report | |||||
| August 31, 2022 | |||||
Avantis® Responsible U.S. Equity ETF (AVSU) | |||||
| Table of Contents | ||
| Chairman’s Letter | |||||
| Avantis Responsible U.S. Equity ETF | |||||
| Performance | |||||
| Portfolio Commentary | |||||
| Fund Characteristics | |||||
| Shareholder Fee Example | 6 | ||||
| Schedule of Investments | |||||
| Statement of Assets and Liabilities | |||||
| Statement of Operations | |||||
| Statement of Changes in Net Assets | |||||
| Notes to Financial Statements | |||||
| Financial Highlights | |||||
| Report of Independent Registered Public Accounting Firm | |||||
| Management | |||||
| Approval of Management Agreement | |||||
| Additional Information | |||||
Any opinions expressed in this report reflect those of the author as of the date of the report, and do not necessarily represent the opinions of American Century Investments® or any other person in the American Century Investments organization. Any such opinions are subject to change at any time based upon market or other conditions and American Century Investments disclaims any responsibility to update such opinions. These opinions may not be relied upon as investment advice and, because investment decisions made by American Century Investments funds are based on numerous factors, may not be relied upon as an indication of trading intent on behalf of any American Century Investments fund. Security examples are used for representational purposes only and are not intended as recommendations to purchase or sell securities. Performance information for comparative indices and securities is provided to American Century Investments by third party vendors. To the best of American Century Investments’ knowledge, such information is accurate at the time of printing.
| Chairman's Letter | ||
Jonathan ThomasDear Investor:
Thank you for reviewing this annual report for the period ended August 31, 2022. Annual reports
help convey important information about fund returns, including market factors that affected
performance. For additional investment insights, please visit avantisinvestors.com.
Mounting Market Challenges Hampered Performance
Asset class performance weakened dramatically during the funds' fiscal year. In late 2021,
generally upbeat economic activity and corporate earnings supported gains for most U.S. and
global stock indices. Returns generally remained positive despite rapidly rising inflation and waning
central bank support—factors that had started to weigh on fixed-income indices.
By early 2022, the market climate shifted quickly. Inflation, which was already at multiyear highs,
rose to levels last seen in the early 1980s. Massive fiscal and monetary support unleashed during
the pandemic was partly to blame. In addition, escalating energy prices, supply chain breakdowns
and labor market shortages further aggravated inflation in the U.S. and other developed markets.
Russia’s invasion of Ukraine in February also exacerbated global inflationary pressures.
The Bank of England launched its inflation-fighting campaign in December and continued to lift
rates through period-end. The Federal Reserve responded to surging inflation in March, launching
an aggressive rate-hike campaign and ending its asset purchase program. Policymakers indicated
taming inflation remains their priority, even as the U.S. economy contracted in 2022’s first two
quarters. Facing record-high inflation in the eurozone, the European Central Bank in July embarked
on its first rate-hike effort in 11 years.
The combination of sharply elevated inflation, tighter monetary policy, geopolitical strife and weak
economies triggered sharp market volatility and fueled global recession fears. Against this
backdrop, most U.S. and global stock and bond indices declined sharply for the reporting period.
Staying Disciplined in Uncertain Times
We expect market volatility to linger as investors navigate a complex environment of high inflation,
rising interest rates and economic uncertainty. In addition, Russia’s invasion of Ukraine
complicates an increasingly tense geopolitical backdrop and threatens Europe’s winter energy
supply. We will continue to monitor the broad backdrop and its influence on financial markets.
We appreciate your confidence in us during these extraordinary times. Our firm has a long history
of helping clients weather unpredictable markets, and we’re confident we will continue to meet
today’s challenges.
Sincerely,
Jonathan Thomas
Chairman
Avantis Investors
2
| Performance | ||
| Avantis Responsible U.S. Equity ETF (AVSU) | |||||||||||||||||||||||
| Total Returns as of August 31, 2022 | Since Inception | Inception Date | |||||||||||||||||||||
| Net Asset Value | -7.32% | 3/15/2022 | |||||||||||||||||||||
| Market Price | -7.28% | 3/15/2022 | |||||||||||||||||||||
| Russell 3000 Index | -6.58% | — | |||||||||||||||||||||
Market price is determined using the bid/ask midpoint at 4:00 p.m. Eastern time, when the net asset value (NAV) is typically calculated. Market performance does not represent the returns you would receive if you traded shares at other times. NAV prices are used to calculate market price performance prior to the date when the fund first traded on the NYSE Arca, Inc.
| Total Annual Fund Operating Expenses | |||||||||||||||||
| 0.15% | |||||||||||||||||
The total annual fund operating expenses shown is as stated in the fund’s prospectus current as of the date of this report. The prospectus may vary from the expense ratio shown elsewhere in this report because it is based on a different time period, includes acquired fund fees and expenses, and, if applicable, does not include fee waivers or expense reimbursements.
Data presented reflect past performance. Past performance is no guarantee of future results. Current performance may be higher or lower than the performance shown. Total returns for periods less than one year are not annualized. Investment return and principal value will fluctuate, and redemption value may be more or less than original cost. Data assumes reinvestment of dividends and capital gains, and none of the charts reflect the deduction of taxes that a shareholder would pay on fund distributions or the redemption of fund shares. To obtain performance data current to the most recent month end, please call 1-833-928-2684 or visit avantisinvestors.com. For additional information about the fund, please consult the prospectus.
3
| Portfolio Commentary | ||
Portfolio Managers: Eduardo Repetto, Mitch Firestein, Daniel Ong, Ted Randall and Matthew Dubin
Fund Strategy
Avantis Responsible U.S. Equity ETF seeks long-term capital appreciation by investing in a diverse group of U.S. companies across market sectors, industry groups and market capitalizations.
The fund limits its investable universe of companies by screening out companies that do not meet certain environmental, social and governance (ESG) metrics. The fund uses third-party commercial data sources and scoring systems as well as proprietary evaluations to decide which securities to exclude due to ESG concerns. Within the investable universe, the fund seeks securities of companies that it expects to have higher returns. It places an enhanced emphasis on securities of companies with smaller market capitalizations and securities of companies it defines as high profitability or value companies. Conversely, the fund seeks to underweight or exclude securities it expects to have lower returns. These include securities of large companies with lower levels of profitability and higher prices relative to their book values or other financial metrics. Under normal market conditions, the fund will invest at least 80% of its assets in equity securities of U.S. companies.
The fund is an actively managed exchange-traded fund (ETF) that does not seek to replicate the performance of a specified index. The portfolio managers continually analyze market and financial data to make buy, sell and hold decisions. When buying or selling a security, the portfolio managers may consider the trade-off between expected returns of the security and implementation or tax costs of the trade. They do this in an attempt to gain trading efficiencies, avoid unnecessary risk and enhance fund performance.
Performance Review
For the period from the fund’s inception on March 15, 2022, through August 31, 2022, Avantis Responsible U.S. Equity ETF returned -7.28%* on a market price basis. On a net asset value (NAV) basis, the fund returned -7.32%. NAV and market price returns reflect fees and operating expenses, while index returns do not.
The fund underperformed the total U.S. stock market, as measured by the Russell 3000 Index, which returned -6.58% for the reporting period. The Russell 3000 Index is an unmanaged index generally representative of the performance of the broad U.S. stock market, including all capitalization categories.
The underperformance was largely due to the fund’s environmental screen. This screen resulted in an underweight to the energy sector, which outperformed for the reporting period. Meanwhile, the fund’s emphasis on companies with the highest book-to-market and profitability characteristics aided relative performance.
*Total returns for periods less than one year are not annualized.
A strategy or emphasis on environmental, social and governance factors (ESG) may limit the investment opportunities available to a portfolio. Therefore, the portfolio may underperform or perform differently than other portfolios that do not have an ESG investment focus. A portfolio’s ESG investment focus may also result in the portfolio investing in securities or industry sectors that perform differently or maintain a different risk profile than the market generally or compared to underlying holdings that are not screened for ESG standards.
4
| Fund Characteristics | ||
| AUGUST 31, 2022 | |||||
| Avantis Responsible U.S. Equity ETF | |||||
| Types of Investments in Portfolio | % of net assets | ||||
| Common Stocks | 99.8% | ||||
| Short-Term Investments | 0.2% | ||||
| Other Assets and Liabilities | —* | ||||
| *Category is less than 0.05% of total net assets. | |||||
| Top Five Industries | % of net assets | ||||
| Software | 6.8% | ||||
| Banks | 6.7% | ||||
| Semiconductors and Semiconductor Equipment | 5.9% | ||||
| Technology Hardware, Storage and Peripherals | 5.8% | ||||
| Insurance | 5.4% | ||||
5
| Shareholder Fee Example | ||
Fund shareholders may incur two types of costs: (1) transaction costs, including brokerage commissions paid on purchases and sales of fund shares; and (2) ongoing costs, including management fees and other fund expenses. This example is intended to help you understand your ongoing costs (in dollars) of investing in your fund and to compare these costs with the ongoing cost of investing in other funds.
The example is based on an investment of $1,000 made at the beginning of the period and held for the entire period from March 1, 2022 to August 31, 2022 (except as noted).
Actual Expenses
The table provides information about actual account values and actual expenses. You may use the information, together with the amount you invested, to estimate the expenses that you paid over the period. Simply divide your account value by $1,000 (for example, an $8,600 account value divided by $1,000 = 8.6), then multiply the result by the number under the heading “Expenses Paid During Period” to estimate the expenses you paid on your account during this period.
Hypothetical Example for Comparison Purposes
The table also provides information about hypothetical account values and hypothetical expenses based on the actual expense ratio of your fund and an assumed rate of return of 5% per year before expenses, which is not the actual return of a fund. The hypothetical account values and expenses may not be used to estimate the actual ending account balance or expenses you paid for the period. You may use this information to compare the ongoing costs of investing in your fund and other funds. To do so, compare this 5% hypothetical example with the 5% hypothetical examples that appear in the shareholder reports of the other funds.
Please note that the expenses shown in the table are meant to highlight your ongoing costs only and do not reflect any transactional costs, such as brokerage commissions paid on purchases and sales of fund shares. Therefore, the table is useful in comparing ongoing costs only, and will not help you determine the relative total costs of owning different funds. In addition, if these transactional costs were included, your costs would have been higher.
| Beginning Account Value 3/1/22 | Ending Account Value 8/31/22 | Expenses Paid During Period(1) 3/1/22 - 8/31/22 | Annualized Expense Ratio(1) | |||||||||||
| Avantis Responsible U.S. Equity ETF | ||||||||||||||
| Actual | $1,000 | $926.80 | $0.67(2) | 0.15% | ||||||||||
| Hypothetical | $1,000 | $1,024.45 | $0.77 | 0.15% | ||||||||||
(1)Expenses are equal to the fund's annualized expense ratio listed in the table above, multiplied by the average account value over the period, multiplied by 184, the number of days in the most recent fiscal half-year, divided by 365, to reflect the one-half year period. Annualized expense ratio reflects actual expenses, including any applicable fee waivers or expense reimbursements and excluding any acquired fund fees and expenses.
(2)Expenses are equal to the fund's annualized expense ratio listed in the table above, multiplied by the average account value over the period, multiplied by 170, the number of days in the period from March 15, 2022 (fund inception) through August 31, 2022, divided by 365, to reflect the period. Had the fund been available for the full period, the expenses paid during the period would have been higher.
6
| Schedule of Investments | ||
AUGUST 31, 2022
| Avantis Responsible U.S. Equity ETF | ||||||||
| Shares | Value | |||||||
| COMMON STOCKS — 99.8% | ||||||||
| Aerospace and Defense — 0.3% | ||||||||
Archer Aviation, Inc., Class A(1) | 62 | $ | 220 | |||||
| Hexcel Corp. | 184 | 10,795 | ||||||
| Kaman Corp. | 92 | 2,918 | ||||||
| L3Harris Technologies, Inc. | 92 | 20,994 | ||||||
| Northrop Grumman Corp. | 69 | 32,981 | ||||||
Parsons Corp.(1) | 69 | 2,855 | ||||||
Terran Orbital Corp.(1) | 31 | 130 | ||||||
| Woodward, Inc. | 115 | 10,703 | ||||||
| 81,596 | ||||||||
| Air Freight and Logistics — 1.3% | ||||||||
| CH Robinson Worldwide, Inc. | 115 | 13,127 | ||||||
| Expeditors International of Washington, Inc. | 410 | 42,185 | ||||||
| FedEx Corp. | 531 | 111,940 | ||||||
| Forward Air Corp. | 74 | 7,181 | ||||||
GXO Logistics, Inc.(1) | 184 | 8,166 | ||||||
Hub Group, Inc., Class A(1) | 130 | 10,375 | ||||||
Radiant Logistics, Inc.(1) | 391 | 2,737 | ||||||
| United Parcel Service, Inc., Class B | 1,058 | 205,792 | ||||||
| 401,503 | ||||||||
Airlines† | ||||||||
Joby Aviation, Inc.(1) | 30 | 159 | ||||||
| Auto Components — 0.5% | ||||||||
American Axle & Manufacturing Holdings, Inc.(1) | 736 | 7,618 | ||||||
Aptiv PLC(1) | 299 | 27,936 | ||||||
| Autoliv, Inc. | 437 | 33,994 | ||||||
| BorgWarner, Inc. | 759 | 28,614 | ||||||
| Dana, Inc. | 345 | 5,337 | ||||||
| Gentex Corp. | 575 | 15,692 | ||||||
Gentherm, Inc.(1) | 115 | 6,888 | ||||||
Goodyear Tire & Rubber Co.(1) | 1,104 | 15,489 | ||||||
| Lear Corp. | 161 | 22,321 | ||||||
Motorcar Parts of America, Inc.(1) | 138 | 2,051 | ||||||
| Standard Motor Products, Inc. | 69 | 2,532 | ||||||
Visteon Corp.(1) | 46 | 5,512 | ||||||
| 173,984 | ||||||||
| Automobiles — 2.0% | ||||||||
| Ford Motor Co. | 4,623 | 70,454 | ||||||
| General Motors Co. | 2,714 | 103,702 | ||||||
| Harley-Davidson, Inc. | 690 | 26,613 | ||||||
Lucid Group, Inc.(1)(2) | 345 | 5,292 | ||||||
Rivian Automotive, Inc., Class A(1) | 92 | 3,009 | ||||||
Tesla, Inc.(1) | 1,449 | 399,359 | ||||||
| Thor Industries, Inc. | 161 | 13,043 | ||||||
| Winnebago Industries, Inc. | 184 | 10,595 | ||||||
Workhorse Group, Inc.(1)(2) | 690 | 2,160 | ||||||
| 634,227 | ||||||||
7
| Avantis Responsible U.S. Equity ETF | ||||||||
| Shares | Value | |||||||
| Banks — 6.7% | ||||||||
ACNB Corp.(2) | 69 | $ | 2,454 | |||||
| Allegiance Bancshares, Inc. | 92 | 3,897 | ||||||
| Associated Banc-Corp. | 644 | 12,906 | ||||||
| Banc of California, Inc. | 207 | 3,494 | ||||||
| BancFirst Corp. | 69 | 7,442 | ||||||
Bancorp, Inc.(1) | 230 | 5,456 | ||||||
| Bank of America Corp. | 5,566 | 187,073 | ||||||
| Bank of Hawaii Corp. | 161 | 12,561 | ||||||
| Bank OZK | 506 | 20,508 | ||||||
| BankUnited, Inc. | 345 | 12,782 | ||||||
| Bankwell Financial Group, Inc. | 69 | 2,175 | ||||||
| Banner Corp. | 161 | 9,782 | ||||||
| Bar Harbor Bankshares | 92 | 2,606 | ||||||
| Baycom Corp. | 115 | 2,140 | ||||||
| BCB Bancorp, Inc. | 138 | 2,484 | ||||||
| Berkshire Hills Bancorp, Inc. | 184 | 5,191 | ||||||
| BOK Financial Corp. | 115 | 10,220 | ||||||
| Byline Bancorp, Inc. | 115 | 2,508 | ||||||
| Camden National Corp. | 69 | 3,121 | ||||||
Carter Bankshares, Inc.(1) | 161 | 2,652 | ||||||
| Central Pacific Financial Corp. | 161 | 3,508 | ||||||
| Citigroup, Inc. | 2,875 | 140,329 | ||||||
| Citizens Financial Group, Inc. | 1,311 | 48,087 | ||||||
| City Holding Co. | 46 | 3,910 | ||||||
| Columbia Banking System, Inc. | 253 | 7,577 | ||||||
| Comerica, Inc. | 529 | 42,479 | ||||||
| Commerce Bancshares, Inc. | 322 | 22,144 | ||||||
| Community Bank System, Inc. | 115 | 7,519 | ||||||
| Cullen/Frost Bankers, Inc. | 138 | 17,934 | ||||||
| Eagle Bancorp, Inc. | 138 | 6,697 | ||||||
| East West Bancorp, Inc. | 529 | 38,178 | ||||||
| F.N.B. Corp. | 1,196 | 14,256 | ||||||
| Farmers & Merchants Bancorp, Inc. | 69 | 1,971 | ||||||
| Fifth Third Bancorp | 1,771 | 60,480 | ||||||
| First BanCorp | 897 | 12,827 | ||||||
| First Bancorp, Inc. | 92 | 2,668 | ||||||
| First Business Financial Services, Inc. | 92 | 3,062 | ||||||
| First Citizens BancShares, Inc., Class A | 23 | 18,675 | ||||||
| First Financial Bancorp | 299 | 6,452 | ||||||
| First Financial Bankshares, Inc. | 299 | 12,710 | ||||||
| First Financial Corp. | 69 | 3,208 | ||||||
| First Hawaiian, Inc. | 391 | 10,053 | ||||||
| First Horizon Corp. | 2,162 | 48,904 | ||||||
| First Interstate Bancsystem, Inc., Class A | 184 | 7,408 | ||||||
| First of Long Island Corp. | 115 | 2,117 | ||||||
| First Republic Bank | 207 | 31,429 | ||||||
| Flushing Financial Corp. | 138 | 2,850 | ||||||
| German American Bancorp, Inc. | 92 | 3,456 | ||||||
| Glacier Bancorp, Inc. | 230 | 11,656 | ||||||
| Home BancShares, Inc. | 460 | 10,824 | ||||||
8
| Avantis Responsible U.S. Equity ETF | ||||||||
| Shares | Value | |||||||
| HomeStreet, Inc. | 115 | $ | 4,003 | |||||
| HomeTrust Bancshares, Inc. | 92 | 2,136 | ||||||
| Huntington Bancshares, Inc. | 2,599 | 34,827 | ||||||
| Independent Bank Corp. (Massachusetts) | 138 | 10,796 | ||||||
| Independent Bank Corp. (Michigan) | 115 | 2,360 | ||||||
| JPMorgan Chase & Co. | 2,645 | 300,816 | ||||||
| KeyCorp | 3,243 | 57,369 | ||||||
| Lakeland Bancorp, Inc. | 230 | 3,747 | ||||||
| M&T Bank Corp. | 506 | 91,981 | ||||||
| Meridian Corp. | 69 | 2,092 | ||||||
| NBT Bancorp, Inc. | 184 | 7,136 | ||||||
| Northeast Bank | 69 | 2,675 | ||||||
| OFG Bancorp | 322 | 8,758 | ||||||
| Pacific Premier Bancorp, Inc. | 322 | 10,549 | ||||||
| PacWest Bancorp | 552 | 14,534 | ||||||
| Park National Corp. | 46 | 6,064 | ||||||
| Parke Bancorp, Inc. | 115 | 2,551 | ||||||
| Pathward Financial, Inc. | 92 | 3,032 | ||||||
| PCB Bancorp. | 115 | 2,160 | ||||||
| Pinnacle Financial Partners, Inc. | 161 | 12,994 | ||||||
| PNC Financial Services Group, Inc. | 529 | 83,582 | ||||||
| Popular, Inc. | 437 | 33,745 | ||||||
| Premier Financial Corp. | 161 | 4,350 | ||||||
| Prosperity Bancshares, Inc. | 230 | 16,302 | ||||||
| Regions Financial Corp. | 2,921 | 63,298 | ||||||
| Renasant Corp. | 161 | 5,368 | ||||||
| Sandy Spring Bancorp, Inc. | 207 | 7,974 | ||||||
| Seacoast Banking Corp. of Florida | 207 | 6,690 | ||||||
| Sierra Bancorp | 92 | 1,906 | ||||||
| Signature Bank | 138 | 24,062 | ||||||
Silvergate Capital Corp., Class A(1) | 46 | 4,192 | ||||||
SVB Financial Group(1) | 115 | 46,750 | ||||||
| Synovus Financial Corp. | 690 | 27,710 | ||||||
| Truist Financial Corp. | 1,794 | 84,031 | ||||||
| Trustmark Corp. | 207 | 6,529 | ||||||
| U.S. Bancorp | 1,863 | 84,971 | ||||||
| UMB Financial Corp. | 138 | 12,347 | ||||||
| Umpqua Holdings Corp. | 966 | 17,137 | ||||||
| United Community Banks, Inc. | 368 | 12,339 | ||||||
| Unity Bancorp, Inc. | 92 | 2,579 | ||||||
| Valley National Bancorp | 1,288 | 14,967 | ||||||
| Washington Federal, Inc. | 253 | 8,099 | ||||||
| Webster Financial Corp. | 460 | 21,643 | ||||||
| Western Alliance Bancorp | 345 | 26,468 | ||||||
| Wintrust Financial Corp. | 253 | 21,338 | ||||||
| Zions Bancorp NA | 644 | 35,439 | ||||||
| 2,169,216 | ||||||||
| Beverages — 1.5% | ||||||||
Boston Beer Co., Inc., Class A(1) | 4 | 1,348 | ||||||
| Brown-Forman Corp., Class A | 92 | 6,493 | ||||||
| Brown-Forman Corp., Class B | 667 | 48,491 | ||||||
9
| Avantis Responsible U.S. Equity ETF | ||||||||
| Shares | Value | |||||||
| Coca-Cola Co. | 2,185 | $ | 134,836 | |||||
| Constellation Brands, Inc., Class A | 161 | 39,614 | ||||||
Duckhorn Portfolio, Inc.(1) | 26 | 474 | ||||||
| Keurig Dr Pepper, Inc. | 598 | 22,796 | ||||||
| Molson Coors Beverage Co., Class B | 506 | 26,145 | ||||||
Monster Beverage Corp.(1) | 348 | 30,913 | ||||||
| PepsiCo, Inc. | 920 | 158,488 | ||||||
Vintage Wine Estates, Inc.(1)(2) | 73 | 432 | ||||||
| 470,030 | ||||||||
| Biotechnology — 3.6% | ||||||||
2seventy bio, Inc.(1) | 102 | 1,502 | ||||||
| AbbVie, Inc. | 1,334 | 179,370 | ||||||
Agios Pharmaceuticals, Inc.(1) | 156 | 3,978 | ||||||
Alkermes PLC(1) | 355 | 8,403 | ||||||
Alnylam Pharmaceuticals, Inc.(1) | 23 | 4,753 | ||||||
Altimmune, Inc.(1) | 142 | 3,135 | ||||||
| Amgen, Inc. | 460 | 110,538 | ||||||
AnaptysBio, Inc.(1) | 92 | 2,136 | ||||||
Anika Therapeutics, Inc.(1) | 10 | 226 | ||||||
Arcellx, Inc.(1) | 127 | 2,282 | ||||||
Arcus Biosciences, Inc.(1) | 92 | 2,215 | ||||||
Biogen, Inc.(1) | 238 | 46,500 | ||||||
BioMarin Pharmaceutical, Inc.(1) | 276 | 24,619 | ||||||
Bioxcel Therapeutics, Inc.(1)(2) | 23 | 315 | ||||||
Bluebird Bio, Inc.(1) | 173 | 1,010 | ||||||
Blueprint Medicines Corp.(1) | 8 | 586 | ||||||
Catalyst Pharmaceuticals, Inc.(1) | 531 | 7,190 | ||||||
ChemoCentryx, Inc.(1) | 97 | 4,945 | ||||||
Concert Pharmaceuticals, Inc.(1) | 24 | 158 | ||||||
Crinetics Pharmaceuticals, Inc.(1) | 92 | 1,737 | ||||||
CureVac NV(1) | 28 | 276 | ||||||
Deciphera Pharmaceuticals, Inc.(1) | 109 | 1,769 | ||||||
Denali Therapeutics, Inc.(1) | 92 | 2,546 | ||||||
Dynavax Technologies Corp.(1) | 747 | 8,568 | ||||||
Editas Medicine, Inc.(1) | 188 | 2,764 | ||||||
Emergent BioSolutions, Inc.(1) | 138 | 3,315 | ||||||
Enanta Pharmaceuticals, Inc.(1) | 46 | 2,800 | ||||||
Entrada Therapeutics, Inc.(1) | 79 | 998 | ||||||
EQRx, Inc.(1) | 1,304 | 6,377 | ||||||
Exact Sciences Corp.(1) | 92 | 3,271 | ||||||
Exelixis, Inc.(1) | 690 | 12,241 | ||||||
| Gilead Sciences, Inc. | 2,493 | 158,231 | ||||||
Halozyme Therapeutics, Inc.(1) | 483 | 19,673 | ||||||
Ideaya Biosciences, Inc.(1) | 101 | 993 | ||||||
Incyte Corp.(1) | 322 | 22,678 | ||||||
Intellia Therapeutics, Inc.(1) | 10 | 601 | ||||||
Ionis Pharmaceuticals, Inc.(1) | 192 | 8,164 | ||||||
Ironwood Pharmaceuticals, Inc.(1) | 808 | 8,694 | ||||||
Kezar Life Sciences, Inc.(1) | 184 | 1,891 | ||||||
Kura Oncology, Inc.(1) | 171 | 2,370 | ||||||
Ligand Pharmaceuticals, Inc.(1) | 68 | 6,282 | ||||||
10
| Avantis Responsible U.S. Equity ETF | ||||||||
| Shares | Value | |||||||
Madrigal Pharmaceuticals, Inc., ADR(1) | 30 | $ | 2,164 | |||||
Mersana Therapeutics, Inc.(1) | 209 | 1,567 | ||||||
Merus NV(1)(2) | 92 | 2,179 | ||||||
Mirati Therapeutics, Inc.(1) | 6 | 486 | ||||||
Moderna, Inc.(1) | 457 | 60,447 | ||||||
Myriad Genetics, Inc.(1) | 92 | 2,055 | ||||||
Neurocrine Biosciences, Inc.(1) | 138 | 14,439 | ||||||
Organogenesis Holdings, Inc.(1) | 34 | 122 | ||||||
Ovid therapeutics, Inc.(1) | 690 | 1,387 | ||||||
Point Biopharma Global, Inc.(1)(2) | 254 | 2,476 | ||||||
Prometheus Biosciences, Inc.(1) | 92 | 4,812 | ||||||
Prothena Corp. PLC(1) | 83 | 2,288 | ||||||
PTC Therapeutics, Inc.(1) | 32 | 1,598 | ||||||
Regeneron Pharmaceuticals, Inc.(1) | 230 | 133,644 | ||||||
REGENXBIO, Inc.(1) | 211 | 6,224 | ||||||
Relay Therapeutics, Inc.(1) | 115 | 2,642 | ||||||
Rigel Pharmaceuticals, Inc.(1) | 904 | 1,284 | ||||||
Rocket Pharmaceuticals, Inc.(1) | 115 | 1,772 | ||||||
Seagen, Inc.(1) | 96 | 14,812 | ||||||
Tango Therapeutics, Inc.(1) | 123 | 504 | ||||||
Tyra Biosciences, Inc.(1) | 10 | 66 | ||||||
Ultragenyx Pharmaceutical, Inc.(1) | 46 | 2,194 | ||||||
United Therapeutics Corp.(1) | 138 | 31,274 | ||||||
Vanda Pharmaceuticals, Inc.(1) | 207 | 2,190 | ||||||
Vertex Pharmaceuticals, Inc.(1) | 621 | 174,973 | ||||||
Verve Therapeutics, Inc.(1) | 6 | 230 | ||||||
Xencor, Inc.(1) | 145 | 3,827 | ||||||
Y-mAbs Therapeutics, Inc.(1) | 11 | 177 | ||||||
| 1,151,933 | ||||||||
| Building Products — 0.8% | ||||||||
| Advanced Drainage Systems, Inc. | 46 | 6,242 | ||||||
| Allegion PLC | 115 | 10,936 | ||||||
| AO Smith Corp. | 437 | 24,669 | ||||||
| Apogee Enterprises, Inc. | 115 | 4,697 | ||||||
| Armstrong World Industries, Inc. | 253 | 21,249 | ||||||
Builders FirstSource, Inc.(1) | 736 | 43,137 | ||||||
| Carlisle Cos., Inc. | 46 | 13,600 | ||||||
| Carrier Global Corp. | 552 | 21,594 | ||||||
| Fortune Brands Home & Security, Inc. | 138 | 8,477 | ||||||
Gibraltar Industries, Inc.(1) | 23 | 963 | ||||||
| Griffon Corp. | 138 | 4,326 | ||||||
Hayward Holdings, Inc.(1) | 138 | 1,450 | ||||||
| Insteel Industries, Inc. | 115 | 3,324 | ||||||
| Johnson Controls International PLC | 207 | 11,207 | ||||||
| Lennox International, Inc. | 23 | 5,523 | ||||||
| Masco Corp. | 161 | 8,190 | ||||||
Masonite International Corp.(1) | 117 | 9,573 | ||||||
PGT Innovations, Inc.(1) | 215 | 4,498 | ||||||
| Quanex Building Products Corp. | 115 | 2,565 | ||||||
| Trane Technologies PLC | 115 | 17,718 | ||||||
Trex Co., Inc.(1) | 138 | 6,457 | ||||||
11
| Avantis Responsible U.S. Equity ETF | ||||||||
| Shares | Value | |||||||
| UFP Industries, Inc. | 161 | $ | 12,782 | |||||
| Zurn Elkay Water Solutions Corp. | 368 | 10,149 | ||||||
| 253,326 | ||||||||
| Capital Markets — 5.0% | ||||||||
| Affiliated Managers Group, Inc. | 23 | 2,929 | ||||||
| Ameriprise Financial, Inc. | 391 | 104,792 | ||||||
| Ares Management Corp., Class A | 138 | 10,231 | ||||||
| Artisan Partners Asset Management, Inc., Class A | 276 | 9,318 | ||||||
| Bank of New York Mellon Corp. | 1,288 | 53,491 | ||||||
| BlackRock, Inc. | 92 | 61,308 | ||||||
| Blackstone, Inc. | 1,058 | 99,389 | ||||||
| Carlyle Group, Inc. | 966 | 31,424 | ||||||
| Cboe Global Markets, Inc. | 92 | 10,853 | ||||||
| Charles Schwab Corp. | 1,472 | 104,438 | ||||||
| CME Group, Inc. | 345 | 67,485 | ||||||
| Cohen & Steers, Inc. | 138 | 9,850 | ||||||
Coinbase Global, Inc., Class A(1) | 253 | 16,900 | ||||||
| Cowen, Inc., Class A | 115 | 4,422 | ||||||
| Diamond Hill Investment Group, Inc. | 23 | 3,934 | ||||||
Donnelley Financial Solutions, Inc.(1) | 92 | 3,905 | ||||||
| Evercore, Inc., Class A | 161 | 15,084 | ||||||
| FactSet Research Systems, Inc. | 69 | 29,900 | ||||||
| Federated Hermes, Inc. | 230 | 7,834 | ||||||
| Franklin Resources, Inc. | 667 | 17,389 | ||||||
| Goldman Sachs Group, Inc. | 506 | 168,331 | ||||||
| Houlihan Lokey, Inc. | 299 | 23,472 | ||||||
| Interactive Brokers Group, Inc., Class A | 92 | 5,666 | ||||||
| Intercontinental Exchange, Inc. | 184 | 18,556 | ||||||
| Invesco Ltd. | 1,104 | 18,183 | ||||||
| Janus Henderson Group PLC | 391 | 9,149 | ||||||
| Jefferies Financial Group, Inc. | 920 | 29,523 | ||||||
| KKR & Co., Inc. | 851 | 43,027 | ||||||
| Lazard Ltd., Class A | 437 | 15,885 | ||||||
| LPL Financial Holdings, Inc. | 161 | 35,634 | ||||||
| MarketAxess Holdings, Inc. | 69 | 17,153 | ||||||
| Moelis & Co., Class A | 276 | 11,498 | ||||||
| Moody's Corp. | 115 | 32,720 | ||||||
| Morgan Stanley | 1,725 | 147,004 | ||||||
| Morningstar, Inc. | 23 | 5,244 | ||||||
| MSCI, Inc. | 23 | 10,333 | ||||||
| Nasdaq, Inc. | 69 | 4,108 | ||||||
| Northern Trust Corp. | 483 | 45,928 | ||||||
Open Lending Corp., Class A(1) | 322 | 3,127 | ||||||
| Piper Sandler Cos. | 115 | 13,176 | ||||||
| Raymond James Financial, Inc. | 575 | 60,013 | ||||||
| S&P Global, Inc. | 207 | 72,901 | ||||||
| SEI Investments Co. | 483 | 26,420 | ||||||
| State Street Corp. | 598 | 40,873 | ||||||
| StepStone Group, Inc., Class A | 161 | 4,394 | ||||||
| Stifel Financial Corp. | 460 | 27,283 | ||||||
| T. Rowe Price Group, Inc. | 322 | 38,640 | ||||||
12
| Avantis Responsible U.S. Equity ETF | ||||||||
| Shares | Value | |||||||
| Tradeweb Markets, Inc., Class A | 92 | $ | 6,402 | |||||
| Victory Capital Holdings, Inc., Class A | 138 | 3,696 | ||||||
| Virtu Financial, Inc., Class A | 690 | 15,842 | ||||||
| 1,619,057 | ||||||||
| Chemicals — 0.9% | ||||||||
| AdvanSix, Inc. | 184 | 6,672 | ||||||
| Albemarle Corp. | 207 | 55,468 | ||||||
| Avient Corp. | 173 | 7,583 | ||||||
Axalta Coating Systems Ltd.(1) | 368 | 9,476 | ||||||
| Balchem Corp. | 42 | 5,536 | ||||||
| Chase Corp. | 21 | 1,851 | ||||||
| DuPont de Nemours, Inc. | 483 | 26,874 | ||||||
| Ecolab, Inc. | 92 | 15,072 | ||||||
| Element Solutions, Inc. | 115 | 2,147 | ||||||
| Huntsman Corp. | 828 | 23,200 | ||||||
Ingevity Corp.(1) | 191 | 13,397 | ||||||
| Innospec, Inc. | 69 | 6,449 | ||||||
| International Flavors & Fragrances, Inc. | 184 | 20,328 | ||||||
| Kronos Worldwide, Inc. | 161 | 2,074 | ||||||
Livent Corp.(1) | 248 | 7,981 | ||||||
| Minerals Technologies, Inc. | 92 | 5,360 | ||||||
| PPG Industries, Inc. | 138 | 17,523 | ||||||
PureCycle Technologies, Inc.(1) | 147 | 1,342 | ||||||
Rayonier Advanced Materials, Inc.(1) | 165 | 746 | ||||||
| Sherwin-Williams Co. | 207 | 48,045 | ||||||
| Stepan Co. | 66 | 6,879 | ||||||
| Trinseo PLC | 276 | 7,322 | ||||||
| 291,325 | ||||||||
| Commercial Services and Supplies — 0.5% | ||||||||
| ACCO Brands Corp. | 210 | 1,245 | ||||||
| Aris Water Solution, Inc., Class A | 70 | 1,190 | ||||||
| Brady Corp., Class A | 92 | 4,282 | ||||||
| Brink's Co. | 115 | 6,357 | ||||||
Cimpress PLC(1) | 4 | 134 | ||||||
| Cintas Corp. | 92 | 37,429 | ||||||
Civeo Corp.(1) | 115 | 3,411 | ||||||
Clean Harbors, Inc.(1) | 138 | 16,204 | ||||||
Copart, Inc.(1) | 253 | 30,272 | ||||||
| Deluxe Corp. | 92 | 1,770 | ||||||
| Ennis, Inc. | 138 | 2,930 | ||||||
| Healthcare Services Group, Inc. | 138 | 1,942 | ||||||
| HNI Corp. | 138 | 4,416 | ||||||
IAA, Inc.(1) | 161 | 5,999 | ||||||
| Interface, Inc. | 253 | 2,826 | ||||||
KAR Auction Services, Inc.(1) | 287 | 4,190 | ||||||
Li-Cycle Holdings Corp.(1) | 239 | 1,723 | ||||||
| MSA Safety, Inc. | 23 | 2,734 | ||||||
| Pitney Bowes, Inc. | 97 | 281 | ||||||
| Rollins, Inc. | 207 | 6,988 | ||||||
SP Plus Corp.(1) | 47 | 1,558 | ||||||
| Steelcase, Inc., Class A | 207 | 2,314 | ||||||
13
| Avantis Responsible U.S. Equity ETF | ||||||||
| Shares | Value | |||||||
| Tetra Tech, Inc. | 46 | $ | 6,247 | |||||
| UniFirst Corp. | 23 | 4,146 | ||||||
Viad Corp.(1) | 7 | 267 | ||||||
| 150,855 | ||||||||
| Communications Equipment — 0.6% | ||||||||
| ADTRAN Holdings, Inc. | 138 | 3,207 | ||||||
Arista Networks, Inc.(1) | 299 | 35,844 | ||||||
Ciena Corp.(1) | 368 | 18,672 | ||||||
| Cisco Systems, Inc. | 1,564 | 69,942 | ||||||
CommScope Holding Co., Inc.(1) | 97 | 1,096 | ||||||
Extreme Networks, Inc.(1) | 414 | 5,933 | ||||||
F5, Inc.(1) | 46 | 7,225 | ||||||
| Juniper Networks, Inc. | 276 | 7,844 | ||||||
Lumentum Holdings, Inc.(1) | 184 | 15,373 | ||||||
| Motorola Solutions, Inc. | 69 | 16,795 | ||||||
NETGEAR, Inc.(1) | 71 | 1,675 | ||||||
NetScout Systems, Inc.(1) | 115 | 3,650 | ||||||
ViaSat, Inc.(1) | 324 | 12,306 | ||||||
Viavi Solutions, Inc.(1) | 437 | 6,153 | ||||||
| 205,715 | ||||||||
| Construction and Engineering — 0.1% | ||||||||
| AECOM | 46 | 3,365 | ||||||
API Group Corp.(1) | 253 | 3,934 | ||||||
NV5 Global, Inc.(1) | 25 | 3,519 | ||||||
WillScot Mobile Mini Holdings Corp.(1) | 483 | 19,388 | ||||||
| 30,206 | ||||||||
| Construction Materials — 0.1% | ||||||||
| Vulcan Materials Co. | 163 | 27,138 | ||||||
| Consumer Finance — 1.5% | ||||||||
| Ally Financial, Inc. | 1,449 | 48,107 | ||||||
| American Express Co. | 437 | 66,424 | ||||||
| Bread Financial Holdings, Inc. | 299 | 11,491 | ||||||
| Capital One Financial Corp. | 966 | 102,222 | ||||||
Credit Acceptance Corp.(1)(2) | 23 | 12,238 | ||||||
| Discover Financial Services | 943 | 94,762 | ||||||
Encore Capital Group, Inc.(1) | 184 | 10,061 | ||||||
Enova International, Inc.(1) | 92 | 3,214 | ||||||
Green Dot Corp., Class A(1) | 184 | 3,733 | ||||||
LendingClub Corp.(1) | 161 | 2,104 | ||||||
| Navient Corp. | 552 | 8,495 | ||||||
| Nelnet, Inc., Class A | 46 | 3,875 | ||||||
| OneMain Holdings, Inc. | 621 | 21,692 | ||||||
PRA Group, Inc.(1) | 92 | 3,398 | ||||||
PROG Holdings, Inc.(1) | 207 | 3,838 | ||||||
| Regional Management Corp. | 69 | 2,325 | ||||||
| SLM Corp. | 1,587 | 24,249 | ||||||
SoFi Technologies, Inc.(1) | 1,035 | 6,127 | ||||||
| Synchrony Financial | 2,024 | 66,286 | ||||||
Upstart Holdings, Inc.(1)(2) | 10 | 259 | ||||||
World Acceptance Corp.(1) | 23 | 2,674 | ||||||
| 497,574 | ||||||||
14
| Avantis Responsible U.S. Equity ETF | ||||||||
| Shares | Value | |||||||
| Containers and Packaging — 0.7% | ||||||||
| AptarGroup, Inc. | 138 | $ | 14,188 | |||||
| Ardagh Metal Packaging SA | 299 | 1,839 | ||||||
| Avery Dennison Corp. | 92 | 16,893 | ||||||
| Ball Corp. | 368 | 20,538 | ||||||
Berry Global Group, Inc.(1) | 92 | 4,998 | ||||||
| Crown Holdings, Inc. | 166 | 15,038 | ||||||
| Graphic Packaging Holding Co. | 345 | 7,683 | ||||||
| Greif, Inc., Class A | 98 | 6,571 | ||||||
| Greif, Inc., Class B | 12 | 783 | ||||||
| International Paper Co. | 84 | 3,496 | ||||||
| Myers Industries, Inc. | 147 | 2,840 | ||||||
| Packaging Corp. of America | 417 | 57,096 | ||||||
| Sealed Air Corp. | 322 | 17,327 | ||||||
| Silgan Holdings, Inc. | 92 | 4,191 | ||||||
| Sonoco Products Co. | 460 | 28,989 | ||||||
| TriMas Corp. | 130 | 3,578 | ||||||
| WestRock Co. | 828 | 33,608 | ||||||
| 239,656 | ||||||||
| Distributors — 0.3% | ||||||||
Funko, Inc., Class A(1) | 83 | 1,848 | ||||||
| Genuine Parts Co. | 345 | 53,824 | ||||||
| LKQ Corp. | 414 | 22,033 | ||||||
| Pool Corp. | 46 | 15,603 | ||||||
| 93,308 | ||||||||
| Diversified Consumer Services — 0.3% | ||||||||
| ADT, Inc. | 322 | 2,347 | ||||||
Adtalem Global Education, Inc.(1) | 115 | 4,334 | ||||||
Bright Horizons Family Solutions, Inc.(1) | 23 | 1,569 | ||||||
frontdoor, Inc.(1) | 138 | 3,240 | ||||||
| Graham Holdings Co., Class B | 23 | 13,005 | ||||||
Grand Canyon Education, Inc.(1) | 184 | 14,974 | ||||||
| H&R Block, Inc. | 138 | 6,210 | ||||||
| Laureate Education, Inc., Class A | 230 | 2,535 | ||||||
OneSpaWorld Holdings Ltd.(1) | 253 | 2,229 | ||||||
Perdoceo Education Corp.(1) | 414 | 4,794 | ||||||
| Service Corp. International | 322 | 19,871 | ||||||
| Strategic Education, Inc. | 46 | 2,976 | ||||||
Stride, Inc.(1) | 138 | 5,263 | ||||||
Udemy, Inc.(1) | 230 | 3,418 | ||||||
Universal Technical Institute, Inc.(1) | 299 | 2,051 | ||||||
| 88,816 | ||||||||
| Diversified Financial Services — 0.5% | ||||||||
| Apollo Global Management, Inc. | 1,081 | 60,082 | ||||||
Cannae Holdings, Inc.(1) | 207 | 4,473 | ||||||
| Equitable Holdings, Inc. | 2,024 | 60,214 | ||||||
| Voya Financial, Inc. | 552 | 33,965 | ||||||
| 158,734 | ||||||||
| Diversified Telecommunication Services — 1.0% | ||||||||
| AT&T, Inc. | 4,071 | 71,405 | ||||||
| Cogent Communications Holdings, Inc. | 46 | 2,450 | ||||||
15
| Avantis Responsible U.S. Equity ETF | ||||||||
| Shares | Value | |||||||
Consolidated Communications Holdings, Inc.(1) | 27 | $ | 155 | |||||
EchoStar Corp., Class A(1) | 161 | 2,964 | ||||||
Frontier Communications Parent, Inc.(1) | 368 | 9,480 | ||||||
Iridium Communications, Inc.(1) | 485 | 21,529 | ||||||
| Lumen Technologies, Inc. | 1,091 | 10,866 | ||||||
Radius Global Infrastructure, Inc., Class A(1) | 161 | 2,217 | ||||||
| Verizon Communications, Inc. | 5,130 | 214,485 | ||||||
| 335,551 | ||||||||
| Electric Utilities — 0.6% | ||||||||
| Constellation Energy Corp. | 515 | 42,019 | ||||||
| Edison International | 772 | 52,318 | ||||||
| Exelon Corp. | 1,955 | 85,844 | ||||||
| Genie Energy Ltd., Class B | 115 | 1,201 | ||||||
| 181,382 | ||||||||
| Electrical Equipment — 0.6% | ||||||||
| Acuity Brands, Inc. | 69 | 11,311 | ||||||
| AMETEK, Inc. | 161 | 19,346 | ||||||
Array Technologies, Inc.(1) | 120 | 2,508 | ||||||
Atkore, Inc.(1) | 299 | 25,239 | ||||||
| AZZ, Inc. | 69 | 2,940 | ||||||
Bloom Energy Corp., Class A(1) | 125 | 3,176 | ||||||
ChargePoint Holdings, Inc.(1)(2) | 161 | 2,620 | ||||||
| Eaton Corp. PLC | 161 | 21,999 | ||||||
| Encore Wire Corp. | 122 | 15,872 | ||||||
| EnerSys | 69 | 4,304 | ||||||
FREYR Battery SA(1)(2) | 276 | 3,930 | ||||||
FuelCell Energy, Inc.(1)(2) | 696 | 2,916 | ||||||
Generac Holdings, Inc.(1) | 23 | 5,069 | ||||||
| GrafTech International Ltd. | 552 | 3,246 | ||||||
| Hubbell, Inc. | 69 | 14,235 | ||||||
| nVent Electric PLC | 184 | 6,065 | ||||||
Plug Power, Inc.(1)(2) | 506 | 14,188 | ||||||
| Regal Rexnord Corp. | 92 | 12,658 | ||||||
| Rockwell Automation, Inc. | 46 | 10,899 | ||||||
| Sensata Technologies Holding PLC | 69 | 2,779 | ||||||
Sunrun, Inc.(1) | 161 | 5,318 | ||||||
Thermon Group Holdings, Inc.(1) | 138 | 2,422 | ||||||
| Vertiv Holdings Co. | 207 | 2,387 | ||||||
| 195,427 | ||||||||
| Electronic Equipment, Instruments and Components — 1.5% | ||||||||
| Advanced Energy Industries, Inc. | 138 | 12,391 | ||||||
| Amphenol Corp., Class A | 276 | 20,294 | ||||||
Arlo Technologies, Inc.(1) | 253 | 1,541 | ||||||
Arrow Electronics, Inc.(1) | 138 | 14,464 | ||||||
| Avnet, Inc. | 322 | 14,133 | ||||||
| Badger Meter, Inc. | 46 | 4,356 | ||||||
| Belden, Inc. | 46 | 3,012 | ||||||
| Benchmark Electronics, Inc. | 92 | 2,525 | ||||||
| CDW Corp. | 161 | 27,483 | ||||||
| Cognex Corp. | 115 | 4,843 | ||||||
| Corning, Inc. | 2,392 | 82,093 | ||||||
16
| Avantis Responsible U.S. Equity ETF | ||||||||
| Shares | Value | |||||||
| CTS Corp. | 115 | $ | 4,867 | |||||
ePlus, Inc.(1) | 56 | 2,639 | ||||||
Fabrinet(1) | 92 | 9,461 | ||||||
Flex Ltd.(1) | 1,978 | 35,228 | ||||||
II-VI, Inc.(1) | 308 | 14,547 | ||||||
Insight Enterprises, Inc.(1) | 69 | 6,287 | ||||||
IPG Photonics Corp.(1) | 69 | 6,251 | ||||||
| Jabil, Inc. | 667 | 40,220 | ||||||
Keysight Technologies, Inc.(1) | 276 | 45,234 | ||||||
Kimball Electronics, Inc.(1) | 71 | 1,529 | ||||||
Knowles Corp.(1) | 207 | 3,136 | ||||||
| Littelfuse, Inc. | 46 | 10,912 | ||||||
| Methode Electronics, Inc. | 92 | 3,722 | ||||||
Napco Security Technologies, Inc.(1) | 50 | 1,483 | ||||||
| National Instruments Corp. | 138 | 5,487 | ||||||
Novanta, Inc.(1) | 23 | 3,075 | ||||||
OSI Systems, Inc.(1) | 46 | 3,833 | ||||||
| PC Connection, Inc. | 46 | 2,285 | ||||||
Plexus Corp.(1) | 58 | 5,436 | ||||||
Sanmina Corp.(1) | 299 | 14,507 | ||||||
ScanSource, Inc.(1) | 92 | 2,665 | ||||||
| TD SYNNEX Corp. | 46 | 4,429 | ||||||
| TE Connectivity Ltd. | 368 | 46,445 | ||||||
Trimble, Inc.(1) | 69 | 4,364 | ||||||
TTM Technologies, Inc.(1) | 350 | 5,506 | ||||||
| Vishay Intertechnology, Inc. | 736 | 14,477 | ||||||
Vishay Precision Group, Inc.(1) | 31 | 1,064 | ||||||
| Vontier Corp. | 184 | 4,033 | ||||||
Zebra Technologies Corp., Class A(1) | 23 | 6,938 | ||||||
| 497,195 | ||||||||
Energy Equipment and Services† | ||||||||
National Energy Services Reunited Corp.(1) | 103 | 723 | ||||||
Newpark Resources, Inc.(1) | 506 | 1,457 | ||||||
Oil States International, Inc.(1) | 322 | 1,578 | ||||||
SEACOR Marine Holdings, Inc.(1) | 24 | 156 | ||||||
| 3,914 | ||||||||
| Entertainment — 0.8% | ||||||||
AMC Entertainment Holdings, Inc., Class A(1) | 332 | 3,028 | ||||||
| Electronic Arts, Inc. | 230 | 29,180 | ||||||
IMAX Corp.(1) | 138 | 2,164 | ||||||
Live Nation Entertainment, Inc.(1) | 115 | 10,391 | ||||||
Madison Square Garden Entertainment Corp.(1) | 69 | 3,834 | ||||||
Marcus Corp.(2) | 138 | 2,220 | ||||||
Netflix, Inc.(1) | 161 | 35,993 | ||||||
Playstudios, Inc.(1) | 575 | 2,082 | ||||||
Playtika Holding Corp.(1) | 138 | 1,453 | ||||||
Roku, Inc.(1) | 46 | 3,128 | ||||||
Take-Two Interactive Software, Inc.(1) | 414 | 50,740 | ||||||
Walt Disney Co.(1) | 577 | 64,670 | ||||||
Warner Bros Discovery, Inc.(1) | 1,196 | 15,835 | ||||||
17
| Avantis Responsible U.S. Equity ETF | ||||||||
| Shares | Value | |||||||
| World Wrestling Entertainment, Inc., Class A | 260 | $ | 17,683 | |||||
| 242,401 | ||||||||
| Food and Staples Retailing — 1.8% | ||||||||
| Albertsons Cos., Inc., Class A | 375 | 10,316 | ||||||
| Andersons, Inc. | 115 | 4,259 | ||||||
BJ's Wholesale Club Holdings, Inc.(1) | 345 | 25,699 | ||||||
| Costco Wholesale Corp. | 401 | 209,362 | ||||||
| PriceSmart, Inc. | 49 | 3,100 | ||||||
| SpartanNash Co. | 236 | 7,182 | ||||||
Sprouts Farmers Market, Inc.(1) | 759 | 21,935 | ||||||
| Sysco Corp. | 646 | 53,114 | ||||||
United Natural Foods, Inc.(1) | 368 | 16,221 | ||||||
US Foods Holding Corp.(1) | 73 | 2,235 | ||||||
| Walgreens Boots Alliance, Inc. | 671 | 23,525 | ||||||
| Walmart, Inc. | 1,541 | 204,260 | ||||||
| 581,208 | ||||||||
| Food Products — 0.9% | ||||||||
| Alico, Inc. | 24 | 815 | ||||||
| Campbell Soup Co. | 184 | 9,270 | ||||||
Darling Ingredients, Inc.(1) | 552 | 41,985 | ||||||
| General Mills, Inc. | 368 | 28,262 | ||||||
| Hershey Co. | 207 | 46,507 | ||||||
| Hormel Foods Corp. | 253 | 12,721 | ||||||
| J.M. Smucker Co. | 207 | 28,978 | ||||||
| Kellogg Co. | 207 | 15,057 | ||||||
| Lamb Weston Holdings, Inc. | 391 | 31,096 | ||||||
| Lancaster Colony Corp. | 46 | 7,753 | ||||||
| McCormick & Co., Inc. | 92 | 7,735 | ||||||
| Mondelez International, Inc., Class A | 851 | 52,643 | ||||||
| 282,822 | ||||||||
| Health Care Equipment and Supplies — 2.1% | ||||||||
| Abbott Laboratories | 1,150 | 118,047 | ||||||
ABIOMED, Inc.(1) | 46 | 11,927 | ||||||
Align Technology, Inc.(1) | 46 | 11,210 | ||||||
| Atrion Corp. | 5 | 3,020 | ||||||
Avanos Medical, Inc.(1) | 92 | 2,266 | ||||||
| Baxter International, Inc. | 276 | 15,859 | ||||||
| Becton Dickinson and Co. | 115 | 29,028 | ||||||
Boston Scientific Corp.(1) | 920 | 37,085 | ||||||
| Cooper Cos., Inc. | 46 | 13,222 | ||||||
CryoPort, Inc.(1) | 85 | 2,776 | ||||||
Cue Health, Inc.(1) | 233 | 776 | ||||||
| DENTSPLY SIRONA, Inc. | 207 | 6,783 | ||||||
DexCom, Inc.(1) | 164 | 13,482 | ||||||
Edwards Lifesciences Corp.(1) | 557 | 50,186 | ||||||
| Embecta Corp. | 49 | 1,564 | ||||||
Glaukos Corp.(1) | 92 | 4,467 | ||||||
Globus Medical, Inc., Class A(1) | 115 | 6,807 | ||||||
Haemonetics Corp.(1) | 109 | 8,178 | ||||||
Hologic, Inc.(1) | 921 | 62,223 | ||||||
ICU Medical, Inc.(1) | 12 | 1,908 | ||||||
18
| Avantis Responsible U.S. Equity ETF | ||||||||
| Shares | Value | |||||||
IDEXX Laboratories, Inc.(1) | 69 | $ | 23,986 | |||||
Inogen, Inc.(1) | 58 | 1,660 | ||||||
Insulet Corp.(1) | 23 | 5,876 | ||||||
Integer Holdings Corp.(1) | 53 | 3,343 | ||||||
Intuitive Surgical, Inc.(1) | 138 | 28,392 | ||||||
| Medtronic PLC | 690 | 60,665 | ||||||
Meridian Bioscience, Inc.(1) | 184 | 5,997 | ||||||
Merit Medical Systems, Inc.(1) | 95 | 5,627 | ||||||
Neogen Corp.(1) | 138 | 2,884 | ||||||
Omnicell, Inc.(1) | 14 | 1,432 | ||||||
Penumbra, Inc.(1) | 23 | 3,776 | ||||||
PROCEPT BioRobotics Corp.(1) | 95 | 3,846 | ||||||
QuidelOrtho Corp.(1) | 164 | 12,999 | ||||||
| ResMed, Inc. | 69 | 15,174 | ||||||
| STERIS PLC | 76 | 15,305 | ||||||
| Stryker Corp. | 138 | 28,318 | ||||||
| Teleflex, Inc. | 46 | 10,408 | ||||||
UFP Technologies, Inc.(1) | 46 | 4,277 | ||||||
| Utah Medical Products, Inc. | 9 | 827 | ||||||
| Zimmer Biomet Holdings, Inc. | 230 | 24,454 | ||||||
Zimvie, Inc.(1) | 93 | 1,415 | ||||||
| 661,475 | ||||||||
| Health Care Providers and Services — 3.2% | ||||||||
23andMe Holding Co., Class A(1) | 450 | 1,517 | ||||||
Acadia Healthcare Co., Inc.(1) | 117 | 9,586 | ||||||
Accolade, Inc.(1) | 88 | 896 | ||||||
agilon health, Inc.(1) | 231 | 4,800 | ||||||
| AmerisourceBergen Corp. | 253 | 37,080 | ||||||
AMN Healthcare Services, Inc.(1) | 208 | 21,349 | ||||||
Apollo Medical Holdings, Inc.(1) | 8 | 345 | ||||||
| Cardinal Health, Inc. | 529 | 37,411 | ||||||
Castle Biosciences, Inc.(1) | 33 | 957 | ||||||
Centene Corp.(1) | 1,012 | 90,817 | ||||||
| Chemed Corp. | 23 | 10,952 | ||||||
| Cigna Corp. | 138 | 39,116 | ||||||
CorVel Corp.(1) | 23 | 3,574 | ||||||
Cross Country Healthcare, Inc.(1) | 64 | 1,624 | ||||||
| CVS Health Corp. | 529 | 51,921 | ||||||
DaVita, Inc.(1) | 69 | 5,885 | ||||||
| Elevance Health, Inc. | 276 | 133,890 | ||||||
| Encompass Health Corp. | 46 | 2,234 | ||||||
Enhabit, Inc.(1) | 11 | 183 | ||||||
| Ensign Group, Inc. | 230 | 19,619 | ||||||
Fulgent Genetics, Inc.(1) | 78 | 3,391 | ||||||
Guardant Health, Inc.(1) | 46 | 2,303 | ||||||
| HCA Healthcare, Inc. | 92 | 18,204 | ||||||
HealthEquity, Inc.(1) | 115 | 7,599 | ||||||
Henry Schein, Inc.(1) | 142 | 10,424 | ||||||
Hims & Hers Health, Inc.(1) | 235 | 1,495 | ||||||
| Humana, Inc. | 131 | 63,113 | ||||||
Invitae Corp.(1)(2) | 341 | 1,037 | ||||||
19
| Avantis Responsible U.S. Equity ETF | ||||||||
| Shares | Value | |||||||
| Laboratory Corp. of America Holdings | 207 | $ | 46,631 | |||||
| McKesson Corp. | 92 | 33,764 | ||||||
ModivCare, Inc.(1) | 23 | 2,491 | ||||||
Molina Healthcare, Inc.(1) | 276 | 93,114 | ||||||
| National Research Corp. | 69 | 2,354 | ||||||
Oak Street Health, Inc.(1) | 107 | 2,803 | ||||||
OPKO Health, Inc.(1) | 891 | 1,942 | ||||||
| Owens & Minor, Inc. | 322 | 9,502 | ||||||
| Patterson Cos., Inc. | 219 | 6,108 | ||||||
| Premier, Inc., Class A | 345 | 12,158 | ||||||
Privia Health Group, Inc.(1) | 115 | 4,576 | ||||||
| Quest Diagnostics, Inc. | 69 | 8,646 | ||||||
R1 RCM, Inc.(1) | 281 | 6,140 | ||||||
| UnitedHealth Group, Inc. | 397 | 206,174 | ||||||
| 1,017,725 | ||||||||
| Health Care Technology — 0.1% | ||||||||
Allscripts Healthcare Solutions, Inc.(1) | 783 | 13,311 | ||||||
American Well Corp., Class A(1) | 626 | 2,848 | ||||||
Change Healthcare, Inc.(1) | 94 | 2,310 | ||||||
Doximity, Inc., Class A(1)(2) | 13 | 431 | ||||||
Evolent Health, Inc., Class A(1) | 115 | 4,226 | ||||||
NextGen Healthcare, Inc.(1) | 161 | 2,760 | ||||||
Phreesia, Inc.(1) | 82 | 2,104 | ||||||
| Simulations Plus, Inc. | 30 | 1,802 | ||||||
Teladoc Health, Inc.(1) | 69 | 2,143 | ||||||
Veeva Systems, Inc., Class A(1) | 69 | 13,753 | ||||||
| 45,688 | ||||||||
| Hotels, Restaurants and Leisure — 1.7% | ||||||||
Airbnb, Inc., Class A(1) | 138 | 15,610 | ||||||
| Aramark | 92 | 3,285 | ||||||
BJ's Restaurants, Inc.(1) | 92 | 2,307 | ||||||
| Bloomin' Brands, Inc. | 253 | 5,116 | ||||||
Booking Holdings, Inc.(1) | 69 | 129,431 | ||||||
Cheesecake Factory, Inc.(2) | 276 | 8,451 | ||||||
Chipotle Mexican Grill, Inc.(1) | 23 | 36,726 | ||||||
| Choice Hotels International, Inc. | 138 | 15,830 | ||||||
Chuy's Holdings, Inc.(1) | 92 | 2,054 | ||||||
| Cracker Barrel Old Country Store, Inc. | 138 | 14,896 | ||||||
| Darden Restaurants, Inc. | 276 | 34,144 | ||||||
Dave & Buster's Entertainment, Inc.(1) | 92 | 3,803 | ||||||
Expedia Group, Inc.(1) | 184 | 18,888 | ||||||
Hilton Grand Vacations, Inc.(1) | 92 | 3,752 | ||||||
| Hilton Worldwide Holdings, Inc. | 161 | 20,505 | ||||||
Hyatt Hotels Corp., Class A(1) | 253 | 22,674 | ||||||
| Jack in the Box, Inc. | 46 | 3,674 | ||||||
| Marriott International, Inc., Class A | 92 | 14,144 | ||||||
| Marriott Vacations Worldwide Corp. | 23 | 3,276 | ||||||
| McDonald's Corp. | 299 | 75,432 | ||||||
| Ruth's Hospitality Group, Inc. | 230 | 4,191 | ||||||
SeaWorld Entertainment, Inc.(1) | 46 | 2,311 | ||||||
Six Flags Entertainment Corp.(1) | 69 | 1,528 | ||||||
20
| Avantis Responsible U.S. Equity ETF | ||||||||
| Shares | Value | |||||||
| Starbucks Corp. | 322 | $ | 27,070 | |||||
| Texas Roadhouse, Inc. | 345 | 30,622 | ||||||
| Travel + Leisure Co. | 69 | 2,926 | ||||||
| Vail Resorts, Inc. | 23 | 5,168 | ||||||
| Wendy's Co. | 322 | 6,176 | ||||||
| Wingstop, Inc. | 23 | 2,619 | ||||||
| Wyndham Hotels & Resorts, Inc. | 115 | 7,514 | ||||||
| Yum! Brands, Inc. | 161 | 17,910 | ||||||
| 542,033 | ||||||||
| Household Durables — 0.8% | ||||||||
Beazer Homes USA, Inc.(1) | 161 | 2,293 | ||||||
Cavco Industries, Inc.(1) | 23 | 5,382 | ||||||
| Century Communities, Inc. | 69 | 3,222 | ||||||
| D.R. Horton, Inc. | 460 | 32,729 | ||||||
| Ethan Allen Interiors, Inc. | 138 | 3,280 | ||||||
| Garmin Ltd. | 161 | 14,247 | ||||||
GoPro, Inc., Class A(1) | 621 | 3,782 | ||||||
Green Brick Partners, Inc.(1) | 115 | 2,801 | ||||||
Helen of Troy Ltd.(1) | 3 | 371 | ||||||
Hovnanian Enterprises, Inc., Class A(1) | 46 | 1,844 | ||||||
| Installed Building Products, Inc. | 23 | 2,083 | ||||||
iRobot Corp.(1) | 46 | 2,708 | ||||||
| KB Home | 230 | 6,590 | ||||||
| La-Z-Boy, Inc. | 138 | 3,642 | ||||||
LGI Homes, Inc.(1) | 23 | 2,183 | ||||||
| M.D.C. Holdings, Inc. | 115 | 3,574 | ||||||
M/I Homes, Inc.(1) | 69 | 2,984 | ||||||
Meritage Homes Corp.(1) | 69 | 5,406 | ||||||
Mohawk Industries, Inc.(1) | 92 | 10,153 | ||||||
| Newell Brands, Inc. | 598 | 10,674 | ||||||
| PulteGroup, Inc. | 966 | 39,278 | ||||||
Skyline Champion Corp.(1) | 253 | 14,338 | ||||||
Sonos, Inc.(1) | 253 | 3,805 | ||||||
Taylor Morrison Home Corp.(1) | 667 | 16,748 | ||||||
| Tempur Sealy International, Inc. | 299 | 7,478 | ||||||
| Toll Brothers, Inc. | 322 | 14,100 | ||||||
TopBuild Corp.(1) | 23 | 4,226 | ||||||
Tri Pointe Homes, Inc.(1) | 575 | 9,965 | ||||||
| Whirlpool Corp. | 253 | 39,620 | ||||||
| 269,506 | ||||||||
| Household Products — 1.2% | ||||||||
| Church & Dwight Co., Inc. | 322 | 26,955 | ||||||
| Clorox Co. | 208 | 30,023 | ||||||
| Colgate-Palmolive Co. | 1,058 | 82,746 | ||||||
| Energizer Holdings, Inc. | 92 | 2,585 | ||||||
| Kimberly-Clark Corp. | 529 | 67,458 | ||||||
| Procter & Gamble Co. | 1,127 | 155,458 | ||||||
| Spectrum Brands Holdings, Inc. | 230 | 14,488 | ||||||
| 379,713 | ||||||||
21
| Avantis Responsible U.S. Equity ETF | ||||||||
| Shares | Value | |||||||
| Independent Power and Renewable Electricity Producers — 0.1% | ||||||||
| Brookfield Renewable Corp., Class A | 253 | $ | 9,713 | |||||
Ormat Technologies, Inc.(2) | 142 | 13,274 | ||||||
Sunnova Energy International, Inc.(1) | 276 | 6,961 | ||||||
| 29,948 | ||||||||
| Industrial Conglomerates — 0.1% | ||||||||
| Honeywell International, Inc. | 207 | 39,196 | ||||||
| Insurance — 5.4% | ||||||||
| Aflac, Inc. | 1,357 | 80,633 | ||||||
Alleghany Corp.(1) | 46 | 38,694 | ||||||
| Allstate Corp. | 782 | 94,231 | ||||||
| American Financial Group, Inc. | 276 | 35,240 | ||||||
| American International Group, Inc. | 1,472 | 76,176 | ||||||
| AMERISAFE, Inc. | 69 | 3,300 | ||||||
| Aon PLC, Class A | 230 | 64,230 | ||||||
Arch Capital Group Ltd.(1) | 1,127 | 51,526 | ||||||
| Argo Group International Holdings Ltd. | 92 | 1,806 | ||||||
| Arthur J. Gallagher & Co. | 299 | 54,289 | ||||||
| Assurant, Inc. | 138 | 21,872 | ||||||
| Assured Guaranty Ltd. | 230 | 11,746 | ||||||
| Axis Capital Holdings Ltd. | 483 | 25,671 | ||||||
Brighthouse Financial, Inc.(1) | 345 | 16,405 | ||||||
| Brown & Brown, Inc. | 92 | 5,800 | ||||||
| Chubb Ltd. | 483 | 91,311 | ||||||
| Cincinnati Financial Corp. | 322 | 31,221 | ||||||
| CNA Financial Corp. | 69 | 2,654 | ||||||
| CNO Financial Group, Inc. | 460 | 8,469 | ||||||
| Employers Holdings, Inc. | 92 | 3,603 | ||||||
| Erie Indemnity Co., Class A | 69 | 14,830 | ||||||
| Everest Re Group Ltd. | 138 | 37,129 | ||||||
| Fidelity National Financial, Inc. | 1,127 | 44,066 | ||||||
| First American Financial Corp. | 414 | 22,149 | ||||||
Genworth Financial, Inc., Class A(1) | 1,909 | 8,056 | ||||||
| Globe Life, Inc. | 345 | 33,531 | ||||||
| Hanover Insurance Group, Inc. | 138 | 17,856 | ||||||
| Hartford Financial Services Group, Inc. | 1,127 | 72,477 | ||||||
Hippo Holdings, Inc.(1) | 1,196 | 1,160 | ||||||
| Horace Mann Educators Corp. | 161 | 5,759 | ||||||
| Kemper Corp. | 92 | 4,232 | ||||||
| Kinsale Capital Group, Inc. | 69 | 17,497 | ||||||
| Lincoln National Corp. | 391 | 18,009 | ||||||
Markel Corp.(1) | 23 | 27,465 | ||||||
| Marsh & McLennan Cos., Inc. | 253 | 40,827 | ||||||
| Mercury General Corp. | 92 | 2,935 | ||||||
| MetLife, Inc. | 1,196 | 76,939 | ||||||
| Old Republic International Corp. | 1,173 | 25,618 | ||||||
Oscar Health, Inc., Class A(1) | 299 | 1,982 | ||||||
| Primerica, Inc. | 207 | 26,237 | ||||||
| Principal Financial Group, Inc. | 828 | 61,901 | ||||||
| Progressive Corp. | 713 | 87,449 | ||||||
| Prudential Financial, Inc. | 644 | 61,663 | ||||||
22
| Avantis Responsible U.S. Equity ETF | ||||||||
| Shares | Value | |||||||
| Reinsurance Group of America, Inc. | 276 | $ | 34,599 | |||||
| RenaissanceRe Holdings Ltd. | 138 | 18,666 | ||||||
| RLI Corp. | 92 | 10,098 | ||||||
| Selective Insurance Group, Inc. | 230 | 18,267 | ||||||
| Travelers Cos., Inc. | 644 | 104,096 | ||||||
| Unum Group | 690 | 26,116 | ||||||
| White Mountains Insurance Group Ltd. | 23 | 31,510 | ||||||
| Willis Towers Watson PLC | 92 | 19,028 | ||||||
| WR Berkley Corp. | 575 | 37,260 | ||||||
| 1,728,284 | ||||||||
| Interactive Media and Services — 3.6% | ||||||||
Alphabet, Inc., Class A(1) | 4,140 | 448,031 | ||||||
Alphabet, Inc., Class C(1) | 3,680 | 401,672 | ||||||
Cars.com, Inc.(1) | 483 | 6,158 | ||||||
Match Group, Inc.(1) | 92 | 5,201 | ||||||
Meta Platforms, Inc., Class A(1) | 1,457 | 237,389 | ||||||
Pinterest, Inc., Class A(1) | 345 | 7,949 | ||||||
| Shutterstock, Inc. | 92 | 5,098 | ||||||
Snap, Inc., Class A(1) | 207 | 2,252 | ||||||
TrueCar, Inc.(1) | 100 | 218 | ||||||
Twitter, Inc.(1) | 460 | 17,825 | ||||||
Yelp, Inc.(1) | 138 | 4,715 | ||||||
Ziff Davis, Inc.(1) | 69 | 5,332 | ||||||
ZoomInfo Technologies, Inc.(1) | 92 | 4,179 | ||||||
| 1,146,019 | ||||||||
| Internet and Direct Marketing Retail — 2.0% | ||||||||
Amazon.com, Inc.(1) | 4,600 | 583,142 | ||||||
Chewy, Inc., Class A(1) | 138 | 4,738 | ||||||
DoorDash, Inc., Class A(1) | 92 | 5,511 | ||||||
| eBay, Inc. | 713 | 31,465 | ||||||
Etsy, Inc.(1) | 115 | 12,145 | ||||||
Liquidity Services, Inc.(1) | 161 | 2,816 | ||||||
PetMed Express, Inc.(2) | 92 | 1,892 | ||||||
Quotient Technology, Inc.(1) | 391 | 727 | ||||||
Revolve Group, Inc.(1)(2) | 35 | 822 | ||||||
Wayfair, Inc., Class A(1)(2) | 23 | 1,212 | ||||||
| 644,470 | ||||||||
| IT Services — 4.5% | ||||||||
| Accenture PLC, Class A | 460 | 132,692 | ||||||
Akamai Technologies, Inc.(1) | 345 | 31,147 | ||||||
| Amdocs Ltd. | 230 | 19,658 | ||||||
| Automatic Data Processing, Inc. | 667 | 163,021 | ||||||
AvidXchange Holdings, Inc.(1) | 138 | 1,075 | ||||||
| Broadridge Financial Solutions, Inc., ADR | 115 | 19,685 | ||||||
| Cass Information Systems, Inc. | 69 | 2,531 | ||||||
Cloudflare, Inc., Class A(1) | 46 | 2,878 | ||||||
| Cognizant Technology Solutions Corp., Class A | 713 | 45,040 | ||||||
| Concentrix Corp. | 69 | 8,679 | ||||||
| CSG Systems International, Inc. | 161 | 9,314 | ||||||
DigitalOcean Holdings, Inc.(1) | 46 | 1,936 | ||||||
DXC Technology Co.(1) | 1,265 | 31,347 | ||||||
23
| Avantis Responsible U.S. Equity ETF | ||||||||
| Shares | Value | |||||||
EPAM Systems, Inc.(1) | 23 | $ | 9,809 | |||||
Euronet Worldwide, Inc.(1) | 92 | 8,157 | ||||||
| EVERTEC, Inc. | 209 | 7,022 | ||||||
ExlService Holdings, Inc.(1) | 46 | 7,715 | ||||||
| Fidelity National Information Services, Inc. | 161 | 14,711 | ||||||
Fiserv, Inc.(1) | 170 | 17,202 | ||||||
FleetCor Technologies, Inc.(1) | 92 | 19,553 | ||||||
Gartner, Inc.(1) | 115 | 32,812 | ||||||
| Genpact Ltd. | 161 | 7,564 | ||||||
| Global Payments, Inc. | 93 | 11,553 | ||||||
Globant SA(1) | 36 | 7,588 | ||||||
GoDaddy, Inc., Class A(1) | 322 | 24,414 | ||||||
| Hackett Group, Inc. | 115 | 2,361 | ||||||
| International Business Machines Corp. | 460 | 59,087 | ||||||
| Jack Henry & Associates, Inc. | 207 | 39,785 | ||||||
Kyndryl Holdings, Inc.(1) | 1,104 | 11,504 | ||||||
| Mastercard, Inc., Class A | 598 | 193,973 | ||||||
| MAXIMUS, Inc. | 46 | 2,787 | ||||||
MongoDB, Inc.(1) | 23 | 7,426 | ||||||
Okta, Inc.(1) | 23 | 2,102 | ||||||
| Paychex, Inc. | 598 | 73,757 | ||||||
PayPal Holdings, Inc.(1) | 506 | 47,281 | ||||||
Sabre Corp.(1) | 253 | 1,819 | ||||||
Snowflake, Inc., Class A(1) | 115 | 20,809 | ||||||
| SS&C Technologies Holdings, Inc. | 92 | 5,130 | ||||||
| Switch, Inc., Class A | 230 | 7,808 | ||||||
| TTEC Holdings, Inc. | 46 | 2,408 | ||||||
Twilio, Inc., Class A(1) | 69 | 4,801 | ||||||
VeriSign, Inc.(1) | 69 | 12,573 | ||||||
| Visa, Inc., Class A | 1,449 | 287,931 | ||||||
| Western Union Co. | 897 | 13,294 | ||||||
WEX, Inc.(1) | 46 | 7,095 | ||||||
| 1,440,834 | ||||||||
| Leisure Products — 0.3% | ||||||||
| Acushnet Holdings Corp. | 115 | 5,480 | ||||||
| Brunswick Corp. | 368 | 27,493 | ||||||
Callaway Golf Co.(1) | 161 | 3,563 | ||||||
| Hasbro, Inc. | 46 | 3,626 | ||||||
Malibu Boats, Inc., Class A(1) | 115 | 6,903 | ||||||
MasterCraft Boat Holdings, Inc.(1) | 115 | 2,770 | ||||||
Mattel, Inc.(1) | 414 | 9,158 | ||||||
Peloton Interactive, Inc., Class A(1) | 184 | 1,875 | ||||||
| Polaris, Inc. | 184 | 20,842 | ||||||
YETI Holdings, Inc.(1) | 115 | 4,242 | ||||||
| 85,952 | ||||||||
| Life Sciences Tools and Services — 1.2% | ||||||||
10X Genomics, Inc., Class A(1) | 46 | 1,518 | ||||||
Adaptive Biotechnologies Corp.(1) | 135 | 1,204 | ||||||
| Agilent Technologies, Inc. | 185 | 23,726 | ||||||
Avantor, Inc.(1) | 305 | 7,598 | ||||||
| Azenta, Inc. | 161 | 8,486 | ||||||
24
| Avantis Responsible U.S. Equity ETF | ||||||||
| Shares | Value | |||||||
Bio-Rad Laboratories, Inc., Class A(1) | 23 | $ | 11,156 | |||||
| Bio-Techne Corp. | 30 | 9,954 | ||||||
| Bruker Corp. | 161 | 9,016 | ||||||
Charles River Laboratories International, Inc.(1) | 29 | 5,952 | ||||||
| Danaher Corp. | 235 | 63,429 | ||||||
Illumina, Inc.(1) | 79 | 15,930 | ||||||
IQVIA Holdings, Inc.(1) | 122 | 25,944 | ||||||
Maravai LifeSciences Holdings, Inc., Class A(1) | 138 | 2,880 | ||||||
Medpace Holdings, Inc.(1) | 46 | 6,790 | ||||||
Mettler-Toledo International, Inc.(1) | 46 | 55,773 | ||||||
NeoGenomics, Inc.(1) | 154 | 1,548 | ||||||
| PerkinElmer, Inc. | 46 | 6,213 | ||||||
Quantum-Si, Inc.(1) | 191 | 596 | ||||||
Repligen Corp.(1) | 23 | 5,045 | ||||||
SomaLogic, Inc.(1) | 207 | 762 | ||||||
Sotera Health Co.(1) | 138 | 2,334 | ||||||
Syneos Health, Inc.(1) | 46 | 2,765 | ||||||
| Thermo Fisher Scientific, Inc. | 138 | 75,254 | ||||||
Waters Corp.(1) | 92 | 27,471 | ||||||
| West Pharmaceutical Services, Inc. | 97 | 28,779 | ||||||
| 400,123 | ||||||||
| Machinery — 2.1% | ||||||||
| AGCO Corp. | 161 | 17,502 | ||||||
| Alamo Group, Inc. | 23 | 3,007 | ||||||
| Allison Transmission Holdings, Inc. | 184 | 6,672 | ||||||
| Barnes Group, Inc. | 115 | 3,571 | ||||||
| Cummins, Inc. | 368 | 79,256 | ||||||
| Deere & Co. | 467 | 170,572 | ||||||
| Dover Corp. | 69 | 8,622 | ||||||
| Esab Corp. | 163 | 6,698 | ||||||
Evoqua Water Technologies Corp.(1) | 322 | 11,296 | ||||||
| Flowserve Corp. | 147 | 4,479 | ||||||
| Franklin Electric Co., Inc. | 69 | 5,993 | ||||||
Gates Industrial Corp. PLC(1) | 161 | 1,726 | ||||||
| Helios Technologies, Inc. | 46 | 2,513 | ||||||
Hyliion Holdings Corp.(1) | 254 | 892 | ||||||
| IDEX Corp. | 46 | 9,256 | ||||||
| Illinois Tool Works, Inc. | 276 | 53,773 | ||||||
| Ingersoll Rand, Inc. | 414 | 19,611 | ||||||
| ITT, Inc. | 184 | 13,345 | ||||||
| John Bean Technologies Corp. | 23 | 2,375 | ||||||
| Kennametal, Inc. | 180 | 4,219 | ||||||
| Lincoln Electric Holdings, Inc. | 230 | 31,439 | ||||||
| Lindsay Corp. | 7 | 1,123 | ||||||
Middleby Corp.(1) | 23 | 3,308 | ||||||
| Nordson Corp. | 46 | 10,450 | ||||||
| Oshkosh Corp. | 322 | 25,683 | ||||||
| Otis Worldwide Corp. | 184 | 13,288 | ||||||
| PACCAR, Inc. | 575 | 50,318 | ||||||
| Parker-Hannifin Corp. | 46 | 12,190 | ||||||
| Pentair PLC | 69 | 3,070 | ||||||
25
| Avantis Responsible U.S. Equity ETF | ||||||||
| Shares | Value | |||||||
Proterra, Inc.(1) | 437 | $ | 2,639 | |||||
| Shyft Group, Inc. | 138 | 3,305 | ||||||
| Snap-on, Inc. | 161 | 35,075 | ||||||
| Stanley Black & Decker, Inc. | 69 | 6,079 | ||||||
| Tennant Co. | 69 | 4,164 | ||||||
| Timken Co. | 184 | 11,590 | ||||||
Titan International, Inc.(1) | 230 | 3,227 | ||||||
| Toro Co. | 207 | 17,166 | ||||||
| Watts Water Technologies, Inc., Class A | 46 | 6,372 | ||||||
| Westinghouse Air Brake Technologies Corp. | 161 | 14,112 | ||||||
| Xylem, Inc. | 46 | 4,191 | ||||||
| 684,167 | ||||||||
| Marine — 0.1% | ||||||||
| Costamare, Inc. | 207 | 2,335 | ||||||
| Matson, Inc. | 235 | 17,310 | ||||||
| Safe Bulkers, Inc. | 506 | 1,614 | ||||||
| 21,259 | ||||||||
| Media — 0.9% | ||||||||
Altice USA, Inc., Class A(1) | 62 | 620 | ||||||
AMC Networks, Inc., Class A(1) | 26 | 697 | ||||||
Charter Communications, Inc., Class A(1) | 46 | 18,981 | ||||||
| Comcast Corp., Class A | 2,438 | 88,231 | ||||||
Cumulus Media, Inc., Class A(1) | 75 | 699 | ||||||
Daily Journal Corp.(1) | 1 | 261 | ||||||
DISH Network Corp., Class A(1) | 654 | 11,347 | ||||||
E.W. Scripps Co., Class A(1) | 138 | 2,063 | ||||||
| Entravision Communications Corp., Class A | 391 | 1,986 | ||||||
| Fox Corp., Class A | 621 | 21,226 | ||||||
| Fox Corp., Class B | 299 | 9,454 | ||||||
| Interpublic Group of Cos., Inc. | 552 | 15,257 | ||||||
| John Wiley & Sons, Inc., Class A | 46 | 2,117 | ||||||
Liberty Broadband Corp., Class A(1) | 23 | 2,319 | ||||||
Liberty Broadband Corp., Class C(1) | 115 | 11,696 | ||||||
| New York Times Co., Class A | 276 | 8,415 | ||||||
| News Corp., Class A | 713 | 12,064 | ||||||
| News Corp., Class B | 207 | 3,569 | ||||||
| Nexstar Media Group, Inc., Class A | 46 | 8,801 | ||||||
| Omnicom Group, Inc. | 253 | 16,926 | ||||||
| Paramount Global, Class B | 1,081 | 25,285 | ||||||
PubMatic, Inc., Class A(1) | 138 | 2,701 | ||||||
| Scholastic Corp. | 92 | 4,224 | ||||||
| Sinclair Broadcast Group, Inc., Class A | 92 | 2,032 | ||||||
Sirius XM Holdings, Inc.(2) | 437 | 2,661 | ||||||
TechTarget, Inc.(1) | 46 | 2,985 | ||||||
Thryv Holdings, Inc.(1) | 92 | 2,353 | ||||||
WideOpenWest, Inc.(1) | 393 | 6,996 | ||||||
| 285,966 | ||||||||
| Metals and Mining — 0.4% | ||||||||
Arconic Corp.(1) | 334 | 8,420 | ||||||
Ascent Industries Co.(1) | 10 | 167 | ||||||
| Commercial Metals Co. | 575 | 23,293 | ||||||
26
| Avantis Responsible U.S. Equity ETF | ||||||||
| Shares | Value | |||||||
| Gold Resource Corp. | 1,035 | $ | 1,760 | |||||
| Newmont Corp. | 1,288 | 53,272 | ||||||
| Reliance Steel & Aluminum Co. | 138 | 25,941 | ||||||
| Royal Gold, Inc. | 161 | 14,796 | ||||||
| Schnitzer Steel Industries, Inc., Class A | 145 | 4,791 | ||||||
| 132,440 | ||||||||
| Multiline Retail — 1.1% | ||||||||
Big Lots, Inc.(2) | 138 | 2,839 | ||||||
| Dillard's, Inc., Class A | 23 | 6,813 | ||||||
| Dollar General Corp. | 299 | 70,989 | ||||||
Dollar Tree, Inc.(1) | 667 | 90,499 | ||||||
| Kohl's Corp. | 782 | 22,224 | ||||||
| Macy's, Inc. | 1,771 | 30,674 | ||||||
| Nordstrom, Inc. | 414 | 7,083 | ||||||
Ollie's Bargain Outlet Holdings, Inc.(1) | 69 | 3,816 | ||||||
| Target Corp. | 667 | 106,947 | ||||||
| 341,884 | ||||||||
| Oil, Gas and Consumable Fuels — 0.2% | ||||||||
Archaea Energy, Inc.(1) | 49 | 968 | ||||||
Battalion Oil Corp.(1) | 138 | 1,827 | ||||||
| Epsilon Energy Ltd. | 120 | 864 | ||||||
| Evolution Petroleum Corp. | 322 | 2,235 | ||||||
Excelerate Energy, Inc., Class A(2) | 12 | 308 | ||||||
Hallador Energy Co.(1) | 132 | 861 | ||||||
| HighPeak Energy, Inc. | 51 | 1,291 | ||||||
| NACCO Industries, Inc., Class A | 25 | 1,124 | ||||||
Ring Energy, Inc.(1) | 644 | 2,087 | ||||||
Sitio Royalties Corp.(2) | 60 | 1,526 | ||||||
Teekay Tankers Ltd., Class A(1) | 93 | 2,288 | ||||||
| Texas Pacific Land Corp. | 24 | 44,171 | ||||||
| VAALCO Energy, Inc. | 483 | 2,420 | ||||||
| Viper Energy Partners LP | 184 | 5,616 | ||||||
| 67,586 | ||||||||
| Paper and Forest Products — 0.1% | ||||||||
Clearwater Paper Corp.(1) | 92 | 3,913 | ||||||
| Glatfelter Corp. | 184 | 896 | ||||||
| Louisiana-Pacific Corp. | 464 | 25,163 | ||||||
| Mercer International, Inc. | 276 | 4,477 | ||||||
| 34,449 | ||||||||
| Personal Products — 0.2% | ||||||||
| Edgewell Personal Care Co. | 69 | 2,688 | ||||||
| Estee Lauder Cos., Inc., Class A | 253 | 64,358 | ||||||
Herbalife Nutrition Ltd.(1) | 69 | 1,800 | ||||||
Olaplex Holdings, Inc.(1) | 161 | 2,145 | ||||||
| 70,991 | ||||||||
| Pharmaceuticals — 4.4% | ||||||||
Arvinas, Inc.(1) | 209 | 8,849 | ||||||
Assertio Holdings, Inc.(1) | 393 | 1,002 | ||||||
ATAI Life Sciences NV(1) | 278 | 1,251 | ||||||
| Bristol-Myers Squibb Co. | 3,452 | 232,699 | ||||||
Catalent, Inc.(1) | 92 | 8,096 | ||||||
27
| Avantis Responsible U.S. Equity ETF | ||||||||
| Shares | Value | |||||||
CinCor Pharma, Inc.(1) | 57 | $ | 1,925 | |||||
DICE Therapeutics, Inc.(1) | 74 | 1,162 | ||||||
Edgewise Therapeutics, Inc.(1) | 85 | 857 | ||||||
Elanco Animal Health, Inc.(1) | 391 | 5,916 | ||||||
Harrow Health, Inc.(1) | 119 | 1,070 | ||||||
Jazz Pharmaceuticals PLC(1) | 92 | 14,280 | ||||||
| Johnson & Johnson | 2,392 | 385,925 | ||||||
| Merck & Co., Inc. | 3,243 | 276,822 | ||||||
| Organon & Co. | 188 | 5,364 | ||||||
| Pfizer, Inc. | 7,137 | 322,806 | ||||||
Pliant Therapeutics, Inc.(1) | 95 | 1,832 | ||||||
| ProPhase Labs, Inc. | 70 | 848 | ||||||
| Royalty Pharma PLC, Class A | 460 | 19,232 | ||||||
Ventyx Biosciences, Inc.(1) | 72 | 1,469 | ||||||
| Viatris, Inc. | 5,244 | 50,080 | ||||||
| Zoetis, Inc. | 437 | 68,404 | ||||||
| 1,409,889 | ||||||||
| Professional Services — 0.8% | ||||||||
ASGN, Inc.(1) | 46 | 4,448 | ||||||
| Barrett Business Services, Inc. | 9 | 726 | ||||||
| Booz Allen Hamilton Holding Corp. | 161 | 15,408 | ||||||
CACI International, Inc., Class A(1) | 3 | 843 | ||||||
CBIZ, Inc.(1) | 194 | 8,470 | ||||||
Clarivate PLC(1) | 299 | 3,489 | ||||||
CoStar Group, Inc.(1) | 207 | 14,415 | ||||||
| CRA International, Inc. | 46 | 4,205 | ||||||
| Dun & Bradstreet Holdings, Inc. | 161 | 2,294 | ||||||
| Equifax, Inc. | 69 | 13,024 | ||||||
| Exponent, Inc. | 46 | 4,318 | ||||||
Forrester Research, Inc.(1) | 46 | 1,913 | ||||||
Franklin Covey Co.(1) | 69 | 3,282 | ||||||
FTI Consulting, Inc.(1) | 23 | 3,694 | ||||||
| Heidrick & Struggles International, Inc. | 138 | 3,927 | ||||||
| Insperity, Inc. | 165 | 17,988 | ||||||
| Jacobs Solutions, Inc. | 46 | 5,731 | ||||||
| KBR, Inc. | 93 | 4,492 | ||||||
| Kelly Services, Inc., Class A | 138 | 2,223 | ||||||
| Kforce, Inc. | 138 | 7,551 | ||||||
| Korn Ferry | 217 | 13,220 | ||||||
| Leidos Holdings, Inc. | 46 | 4,372 | ||||||
| ManpowerGroup, Inc. | 184 | 13,491 | ||||||
| ManTech International Corp., Class A | 46 | 4,412 | ||||||
| Nielsen Holdings PLC | 138 | 3,842 | ||||||
Planet Labs PBC(1) | 746 | 4,088 | ||||||
| Resources Connection, Inc. | 70 | 1,368 | ||||||
| Robert Half International, Inc. | 529 | 40,717 | ||||||
| Science Applications International Corp. | 46 | 4,189 | ||||||
| TransUnion | 92 | 6,796 | ||||||
TriNet Group, Inc.(1) | 184 | 15,162 | ||||||
TrueBlue, Inc.(1) | 207 | 4,252 | ||||||
| Verisk Analytics, Inc. | 115 | 21,523 | ||||||
| 259,873 | ||||||||
28
| Avantis Responsible U.S. Equity ETF | ||||||||
| Shares | Value | |||||||
| Real Estate Management and Development — 0.3% | ||||||||
Anywhere Real Estate, Inc.(1) | 161 | $ | 1,573 | |||||
CBRE Group, Inc., Class A(1) | 414 | 32,689 | ||||||
Cushman & Wakefield PLC(1) | 299 | 4,473 | ||||||
Forestar Group, Inc.(1) | 138 | 1,717 | ||||||
FRP Holdings, Inc.(1) | 19 | 1,093 | ||||||
Howard Hughes Corp.(1) | 115 | 7,318 | ||||||
Jones Lang LaSalle, Inc.(1) | 138 | 23,874 | ||||||
| Kennedy-Wilson Holdings, Inc. | 514 | 9,026 | ||||||
| Marcus & Millichap, Inc. | 184 | 6,878 | ||||||
Opendoor Technologies, Inc.(1) | 64 | 277 | ||||||
| RE/MAX Holdings, Inc., Class A | 115 | 2,617 | ||||||
| RMR Group, Inc., Class A | 51 | 1,328 | ||||||
Seritage Growth Properties, Class A(1) | 125 | 1,568 | ||||||
Stratus Properties, Inc.(1) | 13 | 463 | ||||||
Tejon Ranch Co.(1) | 70 | 1,103 | ||||||
Zillow Group, Inc., Class A(1) | 46 | 1,536 | ||||||
Zillow Group, Inc., Class C(1) | 92 | 3,078 | ||||||
| 100,611 | ||||||||
| Road and Rail — 2.5% | ||||||||
| AMERCO | 23 | 12,090 | ||||||
| ArcBest Corp. | 161 | 12,965 | ||||||
| Covenant Logistics Group, Inc. | 56 | 1,575 | ||||||
| CSX Corp. | 4,462 | 141,222 | ||||||
Daseke, Inc.(1) | 207 | 1,254 | ||||||
| Heartland Express, Inc. | 184 | 2,788 | ||||||
| J.B. Hunt Transport Services, Inc. | 322 | 56,034 | ||||||
| Knight-Swift Transportation Holdings, Inc. | 368 | 18,588 | ||||||
| Landstar System, Inc. | 184 | 26,980 | ||||||
Lyft, Inc., Class A(1) | 138 | 2,033 | ||||||
| Marten Transport Ltd. | 299 | 5,923 | ||||||
| Norfolk Southern Corp. | 491 | 119,377 | ||||||
| Old Dominion Freight Line, Inc. | 253 | 68,667 | ||||||
PAM Transportation Services, Inc.(1) | 92 | 2,733 | ||||||
| Ryder System, Inc. | 299 | 22,856 | ||||||
Saia, Inc.(1) | 115 | 23,785 | ||||||
| Schneider National, Inc., Class B | 322 | 7,361 | ||||||
TuSimple Holdings, Inc., Class A(1) | 50 | 360 | ||||||
Uber Technologies, Inc.(1) | 713 | 20,506 | ||||||
| Union Pacific Corp. | 1,058 | 237,532 | ||||||
| Universal Logistics Holdings, Inc. | 40 | 1,460 | ||||||
USA Truck, Inc.(1) | 115 | 3,606 | ||||||
| Werner Enterprises, Inc. | 276 | 10,982 | ||||||
XPO Logistics, Inc.(1) | 92 | 4,823 | ||||||
| 805,500 | ||||||||
| Semiconductors and Semiconductor Equipment — 5.9% | ||||||||
Advanced Micro Devices, Inc.(1) | 1,748 | 148,353 | ||||||
Allegro MicroSystems, Inc.(1) | 115 | 2,682 | ||||||
| Amkor Technology, Inc. | 230 | 4,630 | ||||||
| Analog Devices, Inc. | 276 | 41,822 | ||||||
| Applied Materials, Inc. | 1,495 | 140,635 | ||||||
29
| Avantis Responsible U.S. Equity ETF | ||||||||
| Shares | Value | |||||||
Axcelis Technologies, Inc.(1) | 161 | $ | 10,777 | |||||
| Broadcom, Inc. | 230 | 114,795 | ||||||
CEVA, Inc.(1) | 33 | 966 | ||||||
Cirrus Logic, Inc.(1) | 168 | 12,884 | ||||||
Cohu, Inc.(1) | 145 | 3,890 | ||||||
Enphase Energy, Inc.(1) | 138 | 39,529 | ||||||
| Entegris, Inc. | 184 | 17,458 | ||||||
First Solar, Inc.(1) | 115 | 14,668 | ||||||
Formfactor, Inc.(1) | 161 | 4,714 | ||||||
GLOBALFOUNDRIES, Inc.(1) | 69 | 4,128 | ||||||
| Intel Corp. | 4,140 | 132,149 | ||||||
| KLA Corp. | 299 | 102,895 | ||||||
| Kulicke & Soffa Industries, Inc. | 262 | 11,014 | ||||||
| Lam Research Corp. | 276 | 120,863 | ||||||
Lattice Semiconductor Corp.(1) | 92 | 4,959 | ||||||
| Marvell Technology, Inc. | 414 | 19,383 | ||||||
MaxLinear, Inc.(1) | 46 | 1,653 | ||||||
| Microchip Technology, Inc. | 368 | 24,012 | ||||||
| Micron Technology, Inc. | 2,392 | 135,220 | ||||||
| MKS Instruments, Inc. | 161 | 16,037 | ||||||
| Monolithic Power Systems, Inc. | 23 | 10,423 | ||||||
| NVIDIA Corp. | 1,035 | 156,223 | ||||||
| NXP Semiconductors NV | 207 | 34,068 | ||||||
ON Semiconductor Corp.(1) | 1,219 | 83,831 | ||||||
Onto Innovation, Inc.(1) | 115 | 8,164 | ||||||
PDF Solutions, Inc.(1) | 92 | 2,427 | ||||||
Photronics, Inc.(1) | 322 | 5,410 | ||||||
Qorvo, Inc.(1) | 115 | 10,325 | ||||||
| QUALCOMM, Inc. | 1,288 | 170,364 | ||||||
Rambus, Inc.(1) | 207 | 5,338 | ||||||
Semtech Corp.(1) | 69 | 3,187 | ||||||
Silicon Laboratories, Inc.(1) | 82 | 10,277 | ||||||
SolarEdge Technologies, Inc.(1) | 46 | 12,695 | ||||||
| Teradyne, Inc. | 552 | 46,721 | ||||||
| Texas Instruments, Inc. | 1,129 | 186,522 | ||||||
Ultra Clean Holdings, Inc.(1) | 138 | 4,039 | ||||||
| Universal Display Corp. | 46 | 5,139 | ||||||
Veeco Instruments, Inc.(1) | 115 | 2,431 | ||||||
Wolfspeed, Inc.(1) | 161 | 18,269 | ||||||
| 1,905,969 | ||||||||
| Software — 6.8% | ||||||||
| A10 Networks, Inc. | 261 | 3,628 | ||||||
ACI Worldwide, Inc.(1) | 92 | 2,180 | ||||||
Adobe, Inc.(1) | 161 | 60,124 | ||||||
Altair Engineering, Inc., Class A(1) | 26 | 1,352 | ||||||
ANSYS, Inc.(1) | 23 | 5,711 | ||||||
Autodesk, Inc.(1) | 161 | 32,480 | ||||||
Avalara, Inc.(1) | 46 | 4,213 | ||||||
| Bentley Systems, Inc., Class B | 115 | 4,229 | ||||||
Bill.com Holdings, Inc.(1) | 46 | 7,446 | ||||||
Black Knight, Inc.(1) | 46 | 3,043 | ||||||
30
| Avantis Responsible U.S. Equity ETF | ||||||||
| Shares | Value | |||||||
Box, Inc., Class A(1) | 138 | $ | 3,554 | |||||
C3.ai, Inc., Class A(1) | 138 | 2,484 | ||||||
Cadence Design Systems, Inc.(1) | 235 | 40,836 | ||||||
CommVault Systems, Inc.(1) | 46 | 2,497 | ||||||
Consensus Cloud Solutions, Inc.(1) | 46 | 2,316 | ||||||
Crowdstrike Holdings, Inc., Class A(1) | 115 | 21,000 | ||||||
Datadog, Inc., Class A(1) | 92 | 9,655 | ||||||
Digital Turbine, Inc.(1) | 138 | 2,549 | ||||||
DocuSign, Inc.(1) | 207 | 12,052 | ||||||
| Dolby Laboratories, Inc., Class A | 92 | 6,738 | ||||||
Dropbox, Inc., Class A(1) | 138 | 2,952 | ||||||
Duck Creek Technologies, Inc.(1) | 115 | 1,369 | ||||||
Dynatrace, Inc.(1) | 69 | 2,634 | ||||||
Elastic NV(1) | 46 | 3,860 | ||||||
Envestnet, Inc.(1) | 46 | 2,409 | ||||||
Fair Isaac Corp.(1) | 23 | 10,336 | ||||||
Fortinet, Inc.(1) | 1,380 | 67,192 | ||||||
Guidewire Software, Inc.(1) | 78 | 5,593 | ||||||
HubSpot, Inc.(1) | 5 | 1,685 | ||||||
| InterDigital, Inc. | 138 | 6,922 | ||||||
| Intuit, Inc. | 92 | 39,724 | ||||||
JFrog Ltd.(1) | 49 | 1,036 | ||||||
LiveRamp Holdings, Inc.(1) | 69 | 1,370 | ||||||
Manhattan Associates, Inc.(1) | 92 | 12,996 | ||||||
| Microsoft Corp. | 5,428 | 1,419,259 | ||||||
NCR Corp.(1) | 230 | 7,141 | ||||||
| NortonLifeLock, Inc. | 391 | 8,833 | ||||||
Nutanix, Inc., Class A(1) | 115 | 1,990 | ||||||
Olo, Inc., Class A(1) | 30 | 234 | ||||||
| Oracle Corp. (New York) | 506 | 37,520 | ||||||
Palantir Technologies, Inc., Class A(1) | 529 | 4,084 | ||||||
Palo Alto Networks, Inc.(1) | 138 | 76,840 | ||||||
Paycom Software, Inc.(1) | 46 | 16,155 | ||||||
Paylocity Holding Corp.(1) | 26 | 6,266 | ||||||
| Pegasystems, Inc. | 15 | 549 | ||||||
| Progress Software Corp. | 69 | 3,321 | ||||||
PROS Holdings, Inc.(1) | 30 | 626 | ||||||
PTC, Inc.(1) | 46 | 5,285 | ||||||
Qualys, Inc.(1) | 92 | 13,975 | ||||||
Rapid7, Inc.(1) | 47 | 2,703 | ||||||
RingCentral, Inc., Class A(1) | 23 | 990 | ||||||
| Roper Technologies, Inc. | 28 | 11,272 | ||||||
Salesforce, Inc.(1) | 207 | 32,317 | ||||||
ServiceNow, Inc.(1) | 92 | 39,985 | ||||||
Smartsheet, Inc., Class A(1) | 35 | 1,164 | ||||||
Splunk, Inc.(1) | 23 | 2,071 | ||||||
SPS Commerce, Inc.(1) | 46 | 5,618 | ||||||
Synopsys, Inc.(1) | 75 | 25,951 | ||||||
Tenable Holdings, Inc.(1) | 46 | 1,822 | ||||||
Teradata Corp.(1) | 302 | 9,936 | ||||||
Trade Desk, Inc., Class A(1) | 184 | 11,537 | ||||||
31
| Avantis Responsible U.S. Equity ETF | ||||||||
| Shares | Value | |||||||
Tyler Technologies, Inc.(1) | 23 | $ | 8,545 | |||||
Unity Software, Inc.(1) | 46 | 1,965 | ||||||
| VMware, Inc., Class A | 138 | 16,012 | ||||||
Workday, Inc., Class A(1) | 69 | 11,355 | ||||||
Zendesk, Inc.(1) | 46 | 3,531 | ||||||
Zoom Video Communications, Inc., Class A(1) | 115 | 9,246 | ||||||
Zscaler, Inc.(1) | 23 | 3,663 | ||||||
| 2,189,926 | ||||||||
| Specialty Retail — 3.9% | ||||||||
| Aaron's Co., Inc. | 115 | 1,368 | ||||||
Abercrombie & Fitch Co., Class A(1) | 368 | 5,295 | ||||||
| Advance Auto Parts, Inc. | 276 | 46,545 | ||||||
| American Eagle Outfitters, Inc. | 667 | 7,510 | ||||||
Asbury Automotive Group, Inc.(1) | 46 | 8,026 | ||||||
AutoNation, Inc.(1) | 253 | 31,524 | ||||||
AutoZone, Inc.(1) | 23 | 48,742 | ||||||
| Bath & Body Works, Inc. | 161 | 6,010 | ||||||
Bed Bath & Beyond, Inc.(1)(2) | 115 | 1,096 | ||||||
| Best Buy Co., Inc. | 736 | 52,028 | ||||||
| Big 5 Sporting Goods Corp. | 161 | 1,971 | ||||||
Boot Barn Holdings, Inc.(1) | 115 | 7,661 | ||||||
| Buckle, Inc. | 184 | 5,939 | ||||||
| Build-A-Bear Workshop, Inc. | 161 | 2,466 | ||||||
Burlington Stores, Inc.(1) | 161 | 22,571 | ||||||
| Caleres, Inc. | 253 | 6,456 | ||||||
| Camping World Holdings, Inc., Class A | 92 | 2,771 | ||||||
CarMax, Inc.(1) | 115 | 10,171 | ||||||
Carvana Co.(1)(2) | 23 | 759 | ||||||
| Cato Corp., Class A | 138 | 1,492 | ||||||
Chico's FAS, Inc.(1) | 782 | 4,442 | ||||||
Children's Place, Inc.(1) | 69 | 2,910 | ||||||
Conn's, Inc.(1) | 138 | 1,326 | ||||||
Dick's Sporting Goods, Inc.(2) | 207 | 22,019 | ||||||
Five Below, Inc.(1) | 161 | 20,589 | ||||||
Floor & Decor Holdings, Inc., Class A(1) | 138 | 11,228 | ||||||
| Foot Locker, Inc. | 437 | 16,099 | ||||||
GameStop Corp., Class A(1)(2) | 184 | 5,270 | ||||||
| Gap, Inc. | 897 | 8,199 | ||||||
Genesco, Inc.(1) | 92 | 5,205 | ||||||
| Group 1 Automotive, Inc. | 92 | 16,430 | ||||||
| Guess?, Inc. | 253 | 4,420 | ||||||
| Haverty Furniture Cos., Inc. | 92 | 2,467 | ||||||
| Hibbett, Inc. | 69 | 4,043 | ||||||
| Home Depot, Inc. | 828 | 238,812 | ||||||
Leslie's, Inc.(1) | 138 | 1,957 | ||||||
| Lithia Motors, Inc. | 138 | 36,631 | ||||||
| Lowe's Cos., Inc. | 276 | 53,583 | ||||||
MarineMax, Inc.(1) | 138 | 5,015 | ||||||
National Vision Holdings, Inc.(1) | 69 | 2,293 | ||||||
O'Reilly Automotive, Inc.(1) | 46 | 32,067 | ||||||
ODP Corp.(1) | 207 | 7,400 | ||||||
32
| Avantis Responsible U.S. Equity ETF | ||||||||
| Shares | Value | |||||||
| Penske Automotive Group, Inc. | 138 | $ | 16,271 | |||||
| Rent-A-Center, Inc. | 161 | 4,160 | ||||||
RH(1) | 46 | 11,772 | ||||||
| Ross Stores, Inc. | 782 | 67,463 | ||||||
Sally Beauty Holdings, Inc.(1) | 253 | 3,765 | ||||||
| Shoe Carnival, Inc. | 92 | 2,189 | ||||||
| Signet Jewelers Ltd. | 322 | 21,049 | ||||||
Sleep Number Corp.(1) | 46 | 1,906 | ||||||
| Sonic Automotive, Inc., Class A | 115 | 6,117 | ||||||
| Tilly's, Inc., Class A | 253 | 1,897 | ||||||
| TJX Cos., Inc. | 2,208 | 137,669 | ||||||
| Tractor Supply Co. | 391 | 72,394 | ||||||
Ulta Beauty, Inc.(1) | 207 | 86,913 | ||||||
Urban Outfitters, Inc.(1) | 253 | 5,093 | ||||||
Victoria's Secret & Co.(1) | 506 | 16,921 | ||||||
| Williams-Sonoma, Inc. | 253 | 37,634 | ||||||
Zumiez, Inc.(1) | 115 | 2,985 | ||||||
| 1,269,004 | ||||||||
| Technology Hardware, Storage and Peripherals — 5.8% | ||||||||
| Apple, Inc. | 10,971 | 1,724,861 | ||||||
Avid Technology, Inc.(1) | 92 | 2,516 | ||||||
| Dell Technologies, Inc., Class C | 322 | 12,329 | ||||||
Eastman Kodak Co.(1) | 55 | 298 | ||||||
| Hewlett Packard Enterprise Co. | 1,472 | 20,019 | ||||||
| HP, Inc. | 690 | 19,810 | ||||||
Immersion Corp.(1) | 144 | 858 | ||||||
| NetApp, Inc. | 368 | 26,544 | ||||||
Pure Storage, Inc., Class A(1) | 184 | 5,330 | ||||||
| Seagate Technology Holdings PLC | 506 | 33,882 | ||||||
Super Micro Computer, Inc.(1) | 140 | 9,111 | ||||||
Western Digital Corp.(1) | 414 | 17,496 | ||||||
| Xerox Holdings Corp. | 276 | 4,587 | ||||||
| 1,877,641 | ||||||||
| Textiles, Apparel and Luxury Goods — 1.3% | ||||||||
Capri Holdings Ltd.(1) | 782 | 36,895 | ||||||
| Carter's, Inc. | 207 | 15,287 | ||||||
| Columbia Sportswear Co. | 138 | 9,831 | ||||||
Crocs, Inc.(1) | 138 | 10,171 | ||||||
Deckers Outdoor Corp.(1) | 46 | 14,792 | ||||||
Fossil Group, Inc.(1) | 276 | 1,167 | ||||||
G-III Apparel Group Ltd.(1) | 184 | 3,877 | ||||||
| Hanesbrands, Inc. | 621 | 5,409 | ||||||
| Kontoor Brands, Inc. | 161 | 5,994 | ||||||
| Levi Strauss & Co., Class A | 322 | 5,439 | ||||||
lululemon athletica, Inc.(1) | 184 | 55,193 | ||||||
| Movado Group, Inc. | 92 | 2,934 | ||||||
| NIKE, Inc., Class B | 1,196 | 127,314 | ||||||
| Oxford Industries, Inc. | 115 | 12,274 | ||||||
| PVH Corp. | 207 | 11,644 | ||||||
| Ralph Lauren Corp. | 207 | 18,905 | ||||||
Skechers USA, Inc., Class A(1) | 276 | 10,433 | ||||||
33
| Avantis Responsible U.S. Equity ETF | ||||||||
| Shares | Value | |||||||
| Steven Madden Ltd. | 299 | $ | 8,704 | |||||
| Tapestry, Inc. | 1,265 | 43,933 | ||||||
Under Armour, Inc., Class A(1) | 391 | 3,292 | ||||||
Under Armour, Inc., Class C(1) | 460 | 3,491 | ||||||
| VF Corp. | 529 | 21,927 | ||||||
| Wolverine World Wide, Inc. | 115 | 2,247 | ||||||
| 431,153 | ||||||||
| Thrifts and Mortgage Finance — 0.6% | ||||||||
Blue Foundry Bancorp(1) | 184 | 2,092 | ||||||
Columbia Financial, Inc.(1) | 115 | 2,453 | ||||||
| Enact Holdings, Inc. | 115 | 2,921 | ||||||
| Essent Group Ltd. | 483 | 19,315 | ||||||
| Federal Agricultural Mortgage Corp., Class C | 46 | 5,025 | ||||||
| Flagstar Bancorp, Inc. | 322 | 12,407 | ||||||
| FS Bancorp, Inc. | 92 | 2,733 | ||||||
| Home Bancorp, Inc. | 69 | 2,694 | ||||||
| Merchants Bancorp | 92 | 2,481 | ||||||
| MGIC Investment Corp. | 1,403 | 20,049 | ||||||
Mr. Cooper Group, Inc.(1) | 207 | 8,756 | ||||||
New York Community Bancorp, Inc.(2) | 1,449 | 14,186 | ||||||
NMI Holdings, Inc., Class A(1) | 483 | 9,916 | ||||||
| Northfield Bancorp, Inc. | 184 | 2,712 | ||||||
| OP Bancorp | 184 | 2,225 | ||||||
| PennyMac Financial Services, Inc. | 184 | 9,774 | ||||||
| Provident Financial Services, Inc. | 276 | 6,411 | ||||||
| Radian Group, Inc. | 805 | 16,994 | ||||||
| Rocket Cos., Inc., Class A | 230 | 1,817 | ||||||
| Southern Missouri Bancorp, Inc. | 46 | 2,426 | ||||||
| TFS Financial Corp. | 161 | 2,302 | ||||||
| TrustCo Bank Corp. NY | 92 | 3,067 | ||||||
| Walker & Dunlop, Inc. | 207 | 20,795 | ||||||
| WSFS Financial Corp. | 276 | 13,345 | ||||||
| 186,896 | ||||||||
| Trading Companies and Distributors — 1.1% | ||||||||
| Air Lease Corp. | 529 | 19,235 | ||||||
| Applied Industrial Technologies, Inc. | 92 | 9,754 | ||||||
Beacon Roofing Supply, Inc.(1) | 46 | 2,526 | ||||||
| Boise Cascade Co. | 299 | 18,637 | ||||||
| Fastenal Co. | 828 | 41,673 | ||||||
| GATX Corp. | 184 | 17,776 | ||||||
| H&E Equipment Services, Inc. | 230 | 7,282 | ||||||
| Herc Holdings, Inc. | 161 | 18,117 | ||||||
Hudson Technologies, Inc.(1) | 227 | 1,884 | ||||||
| McGrath RentCorp | 115 | 9,720 | ||||||
MRC Global, Inc.(1) | 18 | 175 | ||||||
| MSC Industrial Direct Co., Inc., Class A | 115 | 9,109 | ||||||
| Rush Enterprises, Inc., Class A | 184 | 8,659 | ||||||
| Rush Enterprises, Inc., Class B | 69 | 3,494 | ||||||
SiteOne Landscape Supply, Inc.(1) | 46 | 5,757 | ||||||
Titan Machinery, Inc.(1) | 138 | 4,248 | ||||||
| Triton International Ltd. | 437 | 26,041 | ||||||
34
| Avantis Responsible U.S. Equity ETF | ||||||||
| Shares | Value | |||||||
United Rentals, Inc.(1) | 115 | $ | 33,585 | |||||
Univar Solutions, Inc.(1) | 92 | 2,320 | ||||||
Veritiv Corp.(1) | 96 | 11,442 | ||||||
| W.W. Grainger, Inc. | 138 | 76,582 | ||||||
| Watsco, Inc. | 46 | 12,513 | ||||||
WESCO International, Inc.(1) | 69 | 9,086 | ||||||
| 349,615 | ||||||||
| Water Utilities — 0.1% | ||||||||
| American States Water Co. | 58 | 4,812 | ||||||
| American Water Works Co., Inc. | 138 | 20,486 | ||||||
| Consolidated Water Co. Ltd. | 28 | 454 | ||||||
| 25,752 | ||||||||
| Wireless Telecommunication Services — 0.5% | ||||||||
Gogo, Inc.(1) | 56 | 832 | ||||||
T-Mobile US, Inc.(1) | 989 | 142,377 | ||||||
United States Cellular Corp.(1) | 92 | 2,630 | ||||||
| 145,839 | ||||||||
TOTAL COMMON STOCKS (Cost $33,586,473) | 32,085,634 | |||||||
| SHORT-TERM INVESTMENTS — 0.2% | ||||||||
| Money Market Funds — 0.2% | ||||||||
| State Street Institutional U.S. Government Money Market Fund, Premier Class | 29,419 | 29,419 | ||||||
State Street Navigator Securities Lending Government Money Market Portfolio(3) | 52,822 | 52,822 | ||||||
TOTAL SHORT-TERM INVESTMENTS (Cost $82,241) | 82,241 | |||||||
TOTAL INVESTMENT SECURITIES — 100.0% (Cost $33,668,714) | 32,167,875 | |||||||
OTHER ASSETS AND LIABILITIES† | (12,085) | |||||||
| TOTAL NET ASSETS — 100.0% | $ | 32,155,790 | ||||||
| NOTES TO SCHEDULE OF INVESTMENTS | ||||||||
| ADR | - | American Depositary Receipt | ||||||
†Category is less than 0.05% of total net assets.
(1)Non-income producing.
(2)Security, or a portion thereof, is on loan. At the period end, the aggregate value of securities on loan was $62,556. The amount of securities on loan indicated may not correspond with the securities on loan identified because securities with pending sales are in the process of recall from the brokers.
(3)Investment of cash collateral from securities on loan. At the period end, the aggregate value of the collateral held by the fund was $64,167, which includes securities collateral of $11,345.
See Notes to Financial Statements.
35
| Statement of Assets and Liabilities | ||
| AUGUST 31, 2022 | |||||
| Avantis Responsible U.S. Equity ETF | |||||
| Assets | |||||
| Investment securities, at value (cost of $33,615,892) — including $62,556 of securities on loan | $ | 32,115,053 | |||
| Investment made with cash collateral received for securities on loan, at value (cost of $52,822) | 52,822 | ||||
| Total investment securities, at value (cost of $33,668,714) | 32,167,875 | ||||
| Dividends and interest receivable | 44,749 | ||||
| Securities lending receivable | 47 | ||||
| 32,212,671 | |||||
| Liabilities | |||||
| Payable for collateral received for securities on loan | 52,822 | ||||
| Accrued management fees | 4,059 | ||||
| 56,881 | |||||
| Net Assets | $ | 32,155,790 | |||
| Shares outstanding (unlimited number of shares authorized) | 690,000 | ||||
| Net Asset Value Per Share | $ | 46.60 | |||
| Net Assets Consist of: | |||||
| Capital paid in | $ | 33,596,194 | |||
| Distributable earnings | (1,440,404) | ||||
| $ | 32,155,790 | ||||
See Notes to Financial Statements.
36
| Statement of Operations | ||
PERIOD ENDED AUGUST 31, 2022(1) | |||||
| Avantis Responsible U.S. Equity ETF | |||||
| Investment Income (Loss) | |||||
| Income: | |||||
| Dividends (net of foreign taxes withheld of $65) | $ | 135,809 | |||
| Interest | 118 | ||||
| Securities lending, net | 47 | ||||
| 135,974 | |||||
| Expenses: | |||||
| Management fees | 11,588 | ||||
| Net investment income (loss) | 124,386 | ||||
| Realized and Unrealized Gain (Loss) | |||||
| Net realized gain (loss) on investment transactions | 90,157 | ||||
| Change in net unrealized appreciation (depreciation) on investments | (1,500,839) | ||||
| Net realized and unrealized gain (loss) | (1,410,682) | ||||
| Net Increase (Decrease) in Net Assets Resulting from Operations | $ | (1,286,296) | |||
(1)March 15, 2022 (fund inception) through August 31, 2022.
See Notes to Financial Statements.
37
| Statement of Changes in Net Assets | ||
PERIOD ENDED AUGUST 31, 2022(1) | |||||
| Avantis Responsible U.S. Equity ETF | |||||
| Increase (Decrease) in Net Assets | |||||
| Operations | |||||
| Net investment income (loss) | $ | 124,386 | |||
| Net realized gain (loss) | 90,157 | ||||
| Change in net unrealized appreciation (depreciation) | (1,500,839) | ||||
| Net increase (decrease) in net assets resulting from operations | (1,286,296) | ||||
| Distributions to Shareholders | |||||
| From earnings | (47,718) | ||||
| Capital Share Transactions | |||||
| Proceeds from shares sold | 39,104,076 | ||||
| Payments for shares redeemed | (5,614,272) | ||||
| Net increase (decrease) in net assets from capital share transactions | 33,489,804 | ||||
| Net increase (decrease) in net assets | 32,155,790 | ||||
| Net Assets | |||||
| End of period | $ | 32,155,790 | |||
| Transactions in Shares of the Fund | |||||
| Sold | 810,000 | ||||
| Redeemed | (120,000) | ||||
| Net increase (decrease) in shares of the fund | 690,000 | ||||
(1)March 15, 2022 (fund inception) through August 31, 2022.
See Notes to Financial Statements.
38
| Notes to Financial Statements | ||
AUGUST 31, 2022
1. Organization
American Century ETF Trust (the trust) was registered as a Delaware statutory trust in 2017 and is registered under the Investment Company Act of 1940, as amended (the 1940 Act), as an open-end management investment company. Avantis Responsible U.S. Equity ETF (the fund) is one fund in a series issued by the trust. The fund's investment objective is to seek long-term capital appreciation. Shares of the fund are listed for trading on the NYSE Arca, Inc. The fund incepted on March 15, 2022.
2. Significant Accounting Policies
The following is a summary of significant accounting policies consistently followed by the fund in preparation of its financial statements. The fund is an investment company and follows accounting and reporting guidance in accordance with accounting principles generally accepted in the United States of America. This may require management to make certain estimates and assumptions at the date of the financial statements. Actual results could differ from these estimates. Management evaluated the impact of events or transactions occurring through the date the financial statements were issued that would merit recognition or disclosure.
Investment Valuations — The fund determines the fair value of its investments and computes its net asset value (NAV) per share at the close of regular trading (usually 4 p.m. Eastern time) on the New York Stock Exchange (NYSE) on each day the NYSE is open. The Board of Trustees has adopted valuation policies and procedures to guide the investment advisor in the fund’s investment valuation process and to provide methodologies for the oversight of the fund’s pricing function.
Equity securities that are listed or traded on a domestic securities exchange are valued at the last reported sales price or at the official closing price as provided by the exchange. Equity securities traded on foreign securities exchanges are generally valued at the closing price of such securities on the exchange where primarily traded or at the close of the NYSE, if that is earlier. If no last sales price is reported, or if local convention or regulation so provides, the mean of the latest bid and asked prices may be used. Securities traded over-the-counter are valued at the mean of the latest bid and asked prices, the last sales price, or the official closing price.
Open-end management investment companies are valued at the reported NAV per share.
If the fund determines that the market price for an investment is not readily available or the valuation methods mentioned above do not reflect an investment’s fair value, such investment is valued as determined in good faith by the Board of Trustees or its delegate, in accordance with policies and procedures adopted by the Board of Trustees. In its determination of fair value, the fund may review several factors including, but not limited to, market information regarding the specific investment or comparable investments and correlation with other investment types, futures indices or general market indicators. Circumstances that may cause the fund to use these procedures to value an investment include, but are not limited to: an investment has been declared in default or is distressed; trading in a security has been suspended during the trading day or a security is not actively trading on its principal exchange; prices received from a regular pricing source are deemed unreliable; or there is a foreign market holiday and no trading occurred.
The fund monitors for significant events occurring after the close of an investment’s primary exchange but before the fund’s NAV per share is determined. Significant events may include, but are not limited to: corporate announcements and transactions; governmental action and political unrest that could impact a specific investment or an investment sector; or armed conflicts, natural disasters and similar events that could affect investments in a specific country or region. The fund also monitors for significant fluctuations between domestic and foreign markets, as evidenced by the U.S. market or such other indicators that the Board of Trustees, or its delegate, deems appropriate. The fund may apply a model-derived factor to the closing price of equity securities traded on foreign securities exchanges. The factor is based on observable market data as provided by an independent pricing service.
Security Transactions — Security transactions are accounted for as of the trade date. Net realized gains and losses are determined on the identified cost basis, which is also used for federal income tax purposes.
39
Investment Income — Dividend income less foreign taxes withheld, if any, is recorded as of the ex-dividend date. Distributions received on securities that represent a return of capital or long-term capital gain are recorded as a reduction of cost of investments and/or as a realized gain. The fund may estimate the components of distributions received that may be considered nontaxable distributions or long-term capital gain distributions for income tax purposes. Interest income is recorded on the accrual basis and includes accretion of discounts and amortization of premiums. Securities lending income is net of fees and rebates earned by the lending agent for its services.
Segregated Assets — In accordance with the 1940 Act, the fund segregates assets on its books and records to cover certain types of investment securities and other financial instruments. American Century Investment Management, Inc. (ACIM) (the investment advisor) monitors, on a daily basis, the securities segregated to ensure the fund designates a sufficient amount of liquid assets, marked-to-market daily. The fund may also receive assets or be required to pledge assets at the custodian bank or with a broker for collateral requirements.
Income Tax Status — It is the fund’s policy to distribute substantially all net investment income and net realized gains to shareholders and to otherwise qualify as a regulated investment company under provisions of the Internal Revenue Code. Accordingly, no provision has been made for income taxes. The fund files U.S. federal, state, local and non-U.S. tax returns as applicable. The fund's tax returns are subject to examination by the relevant taxing authority until expiration of the applicable statute of limitations, which is generally three years from the date of filing but can be longer in certain jurisdictions. At this time, management believes there are no uncertain tax positions which, based on their technical merit, would not be sustained upon examination and for which it is reasonably possible that the total amounts of unrecognized tax benefits will significantly change in the next twelve months.
Distributions to Shareholders — Distributions from net investment income, if any, are generally declared and paid quarterly. Distributions from net realized gains, if any, are generally declared and paid annually.
Indemnifications — Under the trust’s organizational documents, its officers and trustees are indemnified against certain liabilities arising out of the performance of their duties to the fund. In addition, in the normal course of business, the fund enters into contracts that provide general indemnifications. The maximum exposure under these arrangements is unknown as this would involve future claims that may be made against a fund. The risk of material loss from such claims is considered by management to be remote.
Securities Lending — Securities are lent to qualified financial institutions and brokers. State Street Bank & Trust Co. serves as securities lending agent to the fund pursuant to a Securities Lending Agreement. The lending of securities exposes the fund to risks such as: the borrowers may fail to return the loaned securities, the borrowers may not be able to provide additional collateral, the fund may experience delays in recovery of the loaned securities or delays in access to collateral, or the fund may experience losses related to the investment collateral. To minimize certain risks, loan counterparties pledge collateral in the form of cash and/or securities. The lending agent has agreed to indemnify the fund in the case of default of any securities borrowed. Cash collateral received is invested in the State Street Navigator Securities Lending Government Money Market Portfolio, a money market mutual fund registered under the 1940 Act. The loans may also be secured by U.S. government securities in an amount at least equal to the market value of the securities loaned, plus accrued interest and dividends, determined on a daily basis and adjusted accordingly. By lending securities, the fund seeks to increase its net investment income through the receipt of interest and fees. Such income is reflected separately within the Statement of Operations. The value of loaned securities and related collateral outstanding at period end, if any, are shown on a gross basis within the Schedule of Investments and Statement of Assets and Liabilities.
The following table reflects a breakdown of transactions accounted for as secured borrowings, the gross obligation by the type of collateral pledged, and the remaining contractual maturity of those transactions as of August 31, 2022.
| Remaining Contractual Maturity of Agreements | |||||||||||||||||
Fund / Securities Lending Transactions(1) | Overnight and Continuous | <30 days | Between 30 & 90 days | >90 days | Total | ||||||||||||
| Avantis Responsible U.S. Equity ETF | |||||||||||||||||
| Common Stocks | $ | 52,822 | — | — | — | $ | 52,822 | ||||||||||
| Gross amount of recognized liabilities for securities lending transactions | $ | 52,822 | |||||||||||||||
(1)Amount represents the payable for cash collateral received for securities on loan. This will generally be in the Overnight and Continuous column as the securities are typically callable on demand.
40
3. Fees and Transactions with Related Parties
Certain officers and trustees of the trust are also officers and/or directors of American Century Companies, Inc. (ACC). The trust's investment advisor, ACIM, and the trust’s administrator, American Century Services, LLC, are wholly owned, directly or indirectly, by ACC.
Management Fees — The trust has entered into a management agreement with ACIM, under which ACIM provides the fund with investment advisory and management services in exchange for a single, unified management fee (the fee). The agreement provides that ACIM will pay all expenses of managing and operating the fund, except brokerage and other transaction fees and expenses relating to the acquisition and disposition of portfolio securities, acquired fund fees and expenses, interest, taxes, litigation expenses and extraordinary expenses. The fee is computed and accrued daily based on the daily net assets of the fund and paid monthly in arrears. The annual management fee is 0.15%.
4. Investment Transactions
Purchases and sales of investment securities, excluding short-term investments and in kind transactions, for the period March 15, 2022 (fund inception) through August 31, 2022 were $568,059 and $448,564, respectively.
Securities received or delivered in kind through subscriptions and redemptions for the period March 15, 2022 (fund inception) through August 31, 2022 were $38,974,961 and $5,587,455, respectively. The fund incurred net realized gains of $106,440 from in kind transactions. Net realized gain (loss) on in kind transactions are not considered taxable for federal income tax purposes.
5. Capital Share Transactions
The fund's shares may only be bought and sold in a secondary market through a broker-dealer at a market price. Because ETF shares trade at market prices rather than NAV, shares may trade at a price greater than NAV (a premium) or less than NAV (a discount). The fund issues and redeems shares at its NAV only in aggregations of a specified number of shares (a creation unit) generally in exchange for a designated portfolio of securities and/or cash (including any portion of such securities for which cash may be substituted). Authorized participants may be required to pay an additional variable charge to cover certain brokerage, tax, foreign exchange, execution, market impact and other costs and expenses related to the execution of trades resulting from creation unit transactions. Such variable charges, if any, are included in other capital within the Statement of Changes in Net Assets.
6. Fair Value Measurements
The fund’s investments valuation process is based on several considerations and may use multiple inputs to determine the fair value of the investments held by the fund. In conformity with accounting principles generally accepted in the United States of America, the inputs used to determine a valuation are classified into three broad levels.
•Level 1 valuation inputs consist of unadjusted quoted prices in an active market for identical investments.
•Level 2 valuation inputs consist of direct or indirect observable market data (including quoted prices for comparable investments, evaluations of subsequent market events, interest rates, prepayment speeds, credit risk, etc.). These inputs also consist of quoted prices for identical investments initially expressed in local currencies that are adjusted through translation into U.S. dollars.
•Level 3 valuation inputs consist of unobservable data (including a fund’s own assumptions).
The level classification is based on the lowest level input that is significant to the fair valuation measurement. The valuation inputs are not necessarily an indication of the risks associated with investing in these securities or other financial instruments.
As of period end, the fund’s investment securities were classified as Level 1. The Schedule of Investments provides additional information on the fund's portfolio holdings.
41
7. Risk Factors
The value of the fund’s shares will go up and down, sometimes rapidly or unpredictably, based on the performance of the securities owned by the fund and other factors generally affecting the securities market. Market risks, including political, regulatory, economic and social developments, can affect the value of the fund’s investments. Natural disasters, public health emergencies, war, terrorism and other unforeseeable events may lead to increased market volatility and may have adverse long-term effects on world economies and markets generally.
8. Federal Tax Information
The tax character of distributions paid during the period March 15, 2022 (fund inception) through August 31, 2022 were as follows:
| Avantis Responsible U.S. Equity ETF | |||||
| Distributions Paid From | |||||
| Ordinary income | $ | 47,718 | |||
| Long-term capital gains | — | ||||
The book-basis character of distributions made during the year from net investment income or net realized gains may differ from their ultimate characterization for federal income tax purposes. These differences reflect the differing character of certain income items and net realized gains and losses for financial statement and tax purposes, and may result in reclassification among certain capital accounts on the financial statements.
As of period end, the federal tax cost of investments and the components of distributable earnings on a tax-basis were as follows:
| Avantis Responsible U.S. Equity ETF | |||||
| Federal tax cost of investments | $ | 33,669,941 | |||
| Gross tax appreciation of investments | $ | 433,107 | |||
| Gross tax depreciation of investments | (1,935,173) | ||||
| Net tax appreciation (depreciation) of investments | $ | (1,502,066) | |||
| Undistributed ordinary income | $ | 77,824 | |||
| Accumulated short-term capital losses | $ | (16,162) | |||
The difference between book-basis and tax-basis unrealized appreciation (depreciation) is attributable primarily to the realization to ordinary income for tax purposes of unrealized gains on investments in passive foreign investment companies.
Accumulated capital losses represent net capital loss carryovers that may be used to offset future realized capital gains for federal income tax purposes. The capital loss carryovers may be carried forward for an unlimited period. Future capital loss carryover utilization in any given year may be subject to Internal Revenue Code limitations.
42
| Financial Highlights | ||
| For a Share Outstanding Throughout the Period Indicated | |||||||||||||||||||||||||||||||||||
| Per-Share Data | Ratios and Supplemental Data | ||||||||||||||||||||||||||||||||||
| Income From Investment Operations: | Ratio to Average Net Assets of: | ||||||||||||||||||||||||||||||||||
| Net Asset Value, Beginning of Period | Net Investment Income (Loss)(1) | Net Realized and Unrealized Gain (Loss) | Total From Investment Operations | Distributions From Net Investment Income | Net Asset Value, End of Period | Total Return(2) | Operating Expenses | Net Investment Income (Loss) | Portfolio Turnover Rate(3) | Net Assets, End of Period (in thousands) | |||||||||||||||||||||||||
| Avantis Responsible U.S. Equity ETF | |||||||||||||||||||||||||||||||||||
2022(4) | $50.45 | 0.36 | (4.07) | (3.71) | (0.14) | $46.60 | (7.32)% | 0.15%(5) | 1.61%(5) | 3% | $32,156 | ||||||||||||||||||||||||
| Notes to Financial Highlights | ||
(1)Computed using average shares outstanding throughout the period.
(2)Total returns are calculated based on the net asset value of the last business day. Total returns for periods less than one year are not annualized.
(3)Excludes securities received or delivered in kind.
(4)March 15, 2022 (fund inception) through August 31, 2022.
(5)Annualized.
See Notes to Financial Statements.
| Report of Independent Registered Public Accounting Firm | ||
To the Shareholders and the Board of Trustees of American Century ETF Trust:
Opinion on the Financial Statements and Financial Highlights
We have audited the accompanying statement of assets and liabilities, including the schedule of investments, of Avantis® Responsible U.S. Equity ETF (the “Fund”), one of the funds constituting the American Century ETF Trust, as of August 31, 2022, the related statement of operations, statement of changes in net assets, and financial highlights for the period from March 15, 2022 (fund inception) through August 31, 2022, and the related notes. In our opinion, the financial statements and financial highlights present fairly, in all material respects, the financial position of Avantis® Responsible U.S. Equity ETF of the American Century ETF Trust, as of August 31, 2022, and the results of its operations, the changes in its net assets, and the financial highlights for the period from March 15, 2022 (fund inception) through August 31, 2022, in conformity with accounting principles generally accepted in the United States of America.
Basis for Opinion
These financial statements and financial highlights are the responsibility of the Fund's management. Our responsibility is to express an opinion on the Fund’s financial statements and financial highlights based on our audit. We are a public accounting firm registered with the Public Company Accounting Oversight Board (United States) (PCAOB) and are required to be independent with respect to the Fund in accordance with the U.S. federal securities laws and the applicable rules and regulations of the Securities and Exchange Commission and the PCAOB.
We conducted our audit in accordance with the standards of the PCAOB. Those standards require that we plan and perform the audit to obtain reasonable assurance about whether the financial statements and financial highlights are free of material misstatement, whether due to error or fraud. The Fund is not required to have, nor were we engaged to perform, an audit of its internal control over financial reporting. As part of our audit, we are required to obtain an understanding of internal control over financial reporting but not for the purpose of expressing an opinion on the effectiveness of the Fund’s internal control over financial reporting. Accordingly, we express no such opinion.
Our audit included performing procedures to assess the risks of material misstatement of the financial statements and financial highlights, whether due to error or fraud, and performing procedures that respond to those risks. Such procedures included examining, on a test basis, evidence regarding the amounts and disclosures in the financial statements and financial highlights. Our audit also included evaluating the accounting principles used and significant estimates made by management, as well as evaluating the overall presentation of the financial statements and financial highlights. Our procedures included confirmation of securities owned as of August 31, 2022, by correspondence with the custodian and brokers; when replies were not received from brokers, we performed other auditing procedures. We believe that our audit provides a reasonable basis for our opinion.
/s/ Deloitte & Touche LLP
Kansas City, Missouri
October 17, 2022
We have served as the auditor of one or more American Century investment companies since 1997.
44
| Management | ||
The Board of Trustees
The individuals listed below serve as trustees of the funds. Each trustee will continue to serve in this capacity until death, retirement, resignation or removal from office. The board has adopted a mandatory retirement age for trustees who are not “interested persons,” as that term is defined in the Investment Company Act (independent trustees). Trustees who are not also officers of the trust shall retire on December 31st of the year in which they reach their 75th birthday.
Jonathan S. Thomas is an “interested person” because he currently serves as President and Chief Executive Officer of American Century Companies, Inc. (ACC), the parent company of American Century Investment Management, Inc. (ACIM or the advisor). The other trustees are independent. They are not employees, directors or officers of, and have no financial interest in, ACC or any of its wholly owned, direct or indirect, subsidiaries, including ACIM and American Century Services, LLC (ACS), and they do not have any other affiliations, positions or relationships that would cause them to be considered “interested persons” under the Investment Company Act. The following trustees also serve in this capacity for a number of other registered investment companies in the American Century Investments family of funds: Jonathan S. Thomas, 15; Jeremy I. Bulow, 8; and Stephen E. Yates, 7.
The following table presents additional information about the trustees. The mailing address for each trustee other than Jonathan S. Thomas is 330 Madison Avenue, New York, New York 10017. The mailing address for Jonathan S. Thomas is 4500 Main Street, Kansas City, Missouri 64111.
| Name (Year of Birth) | Position(s) Held with Funds | Length of Time Served | Principal Occupation(s) During Past 5 Years | Number of American Century Portfolios Overseen by Trustee | Other Directorships Held During Past 5 Years | ||||||||||||
| Independent Trustees | |||||||||||||||||
| Reginald M. Browne (1968) | Trustee and Chairman of the Board | Since 2017 (Chairman since 2019) | Principal, GTS Securities (automated capital markets trading firm)(2019 to present); Senior Managing Director, Co Global Head-ETF Group, Cantor Fitzgerald (financial services firm)(2013 to 2019) | 41 | None | ||||||||||||
| Jeremy I. Bulow (1954) | Trustee | Since 2022 | Professor of Economics, Stanford University Graduate School of Business (1979 to present) | 75 | None | ||||||||||||
| Barry A. Mendelson (1958) | Trustee | Since 2017 | Retired | 41 | None | ||||||||||||
| Stephen E. Yates (1948) | Trustee | Since 2017 | Retired | 105 | None | ||||||||||||
| Interested Trustees | |||||||||||||||||
| Jonathan S. Thomas (1963) | Trustee | Since 2017 | President and Chief Executive Officer, ACC (2007 to present). Also serves as Chief Executive Officer, ACS; Director, ACC and other ACC subsidiaries | 139 | None | ||||||||||||
The Statement of Additional Information has additional information about the fund's trustees and is available without charge, upon request, by calling 1-800-345-6488.
45
Officers
The following table presents certain information about the executive officers of the funds. Each officer, except Cleo Chang and Edward Rosenberg, serves as an officer for each of the 16 investment companies in the American Century family of funds. No officer is compensated for his or her service as an officer of the funds. The listed officers are interested persons of the funds and are appointed or re-appointed on an annual basis. The mailing address for each officer listed below is 4500 Main Street, Kansas City, Missouri 64111.
| Name (Year of Birth) | Offices with the Funds | Principal Occupation(s) During the Past Five Years | ||||||
| Patrick Bannigan (1965) | President since 2019 | Executive Vice President and Director, ACC (2012 to present); Chief Financial Officer, Chief Accounting Officer and Treasurer, ACC (2015 to present). Also serves as President, ACS; Vice President, ACIM; Chief Financial Officer, Chief Accounting Officer and/or Director, ACIM, ACS and other ACC subsidiaries | ||||||
| R. Wes Campbell (1974) | Chief Financial Officer and Treasurer since 2018 | Vice President, ACS (2020 to present); Investment Operations and Investment Accounting, ACS (2000 to present) | ||||||
| Amy D. Shelton (1964) | Chief Compliance Officer and Vice President since 2017 | Chief Compliance Officer, American Century funds, (2014 to present); Chief Compliance Officer, ACIM (2014 to present); Chief Compliance Officer, ACIS (2009 to present). Also serves as Vice President, ACIS | ||||||
| John Pak (1968) | General Counsel and Vice President since 2021 | General Counsel and Senior Vice President, ACC (2021 to present). Also serves as General Counsel and Senior Vice President, ACIM, ACS and ACIS. Chief Legal Officer of Investment and Wealth Management,The Bank of New York Mellon (2014 to 2021) | ||||||
| Cleo Chang (1977) | Vice President since 2019 | Senior Vice President, ACIM (2015 to present) | ||||||
| David H. Reinmiller (1963) | Vice President since 2017 | Attorney, ACC (1994 to present). Also serves as Vice President, ACIM and ACS | ||||||
| Edward Rosenberg (1973) | Vice President since 2017 | Senior Vice President, ACIM (2017 to present); Senior Vice President, Flexshares Head of ETF Capital Markets, Northern Trust (2012 to 2017) | ||||||
| C. Jean Wade (1964) | Vice President since 2017 | Senior Vice President, ACS (2017 to present); Vice President, ACS (2000 to 2017) | ||||||
| Ward D. Stauffer (1960) | Secretary since 2019 | Attorney, ACS (2003 to present) | ||||||
46
| Approval of Management Agreement | ||
At a meeting held on March 2, 2022, the Fund's Board of Trustees (the "Board") unanimously approved the initial management agreement pursuant to which American Century Investment Management, Inc. (the “Advisor”) acts as the investment advisor for the Avantis Responsible U.S. Equity ETF (the "Fund"). Under Section 15(c) of the of the Investment Company Act of 1940, new contracts for investment advisory services are required to be approved by a majority of a fund’s independent Trustees and to be evaluated on an annual basis thereafter.
In advance of the Board’s consideration, the Advisor provided information concerning the Fund. The materials circulated and the discussions held detailed the investment objective and strategy proposed to be utilized by the Advisor, the Fund's characteristics and key attributes, the rationale for launching the Fund, the experience of the staff designated to manage the Fund, the proposed pricing, and the markets in which the Fund would be sold. The information considered and the discussions held included, but were not limited to:
•the nature, extent, and quality of investment management and other services to be provided to the Fund;
•the wide range of other programs and services the Advisor would provide to the Fund and its shareholders on a routine and non-routine basis;
•the Fund’s proposed investment objective and strategy, including a discussion of its anticipated investment performance and proposed benchmark;
•the cost of owning the Fund compared to the cost of owning similarly-managed funds;
•the Advisor’s compliance policies, procedures, and regulatory experience; and
•any collateral benefits derived by the Advisor from the management of the Fund.
Part of the Board’s analysis of fee levels involves reviewing certain evaluative data compiled by an independent data provider and comparing the Fund’s fee to the total expense ratio of expected peer funds. The annual management fees charged to shareholders of the Fund was anticipated to be below the median of the total expense ratios of it's peer universe.
When considering the approval of the management agreement for the Fund, the independent Trustees considered the entrepreneurial risk that the Advisor assumes in launching a new fund. In particular, they considered the fact that the Advisor will assume a substantial part of the start-up costs of the Fund and the risk that the Fund will not grow to a level that will become profitable to the Advisor. The Board considered the position that the Fund would take in the lineup of the American Century Investments’ family of funds and the benefits to shareholders of existing funds of the broadened product offering. Finally, while not specifically discussed, but important in the decision to approve the management agreement, is the Trustees’ familiarity with the Advisor. A majority of the Board oversees and evaluates on a continuous basis the nature and quality of all services the Advisor performs for other funds within the American Century Investments’ complex. As such, the Trustees have confidence in the Advisor’s integrity and competence in providing services to the Fund.
The independent Trustees considered all of the information provided by the Advisor and the independent Trustees’ independent counsel in connection with the approval, and evaluated such information for the Fund. In connection with their review, the Trustees did not identify any single factor as being all-important or controlling, and each Trustee may have attributed different levels of importance to different factors. The independent Trustees concluded that the overall arrangements between the Fund and the Advisor, as provided in the management agreement, were fair and reasonable in light of the services to be provided and should be approved.
47
| Additional Information | ||
Retirement Account Information
As required by law, distributions you receive from certain retirement accounts are subject to federal income tax withholding, unless you elect not to have withholding apply*. Tax will be withheld on the total amount withdrawn even though you may be receiving amounts that are not subject to withholding, such as nondeductible contributions. In such case, excess amounts of withholding could occur. You may adjust your withholding election so that a greater or lesser amount will be withheld.
Remember, even if you elect not to have income tax withheld, you are liable for paying income tax on the taxable portion of your withdrawal. If you elect not to have income tax withheld or you don’t have enough income tax withheld, you may be responsible for payment of estimated tax. You may incur penalties under the estimated tax rules if your withholding and estimated tax payments are not sufficient. You can reduce or defer the income tax on a distribution by directly or indirectly rolling such distribution over to another IRA or eligible plan. You should consult your tax advisor for additional information.
State tax will be withheld if, at the time of your distribution, your address is within one of the mandatory withholding states and you have federal income tax withheld (or as otherwise required by state law). State taxes will be withheld from your distribution in accordance with the respective state rules.
*Some 403(b), 457 and qualified retirement plan distributions may be subject to 20% mandatory withholding, as they are subject to special tax and withholding rules. Your plan administrator or plan sponsor is required to provide you with a special tax notice explaining those rules at the time you request a distribution. If applicable, federal and/or state taxes may be withheld from your distribution amount.
Proxy Voting Policies
A description of the policies that the fund's investment advisor uses in exercising the voting rights associated with the securities purchased and/or held by the fund are available without charge, upon request, by calling 1-800-345-6488. It is also available on American Century Investments’ website at americancentury.com/proxy and on the Securities and Exchange Commission’s website at sec.gov. Information regarding how the investment advisor voted proxies relating to portfolio securities during the most recent 12-month period ended June 30 is available at americancentury.com/proxy. It is also available at sec.gov.
Quarterly Portfolio Disclosure
The fund files its complete schedule of portfolio holdings with the Securities and Exchange Commission (SEC) for the first and third quarters of each fiscal year as an exhibit to its reports on Form N-PORT. The fund's Form N-PORT reports are available on the SEC’s website at sec.gov.
48
Other Tax Information
The following information is provided pursuant to provisions of the Internal Revenue Code.
The fund hereby designates up to the maximum amount allowable as qualified dividend income for the fiscal year ended August 31, 2022.
For corporate taxpayers, the fund hereby designates $47,718, or up to the maximum amount allowable, of ordinary income distributions paid during the fiscal year ended August 31, 2022 as qualified for the corporate dividends received deduction.
49
| Notes | ||
50
| Notes | ||
51
| Notes | ||
52
| ||||||||
| Contact Us | avantisinvestors.com | |||||||
| American Century Sales Representatives, Financial Professionals, Broker Dealers, Insurance Companies, Banks and Trust Companies | 1-833-928-2684 | |||||||
| Telecommunications Relay Service for the Deaf | 711 | |||||||
| American Century ETF Trust | ||||||||
Investment Advisor: American Century Investment Management, Inc. Kansas City, Missouri | ||||||||
Distributor: Foreside Fund Services, LLC - Distributor, not affiliated with American Century Investment Services, Inc. | ||||||||
| This report and the statements it contains are submitted for the general information of our shareholders. The report is not authorized for distribution to prospective investors unless preceded or accompanied by an effective prospectus. | ||||||||
| ©2022 American Century Proprietary Holdings, Inc. All rights reserved. CL-ANN-97863 2210 | ||||||||
| Annual Report | |||||
| August 31, 2022 | |||||
Avantis® Responsible Emerging Markets Equity ETF (AVSE) | |||||
Avantis® Responsible International Equity ETF (AVSD) | |||||
| Table of Contents | ||
| Chairman’s Letter | |||||
| Avantis Responsible Emerging Markets Equity ETF | |||||
| Performance | |||||
| Portfolio Commentary | |||||
| Fund Characteristics | |||||
| Avantis Responsible International Equity ETF | |||||
| Performance | |||||
| Portfolio Commentary | |||||
| Fund Characteristics | |||||
| Shareholder Fee Examples | |||||
| Schedules of Investments | |||||
| Statements of Assets and Liabilities | |||||
| Statements of Operations | |||||
| Statements of Changes in Net Assets | |||||
| Notes to Financial Statements | |||||
| Financial Highlights | |||||
| Report of Independent Registered Public Accounting Firm | |||||
| Management | |||||
| Approval of Management Agreement | |||||
| Additional Information | |||||
Any opinions expressed in this report reflect those of the author as of the date of the report, and do not necessarily represent the opinions of American Century Investments® or any other person in the American Century Investments organization. Any such opinions are subject to change at any time based upon market or other conditions and American Century Investments disclaims any responsibility to update such opinions. These opinions may not be relied upon as investment advice and, because investment decisions made by American Century Investments funds are based on numerous factors, may not be relied upon as an indication of trading intent on behalf of any American Century Investments fund. Security examples are used for representational purposes only and are not intended as recommendations to purchase or sell securities. Performance information for comparative indices and securities is provided to American Century Investments by third party vendors. To the best of American Century Investments’ knowledge, such information is accurate at the time of printing.
| Chairman's Letter | ||
Jonathan ThomasDear Investor:
Thank you for reviewing this annual report for the period ended August 31, 2022. Annual reports
help convey important information about fund returns, including market factors that affected
performance. For additional investment insights, please visit avantisinvestors.com.
Mounting Market Challenges Hampered Performance
Asset class performance weakened dramatically during the funds' fiscal year. In late 2021,
generally upbeat economic activity and corporate earnings supported gains for most U.S. and
global stock indices. Returns generally remained positive despite rapidly rising inflation and waning
central bank support—factors that had started to weigh on fixed-income indices.
By early 2022, the market climate shifted quickly. Inflation, which was already at multiyear highs,
rose to levels last seen in the early 1980s. Massive fiscal and monetary support unleashed during
the pandemic was partly to blame. In addition, escalating energy prices, supply chain breakdowns
and labor market shortages further aggravated inflation in the U.S. and other developed markets.
Russia’s invasion of Ukraine in February also exacerbated global inflationary pressures.
The Bank of England launched its inflation-fighting campaign in December and continued to lift
rates through period-end. The Federal Reserve responded to surging inflation in March, launching
an aggressive rate-hike campaign and ending its asset purchase program. Policymakers indicated
taming inflation remains their priority, even as the U.S. economy contracted in 2022’s first two
quarters. Facing record-high inflation in the eurozone, the European Central Bank in July embarked
on its first rate-hike effort in 11 years.
The combination of sharply elevated inflation, tighter monetary policy, geopolitical strife and weak
economies triggered sharp market volatility and fueled global recession fears. Against this
backdrop, most U.S. and global stock and bond indices declined sharply for the reporting period.
Staying Disciplined in Uncertain Times
We expect market volatility to linger as investors navigate a complex environment of high inflation,
rising interest rates and economic uncertainty. In addition, Russia’s invasion of Ukraine
complicates an increasingly tense geopolitical backdrop and threatens Europe’s winter energy
supply. We will continue to monitor the broad backdrop and its influence on financial markets.
We appreciate your confidence in us during these extraordinary times. Our firm has a long history
of helping clients weather unpredictable markets, and we’re confident we will continue to meet
today’s challenges.
Sincerely,
Jonathan Thomas
Chairman
Avantis Investors
2
| Performance | ||
| Avantis Responsible Emerging Markets Equity ETF (AVSE) | |||||||||||||||||||||||||||||
| Total Returns as of August 31, 2022 | |||||||||||||||||||||||||||||
| Since Inception | Inception Date | ||||||||||||||||||||||||||||
| Net Asset Value | -12.04% | 3/28/2022 | |||||||||||||||||||||||||||
| Market Price | -11.99% | 3/28/2022 | |||||||||||||||||||||||||||
| MSCI Emerging Markets IMI Index | -9.99% | — | |||||||||||||||||||||||||||
Market price is determined using the bid/ask midpoint at 4:00 p.m. Eastern time, when the net asset value (NAV) is typically calculated. Market performance does not represent the returns you would receive if you traded shares at other times. NAV prices are used to calculate market price performance prior to the date when the fund first traded on the NYSE Arca, Inc.
| Total Annual Fund Operating Expenses | |||||||||||||||||
| 0.33% | |||||||||||||||||
The total annual fund operating expenses shown is as stated in the fund’s prospectus current as of the date of this report. The prospectus may vary from the expense ratio shown elsewhere in this report because it is based on a different time period, includes acquired fund fees and expenses, and, if applicable, does not include fee waivers or expense reimbursements.
Data presented reflect past performance. Past performance is no guarantee of future results. Current performance may be higher or lower than the performance shown. Total returns for periods less than one year are not annualized. Investment return and principal value will fluctuate, and redemption value may be more or less than original cost. Data assumes reinvestment of dividends and capital gains, and none of the charts reflect the deduction of taxes that a shareholder would pay on fund distributions or the redemption of fund shares. To obtain performance data current to the most recent month end, please call 1-833-928-2684 or visit avantisinvestors.com. For additional information about the funds, please consult the prospectus.
3
| Portfolio Commentary | ||
Portfolio Managers: Eduardo Repetto, Mitch Firestein, Daniel Ong, Ted Randall and Matthew Dubin
Fund Strategy
Avantis Responsible Emerging Markets Equity ETF seeks long-term capital appreciation by investing in a diverse group of companies related to emerging markets across market sectors, industry groups, countries and market capitalizations.
The fund limits its investable universe of companies by screening out companies that do not meet certain environmental, social and governance (ESG) metrics. The fund uses third-party commercial data sources and scoring systems and proprietary evaluations to decide which securities to exclude due to ESG concerns. Within the investable universe, the fund seeks securities of companies that it expects to have higher returns. It places an enhanced emphasis on securities of companies with smaller market capitalizations and securities of companies it defines as high profitability or value companies. Conversely, the fund seeks to underweight or exclude securities it expects to have lower returns. These include securities of large companies with lower levels of profitability and higher prices relative to their book values or other financial metrics. Under normal market conditions, the fund will invest at least 80% of its assets in equity securities of companies related to emerging markets countries.
The fund is an actively managed exchange-traded fund (ETF) that does not seek to replicate the performance of a specified index. The portfolio managers continually analyze market and financial data to make buy, sell and hold decisions. When buying or selling a security, the portfolio managers may consider the trade-off between expected returns of the security and implementation or tax costs of the trade. They do this in an attempt to gain trading efficiencies, avoid unnecessary risk and enhance fund performance.
Performance Review
For the period from the fund’s inception on March 28, 2022, through August 31, 2022, Avantis Responsible Emerging Markets Equity ETF returned -11.99%* on a market price basis. On a net asset value (NAV) basis, the fund returned -12.04%. NAV and market price returns reflect fees and operating expenses, while index returns do not.
The fund underperformed the broad emerging markets stock universe, as measured by the MSCI Emerging Markets IMI Index, which returned -9.99% for the reporting period. The MSCI Emerging Markets IMI Index is an unmanaged index generally representative of the performance of emerging markets stocks across capitalization categories.
The underperformance was largely due to the fund’s environmental screen, which resulted in an underweight to the energy sector. The energy sector outperformed for the reporting period. An underweight to China also detracted, as China was among the better performing emerging markets countries.
*Total returns for periods less than one year are not annualized.
A strategy or emphasis on environmental, social and governance factors (ESG) may limit the investment opportunities available to a portfolio. Therefore, the portfolio may underperform or perform differently than other portfolios that do not have an ESG investment focus. A portfolio’s ESG investment focus may also result in the portfolio investing in securities or industry sectors that perform differently or maintain a different risk profile than the market generally or compared to underlying holdings that are not screened for ESG standards.
4
| Fund Characteristics | ||
| AUGUST 31, 2022 | |||||
| Avantis Responsible Emerging Markets Equity ETF | |||||
| Types of Investments in Portfolio | % of net assets | ||||
| Common Stocks | 99.9% | ||||
| Rights | —* | ||||
| Warrants | —* | ||||
| Short-Term Investments | 0.1% | ||||
| Other Assets and Liabilities | —* | ||||
| *Category is less than 0.05% of total net assets. | |||||
| Top Five Countries | % of net assets | ||||
| China | 29.0% | ||||
| India | 17.3% | ||||
| Taiwan | 17.1% | ||||
| South Korea | 13.4% | ||||
| Brazil | 6.2% | ||||
5
| Performance | ||
| Avantis Responsible International Equity ETF (AVSD) | |||||||||||||||||||||||||||||
| Total Returns as of August 31, 2022 | |||||||||||||||||||||||||||||
| Since Inception | Inception Date | ||||||||||||||||||||||||||||
| Net Asset Value | -10.66% | 3/15/2022 | |||||||||||||||||||||||||||
| Market Price | -10.54% | 3/15/2022 | |||||||||||||||||||||||||||
| MSCI World ex-USA IMI Index | -9.31% | — | |||||||||||||||||||||||||||
Market price is determined using the bid/ask midpoint at 4:00 p.m. Eastern time, when the net asset value (NAV) is typically calculated. Market performance does not represent the returns you would receive if you traded shares at other times. NAV prices are used to calculate market price performance prior to the date when the fund first traded on the NYSE Arca, Inc.
| Total Annual Fund Operating Expenses | |||||||||||||||||
| 0.23% | |||||||||||||||||
The total annual fund operating expenses shown is as stated in the fund’s prospectus current as of the date of this report. The prospectus may vary from the expense ratio shown elsewhere in this report because it is based on a different time period, includes acquired fund fees and expenses, and, if applicable, does not include fee waivers or expense reimbursements.
Data presented reflect past performance. Past performance is no guarantee of future results. Current performance may be higher or lower than the performance shown. Total returns for periods less than one year are not annualized. Investment return and principal value will fluctuate, and redemption value may be more or less than original cost. Data assumes reinvestment of dividends and capital gains, and none of the charts reflect the deduction of taxes that a shareholder would pay on fund distributions or the redemption of fund shares. To obtain performance data current to the most recent month end, please call 1-833-928-2684 or visit avantisinvestors.com. For additional information about the funds, please consult the prospectus.
6
| Portfolio Commentary | ||
Portfolio Managers: Eduardo Repetto, Mitch Firestein, Daniel Ong, Ted Randall and Matthew Dubin
Fund Strategy
Avantis Responsible International Equity ETF seeks long-term capital appreciation by investing in a diverse group of non-U.S. companies across countries, market sectors, industry groups and market capitalizations.
The fund limits its investable universe of companies by screening out companies that do not meet certain environmental, social and governance (ESG) metrics. The fund uses third-party commercial data sources and scoring systems and proprietary evaluations to decide which securities to exclude due to ESG concerns. Within the investable universe, the fund seeks securities of companies that it expects to have higher returns. It places an emphasis on the securities of companies with smaller market capitalizations and securities of companies it defines as high profitability or value companies. Conversely, the fund seeks to underweight or exclude securities it expects to have lower returns. These include securities of large companies with lower levels of profitability and higher prices relative to their book values or other financial metrics. Under normal market conditions, the fund will invest at least 80% of its assets in equity securities.
The fund is an actively managed exchange-traded fund (ETF) that does not seek to replicate the performance of a specified index. The portfolio managers continually analyze market and financial data to make buy, sell and hold decisions. When buying or selling a security, the portfolio managers may consider the trade-off between expected returns of the security and implementation or tax costs of the trade. They do this in an attempt to gain trading efficiencies, avoid unnecessary risk and enhance fund performance.
Performance Review
For the period from the fund’s inception on March 15, 2022, through August 31, 2022, Avantis Responsible International Equity ETF returned -10.54%* on a market price basis. On a net asset value (NAV) basis, the portfolio returned -10.66%. NAV and market price returns reflect fees and operating expenses, while index returns do not.
The fund underperformed the total non-U.S. developed markets stock universe, as measured by the MSCI World ex-USA IMI Index, which returned -9.31% for the reporting period. The MSCI World ex-USA IMI Index is an unmanaged index generally representative of the performance of non-U.S. developed markets stocks across capitalization categories.
The underperformance was largely due to the fund’s environmental screen. This screen resulted in an underweight to the energy sector, which outperformed for the reporting period. Meanwhile, overweighting companies with the highest book-to-market characteristics and underweighting those with the lowest valuation traits boosted relative performance.
*Total returns for periods less than one year are not annualized.
A strategy or emphasis on environmental, social and governance factors (ESG) may limit the investment opportunities available to a portfolio. Therefore, the portfolio may underperform or perform differently than other portfolios that do not have an ESG investment focus. A portfolio’s ESG investment focus may also result in the portfolio investing in securities or industry sectors that perform differently or maintain a different risk profile than the market generally or compared to underlying holdings that are not screened for ESG standards.
7
| Fund Characteristics | ||
| AUGUST 31, 2022 | |||||
| Avantis Responsible International Equity ETF | |||||
| Types of Investments in Portfolio | % of net assets | ||||
| Common Stocks | 99.6% | ||||
| Rights | —* | ||||
| Warrants | —* | ||||
| Short-Term Investments | 0.9% | ||||
| Other Assets and Liabilities | (0.5)% | ||||
| *Category is less than 0.05% of total net assets. | |||||
| Top Five Countries | % of net assets | ||||
| Japan | 21.1% | ||||
| United Kingdom | 13.8% | ||||
| Canada | 11.0% | ||||
| France | 9.1% | ||||
| Switzerland | 8.4% | ||||
8
| Shareholder Fee Examples | ||
Fund shareholders may incur two types of costs: (1) transaction costs, including brokerage commissions paid on purchases and sales of fund shares; and (2) ongoing costs, including management fees and other fund expenses. This example is intended to help you understand your ongoing costs (in dollars) of investing in your fund and to compare these costs with the ongoing cost of investing in other funds.
The example is based on an investment of $1,000 made at the beginning of the period and held for the entire period from March 1, 2022 to August 31, 2022 (except as noted).
Actual Expenses
The table provides information about actual account values and actual expenses for each fund. You may use the information, together with the amount you invested, to estimate the expenses that you paid over the period. First, identify the fund you own. Then simply divide your account value by $1,000 (for example, an $8,600 account value divided by $1,000 = 8.6), then multiply the result by the number under the heading “Expenses Paid During Period” to estimate the expenses you paid on your account during this period.
Hypothetical Example for Comparison Purposes
The table also provides information about hypothetical account values and hypothetical expenses based on the actual expense ratio of your fund and an assumed rate of return of 5% per year before expenses, which is not the actual return of a fund. The hypothetical account values and expenses may not be used to estimate the actual ending account balance or expenses you paid for the period. You may use this information to compare the ongoing costs of investing in your fund and other funds. To do so, compare this 5% hypothetical example with the 5% hypothetical examples that appear in the shareholder reports of the other funds.
Please note that the expenses shown in the table are meant to highlight your ongoing costs only and do not reflect any transactional costs, such as brokerage commissions paid on purchases and sales of fund shares. Therefore, the table is useful in comparing ongoing costs only, and will not help you determine the relative total costs of owning different funds. In addition, if these transactional costs were included, your costs would have been higher.
9
| Beginning Account Value 3/1/22 | Ending Account Value 8/31/22 | Expenses Paid During Period(1) 3/1/22 - 8/31/22 | Annualized Expense Ratio(1) | |||||||||||
| Avantis Responsible Emerging Markets Equity ETF | ||||||||||||||
| Actual | $1,000 | $879.60 | $1.33(2) | 0.33% | ||||||||||
| Hypothetical | $1,000 | $1,023.54 | $1.68 | 0.33% | ||||||||||
| Avantis Responsible International Equity ETF | ||||||||||||||
| Actual | $1,000 | $893.40 | $1.01(3) | 0.23% | ||||||||||
| Hypothetical | $1,000 | $1,024.05 | $1.17 | 0.23% | ||||||||||
(1)Expenses are equal to the fund's annualized expense ratio listed in the table above, multiplied by the average account value over the period, multiplied by 184, the number of days in the most recent fiscal half-year, divided by 365, to reflect the one-half year period. Annualized expense ratio reflects actual expenses, including any applicable fee waivers or expense reimbursements and excluding any acquired fund fees and expenses.
(2)Expenses are equal to the fund's annualized expense ratio listed in the table above, multiplied by the average account value over the period, multiplied by 157, the number of days in the period from March 28, 2022 (fund inception) through August 31, 2022, divided by 365, to reflect the period. Had the fund been available for the full period, the expenses paid during the period would have been higher.
(3)Expenses are equal to the fund's annualized expense ratio listed in the table above, multiplied by the average account value over the period, multiplied by 170, the number of days in the period from March 15, 2022 (fund inception) through August 31, 2022, divided by 365, to reflect the period. Had the fund been available for the full period, the expenses paid during the period would have been higher.
10
| Schedules of Investments | ||
AUGUST 31, 2022
| Avantis Responsible Emerging Markets Equity ETF | ||||||||
| Shares | Value | |||||||
| COMMON STOCKS — 99.9% | ||||||||
| Brazil — 6.2% | ||||||||
| Aeris Industria E Comercio De Equipamentos Para Geracao De Energia SA | 1,200 | $ | 531 | |||||
| AES Brasil Energia SA | 600 | 1,116 | ||||||
| Aliansce Sonae Shopping Centers SA | 900 | 3,031 | ||||||
| Alpargatas SA, Preference Shares | 1,000 | 4,021 | ||||||
| Alupar Investimento SA | 300 | 1,643 | ||||||
| Ambev SA, ADR | 6,225 | 18,052 | ||||||
| Americanas SA | 1,100 | 3,434 | ||||||
Anima Holding SA(1) | 500 | 485 | ||||||
| Arezzo Industria e Comercio SA | 200 | 3,550 | ||||||
| Armac Locacao Logistica E Servicos SA | 100 | 304 | ||||||
| Atacadao SA | 1,400 | 5,358 | ||||||
| Auren Energia SA | 1,400 | 4,123 | ||||||
| B3 SA - Brasil Bolsa Balcao | 7,000 | 16,079 | ||||||
| Banco ABC Brasil SA, Preference Shares | 800 | 2,925 | ||||||
| Banco Bradesco SA | 3,570 | 10,842 | ||||||
| Banco Bradesco SA, ADR | 12,076 | 43,836 | ||||||
| Banco BTG Pactual SA | 2,900 | 14,270 | ||||||
| Banco do Brasil SA | 3,300 | 26,496 | ||||||
| Banco do Estado do Rio Grande do Sul SA, Class B Preference Shares | 2,000 | 4,302 | ||||||
| Banco Santander Brasil SA, ADR | 1,060 | 6,063 | ||||||
| BB Seguridade Participacoes SA | 1,900 | 10,387 | ||||||
| Bemobi Mobile Tech SA | 300 | 810 | ||||||
| Boa Vista Servicos SA | 1,400 | 1,843 | ||||||
| BR Malls Participacoes SA | 5,300 | 8,435 | ||||||
| BR Properties SA | 2,100 | 3,334 | ||||||
BRF SA, ADR(1) | 1,653 | 4,942 | ||||||
C&A MODAS SA(1) | 700 | 435 | ||||||
| CCR SA | 7,900 | 21,108 | ||||||
| Centrais Eletricas Brasileiras SA, ADR | 1,497 | 13,383 | ||||||
| Centrais Eletricas Brasileiras SA, Class B Preference Shares | 500 | 4,623 | ||||||
| Cia Brasileira de Aluminio | 400 | 992 | ||||||
| Cia Brasileira de Distribuicao, ADR | 1,444 | 5,892 | ||||||
| Cia de Saneamento Basico do Estado de Sao Paulo, ADR | 1,103 | 10,324 | ||||||
| Cia de Saneamento de Minas Gerais-COPASA | 800 | 2,079 | ||||||
| Cia de Saneamento do Parana | 900 | 2,988 | ||||||
| Cia de Saneamento do Parana, Preference Shares | 8,300 | 5,616 | ||||||
| Cia de Transmissao de Energia Eletrica Paulista, Preference Shares | 1,400 | 6,442 | ||||||
| Cia Energetica de Minas Gerais, ADR | 1,281 | 3,023 | ||||||
| Cia Ferro Ligas da Bahia - FERBASA, Preference Shares | 500 | 5,082 | ||||||
| Cia Paranaense de Energia | 1,500 | 1,854 | ||||||
| Cia Paranaense de Energia, ADR | 1,566 | 10,273 | ||||||
| Cia Paranaense de Energia, Preference Shares | 11,700 | 15,653 | ||||||
| Cielo SA | 9,200 | 9,744 | ||||||
Clear Sale SA(1) | 200 | 216 | ||||||
11
| Avantis Responsible Emerging Markets Equity ETF | ||||||||
| Shares | Value | |||||||
Construtora Tenda SA(1) | 100 | $ | 113 | |||||
| CPFL Energia SA | 200 | 1,354 | ||||||
| Cruzeiro do Sul Educacional SA | 200 | 179 | ||||||
| Cury Construtora e Incorporadora SA | 800 | 1,370 | ||||||
CVC Brasil Operadora e Agencia de Viagens SA(1) | 1,800 | 2,636 | ||||||
| Cyrela Brazil Realty SA Empreendimentos e Participacoes | 1,700 | 4,666 | ||||||
| Desktop - Sigmanet Comunicacao Multimidia S.A | 100 | 207 | ||||||
| Dexco SA | 2,400 | 4,595 | ||||||
| Dexxos Participacoes SA | 100 | 134 | ||||||
| Direcional Engenharia SA | 300 | 745 | ||||||
EcoRodovias Infraestrutura e Logistica SA(1) | 2,000 | 2,245 | ||||||
| EDP - Energias do Brasil SA | 400 | 1,744 | ||||||
Embraer SA, ADR(1) | 1,325 | 14,125 | ||||||
Empreendimentos Pague Menos S/A(1) | 900 | 875 | ||||||
| Energisa SA | 1,200 | 9,799 | ||||||
| Equatorial Energia SA | 3,300 | 15,370 | ||||||
| Eternit SA | 300 | 744 | ||||||
| Even Construtora e Incorporadora SA | 700 | 799 | ||||||
| Ez Tec Empreendimentos e Participacoes SA | 700 | 2,418 | ||||||
Fertilizantes Heringer SA(1) | 100 | 269 | ||||||
| Fleury SA | 500 | 1,511 | ||||||
| Fras-Le SA | 300 | 735 | ||||||
Gafisa SA(1) | 800 | 185 | ||||||
| GPS Participacoes e Empreendimentos SA | 700 | 1,830 | ||||||
| Grendene SA | 1,300 | 1,892 | ||||||
Grupo Mateus SA(1) | 1,400 | 1,712 | ||||||
| Grupo SBF SA | 300 | 1,270 | ||||||
| Guararapes Confeccoes SA | 600 | 1,065 | ||||||
| Hapvida Participacoes e Investimentos SA | 2,300 | 3,232 | ||||||
| Helbor Empreendimentos SA | 200 | 104 | ||||||
Hidrovias do Brasil SA(1) | 2,800 | 1,319 | ||||||
| Hospital Mater Dei SA | 100 | 176 | ||||||
| Hypera SA | 900 | 7,454 | ||||||
| Iguatemi SA | 1,500 | 5,648 | ||||||
| Iguatemi SA | 2,000 | 934 | ||||||
Infracommerce CXAAS SA(1) | 100 | 107 | ||||||
| Instituto Hermes Pardini SA | 300 | 1,142 | ||||||
International Meal Co. Alimentacao SA, Class A(1) | 900 | 348 | ||||||
| Iochpe Maxion SA | 2,100 | 5,518 | ||||||
| Irani Papel e Embalagem SA | 900 | 1,323 | ||||||
IRB Brasil Resseguros S/A(1) | 5,900 | 1,883 | ||||||
| Itau Unibanco Holding SA, ADR | 13,468 | 66,532 | ||||||
| Jalles Machado SA | 1,300 | 1,874 | ||||||
| JHSF Participacoes SA | 3,900 | 4,663 | ||||||
| Kepler Weber SA | 500 | 2,030 | ||||||
| Klabin SA | 4,500 | 16,400 | ||||||
| Lavvi Empreendimentos Imobiliarios Ltda | 900 | 983 | ||||||
| Light SA | 1,300 | 1,424 | ||||||
| Localiza Rent a Car SA | 2,170 | 25,454 | ||||||
| LOG Commercial Properties e Participacoes SA | 300 | 1,519 | ||||||
Log-in Logistica Intermodal SA(1) | 400 | 3,039 | ||||||
12
| Avantis Responsible Emerging Markets Equity ETF | ||||||||
| Shares | Value | |||||||
| Lojas Quero Quero S/A | 1,900 | $ | 2,527 | |||||
| Lojas Renner SA | 2,400 | 12,280 | ||||||
| LPS Brasil Consultoria de Imoveis SA | 1,700 | 948 | ||||||
| M Dias Branco SA | 500 | 4,102 | ||||||
Magazine Luiza SA(1) | 2,300 | 1,901 | ||||||
| Mahle-Metal Leve SA | 400 | 1,877 | ||||||
| Marcopolo SA, Preference Shares | 3,500 | 1,763 | ||||||
| Marfrig Global Foods SA | 600 | 1,522 | ||||||
Marisa Lojas SA(1) | 1,000 | 486 | ||||||
| Mills Estruturas e Servicos de Engenharia SA | 2,200 | 4,208 | ||||||
| Minerva SA | 2,600 | 7,706 | ||||||
| Mitre Realty Empreendimentos E Participacoes LTDA | 200 | 212 | ||||||
| Movida Participacoes SA | 2,100 | 5,599 | ||||||
| MPM Corporeos SA | 300 | 115 | ||||||
| MRV Engenharia e Participacoes SA | 1,800 | 3,529 | ||||||
| Multilaser Industrial SA | 800 | 741 | ||||||
| Multiplan Empreendimentos Imobiliarios SA | 1,500 | 7,001 | ||||||
| Natura & Co. Holding SA | 1,300 | 3,626 | ||||||
Oceanpact Servicos Maritimos SA(1) | 200 | 87 | ||||||
| Odontoprev SA | 1,020 | 1,796 | ||||||
Omega Energia SA(1) | 900 | 1,939 | ||||||
Oncoclinicas do Brasil Servicos Medicos SA(1) | 100 | 119 | ||||||
Orizon Valorizacao de Residuos SA(1) | 100 | 684 | ||||||
| Petroreconcavo SA | 800 | 4,192 | ||||||
| Portobello SA | 600 | 1,151 | ||||||
| Positivo Tecnologia SA | 400 | 912 | ||||||
| Qualicorp Consultoria e Corretora de Seguros SA | 700 | 1,286 | ||||||
| Raia Drogasil SA | 2,500 | 10,524 | ||||||
| Randon SA Implementos e Participacoes, Preference Shares | 1,000 | 1,840 | ||||||
| Rede D'Or Sao Luiz SA | 200 | 1,280 | ||||||
| Romi SA | 100 | 259 | ||||||
| Rumo SA | 3,500 | 13,590 | ||||||
| Santos Brasil Participacoes SA | 2,800 | 4,349 | ||||||
| Sao Martinho SA | 900 | 5,531 | ||||||
| Sendas Distribuidora SA, ADR | 914 | 16,105 | ||||||
| Ser Educacional SA | 400 | 477 | ||||||
| SIMPAR SA | 1,800 | 3,706 | ||||||
StoneCo Ltd., A Shares(1) | 1,949 | 18,477 | ||||||
| Sul America SA | 2,200 | 10,314 | ||||||
| Suzano SA, ADR | 2,141 | 18,391 | ||||||
| SYN prop e tech SA | 500 | 436 | ||||||
| Tegma Gestao Logistica SA | 100 | 339 | ||||||
| Telefonica Brasil SA, ADR | 627 | 5,091 | ||||||
| TIM SA, ADR | 953 | 10,807 | ||||||
| TOTVS SA | 800 | 4,370 | ||||||
| Transmissora Alianca de Energia Eletrica SA | 2,000 | 16,070 | ||||||
| Trisul SA | 700 | 628 | ||||||
| Tupy SA | 600 | 3,076 | ||||||
| Unifique Telecomunicacoes S/A | 200 | 177 | ||||||
| Unipar Carbocloro SA, Class B Preference Shares | 610 | 11,877 | ||||||
| Valid Solucoes e Servicos de Seguranca em Meios de Pagamento e Identificacao SA | 300 | 609 | ||||||
13
| Avantis Responsible Emerging Markets Equity ETF | ||||||||
| Shares | Value | |||||||
| Vamos Locacao de Caminhoes Maquinas e Equipamentos SA | 1,500 | $ | 4,106 | |||||
Via S/A(1) | 12,700 | 7,836 | ||||||
| Vivara Participacoes SA | 200 | 974 | ||||||
| Vulcabras Azaleia SA | 900 | 2,491 | ||||||
| WEG SA | 1,300 | 7,072 | ||||||
| Wiz Solucoes e Corretagem de Seguros SA | 400 | 625 | ||||||
| YDUQS Participacoes SA | 700 | 1,663 | ||||||
Zamp SA(1) | 1,800 | 2,699 | ||||||
| 805,730 | ||||||||
| Chile — 0.7% | ||||||||
| Aguas Andinas SA, A Shares | 34,996 | 7,809 | ||||||
| Banco de Chile | 65,381 | 6,203 | ||||||
| Banco de Credito e Inversiones SA | 28 | 825 | ||||||
| Banco Santander Chile, ADR | 373 | 5,983 | ||||||
| CAP SA | 754 | 6,083 | ||||||
| Cencosud SA | 3,375 | 4,718 | ||||||
| Cencosud Shopping SA | 184 | 254 | ||||||
| Cia Cervecerias Unidas SA, ADR | 45 | 492 | ||||||
| Embotelladora Andina SA, Class B Preference Shares | 3,991 | 8,171 | ||||||
| Empresa Nacional de Telecomunicaciones SA | 1,405 | 4,442 | ||||||
| Empresas CMPC SA | 7,058 | 13,388 | ||||||
| Falabella SA | 2,129 | 5,017 | ||||||
| Parque Arauco SA | 1,220 | 1,290 | ||||||
| Ripley Corp. SA | 12,061 | 2,207 | ||||||
| Sociedad Quimica y Minera de Chile SA, ADR | 199 | 19,836 | ||||||
| Vina Concha y Toro SA | 3,852 | 4,706 | ||||||
| 91,424 | ||||||||
| China — 29.0% | ||||||||
| 360 DigiTech, Inc., ADR | 1,063 | 16,987 | ||||||
361 Degrees International Ltd.(1) | 8,000 | 4,088 | ||||||
| 3SBio, Inc. | 13,000 | 8,643 | ||||||
| A-Living Smart City Services Co. Ltd. | 1,000 | 1,030 | ||||||
| AAC Technologies Holdings, Inc. | 3,500 | 6,484 | ||||||
| Agile Group Holdings Ltd. | 8,000 | 2,802 | ||||||
Agora, Inc., ADR(1) | 264 | 1,093 | ||||||
| Agricultural Bank of China Ltd., H Shares | 75,000 | 24,507 | ||||||
| AK Medical Holdings Ltd. | 2,000 | 1,734 | ||||||
Alibaba Group Holding Ltd., ADR(1) | 2,543 | 242,628 | ||||||
Alibaba Pictures Group Ltd.(1) | 40,000 | 3,147 | ||||||
| Anhui Expressway Co. Ltd., H Shares | 6,000 | 4,356 | ||||||
| ANTA Sports Products Ltd. | 2,400 | 28,902 | ||||||
Ascletis Pharma, Inc.(1) | 1,000 | 421 | ||||||
| AsiaInfo Technologies Ltd. | 1,600 | 2,294 | ||||||
| Autohome, Inc., ADR | 623 | 22,185 | ||||||
Baidu, Inc., ADR(1) | 222 | 31,961 | ||||||
Bairong, Inc.(1) | 500 | 598 | ||||||
| Bank of China Ltd., H Shares | 225,000 | 78,518 | ||||||
| Bank of Chongqing Co. Ltd., H Shares | 1,000 | 517 | ||||||
| Bank of Communications Co. Ltd., H Shares | 34,000 | 19,372 | ||||||
BeiGene Ltd., ADR(1) | 67 | 11,501 | ||||||
Beijing Capital International Airport Co. Ltd., H Shares(1) | 12,000 | 7,532 | ||||||
14
| Avantis Responsible Emerging Markets Equity ETF | ||||||||
| Shares | Value | |||||||
| Beijing Chunlizhengda Medical Instruments Co. Ltd., H Shares | 250 | $ | 364 | |||||
| Beijing Enterprises Water Group Ltd. | 14,000 | 3,596 | ||||||
| Beijing Tong Ren Tang Chinese Medicine Co. Ltd. | 3,000 | 3,733 | ||||||
Bilibili, Inc., ADR(1) | 17 | 424 | ||||||
| BOC Aviation Ltd. | 2,100 | 16,809 | ||||||
| BOE Varitronix Ltd. | 4,000 | 9,124 | ||||||
| Bosideng International Holdings Ltd. | 28,000 | 15,722 | ||||||
Burning Rock Biotech Ltd., ADR(1) | 42 | 165 | ||||||
| BYD Co. Ltd., H Shares | 2,000 | 61,631 | ||||||
| BYD Electronic International Co. Ltd. | 3,500 | 9,247 | ||||||
| C&D International Investment Group Ltd. | 2,000 | 4,000 | ||||||
Canadian Solar, Inc.(1) | 152 | 6,866 | ||||||
| Cango, Inc., ADR | 267 | 646 | ||||||
| CanSino Biologics, Inc., H Shares | 200 | 1,248 | ||||||
| Cathay Media And Education Group, Inc. | 1,000 | 154 | ||||||
| Central China New Life Ltd. | 2,000 | 863 | ||||||
| Central China Real Estate Ltd. | 1,000 | 66 | ||||||
CGN Mining Co. Ltd.(1) | 20,000 | 2,606 | ||||||
| Cheerwin Group Ltd. | 500 | 127 | ||||||
| China Bohai Bank Co. Ltd., H Shares | 8,500 | 1,408 | ||||||
| China Cinda Asset Management Co. Ltd., H Shares | 75,000 | 10,299 | ||||||
| China CITIC Bank Corp. Ltd., H Shares | 39,000 | 16,720 | ||||||
| China Communications Services Corp. Ltd., H Shares | 24,000 | 10,306 | ||||||
China Conch Environment Protection Holdings Ltd.(1) | 4,500 | 4,017 | ||||||
| China Conch Venture Holdings Ltd. | 8,000 | 16,326 | ||||||
| China Construction Bank Corp., H Shares | 225,000 | 139,091 | ||||||
| China Datang Corp. Renewable Power Co. Ltd., H Shares | 26,000 | 6,511 | ||||||
China Dili Group(1) | 6,000 | 764 | ||||||
China Dongxiang Group Co. Ltd.(1) | 16,000 | 712 | ||||||
| China East Education Holdings Ltd. | 6,500 | 2,747 | ||||||
| China Education Group Holdings Ltd. | 5,000 | 4,356 | ||||||
| China Everbright Bank Co. Ltd., H Shares | 14,000 | 4,292 | ||||||
| China Everbright Greentech Ltd. | 1,000 | 209 | ||||||
| China Everbright Ltd. | 10,000 | 7,303 | ||||||
| China Feihe Ltd. | 16,000 | 13,243 | ||||||
| China Foods Ltd. | 2,000 | 637 | ||||||
| China Galaxy Securities Co. Ltd., H Shares | 21,500 | 11,754 | ||||||
China General Education Group Ltd.(1) | 1,000 | 523 | ||||||
| China Glass Holdings Ltd. | 2,000 | 284 | ||||||
China High Speed Transmission Equipment Group Co. Ltd.(1) | 4,000 | 2,261 | ||||||
| China International Capital Corp. Ltd., H Shares | 4,400 | 7,741 | ||||||
| China Kepei Education Group Ltd. | 2,000 | 514 | ||||||
| China Lesso Group Holdings Ltd. | 7,000 | 8,320 | ||||||
| China Life Insurance Co. Ltd., ADR | 3,111 | 22,119 | ||||||
China Literature Ltd.(1) | 600 | 2,431 | ||||||
| China Medical System Holdings Ltd. | 12,000 | 17,760 | ||||||
| China Meidong Auto Holdings Ltd. | 2,000 | 4,067 | ||||||
China Mengniu Dairy Co. Ltd.(1) | 12,000 | 54,339 | ||||||
| China Merchants Bank Co. Ltd., H Shares | 6,000 | 30,685 | ||||||
| China Merchants Port Holdings Co. Ltd. | 10,000 | 15,013 | ||||||
| China Minsheng Banking Corp. Ltd., H Shares | 29,500 | 9,384 | ||||||
15
| Avantis Responsible Emerging Markets Equity ETF | ||||||||
| Shares | Value | |||||||
| China New Higher Education Group Ltd. | 11,000 | $ | 3,446 | |||||
| China Nonferrous Mining Corp. Ltd. | 19,000 | 8,123 | ||||||
| China Pacific Insurance Group Co. Ltd., H Shares | 10,200 | 21,607 | ||||||
China Rare Earth Holdings Ltd.(1) | 2,000 | 119 | ||||||
China Renaissance Holdings Ltd.(1) | 200 | 226 | ||||||
| China Resources Beer Holdings Co. Ltd. | 2,000 | 13,942 | ||||||
| China Resources Land Ltd. | 12,000 | 49,131 | ||||||
| China Resources Medical Holdings Co. Ltd. | 10,500 | 6,229 | ||||||
| China Resources Mixc Lifestyle Services Ltd. | 1,400 | 6,349 | ||||||
| China Sanjiang Fine Chemicals Co. Ltd. | 2,000 | 409 | ||||||
| China SCE Group Holdings Ltd. | 7,000 | 586 | ||||||
| China Shineway Pharmaceutical Group Ltd. | 5,000 | 3,835 | ||||||
| China Shuifa Singyes Energy Holdings Ltd. | 1,000 | 131 | ||||||
| China South City Holdings Ltd. | 52,000 | 3,269 | ||||||
| China Starch Holdings Ltd. | 35,000 | 1,155 | ||||||
| China Sunshine Paper Holdings Co. Ltd. | 2,000 | 470 | ||||||
| China Taiping Insurance Holdings Co. Ltd. | 12,600 | 12,864 | ||||||
| China Tower Corp. Ltd., H Shares | 272,000 | 33,918 | ||||||
| China Traditional Chinese Medicine Holdings Co. Ltd. | 14,000 | 6,037 | ||||||
China Travel International Investment Hong Kong Ltd.(1) | 22,000 | 3,997 | ||||||
| China Vanke Co. Ltd., H Shares | 2,700 | 5,271 | ||||||
| China Yongda Automobiles Services Holdings Ltd. | 11,000 | 7,758 | ||||||
China Youran Dairy Group Ltd.(1) | 5,000 | 1,514 | ||||||
China Yuhua Education Corp. Ltd.(1) | 14,000 | 2,200 | ||||||
Chindata Group Holdings Ltd., ADR(1) | 1,106 | 9,335 | ||||||
| CIFI Ever Sunshine Services Group Ltd. | 4,000 | 2,458 | ||||||
| CIFI Holdings Group Co. Ltd. | 16,320 | 4,131 | ||||||
| CITIC Securities Co. Ltd., H Shares | 9,000 | 18,242 | ||||||
CMGE Technology Group Ltd.(1) | 4,000 | 987 | ||||||
| CMOC Group Ltd., H Shares | 6,000 | 2,676 | ||||||
| COSCO SHIPPING Holdings Co. Ltd., Class H | 13,500 | 20,154 | ||||||
| COSCO SHIPPING Ports Ltd. | 16,000 | 10,353 | ||||||
| Country Garden Holdings Co. Ltd. | 27,000 | 7,970 | ||||||
| Country Garden Services Holdings Co. Ltd. | 1,000 | 1,965 | ||||||
| CSPC Pharmaceutical Group Ltd. | 50,000 | 50,721 | ||||||
| CSSC Hong Kong Shipping Co. Ltd. | 10,000 | 1,690 | ||||||
| Dali Foods Group Co. Ltd. | 15,500 | 7,086 | ||||||
Daqo New Energy Corp., ADR(1) | 724 | 48,269 | ||||||
Differ Group Auto Ltd.(1) | 4,000 | 1,008 | ||||||
| Digital China Holdings Ltd. | 7,000 | 3,123 | ||||||
| Dongfeng Motor Group Co. Ltd., Class H | 22,000 | 13,949 | ||||||
DouYu International Holdings Ltd., ADR(1) | 317 | 476 | ||||||
| Dynagreen Environmental Protection Group Co. Ltd., H Shares | 1,000 | 367 | ||||||
E-House China Enterprise Holdings Ltd.(1) | 5,100 | 446 | ||||||
| EVA Precision Industrial Holdings Ltd. | 10,000 | 1,913 | ||||||
Everest Medicines Ltd.(1) | 500 | 756 | ||||||
| Excellence Commercial Property & Facilities Management Group Ltd. | 3,000 | 1,247 | ||||||
FIH Mobile Ltd.(1) | 33,000 | 4,275 | ||||||
| FinVolution Group, ADR | 2,083 | 10,248 | ||||||
| First Tractor Co. Ltd., H Shares | 2,000 | 801 | ||||||
16
| Avantis Responsible Emerging Markets Equity ETF | ||||||||
| Shares | Value | |||||||
| Fu Shou Yuan International Group Ltd. | 12,000 | $ | 7,667 | |||||
| Fuyao Glass Industry Group Co. Ltd., H Shares | 2,400 | 11,452 | ||||||
| Ganfeng Lithium Co. Ltd., H Shares | 480 | 4,217 | ||||||
GCL New Energy Holdings Ltd.(1) | 74,000 | 827 | ||||||
GDS Holdings Ltd., Class A(1) | 4,000 | 13,661 | ||||||
| Geely Automobile Holdings Ltd. | 33,000 | 66,304 | ||||||
| Gemdale Properties & Investment Corp. Ltd. | 48,000 | 4,090 | ||||||
| Genertec Universal Medical Group Co. Ltd. | 9,000 | 5,066 | ||||||
| GF Securities Co. Ltd., H Shares | 4,200 | 5,487 | ||||||
Glory Sun Financial Group Ltd.(1) | 80,000 | 365 | ||||||
| Goldpac Group Ltd. | 1,000 | 205 | ||||||
GOME Retail Holdings Ltd.(1) | 15,000 | 468 | ||||||
| Grand Pharmaceutical Group Ltd. | 7,500 | 4,004 | ||||||
| Great Wall Motor Co. Ltd., H Shares | 2,000 | 3,001 | ||||||
| Greenland Hong Kong Holdings Ltd. | 13,000 | 1,353 | ||||||
| Greentown China Holdings Ltd. | 7,500 | 14,151 | ||||||
| Guangzhou Automobile Group Co. Ltd., H Shares | 6,000 | 5,159 | ||||||
| Guangzhou R&F Properties Co. Ltd., H Shares | 12,400 | 2,565 | ||||||
| H World Group Ltd., ADR | 224 | 8,429 | ||||||
Haidilao International Holding Ltd.(1) | 4,000 | 9,412 | ||||||
| Haier Smart Home Co. Ltd., H Shares | 3,200 | 10,454 | ||||||
Hainan Meilan International Airport Co. Ltd., H Shares(1) | 3,000 | 7,064 | ||||||
| Haitian International Holdings Ltd. | 6,000 | 14,700 | ||||||
| Haitong Securities Co. Ltd., H Shares | 10,400 | 6,809 | ||||||
| Hangzhou Tigermed Consulting Co. Ltd., H Shares | 200 | 1,980 | ||||||
| Hansoh Pharmaceutical Group Co. Ltd. | 2,000 | 3,990 | ||||||
| Hello Group, Inc., ADR | 1,032 | 5,315 | ||||||
| Hengan International Group Co. Ltd. | 6,000 | 28,713 | ||||||
Hilong Holding Ltd.(1) | 14,000 | 1,104 | ||||||
| Hisense Home Appliances Group Co. Ltd., H Shares | 1,000 | 1,077 | ||||||
| Hollysys Automation Technologies Ltd. | 651 | 11,087 | ||||||
| Hope Education Group Co. Ltd. | 56,000 | 4,827 | ||||||
Hua Hong Semiconductor Ltd.(1) | 3,000 | 8,806 | ||||||
| Huatai Securities Co. Ltd., H Shares | 10,400 | 13,901 | ||||||
| Huazhong In-Vehicle Holdings Co. Ltd. | 2,000 | 637 | ||||||
| Huijing Holdings Co. Ltd. | 4,000 | 78 | ||||||
HUYA, Inc., ADR(1) | 399 | 1,313 | ||||||
I-Mab, ADR(1) | 14 | 86 | ||||||
iDreamSky Technology Holdings Ltd.(1) | 3,600 | 2,419 | ||||||
| Industrial & Commercial Bank of China Ltd., H Shares | 121,000 | 61,473 | ||||||
Inkeverse Group Ltd.(1) | 3,000 | 491 | ||||||
International Alliance Financial Leasing Co. Ltd.(1) | 9,000 | 4,752 | ||||||
iQIYI, Inc., ADR(1) | 2,529 | 9,256 | ||||||
JD Health International, Inc.(1) | 1,000 | 6,889 | ||||||
| Jiangsu Expressway Co. Ltd., H Shares | 8,000 | 6,852 | ||||||
Jiayuan International Group Ltd.(1) | 10,000 | 275 | ||||||
| Jinchuan Group International Resources Co. Ltd. | 22,000 | 2,374 | ||||||
JinkoSolar Holding Co. Ltd., ADR(1) | 79 | 4,809 | ||||||
| Jinxin Fertility Group Ltd. | 9,000 | 5,861 | ||||||
| Jiumaojiu International Holdings Ltd. | 6,000 | 11,804 | ||||||
| JNBY Design Ltd. | 500 | 544 | ||||||
17
| Avantis Responsible Emerging Markets Equity ETF | ||||||||
| Shares | Value | |||||||
| JOYY, Inc., ADR | 289 | $ | 8,762 | |||||
JW Cayman Therapeutics Co. Ltd.(1) | 2,000 | 1,553 | ||||||
Kandi Technologies Group, Inc.(1) | 223 | 488 | ||||||
Kanzhun Ltd., ADR(1) | 168 | 3,946 | ||||||
KE Holdings, Inc., ADR(1) | 413 | 7,451 | ||||||
| Kingboard Holdings Ltd. | 4,000 | 12,631 | ||||||
| Kingboard Laminates Holdings Ltd. | 7,500 | 7,154 | ||||||
Kingdee International Software Group Co. Ltd.(1) | 1,000 | 1,941 | ||||||
Kingsoft Cloud Holdings Ltd., ADR(1) | 433 | 1,490 | ||||||
| Kingsoft Corp. Ltd. | 4,400 | 13,373 | ||||||
Kuaishou Technology(1) | 1,400 | 12,130 | ||||||
| KWG Group Holdings Ltd. | 6,000 | 1,079 | ||||||
| KWG Living Group Holdings Ltd. | 4,000 | 710 | ||||||
Legend Biotech Corp., ADR(1) | 10 | 465 | ||||||
| Lenovo Group Ltd. | 32,000 | 26,356 | ||||||
LexinFintech Holdings Ltd., ADR(1) | 807 | 1,646 | ||||||
Li Auto, Inc., ADR(1) | 917 | 26,382 | ||||||
| Li Ning Co. Ltd. | 8,500 | 77,421 | ||||||
Lifetech Scientific Corp.(1) | 18,000 | 5,870 | ||||||
Linklogis, Inc., Class B(1) | 1,000 | 672 | ||||||
| Logan Group Co. Ltd. | 2,000 | 218 | ||||||
| Longfor Group Holdings Ltd. | 4,000 | 12,983 | ||||||
| Lonking Holdings Ltd. | 21,000 | 3,556 | ||||||
| Lufax Holding Ltd., ADR | 1,950 | 8,522 | ||||||
Luoyang Glass Co. Ltd., H Shares(1) | 2,000 | 2,780 | ||||||
Luye Pharma Group Ltd.(1) | 8,500 | 2,453 | ||||||
LVGEM China Real Estate Investment Co. Ltd.(1) | 6,000 | 723 | ||||||
Maoyan Entertainment(1) | 1,600 | 1,344 | ||||||
Meitu, Inc.(1) | 7,500 | 797 | ||||||
Meituan, Class B(1) | 2,600 | 62,445 | ||||||
| Midea Real Estate Holding Ltd. | 5,000 | 5,335 | ||||||
| Minth Group Ltd. | 4,000 | 11,319 | ||||||
Mobvista, Inc.(1) | 3,000 | 1,809 | ||||||
Nam Tai Property, Inc.(1) | 45 | 190 | ||||||
| NetDragon Websoft Holdings Ltd. | 3,500 | 7,615 | ||||||
| NetEase, Inc., ADR | 1,248 | 110,460 | ||||||
| New China Life Insurance Co. Ltd., H Shares | 5,100 | 12,004 | ||||||
New Horizon Health Ltd.(1) | 1,500 | 3,835 | ||||||
New Oriental Education & Technology Group, Inc., ADR(1) | 609 | 17,296 | ||||||
| Nexteer Automotive Group Ltd. | 5,000 | 3,716 | ||||||
NIO, Inc., ADR(1) | 1,382 | 27,516 | ||||||
Niu Technologies, ADR(1) | 10 | 60 | ||||||
Noah Holdings Ltd., ADR(1) | 171 | 3,028 | ||||||
| Nongfu Spring Co. Ltd., H Shares | 3,800 | 22,594 | ||||||
| Orient Overseas International Ltd. | 1,000 | 27,875 | ||||||
| People's Insurance Co. Group of China Ltd., H Shares | 35,000 | 10,817 | ||||||
| Pharmaron Beijing Co. Ltd., H Shares | 250 | 1,654 | ||||||
| PICC Property & Casualty Co. Ltd., H Shares | 32,000 | 34,612 | ||||||
Pinduoduo, Inc., ADR(1) | 1,326 | 94,544 | ||||||
Ping An Healthcare and Technology Co. Ltd.(1) | 1,600 | 4,331 | ||||||
| Ping An Insurance Group Co. of China Ltd., H Shares | 17,500 | 102,929 | ||||||
18
| Avantis Responsible Emerging Markets Equity ETF | ||||||||
| Shares | Value | |||||||
| Poly Property Group Co. Ltd. | 15,000 | $ | 3,049 | |||||
| Postal Savings Bank of China Co. Ltd., H Shares | 28,000 | 16,715 | ||||||
Q Technology Group Co. Ltd.(1) | 2,000 | 1,099 | ||||||
| Radiance Holdings Group Co. Ltd. | 7,000 | 3,383 | ||||||
Redco Properties Group Ltd.(1) | 2,000 | 453 | ||||||
Renren, Inc., ADR(1) | 13 | 375 | ||||||
| Sany Heavy Equipment International Holdings Co. Ltd. | 9,000 | 9,323 | ||||||
| SCE Intelligent Commercial Management Holdings Ltd. | 3,000 | 674 | ||||||
Seazen Group Ltd.(1) | 12,000 | 3,983 | ||||||
| Shandong Weigao Group Medical Polymer Co. Ltd., H Shares | 16,400 | 22,248 | ||||||
| Shanghai Fosun Pharmaceutical Group Co. Ltd., H Shares | 500 | 1,609 | ||||||
| Shanghai Pharmaceuticals Holding Co. Ltd., H Shares | 4,000 | 5,815 | ||||||
| Shenzhen Expressway Corp. Ltd., H Shares | 4,000 | 3,502 | ||||||
| Shenzhen International Holdings Ltd. | 18,000 | 15,516 | ||||||
| Shenzhen Investment Ltd. | 22,000 | 4,029 | ||||||
| Shenzhou International Group Holdings Ltd. | 500 | 5,226 | ||||||
Shimao Services Holdings Ltd.(1) | 1,000 | 256 | ||||||
| Shoucheng Holdings Ltd. | 2,000 | 340 | ||||||
| Shui On Land Ltd. | 46,500 | 5,849 | ||||||
| Sihuan Pharmaceutical Holdings Group Ltd. | 26,000 | 3,297 | ||||||
| Simcere Pharmaceutical Group Ltd. | 2,000 | 1,999 | ||||||
| Sino Biopharmaceutical Ltd. | 22,000 | 11,555 | ||||||
| Sino-Ocean Group Holding Ltd. | 14,000 | 2,043 | ||||||
| Sinopec Engineering Group Co. Ltd., H Shares | 20,000 | 8,935 | ||||||
| Sinopharm Group Co. Ltd., H Shares | 8,400 | 18,713 | ||||||
| Sinotruk Hong Kong Ltd. | 4,500 | 4,487 | ||||||
| Skyworth Group Ltd. | 10,000 | 4,968 | ||||||
SOHO China Ltd.(1) | 18,000 | 3,205 | ||||||
Sohu.com Ltd., ADR(1) | 292 | 5,203 | ||||||
South Manganese Investment Ltd.(1) | 17,000 | 1,897 | ||||||
Sun King Technology Group Ltd.(1) | 2,000 | 568 | ||||||
| Sunny Optical Technology Group Co. Ltd. | 1,900 | 25,940 | ||||||
| SY Holdings Group Ltd. | 2,000 | 1,338 | ||||||
TAL Education Group, ADR(1) | 3,905 | 22,571 | ||||||
| TCL Electronics Holdings Ltd. | 7,000 | 3,344 | ||||||
| Tencent Holdings Ltd. | 5,600 | 231,452 | ||||||
Tencent Music Entertainment Group, ADR(1) | 2,052 | 10,486 | ||||||
| Tianneng Power International Ltd. | 8,000 | 8,511 | ||||||
| Times China Holdings Ltd. | 4,000 | 594 | ||||||
| Tingyi Cayman Islands Holding Corp. | 14,000 | 24,860 | ||||||
| Tong Ren Tang Technologies Co. Ltd., H Shares | 7,000 | 4,948 | ||||||
Tongcheng Travel Holdings Ltd.(1) | 8,000 | 16,385 | ||||||
| Topsports International Holdings Ltd. | 16,000 | 12,629 | ||||||
| TravelSky Technology Ltd., H Shares | 8,000 | 13,943 | ||||||
Trip.com Group Ltd., ADR(1) | 952 | 24,485 | ||||||
| Truly International Holdings Ltd. | 16,000 | 3,505 | ||||||
| Tsaker New Energy Tech Co. Ltd. | 4,000 | 716 | ||||||
| Tsingtao Brewery Co. Ltd., H Shares | 2,000 | 19,422 | ||||||
Tuya, Inc., ADR(1) | 480 | 634 | ||||||
| Uni-President China Holdings Ltd. | 12,000 | 10,331 | ||||||
Up Fintech Holding Ltd., ADR(1) | 446 | 1,681 | ||||||
19
| Avantis Responsible Emerging Markets Equity ETF | ||||||||
| Shares | Value | |||||||
Venus MedTech Hangzhou, Inc., H Shares(1) | 500 | $ | 870 | |||||
| Vinda International Holdings Ltd. | 4,000 | 11,180 | ||||||
Vipshop Holdings Ltd., ADR(1) | 4,230 | 49,110 | ||||||
Viva Biotech Holdings(1) | 2,500 | 589 | ||||||
VNET Group, Inc., ADR(1) | 581 | 3,108 | ||||||
| Want Want China Holdings Ltd. | 34,000 | 23,950 | ||||||
Weibo Corp., ADR(1) | 336 | 6,952 | ||||||
| Weichai Power Co. Ltd., H Shares | 4,000 | 5,344 | ||||||
| Wharf Holdings Ltd. | 9,000 | 33,894 | ||||||
| Wuling Motors Holdings Ltd. | 10,000 | 1,319 | ||||||
| WuXi AppTec Co. Ltd., H Shares | 300 | 3,387 | ||||||
Wuxi Biologics Cayman, Inc.(1) | 3,000 | 26,466 | ||||||
Xiabuxiabu Catering Management China Holdings Co. Ltd.(1) | 5,500 | 2,590 | ||||||
| Xiamen International Port Co. Ltd., H Shares | 16,000 | 4,534 | ||||||
| Xinjiang Goldwind Science & Technology Co. Ltd., H Shares | 6,400 | 9,537 | ||||||
Xinjiang Xinxin Mining Industry Co. Ltd., H Shares(1) | 4,000 | 598 | ||||||
| Xinte Energy Co. Ltd., H Shares | 2,000 | 5,219 | ||||||
XPeng, Inc., Class A, ADR(1) | 311 | 5,760 | ||||||
| XTEP International Holdings Ltd. | 11,500 | 15,958 | ||||||
| Yadea Group Holdings Ltd. | 10,000 | 19,074 | ||||||
YiChang HEC ChangJiang Pharmaceutical Co. Ltd., H Shares(1) | 200 | 127 | ||||||
Yihai International Holding Ltd.(1) | 2,000 | 5,037 | ||||||
Yixin Group Ltd.(1) | 13,000 | 1,616 | ||||||
Youdao, Inc., ADR(1) | 12 | 64 | ||||||
| Yuexiu Property Co. Ltd. | 14,000 | 17,511 | ||||||
| Yuexiu Transport Infrastructure Ltd. | 12,000 | 5,742 | ||||||
| Yum China Holdings, Inc. | 2,042 | 102,325 | ||||||
| Yuzhou Group Holdings Co. Ltd. | 10,000 | 432 | ||||||
Zengame Technology Holding Ltd.(1) | 4,000 | 768 | ||||||
| Zhejiang Expressway Co. Ltd., H Shares | 14,000 | 10,656 | ||||||
Zhenro Properties Group Ltd.(1) | 8,000 | 370 | ||||||
| Zhongliang Holdings Group Co. Ltd. | 4,500 | 378 | ||||||
| Zhongsheng Group Holdings Ltd. | 3,500 | 16,549 | ||||||
| Zhongyu Energy Holdings Ltd. | 2,000 | 1,642 | ||||||
Zhou Hei Ya International Holdings Co. Ltd.(1) | 11,000 | 5,495 | ||||||
Zhuguang Holdings Group Co. Ltd.(1) | 2,000 | 254 | ||||||
| Zoomlion Heavy Industry Science and Technology Co. Ltd., Class H | 7,400 | 3,336 | ||||||
| ZTO Express Cayman, Inc., ADR | 1,722 | 44,858 | ||||||
| 3,775,250 | ||||||||
| Colombia — 0.2% | ||||||||
| Bancolombia SA | 708 | 5,467 | ||||||
| Bancolombia SA, ADR | 316 | 8,674 | ||||||
| Interconexion Electrica SA ESP | 1,923 | 8,324 | ||||||
| 22,465 | ||||||||
| Czech Republic — 0.1% | ||||||||
| Komercni banka AS | 425 | 9,954 | ||||||
| Moneta Money Bank AS | 3,008 | 9,544 | ||||||
| 19,498 | ||||||||
| Egypt — 0.1% | ||||||||
| Commercial International Bank Egypt S.A.E., GDR | 4,575 | 8,034 | ||||||
20
| Avantis Responsible Emerging Markets Equity ETF | ||||||||
| Shares | Value | |||||||
| Greece — 0.4% | ||||||||
Aegean Airlines SA(1) | 98 | $ | 481 | |||||
Alpha Services & Holdings SA(1) | 6,966 | 6,433 | ||||||
Eurobank Ergasias Services and Holdings SA, Class A(1) | 7,327 | 6,798 | ||||||
| Hellenic Telecommunications Organization SA | 375 | 5,966 | ||||||
| Holding Co. ADMIE IPTO SA | 54 | 97 | ||||||
| JUMBO SA | 534 | 7,634 | ||||||
LAMDA Development SA(1) | 787 | 4,673 | ||||||
National Bank of Greece SA(1) | 2,075 | 6,696 | ||||||
Piraeus Financial Holdings SA(1) | 4,523 | 4,734 | ||||||
| Terna Energy SA | 312 | 5,565 | ||||||
| Viohalco SA | 74 | 255 | ||||||
| 49,332 | ||||||||
Hong Kong† | ||||||||
| Edvantage Group Holdings Ltd. | 2,000 | 595 | ||||||
| Hungary — 0.2% | ||||||||
| Magyar Telekom Telecommunications PLC | 1,410 | 1,197 | ||||||
| OTP Bank Nyrt | 593 | 12,611 | ||||||
| Richter Gedeon Nyrt | 381 | 7,682 | ||||||
| 21,490 | ||||||||
| India — 17.3% | ||||||||
3i Infotech Ltd.(1) | 335 | 183 | ||||||
3M India Ltd.(1) | 2 | 582 | ||||||
| Aarti Industries Ltd. | 393 | 4,056 | ||||||
| Acrysil Ltd. | 30 | 259 | ||||||
| Action Construction Equipment Ltd. | 218 | 684 | ||||||
Adani Green Energy Ltd.(1) | 464 | 14,020 | ||||||
| Adani Ports & Special Economic Zone Ltd. | 1,290 | 13,497 | ||||||
Aditya Birla Capital Ltd.(1) | 2,590 | 3,658 | ||||||
Aditya Birla Fashion and Retail Ltd.(1) | 258 | 980 | ||||||
Affle India Ltd.(1) | 8 | 129 | ||||||
| AGI Greenpac Ltd. | 487 | 1,898 | ||||||
| AIA Engineering Ltd. | 190 | 6,178 | ||||||
| Alkyl Amines Chemicals | 58 | 2,141 | ||||||
| Allcargo Logistics Ltd. | 743 | 3,301 | ||||||
Alok Industries Ltd.(1) | 1,758 | 422 | ||||||
| Amara Raja Batteries Ltd. | 838 | 5,316 | ||||||
| Ambika Cotton Mills Ltd. | 30 | 665 | ||||||
| Anant Raj Ltd. | 349 | 377 | ||||||
| Andhra Sugars Ltd. | 371 | 674 | ||||||
| Apar Industries Ltd. | 293 | 4,882 | ||||||
| Apcotex Industries Ltd. | 9 | 66 | ||||||
| Apex Frozen Foods Ltd. | 40 | 167 | ||||||
APL Apollo Tubes Ltd.(1) | 706 | 8,302 | ||||||
| Apollo Hospitals Enterprise Ltd. | 150 | 8,059 | ||||||
Apollo Pipes Ltd.(1) | 31 | 212 | ||||||
| Apollo Tyres Ltd. | 3,478 | 10,851 | ||||||
| Aptech Ltd. | 176 | 550 | ||||||
Arvind Ltd.(1) | 1,525 | 1,852 | ||||||
| Asahi India Glass Ltd. | 209 | 1,659 | ||||||
| Ashapura Minechem Ltd. | 143 | 185 | ||||||
21
| Avantis Responsible Emerging Markets Equity ETF | ||||||||
| Shares | Value | |||||||
| Ashok Leyland Ltd. | 6,940 | $ | 13,274 | |||||
Ashoka Buildcon Ltd.(1) | 570 | 568 | ||||||
| Asian Paints Ltd. | 303 | 12,756 | ||||||
Aster DM Healthcare Ltd.(1) | 1,401 | 3,863 | ||||||
| Astra Microwave Products Ltd. | 33 | 145 | ||||||
| Astral Ltd. | 182 | 4,732 | ||||||
| AU Small Finance Bank Ltd. | 758 | 5,961 | ||||||
| Aurobindo Pharma Ltd. | 2,222 | 15,128 | ||||||
| Avadh Sugar & Energy Ltd. | 127 | 847 | ||||||
Avenue Supermarts Ltd.(1) | 118 | 6,633 | ||||||
| Axis Bank Ltd., GDR | 521 | 24,683 | ||||||
| Bajaj Auto Ltd. | 217 | 11,053 | ||||||
| Bajaj Consumer Care Ltd. | 1,241 | 2,499 | ||||||
| Bajaj Electricals Ltd. | 412 | 6,353 | ||||||
| Bajaj Finance Ltd. | 277 | 25,000 | ||||||
| Bajaj Finserv Ltd. | 36 | 7,547 | ||||||
Bajaj Hindusthan Sugar Ltd.(1) | 10,011 | 1,244 | ||||||
| Balaji Amines Ltd. | 64 | 2,747 | ||||||
| Balaji Telefilms Ltd. | 116 | 78 | ||||||
| Balkrishna Industries Ltd. | 277 | 7,037 | ||||||
| Balrampur Chini Mills Ltd. | 1,456 | 6,350 | ||||||
Bandhan Bank Ltd.(1) | 3,225 | 11,130 | ||||||
| BASF India Ltd. | 80 | 3,306 | ||||||
| Bata India Ltd. | 51 | 1,233 | ||||||
| BEML Ltd. | 22 | 505 | ||||||
| Berger Paints India Ltd. | 323 | 2,701 | ||||||
BF Utilities Ltd.(1) | 24 | 120 | ||||||
| Bhansali Engineering Polymers Ltd. | 218 | 344 | ||||||
| Bharat Electronics Ltd. | 8,834 | 33,755 | ||||||
| Bharat Forge Ltd. | 766 | 7,052 | ||||||
Bharat Heavy Electricals Ltd.(1) | 4,607 | 3,366 | ||||||
| Bharat Rasayan Ltd. | 9 | 1,357 | ||||||
| Biocon Ltd. | 314 | 1,215 | ||||||
| Birlasoft Ltd. | 848 | 3,355 | ||||||
| BLS International Services Ltd. | 48 | 154 | ||||||
| Blue Dart Express Ltd. | 24 | 2,561 | ||||||
| Blue Star Ltd. | 294 | 4,033 | ||||||
| Bodal Chemicals Ltd. | 231 | 267 | ||||||
Bombay Dyeing & Manufacturing Co. Ltd.(1) | 90 | 112 | ||||||
Borosil Renewables Ltd.(1) | 349 | 2,441 | ||||||
| Brigade Enterprises Ltd. | 1,316 | 8,357 | ||||||
| Brightcom Group Ltd. | 2,690 | 1,364 | ||||||
| Britannia Industries Ltd. | 328 | 15,348 | ||||||
| BSE Ltd. | 830 | 6,717 | ||||||
| Butterfly Gandhimathi Appliances Ltd. | 2 | 38 | ||||||
| Can Fin Homes Ltd. | 452 | 3,556 | ||||||
| Cantabil Retail India Ltd. | 11 | 211 | ||||||
| Caplin Point Laboratories Ltd. | 162 | 1,577 | ||||||
| Carborundum Universal Ltd. | 372 | 3,915 | ||||||
| Care Ratings Ltd. | 127 | 799 | ||||||
| CCL Products India Ltd. | 757 | 4,529 | ||||||
22
| Avantis Responsible Emerging Markets Equity ETF | ||||||||
| Shares | Value | |||||||
| Ceat Ltd. | 286 | $ | 4,954 | |||||
| Central Depository Services India Ltd. | 24 | 371 | ||||||
| Century Enka Ltd. | 40 | 230 | ||||||
| Cera Sanitaryware Ltd. | 39 | 2,430 | ||||||
CG Power & Industrial Solutions Ltd.(1) | 641 | 1,785 | ||||||
Chalet Hotels Ltd.(1) | 51 | 205 | ||||||
| Chennai Petroleum Corp. Ltd. | 934 | 3,399 | ||||||
| Cholamandalam Financial Holdings Ltd. | 208 | 1,737 | ||||||
| Cholamandalam Investment and Finance Co. Ltd. | 2,135 | 20,917 | ||||||
| Cigniti Technologies Ltd. | 36 | 262 | ||||||
| Cipla Ltd. | 1,982 | 25,683 | ||||||
| City Union Bank Ltd. | 3,805 | 8,515 | ||||||
| Cochin Shipyard Ltd. | 396 | 1,862 | ||||||
| Coforge Ltd. | 63 | 2,777 | ||||||
| Colgate-Palmolive India Ltd. | 599 | 12,577 | ||||||
| Computer Age Management Services Ltd. | 201 | 5,747 | ||||||
| Confidence Petroleum India Ltd. | 270 | 220 | ||||||
| Container Corp. of India Ltd. | 1,075 | 9,325 | ||||||
| Cosmo Films Ltd. | 177 | 2,021 | ||||||
CreditAccess Grameen Ltd.(1) | 641 | 7,934 | ||||||
| CRISIL Ltd. | 66 | 2,698 | ||||||
| Crompton Greaves Consumer Electricals Ltd. | 988 | 5,027 | ||||||
| Cummins India Ltd. | 408 | 6,059 | ||||||
| Cyient Ltd. | 944 | 9,885 | ||||||
| Dabur India Ltd. | 1,009 | 7,357 | ||||||
| Dalmia Bharat Sugar & Industries Ltd. | 176 | 760 | ||||||
| Datamatics Global Services Ltd. | 138 | 521 | ||||||
| DCB Bank Ltd. | 1,457 | 1,709 | ||||||
| DCM Shriram Ltd. | 394 | 5,142 | ||||||
| Deepak Fertilisers & Petrochemicals Corp. Ltd. | 868 | 9,811 | ||||||
DEN Networks Ltd.(1) | 481 | 220 | ||||||
Dhani Services Ltd.(1) | 1,040 | 840 | ||||||
Dish TV India Ltd.(1) | 6,287 | 941 | ||||||
Dishman Carbogen Amcis Ltd.(1) | 161 | 234 | ||||||
| Divi's Laboratories Ltd. | 348 | 15,712 | ||||||
| Dixon Technologies India Ltd. | 21 | 1,068 | ||||||
| DLF Ltd. | 1,481 | 7,154 | ||||||
| Dollar Industries Ltd. | 80 | 471 | ||||||
| Dr Lal PathLabs Ltd. | 140 | 4,460 | ||||||
| Dr Reddy's Laboratories Ltd., ADR | 447 | 23,374 | ||||||
| eClerx Services Ltd. | 85 | 2,232 | ||||||
| Edelweiss Financial Services Ltd. | 3,272 | 2,478 | ||||||
| Eicher Motors Ltd. | 748 | 31,218 | ||||||
EIH Ltd.(1) | 281 | 560 | ||||||
| Elecon Engineering Co. Ltd. | 688 | 3,203 | ||||||
| Electrosteel Castings Ltd. | 1,506 | 689 | ||||||
| Emami Ltd. | 1,598 | 9,673 | ||||||
| Endurance Technologies Ltd. | 101 | 1,885 | ||||||
| Engineers India Ltd. | 2,483 | 2,103 | ||||||
| EPL Ltd. | 773 | 1,643 | ||||||
Equitas Holdings Ltd.(1) | 1,599 | 1,987 | ||||||
23
| Avantis Responsible Emerging Markets Equity ETF | ||||||||
| Shares | Value | |||||||
| Eris Lifesciences Ltd. | 140 | $ | 1,209 | |||||
| Escorts Kubota Ltd. | 296 | 7,379 | ||||||
Eveready Industries India Ltd.(1) | 349 | 1,548 | ||||||
| Everest Industries Ltd. | 78 | 685 | ||||||
| Everest Kanto Cylinder Ltd. | 75 | 109 | ||||||
| Excel Industries Ltd. | 24 | 435 | ||||||
| Exide Industries Ltd. | 4,045 | 8,077 | ||||||
FDC Ltd.(1) | 41 | 135 | ||||||
| FIEM Industries Ltd. | 69 | 1,283 | ||||||
| Filatex India Ltd. | 645 | 903 | ||||||
| Fine Organic Industries Ltd. | 11 | 847 | ||||||
| Finolex Cables Ltd. | 270 | 1,550 | ||||||
| Finolex Industries Ltd. | 2,058 | 3,888 | ||||||
| Firstsource Solutions Ltd. | 332 | 441 | ||||||
Future Consumer Ltd.(1) | 2,618 | 55 | ||||||
Future Retail Ltd.(1) | 209 | 10 | ||||||
| Gabriel India Ltd. | 485 | 951 | ||||||
| Galaxy Surfactants Ltd. | 65 | 2,657 | ||||||
Ganesh Housing Corp. Ltd.(1) | 109 | 483 | ||||||
| Ganesha Ecosphere Ltd. | 26 | 210 | ||||||
| Garden Reach Shipbuilders & Engineers Ltd. | 425 | 1,588 | ||||||
| Garware Technical Fibres Ltd. | 46 | 2,003 | ||||||
| Genus Power Infrastructures Ltd. | 942 | 986 | ||||||
| Geojit Financial Services Ltd. | 339 | 193 | ||||||
| GHCL Ltd. | 1,095 | 8,144 | ||||||
| GlaxoSmithKline Pharmaceuticals Ltd. | 251 | 4,579 | ||||||
| Glenmark Pharmaceuticals Ltd. | 1,382 | 6,401 | ||||||
| Globus Spirits Ltd. | 96 | 1,040 | ||||||
| Godrej Agrovet Ltd. | 38 | 248 | ||||||
Godrej Consumer Products Ltd.(1) | 445 | 5,126 | ||||||
Godrej Properties Ltd.(1) | 33 | 576 | ||||||
Gokaldas Exports Ltd.(1) | 314 | 1,407 | ||||||
| Graphite India Ltd. | 578 | 2,959 | ||||||
| Greaves Cotton Ltd. | 764 | 1,610 | ||||||
| Greenpanel Industries Ltd. | 376 | 2,098 | ||||||
| Greenply Industries Ltd. | 546 | 1,278 | ||||||
GTL Infrastructure Ltd.(1) | 7,553 | 127 | ||||||
| Gufic Biosciences Ltd. | 77 | 202 | ||||||
| Gujarat Alkalies & Chemicals Ltd. | 257 | 2,835 | ||||||
| Gujarat Fluorochemicals Ltd. | 6 | 249 | ||||||
| Gujarat Narmada Valley Fertilizers & Chemicals Ltd. | 1,197 | 11,139 | ||||||
| Gujarat Pipavav Port Ltd. | 2,004 | 2,176 | ||||||
| Gujarat State Fertilizers & Chemicals Ltd. | 3,256 | 6,384 | ||||||
| Happiest Minds Technologies Ltd. | 51 | 648 | ||||||
Hathway Cable & Datacom Ltd.(1) | 3,874 | 862 | ||||||
| Havells India Ltd. | 168 | 2,908 | ||||||
| HBL Power Systems Ltd. | 2,016 | 2,032 | ||||||
| HCL Technologies Ltd. | 3,012 | 35,035 | ||||||
| HDFC Asset Management Co. Ltd. | 115 | 2,967 | ||||||
| HDFC Life Insurance Co. Ltd. | 947 | 6,786 | ||||||
| HEG Ltd. | 98 | 1,533 | ||||||
24
| Avantis Responsible Emerging Markets Equity ETF | ||||||||
| Shares | Value | |||||||
| Heritage Foods Ltd. | 24 | $ | 97 | |||||
| Hero MotoCorp Ltd. | 465 | 16,380 | ||||||
| HFCL Ltd. | 5,119 | 4,700 | ||||||
| HG Infra Engineering Ltd. | 123 | 918 | ||||||
| HIL Ltd. | 34 | 1,568 | ||||||
| Himadri Speciality Chemical Ltd., ADR | 515 | 630 | ||||||
Himatsingka Seide Ltd.(1) | 231 | 302 | ||||||
Hindustan Construction Co. Ltd.(1) | 1,773 | 282 | ||||||
Hindustan Oil Exploration Co. Ltd.(1) | 35 | 71 | ||||||
| Hindustan Unilever Ltd. | 837 | 27,710 | ||||||
| Hindware Home Innovation Ltd. | 224 | 908 | ||||||
| Hitachi Energy India Ltd. | 14 | 652 | ||||||
| Housing Development Finance Corp. Ltd. | 3,515 | 106,418 | ||||||
| ICICI Bank Ltd., ADR | 2,255 | 49,249 | ||||||
| ICICI Lombard General Insurance Co. Ltd. | 324 | 5,205 | ||||||
| ICICI Prudential Life Insurance Co. Ltd. | 460 | 3,396 | ||||||
IDFC First Bank Ltd.(1) | 12,604 | 7,672 | ||||||
IFCI Ltd.(1) | 4,034 | 549 | ||||||
| IIFL Finance Ltd. | 1,872 | 8,018 | ||||||
| IIFL Securities Ltd. | 789 | 704 | ||||||
| IIFL Wealth Management Ltd. | 201 | 4,197 | ||||||
| India Glycols Ltd. | 91 | 1,009 | ||||||
Indiabulls Housing Finance Ltd.(1) | 2,134 | 3,599 | ||||||
Indiabulls Real Estate Ltd.(1) | 3,275 | 3,521 | ||||||
| Indian Energy Exchange Ltd. | 1,415 | 2,820 | ||||||
| Indian Metals & Ferro Alloys Ltd. | 35 | 120 | ||||||
| Indian Railway Catering & Tourism Corp. Ltd. | 133 | 1,167 | ||||||
| Indo Count Industries Ltd. | 105 | 214 | ||||||
Indo Rama Synthetics India Ltd(1) | 481 | 374 | ||||||
| Indoco Remedies Ltd. | 20 | 89 | ||||||
| Indus Towers Ltd. | 4,172 | 10,375 | ||||||
| INEOS Styrolution India Ltd. | 34 | 392 | ||||||
| Infibeam Avenues Ltd. | 814 | 160 | ||||||
| Info Edge India Ltd. | 50 | 2,690 | ||||||
| Infosys Ltd., ADR | 6,772 | 123,928 | ||||||
Inox Wind Ltd.(1) | 156 | 216 | ||||||
Insecticides India Ltd.(1) | 90 | 1,136 | ||||||
| Intellect Design Arena Ltd. | 565 | 4,147 | ||||||
InterGlobe Aviation Ltd.(1) | 93 | 2,322 | ||||||
| IOL Chemicals and Pharmaceuticals Ltd. | 258 | 1,154 | ||||||
| ISGEC Heavy Engineering Ltd. | 33 | 197 | ||||||
| ITD Cementation India Ltd. | 163 | 215 | ||||||
| J Kumar Infraprojects Ltd. | 871 | 3,231 | ||||||
| Jai Corp. Ltd. | 533 | 869 | ||||||
Jain Irrigation Systems Ltd.(1) | 2,789 | 1,404 | ||||||
Jaiprakash Associates Ltd.(1) | 6,016 | 614 | ||||||
Jaiprakash Power Ventures Ltd.(1) | 31,117 | 2,910 | ||||||
Jammu & Kashmir Bank Ltd.(1) | 2,604 | 1,024 | ||||||
| Jamna Auto Industries Ltd. | 2,306 | 3,345 | ||||||
| Jindal Poly Films Ltd. | 165 | 2,160 | ||||||
| JK Paper Ltd. | 1,226 | 6,370 | ||||||
25
| Avantis Responsible Emerging Markets Equity ETF | ||||||||
| Shares | Value | |||||||
| JK Tyre & Industries Ltd. | 1,109 | $ | 1,922 | |||||
| JM Financial Ltd. | 3,659 | 2,906 | ||||||
JSW Ispat Special Products Ltd.(1) | 633 | 223 | ||||||
| Jubilant Foodworks Ltd. | 1,429 | 10,885 | ||||||
| Jubilant Ingrevia Ltd. | 51 | 296 | ||||||
| Jubilant Pharmova Ltd. | 241 | 1,055 | ||||||
Just Dial Ltd.(1) | 23 | 169 | ||||||
| Jyothy Labs Ltd. | 831 | 1,959 | ||||||
| Kajaria Ceramics Ltd. | 389 | 5,641 | ||||||
| Kansai Nerolac Paints Ltd. | 113 | 713 | ||||||
| Karnataka Bank Ltd. | 2,387 | 2,223 | ||||||
| Karur Vysya Bank Ltd. | 5,479 | 4,655 | ||||||
| KEC International Ltd. | 1,170 | 5,939 | ||||||
| KEI Industries Ltd. | 97 | 1,768 | ||||||
| Kellton Tech Solutions Ltd. | 119 | 102 | ||||||
Kiri Industries Ltd.(1) | 107 | 654 | ||||||
| Kirloskar Ferrous Industries Ltd. | 607 | 1,918 | ||||||
| Kitex Garments Ltd. | 301 | 858 | ||||||
| KNR Constructions Ltd. | 1,170 | 3,795 | ||||||
| Kolte-Patil Developers Ltd. | 131 | 502 | ||||||
| Kotak Mahindra Bank Ltd. | 1,014 | 24,056 | ||||||
| KPIT Technologies Ltd. | 264 | 1,824 | ||||||
| KPR Mill Ltd. | 458 | 3,444 | ||||||
| KRBL Ltd. | 598 | 2,345 | ||||||
Lemon Tree Hotels Ltd.(1) | 409 | 354 | ||||||
| LG Balakrishnan & Bros Ltd. | 94 | 815 | ||||||
| LIC Housing Finance Ltd. | 3,127 | 15,889 | ||||||
| Linde India Ltd. | 87 | 3,713 | ||||||
| LT Foods Ltd. | 1,149 | 1,362 | ||||||
| Lupin Ltd. | 1,004 | 8,390 | ||||||
| LUX Industries Ltd. | 48 | 1,087 | ||||||
| Maharashtra Seamless Ltd. | 210 | 2,194 | ||||||
| Mahindra & Mahindra Financial Services Ltd. | 5,394 | 13,738 | ||||||
| Mahindra & Mahindra Ltd. | 2,774 | 45,024 | ||||||
| Mahindra CIE Automotive Ltd. | 1,355 | 4,629 | ||||||
| Mahindra Lifespace Developers Ltd. | 220 | 1,422 | ||||||
| Mahindra Logistics Ltd. | 31 | 186 | ||||||
| Maithan Alloys Ltd. | 69 | 888 | ||||||
| Man Infraconstruction Ltd. | 158 | 178 | ||||||
| Manali Petrochemicals Ltd. | 1,472 | 1,691 | ||||||
| Manappuram Finance Ltd. | 3,576 | 4,698 | ||||||
| Marico Ltd. | 1,356 | 8,902 | ||||||
| Marksans Pharma Ltd. | 1,394 | 906 | ||||||
| Maruti Suzuki India Ltd. | 267 | 30,117 | ||||||
| MAS Financial Services Ltd. | 72 | 674 | ||||||
| Mastek Ltd. | 56 | 1,312 | ||||||
| Mayur Uniquoters Ltd. | 41 | 248 | ||||||
Meghmani Finechem Ltd.(1) | 203 | 3,597 | ||||||
| Meghmani Organics Ltd. | 1,526 | 2,317 | ||||||
| Metropolis Healthcare Ltd. | 81 | 1,444 | ||||||
| Minda Corp. Ltd. | 307 | 858 | ||||||
26
| Avantis Responsible Emerging Markets Equity ETF | ||||||||
| Shares | Value | |||||||
Mirza International Ltd.(1) | 663 | $ | 2,631 | |||||
| Mishra Dhatu Nigam Ltd. | 309 | 768 | ||||||
| MOIL Ltd. | 132 | 270 | ||||||
| Monte Carlo Fashions Ltd. | 87 | 897 | ||||||
| Motherson Sumi Wiring India Ltd. | 1,051 | 1,068 | ||||||
| Motilal Oswal Financial Services Ltd. | 299 | 2,866 | ||||||
| Mphasis Ltd. | 366 | 9,629 | ||||||
| MRF Ltd. | 11 | 11,725 | ||||||
| Mrs Bectors Food Specialities Ltd. | 120 | 521 | ||||||
| MSTC Ltd. | 182 | 618 | ||||||
| Multi Commodity Exchange of India Ltd. | 6 | 96 | ||||||
| Muthoot Finance Ltd. | 558 | 7,310 | ||||||
| Narayana Hrudayalaya Ltd. | 167 | 1,460 | ||||||
| Natco Pharma Ltd. | 452 | 3,476 | ||||||
| National Aluminium Co. Ltd. | 4,225 | 4,207 | ||||||
National Fertilizers Ltd.(1) | 712 | 445 | ||||||
| Nava Ltd. | 1,023 | 2,881 | ||||||
| NBCC India Ltd. | 4,351 | 1,862 | ||||||
| Neogen Chemicals Ltd. | 29 | 535 | ||||||
| Nestle India Ltd. | 80 | 19,918 | ||||||
| Neuland Laboratories Ltd. | 10 | 158 | ||||||
| Newgen Software Technologies Ltd. | 110 | 537 | ||||||
| NIIT Ltd. | 525 | 2,259 | ||||||
| Nippon Life India Asset Management Ltd. | 804 | 3,023 | ||||||
| NOCIL Ltd. | 855 | 2,805 | ||||||
| Oberoi Realty Ltd. | 508 | 6,350 | ||||||
Olectra Greentech Ltd.(1) | 242 | 1,860 | ||||||
Omaxe Ltd.(1) | 298 | 369 | ||||||
| OnMobile Global Ltd. | 473 | 729 | ||||||
| Oracle Financial Services Software Ltd. | 176 | 6,953 | ||||||
| Orient Cement Ltd. | 1,177 | 1,756 | ||||||
| Orient Electric Ltd. | 781 | 2,531 | ||||||
| Page Industries Ltd. | 21 | 13,379 | ||||||
| Paisalo Digital Ltd. | 250 | 234 | ||||||
| Panama Petrochem Ltd. | 251 | 1,013 | ||||||
PC Jeweller Ltd.(1) | 3,055 | 2,710 | ||||||
| PCBL Ltd. | 2,264 | 3,870 | ||||||
| Persistent Systems Ltd. | 210 | 9,133 | ||||||
PG Electroplast Ltd.(1) | 56 | 624 | ||||||
| Phoenix Mills Ltd. | 121 | 2,116 | ||||||
| PI Industries Ltd. | 152 | 6,499 | ||||||
| Pidilite Industries Ltd. | 146 | 4,984 | ||||||
| Piramal Enterprises Ltd. | 239 | 3,154 | ||||||
Piramal Pharma Ltd.(1) | 956 | 2,621 | ||||||
PNB Housing Finance Ltd.(1) | 488 | 2,117 | ||||||
| Pokarna Ltd. | 11 | 76 | ||||||
| Polycab India Ltd. | 74 | 2,270 | ||||||
| Polyplex Corp. Ltd. | 250 | 6,687 | ||||||
| Poonawalla Fincorp Ltd. | 37 | 140 | ||||||
| Power Grid Corp. of India Ltd. | 14,833 | 42,468 | ||||||
Power Mech Projects Ltd.(1) | 38 | 668 | ||||||
27
| Avantis Responsible Emerging Markets Equity ETF | ||||||||
| Shares | Value | |||||||
| Praj Industries Ltd. | 1,308 | $ | 6,803 | |||||
Prakash Industries Ltd.(1) | 468 | 327 | ||||||
| Prestige Estates Projects Ltd. | 567 | 3,220 | ||||||
Pricol Ltd.(1) | 1,179 | 2,536 | ||||||
| Prince Pipes & Fittings Ltd. | 312 | 2,274 | ||||||
| Privi Speciality Chemicals Ltd. | 37 | 640 | ||||||
| Procter & Gamble Health Ltd. | 4 | 211 | ||||||
| PSP Projects Ltd. | 83 | 627 | ||||||
| PTC India Ltd. | 2,192 | 2,314 | ||||||
| Quess Corp. Ltd. | 49 | 349 | ||||||
| Radico Khaitan Ltd. | 329 | 4,284 | ||||||
| Rajesh Exports Ltd. | 131 | 965 | ||||||
| Rallis India Ltd. | 274 | 771 | ||||||
Ramco Systems Ltd.(1) | 27 | 97 | ||||||
| Ramkrishna Forgings Ltd. | 143 | 355 | ||||||
| Rashtriya Chemicals & Fertilizers Ltd. | 2,073 | 2,550 | ||||||
RattanIndia Power Ltd.(1) | 2,552 | 125 | ||||||
| Raymond Ltd. | 534 | 6,362 | ||||||
RBL Bank Ltd.(1) | 1,741 | 2,628 | ||||||
| REC Ltd. | 11,504 | 15,620 | ||||||
| Redington India Ltd. | 4,653 | 8,682 | ||||||
| Relaxo Footwears Ltd. | 151 | 1,884 | ||||||
| Reliance Industrial Infrastructure Ltd. | 30 | 380 | ||||||
Religare Enterprises Ltd.(1) | 56 | 91 | ||||||
| Rhi Magnesita India Ltd. | 246 | 1,809 | ||||||
| Route Mobile Ltd. | 62 | 1,164 | ||||||
| RSWM Ltd. | 144 | 692 | ||||||
| Rupa & Co. Ltd. | 235 | 1,002 | ||||||
| Samvardhana Motherson International Ltd. | 5,286 | 8,063 | ||||||
| Sansera Engineering Ltd. | 57 | 517 | ||||||
| Sarda Energy & Minerals Ltd. | 96 | 1,096 | ||||||
| Saregama India Ltd. | 326 | 1,631 | ||||||
| Satia Industries Ltd. | 456 | 656 | ||||||
| SBI Cards & Payment Services Ltd. | 335 | 3,841 | ||||||
| SBI Life Insurance Co. Ltd. | 538 | 8,891 | ||||||
| Schaeffler India Ltd. | 201 | 7,607 | ||||||
Schneider Electric Infrastructure Ltd.(1) | 102 | 173 | ||||||
SEAMEC Ltd.(1) | 7 | 95 | ||||||
| Sequent Scientific Ltd. | 193 | 271 | ||||||
| Shakti Pumps India Ltd. | 49 | 302 | ||||||
| Shankara Building Products Ltd. | 97 | 922 | ||||||
| Sharda Cropchem Ltd. | 351 | 2,266 | ||||||
| Share India Securities Ltd. | 155 | 2,164 | ||||||
| Shipping Corp. of India Ltd. | 1,242 | 1,824 | ||||||
Shoppers Stop Ltd.(1) | 361 | 2,798 | ||||||
Shree Renuka Sugars Ltd.(1) | 996 | 578 | ||||||
| Shriram City Union Finance Ltd. | 266 | 6,323 | ||||||
| Shriram Transport Finance Co. Ltd. | 1,517 | 25,462 | ||||||
| Siemens Ltd. | 88 | 3,160 | ||||||
| Siyaram Silk Mills Ltd. | 139 | 870 | ||||||
| SKF India Ltd. | 82 | 4,976 | ||||||
28
| Avantis Responsible Emerging Markets Equity ETF | ||||||||
| Shares | Value | |||||||
| Sobha Ltd. | 233 | $ | 2,018 | |||||
| Sonata Software Ltd. | 689 | 6,101 | ||||||
South Indian Bank Ltd.(1) | 9,292 | 952 | ||||||
Southern Petrochemical Industries Corp. Ltd.(1) | 1,412 | 1,074 | ||||||
Spandana Sphoorty Financial Ltd.(1) | 187 | 1,274 | ||||||
| SRF Ltd. | 243 | 7,669 | ||||||
| State Bank of India, GDR | 375 | 24,772 | ||||||
| Steel Strips Wheels Ltd | 30 | 326 | ||||||
Sterling and Wilson Renewable(1) | 333 | 1,229 | ||||||
| Sterlite Technologies Ltd. | 1,461 | 3,115 | ||||||
Stove Kraft Ltd.(1) | 44 | 335 | ||||||
| Sudarshan Chemical Industries Ltd. | 325 | 1,860 | ||||||
| Sumitomo Chemical India Ltd. | 255 | 1,557 | ||||||
| Sun Pharmaceutical Industries Ltd. | 2,729 | 30,456 | ||||||
| Sun TV Network Ltd. | 844 | 5,272 | ||||||
| Sundaram Finance Ltd. | 138 | 3,617 | ||||||
| Sundram Fasteners Ltd. | 523 | 5,454 | ||||||
Sunflag Iron & Steel Co.(1) | 525 | 576 | ||||||
| Sunteck Realty Ltd. | 323 | 1,912 | ||||||
| Suprajit Engineering Ltd. | 837 | 3,541 | ||||||
| Supreme Industries Ltd. | 254 | 6,234 | ||||||
| Surya Roshni Ltd. | 18 | 110 | ||||||
| Suven Pharmaceuticals Ltd. | 645 | 3,950 | ||||||
Suzlon Energy Ltd.(1) | 7,871 | 799 | ||||||
| Syngene International Ltd. | 449 | 3,355 | ||||||
| Tamil Nadu Newsprint & Papers Ltd. | 570 | 1,813 | ||||||
| Tamilnadu Petroproducts Ltd. | 713 | 900 | ||||||
| Tanla Platforms Ltd. | 276 | 2,443 | ||||||
| Tata Coffee Ltd. | 130 | 379 | ||||||
| Tata Communications Ltd. | 432 | 6,461 | ||||||
| Tata Consultancy Services Ltd. | 1,704 | 67,958 | ||||||
| Tata Consumer Products Ltd. | 647 | 6,539 | ||||||
| Tata Elxsi Ltd. | 96 | 10,708 | ||||||
| Tata Investment Corp. Ltd. | 63 | 1,260 | ||||||
| Tata Metaliks Ltd. | 112 | 1,081 | ||||||
Tata Motors Ltd., ADR(1) | 755 | 21,895 | ||||||
| Tata Steel Long Products Ltd. | 18 | 140 | ||||||
Tata Teleservices Maharashtra Ltd.(1) | 595 | 806 | ||||||
| TCI Express Ltd. | 31 | 682 | ||||||
TeamLease Services Ltd.(1) | 66 | 2,796 | ||||||
| Tech Mahindra Ltd. | 1,270 | 16,921 | ||||||
Technocraft Industries India Ltd(1) | 45 | 506 | ||||||
Tejas Networks Ltd.(1) | 62 | 471 | ||||||
| Texmaco Rail & Engineering Ltd. | 1,729 | 1,076 | ||||||
| Thermax Ltd. | 262 | 7,887 | ||||||
| Thirumalai Chemicals Ltd. | 919 | 2,675 | ||||||
Thomas Cook India Ltd.(1) | 224 | 202 | ||||||
| Thyrocare Technologies Ltd. | 49 | 378 | ||||||
| Time Technoplast Ltd. | 2,038 | 3,020 | ||||||
| Tinplate Co. of India Ltd. | 367 | 1,441 | ||||||
Titagarh Wagons Ltd.(1) | 644 | 1,371 | ||||||
29
| Avantis Responsible Emerging Markets Equity ETF | ||||||||
| Shares | Value | |||||||
| Titan Co. Ltd. | 243 | $ | 7,874 | |||||
| Torrent Pharmaceuticals Ltd. | 508 | 9,816 | ||||||
| Transport Corp. of India Ltd. | 155 | 1,379 | ||||||
| Trent Ltd. | 138 | 2,414 | ||||||
| Trident Ltd. | 4,876 | 2,209 | ||||||
| Triveni Engineering & Industries Ltd. | 196 | 573 | ||||||
| Triveni Turbine Ltd. | 635 | 1,617 | ||||||
| TTK Prestige Ltd. | 72 | 862 | ||||||
| Tube Investments of India Ltd. | 450 | 12,688 | ||||||
| TV Today Network Ltd. | 140 | 494 | ||||||
TV18 Broadcast Ltd.(1) | 2,561 | 1,295 | ||||||
| TVS Motor Co. Ltd. | 236 | 2,889 | ||||||
| Uflex Ltd. | 694 | 6,766 | ||||||
Ujjivan Financial Services Ltd.(1) | 265 | 645 | ||||||
United Spirits Ltd.(1) | 973 | 9,835 | ||||||
| UPL Ltd. | 794 | 7,605 | ||||||
| Usha Martin Ltd. | 1,303 | 2,297 | ||||||
| UTI Asset Management Co. Ltd. | 164 | 1,681 | ||||||
VA Tech Wabag Ltd.(1) | 349 | 1,146 | ||||||
| Vaibhav Global Ltd. | 295 | 1,274 | ||||||
| Vakrangee Ltd. | 3,921 | 1,353 | ||||||
Valiant Organics Ltd.(1) | 107 | 792 | ||||||
| Vardhman Textiles Ltd. | 423 | 1,746 | ||||||
Varroc Engineering Ltd.(1) | 466 | 1,992 | ||||||
| Varun Beverages Ltd. | 520 | 6,707 | ||||||
| Venky's India Ltd. | 35 | 913 | ||||||
Vodafone Idea Ltd.(1) | 14,569 | 1,634 | ||||||
| Voltamp Transformers Ltd. | 50 | 1,730 | ||||||
| VRL Logistics Ltd. | 441 | 3,406 | ||||||
| Welspun Corp. Ltd. | 2,059 | 5,773 | ||||||
| Welspun Enterprises Ltd. | 370 | 522 | ||||||
| Welspun India Ltd. | 1,532 | 1,469 | ||||||
| West Coast Paper Mills Ltd. | 271 | 2,125 | ||||||
Westlife Development Ltd.(1) | 18 | 145 | ||||||
| Whirlpool of India Ltd. | 24 | 546 | ||||||
| Wipro Ltd., ADR | 2,152 | 10,782 | ||||||
Wonderla Holidays Ltd.(1) | 85 | 382 | ||||||
Yes Bank Ltd.(1) | 68,455 | 14,031 | ||||||
| Zee Entertainment Enterprises Ltd. | 5,645 | 17,985 | ||||||
Zee Media Corp. Ltd.(1) | 1,302 | 302 | ||||||
| Zen Technologies Ltd. | 88 | 228 | ||||||
| Zensar Technologies Ltd. | 389 | 1,105 | ||||||
| 2,251,561 | ||||||||
| Indonesia — 2.3% | ||||||||
| Ace Hardware Indonesia Tbk PT | 35,200 | 1,708 | ||||||
Adi Sarana Armada Tbk PT(1) | 6,100 | 599 | ||||||
| Aneka Gas Industri Tbk PT | 5,500 | 774 | ||||||
| Bank BTPN Syariah Tbk PT | 9,600 | 1,913 | ||||||
Bank Bukopin Tbk PT(1) | 79,300 | 977 | ||||||
| Bank Central Asia Tbk PT | 59,600 | 32,912 | ||||||
| Bank Mandiri Persero Tbk PT | 63,200 | 37,609 | ||||||
30
| Avantis Responsible Emerging Markets Equity ETF | ||||||||
| Shares | Value | |||||||
| Bank Negara Indonesia Persero Tbk PT | 21,400 | $ | 12,274 | |||||
| Bank Pan Indonesia Tbk PT | 25,300 | 3,401 | ||||||
| Bank Pembangunan Daerah Jawa Barat Dan Banten Tbk PT | 24,400 | 2,285 | ||||||
| Bank Pembangunan Daerah Jawa Timur Tbk PT | 18,900 | 917 | ||||||
| Bank Rakyat Indonesia Persero Tbk PT | 103,900 | 30,342 | ||||||
| Bank Tabungan Negara Persero Tbk PT | 23,300 | 2,361 | ||||||
| Barito Pacific Tbk PT | 18,000 | 994 | ||||||
| BFI Finance Indonesia Tbk PT | 51,800 | 4,358 | ||||||
Buana Lintas Lautan Tbk PT(1) | 106,500 | 1,213 | ||||||
Bumi Serpong Damai Tbk PT(1) | 39,300 | 2,433 | ||||||
| Bundamedik Tbk PT | 12,100 | 468 | ||||||
| Ciputra Development Tbk PT | 85,600 | 5,476 | ||||||
| Dharma Satya Nusantara Tbk PT | 72,400 | 2,460 | ||||||
| Erajaya Swasembada Tbk PT | 84,100 | 2,763 | ||||||
Global Mediacom Tbk PT(1) | 104,400 | 2,531 | ||||||
| Indosat Tbk PT | 9,400 | 4,538 | ||||||
| Industri Jamu Dan Farmasi Sido Muncul Tbk PT | 33,700 | 1,611 | ||||||
| Jaccs Mitra Pinasthika Mustika Tbk PT | 7,200 | 495 | ||||||
Jasa Marga Persero Tbk PT(1) | 19,400 | 4,493 | ||||||
| Kalbe Farma Tbk PT | 23,600 | 2,669 | ||||||
| Kino Indonesia Tbk PT | 1,300 | 208 | ||||||
Link Net Tbk PT(1) | 12,600 | 4,032 | ||||||
Lippo Karawaci Tbk PT(1) | 74,300 | 575 | ||||||
| Mark Dynamics Indonesia Tbk PT | 4,400 | 271 | ||||||
| Matahari Department Store Tbk PT | 10,100 | 2,609 | ||||||
Matahari Putra Prima Tbk PT(1) | 24,000 | 301 | ||||||
| Media Nusantara Citra Tbk PT | 59,700 | 3,677 | ||||||
Mitra Adiperkasa Tbk PT(1) | 105,700 | 7,182 | ||||||
| Mitra Keluarga Karyasehat Tbk PT | 34,800 | 6,234 | ||||||
MNC Kapital Indonesia Tbk PT(1) | 105,100 | 815 | ||||||
MNC Vision Networks Tbk PT(1) | 22,500 | 141 | ||||||
Multipolar Tbk PT(1) | 14,900 | 153 | ||||||
| Pabrik Kertas Tjiwi Kimia Tbk PT | 5,800 | 2,645 | ||||||
Pacific Strategic Financial Tbk PT(1) | 35,200 | 2,834 | ||||||
| Pakuwon Jati Tbk PT | 97,000 | 3,162 | ||||||
| Panin Financial Tbk PT | 115,300 | 2,966 | ||||||
PP Persero Tbk PT(1) | 29,300 | 1,991 | ||||||
PT Adaro Minerals Indonesia Tbk(1) | 42,500 | 4,901 | ||||||
| PT Berkah Beton Sadaya Tbk | 7,300 | 2,249 | ||||||
| PT Blue Bird Tbk | 12,500 | 1,166 | ||||||
| PT Lippo Cikarang Tbk | 6,700 | 534 | ||||||
PT M Cash Integrasi(1) | 200 | 154 | ||||||
| PT Medikaloka Hermina Tbk | 50,000 | 5,025 | ||||||
| PT Sumber Alfaria Trijaya Tbk | 91,500 | 13,429 | ||||||
| PT Temas Tbk | 10,600 | 1,737 | ||||||
| Puradelta Lestari Tbk PT | 36,300 | 430 | ||||||
| Samudera Indonesia Tbk PT | 16,300 | 2,836 | ||||||
| Sarana Menara Nusantara Tbk PT | 68,000 | 5,685 | ||||||
| Sawit Sumbermas Sarana Tbk PT | 43,900 | 4,157 | ||||||
Smartfren Telecom Tbk PT(1) | 888,800 | 5,929 | ||||||
| Steel Pipe Industry of Indonesia PT | 6,500 | 131 | ||||||
31
| Avantis Responsible Emerging Markets Equity ETF | ||||||||
| Shares | Value | |||||||
| Summarecon Agung Tbk PT | 78,500 | $ | 3,167 | |||||
| Surya Citra Media Tbk PT | 40,200 | 612 | ||||||
| Telkom Indonesia Persero Tbk PT, ADR | 1,037 | 31,183 | ||||||
| Tower Bersama Infrastructure Tbk PT | 22,700 | 4,310 | ||||||
| Transcoal Pacific Tbk PT | 800 | 447 | ||||||
| Unilever Indonesia Tbk PT | 24,400 | 7,540 | ||||||
Wijaya Karya Persero Tbk PT(1) | 17,200 | 1,238 | ||||||
| XL Axiata Tbk PT | 24,800 | 4,391 | ||||||
| 305,621 | ||||||||
| Malaysia — 1.9% | ||||||||
| Aeon Co. M Bhd | 6,500 | 2,127 | ||||||
| AEON Credit Service M Bhd | 500 | 1,572 | ||||||
| Alliance Bank Malaysia Bhd | 9,600 | 7,549 | ||||||
| AMMB Holdings Bhd | 13,100 | 12,176 | ||||||
Ancom Nylex Bhd(1) | 3,000 | 620 | ||||||
| Ann Joo Resources Bhd | 300 | 70 | ||||||
| Astro Malaysia Holdings Bhd | 400 | 74 | ||||||
| Axiata Group Bhd | 4,000 | 2,713 | ||||||
| Bank Islam Malaysia Bhd | 1,100 | 640 | ||||||
| Berjaya Food Bhd | 700 | 648 | ||||||
| Bermaz Auto Bhd | 5,100 | 2,070 | ||||||
Boustead Holdings Bhd(1) | 12,300 | 1,786 | ||||||
| Bursa Malaysia Bhd | 3,700 | 5,288 | ||||||
| Carlsberg Brewery Malaysia Bhd | 300 | 1,549 | ||||||
| CIMB Group Holdings Bhd | 12,600 | 15,068 | ||||||
| CTOS Digital Bhd | 300 | 96 | ||||||
Cypark Resources Bhd(1) | 3,300 | 277 | ||||||
| D&O Green Technologies Bhd | 100 | 85 | ||||||
| Dagang NeXchange Bhd | 21,800 | 4,112 | ||||||
| Dayang Enterprise Holdings Bhd | 500 | 121 | ||||||
| DiGi.Com Bhd | 6,600 | 5,509 | ||||||
| Dufu Technology Corp. Bhd | 1,200 | 756 | ||||||
| Eco World Development Group Bhd | 7,800 | 1,161 | ||||||
Ekovest Bhd(1) | 10,100 | 864 | ||||||
| Evergreen Fibreboard Bhd | 4,000 | 456 | ||||||
| Fraser & Neave Holdings Bhd | 100 | 499 | ||||||
| Frontken Corp. Bhd | 2,800 | 1,697 | ||||||
| Gamuda Bhd | 14,600 | 12,440 | ||||||
Greatech Technology Bhd(1) | 1,100 | 869 | ||||||
| Hap Seng Plantations Holdings Bhd | 900 | 454 | ||||||
| Hartalega Holdings Bhd | 6,400 | 2,370 | ||||||
| Heineken Malaysia Bhd | 700 | 3,680 | ||||||
Hengyuan Refining Co. Bhd(1) | 1,100 | 1,301 | ||||||
| Hiap Teck Venture Bhd | 7,600 | 470 | ||||||
| Hong Leong Bank Bhd | 1,100 | 5,120 | ||||||
| Hong Leong Capital Bhd | 300 | 423 | ||||||
| Hong Leong Financial Group Bhd | 400 | 1,729 | ||||||
Hong Seng Consolidated Bhd(1) | 800 | 83 | ||||||
| IHH Healthcare Bhd | 1,600 | 2,208 | ||||||
| IJM Corp. Bhd | 28,900 | 11,000 | ||||||
| Inari Amertron Bhd | 6,800 | 4,047 | ||||||
32
| Avantis Responsible Emerging Markets Equity ETF | ||||||||
| Shares | Value | |||||||
| Innoprise Plantations Bhd | 800 | $ | 282 | |||||
| IOI Properties Group Bhd | 1,100 | 242 | ||||||
JAKS Resources Bhd(1) | 1,300 | 76 | ||||||
KNM Group Bhd(1) | 12,700 | 326 | ||||||
| Kossan Rubber Industries Bhd | 9,500 | 2,138 | ||||||
| Kuala Lumpur Kepong Bhd | 800 | 4,134 | ||||||
| Lingkaran Trans Kota Holdings Bhd | 2,300 | 2,506 | ||||||
| Lotte Chemical Titan Holding Bhd | 2,000 | 763 | ||||||
| Malayan Banking Bhd | 9,200 | 18,405 | ||||||
Malaysia Airports Holdings Bhd(1) | 1,100 | 1,437 | ||||||
| Malaysia Building Society Bhd | 15,500 | 1,998 | ||||||
| Malaysian Pacific Industries Bhd | 300 | 2,014 | ||||||
| Maxis Bhd | 3,300 | 2,829 | ||||||
| Mega First Corp. Bhd | 700 | 566 | ||||||
Mieco Chipboard Bhd(1) | 700 | 87 | ||||||
| MR DIY Group M Bhd | 4,900 | 2,365 | ||||||
| My EG Services Bhd | 5,300 | 940 | ||||||
| Nestle Malaysia Bhd | 100 | 2,967 | ||||||
| Pentamaster Corp. Bhd | 1,100 | 975 | ||||||
| Perak Transit Bhd | 7,500 | 1,460 | ||||||
| Petron Malaysia Refining & Marketing Bhd | 500 | 602 | ||||||
| PPB Group Bhd | 500 | 1,965 | ||||||
| Press Metal Aluminium Holdings Bhd | 2,000 | 2,120 | ||||||
| Public Bank Bhd | 32,300 | 33,916 | ||||||
| RHB Bank Bhd | 6,800 | 8,689 | ||||||
Rubberex Corp. M Bhd(1) | 4,200 | 379 | ||||||
| Scientex Bhd | 3,300 | 2,594 | ||||||
| Sime Darby Bhd | 5,600 | 2,853 | ||||||
| Sime Darby Property Bhd | 7,400 | 791 | ||||||
| SP Setia Bhd Group | 9,100 | 1,517 | ||||||
| Sunway Bhd | 3,100 | 1,132 | ||||||
| Supermax Corp. Bhd | 11,400 | 1,855 | ||||||
| Syarikat Takaful Malaysia Keluarga Bhd | 500 | 371 | ||||||
| Ta Ann Holdings Bhd | 2,700 | 2,403 | ||||||
| TDM Bhd | 1,600 | 75 | ||||||
| Telekom Malaysia Bhd | 5,700 | 7,577 | ||||||
| TIME dotCom Bhd | 4,500 | 4,785 | ||||||
| TSH Resources Bhd | 6,400 | 1,582 | ||||||
| Unisem M Bhd | 2,700 | 1,635 | ||||||
| UWC Bhd | 500 | 431 | ||||||
Velesto Energy Bhd(1) | 11,800 | 222 | ||||||
| ViTrox Corp. Bhd | 200 | 318 | ||||||
| VS Industry Bhd | 4,300 | 962 | ||||||
| Westports Holdings Bhd | 2,000 | 1,551 | ||||||
| 242,612 | ||||||||
| Mexico — 2.2% | ||||||||
Alsea SAB de CV(1) | 1,600 | 2,899 | ||||||
| America Movil SAB de CV, Class L ADR | 2,375 | 40,375 | ||||||
| Arca Continental SAB de CV | 800 | 5,415 | ||||||
| Banco del Bajio SA | 1,700 | 3,562 | ||||||
| Becle SAB de CV | 2,000 | 4,076 | ||||||
33
| Avantis Responsible Emerging Markets Equity ETF | ||||||||
| Shares | Value | |||||||
| Bolsa Mexicana de Valores SAB de CV | 100 | $ | 180 | |||||
Controladora Vuela Cia de Aviacion SAB de CV, ADR(1) | 394 | 3,499 | ||||||
| Corp. Inmobiliaria Vesta SAB de CV | 4,400 | 8,135 | ||||||
| Fomento Economico Mexicano SAB de CV, ADR | 164 | 10,285 | ||||||
| Genomma Lab Internacional SAB de CV, Class B | 7,000 | 5,719 | ||||||
| Gentera SAB de CV | 12,600 | 9,875 | ||||||
| Grupo Aeroportuario del Centro Norte SAB de CV, ADR | 246 | 12,858 | ||||||
| Grupo Aeroportuario del Pacifico SAB de CV, ADR | 88 | 12,546 | ||||||
| Grupo Aeroportuario del Sureste SAB de CV, ADR | 51 | 10,785 | ||||||
| Grupo Bimbo SAB de CV, Series A | 2,400 | 8,085 | ||||||
| Grupo Comercial Chedraui SA de CV | 1,800 | 5,108 | ||||||
| Grupo Financiero Banorte SAB de CV, Class O | 4,800 | 28,352 | ||||||
Grupo Financiero Inbursa SAB de CV, Class O(1) | 6,600 | 10,339 | ||||||
| Grupo Mexico SAB de CV, Series B | 6,600 | 24,865 | ||||||
| Grupo Televisa SAB, ADR | 3,128 | 19,800 | ||||||
Grupo Traxion SAB de CV(1) | 200 | 221 | ||||||
| Industrias Penoles SAB de CV | 800 | 6,614 | ||||||
| Kimberly-Clark de Mexico SAB de CV, A Shares | 4,500 | 6,109 | ||||||
| La Comer SAB de CV | 300 | 507 | ||||||
| Megacable Holdings SAB de CV | 2,300 | 4,825 | ||||||
Nemak SAB de CV(1) | 22,100 | 4,662 | ||||||
| Orbia Advance Corp. SAB de CV | 4,600 | 8,677 | ||||||
| Promotora y Operadora de Infraestructura SAB de CV | 1,235 | 8,689 | ||||||
| Qualitas Controladora SAB de CV | 1,400 | 6,133 | ||||||
| Regional SAB de CV | 1,100 | 5,947 | ||||||
| Wal-Mart de Mexico SAB de CV | 4,100 | 13,436 | ||||||
| 292,578 | ||||||||
| Peru — 0.2% | ||||||||
| Credicorp Ltd. | 137 | 17,658 | ||||||
| Intercorp Financial Services, Inc. | 299 | 6,447 | ||||||
| Southern Copper Corp. | 134 | 6,307 | ||||||
| 30,412 | ||||||||
| Philippines — 0.9% | ||||||||
| Ayala Land, Inc. | 14,300 | 7,259 | ||||||
| Bank of the Philippine Islands | 4,410 | 7,446 | ||||||
| BDO Unibank, Inc. | 4,910 | 11,227 | ||||||
| Century Pacific Food, Inc. | 900 | 398 | ||||||
Converge Information and Communications Technology Solutions, Inc.(1) | 8,400 | 2,590 | ||||||
| Globe Telecom, Inc. | 125 | 4,664 | ||||||
| GT Capital Holdings, Inc. | 560 | 4,796 | ||||||
| International Container Terminal Services, Inc. | 2,170 | 6,989 | ||||||
| Jollibee Foods Corp. | 1,750 | 7,459 | ||||||
| LT Group, Inc. | 14,300 | 2,245 | ||||||
| Manila Electric Co. | 590 | 3,160 | ||||||
| Megaworld Corp. | 45,000 | 1,998 | ||||||
| Metropolitan Bank & Trust Co. | 12,650 | 11,823 | ||||||
Monde Nissin Corp.(1) | 14,900 | 4,373 | ||||||
| Nickel Asia Corp. | 19,900 | 2,016 | ||||||
| PLDT, Inc., ADR | 300 | 8,724 | ||||||
| Puregold Price Club, Inc. | 4,500 | 2,740 | ||||||
34
| Avantis Responsible Emerging Markets Equity ETF | ||||||||
| Shares | Value | |||||||
| Robinsons Land Corp. | 12,200 | $ | 4,074 | |||||
| Robinsons Retail Holdings, Inc. | 540 | 576 | ||||||
| Security Bank Corp. | 5,060 | 8,089 | ||||||
| SM Investments Corp. | 150 | 2,214 | ||||||
| SM Prime Holdings, Inc. | 10,400 | 6,991 | ||||||
| Universal Robina Corp. | 1,660 | 3,603 | ||||||
| Wilcon Depot, Inc. | 3,600 | 1,919 | ||||||
| 117,373 | ||||||||
| Poland — 0.7% | ||||||||
Alior Bank SA(1) | 856 | 4,726 | ||||||
Allegro.eu SA(1) | 453 | 2,376 | ||||||
AmRest Holdings SE(1) | 255 | 1,075 | ||||||
| Asseco Poland SA | 49 | 747 | ||||||
| Bank Handlowy w Warszawie SA | 30 | 379 | ||||||
Bank Millennium SA(1) | 4,838 | 3,888 | ||||||
| Bank Polska Kasa Opieki SA | 543 | 7,512 | ||||||
CCC SA(1) | 18 | 144 | ||||||
| CD Projekt SA | 218 | 3,888 | ||||||
| Cyfrowy Polsat SA | 119 | 491 | ||||||
Dino Polska SA(1) | 105 | 7,660 | ||||||
| KGHM Polska Miedz SA | 673 | 12,612 | ||||||
| LiveChat Software SA | 28 | 621 | ||||||
| LPP SA | 4 | 7,202 | ||||||
mBank SA(1) | 38 | 1,746 | ||||||
| Orange Polska SA | 8,232 | 10,490 | ||||||
| Powszechna Kasa Oszczednosci Bank Polski SA | 1,343 | 6,700 | ||||||
| Powszechny Zaklad Ubezpieczen SA | 1,016 | 6,082 | ||||||
| Santander Bank Polska SA | 119 | 5,407 | ||||||
| TEN Square Games SA | 11 | 227 | ||||||
| Warsaw Stock Exchange | 53 | 388 | ||||||
| XTB SA | 400 | 1,856 | ||||||
| 86,217 | ||||||||
Romania† | ||||||||
| MAS PLC | 350 | 414 | ||||||
| South Africa — 3.9% | ||||||||
| Absa Group Ltd. | 2,485 | 25,738 | ||||||
| AECI Ltd. | 880 | 4,261 | ||||||
| Anglo American Platinum Ltd. | 90 | 6,283 | ||||||
| AngloGold Ashanti Ltd., ADR | 1,717 | 23,145 | ||||||
| Aspen Pharmacare Holdings Ltd. | 946 | 8,118 | ||||||
| Astral Foods Ltd. | 560 | 6,753 | ||||||
| AVI Ltd. | 1,582 | 6,795 | ||||||
| Barloworld Ltd. | 990 | 5,039 | ||||||
| Bid Corp. Ltd. | 184 | 3,485 | ||||||
| Capitec Bank Holdings Ltd. | 95 | 11,296 | ||||||
| Clicks Group Ltd. | 603 | 10,484 | ||||||
| Coronation Fund Managers Ltd. | 780 | 1,436 | ||||||
| DataTec Ltd. | 577 | 1,429 | ||||||
| Dis-Chem Pharmacies Ltd. | 1,671 | 3,459 | ||||||
Discovery Ltd.(1) | 840 | 6,019 | ||||||
| FirstRand Ltd. | 6,738 | 25,167 | ||||||
35
| Avantis Responsible Emerging Markets Equity ETF | ||||||||
| Shares | Value | |||||||
| Foschini Group Ltd. | 483 | $ | 3,576 | |||||
| Gold Fields Ltd., ADR | 1,927 | 15,589 | ||||||
| Grindrod Shipping Holdings Ltd. | 161 | 3,789 | ||||||
| Impala Platinum Holdings Ltd. | 2,146 | 22,487 | ||||||
| Investec Ltd. | 1,083 | 5,085 | ||||||
| KAP Industrial Holdings Ltd. | 27,736 | 7,348 | ||||||
| Kumba Iron Ore Ltd. | 149 | 3,299 | ||||||
| Life Healthcare Group Holdings Ltd. | 3,034 | 3,555 | ||||||
| Merafe Resources Ltd. | 11,416 | 865 | ||||||
| Momentum Metropolitan Holdings | 10,635 | 10,316 | ||||||
| Motus Holdings Ltd. | 1,234 | 8,362 | ||||||
| Mr Price Group Ltd. | 910 | 9,858 | ||||||
| MTN Group Ltd. | 3,220 | 23,306 | ||||||
| MultiChoice Group | 1,818 | 12,277 | ||||||
| Naspers Ltd.,, N Shares | 166 | 23,407 | ||||||
| Nedbank Group Ltd. | 1,593 | 18,803 | ||||||
| NEPI Rockcastle SA | 2,190 | 11,670 | ||||||
| Netcare Ltd. | 6,448 | 5,525 | ||||||
| Ninety One Ltd. | 714 | 1,609 | ||||||
| Oceana Group Ltd. | 26 | 83 | ||||||
| Old Mutual Ltd. | 27,470 | 16,274 | ||||||
| Omnia Holdings Ltd. | 1,610 | 5,805 | ||||||
| Pepkor Holdings Ltd. | 1,698 | 1,994 | ||||||
| Pick n Pay Stores Ltd. | 1,804 | 6,510 | ||||||
PPC Ltd.(1) | 13,102 | 1,948 | ||||||
| Rand Merchant Investment Holdings Ltd. | 3,166 | 4,998 | ||||||
| Raubex Group Ltd. | 524 | 1,067 | ||||||
| Reinet Investments SCA | 701 | 11,482 | ||||||
| Remgro Ltd. | 1,986 | 14,727 | ||||||
| Reunert Ltd. | 980 | 2,570 | ||||||
RMB Holdings Ltd.(1) | 2,200 | 231 | ||||||
| Royal Bafokeng Platinum Ltd. | 776 | 6,578 | ||||||
| Sanlam Ltd. | 2,578 | 8,015 | ||||||
| Santam Ltd. | 212 | 3,009 | ||||||
Sappi Ltd.(1) | 6,753 | 18,001 | ||||||
| Shoprite Holdings Ltd. | 515 | 6,983 | ||||||
| SPAR Group Ltd. | 561 | 5,120 | ||||||
| Standard Bank Group Ltd. | 2,875 | 25,655 | ||||||
Steinhoff International Holdings NV(1) | 15,326 | 2,084 | ||||||
Telkom SA SOC Ltd.(1) | 1,997 | 5,125 | ||||||
| Tiger Brands Ltd. | 622 | 6,052 | ||||||
| Transaction Capital Ltd. | 121 | 266 | ||||||
| Truworths International Ltd. | 2,462 | 8,210 | ||||||
| Vodacom Group Ltd. | 903 | 6,647 | ||||||
| Wilson Bayly Holmes-Ovcon Ltd. | 21 | 108 | ||||||
| Woolworths Holdings Ltd. | 863 | 2,815 | ||||||
| 511,990 | ||||||||
| South Korea — 13.4% | ||||||||
| Advanced Nano Products Co. Ltd. | 15 | 1,079 | ||||||
| Aekyung Industrial Co. Ltd. | 22 | 229 | ||||||
| AfreecaTV Co. Ltd. | 21 | 1,192 | ||||||
36
| Avantis Responsible Emerging Markets Equity ETF | ||||||||
| Shares | Value | |||||||
Agabang&Company(1) | 104 | $ | 326 | |||||
| Ahnlab, Inc. | 19 | 1,182 | ||||||
| Aju IB Investment Co. Ltd. | 40 | 87 | ||||||
Alteogen, Inc.(1) | 25 | 1,179 | ||||||
| Amorepacific Corp. | 49 | 4,466 | ||||||
| AMOREPACIFIC Group | 85 | 2,200 | ||||||
Ananti, Inc.(1) | 673 | 3,406 | ||||||
| BGF Co. Ltd. | 183 | 551 | ||||||
| BGF retail Co. Ltd. | 57 | 6,827 | ||||||
| BH Co. Ltd. | 57 | 1,333 | ||||||
Binex Co. Ltd.(1) | 79 | 876 | ||||||
Bioneer Corp.(1) | 28 | 625 | ||||||
| BNK Financial Group, Inc. | 2,222 | 11,080 | ||||||
| Bukwang Pharmaceutical Co. Ltd. | 34 | 228 | ||||||
| Byucksan Corp. | 247 | 478 | ||||||
| Celltrion Healthcare Co. Ltd. | 71 | 3,799 | ||||||
| Celltrion, Inc. | 188 | 26,462 | ||||||
Chabiotech Co. Ltd.(1) | 26 | 330 | ||||||
| Cheil Worldwide, Inc. | 333 | 5,429 | ||||||
| CJ CheilJedang Corp. | 23 | 6,977 | ||||||
| CJ ENM Co. Ltd. | 79 | 5,758 | ||||||
CJ Logistics Corp.(1) | 40 | 3,526 | ||||||
| Classys, Inc. | 88 | 930 | ||||||
| Com2uSCorp | 10 | 599 | ||||||
Coreana Cosmetics Co. Ltd.(1) | 63 | 145 | ||||||
CosmoAM&T Co. Ltd.(1) | 14 | 669 | ||||||
| Coway Co. Ltd. | 308 | 14,613 | ||||||
| CS Wind Corp. | 63 | 3,210 | ||||||
| Cuckoo Homesys Co. Ltd. | 81 | 1,914 | ||||||
| Dae Han Flour Mills Co. Ltd. | 6 | 655 | ||||||
| Daeduck Electronics Co. Ltd. | 378 | 8,289 | ||||||
Daewoo Engineering & Construction Co. Ltd.(1) | 1,968 | 7,589 | ||||||
Daewoo Shipbuilding & Marine Engineering Co. Ltd.(1) | 53 | 791 | ||||||
| Daishin Securities Co. Ltd. | 177 | 2,027 | ||||||
| Daol Investment & Securities Co. Ltd. | 693 | 2,365 | ||||||
| Daou Technology, Inc. | 278 | 3,887 | ||||||
| DB HiTek Co. Ltd. | 169 | 5,801 | ||||||
| DB Insurance Co. Ltd. | 366 | 16,299 | ||||||
| Dentium Co. Ltd. | 14 | 911 | ||||||
| DGB Financial Group, Inc. | 1,456 | 8,070 | ||||||
| DI Dong Il Corp. | 20 | 263 | ||||||
| DL E&C Co. Ltd. | 230 | 6,981 | ||||||
| DL Holdings Co. Ltd. | 69 | 3,424 | ||||||
| Dong-A Socio Holdings Co. Ltd. | 11 | 890 | ||||||
Dongwha Enterprise Co. Ltd.(1) | 11 | 553 | ||||||
| Dongwon Development Co. Ltd. | 33 | 91 | ||||||
| Doosan Bobcat, Inc. | 54 | 1,388 | ||||||
| Doosan Co. Ltd. | 6 | 367 | ||||||
Doosan Enerbility Co. Ltd.(1) | 474 | 7,124 | ||||||
Doosan Fuel Cell Co. Ltd.(1) | 13 | 368 | ||||||
| DoubleUGames Co. Ltd. | 20 | 638 | ||||||
37
| Avantis Responsible Emerging Markets Equity ETF | ||||||||
| Shares | Value | |||||||
| Douzone Bizon Co. Ltd. | 30 | $ | 804 | |||||
| Dreamtech Co. Ltd. | 48 | 336 | ||||||
Duk San Neolux Co. Ltd.(1) | 21 | 561 | ||||||
| E-MART, Inc. | 79 | 5,735 | ||||||
| Echo Marketing, Inc. | 84 | 1,008 | ||||||
| Ecopro BM Co. Ltd. | 38 | 3,144 | ||||||
| Eo Technics Co. Ltd. | 12 | 669 | ||||||
| Eugene Technology Co. Ltd. | 25 | 507 | ||||||
| F&F Co. Ltd. / New | 16 | 1,688 | ||||||
| Fila Holdings Corp. | 177 | 4,088 | ||||||
Genexine, Inc.(1) | 87 | 1,963 | ||||||
| GOLFZON Co. Ltd. | 34 | 3,342 | ||||||
| Gradiant Corp. | 21 | 291 | ||||||
| Green Cross Corp. | 13 | 1,587 | ||||||
| GS Engineering & Construction Corp. | 531 | 11,878 | ||||||
| GS Retail Co. Ltd. | 377 | 7,127 | ||||||
| Halla Holdings Corp. | 51 | 1,458 | ||||||
| Hana Financial Group, Inc. | 1,408 | 41,038 | ||||||
Hana Micron, Inc.(1) | 343 | 3,250 | ||||||
| Handsome Co. Ltd. | 153 | 3,226 | ||||||
| Hanjin Transportation Co. Ltd. | 81 | 1,552 | ||||||
| Hankook Tire & Technology Co. Ltd. | 342 | 9,642 | ||||||
| Hanmi Semiconductor Co. Ltd. | 125 | 1,110 | ||||||
| Hanon Systems | 550 | 4,206 | ||||||
| Hansae Co. Ltd. | 27 | 317 | ||||||
| Hansol Chemical Co. Ltd. | 34 | 5,491 | ||||||
| Hanssem Co. Ltd. | 45 | 1,800 | ||||||
| Hanwha Investment & Securities Co. Ltd. | 432 | 995 | ||||||
Hanwha Life Insurance Co. Ltd.(1) | 2,381 | 4,085 | ||||||
Hanwha Solutions Corp.(1) | 387 | 15,090 | ||||||
| Hanwha Systems Co. Ltd. | 123 | 1,419 | ||||||
| HDC Hyundai Development Co-Engineering & Construction, E Shares | 178 | 1,645 | ||||||
| Hite Jinro Co. Ltd. | 136 | 3,087 | ||||||
| HMM Co. Ltd. | 1,539 | 25,363 | ||||||
| Hotel Shilla Co. Ltd. | 39 | 2,136 | ||||||
| Huchems Fine Chemical Corp. | 102 | 1,612 | ||||||
Hugel, Inc.(1) | 19 | 1,720 | ||||||
Humax Co. Ltd.(1) | 333 | 989 | ||||||
| Humedix Co. Ltd. | 72 | 1,270 | ||||||
| Hwaseung Enterprise Co. Ltd. | 36 | 354 | ||||||
HYBE Co. Ltd.(1) | 8 | 1,072 | ||||||
Hyosung Chemical Corp.(1) | 3 | 385 | ||||||
| Hyosung Corp. | 31 | 1,723 | ||||||
Hyosung Heavy Industries Corp.(1) | 32 | 1,755 | ||||||
| Hyosung TNC Corp. | 22 | 5,116 | ||||||
| Hyundai Autoever Corp. | 20 | 1,784 | ||||||
| Hyundai Construction Equipment Co. Ltd. | 65 | 1,962 | ||||||
| Hyundai Corp. | 30 | 408 | ||||||
| Hyundai Department Store Co. Ltd. | 122 | 5,612 | ||||||
Hyundai Doosan Infracore Co. Ltd.(1) | 408 | 1,867 | ||||||
38
| Avantis Responsible Emerging Markets Equity ETF | ||||||||
| Shares | Value | |||||||
Hyundai Electric & Energy System Co. Ltd.(1) | 295 | $ | 6,984 | |||||
| Hyundai Elevator Co. Ltd. | 77 | 1,674 | ||||||
| Hyundai Engineering & Construction Co. Ltd. | 477 | 17,056 | ||||||
| Hyundai Futurenet Co. Ltd. | 86 | 172 | ||||||
| Hyundai Greenfood Co. Ltd. | 323 | 1,850 | ||||||
Hyundai Heavy Industries Co. Ltd.(1) | 55 | 5,853 | ||||||
| Hyundai Home Shopping Network Corp. | 59 | 2,198 | ||||||
| Hyundai Marine & Fire Insurance Co. Ltd. | 594 | 13,934 | ||||||
Hyundai Mipo Dockyard Co. Ltd.(1) | 62 | 4,922 | ||||||
| Hyundai Mobis Co. Ltd. | 105 | 16,745 | ||||||
| Hyundai Motor Co. | 362 | 52,592 | ||||||
Hyundai Rotem Co. Ltd.(1) | 119 | 2,672 | ||||||
| Hyundai Wia Corp. | 75 | 4,221 | ||||||
| i-SENS, Inc. | 26 | 725 | ||||||
| iMarketKorea, Inc. | 135 | 1,044 | ||||||
| Industrial Bank of Korea | 1,502 | 10,695 | ||||||
| Innocean Worldwide, Inc. | 85 | 2,688 | ||||||
| Innox Advanced Materials Co. Ltd. | 56 | 1,434 | ||||||
Insun ENT Co. Ltd.(1) | 102 | 817 | ||||||
Interflex Co. Ltd.(1) | 17 | 157 | ||||||
| INTOPS Co. Ltd. | 69 | 1,539 | ||||||
iNtRON Biotechnology, Inc.(1) | 89 | 757 | ||||||
| IS Dongseo Co. Ltd. | 128 | 3,515 | ||||||
| JB Financial Group Co. Ltd. | 1,047 | 5,915 | ||||||
| Jusung Engineering Co. Ltd. | 342 | 4,022 | ||||||
| JYP Entertainment Corp. | 116 | 5,252 | ||||||
| K Car Co. Ltd. | 17 | 271 | ||||||
| Kakao Corp. | 280 | 15,205 | ||||||
Kakao Games Corp.(1) | 78 | 3,042 | ||||||
KakaoBank Corp.(1) | 108 | 2,187 | ||||||
| KB Financial Group, Inc., ADR | 1,309 | 47,883 | ||||||
| KC Co. Ltd. | 71 | 950 | ||||||
| KC Tech Co. Ltd. | 77 | 929 | ||||||
| KCC Corp. | 17 | 3,712 | ||||||
| KEPCO Engineering & Construction Co., Inc. | 40 | 2,177 | ||||||
| KH Vatec Co. Ltd. | 168 | 2,365 | ||||||
| Kia Corp. | 904 | 54,184 | ||||||
| KISCO Corp. | 93 | 478 | ||||||
| KIWOOM Securities Co. Ltd. | 152 | 9,659 | ||||||
| Koh Young Technology, Inc. | 97 | 1,016 | ||||||
KONA I Co. Ltd.(1) | 14 | 168 | ||||||
Korea Circuit Co. Ltd.(1) | 10 | 140 | ||||||
| Korea Investment Holdings Co. Ltd. | 324 | 13,661 | ||||||
| Korea Petrochemical Ind Co. Ltd. | 36 | 3,252 | ||||||
| Korea Real Estate Investment & Trust Co. Ltd. | 715 | 866 | ||||||
Korea Shipbuilding & Offshore Engineering Co. Ltd.(1) | 270 | 19,486 | ||||||
Korean Air Lines Co. Ltd.(1) | 928 | 18,444 | ||||||
| Korean Reinsurance Co. | 445 | 2,768 | ||||||
Krafton, Inc.(1) | 28 | 5,115 | ||||||
| Kukjeon Pharmaceutical Co. Ltd. | 13 | 84 | ||||||
| Kumho Petrochemical Co. Ltd. | 143 | 13,793 | ||||||
39
| Avantis Responsible Emerging Markets Equity ETF | ||||||||
| Shares | Value | |||||||
Kumho Tire Co., Inc.(1) | 454 | $ | 1,172 | |||||
| Kyung Dong Navien Co. Ltd. | 15 | 483 | ||||||
L&F Co. Ltd.(1) | 19 | 3,222 | ||||||
| LEENO Industrial, Inc. | 28 | 2,980 | ||||||
| LF Corp. | 203 | 2,557 | ||||||
| LG Display Co. Ltd., ADR | 1,752 | 10,021 | ||||||
| LG Electronics, Inc. | 216 | 16,163 | ||||||
LG Energy Solution Ltd.(1) | 15 | 5,141 | ||||||
| LG H&H Co. Ltd. | 20 | 10,591 | ||||||
| LG Innotek Co. Ltd. | 74 | 18,837 | ||||||
| LG Uplus Corp. | 1,698 | 14,542 | ||||||
| Lotte Chemical Corp. | 87 | 11,296 | ||||||
| Lotte Chilsung Beverage Co. Ltd. | 33 | 3,797 | ||||||
| Lotte Data Communication Co. | 27 | 540 | ||||||
| LOTTE Fine Chemical Co. Ltd. | 156 | 8,162 | ||||||
| LOTTE Himart Co. Ltd. | 6 | 70 | ||||||
| Lotte Rental Co. Ltd. | 179 | 4,754 | ||||||
| Lotte Shopping Co. Ltd. | 96 | 7,047 | ||||||
| LS Corp. | 84 | 4,186 | ||||||
| LS Electric Co. Ltd. | 77 | 3,194 | ||||||
LVMC Holdings(1) | 647 | 1,449 | ||||||
| LX Hausys Ltd. | 36 | 1,203 | ||||||
LX Holdings Corp.(1) | 448 | 2,795 | ||||||
| LX Semicon Co. Ltd. | 91 | 6,403 | ||||||
| Maeil Dairies Co. Ltd. | 36 | 1,539 | ||||||
| Mando Corp. | 259 | 10,352 | ||||||
| Mcnex Co. Ltd. | 33 | 905 | ||||||
Medytox, Inc.(1) | 7 | 637 | ||||||
| MegaStudyEdu Co. Ltd. | 77 | 4,479 | ||||||
| Meritz Financial Group, Inc. | 177 | 4,057 | ||||||
| Meritz Fire & Marine Insurance Co. Ltd. | 172 | 4,911 | ||||||
| Meritz Securities Co. Ltd. | 2,076 | 7,482 | ||||||
| Mirae Asset Securities Co. Ltd. | 1,679 | 8,188 | ||||||
| NAVER Corp. | 99 | 17,567 | ||||||
| NCSoft Corp. | 44 | 12,365 | ||||||
Neowiz(1) | 52 | 1,517 | ||||||
NEPES Corp.(1) | 59 | 954 | ||||||
| Netmarble Corp. | 13 | 613 | ||||||
| Nexen Tire Corp. | 202 | 999 | ||||||
| NEXTIN, Inc. | 25 | 1,051 | ||||||
| NH Investment & Securities Co. Ltd. | 1,039 | 7,692 | ||||||
NHN Corp.(1) | 45 | 845 | ||||||
NHN KCP Corp.(1) | 27 | 254 | ||||||
| NICE Holdings Co. Ltd. | 180 | 1,833 | ||||||
| NICE Information Service Co. Ltd. | 176 | 1,882 | ||||||
| NongShim Co. Ltd. | 13 | 2,906 | ||||||
| OCI Co. Ltd. | 87 | 7,570 | ||||||
| Ottogi Corp. | 8 | 2,863 | ||||||
| Pan Ocean Co. Ltd. | 2,747 | 10,511 | ||||||
| Partron Co. Ltd. | 361 | 2,326 | ||||||
Pearl Abyss Corp.(1) | 35 | 1,472 | ||||||
40
| Avantis Responsible Emerging Markets Equity ETF | ||||||||
| Shares | Value | |||||||
| PharmaResearch Co. Ltd. | 30 | $ | 1,503 | |||||
| PI Advanced Materials Co. Ltd. | 57 | 1,574 | ||||||
| Pulmuone Co. Ltd. | 21 | 215 | ||||||
| S&S Tech Corp. | 16 | 262 | ||||||
| S-1 Corp. | 72 | 3,126 | ||||||
| Sam Young Electronics Co. Ltd. | 51 | 414 | ||||||
Samsung Biologics Co. Ltd.(1) | 24 | 14,927 | ||||||
| Samsung C&T Corp. | 156 | 13,968 | ||||||
| Samsung Electro-Mechanics Co. Ltd. | 230 | 23,813 | ||||||
| Samsung Electronics Co. Ltd., GDR | 255 | 278,860 | ||||||
| Samsung Fire & Marine Insurance Co. Ltd. | 185 | 26,887 | ||||||
Samsung Heavy Industries Co. Ltd.(1) | 4,709 | 20,893 | ||||||
| Samsung Life Insurance Co. Ltd. | 339 | 15,646 | ||||||
Samsung Pharmaceutical Co. Ltd.(1) | 37 | 100 | ||||||
| Samsung SDI Co. Ltd. | 66 | 29,179 | ||||||
| Samsung SDS Co. Ltd. | 72 | 6,872 | ||||||
| Samsung Securities Co. Ltd. | 437 | 11,002 | ||||||
| Samwha Capacitor Co. Ltd. | 12 | 373 | ||||||
| Sangsangin Co. Ltd. | 450 | 2,863 | ||||||
| SD Biosensor, Inc. | 172 | 4,497 | ||||||
| SeAH Steel Corp. | 18 | 2,556 | ||||||
| SeAH Steel Holdings Corp. | 10 | 1,356 | ||||||
| Sebang Global Battery Co. Ltd. | 23 | 889 | ||||||
| Seegene, Inc. | 154 | 3,608 | ||||||
| Seobu T&D | 47 | 280 | ||||||
| Seojin System Co. Ltd. | 70 | 785 | ||||||
| Seoul Semiconductor Co. Ltd. | 60 | 513 | ||||||
| SFA Engineering Corp. | 81 | 2,473 | ||||||
SFA Semicon Co. Ltd.(1) | 398 | 1,517 | ||||||
| SGC Energy Co. Ltd. | 6 | 167 | ||||||
| Shinhan Financial Group Co. Ltd., ADR | 1,718 | 45,888 | ||||||
| Shinsegae International, Inc. | 94 | 1,949 | ||||||
| Shinsegae, Inc. | 61 | 10,110 | ||||||
SK Bioscience Co. Ltd.(1) | 19 | 1,591 | ||||||
| SK Chemicals Co. Ltd. | 56 | 4,060 | ||||||
| SK Hynix, Inc. | 1,363 | 95,830 | ||||||
SK IE Technology Co. Ltd.(1) | 23 | 1,415 | ||||||
| SK Networks Co. Ltd. | 1,417 | 4,791 | ||||||
| SK Securities Co. Ltd. | 2,515 | 1,410 | ||||||
| SK Telecom Co. Ltd., ADR | 199 | 4,249 | ||||||
| SKC Co. Ltd. | 27 | 2,426 | ||||||
| SL Corp. | 80 | 2,281 | ||||||
| SM Entertainment Co. Ltd. | 51 | 2,617 | ||||||
| Soulbrain Holdings Co. Ltd. | 5 | 84 | ||||||
| STIC Investments, Inc. | 42 | 234 | ||||||
Studio Dragon Corp.(1) | 30 | 1,689 | ||||||
| Sung Kwang Bend Co. Ltd. | 108 | 1,315 | ||||||
Taewoong Co. Ltd.(1) | 36 | 367 | ||||||
Taihan Electric Wire Co. Ltd.(1) | 697 | 968 | ||||||
| TES Co. Ltd. | 133 | 1,962 | ||||||
| TK Corp. | 105 | 1,514 | ||||||
41
| Avantis Responsible Emerging Markets Equity ETF | ||||||||
| Shares | Value | |||||||
| Value Added Technology Co. Ltd. | 33 | $ | 823 | |||||
Vidente Co. Ltd.(1) | 70 | 453 | ||||||
Webzen, Inc.(1) | 48 | 661 | ||||||
| Wemade Co. Ltd. | 41 | 1,877 | ||||||
| WONIK IPS Co. Ltd. | 79 | 1,635 | ||||||
| Wonik QnC Corp. | 106 | 2,149 | ||||||
| Woongjin Thinkbig Co. Ltd. | 476 | 912 | ||||||
| Woori Financial Group, Inc. | 2,664 | 24,098 | ||||||
| Woori Investment Bank Co. Ltd. | 3,924 | 2,582 | ||||||
Woori Technology Investment Co. Ltd.(1) | 501 | 2,175 | ||||||
| YG Entertainment, Inc. | 26 | 1,168 | ||||||
| Youngone Corp. | 91 | 3,013 | ||||||
| Youngone Holdings Co. Ltd. | 62 | 2,443 | ||||||
| Yuhan Corp. | 65 | 2,749 | ||||||
| Zinus, Inc. | 23 | 742 | ||||||
| 1,744,734 | ||||||||
| Taiwan — 17.1% | ||||||||
| Accton Technology Corp. | 1,000 | 9,209 | ||||||
| Acer, Inc. | 15,000 | 10,773 | ||||||
| ACES Electronic Co. Ltd. | 1,000 | 1,217 | ||||||
| Acter Group Corp. Ltd. | 1,000 | 6,949 | ||||||
| Advanced International Multitech Co. Ltd. | 1,000 | 3,318 | ||||||
| Advantech Co. Ltd. | 1,000 | 10,668 | ||||||
| AGV Products Corp. | 2,000 | 652 | ||||||
| Alltek Technology Corp. | 1,080 | 1,335 | ||||||
| Amazing Microelectronic Corp. | 1,000 | 3,574 | ||||||
| AmTRAN Technology Co. Ltd. | 4,000 | 1,670 | ||||||
| Apacer Technology, Inc. | 1,000 | 1,325 | ||||||
| Apex International Co. Ltd. | 1,000 | 2,014 | ||||||
| Ardentec Corp. | 3,000 | 4,479 | ||||||
| ASE Technology Holding Co. Ltd., ADR | 4,897 | 28,207 | ||||||
| Asia Optical Co., Inc. | 1,000 | 2,146 | ||||||
Asia Pacific Telecom Co. Ltd.(1) | 10,000 | 2,297 | ||||||
| Asia Polymer Corp. | 3,000 | 2,689 | ||||||
| Asia Vital Components Co. Ltd. | 2,000 | 7,045 | ||||||
| Asustek Computer, Inc. | 1,000 | 8,321 | ||||||
| AUO Corp. | 35,000 | 19,111 | ||||||
| AURAS Technology Co. Ltd. | 1,000 | 5,044 | ||||||
| Avermedia Technologies | 1,000 | 792 | ||||||
| Bank of Kaohsiung Co. Ltd. | 2,060 | 939 | ||||||
| Basso Industry Corp. | 1,000 | 1,387 | ||||||
| BenQ Materials Corp. | 1,000 | 1,039 | ||||||
| BenQ Medical Technology Corp. | 1,000 | 2,502 | ||||||
| Capital Securities Corp. | 12,000 | 4,685 | ||||||
Career Technology MFG. Co. Ltd.(1) | 2,000 | 1,725 | ||||||
Catcher Technology Co. Ltd.(1) | 3,000 | 18,185 | ||||||
| Cathay Financial Holding Co. Ltd. | 20,000 | 29,097 | ||||||
| Central Reinsurance Co. Ltd. | 1,000 | 699 | ||||||
| Chailease Holding Co. Ltd. | 1,050 | 6,742 | ||||||
| Chang Hwa Commercial Bank Ltd. | 16,160 | 9,334 | ||||||
| Chang Wah Electromaterials, Inc. | 3,000 | 3,409 | ||||||
42
| Avantis Responsible Emerging Markets Equity ETF | ||||||||
| Shares | Value | |||||||
| Charoen Pokphand Enterprise | 1,100 | $ | 2,906 | |||||
| CHC Healthcare Group | 1,000 | 1,523 | ||||||
| Cheng Loong Corp. | 5,000 | 4,632 | ||||||
Cheng Mei Materials Technology Corp.(1) | 4,000 | 1,410 | ||||||
| Cheng Shin Rubber Industry Co. Ltd. | 7,000 | 8,109 | ||||||
| Cheng Uei Precision Industry Co. Ltd. | 2,000 | 2,439 | ||||||
| Chicony Electronics Co. Ltd. | 1,000 | 2,670 | ||||||
| Chin-Poon Industrial Co. Ltd. | 2,000 | 2,038 | ||||||
| China Bills Finance Corp. | 1,000 | 533 | ||||||
| China Chemical & Pharmaceutical Co. Ltd. | 2,000 | 1,499 | ||||||
| China Container Terminal Corp. | 1,000 | 829 | ||||||
| China General Plastics Corp. | 2,000 | 1,546 | ||||||
| China Man-Made Fiber Corp. | 4,000 | 1,074 | ||||||
| China Motor Corp. | 2,000 | 3,043 | ||||||
| China Wire & Cable Co. Ltd. | 1,000 | 864 | ||||||
| Chinese Maritime Transport Ltd. | 1,000 | 1,264 | ||||||
| Chipbond Technology Corp. | 4,000 | 7,466 | ||||||
| ChipMOS Technologies, Inc. | 4,000 | 4,661 | ||||||
| Chroma ATE, Inc. | 2,000 | 12,273 | ||||||
| Chung-Hsin Electric & Machinery Manufacturing Corp. | 4,000 | 8,644 | ||||||
| Chunghwa Telecom Co. Ltd., ADR | 441 | 17,516 | ||||||
| Clevo Co. | 1,000 | 1,131 | ||||||
CMC Magnetics Corp.(1) | 3,000 | 787 | ||||||
| Co-Tech Development Corp. | 1,000 | 1,401 | ||||||
| Collins Co. Ltd. | 1,000 | 596 | ||||||
| Compal Electronics, Inc. | 19,000 | 14,147 | ||||||
| Compeq Manufacturing Co. Ltd. | 7,000 | 12,004 | ||||||
| Concord Securities Co. Ltd. | 2,000 | 713 | ||||||
| Continental Holdings Corp. | 3,000 | 2,939 | ||||||
| Coretronic Corp. | 1,000 | 2,051 | ||||||
CSBC Corp. Taiwan(1) | 1,000 | 600 | ||||||
| CTBC Financial Holding Co. Ltd. | 45,000 | 34,468 | ||||||
| CTCI Corp. | 4,000 | 5,900 | ||||||
| DA CIN Construction Co. Ltd. | 1,000 | 1,009 | ||||||
| Darfon Electronics Corp. | 1,000 | 1,349 | ||||||
Darwin Precisions Corp.(1) | 1,000 | 336 | ||||||
| Delta Electronics, Inc. | 1,000 | 8,562 | ||||||
| Depo Auto Parts Ind Co. Ltd. | 1,000 | 2,713 | ||||||
| Dimerco Express Corp. | 1,000 | 2,634 | ||||||
| Dynamic Holding Co. Ltd. | 3,000 | 1,986 | ||||||
| E Ink Holdings, Inc. | 1,000 | 7,776 | ||||||
| E.Sun Financial Holding Co. Ltd. | 11,741 | 10,818 | ||||||
| Elan Microelectronics Corp. | 2,000 | 6,325 | ||||||
| Elite Material Co. Ltd. | 1,000 | 5,264 | ||||||
| Elitegroup Computer Systems Co. Ltd. | 1,000 | 856 | ||||||
| Emerging Display Technologies Corp. | 1,000 | 751 | ||||||
| Eternal Materials Co. Ltd. | 1,000 | 1,109 | ||||||
Etron Technology, Inc.(1) | 1,000 | 1,706 | ||||||
| Eva Airways Corp. | 12,000 | 13,132 | ||||||
| Evergreen International Storage & Transport Corp. | 2,000 | 1,943 | ||||||
| Evergreen Marine Corp. Taiwan Ltd. | 7,000 | 20,060 | ||||||
43
| Avantis Responsible Emerging Markets Equity ETF | ||||||||
| Shares | Value | |||||||
| EVERGREEN Steel Corp. | 1,000 | $ | 2,011 | |||||
| Everlight Electronics Co. Ltd. | 3,000 | 3,854 | ||||||
| Excelliance Mos Corp. | 1,000 | 4,212 | ||||||
| Excelsior Medical Co. Ltd. | 1,050 | 2,334 | ||||||
| Far Eastern International Bank | 13,000 | 5,232 | ||||||
| Far Eastern New Century Corp. | 15,000 | 16,073 | ||||||
| Far EasTone Telecommunications Co. Ltd. | 8,000 | 19,620 | ||||||
| Farglory F T Z Investment Holding Co. Ltd. | 1,000 | 1,710 | ||||||
| Farglory Land Development Co. Ltd. | 2,000 | 4,181 | ||||||
| Feng TAY Enterprise Co. Ltd. | 1,000 | 5,610 | ||||||
| First Financial Holding Co. Ltd. | 20,400 | 17,699 | ||||||
First Steamship Co. Ltd.(1) | 6,000 | 1,886 | ||||||
| Fitipower Integrated Technology, Inc. | 1,000 | 4,133 | ||||||
FLEXium Interconnect, Inc.(1) | 2,000 | 6,111 | ||||||
| Flytech Technology Co. Ltd. | 1,000 | 2,787 | ||||||
| FocalTech Systems Co. Ltd. | 1,000 | 2,498 | ||||||
| Formosa Laboratories, Inc. | 1,000 | 1,959 | ||||||
| Formosan Union Chemical | 1,000 | 809 | ||||||
| Foxconn Technology Co. Ltd. | 5,000 | 8,267 | ||||||
| Franbo Lines Corp. | 1,000 | 645 | ||||||
| Fubon Financial Holding Co. Ltd. | 17,000 | 31,876 | ||||||
| Fulltech Fiber Glass Corp. | 1,029 | 484 | ||||||
| Gamania Digital Entertainment Co. Ltd. | 1,000 | 1,985 | ||||||
| Gemtek Technology Corp. | 2,000 | 2,070 | ||||||
| General Interface Solution Holding Ltd. | 2,000 | 5,257 | ||||||
| Getac Holdings Corp. | 1,000 | 1,556 | ||||||
| Gigabyte Technology Co. Ltd. | 1,000 | 2,789 | ||||||
| Global Brands Manufacture Ltd. | 2,000 | 1,898 | ||||||
| Globalwafers Co. Ltd. | 1,000 | 15,821 | ||||||
| Gloria Material Technology Corp. | 1,000 | 929 | ||||||
| Gold Circuit Electronics Ltd. | 2,000 | 5,439 | ||||||
| Goldsun Building Materials Co. Ltd. | 4,000 | 3,317 | ||||||
| Gordon Auto Body Parts | 1,000 | 923 | ||||||
| Gourmet Master Co. Ltd. | 1,000 | 3,316 | ||||||
| Grand Fortune Securities Co. Ltd. | 1,000 | 519 | ||||||
| Grand Pacific Petrochemical | 6,000 | 3,685 | ||||||
| Grape King Bio Ltd. | 1,000 | 4,883 | ||||||
| Great Wall Enterprise Co. Ltd. | 1,050 | 1,694 | ||||||
| Greatek Electronics, Inc. | 2,000 | 3,878 | ||||||
| GTM Holdings Corp. | 1,000 | 825 | ||||||
| Hai Kwang Enterprise Corp. | 1,000 | 726 | ||||||
| Hannstar Board Corp. | 2,000 | 2,138 | ||||||
| HannStar Display Corp. | 10,000 | 3,888 | ||||||
| HannsTouch Solution, Inc. | 1,000 | 357 | ||||||
| Highwealth Construction Corp. | 1,000 | 1,586 | ||||||
| Hiroca Holdings Ltd. | 1,000 | 1,826 | ||||||
| Hiwin Technologies Corp. | 1,030 | 6,952 | ||||||
| Ho Tung Chemical Corp. | 4,000 | 1,225 | ||||||
| Holtek Semiconductor, Inc. | 1,000 | 2,416 | ||||||
| Holy Stone Enterprise Co. Ltd. | 1,000 | 2,919 | ||||||
| Hon Hai Precision Industry Co. Ltd. | 33,000 | 117,506 | ||||||
44
| Avantis Responsible Emerging Markets Equity ETF | ||||||||
| Shares | Value | |||||||
| Hong TAI Electric Industrial | 1,000 | $ | 554 | |||||
| Horizon Securities Co. Ltd. | 1,060 | 394 | ||||||
| Hotai Finance Co. Ltd. | 1,000 | 3,429 | ||||||
HTC Corp.(1) | 1,000 | 2,017 | ||||||
| Hua Nan Financial Holdings Co. Ltd. | 17,578 | 13,342 | ||||||
| Huang Hsiang Construction Corp. | 1,000 | 1,504 | ||||||
| Hung Sheng Construction Ltd. | 4,000 | 3,389 | ||||||
| Ibase Technology, Inc. | 1,000 | 2,557 | ||||||
| IBF Financial Holdings Co. Ltd. | 13,650 | 5,975 | ||||||
| IEI Integration Corp. | 1,000 | 2,453 | ||||||
| Innolux Corp. | 52,000 | 20,482 | ||||||
| Inpaq Technology Co. Ltd. | 1,000 | 1,751 | ||||||
Integrated Service Technology, Inc.(1) | 1,000 | 2,207 | ||||||
| International CSRC Investment Holdings Co. | 6,000 | 4,088 | ||||||
| Inventec Corp. | 3,000 | 2,271 | ||||||
| ITE Technology, Inc. | 1,000 | 2,286 | ||||||
| Jarllytec Co. Ltd. | 1,000 | 2,203 | ||||||
| Kaimei Electronic Corp. | 1,000 | 1,896 | ||||||
| Kaori Heat Treatment Co. Ltd. | 1,000 | 3,719 | ||||||
| Kenda Rubber Industrial Co. Ltd. | 1,000 | 1,141 | ||||||
Kenmec Mechanical Engineering Co. Ltd.(1) | 2,000 | 2,179 | ||||||
| Kerry TJ Logistics Co. Ltd. | 1,000 | 1,342 | ||||||
| Kindom Development Co. Ltd. | 3,000 | 2,777 | ||||||
| King Yuan Electronics Co. Ltd. | 7,000 | 8,527 | ||||||
| King's Town Bank Co. Ltd. | 5,000 | 5,768 | ||||||
| Kinik Co. | 1,000 | 5,157 | ||||||
| Kinpo Electronics | 2,000 | 880 | ||||||
| Kinsus Interconnect Technology Corp. | 1,000 | 3,972 | ||||||
| KNH Enterprise Co. Ltd. | 1,000 | 622 | ||||||
| L&K Engineering Co. Ltd. | 2,000 | 2,124 | ||||||
| LandMark Optoelectronics Corp. | 1,000 | 5,776 | ||||||
| Lealea Enterprise Co. Ltd. | 3,000 | 1,127 | ||||||
| Lien Hwa Industrial Holdings Corp. | 1,050 | 1,958 | ||||||
| Lingsen Precision Industries Ltd. | 3,000 | 1,559 | ||||||
| Lite-On Technology Corp. | 2,000 | 4,304 | ||||||
| Longchen Paper & Packaging Co. Ltd. | 4,000 | 2,161 | ||||||
| Lung Yen Life Service Corp. | 1,000 | 1,370 | ||||||
| Macronix International Co. Ltd. | 11,000 | 11,807 | ||||||
| Marketech International Corp. | 1,000 | 4,038 | ||||||
| Materials Analysis Technology, Inc. | 1,000 | 4,039 | ||||||
| MediaTek, Inc. | 1,000 | 21,637 | ||||||
| Mega Financial Holding Co. Ltd. | 9,225 | 10,820 | ||||||
Mercuries Life Insurance Co. Ltd.(1) | 9,000 | 2,099 | ||||||
| Micro-Star International Co. Ltd. | 2,000 | 7,487 | ||||||
| Mitac Holdings Corp. | 5,000 | 4,597 | ||||||
| Mosel Vitelic, Inc. | 1,000 | 1,339 | ||||||
| MPI Corp. | 1,000 | 3,166 | ||||||
| Nan Ya Printed Circuit Board Corp. | 1,000 | 8,724 | ||||||
| Nantex Industry Co. Ltd. | 1,000 | 1,397 | ||||||
| Nanya Technology Corp. | 6,000 | 10,421 | ||||||
| Nien Made Enterprise Co. Ltd. | 1,000 | 9,235 | ||||||
45
| Avantis Responsible Emerging Markets Equity ETF | ||||||||
| Shares | Value | |||||||
| Novatek Microelectronics Corp. | 2,000 | $ | 17,111 | |||||
| Nuvoton Technology Corp. | 1,000 | 4,059 | ||||||
| O-Bank Co. Ltd. | 9,000 | 2,554 | ||||||
| Orient Semiconductor Electronics Ltd. | 3,000 | 1,815 | ||||||
| Oriental Union Chemical Corp. | 3,000 | 1,794 | ||||||
| Pan Jit International, Inc. | 2,000 | 4,532 | ||||||
| Pegatron Corp. | 9,000 | 18,718 | ||||||
| Phoenix Silicon International Corp. | 1,060 | 2,415 | ||||||
| Pixart Imaging, Inc. | 1,000 | 3,083 | ||||||
| Pou Chen Corp. | 10,000 | 9,473 | ||||||
| Powerchip Semiconductor Manufacturing Corp. | 11,000 | 12,335 | ||||||
| Powertech Technology, Inc. | 5,000 | 13,952 | ||||||
| President Chain Store Corp. | 2,000 | 17,575 | ||||||
| President Securities Corp. | 3,000 | 1,644 | ||||||
| Primax Electronics Ltd. | 1,000 | 2,188 | ||||||
| Prince Housing & Development Corp. | 1,000 | 392 | ||||||
| Promate Electronic Co. Ltd. | 1,000 | 1,280 | ||||||
| Qisda Corp. | 2,000 | 1,915 | ||||||
| Quanta Computer, Inc. | 4,000 | 10,370 | ||||||
| Quanta Storage, Inc. | 1,000 | 1,447 | ||||||
| Radiant Opto-Electronics Corp. | 3,000 | 9,858 | ||||||
| Raydium Semiconductor Corp. | 1,000 | 8,998 | ||||||
| Realtek Semiconductor Corp. | 2,000 | 22,473 | ||||||
| Rexon Industrial Corp. Ltd. | 1,000 | 1,121 | ||||||
Ritek Corp.(1) | 1,000 | 278 | ||||||
Roo Hsing Co. Ltd.(1) | 1,000 | 96 | ||||||
| Ruentex Development Co. Ltd. | 2,000 | 4,124 | ||||||
| Ruentex Industries Ltd. | 1,000 | 2,130 | ||||||
| Sanyang Motor Co. Ltd. | 4,000 | 4,762 | ||||||
| Sesoda Corp. | 2,000 | 3,146 | ||||||
| Shanghai Commercial & Savings Bank Ltd. | 14,000 | 22,788 | ||||||
| Sheng Yu Steel Co. Ltd. | 1,000 | 839 | ||||||
| Shih Wei Navigation Co. Ltd. | 2,000 | 1,838 | ||||||
| Shin Foong Specialty & Applied Materials Co. Ltd. | 1,000 | 2,285 | ||||||
| Shin Kong Financial Holding Co. Ltd. | 58,000 | 16,662 | ||||||
| Shin Zu Shing Co. Ltd. | 1,000 | 2,880 | ||||||
| Shinkong Insurance Co. Ltd. | 2,000 | 3,785 | ||||||
| Shinkong Synthetic Fibers Corp. | 6,000 | 3,553 | ||||||
| Sigurd Microelectronics Corp. | 2,000 | 3,335 | ||||||
| Silicon Integrated Systems Corp. | 4,400 | 2,885 | ||||||
| Simplo Technology Co. Ltd. | 1,000 | 9,436 | ||||||
| Sincere Navigation Corp. | 1,000 | 698 | ||||||
| Sinkang Industries Co. Ltd. | 1,000 | 644 | ||||||
| Sino-American Silicon Products, Inc. | 2,000 | 10,904 | ||||||
| Sinon Corp. | 2,000 | 2,967 | ||||||
| SinoPac Financial Holdings Co. Ltd. | 41,410 | 23,476 | ||||||
| Sitronix Technology Corp. | 1,000 | 6,183 | ||||||
| Siward Crystal Technology Co. Ltd. | 1,000 | 1,351 | ||||||
| Solar Applied Materials Technology Corp. | 1,000 | 1,266 | ||||||
| Sonix Technology Co. Ltd. | 1,000 | 1,938 | ||||||
| Sporton International, Inc. | 1,000 | 7,528 | ||||||
46
| Avantis Responsible Emerging Markets Equity ETF | ||||||||
| Shares | Value | |||||||
| Sports Gear Co. Ltd. | 1,000 | $ | 2,795 | |||||
| St Shine Optical Co. Ltd. | 1,000 | 8,778 | ||||||
| Standard Foods Corp. | 1,000 | 1,346 | ||||||
| Stark Technology, Inc. | 1,000 | 2,766 | ||||||
| Symtek Automation Asia Co. Ltd. | 1,000 | 2,962 | ||||||
| Synnex Technology International Corp. | 1,000 | 1,823 | ||||||
| T3EX Global Holdings Corp. | 1,000 | 2,563 | ||||||
| TAI Roun Products Co. Ltd. | 1,000 | 521 | ||||||
| Tai-Saw Technology Co. Ltd. | 1,000 | 1,169 | ||||||
| Taichung Commercial Bank Co. Ltd. | 17,650 | 7,881 | ||||||
Taigen Biopharmaceuticals Holdings Ltd.(1) | 2,000 | 1,240 | ||||||
| Tainan Spinning Co. Ltd. | 1,000 | 616 | ||||||
| Taishin Financial Holding Co. Ltd. | 41,980 | 20,836 | ||||||
| Taita Chemical Co. Ltd. | 1,050 | 775 | ||||||
| Taiwan Business Bank | 34,221 | 14,343 | ||||||
| Taiwan Cement Corp. | 7,399 | 9,525 | ||||||
| Taiwan Cogeneration Corp. | 1,000 | 1,219 | ||||||
| Taiwan Cooperative Financial Holding Co. Ltd. | 18,540 | 16,743 | ||||||
| Taiwan Glass Industry Corp. | 6,000 | 3,443 | ||||||
| Taiwan High Speed Rail Corp. | 7,000 | 6,692 | ||||||
| Taiwan Hon Chuan Enterprise Co. Ltd. | 2,000 | 4,904 | ||||||
| Taiwan Mobile Co. Ltd. | 1,000 | 3,269 | ||||||
| Taiwan Navigation Co. Ltd. | 2,000 | 1,770 | ||||||
| Taiwan Paiho Ltd. | 2,000 | 4,152 | ||||||
| Taiwan PCB Techvest Co. Ltd. | 2,000 | 2,511 | ||||||
| Taiwan Secom Co. Ltd. | 1,000 | 3,358 | ||||||
| Taiwan Semiconductor Co. Ltd. | 1,000 | 3,107 | ||||||
| Taiwan Semiconductor Manufacturing Co. Ltd., ADR | 4,858 | 404,914 | ||||||
| Taiwan Styrene Monomer | 1,000 | 480 | ||||||
| Taiwan Surface Mounting Technology Corp. | 2,000 | 6,665 | ||||||
Taiwan TEA Corp.(1) | 1,000 | 652 | ||||||
| Taiwan-Asia Semiconductor Corp. | 1,000 | 1,276 | ||||||
Tatung Co. Ltd.(1) | 4,000 | 4,511 | ||||||
| Teco Electric and Machinery Co. Ltd. | 9,000 | 8,706 | ||||||
| Tex-Ray Industrial Co. Ltd. | 1,000 | 390 | ||||||
| Thye Ming Industrial Co. Ltd. | 1,000 | 1,410 | ||||||
| Ton Yi Industrial Corp. | 7,000 | 4,644 | ||||||
| Tong Yang Industry Co. Ltd. | 3,000 | 5,348 | ||||||
| Topco Scientific Co. Ltd. | 1,000 | 5,341 | ||||||
| TPK Holding Co. Ltd. | 2,000 | 2,370 | ||||||
| Transcend Information, Inc. | 1,000 | 2,167 | ||||||
| Tripod Technology Corp. | 1,000 | 3,283 | ||||||
| TSRC Corp. | 4,000 | 3,681 | ||||||
| TTY Biopharm Co. Ltd. | 1,000 | 2,489 | ||||||
| Tung Ho Steel Enterprise Corp. | 3,000 | 5,304 | ||||||
| TXC Corp. | 2,000 | 5,661 | ||||||
| TYC Brother Industrial Co. Ltd. | 1,000 | 1,000 | ||||||
Tycoons Group Enterprise(1) | 1,000 | 285 | ||||||
| Tyntek Corp. | 1,000 | 610 | ||||||
| TZE Shin International Co. Ltd. | 1,100 | 604 | ||||||
| Uni-President Enterprises Corp. | 11,000 | 23,772 | ||||||
47
| Avantis Responsible Emerging Markets Equity ETF | ||||||||
| Shares | Value | |||||||
| Unimicron Technology Corp. | 5,000 | $ | 24,499 | |||||
| Union Bank of Taiwan | 13,796 | 7,438 | ||||||
Unitech Printed Circuit Board Corp.(1) | 1,000 | 756 | ||||||
United Microelectronics Corp.(1) | 30,000 | 39,914 | ||||||
United Renewable Energy Co. Ltd.(1) | 3,000 | 2,259 | ||||||
| Unizyx Holding Corp. | 1,000 | 911 | ||||||
| UPC Technology Corp. | 4,000 | 1,836 | ||||||
| USI Corp. | 5,000 | 3,877 | ||||||
| Utechzone Co. Ltd. | 1,000 | 3,005 | ||||||
| Vanguard International Semiconductor Corp. | 2,000 | 4,835 | ||||||
| Wafer Works Corp. | 1,000 | 1,697 | ||||||
| Walsin Lihwa Corp. | 6,419 | 8,290 | ||||||
| Walsin Technology Corp. | 1,000 | 3,022 | ||||||
| Walton Advanced Engineering, Inc. | 1,000 | 439 | ||||||
| Wan Hai Lines Ltd. | 2,150 | 6,060 | ||||||
| We & Win Development Co. Ltd. | 1,000 | 265 | ||||||
| WEI Chih Steel Industrial Co. Ltd. | 1,000 | 868 | ||||||
| Wei Chuan Foods Corp. | 2,000 | 1,333 | ||||||
| Weikeng Industrial Co. Ltd. | 1,000 | 881 | ||||||
| Win Semiconductors Corp. | 1,000 | 5,808 | ||||||
| Winbond Electronics Corp. | 14,000 | 10,087 | ||||||
| Winstek Semiconductor Co. Ltd. | 1,000 | 1,619 | ||||||
| Wisdom Marine Lines Co. Ltd. | 3,000 | 5,653 | ||||||
| Wistron Corp. | 13,000 | 11,786 | ||||||
Wowprime Corp.(1) | 1,000 | 4,083 | ||||||
| WPG Holdings Ltd. | 2,000 | 3,363 | ||||||
| WT Microelectronics Co. Ltd. | 2,000 | 4,218 | ||||||
| XinTec, Inc. | 1,000 | 4,281 | ||||||
| Yageo Corp. | 1,000 | 10,695 | ||||||
| Yang Ming Marine Transport Corp. | 7,000 | 17,932 | ||||||
| Yem Chio Co. Ltd. | 2,000 | 926 | ||||||
| Yeong Guan Energy Technology Group Co. Ltd. | 1,000 | 1,825 | ||||||
| YFY, Inc. | 7,000 | 5,663 | ||||||
| Youngtek Electronics Corp. | 1,000 | 2,132 | ||||||
| Yuanta Financial Holding Co. Ltd. | 33,990 | 22,562 | ||||||
| Yulon Finance Corp. | 1,253 | 6,625 | ||||||
| Yulon Motor Co. Ltd. | 4,000 | 5,389 | ||||||
| Zhen Ding Technology Holding Ltd. | 2,000 | 7,422 | ||||||
| 2,224,767 | ||||||||
| Thailand — 2.5% | ||||||||
| AAPICO Hitech PCL, NVDR | 1,300 | 899 | ||||||
| Advanced Info Service PCL, NVDR | 2,200 | 11,574 | ||||||
| Advanced Information Technology PCL, NVDR | 5,900 | 1,002 | ||||||
| AEON Thana Sinsap Thailand PCL, NVDR | 800 | 3,629 | ||||||
Airports of Thailand PCL, NVDR(1) | 3,400 | 6,775 | ||||||
| AJ Plast PCL, NVDR | 400 | 163 | ||||||
| Amanah Leasing PCL, NVDR | 3,900 | 472 | ||||||
| Amata Corp. PCL, NVDR | 5,300 | 3,035 | ||||||
| AP Thailand PCL, NVDR | 22,200 | 6,079 | ||||||
Aqua Corp. PCL, NVDR(1) | 8,600 | 142 | ||||||
| Asia Plus Group Holdings PCL, NVDR | 4,400 | 371 | ||||||
48
| Avantis Responsible Emerging Markets Equity ETF | ||||||||
| Shares | Value | |||||||
| Asian Sea Corp. PCL, NVDR | 2,300 | $ | 1,122 | |||||
| Asset World Corp. PCL, NVDR | 18,600 | 2,849 | ||||||
Bangkok Airways PCL, NVDR(1) | 800 | 232 | ||||||
| Bangkok Chain Hospital PCL, NVDR | 11,200 | 5,733 | ||||||
| Bangkok Dusit Medical Services PCL, NVDR | 18,400 | 14,747 | ||||||
| Bangkok Life Assurance PCL, NVDR | 3,100 | 3,015 | ||||||
| BCPG PCL, NVDR | 11,600 | 3,431 | ||||||
| BEC World PCL, NVDR | 7,700 | 2,952 | ||||||
| Berli Jucker PCL, NVDR | 1,400 | 1,287 | ||||||
Better World Green PCL, NVDR(1) | 40,500 | 908 | ||||||
| BTS Group Holdings PCL, NVDR | 8,800 | 2,026 | ||||||
| Bumrungrad Hospital PCL, NVDR | 2,200 | 13,027 | ||||||
| Carabao Group PCL, NVDR | 1,000 | 2,767 | ||||||
| Central Pattana PCL, NVDR | 5,500 | 10,430 | ||||||
Central Plaza Hotel PCL, NVDR(1) | 1,100 | 1,287 | ||||||
| Central Retail Corp. PCL, NVDR | 4,700 | 5,210 | ||||||
| CH Karnchang PCL, NVDR | 1,400 | 806 | ||||||
| Charoen Pokphand Foods PCL, NVDR | 10,800 | 7,695 | ||||||
| Chularat Hospital PCL, NVDR | 46,900 | 4,706 | ||||||
| Com7 PCL, NVDR | 1,200 | 1,131 | ||||||
Country Group Holdings PCL, NVDR(1) | 11,700 | 237 | ||||||
| CP ALL PCL, NVDR | 6,200 | 10,450 | ||||||
| Delta Electronics Thailand PCL, NVDR | 300 | 4,299 | ||||||
| Dhipaya Group Holdings PCL, NVDR | 1,700 | 2,902 | ||||||
| Ditto Thailand PCL, NVDR | 900 | 1,425 | ||||||
| Dohome PCL, NVDR | 400 | 167 | ||||||
| Dynasty Ceramic PCL, NVDR | 29,300 | 2,169 | ||||||
| Eastern Polymer Group PCL, NVDR | 3,800 | 1,000 | ||||||
| Eastern Water Resources Development and Management PCL, NVDR | 500 | 88 | ||||||
| Ekachai Medical Care PCL, NVDR | 1,560 | 321 | ||||||
| Energy Absolute PCL, NVDR | 2,500 | 5,837 | ||||||
| Forth Corp. PCL, NVDR | 600 | 952 | ||||||
G J Steel PCL, NVDR(1) | 85,800 | 917 | ||||||
| GFPT PCL, NVDR | 3,500 | 1,610 | ||||||
| Gunkul Engineering PCL, NVDR | 14,500 | 1,977 | ||||||
| Hana Microelectronics PCL, NVDR | 2,800 | 3,269 | ||||||
| Home Product Center PCL, NVDR | 19,500 | 7,428 | ||||||
| Humanica PCL, NVDR | 600 | 207 | ||||||
| Indorama Ventures PCL, NVDR | 6,300 | 7,461 | ||||||
| Interlink Communication PCL, NVDR | 2,600 | 598 | ||||||
| Intouch Holdings PCL, NVDR | 1,700 | 3,386 | ||||||
| IT City PCL (NVDR), NVDR | 1,300 | 222 | ||||||
Italian-Thai Development PCL, NVDR(1) | 34,400 | 1,809 | ||||||
Jasmine International PCL, NVDR(1) | 27,400 | 1,920 | ||||||
| Jay Mart PCL, NVDR | 700 | 996 | ||||||
| JMT Network Services PCL, NVDR | 1,500 | 3,205 | ||||||
| JWD Infologistics PCL, NVDR | 3,000 | 1,404 | ||||||
| Karmarts PCL, NVDR | 6,300 | 793 | ||||||
| KCE Electronics PCL, NVDR | 3,000 | 4,446 | ||||||
| KGI Securities Thailand PCL, NVDR | 7,600 | 1,037 | ||||||
49
| Avantis Responsible Emerging Markets Equity ETF | ||||||||
| Shares | Value | |||||||
| Kiatnakin Phatra Bank PCL, NVDR | 1,800 | $ | 3,573 | |||||
| Krung Thai Bank PCL, NVDR | 13,500 | 6,242 | ||||||
| Krungthai Card PCL, NVDR | 3,500 | 5,771 | ||||||
| Land & Houses PCL, NVDR | 43,200 | 10,539 | ||||||
| Lanna Resources PCL, NVDR | 3,600 | 2,359 | ||||||
| LPN Development PCL, NVDR | 1,700 | 211 | ||||||
Master Ad PCL, NVDR(1) | 10,500 | 161 | ||||||
MBK PCL, NVDR(1) | 7,100 | 3,168 | ||||||
| MCS Steel PCL, NVDR | 3,700 | 1,044 | ||||||
| Mega Lifesciences PCL, NVDR | 2,500 | 3,371 | ||||||
| MFEC PCL, NVDR | 800 | 205 | ||||||
Minor International PCL, NVDR(1) | 3,200 | 2,866 | ||||||
| MK Restaurants Group PCL, NVDR | 1,800 | 2,908 | ||||||
Mono Next PCL, NVDR(1) | 9,000 | 381 | ||||||
| Muangthai Capital PCL, NVDR | 2,000 | 2,327 | ||||||
Nusasiri PCL, NVDR(1) | 5,800 | 162 | ||||||
| Origin Property PCL, NVDR | 4,900 | 1,381 | ||||||
| Osotspa PCL, NVDR | 7,500 | 6,421 | ||||||
Plan B Media PCL, NVDR(1) | 14,600 | 2,638 | ||||||
| Polyplex Thailand PCL, NVDR | 700 | 439 | ||||||
| POSCO-Thainox PCL, NVDR | 5,200 | 169 | ||||||
| Praram 9 Hospital PCL, NVDR | 7,000 | 3,415 | ||||||
| Property Perfect PCL, NVDR | 11,340 | 127 | ||||||
| Pruksa Holding PCL, NVDR | 1,300 | 459 | ||||||
| Quality Houses PCL, NVDR | 59,700 | 3,534 | ||||||
| Rajthanee Hospital PCL, NVDR | 2,100 | 2,073 | ||||||
| Ratchthani Leasing PCL, NVDR | 14,500 | 1,890 | ||||||
| Regional Container Lines PCL, NVDR | 4,100 | 3,647 | ||||||
| RS PCL, NVDR | 1,600 | 675 | ||||||
S Hotels & Resorts PCL, NVDR(1) | 8,800 | 983 | ||||||
| S Kijchai Enterprise PCL, R Shares, NVDR | 4,000 | 618 | ||||||
| Sabina PCL, NVDR | 1,300 | 944 | ||||||
| Sansiri PCL, NVDR | 63,300 | 1,907 | ||||||
| Sappe PCL, NVDR | 1,000 | 1,219 | ||||||
| SC Asset Corp. PCL, NVDR | 2,100 | 202 | ||||||
| SCB X PCL, NVDR | 500 | 1,511 | ||||||
| Sena Development PCL, NVDR | 800 | 87 | ||||||
| Sermsang Power Corp. Co. Ltd., NVDR | 2,770 | 728 | ||||||
| Siam Global House PCL, NVDR | 5,900 | 3,171 | ||||||
| SISB PCL, NVDR | 2,300 | 895 | ||||||
| SNC Former PCL, NVDR | 2,000 | 931 | ||||||
| Somboon Advance Technology PCL, NVDR | 2,400 | 1,282 | ||||||
| Sri Trang Agro-Industry PCL, NVDR | 5,200 | 3,218 | ||||||
| Srisawad Corp. PCL, NVDR | 2,500 | 3,334 | ||||||
STARK Corp. PCL, NVDR(1) | 800 | 92 | ||||||
STP & I PCL, NVDR(1) | 2,700 | 268 | ||||||
| Supalai PCL, NVDR | 10,500 | 5,612 | ||||||
| Super Energy Corp. PCL, NVDR | 54,700 | 1,140 | ||||||
| Tata Steel Thailand PCL, NVDR | 2,300 | 64 | ||||||
| Thai Union Group PCL, NVDR | 7,100 | 3,405 | ||||||
| Thai Vegetable Oil PCL, NVDR | 3,740 | 3,130 | ||||||
50
| Avantis Responsible Emerging Markets Equity ETF | ||||||||
| Shares | Value | |||||||
| Thai Wah PCL, NVDR | 6,300 | $ | 974 | |||||
| Thaicom PCL, NVDR | 600 | 171 | ||||||
| Thaire Life Assurance PCL, NVDR | 800 | 104 | ||||||
| Thanachart Capital PCL, NVDR | 1,900 | 2,107 | ||||||
| Thonburi Healthcare Group PCL, NVDR | 2,800 | 5,237 | ||||||
| Thoresen Thai Agencies PCL, NVDR | 15,300 | 3,477 | ||||||
| Tipco Asphalt PCL, NVDR | 7,000 | 3,204 | ||||||
| Tisco Financial Group PCL, NVDR | 1,300 | 3,340 | ||||||
| TKS Technologies PCL, NVDR | 1,000 | 293 | ||||||
| TOA Paint Thailand PCL, NVDR | 400 | 337 | ||||||
| TQM Alpha PCL, NVDR | 1,500 | 1,758 | ||||||
| Triple i Logistics PCL, NVDR | 2,200 | 790 | ||||||
| TTW PCL, NVDR | 3,200 | 922 | ||||||
U City PCL, NVDR(1) | 26,300 | 972 | ||||||
| VGI PCL, NVDR | 4,500 | 540 | ||||||
| WHA Corp. PCL, NVDR | 31,600 | 3,029 | ||||||
| Workpoint Entertainment PCL, NVDR | 200 | 106 | ||||||
| 326,292 | ||||||||
| Turkey — 0.6% | ||||||||
| AG Anadolu Grubu Holding AS | 45 | 183 | ||||||
| Akbank TAS | 10,689 | 6,865 | ||||||
Aksigorta AS(1) | 1,013 | 208 | ||||||
Albaraka Turk Katilim Bankasi AS(1) | 4,421 | 596 | ||||||
| Alkim Alkali Kimya AS | 221 | 348 | ||||||
Anadolu Anonim Turk Sigorta Sirketi(1) | 847 | 377 | ||||||
| Anadolu Efes Biracilik Ve Malt Sanayii AS | 836 | 1,889 | ||||||
| Aselsan Elektronik Sanayi Ve Ticaret AS | 632 | 904 | ||||||
| Aygaz AS | 55 | 138 | ||||||
| Baskent Dogalgaz Dagitim Gayrimenkul Yatirim Ortakligi AS | 674 | 636 | ||||||
Baticim Bati Anadolu Cimento Sanayii AS(1) | 212 | 377 | ||||||
| BIM Birlesik Magazalar AS | 893 | 5,358 | ||||||
| Bogazici Beton Sanayi Ve Ticaret AS | 359 | 119 | ||||||
| Brisa Bridgestone Sabanci Sanayi ve Ticaret AS | 171 | 347 | ||||||
Bursa Cimento Fabrikasi AS(1) | 1,946 | 363 | ||||||
| Coca-Cola Icecek AS | 136 | 1,193 | ||||||
| Dogus Otomotiv Servis ve Ticaret AS | 206 | 1,130 | ||||||
| EGE Gubre Sanayii AS | 17 | 261 | ||||||
| EGE Seramik Sanayi ve Ticaret AS | 167 | 303 | ||||||
| EIS Eczacibasi Ilac ve Sinai ve Finansal Yatirimlar Sanayi ve Ticaret AS | 940 | 714 | ||||||
| Enerjisa Enerji AS | 826 | 775 | ||||||
| Esenboga Elektrik Uretim AS | 168 | 384 | ||||||
| Europap Tezol Kagit Sanayi VE Ticaret AS | 314 | 188 | ||||||
Fenerbahce Futbol AS(1) | 50 | 164 | ||||||
| Galata Wind Enerji AS | 977 | 783 | ||||||
Girisim Elektrik Taahhut Ticaret Ve Sanayi AS(1) | 203 | 748 | ||||||
Goodyear Lastikleri TAS(1) | 530 | 316 | ||||||
Gozde Girisim Sermayesi Yatirim Ortakligi AS(1) | 678 | 352 | ||||||
| GSD Holding AS | 2,660 | 638 | ||||||
Hektas Ticaret TAS(1) | 371 | 836 | ||||||
| Indeks Bilgisayar Sistemleri Muhendislik Sanayi ve Ticaret AS | 171 | 87 | ||||||
51
| Avantis Responsible Emerging Markets Equity ETF | ||||||||
| Shares | Value | |||||||
Ipek Dogal Enerji Kaynaklari Arastirma Ve Uretim AS(1) | 606 | $ | 596 | |||||
Is Finansal Kiralama AS(1) | 1,844 | 832 | ||||||
| Is Yatirim Menkul Degerler AS | 159 | 248 | ||||||
Izmir Demir Celik Sanayi AS(1) | 1,060 | 154 | ||||||
| Jantsa Jant Sanayi Ve Ticaret AS | 72 | 310 | ||||||
Karsan Otomotiv Sanayii Ve Ticaret AS(1) | 741 | 329 | ||||||
| Kartonsan Karton Sanayi ve Ticaret AS | 106 | 418 | ||||||
| Konya Kagit Sanayi VE Ticaret AS | 261 | 430 | ||||||
| Kordsa Teknik Tekstil AS | 125 | 392 | ||||||
| Logo Yazilim Sanayi Ve Ticaret AS | 116 | 303 | ||||||
| Mavi Giyim Sanayi Ve Ticaret AS, B Shares | 454 | 1,745 | ||||||
Migros Ticaret AS(1) | 468 | 2,100 | ||||||
MLP Saglik Hizmetleri AS(1) | 334 | 742 | ||||||
| Naturel Yenilenebilir Enerji Ticaret AS | 111 | 476 | ||||||
ODAS Elektrik Uretim ve Sanayi Ticaret AS(1) | 3,682 | 912 | ||||||
| Otokar Otomotiv Ve Savunma Sanayi AS | 31 | 813 | ||||||
Parsan Makina Parcalari Sanayii AS(1) | 51 | 112 | ||||||
| Penta Teknoloji Urunleri Dagitim Ticaret AS | 29 | 598 | ||||||
Petkim Petrokimya Holding AS(1) | 2,393 | 1,900 | ||||||
| Polisan Holding AS | 1,677 | 618 | ||||||
Qua Granite Hayal(1) | 438 | 743 | ||||||
Sekerbank Turk AS(1) | 4,749 | 975 | ||||||
Sok Marketler Ticaret AS(1) | 880 | 815 | ||||||
TAV Havalimanlari Holding AS(1) | 441 | 1,505 | ||||||
| Tekfen Holding AS | 736 | 1,204 | ||||||
| Tofas Turk Otomobil Fabrikasi AS | 325 | 1,568 | ||||||
Trabzonspor Sportif Yatirim ve Futbol Isletmeciligi TAS(1) | 500 | 151 | ||||||
Turcas Petrol AS(1) | 576 | 408 | ||||||
| Turk Traktor ve Ziraat Makineleri AS | 34 | 456 | ||||||
| Turkcell Iletisim Hizmetleri AS, ADR | 744 | 2,210 | ||||||
Turkiye Halk Bankasi AS(1) | 4,765 | 2,245 | ||||||
| Turkiye Is Bankasi AS, C Shares | 10,505 | 4,550 | ||||||
Turkiye Sinai Kalkinma Bankasi AS(1) | 9,726 | 2,626 | ||||||
Turkiye Vakiflar Bankasi TAO, D Shares(1) | 5,283 | 2,118 | ||||||
| Vakko Tekstil ve Hazir Giyim Sanayi Isletmeleri AS | 1,513 | 1,714 | ||||||
| Vestel Beyaz Esya Sanayi ve Ticaret AS | 849 | 439 | ||||||
| Vestel Elektronik Sanayi ve Ticaret AS | 626 | 1,024 | ||||||
| Yapi ve Kredi Bankasi AS | 11,445 | 4,422 | ||||||
| Yatas Yatak ve Yorgan Sanayi ve Ticaret AS | 475 | 421 | ||||||
Zorlu Enerji Elektrik Uretim AS(1) | 2,704 | 434 | ||||||
| 71,636 | ||||||||
TOTAL COMMON STOCKS (Cost $13,795,192) | 13,000,025 | |||||||
WARRANTS† | ||||||||
Malaysia† | ||||||||
Eco World Development Group Bhd(1) | 360 | 7 | ||||||
Thailand† | ||||||||
Maco Pharma(1) | 2,625 | 1 | ||||||
TOTAL WARRANTS (Cost $—) | 8 | |||||||
52
| Avantis Responsible Emerging Markets Equity ETF | ||||||||
| Shares | Value | |||||||
RIGHTS† | ||||||||
Brazil† | ||||||||
AES Brasil Energia SA(1) | 142 | $ | 2 | |||||
Infracommerce CXAAS SA(1) | 28 | 3 | ||||||
TOTAL RIGHTS (Cost $—) | 5 | |||||||
| SHORT-TERM INVESTMENTS — 0.1% | ||||||||
| Money Market Funds — 0.1% | ||||||||
State Street Institutional U.S. Government Money Market Fund, Premier Class (Cost $8,563) | 8,563 | 8,563 | ||||||
TOTAL INVESTMENT SECURITIES — 100.0% (Cost $13,803,755) | 13,008,601 | |||||||
OTHER ASSETS AND LIABILITIES† | 5,487 | |||||||
| TOTAL NET ASSETS — 100.0% | $ | 13,014,088 | ||||||
| MARKET SECTOR DIVERSIFICATION | |||||
| (as a % of net assets) | |||||
| Financials | 24.6% | ||||
| Information Technology | 19.7% | ||||
| Consumer Discretionary | 15.5% | ||||
| Industrials | 10.1% | ||||
| Communication Services | 8.3% | ||||
| Consumer Staples | 7.2% | ||||
| Materials | 5.2% | ||||
| Health Care | 4.6% | ||||
| Real Estate | 3.0% | ||||
| Utilities | 1.7% | ||||
| Energy | —* | ||||
| Short-Term Investments | 0.1% | ||||
| Other Assets and Liabilities | —* | ||||
*Category is less than 0.05% of total net assets.
| NOTES TO SCHEDULE OF INVESTMENTS | ||||||||
| ADR | - | American Depositary Receipt | ||||||
| GDR | - | Global Depositary Receipt | ||||||
| NVDR | - | Non-Voting Depositary Receipt | ||||||
†Category is less than 0.05% of total net assets.
(1)Non-income producing.
See Notes to Financial Statements.
53
AUGUST 31, 2022
| Avantis Responsible International Equity ETF | ||||||||
| Shares | Value | |||||||
| COMMON STOCKS — 99.6% | ||||||||
| Australia — 7.5% | ||||||||
29Metals Ltd.(1) | 1,583 | $ | 2,144 | |||||
88 Energy Ltd.(1) | 14,791 | 89 | ||||||
| Accent Group Ltd. | 1,891 | 1,923 | ||||||
| Adairs Ltd. | 689 | 1,062 | ||||||
Aeris Resources Ltd.(1) | 2,630 | 771 | ||||||
| ALS Ltd. | 960 | 7,725 | ||||||
| Altium Ltd. | 178 | 4,390 | ||||||
AMP Ltd.(1) | 16,829 | 13,264 | ||||||
| Ansell Ltd. | 107 | 1,935 | ||||||
| Appen Ltd. | 100 | 251 | ||||||
Arafura Resources Ltd.(1) | 5,367 | 1,146 | ||||||
| ARB Corp. Ltd. | 158 | 3,233 | ||||||
| Ardent Leisure Group Ltd. | 1,690 | 707 | ||||||
| ASX Ltd. | 907 | 48,282 | ||||||
| Atlas Arteria Ltd. | 2,607 | 14,183 | ||||||
Atlassian Corp. PLC, Class A(1) | 123 | 30,462 | ||||||
| AUB Group Ltd. | 160 | 2,393 | ||||||
| Aurizon Holdings Ltd. | 14,297 | 36,159 | ||||||
| Australia & New Zealand Banking Group Ltd. | 6,847 | 105,845 | ||||||
| Australian Clinical Labs Ltd. | 713 | 2,144 | ||||||
| Australian Ethical Investment Ltd. | 301 | 1,319 | ||||||
| Australian Finance Group Ltd. | 1,752 | 2,279 | ||||||
| Baby Bunting Group Ltd. | 724 | 2,150 | ||||||
| Bank of Queensland Ltd. | 3,807 | 18,165 | ||||||
| Bapcor Ltd. | 475 | 2,153 | ||||||
| Bega Cheese Ltd. | 2,798 | 7,596 | ||||||
| Bendigo & Adelaide Bank Ltd. | 3,259 | 20,005 | ||||||
Berkeley Energia Ltd.(1) | 1,767 | 406 | ||||||
| Boral Ltd. | 2,367 | 4,733 | ||||||
| Brambles Ltd. | 6,533 | 54,983 | ||||||
| Bravura Solutions Ltd. | 1,839 | 1,973 | ||||||
| Brickworks Ltd. | 453 | 6,271 | ||||||
| carsales.com Ltd. | 358 | 5,458 | ||||||
| Cedar Woods Properties Ltd. | 367 | 1,136 | ||||||
| Challenger Ltd. | 5,107 | 22,017 | ||||||
| Cleanaway Waste Management Ltd. | 3,254 | 6,180 | ||||||
| Clinuvel Pharmaceuticals Ltd. | 51 | 696 | ||||||
| Cochlear Ltd. | 57 | 8,298 | ||||||
| Codan Ltd. | 330 | 1,622 | ||||||
| Coles Group Ltd. | 4,944 | 59,176 | ||||||
| Collins Foods Ltd. | 103 | 686 | ||||||
| Commonwealth Bank of Australia | 2,584 | 170,756 | ||||||
| Computershare Ltd. | 913 | 15,227 | ||||||
| Credit Corp. Group Ltd. | 432 | 5,952 | ||||||
| CSL Ltd. | 521 | 104,209 | ||||||
| CSR Ltd. | 2,722 | 8,351 | ||||||
Dacian Gold Ltd.(1) | 1,905 | 129 | ||||||
| Data#3 Ltd. | 910 | 3,796 | ||||||
54
| Avantis Responsible International Equity ETF | ||||||||
| Shares | Value | |||||||
| DDH1 Ltd. | 1,950 | $ | 1,128 | |||||
| Deterra Royalties Ltd. | 2,083 | 5,884 | ||||||
| Domino's Pizza Enterprises Ltd. | 123 | 5,302 | ||||||
| Eagers Automotive Ltd. | 677 | 6,094 | ||||||
Eclipx Group Ltd.(1) | 2,678 | 4,336 | ||||||
| Emeco Holdings Ltd. | 2,908 | 1,806 | ||||||
| Endeavour Group Ltd. | 5,165 | 25,561 | ||||||
EVENT Hospitality and Entertainment Ltd.(1) | 249 | 2,501 | ||||||
| Evolution Mining Ltd. | 13,520 | 21,727 | ||||||
| Fenix Resources Ltd. | 6,582 | 1,600 | ||||||
Firefinch Ltd.(1) | 1,565 | 214 | ||||||
| Fortescue Metals Group Ltd. | 6,250 | 77,672 | ||||||
| G8 Education Ltd. | 1,090 | 753 | ||||||
| Genworth Mortgage Insurance Australia Ltd. | 5,303 | 10,203 | ||||||
| Grange Resources Ltd. | 7,522 | 4,447 | ||||||
| GUD Holdings Ltd. | 213 | 1,197 | ||||||
| GWA Group Ltd. | 1,093 | 1,494 | ||||||
| Hansen Technologies Ltd. | 827 | 2,761 | ||||||
| Harvey Norman Holdings Ltd. | 4,567 | 13,114 | ||||||
Hastings Technology Metals Ltd.(1) | 130 | 479 | ||||||
| Healius Ltd. | 847 | 2,141 | ||||||
| Humm Group Ltd. | 3,182 | 1,159 | ||||||
IDP Education Ltd.(2) | 243 | 4,784 | ||||||
| IGO Ltd. | 2,217 | 19,841 | ||||||
| Imdex Ltd. | 1,781 | 2,418 | ||||||
| Infomedia Ltd. | 3,147 | 3,082 | ||||||
| Insignia Financial Ltd. | 509 | 1,197 | ||||||
| Insurance Australia Group Ltd. | 2,258 | 7,135 | ||||||
| Integral Diagnostics Ltd. | 311 | 627 | ||||||
| InvoCare Ltd. | 249 | 1,869 | ||||||
| IPH Ltd. | 488 | 3,163 | ||||||
| IRESS Ltd. | 300 | 2,294 | ||||||
| James Hardie Industries PLC | 926 | 20,988 | ||||||
JB Hi-Fi Ltd.(2) | 684 | 18,865 | ||||||
Jervois Global Ltd.(1) | 2,263 | 818 | ||||||
Judo Capital Holdings Ltd.(1) | 1,330 | 1,085 | ||||||
Kelsian Group Ltd.(2) | 568 | 2,091 | ||||||
| Lendlease Corp. Ltd. | 2,610 | 18,188 | ||||||
| Lifestyle Communities Ltd. | 642 | 7,525 | ||||||
| Link Administration Holdings Ltd. | 509 | 1,492 | ||||||
| Lovisa Holdings Ltd. | 318 | 4,961 | ||||||
| Macquarie Group Ltd. | 317 | 37,930 | ||||||
Magellan Financial Group Ltd.(2) | 695 | 6,101 | ||||||
| McMillan Shakespeare Ltd. | 328 | 3,196 | ||||||
| Medibank Pvt Ltd. | 12,687 | 31,958 | ||||||
Melbana Energy Ltd(1) | 12,084 | 617 | ||||||
Mesoblast Ltd.(1) | 3,114 | 1,811 | ||||||
| Mineral Resources Ltd. | 698 | 29,740 | ||||||
| Monash IVF Group Ltd. | 889 | 633 | ||||||
| Money3 Corp. Ltd. | 612 | 955 | ||||||
| Myer Holdings Ltd. | 7,479 | 2,565 | ||||||
55
| Avantis Responsible International Equity ETF | ||||||||
| Shares | Value | |||||||
| National Australia Bank Ltd. | 6,334 | $ | 131,343 | |||||
Nearmap Ltd.(1) | 2,953 | 4,154 | ||||||
Neometals Ltd.(1) | 641 | 594 | ||||||
| Netwealth Group Ltd. | 429 | 3,808 | ||||||
| Newcrest Mining Ltd. (Sydney) | 1,607 | 19,319 | ||||||
| nib holdings Ltd. | 3,042 | 16,934 | ||||||
| Nick Scali Ltd. | 233 | 1,740 | ||||||
| Nine Entertainment Co. Holdings Ltd. | 5,567 | 8,263 | ||||||
Nuix Ltd.(1) | 1,217 | 560 | ||||||
OFX Group Ltd.(1) | 1,974 | 3,551 | ||||||
Omni Bridgeway Ltd.(1) | 2,245 | 6,948 | ||||||
| oOh!media Ltd. | 2,431 | 2,274 | ||||||
| Orica Ltd. | 2,605 | 27,249 | ||||||
| Orora Ltd. | 3,257 | 7,336 | ||||||
| OZ Minerals Ltd. | 1,957 | 33,727 | ||||||
| Pact Group Holdings Ltd. | 229 | 237 | ||||||
Panoramic Resources Ltd.(1) | 2,171 | 322 | ||||||
Pantoro Ltd.(1) | 579 | 75 | ||||||
| Pendal Group Ltd. | 2,452 | 8,609 | ||||||
| Pepper Money Ltd. | 879 | 935 | ||||||
Perpetual Ltd.(2) | 208 | 3,869 | ||||||
PEXA Group Ltd.(1) | 121 | 1,186 | ||||||
| Platinum Asset Management Ltd. | 1,603 | 1,934 | ||||||
Praemium Ltd.(2) | 2,581 | 1,150 | ||||||
| Premier Investments Ltd. | 451 | 6,485 | ||||||
| Pro Medicus Ltd. | 62 | 2,279 | ||||||
PT Goulamina Holdings Pty Ltd.(1) | 1,597 | 628 | ||||||
| PWR Holdings Ltd. | 241 | 1,554 | ||||||
| QBE Insurance Group Ltd. | 3,519 | 28,851 | ||||||
| Qube Holdings Ltd. | 4,840 | 9,475 | ||||||
| Ramsay Health Care Ltd. | 168 | 8,188 | ||||||
| REA Group Ltd. | 69 | 5,950 | ||||||
| Reece Ltd. | 142 | 1,537 | ||||||
| Reliance Worldwide Corp. Ltd. | 787 | 2,068 | ||||||
Renascor Resources Ltd.(1) | 363 | 46 | ||||||
| Ridley Corp. Ltd. | 3,122 | 4,418 | ||||||
| Sandfire Resources Ltd. | 3,051 | 9,423 | ||||||
| SEEK Ltd. | 150 | 2,116 | ||||||
| Select Harvests Ltd. | 266 | 898 | ||||||
| Seven Group Holdings Ltd. | 228 | 2,868 | ||||||
Seven West Media Ltd.(1) | 10,683 | 3,759 | ||||||
| Sigma Healthcare Ltd. | 4,885 | 2,282 | ||||||
Silver Mines Ltd.(1) | 2,607 | 309 | ||||||
| Sims Ltd. | 1,031 | 10,637 | ||||||
| SmartGroup Corp. Ltd. | 323 | 1,304 | ||||||
| Sonic Healthcare Ltd. | 513 | 11,863 | ||||||
| Southern Cross Media Group Ltd. | 1,529 | 1,117 | ||||||
| Steadfast Group Ltd. | 2,148 | 7,352 | ||||||
Strandline Resources Ltd.(1) | 1,942 | 627 | ||||||
| Suncorp Group Ltd. | 3,697 | 27,303 | ||||||
| Super Retail Group Ltd. | 1,383 | 9,879 | ||||||
56
| Avantis Responsible International Equity ETF | ||||||||
| Shares | Value | |||||||
Superloop Ltd.(1) | 557 | $ | 280 | |||||
Syrah Resources Ltd.(1) | 2,089 | 2,610 | ||||||
| Technology One Ltd. | 883 | 7,071 | ||||||
| Telstra Corp. Ltd. | 11,373 | 30,755 | ||||||
Temple & Webster Group Ltd.(1) | 107 | 363 | ||||||
| Transurban Group | 2,672 | 25,351 | ||||||
| Treasury Wine Estates Ltd. | 1,623 | 14,559 | ||||||
| United Malt Group Ltd. | 2,099 | 5,083 | ||||||
| Vulcan Steel Ltd. | 377 | 2,025 | ||||||
| Wesfarmers Ltd. | 2,125 | 67,977 | ||||||
| Westpac Banking Corp. | 6,507 | 95,507 | ||||||
| WiseTech Global Ltd. | 139 | 5,490 | ||||||
| Woolworths Group Ltd. | 2,663 | 65,650 | ||||||
Xero Ltd.(1) | 73 | 4,295 | ||||||
| 2,019,681 | ||||||||
| Austria — 0.3% | ||||||||
| ANDRITZ AG | 102 | 4,698 | ||||||
| AT&S Austria Technologie & Systemtechnik AG | 177 | 7,878 | ||||||
BAWAG Group AG(1) | 92 | 4,151 | ||||||
| CA Immobilien Anlagen AG | 41 | 1,306 | ||||||
DO & CO. AG(1) | 13 | 1,028 | ||||||
| Erste Group Bank AG | 359 | 8,073 | ||||||
IMMOFINANZ AG(1)(2) | 122 | 1,814 | ||||||
| Lenzing AG | 49 | 3,624 | ||||||
| Oesterreichische Post AG | 63 | 1,759 | ||||||
| Porr AG | 78 | 893 | ||||||
| Raiffeisen Bank International AG | 330 | 4,167 | ||||||
| S IMMO AG | 22 | 503 | ||||||
| Semperit AG Holding | 91 | 1,654 | ||||||
Telekom Austria AG(1) | 287 | 1,792 | ||||||
| UNIQA Insurance Group AG | 519 | 3,431 | ||||||
| Verbund AG | 112 | 10,702 | ||||||
| Vienna Insurance Group AG Wiener Versicherung Gruppe | 191 | 4,528 | ||||||
| Wienerberger AG | 366 | 8,558 | ||||||
| 70,559 | ||||||||
| Belgium — 0.9% | ||||||||
| Ackermans & van Haaren NV | 79 | 11,549 | ||||||
| Ageas SA/NV | 539 | 21,870 | ||||||
AGFA-Gevaert NV(1) | 817 | 2,954 | ||||||
| Anheuser-Busch InBev SA, ADR | 583 | 28,194 | ||||||
| Barco NV | 337 | 7,510 | ||||||
| Bekaert SA | 171 | 5,245 | ||||||
| bpost SA | 1,047 | 6,360 | ||||||
Cie d'Entreprises CFE(1)(2) | 84 | 836 | ||||||
| D'ieteren Group | 48 | 7,236 | ||||||
| Deceuninck NV | 167 | 386 | ||||||
Deme Group NV(1) | 70 | 8,011 | ||||||
| Econocom Group SA | 78 | 243 | ||||||
| Elia Group SA | 67 | 9,733 | ||||||
| Etablissements Franz Colruyt NV | 193 | 5,364 | ||||||
| Exmar NV | 429 | 3,738 | ||||||
57
| Avantis Responsible International Equity ETF | ||||||||
| Shares | Value | |||||||
| Fagron | 521 | $ | 6,689 | |||||
Galapagos NV, ADR(1) | 187 | 9,361 | ||||||
| Gimv NV | 162 | 8,288 | ||||||
| KBC Group NV | 492 | 23,465 | ||||||
Kinepolis Group NV(1) | 87 | 3,814 | ||||||
Ontex Group NV(1) | 584 | 3,353 | ||||||
| Proximus SADP | 814 | 10,362 | ||||||
| Recticel SA | 93 | 1,296 | ||||||
| Shurgard Self Storage SA | 78 | 3,765 | ||||||
| Telenet Group Holding NV | 47 | 668 | ||||||
| UCB SA | 288 | 20,237 | ||||||
| Umicore SA | 1,045 | 33,217 | ||||||
| VGP NV | 21 | 3,053 | ||||||
| 246,797 | ||||||||
| Canada — 11.0% | ||||||||
Absolute Software Corp.(2) | 238 | 2,571 | ||||||
| AG Growth International, Inc. | 142 | 4,246 | ||||||
| AGF Management Ltd., Class B | 238 | 1,118 | ||||||
| Agnico Eagle Mines Ltd. | 907 | 37,403 | ||||||
Aimia, Inc.(1)(2) | 429 | 1,336 | ||||||
| Alamos Gold, Inc., Class A | 2,667 | 19,231 | ||||||
Alexco Resource Corp.(1) | 144 | 65 | ||||||
Algoma Steel Group, Inc.(2) | 600 | 5,482 | ||||||
| Amerigo Resources Ltd. | 1,578 | 1,274 | ||||||
Aritzia, Inc.(1) | 478 | 15,548 | ||||||
Ascot Resources Ltd.(1) | 1,191 | 326 | ||||||
Atrium Mortgage Investment Corp.(2) | 238 | 2,158 | ||||||
| B2Gold Corp. | 6,478 | 19,878 | ||||||
Ballard Power Systems, Inc.(1) | 287 | 2,240 | ||||||
| Bank of Montreal | 1,538 | 141,990 | ||||||
| Bank of Nova Scotia | 2,462 | 136,133 | ||||||
| BCE, Inc. | 238 | 11,485 | ||||||
BELLUS Health, Inc.(1) | 478 | 5,452 | ||||||
Bird Construction, Inc.(2) | 238 | 1,201 | ||||||
Bonterra Energy Corp.(1) | 380 | 2,546 | ||||||
| Boralex, Inc., A Shares | 480 | 18,091 | ||||||
| Boston Pizza Royalties Income Fund | 142 | 1,716 | ||||||
Brookfield Business Corp., Class A(2) | 69 | 1,678 | ||||||
| Brookfield Renewable Corp., Class A | 478 | 18,369 | ||||||
| BRP, Inc. | 142 | 9,849 | ||||||
CAE, Inc.(1) | 238 | 4,346 | ||||||
| Calian Group Ltd. | 142 | 6,504 | ||||||
| Canaccord Genuity Group, Inc. | 678 | 4,052 | ||||||
Canada Goose Holdings, Inc.(1) | 142 | 2,558 | ||||||
| Canadian Imperial Bank of Commerce | 2,400 | 113,499 | ||||||
| Canadian National Railway Co. | 820 | 97,518 | ||||||
| Canadian Tire Corp. Ltd., Class A | 238 | 27,992 | ||||||
| Canadian Western Bank | 478 | 8,913 | ||||||
Capstone Mining Corp.(1) | 2,858 | 6,420 | ||||||
| Cascades, Inc. | 478 | 3,257 | ||||||
| CCL Industries, Inc., Class B | 238 | 11,674 | ||||||
58
| Avantis Responsible International Equity ETF | ||||||||
| Shares | Value | |||||||
Celestica, Inc.(1) | 713 | $ | 7,356 | |||||
| Centerra Gold, Inc. | 1,700 | 7,702 | ||||||
| CES Energy Solutions Corp. | 1,238 | 2,338 | ||||||
CGI, Inc.(1) | 380 | 30,091 | ||||||
| CI Financial Corp. | 478 | 5,241 | ||||||
Cineplex, Inc.(1) | 238 | 1,633 | ||||||
| Cogeco Communications, Inc. | 142 | 8,694 | ||||||
| Colliers International Group, Inc. (Toronto) | 142 | 16,541 | ||||||
| Computer Modelling Group Ltd. | 478 | 1,674 | ||||||
Copper Mountain Mining Corp.(1)(2) | 1,238 | 1,376 | ||||||
| Corby Spirit & Wine Ltd. | 238 | 3,218 | ||||||
| Corus Entertainment, Inc., B Shares | 1,638 | 4,615 | ||||||
| Definity Financial Corp. | 600 | 16,995 | ||||||
Descartes Systems Group, Inc.(1) | 142 | 10,003 | ||||||
| Dollarama, Inc. | 478 | 29,109 | ||||||
| Dorel Industries, Inc., Class B | 478 | 2,471 | ||||||
| DREAM Unlimited Corp., Class A | 142 | 3,048 | ||||||
Eldorado Gold Corp. (Toronto)(1) | 1,238 | 6,825 | ||||||
| Element Fleet Management Corp. | 3,107 | 39,129 | ||||||
| Empire Co. Ltd., Class A | 962 | 27,402 | ||||||
| Enghouse Systems Ltd. | 142 | 3,466 | ||||||
| EQB, Inc. | 142 | 5,694 | ||||||
| Fairfax Financial Holdings Ltd. | 100 | 49,853 | ||||||
| Fiera Capital Corp. | 238 | 1,654 | ||||||
| Finning International, Inc. | 478 | 10,300 | ||||||
First National Financial Corp.(2) | 238 | 6,739 | ||||||
Fission Uranium Corp.(1) | 2,380 | 1,504 | ||||||
Fortuna Silver Mines, Inc.(1) | 2,620 | 6,064 | ||||||
| Franco-Nevada Corp. | 142 | 17,072 | ||||||
Freehold Royalties Ltd.(2) | 858 | 9,368 | ||||||
| Gear Energy Ltd. | 3,191 | 3,013 | ||||||
| George Weston Ltd. | 238 | 27,210 | ||||||
| GFL Environmental, Inc. | 238 | 6,705 | ||||||
| Gildan Activewear, Inc. | 713 | 21,086 | ||||||
| goeasy Ltd. | 100 | 9,126 | ||||||
GoGold Resources, Inc.(1) | 138 | 188 | ||||||
GoldMining, Inc.(1)(2) | 1,522 | 1,344 | ||||||
| Great-West Lifeco, Inc. | 1,107 | 26,003 | ||||||
| Home Capital Group, Inc. | 478 | 10,169 | ||||||
| Hudbay Minerals, Inc. | 1,429 | 6,311 | ||||||
| Hydro One Ltd. | 1,487 | 40,262 | ||||||
i-80 Gold Corp.(1) | 907 | 1,623 | ||||||
| iA Financial Corp., Inc. | 907 | 48,722 | ||||||
IAMGOLD Corp.(1)(2) | 3,238 | 3,871 | ||||||
IBI Group, Inc.(1) | 238 | 3,506 | ||||||
| IGM Financial, Inc. | 142 | 3,865 | ||||||
InPlay Oil Corp.(1) | 400 | 1,139 | ||||||
| Intact Financial Corp. | 238 | 34,476 | ||||||
Interfor Corp.(1) | 620 | 15,253 | ||||||
Karora Resources, Inc.(1) | 1,238 | 2,696 | ||||||
| Labrador Iron Ore Royalty Corp. | 480 | 10,668 | ||||||
59
| Avantis Responsible International Equity ETF | ||||||||
| Shares | Value | |||||||
| Laurentian Bank of Canada | 238 | $ | 6,520 | |||||
| LifeWorks, Inc. | 238 | 5,786 | ||||||
| Linamar Corp. | 342 | 16,168 | ||||||
| Loblaw Cos. Ltd. | 580 | 51,259 | ||||||
| Lundin Mining Corp. | 5,722 | 29,757 | ||||||
| Magna International, Inc. | 778 | 44,944 | ||||||
Major Drilling Group International, Inc.(1) | 762 | 5,164 | ||||||
| Manulife Financial Corp. | 7,491 | 129,589 | ||||||
| Maple Leaf Foods, Inc. | 238 | 4,199 | ||||||
| Martinrea International, Inc. | 787 | 6,202 | ||||||
| MCAN Mortgage Corp. | 142 | 1,730 | ||||||
MDA Ltd.(1) | 142 | 805 | ||||||
| Medical Facilities Corp. | 238 | 1,823 | ||||||
Metro, Inc.(2) | 578 | 30,402 | ||||||
| Mullen Group Ltd. | 700 | 7,494 | ||||||
| National Bank of Canada | 1,558 | 103,076 | ||||||
| Neo Performance Materials, Inc. | 142 | 1,564 | ||||||
North American Construction Group Ltd.(2) | 478 | 5,496 | ||||||
| North West Co., Inc. | 238 | 6,170 | ||||||
Northern Dynasty Minerals Ltd.(1)(2) | 2,380 | 670 | ||||||
Novagold Resources, Inc.(1) | 1,102 | 4,882 | ||||||
| Nutrien Ltd. | 1,149 | 105,482 | ||||||
OceanaGold Corp.(1) | 6,907 | 10,203 | ||||||
| Onex Corp. | 380 | 18,792 | ||||||
| Open Text Corp. | 480 | 15,120 | ||||||
| Osisko Gold Royalties Ltd. (Toronto) | 620 | 6,000 | ||||||
| Pan American Silver Corp. | 1,238 | 18,419 | ||||||
| Pason Systems, Inc. | 600 | 6,350 | ||||||
Pine Cliff Energy Ltd.(2) | 1,809 | 2,603 | ||||||
Pizza Pizza Royalty Corp.(2) | 238 | 2,385 | ||||||
| Polaris Renewable Energy, Inc. | 142 | 2,085 | ||||||
| Power Corp. of Canada | 478 | 12,291 | ||||||
| PrairieSky Royalty Ltd. | 500 | 6,815 | ||||||
| Quebecor, Inc., Class B | 667 | 14,408 | ||||||
Real Matters, Inc.(1) | 478 | 2,107 | ||||||
Recipe UnLtd. Corp.(1) | 61 | 914 | ||||||
Resolute Forest Products, Inc.(1) | 400 | 8,095 | ||||||
| Restaurant Brands International, Inc. | 762 | 44,983 | ||||||
| Ritchie Bros Auctioneers, Inc. | 338 | 23,414 | ||||||
| Rogers Communications, Inc., Class B | 478 | 20,582 | ||||||
| Royal Bank of Canada | 2,062 | 191,748 | ||||||
| Russel Metals, Inc. | 578 | 12,499 | ||||||
| Sandstorm Gold Ltd. | 1,029 | 5,853 | ||||||
| Saputo, Inc. | 238 | 6,044 | ||||||
Shawcor Ltd.(1) | 478 | 2,861 | ||||||
Sherritt International Corp.(1)(2) | 3,093 | 918 | ||||||
Shopify, Inc., Class A(1) | 200 | 6,332 | ||||||
| Sleep Country Canada Holdings, Inc. | 242 | 4,883 | ||||||
| Softchoice Corp. | 238 | 3,329 | ||||||
Spin Master Corp., VTG Shares(1) | 238 | 8,354 | ||||||
| Sprott, Inc. | 142 | 5,370 | ||||||
60
| Avantis Responsible International Equity ETF | ||||||||
| Shares | Value | |||||||
SSR Mining, Inc.(2) | 1,191 | $ | 16,078 | |||||
| Stantec, Inc. | 238 | 11,295 | ||||||
| Stella-Jones, Inc. | 438 | 13,337 | ||||||
| StorageVault Canada, Inc. | 200 | 929 | ||||||
| Sun Life Financial, Inc. | 1,142 | 50,311 | ||||||
| Surge Energy, Inc. | 478 | 3,669 | ||||||
| Teck Resources Ltd., Class B | 3,087 | 104,549 | ||||||
| TELUS Corp. | 813 | 18,311 | ||||||
| TFI International, Inc. | 238 | 23,745 | ||||||
| Thomson Reuters Corp. | 100 | 11,012 | ||||||
| Tidewater Midstream and Infrastructure Ltd. | 2,191 | 2,019 | ||||||
| Toromont Industries Ltd. | 380 | 29,414 | ||||||
| Toronto-Dominion Bank | 1,571 | 101,065 | ||||||
| Total Energy Services, Inc. | 429 | 2,375 | ||||||
| Transcontinental, Inc., Class A | 338 | 4,262 | ||||||
| TransGlobe Energy Corp. | 762 | 2,530 | ||||||
| Tricon Residential, Inc. (Toronto) | 1,287 | 13,435 | ||||||
Trisura Group Ltd.(1) | 238 | 6,303 | ||||||
Uni-Select, Inc.(1) | 238 | 6,732 | ||||||
| Wajax Corp. | 478 | 7,723 | ||||||
| West Fraser Timber Co. Ltd. | 620 | 55,469 | ||||||
| Western Forest Products, Inc. | 4,000 | 4,690 | ||||||
Westport Fuel Systems, Inc.(1) | 629 | 685 | ||||||
| Westshore Terminals Investment Corp. | 142 | 3,306 | ||||||
| Wheaton Precious Metals Corp. | 478 | 14,591 | ||||||
| Winpak Ltd. | 142 | 4,696 | ||||||
| WSP Global, Inc. | 238 | 28,362 | ||||||
| Yamana Gold, Inc. | 5,907 | 26,086 | ||||||
Yangarra Resources Ltd.(1) | 1,049 | 2,252 | ||||||
| 2,964,700 | ||||||||
| Denmark — 2.2% | ||||||||
ALK-Abello A/S(1) | 335 | 6,228 | ||||||
| Alm Brand A/S | 2,988 | 4,378 | ||||||
Bang & Olufsen A/S(1) | 180 | 312 | ||||||
Bavarian Nordic A/S(1) | 154 | 5,802 | ||||||
| Carlsberg A/S, B Shares | 58 | 7,531 | ||||||
| Chemometec A/S | 29 | 3,102 | ||||||
| Chr Hansen Holding A/S | 98 | 5,710 | ||||||
| Coloplast A/S, B Shares | 142 | 16,221 | ||||||
| Danske Bank A/S | 1,931 | 25,785 | ||||||
| DSV A/S | 72 | 10,639 | ||||||
| FLSmidth & Co. A/S | 100 | 2,768 | ||||||
Genmab A/S, ADR(1) | 991 | 35,171 | ||||||
| GN Store Nord A/S | 87 | 2,461 | ||||||
| H Lundbeck A/S | 629 | 2,470 | ||||||
H Lundbeck A/S, A Shares(1) | 158 | 605 | ||||||
H+H International A/S, B Shares(1) | 79 | 1,270 | ||||||
ISS A/S(1) | 57 | 998 | ||||||
Jyske Bank A/S(1) | 222 | 11,112 | ||||||
Nilfisk Holding A/S(1) | 42 | 939 | ||||||
NKT A/S(1) | 146 | 7,453 | ||||||
61
| Avantis Responsible International Equity ETF | ||||||||
| Shares | Value | |||||||
| Novo Nordisk A/S, ADR | 2,457 | $ | 260,688 | |||||
| Novozymes A/S, B Shares | 412 | 23,646 | ||||||
NTG Nordic Transport Group A/S(1) | 9 | 349 | ||||||
| Orsted A/S | 282 | 27,524 | ||||||
| Pandora A/S | 192 | 11,535 | ||||||
| Per Aarsleff Holding A/S | 104 | 2,991 | ||||||
| Ringkjoebing Landbobank A/S | 34 | 3,630 | ||||||
| ROCKWOOL A/S, B Shares | 33 | 6,793 | ||||||
| Royal Unibrew A/S | 49 | 3,671 | ||||||
| SimCorp A/S | 103 | 7,522 | ||||||
| Solar A/S, B Shares | 50 | 4,042 | ||||||
| Spar Nord Bank A/S | 457 | 5,174 | ||||||
| Sparekassen Sjaelland-Fyn A/S | 97 | 2,114 | ||||||
| Sydbank A/S | 287 | 8,293 | ||||||
| Topdanmark A/S | 179 | 9,387 | ||||||
| Tryg A/S | 691 | 15,614 | ||||||
| Vestas Wind Systems A/S | 2,186 | 54,696 | ||||||
| 598,624 | ||||||||
| Finland — 1.0% | ||||||||
| Aktia Bank Oyj | 171 | 1,765 | ||||||
| Anora Group Oyj | 65 | 530 | ||||||
| Cargotec Oyj, B Shares | 13 | 442 | ||||||
| Caverion OYJ | 171 | 837 | ||||||
Citycon Oyj(1) | 350 | 2,480 | ||||||
| Elisa Oyj | 189 | 10,107 | ||||||
F-Secure Oyj(1) | 53 | 133 | ||||||
| Huhtamaki Oyj | 28 | 980 | ||||||
| Kemira Oyj | 482 | 5,802 | ||||||
| Kesko Oyj, B Shares | 762 | 16,031 | ||||||
| Kojamo Oyj | 379 | 6,345 | ||||||
| Kone Oyj, B Shares | 564 | 22,556 | ||||||
| Konecranes Oyj | 98 | 2,304 | ||||||
| Lassila & Tikanoja Oyj | 93 | 999 | ||||||
| Marimekko Oyj | 238 | 2,347 | ||||||
| Metso Outotec Oyj | 1,353 | 10,582 | ||||||
| Nokia Oyj, ADR | 6,195 | 31,285 | ||||||
| Nokian Renkaat Oyj | 361 | 3,747 | ||||||
| Orion Oyj, Class B | 308 | 13,965 | ||||||
| Outokumpu Oyj | 2,079 | 8,337 | ||||||
| Puuilo Oyj | 362 | 1,727 | ||||||
QT Group Oyj(1) | 29 | 1,470 | ||||||
| Raisio Oyj, V Shares | 191 | 416 | ||||||
| Rovio Entertainment Oyj | 58 | 349 | ||||||
| Sampo Oyj, A Shares | 809 | 36,599 | ||||||
| Sanoma Oyj | 139 | 1,896 | ||||||
| Stora Enso Oyj, R Shares | 1,903 | 28,328 | ||||||
| Taaleri Oyj | 89 | 869 | ||||||
| Talenom Oyj | 78 | 851 | ||||||
| TietoEVRY Oyj | 63 | 1,612 | ||||||
| Tokmanni Group Corp. | 271 | 3,235 | ||||||
| UPM-Kymmene Oyj | 737 | 25,039 | ||||||
62
| Avantis Responsible International Equity ETF | ||||||||
| Shares | Value | |||||||
| Uponor Oyj | 222 | $ | 3,326 | |||||
| Valmet Oyj | 213 | 5,399 | ||||||
| Wartsila Oyj Abp | 754 | 6,217 | ||||||
YIT Oyj(2) | 608 | 1,990 | ||||||
| 260,897 | ||||||||
| France — 9.1% | ||||||||
Accor SA(1) | 309 | 7,370 | ||||||
Aeroports de Paris(1) | 73 | 9,996 | ||||||
| Airbus SE | 640 | 62,716 | ||||||
ALD SA(2) | 813 | 8,849 | ||||||
| Alstom SA | 549 | 11,251 | ||||||
| Alten SA | 119 | 14,631 | ||||||
| Amundi SA | 120 | 6,084 | ||||||
APERAM SA(2) | 151 | 4,076 | ||||||
| Arkema SA | 368 | 31,067 | ||||||
Atos SE(1) | 118 | 1,191 | ||||||
| Aubay | 17 | 832 | ||||||
| AXA SA | 4,747 | 111,800 | ||||||
Believe SA(1) | 30 | 247 | ||||||
| Beneteau SA | 167 | 1,780 | ||||||
| Bigben Interactive | 33 | 404 | ||||||
| BioMerieux | 197 | 18,016 | ||||||
| Biosynex | 53 | 779 | ||||||
| BNP Paribas SA | 1,603 | 74,492 | ||||||
| Bureau Veritas SA | 913 | 22,661 | ||||||
| Capgemini SE | 190 | 32,828 | ||||||
Carbios SACA(1) | 25 | 718 | ||||||
| Carrefour SA | 3,574 | 59,652 | ||||||
Casino Guichard Perrachon SA(1) | 122 | 1,581 | ||||||
| Catana Group | 227 | 1,403 | ||||||
| Chargeurs SA | 42 | 629 | ||||||
| Cie de Saint-Gobain | 1,762 | 70,969 | ||||||
Cie des Alpes(1) | 232 | 3,670 | ||||||
| Cie Generale des Etablissements Michelin SCA | 3,475 | 84,516 | ||||||
| Cie Plastic Omnium SA | 492 | 9,123 | ||||||
Coface SA(1) | 744 | 7,440 | ||||||
| Credit Agricole SA | 1,774 | 16,327 | ||||||
| Danone SA | 387 | 20,364 | ||||||
| Dassault Systemes SE | 399 | 15,387 | ||||||
DBV Technologies SA(1) | 183 | 756 | ||||||
| Derichebourg SA | 729 | 4,101 | ||||||
| Edenred | 303 | 15,326 | ||||||
| Electricite de France SA | 2,823 | 33,752 | ||||||
| Elis SA | 136 | 1,739 | ||||||
| Equasens | 9 | 697 | ||||||
| Esker SA | 9 | 1,167 | ||||||
| EssilorLuxottica SA | 160 | 23,830 | ||||||
Esso SA Francaise(1) | 11 | 677 | ||||||
| Etablissements Maurel et Prom SA | 717 | 3,629 | ||||||
| Eurazeo SE | 383 | 22,873 | ||||||
Euroapi SA(1) | 236 | 3,679 | ||||||
63
| Avantis Responsible International Equity ETF | ||||||||
| Shares | Value | |||||||
Eurobio Scientific SA(1) | 72 | $ | 1,328 | |||||
| Eurofins Scientific SE | 399 | 27,606 | ||||||
| Euronext NV | 109 | 8,055 | ||||||
| Eutelsat Communications SA | 1,608 | 14,544 | ||||||
Faurecia SE(1) | 659 | 9,451 | ||||||
| Fnac Darty SA | 9 | 303 | ||||||
Francaise Energie(1) | 8 | 476 | ||||||
Genfit(1) | 530 | 2,244 | ||||||
| Getlink SE | 780 | 14,688 | ||||||
Groupe Gorge SA(1) | 20 | 403 | ||||||
| Groupe LDLC | 19 | 518 | ||||||
| Guerbet | 21 | 407 | ||||||
| Hermes International | 54 | 69,161 | ||||||
ID Logistics Group(1) | 18 | 5,036 | ||||||
| Ipsen SA | 268 | 25,684 | ||||||
| IPSOS | 38 | 1,726 | ||||||
| Jacquet Metals SACA | 58 | 918 | ||||||
JCDecaux SA(1) | 408 | 5,658 | ||||||
| Kaufman & Broad SA | 77 | 1,824 | ||||||
| Kering SA | 151 | 75,765 | ||||||
| L'Oreal SA | 180 | 61,820 | ||||||
| Legrand SA | 251 | 18,161 | ||||||
| LVMH Moet Hennessy Louis Vuitton SE | 343 | 221,326 | ||||||
| Maisons du Monde SA | 249 | 2,383 | ||||||
| Manitou BF SA | 38 | 626 | ||||||
McPhy Energy SA(1) | 86 | 1,091 | ||||||
| Mersen SA | 112 | 3,312 | ||||||
| Metropole Television SA | 217 | 2,679 | ||||||
Nacon SA(1) | 9 | 43 | ||||||
| Neoen SA | 207 | 8,550 | ||||||
| Nexans SA | 177 | 16,172 | ||||||
| Nexity SA | 100 | 2,239 | ||||||
Novacyt SA(1) | 189 | 225 | ||||||
Orange SA, ADR(2) | 9,067 | 91,486 | ||||||
Orpea SA(1) | 127 | 2,763 | ||||||
| Pernod Ricard SA | 280 | 51,377 | ||||||
| Publicis Groupe SA | 148 | 7,226 | ||||||
| Quadient SA | 234 | 3,964 | ||||||
| Remy Cointreau SA | 81 | 15,022 | ||||||
Renault SA(1) | 532 | 15,153 | ||||||
ReWorld Media SA(1) | 207 | 1,312 | ||||||
Rexel SA(1) | 918 | 14,910 | ||||||
| Safran SA | 1,051 | 107,154 | ||||||
| Sanofi, ADR | 2,146 | 88,050 | ||||||
| Sartorius Stedim Biotech | 31 | 11,339 | ||||||
| Schneider Electric SE | 223 | 26,505 | ||||||
| SCOR SE | 757 | 12,527 | ||||||
| SEB SA | 91 | 6,740 | ||||||
| SES SA | 4,009 | 28,145 | ||||||
SES-imagotag SA(1) | 43 | 4,298 | ||||||
SMCP SA(1) | 348 | 1,906 | ||||||
64
| Avantis Responsible International Equity ETF | ||||||||
| Shares | Value | |||||||
| Societe BIC SA | 123 | $ | 6,997 | |||||
| Societe Generale SA | 1,749 | 38,557 | ||||||
| Sodexo SA | 140 | 10,707 | ||||||
SOITEC(1) | 131 | 18,502 | ||||||
Solutions 30 SE(1) | 732 | 2,137 | ||||||
| Somfy SA | 29 | 3,208 | ||||||
| Sopra Steria Group SACA | 40 | 5,521 | ||||||
| SPIE SA | 468 | 10,189 | ||||||
| STMicroelectronics NV, NY Shares | 2,870 | 100,163 | ||||||
| Sword Group | 29 | 1,163 | ||||||
Technicolor SA(1) | 940 | 2,922 | ||||||
| Teleperformance | 157 | 44,715 | ||||||
| Television Francaise 1 | 449 | 2,847 | ||||||
| Thales SA | 550 | 66,308 | ||||||
| Trigano SA | 9 | 779 | ||||||
Ubisoft Entertainment SA(1) | 749 | 34,540 | ||||||
| Valeo | 1,187 | 22,674 | ||||||
| Vinci SA | 1,183 | 109,136 | ||||||
| Virbac SA | 26 | 9,639 | ||||||
| Vivendi SE | 2,000 | 18,129 | ||||||
Voltalia SA(1) | 140 | 2,998 | ||||||
| Wavestone | 33 | 1,537 | ||||||
Worldline SA(1) | 100 | 4,284 | ||||||
| 2,437,026 | ||||||||
| Germany — 6.4% | ||||||||
| 1&1 AG | 49 | 788 | ||||||
| 7C Solarparken AG | 288 | 1,550 | ||||||
| Adesso SE | 18 | 2,181 | ||||||
| adidas AG | 295 | 43,744 | ||||||
ADLER Group SA(1) | 301 | 844 | ||||||
| Allianz SE | 518 | 87,561 | ||||||
| Amadeus Fire AG | 29 | 2,893 | ||||||
| Aroundtown SA | 2,764 | 8,061 | ||||||
| Atoss Software AG | 22 | 2,918 | ||||||
| Aumann AG | 33 | 507 | ||||||
| Aurubis AG | 208 | 12,594 | ||||||
| BASF SE | 1,574 | 66,578 | ||||||
| Bayer AG | 705 | 37,286 | ||||||
| Bayerische Motoren Werke AG | 639 | 47,081 | ||||||
| Bayerische Motoren Werke AG, Preference Shares | 108 | 7,509 | ||||||
| BayWa AG | 33 | 1,428 | ||||||
| Bechtle AG | 191 | 7,317 | ||||||
| Beiersdorf AG | 232 | 23,418 | ||||||
| Bertrandt AG | 13 | 444 | ||||||
| Bilfinger SE | 67 | 1,989 | ||||||
Borussia Dortmund GmbH & Co. KGaA(1) | 120 | 470 | ||||||
| Brenntag SE | 103 | 6,753 | ||||||
| Carl Zeiss Meditec AG | 76 | 9,459 | ||||||
| CECONOMY AG | 995 | 1,440 | ||||||
| Cewe Stiftung & Co. KGAA | 30 | 2,372 | ||||||
| Cliq Digital AG | 44 | 1,152 | ||||||
65
| Avantis Responsible International Equity ETF | ||||||||
| Shares | Value | |||||||
Commerzbank AG(1) | 4,051 | $ | 26,955 | |||||
| CompuGroup Medical SE & Co. KgaA | 83 | 3,122 | ||||||
| Continental AG | 193 | 11,112 | ||||||
| Covestro AG | 919 | 27,710 | ||||||
CTS Eventim AG & Co. KGaA(1) | 261 | 14,032 | ||||||
Daimler Truck Holding AG(1) | 1,794 | 45,870 | ||||||
| Datagroup SE | 23 | 1,510 | ||||||
Delivery Hero SE(1) | 38 | 1,577 | ||||||
| Dermapharm Holding SE | 56 | 2,597 | ||||||
| Deutsche Bank AG | 4,503 | 37,420 | ||||||
| Deutsche Beteiligungs AG | 58 | 1,622 | ||||||
| Deutsche Boerse AG | 272 | 45,988 | ||||||
Deutsche Lufthansa AG(1) | 3,484 | 20,713 | ||||||
| Deutsche Pfandbriefbank AG | 710 | 6,127 | ||||||
| Deutsche Post AG | 2,037 | 74,349 | ||||||
| Deutsche Rohstoff AG | 40 | 1,090 | ||||||
| Deutsche Telekom AG | 4,138 | 77,990 | ||||||
| Deutz AG | 432 | 1,627 | ||||||
| DIC Asset AG | 102 | 1,044 | ||||||
| Draegerwerk AG & Co. KGaA | 15 | 606 | ||||||
| Draegerwerk AG & Co. KGaA, Preference Shares | 16 | 757 | ||||||
| Duerr AG | 170 | 3,745 | ||||||
| ElringKlinger AG | 168 | 1,179 | ||||||
| Encavis AG | 539 | 11,519 | ||||||
| Energiekontor AG | 47 | 4,129 | ||||||
| Evonik Industries AG | 599 | 11,168 | ||||||
Evotec SE(1) | 351 | 7,716 | ||||||
| Fielmann AG | 130 | 4,831 | ||||||
flatexDEGIRO AG(1) | 230 | 2,213 | ||||||
Fraport AG Frankfurt Airport Services Worldwide(1) | 93 | 4,021 | ||||||
| Freenet AG | 300 | 6,539 | ||||||
| Fresenius Medical Care AG & Co. KGaA, ADR | 221 | 3,779 | ||||||
| Fresenius SE & Co. KGaA | 110 | 2,721 | ||||||
| GEA Group AG | 567 | 19,724 | ||||||
| Gerresheimer AG | 163 | 8,526 | ||||||
| GFT Technologies SE | 61 | 2,028 | ||||||
| Grand City Properties SA | 378 | 4,485 | ||||||
| GRENKE AG | 136 | 3,270 | ||||||
| Hamburger Hafen und Logistik AG | 191 | 2,336 | ||||||
| Hannover Rueck SE | 87 | 12,823 | ||||||
HelloFresh SE(1) | 427 | 10,195 | ||||||
| Henkel AG & Co. KGaA | 123 | 7,692 | ||||||
| Henkel AG & Co. KGaA, Preference Shares | 213 | 13,746 | ||||||
| Hensoldt AG | 160 | 3,558 | ||||||
| HOCHTIEF AG | 98 | 4,839 | ||||||
| Hornbach Holding AG & Co. KGaA | 62 | 4,373 | ||||||
| HUGO BOSS AG | 392 | 21,365 | ||||||
Hypoport SE(1) | 7 | 1,367 | ||||||
| Infineon Technologies AG | 2,109 | 51,605 | ||||||
| Instone Real Estate Group SE | 352 | 3,116 | ||||||
| Jenoptik AG | 163 | 3,449 | ||||||
66
| Avantis Responsible International Equity ETF | ||||||||
| Shares | Value | |||||||
| JOST Werke AG | 70 | $ | 2,594 | |||||
| Jungheinrich AG, Preference Shares | 128 | 3,125 | ||||||
| KION Group AG | 182 | 7,272 | ||||||
| Kloeckner & Co. SE | 278 | 2,509 | ||||||
| Knorr-Bremse AG | 182 | 8,821 | ||||||
Koenig & Bauer AG(1) | 51 | 595 | ||||||
| Kontron AG | 290 | 4,412 | ||||||
| Krones AG | 78 | 6,424 | ||||||
| Lang & Schwarz AG | 33 | 470 | ||||||
| Lanxess AG | 376 | 12,687 | ||||||
| LEG Immobilien SE | 167 | 12,621 | ||||||
Leoni AG(1) | 233 | 1,633 | ||||||
Manz AG(1) | 3 | 82 | ||||||
| Mercedes-Benz Group AG | 1,171 | 65,653 | ||||||
| Merck KGaA | 63 | 10,822 | ||||||
METRO AG(1) | 621 | 4,944 | ||||||
| MTU Aero Engines AG | 247 | 43,561 | ||||||
| Muenchener Rueckversicherungs-Gesellschaft AG | 143 | 34,166 | ||||||
| Mutares SE & Co. KGaA | 109 | 1,759 | ||||||
Nagarro SE(1) | 23 | 2,311 | ||||||
| Nemetschek SE | 140 | 8,247 | ||||||
| New Work SE | 17 | 2,026 | ||||||
Nordex SE(1) | 151 | 1,452 | ||||||
| Norma Group SE | 146 | 2,296 | ||||||
| Patrizia SE | 42 | 531 | ||||||
| Pfeiffer Vacuum Technology AG | 14 | 1,848 | ||||||
| Porsche Automobil Holding SE, Preference Shares | 288 | 20,307 | ||||||
| ProSiebenSat.1 Media SE | 292 | 2,257 | ||||||
| Puma SE | 150 | 9,169 | ||||||
PVA TePla AG(1) | 158 | 2,654 | ||||||
QIAGEN NV(1) | 442 | 20,080 | ||||||
| Rational AG | 9 | 4,854 | ||||||
| Rheinmetall AG | 221 | 35,083 | ||||||
| SAF-Holland SE | 145 | 1,154 | ||||||
| SAP SE, ADR | 321 | 27,356 | ||||||
| Sartorius AG, Preference Shares | 37 | 15,415 | ||||||
| Schaeffler AG, Preference Shares | 856 | 4,460 | ||||||
| Scout24 SE | 143 | 8,239 | ||||||
| Secunet Security Networks AG | 9 | 1,958 | ||||||
SGL Carbon SE(1) | 211 | 1,434 | ||||||
| Siemens AG | 557 | 56,421 | ||||||
Siemens Energy AG(1) | 705 | 10,370 | ||||||
| Siemens Healthineers AG | 385 | 18,813 | ||||||
| Siltronic AG | 37 | 2,536 | ||||||
| Sixt SE | 88 | 8,605 | ||||||
| Sixt SE, Preference Shares | 110 | 6,575 | ||||||
| Stabilus SA | 139 | 7,110 | ||||||
| STRATEC SE | 51 | 4,347 | ||||||
| Stroeer SE & Co. KGaA | 98 | 4,165 | ||||||
| SUESS MicroTec SE | 97 | 1,201 | ||||||
| Symrise AG | 120 | 12,556 | ||||||
67
| Avantis Responsible International Equity ETF | ||||||||
| Shares | Value | |||||||
| Synlab AG | 252 | $ | 3,694 | |||||
| TAG Immobilien AG | 389 | 3,589 | ||||||
TeamViewer AG(1) | 653 | 6,535 | ||||||
| Telefonica Deutschland Holding AG | 5,671 | 14,722 | ||||||
| United Internet AG | 430 | 9,727 | ||||||
| Varta AG | 47 | 3,297 | ||||||
Vitesco Technologies Group AG, Class A(1) | 132 | 6,446 | ||||||
| Volkswagen AG | 44 | 8,139 | ||||||
| Volkswagen AG, Preference Shares | 273 | 38,831 | ||||||
| Vonovia SE | 1,628 | 44,072 | ||||||
| Wacker Chemie AG | 70 | 9,955 | ||||||
| Wacker Neuson SE | 134 | 2,218 | ||||||
Zalando SE(1) | 259 | 5,997 | ||||||
| 1,711,414 | ||||||||
| Hong Kong — 2.6% | ||||||||
| AIA Group Ltd. | 17,200 | 165,485 | ||||||
| ASMPT Ltd. | 2,200 | 17,040 | ||||||
| Bank of East Asia Ltd. | 10,000 | 12,599 | ||||||
| BOC Hong Kong Holdings Ltd. | 9,500 | 32,697 | ||||||
| Budweiser Brewing Co. APAC Ltd. | 1,300 | 3,821 | ||||||
| Cafe de Coral Holdings Ltd. | 2,000 | 2,863 | ||||||
| Chow Tai Fook Jewellery Group Ltd. | 1,600 | 3,220 | ||||||
| CITIC Telecom International Holdings Ltd. | 2,000 | 691 | ||||||
| CK Asset Holdings Ltd. | 6,500 | 43,873 | ||||||
| CK Hutchison Holdings Ltd. | 3,500 | 22,602 | ||||||
Cowell e Holdings, Inc.(1) | 2,000 | 4,054 | ||||||
| E-Commodities Holdings Ltd. | 16,000 | 3,573 | ||||||
| EC Healthcare | 1,000 | 703 | ||||||
Esprit Holdings Ltd.(1) | 2,500 | 311 | ||||||
ESR Group Ltd.(1) | 1,800 | 5,040 | ||||||
| First Pacific Co. Ltd. | 2,000 | 771 | ||||||
Fosun Tourism Group(1)(2) | 600 | 838 | ||||||
Futu Holdings Ltd., ADR(1) | 28 | 1,375 | ||||||
| Giordano International Ltd. | 10,000 | 2,327 | ||||||
Green Future Food Hydrocolloid Marine Science Co. Ltd.(1) | 2,000 | 892 | ||||||
| Hang Lung Group Ltd. | 8,000 | 13,531 | ||||||
| Hang Lung Properties Ltd. | 10,000 | 16,630 | ||||||
| Hang Seng Bank Ltd. | 1,200 | 18,788 | ||||||
| Henderson Land Development Co. Ltd. | 7,000 | 23,416 | ||||||
| HKBN Ltd. | 1,000 | 955 | ||||||
| HKT Trust & HKT Ltd. | 7,000 | 9,391 | ||||||
| Hong Kong Exchanges & Clearing Ltd. | 1,500 | 60,442 | ||||||
| Hongkong Land Holdings Ltd. | 2,900 | 14,019 | ||||||
| Hysan Development Co. Ltd. | 1,000 | 2,818 | ||||||
| IGG, Inc. | 3,000 | 1,290 | ||||||
| Johnson Electric Holdings Ltd. | 500 | 591 | ||||||
| K Wah International Holdings Ltd. | 7,000 | 2,640 | ||||||
| Kerry Properties Ltd. | 5,000 | 11,528 | ||||||
| Luk Fook Holdings International Ltd. | 2,000 | 5,113 | ||||||
| Man Wah Holdings Ltd. | 6,000 | 4,742 | ||||||
| Modern Dental Group Ltd. | 1,000 | 285 | ||||||
68
| Avantis Responsible International Equity ETF | ||||||||
| Shares | Value | |||||||
| MTR Corp. Ltd. | 1,000 | $ | 5,121 | |||||
| New World Development Co. Ltd. | 10,000 | 32,586 | ||||||
| NWS Holdings Ltd. | 14,000 | 13,468 | ||||||
| Oriental Watch Holdings | 2,000 | 1,142 | ||||||
| Pacific Textiles Holdings Ltd. | 9,000 | 3,380 | ||||||
| PC Partner Group Ltd. | 2,000 | 1,901 | ||||||
| PCCW Ltd. | 8,000 | 4,005 | ||||||
| Perfect Medical Health Management Ltd. | 1,000 | 511 | ||||||
Shangri-La Asia Ltd.(1) | 2,000 | 1,595 | ||||||
| Singamas Container Holdings Ltd. | 16,000 | 1,482 | ||||||
| Sino Land Co. Ltd. | 18,000 | 26,322 | ||||||
| Sun Hung Kai Properties Ltd. | 3,500 | 41,119 | ||||||
| SUNeVision Holdings Ltd. | 4,000 | 2,621 | ||||||
| Swire Properties Ltd. | 4,200 | 9,680 | ||||||
| Tam Jai International Co. Ltd. | 2,000 | 666 | ||||||
| Techtronic Industries Co. Ltd. | 500 | 5,897 | ||||||
| Texhong Textile Group Ltd. | 3,500 | 3,288 | ||||||
| Time Interconnect Technology Ltd. | 8,000 | 2,315 | ||||||
| Value Partners Group Ltd. | 8,000 | 2,346 | ||||||
| VSTECS Holdings Ltd. | 2,000 | 1,322 | ||||||
| VTech Holdings Ltd. | 1,300 | 8,841 | ||||||
| Wharf Real Estate Investment Co. Ltd. | 2,000 | 9,100 | ||||||
| Yue Yuen Industrial Holdings Ltd. | 6,000 | 8,946 | ||||||
Zensun Enterprises Ltd.(1) | 3,000 | 947 | ||||||
| 699,555 | ||||||||
| Ireland — 0.5% | ||||||||
| AIB Group PLC | 4,535 | 10,287 | ||||||
| Bank of Ireland Group PLC | 6,964 | 42,909 | ||||||
| Cairn Homes PLC | 3,773 | 3,763 | ||||||
Dalata Hotel Group PLC(1) | 1,251 | 4,382 | ||||||
Glenveagh Properties PLC(1) | 5,562 | 5,661 | ||||||
| Kerry Group PLC, A Shares | 286 | 29,493 | ||||||
| Kingspan Group PLC | 234 | 13,249 | ||||||
| Origin Enterprises PLC | 1,921 | 7,201 | ||||||
| Smurfit Kappa Group PLC | 908 | 30,445 | ||||||
Uniphar PLC(1) | 393 | 1,341 | ||||||
| 148,731 | ||||||||
| Israel — 1.1% | ||||||||
| AFI Properties Ltd. | 13 | 642 | ||||||
| Africa Israel Residences Ltd. | 32 | 1,690 | ||||||
Airport City Ltd.(1) | 147 | 3,076 | ||||||
| Alony Hetz Properties & Investments Ltd. | 322 | 5,193 | ||||||
| Altshuler Shaham Penn Ltd. | 336 | 1,028 | ||||||
Amos Luzon Development & Energy Group Ltd.(1) | 1,331 | 758 | ||||||
| Amot Investments Ltd. | 466 | 3,330 | ||||||
Argo Properties NV(1) | 20 | 637 | ||||||
| AudioCodes Ltd. | 33 | 734 | ||||||
| Aura Investments Ltd. | 320 | 621 | ||||||
| Azorim-Investment Development & Construction Co. Ltd. | 328 | 1,341 | ||||||
| Azrieli Group Ltd. | 47 | 3,899 | ||||||
B Communications Ltd.(1) | 188 | 971 | ||||||
69
| Avantis Responsible International Equity ETF | ||||||||
| Shares | Value | |||||||
| Bank Hapoalim BM | 3,173 | $ | 32,896 | |||||
| Bank Leumi Le-Israel BM | 2,899 | 30,646 | ||||||
| Big Shopping Centers Ltd. | 19 | 2,717 | ||||||
| Blue Square Real Estate Ltd. | 21 | 1,815 | ||||||
| Caesarstone Ltd. | 88 | 897 | ||||||
Camtek Ltd.(1) | 20 | 537 | ||||||
| Carasso Motors Ltd. | 393 | 2,491 | ||||||
Cellebrite DI Ltd.(1)(2) | 39 | 189 | ||||||
Ceragon Networks Ltd.(1)(2) | 564 | 1,246 | ||||||
Check Point Software Technologies Ltd.(1) | 146 | 17,555 | ||||||
Cognyte Software Ltd.(1) | 267 | 1,394 | ||||||
CyberArk Software Ltd.(1) | 23 | 3,318 | ||||||
| Danel Adir Yeoshua Ltd. | 17 | 2,077 | ||||||
| Delek Automotive Systems Ltd. | 397 | 6,122 | ||||||
| Delta Galil Industries Ltd. | 57 | 3,024 | ||||||
| Electra Consumer Products 1970 Ltd. | 37 | 1,711 | ||||||
| Energix-Renewable Energies Ltd. | 151 | 688 | ||||||
| FIBI Holdings Ltd. | 78 | 4,100 | ||||||
| Formula Systems 1985 Ltd. | 7 | 695 | ||||||
| Fox Wizel Ltd. | 22 | 3,193 | ||||||
| Gazit-Globe Ltd. | 409 | 2,662 | ||||||
Gilat Satellite Networks Ltd.(1) | 151 | 981 | ||||||
| Hilan Ltd. | 48 | 2,921 | ||||||
| ICL Group Ltd. | 1,446 | 13,807 | ||||||
| Infinya Ltd. | 31 | 3,145 | ||||||
Innoviz Technologies Ltd.(1) | 177 | 889 | ||||||
| Isracard Ltd. | 1,434 | 4,773 | ||||||
| Israel Land Development - Urban Renewal Ltd. | 151 | 2,691 | ||||||
| Israel Shipyards Industries | 22 | 643 | ||||||
| Isras Investment Co. Ltd. | 11 | 2,635 | ||||||
| Ituran Location and Control Ltd. | 93 | 2,312 | ||||||
| M Yochananof & Sons Ltd. | 29 | 1,824 | ||||||
| Magic Software Enterprises Ltd. | 159 | 2,730 | ||||||
| Matrix IT Ltd. | 77 | 2,021 | ||||||
| Maytronics Ltd. | 29 | 417 | ||||||
| Mega Or Holdings Ltd. | 33 | 1,141 | ||||||
| Melisron Ltd. | 42 | 3,430 | ||||||
| Mivne Real Estate KD Ltd. | 821 | 3,013 | ||||||
| Mizrahi Tefahot Bank Ltd. | 438 | 17,814 | ||||||
Nano Dimension Ltd., ADR(1)(2) | 142 | 422 | ||||||
Neto Malinda Trading Ltd.(1) | 33 | 1,278 | ||||||
Nice Ltd., ADR(1)(2) | 39 | 8,321 | ||||||
| Norstar Holdings, Inc. | 79 | 759 | ||||||
Nova Ltd.(1) | 67 | 6,575 | ||||||
| One Software Technologies Ltd. | 225 | 4,148 | ||||||
OY Nofar Energy Ltd.(1) | 22 | 738 | ||||||
Partner Communications Co. Ltd.(1) | 678 | 5,864 | ||||||
Perion Network Ltd.(1) | 169 | 3,438 | ||||||
| Prashkovsky Investments and Construction Ltd. | 37 | 1,237 | ||||||
Property & Building Corp. Ltd.(1) | 11 | 1,128 | ||||||
RADA Electronic Industries Ltd.(1) | 22 | 221 | ||||||
70
| Avantis Responsible International Equity ETF | ||||||||
| Shares | Value | |||||||
Radware Ltd.(1) | 97 | $ | 2,082 | |||||
| Retailors Ltd. | 70 | 1,804 | ||||||
| Sapiens International Corp. NV | 52 | 1,169 | ||||||
| Scope Metals Group Ltd. | 71 | 3,559 | ||||||
| Shufersal Ltd. | 1,427 | 9,773 | ||||||
| Sisram Medical Ltd. | 400 | 467 | ||||||
| Strauss Group Ltd. | 150 | 3,923 | ||||||
| Summit Real Estate Holdings Ltd. | 67 | 1,263 | ||||||
| Tamar Petroleum Ltd. | 278 | 899 | ||||||
| Tel Aviv Stock Exchange Ltd. | 440 | 2,092 | ||||||
Teva Pharmaceutical Industries Ltd., ADR(1) | 1,412 | 12,765 | ||||||
Wix.com Ltd.(1) | 28 | 1,772 | ||||||
| YH Dimri Construction & Development Ltd. | 32 | 2,537 | ||||||
| 289,314 | ||||||||
| Italy — 2.1% | ||||||||
| ACEA SpA | 667 | 7,987 | ||||||
| Amplifon SpA | 279 | 7,271 | ||||||
| Anima Holding SpA | 135 | 459 | ||||||
| Arnoldo Mondadori Editore SpA | 1,063 | 1,735 | ||||||
| Assicurazioni Generali SpA | 1,081 | 15,855 | ||||||
| Atlantia SpA | 1,450 | 33,203 | ||||||
Autogrill SpA(1) | 857 | 5,621 | ||||||
| Azimut Holding SpA | 826 | 13,158 | ||||||
| Banca Generali SpA | 374 | 9,887 | ||||||
| Banca IFIS SpA | 231 | 2,758 | ||||||
| Banca Mediolanum SpA | 1,177 | 7,500 | ||||||
| Banco BPM SpA | 8,437 | 20,948 | ||||||
| BFF Bank SpA | 1,260 | 7,976 | ||||||
| Brembo SpA | 278 | 2,550 | ||||||
| Brunello Cucinelli SpA | 220 | 11,394 | ||||||
| Cairo Communication SpA | 670 | 1,042 | ||||||
| Carel Industries SpA | 67 | 1,436 | ||||||
| CNH Industrial NV | 2,748 | 33,457 | ||||||
d'Amico International Shipping SA(1) | 13,842 | 3,325 | ||||||
| Davide Campari-Milano NV | 277 | 2,718 | ||||||
| De' Longhi SpA | 228 | 3,982 | ||||||
| DiaSorin SpA | 11 | 1,443 | ||||||
| Digital Bros SpA | 45 | 1,110 | ||||||
Digital Value SpA(1) | 9 | 600 | ||||||
| doValue SpA | 317 | 1,816 | ||||||
Enav SpA(1) | 699 | 2,890 | ||||||
| Esprinet SpA | 120 | 816 | ||||||
| Ferrari NV | 122 | 23,551 | ||||||
| Fila SpA | 87 | 656 | ||||||
Fincantieri SpA(1) | 4,368 | 2,190 | ||||||
| FinecoBank Banca Fineco SpA | 1,076 | 11,634 | ||||||
Geox SpA(1) | 567 | 440 | ||||||
GVS SpA(1) | 78 | 704 | ||||||
| Infrastrutture Wireless Italiane SpA | 177 | 1,640 | ||||||
Innovatec SpA(1) | 280 | 544 | ||||||
| Interpump Group SpA | 29 | 1,023 | ||||||
71
| Avantis Responsible International Equity ETF | ||||||||
| Shares | Value | |||||||
| Intesa Sanpaolo SpA | 23,533 | $ | 40,512 | |||||
Iveco Group NV(1) | 809 | 4,091 | ||||||
Juventus Football Club SpA(1) | 6,262 | 2,265 | ||||||
| Leonardo SpA | 1,800 | 14,731 | ||||||
| Maire Tecnimont SpA | 973 | 2,469 | ||||||
| MARR SpA | 144 | 1,691 | ||||||
| Mediobanca Banca di Credito Finanziario SpA | 1,513 | 11,977 | ||||||
MFE-MediaForEurope NV, Class A(1) | 4,931 | 2,092 | ||||||
MFE-MediaForEurope NV, Class B(1) | 1,792 | 1,042 | ||||||
| Moncler SpA | 247 | 10,989 | ||||||
Nexi SpA(1) | 119 | 976 | ||||||
| Orsero SpA | 91 | 1,502 | ||||||
| OVS SpA | 1,733 | 2,621 | ||||||
| Piaggio & C SpA | 723 | 1,766 | ||||||
| Poste Italiane SpA | 1,900 | 15,185 | ||||||
| Prysmian SpA | 590 | 18,103 | ||||||
| RAI Way SpA | 743 | 3,594 | ||||||
| Recordati Industria Chimica e Farmaceutica SpA | 39 | 1,591 | ||||||
| Reply SpA | 20 | 2,354 | ||||||
Safilo Group SpA(1) | 778 | 1,090 | ||||||
| Salvatore Ferragamo SpA | 333 | 5,356 | ||||||
| Sanlorenzo SpA/Ameglia | 32 | 1,005 | ||||||
| Sesa SpA | 60 | 7,334 | ||||||
| SOL SpA | 100 | 1,786 | ||||||
| Stellantis NV | 3,788 | 50,458 | ||||||
| Technogym SpA | 498 | 3,415 | ||||||
| Terna - Rete Elettrica Nazionale | 7,046 | 50,092 | ||||||
Tod's SpA(1) | 50 | 2,020 | ||||||
| UniCredit SpA | 4,917 | 48,117 | ||||||
Unieuro SpA(2) | 91 | 1,035 | ||||||
| Unipol Gruppo SpA | 1,493 | 6,252 | ||||||
| Wiit SpA | 43 | 764 | ||||||
| 563,594 | ||||||||
| Japan — 21.1% | ||||||||
| A&D HOLON Holdings Co. Ltd. | 100 | 685 | ||||||
| Advantest Corp. | 300 | 16,991 | ||||||
| Adways, Inc. | 100 | 536 | ||||||
Aeon Co. Ltd.(2) | 1,800 | 35,110 | ||||||
| Aeon Fantasy Co. Ltd. | 100 | 2,565 | ||||||
| Aeon Mall Co. Ltd. | 800 | 9,542 | ||||||
| Aiful Corp. | 1,200 | 3,386 | ||||||
| Ain Holdings, Inc. | 100 | 5,715 | ||||||
| Air Water, Inc. | 1,100 | 13,761 | ||||||
| Aisan Industry Co. Ltd. | 700 | 3,666 | ||||||
| Aisin Corp. | 300 | 8,920 | ||||||
| Ajinomoto Co., Inc. | 800 | 22,112 | ||||||
| Akatsuki, Inc. | 100 | 1,700 | ||||||
Akebono Brake Industry Co. Ltd.(1) | 700 | 853 | ||||||
| Alconix Corp. | 100 | 1,017 | ||||||
Alfresa Holdings Corp.(2) | 200 | 2,393 | ||||||
72
| Avantis Responsible International Equity ETF | ||||||||
| Shares | Value | |||||||
| Alpen Co. Ltd. | 100 | $ | 1,505 | |||||
| Alps Alpine Co. Ltd. | 900 | 8,051 | ||||||
| Altech Corp. | 100 | 1,340 | ||||||
| Amada Co. Ltd. | 900 | 7,042 | ||||||
| Amano Corp. | 300 | 5,550 | ||||||
| Anritsu Corp. | 700 | 8,251 | ||||||
| AOKI Holdings, Inc. | 100 | 506 | ||||||
| Aoyama Trading Co. Ltd. | 400 | 2,654 | ||||||
| Aoyama Zaisan Networks Co. Ltd. | 100 | 690 | ||||||
| Aozora Bank Ltd. | 700 | 13,512 | ||||||
| Arata Corp. | 100 | 2,963 | ||||||
| Arcland Sakamoto Co. Ltd. | 100 | 1,072 | ||||||
| Arcland Service Holdings Co. Ltd. | 100 | 1,488 | ||||||
| Arcs Co. Ltd. | 300 | 4,387 | ||||||
| Argo Graphics, Inc. | 100 | 2,783 | ||||||
| Arisawa Manufacturing Co. Ltd. | 100 | 954 | ||||||
| ArtSpark Holdings, Inc. | 200 | 1,338 | ||||||
Aruhi Corp.(1) | 100 | 758 | ||||||
| Asahi Co. Ltd. | 100 | 955 | ||||||
| Asahi Diamond Industrial Co. Ltd. | 400 | 2,232 | ||||||
| Asahi Group Holdings Ltd. | 300 | 10,058 | ||||||
| Asahi Holdings, Inc. | 300 | 4,471 | ||||||
| Asahi Intecc Co. Ltd. | 100 | 1,779 | ||||||
| Asahi Kasei Corp. | 4,300 | 31,423 | ||||||
| ASAHI YUKIZAI Corp. | 100 | 1,646 | ||||||
| Asanuma Corp. | 100 | 2,026 | ||||||
| Asics Corp. | 700 | 12,799 | ||||||
| ASKA Pharmaceutical Holdings Co. Ltd. | 100 | 850 | ||||||
| ASKUL Corp. | 200 | 2,642 | ||||||
| Astellas Pharma, Inc. | 2,300 | 32,609 | ||||||
Atrae, Inc.(1) | 100 | 1,155 | ||||||
| Aucnet, Inc. | 100 | 1,551 | ||||||
| Autobacs Seven Co. Ltd. | 700 | 7,175 | ||||||
| Avant Corp. | 100 | 1,082 | ||||||
| Axial Retailing, Inc. | 100 | 2,496 | ||||||
| Azbil Corp. | 100 | 2,849 | ||||||
| Bandai Namco Holdings, Inc. | 500 | 37,518 | ||||||
| Bank of Kyoto Ltd. | 100 | 3,898 | ||||||
| Bank of the Ryukyus Ltd. | 200 | 1,114 | ||||||
| Belc Co. Ltd. | 100 | 4,009 | ||||||
| Belluna Co. Ltd. | 700 | 3,710 | ||||||
| Benesse Holdings, Inc. | 700 | 11,002 | ||||||
| BeNext-Yumeshin Group Co. | 100 | 1,179 | ||||||
Bic Camera, Inc.(2) | 700 | 5,730 | ||||||
| BIPROGY Inc | 400 | 8,859 | ||||||
| BML, Inc. | 100 | 2,559 | ||||||
| Bridgestone Corp. | 1,200 | 46,049 | ||||||
| Brother Industries Ltd. | 1,100 | 21,051 | ||||||
| Canon Marketing Japan, Inc. | 100 | 2,268 | ||||||
| Canon, Inc., ADR | 638 | 15,235 | ||||||
| Capcom Co. Ltd. | 700 | 19,106 | ||||||
73
| Avantis Responsible International Equity ETF | ||||||||
| Shares | Value | |||||||
| Carenet, Inc. | 200 | $ | 1,713 | |||||
| Casio Computer Co. Ltd. | 300 | 2,833 | ||||||
| Cawachi Ltd. | 100 | 1,518 | ||||||
| Central Japan Railway Co. | 100 | 11,773 | ||||||
| Charm Care Corp. KK | 100 | 895 | ||||||
| Chiba Bank Ltd. | 1,900 | 10,263 | ||||||
Chiyoda Corp.(1) | 100 | 285 | ||||||
| Chugai Pharmaceutical Co. Ltd. | 1,100 | 28,389 | ||||||
| Citizen Watch Co. Ltd. | 1,900 | 8,118 | ||||||
| CKD Corp. | 300 | 3,947 | ||||||
| CMIC Holdings Co. Ltd. | 100 | 1,188 | ||||||
| CMK Corp. | 100 | 336 | ||||||
| Coca-Cola Bottlers Japan Holdings, Inc. | 700 | 7,159 | ||||||
| COLOPL, Inc. | 100 | 505 | ||||||
| Comture Corp. | 100 | 1,742 | ||||||
| Concordia Financial Group Ltd. | 2,500 | 7,928 | ||||||
| Cosmos Pharmaceutical Corp. | 100 | 10,532 | ||||||
| Credit Saison Co. Ltd. | 1,100 | 13,839 | ||||||
| Creek & River Co. Ltd. | 100 | 1,731 | ||||||
CrowdWorks, Inc.(1) | 100 | 1,054 | ||||||
| CyberAgent, Inc. | 900 | 8,774 | ||||||
| Dai Nippon Printing Co. Ltd. | 700 | 14,734 | ||||||
| Dai-Dan Co. Ltd. | 100 | 1,597 | ||||||
| Dai-ichi Life Holdings, Inc. | 2,300 | 39,739 | ||||||
| Daifuku Co. Ltd. | 100 | 5,834 | ||||||
| Daihen Corp. | 100 | 2,961 | ||||||
| Daiichi Sankyo Co. Ltd. | 1,100 | 33,057 | ||||||
| Daikin Industries Ltd. | 100 | 17,457 | ||||||
| Daishinku Corp. | 700 | 4,928 | ||||||
| Daito Pharmaceutical Co. Ltd. | 100 | 1,908 | ||||||
| Daito Trust Construction Co. Ltd. | 300 | 29,513 | ||||||
| Daiwa House Industry Co. Ltd. | 800 | 17,886 | ||||||
| Daiwa Securities Group, Inc. | 3,800 | 16,588 | ||||||
DCM Holdings Co. Ltd.(2) | 700 | 5,191 | ||||||
| DeNA Co. Ltd. | 100 | 1,368 | ||||||
| Denso Corp. | 200 | 10,916 | ||||||
| Dentsu Group, Inc. | 700 | 22,543 | ||||||
| Dexerials Corp. | 700 | 19,462 | ||||||
| Digital Arts, Inc. | 100 | 4,647 | ||||||
| Digital Garage, Inc. | 200 | 5,575 | ||||||
| Digital Holdings, Inc. | 100 | 933 | ||||||
| Digital Information Technologies Corp. | 100 | 1,121 | ||||||
| Direct Marketing MiX, Inc. | 100 | 1,324 | ||||||
| Disco Corp. | 100 | 24,281 | ||||||
| DMG Mori Co. Ltd. | 400 | 5,191 | ||||||
| Doshisha Co. Ltd. | 100 | 1,093 | ||||||
| DTS Corp. | 100 | 2,576 | ||||||
| Duskin Co. Ltd. | 200 | 4,123 | ||||||
| E-Guardian, Inc. | 100 | 2,152 | ||||||
| Eagle Industry Co. Ltd. | 100 | 840 | ||||||
| East Japan Railway Co. | 200 | 10,359 | ||||||
74
| Avantis Responsible International Equity ETF | ||||||||
| Shares | Value | |||||||
| Ebara Corp. | 700 | $ | 26,517 | |||||
EDION Corp.(2) | 700 | 6,022 | ||||||
| Eiken Chemical Co. Ltd. | 200 | 2,733 | ||||||
| Eisai Co. Ltd. | 500 | 20,387 | ||||||
| Eizo Corp. | 100 | 2,722 | ||||||
| Elan Corp. | 200 | 1,624 | ||||||
| Elematec Corp. | 200 | 1,950 | ||||||
| en Japan, Inc. | 100 | 1,709 | ||||||
| Envipro Holdings, Inc. | 100 | 686 | ||||||
| Exedy Corp. | 100 | 1,288 | ||||||
| F.C.C. Co. Ltd. | 700 | 7,245 | ||||||
| FANUC Corp. | 100 | 16,110 | ||||||
| Fast Retailing Co. Ltd. | 100 | 58,473 | ||||||
FDK Corp.(1) | 100 | 623 | ||||||
| Ferrotec Holdings Corp. | 400 | 9,105 | ||||||
| Fibergate, Inc. | 100 | 733 | ||||||
| FIDEA Holdings Co. Ltd. | 100 | 949 | ||||||
| Financial Products Group Co. Ltd. | 700 | 6,285 | ||||||
| First Bank of Toyama Ltd. | 300 | 908 | ||||||
| Fixstars Corp. | 100 | 876 | ||||||
| FP Corp. | 100 | 2,347 | ||||||
| Frontier Management, Inc. | 100 | 969 | ||||||
| Fuji Electric Co. Ltd. | 700 | 30,241 | ||||||
| Fuji Oil Co. Ltd. | 400 | 1,067 | ||||||
| Fuji Seal International, Inc. | 200 | 2,219 | ||||||
| Fuji Soft, Inc. | 100 | 5,839 | ||||||
| Fujibo Holdings, Inc. | 100 | 2,595 | ||||||
| FUJIFILM Holdings Corp. | 100 | 5,077 | ||||||
| Fujikura Ltd. | 1,300 | 9,232 | ||||||
| Fujitsu Ltd. | 400 | 47,069 | ||||||
| Fukui Computer Holdings, Inc. | 100 | 2,547 | ||||||
| Fukuoka Financial Group, Inc. | 900 | 16,083 | ||||||
| Fukuyama Transporting Co. Ltd. | 100 | 2,271 | ||||||
| FULLCAST Holdings Co. Ltd. | 100 | 1,750 | ||||||
| Funai Soken Holdings, Inc. | 200 | 3,426 | ||||||
| Furukawa Battery Co. Ltd. | 100 | 831 | ||||||
| Furukawa Co. Ltd. | 100 | 907 | ||||||
| Furukawa Electric Co. Ltd. | 700 | 12,263 | ||||||
| Furuno Electric Co. Ltd. | 100 | 805 | ||||||
| Futaba Corp. | 100 | 475 | ||||||
| Future Corp. | 100 | 1,217 | ||||||
| Fuyo General Lease Co. Ltd. | 100 | 5,905 | ||||||
| G-7 Holdings, Inc. | 100 | 1,072 | ||||||
| G-Tekt Corp. | 100 | 1,000 | ||||||
| Gakken Holdings Co. Ltd. | 200 | 1,409 | ||||||
| Genky DrugStores Co. Ltd. | 100 | 2,630 | ||||||
| GLOBERIDE, Inc. | 100 | 1,960 | ||||||
| Glory Ltd. | 700 | 11,052 | ||||||
| GMO Financial Holdings, Inc. | 200 | 1,088 | ||||||
| GMO Payment Gateway, Inc. | 100 | 7,930 | ||||||
| Goldcrest Co. Ltd. | 100 | 1,246 | ||||||
75
| Avantis Responsible International Equity ETF | ||||||||
| Shares | Value | |||||||
| Goldwin, Inc. | 100 | $ | 5,955 | |||||
| Golf Digest Online, Inc. | 100 | 1,515 | ||||||
| GS Yuasa Corp. | 300 | 5,444 | ||||||
| GungHo Online Entertainment, Inc. | 700 | 11,560 | ||||||
| Gunze Ltd. | 100 | 2,826 | ||||||
| H.U. Group Holdings, Inc. | 700 | 14,218 | ||||||
| H2O Retailing Corp. | 700 | 4,932 | ||||||
| Hachijuni Bank Ltd. | 1,500 | 5,144 | ||||||
| Hakuhodo DY Holdings, Inc. | 1,100 | 9,814 | ||||||
| Hakuto Co. Ltd. | 100 | 2,376 | ||||||
| Hamakyorex Co. Ltd. | 100 | 2,277 | ||||||
| Hamamatsu Photonics KK | 300 | 12,720 | ||||||
| Hankyu Hanshin Holdings, Inc. | 700 | 20,992 | ||||||
| Hanwa Co. Ltd. | 200 | 4,948 | ||||||
| Happinet Corp. | 100 | 1,159 | ||||||
| Haseko Corp. | 1,400 | 16,043 | ||||||
| Heiwa Real Estate Co. Ltd. | 200 | 5,640 | ||||||
| Heiwado Co. Ltd. | 200 | 2,859 | ||||||
| Hirose Electric Co. Ltd. | 100 | 14,170 | ||||||
| Hitachi Construction Machinery Co. Ltd. | 300 | 6,167 | ||||||
| Hitachi Transport System Ltd. | 100 | 6,313 | ||||||
| Hokko Chemical Industry Co. Ltd. | 100 | 760 | ||||||
| Honda Motor Co. Ltd., ADR | 2,263 | 60,015 | ||||||
| Honeys Holdings Co. Ltd. | 100 | 887 | ||||||
| Hoosiers Holdings Co. Ltd. | 200 | 1,160 | ||||||
| Horiba Ltd. | 200 | 9,111 | ||||||
| Hosiden Corp. | 100 | 1,136 | ||||||
| Hotland Co. Ltd. | 100 | 938 | ||||||
| Hoya Corp. | 300 | 30,593 | ||||||
| HS Holdings Co. Ltd. | 700 | 5,857 | ||||||
| Hulic Co. Ltd. | 2,000 | 15,156 | ||||||
| Hyakujushi Bank Ltd. | 100 | 1,220 | ||||||
| I'rom Group Co. Ltd. | 100 | 1,731 | ||||||
| Ibiden Co. Ltd. | 300 | 9,522 | ||||||
| Ichiyoshi Securities Co. Ltd. | 200 | 911 | ||||||
| Idec Corp. | 200 | 4,178 | ||||||
| IDOM, Inc. | 700 | 4,143 | ||||||
Iida Group Holdings Co. Ltd.(2) | 700 | 10,663 | ||||||
| Inaba Denki Sangyo Co. Ltd. | 700 | 13,805 | ||||||
| Infocom Corp. | 100 | 1,449 | ||||||
| INFRONEER Holdings, Inc. | 1,000 | 7,148 | ||||||
| Insource Co. Ltd. | 100 | 2,007 | ||||||
| Intage Holdings, Inc. | 100 | 1,148 | ||||||
| Internet Initiative Japan, Inc. | 700 | 25,281 | ||||||
| Isetan Mitsukoshi Holdings Ltd. | 800 | 6,322 | ||||||
| Ishihara Sangyo Kaisha Ltd. | 700 | 5,625 | ||||||
| Isuzu Motors Ltd. | 2,100 | 26,081 | ||||||
| Ito En Ltd. | 100 | 4,389 | ||||||
| Itochu Techno-Solutions Corp. | 200 | 5,047 | ||||||
| IwaiCosmo Holdings, Inc. | 100 | 902 | ||||||
| J Front Retailing Co. Ltd. | 1,300 | 10,303 | ||||||
76
| Avantis Responsible International Equity ETF | ||||||||
| Shares | Value | |||||||
| J Trust Co. Ltd. | 700 | $ | 3,096 | |||||
| J-Lease Co. Ltd. | 100 | 1,847 | ||||||
| J-Oil Mills, Inc. | 100 | 1,149 | ||||||
| JAC Recruitment Co. Ltd. | 100 | 1,415 | ||||||
| JAFCO Group Co. Ltd. | 500 | 7,236 | ||||||
| Japan Aviation Electronics Industry Ltd. | 700 | 11,706 | ||||||
Japan Communications, Inc.(1) | 700 | 1,140 | ||||||
| Japan Exchange Group, Inc. | 1,100 | 16,392 | ||||||
| Japan Lifeline Co. Ltd. | 500 | 3,630 | ||||||
| Japan Material Co. Ltd. | 100 | 1,384 | ||||||
| Japan Post Bank Co. Ltd. | 700 | 5,103 | ||||||
| Japan Post Holdings Co. Ltd. | 3,400 | 23,456 | ||||||
| Japan Post Insurance Co. Ltd. | 1,000 | 15,318 | ||||||
| Japan Wool Textile Co. Ltd. | 200 | 1,470 | ||||||
| JINUSHI Co. Ltd. | 100 | 1,439 | ||||||
| JM Holdings Co. Ltd. | 100 | 1,145 | ||||||
| Joshin Denki Co. Ltd. | 100 | 1,378 | ||||||
| Joyful Honda Co. Ltd. | 300 | 3,742 | ||||||
| JSR Corp. | 600 | 13,384 | ||||||
| JTEKT Corp. | 1,200 | 8,447 | ||||||
| Juki Corp. | 100 | 506 | ||||||
| Justsystems Corp. | 100 | 2,511 | ||||||
| JVCKenwood Corp. | 900 | 1,321 | ||||||
| K's Holdings Corp. | 1,100 | 10,135 | ||||||
| Kaga Electronics Co. Ltd. | 100 | 2,960 | ||||||
| Kakaku.com, Inc. | 100 | 1,841 | ||||||
| Kamigumi Co. Ltd. | 300 | 5,871 | ||||||
| Kanamoto Co. Ltd. | 200 | 3,079 | ||||||
| Kanematsu Corp. | 700 | 7,573 | ||||||
| Kanematsu Electronics Ltd. | 100 | 3,051 | ||||||
| Kao Corp. | 700 | 30,310 | ||||||
| Kato Sangyo Co. Ltd. | 100 | 2,459 | ||||||
| KDDI Corp. | 2,800 | 85,683 | ||||||
| Keihanshin Building Co. Ltd. | 100 | 903 | ||||||
| Kenko Mayonnaise Co. Ltd. | 100 | 1,098 | ||||||
| KH Neochem Co. Ltd. | 700 | 12,881 | ||||||
| Kintetsu Group Holdings Co. Ltd. | 100 | 3,396 | ||||||
| Kirin Holdings Co. Ltd. | 700 | 11,523 | ||||||
| Kito Corp. | 100 | 1,940 | ||||||
| Koa Corp. | 200 | 3,382 | ||||||
| Kobe Bussan Co. Ltd. | 300 | 7,640 | ||||||
| Kohnan Shoji Co. Ltd. | 100 | 2,479 | ||||||
Kojima Co. Ltd.(2) | 200 | 917 | ||||||
| Kokusai Pulp & Paper Co. Ltd. | 700 | 3,568 | ||||||
| Kokuyo Co. Ltd. | 700 | 9,015 | ||||||
| Komatsu Ltd. | 1,200 | 25,102 | ||||||
| KOMEDA Holdings Co. Ltd. | 100 | 1,650 | ||||||
| Komeri Co. Ltd. | 200 | 3,756 | ||||||
Konica Minolta, Inc.(2) | 2,800 | 9,695 | ||||||
| Konoike Transport Co. Ltd. | 200 | 1,898 | ||||||
Kosaido Holdings Co. Ltd.(1) | 100 | 860 | ||||||
77
| Avantis Responsible International Equity ETF | ||||||||
| Shares | Value | |||||||
| Kubota Corp. | 1,000 | $ | 15,530 | |||||
| Kumagai Gumi Co. Ltd. | 200 | 3,826 | ||||||
| Kurabo Industries Ltd. | 100 | 1,526 | ||||||
| Kuraray Co. Ltd. | 2,100 | 15,951 | ||||||
| Kurita Water Industries Ltd. | 200 | 7,781 | ||||||
| Kusuri no Aoki Holdings Co. Ltd. | 100 | 4,411 | ||||||
| Kyocera Corp. | 300 | 16,675 | ||||||
| Kyowa Kirin Co. Ltd. | 200 | 4,483 | ||||||
| Kyushu Financial Group, Inc. | 1,400 | 3,824 | ||||||
| LAND Co. Ltd. | 4,500 | 324 | ||||||
| Lasertec Corp. | 100 | 13,845 | ||||||
| Lawson, Inc. | 300 | 9,942 | ||||||
Leopalace21 Corp.(1) | 200 | 475 | ||||||
| Link & Motivation, Inc. | 100 | 458 | ||||||
| Lintec Corp. | 200 | 3,333 | ||||||
| Lion Corp. | 100 | 1,168 | ||||||
| LITALICO, Inc. | 100 | 2,089 | ||||||
| Lixil Corp. | 800 | 13,912 | ||||||
| m-up Holdings, Inc. | 100 | 1,035 | ||||||
| M3, Inc. | 200 | 6,406 | ||||||
| Mabuchi Motor Co. Ltd. | 100 | 2,839 | ||||||
| Macnica Holdings, Inc. | 200 | 4,291 | ||||||
| Maeda Kosen Co. Ltd. | 100 | 2,322 | ||||||
| Mani, Inc. | 100 | 1,254 | ||||||
| Marubeni Corp. | 2,800 | 29,182 | ||||||
Marui Group Co. Ltd.(2) | 1,000 | 17,936 | ||||||
| MARUKA FURUSATO Corp. | 100 | 2,437 | ||||||
| Maruwa Co. Ltd. | 100 | 12,580 | ||||||
| Maruzen Showa Unyu Co. Ltd. | 100 | 2,283 | ||||||
| MatsukiyoCocokara & Co. | 100 | 3,968 | ||||||
| Maxell Ltd. | 700 | 7,425 | ||||||
| Mazda Motor Corp. | 3,600 | 31,882 | ||||||
| McDonald's Holdings Co. Japan Ltd. | 200 | 7,149 | ||||||
Mebuki Financial Group, Inc.(2) | 5,000 | 9,583 | ||||||
| Medical Data Vision Co. Ltd. | 100 | 801 | ||||||
| Medipal Holdings Corp. | 700 | 9,577 | ||||||
| Meidensha Corp. | 100 | 1,433 | ||||||
| MEIJI Holdings Co. Ltd. | 500 | 23,819 | ||||||
| Meiko Electronics Co. Ltd. | 200 | 4,646 | ||||||
| Meitec Corp. | 300 | 5,275 | ||||||
| Menicon Co. Ltd. | 100 | 2,401 | ||||||
| Micronics Japan Co. Ltd. | 700 | 7,171 | ||||||
| MINEBEA MITSUMI, Inc. | 1,500 | 25,781 | ||||||
| Ministop Co. Ltd. | 100 | 1,015 | ||||||
| Miroku Jyoho Service Co. Ltd. | 200 | 2,214 | ||||||
| Mitsubishi Electric Corp. | 2,300 | 23,253 | ||||||
| Mitsubishi Estate Co. Ltd. | 1,100 | 14,814 | ||||||
| Mitsubishi Gas Chemical Co., Inc. | 400 | 5,946 | ||||||
| Mitsubishi HC Capital, Inc. | 3,100 | 15,023 | ||||||
| Mitsubishi Heavy Industries Ltd. | 1,300 | 50,116 | ||||||
| Mitsubishi Logistics Corp. | 200 | 5,197 | ||||||
78
| Avantis Responsible International Equity ETF | ||||||||
| Shares | Value | |||||||
Mitsubishi Motors Corp.(1) | 1,300 | $ | 5,200 | |||||
| Mitsubishi Pencil Co. Ltd. | 100 | 1,003 | ||||||
| Mitsubishi Research Institute, Inc. | 100 | 2,994 | ||||||
| Mitsubishi Shokuhin Co. Ltd. | 100 | 2,455 | ||||||
| Mitsubishi UFJ Financial Group, Inc., ADR | 15,217 | 78,368 | ||||||
| Mitsui Chemicals, Inc. | 1,000 | 22,466 | ||||||
| Mitsui Fudosan Co. Ltd. | 900 | 18,217 | ||||||
| Mitsui Matsushima Holdings Co. Ltd. | 100 | 2,618 | ||||||
| Mitsui-Soko Holdings Co. Ltd. | 100 | 2,417 | ||||||
| Mixi, Inc. | 100 | 1,717 | ||||||
| Miyazaki Bank Ltd. | 100 | 1,598 | ||||||
Mizuho Financial Group, Inc., ADR(2) | 17,783 | 40,723 | ||||||
| Mizuho Leasing Co. Ltd. | 200 | 4,831 | ||||||
| Mizuho Medy Co. Ltd. | 100 | 2,144 | ||||||
| Mizuno Corp. | 100 | 1,924 | ||||||
Monex Group, Inc.(2) | 600 | 2,140 | ||||||
| MonotaRO Co. Ltd. | 300 | 5,383 | ||||||
| Morinaga & Co. Ltd. | 100 | 2,856 | ||||||
| MOS Food Services, Inc. | 200 | 4,565 | ||||||
| MS&AD Insurance Group Holdings, Inc. | 1,200 | 35,803 | ||||||
| Murata Manufacturing Co. Ltd. | 900 | 48,462 | ||||||
| Musashi Seimitsu Industry Co. Ltd. | 100 | 1,211 | ||||||
| Nabtesco Corp. | 800 | 18,944 | ||||||
| Nagahori Corp. | 100 | 876 | ||||||
| Nagase & Co. Ltd. | 700 | 10,046 | ||||||
| NEC Corp. | 1,000 | 36,472 | ||||||
| Neturen Co. Ltd. | 700 | 3,450 | ||||||
| Nexon Co. Ltd. | 300 | 5,974 | ||||||
| NGK Insulators Ltd. | 1,100 | 15,705 | ||||||
| NGK Spark Plug Co. Ltd. | 800 | 16,414 | ||||||
| NHK Spring Co. Ltd. | 1,100 | 7,429 | ||||||
| Nichias Corp. | 300 | 5,181 | ||||||
| Nichiha Corp. | 100 | 1,993 | ||||||
| Nidec Corp. | 100 | 6,643 | ||||||
| Nifco, Inc. | 700 | 15,799 | ||||||
| Nihon Chouzai Co. Ltd. | 100 | 962 | ||||||
| Nihon House Holdings Co. Ltd. | 200 | 610 | ||||||
| Nihon M&A Center Holdings, Inc. | 700 | 8,675 | ||||||
| Nikkon Holdings Co. Ltd. | 300 | 5,078 | ||||||
| Nikon Corp. | 700 | 7,991 | ||||||
| Nintendo Co. Ltd. | 100 | 40,935 | ||||||
| Nippon Carbon Co. Ltd. | 100 | 2,942 | ||||||
Nippon Chemi-Con Corp.(1) | 100 | 1,311 | ||||||
| Nippon Coke & Engineering Co. Ltd. | 900 | 651 | ||||||
| Nippon Denko Co. Ltd. | 700 | 1,858 | ||||||
| NIPPON EXPRESS HOLDINGS, Inc. | 300 | 16,507 | ||||||
| Nippon Paper Industries Co. Ltd. | 700 | 4,567 | ||||||
| Nippon Parking Development Co. Ltd. | 1,300 | 1,503 | ||||||
| Nippon Pillar Packing Co. Ltd. | 100 | 1,861 | ||||||
| Nippon Sanso Holdings Corp. | 200 | 3,637 | ||||||
| Nippon Seiki Co. Ltd. | 300 | 1,773 | ||||||
79
| Avantis Responsible International Equity ETF | ||||||||
| Shares | Value | |||||||
Nippon Sheet Glass Co. Ltd.(1) | 400 | $ | 1,525 | |||||
| Nippon Shokubai Co. Ltd. | 100 | 3,965 | ||||||
| Nippon Signal Co. Ltd. | 300 | 2,005 | ||||||
| Nippon Soda Co. Ltd. | 200 | 6,614 | ||||||
| Nippon Steel Trading Corp. | 100 | 3,847 | ||||||
| Nippon Telegraph & Telephone Corp. | 1,900 | 51,498 | ||||||
| Nippon Thompson Co. Ltd. | 700 | 2,875 | ||||||
| Nippon Yakin Kogyo Co. Ltd. | 100 | 2,065 | ||||||
| Nipro Corp. | 900 | 7,327 | ||||||
| Nishi-Nippon Railroad Co. Ltd. | 700 | 14,484 | ||||||
| Nishimatsuya Chain Co. Ltd. | 700 | 8,199 | ||||||
| Nishio Rent All Co. Ltd. | 100 | 2,086 | ||||||
| Nissan Chemical Corp. | 200 | 10,077 | ||||||
| Nissha Co. Ltd. | 700 | 9,103 | ||||||
| Nissin Electric Co. Ltd. | 200 | 2,131 | ||||||
| Nissin Foods Holdings Co. Ltd. | 100 | 7,155 | ||||||
| Nitori Holdings Co. Ltd. | 100 | 9,560 | ||||||
| Nitto Boseki Co. Ltd. | 100 | 1,812 | ||||||
| Nitto Denko Corp. | 400 | 24,653 | ||||||
| Nitto Kogyo Corp. | 100 | 1,845 | ||||||
| Nittoc Construction Co. Ltd. | 100 | 648 | ||||||
| NOF Corp. | 100 | 3,790 | ||||||
| Nohmi Bosai Ltd. | 100 | 1,183 | ||||||
| Nojima Corp. | 700 | 14,103 | ||||||
| NOK Corp. | 700 | 6,221 | ||||||
| Nomura Co. Ltd. | 100 | 677 | ||||||
| North Pacific Bank Ltd. | 1,300 | 2,152 | ||||||
| NSD Co. Ltd. | 100 | 1,797 | ||||||
| NSK Ltd. | 700 | 3,795 | ||||||
| NTT Data Corp. | 1,100 | 15,480 | ||||||
| Obayashi Corp. | 2,700 | 18,675 | ||||||
| Obic Co. Ltd. | 100 | 14,790 | ||||||
| Odakyu Electric Railway Co. Ltd. | 700 | 9,563 | ||||||
| Ogaki Kyoritsu Bank Ltd. | 200 | 2,481 | ||||||
Oisix ra daichi, Inc.(1) | 100 | 1,360 | ||||||
| Oita Bank Ltd. | 100 | 1,361 | ||||||
| Oji Holdings Corp. | 4,800 | 19,151 | ||||||
| Okamura Corp. | 200 | 1,910 | ||||||
| Oki Electric Industry Co. Ltd. | 700 | 3,777 | ||||||
| Olympus Corp. | 1,700 | 36,205 | ||||||
| Omron Corp. | 100 | 5,263 | ||||||
| Ono Pharmaceutical Co. Ltd. | 200 | 4,774 | ||||||
| Open House Group Co. Ltd. | 100 | 3,914 | ||||||
| Oracle Corp. (Tokyo) | 100 | 5,957 | ||||||
| Orient Corp. | 4,100 | 3,585 | ||||||
| Oriental Land Co. Ltd. | 100 | 14,909 | ||||||
| Oriental Shiraishi Corp. | 800 | 1,447 | ||||||
| ORIX Corp., ADR | 505 | 41,587 | ||||||
| Otsuka Corp. | 100 | 3,232 | ||||||
| Pacific Industrial Co. Ltd. | 700 | 5,450 | ||||||
| Pan Pacific International Holdings Corp. | 1,100 | 19,751 | ||||||
80
| Avantis Responsible International Equity ETF | ||||||||
| Shares | Value | |||||||
Park24 Co. Ltd.(1) | 700 | $ | 9,974 | |||||
| Persol Holdings Co. Ltd. | 700 | 14,052 | ||||||
| Pigeon Corp. | 200 | 2,979 | ||||||
| Pilot Corp. | 100 | 3,579 | ||||||
| Piolax, Inc. | 100 | 1,447 | ||||||
| Pola Orbis Holdings, Inc. | 100 | 1,103 | ||||||
| Pole To Win Holdings Inc | 700 | 5,091 | ||||||
| Premium Group Co. Ltd. | 300 | 3,721 | ||||||
| Press Kogyo Co. Ltd. | 700 | 2,214 | ||||||
| Prestige International, Inc. | 700 | 3,362 | ||||||
| Qol Holdings Co. Ltd. | 100 | 907 | ||||||
| Raccoon Holdings, Inc. | 100 | 996 | ||||||
| Rakus Co. Ltd. | 100 | 1,177 | ||||||
| Rakuten Group, Inc. | 1,900 | 9,221 | ||||||
RaQualia Pharma, Inc.(1) | 100 | 756 | ||||||
| Recruit Holdings Co. Ltd. | 1,500 | 47,686 | ||||||
| Relia, Inc. | 300 | 2,177 | ||||||
| Relo Group, Inc. | 500 | 8,037 | ||||||
Renesas Electronics Corp.(1) | 1,200 | 11,362 | ||||||
Rengo Co. Ltd.(2) | 1,300 | 7,659 | ||||||
| Resona Holdings, Inc. | 7,700 | 28,346 | ||||||
| Resorttrust, Inc. | 700 | 11,233 | ||||||
| Retail Partners Co. Ltd. | 100 | 770 | ||||||
| Ricoh Co. Ltd. | 2,100 | 16,505 | ||||||
| Ricoh Leasing Co. Ltd. | 100 | 2,574 | ||||||
| Rion Co. Ltd. | 100 | 1,526 | ||||||
| Riso Kyoiku Co. Ltd. | 700 | 1,570 | ||||||
| Rohm Co. Ltd. | 200 | 14,964 | ||||||
| Roland DG Corp. | 100 | 2,346 | ||||||
| Round One Corp. | 700 | 10,072 | ||||||
| Ryoden Corp. | 100 | 1,178 | ||||||
| Ryohin Keikaku Co. Ltd. | 700 | 6,492 | ||||||
| S-Pool, Inc. | 700 | 5,399 | ||||||
| Sakai Chemical Industry Co. Ltd. | 100 | 1,411 | ||||||
| Sakai Moving Service Co. Ltd. | 100 | 3,300 | ||||||
| San ju San Financial Group, Inc. | 100 | 1,065 | ||||||
| San-In Godo Bank Ltd. | 800 | 3,933 | ||||||
| Sangetsu Corp. | 200 | 2,336 | ||||||
| Sankyu, Inc. | 200 | 6,151 | ||||||
| Santen Pharmaceutical Co. Ltd. | 1,600 | 11,495 | ||||||
| Sanwa Holdings Corp. | 1,100 | 10,884 | ||||||
| Sapporo Holdings Ltd. | 200 | 4,384 | ||||||
| Sato Holdings Corp. | 100 | 1,374 | ||||||
| SB Technology Corp. | 100 | 1,780 | ||||||
| SCREEN Holdings Co. Ltd. | 200 | 13,285 | ||||||
| Scroll Corp. | 700 | 3,944 | ||||||
| SCSK Corp. | 600 | 9,770 | ||||||
| Secom Co. Ltd. | 300 | 19,113 | ||||||
| Seibu Holdings, Inc. | 700 | 7,092 | ||||||
| Seiko Epson Corp. | 1,400 | 21,999 | ||||||
| Seiko Holdings Corp. | 200 | 4,121 | ||||||
81
| Avantis Responsible International Equity ETF | ||||||||
| Shares | Value | |||||||
| Seino Holdings Co. Ltd. | 700 | $ | 5,559 | |||||
| Sekisui House Ltd. | 700 | 11,903 | ||||||
| Sekisui Jushi Corp. | 100 | 1,236 | ||||||
| Senshu Ikeda Holdings, Inc. | 1,000 | 1,588 | ||||||
Septeni Holdings Co. Ltd.(2) | 700 | 2,495 | ||||||
| Seria Co. Ltd. | 100 | 1,950 | ||||||
| SG Holdings Co. Ltd. | 1,000 | 16,587 | ||||||
| Sharp Corp. | 1,100 | 7,874 | ||||||
| Shibaura Electronics Co. Ltd. | 100 | 3,744 | ||||||
Shiga Bank Ltd.(2) | 200 | 3,690 | ||||||
| Shikoku Bank Ltd. | 100 | 616 | ||||||
| Shimadzu Corp. | 400 | 11,682 | ||||||
| Shimamura Co. Ltd. | 100 | 9,064 | ||||||
| Shimano, Inc. | 100 | 17,691 | ||||||
Shin Nippon Biomedical Laboratories Ltd.(2) | 200 | 3,410 | ||||||
| Shin-Etsu Chemical Co. Ltd. | 400 | 46,453 | ||||||
| Shin-Etsu Polymer Co. Ltd. | 100 | 957 | ||||||
| Shionogi & Co. Ltd. | 200 | 9,765 | ||||||
| Ship Healthcare Holdings, Inc. | 700 | 13,087 | ||||||
| Shiseido Co. Ltd. | 600 | 22,664 | ||||||
| Shizuoka Bank Ltd. | 1,100 | 6,366 | ||||||
| Shoei Co. Ltd. | 100 | 3,963 | ||||||
| Showa Denko KK | 900 | 13,836 | ||||||
| SIGMAXYZ Holdings, Inc. | 200 | 1,762 | ||||||
| Sinko Industries Ltd. | 100 | 1,157 | ||||||
| SKY Perfect JSAT Holdings, Inc. | 1,100 | 4,372 | ||||||
Skylark Holdings Co. Ltd.(1)(2) | 700 | 7,700 | ||||||
| SMS Co. Ltd. | 100 | 2,277 | ||||||
| Snow Peak, Inc. | 100 | 1,559 | ||||||
| Softbank Corp. | 3,000 | 32,890 | ||||||
| SoftBank Group Corp. | 1,200 | 47,534 | ||||||
| Sohgo Security Services Co. Ltd. | 100 | 2,591 | ||||||
| Solasto Corp. | 100 | 641 | ||||||
| Sompo Holdings, Inc. | 1,100 | 47,164 | ||||||
| Sony Group Corp., ADR | 1,005 | 79,747 | ||||||
Sosei Group Corp.(1) | 300 | 3,723 | ||||||
| Square Enix Holdings Co. Ltd. | 100 | 4,342 | ||||||
| Stanley Electric Co. Ltd. | 100 | 1,846 | ||||||
| Star Micronics Co. Ltd. | 700 | 9,205 | ||||||
| Starts Corp., Inc. | 300 | 5,763 | ||||||
| Subaru Corp. | 2,100 | 38,173 | ||||||
| Sugi Holdings Co. Ltd. | 100 | 4,243 | ||||||
| SUMCO Corp. | 1,900 | 25,788 | ||||||
| Sumida Corp. | 200 | 1,389 | ||||||
| Sumitomo Bakelite Co. Ltd. | 100 | 3,152 | ||||||
| Sumitomo Dainippon Pharma Co. Ltd. | 700 | 5,214 | ||||||
| Sumitomo Electric Industries Ltd. | 1,200 | 13,746 | ||||||
| Sumitomo Forestry Co. Ltd. | 700 | 11,835 | ||||||
| Sumitomo Mitsui Financial Group, Inc., ADR | 8,919 | 53,960 | ||||||
| Sumitomo Mitsui Trust Holdings, Inc. | 900 | 27,993 | ||||||
| Sumitomo Realty & Development Co. Ltd. | 800 | 19,565 | ||||||
82
| Avantis Responsible International Equity ETF | ||||||||
| Shares | Value | |||||||
| Sumitomo Rubber Industries Ltd. | 900 | $ | 7,723 | |||||
| Sumitomo Warehouse Co. Ltd. | 100 | 1,569 | ||||||
| Sun Frontier Fudousan Co. Ltd. | 700 | 6,039 | ||||||
| Sundrug Co. Ltd. | 400 | 9,787 | ||||||
| Suntory Beverage & Food Ltd. | 700 | 25,569 | ||||||
| Suzuken Co. Ltd. | 700 | 16,776 | ||||||
| Suzuki Motor Corp. | 700 | 24,466 | ||||||
| SWCC Showa Holdings Co. Ltd. | 700 | 9,171 | ||||||
SymBio Pharmaceuticals Ltd.(1) | 100 | 506 | ||||||
| Sysmex Corp. | 100 | 6,113 | ||||||
| Systena Corp. | 800 | 2,451 | ||||||
| Syuppin Co. Ltd. | 100 | 890 | ||||||
| T&D Holdings, Inc. | 1,700 | 18,566 | ||||||
| T-Gaia Corp. | 100 | 1,189 | ||||||
| Tachi-S Co. Ltd. | 100 | 878 | ||||||
| Taisei Corp. | 1,000 | 30,320 | ||||||
| Taiyo Yuden Co. Ltd. | 400 | 12,362 | ||||||
| Takaoka Toko Co. Ltd. | 100 | 1,382 | ||||||
| Takara Bio, Inc. | 100 | 1,401 | ||||||
| Takara Holdings, Inc. | 500 | 3,794 | ||||||
| Takasago Thermal Engineering Co. Ltd. | 700 | 8,271 | ||||||
Takashimaya Co. Ltd.(2) | 700 | 7,744 | ||||||
| Takeda Pharmaceutical Co. Ltd., ADR | 1,792 | 24,640 | ||||||
Tanaka Chemical Corp.(1) | 100 | 1,109 | ||||||
| Tanseisha Co. Ltd. | 100 | 570 | ||||||
| TDK Corp. | 1,300 | 45,451 | ||||||
| TechMatrix Corp. | 300 | 3,696 | ||||||
| TechnoPro Holdings, Inc. | 700 | 15,746 | ||||||
| Teijin Ltd. | 1,200 | 12,687 | ||||||
| Terumo Corp. | 200 | 6,420 | ||||||
| TIS, Inc. | 700 | 19,934 | ||||||
| TKC Corp. | 100 | 2,499 | ||||||
| Toagosei Co. Ltd. | 700 | 5,454 | ||||||
| Tochigi Bank Ltd. | 200 | 414 | ||||||
| Toho Co. Ltd. | 100 | 3,798 | ||||||
| Toho Holdings Co. Ltd. | 300 | 3,973 | ||||||
| Tokai Carbon Co. Ltd. | 700 | 5,110 | ||||||
| Tokai Corp/Gifu | 100 | 1,323 | ||||||
| Tokai Rika Co. Ltd. | 100 | 1,074 | ||||||
| Tokio Marine Holdings, Inc. | 1,200 | 66,503 | ||||||
| Tokyo Century Corp. | 200 | 7,143 | ||||||
| Tokyo Electron Device Ltd. | 100 | 4,224 | ||||||
| Tokyo Electron Ltd. | 100 | 31,364 | ||||||
| Tokyo Individualized Educational Institute, Inc. | 100 | 409 | ||||||
| Tokyo Kiraboshi Financial Group, Inc. | 200 | 3,225 | ||||||
| Tokyo Seimitsu Co. Ltd. | 300 | 9,993 | ||||||
| Tokyo Tatemono Co. Ltd. | 1,000 | 14,990 | ||||||
| Tokyu Corp. | 1,200 | 14,265 | ||||||
| Tokyu Fudosan Holdings Corp. | 1,600 | 8,598 | ||||||
| Tomy Co. Ltd. | 700 | 6,636 | ||||||
| Topcon Corp. | 900 | 12,140 | ||||||
83
| Avantis Responsible International Equity ETF | ||||||||
| Shares | Value | |||||||
| Toppan, Inc. | 700 | $ | 10,993 | |||||
| Topy Industries Ltd. | 100 | 1,014 | ||||||
| Toray Industries, Inc. | 5,100 | 29,103 | ||||||
| Torishima Pump Manufacturing Co. Ltd. | 100 | 1,054 | ||||||
| Tosei Corp. | 100 | 999 | ||||||
| Toshiba Corp. | 300 | 11,110 | ||||||
| Toshiba TEC Corp. | 100 | 2,976 | ||||||
| Tosho Co. Ltd. | 100 | 826 | ||||||
| TOTO Ltd. | 100 | 3,447 | ||||||
| Toyo Corp. | 100 | 951 | ||||||
| Toyo Seikan Group Holdings Ltd. | 900 | 10,650 | ||||||
| Toyo Tanso Co. Ltd. | 100 | 2,423 | ||||||
| Toyo Tire Corp. | 300 | 3,636 | ||||||
| Toyobo Co. Ltd. | 700 | 5,304 | ||||||
| Toyoda Gosei Co. Ltd. | 700 | 12,178 | ||||||
| Toyota Boshoku Corp. | 500 | 7,261 | ||||||
| Toyota Industries Corp. | 200 | 11,179 | ||||||
| Toyota Motor Corp., ADR | 979 | 146,233 | ||||||
| Toyota Tsusho Corp. | 600 | 21,005 | ||||||
| TPR Co. Ltd. | 100 | 916 | ||||||
| Transcosmos, Inc. | 200 | 5,517 | ||||||
| TRE Holdings Corp. | 700 | 8,573 | ||||||
| Trend Micro, Inc. | 500 | 30,784 | ||||||
| Trenders, Inc. | 100 | 1,381 | ||||||
| Trusco Nakayama Corp. | 100 | 1,398 | ||||||
| TS Tech Co. Ltd. | 700 | 7,831 | ||||||
| TSI Holdings Co. Ltd. | 700 | 1,949 | ||||||
| Tsukuba Bank Ltd. | 700 | 983 | ||||||
| Tsuruha Holdings, Inc. | 100 | 5,551 | ||||||
| TV Asahi Holdings Corp. | 100 | 1,042 | ||||||
| Uchida Yoko Co. Ltd. | 100 | 3,582 | ||||||
| Ulvac, Inc. | 300 | 11,633 | ||||||
| Unicharm Corp. | 700 | 24,326 | ||||||
| Unipres Corp. | 700 | 4,823 | ||||||
| United Arrows Ltd. | 100 | 1,313 | ||||||
Unitika Ltd.(1) | 700 | 1,302 | ||||||
| Ushio, Inc. | 100 | 1,214 | ||||||
| USS Co. Ltd. | 1,000 | 17,647 | ||||||
| UT Group Co. Ltd. | 100 | 1,992 | ||||||
UUUM Co. Ltd.(1) | 100 | 779 | ||||||
| Valqua Ltd. | 100 | 1,943 | ||||||
| ValueCommerce Co. Ltd. | 100 | 1,826 | ||||||
| Vector, Inc. | 200 | 1,671 | ||||||
| VT Holdings Co. Ltd. | 700 | 2,424 | ||||||
| Wacoal Holdings Corp. | 100 | 1,598 | ||||||
| Wacom Co. Ltd. | 700 | 4,201 | ||||||
| Warabeya Nichiyo Holdings Co. Ltd. | 100 | 1,628 | ||||||
| Welcia Holdings Co. Ltd. | 100 | 2,094 | ||||||
| West Japan Railway Co. | 100 | 3,892 | ||||||
| Will Group, Inc. | 100 | 963 | ||||||
| Xebio Holdings Co. Ltd. | 100 | 693 | ||||||
84
| Avantis Responsible International Equity ETF | ||||||||
| Shares | Value | |||||||
| YAC Holdings Co. Ltd. | 100 | $ | 1,006 | |||||
| Yakult Honsha Co. Ltd. | 100 | 5,915 | ||||||
| YAMABIKO Corp. | 100 | 816 | ||||||
| Yamada Holdings Co. Ltd. | 4,700 | 16,267 | ||||||
Yamaguchi Financial Group, Inc.(2) | 1,200 | 6,584 | ||||||
| Yamaha Corp. | 100 | 3,901 | ||||||
| Yamaha Motor Co. Ltd. | 1,000 | 20,724 | ||||||
| Yamaichi Electronics Co. Ltd. | 100 | 1,480 | ||||||
| Yamato Holdings Co. Ltd. | 1,100 | 17,148 | ||||||
| Yamazen Corp. | 700 | 4,687 | ||||||
| Yaskawa Electric Corp. | 200 | 6,513 | ||||||
| Yellow Hat Ltd. | 200 | 2,582 | ||||||
| Yokogawa Electric Corp. | 400 | 6,981 | ||||||
| Yokohama Rubber Co. Ltd. | 800 | 13,084 | ||||||
| Yokorei Co. Ltd. | 200 | 1,326 | ||||||
| Yonex Co. Ltd. | 500 | 5,653 | ||||||
| Yuasa Trading Co. Ltd. | 100 | 2,519 | ||||||
| Z Holdings Corp. | 700 | 2,058 | ||||||
| Zenkoku Hosho Co. Ltd. | 300 | 9,913 | ||||||
| Zenrin Co. Ltd. | 100 | 684 | ||||||
| ZIGExN Co. Ltd. | 200 | 484 | ||||||
| ZOZO, Inc. | 200 | 4,421 | ||||||
| 5,675,845 | ||||||||
| Netherlands — 3.4% | ||||||||
| Aalberts NV | 316 | 11,588 | ||||||
| ABN AMRO Bank NV, CVA | 1,721 | 16,533 | ||||||
Adyen NV(1) | 47 | 72,528 | ||||||
| Aegon NV, NY Shares | 10,633 | 47,742 | ||||||
AerCap Holdings NV(1) | 641 | 28,236 | ||||||
| Akzo Nobel NV | 355 | 22,366 | ||||||
| Arcadis NV | 248 | 7,906 | ||||||
| ASM International NV | 82 | 22,295 | ||||||
| ASML Holding NV, NY Shares | 389 | 190,587 | ||||||
| ASR Nederland NV | 1,019 | 41,590 | ||||||
| B&S Group Sarl | 217 | 1,103 | ||||||
| BE Semiconductor Industries NV | 350 | 16,626 | ||||||
| Brunel International NV | 65 | 609 | ||||||
| Coca-Cola Europacific Partners PLC | 361 | 17,750 | ||||||
Constellium SE(1) | 188 | 2,504 | ||||||
| Corbion NV | 102 | 2,896 | ||||||
| Flow Traders | 288 | 5,763 | ||||||
| Heineken Holding NV | 49 | 3,476 | ||||||
| Heineken NV | 212 | 19,054 | ||||||
| IMCD NV | 50 | 6,898 | ||||||
ING Groep NV, ADR(2) | 4,771 | 41,889 | ||||||
InPost SA(1) | 267 | 1,374 | ||||||
Just Eat Takeaway.com NV(1) | 689 | 11,462 | ||||||
| Koninklijke Ahold Delhaize NV | 2,822 | 77,624 | ||||||
Koninklijke BAM Groep NV(1) | 2,152 | 5,736 | ||||||
| Koninklijke DSM NV | 407 | 51,899 | ||||||
| Koninklijke KPN NV | 16,049 | 51,069 | ||||||
85
| Avantis Responsible International Equity ETF | ||||||||
| Shares | Value | |||||||
| Koninklijke Philips NV, NY Shares | 703 | $ | 11,656 | |||||
NN Group NV(2) | 1,104 | 45,372 | ||||||
| Ordina NV | 300 | 1,184 | ||||||
Pharming Group NV(1) | 3,412 | 4,103 | ||||||
| PostNL NV | 3,534 | 7,530 | ||||||
Prosus NV(1) | 431 | 26,640 | ||||||
| Randstad NV | 230 | 10,711 | ||||||
| TKH Group NV | 276 | 9,629 | ||||||
TomTom NV(1) | 97 | 781 | ||||||
| Universal Music Group NV | 338 | 6,712 | ||||||
| Van Lanschot Kempen NV | 42 | 885 | ||||||
| Wolters Kluwer NV | 121 | 11,833 | ||||||
| 916,139 | ||||||||
| New Zealand — 0.3% | ||||||||
a2 Milk Co. Ltd.(1) | 1,612 | 6,132 | ||||||
| Arvida Group Ltd. | 1,743 | 1,607 | ||||||
Auckland International Airport Ltd.(1) | 1,662 | 7,665 | ||||||
| Chorus Ltd. | 2,738 | 13,409 | ||||||
| Fisher & Paykel Healthcare Corp. Ltd. | 233 | 2,789 | ||||||
| Fletcher Building Ltd. | 2,532 | 8,644 | ||||||
| KMD Brands Ltd. | 3,188 | 2,099 | ||||||
| Mercury NZ Ltd. | 3,064 | 10,843 | ||||||
| Meridian Energy Ltd. | 967 | 2,950 | ||||||
Pushpay Holdings Ltd.(1) | 2,267 | 1,765 | ||||||
| Ryman Healthcare Ltd. | 1,105 | 6,184 | ||||||
| Spark New Zealand Ltd. | 4,623 | 15,293 | ||||||
| 79,380 | ||||||||
| Norway — 0.9% | ||||||||
2020 Bulkers Ltd.(1) | 82 | 730 | ||||||
| ABG Sundal Collier Holding ASA | 2,153 | 1,263 | ||||||
Adevinta ASA(1) | 170 | 1,375 | ||||||
Atea ASA(1) | 128 | 1,409 | ||||||
| Austevoll Seafood ASA | 27 | 289 | ||||||
Awilco LNG AS(1) | 1,003 | 585 | ||||||
| B2Holding ASA | 1,068 | 964 | ||||||
| Bakkafrost P/F | 51 | 2,984 | ||||||
| Belships ASA | 872 | 1,306 | ||||||
| Bonheur ASA | 189 | 7,075 | ||||||
Borr Drilling Ltd.(1) | 997 | 3,885 | ||||||
| Borregaard ASA | 345 | 5,262 | ||||||
Crayon Group Holding ASA(1) | 63 | 682 | ||||||
| DNB Bank ASA | 1,458 | 27,722 | ||||||
| Elmera Group ASA | 133 | 266 | ||||||
| Elopak ASA | 680 | 1,361 | ||||||
| Europris ASA | 531 | 3,186 | ||||||
| Gjensidige Forsikring ASA | 248 | 5,033 | ||||||
| Grieg Seafood ASA | 122 | 1,476 | ||||||
Hunter Group ASA(1) | 1,712 | 361 | ||||||
Kahoot! ASA(1) | 257 | 510 | ||||||
| Kid ASA | 161 | 1,448 | ||||||
| Kitron ASA | 364 | 729 | ||||||
86
| Avantis Responsible International Equity ETF | ||||||||
| Shares | Value | |||||||
Kongsberg Automotive ASA(1) | 7,409 | $ | 1,887 | |||||
| Kongsberg Gruppen ASA | 207 | 7,075 | ||||||
| Leroy Seafood Group ASA | 481 | 3,214 | ||||||
Magseis Fairfield ASA(1) | 1,999 | 1,714 | ||||||
| Mowi ASA | 1,066 | 21,855 | ||||||
Nordic Semiconductor ASA(1) | 160 | 2,446 | ||||||
| Norsk Hydro ASA | 4,100 | 28,172 | ||||||
Norske Skog ASA(1) | 365 | 2,537 | ||||||
Norwegian Energy Co. ASA(1) | 327 | 11,735 | ||||||
Odfjell Technology Ltd.(1) | 80 | 200 | ||||||
| OKEA ASA | 459 | 2,384 | ||||||
| Orkla ASA | 815 | 6,825 | ||||||
Panoro Energy ASA(1) | 787 | 2,335 | ||||||
| Pareto Bank ASA | 387 | 1,877 | ||||||
Petronor E&P ASA(1) | 501 | 43 | ||||||
| Protector Forsikring ASA | 251 | 3,005 | ||||||
Rana Gruber ASA(2) | 253 | 1,100 | ||||||
| Scatec ASA | 729 | 7,395 | ||||||
| Schibsted ASA, B Shares | 307 | 5,265 | ||||||
| Schibsted ASA, Class A | 231 | 4,227 | ||||||
Siem Offshore, Inc.(1) | 402 | 540 | ||||||
Solstad Offshore ASA(1) | 782 | 2,310 | ||||||
| SpareBank 1 Nord Norge | 732 | 6,598 | ||||||
| Sparebank 1 Oestlandet | 151 | 1,721 | ||||||
| SpareBank 1 SMN | 820 | 9,984 | ||||||
| SpareBank 1 SR-Bank ASA | 548 | 6,268 | ||||||
| Storebrand ASA | 1,103 | 8,829 | ||||||
| Telenor ASA | 1,032 | 11,293 | ||||||
| TGS ASA | 637 | 9,694 | ||||||
| TOMRA Systems ASA | 354 | 8,067 | ||||||
| Veidekke ASA | 328 | 3,350 | ||||||
| 253,846 | ||||||||
| Portugal — 0.2% | ||||||||
| Altri SGPS SA | 969 | 5,468 | ||||||
| Banco Comercial Portugues SA, R Shares | 23,428 | 3,409 | ||||||
| Corticeira Amorim SGPS SA | 271 | 2,737 | ||||||
| CTT-Correios de Portugal SA | 858 | 2,795 | ||||||
| EDP Renovaveis SA | 489 | 11,859 | ||||||
Greenvolt-Energias Renovaveis SA(1) | 182 | 1,758 | ||||||
| Jeronimo Martins SGPS SA | 480 | 10,642 | ||||||
| Mota-Engil SGPS SA | 333 | 401 | ||||||
| Navigator Co. SA | 943 | 3,742 | ||||||
| NOS SGPS SA | 1,580 | 5,824 | ||||||
| Sonae SGPS SA | 10,762 | 10,817 | ||||||
| 59,452 | ||||||||
| Singapore — 1.4% | ||||||||
| Ascendas India Trust | 6,000 | 4,881 | ||||||
| Aztech Global Ltd. | 2,700 | 1,707 | ||||||
| Capitaland Investment Ltd. | 4,700 | 12,374 | ||||||
| City Developments Ltd. | 1,700 | 9,871 | ||||||
| ComfortDelGro Corp. Ltd. | 21,300 | 21,467 | ||||||
87
| Avantis Responsible International Equity ETF | ||||||||
| Shares | Value | |||||||
| DBS Group Holdings Ltd. | 2,300 | $ | 53,552 | |||||
Dyna-Mac Holdings Ltd.(1) | 4,200 | 593 | ||||||
Grab Holdings Ltd., Class A(1) | 651 | 1,855 | ||||||
| Haw Par Corp. Ltd. | 100 | 782 | ||||||
| Hong Fok Corp. Ltd. | 5,000 | 3,785 | ||||||
| Hour Glass Ltd. | 1,300 | 2,155 | ||||||
| Hutchison Port Holdings Trust, U Shares | 55,000 | 11,802 | ||||||
| iFAST Corp. Ltd. | 800 | 2,557 | ||||||
| ISDN Holdings Ltd. | 1,300 | 440 | ||||||
| Jiutian Chemical Group Ltd. | 24,900 | 1,651 | ||||||
Maxeon Solar Technologies Ltd.(1) | 133 | 2,640 | ||||||
| Netlink Nbn Management Pte. Ltd. | 7,000 | 4,679 | ||||||
| Oversea-Chinese Banking Corp. Ltd. | 5,300 | 45,682 | ||||||
| Raffles Medical Group Ltd. | 8,100 | 8,060 | ||||||
Rex International Holding Ltd.(1) | 1,500 | 295 | ||||||
| Riverstone Holdings Ltd. | 8,200 | 4,227 | ||||||
| Samudera Shipping Line Ltd. | 3,200 | 2,282 | ||||||
SATS Ltd.(1) | 1,200 | 3,466 | ||||||
Sea Ltd., ADR(1) | 177 | 10,974 | ||||||
| Sheng Siong Group Ltd. | 5,000 | 5,795 | ||||||
SIA Engineering Co. Ltd.(1) | 800 | 1,417 | ||||||
| Singapore Exchange Ltd. | 2,800 | 19,001 | ||||||
| Singapore Post Ltd. | 15,900 | 6,591 | ||||||
| Singapore Technologies Engineering Ltd. | 200 | 533 | ||||||
| Singapore Telecommunications Ltd. | 16,300 | 30,601 | ||||||
| Stamford Land Corp. Ltd. | 2,000 | 551 | ||||||
| StarHub Ltd. | 2,100 | 1,846 | ||||||
| United Overseas Bank Ltd. | 3,700 | 72,148 | ||||||
| UOL Group Ltd. | 3,300 | 16,328 | ||||||
| Venture Corp. Ltd. | 700 | 9,145 | ||||||
Yangzijiang Financial Holding Ltd.(1) | 9,200 | 2,461 | ||||||
| Yanlord Land Group Ltd. | 6,900 | 5,078 | ||||||
Yoma Strategic Holdings Ltd.(1) | 14,200 | 1,318 | ||||||
| 384,590 | ||||||||
| Spain — 2.0% | ||||||||
| Acciona SA | 24 | 4,701 | ||||||
Aena SME SA(1) | 290 | 35,618 | ||||||
| Almirall SA | 578 | 5,214 | ||||||
Amadeus IT Group SA(1) | 543 | 28,665 | ||||||
Amper SA(1) | 7,550 | 1,339 | ||||||
| Applus Services SA | 301 | 2,014 | ||||||
| Atresmedia Corp. de Medios de Comunicacion SA | 885 | 2,424 | ||||||
| Banco Bilbao Vizcaya Argentaria SA, ADR | 7,857 | 34,885 | ||||||
| Banco de Sabadell SA | 29,871 | 20,543 | ||||||
| Banco Santander SA, ADR | 23,059 | 55,572 | ||||||
| Bankinter SA | 2,815 | 14,426 | ||||||
| CaixaBank SA | 7,777 | 23,483 | ||||||
| Cellnex Telecom SA | 248 | 9,658 | ||||||
| CIE Automotive SA | 92 | 2,256 | ||||||
| Construcciones y Auxiliar de Ferrocarriles SA | 96 | 2,778 | ||||||
Deoleo SA(1)(2) | 1,100 | 315 | ||||||
88
| Avantis Responsible International Equity ETF | ||||||||
| Shares | Value | |||||||
eDreams ODIGEO SA(1) | 92 | $ | 498 | |||||
| Ence Energia y Celulosa SA | 1,095 | 3,876 | ||||||
| Ercros SA | 520 | 1,597 | ||||||
| Ferrovial SA (Madrid) | 259 | 6,494 | ||||||
| Fluidra SA | 359 | 5,742 | ||||||
| Gestamp Automocion SA | 1,306 | 4,782 | ||||||
| Global Dominion Access SA | 352 | 1,363 | ||||||
Grifols SA(1) | 93 | 1,124 | ||||||
| Grupo Catalana Occidente SA | 180 | 5,293 | ||||||
| Iberdrola SA | 10,515 | 109,479 | ||||||
| Indra Sistemas SA | 817 | 6,423 | ||||||
| Industria de Diseno Textil SA | 1,436 | 31,005 | ||||||
| Laboratorios Farmaceuticos Rovi SA | 93 | 4,565 | ||||||
| Mapfre SA | 3,489 | 5,788 | ||||||
Mediaset Espana Comunicacion SA(1) | 382 | 1,063 | ||||||
Melia Hotels International SA(1) | 670 | 4,063 | ||||||
| Neinor Homes SA | 281 | 2,883 | ||||||
Obrascon Huarte Lain SA(1) | 2,692 | 1,541 | ||||||
| Pharma Mar SA | 117 | 6,815 | ||||||
| Prosegur Cash SA | 1,672 | 1,144 | ||||||
| Prosegur Cia de Seguridad SA | 102 | 188 | ||||||
| Red Electrica Corp. SA | 930 | 17,003 | ||||||
| Sacyr SA | 3,705 | 8,288 | ||||||
Siemens Gamesa Renewable Energy SA(1) | 78 | 1,405 | ||||||
Solaria Energia y Medio Ambiente SA(1) | 367 | 7,793 | ||||||
Telefonica SA, ADR(2) | 11,039 | 45,039 | ||||||
| Viscofan SA | 277 | 15,585 | ||||||
| 544,730 | ||||||||
| Sweden — 3.4% | ||||||||
| AAK AB | 443 | 6,786 | ||||||
| AcadeMedia AB | 407 | 1,783 | ||||||
| AddTech AB, B Shares | 627 | 8,796 | ||||||
| AFRY AB | 12 | 158 | ||||||
| Alfa Laval AB | 479 | 12,774 | ||||||
| Alimak Group AB | 49 | 360 | ||||||
Alleima AB(1) | 208 | 836 | ||||||
| Ambea AB | 260 | 1,054 | ||||||
Arise AB(1) | 253 | 1,807 | ||||||
| Arjo AB, B Shares | 423 | 1,900 | ||||||
| Assa Abloy AB, Class B | 573 | 11,605 | ||||||
| Atlas Copco AB, A Shares | 3,510 | 35,630 | ||||||
| Atlas Copco AB, B Shares | 2,040 | 18,576 | ||||||
| Atrium Ljungberg AB, B Shares | 149 | 2,160 | ||||||
Attendo AB(1) | 290 | 635 | ||||||
| Avanza Bank Holding AB | 505 | 8,095 | ||||||
| Axfood AB | 376 | 11,334 | ||||||
| BE Group AB | 48 | 458 | ||||||
| Beijer Ref AB | 317 | 4,104 | ||||||
| Bilia AB, A Shares | 672 | 8,360 | ||||||
| BillerudKorsnas AB | 760 | 9,882 | ||||||
| BioGaia AB, B Shares | 308 | 2,486 | ||||||
89
| Avantis Responsible International Equity ETF | ||||||||
| Shares | Value | |||||||
| Biotage AB | 200 | $ | 3,364 | |||||
| Boliden AB | 975 | 31,222 | ||||||
| Bonava AB, B Shares | 257 | 920 | ||||||
Boozt AB(1)(2) | 97 | 569 | ||||||
| Bravida Holding AB | 422 | 3,819 | ||||||
| Bufab AB | 6 | 139 | ||||||
| Bure Equity AB | 223 | 4,405 | ||||||
| Byggmax Group AB | 390 | 1,602 | ||||||
| Castellum AB | 623 | 8,743 | ||||||
| Catena AB | 91 | 3,741 | ||||||
Catena Media PLC(1) | 421 | 1,265 | ||||||
| Cibus Nordic Real Estate AB | 147 | 2,341 | ||||||
Cint Group AB(1) | 223 | 1,330 | ||||||
| Clas Ohlson AB, B Shares | 418 | 3,770 | ||||||
| Cloetta AB, B Shares | 1,761 | 3,079 | ||||||
| Coor Service Management Holding AB | 416 | 3,221 | ||||||
| Corem Property Group AB, B Shares | 1,547 | 1,804 | ||||||
| Dios Fastigheter AB | 318 | 2,354 | ||||||
| Dometic Group AB | 18 | 102 | ||||||
| Electrolux AB, B Shares | 870 | 11,001 | ||||||
| Electrolux Professional AB, B Shares | 1,048 | 5,206 | ||||||
Elekta AB, B Shares(2) | 1,259 | 7,217 | ||||||
Embracer Group AB(1) | 662 | 4,107 | ||||||
| Epiroc AB, A Shares | 852 | 13,036 | ||||||
| Epiroc AB, B Shares | 503 | 6,848 | ||||||
| EQT AB | 279 | 6,249 | ||||||
| Essity AB, B Shares | 584 | 12,955 | ||||||
| Fabege AB | 560 | 4,950 | ||||||
Fastighets AB Balder, B Shares(1) | 933 | 5,152 | ||||||
| Fortnox AB | 1,770 | 7,833 | ||||||
G5 Entertainment AB(2) | 38 | 627 | ||||||
| GARO AB | 87 | 946 | ||||||
| Getinge AB, B Shares | 362 | 6,705 | ||||||
| Granges AB | 353 | 2,736 | ||||||
| H & M Hennes & Mauritz AB, B Shares | 2,089 | 21,695 | ||||||
| Hanza AB | 120 | 536 | ||||||
| Hemnet Group AB | 119 | 1,578 | ||||||
| Hexagon AB, B Shares | 1,260 | 12,876 | ||||||
| Hexatronic Group AB | 287 | 2,795 | ||||||
| Hexpol AB | 646 | 5,735 | ||||||
| HMS Networks AB | 91 | 3,307 | ||||||
Hoist Finance AB(1) | 549 | 1,662 | ||||||
| Holmen AB, B Shares | 201 | 8,624 | ||||||
| Hufvudstaden AB, A Shares | 458 | 5,456 | ||||||
| Husqvarna AB, B Shares | 720 | 4,844 | ||||||
| Industrivarden AB, A Shares | 232 | 5,142 | ||||||
| Indutrade AB | 583 | 10,795 | ||||||
| Instalco AB | 378 | 1,887 | ||||||
| Intrum AB | 120 | 2,155 | ||||||
| Investment AB Latour, B Shares | 78 | 1,537 | ||||||
| Inwido AB | 109 | 1,066 | ||||||
90
| Avantis Responsible International Equity ETF | ||||||||
| Shares | Value | |||||||
| JM AB | 237 | $ | 4,075 | |||||
Karnov Group AB(1) | 310 | 1,664 | ||||||
Karo Pharma AB(1) | 93 | 523 | ||||||
| Lindab International AB | 308 | 4,412 | ||||||
| Loomis AB | 538 | 14,533 | ||||||
| MEKO AB | 178 | 1,626 | ||||||
Millicom International Cellular SA, SDR(1) | 421 | 6,024 | ||||||
| MIPS AB | 65 | 2,929 | ||||||
Modern Times Group MTG AB, B Shares(1) | 508 | 4,448 | ||||||
| Mycronic AB | 183 | 2,170 | ||||||
| NCC AB, B Shares | 132 | 1,242 | ||||||
| New Wave Group AB, B Shares | 291 | 4,681 | ||||||
| Nibe Industrier AB, B Shares | 702 | 6,574 | ||||||
| Nobia AB | 824 | 2,122 | ||||||
| Nordea Bank Abp | 4,537 | 42,066 | ||||||
| Nordnet AB publ | 534 | 6,393 | ||||||
Note AB(1) | 37 | 616 | ||||||
| Nyfosa AB | 503 | 4,226 | ||||||
Oncopeptides AB(1) | 120 | 334 | ||||||
OX2 AB(1) | 401 | 3,576 | ||||||
Pandox AB(1) | 431 | 5,328 | ||||||
| Paradox Interactive AB | 252 | 3,962 | ||||||
| Platzer Fastigheter Holding AB, B Shares | 157 | 1,217 | ||||||
| Resurs Holding AB | 916 | 1,952 | ||||||
| Rvrc Holding AB | 117 | 283 | ||||||
| Saab AB, B Shares | 373 | 12,461 | ||||||
| Samhallsbyggnadsbolaget i Norden AB | 1,946 | 3,124 | ||||||
| Samhallsbyggnadsbolaget i Norden AB, D Shares | 284 | 559 | ||||||
| Sandvik AB | 1,041 | 16,230 | ||||||
Scandic Hotels Group AB(1) | 760 | 2,699 | ||||||
Sectra AB, B Shares(1) | 565 | 8,414 | ||||||
| Securitas AB, B Shares | 479 | 4,194 | ||||||
Sinch AB(1)(2) | 427 | 826 | ||||||
| Skandinaviska Enskilda Banken AB, A Shares | 2,514 | 25,061 | ||||||
| Skanska AB, B Shares | 1,383 | 20,431 | ||||||
| SKF AB, B Shares | 662 | 9,925 | ||||||
| SkiStar AB | 381 | 4,903 | ||||||
SolTech Energy Sweden AB(1) | 603 | 1,010 | ||||||
Spotify Technology SA(1) | 27 | 2,920 | ||||||
Stillfront Group AB(1) | 643 | 1,368 | ||||||
| Svenska Cellulosa AB SCA, B Shares | 1,147 | 17,186 | ||||||
| Svenska Handelsbanken AB, A Shares | 3,382 | 27,699 | ||||||
| Sweco AB, B Shares | 272 | 2,564 | ||||||
| Swedbank AB, A Shares | 2,472 | 31,950 | ||||||
| SwedenCare AB | 35 | 205 | ||||||
| Tele2 AB, B Shares | 1,070 | 11,395 | ||||||
| Telefonaktiebolaget LM Ericsson, ADR | 4,238 | 31,488 | ||||||
| Telia Co. AB | 6,562 | 23,096 | ||||||
| Thule Group AB | 87 | 2,122 | ||||||
Tobii AB(1) | 162 | 363 | ||||||
Tobii Dynavox AB(1) | 233 | 495 | ||||||
91
| Avantis Responsible International Equity ETF | ||||||||
| Shares | Value | |||||||
| Trelleborg AB, B Shares | 1,132 | $ | 23,523 | |||||
Truecaller AB, B Shares(1) | 407 | 2,140 | ||||||
Viaplay Group AB, B Shares(1) | 58 | 1,476 | ||||||
| Vitec Software Group AB, B Shares | 106 | 3,954 | ||||||
| Vitrolife AB | 22 | 525 | ||||||
| Volvo AB, A Shares | 318 | 5,292 | ||||||
| Volvo AB, B Shares | 2,410 | 38,175 | ||||||
Volvo Car AB, Class B(1)(2) | 1,901 | 11,580 | ||||||
| Wallenstam AB, B Shares | 858 | 3,850 | ||||||
| Wihlborgs Fastigheter AB | 1,015 | 7,271 | ||||||
| 902,077 | ||||||||
| Switzerland — 8.4% | ||||||||
ABB Ltd., ADR(2) | 793 | 21,863 | ||||||
| Adecco Group AG | 607 | 19,242 | ||||||
| Alcon, Inc. | 615 | 40,493 | ||||||
| Allreal Holding AG | 48 | 7,525 | ||||||
ALSO Holding AG(1) | 22 | 3,657 | ||||||
ams-OSRAM AG(1) | 499 | 3,651 | ||||||
| Arbonia AG | 171 | 2,241 | ||||||
| Ascom Holding AG | 63 | 406 | ||||||
| Autoneum Holding AG | 12 | 1,345 | ||||||
| Baloise Holding AG | 227 | 32,760 | ||||||
| Banque Cantonale Vaudoise | 112 | 10,628 | ||||||
| Barry Callebaut AG | 10 | 20,461 | ||||||
Basilea Pharmaceutica AG(1) | 14 | 556 | ||||||
| Belimo Holding AG | 7 | 2,655 | ||||||
| Bossard Holding AG, Class A | 10 | 1,991 | ||||||
| Bucher Industries AG | 28 | 9,976 | ||||||
| Calida Holding AG | 33 | 1,440 | ||||||
| Cembra Money Bank AG | 158 | 10,656 | ||||||
| Chocoladefabriken Lindt & Spruengli AG, Participation Ceritificate | 1 | 10,576 | ||||||
| Cie Financiere Richemont SA, Class A | 531 | 59,381 | ||||||
Clariant AG(1) | 677 | 12,500 | ||||||
| Comet Holding AG | 20 | 3,478 | ||||||
Credit Suisse Group AG, ADR(2) | 5,455 | 28,148 | ||||||
| DKSH Holding AG | 239 | 17,782 | ||||||
| dormakaba Holding AG | 11 | 4,613 | ||||||
Flughafen Zurich AG(1) | 59 | 9,935 | ||||||
| Forbo Holding AG | 7 | 8,735 | ||||||
| Galenica AG | 33 | 2,321 | ||||||
| Geberit AG | 28 | 12,937 | ||||||
| Georg Fischer AG | 388 | 21,023 | ||||||
| Givaudan SA | 3 | 9,572 | ||||||
| Helvetia Holding AG | 161 | 17,746 | ||||||
| Huber + Suhner AG | 61 | 5,081 | ||||||
Idorsia Ltd.(1) | 117 | 1,831 | ||||||
Implenia AG(1) | 20 | 591 | ||||||
| Inficon Holding AG | 10 | 6,971 | ||||||
| Intershop Holding AG | 3 | 1,955 | ||||||
Julius Baer Group Ltd.(1) | 791 | 38,221 | ||||||
| Kardex Holding AG | 7 | 1,227 | ||||||
92
| Avantis Responsible International Equity ETF | ||||||||
| Shares | Value | |||||||
| Komax Holding AG | 11 | $ | 2,866 | |||||
| Kuehne + Nagel International AG | 171 | 39,520 | ||||||
| LEM Holding SA | 1 | 1,647 | ||||||
| Leonteq AG | 70 | 3,975 | ||||||
| Logitech International SA | 741 | 36,869 | ||||||
| Lonza Group AG | 28 | 14,933 | ||||||
| Mobilezone Holding AG | 407 | 6,738 | ||||||
| Mobimo Holding AG | 27 | 6,628 | ||||||
| Nestle SA | 1,557 | 182,205 | ||||||
| Novartis AG, ADR | 4,210 | 338,989 | ||||||
| OC Oerlikon Corp. AG | 650 | 4,748 | ||||||
| Partners Group Holding AG | 53 | 51,158 | ||||||
Peach Property Group AG(1) | 42 | 1,306 | ||||||
PolyPeptide Group AG(1) | 6 | 221 | ||||||
| PSP Swiss Property AG | 162 | 18,328 | ||||||
| Roche Holding AG | 1,131 | 364,455 | ||||||
| Roche Holding AG, Bearer Shares | 42 | 16,042 | ||||||
| Schindler Holding AG | 76 | 12,836 | ||||||
| Schindler Holding AG, Bearer Participation Certificate | 137 | 23,866 | ||||||
| Schweiter Technologies AG, Bearer Shares | 2 | 2,098 | ||||||
| SGS SA | 12 | 26,426 | ||||||
Siegfried Holding AG(1) | 11 | 8,778 | ||||||
SIG Group AG(1) | 167 | 3,916 | ||||||
| Sika AG | 41 | 9,225 | ||||||
Softwareone Holding AG(1) | 200 | 2,629 | ||||||
| Sonova Holding AG | 47 | 12,383 | ||||||
| St Galler Kantonalbank AG | 14 | 6,584 | ||||||
| Stadler Rail AG | 313 | 9,553 | ||||||
| Straumann Holding AG | 234 | 25,642 | ||||||
| Sulzer AG | 112 | 6,684 | ||||||
| Swatch Group AG | 179 | 8,141 | ||||||
| Swatch Group AG, Bearer Shares | 97 | 23,522 | ||||||
| Swiss Life Holding AG | 117 | 61,153 | ||||||
| Swiss Prime Site AG | 236 | 20,297 | ||||||
| Swiss Re AG | 553 | 42,999 | ||||||
| Swisscom AG | 118 | 61,010 | ||||||
| Swissquote Group Holding SA | 49 | 5,436 | ||||||
| Tecan Group AG | 7 | 2,576 | ||||||
| Temenos AG | 112 | 9,172 | ||||||
u-blox Holding AG(1) | 57 | 7,900 | ||||||
UBS Group AG(1) | 6,657 | 105,513 | ||||||
VAT Group AG(1) | 37 | 8,847 | ||||||
| Vontobel Holding AG | 168 | 10,336 | ||||||
| VZ Holding AG | 49 | 3,920 | ||||||
| Ypsomed Holding AG | 7 | 1,070 | ||||||
| Zehnder Group AG | 57 | 3,367 | ||||||
| Zurich Insurance Group AG | 402 | 178,448 | ||||||
| 2,261,125 | ||||||||
| United Kingdom — 13.8% | ||||||||
| 3i Group PLC | 3,810 | 53,631 | ||||||
| abrdn PLC | 5,958 | 10,125 | ||||||
93
| Avantis Responsible International Equity ETF | ||||||||
| Shares | Value | |||||||
| Admiral Group PLC | 669 | $ | 16,457 | |||||
| Advanced Medical Solutions Group PLC | 280 | 979 | ||||||
| AG Barr PLC | 321 | 1,879 | ||||||
| Airtel Africa PLC | 3,400 | 5,220 | ||||||
| AJ Bell PLC | 1,046 | 3,568 | ||||||
| Alliance Pharma PLC | 1,623 | 1,789 | ||||||
| Alpha FX Group PLC | 201 | 4,246 | ||||||
| Anglo American PLC | 3,368 | 108,229 | ||||||
| Anglo-Eastern Plantations PLC | 241 | 2,513 | ||||||
| Antofagasta PLC | 1,866 | 23,743 | ||||||
| Ashmore Group PLC | 1,876 | 4,420 | ||||||
| Ashtead Group PLC | 1,031 | 50,651 | ||||||
ASOS PLC(1) | 141 | 1,134 | ||||||
| Associated British Foods PLC | 1,016 | 17,944 | ||||||
Aston Martin Lagonda Global Holdings PLC(1)(2) | 155 | 800 | ||||||
| AstraZeneca PLC, ADR | 2,472 | 154,203 | ||||||
| Auto Trader Group PLC | 4,307 | 32,521 | ||||||
| Avast PLC | 97 | 796 | ||||||
| AVEVA Group PLC | 20 | 649 | ||||||
| Aviva PLC | 7,863 | 38,145 | ||||||
| B&M European Value Retail SA | 4,261 | 18,272 | ||||||
| BAE Systems PLC | 5,228 | 47,084 | ||||||
| Balfour Beatty PLC | 3,865 | 14,139 | ||||||
| Bank of Georgia Group PLC | 324 | 7,524 | ||||||
| Barclays PLC, ADR | 8,106 | 63,146 | ||||||
| Barratt Developments PLC | 3,026 | 14,981 | ||||||
| Beazley PLC | 3,221 | 21,734 | ||||||
| Bellway PLC | 302 | 7,141 | ||||||
| Berkeley Group Holdings PLC | 539 | 22,817 | ||||||
| Biffa PLC | 2,291 | 10,694 | ||||||
| Bodycote PLC | 393 | 2,506 | ||||||
boohoo Group PLC(1) | 987 | 478 | ||||||
| Brewin Dolphin Holdings PLC | 2,440 | 14,509 | ||||||
| Britvic PLC | 1,045 | 9,497 | ||||||
| BT Group PLC | 40,343 | 70,572 | ||||||
| Bunzl PLC | 522 | 17,312 | ||||||
| Burberry Group PLC | 1,463 | 29,595 | ||||||
| Burford Capital Ltd. | 1,059 | 9,906 | ||||||
| Bytes Technology Group PLC | 1,538 | 7,422 | ||||||
| Capital Ltd. | 1,380 | 1,331 | ||||||
Carnival PLC, ADR(1) | 100 | 847 | ||||||
Centrica PLC(1) | 30,580 | 26,821 | ||||||
| Chesnara PLC | 818 | 2,868 | ||||||
| Clarkson PLC | 200 | 6,990 | ||||||
| Close Brothers Group PLC | 1,126 | 13,321 | ||||||
| CMC Markets PLC | 1,544 | 4,118 | ||||||
| Coats Group PLC | 16,171 | 11,271 | ||||||
Coca-Cola HBC AG(1) | 1,046 | 23,869 | ||||||
| Compass Group PLC | 1,389 | 29,879 | ||||||
| Computacenter PLC | 458 | 13,120 | ||||||
| ConvaTec Group PLC | 3,992 | 10,072 | ||||||
94
| Avantis Responsible International Equity ETF | ||||||||
| Shares | Value | |||||||
Countryside Partnerships PLC(1) | 757 | $ | 2,120 | |||||
| Cranswick PLC | 276 | 9,876 | ||||||
| Crest Nicholson Holdings PLC | 1,641 | 4,460 | ||||||
| Croda International PLC | 139 | 10,834 | ||||||
De La Rue PLC(1) | 600 | 599 | ||||||
| Dechra Pharmaceuticals PLC | 29 | 1,173 | ||||||
| Diageo PLC, ADR | 640 | 112,890 | ||||||
| Direct Line Insurance Group PLC | 7,310 | 17,411 | ||||||
| Domino's Pizza Group PLC | 660 | 1,806 | ||||||
| dotdigital group PLC | 978 | 987 | ||||||
| Dr. Martens PLC | 3,538 | 9,645 | ||||||
| Drax Group PLC | 3,223 | 23,775 | ||||||
| DS Smith PLC | 4,283 | 13,273 | ||||||
| Dunelm Group PLC | 657 | 5,244 | ||||||
Elementis PLC(1) | 671 | 861 | ||||||
| EMIS Group PLC | 414 | 9,056 | ||||||
Ergomed PLC(1) | 189 | 2,449 | ||||||
| Euromoney Institutional Investor PLC | 42 | 708 | ||||||
| Experian PLC | 792 | 24,034 | ||||||
FD Technologies PLC(1) | 6 | 111 | ||||||
| Ferguson PLC | 439 | 50,840 | ||||||
| Firstgroup PLC | 8,864 | 11,806 | ||||||
| Forterra PLC | 2,430 | 7,456 | ||||||
| Foxtons Group PLC | 1,387 | 599 | ||||||
Frasers Group PLC(1) | 1,310 | 12,198 | ||||||
Frontier Developments PLC(1) | 63 | 1,068 | ||||||
Funding Circle Holdings PLC(1) | 720 | 272 | ||||||
| Games Workshop Group PLC | 210 | 17,292 | ||||||
| Gamma Communications PLC | 200 | 2,502 | ||||||
| Genus PLC | 21 | 612 | ||||||
Georgia Capital PLC(1) | 228 | 1,809 | ||||||
Go-Ahead Group PLC(1) | 539 | 9,669 | ||||||
Golar LNG Ltd.(1) | 609 | 16,607 | ||||||
| Grafton Group PLC | 1,630 | 13,682 | ||||||
| Grainger PLC | 2,840 | 8,843 | ||||||
Greencore Group PLC(1) | 320 | 316 | ||||||
| Greggs PLC | 519 | 11,094 | ||||||
| GSK PLC, ADR | 4,571 | 148,466 | ||||||
Gym Group PLC(1) | 494 | 828 | ||||||
Haleon PLC, ADR(1) | 3,909 | 23,376 | ||||||
| Halfords Group PLC | 1,593 | 2,408 | ||||||
| Halma PLC | 67 | 1,612 | ||||||
| Hargreaves Lansdown PLC | 1,210 | 11,455 | ||||||
| Hays PLC | 3,010 | 4,081 | ||||||
| Helical PLC | 630 | 2,850 | ||||||
Helios Towers PLC(1) | 3,908 | 5,600 | ||||||
| Hikma Pharmaceuticals PLC | 777 | 11,842 | ||||||
| Hill & Smith Holdings PLC | 654 | 7,901 | ||||||
| Hiscox Ltd. | 1,385 | 14,431 | ||||||
| Hollywood Bowl Group PLC | 378 | 755 | ||||||
| HomeServe PLC | 658 | 9,058 | ||||||
95
| Avantis Responsible International Equity ETF | ||||||||
| Shares | Value | |||||||
| Howden Joinery Group PLC | 2,923 | $ | 19,326 | |||||
HSBC Holdings PLC, ADR(2) | 4,877 | 150,358 | ||||||
Hurricane Energy PLC(1) | 22,448 | 1,915 | ||||||
| Ibstock PLC | 2,984 | 6,559 | ||||||
| IG Group Holdings PLC | 2,352 | 22,320 | ||||||
IGas Energy PLC(1) | 522 | 492 | ||||||
| IMI PLC | 467 | 6,211 | ||||||
| Inchcape PLC | 1,563 | 13,725 | ||||||
| Informa PLC | 393 | 2,486 | ||||||
| InterContinental Hotels Group PLC | 190 | 10,314 | ||||||
| Intermediate Capital Group PLC | 1,396 | 22,068 | ||||||
| Intertek Group PLC | 473 | 21,710 | ||||||
| Investec PLC | 4,115 | 19,780 | ||||||
IOG PLC(1) | 3,522 | 1,166 | ||||||
| IP Group PLC | 5,307 | 4,307 | ||||||
| ITV PLC | 5,925 | 4,409 | ||||||
IWG PLC(1) | 3,151 | 5,873 | ||||||
J D Wetherspoon PLC(1) | 49 | 274 | ||||||
| J Sainsbury PLC | 6,663 | 15,727 | ||||||
| JD Sports Fashion PLC | 7,883 | 10,311 | ||||||
Johnson Service Group PLC(1) | 1,032 | 1,153 | ||||||
Jubilee Metals Group PLC(1) | 3,462 | 475 | ||||||
| Jupiter Fund Management PLC | 1,478 | 1,667 | ||||||
| Just Group PLC | 7,161 | 5,980 | ||||||
| Kainos Group PLC | 383 | 6,043 | ||||||
| Kingfisher PLC | 10,522 | 28,265 | ||||||
| Lancashire Holdings Ltd. | 667 | 3,827 | ||||||
| Learning Technologies Group PLC | 717 | 950 | ||||||
| Legal & General Group PLC | 17,509 | 51,285 | ||||||
Liberty Global PLC, Class A(1) | 479 | 9,676 | ||||||
Liberty Global PLC, Class C(1) | 873 | 18,604 | ||||||
| Liontrust Asset Management PLC | 297 | 3,154 | ||||||
| Lloyds Banking Group PLC, ADR | 45,450 | 90,900 | ||||||
| London Stock Exchange Group PLC | 247 | 23,169 | ||||||
| Lookers PLC | 3,899 | 3,692 | ||||||
| Luxfer Holdings PLC | 29 | 477 | ||||||
| M&G PLC | 10,678 | 24,233 | ||||||
| Man Group PLC | 8,503 | 24,028 | ||||||
Marks & Spencer Group PLC(1) | 6,407 | 9,054 | ||||||
| Marshalls PLC | 532 | 2,063 | ||||||
Marston's PLC(1) | 5,261 | 2,218 | ||||||
| ME Group International PLC | 2,233 | 2,272 | ||||||
| Mediclinic International PLC | 2,762 | 16,050 | ||||||
Metro Bank PLC(1) | 442 | 415 | ||||||
| Micro Focus International PLC, ADR | 200 | 1,206 | ||||||
Mitchells & Butlers PLC(1) | 2,258 | 4,038 | ||||||
| Mitie Group PLC | 16,164 | 13,575 | ||||||
| Mondi PLC | 1,402 | 23,800 | ||||||
| Moneysupermarket.com Group PLC | 1,813 | 4,144 | ||||||
| Morgan Sindall Group PLC | 117 | 2,336 | ||||||
| NatWest Group PLC, ADR | 7,413 | 40,993 | ||||||
96
| Avantis Responsible International Equity ETF | ||||||||
| Shares | Value | |||||||
| Next PLC | 609 | $ | 41,011 | |||||
| Ninety One PLC | 3,502 | 8,023 | ||||||
Ocado Group PLC(1) | 62 | 521 | ||||||
| OSB Group PLC | 2,091 | 13,332 | ||||||
| Pagegroup PLC | 1,989 | 9,990 | ||||||
| Paragon Banking Group PLC | 1,800 | 11,188 | ||||||
| Pearson PLC, ADR | 2,666 | 26,767 | ||||||
Pendragon PLC(1) | 4,371 | 1,134 | ||||||
| Pennon Group PLC | 1,859 | 20,128 | ||||||
| Persimmon PLC | 1,331 | 22,775 | ||||||
| Pets at Home Group PLC | 133 | 489 | ||||||
| Phoenix Group Holdings PLC | 1,870 | 13,061 | ||||||
| Plus500 Ltd. | 952 | 18,760 | ||||||
| Premier Foods PLC | 2,613 | 3,270 | ||||||
| Provident Financial PLC | 1,917 | 3,836 | ||||||
| Prudential PLC, ADR | 921 | 19,442 | ||||||
| QinetiQ Group PLC | 2,739 | 11,067 | ||||||
| Quilter PLC | 4,762 | 5,810 | ||||||
| Rathbones Group PLC | 261 | 5,456 | ||||||
| Reach PLC | 1,382 | 1,188 | ||||||
| Reckitt Benckiser Group PLC | 1,054 | 81,328 | ||||||
| Redde Northgate PLC | 2,359 | 9,363 | ||||||
| Redrow PLC | 913 | 5,363 | ||||||
| RELX PLC, ADR | 3,510 | 91,892 | ||||||
Renewi PLC(1) | 258 | 2,323 | ||||||
| Renishaw PLC | 60 | 2,566 | ||||||
| Rentokil Initial PLC | 1,991 | 12,025 | ||||||
Restaurant Group PLC(1) | 2,143 | 1,017 | ||||||
| Restore PLC | 457 | 2,321 | ||||||
| Rhi Magnesita NV | 13 | 272 | ||||||
| Rightmove PLC | 4,477 | 31,469 | ||||||
Rolls-Royce Holdings PLC(1) | 4,718 | 4,205 | ||||||
| Royal Mail PLC | 3,383 | 10,794 | ||||||
| RS GROUP PLC | 1,694 | 21,310 | ||||||
| Sage Group PLC | 2,748 | 22,777 | ||||||
Savannah Energy PLC(1) | 639 | 245 | ||||||
| Savills PLC | 851 | 9,346 | ||||||
| Schroders PLC | 315 | 9,798 | ||||||
Senior PLC(1) | 458 | 691 | ||||||
| Serco Group PLC | 8,516 | 17,273 | ||||||
| Severn Trent PLC | 461 | 14,891 | ||||||
SIG PLC(1) | 929 | 361 | ||||||
| Sirius Real Estate Ltd. | 2,397 | 2,261 | ||||||
| Smart Metering Systems PLC | 472 | 4,981 | ||||||
| Smith & Nephew PLC, ADR | 910 | 21,694 | ||||||
| Smiths Group PLC | 393 | 6,789 | ||||||
| Softcat PLC | 779 | 11,682 | ||||||
| Spectris PLC | 171 | 5,529 | ||||||
| Speedy Hire PLC | 3,370 | 1,600 | ||||||
| Spirax-Sarco Engineering PLC | 118 | 14,405 | ||||||
Spire Healthcare Group PLC(1) | 1,314 | 3,540 | ||||||
97
| Avantis Responsible International Equity ETF | ||||||||
| Shares | Value | |||||||
| Spirent Communications PLC | 3,353 | $ | 10,030 | |||||
SSP Group PLC(1) | 2,200 | 5,391 | ||||||
| St. James's Place PLC | 2,459 | 31,475 | ||||||
| Standard Chartered PLC (London) | 8,033 | 55,638 | ||||||
| SThree PLC | 559 | 2,282 | ||||||
Strix Group PLC(2) | 1,058 | 1,819 | ||||||
Superdry PLC(1) | 387 | 563 | ||||||
| Synthomer PLC | 1,499 | 3,422 | ||||||
| Tate & Lyle PLC | 3,629 | 32,136 | ||||||
| Taylor Wimpey PLC | 9,328 | 11,702 | ||||||
| TBC Bank Group PLC | 349 | 7,185 | ||||||
Team17 Group PLC(1) | 158 | 731 | ||||||
Ted Baker PLC(1) | 591 | 747 | ||||||
| Telecom Plus PLC | 533 | 12,041 | ||||||
| TI Fluid Systems PLC | 642 | 1,088 | ||||||
| TP ICAP Group PLC | 1,230 | 2,194 | ||||||
| Travis Perkins PLC | 690 | 6,786 | ||||||
Tremor International Ltd.(1) | 329 | 1,256 | ||||||
TUI AG(1) | 1,618 | 2,481 | ||||||
| Tyman PLC | 251 | 670 | ||||||
| Unilever PLC, ADR | 2,823 | 128,136 | ||||||
| United Utilities Group PLC | 4,104 | 50,300 | ||||||
| Vertu Motors PLC | 4,229 | 2,382 | ||||||
| Vesuvius PLC | 149 | 599 | ||||||
| Virgin Money UK PLC | 9,798 | 16,942 | ||||||
| Vistry Group PLC | 1,147 | 10,272 | ||||||
| Vodafone Group PLC, ADR | 6,967 | 93,497 | ||||||
| Watkin Jones PLC | 617 | 1,356 | ||||||
| Weir Group PLC | 278 | 4,682 | ||||||
WH Smith PLC(1) | 388 | 6,432 | ||||||
| Whitbread PLC | 739 | 21,419 | ||||||
| Wickes Group PLC | 2,665 | 3,695 | ||||||
| Wincanton PLC | 880 | 3,453 | ||||||
WPP PLC, ADR(2) | 380 | 16,306 | ||||||
Yellow Cake PLC(1) | 1,955 | 9,532 | ||||||
| YouGov PLC | 233 | 2,703 | ||||||
| 3,711,893 | ||||||||
United States† | ||||||||
| ADTRAN Holdings, Inc. | 52 | 1,202 | ||||||
GXO Logistics, Inc.(1) | 17 | 754 | ||||||
| 1,956 | ||||||||
TOTAL COMMON STOCKS (Cost $28,455,889) | 26,801,925 | |||||||
RIGHTS† | ||||||||
Germany† | ||||||||
7C Solarparken AG(1) (Cost $—) | 288 | 5 | ||||||
WARRANTS† | ||||||||
Australia† | ||||||||
Magellan Financial Group Ltd.(1)(2) (Cost $—) | 4 | 2 | ||||||
98
| Avantis Responsible International Equity ETF | ||||||||
| Shares | Value | |||||||
| SHORT-TERM INVESTMENTS — 0.9% | ||||||||
| Money Market Funds — 0.9% | ||||||||
| State Street Institutional U.S. Government Money Market Fund, Premier Class | 24,800 | $ | 24,800 | |||||
State Street Navigator Securities Lending Government Money Market Portfolio(3) | 215,191 | 215,191 | ||||||
TOTAL SHORT-TERM INVESTMENTS (Cost $239,991) | 239,991 | |||||||
TOTAL INVESTMENT SECURITIES — 100.5% (Cost $28,695,880) | 27,041,923 | |||||||
| OTHER ASSETS AND LIABILITIES — (0.5)% | (143,482) | |||||||
| TOTAL NET ASSETS — 100.0% | $ | 26,898,441 | ||||||
| MARKET SECTOR DIVERSIFICATION | |||||
| (as a % of net assets) | |||||
| Financials | 26.5% | ||||
| Industrials | 16.5% | ||||
| Consumer Discretionary | 12.2% | ||||
| Health Care | 9.3% | ||||
| Materials | 8.3% | ||||
| Information Technology | 7.5% | ||||
| Consumer Staples | 7.4% | ||||
| Communication Services | 6.1% | ||||
| Real Estate | 3.0% | ||||
| Utilities | 2.5% | ||||
| Energy | 0.3% | ||||
| Short-Term Investments | 0.9% | ||||
| Other Assets and Liabilities | (0.5)% | ||||
| NOTES TO SCHEDULE OF INVESTMENTS | ||||||||
| ADR | - | American Depositary Receipt | ||||||
| CVA | - | Certificaten Van Aandelen | ||||||
| SDR | - | Swedish Depositary Receipt | ||||||
†Category is less than 0.05% of total net assets.
(1)Non-income producing.
(2)Security, or a portion thereof, is on loan. At the period end, the aggregate value of securities on loan was $340,081. The amount of securities on loan indicated may not correspond with the securities on loan identified because securities with pending sales are in the process of recall from the brokers.
(3)Investment of cash collateral from securities on loan. At the period end, the aggregate value of the collateral held by the fund was $356,532, which includes securities collateral of $141,341.
See Notes to Financial Statements.
99
| Statements of Assets and Liabilities | ||
| AUGUST 31, 2022 | ||||||||
| Avantis Responsible Emerging Markets Equity ETF | Avantis Responsible International Equity ETF | |||||||
| Assets | ||||||||
| Investment securities, at value (cost of $13,803,755 and $28,480,689, respectively) — including $— and $340,081, respectively of securities on loan | $ | 13,008,601 | $ | 26,826,732 | ||||
| Investment made with cash collateral received for securities on loan, at value (cost of $— and $215,191, respectively) | — | 215,191 | ||||||
| Total investment securities, at value (cost of $13,803,755 and $28,695,880, respectively) | 13,008,601 | 27,041,923 | ||||||
| Cash | — | 108 | ||||||
| Foreign currency holdings, at value (cost of $4,689 and $2,137, respectively) | 4,677 | 2,134 | ||||||
| Receivable for investments sold | 159 | — | ||||||
| Dividends and interest receivable | 25,049 | 74,267 | ||||||
| Securities lending receivable | — | 356 | ||||||
| 13,038,486 | 27,118,788 | |||||||
| Liabilities | ||||||||
| Payable for collateral received for securities on loan | — | 215,191 | ||||||
| Payable for investments purchased | 413 | — | ||||||
| Accrued management fees | 3,687 | 5,156 | ||||||
| Accrued foreign taxes | 20,298 | — | ||||||
| 24,398 | 220,347 | |||||||
| Net Assets | $ | 13,014,088 | $ | 26,898,441 | ||||
| Shares outstanding (unlimited number of shares authorized) | 300,000 | 600,000 | ||||||
| Net Asset Value Per Share | $ | 43.38 | $ | 44.83 | ||||
| Net Assets Consist of: | ||||||||
| Capital paid in | $ | 13,743,914 | $ | 28,474,658 | ||||
| Distributable earnings | (729,826) | (1,576,217) | ||||||
| $ | 13,014,088 | $ | 26,898,441 | |||||
See Notes to Financial Statements.
100
| Statements of Operations | ||
| PERIOD ENDED AUGUST 31, 2022 | ||||||||
Avantis Responsible Emerging Markets Equity ETF(1) | Avantis Responsible International Equity ETF(2) | |||||||
| Investment Income (Loss) | ||||||||
| Income: | ||||||||
| Dividends (net of foreign taxes withheld of $27,186 and $20,514, respectively) | $ | 171,273 | $ | 216,072 | ||||
| Interest | 371 | 788 | ||||||
| Securities lending, net | — | 356 | ||||||
| 171,644 | 217,216 | |||||||
| Expenses: | ||||||||
| Management fees | 10,852 | 15,419 | ||||||
| Net investment income (loss) | 160,792 | 201,797 | ||||||
| Realized and Unrealized Gain (Loss) | ||||||||
| Net realized gain (loss) on: | ||||||||
| Investment transactions (net of foreign tax expenses paid (refunded) of $17 and $—, respectively) | (34,906) | (13,316) | ||||||
| Foreign currency translation transactions | (11,996) | (3,454) | ||||||
| (46,902) | (16,770) | |||||||
| Change in net unrealized appreciation (depreciation) on: | ||||||||
| Investments (includes (increase) decrease in accrued foreign taxes of $(20,298) and $—, respectively) | (815,452) | (1,653,957) | ||||||
| Translation of assets and liabilities in foreign currencies | (184) | (1,132) | ||||||
| (815,636) | (1,655,089) | |||||||
| Net realized and unrealized gain (loss) | (862,538) | (1,671,859) | ||||||
| Net Increase (Decrease) in Net Assets Resulting from Operations | $ | (701,746) | $ | (1,470,062) | ||||
(1)March 28, 2022 (fund inception) through August 31, 2022.
(2)March 15, 2022 (fund inception) through August 31, 2022.
See Notes to Financial Statements.
101
| Statements of Changes in Net Assets | ||
| PERIOD ENDED AUGUST 31, 2022 | ||||||||
Avantis Responsible Emerging Markets Equity ETF(1) | Avantis Responsible International Equity ETF(2) | |||||||
| Increase (Decrease) in Net Assets | ||||||||
| Operations | ||||||||
| Net investment income (loss) | $ | 160,792 | $ | 201,797 | ||||
| Net realized gain (loss) | (46,902) | (16,770) | ||||||
| Change in net unrealized appreciation (depreciation) | (815,636) | (1,655,089) | ||||||
| Net increase (decrease) in net assets resulting from operations | (701,746) | (1,470,062) | ||||||
| Distributions to Shareholders | ||||||||
| From earnings | (28,080) | (106,155) | ||||||
| Capital Share Transactions | ||||||||
| Proceeds from shares sold | 13,723,663 | 28,455,437 | ||||||
| Other capital | 20,251 | 19,221 | ||||||
| Net increase (decrease) in net assets from capital share transactions | 13,743,914 | 28,474,658 | ||||||
| Net increase (decrease) in net assets | 13,014,088 | 26,898,441 | ||||||
| Net Assets | ||||||||
| End of period | $ | 13,014,088 | $ | 26,898,441 | ||||
| Transactions in Shares of the Funds | ||||||||
| Sold | 300,000 | 600,000 | ||||||
(1)March 28, 2022 (fund inception) through August 31, 2022.
(2)March 15, 2022 (fund inception) through August 31, 2022.
See Notes to Financial Statements.
102
| Notes to Financial Statements | ||
AUGUST 31, 2022
1. Organization
American Century ETF Trust (the trust) was registered as a Delaware statutory trust in 2017 and is registered under the Investment Company Act of 1940, as amended (the 1940 Act), as an open-end management investment company. Avantis Responsible Emerging Markets Equity ETF and Avantis Responsible International Equity ETF (collectively, the funds) are two funds in a series issued by the trust. Each of the funds’ investment objective is to seek long-term capital appreciation. Shares of the funds are listed for trading on the NYSE Arca, Inc. Avantis Responsible Emerging Markets Equity ETF incepted on March 28, 2022. Avantis Responsible International Equity ETF incepted on March 15, 2022.
2. Significant Accounting Policies
The following is a summary of significant accounting policies consistently followed by the funds in preparation of their financial statements. Each fund is an investment company and follows accounting and reporting guidance in accordance with accounting principles generally accepted in the United States of America. This may require management to make certain estimates and assumptions at the date of the financial statements. Actual results could differ from these estimates. Management evaluated the impact of events or transactions occurring through the date the financial statements were issued that would merit recognition or disclosure.
Investment Valuations — The funds determine the fair value of their investments and compute their net asset value (NAV) per share at the close of regular trading (usually 4 p.m. Eastern time) on the New York Stock Exchange (NYSE) on each day the NYSE is open. The Board of Trustees has adopted valuation policies and procedures to guide the investment advisor in the funds' investment valuation process and to provide methodologies for the oversight of the funds' pricing function.
Equity securities that are listed or traded on a domestic securities exchange are valued at the last reported sales price or at the official closing price as provided by the exchange. Equity securities traded on foreign securities exchanges are generally valued at the closing price of such securities on the exchange where primarily traded or at the close of the NYSE, if that is earlier. If no last sales price is reported, or if local convention or regulation so provides, the mean of the latest bid and asked prices may be used. Securities traded over-the-counter are valued at the mean of the latest bid and asked prices, the last sales price, or the official closing price. Equity securities initially expressed in local currencies are translated into U.S. dollars at the mean of the appropriate currency exchange rate at the close of the NYSE as provided by an independent pricing service.
Open-end management investment companies are valued at the reported NAV per share.
If the funds determine that the market price for an investment is not readily available or the valuation methods mentioned above do not reflect an investment’s fair value, such investment is valued as determined in good faith by the Board of Trustees or its delegate, in accordance with policies and procedures adopted by the Board of Trustees. In its determination of fair value, the funds may review several factors including, but not limited to, market information regarding the specific investment or comparable investments and correlation with other investment types, futures indices or general market indicators. Circumstances that may cause the funds to use these procedures to value an investment include, but are not limited to: an investment has been declared in default or is distressed; trading in a security has been suspended during the trading day or a security is not actively trading on its principal exchange; prices received from a regular pricing source are deemed unreliable; or there is a foreign market holiday and no trading occurred.
The funds monitor for significant events occurring after the close of an investment’s primary exchange but before each fund’s NAV per share is determined. Significant events may include, but are not limited to: corporate announcements and transactions; governmental action and political unrest that could impact a specific investment or an investment sector; or armed conflicts, natural disasters and similar events that could affect investments in a specific country or region. The funds also monitor for significant fluctuations between domestic and foreign markets, as evidenced by the U.S. market or such other indicators that the Board of Trustees, or its delegate, deems appropriate. The funds may apply a model-derived factor to the closing price of equity securities traded on foreign securities exchanges. The factor is based on observable market data as provided by an independent pricing service.
103
Security Transactions — Security transactions are accounted for as of the trade date. Net realized gains and losses are determined on the identified cost basis, which is also used for federal income tax purposes. Certain countries impose taxes on realized gains on the sale of securities registered in their country. The funds record the foreign tax expense, if any, on an accrual basis. The foreign tax expense on realized gains and unrealized appreciation reduces the net realized gain (loss) on investment transactions and net unrealized appreciation (depreciation) on investments, respectively.
Investment Income — Dividend income less foreign taxes withheld, if any, is recorded as of the ex-dividend date. Distributions received on securities that represent a return of capital or long-term capital gain are recorded as a reduction of cost of investments and/or as a realized gain. The funds may estimate the components of distributions received that may be considered nontaxable distributions or long-term capital gain distributions for income tax purposes. Interest income is recorded on the accrual basis and includes accretion of discounts and amortization of premiums. Securities lending income is net of fees and rebates earned by the lending agent for its services.
Foreign Currency Translations — All assets and liabilities initially expressed in foreign currencies are translated into U.S. dollars at prevailing exchange rates at period end. The funds may enter into spot foreign currency exchange contracts to facilitate transactions denominated in a foreign currency. Purchases and sales of investment securities, dividend and interest income, spot foreign currency exchange contracts, and expenses are translated at the rates of exchange prevailing on the respective dates of such transactions. Net realized and unrealized foreign currency exchange gains or losses related to investment securities are a component of net realized gain (loss) on investment transactions and change in net unrealized appreciation (depreciation) on investments, respectively.
Segregated Assets — In accordance with the 1940 Act, the funds segregate assets on their books and records to cover certain types of investment securities and other financial instruments. American Century Investment Management, Inc. (ACIM) (the investment advisor) monitors, on a daily basis, the securities segregated to ensure the funds designate a sufficient amount of liquid assets, marked-to-market daily. The funds may also receive assets or be required to pledge assets at the custodian bank or with a broker for collateral requirements.
Income Tax Status — It is each fund’s policy to distribute substantially all net investment income and net realized gains to shareholders and to otherwise qualify as a regulated investment company under provisions of the Internal Revenue Code. Accordingly, no provision has been made for income taxes. The funds file U.S. federal, state, local and non-U.S. tax returns as applicable. The funds' tax returns are subject to examination by the relevant taxing authority until expiration of the applicable statute of limitations, which is generally three years from the date of filing but can be longer in certain jurisdictions. At this time, management believes there are no uncertain tax positions which, based on their technical merit, would not be sustained upon examination and for which it is reasonably possible that the total amounts of unrecognized tax benefits will significantly change in the next twelve months.
Distributions to Shareholders — Distributions from net investment income, if any, are generally declared and paid semiannually. Distributions from net realized gains, if any, are generally declared and paid annually.
Indemnifications — Under the trust’s organizational documents, its officers and trustees are indemnified against certain liabilities arising out of the performance of their duties to the funds. In addition, in the normal course of business, the funds enter into contracts that provide general indemnifications. The maximum exposure under these arrangements is unknown as this would involve future claims that may be made against a fund. The risk of material loss from such claims is considered by management to be remote.
104
Securities Lending — Securities are lent to qualified financial institutions and brokers. State Street Bank & Trust Co. serves as securities lending agent to the funds pursuant to a Securities Lending Agreement. The lending of securities exposes the funds to risks such as: the borrowers may fail to return the loaned securities, the borrowers may not be able to provide additional collateral, the funds may experience delays in recovery of the loaned securities or delays in access to collateral, or the funds may experience losses related to the investment collateral. To minimize certain risks, loan counterparties pledge collateral in the form of cash and/or securities. The lending agent has agreed to indemnify the funds in the case of default of any securities borrowed. Cash collateral received is invested in the State Street Navigator Securities Lending Government Money Market Portfolio, a money market mutual fund registered under the 1940 Act. The loans may also be secured by U.S. government securities in an amount at least equal to the market value of the securities loaned, plus accrued interest and dividends, determined on a daily basis and adjusted accordingly. By lending securities, the funds seek to increase their net investment income through the receipt of interest and fees. Such income is reflected separately within the Statements of Operations. The value of loaned securities and related collateral outstanding at period end, if any, are shown on a gross basis within the Schedules of Investments and Statements of Assets and Liabilities.
The following table reflects a breakdown of transactions accounted for as secured borrowings, the gross obligation by the type of collateral pledged, and the remaining contractual maturity of those transactions as of August 31, 2022.
| Remaining Contractual Maturity of Agreements | |||||||||||||||||
Fund / Securities Lending Transactions(1) | Overnight and Continuous | <30 days | Between 30 & 90 days | >90 days | Total | ||||||||||||
| Avantis Responsible International Equity ETF | |||||||||||||||||
| Common Stocks | $ | 215,190 | — | — | — | $ | 215,190 | ||||||||||
| Warrants | 1 | — | — | — | 1 | ||||||||||||
| Total Borrowings | $ | 215,191 | — | — | — | $ | 215,191 | ||||||||||
| Gross amount of recognized liabilities for securities lending transactions | $ | 215,191 | |||||||||||||||
(1)Amount represents the payable for cash collateral received for securities on loan. This will generally be in the Overnight and Continuous column as the securities are typically callable on demand.
3. Fees and Transactions with Related Parties
Certain officers and trustees of the trust are also officers and/or directors of American Century Companies, Inc. (ACC). The trust's investment advisor, ACIM, and the trust’s administrator, American Century Services, LLC, are wholly owned, directly or indirectly, by ACC.
Management Fees — The trust has entered into a management agreement with ACIM, under which ACIM provides the funds with investment advisory and management services in exchange for a single, unified management fee (the fee). The agreement provides that ACIM will pay all expenses of managing and operating the funds, except brokerage and other transaction fees and expenses relating to the acquisition and disposition of portfolio securities, acquired fund fees and expenses, interest, taxes, litigation expenses and extraordinary expenses. The fee is computed and accrued daily based on the daily net assets of each fund and paid monthly in arrears.
The annual management fee for each fund is as follows:
| Annual Management Fee | |||||
| Avantis Responsible Emerging Markets Equity ETF | 0.33% | ||||
| Avantis Responsible International Equity ETF | 0.23% | ||||
Interfund Transactions — The funds may enter into security transactions with other American Century Investments funds and other client accounts of the investment advisor, in accordance with the 1940 Act rules and procedures adopted by the Board of Trustees. The rules and procedures require, among other things, that these transactions be effected at the independent current market price of the security. There were no interfund transactions during the period.
105
4. Investment Transactions
Purchases and sales of investment securities, excluding short-term investments and in kind transactions, for the period ended August 31, 2022 were as follows:
Avantis Responsible Emerging Markets Equity ETF(1) | Avantis Responsible International Equity ETF(2) | |||||||
| Purchases | $ | 13,128,623 | $ | 13,290,423 | ||||
| Sales | $ | 165,141 | $ | 427,042 | ||||
(1)March 28, 2022 (fund inception) through August 31, 2022.
(2)March 15, 2022 (fund inception) through August 31, 2022.
Securities received or delivered in kind through subscriptions and redemptions and in kind net realized gain (loss) for the period ended August 31, 2022 were as follows:
| In kind Subscriptions | In kind Redemptions | In kind Net Realized Gain/(Loss)* | |||||||||
Avantis Responsible Emerging Markets Equity ETF(1) | $ | 867,219 | — | — | |||||||
Avantis Responsible International Equity ETF(2) | $ | 15,617,616 | — | — | |||||||
*Net realized gain (loss) on in kind transactions are not considered taxable for federal income tax purposes.
(1)March 28, 2022 (fund inception) through August 31, 2022.
(2)March 15, 2022 (fund inception) through August 31, 2022.
5. Capital Share Transactions
Each fund’s shares may only be bought and sold in a secondary market through a broker-dealer at a market price. Because ETF shares trade at market prices rather than NAV, shares may trade at a price greater than NAV (a premium) or less than NAV (a discount). Each fund issues and redeems shares at their NAV only in aggregations of a specified number of shares (a creation unit) generally in exchange for a designated portfolio of securities and/or cash (including any portion of such securities for which cash may be substituted). Authorized participants may be required to pay an additional variable charge to cover certain brokerage, tax, foreign exchange, execution, market impact and other costs and expenses related to the execution of trades resulting from creation unit transactions. Such variable charges, if any, are included in other capital within the Statements of Changes in Net Assets.
6. Fair Value Measurements
The funds’ investment valuation process is based on several considerations and may use multiple inputs to determine the fair value of the investments held by the funds. In conformity with accounting principles generally accepted in the United States of America, the inputs used to determine a valuation are classified into three broad levels.
•Level 1 valuation inputs consist of unadjusted quoted prices in an active market for identical investments.
•Level 2 valuation inputs consist of direct or indirect observable market data (including quoted prices for comparable investments, evaluations of subsequent market events, interest rates, prepayment speeds, credit risk, etc.). These inputs also consist of quoted prices for identical investments initially expressed in local currencies that are adjusted through translation into U.S. dollars.
•Level 3 valuation inputs consist of unobservable data (including a fund’s own assumptions).
The level classification is based on the lowest level input that is significant to the fair valuation measurement. The valuation inputs are not necessarily an indication of the risks associated with investing in these securities or other financial instruments.
106
The following is a summary of the level classifications as of period end. The Schedules of Investments provide additional information on the funds’ portfolio holdings.
| Avantis Responsible Emerging Markets Equity ETF | |||||||||||
| Level 1 | Level 2 | Level 3 | |||||||||
| Assets | |||||||||||
| Investment Securities | |||||||||||
| Common Stocks | |||||||||||
| Brazil | $ | 265,316 | $ | 540,414 | — | ||||||
| Chile | 26,311 | 65,113 | — | ||||||||
| China | 1,055,056 | 2,720,194 | — | ||||||||
| Colombia | 8,674 | 13,791 | — | ||||||||
| India | 229,228 | 2,022,333 | — | ||||||||
| Indonesia | 31,183 | 274,438 | — | ||||||||
| Mexico | 110,148 | 182,430 | — | ||||||||
| Peru | 30,412 | — | — | ||||||||
| Philippines | 8,724 | 108,649 | — | ||||||||
| South Africa | 38,734 | 473,256 | — | ||||||||
| South Korea | 108,041 | 1,636,693 | — | ||||||||
| Taiwan | 450,637 | 1,774,130 | — | ||||||||
| Turkey | 2,210 | 69,426 | — | ||||||||
| Other Countries | — | 754,484 | — | ||||||||
| Warrants | — | 8 | — | ||||||||
| Rights | — | 5 | — | ||||||||
| Short-Term Investments | 8,563 | — | — | ||||||||
| $ | 2,373,237 | $ | 10,635,364 | — | |||||||
107
| Avantis Responsible International Equity ETF | |||||||||||
| Level 1 | Level 2 | Level 3 | |||||||||
| Assets | |||||||||||
| Investment Securities | |||||||||||
| Common Stocks | |||||||||||
| Australia | $ | 30,462 | $ | 1,989,219 | — | ||||||
| Belgium | 37,555 | 209,242 | — | ||||||||
| Canada | 6,560 | 2,958,140 | — | ||||||||
| Denmark | 295,859 | 302,765 | — | ||||||||
| Finland | 31,285 | 229,612 | — | ||||||||
| France | 279,699 | 2,157,327 | — | ||||||||
| Germany | 88,635 | 1,622,779 | — | ||||||||
| Hong Kong | 1,375 | 698,180 | — | ||||||||
| Israel | 54,117 | 235,197 | — | ||||||||
| Japan | 540,508 | 5,135,337 | — | ||||||||
| Netherlands | 340,364 | 575,775 | — | ||||||||
| Singapore | 15,469 | 369,121 | — | ||||||||
| Spain | 135,496 | 409,234 | — | ||||||||
| Sweden | 34,408 | 867,669 | — | ||||||||
| Switzerland | 494,513 | 1,766,612 | — | ||||||||
| United Kingdom | 1,229,483 | 2,482,410 | — | ||||||||
| United States | 754 | 1,202 | — | ||||||||
| Other Countries | — | 1,175,562 | — | ||||||||
| Rights | — | 5 | — | ||||||||
| Warrants | — | 2 | — | ||||||||
| Short-Term Investments | 239,991 | — | — | ||||||||
| $ | 3,856,533 | $ | 23,185,390 | — | |||||||
7. Risk Factors
The value of the funds’ shares will go up and down, sometimes rapidly or unpredictably, based on the performance of the securities owned by the funds and other factors generally affecting the securities market. Market risks, including political, regulatory, economic and social developments, can affect the value of the funds’ investments. Natural disasters, public health emergencies, war, terrorism and other unforeseeable events may lead to increased market volatility and may have adverse long-term effects on world economies and markets generally.
There are certain risks involved in investing in foreign securities. These risks include those resulting from political events (such as civil unrest, national elections and imposition of exchange controls), social and economic events (such as labor strikes and rising inflation), and natural disasters. Securities of foreign issuers may be less liquid and more volatile. Investing in emerging markets or a significant portion of assets in one country or region may accentuate these risks.
108
8. Federal Tax Information
The tax character of distributions paid during the period ended August 31, 2022 were as follows:
| 2022 | ||||||||
| Distributions Paid From: | ||||||||
| Ordinary Income | Long-term Capital Gains | |||||||
Avantis Responsible Emerging Markets Equity ETF(1) | $ | 28,080 | — | |||||
Avantis Responsible International Equity ETF(2) | $ | 106,155 | — | |||||
(1)March 28, 2022 (fund inception) through August 31, 2022.
(2)March 15, 2022 (fund inception) through August 31, 2022.
The book-basis character of distributions made during the year from net investment income or net realized gains may differ from their ultimate characterization for federal income tax purposes. These differences reflect the differing character of certain income items and net realized gains and losses for financial statement and tax purposes, and may result in reclassification among certain capital accounts on the financial statements.
As of period end, the federal tax cost of investments and the components of distributable earnings on a tax-basis were as follows:
| Avantis Responsible Emerging Markets Equity ETF | Avantis Responsible International Equity ETF | |||||||
| Federal tax cost of investments | $ | 13,840,805 | $ | 28,719,368 | ||||
| Gross tax appreciation of investments | $ | 411,996 | $ | 393,811 | ||||
| Gross tax depreciation of investments | (1,244,200) | (2,071,256) | ||||||
| Net tax appreciation (depreciation) of investments | (832,204) | (1,677,445) | ||||||
| Net tax appreciation (depreciation) on translation of assets and liabilities in foreign currencies | (20,482) | (1,132) | ||||||
| Net tax appreciation (depreciation) | $ | (852,686) | $ | (1,678,577) | ||||
| Undistributed ordinary income | $ | 157,920 | $ | 116,740 | ||||
| Accumulated short-term capital losses | $ | (35,060) | $ | (14,380) | ||||
The difference between book-basis and tax-basis unrealized appreciation (depreciation) is attributable primarily to the realization to ordinary income for tax purposes of unrealized gains on investments in passive
foreign investment companies.
Accumulated capital losses represent net capital loss carryovers that may be used to offset future realized
capital gains for federal income tax purposes. The capital loss carryovers may be carried forward for an
unlimited period. Future capital loss carryover utilization in any given year may be subject to Internal Revenue
Code limitations.
109
| Financial Highlights | ||
| For a Share Outstanding Throughout the Period Indicated | ||||||||||||||||||||||||||||||||||||||
| Per-Share Data | Ratios and Supplemental Data | |||||||||||||||||||||||||||||||||||||
| Income From Investment Operations: | Ratio to Average Net Assets of: | |||||||||||||||||||||||||||||||||||||
| Net Asset Value, Beginning of Period | Net Investment Income (Loss)(1) | Net Realized and Unrealized Gain (Loss) | Total From Investment Operations | Distributions From Net Investment Income | Other Capital(1) | Net Asset Value, End of Period | Total Return(2) | Operating Expenses | Net Investment Income (Loss) | Portfolio Turnover Rate(3) | Net Assets, End of Period (in thousands) | |||||||||||||||||||||||||||
| Avantis Responsible Emerging Markets Equity ETF | ||||||||||||||||||||||||||||||||||||||
2022(4) | $49.47 | 0.93 | (7.00) | (6.07) | (0.14) | 0.12 | $43.38 | (12.04)% | 0.33%(5) | 4.89%(5) | 2% | $13,014 | ||||||||||||||||||||||||||
| Notes to Financial Highlights | ||
(1)Computed using average shares outstanding throughout the period.
(2)Total returns are calculated based on the net asset value of the last business day. Total returns for periods less than one year are not annualized.
(3)Excludes securities received or delivered in kind.
(4)March 28, 2022 (fund inception) through August 31, 2022.
(5)Annualized.
See Notes to Financial Statements.
| For a Share Outstanding Throughout the Period Indicated | ||||||||||||||||||||||||||||||||||||||
| Per-Share Data | Ratios and Supplemental Data | |||||||||||||||||||||||||||||||||||||
| Income From Investment Operations: | Ratio to Average Net Assets of: | |||||||||||||||||||||||||||||||||||||
| Net Asset Value, Beginning of Period | Net Investment Income (Loss)(1) | Net Realized and Unrealized Gain (Loss) | Total From Investment Operations | Distributions From Net Investment Income | Other Capital(1) | Net Asset Value, End of Period | Total Return(2) | Operating Expenses | Net Investment Income (Loss) | Portfolio Turnover Rate(3) | Net Assets, End of Period (in thousands) | |||||||||||||||||||||||||||
| Avantis Responsible International Equity ETF | ||||||||||||||||||||||||||||||||||||||
2022(4) | $50.51 | 0.66 | (6.10) | (5.44) | (0.30) | 0.06 | $44.83 | (10.66)% | 0.23%(5) | 3.01%(5) | 3% | $26,898 | ||||||||||||||||||||||||||
| Notes to Financial Highlights | ||
(1)Computed using average shares outstanding throughout the period.
(2)Total returns are calculated based on the net asset value of the last business day. Total returns for periods less than one year are not annualized.
(3)Excludes securities received or delivered in kind.
(4)March 15, 2022 (fund inception) through August 31, 2022.
(5)Annualized.
See Notes to Financial Statements.
| Report of Independent Registered Public Accounting Firm | ||
To the Shareholders and the Board of Trustees of American Century ETF Trust:
Opinion on the Financial Statements and Financial Highlights
We have audited the accompanying statements of assets and liabilities, including the schedules of investments, of Avantis® Responsible Emerging Markets Equity ETF and Avantis® Responsible International Equity ETF (the “Funds”), two of the funds constituting the American Century ETF Trust, as of August 31, 2022, the related statements of operations, statements of changes in net assets, and financial highlights for the periods indicated in the table below; and the related notes. In our opinion, the financial statements and financial highlights present fairly, in all material respects, the financial position of each of the Funds constituting American Century ETF Trust as of August 31, 2022, and the results of their operations, the changes in their net assets, and the financial highlights for the periods listed in the table below, in conformity with accounting principles generally accepted in the United States of America.
| Individual Fund Constituting the American Century ETF Trust | Statement of Operations | Statements of Changes in Net Assets | Financial Highlights | ||||||||
Avantis® Responsible Emerging Markets Equity ETF | For the period March 28, 2022 (fund inception) through August 31, 2022 | ||||||||||
Avantis® Responsible International Equity ETF | For the period March 15, 2022 (fund inception) through August 31, 2022 | ||||||||||
Basis for Opinion
These financial statements and financial highlights are the responsibility of the Funds’ management. Our responsibility is to express an opinion on the Funds’ financial statements and financial highlights based on our audits. We are a public accounting firm registered with the Public Company Accounting Oversight Board (United States) (PCAOB) and are required to be independent with respect to the Funds in accordance with the U.S. federal securities laws and the applicable rules and regulations of the Securities and Exchange Commission and the PCAOB.
We conducted our audits in accordance with the standards of the PCAOB. Those standards require that we plan and perform the audit to obtain reasonable assurance about whether the financial statements and financial highlights are free of material misstatement, whether due to error or fraud. The Funds are not required to have, nor were we engaged to perform, an audit of their internal control over financial reporting. As part of our audits, we are required to obtain an understanding of internal control over financial reporting but not for the purpose of expressing an opinion on the effectiveness of the Funds’ internal control over financial reporting. Accordingly, we express no such opinion.
112
Our audits included performing procedures to assess the risks of material misstatement of the financial statements and financial highlights, whether due to error or fraud, and performing procedures that respond to those risks. Such procedures included examining, on a test basis, evidence regarding the amounts and disclosures in the financial statements and financial highlights. Our audits also included evaluating the accounting principles used and significant estimates made by management, as well as evaluating the overall presentation of the financial statements and financial highlights. Our procedures included confirmation of securities owned as of August 31, 2022, by correspondence with the custodian and brokers; when replies were not received from brokers, we performed other auditing procedures. We believe that our audits provide a reasonable basis for our opinion.
/s/ Deloitte & Touche LLP
Kansas City, Missouri
October 17, 2022
We have served as the auditor of one or more American Century investment companies since 1997.
113
| Management | ||
The Board of Trustees
The individuals listed below serve as trustees of the funds. Each trustee will continue to serve in this capacity until death, retirement, resignation or removal from office. The board has adopted a mandatory retirement age for trustees who are not “interested persons,” as that term is defined in the Investment Company Act (independent trustees). Trustees who are not also officers of the trust shall retire on December 31st of the year in which they reach their 75th birthday.
Jonathan S. Thomas is an “interested person” because he currently serves as President and Chief Executive Officer of American Century Companies, Inc. (ACC), the parent company of American Century Investment Management, Inc. (ACIM or the advisor). The other trustees are independent. They are not employees, directors or officers of, and have no financial interest in, ACC or any of its wholly owned, direct or indirect, subsidiaries, including ACIM and American Century Services, LLC (ACS), and they do not have any other affiliations, positions or relationships that would cause them to be considered “interested persons” under the Investment Company Act. The following trustees also serve in this capacity for a number of other registered investment companies in the American Century Investments family of funds: Jonathan S. Thomas, 15; Jeremy I. Bulow, 8; and Stephen E. Yates, 7.
The following table presents additional information about the trustees. The mailing address for each trustee other than Jonathan S. Thomas is 330 Madison Avenue, New York, New York 10017. The mailing address for Jonathan S. Thomas is 4500 Main Street, Kansas City, Missouri 64111.
| Name (Year of Birth) | Position(s) Held with Funds | Length of Time Served | Principal Occupation(s) During Past 5 Years | Number of American Century Portfolios Overseen by Trustee | Other Directorships Held During Past 5 Years | ||||||||||||
| Independent Trustees | |||||||||||||||||
| Reginald M. Browne (1968) | Trustee and Chairman of the Board | Since 2017 (Chairman since 2019) | Principal, GTS Securities (automated capital markets trading firm)(2019 to present); Senior Managing Director, Co Global Head-ETF Group, Cantor Fitzgerald (financial services firm)(2013 to 2019) | 41 | None | ||||||||||||
| Jeremy I. Bulow (1954) | Trustee | Since 2022 | Professor of Economics, Stanford University Graduate School of Business (1979 to present) | 75 | None | ||||||||||||
| Barry A. Mendelson (1958) | Trustee | Since 2017 | Retired | 41 | None | ||||||||||||
| Stephen E. Yates (1948) | Trustee | Since 2017 | Retired | 105 | None | ||||||||||||
| Interested Trustees | |||||||||||||||||
| Jonathan S. Thomas (1963) | Trustee | Since 2017 | President and Chief Executive Officer, ACC (2007 to present). Also serves as Chief Executive Officer, ACS; Director, ACC and other ACC subsidiaries | 139 | None | ||||||||||||
The Statement of Additional Information has additional information about the funds' trustees and is available without charge, upon request, by calling 1-800-345-6488.
114
Officers
The following table presents certain information about the executive officers of the funds. Each officer, except Cleo Chang and Edward Rosenberg, serves as an officer for each of the 16 investment companies in the American Century family of funds. No officer is compensated for his or her service as an officer of the funds. The listed officers are interested persons of the funds and are appointed or re-appointed on an annual basis. The mailing address for each officer listed below is 4500 Main Street, Kansas City, Missouri 64111.
| Name (Year of Birth) | Offices with the Funds | Principal Occupation(s) During the Past Five Years | ||||||
| Patrick Bannigan (1965) | President since 2019 | Executive Vice President and Director, ACC (2012 to present); Chief Financial Officer, Chief Accounting Officer and Treasurer, ACC (2015 to present). Also serves as President, ACS; Vice President, ACIM; Chief Financial Officer, Chief Accounting Officer and/or Director, ACIM, ACS and other ACC subsidiaries | ||||||
| R. Wes Campbell (1974) | Chief Financial Officer and Treasurer since 2018 | Vice President, ACS (2020 to present); Investment Operations and Investment Accounting, ACS (2000 to present) | ||||||
| Amy D. Shelton (1964) | Chief Compliance Officer and Vice President since 2017 | Chief Compliance Officer, American Century funds, (2014 to present); Chief Compliance Officer, ACIM (2014 to present); Chief Compliance Officer, ACIS (2009 to present). Also serves as Vice President, ACIS | ||||||
| John Pak (1968) | General Counsel and Vice President since 2021 | General Counsel and Senior Vice President, ACC (2021 to present). Also serves as General Counsel and Senior Vice President, ACIM, ACS and ACIS. Chief Legal Officer of Investment and Wealth Management,The Bank of New York Mellon (2014 to 2021) | ||||||
| Cleo Chang (1977) | Vice President since 2019 | Senior Vice President, ACIM (2015 to present) | ||||||
| David H. Reinmiller (1963) | Vice President since 2017 | Attorney, ACC (1994 to present). Also serves as Vice President, ACIM and ACS | ||||||
| Edward Rosenberg (1973) | Vice President since 2017 | Senior Vice President, ACIM (2017 to present); Senior Vice President, Flexshares Head of ETF Capital Markets, Northern Trust (2012 to 2017) | ||||||
| C. Jean Wade (1964) | Vice President since 2017 | Senior Vice President, ACS (2017 to present); Vice President, ACS (2000 to 2017) | ||||||
| Ward D. Stauffer (1960) | Secretary since 2019 | Attorney, ACS (2003 to present) | ||||||
115
| Approval of Management Agreement | ||
At a meeting held on March 2, 2022, the Funds’ Board of Trustees (the "Board") unanimously approved the initial management agreement pursuant to which American Century Investment Management, Inc. (the “Advisor”) acts as the investment advisor for the Avantis Responsible Emerging Markets Equity ETF and Avantis Responsible International Equity ETF (collectively the "Funds"). Under Section 15(c) of the of the Investment Company Act of 1940, new contracts for investment advisory services are required to be approved by a majority of a fund’s independent Trustees and to be evaluated on an annual basis thereafter.
In advance of the Board’s consideration, the Advisor provided information concerning the Funds. The materials circulated and the discussions held detailed the investment objective and strategy proposed to be utilized by the Advisor, the Funds’ characteristics and key attributes, the rationale for launching the Funds, the experience of the staff designated to manage the Funds, the proposed pricing, and the markets in which the Funds would be sold. The information considered and the discussions held included, but were not limited to:
•the nature, extent, and quality of investment management and other services to be provided to the Funds;
•the wide range of other programs and services the Advisor would provide to each Fund and its shareholders on a routine and non-routine basis;
•each Fund’s proposed investment objective and strategy, including a discussion of its anticipated investment performance and proposed benchmark;
•the cost of owning each Fund compared to the cost of owning similarly-managed funds;
•the Advisor’s compliance policies, procedures, and regulatory experience; and
•any collateral benefits derived by the Advisor from the management of the Funds.
Part of the Board’s analysis of fee levels involves reviewing certain evaluative data compiled by an independent data provider and comparing each Fund’s fee to the total expense ratio of expected peer funds. The annual management fees charged to shareholders of each of the Funds were anticipated to be below the median of the total expense ratios of their respective peer universe.
When considering the approval of the management agreement for the Funds, the independent Trustees considered the entrepreneurial risk that the Advisor assumes in launching a new fund. In particular, they considered the fact that the Advisor will assume a substantial part of the start-up costs of the Funds and the risk that the Funds will not grow to a level that will become profitable to the Advisor. The Board considered the position that the Funds would take in the lineup of the American Century Investments’ family of funds and the benefits to shareholders of existing funds of the broadened product offering. Finally, while not specifically discussed, but important in the decision to approve the management agreement, is the Trustees’ familiarity with the Advisor. A majority of the Board oversees and evaluates on a continuous basis the nature and quality of all services the Advisor performs for other funds within the American Century Investments’ complex. As such, the Trustees have confidence in the Advisor’s integrity and competence in providing services to the Funds.
The independent Trustees considered all of the information provided by the Advisor and the independent Trustees’ independent counsel in connection with the approval, and evaluated such information for the Funds. In connection with their review, the Trustees did not identify any single factor as being all-important or controlling, and each Trustee may have attributed different levels of importance to different factors. The independent Trustees concluded that the overall arrangements between the Funds and the Advisor, as provided in the management agreement, were fair and reasonable in light of the services to be provided and should be approved.
116
| Additional Information | ||
Retirement Account Information
As required by law, distributions you receive from certain retirement accounts are subject to federal income tax withholding, unless you elect not to have withholding apply*. Tax will be withheld on the total amount withdrawn even though you may be receiving amounts that are not subject to withholding, such as nondeductible contributions. In such case, excess amounts of withholding could occur. You may adjust your withholding election so that a greater or lesser amount will be withheld.
Remember, even if you elect not to have income tax withheld, you are liable for paying income tax on the taxable portion of your withdrawal. If you elect not to have income tax withheld or you don’t have enough income tax withheld, you may be responsible for payment of estimated tax. You may incur penalties under the estimated tax rules if your withholding and estimated tax payments are not sufficient. You can reduce or defer the income tax on a distribution by directly or indirectly rolling such distribution over to another IRA or eligible plan. You should consult your tax advisor for additional information.
State tax will be withheld if, at the time of your distribution, your address is within one of the mandatory withholding states and you have federal income tax withheld (or as otherwise required by state law). State taxes will be withheld from your distribution in accordance with the respective state rules.
*Some 403(b), 457 and qualified retirement plan distributions may be subject to 20% mandatory withholding, as they are subject to special tax and withholding rules. Your plan administrator or plan sponsor is required to provide you with a special tax notice explaining those rules at the time you request a distribution. If applicable, federal and/or state taxes may be withheld from your distribution amount.
Proxy Voting Policies
A description of the policies that the funds' investment advisor uses in exercising the voting rights associated with the securities purchased and/or held by the funds is available without charge, upon request, by calling 1-800-345-6488. It is also available on American Century Investments’ website at americancentury.com/proxy and on the Securities and Exchange Commission’s website at sec.gov. Information regarding how the investment advisor voted proxies relating to portfolio securities during the most recent 12-month period ended June 30 is available at americancentury.com/proxy. It is also available at sec.gov.
Quarterly Portfolio Disclosure
The funds file their complete schedule of portfolio holdings with the Securities and Exchange Commission (SEC) for the first and third quarters of each fiscal year as an exhibit to their reports on Form N-PORT. The funds' Form N-PORT reports are available on the SEC’s website at sec.gov.
117
Other Tax Information
The following information is provided pursuant to provisions of the Internal Revenue Code.
The funds hereby designate up to the maximum amount allowable as qualified dividend income for the fiscal year ended August 31, 2022.
For corporate taxpayers, Avantis Responsible Emerging Markets Equity ETF hereby designates $438, or up to the maximum amount allowable, of ordinary income distributions paid during the fiscal year ended August 31, 2022 as qualified for the corporate dividends received deduction.
For the fiscal year ended August 31, 2022, the funds intend to pass through to shareholders the following foreign source income and foreign taxes paid, or up to the maximum amount allowable, as a foreign tax credit.
| Foreign Tax Credit | Foreign Source Income | |||||||||||||
| Amount | Per Outstanding Share | Amount | Per Outstanding Share | |||||||||||
| Avantis Responsible Emerging Markets Equity ETF | $ | 27,186 | $ | 0.0906 | $ | 198,014 | $ | 0.6600 | ||||||
| Avantis Responsible International Equity ETF | $ | 20,398 | $ | 0.0340 | $ | 235,573 | $ | 0.3926 | ||||||
118
| Notes | ||
119
| Notes | ||
120
| ||||||||
| Contact Us | avantisinvestors.com | |||||||
| American Century Sales Representatives, Financial Professionals, Broker Dealers, Insurance Companies, Banks and Trust Companies | 1-833-928-2684 | |||||||
| Telecommunications Relay Service for the Deaf | 711 | |||||||
| American Century ETF Trust | ||||||||
Investment Advisor: American Century Investment Management, Inc. Kansas City, Missouri | ||||||||
Distributor: Foreside Fund Services, LLC - Distributor, not affiliated with American Century Investment Services, Inc. | ||||||||
| This report and the statements it contains are submitted for the general information of our shareholders. The report is not authorized for distribution to prospective investors unless preceded or accompanied by an effective prospectus. | ||||||||
| ©2022 American Century Proprietary Holdings, Inc. All rights reserved. CL-ANN-97865 2210 | ||||||||
(b) None.
ITEM 2. CODE OF ETHICS.
(a) The registrant has adopted a Code of Ethics for Senior Financial Officers that applies to the registrant’s principal executive officer, principal financial officer, principal accounting officer, and persons performing similar functions.
(b) No response required.
(c) None.
(d) None.
(e) Not applicable.
(f) The registrant’s Code of Ethics for Senior Financial Officers was filed as Exhibit 13(a)(1) to American Century ETF Trust’s Annual Certified Shareholder Report on Form N-CSR, File No. 811-23305, on October 25, 2018, and is incorporated herein by reference.
ITEM 3. AUDIT COMMITTEE FINANCIAL EXPERT.
(a)(1) The registrant's board has determined that the registrant has at least one audit committee financial expert serving on its audit committee.
(a)(2) Barry A. Mendelson, Reginald M. Browne, Stephen E. Yates and Jeremy Bulow are the registrant's designated audit committee financial experts. They are "independent" as defined in Item 3 of Form N-CSR.
(a)(3) Not applicable.
(b) No response required.
(c) No response required.
(d) No response required.
ITEM 4. PRINCIPAL ACCOUNTANT FEES AND SERVICES.
(a) Audit Fees.
The aggregate fees billed for each of the last two fiscal years for professional services rendered by the principal accountant for the audit of the registrant’s annual financial statements or services that are normally provided by the accountant in connection with statutory and regulatory filings or engagements for those fiscal years were as follows:
FY 2021: $582,975
FY 2022: $708,220
(b) Audit-Related Fees.
The aggregate fees billed in each of the last two fiscal years for assurance and related services by the principal accountant that are reasonably related to the performance of the audit of the registrant’s financial statements and are not reported under paragraph (a) of this Item were as follows:
For services rendered to the registrant:
FY 2021: $0
FY 2022: $0
Fees required to be approved pursuant to paragraph (c)(7)(ii) of Rule 2-01 of Regulation S-X (relating to certain engagements for non-audit services with the registrant’s investment adviser and its affiliates):
FY 2021: $0
FY 2022: $0
(c) Tax Fees.
The aggregate fees billed in each of the last two fiscal years for professional services rendered by the principal accountant for tax compliance, tax advice, and tax planning were as follows:
For services rendered to the registrant:
FY 2021: $0
FY 2022: $0
Fees required to be approved pursuant to paragraph (c)(7)(ii) of Rule 2-01 of Regulation S-X (relating to certain engagements for non-audit services with the registrant’s investment adviser and its affiliates):
FY 2021: $0
FY 2022: $0
(d) All Other Fees.
The aggregate fees billed in each of the last two fiscal years for products and services provided by the principal accountant, other than the services reported in paragraphs (a) through (c) of this Item were as follows:
For services rendered to the registrant:
FY 2021: $0
FY 2022: $0
Fees required to be approved pursuant to paragraph (c)(7)(ii) of Rule 2-01 of Regulation S-X (relating to certain engagements for non-audit services with the registrant’s investment adviser and its affiliates):
FY 2021: $0
FY 2022: $0
(e)(1) In accordance with paragraph (c)(7)(i)(A) of Rule 2-01 of Regulation S-X, before the accountant is engaged by the registrant to render audit or non-audit services, the engagement is approved by the registrant’s audit committee. Pursuant to paragraph (c)(7)(ii) of Rule 2-01 of Regulation S-X, the registrant’s audit committee also pre-approves its accountant’s engagements for non-audit services with the registrant’s investment adviser, its parent company, and any entity controlled by, or under common control with the investment adviser that provides ongoing services to the registrant, if the engagement relates directly to the operations and financial reporting of the registrant.
(e)(2) All services described in each of paragraphs (b) through (d) of this Item were pre-approved before the engagement by the registrant’s audit committee pursuant to paragraph (c)(7)(i)(A) of Rule 2-01 of Regulation S-X. Consequently, none of such services were required to be approved by the audit committee pursuant to paragraph (c)(7)(i)(C).
(f) The percentage of hours expended on the principal accountant’s engagement to audit the registrant’s financial statements for the most recent fiscal year that were attributed to work performed by persons other than the principal accountant’s full-time, permanent employees was less than 50%.
(g) The aggregate non-audit fees billed by the registrant’s accountant for services rendered to the registrant, and rendered to the registrant’s investment adviser (not including any sub-adviser whose role is primarily portfolio management and is subcontracted with or overseen by another investment adviser), and any entity controlling, controlled by, or under common control with the adviser that provides ongoing services to the registrant for each of the last two fiscal years of the registrant were as follows:
FY 2021: $2,832,126
FY 2022: $50,000
(h) The registrant’s investment adviser and accountant have notified the registrant’s audit committee of all non-audit services that were rendered by the registrant’s accountant to the registrant’s investment adviser, its parent company, and any entity controlled by, or under common control with the investment adviser that provides services to the registrant, which services were not required to be pre-approved pursuant to paragraph (c)(7)(ii) of Rule 2-01 of Regulation S-X. The notification provided to the registrant’s audit committee included sufficient details regarding such services to allow the registrant’s audit committee to consider the continuing independence of its principal accountant.
ITEM 5. AUDIT COMMITTEE OF LISTED REGISTRANTS.
(a) The registrant has a separately-designated standing audit committee established in accordance with Section 3(a)(58)(A) of the Securities Exchange Act of 1934. The audit committee members are Barry A. Mendelson, Ronald J. Gilson, Stephen E. Yates and Reginald Browne.
(b) Not applicable.
ITEM 6. INVESTMENTS.
(a) The schedule of investments is included as part of the report to stockholders filed under Item 1 of this Form.
(b) Not applicable.
ITEM 7. DISCLOSURE OF PROXY VOTING POLICIES AND PROCEDURES FOR CLOSED-END MANAGEMENT INVESTMENT COMPANIES.
Not applicable.
ITEM 8. PORTFOLIO MANAGERS OF CLOSED-END MANAGEMENT INVESTMENT COMPANIES.
Not applicable.
ITEM 9. PURCHASES OF EQUITY SECURITIES BY CLOSED-END MANAGEMENT INVESTMENT COMPANY AND AFFILIATED PURCHASERS.
Not applicable.
ITEM 10. SUBMISSION OF MATTERS TO A VOTE OF SECURITY HOLDERS.
During the reporting period, there were no material changes to the procedures by which shareholders may recommend nominees to the registrant’s board.
ITEM 11. CONTROLS AND PROCEDURES.
(a) The registrant's principal executive officer and principal financial officer have concluded that the registrant's disclosure controls and procedures (as defined in Rule 30a-3(c) under the Investment Company Act of 1940) are effective based on their evaluation of these controls and procedures as of a date within 90 days of the filing date of this report.
(b) There were no changes in the registrant's internal control over financial reporting (as defined in Rule 30a-3(d) under the Investment Company Act of 1940) that occurred during the period covered by this report that have materially affected, or are reasonably likely to materially affect, the registrant's internal control over financial reporting.
ITEM 12. DISCLOSURE OF SECURITIES LENDING ACTIVITIES FOR CLOSED-END MANAGEMENT INVESTMENT COMPANIES.
Not applicable.
ITEM 13. EXHIBITS.
(a)(1) Registrant’s Code of Ethics for Senior Financial Officers, which is the subject of the disclosure required by Item 2 of Form N-CSR, was filed as Exhibit 13(a)(1) to American Century ETF Trust’s Certified Shareholder Report on Form N-CSR, File No. 811-21591, on File No. 811-23305, on October 25, 2018.
(a)(2) Separate certifications by the registrant’s principal executive officer and principal financial officer, pursuant to Section 302 of the Sarbanes-Oxley Act of 2002 and Rule 30a-2(a) under the Investment Company Act of 1940, are filed and attached hereto as EX-99.CERT.
(a)(3) Not applicable.
(a)(4) Not applicable.
(b) A certification by the registrant’s chief executive officer and chief financial officer, pursuant to Section 906 of the Sarbanes-Oxley Act of 2002, is furnished and attached hereto as EX-99.906CERT.
SIGNATURES
Pursuant to the requirements of the Securities Exchange Act of 1934 and the Investment Company Act of 1940, the registrant has duly caused this report to be signed on its behalf by the undersigned, thereunto duly authorized.
| Registrant: | American Century ETF Trust | |||||||||||||
| By: | /s/ Patrick Bannigan | |||||||||||||
| Name: | Patrick Bannigan | |||||||||||||
| Title: | President | |||||||||||||
| Date: | October 26, 2022 | |||||||||||||
Pursuant to the requirements of the Securities Exchange Act of 1934 and the Investment Company Act of 1940, this report has been signed below by the following persons on behalf of the registrant and in the capacities and on the dates indicated.
| By: | /s/ Patrick Bannigan | ||||||||||
| Name: | Patrick Bannigan | ||||||||||
| Title: | President | ||||||||||
| (principal executive officer) | |||||||||||
| Date: | October 26, 2022 | ||||||||||
| By: | /s/ R. Wes Campbell | ||||||||||
| Name: | R. Wes Campbell | ||||||||||
| Title: | Treasurer and Chief Financial Officer | ||||||||||
| (principal financial officer) | |||||||||||
| Date: | October 26, 2022 | ||||||||||