
May 3, 2021 First Quarter 2021 Earnings Presentation
Disclaimer 2 IMPORTANT: You must read the following information before continuing to the rest of the presentation, which is being provided to you for informational purposes only. Financial information contained in this presentation is unaudited. Forward-Looking Statements This presentation contains forward-looking statements. These forward-looking statements include projections, estimates and assumptions about Canadian net revenue, adjusted EBITDA and P/E multiples; estimated proceeds in the Katapult transaction; and debt capitalization and liquidity levels. In addition, words such as “guidance,” “estimate,” “anticipate,” “believe,” “forecast,” “step,” “plan,” “predict,” “focused,” “project,” “is likely,” “expect,” “intend,” “should,” “will,” “confident,” variations of such words and similar expressions are intended to identify forward-looking statements. Our ability to achieve these forward-looking statements is based on certain assumptions, judgments and other factors, both within and outside of our control, that could cause actual results to differ materially from those in the forward-looking statements, including: the inability of the parties to the Katapult transaction to successfully or timely consummate the proposed business combination, including the risk that any required regulatory approvals are not obtained, are delayed or are subject to unanticipated conditions that could adversely affect the combined company or the expected benefits of the proposed transaction or that the approval of FinServ stockholders is not obtained; failure to realize the anticipated benefits of the proposed Katapult transaction; risks relating to the uncertainty of projected financial information; the effects of competition on future business; the ability to attract and retain customers; market, financial, political and legal conditions; the impact of COVID-19 pandemic on us, our investments and the global economy; risks related to the concentration of Katapult’s business among a relatively small number of merchants; the ability of FinServ or the combined company to issue equity or equity-linked securities or obtain debt financing in connection with the proposed business combination or in the future; our dependence on third-party lenders to provide the cash we need to fund our loans and our ability to affordably access third-party financing; errors in our internal forecasts; our level of indebtedness; our ability to integrate acquired businesses; our dependence on third-party lenders to provide the cash we need to fund our loans and our ability to affordably access third-party financing; actions of regulators and the negative impact of those actions on our business; our ability to protect our proprietary technology and analytics and keep up with that of our competitors; disruption of our information technology systems that adversely affect our business operations; ineffective pricing of the credit risk of our prospective or existing customers; inaccurate information supplied by customers or third parties that could lead to errors in judging customers’ qualifications to receive loans; improper disclosure of customer personal data; failure of third parties who provide products, services or support to us; any failure of third-party lenders upon whom we rely to conduct business in certain states; disruption to our relationships with banks and other third-party electronic payment solutions providers; disruption caused by employee or third-party theft and errors in our stores as well as other factors discussed in our filings with the Securities and Exchange Commission. These projections, estimates and assumptions may prove to be inaccurate in the future. These forward-looking statements are not guarantees of future performance and involve known and unknown risks and uncertainties that are difficult to predict with regard to timing, extent, likelihood and degree of occurrence. There may be additional risks that CURO presently does not know or that it currently believes are immaterial that could also cause actual results to differ from those contained in the forward-looking statements. Given these risks and uncertainties, investors should not place undue reliance on forward-looking statements as a prediction of actual future results. We undertake no obligation to update, amend or clarify any forward-looking statement for any reason. Non-GAAP Financial Measures In addition to the financial information prepared in conformity with U.S. GAAP, we provide in this presentation certain “non-GAAP financial measures,” including: Adjusted Net Income (Net Income from continuing operations minus certain non-cash and other adjusting items); Adjusted Earnings Per Share (Adjusted net income divided by diluted weighted average shares outstanding); Adjusted EBITDA (EBITDA plus or minus certain non-cash and other adjusting items); Gross Combined Loans Receivable (includes loans originated by third-party lenders through CSO programs which are not included in our consolidated financial statements); and Adjusted Return on Average Assets. Such measures are intended as a supplemental measure of the Company’s performance that are not required by, or presented in accordance with, GAAP. The Company presents Adjusted Net Income, Adjusted Earnings Per Share, Adjusted EBITDA, Gross Combined Loans Receivable and Adjusted Return on Average Assets because it believes that, when viewed with the Company’s GAAP results and the accompanying reconciliation, such measures provide useful information for comparing the Company’s performance over various reporting periods as they remove from the Company’s operating results the impact of items that the Company believes do not reflect its core operating performance. Adjusted Net Income, Adjusted Earnings Per Share, Adjusted EBITDA, Gross Combined Loans Receivable and Adjusted Return on Average Assets are not substitutes for net earnings, cash flows provided by operating activities or any other measure prescribed by GAAP. There are limitations to using non-GAAP measures such as Adjusted Net Income, Adjusted Earnings Per Share, Adjusted EBITDA, Gross Combined Loans Receivable and Adjusted Return on Average Assets. Although the Company believes that Adjusted Net Income, Adjusted Earnings Per Share, Adjusted EBITDA, Gross Combined Loans Receivable and Adjusted Return on Average Assets can make an evaluation of its operating performance more consistent because they remove items that do not reflect its core operations, other companies in the Company’s industry may define Adjusted Net Income, Adjusted Earnings Per Share, Adjusted EBITDA, Gross Combined Loans Receivable and Adjusted Return on Average Assets differently than the Company does. As a result, it may be difficult to use Adjusted Net Income, Adjusted Earnings Per Share, Adjusted EBITDA, Gross Combined Loans Receivable and Adjusted Return on Average Assets to compare the performance of those companies to the Company’s performance. Adjusted Net Income, Adjusted Earnings Per Share, Adjusted EBITDA, Gross Combined Loans Receivable and Adjusted Return on Average Assets should not be considered as measures of the income generated by the Company’s business or discretionary cash available to it to invest in the growth of its business. The Company’s management compensates for these limitations by reference to its GAAP results and using Adjusted Net Income, Adjusted Earnings Per Share, Adjusted EBITDA, Gross Combined Loans Receivable and Adjusted Return on Average Assets as supplemental measures. Reconciliation of non-GAAP metrics to the closest comparable GAAP metrics included within Exhibit 99.1 on Form 8-K filed on February 4, 2021, slides 18-19 and within the Supplemental Tables to the CURO Q4 2020 Conference Call at https://ir.curo.com/events-and-presentations.

CURO at a Glance 3 Canada Point-of-Sale Lending Business Acquired Flexiti, an emerging growth Canadian point-of-sale / buy-now-pay-later provider, allowing us to access the full spectrum of Canadian consumers U.S. Lending Business Online in 34 states; 210 stores in 14 states Market leader in revenue in fragmented non-prime market with diverse product set Card Products Revolve mobile app-enabled virtual checking account with FDIC-insured deposits allows customers to build banking history; Opt+ reloadable debit card 415,000 active accounts card programs as of March 2021 with over $6 million of TTM revenue Strong and Expanding Portfolio of Brands Business Overview Founded in 1997, CURO is a tech-enabled, multi-channel and multi-product consumer finance company serving a wide range of non-prime and prime consumers in the U.S. and Canada, and a market leader in the industry based on revenues Investment in Katapult 47.7% ownership of Katapult, a rapidly growing and profitable virtual lease-to-own platform for online, brick and mortar and omni-channel retailers Katapult announced agreement in December to merge with FinServ, a SPAC; Value to CURO as of April 30, 2021 of cash and retained shares of approximately $445 million Canada Direct Lending Business Cash Money and LendDirect focus on non-prime open-end loans and payment protection insurance since 2018 in 202 stores in seven provinces and online in five provinces
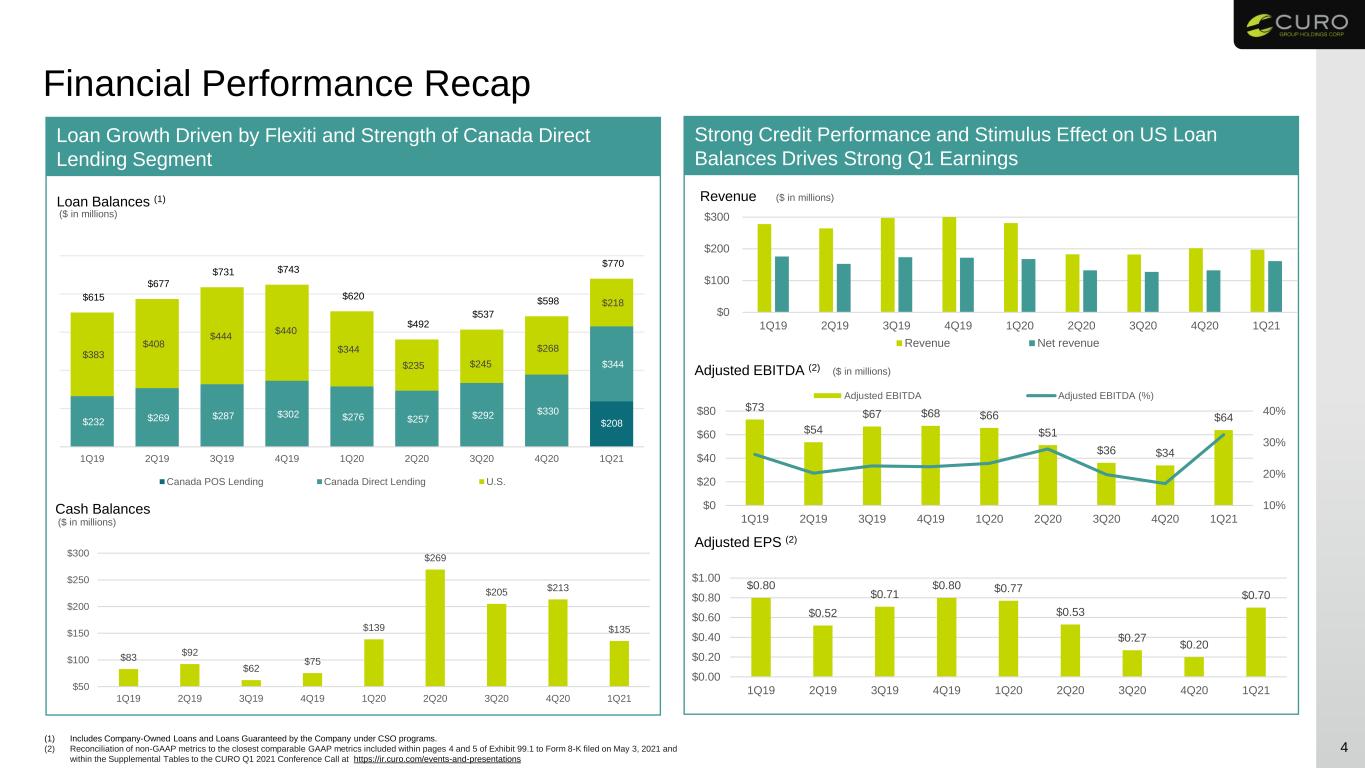
Strong Credit Performance and Stimulus Effect on US Loan Balances Drives Strong Q1 Earnings 4 Revenue $0 $100 $200 $300 1Q19 2Q19 3Q19 4Q19 1Q20 2Q20 3Q20 4Q20 1Q21 Revenue Net revenue ($ in millions) Adjusted EBITDA (2) ($ in millions) $73 $54 $67 $68 $66 $51 $36 $34 $64 10% 20% 30% 40% $0 $20 $40 $60 $80 1Q19 2Q19 3Q19 4Q19 1Q20 2Q20 3Q20 4Q20 1Q21 Adjusted EBITDA Adjusted EBITDA (%) Adjusted EPS (2) $0.80 $0.52 $0.71 $0.80 $0.77 $0.53 $0.27 $0.20 $0.70 $0.00 $0.20 $0.40 $0.60 $0.80 $1.00 1Q19 2Q19 3Q19 4Q19 1Q20 2Q20 3Q20 4Q20 1Q21 Loan Balances (1) $208$232 $269 $287 $302 $276 $257 $292 $330 $344 $383 $408 $444 $440 $344 $235 $245 $268 $218 $615 $677 $731 $743 $620 $492 $537 $598 $770 1Q19 2Q19 3Q19 4Q19 1Q20 2Q20 3Q20 4Q20 1Q21 Canada POS Lending Canada Direct Lending U.S. ($ in millions) Cash Balances $83 $92 $62 $75 $139 $269 $205 $213 $135 $50 $100 $150 $200 $250 $300 1Q19 2Q19 3Q19 4Q19 1Q20 2Q20 3Q20 4Q20 1Q21 ($ in millions) (1) Includes Company-Owned Loans and Loans Guaranteed by the Company under CSO programs. (2) Reconciliation of non-GAAP metrics to the closest comparable GAAP metrics included within pages 4 and 5 of Exhibit 99.1 to Form 8-K filed on May 3, 2021 and within the Supplemental Tables to the CURO Q1 2021 Conference Call at https://ir.curo.com/events-and-presentations Loan Growth Driven by Flexiti and Strength of Canada Direct Lending Segment Financial Performance Recap
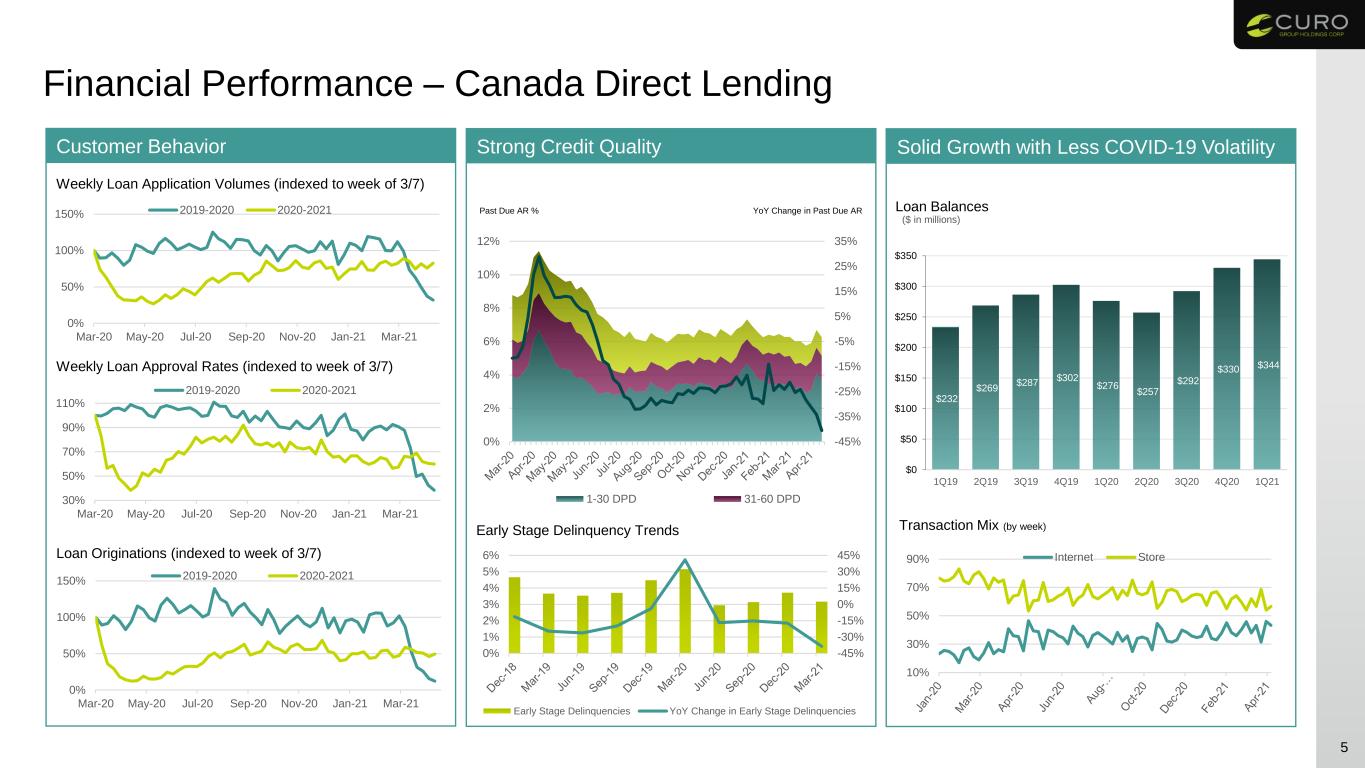
Financial Performance – Canada Direct Lending 5 Transaction Mix (by week) $232 $269 $287 $302 $276 $257 $292 $330 $344 $0 $50 $100 $150 $200 $250 $300 $350 1Q19 2Q19 3Q19 4Q19 1Q20 2Q20 3Q20 4Q20 1Q21 Loan Balances ($ in millions) -45% -30% -15% 0% 15% 30% 45% 0% 1% 2% 3% 4% 5% 6% Early Stage Delinquencies YoY Change in Early Stage Delinquencies Early Stage Delinquency Trends -45% -35% -25% -15% -5% 5% 15% 25% 35% 0% 2% 4% 6% 8% 10% 12% 1-30 DPD 31-60 DPD YoY Change in Past Due ARPast Due AR % Customer Behavior Weekly Loan Application Volumes (indexed to week of 3/7) Weekly Loan Approval Rates (indexed to week of 3/7) Loan Originations (indexed to week of 3/7) 30% 50% 70% 90% 110% Mar-20 May-20 Jul-20 Sep-20 Nov-20 Jan-21 Mar-21 2019-2020 2020-2021 0% 50% 100% 150% Mar-20 May-20 Jul-20 Sep-20 Nov-20 Jan-21 Mar-21 2019-2020 2020-2021 0% 50% 100% 150% Mar-20 May-20 Jul-20 Sep-20 Nov-20 Jan-21 Mar-21 2019-2020 2020-2021 Strong Credit Quality Solid Growth with Less COVID-19 Volatility 10% 30% 50% 70% 90% Internet Store

Financial Performance – U.S. 6 Transaction Mix (by week) Loan Balances (1) ($ in millions) Early Stage Delinquency Trends YoY Change in Past Due ARPast Due AR % Customer Behavior Weekly Loan Application Volumes (indexed to week of 3/7) Weekly Loan Approval Rates (indexed to week of 3/7) Loan Originations (indexed to week of 3/7) Credit Performance with Stimulus Impacts Stimulus Reduces Loan Balances 0% 75% 150% 225% 300% Mar-20 May-20 Jul-20 Sep-20 Nov-20 Jan-21 Mar-21 2019-2020 2020-2021 0% 100% 200% 300% Mar-20 May-20 Jul-20 Sep-20 Nov-20 Jan-21 Mar-21 2019-2020 2020-2021 30% 50% 70% 90% 110% Mar-20 May-20 Jul-20 Sep-20 Nov-20 Jan-21 Mar-21 2019-2020 2020-2021 -35% -25% -15% -5% 5% 15% 25% 0% 5% 10% 15% 20% 25% 30% 1-30 DPD 31-60 DPD -50% -30% -10% 10% 30% 0% 4% 8% 12% 16% Early Stage Delinquencies YoY Change in Early Stage Delinquencies $383 $408 $444 $440 $344 $235 $245 $268 $218 $0 $150 $300 $450 1Q19 2Q19 3Q19 4Q19 1Q20 2Q20 3Q20 4Q20 1Q21 20% 35% 50% 65% 80% Internet Store (1) Includes Company-Owned Loans and Loans Guaranteed by the Company under CSO programs.
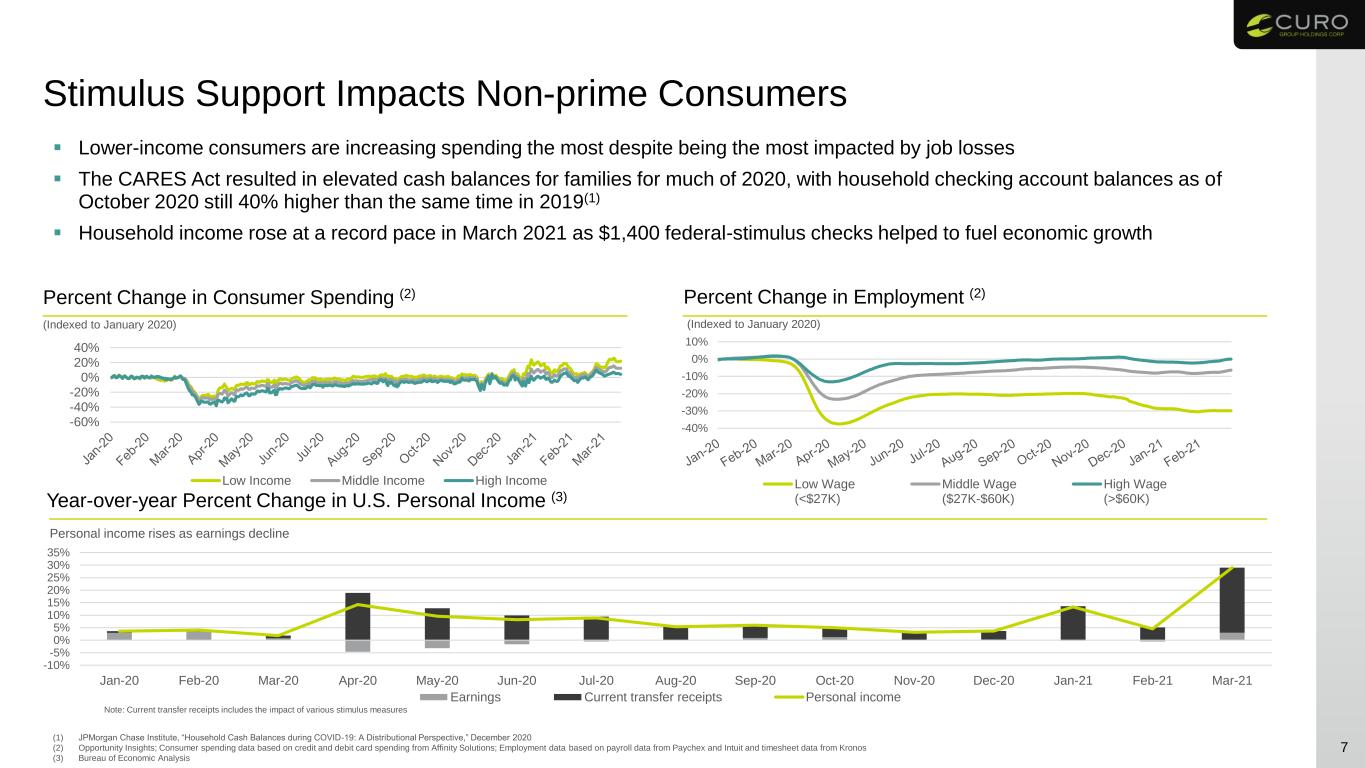
Stimulus Support Impacts Non-prime Consumers 7 Lower-income consumers are increasing spending the most despite being the most impacted by job losses The CARES Act resulted in elevated cash balances for families for much of 2020, with household checking account balances as of October 2020 still 40% higher than the same time in 2019(1) Household income rose at a record pace in March 2021 as $1,400 federal-stimulus checks helped to fuel economic growth (1) JPMorgan Chase Institute, “Household Cash Balances during COVID-19: A Distributional Perspective,” December 2020 (2) Opportunity Insights; Consumer spending data based on credit and debit card spending from Affinity Solutions; Employment data based on payroll data from Paychex and Intuit and timesheet data from Kronos (3) Bureau of Economic Analysis Percent Change in Employment (2)Percent Change in Consumer Spending (2) (Indexed to January 2020) -40% -30% -20% -10% 0% 10% Low Wage (<$27K) Middle Wage ($27K-$60K) High Wage (>$60K) (Indexed to January 2020) Year-over-year Percent Change in U.S. Personal Income (3) Personal income rises as earnings decline -10% -5% 0% 5% 10% 15% 20% 25% 30% 35% Jan-20 Feb-20 Mar-20 Apr-20 May-20 Jun-20 Jul-20 Aug-20 Sep-20 Oct-20 Nov-20 Dec-20 Jan-21 Feb-21 Mar-21 Earnings Current transfer receipts Personal income Note: Current transfer receipts includes the impact of various stimulus measures -60% -40% -20% 0% 20% 40% Low Income Middle Income High Income
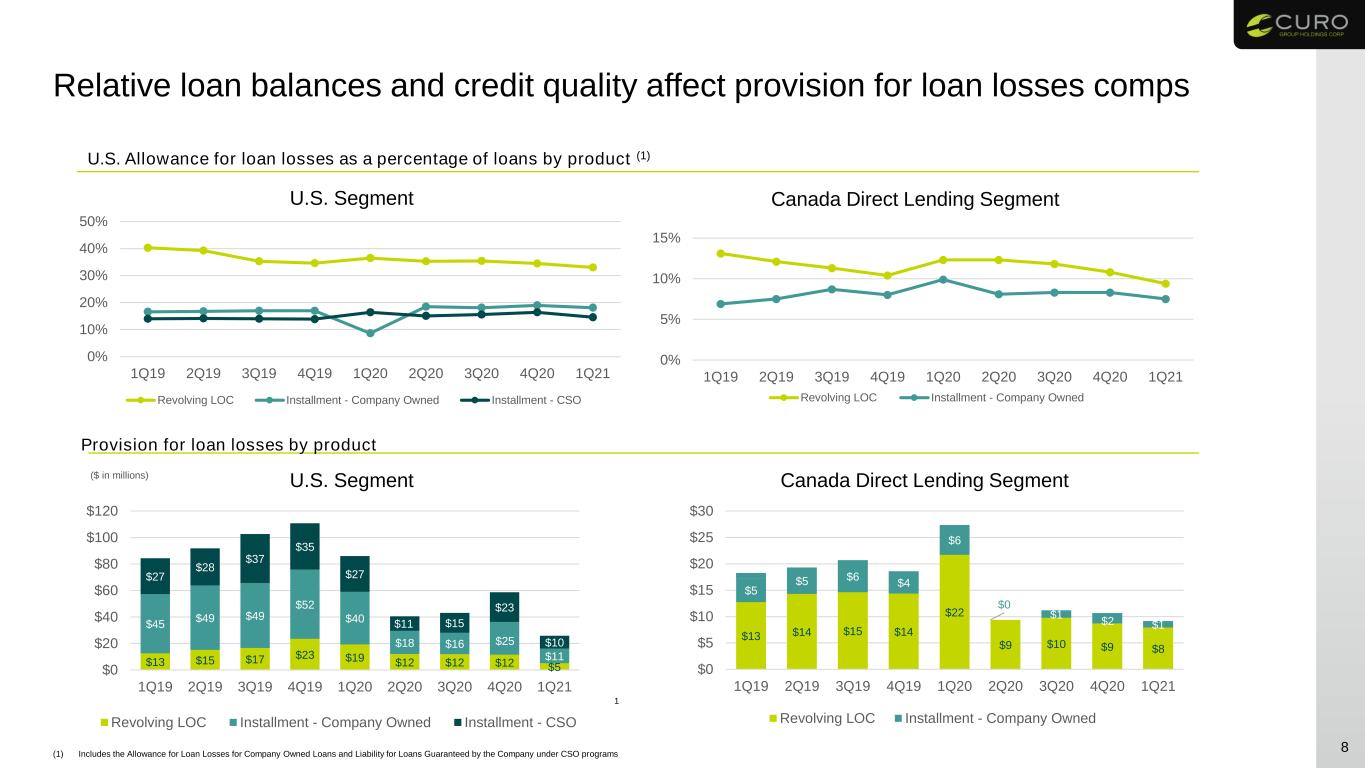
Relative loan balances and credit quality affect provision for loan losses comps 8 ($ in millions) U.S. Allowance for loan losses as a percentage of loans by product (1) Provision for loan losses by product 0% 10% 20% 30% 40% 50% 1Q19 2Q19 3Q19 4Q19 1Q20 2Q20 3Q20 4Q20 1Q21 Revolving LOC Installment - Company Owned Installment - CSO (1) Includes the Allowance for Loan Losses for Company Owned Loans and Liability for Loans Guaranteed by the Company under CSO programs 1 $13 $15 $17 $23 $19 $12 $12 $12 $5 $45 $49 $49 $52 $40 $18 $16 $25 $11 $27 $28 $37 $35 $27 $11 $15 $23 $10 $0 $20 $40 $60 $80 $100 $120 1Q19 2Q19 3Q19 4Q19 1Q20 2Q20 3Q20 4Q20 1Q21 Revolving LOC Installment - Company Owned Installment - CSO 0% 5% 10% 15% 1Q19 2Q19 3Q19 4Q19 1Q20 2Q20 3Q20 4Q20 1Q21 Revolving LOC Installment - Company Owned $13 $14 $15 $14 $22 $9 $10 $9 $8 $5 $5 $6 $4 $6 $0 $1 $2 $1 $0 $5 $10 $15 $20 $25 $30 1Q19 2Q19 3Q19 4Q19 1Q20 2Q20 3Q20 4Q20 1Q21 Revolving LOC Installment - Company Owned U.S. Segment Canada Direct Lending Segment U.S. Segment Canada Direct Lending Segment
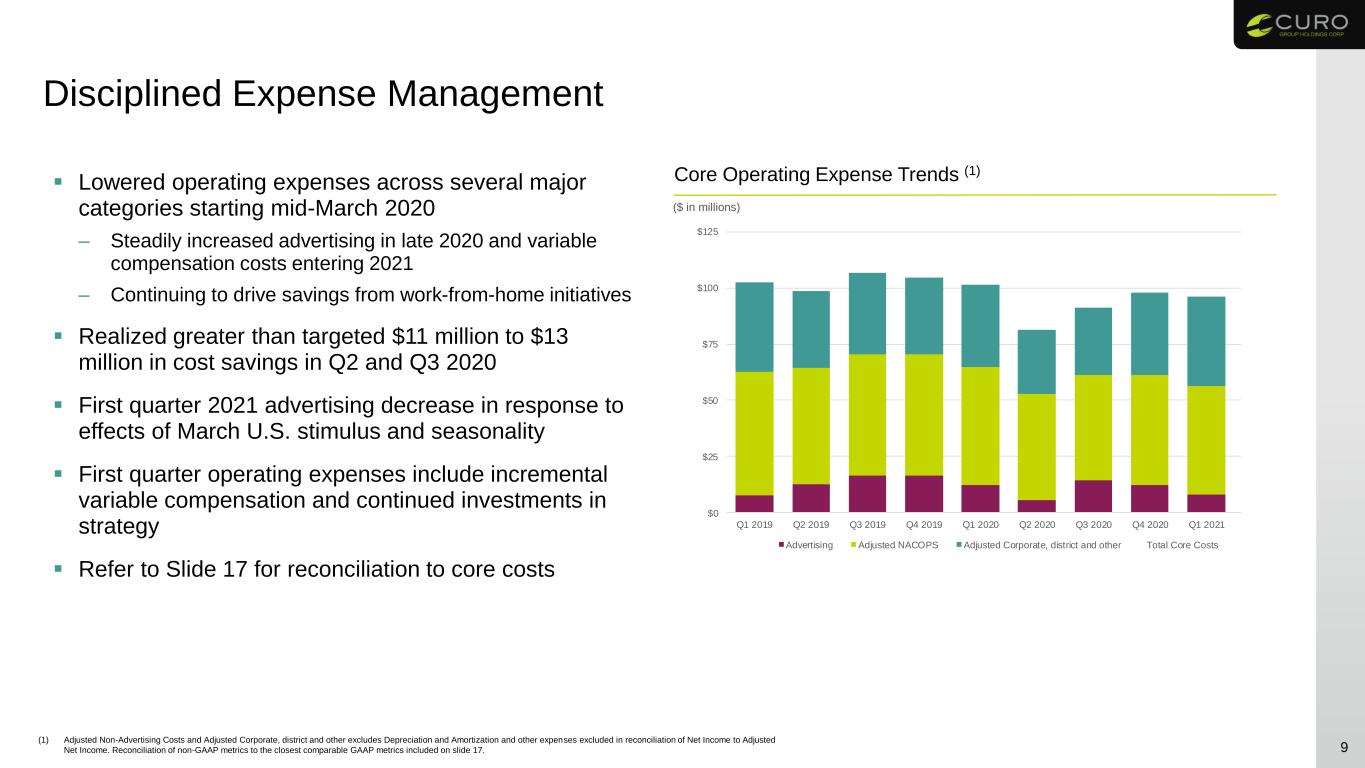
Disciplined Expense Management Lowered operating expenses across several major categories starting mid-March 2020 – Steadily increased advertising in late 2020 and variable compensation costs entering 2021 – Continuing to drive savings from work-from-home initiatives Realized greater than targeted $11 million to $13 million in cost savings in Q2 and Q3 2020 First quarter 2021 advertising decrease in response to effects of March U.S. stimulus and seasonality First quarter operating expenses include incremental variable compensation and continued investments in strategy Refer to Slide 17 for reconciliation to core costs 9 Core Operating Expense Trends (1) ($ in millions) (1) Adjusted Non-Advertising Costs and Adjusted Corporate, district and other excludes Depreciation and Amortization and other expenses excluded in reconciliation of Net Income to Adjusted Net Income. Reconciliation of non-GAAP metrics to the closest comparable GAAP metrics included on slide 17. $0 $25 $50 $75 $100 $125 Q1 2019 Q2 2019 Q3 2019 Q4 2019 Q1 2020 Q2 2020 Q3 2020 Q4 2020 Q1 2021 Advertising Adjusted NACOPS Adjusted Corporate, district and other Total Core Costs
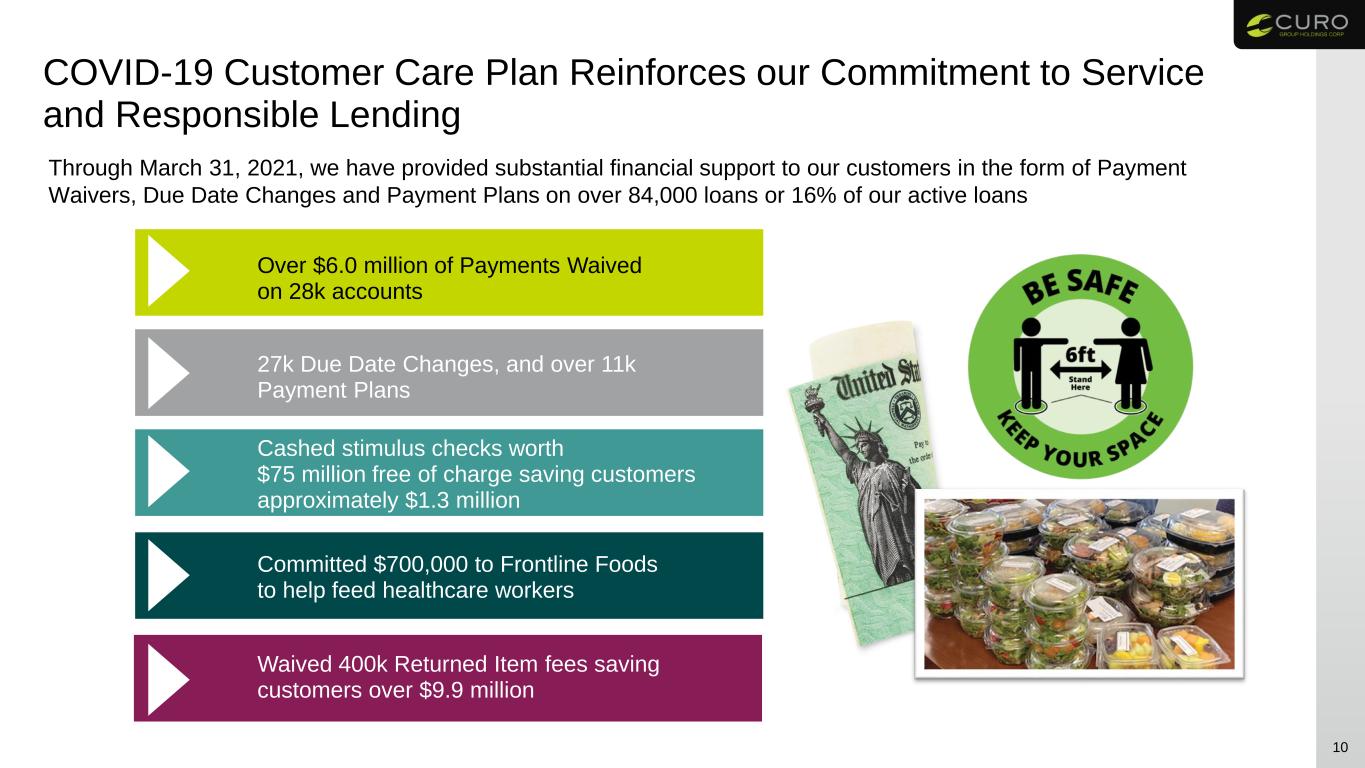
COVID-19 Customer Care Plan Reinforces our Commitment to Service and Responsible Lending 10 Through March 31, 2021, we have provided substantial financial support to our customers in the form of Payment Waivers, Due Date Changes and Payment Plans on over 84,000 loans or 16% of our active loans Over $6.0 million of Payments Waived on 28k accounts 27k Due Date Changes, and over 11k Payment Plans Cashed stimulus checks worth $75 million free of charge saving customers approximately $1.3 million Committed $700,000 to Frontline Foods to help feed healthcare workers Waived 400k Returned Item fees saving customers over $9.9 million
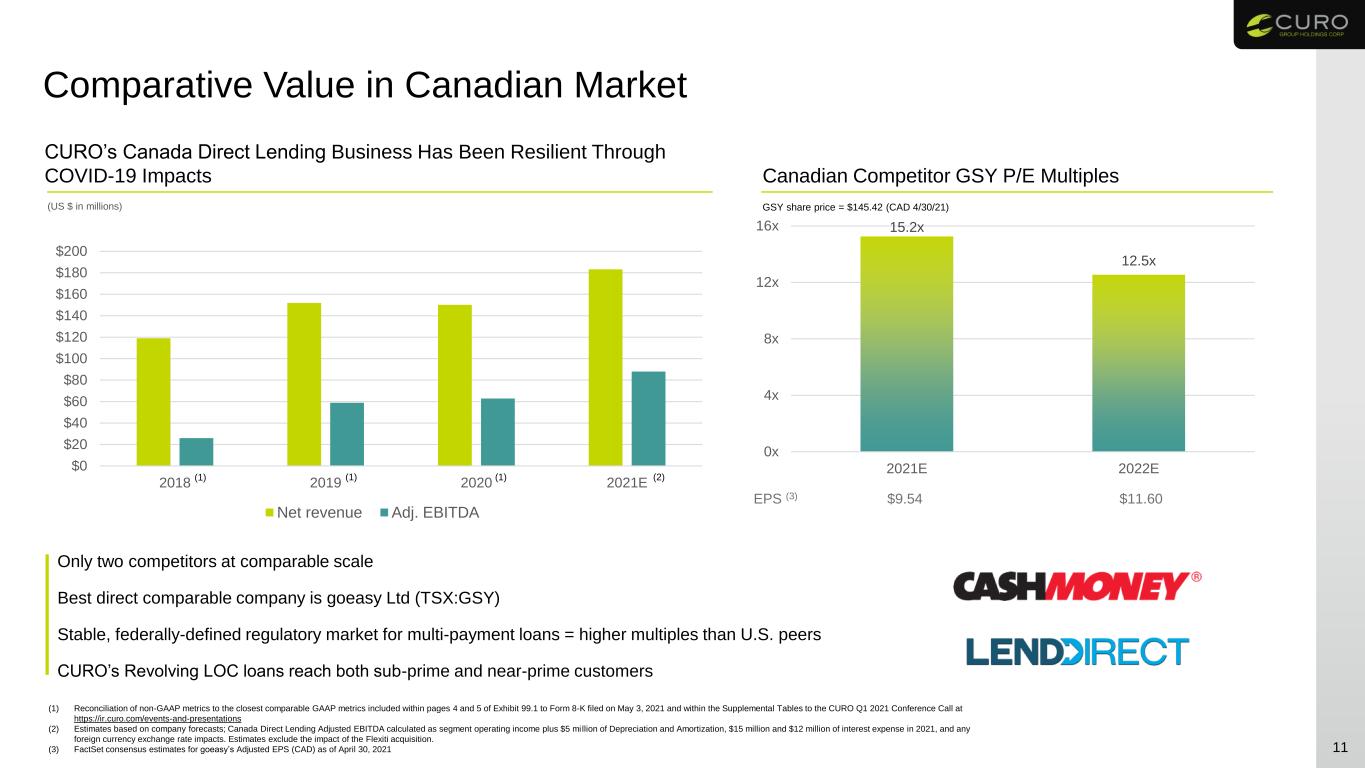
Comparative Value in Canadian Market 11 CURO’s Canada Direct Lending Business Has Been Resilient Through COVID-19 Impacts (US $ in millions) Only two competitors at comparable scale Best direct comparable company is goeasy Ltd (TSX:GSY) Stable, federally-defined regulatory market for multi-payment loans = higher multiples than U.S. peers CURO’s Revolving LOC loans reach both sub-prime and near-prime customers (1) Reconciliation of non-GAAP metrics to the closest comparable GAAP metrics included within pages 4 and 5 of Exhibit 99.1 to Form 8-K filed on May 3, 2021 and within the Supplemental Tables to the CURO Q1 2021 Conference Call at https://ir.curo.com/events-and-presentations (2) Estimates based on company forecasts; Canada Direct Lending Adjusted EBITDA calculated as segment operating income plus $5 mi llion of Depreciation and Amortization, $15 million and $12 million of interest expense in 2021, and any foreign currency exchange rate impacts. Estimates exclude the impact of the Flexiti acquisition. (3) FactSet consensus estimates for goeasy’s Adjusted EPS (CAD) as of April 30, 2021 $0 $20 $40 $60 $80 $100 $120 $140 $160 $180 $200 2018 2019 2020 2021E Net revenue Adj. EBITDA GSY share price = $145.42 (CAD 4/30/21) 15.2x 12.5x 0x 4x 8x 12x 16x 2021E 2022E EPS (3) $9.54 $11.60 Canadian Competitor GSY P/E Multiples (1) (2)(1)(1)
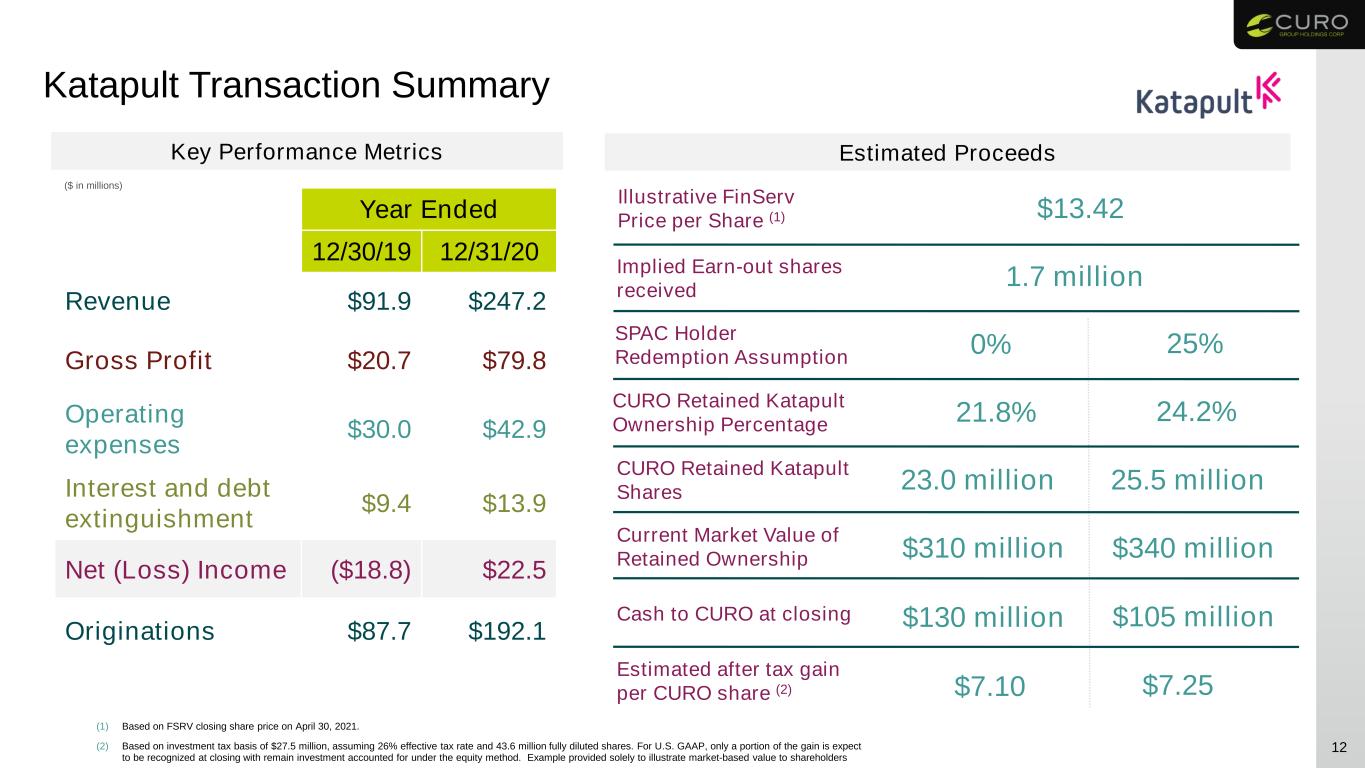
12 Katapult Transaction Summary Key Performance Metrics Illustrative FinServ Price per Share (1) $13.42 0% Estimated Proceeds SPAC Holder Redemption Assumption 25% Cash to CURO at closing $130 million $105 million CURO Retained Katapult Ownership Percentage 1.7 million Implied Earn-out shares received 21.8% 24.2% Current Market Value of Retained Ownership $310 million $340 million Estimated after tax gain per CURO share (2) (1) Based on FSRV closing share price on April 30, 2021. (2) Based on investment tax basis of $27.5 million, assuming 26% effective tax rate and 43.6 million fully diluted shares. For U.S. GAAP, only a portion of the gain is expect to be recognized at closing with remain investment accounted for under the equity method. Example provided solely to illustrate market-based value to shareholders $7.10 $7.25 Year Ended 12/30/19 12/31/20 Revenue $91.9 $247.2 Gross Profit $20.7 $79.8 Operating expenses $30.0 $42.9 Interest and debt extinguishment $9.4 $13.9 Net (Loss) Income ($18.8) $22.5 Originations $87.7 $192.1 CURO Retained Katapult Shares 23.0 million 25.5 million ($ in millions)

13 Flexible Product Offerings Payments are deferred until the end of the promotional period Terms ranging from 3 to 24 months Split the purchase into equal monthly payments Terms ranging from 3 to 72 months Use the Flexiti account to make everyday purchases No promotional terms, pay off monthly Deferred Payment Option Equal Monthly Payments Regular Credit Purchase Company Overview – Flexiti “Apply and buy” POS/BNPL financing platform Fully automated application process; transact in three minutes Revolving credit line for in-network at ~6,600 locations and e-commerce sites Significant acceleration of e-commerce in 2020 Proprietary technology supports omni-channel customer journey Key Company Highlights 2013 Founded 6,600 Merchant locations and e-commerce sites C$1,325 Avg. Transaction Size during the first quarter 738 / C$101k Avg. Origination Risk Score / Income C$253.9 million loan balances with nearly 175,000 active cards as of 3/31/21 C$4.3 billion open to buy with 1.4 million customers
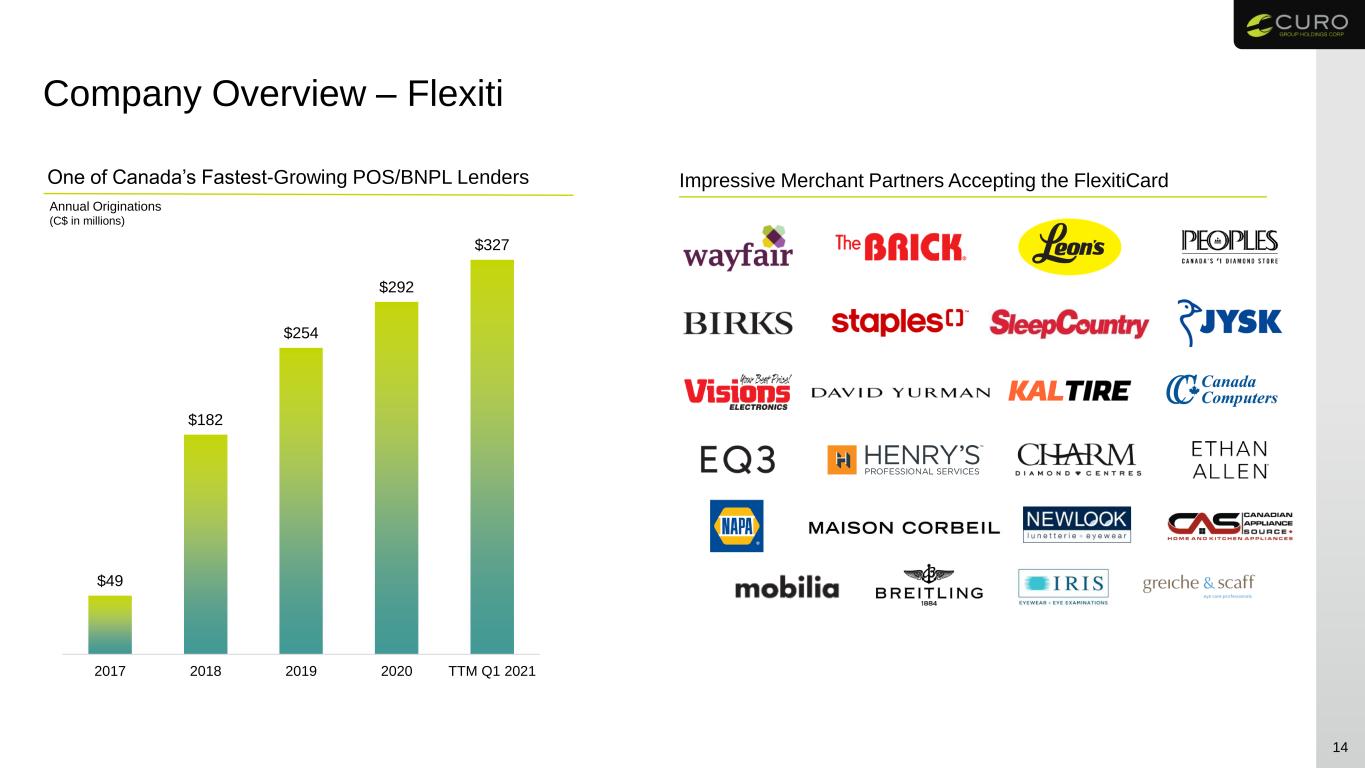
14 One of Canada’s Fastest-Growing POS/BNPL Lenders Annual Originations (C$ in millions) $49 $182 $254 $292 $327 2017 2018 2019 2020 TTM Q1 2021 Impressive Merchant Partners Accepting the FlexitiCard Company Overview – Flexiti
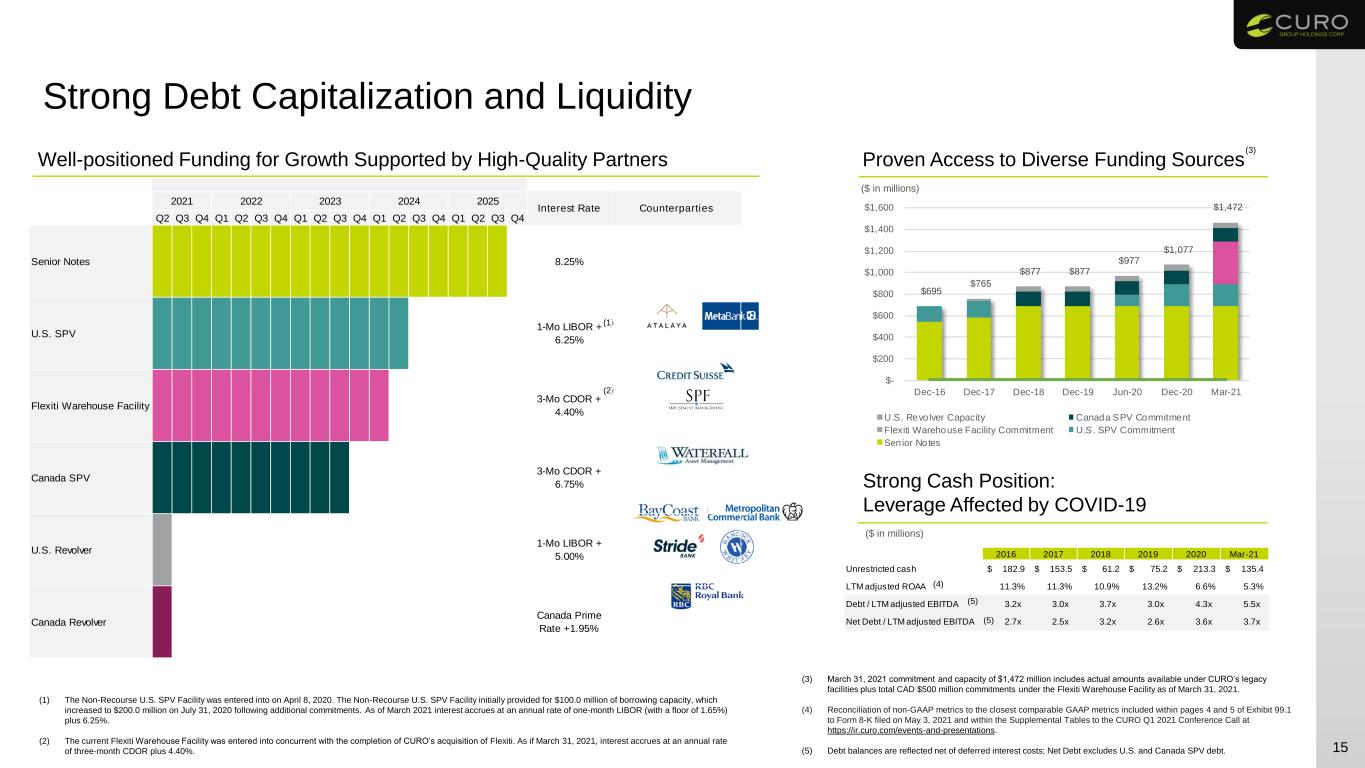
2016 2017 2018 2019 2020 Mar-21 Unrestricted cash 182.9$ 153.5$ 61.2$ 75.2$ 213.3$ 135.4$ LTM adjusted ROAA 11.3% 11.3% 10.9% 13.2% 6.6% 5.3% Debt / LTM adjusted EBITDA 3.2x 3.0x 3.7x 3.0x 4.3x 5.5x Net Debt / LTM adjusted EBITDA 2.7x 2.5x 3.2x 2.6x 3.6x 3.7x Strong Debt Capitalization and Liquidity 15 (3) March 31, 2021 commitment and capacity of $1,472 million includes actual amounts available under CURO’s legacy facilities plus total CAD $500 million commitments under the Flexiti Warehouse Facility as of March 31, 2021. (4) Reconciliation of non-GAAP metrics to the closest comparable GAAP metrics included within pages 4 and 5 of Exhibit 99.1 to Form 8-K filed on May 3, 2021 and within the Supplemental Tables to the CURO Q1 2021 Conference Call at https://ir.curo.com/events-and-presentations. (5) Debt balances are reflected net of deferred interest costs; Net Debt excludes U.S. and Canada SPV debt. ($ in millions) Well-positioned Funding for Growth Supported by High-Quality Partners Strong Cash Position: Leverage Affected by COVID-19 Proven Access to Diverse Funding Sources ($ in millions) (1) (2) (1) The Non-Recourse U.S. SPV Facility was entered into on April 8, 2020. The Non-Recourse U.S. SPV Facility initially provided for $100.0 million of borrowing capacity, which increased to $200.0 million on July 31, 2020 following additional commitments. As of March 2021 interest accrues at an annual rate of one-month LIBOR (with a floor of 1.65%) plus 6.25%. (2) The current Flexiti Warehouse Facility was entered into concurrent with the completion of CURO’s acquisition of Flexiti. As if March 31, 2021, interest accrues at an annual rate of three-month CDOR plus 4.40%. (1) (2) (5) (5) (4) (3) Q2 Q3 Q4 Q1 Q2 Q3 Q4 Q1 Q2 Q3 Q4 Q1 Q2 Q3 Q4 Q1 Q2 Q3 Q4 Senior Notes 8.25% U.S. SPV 1-Mo LIBOR + 6.25% Flexiti Warehouse Facility 3-Mo CDOR + 4.40% Canada SPV 3-Mo CDOR + 6.75% U.S. Revolver 1-Mo LIBOR + 5.00% Canada Revolver Canada Prime Rate +1.95% Interest Rate Counterparties 2021 2022 2023 2024 2025 $695 $765 $877 $877 $977 $1,077 $1,472 $- $200 $400 $600 $800 $1,000 $1,200 $1,400 $1,600 Dec-16 Dec-17 Dec-18 Dec-19 Jun-20 Dec-20 Mar-21 U.S. Revolver Capacity Canada SPV Commitment Flexiti Warehouse Facility Commitment U.S. SPV Commitment Senior Notes

16 Appendix
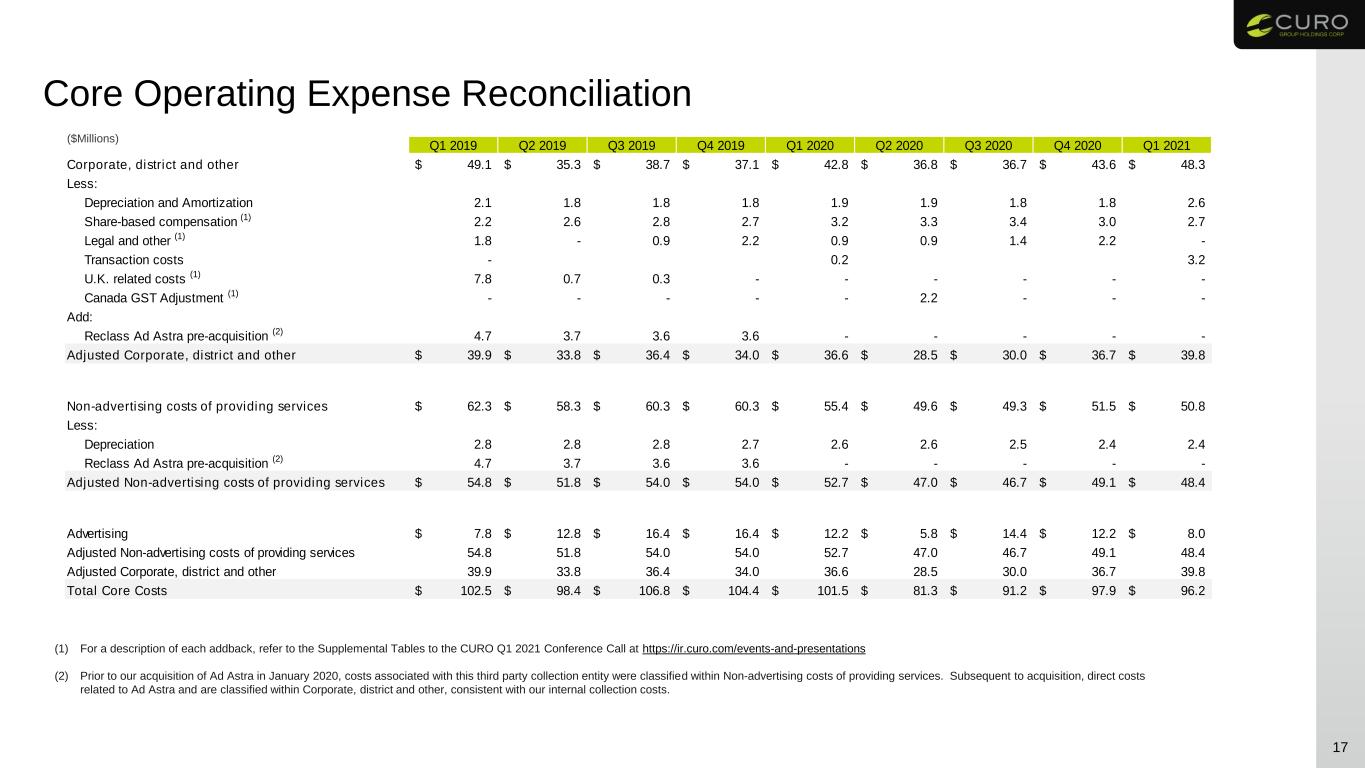
Core Operating Expense Reconciliation 17 (1) For a description of each addback, refer to the Supplemental Tables to the CURO Q1 2021 Conference Call at https://ir.curo.com/events-and-presentations (2) Prior to our acquisition of Ad Astra in January 2020, costs associated with this third party collection entity were classified within Non-advertising costs of providing services. Subsequent to acquisition, direct costs related to Ad Astra and are classified within Corporate, district and other, consistent with our internal collection costs. ($Millions) Q1 2019 Q2 2019 Q3 2019 Q4 2019 Q1 2020 Q2 2020 Q3 2020 Q4 2020 Q1 2021 Corporate, district and other 49.1$ 35.3$ 38.7$ 37.1$ 42.8$ 36.8$ 36.7$ 43.6$ 48.3$ Less: Depreciation and Amortization 2.1 1.8 1.8 1.8 1.9 1.9 1.8 1.8 2.6 Share-based compensation (1) 2.2 2.6 2.8 2.7 3.2 3.3 3.4 3.0 2.7 Legal and other (1) 1.8 - 0.9 2.2 0.9 0.9 1.4 2.2 - Transaction costs - 0.2 3.2 U.K. related costs (1) 7.8 0.7 0.3 - - - - - - Canada GST Adjustment (1) - - - - - 2.2 - - - Add: Reclass Ad Astra pre-acquisition (2) 4.7 3.7 3.6 3.6 - - - - - Adjusted Corporate, district and other 39.9$ 33.8$ 36.4$ 34.0$ 36.6$ 28.5$ 30.0$ 36.7$ 39.8$ Non-advertising costs of providing services 62.3$ 58.3$ 60.3$ 60.3$ 55.4$ 49.6$ 49.3$ 51.5$ 50.8$ Less: Depreciation 2.8 2.8 2.8 2.7 2.6 2.6 2.5 2.4 2.4 Reclass Ad Astra pre-acquisition (2) 4.7 3.7 3.6 3.6 - - - - - Adjusted Non-advertising costs of providing services 54.8$ 51.8$ 54.0$ 54.0$ 52.7$ 47.0$ 46.7$ 49.1$ 48.4$ Advertising 7.8$ 12.8$ 16.4$ 16.4$ 12.2$ 5.8$ 14.4$ 12.2$ 8.0$ Adjusted Non-advertising costs of providing services 54.8 51.8 54.0 54.0 52.7 47.0 46.7 49.1 48.4 Adjusted Corporate, district and other 39.9 33.8 36.4 34.0 36.6 28.5 30.0 36.7 39.8 Total Core Costs 102.5$ 98.4$ 106.8$ 104.4$ 101.5$ 81.3$ 91.2$ 97.9$ 96.2$

Canada Adjusted EBITDA Reconciliation 18 ($Millions) (1) For a description of legal and other costs, Canada GST and other adjustments used in the reconciliation to Adjusted EBITDA, refer to the Supplemental Tables to the CURO Q1 2021 Conference Call at https://ir.curo.com/events-and-presentations Canada Direct Lending Income Statement Revenue 191.9$ 228.3$ 208.9$ 58.4$ Provision for losses 73.0 76.4 58.6 9.2 Net revenue 118.9 151.8 150.2 49.2 Advertising costs 10.5 6.7 3.9 0.9 Non-advertising costs of providing services 67.8 69.5 68.2 18.1 Total cost of providing services 78.3 76.2 72.1 19.0 Gross margin 40.6 75.7 78.2 30.2 Corporate, district and other 19.6 21.9 22.7 5.6 Interest expense 4.0 10.4 9.3 2.4 Total operating expense 23.6 32.4 32.0 8.0 Segment operating income 17.0 43.3 46.2 22.2 Interest expense 4.0 10.4 9.3 2.4 Depreciation and amortization 4.5 4.8 4.5 1.1 EBITDA 25.5 58.6 60.0 25.7 Legal and related costs (1) 0.1 - - - Other adjustments (1) 0.3 0.3 2.2 0.0 1 1 Adjusted EBITDA 25.9$ 58.9 62.8 25.8 Adjusted EBITDA Margin 13.5% 25.8% 30.1% 44.1% March 31, 2021 For the three months ended 2020 For the year ended December 31, 20192018


