
ABS Investor Presentation October 2023

Disclaimer IMPORTANT: You must read the following information before continuing to the rest of the presentation, which is being provided to you for informational purposes only. FORWARD-LOOKING STATEMENTS This presentation contains forward-looking statements. These forward-looking statements include projections, estimates and assumptions about various matters such as our future operational performance, our growth strategy framework and our third quarter outlook. In addition, words such as “estimate,” “believe,” “forecast,” “predict,” “project,” “intend,” “should” and variations of such words and similar expressions are intended to identify forward-looking statements. Our ability to achieve these forward-looking statements is based on certain assumptions, judgments and other factors, both within and outside of our control, that could cause actual results to differ materially from those in the forward-looking statements, including, risks relating to the uncertainty of projected financial information and forecasts, our level of indebtedness; our dependence on third-party lenders to provide the cash we need to fund our indebtedness and our ability to affordably access third-party financing; the impact of regulations on our business; the effects of competition on our business; our ability to attract and retain customers; global economic, market, financial, political or public health conditions or events; our ability to integrate acquired businesses; our ability to protect our proprietary technology and analytics; disruption of our information technology systems; improper disclosure of customer personal data, as well as other factors discussed in our filings with the Securities and Exchange Commission. The foregoing factors, as well as other existing risk factors and new risk factors that emerge from time to time, may cause actual results to differ materially from those contained in any forward-looking statements. Given these risks and uncertainties, investors should not place undue reliance on forward- looking statements as a prediction of actual future results. Furthermore, the Company undertakes no obligation to update, amend or clarify forward-looking statements. NON-GAAP FINANCIAL MEASURES In addition to the financial information prepared in conformity with U.S. GAAP, we provide certain “non-GAAP financial measures,” which are intended as a supplemental measure of our performance that are not required by, or presented in accordance with, GAAP. We present these non-GAAP financial measures because we believe that, when viewed with our GAAP results and the accompanying reconciliation, such measures provide useful information for comparing our performance over various reporting periods as they remove from our operating results the impact of items that we believe do not reflect our core operating performance. These non-GAAP financial measures are not substitutes for any GAAP financial measure and there are limitations to using them. Although we believe that these non-GAAP financial measures can make an evaluation of our operating performance more consistent because they remove items that do not reflect our core operations, other companies in our industry may define their own non-GAAP financial measures differently or use different measures. As a result, it may be difficult to use any non-GAAP financial measure to compare the performance of other companies to our performance. The non-GAAP financial measures presented in these slides should not be considered as measures of the income generated by our business or discretionary cash available to us to invest in the growth of our business. Our management compensates for these limitations by reference to GAAP results and using these non-GAAP financial measures as supplemental measures. 2
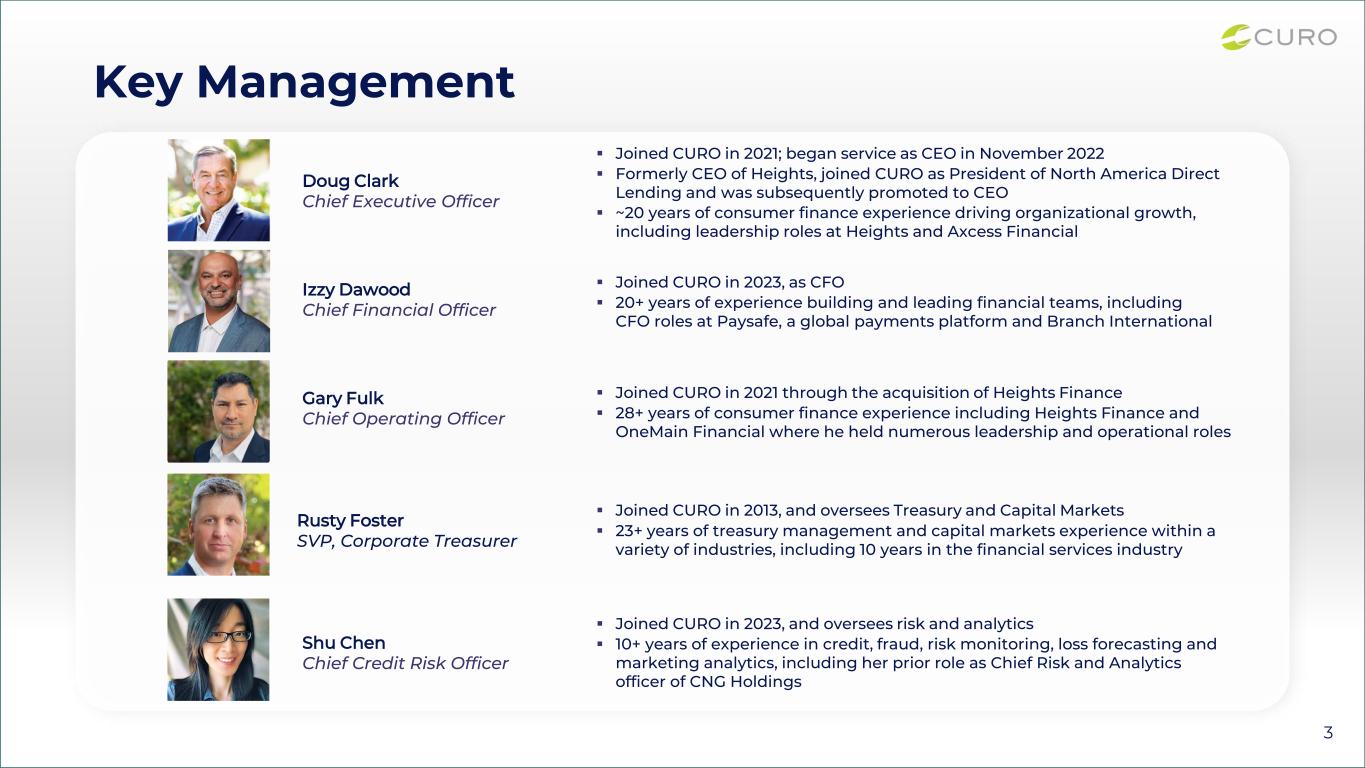
Key Management 3 Rusty Foster SVP, Corporate Treasurer ▪ Joined CURO in 2013, and oversees Treasury and Capital Markets ▪ 23+ years of treasury management and capital markets experience within a variety of industries, including 10 years in the financial services industry Doug Clark Chief Executive Officer Izzy Dawood Chief Financial Officer Shu Chen Chief Credit Risk Officer Gary Fulk Chief Operating Officer ▪ Joined CURO in 2021; began service as CEO in November 2022 ▪ Formerly CEO of Heights, joined CURO as President of North America Direct Lending and was subsequently promoted to CEO ▪ ~20 years of consumer finance experience driving organizational growth, including leadership roles at Heights and Axcess Financial ▪ Joined CURO in 2023, as CFO ▪ 20+ years of experience building and leading financial teams, including CFO roles at Paysafe, a global payments platform and Branch International ▪ Joined CURO in 2021 through the acquisition of Heights Finance ▪ 28+ years of consumer finance experience including Heights Finance and OneMain Financial where he held numerous leadership and operational roles ▪ Joined CURO in 2023, and oversees risk and analytics ▪ 10+ years of experience in credit, fraud, risk monitoring, loss forecasting and marketing analytics, including her prior role as Chief Risk and Analytics officer of CNG Holdings

4 Company Overview ▪ Omni-channel consumer finance company serving consumers in the U.S. and Canada ▪ Operates in almost 500 branches across 13 states in the U.S. and nearly 150 branches in Canada, eight provinces with retail locations and eight provinces and one territory online ▪ Secured and unsecured installment and open-end loan products for near-prime and non-prime consumers as well as credit insurance and other ancillary financial products ▪ CURO is a publicly traded company: NYSE Listed: “CURO”

Strategic Transformation 5 Acquisition of First Heritage Credit Expands <36% APR lending capabilities, adding new strategic geographies Sale of Legacy U.S. Direct Lending Business Accelerates transition from and reduces exposure to high APR loan products Acquisition of Heights Entrance into the <36% APR loan market Refinanced and upsized Warehouse Facilities for Heights ($425M) and First Heritage ($225M) as part of the acquisitions Refinanced Senior Notes and upsized issue to $1B 2021 2022 2023 Issued $150M Sr Term Loan and executed uptier exchange on $1B Senior Notes Executed new C$110M Warehouse Facility in Canada CURO started as a U.S. short-term lender, but through investments and M&A, has repositioned the business to align with go-forward strategy of offering longer term, higher balance and lower risk credit products Sale of Flexiti Completes transformation allowing us to focus exclusively on our Direct Lending business
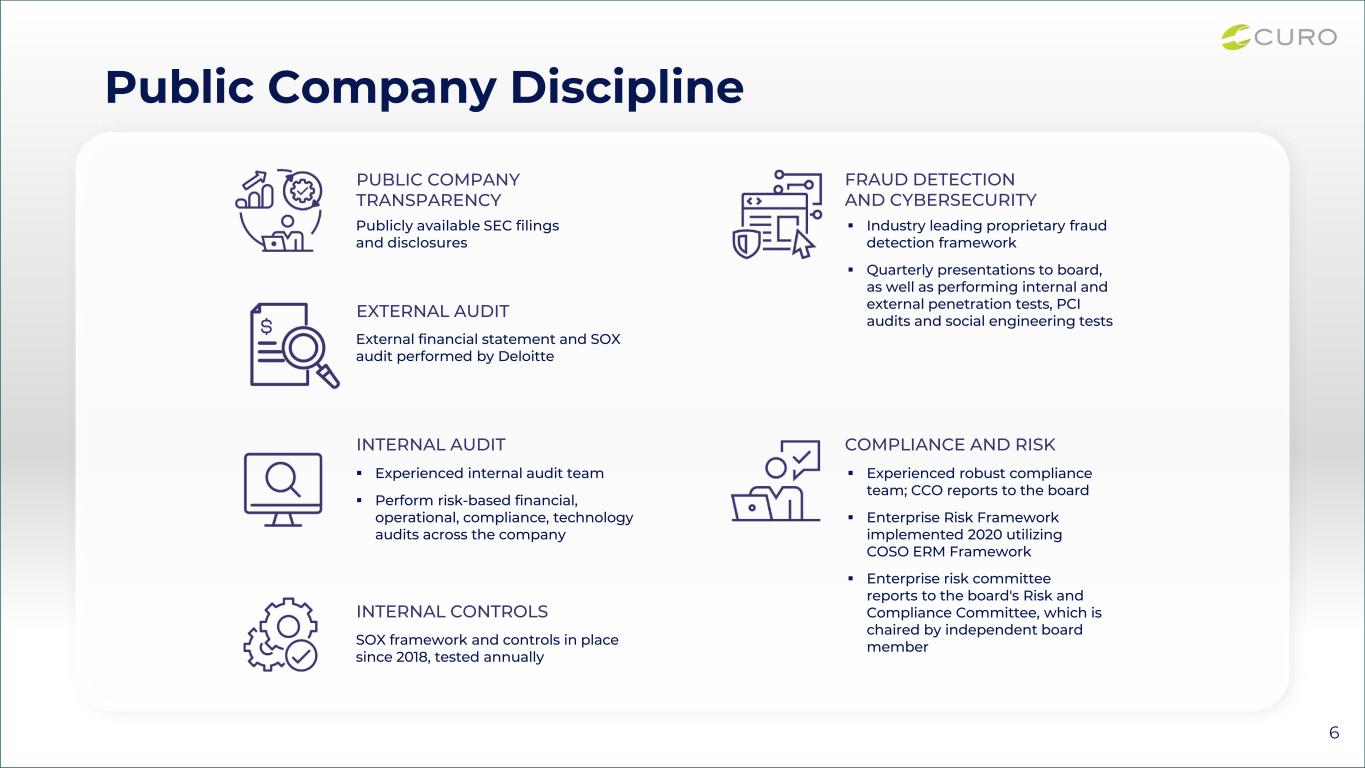
Public Company Discipline 6 PUBLIC COMPANY TRANSPARENCY Publicly available SEC filings and disclosures EXTERNAL AUDIT External financial statement and SOX audit performed by Deloitte COMPLIANCE AND RISK ▪ Experienced robust compliance team; CCO reports to the board ▪ Enterprise Risk Framework implemented 2020 utilizing COSO ERM Framework ▪ Enterprise risk committee reports to the board's Risk and Compliance Committee, which is chaired by independent board member INTERNAL AUDIT ▪ Experienced internal audit team ▪ Perform risk-based financial, operational, compliance, technology audits across the company FRAUD DETECTION AND CYBERSECURITY ▪ Industry leading proprietary fraud detection framework ▪ Quarterly presentations to board, as well as performing internal and external penetration tests, PCI audits and social engineering tests INTERNAL CONTROLS SOX framework and controls in place since 2018, tested annually
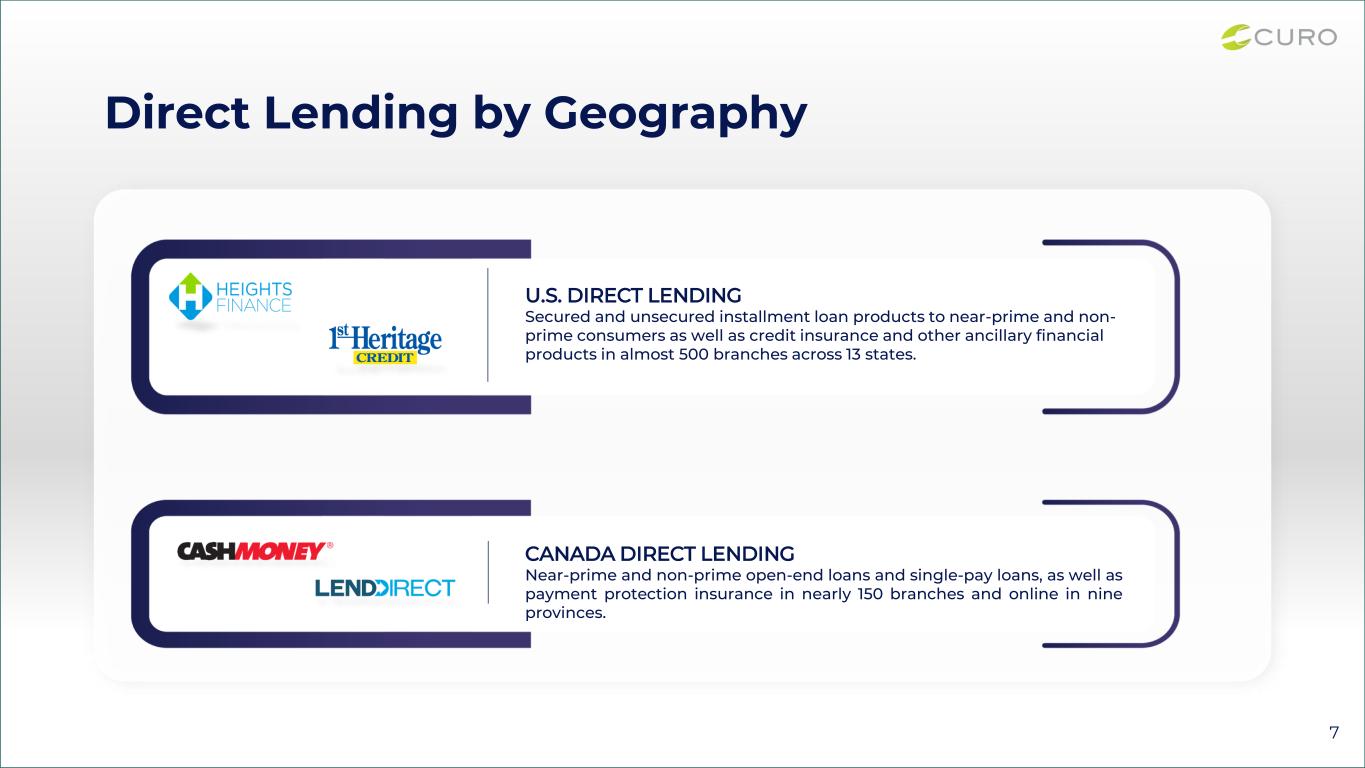
U.S. DIRECT LENDING Secured and unsecured installment loan products to near-prime and non- prime consumers as well as credit insurance and other ancillary financial products in almost 500 branches across 13 states. Direct Lending by Geography 7 CANADA DIRECT LENDING Near-prime and non-prime open-end loans and single-pay loans, as well as payment protection insurance in nearly 150 branches and online in nine provinces.

Direct Lending (U.S.) Overview 8 Overview: • Gross AR >$700M • Almost 500 branches across 13 states • Near-prime and non-prime, both secured and unsecured • Ongoing shift to larger, lower rate loans decreases regulatory risk Loan Characteristics1 ≤ 36% APR > 36% APR % of Portfolio 51% 49% Avg Original Balance ~$6,600 ~$2,000 Avg Term 42 24 Avg FICO 632 612 Avg Yield2 ~36% ~61% % Secured 38% 12% 1 As of 6/30/23, all values are rounded 2 Avg Yield = (Revenue / Average Receivables) and includes approximately 6% of ancillary insurance yield

Direct Lending (Canada) Overview 9 Open-end Loan Characteristics1,2 Avg Original Balance ~C$3,500 Avg Term n/a2 Avg Credit Vision Score 627 Avg Yield3 ~58% 1 As of 6/30/23, all values are rounded 2 Our primary product in Canada is an open-ended product 3 Avg Yield = (Revenue / Average Receivables) and includes approximately 13% of ancillary insurance yield Overview: • Gross AR ~$500M • Nearly 150 branches across nine provinces and online • Open-end loans and single-pay loans • Omni-channel solution (online and branch) • Typical customer: 33% homeowners, average annual net income of ~C$36,000, and nine years in current job

Our Typical Customer in the U.S. 10 Average Monthly Net Income ~$2,300 Average FICO 626 Home Ownership 46% Avg Years at Residence 10.2 Note: The above demographics are as of 9/30/2023
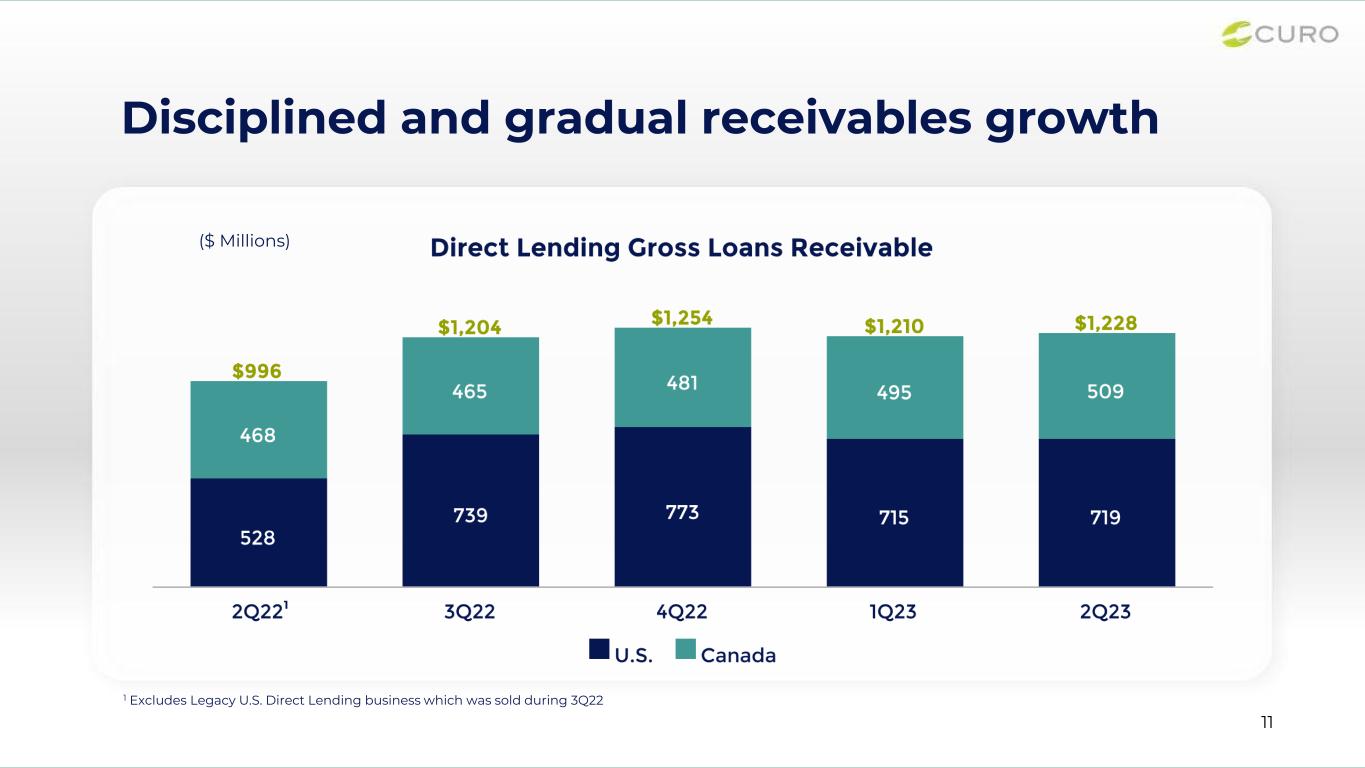
Disciplined and gradual receivables growth 11 ($ Millions) 1 Excludes Legacy U.S. Direct Lending business which was sold during 3Q22 1

Delinquency Rates Remain Relatively Stable ($ Millions) 12 Canada U.S. Total Direct Lending 1 Source: 2Q23 Earnings Presentation 1 Implemented change in charge-off policy in Canada during 1Q23

Credit Quality Improving Highlights: • In the U.S., Direct Lending net charge-offs ("NCOs") declined sequentially • In Canada, 2Q23 NCOs reflect a full period of the change in charge-off policy, while 1Q23 NCOs were artificially low due to this change in policy. Excluding the change in policy during 1Q23, NCOs in Canada decreased on a sequential basis ($ Millions) * Direct Lending NCOs by Geography 13 Source: 2Q23 Earnings Presentation * Legacy U.S. Direct Lending business was sold and First Heritage Credit was acquired 1 1Q23 NCOs excluding policy change. Reported 1Q23 Direct Lending NCOs and NCO % were $47M and 15.6%, respectively in the U.S. and $10M and 8.0%, respectively in Canada, including the change in charge-off policy 1 1* 1
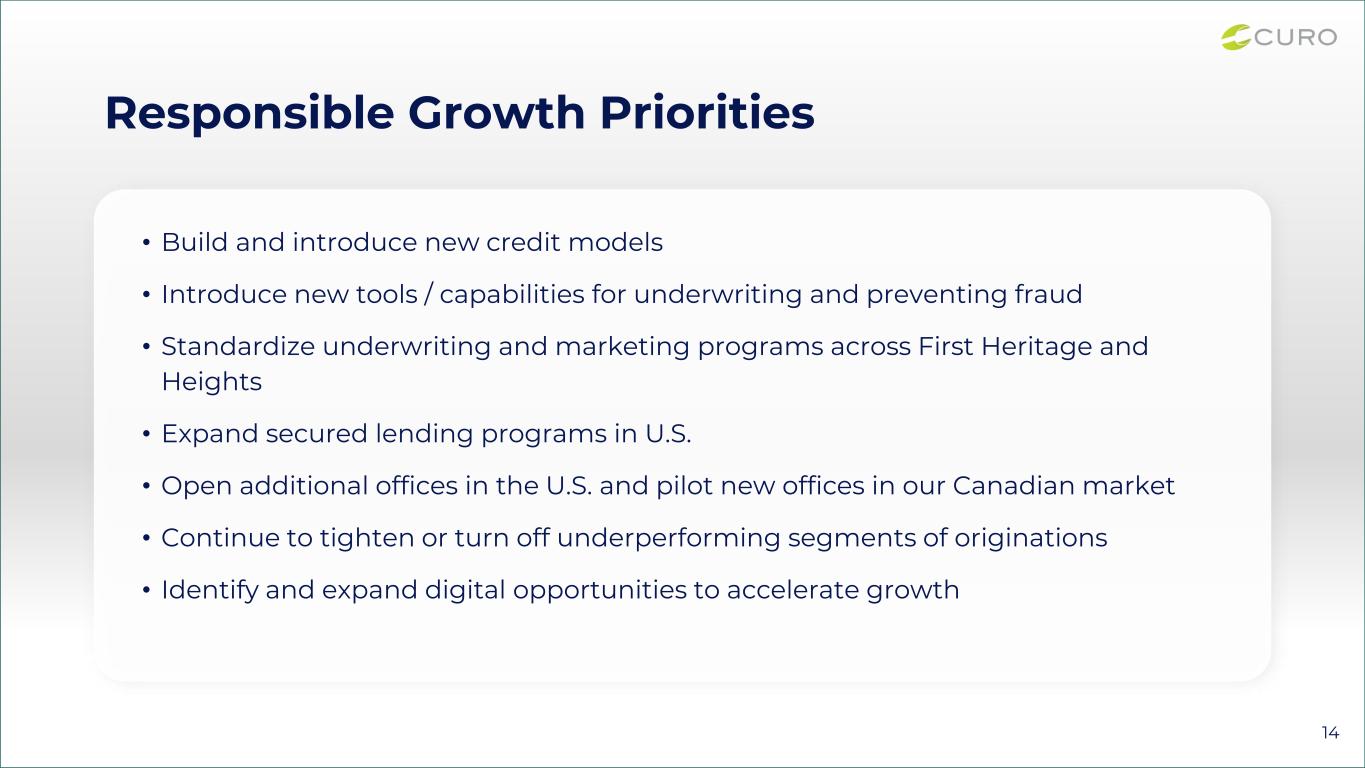
Responsible Growth Priorities 14 • Build and introduce new credit models • Introduce new tools / capabilities for underwriting and preventing fraud • Standardize underwriting and marketing programs across First Heritage and Heights • Expand secured lending programs in U.S. • Open additional offices in the U.S. and pilot new offices in our Canadian market • Continue to tighten or turn off underperforming segments of originations • Identify and expand digital opportunities to accelerate growth
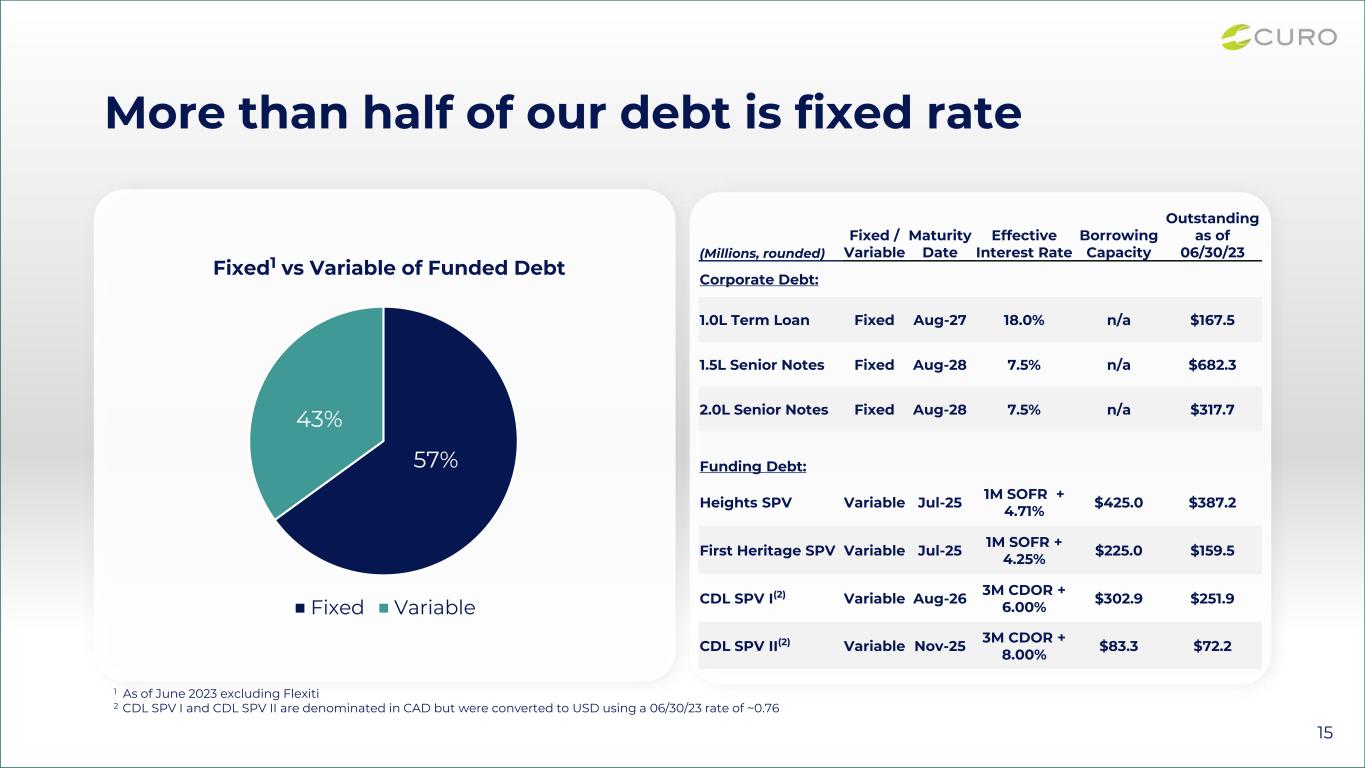
15 More than half of our debt is fixed rate 57% 43% Fixed1 vs Variable of Funded Debt Fixed Variable (Millions, rounded) Fixed / Variable Maturity Date Effective Interest Rate Borrowing Capacity Outstanding as of 06/30/23 Corporate Debt: 1.0L Term Loan Fixed Aug-27 18.0% n/a $167.5 1.5L Senior Notes Fixed Aug-28 7.5% n/a $682.3 2.0L Senior Notes Fixed Aug-28 7.5% n/a $317.7 Funding Debt: Heights SPV Variable Jul-25 1M SOFR + 4.71% $425.0 $387.2 First Heritage SPV Variable Jul-25 1M SOFR + 4.25% $225.0 $159.5 CDL SPV I(2) Variable Aug-26 3M CDOR + 6.00% $302.9 $251.9 CDL SPV II(2) Variable Nov-25 3M CDOR + 8.00% $83.3 $72.2 1 As of June 2023 excluding Flexiti 2 CDL SPV I and CDL SPV II are denominated in CAD but were converted to USD using a 06/30/23 rate of ~0.76

U.S. Portfolio & Credit Trends (≤ 36% APR)

Portfolio Trends (≤ 36% APR)1,2 171 First Heritage acquired in July 2022 and reflected in data accordingly 2 Data reflects averages 610 620 630 640 FICO 28% 29% 30% 31% APR 37 38 39 40 41 42 43 44 Original Term $4,000 $4,250 $4,500 $4,750 $5,000 Original Balance
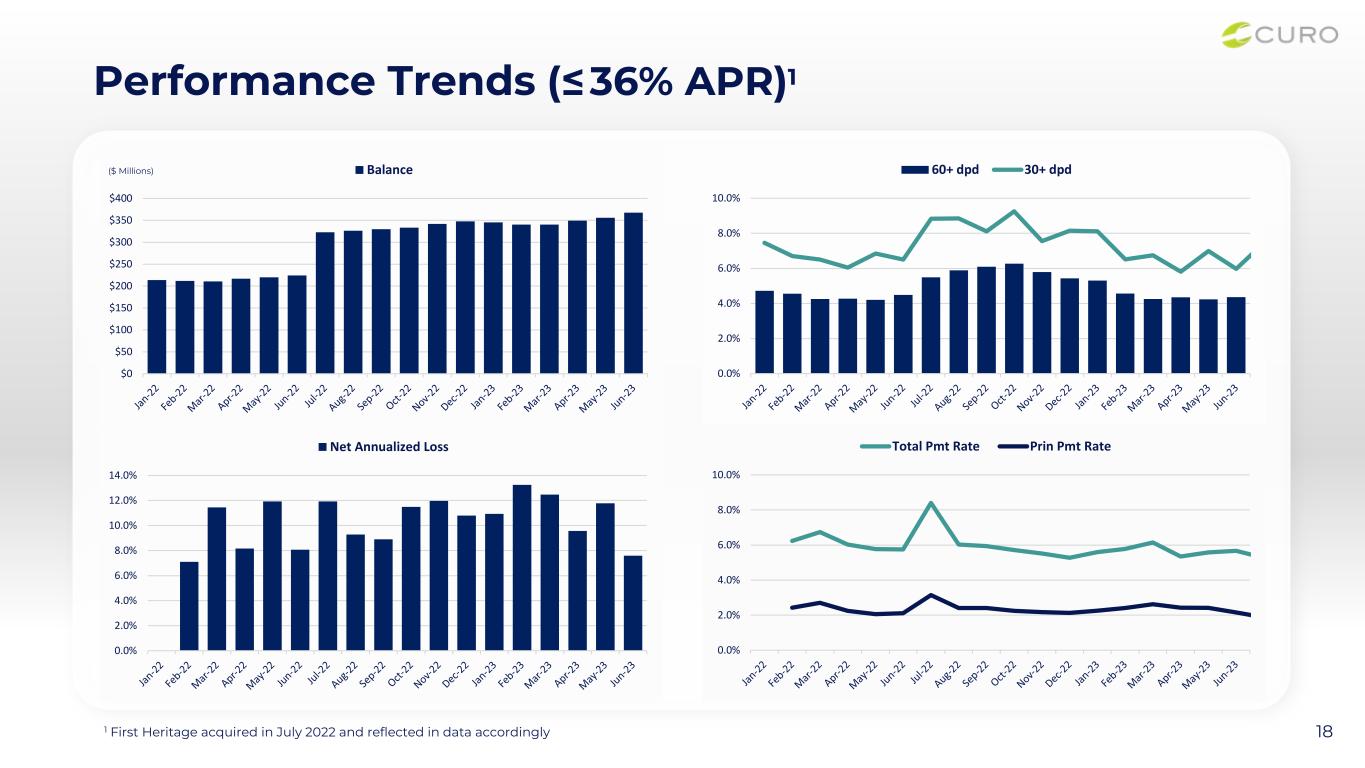
Performance Trends (≤ 36% APR)1 181 First Heritage acquired in July 2022 and reflected in data accordingly 0.0% 2.0% 4.0% 6.0% 8.0% 10.0% 60+ dpd 30+ dpd 0.0% 2.0% 4.0% 6.0% 8.0% 10.0% 12.0% 14.0% Net Annualized Loss 0.0% 2.0% 4.0% 6.0% 8.0% 10.0% Total Pmt Rate Prin Pmt Rate $0 $50 $100 $150 $200 $250 $300 $350 $400 Balance($ Millions)

Appendix

Updated 3Q 2023 Outlook Excluding Flexiti Strengthen our Foundation Execute with Excellence Grow Responsibly Continue to maintain adequate liquidity and capacity for growth EOP Receivables: $1.23-1.28B Revenue: $165-170MM Net Charge-off: 17.0-19.5% Operating Expenses: $90-100M Note: There have been no material changes vs our prior published targets other than the removal of Flexiti from our 3Q 2023 outlook Updated 3Q 2023 targets to reflect the removal of Flexiti, our Canada POS Lending Segment, on August 31, 2023 20


