Exhibit 99.2
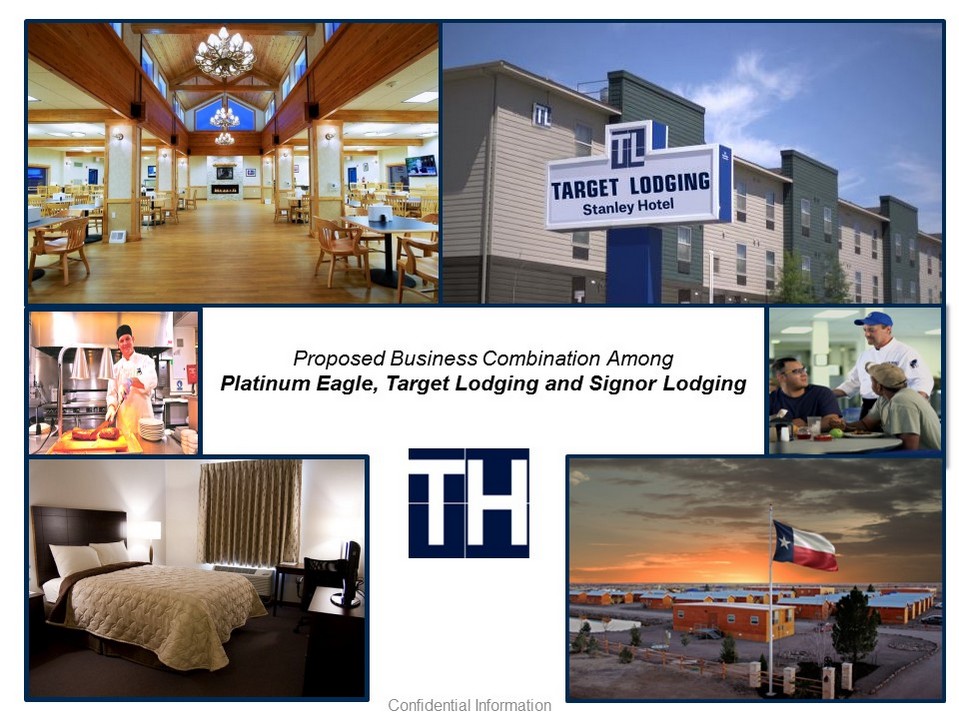
Confidential Information Proposed Business Combination Among Platinum Eagle, Target Lodging and Signor Lodging
2 Disclaimer Important Information This investor presentation (“Investor Presentation”) is for informational purposes only and does not constitute an offer to sell, a s olicitation of an offer to buy, or a recommendation to purchase any equity, debt or other financial instruments of Platinum E agl e Acquisition Corp. (“Platinum Eagle”), Target Logistics Management, LLC (“Target Lodging”) or RL Signor Holdings, LLC (“Signor Lodging”) or any of Platinum Ea gle’s, Target Lodging’s or Signor Lodging’s affiliates. The Investor Presentation has been prepared to assist investors in ma kin g their own evaluation with respect to the proposed business combination (the “Business Combination”), as contemplated in the definitive merger agreement s e ntered into by Platinum Eagle, Target Lodging and Signor Lodging, and for no other purpose. It is not intended to form the ba sis of any investment decision or any other decision in respect of the Business Combination. The information contained herein does not purport to be all - inclus ive. The data contained herein is derived from various internal and external sources. No representation is made as to the rea son ableness of the assumptions made within or the accuracy or completeness of any projections or modeling or any other information contained herein. Any dat a o n past performance or modeling contained herein is not an indication as to future performance. Platinum Eagle, Target Lodging an d Signor Lodging assume no obligation to update the information in this Investor Presentation, except as required by law. Important Information About the Business Combination and Where to Find It In connection with the Business Combination, Platinum Eagle has filed a registration statement on Form S - 4 (the “Registration St atement”) with the United States Securities and Exchange Commission (the “SEC”), which includes a proxy statement/prospectus, th at will be both the proxy statement to be distributed to holders of Platinum Eagle’s ordinary shares in connection with Platinum Eagle’s solicitation o f p roxies for the vote by Platinum Eagle’s shareholders with respect to the Business Combination and other matters as may be des cri bed in the Registration Statement, as well as the prospectus relating to the offer and sale of the securities to be issued in the Business Combinatio n. After the Registration Statement is declared effective, Platinum Eagle will mail a definitive proxy statement/prospectus and oth er relevant documents to its shareholders. Platinum Eagle’s shareholders and other interested persons are advised to read the preliminary proxy statement/ pro spectus included in the Registration Statement and the amendments thereto and, when available, the definitive proxy statement /pr ospectus, as these materials will contain important information about Target Lodging, Signor Lodging and Platinum Eagle and the Business Combina tio n. The definitive proxy statement/prospectus will be mailed to shareholders of Platinum Eagle as of a record date to be estab lis hed for voting on the Business Combination. Shareholders will also be able to obtain copies of the proxy statement/prospectus and other documents f ile d with the SEC that will be incorporated by reference in the proxy statement/prospectus, without charge, once available, at t he SEC’s web site at www.sec.gov, or by directing a request to: Platinum Eagle Acquisition Corp., 2121 Avenue of the Stars, Suite 2300, Los Angele s, California, Attention: Eli Baker, President, Chief Financial Officer and Secretary, (310) 209 - 7280. Participants in the Solicitation Platinum Eagle and its directors and executive officers may be deemed participants in the solicitation of proxies from Platin um Eagle’s shareholders with respect to the Business Combination. A list of the names of those directors and executive officers and a description of their interests in Platinum Eagle is contained in Platinum Eagle’s registration statement on Form S - 1, as amended as of January 9, 2018, and is ava ilable free of charge at the SEC’s web site at www.sec.gov, or by directing a request to Platinum Eagle Acquisition Corp., 21 21 Avenue of the Stars, Suite 2300, Los Angeles, California, Attention: Eli Baker, President, Chief Financial Officer and Secretary, (310) 209 - 7280. Additiona l information regarding the interests of such participants is contained in the proxy statement/prospectus for the Business Co mbi nation. Each of Target Lodging and Signor Lodging and its directors and executive officers may also be deemed to be participants in t he solicitation of proxies from the shareholders of Platinum Eagle in connection with the Business Combination. A list of the na mes of such directors and executive officers and information regarding their interests in the Business Combination are contained in the proxy statement/prospectu s f or the Business Combination. Forward - Looking Statements This Investor Presentation includes “forward - looking statements” within the meaning of the “safe harbor” provisions of the Priva te Securities Litigation Reform Act of 1995. When used in this Investor Presentation, the words “estimates,” “projected,” “ex pec ts,” “anticipates,” “forecasts,” “plans,” “intends,” “believes,” “seeks,” “may,” “will,” “should,” “future,” “propose” and variations of these words or simila r e xpressions (or the negative versions of such words or expressions) are intended to identify forward - looking statements. These fo rward - looking statements include, without limitation, Platinum Eagle’s, Target Lodging’s and/or Signor Lodging’s expectations with respect to future performanc e a nd anticipated financial impact of the Business Combination and the satisfaction of the closing conditions to the Business Co mbi nation. These forward - looking statements are not guarantees of future performance, conditions or results, and involve a number of known and unknown risks, unc ertainties, assumptions and other important factors, many of which are outside Platinum Eagle’s, Target Lodging’s and/or Sign or Lodging’s control, that could cause actual results or outcomes to differ materially from those discussed in the forward - looking statements. Important factors, among others, that may affect actual results or outcomes include the inability to complete the Business Combination (includin g due to the failure to receive required shareholder approvals, or the failure of other closing conditions); the inability to recognize the anticipated benef its of the Business Combination; the inability to meet Nasdaq listing standards; costs related to the Business Combination; the c om bined company’s ability to manage growth; the combined company’s ability to execute its business plan and meet its projections; the combined company’s ability to identify, consummate and integrate acquisitions; rising costs adversely affecting the combined company’s profitability; poten tia l litigation involving Platinum Eagle, Target Lodging, Signor Lodging, or after the closing, the combined company; general economic and market conditions imp act ing demand for Target Lodging’s and/or Signor Lodging’s products and services, and in particular economic and market conditio ns in the oil industry in the markets in which Target Lodging and Signor Lodging operate; and other risks and uncertainties indicated from time to time in the proxy statement/prospectus relating to the Business Combination, including those under “Risk Factors” therein, and in Platinu m Eagle’s other filings with the SEC. None of Platinum Eagle, Target Lodging or Signor Lodging undertakes any obligation to update or revise any forward - looking statements, whether as a result of new information, future events or otherwise, except as required by law. No Offer or Solicitation This Investor Presentation does not constitute a solicitation of a proxy, consent or authorization with respect to any securi tie s or in respect of the Business Combination. This Investor Presentation also does not constitute an offer to sell or the soli cit ation of an offer to buy any securities, nor will there be any sale of securities in any states or jurisdictions in which such offer, solicitation or sale would be unlawf ul prior to registration or qualification under the securities laws of any such jurisdiction. No offering of securities will be mad e except by means of a prospectus meeting the requirements of section 10 of the Securities Act of 1933, as amended, or an exemption therefrom. Industry and Market Data In this Investor Presentation, we rely on and refer to information and statistics regarding market participants in the sector s i n which Target Lodging and Signor Lodging compete and other industry data. We obtained this information and statistics from t hir d - party sources, including reports by market research firms, and company filings. Historical and Projected Financial Information This Investor Presentation contains financial forecasts. These financial forecasts were prepared in good faith by Platinum Ea gle , Target Lodging and/or Signor Lodging on a basis believed to be reasonable. Such financial forecasts have not been prepared in conformity with generally accepted accounting principles (GAAP). None of Platinum Eagle’s, Target Lodging’s or Signor Lodging’s independent auditors ha ve audited, reviewed, compiled or performed any procedures with respect to the projections for the purpose of their inclusion in th is Investor Presentation, and accordingly, none of them expressed an opinion nor provided any other form of assurance with respect thereto for the purpose of this Investor Presentation. These projections are for illustrative purposes only and should not be relied upon as being neces sar ily indicative of future results. Certain of the above - mentioned projected information has been provided for purposes of providing comparisons with historical dat a. The assumptions and estimates underlying the prospective financial information are inherently uncertain and are subject to a wide variety of significant business, economic and competitive risks and uncertainties that could cause actual results to differ materially from those co nta ined in the prospective financial information. Projections are inherently uncertain due to a number of factors outside of Pla tin um Eagle’s, Target Lodging’s and/or Signor Lodging’s control. Accordingly, there can be no assurance that the prospective results are indicative of future perfor man ce of Target Lodging, Signor Lodging or the combined company after the Business Combination or that actual results will not d iff er materially from those presented in the prospective financial information. Inclusion of the prospective financial information in this Investor Prese nta tion should not be regarded as a representation by any person that the results contained in the prospective financial informa tio n will be achieved. Non - GAAP Financial Measures This Investor Presentation includes EBITDA and Free Cash Flow, which is are measurements not calculated in accordance with U. S. generally accepted accounting principles (“GAAP”). Platinum Eagle, Target Lodging and Signor Lodging believe that these non - GAA P measures are useful to investors for two principal reasons. First, they believe these measures assists investors in comparing performance ove r various reporting periods on a consistent basis by removing from operating results the impact of items that do not reflect cor e operating performance. Second, they are key metrics used by management to assess financial performance and may (subject to the limitations described below) ena ble investors to compare the performance of the combined company to its competitors. Platinum Eagle, Target Lodging and Signo r L odging believe that the use of these non - GAAP financial measures provide an additional tool for investors to use in evaluating ongoing operating results and trends. These non - GAAP measures should not be considered in isolation from, or as an alternative to, financial measures det ermined in accordance with GAAP. Other companies may calculate EBITDA or Free Cash Flow and other non - GAAP financial measures differently, and therefore th e measures referenced herein may not be directly comparable to similarly titled measures of other companies.

3 Troy Schrenk Chief Commercial Officer Andy Aberdale Chief Financial Officer Entrepreneurial Team with Proven Execution Capabilities TL’s Core Management Team has been together since the “ beginning ” TL has the most experienced team in the industry Hospitality, overall accommodations operations, sales and construction are industry leading The TL Team is driven by our core values. A high integrity and personally committed team motivated by service excellence and execution, and delivering on the promises we’ve made to our customers Management Team Brad Archer President & Chief Executive Officer • Extensive career in the public and private modular, lodging and hospitality industries • Proven track record of success • Responsible for business strategy and operations • 20+ years of experience in finance, accounting, operations and technology positions • Leads tactical and strategic financial and administrative operations • Experienced career across real estate, modular and community development, strategy and marketing/sales with public and private companies
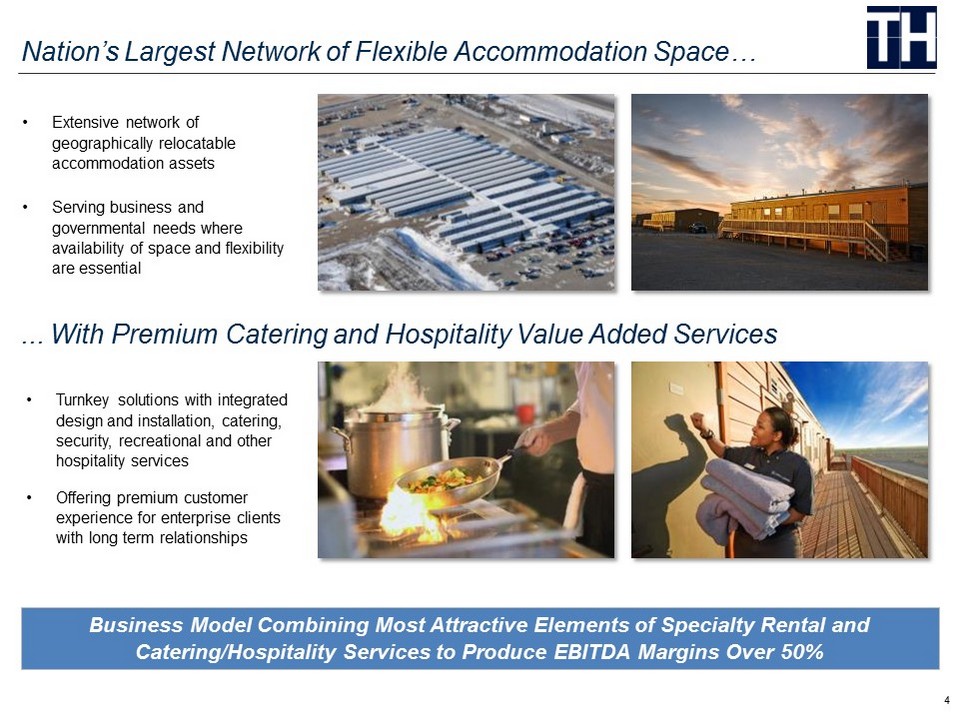
4 Nation’s Largest Network of Flexible Accommodation Space… Business Model Combining Most Attractive Elements of Specialty Rental and Catering/Hospitality Services to Produce EBITDA Margins Over 50% • Turnkey solutions with integrated design and installation, catering, security, recreational and other hospitality services • Offering premium customer experience for enterprise clients with long term relationships ... With Premium Catering and Hospitality Value Added Services • Extensive network of geographically relocatable accommodation assets • Serving business and governmental needs where availability of space and flexibility are essential
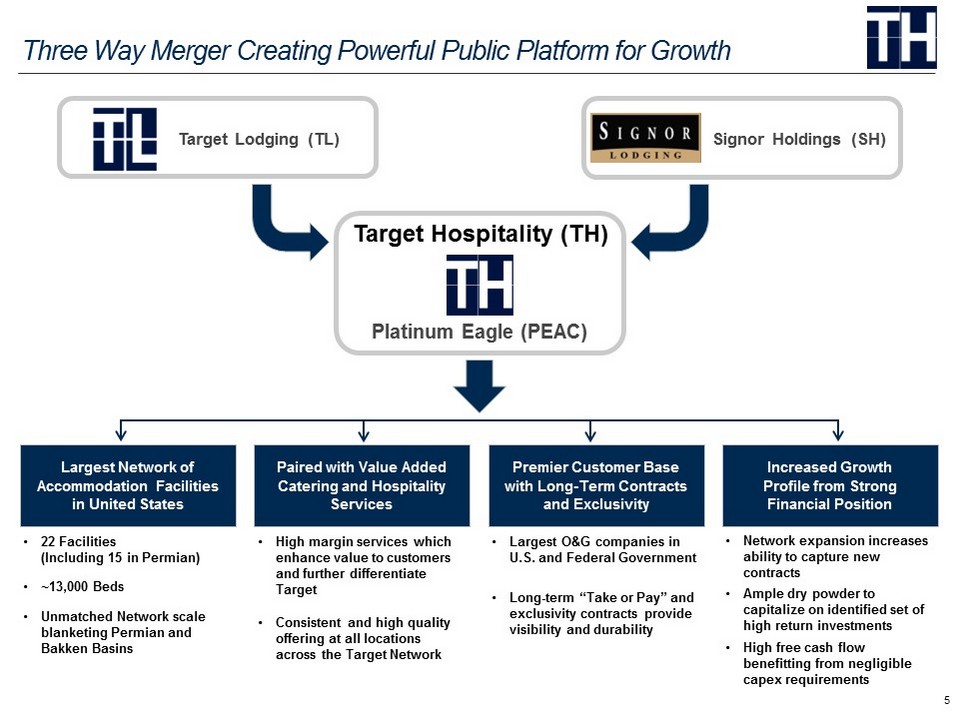
5 Click to edit footnote text Three Way Merger Creating Powerful Public Platform for Growth • 22 Facilities (Including 15 in Permian) • ~13,000 Beds • Unmatched Network scale blanketing Permian and Bakken Basins Platinum Eagle (PEAC) Target Hospitality (TH) • High margin services which enhance value to customers and further differentiate Target • Consistent and high quality offering at all locations across the Target Network • Network expansion increases ability to capture new contracts • Ample dry powder to capitalize on identified set of high return investments • High free cash flow benefitting from negligible capex requirements Largest Network of Accommodation Facilities in United States Increased Growth Profile from Strong Financial Position Paired with Value Added Catering and Hospitality Services Target Lodging (TL ) Signor Holdings (SH) • Largest O&G companies in U.S. and Federal Government • Long - term “Take or Pay” and exclusivity contracts provide visibility and durability Premier Customer Base with Long - Term Contracts and Exclusivity
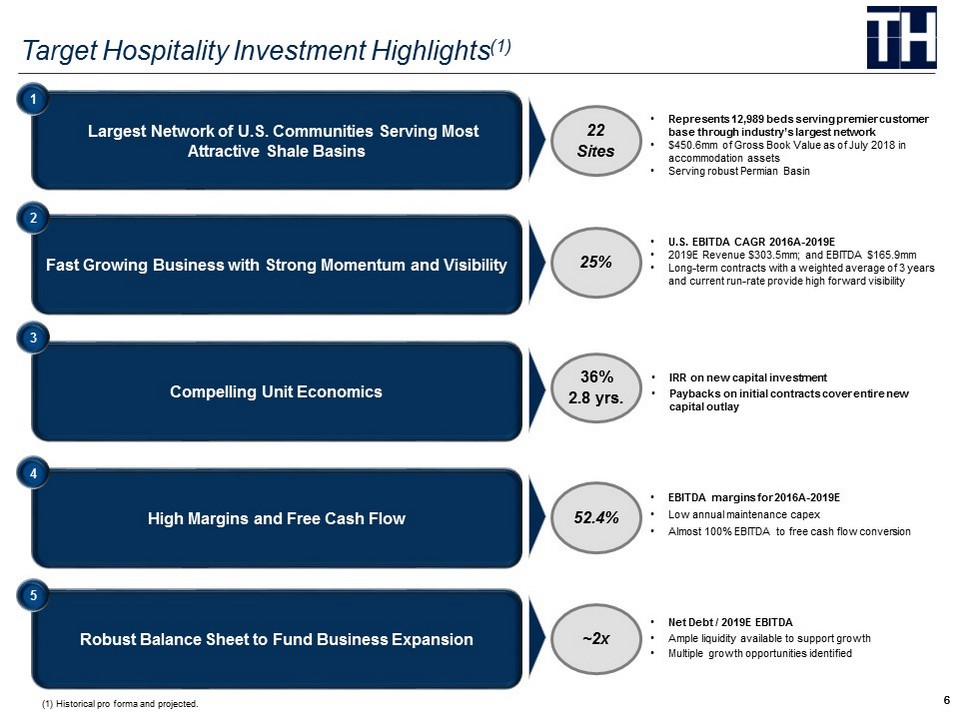
6 6 Target Hospitality Investment Highlights (1) Click to edit footnote text Largest Network of U.S. Communities Serving Most Attractive Shale Basins 1 • Represents 12,989 beds serving premier customer base through industry’s largest network • $450.6mm of Gross Book Value as of July 2018 in accommodation assets • Serving robust Permian Basin 22 Sites Fast Growing Business with Strong Momentum and Visibility 2 • U.S. EBITDA CAGR 2016A - 2019E • 2019E Revenue $ 303.5mm ; and EBITDA $ 165.9mm • Long - term contracts with a weighted average of 3 years and current run - rate provide high forward visibility 25% Compelling Unit Economics 3 • IRR on new capital investment • Paybacks on initial contracts cover entire new capital outlay 36% 2.8 yrs . High Margins and Free Cash Flow 4 • EBITDA margins for 2016A - 2019E • Low annual maintenance capex • Almost 100% EBITDA to free cash flow conversion 52.4% Robust Balance Sheet to Fund Business Expansion 5 • Net Debt / 2019E EBITDA • Ample liquidity available to support growth • Multiple growth opportunities identified ~2x (1) Historical pro forma and projected.
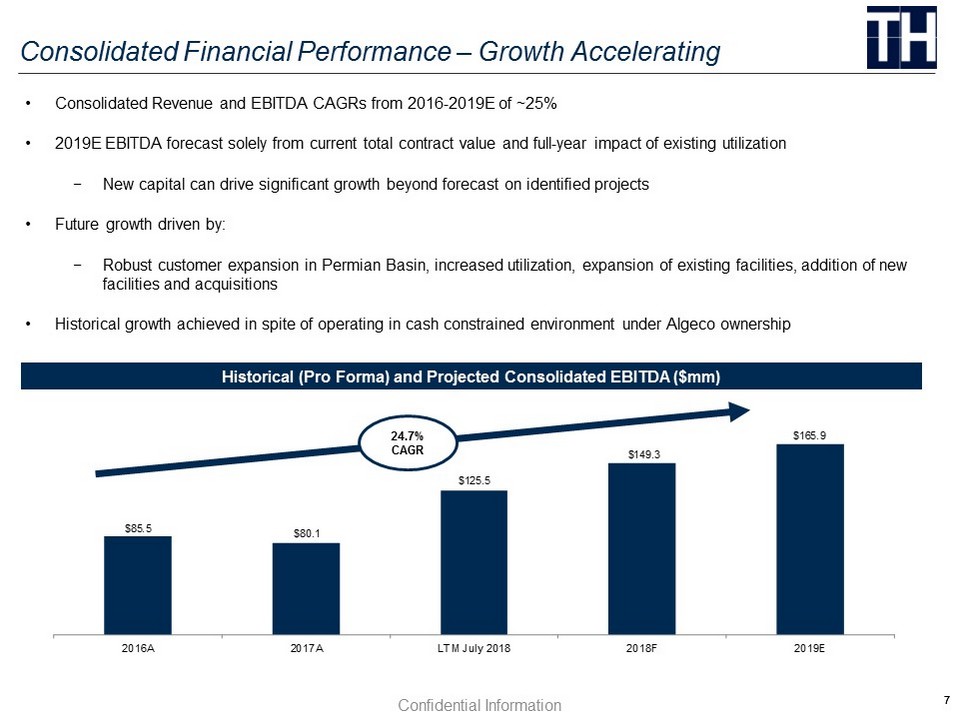
7 7 $85.5 $80.1 $125.5 $149.3 $165.9 2016A 2017A LTM July 2018 2018F 2019E Consolidated Financial Performance – Growth Accelerating Confidential Information • Consolidated Revenue and EBITDA CAGRs from 2016 - 2019E of ~25% • 2019E EBITDA forecast solely from current total contract value and full - year impact of existing utilization − New capital can drive significant growth beyond forecast on identified projects • Future growth driven by: − Robust customer expansion in Permian Basin, increased utilization, expansion of existing facilities, addition of new facilities and acquisitions • Historical growth achieved in spite of operating in cash constrained environment under Algeco ownership Historical (Pro Forma) and Projected Consolidated EBITDA ($mm ) 24.7% CAGR
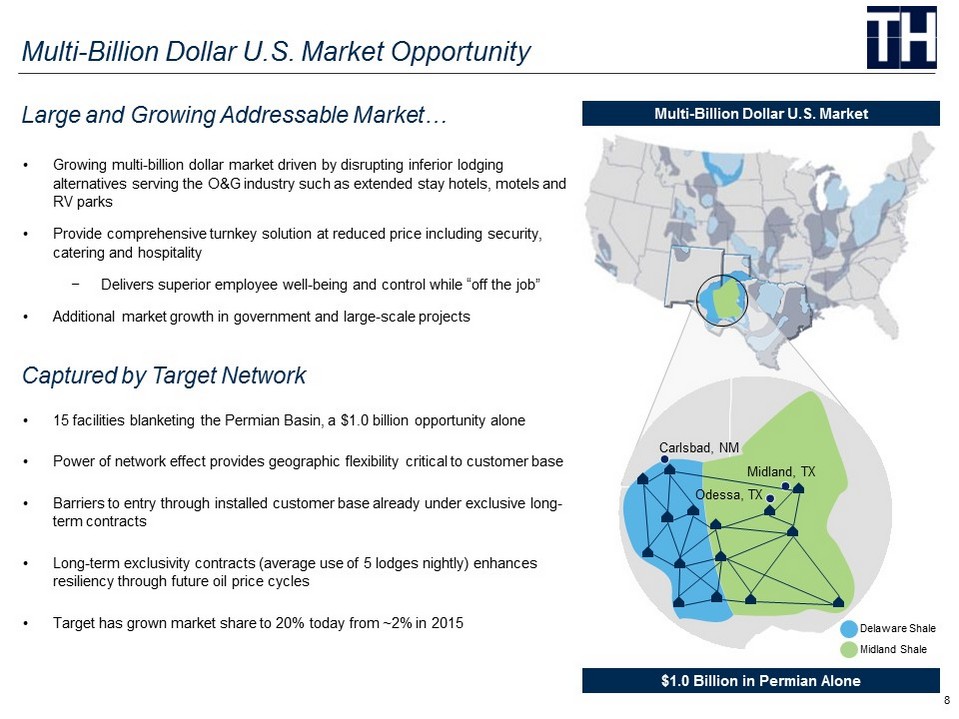
8 Multi - Billion Dollar U.S. Market Opportunity Delaware Shale Midland Shale Multi - Billion Dollar U.S. Market $1.0 Billion in Permian Alone Carlsbad, NM Odessa, TX Midland, TX • 15 facilities blanketing the Permian Basin, a $1.0 billion opportunity alone • Power of network effect provides geographic flexibility critical to customer base • Barriers to entry through installed customer base already under exclusive long - term contracts • Long - term exclusivity contracts (average use of 5 lodges nightly) enhances resiliency through future oil price cycles • Target has grown market share to 20% today from ~2% in 2015 Captured by Target Network • Growing multi - billion dollar market driven by disrupting inferior lodging alternatives serving the O&G industry such as extended stay hotels, motels and RV parks • Provide comprehensive turnkey solution at reduced price including security, catering and hospitality − Delivers superior employee well - being and control while “off the job” • Additional market growth in government and large - scale projects Large and Growing Addressable Market…
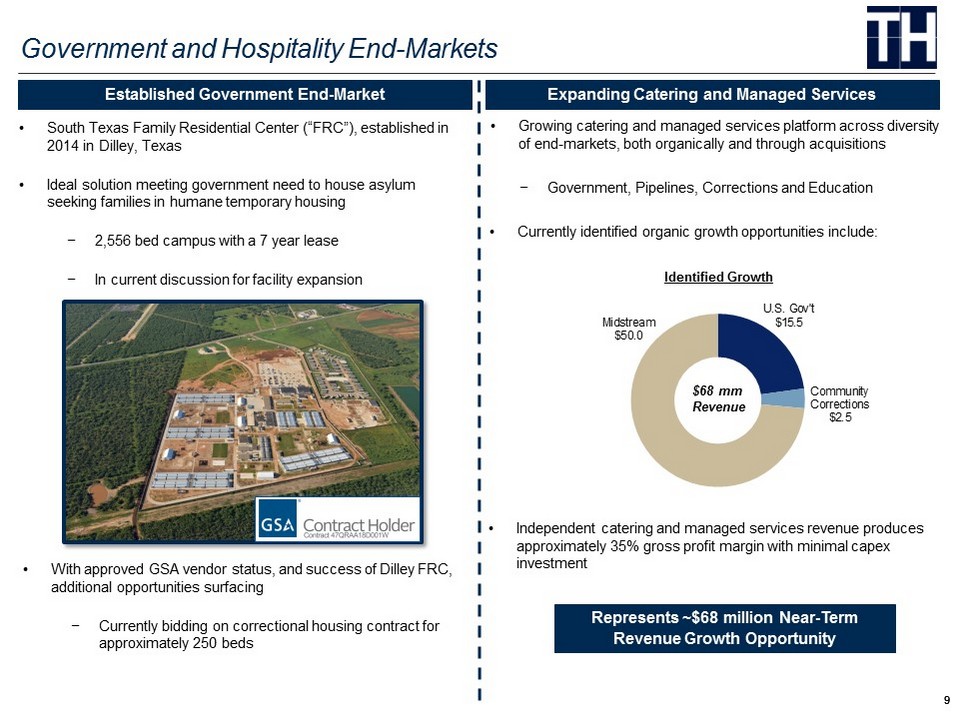
9 9 • Growing catering and managed services platform across diversity of end - markets, both organically and through acquisitions − Government, Pipelines, Corrections and Education • Currently identified organic growth opportunities include: Government and Hospitality End - Markets • With approved GSA vendor status, and success of Dilley FRC, additional opportunities surfacing − Currently bidding on correctional housing contract for approximately 250 beds Established Government End - Market Expanding Catering and Managed Services U.S. Gov't $15.5 Community Corrections $2.5 Midstream $50.0 Identified Growth $68 mm Revenue • South Texas F amily R esidential C enter (“FRC ”), established in 2014 in Dilley , Texas • Ideal solution meeting government need to house asylum seeking families in humane temporary housing − 2,556 bed campus with a 7 year lease − In current discussion for facility expansion Represents ~$68 million Near - Term Revenue Growth Opportunity • Independent catering and managed services revenue produces approximately 35% gross profit margin with minimal capex investment
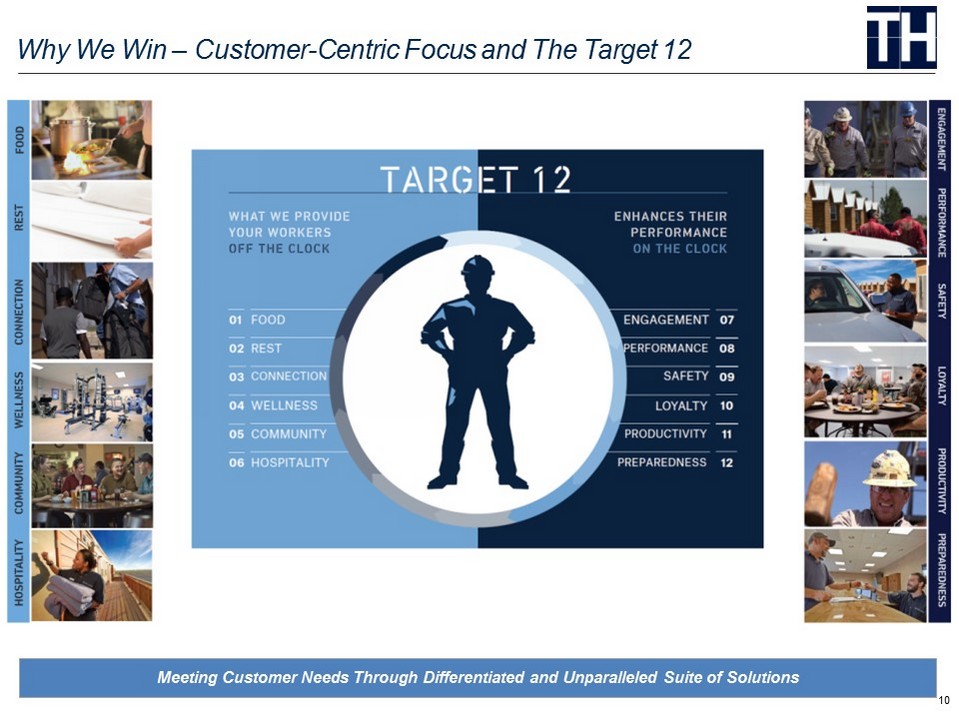
10 Why We Win – Customer - Centric Focus and The Target 12 Meeting Customer Needs Through Differentiated and Unparalleled Suite of Solutions 01 FOOD 02 REST 03 CONNECTION 04 WELLNESS 05 COMMUNITY 06 HOSPITALITY ENGAGEMENT 07 PERFORMANCE 08 SAFETY 09 LOYALTY 10 PRODUCTIVITY 11 PREPAREDENESS 12

11 Premier Customer Base and Durable Commercial Contracts Serving the Largest O&G Companies in the United States Business Underwritten by Strong Commercial Contracts • Diversified across O&G value chain • Focus on large Upstream customers underpins stability and growth • Integrated into customer planning process • Long - term “take or pay” contracts provide Visibility & Durability • 83% of 2018 revenue from “take or pay” contracts • 85% of contracts exclusive to Target Network • $266 million of estimated contracted revenue for 2019 (1) • Weighted average contract term 40.6 months ($ in millions) Exclusivity Contracts 85% Take or Pay Contracts 83% 2019 Revenue $303.5 Estimated Contracted Revenue: 88% Uncontracted Revenue: 12% (1) Based on contracted revenue, estimated contract overages and direct forecast planning with customers. Weighted Avg. Contract Duration 40.6 Months
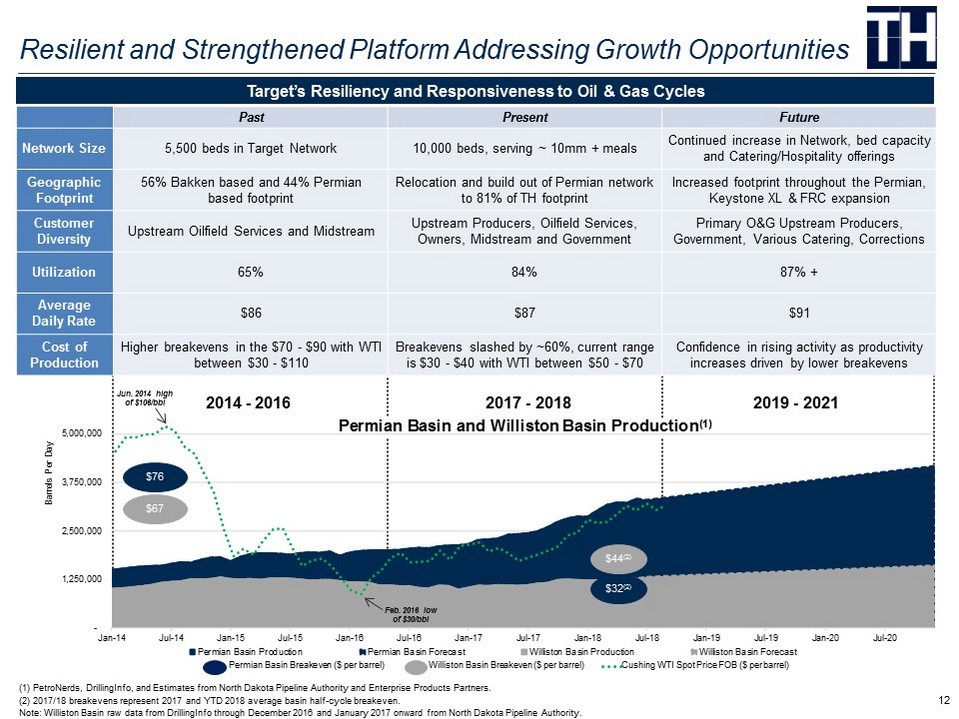
12 - 1,250,000 2,500,000 3,750,000 5,000,000 Jan-14 Jul-14 Jan-15 Jul-15 Jan-16 Jul-16 Jan-17 Jul-17 Jan-18 Jul-18 Jan-19 Jul-19 Jan-20 Jul-20 Barrels Per Day Permian Basin and Williston Basin Production (1) Permian Basin Production Permian Basin Forecast Williston Basin Production Williston Basin Forecast Resilient and Strengthened Platform Addressing Growth Opportunities Past Present Future Network Size 5,500 beds in Target Network 10,000 beds, serving ~ 10mm + meals Continued increase in Network, bed capacity and Catering/Hospitality offerings Geographic Footprint 56% Bakken b ased and 44% Permian based footprint Relocation and build out of Permian network to 81% of TH footprint Increased footprint throughout the Permian, Keystone XL & FRC expansion Customer Diversity Upstream Oilfield Services and Midstream Upstream Producers, Oilfield Services, Owners, Midstream and Government Primary O&G Upstream Producers, Government, Various Catering , Corrections Utilization 65% 84% 87% + Average Daily Rate $86 $87 $91 Cost of Production Higher breakevens in the $ 70 - $ 90 with WTI between $30 - $ 110 Breakevens slashed by ~60%, current range is $ 30 - $ 40 with WTI between $50 - $70 Confidence in rising activity as productivity increases driven by lower breakevens Target’s Resiliency and Responsiveness to Oil & Gas Cycles (1) PetroNerds , DrillingInfo , and Estimates from North Dakota Pipeline Authority and Enterprise Products Partners. (2) 2017/18 breakevens represent 2017 and YTD 2018 average basin half - cycle breakeven. Note: Williston Basin raw data from DrillingInfo through December 2016 and January 2017 onward from North Dakota Pipeline Authority. 2014 - 2016 2017 - 2018 2019 - 2021 $44 (2) $32 (2) Permian Basin Breakeven ($ per barrel) Williston Basin Breakeven ($ per barrel) $76 $67 Cushing WTI Spot Price FOB ($ per barrel) Feb. 2016 low of $30/ bbl Jun. 2014 high of $106/ bbl
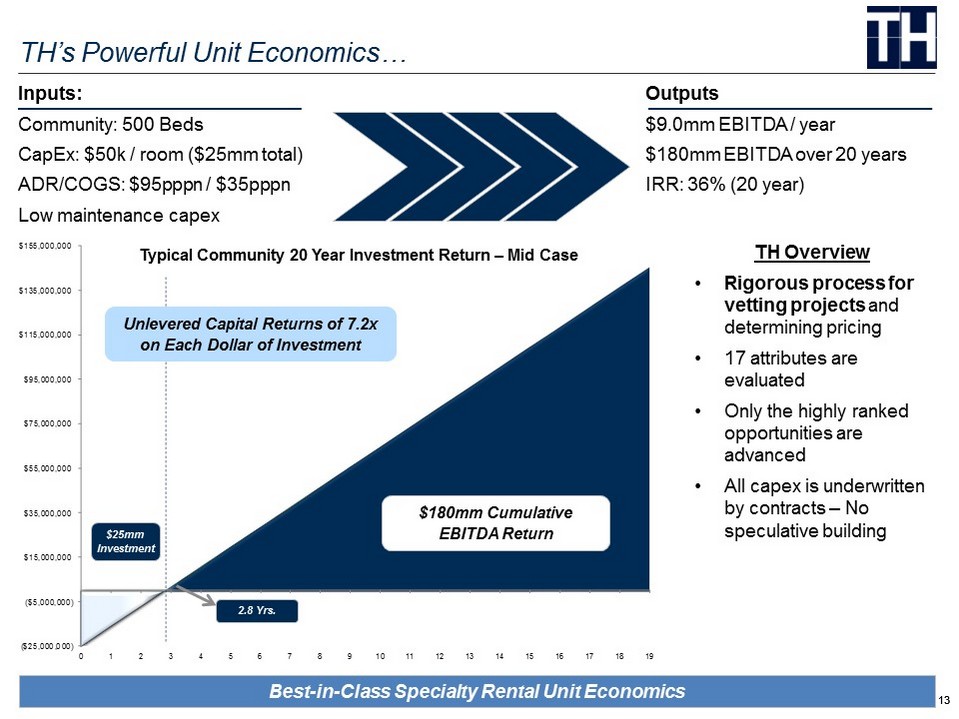
13 13 ($25,000,000) ($5,000,000) $15,000,000 $35,000,000 $55,000,000 $75,000,000 $95,000,000 $115,000,000 $135,000,000 $155,000,000 0 1 2 3 4 5 6 7 8 9 10 11 12 13 14 15 16 17 18 19 TH’s Powerful Unit Economics… Click to edit footnote text TH Overview • Rigorous process for vetting projects and determining pricing • 17 attributes are evaluated • Only the highly ranked opportunities are advanced • All capex is underwritten by contracts – No speculative building Outputs $ 9.0mm EBITDA / year $ 180mm EBITDA over 20 years IRR: 36 % (20 year ) Inputs: Community: 500 Beds CapEx : $ 50k / room ($ 25mm total ) ADR/COGS : $ 95pppn / $ 35pppn Low maintenance capex Typical Community 20 Year Investment Return – Mid Case $ 180mm Cumulative EBITDA Return 2.8 Yrs. $25mm Investment Best - in - Class Specialty Rental Unit Economics Unlevered Capital Returns of 7.2x on Each Dollar of Investment
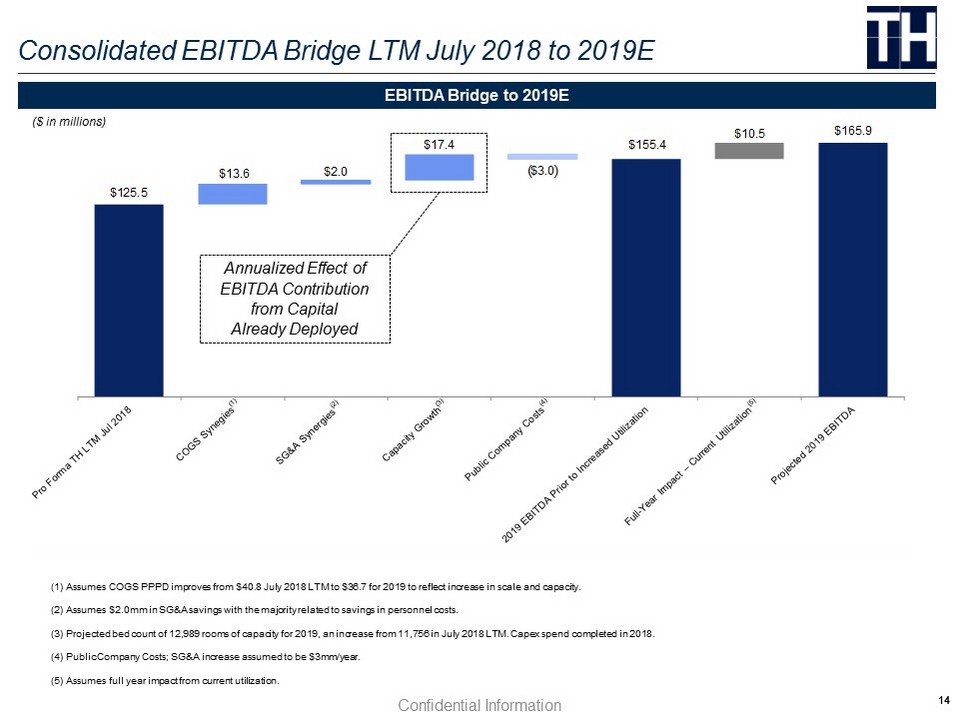
14 14 $125.5 $155.4 $165.9 $13.6 $2.0 $17.4 $3.0 $10.5 Consolidated EBITDA Bridge LTM July 2018 to 2019E Confidential Information (1) Assumes COGS PPPD improves from $ 40.8 July 2018 LTM to $ 36.7 for 2019 to reflect increase in scale and capacity. (2) Assumes $ 2.0mm in SG&A savings with the majority related to savings in personnel costs. (3) Projected bed count of 12,989 rooms of capacity for 2019, an increase from 11,756 in July 2018 LTM. Capex spend completed in 2018. ( 4) Public Company Costs; SG&A increase assumed to be $ 3mm/year. (5) Assumes full year impact from current utilization. ( ) EBITDA Bridge to 2019E ($ in millions) Annualized Effect of EBITDA Contribution from Capital Already Deployed

15 15 $149.3 $54.3 $2.4 $15.6 $131.3 $55.2 $14.8 $7.0 2018F EBITDA TL Maintenance Capex Deferred Revenue 2018F Discretionary Free Cash Flow TL Growth Capex SH Growth Capex SH Capex Facilities Improvement 2018F Free Cash Flow $165.9 $136.4 $3.0 $13.5 $149.4 $13.0 2019E EBITDA TL Maintenance Capex Deferred Revenue 2019E Discretionary Free Cash Flow SH Capex Facilities Improvement 2019E Free Cash Flow Exceptional Free Cash Flow Profile Click to edit footnote text 2018F Pro Forma Free Cash Flow Bridge (1) (3) (2) 2019E Free Cash Flow Bridge ($ in millions) (1) (2) Free Cash Flow Profile: ~ 90% Free Cash Flow Conversion with 12% Unlevered Free Cash Flow Yield (3) ($ in millions) Confidential Information (1) Maintenance Capex planned to increase to ~$3.0mm per year for TH beginning in 2019. (2) Deferred revenue reduction to free cash flow adjusts for receipt of upfront cash payments on contracts amortized over year as se rvices performed. (3) SH CapEx Facilities Improvement is to bring acquisition up to TL standards. Expected spend is ~$7mm in 2018 and ~$13mm in 20 19.
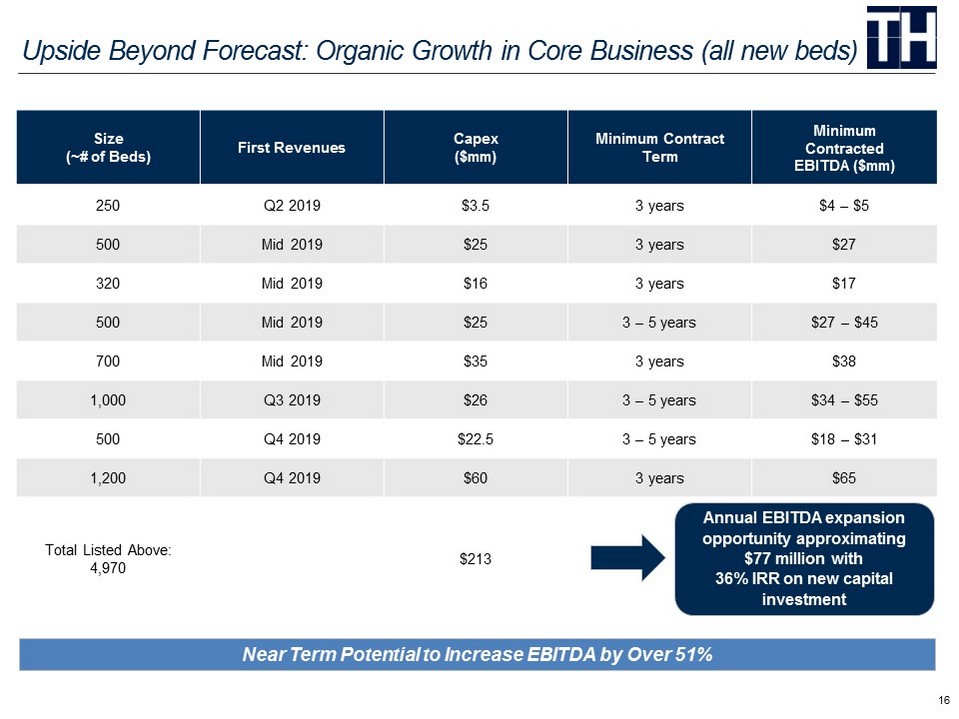
16 United States: 206 Outlook and Focus Upside Beyond Forecast: Organic Growth in Core Business (all new beds) Size (~# of Beds) First Revenues Capex ($mm) Minimum Contract Term Minimum Contracted EBITDA ($mm) 250 Q2 2019 $3.5 3 years $4 – $5 500 Mid 2019 $25 3 years $27 320 Mid 2019 $16 3 years $17 500 Mid 2019 $25 3 – 5 years $27 – $45 700 Mid 2019 $35 3 years $38 1,000 Q3 2019 $26 3 – 5 years $34 – $55 500 Q4 2019 $22.5 3 – 5 years $18 – $31 1,200 Q4 2019 $60 3 years $65 Total Listed Above: 4,970 $213 Near Term Potential to Increase EBITDA by Over 51% Annual EBITDA expansion opportunity approximating $77 million with 36% IRR on new capital investment
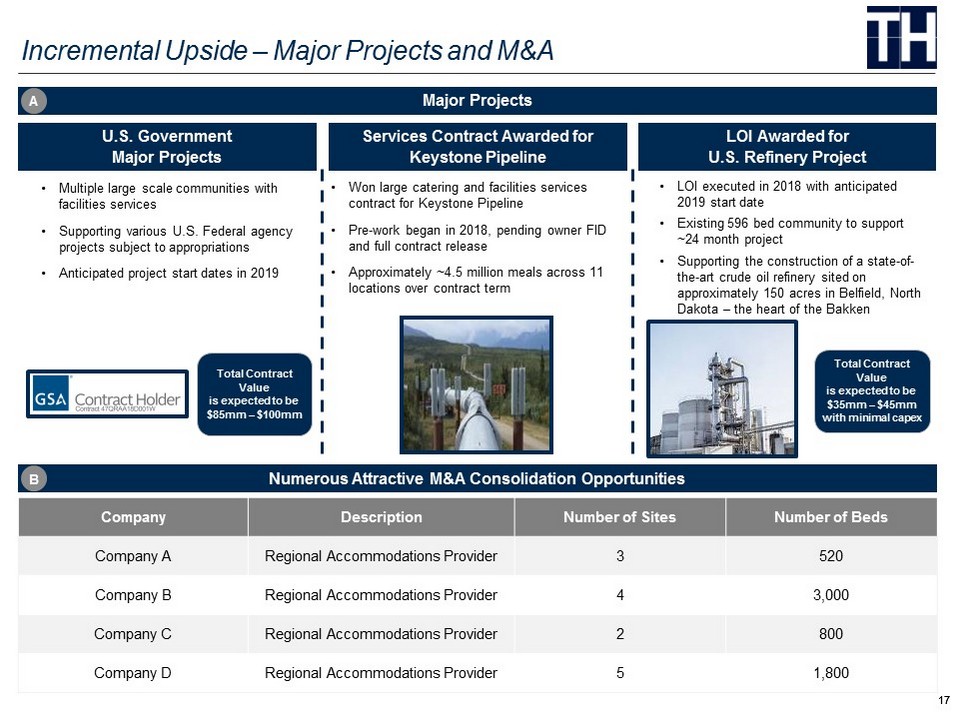
17 17 LOI Awarded for U.S . Refinery Project • LOI executed in 2018 with anticipated 2019 start date • Existing 596 bed community to support ~24 month project • Supporting the construction of a state - of - the - art crude oil refinery sited on approximately 150 acres in Belfield , North Dakota – the heart of the Bakken Total Contract Value is expected to be $35mm – $ 45mm with minimal capex Click to edit footnote text Incremental Upside – Major Projects and M&A Company Description Number of Sites Number of Beds Company A Regional Accommodations Provider 3 520 Company B Regional Accommodations Provider 4 3,000 Company C Regional Accommodations Provider 2 800 Company D Regional Accommodations Provider 5 1,800 Numerous Attractive M&A Consolidation Opportunities Services Contract Awarded for Keystone Pipeline • Won large catering and facilities services contract for Keystone Pipeline • Pre - work began in 2018, pending owner FID and full contract release • Approximately ~4.5 million meals across 11 locations over contract term U.S. Government Major Projects • Multiple large scale communities with facilities services • Supporting various U.S. Federal agency projects subject to appropriations • Anticipated project start dates in 2019 Total Contract Value is expected to be $85mm – $100mm B Major Projects A
18 Appendix

19 Entrepreneurial Team w ith Proven Execution Capabilities Supported by Experienced Board • TL’s Core Management Team has been together since the “ beginning ” • TL has the most experienced team in the industry • Hospitality, overall accommodations operations, sales and construction are industry leading • The TL Team is driven by our core values. A high integrity and personally committed team motivated by service excellence and execution, and delivering on the promises we’ve made to our customers Brad Archer : President & Chief Executive Officer 25 years in the modular, lodging and hospitality industries (Including 5 with public companies) Extensive track record of success in executive management Responsible for running all facets of business including strategy and operations Andy Aberdale : Chief Financial Officer 20+ years of experience in finance, accounting, operations and technology positions Leads Target’s tactical and strategic financial and administrative operations Troy Schrenk : Chief Commercial Officer 18 years in real estate, modular and community development, strategy and marketing/sales with public and private companies • Stephen and Gary have been instrumental in the growth of Algeco and Williams Scotsman and are both currently on the TL Board of Directors • Jeff was a Double Eagle Founder and is currently on the WSC Board of Directors • Stephen, Gary and Jeff collaborated on and completed successful SPAC merger between Double Eagle Acquisition Corp. and Williams Scotsman Management Team Board of Directors Stephen Robertson : Chairman of Target Hospitality, Co - Founder TDR Capital 30 years of private equity experience Previously Chairman of Algeco Europe and current board member of Algeco Scotsman Gary Lindsay : Partner , TDR Capital 15 years of private equity experience Day - to - day management of Algeco investment since 2010 Current board m ember of WSC and Algeco Scotsman Jeff Sagansky : CEO of Platinum Eagle Acquisition Corp. Experienced media/communications investor and studio/network CEO Sponsor and President of Global Eagle and Silver Eagle Serves on Board of Global Eagle Sponsor of Double Eagle Acquisition Corp. and current WillScot Corporation board m ember
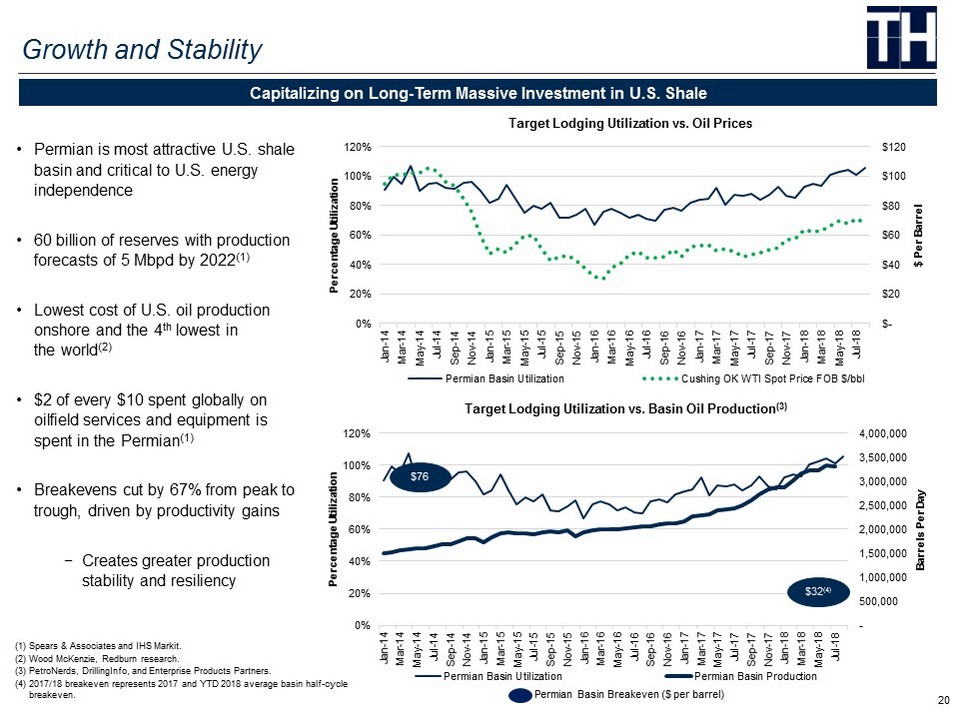
20 - 500,000 1,000,000 1,500,000 2,000,000 2,500,000 3,000,000 3,500,000 4,000,000 0% 20% 40% 60% 80% 100% 120% Jan-14 Mar-14 May-14 Jul-14 Sep-14 Nov-14 Jan-15 Mar-15 May-15 Jul-15 Sep-15 Nov-15 Jan-16 Mar-16 May-16 Jul-16 Sep-16 Nov-16 Jan-17 Mar-17 May-17 Jul-17 Sep-17 Nov-17 Jan-18 Mar-18 May-18 Jul-18 Barrels Per Day Percentage Utilization Target Lodging Utilization vs. Basin Oil Production (3) Permian Basin Utilization Permian Basin Production Growth and Stability Capitalizing on Long - Term Massive Investment in U.S. Shale • Permian is most attractive U.S. shale basin and critical to U.S. energy independence • 60 billion of reserves with production forecasts of 5 Mbpd by 2022 (1) • Lowest cost of U.S. oil production onshore and the 4 th lowest in the world (2) • $2 of every $10 spent globally on oilfield services and equipment is spent in the Permian (1) • Breakevens cut by 67% from peak to trough, driven by productivity gains − Creates greater p roduction stability and resiliency (1) Spears & Associates and IHS Markit. (2) Wood McKenzie, Redburn research. (3) PetroNerds, DrillingInfo, and Enterprise Products Partners. (4) 2017/18 breakeven represents 2017 and YTD 2018 average basin half - cycle iiiiiii breakeven . $- $20 $40 $60 $80 $100 $120 0% 20% 40% 60% 80% 100% 120% Jan-14 Mar-14 May-14 Jul-14 Sep-14 Nov-14 Jan-15 Mar-15 May-15 Jul-15 Sep-15 Nov-15 Jan-16 Mar-16 May-16 Jul-16 Sep-16 Nov-16 Jan-17 Mar-17 May-17 Jul-17 Sep-17 Nov-17 Jan-18 Mar-18 May-18 Jul-18 $ Per Barrel Percentage Utilization Target Lodging Utilization vs. Oil Prices Permian Basin Utilization Cushing OK WTI Spot Price FOB $/bbl Permian Basin Breakeven ($ per barrel) $76 $32 (4)
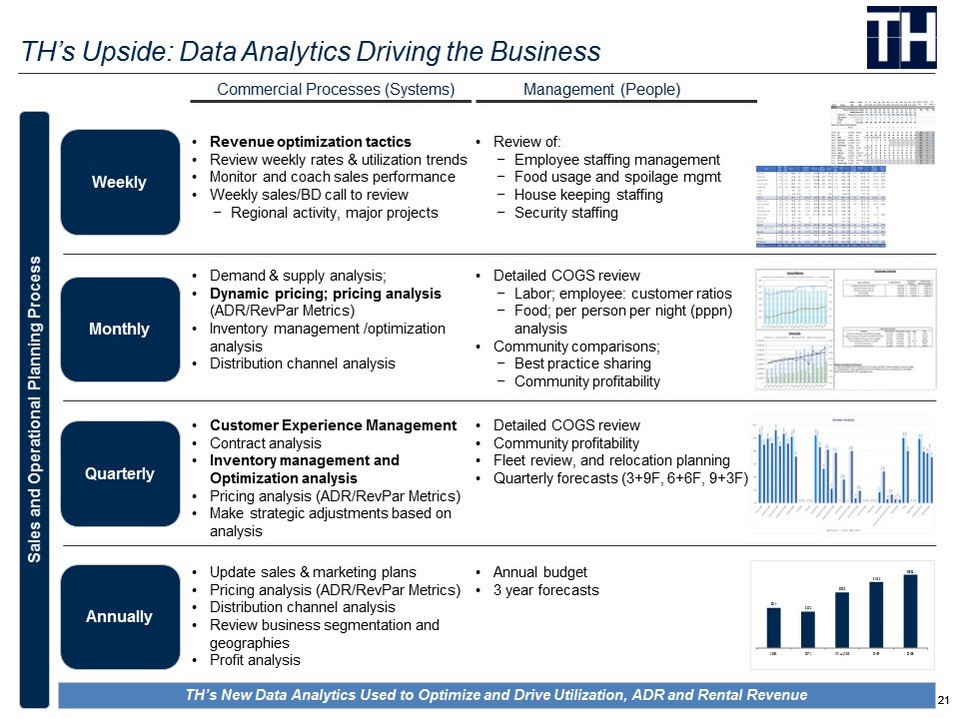
21 21 TH’s Upside: Data Analytics Driving the Business Sales and Operational Planning Process Commercial Processes (Systems) Management (People) • Revenue optimization tactics • Review weekly rates & utilization trends • Monitor and coach sales performance • Weekly sales/BD call to review − Regional activity, major projects Weekly Quarterly Monthly • Detailed COGS review − Labor; employee: customer ratios − Food; per person per night (pppn) analysis • Community comparisons; − Best practice sharing − Community profitability • Update sales & marketing plans • Pricing analysis (ADR/RevPar Metrics) • Distribution channel analysis • Review business segmentation and geographies • Profit analysis • Customer Experience Management • Contract analysis • Inventory management and Optimization analysis • Pricing analysis (ADR/RevPar Metrics) • Make strategic adjustments based on analysis • Review of: − Employee staffing management − Food usage and spoilage mgmt − H ouse keeping staffing − Security staffing • Demand & supply analysis; • Dynamic pricing; pricing analysis (ADR/RevPar Metrics) • Inventory management /optimization analysis • Distribution channel analysis • Annual budget • 3 year forecasts • Detailed COGS review • Community profitability • Fleet review, and relocation planning • Quarterly forecasts (3+9F, 6+6F, 9+3F) Weekly Monthly Quarterly Annually TH’s New Data Analytics Used to Optimize and Drive Utilization, ADR and Rental Revenue $91.1 $82.0 $125.5 $149.3 $165.9 2016A 2017A LTM July 2018 2018F 2019E

22 Illustrative Transaction Framework Click to edit footnote text P F equity value breakdown Ownership PF Shares SPAC shareholders 30.8% 32.5mm SPAC sponsor promote shares 5.8% 6.1mm PIPE shareholders 7.6% 8.0mm Sellers rollover equity 55.9% 59.1mm Total shares outstanding 100.0 % 105.7mm $1,397 $1,503 Uses Cash to sellers $720.0 Sellers roll - over equity $591.0 Deal expenses $25.0 Total uses $1,336.0 Sources EAGL cash in trust (1) $325.0 PIPE raise $80.0 Debt raise $340.0 Sellers roll - over equity $591.0 Total sources $1,336.0 • $1,311mm purchase price − Implied purchase multiple of 7.9x 2019E EBITDA − Assumes 2019E EBITDA of $166mm • SPAC founder shares structured as an earnout , with 6.1mm vesting upfront and the remaining shares vesting 50% at $12.50 and 50% at $15.00 • $80mm PIPE raised alongside the transaction • Assumes $325mm of SPAC proceeds remain in trust at close • The transaction results in a fully - diluted multiple of 8.4x TEV / 2019E EBITDA Transaction Sources and Uses ($mm) Key Transaction Terms Pro Forma Ownership Pro Forma TEV ($mm) (1) Cash in trust at transaction close may be greater than $325mm given the investment yield. Any accrued interest will be added to cash consideration to sellers and an equal amount will be deducted from seller roll - over equity. As of June 30, 2018, accrued interest in the trust is $2.2mm. $340 $340 $325 $358 $80 $88 $591 $650 $61 $67 0.0 200.0 400.0 600.0 800.0 1,000.0 1,200.0 1,400.0 1,600.0 Before announcement Publicly-traded PF company Implied EV Net debt SPAC shareholders PIPE investment Sellers rollover Sponsor shares

23 Characteristic Specialty Rental Market Leaders (1) Market Leader Average Unit Cost $32,400 $3,000 $50,000 (5) Average Daily Rental Rate (2) $30.00 ± $3.33 $70.00 (6) Average Revenue Payback Period (3) ~36 months ~30 months ~24 months Target Time Utilization 80% 75% 95% Average Economic Life 20 years 30 years 20+ years Multiple of Cost Returned Over Asset Life (4) 5.3x 9.0x 9.7x EBITDA Margin ~30% ~35% ~52% Superior ROIC Compared to Specialty Rental Comparables Note: Table analyzes return on new capital investment by specialty rental verticals. (1) Source: Public filings. (2) Average daily rate for WSC and MINI calculated by dividing original unit cost by the average revenue payback period assuming a 3 0 day month. (3) Calculated by dividing original unit cost by the average monthly rental revenue (not time utilization adjusted). (4) Represents utilization adjusted revenue earned over useful life divided by original equipment cost. (5) Represents average cost per bed. (6) Portion of $95 ADR attributed to facilities (73.3%) based on July 2018 YTD revenue. • Superior returns enhanced by positive differentiation in Target business model − Highest profitability – Specialty Rental industry leading EBITDA margins of ~52% − Long - term contracts with entire capital outlay returned through initial contract − Low maintenance expense and superior FCF characteristics − Heightened returns on capital from attached catering and hospitality services
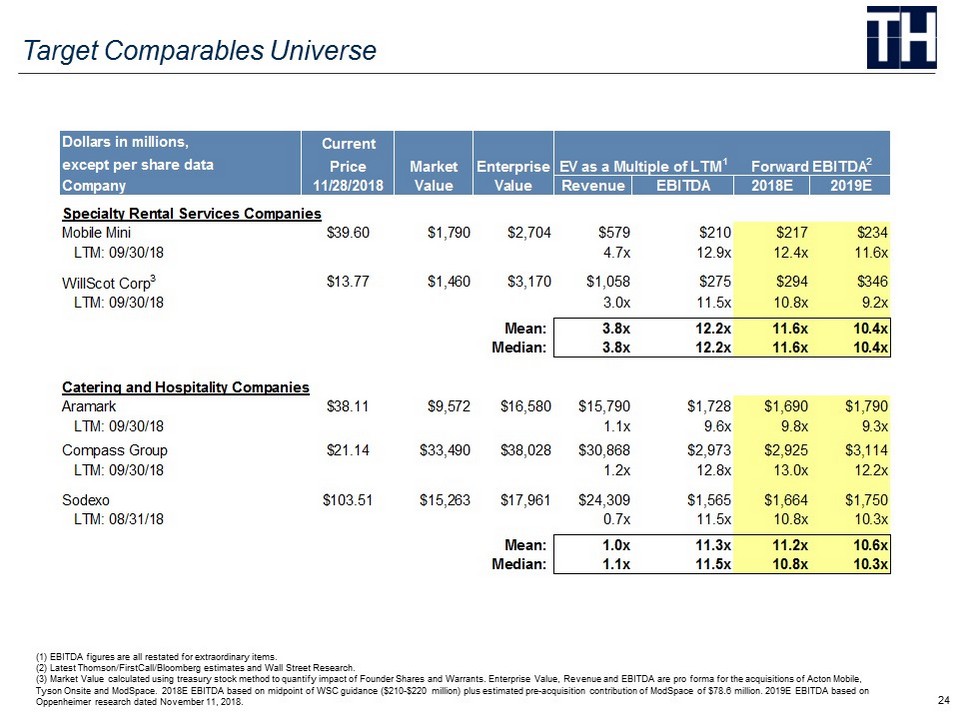
24 (1) EBITDA figures are all restated for extraordinary items. (2) Latest Thomson/ FirstCall /Bloomberg estimates and Wall Street Research. (3) Market Value calculated using treasury stock method to quantify impact of Founder Shares and Warrants. Enterprise Value, Revenue and EBITDA are pro forma for the acquisitions of Acton Mobile, Tyson Onsite and ModSpace . 2018E EBITDA based on midpoint of WSC guidance ($210 - $ 220 million) plus estimated pre - acquisition contribution of ModSpace of $78.6 million. 2019E EBITDA based on Oppenheimer research dated November 11, 2018. Target Comparables Universe Dollars in millions, Current except per share data Price Market Enterprise Forward EBITDA 2 Price/CY EPS 2 Company 11/28/2018 Value Value Revenue EBITDA 2018E 2019E Specialty Rental Services Companies Mobile Mini $39.60 $1,790 $2,704 $579 $210 $217 $234 LTM: 09/30/18 4.7x 12.9x 12.4x 11.6x WillScot Corp 3 $13.77 $1,460 $3,170 $1,058 $275 $294 $346 LTM: 09/30/18 3.0x 11.5x 10.8x 9.2x Mean: 3.8x 12.2x 11.6x 10.4x Median: 3.8x 12.2x 11.6x 10.4x Catering and Hospitality Companies Aramark $38.11 $9,572 $16,580 $15,790 $1,728 $1,690 $1,790 LTM: 09/30/18 1.1x 9.6x 9.8x 9.3x Compass Group $21.14 $33,490 $38,028 $30,868 $2,973 $2,925 $3,114 LTM: 09/30/18 1.2x 12.8x 13.0x 12.2x Sodexo $103.51 $15,263 $17,961 $24,309 $1,565 $1,664 $1,750 LTM: 08/31/18 0.7x 11.5x 10.8x 10.3x Mean: 1.0x 11.3x 11.2x 10.6x Median: 1.1x 11.5x 10.8x 10.3x EV as a Multiple of LTM 1

25