Filed by One Madison Corporation
pursuant to Rule 425 under the Securities Act of 1933
and deemed filed pursuant to Rule 14a-12
under the Securities Exchange Act of 1934
Subject Company: One Madison Corporation
Commission File No. 001-38348
Date: January 29, 2019
The following update and press release was included in the Current Report on Form 8-K filed by One Madison Corporation with the Securities and Exchange Commission on January 29, 2019.
On January 29, 2019, One Madison Corporation (the “Company”) prepared an investor presentation for use in connection with the previously announced business combination pursuant to the Stock Purchase Agreement dated December 12, 2018 by and among the Company, Rack Holdings L.P. and Rack Holdings Inc. pursuant to which One Madison will acquire all of the issued and outstanding equity interests of Rack Holdings Inc., on the terms and subject to the conditions set forth in the Stock Purchase Agreement. A copy of the investor presentation is set forth below.
0 Investor Presentation
1 Disclaimer CAUTION ABOUT FORWARD - LOOKING STATEMENTS The information in this press release may contain “forward - looking statements” within the meaning of Section 27A of the Securiti es Act of 1933, as amended (the “Securities Act”), and Section 21E of the Securities Exchange Act of 1934, as amended (the “Exchange Act”). Our forward - looking statements include, but are not limited to, statements regarding our or our management tea m’s expectations, hopes, beliefs, intentions or strategies regarding the future. Statements that are not historical facts, in clu ding statements about the pending transaction among One Madison Corporation (the “Company”), Rack Holdings L.P. and Rack Holdings Inc . (“ Ranpak ”) and the transactions contemplated thereby, and the parties, perspectives and expectations, are forward - looking statements. In addition, any statements that refer to estimates, projections, forecasts or other characterizations of future ev ents or circumstances, including any underlying assumptions, are forward - looking statements. The words “anticipate,” “believe,” “continue,” “could,” “estimate,” “expect,” “forecast,” “intend,” “may,” “might,” “plan,” “possible,” “potential,” “predict,” “project,” “ sho uld,” “would” and similar expressions may identify forward - looking statements, but the absence of these words does not mean that a statement is not forward - looking. Forward - looking statements in this presentation may include, for example, statements about: our ability to complete our initial business combination; our expectations around the performance of the prospective target business or busi ne ss; our success in retaining or recruiting, or changes required in, our officers, key employees or directors following our initial bu sin ess combination; our officers and directors allocating their time to other businesses and potentially having conflicts of int ere st with our business or in approving our initial business combination; the proceeds of the forward purchase shares being available to us; ou r potential ability to obtain additional financing to complete our initial business combination; our public securities’ poten tia l liquidity and trading; the lack of a market for our securities; the use of proceeds not held in the trust account or available to us from i nte rest income on the trust account balance; the trust account not being subject to claims of third parties; or our financial pe rfo rmance following this offering. The forward - looking statements contained in this presentation are based on our current expectations and beliefs concerning futur e developments and their potential effects on us taking into account information currently available to us. There can be no ass urance that future developments affecting us will be those that we have anticipated. These forward - looking statements involve a number of risks, uncertainties (some of which are beyond our control) or other assumptions that may cause actual results or performa nc e to be materially different from those expressed or implied by these forward - looking statements. These risks include, but are not l imited to: (1) the occurrence of any event, change or other circumstances that could result in the failure to consummate; (2) th e possibility that the terms and conditions set forth in any definitive agreements with respect to the initial business combina tio n may differ materially from the terms and conditions set forth herein; (3) the outcome of any legal proceedings that may be ins tituted against the Company, Ranpak or others following the announcement of the initial business combination and any definitive agreements with respect thereto; (4 ) the inability to complete the initial business combination due to the failure to obtain approval of the stockholders of the Company, to obtain financing to complete the initial business combination or to satisfy other conditions to closing in the definitive agreements with respect to the initial business combination; (5) changes to the proposed structure of the initial business combination that may be required or appropriate as a result of applicable laws or regulations or as a condition to o bta ining regulatory approval of the initial business combination; (6) the ability to meet and maintain NYSE’s listing standards fol lowing the consummation of the initial business combination; (7) the risk that the initial business combination disrupts current plans a nd operations of Ranpak as a result of the announcement and consummation of the initial business combination; (8) costs related to the initial business combination; (9) changes in applicable laws or regulations; (10) the possibility that Ranpak or the Company may be adversely affected by other economic, business, and/or competitive factors; and (11) other risks and un ce rtainties indicated from time to time in filings made with the SEC. Should one or more of these risks or uncertainties materialize, they could cause our actual results to differ materially from the forward - looking statements. We are not undertaking any obligation to update or revise any forward looking statements whether as a result of new information, future events or otherwise. You should not take any statement regard ing past trends or activities as a representation that the trends or activities will continue in the future. Accordingly, you s hould not put undue reliance on these statements. USE OF NON - GAAP FINANCIAL MEASURES This investor presentation includes non - GAAP financial measures for Ranpak , including adjusted EBITDA and free cash flow. Ranpak believes presentation of these non - GAAP measures is useful because they allow management to more effectively evaluate its operating performance and compare the results of its operations from period to period and against its peers without regard to fi nancing methods or capital structure. Management does not consider these non - GAAP measures in isolation or as an alternative to similar financial measures determined in accordance with GAAP. The computations of EBITDA, adjusted EBITDA and free cash flow ma y not be comparable to other similarly titled measures of other companies. These non - GAAP financial measures should not be considered as alternatives to, or more meaningful than, measures of financial performance as determined in accordance with GA AP or as indicators of operating performance. Ranpak is not in a position to reasonably estimate the expected GAAP net income (loss) for fiscal year 2019. However, it expects to generate a GAAP net loss for such period. USE OF PROJECTIONS This presentation includes financial estimates and projections, including with respect to Ranpak’s estimated revenues, net income, EBITDA, adjusted EBITDA, adjusted EBITDA margin, free cash flow and free cash flow conversion f or future periods. Neither Ranpak’s independent auditors, nor the independent registered public accounting firm of the Company, have audited, reviewed, compiled, o r performed any procedures with respect to the estimates and projections for the purpose of their inclusion in this investor presentation, and accordingly, neither of them expressed an opinion or provided any other form of assurance with respect ther eto for the purpose of this investor presentation. You should not place undue reliance on these estimates and projections as they m ay not necessarily be indicative of future results. The assumptions underlying estimated and projected financial information are inherently uncertain and are subject to a wide v ari ety of significant business, economic and competitive risks and uncertainties that could cause actual results to differ mater ial ly from those contained in the prospective financial information. Accordingly, there can be no assurance that the estimated and proje cte d results are indicative of the future performance of Ranpak or the Company or that actual results will not differ materially from those estimated or projected results presented . Inclusion of the estimated and projected financial information in this presentatio n s hould not be regarded as a representation by any person that the results contained in the estimated and projected financial i nfo rmation will be achieved. NO OFFER OR SOLICITATION This presentation is for informational purposes only and shall not constitute an offer to sell or the solicitation of an offe r t o buy any securities pursuant to the proposed business combination or otherwise, nor shall there be any sale of securities in an y jurisdiction in which the offer, solicitation or sale would be unlawful prior to the registration or qualification under the securities laws of any jurisdiction. No offer or securities shall be made except by means of a prospectus meeting the requirements of Section 10 of the Securities Act. ADDITIONAL INFORMATION In connection with the proposed acquisition, the Company will file a proxy statement/prospectus with the Securities and Excha nge Commission (the “ SEC ”). STOCKHOLDERS ARE ADVISED TO READ THE proxy statement/prospectus WHEN IT BECOMES AVAILABLE BECAUSE IT WILL CONTAIN IMPORTANT INFORMATION. Stockholders may obtain a free copy of the proxy statement/prospectu s ( when available) and any other relevant documents filed with the SEC from the SEC’s website at http://www.sec.gov. In addition, stockholders will be able to obtain, without charge, a copy of the proxy statement/prospectu s and other relevant documents (when available) at the Company’s website at http://www.onemadisoncorp.com/corporate - governance -- investor - relations.html or by contacting the Company’s investor relations department via e - mail at info@onemadisongroup.com. PARTICIPANTS IN THE SOLICITATION The Company and its directors, executive officers and other members of its management and employees may be deemed to be parti cip ants in the solicitation of proxies from the Company’s stockholders with respect to the proposed acquisition. Information abo ut the Company’s directors and executive officers and their ownership of the Company’s common stock is set forth in the Company’ s f iling with the SEC on (i) Form S - 1, dated as of October 13, 2017, as amended on January 5, 2018 and (ii) Form 10 - K, dated as of March 29, 2018, as supplemented by the Reports on Form 8 - K filed on May 23, 2018, September 13, 2018, and December 13, 2018. Stockholders may obtain additional information regarding the direct and indirect interests of the participants in the solicitation of proxies in connection with the proposed acquisition, including the interests of the Company’s directors and e xec utive officers in the proposed acquisition, which may be different than those of the Company’s stockholders generally, by rea din g the proxy statement/prospectus and other relevant documents regarding the proposed acquisition, which will be filed with the SEC.

2 Table of contents Introduction Ranpak Business Overview Industry Overview Growth Opportunities 4 3 2 1 Appendix Financial and Valuation Overview 5

The Paper Packaging Experts ™ 3 Introduction
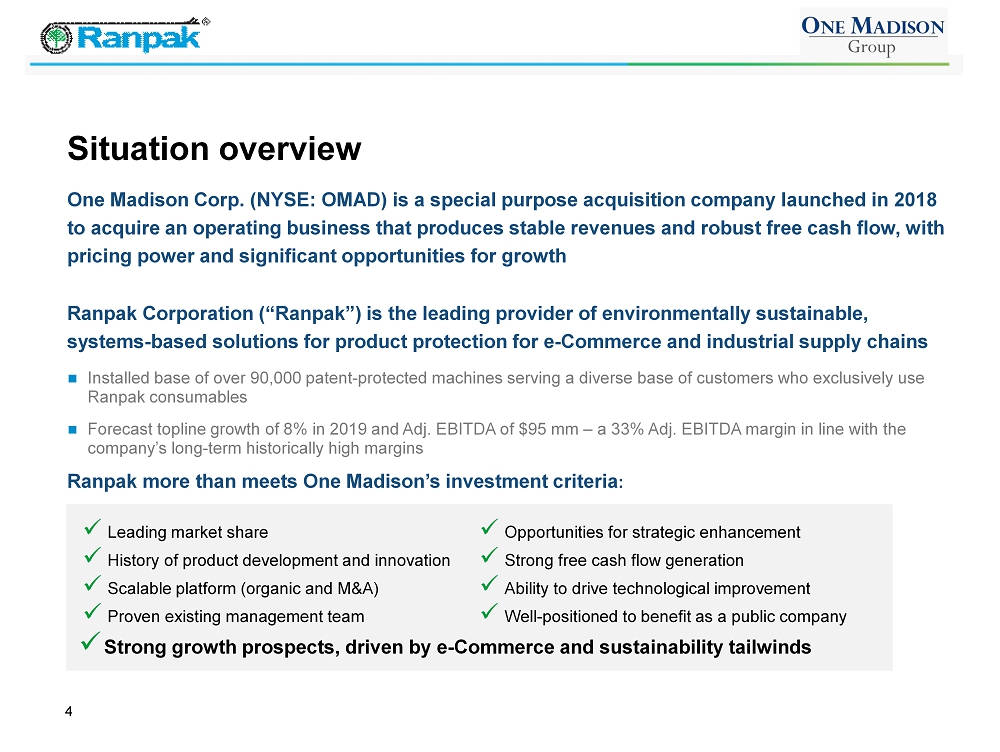
4 Situation overview One Madison Corp. (NYSE: OMAD) is a special purpose acquisition company launched in 2018 to acquire an operating business that produces stable revenues and robust free cash flow, with pricing power and significant opportunities for growth Ranpak Corporation (“Ranpak”) is the leading provider of environmentally sustainable, systems - based solutions for product protection for e - Commerce and industrial supply chains Installed base of over 90,000 patent - protected machines serving a diverse base of customers who exclusively use Ranpak consumables Forecast topline growth of 8% in 2019 and Adj. EBITDA of $95 mm – a 33% Adj. EBITDA margin in line with the company’s long - term historically high margins Ranpak more than meets One Madison’s investment criteria : x Leading market share x History of product development and innovation x Scalable platform (organic and M&A) x Proven existing management team x Opportunities for strategic enhancement x Strong free cash flow generation x Ability to drive technological improvement x Well - positioned to benefit as a public company x Strong growth prospects, driven by e - Commerce and sustainability tailwinds
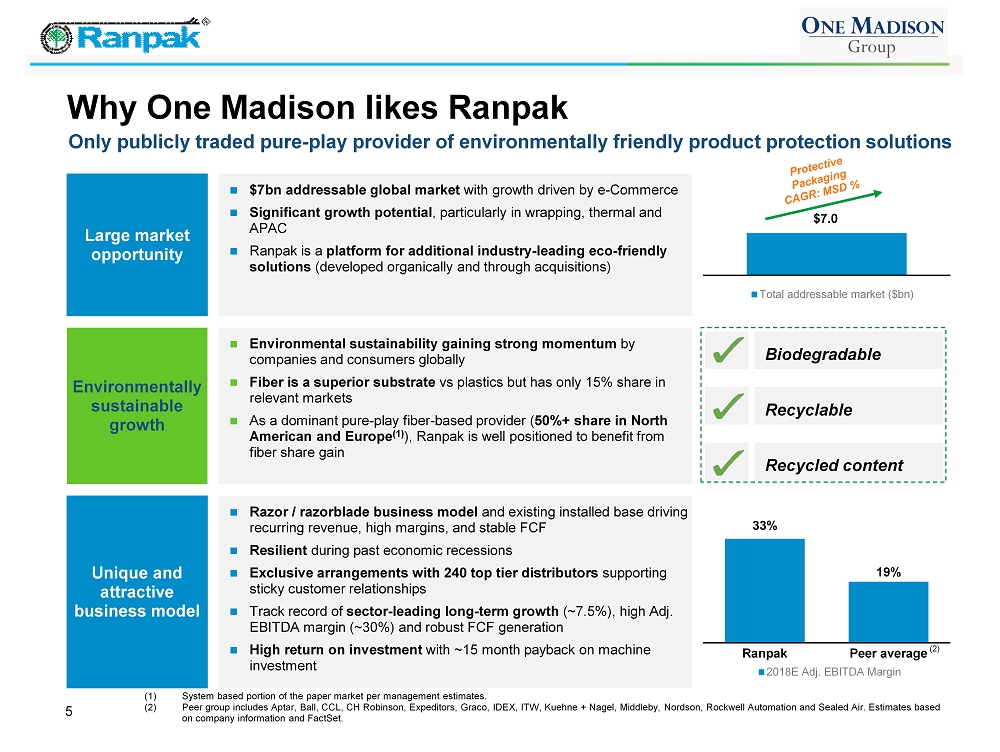
5 Why One Madison likes Ranpak $7bn addressable global market with growth driven by e - Commerce Significant growth potential , particularly in wrapping, thermal and APAC Ranpak is a platform for additional industry - leading eco - friendly solutions (developed organically and through acquisitions) (1) System based portion of the paper market per management estimates. (2) Peer group includes Aptar , Ball, CCL, CH Robinson, Expeditors, Graco, IDEX, ITW, Kuehne + Nagel, Middleby , Nordson, Rockwell Automation and Sealed Air. Estimates based on company information and FactSet. Environmental sustainability gaining strong momentum by companies and consumers globally Fiber is a superior substrate vs plastics but has only 15% share in relevant markets As a dominant pure - play fiber - based provider ( 50%+ share in North American and Europe (1) ), Ranpak is well positioned to benefit from fiber share gain Razor / razorblade business model and existing installed base driving recurring revenue, high margins, and stable FCF Resilient during past economic recessions Exclusive arrangements with 240 top tier distributors supporting sticky customer relationships Track record of sector - leading long - term growth (~7.5%), high Adj. EBITDA margin (~30%) and robust FCF generation High return on investment with ~15 month payback on machine investment Large market opportunity Environmentally sustainable growth Unique and attractive business model from now and what the Biodegradable Recyclable Recycled content 33% 19% Ranpak Peer average 2018E Adj. EBITDA Margin $7.0 Total addressable market ($bn) Only publicly traded pure - play provider of environmentally friendly product protection solutions (2)

6 The circular economy demands sustainable solutions Environmental sustainability mindshare is accelerating among policymakers, companies, and consumers Source: Citi “Rethinking Single - Use Plastics August 2018”. Straws Cotton buds Cutlery European Union All plastic packaging must be recyclable or reusable by 2030 Leading position on plastics regulation United Kingdom Scotland Matching EU’s goals for 2030 Considering bans, taxes & deposit schemes on plastic products Sweden Cutlery ban begins in 2020 France Banning all single - use plastics by 2030 Taiwan Various cities have banned single - use plastics but there are no statewide or national initiatives United States Banning all single - use plastics by 2030 Italy Maharashtra has banned all single - use plastics; planning country - wide implementation in 2022 India Alameda, Carmel, Manhattan Beach, Oakland, Richmond, Berkeley Davis, Malibu, San Luis California Florida Miami Beach, Fort Myers Washington Seattle, Edmonds New Jersey Monmouth Beach Customer preferences are driving regulators’ response – Ranpak is the beneficiary of customer preferences on one side and legislative / regulatory responses on the other
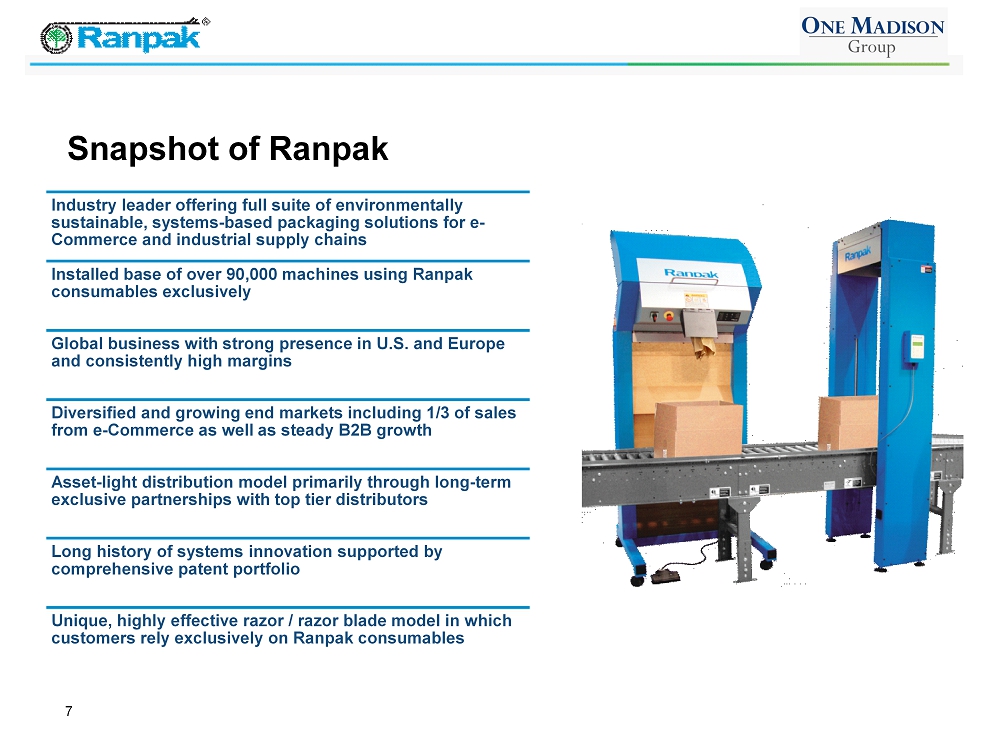
7 Snapshot of Ranpak Industry leader offering full suite of environmentally sustainable, systems - based packaging solutions for e - Commerce and industrial supply chains Installed base of over 90,000 machines using Ranpak consumables exclusively Global business with strong presence in U.S. and Europe and consistently high margins Diversified and growing end markets including 1/3 of sales from e - Commerce as well as steady B2B growth Asset - light distribution model primarily through long - term exclusive partnerships with top tier distributors Long history of systems innovation supported by comprehensive patent portfolio Unique, highly effective razor / razor blade model in which customers rely exclusively on Ranpak consumables
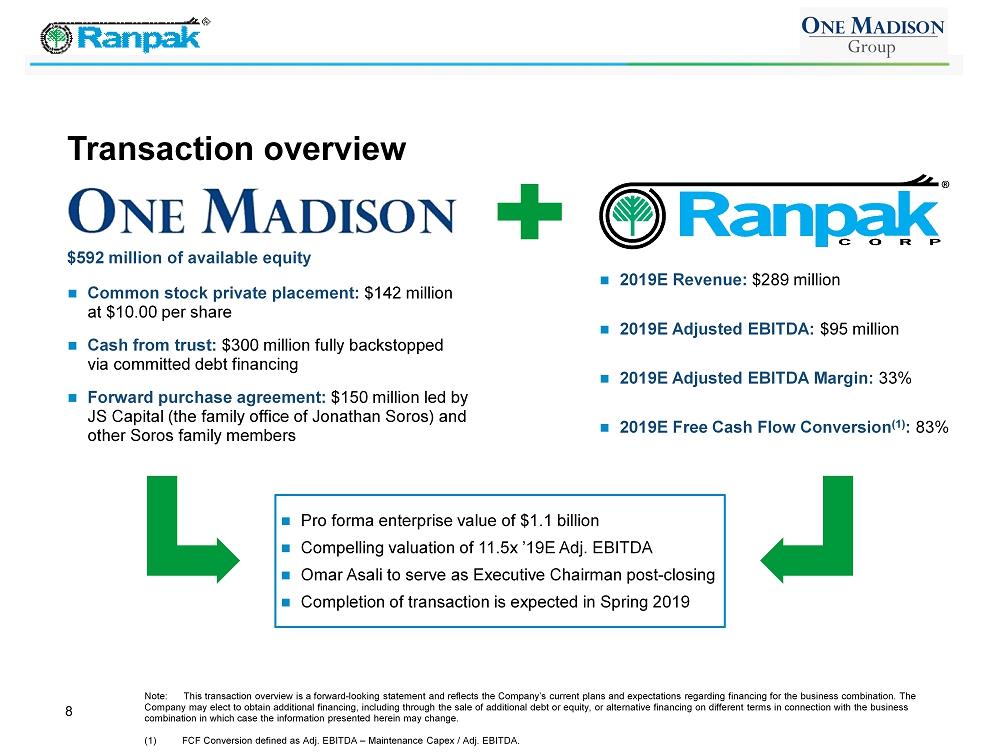
8 Transaction overview Pro forma enterprise value of $1.1 billion Compelling valuation of 11.5x ’19E Adj. EBITDA Omar Asali to serve as Executive Chairman post - closing Completion of transaction is expected in Spring 2019 $592 million of available equity Common stock private placement: $142 million at $10.00 per share Cash from trust: $300 million fully backstopped via committed debt financing Forward purchase agreement: $150 million led by JS Capital (the family office of Jonathan Soros) and other Soros family members 2019E Revenue: $289 million 2019E Adjusted EBITDA: $95 million 2019E Adjusted EBITDA Margin: 33% 2019E Free Cash Flow Conversion (1) : 83% Note: This transaction overview is a forward - looking statement and reflects the Company’s current plans and expectations regardi ng financing for the business combination. The Company may elect to obtain additional financing, including through the sale of additional debt or equity, or alternative fin anc ing on different terms in connection with the business combination in which case the information presented herein may change. (1) FCF Conversion defined as Adj. EBITDA – Maintenance Capex / Adj. EBITDA.

Public investors 43% Anchor investors 28% Private placement 21% Sponsor promote 8% 9 Transaction structure Note: The sources and uses of funds presented herein are forward - looking statements and reflect the Company’s current plans and expectations regarding financing for the business combination. The Company may elect to obtain additional financing, including through the sale of additional debt or equity, or alternative fin anc ing on different terms in connection with the business combination in which case the information presented herein may change. (1) Includes 30 million public shares, 15 million forward purchase shares, 14.2 million shares from common stock private placeme nt, 9 million promote shares and 0.8 million shares related to the proposed exchange of 8 million private placement warrants for shares. Excludes 2.3 million earnout shares. None of the holders of the private placement warrants have committed to participate in the proposed private placement warrant exchange, and there can be no assurances that any such holders will participate in suc h e xchange. (2) 7.0% of the 2.3 million shares (or 157.5 thousand) are held by BSOF and released at a price of $12.25. (3) Public investors include any shares purchased by BSOF in the IPO. Anchor investors includes the 15 million FPA, 3.8 million associated founder shares and 0.8 million shares via the private placement warrant exchange. Sponsor promote excludes any founder shares associated with the FPA and the earnout shares. Common stock private placement in the amount of 14.2 million shares at $10.00 per share 2.3 million of the sponsor promote shares subject to an earnout at a price of $12.50 (2) − Represents 30% of the 7.5 million Class B shares related to the IPO Proposed conversion of 8.0 million private placement warrants into 0.8 million shares Cash in trust fully backstopped via committed debt financing − 7 Year Term Loan at L + 3.750% Structural overview Implied firm value Sources and uses Ownership (3) ($ in mm, except per share values) Shares outstanding (mm) 69.0 Share price $10.00 Equity value $690 Net debt 399 Enterprise value $1,089 Transaction and leverage multiples EV / '19E EBITDA ($95) 11.5x Net debt ($399) / '19E EBITDA ($95) 4.2 (1) ($ in mm) Sources Cash in trust $300 Anchor investors 150 Additional equity 142 New debt 407 Total sources $999 Uses Purchase price $950 Transaction fees 41 Cash to balance sheet 8 Total uses $999
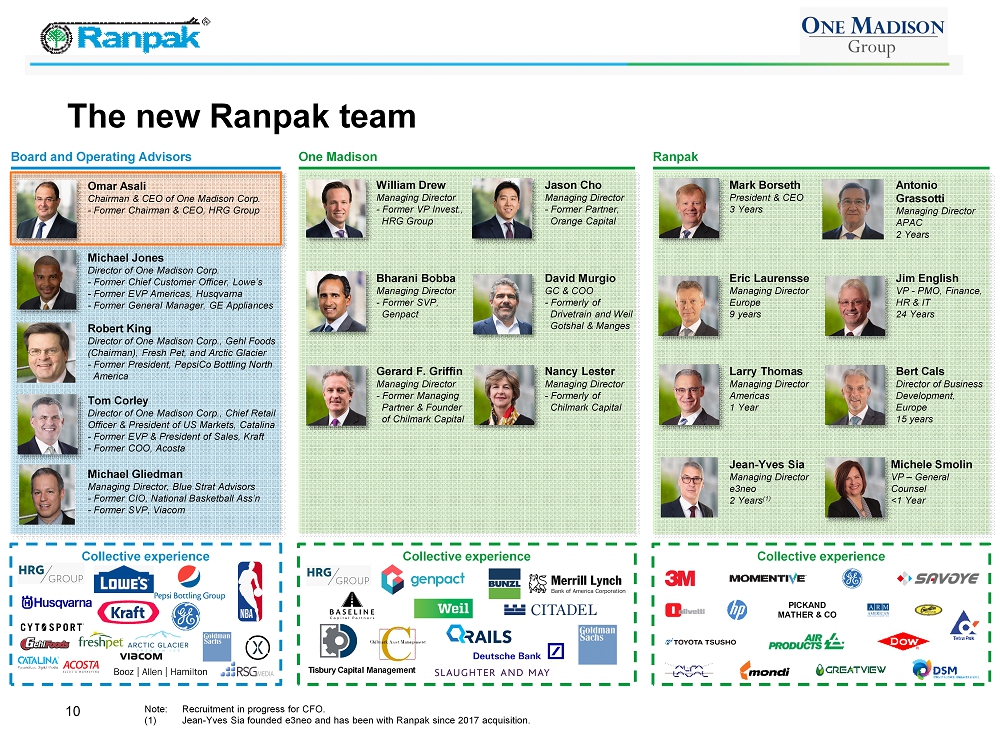
The new Ranpak team Board and Operating Advisors 10 Ranpak Collective experience Collective experience PICKAND MATHER & CO Omar Asali Chairman & CEO of One Madison Corp. - Former Chairman & CEO, HRG Group Robert King Director of One Madison Corp., Gehl Foods (Chairman), Fresh Pet, and Arctic Glacier - Former President, PepsiCo Bottling North America Tom Corley Director of One Madison Corp., Chief Retail Officer & President of US Markets, Catalina - Former EVP & President of Sales, Kraft - Former COO, Acosta Michael Gliedman Managing Director, Blue Strat Advisors - Former CIO, National Basketball Ass’n - Former SVP, Viacom Mark Borseth President & CEO 3 Years Antonio Grassotti Managing Director APAC 2 Years Eric Laurensse Managing Director Europe 9 years Jim English VP - PMO, Finance, HR & IT 24 Years Larry Thomas Managing Director Americas 1 Year Bert Cals Director of Business Development, Europe 15 years Jean - Yves Sia Managing Director e3neo 2 Years (1) One Madison Collective experience Note: Recruitment in progress for CFO. (1) Jean - Yves Sia founded e3neo and has been with Ranpak since 2017 acquisition. William Drew Managing Director - Former VP Invest., HRG Group Bharani Bobba Managing Director - Former SVP, Genpact Gerard F. Griffin Managing Director - Former Managing Partner & Founder of Chilmark Capital Jason Cho Managing Director - Former Partner, Orange Capital David Murgio GC & COO - Formerly of Drivetrain and Weil Gotshal & Manges Nancy Lester Managing Director - Formerly of Chilmark Capital Tisbury Capital Management Michael Jones Director of One Madison Corp. - Former Chief Customer Officer, Lowe’s - Former EVP Americas, Husqvarna - Former General Manager, GE Appliances Michele Smolin VP – General Counsel <1 Year
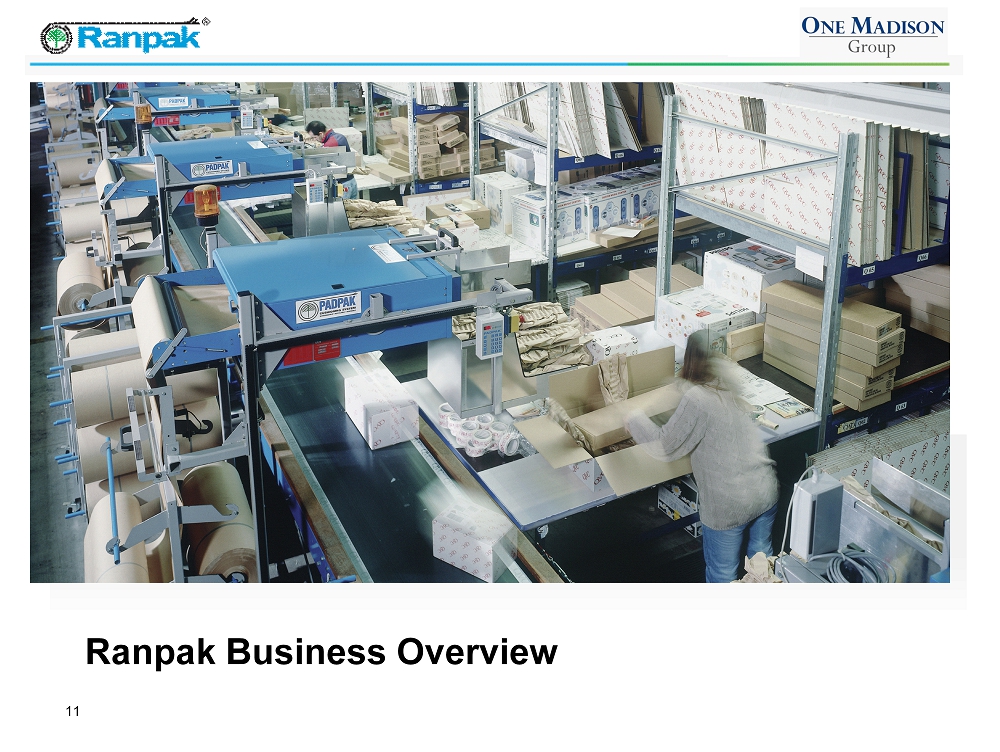
The Paper Packaging Experts ™ 11 Ranpak Business Overview
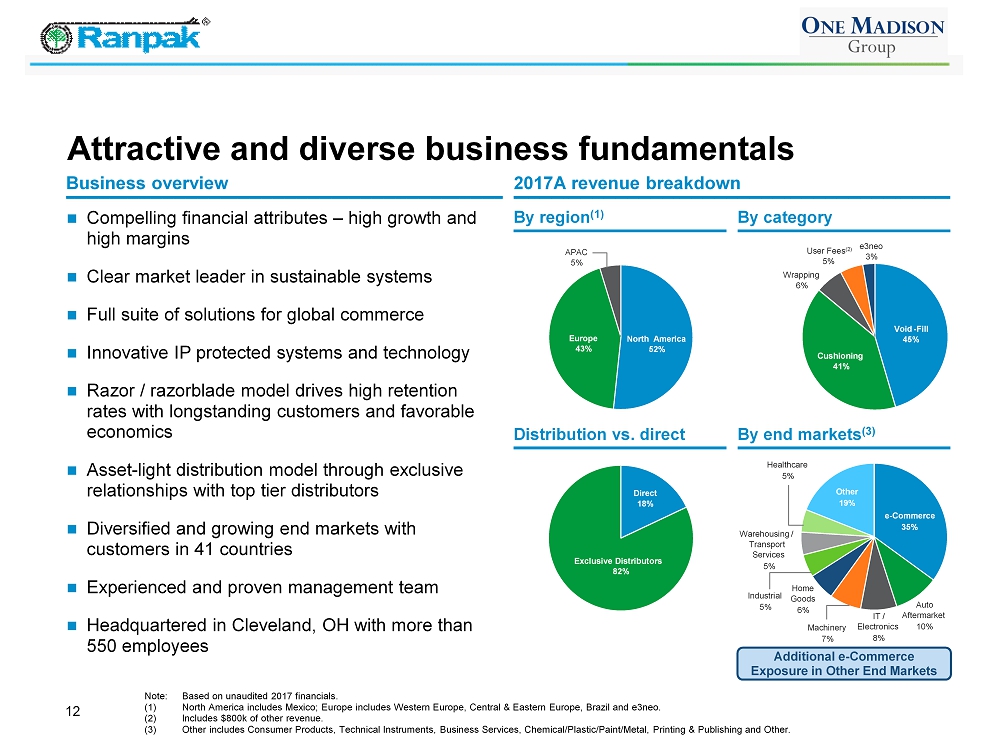
12 Attractive and diverse business fundamentals Compelling financial attributes – high growth and high margins Clear market leader in sustainable systems Full suite of solutions for global commerce Innovative IP protected systems and technology Razor / razorblade model drives high retention rates with longstanding customers and favorable economics Asset - light distribution model through exclusive relationships with top tier distributors Diversified and growing end markets with customers in 41 countries Experienced and proven management team Headquartered in Cleveland, OH with more than 550 employees Note: Based on unaudited 2017 financials. (1) North America includes Mexico; Europe includes Western Europe, Central & Eastern Europe, Brazil and e3neo. (2) Includes $800k of other revenue. (3) Other includes Consumer Products, Technical Instruments, Business Services, Chemical/Plastic/Paint/Metal, Printing & Publish ing and Other. 2017A revenue breakdown Business overview By region (1) By category Distribution vs. direct By end markets (3) Additional e - Commerce Exposure in Other End Markets Void - Fill 45% Cushioning 41% Wrapping 6% User Fees (2) 5% e3neo 3% Europe 43% APAC 5% North America 52% Direct 18% Exclusive Distributors 82% e - Commerce 35% Auto Aftermarket 10% IT / Electronics 8% Machinery 7% Home Goods 6% Industrial 5% Warehousing / Transport Services 5% Healthcare 5% Other 19%
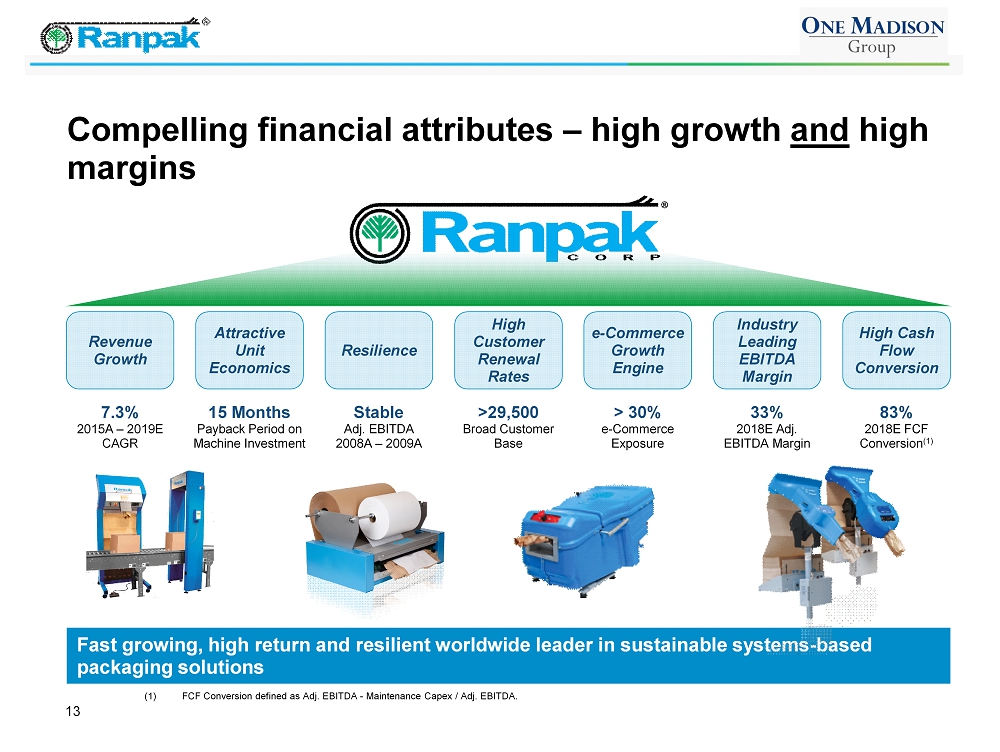
13 Fast growing, high return and resilient worldwide leader in sustainable systems - based packaging solutions Compelling financial attributes – high growth and high margins (1) FCF Conversion defined as Adj. EBITDA - Maintenance Capex / Adj. EBITDA. >29,500 Broad Customer Base 15 Months Payback Period on Machine Investment 83% 2018E FCF Conversion (1) 33% 2018E Adj. EBITDA Margin > 30% e - Commerce Exposure Revenue Growth Industry Leading EBITDA Margin High Cash Flow Conversion Attractive Unit Economics Resilience High Customer Renewal Rates e - Commerce Growth Engine Stable Adj. EBITDA 2008A – 2009A 7.3% 2015A – 2019E CAGR
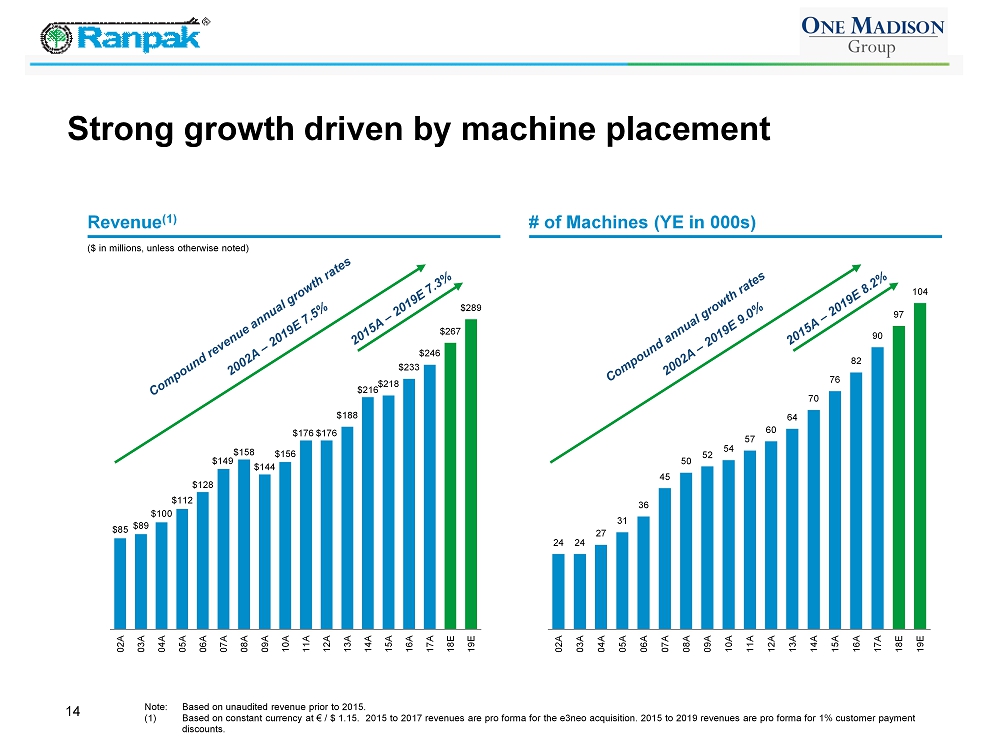
24 24 27 31 36 45 50 52 54 57 60 64 70 76 82 90 97 104 02A 03A 04A 05A 06A 07A 08A 09A 10A 11A 12A 13A 14A 15A 16A 17A 18E 19E 14 Strong growth driven by machine placement $85 $89 $100 $112 $128 $149 $158 $144 $156 $176 $176 $188 $216 $218 $233 $246 $267 $289 02A 03A 04A 05A 06A 07A 08A 09A 10A 11A 12A 13A 14A 15A 16A 17A 18E 19E Note: Based on unaudited revenue prior to 2015. (1) Based on constant currency at € / $ 1.15. 2015 to 2017 revenues are pro forma for the e3neo acquisition. 2015 to 2019 reven ues are pro forma for 1% customer payment discounts. ($ in millions, unless otherwise noted) Revenue (1) # of Machines (YE in 000s)
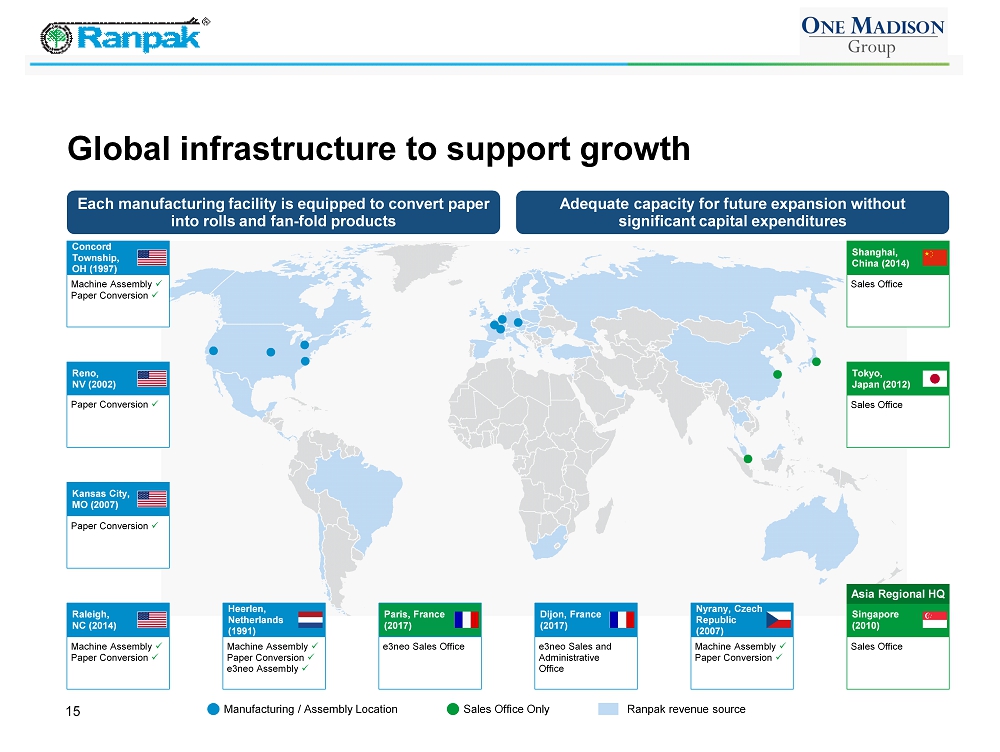
15 Global infrastructure to support growth Concord Township, OH (1997) Machine Assembly x Paper Conversion x Shanghai , China (2014) Sales Office Tokyo, Japan (2012) Sales Office Heerlen, Netherlands (1991) Machine Assembly x Paper Conversion x e3neo Assembly x Reno , NV (2002) Paper Conversion x Kansas City, MO (2007) Paper Conversion x Raleigh, NC (2014) Machine Assembly x Paper Conversion x Singapore (2010) Sales Office Asia Regiona l HQ Each manufacturing facility is equipped to convert paper into rolls and fan - fold products Adequate capacity for future expansion without significant capital expenditures Nyrany, Czech Republic (2007) Machine Assembly x Paper Conversion x Paris, France (2017) e3neo Sales Office Dijon, France (2017) e3neo Sales and Administrative Office Manufacturing / Assembly Location Sales Office Only Ranpak revenue source
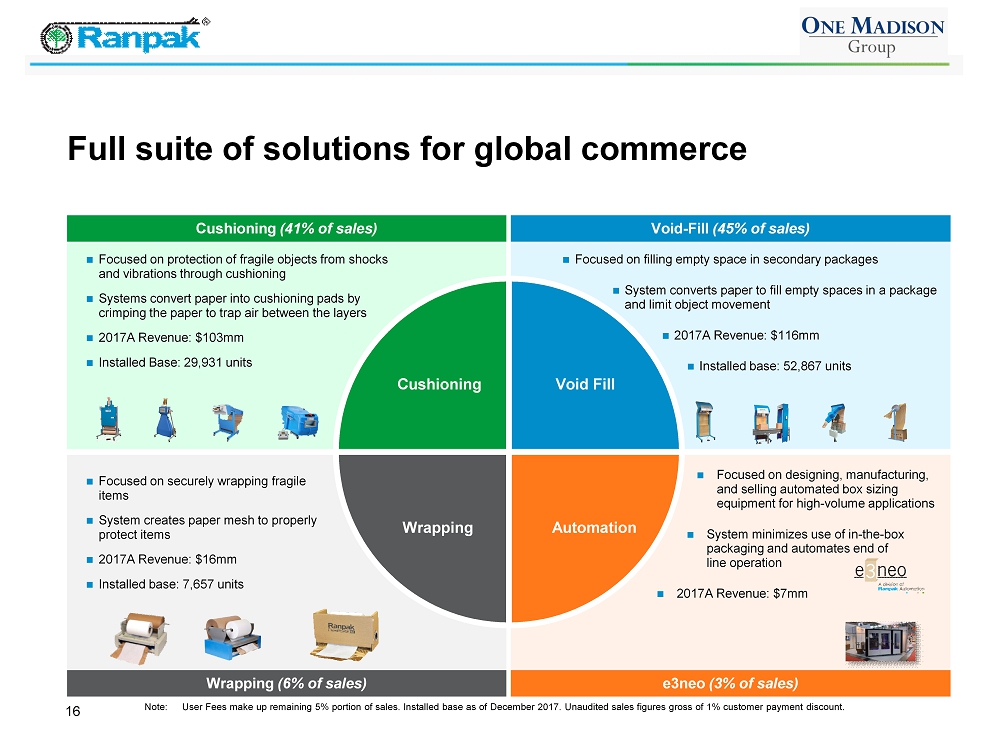
Note: User Fees make up remaining 5% portion of sales. Installed base as of December 2017. Unaudited sales figures gross of 1% c ustomer payment discount. 16 Full suite of solutions for global commerce Wrapping (6% of sales) Cushioning (41% of sales) e3neo (3% of sales) Void - Fill (45% of sales) Focused on filling empty space in secondary packages System converts paper to fill empty spaces in a package and limit object movement 2017A Revenue: $116mm Installed base: 52,867 units Focused on protection of fragile objects from shocks and vibrations through cushioning Systems convert paper into cushioning pads by crimping the paper to trap air between the layers 2017A Revenue: $103mm Installed Base: 29,931 units Focused on designing, manufacturing, and selling automated box sizing equipment for high - volume applications System minimizes use of in - the - box packaging and automates end of line operation 2017A Revenue: $7mm Focused on securely wrapping fragile items System creates paper mesh to properly protect items 2017A Revenue: $16mm Installed base: 7,657 units Void Fill Automation Wrapping Cushioning
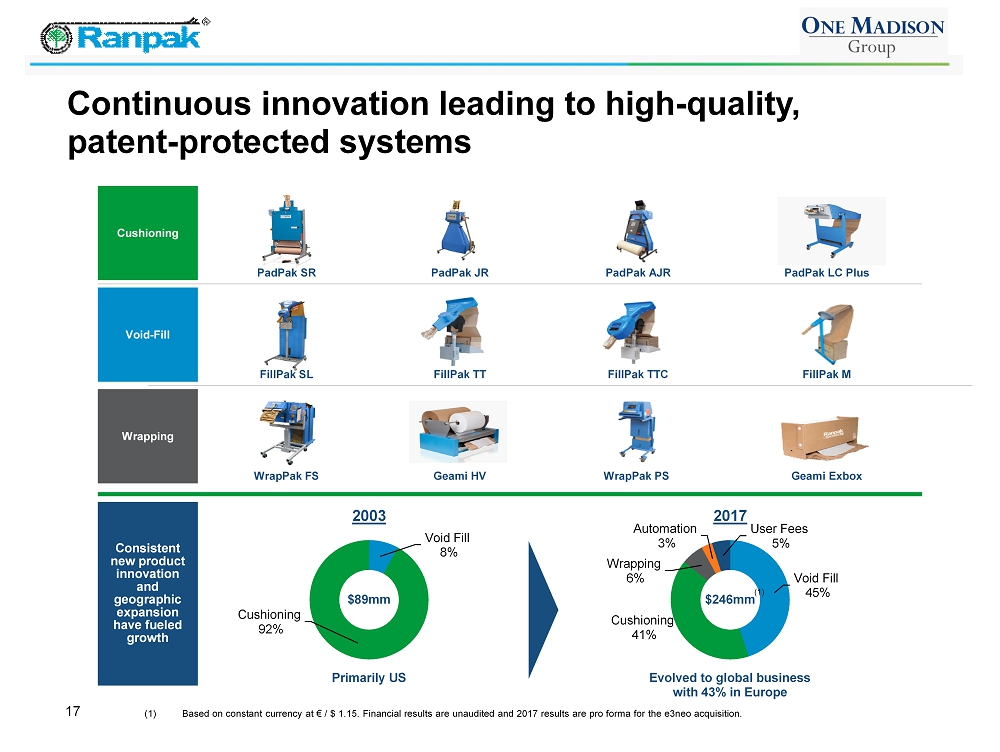
Void Fill 8% Cushioning 92% Void Fill 45% Cushioning 41% Wrapping 6% Automation 3% User Fees 5% 17 Continuous innovation leading to high - quality, patent - protected systems WrapPak PS WrapPak FS Geami HV Wrapping Geami Exbox Consistent new product innovation and geographic expansion have fueled growth 2003 2017 (1) Based on constant currency at € / $ 1.15. Financial results are unaudited and 2017 results are pro forma for the e3neo acqui sition. $89mm $246mm PadPak AJR PadPak SR PadPak JR Cushioning PadPak LC Plus FillPak TTC FillPak SL FillPak TT Void - Fill FillPak M Primarily US Evolved to global business with 43% in Europe (1)
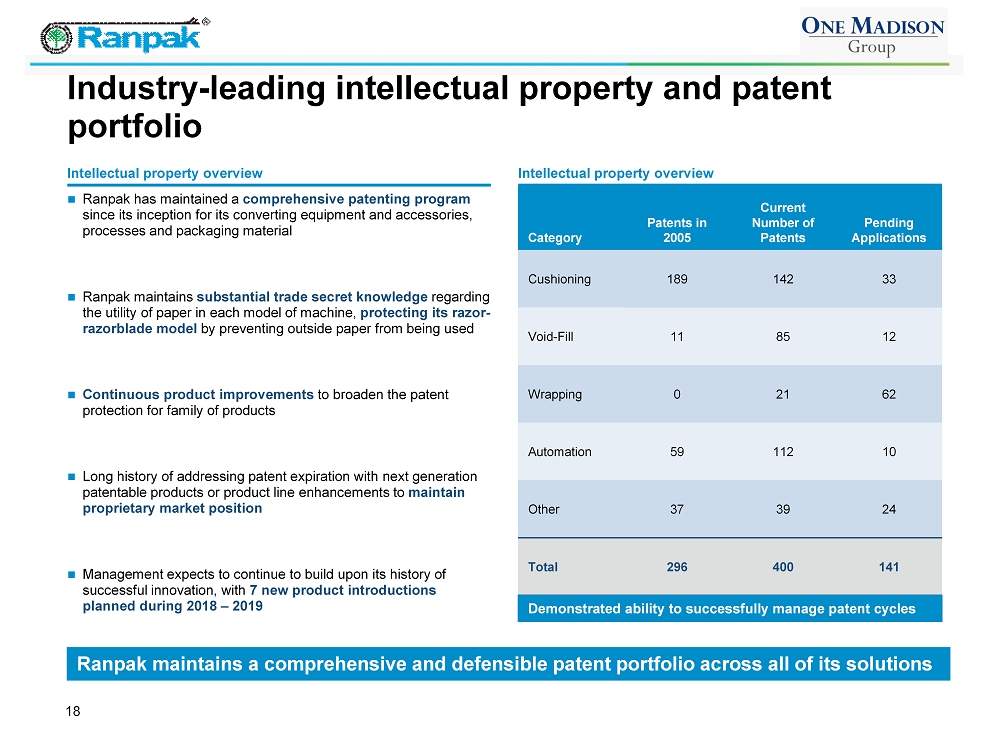
Industry - leading intellectual property and patent portfolio 18 Intellectual property overview Ranpak has maintained a comprehensive patenting program since its inception for its converting equipment and accessories, processes and packaging material Ranpak maintains substantial trade secret knowledge regarding the utility of paper in each model of machine, protecting its razor - razorblade model by preventing outside paper from being used Continuous product improvements to broaden the patent protection for family of products Long history of addressing patent expiration with next generation patentable products or product line enhancements to maintain proprietary market position Management expects to continue to build upon its history of successful innovation, with 7 new product introductions planned during 2018 – 2019 Intellectual property overview Category Patents in 2005 Current Number of Patents Pending Applications Cushioning 189 142 33 Void - Fill 11 85 12 Wrapping 0 21 62 Automation 59 112 10 Other 37 39 24 Total 296 400 141 Ranpak maintains a comprehensive and defensible patent portfolio across all of its solutions Demonstrated ability to successfully manage patent cycles
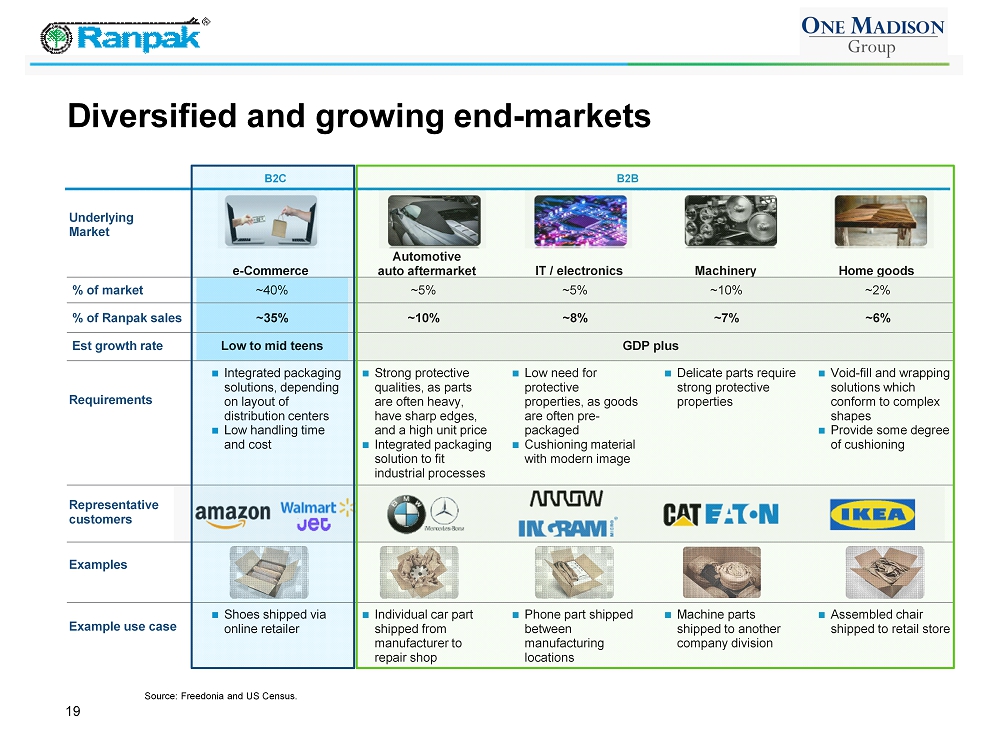
% of market ~40% ~5% ~5% ~10% ~2% % of Ranpak sales ~35% ~10% ~8% ~7% ~6% Est growth rate Low to mid teens GDP plus B2C B2B 19 Diversified and growing end - markets Source: Freedonia and US Census. Underlying Market e - Commerce Automotive auto aftermarket IT / electronics Machinery Home goods Integrated packaging solutions, depending on layout of distribution centers Low handling time and cost Strong protective qualities, as parts are often heavy, have sharp edges, and a high unit price Integrated packaging solution to fit industrial processes Low need for protective properties, as goods are often pre - packaged Cushioning material with modern image Delicate parts require strong protective properties Void - fill and wrapping solutions which conform to complex shapes Provide some degree of cushioning Requirements Representative customers Examples Shoes shipped via online retailer Individual car part shipped from manufacturer to repair shop Phone part shipped between manufacturing locations Machine parts shipped to another company division Assembled chair shipped to retail store Example use case
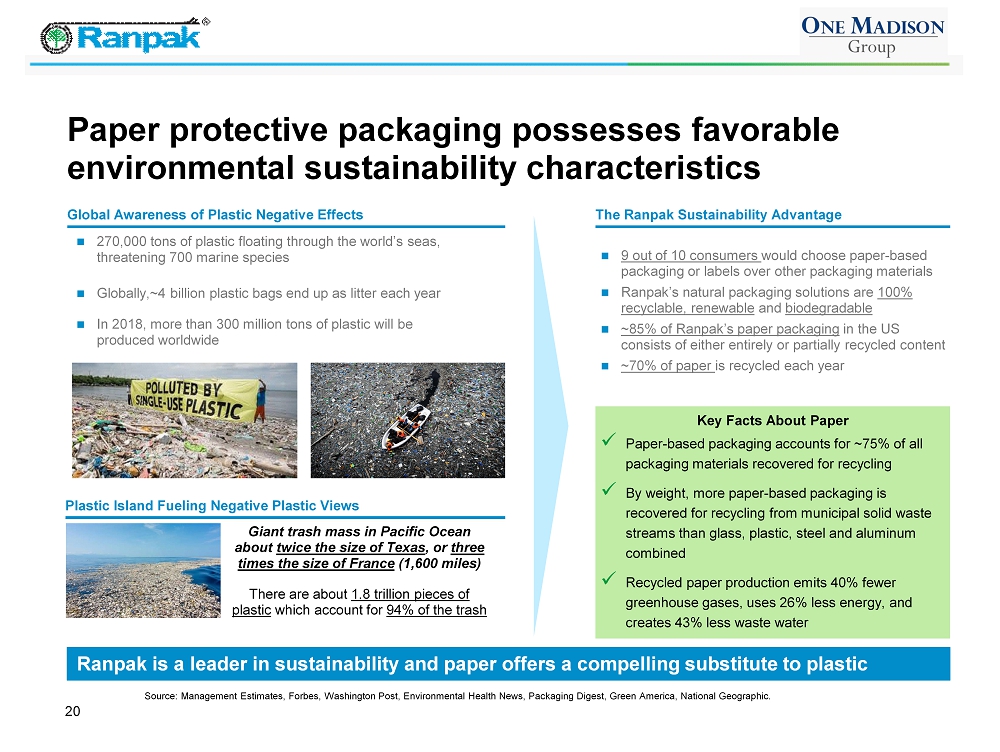
20 Ranpak is a leader in sustainability and paper offers a compelling substitute to plastic Paper protective packaging possesses favorable environmental sustainability characteristics 9 out of 10 consumers would choose paper - based packaging or labels over other packaging materials Ranpak’s natural packaging solutions are 100% recyclable, renewable and biodegradable ~85% of Ranpak’s paper packaging in the US consists of either entirely or partially recycled content ~70% of paper is recycled each year The Ranpak Sustainability Advantage Global Awareness of Plastic Negative Effects 270,000 tons of plastic floating through the world’s seas, threatening 700 marine species Globally,~4 billion plastic bags end up as litter each year In 2018, more than 300 million tons of plastic will be produced worldwide Plastic Island Fueling Negative Plastic Views There are about 1.8 trillion pieces of plastic which account for 94% of the trash Giant trash mass in Pacific Ocean about twice the size of Texas , or three times the size of France (1,600 miles) Key Facts About Paper x Paper - based packaging accounts for ~75% of all packaging materials recovered for recycling x By weight, more paper - based packaging is recovered for recycling from municipal solid waste streams than glass, plastic, steel and aluminum combined x Recycled paper production emits 40% fewer greenhouse gases, uses 26% less energy, and creates 43% less waste water Source: Management Estimates, Forbes, Washington Post, Environmental Health News, Packaging Digest, Green America, National G eog raphic.
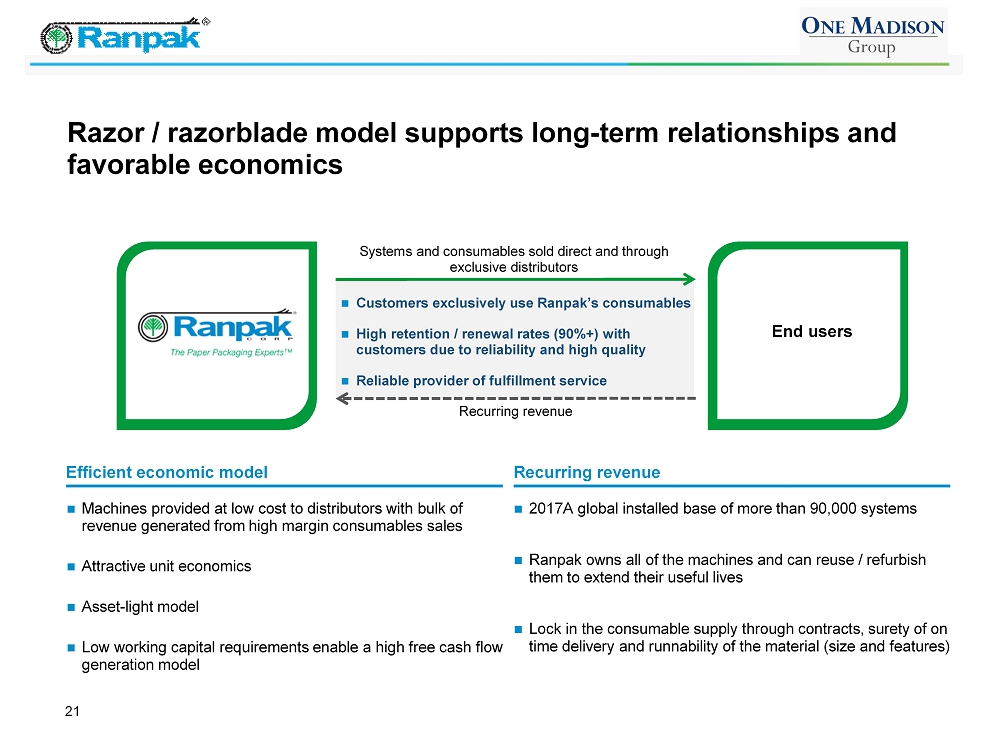
Customers exclusively use Ranpak’s consumables High retention / renewal rates (90%+) with customers due to reliability and high quality Reliable provider of fulfillment service 21 Razor / razorblade model supports long - term relationships and favorable economics Machines provided at low cost to distributors with bulk of revenue generated from high margin consumables sales Attractive unit economics Asset - light model Low working capital requirements enable a high free cash flow generation model Recurring revenue Efficient economic model 2017A global installed base of more than 90,000 systems Ranpak owns all of the machines and can reuse / refurbish them to extend their useful lives Lock in the consumable supply through contracts, surety of on time delivery and runnability of the material (size and features) 26,000+ End Users 230+ Distributors End users 230+ Distributors Systems and consumables sold direct and through exclusive distributors Recurring revenue

E - Commerce Auto OE & aftermarket IT / electronics Machinery Home goods Revenue breakdown by relationship length (1) Number of distributor - serviced accounts by size (1) 22 Exclusive distribution network enables sales reach to thousands of small, fragmented end - users while maintaining an asset - light capital base and lean salesforce Asset - light distribution model through long - term exclusive partnerships with top tier distributors Sells value - added consumables to end - users through an established network of more than 240 exclusive distributors worldwide − End - users are contractually committed to buy Ranpak’s high margin and specialized consumables, and they do – customers rely on Ranpak ‘s unique specifications, characteristics and surety of supply The distribution network grants Ranpak flexibility to sell to thousands of end - users with a lean salesforce Very strong relationships with distributors, with many lasting over 20 years and very limited turnover Fragmented end - user base with small average account size , granting Ranpak pricing power and competitive barrier − Select accounts are served directly − Customers in diverse set of end markets mitigates macroeconomic risk Long - standing customer partnerships Exclusive distributors > $75k 3% $35k - $75k 3% $10k - $35k 14% $2.5k - $10k 44% < $2.5k 36% < 5 Years 12% 5 - 10 Years 7% 10 - 15 Years 8% > 15 Years 73% Average account size approximately $8,500 Select end - users by sector (1) Based on unaudited 2017 financials. 80% under $10k
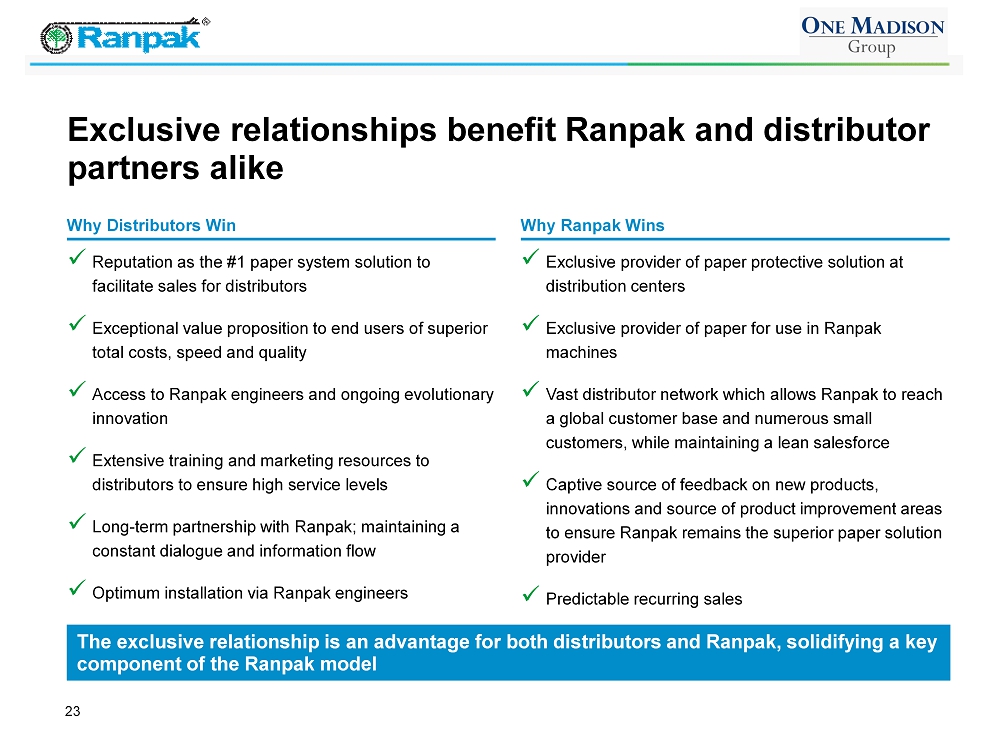
23 The exclusive relationship is an advantage for both distributors and Ranpak , solidifying a key component of the Ranpak model Exclusive relationships benefit Ranpak and distributor partners alike Why Distributors Win Why Ranpak Wins x Reputation as the #1 paper system solution to facilitate sales for distributors x Exceptional value proposition to end users of superior total costs, speed and quality x Access to Ranpak engineers and ongoing evolutionary innovation x Extensive training and marketing resources to distributors to ensure high service levels x Long - term partnership with Ranpak; maintaining a constant dialogue and information flow x Optimum installation via Ranpak engineers x Exclusive provider of paper protective solution at distribution centers x Exclusive provider of paper for use in Ranpak machines x Vast distributor network which allows Ranpak to reach a global customer base and numerous small customers, while maintaining a lean salesforce x Captive source of feedback on new products, innovations and source of product improvement areas to ensure Ranpak remains the superior paper solution provider x Predictable recurring sales
The Paper Packaging Experts ™ 24 Industry Overview
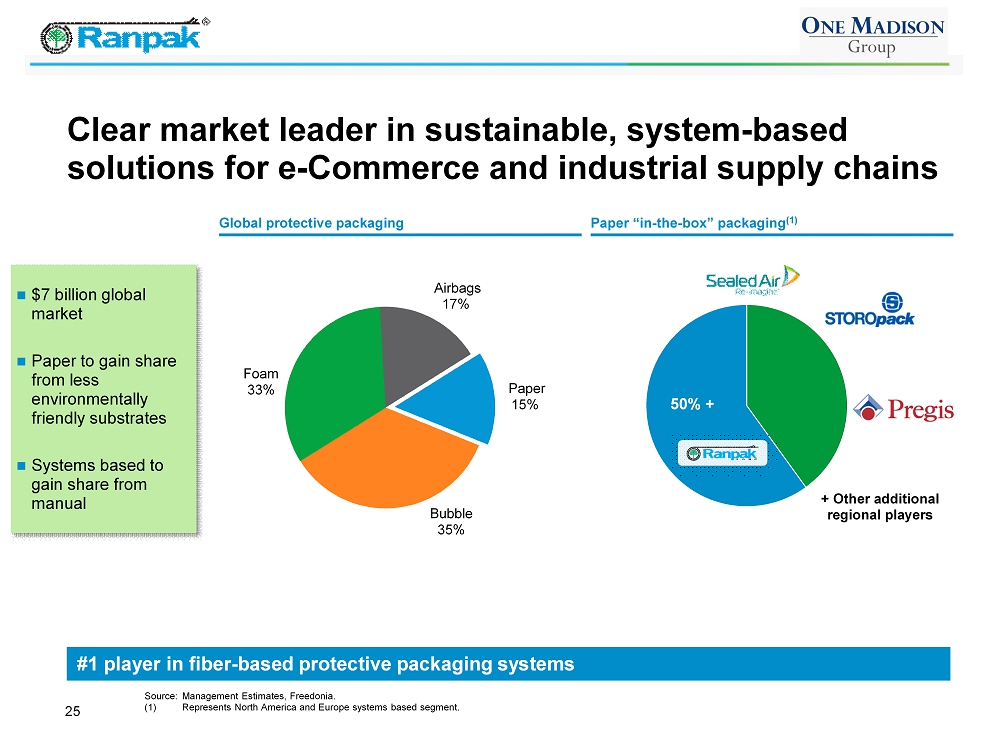
+ Other additional regional players 50% + 25 Clear market leader in sustainable, system - based solutions for e - Commerce and industrial supply chains Source: Management Estimates, Freedonia . (1) Represents North America and Europe systems based segment. Paper “in - the - box” packaging (1) Global protective packaging #1 player in fiber - based protective packaging systems Bubble 35% Foam 33% Airbags 17% Paper 15% $7 billion global market Paper to gain share from less environmentally friendly substrates Systems based to gain share from manual
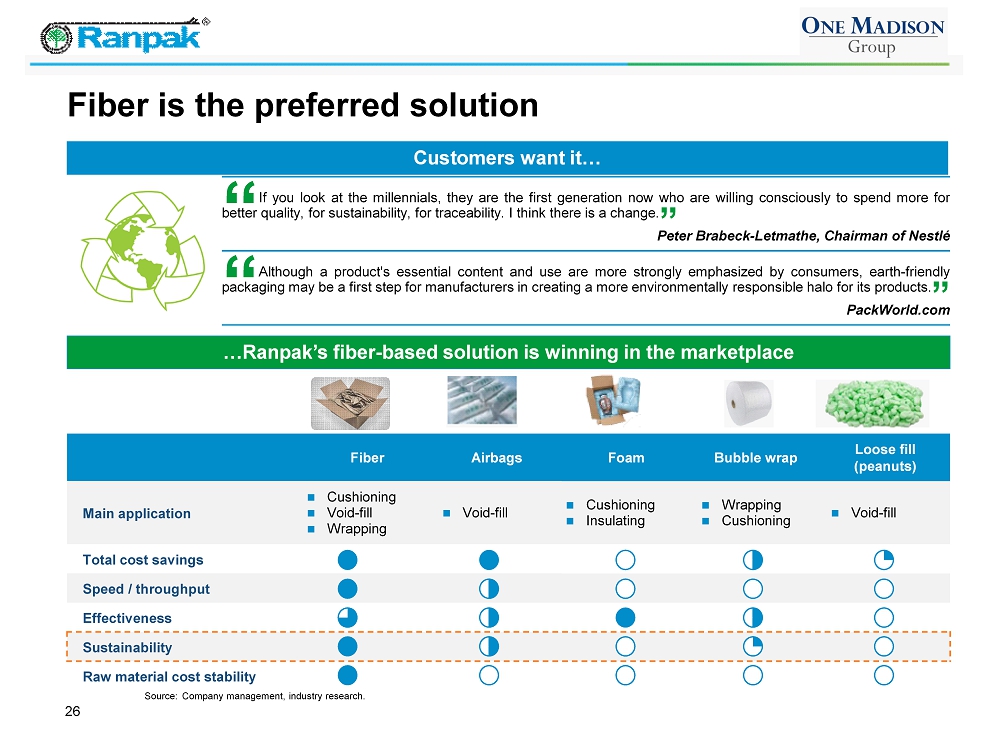
26 Fiber is the preferred solution … Ranpak’s fiber - based solution is winning in the marketplace Source: Company management, industry research. Fiber Airbags Foam Bubble wrap Loose fill (peanuts) Main application Cushioning Void - fill Wrapping Void - fill Cushioning Insulating Wrapping Cushioning Void - fill Total cost savings Speed / throughput Effectiveness Sustainability Raw material cost stability Customers want it… “ If you look at the millennials, they are the first generation now who are willing consciously to spend more for better quality, for sustainability, for traceability . I think there is a change . ” Peter Brabeck - Letmathe , Chairman of Nestlé “ Although a product's essential content and use are more strongly emphasized by consumers, earth - friendly packaging may be a first step for manufacturers in creating a more environmentally responsible halo for its products . ” PackWorld.com
The Paper Packaging Experts ™ 27 Growth Opportunities
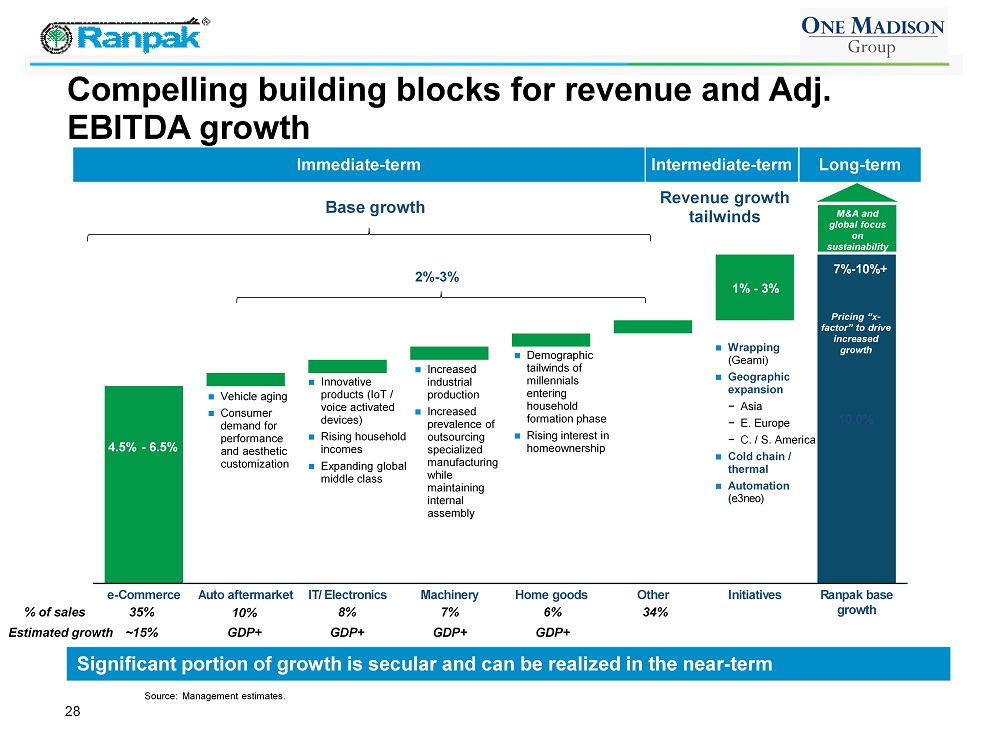
28 Compelling building blocks for revenue and Adj. EBITDA growth 4.5% - 6.5% 10.0% e-Commerce Auto aftermarket IT/Electronics Machinery Home goods Other Initiatives Ranpak base growth M&A and global focus on sustainability Wrapping (Geami) Geographic expansion − Asia − E. Europe − C. / S. America Cold chain / thermal Automation ( e3neo) Significant portion of growth is secular and can be realized in the near - term Pricing “x - factor” to drive increased growth Revenue growth tailwinds Base growth 1% - 3% Intermediate - term 7% - 10%+ Vehicle aging Consumer demand for performance and aesthetic customization Innovative products ( IoT / voice activated devices) Rising household incomes Expanding global middle class Long - term Immediate - term Increased industrial production Increased prevalence of outsourcing specialized manufacturing while maintaining internal assembly Demographic tailwinds of millennials entering household formation phase Rising interest in homeownership 35% 10% 8% 7% 6% % of sales Source: Management estimates. 34% Estimated growth ~15% GDP+ GDP+ GDP+ GDP+ 2% - 3%
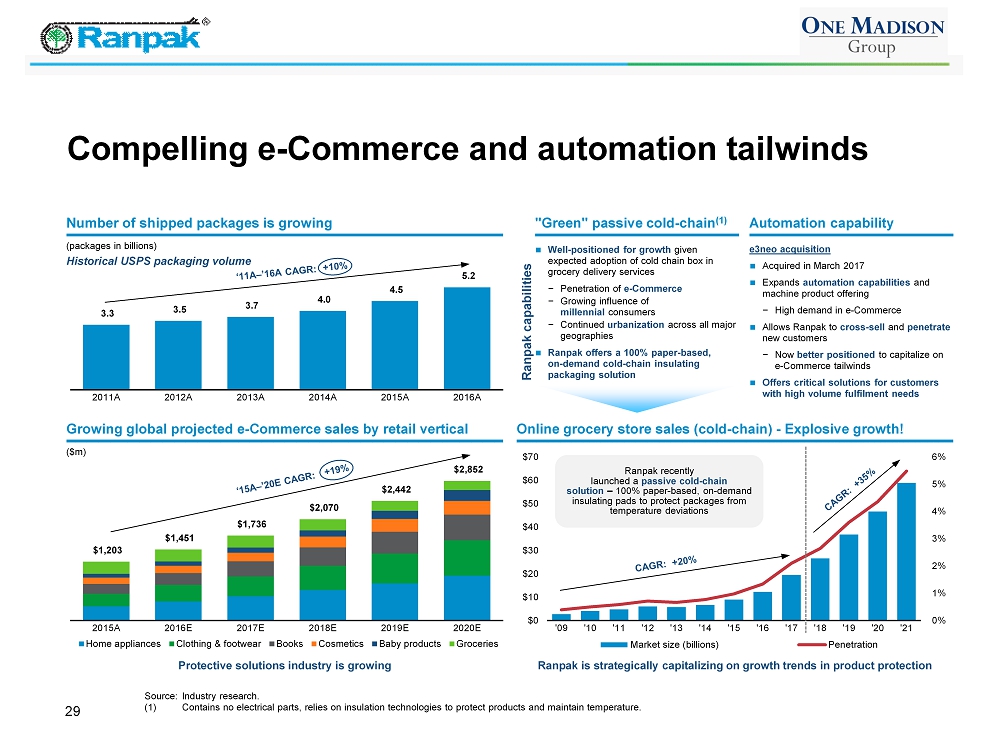
e3neo acquisition Acquired in March 2017 Expands automation capabilities and machine product offering − High demand in e - Commerce Allows Ranpak to cross - sell and penetrate new customers − Now better positioned to capitalize on e - Commerce tailwinds Offers critical solutions for customers with high volume fulfilment needs Automation capability 3.3 3.5 3.7 4.0 4.5 5.2 2011A 2012A 2013A 2014A 2015A 2016A $1,203 $1,451 $1,736 $2,070 $2,442 $2,852 2015A 2016E 2017E 2018E 2019E 2020E Home appliances Clothing & footwear Books Cosmetics Baby products Groceries 29 "Green" passive cold - chain (1) Compelling e - Commerce and automation tailwinds Number of shipped packages is growing Well - positioned for growth given expected adoption of cold chain box in grocery delivery services − Penetration of e - Commerce − Growing influence of millennial consumers − Continued urbanization across all major geographies Ranpak offers a 100% paper - based, on - demand cold - chain insulating packaging solution Online grocery store sales (cold - chain) - Explosive growth! Growing global projected e - Commerce sales by retail vertical Source: Industry research. (1) Contains no electrical parts, relies on insulation technologies to protect products and maintain temperature. (packages in billions) Ranpak capabilities ($m) Protective solutions industry is growing 0% 1% 2% 3% 4% 5% 6% $0 $10 $20 $30 $40 $50 $60 $70 '09 '10 '11 '12 '13 '14 '15 '16 '17 '18 '19 '20 '21 Market size (billions) Penetration Ranpak is strategically capitalizing on growth trends in product protection Ranpak recently launched a passive cold - chain solution – 100% paper - based, on - demand insulating pads to protect packages from temperature deviations Historical USPS packaging volume
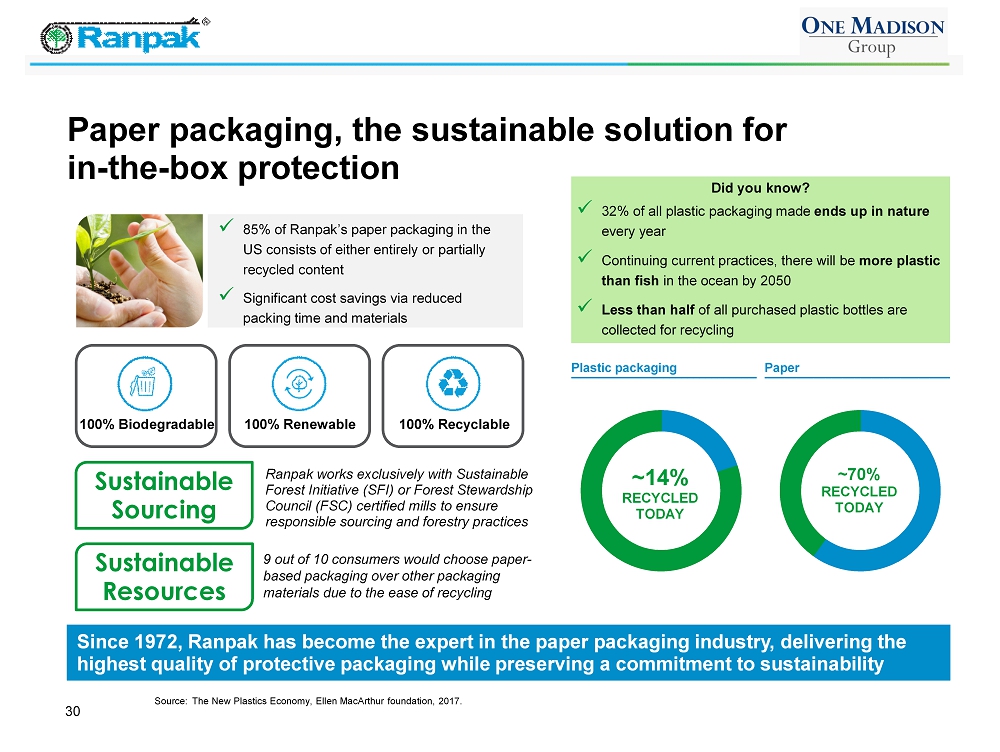
30 Paper packaging, the sustainable solution for in - the - box protection Sustainable Sourcing Sustainable Resources x 85% of Ranpak’s paper packaging in the US consists of either entirely or partially recycled content x Significant cost savings via reduced packing time and materials Ranpak works exclusively with Sustainable Forest Initiative (SFI) or Forest Stewardship Council (FSC) certified mills to ensure responsible sourcing and forestry practices 9 out of 10 consumers would choose paper - based packaging over other packaging materials due to the ease of recycling 100% Biodegradable 100% Renewable 100% Recyclable Since 1972, Ranpak has become the expert in the paper packaging industry, delivering the highest quality of protective packaging while preserving a commitment to sustainability Did you know? x 32% of all plastic packaging made ends up in nature every year x Continuing current practices, there will be more plastic than fish in the ocean by 2050 x Less than half of all purchased plastic bottles are collected for recycling ~14% RECYCLED TODAY ~70% RECYCLED TODAY Plastic packaging Paper Source: The New Plastics Economy, Ellen MacArthur foundation, 2017.

Focus on areas with: higher labor costs, internet penetration, IP protection, industrial growth Aggressively pursue growth in China and India, especially related to e - Commerce Leverage relationships with existing multi - national customers Partner with local distributors and end use customers to create a strategic presence 31 Priority growth opportunities APAC Ranpak’s APAC business currently represents only 5% of overall company Longer term Near term Sales offices located in Japan, China and Singapore Recently reorganized sales personnel and distribution network in China Given the market size, APAC has the potential to become as big if not bigger than NA or EU Wrapping Paper - based systems led by Geami & WrapPak are compelling alternatives to plastic bubble wraps Global bubble wrap market $2.6bn NA $0.8bn Geami marketing Source: Industry research and Statista. Presentation Perfect in - the - box presentation enhances the customer unboxing experience Time savings Pads are created at high speed with minimal reloading necessary Cost effective Less material is needed to provide optimal protection EMEA $0.8bn APAC $1.1bn vs. Ranpak’s 2017 wrapping revenue of $16m 31 13 9 China USA Japan Parcels (in b) Parcel Shipping Business is Booming Worldwide
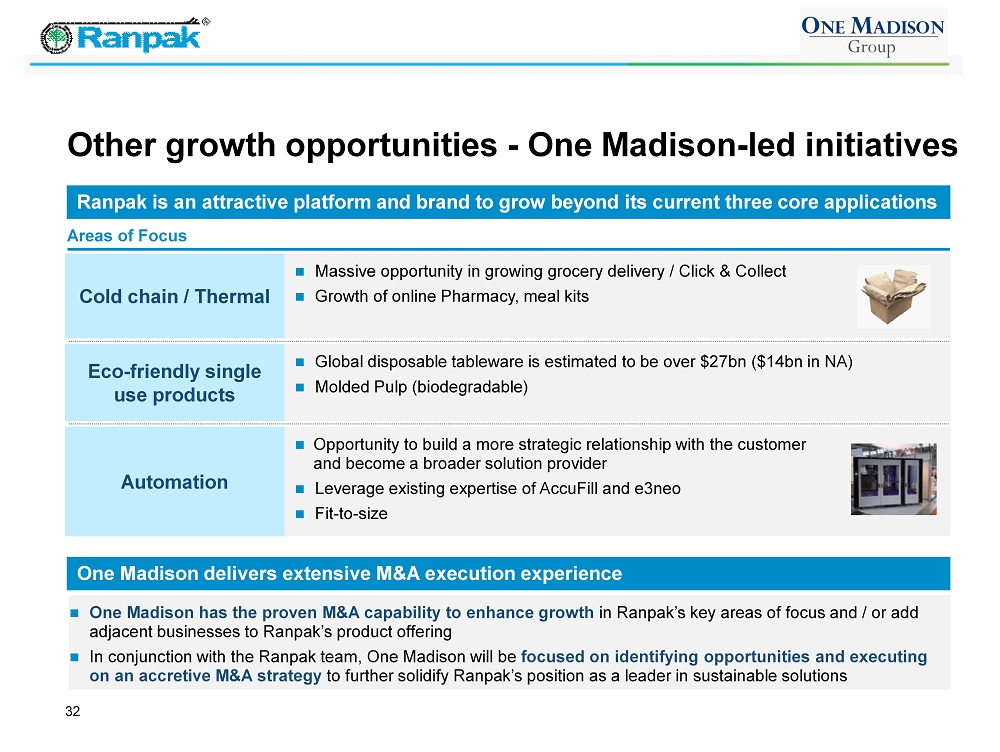
32 Other growth opportunities - One Madison - led initiatives Ranpak is an attractive platform and brand to grow beyond its current three core applications Massive opportunity in growing grocery delivery / Click & Collect Growth of online Pharmacy, meal kits Cold chain / Thermal Areas of Focus Global disposable tableware is estimated to be over $27bn ($14bn in NA) Molded Pulp (biodegradable) Eco - friendly single use products Opportunity to build a more strategic relationship with the customer and become a broader solution provider Leverage existing expertise of AccuFill and e3neo Fit - to - size Automation One Madison delivers extensive M&A execution experience One Madison has the proven M&A capability to enhance growth in Ranpak’s key areas of focus and / or add adjacent businesses to Ranpak’s product offering In conjunction with the Ranpak team, One Madison will be focused on identifying opportunities and executing on an accretive M&A strategy to further solidify Ranpak’s position as a leader in sustainable solutions
The Paper Packaging Experts ™ 33 Financial and Valuation Overview
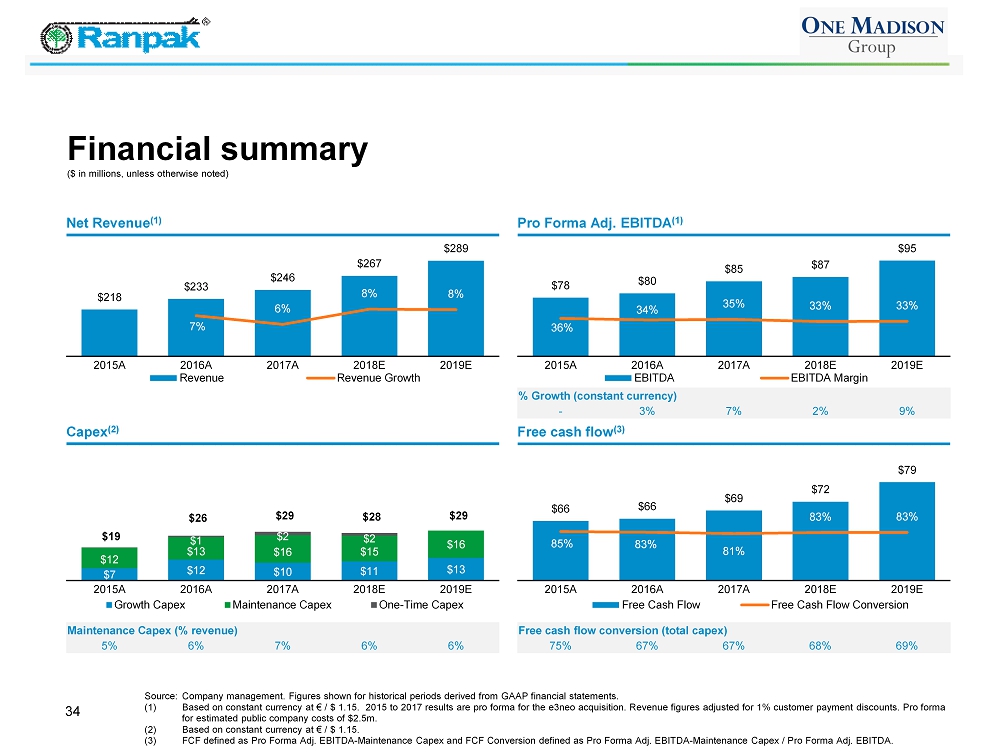
Capex (2) Free cash flow (3) % Growth (constant currency) - 3% 7% 2% 9% 34 Financial summary Source: Company management. Figures shown for historical periods derived from GAAP financial statements. (1) Based on constant currency at € / $ 1.15. 2015 to 2017 results are pro forma for the e3neo acquisition. Revenue figures adjusted for 1% customer payment discounts. Pro form a for estimated public company costs of $2.5m. (2) Based on constant currency at € / $ 1.15. (3) FCF defined as Pro Forma Adj. EBITDA - Maintenance Capex and FCF Conversion defined as Pro Forma Adj. EBITDA - Maintenance Capex / Pro Forma Adj. EBITDA. Net Revenue (1) Pro Forma Adj. EBITDA (1) $218 $233 $246 $267 $289 7% 6% 8% 8% 2015A 2016A 2017A 2018E 2019E Revenue Revenue Growth $78 $80 $85 $87 $95 36% 34% 35% 33% 33% 2015A 2016A 2017A 2018E 2019E EBITDA EBITDA Margin $7 $12 $10 $11 $13 $12 $13 $16 $15 $16 $1 $2 $2 2015A 2016A 2017A 2018E 2019E Growth Capex Maintenance Capex One-Time Capex $19 $26 $29 $28 $29 Maintenance Cape x (% revenue) 5% 6% 7% 6% 6% Free cash flow conversion (total capex) 75% 67% 67% 68% 69% $66 $66 $69 $72 $79 85% 83% 81% 83% 83% 2015A 2016A 2017A 2018E 2019E Free Cash Flow Free Cash Flow Conversion ($ in millions, unless otherwise noted)
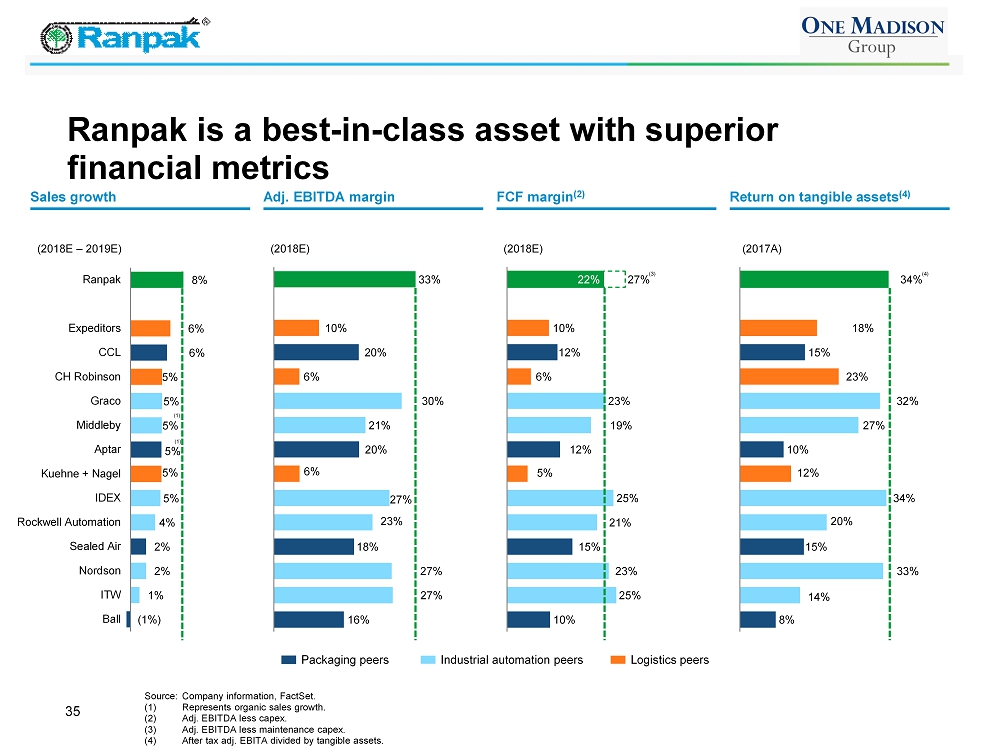
35 Ranpak is a best - in - class asset with superior financial metrics Sales growth Adj. EBITDA margin Return on tangible assets (4) (1%) 1% 2% 2% 4% 5% 5% 5% 5% 5% 5% 6% 6% 8% Ball ITW Nordson Sealed Air Rockwell Automation IDEX Kuehne + Nagel Aptar Middleby Graco CH Robinson CCL Expeditors Ranpak 16% 27% 27% 18% 23% 27% 6% 20% 21% 30% 6% 20% 10% 33% 10% 25% 23% 15% 21% 25% 5% 12% 19% 23% 6% 12% 10% 22% 27% Packaging peers Logistics peers Industrial automation peers (2018E – 2019E) (2018E) (2018E) Source: Company information, FactSet . (1) Represents organic sales growth. (2) Adj. EBITDA less capex. (3) Adj. EBITDA less maintenance capex. (4) After tax adj. EBITA divided by tangible assets. (3) FCF margin (2) 8% 14% 33% 15% 20% 34% 12% 10% 27% 32% 23% 15% 18% 34% (4) (1) (1) (2017A)
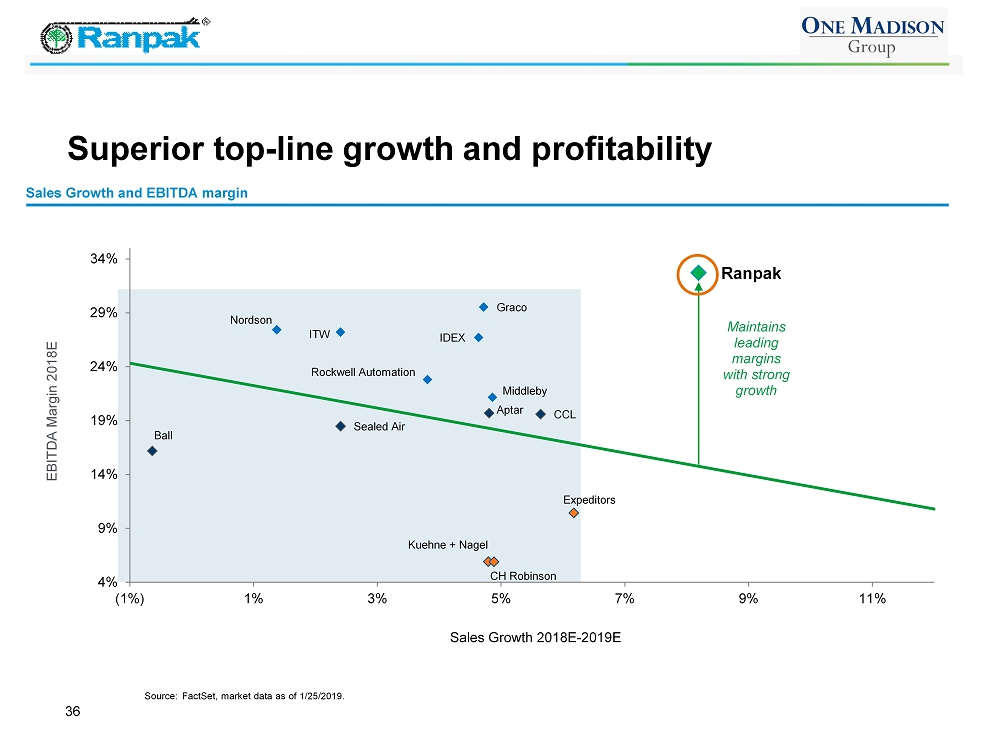
36 Superior top - line growth and profitability Source: FactSet, market data as of 1/25/2019. Sales Growth and EBITDA margin Sales Growth 2018E - 2019E EBITDA Margin 2018E Maintains leading margins with strong growth Ranpak Ball Sealed Air CCL Aptar ITW Rockwell Automation IDEX Nordson Middleby Graco Kuehne + Nagel CH Robinson Expeditors 4% 9% 14% 19% 24% 29% 34% (1%) 1% 3% 5% 7% 9% 11%

12.0x 12.4x 12.5x 12.0x 12.4x 13.1x 13.6x 14.2x 15.6x 10.2x 10.8x 12.0x 12.3x 11.5x Kuehne + Nagel CH Robinson Expeditors ITW Middleby Rockwell Automation Nordson Graco IDEX Sealed Air CCL Aptar Ball Ranpak 37 Ranpak valuation in perspective Source: FactSet, market data as of 1/25/2019. (1) After tax adj. EBITA divided by tangible assets. Sales Growth and Valuation in Perspective EBITDA Margin and Valuation in Perspective Sales Growth 2018E - 2019E FV / 2019E EBITDA EBITDA Margin 2018E FV / 2019E EBITDA ROTA (1) and Valuation in Perspective FV / 2019E EBITDA 2017A ROTA Packaging peers Logistics peers Industrial automation peers Average 13.5x Average 11.3x Average 12.3x EV / EBITDA 2019E Ranpak Ball Sealed Air CCL Aptar ITW Rockwell Automation IDEX Nordson Middleby Graco Kuehne + Nagel CH Robinson Expeditors 9.5x 10.5x 11.5x 12.5x 13.5x 14.5x 15.5x 4% 14% 24% 34% Ranpak Ball Sealed Air CCL Aptar ITW Rockwell Automation IDEX Nordson Middleby Graco Kuehne + Nagel CH Robinson Expeditors 9.5x 10.5x 11.5x 12.5x 13.5x 14.5x 15.5x (1%) 4% 9% Ranpak Ball Sealed Air CCL Aptar ITW Rockwell Automation IDEX Nordson Middleby Graco Kuehne + Nagel CH Robinson Expeditors 9.5x 10.5x 11.5x 12.5x 13.5x 14.5x 15.5x 0% 10% 20% 30%
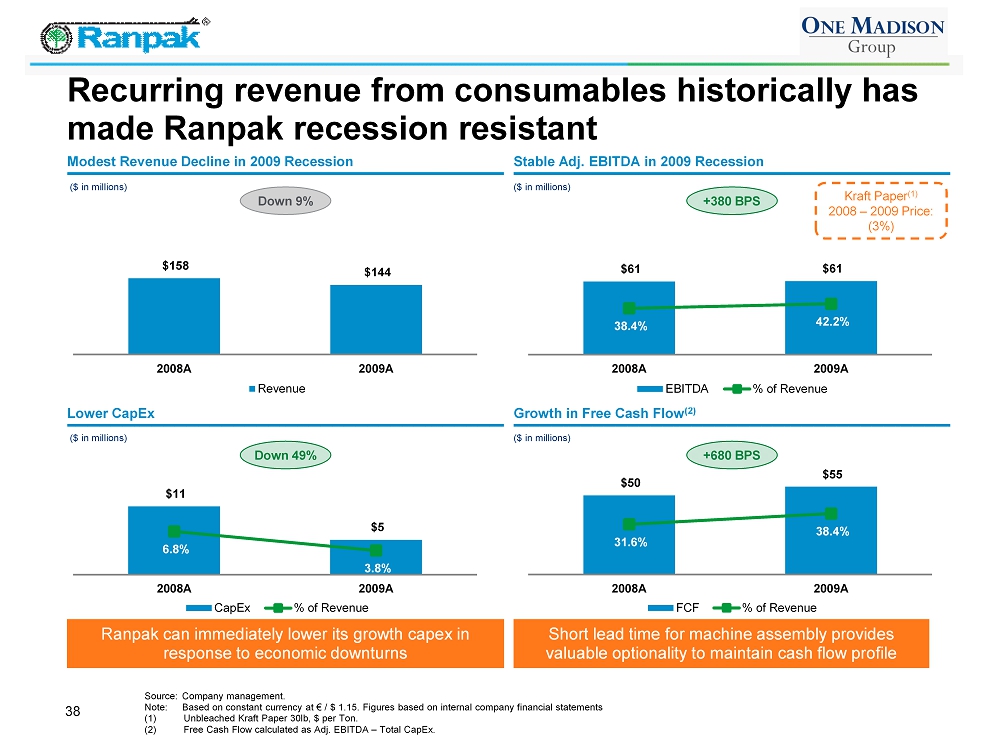
38 Recurring revenue from consumables historically has made Ranpak recession resistant Source: Company management. Note: Based on constant currency at € / $ 1.15. Figures based on internal company financial statements (1) Unbleached Kraft Paper 30lb, $ per Ton. (2) Free Cash Flow calculated as Adj. EBITDA – Total CapEx . Lower CapEx Stable Adj. EBITDA in 2009 Recession Modest Revenue Decline in 2009 Recession Growth in Free Cash Flow (2) Down 9% +380 BPS Kraft Paper (1) 2008 – 2009 Price: (3%) ($ in millions) ($ in millions) ($ in millions) ($ in millions) $61 $61 38.4% 42.2% 2008A 2009A EBITDA % of Revenue $158 $144 2008A 2009A Revenue $50 $55 31.6% 38.4% 2008A 2009A FCF % of Revenue $11 $5 6.8% 3.8% 2008A 2009A CapEx % of Revenue Down 49 % +680 BPS Ranpak can immediately lower its growth capex in response to economic downturns Short lead time for machine assembly provides valuable optionality to maintain cash flow profile
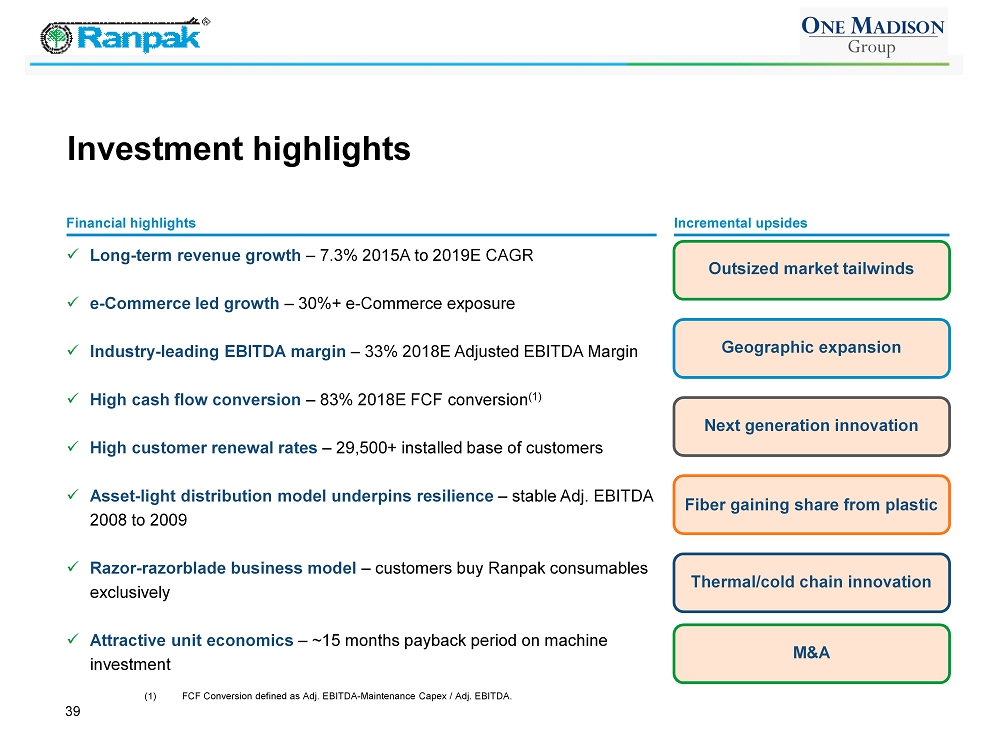
39 Investment highlights (1) FCF Conversion defined as Adj. EBITDA - Maintenance Capex / Adj. EBITDA. x Long - term revenue growth – 7.3% 2015A to 2019E CAGR x e - Commerce led growth – 30%+ e - Commerce exposure x Industry - leading EBITDA margin – 33% 2018E Adjusted EBITDA Margin x High cash flow conversion – 83% 2018E FCF conversion (1) x High customer renewal rates – 29,500+ installed base of customers x Asset - light distribution model underpins resilience – stable Adj. EBITDA 2008 to 2009 x Razor - razorblade business model – customers buy Ranpak consumables exclusively x Attractive unit economics – ~15 months payback period on machine investment Financial highlights Incremental upsides Outsized market tailwinds Geographic expansion Next generation innovation Fiber gaining share from plastic Thermal/cold chain innovation M&A

The Paper Packaging Experts ™ 40 Appendix

41 One Madison Team One Madison has the industry and functional expertise to drive growth at Ranpak Managing Director, Blue Strat Advisors Previous roles − Chief Information Officer for the National Basketball Association (NBA) − Senior Vice President, Application Development for Viacom, MTVN, Showtime Networks, Inc. − Principal, Booz Allen & Hamilton Advisory Roles: Littlejohn & Co., RSG Media Board of Directors: METACORTEX AI (Non - executive Chairman) Michael Jones Tom Corley Robert King Previous roles − Chief Customer Officer and Chief Merchandising Officer for Lowe’s Companies − Head of Business Unit Americas and Executive Vice President at Husqvarna AB − General Manager within appliance division of General Electric − Board of Directors of Johnson C. Smith University Global Chief Retail Officer and President of US Retail Markets for Catalina Previous roles − Chief Operating Officer of Acosta, Inc − Executive Vice President of US Sales and Foodservice of Kraft Foods Group − President of US Retail Sales and Foodservice of Kraft Foods Group Previous roles − Chief Executive Officer of CytoSport , Inc (makers of Muscle Milk) − Executive Vice President and President of North America of Pepsi Bottling Group (21 years in North America Pepsi System) Advisory Roles: TSG Consumer Partners and Wind Point Partners Board of Directors: Gehl Foods (Chairman), Exal Corp, Fresh Pet, Arctic Glacier Michael Gliedman One Madison Operating Advisors Chairman and CEO of One Madison Group LLC (sponsor of One Madison Corporation) Previous roles − CEO and President of HRG Group − Managing Director and Head of Global Strategy of Harbinger Capital Partners − Co - Head of Goldman Sachs Hedge Fund Strategies − Goldman Sachs Investment Banking Omar Asali Chairman & CEO

Most recently at Drivetrain LLC, a provider of independent fiduciary services for companies. Previous roles − Investment Counsel at Harbinger Capital Partners − Weil, Gotshal & Manges LLP, Corporate Department 42 One Madison Team One Madison has the proven M&A capability to enhance growth in Ranpak’s key areas of focus and / or add adjacent businesses to Ranpak’s product offering Most recently Founder and Managing Partner of Chilmark Capital Management, his family office, and co - founder of QRails Previous roles − Founder and Managing Partner, Tisbury Capital Management − Managing Director, Citadel Investment Group William Drew Jason Cho Bharani Bobba Most recently Vice President, Investments at HRG Group Previous roles − Investment analyst at Harbinger Capital Partners − Deutsche Bank Investment Banking Most recently Partner, Senior Research Analyst at Orange Capital Previous roles − Vice President, Goldman Sachs Hedge Fund Strategies − Goldman Sachs Investment Banking Most recently Senior Vice President with responsibility for strategy, M&A and other growth initiatives for the Consumer, Retail and Healthcare Business Unit of Genpact Previous roles − Founding Partner of Baseline Partners − Merrill Lynch Investment Banking Gerard F. Griffin Nancy Lester Most recently at Chilmark Capital Management Previous roles − Director and Executive Committee Board Member, Corporate Development Bunzl PLC − Slaughter and May One Madison Investment Team: New York London David Murgio
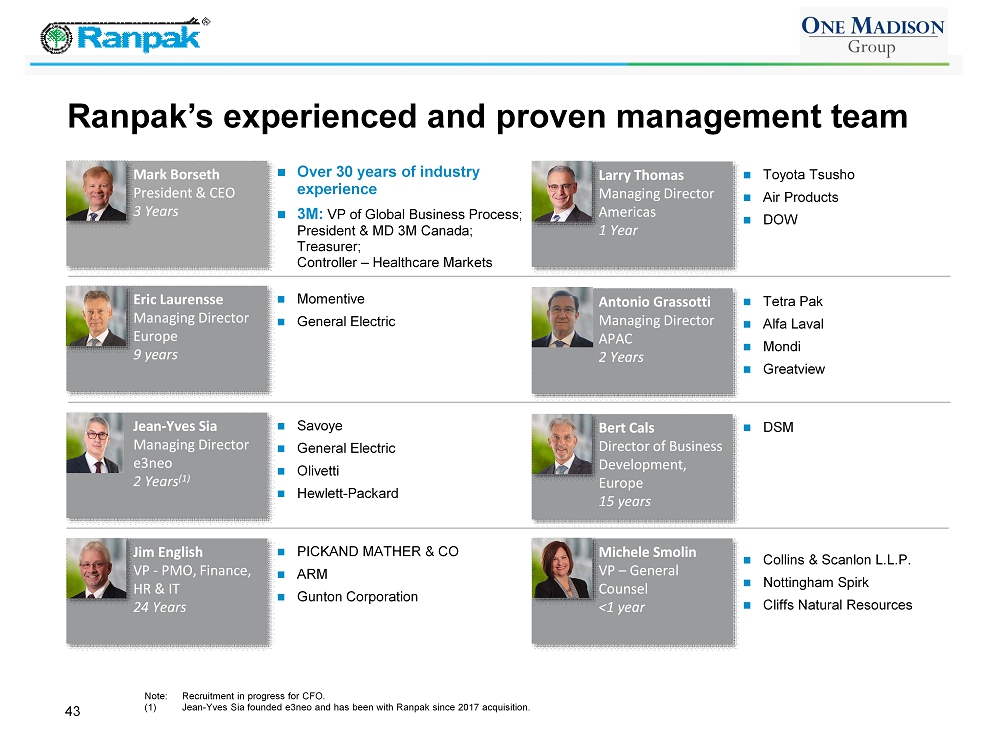
43 Ranpak’s experienced and proven management team Note: Recruitment in progress for CFO. (1) Jean - Yves Sia founded e3neo and has been with Ranpak since 2017 acquisition. Eric Laurensse Managing Director Europe 9 years Larry Thomas Managing Director Americas 1 Year Momentive General Electric Toyota Tsusho Air Products DOW PICKAND MATHER & CO ARM Gunton Corporation Jim English VP - PMO, Finance, HR & IT 24 Years Bert Cals Director of Business Development, Europe 15 years DSM Tetra Pak Alfa Laval Mondi Greatview Jean - Yves Sia Managing Director e3neo 2 Years (1) Savoye General Electric Olivetti Hewlett - Packard Antonio Grassotti Managing Director APAC 2 Years Mark Borseth President & CEO 3 Years Over 30 years of industry experience 3M: VP of Global Business Process; President & MD 3M Canada; Treasurer; Controller – Healthcare Markets Michele Smolin VP – General Counsel <1 year Collins & Scanlon L.L.P. Nottingham Spirk Cliffs Natural Resources

44 Key financial reconciliation Gross to net revenue $000 FY15 FY16 FY17 Reported net revenue $210,982 $224,708 $244,092 Pro forma e3neo 3,159 4,087 68 Currency adjustment 3,556 4,399 2,119 Pro forma net revenue $217,697 $233,194 $246,239 Pro forma Adjusted EBITDA $000 FY15 FY16 FY17 Net Loss ($69,128) ($65,078) ($25,118) Depreciation & amortization 115,096 113,471 116,248 Interest expense 37,380 33,985 30,690 Income tax benefit (568) (3,145) (43,225) Unrealized (gain) / loss on translation (10,991) (3,181) 14,209 Currency adjustment 1,397 1,646 759 Other non - core and non - cash adjustments 6,613 4,014 (5,533) Adjusted EBITDA $79,799 $81,713 $88,029 Pro forma e3neo 219 386 (197) Pro forma public company costs (2,500) (2,500) (2,604) Pro forma Adjusted EBITDA $77,518 $79,599 $85,229 Adjusted maintenance capital expenditures (11,945) (13,222) (16,026) Free cash flow $65,573 $66,377 $69,202 The summary financial statement data of Ranpak included herein have been derived from the financial statements of Ranpak that we re prepared in accordance with US GAAP. However, such financial statements have not been audited in accordance with US PCAOB auditing standards. There can be no guarantee that, w hen such financial statements are audited in accordance with US PCAOB auditing standards, adjustments will not be required; as a result, the data presented in the Company’s preliminary p rox y statement/prospectus to be filed with the SEC to solicit shareholder approval of the initial business combination and in future filings with the SEC may be different to the data pres ent ed herein.
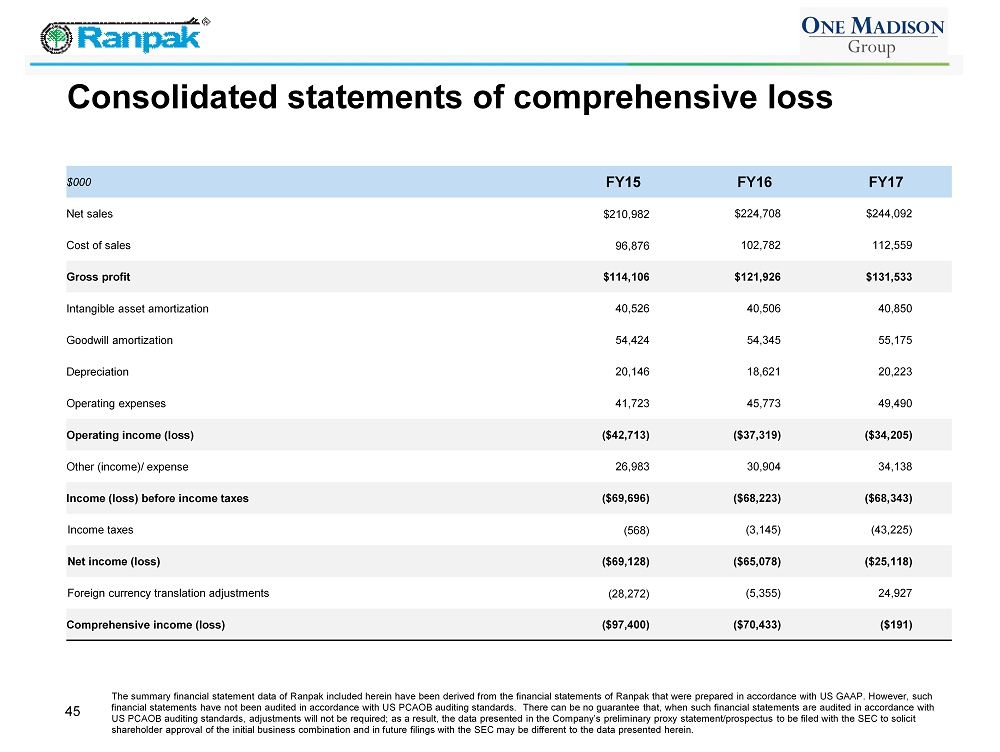
45 Consolidated statements of comprehensive loss $000 FY15 FY16 FY17 Net sales $210,982 $224,708 $244,092 Cost of sales 96,876 102,782 112,559 Gross profit $114,106 $121,926 $131,533 Intangible asset amortization 40,526 40,506 40,850 Goodwill amortization 54,424 54,345 55,175 Depreciation 20,146 18,621 20,223 Operating expenses 41,723 45,773 49,490 Operating income (loss) ($42,713) ($37,319) ($34,205) Other (income)/ expense 26,983 30,904 34,138 Income (loss) before income taxes ($69,696) ($68,223) ($68,343) Income taxes (568) (3,145) (43,225) Net income (loss) ($69,128) ($65,078) ($25,118) Foreign currency translation adjustments (28,272) (5,355) 24,927 Comprehensive income (loss) ($97,400) ($70,433) ($191) The summary financial statement data of Ranpak included herein have been derived from the financial statements of Ranpak that we re prepared in accordance with US GAAP. However, such financial statements have not been audited in accordance with US PCAOB auditing standards. There can be no guarantee that, w hen such financial statements are audited in accordance with US PCAOB auditing standards, adjustments will not be required; as a result, the data presented in the Company’s preliminary p rox y statement/prospectus to be filed with the SEC to solicit shareholder approval of the initial business combination and in future filings with the SEC may be different to the data pres ent ed herein.
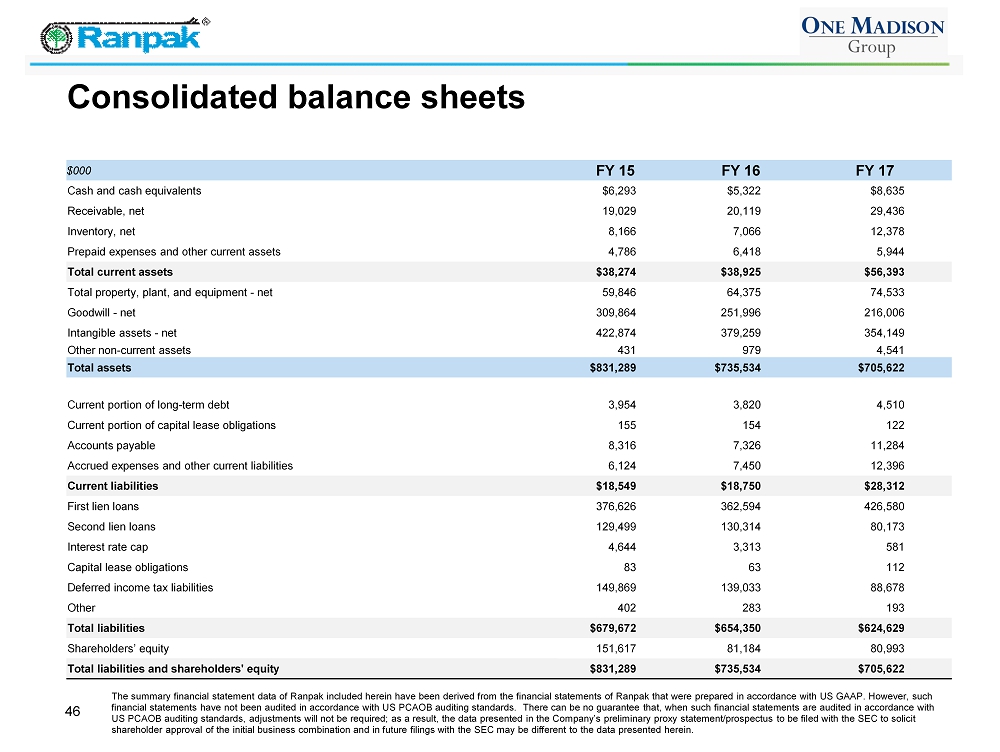
46 Consolidated balance sheets $000 FY 15 FY 16 FY 17 Cash and cash equivalents $6,293 $5,322 $8,635 Receivable, net 19,029 20,119 29,436 Inventory, net 8,166 7,066 12,378 Prepaid expenses and other current assets 4,786 6,418 5,944 Total current assets $38,274 $38,925 $56,393 Total property, plant, and equipment - net 59,846 64,375 74,533 Goodwill - net 309,864 251,996 216,006 Intangible assets - net 422,874 379,259 354,149 Other non - current assets 431 979 4,541 Total assets $831,289 $735,534 $705,622 Current portion of long - term debt 3,954 3,820 4,510 Current portion of capital lease obligations 155 154 122 Accounts payable 8,316 7,326 11,284 Accrued expenses and other current liabilities 6,124 7,450 12,396 Current liabilities $18,549 $18,750 $28,312 First lien loans 376,626 362,594 426,580 Second lien loans 129,499 130,314 80,173 Interest rate cap 4,644 3,313 581 Capital lease obligations 83 63 112 Deferred income tax liabilities 149,869 139,033 88,678 Other 402 283 193 Total liabilities $679,672 $654,350 $624,629 Shareholders’ equity 151,617 81,184 80,993 Total liabilities and shareholders' equity $831,289 $735,534 $705,622 The summary financial statement data of Ranpak included herein have been derived from the financial statements of Ranpak that we re prepared in accordance with US GAAP. However, such financial statements have not been audited in accordance with US PCAOB auditing standards. There can be no guarantee that, w hen such financial statements are audited in accordance with US PCAOB auditing standards, adjustments will not be required; as a result, the data presented in the Company’s preliminary p rox y statement/prospectus to be filed with the SEC to solicit shareholder approval of the initial business combination and in future filings with the SEC may be different to the data pres ent ed herein.
No Offer or Solicitation
This communication is for informational purposes only and shall not constitute an offer to sell or the solicitation of an offer to buy any securities pursuant to the proposed business combination or otherwise, nor shall there be any sale of securities in any jurisdiction in which the offer, solicitation or sale would be unlawful prior to the registration or qualification under the securities laws of any such jurisdiction. No offer of securities shall be made except by means of a prospectus meeting the requirements of Section 10 of the Securities Act.
Additional Information
In connection with the proposed acquisition, One Madison will file a proxy statement/prospectus with the Securities and Exchange Commission (the “SEC”). STOCKHOLDERS ARE ADVISED TO READ THE PROXY STATEMENT/PROSPECTUS WHEN IT BECOMES AVAILABLE BECAUSE IT WILL CONTAIN IMPORTANT INFORMATION. Stockholders may obtain a free copy of the proxy statement/prospectus (when available) and any other relevant documents filed with the SEC from the SEC’s website at http://www.sec.gov. In addition, stockholders will be able to obtain, without charge, a copy of the proxy statement/prospectus and other relevant documents (when available) at One Madison’s website at http://www.onemadisoncorp.com/corporate-governance--investor-relations.html or by contacting One Madison’s investor relations department via e-mail at info@onemadisongroup.com.
Participants in the Solicitation
One Madison and its directors, executive officers and other members of its management and employees may be deemed to be participants in the solicitation of proxies from One Madison’s stockholders with respect to the proposed acquisition. Information about One Madison’s directors and executive officers and their ownership of One Madison’s common stock is set forth in One Madison’s filing with the SEC on (i) Form S-1, dated as of October 13, 2017, as amended on January 5, 2018 and (ii) Form 10-K, dated as of March 29, 2018, as supplemented by the Reports on Form 8-K filed on May 23, 2018, September 13, 2018 and December 13, 2018. Stockholders may obtain additional information regarding the direct and indirect interests of the participants in the solicitation of proxies in connection with the proposed acquisition, including the interests of One Madison’s directors and executive officers in the proposed acquisition, which may be different than those of One Madison’s stockholders generally, by reading the proxy statement/prospectus and other relevant documents regarding the proposed acquisition, which will be filed with the SEC.
CAUTION ABOUT FORWARD-LOOKING STATEMENTS
The information in this communication may contain “forward-looking statements” within the meaning of Section 27A of the Securities Act of 1933, as amended (the “Securities Act”), and Section 21E of the Securities Exchange Act of 1934, as amended (the “Exchange Act”). Our forward-looking statements include, but are not limited to, statements regarding our or our management team’s expectations, hopes, beliefs, intentions or strategies regarding the future. Statements that are not historical facts, including statements about the pending transaction among One Madison Corporation (the “Company”), Rack Holdings L.P. and Rack Holdings Inc. (“Ranpak”) and the transactions contemplated thereby, and the parties, perspectives and expectations, are forward-looking statements. In addition, any statements that refer to estimates, projections, forecasts or other characterizations of future events or circumstances, including any underlying assumptions, are forward-looking statements. The words “anticipate,” “believe,” “continue,” “could,” “estimate,” “expect,” “forecast,” “intend,” “may,” “might,” “plan,” “possible,” “potential,” “predict,” “project,” “should,” “would” and similar expressions may identify forward-looking statements, but the absence of these words does not mean that a statement is not forward-looking. Forward-looking statements in this presentation may include, for example, statements about: our ability to select an appropriate target business or businesses; our ability to complete our initial business combination; our expectations around the performance of the prospective target business or business; our success in retaining or recruiting, or changes required in, our officers, key employees or directors following our initial business combination; our officers and directors allocating their time to other businesses and potentially having conflicts of interest with our business or in approving our initial business combination; the proceeds of the forward purchase shares being available to us; our potential ability to obtain additional financing to complete our initial business combination; our pool of prospective target businesses; the ability of our officers and directors to generate a number of potential acquisition opportunities; our public securities’ potential liquidity and trading; the lack of a market for our securities; the use of proceeds not held in the trust account or available to us from interest income on the trust account balance; the trust account not being subject to claims of third parties; or our financial performance following this offering.
The forward-looking statements contained in this communication are based on our current expectations and beliefs concerning future developments and their potential effects on us taking into account information currently available to us. There can be no assurance that future developments affecting us will be those that we have anticipated. These forward-looking statements involve a number of risks, uncertainties (some of which are beyond our control) or other assumptions that may cause actual results or performance to be materially different from those expressed or implied by these forward-looking statements. These risks include, but are not limited to: (1) the occurrence of any event, change or other circumstances that could result in the failure to consummate the initial business combination; (2) the possibility that the terms and conditions set forth in any definitive agreements with respect to the initial business combination may differ materially from the terms and conditions set forth herein; (3) the outcome of any legal proceedings that may be instituted against the Company, Ranpak or others following the announcement of the initial business combination and any definitive agreements with respect thereto; (4) the inability to complete the initial business combination due to the failure to obtain approval of the stockholders of the Company, to obtain financing to complete the initial business combination or to satisfy other conditions to closing in the definitive agreements with respect to the initial business combination; (5) changes to the proposed structure of the initial business combination that may be required or appropriate as a result of applicable laws or regulations or as a condition to obtaining regulatory approval of the initial business combination; (6) the ability to meet and maintain NYSE’s listing standards following the consummation of the initial business combination; (7) the risk that the initial business combination disrupts current plans and operations of Ranpak as a result of the announcement and consummation of the initial business combination; (8) costs related to the initial business combination; (9) changes in applicable laws or regulations; (10) the possibility that Ranpak or the combined company may be adversely affected by other economic, business, and/or competitive factors; and (11) other risks and uncertainties indicated from time to time in filings made with the SEC. Should one or more of these risks or uncertainties materialize, they could cause our actual results to differ materially from the forward-looking statements. We are not undertaking any obligation to update or revise any forward looking statements whether as a result of new information, future events or otherwise. You should not take any statement regarding past trends or activities as a representation that the trends or activities will continue in the future. Accordingly, you should not put undue reliance on these statements.