Virtual Investor Day January 12, 2021
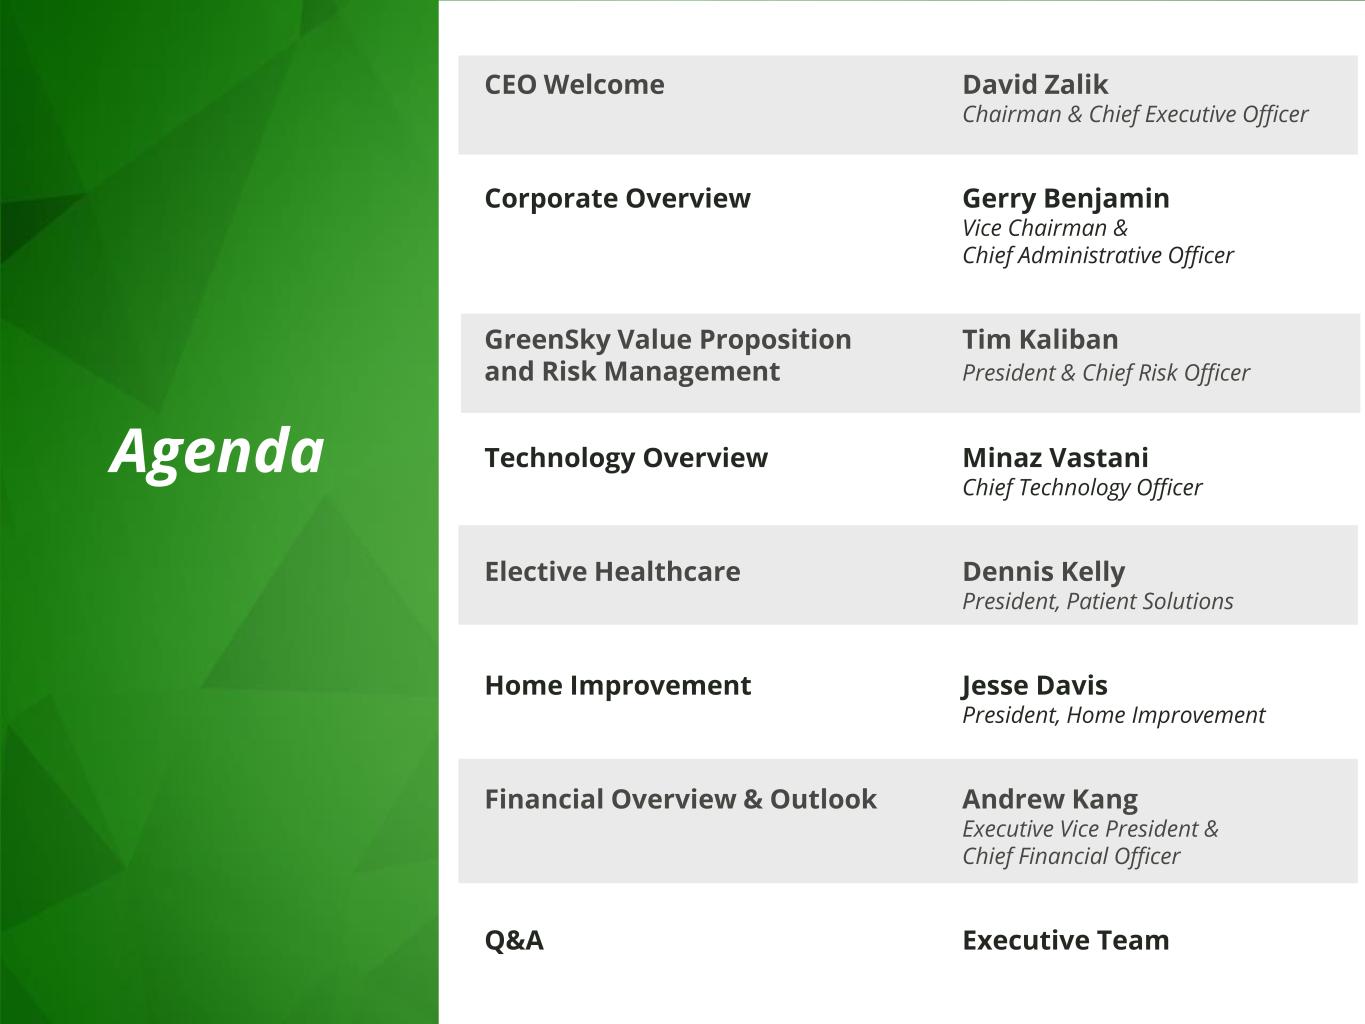
Agenda CEO Welcome David Zalik Chairman & Chief Executive Officer Corporate Overview Gerry Benjamin Vice Chairman & Chief Administrative Officer GreenSky Value Proposition Tim Kaliban and Risk Management President & Chief Risk Officer Technology Overview Minaz Vastani Chief Technology Officer Elective Healthcare Dennis Kelly President, Patient Solutions Home Improvement Jesse Davis President, Home Improvement Financial Overview & Outlook Andrew Kang Executive Vice President & Chief Financial Officer Q&A Executive Team

Forward-Looking Statements and Non-GAAP Financial Measures Forward-Looking Statements This presentation contains forward-looking statements that reflect the Company's current views with respect to, among other things, its estimated 2020 transaction volume, adjusted EBITDA, revenue and servicing portfolio; its operations; its financial performance; the impact of COVID-19; post-COVID-19 recovery of the elective healthcare business and the elective healthcare industry; and funding capacity and liquidity profile. You generally can identify these statements by the use of words such as “outlook,” “potential,” “continue,” “may,” “seek,” “approximately,” “predict,” “believe,” “expect,” “plan,” “intend,” “estimate” or “anticipate” and similar expressions or the negative versions of these words or comparable words, as well as future or conditional verbs such as “will,” “should,” “would,” “likely” and “could.” These statements are subject to certain risks and uncertainties that could cause actual results to differ materially from those included in the forward-looking statements. These risks and uncertainties include those risks described in GreenSky's filings with the Securities and Exchange Commission and include, but are not limited to, risks related to the extent and duration of the COVID-19 pandemic and its impact on the Company, its bank partners and merchants, GreenSky program borrowers, loan demand (including, in particular, for elective healthcare procedures), the capital markets (including the Company's ability to obtain additional funding or close new institutional financings) and the economy in general; the Company's ability to retain existing, and attract new, merchants and bank partners or other funding partners, including the risk that one or more bank partners do not renew their funding commitments or reduce existing commitments; its future financial performance, including trends in revenue, cost of revenue, gross profit or gross margin, operating expenses, and free cash flow; changes in market interest rates; increases in loan delinquencies; its ability to operate successfully in a highly regulated industry; the effect of management changes; cyberattacks and security vulnerabilities in its products and services; and the Company's ability to compete successfully in highly competitive markets. The forward- looking statements speak only as of the date on which they are made, and, except to the extent required by federal securities laws, GreenSky disclaims any obligation to update any forward-looking statement to reflect events or circumstances after the date on which the statement is made or to reflect the occurrence of unanticipated events. In light of these risks and uncertainties, there is no assurance that the events or results suggested by the forward- looking statements will in fact occur, and you should not place undue reliance on these forward-looking statements. Non-GAAP Financial Measures This presentation presents information about the Company’s Adjusted EBITDA and Adjusted EBITDA Margin, which are non-GAAP financial measures provided as supplements to the results provided in accordance with accounting principles generally accepted in the United States of America (“GAAP”). We believe that Adjusted EBITDA and Adjusted EBITDA Margin are key financial indicators of our business performance over the long term and provide useful information regarding whether cash provided by operating activities is sufficient to maintain and grow our business. We believe that this methodology for determining Adjusted EBITDA and Adjusted EBITDA Margin can provide useful supplemental information to help investors better understand the economics of our platform. We are presenting these non-GAAP measures to assist investors in evaluating our financial performance and because we believe that these measures provide an additional tool for investors to use in comparing our core financial performance over multiple periods with other companies in our industry. These non-GAAP measures are presented for supplemental informational purposes only. These non-GAAP measures have limitations as analytical tools and should not be considered in isolation from, or as a substitute for, the analysis of other GAAP financial measures, such as net income. The non-GAAP measures GreenSky uses may differ from the non-GAAP measures used by other companies. A reconciliation of these non-GAAP financial measures to the most directly comparable GAAP financial measure is provided below for each of the fiscal periods indicated. Note: Due to rounding, numbers presented throughout this presentation may not add precisely to the totals provided, and percentages may not precisely reflect the absolute figures. 3
David Zalik Chairman & Chief Executive Officer CEO Welcome

Our Company: Founded in 2006, and publicly-traded since May 2018, GreenSky is a financial technology company providing point-of-sale financing and payment solutions to a growing ecosystem of merchants, consumers, banks and investors. Deep Domain Expertise & Scale: We have developed deep domain expertise and achieved significant scale, having facilitated in excess of $26 billion of commerce since inception. Our Mission: To help businesses grow and delight their customers. 5
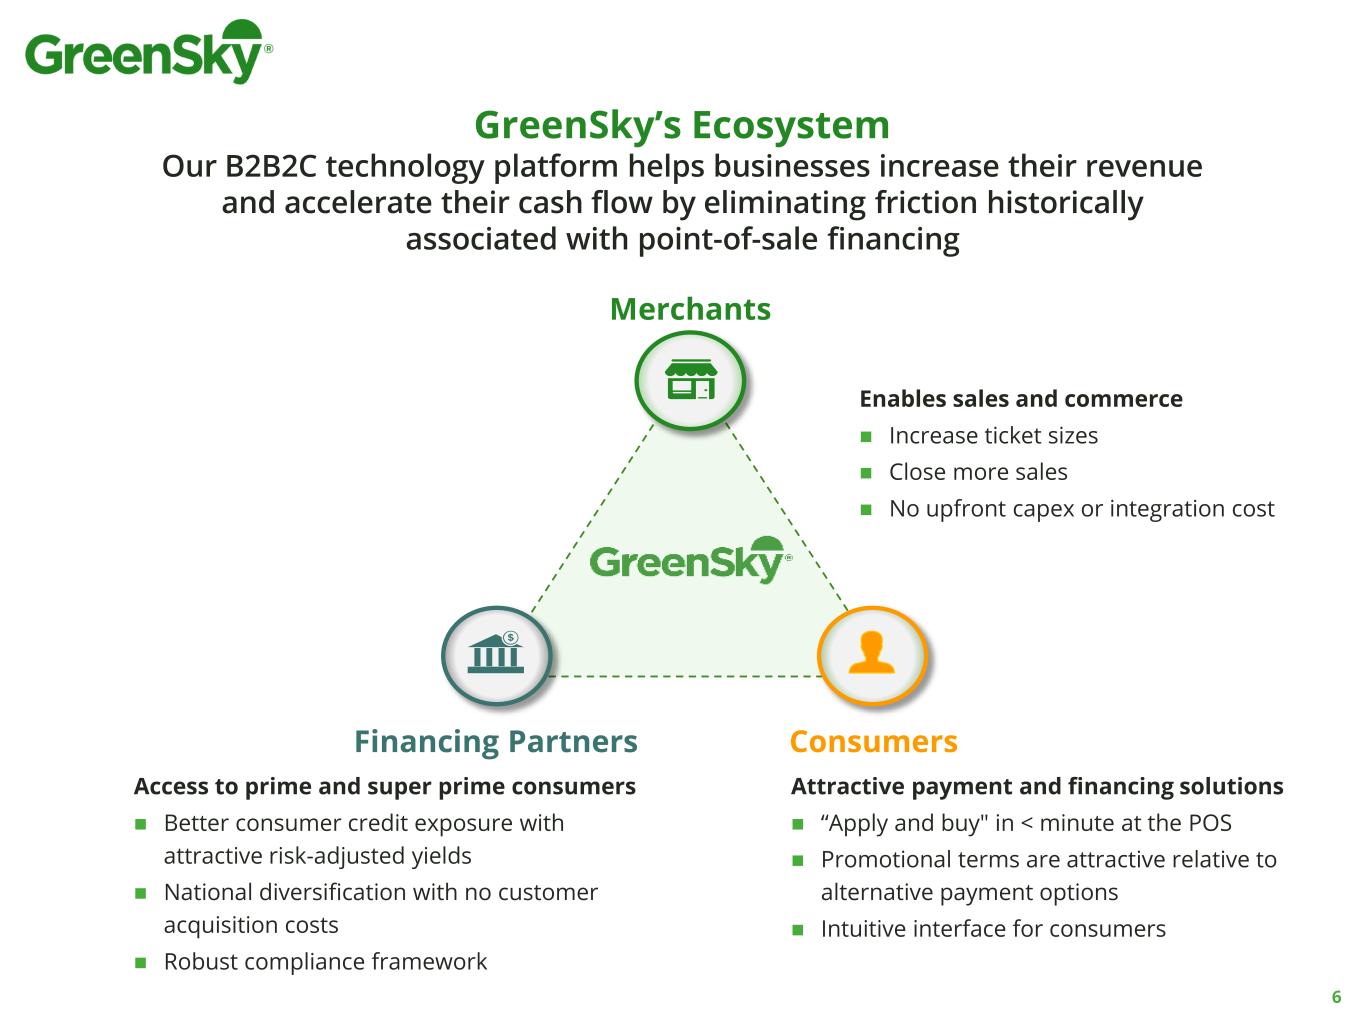
Financing Partners Merchants Consumers GreenSky’s Ecosystem Our B2B2C technology platform helps businesses increase their revenue and accelerate their cash flow by eliminating friction historically associated with point-of-sale financing Enables sales and commerce ◼ Increase ticket sizes ◼ Close more sales ◼ No upfront capex or integration cost Attractive payment and financing solutions ◼ “Apply and buy" in < minute at the POS ◼ Promotional terms are attractive relative to alternative payment options ◼ Intuitive interface for consumers Access to prime and super prime consumers ◼ Better consumer credit exposure with attractive risk-adjusted yields ◼ National diversification with no customer acquisition costs ◼ Robust compliance framework 6
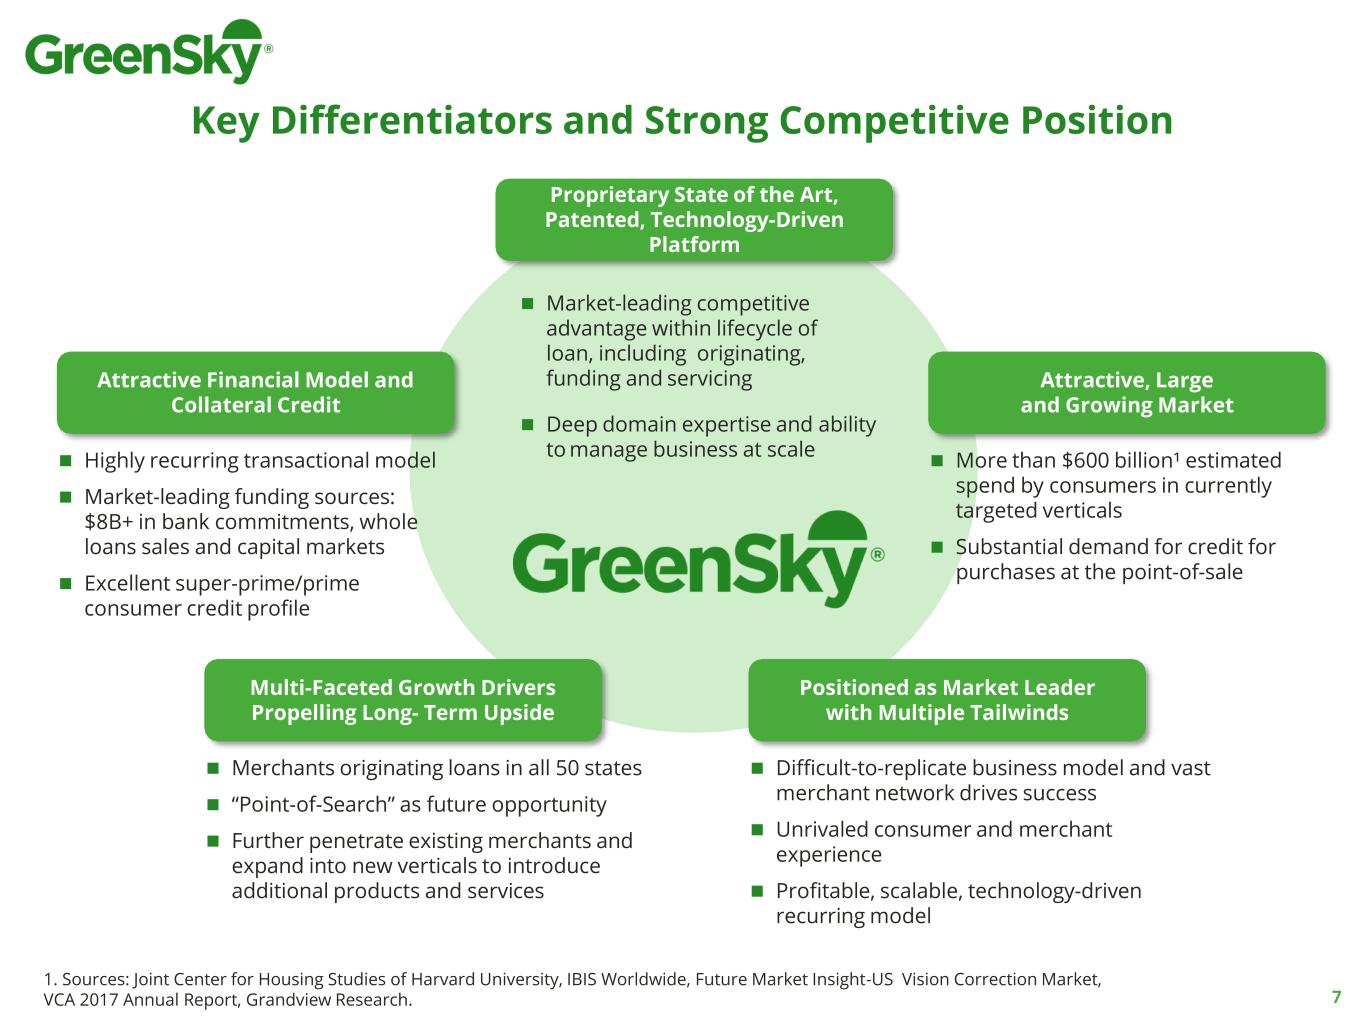
◼ Market-leading competitive advantage within lifecycle of loan, including originating, funding and servicing ◼ Deep domain expertise and ability to manage business at scale Proprietary State of the Art, Patented, Technology-Driven Platform 1. Sources: Joint Center for Housing Studies of Harvard University, IBIS Worldwide, Future Market Insight-US Vision Correction Market, VCA 2017 Annual Report, Grandview Research. Key Differentiators and Strong Competitive Position ◼ More than $600 billion¹ estimated spend by consumers in currently targeted verticals ◼ Substantial demand for credit for purchases at the point-of-sale Attractive, Large and Growing Market ◼ Difficult-to-replicate business model and vast merchant network drives success ◼ Unrivaled consumer and merchant experience ◼ Profitable, scalable, technology-driven recurring model Positioned as Market Leader with Multiple Tailwinds ◼ Merchants originating loans in all 50 states ◼ “Point-of-Search” as future opportunity ◼ Further penetrate existing merchants and expand into new verticals to introduce additional products and services Multi-Faceted Growth Drivers Propelling Long- Term Upside Attractive Financial Model and Collateral Credit ◼ Highly recurring transactional model ◼ Market-leading funding sources: $8B+ in bank commitments, whole loans sales and capital markets ◼ Excellent super-prime/prime consumer credit profile 7

Key Growth Strategies ▪ Continue building merchant relationships with Sponsor groups and large volume partners ▪ Home Improvement remains highly fragmented with great opportunity for additional penetration ▪ Patient Solutions recovery and growth ▪ Expand offerings into homeowner-focused markets which align to GreenSky customer base ▪ Continue focusing on industry-leading, high quality e-Commerce ▪ Develop credit products for customers throughout the entire credit spectrum ▪ Further expand bank partners and funding sources ▪ Leverage affinity relationships to offer new and existing customers desired products (Mortgage Refinance, etc.) ▪ Drive net new product offerings to customers (Credit Card, Secured, other) Widen Spectrum of Constituents New industry Verticals Complementary Products – Cross Sell Continued Organic Growth – Increase Market Share 8
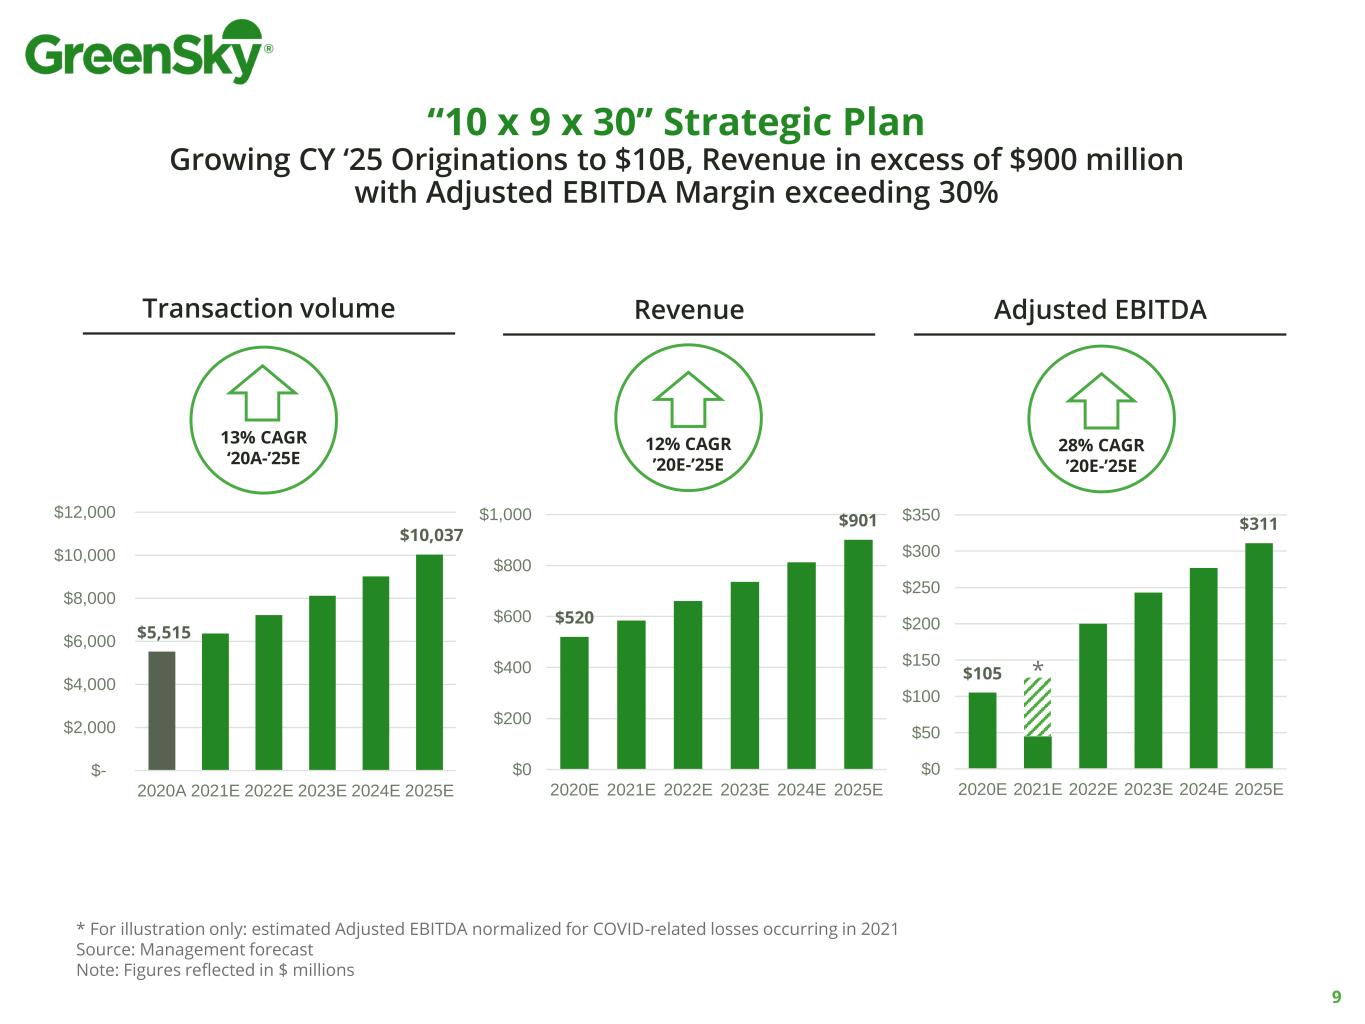
9 Transaction volume Revenue Adjusted EBITDA 13% CAGR ‘20A-’25E 28% CAGR ’20E-’25E 12% CAGR ’20E-’25E $5,515 $10,037 $- $2,000 $4,000 $6,000 $8,000 $10,000 $12,000 2020A 2021E 2022E 2023E 2024E 2025E $520 $901 $0 $200 $400 $600 $800 $1,000 2020E 2021E 2022E 2023E 2024E 2025E $105 $311 $0 $50 $100 $150 $200 $250 $300 $350 2020E 2021E 2022E 2023E 2024E 2025E “10 x 9 x 30” Strategic Plan Growing CY ‘25 Originations to $10B, Revenue in excess of $900 million with Adjusted EBITDA Margin exceeding 30% * For illustration only: estimated Adjusted EBITDA normalized for COVID-related losses occurring in 2021 Source: Management forecast Note: Figures reflected in $ millions *
Gerry Benjamin Vice Chairman & Chief Administrative Officer Corporate Overview
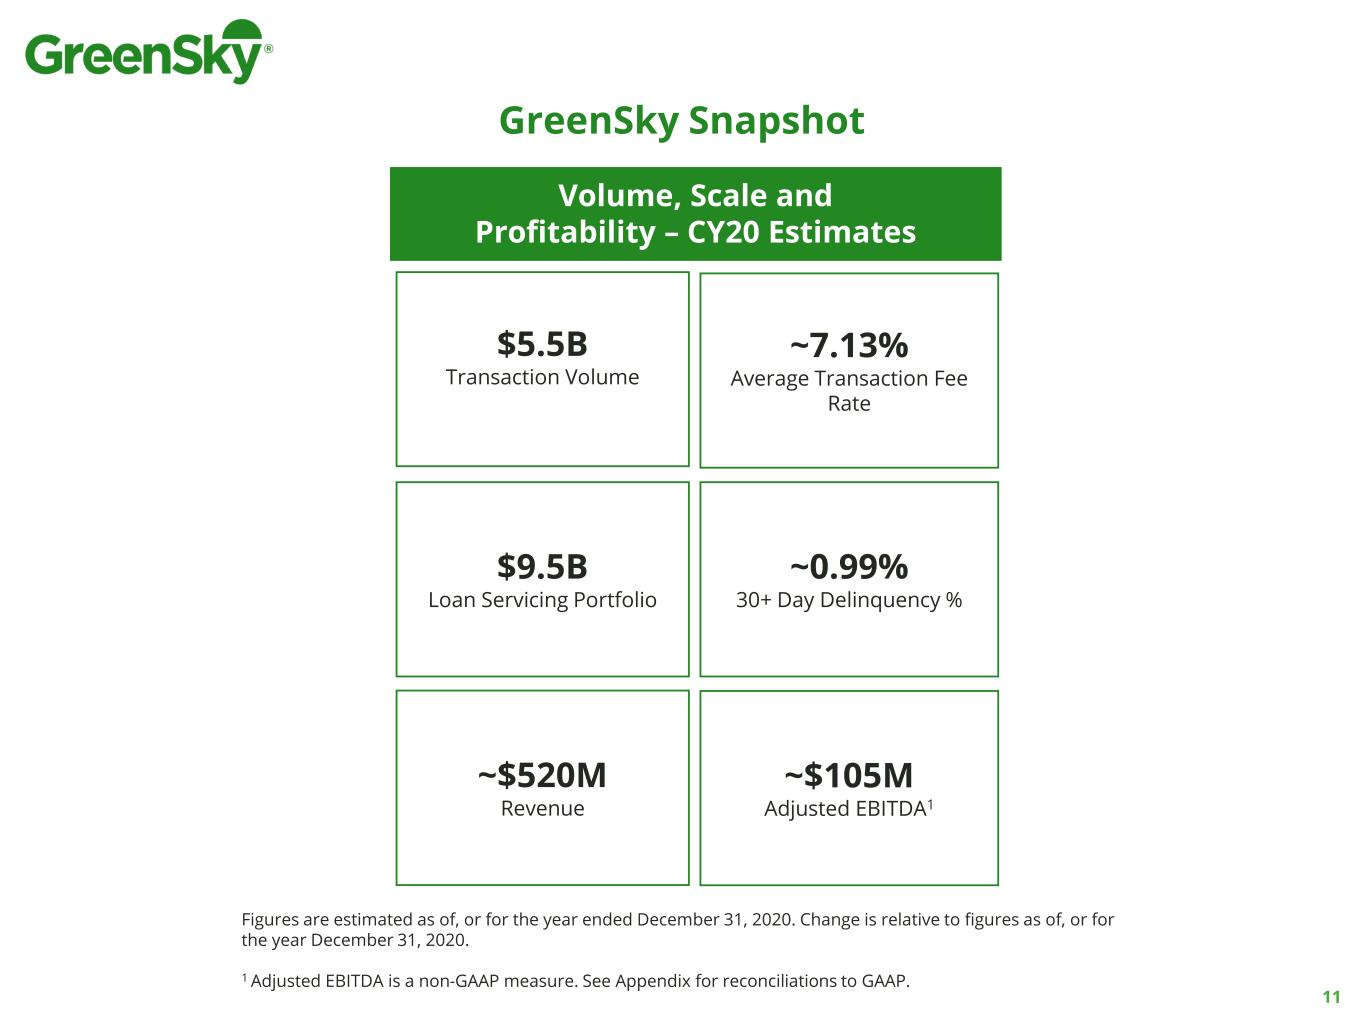
Figures are estimated as of, or for the year ended December 31, 2020. Change is relative to figures as of, or for the year December 31, 2020. 1 Adjusted EBITDA is a non-GAAP measure. See Appendix for reconciliations to GAAP. Volume, Scale and Profitability – CY20 Estimates ~7.13% Average Transaction Fee Rate ~$105M Adjusted EBITDA1 ~$520M Revenue $9.5B Loan Servicing Portfolio $5.5B Transaction Volume ~0.99% 30+ Day Delinquency % GreenSky Snapshot 11
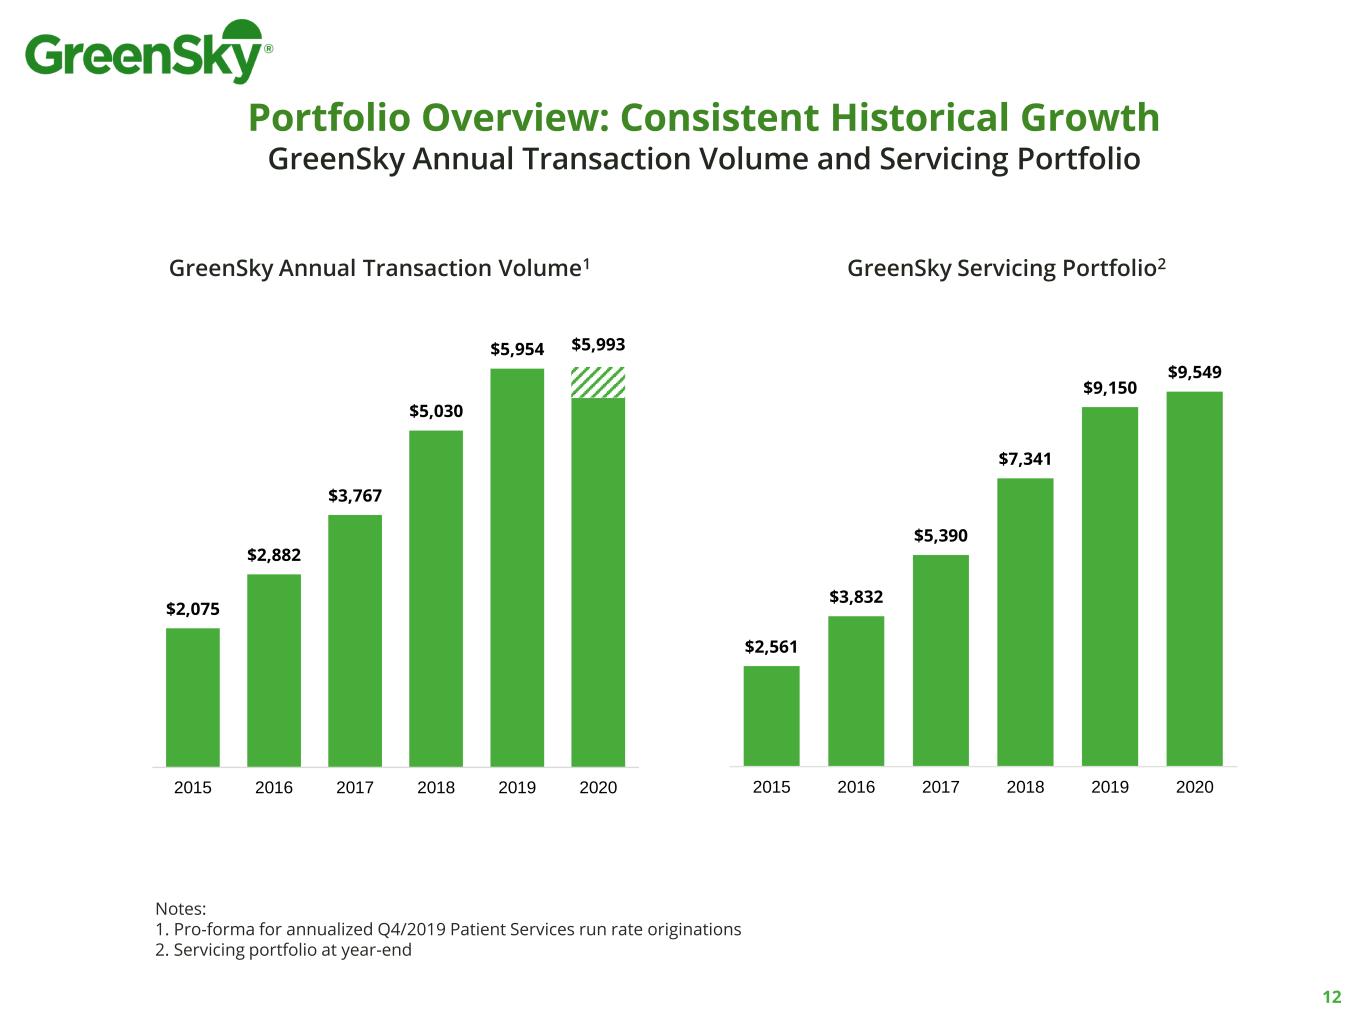
Portfolio Overview: Consistent Historical Growth GreenSky Annual Transaction Volume and Servicing Portfolio Notes: 1. Pro-forma for annualized Q4/2019 Patient Services run rate originations 2. Servicing portfolio at year-end 12 $2,561 $3,832 $5,390 $7,341 $9,150 $9,549 2015 2016 2017 2018 2019 2020 GreenSky Annual Transaction Volume1 GreenSky Servicing Portfolio2 $2,075 $2,882 $3,767 $5,030 $5,954 $5,993 2015 2016 2017 2018 2019 2020
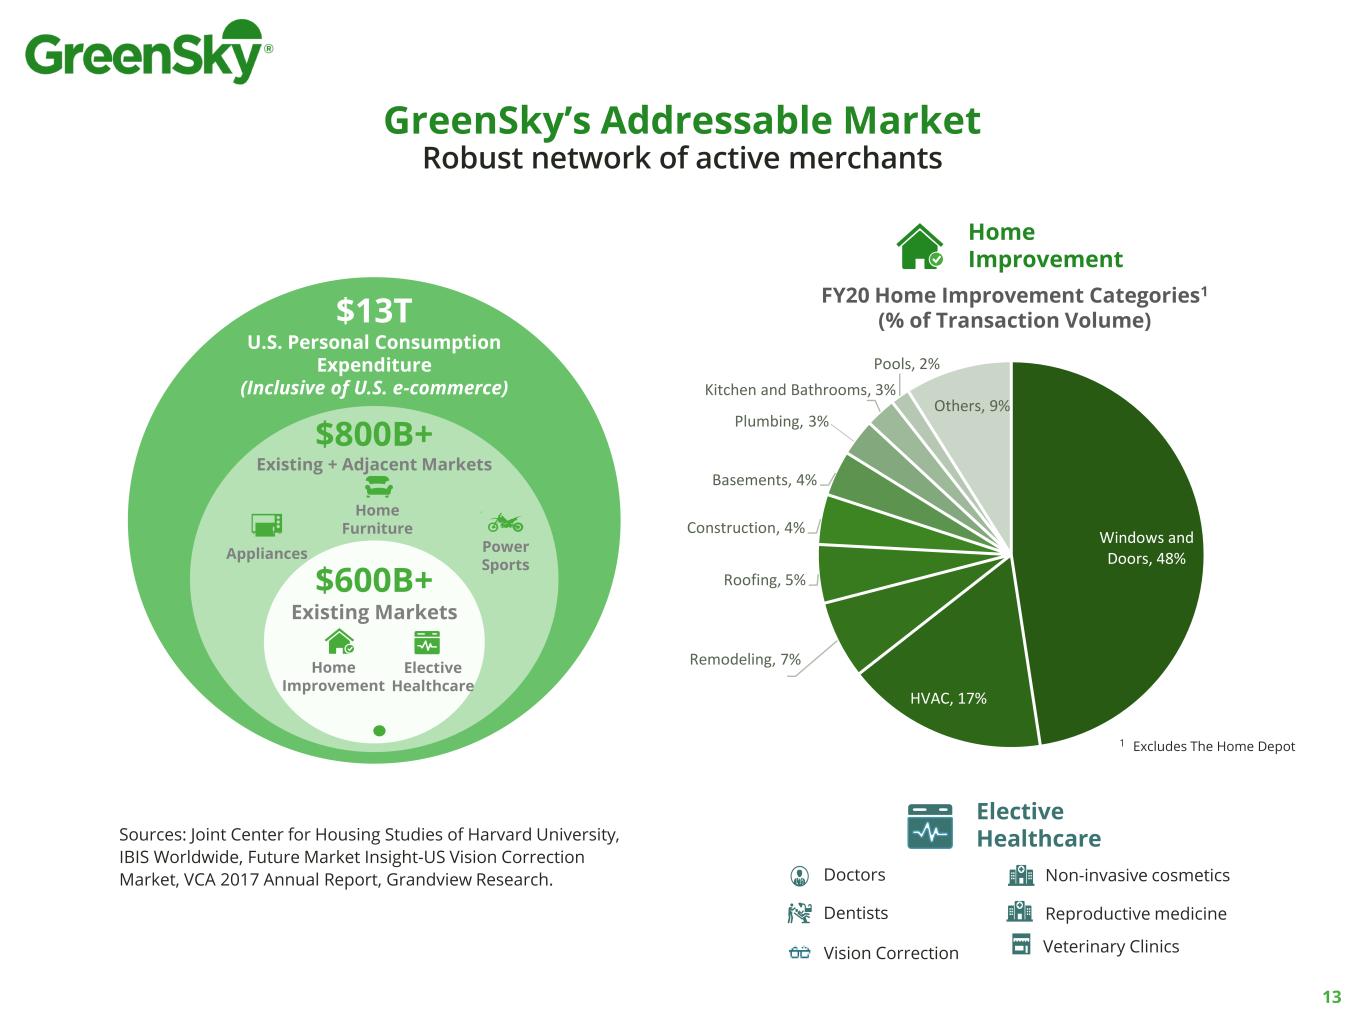
Windows and Doors, 48% HVAC, 17% Remodeling, 7% Roofing, 5% Construction, 4% Basements, 4% Kitchen and Bathrooms, 3% Pools, 2% Others, 9% $13T U.S. Personal Consumption Expenditure (Inclusive of U.S. e-commerce) $800B+ Existing + Adjacent Markets $600B+ Existing Markets Elective Healthcare Appliances Power Sports Home Furniture Home Improvement Home Improvement Elective Healthcare FY20 Home Improvement Categories1 (% of Transaction Volume) GreenSky’s Addressable Market Robust network of active merchants Doctors Dentists Non-invasive cosmetics Veterinary ClinicsVision Correction Reproductive medicine Sources: Joint Center for Housing Studies of Harvard University, IBIS Worldwide, Future Market Insight-US Vision Correction Market, VCA 2017 Annual Report, Grandview Research. 1 Excludes The Home Depot 13 Plumbing, 3%
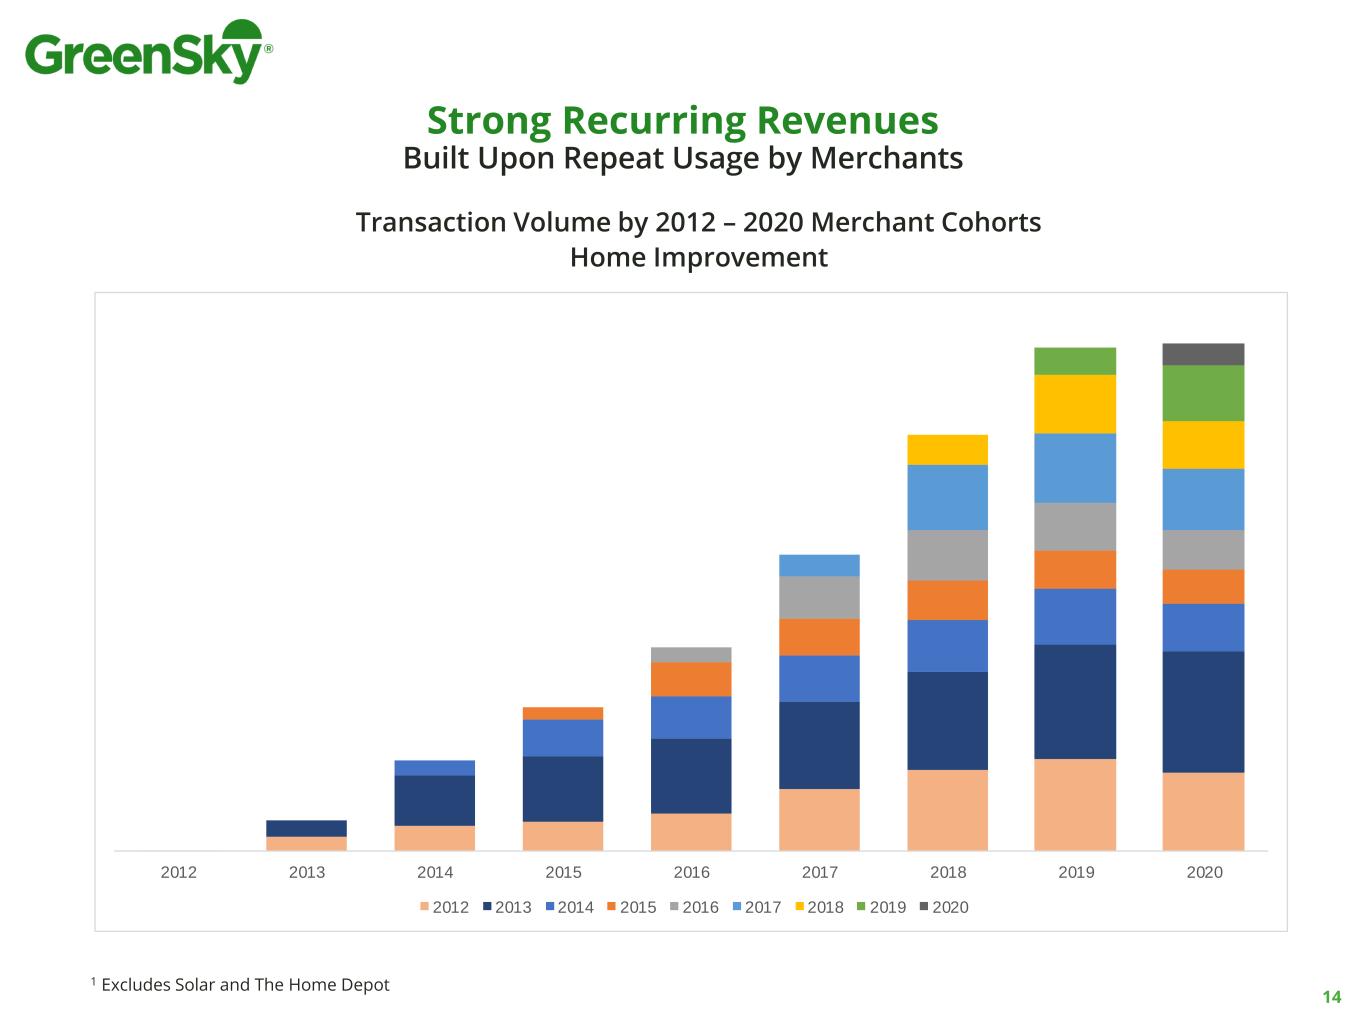
Strong Recurring Revenues Built Upon Repeat Usage by Merchants 1 Excludes Solar and The Home Depot 14 2012 2013 2014 2015 2016 2017 2018 2019 2020 2012 2013 2014 2015 2016 2017 2018 2019 2020 Transaction Volume by 2012 – 2020 Merchant Cohorts Home Improvement
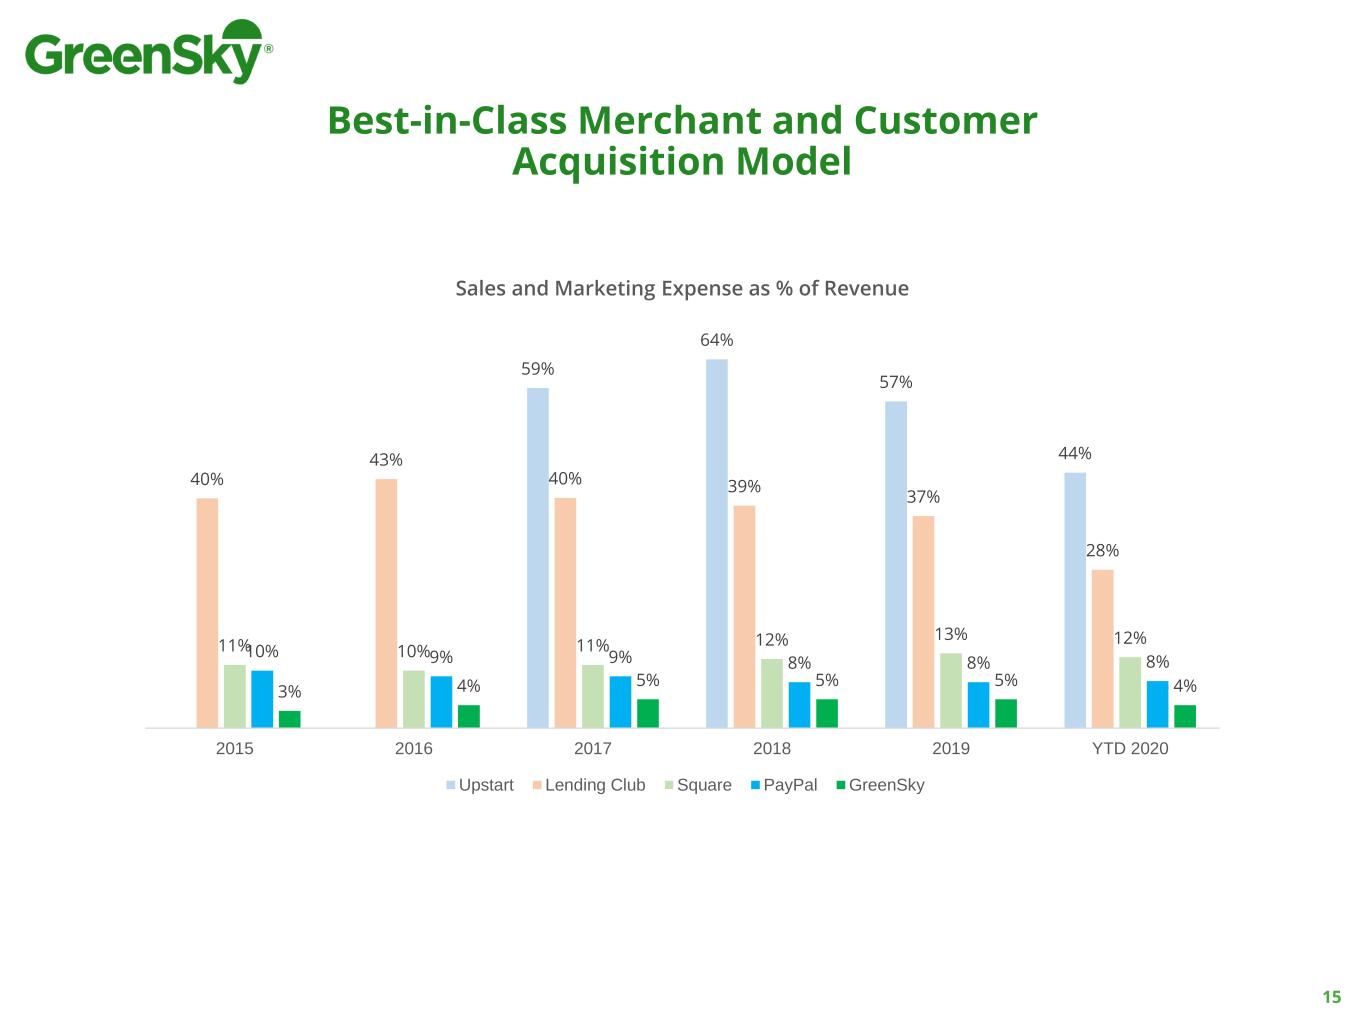
Best-in-Class Merchant and Customer Acquisition Model 15 59% 64% 57% 44% 40% 43% 40% 39% 37% 28% 11% 10% 11% 12% 13% 12% 10% 9% 9% 8% 8% 8% 3% 4% 5% 5% 5% 4% 2015 2016 2017 2018 2019 YTD 2020 Sales and Marketing Expense as % of Revenue Upstart Lending Club Square PayPal GreenSky
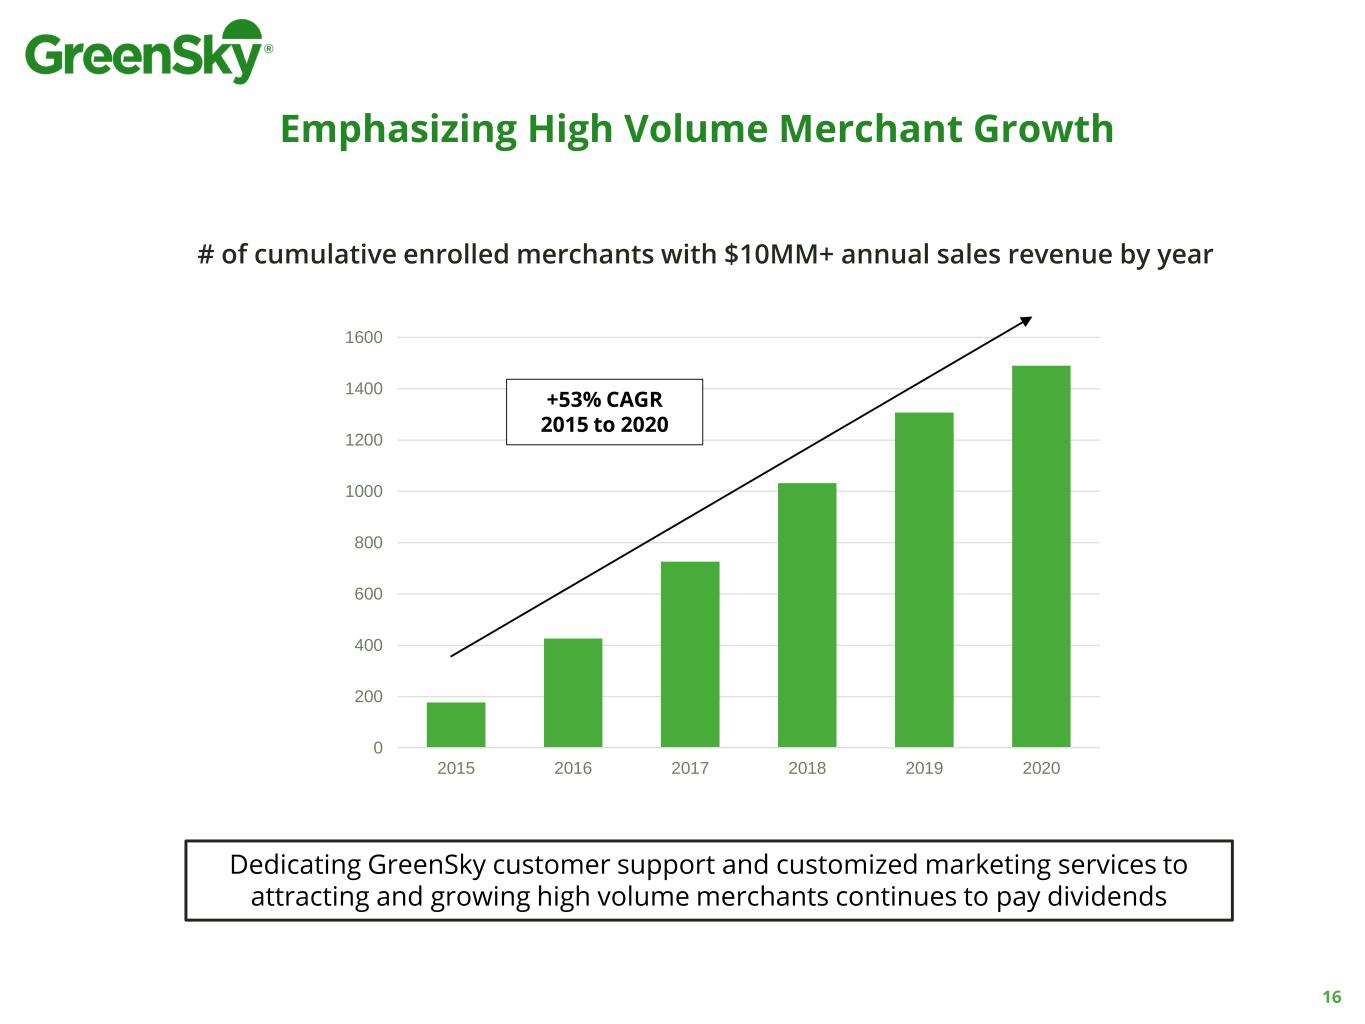
0 200 400 600 800 1000 1200 1400 1600 2015 2016 2017 2018 2019 2020 Emphasizing High Volume Merchant Growth # of cumulative enrolled merchants with $10MM+ annual sales revenue by year +53% CAGR 2015 to 2020 Dedicating GreenSky customer support and customized marketing services to attracting and growing high volume merchants continues to pay dividends 16
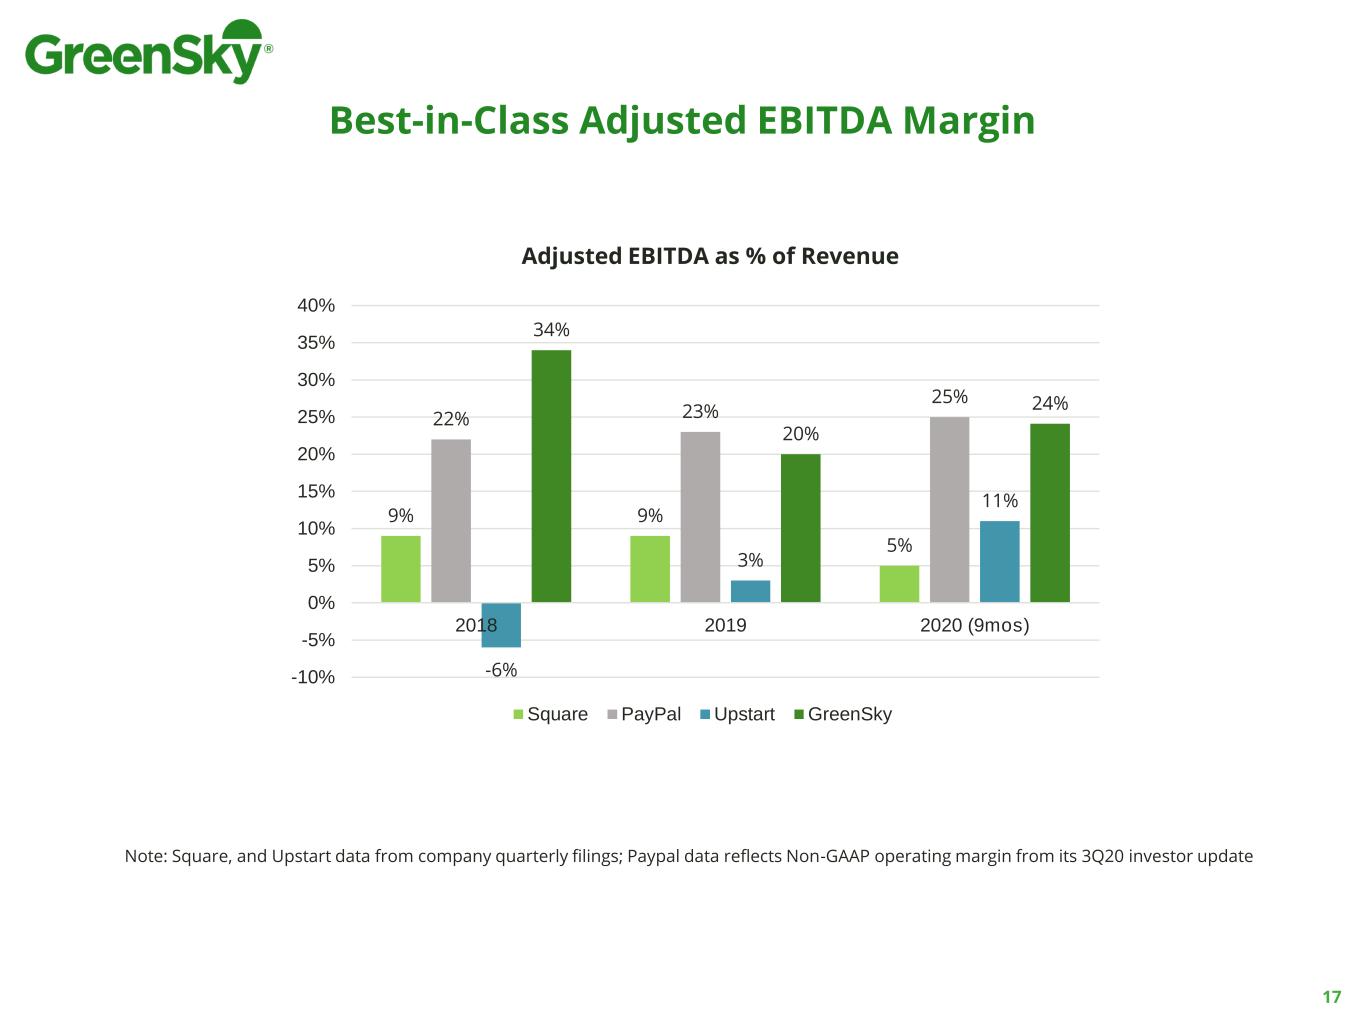
Best-in-Class Adjusted EBITDA Margin Note: Square, and Upstart data from company quarterly filings; Paypal data reflects Non-GAAP operating margin from its 3Q20 investor update 17 9% 9% 5% 22% 23% 25% -6% 3% 11% 34% 20% 24% -10% -5% 0% 5% 10% 15% 20% 25% 30% 35% 40% 2018 2019 2020 (9mos) Adjusted EBITDA as % of Revenue Square PayPal Upstart GreenSky

Loan Servicing Portfolio FICO Distribution Demonstrated consistently high credit standards through economic cycles ✓ 65% over 740 FICO ✓ 88% over 700 FICO ✓ 2% less than 660 FICO✓ 40% over 780 FICO 18 0% 10% 20% 30% 40% 50% 60% 70% 80% 90% 100% FICO: 780+ FICO: 740-780 FICO: 720-740 FICO: 700-720 FICO: 680-700 FICO: 660-680 FICO: 640-660 FICO: <640
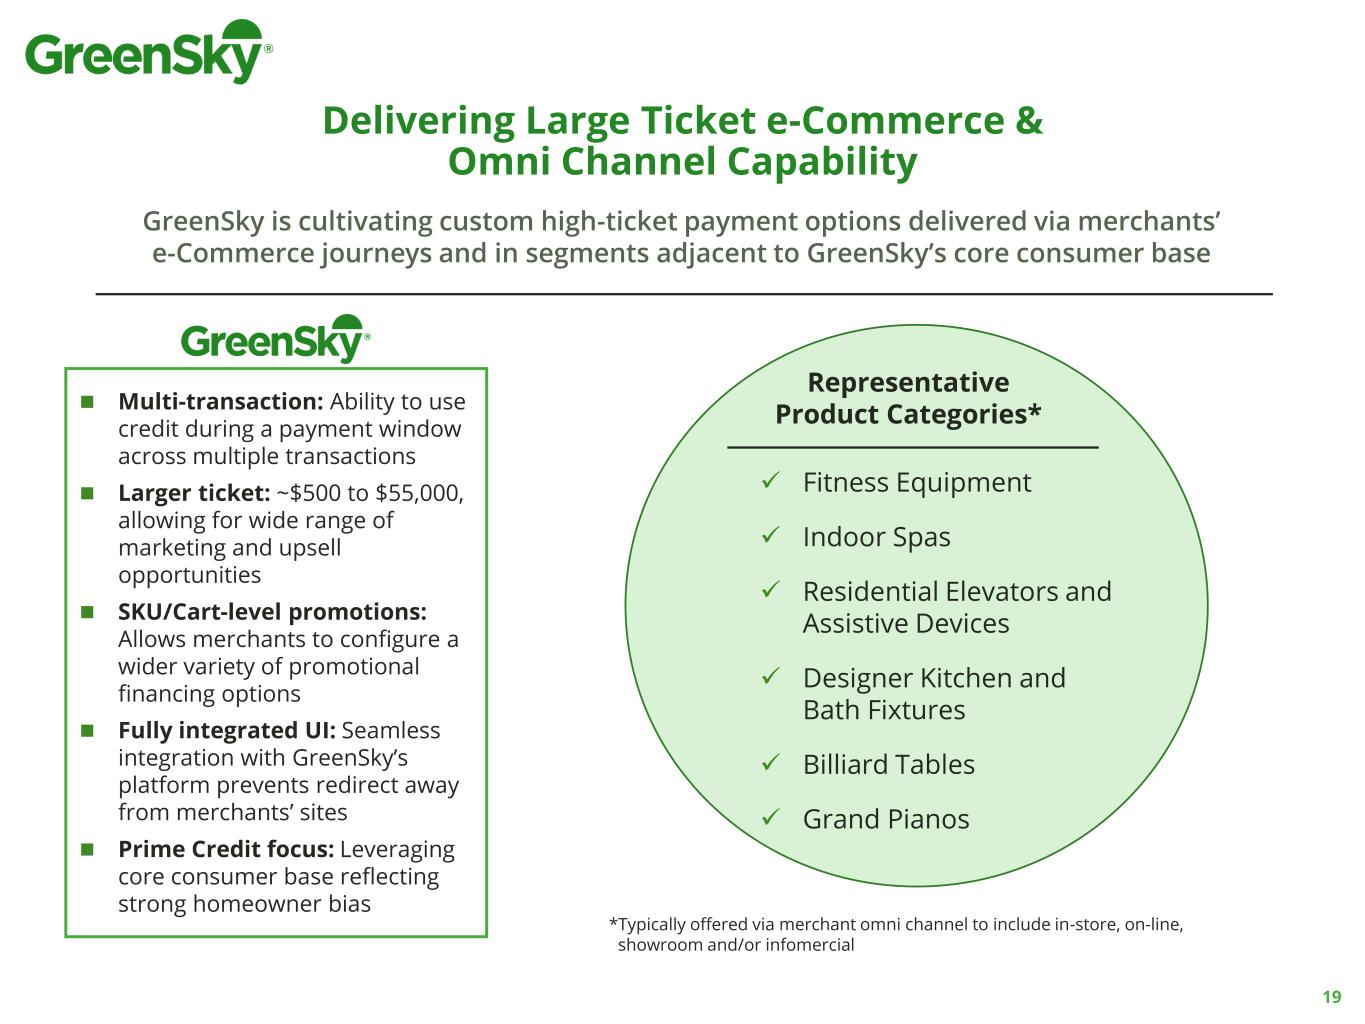
19 GreenSky is cultivating custom high-ticket payment options delivered via merchants’ e-Commerce journeys and in segments adjacent to GreenSky’s core consumer base ◼ Multi-transaction: Ability to use credit during a payment window across multiple transactions ◼ Larger ticket: ~$500 to $55,000, allowing for wide range of marketing and upsell opportunities ◼ SKU/Cart-level promotions: Allows merchants to configure a wider variety of promotional financing options ◼ Fully integrated UI: Seamless integration with GreenSky’s platform prevents redirect away from merchants’ sites ◼ Prime Credit focus: Leveraging core consumer base reflecting strong homeowner bias Delivering Large Ticket e-Commerce & Omni Channel Capability *Typically offered via merchant omni channel to include in-store, on-line, showroom and/or infomercial ✓ Fitness Equipment ✓ Indoor Spas ✓ Residential Elevators and Assistive Devices ✓ Designer Kitchen and Bath Fixtures ✓ Billiard Tables ✓ Grand Pianos Representative Product Categories*
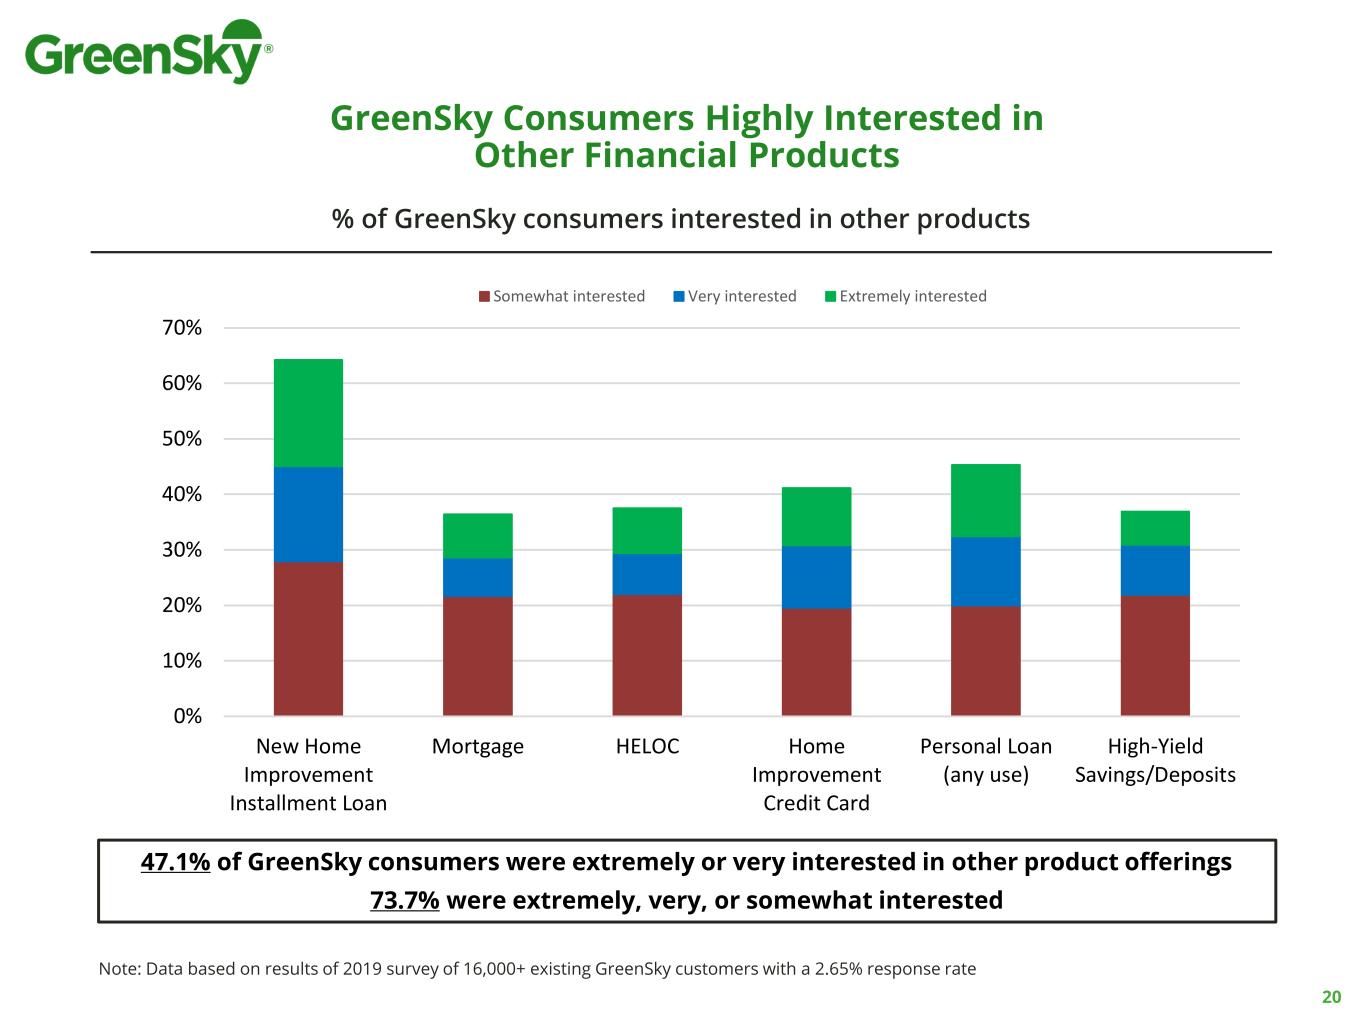
GreenSky Consumers Highly Interested in Other Financial Products 0% 10% 20% 30% 40% 50% 60% 70% New Home Improvement Installment Loan Mortgage HELOC Home Improvement Credit Card Personal Loan (any use) High-Yield Savings/Deposits % of GreenSky Customers Interested in Other Products Somewhat interested Very interested Extremely interested 0% 10% 20% 30% 40% 50% 60% 70% New Home Improvement Installment Loan Mortgage HELOC Home Improvement Credit Card Personal Loan (any use) High-Yield Savings/Deposits % of GreenSky Customers Interested in Other Products Somewhat interested Very int rested Extremely interested % of GreenSky consumers interested in other products Note: Data based on results of 2019 survey of 16,000+ existing GreenSky customers with a 2.65% response rate 47.1% of GreenSky consumers were extremely or very interested in other product offerings 73.7% were extremely, very, or somewhat interested 20
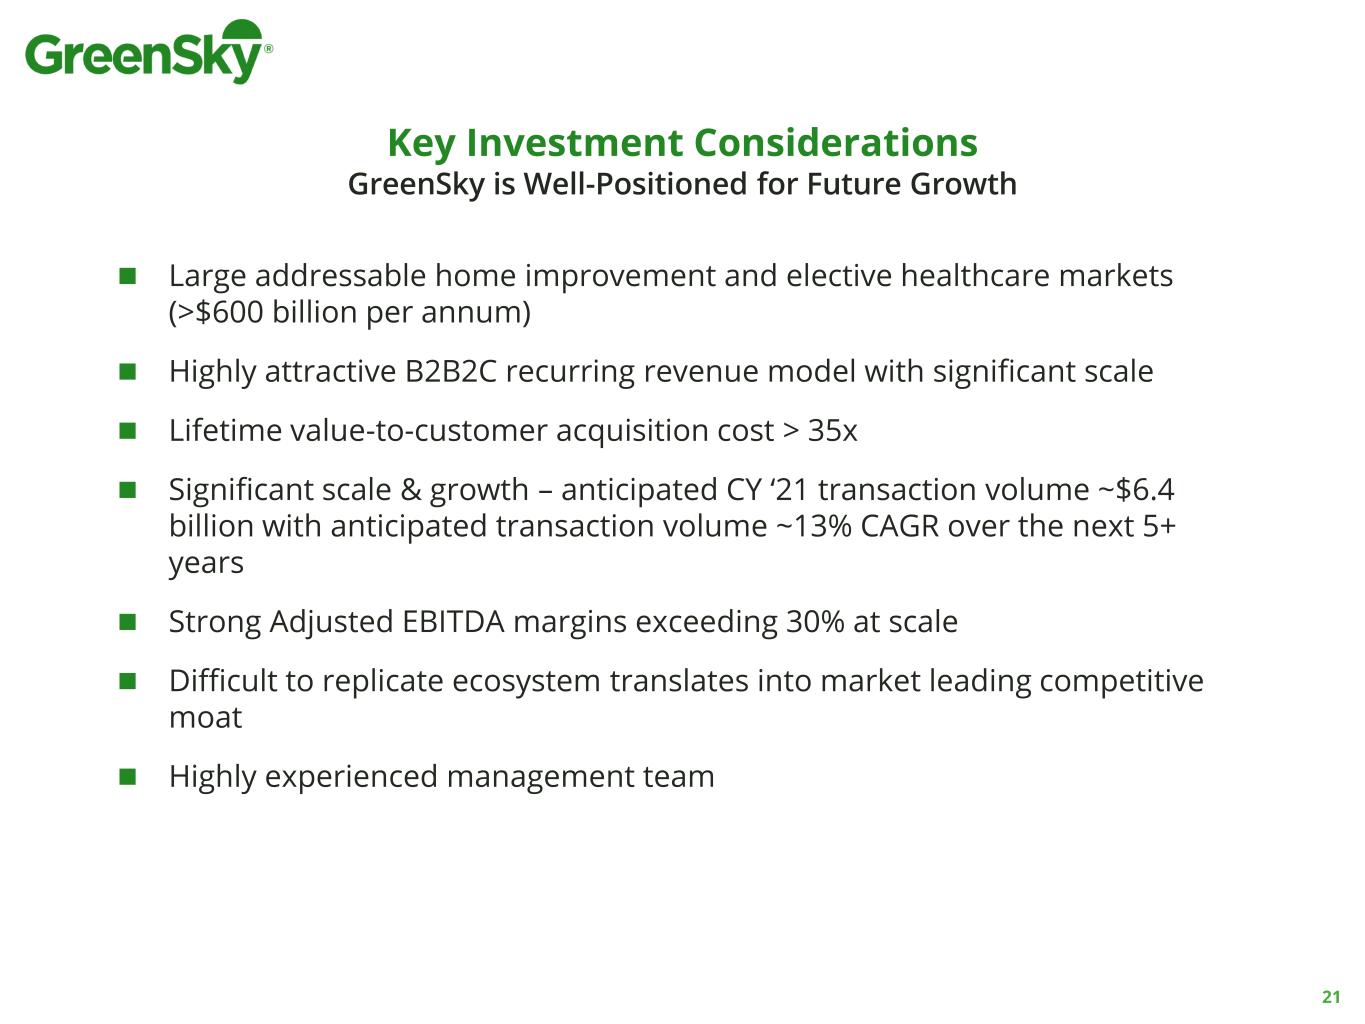
Key Investment Considerations GreenSky is Well-Positioned for Future Growth ◼ Large addressable home improvement and elective healthcare markets (>$600 billion per annum) ◼ Highly attractive B2B2C recurring revenue model with significant scale ◼ Lifetime value-to-customer acquisition cost > 35x ◼ Significant scale & growth – anticipated CY ‘21 transaction volume ~$6.4 billion with anticipated transaction volume ~13% CAGR over the next 5+ years ◼ Strong Adjusted EBITDA margins exceeding 30% at scale ◼ Difficult to replicate ecosystem translates into market leading competitive moat ◼ Highly experienced management team 21
Tim Kaliban President & Chief Risk Officer GreenSky Value Proposition and Risk Management

As technology transforms and streamlines commerce, GreenSky’s proprietary platform delivers a best-in-class user experience Application ID: 0001234567 Reference #: Applicant: John Doe Approved Loan Amount: $55,000.00 GreenSky’s solution is instant, paperless and mobile ✓ Seamless experience for merchants and their salespeople—easy to use, effortless to integrate with existing payments systems ✓ Intuitive, non-invasive application experience for consumers—“apply and buy” in less than 60 seconds at the point of sale x Competitive legacy solutions often involve paper applications and a substantial time lag between a consumer deciding to apply for a loan and receiving approval, and then from approval to funding 23
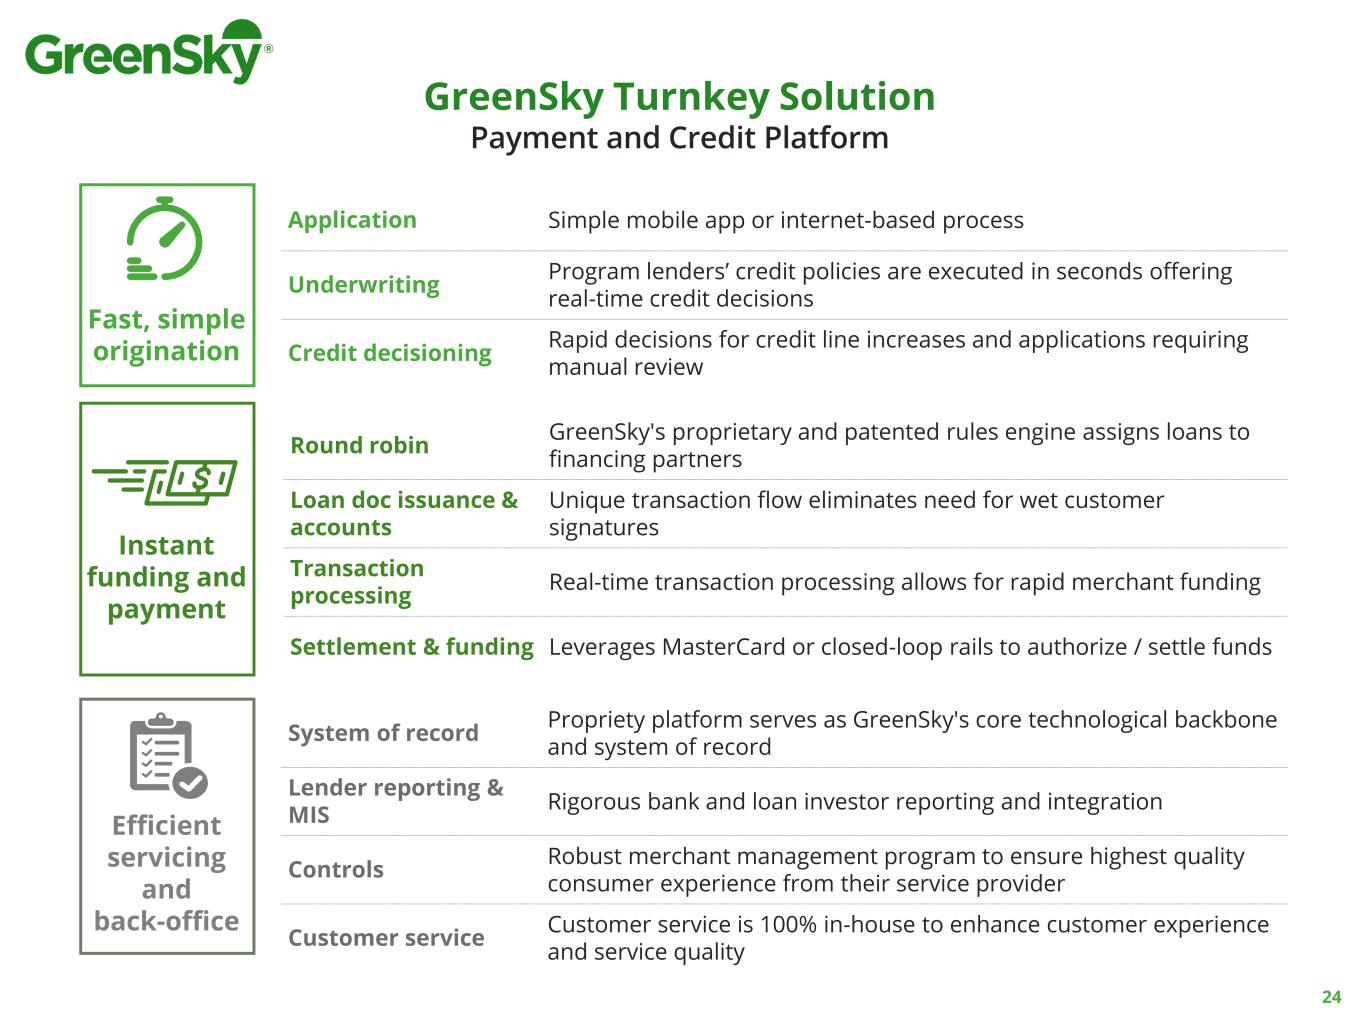
Application Simple mobile app or internet-based process Underwriting Program lenders’ credit policies are executed in seconds offering real-time credit decisions Credit decisioning Rapid decisions for credit line increases and applications requiring manual review Round robin GreenSky's proprietary and patented rules engine assigns loans to financing partners Loan doc issuance & accounts Unique transaction flow eliminates need for wet customer signatures Transaction processing Real-time transaction processing allows for rapid merchant funding Settlement & funding Leverages MasterCard or closed-loop rails to authorize / settle funds System of record Propriety platform serves as GreenSky's core technological backbone and system of record Lender reporting & MIS Rigorous bank and loan investor reporting and integration Controls Robust merchant management program to ensure highest quality consumer experience from their service provider Customer service Customer service is 100% in-house to enhance customer experience and service quality Fast, simple origination Instant funding and payment Efficient servicing and back-office GreenSky Turnkey Solution Payment and Credit Platform 24
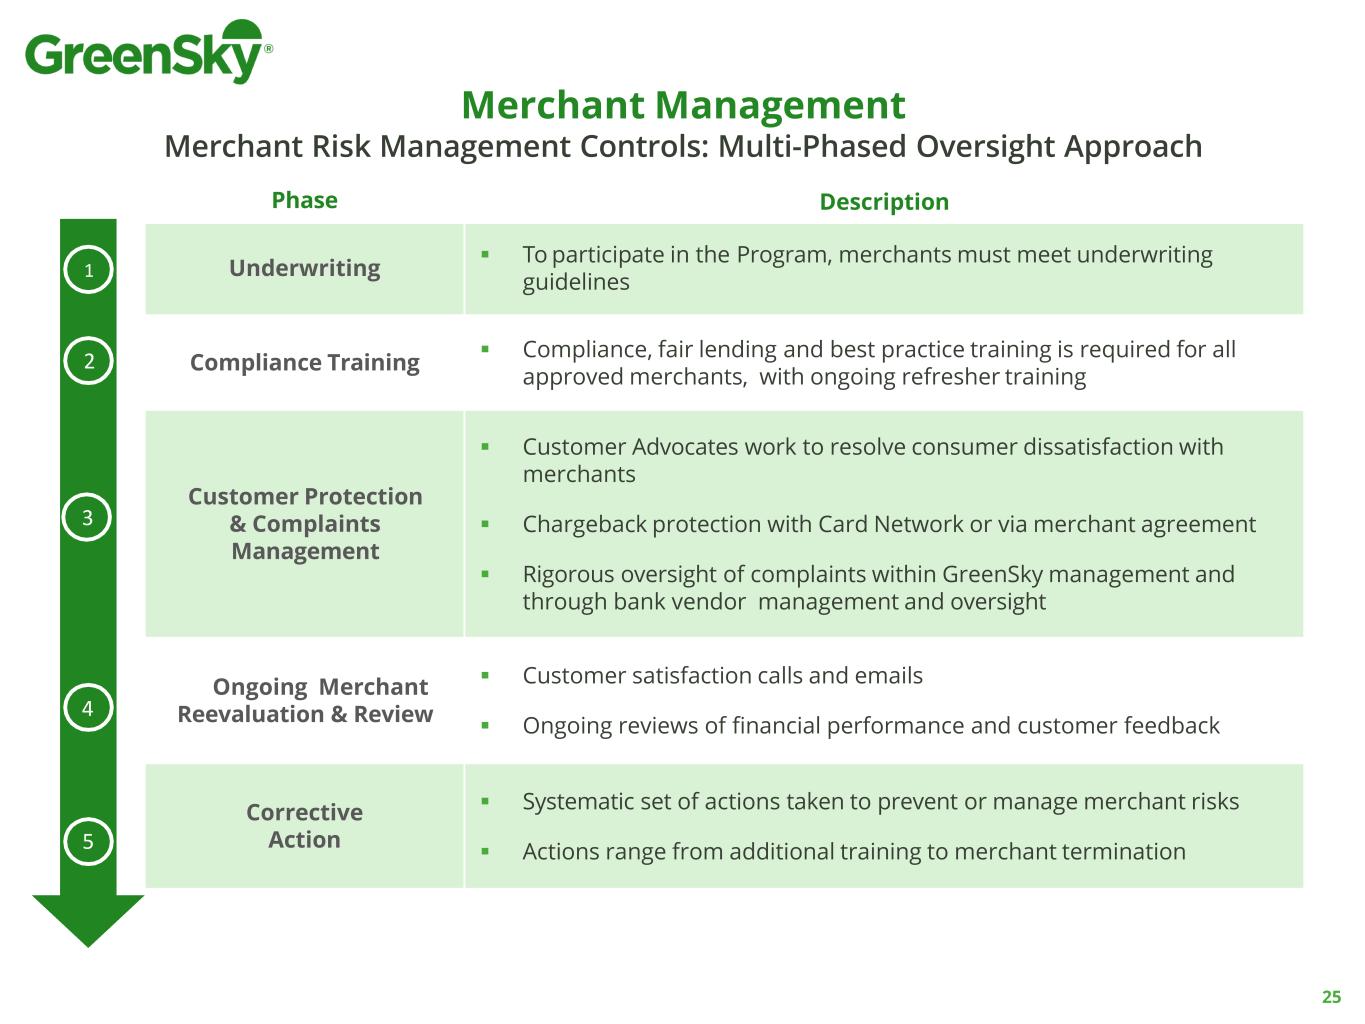
Phase Description Underwriting ▪ To participate in the Program, merchants must meet underwriting guidelines Compliance Training ▪ Compliance, fair lending and best practice training is required for all approved merchants, with ongoing refresher training Customer Protection & Complaints Management ▪ Customer Advocates work to resolve consumer dissatisfaction with merchants ▪ Chargeback protection with Card Network or via merchant agreement ▪ Rigorous oversight of complaints within GreenSky management and through bank vendor management and oversight Ongoing Merchant Reevaluation & Review ▪ Customer satisfaction calls and emails ▪ Ongoing reviews of financial performance and customer feedback Corrective Action ▪ Systematic set of actions taken to prevent or manage merchant risks ▪ Actions range from additional training to merchant termination Merchant Management Merchant Risk Management Controls: Multi-Phased Oversight Approach 1 2 3 4 5 25

Strong Credit Performance ◼ Weighted average FICO scores at origination in 2020 were at all time highs ◼ 30+ day delinquencies were 39 bps lower compared to 2019, demonstrating ongoing positive trend in credit performance, despite the impact of COVID-19 ◼ Benefit of 2020 COVID deferrals are expected to adversely impact 2021 credit performance 771 773 783 784 781 758 758 759 761 763 Q4’19 Q1'20 Q2'20 Q3'20 Q4'20 Weighted Average FICO Scores FICO (Weighted Avg. of Loans Originated during the Quarter) FICO (Weighted Avg. of Loan Servicing Portfolio) 1Represents delinquencies of 30+ days as a percentage of balance with payment due. 1.18% 1.04% 1.44% 1.48%1.31% 1.31% 1.29% 1.38% 1.23% 0.74% 1.04% 0.99% 0.00% 0.50% 1.00% 1.50% 2.00% 2.50% Q1 Q2 Q3 Q4 Delinquency %1 (30+ Days) 2018 2019 2020 26
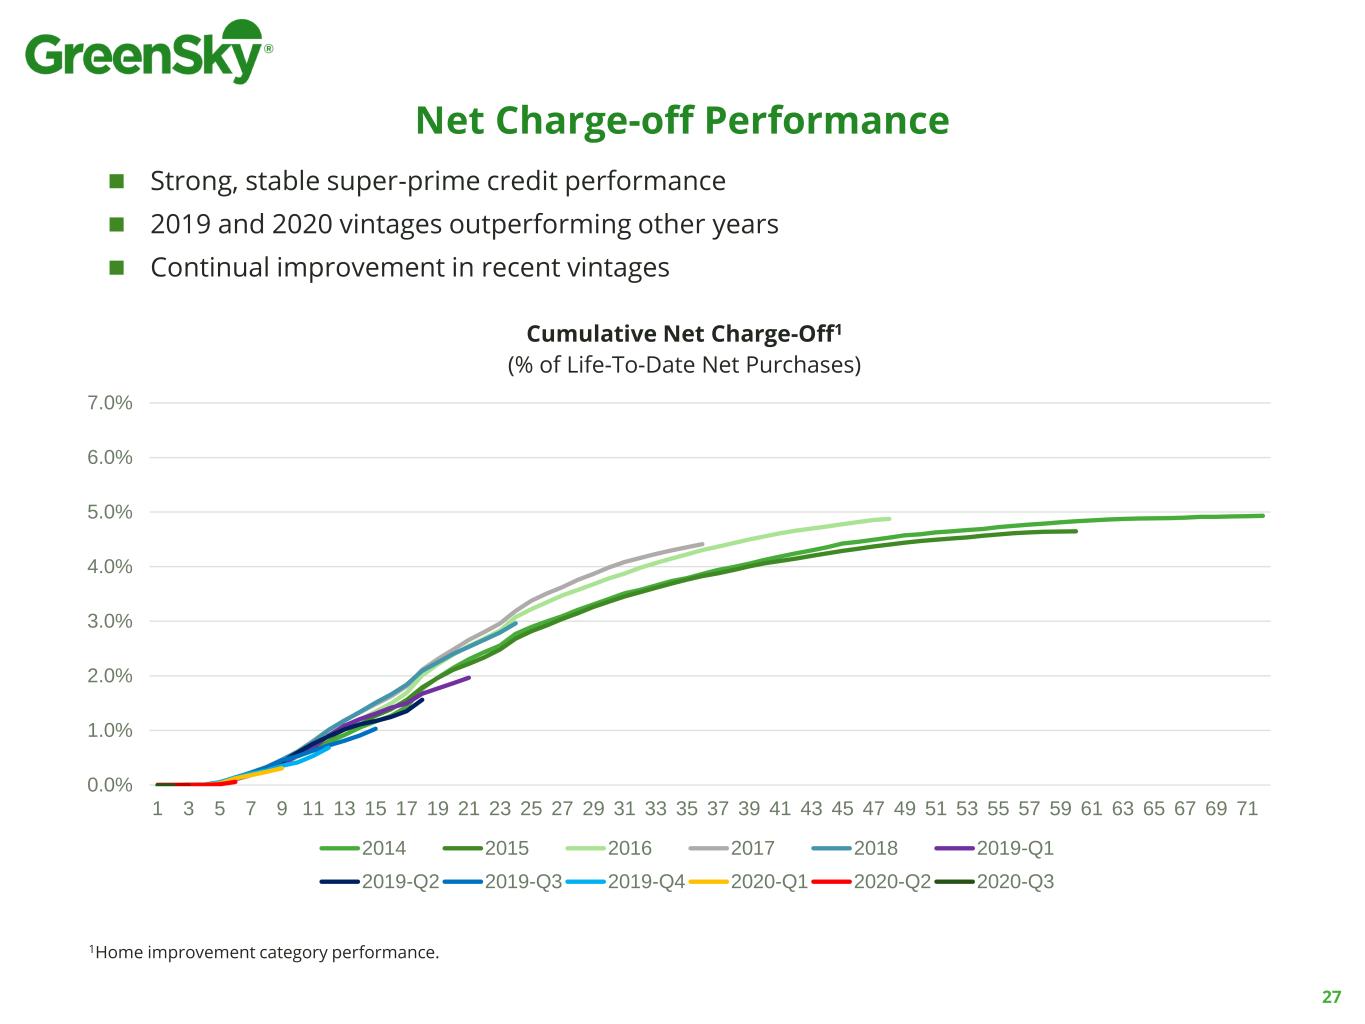
Net Charge-off Performance ◼ Strong, stable super-prime credit performance ◼ 2019 and 2020 vintages outperforming other years ◼ Continual improvement in recent vintages 27 0.0% 1.0% 2.0% 3.0% 4.0% 5.0% 6.0% 7.0% 1 3 5 7 9 11 13 15 17 19 21 23 25 27 29 31 33 35 37 39 41 43 45 47 49 51 53 55 57 59 61 63 65 67 69 71 Cumulative Net Charge-Off1 (% of Life-To-Date Net Purchases) 2014 2015 2016 2017 2018 2019-Q1 2019-Q2 2019-Q3 2019-Q4 2020-Q1 2020-Q2 2020-Q3 1Home improvement category performance.

Minaz Vastani Chief Technology Officer Technology Overview
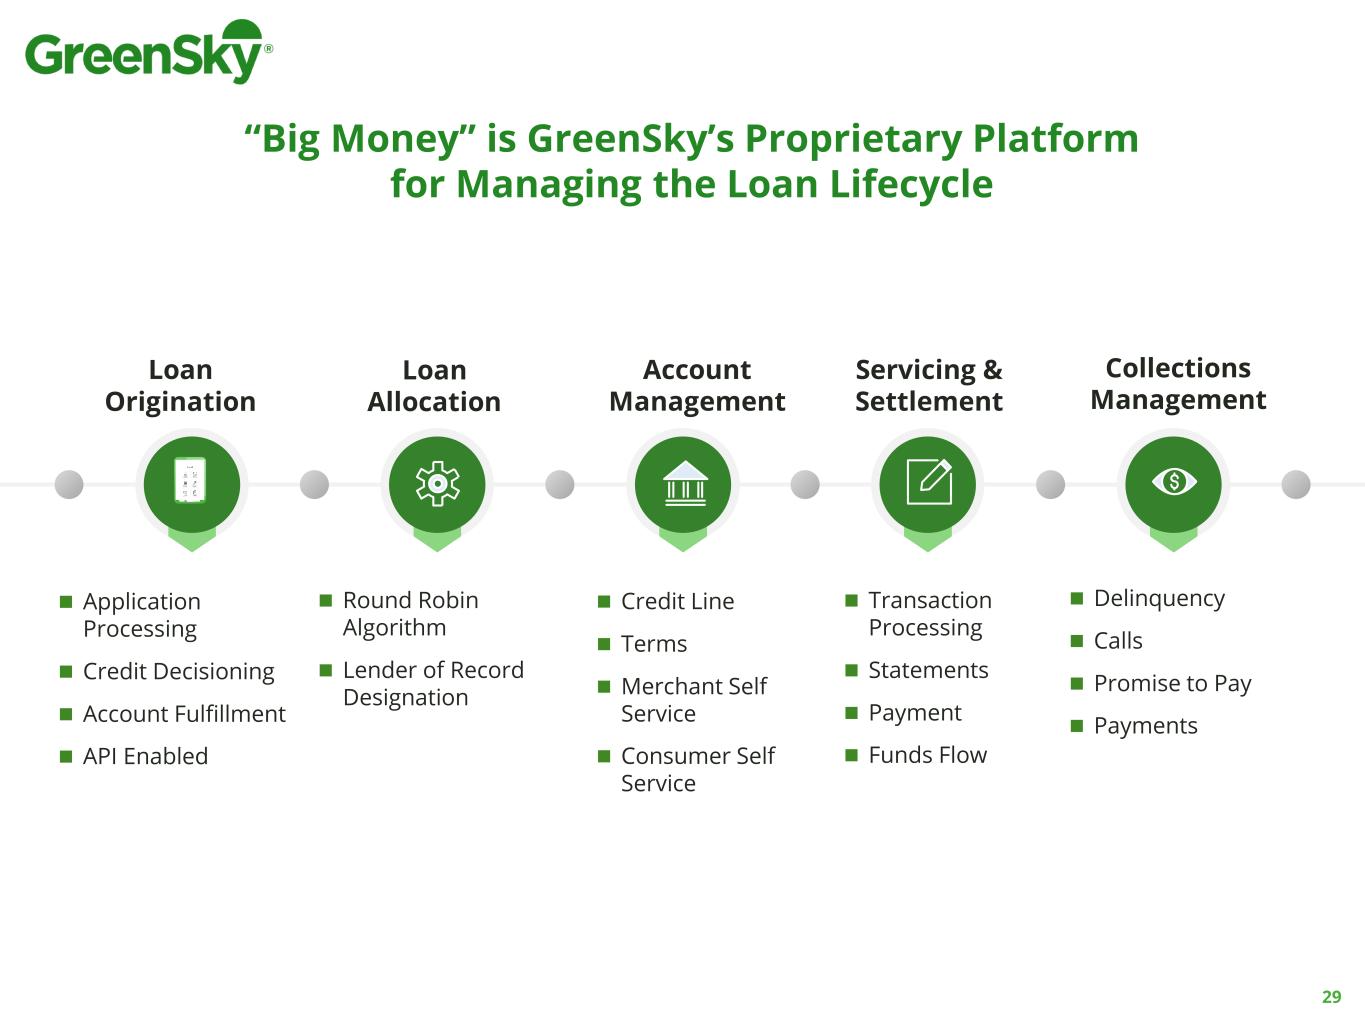
◼ Round Robin Algorithm ◼ Lender of Record Designation Loan Allocation ◼ Credit Line ◼ Terms ◼ Merchant Self Service ◼ Consumer Self Service Account Management ◼ Transaction Processing ◼ Statements ◼ Payment ◼ Funds Flow Servicing & Settlement ◼ Application Processing ◼ Credit Decisioning ◼ Account Fulfillment ◼ API Enabled Loan Origination ◼ Delinquency ◼ Calls ◼ Promise to Pay ◼ Payments Collections Management 29 “Big Money” is GreenSky’s Proprietary Platform for Managing the Loan Lifecycle
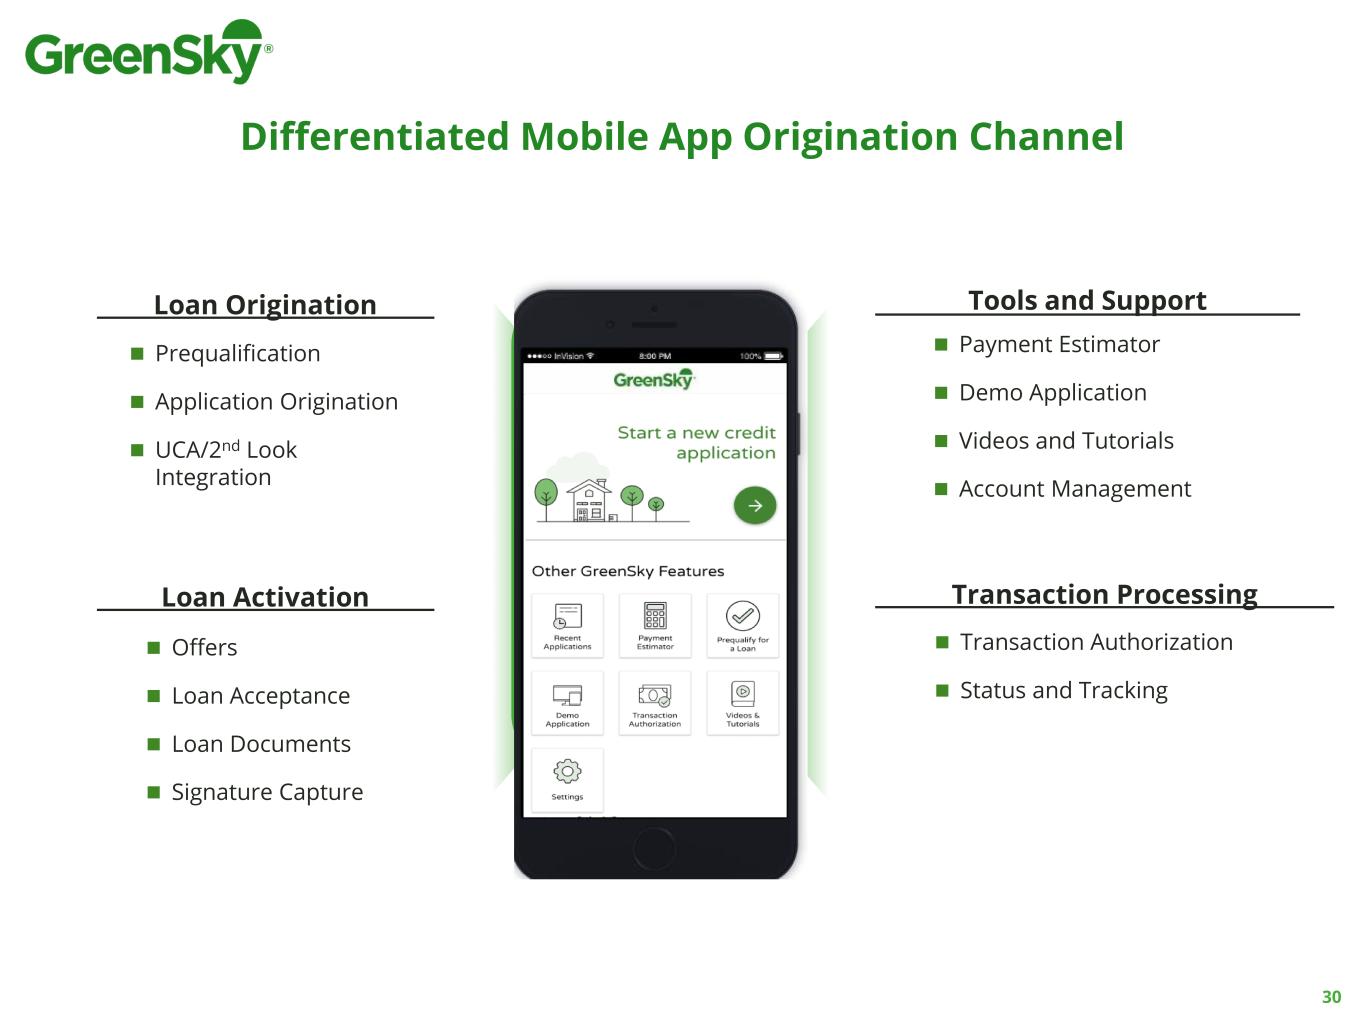
Differentiated Mobile App Origination Channel Loan Origination Transaction ProcessingLoan Activation Tools and Support ◼ Prequalification ◼ Application Origination ◼ UCA/2nd Look Integration ◼ Transaction Authorization ◼ Status and Tracking ◼ Offers ◼ Loan Acceptance ◼ Loan Documents ◼ Signature Capture ◼ Payment Estimator ◼ Demo Application ◼ Videos and Tutorials ◼ Account Management 30

“Big Money” Ecosystem is a Key Technology Differentiator Instant credit and merchant underwriting powered by decision engine System of record for loan and merchant data Integrates custom and 3rd party systems and data Defensible information security ecosystem Scalable, cost efficient Scale out analytics and Machine Learning enabled 31
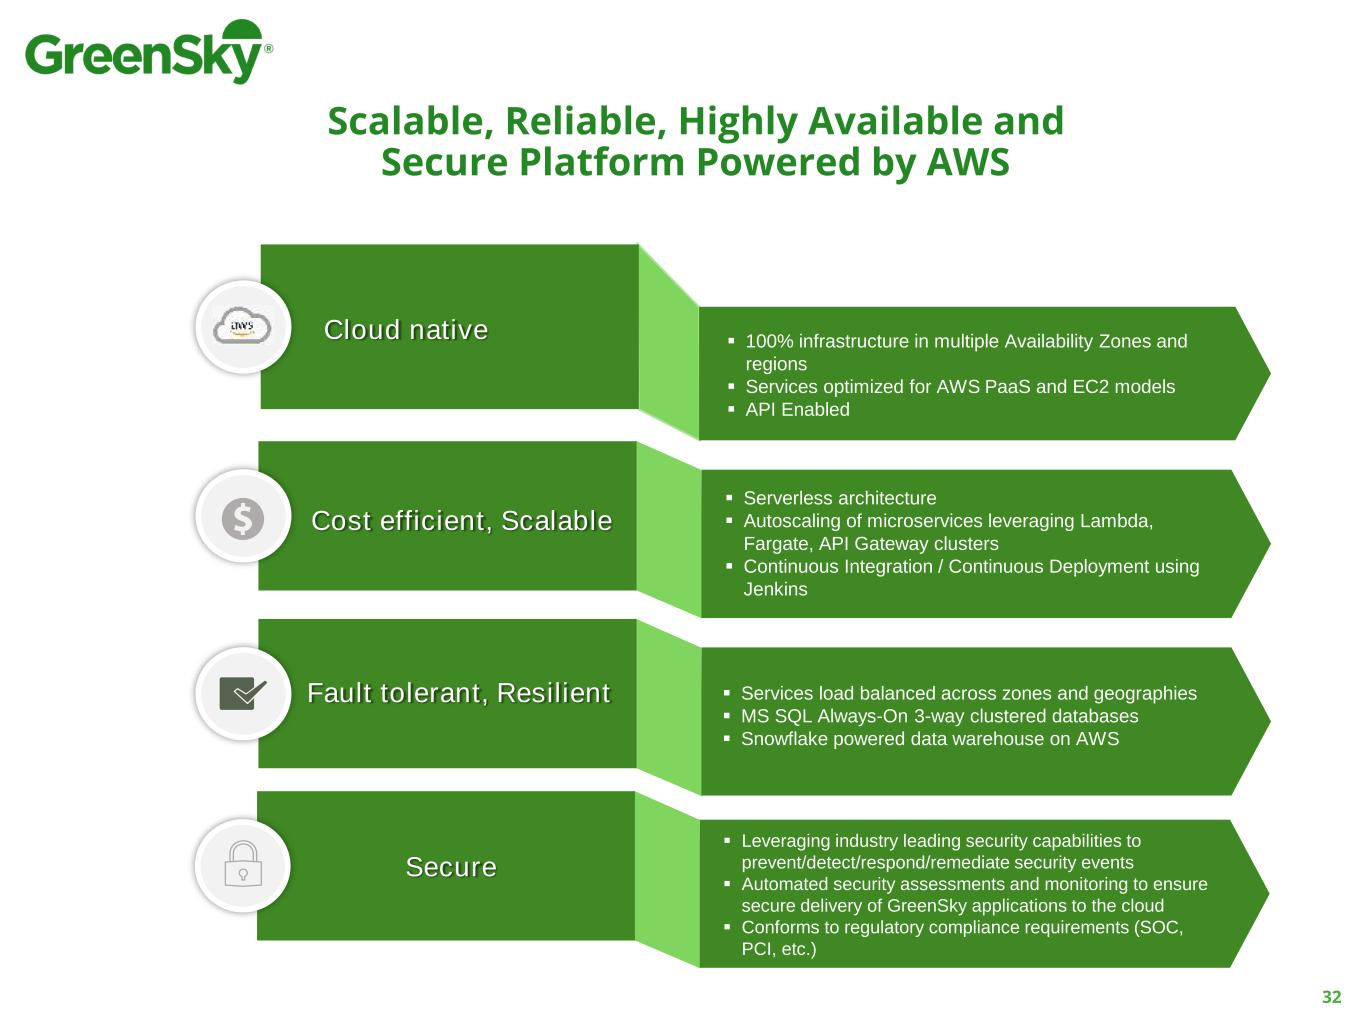
32 Scalable, Reliable, Highly Available and Secure Platform Powered by AWS Cloud native ▪ 100% infrastructure in multiple Availability Zones and regions ▪ Services optimized for AWS PaaS and EC2 models ▪ API Enabled Cost efficient, Scalable ▪ Serverless architecture ▪ Autoscaling of microservices leveraging Lambda, Fargate, API Gateway clusters ▪ Continuous Integration / Continuous Deployment using Jenkins Fault tolerant, Resilient ▪ Services load balanced across zones and geographies ▪ MS SQL Always-On 3-way clustered databases ▪ Snowflake powered data warehouse on AWS ▪ Leveraging industry leading security capabilities to prevent/detect/respond/remediate security events ▪ Automated security assessments and monitoring to ensure secure delivery of GreenSky applications to the cloud ▪ Conforms to regulatory compliance requirements (SOC, PCI, etc.) Secure
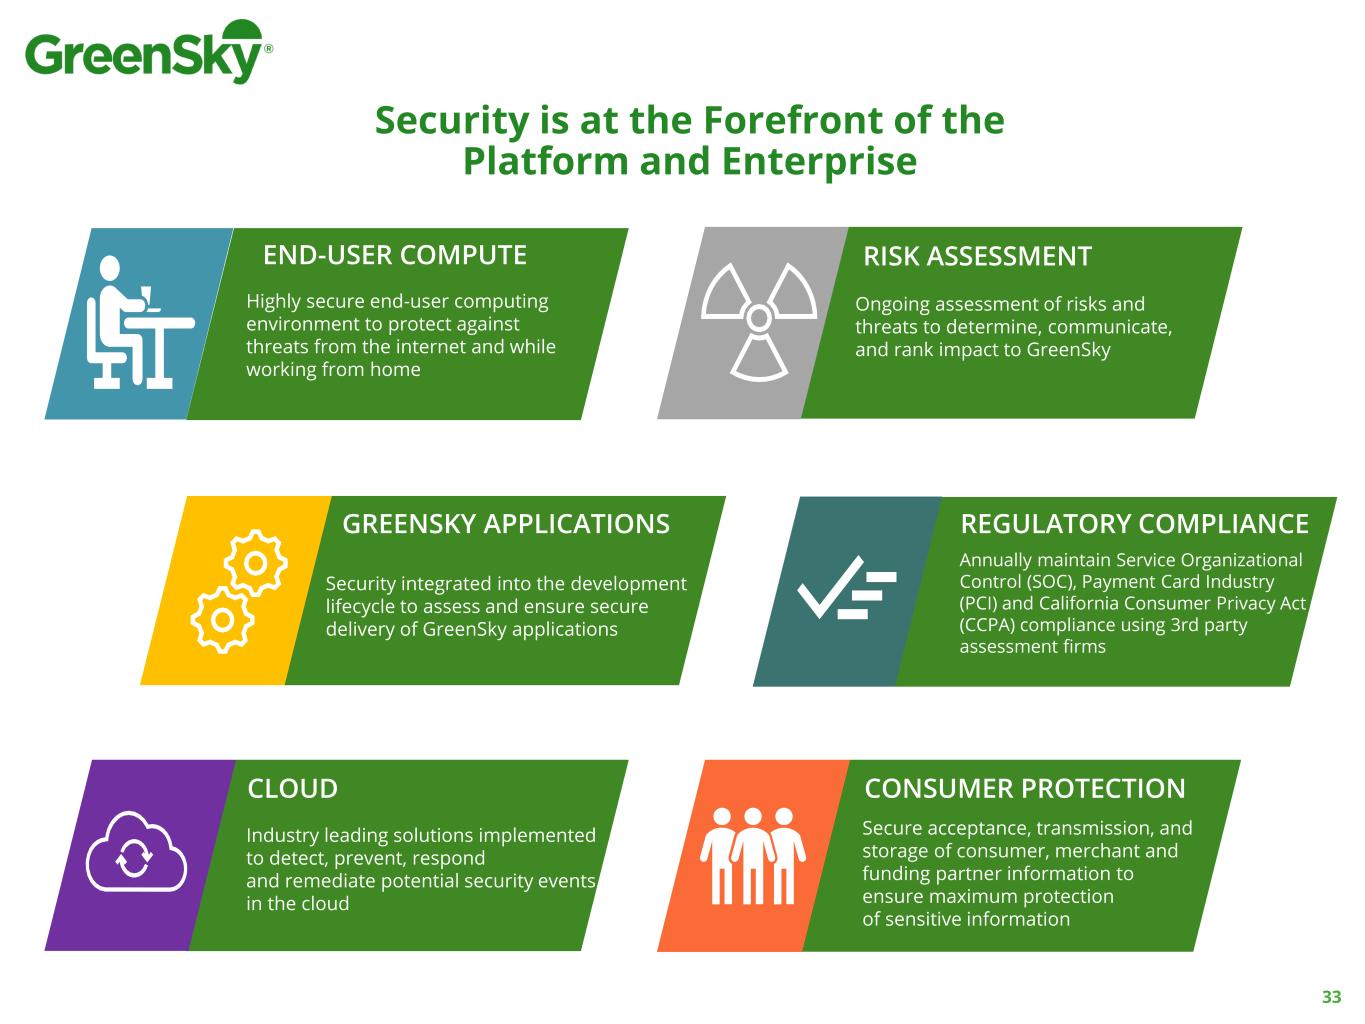
33 Highly secure end-user computing environment to protect against threats from the internet and while working from home END-USER COMPUTE Industry leading solutions implemented to detect, prevent, respond and remediate potential security events in the cloud CLOUD REGULATORY COMPLIANCE Annually maintain Service Organizational Control (SOC), Payment Card Industry (PCI) and California Consumer Privacy Act (CCPA) compliance using 3rd party assessment firms CONSUMER PROTECTION Secure acceptance, transmission, and storage of consumer, merchant and funding partner information to ensure maximum protection of sensitive information Ongoing assessment of risks and threats to determine, communicate, and rank impact to GreenSky RISK ASSESSMENT Security integrated into the development lifecycle to assess and ensure secure delivery of GreenSky applications GREENSKY APPLICATIONS Security is at the Forefront of the Platform and Enterprise

Scale-out Analytics Drives Intelligent Decisions for Systems, Analysts and Data Scientists Data Warehouse Data Lake Data Engineering Data Science Data Exchange Data Sources Data Consumers GreenSky Databases Enterprise Applications Third Party Data Mobile / Web Traffic Data Operational Reporting Ad Hoc Analysis Real-time Analytics Machine Learning Models Data Transformation & Streaming 34

Dennis Kelly President, Patient Solutions Elective Healthcare
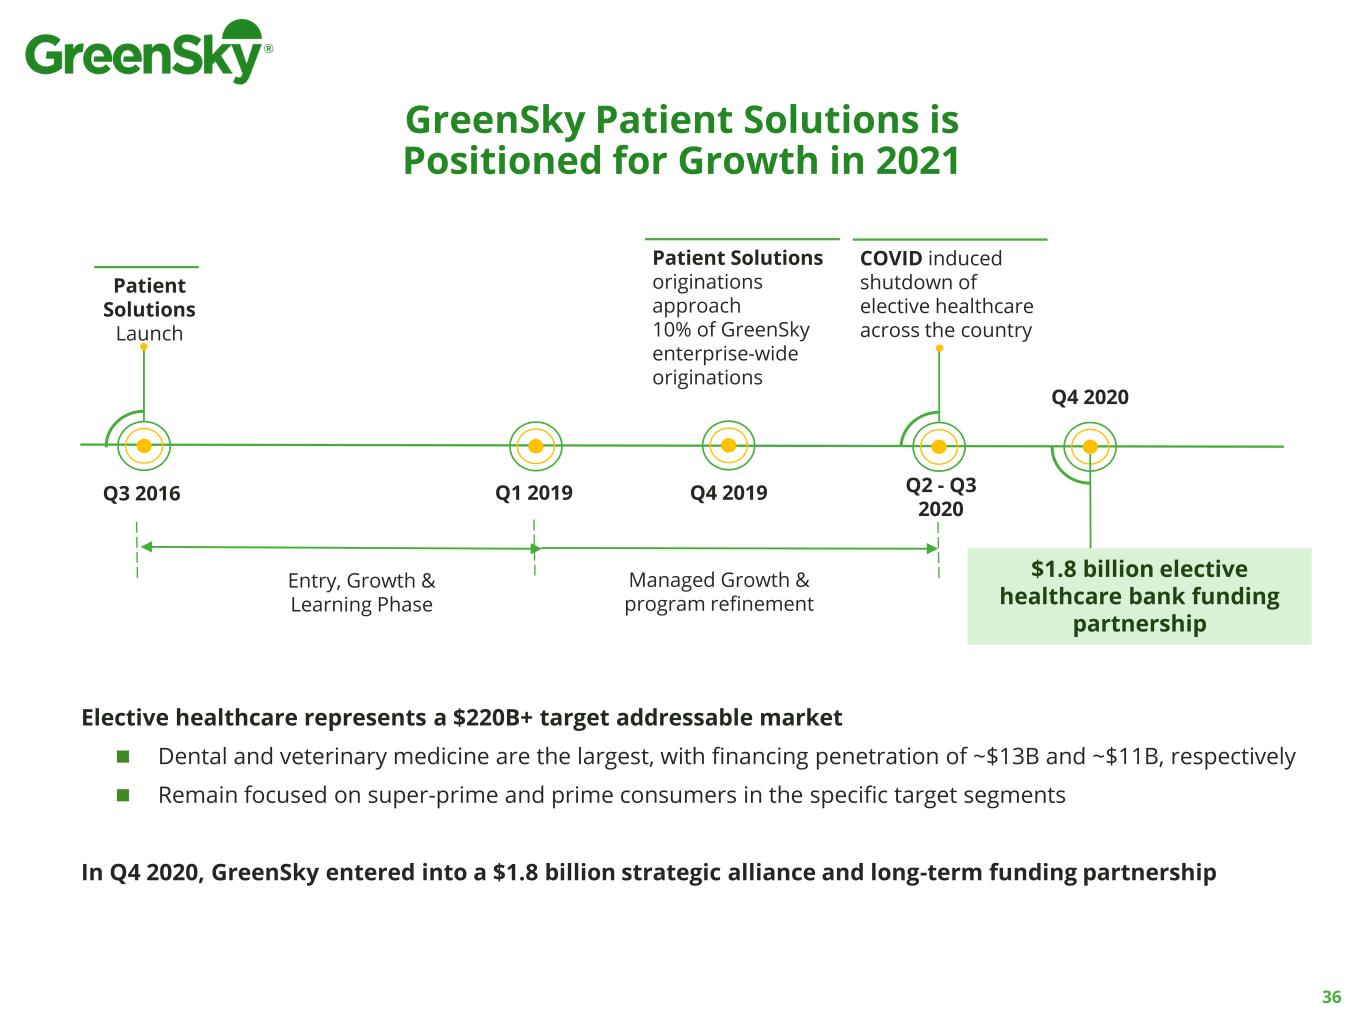
GreenSky Patient Solutions is Positioned for Growth in 2021 Q3 2016 Patient Solutions Launch Entry, Growth & Learning Phase Managed Growth & program refinement Q2 - Q3 2020 COVID induced shutdown of elective healthcare across the country Q4 2020 $1.8 billion elective healthcare bank funding partnership Q1 2019 Elective healthcare represents a $220B+ target addressable market ◼ Dental and veterinary medicine are the largest, with financing penetration of ~$13B and ~$11B, respectively ◼ Remain focused on super-prime and prime consumers in the specific target segments In Q4 2020, GreenSky entered into a $1.8 billion strategic alliance and long-term funding partnership Patient Solutions originations approach 10% of GreenSky enterprise-wide originations Q4 2019 36
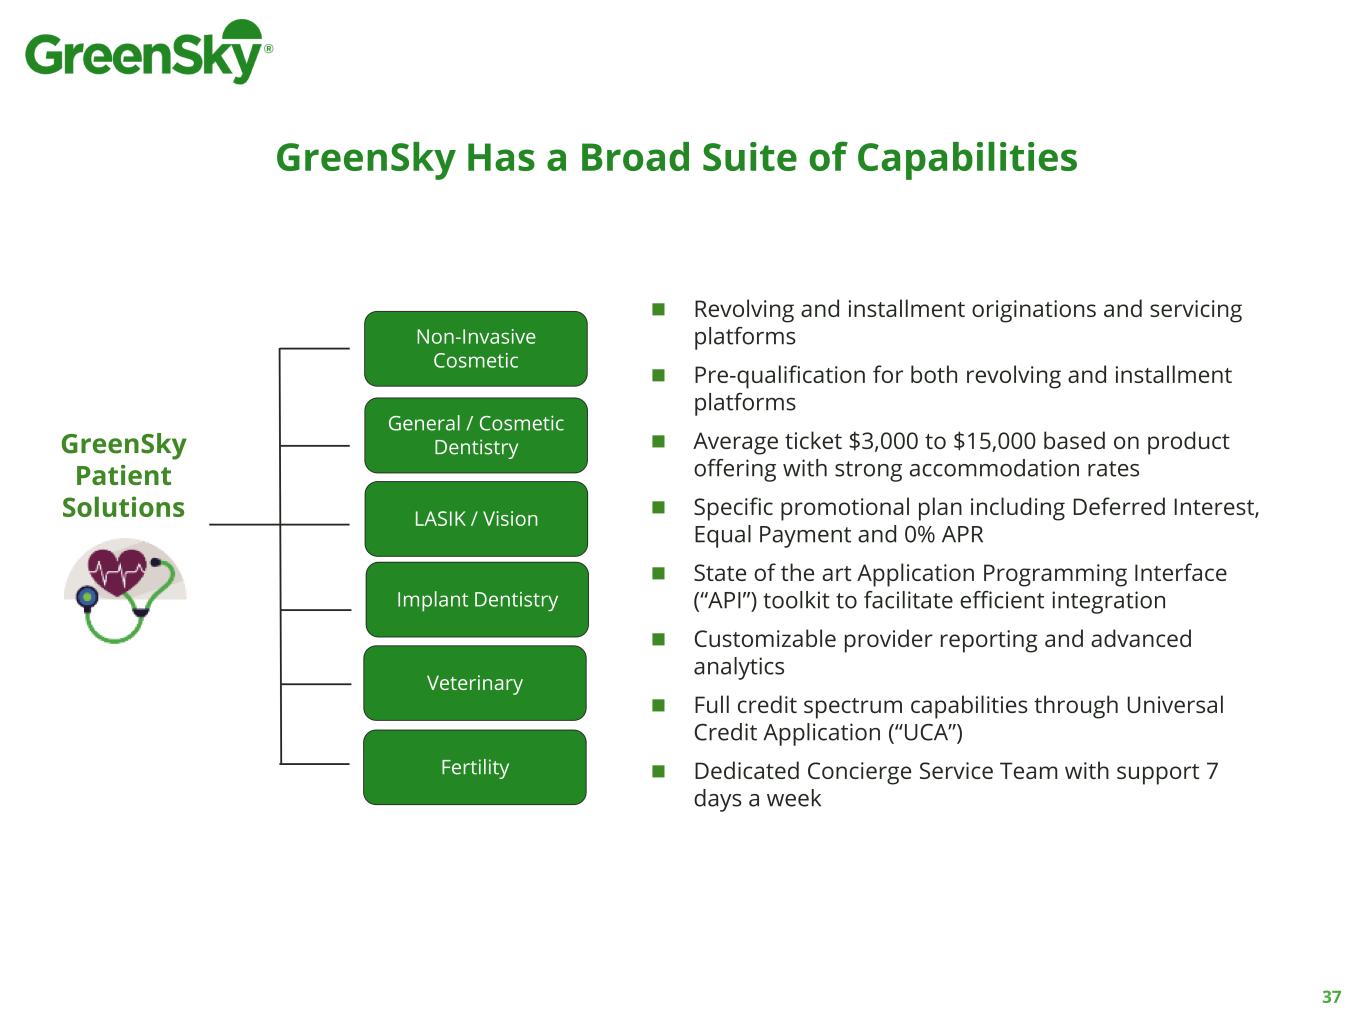
GreenSky Has a Broad Suite of Capabilities ◼ Revolving and installment originations and servicing platforms ◼ Pre-qualification for both revolving and installment platforms ◼ Average ticket $3,000 to $15,000 based on product offering with strong accommodation rates ◼ Specific promotional plan including Deferred Interest, Equal Payment and 0% APR ◼ State of the art Application Programming Interface (“API”) toolkit to facilitate efficient integration ◼ Customizable provider reporting and advanced analytics ◼ Full credit spectrum capabilities through Universal Credit Application (“UCA”) ◼ Dedicated Concierge Service Team with support 7 days a week General / Cosmetic Dentistry LASIK / Vision Veterinary Fertility GreenSky Patient Solutions Non-Invasive Cosmetic Implant Dentistry 37
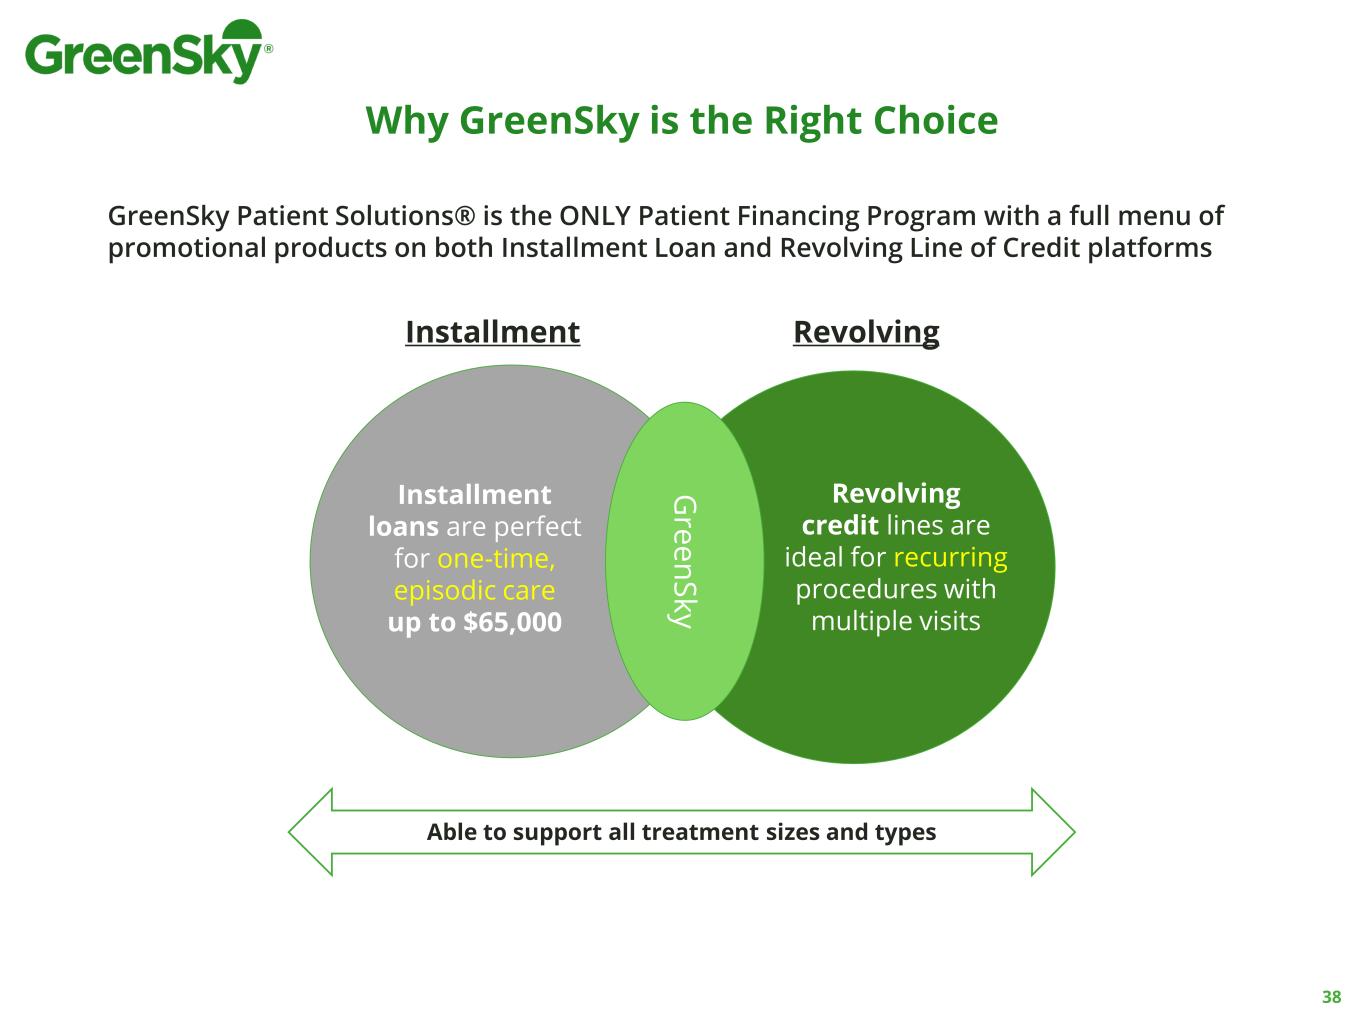
Why GreenSky is the Right Choice GreenSky Patient Solutions® is the ONLY Patient Financing Program with a full menu of promotional products on both Installment Loan and Revolving Line of Credit platforms Installment Installment loans are perfect for one-time, episodic care up to $65,000 Revolving credit lines are ideal for recurring procedures with multiple visits G re e n S k y Revolving Able to support all treatment sizes and types 38

Patient Solutions Has Aligned its Product Strategy to Position its Business Post COVID-19 COVID-19 Update ◼ Several themes are emerging from the induced shutdown of elective healthcare due to COVID-19: ▪ Virtual Consults ▪ Need for Paperless / Contactless end-to-end UX (origination and transaction) ▪ Appetite for Full Spectrum Lending Options (Universal Credit Application) ▪ Interest in API Integrations from Partners and Sponsors Digital capabilities ◼ Paperless origination and transaction process ▪ QR codes available for easy pre-qualification ▪ Remote transaction authorization via SMS or Email ◼ Universal Credit Application for Providers interested in “buying deeper” ◼ Full suite of APIs for Revolving and Installment platforms 39

Well Established National Sales Strategy ◼ Leads are sourced organically via inbound, via sponsors for referrals, and via outside sales efforts for prospecting Lead sourcing ◼ Targeting enterprise accounts backed by corporate-owned or private equity sponsored groups (e.g., vision, dental, fertility) ◼ Focused on channel partners with large embedded base of Providers ◼ Regional and inside sales strategy ◼ Leveraging API toolkit to build greater share of wallet and stickiness Sales ◼ Onboard & train new ◼ Grow existing book ◼ Service Providers Growth & management GSPS Field Sales Team (as of 12.31.20) 1 Regional sales offices 40

Jesse Davis President, Home Improvement Home Improvement
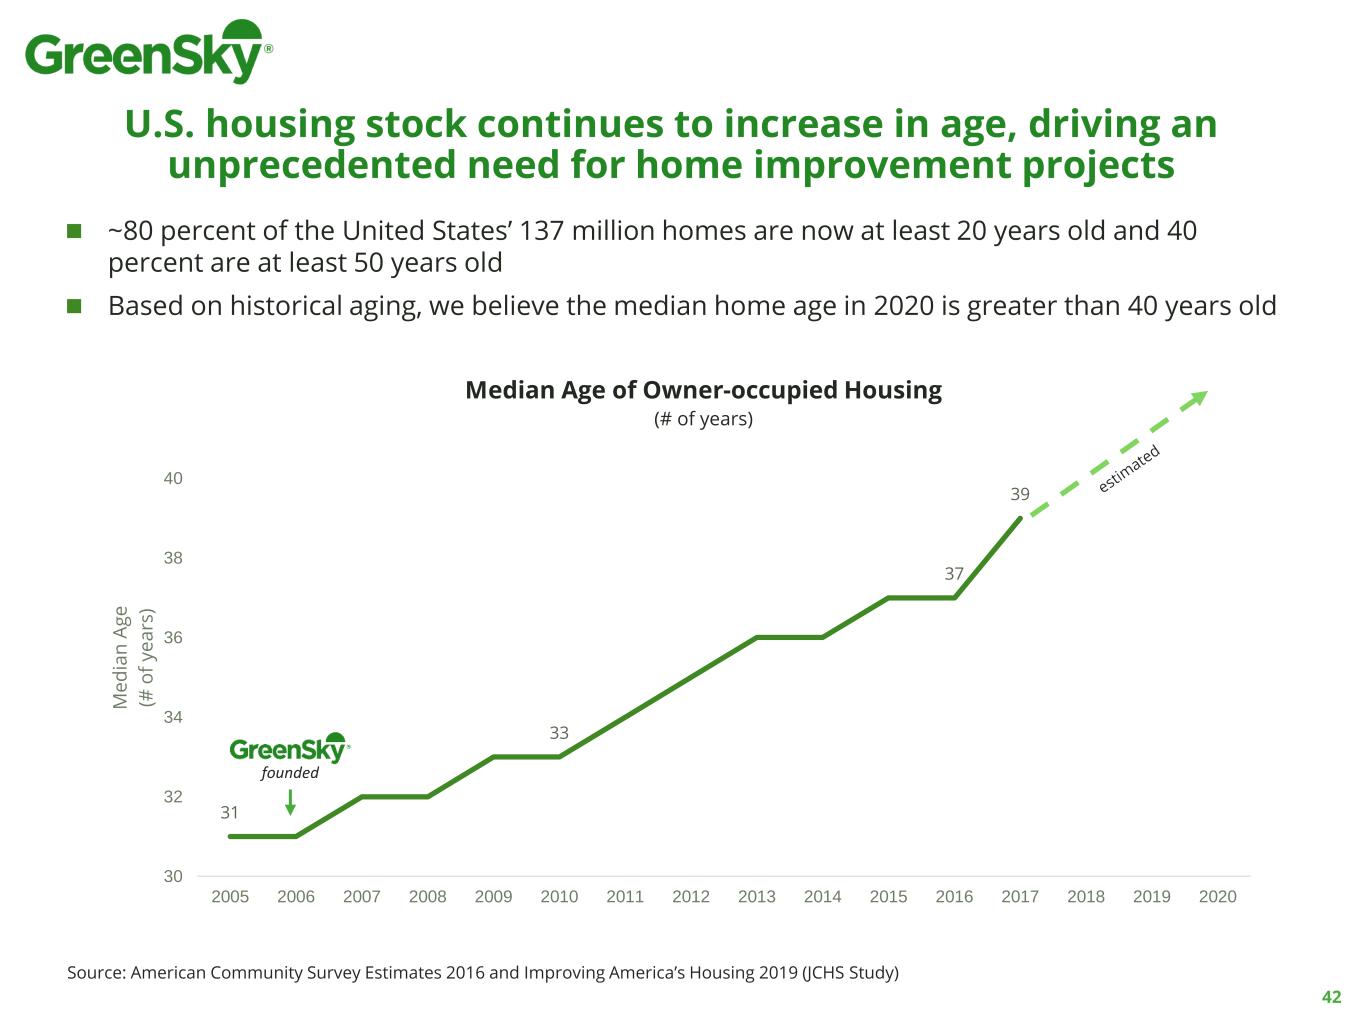
U.S. housing stock continues to increase in age, driving an unprecedented need for home improvement projects Median Age of Owner-occupied Housing (# of years) Source: American Community Survey Estimates 2016 and Improving America’s Housing 2019 (JCHS Study) 31 33 37 39 30 32 34 36 38 40 2005 2006 2007 2008 2009 2010 2011 2012 2013 2014 2015 2016 2017 2018 2019 2020 M e d ia n A g e (# o f y e a rs ) founded ◼ ~80 percent of the United States’ 137 million homes are now at least 20 years old and 40 percent are at least 50 years old ◼ Based on historical aging, we believe the median home age in 2020 is greater than 40 years old 42
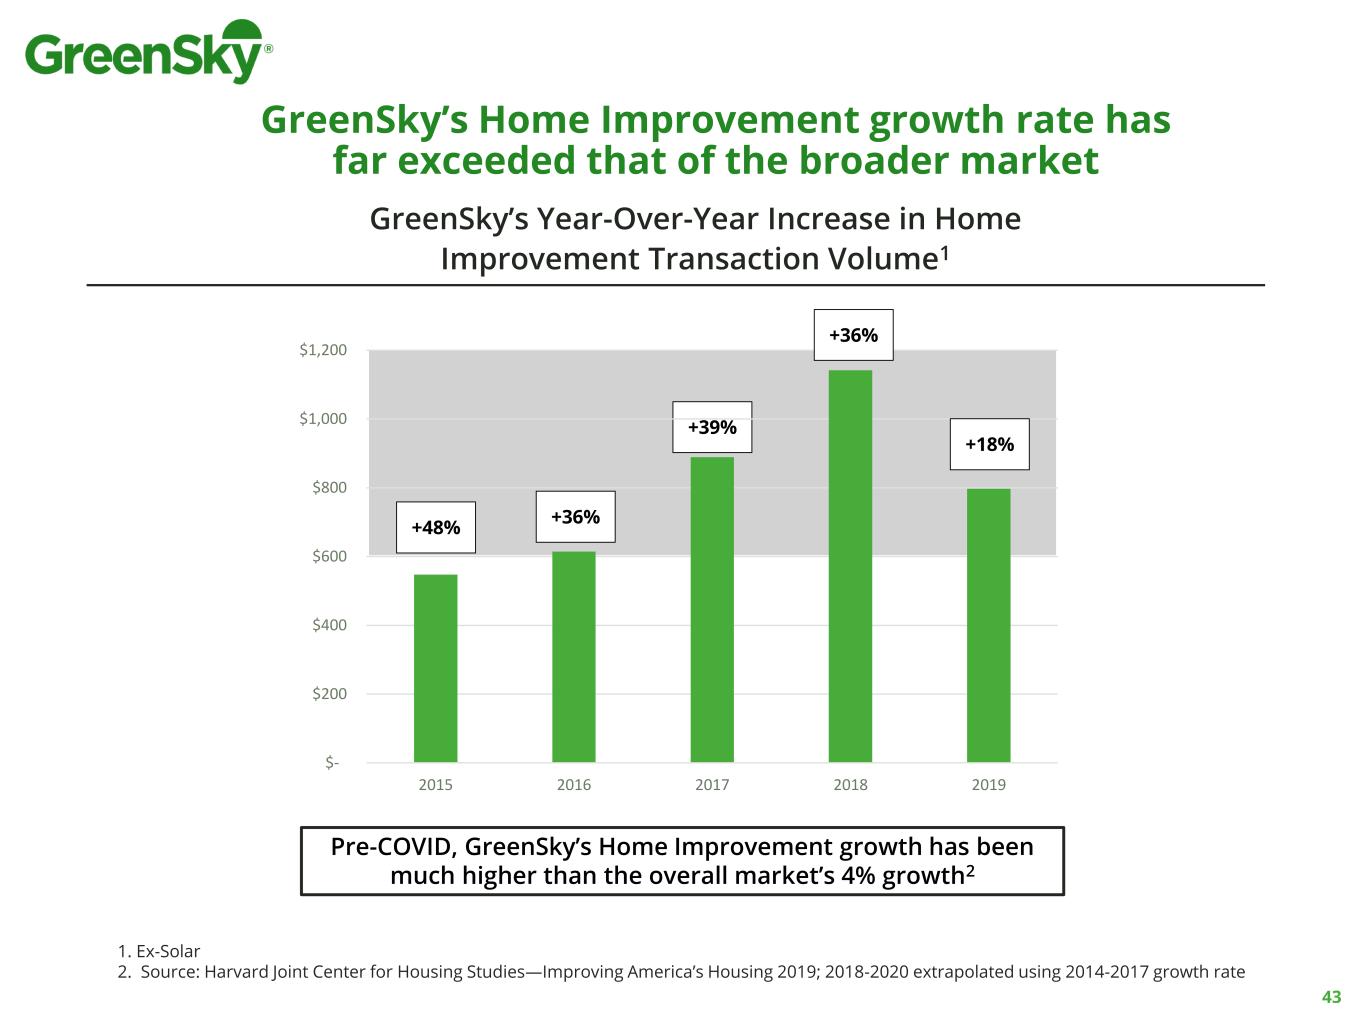
43 GreenSky’s Home Improvement growth rate has far exceeded that of the broader market GreenSky’s Year-Over-Year Increase in Home Improvement Transaction Volume1 1. Ex-Solar 2. Source: Harvard Joint Center for Housing Studies—Improving America’s Housing 2019; 2018-2020 extrapolated using 2014-2017 growth rate Pre-COVID, GreenSky’s Home Improvement growth has been much higher than the overall market’s 4% growth2 +48% +36% +39% $- $200 $400 $600 $800 $1,000 $1,200 2015 2016 2017 2018 2019 +36% +18%

GreenSky continues to expand across diversified categories of home improvement commerce ◼ Windows & doors growth based on top tier merchant projections - could exceed target with incremental pipeline conversion vs. plan ◼ HVAC fueled by incremental sponsor and manufacturer interest and large potential OEM targets whose exclusivity with competitors is expiring ◼ API integrations within market leading SAAS solutions. These integrations are inclusive of software in pricing proposal systems, CRMs, lead management, marketing automation, and others. Optimizing integration within the growing technology sector is expanding the adoption of financing within all categories. Home Improvement FY20 Home Improvement Categories1 (% of Transaction Volume) 1 Excludes The Home Depot Windows and Doors, 48% HVAC, 17% Remodeling, 7% Roofing, 5% Construction, 4% Basements, 4% Kitchen and Bathrooms, 3% Pools, 2% Others, 9%Plumbing, 3% 44

GreenSky leverages a multi-channel strategy to acquire and onboard home improvement merchants Direct to merchant Organic referral SponsorsInbound/Self-serve Optimized for high- value merchants Driven by low-cost word of mouth Driven by aligned incentives Driven by informed need • Manufacturers and trade associations with vast networks of merchants in a particular product sphere • Referrals from existing merchants and/or their salespeople • Formalized merchant referral program as part of larger merchant channel strategy • No intermediary between GreenSky and the merchant • Majority of merchants have annual transaction volume between $1mm-$10mm • GreenSky’s marketing and market awareness drive merchants to enroll online or via inbound calls • Majority of merchants have annual transaction volume <$2mm 45

GreenSky Competitive Advantages GreenSky Synchrony Wells Fargo Service Finance Industry’s fastest credit application Up to $100,000 credit limits More than 100 credit plans Multiple Consumer Transactions Payment estimator Universal credit application (“UCA”) Pre-approval engine & marketing services Turnkey marketing services White label mobile app Pre-qualification Lead generation programs Non-owner occupied loans Hybrid loan terms Industry leading change order enablement Industry leading merchant training & support 46

2021 Sales & Growth Strategy ◼ Expanding Outside Sales footprint ◼ Marketing initiatives that drive promotional product offerings ◼ Over 90 incremental exclusive relationships signed in 4th quarter 2020 ◼ Continued focus on integrated partnerships leveraging GreenSky’s API capability with a rapidly growing sector of home improvement ◼ Launched new and dedicated training team providing merchants greater than $1 million in revenue access to a 1-on-1 relationship manager ◼ Expanded Sponsor Partner Support Team ◼ Launch joint marketing support programs to help drive consumer and merchant adoption of promotional financing products 47

Andrew Kang Executive Vice President & Chief Financial Officer Financial Outlook
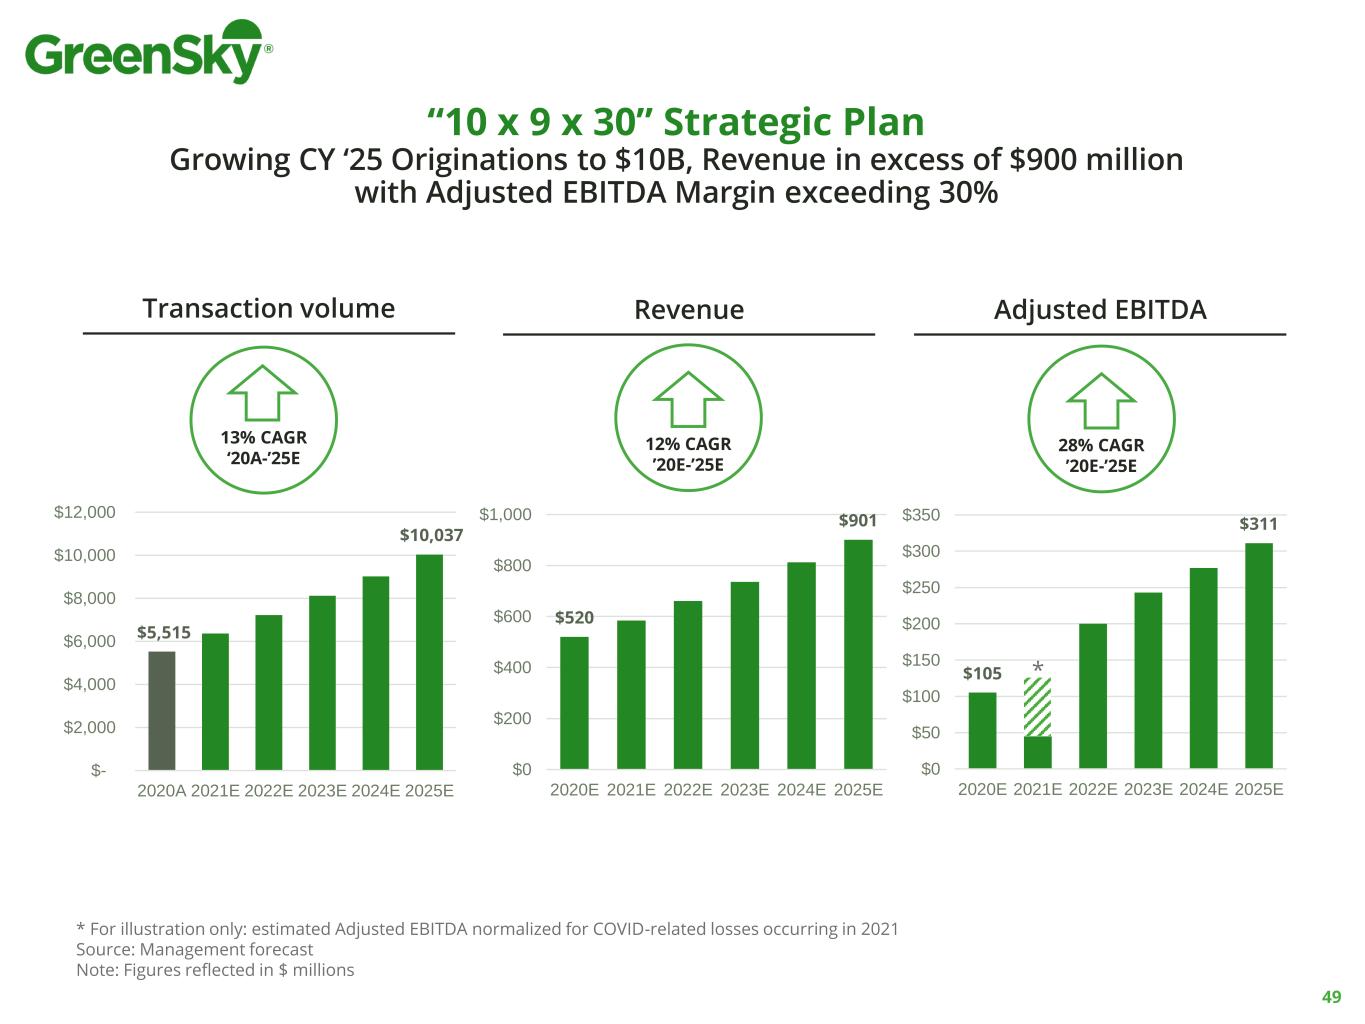
49 Transaction volume Revenue Adjusted EBITDA 13% CAGR ‘20A-’25E 28% CAGR ’20E-’25E 12% CAGR ’20E-’25E $5,515 $10,037 $- $2,000 $4,000 $6,000 $8,000 $10,000 $12,000 2020A 2021E 2022E 2023E 2024E 2025E $520 $901 $0 $200 $400 $600 $800 $1,000 2020E 2021E 2022E 2023E 2024E 2025E $105 $311 $0 $50 $100 $150 $200 $250 $300 $350 2020E 2021E 2022E 2023E 2024E 2025E “10 x 9 x 30” Strategic Plan Growing CY ‘25 Originations to $10B, Revenue in excess of $900 million with Adjusted EBITDA Margin exceeding 30% * For illustration only: estimated Adjusted EBITDA normalized for COVID-related losses occurring in 2021 Source: Management forecast Note: Figures reflected in $ millions *
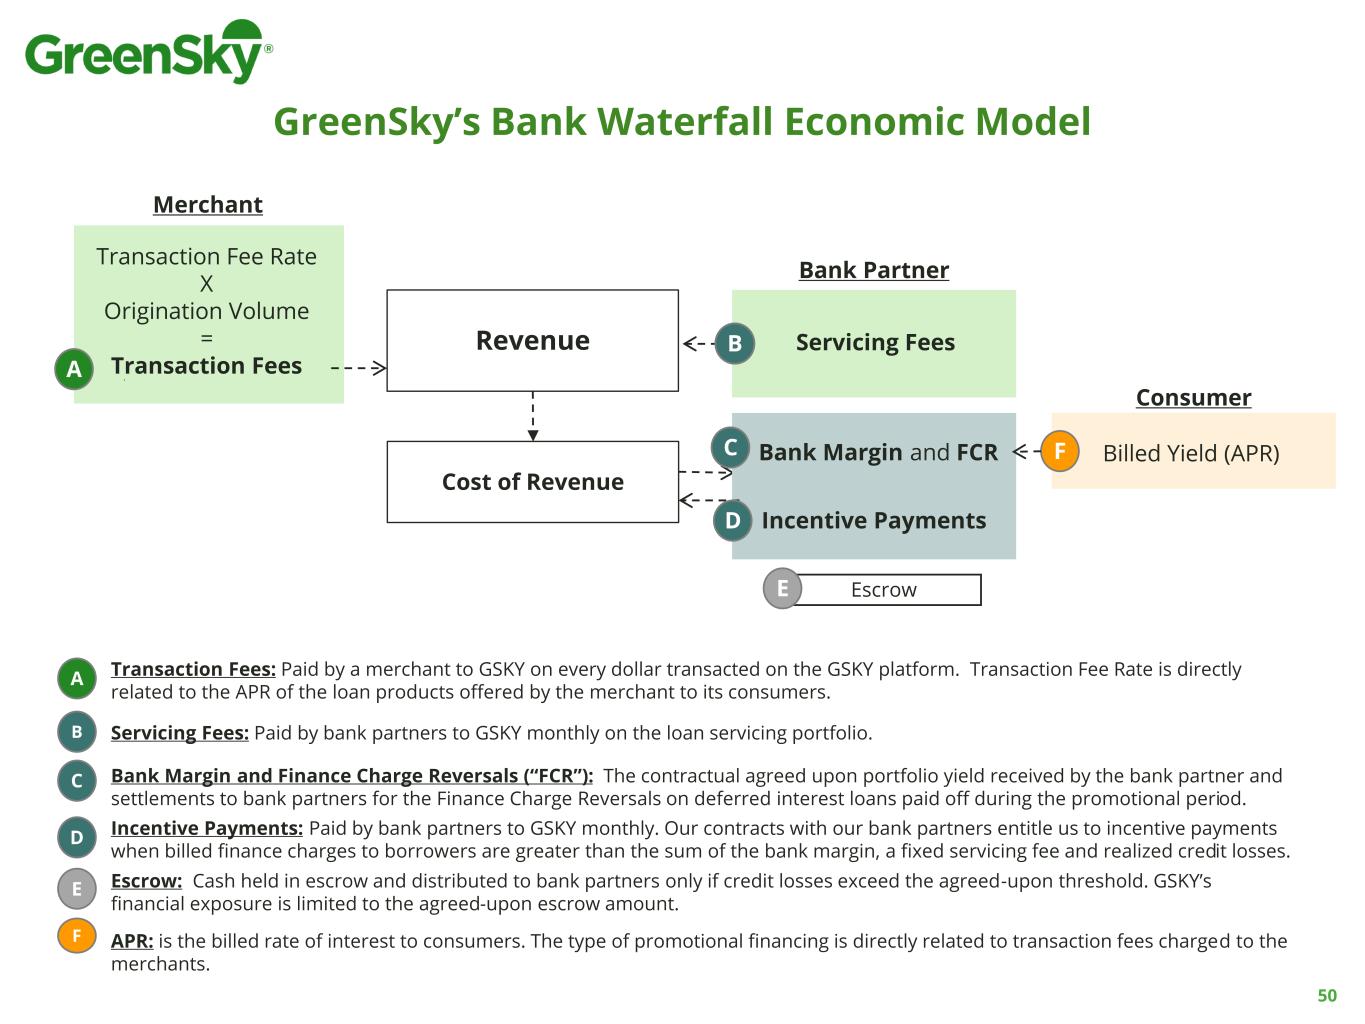
B Servicing Fees: Paid by bank partners to GSKY monthly on the loan servicing portfolio. C Bank Margin and Finance Charge Reversals (“FCR”): The contractual agreed upon portfolio yield received by the bank partner and settlements to bank partners for the Finance Charge Reversals on deferred interest loans paid off during the promotional period. F APR: is the billed rate of interest to consumers. The type of promotional financing is directly related to transaction fees charged to the merchants. Merchant Bank Partner Revenue Cost of Revenue Transaction Fee Rate X Origination Volume = Transaction Fees Servicing Fees Consumer Billed Yield (APR) Incentive Payments B C F A Transaction Fees: Paid by a merchant to GSKY on every dollar transacted on the GSKY platform. Transaction Fee Rate is directly related to the APR of the loan products offered by the merchant to its consumers. A GreenSky’s Bank Waterfall Economic Model 50 EscrowE Escrow: Cash held in escrow and distributed to bank partners only if credit losses exceed the agreed-upon threshold. GSKY’s financial exposure is limited to the agreed-upon escrow amount. E Bank Margin and FCR D D Incentive Payments: Paid by bank partners to GSKY monthly. Our contracts with our bank partners entitle us to incentive payments when billed finance charges to borrowers are greater than the sum of the bank margin, a fixed servicing fee and realized credit losses.
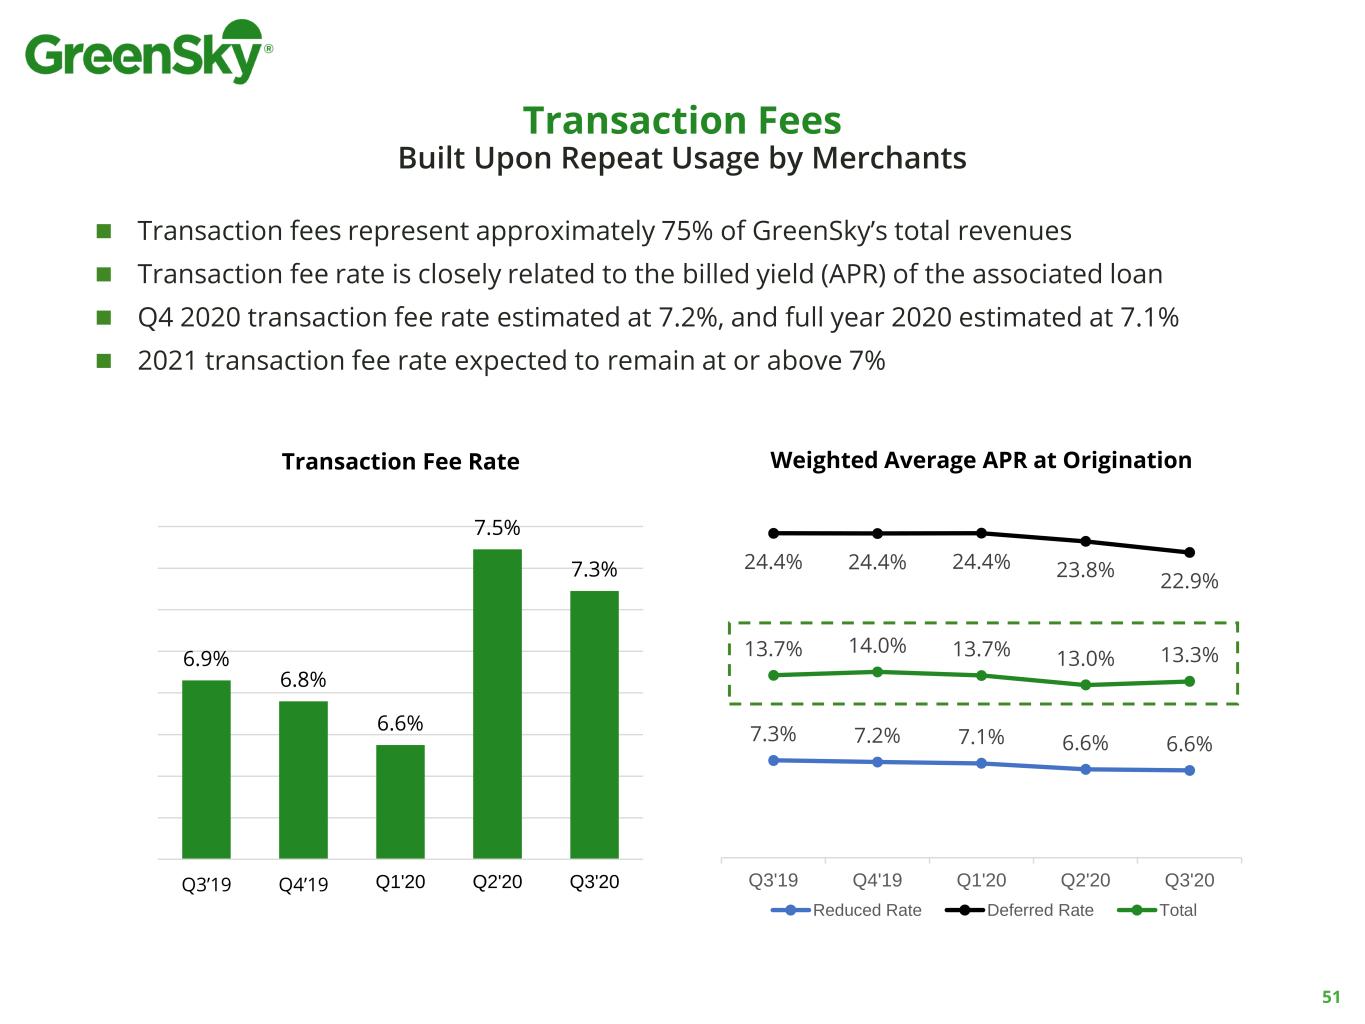
Transaction Fees Built Upon Repeat Usage by Merchants 51 6.9% 6.8% 6.6% 7.5% 7.3% Q3’19 Q4’19 Q1'20 Q2'20 Q3'20 Transaction Fee Rate ◼ Transaction fees represent approximately 75% of GreenSky’s total revenues ◼ Transaction fee rate is closely related to the billed yield (APR) of the associated loan ◼ Q4 2020 transaction fee rate estimated at 7.2%, and full year 2020 estimated at 7.1% ◼ 2021 transaction fee rate expected to remain at or above 7% 7.3% 7.2% 7.1% 6.6% 6.6% 24.4% 24.4% 24.4% 23.8% 22.9% 13.7% 14.0% 13.7% 13.0% 13.3% Q3'19 Q4'19 Q1'20 Q2'20 Q3'20 Weighted Average APR at Origination Reduced Rate Deferred Rate Total
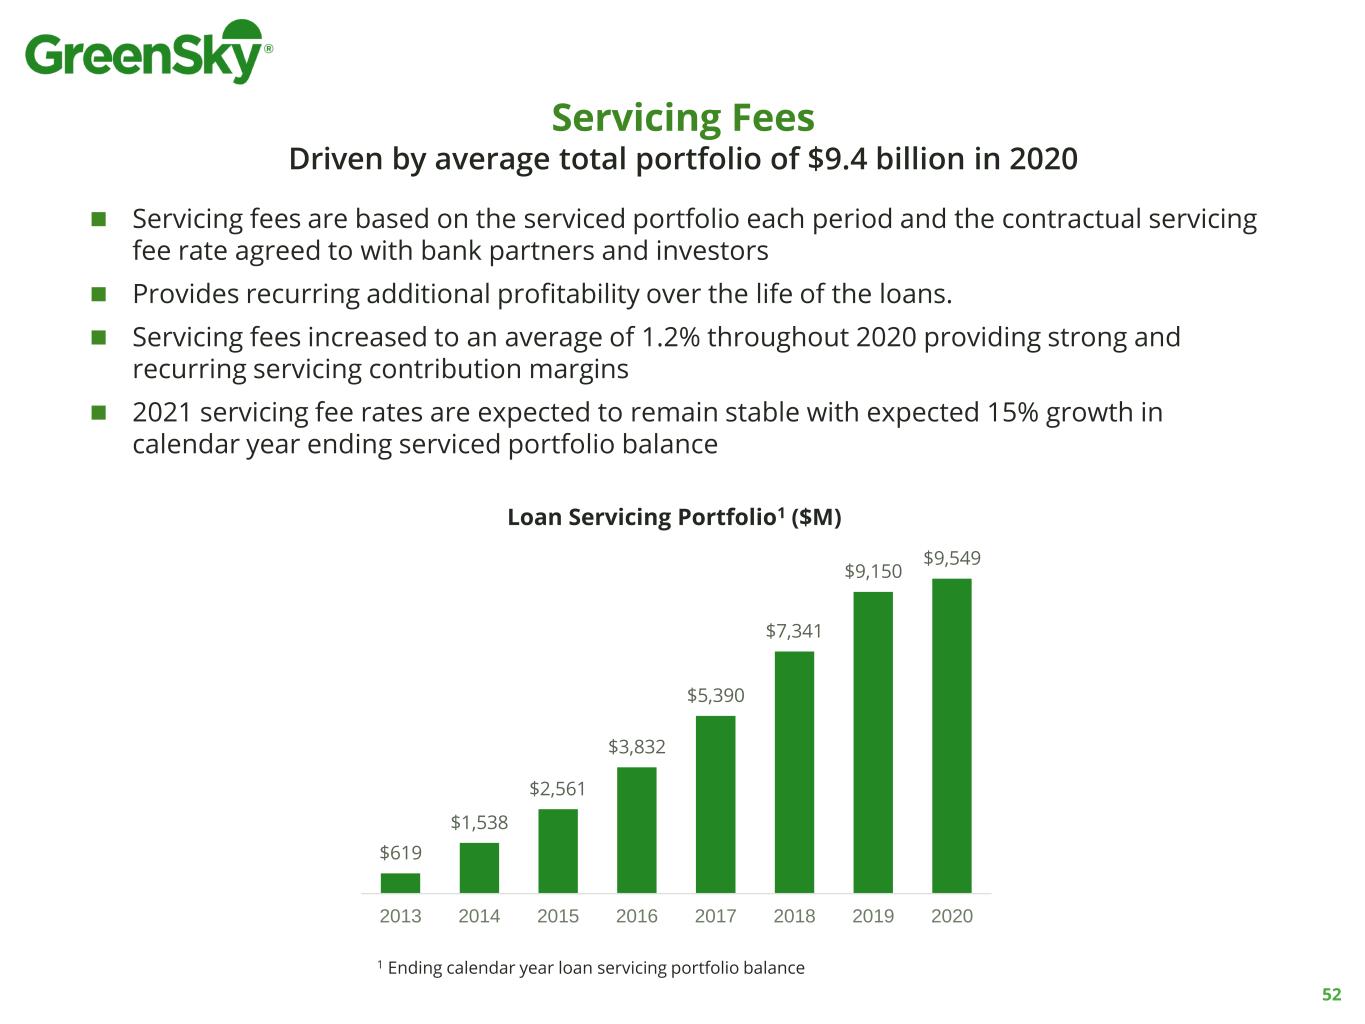
◼ Servicing fees are based on the serviced portfolio each period and the contractual servicing fee rate agreed to with bank partners and investors ◼ Provides recurring additional profitability over the life of the loans. ◼ Servicing fees increased to an average of 1.2% throughout 2020 providing strong and recurring servicing contribution margins ◼ 2021 servicing fee rates are expected to remain stable with expected 15% growth in calendar year ending serviced portfolio balance 52 Servicing Fees Driven by average total portfolio of $9.4 billion in 2020 $619 $1,538 $2,561 $3,832 $5,390 $7,341 $9,150 $9,549 2013 2014 2015 2016 2017 2018 2019 2020 Loan Servicing Portfolio1 ($M) 1 Ending calendar year loan servicing portfolio balance
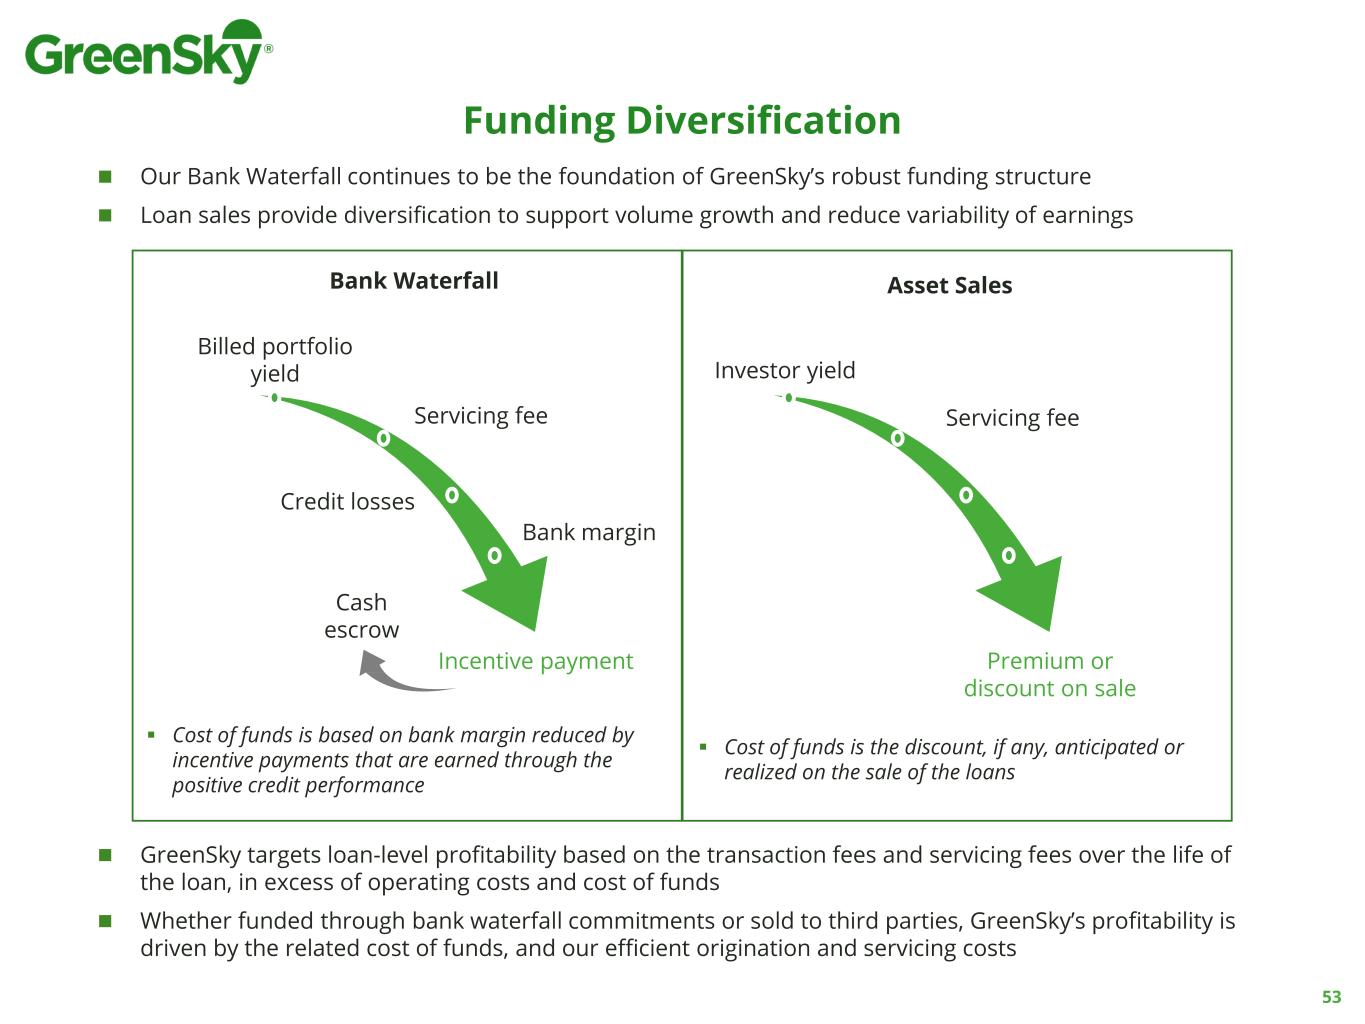
Funding Diversification 53 Bank Waterfall Billed portfolio yield Servicing fee Credit losses Cash escrow Bank margin Incentive payment Asset Sales Servicing fee Investor yield Premium or discount on sale ◼ Our Bank Waterfall continues to be the foundation of GreenSky’s robust funding structure ◼ Loan sales provide diversification to support volume growth and reduce variability of earnings ▪ Cost of funds is based on bank margin reduced by incentive payments that are earned through the positive credit performance ▪ Cost of funds is the discount, if any, anticipated or realized on the sale of the loans ◼ GreenSky targets loan-level profitability based on the transaction fees and servicing fees over the life of the loan, in excess of operating costs and cost of funds ◼ Whether funded through bank waterfall commitments or sold to third parties, GreenSky’s profitability is driven by the related cost of funds, and our efficient origination and servicing costs

Life of Loan Profitability Illustration 54 ◼ GSKY targets a lifetime contribution margin for each loan that takes into account the transaction fee rate, servicing fee margin, origination costs and bank waterfall costs1 or loan sale costs over the life of the loan ◼ Based on our most recent asset sale pricing, loan sale costs are equivalent to our historical bank waterfall costs ▪ Loan sale costs have decreased significantly since the initial sale in Q3 2020 ▪ 2021 loan sales are estimated to be approximately 20% of annual originations ▪ Our loan sales strategy provides increased funding capacity, reduces variability of future earnings due to finance charge reversals, credit losses and interest rate risk ▪ This diversification of funding will allow GreenSky to optimize its cost of funds between bank waterfall and loan sales 1 Bank waterfall costs are defined as billed yield, less FCR, less credit losses, less bank margin ▪ The illustrative economics above are based on the estimated product mix of loans for 2021 ▪ Actual loan sales costs will depend on the actual mix of loan product types sold Bank Waterfall Loan Sale Cost Example Cost Example Transaction Fee Rate 7.2% 7.2% Servicing Fee Margin 1.3% 1.3% Origination Costs (0.5)% (0.5)% Bank Waterfall Costs1 (2.6)% - Loan Sales Costs - (2.7)% Cost of Revenue (3.1)% (3.2)% Contribution Margin 5.4% 5.3%
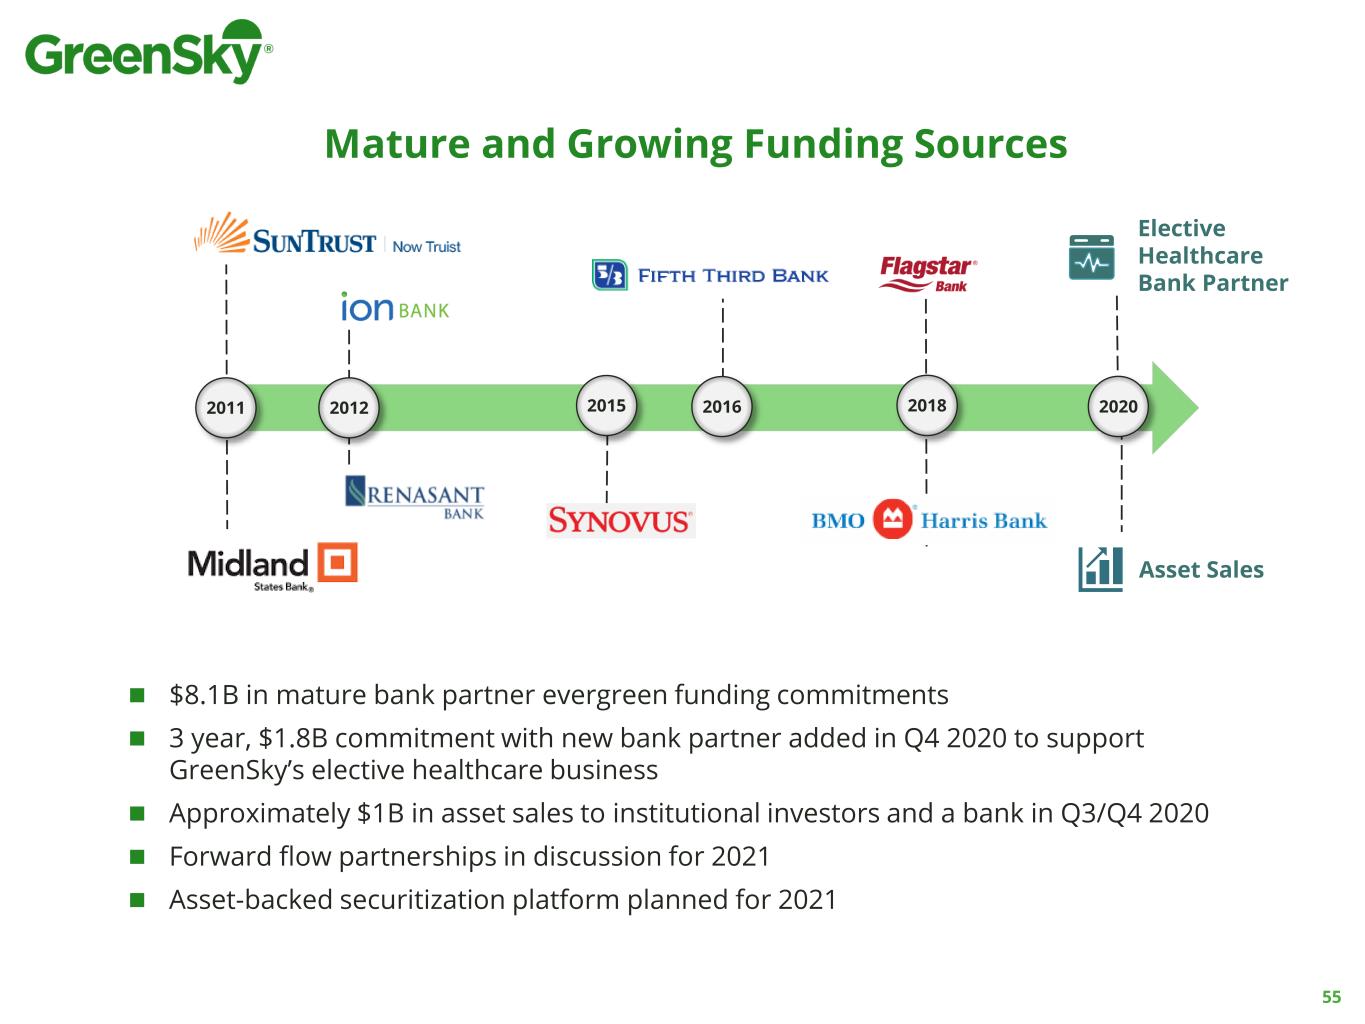
55 20162011 2015 20182012 2020 ◼ $8.1B in mature bank partner evergreen funding commitments ◼ 3 year, $1.8B commitment with new bank partner added in Q4 2020 to support GreenSky’s elective healthcare business ◼ Approximately $1B in asset sales to institutional investors and a bank in Q3/Q4 2020 ◼ Forward flow partnerships in discussion for 2021 ◼ Asset-backed securitization platform planned for 2021 Mature and Growing Funding Sources Elective Healthcare Bank Partner Asset Sales
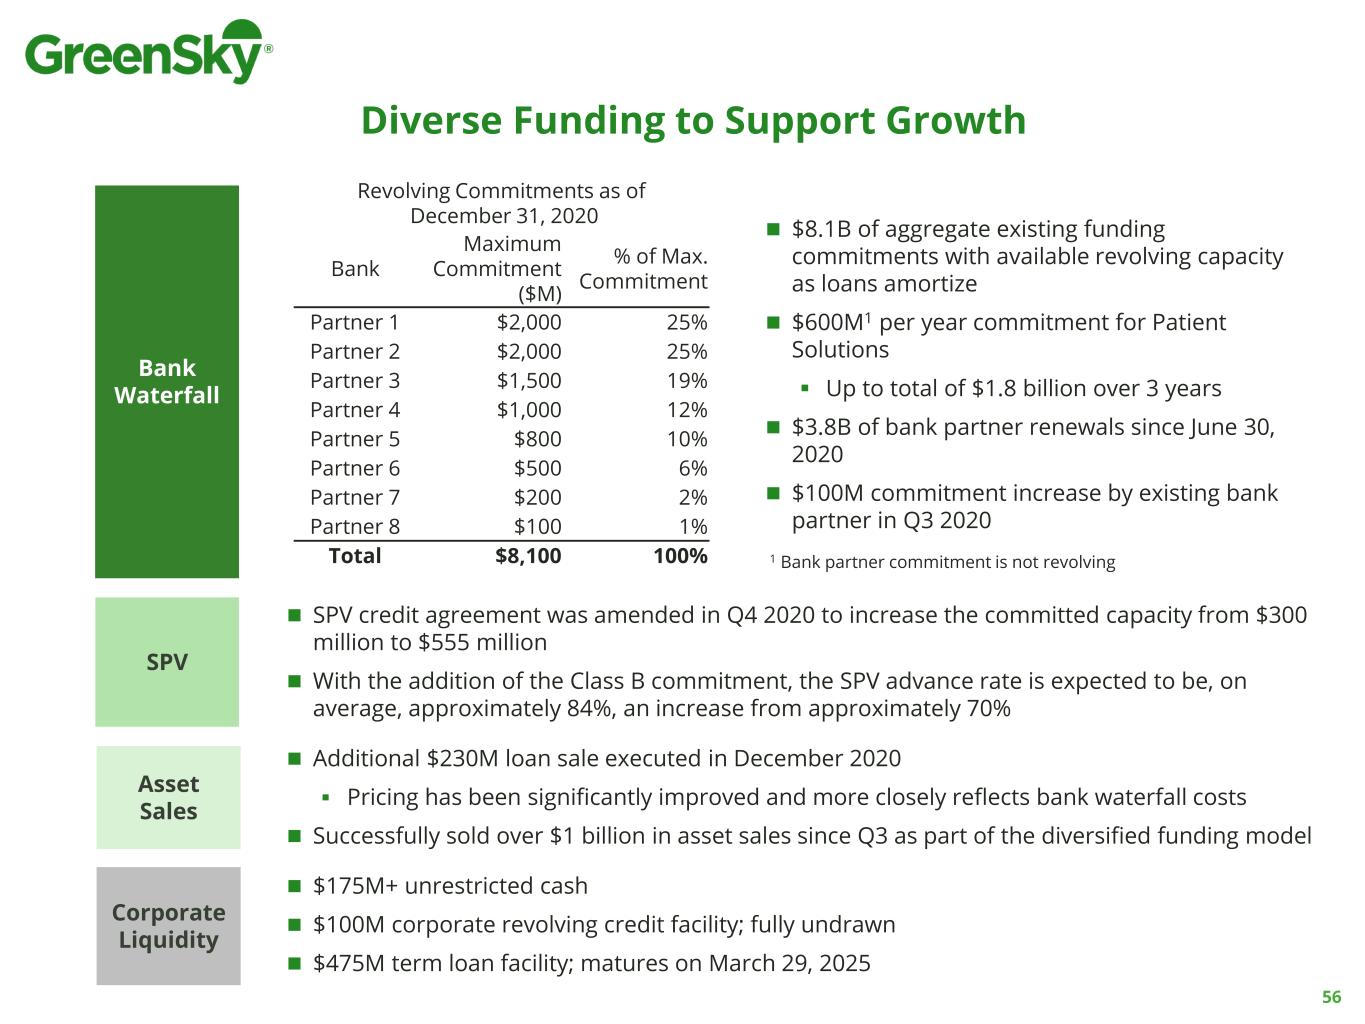
Diverse Funding to Support Growth 56 Bank Waterfall SPV Revolving Commitments as of December 31, 2020 Bank Maximum Commitment ($M) % of Max. Commitment Partner 1 $2,000 25% Partner 2 $2,000 25% Partner 3 $1,500 19% Partner 4 $1,000 12% Partner 5 $800 10% Partner 6 $500 6% Partner 7 $200 2% Partner 8 $100 1% Total $8,100 100% ◼ $8.1B of aggregate existing funding commitments with available revolving capacity as loans amortize ◼ $600M1 per year commitment for Patient Solutions ▪ Up to total of $1.8 billion over 3 years ◼ $3.8B of bank partner renewals since June 30, 2020 ◼ $100M commitment increase by existing bank partner in Q3 2020 ◼ SPV credit agreement was amended in Q4 2020 to increase the committed capacity from $300 million to $555 million ◼ With the addition of the Class B commitment, the SPV advance rate is expected to be, on average, approximately 84%, an increase from approximately 70% ◼ Additional $230M loan sale executed in December 2020 ▪ Pricing has been significantly improved and more closely reflects bank waterfall costs ◼ Successfully sold over $1 billion in asset sales since Q3 as part of the diversified funding model ◼ $175M+ unrestricted cash ◼ $100M corporate revolving credit facility; fully undrawn ◼ $475M term loan facility; matures on March 29, 2025 1 Bank partner commitment is not revolving Asset Sales Corporate Liquidity
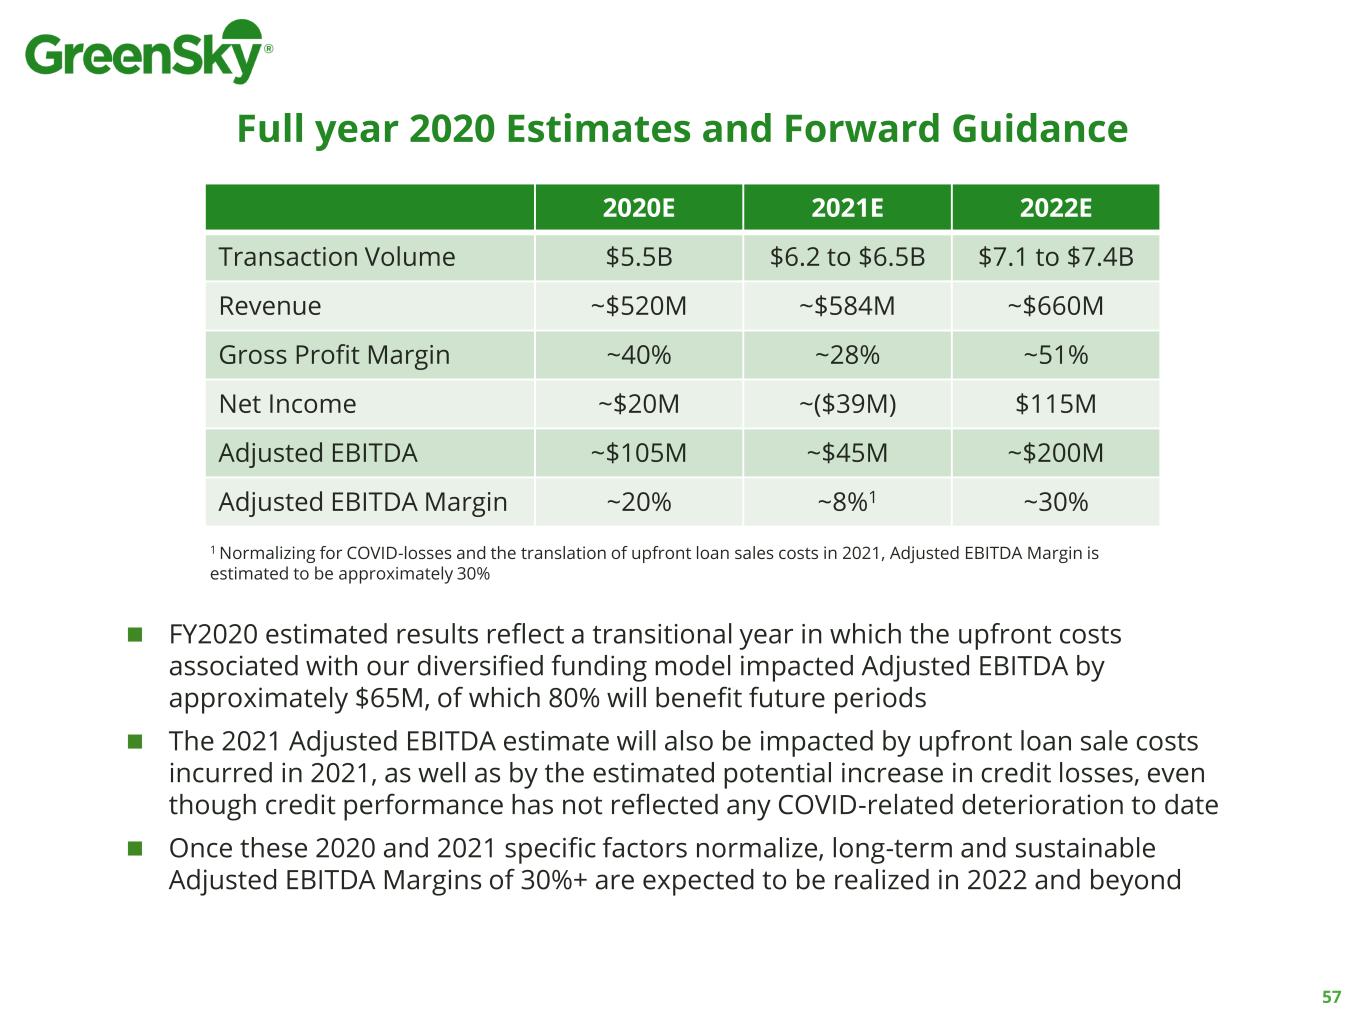
Full year 2020 Estimates and Forward Guidance 57 2020E 2021E 2022E Transaction Volume $5.5B $6.2 to $6.5B $7.1 to $7.4B Revenue ~$520M ~$584M ~$660M Gross Profit Margin ~40% ~28% ~51% Net Income ~$20M ~($39M) $115M Adjusted EBITDA ~$105M ~$45M ~$200M Adjusted EBITDA Margin ~20% ~8%1 ~30% ◼ FY2020 estimated results reflect a transitional year in which the upfront costs associated with our diversified funding model impacted Adjusted EBITDA by approximately $65M, of which 80% will benefit future periods ◼ The 2021 Adjusted EBITDA estimate will also be impacted by upfront loan sale costs incurred in 2021, as well as by the estimated potential increase in credit losses, even though credit performance has not reflected any COVID-related deterioration to date ◼ Once these 2020 and 2021 specific factors normalize, long-term and sustainable Adjusted EBITDA Margins of 30%+ are expected to be realized in 2022 and beyond 1 Normalizing for COVID-losses and the translation of upfront loan sales costs in 2021, Adjusted EBITDA Margin is estimated to be approximately 30%
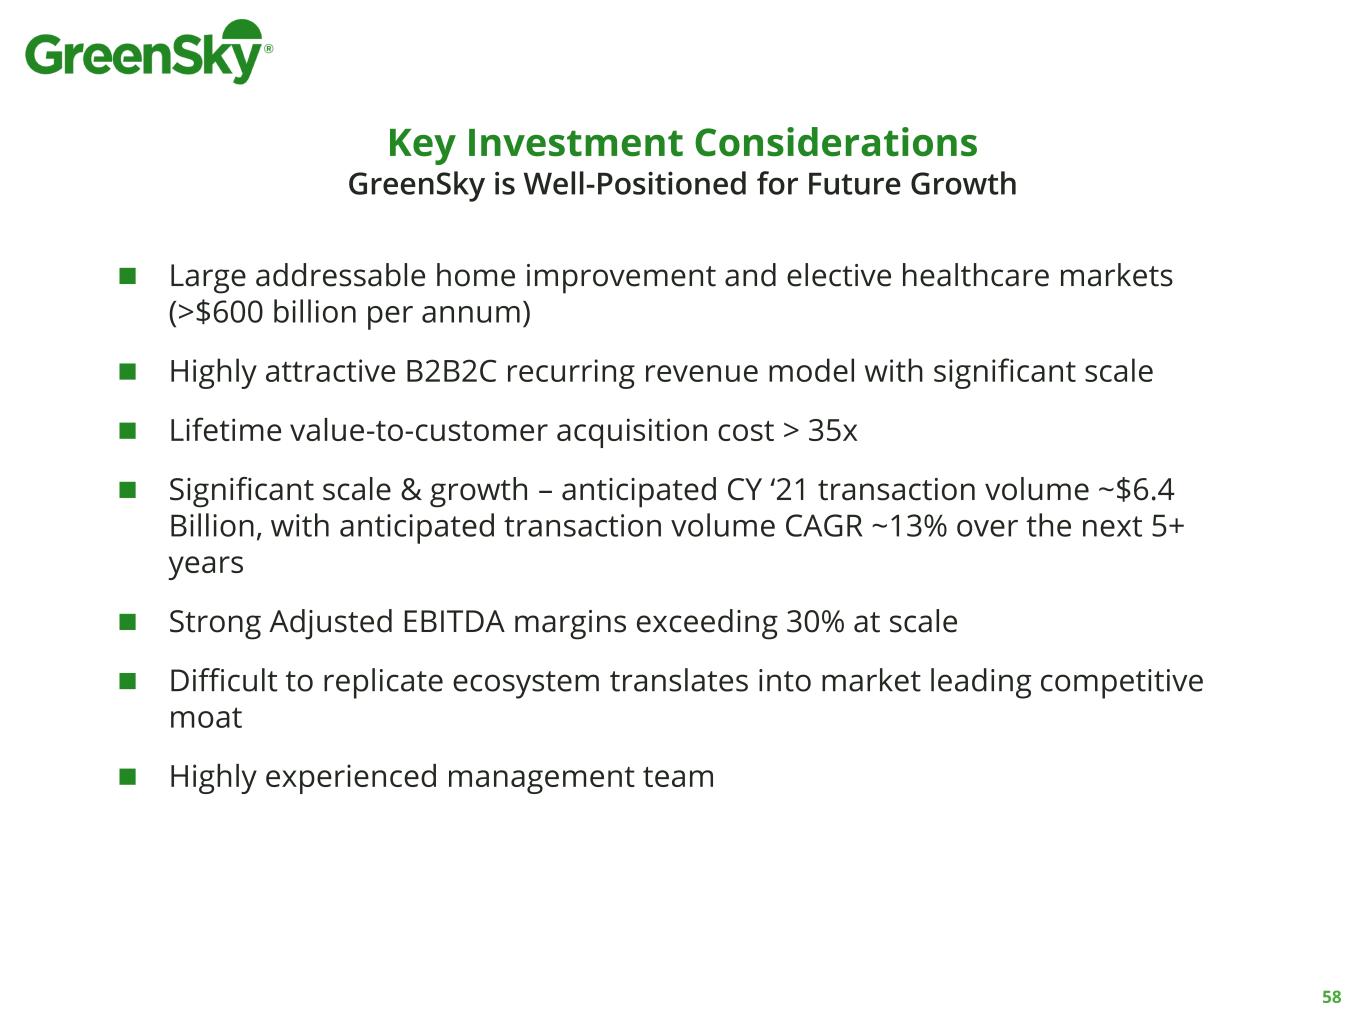
Key Investment Considerations GreenSky is Well-Positioned for Future Growth ◼ Large addressable home improvement and elective healthcare markets (>$600 billion per annum) ◼ Highly attractive B2B2C recurring revenue model with significant scale ◼ Lifetime value-to-customer acquisition cost > 35x ◼ Significant scale & growth – anticipated CY ‘21 transaction volume ~$6.4 Billion, with anticipated transaction volume CAGR ~13% over the next 5+ years ◼ Strong Adjusted EBITDA margins exceeding 30% at scale ◼ Difficult to replicate ecosystem translates into market leading competitive moat ◼ Highly experienced management team 58

Thank You! Questions & Answers

Appendix and Non-GAAP Reconciliations

Loan Sale Cost Illustration - Life of Loan ◼ Loan sales accelerate the cost of revenue through upfront realized gain or loss at time of sale that would have otherwise been incurred over the life of the loan under GreenSky’s bank waterfall ◼ Translating loan sale costs over the life of the loans sold would approximate an amortization of those costs over the amortization of the underlying loan balances ◼ The amortization timing depends on the term and prepayment assumptions of the loans sold ◼ For example, assuming an approximate 5-year loan term, 2.4 year weighted average life, and a mid-year convention, the estimated cost of loans sales would be distributed based on the following example schedule: ◼ ~20% in year of loan sale or mark-to-market (year 1) ◼ ~35% in following year (year 2) ◼ ~25% in year 3 ◼ ~15% in year 4 ◼ ~5% in year 5 61

Reconciliation of 2018 Adjusted EBITDA Year ended ($ in thousands) 12/31/2018 Net income $127,980 Interest expense 1 23,584 Tax expense (benefit) 5,534 Depreciation and amortization 4,478 Equity-based compensation expense 2 6,054 Servicing liability changes 3 945 Discontinued charged-off receivables programs 4 (26,692) Transaction and non-recurring expenses 5 2,393 Adjusted EBITDA $144,276 Revenue 420,298 Adjusted EBITDA margin 34% 1 Includes interest expense on our term loan. 2 Includes equity-based compensation to employees and directors, as well as equity-based payments to non-employees. 3 Includes the non-cash changes in the fair value of servicing liabilities related to our servicing liabilities associated with Bank Partner agreements and other contractual arrangements. 2018 amounts have been updated to be consistent with the Company's 2020 presentation in accordance with our Non-GAAP policy. 4 Includes the amounts related to the now discontinued program of transferring our rights to charged-off receivables to third parties. 2018 amounts have been updated to be consistent with the Company's 2020 presentation in accordance with our Non-GAAP policy. 5 Includes certain costs associated with our IPO, which were not deferrable against the proceeds of the IPO. Further, includes certain costs, such as legal and debt arrangement costs, related to our March 2018 term loan upsizing. 62
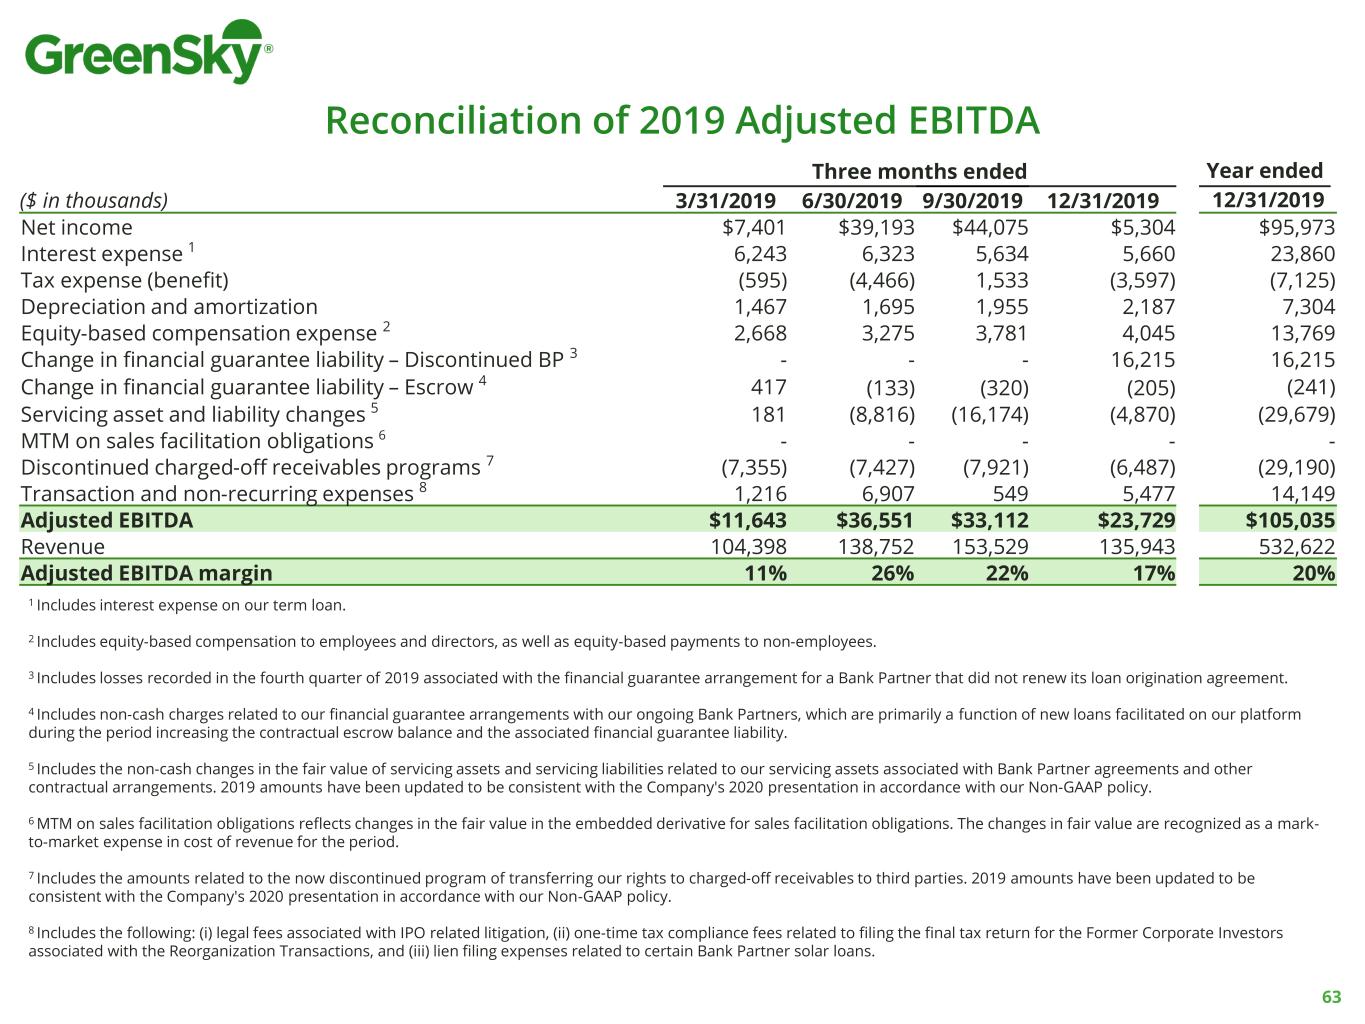
Reconciliation of 2019 Adjusted EBITDA Three months ended Year ended ($ in thousands) 3/31/2019 6/30/2019 9/30/2019 12/31/2019 12/31/2019 Net income $7,401 $39,193 $44,075 $5,304 $95,973 Interest expense 1 6,243 6,323 5,634 5,660 23,860 Tax expense (benefit) (595) (4,466) 1,533 (3,597) (7,125) Depreciation and amortization 1,467 1,695 1,955 2,187 7,304 Equity-based compensation expense 2 2,668 3,275 3,781 4,045 13,769 Change in financial guarantee liability – Discontinued BP 3 - - - 16,215 16,215 Change in financial guarantee liability – Escrow 4 417 (133) (320) (205) (241) Servicing asset and liability changes 5 181 (8,816) (16,174) (4,870) (29,679) MTM on sales facilitation obligations 6 - - - - - Discontinued charged-off receivables programs 7 (7,355) (7,427) (7,921) (6,487) (29,190) Transaction and non-recurring expenses 8 1,216 6,907 549 5,477 14,149 Adjusted EBITDA $11,643 $36,551 $33,112 $23,729 $105,035 Revenue 104,398 138,752 153,529 135,943 532,622 Adjusted EBITDA margin 11% 26% 22% 17% 20% 1 Includes interest expense on our term loan. 2 Includes equity-based compensation to employees and directors, as well as equity-based payments to non-employees. 3 Includes losses recorded in the fourth quarter of 2019 associated with the financial guarantee arrangement for a Bank Partner that did not renew its loan origination agreement. 4 Includes non-cash charges related to our financial guarantee arrangements with our ongoing Bank Partners, which are primarily a function of new loans facilitated on our platform during the period increasing the contractual escrow balance and the associated financial guarantee liability. 5 Includes the non-cash changes in the fair value of servicing assets and servicing liabilities related to our servicing assets associated with Bank Partner agreements and other contractual arrangements. 2019 amounts have been updated to be consistent with the Company's 2020 presentation in accordance with our Non-GAAP policy. 6 MTM on sales facilitation obligations reflects changes in the fair value in the embedded derivative for sales facilitation obligations. The changes in fair value are recognized as a mark- to-market expense in cost of revenue for the period. 7 Includes the amounts related to the now discontinued program of transferring our rights to charged-off receivables to third parties. 2019 amounts have been updated to be consistent with the Company's 2020 presentation in accordance with our Non-GAAP policy. 8 Includes the following: (i) legal fees associated with IPO related litigation, (ii) one-time tax compliance fees related to filing the final tax return for the Former Corporate Investors associated with the Reorganization Transactions, and (iii) lien filing expenses related to certain Bank Partner solar loans. 63

Reconciliation of 2020 Adjusted EBITDA Three months ended ($ in thousands) 3/31/2020 6/30/2020 9/30/2020 Net income $(10,919) $13,355 $2,811 Interest expense 1 5,620 5,894 6,775 Tax expense (benefit) (895) 1,497 197 Depreciation and amortization 2,445 2,762 2,973 Equity-based compensation expense 2 3,499 3,481 4,338 Change in financial guarantee liability – Escrow 3 18,408 10,248 (2,382) Servicing asset and liability changes 4 (2,306) 568 368 MTM on sales facilitation obligations 5 - - 18,262 Transaction and non-recurring expenses 6 1,233 2,025 5,367 Adjusted EBITDA $17,085 $39,830 $38,709 Revenue 121,857 132,962 142,023 Adjusted EBITDA margin 14% 30% 27% 1 Includes interest expense on our term loan. Interest expense on the SPV Facility and its related loans receivables held for sale are excluded from the adjustment above as such amounts are a component of cost of revenue in our on-going business. 2 Includes equity-based compensation to employees and directors, as well as equity-based payments to non-employees. 3 Includes non-cash charges related to our financial guarantee arrangements with our ongoing Bank Partners, which are primarily a function of new loans facilitated on our platform during the period increasing the contractual escrow balance and the associated financial guarantee liability. 4 Includes the non-cash changes in the fair value of servicing assets and servicing liabilities related to our servicing assets associated with Bank Partner agreements and other contractual arrangements. 5 MTM on sales facilitation obligations reflects changes in the fair value in the embedded derivative for sales facilitation obligations. The changes in fair value are recognized as a mark-to-market expense in cost of revenue for the period. 6 Includes professional fees and other costs associated with our strategic alternatives review process and IPO related litigation, as well as increased costs resulting from the COVID-19 pandemic. 64
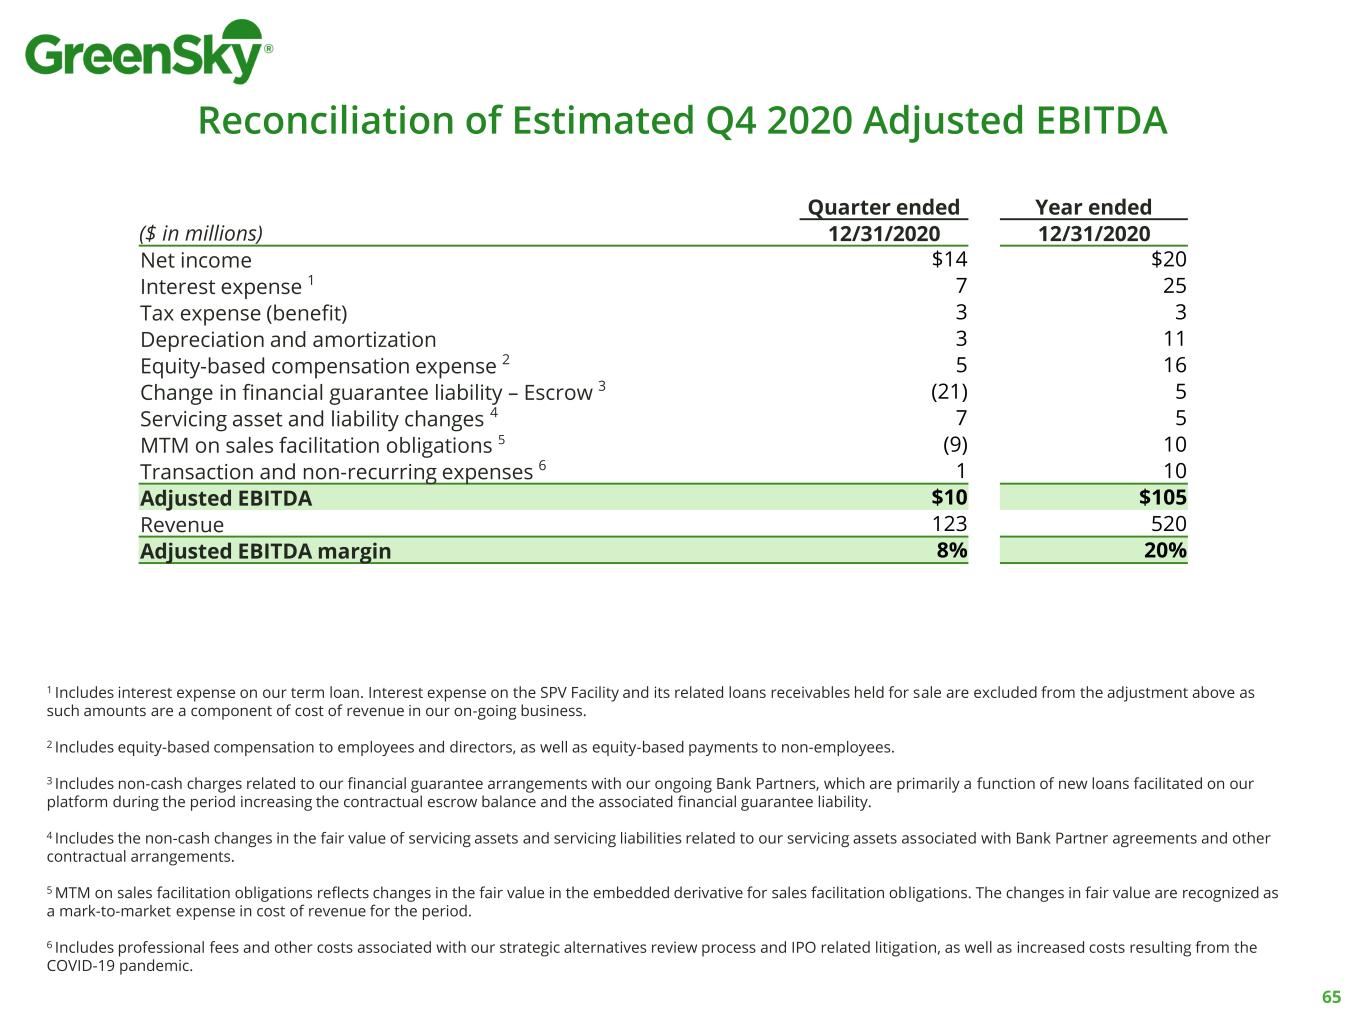
Reconciliation of Estimated Q4 2020 Adjusted EBITDA Quarter ended Year ended ($ in millions) 12/31/2020 12/31/2020 Net income $14 $20 Interest expense 1 7 25 Tax expense (benefit) 3 3 Depreciation and amortization 3 11 Equity-based compensation expense 2 5 16 Change in financial guarantee liability – Escrow 3 (21) 5 Servicing asset and liability changes 4 7 5 MTM on sales facilitation obligations 5 (9) 10 Transaction and non-recurring expenses 6 1 10 Adjusted EBITDA $10 $105 Revenue 123 520 Adjusted EBITDA margin 8% 20% 1 Includes interest expense on our term loan. Interest expense on the SPV Facility and its related loans receivables held for sale are excluded from the adjustment above as such amounts are a component of cost of revenue in our on-going business. 2 Includes equity-based compensation to employees and directors, as well as equity-based payments to non-employees. 3 Includes non-cash charges related to our financial guarantee arrangements with our ongoing Bank Partners, which are primarily a function of new loans facilitated on our platform during the period increasing the contractual escrow balance and the associated financial guarantee liability. 4 Includes the non-cash changes in the fair value of servicing assets and servicing liabilities related to our servicing assets associated with Bank Partner agreements and other contractual arrangements. 5 MTM on sales facilitation obligations reflects changes in the fair value in the embedded derivative for sales facilitation obligations. The changes in fair value are recognized as a mark-to-market expense in cost of revenue for the period. 6 Includes professional fees and other costs associated with our strategic alternatives review process and IPO related litigation, as well as increased costs resulting from the COVID-19 pandemic. 65
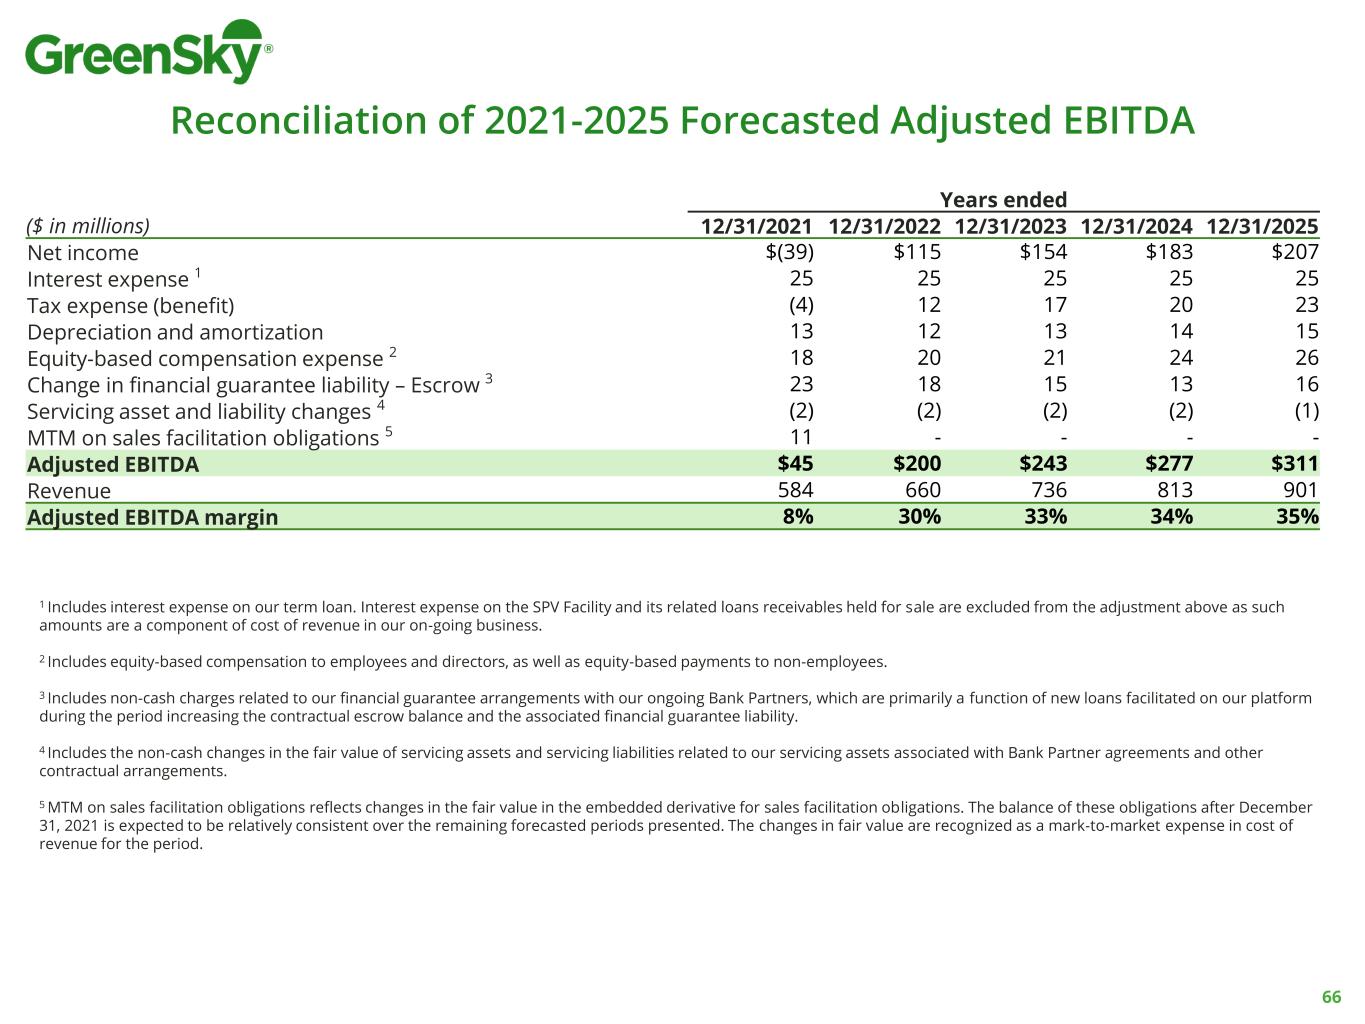
Reconciliation of 2021-2025 Forecasted Adjusted EBITDA Years ended ($ in millions) 12/31/2021 12/31/2022 12/31/2023 12/31/2024 12/31/2025 Net income $(39) $115 $154 $183 $207 Interest expense 1 25 25 25 25 25 Tax expense (benefit) (4) 12 17 20 23 Depreciation and amortization 13 12 13 14 15 Equity-based compensation expense 2 18 20 21 24 26 Change in financial guarantee liability – Escrow 3 23 18 15 13 16 Servicing asset and liability changes 4 (2) (2) (2) (2) (1) MTM on sales facilitation obligations 5 11 - - - - Adjusted EBITDA $45 $200 $243 $277 $311 Revenue 584 660 736 813 901 Adjusted EBITDA margin 8% 30% 33% 34% 35% 1 Includes interest expense on our term loan. Interest expense on the SPV Facility and its related loans receivables held for sale are excluded from the adjustment above as such amounts are a component of cost of revenue in our on-going business. 2 Includes equity-based compensation to employees and directors, as well as equity-based payments to non-employees. 3 Includes non-cash charges related to our financial guarantee arrangements with our ongoing Bank Partners, which are primarily a function of new loans facilitated on our platform during the period increasing the contractual escrow balance and the associated financial guarantee liability. 4 Includes the non-cash changes in the fair value of servicing assets and servicing liabilities related to our servicing assets associated with Bank Partner agreements and other contractual arrangements. 5 MTM on sales facilitation obligations reflects changes in the fair value in the embedded derivative for sales facilitation obligations. The balance of these obligations after December 31, 2021 is expected to be relatively consistent over the remaining forecasted periods presented. The changes in fair value are recognized as a mark-to-market expense in cost of revenue for the period. 66


