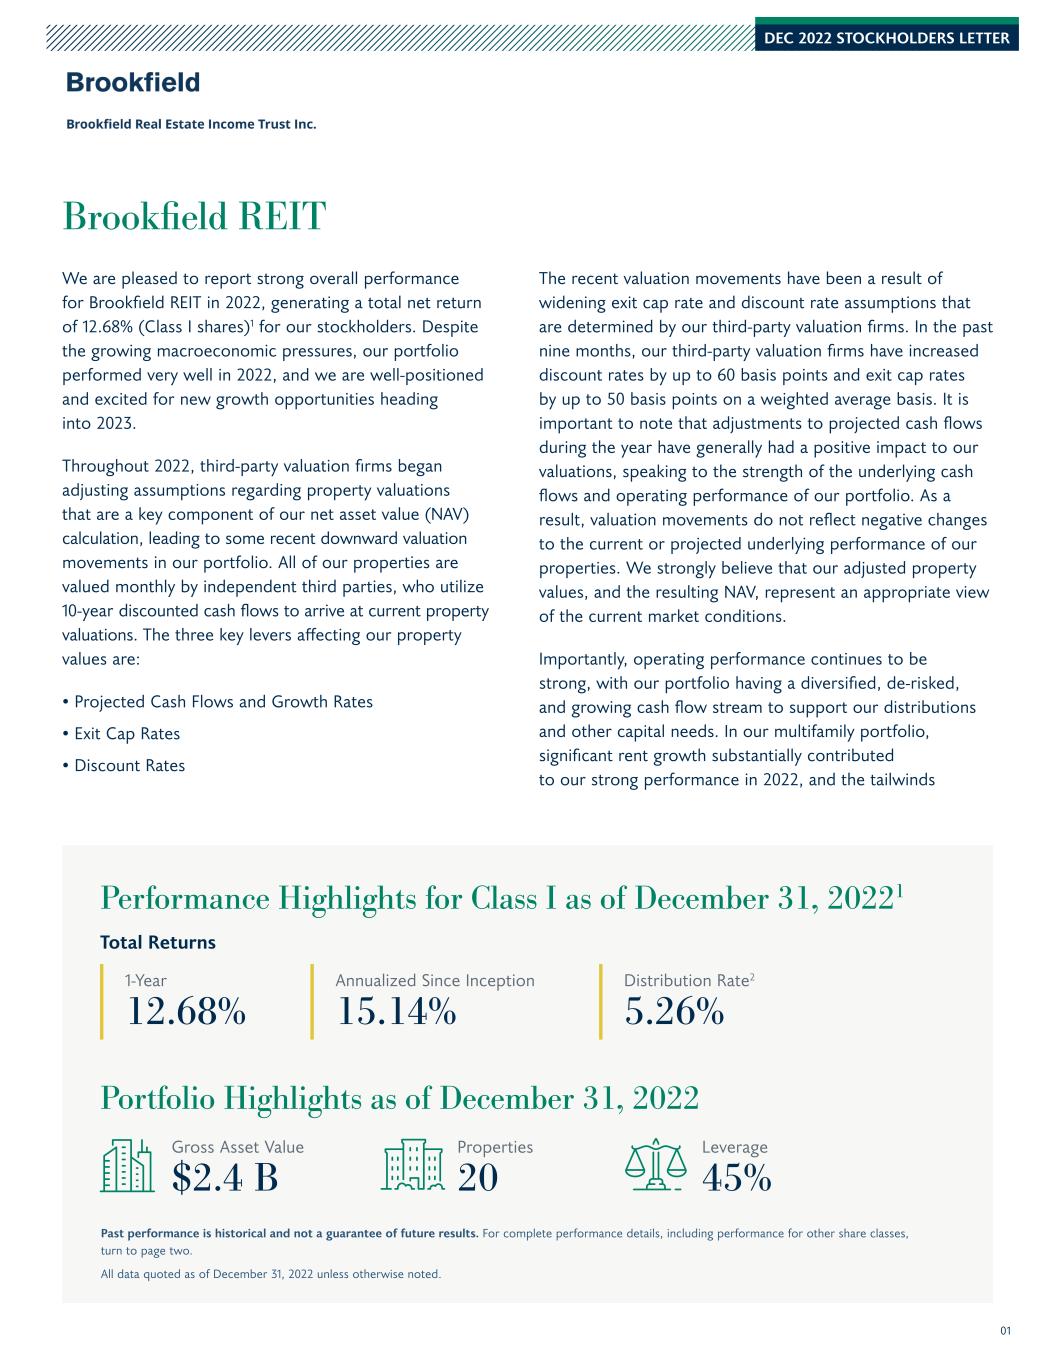
DEC 2022 STOCKHOLDERS LETTER 01 Brookfield REIT We are pleased to report strong overall performance for Brookfield REIT in 2022, generating a total net return of 12.68% (Class I shares)1 for our stockholders. Despite the growing macroeconomic pressures, our portfolio performed very well in 2022, and we are well-positioned and excited for new growth opportunities heading into 2023. Throughout 2022, third-party valuation firms began adjusting assumptions regarding property valuations that are a key component of our net asset value (NAV) calculation, leading to some recent downward valuation movements in our portfolio. All of our properties are valued monthly by independent third parties, who utilize 10-year discounted cash flows to arrive at current property valuations. The three key levers affecting our property values are: • Projected Cash Flows and Growth Rates • Exit Cap Rates • Discount Rates The recent valuation movements have been a result of widening exit cap rate and discount rate assumptions that are determined by our third-party valuation firms. In the past nine months, our third-party valuation firms have increased discount rates by up to 60 basis points and exit cap rates by up to 50 basis points on a weighted average basis. It is important to note that adjustments to projected cash flows during the year have generally had a positive impact to our valuations, speaking to the strength of the underlying cash flows and operating performance of our portfolio. As a result, valuation movements do not reflect negative changes to the current or projected underlying performance of our properties. We strongly believe that our adjusted property values, and the resulting NAV, represent an appropriate view of the current market conditions. Importantly, operating performance continues to be strong, with our portfolio having a diversified, de-risked, and growing cash flow stream to support our distributions and other capital needs. In our multifamily portfolio, significant rent growth substantially contributed to our strong performance in 2022, and the tailwinds Gross Asset Value $2.4 B Properties 20 1-Year 12.68% Annualized Since Inception 15.14% Leverage 45% Distribution Rate2 5.26% Performance Highlights for Class I as of December 31, 20221 Portfolio Highlights as of December 31, 2022 Total Returns Past performance is historical and not a guarantee of future results. For complete performance details, including performance for other share classes, turn to page two. All data quoted as of December 31, 2022 unless otherwise noted.

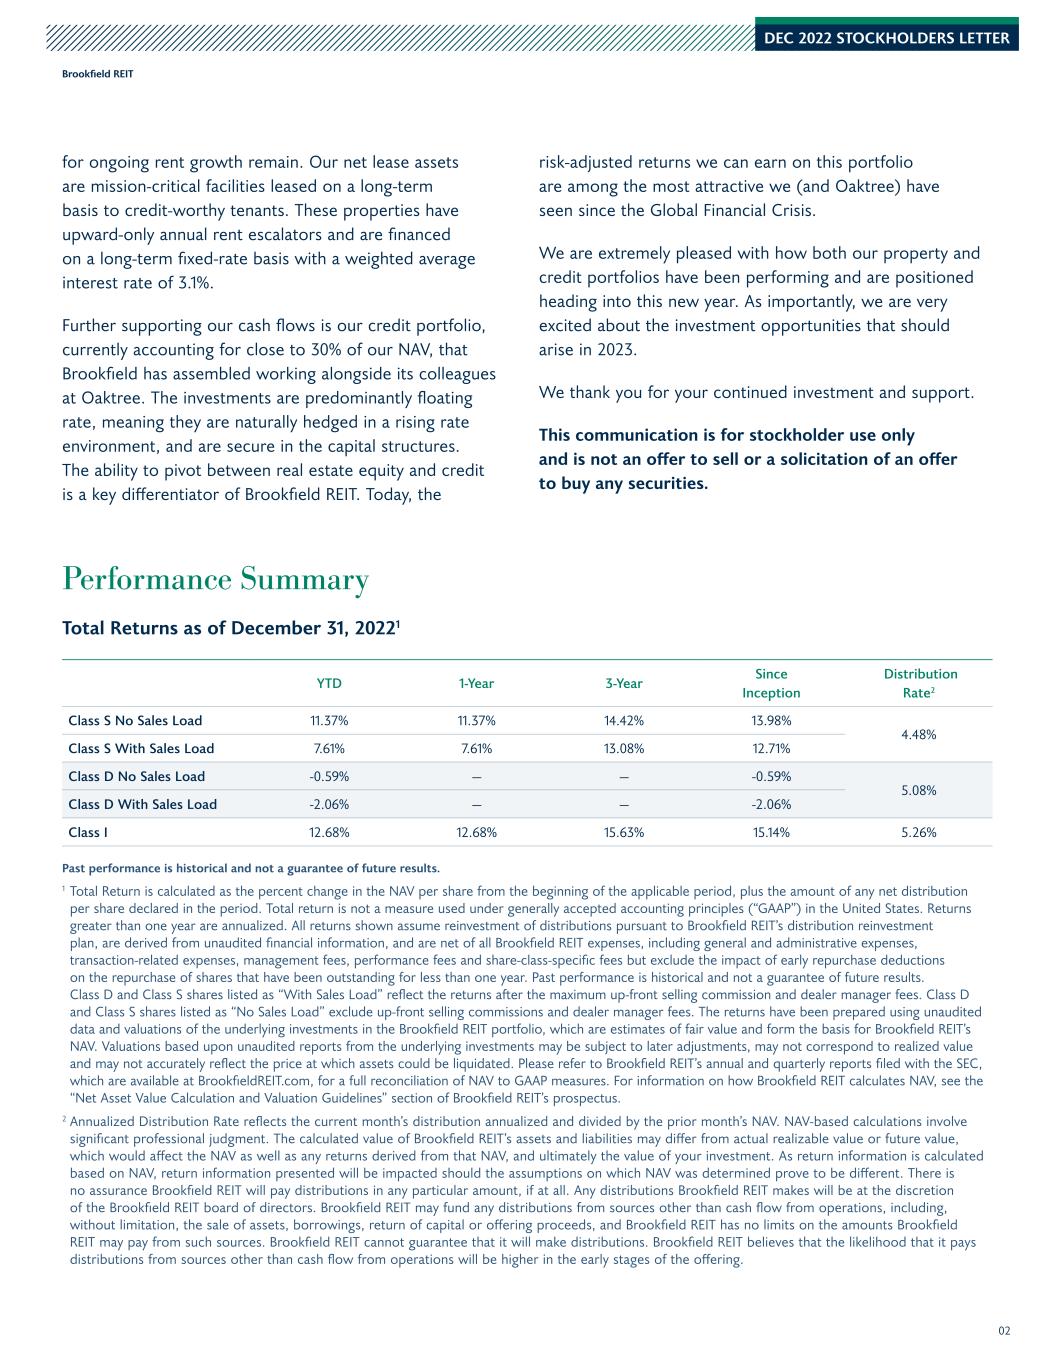
DEC 2022 STOCKHOLDERS LETTER 02 for ongoing rent growth remain. Our net lease assets are mission-critical facilities leased on a long-term basis to credit-worthy tenants. These properties have upward-only annual rent escalators and are financed on a long-term fixed-rate basis with a weighted average interest rate of 3.1%. Further supporting our cash flows is our credit portfolio, currently accounting for close to 30% of our NAV, that Brookfield has assembled working alongside its colleagues at Oaktree. The investments are predominantly floating rate, meaning they are naturally hedged in a rising rate environment, and are secure in the capital structures. The ability to pivot between real estate equity and credit is a key differentiator of Brookfield REIT. Today, the risk-adjusted returns we can earn on this portfolio are among the most attractive we (and Oaktree) have seen since the Global Financial Crisis. We are extremely pleased with how both our property and credit portfolios have been performing and are positioned heading into this new year. As importantly, we are very excited about the investment opportunities that should arise in 2023. We thank you for your continued investment and support. This communication is for stockholder use only and is not an offer to sell or a solicitation of an offer to buy any securities. Brookfield REIT Performance Summary Past performance is historical and not a guarantee of future results. 1 Total Return is calculated as the percent change in the NAV per share from the beginning of the applicable period, plus the amount of any net distribution per share declared in the period. Total return is not a measure used under generally accepted accounting principles (“GAAP”) in the United States. Returns greater than one year are annualized. All returns shown assume reinvestment of distributions pursuant to Brookfield REIT’s distribution reinvestment plan, are derived from unaudited financial information, and are net of all Brookfield REIT expenses, including general and administrative expenses, transaction-related expenses, management fees, performance fees and share-class-specific fees but exclude the impact of early repurchase deductions on the repurchase of shares that have been outstanding for less than one year. Past performance is historical and not a guarantee of future results. Class D and Class S shares listed as “With Sales Load” reflect the returns after the maximum up-front selling commission and dealer manager fees. Class D and Class S shares listed as “No Sales Load” exclude up-front selling commissions and dealer manager fees. The returns have been prepared using unaudited data and valuations of the underlying investments in the Brookfield REIT portfolio, which are estimates of fair value and form the basis for Brookfield REIT’s NAV. Valuations based upon unaudited reports from the underlying investments may be subject to later adjustments, may not correspond to realized value and may not accurately reflect the price at which assets could be liquidated. Please refer to Brookfield REIT’s annual and quarterly reports filed with the SEC, which are available at BrookfieldREIT.com, for a full reconciliation of NAV to GAAP measures. For information on how Brookfield REIT calculates NAV, see the “Net Asset Value Calculation and Valuation Guidelines” section of Brookfield REIT’s prospectus. 2 Annualized Distribution Rate reflects the current month’s distribution annualized and divided by the prior month’s NAV. NAV-based calculations involve significant professional judgment. The calculated value of Brookfield REIT’s assets and liabilities may differ from actual realizable value or future value, which would affect the NAV as well as any returns derived from that NAV, and ultimately the value of your investment. As return information is calculated based on NAV, return information presented will be impacted should the assumptions on which NAV was determined prove to be different. There is no assurance Brookfield REIT will pay distributions in any particular amount, if at all. Any distributions Brookfield REIT makes will be at the discretion of the Brookfield REIT board of directors. Brookfield REIT may fund any distributions from sources other than cash flow from operations, including, without limitation, the sale of assets, borrowings, return of capital or offering proceeds, and Brookfield REIT has no limits on the amounts Brookfield REIT may pay from such sources. Brookfield REIT cannot guarantee that it will make distributions. Brookfield REIT believes that the likelihood that it pays distributions from sources other than cash flow from operations will be higher in the early stages of the offering. Total Returns as of December 31, 20221 YTD 1-Year 3-Year Since Inception Distribution Rate2 Class S No Sales Load 11.37% 11.37% 14.42% 13.98% 4.48% Class S With Sales Load 7.61% 7.61% 13.08% 12.71% Class D No Sales Load -0.59% — — -0.59% 5.08% Class D With Sales Load -2.06% — — -2.06% Class I 12.68% 12.68% 15.63% 15.14% 5.26%

DEC 2022 STOCKHOLDERS LETTER 03© 2023 Brookfield Asset Management Inc. Brookfield REIT Contact Us brookfieldREIT.com info@brookfieldoaktree.com +1 855-777-8001 FORWARD-LOOKING STATEMENTS Statements contained in this letter that are not historical facts are based on our current expectations, estimates, projections, opinions or beliefs. Such statements are not facts and involve known and unknown risks, uncertainties, and other factors. Stockholders should not rely on these statements as if they were fact. Certain information contained in this letter constitutes “forward-looking statements,” which can be identified by the use of forward-looking terminology such as “may,” “will,” “should,” “expect,” “anticipate,” “project,” “target,” “estimate,” “intend,” “continue,” “forecast,” or “believe” or the negatives thereof or other variations thereon or other comparable terminology. Due to various risks and uncertainties, including those described in our annual and quarterly reports filed with the SEC, actual events or results or our actual performance may differ materially from those reflected or contemplated in such forward-looking statements. No representation or warranty is made as to future performance or such forward-looking statements. In light of the significant uncertainties inherent in these forward-looking statements, the inclusion of this information should not be regarded as a representation by us or any other person that our objectives and plans, which we consider to be reasonable, will be achieved. Stockholders should carefully review the “Risk Factors” section of our annual and quarterly reports filed with the SEC for a discussion of the risks and uncertainties that we believe are material our its business, operating results, prospects and financial condition. Except as otherwise required by federal securities laws, we do not undertake to publicly update or revise any forward-looking statements, whether as a result of new information, future events or otherwise, unless required by law.


