
Detour Lake Operation Ontario, Canada NI 43-101 Technical Report Report Prepared By: Andre Leite, P.Eng Jean-Francois Dupont, P.Eng Veronika Raizman, P.Geo Paul Andrew Fournier, P.Eng Report Prepared For: Kirkland Lake Gold Ltd. Effective Date: December 31, 2020

CERTIFICATE OF QUALIFIED PERSON I, Andre Leite, P. Eng. am employed as a Detour Lake Mine Technical Service Manager with Kirkland Lake Gold Ltd, with an address at Royal Bank Plaza, South Tower 200 Bay Street, Suite 2800 Toronto, Ontario, M5J 2J1 Canada. This certificate applies to the technical report titled “Detour Lake Operation NI 43-101 Technical Report” that has an effective date of 31 December, 2020 (the “technical report”). I am a Professional Engineer with Professional Engineers Ontario, license number 100153687; a chartered professional member of the Australasian Institute of Mining and Metallurgy (MAusIMM(CP)), member number 301888. I graduated from McGill University (Canada) in 2008 with a Master’ s Degree in Mining Engineering and from Universidade Federal de Minas Gerais in 2004 with a Bachelor’ s Degree in Mining Engineering. I have practiced my profession for 17 years. I have been directly involved in the mineral resource modelling for the Detour Main Pit and have reviewed in detail the mineral resource modelling for the North pit, W est Detour and 58N deposits. I have also participated in life of mine planning. I have two years of experience as the Detour Lake Mine Technical Service Manager. Prior to that I held the positions of Technical Service Manager V ale Base Metals Asia Pacific, responsible for mineral resource and mineral reserve estimates for V ale Base Metal operations in the region; Principal Mine Engineer V ale Base Metals Global, leading the initiatives associated with corporate governance, technical services and technology and innovation for the Base Metals business with a major focus on their open pit operations; as mineral resource and mineral reserve specialist with the Inco (later V ale) Mineral Resources and Mineral Reserves team supporting all operations globally with mineral resource modelling, mine design, mine production planning and mineral reserve definition. As a result of my experience and qualifications, I am a Qualified Person as defined in National Instrument 43–101 Standards of Disclosure for Mineral Projects (NI 43–101) for those sections of the technical report that I am responsible for preparing. I work at Detour Lake mine site, and this familiarity with the operation serves as my personal inspection. I am responsible for Sections 1.1 to 1.8, 1.10 to 1.14, 1.16, 1.18, 1.23 to 1.25; Section 2; Section 3; Section 4; Section 5; Section 6; Section 7; Section 8; Section 9; Section 10; Section 11; Section 12; Section 14; Section 15; Section 16; Section 18; Section 19; Section 23; Section 24; Sections 25.1 to 25.4, 25.6 to 25.8. 25.10, 25.12, 25.16, 25.17; Section 26, Section 27, and Appendix A of the technical report. I have been involved with the Detour Lake Mine for two years in my role as a Technical Service Manager working at site. I have read NI 43–101 and the sections of the technical report for which I am responsible have been prepared in compliance with that Instrument. As of the effective date of the technical report, to the best of my knowledge, information and belief, the sections of the technical report for which I am responsible contain all scientific and technical information that is required to be disclosed to make the technical report not misleading. Dated: 30 March, 2021 “Signed” Andre Leite, P.Eng.

CERTIFICATE OF QUALIFIED PERSON I, Jean-Francois Dupont (P. Eng., OIQ) am employed as the Detour Lake Mine Chief Metallurgist with Kirkland Lake Gold Ltd, with an address at 1B First Avenue, Cochrane, Ontario. This certificate applies to the technical report titled “Detour Lake Operation NI 43-101 Technical Report” that has an effective date of 31 December, 2020 (the “technical report”). I am a Professional Engineer, member of L’ Ordre Des Ingé nieurs du Qué bec, license number 117145. I graduated from Laval University (Canada) in 1996 with a Bachelor’ s Degree in Mining Engineering, majoring in mineral processing. I have practiced my profession for 24 years. I joined Detour Gold Corporation, a predecessor company to Kirkland Lake Gold Ltd. in 2011 and was directly involved in the engineering, construction and commissioning of the Detour Lake Mine processing plant. I have worked in the Detour Lake Mine processing plant for eight years. I have also participated in the elaboration of life-of-mine plans. Prior to that, I held various positions with Barrick Gold for 14 years including five years at the Corporate office as Comminution Metallurgist. This position gave me exposure to the 19 processing plants Barrick Gold had at the time. As a result of my experience and qualifications, I am a Qualified Person as defined in National Instrument 43–101 Standards of Disclosure for Mineral Projects (NI 43–101) for those sections of the technical report that I am responsible for preparing. I am directly employed at the Detour Operation, and have been since 2011. This familiarity with the operations serves as my personal inspection for the purposes of the technical report. I am responsible for Sections 1.1, 1.2, 1.9, 1.15; Sections 2.1 to 2.6; Section 13; Section 17; Sections 25.1, 25.5, 25.9; and Section 27 of the technical report. I am not independent of Kirkland Lake Gold Ltd, as independence is described by Section 1.5 of NI 43–101. I have been involved with the Detour Operation since 2011 during engineering, construction, commissioning, and operations of the process plant. I have read NI 43–101 and the sections of the technical report for which I am responsible have been prepared in compliance with that Instrument. As of the effective date of the technical report, to the best of my knowledge, information and belief, the sections of the technical report for which I am responsible contain all scientific and technical information that is required to be disclosed to make the technical report not misleading. Dated: 30 March, 2021 “Signed” J-F Dupont, P. Eng (OIQ)

CERTIFICATE OF QUALIFIED PERSON I, V eronika Raizman, P. Geo. am employed as a Manager for Reclamation and Geochemistry, with Kirkland Lake Gold Inc., with an address at Royal Bank Plaza, South Tower 200 Bay Street, Suite 2800 Toronto, Ontario, M5J 2J1 Canada. This certificate applies to the technical report titled “Detour Lake Operation NI 43-101 Technical Report” that has an effective date of 31 December, 2020 (the “technical report”). I am a Professional Geoscientist registered with the Professional Geoscientists of Ontario (Membership # 2563). I graduated from the University of Toronto with a Ph.D. in Earth Sciences (2015), a M.Sc. in Geology (2011), and a H .B.Sc. in Environmental and Physical Geography (2010). I have practiced my profession for 10 years. Prior to joining the Detour Lake Mine in 2016, I served as a geochemist with SRK Consulting Ltd., where I gained experience in the prediction and management of acid rock drainage and metal leaching during all phases of the mining cycle, as well as mine waste characterization using static, kinetic, and field testing programs. At the Detour Lake Mine, I have previously served in multiple roles, including Environmental Specialist; Geochemistry, Research and Closure Coordinator; and Senior Advisor for Mine Closure Planning and Geochemistry. My duties have supported, but not been limited to, 1) environmental permitting, reporting and compliance, including Indigenous consultation; 2) management of geochemical monitoring programs, including water quality (i.e. effluent and receiving environment) and mine wastes (i.e. waste rock and tailings); and 3) planning and execution of progressive reclamation and mine closure activities. As a result of my experience and qualifications, I am a Qualified Person as defined in National Instrument 43–101 Standards of Disclosure for Mineral Projects (NI 43–101) for those sections of the technical report that I am responsible for preparing. I have worked at Detour Lake mine site, and this familiarity with the operation serves as my personal inspection. I am responsible for Sections 1.1, 1.2, 1.17; Sections 2.1 to 2.4, 2.6; Section 20; Sections 25.1, 25.11; and Section 27 of the technical report. I was based at the Detour Lake Mine for four years and five months, followed by my current role as Manager for Reclamation and Geochemistry at the Kirkland Lake Gold Inc. Toronto corporate office, where I have served for five months. I have read NI 43–101, and the sections of the technical report for which I am responsible have been prepared in compliance with that Instrument. As of the effective date of the technical report, to the best of my knowledge, information and belief, the sections of the technical report for which I am responsible contain all scientific and technical information that is required to be disclosed to make the technical report not misleading. Dated: 30 March, 2021 “Signed” V eronika Raizman, P.Geo.

CERTIFICATE OF QUALIFIED PERSON I, Paul Andrew Fournier, P.Eng., am employed as a Manager, Cost Accounting at the Corporate Office of Kirkland Lake Gold Ltd, with an address at Royal Bank Plaza, South Tower 200 Bay Street, Suite 2800 Toronto, Ontario, M5J 2J1, Canada. This certificate applies to the technical report titled “Detour Lake Operation NI 43-101 Technical Report” that has an effective date of 31 December, 2020 (the “technical report”). I am a Professional Engineer with Professional Engineers Ontario, license number 100218548. I graduated from McGill University (Canada) in 2011 with a Bachelor of Materials Engineering degree. I passed the Level II Exam of the CFA® Program of the CFA Institute in 2018. I have practiced my profession since graduation. I have seven years of experience in process and metallurgical engineering in mining and metals, including four years with the processing plant at the Detour Lake Mine. This experience includes five years of metals accounting, cost estimation, production and economic forecasting. I have two years of experience in financial analysis specifically for the Detour Lake Mine. As part of my role with Kirkland Lake Gold Ltd, I prepared the financial model for the Detour Lake Mine consolidated budget for 2020 and 2021. I have intimate knowledge of the cost model for the Detour Lake Mine through experience in budgeting, forecasting, monthly reporting, and variance analysis. As a result of my experience and qualifications, I am a Qualified Person as defined in National Instrument 43– 101 Standards of Disclosure for Mineral Projects (NI 43–101) for those sections of the technical report that I am responsible for preparing. My latest personal inspection of the Detour Lake Mine property was a 14-day rotation from July 2nd to 15th, 2020. I am responsible for Sections 1.1, 1.2, 1.19, 1.20, 1.21, 1.22, 1.23; Sections 2.1 to 2.6; Section 21, Section 22, Sections 25.1, 25.13, 25.14, 25.15, 25.17, and Section 27 of the technical report. I am not independent of Kirkland Lake Gold Ltd as I am currently employed as Manager, Cost Accounting. I have been involved with the Detour Gold Mine since 2014, first with the process plant, and then as a financial analyst. I have read NI 43–101 and the sections of the technical report for which I am responsible have been prepared in compliance with that Instrument. As of the effective date of the technical report, to the best of my knowledge, information and belief, the sections of the technical report for which I am responsible contain all scientific and technical information that is required to be disclosed to make the technical report not misleading. Dated: 30 March, 2021 “Signed” Paul Andrew Fournier, P.Eng.
Detour Lake Operations Ontario, Canada NI 43-101 Technical Report March 2021 a Cautionary Statements Cautionary Notes Forward-Looking Information This Technical Report contains certain forward-looking information and forward-looking statements, as defined in applicable securities laws (collectively referred to herein as “forward-looking statements”). Forward-looking statements reflect current expectations or beliefs regarding future events or Kirkland Lake Gold Ltd.’s (Kirkland Lake Gold or the Company) future performance. All statements other than statements of historical fact are forward-looking statements. Often, but not always, forward-looking statements can be identified by the use of words such as “plans”, “expects”, “is expected”, “budget”, “scheduled”, “estimates”, “continues”, “forecasts”, “projects”, “predicts”, “intends”, “anticipates”, “targets”, or “believes”, or variations of, or the negatives of, such words and phrases or state that certain actions, events or results “may”, “could”, “would”, “should”, “might” or “will” be taken, occur or be achieved. Forward-looking statements involve known and unknown risks, uncertainties and other factors which may cause actual results, performance or achievements to be materially different from any of its future results, performance or achievements expressed or implied by forward-looking statements. These risks, uncertainties and other factors include, but are not limited to, assumptions and parameters underlying the life of mine update not being realized, a decrease in the future gold price, discrepancies between actual and estimated production, discrepancies related to the impact of various capital projects and the anticipated benefits therein, required capital investments; estimates of net present value and internal rate of returns; the accuracy of mineral reserve and mineral resource estimates, production estimates and capital and operating cost estimates and the assumptions on which such estimates are based; market competition; ongoing relations with employees and impacted communities changes in costs (including labour, supplies, fuel and equipment), changes to tax rates, environmental compliance and changes in environmental legislation and regulation, exchange rate fluctuations, general economic conditions and other risks involved in the gold exploration and development industry, as well as those risk factors discussed in the Technical Report. Such forward-looking statements are also based on a number of assumptions which may prove to be incorrect, including, but not limited to, assumptions about the following: the availability of financing for exploration and development activities; operating and capital costs; the Company’s ability to attract and retain skilled staff; sensitivity to metal prices and other sensitivities; the supply and demand for, and the level and volatility of the price of gold; the supply and availability of consumables and services; the exchange rates of the Canadian dollar to the U.S. dollar; energy and fuel costs; the accuracy of reserve and resource estimates and the assumptions on which the reserve and resource estimates are based; market competition; ongoing relations with employees and impacted communities and general business and economic conditions. Accordingly, readers should not place undue reliance on forward-looking statements. The
Detour Lake Operations Ontario, Canada NI 43-101 Technical Report March 2021 b forward-looking statements contained herein are made as of the date hereof, or such other date or dates specified in such statements. All forward-looking statements in this Technical Report are necessarily based on opinions and estimates made as of the date such statements are made and are subject to important risk factors and uncertainties, many of which cannot be controlled or predicted. Kirkland Lake Gold and the Qualified Persons who authored the Technical Report undertake no obligation to update publicly or otherwise revise any forward-looking statements contained herein whether as a result of new information or future events or otherwise, except as may be required by law. Non-IFRS Financial Performance Measures Kirkland Lake Gold has included certain non-IFRS measures in this document. The Company believes that these measures, in addition to conventional measures prepared in accordance with IFRS, provide investors an improved ability to evaluate the underlying performance of the Company. The non-IFRS measures are intended to provide additional information and should not be considered in isolation or as a substitute for measures of performance prepared in accordance with IFRS. These measures do not have any standardized meaning prescribed under IFRS, and therefore may not be comparable to other issuers. Free Cash Flow Before & After Tax In the gold mining industry, free cash flow is a common performance measure with no standardized meaning. Kirkland Lake Gold calculated free cash flow before taxes by deducting site operating costs, royalties and first nations payments, changes in inventory, capital expenditures, reclamation expenditures, and lease payments from net revenues and changes in working capital. Free cash flow after taxes is calculated by deducting tax expenses from free cash flow before taxes. Kirkland Lake Gold discloses free cash flow before and after tax as it believes the measure provides valuable assistance to investors and analysts in evaluating the Company’s ability to generate cash flow after capital investments and build the cash resources of the Company. The most directly comparable measure prepared in accordance with IFRS is net cash provided by operating activities less net cash used in investing activities. Operating Unit Costs Kirkland Lake Gold reports the following operating unit costs: • Mining operating unit cost (C$/t ex-pit): calculated as mining operating costs excluding adjustment for deferred stripping divided by total tonnes mined (ore + waste). • Operating unit cost per tonne (C$/t milled): calculated as operating costs divided by total tonnes milled. This is calculated for the different components of operating cost. Operating costs include mite site operating costs such as mining, processing, and site administration, as well as adjustments for deferred stripping, royalties, and changes in inventory.

Detour Lake Operations Ontario, Canada NI 43-101 Technical Report March 2021 c • Operating unit cost per ounce (C$/t oz sold): calculated as operating costs per ounce on a gross gold sales basis, where gross gold sales represent gold production after adjustment for changes in gold-in-circuit and dore inventory. Kirkland Lake Gold discloses operating costs and operating unit cost per tonne and per ounce as it believes the measures provide valuable assistance to investors and analysts in evaluating the Company’s operational performance and ability to generate cash flow. The most directly comparable measure prepared in accordance with IFRS is total production expenses. Operating cash costs and operating cash cost per ounce of gold should not be considered in isolation or as a substitute for measures prepared in accordance with IFRS. Operating Margin The operating margin represents net revenue after site operating costs, royalties and First Nations payments, and changes in inventory. Operating margin is an indicator of the Company’s ability to generate liquidity by producing operating cash flow to fund working capital needs, service debt obligations, and fund capital expenditures. Operating Cash Costs and Operating Cash Costs per Ounce Sold Operating cash costs and operating cash cost per tonne and per ounce sold are non-IFRS measures. In the gold mining industry, these metrics are common performance measures but do not have any standardized meaning under IFRS. Operating cash costs include mine site operating costs such as mining, processing and administration, but exclude royalty expenses, depreciation and depletion and share based payment expenses and reclamation costs. Operating cash cost per ounce sold is based on ounces sold and is calculated by dividing operating cash costs by volume of gold ounces sold. Kirkland Lake Gold discloses operating cash costs and operating cash cost per tonne and per ounce as it believes the measures provide valuable assistance to investors and analysts in evaluating the Company’s operational performance and ability to generate cash flow. The most directly comparable measure prepared in accordance with IFRS is total production expenses. Operating cash costs and operating cash cost per ounce of gold should not be considered in isolation or as a substitute for measures prepared in accordance with IFRS. AISC and AISC per Ounce Sold All-in sustaining costs (AISC) and AISC per ounce are non-IFRS measures. These measures are intended to assist readers in evaluating the total costs of producing gold from current operations. While there is no standardized meaning across the industry for this measure, Kirkland Lake Gold’s definition conforms to the definition of AISC as set out by the World Gold Council in its guidance note dated June 27, 2013. The Company defines AISC as the sum of operating costs (as defined and calculated above), royalty expenses, sustaining capital, corporate expenses and reclamation cost accretion related to current operations. Corporate expenses include general and administrative expenses, net of transaction related costs, severance expenses for management changes and interest income. AISC excludes growth capital expenditures,
Detour Lake Operations Ontario, Canada NI 43-101 Technical Report March 2021 d growth exploration expenditures, reclamation cost accretion not related to current operations, interest expense, debt repayment and taxes. Sustaining and Growth Capital Sustaining capital and growth capital are non-IFRS measures. Sustaining capital is defined as capital required to maintain current operations at existing levels. Growth capital is defined as capital expenditures for major growth projects or enhancement capital for significant infrastructure improvements at existing operations. Both measurements are used by management to assess the effectiveness of investment programs. Working Capital Working capital is a non-IFRS measure. In the gold mining industry, working capital is a common measure of liquidity, but does not have any standardized meaning. The most directly comparable measure prepared in accordance with IFRS is current assets and current liabilities. Working capital is calculated by deducting accounts payables from accounts receivables, supplies inventory, and gold inventory (ore stockpiles, gold-in-circuit, and dore inventory). Working capital should not be considered in isolation or as a substitute from measures prepared in accordance with IFRS. The measure is intended to assist readers in evaluating Kirkland Lake Gold’s liquidity.

Detour Lake Operations Ontario, Canada NI 43-101 Technical Report March 2021 i Table of Contents 1.0 Summary ............................................................................................... 1-1 1.1 Introduction ......................................................................................................... 1-1 1.2 Terms of Reference ............................................................................................ 1-1 1.3 Property Description and Location ..................................................................... 1-1 1.4 Mineral Tenure, Surface Rights, Water Rights and Royalties ............................ 1-2 1.5 Geology and Mineralization ................................................................................ 1-3 1.6 History ................................................................................................................ 1-5 1.7 Drilling and Sampling ......................................................................................... 1-5 1.8 Data Verification ................................................................................................. 1-8 1.9 Metallurgical Testwork ........................................................................................ 1-9 1.10 Mineral Resource Estimates ............................................................................ 1-10 1.11 Mineral Resource Statement ............................................................................ 1-12 1.12 Mineral Reserve Estimates .............................................................................. 1-15 1.13 Mineral Reserve Statement .............................................................................. 1-16 1.14 Mining Methods ................................................................................................ 1-18 1.15 Recovery Methods ........................................................................................... 1-19 1.16 Project Infrastructure ........................................................................................ 1-20 1.17 Environmental, Permitting and Social Considerations ...................................... 1-21 1.17.1 Environmental and Supporting Studies ............................................................ 1-21 1.17.2 Monitoring ......................................................................................................... 1-21 1.17.3 Tailings Management Area .............................................................................. 1-23 1.17.4 Water Management .......................................................................................... 1-23 1.17.5 Permits ............................................................................................................. 1-24 1.17.6 Closure and Reclamation ................................................................................. 1-25 1.17.7 Social Considerations ....................................................................................... 1-25 1.18 Markets and Contracts ..................................................................................... 1-26 1.19 Capital Cost Estimates ..................................................................................... 1-26 1.20 Operating Cost Estimates ................................................................................ 1-27 1.21 Economic Analysis ........................................................................................... 1-29 1.22 Sensitivity Analysis ........................................................................................... 1-30 1.23 Interpretation and Conclusions ......................................................................... 1-30 1.24 Risks and Opportunities ................................................................................... 1-33 1.25 Recommendations ........................................................................................... 1-34 2.0 Introduction ........................................................................................... 2-1 2.1 Introduction ......................................................................................................... 2-1 2.2 Terms of Reference ............................................................................................ 2-1 2.3 Qualified Persons ............................................................................................... 2-1

Detour Lake Operations Ontario, Canada NI 43-101 Technical Report March 2021 ii 2.4 Site Visits and Scope of Personal Inspection ..................................................... 2-2 2.5 Effective Dates ................................................................................................... 2-3 2.6 Information Sources and References ................................................................. 2-3 2.7 Previous Technical Reports ............................................................................... 2-4 3.0 Reliance on Other Experts ................................................................... 3-1 4.0 Property Description and Location ..................................................... 4-1 4.1 Introduction ......................................................................................................... 4-1 4.2 Property and Title in Ontario .............................................................................. 4-1 4.2.1 Introduction ......................................................................................................... 4-1 4.2.2 Mineral Tenure ................................................................................................... 4-1 4.2.3 Ontario Modernizing the Mining Act Process ..................................................... 4-3 4.2.4 Surface Rights .................................................................................................... 4-3 4.2.5 Environmental Considerations............................................................................ 4-4 4.2.6 Closure Considerations ...................................................................................... 4-4 4.2.7 First Nations Considerations .............................................................................. 4-4 4.2.8 Fraser Institute Survey ....................................................................................... 4-4 4.3 Project Ownership .............................................................................................. 4-5 4.3.1 Ownership History .............................................................................................. 4-5 4.3.2 Current Ownership ............................................................................................. 4-6 4.4 Mineral Tenure ................................................................................................... 4-6 4.4.1 Patented Documents ........................................................................................ 4-10 4.4.2 Leasehold Documents ...................................................................................... 4-10 4.4.3 Cell Mining Claims ............................................................................................ 4-10 4.4.4 Claims .............................................................................................................. 4-10 4.5 Surface Rights .................................................................................................. 4-10 4.6 Water Rights ..................................................................................................... 4-11 4.7 Royalties and Encumbrances ........................................................................... 4-11 4.8 Permitting Considerations ................................................................................ 4-12 4.9 Environmental Considerations.......................................................................... 4-13 4.10 Social License Considerations ......................................................................... 4-13 4.11 Comment on Property Description and Location .............................................. 4-13 5.0 Accessibility, Climate, Local Resources, Infrastructure, and Physiography ........................................................................................ 5-1 5.1 Accessibility ........................................................................................................ 5-1 5.2 Climate ............................................................................................................... 5-1 5.3 Local Resources and Infrastructure.................................................................... 5-1 5.4 Physiography ...................................................................................................... 5-1 5.5 Sufficiency of Surface Rights.............................................................................. 5-2 6.0 History ................................................................................................... 6-1
Detour Lake Operations Ontario, Canada NI 43-101 Technical Report March 2021 iii 6.1 Exploration History ............................................................................................. 6-1 6.2 Production History .............................................................................................. 6-1 7.0 Geological Setting and Mineralization ................................................ 7-1 7.1 Regional Geology ............................................................................................... 7-1 7.2 Project Geology .................................................................................................. 7-1 7.2.1 Lithologies .......................................................................................................... 7-1 7.2.2 Structure ............................................................................................................. 7-5 7.2.3 Metamorphism .................................................................................................... 7-7 7.2.4 Alteration ............................................................................................................ 7-7 7.2.5 Mineralization ..................................................................................................... 7-7 7.3 Deposit Descriptions .......................................................................................... 7-7 7.3.1 Detour Lake ........................................................................................................ 7-7 7.3.2 West Detour and North Pit Areas ..................................................................... 7-13 7.3.3 Zone 58N .......................................................................................................... 7-14 7.3.1 Zone 75 ............................................................................................................ 7-16 8.0 Deposit Types ....................................................................................... 8-1 8.1 Deposit Model .................................................................................................... 8-1 8.2 Comment on Deposit Types ............................................................................... 8-1 9.0 Exploration ............................................................................................ 9-1 9.1 Grids and Surveys .............................................................................................. 9-1 9.2 Geological Mapping ............................................................................................ 9-1 9.3 Geochemical Surveys ........................................................................................ 9-1 9.3.1 Soil ..................................................................................................................... 9-1 9.3.2 Channel .............................................................................................................. 9-1 9.3.1 Trench ................................................................................................................ 9-2 9.4 Geophysical Surveys .......................................................................................... 9-2 9.4.1 Airborne .............................................................................................................. 9-2 9.4.1 Ground ............................................................................................................... 9-2 9.5 Petrology, Mineralogy, and Research Studies ................................................... 9-6 9.6 Exploration Potential .......................................................................................... 9-6 10.0 Drilling ................................................................................................. 10-1 10.1 Introduction ....................................................................................................... 10-1 10.2 Drill Methods .................................................................................................... 10-1 10.3 Logging Procedures ......................................................................................... 10-4 10.3.1 Legacy .............................................................................................................. 10-4 10.3.2 Pelangio ........................................................................................................... 10-5 10.3.3 Trade Winds ..................................................................................................... 10-5 10.3.4 Detour Gold ...................................................................................................... 10-5 10.3.5 Kirkland Lake Gold ........................................................................................... 10-6

Detour Lake Operations Ontario, Canada NI 43-101 Technical Report March 2021 iv 10.4 Recovery .......................................................................................................... 10-7 10.5 Collar Surveys .................................................................................................. 10-7 10.5.1 Legacy .............................................................................................................. 10-7 10.5.2 Trade Winds/Detour Gold ................................................................................. 10-8 10.5.3 Kirkland Lake Gold ........................................................................................... 10-8 10.6 Downhole Surveys ........................................................................................... 10-9 10.6.1 Legacy .............................................................................................................. 10-9 10.6.2 Trade Winds/Detour Gold ................................................................................. 10-9 10.6.3 Kirkland Lake Gold ......................................................................................... 10-10 10.7 Sample Length/True Thickness ...................................................................... 10-10 10.8 Grade Control ................................................................................................. 10-10 10.9 Twin Hole Drilling ........................................................................................... 10-10 10.10 Drilling Since Database Close-out Date ......................................................... 10-11 10.11 Comments on Drilling ..................................................................................... 10-11 11.0 Sample Preparation, Analyses, and Security ................................... 11-1 11.1 Drill Sampling Methods .................................................................................... 11-1 11.1.1 Legacy .............................................................................................................. 11-1 11.1.2 Trade Winds ..................................................................................................... 11-2 11.1.3 Detour Gold ...................................................................................................... 11-3 11.1.4 Kirkland Lake Gold ........................................................................................... 11-3 11.1.5 Grade Control ................................................................................................... 11-3 11.2 Underground Sampling Methods ...................................................................... 11-3 11.3 Bulk Sampling Methods .................................................................................... 11-4 11.4 Density Determinations .................................................................................... 11-5 11.4.1 Detour Lake ...................................................................................................... 11-5 11.4.2 West Detour ..................................................................................................... 11-5 11.4.3 Zone 58N .......................................................................................................... 11-6 11.5 Analytical and Test Laboratories ...................................................................... 11-6 11.5.1 Primary Laboratories ........................................................................................ 11-6 11.5.2 Secondary/Check Laboratories ........................................................................ 11-7 11.5.3 Grade Control ................................................................................................... 11-7 11.6 Sample Preparation and Analysis .................................................................... 11-7 11.6.1 Legacy .............................................................................................................. 11-7 11.6.2 Trade Winds/Detour Gold ................................................................................. 11-9 11.6.3 Kirkland Lake Gold ......................................................................................... 11-11 11.6.1 Grade Control ................................................................................................. 11-11 11.7 Quality Assurance and Quality Control........................................................... 11-11 11.7.1 Legacy ............................................................................................................ 11-11 11.7.2 Detour Gold .................................................................................................... 11-12 11.7.3 Kirkland Lake Gold ......................................................................................... 11-14 11.7.4 Grade Control ................................................................................................. 11-14

Detour Lake Operations Ontario, Canada NI 43-101 Technical Report March 2021 v 11.8 Databases ...................................................................................................... 11-14 11.9 Sample Security ............................................................................................. 11-15 11.9.1 Legacy ............................................................................................................ 11-15 11.9.2 Detour Gold .................................................................................................... 11-16 11.9.3 Kirkland Lake Gold ......................................................................................... 11-16 11.10 Sample Storage .............................................................................................. 11-16 11.11 Comments on Sample Preparation, Analyses and Security ........................... 11-17 12.0 Data Verification ................................................................................. 12-1 12.1 Historical Verification Programs ....................................................................... 12-1 12.1.1 2005–2006 ....................................................................................................... 12-1 12.1.2 2009 ................................................................................................................. 12-1 12.1.3 2009–2010 ....................................................................................................... 12-2 12.1.4 2010–2011 ....................................................................................................... 12-3 12.1.5 2012–2013 ....................................................................................................... 12-4 12.1.6 Verification of the Detour Gold Drill Holes ........................................................ 12-4 12.1.7 Verification of the Trade Winds Drill Holes ....................................................... 12-4 12.1.8 Follow up on Trade Winds Drills Hole Verification ............................................ 12-5 12.1.9 Zone 58N Deposit Data Verification ................................................................. 12-6 12.2 External Data Verification ................................................................................. 12-6 12.3 Kirkland Lake Gold Verification Programs ........................................................ 12-7 12.4 Verification Completed by the QP .................................................................... 12-7 12.5 Comments on Data Verification ........................................................................ 12-7 13.0 Mineral Processing and Metallurgical Testing ................................. 13-1 13.1 Introduction ....................................................................................................... 13-1 13.2 Historical Metallurgical Testwork ...................................................................... 13-1 13.3 Detour Lake/West Detour Testwork Programs and Results ............................. 13-1 13.3.1 Comminution .................................................................................................... 13-1 13.3.2 Grinding Circuit Simulation ............................................................................... 13-2 13.3.3 Gravity Gold Recovery ..................................................................................... 13-2 13.3.4 Leach Test Work .............................................................................................. 13-5 13.3.5 West Detour ..................................................................................................... 13-9 13.3.6 Impact of Copper On Recovery and Cyanide Consumption ............................. 13-9 13.3.7 Carbon-in-Pulp Solution Losses Reduction ...................................................... 13-9 13.3.8 Carbon Losses Minimization .......................................................................... 13-10 13.3.9 Cyanide Destruction ....................................................................................... 13-10 13.4 Zone 58N Testwork ........................................................................................ 13-11 13.4.1 Metallurgical Testing ...................................................................................... 13-11 13.4.1 Phase I Results .............................................................................................. 13-11 13.4.2 Phase II Results ............................................................................................. 13-12 13.4.3 Consumables ................................................................................................. 13-12 13.4.4 Additional Sample Characterization ............................................................... 13-12

Detour Lake Operations Ontario, Canada NI 43-101 Technical Report March 2021 vi 13.4.5 Conclusions .................................................................................................... 13-13 13.5 Recovery Model ............................................................................................. 13-13 13.5.1 Recovery Equations ....................................................................................... 13-13 13.5.2 LOM Recovery Forecasts ............................................................................... 13-14 13.5.3 Recovery Improvement Initiatives .................................................................. 13-14 13.6 Metallurgical Variability ................................................................................... 13-15 13.7 Deleterious Elements ..................................................................................... 13-16 14.0 Mineral Resource Estimates .............................................................. 14-1 14.1 Introduction ....................................................................................................... 14-1 14.2 Geological Interpretation .................................................................................. 14-1 14.3 Underground Void and Stope Interpretation ..................................................... 14-3 14.4 Grade Capping ................................................................................................. 14-3 14.4.1 Reconciliation Study ......................................................................................... 14-3 14.4.2 Grade Capping ................................................................................................. 14-6 14.5 Compositing ..................................................................................................... 14-9 14.6 Variography .................................................................................................... 14-10 14.7 Block Models .................................................................................................. 14-13 14.8 Density ........................................................................................................... 14-14 14.9 Grade Interpolation ......................................................................................... 14-14 14.10 Model Validation ............................................................................................. 14-18 14.11 Mineral Resource Classification ..................................................................... 14-21 14.12 Reasonable Prospects for Eventual Economic Extraction ............................. 14-25 14.13 Mineral Resource Statement .......................................................................... 14-25 14.14 Factors that May Affect the Resource Estimate ............................................. 14-30 14.15 Comments on Mineral Resource Estimates ................................................... 14-30 15.0 Mineral Reserve Estimates ................................................................ 15-1 15.1 Introduction ....................................................................................................... 15-1 15.2 Block Model ...................................................................................................... 15-1 15.3 Pit Optimization ................................................................................................ 15-1 15.3.1 Basis of Optimization ........................................................................................ 15-1 15.3.2 Engineered Pit Designs .................................................................................... 15-2 15.4 Cut-off Grade .................................................................................................... 15-2 15.5 Dilution ............................................................................................................. 15-2 15.6 Mineral Reserves Statement ............................................................................ 15-4 15.7 Factors that May Affect the Mineral Reserves Estimate ................................... 15-4 15.8 Comment on Mineral Reserves Estimates ....................................................... 15-4 16.0 Mining Methods .................................................................................. 16-1 16.1 Overview .......................................................................................................... 16-1
Detour Lake Operations Ontario, Canada NI 43-101 Technical Report March 2021 vii 16.2 Geotechnical Considerations............................................................................ 16-1 16.3 Hydrological Considerations ............................................................................. 16-3 16.4 Open Pit Designs ............................................................................................. 16-4 16.4.1 Design Constraints ........................................................................................... 16-4 16.4.2 Pit Phases ........................................................................................................ 16-5 16.4.3 Pit Sizes ........................................................................................................... 16-5 16.5 Overburden and Pre-Stripping ......................................................................... 16-5 16.6 Stockpile and Waste Rock Storage Facilities ................................................... 16-5 16.6.1 Strategy ............................................................................................................ 16-5 16.6.2 Design Criteria .................................................................................................. 16-8 16.7 Mining Operations ............................................................................................ 16-8 16.7.1 Ore Mining and Stockpiles ............................................................................. 16-11 16.7.2 Waste Mining .................................................................................................. 16-11 16.8 Mine Production Plan ..................................................................................... 16-11 16.9 Drilling and Blasting ........................................................................................ 16-12 16.10 Equipment ...................................................................................................... 16-12 16.11 Maintenance and Repair Contract .................................................................. 16-15 16.12 Comments on Mining Methods ....................................................................... 16-15 17.0 Recovery Methods .............................................................................. 17-1 17.1 Overview .......................................................................................................... 17-1 17.2 Flowsheet ......................................................................................................... 17-2 17.3 Plant Design ..................................................................................................... 17-2 17.3.1 Crushing and Grinding ..................................................................................... 17-2 17.3.2 Leach and Carbon-in-PuIp ............................................................................. 17-10 17.3.3 Acid Wash, Stripping, Electrowinning, and Refining ....................................... 17-10 17.3.4 Thickening ...................................................................................................... 17-11 17.3.5 Tailings ........................................................................................................... 17-11 17.4 Energy, Water, and Process Materials Requirements .................................... 17-11 17.4.1 Power ............................................................................................................. 17-11 17.4.2 Water .............................................................................................................. 17-12 17.4.3 Consumables ................................................................................................. 17-12 18.0 Infrastructure ...................................................................................... 18-1 18.1 Overview .......................................................................................................... 18-1 18.2 Road and Logistics ........................................................................................... 18-1 18.3 Stockpiles ......................................................................................................... 18-3 18.4 Tailings Management Area .............................................................................. 18-3 18.5 Mine Site Built Infrastructure ............................................................................ 18-3 18.5.1 Mine Service Facilities ...................................................................................... 18-3 18.5.2 Process Plant ................................................................................................... 18-3 18.5.3 Administration ................................................................................................... 18-4

Detour Lake Operations Ontario, Canada NI 43-101 Technical Report March 2021 viii 18.5.4 Explosives Plant ............................................................................................... 18-4 18.6 Off-Site Built Infrastructure ............................................................................... 18-4 18.7 Camp and Accommodations ............................................................................ 18-4 18.8 Communications ............................................................................................... 18-4 18.9 Water Management .......................................................................................... 18-5 18.10 Water Supply .................................................................................................... 18-5 18.11 Power Supply ................................................................................................... 18-6 19.0 Market Studies and Contracts ........................................................... 19-1 19.1 Market Studies ................................................................................................. 19-1 19.2 Commodity Prices ............................................................................................ 19-1 19.3 Material Contracts ............................................................................................ 19-1 19.4 Comments on Market Studies and Contracts ................................................... 19-1 20.0 Environmental Studies, Permitting and Social or Community Impact .................................................................................................. 20-1 20.1 Environmental and Supporting Studies ............................................................ 20-1 20.2 Site Monitoring ................................................................................................. 20-1 20.2.1 Air Quality ......................................................................................................... 20-1 20.2.2 Metals Leaching and Acid Rock Drainage........................................................ 20-2 20.2.3 Ground Water, Surface Water and Aquatic Resources .................................... 20-2 20.2.4 Vegetation and Wildlife ..................................................................................... 20-3 20.2.5 Cultural and Heritage Resources ..................................................................... 20-4 20.3 Tailings Management Area .............................................................................. 20-4 20.3.1 Tailings Management Area .............................................................................. 20-4 20.3.2 Cell 1 ................................................................................................................ 20-6 20.3.3 Cell 2 ................................................................................................................ 20-6 20.3.4 Cell 3 ................................................................................................................ 20-6 20.3.5 Performance Monitoring ................................................................................... 20-6 20.4 Water Management .......................................................................................... 20-7 20.5 Permitting Considerations ................................................................................ 20-9 20.6 Social and Community Impact Considerations ............................................... 20-10 20.6.1 Consultation Principles ................................................................................... 20-10 20.6.2 First Nations ................................................................................................... 20-12 20.7 Closure and Reclamation Planning ................................................................ 20-12 21.0 Capital and Operating Costs .............................................................. 21-1 21.1 Capital Cost Estimates ..................................................................................... 21-1 21.1.1 Summary .......................................................................................................... 21-1 21.1.2 Mining ............................................................................................................... 21-1 21.1.3 Processing Plant .............................................................................................. 21-1 21.1.4 Site Administration ........................................................................................... 21-2

Detour Lake Operations Ontario, Canada NI 43-101 Technical Report March 2021 ix 21.1.5 Tailings Management Area .............................................................................. 21-3 21.1.6 Deferred Stripping Costs .................................................................................. 21-3 21.1.7 West Detour ..................................................................................................... 21-3 21.2 Operating Cost Estimates ................................................................................ 21-3 21.2.1 Summary .......................................................................................................... 21-3 21.2.2 Basis of Estimate .............................................................................................. 21-4 21.2.3 Mining Costs ..................................................................................................... 21-5 21.2.4 Processing Costs ............................................................................................. 21-5 21.2.5 Site Administration Costs ................................................................................. 21-5 21.3 Comments on Capital and Operating Costs ..................................................... 21-6 22.0 Economic Analysis ............................................................................. 22-1 22.1 Methodology Used ........................................................................................... 22-1 22.2 Financial Model Parameters ............................................................................. 22-1 22.2.1 Mineral Reserves and Mine Life ....................................................................... 22-1 22.2.2 Metallurgical Recoveries .................................................................................. 22-1 22.2.3 Metal Prices and Exchange Rates ................................................................... 22-1 22.2.4 Gross Gold Revenue ........................................................................................ 22-1 22.2.5 Transport and Refining Charges ...................................................................... 22-2 22.2.6 Net Gold Revenue ............................................................................................ 22-2 22.2.7 Capital and Operating Costs ............................................................................ 22-2 22.2.8 Royalties ........................................................................................................... 22-2 22.2.9 Working Capital ................................................................................................ 22-2 22.2.10 Taxes .......................................................................................................... 22-2 22.2.11 Closure Costs and Salvage Value .............................................................. 22-3 22.2.12 Lease Payments ......................................................................................... 22-3 22.2.13 Financing .................................................................................................... 22-3 22.2.14 Inflation ....................................................................................................... 22-3 22.3 Economic Analysis ........................................................................................... 22-3 22.4 Sensitivity Analysis ........................................................................................... 22-4 22.5 Comments on Economic Analysis .................................................................... 22-4 23.0 Adjacent Properties ............................................................................ 23-1 24.0 Other Relevant Data and Information ................................................ 24-1 25.0 Interpretation and Conclusions ......................................................... 25-1 25.1 Introduction ....................................................................................................... 25-1 25.2 Mineral Tenure, Surface Rights, Water Rights, Royalties and Agreements ..... 25-1 25.3 Geology and Mineralization .............................................................................. 25-1 25.4 Exploration, Drilling and Analytical Data Collection in Support of Mineral Resource Estimation ........................................................................................ 25-2 25.5 Metallurgical Testwork ...................................................................................... 25-2 25.6 Mineral Resource Estimates ............................................................................ 25-3

Detour Lake Operations Ontario, Canada NI 43-101 Technical Report March 2021 x 25.7 Mineral Reserve Estimates .............................................................................. 25-3 25.8 Mine Plan ......................................................................................................... 25-3 25.9 Recovery Plan .................................................................................................. 25-4 25.10 Infrastructure .................................................................................................... 25-4 25.11 Environmental, Permitting and Social Considerations ...................................... 25-5 25.12 Markets and Contracts ..................................................................................... 25-6 25.13 Capital Cost Estimates ..................................................................................... 25-6 25.14 Operating Cost Estimates ................................................................................ 25-6 25.15 Economic Analysis ........................................................................................... 25-7 25.16 Risks and Opportunities ................................................................................... 25-7 25.17 Conclusions ...................................................................................................... 25-8 26.0 Recommendations .............................................................................. 26-1 27.0 References .......................................................................................... 27-1 Table of Tables Table 1-1: Conceptual Resource Pit Optimization Parameters ......................................... 1-13 Table 1-2: Underground Cut-off Grade Input Parameters ................................................. 1-13 Table 1-3: Measured and Indicated Mineral Resource Statement .................................... 1-14 Table 1-4: Inferred Mineral Resource Statement ............................................................... 1-14 Table 1-5: Pit Optimization Parameters ............................................................................. 1-16 Table 1-6: Mineral Reserves Statement ............................................................................. 1-17 Table 1-7: Capital Cost Summary by Area ......................................................................... 1-28 Table 1-8: Operating Cost Summary ................................................................................. 1-28 Table 1-9: Operating Unit Cost Summary .......................................................................... 1-29 Table 1-10: Summary of Discounted Free Cash Flow Analysis. .......................................... 1-31 Table 4-1: Mineral Tenure Summary Table ......................................................................... 4-7 Table 4-2: Royalty Summary Table .................................................................................... 4-12 Table 6-1: Exploration History .............................................................................................. 6-2 Table 6-2: Production History, Kirkland Gold ....................................................................... 6-3 Table 7-1: Lithology Table .................................................................................................... 7-3 Table 9-1: Ground Geophysical Surveys ............................................................................. 9-4 Table 10-1: Drill Summary Table ......................................................................................... 10-2 Table 10-2: Drilling Supporting Mineral Resource Estimates .............................................. 10-2 Table 11-1: Detour Gold Analytical Methods, Deposits ..................................................... 11-10 Table 11-2: Detour Gold Analytical Methods, Exploration ................................................. 11-10 Table 11-3: Kirkland Lake Gold Analytical Methods, Exploration ...................................... 11-11 Table 13-1: Comminution Testwork, Detour Lake ............................................................... 13-3 Table 13-2: Comminution Testwork Comparison, Detour Lake vs West Detour ................. 13-3 Table 13-3: Plant Recoveries, 2013–2020 ........................................................................... 13-6 Table 13-4: Recovery Gains, Intensive Releach .................................................................. 13-7 Table 13-5: CIP Solution Grades, 2017–2020 ................................................................... 13-10 Table 14-1: Capping Thresholds, Detour Lake .................................................................... 14-7

Detour Lake Operations Ontario, Canada NI 43-101 Technical Report March 2021 xi Table 14-2: West Detour Deposit Capping Limits for GTs of Original Sample Data ........... 14-8 Table 14-3: North Pit Deposit Descriptive Statistics for Uncapped and Capped 3 m Composite Gold Values .................................................................................... 14-8 Table 14-4: Zone 58N Grade Capping by Mineralized Domain ........................................... 14-9 Table 14-5: Variogram Parameters, Detour Lake Mine ..................................................... 14-12 Table 14-6: Dynamic Anisotropy Surfaces, Detour Lake ................................................... 14-15 Table 14-7: Dynamic Anisotropy Search Parameters, Detour Lake .................................. 14-15 Table 14-8: Detour Lake Block Model Estimation Parameters .......................................... 14-16 Table 14-9: West Detour Block Model Estimation Parameters .......................................... 14-16 Table 14-10: North Pit Search Ellipse Parameters for Gold Grade Estimation for Domain 40 and Domain 9 ............................................................................................. 14-19 Table 14-11: Mineral Domain 1 – Capped ........................................................................... 14-19 Table 14-12: Conceptual Resource Pit Optimization Parameters ....................................... 14-27 Table 14-13: Underground Cut-off Grade Input Parameters ............................................... 14-28 Table 14-14: Measured and Indicated Mineral Resource Statement .................................. 14-29 Table 14-15: Inferred Mineral Resource Statement ............................................................. 14-29 Table 15-1: Pit Optimization Parameters ............................................................................. 15-3 Table 15-2: LOM Mill Cut-off Grades by Year ...................................................................... 15-3 Table 15-3: Mineral Reserves Statement ............................................................................. 15-5 Table 16-1: Detour Lake Pit Geotechnical Design Parameter ............................................. 16-2 Table 16-2: Pit Final Dimensions ......................................................................................... 16-7 Table 16-3: WRSF Design Parameters .............................................................................. 16-10 Table 16-4: Stockpile Design Parameters .......................................................................... 16-12 Table 16-5: Forecast Mine Production Plan ....................................................................... 16-13 Table 16-6: LOM Mining Equipment Fleet (maximum per period) ..................................... 16-16 Table 17-1: Production Rates, 2016–2020 .......................................................................... 17-2 Table 17-2: Key Design Parameters .................................................................................... 17-4 Table 17-3: Choke Feed Events, 2019–2021 (year to date) ................................................ 17-8 Table 19-1: Material Contracts Currently in Place ............................................................... 19-2 Table 20-1: Cell 2 TMA Raise Schedule .............................................................................. 20-7 Table 20-2: Cell 3 TMA Raise Schedule .............................................................................. 20-7 Table 20-3: List of Anticipated Environmental Approvals Required ................................... 20-11 Table 20-4: Financial Assurance Timing Summary ........................................................... 20-13 Table 21-1: Capital Cost Summary by Area ......................................................................... 21-2 Table 21-2: Capital Cost Summary by Sustaining/Growth ................................................... 21-2 Table 21-3: Operating Cost Summary ................................................................................. 21-4 Table 21-4: Operating Unit Cost Summary .......................................................................... 21-4 Table 22-1: Cash Flow Analysis ................................................................................................. 22-5 Table 22-2: Sensitivity of After-Tax Net Present Value to Gold Price and Exchange Rate .......................................................................................................................... 22-6 Table of Figures Figure 1-1: Sensitivity of After-Tax Net Present Value to Gold Price, Exchange Rate, Operating Cost, and Capital Cost ..................................................................... 1-32 Figure 1-2: Sensitivity of After-Tax Net Present Value to Gold Price and Exchange Rate .......................................................................................................................... 1-32 Figure 1-3: Sensitivity of After-Tax Net Present Value to Discount Rate ............................ 1-33
Detour Lake Operations Ontario, Canada NI 43-101 Technical Report March 2021 xii Figure 2-1: Project Location Plan .......................................................................................... 2-2 Figure 4-1: Mineral Tenure Summary Location Plan ............................................................ 4-8 Figure 4-2: Detour Lake Operations Mining Lease and Mining Patent Location Plan .......... 4-9 Figure 4-3: Detour Lake Property Area Map Showing Areas with Royalty Payments ........ 4-12 Figure 7-1: Regional Geology Plan ....................................................................................... 7-2 Figure 7-2: Project Geology Map .......................................................................................... 7-4 Figure 7-3: Local Structural Setting ....................................................................................... 7-6 Figure 7-4: Deposit Geology Plan ......................................................................................... 7-9 Figure 7-5: Geological Section, Detour Lake, 589690 E (looking east) ................................ 7-9 Figure 7-6: Geological Section, Detour Lake, 590,740 E (looking east) ............................. 7-10 Figure 7-7: Geological Section, Detour Lake, 591,640 E (looking east) ............................. 7-10 Figure 7-8: Plan of Footwall and Hanging Wall Mineralization (60 m elevation) ................. 7-12 Figure 7-9: Footwall and Hangingwall Mineralization Section 592040E (looking east) ...... 7-12 Figure 7-10: Geological Section, West Detour, 16,340 E (looking west) .............................. 7-15 Figure 7-11: Cross Section, Zone 58N, Zone 75, 595505 E (looking west) .......................... 7-16 Figure 9-1: Airborne Geophysical Map .................................................................................. 9-3 Figure 9-2: Ground Geophysical Survey Location Map ........................................................ 9-5 Figure 10-1: Drill Collar Location Plan, Drilling Supporting Mineral Resource Estimation at North Pit, West Detour, and Detour Lake ..................................................... 10-3 Figure 10-2: Drill Collar Location Plan, Drilling Supporting Mineral Resource Estimation at Zone 58N and Zone 75 ................................................................................. 10-4 Figure 13-1: Plant Recovery versus Gravity Recovery ......................................................... 13-4 Figure 13-2: Feasibility Study Testwork Recovery Predictions versus Operating Data ........ 13-4 Figure 13-3: Average 2020 Leach Circuit Profile .................................................................. 13-6 Figure 13-4: Tails Releach Results 2019–2020 .................................................................... 13-7 Figure 13-5: Gold in Tails (g/t) vs. P80, Detour Lake Samples .............................................. 13-8 Figure 13-6: 2020 CIP Adsorption Profile ............................................................................ 13-10 Figure 13-7: Recovery versus Head Grades, 2019–2020 ................................................... 13-14 Figure 13-8: Grade–Recovery Relationship, Zone 58N ...................................................... 13-15 Figure 14-1: Reporting Limits for Detour Lake, West Detour and North Pit Areas ............... 14-2 Figure 14-2: Detour Lake Plan View of the Open Pit Showing Mineralized Zones ............... 14-2 Figure 14-3: West Detour Isometric View of the Open Pit Showing Mineralized Domains (looking east–northeast) ................................................................................... 14-4 Figure 14-4: Isometric View of the North Pit (looking northeast) ........................................... 14-4 Figure 14-5: Zone 58N Deposit Isometric View of the Mineralized Domains (looking southeast) ......................................................................................................... 14-5 Figure 14-6: Plan and Section of 4Y Production Reconciliation Area ................................... 14-5 Figure 14-7: Domains Used to Establish Capping Thresholds, Detour Lake ........................ 14-7 Figure 14-8: Pairwise Variogram ......................................................................................... 14-11 Figure 14-9: Model Grade Distribution (Section 589825E) ................................................. 14-20 Figure 14-10: Model Grade Distribution (Section 589705E) ................................................. 14-20 Figure 14-11: Example Confidence Classifications, Detour Lake Mine (Section 591670E) . 14-22 Figure 14-12: Example Confidence Classifications, West Detour (Section 16,000E) ........... 14-23 Figure 14-13: North Pit Block Classification .......................................................................... 14-24 Figure 14-14: Example Confidence Classifications (Section 16,660E, mine grid) ................ 14-24 Figure 14-15: Zone 58N Block Classification Composite Longitudinal Section (5,533,700 N) .................................................................................................. 14-26 Figure 14-16: Isometric View of the Mineral Reserve Pits (Brown) in Relation to the Mineral Resource Pits (Green) .................................................................................... 14-27

Detour Lake Operations Ontario, Canada NI 43-101 Technical Report March 2021 xiii Figure 16-1: Detour Lake Pit Geotechnical Sectors .............................................................. 16-2 Figure 16-2: West Detour and North Pits - Pit Slope Recommendations ............................. 16-3 Figure 16-3: Mine Water Management Systems ................................................................... 16-4 Figure 16-4: LOM Pit Phases ................................................................................................ 16-6 Figure 16-5: Detour Lake Ultimate Pit Design – Plan View ................................................... 16-7 Figure 16-6: West Detour and North Pit Ultimate Pit Design – Plan View ............................ 16-7 Figure 16-7: Site and WRSF Layout ..................................................................................... 16-9 Figure 16-8: Inpit WRSF Layout .......................................................................................... 16-10 Figure 16-9: Tonnes Mined per Pit ...................................................................................... 16-14 Figure 16-10: LOM Gold Production Profile .......................................................................... 16-14 Figure 17-1: Process Flowsheet ............................................................................................ 17-3 Figure 17-2: Primary Crusher Product Size versus Plant Throughput .................................. 17-7 Figure 17-3: Throughput versus Choke Feed Events ........................................................... 17-8 Figure 18-1: Infrastructure Layout Plan ................................................................................. 18-2 Figure 22-1: Sensitivity of After-Tax Net Present Value to Gold Price, Exchange Rate, Operating Cost, and Capital Cost ..................................................................... 22-6 Figure 22-2: Sensitivity of After-Tax Net Present Value to Discount Rate ............................ 22-7 Table of Appendices Appendix A: Mineral Claims List and Mineral Claims Location Plans

Detour Lake Operations Ontario, Canada NI 43-101 Technical Report March 2021 1-1 1.0 Summary 1.1 Introduction Mr. Andre Leite, Mr. Jean-Francois Dupont, Dr. Veronika Raizman, and Mr. Paul Andrew Fournier prepared a NI 43-101 Technical Report (the Report) on the Detour Lake Operations (the Detour Lake Operations, Detour Lake Mine, or the Project) for Kirkland Lake Gold Ltd (Kirkland Lake Gold). The Detour Lake Operations are located in in northeastern Ontario. The Detour Lake Operations consist of the operating Detour Lake Main Pit, and planned open pit operations at the West Detour and North Pits. Mineral Resources are estimated for the Detour Lake, West Detour and Zone 58N areas. Mineral Reserves are estimated for the Detour Lake and West Detour areas. The West Detour estimate is split into the West Detour and North Pit pits. 1.2 Terms of Reference The Report provides updated information on the Mineral Resource and Mineral Reserve estimates and operations, and supports disclosure in Kirkland Lake Gold’s 2020 Annual Information Form. Units used in the report are metric units unless otherwise noted. Monetary units are in Canadian dollars (C$) unless otherwise stated. All ounce units refer to troy ounces. The Report uses Canadian English. Mineral Resources are reported in accordance with the Canadian Institute of Mining, Metallurgy and Petroleum (CIM) Definition Standards for Mineral Resources and Mineral Reserves (May 2014; the 2014 CIM Definition Standards). 1.3 Property Description and Location The Project is situated approximately 300 km northeast of Timmins and 185 km by road northeast of Cochrane. From the town of Cochrane (population of approximately 5,000 residents), the Project is easily accessible by the Detour Lake Mine road, the northern extension of Highway 652. The first 151 km on Highway 652 is paved surface, followed by 34 km of well-maintained gravel surfaced road to the mine site. Road access is available year-round. The closest major airport to the site is at Timmins, Ontario, approximately 61 km to the southeast. The climate in the Project area is characterized by cold winters and mild summers. The average total annual precipitation is estimated at 862 mm with approximately 30% falling as snow, and the greatest precipitation contribution occurring as rain during June through October. The predominant wind direction is from the west. Mining and exploration activities are conducted year-round. Site topography is subdued with maximum local relief of approximately 30 m. The elevation ranges from approximately 260–288 metres above sea level. Areas of higher relief are

Detour Lake Operations Ontario, Canada NI 43-101 Technical Report March 2021 1-2 sparsely wooded with jack pine, black and white spruce, balsam fir, trembling aspen, and white birch. Areas that are slightly lower in relief are poorly drained and characterized by muskeg. There is very little bedrock outcrop and much of the Project area is overlain by thick accumulations of glacial material that includes till and glaciofluvial material (poorly sorted sand with lenses of gravel). Numerous small streams linking elliptical lakes and ponds, generally oriented parallel to the pattern of glacial fluting. Many small and shallow lakes are found within the Project area, the largest being Sunday Lake. 1.4 Mineral Tenure, Surface Rights, Water Rights and Royalties On January 31, 2020, Kirkland Lake Gold completed the acquisition of Detour Gold Corporation (Detour Gold) and Detour Gold became a wholly-owned subsidiary of Kirkland Lake Gold. On January 2, 2021, Detour Gold was amalgamated with Kirkland Lake Gold Inc., a wholly-owned subsidiary of Kirkland Lake Gold, and the amalgamated entity was renamed Kirkland Lake Gold Inc. The 646 km² Project area forms one contiguous group of mining patents, mining leases and cell mining claims in the District of Cochrane, Ontario, with a small group of cell claims in Massicotte Township, Québec. The mineral tenure in Ontario consists of • 2,213 cell mining claims: 39,714 ha; • 44 lease documents: 23,712 ha; • 6 patent documents: 602 ha. There are an additional 20 claims covering 549 ha in Quebec. The patented parcels of land are the most secure form of land tenure and are subject to an annual mining tax payable to the Crown. The patented lands are described by the legal survey of individual mining claims and surveyed mining locations. The leasehold mining lands consist of 21-year mining leases issued for mining claims that were legally surveyed as individual mining claims or defined by the perimeter survey of groups of mining claims. The Mining Act (Ontario) contains provisions for the renewal of 21-year mining leases. Applications for renewal are subject to review and consent by the Ministry of Energy, Northern Development and Mines (ENDM). Upon registering cell mining claims (cells) in Ontario, Kirkland Lake Gold must perform and file exploration assessment work and apply on those cells assessment work credits to maintain them in good standing. The first unit of assessment work of $400 per 20 ha is required by the second anniversary date of the recording of the cell and an additional unit is required to be performed and filed for each year thereafter. A claim in Québec provides the stakeholder with a two-year right to explore within the claim holdings for any mineral substance with exceptions. After the initial two- year period claims can be renewed for an additional two-year term on certain conditions including that sufficient assessment work is performed on the claims or payment is made in lieu.
Detour Lake Operations Ontario, Canada NI 43-101 Technical Report March 2021 1-3 Kirkland Lake Gold has 30 leases and 10 patents totaling 18,574.442 ha of surface rights on the Detour Lake Project. The surface rights are sufficient for all surface infrastructure and mine operation. Kirkland Lake Gold does not exclusively hold water rights in the region. As part of the ongoing environmental compliance Kirkland Lake Gold is required to capture all site runoff from stockpiles and the open pits. Water taking from groundwater and freshwater sources is regulated by the Ontario Ministry of Environment, Conservation and Parks (MECP) via Permits to Take Water (PTTW). The Detour Lake Mine has a number of active PTTW, which are renewed at the required regulatory frequency in order to support activities over the life- of-mine (LOM). Since this water is required to be captured it puts the site water balance in a surplus over the LOM, providing sufficient water to be used for processing in the mill, with the excess being discharged to the environment under the permitted discharge conditions for the operations. Certain of the claims are subject to a 2% royalty payable to Franco-Nevada Corporation. This royalty is included in the cash flow analysis. Other claims are subject to royalties to third-parties but these claims do not fall within the area of the estimated Mineral Resources and Mineral Reserves. Kirkland Lake Gold has certain payments to First Nations groups in the area of the estimated Mineral Resources and Mineral Reserves; these payments are included in the economic analysis. The Detour Lake Operations are not subject to any other back-in rights payments, agreements or encumbrances. Exploration activities require water-taking permits to be obtained to provide the necessary water for exploration drilling activities. To date, all such permits have been granted as required. Current exploration liabilities consist with respect to the environment primarily consist of the potential for fuel and lubricant spills and the risk of fire during the drier months resulting from heavy equipment. 1.5 Geology and Mineralization The Detour Lake and West Detour deposits are considered to be examples of orogenic greenstone-hosted hydrothermal lode gold deposits. The Project is located within the northwestern portion of the Abitibi Greenstone Belt that consists of east–west-trending synclines of felsic to ultramafic volcanic rocks. Intervening domes are cored by syn-volcanic tonalite and gabbrodiorite rocks and alternate with east– west-trending bands of late tectonic turbiditic and conglomeratic sedimentary rocks. Most of the volcanic and sedimentary strata dip vertically and are commonly bound by abrupt, east–west-trending faults with varied dips. In the Project area, the greenstone–granite architecture is partially aligned and disrupted along a linear, east–west-trending belt that defines the position of the Sunday Lake Deformation Zone. Supracrustal rocks within the Project area consist of a thick sequence of mafic to ultramafic lithologies, which are predominantly volcanic in origin, and are part of the Deloro assemblage. They occur within regional synclinal–anticlinal fold structures

Detour Lake Operations Ontario, Canada NI 43-101 Technical Report March 2021 1-4 traced for over 30 km across the Project and are in structural contact to the south with the younger sediments of the Caopatina assemblage. These rocks are bounded to the north and west by the Opatica basement gneissic rocks. To the east and south, the Deloro assemblage is intruded by several large, weakly foliated granodioritic to tonalitic intrusions which are intersected by numerous local felsic to mafic dykes, sills and younger regional Proterozoic diabase dykes. There are two recognized episodes of gold mineralization at the Detour Lake and West Detour deposits. The first episode consists of a wide and generally auriferous sulphide-poor quartz vein stockwork formed in the hanging wall of the Sunday Lake Deformation Zone. The sulphide- poor quartz vein stockworks observed in the hanging wall have sub-vertical north or south dips and are parallel to a series of east-west trending high strain zones. These veins form a weak stockwork and are boudinaged and/or folded. The second episode is a stage of gold mineralization overprinting the early auriferous stockwork, principally in the hanging wall of the Sunday Lake Deformation Zone, with a higher sulphide content. The sulphide-rich gold mineralization predominantly fills structural sites in deformed quartz veins, fractures and veins crosscutting the foliation fabric but also in pillow breccias and selvages. The distribution of sulphide-rich mineralization is strongly controlled by the geometry of kinematic orientation. The major structural feature is the 30 km-long Sunday Lake Deformation Zone, an east– west-trending, steeply north-dipping deformation corridor. A regional east–west trending structure, the Massicotte Deformation Zone is recognized several kilometres to the south of the Sunday Lake Deformation Zone and extends for over 30 km in strike length. It marks the southern contact between the Caopatina assemblage sedimentary rocks and the underlying Deloro assemblage volcanic rocks. The third major structure is the Lower Detour Deformation Zone, a 30 km long, east–west-trending, and steeply south-dipping one that separates Caopatina assemblage sedimentary rocks and the underlying Deloro assemblage volcanic rocks. The youngest structures are a series of 120–145° trending faults, which are locally intruded by Proterozoic-age diabase dykes. Two east-trending synform–antiform pairs are developed in the volcanic assemblage, the North Walter Lake Synform and the Airstrip Antiform. Mineralization at Detour Lake has a strike extent of 3.75 km, a width of 1.35 km, and an approximate elevation range of 800 m. Mineralization is hosted within a broad assemblage of mafic volcanic rocks with an overall east–west trend. The bulk of the mineralization within this corridor is concentrated along a highly-strained corridor of a moderate to strong potassic alteration envelope at the contacts between pillowed and massive mafic flows. Gold is associated with quartz–carbonate–pyrite–pyrrhotite ± tourmaline veins and/or disseminated to very local semi-massive sulphides in hydrothermally-altered wall rocks. The West Detour deposit has a strike extent of 3.1 km, a width of 2.2 km, and an approximate elevation range of 1 km. Generally, the gold zones occur in a variety of structural settings and several rock types including massive to pillowed tholeiitic basalt
Detour Lake Operations Ontario, Canada NI 43-101 Technical Report March 2021 1-5 flows, variably deformed-altered basaltic to peridotitic komatiite units, cherty tuffs, gabbro and deformed felsic to intermediate dykes. Mineralized lenses vary from 5–5 m in true width. Gold is associated with pyrite, pyrrhotite, and rarely chalcopyrite. The Zone 58N deposit has an east–west strike length of 450 m, extends from surface to a depth of 800 m, and the mineralized system remains open at depth. Gold mineralization in Zone 58N is within the southern portion of a feldspar porphyry intrusion, and hosted by a swarm of plagioclase-phyric tonalitic dykes that intrude mafic rocks of the Deloro assemblage. Gold is found within and at the margins of quartz ± tourmaline ± carbonate stockwork-type veins that infill areas of brittle deformation. Visible gold occurs in nearly every drill hole that intersects mineralization and is also present as micro-inclusions within pyrite grains, or intergrown with bismuth-tellurides. Exploration potential remains in the area where Mineral Resources are estimated with all deposits remaining open at depth. Regionally, geophysical surveys and exploration drill holes have identified a number of gold-bearing structural trends that warrant additional exploration evaluation. 1.6 History Companies who have had Project involvement prior to Kirkland Lake Gold’s Project interest include Amoco Canada Petroleum Company Ltd. (Amoco), Campbell Red Lake Mines (Campbell), Dome Mines Ltd. (Dome), Placer Dome Inc. (Placer Dome), Pelangio-Larder Mines Limited (Pelangio-Larder), Franco–Nevada Mining Company Limited (Franco– Nevada), Marl Resources Corp. (Marl Resources), Pelangio Mines Inc. (Pelangio), Trade Winds Ventures Inc. (Trade Winds), Goldcorp Canada Ltd. (Goldcorp) and Detour Gold. Work completed included geological mapping, geochemical surveys (rock chip, grab, channel, trench and soil sampling), airborne geophysical surveys, ground geophysical surveys (Crone electromagnetic, RADEM, magnetometer, Induced polarization (IP)) , core and reverse circulation (RC) drilling, metallurgical testwork, mineral resource and mineral reserve estimates, mining studies, environmental studies, and geotechnical and hydrological studies. Campbell mined the Campbell open pit from 1983–1987. Placer Dome conducted underground operations from 1987–1999 and briefly restarted open pit mining in 1998. Detour Gold commenced operations at the Detour Lake Main Pit in 2013. Since acquisition of the Detour Gold Operations, Kirkland Lake Gold has completed additional exploration drilling, mineral resource and mineral reserve estimates, updated the mining method and mine planning, migrated data to a new Fusion database, expanded or is in the process of constructing selected infrastructure (core storage, accommodations camp, an airfield and aerodrome, onsite assay laboratory, additional mobile maintenance offices and shops) and continued with permitting of the West Detour project. 1.7 Drilling and Sampling Core drilling completed on the Project (including 58N) within the database totals 8,206 drill holes (1,760,008.9 m).

Detour Lake Operations Ontario, Canada NI 43-101 Technical Report March 2021 1-6 Drilling and assaying that supports the Mineral Resource estimate for the Detour Lake deposit were completed from 1974–2016 by Amoco Canada Petroleum Company Ltd. (Amoco), Campbell Red Lake Mines (Campbell), Dome Mines Ltd. (Dome), Placer Dome, Tradewinds, Pelangio and Detour Gold . Within the immediate area of the Mineral Resource estimate, there are a total of 6,519 core drill holes (1,128,965.7 m). Drilling and assaying that supports the Mineral Resource estimate for the West Detour area was completed from 1996–2013 by Placer Dome, Tradewinds, Pelangio and Detour Gold. Within the immediate area of the Mineral Resource estimate for West Detour, there are a total of 776 core drill holes (266,927.5 m). Drilling and assaying that supports the Mineral Resource estimate for the North Pit deposit was completed from 2004–2016 by Tradewinds, Pelangio Metals, and Detour Gold. Within the immediate area of the Mineral Resource estimate, there are a total of 101 core drill holes (21,945 m). Drilling and assaying that supports the Mineral Resource estimate for the Zone 58N deposit was completed by Detour Gold from 2012–2017. Within the immediate area of the Mineral Resource estimate, there are a total of 370 core drill holes (138,433 m). Core drilling from surface included the following core size diameters: AQ (27 mm), BQ (36.4 mm) and NQ (47.6 mm). Core drilling from underground included the following core size diameters: EX (21 mm), AQ (27 mm), BQ (36.4 mm), BQTK (45 mm) and NQ (47.6 mm). Geological and geotechnical logging has evolved over the various exploration and mining campaigns. Standard procedures for logging during the legacy (pre-Trade Winds) campaigns were not well documented and varied considerably between programs. Trade Winds used the same pre-set terminology and codes as the Placer Dome programs. Detour Gold developed a geological legend for the Project area incorporating advances in understanding of the regional and local geology, and the deposit-scale geology, structure, alteration and mineralization. Kirkland Lake Gold currently uses the Detour Gold logging schema. Surface collar surveys include a mix of measurements from cut grids, and differential global positioning system (DGPS) instruments. The initial position and azimuth of most underground holes was typically determined using measurements from underground survey stations and reference points. Down-hole surveys have used acid tests, and Tropari, Sperry Sun, Flexit SmartTool, Reflex EZ-Shot, Reflex Maxibor II, and Reflex Gyro Sprint-IQ instruments. Depending on the campaign and instrumentation being used, survey data could be collected at 3–75 m intervals downhole. In general, core recovery exceeded 95% with losses generally occurring within overburden, the first few metres of bedrock, or when going through a fault zone. Grade control drilling uses RC methods; these drill holes do not support Mineral Resource estimation.

Detour Lake Operations Ontario, Canada NI 43-101 Technical Report March 2021 1-7 Core was typically split for sampling, with one half sent for assay and the other half retained as a reference. A small percentage of the core drilled during Kirkland Lake Gold’s ownership was not sawn and was shipped as whole core samples. Sample intervals ranged from 0.3–1.5 m. Bulk density determinations for the Detour Lake deposit initially used an average derived from the historical mining operations. Kirkland Lake Gold reviewed available bulk density values, and for the current Mineral Resource estimate, a density value was determined for each assigned lithology code by constructing histograms and removing outliers and determining the average for each lithology. Lithologies without a bulk density were assigned an average density of 2.99 t/m3. The resource estimate uses an average value of 2.91 t/m3 for the West Detour deposit, based on 632 determinations. The Zone 58N estimate uses an average value of 2.8 t/m3, based on 2,644 measurements. A number of laboratories were used over the Project history. Where known, the laboratories used during the legacy programs included Assayers Limited, in Rouyn, Quebec, (Assayers); the Dome Mine Laboratory in Timmins (Dome laboratory), Ontario; Swastika Laboratories Ltd, in Swastika, Ontario (Swastika); the Detour Lake Mine assay laboratory (Detour Lake laboratory); X-Ral Laboratories in Rouyn, Quebec (X-Ral); Bondar Clegg in Ottawa, Ontario (Bondar Clegg); Chemex Laboratories in Mississauga, Ontario (Chemex Mississauga); Chemex Laboratories in Rouyn, Quebec (Chemex Rouyn); Accurassay Laboratories in Thunder Bay, Ontario (Accurassay Thunder Bay); and Activation Laboratories Ltd in Timmins, Ontario (Actlabs). Accreditations at the time the work was performed is not known. All laboratories other than the Dome laboratory and the Detour Lake laboratory were independent of the operators at the time. All laboratories were independent of Kirkland Lake Gold. Trade Winds and Detour Gold used SGS Minerals in Garson, Ontario (SGS Garson), SGS Minerals in Don Mills, Ontario (SGS Don Mills), Accurassay in Timmins, Ontario (Accurassay Timmins) Accurassay in Thunder Bay, Ontario (Accurassay Thunder Bay), ALS Minerals in Sudbury, Ontario (ALS Sudbury), ALS Minerals in Vancouver, B.C. (ALS Vancouver). Where known, the laboratories held ISO17025 accreditation for selected analytical techniques. The laboratories were independent of Trade Winds and Detour Gold and are independent of Kirkland Lake Gold. Kirkland Lake Gold used ALS Sudbury, ALS Vancouver, and Actlabs. The laboratories hold ISO17025 accreditation for selected analytical techniques. The laboratories are independent of Kirkland Lake Gold. Grade control samples are analysed at SGS Minerals in Cochrane (SGS Cochrane) and ActLabs. The laboratories currently hold ISO17025 accreditation for selected analytical techniques. The laboratories were independent of Detour Gold and are independent of Kirkland Lake Gold. Sample preparation and analysis protocols varied during the legacy programs. Samples were typically crushed, ground or pulverized, and assayed using either fire assay of a one- assay-ton sub-sample, an aqua regia digestion and ketone extraction method, atomic absorption (AA) or a pulp and metallics procedure. During the Detour Gold programs, samples were crushed, pulverized, and analyzed using either fire assaying with atomic absorption spectroscopy (AAS) finish, an inductively-coupled plasma–atomic emission

Detour Lake Operations Ontario, Canada NI 43-101 Technical Report March 2021 1-8 spectroscopy (ICP–AES) finish, a gravimetric finish, metallic screen procedures, or an inductively-coupled plasma–optical emission spectrometry (ICP–OES) finish. During the Kirkland Lake Gold programs, samples were crushed, pulverized, and analyzed using AAS and samples >10 g/t analyzed with a gravimetric finish. Selected high-grade samples are analyzed using a screen metallics procedure. Grade control samples are crushed, pulverized and assayed using assay with an ICP–OES finish. Sulphur and carbon analysis are done on 14 m composites (equivalent to one bench) using LECO. Quality assurance and quality control (QA/QC) in the form of insertion of blanks, standard reference material (standards) and duplicates was not routinely practiced during legacy program submission of samples for analysis. The QA/QC for the legacy programs typically relied on the laboratory’s internal protocols. After 1993, standards, blanks and duplicates were routinely inserted in the sample stream. Review of the available QA/QC program results do not indicate any problems with the analytical programs, and the gold analytical data are acceptable to support Mineral Resource and Mineral Reserve estimation. Kirkland Lake Gold has migrated the Detour Gold Access databases to a Fusion database. Kirkland Lake Gold performed a major data verification exercise during the data migration to a Fusion. Verification procedures included the review and modifications of coordinates, surveys, samples, lithologies, alteration, mineralization, deformation, structure, veining, and rock quality designation (RQD) data. Currently, logging and geotechnical data are directly uploaded from the logging software. Collar survey data are uploaded from a (DGPS) Topcon GR3 instrument with a Nikon total station instrument. The Universal Transverse Mercator (UTM), 1983 North American Datum (NAD83) system was used to record position data. Downhole survey data are uploaded from a REFLEX GYRO SPRINT-IQ™ The Universal Transverse Mercator (UTM), 1983 North American Datum (NAD83) system was used to record position data. All data are checked using inbuilt software checking routines. Sample security was managed by exploration staff from the drilling phase through to core processing and subsequent dispatching by contracted couriers directly to the analytical facilities. Sample collection was systematically monitored from the drill rigs to the core facility and storage area which is turn is security monitored gated on-site preparation facility. Chain-of-custody procedures consist of sample submittal forms to be sent to the laboratory with sample shipments to ensure that all samples are received by the laboratory. 1.8 Data Verification A number of data verification programs for Detour Lake and the West Detour project deposits were carried out by independent consultants and Detour Gold personnel over time. Kirkland Lake Gold personnel re-verified the entire database during migration of the data from the three Access databases used by Detour Gold to the current Fusion database. The QP personally verified the integrity of the database and validity of the collar, survey, assay and lithological coding data. Positive production reconciliation since the start of the mining operations at Detour Lake validates the assumptions of metal content and gold extraction. The QP considers that a reasonable level of verification has been completed and that no

Detour Lake Operations Ontario, Canada NI 43-101 Technical Report March 2021 1-9 material issues have been left unidentified from the programs undertaken. The data are acceptable to be used in Mineral Resource and Mineral Reserve estimation. 1.9 Metallurgical Testwork The Detour Lake Mine process plant was constructed in 2012, started operations in 2013, and has been operating since. The plant design was based on metallurgical testwork completed during pre-feasibility and feasibility studies, conducted from 2009–2010. Most of the metallurgical testing was completed at SGS Lakefield Research Limited in Ontario (SGS Lakefield) with follow-up testwork (lead nitrate and oxygen control) carried out on-site by site personnel. Metallurgical testwork completed as part of the 2009 pre-feasibility study on Detour Lake included mineralogical examination; gravity recovery tests, including gravity recoverable gold (GRG) tests; cyanide leach tests on gravity tailings; grade variability testing; barren solution recycle testing; cyanide destruction tests; preparation of tailings for chemical and physical characterization and environmental testing; and environmental testwork. During the 2010 Detour Lake feasibility study, tests focused on project optimization, and included evaluation of gold recovery versus grind size, use of oxygen in leach and crushing and grinding studies. Since those studies, extensive plant testwork has proved the benefit of leaching with high oxygen rates and lead nitrate. Three full grinding circuit surveys were completed by Detour Lake Operations personnel and modelled by third-party consultants BBA using JKSimMet to assist with grinding circuit optimizations and characterization. Improvements are planned for the gravity circuit to increase gold recovery (feeding of cyclone underflow to the gravity circuit, operating the intensive leach reactor in leach mode for more time); are planned or underway for the leach circuit to increase gold recovery (addition of a sixth leach tank to the leach trains, improvements in oxygen diffusion, reduced leach densities, and lead nitrate addition); improving grind fineness (ball size optimization, process control improvement, increase ball-mill power; and expectation of reduced hardness of mineralization from Detour West); better cyanide control (limiting copper dissolution through temperature control); reducing carbon-in-pulp solution losses; and minimizing gold-in-carbon losses. Work conducted on the Zone 58N area included head assaying, mineralogy, gravity concentration, cyanide leach tests. The mineralization was evaluated to check if the current process plant flowsheet could be used. Based on the results of the Zone 58N metallurgical testing, the existing Detour Lake process plant is capable of processing the Zone 58N mineralization. Metallurgical recovery forecasts are based on equations developed during the Detour Lake pre-feasibility and feasibility studies, modified with information from ROM operations. As the West Detour deposit has similar mineralogy to that of the Detour Lake deposit, the same recovery assumptions are used for the West Detour mineralization. The metallurgical recovery assumptions used in the 2020 Detour Lake Mine LOM plan average 91.9%. Recoveries for Zone 58N are forecast at 98.1%.

Detour Lake Operations Ontario, Canada NI 43-101 Technical Report March 2021 1-10 The variability of the ore in the Detour Main Pit is related to the talc, copper and sulphur content. The talc zone is mainly located on the southern end of the Main Pit. Copper and sulphur are present throughout the pit in various quantities. High-talc ores are soft and process faster. High-talc ore used to impact recovery in the past and talc ores were limited to 15% of the plant feed. However, the operations have that recovery can be maintained with very high lead nitrate dosage rates. Processing of 40% talc ore in 2020 yielded similar recoveries as non-talc ore. Sulphur content can impact recovery, and blending strategies to avoid feeding the plant with ores over 2% sulphur are in place and have worked successfully. Copper is an element that impact cyanide and SO2 consumption. It is managed by blending if too high and controlling slurry temperature to leach feed. To avoid the copper plating on the carbon, a control strategy on the cyanide/copper ratio is in place. 1.10 Mineral Resource Estimates Mineral Resources are estimated for the Detour Lake, West Detour, North Pit and Zone 58N areas. The geological model for Detour Lake consists of 3D wireframes built by Kirkland Lake Gold in 2020. The geological model for the West Detour deposit consists of 3D wireframes built in 2013 by Detour Gold and Thon Consulting. The geological model for the North Pit is based on interpreted mineralized zone (domain) established using an Indicator Kriging (IK) interpolation of gold grades using at an indicator cut-off grade of 0.2 g/t Au and a 0.4 cut- off probability to be above the grade cut-off built by P. Daigle Consulting Services in 2016. The geological model for 58N consists of 3D wireframes built in 2018 by G Mining Services Inc. Drill hole spacing across the Detour Lake deposit is generally on the order of 40 m in the north–south and east–west directions. A block size of 10 x 10 x 7.5 m was selected to accommodate the drill hole spacing and width of the mineralization. Drill hole spacing across the West Detour deposit is generally on the order of 40 m in the north–south and east–west directions. A block size of 10 x 5 x 6 m was selected to accommodate the drill hole spacing and width of the mineralization. The West Detour deposit has narrower mineralized zones and the model was built at 6 m heights, offering the possibility of regularizing (combining) two blocks into a 12-m bench, or selecting 6-m benches. Mineral Resource reporting is done on the combined 12-m block size. A block size of 6 x 3 x 6 m was selected to model the North Pit deposit in order to capture the width of mineralization and planned higher mine selectivity. The Zone 58N model was created to encompass all the known mineralization drilled at Zone 58N, and block sizes were decided based on a typical underground mining scenario (3 m minimum width). Due to the often narrow nature of mineralization, a percentage block model was adopted in Geovia GEMS, and subsequently converted to a sub-blocked model for mine planning purposes. Three main broad mineralized domains (MZ1, spatially associated with the chert marker horizon; MZ2, associated with the historic Quartz Hangingwall mineralized zone; and MZ3,

Detour Lake Operations Ontario, Canada NI 43-101 Technical Report March 2021 1-11 encompasses widespread disseminated mineralization to the north of MZ2) were defined, with a fourth zone (MX4) containing all data that were not part of the three mineralized domains. Nine domains were constructed for West Detour, by interpreting limits of mineralization on sections that corresponded to broad mineralized zones with higher than usual concentration of samples with potentially economic gold grades. Domain 1 at West Detour corresponds to the chert marker horizon geological unit. All the other mineralized domains were built around Domain 1. Three geological domains were created for the North Pit, together with a gold grade envelope that used a cut-off grade of 0.20 g/t Au. Nine domains were modelled for Zone 58N, based on alteration intensities described as moderate or stronger, plus an additional zone of mineralization present in the hanging wall. A 3D model of all prior mined areas in the Detour Lake area was created from available plans and sections. Individual models were created for underground access, stopes, and the Campbell open pit. Volume reconciliation versus prior mining records showed that the majority of underground openings are accounted for. This model was used to deplete the block model. For Detour Lake, samples for grade estimation were first composited to 1 m, separated by mineral zones, capped, and then composited into 5 m down-hole intervals. Composites for the West Detour deposit were created on 5 m capped grade down-hole intervals. The North Pit dataset was composited on 3 m down-hole intervals. A composite length of 2 m was selected for Zone 58N, which resulted in a minimum of two composites per drill hole (applying a 4 m minimum downhole thickness rule) per domain. Grade capping was applied based on a reconciliation study for Detour Lake, and on examination of probability plots for West Detour, North Pit and Zone 58N. Spatial continuity of the composite grades within each deposit was assessed using variography and correlograms. At Detour Lake, average length weighted densities were determined for these different lithologies. The average density for each lithology was then assigned to the global drillhole database. Intervals without a density value were assigned a value based on a similar lithology and indeterminate intervals were assigned an average density of 2.99 t/m3. A density of 2.9 t/m3 in rock and 1.8 t/m3 in overburden and backfill was used for tonnage determination in the West Detour and North Pit models. The Zone 58N deposit used a density of 2.7 t/m3, derived from drill core measurements. The interpolation of the Detour Lake resource model was completed using ordinary kriging (OK). An inverse distance weighting to the second power (ID2) interpolation, an ID3, and nearest neighbour (NN) estimates were completed concurrent to the OK estimate for validation purposes. Density was estimated using an ID3 method and used the gold search parameters. The interpolation of the West Detour deposit resource model was completed using OK. The North Pit deposit block model was estimated using OK interpolation method on 3 m capped composite gold grades. ID2 and NN interpolations were also estimated for validation purposes. Due to the highly erratic distribution of gold grades at Zone 58N, a five-pass interpolation strategy was adopted using a combination of NN and ID3.

Detour Lake Operations Ontario, Canada NI 43-101 Technical Report March 2021 1-12 Models were validated using a combination of visual inspection, global bias checks and swath plots. Results were considered acceptable. Mineral Resource confidence classifications were assigned based on a combination of distance to the nearest drill hole, a minimum number of drill holes, and geological and grade continuity. The Detour Lake, West Detour and North Pit resource models were combined in a common model. A pit optimization exercise using Maptek-Vulcan was conducted based on the parameters listed in Table 1-1. The exercise constrained the Measured, Indicated and Inferred Mineral Resource estimates. A revenue factor of one was used to guide the pit design. The conceptual pit encompassed both Detour Lake and West Detour within a single pit. The North Pit remained as a separate pit. For resource estimation reporting purposes, the common model was divided along section line 16,995 E to separate the Detour Lake estimate from the West Detour estimate. The combined model was adjusted for mining depletions as of year-end 2020. Mineral Resources are reported considering a 0.5 g/t Au cut-off grade. The Zone 58N deposit estimate assumes that the deposit will be mined using underground mining methods, based on the use of transverse and longitudinal long-hole stopes. The stoping geometry and stope heights are based on geological interpretation with dilution assumptions considered. The mineralized domains were modelled with a minimum thickness of 4 m downhole (approximately 3 m true thickness), to ensure that minimum underground mining widths were addressed. The estimate is reported above a cut-off grade of 2.2 g/t Au using the parameters listed in Table 1-2. 1.11 Mineral Resource Statement Mineral Resources are reported using the 2014 CIM Definition Standards and are reported exclusive of those Mineral Resources converted to Mineral Reserves. Mineral Resources that are not Mineral Reserves do not have demonstrated economic viability. The Qualified Person for the estimate is Mr. Andre Leite, P.Eng., a Kirkland Lake Gold employee. Mineral Resources are reported in Table 1-3 and Table 1-4, and have an effective date of December 31, 2020.
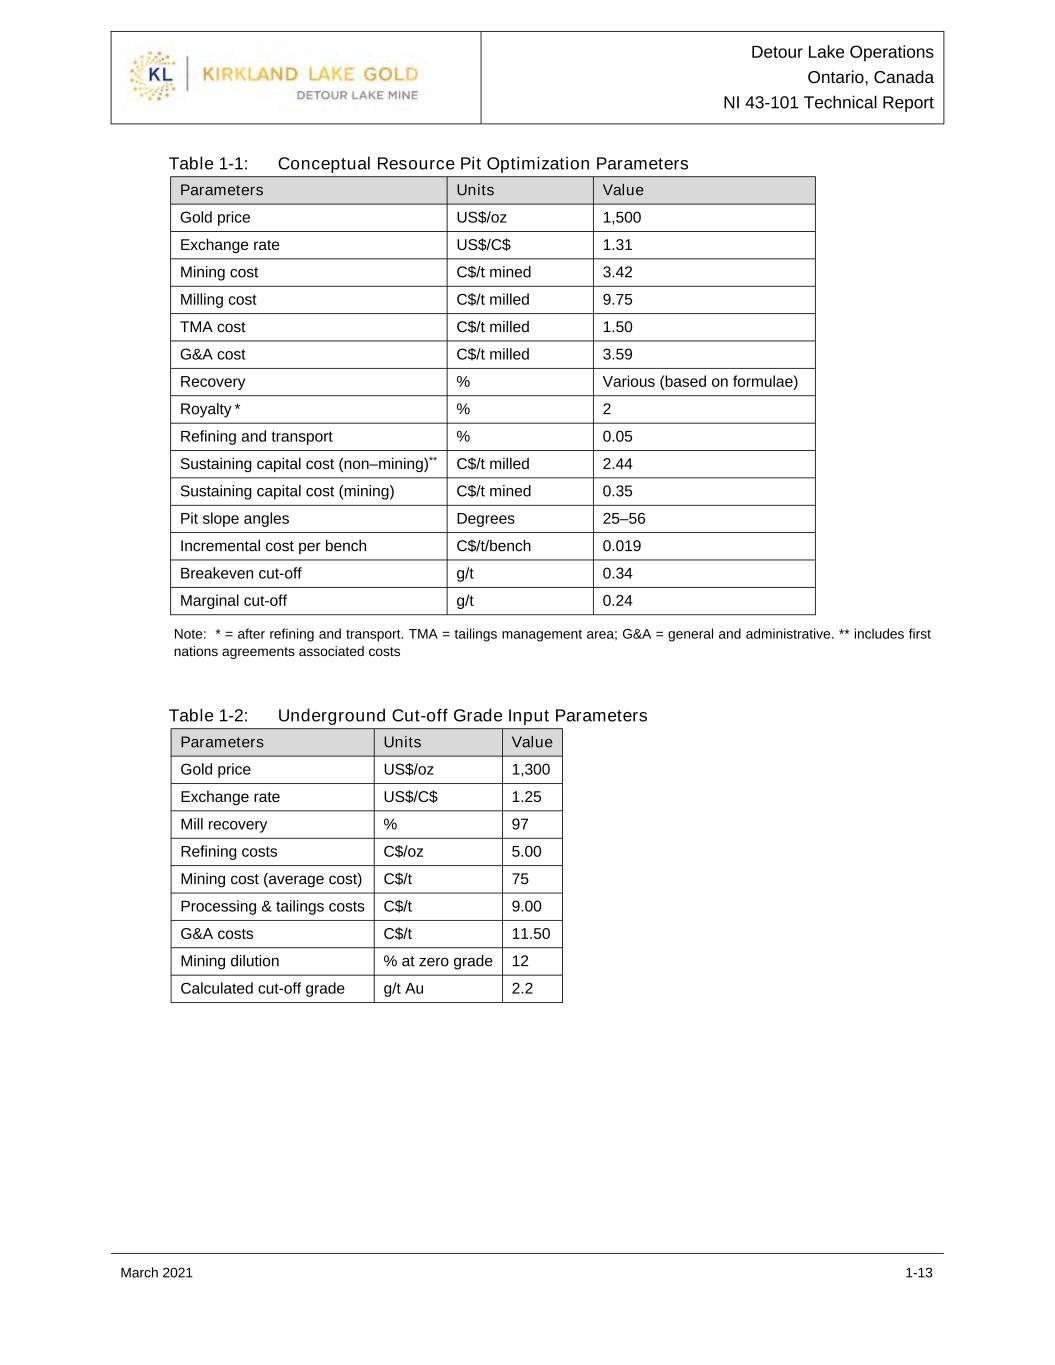
Detour Lake Operations Ontario, Canada NI 43-101 Technical Report March 2021 1-13 Table 1-1: Conceptual Resource Pit Optimization Parameters Parameters Units Value Gold price US$/oz 1,500 Exchange rate US$/C$ 1.31 Mining cost C$/t mined 3.42 Milling cost C$/t milled 9.75 TMA cost C$/t milled 1.50 G&A cost C$/t milled 3.59 Recovery % Various (based on formulae) Royalty * % 2 Refining and transport % 0.05 Sustaining capital cost (non–mining)** C$/t milled 2.44 Sustaining capital cost (mining) C$/t mined 0.35 Pit slope angles Degrees 25–56 Incremental cost per bench C$/t/bench 0.019 Breakeven cut-off g/t 0.34 Marginal cut-off g/t 0.24 Note: * = after refining and transport. TMA = tailings management area; G&A = general and administrative. ** includes first nations agreements associated costs Table 1-2: Underground Cut-off Grade Input Parameters Parameters Units Value Gold price US$/oz 1,300 Exchange rate US$/C$ 1.25 Mill recovery % 97 Refining costs C$/oz 5.00 Mining cost (average cost) C$/t 75 Processing & tailings costs C$/t 9.00 G&A costs C$/t 11.50 Mining dilution % at zero grade 12 Calculated cut-off grade g/t Au 2.2
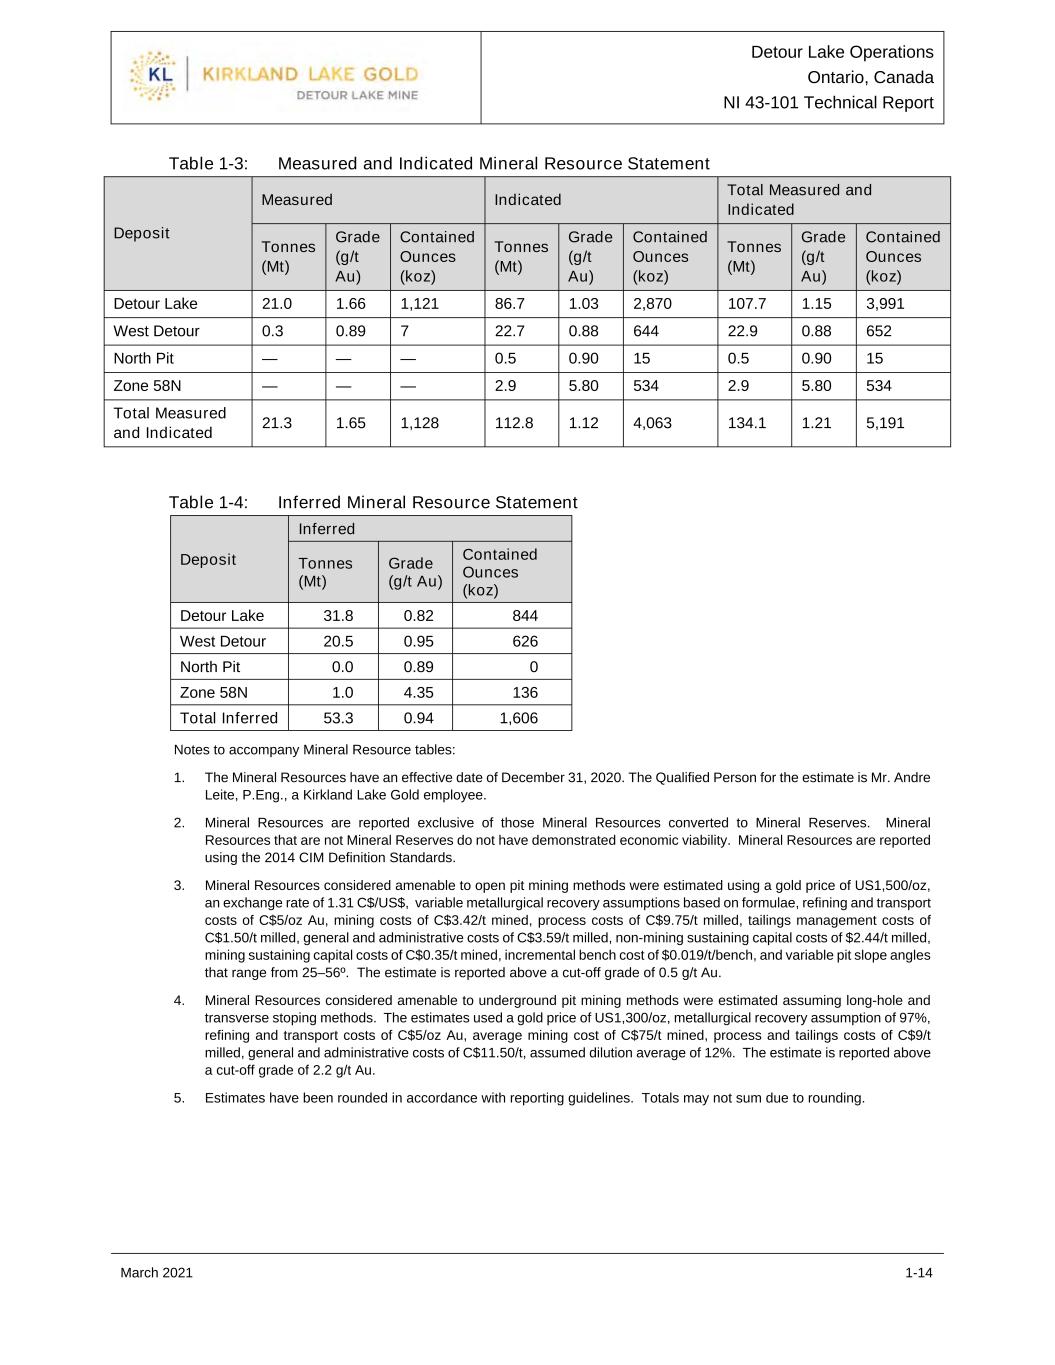
Detour Lake Operations Ontario, Canada NI 43-101 Technical Report March 2021 1-14 Table 1-3: Measured and Indicated Mineral Resource Statement Deposit Measured Indicated Total Measured and Indicated Tonnes (Mt) Grade (g/t Au) Contained Ounces (koz) Tonnes (Mt) Grade (g/t Au) Contained Ounces (koz) Tonnes (Mt) Grade (g/t Au) Contained Ounces (koz) Detour Lake 21.0 1.66 1,121 86.7 1.03 2,870 107.7 1.15 3,991 West Detour 0.3 0.89 7 22.7 0.88 644 22.9 0.88 652 North Pit — — — 0.5 0.90 15 0.5 0.90 15 Zone 58N — — — 2.9 5.80 534 2.9 5.80 534 Total Measured and Indicated 21.3 1.65 1,128 112.8 1.12 4,063 134.1 1.21 5,191 Table 1-4: Inferred Mineral Resource Statement Deposit Inferred Tonnes (Mt) Grade (g/t Au) Contained Ounces (koz) Detour Lake 31.8 0.82 844 West Detour 20.5 0.95 626 North Pit 0.0 0.89 0 Zone 58N 1.0 4.35 136 Total Inferred 53.3 0.94 1,606 Notes to accompany Mineral Resource tables: 1. The Mineral Resources have an effective date of December 31, 2020. The Qualified Person for the estimate is Mr. Andre Leite, P.Eng., a Kirkland Lake Gold employee. 2. Mineral Resources are reported exclusive of those Mineral Resources converted to Mineral Reserves. Mineral Resources that are not Mineral Reserves do not have demonstrated economic viability. Mineral Resources are reported using the 2014 CIM Definition Standards. 3. Mineral Resources considered amenable to open pit mining methods were estimated using a gold price of US1,500/oz, an exchange rate of 1.31 C$/US$, variable metallurgical recovery assumptions based on formulae, refining and transport costs of C$5/oz Au, mining costs of C$3.42/t mined, process costs of C$9.75/t milled, tailings management costs of C$1.50/t milled, general and administrative costs of C$3.59/t milled, non-mining sustaining capital costs of $2.44/t milled, mining sustaining capital costs of C$0.35/t mined, incremental bench cost of $0.019/t/bench, and variable pit slope angles that range from 25–56º. The estimate is reported above a cut-off grade of 0.5 g/t Au. 4. Mineral Resources considered amenable to underground pit mining methods were estimated assuming long-hole and transverse stoping methods. The estimates used a gold price of US1,300/oz, metallurgical recovery assumption of 97%, refining and transport costs of C$5/oz Au, average mining cost of C$75/t mined, process and tailings costs of C$9/t milled, general and administrative costs of C$11.50/t, assumed dilution average of 12%. The estimate is reported above a cut-off grade of 2.2 g/t Au. 5. Estimates have been rounded in accordance with reporting guidelines. Totals may not sum due to rounding.
Detour Lake Operations Ontario, Canada NI 43-101 Technical Report March 2021 1-15 Factors that may affect the Mineral Resource estimates include: metal price and exchange rate assumptions; changes to the assumptions used to generate the estimation domains; changes in local interpretations of mineralization geometry and continuity of mineralized zones; changes to geological and mineralization shape and geological and grade continuity assumptions; changes in the treatment of high-grade gold values; density assignments; changes to geotechnical, mining and metallurgical recovery assumptions; changes to the input and design parameter assumptions that pertain to the assumptions for open pit and underground mining constraining the estimates; and assumptions as to the continued ability to access the site, retain mineral and surface rights titles, maintain environment and other regulatory permits, and maintain the social license to operate. 1.12 Mineral Reserve Estimates Mineral Reserves are reported as the diluted ore tonnage and grade scheduled to be fed to the mill over the life of the operation, based on open pit mining methods. The associated production schedule considers an optimized mill and stockpile strategy to maximize discounted cash flows. Measured and Indicated Mineral Resources within the Detour Lake, West Detour and North Pit final pits were converted to Proven and Probable Mineral Reserves respectively. Inferred Mineral Resources captured within the pit shells were set to waste. Each deposit was optimized independently to reflect the different bench height planned for that pit. The parameters and respective values assumed in the pit optimization process are presented in Table 1-5. Based on the costs and price assumptions presented in the table, a set of pit shells associated with a range of revenue factors was generated for each of the deposits. The final pit selection was based on conventional best-worst case analysis of discounted cash-flows. The selected shells guiding final pit design were associated with revenue-factors of 0.88 for Detour, 0.95 for West Detour and 0.90 for North Pit. The engineered pit designs were completed using the pit optimization shells as a guide in order to maximize the value and gold recovered inside the ultimate pits. The resulting pit designs include practical geometry that is required in an operational mine, such as the haul road to access all the benches, recommended pit slopes with geotechnical berms, proper benching configuration and smoothed pit walls. The cut-off evaluation incorporated considerations of mill and stockpile capacities, mine constraints and economic parameters when defining mill and stockpile cut-off grades over time in a yearly basis. The marginal cut-off grade is 0.27 g/t Au but an elevated cut-off of 0.35 g/t Au is used as a minimum in the cut-off grade optimization process. Mining will use the variable optimized cut-off grade strategy, because it moves forward ounce production and delays stripping as much as possible.

Detour Lake Operations Ontario, Canada NI 43-101 Technical Report March 2021 1-16 Table 1-5: Pit Optimization Parameters Optimization Parameter Unit Value Gold price US$/oz 1,300 Exchange rate C$/US$ 1.31 Royalty % 2 Refiner charge % 0.05 Net gold prices C$/oz 1,665 Metallurgical recovery % Variable Inter-ramp pit slope angles º 25.1–56.3 Mining cost (excluding incremental haulage) C$/t mined 3.42 Incremental haulage cost Detour Lake Pit C$/7.25 m bench 0.019 West Detour and North Pit C$/6 m bench 0.015 Process cost C$/t milled 9.75 G&A C$/t milled 3.59 Sustaining capital (non-mining)* C$/t milled 3.42 Sustaining capital (mining) C$/t mined 0.35 Breakeven cut-off g/t 0.40 Marginal cut-off g/t 0.27 Note: = * includes First Nations agreements associated costs Mine dilution is accounted for by the use of mine panels that emulate variable degrees of dilution as a function of the continuity of the mineralization at different cut-off grades. Different panels sizes and dimensions were tested against production reconciliation results for the past four years (2016–2019) at a cut-off grade of 0.5 g/t Au. The average dilution factored in over the LOM represents a 7% increase in tonnage and 6% lower grade. 1.13 Mineral Reserve Statement Mineral Reserves are reported using the 2014 CIM Definition Standards. The Qualified Person for the estimate is Mr. Andre Leite, P.Eng., a Kirkland Lake Gold employee. Mineral Reserves have an effective date of December 31, 2020 and are summarized in Table 1-6. Mineral Reserves are reported using a variable optimized cut-off strategy with a minimum cut-off grade of 0.35 g/t Au.
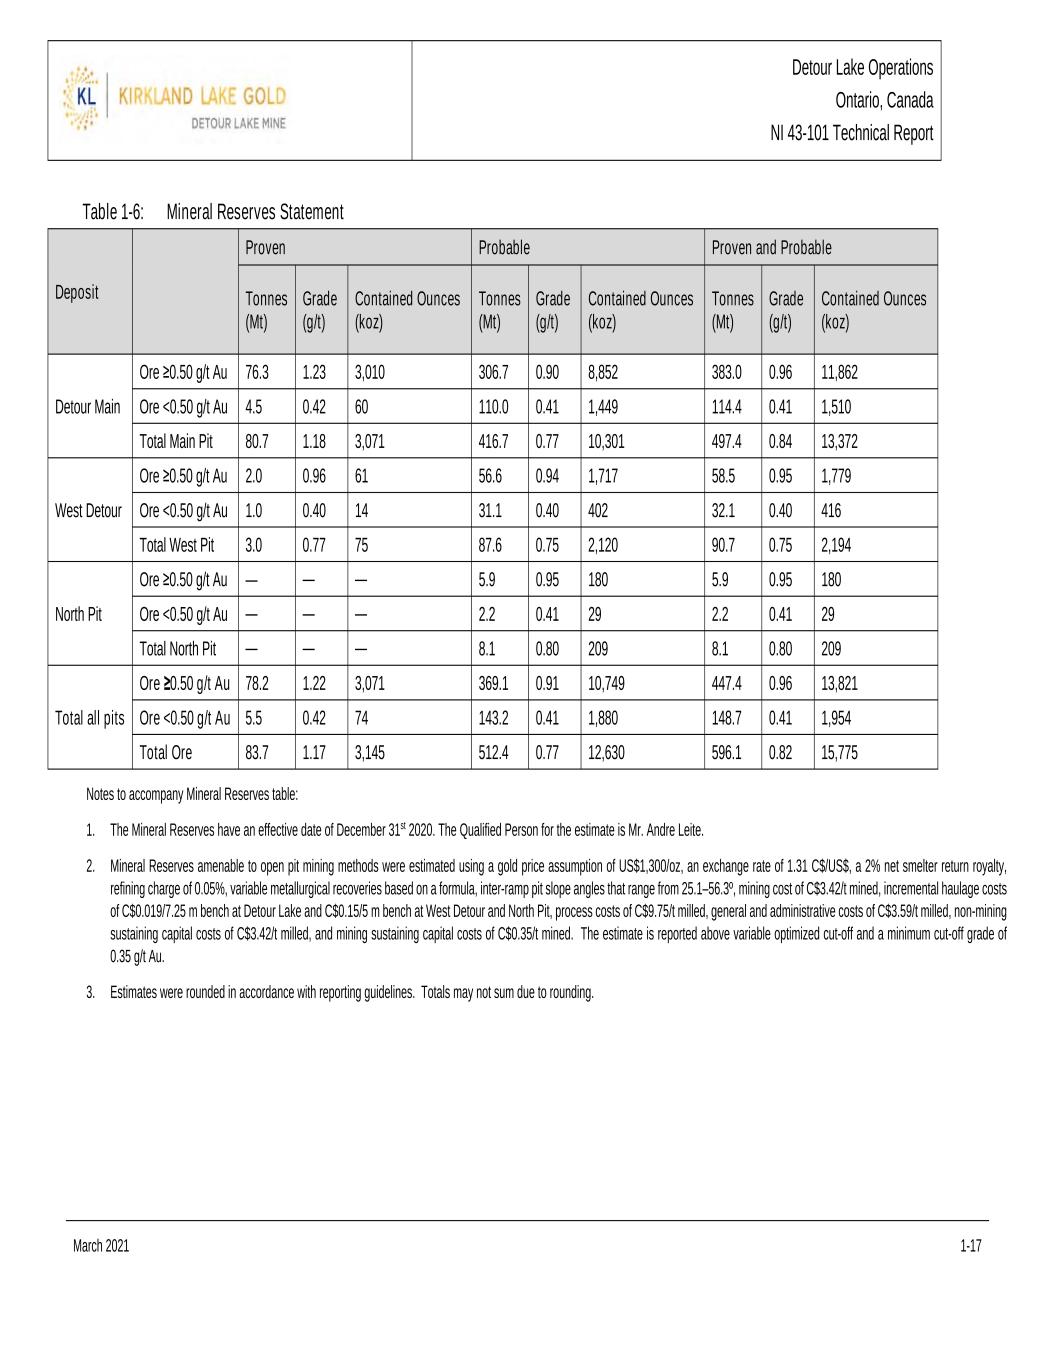
Detour Lake Operations Ontario, Canada NI 43-101 Technical Report March 2021 1-17 Table 1-6: Mineral Reserves Statement Deposit Proven Probable Proven and Probable Tonnes (Mt) Grade (g/t) Contained Ounces (koz) Tonnes (Mt) Grade (g/t) Contained Ounces (koz) Tonnes (Mt) Grade (g/t) Contained Ounces (koz) Detour Main Ore ≥0.50 g/t Au 76.3 1.23 3,010 306.7 0.90 8,852 383.0 0.96 11,862 Ore <0.50 g/t Au 4.5 0.42 60 110.0 0.41 1,449 114.4 0.41 1,510 Total Main Pit 80.7 1.18 3,071 416.7 0.77 10,301 497.4 0.84 13,372 West Detour Ore ≥0.50 g/t Au 2.0 0.96 61 56.6 0.94 1,717 58.5 0.95 1,779 Ore <0.50 g/t Au 1.0 0.40 14 31.1 0.40 402 32.1 0.40 416 Total West Pit 3.0 0.77 75 87.6 0.75 2,120 90.7 0.75 2,194 North Pit Ore ≥0.50 g/t Au — — — 5.9 0.95 180 5.9 0.95 180 Ore <0.50 g/t Au — — — 2.2 0.41 29 2.2 0.41 29 Total North Pit — — — 8.1 0.80 209 8.1 0.80 209 Total all pits Ore ≥0.50 g/t Au 78.2 1.22 3,071 369.1 0.91 10,749 447.4 0.96 13,821 Ore <0.50 g/t Au 5.5 0.42 74 143.2 0.41 1,880 148.7 0.41 1,954 Total Ore 83.7 1.17 3,145 512.4 0.77 12,630 596.1 0.82 15,775 Notes to accompany Mineral Reserves table: 1. The Mineral Reserves have an effective date of December 31st 2020. The Qualified Person for the estimate is Mr. Andre Leite. 2. Mineral Reserves amenable to open pit mining methods were estimated using a gold price assumption of US$1,300/oz, an exchange rate of 1.31 C$/US$, a 2% net smelter return royalty, refining charge of 0.05%, variable metallurgical recoveries based on a formula, inter-ramp pit slope angles that range from 25.1–56.3º, mining cost of C$3.42/t mined, incremental haulage costs of C$0.019/7.25 m bench at Detour Lake and C$0.15/5 m bench at West Detour and North Pit, process costs of C$9.75/t milled, general and administrative costs of C$3.59/t milled, non-mining sustaining capital costs of C$3.42/t milled, and mining sustaining capital costs of C$0.35/t mined. The estimate is reported above variable optimized cut-off and a minimum cut-off grade of 0.35 g/t Au. 3. Estimates were rounded in accordance with reporting guidelines. Totals may not sum due to rounding.

Detour Lake Operations Ontario, Canada NI 43-101 Technical Report March 2021 1-18 Factors that may affect the Mineral Reserve estimates include: changes to the gold price and exchange rate assumptions; changes to pit slope and geotechnical assumptions; changes to operating cost assumptions used in the constraining pit shell; changes to pit designs from those currently envisaged; unforeseen dilution; changes to hydrogeological and pit dewatering assumptions; changes to inputs to capital and operating cost estimates; ability to permit West Detour and North Pit pits and western extent of the ultimate Detour Lake pit; and changes to modifying factor assumptions, including environmental, permitting and social licence to operate. 1.14 Mining Methods The geotechnical design parameters for Detour Lake Main Pit were reviewed by Golder in 2020. The assessment accounts for a revised bench height of 14.5 m for the Main Pit implemented in 2020 and for information obtained as temporary and final walls are exposed. The geotechnical parameters for the West Detour and North pit were also provided by Golder. A process of ongoing geotechnical monitoring and documentation was implemented at the mine and additional risk mitigation techniques continue to be evaluated and employed as needed. The mine water management plan is matched to the mine development strategy. Water management infrastructure includes non-contact water diversion structures and water retention ponds, appropriately sized based on hydrological/hydrogeological modeling and the changes in mining activity and stockpiling over the LOM. The Detour Lake pit design incorporates a double ramp access for most of the LOM. The final ramp and principal access will be located in the north wall. The West Detour and North Pit were designed using a single ramp access. There are a total of nine phases designed for the LOM: five for the Detour Lake Main Pit, three for the West Detour Pit and one for North Pit. The mine operation also requires the management of old underground workings; in general, historical records of underground workings are very reliable. Standard operational procedures regulate the mining activity in these affected areas to ensure a safe operation and risk management. Both waste rock storage facility (WRSF) and stockpile strategies are in agreement with the permitting strategy for the West Detour pit; and respect related environmental constraints. Currently the mine has two WRSFs (MRS1 and MRS2), one ore stockpile (ROMPAD) and one overburden/topsoil stockpile for mine reclamation purposes (OVB1). The mine plan accounts for three additional ore stockpiles (MRS4, MRS5 and a temporary stockpile within the MRS2 WRSF footprint), three new WRSFs (MRS3, MRS2-extension and Inpit) and one new overburden/topsoil stockpile (West Detour Overburden stock). The Detour Lake Mine uses conventional truck-shovel open pit mining. The mine is operated using an Owner-operator mining equipment and labour strategy. Excluding the muskeg and overburden/till top layer, all material must be blasted. Pioneering drilling and
Detour Lake Operations Ontario, Canada NI 43-101 Technical Report March 2021 1-19 blasting is required in the overburden/rock contact. Additionally, during winter months free digging of overburden material is not possible due to frost. Mining at West Detour is planned to employ similar conventional mining methods with the initial use of smaller equipment for the pre-stripping phase, especially in overburden. Given the smaller dimensions of the North Pit, a smaller fleet size will be used. The Detour Lake Mine operates 24-hr per day year-round on 12 hr shifts for all operational crews. Operational teams work on a 7-day in/7-day out rotation. The mine has implemented a successful hot-seating process for its main production equipment (shovel, trucks and drills). Management/supervisory and support personnel work at site on different schedules. The mine production schedule forecasts a total 1,725 Mt to be mined over a period of 18 years (2021–2038). A total of 597 Mt of ore is planned to be milled over a period of 22 years (2021–2042); with the last four years of production supported by long-term stockpile reclaim. The optimized and variable cut-off strategy combined with 158 Mt of stockpile capacity, results in an average LOM stripping ratio of 1.90. 1.15 Recovery Methods The process plant is based on a robust metallurgical flowsheet designed for optimum recovery with minimum operating costs. The flowsheet is based upon unit operations that are well proven in industry. The primary crushing system is a single stage, open circuit, primary gyratory crusher that feeds a secondary cone crusher operated in open circuit. The gold recovery circuit selected was a leach circuit followed by a carbon-in-pulp (CIP) circuit. The mineralization then proceeds to acid wash, stripping, electrowinning, and refining. The processing plant was designed to process ore at an average throughput of 55,000 t/d or 20 Mt/a, equivalent to milling rates of 2,500 tonnes per operating hour (tpoh) with operating time of 92% in a 24 hour day. While operating time has lagged at around 89%, the milling has far exceeded the design rate averaging 2,952 t/hr in 2020 for 23.06 Mt milled. On at least 70 occasions in 2020, a 74 kt milled per day rate was achieved. With the upturn of current performance of the processing plant, ongoing optimization efforts and some new capital initiatives, the LOM plan assumes that the plant throughput will increase from 23 Mt in 2020 to 28.0 Mt in 2025 and thereafter. The annual plant throughput of 28.0 Mt is planned to be achieved by increasing the milling rate to 3,436 t/hr and improving operating time to 93%. Various initiatives have been developed to bring the plant to the 28 Mt throughput rate. Those initiatives are: improved fragmentation; improved primary crusher choke feeding; secondary crusher screens; curved pulp lifters; semi-autogenous grind (SAG) mill speed increase; permit to go over 75,000 t/d; re-feed system after the secondary crushers; pebble crusher variable speed drives; ore blending; and an increase in plant operating time to 93%.

Detour Lake Operations Ontario, Canada NI 43-101 Technical Report March 2021 1-20 Energy consumption is not expected to significantly increase as a result of the increased throughput rate. A lot of the initiatives to increase plant throughput are related to increases in grinding efficiency with the same power. The LOM assumes at 28.0 Mt to use 731,000 MWh per year, which the plant electrical system is adequately designed to supply. A decant tower system is used to reclaim and pump water from the tailings management area (TMA) back to the process plant to satisfy process water requirements. For Cell#2 a barge reclaim water system will be used. Reclaim water is piped to the process plant. Depending on the water balance in the TMA, water from the open pit and various collection ditches around the WRSFs can also be directed to the plant. Make-up water for the reagent mixing is sourced from East Lake when required. Consumables used in the plant include: steel balls; quicklime (CaO); sodium cyanide (NaCN) for gold dissolution and desorption; SO2 and SMBS; anti-scalant; caustic; copper sulphate; carbon is used for gold collection; and ore anti-freeze conditioner. 1.16 Project Infrastructure Surface infrastructure to support operations is primarily in place, and includes: • Three open pits: Detour Lake Main (in operation), West Detour and North Pit (to be constructed); �� Processing facilities: grinding and leaching facilities, along with management and engineering offices, change house, workshop, warehouse, and assay laboratory facilities; • Mine facilities: management and engineering offices, change house, heavy mining vehicle and light vehicle workshops, wash bay, warehouse, explosives magazine, crusher, mine access gate house, return water pump house; • Administration buildings: facilities for overall site management, safety inductions, and general and administrative functions; • Accommodation camp; • Four stockpiles: ROM pad, MRS4, MRS5 and the temporary MRS2; • Four WRSFs: MRS1, MRS2, MRS3 and Inpit ; • Three tailings storage facilities: cell 1, 2 and 3; • Water management facilities: stormwater and water storage dams, diversions, culverts; • Landfill facility. Projects were ongoing through 2020 which included construction of additional camp capacity, construction of an airfield and aerodrome, construction of an onsite assay laboratory, construction of additional mobile maintenance offices and shops, and construction of additional exploration facilities.

Detour Lake Operations Ontario, Canada NI 43-101 Technical Report March 2021 1-21 Facilities in Cochrane include administration offices, a bus terminal with employee parking lot and security check-ins, four houses and an eight-unit apartment block. Kirkland Lake Gold has a shared services centre in Timmins that services the Detour Lake Mine. SGS Minerals operates a full-service analytical laboratory in Cochrane in support of the Detour Lake Mine. Workers are accommodated in two camps. The Little Hopper Lodge (previously referred to as the Permanent Camp) is located 7 km west of the mining operations in close proximity to Little Hopper Lake. The Sagimeo Lodge is located just south of the mine services building. Accommodations are in the process of being expanded, and will have a total capacity of 1,447 persons. Potable water for the Little Hopper Lodge is obtained from Little Hopper Lake. This is adequate for the Detour Lake’s current and future needs. Potable water for the Sagimeo Lodge, mine services facilities, site administration facility, and the processing plant is obtained from borehole wells close to the camp. Fresh water is pumped from East Lake and is primarily used in the processing plant for reagent mixing but is also used as wash water in the truck wash facility and water make-up for the fire water tank. The existing 180 km-long powerline runs from the processing facility to a tie in at Island Falls, and thence to the Pinard substation. The 230 kV transmission line allows for the distribution of more than 85 MW of power, suitable to service the entire Detour Lake Operations. In the event of a power failure, there is sufficient emergency power generation for the provision of basic services. 1.17 Environmental, Permitting and Social Considerations 1.17.1 Environmental and Supporting Studies The Detour Lake Main Pit and West Detour areas were subject to extensive baseline, environmental monitoring, and technical studies, as per provincial and federal regulatory requirements. The presence of Woodland Caribou is of particular note because it is a Species at Risk, designated as Threatened under the Provincial Endangered Species Act (ESA) and Federal Species at Risk Act. Potential impacts and mitigation measures are being addressed through the process of an Endangered Species Act Permit, for which approval is anticipated in 2021. 1.17.2 Monitoring The mine is required to comply with air quality standards, point of impingement guidelines, and ambient air quality criteria specified in Ontario Reg. 419/05. The installed operating monitoring systems demonstrate compliance with these standards, which confirms the predictions of no significant air quality or noise impacts. Due to historical mining in the region, the geological materials (ore, waste rock, tailings, and overburden) at the Detour Lake Main Pit have undergone multiple metal leaching and acid rock drainage (ML/ARD) assessments by various investigators in compliance with best-

Detour Lake Operations Ontario, Canada NI 43-101 Technical Report March 2021 1-22 practice, industry-standard methods. To date, over 80% of waste rock has been classified as non-potentially acid generating (NAG). Analytical results continue to support that ARD risk is low based on low sulphide content. To provide greater assurance in the event of ARD during operations and/or closure, PAG and NAG waste rock materials are segregated into separate stockpiles. Production tailings are governed by the same classification criteria as waste rock and are subject to frequent confirmatory sampling. Mine-contact water from all mine facilities, including stockpiles and tailings management area (TMA) cells, is captured by the water management system, a network of collection ditches, ponds, pipelines and pumping infrastructure to ensure environmental protection. Discharge of surplus mine-contact water occurs only at select, specially permitted locations, provided that water quality meets federal, provincial, and site-specific permitted criteria. Water that has been in contact with processing reagents (i.e., water stored in the TMA) is not discharged, and is instead re-circulated through the process plant or locked in tailings void spaces. Kirkland Lake Gold notes the following: • Water quality: the monitoring network includes 71 surface water stations and 141 groundwater stations. Regular data collection, analysis, and interpretation on a monthly and quarterly basis allow for risk identification and adaptive management; • Fisheries and other aquatic resources: mitigation measures were implemented to limit potential effects related to mining of the Detour Lake Main Pit on aquatic resources. In addition, a fish compensation plan was approved by the federal and provincial regulatory agencies, following full consultation with Indigenous communities, to address impacts related to the development of the TMA and mine rock stockpiles. Additional mitigation measures and compensations plans have been proposed to address potential impacts to fisheries and other aquatic resources related to the development of the West Detour pit. • Groundwater: no significant environmental impacts to groundwater are currently predicted to occur in conjunction with the mining of the Detour Lake Main Pit, West Detour Pit, or North Pit, or the development of mine rock stockpiles or the TMA, after the implementation of proposed mitigation measures; • Vegetation and wildlife: measures to minimize adverse effects to area plants and wildlife include but are not limited to: minimizing the project footprint; maintaining a minimum 120 m buffer around watercourses; avoidance of unnecessary disturbance to wetlands; and avoidance of tree clearing during the bird nesting period. Recommendations for the protection of Woodland Caribou include as reasonable: minimizing the overall project footprint; avoidance of critical over-wintering habitat; minimizing disturbance to mature upland black spruce–jack pine forests that support a high abundance of terrestrial and arboreal lichens (a preferred food source); and minimizing the potential for caribou/vehicular traffic interaction. Kirkland Lake Gold has also implemented a caribou tracking and monitoring program.
Detour Lake Operations Ontario, Canada NI 43-101 Technical Report March 2021 1-23 • Cultural and heritage resources: none of the studies completed identified archaeological sites that are proximal to the Detour Lake Mine site, including the West Detour area, that are likely to be affected by the mine in any foreseeable manner. The overall potential for encountering cultural heritage or archaeological sites that would conflict with the proposed development plan for the site is considered to be extremely low. 1.17.3 Tailings Management Area Tailings are stored at surface in an engineered TMA located east of the process plant. The TMA consists of three cells being developed in a planned, progressive manner: Cell 1 was built over a historic tailings storage facility from a previous mining operation; Cell 2 was developed to the north of Cell 1; and the Cell 3 area was cleared to the south of Cell 1. Cells 1 and 2 are dominantly tailings storage cells, while the Cell 3 area will first be used for the mine water pond (a water management facility), until the Cell 3 tailing facility is constructed later in the mine life (2027). The TMA is designed to function as three independent cells for tailings and water management. Tailings deposition will generally occur in only one cell at any time with water recycle for process plant use occurring mainly from the active cells, but possibly also during some periods from the inactive deposition cell prior to final closure. The initial design of the TMA was optimized during ongoing operations, as additional information became available through ongoing construction and in response to a requirement for additional capacity (and wish to stay within the same footprint). In Q4 2020, tailings deposition was transitioned from Cell 1 to Cell 2. The construction of a thickened tails tails is planned with deposition of thickened tails starting in January 2025. Starting in 2037, tails are to be deposited in the Detour Main Pit (mine operation in the Detour Main Pit is forecast to be complete in 2036). The TMA Cell 2 and Cell 3 facility will provide for storage of approximately 283 Mm3 (454 Mt) of tailings solids. Capital investment is reflected in the cash flow model. Inspection and monitoring is performed during construction and operation of the tailings dams to assess their performance and safety; and to verify that actual conditions are consistent with the design assumptions and intentions. Inspection and monitoring also optimizes maintenance and repair costs, provides warning of potential impending risks, and provides sufficient time to implement remedial measures, if required. A dam safety review completed in 2020 confirmed that the TMA is performing as designed. 1.17.4 Water Management Environmental protection is ensured through the water management network, which collects seepage and runoff from all mine waste facilities through a system of ditching, pumping, and pipeline infrastructure. The modular design allows for the addition of treatment facilities if required. In 2020, a mine water pond with a capacity of 3.5 Mm3 was completed. The mine water pond serves as a central water management facility (e.g., for

Detour Lake Operations Ontario, Canada NI 43-101 Technical Report March 2021 1-24 open pit water and local runoff), and provides additional contingencies for storage and treatment, if needed. Tailings, tailings slurry water, and water reclaimed for the operation of the process plant are managed through the TMA. 1.17.5 Permits Most mining projects in Canada are reviewed under one or more EA processes. The federal EA process for Canadian mines is detailed in the CEAA. A federal EA was triggered for the Detour Lake project due to: • The requirement for an Explosives Factory License under the Explosives Act for a project-dedicated explosives manufacturing factory; and • The need for one or more Authorization(s) for Harmful Alteration Disruption or Destruction of Fish Habitat according to the Fisheries Act. These licences/authorizations were granted. Four provincial EAs were approved for the Detour Lake project: • July 2010: Ontario Ministry of Environment Class EA for Electricity Projects, for the diesel power generation required to support the construction phase (AMEC 2010a); • November 2010: Ontario MNR Class EA for Resource Stewardship and Facility Development Projects, for the construction of facilities off-lease, and for such aspects as on-lease aggregate operations or in-water works (AMEC 2010c); • December 2010: Ontario individual EA for Electricity Projects, for construction of a 230 kV transmission line (AMEC 2010b); • March 2012: Ontario MOE individual EA for Electricity Projects of 10 MW, for allowing a diesel-generated contingency power supply to service the construction needs should the powerline not be operable by the third quarter of 2011. With the successful energizing of the powerline in October 2011, these facilities were not installed. In accordance with Section 143(2) of the Mining Act, R.S.O. 1990, Detour Gold submitted a Mine Closure Plan (for Production) in 2010, followed by Closure Plan Update Amendments in 2014 and 2019. ENDM filed these documents on October 28, 2010, February 18, 2015, and November 8, 2019, respectively. Subsequent permits, such as Permits to Take Water and Environmental Compliance Approvals, have been approved, renewed, and/or amended as needed in order to support ongoing development and operations. Prior to development of the West Detour project, a number of Provincial and Federal environmental approvals, or amendments to existing approvals, will be required. In particular, the West Detour project will be subject to a Class C Environmental Assessment pursuant to the Ontario Environmental Assessment Act as managed by MNRF. The

Detour Lake Operations Ontario, Canada NI 43-101 Technical Report March 2021 1-25 Environmental Study Report (ESR) was published in Draft in January 2017, and a Final ESR was submitted to MNRF in August 2019. An ESR Addendum was submitted in October 2020 to address additional comments from government and Indigenous communities. The completion of the West Detour ESR process is anticipated for 2021. The environmental approval applications will provide additional detail regarding the engineering design of the proposed West Detour project facilities, potential effects and proposed mitigations measures. No changes were expected to the approvals list at the Report effective date. 1.17.6 Closure and Reclamation Kirkland Lake Gold acknowledges that the company will be responsible for providing the full amount of the financial assurance for the closure and rehabilitation of the Detour Lake Mine and the West Detour project, subject to any required or approved changes to the Closure Plan. There are six developmental phases that trigger the issuance of security bonding for the operation. Financial assurance is submitted to the ENDM prior to the beginning of the associated activities of each phase, or as otherwise arranged with the ENDM. As per the Detour Lake Mine Closure Plan Amendment 2, the total estimated closure cost for the Detour Lake Operations at peak development (i.e., all facilities constructed) is $147,734,282, exclusive of the West Detour project. Security provided to the ENDM to date for the present stage of development totals $103,718,794. Financial assurance for the West Detour project will be formalized with the filing of Closure Plan Amendment 3, anticipated for Q4 2021/Q1 2022. 1.17.7 Social Considerations Kirkland Lake Gold has undertaken ongoing consultation with the public, government regulators and its Indigenous partners regarding the operations, environmental commitments and planned activities. Kirkland Lake Gold has established the following consultation principles: • Early notification; • Open communication; • Accessible information; • Flexible process; • Capacity building; • Mutual respect. These principles continue to guide interactions within mine permitting, operations, and exploration. The Company has agreements with First Nations who have treaty and Indigenous rights which they assert within the operations area of the Detour Lake mine. These agreements
Detour Lake Operations Ontario, Canada NI 43-101 Technical Report March 2021 1-26 provides a framework for strengthened collaboration in the development and operations of the mine and outlines tangible benefits for the First Nations, including direct financial support, skills training and employment, opportunities for business development and contracting, and a framework for issues resolution, regulatory permitting and the Company’s future financial contributions. In addition, the Company engages with Indigenous communities in connection with permitting applications and ongoing projects. 1.18 Markets and Contracts No market studies are currently relevant as Detour Lake is an operating mine producing a readily-saleable commodity in the form of doré. Doré is sent via secure transportation to a refinery for further refining. Detour Gold sells its gold production into the market at spot prices or on a forward sales basis. The proceeds from these sales are credited to Detour Gold’s account upon delivery of the gold to the counterparty. The estimated bullion transport costs, liability charges and refining costs used for the financial analysis are based on contract prices agreed with third-parties. Commodity prices used in Mineral Resource and Mineral Reserve estimates are set by Kirkland Lake Gold at the corporate level. The current gold price provided for Mineral Reserve estimation is US$1,300/oz, and US$ 1,500/oz for Mineral Resource estimation. Both Mineral Resource and Mineral Reserve estimates use an exchange rate assumption of 1.31 C$/US$. Kirkland Lake Gold has a number of contracts, agreement and/or purchase orders in place for supply and services that are material to the operation. All contracts or agreements are negotiated with vendors and have a contractual scope, terms and conditions. Contracts are negotiated and renewed as needed. Contract terms are considered to be within industry norms, and typical of similar contracts in Canada with which Kirkland Lake Gold is familiar. 1.19 Capital Cost Estimates Capital costs consist largely of mining equipment (replacements, additions, component replacements, capitalized maintenance), construction of tailings cells and dam raises, deferred stripping using a by-phase approach, and processing plant projects to increase plant capacity to 28 Mt/a. Capital costs for the first three years of plan are based on budget cycle estimates with supplier quotes, engineered designs, maintenance strategies, production plans or preliminary estimates. Estimates in later years are based on maintenance strategies, equipment replacement schedules, and long-term sustaining capital estimates are based on recent operating history and current asset value. Tailings cells 2 and 3 are based on physical material movement requirements and recent unit cost history. The LOM capital cost estimate is provided in Table 1-7. The LOM plan estimated total capital cost is C$4,744 million.

Detour Lake Operations Ontario, Canada NI 43-101 Technical Report March 2021 1-27 1.20 Operating Cost Estimates Operating costs for are based on actual costs seen during operations at site and are projected through the LOM plan. All operating costs were evaluated on an annual basis and include all costs related to: • Mining ore and waste from the Detour Lake, West Detour and North pits; • Processing of ore; • All expenses associated with site administration; • Adjustments for deferred stripping and changes in inventory; • Costs related to agreements with First Nations; • Royalties to Franco Nevada and First Nations. The consumables for the operation are based on current prices or contracts for future years. In general, approximately 80% of operating costs are based in Canadian dollars and 20% have US dollar exposure. The exchange rate used in the financial model is 1.31 C$/US$. The LOM operating cost estimate is provided in Table 1-8 and Table 1-9. The LOM plan estimated total operating cost is $12,538 million. The LOM mining unit cost1 is C$3.47/t mined. The LOM operating unit cost in C$/t milled1 is C$21.00/t milled. The LOM operating unit cost in C$/oz sold1 is C$864/oz sold. 1 Refer to Cautionary Statement on Non-IFRS Financial Performance Measures.

Detour Lake Operations Ontario, Canada NI 43-101 Technical Report March 2021 1-28 Table 1-7: Capital Cost Summary by Area Capital Cost Summary (C$M) 2021–2025 2026– 2030 2031– 2035 2036– 2040 2041– 2043 LOM Mining 1 529 557 285 138 29 1,538 Deferred stripping 606 717 48 — — 1,371 Processing 301 64 53 38 7 463 Tailings management 308 358 332 — — 997 West Detour 87 9 2 1 — 100 Site administrative 2 148 39 38 38 12 274 Total Capital Costs 1,978 1,744 757 216 48 4,744 Notes: 1. Includes capital projects, equipment replacements/additions, planned component replacements, and capitalized portion of maintenance and repair contract of 795 haul trucks. 2. Includes infrastructure, water management, and camp. Table 1-8: Operating Cost Summary Operating Cost (C$M) 2021– 2025 2026– 2030 2031– 2035 2036– 2040 2041– 2043 LOM Mining 1,2 1,826 1,886 1,530 665 83 5,989 Processing 3 1,084 1,244 1,244 1,244 394 5,209 Site administration 4,5 508 519 502 295 86 1,910 Subtotal 3,417 3,649 3,276 2,204 563 13,109 Adjustments 6 (734) (695) (231) 671 418 (571) Total 2,683 2,954 3,045 2,875 981 12,538 Notes: 1. Excludes adjustment for deferred stripping. 2. Mining costs reduction reflect depletion of stockpiles late in mine life. 3. Increase in Processing costs reflects increased electricity price starting in 2025. 4. Includes First Nations costs. 5. Reduction in the Site Administration charges late in the mine life reflects a reduction in mining activity. 6. Includes adjustments for deferred stripping, royalties, and changes in inventory.
Detour Lake Operations Ontario, Canada NI 43-101 Technical Report March 2021 1-29 Table 1-9: Operating Unit Cost Summary 2021– 2025 2026– 2030 2031– 2035 2036– 2040 2041– 2043 LOM Mining unit cost (C$/t ex-pit) 1 Mining 2 3.19 2.98 3.69 6.29 — 3.47 Operating unit cost (C$/t milled) 1 Mining 2,3 13.75 13.47 10.93 4.75 1.87 10.03 Processing 4 8.16 8.88 8.89 8.88 8.91 8.73 Site administration 5,6 3.82 3.71 3.59 2.11 1.95 3.20 Subtotal 25.74 26.06 23.40 15.74 12.73 21.96 Adjustments 7 (5.53) (4.96) (1.65) 4.79 9.46 (0.96) Total 20.21 21.10 21.75 20.53 22.19 21.00 Operating unit cost (C$/oz sold) 1 Total 742 916 687 1,078 1,697 864 Notes: 1. Refer to Cautionary Statement on Non-IFRS Financial Performance Measures. 2. Excludes adjustment for deferred stripping. 3. Mining costs reduction reflect depletion of stockpiles late in mine life. 4. Increase in Processing costs reflects increased electricity price starting in 2025. 5. Includes First Nations costs. 6. Reduction in Site Administration charges late in mine life reflects reduction in mining activity. 7. Includes adjustments for deferred stripping, royalties, and changes in inventory. 1.21 Economic Analysis The Project was valued using a discounted cash flow approach. Estimates were prepared for all the individual elements of cash revenue and cash expenditures for ongoing operations. Cash flows are assumed to occur in the middle of each period. Operating costs were prepared based on recent operating history and technical assumptions associated with the production profile. Capital costs were prepared based on engineering estimates, vendor quotes, maintenance strategies, or estimated long-term requirements based on current asset value. The currency used to calculate the cash flow is Canadian dollars. A discount rate of 5% was assumed based on more than seven years of commercial production in a stable low- risk jurisdiction. Royalties included in the economic analysis are: • Franco Nevada: 2% net smelter return; • First Nations payments. Taxes included in the economic evaluation are the Federal Income Tax (15%), Provincial Income Tax (10%), and the Ontario Mining Tax. Depreciation schedules based on current depreciable balances and yearly capital additions were used to model tax depreciation for Processing and Transportation Assets as well as Mining Assets. The tax model was

Detour Lake Operations Ontario, Canada NI 43-101 Technical Report March 2021 1-30 completed at the Project level, which has the Detour Lake Mine as a stand-alone operating asset. Closure costs are based on reclamation schedule extending through to the next century up to the year 2337. Progressive reclamation occurs throughout the operating period. Reclamation activities are broken down into active closure, passive closure/flooding of the mine pit, final closure/ active discharge, and post closure/passive discharge. The base case economic analysis assumes 100% equity financing and is reported on a 100% project ownership basis. The base case economic analysis assumes constant prices with no inflationary adjustments. Capital and operating costs are expressed in 2021 Canadian dollars. The cumulative free cash flow before tax 1 is estimated at $11,141 M. The cumulative free cash flow after tax2 is $8,354 M. At a 5% discount rate, the net present value of free cash flow before tax is $6,614 M and of free cash flows after tax is $4,968 M. Internal rate of return and payback period results are not relevant as the cumulative discounted after-tax free cash flows are never negative. This reflects the fact that the Detour Lake Mine is already in operation and that operating cash flows are sufficient to cover sustaining and growth capital requirements. Table 1-10 is a summary of the discounted cash flow analysis. 1.22 Sensitivity Analysis A sensitivity analysis was performed considering variations in metal prices, exchange rates, operating costs and capital costs. Flexing based on gold grade processed was excluded because it reflects the same sensitivity as gold price (given flat gold price assumption). Results are shown in Figure 1-1. Sensitivity of the Project to changes in gold price and exchange rate are shown in Figure 1-2; the Project has positive after tax net present value under the Base Case (US$1,500/oz and 1.31 C$/US$) and under the assumptions of Mineral Reserve estimation (US$1,300/oz and 1.31 C$/US$). The sensitivity to discount rate and the assumed discount rate range is shown in Figure 1-3. The undiscounted free cash flow after tax1 is negative at a gold price of US$895/oz. The net present value of free cash flow after tax1 is negative at a gold price of US$940/oz. The Project is most sensitive to changes in the gold price and exchange rate, less sensitive to operating cost changes, and least sensitive to changes in the capital cost assumptions. 1.23 Interpretation and Conclusions Under the assumptions presented in this Report, the Project has a positive free cash flow after tax 2, and Mineral Reserve estimates can be supported. 1 Refer to Cautionary Statement on Non-IFRS Financial Performance Measures.
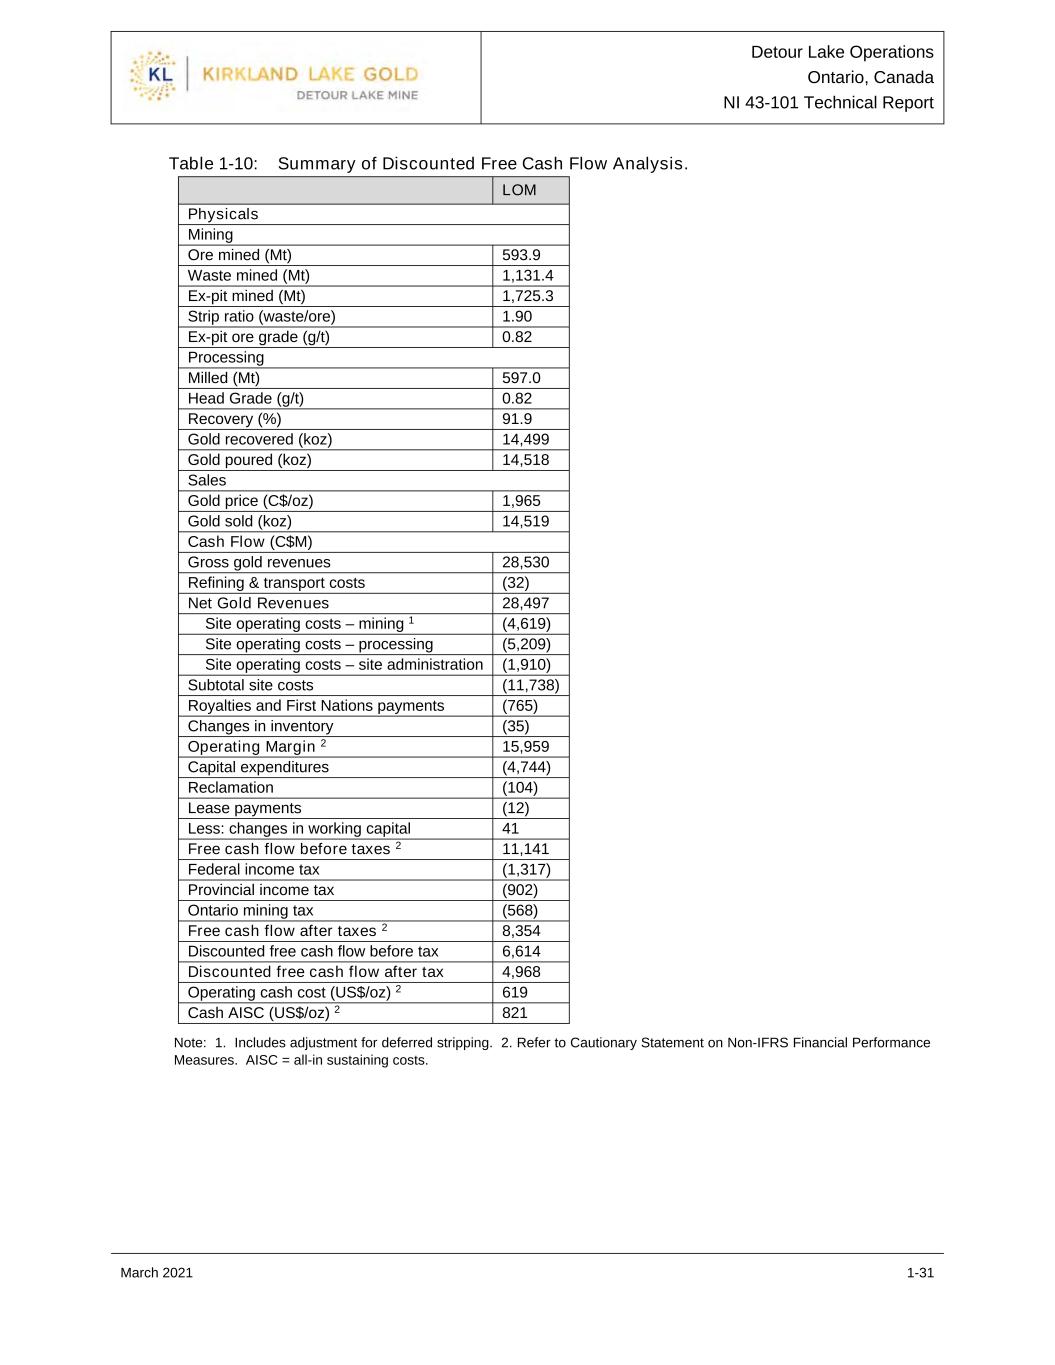
Detour Lake Operations Ontario, Canada NI 43-101 Technical Report March 2021 1-31 Table 1-10: Summary of Discounted Free Cash Flow Analysis. LOM Physicals Mining Ore mined (Mt) 593.9 Waste mined (Mt) 1,131.4 Ex-pit mined (Mt) 1,725.3 Strip ratio (waste/ore) 1.90 Ex-pit ore grade (g/t) 0.82 Processing Milled (Mt) 597.0 Head Grade (g/t) 0.82 Recovery (%) 91.9 Gold recovered (koz) 14,499 Gold poured (koz) 14,518 Sales Gold price (C$/oz) 1,965 Gold sold (koz) 14,519 Cash Flow (C$M) Gross gold revenues 28,530 Refining & transport costs (32) Net Gold Revenues 28,497 Site operating costs – mining 1 (4,619) Site operating costs – processing (5,209) Site operating costs – site administration (1,910) Subtotal site costs (11,738) Royalties and First Nations payments (765) Changes in inventory (35) Operating Margin 2 15,959 Capital expenditures (4,744) Reclamation (104) Lease payments (12) Less: changes in working capital 41 Free cash flow before taxes 2 11,141 Federal income tax (1,317) Provincial income tax (902) Ontario mining tax (568) Free cash flow after taxes 2 8,354 Discounted free cash flow before tax 6,614 Discounted free cash flow after tax 4,968 Operating cash cost (US$/oz) 2 619 Cash AISC (US$/oz) 2 821 Note: 1. Includes adjustment for deferred stripping. 2. Refer to Cautionary Statement on Non-IFRS Financial Performance Measures. AISC = all-in sustaining costs.

Detour Lake Operations Ontario, Canada NI 43-101 Technical Report March 2021 1-32 Figure 1-1: Sensitivity of After-Tax Net Present Value to Gold Price, Exchange Rate, Operating Cost, and Capital Cost Note: Figure prepared by Kirkland Lake Gold, 2020. Figure 1-2: Sensitivity of After-Tax Net Present Value to Gold Price and Exchange Rate 0.0 1.0 2.0 3.0 4.0 5.0 6.0 7.0 -15% -10% -5% 0% 5% 10% 15% Af te r- Ta x N PV @ 5% (C $B ) Change in Variable Gold Price Exchange Rate Operating Cost Capital Cost -0.10 -0.05 Base +0.05 +0.10 1.21 1.26 1.31 1.36 1.41 -200 1,300 2,480 2,856 3,248 3,647 4,023 -100 1,400 3,280 3,711 4,118 4,523 4,936 Base 1,500 4,085 4,522 4,968 5,393 5,816 +100 1,600 4,870 5,331 5,786 6,238 6,689 +200 1,700 5,631 6,114 6,596 7,077 7,554 G ol d Pr ic e (U SD /o z) After Tax NPV @ 5% (C$M) Exchange Rate (CAD/USD)

Detour Lake Operations Ontario, Canada NI 43-101 Technical Report March 2021 1-33 Figure 1-3: Sensitivity of After-Tax Net Present Value to Discount Rate Note: Figure prepared by Kirkland Lake, 2020. 1.24 Risks and Opportunities The major risks to the Detour Lake Operations are associated with: • Negative variations to the gold and diesel price assumptions; • Significant additional dilution or ore losses; • Significant delays in the assumed permitting timeline for the West Detour project; • Changes in the geotechnical assumptions; • Lower than planned plant production capacity. The major opportunities are: • Exploration potential in the “saddle” zone (area between Detour Main and West Pits), to the west of the West Detour pit and at depth in the West Detour and Detour Main pit areas; • Further improvements in the grade control processes with the installation of an assay laboraroty at the mine site; C$5.0B @ 5% 0 1 2 3 4 5 6 7 8 9 0% 1% 2% 3% 4% 5% 6% 7% 8% 9% Af te r- Ta x N PV @ 5% (C $B ) Discount Rate Discount Rate Range Extrapolation to Undiscounted Base Case

Detour Lake Operations Ontario, Canada NI 43-101 Technical Report March 2021 1-34 • Increased level of automation in the mine operation (upgrade of the mine network to LTE enables higher level of automation); • Use of alternative energy sources to diesel with the intent of improving business sustainability and competitiveness; 1.25 Recommendations The QPs have no meaningful recommendations that can be made. The Detour Lake Operations have various initiatives that are underway to bring the plant to the 28 Mt/a throughput rate; these initiatives are captured in the capital and operating cost estimates.

Detour Lake Operations Ontario, Canada NI 43-101 Technical Report March 2021 2-1 2.0 Introduction 2.1 Introduction Mr. Andre Leite, Mr. Jean-Francois Dupont, Dr. Veronika Raizman, and Mr. Paul Andrew Fournier prepared a NI 43-101 Technical Report (the Report) on the Detour Lake Operations (the Detour Lake Operations, Detour Lake Mine, or the Project) for Kirkland Lake Gold Ltd (Kirkland Lake Gold). The Detour Lake Operations are located in in northeastern Ontario (Figure 2-1). The Detour Lake Operations consist of the operating Detour Lake Main Pit, and planned open pit operations at the West Detour and North Pits. Mineral Resources are estimated for the Detour Lake, West Detour and Zone 58N areas. Mineral Reserves are estimated for the Detour Lake and West Detour areas. The West Detour estimate is split into the West Detour and North Pit pits. 2.2 Terms of Reference The Report provides updated information on the Mineral Resource and Mineral Reserve estimates and operations, and supports disclosure in Kirkland Lake Gold’s 2020 Annual Information Form. Units used in the report are metric units unless otherwise noted. Monetary units are in Canadian dollars (C$) unless otherwise stated. All ounce units refer to troy ounces. The Report uses Canadian English. Mineral Resources are reported in accordance with the Canadian Institute of Mining, Metallurgy and Petroleum (CIM) Definition Standards for Mineral Resources and Mineral Reserves (May 2014; the 2014 CIM Definition Standards). 2.3 Qualified Persons The following Kirkland Lake Gold employees serve as the qualified persons for this Technical Report as defined in National Instrument 43-101, Standards of Disclosure for Mineral Projects, and in compliance with Form 43-101F1: • Mr. Andre Leite, P.Eng, Detour Lake Mine Technical Service Manager; • Mr. Jean Francois Dupont, P.Eng, Detour Lake Chief Metallurgist; • Dr. Veronika Raizman, P.Geo., Manager, Reclamation & Geochemistry; • Mr. Paul Andrew Fournier, P.Eng, Manager, Cost Accounting.

Detour Lake Operations Ontario, Canada NI 43-101 Technical Report March 2021 2-2 Figure 2-1: Project Location Plan Note: Figure prepared by Kirkland Lake Gold, 2020. 2.4 Site Visits and Scope of Personal Inspection Mr. Andre Leite works for the Detour Lake Mine as a Technical Service Manager since October 2018. He is current based at Kirkland Lake Gold’s Timmins hub office and regularly visits the mine site. His most recent site visit in 2020 was on December 2, 2020. During that site visit, he reviewed weekly and daily mine plans, held discussions on grade control processes and results and participated in operational management meetings. Mr. Jean Francois Dupont has worked at the Detour Lake Mine from 2011 and has been based at the Detour Operation since that time to the Report effective date. Mr Dupont was directly involved in the engineering, construction and commissioning of the Detour Lake Mine processing plant, and has been involved with plant operations since commissioning.
Detour Lake Operations Ontario, Canada NI 43-101 Technical Report March 2021 2-3 Dr. Veronika Raizman was based at the Detour Lake Mine from 2016 to 2020, and now works from Kirkland Lake Gold Inc.’s Toronto corporate office. Her most recent site visit was from March 12 to 19, 2020. During that site visit, Dr. Raizman performed her regular duties with respect to the management of the Detour Lake Mine’s geochemical monitoring, reclamation programs, and regulatory permitting and compliance. Mr. Paul Andrew Fournier’s most recent site visit was from July 2–15, 2020. During this visit, he viewed the mine services facility, the exterior of the processing plant, and Little Hopper Lodge. He had discussions with site personnel for the preparation of the financial model for the quarterly (6+6) forecast. 2.5 Effective Dates There are a number of effective dates pertinent to the Report, as follows: • Most recent information on the ongoing drilling program: December 31, 2020; • Most recent information on mineral tenure and surface rights: December 31, 2020; • Geotechnical mine design parameters for Detour pit: May 5, 2020; • Geotechnical mine design parameters for West and North Pit: September 26, 2019; • Database close-out date for purposes of Mineral Resource estimation: o Detour Lake: April 24, 2020; o West Detour: June 7, 2013; o North Pit: November 24, 2016; o Zone 58N: February 2018; • Effective date of the Mineral Reserve estimates: December 31, 2020; • Effective date of the financial analysis that supports the Mineral Reserves: December 31, 2020. The overall Report effective date is taken to be the date of the financial analysis that supports the Mineral Reserves and is December 31, 2020. 2.6 Information Sources and References Reports and documents listed in Section 3 and Section 27 of this Report were used to support preparation of the Report. Additional information was provided by Kirkland Lake Gold personnel as required. Information pertaining to surface rights, royalties, environmental, permitting and social considerations, marketing and taxation were sourced from Kirkland Lake Gold experts in those fields as required.

Detour Lake Operations Ontario, Canada NI 43-101 Technical Report March 2021 2-4 2.7 Previous Technical Reports Kirkland Lake Gold has not previously filed a technical report on the Project. The following reports were filed by Detour Gold Corporation (Detour Gold): • Kallio, E.A., 2006: Technical Report for the Detour Lake Mine Option Property: technical report prepared for Detour Gold Corporation, effective date 21 September, 2006; • Risto, R., Breede, K., el Rassi, D., and Kociumbas, M.W., 2008: Technical Report and Mineral Resource Estimate for the Detour Lake Mine Option Property, Ontario: technical report prepared for Detour Gold Corporation, effective date 25 January, 2008; • Risto, R., Breede, K., Live, P., Castro, L., and Melis, L., 2008: Technical Report and Mineral Resource Estimate Update for the Detour Lake Mine Option Property, Ontario: technical report prepared for Detour Gold Corporation, effective date 18 August, 2008; • Desautels, P., and Zurowski, G., 2009: Technical Report and Mineral Resource Estimate on the Block A Property, Ontario, Canada: technical report prepared for Trade Winds Ventures Inc. and Detour Gold Corporation, effective date 9 July, 2009; • Crépeau, R., Brimage, D., Allaire, A., Jacobs, C.A., Houde, D., Li, D., Nakai- Lajoie, P., Live, P., Dagbert, M., Melis, L.A., Saucier, G., Noack, G., and Daniel, S.E., 2009: Technical Report, Pre-Feasibility Study of the Detour Lake Project, Ontario: technical report prepared for Detour Gold Corporation, effective date 19 October, 2009; • Allaire, A., Dagbert, M., Daniel, S.E., Laferrière, A., Li, D., and Live, P., 2010: Technical Report, Feasibility Study of the Detour Lake Project, Ontario: technical report prepared for Detour Gold Corporation, effective date 30 June, 2010; • Allaire, A., Dagbert, M., Laferrière, A., and Live, P., 2011: Technical Report, Mineral Resource and Mineral Reserve Update of the Detour Lake Project, Ontario: technical report prepared for Detour Gold Corporation, effective date 15 March, 2011; • Ritchie, D.G., Allaire, A., Live, P., Dagbert, M., and Dupéré, M., 2012: Detour Lake Mine – NI 43-101 Technical Report: Detour Lake Updated Mine Plan NI 43-101 Technical Report: technical report prepared for Detour Gold Corporation, effective date 18 October, 2012; • Allaire, A., Live, P., Dupéré, M., Camus, Y., and Ritchie, D.G., 2014: technical report prepared for Detour Gold Corporation, effective date 4 February, 2014;
Detour Lake Operations Ontario, Canada NI 43-101 Technical Report March 2021 2-5 • Anwyll, D., Croal, A.G., McMullen, J., and Ritchie, D.G., 2016: Detour Lake Mine – NI 43-101 Technical Report: technical report prepared for Detour Gold Corporation, effective date 25 January, 2016; • Anwyll, D., Bassotti, M., Daigle, P., Janusauskas, D., McMullen, J., Sirois, R., and Wallin, R., 2018: Detour Lake Operation, Ontario, Canada, NI 43-101 Technical Report: technical report prepared for Detour Gold Corporation, effective date 27 June, 2018. The following reports were filed by Pelangio Mines Inc. (Pelangio): • Kallio, E.A., 2005: Technical Report for the Detour Lake Mine Option Property: technical report prepared for Pelangio Mines Inc., effective date 10 May, 2005; • Kallio, E.A., 2006: Technical Report for the Detour Lake Mine Option Property: technical report prepared for Pelangio Mines Inc., effective date 21 September, 2006; • Risto, R., Breede, K., el Rassi, D., and Kociumbas, M.W., 2008: Technical Report and Mineral Resource Estimate for the Detour Lake Mine Option Property, Ontario: technical report prepared for Pelangio Mines Inc., effective date 25 January, 2008; • Risto, R., Breede, K., Live, P., Castro, L., and Melis, L., 2008: Technical Report and Mineral Resource Estimate Update for the Detour Lake Mine Option Property, Ontario: technical report prepared for Pelangio Mines Inc., effective date 18 August, 2008. The following reports were filed by Trade Winds Ventures Inc. (Trade Winds): • Desautels, P., 2009: Technical Report and Mineral Resource Estimate on the Gowest Property, Ontario, Canada: technical report prepared for Trade Winds Ventures Inc., effective date 28 April, 2009. • Desautels, P., and Zurowski, G., 2009: Technical Report and Mineral Resource Estimate on the Block A Property, Ontario, Canada: technical report prepared for Trade Winds Ventures Inc. and Detour Gold Corporation, effective date 9 July, 2009; • Desautels, P., Zurowski, G., and Holloway, A., 2011: Technical Report and Mineral Resource Update on the Block A Property, Ontario, Canada: technical report prepared for Trade Winds Ventures Inc., effective date 14 February, 2011.

Detour Lake Operations Ontario, Canada NI 43-101 Technical Report March 2021 3-1 3.0 Reliance on Other Experts This section is not relevant to this Report.

Detour Lake Operations Ontario, Canada NI 43-101 Technical Report March 2021 4-1 4.0 Property Description and Location 4.1 Introduction The Project is situated approximately 300 km northeast of Timmins and 185 km by road northeast of Cochrane. The Project centroid is at approximately 590,000mE 5,540,000mN NAD 83 Datum, Zone 17 within NTS areas 32E13. The Detour Lake open pit mine is centered at UTM 594000E, 5542000N (NAD 83 Zone 17). 4.2 Property and Title in Ontario This section provides a general overview of mineral-related law and title in Ontario, sourced from public domain documentation, including Natural Resources Canada (2015), The Fraser Institute (2020), Norton Rose Fulbright, (2013), and the Ontario Mines Act (1990). 4.2.1 Introduction Until 1913, surface rights and mineral rights were acquired with land purchase. At that time, the Ontario Government enacted legislation reserving land mineral rights to the Crown and granting leases to individuals or companies seeking to extract minerals. Where mineral rights are privately owned due to granting prior to 1913, they can be sold independently of surface rights, so that surface and mineral rights on the same property can be held by different owners. The Ministry of Energy, Northern Development and Mines (ENDM) and the Ontario Ministry of Natural Resources and Forestry (MNRF) act as the two main regulatory bodies. The Canadian Federal Government may also be involved in the mining process where First Nations matters arise, or where the subject lands are federally regulated such as when the lands are classified as navigable bodies of water. 4.2.2 Mineral Tenure Mining Claim Historically, a mining claim was a square or rectangular area of open Crown land (land that belongs to the Province of Ontario) or Crown mineral rights that a licenced prospector marks out with a series of claim posts and blazed lines which could range in size from 16 ha (a one-unit claim) to 256 ha (a 16-unit claim). The mining claims in the Sudbury area are administered under Mining Act, R.S.O. 1990, c. M.14 as well as several regulations thereunder.

Detour Lake Operations Ontario, Canada NI 43-101 Technical Report March 2021 4-2 Mining Lease A mining claim can be converted into a mining lease. To convert a mining claim into a lease an application letter must be submitted to the Provincial Recording Office’s Technical Services Unit any time after the fifth unit of assessment work has been performed (cash payment may be made in lieu of the second to fifth unit of assessment work) on the land and the work has been submitted and approved. After submitting the application letter, the land covered by the mining claims must be surveyed. The applicant may also request that the surface rights be included in the Mining Lease where the surface rights are held by the Crown. Where the surface rights are privately held, the lessee of the mineral rights may need to acquire the surface rights if required for development or production purposes. A lease grants its owner title and ownership to the land, permits the extracting and sale of extracted resources and removes the requirement to perform yearly assessment work. To maintain a lease, rent must be paid annually. A lease expires after 21 years but can be renewed if the lease-holder can demonstrate continuous production of minerals for at least one year since the issuance or if the lease-holder can show that it has taken a reasonable effort to bring the property into production. A mining lease can also be renewed on the basis of contiguity with other mining leases where production has occurred. A mining lease cannot be transferred or mortgaged by the lessee without the prior consent of the ENDM. Transfers require the lessee to submit various documentation and pay a fee. Patented Claims The owner of freehold lands in Ontario holds a fee-simple real property interest. Historically, the holder of a mining claim interested in removing minerals from the ground could, instead of obtaining a mining lease, apply to the MNRF to acquire the freehold interest in the subject lands through the granting of a mining patent. Such patents can include surface and mining rights, or may only comprise mining rights. They give the patentee all of the Crown’s title to the subject lands and to all mines and minerals relating to such lands, subject to any reservations set out in the patent. Patented claims are subject to annual Ontario mining taxes and, where surface rights are held, Ontario mineral land taxes. No regulatory consent is required for the patentee to transfer or mortgage those lands other than Planning Act approval where the transferred lands are adjacent to other lands held by the same party. Mining Licence of Occupation These mining licences of occupation allow the holder to use the land in the manner specified in each licence, including the right to dig, excavate and remove ores and minerals from and under the land. The Province of Ontario has the right to revoke licences of occupation on 30 days prior notice.

Detour Lake Operations Ontario, Canada NI 43-101 Technical Report March 2021 4-3 4.2.3 Ontario Modernizing the Mining Act Process Information in this section was derived from the Ministry of Energy, Northern Development and Mines (ENDM) website, and the QP has not independently verified the information. Ontario has fully implemented the third phase of the Ontario government’s Modernizing the Mining Act (MAM) process. This phase: • Moves Ontario’s mining lands administration systems from ground staking and paper map staking to online registration of mining claims • Creates an online Mining Land Administration System (MLAS) that enhances client access to Ontario’s mining lands data and improves their ability to manage their files online. On April 10, 2018, Ontario converted Ontario’s manual system of ground and paper staking, and maintaining unpatented mining claims to an online system. All active, unpatented claims were converted from their legally defined location by claim posts on the ground or by township survey to a cell-based provincial grid. Mining claims are now legally defined by their cell position on the grid and coordinate location in the MLAS Map Viewer. These changes bring greater accuracy and certainty to the location of mining claims, greater certainty of rights and interests, as well as flexible management of land assets. Annual assessment work requirements remain unchanged, despite new cell sizes being 11% to 50% larger than the size of traditional claim units. Assessment work requirements are C$400 per cell claim and C$200 per boundary claim or any claim that is encumbered. Where work has not been completed ahead of the due date, claims forfeit to the Crown. Under the MLAS system, registering a mining claim is now completed by paying a single registration fee of $50 per cell. 4.2.4 Surface Rights Surface rights refer to any right in land that is not a mining right. The process of acquiring surface rights for mining purposes depends on the owner of the rights: • If the surface rights are owned by the claim holder, then no action is required • If the surface rights are owned by the Crown, then the ownership of the surface rights will be granted to the claim holder during the lease application process as requested by the claim holder • If the surface rights are privately owned by an individual or company, then an agreement to allow the claim holder to use the land must be made with the surface rights holder. The agreement should outline the compensation given if the land covered by the surface rights sustains any damages. Confirmation of an agreement with the surface rights owner is required for grant of a mining lease, or an order of the Mining Lands Commissioner indicating that surface rights compensation, if any, has been paid, secured or settled must be provided.
Detour Lake Operations Ontario, Canada NI 43-101 Technical Report March 2021 4-4 4.2.5 Environmental Considerations The Ontario Environmental Assessment Act is the legislation most often applied to environmental aspects of mining projects in Ontario. Mining project components may also be subject to the Federal Canadian Environmental Assessment Act. Projects that are directly undertaken by a public agency; are undertaken on their behalf to fulfill a public agency responsibility or involve a public agency resource (for example, use of Crown lands, funding from a government agency, or impact on resources under government jurisdiction such as water bodies, fish habitat, timber or mineral resources) are required to follow an environmental assessment (EA) process. Both the Provincial and Federal EA acts generally apply. Both EA acts provide opportunities for varying levels of effort for conducting an EA, with the most intensive and longer-term processes required either for those projects that have the greatest potential to cause significant adverse environmental effects, or which are relatively unique, with perhaps the scope of potential impacts unknown. A minimum amount of six months should be anticipated for completion of an environmental assessment, with a likely need of one year or more from the start of the process through to receipt of approval from the relevant agency. 4.2.6 Closure Considerations All land affected by mining development activity must be rehabilitated after the activity has finished. A closure plan must be developed and acknowledged by the ENDM before mine development can begin. The plan outlines how the affected land will be rehabilitated and the costs associated with doing so. A financial guarantee equal to the estimated cost of the rehabilitation work is held in trust by the ENDM that is included with the submission of a closure plan. 4.2.7 First Nations Considerations Section 35 of the Canadian Constitution Act, 1982, recognizes and protects aboriginal and treaty rights in Canada. The Crown has a legal duty to engage in meaningful consultation whenever it has reason to believe that its decisions or actions might infringe upon recognized aboriginal or treaty rights. ENDM has the responsibility for coordinating the Crown’s consultation efforts on decisions relating to mining and mineral exploration. If the project requires approvals or decisions by other Ministries with mineral development regulatory authority, there will be a coordinated approach to the government’s consultation with aboriginal communities. 4.2.8 Fraser Institute Survey Kirkland Lake Gold has used the Investment Attractiveness Index from the 2020 Fraser Institute Annual Survey of Mining Companies report (the Fraser Institute survey) as a
Detour Lake Operations Ontario, Canada NI 43-101 Technical Report March 2021 4-5 credible source for the assessment of the overall political risk facing an exploration or mining project in Ontario. Kirkland Lake Gold used the Fraser Institute survey because it is globally regarded as an independent report-card style assessment to governments on how attractive their policies are from the point of view of an exploration manager or mining company, and forms a proxy for the assessment by industry of political risk in Ontario from the mining perspective. Overall, Ontario ranked 20th out of the 77 jurisdictions in the survey in 2020 for investment attractiveness, 31st for policy perception, and 20th for best practices mineral potential. 4.3 Project Ownership 4.3.1 Ownership History The original ownership interest was held by Amoco Canada Petroleum Company Ltd. (Amoco). In 1978, Amoco signed a joint venture (JV) agreement with Campbell Red Lake Mines (Campbell) and Dome Mines Ltd. (Dome). In 1987, Campbell, Dome and Placer Development merged to become Placer Dome Inc. (Placer). Placer acquired Amoco’s interest in the JV. In December 1998, Pelangio-Larder Mines Limited (Pelangio-Larder) and Franco–Nevada Mining Company Limited (Franco–Nevada) formed the Detour Lake Joint Venture and acquired the Mine Property from Placer Dome (CLA) Ltd. The Detour Lake Joint Venture also acquired certain parts of the Detour Exploration Lands surrounding the Mine Property pursuant to an assignment of the letter agreement dated as of September 28, 1998, between Pelangio-Larder and Placer. Marl Resources Corp. (Marl Resources), the predecessor company to Pelangio Mines Inc. (Pelangio), acquired the majority of Pelangio-Larder’s assets, including the Pelangio-Larder interest in the Detour Lake Joint Venture. Franco–Nevada’s Project interest, due to merger and acquisition activity, passed to Newmont Mining Corporation of Canada Limited (Newmont). In May 2002, Pelangio completed the purchase of all of Newmont’s interest in the Detour Lake Joint Venture, subject to the retention of a 2% net smelter return (NSR) royalty retained by Newmont on the Mine Property and on certain claims staked by Pelangio (Blocks A to E). Newmont subsequently assigned its 2% NSR royalty to Franco–Nevada. In June 2002, Pelangio purchased the Purchased Claims from a prospector subject to the retention of a 2% NSR by the selling prospector. In September 2003, Pelangio granted Trade Winds Ventures Inc. (Trade Winds) an option to acquire a 50% interest in Block A, located immediately west of the Mine Property. Trade Winds earned a 50% interest in Block A on December 31, 2006. Detour Gold was incorporated on July 19, 2006 to acquire the mineral tenures hosting the Detour Lake deposit, through a Purchase Agreement with Pelangio. All conditions set out in the Purchase Agreement, including the completion of an initial public offering, were
Detour Lake Operations Ontario, Canada NI 43-101 Technical Report March 2021 4-6 fulfilled on January 31, 2007, and the titles held by Pelangio were transferred to Detour Gold. A JV agreement with Trade Winds was signed on April 8, 2009. The option on the Mine Property was exercised on October 30, 2008, when Detour Gold became the sole owner of all related surface rights, titles, and permits that were transferred from Goldcorp Canada Ltd. (Goldcorp), as successor to Placer Dome. In connection with the purchase of the Mine Property, Goldcorp held a 1% NSR on the Mine Property, which Detour Gold purchased for $1 million in November 2012. In September 2010, Detour Gold acquired the Aurora claims blocks from Conquest Resources, and entered into an Option and Joint Venture Agreement to acquire a 50% interest in Conquest’s Sunday Lake claim block. The remaining interest in the Sunday Lake claims block was acquired in December 2014, giving Detour Gold a 100% interest in those claims. In December 2011, Detour Gold acquired Trade Winds Ventures Inc., giving Detour Gold a 100% interest in the Block A and Gowest properties. Detour Gold amalgamated with its wholly-owned subsidiary Trade Winds effective January 1, 2014. On January 31, 2020, Kirkland Lake Gold completed the acquisition of Detour Gold and Detour Gold became a wholly-owned subsidiary of Kirkland Lake Gold. On January 2, 2021, Detour Gold was amalgamated with Kirkland Lake Gold Inc., a wholly- owned subsidiary of Kirkland Lake Gold and the amalgamated entity was renamed Kirkland Lake Gold Inc. 4.3.2 Current Ownership The Project is wholly-owned by Kirkland Lake Gold Inc., a subsidiary of Kirkland Lake Gold. 4.4 Mineral Tenure The 646 km² Project area forms one contiguous group of mining patents, mining leases and cell mining claims in the District of Cochrane, Ontario, with a small group of cell claims in Massicotte Township, Québec. The Detour Lake Operations are within the following mining leases and mining patents: LEA-109295, LEA-107399, LEA-109361, LEA-109040, LEA- 107400, LEA-107392, LEA-108893, LEA-107394, LEA-107174, LEA-108269, LEA-109382, LEA-107398, LEA-107395, LEA-107396, LEA-107397, LEA-107393, LEA-107402, LEA- 107397, LEA-107401, LEA-107404, PAT-5479, PAT-5477, PAT-5478, PAT-5482, PAT- 5485, PAT-5484, PAT-5483, PAT-5481, PAT-5476, and PAT-5480. A summary of the mineral tenure is provided in Table 4-1 and shown in Figure 4-1 and Figure 4-2. Appendix A contains the details of the individual mineral tenures, including location, area, expiry date and any associated royalties. More detailed location maps are provided with the claims tables in Appendix A.
Detour Lake Operations Ontario, Canada NI 43-101 Technical Report March 2021 4-7 Table 4-1: Mineral Tenure Summary Table Description Units Area (ha) Ontario Cell mining claims 2,213 39,714 Lease documents 44 23,712 Patent documents 6 602 Québec Claims 20 549 Total 2,283 64,577
Detour Lake Operations Ontario, Canada NI 43-101 Technical Report March 2021 4-8 Figure 4-1: Mineral Tenure Summary Location Plan Note: Figure prepared by Kirkland Lake Gold, 2020. Appendix A includes subset figures that more clearly show the individual claim numbers.

Detour Lake Operations Ontario, Canada NI 43-101 Technical Report March 2021 4-9 Figure 4-2: Detour Lake Operations Mining Lease and Mining Patent Location Plan Note: Figure prepared by Kirkland Lake Gold, 2020. Appendix A has subset figures that explain the infrastructure shown.

Detour Lake Operations Ontario, Canada NI 43-101 Technical Report March 2021 4-10 4.4.1 Patented Documents The patented parcels of land are the most secure form of land tenure and are subject to an annual mining tax payable to the Crown. The patented lands are described by the legal survey of individual mining claims and surveyed mining locations. 4.4.2 Leasehold Documents The leasehold mining lands consist of 21-year mining leases issued for mining claims that were legally surveyed as individual mining claims or defined by the perimeter survey of groups of mining claims. Each perimeter survey is given a Certified Legal Manager (CLM) designation to describe the surveyed group of claims. Leaseholders are subject to an annual rental payable to the Crown. The Mining Act (Ontario) contains provisions for the renewal of 21-year mining leases. Applications for renewal are subject to review and consent by the ENDM. 4.4.3 Cell Mining Claims Mining claims are legally defined by their cell position on the grid and coordinate location in the Mining Lands Administration System (MLAS) map viewer. The unpatented mining claims (cell mining claims) held by Kirkland Lake Gold do not confer any right, title, interest or claims in or to the mining claims other than the right to proceed as is in the Mining Act (Ontario). Upon registering cell mining claims (cells), Kirkland Lake Gold must perform and file exploration assessment work and apply on those cells assessment work credits to maintain them in good standing. The first unit of assessment work of $400 per 20 ha is required by the second anniversary date of the recording of the cell and an additional unit is required to be performed and filed for each year thereafter. Until a mining lease for the mining claims is issued, the Kirkland Lake Gold does not have the right to remove or otherwise dispose of any minerals found in, upon or under the mining claim. 4.4.4 Claims A claim in Québec provides the stakeholder with a two-year right to explore within the claim holdings for any mineral substance with exceptions. After the initial two-year period claims can be renewed for an additional two-year term on certain conditions including that sufficient assessment work is performed on the claims or payment is made in lieu. 4.5 Surface Rights Kirkland Lake Gold has 30 leases and 10 patents totaling 18,574.442 ha of surface rights on the Detour Lake Project. The patented lands are subject to a yearly annual mining tax payable to the Crown. The 21-year mining leases are subject to an annual rental payable to the Crown and applications for renewal are subject to review and consent by the MNDM. Fourteen leases totaling 4,679.946 ha will require renewal in 2023.

Detour Lake Operations Ontario, Canada NI 43-101 Technical Report March 2021 4-11 Kirkland Lake Gold’s surface rights are sufficient for all the infrastructure and operation of the mine. The infrastructure included the construction of a 230-kV transmission line, a processing plant facility, various mine site buildings (mine services facility, bulk explosives plant, wash bay, fuel and lube island, etc.), a permanent camp, and new roads to connect the infrastructure buildings. 4.6 Water Rights Kirkland Lake Gold does not exclusively hold water rights in the region. As part of the ongoing environmental compliance Kirkland Lake Gold is required to capture all site runoff from stockpiles and the open pits. Water taking from groundwater and freshwater sources is regulated by the Ontario Ministry of Environment, Conservation and Parks (MECP) via Permits to Take Water (PTTW). The Detour Lake Mine has a number of active PTTW, which are renewed at the required regulatory frequency in order to support activities over the life- of-mine (LOM). Since this water is required to be captured it puts the site water balance in a surplus over the LOM, providing sufficient water to be used for processing in the mill, with the excess being discharged to the environment under the permitted discharge conditions for the operations. 4.7 Royalties and Encumbrances The Project is subject to the royalties listed in Table 4-2. Claim blocks that are subject to royalties are provided in Appendix A and are shown in Figure 4-3. Kirkland Lake Gold has an option to acquire 50% of the royalty on the Gowest property at any time up to the date that is one year from the date from which “commercial production” commences on the Gowest property. Prism Resources Inc. (Prism) claims it is entitled to a 7.5% net profit interest on the Aurora and Sunday Lake properties (the NPI). Kirkland Lake Gold disputes the claim made by Prism and has asserted that the NPI does not in fact exist. Prism commenced proceedings against Detour Gold Corporation in British Columbia and in August 2018 the Supreme Court of British Columbia declined to exercise jurisdiction and the proceeding was stayed. In April 2019, Prism filed a statement of claim against Detour Gold Corporation and applied for a summary judgement motion against Detour Gold Corporation. The summary judgement motion was set to proceed in January 2021; however, to date, the matter has been adjourned to March 2021. Kirkland Lake Gold believes this claim is without merit and has filed a security for costs motion pursuant to which Prism has been required to post security for costs in the amount of $98,415.41 into court. The Detour Lake Operations are not subject to any other back-in rights payments, agreements or encumbrances.
Detour Lake Operations Ontario, Canada NI 43-101 Technical Report March 2021 4-12 Table 4-2: Royalty Summary Table Property NSR Amount NSR Holder Buy-out Option Blocks A through E 2% Franco–Nevada none Mine property 2% Franco–Nevada none Purchased claims (individual) 2% Individual prospector none Gowest 1% Franco–Nevada $750,000 Figure 4-3: Detour Lake Property Area Map Showing Areas with Royalty Payments Note: Figure prepared by Kirkland Lake Gold, 2020 4.8 Permitting Considerations Permitting considerations for operations are discussed in Section 20. Exploration activities require water-taking permits to be obtained to provide the necessary water for exploration drilling activities. To date, all such permits have been granted as required.
Detour Lake Operations Ontario, Canada NI 43-101 Technical Report March 2021 4-13 4.9 Environmental Considerations Environmental considerations for operations are discussed in Section 20. Current exploration liabilities consist with respect to the environment primarily consist of the potential for fuel and lubricant spills and the risk of fire during the drier months resulting from heavy equipment. Liabilities and closure considerations associated with the current operations are provided in Section 20. 4.10 Social License Considerations Social licence considerations for operations are discussed in Section 20. 4.11 Comment on Property Description and Location To the extent known to the QP, there are no other significant factors and risks that may affect access, title, or the right or ability to perform work on the Project that have not been discussed in this Report.

Detour Lake Operations Ontario, Canada NI 43-101 Technical Report March 2021 5-1 5.0 Accessibility, Climate, Local Resources, Infrastructure, and Physiography 5.1 Accessibility From the town of Cochrane (population of approximately 5,000 residents), the Project is easily accessible by the Detour Lake Mine road, the northern extension of Highway 652. The first 151 km on Highway 652 is paved surface, followed by 34 km of well-maintained gravel surfaced road to the mine site. Road access is available year-round. The closest major airport to the site is at Timmins, Ontario, approximately 61 km to the southeast. Site access is controlled by a 24 hour a day manned security gate to prevent the general public accidentally accessing the active mining areas. 5.2 Climate The climate in the Project area is characterized by cold winters and mild summers. The mean annual temperature is estimated at 0.5°C, with average daily temperatures ranging from -18.7°C in January to 16.5°C in July. The average total annual precipitation is estimated at 862 mm with approximately 30% falling as snow, and the greatest precipitation contribution occurring as rain during June through October. The predominant wind direction is from the west. Mining and exploration activities are conducted year-round. 5.3 Local Resources and Infrastructure The closest settlement to the Project is the Town of Cochrane, Ontario. The region benefits from a strong contractor and supplier base to the mining industry. Skilled labour and suppliers are readily available in Cochrane, Timmins, Kapuskasing, Iroquois Falls, and Kirkland Lake Gold. Additional information on site infrastructure is provided in Section 18. 5.4 Physiography Site topography is subdued with maximum local relief of approximately 30 m. The elevation ranges from approximately 260–288 metres above sea level. There is a pronounced north/south fluting of the landscape consistent with the general direction of the most recent glaciations in this area.
Detour Lake Operations Ontario, Canada NI 43-101 Technical Report March 2021 5-2 Areas of higher relief are sparsely wooded with jack pine, black and white spruce, balsam fir, trembling aspen, and white birch. Areas that are slightly lower in relief are poorly drained and characterized by muskeg. There is very little bedrock outcrop and much of the Project area is overlain by thick accumulations of glacial material that includes till and glaciofluvial material (poorly sorted sand with lenses of gravel). Numerous small streams linking elliptical lakes and ponds, generally oriented parallel to the pattern of glacial fluting. Numerous small and shallow lakes are found within the Project area, the largest being Sunday Lake, with a surface area of approximately 2.8 km2. 5.5 Sufficiency of Surface Rights There is sufficient surface area for the open pits, waste rock storage facilities (WRSFs), plant, TMA; (cells one, two and three), associated infrastructure, and other operational requirements for the LOM and mine plan discussed in this Report.

Detour Lake Operations Ontario, Canada NI 43-101 Technical Report March 2021 6-1 6.0 History 6.1 Exploration History The exploration history is summarized in Table 6-1. 6.2 Production History During the initial 17-year mine life from 1987–1999, production is estimated at 1.7 Moz Au from about 14.3 Mt grading 3.82 g/t Au, with mill recovery averaging 93.1%. Production during the Detour Gold ownership period (2013–30 January 2020) is estimated at 3.6 Moz Au from about 135.5 Mt grading 0.90 g/t Au, with mill recovery averaging 90.1%. Production since Kirkland Gold became Project operator is provided in Table 6-2.
Detour Lake Operations Ontario, Canada NI 43-101 Technical Report March 2021 6-2 Table 6-1: Exploration History Year Company Work Completed 1974– 1979 Amoco Completed regional airborne geophysical surveys, ground Crone electromagnetic, RADEM and magnetometer surveys, drilling (335 core holes for 57,339 m in Mine Property area, 6 core holes for 986 m in Block A), decline construction, construction of a winter road, mineral resource estimate, and completion of a feasibility study in the Mine Property area. The feasibility study results were not encouraging and the property was offered for joint venture. 1978 Amoco, Campbell and Dome JV agreement signed. 1979– 1987 Campbell and Dome Completed channel and rock chip sampling, surface and underground drilling, mineral resource and reserve estimates in the Mine Property area. Open pit mining commenced in 1983 and was completed in 1987. 1983– 1984 Global Energy Corporation Option from Ingamar Exploration Ltd on Block A. Completed 15 drill holes. Narrow gold intersections returned from several closely spaced holes approximately 400 m north of Lindbergh Lake (west of the West Detour deposit). 1987– 1999 Placer Dome Inc. Merger between Campbell, Dome and Placer Development. Acquired Amoco’s 50% property interest in 1988. Open pit mining briefly recommenced in 1998. Underground mining at Detour Lake commenced in 1987 and ran to 1999. Due to a combination of low metal prices and production and grade problems all mining ceased in 1999, and reclamation activities were initiated. Drilling in the period 1987–1998 consisted of 4,219 surface and underground holes (435,002 m). Placer Dome completed an additional 90,889 m in 283 core holes for exploration purposes on the Mine Property and 62,147 m in 133 holes in outlying areas. 1998 Pelangio- Larder/Franco– Nevada Acquired the Mine Property from Placer Dome. Also acquired certain parts of the Detour Exploration Lands surrounding the Mine Property. 2000 Trade Winds Marl Resources acquired the Pelangio-Larder interests. Franco–Nevada interest passes to Newmont. 2002 Pelangio Completed the purchase Newmont’s interest in the Detour Lake JV. Newmont retains 2% NSR, subsequently transferred NSR to Franco–Nevada. 2003 High River Gold Mines Ltd. Pelangio and High River Gold Mines formed a strategic alliance whereby High River acquired 19% of Pelangio shares and provided technical expertise and operations management to Palangio. 2003– 2011 Trade Winds Completed core holes (134,000) m in the Block A and Gowest properties. Drilling of 109,718 m in 329 holes at Detour West. Mineral resource estimate for West Detour deposit. 2004– 2006 Pelangio Completed drilling consisting of 127 core holes (29,769 m) and a mineral resource estimate assuming a combined underground and open pit operation. 2006– 2019 Detour Gold Purchase agreement with Pelangio in 2007 to acquire all Detour Lake assets, including Block A. Acquired Goldcorp (successor to Placer) interest in Mine Property in 2008. Concluded JV agreement with Trade Winds in 2009. Acquired Aurora property from Conquest Resources in 2010. Acquired Trade Winds and thereby a 100% interest in the Block A and Gowest properties. Purchased Goldcorp 1% NSR on the Mine Property for $1 million in 2012. Obtained 100% interest in Sunday Lake Property in 2014. Completed geological mapping, mobile metal ion (MMI), bedrock grab and channel geochemical surveys, an amplified geochemical imaging soil gas survey,

Detour Lake Operations Ontario, Canada NI 43-101 Technical Report March 2021 6-3 Year Company Work Completed age dating, airborne geophysical surveys, ground induced polarization (IP), infill drilling (541,087 m in 1,395 core holes at Detour Lake; 49,158 m in 156 core holes at West Detour), geotechnical, metallurgical and condemnation drilling, mineral resource and mineral reserve estimates, pre-feasibility and feasibility studies assuming open pit mining. Mine construction commenced in 2012, and commercial production was declared in 2013. Exploration core drilling included 12,054 m in 38 holes peripheral to the Detour Lake Mine in 2008; 5,025 m in 22 holes targeting the vicinity of Detour Lake Mine, the Sunday Lake Property and LDDZ (in the Lower Detour area) during 2011; 5,061 m in 17 holes targeting the Lower Detour area in 2012; 26,765 m in 80 holes targeting the Lower Detour area and Sunday Lake Property in 2013; 14,874 m in 40 holes targeting the Lower Detour area in 2014; 36,577 m in 72 holes targeting Zone 58N in the Lower Detour area in 2015; 52,079 m in 168 holes targeting Zone 58N and 17,434 m in 59 holes in Lower Detour and tailings management areas (TMA), and Massicotte claims during 2016, 35,212 m in 99 holes targeting Zone 58N and 1,155 m in 3 holes in TMA area during 2017. During 2019, Detour gold completed 41 core drill holes within the Lower Detour Property totalling 13,651 m. 2020 Kirkland Lake Gold In 2020 during the acquisition period of Detour Gold by Kirkland Lake Gold Inc., 11 holes were drilled at 58N totaling 3,693 m. Kirkland Lake Gold commenced a large surface core program to look for mineralization extensions that could potentially support Mineral Resource estimation or upgrades to confidence categories, with 78 core holes with 6 wedge holes totalling 66,115 m drilled in 2020. In support of the core program, exploration offices were expanded, a new core logging facility was constructed to provide additional logging space, and laydown areas were expanded. The database was changed from Access to Fusion (a Datamine product) and logging is now performed using DH logger (an Access logging program). Table 6-2: Production History, Kirkland Gold Year Ore milled (Mt) Grade (g/t Au) Recovery (%) Recovered Gold (koz) 2020* 21.1 0.83 91.4 516.8 Note = *January 31 2020 to December 31 2020.
Detour Lake Operations Ontario, Canada NI 43-101 Technical Report March 2021 7-1 7.0 Geological Setting and Mineralization 7.1 Regional Geology The regional geology description is summarized from Oliver et al., (2011). The Project is located within the northwestern portion of the Abitibi Greenstone Belt, which lies, in turn, within the eastern part of the Wawa-Abitibi sub-province, a Neoarchean granite- greenstone sub province in the southern Superior Province of the Canadian Shield craton. The Abitibi Greenstone Belt consists of east–west-trending synclines of felsic to ultramafic volcanic rocks. Intervening domes are cored by syn-volcanic tonalite and gabbrodiorite rocks and alternate with east–west-trending bands of late tectonic turbiditic and conglomeratic sedimentary rocks. Most of the volcanic and sedimentary strata dip vertically and are commonly bound by abrupt, east–west-trending faults with varied dips. The stratigraphy of the Abitibi Greenstone Belt is subdivided into earlier volcanic-dominated episodes that include the Pacaud assemblage (2770–2736 Ma), the Deloro assemblage (2730–2724 Ma), the Stoughton-Roquemaure assemblage (2723–2720 Ma), the Kidd- Munro assemblage (2719–2711 Ma), the Tisdale assemblage (2710–2704 Ma), and the Blake River assemblage (2704–2695 Ma). These sequences are unconformably overlain by turbidites and calc-alkaline volcanic rocks of the Caopatina assemblage (ca. 2700 Ma) in the north and the Porcupine assemblage (2690–2685 Ma) in the south. These units in turn are unconformably overlain by coarse clastic and alkaline volcanic rocks of the Opemisca assemblage (ca. 2692 Ma) in the north and the Timiskaming assemblage (2676– 2670 Ma) in the south. A regional geology figure is included as Figure 7-1. 7.2 Project Geology In the Project area, the greenstone–granite architecture is partially aligned and disrupted along a linear, east–west-trending belt that defines the position of the Sunday Lake Deformation Zone. Supracrustal rocks within the Project area consist of a thick sequence of mafic to ultramafic lithologies, which are predominantly volcanic in origin, and are part of the Deloro assemblage. They occur within regional synclinal-anticlinal fold structures traced for over 30 km across the Project and are in structural contact to the south with the younger sediments of the Caopatina assemblage. These rocks are bounded to the north and west by the Opatica basement gneissic rocks. To the east and south, the Deloro assemblage is intruded by several large, weakly foliated granodioritic to tonalitic intrusions which are intersected by numerous local felsic to mafic dykes, sills and younger regional Proterozoic diabase dykes. 7.2.1 Lithologies The major lithologies in the Project area are summarized in Table 7-1. A Project-scale geology plan is provided in Figure 7-2.

Detour Lake Operations Ontario, Canada NI 43-101 Technical Report March 2021 7-2 Figure 7-1: Regional Geology Plan Note: Figure from Oliver et al., (2011).

Detour Lake Operations Ontario, Canada NI 43-101 Technical Report March 2021 7-3 Table 7-1: Lithology Table Major Unit Sub-Unit Description Comment Tonalitic to granodiorite intrusions Weakly foliated and distinctly tonalitic in composition. The intrusion shifts to a more granodioritic composition within 300 m of its contact. Felsic to mafic dykes The dykes can have a variety of colours and textures ranging from light to dark coloured and aphanitic to feldspar porphyritic. Intermediate dykes are less common and are predominantly fine-grained and locally porphyritic. Most dykes have east-west trends, parallel to sub-parallel to the main foliation. Intrude all earlier units Caopatina assemblage Poorly to well laminated metasedimentary unit (argillites, greywackes and quartz wackes) and mafic volcaniclastics Upper Detour Lake Formation Chloritic greenstone Mafic to ultramafic komatiitic volcanic rocks, strongly altered to chlorite or talc–chlorite schist Amphibolite dykes (flow) Lower strain mafic dykes or flows, concordant with the stratigraphy. The amphibolite units generally occur at the base of the first two pillow flow sequences north of the Sunday Lake Deformation Zone and show less pervasive mineralization and alteration than the adjacent flows. Massive flows Grey; fine to medium grained with local porphyritic texture; weak to moderately foliated. Pillow-structure, hyaloclastite and vesicles filled by calcite may be present locally Several very massive magnesium-rich tholeiitic flow sequences are present in the hanging wall sequence of the Detour Lake Mine and West Detour deposit Pillow flows Fine to medium-grained; usually shows foliation. Characterized by pillow selvages, the formation of hyaloclastite, and vesicles filled by calcite Common throughout the Detour Lake Mine and West Detour areas Lower Detour Lake Formation Mafic sills and dykes Abundant mafic (gabbroic) intrusions, finer- grained flows, and dykes Mafic intrusions may be strongly magnetic Megacrystic diorite Megacrystic diorite sill Mafic volcanic Dense green–black flow unit Lies to the south of the talc– chlorite alteration zone of the Detour Lake Mine Ultramafic flows and sills Thick sequence of ultramafic flows, with locally-preserved spinifex textures, coarse- grained pyroxenites, and fine-grained ultramafic sills. Conformable contact relations with the other volcanic units. Not observed in the West Detour deposit.

Detour Lake Operations Ontario, Canada NI 43-101 Technical Report March 2021 7-4 Major Unit Sub-Unit Description Comment Mafic flow contact unit (chloritic schist) 5–20 m-thick flow unit, fine grained, light to dark greenish black; commonly overlies ultramafic rocks Is present on both the footwall and hanging wall sides of the chert marker horizon Chert marker horizon Thin (0.5–2.0 m thick), cream to buff, locally laminated, and commonly strongly sulphidized felsic rock. May represent deformed tuffaceous or volcaniclastic rocks, which mark the transition from ultramafic- to mafic- dominated volcanism in the Detour Lake Formation. Not observed in the West Detour deposit. Figure 7-2: Project Geology Map Note: Figure prepared by Kirkland Lake Gold, 2020. SLDZ = Sunday Lake Deformation Zone; MDZ = Massicotte Deformation Zone; LDDZ = Lower Detour Deformation Zone.

Detour Lake Operations Ontario, Canada NI 43-101 Technical Report March 2021 7-5 The Deloro Assemblage, north of the SLDZ, is sub-divided into the Upper Detour Lake Formation, a volcanic assemblage dominated by tholeiitic basalt (mainly high-Mg massive and high-Fe pillowed flows); and the Lower Detour Lake Formation, an ultramafic-dominant komatiitic and high-Mg tholeiitic volcanic and intrusive assemblage. Where the komatiitic lithologies are in contact with the Sunday Lake Deformation Zone, they are highly deformed and altered into talc–chlorite schist. The contact is highly mylonitized, mineralized and silicified and hosts a strongly deformed felsic to intermediate dyke-like body known locally as the “chert marker horizon”. The chert marker horizon is not a chert unit, but rather a fine-grained felsic volcaniclastic unit and/or a series of intensely silicified and sulphidized volcanic rocks and intermediate sills and dykes. It occurs between mafic-dominated volcanic rocks of the Upper Detour Formation (hosts hanging wall mineralization) and ultramafic volcanic rocks of the Lower Detour Formation (hosts footwall mineralization). 7.2.2 Structure The major structural feature is the 30 km-long Sunday Lake Deformation Zone, an east– west-trending, steeply north-dipping deformation corridor. The zone marks the northern contact between the Caopatina assemblage sedimentary rocks and the underlying Deloro assemblage volcanic rocks. Mineralization at Detour Lake and West Detour is spatially related to Sunday Lake Deformation Zone structures. Kinematic indicators confirm sinistral–reverse north over south motion along the Sunday Lake Deformation Zone. A regional east–west trending structure, the Massicotte Deformation Zone is recognized several kilometres to the south of the Sunday Lake Deformation Zone and extends for over 30 km in strike length. It marks the southern contact between the Caopatina assemblage sedimentary rocks and the underlying Deloro assemblage volcanic rocks. The third major structure is the Lower Detour Deformation Zone, a 30 km long, east–west- trending, and steeply south-dipping one that separates Caopatina assemblage sedimentary rocks and the underlying Deloro assemblage volcanic rocks. The 58 North Zone (58N) occurs immediately south of the Lower Detour Deformation Zone. The youngest structures are a series of 120–145° trending faults, which are locally intruded by Proterozoic-age diabase dykes. Two east-trending synform–antiform pairs are developed in the volcanic assemblage, the North Walter Lake Synform and the Airstrip Antiform (Figure 7-3). These folds are tight, upright, slightly overturned, and south-facing. A later fold set consists of broad open folds that have axial traces striking at approximately 145°,and plunging 10–35° to the northwest. The inter-limb distances of these folds are approximately 8–12 km.
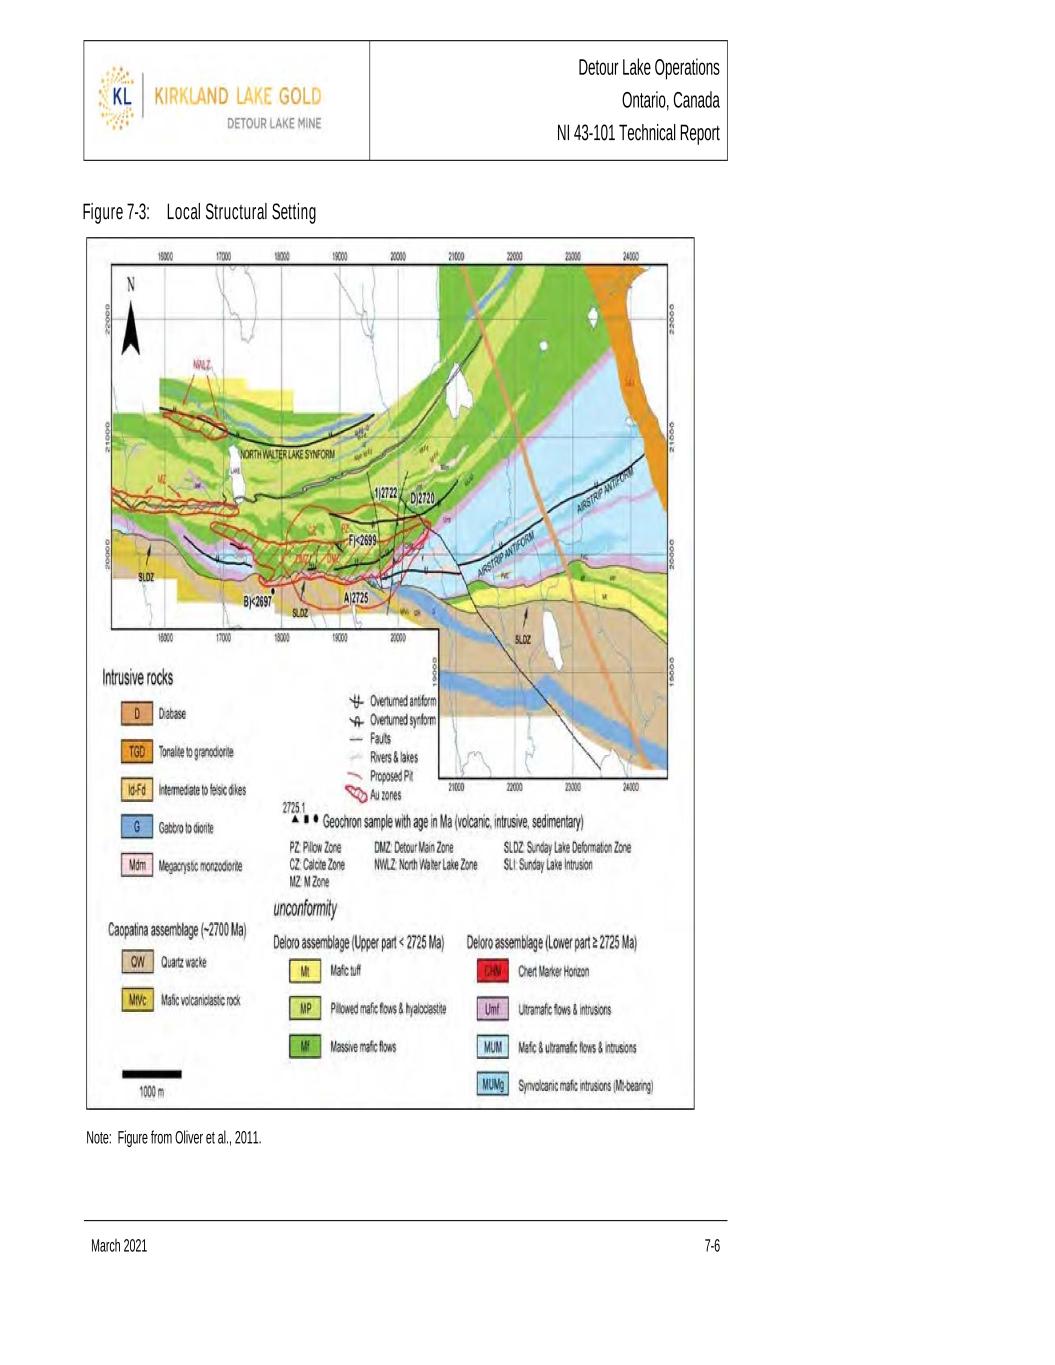
Detour Lake Operations Ontario, Canada NI 43-101 Technical Report March 2021 7-6 Figure 7-3: Local Structural Setting Note: Figure from Oliver et al., 2011.

Detour Lake Operations Ontario, Canada NI 43-101 Technical Report March 2021 7-7 7.2.3 Metamorphism All rock units have undergone upper greenschist to lower-grade amphibolite metamorphism. 7.2.4 Alteration All lithological units are hydrothermally altered proximal to major deformation zones. Strong secondary biotite is developed in mafic rocks. Talc–actinolite chlorite assemblages formed in ultramafic sills next to the chert marker horizon and across the northern edge of the Detour Lake deposit and through the West Detour deposit. The footwall magnesium- rich komatiitic volcanic rocks show alteration to schistose rocks with a mineral assemblage of chlorite–talc–calcite–tremolite/actinolite–biotite. Silicification may overprint the biotite alteration or occur as an intense pinkish halo with associated potassic feldspar flooding. 7.2.5 Mineralization There are two recognized episodes of gold mineralization at the Detour Lake and West Detour deposits. The first episode consists of a wide and generally auriferous sulphide-poor quartz vein stockwork formed in the hanging wall of the Sunday Lake Deformation Zone. The sulphide- poor quartz vein stockworks observed in the hanging wall have sub-vertical north or south dips and are parallel to a series of east-west trending high strain zones. These veins form a weak stockwork and are boudinaged and/or folded. The second episode is a stage of gold mineralization overprinting the early auriferous stockwork, principally in the hanging wall of the Sunday Lake Deformation Zone, with a higher sulphide content. The sulphide-rich gold mineralization predominantly fills structural sites in deformed quartz veins, fractures and veins crosscutting the foliation fabric but also in pillow breccias and selvages. The distribution of sulphide-rich mineralization is strongly controlled by the geometry of kinematic orientation (i.e., pyrite and pyrrhotite concentrations have a shallow westerly plunge similar to the plunge of the main flexure zone in the Sunday Lake Deformation Zone at an angle of about 40° (in the area of the former Campbell pit), shallowing to approximately 10° further to the west). 7.3 Deposit Descriptions 7.3.1 Detour Lake Dimensions Mineralization at Detour Lake is hosted within a broad corridor. In mine grid coordinates the mineralization extends from 16,900E to 20,650E, 19300N to 20,650N and 5,500 m
Detour Lake Operations Ontario, Canada NI 43-101 Technical Report March 2021 7-8 elevation to 6,300 m elevation. This corresponds to a strike extent of 3.75 km, a width of 1.35 km, and an approximate elevation range of 800 m. Lithologies Mineralization is hosted within a broad assemblage of mafic volcanic rocks with an overall east–west trend. Detour Gold had drill tested this mineralized corridor for a distance of over 5 km, west from the former Campbell pit. The bulk of the mineralization within this corridor is concentrated along a highly-strained corridor of a moderate to strong potassic alteration envelope at the contacts between pillowed and massive mafic flows. At the eastern end of this corridor at the Detour Lake Mine is the Main Zone. The Main Zone was the largest gold-bearing mineralized zone and consisted of gold mineralization occurring in the chert marker horizon or in quartz and quartz-carbonate vein systems splaying from the Sunday Lake Deformation Zone. Historic quartz zones Q50, Q70, Q100, and Q120 zones were typical quartz veins arrays splaying off the Sunday Lake Deformation Zone into the hanging wall. The former Campbell open pit is located at the shallowest zone developed along the contact between massive Mg-rich tholeiitic and pillowed Fe-rich tholeiitic volcanic rocks. West of section 19,620E, the mineralization mainly straddles the lower massive flow-pillow flow contact and is commonly associated with increased biotite alteration. Mineralization is generally well distributed within this sequence but lithological changes to coarser and massive facies may locally affect mineralization continuity. From sections 16,160E to 17,160E, Placer Dome intersected the QK Zone along a massive flow-pillow flow contact between 600–750 m below surface. A geology plan is included as Figure 7-4, and geological cross-sections in Figure 7-5 to Figure 7-7. The Main Zone mineralization, the focus of historical underground mining, strikes easterly to northeasterly, has an average dip of 700N. It has a plunge of 400W near surface, flattening out to 0º below the 660 m level. The hanging wall contact is irregular, resulting from diverging quartz vein structures. The footwall contact is more regular and undulates with local dips varying from 300 to near vertical. The Quartz Hangingwall Zones strike at azimuth 0800 with a vertical to near vertical dip, and a plunge of 450_W parallel to the Main Zone. The Main Zone extends to a depth of 745 m, is open to the west along strike, and dips north at an average of 700. The Quartz Hangingwall Zones, also the subject of historical underground mining, are characterized by discrete groups of steeply- dipping (predominately north) quartz veins. Generally having widths of 3–5 m, these quartz zones appear to splay off the chert marker horizon, although it is difficult to trace these zones directly back to the chert. Potassic alteration is locally associated with these zones.

Detour Lake Operations Ontario, Canada NI 43-101 Technical Report March 2021 7-9 Figure 7-4: Deposit Geology Plan Note: Figure prepared by Kirkland Lake Gold, 2020. In this figure, green = pillowed volcanic rocks; blue = ultramafic intrusive rocks; magenta = talc; khaki = volcaniclastic rocks and tan = granodiorite. Red shapes are the outlines of the mineralized envelopes. Figure 7-5: Geological Section, Detour Lake, 589690 E (looking east) Note: Figure prepared by Kirkland Lake Gold, 2020. In this figure, green = pillowed volcanic rocks; purple = ultramafic intrusive rocks; magenta = talc. Red shapes are the outlines of the mineralized envelopes. Blue lines are drill traces.

Detour Lake Operations Ontario, Canada NI 43-101 Technical Report March 2021 7-10 Figure 7-6: Geological Section, Detour Lake, 590,740 E (looking east) Note: Figure prepared by Kirkland Lake Gold, 2020. In this figure, green = pillowed volcanic rocks; magenta = talc. Red shapes are the outlines of the mineralized envelopes. Drill traces in blue. Figure 7-7: Geological Section, Detour Lake, 591,640 E (looking east) Note: Figure prepared by Kirkland Lake Gold, 2020. In this figure, green = pillowed volcanic rocks; magenta = talc; thick black line = chert marker horizon; pale yellow = volcaniclastic rocks. Red shapes are the outlines of the mineralized envelopes. Drill traces in blue.

Detour Lake Operations Ontario, Canada NI 43-101 Technical Report March 2021 7-11 The mineralization hosted in the Main and Quartz Hangingwall Zones was tested by underground core drilling to a vertical depth of 900 m from surface and approximately 100 m below historical mine workings. The results from this drilling demonstrate that there may be potential to extend this mineralization at depth. The footwall Talc Zone is principally located between sections 19,700E and 20,540E (eastern end of the Detour Lake Mine). It is hosted in highly altered (i.e., serpentinized and talcose) ultramafic flows with mineralization concentrated at both the upper contact (chert marker horizon), and lower contact of the Sunday Lake Deformation Zone, next to barren volcaniclastics and mafic volcanic rocks. Locally, the mineralization is cut by felsic to intermediate intrusive dykes, ranging in width from 0.3–25 m. The footwall mineralization commonly contains boudins of quartz veins and felsic as well as intermediate dyke slivers. It is generally intensely sheared, especially in the area adjacent to the contact with the volcaniclastic sediments. Mineralization Gold is associated with quartz–carbonate–pyrite–pyrrhotite ± tourmaline veins and/or disseminated to very local semi-massive sulphides in hydrothermally-altered wall rocks. There are two main mineralized zones, defined as hanging wall mineralization and footwall mineralization. Figure 7-8 is a plan view example showing the distribution of the two mineralized zones. Figure 7-9 is a section view example. Hanging Wall The hanging wall gold mineralization occurs in several different rock units within broad sub- vertical mineralized envelopes and splits into several sub-vertical domains sub-parallel to the orientation of the Sunday Lake Deformation Zone. The Main Zone was the largest gold-bearing mineralized zone exploited in the period 1983– 1987 and consists of gold mineralization occurring in the chert marker horizon or in quartz and quartz–carbonate vein systems splaying from the Sunday Lake Deformation Zone. In the Campbell pit area, <1 m thick quartz veins, with a frequency of greater than one vein per metre, were part of a series of sub-vertically dipping east–west-trending highly-strained zones. Gold generally occurred as free gold with these veins. West of section 19,620E, mineralization is commonly associated with increased biotite alteration, shearing, narrow quartz veining and minor pyrite or pyrrhotite. Local zones of strong brecciation with sulphide infilling have also been recognized along with minor chalcopyrite, telluride minerals and visible gold. Gold mineralization is associated with a series of sub-vertical to arcuate deformation zones characterized by enhanced strained fabrics, well defined open-space breccias, and to a lesser degree sheeted shear-hosted veins and extensional veins.

Detour Lake Operations Ontario, Canada NI 43-101 Technical Report March 2021 7-12 Figure 7-8: Plan of Footwall and Hanging Wall Mineralization (60 m elevation) Note: Figure prepared by Kirkland Lake Gold, 2020. Figure 7-9: Footwall and Hangingwall Mineralization Section 592040E (looking east) Note: Figure prepared by Kirkland Lake Gold, 2020.

Detour Lake Operations Ontario, Canada NI 43-101 Technical Report March 2021 7-13 The QK Zone further to the west is open down plunge and has not been tested below 800 m. This mineralization is associated with narrow parallel to sub-parallel quartz veins, quartz boudins and sulphide rich veins/breccias with adjacent silicification and potassic alteration envelopes. Footwall Mineralization The Talc Zone varies in width from 4–15 m and tends to be less continuous along strike. Gold in the Talc Zone is dominantly associated with pyrite, pyrrhotite, and minor chalcopyrite along foliation planes, narrow discrete shears or strain zones, and in irregular lenses. The zones also contain short deformed lenses or boudinaged quartz veins. In some cases, it appears that the mineralization is controlled by strong fault structures containing several centimetres of gouge material. 7.3.2 West Detour and North Pit Areas Dimensions The West Detour mineralization extends from mine grid sections 14,500E to 17,600E and 19,100N to 21,300N and between elevation 5,300 and 6,300 m. This corresponds to a strike extent of 3.1 km, a width of 2.2 km, and an approximate elevation range of 1 km. Lithologies Generally, the gold zones occur in a variety of structural settings and several rock types including massive to pillowed tholeiitic basalt flows, variably deformed-altered basaltic to peridotitic komatiite units, cherty tuffs, gabbro and deformed felsic to intermediate dykes. Larger gold zones are subparallel to concordant with stratigraphy (contact related) and smaller quartz and potassic veins occur along splays. Most of the West Detour mineralization is closely associated with talc/chlorite greenstone schist within an auriferous structural corridor referred to as the M Zone. The QK Zone extends from 16,160E to 17,160E between 600–750 m below surface. Approximately 200 m north of the M Zone, the North Walter Lake Zone is developed in a zone of high strain with deformed quartz veins within pillowed to massive mafic volcanic flows. The North Walter Lake Zone gold mineralization is very similar to that found in the Detour Lake Mine hanging wall sequence. It is hosted by a komatiitic tholeiite mafic volcanic unit and flanked by Fe-tholeiitic mafic rocks in the hanging wall and Mg-tholeiitic mafic rocks in the footwall. Mineralization The M Zone lies approximately 400–500 m north of the chert maker horizon and is a westerly-trending gold system that is spatially associated with the margins of the chlorite schist unit. The chlorite schist stratigraphic horizon and associated gold mineralization was traced by drilling for approximately 5 km. The footwall and hanging wall sequence of the

Detour Lake Operations Ontario, Canada NI 43-101 Technical Report March 2021 7-14 chlorite schist in the M Zone is variably biotite altered with fairly abundant fractures and well-defined foliation (local veining) with associated pyrite, pyrrhotite, and rarely chalcopyrite. The mineralized zones appear lensoidal and plunge 20° west. Mineralized lenses vary from 5–5 m in true width. Mineralization hosted in the QK zone is associated with narrow veins that are parallel to sub-parallel to stratigraphy, quartz boudins, and sulphide-rich veins/breccias within silicified and potassic alteration envelopes up to 25 m in true width. Gold mineralization in the North Walter Lake Zone is within a relatively weak quartz vein stockwork with a low pyrite and pyrrhotite sulphide content. Mineralization is associated with moderate to strong shearing, potassic alteration of the mafic volcanic units, narrow quartz veining and minor pyrite and pyrrhotite. An example cross-section showing the geology and mineralized zones at West Detour is included as Figure 7-10. 7.3.3 Zone 58N Dimensions The Zone 58N mineralized system has been intersected over an east–west strike length of 450 m, from surface to a depth of 800 m, and the mineralized system remains open at depth. The mineralization extends from approximately 595,300E to 595,750E and 5,533,700N to 5,533,800N (UTM coordinates). The width of the mineralization is variable, ranging from 4 m to >100 m at the centre of the deposit. Infill drilling has demonstrated that the geology and mineralization dip subvertically at 75º to the south. Lithologies Gold mineralization in Zone 58N is within the southern portion of a feldspar porphyry intrusion, and characterized by intense brittle deformation and stockworks of quartz ± carbonate ± tourmaline veins with strong biotite–sericite–silica alteration. The thickness of the feldspar porphyry host rock can be >100 m and on average, mineralized lenses are 30 m wide. The feldspar porphyry intrusion narrows to the east and west near surface. Gold mineralization within Zone 58N is hosted by a swarm of plagioclase-phyric tonalitic dykes that intrude mafic rocks of the Deloro assemblage. The geometry of host dykes is controlled by a large (~1,000 m in diameter) cylindrically- shaped intermediate equigranular intrusion, resulting in emplacement at a slightly oblique angle to the strike of regional stratigraphy. The dyke rocks, and associated mineralization, reach a maximum width of 150 m near the southwestern portion of the intermediate intrusion, and taper along strike.

Detour Lake Operations Ontario, Canada NI 43-101 Technical Report March 2021 7-15 Figure 7-10: Geological Section, West Detour, 16,340 E (looking west) Note: Figure prepared by Detour Gold, 2018. Mineralization Visible gold is often present and occurs within coarse pyrite or as free gold within quartz. Sulphide mineralization associated with gold ranges from 0.5–5% pyrite with minor chalcopyrite, bismuth-tellurides, molybdenite and scheelite. Gold is found within and at the margins of quartz ± tourmaline ± carbonate stockwork-type veins that infill areas of brittle deformation. Visible gold occurs in nearly every drill hole that intersects mineralization and is also present as micro-inclusions within pyrite grains, or intergrown with bismuth-tellurides. A simplified cross-section showing the mineralized zones is provided as Figure 7-11.

Detour Lake Operations Ontario, Canada NI 43-101 Technical Report March 2021 7-16 Figure 7-11: Cross Section, Zone 58N, Zone 75, 595505 E (looking west) Note: Figure prepared by Detour Gold, 2018. 7.3.1 Zone 75 The surface expression of Zone 75 is located 20–50 m south of Zone 58N. Dimensions The Zone 75 mineralized system has been intersected over an east–west strike length of approximately 650 m, from surface to a depth of 600 m, and the mineralized system remains open at depth. The mineralization extends from approximately 595,200E to 595,775E and 5,533,700N to 5,533,775N (UTM coordinates). Mineralized intervals in the 75 Zone are 1– 5 m wide and up to 9 m locally.
Detour Lake Operations Ontario, Canada NI 43-101 Technical Report March 2021 7-17 Lithologies Zone 75 mineralization is localized to the stratigraphic contact of high-Mg and high-Fe tholeiitic mafic units. It is hosted by mylonitized and highly silicified rocks that have been subjected to chlorite, biotite and sericite alteration, which occasionally results in a banded chert-like appearance. Zone 75 dips at approximately 70º south. Mineralization When in close spatial proximity to Zone 58N, the mineralization within Zone 75 is much stronger and gold grades typically increase significantly. At depth when the lateral distance between Zone 58N and Zone 75 increases to >50 m, mineralization dramatically decreases in terms of both sulphide and gold content. The sulphide content of Zone 75 is much higher than Zone 58N, reaching up to 20% pyrite with lesser associated pyrrhotite, chalcopyrite, and sphalerite. Visible gold is rarely identified. Mineralized intervals are typically 1–5 m wide, and can reach as much as 9 m wide when in contact with feldspar porphyry dyke rocks. The simplified cross-section provided as Figure 7-11 includes Zone 75.
Detour Lake Operations Ontario, Canada NI 43-101 Technical Report March 2021 8-1 8.0 Deposit Types 8.1 Deposit Model The Detour Lake and West Detour deposits are considered to be examples of orogenic greenstone-hosted hydrothermal lode gold deposits. Greenstone-hosted hydrothermal lode gold deposits are typical of the Abitibi Greenstone Belt, and in particular the gold deposits found along the Destor–Porcupine Fault Zone from Timmins, Ontario through to Destor, Québec. These deposit types are found in greenstone belts around the world and are responsible for a large proportion of past world gold production, including most of the Canadian gold production. The majority of Archean orogenic greenstone-hosted lode gold deposits occur within volcano–plutonic domains, which are typically distributed along crustal-scale fault zones occurring along or in close proximity to terrane or sub-province boundaries (Card et al, 1989). Elongate belts of metavolcanic and some metasedimentary rocks containing subsidiary amounts of ultramafic to felsic intrusive rocks typically dominate these domains. The intrusive rocks will have typically been emplaced in multiple pulses throughout the geologic evolution of the area. Metamorphism within the belts is generally greenschist to lower amphibolite facies. The structure of the gold districts is characterized by the presence of multiple generations of structural fabrics indicating the presence of several periods of deformation. The deposit model for the 58, 58N, and 75 Zones is not firmly established. These mineralized lenses share characteristics with both syenite-associated oxidized intrusion- related deposits of the Kirkland Lake area (Robert, 2001) and the Sigma-Lamaque deposits of the southern Abitibi (Robert, 1986), the latter of which are thought to be associated with hydrothermal lode gold deposits. Syenite-associated intrusion-related gold deposits are distally related to major fault zones, and in association with preserved slivers of Temiskaming-like conglomerate rocks. The deposits consist of stockworks of gold-rich veins and zoned alteration and can be found within or at the margins of composite intrusive stocks, satellite dykes and sills, and along secondary faults and lithological contacts away from the intrusions. Ore bodies in these different locations are interpreted to represent proximal to distal components of large magmatic-hydrothermal systems centered on, and possibly genetically sourced from, composite intrusive stocks. These intrusions, and associated mineralization, are contemporaneous with the deposition of Temiskaming-like rocks and usually post-date major D1 regional deformation. 8.2 Comment on Deposit Types The QP is of the opinion that exploration programs that use a greenstone-hosted hydrothermal lode gold deposit or a syenite-associated intrusion-related gold deposit model are applicable to the Project area.

Detour Lake Operations Ontario, Canada NI 43-101 Technical Report March 2021 9-1 9.0 Exploration 9.1 Grids and Surveys Kirkland Lake Gold’s exploration drill targeting was planned and communicated using the local mine grid terminology in 2020; however, both collar survey locational data and down hole survey data were recorded in the Universal Transverse Mercator (UTM), 1983 North American Datum (NAD83) system. 9.2 Geological Mapping Detour Gold conducted reconnaissance field mapping programs between Hopper Lake and the Lower Detour area, and in the Lower Detour area along 200 m-spaced cut lines with maps produced at 1:5,000 scale. The mapping programs were used to field-check areas of geophysical anomalism and sites of historical drilling. Detailed mapping at 1:50 scale was conducted on selected outcrops and trenches along with channel sampling. 9.3 Geochemical Surveys 9.3.1 Soil Over 10,000 mobile metal ion samples were collected by Detour Gold in the period 2010– 2011, at 50 x 400 m line spacing. Samples were taken from 10–25 cm depth. The sampling identified a gold-mineralized corridor of about 30 km extent along the Lower Detour Deformation Zone. Data were used in exploration targeting in conjunction with ground geophysical data. A trial amplified geochemical imaging soil gas survey was conducted by Detour Gold in 2017 with a total of 33 samples collected. Of those samples, eight were collected near the western extent of the Detour Lake Project area over barren intrusive rocks, and the remining samples were collected in the West Detour area over known mineralization. Results indicated a positive correlation to known mineralization in the West Detour area with Factor 4, an assemblage focused on elevated values for several sulphide compounds, and C3–C4 compounds identified. In the area over barren intrusive rocks no elevated response was identified. Assay results from the soil gas survey indicated that only nine of the 56 elements in the multi-element suite were above detection limit and had suitable quality control measures. However, those nine elements generally had very low values and were not considered to be reliable vectors to mineralization. 9.3.2 Channel Channel and chip sampling, consisting of 45 samples, were completed in conjunction with outcrop mapping in the summer of 2012 and 2013. Results returned six samples above the
Detour Lake Operations Ontario, Canada NI 43-101 Technical Report March 2021 9-2 detection limit of 0.05 ppb Au. Of those six samples, three were collected from a medium grained tonalite–granodiorite outcrop near the TMA east of the Detour Lake Mine. Channel samples were collected as part of the regional mapping program that was focused on the Lower Detour area and specially the 58N prospect. One 40 m long hand-cleared area exposed a narrow east–west-trending silicified shear zone (up to 4 m wide) with minor quartz breccia stockwork and minor pyrite and pyrrhotite. The clearing was approximately 50 m south of the surface projection of a mineralized sheared zone intersected by drilling. 9.3.1 Trench In 2014 and 2016, 13 trenches were excavated in the outcrop within the planned TMA area, mapped, and sampled. A total of 151 channel samples were submitted for assay. The trenches identified gold mineralization associated with the Sunday Lake tonalite– granodiorite intrusion. Mapping and sampling in the area identified shear zones up to several metres in width that locally exploit northeast-trending mafic–intrusive contacts. 9.4 Geophysical Surveys 9.4.1 Airborne CGG Canada Services Ltd. completed a 13,816 line-km helicopter-borne MIDAS high resolution magnetic survey in 2015 over the entire Project area on behalf of Detour Gold. The survey was flown on 50 m line spacing at an elevation of approximately 30 m. The survey produced high quality total magnetic intensity and gradient data for additional processing. Final products received included line and grid data in the form of a Geosoft database (*.gdb) and XYZ file and Geosoft grids (*.grd), horizontal gradient enhanced total magnetic field, calculated vertical magnetic gradient, measured transverse magnetic gradient, total magnetic field, and digital elevation model. Third-party consultants Geoscience North produced various 3D inversions of the data along with further processing including tilt derivative and analytical signal. These products were used by Detour Gold and Kirkland Lake Gold to map the subsurface geology, and to generate a Project- and local-scale structural interpretation to help define drill targets. A map showing the airborne geophysical response in the Project area is provided as Figure 9-1. 9.4.1 Ground Completed geophysical surveys are summarized in Table 9-1 and the outlines of the various surveys are shown in Figure 9-2. Historical IP data was conducted with different arrays including dipole–dipole, gradient and pole dipole.
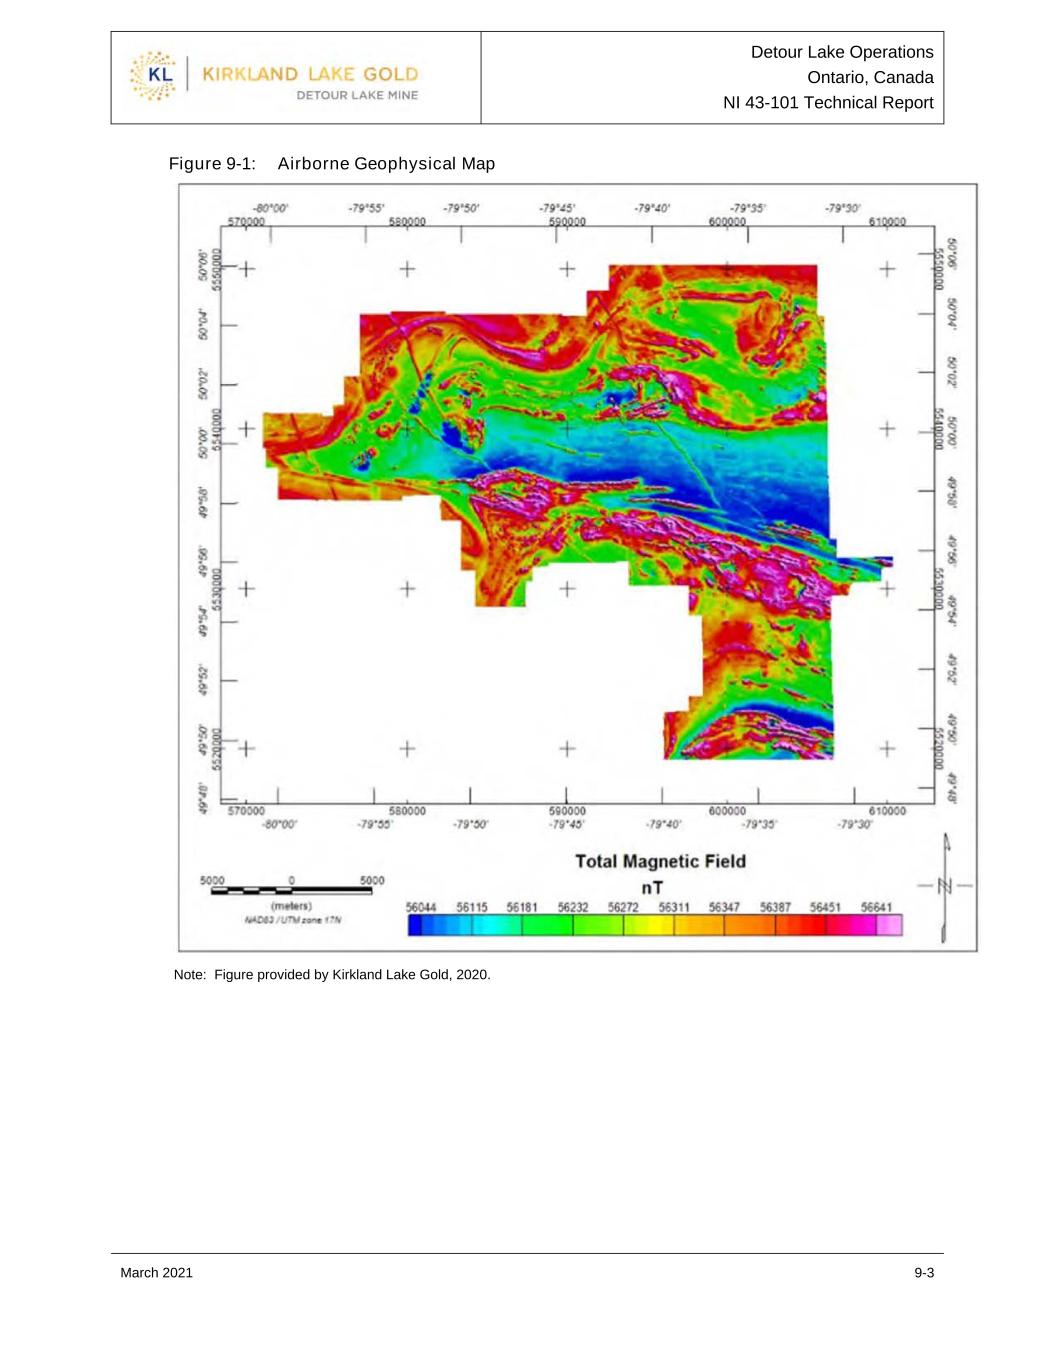
Detour Lake Operations Ontario, Canada NI 43-101 Technical Report March 2021 9-3 Figure 9-1: Airborne Geophysical Map Note: Figure provided by Kirkland Lake Gold, 2020.

Detour Lake Operations Ontario, Canada NI 43-101 Technical Report March 2021 9-4 Table 9-1: Ground Geophysical Surveys Year Company/Contractor Survey Comment 2011– 2012 Detour Gold 383 line-km phase domain dipole- dipole IP; lines 200 m apart, Outlined a number of geophysical anomalies tested by regional drilling programs with the 58, 75 zones identified in these campaigns. 2013 Detour Gold 67 line-km of time domain IP geophysical surveys; 51 line-km of gradient array and 5 line-km of sectional IP conducted in the Lower Detour area; 16 line-km of gradient array and 3 line-km of sectional IP completed in the Sunday Lake area Outlined several anomalies with follow up completed by core drilling programs in 2013 to 2015. Lower Detour Lake grid remains untested. 2014 Insight Geophysics 5.35 line-km of IP and sectional IP Designed to test overburden cover in North Walter Lake area. Not successful in delineating anomalies as it was run in an east–west orientation. 2015 Abitibi Geophysics 10 line-km of OreVision IP on Zone 58N of the Lower Detour area on lines spaced at 100 m; 60 line-km to the east of Lower Detour Lake on lines spaced at 200 m 58N grid correlated well to known mineralized zones and identified some anomalies proximal to 58N. Testing was not successful in identifying new mineralization. Numerous anomalies identified in Lower Detour East that remain untested. 2016 Abitibi Geophysics 147 line-kilometres of OreVision IP spaced at 100–200 m on the eastern end of the Lower Detour trend and in the area of the tailings facility. Borehole time domain IP at 75 and 58N Zones Produced near-surface and deep targets in the TMA area that were tested in 2016 and 2017. Lower Detour grid identified several anomalies that remain untested. 2017 Abitibi Geophysics 110 line-km of OreVision IP spaced at 200 m at the northeastern end of the TMA Identified anomalies were tested in 2017.
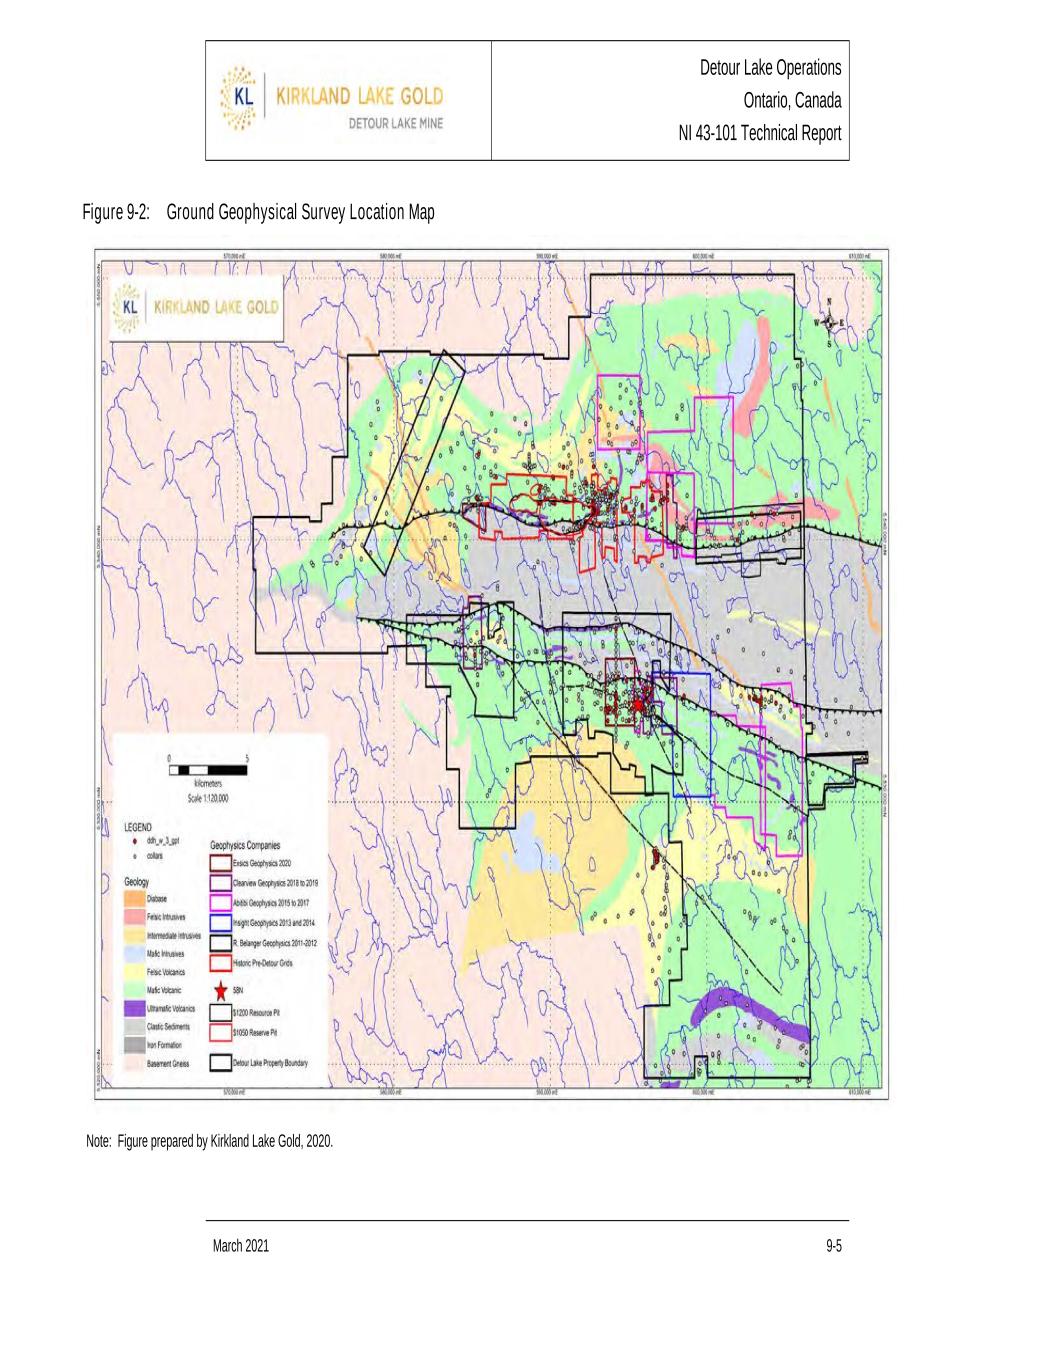
Detour Lake Operations Ontario, Canada NI 43-101 Technical Report March 2021 9-5 Figure 9-2: Ground Geophysical Survey Location Map Note: Figure prepared by Kirkland Lake Gold, 2020.

Detour Lake Operations Ontario, Canada NI 43-101 Technical Report March 2021 9-6 9.5 Petrology, Mineralogy, and Research Studies In 2016, samples were collected from Zone 58N area to determine the age of the various lithologies and timing of the gold mineralization. Uranium–lead analysis (ID-TIMS method) of magmatic zircons from the tonalitic host rock indicated an age of 2694.5 ±1.5 Ma. Uranium–lead analysis (LA-ICP-MS method) of hydrothermal titanites associated with Zone 58N mineralization indicates an age of 2680 ±12 Ma. These geochronology results indicate that Zone 58N mineralization occurred slightly later than at the Detour Lake deposit, which occurred at 2697 Ma (Oliver et al. 2012). Based on those results, it is likely that multiple metallogenic events occurred on these two major deformation zones, which is encouraging for the exploration potential of the area. In 2017, work done by the Geological Survey of Canada, as part of the ongoing TGI 5 project, was published in a preliminary progress report: • Castonguay, S., Dube, B., Mercier-Langevin, P., and Wodicka, N., 2018: Nature and Significance of Deformation Zones on Gold Mineralization in the Detour Lake Area: Implications for Exploration in Ontario and Québec. Geochemical and geochronological sampling was completed by the progress report authors, but no results of this work had been published at the Report effective date. 9.6 Exploration Potential Exploration potential remains in the area where Mineral Resources are estimated. The Main and Quartz Hangingwall Zones in the Detour Lake deposit remain open at depth. The West Detour deposit also has depth potential, as does the 58N Zone and Zone 75. Regionally, geophysical surveys and exploration drill holes have identified a number of gold- bearing structural trends that warrant additional exploration evaluation.
Detour Lake Operations Ontario, Canada NI 43-101 Technical Report March 2021 10-1 10.0 Drilling 10.1 Introduction Table 10-1 summarizes all drilling in the Project area to December 31, 2020 that is included in the Project database. The database does not have a complete record of all of the historical drilling. Core drilling completed on the Project (including 58N) within the database totals 8,206 drill holes (1,760,008.9 m). Figure 7-2 included the collar locations. Drilling and assaying that supports the Mineral Resource estimate for the Detour Lake deposit were completed from 1974–2016 (Table 10-2). Within the immediate area of the Mineral Resource estimate, there are a total of 6,519 core drill holes (1,128,965.7 m). Drill collar locations for those drill holes are shown in Figure 10-1. Drilling and assaying that supports the Mineral Resource estimate for the West Detour deposit was completed from 1996–2013 by Placer Dome, Tradewinds, Pelangio and Detour Gold (Table 10-2). Within the immediate area of the Mineral Resource estimate, there are a total of 776 core drill holes (266,927.5 m). Drill collar locations for those drill holes are shown in Figure 10-1. Drilling and assaying that supports the Mineral Resource estimate for the North Pit deposit was completed from 2004–2016 by Tradewinds, Pelangio Metals, and Detour Gold. Placer Dome completed one drill hole in the area drilled in the 1990s. (Table 10-2). Within the immediate area of the Mineral Resource estimate, there are a total of 101 core drill holes (21,945.6 m). Drill collar locations for those drill holes are shown in Figure 10-1. Drilling and assaying that supports the Mineral Resource estimate for the Zone 58N deposit was completed by Detour Gold from 2012–2017 (Table 10-2). Within the immediate area of the Mineral Resource estimate, there are a total of 370 core drill holes (138,433 m). Drill collar locations for those drill holes are shown in Figure 10-2. 10.2 Drill Methods Where known, drill contractors have included Forage Marcel Lafrenière Inc, Landdrill International Inc, and Major Group International Inc (formerly Bradley Brothers). Core drilling from surface included the following core size diameters: AQ (27 mm), BQ (36.4 mm) and NQ (47.6 mm). Core drilling from underground included the following core size diameters: EX (21 mm), AQ (27 mm), BQ (36.4 mm), BQTK (45 mm) and NQ (47.6 mm).
Detour Lake Operations Ontario, Canada NI 43-101 Technical Report March 2021 10-2 Table 10-1: Drill Summary Table Year Operator Number of Drill Holes Metres 1983 Global Energy 7 989.9 1974–1979 Amoco 314 (underground and surface) 51,935 1979–1987 Campbell 401 (underground and surface) 30,350 1987–1999 Placer Dome 4,528 (underground and surface) 557,023 2003–2012 Trade Winds 466 199,973 2004–2006 Pelangio Mines 127 29,769 2007–2017 Detour Gold 2,227 806,510 2018–2019 Detour Gold 41 13,651 2020 Kirkland Lake Gold 95 69,808 Totals 8,206 1,760,008.9 Table 10-2: Drilling Supporting Mineral Resource Estimates Deposit Number of Core Drill Holes Metres Detour Lake 6,519 1,128,965.7 West Detour 776 266,927.5 North Pit 101 21,945.6 Zone 58N/Zone 75 370 138,433 Totals 7,766 1,556,271.8 Note: Drill hole numbers exclude overlapping areas considered during the resource modeling proccess; therefore metres may vary from totals reported in internal Mineral Resource modelling reports.

Detour Lake Operations Ontario, Canada NI 43-101 Technical Report March 2021 10-3 Figure 10-1: Drill Collar Location Plan, Drilling Supporting Mineral Resource Estimation at North Pit, West Detour, and Detour Lake Note: Figure prepared by Kirkland Lake Gold, 2021. No drilling in this area was completed by Kirkland Lake Gold. All drilling shown is by previous operators.

Detour Lake Operations Ontario, Canada NI 43-101 Technical Report March 2021 10-4 Figure 10-2: Drill Collar Location Plan, Drilling Supporting Mineral Resource Estimation at Zone 58N and Zone 75 Note: Figure prepared by Kirkland Lake Gold, 2021. No drilling in this area was completed by Kirkland Lake Gold. All drilling shown is by previous operators. 10.3 Logging Procedures 10.3.1 Legacy Legacy drilling from 1974–1999 includes drilling information collected from Detour Lake, West Detour and the North Pit areas of the Project. This information is used in support of the current mineral resource estimates. Both underground and surface core drilled by Amoco and Placer Dome between 1974– 1999 was handled and logged at a facility located at the Detour Lake Mine site. Standard procedures for logging were not well documented and varied considerably between programs. Logging prior to 1980 was conducted by employees or contractors working for Amoco, Campbell or Placer. Logging after 1987 was conducted mainly by personnel working for the Detour Lake Mine geology department or Placer’s exploration department. The earlier logs by Amoco and Campbell appear to have been compiled as handwritten logs, which were sometimes re-typed with a mechanical typewriter and the later ones with various computer logging programs. The majority of logs were conducted with a logging

Detour Lake Operations Ontario, Canada NI 43-101 Technical Report March 2021 10-5 program implemented in the early 1980s by the Detour Lake Mine geology department. Most of the logs compiled by Placer’s exploration department were compiled using an in- house program referred to as Geology, and logs from the Pelangio drill programs were initially recorded as hard-copy logs or in Excel spreadsheets. All of the data were eventually compiled to a Gemcom database. Historic coding of lithology, structure and mineralization appear to have varied with time. Logging by Amoco and Campbell was done using a generic system similar to that found on government maps. Most of the later logging by Placer Dome was done with a revised system, which contained rock names, and codes, which were standardized and were specific to the deposit. 10.3.2 Pelangio Pelangio drilling tested the Detour Lake and North Pit areas. Core was logged at a facility located at the Detour Lake Mine site between 2004–2005. All intervals designated for sampling were assigned and tagged by a geologist that took rock type and geology into consideration. Most routine sampling was on 1 m widths, but narrowed locally to accommodate geological and mineralized zone boundaries. The minimum width was 0.50 m. 10.3.3 Trade Winds Drilling completed by Trade Winds was focused on the West Detour and North Pit areas. Core was marked at 1 m intervals, and driller measurement block corrections undertaken. Logging used the same pre-set terminology and codes as the Placer Dome programs. Geotechnical logging including core recovery, rock quality designation (RQD) and magnetic susceptibility readings (hand held unit) were collected and recorded in Excel spreadsheets. Core was photographed dry. All of the above procedures were monitored and performed on site under direct geological supervision of a qualified geologist. Core recovery averaged 98.9%. 10.3.4 Detour Gold A geological legend was progressively developed for the Project area incorporating advances in understanding of the regional and local geology, and the deposit-scale geology, structure, alteration and mineralization. Logging of RC chips was completed at the drill rig. The basic geological log included: primary lithology; alteration; mineralization; degree of oxidation; sample quality; depth of water inflow (estimation of rates); sample moisture content; veining; texture; fabric; presence of key minerals; sulphide grain size (from grain size chart). Areas of slow or hard drilling were marked onto the drill logs for geotechnical purposes. AcQuire software was
Detour Lake Operations Ontario, Canada NI 43-101 Technical Report March 2021 10-6 used to record observations made on percussion chips into touch screen and laptop computers. Drill core was placed into wooden core trays at the drill, with depths of each run marked on wooden blocks and inserted into the trays by the drill crew. These trays were delivered to the Exploration Department facility on site. Core was fitted together in the box and rolled to foliation or to the bottom line to designate the axis along which to cut the core. In each campaign, a single side of the core was consistently sampled. The portion to be saved was fitted back into the core box to be kept as a permanent record. All logging and marking of samples was done by Detour Gold’s geologists. Photographing, recovery, fractures, and rock strengths measurements were carried out by geotechnicians under geological supervision. Lithology was logged on a variable interval basis with intervals determined from combinations of rock type, alteration, structure, and mineralisation. Geological logging was performed using and collected using a Microsoft Access database developed for Detour Gold. The data were transferred into various database systems depending on desired end usage of the data. Lithology was logged based on the geological unit, with subdivisions created based on alteration and mineralization. 10.3.5 Kirkland Lake Gold Drill core is placed into wooden core trays at the drill, with depths of each run marked on wooden blocks and inserted into the trays by the drill crew. These trays are delivered to the Kirkland Lake Gold exploration department facility on site. Logging of drill core begins with the checking of the core box numbers and meterage when the core is brought to the logging facility. Core is rotated to fit fractures together. The starting and ending depth, and corresponding box number for each box is entered into the core index sheet and used to print box tags. RQD is recorded, as are the core recovery and core competency percentages, and the natural fracture frequency. Drill hole tab and collar information is added by the geologist and including hole type, hole size, drill location, casing, coordinates, planned azimuth, planned dip, contractor, type of drilling, casing status, wedges, extension, survey instrument, cemented/plugged, abandoned hole, flagged hole and drilling start date. Geological logging including overburden, lithologies, alteration, mineralization, structure, deformation and veining are systematically recorded in DHLogger and uploaded into the Fusion Database. Lithologies are logged as major and minor units with a minor being between 0.1 to 1 metre in core width and has no relation or potential for gold mineralization. Any visible gold identified by the logger is flagged and the interval noted in the hole flags section. Veining is recorded as individual veins and as veining percentages. Alteration, sulphide and deformation are a continuous log within the major lithology. Structures are logged as point and intervals and describe the type of fabric, the angle to the core axis, and the intensity.

Detour Lake Operations Ontario, Canada NI 43-101 Technical Report March 2021 10-7 10.4 Recovery In general, core recovery exceeds 90% with losses generally occurring within overburden, the first few metres of bedrock, or when going through a fault zone. 10.5 Collar Surveys 10.5.1 Legacy Legacy drilling completed by Amoco, Campbell Red Lake and Placer Dome was used for grade estimation in 2020 for Detour Lake, in 2013 for West Detour and in 2016 for the North Pit area. The following information on the legacy collar surveys is abstracted from Kallio (2006). Most of the drill holes on surface were originally spotted using measurements from cut grids. The hole locations for the 2005 Pelangio drill program were determined by measurements from a short baseline that was installed to the west of the former open pit by Sutcliffe Rody Quesnel of Timmins, Ontario, and the drill holes for the 2006 program were located by surveying in with a differential global positioning system (DGPS). Holes drilled by Amoco were located using an east–west-trending grid that used imperial measurements, which was installed in the mid-1970s. Drill holes completed by Campbell, Placer Dome, and Pelangio were located using a true north grid, which was established around 1981. The initial elevations for most legacy drill hole collars were assumed to be derived from a combination of topographic maps and data points from previous drill holes or nearby survey stations. The azimuths were probably determined by measurements from pickets or a compass. Azimuths for the Pelangio drilling were determined by turning off angles from the new baseline using an optical square prism. The reliability of collar locations for most historic surface drill holes is unknown as many were drilled from areas within, or immediately surrounding, the former pit on lands, which have now been reclaimed. Most of the available information was obtained from drill log headers. The only original survey data that have been located were for some selected holes of the 38, 38W and the 464 series. Holes from the 38 and 38 W series were surveyed by H. Sutcliffe and holes from the 464 series by General Exploration Services of Timmins, Ontario. The initial position and azimuth of most underground holes was typically determined using measurements from underground survey stations and reference points. The measurements were usually done by a geologist or diamond drill foreman, but were sometimes surveyed in by the mine surveyors in situations requiring greater accuracy. Initial collar elevations are assumed to have been determined using engineering plans and starting dips set with a degree rule. Holes not surveyed during the initial setup were often picked up by the mine survey department after completion of the drill hole.

Detour Lake Operations Ontario, Canada NI 43-101 Technical Report March 2021 10-8 Data from surveying of underground holes was located on a combination of drill log headers, a survey ledger book and survey sheets prepared by the Detour Lake Mine survey department. Data for several holes was also recorded in computer files generated with the MINSURV program, a multi-purpose software application instituted by the mine survey department in the early 1990s to store and manipulate survey data. Kallio (2006) reviewed the survey sheets and indicated that they contained information from holes drilled by Placer Dome between surface and the 15 level and that approximately 50% of holes were represented. 10.5.2 Trade Winds/Detour Gold Detour Gold survey protocols included that foresights and backsights were laid out by Talbot Surveys Ltd. (Talbot) using a differential global positioning system (DGPS) Topcon GR3 instrument with a Nikon total station instrument. The Universal Transverse Mercator (UTM), 1983 North American Datum (NAD83) system was used to record position data. Survey data were converted to the mine grid for compatibility with the historical data. Occasionally, when Talbot staff were unavailable, hand-held global positioning system (GPS) units or compass and chain methods were used to locate collar pickets, which were inadvertently moved or destroyed. For exploration and reconnaissance drilling programs, drill hole collars were surveyed using GPS units. Trade Winds used the Detour Gold protocols from 2009 onward. Once the drill rig was positioned on the planned location, it was lined up using a Reflex GPS casing alignment instrument working within ±0.2–0.5º accuracy. After a drill hole was completed and the rig moved off drill site, the casing was covered with a steel cap and a wooden marker was placed next to the casing with the hole collar identification. Talbot returned to site approximately every second week and surveyed the casing locations, as well as the azimuth and inclination of the holes drilled during this period. Measurements were done at the top of the casing (usually sticking out 15 cm above ground). The 2016 infill drilling of the North pit and Detour West pit used compass and chain methods to locate collar pickets. Final hole locations for the North pit were surveyed by Labelle Surveys, Timmins, Ontario. The two drill holes completed in 2017 were not surveyed. 10.5.3 Kirkland Lake Gold Kirkland Lake Gold used a Reflex TN14 Gyrocompass for spotting and aligning drill holes during the 2020 drill program. Drill hole collar surveys were systematically surveyed by Talbot Surveys Ltd. using a differential global positioning system (DGPS) Topcon GR3 instrument with a Nikon total station instrument.

Detour Lake Operations Ontario, Canada NI 43-101 Technical Report March 2021 10-9 10.6 Downhole Surveys 10.6.1 Legacy Down-hole survey procedures varied with time and are not well documented. The following is abstracted from Kallio (2006). Most of the early programs by Amoco and Campbell appear to have been surveyed with acid tests and with some limited Tropari testing. Spacing of the tests varies between 30– 60 m, but occasionally surveys may be as much as 120 m apart. Downhole surveying during later drilling by the Detour Lake Mine geology department was often completed using a combination of Tropari and acid tests, which were taken by the diamond drillers. Spacing between consecutive tests varied from 30–60 m, but locally could be as much as 200 m between measurements. Most drill holes <60 m, such as those from the 56Lv to 66 Lv series were typically only surveyed with a single acid test at the bottom of the hole. Downhole surveying conducted by Placer’s exploration department was often conducted using a combination of Sperry Sun and acid testing. Spacing between acid or Sperry Sun tests typically varied between 50–75 m. Spacing between consecutive Tropari tests was as much as 200 m. Downhole surveying by Pelangio was completed using a Flexit SmartTool supplied by Fordia of Val d’Or, Quebec. Drillers, who had been trained by the supplier, took all tests. Testing in 2005 was at 30 m intervals and testing in 2006 at 3 m intervals down the length of the hole. All tests were checked for magnetic interference. Available data from past downhole surveying was in the form of drill log headers or survey ledgers prepared by past project operators. 10.6.2 Trade Winds/Detour Gold Downhole surveying of Tradewinds drill holes was also done by a Flexit SmartTool whereby azimuth and dip reading were collected every 3 m down hole by the drillers. Tradewinds removed irregular readings that were caused by magnetic interference. For the Detour Gold programs, Reflex EZ-Shot (EZ-Shot) and Reflex Maxibor II (Maxibor) instrumentation were used. The primary survey was completed at 30–60 m intervals using an EZ-Shot instrument. Immediately after the drill hole was completed, surveys of the direction and dip changes were carried out using a Reflex Maxibor II instrument. The instrument was lowered down the hole and readings taken every 3 m on the way back up. In 2010, Detour Gold discontinued the use of the Maxibor check surveys because the results were comparable with those obtained using the EZ-Shot.

Detour Lake Operations Ontario, Canada NI 43-101 Technical Report March 2021 10-10 10.6.3 Kirkland Lake Gold Kirkland Lake Gold used a Reflex EZ Trac and Reflex Gyro Sprint-IQ instrument for down hole surveys during its 2020 exploration program. The primary survey was completed at 10 m below casing followed by surveys completed at 50 m intervals. A final continuous survey was completed at the end of each hole. 10.7 Sample Length/True Thickness For surface drilling programs testing the Detour Lake deposit, the true width is estimated to be 65–75% of the drilled length, except for exploration holes drilled to the north (i.e., 19,480E to 20,440E) where the true width is estimated at 60–65% of the drilled length. Actual true width is dependent of the inclination and direction of the hole when intercepting the mineralized zone. For surface drilling programs testing the West Detour deposit, the true width is estimated to be 65–75% of the drilled length. Actual true width is dependent of the inclination and direction of the hole when intercepting the mineralized zone. For historic underground drilling programs at the Detour Lake and West Detour deposits drill was done in “fans” and true thickness of mineralization is variable from approximately 60–85% of drilled thickness. 10.8 Grade Control Grade control at the Detour Lake Mine is done through RC drilling, conducted at 10 m spacing (north–south) on 20 m sections. Holes are drilled at an azimuth of 180° (due south), at -60° inclination. Lengths of holes are designed to intercept either two or three full benches, thus are typically 28 m or 42 m long, unless adjusted for unusual bench heights. The occasional area can be drilled to 56 m depth to accommodate drill access near old underground workings or other circumstances. All holes locations are surveyed. Any RC hole over 3 benches has a gyroscopic survey performed for hole deviation. Detour Lake RC grade control holes are not used to support Mineral Resource estimation. A grade control testing program consisting of 47 drill holes on a 20-m section spacing was carried out on the West Detour deposit in 2016 to test the grade estimation model and define the impact of tighter spaced drilling on the modelled ore zones. This drilling is also not used in estimation. 10.9 Twin Hole Drilling In 2016, an infill drilling program of 5,353 m in 44 holes (excluding one hole abandoned due to excessive deviation) was carried out on a 20 x 20 m spacing to simulate grade control and evaluate the resource block model current at the time. The grade control drilling

Detour Lake Operations Ontario, Canada NI 43-101 Technical Report March 2021 10-11 targeted a geologically complex ore domain area of the West Detour pit in order to validate modeling assumptions and determine if an alternate modeling methodology would be preferable. Composites simulating ore zones were created from each drill hole. Results were compared with the grade interpolation models that intersected the drill hole traces, and were considered to validate the resource estimate current at the time. This program also twinned nine holes from Trade Winds and one hole from the 2012 Detour Gold drilling program. The drilling covered an area of 120 m (Sections 15,780E to 15,900E) by 150 m (20,375N to 20,525N), from bedrock surface to a depth of approximately 100 m (6,270EL to 6,170EL). The results from the twinned-hole test indicated that over the entire mineralized intervals the correlation was positive, although results varied considerably over individual intervals (both length of mineralized zones and gold grade) as expected due to the high nugget effect. There did not appear to be a grade bias in the area tested. 10.10 Drilling Since Database Close-out Date Drilling completed after the database close out includes 11 core drill holes totalling 3,693 m at 58N and 78 core holes with six wedge holes totalling 66,115 m at West Detour. The drill holes completed in 2020 by Kirkland Lake Gold targeted the “saddle” zone (the area between the Main and West Detour reserve pits) and to the west of, and at depth under the West Detour Pit. The additional drill holes are located outside the Mineral Reserve pit and have confirmed the continuity of the mineralization. In the QP’s opinion, the new drilling has no material impact on the Measured or Indicated Mineral Resources. The new drilling may have the potential to support upgrade of existing Inferred Mineral Resources when incorporated into an updated model. 10.11 Comments on Drilling In the opinion of the QP, the quantity and quality of the logged geological data, collar, and downhole survey data collected in the exploration and infill drill programs are sufficient to support Mineral Resource and Mineral Reserve estimation and mine planning as follows: • Core and RC logging meets industry standards for gold exploration at the time the logging was conducted; • Collar surveys have been performed using industry standard instrumentation at the time the survey was conducted; • Downhole surveys were performed using industry standard instrumentation at the time the survey was conducted; • Recovery data from core drill programs are acceptable; • Drill orientations are generally appropriate for the mineralization style and the orientation of mineralization for the bulk of the deposit areas.

Detour Lake Operations Ontario, Canada NI 43-101 Technical Report March 2021 10-12 Drilling has generally been done at regularly-spaced intervals and is considered representative of the deposits. Drilling was not specifically targeted to the high-grade portions of the deposits, rather, a relatively consistent drill spacing was completed.

Detour Lake Operations Ontario, Canada NI 43-101 Technical Report March 2021 11-1 11.0 Sample Preparation, Analyses, and Security 11.1 Drill Sampling Methods 11.1.1 Legacy Information on the sampling conducted during legacy drill programs is abstracted from Kallio (2006). Employees and contractors working for Amoco at core logging facilities located at the Detour Lake site conducted sampling between 1974 and 1979. General procedures were similar for both underground and surface drill core and involved sampling of most of the drill hole. Core samples were typically collected on standard 5-ft (1.52 m) intervals with some being narrowed to as little as 1-ft (0.3 m), when better grades were expected. In most cases the collection of samples was done by splitting and extracting ½ of the core with a mechanical splitter. Most samples with visible gold were whole-core sampled and indicated by a notation of “ w/c” in the log. Samples were packed in bags containing numbered tags and transported to the laboratory by air. Employees and contractors working for Campbell at core logging facilities located at the Detour Lake site conducted sampling between 1979 and 1983. Sampling was conducted on new core from both surface and underground drilling completed by Campbell, as well as on selected intervals of older core from Amoco drilling. The procedures used were defined by Campbell, and Kallio (2006) thought that they were similar for both underground and surface drill core. Most sampling of core from new drilling was conducted from the top to the bottom of the drill hole on standard 5-ft (1.52 m) intervals, but with some occasional sampling on narrower intervals. Samples were split, extracting ½ core with a mechanical splitter, but with some local whole core sampling. No information was available to explain where the different methods were used. Sampling of older core from Amoco drill programs was intermittently conducted. Results of the re-sampling indicate that program was focused on filling in gaps in sampling from previous work. The procedure for this re-sampling is unknown. Samples were shipped to the laboratory by road or air. Sampling between 1987 and 1999 was conducted by employees and contractors working for the Detour Lake Mine geology department or Placer’s exploration department, depending on which group was co-ordinating the work. Most sampling by the Detour Lake Mine geology department was carried out from top to bottom of the hole based on 1 m sample intervals, and whole core methods, with the exception of selected intervals of BQ or BQTK-size core, which were sometimes sawed in half to preserve a portion for future reference. Extra waste samples of 0.5 m in length were collected on either side of potentially gold-bearing structures to allow calculation of grade over a minimum 3 m width. The sampling by Placer’s exploration department was targeted towards selected intervals of a drill hole that were considered to have the best potential for hosting significant mineralization. Sample widths varied from 0.3–1.0 m in length and were delimited by geological boundaries. Collection of the samples was accomplished by sawing the core

Detour Lake Operations Ontario, Canada NI 43-101 Technical Report March 2021 11-2 with a core saw and extracting ½ of the core. Observation of the cross piled core remaining from these holes indicates that the sawing was done along a consistent centerline and resulted in two equal core halves. Employees working for Pelangio or High River Gold at a core logging facility located at the Detour Lake Mine site completed the 2004–2005 sampling. Most routine sampling was on 1 m widths, but narrowed locally to accommodate geological and mineralized zone boundaries. The minimum width for most intervals sampled was 0.50 m. Collection of the samples was conducted by a technician by extracting ½ of the core in the boxes as marked by a geologist. Most samples in 2004 were collected by splitting with a hydraulic splitter, and most from samples in 2005, and specifically those drilled west of the open pit, were cut with a core saw. Sampling during the 2006 Pelangio drill program was completed by employees and contractors working for Pelangio at a core logging facility located at the Detour Lake Mine site. Routine sampling was conducted at 1 m widths, but narrowed locally to as low as 0.50 m to accommodate geological and mineralized zone boundaries. Samples were collected by a technician by sawing of the NQ sized core into two equal halves and placing one half of the core into a plastic sample bag. 11.1.2 Trade Winds Trade Winds sampled continuously within the mineralized zones at approximately 1 m intervals. All core collected from Trade Winds’ drilling program was sampled on site under the supervision of a Trade Winds QP geologist. The core was split using a conventional splitter or cut using a diamond saw, placed into plastic sample bags with the tag, and placed in plastic containers for shipping in batches of 20 direct to ALS Chemex Laboratories (ALS Chemex) in Val d’Or, Québec. All samples were stored in Trade Winds’ core shed until they were shipped and half the core was left in the core boxes as a permanent record and stored on site at the core farm located in the airstrip stage-in area. Following the 2010 drill program, Trade Winds completed four acid "near-total" digestion standard multi-element ICP package (ME-ICP61) to all core assays. A total of 53,664 samples were first analysed using a Pearson correlation table with the intent of screening elements that required in-depth studies. Results showed a moderate correlation with silver and bismuth and to a lesser degree with sulphur and cadmium. Gold assays >10 g/t Au showed a stronger bismuth and cadmium correlation. The elements of interest, namely bismuth, chromium, magnesium, manganese, iron, zinc, and silver, were examined spatially in 3D to assess their usability for assisting the geological interpretation. Individually, the single elements did not indicate that they would help the model much. A weak to moderate correlation with gold and the degree of potassic alteration was observed for the Detour West area.

Detour Lake Operations Ontario, Canada NI 43-101 Technical Report March 2021 11-3 11.1.3 Detour Gold Detour Gold personnel sampled on nominal 1 m sample intervals. Where gold was visible in the drill core, the sample was broken down into 0.5 m samples for gravimetric or screen metallic analyses. Samples were marked both on core and corresponding sample tags and bags. In each drill campaign, a single side of the core was consistently sampled. The portion to be saved was fitted back into the core box and kept as a permanent record. Samples were bagged and numbered by a technician and double-checked for accuracy. 11.1.4 Kirkland Lake Gold Kirkland Lake Gold personnel sampled exploration core holes according to lithology and vein structure. Samples primarily did not exceed 1 metre in length. A small percentage of the core was not sawn and was shipped as whole core samples. Sampling followed a cut- line marked on the core by the logging geologist. Samples were bagged immediately after cutting and a printed sample tag was attached to the sample bag as it was stapled shut. Rice bag tags (stating dispatch name and samples within rice bag) and zip ties were prepared in advance and the information double-checked by the core technician assigned to the drill hole, and a random due diligence check was performed by the senior core technician. In general, for NQ core, five samples were placed in rice bags before being placed in sample bins or on shrink-wrapped pallets. Samples were shipped to the assay laboratory using either shrink-wrapped pallets or large secure bins. Shipments were moved to an accessible location near the exploration facility for transport on designated shipment days. 11.1.5 Grade Control Samples are taken at 1 m intervals through the use of a rotary cone splitter to ensure proper sampling of the material. Samples of 4–6 kg are taken and bagged separately. Field duplicate samples are taken at a rate of one per hole for a 28 m hole and two per hole for 42 m holes. Commercial standards and blanks are included in the sample shipments. Where placement of the RC drill is not possible, or on occasions where sampling for waste characterization only is required, blast holes are sampled at a spacing of 12 x 14 m (every second section). The technician uses a shovel to cut a slot in the spoil pile at the location selected (channel sampling). The slot needs to be cut from the inner edge of the cone adjacent to the hole, to the outer edge of the cone, ensuring good representation of the full material. Each sample is between 4–6 kg. 11.2 Underground Sampling Methods Information on the underground sampling is abstracted from Kallio (2006). Chip and muck sampling in most areas was conducted using standard procedures established by the Detour Lake Mine geology department.
Detour Lake Operations Ontario, Canada NI 43-101 Technical Report March 2021 11-4 Routine chip sampling was conducted by subdividing the face into a continuous series of 1 m wide panels, with only minor variations in width for changes to rock type and economic indicators. The number of samples per face ranged from 3–6. Samples were collected by hammering off chips of rock from within each of the panels. The average sample size was usually about one kilogram, but could vary from 0.5–2 kg. After 1996, the procedure was changed slightly so that the width of panels were set with boundaries defined by major changes in rock type and economic indicators such as quartz, pyrite, chalcopyrite, sulphide breccia veins and potassic alteration. The typical sample size was 1.5–2 kg. A modified chip sampling procedure was used by Placer Dome in the QK Zone. The width of the panels was governed by major changes in rock type and economic indicators, ranging from 0.30–1.0 m. Five samples were typically taken per face, typically 2–4 kg in weight. Routine muck sampling was conducted in most new development and in active stopes of the Detour Lake Mine. The procedure for taking the samples up to at least the end of 1990 consisted of grabbing approximately 1.5 kg of broken rock material from scoop buckets and/or broken muck piles which was mainly -2 inch (-51 mm) in diameter. This procedure may have been modified after 1990 to include larger and more frequent sampling, but there is no firm documentation to support if or to indicate when this might have occurred. After 1996, samples were collected from scoop buckets, with the number collected being based on the mining method being used. For development headings and mechanized cut and fill stopes, a minimum of four samples per blast were taken with each sample consisting of approximately 5 kg of mixed fines and -3 inch (-76 mm) material. Under routine conditions, development headings had one sample collected for every five buckets, and longhole stopes had one sample taken for every 10 buckets, but this could be increased in situations where the grade declined to below the cut-off grade. Collection of muck samples in the QK zone area was conducted by the scoop operators. The basic procedure in all headings involved taking one sample for every five buckets with a minimum of five samples in total from each heading regardless of blast size. Each sample was approximately 5 kg in size and consisted of material between ½–3 inches (13–76 mm) in size. 11.3 Bulk Sampling Methods Information on the bulk sampling is abstracted from Kallio (2006). Bulk sampling was conducted by Amoco in the late 1970s during the early project evaluation stages. These data are no longer available. Placer Dome conducted bulk sampling in 1997 during the QK project. In total, 39 drift rounds comprising 6,718 t was extracted and transported to surface, where it was crushed and processed through a sampling tower. All of the drift rounds in the sample were mapped, channel sampled and muck sampled in detail during the extraction. Samples from the tower were then sent to Placer Dome’s research laboratory in Vancouver for gravity concentrate- cyanide leach analysis.
Detour Lake Operations Ontario, Canada NI 43-101 Technical Report March 2021 11-5 11.4 Density Determinations 11.4.1 Detour Lake Prior to late 2009, no systematic specific gravity (SG) measurements were taken during the Detour Gold drilling programs. The values used for the tonnage calculation relied mainly on historical data derived from prior production. During the life of the former Detour Lake Mine, the operator used a density of 2.9 t/m3. This number was used by Detour Gold as the average SG for all rock types. From October 2009 to November 2010, Detour Gold staff completed SG measurements on 4,603 samples using an inert gas pycnometer. The measurement was conducted on the pulp fraction of every 40th sample. The average SG value obtained from this program was 2.98 t/m3. In 2009, SGS Geostat conducted independent SG measurements on 211 samples from twin drilled hole DG-09-806 and on 312 samples from compositing 24 drill holes (total leaching test), all located within the eastern part of the Detour Lake deposit. Results from the total leaching test and twin drill hole samples gave an average SG of 2.9 t/m3. In 2010 and 2011, SGS Geostat conducted additional SG measurements on 120 duplicate half-core samples using the water displacement methodology (weight in air divided by the volume displaced by the core sample in a graduated cylinder). The independent verification of the SG returned similar observations as the 2009 data verification program. The massive, weakly-altered mafic volcanic units generally show higher SG values (2.9– 3.0 t/m3) than the more altered pillowed mafic volcanic units (2.8–2.9 t/m3). The more felsic lithologies observed in the eastern area of the deposit, typically as intermediate intrusive units, returned SG values in the 2.7–2.8 t/m3 range. The range of SG values observed for the different lithologies generally reflects the variation in geochemical composition (including the intensity of alteration) and the natural porosity of the rock units. The average SG value calculated from both data set supported the assumed historical SG value of 2.9 t/m3, was used in all studies by Detour Gold. In 2020 Kirkland Lake Gold reviewed available bulk density values. Detour Gold samples, when combined with those of former operator Pelangio, represent a total of 7,045 samples that were collected for density from recently-drilled boreholes for various lithologies. Most of these samples were 1 m in length. A density value was determined for each assigned lithology code by constructing histograms and removing outliers and determining the average for each lithology. Lithologies without a bulk density were assigned an average density of 2.99 t/m3. 11.4.2 West Detour No independent review of the SG was done on the West Detour deposit by SGS Geostat. WGM (2011) mentioned three composite measurements varying from 2.95 t/m3 to 3.02 t/m3,
Detour Lake Operations Ontario, Canada NI 43-101 Technical Report March 2021 11-6 and a more exhaustive set of 632 data points ranging from 2.52 t/m3 to 3.55 t/m3 with an average of 2.91 t/m3. 11.4.3 Zone 58N Starting in 2014 for the regional exploration program, including Zone 58N, core was measured for SG by Detour Gold personnel using full core water immersion technique. A total of 2,644 measurements were made, and values ranged from 2.09–3.68 t/m3, averaging 2.8 t/m3. 11.5 Analytical and Test Laboratories 11.5.1 Primary Laboratories Where known, the laboratories used during the legacy programs included Assayers Limited, in Rouyn, Quebec, (Assayers); the Dome Mine Laboratory in Timmins (Dome laboratory), Ontario; Swastika Laboratories Ltd, in Swastika, Ontario (Swastika); the Detour Lake Mine assay laboratory (Detour Lake laboratory); X-Ral Laboratories in Rouyn, Quebec (X-Ral); Bondar Clegg in Ottawa, Ontario (Bondar Clegg); Chemex Laboratories in Mississauga, Ontario (Chemex Mississauga); Chemex Laboratories in Rouyn, Quebec (Chemex Rouyn); Accurassay Laboratories in Thunder Bay, Ontario (Accurassay Thunder Bay); and Activation Laboratories Ltd in Timmins, Ontario (Actlabs). Accreditations at the time the work was performed is not known. All laboratories other than the Dome laboratory and the Detour Lake laboratory were independent of the operators at the time. All laboratories were independent of Kirkland Lake Gold. Detour Gold used SGS Minerals in Garson, Ontario (SGS Garson) and Don Mills, Ontario (SGS Don Mills), Ontario for sample preparation and SGS Don Mills for analysis during the 2007–2012 Detour Lake and 2012 West Detour drill campaigns. At the time the laboratories held ISO17025 accreditation for selected analytical techniques. The laboratories were independent of Detour Gold and are independent of Kirkland Lake Gold. Samples from the 2008–2013 Detour Gold campaigns were sent to Accurassay in Timmins, Ontario (Accurassay Timmins) for sample preparation and to Accurassay Thunder Bay for analysis. The laboratories held ISO17025 accreditation for selected analytical techniques. The laboratories were independent of Detour Gold and are independent of Kirkland Lake Gold. For the 2014–2015 regional exploration programs (including Zone 58N), Detour Gold sent all of its samples to ALS Minerals in Sudbury, Ontario (ALS Sudbury) for sample preparation. Analysis was completed by ALS Minerals in Vancouver, B.C. (ALS Vancouver). The laboratories held ISO17025 accreditation for selected analytical techniques. The laboratories were independent of Detour Gold and are independent of Kirkland Lake Gold. During the Detour Gold campaigns of 2016–2017, sample preparation was performed at ALS Sudbury, and analysis at a number of ALS Minerals laboratories globally, including
Detour Lake Operations Ontario, Canada NI 43-101 Technical Report March 2021 11-7 Vancouver; Val D’or in Québec (ALS Val D’or); Reno in Nevada; and on rare occasions in Lima in Peru and Loughrea in Ireland. The laboratories held ISO17025 accreditation for selected analytical techniques. The laboratories were independent of Detour Gold and are independent of Kirkland Lake Gold. For the 2018–2019 regional exploration campaigns, Detour Gold sent samples to ALS Timmins for sample preparation, with analysis completed at ALS Vancouver. The laboratories held ISO17025 accreditation for selected analytical techniques. The laboratories were independent of Detour Gold and are independent of Kirkland Lake Gold. In 2020, Kirkland Lake Gold used ALS Minerals, with sample preparation completed at ALS Timmins and analysis at ALS Vancouver. Exploration samples were also submitted to Actlabs in Timmins, Ontario. The laboratory conducted both sample preparation and analysis. The laboratories hold ISO17025 accreditation for selected analytical techniques. The laboratories are independent of Kirkland Lake Gold. 11.5.2 Secondary/Check Laboratories ALS Vancouver was used as a secondary laboratory for the 2012 drill campaigns. 11.5.3 Grade Control Grade control samples are analysed at SGS Cochrane and ActLabs. The laboratories currently hold ISO17025 accreditation for selected analytical techniques. The laboratories were independent of Detour Gold and are independent of Kirkland Lake Gold. 11.6 Sample Preparation and Analysis 11.6.1 Legacy Information on the legacy sample preparation and analysis is abstracted from Kallio (2006). The 1974–1979 samples were prepared by grinding split core to ¼ inch, selecting a half- assay-ton sub sample and fire assaying. Samples from later drill holes were prepared with a mixture of whole core and split core sampling methods whereby the core was ground to 100 mesh, split to one-assay-ton and fire assayed. Although no records are available at the Dome laboratory, crushing and grinding of samples in the period 1979–1987 used a cone crusher and manual pulverizer and all analysis was completed using fire assay of a one-assay-ton sub-sample. The procedures used at Swastika in the same time frame are unknown. From 1987 to 1991, procedures were the same for all core sizes and consisted of crushing to -½ inch using a Rhino crusher, followed by splitting of 150 g and pulverization to -150 mesh. Samples were weighed at 10 g and analyzed using an aqua regia digestion and

Detour Lake Operations Ontario, Canada NI 43-101 Technical Report March 2021 11-8 ketone extraction method. Most of the intervals were only assayed once, but some containing higher-grade and visible gold were checked with a second assay of the pulp. From 1995–1999, the same procedure was used for all core sizes and consisted of crushing to -10 mesh, followed by splitting of 300 g and pulverization to -200 mesh. Samples were weighed, and fused, followed by cupellation. Samples were digested in nitric acid and hydrochloric acid and analyzed using atomic absorption (AA) fitted with an autosampler. Most of intervals were assayed only once, with some intervals containing higher grades and visible gold being assayed twice. The chip and muck samples collected from 1987–1999 underwent the same initial steps as for drill core samples, followed by weighing, digestion in 30 ml of aqua regia and filtration. This was followed by addition of 10 ml of ketone and analysis using AA. The routine procedure for most core samples to the end of 1993, involved the crushing of samples weighing between 1–2 kg to approximately -10 mesh, followed by splitting out and pulverizing to -150 mesh a subsample weighing approximately 250–300 g, splitting and analysis of a 1 assay tonne subsample using fire assay and AA finish. This procedure seems to have been slightly modified in 1993 to include re-assaying of certain higher grade samples with either the same processes as the initial sample or with a pulp and metallic procedure. The detection limit for all gold assaying at Swastika was 0.001 g/t, at Assayers was 0.05 g/t and at X-Ral was 0.01 g/t. The procedure at Chemex from 1993 involved crushing of samples to -10 mesh, followed by splitting and pulverization of a 150 g sub-sample using a ring and puck pulverizer and splitting and analysis of a 30 gram subsample. Initial assaying of samples at Chemex was often conducted with fire assay and an AA finish that had an upper limit of 12 g/t. Samples exceeding the upper limit were usually re-assayed using a fire assay and gravimetric finish. A large number of samples with visible gold and higher-grade values from the initial assaying were also usually re-analyzed with pulp and metallic methods. The detection limit for all assaying at Chemex was 0.03 g/t. The 2004–2005 protocols at ALS Mississauga included dry crushing of samples to >70% passing –10 mesh (2 mm screen), riffle splitting and pulverization of 250 g subsamples to > 85% passing 75 µm screens and fire assaying of one-assay-ton subsamples. Samples with visible gold were analyzed with a pulp and metallics procedure. Protocols at Accurassay Thunder Bay included crushing to 90 % -10 mesh and then splitting of a 30 g sub-sample and pulverizing to -150 mesh. Analysis was usually done with the fire assay technique except for intervals containing free gold or elevated values on the initial analysis, which were done using the pulp and metallics procedure. The pulp and metallics procedure in 2004 was based on a 1 kg split, but this was adjusted in 2005 to total pulverization. For the 2006 program, samples were processed at Swastika using dry crushing to >90% passing -10 mesh, riffle splitting and pulverization of 350 g sub-samples. The analysis was conducted using fire assay of one-assay-ton sub-samples then using pulp and metallic screen procedures for samples with visible gold.
Detour Lake Operations Ontario, Canada NI 43-101 Technical Report March 2021 11-9 11.6.2 Trade Winds/Detour Gold The sample preparation used at SGS Don Mills and SGS Garson consisted of crushing to 90% passing -10 mesh (2 mm), riffle splitting to obtain a 500 g subsample, pulverizing to 90% passing 200 mesh (75 μm) and sub-sampling to obtain a 50 g pulp for assaying. For Block A, samples by Trade Winds were sent to ALS Val-d’Or and ALS Vancouver from 2003–2010. Sample preparation consists of crushing to 70% passing -10 mesh (2 mm), riffle splitting to obtain a 1 kg subsample, pulverizing to 85% passing 200 mesh (75 μm) and sub-sampling to obtain a 50 g pulp (Au-AA24) for assaying. For 2011, Trade Winds sent their samples to Actlabs where the preparation procedure was very similar to the one used by the ALS laboratories. Starting in 2007, routine gold analysis for the Detour Lake deposit was done using fire assaying with atomic absorption spectroscopy (AAS) finish (SGS Code FAA515) then later an inductively-coupled plasma–atomic emission spectroscopy (ICP–AES) finish (SGS Code FAI505 and FAI525). Where the gold assays exceeded 10 g/t Au, the fire assay was repeated with a gravimetric finish (SGS Code FAG505). All samples with visible gold identified during the field logging procedure went directly to the metallic screen procedures (SGS Code FAS30K and FAS31K) using a nominal 500 g split of the original -10 mesh sample (2 mm). All routine assayed samples (fire assay atomic absorption or fire assay- gravimetric) returning values ≥5 g/t Au on the first analysis were reanalyzed using the metallic screen procedure. For the metallic screen procedure, the sub-samples were screened at -150 mesh (106 μm), and then both the coarse and fine fractions (duplicate and often triplicate assays on the fine fraction) were completed using fire assaying with an inductively-coupled plasma–optical emission spectrometry (ICP–OES) finish. Selected samples were also analyzed for copper using sodium peroxide fusion and ICP–OES finish. The sample preparation procedure at Accurassay Timmins, used from 2008–2013, consisted of crushing to 75% passing -8 mesh, riffle splitting to obtain a 500 g subsample, pulverizing to 85% passing 200 mesh, and sub-sampling to obtain a 50 g pulp. During the 2014–2017 drill campaigns, the routine sample preparation at ALS Sudbury included drying and crushing the full sample to 70% 2 mm or better, splitting to obtain a 1 kg sub-sample, pulverizing to 85% passing 75 μm, and sub-sampling again to obtain a 50 g. Different analytical protocols were used, depending on whether the assay sample was classified as deposit-related (Table 11-1) or exploration (Table 11-2).
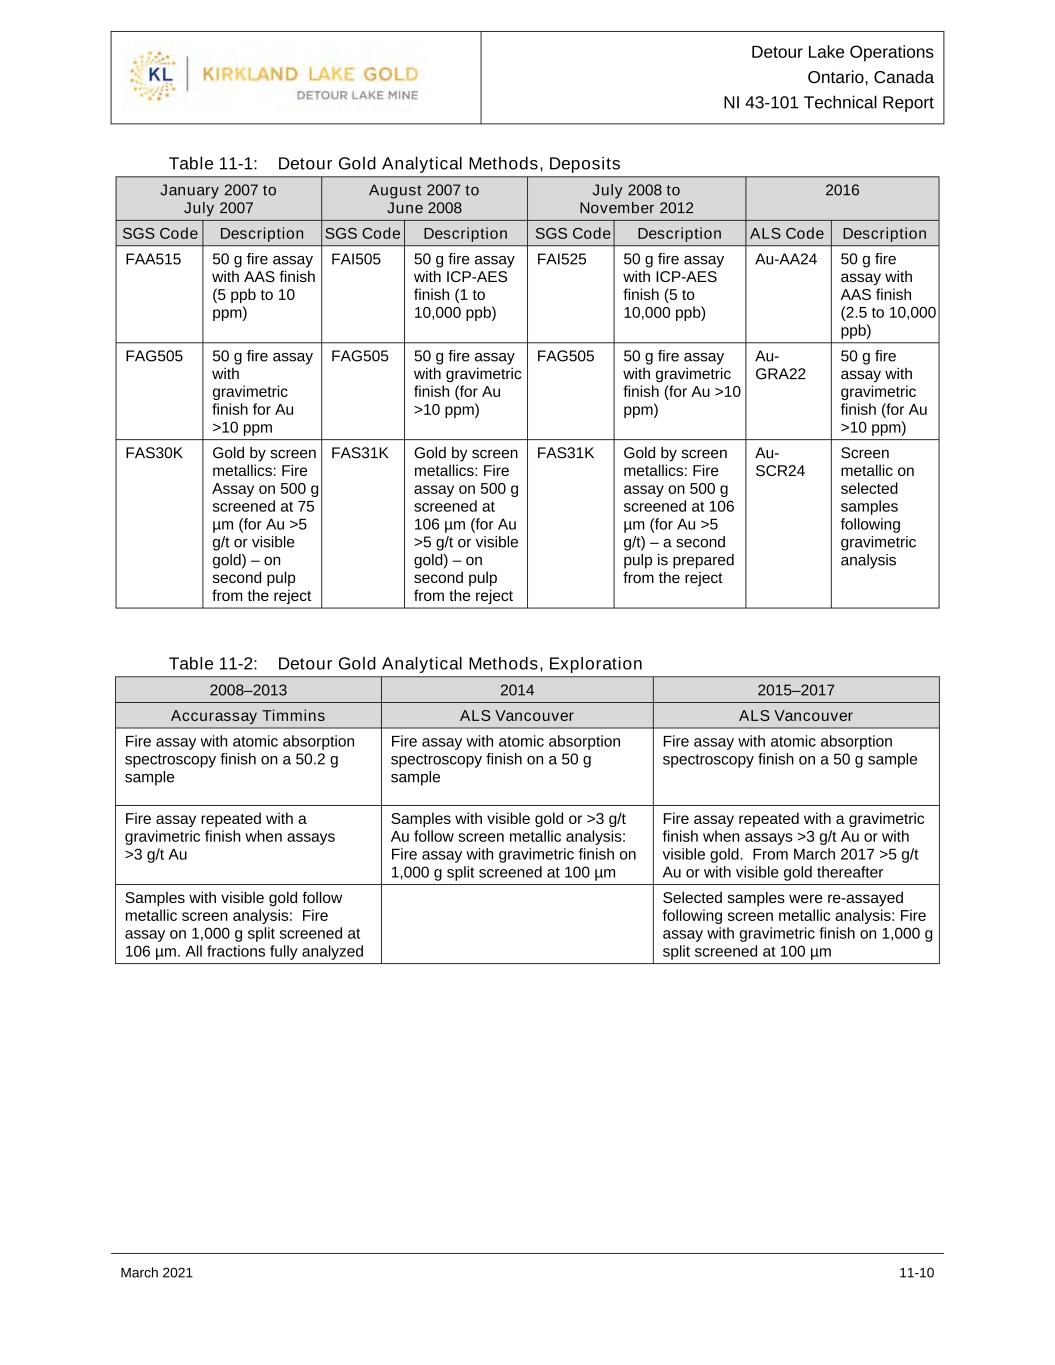
Detour Lake Operations Ontario, Canada NI 43-101 Technical Report March 2021 11-10 Table 11-1: Detour Gold Analytical Methods, Deposits Table 11-2: Detour Gold Analytical Methods, Exploration January 2007 to July 2007 August 2007 to June 2008 July 2008 to November 2012 2016 SGS Code Description SGS Code Description SGS Code Description ALS Code Description FAA515 50 g fire assay with AAS finish (5 ppb to 10 ppm) FAI505 50 g fire assay with ICP-AES finish (1 to 10,000 ppb) FAI525 50 g fire assay with ICP-AES finish (5 to 10,000 ppb) Au-AA24 50 g fire assay with AAS finish (2.5 to 10,000 ppb) FAG505 50 g fire assay with gravimetric finish for Au >10 ppm FAG505 50 g fire assay with gravimetric finish (for Au >10 ppm) FAG505 50 g fire assay with gravimetric finish (for Au >10 ppm) Au- GRA22 50 g fire assay with gravimetric finish (for Au >10 ppm) FAS30K Gold by screen metallics: Fire Assay on 500 g screened at 75 µm (for Au >5 g/t or visible gold) – on second pulp from the reject FAS31K Gold by screen metallics: Fire assay on 500 g screened at 106 µm (for Au >5 g/t or visible gold) – on second pulp from the reject FAS31K Gold by screen metallics: Fire assay on 500 g screened at 106 µm (for Au >5 g/t) – a second pulp is prepared from the reject Au- SCR24 Screen metallic on selected samples following gravimetric analysis 2008–2013 2014 2015–2017 Accurassay Timmins ALS Vancouver ALS Vancouver Fire assay with atomic absorption spectroscopy finish on a 50.2 g sample Fire assay with atomic absorption spectroscopy finish on a 50 g sample Fire assay with atomic absorption spectroscopy finish on a 50 g sample Fire assay repeated with a gravimetric finish when assays >3 g/t Au Samples with visible gold or >3 g/t Au follow screen metallic analysis: Fire assay with gravimetric finish on 1,000 g split screened at 100 µm Fire assay repeated with a gravimetric finish when assays >3 g/t Au or with visible gold. From March 2017 >5 g/t Au or with visible gold thereafter Samples with visible gold follow metallic screen analysis: Fire assay on 1,000 g split screened at 106 µm. All fractions fully analyzed Selected samples were re-assayed following screen metallic analysis: Fire assay with gravimetric finish on 1,000 g split screened at 100 µm
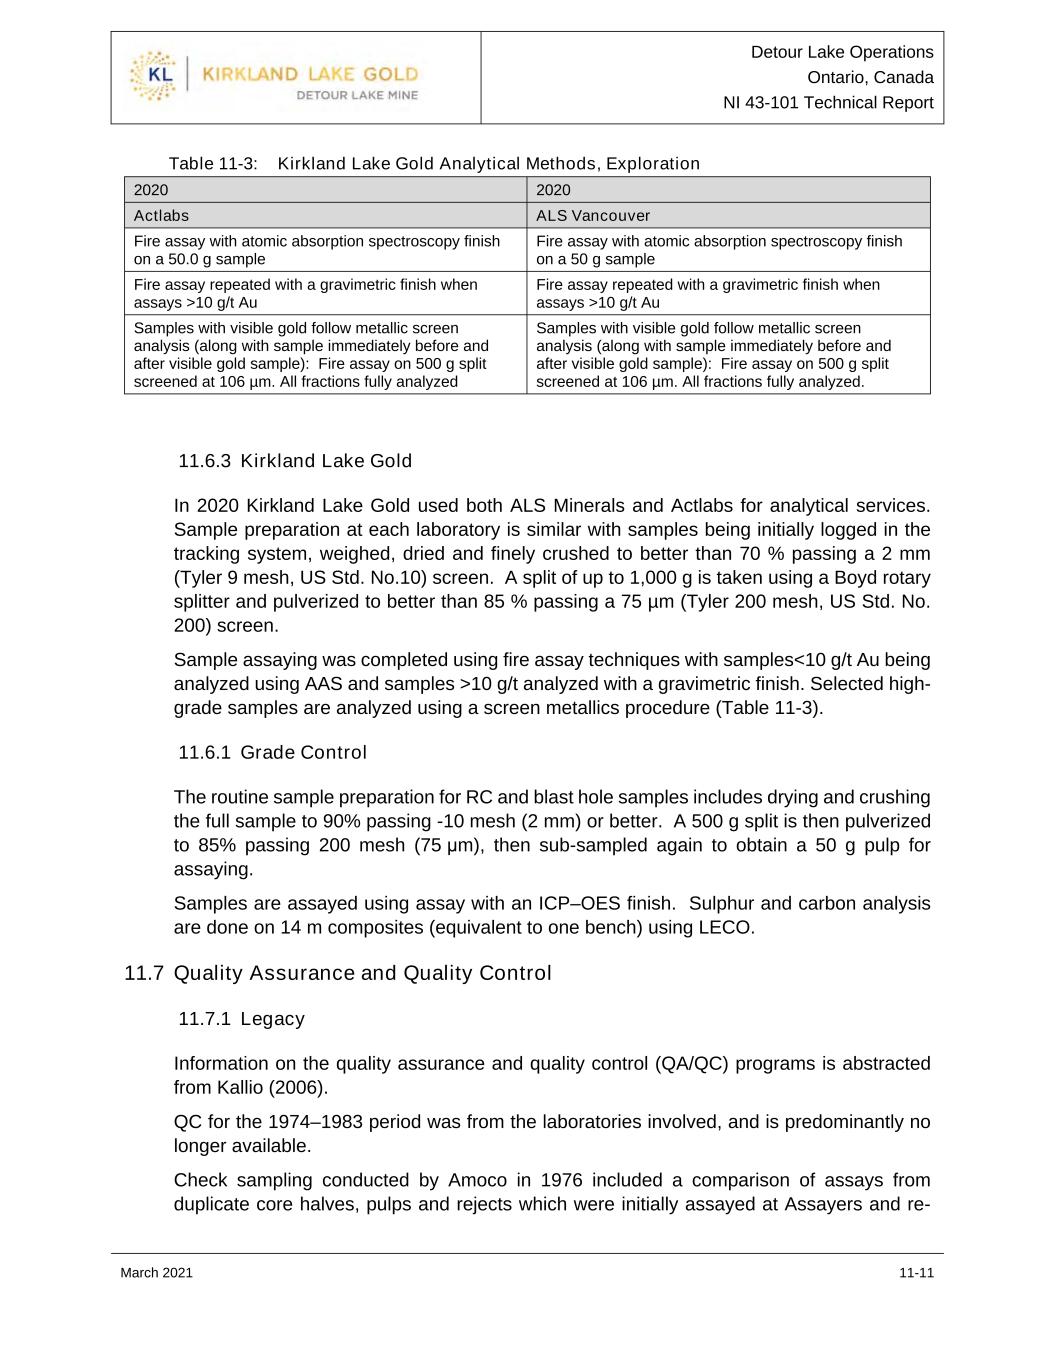
Detour Lake Operations Ontario, Canada NI 43-101 Technical Report March 2021 11-11 Table 11-3: Kirkland Lake Gold Analytical Methods, Exploration 2020 2020 Actlabs ALS Vancouver Fire assay with atomic absorption spectroscopy finish on a 50.0 g sample Fire assay with atomic absorption spectroscopy finish on a 50 g sample Fire assay repeated with a gravimetric finish when assays >10 g/t Au Fire assay repeated with a gravimetric finish when assays >10 g/t Au Samples with visible gold follow metallic screen analysis (along with sample immediately before and after visible gold sample): Fire assay on 500 g split screened at 106 µm. All fractions fully analyzed Samples with visible gold follow metallic screen analysis (along with sample immediately before and after visible gold sample): Fire assay on 500 g split screened at 106 µm. All fractions fully analyzed. 11.6.3 Kirkland Lake Gold In 2020 Kirkland Lake Gold used both ALS Minerals and Actlabs for analytical services. Sample preparation at each laboratory is similar with samples being initially logged in the tracking system, weighed, dried and finely crushed to better than 70 % passing a 2 mm (Tyler 9 mesh, US Std. No.10) screen. A split of up to 1,000 g is taken using a Boyd rotary splitter and pulverized to better than 85 % passing a 75 µm (Tyler 200 mesh, US Std. No. 200) screen. Sample assaying was completed using fire assay techniques with samples<10 g/t Au being analyzed using AAS and samples >10 g/t analyzed with a gravimetric finish. Selected high- grade samples are analyzed using a screen metallics procedure (Table 11-3). 11.6.1 Grade Control The routine sample preparation for RC and blast hole samples includes drying and crushing the full sample to 90% passing -10 mesh (2 mm) or better. A 500 g split is then pulverized to 85% passing 200 mesh (75 μm), then sub-sampled again to obtain a 50 g pulp for assaying. Samples are assayed using assay with an ICP–OES finish. Sulphur and carbon analysis are done on 14 m composites (equivalent to one bench) using LECO. 11.7 Quality Assurance and Quality Control 11.7.1 Legacy Information on the quality assurance and quality control (QA/QC) programs is abstracted from Kallio (2006). QC for the 1974–1983 period was from the laboratories involved, and is predominantly no longer available. Check sampling conducted by Amoco in 1976 included a comparison of assays from duplicate core halves, pulps and rejects which were initially assayed at Assayers and re-

Detour Lake Operations Ontario, Canada NI 43-101 Technical Report March 2021 11-12 assayed at Swastika, and indicates a reasonably good correspondence between the two data sets. A comparison of fire assays with complete leaching was conducted in 1978 by IREM-MERI using 245 duplicate halves of NQ core collected by Amoco. This program had one side of the drill core assayed using fire assay, and the second half assayed using complete leaching. The results of the comparisons indicated no overall bias, but a tendency for the original low-grade samples to be slightly underestimated and original high-grade samples to be slightly overestimated, with the point of reversal being at approximately 0.30 oz/ton. During 1991–1992, Swastika re-assayed one pulp for approximately every 20 samples processed as well as most original assays when the gold value was >1 g/t. Placer’s exploration department undertook a blind re-assay program by having Chemex re-assay 250 Swastika rejects. During 1992, Assayers re-analyzed one pulp for every 20 samples processed, one reject for every 25 samples, and most original assays when the gold value was >1 g/t. The 1993 program comprised routine checking of pulps by X-Ral, consisting of reanalyzing one pulp for approximately every 25 samples processed. Placer’s exploration department had samples grading greater than 500 ppb Au re-assayed, required reanalysis of samples grading >5 g/t Au or with visible gold at a second laboratory using pulp and metallics, and requested Chemex re-assay selected samples. Quality control procedures after 1993 included routine insertion of quality control standards, blanks and duplicates by Chemex laboratories as well as re-assaying of selected samples with visible gold and/or unusually high initial results with pulp and metallics. Kallio (2006) noted that one ‘in-house’ or Canmet standard plus a blank and a duplicate were inserted into the sample stream for every batch of 20 samples. Procedures for 2005 included duplicates, blank core samples and standards inserted at the approximate rate of one in 20 samples processed at the site as well as routine quality control by ALS Chemex and Accurassay. All samples with visible gold or returning initial results >10 g/t Au were re-analyzed with pulp and metallics. Review of the blank and standard results indicated that most were within a reasonable tolerance of the original value. Many of the duplicate data had a wide spread, which resulted in the duplicates being reassayed using pulp and metallics. Pelangio conducted a verification program on selected samples from 1982–1995 through re-assaying of original and new pulps. The reviews supported the earlier observation of a wide spread in assay results from duplicate data. 11.7.2 Detour Gold During the period 2007–2011, Detour Gold had the following QA/QC sample insertion rates for the Detour Lake drill programs: coarse blanks, 1:40; standard reference material (standard), 1:40; drill core duplicate, 1:40; and preparation duplicate, 1:30. Certified reference material used during this timeframe consisted of nine different standards purchased from OREAS (Australia).
Detour Lake Operations Ontario, Canada NI 43-101 Technical Report March 2021 11-13 There was no evidence of systematic gold contamination based on the blanks that were inserted with the sample stream. In addition, there was no bias evident between original and duplicate halves of the drill core that could indicate that technicians were preferentially submitting the more mineralized half of the core for assay. Differences between core duplicate assays were expected based on the review of reproducibility for preparation duplicates. QA/QC for the Block A area prior to 2012 included insertion of standards, blanks, and duplicates. Insertion rates are not known. Blanks were barren granite material, and standards were sourced from CDN Resource Laboratories Ltd. and Rocklabs Ltd., independent suppliers of standards to the mining industry. Review of the QA/QC program indicated no significant instances of bias or contamination. Detour Gold followed the same QA/QC procedures in 2012 for the Block A area as for Detour Lake. QA/QC samples included blanks, standards and duplicates. There was no evidence of systematic gold contamination based on the blanks that were inserted with samples. The standard data indicated a change in the performance of SGS Don Mills during the year. All of the low-grade standards (0.3–1.6 g/t Au) showed a low bias in the order of -5% and very high failures rates; whereas the high-grade standard performed well. It was concluded that SGS Don Mills made changes to its fire assay procedures that resulted in a low bias post-May 2012 for gold concentrations <1 g/t Au. In general, the reproducibility for preparation duplicates was similar to previous periods and within expected ranges. Results for pulp duplicates were very similar to data for preparation duplicates; reproducibility issues were noted in the finer-ground materials. The reproducibility was similar to the results for preparation duplicates for the Detour Lake deposit and within expected ranges. There was no bias evident between original and duplicate halves of the drill core. A metallics versus fire assay comparison was performed on the 2012 Block A data. The subset of samples selected on the basis of original 50 g fire assay determinations agreed reasonably well with the FA-MET re-analyses. Selected sample pulps and core samples originally assayed by SGS Don Mills were re-assayed at SGS Cochrane. SGS Don Mills assays were biased high by 4.84% when compared to the SGS Cochrane assays on the suite of samples selected for check assays. SGS Cochrane reported on average 5% low on the standards included with samples, suggesting that the two sets of assays were comparable. The QA/QC samples included in the 2016 West Detour drilling had the following insertion rates: coarse blank, 1:20; and standard, 1:20. Standards used were from Oreas. The blank material was crushed limestone. Core duplicates were omitted from this drilling program following a review of historical duplicate data. There was no evidence of systematic gold contamination based on the blanks that were inserted with the samples. The standard data results were in an acceptable range. The Zone 58N drilling programs from 2014–2017 had coarse blanks and standards inserted at a 1:20 rate. Standards were sourced from OREAS (Australia). No duplicates were used. The blank material was a crushed limestone. There was no evidence of systematic gold contamination based on the blanks that were inserted with the samples.
Detour Lake Operations Ontario, Canada NI 43-101 Technical Report March 2021 11-14 Standard re-assays were not requested if the results were within ± 10–15% or within waste rock. Plotting of the standard results for 2014–2015 showed a low bias for samples processed prior to August 2014; however, most were within the -15% range. Review of the 2016 standard results indicated an issue with the gravimetric fire assay method. Investigation showed that the Au-GRAV assay was being done on a 10 g sample instead of the 50 g and this smaller sample caused problems when trying to remove the silver from the doré bead. Detour Gold instructed ALS Vancouver to discontinue assaying using FA- GRAV on <20 g of material, and discontinue FA-GRAV if the original sample assayed <5.0 g/t Au. In 2017, the blank material was changed to a silica sand. The 2017 standard results were considered to be acceptable. 11.7.3 Kirkland Lake Gold Kirkland Lake Gold implemented a systematic QA/QC program for its 2020 exploration drilling program which includes the insertion of one standard and one coarse blank material every 20 samples dispatched. One coarse blank or a standard is inserted within every 10 samples. The standard is generally inserted close to samples that are anticipated to be auriferous. Where visible gold is observed a high-grade standard is placed prior to the sample and a coarse blank is placed after the sample along with a wash code designation communicated to the analytical laboratory to ensure a silica wash is completed immediately after the sample containing visible gold is crushed. Kirkland Lake Gold uses six OREAS gold standards sourced from Australia, specifically OREAS209 (1.58 g/t Au), OREAS216b (6.66 g/t Au), OREAS217 (0.338 g/t Au), OREAS219 (0.76 g/t Au), OREAS223 (1.78 g/t Au), and OREAS231 (0.542 g/t Au). At ALS Vancouver, internal laboratory checks include the insertion of one blank, two standards, and three duplicates for every 78 samples (per fusion furnace). QA/QC conducted by Actlabs consists of the insertion of two blanks every 24 samples, one preparation duplicate every 50 samples, one laboratory duplicate every 10 samples, and multiple standards for every 24 samples. Each laboratory does its own bias, precision, accuracy and contaminations checks based on the results of the inserted QA/QC samples. 11.7.4 Grade Control QA/QC of all RC and blast holes is monitored on a daily basis using an acQuire database system. All assays that pass QA/QC are accepted into the database, while assays that fail the QA/QC are reanalyzed by SGS Cochrane as per the mine’s QA/QC procedure. 11.8 Databases The original Detour Gold database consisted of three Access databases covering three different projects Detour (Main Mine), Regional, and West. Kirkland Lake Gold merged the three databases into one Fusion database with each drill hole being applied a “Project

Detour Lake Operations Ontario, Canada NI 43-101 Technical Report March 2021 11-15 Number” that reflects the Access database they originated from. Two business units were created in the Fusion database to retain the old data while allowing for new rules to be applied for future logging (limits for sample lengths, overlaps in data, etc.). The “HISTORIC” business unit contains all the data from the Access databases and the DETOUR business unit will be used for future logging. Any discrepancies or questions were directed to the database manager who created the Access databases. The Fusion tables were set up with fields to effectively enter new data while retaining the original data from the Access database. Fields containing original data that were altered during migration are not available to the loggers for future reference but can be accessed by querying the database. Reference tables were created for drop-down pick lists that consist of a comprehensive compilation of the data in the Access databases. Kirkland Lake Gold performed a major data verification exercise during the data migration to Fusion. Verification procedures included the review and modifications of coordinates, surveys, samples, lithologies, alteration, mineralization, deformation, structure, veining, and RQD data. Currently, logging and geotechnical data are directly uploaded from the logging software directly into the Fusion database. Collar survey data and down-hole survey data are uploaded to the Fusion database in UTM coordinates. All data are checked using inbuilt software checking routines. 11.9 Sample Security 11.9.1 Legacy The information on compilation of the legacy data into a database is abstracted from Kallio (2006). The vast majority of samples appear to have been collected by experienced and knowledgeable personnel working for Placer, Campbell, Amoco and Pelangio at core facilities located at or quite near to the site of drilling. The facilities used by Amoco and Campbell would have been located at an exploration site with relatively restricted access, and those by Placer Dome were at an operating minesite which would have been monitored closely by personnel from both the Security and Geology departments, with relatively limited access to others. The facilities used by Pelangio were located close to the original mine buildings. Procedures for sampling, handling, shipping and analyzing the samples were defined by personnel from each company who were considered to be competent and knowledgeable in their respective fields of work. Sample tagging by Placer, for at least the later parts of the mine life, was done using a bar code system, which should have resulted in less possibility for analytical errors. Transportation of samples to the assay laboratory from early programs was by air and/or ground transport with minimal ability for tampering by outside personnel. Transportation of most of the later samples collected by DMG, which were being processed at an onsite laboratory, was by a truck driven by workers at the site. Transportation of

Detour Lake Operations Ontario, Canada NI 43-101 Technical Report March 2021 11-16 samples collected by Placer Dome and Pelangio, which were being processed at off site laboratories would have been by a truck driven by employees working on the drill programs or bonded carrier. 11.9.2 Detour Gold Sample security was monitored by Detour Security and Exploration Staff. Samples were placed individually in plastic bags and transported within marked and sealed rice bags by courier directly to analytical laboratories. Sample collection from drill point to laboratory relies upon the fact that samples are either always attended to, or stored in the locked on- site preparation facility, or stored in a secure area prior to laboratory shipment. Chain-of-custody procedures consist of sample submittal forms to be sent to the laboratory with sample shipments to ensure that all samples are received by the laboratory. 11.9.3 Kirkland Lake Gold Samples are directly shipped from site, using Gold Heart Courier to certified off-site analytical laboratories for preparation and assaying. All sample shipments leaving site are tracked by the Kirkland Lake Gold–Detour Lake site warehouse. Analytical laboratories send sample receipt confirmation to Kirkland Lake Gold representatives and verify all samples are received for the appropriate dispatch. 11.10 Sample Storage Detour Gold compiled a complete inventory of the historical core on site. Much of the early historical drill core is in deteriorating condition due to decay of the core trays. Many of the older pulps and rejects from both Detour Lake and West Detour were stored in a dome (WeatherHaven tent) in Cochrane. During a severe snowstorm in the winter of 2016, the dome collapsed and the subsequent winter snow and spring rain damaged the cardboard boxes (shrink-wrapped with plastic on wooden pellets). Following the removal of the collapsed structure, many of the boxes were damaged and not recoverable. The pressure of two layers of pellets crushed the cardboard boxes with water penetrating bags or erasing markings on boxes and on pulp envelopes. The recoverable portion was moved to permanent storage facilities at site. All pulps since 2014, and most of the rejects, are stored at Kirkland Lake Gold’s Cochrane facility. All core boxes in which samples were collected during the Detour Gold and Kirkland Lake Gold programs were placed in steel core racks or on pallets at the Kirkland Lake Gold core storage facility, which is not guarded but is located within the mine site controlled area.
Detour Lake Operations Ontario, Canada NI 43-101 Technical Report March 2021 11-17 11.11 Comments on Sample Preparation, Analyses and Security In the opinion of the QP: • Sample collection, preparation, analysis and security for core drill programs are in line with industry-standard methods for gold deposits at the time the samples were collected; • Drill programs included insertion of blank, duplicate, and standard reference material samples; • QA/QC methods are practiced during density measurement programs, which are industry leading practices; • QA/QC program results do not indicate any problems with the analytical programs (refer to discussion in Section 12); • Data are subject to validation, which includes checks on surveys, collar co- ordinates, and assay data. The checks are appropriate, and consistent with industry standards (refer to discussion in Section 12); • Retained core has been catalogued and is stored in designated core storage facilities. The QP is of the opinion that the quality of the gold analytical data is sufficiently reliable to support Mineral Resource estimation without limitations on Mineral Resource confidence categories.
Detour Lake Operations Ontario, Canada NI 43-101 Technical Report March 2021 12-1 12.0 Data Verification 12.1 Historical Verification Programs 12.1.1 2005–2006 Very little data verification work was documented prior to 2005. Kallio (2005, 2006) completed an initial verification program of the historic drill hole database and conducted some independent check sampling of the pre-2004 and Pelangio assay data (Kallio, 2006). The validation of the database information versus the historical records did not return any significant errors. Only minor discrepancies related to data entry errors, inconsistent coding, rounding errors or missing data were identified. Independent check sampling of 96 historical drill core intervals indicated poor correspondence of grades between historic and new assays, high variability between duplicates and tendencies for most new assays to be lower than the original. Additional data verification on the Pelangio drilling indicated minor errors in the database. Check assays of core, pulps and rejects were also conducted. Results from the check assays showed a significant variability between comparative assays with higher values returned from the check assays. Kallio (2006) also conducted some comparison of assays results from different drill programs located within a test block of the Detour Lake deposit and comparisons between paired Pelangio and historic holes in close proximity to each other. Results indicated significant variation in average grades between each drill programs at different cut-off grades with Pelangio holes having the highest average grade. Reasons for these differences were not identified and it was suggested that the unknown quality of historic assay procedures, inconsistent determination of historic capping levels, small core size and historic assay averaging may have contributed to the discrepancies. Kallio (2006) recommended additional verification of the historical assay. In 2008, WGM conducted some independent check sampling of the Detour Gold assay data with no significant database verification. 12.1.2 2009 As part of the pre-feasibility study (Met-Chem, 2009), further database verification work was carried out in early 2009 by Scott Wilson Roscoe Postle Associate Inc. (Scott Wilson RPA). The database verification program consisted of a review of the digital database against all available data including original logs, survey documents, assay certificates, underground void wireframes, topography, and plotted maps. Collar coordinates, downhole surveys, geology and assays were checked from a random selection of drill holes from each historic drilling campaign. Additional checks were completed on specific holes that could have a significant effect on local high-grade block estimates and holes that were questionable due to location or inconsistent data.
Detour Lake Operations Ontario, Canada NI 43-101 Technical Report March 2021 12-2 As Detour Gold drill hole data and underground voids were captured independently of each other, an additional validation comparing their relative locations was conducted. Although the distances between drill hole breakthroughs and voids vary, most breakthroughs could be explained by the presence of a modeled void in the vicinity. Checks on duplicate pulps, preparation samples and core samples were carried out on the Detour Gold drill hole data. Results indicated that precision of all samples, including pulp duplicates, was extremely variable even at low grades. Assay precision will influence the selection of appropriate grade interpolation parameters and method for resource estimation. Scott Wilson RPA concluded that the drilling, data collection and QA/QC procedures undertaken by Detour Gold corresponded to industry standard practices and were considered to be acceptable. Scott Wilson RPA conducted studies to assess drill hole data reliability for use in resource estimation. Comparisons were run between Detour Gold holes and all other previously drilled holes within separate domains and test blocks for Detour Lake. Results indicated that over large domains, average grades showed reasonable to poor correlation; however, similar distinct trends existed locally between the datasets. Historic holes generally contained local higher average gold grades compared to Detour Gold holes and reflected local trends dependent on hole locations. Detour Gold assays were distributed at relatively equal spacing throughout the domains and may be more representative of the overall gold grades. Scott Wilson RPA recommended additional studies to assess the validity of historic underground holes especially in the area below the current influence of Detour Gold surface holes (5,900 metres elevation) involving reconciliation of historic assays with underground production (after final stope models have been generated) and additional data collection at depth. Scott Wilson RPA was of the opinion that the database finalized in June 2009 was valid and acceptable for use in mineral resource estimation work. 12.1.3 2009–2010 As part of the Detour Lake feasibility study, SGS Geostat conducted an extensive statistical review and data verification program in late 2009 (BBA, 2010). The data verification program included • Verification of the drill hole database versus historical records; • Independent check sampling of some historical assay data; • Drilling of five independent holes designed to twin recent Detour Gold holes and historical holes; • Total gold analysis of 24 composites located with a test block using gravity concentration and cyanide leaching.

Detour Lake Operations Ontario, Canada NI 43-101 Technical Report March 2021 12-3 The SGS Geostat data verification program led to the following conclusions. Comparison of the mean gold grade in the same block between the Detour Gold analytical data and the historical data showed a mean grade systematically higher for the historical data. In order to diminish this discrepancy, the missing assay values from the historical drill holes were replaced with 0.01 g/t Au. Check sampling had identified a potential positive bias for the historical assays from hole CRL-039. In order to quantify the effect of a potential analytical bias toward some of the historical drill assays, SGS Geostat conducted a resource estimation exercise on the mineralized Domain 2 with the objective of quantifying the effect of the CRL series assays on the overall gold content of the mineralized domain. Based on these results, SGS Geostat considered the effect of removing the historical CRL series drill holes to be insignificant compare to overall gold content in the Detour Lake deposit. The twin drilling campaign conducted as part of the independent verification program showed a fair to good correlation between the historical and Detour Gold assay data collected from the twin drill holes. From the total of five holes completed for this test, hole CRL-030 was the only hole showing poor correlation with the original data. Total gold analysis (using gravity concentration coupled with bulk cyanidation) was conducted over 24 recent drill sections contained within a test block located just west of the former Campbell pit to characterize the nugget effect for a localized area of the Detour Lake deposit. Results showed a good relationship between the calculated head grade from the total gold analysis data and the fire assay data used by Detour Gold. Overall, the program demonstrated that the original fire assays used by Detour Gold in the test block area was a good approximation of the total gold content estimated from the gravity and cyanidation test work. 12.1.4 2010–2011 As part of the 2010 and 2011 year-end mineral resource estimation updates, SGS Geostat conducted independent check sampling on selected 2010–2011 Detour Gold drill core and independent measurement of the SG on the check core samples to validate the average SG value of the Detour Lake deposit. Independent check sampling was carried out on 60 samples selected from drill holes in 2010 and 57 samples selected from drill holes in 2011. Overall, the assay results of the duplicate samples showed a good correlation with the original assays except for the samples with high gold values. For 2010, all the samples with gold >5 g/t returned gold values lower than the original samples. For 2011, eight samples were originally higher than 5 g/t Au, with four (or 50%) returning gold values greater than the original samples. Based on sorted average values, 13 samples for 2010 and 2011 were >5 g/t Au, which was not enough to statistically define any analytical bias for these high values. However, the results showed significant variability of the high-grade samples due to the nugget effect and the importance in the application of a conservative capping of the assays used for the mineral resource estimation. A significant variability was observed between the original and
Detour Lake Operations Ontario, Canada NI 43-101 Technical Report March 2021 12-4 duplicate results. The variability observed for the duplicate samples was in line with Detour Gold’s QA/QC results for half core duplicates collected since 2007. 12.1.5 2012–2013 As part of the 2012 and 2013 year-end mineral resource estimation update for West Detour, SGS Geostat conducted an independent analytical check program during 2012 and 2013 on selected Detour Gold drill core (from 2011 and 2012) in the western part of the Detour Lake deposit and eastern portion of the West Detour deposit, and on selected Trade Winds drill core in the western portion of the West Detour deposit. A total of 193 quarter-core samples selected from drill holes series DG11 (30) and DBKA (36) as well the Trade Winds drill holes series TWDDH (127) were analyzed, along with selected standards and blanks. 12.1.6 Verification of the Detour Gold Drill Holes In November 2012, SGS Geostat performed different statistical tests including lognormal student T-test and sign test on the data from the independent sampling program on the DG and DBKA series (total 66). SGS Geostat could not confirm the presence of any bias on the independent samples series from the Detour Gold samples. Overall, the assay results of the duplicate samples showed an average correlation (R2=0.5 for log values) with the original assays except for the samples with high gold values. The average grade of the Detour Gold sample series was 2.37 g/t Au and for the SGS Geostat series, the average grade was 2.27 g/t Au. Fourteen of the 34 duplicate gold values >1.0 g/t Au returned values lower than the original samples. The 34 samples >1.0 g/t Au were not sufficient to statistically define an analytical bias for these values. A contributing factor to the discrepancy could be due to sampling quarter core rather than half core. However, these results showed the significant variability of the high-grade samples due to the nugget effect and the importance in the application of a conservative capping of the analytical composites used in Mineral Resource estimation. Significant variability was observed between the original and duplicate results. This behavior in the variability duplicate samples was expected due to the significant nugget effect observed at the Detour Lake and West Detour deposits. The variability observed for the duplicate samples was in line with Detour Gold’s QA/QC results for half core duplicates collected since 2007. 12.1.7 Verification of the Trade Winds Drill Holes In July 2013, SGS Geostat performed different statistical tests including lognormal student T-test and sign test on the data from the independent sampling program on the TWDDH series drill holes (127). A total of 125 original and check fire assay results were retained to verify the same procedure. The sign test and student T-tests performed on the fire assay results showed a bias towards the original Trade Winds samples. Overall, the assay results of the duplicate samples sent to ALS Minerals returned values lower than the original values, with only 49 of the 125 fire assay results being over the original results. The fire assay results showed an average correlation (R2=0.8 for log

Detour Lake Operations Ontario, Canada NI 43-101 Technical Report March 2021 12-5 values) with the original assays. The average grade of the Trade Winds sample series was 2.03 g/t Au and SGS Geostat was 1.34 g/t Au. Sixteen of the 23 duplicate gold values between 1.0–5.0 g/t Au returned values lower than the original samples. The sign test performed on all 125 pairs (fire assay results) of values indicated a bias when considering the whole population. By sorting according to the original values of Trade Winds samples, there was a bias present for values >9 g/t Au (eight duplicates lower versus one duplicate higher). The selection of high-grade intervals may have influenced this result. SGS Geostat found that the Trade Winds sample grades (average) were almost always higher than those of the control data. This observation was systematic and significant enough to warrant further investigations. A contributing factor to the discrepancy could be attributed to duplicate assays being done on a smaller sample size coming from a quarter of the core instead of half core. SGS Geostat found that there were about as many Trade Winds data points (135,000 assays, 39% of overall data) as Detour Gold (122,000 assays, 35% of overall data) in the database, and the remainder came from prior historical drilling (92,000 assays, 26% of overall data). In order to assess the impact of the TW series data on Mineral Resource estimation, SGS Geostat carried out grade interpolations using the same procedures while removing the TW series. Results from this exercise indicated that the Mineral Resource estimate obtained was very similar, using the same gold cut-off grade. It was SGS Geostat’s opinion that the Trade Winds database was valid and acceptable for use in Mineral Resource estimation studies. However, they recommended that further monitoring be completed to investigate this potential bias on the estimation of mineral resources. 12.1.8 Follow up on Trade Winds Drills Hole Verification In late 2014, Detour Gold located and conducted test sampling on 63 original Trade Winds coarse rejects and pulps from the samples used by SGS Geostat in their 2012–2013 verification. Although the sample amount is limited, no significant bias was found. Forty- one samples were within 10% of the original assays, 12 samples returned results values higher than 10% of the original assays, and 10 samples returned values lower than the original assays. An additional 218 original coarse rejects and pulps were located for Trade Winds (125 from TWDDH series) and Detour Gold (93 from DBKA series). Similar results were found. Of the 125 Trade Winds samples, 79 returned assays within 10% of the original values, 25 returned higher assays and 21 returned lower assays than the original assays. Of the 93 Detour Gold DBKA samples, 63 returned assays within 10% of the original values, 20 returned higher assays and 10 returned lower assays than the original assays. Results of the new assays from original coarse rejects and pulps from the TWDDH and DBKA drill series showed good reproducibility given the natural variability of gold due to high nugget effect. The results validated the original assays from pulps and rejects. However, it did not explain the discrepancy between original assay values and results
Detour Lake Operations Ontario, Canada NI 43-101 Technical Report March 2021 12-6 obtained when submitting second half of remaining core from earlier Trade Winds core holes. The prior test used quarter-core and concentrated on high grade zones only, which may have biased the results. It was therefore decided that twinning some TWDDH would be the best way to validate the original assay results. A twin drill hole program was completed in 2016 (see Section 10.9). 12.1.9 Zone 58N Deposit Data Verification Assay Certificate Verification Third-party consultants G Mining randomly selected several assay certificates in .pdf form from each year, and visually compared them with the assay flat file. In addition, the .csv files were cross-checked with the assay flat file using the sampleID as the key field and excel formula. G Mining did not find any discrepancies and believed that the integrity of the drilling database as reviewed was high. Intra-laboratory Check Assays Intra-laboratory check assays were undertaken at both Actlabs (2016) and SGS Cochrane (2017) for comparison with the results obtained from the routine laboratory (ALS Vancouver). In 2016, 92 samples from 20 drill holes were analyzed at Actlabs, where the fine fraction pulp was sent and analyzed using the typical analysis route (fire assay followed by AA finish, with samples >5 g/t Au being sent for gravimetrics where possible). Due to the extreme nugget effect observed at Zone 58N, the fine fraction material was considered the most appropriate to test for intra-laboratory bias. In 2017, 50 samples from five drill holes were analyzed at SGS Cochrane. The fine fraction showed very good repeatability between the two datasets. The 2016 results have a minor high bias to ALS Vancouver when samples are <1 g/t Au and the 2017 results have a slight high bias to SGS Cochrane when samples are <3 g/t Au. 12.2 External Data Verification Kirkland Lake Gold requested that third-party consultants Wood Canada Limited (Wood) perform a due-diligence audit of the Mineral Resource estimate (3 June 2020 model) for the open pit. The audit was performed in five phases: geology, data evaluation, resource modelling, resource model validation and reporting, and a risk and opportunity assessment. Kirkland Lake Gold personnel addressed items arising from the review at the end of each stage. Wood’s opinion was that the overall model construction was reasonable and suitable for reporting Mineral Resources within the open pit and the mineral resource confidence classification was reasonable. The overall geological interpretation and estimation domains, used in conjunction with dynamic anisotropy, were shown to be a reasonable

Detour Lake Operations Ontario, Canada NI 43-101 Technical Report March 2021 12-7 approach for the open pit model. The model, however, was not considered suitable for higher-grade underground mine planning or resource reporting. Wood recommended that a new dynamic anisotropy model for future high-grade underground models be constructed. Kirkland Lake Gold also had a third-party mining expert audit the 2020 LOM plan. That audit was conducted in two phases, one which focused on open pit mine design, production schedule, and cost estimates, and a second, which consisted of a risk and opportunity assessment. The objective of the audit was to confirm that each step in the mine planning process was appropriate and based on information of suitable quality. The audit was conducted in sufficient detail to verify the accuracy of supporting information, verify methods used and independently validated critical steps or estimates by reviewing pertinent documentation, fundamental data, and verification of inputs and assumptions. No major items for remediation were noted from the audit. Recommendations included the development of a consistent methodology for mineral resource modelling for all three deposits, development of detailed operational procedures for flitch mining, and incorporation of reclamation and closure plan activities in the LOM production schedule. 12.3 Kirkland Lake Gold Verification Programs Kirkland Lake Gold personnel re-verified the entire database during migration of the data from the three Access databases used by Detour Gold to the current Fusion database. Verification programs include daily dispatch reporting and review, and review and approval of received assay data prior to uploading into the Fusion database. Kirkland Lake Gold personnel also conduct monthly assay quality control reporting, and QA/QC statistical reporting. 12.4 Verification Completed by the QP Verification completed by the QP includes site visits, verification of the database integrity, and the validity of the collar, survey, assay and lithological coding data. 12.5 Comments on Data Verification A number of data verification programs for Detour Lake and the West Detour project deposits were carried out by independent consultants and Detour Gold personnel over time. Kirkland Lake Gold personnel re-verified the entire database during migration of the data from the three Access databases used by Detour Gold to the current Fusion database. The QP personally verified the integrity of the database and validity of the collar, survey, assay and lithological coding data, and conducted site visits. Positive production reconciliation since the start of the mining operations at Detour Lake validates the assumptions of metal content and gold extraction.

Detour Lake Operations Ontario, Canada NI 43-101 Technical Report March 2021 12-8 The QP considers that a reasonable level of verification has been completed and that no material issues have been left unidentified from the programs undertaken. The data are acceptable to be used in Mineral Resource and Mineral Reserve estimation.

Detour Lake Operations Ontario, Canada NI 43-101 Technical Report March 2021 13-1 13.0 Mineral Processing and Metallurgical Testing 13.1 Introduction The Detour Lake Mine process plant was constructed in 2012, started operations in 2013, and has been operating since. The plant design was based on metallurgical testwork completed during pre-feasibility and feasibility studies, conducted from 2009–2010. Most of the metallurgical testing was completed at SGS Lakefield Research Limited in Ontario (SGS Lakefield) with follow-up testwork (lead nitrate and oxygen control) carried out on-site by site personnel. Recoveries from Detour Main have been in line with the feasibility study while milling rates have exceeded plant design predictions in that study. 13.2 Historical Metallurgical Testwork Metallurgical testwork completed as part of the 2009 pre-feasibility study included mineralogical examination; gravity recovery tests, including gravity recoverable gold (GRG) tests; cyanide leach tests on gravity tailings; grade variability testing; barren solution recycle testing; cyanide destruction tests; preparation of tailings for chemical and physical characterization and environmental testing; and environmental testwork. During the 2010 feasibility study, tests focused on project optimization, and included evaluation of gold recovery versus grind size, use of oxygen in leach and crushing and grinding studies. Extensive plant testwork proved the benefit of leaching with high oxygen rates and lead nitrate. Three full grinding circuit surveys were completed by Detour personnel and modelled by third-party consultants BBA using JKSimMet to assist with grinding circuit optimizations and characterization. 13.3 Detour Lake/West Detour Testwork Programs and Results 13.3.1 Comminution A total of 132 HQ core samples were used for comminution tests on eight domains within the Detour Lake deposit. Tests included semi-autogenous grind (SAG) mill comminution (SMC) tests for A and b parameters, drop weight index (DWi), crushing work index (CWi), Bond ball mill work index (BWi), Bond rod mill work index (RWi) and abrasion index (Ai). Specific gravity tests were also conducted, using wax immersion, pycnometer and SMC methods. A total of 61 core samples from West Detour were also subject to comminution tests. The results of those tests were confirmed through the various grinding survey campaigns.
Detour Lake Operations Ontario, Canada NI 43-101 Technical Report March 2021 13-2 Table 13-1 summarizes the testwork results for Detour Lake. Table 13-2 provides a comparison between the West Detour and Detour Lake tests, using the 75th percentile results. Mineralization from West Detour is softer in terms of RWi and BWi and less abrasive than mineralization at Detour Lake. 13.3.2 Grinding Circuit Simulation The grindability results from the comminution testing were used to conduct JKSimMet simulations of different SAG mill circuit configurations and operational variables (circulating load, P80, etc.). A SAG-ball-crushing (SABC) grinding circuit configuration was selected for the process plant. In the design, the feed to the SAG mill was subjected to primary and secondary crushing to reduce the feed size to the SAG mill due to the high ore hardness. The grinding circuit design basis was reviewed by third-party consultants Ausenco and SAG Design and was deemed appropriate for the hardness of the ores that the Detour Lake plant would process. Once the circuit was operational, this model was updated three times with crushing/grinding circuit surveys that served as the basis for circuit optimisation. 13.3.3 Gravity Gold Recovery The results of the gravity recovery tests performed at the feasibility study stage indicated that gravity recovery was a key component of the milling process for Detour Lake. This was verified with plant data where the plant recovery is clearly influenced by gravity recovery. Figure 13-1 illustrates the plant recovery versus gravity recovery. During the feasibility study, laboratory testwork recoveries varied from 30–45% (25–75th percentile) to as much as 70%. Similar tests for West Detour indicated that gravity recovery ranged from 20.1–80.4% for the samples tested. This variability was taken to be consistent with the nature of free gold in some samples and more disseminated in other samples. No marked differences in the respective responses were noted between the Main and West areas of the deposit. Figure 13-2 is a graphic showing the testwork recoveries from the feasibility study versus operating data. It is therefore believed that the gravity recovery can be increased. This can be substantiated by the fact that the gravity circuit is fed from cyclone feed material vs ball-mill discharge as per the original design. Operational issues prevented feeding the gravity circuit with ball- mill discharge material. However, a new design was developed where cyclone underflow will now feed the gravity circuit. This is expected to increase the gravity recovery. The other improvement for the gravity circuit is the use of an intensive leach reactor (ILR). The leach reactor leaches the gravity concentrate. The amount of material the ILR leaches limits the amount of gravity concentrate the gravity circuit can generate. If more concentrate can be generated, the gravity recovery will increase.

Detour Lake Operations Ontario, Canada NI 43-101 Technical Report March 2021 13-3 Table 13-1: Comminution Testwork, Detour Lake Statistics SG (g/cm3) SMC Test (A x b) CWi (kWh/t) RWi (kWh/t) BWi @150 µm (kWh/t) Ai (g) Wax Pycnometer SMC Average 2.89 2.89 2.92 26.0 14.2 18.0 14.3 0.421 Minimum 2.49 2.67 2.72 53.1 5.2 12.0 9.1 0.08 10th percentile 2.74 2.81 2.80 30.2 9.9 15.9 11.2 0.238 25th percentile 2.82 2.84 2.88 27.5 11.9 17.2 12.7 0.365 Median 2.90 2.90 2.94 25.7 14.8 18.0 14.3 0.484 75th percentile 2.98 2.93 2.98 24.3 16.9 18.9 15.5 0.54 90th percentile 3.01 2.98 3.01 23.4 19.7 19.9 16.5 0.544 Maximum 3.19 3.09 3.10 22.5 25.6 22.7 20.1 0.548 Table 13-2: Comminution Testwork Comparison, Detour Lake vs West Detour Deposit JKTech Parameters Relative Density SG Work Indices SMC Test (A x b) DWI (kWh/m3) Wax (g/cm3) SMC (g/cm3) Pycnometer (g/cm3) CWi (kWh/t) RWi (kWh/t) BWi (kWh/t) Ai (g) Detour Lake 24.3 11.4 2.98 2.98 2.93 16.9 18.9 15.5 0.54 West Detour 24.8 11.6 2.98 2.97 2.99 16.4 17.1 13.2 0.38 7 % Difference -2% -2% - - 2% -3% -10% -15% - 28%

Detour Lake Operations Ontario, Canada NI 43-101 Technical Report March 2021 13-4 Figure 13-1: Plant Recovery versus Gravity Recovery Note: Figure prepared by Kirkland Gold, 2020. Figure 13-2: Feasibility Study Testwork Recovery Predictions versus Operating Data Note: Figure prepared by Kirkland Lake Gold, 2020. = feasibility study data. = operating data.

Detour Lake Operations Ontario, Canada NI 43-101 Technical Report March 2021 13-5 A time study of the ILR has shown that it is only in leaching mode 52% of the time. The addition of leach aid to the ILR has also proven to be efficient in improving leach kinetics and reducing the amount of time needed to leach the gold. An automatic dosage system for leach aid is part of the ILR optimization plan. Other ILR optimization target items are: • Improved oxygen addition through better sparging; • Increased drum speed; • Improved flocculation for desliming. 13.3.4 Leach Test Work Extensive testwork (leach profiles, final tails re-leach, gold leach kinetics tests) were completed in the plant and in the laboratory to improve recovery. Plant recovery has gone up significantly from 2019 as a result of this work (Table 13-3). While the leach extraction appears to be robust, it is planned to add a sixth leach tank to each of the leach trains to maintain the recovery at the 28 Mt/a throughput rate. Circuit modifications to improve oxygen diffusion, reduced leach densities and lead nitrate addition had a significant impact on maintaining and improving recovery in the leaching circuit at the higher throughput rate. For 2020, the average leach circuit profile is as shown in Figure 13-3. The plant conducts weekly final tails re-leach of the final leach tails to establish potential gold losses. The final tails are re-leached with a very high cyanide concentration (1,000 ppm). After this test is done, the final tails is then re-ground for seven minutes in a small laboratory ball-mill. The grind fineness then improves from 70% passing 75 µm to 80% passing 75 µm. The ore is then re-leached for eight hours at a very high cyanide concentration (1,000 ppm). Results for 2018–2020 are illustrated in Figure 13-4 and summarized in Table 13-4. The potential to improve the recovery through better grind fineness therefore exists and validate the feasibility test work (Figure 13-5). It is also believed that the gold gained through the intensive leaching represent the potential gold lost due to gravity recovery. Initiatives to improve the grind fineness include: • Ball size optimization; • Process control improvement; • Increase ball-mill power; • Reduced hardness of mineralization from Detour West.
Detour Lake Operations Ontario, Canada NI 43-101 Technical Report March 2021 13-6 Table 13-3: Plant Recoveries, 2013–2020 Year Recovery (%) Head Grade (g/t) 2013 86.2 0.750 2014 90.7 0.884 2015 90.9 0.876 2016 89.2 0.902 2017 89.6 0.929 2018 90.1 1.038 2019 92.1 0.922 2020 91.3 0.834 Figure 13-3: Average 2020 Leach Circuit Profile Note: Figure prepared by Kirkland Lake Gold, 2020. Tank 5Tank 4Tank 3Tank 2Tank 1 89.0% 88.0% 87.0% 86.0% 85.0% 84.0% 83.0% 82.0% 81.0% 80.0% Cu m m ul at iv e Ex tra ct io n 81.4% 86.1% 87.0% 87.1% 87.2% 95% CI for the Mean Interval Plot of Cummulative % Extraction Through Leach Train
Detour Lake Operations Ontario, Canada NI 43-101 Technical Report March 2021 13-7 Figure 13-4: Tails Releach Results 2019–2020 Note: Figure prepared by Kirkland Lake Gold, 2020. Table 13-4: Recovery Gains, Intensive Releach Year Potential Gain in Recovery Intensive Re-Leach (%) Potential Gain in Recovery Total with Regrind (%) 2018 2.97 4.19 2019 1.42 2.53 2020 1.22 2.23

Detour Lake Operations Ontario, Canada NI 43-101 Technical Report March 2021 13-8 Figure 13-5: Gold in Tails (g/t) vs. P80, Detour Lake Samples Note: Figure prepared by Detour Gold, 2011. Ball Size Optimization The ball size is key for an improved grind. Since the start of the plant, a blend of 2.5” and 3 ¼” balls were added to the ball mills (70/30). To determine the optimum ball size required for the Detour Lake ore, a grinding circuit survey was performed in 2020. A sample of 500 kg of ball-mill circuit feed was taken and sent to Metcom, a metallurgical consultant, for ball blend testing. The intent of the testwork is to determine the optimum ball size for the Detour Lake ore. Circulating Load Increase The Detour Lake ball mill circuit is constraint by a restriction in the ball mill discharge launder. This prevents the ball mill circuit from being optimally run. Usually, a ball mill circuit runs at 350% of the circulating load; however, the Detour ball-mill circuit runs at 250% because of a ball mill launder constraint. This bottleneck will be removed part of the capital improvements program. Gains in grinding efficiencies are expected from this initiative.

Detour Lake Operations Ontario, Canada NI 43-101 Technical Report March 2021 13-9 Ball-Mill Power Increase The Detour Lake ball mills have 15 MW motors. A study done by ABB has indicated that the motors can be safely operated at 16.0 MW. To maintain the gear rating of 15 MW, the speed of the ball mill will be increased to maintain the same torque limits. This has been tested and proven to work. Issues with pinion bearing reliability have prevented the implementation of this initiative, but once the pinion issue is resolved, it will be implemented. Reduced Hardness From Detour West The Detour West ore is softer for the ball mill than the Detour Main Pit ore. This will translate into finer grinds to going to the leach circuit. 13.3.5 West Detour Gravity tailings testwork on West Detour samples was conducted to assess sensitivity to grind size and sodium cyanide (NaCN) concentration. Using 0.5 g/L NaCN, gravity + cyanidation recovery was measured to vary from 88.3–98.7%. Recovery was found to increase with finer grind size. Cyanidation recovery response to head grade for West Detour indicated that the grade variability composites were also similar to those from Detour Lake. From a leaching perspective, no adverse effects were predicted when in blending West Detour mineralization with that from Detour Lake as plant feed. The laboratory cyanide consumption profiles for Detour Lake and West Detour were similar 0.40 kg/t for Detour Lake vs. 0.39 kg/t for West Detour. 13.3.6 Impact of Copper On Recovery and Cyanide Consumption The Detour Lake mineralization contains copper concentrations varying from 0.025–0.08% with copper dissolution in leach varying from 5–15%. Metallurgical testwork results showed that these extraction rates provided leach solution grades normally varying from 20– 60 mg/L in copper content, with outliers in the 80–280 mg/L in grade variation tests when gold grades varied from 2.0–9.0 g/t Au). Data obtained from the process plant are in line with these laboratory observations. It was found that temperature control was the key to limiting copper dissolution. Leach density set-points were dropped to minimise the temperature. With the increase plant throughput, the slurry temperature has dropped over the years. Controlling copper dissolution is key to controlling the cyanide consumption. 13.3.7 Carbon-in-Pulp Solution Losses Reduction The carbon-in-pulp (CIP) solution losses can be reduced. Historical solution losses are illustrated in Table 13-5. The CIP adsorption profile illustrated in Figure 13-6 supports this assumption.

Detour Lake Operations Ontario, Canada NI 43-101 Technical Report March 2021 13-10 Table 13-5: CIP Solution Grades, 2017–2020 Year CIP Tails Solutions (g/t Au) 2017 0.0101 2018 0.0131 2019 0.0078 2020 0.0080 Figure 13-6: 2020 CIP Adsorption Profile Note: Figure prepared by Kirkland Lake Gold, 2020. 13.3.8 Carbon Losses Minimization Carbon losses were estimated to result in a 0.4% gold loss in the final tails and are another area where gold losses can be minimized. Capital expenditures to reduce this number are planned, such as replacement of carbon pumps and improved carbon sizing. 13.3.9 Cyanide Destruction Cyanide destruction uses the SO2/air method. The current plant performance is in line with the feasibility study test work. A fourth detox tank is planned to be built to sustain the 28 Mt/a throughput rate.
Detour Lake Operations Ontario, Canada NI 43-101 Technical Report March 2021 13-11 13.4 Zone 58N Testwork Two testwork phases, Phase I in 2016 with Phase II in 2017, were conducted on 31 samples. A similar metallurgical testing approach was used and aimed at evaluating if the existing processing flowsheet was compatible with processing of Zone 58N material. 13.4.1 Metallurgical Testing Each sample was ground to a target P80 in the range 75–90 µm, subjected to head assaying, mineralogy, and third-party testing. Material for each composite was processed through a Knelson MD-3 concentrator. In Phase I, the Knelson concentrate was recovered and upgraded further by treatment on a Mozley mineral separator. The Mozley concentrate and the Mozley tailing were each assayed to extinction. For Phase II, the Knelson concentrate was recovered and forwarded to intensive cyanidation testing in order to produce a metallurgical balance for this step. The Knelson tailing from each composite sample was forwarded in its entirety to cyanidation test work. Combining the intensive cyanidation results of the gravity concentrate with the leaching performance allowed the total recovery to be determined. Bulk cyanide leaches were carried out at 40% solids for 24 hours. The pH was maintained in the range of 10.5–11.0 with the addition of hydrated lime while the NaCN concentration was maintained at 0.5 g/L. An initial dose of 0.1 kg/t of Pb(NO3)2 was added to each test to mimic the current processing facility conditions. Upon completion of each of the cyanide leach tests, six representative 500 mL pulp subsamples were taken. Each subsample was filtered, and the solids were washed with water. The solids were dried and then a 30 g sample from each was riffled out and sent for gold analysis by fire assay. From the six fire assay beads generated, pairs of beads were combined and analyzed as one in order to lower the detection limit and produce final gold assays in triplicate. 13.4.1 Phase I Results Eight composites were prepared using 68 interval samples. The gold grades calculated varied from 1.84–15.4 g/t. The Knelson gravity concentrate showed very high gold recoveries ranging from 75–93% with a mass pull ranging from 0.73���1.15% for the eight composites. The Knelson gravity tailing cyanidation testing from all the composite samples produced gold recoveries ranging from 87–98%. The gravity tail leaching results showed the final residue tailing gold grade ranged from 0.015–0.157 g/t. Gold recoveries associated with the gravity tails leaching exceeded 90% for all except one sample, which was reported at 87%. When combining the gold recovered from both the gravity concentrate and the leached Knelson gravity tailing material, the overall gold recovery ranged from 97.5%–>99%.
Detour Lake Operations Ontario, Canada NI 43-101 Technical Report March 2021 13-12 It was concluded that the composite samples tested are amenable to the gravity separation/gravity tailing cyanidation flowsheet as currently practiced in the existing plant. The total calculated gold head grades and recoveries (adding all units of operations) for all composites samples exceeded 97.5%. 13.4.2 Phase II Results Gravity separation showed that 67–95% of the gold in 0.68–1.14% of the mass was recoverable to a Knelson concentrate. Intensive cyanidation of each of the Knelson gravity concentrates produced gold extractions, ranging from 97.6–99.9%, producing tailing gold grades for this unit of operation ranging from 0.69 g/t equivalent to a net recovery reduction potential range of 0.12–1.79%. At the industrial scale, this intensive cyanidation residue would be recirculated via the milling circuit for additional size reduction and leaching. This step cannot be easily replicated in the laboratory and the final recovery reconciliation assumes full losses associated with the intensive cyanidation step of the gravity concentrate, which therefore represent a worst- case scenario. The Knelson gravity tailing cyanidation of the for all of the composite samples produced unit of operation gold recoveries, ranging from 84.4–95.4%. When combining the gravity concentrate intensive cyanidation recovery with the gravity tailing cyanidation results, total gold recoveries ranged from 93.9–99.6%. Phase II testing supported that material from Zone 58N is amenable to the existing plant flowsheet, which already incorporates gravity separation followed by intensive cyanidation of the gravity concentrate and cyanidation of the gravity tailings. The calculated gold head grades varied from 0.75–35.5 g/t. 13.4.3 Consumables Cyanide and lime consumptions resulting from the testwork were in line with forecasted plant consumption for the existing plant. 13.4.4 Additional Sample Characterization Mercury Analysis A representative pulverized sample of each composite was submitted for mercury analysis to a detection limit of 0.3 g/t. The results showed that all composites reported a mercury value of <0.3 g/t.
Detour Lake Operations Ontario, Canada NI 43-101 Technical Report March 2021 13-13 Semi-Quantitative ICP Scan Analysis A representative 75 µm pulverized sample of each of the 23 composites (~100 g) was submitted for a semi-quantitative ICP scan analysis. No elements raised concern and confirmed compliance with the proposed recovery method and environmental disposal. Gold Screen Fraction Analysis Given the high percentage of gold recovered by gravity, four Phase II composites were selected for head gold grade determination by screen fraction analysis. The four fractions chosen and submitted for assay were +10 mesh (+1,700µm), +14 mesh (+1,180 µm), +48 mesh (+300 µm), and -48 mesh (-300 µm). The gold grades determined ranged from 9.4– 20.2 g/t. The gold distribution as well as the mass distribution were approximately 50% between the +14 mesh and -14 mesh fractions, with the exception of one composite. A large proportion of the gold grains were found to be distributed in the coarser size fractions, which has also been evidenced by the occurrence of visible gold in the diamond drill core. 13.4.5 Conclusions Based on the results of the Zone 58N metallurgical testing and a conceptual plant throughput range of 1,000–2,000 t/d, the existing process plant is capable of processing the Zone 58N mineralization. 13.5 Recovery Model 13.5.1 Recovery Equations The recovery equation for the LOM is derived from 2019–2020 plant data (Figure 13-7). The current recovery equation is: • Gold Recovery (%) = (0.8787 + 0.0427 x HG) x 100 where HG represent the head grade in g/t. This relationship includes allowances for gold solution losses occurring at the processing facility.

Detour Lake Operations Ontario, Canada NI 43-101 Technical Report March 2021 13-14 Figure 13-7: Recovery versus Head Grades, 2019–2020 Note: Figure prepared by Kirkland Lake Gold, 2020. 13.5.2 LOM Recovery Forecasts The LOM recovery of 91.9% will follow the 2019–2020 model with a 0.75% improvement forecast starting in 2022 as a result of the various initiatives to improve the recovery are implemented. Laboratory testwork performed by SGS indicated that the West Detour deposit has a similar mineralogy to that of the Detour Lake deposit with similar recoveries. The same recovery assumptions are therefore used for the West Detour mineralization as for the Main Pit. For the Zone 58N, a recovery of 98.1% is predicted based on the following gold head grade–gold recovery relationship (Figure 13-8): • Gold Recovery (%) = (0.9204+ (0.0221xHG) – (0.002 x (HG)) x 100 where HG represent the head grade in g/t. This relationship also accounts for gold solution losses occurring at the processing facility. 13.5.3 Recovery Improvement Initiatives The recovery improvement initiatives include: • Grind size fineness improvement: - Ball size optimization; - Process control improvements; - Increase ball-mill power; - Reduced hardness from Detour West;

Detour Lake Operations Ontario, Canada NI 43-101 Technical Report March 2021 13-15 Figure 13-8: Grade–Recovery Relationship, Zone 58N Note: Figure prepared by Kirkland Lake Gold, 2020. • CIP solution losses reduction: - Elution circuit optimization; - Improved carbon management; • Gravity recovery improvement: - Leach reactor cycle improvement; - Conversion of gravity circuit feed from cyclone feed to cyclone underflow; • Carbon losses minimization: - CIP feed screen to avoid rocks being mixed with carbon; - New loaded carbon pump; - Better carbon screening; • Improve leach extraction: - Addition of four more leach tanks; - Improved understanding to lead nitrate and cyanide dosage with talc ores using electrochemistry probe. 13.6 Metallurgical Variability The variability of the ore in the Main Detour Pit is related to the talc, copper and sulphur content. The talc zone is mainly located on the south end of the Main Pit while copper and sulphur are present throughout the pit in various quantities. High-talc ore are soft and will process faster. High-talc ore used to impact recovery in the past and talc ores were limited
Detour Lake Operations Ontario, Canada NI 43-101 Technical Report March 2021 13-16 to 15% of plant feed. It was found that recovery could be maintained with very high lead nitrate dosage rates. Processing of 40% talc ore in feed in 2020 yielded similar recoveries as non-talc ore. Sulphur content also impacts recovery, and blending strategies to avoid feeding the plant with ores over 2% sulphur are in place and have worked successfully. 13.7 Deleterious Elements Copper is an element that impact cyanide and SO2 consumption. It is managed by blending if too high and controlling slurry temperature to leach feed. To avoid the copper plating on the carbon, a control strategy on the cyanide/copper ratio is in place.
Detour Lake Operations Ontario, Canada NI 43-101 Technical Report March 2021 14-1 14.0 Mineral Resource Estimates 14.1 Introduction Mineral Resources are estimated for the Detour Lake, West Detour, North Pit and Zone 58N areas. The outlines of the estimated areas are shown in Figure 14-1 for Detour Lake, West Detour, and North Pit. Zone 58N is covered by a stand-alone model. The database cut-off date for the drilling supporting the Detour Lake estimate is 24 April, 2020 and West Detour estimate is 7 June, 2013. The database cut-off date for the drilling supporting the North Pit estimate is 24 November, 2016. The database cut-off date for the drilling supporting the Zone 58N estimate is September 3, 2018. 14.2 Geological Interpretation The geological model for Detour Lake consists of 3D wireframes built by Kirkland Lake Gold in 2020. The geological model for the West Detour deposit consists of 3D wireframes built in 2013 by Detour Gold and Thon Consulting. The geological model for the North Pit is based on interpreted mineralized zone (domain) established using an indicator kriging (IK) interpolation of gold grades using at an indicator cut-off grade of 0.2 g/t Au and a 0.4 cut- off probability to be above the grade cut-off built by P. Daigle Consulting Services in 2016. The geological model for 58N consists of 3D wireframes built in 2018 by G Mining Services Inc. Three main broad mineralized domains containing most of the mineralization at the Detour Lake deposit were defined, with a fourth zone containing all data that were not part of the three mineralized domains: • Mineralized domain 1 (MZ1) is spatially associated with the chert marker horizon; • Mineralized domain 2 (MZ2) is associated with the historic Quartz Hangingwall mineralized zone; • Mineralized domain 3 (MZ3) is the broadest of zones and encompasses widespread disseminated mineralization to the north of mineral domain 2; • Mineralized domain 4 (MZ 4) encompasses the areas outside of MZ1, MZ2 and MZ3. For overlapping purposes, the domains were extended into the West Detour area. Domains are shown in Figure 14-2 for the Detour Lake model.

Detour Lake Operations Ontario, Canada NI 43-101 Technical Report March 2021 14-2 Figure 14-1: Reporting Limits for Detour Lake, West Detour and North Pit Areas Note: Figure prepared by Detour Gold, 2018. Map north is to the top of the plan. Figure 14-2: Detour Lake Plan View of the Open Pit Showing Mineralized Zones Note: Figure prepared by Kirkland Lake Gold, 2021.

Detour Lake Operations Ontario, Canada NI 43-101 Technical Report March 2021 14-3 For West Detour, mineralized domains were defined by interpreting limits of mineralization on sections that correspond to broad mineralized zones with higher than usual concentration of samples with potentially economic gold grades. Domain 1 corresponds to the chert marker horizon geological unit which crosses most of the Detour Lake deposit from east to west with a well-defined flexure on the east side. All the other mineralized domains were built around Domain 1 and share the same east–west trend with a typically sub-vertical dip. The grade envelope used for West Detour is shown in Figure 14-3. The geological model for the North Pit was created using drill hole lithology interpretations, on section, aided by ICP geochemistry. A gold grade envelope was established using indicator kriging (IK), based on an indicator cut-off grade of 0.20 g/t Au. A wireframe was created based on the indicator probability. Three main volcanic rock units were modeled: a hanging wall iron-rich tholeiite, a central calc-alkaline komatiite, and a footwall magnesium-rich tholeiite (Figure 14-4). However, gold mineralization does not seem to be constrained by these units and appears to follow the general lithology orientation. Nine principal sub-vertical mineralized conduits were identified in Zone 58N, based on alteration intensities described as moderate or stronger, plus an additional zone of mineralization present in the hanging wall (Zone 75). The mineralized domains show a strong sub-vertical continuity and limited strike extent to the east and west. Within the two largest domains (1 and 7), high-grade sub-parallel shoots were interpreted to plunge shallowly to the east. The domains are shown in Figure 14-5. 14.3 Underground Void and Stope Interpretation A 3D model of all prior mined areas in the Detour Lake area was created from available plans and sections. Individual models were created for underground access, stopes, and the Campbell open pit. Volume reconciliation versus prior mining records showed that the majority of underground openings are accounted for. This model was used to deplete the block model. 14.4 Grade Capping 14.4.1 Reconciliation Study A high-level review of available reconciliation data was undertaken by third-party consultants, Wood plc (Wood) to determine appropriate grade capping thresholds for the various mineralized zones or domains (MZs). The study area was established as the latest four years of mining from January 2016 through December 2019 (four year or 4Y area) where the data and grade control procedures were best understood. This was performed by selecting only those model block centroids that lie below the end of year wireframe surface EOY_31Dec2015 and above the end of year wireframe surface EOY_31Dec2019 (Figure 14-6).

Detour Lake Operations Ontario, Canada NI 43-101 Technical Report March 2021 14-4 Figure 14-3: West Detour Isometric View of the Open Pit Showing Mineralized Domains (looking east–northeast) Note: Figure prepared by Detour Gold, 2018. Figure 14-4: Isometric View of the North Pit (looking northeast) Note: Figure prepared by Detour Gold, 2018.
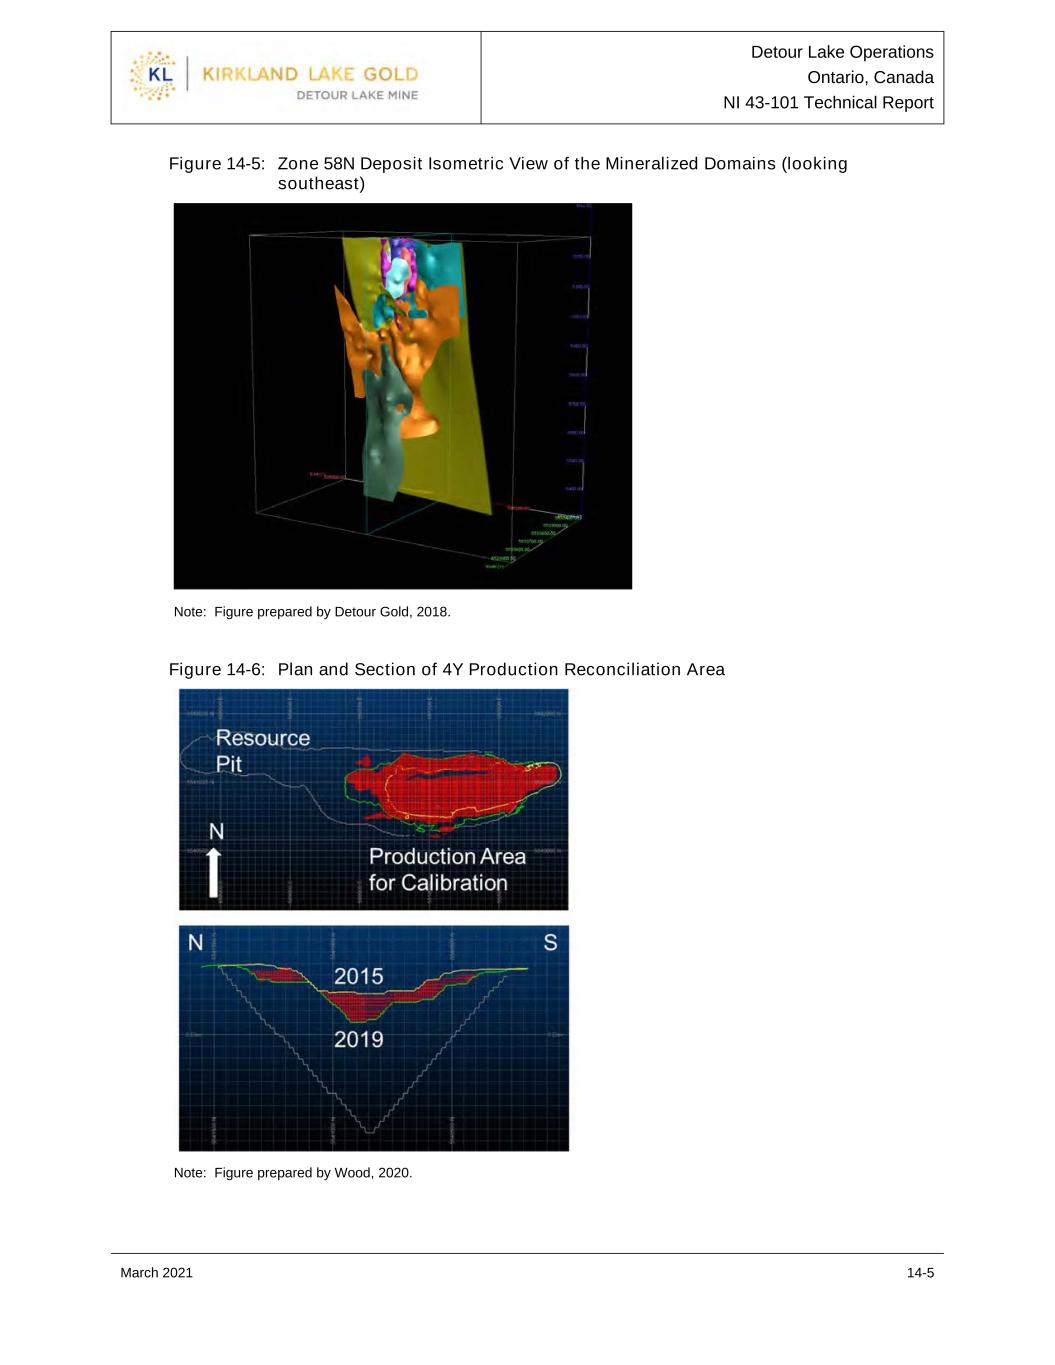
Detour Lake Operations Ontario, Canada NI 43-101 Technical Report March 2021 14-5 Figure 14-5: Zone 58N Deposit Isometric View of the Mineralized Domains (looking southeast) Note: Figure prepared by Detour Gold, 2018. Figure 14-6: Plan and Section of 4Y Production Reconciliation Area Note: Figure prepared by Wood, 2020.
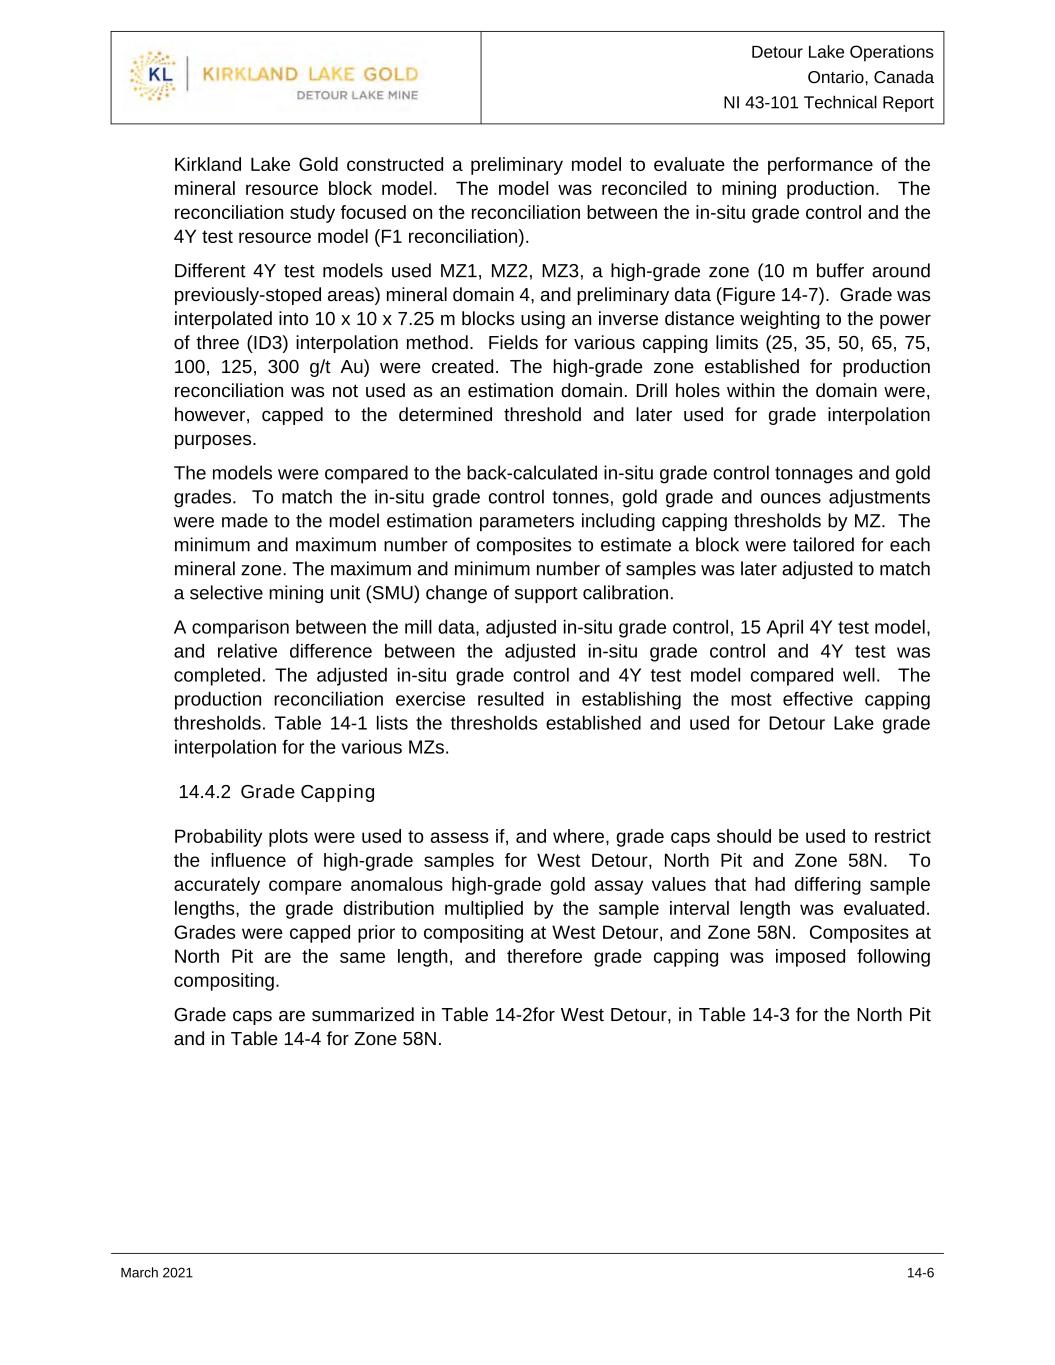
Detour Lake Operations Ontario, Canada NI 43-101 Technical Report March 2021 14-6 Kirkland Lake Gold constructed a preliminary model to evaluate the performance of the mineral resource block model. The model was reconciled to mining production. The reconciliation study focused on the reconciliation between the in-situ grade control and the 4Y test resource model (F1 reconciliation). Different 4Y test models used MZ1, MZ2, MZ3, a high-grade zone (10 m buffer around previously-stoped areas) mineral domain 4, and preliminary data (Figure 14-7). Grade was interpolated into 10 x 10 x 7.25 m blocks using an inverse distance weighting to the power of three (ID3) interpolation method. Fields for various capping limits (25, 35, 50, 65, 75, 100, 125, 300 g/t Au) were created. The high-grade zone established for production reconciliation was not used as an estimation domain. Drill holes within the domain were, however, capped to the determined threshold and later used for grade interpolation purposes. The models were compared to the back-calculated in-situ grade control tonnages and gold grades. To match the in-situ grade control tonnes, gold grade and ounces adjustments were made to the model estimation parameters including capping thresholds by MZ. The minimum and maximum number of composites to estimate a block were tailored for each mineral zone. The maximum and minimum number of samples was later adjusted to match a selective mining unit (SMU) change of support calibration. A comparison between the mill data, adjusted in-situ grade control, 15 April 4Y test model, and relative difference between the adjusted in-situ grade control and 4Y test was completed. The adjusted in-situ grade control and 4Y test model compared well. The production reconciliation exercise resulted in establishing the most effective capping thresholds. Table 14-1 lists the thresholds established and used for Detour Lake grade interpolation for the various MZs. 14.4.2 Grade Capping Probability plots were used to assess if, and where, grade caps should be used to restrict the influence of high-grade samples for West Detour, North Pit and Zone 58N. To accurately compare anomalous high-grade gold assay values that had differing sample lengths, the grade distribution multiplied by the sample interval length was evaluated. Grades were capped prior to compositing at West Detour, and Zone 58N. Composites at North Pit are the same length, and therefore grade capping was imposed following compositing. Grade caps are summarized in Table 14-2for West Detour, in Table 14-3 for the North Pit and in Table 14-4 for Zone 58N.

Detour Lake Operations Ontario, Canada NI 43-101 Technical Report March 2021 14-7 Figure 14-7: Domains Used to Establish Capping Thresholds, Detour Lake Note: Figure prepared by Wood, 2020 Table 14-1: Capping Thresholds, Detour Lake Zone Cap (g/t Au) MZ1 50 MZ2 65 MZ3 35 MZ4 35 HG 100
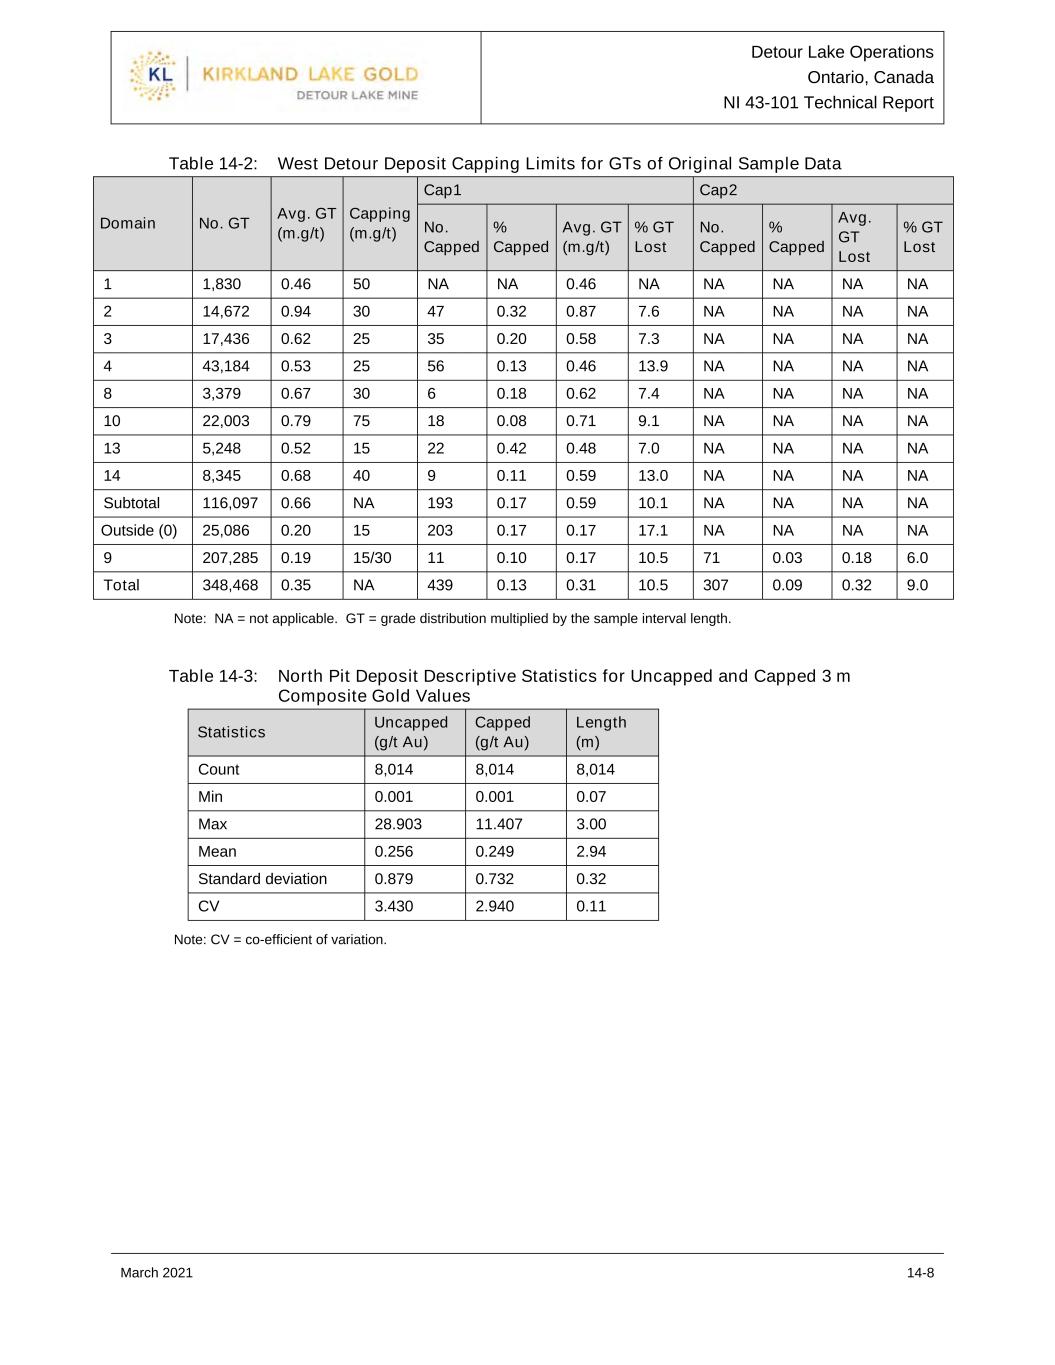
Detour Lake Operations Ontario, Canada NI 43-101 Technical Report March 2021 14-8 Table 14-2: West Detour Deposit Capping Limits for GTs of Original Sample Data Domain No. GT Avg. GT (m.g/t) Capping (m.g/t) Cap1 Cap2 No. Capped % Capped Avg. GT (m.g/t) % GT Lost No. Capped % Capped Avg. GT Lost % GT Lost 1 1,830 0.46 50 NA NA 0.46 NA NA NA NA NA 2 14,672 0.94 30 47 0.32 0.87 7.6 NA NA NA NA 3 17,436 0.62 25 35 0.20 0.58 7.3 NA NA NA NA 4 43,184 0.53 25 56 0.13 0.46 13.9 NA NA NA NA 8 3,379 0.67 30 6 0.18 0.62 7.4 NA NA NA NA 10 22,003 0.79 75 18 0.08 0.71 9.1 NA NA NA NA 13 5,248 0.52 15 22 0.42 0.48 7.0 NA NA NA NA 14 8,345 0.68 40 9 0.11 0.59 13.0 NA NA NA NA Subtotal 116,097 0.66 NA 193 0.17 0.59 10.1 NA NA NA NA Outside (0) 25,086 0.20 15 203 0.17 0.17 17.1 NA NA NA NA 9 207,285 0.19 15/30 11 0.10 0.17 10.5 71 0.03 0.18 6.0 Total 348,468 0.35 NA 439 0.13 0.31 10.5 307 0.09 0.32 9.0 Note: NA = not applicable. GT = grade distribution multiplied by the sample interval length. Table 14-3: North Pit Deposit Descriptive Statistics for Uncapped and Capped 3 m Composite Gold Values Statistics Uncapped (g/t Au) Capped (g/t Au) Length (m) Count 8,014 8,014 8,014 Min 0.001 0.001 0.07 Max 28.903 11.407 3.00 Mean 0.256 0.249 2.94 Standard deviation 0.879 0.732 0.32 CV 3.430 2.940 0.11 Note: CV = co-efficient of variation.
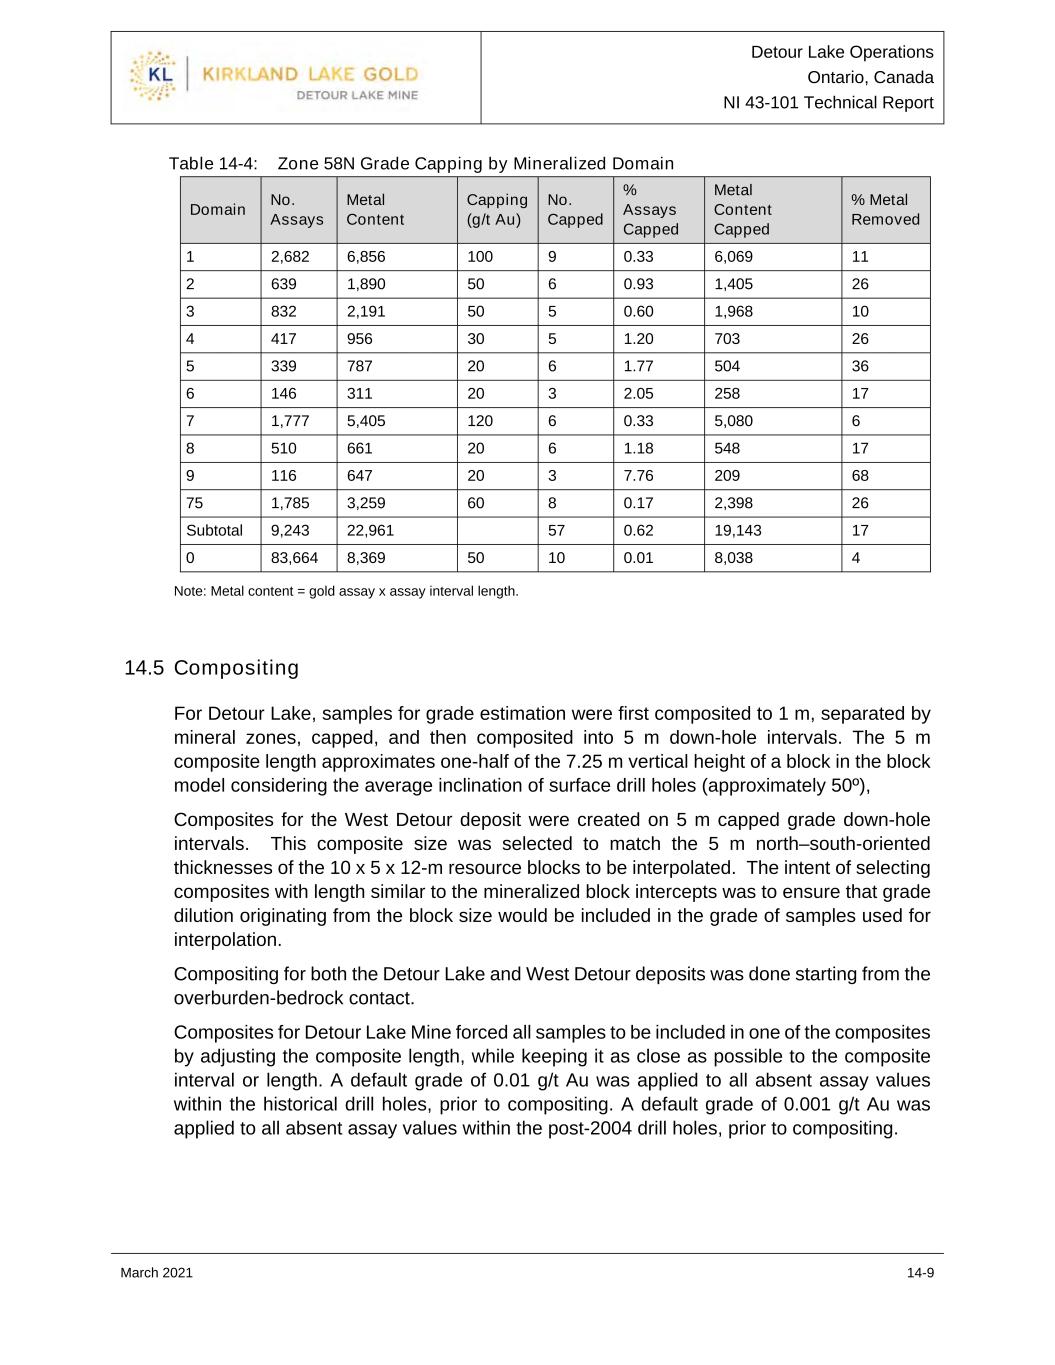
Detour Lake Operations Ontario, Canada NI 43-101 Technical Report March 2021 14-9 Table 14-4: Zone 58N Grade Capping by Mineralized Domain Domain No. Assays Metal Content Capping (g/t Au) No. Capped % Assays Capped Metal Content Capped % Metal Removed 1 2,682 6,856 100 9 0.33 6,069 11 2 639 1,890 50 6 0.93 1,405 26 3 832 2,191 50 5 0.60 1,968 10 4 417 956 30 5 1.20 703 26 5 339 787 20 6 1.77 504 36 6 146 311 20 3 2.05 258 17 7 1,777 5,405 120 6 0.33 5,080 6 8 510 661 20 6 1.18 548 17 9 116 647 20 3 7.76 209 68 75 1,785 3,259 60 8 0.17 2,398 26 Subtotal 9,243 22,961 57 0.62 19,143 17 0 83,664 8,369 50 10 0.01 8,038 4 Note: Metal content = gold assay x assay interval length. 14.5 Compositing For Detour Lake, samples for grade estimation were first composited to 1 m, separated by mineral zones, capped, and then composited into 5 m down-hole intervals. The 5 m composite length approximates one-half of the 7.25 m vertical height of a block in the block model considering the average inclination of surface drill holes (approximately 50º), Composites for the West Detour deposit were created on 5 m capped grade down-hole intervals. This composite size was selected to match the 5 m north–south-oriented thicknesses of the 10 x 5 x 12-m resource blocks to be interpolated. The intent of selecting composites with length similar to the mineralized block intercepts was to ensure that grade dilution originating from the block size would be included in the grade of samples used for interpolation. Compositing for both the Detour Lake and West Detour deposits was done starting from the overburden-bedrock contact. Composites for Detour Lake Mine forced all samples to be included in one of the composites by adjusting the composite length, while keeping it as close as possible to the composite interval or length. A default grade of 0.01 g/t Au was applied to all absent assay values within the historical drill holes, prior to compositing. A default grade of 0.001 g/t Au was applied to all absent assay values within the post-2004 drill holes, prior to compositing.

Detour Lake Operations Ontario, Canada NI 43-101 Technical Report March 2021 14-10 Only composites of at least half the nominal composite length (i.e., 2.5 m) were used for Detour West. A default grade of 0.01 g/t Au was applied to all missing assay values within the historical drill holes (referred to as ‘padding’), prior to compositing. The North pit dataset was composited on 3 m down-hole intervals. Composites were started at the top of hole and all composites were used in resource estimation. Missing assays were replaced by 0.00 g/t Au prior to compositing. A new attribute was created in the composite table for coding the indicator. A code of ‘1’ was assigned to all composite grades ≥0.20 g/t Au and a code of ‘0’ was assigned to all composite grades <0.20 g/t Au. A composite length of 2 m was selected for Zone 58N, which resulted in a minimum of two composites per drill hole (applying a 4 m minimum downhole thickness rule) per domain. 14.6 Variography A review of the lithology, structural, alteration, and assay trends at the Detour Lake Mine concluded that the trend of the gold mineralization is relatively consistent, following a strike of 80° with a 60–80° dip to the north, and no obvious differences in trends were noted between the different mineral zones. Local variations within the overall trend were accounted for using dynamic anisotropy during the grade estimations which aligns the search ellipse with the structural trends for every block in the model. Variograms (relative pairwise and correlograms) were calculated and modelled for each MZ using a generalized trend of 900 and a vertical dip for the three primary directions. Since the variograms were constructed before the capping thresholds were established, the composites used for variography were capped at 50 g/t Au. The nugget effect values for each variogram were first established using down-hole variograms and then directional variograms were modeled. Variograms for MZ4 were inconclusive and as a result, the variogram parameters from MZ3 were used for MZ4. An example of modeled gold variograms in three primary directions for MZ1 are shown in Figure 14-8 and variogram parameters for all MZs are summarized in Table 14-5. The thick disseminated zones of mineralization explain the relatively similar variogram ranges in these directions. Spatial continuity of the grade of composites in each domain at West Detour was assessed through correlograms (the calculated correlation coefficient of grades from pairs of composites separated by a given distance in a given direction). Directions investigated were the east–west horizontal average strike, the vertical average dip, the horizontal north– south direction across average strike and dip, as well as two intermediate directions in east– west-trending vertical planes (i.e., a dip of 45° to west and a dip of 45° to east). In each case, the average downhole correlogram (along drill holes) was calculated to better assess the magnitude of the nugget effect.
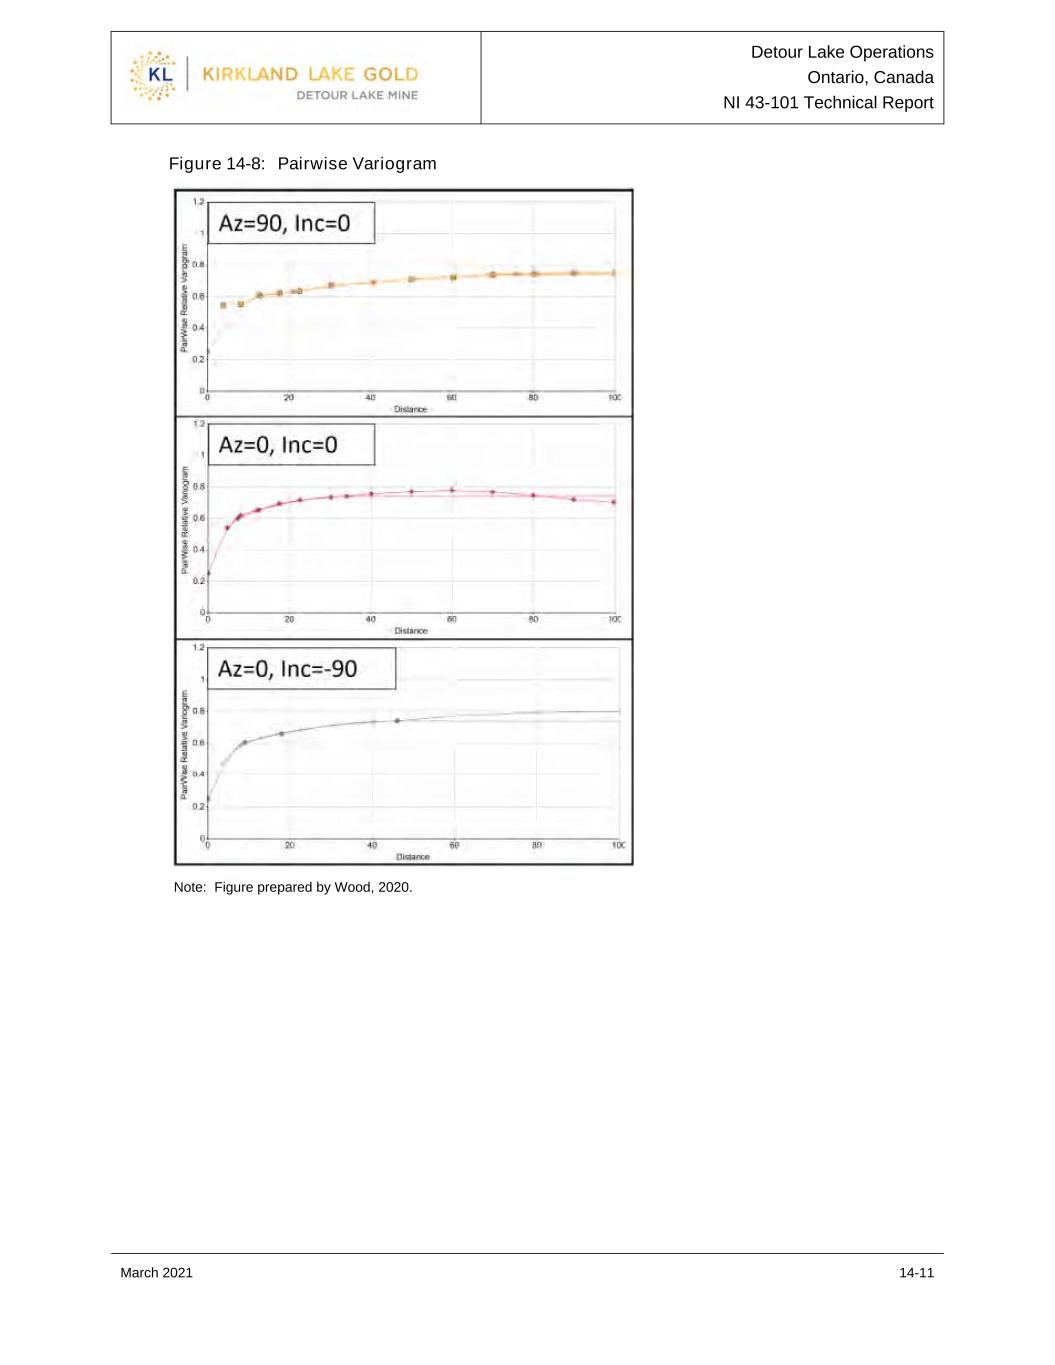
Detour Lake Operations Ontario, Canada NI 43-101 Technical Report March 2021 14-11 Figure 14-8: Pairwise Variogram Note: Figure prepared by Wood, 2020.

Detour Lake Operations Ontario, Canada NI 43-101 Technical Report March 2021 14-12 Table 14-5: Variogram Parameters, Detour Lake Mine Azimuth/ Inclination Domain VG Type Rotation Z/X/Z Axis Nugget Structure C1/C2/C3 Range a1/a2/a3 90/0 Au 0/0/0 X 0.25 0.29/0.02/0.18 13/21/76 0/0 MZ1 Y 8/12/34 0/-90 PW Relative Z 9/18/46 90/0 Au 0/0/0 X 0.35 0.28/0.1/0.14 10/21/98 0/0 MZ2 Y 7/20/47 0/-90 PW Relative Z 7/14/77 90/0 Au 0/0/0 X 0.25 0.38/0.17/0.09 8/22/100 0/0 MZ3 Y 10/18/47 0/-90 PW Relative Z 7/17/60 90/0 Au 0/0/0 X 0.25 0.38/0.17/0.09 8/22/100 0/0 MZ4 Y 10/18/47 0/-90 PW Relative Z 7/17/60 Results of variogram models for West Detour showed that for most domains the spatial continuity of the grade of composites was characterized by: • A significant relative nugget effect of 50% to 70%; • A generally well-defined anisotropy with best continuity (lowest curve) along the average east–west horizontal strike (dip to west); • Poorest continuity (highest curve) across dip and strike; • Intermediate continuity along the average vertical dip (dip to east). Variography on gold grades for the North Pit deposit was completed on the 3 m point composite capped gold grades. Variography was carried out using Sage2001 software on the 0.20 g/t Au indicator values. Domain 40 and Domain 9 were determined separately. The variography for Domain 40 resulted in relatively smooth variograms, although with a very high nugget value. For Domain 9, the variograms did not produce very robust variography. Variogram ranges were kept for Domain 9 but the orientations from Domain 40 were honoured. The variograms for Domain 40 were used in determining search neighbourhood for gold grade interpolation. Conventional variographic analysis was attempted on the 2 m composites from Zone 58N for the grouped mineralized domains but it was not possible to extract variogram models as the experimental variograms were too erratic. Composites within a 50 ppb Au grade shell were selected and used to generate indicator variograms at various thresholds to identify directions of anisotropy. The range of the indicator variogram models was reduced to the drill spacing (25 x 25 m) above an indicator threshold of 1.0 g/t Au. The orientation of the

Detour Lake Operations Ontario, Canada NI 43-101 Technical Report March 2021 14-13 major axis is an 85° plunge (downwards) towards 10° azimuth, highlighting the vertical continuity of the deposit. 14.7 Block Models Drill hole spacing across the Detour Lake deposit is generally on the order of 40 m in the north–south and east–west directions. A block size of 10 x 10 x 7.5 m was selected to accommodate the drill hole spacing and width of the mineralization. The 10-m east–west and 10 m north–south dimensions corresponded to approximately half the minimum spacing between surface drill holes. The 7.5 m vertical dimension took equipment size into consideration and also represents half of the bench height used in the open pit. The percentage of every block that was affected by prior mining activity was recorded from the 3D old workings model. Drill hole spacing across the West Detour deposit is generally on the order of 40 m in the north–south and east–west directions. A block size of 10 x 5 x 6 m was selected to accommodate the drill hole spacing and width of the mineralization. The 10-m east–west dimension corresponded to approximately half the minimum spacing between surface drill holes. The 5-m north–south dimension was selected to account for the perceived greater variability in grade along that direction. The West Detour deposit has narrower mineralized zones and the model was built at 6 m heights, offering the possibility of regularizing (combining) two blocks into a 12-m bench, or selecting 6-m benches. Mineral Resource reporting is done on the combined 12-m block size. There is an exploration ramp between elevation 5,630 and 5,510 metres EL. The ramp connects to the prior underground operation at the Detour Lake Mine. Presently 119 blocks fall inside the ramp volume and were taken out of the resource block model. For reporting purposes all blocks east of section 16,995E were considered to be part of the Detour Lake area, while blocks west of 16,995E were considered to be part of the West Detour area. Subsequent to the 2016 infill drilling of the North pit deposit, a decision to separate it from the West Detour dataset was taken to allow for smaller block sizes and a different modeling methodology to better address the narrow mineralization and smaller mining equipment to be used. The North pit deposit model is contained between sections 15,800E and 17,500E, north of 20,800N. The block model for the North Pit was created to overlap the northern portion of West Detour deposit in order to capture the mineralized trend. The block model matrix is the same for both the IK model and the gold grade model. Together, the three models cover the open pit designs in their entirety. The Zone 58N model was created to encompass all the known mineralization drilled at Zone 58N, and block sizes were decided based on a typical underground mining scenario (3 m minimum width). Due to the often narrow nature of mineralization, a percentage block model was adopted in Geovia GEMS, and subsequently converted to a sub-blocked model for mine planning purposes.
Detour Lake Operations Ontario, Canada NI 43-101 Technical Report March 2021 14-14 14.8 Density A total of 7,045 samples that have been collected for density from recently drilled boreholes from various lithologies across the property. Most of these samples are 1 m in length. At Detour Lake, average length weighted densities were determined for these different lithologies. The average density for each lithology was then assigned to the global drillhole database. Intervals without a density value were assigned a value based on a similar lithology and indeterminate intervals were assigned an average density of 2.99 t/m3. A density of 2.9 t/m3 in rock and 1.8 t/m3 in overburden and backfill was used for tonnage determination in the West Detour and North Pit models. The Zone 58N deposit used a density of 2.7 t/m3, derived from drill core measurements. 14.9 Grade Interpolation To attempt to honour the distribution of local mineralization trends, a dynamic anisotropy process was implemented for the Detour Lake estimate. The dynamic anisotropy model was constructed as follows: • Mineral Zones and some lithology wireframes were used as a framework to represent the trends of the mineralization; • The hanging wall and footwall surfaces of several domains were used and only one surface was used for domains sharing a common footwall or hanging wall surface. The lithology wireframes of the hanging wall of the north talc horizon, the major contact between massive and pillowed units, and the southern talc footwall and hanging wall were used for dynamic anisotropy. Table 14-6 lists the surfaces used; • Surfaces with irregularities/jogs were smoothed using up to two smoothing passes (Table 14-7); • Dynamic anisotropy angles were interpolated using ID3. The interpolation of the Detour Lake resource model was completed using ordinary kriging (OK). An inverse distance weighting to the second power (ID2) interpolation, an ID3, and nearest neighbour (NN) estimates were completed concurrent to the OK estimate for validation purposes. Search file parameters related to the number of samples used to estimate a block were determined based on the 4Y reconciliation studies and an in-situ selectivity/dilution study completed by Wood. Search parameters for the all encompassing mineral zone were set to the same as those used for MZ3. Search parameters were based on distances used for drill spacing supporting classification of Measured Mineral Resources (20 x 20 m). The second search distance was 30 x 30 m followed by a third 60 x 60 m search. Search orientations varied on a block by block basis using Datamine’s dynamic anisotropy process.

Detour Lake Operations Ontario, Canada NI 43-101 Technical Report March 2021 14-15 Table 14-6: Dynamic Anisotropy Surfaces, Detour Lake Surface Type (Min/Litho) Hangingwall Footwall Smoothed HW min zone 1 Min Y N Y HW min zone 6 Min Y N Y Min zone 10 Min Y Y Y North pit north Min Y Y Y North pit south Min Y Y Y Talc north Litho Y N Y Talc south Litho Y Y Y Pillowed/massive flow contact Litho N Y Y Table 14-7: Dynamic Anisotropy Search Parameters, Detour Lake Search 1 Search 2 Search 3 Maxkey1 Distance Min/Max Distance Min/Max Distance Min/Max 140 6/12 210 6/12 420 3/6 3 70 105 210 140 210 420 Note: 1 = maximum number of samples from one drill hole The minimum and maximum number of samples were selected based on an in-situ selectivity/dilution study. A maximum of 3–7 samples from a single drill hole were used to ensure that at least two drill holes were used for any estimate. Density was estimated using an ID3 method and used the gold search parameters. Estimation parameters for the Detour Lake deposit are listed in Table 14-8. The interpolation of the West Detour deposit resource model was completed using OK. Multiple dip and dip directions were used per domain. A “panel” approach was used to set local orientation. The panels were limited by ranges of easting and elevation. A four pass estimation was used, with the same intent as described for Detour Lake. The majority of the blocks were interpolated in the first pass with more constrained search conditions with the exception of Domain 9, which represented the background of the model. Estimation parameters for the West Detour deposit are listed in Table 14-9. The North Pit deposit block model was estimated using OK interpolation method on 3 m capped composite gold grades. ID2 and NN interpolations were also estimated for validation purposes.
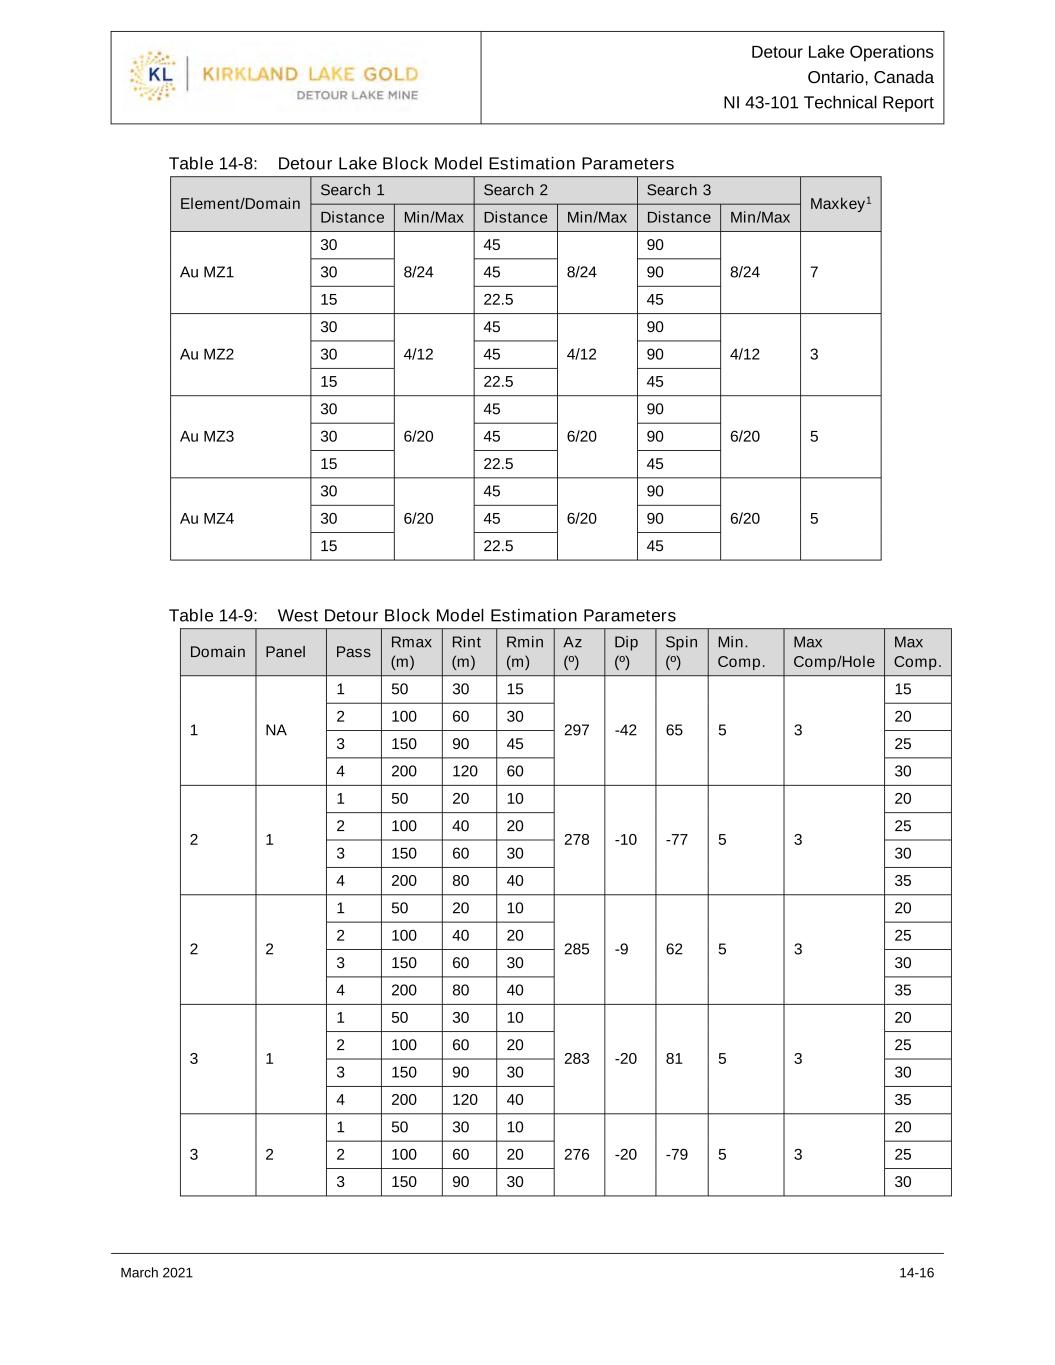
Detour Lake Operations Ontario, Canada NI 43-101 Technical Report March 2021 14-16 Table 14-8: Detour Lake Block Model Estimation Parameters Element/Domain Search 1 Search 2 Search 3 Maxkey1 Distance Min/Max Distance Min/Max Distance Min/Max Au MZ1 30 8/24 45 8/24 90 8/24 7 30 45 90 15 22.5 45 Au MZ2 30 4/12 45 4/12 90 4/12 3 30 45 90 15 22.5 45 Au MZ3 30 6/20 45 6/20 90 6/20 5 30 45 90 15 22.5 45 Au MZ4 30 6/20 45 6/20 90 6/20 5 30 45 90 15 22.5 45 Table 14-9: West Detour Block Model Estimation Parameters Domain Panel Pass Rmax (m) Rint (m) Rmin (m) Az (º) Dip (º) Spin (º) Min. Comp. Max Comp/Hole Max Comp. 1 NA 1 50 30 15 297 -42 65 5 3 15 2 100 60 30 20 3 150 90 45 25 4 200 120 60 30 2 1 1 50 20 10 278 -10 -77 5 3 20 2 100 40 20 25 3 150 60 30 30 4 200 80 40 35 2 2 1 50 20 10 285 -9 62 5 3 20 2 100 40 20 25 3 150 60 30 30 4 200 80 40 35 3 1 1 50 30 10 283 -20 81 5 3 20 2 100 60 20 25 3 150 90 30 30 4 200 120 40 35 3 2 1 50 30 10 276 -20 -79 5 3 20 2 100 60 20 25 3 150 90 30 30
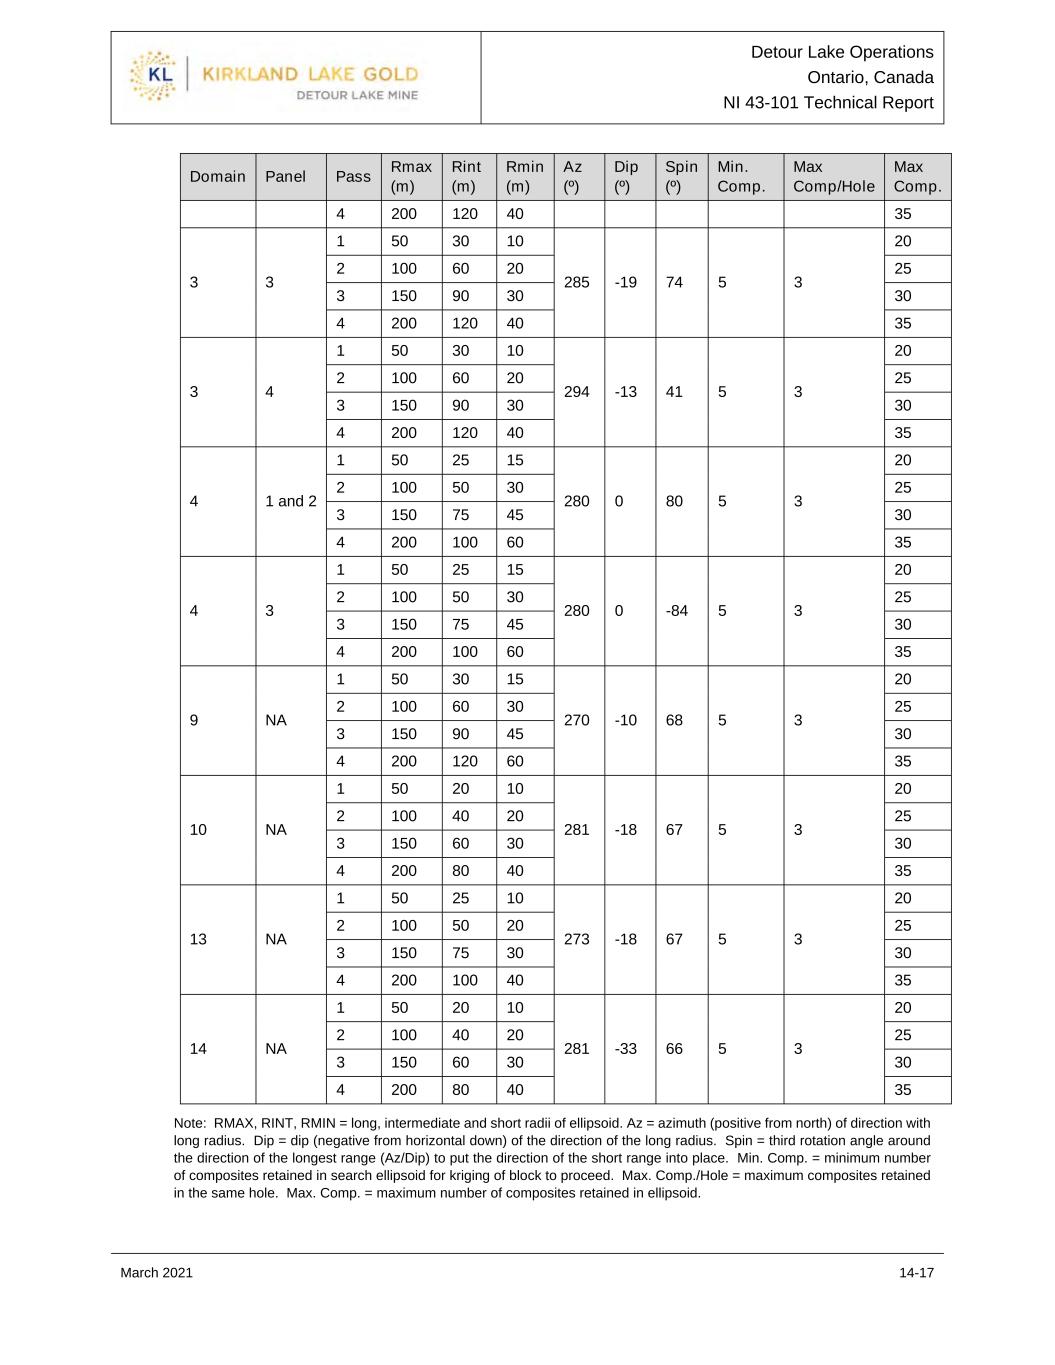
Detour Lake Operations Ontario, Canada NI 43-101 Technical Report March 2021 14-17 Domain Panel Pass Rmax (m) Rint (m) Rmin (m) Az (º) Dip (º) Spin (º) Min. Comp. Max Comp/Hole Max Comp. 4 200 120 40 35 3 3 1 50 30 10 285 -19 74 5 3 20 2 100 60 20 25 3 150 90 30 30 4 200 120 40 35 3 4 1 50 30 10 294 -13 41 5 3 20 2 100 60 20 25 3 150 90 30 30 4 200 120 40 35 4 1 and 2 1 50 25 15 280 0 80 5 3 20 2 100 50 30 25 3 150 75 45 30 4 200 100 60 35 4 3 1 50 25 15 280 0 -84 5 3 20 2 100 50 30 25 3 150 75 45 30 4 200 100 60 35 9 NA 1 50 30 15 270 -10 68 5 3 20 2 100 60 30 25 3 150 90 45 30 4 200 120 60 35 10 NA 1 50 20 10 281 -18 67 5 3 20 2 100 40 20 25 3 150 60 30 30 4 200 80 40 35 13 NA 1 50 25 10 273 -18 67 5 3 20 2 100 50 20 25 3 150 75 30 30 4 200 100 40 35 14 NA 1 50 20 10 281 -33 66 5 3 20 2 100 40 20 25 3 150 60 30 30 4 200 80 40 35 Note: RMAX, RINT, RMIN = long, intermediate and short radii of ellipsoid. Az = azimuth (positive from north) of direction with long radius. Dip = dip (negative from horizontal down) of the direction of the long radius. Spin = third rotation angle around the direction of the longest range (Az/Dip) to put the direction of the short range into place. Min. Comp. = minimum number of composites retained in search ellipsoid for kriging of block to proceed. Max. Comp./Hole = maximum composites retained in the same hole. Max. Comp. = maximum number of composites retained in ellipsoid.
Detour Lake Operations Ontario, Canada NI 43-101 Technical Report March 2021 14-18 The gold estimation block model was interpolated using two passes. The first pass used a minimum of three points and a maximum of 10 point composites to estimate a block with a maximum of two points per drill hole. The second pass used a minimum of two points and a maximum of 10 point composites with a maximum of two points per drill hole. The passes were run in reverse order to avoid re-estimation of zero grades. The search ellipse parameters for pass 1 and pass 2 are provided in Table 14-10. Due to the highly erratic distribution of gold grades at Zone 58N, a five-pass interpolation strategy was adopted: • Pass 1: NN pass within a search ellipse of 10 x 5 x 5 m; • Pass 2: inverse distance weighting to the third power (ID3) within a search ellipse of 40 (X) x 30 (Y) x 15 m (Z), with a minimum of seven composites and a maximum of 12 composites; • Pass 3: ID3 within a search ellipse of 60 (X) x 50 (Y) x 25 m (Z), with a minimum of four composites and a maximum of 12 composites; • Pass 4: ID3 within a search ellipse of 80 (X) x 70 (Y) x 45 m (Z), with a minimum of two composites and a maximum of 12 composites; • Pass 5: ID3 within a search ellipse of 120 (X) x 100 (Y) x 60 m (Z), with a minimum of one composite and a maximum of 12 composites. Search ellipses were orientated according to the dip and dip direction of each individual mineralized domain. High-grade restrictions (Table 14-11) were used to limit the influence of high-grade composites within the search ellipse during interpolation. 14.10 Model Validation Global bias checks were done for each mineral zone in the Detour Lake block model, whereby average gold grades from the OK, ID and NN models were compared. The NN model is a theoretically unbiased global average estimate and provides a basis from which to check the performance of the OK model when no cut-off is applied. The global mean gold grade for the NN and OK models are within 5%. Estimates for all mineral domains compare well and the estimate is considered acceptable. West–east and south–north oriented swath plots demonstrated good agreement between all models. Visual checks were also completed to examine the distribution of grade through the model. These checks demonstrated that interpolated block model grades respect the grades in the composited drill holes (Figure 14-9 and Figure 14-10). No information is available to Kirkland Lake Gold as to the model validation checks undertaken by SGS on the West Detour model in 2013.

Detour Lake Operations Ontario, Canada NI 43-101 Technical Report March 2021 14-19 Table 14-10: North Pit Search Ellipse Parameters for Gold Grade Estimation for Domain 40 and Domain 9 Azimuth (°) Dip (°) Azimuth (°) Range X (m) Range Y (m) Range Z (m) Variogram Type Pass 1 78.817 6.578 209.712 62.000 30.807 10.826 Ellipsoidal Pass 2 78.817 6.578 209.712 90.000 45.000 15.000 Ellipsoidal Table 14-11: Mineral Domain 1 – Capped Min Zone Field Min Max Mean Var MZ 1 AUMZ1_ID 0.001 14.04 1.22 1.283 AUMZ1ID2 0.001 19.50 1.21 1.425 AUMZ1ID3 0.001 23.17 1.20 1.583 AUMZ1_NN 0.001 36.61 1.17 4.561 AUMZ1_OK 0.001 16.80 1.21 1.278 % RD NN_OK 3.3% MZ 2 AUMZ2_ID 0.001 11.25 0.79 0.549 AUMZ2ID2 0.001 14.42 0.79 0.632 AUMZ2ID3 0.001 17.45 0.78 0.722 AUMZ2_NN 0.001 57.96 0.79 2.570 AUMZ2_OK 0.001 11.46 0.79 0.536 % RD NN_OK 0% MZ 3 AUMZ3_ID 0.001 10.60 0.34 0.114 AUMZ3ID2 0.001 12.03 0.34 0.130 AUMZ3ID3 0.001 13.94 0.33 0.146 AUMZ3_NN 0.001 24.60 0.33 0.481 AUMZ3_OK 0.001 9.47 0.34 0.110 % RD NN_OK 2.9%

Detour Lake Operations Ontario, Canada NI 43-101 Technical Report March 2021 14-20 Figure 14-9: Model Grade Distribution (Section 589825E) Note: Figure prepared by Kirkland Lake Gold, 2020. Figure 14-10: Model Grade Distribution (Section 589705E) Note: Figure prepared by Kirkland Lake Gold, 2020.

Detour Lake Operations Ontario, Canada NI 43-101 Technical Report March 2021 14-21 The North Pit block model was validated visually along sections to ensure grades correlated with the composite data set. No apparent bias was observed between block grades and supporting composite grades. Another validation was made of the mean interpolated grades for each domain compared to the mean of the composite grades. There appears to be no bias in the OK or ID2 interpolated grades. Swath plots demonstrate that interpolated grades compare well with the composite values in following the increases and decreases of the composite values. As expected, where there is a low sample density (low sample support), the interpolated values show noted differences between the composite values and interpolated values. Validation checks were made on the Zone 58N model to ensure an acceptable interpolation of gold grade. These include visual checks on section, global statistical checks (descriptive statistics), local statistical checks (swath plots) and smoothing checks (quantile–quantile plots). For the 2 m composites estimate, no significant issues were identified and the representation of gold grades in the block model from the 2 m composites was considered to be acceptable. Sensitivity estimations for the top 500 m of the deposit using full-domain and 1 m composites investigated the impact of capping and high grade restraining within the mineralized domains. A multiple indicator krige (MIK) model was developed using a broad 50 ppb Au envelope as an estimate comparison. Only blocks estimated in the first three passes were considered (up to and including the Pass 3 search ellipse). The sensitivity estimations show similar contained ounces for the four principal methods of interpolation with grades varying according to the level of smoothing observed. The MIK model reported more tonnage due to the lack of geological constraint at a grade similar to the full-domain composites. The 2 m composite model was used for tabulating the Mineral Resource estimate. 14.11 Mineral Resource Classification Mineral Resources at Detour Lake were classified as follows: • Measured: blocks recognized by adjacent holes on a nominal 20 x 20 m grid (or less) in section and on plan; • Indicated: blocks recognized by adjacent holes on a nominal 40 x 40 m grid (or less) in section and on plan; • Inferred: blocks recognized by adjacent holes on a nominal 100 x 100 m grid (or less) in section and on plan; • Other: all other estimated blocks. Figure 14-11 is an example section showing the assigned confidence categories for Detour Lake.
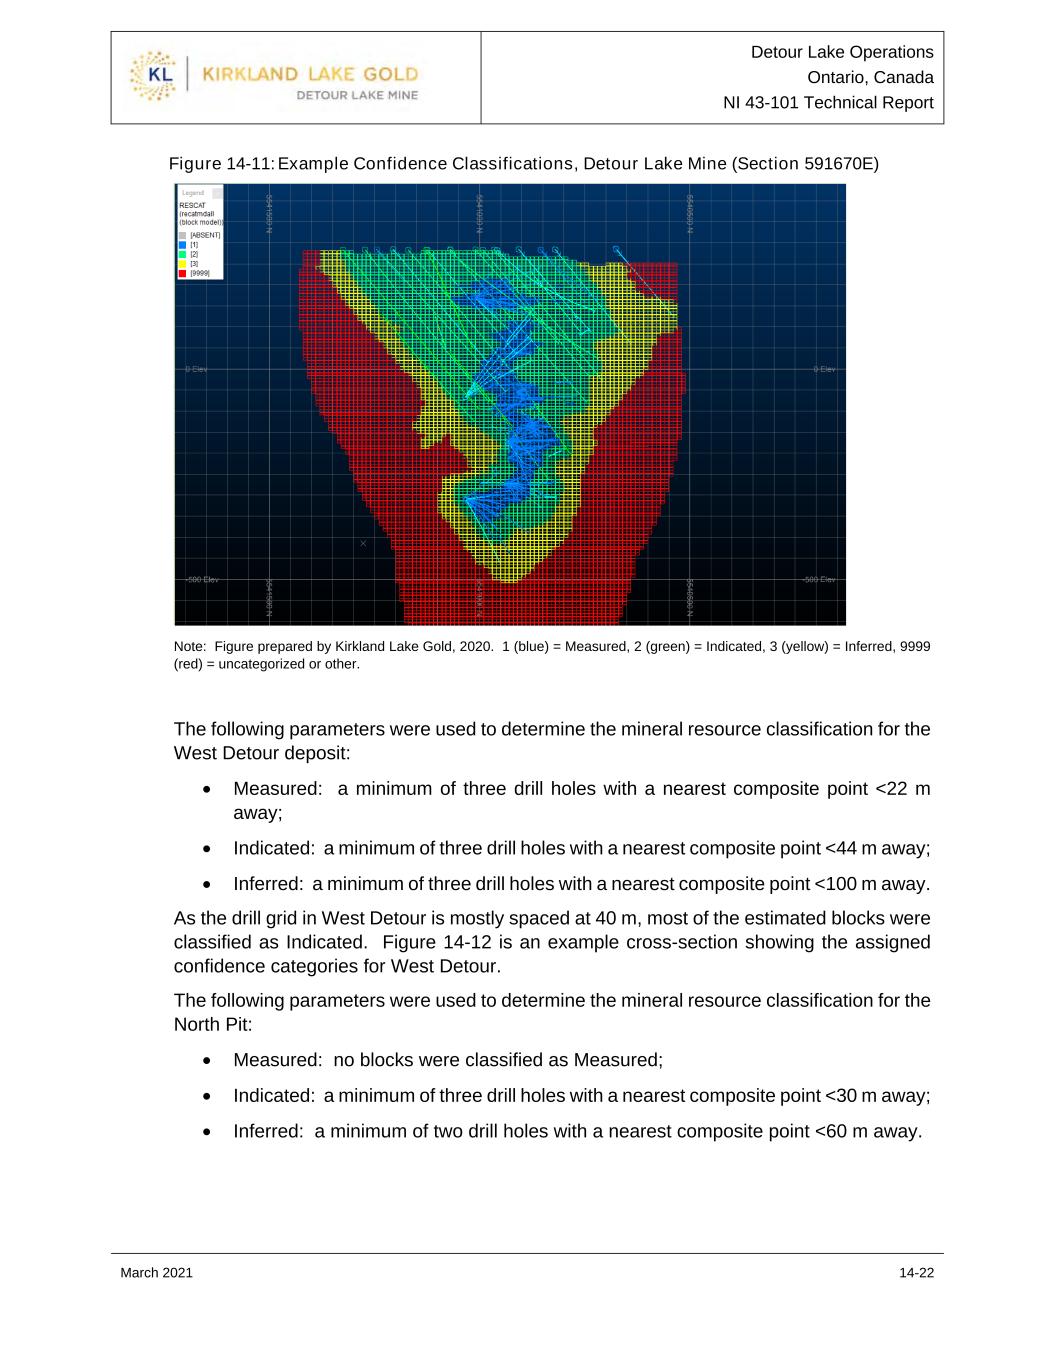
Detour Lake Operations Ontario, Canada NI 43-101 Technical Report March 2021 14-22 Figure 14-11: Example Confidence Classifications, Detour Lake Mine (Section 591670E) Note: Figure prepared by Kirkland Lake Gold, 2020. 1 (blue) = Measured, 2 (green) = Indicated, 3 (yellow) = Inferred, 9999 (red) = uncategorized or other. The following parameters were used to determine the mineral resource classification for the West Detour deposit: • Measured: a minimum of three drill holes with a nearest composite point <22 m away; • Indicated: a minimum of three drill holes with a nearest composite point <44 m away; • Inferred: a minimum of three drill holes with a nearest composite point <100 m away. As the drill grid in West Detour is mostly spaced at 40 m, most of the estimated blocks were classified as Indicated. Figure 14-12 is an example cross-section showing the assigned confidence categories for West Detour. The following parameters were used to determine the mineral resource classification for the North Pit: • Measured: no blocks were classified as Measured; • Indicated: a minimum of three drill holes with a nearest composite point <30 m away; • Inferred: a minimum of two drill holes with a nearest composite point <60 m away.

Detour Lake Operations Ontario, Canada NI 43-101 Technical Report March 2021 14-23 Figure 14-12: Example Confidence Classifications, West Detour (Section 16,000E) Note: Figure prepared by Kirkland Lake Gold, 2020. 1 (blue) = Measured, 2 (green) = Indicated, 3 (yellow) = Inferred. Due to the approximate 40 m drill hole spacing, the classification criteria can result in isolated columns of Inferred blocks within the core of the Indicated material. To account for isolated blocks, polylines were created at a nominal 30 m area of influence from the drill holes on an inclined plan perpendicular to the direction of the drill holes. These polylines were used to create an Indicated wireframe to capture these isolated Inferred blocks and converted them to Indicated. Similarly, for isolated unclassified or Indicated blocks within the Inferred class material, polylines were created to capture isolated unclassed and Indicated blocks and convert them to Inferred. Figure 14-13 shows the blocks classified as Indicated and Inferred for blocks with gold grades ≥0.50 g/t Au. Figure 14-14 is an example cross-section showing the assigned confidence categories for the North Pit area. Mineral Resource confidence categories for the Zone 58N deposit are based on the estimation passes, which in turn are a function of drill hole spacing and minimum composites to estimate a block. The drill hole spacing at Zone 58N is roughly 25 x 25 m in the upper 500 m of the deposit with a sparser drill hole spacing of approximately 40 x 40 m deeper than 500 m.
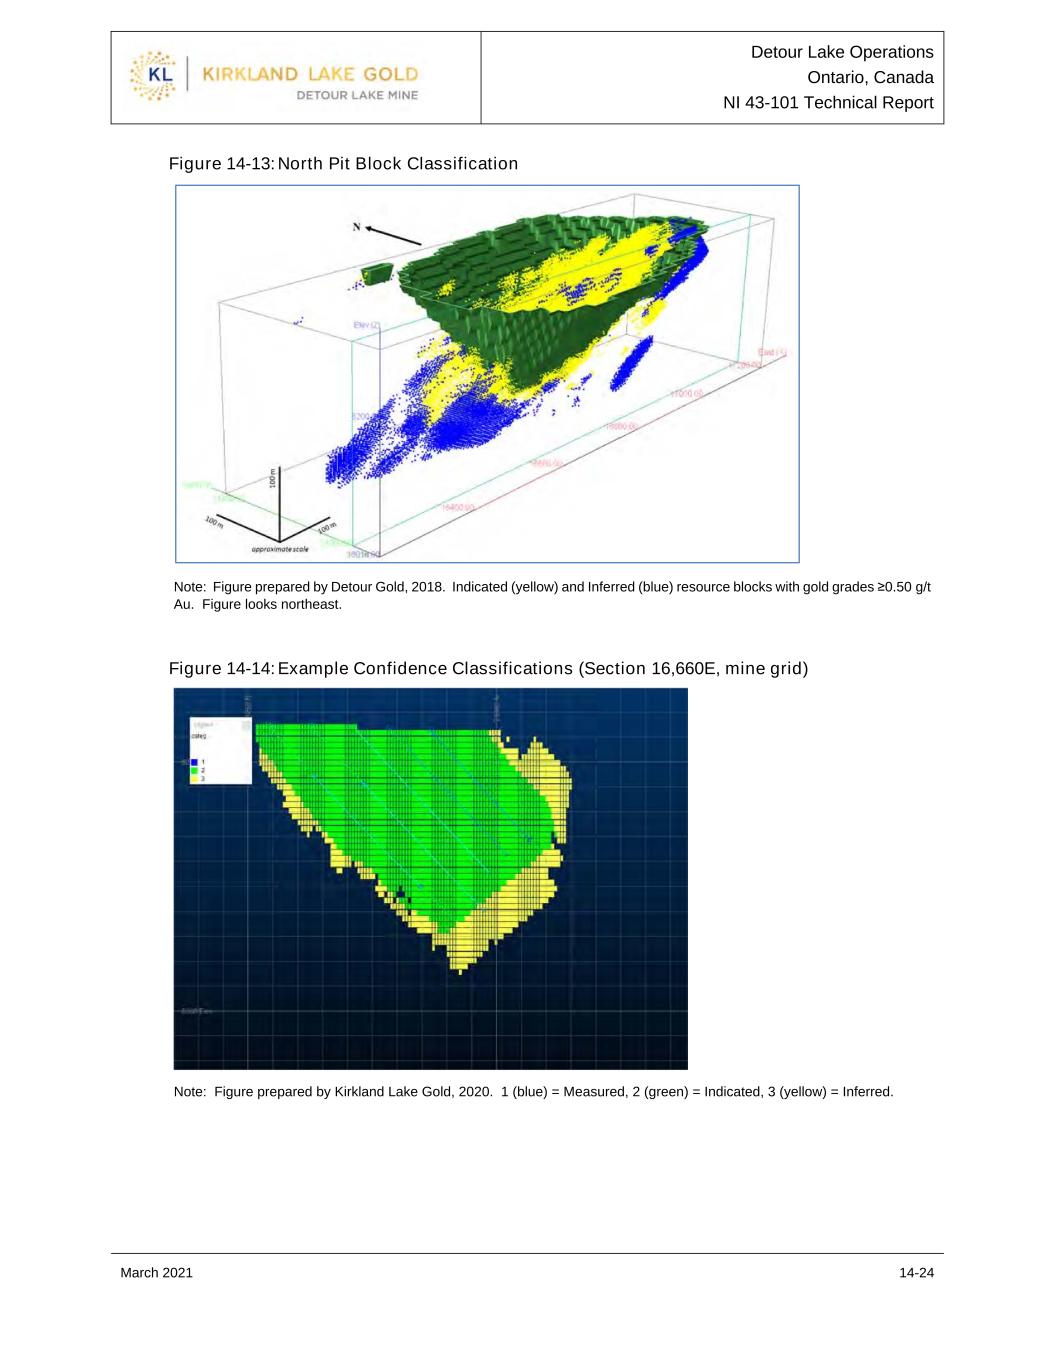
Detour Lake Operations Ontario, Canada NI 43-101 Technical Report March 2021 14-24 Figure 14-13: North Pit Block Classification Note: Figure prepared by Detour Gold, 2018. Indicated (yellow) and Inferred (blue) resource blocks with gold grades ≥0.50 g/t Au. Figure looks northeast. Figure 14-14: Example Confidence Classifications (Section 16,660E, mine grid) Note: Figure prepared by Kirkland Lake Gold, 2020. 1 (blue) = Measured, 2 (green) = Indicated, 3 (yellow) = Inferred.

Detour Lake Operations Ontario, Canada NI 43-101 Technical Report March 2021 14-25 The following parameters were used to determine the mineral resource classification for Zone 58N: • Measured: There are blocks classified as Measured; • Indicated: blocks estimated in passes 1, 2 and 3 above elevation 5780m RL; • Inferred: blocks estimated in pass 4, in addition to estimation passes 1, 2 and 3 below elevation 5780m RL; • All material below elevation 5780m RL is considered Inferred due to the wider drill hole spacing. The mineral resource classification in section view for the Zone 58N deposit is shown in Figure 14-15. 14.12 Reasonable Prospects for Eventual Economic Extraction The Detour Lake, West Detour and North Pit resource models were combined in a common model. A pit optimization exercise using Maptek-Vulcan was conducted based on the parameters listed in Table 14-12. The exercise constrained the Measured, Indicated and Inferred Resources estimates. A revenue factor of one was used to guide the pit design. The conceptual pit layouts are shown in Figure 14-16 in relation to the final designed Mineral Reserve pit outlines. The conceptual pit encompassed both Detour Lake and West Detour within a single pit. The North Pit remained as a separate pit. For resource estimation reporting purposes, the common model was divided along section line 16,995 E to separate the Detour Lake estimate from the West Detour estimate. The combined model was adjusted for mining depletions as of year-end 2020. The estimate is reported above a cut-off grade of 0.5 g/t Au. The Zone 58N deposit assumes that it will be mined using underground mining methods, based on the use of transverse and longitudinal long-hole stopes. The stoping geometry and stope heights are based on geological interpretation with dilution assumptions considered. The mineralized domains were modelled with a minimum thickness of 4 m downhole (approximately 3 m true thickness), to ensure that minimum underground mining widths were addressed. The estimate is reported above a cut-off grade of 2.2 g/t Au using the parameters listed in Table 14-13. 14.13 Mineral Resource Statement Mineral Resources are reported using the 2014 CIM Definition Standards and are reported exclusive of those Mineral Resources converted to Mineral Reserves. Mineral Resources that are not Mineral Reserves do not have demonstrated economic viability. The Qualified Person for the estimate is Mr. Andre Leite, P.Eng., a Kirkland Lake Gold employee. Mineral Resources are reported in Table 14-14 and Table 14-15, and have an effective date of December 31, 2020.

Detour Lake Operations Ontario, Canada NI 43-101 Technical Report March 2021 14-26 Figure 14-15: Zone 58N Block Classification Composite Longitudinal Section (5,533,700 N) Note: Figure prepared by Detour Gold, 2018. Figure looks north.

Detour Lake Operations Ontario, Canada NI 43-101 Technical Report March 2021 14-27 Table 14-12: Conceptual Resource Pit Optimization Parameters Parameters Units Value Gold price US$/oz 1,500 Exchange rate US$/C$ 1.31 Mining cost C$/t mined 3.42 Milling cost C$/t milled 9.75 TMA cost C$/t milled 1.50 G&A cost C$/t milled 3.59 Recovery % Various (based on formulae) Royalty * % 2 Refining and transport % 0.05 Sustaining capital cost (non–mining) C$/t milled 2.44 Sustaining capital cost (mining) C$/t mined 0.35 Pit slope angles Degrees 25–56 Incremental cost per bench C$/t/bench 0.019 Breakeven cut-off g/t 0.34 Marginal cut-off g/t 0.24 Note: * = after refining and transport. TMA = tailings management area; G&A = general and administrative. ** includes First Nations agreements associated costs. Figure 14-16: Isometric View of the Mineral Reserve Pits (Brown) in Relation to the Mineral Resource Pits (Green) Note: Figure prepared by Detour Gold, 2021.

Detour Lake Operations Ontario, Canada NI 43-101 Technical Report March 2021 14-28 Table 14-13: Underground Cut-off Grade Input Parameters Parameters Units Value Gold price US$/oz 1,300 Exchange rate US$/C$ 1.25 Mill recovery % 97 Refining costs C$/oz 5.00 Mining cost (average cost) C$/t 75 Processing & tailings costs C$/t 9.00 G&A costs C$/t 11.50 Mining dilution % at zero grade 12 Calculated cut-off grade g/t Au 2.2

Detour Lake Operations Ontario, Canada NI 43-101 Technical Report March 2021 14-29 Table 14-14: Measured and Indicated Mineral Resource Statement Deposit Measured Indicated Total Measured and Indicated Tonnes (Mt) Grade (g/t Au) Contained Ounces (koz) Tonnes (Mt) Grade (g/t Au) Contained Ounces (koz) Tonnes (Mt) Grade (g/t Au) Contained Ounces (koz) Detour Lake 21.0 1.66 1,121 86.7 1.03 2,870 107.7 1.15 3,991 West Detour 0.3 0.89 7 22.7 0.88 644 22.9 0.88 652 North Pit — — — 0.5 0.90 15 0.5 0.90 15 Zone 58N — — — 2.9 5.80 534 2.9 5.80 534 Total Measured and Indicated 21.3 1.65 1,128 112.8 1.12 4,063 134.1 1.21 5,191 Table 14-15: Inferred Mineral Resource Statement Deposit Inferred Tonnes (Mt) Grade (g/t Au) Contained Ounces (koz) Detour Lake 31.8 0.82 844 West Detour 20.5 0.95 626 North Pit 0.0 0.89 0 Zone 58N 1.0 4.35 136 Total Inferred 53.3 0.94 1,606 Notes to accompany Mineral Resource tables: 1. The Mineral Resources have an effective date of December 31, 2020. The Qualified Person for the estimate is Mr. Andre Leite, P.Eng., a Kirkland Lake Gold employee. 2. Mineral Resources are reported exclusive of those Mineral Resources converted to Mineral Reserves. Mineral Resources that are not Mineral Reserves do not have demonstrated economic viability. Mineral Resources are reported using the 2014 CIM Definition Standards. 3. Mineral Resources considered amenable to open pit mining methods were estimated using a gold price of US1,500/oz, variable metallurgical recovery assumptions based on formulae, refining and transport costs of C$5/oz Au, mining costs of C$3.42/t mined, process costs of C$9.75/t milled, tailings management costs of C$1.50/t milled, general and administrative costs of C$3.59/t milled, non-mining sustaining capital costs of $2.44/t milled, mining sustaining capital costs of C$0.35/t mined, incremental bench cost of $0.019/t/bench, and variable pit slope angles that range from 25– 56º. The estimate is reported above a cut-off grade of 0.5 g/t Au. 4. Mineral Resources considered amenable to underground pit mining methods were estimated assuming long-hole and transverse stoping methods. The estimates used a gold price of US1,300/oz, metallurgical recovery assumption of 97%, refining and transport costs of C$5/oz Au, average mining cost of C$75/t mined, process and tailings costs of C$9/t milled, general and administrative costs of C$11.50/t, assumed dilution average of 12%. The estimate is reported above a cut-off grade of 2.2 g/t Au. 5. Estimates have been rounded in accordance with reporting guidelines. Totals may not sum due to rounding.
Detour Lake Operations Ontario, Canada NI 43-101 Technical Report March 2021 14-30 14.14 Factors that May Affect the Resource Estimate Factors that may affect the Mineral Resource estimates include: • Metal price and exchange rate assumptions; • Changes to the assumptions used to generate the estimation domains; • Changes in local interpretations of mineralization geometry and continuity of mineralized zones; • Changes to geological and mineralization shape and geological and grade continuity assumptions; • Changes in the treatment of high-grade gold values; • Density assignments; • Changes to geotechnical, mining and metallurgical recovery assumptions; • Changes to the input and design parameter assumptions that pertain to the assumptions for open pit and underground mining constraining the estimates; • Assumptions as to the continued ability to access the site, retain mineral and surface rights titles, maintain environment and other regulatory permits, and maintain the social license to operate. 14.15 Comments on Mineral Resource Estimates Mineral Resources are reported using the 2014 CIM Definition Standards. There are no other environmental, legal, title, taxation, socioeconomic, marketing, political or other relevant factors known to the QP that would materially affect the estimation of Mineral Resources that are not discussed in this Report.
Detour Lake Operations Ontario, Canada NI 43-101 Technical Report March 2021 15-1 15.0 Mineral Reserve Estimates 15.1 Introduction Mineral Reserves are reported as the diluted ore tonnage and grade scheduled to be fed to the mill over the life of the operation, based on open pit mining methods. The associated production schedule considers an optimized mill and stockpile strategy to maximize discounted cash flows. Measured and Indicated Mineral Resources within the Detour Lake, West Detour and North Pit final pits were converted to Proven and Probable Mineral Reserves respectively. Inferred Mineral Resources captured within the pit shells were set to waste. 15.2 Block Model A block size of 10 x 10 x 7.25 m was used for the Detour Lake, 10 x 5 x 12 m for West Detour, and 6 x 6 x 6 m was used for the North Pit. The models contain blocks coded with the following information: • Gold grade (diluted and undiluted); • Resource confidence category (Measured, Indicated and Inferred); • Density; • Lithology and domain; • Material volumes (below topography, rock, overburden, fill material in historical underground workings and stopes). 15.3 Pit Optimization 15.3.1 Basis of Optimization The pit optimization exercise was completed using Maptek Vulcan pit optimizer. Each deposit was optimized independently to reflect the different bench height planned for each pit. The optimization only considered Measured and Indicated Mineral Resources as possible cash flow-generating material; all Inferred Mineral Resources were treated as waste. The gold grade of each block was adjusted for any overburden, till, or partial backfill from prior mining activities. The gold grades were also adjusted to account for mine dilution and ore losses. The dilution process was calibrated using production reconciliation results for the past four years. The geotechnical parameters used in the optimization respect the prescribed intra-ramp angles for the Detour, West Detour and North pits as established by third-party consultants, Golder Associates (Golder 2019, 2020). The overall angles used in the optimization process account for final ramps and geotechnical catch berms requirements.
Detour Lake Operations Ontario, Canada NI 43-101 Technical Report March 2021 15-2 Gold recovery is calculated as a function of the diluted block grade and based on a recovery formula calibrated using past production results. The parameters and respective values assumed in the pit optimization process are presented in Table 15-1. Based on the costs and price assumptions presented in the table, a set of pit shells associated with a range of revenue factors was generated for each of the deposits. The final pit selection was based on conventional best-worst case analysis of discounted cash-flows. The selected shells guiding final pit design were associated with revenue-factors of 0.88 for Detour, 0.95 for West Detour and 0.90 for the North Pit. 15.3.2 Engineered Pit Designs The engineered pit designs were completed using the pit optimization shells as a guide in order to maximize the value and gold recovered inside the ultimate pits. The resulting pit designs include practical geometry that is required in an operational mine, such as the haul road to access all the benches, recommended pit slopes with geotechnical berms, proper benching configuration and smoothed pit walls. Details of the designs are provided in Section 16 of this Report. 15.4 Cut-off Grade The cut-off grade strategy adopted by Kirkland Lake Gold maximizes the discounted cashflows. The process was completed using Maptek Evolution Strategy software. The cut-off evaluation incorporated considerations of mill and stockpile capacities, mine constraints and economic parameters when defining mill and stockpile cut-off grades over time in a yearly basis. Table 15-2 summarizes the average annual cut-off grades for the mill feed over the LOM. A minimum cut-off grade of 0.35 g/t Au is used. Mining will use a variable cut-off grade strategy, because it moves forward ounce production and delays stripping as much as possible as it aims to maximize discounted cash flows. 15.5 Dilution Mine dilution is accounted for by the use of mine panels that emulate variable degrees of dilution as a function of the continuity of the mineralization at different cut-off grades. The process use Maptek Vulcan implementation of a mine shape optimizer (MSO). Different panels sizes and dimensions were tested against production reconciliation results for the past four years (2016–2019) at a cut-off grade of 0.5 g/t Au. The average dilution factored in over the LOM represents a 7% increase in tonnage and 6% lower grade.

Detour Lake Operations Ontario, Canada NI 43-101 Technical Report March 2021 15-3 Table 15-1: Pit Optimization Parameters Optimization Parameter Unit Value Gold price US$/oz 1,300 Exchange rate C$/US$ 1.31 Royalty % 2 Refiner charge % 0.05 Net gold prices C$/oz 1,665 Metallurgical recovery % Variable Inter-ramp pit slope angles º 25.1–56.3 Mining cost (excluding incremental haulage) C$/t mined 3.42 Incremental haulage cost Detour Lake Pit C$/7.25 m bench 0.019 West Detour and North Pit C$/6 m bench 0.015 Process cost C$/t milled 9.75 G&A C$/t milled 3.59 Sustaining capital (non-mining)* C$/t milled 3.42 Sustaining capital (mining) C$/t mined 0.35 Breakeven cut-off g/t 0.40 Marginal cut-off g/t 0.27 Note: = * includes First Nations agreements associated costs Table 15-2: LOM Mill Cut-off Grades by Year Year Mill Cut-off Grade (g/t Au) 2021 0.57 2022 0.51 2023 0.56 2024 0.55 2025 0.48 2026 0.52 2027 0.36 2028 0.35 2029 0.36 2030 0.45 2031 0.56 2032 0.66 2033 0.68 2034 0.49 2035 0.50 2036 0.40
Detour Lake Operations Ontario, Canada NI 43-101 Technical Report March 2021 15-4 Year Mill Cut-off Grade (g/t Au) 2037 0.53 2038 0.35 15.6 Mineral Reserves Statement Mineral Reserves are reported using the 2014 CIM Definition Standards. The Qualified Person for the estimate is Mr. Andre Leite, P.Eng., a Kirkland Lake Gold employee. Mineral Reserves have an effective date of December 31, 2020 and are summarized in Table 15-3. Mineral Reserves are reported based on optimized and variable yearly cut-off grades summarized in Table 15-2 and considering a minimum cut-off of 0.35 g/t Au. 15.7 Factors that May Affect the Mineral Reserves Estimate Factors that may affect the Mineral Reserve estimates include: • Changes to the gold price and exchange rate assumptions; • Changes to pit slope and geotechnical assumptions; • Changes to operating cost assumptions used in the constraining pit shell; • Changes to pit designs from those currently envisaged; • Unforeseen dilution; • Changes to hydrogeological and pit dewatering assumptions; • Changes to inputs to capital and operating cost estimates; • Ability to permit West Detour and North Pit pits and western extent of the ultimate Detour Lake pit; • Changes to modifying factor assumptions, including environmental, permitting and social licence to operate. 15.8 Comment on Mineral Reserves Estimates Mineral Reserves are reported using the 2014 CIM Definition Standards. There are no other environmental, legal, title, taxation, socioeconomic, marketing, political or other relevant factors known to the QP that would materially affect the estimation of Mineral Reserves that are not discussed in this Report.
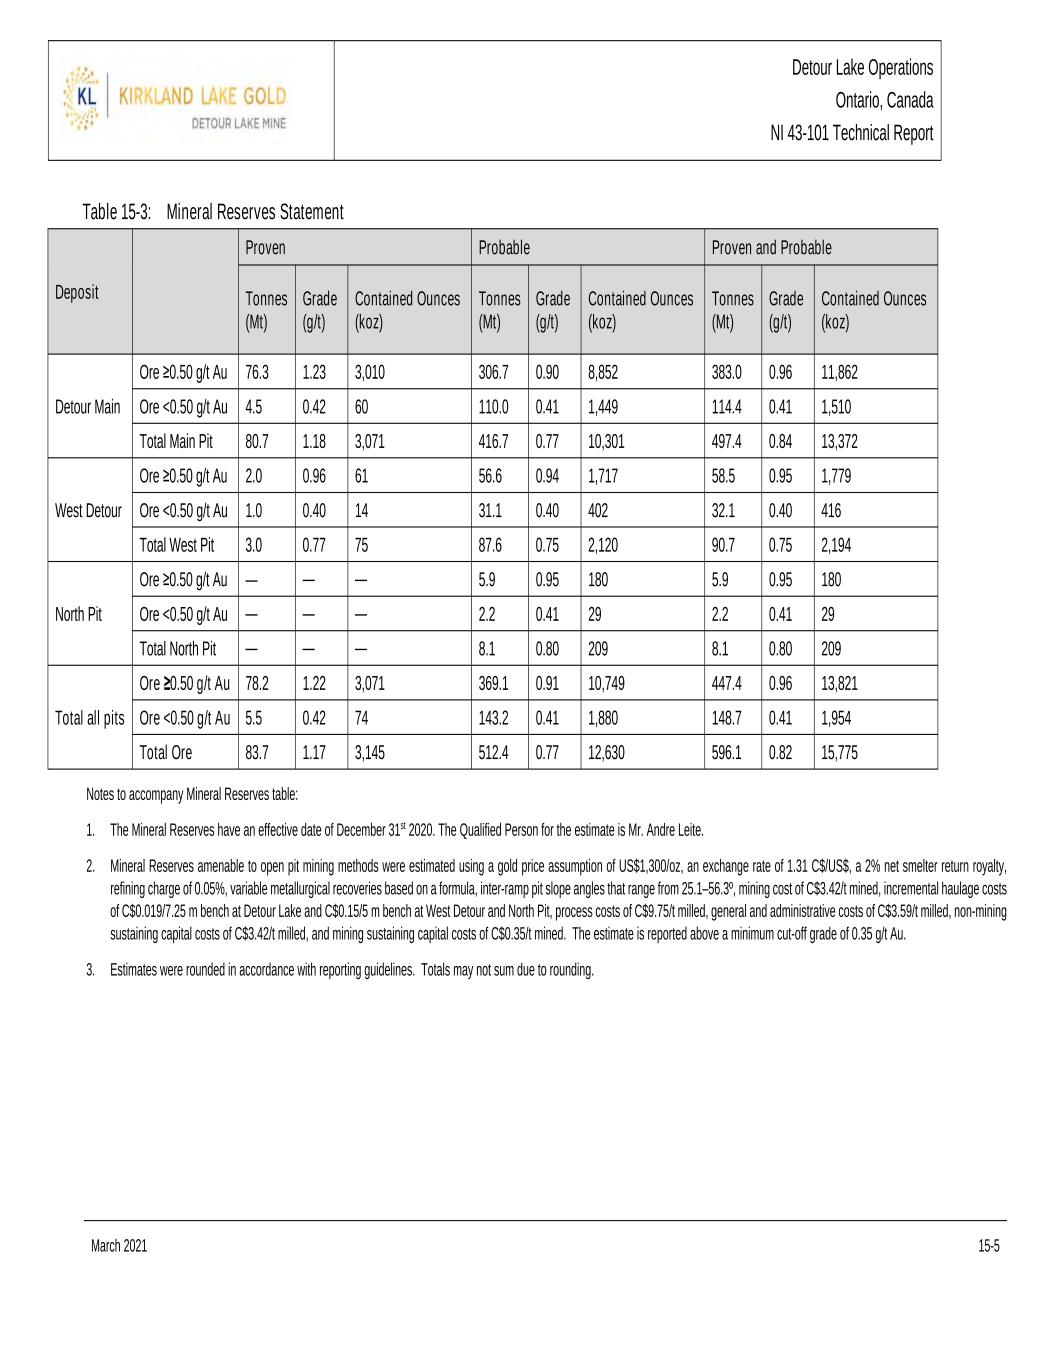
Detour Lake Operations Ontario, Canada NI 43-101 Technical Report March 2021 15-5 Table 15-3: Mineral Reserves Statement Deposit Proven Probable Proven and Probable Tonnes (Mt) Grade (g/t) Contained Ounces (koz) Tonnes (Mt) Grade (g/t) Contained Ounces (koz) Tonnes (Mt) Grade (g/t) Contained Ounces (koz) Detour Main Ore ≥0.50 g/t Au 76.3 1.23 3,010 306.7 0.90 8,852 383.0 0.96 11,862 Ore <0.50 g/t Au 4.5 0.42 60 110.0 0.41 1,449 114.4 0.41 1,510 Total Main Pit 80.7 1.18 3,071 416.7 0.77 10,301 497.4 0.84 13,372 West Detour Ore ≥0.50 g/t Au 2.0 0.96 61 56.6 0.94 1,717 58.5 0.95 1,779 Ore <0.50 g/t Au 1.0 0.40 14 31.1 0.40 402 32.1 0.40 416 Total West Pit 3.0 0.77 75 87.6 0.75 2,120 90.7 0.75 2,194 North Pit Ore ≥0.50 g/t Au — — — 5.9 0.95 180 5.9 0.95 180 Ore <0.50 g/t Au — — — 2.2 0.41 29 2.2 0.41 29 Total North Pit — — — 8.1 0.80 209 8.1 0.80 209 Total all pits Ore ≥0.50 g/t Au 78.2 1.22 3,071 369.1 0.91 10,749 447.4 0.96 13,821 Ore <0.50 g/t Au 5.5 0.42 74 143.2 0.41 1,880 148.7 0.41 1,954 Total Ore 83.7 1.17 3,145 512.4 0.77 12,630 596.1 0.82 15,775 Notes to accompany Mineral Reserves table: 1. The Mineral Reserves have an effective date of December 31st 2020. The Qualified Person for the estimate is Mr. Andre Leite. 2. Mineral Reserves amenable to open pit mining methods were estimated using a gold price assumption of US$1,300/oz, an exchange rate of 1.31 C$/US$, a 2% net smelter return royalty, refining charge of 0.05%, variable metallurgical recoveries based on a formula, inter-ramp pit slope angles that range from 25.1–56.3º, mining cost of C$3.42/t mined, incremental haulage costs of C$0.019/7.25 m bench at Detour Lake and C$0.15/5 m bench at West Detour and North Pit, process costs of C$9.75/t milled, general and administrative costs of C$3.59/t milled, non-mining sustaining capital costs of C$3.42/t milled, and mining sustaining capital costs of C$0.35/t mined. The estimate is reported above a minimum cut-off grade of 0.35 g/t Au. 3. Estimates were rounded in accordance with reporting guidelines. Totals may not sum due to rounding.

Detour Lake Operations Ontario, Canada NI 43-101 Technical Report March 2021 16-1 16.0 Mining Methods 16.1 Overview The Detour Lake Mine uses conventional truck-shovel open pit mining. The mine is operated using an Owner-operator mining equipment and labour strategy. Excluding the muskeg, overburden/till top layer, all material must be blasted. Pioneering drilling and blasting is required in the overburden/rock contact. Additionally, during winter months free digging of overburden material is not possible due to frost. The mine operation also requires the management of old underground workings; in general, historical records of underground workings are very reliable. Standard operational procedures regulate the mining activity in these affected areas to ensure a safe operation and risk management. Mining at West Detour is planned to employ similar conventional mining methods with the initial use of smaller equipment for the pre-stripping phase, especially in overburden. Given the smaller dimensions of the North Pit, a smaller fleet size will be used. The mine production schedule forecasts a total 1,725 Mt to be mined over a period of 18 years (2021–2038). A total of 597 Mt of ore is planned to be milled over a period of 22 years (2021–2042); with the last four years of production supported by long-term stockpile reclaim. The optimized and variable cut-off strategy combined with 158 Mt of stockpile capacity, results in an average LOM stripping ratio of 1.90. 16.2 Geotechnical Considerations The geotechnical design parameters for Detour Lake Main Pit were reviewed by Golder in 2020 (Golder, 2020). The assessment accounts for a revised bench height of 14.5 m for the Main Pit implemented in 2020 and for information obtained as temporary and final walls are exposed. The geotechnical sectors are shown in Figure 16-1, and the pit slope assumptions are provided in Table 16-1. The geotechnical parameters for the West Detour and North pit were also provided by Golder (Golder, 2013). In 2019 Golder re-assessed both West Detour and North Pit designs and confirmed previous recommendations. The bench face angles varied from 65–75° and the inter ramp angles varied between 46–56°. The main geotechnical parameters implemented in the ultimate pit design are schematically represented in Figure 16-2. A process of ongoing geotechnical monitoring and documentation was implemented at the mine and additional risk mitigation techniques continue to be evaluated and employed as needed.
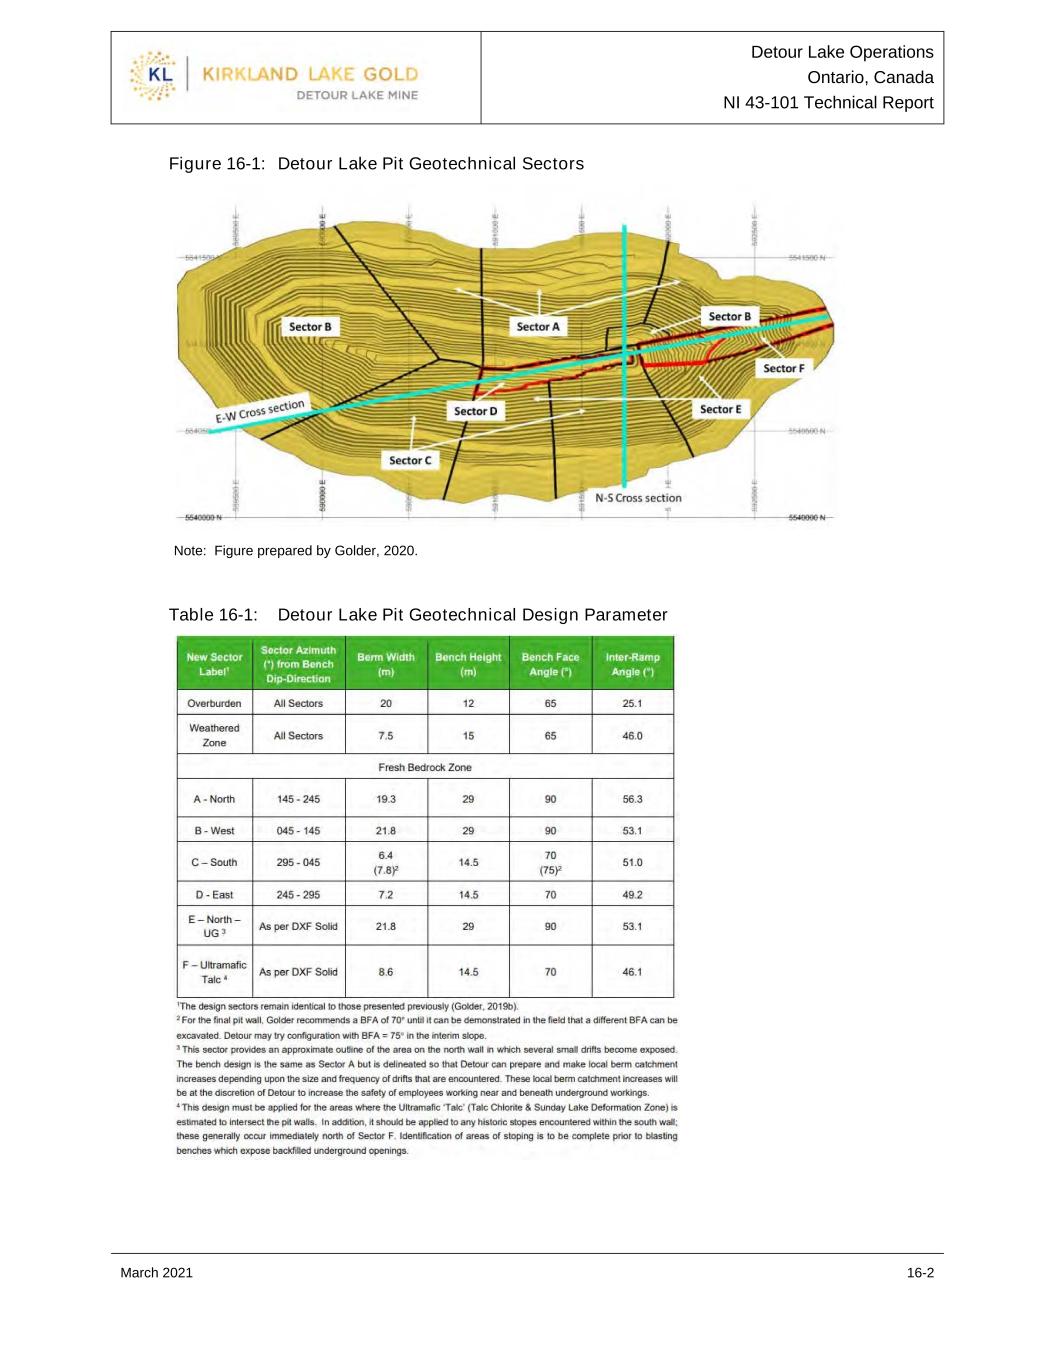
Detour Lake Operations Ontario, Canada NI 43-101 Technical Report March 2021 16-2 Figure 16-1: Detour Lake Pit Geotechnical Sectors Note: Figure prepared by Golder, 2020. Table 16-1: Detour Lake Pit Geotechnical Design Parameter

Detour Lake Operations Ontario, Canada NI 43-101 Technical Report March 2021 16-3 Figure 16-2: West Detour and North Pits - Pit Slope Recommendations Note: Figure prepared by Detour Gold, 2018. 16.3 Hydrological Considerations The mine water management plan is matched to the mine development strategy. It accounts for a pit dewatering system consisting of pump stations, pit sumps and old underground workings (used as additional water storage capacity to manage water inflows). Water management infrastructure includes non-contact water diversion structures and water retention ponds, appropriately sized based on hydrological/hydrogeological modeling and the changes in mining activity and stockpiling over the LOM. Figure 16-4 shows the changes in the water management structures in relation to the operations at four time snapshots.

Detour Lake Operations Ontario, Canada NI 43-101 Technical Report March 2021 16-4 Figure 16-3: Mine Water Management Systems Note: Figure prepared by Kirkland Lake Gold, 2020. In these figures, EOM = end of mine life; MRS =mine residue storage; thick grey line is haulage road locations. 16.4 Open Pit Designs 16.4.1 Design Constraints The design of each one of the three final pits (Detour Lake, West Detour and North Pit) is guided by the respective optimized shells. The final pit design incorporates the geotechnical parameters prescribed by Golder (Golder 2019, 2020). The Detour Lake pit design incorporates a double ramp access for most of the LOM. The final ramp and principal access will be located in the north wall. The West Detour and North Pit were designed using a single ramp access. All ramps are designed to accommodate the safe operation of 795CAT super class trucks. Typical road width is 33 m with a total length of 40 m to allow for safety berm and drainage. Ramp widths are adjusted at the bottom of the pit to a one-way lane. Other design parameters include a ramp slope (10%), minimum curve radius (39 m) and construction constraints (super elevation, crowning).
Detour Lake Operations Ontario, Canada NI 43-101 Technical Report March 2021 16-5 16.4.2 Pit Phases The phase design process accounted for the deposit geometry and spatial value/grade/quality distribution, operational conditions, haulage access/congestion over time, equipment dimensions and geotechnical considerations. The nested shells obtained during the pit optimization exercise were also used during the design process to prioritize higher-value ore and lower stripping ratio areas. Equipment operational dimensions defined the minimum widths for phase design. In general, a minimum of 150 m width was targeted during the design process. There are a total of nine phases designed for the LOM: five for the Detour Lake Main Pit, three for West Detour and one for North Pit. These are shown in Figure 16-4. 16.4.3 Pit Sizes The final pit dimensions for the Detour Lake Main Pit, West Detour Pit and North Pit are provided in Table 16-2. A plan view of the Detour Main Pit final pit design is displayed in Figure 16-5. A plan view of the West Detour Pit and North Pit designs is displayed in Figure 16-6. 16.5 Overburden and Pre-Stripping Bedrock at both Detour Lake and West Detour is overlain by overburden composed of layers of muskeg, till, gravel, and sand. These overburden layers may be as thick as 40 m. At the start of each mining phase, this material must be stripped prior to the drilling and blasting of rock material. Depending on the material quality, weather and moisture content, this overburden material is typically ‘free-digging’ and does not require drilling and blasting. A portion of the till material (subject to quality control specifications) is stockpiled and used for tailings management area (TMA) construction purposes. The remaining overburden is stockpiled either in the main overburden stockpile or within designated areas of the WRSFs. A portion of this material will be rehandled for the reclamation of various waste rock stockpiles and/or TMA cells. Whenever possible, this overburden is directly placed for the progressive reclamation of ultimate WRSF slopes. 16.6 Stockpile and Waste Rock Storage Facilities 16.6.1 Strategy Both WRSF and stockpile strategies are in agreement with the permitting strategy for the West Detour pit; and respect related environmental constraints. Currently the mine has two WRSFs (MRS1 and MRS2), one ore stockpile (ROMPAD) and one overburden/topsoil stockpile for mine reclamation purposes (OVB1). The mine plan accounts for three additional ore stockpiles (MRS4, MR5 and a temporary stockpile within the MRS2 WRSF footprint), three new WRSFs (MRS3, MRS2-extension and Inpit) and one new overburden/topsoil stockpile (West Detour Overburden stock).
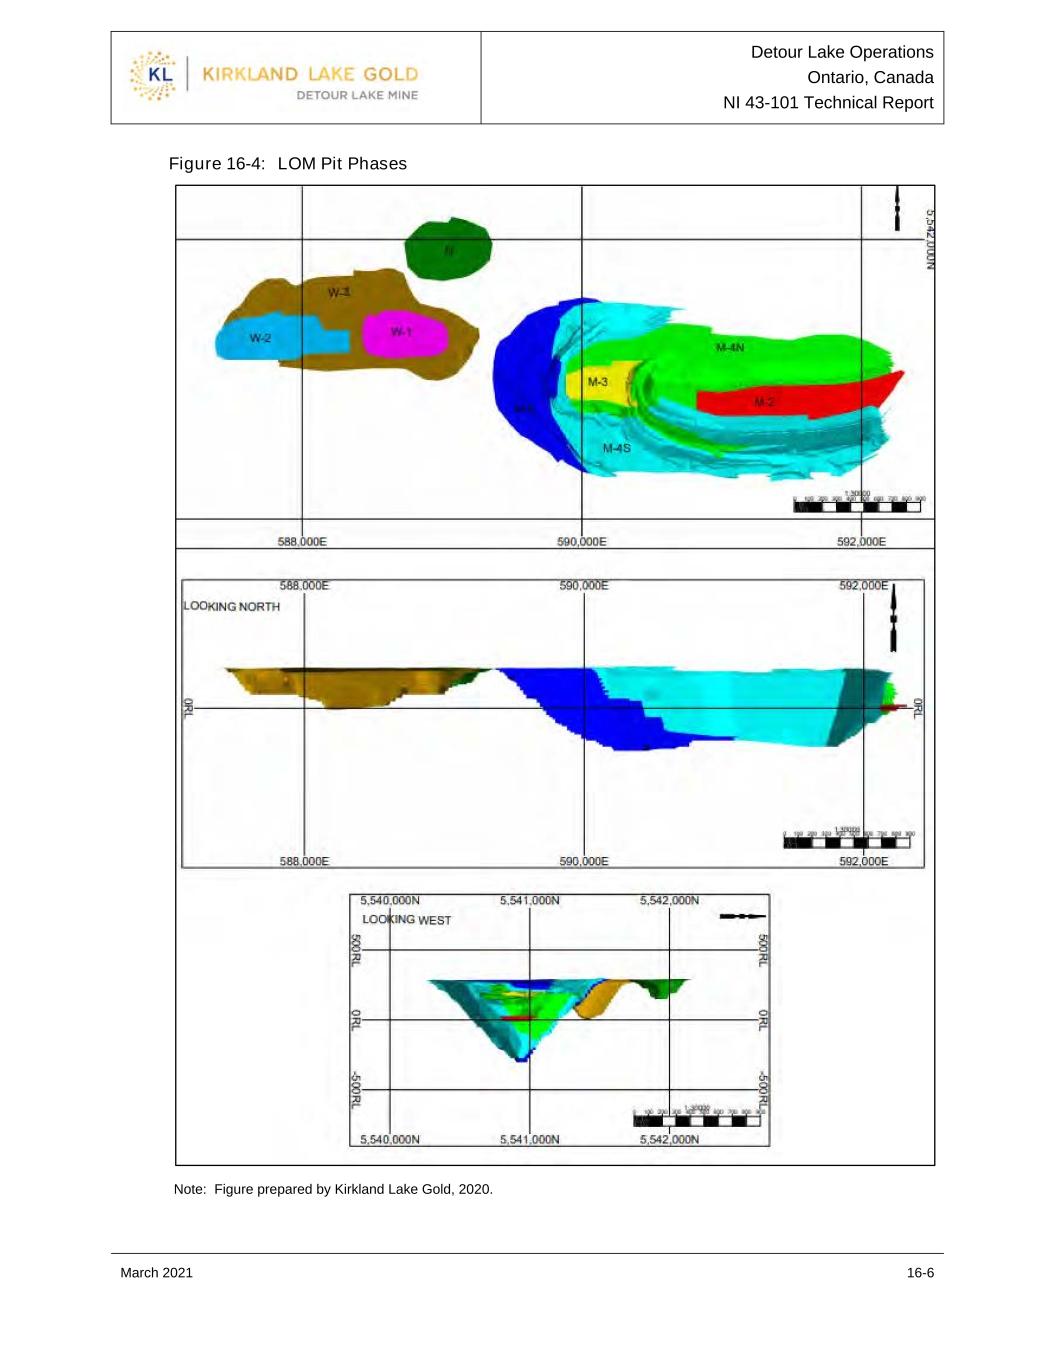
Detour Lake Operations Ontario, Canada NI 43-101 Technical Report March 2021 16-6 Figure 16-4: LOM Pit Phases Note: Figure prepared by Kirkland Lake Gold, 2020.
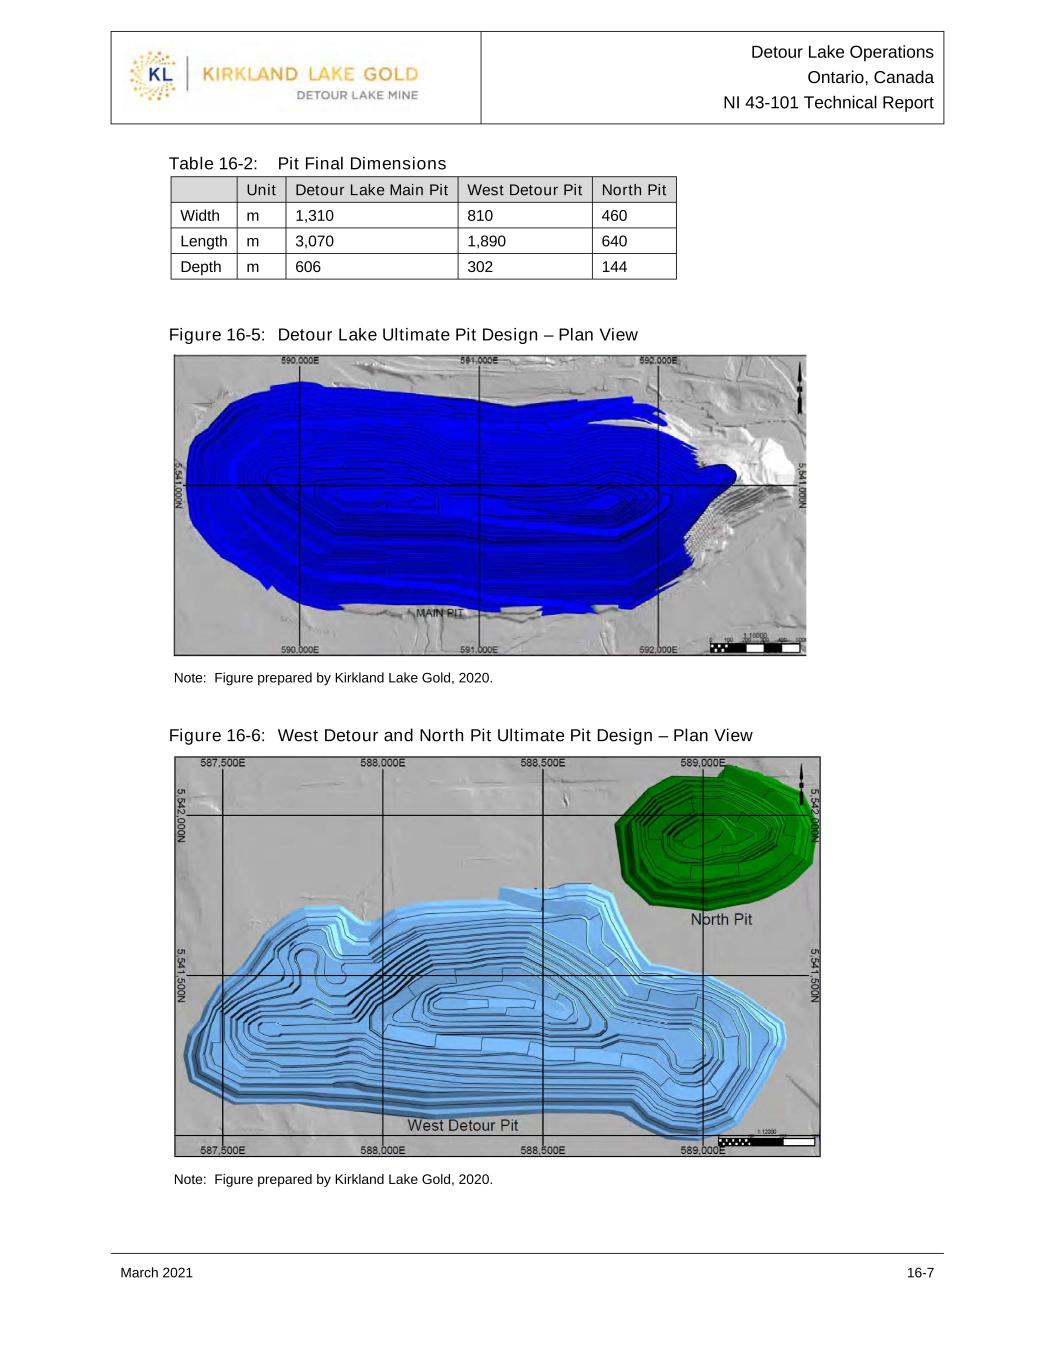
Detour Lake Operations Ontario, Canada NI 43-101 Technical Report March 2021 16-7 Table 16-2: Pit Final Dimensions Unit Detour Lake Main Pit West Detour Pit North Pit Width m 1,310 810 460 Length m 3,070 1,890 640 Depth m 606 302 144 Figure 16-5: Detour Lake Ultimate Pit Design – Plan View Note: Figure prepared by Kirkland Lake Gold, 2020. Figure 16-6: West Detour and North Pit Ultimate Pit Design – Plan View Note: Figure prepared by Kirkland Lake Gold, 2020.

Detour Lake Operations Ontario, Canada NI 43-101 Technical Report March 2021 16-8 Figure 16-7 shows the ex-pit WRSF locations. The inpit WRSF is shown in Figure 16-8. The waste material is classified as non-acid-generating (NAG), potentially acid-generating (PAG), overburden or topsoil. All PAG waste is routed to MRS1 or MRS3. NAG and overburden material not suitable for reclamation is routed to MRS2, MRS2-extension or used as construction material for the tailings cells. The stockpile strategy has the objective of maximizing discounted cash flow by the adoption of an optimized cut-off grade strategy constrained by the available stockpile capacity. MRS4 and MRS5 are long-term stockpiles that will only be reclaimed at the end of the LOM, after active mining has ceased. The ore routed to the long-term stockpiles represents material that has to be mined (within final pit limits) and that generates positive cash-flow at the end of the mine operation. The ROM pad and MRS2 temporary stockpile will receive material that will be reclaimed during mining operations. The MRS2 temporary stock is planned to be fully reclaimed by 2028 and the area used for waste deposition. 16.6.2 Design Criteria WRSFs are designed accounting for geotechnical considerations, reclamation requirements, environmental and operational constraints and the tonnage and sequence of deposition. Table 16-3 summarizes the WRSF design parameters. Stockpiles are designed accounting for geotechnical considerations, environmental and operational constraints and the tonnage and sequence of deposition. Table 16-4 summarizes the stockpile design parameters. 16.7 Mining Operations The Detour Lake Mine uses conventional truck-shovel open pit mining. Excluding the muskeg, overburden/till top layer, all material must be blasted. Pioneering drilling and blasting is required in the overburden/rock contact. Additionally, during winter months free digging of overburden material is not possible due to frost. The mine operation also requires the management of old underground workings. Underground workings records are considered of good quality. The mine has been operating in historical underground working areas for the past years; the reconciliation of historical recordings and field observation of these workings is very good. The assumption that stopes were backfilled using sand/rock filled has also been confirmed. There are procedures in place to ensure safe operations in these areas. The procedures define zones classified by the risk of ground instability. The Detour Lake Mine has used a 12 m bench-height since operations commenced. A 6 m sub-bench was used to mine the areas requiring pioneering to improve operational conditions related to boulders and pinnacles of bedrock.

Detour Lake Operations Ontario, Canada NI 43-101 Technical Report March 2021 16-9 Figure 16-7: Site and WRSF Layout Note: Figure prepared by Kirkland Lake Gold, 2020.
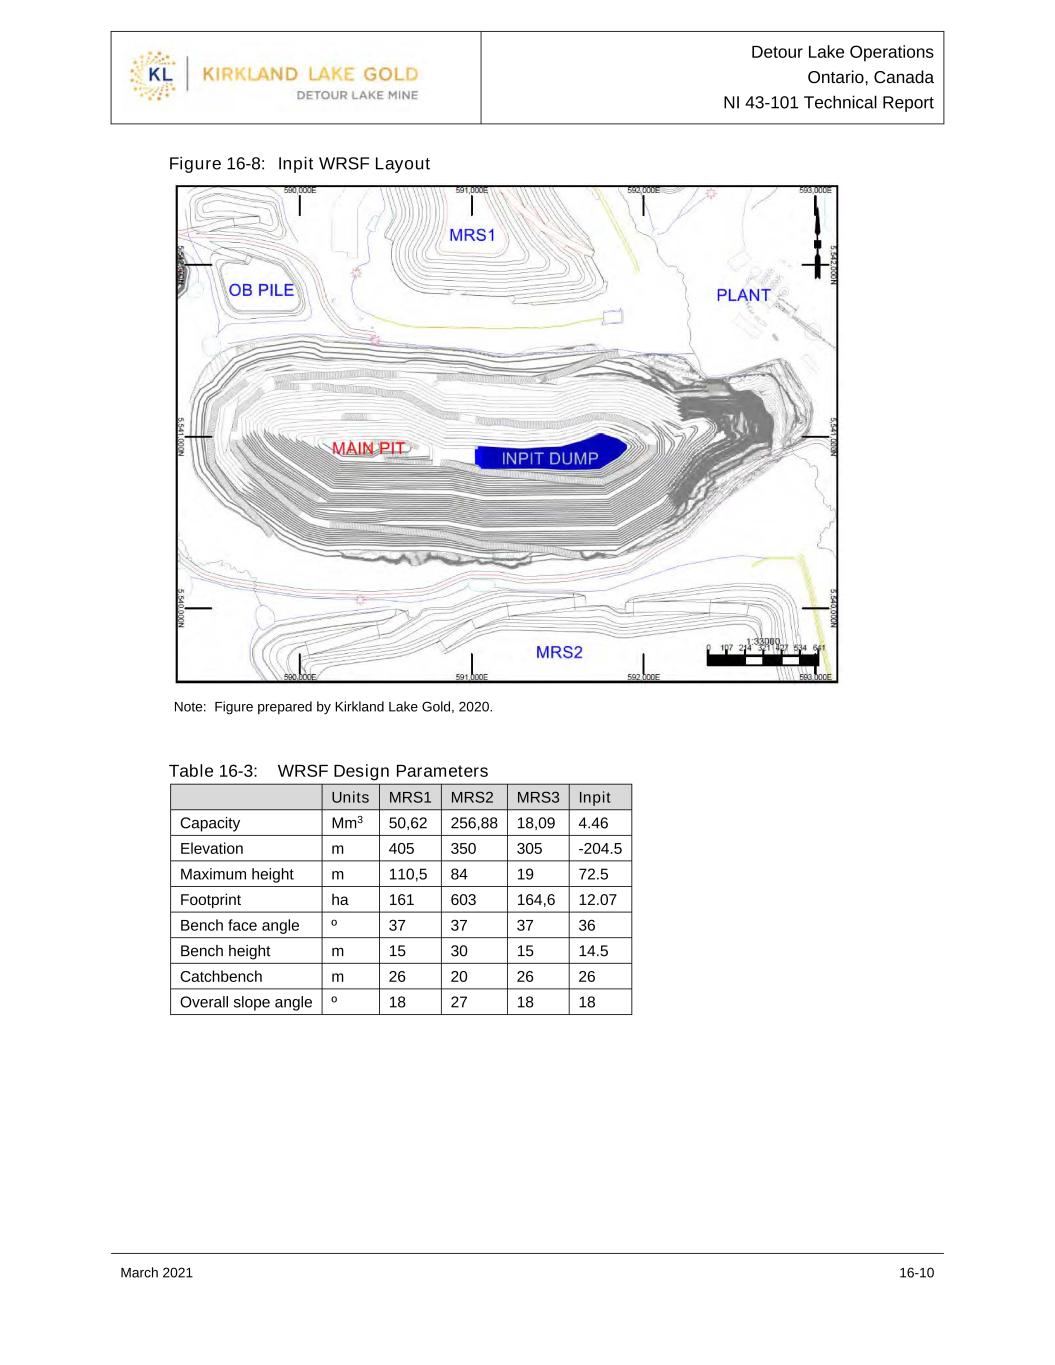
Detour Lake Operations Ontario, Canada NI 43-101 Technical Report March 2021 16-10 Figure 16-8: Inpit WRSF Layout Note: Figure prepared by Kirkland Lake Gold, 2020. Table 16-3: WRSF Design Parameters Units MRS1 MRS2 MRS3 Inpit Capacity Mm3 50,62 256,88 18,09 4.46 Elevation m 405 350 305 -204.5 Maximum height m 110,5 84 19 72.5 Footprint ha 161 603 164,6 12.07 Bench face angle º 37 37 37 36 Bench height m 15 30 15 14.5 Catchbench m 26 20 26 26 Overall slope angle º 18 27 18 18

Detour Lake Operations Ontario, Canada NI 43-101 Technical Report March 2021 16-11 Starting in mid-2020 the mine transited to a 14.5 m bench height for areas to be primarily mined by rope shovels and to 7.25 m benches in areas to be mined using hydraulic shovels. The revised mine design has led to improvements in shovel productivities. The mine operates 24-hr per day year-round on 12 hr shifts for all operational crews. Operational teams work on a seven-day in/seven-day out rotation. The mine has implemented a successful hot-seating process for its main production equipment (shovel, trucks and drills). Management/supervisory and support personnel work at site on different schedules. 16.7.1 Ore Mining and Stockpiles Mineralized zones previously delineated by core drilling are infilled using RC drilling, which is typically performed well ahead of production to decouple this step from the mining phase. The additional information is used to generate a short-term grade control model. Ore polygons based on different grade bins and material types are generated based on the grade control model. Blast movement technology is used to incorporate and adjust ore polygons for horizontal movement during blasting. The moved polygons limits are marked in the field to guide the excavation. Whenever possible, mined ore is delivered directly to the primary crusher in order to avoid unnecessary rehandling. When the mined ore tonnage exceeds the operating capacity of the crusher, the ore is placed on one of the ROM stockpiles for later mill feed. The ROM stockpiles are located in close proximity to the primary crusher to allow for efficient feeding into the plant. Ore in ROM stockpiles is segregated into piles consisting of similar grade material to allow for controlled feeding as required. The ROM stockpiles provide additional buffering capacity to ensure that crusher feed is maximized while also limiting excessive tramming of loading equipment between ore and waste areas in the pit. 16.7.2 Waste Mining Waste mining is generally allocated to the rope shovel fleet. The grade control process also delineates waste into PAG or NAG material. PAG material must be routed to the MRS3 or MRS1 WRSFs. Overburden material is generally mined by the hydraulic shovels. 16.8 Mine Production Plan The vertical advancement rates assumed in the mine plan consider the spatial distribution of the mineralization, proposed development strategy, presence of underground workings and bench mining. The plan assumes a general limit of 6–8 benches per year in large development areas (waste and ore bulk mining) and 3–4 bench per year when mining areas that are primarily ore.

Detour Lake Operations Ontario, Canada NI 43-101 Technical Report March 2021 16-12 Table 16-4: Stockpile Design Parameters Temporary MRS2 MRS4 MRS5 Capacity (Mm3) 8.4 11.53 58.23 Maximum height (m) 46.5 41.75 46 Footprint (ha) 54.2 57.2 188 Bench face angle (°) 37 37 37 Bench height (m) 8 15 15 Catchbench width (m) 14 26 26 Overall slope angle (°) 18 18 18 Shovel area requirements are also analyzed; ensuring the plan allows for the required space to operate the shovels efficiently. Ramp material flow limits and congestion analysis are also incorporated into designs. A maximum of a 90 Mt per ramp limit is assumed. A maximum of 30 Mt/a is planned for the West Detour pit due to the pit size. A maximum North Pit mining rate of 6 Mt per year is due to pit and equipment size. The annual mine production plan is based on the current Mineral Reserve estimates and the forecast is presented in Table 16-5, inclusive of dilution and ore losses. The forecast average annual gold production and tonnes mined per pit are illustrated in Figure 16-9 and Figure 16-10, respectively. 16.9 Drilling and Blasting Drilling and blasting activities are performed by Kirkland Lake Gold personnel. Dyno Nobel is the explosives supplier. Different objectives and geological/fractural information are considered when design the patterns and loading plans. Yields vary with the different objectives (wall control, fragmentation, higher fragmentation, reduction of overcasting material) and with areas in the pit. 16.10 Equipment The primary drill fleet at Detour Lake consists of electric and diesel Epiroc PV 271s, SmartROC D65s and DM45s drill rigs. Production drilling is performed primarily but not exclusively by PV271s drill rigs. The D65 and DM45 drills are mostly used for trim, pre-split and secondary drilling. The DM45 is the primary drill rig used for underground collapse and probe drilling. The primary loading fleet consists of 28 m3 CAT 6060 hydraulic shovels (operating primarily in ore) and 48 m3 CAT 7495 rope shovels (operating primarily in waste zones). The shovel size was matched with a fleet of 300-t CAT 795 trucks. This fleet combination requires 5.5 passes for a hydraulic shovel and three to four passes for a rope shovel to fill a truck.
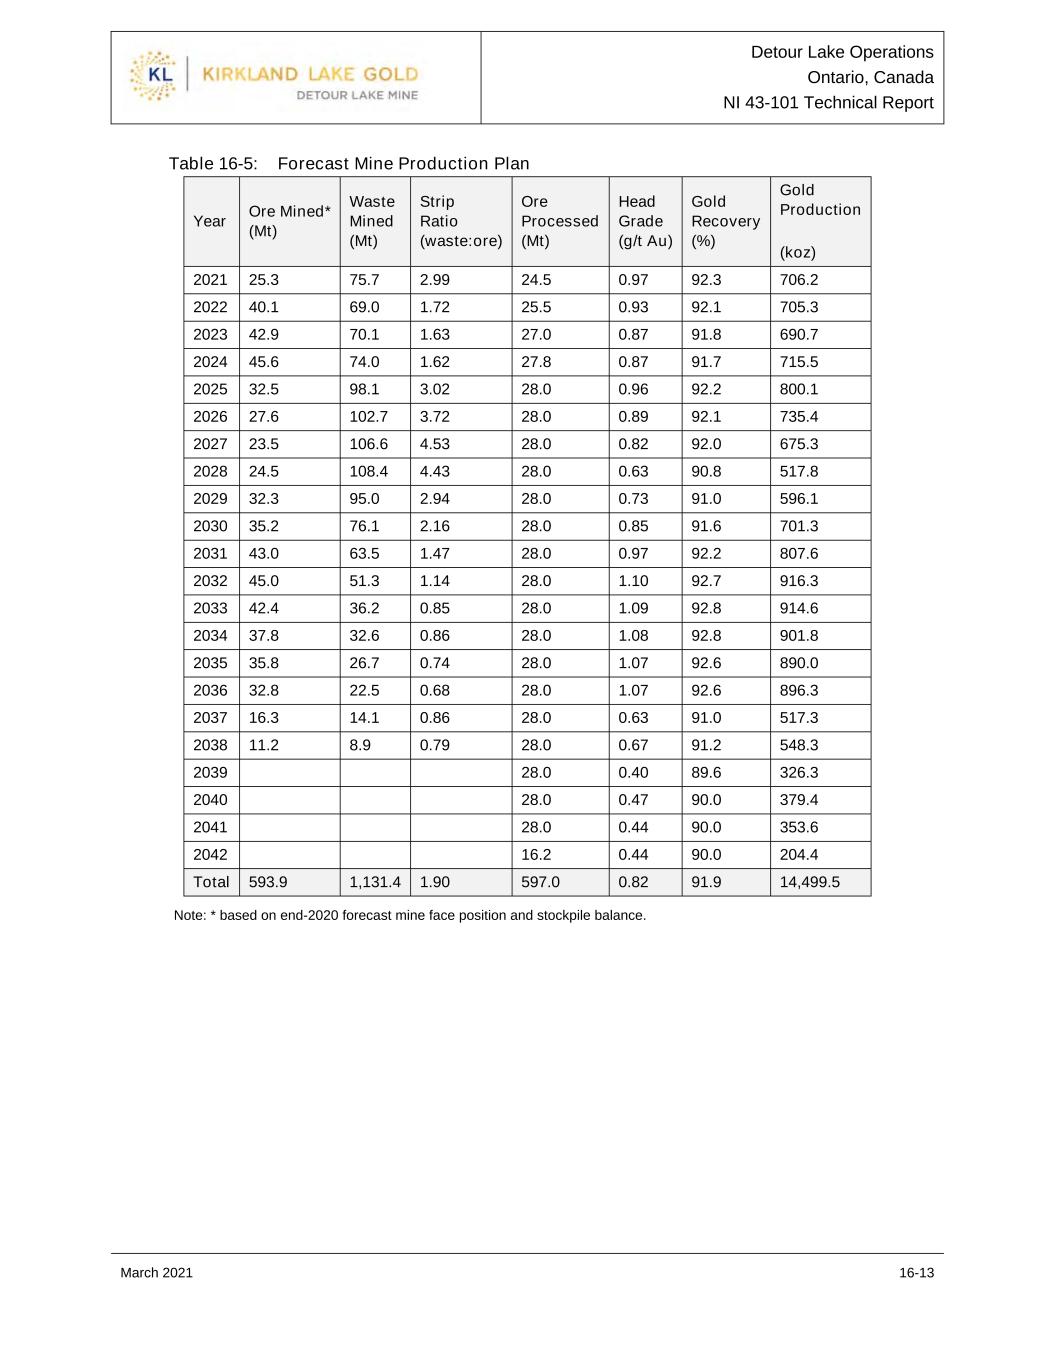
Detour Lake Operations Ontario, Canada NI 43-101 Technical Report March 2021 16-13 Table 16-5: Forecast Mine Production Plan Year Ore Mined* (Mt) Waste Mined (Mt) Strip Ratio (waste:ore) Ore Processed (Mt) Head Grade (g/t Au) Gold Recovery (%) Gold Production (koz) 2021 25.3 75.7 2.99 24.5 0.97 92.3 706.2 2022 40.1 69.0 1.72 25.5 0.93 92.1 705.3 2023 42.9 70.1 1.63 27.0 0.87 91.8 690.7 2024 45.6 74.0 1.62 27.8 0.87 91.7 715.5 2025 32.5 98.1 3.02 28.0 0.96 92.2 800.1 2026 27.6 102.7 3.72 28.0 0.89 92.1 735.4 2027 23.5 106.6 4.53 28.0 0.82 92.0 675.3 2028 24.5 108.4 4.43 28.0 0.63 90.8 517.8 2029 32.3 95.0 2.94 28.0 0.73 91.0 596.1 2030 35.2 76.1 2.16 28.0 0.85 91.6 701.3 2031 43.0 63.5 1.47 28.0 0.97 92.2 807.6 2032 45.0 51.3 1.14 28.0 1.10 92.7 916.3 2033 42.4 36.2 0.85 28.0 1.09 92.8 914.6 2034 37.8 32.6 0.86 28.0 1.08 92.8 901.8 2035 35.8 26.7 0.74 28.0 1.07 92.6 890.0 2036 32.8 22.5 0.68 28.0 1.07 92.6 896.3 2037 16.3 14.1 0.86 28.0 0.63 91.0 517.3 2038 11.2 8.9 0.79 28.0 0.67 91.2 548.3 2039 28.0 0.40 89.6 326.3 2040 28.0 0.47 90.0 379.4 2041 28.0 0.44 90.0 353.6 2042 16.2 0.44 90.0 204.4 Total 593.9 1,131.4 1.90 597.0 0.82 91.9 14,499.5 Note: * based on end-2020 forecast mine face position and stockpile balance.

Detour Lake Operations Ontario, Canada NI 43-101 Technical Report March 2021 16-14 Figure 16-9: Tonnes Mined per Pit Note: Figure prepared by Kirkland Lake Gold, 2020. Figure 16-10: LOM Gold Production Profile Note: Figure prepared by Kirkland Lake Gold, 2020. The primary loading fleet is supplemented by CAT 6030 excavators and CAT 992 and CAT 993 front-end wheel loaders that are used for pit clean-up, ROM stockpile rehandle, TMA material rehandle and overburden stripping. Overburden mining is primarily be allocated to CAT 6060s fleet for the Detour Lake Main Pit. The West Detour Pit and North Pit will primarily use the CAT 6030 fleet. The 6060s fleet will be the main loading unit when mining the West Detour pit. The CAT 6030s will be used for mining in the North Pit due to the better selectivity offered by the smaller bucket size and ability to mine in smaller benches. The number of haul trucks required was calculated based on the rated payload of the trucks and the productivities computed from the cycle times. The appropriate mechanical
Detour Lake Operations Ontario, Canada NI 43-101 Technical Report March 2021 16-15 availability, utilization and operating delays were applied to determine the number of trucks required for production. Average annual haul profiles were created based on the mine production plan. Both CAT 795 and CAT 777 units are used. The quantity of support equipment required was based on operational factors, such as the quantity of loading units to service and number of waste dumps, stockpiles and roads to maintain. The overall equipment requirements over the LOM are summarized in Table 16-6. 16.11 Maintenance and Repair Contract Kirkland Lake Gold currently has a maintenance and repair contract (MARC) agreement with CAT dealer Toromont for the CAT 795 truck fleet. The MARC consists of a variable sliding-scale hourly cost and a fixed overhead fee. 16.12 Comments on Mining Methods The QP notes the following. • The mining operations use conventional open pit mining methods and equipment; • Mining is conducted by the Owner at Detour Lake. Mining of West Detour and North Pit is also planned to be Owner operated; • Five pit phases are planned over an 18-year mine life in the Detour Lake pit; • Three pit phases are planned over a 16-year mine life in the West Detour pit; • One pit phase is planned over a six-year mine life in the North Pit; • There is a planned three-year initial operation phase for the West Detour and North pits to allow for the construction of all required infrastructure, and also limited pre- stripping.

Detour Lake Operations Ontario, Canada NI 43-101 Technical Report March 2021 16-16 Table 16-6: LOM Mining Equipment Fleet (maximum per period) Item Purpose 2021 2022 2023 2024 2025 2026 2027 2028 2029 2030 2031 2032 2033 2034 2035 2036 2037 2038 2039 2040 2041 2042 Atlas Copco D65 Drills 4 4 3 4 4 3 3 3 3 3 3 3 2 2 2 2 1 1 0 0 0 0 Atlas Copco D-PV271 4 5 5 5 5 5 5 5 5 5 5 4 3 3 3 3 1 1 0 0 0 0 Atlas Copco E-PV271 4 4 5 5 6 6 6 6 6 5 5 5 4 4 4 3 2 1 0 0 0 0 Atlas Copco DM45 2 2 2 2 2 2 1 1 2 1 1 1 1 2 2 2 1 1 0 0 0 0 CAT 6030 Primary Loading Unit 2 2 2 2 2 2 2 2 0 0 0 0 0 0 0 0 0 0 0 0 0 0 CAT 6060FSD 3 3 3 2 2 2 2 2 2 1 1 1 1 1 1 1 1 1 1 1 1 1 CAT 6060FSE 2 2 2 1 2 2 2 2 2 2 2 2 2 1 2 2 1 2 1 1 1 1 CAT 7495 2 2 2 3 3 3 3 3 3 3 3 3 2 2 1 1 1 0 0 0 0 0 CAT 777 Trucks 7 3 10 10 10 10 10 10 3 3 3 3 3 3 3 3 3 3 3 0 0 0 CAT 795 36 39 45 49 54 54 54 52 50 49 49 44 42 46 38 33 18 15 6 7 7 7 CAT 349 Excavators 1 1 1 1 1 1 1 1 1 1 1 1 1 1 1 1 1 1 1 1 1 1 CAT 390 4 4 4 4 4 4 4 4 3 3 3 3 3 2 2 1 1 1 1 1 0 0 CAT 16M Graders 2 2 2 2 3 3 3 3 2 2 2 2 2 2 1 1 1 1 0 0 0 0 CAT 24M 2 2 2 2 2 2 2 2 2 2 2 2 2 2 1 1 1 1 1 1 1 1 CAT D10 Dozer 6 10 11 11 13 13 13 13 12 11 11 11 10 9 8 7 6 5 1 1 1 1 CAT D11 4 3 3 3 3 3 3 3 3 3 3 3 2 1 1 1 0 0 0 0 0 0 CAT 844K 2 2 2 2 2 2 2 2 2 2 2 2 2 2 1 1 1 1 1 1 1 1 CAT 980K Loaders 2 2 2 2 2 2 2 2 2 2 2 2 2 2 2 2 1 1 1 1 1 1 CAT 930 2 2 2 2 2 2 2 2 2 2 2 2 2 2 1 1 1 1 0 0 0 0 CAT 992 1 1 1 1 1 1 1 1 1 1 1 1 1 1 1 1 1 1 1 1 0 0 CAT 993 1 1 1 1 1 1 1 1 1 1 1 1 1 1 1 1 1 1 1 1 1 1 740 Truck Support 1 1 1 1 1 1 1 1 1 1 1 1 1 1 1 1 1 1 1 1 1 1

Detour Lake Operations Ontario, Canada NI 43-101 Technical Report March 2021 17-1 17.0 Recovery Methods 17.1 Overview The process plant is based on a robust metallurgical flowsheet designed for optimum recovery with minimum operating costs. The flowsheet is based upon unit operations that are well proven in industry. The processing plant was designed to process ore at an average throughput of 55,000 t/d or 20 Mt/a, equivalent to milling rates of 2,500 tpoh with operating time of 92% in a 24 hour day. While operating time has lagged at around 89%, the milling has far exceeded the design rate averaging 2,952 t/hr in 2020 for 23.06 Mt milled. On at least 70 occasions in 2020, a 74 kt milled per day rate was achieved. Table 17-1 shows the production rates from 2017–2020. With the upturn of current performance of the processing plant, ongoing optimization efforts and some new capital initiatives, the LOM plan assumes that the plant throughput will increase from 23 Mt/a in 2020 to 28.0 Mt/a in 2025 and thereafter. The annual plant throughput of 28.0 Mt/a is planned to be achieved by increasing the milling rate to 3,436 t/hr and improving operating time to 93%. Various initiatives have been developed to bring the plant to the 28 Mt/a throughput rate. Those initiatives are: • Improved fragmentation; • Improved primary crusher choke feeding; • Secondary crusher screens; • Curved pulp lifters; • SAG mill speed increase; • Permit to go over 75,000 t/d; • Re-feed system after the secondary crushers; • Pebble crusher variable speed drives; • Ore blending; • Increase plant operating time to 93%.
Detour Lake Operations Ontario, Canada NI 43-101 Technical Report March 2021 17-2 Table 17-1: Production Rates, 2016–2020 Item Unit 2016 2017 2018 2019 2020 Operating time % 86 86 84 87 89 Hourly production tpoh 2740 2844 2796 2880 2952 Daily production t/d 56792 58514 56594 60370 62857 Annual production Mt 20.7 21.4 20.7 22.0 23.0 17.2 Flowsheet A simplified process flowsheet is presented in Figure 17-1. 17.3 Plant Design The processing plant was designed to process ore at an average throughput of 55,000 t/d or 20 Mt/a, equivalent to milling rates of 2,500 t/hr with operating time of 92% in a 24 hour day. Key equipment is summarized in Table 17-2. 17.3.1 Crushing and Grinding Crushing Circuit The primary crushing system is a single stage, open circuit, primary gyratory crusher (60 x 113 inches). The crusher selection was based on a feed top size of 1,200 mm and a product P80 of 165 mm. The primary crusher has a capacity of 5,000 t/hr at a 138 mm close side setting. Assuming an 80% availability, the primary crusher has a capacity of 96,000 t/d. The live capacity of the feed and discharge hoppers of the gyratory crusher was designed for two truck loads each, assuming a nominal payload of 300 t. The crushed ore storage pile was designed with a live capacity corresponding to approximately 12 hours of crushing or 30,000 t, and an overall capacity (live plus dead) of 100,000 t. Ore is reclaimed from the stockpile through two reclaim tunnels, one for each grinding line. Four apron feeders, two in each reclaim tunnel, discharge the crushed ore onto a belt conveyor that feeds a secondary cone crusher operated in open circuit. The secondary crusher is fed with the gyratory product with a P80 of 165 mm, and gives a product with a P80 of 50 mm. The secondary crusher product is conveyed directly to the SAG mill. The secondary crusher is equipped with a bypass chute to maintain high process plant availability. During maintenance of the secondary crusher, the bypass is put into place to feed the SAG mill directly from the stockpile.
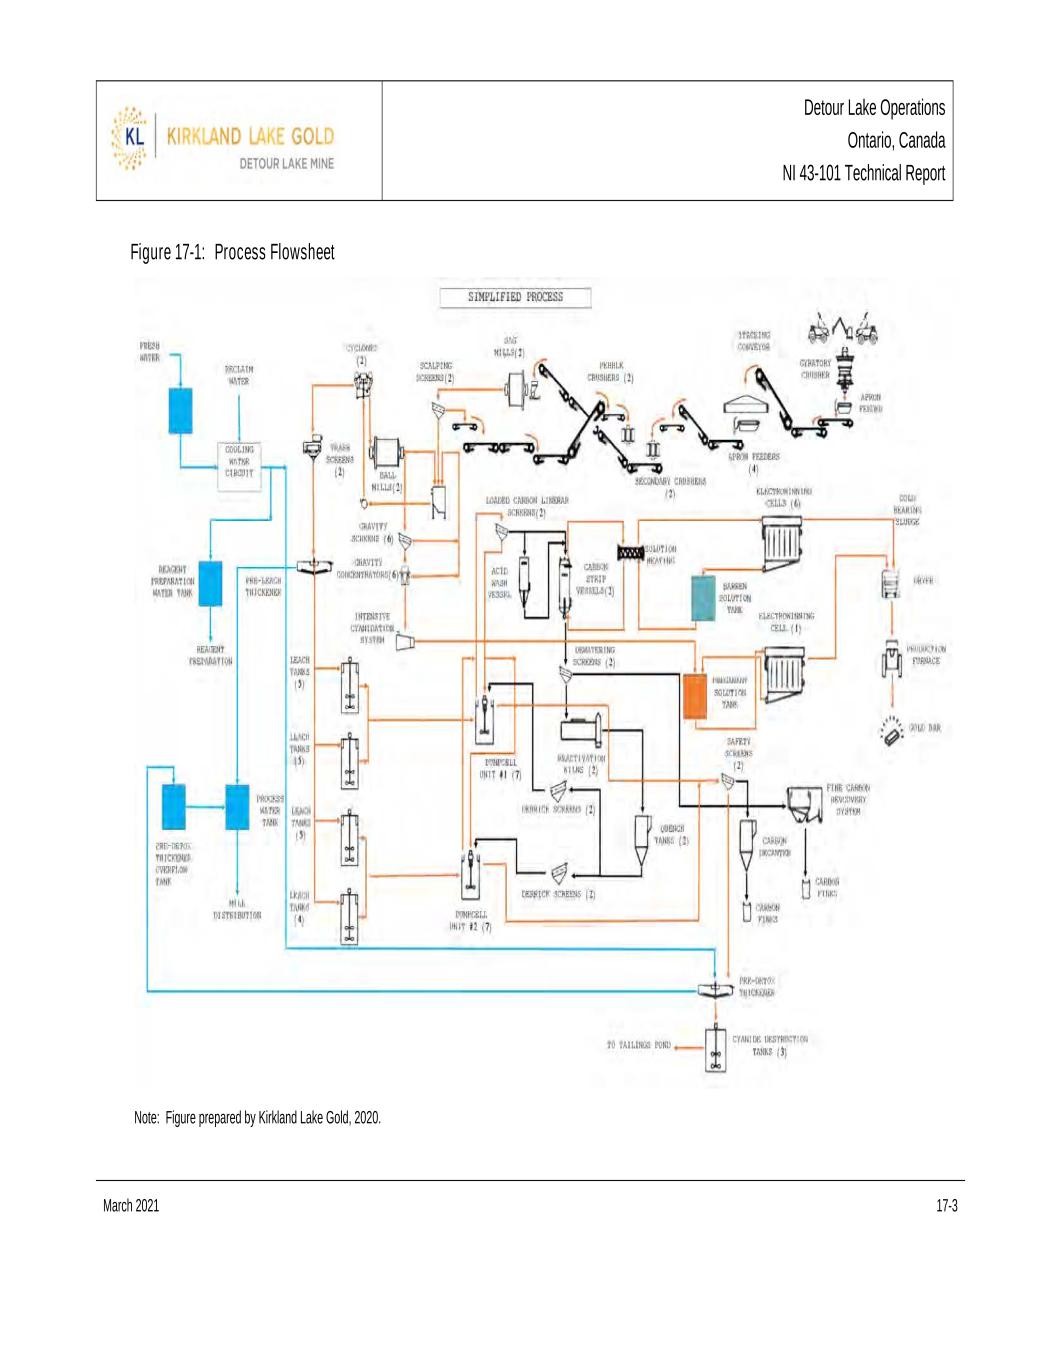
Detour Lake Operations Ontario, Canada NI 43-101 Technical Report March 2021 17-3 Figure 17-1: Process Flowsheet Note: Figure prepared by Kirkland Lake Gold, 2020.

Detour Lake Operations Ontario, Canada NI 43-101 Technical Report March 2021 17-4 Table 17-2: Key Design Parameters Area Item Units Note Crushing and grinding Primary crusher Number 1 Crusher type Gyratory Crusher size Inches 60 × 113 Motor installed kW 1,000 Crusher capacity (instantaneous) tpoh 5,485 @ OSS = 178; 6,160 @ OSS = 203 Design throughput rate tpoh 3,900 Stockpile Live capacity H 12 Live capacity (design) t 30,000 Live capacity (live + dead) t 100,000 Secondary crushers Number 2 Pre-crusher model XL1100 Motor installed kW 745 Design throughput rate tpoh 1,550 Pre-crusher final product size mm 50 SAG mills Number 2 Mill size Metres 10.70 x 5.33 EGL Type of drive train Twin Pinions Design recirculating load % 35 Transfer size – passing (P80) µm 1,606 Estimated power consumption (@ pinion) kWh/t 9.4 Selected motor (per mill) kW 2 x 7500 Pebble crushers Number 2 Pebble crusher model XL1100 Motor installed kW 746 Design throughput rate tpoh 450 Pre-crusher final product size mm 13 Ball mills Number 2 Mill size metres 7.73 x 12.19 EGL Type of drive train Twin Pinions Recirculating load % 250 Product size – passing (P80) µm 95 Estimated power consumption (@ pinion) kWh/t 10.0 Selected motor (per mill) kW 2 × 7500

Detour Lake Operations Ontario, Canada NI 43-101 Technical Report March 2021 17-5 Area Item Units Note Hydrocyclone Clusters Number 2 Number of hydrocyclones per cluster 10 operating + 2 spares Hydrocyclone diameter metres 0.84 (33 inches) Hydrocyclone underflow density % 70 Operating pressure kPa 83 Gravity Number of gravity concentrators Number 6 Concentrator model Falcon SB Concentrator Model SB5200-BSE Concentrator maximum capacity (each) tpoh 400 Intensive cyanidation reactor model Gekko - ILR4000BA Leaching and carbon-in- pulp circuit Leaching Circuit Average leach time h 29 Leach density % solid 50 Number of leach tanks 20 Average volume per tank m3 4,988 CIP circuit Type Carrousel Number of carousel lines 2 Number of tanks per lines 7 Volume per tank m3 330 Design gold feed solution grade mg/L 1.2 Design carbon adsorption g/t 3,550 Carbon content per CIP tank t 20 Stripping, electrowinning, and refining Acid wash vessels Number 1 Acid wash vessel capacity t 10 Acid type used Hydrochloric acid Elution circuit type Zadra high pressure Carbon stripping vessels Number 2 Carbon stripping vessel capacity (each) t 10 Barren solution tank capacity m3 120 ILR pregnant solution tank capacity m3 13 Carbon reactivation kilns Number 2 Reactivation kiln capacity t/d 10

Detour Lake Operations Ontario, Canada NI 43-101 Technical Report March 2021 17-6 Area Item Units Note Kiln type/heat source Gas fired/propane Quench tanks Number 2 Quench tank capacity (each) t 12 Carbon attrition tanks Number 1 Carbon attrition tank capacity t 1 Electrowinning cells Number 6 + 1 Electrowinning cell volume (each) m3 3.54 Induction furnaces Number 1 Thickening Pre-leach thickener solids feed rate (design) tpoh 2,569 Pre-leach thickener slurry feed rate (design) m3/h 7,218 Pre-leach thickener sizing criteria tpoh/m2 1.18 Pre-leach thickener selected diameter metre 55 Pre-detox thickener solids feed rate (design) tpoh 2,569 Pre-detox thickener slurry feed rate (design) m3/h 5,283 Pre-detox thickener sizing criteria tpoh/m2 1.16 Pre-detox thickener selected diameter metre 55 Tailings Type of cyanide destruction (CND) system SO2/air CND tanks Number 3 CND tank size (each) m 14.4 m diameter by 17.0 m high CND tank volume (each) m3 2,775 Crusher Improvement Initiatives The primary crusher is a key area where initiatives are planned to generate a finer product that will translate into a higher plant throughput. The impact of fragmentation on throughput has been well documented and has a very high impact on throughput. The relationship shown in Figure 17-2 was derived from operating data.

Detour Lake Operations Ontario, Canada NI 43-101 Technical Report March 2021 17-7 Figure 17-2: Primary Crusher Product Size versus Plant Throughput Note: Figure prepared by Kirkland Lake Gold, 2020. It has been established that each 50 mm reduction in the P80 equals about a 300 t/hr increase in plant throughput. In 2019, the Detour Lake Mine started a drill-and-blast optimization project that has resulted in higher throughput rates and better operational conditions. The initiative is ongoing as the mine aims to further optimize the process. The choke feeding of the primary crusher is another key element to increase the plant throughput milling rates. It has been well established that the longer a crusher stays full, the finer the product will be (choke feeding). A unit of measure was created to measure choke feeding which is the Tons/#Empty events. For example, if 50,000 t was crushed and the crusher went empty 100 times, the Ton/#Empty event would be 500. Figure 17-3 and Table 17-3 highlight that if the average could be increased from 600 t/empty event to 800 t/empty event, the throughput rates would increase by 45 t/hr. The primary crusher choke feeding can be improved. The avenues to do this are to improve dispatching of trucks, better fragmentation to avoid bridging of the crusher, an excavator dedicated to the primary crusher re-feed, and improved rock breaker availability and performance. One of the most important improvements associated with increases in the milling rate will be the addition of screens over the secondary crushers. The first consideration for efficient secondary crushing is to have the correct feed preparation. A secondary cone crusher achieves its best work when fines smaller than the desired crusher product are removed from the feed. This was not done during the initial design, and as a result, the secondary crushers receive direct feed from the primary crusher with all the fines still in the feed.
Detour Lake Operations Ontario, Canada NI 43-101 Technical Report March 2021 17-8 Figure 17-3: Throughput versus Choke Feed Events Table 17-3: Choke Feed Events, 2019–2021 (year to date) Year Tonnes Crushed/Empty Events 2019 318 2020 599 2021 (year to date) 589 By removing these fines prior to crushing, a more efficient head movement can be achieved as the coarse particles are easily broken into smaller particles due to the voids created in the crushing chamber. Fines will therefore take power and will cut the capacity of the crusher. Screens can be retrofitted over the secondary crushers and are part of the capital plan to increase the plant throughput in 2021. The benefit to the throughput was confirmed by BBA with modeling of the 2018 grinding circuit surveys using JKSimMet software. Grinding Circuit The SAG mill operates in closed circuit with a pebble crusher while the ball mill operates in closed circuit with hydrocyclones. The design circulating load from the cyclones to the ball mill is 250% of the SAG mill new feed. The pebble crushing circuit with a design discharge P80 of 13 mm processes the equivalent of up to 25% of the fresh feed. Around 15% of the cyclone feed material is sent to the gravity recovery circuit. Six gravity concentrators with 48 inch bowls were selected (three per grinding line supporting a strategy
Detour Lake Operations Ontario, Canada NI 43-101 Technical Report March 2021 17-9 of two units in operation at all time). A batch-intensive cyanidation system is used to process the gravity concentrate. The extraction performance of gold from the gravity concentrate by the intensive cyanidation system is 99%. The pregnant solution is pumped to a tank in the gold room followed by electrowinning in a dedicated cell. Curved Pulp Lifters As part of the initiatives to increase the milling rates, the SAG mill pulp lifters will be converted to curved from their current radial configuration. Evidence of severe backflow has been seen on the pulp lifters indicating the pulp lifters are not empty when they go back inside the charge. The other benefit the pulp lifters will enable is to run the mill faster. With the current radial pulp lifters, if the mill is sped up, the discharge rate drops as there is insufficient time for the pulp lifters to be emptied. If the speed is dropped, the mill throughput drops significantly as the Detour Lake Main ore is very hard and needs high speeds and impacts to break. The opposite is believed to be true as if the mill is sped up more than currently, it will increase the efficiency and thus the throughput. Air Permit Limits on Throughput The mill was constrained by an air permit limiting the throughput to 75,000 t/d. In 2020, there were 70 events where the air permit resulted in lower throughput. On January 13 2020, this air limit was lifted to an annual tonnage of 32 Mt. The removal of this limit will definitely have a positive impact on the daily throughput Re-Feed System After the Secondary Crushers Every time a crusher goes down, whether the crusher is primary, secondary, pebble, the plant throughput is impacted. The goal with the re-feed system is to generate 750 kt of -2.5” feed annually, which is the equivalent size of the secondary crusher discharge. This material would be re-fed onto the SAG mill feed conveyor during of crusher downtime events. Pebble Crusher Variable Speed Drives By its nature, the rate of pebbles a SAG mill generates is not uniform. The rate is influenced by the ore feed size, mill speed and load inside the mill. The result is that the power of the pebble crusher cannot be maximized due to the variation in feed to the pebble crushers. The crusher is gapped so it can receive any surge in pebbles. The average power is therefore maintained around 450 kW while the motor is rated for 750 kW. The pebble crusher is rarely choke fed. By installing a variable speed drive (VFD) on the pebble crusher motors, the speed can be increased and decreased to maintain a set-point of 550 kW for power draw. This will enable
Detour Lake Operations Ontario, Canada NI 43-101 Technical Report March 2021 17-10 the crusher to be choke fed and reduce the particle size coming out of the crusher. With a reduced particle size, the SAG mill throughput will increase. For each kW of pebble crusher power, the SAG milling rate will increase by about 0.4 t/hr. Ore Blending Ore blending is an avenue that the processing plant will use to optimize milling rates. With the open pit supplying more ore than what the mill can process for the next five years, talc ore can be stockpiled and processed opportunistically. That means that when the ore from the pit is soft, talc ore can be stockpiled and reclaimed when the ore will be harder. The same strategy can be applied to ore that is blasted aiming for a high fragmentation rate. Increase Plant Operating Time to 93% The operating time for the processing plant is calculated when the ore is on the belt feeding the SAG mills. Operating time is typically 1–2% lower than the mechanical/electrical availability. Although plant operating time has improved since start-up, the design rate of 92% has not yet been achieved over an annual basis, instead averaging around 88–89%. The root causes resulting in lower operating time were identified and corrective measures are in the process of being engineered such that implementation will increase the availability to 93% which is the industry standard for this type of milling circuit. 17.3.2 Leach and Carbon-in-PuIp The gold recovery circuit selected was a “leach circuit followed by a CIP” circuit. The designed retention time for leaching is 29 hours. The leach feed size was designed at a P80 of 95 µm. Four new leach tanks are planned to be built to support the increase in throughput to 28 Mt/a. The CIP design selected uses a carrousel type system with an average design retention time of 80 minutes in this circuit. Upgrades to the pumpcells will support the 28 Mt/a throughput rate. The VSD and motors for the CIP tails pumps will be upgraded to 500 hp from 350 hp. The current adsorbtion profile and modeling support the planned increase in throughput rate. 17.3.3 Acid Wash, Stripping, Electrowinning, and Refining The stripping system uses a modified version (i.e. ,on-line electrowinning and no pregnant solution tank) of the high-pressure Zadra process to recover the gold from the loaded carbon. The circuit incorporates an acid wash stage and is designed to handle up to 10 t of carbon per day. The acid wash stage is not currently used and will be converted into a plastic
Detour Lake Operations Ontario, Canada NI 43-101 Technical Report March 2021 17-11 removal vessel. The build up of calcium is not sufficient to warrant the use of the acid wash vessel. The stripping circuit is designed to handle up to 10 t of carbon per stripping cycle (approximately 8–10 hours); 100% of the carbon is regenerated in two regeneration kilns designed to handle up to 20 t of carbon per day. The electrowinning is done “in-line” with the stripping circuit. The flow of pregnant solution is split between three rows of two electrowinning cells. One dedicated electrowinning cell handles the pregnant solution from the ILR tank. The refining equipment is designed to handle the gold from the stripping circuit and from the gravity recovery system. The electrowinning sludge is filtered, dried and mixed with fluxes, before being smelted using induction furnaces. The current elution capacity is estimated to be 2.5 strips of 10 t per day. In 2020, 1.75 strips per day were completed. There is sufficient capacity to cover the increased throughput for the LOM. 17.3.4 Thickening The feed to the leach circuit is maintained at a density of 50–55% solids by weight using one high rate thickener. The overflow of the pre-leach thickener is recycled to the process water tank. The pre-detox thickener is used to thicken the leach tails slurry to 55–60% solids and the overflow is recycled to the process water circuit. The thickener capacity is over 90 kt/d and can support the increase throughput without any modifications. Current flocculent consumption is low at 10 g/t. 17.3.5 Tailings The underflow of the pre-detox thickener is diluted using reclaim water prior to cyanide destruction. The tailings slurry coming out of the cyanide destruction unit and is pumped into the tailings storage area via two parallel pipelines, each with a maximum flow of 2,500 m3/hr each; sufficient to support the increase in throughput to 28 Mt/dr. Some minor upgrades to motors and VFD may be needed when going to cell #3 of the TMA. The selected cyanide destruction process is the Inco SO2/air process. Liquid SO2 is used with sodium metasulphite as a back up. A fourth detox tank is planned to be installed to support the increase in plant throughput. 17.4 Energy, Water, and Process Materials Requirements 17.4.1 Power Energy consumption is not expected to significantly increase as a result of the increased throughput rate. A lot of the initiatives to increase plant throughput are related to increases
Detour Lake Operations Ontario, Canada NI 43-101 Technical Report March 2021 17-12 in grinding efficiency with the same power. The increase in energy consumption is mostly related to the increase in run time. The historical plant power consumption for the plant from 2018–2020 as: • 2018: 680,198 MWh for 20.7 Mt, 0.033 MWh/t; • 2019: 713,723 MWh for 22.0 Mt, 0.032 MWh/t; • 2020: 710,252 MWh for 23.0 Mt, 0.031 MWh/t. The LOM assumes that the 28.0 Mt/a throughput rate will use 731,000 MWh per year, which the plant electrical system is adequately designed to supply. 17.4.2 Water A decant tower system is used to reclaim and pump water from the TMA back to the process plant to satisfy process water requirements. For Cell#2 a barge reclaim water system will be used. Reclaim water is piped to the process plant. Depending on the water balance in the TMA, water from the open pit and various collection ditches around the WRSFs can also be directed to the plant. Make-up water for the reagent mixing is sourced from East Lake when required. 17.4.3 Consumables Consumables used in the plant include: • Steel balls for grinding media; • Quicklime (CaO) for pH control; • Sodium cyanide (NaCN) for gold dissolution and desorption; • SO2 and SMBS for cyanide destruction; • Anti-scalant for process water and strip solution; • Caustic for pH adjustment for the strip solution, cyanide mixing and ILR solution; • Copper sulphate to start cyanide destruction reaction; • Carbon for gold collection; • Ore anti-freeze conditioner; added in winter.
Detour Lake Operations Ontario, Canada NI 43-101 Technical Report March 2021 18-1 18.0 Infrastructure 18.1 Overview Surface infrastructure to support operations is in primarily in place, and includes: • Three open pits: Detour Lake Main (in operation), West Detour and North Pit (to be constructed); • Processing facilities: grinding and leaching facilities, along with management and engineering offices, change house, workshop, warehouse, and assay laboratory facilities; • Mine facilities: management and engineering offices, change house, heavy mining vehicle and light vehicle workshops, wash bay, warehouse, explosives magazine, crusher, mine access gate house, return water pump house; • Administration buildings: facilities for overall site management, safety inductions, and general and administrative functions; • Accommodation camp; • Four stockpiles: ROM pad, MRS4, MRS5 and the temporary MRS2; • Four WRSFs: MRS1, MRS2, MRS3 and Inpit ; • Three tailings storage facilities: cell 1, 2 and 3; • Water management facilities: stormwater and water storage dams, diversions, culverts; • Landfill facility. A layout plan showing the facilities constructed to support mining operations is provided in Figure 18-1. Projects were ongoing through 2020 which included construction of additional camp capacity, construction of an airfield and aerodrome, construction of an onsite assay laboratory, construction of additional mobile maintenance offices and shops, and construction of additional exploration facilities. 18.2 Road and Logistics A discussion of the access routes was provided in Section 5.1. Site access is provided through a guard/security house located at the entrance to the site on the main access road. Visitor car and truck parking bays are provided adjacent to the guard house. The guard house is equipped with radio and telephone communication and is manned continuously.

Detour Lake Operations Ontario, Canada NI 43-101 Technical Report March 2021 18-2 Figure 18-1: Infrastructure Layout Plan Note: Figure prepared by Kirkland Lake Gold, 2021.

Detour Lake Operations Ontario, Canada NI 43-101 Technical Report March 2021 18-3 18.3 Stockpiles Stockpiles are discussed in Section 16.6. 18.4 Tailings Management Area TMA Cell 1 and Cell 2 are located approximately 2 km east–northeast of the Detour Lake Main open pit. TMA Cell 1 contains approximately 153 Mt of tailings. The facilities are discussed in Section 20.3. 18.5 Mine Site Built Infrastructure 18.5.1 Mine Service Facilities The mine service facilities are sufficient to support maintenance of the current mining operations fleet. It is located approximately 1.2 km south of the processing plant. The largest floor space allocation is for the workshop and work-bays. The LOM plan includes capital for expanding the work-bays to accommodate a larger number of trucks. An appropriately-sized truck wash facility was constructed adjacent to the mine service facilities building to allow for washing and cleaning of heavy equipment prior to maintenance taking place. In proximity to the mine service facilities and truck wash buildings are a diesel and gasoline fuel storage and re-fueling station. 18.5.2 Process Plant The processing plant comprises three main buildings (the primary crushing building, the secondary and pebble crushing building and the main process plant building). Additional process facilities are located adjacent to these buildings. The primary crushing building is located approximately 450 m to the northeast of the eastern Detour Lake Main Pit limit. Adjacent to the primary crusher, a ROM stockpile was established to help manage the crusher downtime. The crusher building houses the gyratory crusher and the tail end of the stockpile feed conveyor. The crushed ore stockpile has a capacity of approximately 100,000 t. Under the stockpile, two reclaim tunnels were installed for the conveyors to recover the crushed material. Each conveyor reclaims crushed ore from the stockpile to a secondary crusher located in the secondary and pebble crusher building. In this building, a conveyor collects both secondary and pebble secondary crusher undersize to convey the ore to the SAG mill. Both secondary crushers and pebble crushers are equipped with shuttle chutes and bypass chutes to enable maintenance of crushers without stopping a grinding line. The main processing plant building houses the grinding, CIP, gravity and intensive cyanidation, reagents, stripping, electrowinning, refining areas, compressors as well as
Detour Lake Operations Ontario, Canada NI 43-101 Technical Report March 2021 18-4 tailings pumps. The leach tanks are located north of the main process building between the thickeners. The tanks are arranged in two sets of 10 tanks (four rows of five tanks) on a large containment concrete pad. The process staff offices are located within the main processing plant. This office complex also houses a conference room, lunch room, change rooms, washrooms, documentation room and a metallurgical laboratory. The plant maintenance shops are located on the first and second floors of the main processing plant building on the south side of the grinding area. 18.5.3 Administration Site administration facilities are incorporated within the mine service facilities, and include offices, warehouse, change rooms, and showers. In addition, the building also includes the emergency services area (an examination room, a treatment room and a covered garage houses the ambulance). 18.5.4 Explosives Plant Dyno Nobel operates a bulk explosives plant approximately 3.5 km west of the processing plant facilities. The designed manufacturing capacity is sufficient to meet the mine’s requirements. 18.6 Off-Site Built Infrastructure Facilities in Cochrane include administration offices, a bus terminal with employee parking lot and security check-ins, four houses and an eight-unit apartment block. Kirkland Lake Gold has a shared services centre in Timmins that services the Detour Lake Mine. SGS Minerals operates a full-service analytical laboratory in Cochrane in support of the Detour Lake Mine. 18.7 Camp and Accommodations Workers are accommodated in two camps. The Little Hopper Lodge (previously referred to as the Permanent Camp) is located 7 km west of the mining operations in close proximity to Little Hopper Lake. . The Sagimeo Lodge is located just south of the mine services building. Accommodations are in the process of being expanded, and will have a total capacity of 1,447 persons. 18.8 Communications A fibre optic link provides internet access and VOIP phone connectivity to the Detour Lake Mine and connects all facilities to the offices in Cochrane and Toronto. Voice and data are communicated by radio and wireless backbone where the use of fibre is not practical.

Detour Lake Operations Ontario, Canada NI 43-101 Technical Report March 2021 18-5 Satellite phones and copper-lines are used as emergency backup communication methods in the event of fibre optic service disruptions. 18.9 Water Management The existing water management system was designed to minimize the amount of fresh water (non-contact water) required to operate the mine and process plant and to minimize discharge of treated contact water to the environment. Currently water management infrastructure is also designed to segregate and recycle water that has been in contact with process reagents (process water), this water is fully contained within the TMA in a closed loop and never discharged to the receiving environment. Contact water from the open pit is captured in a collection of sumps and pumped through a network of piping to one of two sediment collection ponds on the surface. Water from old underground workings are also dewatered using a borehole and pumped into one of the pit sumps before being transferred to the surface collection ponds. Water in the sediment collection ponds is then either used to supplement water for the mill or transferred to the Mine Water Pond. Stockpile runoff is managed using a series of collection ditches and ponds. Stockpiles are encompassed by ditches that gravity feed to ponds located at topographic lows. Runoff collected in these ponds is then pumped through a network of piping to one of the sediment ponds where it is either used to supplement water for the mill or transferred to the Mine Water Pond. As indicated in Section 1.17.4 the mine water pond serves as a central water management facility (e.g., for open pit water and local runoff), and provides additional contingencies for storage and treatment, if needed. Additional details on water management and discharge considerations can be found in Section 20.4. 18.10 Water Supply Potable water for the Little Hopper Lodge is obtained from Little Hopper Lake, adjacent to the lodge, and processed through a water purification plant. This is adequate for the Detour Lake’s current and future needs. Potable water for the Sagimeo Lodge, mine services facilities, site administration facility, and the processing plant is obtained from borehole wells close to the camp, and processed through a water purification plant. Fresh water is pumped from East Lake. This water is primarily used in the processing plant for reagent mixing but is also used as wash water in the truck wash facility and water make- up for the fire water tank.
Detour Lake Operations Ontario, Canada NI 43-101 Technical Report March 2021 18-6 18.11 Power Supply The existing 180 km long powerline runs from the processing facility to a tie in at Island Falls, and thence to the Pinard substation. The 230 kV transmission line allows for the distribution of more than 85 MW of power, suitable to service the entire Detour Lake mining operation. In the event of a power failure, there is sufficient emergency power generation for the provision of basic services.

Detour Lake Operations Ontario, Canada NI 43-101 Technical Report March 2021 19-1 19.0 Market Studies and Contracts 19.1 Market Studies No market studies are currently relevant as Detour Lake is an operating mine producing a readily-saleable commodity in the form of doré. Doré is sent via secure transportation to a refinery for further refining. Kirkland Lake Gold sells its gold production into the market at spot prices or on a forward sales basis. The proceeds from these sales are credited to Kirkland Lake Gold’s account upon delivery of the gold to the counterparty. The estimated bullion transport costs, liability charges and refining costs used for the financial analysis are based on contract prices agreed with third-parties. 19.2 Commodity Prices Commodity prices used in Mineral Resource and Mineral Reserve estimates are set by Kirkland Lake Gold at the corporate level. The current gold price provided for Mineral Reserve estimation is US$1,300/oz, and US$ 1,500/oz for Mineral Resource estimation. Both Mineral Resource and Mineral Reserve estimates use an exchange rate assumption of 1.31 C$/US$. 19.3 Material Contracts Kirkland Lake Gold has a number of contracts, agreement and/or purchase orders in place for supply and services that are material to the operation (Table 19-1). All contracts or agreements are negotiated with vendors and have a contractual scope, terms and conditions. Contracts are negotiated and renewed as needed. Contract terms are considered to be within industry norms, and typical of similar contracts in Canada with which Kirkland Lake Gold is familiar. 19.4 Comments on Market Studies and Contracts The QP notes the following. • The doré produced by the mine is readily marketable. Metal prices are set corporately for Mineral Resource and Mineral Reserve estimation; • The QP has reviewed commodity pricing assumptions, marketing assumptions and the current major contract areas, and considers the information acceptable for use in estimating Mineral Reserves and in the economic analysis that supports the Mineral Reserves.
Detour Lake Operations Ontario, Canada NI 43-101 Technical Report March 2021 19-2 Table 19-1: Material Contracts Currently in Place Product Supplier Status of Contract Heavy equipment (CAT) parts and maintenance Toromont Industries Ltd. MARC contract, support agreement, stock and parts inventory management Diesel Imperial Oil Supply agreement Plant reagents The Chemours Company (cyanide) Univar Canada Ltd. (sulphur dioxide and other reagents) Supply agreement Power IESO (Independent Electrical System Operator) Power supply agreement Grinding media Molycop Inc. Supply agreement Mill liners and other wear material Bradken Limited Supply agreement Open pit explosives Orica Mining Services Supply, services and explosive manufacture agreement TMA construction Teranorth Construction and Engineering Limited North Rock Construction Northec Construction Construction services Camp and catering Aramark Remote Workplace Service agreement Heavy fabrication Carriere Industrial Supply Ltd. The Bucket Shop Fabrication and labour agreement Heavy equipment (drills) parts and maintenance Epiroc Supply and service agreement Tire Supply Bridgestone, Goodyear, Michelin Supply contract Labour supply Levert Personnel Resources Inc. Labour supply agreement Core and reverse circulation drilling Boart Longyear; FTE Drilling Service agreements Lubricants Imperial Oil Supply agreement Assay SGS Canada Inc. Service agreement Refining services Asahi Refining Service agreement

Detour Lake Operations Ontario, Canada NI 43-101 Technical Report March 2021 20-1 20.0 Environmental Studies, Permitting and Social or Community Impact 20.1 Environmental and Supporting Studies The Detour Lake Main Pit and West Detour areas were subject to extensive baseline, environmental monitoring, and technical studies, as per provincial and federal regulatory requirements. Local site area watersheds tend to be of small to modest size, generally less than 50 km2. The majority of the West Detour area is within the watersheds of Lindbergh Lake/Creek and Linden Creek. Both watersheds drain south into the Detour River. The Detour River flows into the Turgeon River and Harricanaw River, and eventually into James Bay. A number of small and generally shallow, lakes also occur in the area. Vegetation communities are typical of the region and are comprised primarily of coniferous and mixed coniferous forests, and open and treed muskeg. There is extensive evidence of previous land disturbances by forestry activities, as well as past exploration (primarily by other exploration companies). Fish and wildlife species in the area are generally typical of those inhabiting the boreal forests of northeastern Ontario. The presence of Woodland Caribou is of particular note because it is a Species at Risk (SAR), designated as Threatened under the Provincial Endangered Species Act (ESA) and Federal Species at Risk Act. Potential impacts and mitigation measures are being addressed through the process of an Endangered Species Act Permit, for which approval is anticipated in 2021. 20.2 Site Monitoring 20.2.1 Air Quality The Detour Lake Mine site is remote from off-property human receptors (permanent and seasonal residences and commercial establishments); hence there are no restrictions on air and noise emissions relative to human receptors. The mine is required to comply with air quality standards, point of impingement guidelines, and ambient air quality criteria specified in Ontario Reg. 419/05. The installed operating monitoring systems demonstrate compliance with these standards, which confirms the predictions of no significant air quality or noise impacts. Air quality and noise modeling undertaken for the West Detour project Draft Environmental Study Report (ESR) confirmed that the project will comply with the required provincial standards and criteria.

Detour Lake Operations Ontario, Canada NI 43-101 Technical Report March 2021 20-2 20.2.2 Metals Leaching and Acid Rock Drainage Due to historical mining in the region, the geological materials (ore, waste rock, tailings, and overburden) at the Detour Lake Main Pit have undergone multiple metal leaching and acid rock drainage (ML/ARD) assessments by various investigators in compliance with best- practice, industry-standard methods. It was predicted that ML/ARD potential for waste rock and tailings is low due to the relative lack of enrichment in sulphide and other metals. To date, over 80% of waste rock has been classified as non-potentially acid generating (NAG). Analytical results continue to support that ARD risk is low based on low sulphide content. To provide greater assurance in the event of ARD during operations and/or closure, PAG and NAG waste rock materials are segregated into separate stockpiles. The natural topography under MRS1, the storage facility for PAG water rock, is sloped towards the open pit, allowing mine contact water to be managed more efficiently. Similarly, PAG rock from the West Detour and North Pit pits will be segregated in a new stockpile, MRS3. NAG waste rock is generally stored in MRS2. Production tailings are governed by the same classification criteria as waste rock and are subject to frequent confirmatory sampling. Composites are collected weekly and undergo ML/ARD characterization monthly at a minimum. Based on geochemical testing to date, Detour Lake Main Pit tailings continue to have low ML/ARD potential, which is consistent with project development predictive studies and ongoing characterization work conducted since operations commenced in 2013. Mine-contact water from all mine facilities, including stockpiles and TMA cells, is captured by the water management system, a network of collection ditches, ponds, pipelines and pumping infrastructure to ensure environmental protection. Discharge of surplus mine- contact water occurs only at select, specially permitted locations, provided that water quality meets federal, provincial, and site-specific permitted criteria. Water that has been in contact with processing reagents (i.e., water stored in the TMA) is not discharged, and is instead re-circulated through the process plant or locked in tailings void spaces. 20.2.3 Ground Water, Surface Water and Aquatic Resources Kirkland Lake Gold has a several programs designed to be protective of environmental water quality. The monitoring network includes 71 surface water stations and 141 groundwater stations. Regular data collection, analysis, and interpretation on a monthly and quarterly basis allow for risk identification and adaptive management. Parameters associated with waste rock weathering have been observed in surface waters in the Karel Creek, Linden Creek, Easter Creek, and East Creek watersheds. Parameter levels were not deemed to be of concern because they were either below water quality guidelines, within or similar to baseline range, and/or engineered controls have shown to be effective following implementation. There have been no significant changes to surface water quality related to mining operations in the Sunday Lake, Deem Lake, and Lower Detour watersheds, indicating that any significant trends were localized to the mine site and do not extend beyond the site watershed boundaries.
Detour Lake Operations Ontario, Canada NI 43-101 Technical Report March 2021 20-3 Development of the Detour Lake Mine site adversely affected some fisheries and other aquatic resources through the displacement or alteration of fish habitat. Mitigation measures were implemented to limit potential effects related to mining of the Detour Lake Main Pit on aquatic resources. In addition, a fish compensation plan was approved by the federal and provincial regulatory agencies, following full consultation with Indigenous communities, to address impacts related to the development of the TMA and mine rock stockpiles. Additional mitigation measures and compensations plans have been proposed to address potential impacts to fisheries and other aquatic resources related to the development of the West Detour pit. This will require the removal of Walter Lake and will have an impact on Linden Creek. In advance of the project being undertaken, the required regulatory approvals will be obtained and appropriate compensations plans based on previous experience at the site will be implemented. These plans are currently being discussed with the relevant regulatory agencies and Indigenous communities. Groundwater concentrations in the Karel Creek, Linden Creek, Easter Creek, East Creek, Sunday Lake, Deem Lake, and Lower Detour watersheds were generally below environmental monitoring screening criteria where applicable. Based on sampling results to date and comparison to previous data, there were no significant changes to the groundwater quality, except for potential seepage to groundwater in the vicinity of TMA Cell 1, which is being addressed through a detailed investigation. There are no local groundwater users in the immediate area that could potentially be affected by groundwater depletion that is directly linked to open pit development. No significant environmental impacts to groundwater are currently predicted to occur in conjunction with the mining of the Detour Lake Main Pit, West Detour Pit, or North Pit, or the development of mine rock stockpiles or the TMA, after the implementation of proposed mitigation measures. Kirkland Lake Gold is committed to continuous improvement through monitoring and the identification and mitigation of risks to the receiving environment. 20.2.4 Vegetation and Wildlife Potential impacts to vegetation and wildlife are linked as the principal mine-related impacts to wildlife typically involve habitat alterations. Measures to minimize adverse effects to area plants and wildlife include but are not limited to: minimizing the project footprint; maintaining a minimum 120 m buffer around watercourses; avoidance of unnecessary disturbance to wetlands; and avoidance of tree clearing during the bird nesting period. In addition, there are a number of habitat and wildlife considerations linked to Woodland Caribou, which has been identified as a species at risk. Recommendations for the protection of Woodland Caribou include, as reasonable: minimizing the overall project footprint; avoidance of critical over-wintering habitat; minimizing disturbance to mature upland black spruce–jack pine forests that support a high abundance of terrestrial and arboreal lichens (a preferred food source); and minimizing the potential for caribou/vehicular

Detour Lake Operations Ontario, Canada NI 43-101 Technical Report March 2021 20-4 traffic interaction. Kirkland Lake Gold has also implemented a caribou tracking and monitoring program. Additional consultation is in progress with MNRF for finalizing mitigation and compensation requirements related to caribou and the West Detour pit. 20.2.5 Cultural and Heritage Resources Archaeological investigations were historically carried out for the mine access road associated with the previous operation, and more recently as part of baseline investigations. These studies included Aboriginal participation. None of the studies identified archaeological sites that are proximal to the Detour Lake Main mine site, including the West Detour area, that are likely to be affected by the mine in any foreseeable manner. The overall potential for encountering cultural heritage or archaeological sites that would conflict with the proposed development plan for the site is considered to be extremely low. 20.3 Tailings Management Area 20.3.1 Tailings Management Area Tailings are stored in at surface in an engineered TMA that is located east of the process plant. The TMA consists of three cells being developed in a planned, progressive manner: • Cell 1 was built over a historic tailings storage facility from a previous mining operation; • Cell 2 was developed to the north of Cell 1; • The Cell 3 area was cleared to the south of Cell 1. Cells 1 and 2 are dominantly tailings storage cells, while the Cell 3 area will first be used for the mine water pond (a water management facility), until the Cell 3 tailing facility is constructed later in the mine life (2027). The planned raise schedule is set out in The TMA is designed to function as three independent cells for tailings and water management. Tailings deposition will generally occur in only one cell at any time with water recycle for process plant use occurring mainly from the active cells, but possibly also during some periods from the inactive deposition cell prior to final closure. The initial design of the TMA was optimized during ongoing operations, as additional information became available through ongoing construction and in response to a requirement for additional capacity (and wish to stay within the same footprint). In Q4 2020, tailings deposition was transitioned from Cell 1 to Cell 2. The construction of a thickened tails is planned with deposition of thickened tails starting in January 2025. Starting in 2037, tails are to be deposited in the Detour Main Pit (mine operation in the Detour Main Pit is forecast to be complete in 2036). The TMA Cell 2 and Cell 3 facility will provide for storage of approximately 283 Mm3 (454 Mt) of tailings solids. Capital investment is reflected in the cash flow model. The general design and operating practices are as follows:
Detour Lake Operations Ontario, Canada NI 43-101 Technical Report March 2021 20-5 • The tailings produced will increase year over year for a five-year period starting at a rate of approximately 23 Mt/a (63,0133 t/d) in 2020 to 28 Mt/a (76,712 t/d) in 2025 (maximum 90,000 t/d). Tailings will be pre-treated for cyanide destruction at the process plant and pumped from there through a surface pipeline to the TMA; • Tailings will be pumped as slurry and deposited in Cell 2 and Cell 3 using a combination of spigotting and end-dumping to form smooth tailings beaches while progressively sloping the cell to direct final surface drainage to spillway location until 2037 for a total of 441 Mt, at which time tailings deposition will be deposited in the Main Pit when mining is complete. There will be a total of 156 Mt of tailings deposited in the Detour Main Pit. • It is expected that a thickened tails plant will be constructed and will be depositing thickened in the facility starting in January 2025 until 2037 at which time the tails will be deposited in the Main Pit. Test work has shown that a density of 1.7 t/m3 will be used for the consolidated tails calculation. • The design maximizes the tailings storage volume while minimizing the dam height, with dams being raised in stages to support utilization of waste rock produced during operations (and thereby reducing stockpiling requirements); • The dams are designed for the most severe flood and earthquake criteria, being the probable maximum flood and the maximum credible earthquake in accordance with the higher standard of either Canadian Dam Association/MAC Dam Safety Guidelines or ANCOLD Dam Safety Guidelines; • An emergency spillway that meets the probable maximum flood is maintained for each dam lift and for each tailing cell. This ensures water can be discharged in an emergency situation without eroding the dam; • Dams have a low permeability element(s) to provide for efficient water management and minimize seepage rates; • Detailed design documents are provided to applicable regulatory authorities for review and approval in advance of each lift of the dam. The TMA currently serves as the central water management facility for local runoff, tailings slurry water, mine water, and water reclaimed for operation of the process plant. It is expected that a process water pond will be constructed prior to the commissioning of the thickened tails plant in 2025. The regulatory approval applications, submitted to the Ministry of Environment, Conservation and Parks (MECP) for amended environmental compliance approval (ECA) #8672-ANBKVR and either MNRF or ENDM for dam approval, provide the approved detailed design and should be referred to for design details. On an annual basis, the regulatory authorities receive operational information on water quality and receiving environment monitoring (annual ECA report submitted to the MECP) and geotechnical information on the dams (annual as-built report submitted to MNRF/ENDM).

Detour Lake Operations Ontario, Canada NI 43-101 Technical Report March 2021 20-6 Inspection and monitoring activities are performed during construction and operation of the tailings dams to assess their performance and safety; and to verify that actual conditions are consistent with the design assumptions and intentions. Inspection and monitoring also optimizes maintenance and repair costs, provides warning of potential impending risks, and provides sufficient time to implement remedial measures, if required. A dam safety review completed in 2020 confirmed that the TMA Cell 1 is performing as designed. In addition, various dam safety inspections are conducted on a monthly, weekly, and daily basis. 20.3.2 Cell 1 Deposition of tailings in TMA Cell 1 began in 2013 and continued into Q4 2020 to a final elevation of 322 masl and volume of 153.1 Mt. TMA Cell 1 was constructed in a series of annual raises intended to provide capacity for tailings as needed and to maintain sufficient freeboard on the dams. The final raise, Stage 8, was completed in 2019. 20.3.3 Cell 2 Cell 2 is the second cell for tailings storage. The construction for the starter dam (Stage 1) has been completed (2020). The starter dam comprises a silty sand to sandy silt till core with graded granular chimney and blanket filters downstream of the core. The upstream and downstream shells of the Cell 2 starter dam consist of mine run rockfill with upstream and downstream slopes of 2H:1V. The total length of the Cell 2 starter dam is 7.5 km and ties to the existing Cell 1 Dam. At full capacity, Cell 2 will provide containment for 246 Mt of dry tailings and a pond volume of 5 Mm3, corresponding to an ultimate dam crest elevation of 319 masl. Deposition of tailings in TMA Cell 2 began in Q4 2020. The 5.5 Mm3 water pond volume will be removed before the thickened tails are deposited in 2025. Subsequent raises beyond the Cell 2 starter dam crest elevation of 290 m will be accomplished by means of a downstream raised rockfill shell with a geomembrane liner on the upstream face of the dam, with the final design subject to ongoing engineering. Table 20-1 summarizes the proposed raise schedule. The starter dam phase is complete. 20.3.4 Cell 3 Establishment of a mine water pond within the Cell 3 area was part of the design addressed in the Detour Lake Mine Environmental Study Report and associated TMA approvals. Construction of Cell 3 is scheduled to start in 2027 with a similar design methodology as Cell 2. Cell 3 will provide containment for 208 Mt of dry tailings. The proposed raise schedule is presented in Table 20-2. 20.3.5 Performance Monitoring Inspection and monitoring is performed during construction and operation of the tailings dams to assess their performance and safety; and to verify that actual conditions are consistent with the design assumptions and intentions.
Detour Lake Operations Ontario, Canada NI 43-101 Technical Report March 2021 20-7 Table 20-1: Cell 2 TMA Raise Schedule Raising Sequence (Calendar Year) Tailings Tonnage (Mt) Tailings Volume (Mm3) Operating Pond (Mm3) EDF (Mm3) Cumulative Total Storage (Mm3) (m) Starter dam (2018–2020) 25.4 19.5 5.0 2.4 26.9 286.7 Stage 2 raise (2021) 51.5 34.4 5.0 2.4 41.8 290.4 Stage 3 raise (2022) 78.4 52.3 0.0 2.4 54.7 293.4 Stage 4 raise (2023) 106.1 70.7 0.0 2.4 73.1 297.6 Stage 5 raise (2024) 134.1 88.0 0.0 2.4 90.4 301.5 Stage 6 raise (2025) 162.1 104.9 0.0 2.4 107.3 305.2 Stage 7 raise (2026) 190.0 121.9 0.0 2.4 124.3 308.9 Stage 8 raise (2027) 218.1 138.9 0.0 2.4 141.3 312.5 Stage 9 raise (2028) 246.1 155.9 0.0 2.4 158.3 316.0 Table 20-2: Cell 3 TMA Raise Schedule Raising Sequence (Calendar Year) Tailings Tonnage (Mt) Tailings Volume (Mm3) Operating Pond (Mm3) EDF (Mm3) Cumulative Total Storage (Mm3) (m) Starter dam (2027–2029) 29.2 17.7 0.0 1.5 19.2 283.7 Stage 2 raise (2030) 58.4 35.4 0.0 1.5 36.9 291.1 Stage 3 raise (2031) 87.7 53.1 0.0 1.5 54.6 298.2 Stage 4 raise (2032) 116.9 70.8 0.0 1.5 72.3 305.0 Stage 5 raise (2033) 146.1 88.5 0.0 1.5 90.0 311.6 Stage 6 raise (2034) 175.3 106.2 0.0 1.5 107.7 317.9 Stage 7 raise (2035) 208.7 126.5 0.0 1.5 128.0 325.0 Inspection and monitoring also optimizes maintenance and repair costs, provides warning of potential impending risks, and provides sufficient time to implement remedial measures, if required. A dam safety review completed in 2020 confirmed that the TMA is performing as designed. 20.4 Water Management Operational water management, risk assessment, and mitigation planning are informed by: • The integrated surface water-groundwater model, which captures hydrological and hydrogeological information to characterize and predict flows (e.g., pit draw down, water level fluctuations in the local watershed);
Detour Lake Operations Ontario, Canada NI 43-101 Technical Report March 2021 20-8 • The water balance/water quality model captures water quantity and quality for both the operating and post-closure periods, under for average, wet and dry conditions. The model considers sources from the TMA, open pit, and mine rock stockpiles, and other sources. This information is used to ensure sufficient water is available to operate the process plant, manage the volume of water in the TMA and mine water pond, and identify effluent discharge requirements. Environmental protection is ensured through the water management network, which collects seepage and runoff from all mine waste facilities through a system of ditching, pumping, and pipeline infrastructure. The modular design allows for the addition of treatment facilities if required. In 2020, a mine water pond with a capacity of 3.5 Mm3 was completed. The mine water pond serves as a central water management facility (e.g., for open pit water and local runoff), and provides additional contingencies for storage and treatment, if needed. Tailings, tailings slurry water, and water reclaimed for the operation of the process plant are managed through the TMA. The water management objectives for the TMA are as follows: • Provide adequate retention time for control of total suspended solids prior to reclaiming water for process plant use; • Optimize reclaim water volume for process plant operations; • Allow for settling of suspended solids and natural degradation of ammonia in a separate mine water pond if and when effluent discharge to the environment is required; • Handle upset conditions and/or runoff generated from major storm events. Water is continuously reclaimed back to the plant site for processing needs using a decant tower with pumping facilities located in the tailings pond. Make-up water for the operation of the process plant is sourced from East Lake when required. The TMA is designed to contain runoff resulting from an environmental design flood. As a minimum, the environmental design flood was selected as the 1:100 year 15-day spring maximum runoff with no discharge to the environment. The TMA was designed for ‘no- discharge’ under this condition. The TMA has sufficient freeboard to safely pass the runoff resulting from the inflow design flood through the emergency spillway. The inflow design flood is the 24-hour probable maximum flood event. The discharge from the spillway is directed towards the watershed of East Lake which flows into the Detour River system and north to Hudson Bay. The proactive management of water issues included incorporating prevention measures into the design of the TMA. The following strategies have been adopted to reduce the risk of contaminants entering the local groundwater or surface water regimes: • The milling includes a final process step to destroy cyanide to very low levels in the tailings before it is pumped to the TMA;
Detour Lake Operations Ontario, Canada NI 43-101 Technical Report March 2021 20-9 • TMA seepage collection ditches and ponds have been constructed at the base of Cell 1 with pumps installed to recycle the water back to the TMA. Additional ditches and pumps will be installed for Cells 2 and 3 when required. When required, water collected from the mine site (that has not been in contact with processed reagents) is discharged to East Creek to prevent the accumulation of water above target operating levels. In 2023, the discharge location will be transferred to a location on Sunday Creek, pending regulatory approval. 20.5 Permitting Considerations Most mining projects in Canada are reviewed under one or more EA processes. The federal EA process for Canadian mines is detailed in the CEAA. A federal EA was triggered for the Detour Lake project due to: • The requirement for an Explosives Factory License under the Explosives Act for a project-dedicated explosives manufacturing factory; • The need for one or more Authorization(s) for Harmful Alteration Disruption or Destruction of Fish Habitat according to the Fisheries Act. These licences/authorizations were granted. Four provincial EAs were approved for the Detour Lake project: • July 2010: Ontario Ministry of Environment Class EA for Electricity Projects, for the diesel power generation required to support the construction phase (AMEC 2010a); • November 2010: Ontario MNR Class EA for Resource Stewardship and Facility Development Projects, for the construction of facilities off-lease, and for such aspects as on-lease aggregate operations or in-water works (AMEC 2010c); • December 2010: Ontario individual EA for Electricity Projects, for construction of a 230 kV transmission line (AMEC 2010b); • March 2012: Ontario MOE individual EA for Electricity Projects of 10 MW, for allowing a diesel-generated contingency power supply to service the construction needs should the powerline not be operable by the third quarter of 2011. With the successful energizing of the powerline in October 2011, these facilities were not installed. In accordance with Section 143(2) of the Mining Act, R.S.O. 1990, Detour Gold submitted a Mine Closure Plan (for Production) in 2010, followed by Closure Plan Update Amendments in 2014 and 2019. ENDM filed these documents on October 28, 2010, February 18, 2015, and November 8, 2019, respectively. Subsequent permits, such as Permits to Take Water and Environmental Compliance Approvals, have been approved, renewed, and/or amended as needed in order to support ongoing development and operations.
Detour Lake Operations Ontario, Canada NI 43-101 Technical Report March 2021 20-10 Prior to development of the West Detour project, a number of Provincial and Federal environmental approvals, or amendments to existing approvals, will be required. In particular, the West Detour project will be subject to a Class C Environmental Assessment pursuant to the Ontario Environmental Assessment Act as managed by MNRF. The ESR was published in Draft in January 2017, and a Final ESR was submitted to MNRF in August 2019. An ESR Addendum was submitted in October 2020 to address additional comments from government and Indigenous communities. The completion of the West Detour ESR process is anticipated for 2021. Table 20-3 lists additional environmental approvals expected to be required to develop, operate and close the West Detour project. 20.6 Social and Community Impact Considerations The Detour Lake Mine continues to have a positive socio-economic impact on local communities. At the end of 2020, the permanent workforce totaled 1,067 employees. The Detour Lake Mine also creates local and provincial business opportunities. 20.6.1 Consultation Principles Kirkland Lake Gold has undertaken ongoing consultation with the public, government regulators and its Indigenous partners regarding the operations, environmental commitments and planned activities. Kirkland Lake Gold has established the following consultation principles: • Early notification: information about the project will be provided to stakeholders in a timely manner to facilitate the stakeholder engagement process; • Open communication: all pertinent information about the project will be shared with stakeholders. Stakeholder input will be sought, documented, and will be addressed in the project. If input is not addressed, a reason will be provided; • Accessible information: a variety of stakeholder engagement methods will be used that are written in plain language to distribute information about the project and to gather stakeholder feedback; • Flexible process: feedback on the stakeholder engagement process will be sought from interested individuals and stakeholders to ensure that meaningful opportunities for input are provided. Changes will be made to the public and stakeholder participation program as necessary to reflect stakeholder needs; • Capacity building: where acceptable and appropriate to all parties involved, community liaisons and working committees will be worked with to facilitate information exchange; • Mutual respect: respect will be given to the differing values and constraints of each party and to project timelines. There will be follow-through on commitments made.

Detour Lake Operations Ontario, Canada NI 43-101 Technical Report March 2021 20-11 Table 20-3: List of Anticipated Environmental Approvals Required Permit/Approval Agency Responsible Description Provincial Permit to Take Water Ontario Water Resources Act MECP Taking of water of > 50,000 L/d (mine dewatering and development) ECA Amendment Environmental Protection Act MECP Amendment to the existing DLM approvals (air and noise; industrial sewage works) Work Permit Public Lands Act / Lakes and Rivers Improvement Act MNRF Work/construction on Crown land, including work below the high-water mark of local watercourses and construction of dams if needed Land Use Permit Public Lands Act MNRF Establish of tenure for facilities constructed on Crown land (pipeline and associated infrastructure/facilities) Forest Resource License (Cutting Permit) Crown Forest Sustainability Act MNRF Clearing of Crown merchantable timber (if any) Endangered Species Act Permit Endangered Species Act MECP Management of activities related to species-at-risk for Woodland Caribou Closure Plan Amendment Mining Act ENDM For mine development, production and eventual decommissioning of the West Detour project Federal Authorization(s) for Serious Harm to Fish Fisheries Act DFO For the establishment of the: mine rock stockpile(s); watercourse diversions / rerouting; and/or mine dewatering groundwater effects that would cause disruption to watercourses supporting fisheries Listing on Schedule 2 of MDMER to authorize deposition of a deleterious substance in a water frequented by fish ECCC For the establishment of mine rock stockpile(s) over waters frequented by fish Notes: ECCC = Environment and Climate Change Canada; ENDM = Ministry of Energy, Northern Development and Mines; MECP = Ministry of Environment, Conservation and Parks. MNRF = Ministry of Natural Resources and Forestry, DFO = Department of Fisheries and Oceans These principles continue to guide interactions within mine permitting, operations, and exploration. The environmental approval applications will provide additional detail regarding the engineering design of the proposed West Detour project facilities, potential effects and proposed mitigations measures. No changes were expected to the approvals list at the Report effective date.
Detour Lake Operations Ontario, Canada NI 43-101 Technical Report March 2021 20-12 20.6.2 First Nations The Company has agreements with First Nations who have treaty and Indigenous rights which they assert within the operations area of the Detour Lake mine. These agreements provides a framework for strengthened collaboration in the development and operations of the mine and outlines tangible benefits for the First Nations, including direct financial support, skills training and employment, opportunities for business development and contracting, and a framework for issues resolution, regulatory permitting and the Company’s future financial contributions. In addition, the Company engages with Indigenous communities in connection with permitting applications and ongoing projects. Indigenous employees at the Detour Lake Mine comprised 18% of the workforce as of December 31, 2020, compared to the Ontario mining industry average of 11.2%. At the end of 2020, the Detour Lake Mine had 150 employees from our local Indigenous partner communities and 42 self-identified Indigenous employees from other First Nations and Métis communities. 20.7 Closure and Reclamation Planning Kirkland Lake Gold acknowledges that the company will be responsible for providing the full amount of the financial assurance for the closure and rehabilitation of the Detour Lake Mine and the West Detour project, subject to any required or approved changes to the Closure Plan. There are six developmental phases that trigger the issuance of security bonding for the operation (Table 20-4). Financial assurance is submitted to the ENDM prior to the beginning of the associated activities of each phase, or as otherwise arranged with the ENDM. As per the Detour Lake Mine Closure Plan Amendment 2, the total estimated closure cost for the Detour Lake Operations at peak development (i.e., all facilities constructed) is $147,734,282, exclusive of the West Detour project. Security provided to ENDM to date for the present stage of development totals $103,718,794. Financial assurance for the West Detour project will be formalized with the filing of Closure Plan Amendment 3, anticipated for Q4 2021/Q1 2022.
Detour Lake Operations Ontario, Canada NI 43-101 Technical Report March 2021 20-13 Table 20-4: Financial Assurance Timing Summary Financial Assurance Phase Description Timing for Providing Additional Security Phase 1 & Phase 2 Pre-construction and construction of Detour Lake Mine Completed in 2018 and 2019 Phase 3 Start of tailings deposition in Cell 2 Completed in 2020 Phase 4 Onset of West Detour Project development Planned for 2023 Phase 5 Start of tailings deposition in Cell 3 Planned for 2031 Phase 6 End of processing, active closure, post-closure infrastructure, maintenance and monitoring Planned for 2041

Detour Lake Operations Ontario, Canada NI 43-101 Technical Report March 2021 21-1 21.0 Capital and Operating Costs 21.1 Capital Cost Estimates 21.1.1 Summary Capital costs are summarized by area in five-year periods in Table 21-1. Capital costs are greater at the start of the plan due to growth capital investments required to increase plant throughput to 28 Mt/a (refer to Table 21-2 for a summary of sustaining2 versus growth1 capital). Capital costs consist largely of mining equipment (replacements, additions, component replacements, capitalized maintenance), construction of tailings cells and dam raises, deferred stripping using a by-phase approach, and processing plant projects to increase plant capacity to 28 Mt/a. Capital costs for the first three years of plan are based on budget cycle estimates with supplier quotes, engineered designs, maintenance strategies, production plans or preliminary estimates. Estimates in later years are based on maintenance strategies, equipment replacement schedules, and long-term sustaining capital estimates are based on recent operating history and current asset value. Tailings cells 2 and 3 are based on physical material movement requirements and recent unit cost history. 21.1.2 Mining Mining capital includes additional and replacement equipment capital, planned component replacements of major fleets, and the capitalized portion of the Maintenance and Repair Contract (MARC) for the 795 haul truck fleet. Major capital projects include expansion of the truck shop to accommodate increased fleet count, the construction of field maintenance domes and a large office and dry complex, as well upgrades to pit electrical and wireless infrastructure. 21.1.3 Processing Plant Capital spending in the process plant includes a significant portion of growth capital in 2021–2022 required to achieve 28 Mt/a. This includes secondary crusher feed pre- screening, a re-feed system after the secondary crushers, and addition of leaching and cyanide destruction tanks. Mining, processing and exploration samples are currently shipped off-site for assaying by a contractor. The construction of an automated on-site laboratory in 2021 will internalize assaying costs as well as provide shorter turnaround time to improve operational decision- making. 1 Refer to Cautionary Statement on Non-IFRS Financial Performance Measures

Detour Lake Operations Ontario, Canada NI 43-101 Technical Report March 2021 21-2 Table 21-1: Capital Cost Summary by Area Capital Cost Summary (C$M) 2021– 2025 2026– 2030 2031– 2035 2036– 2040 2041– 2043 LOM Mining 1 529 557 285 138 29 1,538 Deferred stripping 606 717 48 — — 1,371 Processing 301 64 53 38 7 463 Tailings management 308 358 332 — — 997 West Detour 87 9 2 1 — 100 Site administration 2 148 39 38 38 12 274 Total Capital Costs 1,978 1,744 757 216 48 4,744 Notes: 1. Includes capital projects, equipment replacements/additions, planned component replacements, and capitalized portion of maintenance and repair contract of 795 haul trucks. 2. Includes infrastructure, water management, and camp. Table 21-2: Capital Cost Summary by Sustaining/Growth Area Capital Cost Summary (C$M) 2021– 2025 2026– 2030 2031– 2035 2036– 2040 2041– 2043 LOM Sustaining 1 Projects, equipment, maintenance 856 991 566 214 48 2,676 Deferred stripping 127 212 48 — — 387 Sub-total 983 1,204 614 214 48 3,063 Growth 1 Projects, equipment 516 36 144 1 — 697 Deferred stripping 479 504 — — — 983 Subtotal 995 541 144 1 — 1,680 Total Capital Costs 1,978 1,744 757 216 48 4,744 Notes: 1. Refer to Cautionary Statement on Non-IFRS Financial Performance Measures. Construction of a tailings thickening plant required for the transition to thickened tailings is included in 2023–2024. 21.1.4 Site Administration Major site administration capital projects include the construction of long-term evolution (LTE) communication towers to improve cellular coverage along the roadways between the town of Cochrane and the Detour Lake Mine site as well as upgrade the existing mesh wi– fi network onsite to a private LTE solution. Construction of a new mine water pond required for the transition to thickened tailings is included in 2022; similarly, a water treatment plant is included in 2024. Additional camp capacity with the construction of new wings to existing camps will support greater workforce requirements in the peak years of mining activity. Site administration costs also include site infrastructure maintenance, water management, and camps.
Detour Lake Operations Ontario, Canada NI 43-101 Technical Report March 2021 21-3 21.1.5 Tailings Management Area Tailings cells 2 and 3 are based on physical material movement requirements and recent unit cost history. Physical requirements include the placement of non-acid generating waste rock, till, and the production of crushed waste for dam filter elements. Additional TMA capital costs include support of construction management, quality control, geotechnical control, physical infrastructure such as power lines, pumps and pipelines, as well as camp accommodations. Mining costs related to the incremental hauling of waste for strategic placement favorable to TMA construction are transferred to TMA capital costs. Costs associated with the operation and maintenance of mining equipment for TMA construction are also transferred to TMA capital costs. Construction of Cell 3 will be completed in 2035, and starting in 2037, process plant tailings will be sent to fill the Detour Lake Main Pit, with no associated TMA capital costs. 21.1.6 Deferred Stripping Costs Stripping costs which provide probable future economic benefits and identifiable improved access to the ore body and which can be measured reliably can be capitalized. The estimates for deferred stripping are based on the excess tonnes of waste material mined above the LOM average strip ratio multiplied by the average unit mining cost per period, on a per pit basis. Operationally, deferred stripping is managed on a monthly basis. Actual monthly results will differ as the cost estimate is calculated based on annual average stripping ratios which can vary significantly from month to month. Deferred stripping is classified as sustaining capital except where: • It is expected to take at least 12 months; • It will provide an ore production phase expected to be >5 years; in which case it is classified as growth capital. 21.1.7 West Detour Capital costs related to the West Detour project including drilling of environmental monitoring wells, fish compensation, Caribou offsetting, milestone payments to First Nations, as well as water management required for permitting. 21.2 Operating Cost Estimates 21.2.1 Summary The operating cost estimate is summarized in Table 21-3, and the unit cost forecasts are provided in Table 21-4.
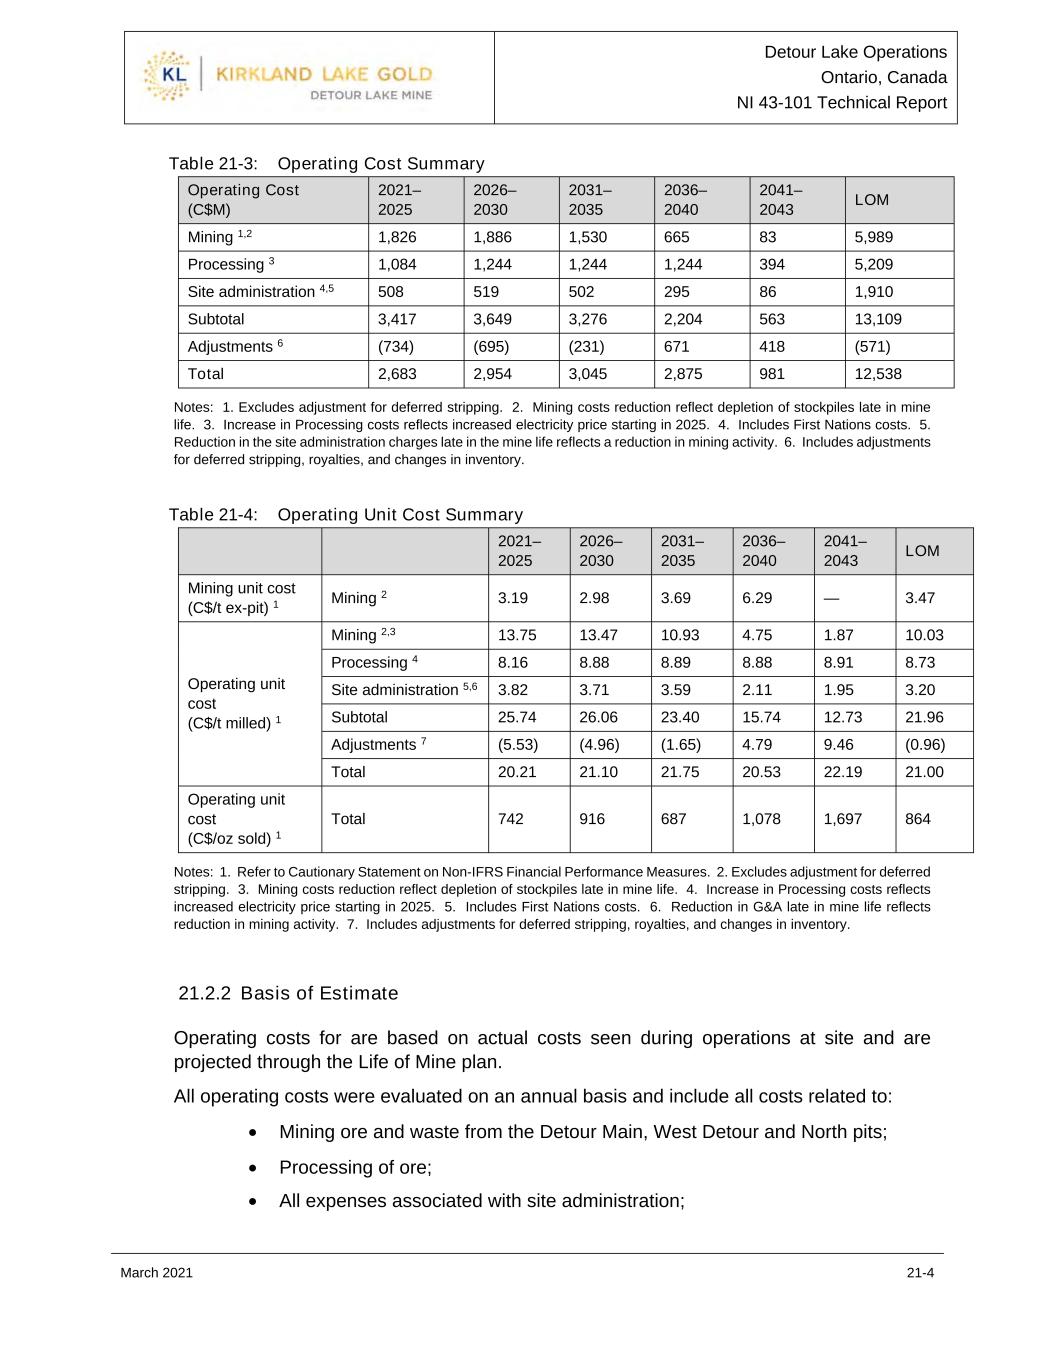
Detour Lake Operations Ontario, Canada NI 43-101 Technical Report March 2021 21-4 Table 21-3: Operating Cost Summary Operating Cost (C$M) 2021– 2025 2026– 2030 2031– 2035 2036– 2040 2041– 2043 LOM Mining 1,2 1,826 1,886 1,530 665 83 5,989 Processing 3 1,084 1,244 1,244 1,244 394 5,209 Site administration 4,5 508 519 502 295 86 1,910 Subtotal 3,417 3,649 3,276 2,204 563 13,109 Adjustments 6 (734) (695) (231) 671 418 (571) Total 2,683 2,954 3,045 2,875 981 12,538 Notes: 1. Excludes adjustment for deferred stripping. 2. Mining costs reduction reflect depletion of stockpiles late in mine life. 3. Increase in Processing costs reflects increased electricity price starting in 2025. 4. Includes First Nations costs. 5. Reduction in the site administration charges late in the mine life reflects a reduction in mining activity. 6. Includes adjustments for deferred stripping, royalties, and changes in inventory. Table 21-4: Operating Unit Cost Summary 2021–2025 2026– 2030 2031– 2035 2036– 2040 2041– 2043 LOM Mining unit cost (C$/t ex-pit) 1 Mining 2 3.19 2.98 3.69 6.29 — 3.47 Operating unit cost (C$/t milled) 1 Mining 2,3 13.75 13.47 10.93 4.75 1.87 10.03 Processing 4 8.16 8.88 8.89 8.88 8.91 8.73 Site administration 5,6 3.82 3.71 3.59 2.11 1.95 3.20 Subtotal 25.74 26.06 23.40 15.74 12.73 21.96 Adjustments 7 (5.53) (4.96) (1.65) 4.79 9.46 (0.96) Total 20.21 21.10 21.75 20.53 22.19 21.00 Operating unit cost (C$/oz sold) 1 Total 742 916 687 1,078 1,697 864 Notes: 1. Refer to Cautionary Statement on Non-IFRS Financial Performance Measures. 2. Excludes adjustment for deferred stripping. 3. Mining costs reduction reflect depletion of stockpiles late in mine life. 4. Increase in Processing costs reflects increased electricity price starting in 2025. 5. Includes First Nations costs. 6. Reduction in G&A late in mine life reflects reduction in mining activity. 7. Includes adjustments for deferred stripping, royalties, and changes in inventory. 21.2.2 Basis of Estimate Operating costs for are based on actual costs seen during operations at site and are projected through the Life of Mine plan. All operating costs were evaluated on an annual basis and include all costs related to: • Mining ore and waste from the Detour Main, West Detour and North pits; • Processing of ore; • All expenses associated with site administration;

Detour Lake Operations Ontario, Canada NI 43-101 Technical Report March 2021 21-5 • Adjustments for deferred stripping and changes in inventory; • Costs related to agreements with First Nations; • Royalties payable to Franco–Nevada and First Nations. The consumables for the operation are based on current prices or contracts for future years. In general, approximately 80% of operating costs are based in Canadian dollars and 20% have US dollar exposure. The exchange rate used in the financial model is 1.31 C$/US$. 21.2.3 Mining Costs Key inputs to the mining costs include the following: • Material movement schedule; • Equipment fleet productivities and operating time parameters; • Equipment operating and maintenance costs profiles; and • Truck cycle times and diesel fuel consumptions. These parameters are adjusted over the LOM to reflect the specific mining locations and material types, life-cycle equipment costing and improvements in operating efficiency, etc. The biggest contributor to the mining costs is labour, followed in order by maintenance, diesel, and consumables. Mining costs related to the TMA for incremental haul of waste rock to favorable WRSF locations and operation of mining equipment are transferred from mine operating to capital costs. 21.2.4 Processing Costs The operating cost estimate for the processing plant was based on operating expenditures experienced to date. Key drivers for processing costs include the tonnes processed, power costs (electricity), reagent and consumables consumption and plant maintenance (operating time and shutdown work). Kirkland Lake Gold has a power contract in place to the end of 2024. A modelled rate of $25/MWh (or $0.025/kWh) was applied up to the end of the contract. From 2025 onward, the electricity price was estimated at $74/MWh (or $0.074/kWh). Processing costs reflect the transition to an on-site assay laboratory in late 2021. The biggest contributor to the process costs is consumables/reagents, followed in order by power, labour, and maintenance costs. 21.2.5 Site Administration Costs Site administration costs include all materials and personnel costs associated with the mine administration and infrastructure support. These costs include: camp (including personnel

Detour Lake Operations Ontario, Canada NI 43-101 Technical Report March 2021 21-6 transport), site infrastructure, First Nations, security, IT and telecoms, supply chain, human resources, finance, environment, health and safety, contracts, and site management. General and administrative costs were scaled back in the late stages of the mine life to reflect the declining administrative support required for declining mining activities starting in 2036. 21.3 Comments on Capital and Operating Costs The QP notes that the carbon tax under the output-based pricing system was included in the mining costs and assessed based on the carbon prices currently legislated; that is, a progressive increase to C$50/t CO2eq in 2022 with no further increase.

Detour Lake Operations Ontario, Canada NI 43-101 Technical Report March 2021 22-1 22.0 Economic Analysis 22.1 Methodology Used The Project was valued using a discounted cash flow approach. Estimates were prepared for all the individual elements of cash revenue and cash expenditures for ongoing operations. Cash flows are assumed to occur in the middle of each period. Operating costs were prepared based on recent operating history and technical assumptions associated with the production profile. Capital costs were prepared based on engineering estimates, vendor quotes, maintenance strategies, or estimated long-term requirements based on recent operating history and current asset values. The currency used to calculate the cash flow is Canadian dollars. A discount rate of 5% was assumed based on more than seven years of commercial production in a stable low- risk jurisdiction. 22.2 Financial Model Parameters 22.2.1 Mineral Reserves and Mine Life The mine plan is based on the Mineral Reserves in Section 15. The operations have an estimated 22-year mine life. The financial model includes an additional year to account for discounted closure costs extending through to end of closure period. 22.2.2 Metallurgical Recoveries The metallurgical recovery assumptions and basis are outlined in Section 13. The average LOM recovery used in the economic analysis is 91.9%. 22.2.3 Metal Prices and Exchange Rates The gold price assumption used in the economic analysis is US$1,500/oz Au at an exchange rate of 1.31 C$/US$. Gold price assumptions are determined corporately by Kirkland Lake Gold. The assumption is more conservative than the London Metal Exchange closing prices on December 31, 2020 for spot (US$1,894/oz Au) and 24-month futures (US$1,907/oz Au). It is slightly higher than the London Bullion Market Association average monthly precious metals price for the past three years (US$1,477/oz Au). 22.2.4 Gross Gold Revenue Gross gold revenue consists of inflows from the sale of gold before any refining and transport costs and royalties.
Detour Lake Operations Ontario, Canada NI 43-101 Technical Report March 2021 22-2 22.2.5 Transport and Refining Charges Doré transport and refining charges are based on existing agreements and fluctuate based on number of gold shipments, shipment volume, and gold content. 22.2.6 Net Gold Revenue Net gold revenue is gross revenue after transport and refining charges. 22.2.7 Capital and Operating Costs The capital and operating cost estimates were included in Section 21. Mining operating costs are presented with the adjustment for deferred stripping. 22.2.8 Royalties Royalties included in the economic analysis are: • Franco–Nevada: 2% net smelter return; • First Nations payments. 22.2.9 Working Capital1 Changes in working capital include: • Change in inventories of ore stockpiles, gold-in-circuit, and doré (“Change in inventory” above Operating Margin) • Changes in accounts payables, accounts receivables, and supplies inventory. The economic model assumes four days for accounts receivables, 30 days for accounts payable, and 27 days of supply inventory. These assumptions were based on recent operating history. Changes in working capital in the initial stages of the mine life reflect accumulation of ore stockpiles. Depletion of these stockpiles starts in 2037 with termination of ex-pit mining in 2038. Gold-in-circuit and doré inventory are depleted and sold in the last year of production, which is 2042. 22.2.10 Taxes Taxes included in the economic evaluation are the Federal Income tax (15%), Provincial Income Tax (10%), and the Ontario Mining Tax. Depreciation schedules based on current depreciable balances and yearly capital additions were used to model tax depreciation for processing and transportation assets as well as mining assets. 1 Refer to Cautionary Statement on Non-IFRS Financial Performance Measures.
Detour Lake Operations Ontario, Canada NI 43-101 Technical Report March 2021 22-3 The tax model was completed at the Project level, which has the Detour Lake Mine as a stand-alone operating asset. 22.2.11 Closure Costs and Salvage Value Closure costs are based on reclamation schedule extending through to the next centuries up to year 2337. Progressive reclamation occurs throughout the operating period. Reclamation activities are broken down into active closure, passive closure/flooding of the mine pit, final closure/ active discharge, and post closure/passive discharge. Costs extending beyond 2043 were discounted back to 2043 at the Project discount rate and included in that year. Reclamation costs excluded from the Asset Retirement Obligation (approximately 20% of total) are included in site administration costs. No salvage value of assets was factored into the economic model. 22.2.12 Lease Payments Lease payments reflect payments associated with Right of Use Assets recognized under International Financial Reporting Standards (IFRS) 16. 22.2.13 Financing The base case economic analysis assumes 100% equity financing and is reported on a 100% project ownership basis. 22.2.14 Inflation The base case economic analysis assumes constant prices with no inflationary adjustments. Capital and operating costs are expressed in 2021 Canadian dollars. 22.3 Economic Analysis The cumulative free cash flow before tax1 is estimated at $11,141 M. The cumulative free cash flow after tax 1 is $8,354 M. At a 5% discount rate, the net present value of free cash flows before tax is $6,614 M and of free cash flow after tax is $4,968 M. Internal rate of return and payback period results are not relevant as the cumulative discounted after-tax free cash flows are never negative. This reflects the fact that the Detour Lake Mine is already in operation and that operating cash flows are sufficient to cover sustaining and growth capital requirements. 1 Refer to Cautionary Statement on Non-IFRS Financial Performance Measures.

Detour Lake Operations Ontario, Canada NI 43-101 Technical Report March 2021 22-4 Table 22-1 is a summary of the discounted cash flow analysis. Free cash flows in years 2027–2029 are lower due to a combination of lower head-grades due to the mining position and concurrent construction of TMA Cells 2 and 3. Negative free cash flow in 2043 reflects discounted closure costs with no further operational revenue. Higher operating cash cost (US$/oz) 1 and cash all-in sustaining costs (AISC; in US$/oz) 1 in the later stages of the mine plan (2039–2042) reflect the impact of changes in inventory with the depletion of ore stockpiles and lower plant head grade. 22.4 Sensitivity Analysis A sensitivity analysis was performed considering variations in gold price, exchange rate, operating and capital costs. Flexing based on gold grade processed was excluded because it reflects the same sensitivity as gold price (given flat gold price assumption). Results are shown in Figure 22-1. Sensitivity of the Project to changes in gold price and exchange rate are shown in Table 22-2; the project has positive after tax net present value under the Base Case (US$1,500/oz and 1.31 C$/US$) and under the assumptions of Mineral Reserve estimation (US$1,300/oz and 1.31 C$/US$). The sensitivity to discount rate and the assumed discount rate range is shown in Figure 22-2. The undiscounted free cash flow after tax 1 is negative at a gold price of US$895/oz. The net present value of free cash flow after tax1 is negative at a gold price of US$940/oz. The Project is most sensitive to changes in the gold price and exchange rate, less sensitive to operating cost changes, and least sensitive to changes in the capital cost assumptions. 22.5 Comments on Economic Analysis The QP reviewed the financial analysis. The Project has positive economics until the end of the LOM plan, which supports Mineral Reserve declaration. The QP notes the following: • While there is a history of silver in doré payments, silver is not estimated in the Mineral Resources or Mineral Reserves, and therefore not included in the financial analysis. Payments for silver in doré represent a minor upside to the Project. • The tax model assumes Detour Lake Mine is a stand-alone tax entity. Corporate tax synergies with other Kirkland Lake Gold mining operations in Ontario are not included in the economic analysis. 1 Refer to Cautionary Statement on Non-IFRS Financial Performance Measures.

Detour Lake Operations Ontario, Canada NI 43-101 Technical Report March 2021 22-5 Table 22-1: Cash Flow Analysis 2021 2022 2023 2024 2025 2026 2027 2028 2029 2030 2031 2032 2033 2034 2035 2036 2037 2038 2039 2040 2041 2042 2043 Total LOM Physicals Mining Ore mined (Mt) 25.3 40.1 42.9 45.6 32.5 27.6 23.5 24.5 32.3 35.2 43.0 45.0 42.4 37.8 35.8 32.8 16.3 11.2 — — — — — 593.9 Waste mined (Mt) 75.7 69.0 70.1 74.0 98.1 102.7 106.6 108.4 95.0 76.1 63.5 51.3 36.2 32.6 26.7 22.5 14.1 8.9 — — — — — 1,131.4 Ex-pit mined (Mt) 101.0 109.2 112.9 119.6 130.6 130.3 130.1 132.8 127.2 111.3 106.5 96.3 78.6 70.4 62.5 55.3 30.4 20.1 — — — — — 1,725.3 Strip ratio (waste/ore) 2.99 1.72 1.63 1.62 3.02 3.72 4.53 4.43 2.94 2.16 1.47 1.14 0.85 0.86 0.74 0.68 0.86 0.79 — — — — — 1.90 Ex-pit ore grade (g/t) 1.00 0.74 0.71 0.70 0.89 0.90 0.89 0.67 0.68 0.76 0.79 0.86 0.89 0.91 0.92 0.98 0.74 0.94 — — — — — 0.82 Processing Milled (Mt) 24.5 25.5 27.0 27.8 28.0 28.0 28.0 28.0 28.0 28.0 28.0 28.0 28.0 28.0 28.0 28.0 28.0 28.0 28.0 28.0 28.0 16.2 — 597.0 Head grade (g/t) 0.97 0.93 0.87 0.87 0.96 0.89 0.82 0.63 0.73 0.85 0.97 1.10 1.09 1.08 1.07 1.07 0.63 0.67 0.40 0.47 0.44 0.44 — 0.82 Recovery (%) 92.3 92.1 91.8 91.7 92.2 92.1 92.0 90.8 91.1 91.6 92.2 92.7 92.8 92.8 92.6 92.6 91.0 91.2 89.6 90.0 90.1 90.0 — 91.9 Gold recovered (koz) 706 706 691 715 800 735 676 518 596 701 808 916 915 902 890 896 517 549 326 379 354 204 — 14,499 Gold poured (koz) 706 706 691 715 800 735 676 518 596 701 808 916 915 902 890 896 517 549 326 379 354 223 — 14,518 Sales Gold price (C$/oz) 1,965 1,965 1,965 1,965 1,965 1,965 1,965 1,965 1,965 1,965 1,965 1,965 1,965 1,965 1,965 1,965 1,965 1,965 1,965 1,965 1,965 1,965 — 1,965 Gold sold (koz) 706 706 691 715 800 735 676 518 596 701 808 916 915 902 890 896 517 549 326 379 354 224 — 14,519 Cash Flow (C$M) Gross gold revenues 1,388 1,386 1,357 1,406 1,572 1,445 1,327 1,017 1,171 1,378 1,587 1,800 1,797 1,772 1,749 1,761 1,016 1,078 640 745 695 441 — 28,530 Transportation and refining charges (2) (2) (2) (2) (2) (2) (2) (1) (1) (2) (2) (2) (2) (2) (2) (2) (1) (1) (1) (1) (1) (0) — (32) Net Gold Revenues 1,386 1,385 1,356 1,404 1,570 1,443 1,326 1,016 1,170 1,376 1,585 1,798 1,795 1,770 1,747 1,759 1,015 1,077 640 744 694 440 — 28,497 Site operating costs – mining 1 (214) (232) (305) (288) (182) (174) (169) (241) (300) (286) (307) (318) (296) (302) (259) (235) (163) (148) (58) (60) (51) (31) — (4,619) Site operating costs – processing (206) (206) (208) (214) (249) (249) (249) (249) (249) (249) (249) (249) (249) (249) (249) (249) (249) (249) (249) (249) (249) (145) — (5,209) Site operating costs – site administration (105) (101) (100) (99) (102) (103) (102) (108) (106) (100) (100) (101) (102) (100) (100) (62) (67) (60) (53) (53) (50) (32) (5) (1,910) Subtotal site operating costs (525) (538) (613) (601) (533) (525) (520) (597) (655) (635) (655) (668) (647) (651) (607) (546) (478) (457) (360) (362) (350) (208) (5) (11,738) Royalties and First Nations payments (39) (39) (38) (39) (44) (40) (37) (23) (27) (39) (44) (50) (50) (50) (49) (49) (23) (25) (15) (17) (16) (10) — (765) Changes in inventory 11 77 123 107 9 1 (11) 35 67 53 87 106 91 92 51 28 (43) (81) (213) (232) (227) (165) — (35) Operating Margin 2 833 885 827 870 1,002 879 757 430 555 756 972 1,187 1,189 1,161 1,141 1,192 470 514 52 133 100 58 (5) 15,959 Capital expenditures (451) (455) (333) (335) (405) (459) (453) (354) (239) (239) (209) (139) (174) (124) (111) (67) (46) (42) (34) (26) (28) (20) — (4,744) Reclamation (asset retirement obligation) (2) (2) (2) (2) (2) (1) (1) (1) (1) (1) (1) (3) (3) (3) (3) (3) (1) (13) (19) (20) (7) (2) (15) (104) Lease payments (1) (1) (1) (1) (1) (1) (1) (1) (1) (1) (1) (1) (1) (1) (1) (1) (1) (1) (1) (1) (1) (0) - (12) Less: changes in working capital2 (12) (77) (123) (107) (11) 1 12 (32) (69) (56) (89) (109) (91) (92) (51) (28) 50 80 217 231 228 171 (2) 41 Free Cash Flow Before Taxes 2 368 351 369 425 584 419 316 43 246 460 673 935 920 943 976 1,093 473 538 215 317 293 206 (21) 11,141 Federal income tax — — — (79) (80) (62) (43) (8) (40) (71) (105) (141) (142) (140) (140) (148) (53) (60) — (5) (4) (0) 3 (1,317) Provincial income tax (10) (11) (1) (55) (53) (41) (29) (5) (27) (47) (70) (94) (94) (94) (93) (98) (35) (40) — (4) (3) (0) 2 (902) Ontario mining tax (7) (27) (23) (27) (24) (15) (11) (2) (11) (19) (41) (67) (66) (64) (61) (67) (14) (16) — (3) (3) (1) — (568) Free Cash Flow After Taxes 2 352 313 345 264 428 301 234 28 168 322 457 634 619 645 682 779 371 423 215 305 283 204 (16) 8,354 Discounted free cash flow before tax 360 326 327 358 469 321 230 30 162 290 403 534 500 488 481 513 211 229 87 122 108 72 (7) 6,614 Discounted Free Cash Flow After Tax 344 291 306 222 343 230 170 20 111 203 274 362 336 334 336 366 166 180 87 118 104 71 (5) 4,968 Cumulative Discounted Free Cash Flow After Tax 344 635 940 1,162 1,506 1,736 1,907 1,926 2,038 2,240 2,514 2,876 3,212 3,546 3,882 4,247 4,413 4,593 4,680 4,798 4,902 4,973 4,968 4,968 Operating cash cost (US$/oz) 2 556 499 542 528 500 544 600 829 753 633 537 468 464 473 477 441 770 749 1,342 1,196 1,247 1,268 — 619 Cash AISC (US$/oz) 2 844 780 792 741 726 844 904 1,278 1,088 905 735 597 623 597 615 541 872 843 1,458 1,285 1,342 1,373 — 821 Note: 1. Includes adjustment for deferred stripping. 2. Refer to Cautionary Statement on Non-IFRS Financial Performance Measures.

Detour Lake Operations Ontario, Canada NI 43-101 Technical Report March 2021 22-6 Figure 22-1: Sensitivity of After-Tax Net Present Value to Gold Price, Exchange Rate, Operating Cost, and Capital Cost Note: Figure prepared by Kirkland Lake Gold, 2020. Table 22-2: Sensitivity of After-Tax Net Present Value to Gold Price and Exchange Rate 0.0 1.0 2.0 3.0 4.0 5.0 6.0 7.0 -15% -10% -5% 0% 5% 10% 15% Af te r- Ta x N PV @ 5% (C $B ) Change in Variable Gold Price Exchange Rate Operating Cost Capital Cost -0.10 -0.05 Base +0.05 +0.10 1.21 1.26 1.31 1.36 1.41 -200 1,300 2,480 2,856 3,248 3,647 4,023 -100 1,400 3,280 3,711 4,118 4,523 4,936 Base 1,500 4,085 4,522 4,968 5,393 5,816 +100 1,600 4,870 5,331 5,786 6,238 6,689 +200 1,700 5,631 6,114 6,596 7,077 7,554 G ol d Pr ic e (U SD /o z) After Tax NPV @ 5% (C$M) Exchange Rate (CAD/USD)

Detour Lake Operations Ontario, Canada NI 43-101 Technical Report March 2021 22-7 Figure 22-2: Sensitivity of After-Tax Net Present Value to Discount Rate Note: Figure prepared by Kirkland Lake Gold, 2020. C$5.0B @ 5% 0 1 2 3 4 5 6 7 8 9 0% 1% 2% 3% 4% 5% 6% 7% 8% 9% Af te r- Ta x N PV @ 5% (C $B ) Discount Rate Discount Rate Range Extrapolation to Undiscounted Base Case

Detour Lake Operations Ontario, Canada NI 43-101 Technical Report March 2021 23-1 23.0 Adjacent Properties There are no adjacent properties that are relevant to this Report.

Detour Lake Operations Ontario, Canada NI 43-101 Technical Report March 2021 24-1 24.0 Other Relevant Data and Information This section is not relevant to this Report.

Detour Lake Operations Ontario, Canada NI 43-101 Technical Report March 2021 25-1 25.0 Interpretation and Conclusions 25.1 Introduction The QPs note the following interpretations and conclusions in their respective areas of expertise, based on the review of data available for this Report. 25.2 Mineral Tenure, Surface Rights, Water Rights, Royalties and Agreements Information obtained from Kirkland Lake Gold experts supports that the mineral tenure held is valid, and the granted mining lease is sufficient to support a declaration of Mineral Resources and Mineral Reserves. Kirkland Lake Gold has 30 leases and 10 patents totaling 18,574.442 ha of surface rights on the Detour Lake Project. The surface rights are sufficient for all surface infrastructure and mine operation. Surface run-off that is captured at the operations provides the process water. This source is sufficient for the LOM plan. Certain of the claims are subject to a 2% royalty payable to Franco-Nevada Corporation. This royalty is included in the cash flow analysis. Other claims are subject to royalties to third-parties but these claims do not fall within the area of the estimated Mineral Resources and Mineral Reserves. Kirkland Lake Gold has certain payments to First Nations groups in the area of the estimated Mineral Resources and Mineral Reserves; these payments are included in the economic analysis. The Detour Lake Operations are not subject to any other back-in rights payments, agreements or encumbrances. To the extent known, there are no other significant factors and risks that may affect access, title, or the right or ability to perform work on the Project that have not been discussed in this Report. 25.3 Geology and Mineralization The Detour Lake and West Detour deposits are considered to be examples of orogenic greenstone-hosted hydrothermal lode gold deposits. The geological understanding of the settings, lithologies, and structural and alteration controls on mineralization in the different zones is sufficient to support estimation of Mineral Resources and Mineral Reserves. The geological knowledge of the area is also considered sufficiently acceptable to reliably inform mine planning. The mineralization style and setting are well understood and can support declaration of Mineral Resources and Mineral Reserves. Exploration potential remains in the area where Mineral Resources are estimated with all deposits remaining open at depth. Regionally, geophysical surveys and exploration drill
Detour Lake Operations Ontario, Canada NI 43-101 Technical Report March 2021 25-2 holes have identified a number of gold-bearing structural trends that warrant additional exploration evaluation. 25.4 Exploration, Drilling and Analytical Data Collection in Support of Mineral Resource Estimation The exploration programs completed to date are appropriate for the style of the deposits on the Project. Sampling methods are acceptable for Mineral Resource and Mineral Reserve estimation. Sample preparation, analysis and security are generally performed in accordance with exploration best practices and industry standards. The quantity and quality of the lithological, geotechnical, collar and down-hole survey data collected during the exploration and delineation drilling programs are sufficient to support Mineral Resource and Mineral Reserve estimation. The collected sample data adequately reflect deposit dimensions, true widths of mineralization, and the style of the deposits. Sampling is representative of the gold grades in the deposits, reflecting areas of higher and lower grades. The QA/QC programs adequately address issues of precision, accuracy and contamination. Drilling programs since 1993 typically included blanks, duplicates and standard samples. QA/QC submission rates meet industry-accepted standards. The data verification programs concluded that the data collected from the Project adequately support the geological interpretations and constitute a database of sufficient quality to support the use of the data in Mineral Resource and Mineral Reserve estimation. 25.5 Metallurgical Testwork Metallurgical testwork and associated analytical procedures were appropriate to the mineralization type, appropriate to establish processing routes, and were performed using samples that are typical of the mineralization styles found within the Project. Samples selected for testing were representative of the various types and styles of mineralization. Samples were selected from a range of depths within the deposits. Sufficient samples were taken so that tests were performed on sufficient sample mass. The variability of the ore in the Main Detour Pit is related to the talc, copper and sulphur content. Processing of 40% talc ore in feed in 2020 using lead nitrate, yielded similar recoveries as non-talc ore. Sulphur content also impacted recovery and blending strategies to avoid feeding the plant with ores over 2% sulphur are in place and have worked successfully. The recovery equation for the LOM is derived from 2019–2020 plant data. The LOM recovery will follow the 2019–2020 model with a 0.75% improvement forecast starting in 2022 as a result of the various initiatives to improve the recovery are implemented. The lab testwork performed by SGS indicated that the West Detour deposit has similar mineralogy
Detour Lake Operations Ontario, Canada NI 43-101 Technical Report March 2021 25-3 to that of the Detour Lake deposit with similar recoveries. The same recovery assumptions are therefore used for the West Detour Pit and North Pit mineralization as for the Main Pit. Recovery factors estimated are based on appropriate metallurgical testwork, and are appropriate to the mineralization types and the selected process routes. The average LOM recovery forecast is 91.9% for the Detour Lake Main, Detour West and North Pits. 25.6 Mineral Resource Estimates Mineral Resources are reported using the 2014 CIM Definition Standards, and assume both open pit and underground mining methods. Factors that may affect the Mineral Resource estimates include: metal price and exchange rate assumptions; changes to the assumptions used to generate the estimation domains; changes in local interpretations of mineralization geometry and continuity of mineralized zones; changes to geological and mineralization shape and geological and grade continuity assumptions; changes in the treatment of high-grade gold values; density assignments; changes to geotechnical, mining and metallurgical recovery assumptions; changes to the input and design parameter assumptions that pertain to the assumptions for open pit and underground mining constraining the estimates; and assumptions as to the continued ability to access the site, retain mineral and surface rights titles, maintain environment and other regulatory permits, and maintain the social license to operate. There is upside potential for the estimates if mineralization that is currently classified as Inferred can be upgraded to higher-confidence Mineral Resource categories. 25.7 Mineral Reserve Estimates Mineral Reserves are reported using the 2014 CIM Definition Standards and are based on open pit mining methods. Factors that may affect the Mineral Reserve estimates include: changes to the gold price and exchange rate assumptions; changes to pit slope and geotechnical assumptions; changes to operating cost assumptions used in the constraining pit shell; changes to pit designs from those currently envisaged; unforeseen dilution; changes to hydrogeological and pit dewatering assumptions; changes to inputs to capital and operating cost estimates; ability to permit West Detour and North Pit pits and western extent of the ultimate Detour Lake pit; and changes to modifying factor assumptions, including environmental, permitting and social licence to operate. There is upside potential for the estimates if mineralization that is currently classified as Mineral Resources potentially amenable to underground mining methods can be converted to Mineral Reserves following appropriate technical studies. 25.8 Mine Plan The mining operations use conventional open pit mining methods and equipment.

Detour Lake Operations Ontario, Canada NI 43-101 Technical Report March 2021 25-4 Mining is based on a phased approach with stockpiling to bring high-grade forward and provide operational flexibility. There are a total of nine phases designed for the LOM: five for the Detour Lake Main Pit, three for the West Detour Pit, and one for North Pit. The mine production schedule forecasts a total 1,725 Mt to be mined over a period of 18 years (2021–2038). A total of 597 Mt of ore is planned to be milled over a period of 22 years (2021–2042); with the last four years of production supported by long-term stockpile reclaim. The optimized and variable cut-off strategy combined with 158 Mt of stockpile capacity, results in an average LOM stripping ratio of 1.90. 25.9 Recovery Plan The process methods are conventional to the industry. The comminution and recovery processes are widely used in the industry with no significant elements of technological innovation. The process plant flowsheet design was based on testwork results, previous study designs and industry standard practices. The process facilities in use are appropriate to the mineralization styles. With the upturn of current performance of the processing plant, ongoing optimization efforts and some new capital initiatives, the LOM plan assumes that the plant throughput will increase from 23 Mt/a in 2020 to 28.0 Mt/a in 2025 and thereafter. Various initiatives have been developed to bring the plant to the 28 Mt/a throughput rate. The plant will produce variations in recovery due to the day-to-day changes in ore type or combinations of ore type being processed. These variations are expected to trend to the forecast recovery value for monthly or longer reporting periods. 25.10 Infrastructure All key infrastructure is built for the Detour Lake Operations. Projects were ongoing through 2020 which included construction of additional camp capacity, construction of an airfield and aerodrome, construction of an onsite assay laboratory, construction of additional mobile maintenance offices and shops, and construction of additional exploration facilities. Potable water is supplied from lake and groundwater sources. Fresh water is sourced from a lake. Process water is recycled from the TMA. The existing 180 km-long powerline runs from the processing facility to a tie in at Island Falls, and thence to the Pinard substation. The 230 kV transmission line allows for the distribution of more than 85 MW of power, suitable to service the entire Detour Lake Operations. In the event of a power failure, there is sufficient emergency power generation for the provision of basic services.
Detour Lake Operations Ontario, Canada NI 43-101 Technical Report March 2021 25-5 25.11 Environmental, Permitting and Social Considerations The Detour Lake Main Pit and West Detour areas were subject to extensive baseline, environmental monitoring, and technical studies, as per provincial and federal regulatory requirements. The presence of Woodland Caribou is of particular note because it is a Species at Risk, designated as Threatened under the Provincial Endangered Species Act (ESA) and Federal Species at Risk Act. Potential impacts and mitigation measures are being addressed through the process of an Endangered Species Act Permit, for which approval is anticipated in 2021. Kirkland Lake Gold conducts ongoing monitoring and annual reporting under the terms of its permits and approvals. Tailings are stored in at surface in engineered TMA located east of the process plant. The TMA consists of three cells being developed in a planned, progressive manner. The TMA is designed to function as three independent cells for tailings and water management. Tailings, tailings slurry water, and water reclaimed for the operation of the process plant are managed through the TMA. Inspection and monitoring is performed during construction and operation of the tailings dams to assess their performance and safety; and to verify that actual conditions are consistent with the design assumptions and intentions. Environmental protection is ensured through the water management network, which collects seepage and runoff from all mine waste facilities through a system of ditching, pumping, and pipeline infrastructure. The modular design allows for the addition of treatment facilities if required. All permits required for the current Detour Lake Main Pit are in place. Prior to development of the West Detour project, a number of Provincial and Federal environmental approvals, or amendments to existing approvals, will be required. The completion of the West Detour ESR process is anticipated for 2021. The environmental approval applications will provide additional detail regarding the engineering design of the proposed West Detour project facilities, potential effects and proposed mitigations measures. No changes were expected to the approvals list at the Report effective date. As per the Detour Lake Mine Closure Plan Amendment 2, the total estimated closure cost for the Detour Lake Operations at peak development (i.e., all facilities constructed) is $147,734,282, exclusive of the West Detour Project. Security provided to ENDM to date for the present stage of development totals $103,718,794. Financial assurance for the West Detour project will be formalized with the filing of Closure Plan Amendment 3, anticipated for Q4 2021/Q1 2022. Kirkland Lake Gold has undertaken ongoing consultation with the public, government regulators and its Indigenous partners regarding the operations, environmental commitments and planned activities. The company has established firm consultation principles. These principles continue to guide interactions within mine permitting, operations, and exploration.
Detour Lake Operations Ontario, Canada NI 43-101 Technical Report March 2021 25-6 The Company has agreements with First Nations who have treaty and Indigenous rights which they assert within the operations area of the Detour Lake mine. These agreements provides a framework for strengthened collaboration in the development and operations of the mine and outlines tangible benefits for the First Nations, including direct financial support, skills training and employment, opportunities for business development and contracting, and a framework for issues resolution, regulatory permitting and the Company’s future financial contributions. In addition, the Company engages with Indigenous communities in connection with permitting applications and ongoing projects. 25.12 Markets and Contracts Doré from the mine is readily marketable, and contracts are in place for doré sales. Commodity prices used in Mineral Resource and Mineral Reserve estimates are set by Kirkland Lake Gold at the corporate level. The current gold price provided for Mineral Reserve estimation is US$1,300/oz, and US$ 1,500/oz for Mineral Resource estimation. Both Mineral Resource and Mineral Reserve estimates use an exchange rate assumption of 1.31 C$/US$. Kirkland Lake Gold has a number of contracts, agreement and/or purchase orders in place for supply and services that are material to the operation. All contracts or agreements are negotiated with vendors and have a contractual scope, terms and conditions. Contracts are negotiated and renewed as needed. Contract terms are considered to be within industry norms, and typical of similar contracts in Canada with which Kirkland Lake Gold is familiar. 25.13 Capital Cost Estimates Capital costs consist largely of mining equipment (replacements, additions, component replacements, capitalized maintenance), construction of tailings cells and dam raises, deferred stripping using a by-phase approach, and processing plant projects to increase plant capacity to 28 Mt/a. Capital cost estimates are acceptable to support declaration of Mineral Reserves. The LOM plan estimated total capital cost is C$4,744 million. 25.14 Operating Cost Estimates Operating costs for are based on actual costs seen during operations at site and are projected through the LOM plan. The consumables for the operation are based on current prices or contracts for future years. In general, approximately 80% of operating costs are based in Canadian dollars and 20% have US dollar exposure. The exchange rate used in the financial model is 1.31 C$/US$. Operating cost estimates are acceptable to support declaration of Mineral Reserves. The LOM plan estimated total operating cost is C$12,538 million.

Detour Lake Operations Ontario, Canada NI 43-101 Technical Report March 2021 25-7 The LOM unit cost in C$/t mined 1 is C$3.47/t mined. The LOM unit cost in C$/t milled 1 is C$21.00/t milled. The LOM unit cost in C$/oz sold 1 is C$864/oz sold. 25.15 Economic Analysis The cumulative free cash flow before tax 1 is estimated at $11,141 M. The cumulative free cash flow after tax1 is $8,354 M. At a 5% discount rate, the net present value of free cash flows before tax is $6,614 M and of free cash flow after tax is $4,968 M. Internal rate of return and payback period results are not relevant as the cumulative discounted after-tax free cash flows are never negative. This reflects the fact that the Detour Lake Mine is already in operation and that operating cash flows are sufficient to cover sustaining and growth capital requirements. The Project is most sensitive to changes in the gold price and exchange rate, less sensitive to operating cost changes, and least sensitive to changes in the capital cost assumptions. 25.16 Risks and Opportunities The major risks to the Detour Lake Operations are associated with: • Negative variations to the gold and diesel price assumptions; • Significant additional dilution or ore losses; • Significant delays in the assumed permitting timeline for the West Detour project; • Changes in the geotechnical assumptions; • Lower than planned plant production capacity. The major opportunities are: • Exploration potential in the “saddle” zone (area between Detour Main and West Pits), to the west of the West Detour pit and at depth in the West Detour and Detour Main pit areas; • Further improvements in the grade control processes with the installation of an assay laboratory at the mine site; • Increased level of automation in the mine operation (upgrade of the mine network to LTE enables higher level of automation); • Use of alternative energy sources to diesel with the intent of improving business sustainability and competitiveness; 1 Refer to Cautionary Statement on Non-IFRS Financial Performance Measures.

Detour Lake Operations Ontario, Canada NI 43-101 Technical Report March 2021 25-8 25.17 Conclusions Under the assumptions presented in this Report, the Project has a positive cumulative discounted free cash flow after tax 1, and Mineral Reserve estimates can be supported. 1 Refer to Cautionary Statement on Non-IFRS Financial Performance Measures

Detour Lake Operations Ontario, Canada NI 43-101 Technical Report March 2021 26-1 26.0 Recommendations The QPs have no meaningful recommendations that can be made. The Detour Lake Operations have various initiatives that are underway to bring the plant to the 28 Mt/a throughput rate; these initiatives are captured in the capital and operating cost estimates.
Detour Lake Operations Ontario, Canada NI 43-101 Technical Report March 2021 27-1 27.0 References AMEC 2010a. EA for Electricity Projects, for the Diesel Power Generation Required to Support the Construction Phase. AMEC 2010b, EA for Electricity Projects, for Construction of a 230 kilovolt Transmission Line. AMEC 2010c, EA for Resource Stewardship and Facility Development Projects, for the Construction of Facilities Off-Lease. Barclay, W., 1993, Aspect of Structural Geology at the Detour Lake Mine, Ongoing Studies for Placer Dome Inc. BBA, 2010, Feasibility Study Report of the Detour Lake Project, Ontario for Detour Gold Corporation. September 2010. BBA, 2010, Technical Report Feasibility Study of the Detour Lake Project, Ontario for Detour Gold Corporation. June 30, 2010. BBA, 2011, Mineral Resource and Mineral Reserve Update, NI 43-101 Technical Report of the Detour Lake Project, Ontario for Detour Gold Corporation. March 15, 2011. BBA, 2012, Updated Mine Production Plan, NI 43-101 Technical Report of the Detour Lake Project, Ontario for Detour Gold Corporation. October 18, 2012. BBA, 2014, NI 43-101 Technical Report of the Detour Lake Mine, Ontario for Detour Gold Corporation. February 4, 2014. Bernier, L., 2011, Petrographical and Lithogeochemical Analyses of an Amphibolite Unit (AM) from the Detour Mine Sequence, Detour Gold, Internal report prepared for Detour Gold Corp. Canadian Environmental Assessment Agency, 2011, Comprehensive Study Report of the Detour Lake Gold Mine. November 2011. Card et al, 1989, The Archean Superior Province of the Canadian Shield and Its Lode Gold Deposits, Economic Geological Survey of Canada, Contribution Series 38788 Geology Monograph vol. 6, 1989, p. 11-28. Detour Gold Corporation, 2016, Mineral Resource and Reserve Estimate for the Detour Lake Property, NI 43-101 Technical Report of the Detour Lake Property, Ontario. January 25, 2016. Golder Associates, 2011, Updates to the Pit Slope Design for the Detour Lake Project, Report 10-1117-0053. Golder Associates, 2012, Initial Pre-feasibility Level Geotechnical Investigation. Golder Associates, 2013, Feasibility Pit Slope Design for the Trade Winds Open Pit.
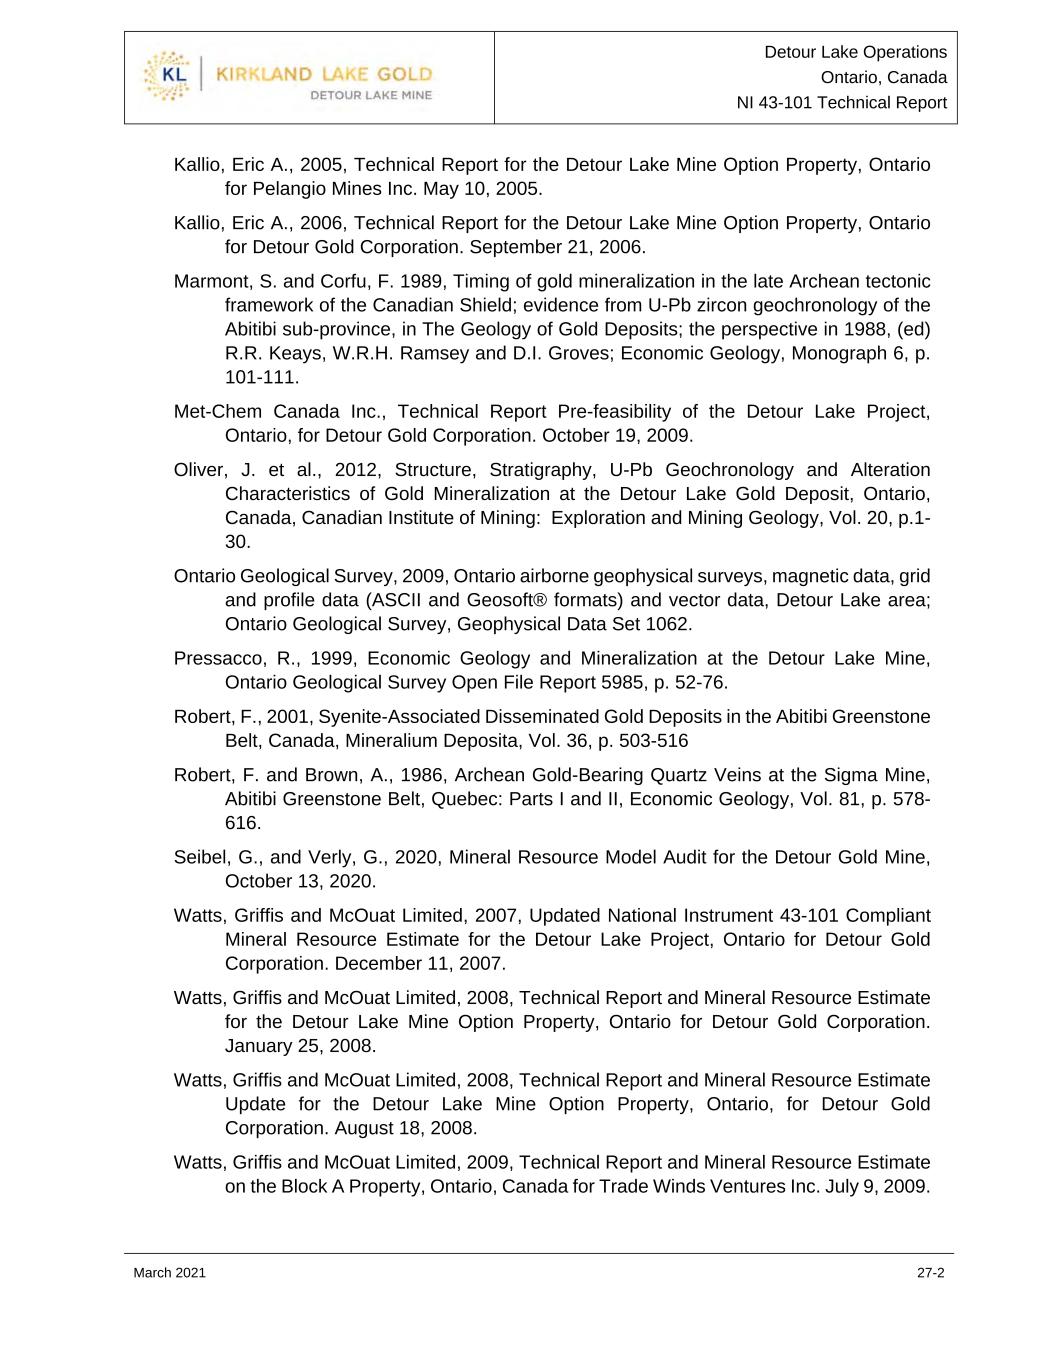
Detour Lake Operations Ontario, Canada NI 43-101 Technical Report March 2021 27-2 Kallio, Eric A., 2005, Technical Report for the Detour Lake Mine Option Property, Ontario for Pelangio Mines Inc. May 10, 2005. Kallio, Eric A., 2006, Technical Report for the Detour Lake Mine Option Property, Ontario for Detour Gold Corporation. September 21, 2006. Marmont, S. and Corfu, F. 1989, Timing of gold mineralization in the late Archean tectonic framework of the Canadian Shield; evidence from U-Pb zircon geochronology of the Abitibi sub-province, in The Geology of Gold Deposits; the perspective in 1988, (ed) R.R. Keays, W.R.H. Ramsey and D.I. Groves; Economic Geology, Monograph 6, p. 101-111. Met-Chem Canada Inc., Technical Report Pre-feasibility of the Detour Lake Project, Ontario, for Detour Gold Corporation. October 19, 2009. Oliver, J. et al., 2012, Structure, Stratigraphy, U-Pb Geochronology and Alteration Characteristics of Gold Mineralization at the Detour Lake Gold Deposit, Ontario, Canada, Canadian Institute of Mining: Exploration and Mining Geology, Vol. 20, p.1- 30. Ontario Geological Survey, 2009, Ontario airborne geophysical surveys, magnetic data, grid and profile data (ASCII and Geosoft® formats) and vector data, Detour Lake area; Ontario Geological Survey, Geophysical Data Set 1062. Pressacco, R., 1999, Economic Geology and Mineralization at the Detour Lake Mine, Ontario Geological Survey Open File Report 5985, p. 52-76. Robert, F., 2001, Syenite-Associated Disseminated Gold Deposits in the Abitibi Greenstone Belt, Canada, Mineralium Deposita, Vol. 36, p. 503-516 Robert, F. and Brown, A., 1986, Archean Gold-Bearing Quartz Veins at the Sigma Mine, Abitibi Greenstone Belt, Quebec: Parts I and II, Economic Geology, Vol. 81, p. 578- 616. Seibel, G., and Verly, G., 2020, Mineral Resource Model Audit for the Detour Gold Mine, October 13, 2020. Watts, Griffis and McOuat Limited, 2007, Updated National Instrument 43-101 Compliant Mineral Resource Estimate for the Detour Lake Project, Ontario for Detour Gold Corporation. December 11, 2007. Watts, Griffis and McOuat Limited, 2008, Technical Report and Mineral Resource Estimate for the Detour Lake Mine Option Property, Ontario for Detour Gold Corporation. January 25, 2008. Watts, Griffis and McOuat Limited, 2008, Technical Report and Mineral Resource Estimate Update for the Detour Lake Mine Option Property, Ontario, for Detour Gold Corporation. August 18, 2008. Watts, Griffis and McOuat Limited, 2009, Technical Report and Mineral Resource Estimate on the Block A Property, Ontario, Canada for Trade Winds Ventures Inc. July 9, 2009.

Detour Lake Operations Ontario, Canada NI 43-101 Technical Report March 2021 27-3 Watts, Griffis and McOuat Limited, 2011, Technical Report and Mineral Resource Update on the Block A Property, Ontario, Canada for Trade Winds Ventures Inc. February 14, 2011.

Detour Lake Operations Ontario, Canada NI 43-101 Technical Report March 2021 Appendix A Appendix A Tenure Number Lease - Patent Rights Status Due Date Hectares Pin Number Ownership Royalty (Y/N) LEA-107174 Lease M & S Renewal in process 2019-Apr-30 269.16 65475-0021(LT) (403804) Detour Gold Corporation Y LEA-107392 Lease M & S Active 2023-Feb-28 331.02 65475-0004(LT) (403804) Detour Gold Corporation Y LEA-107393 Lease M & S Active 2023-Mar-31 391.59 65475-0011(LT) (403804) Detour Gold Corporation Y LEA-107394 Lease M & S Active 2023-Feb-28 301.96 65475-0005(LT) (403804) Detour Gold Corporation Y LEA-107395 Lease M & S Active 2023-Feb-28 424.13 65475-0024(LT) (403804) Detour Gold Corporation Y LEA-107396 Lease M & S Active 2023-Feb-28 352.27 65475-0025(LT) (403804) Detour Gold Corporation Y LEA-107397 Lease M & S Active 2023-Mar-31 268.65 65475-0027(LT) (403804) Detour Gold Corporation Y LEA-107398 Lease M & S Active 2023-Feb-28 370.87 65475-0026(LT) (403804) Detour Gold Corporation Y LEA-107399 Lease M & S Active 2023-Mar-31 281.93 65475-0006(LT) (403804) Detour Gold Corporation Y LEA-107400 Lease M & S Active 2023-Mar-31 349.79 65475-0007(LT) (403804) Detour Gold Corporation Y LEA-107401 Lease M & S Active 2023-Mar-31 274.45 65475-0008(LT) (403804) Detour Gold Corporation Y LEA-107402 Lease M & S Active 2023-Mar-31 199.50 65475-0009(LT) (403804) Detour Gold Corporation Y LEA-107403 Lease M & S Active 2023-Mar-31 404.87 65475-0012(LT) (403804) Detour Gold Corporation Y LEA-107404 Lease M & S Active 2023-Mar-31 460.26 65475-0010(LT) (403804) Detour Gold Corporation Y LEA-108269 Lease M & S Active 2028-Dec-31 137.56 65475-0014(LT) (403804) Detour Gold Corporation N LEA-108375 Lease M & S Active 2030-Apr-30 332.22 65475-0016(LT) (403804) Detour Gold Corporation N LEA-108590 Lease M & S Active 2031-Dec-31 501.62 65475-0019(LT) (403804) Detour Gold Corporation N LEA-108591 Lease M & S Active 2031-Dec-31 487.31 65475-0018(LT) (403804) Detour Gold Corporation N LEA-108598 Lease M & S Active 2031-Oct-31 41.88 65475-0020(LT) (403804) Detour Gold Corporation N LEA-108599 Lease M & S Active 2031-Sep-30 31.52 65475-0017(LT) (403804) Detour Gold Corporation N LEA-108893 Lease M & S Active 2033-Jun-30 137.53 65475-0047(LT) (403804) Detour Gold Corporation N LEA-108894 Lease M & S Active 2033-Jun-30 274.39 65475-0048(LT) (403804) Detour Gold Corporation N LEA-108939 Lease MRO Active 2032-Dec-31 276.10 65475-0028(LT) (403804) Detour Gold Corporation Y LEA-108940 Lease MRO Active 2032-Dec-31 448.10 65475-0023(LT) (403804) Detour Gold Corporation Y LEA-108941 Lease MRO Active 2032-Dec-31 279.18 65475-0022(LT) (403804) Detour Gold Corporation Y
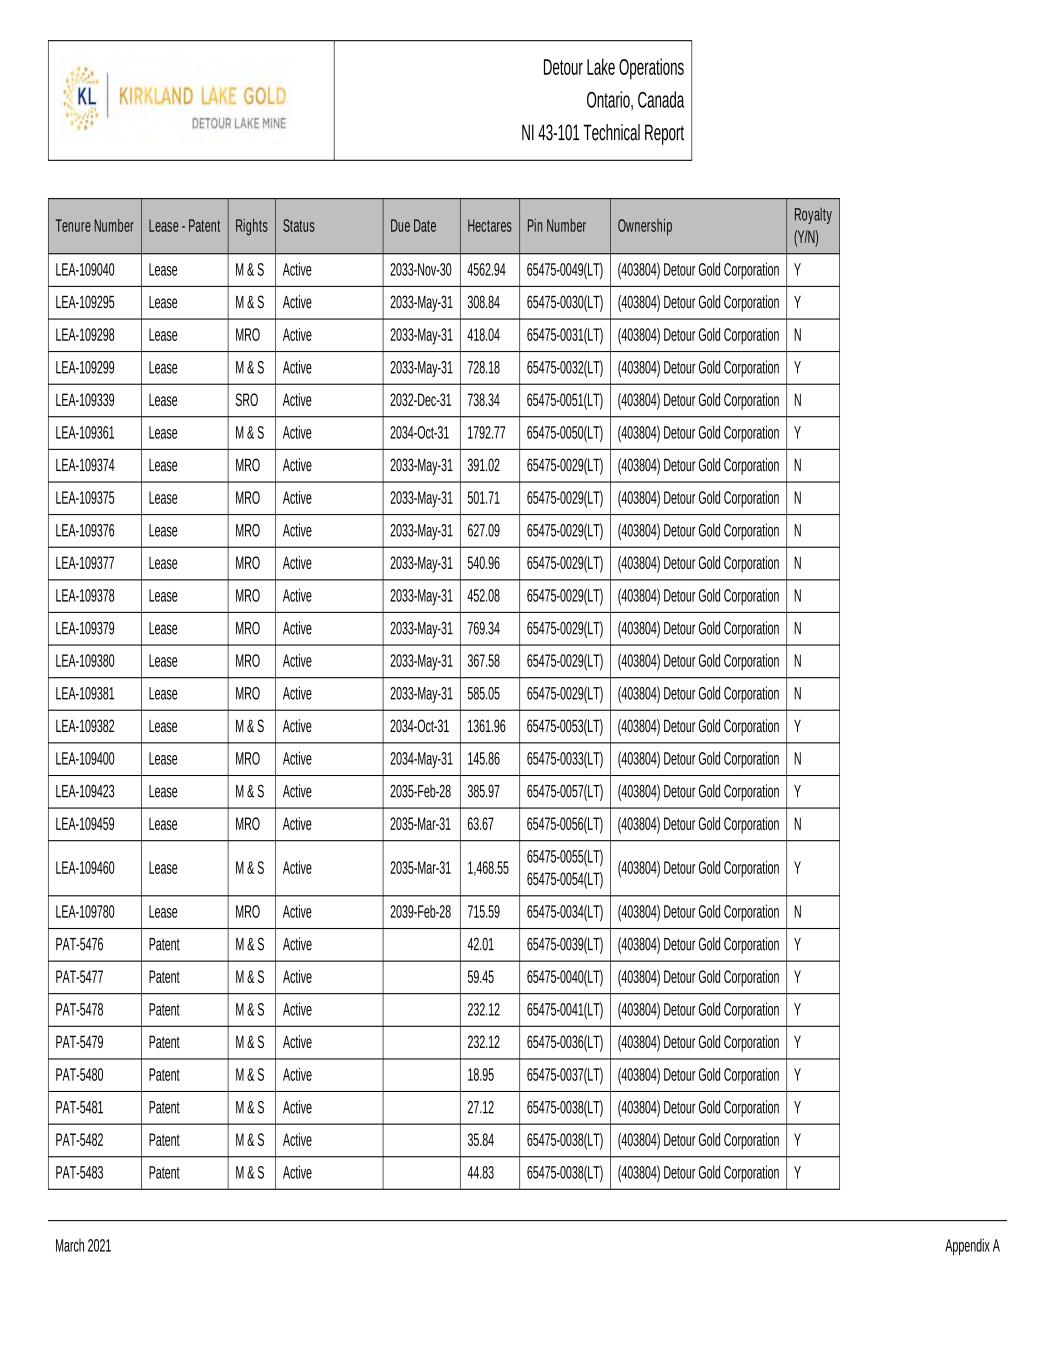
Detour Lake Operations Ontario, Canada NI 43-101 Technical Report March 2021 Appendix A Tenure Number Lease - Patent Rights Status Due Date Hectares Pin Number Ownership Royalty (Y/N) LEA-109040 Lease M & S Active 2033-Nov-30 4562.94 65475-0049(LT) (403804) Detour Gold Corporation Y LEA-109295 Lease M & S Active 2033-May-31 308.84 65475-0030(LT) (403804) Detour Gold Corporation Y LEA-109298 Lease MRO Active 2033-May-31 418.04 65475-0031(LT) (403804) Detour Gold Corporation N LEA-109299 Lease M & S Active 2033-May-31 728.18 65475-0032(LT) (403804) Detour Gold Corporation Y LEA-109339 Lease SRO Active 2032-Dec-31 738.34 65475-0051(LT) (403804) Detour Gold Corporation N LEA-109361 Lease M & S Active 2034-Oct-31 1792.77 65475-0050(LT) (403804) Detour Gold Corporation Y LEA-109374 Lease MRO Active 2033-May-31 391.02 65475-0029(LT) (403804) Detour Gold Corporation N LEA-109375 Lease MRO Active 2033-May-31 501.71 65475-0029(LT) (403804) Detour Gold Corporation N LEA-109376 Lease MRO Active 2033-May-31 627.09 65475-0029(LT) (403804) Detour Gold Corporation N LEA-109377 Lease MRO Active 2033-May-31 540.96 65475-0029(LT) (403804) Detour Gold Corporation N LEA-109378 Lease MRO Active 2033-May-31 452.08 65475-0029(LT) (403804) Detour Gold Corporation N LEA-109379 Lease MRO Active 2033-May-31 769.34 65475-0029(LT) (403804) Detour Gold Corporation N LEA-109380 Lease MRO Active 2033-May-31 367.58 65475-0029(LT) (403804) Detour Gold Corporation N LEA-109381 Lease MRO Active 2033-May-31 585.05 65475-0029(LT) (403804) Detour Gold Corporation N LEA-109382 Lease M & S Active 2034-Oct-31 1361.96 65475-0053(LT) (403804) Detour Gold Corporation Y LEA-109400 Lease MRO Active 2034-May-31 145.86 65475-0033(LT) (403804) Detour Gold Corporation N LEA-109423 Lease M & S Active 2035-Feb-28 385.97 65475-0057(LT) (403804) Detour Gold Corporation Y LEA-109459 Lease MRO Active 2035-Mar-31 63.67 65475-0056(LT) (403804) Detour Gold Corporation N LEA-109460 Lease M & S Active 2035-Mar-31 1,468.55 65475-0055(LT) 65475-0054(LT) (403804) Detour Gold Corporation Y LEA-109780 Lease MRO Active 2039-Feb-28 715.59 65475-0034(LT) (403804) Detour Gold Corporation N PAT-5476 Patent M & S Active 42.01 65475-0039(LT) (403804) Detour Gold Corporation Y PAT-5477 Patent M & S Active 59.45 65475-0040(LT) (403804) Detour Gold Corporation Y PAT-5478 Patent M & S Active 232.12 65475-0041(LT) (403804) Detour Gold Corporation Y PAT-5479 Patent M & S Active 232.12 65475-0036(LT) (403804) Detour Gold Corporation Y PAT-5480 Patent M & S Active 18.95 65475-0037(LT) (403804) Detour Gold Corporation Y PAT-5481 Patent M & S Active 27.12 65475-0038(LT) (403804) Detour Gold Corporation Y PAT-5482 Patent M & S Active 35.84 65475-0038(LT) (403804) Detour Gold Corporation Y PAT-5483 Patent M & S Active 44.83 65475-0038(LT) (403804) Detour Gold Corporation Y

Detour Lake Operations Ontario, Canada NI 43-101 Technical Report March 2021 Appendix A Tenure Number Lease - Patent Rights Status Due Date Hectares Pin Number Ownership Royalty (Y/N) PAT-5484 Patent M & S Active 67.38 65475-0038(LT) (403804) Detour Gold Corporation Y PAT-5485 Patent M & S Active 30.76 65475-0038(LT) (403804) Detour Gold Corporation Y

Detour Lake Operations Ontario, Canada NI 43-101 Technical Report March 2021 Appendix A Claim Number Claim Type Ownership Township Anniversary Date Work Required Royalty Y/N 102186 BCMC Detour Gold Corporation 100% Lower Detour Lake 10/14/2026 200 Y 102789 SCMC Detour Gold Corporation 100% Lower Detour Lake 6/3/2026 400 N 103323 SCMC Detour Gold Corporation 100% Lower Detour Lake 4/19/2027 400 N 103379 BCMC Detour Gold Corporation 100% Lower Detour Lake 4/19/2027 200 N 103760 BCMC Detour Gold Corporation 100% Atkinson Lake 4/19/2027 200 N 103801 SCMC Detour Gold Corporation 100% Sunday Lake 4/26/2027 400 N 103802 SCMC Detour Gold Corporation 100% Sunday Lake 4/26/2027 200 N 103814 SCMC Detour Gold Corporation 100% Lower Detour Lake 8/8/2026 200 N 103840 SCMC Detour Gold Corporation 100% Lower Detour Lake 8/8/2026 400 N 104221 SCMC Detour Gold Corporation 100% West of Sunday Lake 8/20/2027 400 N 104222 SCMC Detour Gold Corporation 100% West of Sunday Lake 8/20/2027 400 N 104223 BCMC Detour Gold Corporation 100% West of Sunday Lake 8/20/2027 200 N 104688 SCMC Detour Gold Corporation 100% Sunday Lake 4/26/2027 400 N 104689 SCMC Detour Gold Corporation 100% Sunday Lake 4/26/2027 400 N 104741 BCMC Detour Gold Corporation 100% Sunday Lake 4/26/2027 200 N 104753 SCMC Detour Gold Corporation 100% Lower Detour Lake 8/8/2026 200 N 104754 SCMC Detour Gold Corporation 100% Lower Detour Lake 8/8/2026 400 N 104946 SCMC Detour Gold Corporation 100% Atkinson Lake 4/19/2027 400 N 104947 SCMC Detour Gold Corporation 100% Atkinson Lake 4/19/2027 400 N 104950 BCMC Detour Gold Corporation 100% West of Sunday Lake 5/28/2027 200 Y 105245 SCMC Detour Gold Corporation 100% Hopper Lake 5/28/2027 400 Y 105387 SCMC Detour Gold Corporation 100% Lower Detour Lake 3/11/2027 400 N 105398 SCMC Detour Gold Corporation 100% Sunday Lake 4/26/2027 400 N 105417 SCMC Detour Gold Corporation 100% Sunday Lake 4/26/2027 400 N 105418 SCMC Detour Gold Corporation 100% Sunday Lake 4/26/2027 400 N 105516 BCMC Detour Gold Corporation 100% West of Sunday Lake 4/23/2027 200 Y 105519 SCMC Detour Gold Corporation 100% Hopper Lake 3/15/2027 400 Y 105520 SCMC Detour Gold Corporation 100% Hopper Lake 3/15/2027 400 Y 105954 BCMC Detour Gold Corporation 100% West of Sunday Lake 10/25/2027 200 N 106191 SCMC Detour Gold Corporation 100% Sunday Lake 4/26/2027 400 N 106192 SCMC Detour Gold Corporation 100% Sunday Lake 4/26/2027 400 N 106573 SCMC Detour Gold Corporation 100% Atkinson Lake 4/19/2027 400 N 106574 SCMC Detour Gold Corporation 100% Atkinson Lake 4/19/2027 400 N 106593 BCMC Detour Gold Corporation 100% Hopper Lake 8/20/2027 200 N 106613 SCMC Detour Gold Corporation 100% West of Sunday Lake 6/3/2027 400 N 106683 SCMC Detour Gold Corporation 100% Lower Detour Lake 6/3/2026 400 N 107181 SCMC Detour Gold Corporation 100% West of Sunday Lake 4/13/2027 400 Y 107249 SCMC Detour Gold Corporation 100% Hopper Lake 8/20/2027 400 N 107299 SCMC Detour Gold Corporation 100% Sunday Lake 4/26/2027 200 N 107359 BCMC Detour Gold Corporation 100% Hopper Lake 5/28/2027 200 Y 107573 SCMC Detour Gold Corporation 100% Atkinson Lake 4/19/2027 400 N

Detour Lake Operations Ontario, Canada NI 43-101 Technical Report March 2021 Appendix A Claim Number Claim Type Ownership Township Anniversary Date Work Required Royalty Y/N 107574 SCMC Detour Gold Corporation 100% Atkinson Lake 4/19/2027 400 N 107617 SCMC Detour Gold Corporation 100% West of Sunday Lake 9/18/2027 200 Y 107620 BCMC Detour Gold Corporation 100% Atkinson Lake 4/19/2025 200 N 107621 SCMC Detour Gold Corporation 100% Atkinson Lake 4/19/2027 400 N 107665 SCMC Detour Gold Corporation 100% Sunday Lake 4/26/2027 400 N 107700 BCMC Detour Gold Corporation 100% Atkinson Lake 4/19/2027 200 N 107710 SCMC Detour Gold Corporation 100% Sunday Lake 4/26/2027 400 N 107711 SCMC Detour Gold Corporation 100% Sunday Lake 4/26/2027 400 N 107909 SCMC Detour Gold Corporation 100% Sunday Lake 4/26/2027 400 N 107910 SCMC Detour Gold Corporation 100% Sunday Lake 4/26/2027 400 N 108280 BCMC Detour Gold Corporation 100% West of Sunday Lake 4/23/2027 200 Y 108302 SCMC Detour Gold Corporation 100% Atkinson Lake 4/19/2027 400 N 108550 SCMC Detour Gold Corporation 100% West of Sunday Lake 4/23/2026 400 Y 108551 SCMC Detour Gold Corporation 100% West of Sunday Lake 4/23/2026 400 Y 108552 SCMC Detour Gold Corporation 100% West of Sunday Lake 4/23/2026 400 Y 108798 SCMC Detour Gold Corporation 100% Hopper Lake 3/15/2027 400 Y 108861 BCMC Detour Gold Corporation 100% Atkinson Lake 4/19/2025 200 N 108862 BCMC Detour Gold Corporation 100% Atkinson Lake 4/19/2025 200 N 108863 BCMC Detour Gold Corporation 100% Atkinson Lake 4/19/2025 200 N 109046 SCMC Detour Gold Corporation 100% Atkinson Lake 4/19/2027 400 N 109332 SCMC Detour Gold Corporation 100% Sunday Lake 4/26/2027 400 N 109363 SCMC Detour Gold Corporation 100% Lower Detour Lake 4/19/2027 400 N 109375 SCMC Detour Gold Corporation 100% West of Sunday Lake 4/23/2027 400 Y 109399 BCMC Detour Gold Corporation 100% West of Sunday Lake 4/23/2027 200 Y 109400 BCMC Detour Gold Corporation 100% West of Sunday Lake 4/23/2027 200 Y 109424 SCMC Detour Gold Corporation 100% Hopper Lake 8/20/2027 400 N 109914 SCMC Detour Gold Corporation 100% Sunday Lake 4/26/2027 400 N 109915 SCMC Detour Gold Corporation 100% Sunday Lake 4/26/2027 400 N 110021 BCMC Detour Gold Corporation 100% Sunday Lake 4/26/2027 200 N 110187 SCMC Detour Gold Corporation 100% Atkinson Lake 4/19/2027 400 N 110188 BCMC Detour Gold Corporation 100% Atkinson Lake 4/19/2025 200 N 110197 SCMC Detour Gold Corporation 100% Sunday Lake 4/26/2027 400 N 110328 SCMC Detour Gold Corporation 100% Atkinson Lake 4/19/2027 400 N 110577 SCMC Detour Gold Corporation 100% Lower Detour Lake 3/11/2027 400 N 110760 SCMC Detour Gold Corporation 100% Hopper Lake 8/20/2027 400 N 110799 SCMC Detour Gold Corporation 100% Sunday Lake 7/12/2027 200 Y 110882 SCMC Detour Gold Corporation 100% Sunday Lake 4/26/2027 200 N 110883 SCMC Detour Gold Corporation 100% Sunday Lake 4/26/2027 200 N 110916 SCMC Detour Gold Corporation 100% West of Sunday Lake 8/20/2027 400 N 110917 SCMC Detour Gold Corporation 100% West of Sunday Lake 8/20/2027 400 N 111024 SCMC Detour Gold Corporation 100% Hopper Lake 9/8/2026 400 N
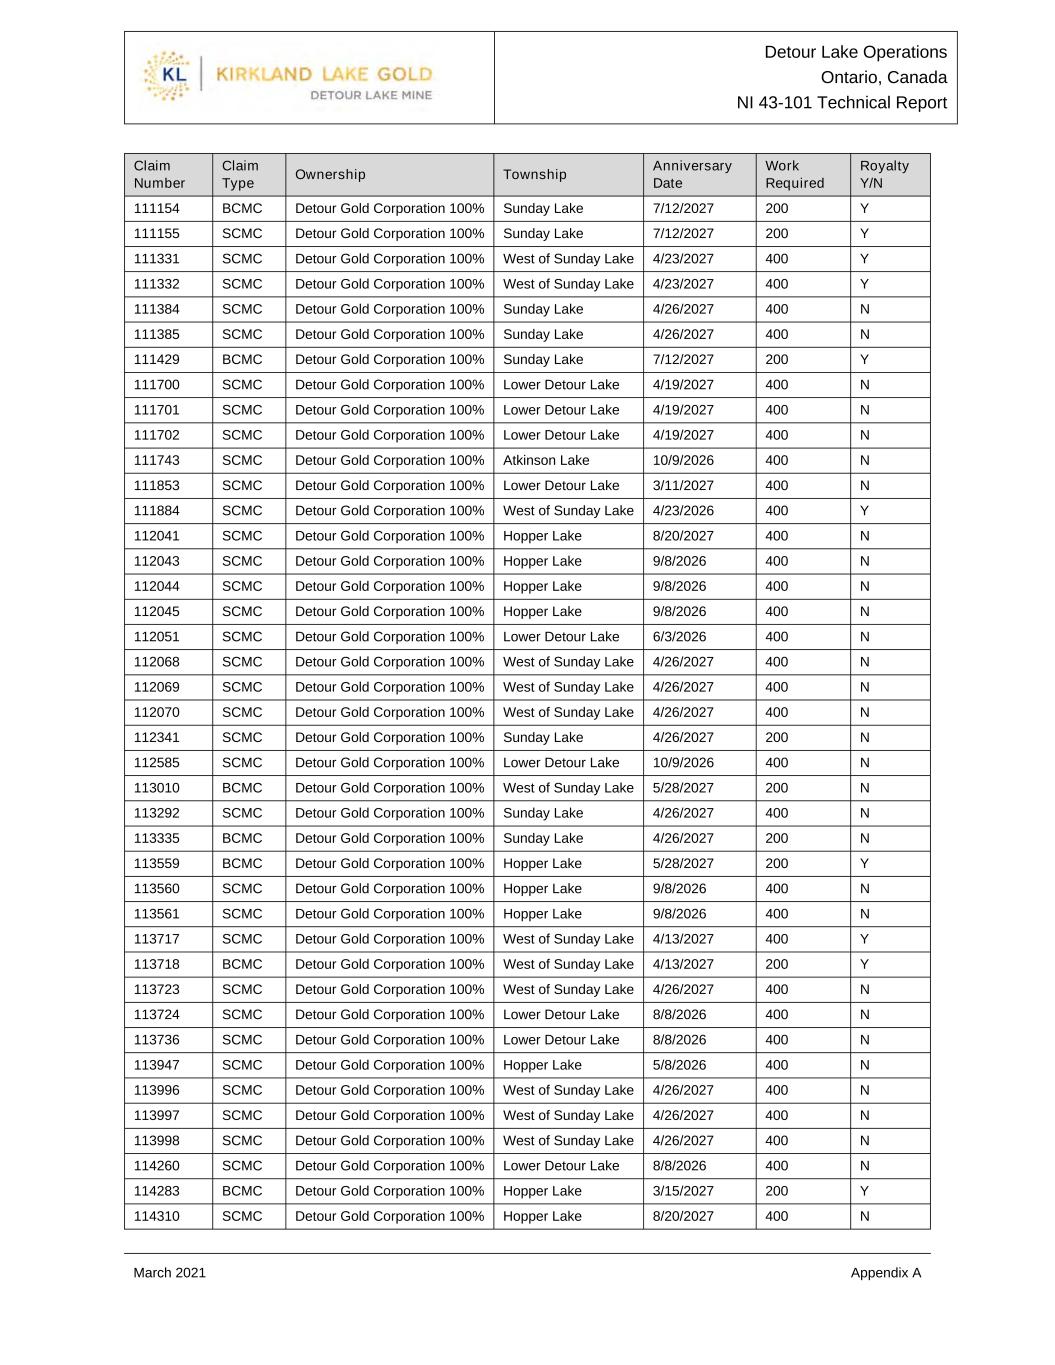
Detour Lake Operations Ontario, Canada NI 43-101 Technical Report March 2021 Appendix A Claim Number Claim Type Ownership Township Anniversary Date Work Required Royalty Y/N 111154 BCMC Detour Gold Corporation 100% Sunday Lake 7/12/2027 200 Y 111155 SCMC Detour Gold Corporation 100% Sunday Lake 7/12/2027 200 Y 111331 SCMC Detour Gold Corporation 100% West of Sunday Lake 4/23/2027 400 Y 111332 SCMC Detour Gold Corporation 100% West of Sunday Lake 4/23/2027 400 Y 111384 SCMC Detour Gold Corporation 100% Sunday Lake 4/26/2027 400 N 111385 SCMC Detour Gold Corporation 100% Sunday Lake 4/26/2027 400 N 111429 BCMC Detour Gold Corporation 100% Sunday Lake 7/12/2027 200 Y 111700 SCMC Detour Gold Corporation 100% Lower Detour Lake 4/19/2027 400 N 111701 SCMC Detour Gold Corporation 100% Lower Detour Lake 4/19/2027 400 N 111702 SCMC Detour Gold Corporation 100% Lower Detour Lake 4/19/2027 400 N 111743 SCMC Detour Gold Corporation 100% Atkinson Lake 10/9/2026 400 N 111853 SCMC Detour Gold Corporation 100% Lower Detour Lake 3/11/2027 400 N 111884 SCMC Detour Gold Corporation 100% West of Sunday Lake 4/23/2026 400 Y 112041 SCMC Detour Gold Corporation 100% Hopper Lake 8/20/2027 400 N 112043 SCMC Detour Gold Corporation 100% Hopper Lake 9/8/2026 400 N 112044 SCMC Detour Gold Corporation 100% Hopper Lake 9/8/2026 400 N 112045 SCMC Detour Gold Corporation 100% Hopper Lake 9/8/2026 400 N 112051 SCMC Detour Gold Corporation 100% Lower Detour Lake 6/3/2026 400 N 112068 SCMC Detour Gold Corporation 100% West of Sunday Lake 4/26/2027 400 N 112069 SCMC Detour Gold Corporation 100% West of Sunday Lake 4/26/2027 400 N 112070 SCMC Detour Gold Corporation 100% West of Sunday Lake 4/26/2027 400 N 112341 SCMC Detour Gold Corporation 100% Sunday Lake 4/26/2027 200 N 112585 SCMC Detour Gold Corporation 100% Lower Detour Lake 10/9/2026 400 N 113010 BCMC Detour Gold Corporation 100% West of Sunday Lake 5/28/2027 200 N 113292 SCMC Detour Gold Corporation 100% Sunday Lake 4/26/2027 400 N 113335 BCMC Detour Gold Corporation 100% Sunday Lake 4/26/2027 200 N 113559 BCMC Detour Gold Corporation 100% Hopper Lake 5/28/2027 200 Y 113560 SCMC Detour Gold Corporation 100% Hopper Lake 9/8/2026 400 N 113561 SCMC Detour Gold Corporation 100% Hopper Lake 9/8/2026 400 N 113717 SCMC Detour Gold Corporation 100% West of Sunday Lake 4/13/2027 400 Y 113718 BCMC Detour Gold Corporation 100% West of Sunday Lake 4/13/2027 200 Y 113723 SCMC Detour Gold Corporation 100% West of Sunday Lake 4/26/2027 400 N 113724 SCMC Detour Gold Corporation 100% Lower Detour Lake 8/8/2026 400 N 113736 SCMC Detour Gold Corporation 100% Lower Detour Lake 8/8/2026 400 N 113947 SCMC Detour Gold Corporation 100% Hopper Lake 5/8/2026 400 N 113996 SCMC Detour Gold Corporation 100% West of Sunday Lake 4/26/2027 400 N 113997 SCMC Detour Gold Corporation 100% West of Sunday Lake 4/26/2027 400 N 113998 SCMC Detour Gold Corporation 100% West of Sunday Lake 4/26/2027 400 N 114260 SCMC Detour Gold Corporation 100% Lower Detour Lake 8/8/2026 400 N 114283 BCMC Detour Gold Corporation 100% Hopper Lake 3/15/2027 200 Y 114310 SCMC Detour Gold Corporation 100% Hopper Lake 8/20/2027 400 N
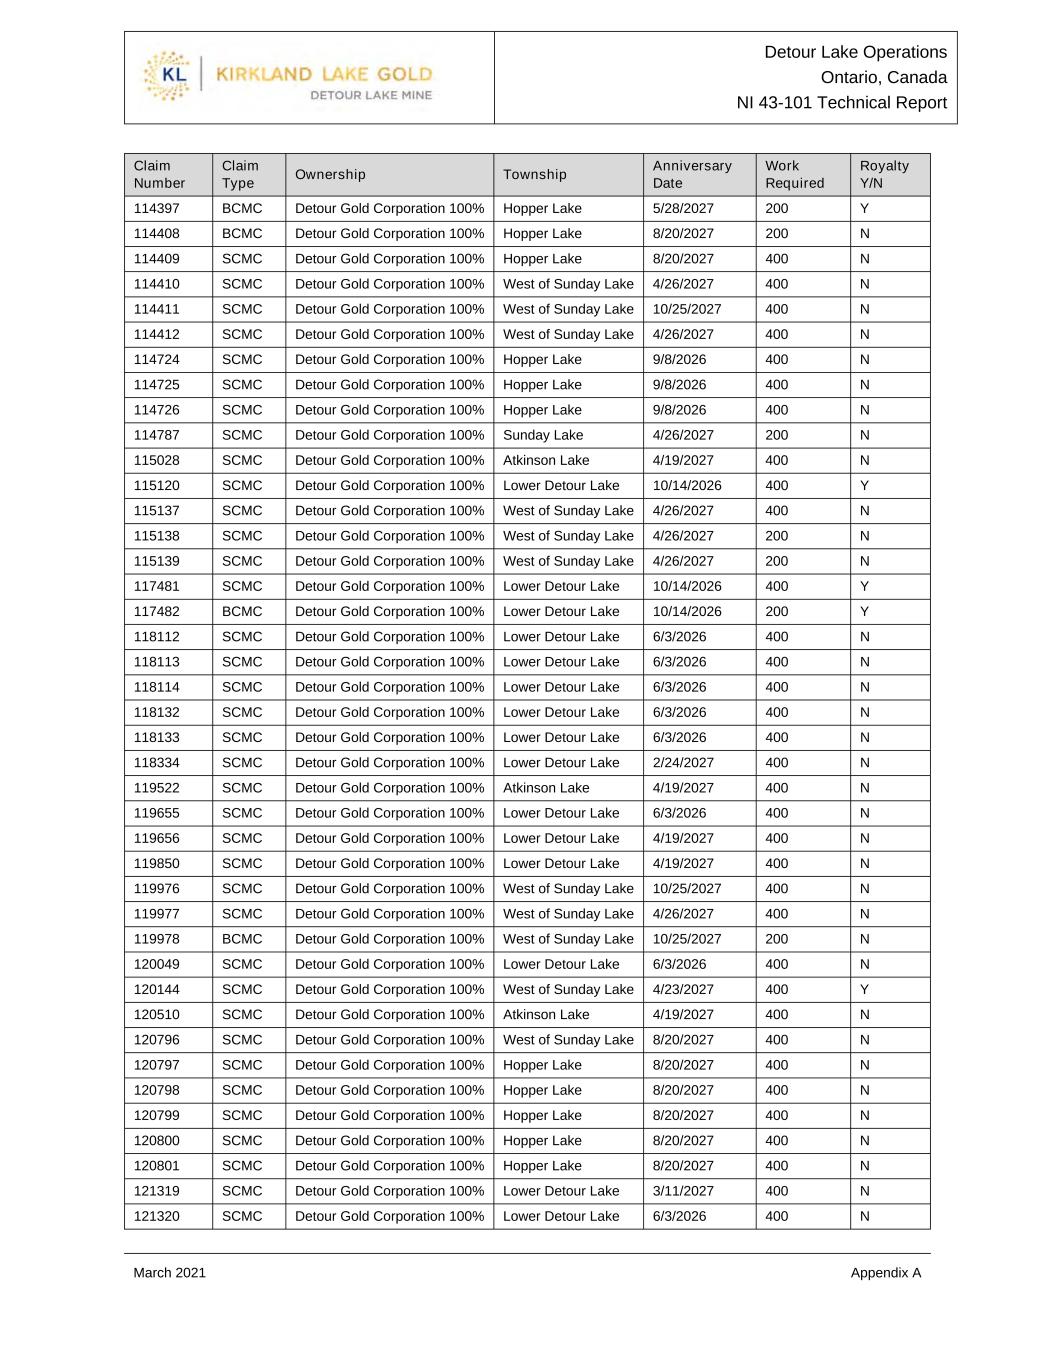
Detour Lake Operations Ontario, Canada NI 43-101 Technical Report March 2021 Appendix A Claim Number Claim Type Ownership Township Anniversary Date Work Required Royalty Y/N 114397 BCMC Detour Gold Corporation 100% Hopper Lake 5/28/2027 200 Y 114408 BCMC Detour Gold Corporation 100% Hopper Lake 8/20/2027 200 N 114409 SCMC Detour Gold Corporation 100% Hopper Lake 8/20/2027 400 N 114410 SCMC Detour Gold Corporation 100% West of Sunday Lake 4/26/2027 400 N 114411 SCMC Detour Gold Corporation 100% West of Sunday Lake 10/25/2027 400 N 114412 SCMC Detour Gold Corporation 100% West of Sunday Lake 4/26/2027 400 N 114724 SCMC Detour Gold Corporation 100% Hopper Lake 9/8/2026 400 N 114725 SCMC Detour Gold Corporation 100% Hopper Lake 9/8/2026 400 N 114726 SCMC Detour Gold Corporation 100% Hopper Lake 9/8/2026 400 N 114787 SCMC Detour Gold Corporation 100% Sunday Lake 4/26/2027 200 N 115028 SCMC Detour Gold Corporation 100% Atkinson Lake 4/19/2027 400 N 115120 SCMC Detour Gold Corporation 100% Lower Detour Lake 10/14/2026 400 Y 115137 SCMC Detour Gold Corporation 100% West of Sunday Lake 4/26/2027 400 N 115138 SCMC Detour Gold Corporation 100% West of Sunday Lake 4/26/2027 200 N 115139 SCMC Detour Gold Corporation 100% West of Sunday Lake 4/26/2027 200 N 117481 SCMC Detour Gold Corporation 100% Lower Detour Lake 10/14/2026 400 Y 117482 BCMC Detour Gold Corporation 100% Lower Detour Lake 10/14/2026 200 Y 118112 SCMC Detour Gold Corporation 100% Lower Detour Lake 6/3/2026 400 N 118113 SCMC Detour Gold Corporation 100% Lower Detour Lake 6/3/2026 400 N 118114 SCMC Detour Gold Corporation 100% Lower Detour Lake 6/3/2026 400 N 118132 SCMC Detour Gold Corporation 100% Lower Detour Lake 6/3/2026 400 N 118133 SCMC Detour Gold Corporation 100% Lower Detour Lake 6/3/2026 400 N 118334 SCMC Detour Gold Corporation 100% Lower Detour Lake 2/24/2027 400 N 119522 SCMC Detour Gold Corporation 100% Atkinson Lake 4/19/2027 400 N 119655 SCMC Detour Gold Corporation 100% Lower Detour Lake 6/3/2026 400 N 119656 SCMC Detour Gold Corporation 100% Lower Detour Lake 4/19/2027 400 N 119850 SCMC Detour Gold Corporation 100% Lower Detour Lake 4/19/2027 400 N 119976 SCMC Detour Gold Corporation 100% West of Sunday Lake 10/25/2027 400 N 119977 SCMC Detour Gold Corporation 100% West of Sunday Lake 4/26/2027 400 N 119978 BCMC Detour Gold Corporation 100% West of Sunday Lake 10/25/2027 200 N 120049 SCMC Detour Gold Corporation 100% Lower Detour Lake 6/3/2026 400 N 120144 SCMC Detour Gold Corporation 100% West of Sunday Lake 4/23/2027 400 Y 120510 SCMC Detour Gold Corporation 100% Atkinson Lake 4/19/2027 400 N 120796 SCMC Detour Gold Corporation 100% West of Sunday Lake 8/20/2027 400 N 120797 SCMC Detour Gold Corporation 100% Hopper Lake 8/20/2027 400 N 120798 SCMC Detour Gold Corporation 100% Hopper Lake 8/20/2027 400 N 120799 SCMC Detour Gold Corporation 100% Hopper Lake 8/20/2027 400 N 120800 SCMC Detour Gold Corporation 100% Hopper Lake 8/20/2027 400 N 120801 SCMC Detour Gold Corporation 100% Hopper Lake 8/20/2027 400 N 121319 SCMC Detour Gold Corporation 100% Lower Detour Lake 3/11/2027 400 N 121320 SCMC Detour Gold Corporation 100% Lower Detour Lake 6/3/2026 400 N

Detour Lake Operations Ontario, Canada NI 43-101 Technical Report March 2021 Appendix A Claim Number Claim Type Ownership Township Anniversary Date Work Required Royalty Y/N 121321 SCMC Detour Gold Corporation 100% Lower Detour Lake 6/3/2026 200 N 121322 SCMC Detour Gold Corporation 100% Lower Detour Lake 6/3/2026 200 N 121323 BCMC Detour Gold Corporation 100% Lower Detour Lake 6/3/2026 200 N 121324 SCMC Detour Gold Corporation 100% West of Sunday Lake 6/3/2027 400 N 121388 SCMC Detour Gold Corporation 100% Lower Detour Lake 6/3/2026 400 N 121498 SCMC Detour Gold Corporation 100% Lower Detour Lake 3/11/2027 400 N 121499 SCMC Detour Gold Corporation 100% Lower Detour Lake 3/11/2027 400 N 122553 SCMC Detour Gold Corporation 100% Lower Detour Lake 6/3/2026 400 N 122966 SCMC Detour Gold Corporation 100% Lower Detour Lake 4/19/2027 400 N 123229 SCMC Detour Gold Corporation 100% Sunday Lake 4/26/2027 200 N 123326 BCMC Detour Gold Corporation 100% Atkinson Lake 4/19/2027 200 N 123408 BCMC Detour Gold Corporation 100% West of Sunday Lake 5/28/2027 200 Y 123428 SCMC Detour Gold Corporation 100% Hopper Lake 9/8/2026 400 N 123486 SCMC Detour Gold Corporation 100% Hopper Lake 5/8/2026 400 N 123884 SCMC Detour Gold Corporation 100% Lower Detour Lake 8/8/2026 200 N 123885 SCMC Detour Gold Corporation 100% Lower Detour Lake 8/8/2026 200 N 123969 SCMC Detour Gold Corporation 100% Lower Detour Lake 10/9/2026 400 N 124008 SCMC Detour Gold Corporation 100% West of Sunday Lake 5/28/2027 400 Y 124055 BCMC Detour Gold Corporation 100% Atkinson Lake 4/19/2027 200 N 124089 SCMC Detour Gold Corporation 100% Sunday Lake 4/26/2027 400 N 124133 BCMC Detour Gold Corporation 100% Atkinson Lake 4/19/2027 200 N 124137 SCMC Detour Gold Corporation 100% Sunday Lake 4/26/2027 400 N 124138 SCMC Detour Gold Corporation 100% Sunday Lake 4/26/2027 400 N 124139 SCMC Detour Gold Corporation 100% Sunday Lake 4/26/2027 400 N 125142 SCMC Detour Gold Corporation 100% Lower Detour Lake 6/3/2026 400 N 125143 SCMC Detour Gold Corporation 100% Lower Detour Lake 6/3/2026 400 N 125165 SCMC Detour Gold Corporation 100% Lower Detour Lake 6/3/2026 400 N 125311 SCMC Detour Gold Corporation 100% Lower Detour Lake 3/11/2027 400 N 125361 SCMC Detour Gold Corporation 100% Sunday Lake 4/26/2027 400 N 125362 SCMC Detour Gold Corporation 100% Sunday Lake 4/26/2027 400 N 126183 BCMC Detour Gold Corporation 100% West of Sunday Lake 4/23/2027 200 Y 126554 BCMC Detour Gold Corporation 100% Hopper Lake 5/28/2027 200 Y 127183 SCMC Detour Gold Corporation 100% Lower Detour Lake 4/19/2027 400 N 127184 SCMC Detour Gold Corporation 100% Lower Detour Lake 4/19/2027 400 N 127295 SCMC Detour Gold Corporation 100% Sunday Lake 4/26/2027 400 N 127296 SCMC Detour Gold Corporation 100% Sunday Lake 4/26/2027 400 N 127297 SCMC Detour Gold Corporation 100% Sunday Lake 4/26/2027 400 N 127298 SCMC Detour Gold Corporation 100% Sunday Lake 4/26/2027 400 N 127366 SCMC Detour Gold Corporation 100% Atkinson Lake 4/19/2027 400 N 127456 SCMC Detour Gold Corporation 100% Sunday Lake 4/26/2027 400 N 127457 SCMC Detour Gold Corporation 100% Sunday Lake 4/26/2027 400 N

Detour Lake Operations Ontario, Canada NI 43-101 Technical Report March 2021 Appendix A Claim Number Claim Type Ownership Township Anniversary Date Work Required Royalty Y/N 127653 BCMC Detour Gold Corporation 100% Lower Detour Lake 6/3/2026 200 N 127654 BCMC Detour Gold Corporation 100% Lower Detour Lake 6/3/2026 200 N 127655 SCMC Detour Gold Corporation 100% Lower Detour Lake 6/3/2026 400 N 127881 SCMC Detour Gold Corporation 100% Lower Detour Lake 8/8/2026 400 N 127882 SCMC Detour Gold Corporation 100% Lower Detour Lake 8/8/2026 400 N 128152 SCMC Detour Gold Corporation 100% Lower Detour Lake 8/8/2026 200 N 128153 SCMC Detour Gold Corporation 100% Lower Detour Lake 8/8/2026 400 N 128195 SCMC Detour Gold Corporation 100% Hopper Lake 8/20/2027 400 N 128196 SCMC Detour Gold Corporation 100% Hopper Lake 8/20/2027 400 N 128576 SCMC Detour Gold Corporation 100% Atkinson Lake 4/19/2027 400 N 128577 SCMC Detour Gold Corporation 100% Atkinson Lake 4/19/2027 400 N 129218 SCMC Detour Gold Corporation 100% Atkinson Lake 10/9/2026 400 N 129314 SCMC Detour Gold Corporation 100% Lower Detour Lake 10/25/2027 200 N 129320 SCMC Detour Gold Corporation 100% Lower Detour Lake 6/3/2026 400 N 129321 SCMC Detour Gold Corporation 100% Lower Detour Lake 10/9/2026 400 N 129339 SCMC Detour Gold Corporation 100% Lower Detour Lake 4/19/2027 400 N 129889 SCMC Detour Gold Corporation 100% Lower Detour Lake 4/19/2027 400 N 130033 SCMC Detour Gold Corporation 100% West of Sunday Lake 4/23/2026 400 Y 130034 SCMC Detour Gold Corporation 100% Lower Detour Lake 9/22/2026 200 N 130035 SCMC Detour Gold Corporation 100% Lower Detour Lake 9/22/2026 400 N 130036 SCMC Detour Gold Corporation 100% Atkinson Lake 4/19/2027 400 N 130037 BCMC Detour Gold Corporation 100% Lower Detour Lake 4/19/2027 200 N 130261 SCMC Detour Gold Corporation 100% Hopper Lake 5/28/2027 400 Y 130653 SCMC Detour Gold Corporation 100% West of Sunday Lake 9/18/2027 200 Y 130826 SCMC Detour Gold Corporation 100% West of Sunday Lake 5/28/2027 400 Y 131422 BCMC Detour Gold Corporation 100% West of Sunday Lake 4/23/2027 200 Y 131423 SCMC Detour Gold Corporation 100% Atkinson Lake 4/19/2027 400 N 131424 SCMC Detour Gold Corporation 100% Atkinson Lake 4/19/2027 400 N 131425 SCMC Detour Gold Corporation 100% Atkinson Lake 4/19/2027 400 N 131426 SCMC Detour Gold Corporation 100% Atkinson Lake 4/19/2027 400 N 131427 SCMC Detour Gold Corporation 100% Atkinson Lake 4/19/2027 400 N 131428 SCMC Detour Gold Corporation 100% Lower Detour Lake 8/8/2026 400 N 131518 SCMC Detour Gold Corporation 100% Lower Detour Lake 6/3/2026 400 N 131730 SCMC Detour Gold Corporation 100% Hopper Lake 8/20/2027 400 N 131869 SCMC Detour Gold Corporation 100% Lower Detour Lake 3/11/2027 200 N 131922 BCMC Detour Gold Corporation 100% Lower Detour Lake 10/14/2026 200 Y 131979 SCMC Detour Gold Corporation 100% West of Sunday Lake 4/26/2027 400 N 132271 SCMC Detour Gold Corporation 100% West of Sunday Lake 10/25/2027 400 N 132364 SCMC Detour Gold Corporation 100% Lower Detour Lake 3/11/2027 400 N 132395 SCMC Detour Gold Corporation 100% West of Sunday Lake 4/23/2026 400 Y 132396 SCMC Detour Gold Corporation 100% West of Sunday Lake 4/23/2026 400 Y

Detour Lake Operations Ontario, Canada NI 43-101 Technical Report March 2021 Appendix A Claim Number Claim Type Ownership Township Anniversary Date Work Required Royalty Y/N 132566 SCMC Detour Gold Corporation 100% West of Sunday Lake 4/26/2027 400 N 132569 SCMC Detour Gold Corporation 100% Hopper Lake 9/8/2026 400 N 132718 SCMC Detour Gold Corporation 100% Sunday Lake 4/26/2027 400 N 132767 SCMC Detour Gold Corporation 100% Atkinson Lake 4/19/2027 400 N 132788 SCMC Detour Gold Corporation 100% Hopper Lake 8/20/2027 400 N 132810 SCMC Detour Gold Corporation 100% Lower Detour Lake 3/11/2027 400 N 132811 SCMC Detour Gold Corporation 100% Lower Detour Lake 3/11/2027 400 N 132812 SCMC Detour Gold Corporation 100% Lower Detour Lake 3/11/2027 400 N 132813 SCMC Detour Gold Corporation 100% Lower Detour Lake 6/3/2026 200 N 132972 SCMC Detour Gold Corporation 100% Sunday Lake 4/26/2027 400 N 133013 BCMC Detour Gold Corporation 100% West of Sunday Lake 5/28/2027 200 Y 133457 SCMC Detour Gold Corporation 100% Sunday Lake 4/26/2027 400 N 133458 SCMC Detour Gold Corporation 100% Sunday Lake 4/26/2027 400 N 133459 SCMC Detour Gold Corporation 100% Sunday Lake 4/26/2027 400 N 133713 SCMC Detour Gold Corporation 100% Lower Detour Lake 6/3/2026 400 N 133781 SCMC Detour Gold Corporation 100% Sunday Lake 4/26/2027 400 N 133782 SCMC Detour Gold Corporation 100% Sunday Lake 4/26/2027 400 N 133822 BCMC Detour Gold Corporation 100% Sunday Lake 7/12/2027 200 Y 133918 SCMC Detour Gold Corporation 100% West of Sunday Lake 4/26/2027 400 N 133921 SCMC Detour Gold Corporation 100% Lower Detour Lake 8/8/2026 400 N 133922 SCMC Detour Gold Corporation 100% West of Sunday Lake 4/26/2027 200 N 133923 SCMC Detour Gold Corporation 100% West of Sunday Lake 4/26/2027 200 N 133924 SCMC Detour Gold Corporation 100% West of Sunday Lake 4/26/2027 400 N 133968 SCMC Detour Gold Corporation 100% Lower Detour Lake 3/11/2027 200 N 133972 SCMC Detour Gold Corporation 100% Hopper Lake 8/20/2027 400 N 133989 BCMC Detour Gold Corporation 100% Lower Detour Lake 10/14/2026 200 Y 133990 BCMC Detour Gold Corporation 100% Lower Detour Lake 10/14/2026 200 Y 133999 BCMC Detour Gold Corporation 100% Lower Detour Lake 10/14/2026 200 Y 134019 SCMC Detour Gold Corporation 100% Hopper Lake 8/31/2026 400 N 134020 SCMC Detour Gold Corporation 100% West of Sunday Lake 4/26/2027 400 N 134021 SCMC Detour Gold Corporation 100% West of Sunday Lake 4/26/2027 400 N 134022 SCMC Detour Gold Corporation 100% West of Sunday Lake 4/26/2027 200 N 134316 BCMC Detour Gold Corporation 100% Atkinson Lake 4/19/2025 200 N 134689 SCMC Detour Gold Corporation 100% Sunday Lake 4/26/2027 400 N 134731 SCMC Detour Gold Corporation 100% Sunday Lake 4/26/2027 400 N 135303 SCMC Detour Gold Corporation 100% Atkinson Lake 4/19/2027 400 N 135344 SCMC Detour Gold Corporation 100% Sunday Lake 4/26/2027 400 N 135392 SCMC Detour Gold Corporation 100% Lower Detour Lake 8/8/2026 400 N 135423 SCMC Detour Gold Corporation 100% Hopper Lake 9/8/2026 200 N 135424 SCMC Detour Gold Corporation 100% Hopper Lake 9/8/2026 400 N 135485 SCMC Detour Gold Corporation 100% Hopper Lake 9/8/2026 200 N

Detour Lake Operations Ontario, Canada NI 43-101 Technical Report March 2021 Appendix A Claim Number Claim Type Ownership Township Anniversary Date Work Required Royalty Y/N 135493 SCMC Detour Gold Corporation 100% Atkinson Lake 4/19/2027 400 N 135494 SCMC Detour Gold Corporation 100% Atkinson Lake 4/19/2027 400 N 135495 SCMC Detour Gold Corporation 100% Atkinson Lake 4/19/2027 400 N 135496 SCMC Detour Gold Corporation 100% Atkinson Lake 4/19/2027 400 N 135497 SCMC Detour Gold Corporation 100% Atkinson Lake 4/19/2027 400 N 135546 SCMC Detour Gold Corporation 100% Atkinson Lake 4/19/2027 400 N 135547 SCMC Detour Gold Corporation 100% Atkinson Lake 4/19/2027 400 N 136139 SCMC Detour Gold Corporation 100% Sunday Lake 4/26/2027 400 N 136308 SCMC Detour Gold Corporation 100% Atkinson Lake 4/19/2027 400 N 136372 SCMC Detour Gold Corporation 100% Lower Detour Lake 3/11/2027 200 N 136378 SCMC Detour Gold Corporation 100% Lower Detour Lake 10/25/2026 400 N 136386 SCMC Detour Gold Corporation 100% Lower Detour Lake 3/11/2027 400 N 136549 SCMC Detour Gold Corporation 100% Sunday Lake 4/26/2027 400 N 136550 SCMC Detour Gold Corporation 100% Sunday Lake 4/26/2027 400 N 137061 SCMC Detour Gold Corporation 100% Sunday Lake 7/12/2027 200 Y 137089 SCMC Detour Gold Corporation 100% Lower Detour Lake 6/3/2026 400 N 137090 SCMC Detour Gold Corporation 100% Lower Detour Lake 6/3/2026 400 N 137105 SCMC Detour Gold Corporation 100% Sunday Lake 4/26/2027 400 N 137243 SCMC Detour Gold Corporation 100% Sunday Lake 4/26/2027 400 N 137405 BCMC Detour Gold Corporation 100% West of Sunday Lake 4/23/2027 200 Y 137406 SCMC Detour Gold Corporation 100% West of Sunday Lake 4/23/2027 400 Y 137407 SCMC Detour Gold Corporation 100% West of Sunday Lake 4/23/2027 400 Y 137422 SCMC Detour Gold Corporation 100% Hopper Lake 3/15/2027 200 N 137610 SCMC Detour Gold Corporation 100% Lower Detour Lake 8/8/2026 200 N 137611 SCMC Detour Gold Corporation 100% Lower Detour Lake 8/8/2026 400 N 137612 SCMC Detour Gold Corporation 100% Lower Detour Lake 8/8/2026 400 N 137675 BCMC Detour Gold Corporation 100% West of Sunday Lake 8/20/2027 200 N 137676 SCMC Detour Gold Corporation 100% Lower Detour Lake 3/11/2027 400 N 137677 SCMC Detour Gold Corporation 100% Lower Detour Lake 3/11/2027 400 N 137678 SCMC Detour Gold Corporation 100% Lower Detour Lake 10/25/2026 400 N 137679 SCMC Detour Gold Corporation 100% Lower Detour Lake 3/11/2027 400 N 137680 SCMC Detour Gold Corporation 100% Lower Detour Lake 3/11/2027 400 N 138203 SCMC Detour Gold Corporation 100% West of Sunday Lake 4/23/2027 400 Y 138370 SCMC Detour Gold Corporation 100% Sunday Lake 4/26/2027 400 N 138524 BCMC Detour Gold Corporation 100% Sunday Lake 7/12/2027 200 Y 138525 SCMC Detour Gold Corporation 100% Sunday Lake 7/12/2027 200 Y 138545 SCMC Detour Gold Corporation 100% Lower Detour Lake 10/9/2026 400 N 138744 SCMC Detour Gold Corporation 100% Sunday Lake 4/26/2027 400 N 138745 SCMC Detour Gold Corporation 100% Sunday Lake 4/26/2027 400 N 138746 SCMC Detour Gold Corporation 100% Sunday Lake 4/26/2027 400 N 138884 SCMC Detour Gold Corporation 100% Lower Detour Lake 8/8/2026 400 N

Detour Lake Operations Ontario, Canada NI 43-101 Technical Report March 2021 Appendix A Claim Number Claim Type Ownership Township Anniversary Date Work Required Royalty Y/N 138885 SCMC Detour Gold Corporation 100% Hopper Lake 8/20/2027 400 N 138936 SCMC Detour Gold Corporation 100% Sunday Lake 4/26/2027 400 N 138937 SCMC Detour Gold Corporation 100% Sunday Lake 4/26/2027 400 N 138938 SCMC Detour Gold Corporation 100% Sunday Lake 4/26/2027 400 N 138985 SCMC Detour Gold Corporation 100% West of Sunday Lake 4/26/2027 400 N 139123 SCMC Detour Gold Corporation 100% Lower Detour Lake 6/3/2026 400 N 139124 SCMC Detour Gold Corporation 100% Lower Detour Lake 6/3/2026 400 N 139186 BCMC Detour Gold Corporation 100% West of Sunday Lake 6/3/2027 200 N 139187 BCMC Detour Gold Corporation 100% West of Sunday Lake 6/3/2027 200 N 139345 SCMC Detour Gold Corporation 100% Lower Detour Lake 8/8/2026 400 N 139506 SCMC Detour Gold Corporation 100% Sunday Lake 4/26/2027 400 N 139507 SCMC Detour Gold Corporation 100% Sunday Lake 4/26/2027 400 N 139632 SCMC Detour Gold Corporation 100% Sunday Lake 4/26/2027 400 N 139650 SCMC Detour Gold Corporation 100% Hopper Lake 5/8/2026 200 N 139651 SCMC Detour Gold Corporation 100% Hopper Lake 5/8/2026 400 N 139652 SCMC Detour Gold Corporation 100% Hopper Lake 5/8/2026 400 N 139653 SCMC Detour Gold Corporation 100% Hopper Lake 5/8/2026 400 N 139681 BCMC Detour Gold Corporation 100% Hopper Lake 5/8/2026 200 N 139695 SCMC Detour Gold Corporation 100% Atkinson Lake 4/19/2027 400 N 139698 BCMC Detour Gold Corporation 100% Hopper Lake 8/20/2027 200 N 139699 SCMC Detour Gold Corporation 100% Hopper Lake 8/20/2027 400 N 139700 SCMC Detour Gold Corporation 100% Hopper Lake 8/20/2027 400 N 139834 SCMC Detour Gold Corporation 100% Hopper Lake 9/8/2026 400 N 140053 BCMC Detour Gold Corporation 100% Atkinson Lake 4/19/2027 200 N 140054 BCMC Detour Gold Corporation 100% Atkinson Lake 4/19/2027 200 N 140219 SCMC Detour Gold Corporation 100% Hopper Lake 8/20/2027 400 N 140220 SCMC Detour Gold Corporation 100% Hopper Lake 8/20/2027 400 N 140451 SCMC Detour Gold Corporation 100% Lower Detour Lake 3/11/2027 400 N 140540 SCMC Detour Gold Corporation 100% Hopper Lake 9/8/2026 400 N 141074 SCMC Detour Gold Corporation 100% Sunday Lake 4/26/2027 400 N 141092 SCMC Detour Gold Corporation 100% Sunday Lake 4/26/2027 400 N 141520 SCMC Detour Gold Corporation 100% Hopper Lake 5/8/2026 200 N 141521 SCMC Detour Gold Corporation 100% Hopper Lake 5/8/2026 400 N 141534 SCMC Detour Gold Corporation 100% Atkinson Lake 4/19/2027 400 N 141630 SCMC Detour Gold Corporation 100% Sunday Lake 4/26/2027 200 N 141631 SCMC Detour Gold Corporation 100% Sunday Lake 4/26/2027 400 N 141632 SCMC Detour Gold Corporation 100% Sunday Lake 4/26/2027 400 N 142167 SCMC Detour Gold Corporation 100% Atkinson Lake 4/19/2027 400 N 142168 SCMC Detour Gold Corporation 100% Atkinson Lake 4/19/2027 400 N 142292 SCMC Detour Gold Corporation 100% West of Sunday Lake 3/3/2027 200 N 142293 SCMC Detour Gold Corporation 100% West of Sunday Lake 3/3/2027 400 N

Detour Lake Operations Ontario, Canada NI 43-101 Technical Report March 2021 Appendix A Claim Number Claim Type Ownership Township Anniversary Date Work Required Royalty Y/N 142358 SCMC Detour Gold Corporation 100% Atkinson Lake 4/19/2027 400 N 142434 SCMC Detour Gold Corporation 100% Lower Detour Lake 4/19/2027 400 N 142580 SCMC Detour Gold Corporation 100% Sunday Lake 4/26/2027 400 N 142878 SCMC Detour Gold Corporation 100% Sunday Lake 4/26/2027 400 N 143108 SCMC Detour Gold Corporation 100% Sunday Lake 7/12/2027 400 Y 143146 SCMC Detour Gold Corporation 100% Lower Detour Lake 6/3/2026 400 N 143195 SCMC Detour Gold Corporation 100% Lower Detour Lake 6/3/2026 400 N 143346 BCMC Detour Gold Corporation 100% Lower Detour Lake 6/3/2026 200 N 143347 SCMC Detour Gold Corporation 100% Lower Detour Lake 6/3/2026 400 N 143549 SCMC Detour Gold Corporation 100% Lower Detour Lake 6/3/2026 400 N 143620 BCMC Detour Gold Corporation 100% West of Sunday Lake 5/28/2027 200 Y 143678 SCMC Detour Gold Corporation 100% Sunday Lake 4/26/2027 400 N 143679 SCMC Detour Gold Corporation 100% Sunday Lake 4/26/2027 200 N 143712 SCMC Detour Gold Corporation 100% West of Sunday Lake 8/20/2027 400 N 143713 BCMC Detour Gold Corporation 100% West of Sunday Lake 5/28/2027 200 Y 143714 SCMC Detour Gold Corporation 100% Lower Detour Lake 10/25/2027 400 N 143715 SCMC Detour Gold Corporation 100% Lower Detour Lake 3/11/2027 400 N 143716 SCMC Detour Gold Corporation 100% Lower Detour Lake 10/25/2026 400 N 143963 BCMC Detour Gold Corporation 100% Sunday Lake 7/12/2027 200 Y 143964 SCMC Detour Gold Corporation 100% Sunday Lake 7/12/2027 400 Y 144481 SCMC Detour Gold Corporation 100% West of Sunday Lake 4/26/2027 400 N 144845 SCMC Detour Gold Corporation 100% Lower Detour Lake 8/8/2026 400 N 144898 SCMC Detour Gold Corporation 100% Sunday Lake 4/26/2027 200 N 144950 SCMC Detour Gold Corporation 100% Sunday Lake 4/26/2027 400 N 144951 SCMC Detour Gold Corporation 100% Sunday Lake 4/26/2027 400 N 144952 SCMC Detour Gold Corporation 100% Sunday Lake 4/26/2027 400 N 144953 SCMC Detour Gold Corporation 100% Sunday Lake 4/26/2027 400 N 145102 SCMC Detour Gold Corporation 100% Lower Detour Lake 6/3/2026 400 N 145146 SCMC Detour Gold Corporation 100% Hopper Lake 8/20/2027 400 N 145149 SCMC Detour Gold Corporation 100% Lower Detour Lake 6/3/2026 400 N 145150 BCMC Detour Gold Corporation 100% Lower Detour Lake 6/3/2026 200 N 145151 SCMC Detour Gold Corporation 100% Lower Detour Lake 6/3/2026 400 N 145152 BCMC Detour Gold Corporation 100% Lower Detour Lake 6/3/2026 200 N 145169 SCMC Detour Gold Corporation 100% West of Sunday Lake 4/26/2027 400 N 145256 SCMC Detour Gold Corporation 100% Sunday Lake 4/26/2027 400 N 145323 SCMC Detour Gold Corporation 100% Sunday Lake 4/26/2027 200 N 145652 SCMC Detour Gold Corporation 100% Lower Detour Lake 8/8/2026 200 N 145653 SCMC Detour Gold Corporation 100% Lower Detour Lake 8/8/2026 400 N 145952 SCMC Detour Gold Corporation 100% Hopper Lake 9/8/2026 400 N 146180 SCMC Detour Gold Corporation 100% Lower Detour Lake 10/25/2027 400 N 146184 SCMC Detour Gold Corporation 100% Lower Detour Lake 10/9/2026 400 N

Detour Lake Operations Ontario, Canada NI 43-101 Technical Report March 2021 Appendix A Claim Number Claim Type Ownership Township Anniversary Date Work Required Royalty Y/N 146191 SCMC Detour Gold Corporation 100% Hopper Lake 8/20/2027 400 N 146192 SCMC Detour Gold Corporation 100% Hopper Lake 8/20/2027 400 N 146400 SCMC Detour Gold Corporation 100% Lower Detour Lake 3/11/2027 200 N 146438 BCMC Detour Gold Corporation 100% Lower Detour Lake 10/14/2026 200 Y 146439 SCMC Detour Gold Corporation 100% Lower Detour Lake 10/14/2026 400 Y 146450 SCMC Detour Gold Corporation 100% Hopper Lake 9/8/2026 400 N 146559 SCMC Detour Gold Corporation 100% West of Sunday Lake 4/26/2027 400 N 146840 SCMC Detour Gold Corporation 100% West of Sunday Lake 4/13/2027 400 Y 147345 SCMC Detour Gold Corporation 100% Lower Detour Lake 6/3/2026 400 N 147433 SCMC Detour Gold Corporation 100% West of Sunday Lake 4/23/2027 400 Y 147434 SCMC Detour Gold Corporation 100% Lower Detour Lake 9/22/2026 400 N 147435 SCMC Detour Gold Corporation 100% Lower Detour Lake 9/22/2026 400 N 147436 SCMC Detour Gold Corporation 100% Lower Detour Lake 8/8/2026 400 N 147437 BCMC Detour Gold Corporation 100% Lower Detour Lake 4/19/2027 200 N 147452 SCMC Detour Gold Corporation 100% West of Sunday Lake 10/25/2027 400 N 147518 SCMC Detour Gold Corporation 100% Lower Detour Lake 6/3/2026 400 N 147805 SCMC Detour Gold Corporation 100% Lower Detour Lake 4/19/2027 400 N 147811 SCMC Detour Gold Corporation 100% Hopper Lake 8/20/2027 400 N 147843 SCMC Detour Gold Corporation 100% Atkinson Lake 10/9/2026 400 N 147903 SCMC Detour Gold Corporation 100% Hopper Lake 8/20/2027 400 N 147904 SCMC Detour Gold Corporation 100% Hopper Lake 8/20/2027 400 N 147924 BCMC Detour Gold Corporation 100% Hopper Lake 5/28/2027 200 Y 147934 BCMC Detour Gold Corporation 100% West of Sunday Lake 9/18/2027 200 Y 148006 SCMC Detour Gold Corporation 100% Lower Detour Lake 3/11/2027 400 N 148013 BCMC Detour Gold Corporation 100% Lower Detour Lake 10/14/2026 200 Y 148014 SCMC Detour Gold Corporation 100% West of Sunday Lake 4/26/2027 400 N 148015 SCMC Detour Gold Corporation 100% Lower Detour Lake 10/25/2026 400 N 148016 SCMC Detour Gold Corporation 100% Lower Detour Lake 10/25/2026 400 N 148017 SCMC Detour Gold Corporation 100% West of Sunday Lake 4/26/2027 400 N 148462 SCMC Detour Gold Corporation 100% Lower Detour Lake 10/25/2027 400 N 148574 SCMC Detour Gold Corporation 100% West of Sunday Lake 4/26/2027 400 N 148602 SCMC Detour Gold Corporation 100% Sunday Lake 4/26/2027 400 N 148627 SCMC Detour Gold Corporation 100% West of Sunday Lake 4/13/2027 200 Y 148632 SCMC Detour Gold Corporation 100% Lower Detour Lake 3/11/2027 400 N 148649 BCMC Detour Gold Corporation 100% West of Sunday Lake 4/13/2027 200 Y 148650 BCMC Detour Gold Corporation 100% West of Sunday Lake 4/13/2027 200 Y 148655 SCMC Detour Gold Corporation 100% West of Sunday Lake 4/26/2025 400 N 148656 SCMC Detour Gold Corporation 100% West of Sunday Lake 4/26/2025 400 N 148657 SCMC Detour Gold Corporation 100% West of Sunday Lake 4/26/2025 400 N 148659 SCMC Detour Gold Corporation 100% Lower Detour Lake 6/3/2026 400 N 148747 BCMC Detour Gold Corporation 100% Hopper Lake 8/20/2027 200 N

Detour Lake Operations Ontario, Canada NI 43-101 Technical Report March 2021 Appendix A Claim Number Claim Type Ownership Township Anniversary Date Work Required Royalty Y/N 148757 SCMC Detour Gold Corporation 100% Lower Detour Lake 3/11/2027 400 N 148758 SCMC Detour Gold Corporation 100% Lower Detour Lake 6/3/2026 400 N 149322 SCMC Detour Gold Corporation 100% Sunday Lake 4/26/2026 400 N 149389 SCMC Detour Gold Corporation 100% Sunday Lake 4/26/2027 400 N 149390 SCMC Detour Gold Corporation 100% Sunday Lake 4/26/2027 400 N 149905 BCMC Detour Gold Corporation 100% Hopper Lake 3/3/2027 200 N 149906 SCMC Detour Gold Corporation 100% Lower Detour Lake 3/11/2027 400 N 149941 BCMC Detour Gold Corporation 100% Lower Detour Lake 10/14/2026 200 Y 150213 SCMC Detour Gold Corporation 100% Sunday Lake 4/26/2027 400 N 150214 SCMC Detour Gold Corporation 100% Sunday Lake 4/26/2027 400 N 150530 SCMC Detour Gold Corporation 100% Sunday Lake 4/26/2027 400 N 150861 BCMC Detour Gold Corporation 100% West of Sunday Lake 5/28/2027 200 Y 150881 SCMC Detour Gold Corporation 100% Hopper Lake 9/8/2026 400 N 150929 SCMC Detour Gold Corporation 100% Hopper Lake 3/15/2027 400 Y 150986 SCMC Detour Gold Corporation 100% Atkinson Lake 4/19/2027 400 N 150987 SCMC Detour Gold Corporation 100% Atkinson Lake 4/19/2027 400 N 151422 SCMC Detour Gold Corporation 100% West of Sunday Lake 4/13/2027 400 Y 151426 SCMC Detour Gold Corporation 100% Lower Detour Lake 3/11/2027 400 N 151448 SCMC Detour Gold Corporation 100% Lower Detour Lake 6/3/2026 400 N 151449 BCMC Detour Gold Corporation 100% Lower Detour Lake 6/3/2026 200 N 151756 SCMC Detour Gold Corporation 100% Sunday Lake 4/26/2027 400 N 151868 SCMC Detour Gold Corporation 100% Lower Detour Lake 10/9/2026 400 N 151902 SCMC Detour Gold Corporation 100% West of Sunday Lake 5/28/2027 400 Y 152118 BCMC Detour Gold Corporation 100% Lower Detour Lake 3/11/2027 200 N 152132 BCMC Detour Gold Corporation 100% West of Sunday Lake 4/26/2027 200 N 152133 SCMC Detour Gold Corporation 100% Lower Detour Lake 8/8/2026 400 N 152134 SCMC Detour Gold Corporation 100% West of Sunday Lake 4/26/2027 200 N 152180 SCMC Detour Gold Corporation 100% Hopper Lake 3/3/2027 200 N 152207 BCMC Detour Gold Corporation 100% Lower Detour Lake 10/14/2026 200 Y 152227 SCMC Detour Gold Corporation 100% Hopper Lake 8/20/2027 400 N 152450 BCMC Detour Gold Corporation 100% Hopper Lake 5/28/2027 200 Y 152605 SCMC Detour Gold Corporation 100% Sunday Lake 7/12/2027 200 Y 152606 SCMC Detour Gold Corporation 100% Sunday Lake 7/12/2027 200 Y 152897 SCMC Detour Gold Corporation 100% Sunday Lake 4/26/2027 400 N 153199 SCMC Detour Gold Corporation 100% Lower Detour Lake 3/11/2027 400 N 153204 SCMC Detour Gold Corporation 100% Sunday Lake 4/26/2026 400 N 153205 SCMC Detour Gold Corporation 100% Sunday Lake 4/26/2027 400 N 153394 SCMC Detour Gold Corporation 100% Sunday Lake 7/12/2027 400 Y 153436 SCMC Detour Gold Corporation 100% Sunday Lake 4/26/2027 400 N 153817 BCMC Detour Gold Corporation 100% West of Sunday Lake 4/23/2027 200 Y 153818 BCMC Detour Gold Corporation 100% West of Sunday Lake 4/23/2027 200 Y
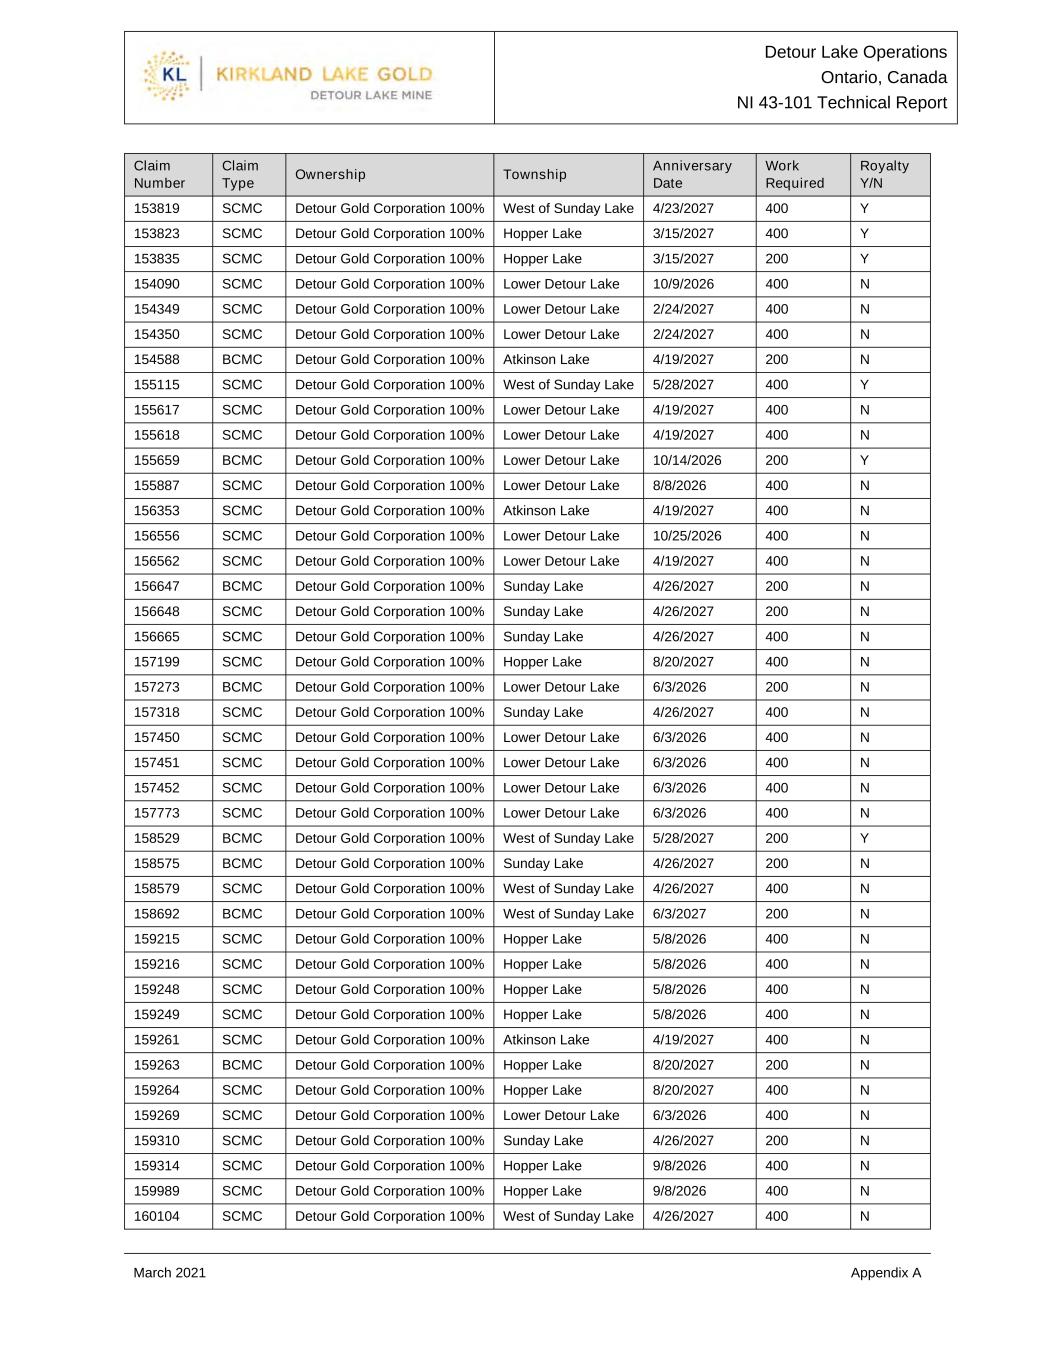
Detour Lake Operations Ontario, Canada NI 43-101 Technical Report March 2021 Appendix A Claim Number Claim Type Ownership Township Anniversary Date Work Required Royalty Y/N 153819 SCMC Detour Gold Corporation 100% West of Sunday Lake 4/23/2027 400 Y 153823 SCMC Detour Gold Corporation 100% Hopper Lake 3/15/2027 400 Y 153835 SCMC Detour Gold Corporation 100% Hopper Lake 3/15/2027 200 Y 154090 SCMC Detour Gold Corporation 100% Lower Detour Lake 10/9/2026 400 N 154349 SCMC Detour Gold Corporation 100% Lower Detour Lake 2/24/2027 400 N 154350 SCMC Detour Gold Corporation 100% Lower Detour Lake 2/24/2027 400 N 154588 BCMC Detour Gold Corporation 100% Atkinson Lake 4/19/2027 200 N 155115 SCMC Detour Gold Corporation 100% West of Sunday Lake 5/28/2027 400 Y 155617 SCMC Detour Gold Corporation 100% Lower Detour Lake 4/19/2027 400 N 155618 SCMC Detour Gold Corporation 100% Lower Detour Lake 4/19/2027 400 N 155659 BCMC Detour Gold Corporation 100% Lower Detour Lake 10/14/2026 200 Y 155887 SCMC Detour Gold Corporation 100% Lower Detour Lake 8/8/2026 400 N 156353 SCMC Detour Gold Corporation 100% Atkinson Lake 4/19/2027 400 N 156556 SCMC Detour Gold Corporation 100% Lower Detour Lake 10/25/2026 400 N 156562 SCMC Detour Gold Corporation 100% Lower Detour Lake 4/19/2027 400 N 156647 BCMC Detour Gold Corporation 100% Sunday Lake 4/26/2027 200 N 156648 SCMC Detour Gold Corporation 100% Sunday Lake 4/26/2027 200 N 156665 SCMC Detour Gold Corporation 100% Sunday Lake 4/26/2027 400 N 157199 SCMC Detour Gold Corporation 100% Hopper Lake 8/20/2027 400 N 157273 BCMC Detour Gold Corporation 100% Lower Detour Lake 6/3/2026 200 N 157318 SCMC Detour Gold Corporation 100% Sunday Lake 4/26/2027 400 N 157450 SCMC Detour Gold Corporation 100% Lower Detour Lake 6/3/2026 400 N 157451 SCMC Detour Gold Corporation 100% Lower Detour Lake 6/3/2026 400 N 157452 SCMC Detour Gold Corporation 100% Lower Detour Lake 6/3/2026 400 N 157773 SCMC Detour Gold Corporation 100% Lower Detour Lake 6/3/2026 400 N 158529 BCMC Detour Gold Corporation 100% West of Sunday Lake 5/28/2027 200 Y 158575 BCMC Detour Gold Corporation 100% Sunday Lake 4/26/2027 200 N 158579 SCMC Detour Gold Corporation 100% West of Sunday Lake 4/26/2027 400 N 158692 BCMC Detour Gold Corporation 100% West of Sunday Lake 6/3/2027 200 N 159215 SCMC Detour Gold Corporation 100% Hopper Lake 5/8/2026 400 N 159216 SCMC Detour Gold Corporation 100% Hopper Lake 5/8/2026 400 N 159248 SCMC Detour Gold Corporation 100% Hopper Lake 5/8/2026 400 N 159249 SCMC Detour Gold Corporation 100% Hopper Lake 5/8/2026 400 N 159261 SCMC Detour Gold Corporation 100% Atkinson Lake 4/19/2027 400 N 159263 BCMC Detour Gold Corporation 100% Hopper Lake 8/20/2027 200 N 159264 SCMC Detour Gold Corporation 100% Hopper Lake 8/20/2027 400 N 159269 SCMC Detour Gold Corporation 100% Lower Detour Lake 6/3/2026 400 N 159310 SCMC Detour Gold Corporation 100% Sunday Lake 4/26/2027 200 N 159314 SCMC Detour Gold Corporation 100% Hopper Lake 9/8/2026 400 N 159989 SCMC Detour Gold Corporation 100% Hopper Lake 9/8/2026 400 N 160104 SCMC Detour Gold Corporation 100% West of Sunday Lake 4/26/2027 400 N

Detour Lake Operations Ontario, Canada NI 43-101 Technical Report March 2021 Appendix A Claim Number Claim Type Ownership Township Anniversary Date Work Required Royalty Y/N 160360 SCMC Detour Gold Corporation 100% West of Sunday Lake 8/20/2027 400 N 161707 SCMC Detour Gold Corporation 100% Sunday Lake 4/26/2027 400 N 161908 SCMC Detour Gold Corporation 100% Hopper Lake 8/20/2027 400 N 161941 SCMC Detour Gold Corporation 100% Atkinson Lake 10/9/2026 400 N 161942 SCMC Detour Gold Corporation 100% Atkinson Lake 10/9/2026 400 N 162048 SCMC Detour Gold Corporation 100% Hopper Lake 8/20/2027 400 N 162049 SCMC Detour Gold Corporation 100% West of Sunday Lake 4/26/2027 400 N 162050 SCMC Detour Gold Corporation 100% Lower Detour Lake 3/11/2027 400 N 162051 SCMC Detour Gold Corporation 100% Lower Detour Lake 3/11/2027 200 N 162052 SCMC Detour Gold Corporation 100% Lower Detour Lake 3/11/2027 400 N 162107 SCMC Detour Gold Corporation 100% West of Sunday Lake 4/26/2027 400 N 162144 SCMC Detour Gold Corporation 100% Sunday Lake 4/26/2027 400 N 162317 SCMC Detour Gold Corporation 100% Atkinson Lake 4/19/2027 400 N 162427 SCMC Detour Gold Corporation 100% Atkinson Lake 4/19/2027 400 N 162526 SCMC Detour Gold Corporation 100% Atkinson Lake 4/19/2027 400 N 162527 BCMC Detour Gold Corporation 100% Atkinson Lake 4/19/2027 200 N 162642 SCMC Detour Gold Corporation 100% Atkinson Lake 10/9/2026 400 N 162947 SCMC Detour Gold Corporation 100% Lower Detour Lake 6/3/2026 400 N 162948 SCMC Detour Gold Corporation 100% Lower Detour Lake 6/3/2026 400 N 162949 SCMC Detour Gold Corporation 100% Lower Detour Lake 6/3/2026 400 N 163201 SCMC Detour Gold Corporation 100% Lower Detour Lake 6/3/2026 400 N 163202 SCMC Detour Gold Corporation 100% Lower Detour Lake 10/9/2026 400 N 163260 SCMC Detour Gold Corporation 100% Lower Detour Lake 10/25/2027 400 N 163261 SCMC Detour Gold Corporation 100% Lower Detour Lake 10/25/2027 200 N 163271 SCMC Detour Gold Corporation 100% Lower Detour Lake 6/3/2026 400 N 163272 SCMC Detour Gold Corporation 100% Lower Detour Lake 10/9/2026 400 N 163329 BCMC Detour Gold Corporation 100% Sunday Lake 7/12/2027 200 N 163330 SCMC Detour Gold Corporation 100% Sunday Lake 7/12/2027 400 Y 163331 SCMC Detour Gold Corporation 100% Sunday Lake 7/12/2027 400 Y 163354 SCMC Detour Gold Corporation 100% Lower Detour Lake 10/9/2026 400 N 163490 SCMC Detour Gold Corporation 100% West of Sunday Lake 6/3/2027 400 N 163979 SCMC Detour Gold Corporation 100% West of Sunday Lake 4/23/2026 400 Y 163981 SCMC Detour Gold Corporation 100% Lower Detour Lake 9/22/2026 200 N 163982 SCMC Detour Gold Corporation 100% Lower Detour Lake 9/22/2026 400 N 163983 SCMC Detour Gold Corporation 100% Lower Detour Lake 4/19/2027 400 N 163984 SCMC Detour Gold Corporation 100% Atkinson Lake 4/19/2027 400 N 163985 SCMC Detour Gold Corporation 100% Atkinson Lake 4/19/2027 400 N 164140 SCMC Detour Gold Corporation 100% Sunday Lake 4/26/2027 400 N 164453 SCMC Detour Gold Corporation 100% Lower Detour Lake 4/19/2027 400 N 164496 SCMC Detour Gold Corporation 100% Lower Detour Lake 3/11/2027 400 N 164497 SCMC Detour Gold Corporation 100% Lower Detour Lake 6/3/2026 400 N

Detour Lake Operations Ontario, Canada NI 43-101 Technical Report March 2021 Appendix A Claim Number Claim Type Ownership Township Anniversary Date Work Required Royalty Y/N 164499 BCMC Detour Gold Corporation 100% Lower Detour Lake 6/3/2026 200 N 164680 SCMC Detour Gold Corporation 100% Atkinson Lake 4/19/2027 400 N 164693 SCMC Detour Gold Corporation 100% Sunday Lake 4/26/2027 400 N 165090 SCMC Detour Gold Corporation 100% Atkinson Lake 4/19/2027 400 N 165091 SCMC Detour Gold Corporation 100% Atkinson Lake 4/19/2027 400 N 165160 SCMC Detour Gold Corporation 100% West of Sunday Lake 10/25/2027 400 N 165161 SCMC Detour Gold Corporation 100% West of Sunday Lake 10/25/2027 400 N 165246 SCMC Detour Gold Corporation 100% Lower Detour Lake 6/3/2026 400 N 165327 SCMC Detour Gold Corporation 100% Hopper Lake 9/8/2026 400 N 165375 SCMC Detour Gold Corporation 100% Hopper Lake 9/8/2026 400 N 165970 SCMC Detour Gold Corporation 100% Atkinson Lake 4/19/2027 400 N 165971 SCMC Detour Gold Corporation 100% Atkinson Lake 4/19/2027 400 N 166425 SCMC Detour Gold Corporation 100% West of Sunday Lake 8/20/2027 400 N 166426 SCMC Detour Gold Corporation 100% West of Sunday Lake 8/20/2027 400 N 166427 SCMC Detour Gold Corporation 100% West of Sunday Lake 8/20/2027 400 N 166428 BCMC Detour Gold Corporation 100% West of Sunday Lake 8/20/2027 200 N 166772 BCMC Detour Gold Corporation 100% Hopper Lake 8/20/2027 200 N 166773 SCMC Detour Gold Corporation 100% Hopper Lake 8/20/2027 400 N 167108 SCMC Detour Gold Corporation 100% Lower Detour Lake 6/3/2026 400 N 167370 SCMC Detour Gold Corporation 100% Lower Detour Lake 3/11/2027 400 N 167426 SCMC Detour Gold Corporation 100% West of Sunday Lake 4/26/2027 400 N 167495 SCMC Detour Gold Corporation 100% Lower Detour Lake 3/11/2027 400 N 167731 SCMC Detour Gold Corporation 100% Sunday Lake 4/26/2027 200 N 167821 SCMC Detour Gold Corporation 100% Atkinson Lake 4/19/2027 400 N 167822 SCMC Detour Gold Corporation 100% Atkinson Lake 4/19/2027 400 N 167842 SCMC Detour Gold Corporation 100% Sunday Lake 4/26/2027 400 N 167955 BCMC Detour Gold Corporation 100% West of Sunday Lake 4/23/2027 200 Y 167956 SCMC Detour Gold Corporation 100% West of Sunday Lake 4/23/2027 400 Y 168181 BCMC Detour Gold Corporation 100% Lower Detour Lake 3/11/2027 200 N 168393 SCMC Detour Gold Corporation 100% Lower Detour Lake 8/8/2026 200 N 168486 SCMC Detour Gold Corporation 100% Lower Detour Lake 10/9/2026 400 N 168556 SCMC Detour Gold Corporation 100% Sunday Lake 7/12/2027 400 Y 168557 SCMC Detour Gold Corporation 100% Sunday Lake 7/12/2027 400 Y 168704 SCMC Detour Gold Corporation 100% Lower Detour Lake 8/8/2026 400 N 168705 SCMC Detour Gold Corporation 100% West of Sunday Lake 4/26/2027 400 N 168751 BCMC Detour Gold Corporation 100% Hopper Lake 3/3/2027 200 N 168778 SCMC Detour Gold Corporation 100% Lower Detour Lake 10/14/2026 400 Y 168800 SCMC Detour Gold Corporation 100% Hopper Lake 8/31/2026 400 N 169279 SCMC Detour Gold Corporation 100% Lower Detour Lake 10/9/2026 400 N 169280 SCMC Detour Gold Corporation 100% Lower Detour Lake 10/9/2026 400 N 169281 SCMC Detour Gold Corporation 100% Lower Detour Lake 10/9/2026 400 N
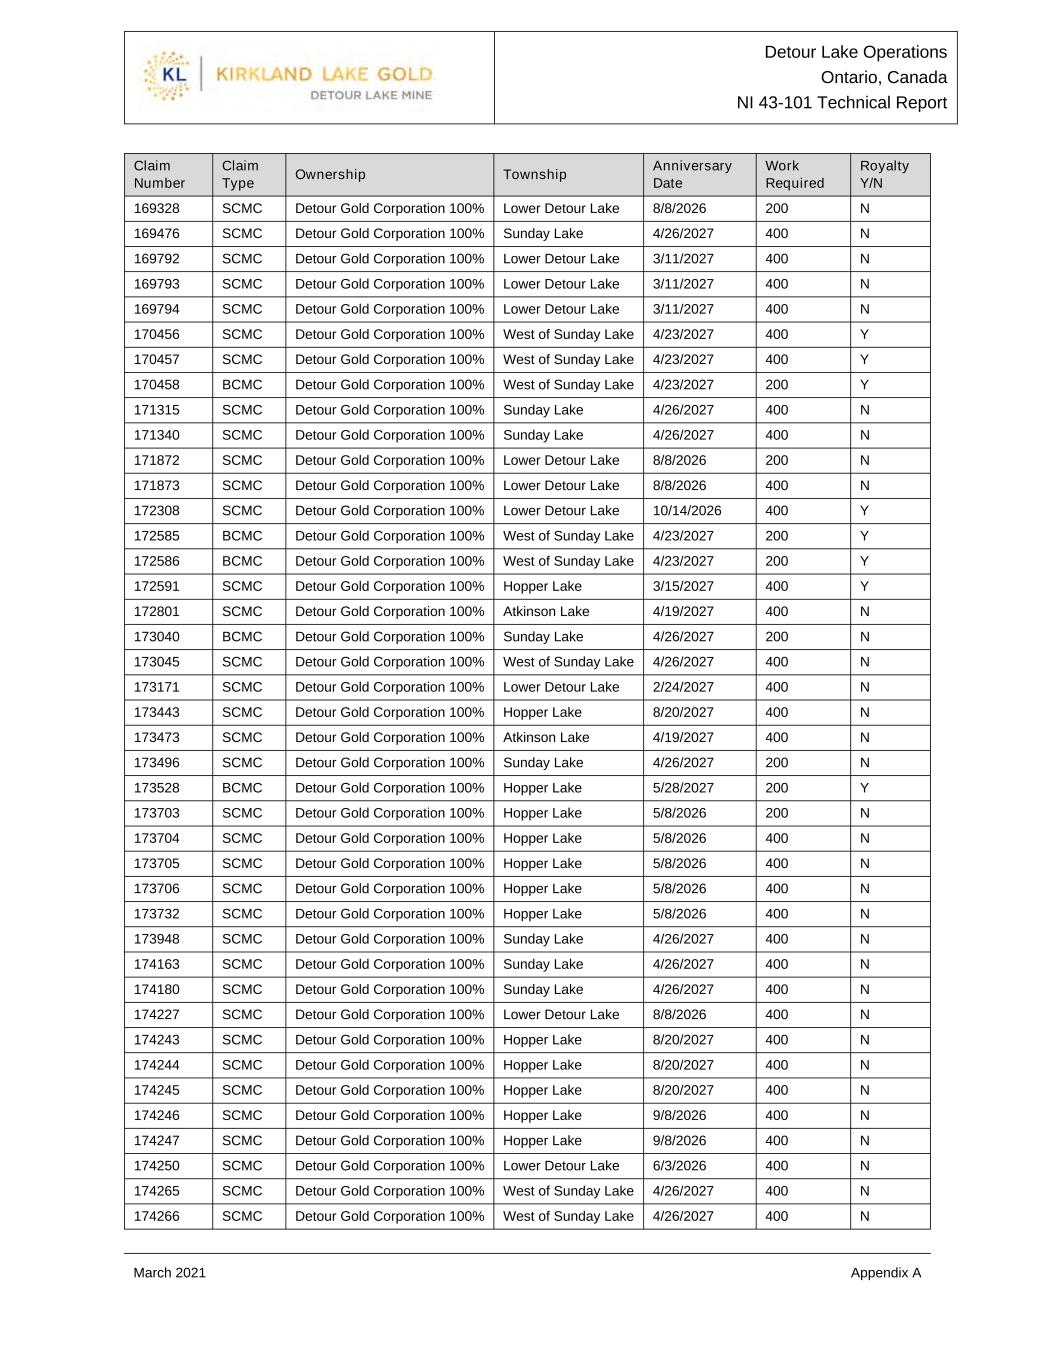
Detour Lake Operations Ontario, Canada NI 43-101 Technical Report March 2021 Appendix A Claim Number Claim Type Ownership Township Anniversary Date Work Required Royalty Y/N 169328 SCMC Detour Gold Corporation 100% Lower Detour Lake 8/8/2026 200 N 169476 SCMC Detour Gold Corporation 100% Sunday Lake 4/26/2027 400 N 169792 SCMC Detour Gold Corporation 100% Lower Detour Lake 3/11/2027 400 N 169793 SCMC Detour Gold Corporation 100% Lower Detour Lake 3/11/2027 400 N 169794 SCMC Detour Gold Corporation 100% Lower Detour Lake 3/11/2027 400 N 170456 SCMC Detour Gold Corporation 100% West of Sunday Lake 4/23/2027 400 Y 170457 SCMC Detour Gold Corporation 100% West of Sunday Lake 4/23/2027 400 Y 170458 BCMC Detour Gold Corporation 100% West of Sunday Lake 4/23/2027 200 Y 171315 SCMC Detour Gold Corporation 100% Sunday Lake 4/26/2027 400 N 171340 SCMC Detour Gold Corporation 100% Sunday Lake 4/26/2027 400 N 171872 SCMC Detour Gold Corporation 100% Lower Detour Lake 8/8/2026 200 N 171873 SCMC Detour Gold Corporation 100% Lower Detour Lake 8/8/2026 400 N 172308 SCMC Detour Gold Corporation 100% Lower Detour Lake 10/14/2026 400 Y 172585 BCMC Detour Gold Corporation 100% West of Sunday Lake 4/23/2027 200 Y 172586 BCMC Detour Gold Corporation 100% West of Sunday Lake 4/23/2027 200 Y 172591 SCMC Detour Gold Corporation 100% Hopper Lake 3/15/2027 400 Y 172801 SCMC Detour Gold Corporation 100% Atkinson Lake 4/19/2027 400 N 173040 BCMC Detour Gold Corporation 100% Sunday Lake 4/26/2027 200 N 173045 SCMC Detour Gold Corporation 100% West of Sunday Lake 4/26/2027 400 N 173171 SCMC Detour Gold Corporation 100% Lower Detour Lake 2/24/2027 400 N 173443 SCMC Detour Gold Corporation 100% Hopper Lake 8/20/2027 400 N 173473 SCMC Detour Gold Corporation 100% Atkinson Lake 4/19/2027 400 N 173496 SCMC Detour Gold Corporation 100% Sunday Lake 4/26/2027 200 N 173528 BCMC Detour Gold Corporation 100% Hopper Lake 5/28/2027 200 Y 173703 SCMC Detour Gold Corporation 100% Hopper Lake 5/8/2026 200 N 173704 SCMC Detour Gold Corporation 100% Hopper Lake 5/8/2026 400 N 173705 SCMC Detour Gold Corporation 100% Hopper Lake 5/8/2026 400 N 173706 SCMC Detour Gold Corporation 100% Hopper Lake 5/8/2026 400 N 173732 SCMC Detour Gold Corporation 100% Hopper Lake 5/8/2026 400 N 173948 SCMC Detour Gold Corporation 100% Sunday Lake 4/26/2027 400 N 174163 SCMC Detour Gold Corporation 100% Sunday Lake 4/26/2027 400 N 174180 SCMC Detour Gold Corporation 100% Sunday Lake 4/26/2027 400 N 174227 SCMC Detour Gold Corporation 100% Lower Detour Lake 8/8/2026 400 N 174243 SCMC Detour Gold Corporation 100% Hopper Lake 8/20/2027 400 N 174244 SCMC Detour Gold Corporation 100% Hopper Lake 8/20/2027 400 N 174245 SCMC Detour Gold Corporation 100% Hopper Lake 8/20/2027 400 N 174246 SCMC Detour Gold Corporation 100% Hopper Lake 9/8/2026 400 N 174247 SCMC Detour Gold Corporation 100% Hopper Lake 9/8/2026 400 N 174250 SCMC Detour Gold Corporation 100% Lower Detour Lake 6/3/2026 400 N 174265 SCMC Detour Gold Corporation 100% West of Sunday Lake 4/26/2027 400 N 174266 SCMC Detour Gold Corporation 100% West of Sunday Lake 4/26/2027 400 N

Detour Lake Operations Ontario, Canada NI 43-101 Technical Report March 2021 Appendix A Claim Number Claim Type Ownership Township Anniversary Date Work Required Royalty Y/N 174519 SCMC Detour Gold Corporation 100% Lower Detour Lake 6/3/2026 400 N 174520 SCMC Detour Gold Corporation 100% Lower Detour Lake 4/19/2027 400 N 174733 SCMC Detour Gold Corporation 100% Atkinson Lake 4/19/2027 400 N 174734 SCMC Detour Gold Corporation 100% Atkinson Lake 4/19/2027 400 N 174776 SCMC Detour Gold Corporation 100% Hopper Lake 8/20/2027 400 N 174995 SCMC Detour Gold Corporation 100% Lower Detour Lake 3/11/2027 400 N 175034 SCMC Detour Gold Corporation 100% Lower Detour Lake 10/14/2026 400 Y 175035 BCMC Detour Gold Corporation 100% Lower Detour Lake 10/14/2026 200 Y 175050 SCMC Detour Gold Corporation 100% Hopper Lake 9/8/2026 400 N 175404 SCMC Detour Gold Corporation 100% Lower Detour Lake 10/9/2026 400 N 175608 SCMC Detour Gold Corporation 100% Atkinson Lake 10/9/2026 400 N 175717 SCMC Detour Gold Corporation 100% Lower Detour Lake 3/11/2027 400 N 175791 SCMC Detour Gold Corporation 100% Atkinson Lake 4/19/2027 400 N 175957 SCMC Detour Gold Corporation 100% Lower Detour Lake 10/9/2026 400 N 176019 SCMC Detour Gold Corporation 100% Lower Detour Lake 4/19/2027 400 N 176432 SCMC Detour Gold Corporation 100% Lower Detour Lake 6/3/2026 400 N 176457 SCMC Detour Gold Corporation 100% Lower Detour Lake 4/19/2027 400 N 176673 BCMC Detour Gold Corporation 100% West of Sunday Lake 4/23/2026 200 Y 176679 SCMC Detour Gold Corporation 100% Atkinson Lake 4/19/2027 400 N 176680 BCMC Detour Gold Corporation 100% Lower Detour Lake 4/19/2027 200 N 176692 BCMC Detour Gold Corporation 100% West of Sunday Lake 10/25/2027 200 N 176693 BCMC Detour Gold Corporation 100% West of Sunday Lake 10/25/2027 200 N 176800 SCMC Detour Gold Corporation 100% West of Sunday Lake 4/23/2027 400 Y 177085 SCMC Detour Gold Corporation 100% Lower Detour Lake 4/19/2027 400 N 177088 SCMC Detour Gold Corporation 100% Hopper Lake 8/20/2027 400 N 177089 SCMC Detour Gold Corporation 100% Hopper Lake 8/20/2027 400 N 177090 SCMC Detour Gold Corporation 100% Hopper Lake 8/20/2027 400 N 177456 SCMC Detour Gold Corporation 100% Atkinson Lake 4/19/2027 400 N 177871 BCMC Detour Gold Corporation 100% Lower Detour Lake 4/19/2027 200 N 178027 SCMC Detour Gold Corporation 100% Lower Detour Lake 3/11/2027 400 N 178028 SCMC Detour Gold Corporation 100% Lower Detour Lake 6/3/2026 400 N 178029 SCMC Detour Gold Corporation 100% Lower Detour Lake 6/3/2026 400 N 178191 SCMC Detour Gold Corporation 100% Sunday Lake 4/26/2027 400 N 178192 SCMC Detour Gold Corporation 100% Sunday Lake 4/26/2027 400 N 178235 SCMC Detour Gold Corporation 100% West of Sunday Lake 4/23/2027 400 Y 178657 SCMC Detour Gold Corporation 100% Sunday Lake 4/26/2027 400 N 178658 SCMC Detour Gold Corporation 100% Sunday Lake 4/26/2027 400 N 178932 SCMC Detour Gold Corporation 100% Lower Detour Lake 4/19/2027 400 N 179441 SCMC Detour Gold Corporation 100% Hopper Lake 9/8/2026 400 N 179467 SCMC Detour Gold Corporation 100% Hopper Lake 3/15/2027 400 Y 179834 SCMC Detour Gold Corporation 100% West of Sunday Lake 8/20/2027 400 N
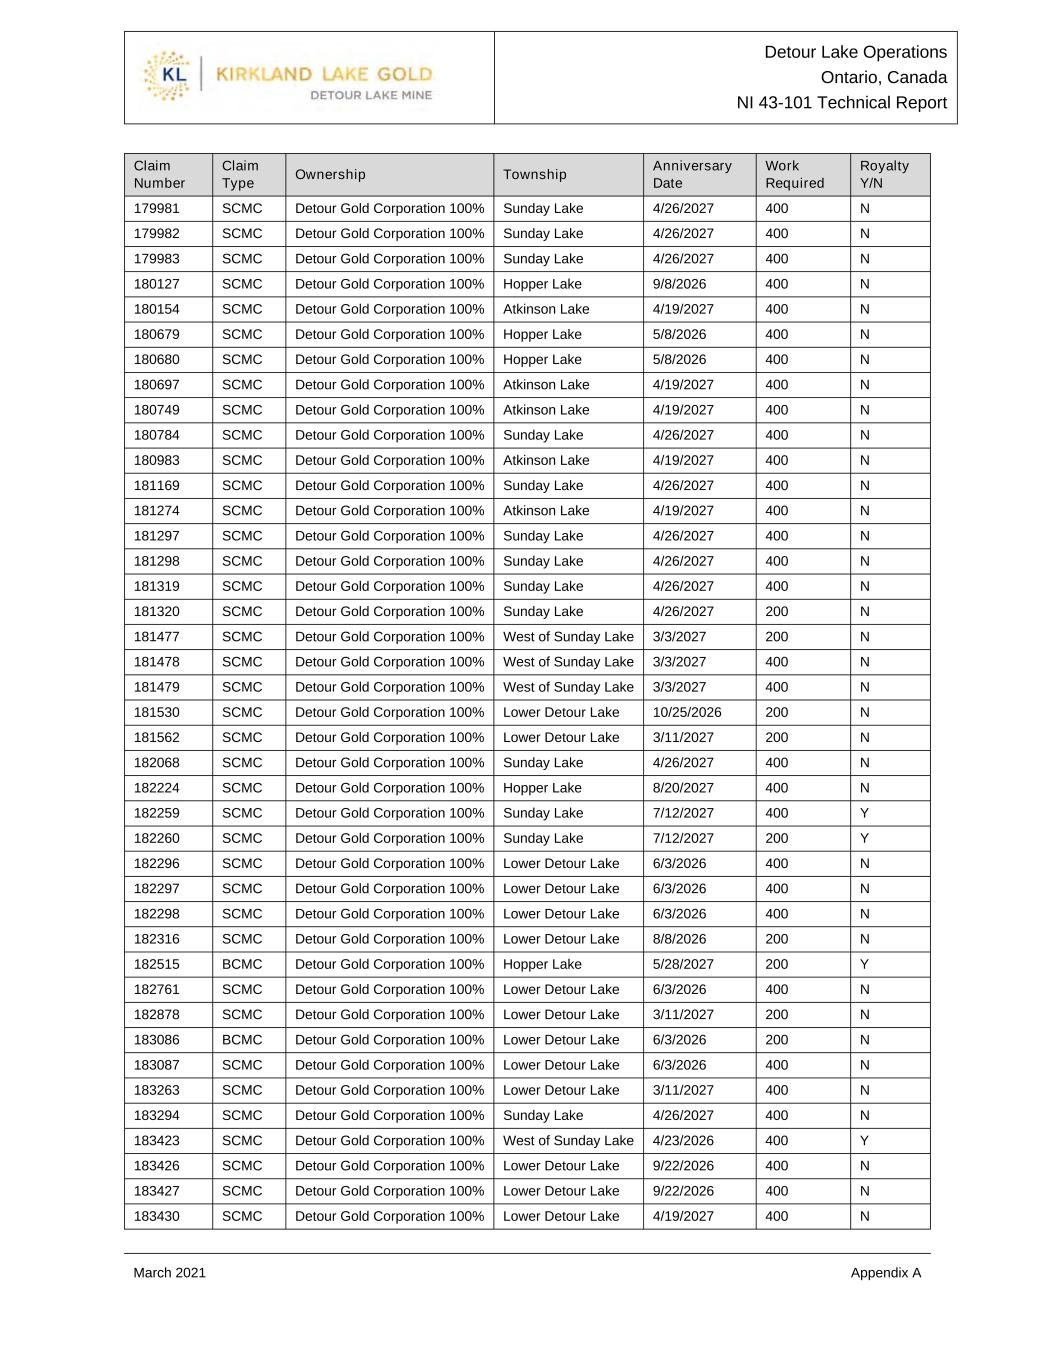
Detour Lake Operations Ontario, Canada NI 43-101 Technical Report March 2021 Appendix A Claim Number Claim Type Ownership Township Anniversary Date Work Required Royalty Y/N 179981 SCMC Detour Gold Corporation 100% Sunday Lake 4/26/2027 400 N 179982 SCMC Detour Gold Corporation 100% Sunday Lake 4/26/2027 400 N 179983 SCMC Detour Gold Corporation 100% Sunday Lake 4/26/2027 400 N 180127 SCMC Detour Gold Corporation 100% Hopper Lake 9/8/2026 400 N 180154 SCMC Detour Gold Corporation 100% Atkinson Lake 4/19/2027 400 N 180679 SCMC Detour Gold Corporation 100% Hopper Lake 5/8/2026 400 N 180680 SCMC Detour Gold Corporation 100% Hopper Lake 5/8/2026 400 N 180697 SCMC Detour Gold Corporation 100% Atkinson Lake 4/19/2027 400 N 180749 SCMC Detour Gold Corporation 100% Atkinson Lake 4/19/2027 400 N 180784 SCMC Detour Gold Corporation 100% Sunday Lake 4/26/2027 400 N 180983 SCMC Detour Gold Corporation 100% Atkinson Lake 4/19/2027 400 N 181169 SCMC Detour Gold Corporation 100% Sunday Lake 4/26/2027 400 N 181274 SCMC Detour Gold Corporation 100% Atkinson Lake 4/19/2027 400 N 181297 SCMC Detour Gold Corporation 100% Sunday Lake 4/26/2027 400 N 181298 SCMC Detour Gold Corporation 100% Sunday Lake 4/26/2027 400 N 181319 SCMC Detour Gold Corporation 100% Sunday Lake 4/26/2027 400 N 181320 SCMC Detour Gold Corporation 100% Sunday Lake 4/26/2027 200 N 181477 SCMC Detour Gold Corporation 100% West of Sunday Lake 3/3/2027 200 N 181478 SCMC Detour Gold Corporation 100% West of Sunday Lake 3/3/2027 400 N 181479 SCMC Detour Gold Corporation 100% West of Sunday Lake 3/3/2027 400 N 181530 SCMC Detour Gold Corporation 100% Lower Detour Lake 10/25/2026 200 N 181562 SCMC Detour Gold Corporation 100% Lower Detour Lake 3/11/2027 200 N 182068 SCMC Detour Gold Corporation 100% Sunday Lake 4/26/2027 400 N 182224 SCMC Detour Gold Corporation 100% Hopper Lake 8/20/2027 400 N 182259 SCMC Detour Gold Corporation 100% Sunday Lake 7/12/2027 400 Y 182260 SCMC Detour Gold Corporation 100% Sunday Lake 7/12/2027 200 Y 182296 SCMC Detour Gold Corporation 100% Lower Detour Lake 6/3/2026 400 N 182297 SCMC Detour Gold Corporation 100% Lower Detour Lake 6/3/2026 400 N 182298 SCMC Detour Gold Corporation 100% Lower Detour Lake 6/3/2026 400 N 182316 SCMC Detour Gold Corporation 100% Lower Detour Lake 8/8/2026 200 N 182515 BCMC Detour Gold Corporation 100% Hopper Lake 5/28/2027 200 Y 182761 SCMC Detour Gold Corporation 100% Lower Detour Lake 6/3/2026 400 N 182878 SCMC Detour Gold Corporation 100% Lower Detour Lake 3/11/2027 200 N 183086 BCMC Detour Gold Corporation 100% Lower Detour Lake 6/3/2026 200 N 183087 SCMC Detour Gold Corporation 100% Lower Detour Lake 6/3/2026 400 N 183263 SCMC Detour Gold Corporation 100% Lower Detour Lake 3/11/2027 400 N 183294 SCMC Detour Gold Corporation 100% Sunday Lake 4/26/2027 400 N 183423 SCMC Detour Gold Corporation 100% West of Sunday Lake 4/23/2026 400 Y 183426 SCMC Detour Gold Corporation 100% Lower Detour Lake 9/22/2026 400 N 183427 SCMC Detour Gold Corporation 100% Lower Detour Lake 9/22/2026 400 N 183430 SCMC Detour Gold Corporation 100% Lower Detour Lake 4/19/2027 400 N

Detour Lake Operations Ontario, Canada NI 43-101 Technical Report March 2021 Appendix A Claim Number Claim Type Ownership Township Anniversary Date Work Required Royalty Y/N 183431 SCMC Detour Gold Corporation 100% Lower Detour Lake 4/19/2027 400 N 183432 BCMC Detour Gold Corporation 100% Lower Detour Lake 4/19/2027 200 N 183459 SCMC Detour Gold Corporation 100% West of Sunday Lake 10/25/2027 400 N 183460 SCMC Detour Gold Corporation 100% West of Sunday Lake 10/25/2027 400 N 183461 SCMC Detour Gold Corporation 100% West of Sunday Lake 10/25/2027 400 N 184317 SCMC Detour Gold Corporation 100% Atkinson Lake 4/19/2027 400 N 184318 SCMC Detour Gold Corporation 100% Atkinson Lake 4/19/2027 400 N 184531 SCMC Detour Gold Corporation 100% Atkinson Lake 4/19/2027 400 N 184825 SCMC Detour Gold Corporation 100% Lower Detour Lake 6/3/2026 200 N 185013 SCMC Detour Gold Corporation 100% Lower Detour Lake 3/11/2027 400 N 185054 SCMC Detour Gold Corporation 100% Lower Detour Lake 3/11/2027 400 N 185055 SCMC Detour Gold Corporation 100% Lower Detour Lake 3/11/2027 200 N 185414 SCMC Detour Gold Corporation 100% Lower Detour Lake 6/3/2026 400 N 185449 SCMC Detour Gold Corporation 100% Sunday Lake 4/26/2027 400 N 185464 SCMC Detour Gold Corporation 100% West of Sunday Lake 6/3/2027 200 N 185596 SCMC Detour Gold Corporation 100% Sunday Lake 4/26/2027 400 N 185620 SCMC Detour Gold Corporation 100% Lower Detour Lake 4/19/2027 400 N 185646 BCMC Detour Gold Corporation 100% West of Sunday Lake 4/23/2027 200 Y 185787 SCMC Detour Gold Corporation 100% Sunday Lake 4/26/2027 400 N 185892 BCMC Detour Gold Corporation 100% Hopper Lake 8/20/2027 200 N 186375 SCMC Detour Gold Corporation 100% Sunday Lake 7/12/2027 400 Y 186751 SCMC Detour Gold Corporation 100% Sunday Lake 4/26/2027 400 N 186860 SCMC Detour Gold Corporation 100% Lower Detour Lake 6/3/2026 400 N 186861 SCMC Detour Gold Corporation 100% Lower Detour Lake 6/3/2026 400 N 187126 SCMC Detour Gold Corporation 100% Sunday Lake 4/26/2027 400 N 187127 SCMC Detour Gold Corporation 100% Sunday Lake 4/26/2027 400 N 187166 BCMC Detour Gold Corporation 100% Sunday Lake 7/12/2027 200 Y 187225 SCMC Detour Gold Corporation 100% Sunday Lake 4/26/2027 400 N 187226 SCMC Detour Gold Corporation 100% Sunday Lake 4/26/2027 400 N 187310 SCMC Detour Gold Corporation 100% Atkinson Lake 4/19/2027 400 N 187311 BCMC Detour Gold Corporation 100% Atkinson Lake 4/19/2025 200 N 187336 SCMC Detour Gold Corporation 100% Sunday Lake 4/26/2027 400 N 187409 SCMC Detour Gold Corporation 100% West of Sunday Lake 5/28/2027 400 Y 187457 SCMC Detour Gold Corporation 100% Atkinson Lake 4/19/2027 400 N 187458 SCMC Detour Gold Corporation 100% Atkinson Lake 4/19/2027 400 N 187510 SCMC Detour Gold Corporation 100% Atkinson Lake 4/19/2027 400 N 187551 SCMC Detour Gold Corporation 100% Sunday Lake 4/26/2027 400 N 187635 SCMC Detour Gold Corporation 100% Sunday Lake 4/26/2027 400 N 187969 SCMC Detour Gold Corporation 100% Lower Detour Lake 10/9/2026 400 N 188102 SCMC Detour Gold Corporation 100% Atkinson Lake 4/19/2027 400 N 188116 SCMC Detour Gold Corporation 100% Sunday Lake 4/26/2027 400 N

Detour Lake Operations Ontario, Canada NI 43-101 Technical Report March 2021 Appendix A Claim Number Claim Type Ownership Township Anniversary Date Work Required Royalty Y/N 188399 BCMC Detour Gold Corporation 100% Atkinson Lake 4/19/2027 200 N 188540 SCMC Detour Gold Corporation 100% Lower Detour Lake 6/3/2026 400 N 188997 SCMC Detour Gold Corporation 100% Lower Detour Lake 4/19/2027 400 N 189291 SCMC Detour Gold Corporation 100% Lower Detour Lake 3/11/2027 400 N 189292 SCMC Detour Gold Corporation 100% Lower Detour Lake 3/11/2027 400 N 189301 SCMC Detour Gold Corporation 100% Sunday Lake 4/26/2026 400 N 189302 SCMC Detour Gold Corporation 100% Sunday Lake 4/26/2026 400 N 189744 SCMC Detour Gold Corporation 100% Lower Detour Lake 6/3/2026 400 N 189757 SCMC Detour Gold Corporation 100% Lower Detour Lake 2/24/2027 400 N 189943 BCMC Detour Gold Corporation 100% Hopper Lake 3/15/2027 200 Y 190117 BCMC Detour Gold Corporation 100% West of Sunday Lake 5/28/2027 200 Y 190220 SCMC Detour Gold Corporation 100% Atkinson Lake 4/19/2027 400 N 190546 SCMC Detour Gold Corporation 100% Lower Detour Lake 4/19/2027 400 N 190547 SCMC Detour Gold Corporation 100% Lower Detour Lake 4/19/2027 400 N 190850 BCMC Detour Gold Corporation 100% Lower Detour Lake 8/8/2026 200 N 190851 SCMC Detour Gold Corporation 100% Hopper Lake 8/20/2027 400 N 190888 SCMC Detour Gold Corporation 100% Atkinson Lake 4/19/2027 400 N 190889 BCMC Detour Gold Corporation 100% Atkinson Lake 4/19/2027 200 N 190911 SCMC Detour Gold Corporation 100% Sunday Lake 4/26/2027 400 N 190912 SCMC Detour Gold Corporation 100% Sunday Lake 4/26/2027 400 N 190913 SCMC Detour Gold Corporation 100% Sunday Lake 4/26/2027 400 N 190985 SCMC Detour Gold Corporation 100% Sunday Lake 4/26/2027 400 N 191090 SCMC Detour Gold Corporation 100% West of Sunday Lake 4/26/2027 400 N 191091 SCMC Detour Gold Corporation 100% West of Sunday Lake 4/26/2027 400 N 191095 SCMC Detour Gold Corporation 100% Lower Detour Lake 10/14/2026 400 Y 191096 SCMC Detour Gold Corporation 100% Lower Detour Lake 10/14/2026 400 Y 191271 SCMC Detour Gold Corporation 100% Sunday Lake 4/26/2027 400 N 191341 SCMC Detour Gold Corporation 100% Sunday Lake 4/26/2027 400 N 191350 SCMC Detour Gold Corporation 100% Lower Detour Lake 9/22/2026 400 N 191477 SCMC Detour Gold Corporation 100% Sunday Lake 4/26/2027 400 N 191742 SCMC Detour Gold Corporation 100% Lower Detour Lake 6/3/2026 400 N 191743 SCMC Detour Gold Corporation 100% Lower Detour Lake 6/3/2026 400 N 192130 SCMC Detour Gold Corporation 100% Sunday Lake 4/26/2027 400 N 192153 SCMC Detour Gold Corporation 100% Sunday Lake 4/26/2027 400 N 192280 SCMC Detour Gold Corporation 100% Hopper Lake 5/8/2026 200 N 192281 SCMC Detour Gold Corporation 100% Hopper Lake 9/8/2026 400 N 192296 SCMC Detour Gold Corporation 100% Hopper Lake 5/8/2026 400 N 192304 SCMC Detour Gold Corporation 100% Atkinson Lake 4/19/2027 400 N 192307 SCMC Detour Gold Corporation 100% Hopper Lake 9/8/2026 400 N 192328 SCMC Detour Gold Corporation 100% West of Sunday Lake 4/26/2027 400 N 192477 SCMC Detour Gold Corporation 100% Lower Detour Lake 4/19/2027 400 N
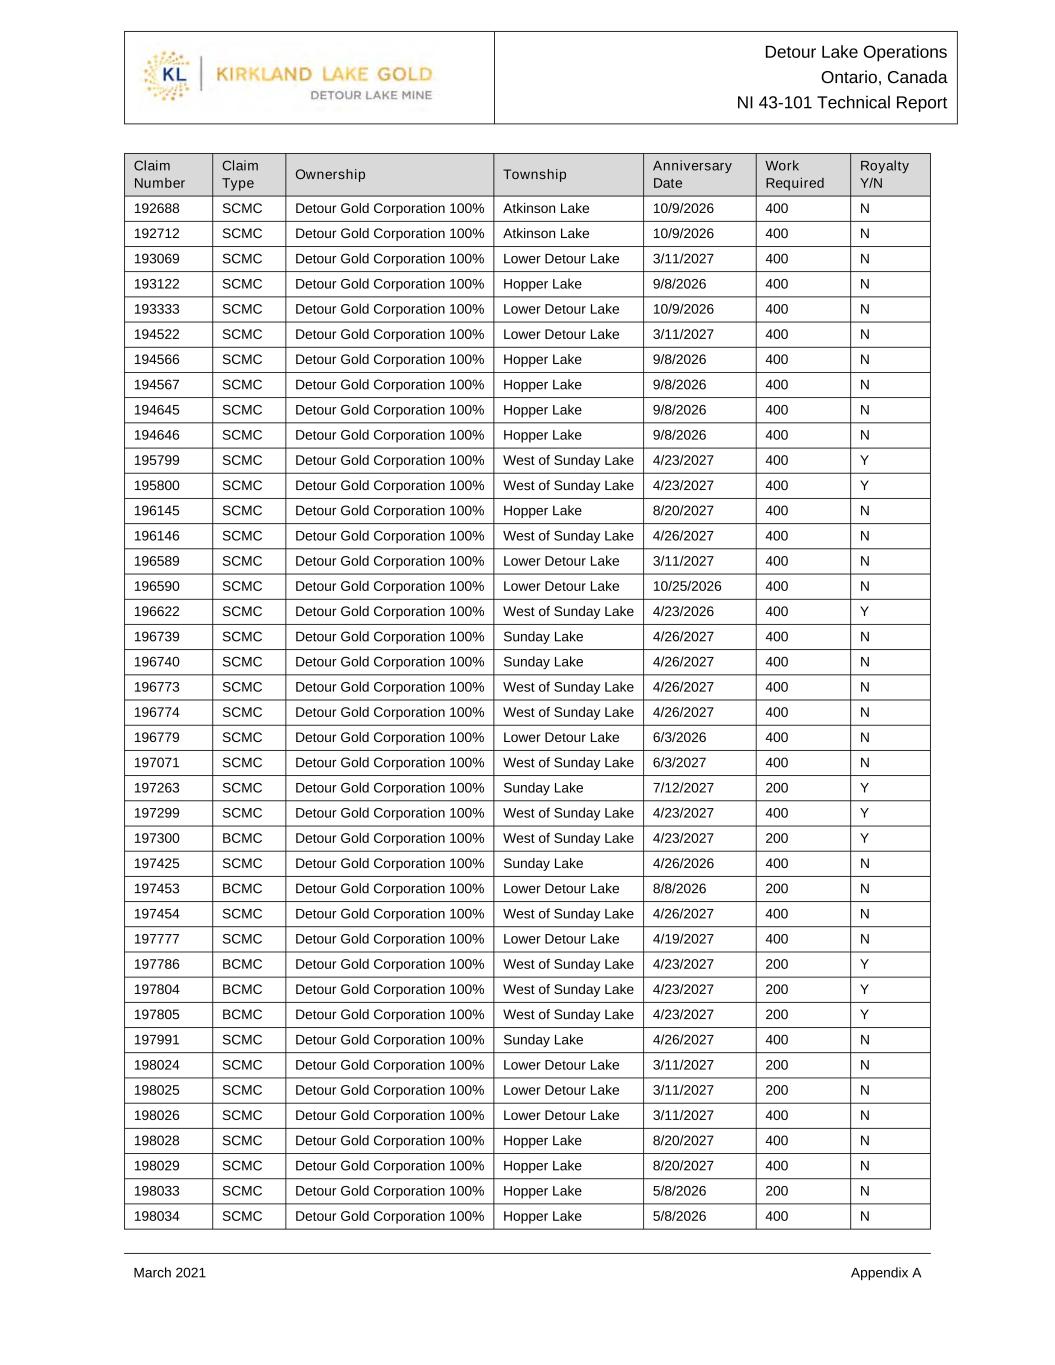
Detour Lake Operations Ontario, Canada NI 43-101 Technical Report March 2021 Appendix A Claim Number Claim Type Ownership Township Anniversary Date Work Required Royalty Y/N 192688 SCMC Detour Gold Corporation 100% Atkinson Lake 10/9/2026 400 N 192712 SCMC Detour Gold Corporation 100% Atkinson Lake 10/9/2026 400 N 193069 SCMC Detour Gold Corporation 100% Lower Detour Lake 3/11/2027 400 N 193122 SCMC Detour Gold Corporation 100% Hopper Lake 9/8/2026 400 N 193333 SCMC Detour Gold Corporation 100% Lower Detour Lake 10/9/2026 400 N 194522 SCMC Detour Gold Corporation 100% Lower Detour Lake 3/11/2027 400 N 194566 SCMC Detour Gold Corporation 100% Hopper Lake 9/8/2026 400 N 194567 SCMC Detour Gold Corporation 100% Hopper Lake 9/8/2026 400 N 194645 SCMC Detour Gold Corporation 100% Hopper Lake 9/8/2026 400 N 194646 SCMC Detour Gold Corporation 100% Hopper Lake 9/8/2026 400 N 195799 SCMC Detour Gold Corporation 100% West of Sunday Lake 4/23/2027 400 Y 195800 SCMC Detour Gold Corporation 100% West of Sunday Lake 4/23/2027 400 Y 196145 SCMC Detour Gold Corporation 100% Hopper Lake 8/20/2027 400 N 196146 SCMC Detour Gold Corporation 100% West of Sunday Lake 4/26/2027 400 N 196589 SCMC Detour Gold Corporation 100% Lower Detour Lake 3/11/2027 400 N 196590 SCMC Detour Gold Corporation 100% Lower Detour Lake 10/25/2026 400 N 196622 SCMC Detour Gold Corporation 100% West of Sunday Lake 4/23/2026 400 Y 196739 SCMC Detour Gold Corporation 100% Sunday Lake 4/26/2027 400 N 196740 SCMC Detour Gold Corporation 100% Sunday Lake 4/26/2027 400 N 196773 SCMC Detour Gold Corporation 100% West of Sunday Lake 4/26/2027 400 N 196774 SCMC Detour Gold Corporation 100% West of Sunday Lake 4/26/2027 400 N 196779 SCMC Detour Gold Corporation 100% Lower Detour Lake 6/3/2026 400 N 197071 SCMC Detour Gold Corporation 100% West of Sunday Lake 6/3/2027 400 N 197263 SCMC Detour Gold Corporation 100% Sunday Lake 7/12/2027 200 Y 197299 SCMC Detour Gold Corporation 100% West of Sunday Lake 4/23/2027 400 Y 197300 BCMC Detour Gold Corporation 100% West of Sunday Lake 4/23/2027 200 Y 197425 SCMC Detour Gold Corporation 100% Sunday Lake 4/26/2026 400 N 197453 BCMC Detour Gold Corporation 100% Lower Detour Lake 8/8/2026 200 N 197454 SCMC Detour Gold Corporation 100% West of Sunday Lake 4/26/2027 400 N 197777 SCMC Detour Gold Corporation 100% Lower Detour Lake 4/19/2027 400 N 197786 BCMC Detour Gold Corporation 100% West of Sunday Lake 4/23/2027 200 Y 197804 BCMC Detour Gold Corporation 100% West of Sunday Lake 4/23/2027 200 Y 197805 BCMC Detour Gold Corporation 100% West of Sunday Lake 4/23/2027 200 Y 197991 SCMC Detour Gold Corporation 100% Sunday Lake 4/26/2027 400 N 198024 SCMC Detour Gold Corporation 100% Lower Detour Lake 3/11/2027 200 N 198025 SCMC Detour Gold Corporation 100% Lower Detour Lake 3/11/2027 200 N 198026 SCMC Detour Gold Corporation 100% Lower Detour Lake 3/11/2027 400 N 198028 SCMC Detour Gold Corporation 100% Hopper Lake 8/20/2027 400 N 198029 SCMC Detour Gold Corporation 100% Hopper Lake 8/20/2027 400 N 198033 SCMC Detour Gold Corporation 100% Hopper Lake 5/8/2026 200 N 198034 SCMC Detour Gold Corporation 100% Hopper Lake 5/8/2026 400 N

Detour Lake Operations Ontario, Canada NI 43-101 Technical Report March 2021 Appendix A Claim Number Claim Type Ownership Township Anniversary Date Work Required Royalty Y/N 198035 SCMC Detour Gold Corporation 100% Hopper Lake 5/8/2026 200 N 198036 SCMC Detour Gold Corporation 100% Hopper Lake 5/8/2026 400 N 198070 SCMC Detour Gold Corporation 100% West of Sunday Lake 4/26/2027 200 N 198661 SCMC Detour Gold Corporation 100% Sunday Lake 4/26/2027 400 N 198662 SCMC Detour Gold Corporation 100% Sunday Lake 4/26/2027 400 N 199065 SCMC Detour Gold Corporation 100% Hopper Lake 3/15/2027 400 Y 199242 SCMC Detour Gold Corporation 100% Lower Detour Lake 10/9/2026 400 N 199243 SCMC Detour Gold Corporation 100% Lower Detour Lake 10/9/2026 400 N 199659 SCMC Detour Gold Corporation 100% Hopper Lake 5/8/2026 200 N 199660 SCMC Detour Gold Corporation 100% Hopper Lake 5/8/2026 400 N 199661 SCMC Detour Gold Corporation 100% Hopper Lake 5/8/2026 400 N 199676 SCMC Detour Gold Corporation 100% Atkinson Lake 4/19/2027 400 N 199819 SCMC Detour Gold Corporation 100% Atkinson Lake 4/19/2027 400 N 199820 BCMC Detour Gold Corporation 100% Atkinson Lake 4/19/2025 200 N 200230 SCMC Detour Gold Corporation 100% Atkinson Lake 4/19/2027 400 N 200231 SCMC Detour Gold Corporation 100% Atkinson Lake 4/19/2027 400 N 200273 SCMC Detour Gold Corporation 100% Sunday Lake 4/26/2027 200 N 200947 SCMC Detour Gold Corporation 100% West of Sunday Lake 3/3/2027 400 N 201168 SCMC Detour Gold Corporation 100% Lower Detour Lake 3/11/2027 200 N 201177 SCMC Detour Gold Corporation 100% Lower Detour Lake 4/19/2027 400 N 201279 SCMC Detour Gold Corporation 100% Sunday Lake 4/26/2027 400 N 201280 BCMC Detour Gold Corporation 100% Sunday Lake 4/26/2027 200 N 201526 SCMC Detour Gold Corporation 100% Sunday Lake 4/26/2027 400 N 201527 SCMC Detour Gold Corporation 100% Sunday Lake 4/26/2027 400 N 201528 SCMC Detour Gold Corporation 100% Sunday Lake 4/26/2027 400 N 201689 SCMC Detour Gold Corporation 100% Lower Detour Lake 3/11/2027 200 N 201692 SCMC Detour Gold Corporation 100% West of Sunday Lake 9/18/2026 200 Y 202193 SCMC Detour Gold Corporation 100% Lower Detour Lake 6/3/2026 400 N 202354 SCMC Detour Gold Corporation 100% Atkinson Lake 4/19/2027 400 N 202400 SCMC Detour Gold Corporation 100% Sunday Lake 7/12/2027 400 Y 202462 SCMC Detour Gold Corporation 100% Sunday Lake 4/26/2027 400 N 202659 BCMC Detour Gold Corporation 100% Sunday Lake 7/12/2027 200 Y 202677 SCMC Detour Gold Corporation 100% Lower Detour Lake 10/9/2026 400 N 202758 BCMC Detour Gold Corporation 100% Lower Detour Lake 6/3/2026 200 N 203004 SCMC Detour Gold Corporation 100% Lower Detour Lake 8/8/2026 400 N 203005 SCMC Detour Gold Corporation 100% Hopper Lake 8/20/2027 400 N 203320 SCMC Detour Gold Corporation 100% West of Sunday Lake 4/26/2027 400 N 203321 SCMC Detour Gold Corporation 100% West of Sunday Lake 6/3/2027 400 N 203563 SCMC Detour Gold Corporation 100% Sunday Lake 4/26/2027 400 N 203631 SCMC Detour Gold Corporation 100% Sunday Lake 4/26/2027 400 N 203741 BCMC Detour Gold Corporation 100% West of Sunday Lake 5/28/2026 200 Y
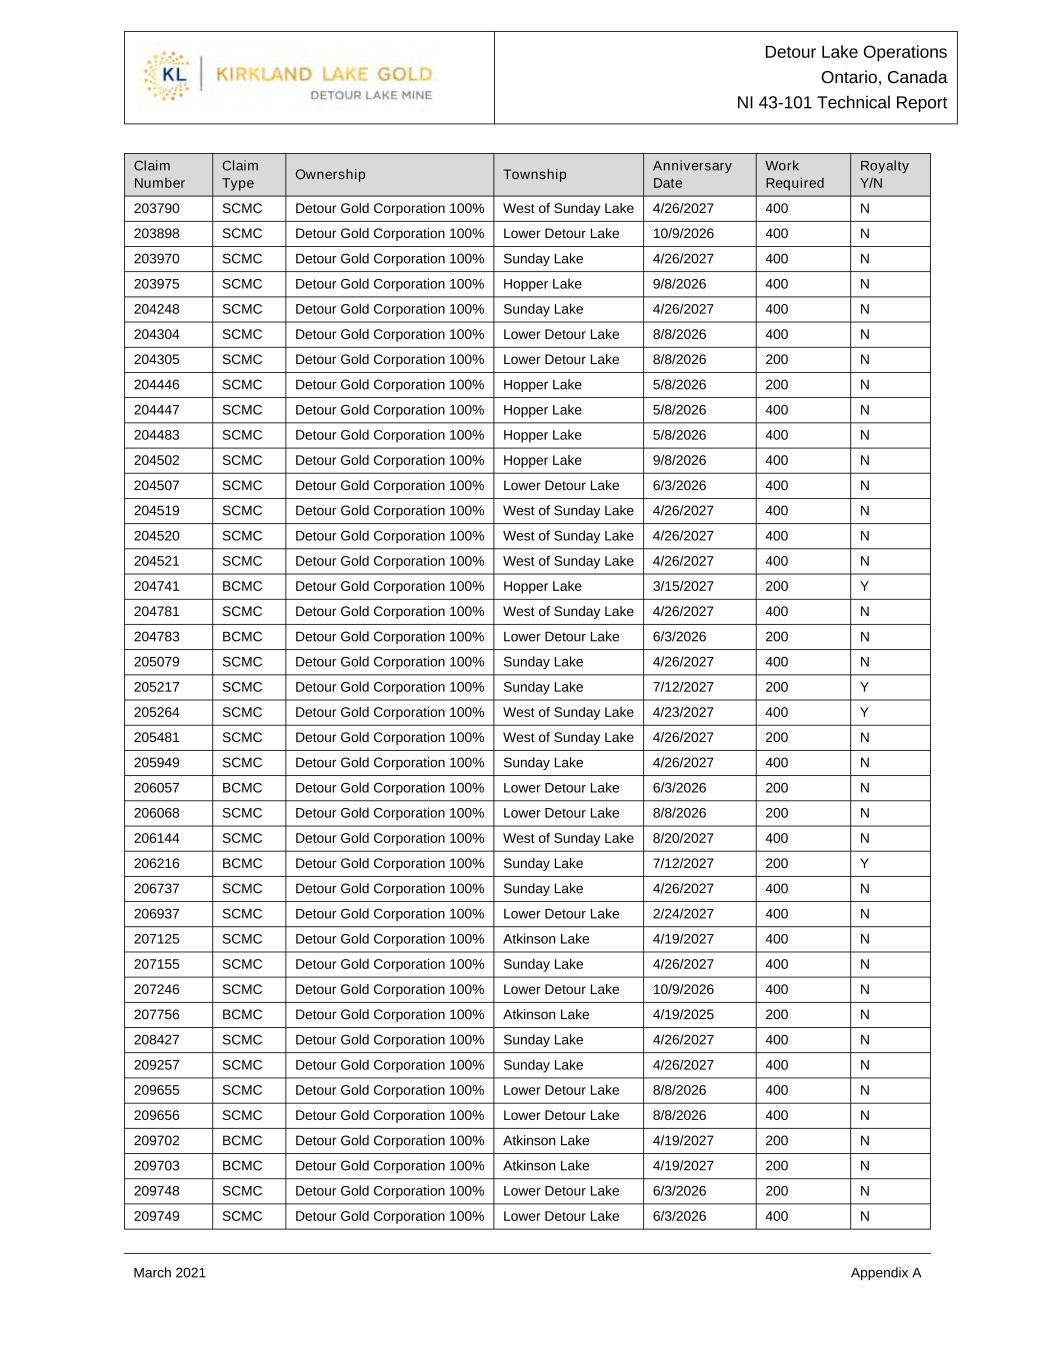
Detour Lake Operations Ontario, Canada NI 43-101 Technical Report March 2021 Appendix A Claim Number Claim Type Ownership Township Anniversary Date Work Required Royalty Y/N 203790 SCMC Detour Gold Corporation 100% West of Sunday Lake 4/26/2027 400 N 203898 SCMC Detour Gold Corporation 100% Lower Detour Lake 10/9/2026 400 N 203970 SCMC Detour Gold Corporation 100% Sunday Lake 4/26/2027 400 N 203975 SCMC Detour Gold Corporation 100% Hopper Lake 9/8/2026 400 N 204248 SCMC Detour Gold Corporation 100% Sunday Lake 4/26/2027 400 N 204304 SCMC Detour Gold Corporation 100% Lower Detour Lake 8/8/2026 400 N 204305 SCMC Detour Gold Corporation 100% Lower Detour Lake 8/8/2026 200 N 204446 SCMC Detour Gold Corporation 100% Hopper Lake 5/8/2026 200 N 204447 SCMC Detour Gold Corporation 100% Hopper Lake 5/8/2026 400 N 204483 SCMC Detour Gold Corporation 100% Hopper Lake 5/8/2026 400 N 204502 SCMC Detour Gold Corporation 100% Hopper Lake 9/8/2026 400 N 204507 SCMC Detour Gold Corporation 100% Lower Detour Lake 6/3/2026 400 N 204519 SCMC Detour Gold Corporation 100% West of Sunday Lake 4/26/2027 400 N 204520 SCMC Detour Gold Corporation 100% West of Sunday Lake 4/26/2027 400 N 204521 SCMC Detour Gold Corporation 100% West of Sunday Lake 4/26/2027 400 N 204741 BCMC Detour Gold Corporation 100% Hopper Lake 3/15/2027 200 Y 204781 SCMC Detour Gold Corporation 100% West of Sunday Lake 4/26/2027 400 N 204783 BCMC Detour Gold Corporation 100% Lower Detour Lake 6/3/2026 200 N 205079 SCMC Detour Gold Corporation 100% Sunday Lake 4/26/2027 400 N 205217 SCMC Detour Gold Corporation 100% Sunday Lake 7/12/2027 200 Y 205264 SCMC Detour Gold Corporation 100% West of Sunday Lake 4/23/2027 400 Y 205481 SCMC Detour Gold Corporation 100% West of Sunday Lake 4/26/2027 200 N 205949 SCMC Detour Gold Corporation 100% Sunday Lake 4/26/2027 400 N 206057 BCMC Detour Gold Corporation 100% Lower Detour Lake 6/3/2026 200 N 206068 SCMC Detour Gold Corporation 100% Lower Detour Lake 8/8/2026 200 N 206144 SCMC Detour Gold Corporation 100% West of Sunday Lake 8/20/2027 400 N 206216 BCMC Detour Gold Corporation 100% Sunday Lake 7/12/2027 200 Y 206737 SCMC Detour Gold Corporation 100% Sunday Lake 4/26/2027 400 N 206937 SCMC Detour Gold Corporation 100% Lower Detour Lake 2/24/2027 400 N 207125 SCMC Detour Gold Corporation 100% Atkinson Lake 4/19/2027 400 N 207155 SCMC Detour Gold Corporation 100% Sunday Lake 4/26/2027 400 N 207246 SCMC Detour Gold Corporation 100% Lower Detour Lake 10/9/2026 400 N 207756 BCMC Detour Gold Corporation 100% Atkinson Lake 4/19/2025 200 N 208427 SCMC Detour Gold Corporation 100% Sunday Lake 4/26/2027 400 N 209257 SCMC Detour Gold Corporation 100% Sunday Lake 4/26/2027 400 N 209655 SCMC Detour Gold Corporation 100% Lower Detour Lake 8/8/2026 400 N 209656 SCMC Detour Gold Corporation 100% Lower Detour Lake 8/8/2026 400 N 209702 BCMC Detour Gold Corporation 100% Atkinson Lake 4/19/2027 200 N 209703 BCMC Detour Gold Corporation 100% Atkinson Lake 4/19/2027 200 N 209748 SCMC Detour Gold Corporation 100% Lower Detour Lake 6/3/2026 200 N 209749 SCMC Detour Gold Corporation 100% Lower Detour Lake 6/3/2026 400 N
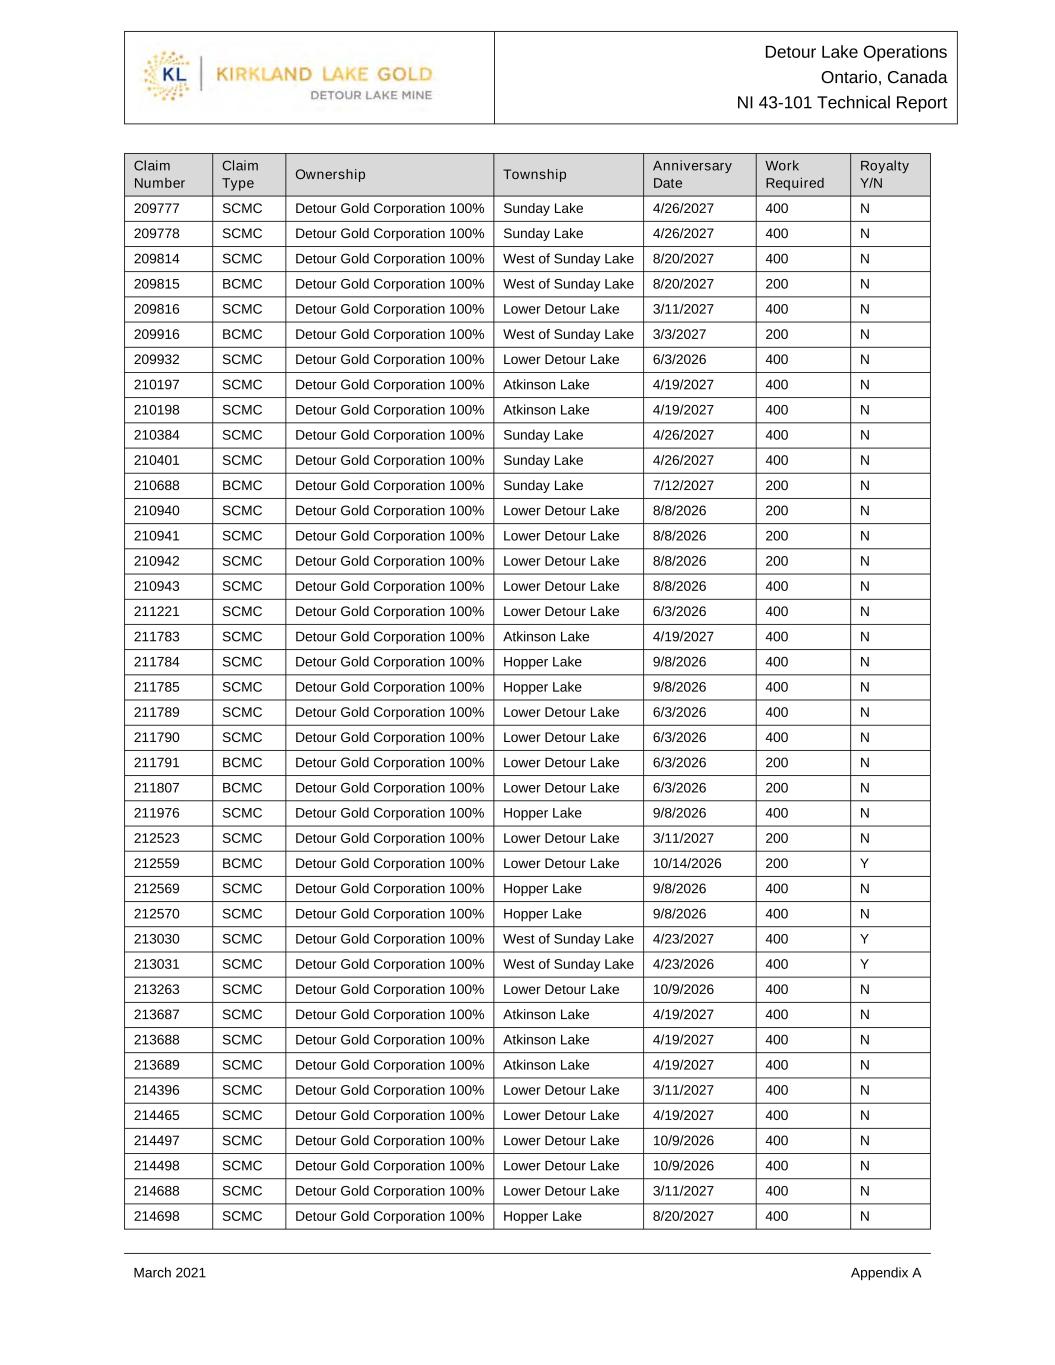
Detour Lake Operations Ontario, Canada NI 43-101 Technical Report March 2021 Appendix A Claim Number Claim Type Ownership Township Anniversary Date Work Required Royalty Y/N 209777 SCMC Detour Gold Corporation 100% Sunday Lake 4/26/2027 400 N 209778 SCMC Detour Gold Corporation 100% Sunday Lake 4/26/2027 400 N 209814 SCMC Detour Gold Corporation 100% West of Sunday Lake 8/20/2027 400 N 209815 BCMC Detour Gold Corporation 100% West of Sunday Lake 8/20/2027 200 N 209816 SCMC Detour Gold Corporation 100% Lower Detour Lake 3/11/2027 400 N 209916 BCMC Detour Gold Corporation 100% West of Sunday Lake 3/3/2027 200 N 209932 SCMC Detour Gold Corporation 100% Lower Detour Lake 6/3/2026 400 N 210197 SCMC Detour Gold Corporation 100% Atkinson Lake 4/19/2027 400 N 210198 SCMC Detour Gold Corporation 100% Atkinson Lake 4/19/2027 400 N 210384 SCMC Detour Gold Corporation 100% Sunday Lake 4/26/2027 400 N 210401 SCMC Detour Gold Corporation 100% Sunday Lake 4/26/2027 400 N 210688 BCMC Detour Gold Corporation 100% Sunday Lake 7/12/2027 200 N 210940 SCMC Detour Gold Corporation 100% Lower Detour Lake 8/8/2026 200 N 210941 SCMC Detour Gold Corporation 100% Lower Detour Lake 8/8/2026 200 N 210942 SCMC Detour Gold Corporation 100% Lower Detour Lake 8/8/2026 200 N 210943 SCMC Detour Gold Corporation 100% Lower Detour Lake 8/8/2026 400 N 211221 SCMC Detour Gold Corporation 100% Lower Detour Lake 6/3/2026 400 N 211783 SCMC Detour Gold Corporation 100% Atkinson Lake 4/19/2027 400 N 211784 SCMC Detour Gold Corporation 100% Hopper Lake 9/8/2026 400 N 211785 SCMC Detour Gold Corporation 100% Hopper Lake 9/8/2026 400 N 211789 SCMC Detour Gold Corporation 100% Lower Detour Lake 6/3/2026 400 N 211790 SCMC Detour Gold Corporation 100% Lower Detour Lake 6/3/2026 400 N 211791 BCMC Detour Gold Corporation 100% Lower Detour Lake 6/3/2026 200 N 211807 BCMC Detour Gold Corporation 100% Lower Detour Lake 6/3/2026 200 N 211976 SCMC Detour Gold Corporation 100% Hopper Lake 9/8/2026 400 N 212523 SCMC Detour Gold Corporation 100% Lower Detour Lake 3/11/2027 200 N 212559 BCMC Detour Gold Corporation 100% Lower Detour Lake 10/14/2026 200 Y 212569 SCMC Detour Gold Corporation 100% Hopper Lake 9/8/2026 400 N 212570 SCMC Detour Gold Corporation 100% Hopper Lake 9/8/2026 400 N 213030 SCMC Detour Gold Corporation 100% West of Sunday Lake 4/23/2027 400 Y 213031 SCMC Detour Gold Corporation 100% West of Sunday Lake 4/23/2026 400 Y 213263 SCMC Detour Gold Corporation 100% Lower Detour Lake 10/9/2026 400 N 213687 SCMC Detour Gold Corporation 100% Atkinson Lake 4/19/2027 400 N 213688 SCMC Detour Gold Corporation 100% Atkinson Lake 4/19/2027 400 N 213689 SCMC Detour Gold Corporation 100% Atkinson Lake 4/19/2027 400 N 214396 SCMC Detour Gold Corporation 100% Lower Detour Lake 3/11/2027 400 N 214465 SCMC Detour Gold Corporation 100% Lower Detour Lake 4/19/2027 400 N 214497 SCMC Detour Gold Corporation 100% Lower Detour Lake 10/9/2026 400 N 214498 SCMC Detour Gold Corporation 100% Lower Detour Lake 10/9/2026 400 N 214688 SCMC Detour Gold Corporation 100% Lower Detour Lake 3/11/2027 400 N 214698 SCMC Detour Gold Corporation 100% Hopper Lake 8/20/2027 400 N
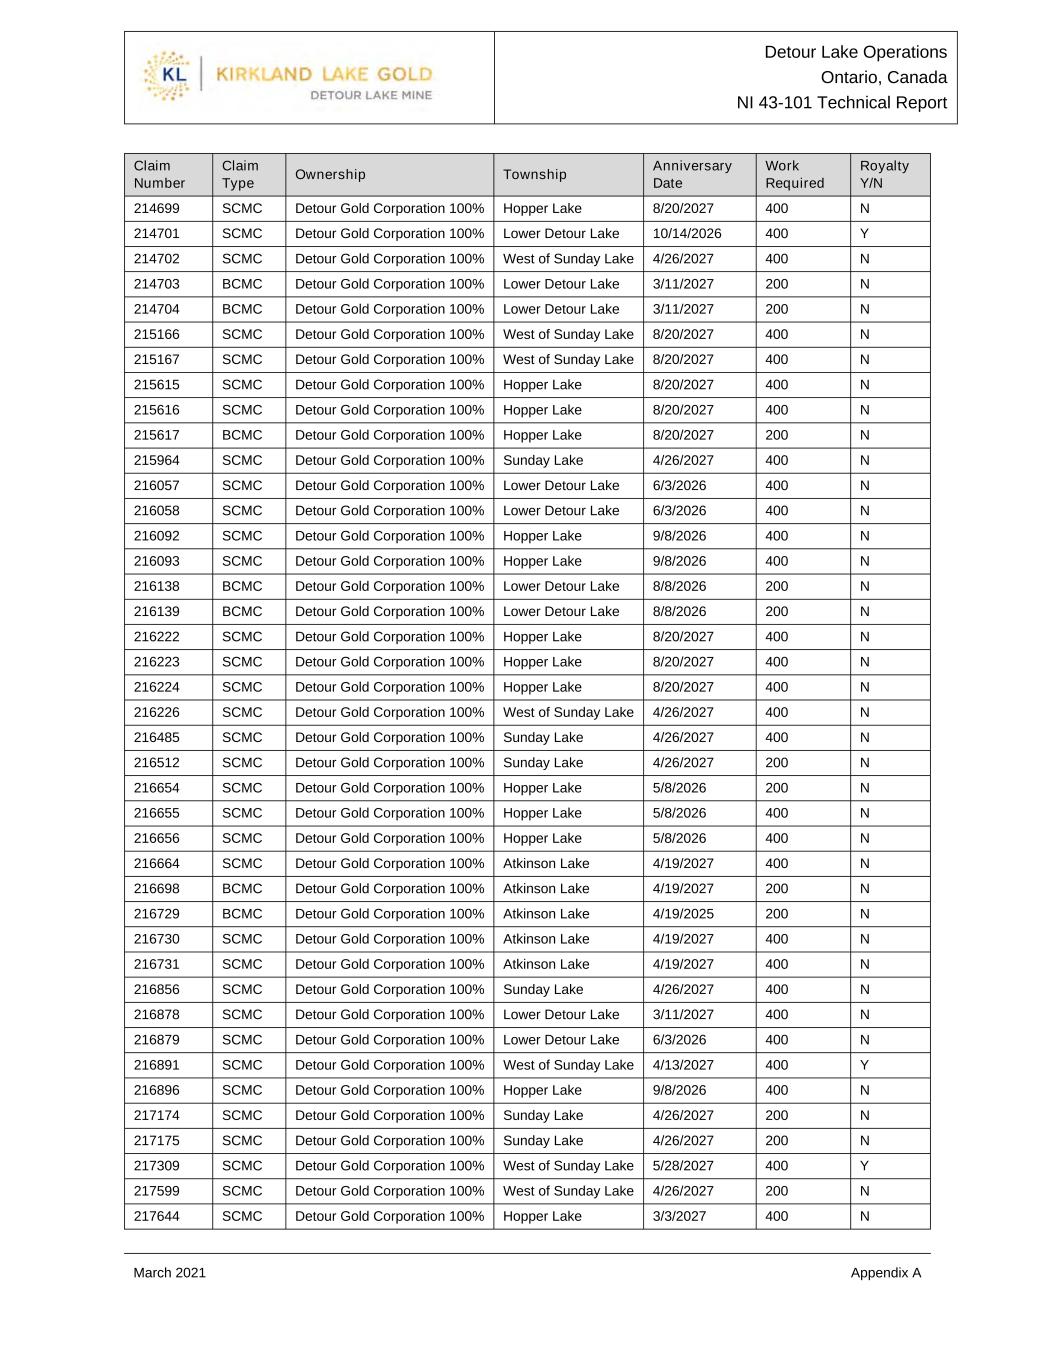
Detour Lake Operations Ontario, Canada NI 43-101 Technical Report March 2021 Appendix A Claim Number Claim Type Ownership Township Anniversary Date Work Required Royalty Y/N 214699 SCMC Detour Gold Corporation 100% Hopper Lake 8/20/2027 400 N 214701 SCMC Detour Gold Corporation 100% Lower Detour Lake 10/14/2026 400 Y 214702 SCMC Detour Gold Corporation 100% West of Sunday Lake 4/26/2027 400 N 214703 BCMC Detour Gold Corporation 100% Lower Detour Lake 3/11/2027 200 N 214704 BCMC Detour Gold Corporation 100% Lower Detour Lake 3/11/2027 200 N 215166 SCMC Detour Gold Corporation 100% West of Sunday Lake 8/20/2027 400 N 215167 SCMC Detour Gold Corporation 100% West of Sunday Lake 8/20/2027 400 N 215615 SCMC Detour Gold Corporation 100% Hopper Lake 8/20/2027 400 N 215616 SCMC Detour Gold Corporation 100% Hopper Lake 8/20/2027 400 N 215617 BCMC Detour Gold Corporation 100% Hopper Lake 8/20/2027 200 N 215964 SCMC Detour Gold Corporation 100% Sunday Lake 4/26/2027 400 N 216057 SCMC Detour Gold Corporation 100% Lower Detour Lake 6/3/2026 400 N 216058 SCMC Detour Gold Corporation 100% Lower Detour Lake 6/3/2026 400 N 216092 SCMC Detour Gold Corporation 100% Hopper Lake 9/8/2026 400 N 216093 SCMC Detour Gold Corporation 100% Hopper Lake 9/8/2026 400 N 216138 BCMC Detour Gold Corporation 100% Lower Detour Lake 8/8/2026 200 N 216139 BCMC Detour Gold Corporation 100% Lower Detour Lake 8/8/2026 200 N 216222 SCMC Detour Gold Corporation 100% Hopper Lake 8/20/2027 400 N 216223 SCMC Detour Gold Corporation 100% Hopper Lake 8/20/2027 400 N 216224 SCMC Detour Gold Corporation 100% Hopper Lake 8/20/2027 400 N 216226 SCMC Detour Gold Corporation 100% West of Sunday Lake 4/26/2027 400 N 216485 SCMC Detour Gold Corporation 100% Sunday Lake 4/26/2027 400 N 216512 SCMC Detour Gold Corporation 100% Sunday Lake 4/26/2027 200 N 216654 SCMC Detour Gold Corporation 100% Hopper Lake 5/8/2026 200 N 216655 SCMC Detour Gold Corporation 100% Hopper Lake 5/8/2026 400 N 216656 SCMC Detour Gold Corporation 100% Hopper Lake 5/8/2026 400 N 216664 SCMC Detour Gold Corporation 100% Atkinson Lake 4/19/2027 400 N 216698 BCMC Detour Gold Corporation 100% Atkinson Lake 4/19/2027 200 N 216729 BCMC Detour Gold Corporation 100% Atkinson Lake 4/19/2025 200 N 216730 SCMC Detour Gold Corporation 100% Atkinson Lake 4/19/2027 400 N 216731 SCMC Detour Gold Corporation 100% Atkinson Lake 4/19/2027 400 N 216856 SCMC Detour Gold Corporation 100% Sunday Lake 4/26/2027 400 N 216878 SCMC Detour Gold Corporation 100% Lower Detour Lake 3/11/2027 400 N 216879 SCMC Detour Gold Corporation 100% Lower Detour Lake 6/3/2026 400 N 216891 SCMC Detour Gold Corporation 100% West of Sunday Lake 4/13/2027 400 Y 216896 SCMC Detour Gold Corporation 100% Hopper Lake 9/8/2026 400 N 217174 SCMC Detour Gold Corporation 100% Sunday Lake 4/26/2027 200 N 217175 SCMC Detour Gold Corporation 100% Sunday Lake 4/26/2027 200 N 217309 SCMC Detour Gold Corporation 100% West of Sunday Lake 5/28/2027 400 Y 217599 SCMC Detour Gold Corporation 100% West of Sunday Lake 4/26/2027 200 N 217644 SCMC Detour Gold Corporation 100% Hopper Lake 3/3/2027 400 N
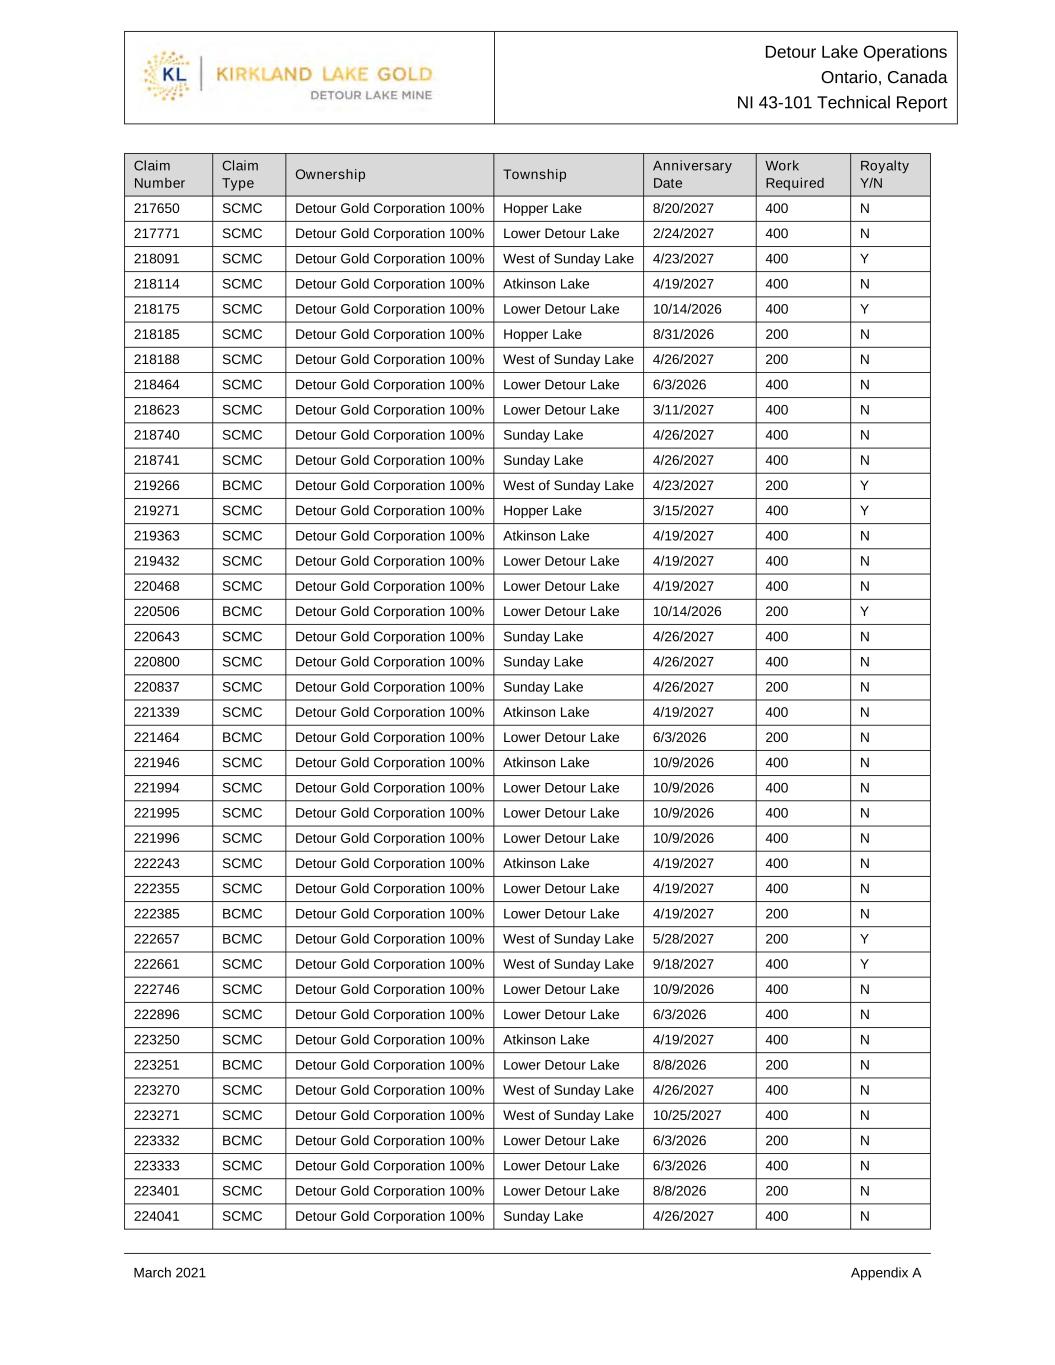
Detour Lake Operations Ontario, Canada NI 43-101 Technical Report March 2021 Appendix A Claim Number Claim Type Ownership Township Anniversary Date Work Required Royalty Y/N 217650 SCMC Detour Gold Corporation 100% Hopper Lake 8/20/2027 400 N 217771 SCMC Detour Gold Corporation 100% Lower Detour Lake 2/24/2027 400 N 218091 SCMC Detour Gold Corporation 100% West of Sunday Lake 4/23/2027 400 Y 218114 SCMC Detour Gold Corporation 100% Atkinson Lake 4/19/2027 400 N 218175 SCMC Detour Gold Corporation 100% Lower Detour Lake 10/14/2026 400 Y 218185 SCMC Detour Gold Corporation 100% Hopper Lake 8/31/2026 200 N 218188 SCMC Detour Gold Corporation 100% West of Sunday Lake 4/26/2027 200 N 218464 SCMC Detour Gold Corporation 100% Lower Detour Lake 6/3/2026 400 N 218623 SCMC Detour Gold Corporation 100% Lower Detour Lake 3/11/2027 400 N 218740 SCMC Detour Gold Corporation 100% Sunday Lake 4/26/2027 400 N 218741 SCMC Detour Gold Corporation 100% Sunday Lake 4/26/2027 400 N 219266 BCMC Detour Gold Corporation 100% West of Sunday Lake 4/23/2027 200 Y 219271 SCMC Detour Gold Corporation 100% Hopper Lake 3/15/2027 400 Y 219363 SCMC Detour Gold Corporation 100% Atkinson Lake 4/19/2027 400 N 219432 SCMC Detour Gold Corporation 100% Lower Detour Lake 4/19/2027 400 N 220468 SCMC Detour Gold Corporation 100% Lower Detour Lake 4/19/2027 400 N 220506 BCMC Detour Gold Corporation 100% Lower Detour Lake 10/14/2026 200 Y 220643 SCMC Detour Gold Corporation 100% Sunday Lake 4/26/2027 400 N 220800 SCMC Detour Gold Corporation 100% Sunday Lake 4/26/2027 400 N 220837 SCMC Detour Gold Corporation 100% Sunday Lake 4/26/2027 200 N 221339 SCMC Detour Gold Corporation 100% Atkinson Lake 4/19/2027 400 N 221464 BCMC Detour Gold Corporation 100% Lower Detour Lake 6/3/2026 200 N 221946 SCMC Detour Gold Corporation 100% Atkinson Lake 10/9/2026 400 N 221994 SCMC Detour Gold Corporation 100% Lower Detour Lake 10/9/2026 400 N 221995 SCMC Detour Gold Corporation 100% Lower Detour Lake 10/9/2026 400 N 221996 SCMC Detour Gold Corporation 100% Lower Detour Lake 10/9/2026 400 N 222243 SCMC Detour Gold Corporation 100% Atkinson Lake 4/19/2027 400 N 222355 SCMC Detour Gold Corporation 100% Lower Detour Lake 4/19/2027 400 N 222385 BCMC Detour Gold Corporation 100% Lower Detour Lake 4/19/2027 200 N 222657 BCMC Detour Gold Corporation 100% West of Sunday Lake 5/28/2027 200 Y 222661 SCMC Detour Gold Corporation 100% West of Sunday Lake 9/18/2027 400 Y 222746 SCMC Detour Gold Corporation 100% Lower Detour Lake 10/9/2026 400 N 222896 SCMC Detour Gold Corporation 100% Lower Detour Lake 6/3/2026 400 N 223250 SCMC Detour Gold Corporation 100% Atkinson Lake 4/19/2027 400 N 223251 BCMC Detour Gold Corporation 100% Lower Detour Lake 8/8/2026 200 N 223270 SCMC Detour Gold Corporation 100% West of Sunday Lake 4/26/2027 400 N 223271 SCMC Detour Gold Corporation 100% West of Sunday Lake 10/25/2027 400 N 223332 BCMC Detour Gold Corporation 100% Lower Detour Lake 6/3/2026 200 N 223333 SCMC Detour Gold Corporation 100% Lower Detour Lake 6/3/2026 400 N 223401 SCMC Detour Gold Corporation 100% Lower Detour Lake 8/8/2026 200 N 224041 SCMC Detour Gold Corporation 100% Sunday Lake 4/26/2027 400 N
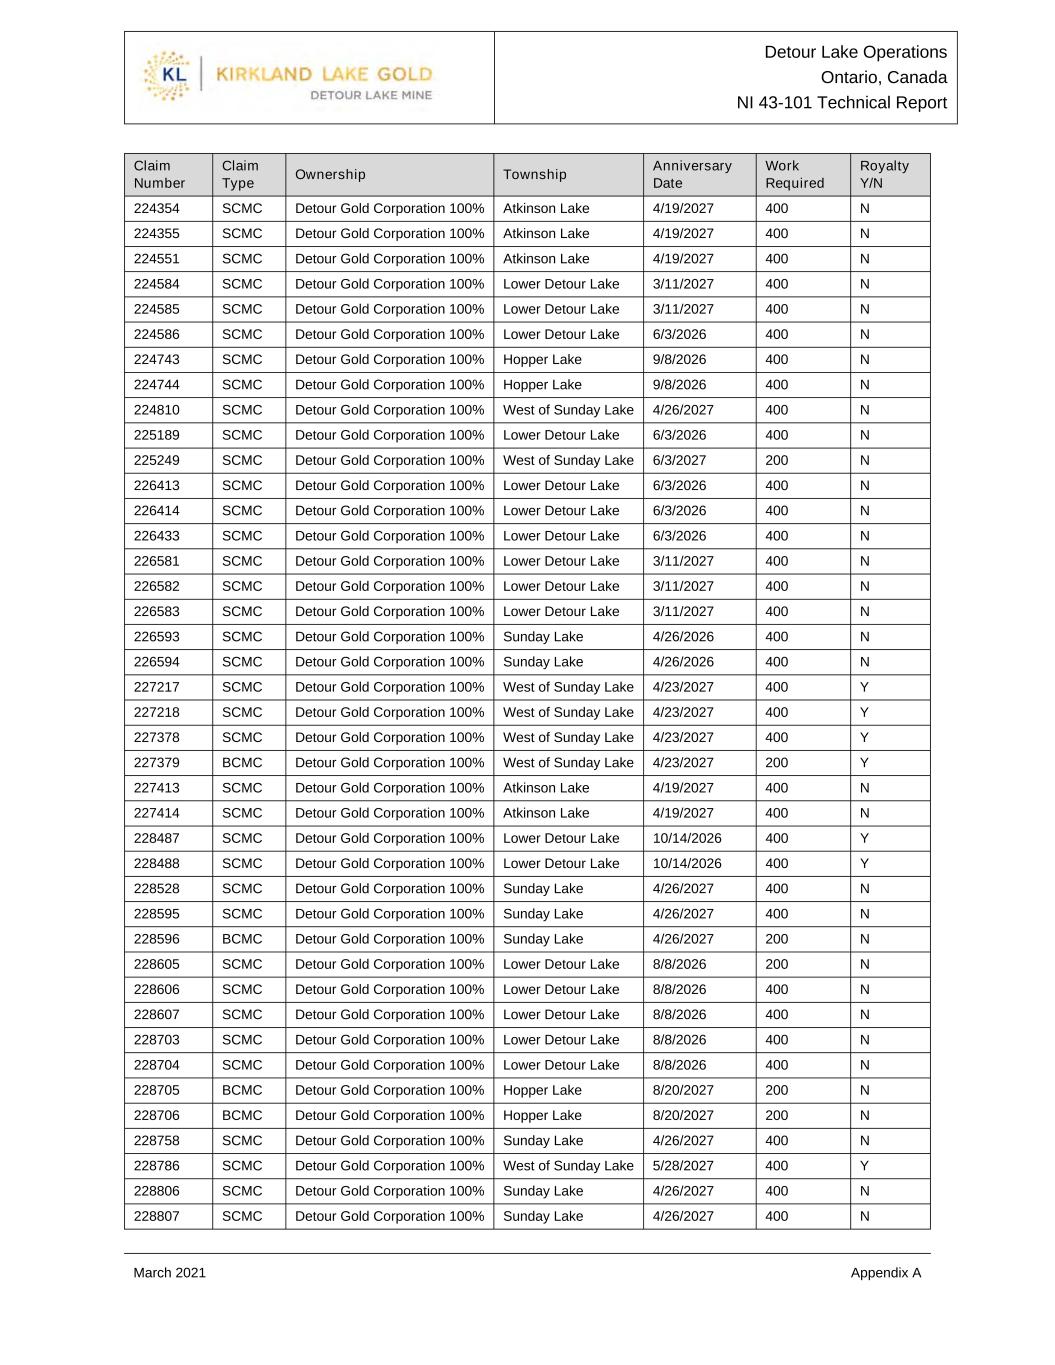
Detour Lake Operations Ontario, Canada NI 43-101 Technical Report March 2021 Appendix A Claim Number Claim Type Ownership Township Anniversary Date Work Required Royalty Y/N 224354 SCMC Detour Gold Corporation 100% Atkinson Lake 4/19/2027 400 N 224355 SCMC Detour Gold Corporation 100% Atkinson Lake 4/19/2027 400 N 224551 SCMC Detour Gold Corporation 100% Atkinson Lake 4/19/2027 400 N 224584 SCMC Detour Gold Corporation 100% Lower Detour Lake 3/11/2027 400 N 224585 SCMC Detour Gold Corporation 100% Lower Detour Lake 3/11/2027 400 N 224586 SCMC Detour Gold Corporation 100% Lower Detour Lake 6/3/2026 400 N 224743 SCMC Detour Gold Corporation 100% Hopper Lake 9/8/2026 400 N 224744 SCMC Detour Gold Corporation 100% Hopper Lake 9/8/2026 400 N 224810 SCMC Detour Gold Corporation 100% West of Sunday Lake 4/26/2027 400 N 225189 SCMC Detour Gold Corporation 100% Lower Detour Lake 6/3/2026 400 N 225249 SCMC Detour Gold Corporation 100% West of Sunday Lake 6/3/2027 200 N 226413 SCMC Detour Gold Corporation 100% Lower Detour Lake 6/3/2026 400 N 226414 SCMC Detour Gold Corporation 100% Lower Detour Lake 6/3/2026 400 N 226433 SCMC Detour Gold Corporation 100% Lower Detour Lake 6/3/2026 400 N 226581 SCMC Detour Gold Corporation 100% Lower Detour Lake 3/11/2027 400 N 226582 SCMC Detour Gold Corporation 100% Lower Detour Lake 3/11/2027 400 N 226583 SCMC Detour Gold Corporation 100% Lower Detour Lake 3/11/2027 400 N 226593 SCMC Detour Gold Corporation 100% Sunday Lake 4/26/2026 400 N 226594 SCMC Detour Gold Corporation 100% Sunday Lake 4/26/2026 400 N 227217 SCMC Detour Gold Corporation 100% West of Sunday Lake 4/23/2027 400 Y 227218 SCMC Detour Gold Corporation 100% West of Sunday Lake 4/23/2027 400 Y 227378 SCMC Detour Gold Corporation 100% West of Sunday Lake 4/23/2027 400 Y 227379 BCMC Detour Gold Corporation 100% West of Sunday Lake 4/23/2027 200 Y 227413 SCMC Detour Gold Corporation 100% Atkinson Lake 4/19/2027 400 N 227414 SCMC Detour Gold Corporation 100% Atkinson Lake 4/19/2027 400 N 228487 SCMC Detour Gold Corporation 100% Lower Detour Lake 10/14/2026 400 Y 228488 SCMC Detour Gold Corporation 100% Lower Detour Lake 10/14/2026 400 Y 228528 SCMC Detour Gold Corporation 100% Sunday Lake 4/26/2027 400 N 228595 SCMC Detour Gold Corporation 100% Sunday Lake 4/26/2027 400 N 228596 BCMC Detour Gold Corporation 100% Sunday Lake 4/26/2027 200 N 228605 SCMC Detour Gold Corporation 100% Lower Detour Lake 8/8/2026 200 N 228606 SCMC Detour Gold Corporation 100% Lower Detour Lake 8/8/2026 400 N 228607 SCMC Detour Gold Corporation 100% Lower Detour Lake 8/8/2026 400 N 228703 SCMC Detour Gold Corporation 100% Lower Detour Lake 8/8/2026 400 N 228704 SCMC Detour Gold Corporation 100% Lower Detour Lake 8/8/2026 400 N 228705 BCMC Detour Gold Corporation 100% Hopper Lake 8/20/2027 200 N 228706 BCMC Detour Gold Corporation 100% Hopper Lake 8/20/2027 200 N 228758 SCMC Detour Gold Corporation 100% Sunday Lake 4/26/2027 400 N 228786 SCMC Detour Gold Corporation 100% West of Sunday Lake 5/28/2027 400 Y 228806 SCMC Detour Gold Corporation 100% Sunday Lake 4/26/2027 400 N 228807 SCMC Detour Gold Corporation 100% Sunday Lake 4/26/2027 400 N

Detour Lake Operations Ontario, Canada NI 43-101 Technical Report March 2021 Appendix A Claim Number Claim Type Ownership Township Anniversary Date Work Required Royalty Y/N 229294 SCMC Detour Gold Corporation 100% Atkinson Lake 4/19/2027 400 N 229295 SCMC Detour Gold Corporation 100% Atkinson Lake 4/19/2027 400 N 229413 SCMC Detour Gold Corporation 100% Sunday Lake 4/26/2027 400 N 229429 SCMC Detour Gold Corporation 100% Sunday Lake 4/26/2027 400 N 229430 SCMC Detour Gold Corporation 100% Sunday Lake 4/26/2027 400 N 229431 SCMC Detour Gold Corporation 100% Sunday Lake 4/26/2027 400 N 229485 SCMC Detour Gold Corporation 100% Lower Detour Lake 8/8/2026 200 N 229523 SCMC Detour Gold Corporation 100% Atkinson Lake 4/19/2027 400 N 229524 SCMC Detour Gold Corporation 100% Atkinson Lake 4/19/2027 400 N 229525 SCMC Detour Gold Corporation 100% Atkinson Lake 4/19/2027 400 N 229526 SCMC Detour Gold Corporation 100% Atkinson Lake 4/19/2027 400 N 229653 SCMC Detour Gold Corporation 100% Lower Detour Lake 6/3/2026 400 N 229654 SCMC Detour Gold Corporation 100% Lower Detour Lake 6/3/2026 400 N 229655 SCMC Detour Gold Corporation 100% Lower Detour Lake 6/3/2026 400 N 229693 SCMC Detour Gold Corporation 100% Atkinson Lake 4/19/2027 400 N 229836 SCMC Detour Gold Corporation 100% Lower Detour Lake 4/19/2027 400 N 229837 BCMC Detour Gold Corporation 100% Lower Detour Lake 4/19/2027 200 N 229978 SCMC Detour Gold Corporation 100% Lower Detour Lake 10/9/2026 400 N 230616 SCMC Detour Gold Corporation 100% Lower Detour Lake 4/19/2027 400 N 230617 BCMC Detour Gold Corporation 100% Lower Detour Lake 4/19/2027 200 N 230694 SCMC Detour Gold Corporation 100% Sunday Lake 4/26/2027 400 N 230697 SCMC Detour Gold Corporation 100% Hopper Lake 9/8/2026 400 N 230741 SCMC Detour Gold Corporation 100% Atkinson Lake 4/19/2027 400 N 230754 SCMC Detour Gold Corporation 100% Sunday Lake 4/26/2027 400 N 231275 BCMC Detour Gold Corporation 100% West of Sunday Lake 4/23/2026 200 Y 231278 SCMC Detour Gold Corporation 100% Lower Detour Lake 9/22/2026 400 N 231302 SCMC Detour Gold Corporation 100% West of Sunday Lake 10/25/2027 400 N 231359 SCMC Detour Gold Corporation 100% Hopper Lake 9/8/2026 400 N 232183 SCMC Detour Gold Corporation 100% Lower Detour Lake 10/9/2026 400 N 232580 SCMC Detour Gold Corporation 100% Atkinson Lake 4/19/2027 400 N 232601 SCMC Detour Gold Corporation 100% Hopper Lake 8/20/2027 400 N 232602 SCMC Detour Gold Corporation 100% Hopper Lake 8/20/2027 400 N 232603 SCMC Detour Gold Corporation 100% Hopper Lake 8/20/2027 400 N 232622 SCMC Detour Gold Corporation 100% Lower Detour Lake 6/3/2026 400 N 232623 SCMC Detour Gold Corporation 100% Lower Detour Lake 6/3/2026 200 N 232624 SCMC Detour Gold Corporation 100% Lower Detour Lake 6/3/2026 400 N 232696 SCMC Detour Gold Corporation 100% Lower Detour Lake 6/3/2026 200 N 232767 SCMC Detour Gold Corporation 100% Hopper Lake 8/20/2027 400 N 232768 SCMC Detour Gold Corporation 100% Hopper Lake 8/20/2027 400 N 233182 SCMC Detour Gold Corporation 100% West of Sunday Lake 8/20/2027 400 N 233213 SCMC Detour Gold Corporation 100% Lower Detour Lake 6/3/2026 400 N

Detour Lake Operations Ontario, Canada NI 43-101 Technical Report March 2021 Appendix A Claim Number Claim Type Ownership Township Anniversary Date Work Required Royalty Y/N 233245 SCMC Detour Gold Corporation 100% Sunday Lake 4/26/2027 400 N 233246 SCMC Detour Gold Corporation 100% Sunday Lake 4/26/2027 400 N 233372 SCMC Detour Gold Corporation 100% Hopper Lake 8/20/2027 400 N 233373 SCMC Detour Gold Corporation 100% Hopper Lake 8/20/2027 400 N 233422 SCMC Detour Gold Corporation 100% West of Sunday Lake 4/26/2025 400 N 233423 SCMC Detour Gold Corporation 100% West of Sunday Lake 4/26/2027 400 N 233477 SCMC Detour Gold Corporation 100% Sunday Lake 4/26/2027 400 N 233478 SCMC Detour Gold Corporation 100% Sunday Lake 4/26/2027 400 N 233479 BCMC Detour Gold Corporation 100% Hopper Lake 3/15/2027 200 Y 233515 SCMC Detour Gold Corporation 100% Lower Detour Lake 3/11/2027 400 N 233709 SCMC Detour Gold Corporation 100% West of Sunday Lake 8/20/2027 400 N 233710 SCMC Detour Gold Corporation 100% West of Sunday Lake 8/20/2027 400 N 234043 SCMC Detour Gold Corporation 100% Lower Detour Lake 10/25/2027 400 N 234044 BCMC Detour Gold Corporation 100% Lower Detour Lake 6/3/2026 200 N 234045 BCMC Detour Gold Corporation 100% Lower Detour Lake 6/3/2026 200 N 234551 SCMC Detour Gold Corporation 100% Sunday Lake 4/26/2027 400 N 234704 SCMC Detour Gold Corporation 100% Hopper Lake 9/8/2026 400 N 234741 SCMC Detour Gold Corporation 100% West of Sunday Lake 4/26/2027 400 N 234781 SCMC Detour Gold Corporation 100% Hopper Lake 3/3/2027 400 N 234794 SCMC Detour Gold Corporation 100% Hopper Lake 5/8/2026 400 N 234814 BCMC Detour Gold Corporation 100% Lower Detour Lake 10/14/2026 200 Y 234815 SCMC Detour Gold Corporation 100% Lower Detour Lake 10/14/2026 400 Y 235150 BCMC Detour Gold Corporation 100% Atkinson Lake 4/19/2027 200 N 235206 SCMC Detour Gold Corporation 100% Lower Detour Lake 8/8/2026 200 N 235270 SCMC Detour Gold Corporation 100% Hopper Lake 5/8/2026 400 N 235271 SCMC Detour Gold Corporation 100% Hopper Lake 9/8/2026 400 N 235282 SCMC Detour Gold Corporation 100% Atkinson Lake 4/19/2027 400 N 235283 SCMC Detour Gold Corporation 100% Atkinson Lake 4/19/2027 400 N 235284 SCMC Detour Gold Corporation 100% Atkinson Lake 4/19/2027 400 N 235359 SCMC Detour Gold Corporation 100% Sunday Lake 4/26/2027 400 N 235393 SCMC Detour Gold Corporation 100% Atkinson Lake 4/19/2027 400 N 235509 SCMC Detour Gold Corporation 100% Sunday Lake 4/26/2027 400 N 235548 SCMC Detour Gold Corporation 100% Sunday Lake 4/26/2027 400 N 235913 SCMC Detour Gold Corporation 100% Sunday Lake 4/26/2027 400 N 235914 SCMC Detour Gold Corporation 100% Sunday Lake 4/26/2027 400 N 235915 SCMC Detour Gold Corporation 100% Sunday Lake 4/26/2027 400 N 236031 SCMC Detour Gold Corporation 100% Hopper Lake 3/3/2027 400 N 236032 SCMC Detour Gold Corporation 100% Hopper Lake 3/3/2027 200 N 236033 SCMC Detour Gold Corporation 100% Hopper Lake 3/3/2027 400 N 236119 SCMC Detour Gold Corporation 100% Hopper Lake 5/8/2026 200 N 236120 SCMC Detour Gold Corporation 100% Hopper Lake 5/8/2026 400 N
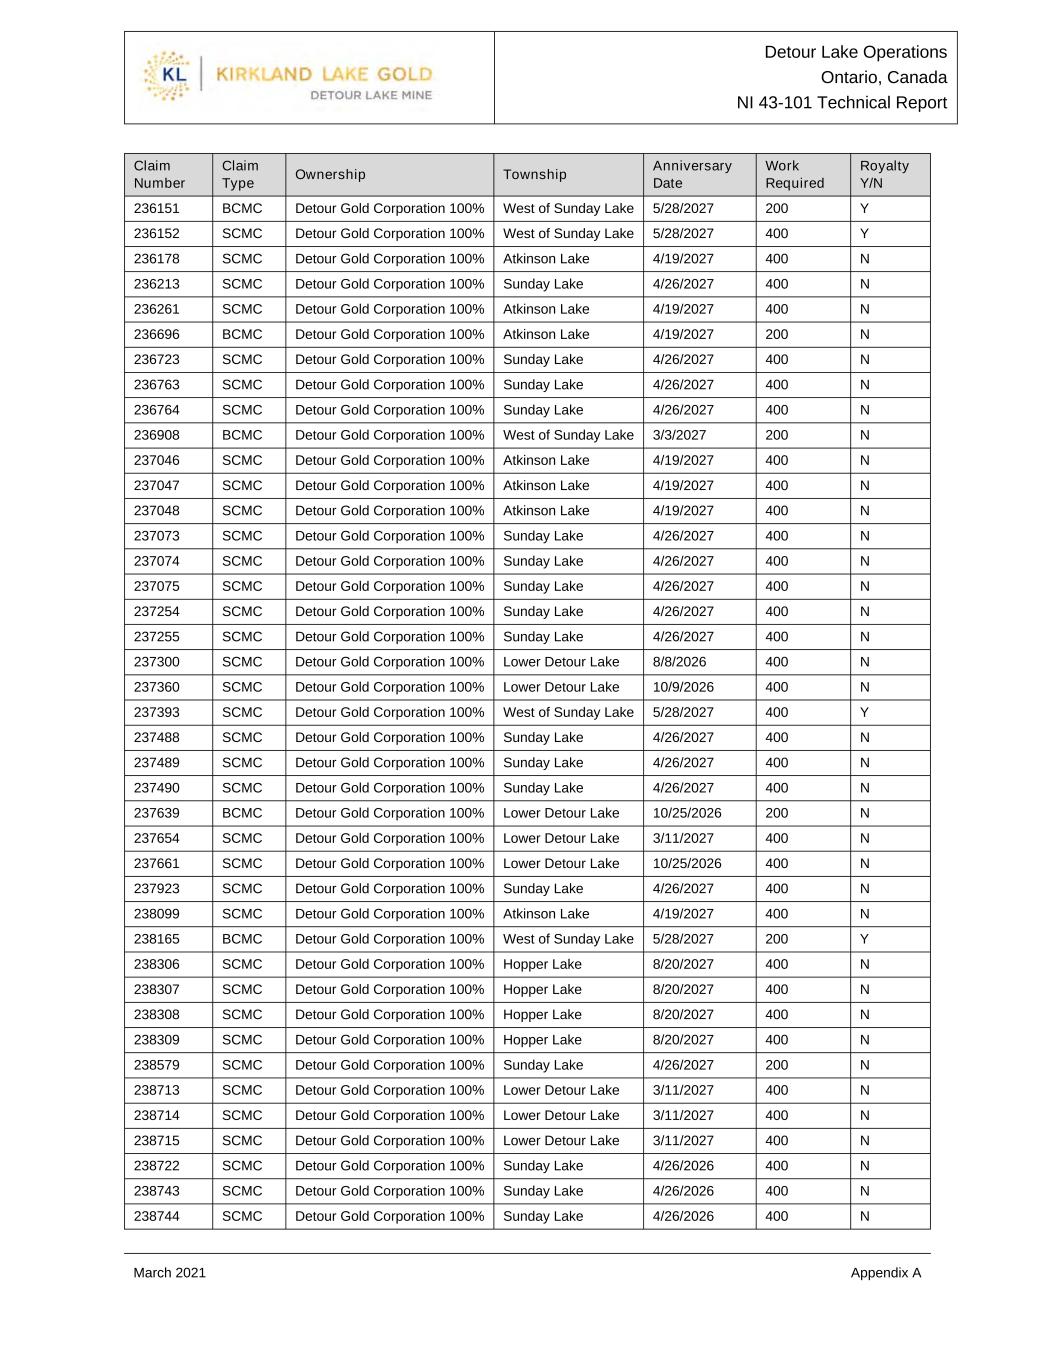
Detour Lake Operations Ontario, Canada NI 43-101 Technical Report March 2021 Appendix A Claim Number Claim Type Ownership Township Anniversary Date Work Required Royalty Y/N 236151 BCMC Detour Gold Corporation 100% West of Sunday Lake 5/28/2027 200 Y 236152 SCMC Detour Gold Corporation 100% West of Sunday Lake 5/28/2027 400 Y 236178 SCMC Detour Gold Corporation 100% Atkinson Lake 4/19/2027 400 N 236213 SCMC Detour Gold Corporation 100% Sunday Lake 4/26/2027 400 N 236261 SCMC Detour Gold Corporation 100% Atkinson Lake 4/19/2027 400 N 236696 BCMC Detour Gold Corporation 100% Atkinson Lake 4/19/2027 200 N 236723 SCMC Detour Gold Corporation 100% Sunday Lake 4/26/2027 400 N 236763 SCMC Detour Gold Corporation 100% Sunday Lake 4/26/2027 400 N 236764 SCMC Detour Gold Corporation 100% Sunday Lake 4/26/2027 400 N 236908 BCMC Detour Gold Corporation 100% West of Sunday Lake 3/3/2027 200 N 237046 SCMC Detour Gold Corporation 100% Atkinson Lake 4/19/2027 400 N 237047 SCMC Detour Gold Corporation 100% Atkinson Lake 4/19/2027 400 N 237048 SCMC Detour Gold Corporation 100% Atkinson Lake 4/19/2027 400 N 237073 SCMC Detour Gold Corporation 100% Sunday Lake 4/26/2027 400 N 237074 SCMC Detour Gold Corporation 100% Sunday Lake 4/26/2027 400 N 237075 SCMC Detour Gold Corporation 100% Sunday Lake 4/26/2027 400 N 237254 SCMC Detour Gold Corporation 100% Sunday Lake 4/26/2027 400 N 237255 SCMC Detour Gold Corporation 100% Sunday Lake 4/26/2027 400 N 237300 SCMC Detour Gold Corporation 100% Lower Detour Lake 8/8/2026 400 N 237360 SCMC Detour Gold Corporation 100% Lower Detour Lake 10/9/2026 400 N 237393 SCMC Detour Gold Corporation 100% West of Sunday Lake 5/28/2027 400 Y 237488 SCMC Detour Gold Corporation 100% Sunday Lake 4/26/2027 400 N 237489 SCMC Detour Gold Corporation 100% Sunday Lake 4/26/2027 400 N 237490 SCMC Detour Gold Corporation 100% Sunday Lake 4/26/2027 400 N 237639 BCMC Detour Gold Corporation 100% Lower Detour Lake 10/25/2026 200 N 237654 SCMC Detour Gold Corporation 100% Lower Detour Lake 3/11/2027 400 N 237661 SCMC Detour Gold Corporation 100% Lower Detour Lake 10/25/2026 400 N 237923 SCMC Detour Gold Corporation 100% Sunday Lake 4/26/2027 400 N 238099 SCMC Detour Gold Corporation 100% Atkinson Lake 4/19/2027 400 N 238165 BCMC Detour Gold Corporation 100% West of Sunday Lake 5/28/2027 200 Y 238306 SCMC Detour Gold Corporation 100% Hopper Lake 8/20/2027 400 N 238307 SCMC Detour Gold Corporation 100% Hopper Lake 8/20/2027 400 N 238308 SCMC Detour Gold Corporation 100% Hopper Lake 8/20/2027 400 N 238309 SCMC Detour Gold Corporation 100% Hopper Lake 8/20/2027 400 N 238579 SCMC Detour Gold Corporation 100% Sunday Lake 4/26/2027 200 N 238713 SCMC Detour Gold Corporation 100% Lower Detour Lake 3/11/2027 400 N 238714 SCMC Detour Gold Corporation 100% Lower Detour Lake 3/11/2027 400 N 238715 SCMC Detour Gold Corporation 100% Lower Detour Lake 3/11/2027 400 N 238722 SCMC Detour Gold Corporation 100% Sunday Lake 4/26/2026 400 N 238743 SCMC Detour Gold Corporation 100% Sunday Lake 4/26/2026 400 N 238744 SCMC Detour Gold Corporation 100% Sunday Lake 4/26/2026 400 N

Detour Lake Operations Ontario, Canada NI 43-101 Technical Report March 2021 Appendix A Claim Number Claim Type Ownership Township Anniversary Date Work Required Royalty Y/N 238745 SCMC Detour Gold Corporation 100% Sunday Lake 4/26/2026 400 N 238746 SCMC Detour Gold Corporation 100% Sunday Lake 4/26/2027 400 N 238850 SCMC Detour Gold Corporation 100% West of Sunday Lake 4/23/2027 400 Y 238879 SCMC Detour Gold Corporation 100% Atkinson Lake 4/19/2027 400 N 238954 SCMC Detour Gold Corporation 100% West of Sunday Lake 8/20/2027 400 N 238955 SCMC Detour Gold Corporation 100% West of Sunday Lake 8/20/2027 400 N 238956 BCMC Detour Gold Corporation 100% West of Sunday Lake 8/20/2027 200 N 239135 BCMC Detour Gold Corporation 100% Lower Detour Lake 8/8/2026 200 N 239136 BCMC Detour Gold Corporation 100% Lower Detour Lake 8/8/2026 200 N 239205 SCMC Detour Gold Corporation 100% Lower Detour Lake 10/9/2026 400 N 239271 SCMC Detour Gold Corporation 100% Sunday Lake 4/26/2027 400 N 239553 SCMC Detour Gold Corporation 100% Lower Detour Lake 8/8/2026 400 N 239554 BCMC Detour Gold Corporation 100% Hopper Lake 8/20/2027 200 N 239555 SCMC Detour Gold Corporation 100% Hopper Lake 8/20/2027 400 N 239556 SCMC Detour Gold Corporation 100% Hopper Lake 3/3/2027 400 N 239557 SCMC Detour Gold Corporation 100% Hopper Lake 8/20/2027 400 N 239598 SCMC Detour Gold Corporation 100% Atkinson Lake 4/19/2027 400 N 239613 SCMC Detour Gold Corporation 100% Sunday Lake 4/26/2027 400 N 239719 SCMC Detour Gold Corporation 100% West of Sunday Lake 4/26/2027 400 N 240126 SCMC Detour Gold Corporation 100% Sunday Lake 4/26/2027 400 N 240410 SCMC Detour Gold Corporation 100% Hopper Lake 5/8/2026 400 N 240411 SCMC Detour Gold Corporation 100% Hopper Lake 5/8/2026 400 N 240412 SCMC Detour Gold Corporation 100% Hopper Lake 5/8/2026 400 N 240425 SCMC Detour Gold Corporation 100% Hopper Lake 8/20/2027 400 N 240426 SCMC Detour Gold Corporation 100% Hopper Lake 8/20/2027 400 N 240427 SCMC Detour Gold Corporation 100% Lower Detour Lake 6/3/2026 400 N 240440 SCMC Detour Gold Corporation 100% West of Sunday Lake 4/26/2027 400 N 240766 SCMC Detour Gold Corporation 100% Lower Detour Lake 8/8/2026 400 N 240767 SCMC Detour Gold Corporation 100% Lower Detour Lake 8/8/2026 400 N 240768 SCMC Detour Gold Corporation 100% Lower Detour Lake 8/8/2026 200 N 240812 SCMC Detour Gold Corporation 100% Sunday Lake 4/26/2027 400 N 240883 SCMC Detour Gold Corporation 100% Hopper Lake 8/20/2027 400 N 240884 SCMC Detour Gold Corporation 100% Hopper Lake 8/20/2027 400 N 241153 SCMC Detour Gold Corporation 100% Lower Detour Lake 10/14/2026 400 Y 241154 SCMC Detour Gold Corporation 100% Lower Detour Lake 10/14/2026 400 Y 241687 SCMC Detour Gold Corporation 100% Lower Detour Lake 3/11/2027 200 N 241726 BCMC Detour Gold Corporation 100% Lower Detour Lake 10/14/2026 200 Y 241741 SCMC Detour Gold Corporation 100% Hopper Lake 9/8/2026 400 N 241853 SCMC Detour Gold Corporation 100% Atkinson Lake 4/19/2027 400 N 241854 SCMC Detour Gold Corporation 100% Atkinson Lake 4/19/2027 400 N 242076 SCMC Detour Gold Corporation 100% Lower Detour Lake 10/9/2026 400 N
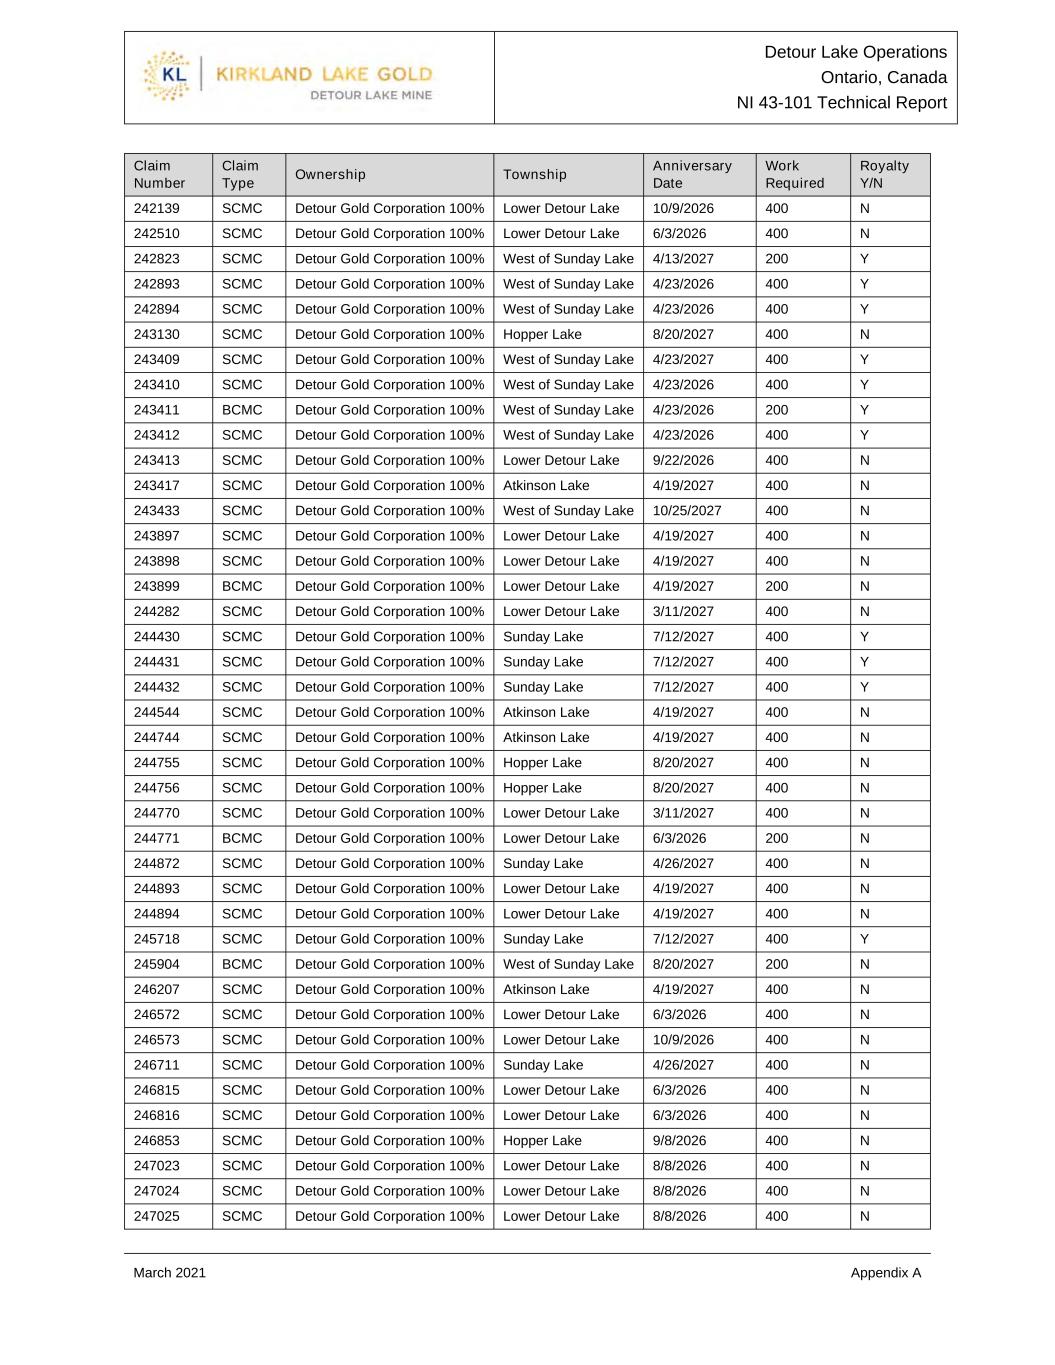
Detour Lake Operations Ontario, Canada NI 43-101 Technical Report March 2021 Appendix A Claim Number Claim Type Ownership Township Anniversary Date Work Required Royalty Y/N 242139 SCMC Detour Gold Corporation 100% Lower Detour Lake 10/9/2026 400 N 242510 SCMC Detour Gold Corporation 100% Lower Detour Lake 6/3/2026 400 N 242823 SCMC Detour Gold Corporation 100% West of Sunday Lake 4/13/2027 200 Y 242893 SCMC Detour Gold Corporation 100% West of Sunday Lake 4/23/2026 400 Y 242894 SCMC Detour Gold Corporation 100% West of Sunday Lake 4/23/2026 400 Y 243130 SCMC Detour Gold Corporation 100% Hopper Lake 8/20/2027 400 N 243409 SCMC Detour Gold Corporation 100% West of Sunday Lake 4/23/2027 400 Y 243410 SCMC Detour Gold Corporation 100% West of Sunday Lake 4/23/2026 400 Y 243411 BCMC Detour Gold Corporation 100% West of Sunday Lake 4/23/2026 200 Y 243412 SCMC Detour Gold Corporation 100% West of Sunday Lake 4/23/2026 400 Y 243413 SCMC Detour Gold Corporation 100% Lower Detour Lake 9/22/2026 400 N 243417 SCMC Detour Gold Corporation 100% Atkinson Lake 4/19/2027 400 N 243433 SCMC Detour Gold Corporation 100% West of Sunday Lake 10/25/2027 400 N 243897 SCMC Detour Gold Corporation 100% Lower Detour Lake 4/19/2027 400 N 243898 SCMC Detour Gold Corporation 100% Lower Detour Lake 4/19/2027 400 N 243899 BCMC Detour Gold Corporation 100% Lower Detour Lake 4/19/2027 200 N 244282 SCMC Detour Gold Corporation 100% Lower Detour Lake 3/11/2027 400 N 244430 SCMC Detour Gold Corporation 100% Sunday Lake 7/12/2027 400 Y 244431 SCMC Detour Gold Corporation 100% Sunday Lake 7/12/2027 400 Y 244432 SCMC Detour Gold Corporation 100% Sunday Lake 7/12/2027 400 Y 244544 SCMC Detour Gold Corporation 100% Atkinson Lake 4/19/2027 400 N 244744 SCMC Detour Gold Corporation 100% Atkinson Lake 4/19/2027 400 N 244755 SCMC Detour Gold Corporation 100% Hopper Lake 8/20/2027 400 N 244756 SCMC Detour Gold Corporation 100% Hopper Lake 8/20/2027 400 N 244770 SCMC Detour Gold Corporation 100% Lower Detour Lake 3/11/2027 400 N 244771 BCMC Detour Gold Corporation 100% Lower Detour Lake 6/3/2026 200 N 244872 SCMC Detour Gold Corporation 100% Sunday Lake 4/26/2027 400 N 244893 SCMC Detour Gold Corporation 100% Lower Detour Lake 4/19/2027 400 N 244894 SCMC Detour Gold Corporation 100% Lower Detour Lake 4/19/2027 400 N 245718 SCMC Detour Gold Corporation 100% Sunday Lake 7/12/2027 400 Y 245904 BCMC Detour Gold Corporation 100% West of Sunday Lake 8/20/2027 200 N 246207 SCMC Detour Gold Corporation 100% Atkinson Lake 4/19/2027 400 N 246572 SCMC Detour Gold Corporation 100% Lower Detour Lake 6/3/2026 400 N 246573 SCMC Detour Gold Corporation 100% Lower Detour Lake 10/9/2026 400 N 246711 SCMC Detour Gold Corporation 100% Sunday Lake 4/26/2027 400 N 246815 SCMC Detour Gold Corporation 100% Lower Detour Lake 6/3/2026 400 N 246816 SCMC Detour Gold Corporation 100% Lower Detour Lake 6/3/2026 400 N 246853 SCMC Detour Gold Corporation 100% Hopper Lake 9/8/2026 400 N 247023 SCMC Detour Gold Corporation 100% Lower Detour Lake 8/8/2026 400 N 247024 SCMC Detour Gold Corporation 100% Lower Detour Lake 8/8/2026 400 N 247025 SCMC Detour Gold Corporation 100% Lower Detour Lake 8/8/2026 400 N

Detour Lake Operations Ontario, Canada NI 43-101 Technical Report March 2021 Appendix A Claim Number Claim Type Ownership Township Anniversary Date Work Required Royalty Y/N 247026 SCMC Detour Gold Corporation 100% Hopper Lake 8/20/2027 400 N 247027 BCMC Detour Gold Corporation 100% Hopper Lake 3/3/2027 200 N 247034 SCMC Detour Gold Corporation 100% Lower Detour Lake 3/11/2027 400 N 247035 SCMC Detour Gold Corporation 100% Lower Detour Lake 3/11/2027 400 N 247189 SCMC Detour Gold Corporation 100% Sunday Lake 4/26/2027 400 N 247481 SCMC Detour Gold Corporation 100% Sunday Lake 4/26/2027 400 N 247482 SCMC Detour Gold Corporation 100% Sunday Lake 4/26/2027 400 N 247483 SCMC Detour Gold Corporation 100% Sunday Lake 4/26/2027 400 N 247594 SCMC Detour Gold Corporation 100% Sunday Lake 4/26/2027 400 N 247595 SCMC Detour Gold Corporation 100% Sunday Lake 4/26/2027 400 N 247795 SCMC Detour Gold Corporation 100% West of Sunday Lake 4/26/2027 400 N 247939 SCMC Detour Gold Corporation 100% Lower Detour Lake 10/9/2026 400 N 248012 SCMC Detour Gold Corporation 100% Sunday Lake 4/26/2027 400 N 248013 SCMC Detour Gold Corporation 100% Sunday Lake 4/26/2027 400 N 248017 SCMC Detour Gold Corporation 100% Hopper Lake 9/8/2026 400 N 248018 SCMC Detour Gold Corporation 100% Hopper Lake 9/8/2026 400 N 248049 BCMC Detour Gold Corporation 100% Sunday Lake 4/26/2027 200 N 248058 SCMC Detour Gold Corporation 100% Lower Detour Lake 9/22/2026 200 N 248059 SCMC Detour Gold Corporation 100% Lower Detour Lake 8/8/2027 200 N 248060 SCMC Detour Gold Corporation 100% Lower Detour Lake 8/8/2026 400 N 248472 SCMC Detour Gold Corporation 100% Hopper Lake 8/20/2027 400 N 248478 SCMC Detour Gold Corporation 100% Lower Detour Lake 6/3/2026 400 N 248497 SCMC Detour Gold Corporation 100% West of Sunday Lake 4/26/2027 400 N 248498 SCMC Detour Gold Corporation 100% West of Sunday Lake 4/26/2027 400 N 248697 SCMC Detour Gold Corporation 100% Hopper Lake 9/8/2026 400 N 248801 SCMC Detour Gold Corporation 100% Atkinson Lake 4/19/2027 400 N 248802 SCMC Detour Gold Corporation 100% Atkinson Lake 4/19/2027 400 N 248803 BCMC Detour Gold Corporation 100% Atkinson Lake 4/19/2027 200 N 248809 BCMC Detour Gold Corporation 100% West of Sunday Lake 5/28/2027 200 Y 248810 SCMC Detour Gold Corporation 100% West of Sunday Lake 5/28/2027 400 Y 248895 SCMC Detour Gold Corporation 100% Hopper Lake 8/20/2027 400 N 249260 SCMC Detour Gold Corporation 100% Lower Detour Lake 6/3/2026 400 N 249303 BCMC Detour Gold Corporation 100% Hopper Lake 8/20/2027 200 N 249400 SCMC Detour Gold Corporation 100% Atkinson Lake 10/9/2026 400 N 249472 SCMC Detour Gold Corporation 100% Lower Detour Lake 10/9/2026 400 N 249748 SCMC Detour Gold Corporation 100% Lower Detour Lake 3/11/2027 200 N 249799 SCMC Detour Gold Corporation 100% Lower Detour Lake 10/14/2026 400 Y 249814 SCMC Detour Gold Corporation 100% Lower Detour Lake 10/14/2026 400 Y 249815 SCMC Detour Gold Corporation 100% Hopper Lake 9/8/2026 400 N 250002 SCMC Detour Gold Corporation 100% West of Sunday Lake 4/26/2027 400 N 250003 SCMC Detour Gold Corporation 100% West of Sunday Lake 4/26/2027 400 N

Detour Lake Operations Ontario, Canada NI 43-101 Technical Report March 2021 Appendix A Claim Number Claim Type Ownership Township Anniversary Date Work Required Royalty Y/N 250004 SCMC Detour Gold Corporation 100% West of Sunday Lake 4/26/2027 400 N 250005 SCMC Detour Gold Corporation 100% West of Sunday Lake 4/26/2027 400 N 250006 SCMC Detour Gold Corporation 100% West of Sunday Lake 4/26/2027 400 N 250099 SCMC Detour Gold Corporation 100% Lower Detour Lake 4/19/2027 400 N 250746 SCMC Detour Gold Corporation 100% Lower Detour Lake 9/22/2026 400 N 250748 SCMC Detour Gold Corporation 100% Atkinson Lake 4/19/2027 400 N 250749 SCMC Detour Gold Corporation 100% Atkinson Lake 4/19/2027 400 N 250750 BCMC Detour Gold Corporation 100% Lower Detour Lake 4/19/2027 200 N 250770 BCMC Detour Gold Corporation 100% West of Sunday Lake 10/25/2027 200 N 250844 BCMC Detour Gold Corporation 100% Lower Detour Lake 6/3/2026 200 N 250845 BCMC Detour Gold Corporation 100% Lower Detour Lake 6/3/2026 200 N 250846 SCMC Detour Gold Corporation 100% Lower Detour Lake 6/3/2026 400 N 251197 SCMC Detour Gold Corporation 100% Atkinson Lake 10/9/2026 400 N 251198 SCMC Detour Gold Corporation 100% Atkinson Lake 10/9/2026 400 N 251199 SCMC Detour Gold Corporation 100% Atkinson Lake 10/9/2026 400 N 251257 SCMC Detour Gold Corporation 100% West of Sunday Lake 4/26/2027 400 N 251313 SCMC Detour Gold Corporation 100% West of Sunday Lake 4/26/2025 400 N 251314 SCMC Detour Gold Corporation 100% West of Sunday Lake 4/26/2025 400 N 251315 SCMC Detour Gold Corporation 100% West of Sunday Lake 4/26/2027 400 N 251357 SCMC Detour Gold Corporation 100% Hopper Lake 3/15/2027 400 Y 251380 SCMC Detour Gold Corporation 100% West of Sunday Lake 4/13/2027 200 Y 251382 BCMC Detour Gold Corporation 100% Hopper Lake 5/28/2027 200 Y 251395 BCMC Detour Gold Corporation 100% Hopper Lake 3/15/2027 200 Y 251396 BCMC Detour Gold Corporation 100% West of Sunday Lake 4/13/2027 200 Y 251398 SCMC Detour Gold Corporation 100% West of Sunday Lake 4/26/2027 400 N 251401 BCMC Detour Gold Corporation 100% Lower Detour Lake 6/3/2026 200 N 251402 BCMC Detour Gold Corporation 100% Lower Detour Lake 8/8/2026 200 N 251603 SCMC Detour Gold Corporation 100% Lower Detour Lake 4/19/2027 400 N 252038 SCMC Detour Gold Corporation 100% West of Sunday Lake 8/20/2027 400 N 252039 SCMC Detour Gold Corporation 100% West of Sunday Lake 8/20/2027 400 N 252095 SCMC Detour Gold Corporation 100% Atkinson Lake 4/19/2027 400 N 252096 SCMC Detour Gold Corporation 100% Atkinson Lake 4/19/2027 400 N 252113 SCMC Detour Gold Corporation 100% Hopper Lake 8/20/2027 400 N 252114 SCMC Detour Gold Corporation 100% Hopper Lake 8/20/2027 400 N 252125 SCMC Detour Gold Corporation 100% Lower Detour Lake 6/3/2026 400 N 252128 SCMC Detour Gold Corporation 100% West of Sunday Lake 6/3/2027 400 N 252220 SCMC Detour Gold Corporation 100% Lower Detour Lake 6/3/2026 400 N 252313 SCMC Detour Gold Corporation 100% Lower Detour Lake 3/11/2027 400 N 252447 SCMC Detour Gold Corporation 100% Sunday Lake 7/12/2027 200 Y 252490 SCMC Detour Gold Corporation 100% West of Sunday Lake 4/23/2027 400 Y 252730 SCMC Detour Gold Corporation 100% Lower Detour Lake 10/9/2026 400 N
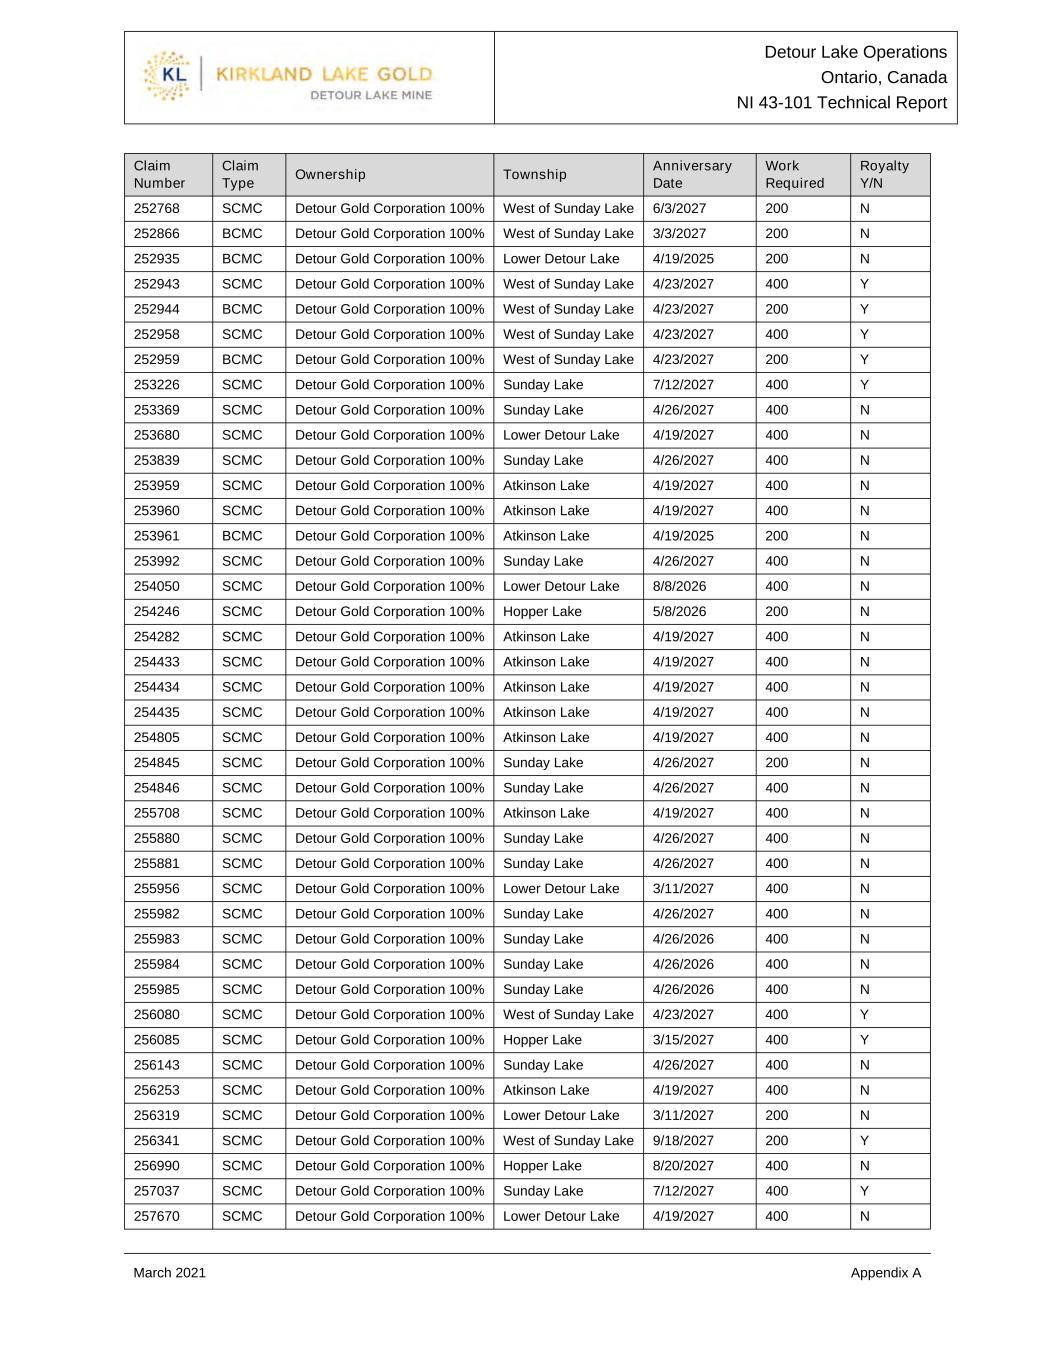
Detour Lake Operations Ontario, Canada NI 43-101 Technical Report March 2021 Appendix A Claim Number Claim Type Ownership Township Anniversary Date Work Required Royalty Y/N 252768 SCMC Detour Gold Corporation 100% West of Sunday Lake 6/3/2027 200 N 252866 BCMC Detour Gold Corporation 100% West of Sunday Lake 3/3/2027 200 N 252935 BCMC Detour Gold Corporation 100% Lower Detour Lake 4/19/2025 200 N 252943 SCMC Detour Gold Corporation 100% West of Sunday Lake 4/23/2027 400 Y 252944 BCMC Detour Gold Corporation 100% West of Sunday Lake 4/23/2027 200 Y 252958 SCMC Detour Gold Corporation 100% West of Sunday Lake 4/23/2027 400 Y 252959 BCMC Detour Gold Corporation 100% West of Sunday Lake 4/23/2027 200 Y 253226 SCMC Detour Gold Corporation 100% Sunday Lake 7/12/2027 400 Y 253369 SCMC Detour Gold Corporation 100% Sunday Lake 4/26/2027 400 N 253680 SCMC Detour Gold Corporation 100% Lower Detour Lake 4/19/2027 400 N 253839 SCMC Detour Gold Corporation 100% Sunday Lake 4/26/2027 400 N 253959 SCMC Detour Gold Corporation 100% Atkinson Lake 4/19/2027 400 N 253960 SCMC Detour Gold Corporation 100% Atkinson Lake 4/19/2027 400 N 253961 BCMC Detour Gold Corporation 100% Atkinson Lake 4/19/2025 200 N 253992 SCMC Detour Gold Corporation 100% Sunday Lake 4/26/2027 400 N 254050 SCMC Detour Gold Corporation 100% Lower Detour Lake 8/8/2026 400 N 254246 SCMC Detour Gold Corporation 100% Hopper Lake 5/8/2026 200 N 254282 SCMC Detour Gold Corporation 100% Atkinson Lake 4/19/2027 400 N 254433 SCMC Detour Gold Corporation 100% Atkinson Lake 4/19/2027 400 N 254434 SCMC Detour Gold Corporation 100% Atkinson Lake 4/19/2027 400 N 254435 SCMC Detour Gold Corporation 100% Atkinson Lake 4/19/2027 400 N 254805 SCMC Detour Gold Corporation 100% Atkinson Lake 4/19/2027 400 N 254845 SCMC Detour Gold Corporation 100% Sunday Lake 4/26/2027 200 N 254846 SCMC Detour Gold Corporation 100% Sunday Lake 4/26/2027 400 N 255708 SCMC Detour Gold Corporation 100% Atkinson Lake 4/19/2027 400 N 255880 SCMC Detour Gold Corporation 100% Sunday Lake 4/26/2027 400 N 255881 SCMC Detour Gold Corporation 100% Sunday Lake 4/26/2027 400 N 255956 SCMC Detour Gold Corporation 100% Lower Detour Lake 3/11/2027 400 N 255982 SCMC Detour Gold Corporation 100% Sunday Lake 4/26/2027 400 N 255983 SCMC Detour Gold Corporation 100% Sunday Lake 4/26/2026 400 N 255984 SCMC Detour Gold Corporation 100% Sunday Lake 4/26/2026 400 N 255985 SCMC Detour Gold Corporation 100% Sunday Lake 4/26/2026 400 N 256080 SCMC Detour Gold Corporation 100% West of Sunday Lake 4/23/2027 400 Y 256085 SCMC Detour Gold Corporation 100% Hopper Lake 3/15/2027 400 Y 256143 SCMC Detour Gold Corporation 100% Sunday Lake 4/26/2027 400 N 256253 SCMC Detour Gold Corporation 100% Atkinson Lake 4/19/2027 400 N 256319 SCMC Detour Gold Corporation 100% Lower Detour Lake 3/11/2027 200 N 256341 SCMC Detour Gold Corporation 100% West of Sunday Lake 9/18/2027 200 Y 256990 SCMC Detour Gold Corporation 100% Hopper Lake 8/20/2027 400 N 257037 SCMC Detour Gold Corporation 100% Sunday Lake 7/12/2027 400 Y 257670 SCMC Detour Gold Corporation 100% Lower Detour Lake 4/19/2027 400 N

Detour Lake Operations Ontario, Canada NI 43-101 Technical Report March 2021 Appendix A Claim Number Claim Type Ownership Township Anniversary Date Work Required Royalty Y/N 257700 BCMC Detour Gold Corporation 100% Lower Detour Lake 10/14/2026 200 Y 257701 SCMC Detour Gold Corporation 100% Lower Detour Lake 10/14/2026 400 Y 257702 SCMC Detour Gold Corporation 100% Lower Detour Lake 10/14/2026 400 Y 257877 SCMC Detour Gold Corporation 100% Hopper Lake 8/20/2027 400 N 258387 SCMC Detour Gold Corporation 100% Atkinson Lake 4/19/2027 400 N 258388 SCMC Detour Gold Corporation 100% Atkinson Lake 4/19/2027 400 N 258389 SCMC Detour Gold Corporation 100% Atkinson Lake 4/19/2027 400 N 258470 SCMC Detour Gold Corporation 100% Lower Detour Lake 8/8/2026 400 N 258491 SCMC Detour Gold Corporation 100% Sunday Lake 4/26/2027 200 N 258527 BCMC Detour Gold Corporation 100% West of Sunday Lake 8/20/2027 200 N 258528 SCMC Detour Gold Corporation 100% Hopper Lake 8/20/2027 400 N 258529 SCMC Detour Gold Corporation 100% Lower Detour Lake 10/25/2026 400 N 258694 SCMC Detour Gold Corporation 100% Sunday Lake 7/12/2027 200 Y 258709 SCMC Detour Gold Corporation 100% Lower Detour Lake 10/9/2026 400 N 259008 SCMC Detour Gold Corporation 100% Lower Detour Lake 6/3/2026 400 N 259031 BCMC Detour Gold Corporation 100% Lower Detour Lake 4/19/2027 200 N 259352 SCMC Detour Gold Corporation 100% West of Sunday Lake 4/26/2027 400 N 259353 BCMC Detour Gold Corporation 100% West of Sunday Lake 6/3/2027 200 N 259807 BCMC Detour Gold Corporation 100% Sunday Lake 4/26/2027 200 N 259810 SCMC Detour Gold Corporation 100% West of Sunday Lake 4/26/2027 400 N 259811 SCMC Detour Gold Corporation 100% West of Sunday Lake 4/26/2027 400 N 259954 SCMC Detour Gold Corporation 100% Hopper Lake 5/8/2026 400 N 259981 SCMC Detour Gold Corporation 100% Hopper Lake 9/8/2026 400 N 260030 SCMC Detour Gold Corporation 100% Atkinson Lake 4/19/2027 400 N 260042 SCMC Detour Gold Corporation 100% Sunday Lake 4/26/2027 400 N 260043 SCMC Detour Gold Corporation 100% Sunday Lake 4/26/2027 400 N 260044 SCMC Detour Gold Corporation 100% Sunday Lake 4/26/2027 200 N 260479 SCMC Detour Gold Corporation 100% Hopper Lake 5/8/2026 400 N 260488 SCMC Detour Gold Corporation 100% Hopper Lake 9/8/2026 400 N 260489 SCMC Detour Gold Corporation 100% Hopper Lake 9/8/2026 400 N 260494 BCMC Detour Gold Corporation 100% Lower Detour Lake 6/3/2026 200 N 260512 BCMC Detour Gold Corporation 100% Lower Detour Lake 6/3/2026 200 N 260688 SCMC Detour Gold Corporation 100% Hopper Lake 9/8/2026 400 N 260689 SCMC Detour Gold Corporation 100% Hopper Lake 9/8/2026 400 N 260744 SCMC Detour Gold Corporation 100% West of Sunday Lake 4/26/2027 400 N 261045 SCMC Detour Gold Corporation 100% Lower Detour Lake 4/19/2027 400 N 261046 SCMC Detour Gold Corporation 100% Lower Detour Lake 4/19/2027 400 N 261047 SCMC Detour Gold Corporation 100% Lower Detour Lake 4/19/2027 400 N 261257 BCMC Detour Gold Corporation 100% Lower Detour Lake 10/14/2026 200 Y 261258 SCMC Detour Gold Corporation 100% Lower Detour Lake 10/14/2026 400 Y 261699 SCMC Detour Gold Corporation 100% Atkinson Lake 4/19/2027 400 N

Detour Lake Operations Ontario, Canada NI 43-101 Technical Report March 2021 Appendix A Claim Number Claim Type Ownership Township Anniversary Date Work Required Royalty Y/N 261700 SCMC Detour Gold Corporation 100% Atkinson Lake 4/19/2027 400 N 261701 SCMC Detour Gold Corporation 100% Atkinson Lake 4/19/2027 400 N 261965 SCMC Detour Gold Corporation 100% Lower Detour Lake 10/9/2026 400 N 262058 SCMC Detour Gold Corporation 100% Hopper Lake 8/20/2027 400 N 262078 SCMC Detour Gold Corporation 100% Lower Detour Lake 8/8/2026 200 N 262085 SCMC Detour Gold Corporation 100% West of Sunday Lake 9/18/2027 400 Y 262462 SCMC Detour Gold Corporation 100% West of Sunday Lake 4/23/2027 400 Y 262463 SCMC Detour Gold Corporation 100% West of Sunday Lake 4/23/2026 400 Y 262652 SCMC Detour Gold Corporation 100% Lower Detour Lake 3/11/2027 400 N 262653 BCMC Detour Gold Corporation 100% Lower Detour Lake 3/11/2027 200 N 262723 SCMC Detour Gold Corporation 100% West of Sunday Lake 4/26/2027 400 N 262724 SCMC Detour Gold Corporation 100% West of Sunday Lake 4/26/2027 400 N 262788 SCMC Detour Gold Corporation 100% West of Sunday Lake 4/13/2027 200 Y 262801 BCMC Detour Gold Corporation 100% Hopper Lake 3/15/2027 200 Y 263163 SCMC Detour Gold Corporation 100% Hopper Lake 8/20/2027 400 N 263310 SCMC Detour Gold Corporation 100% West of Sunday Lake 4/26/2027 400 N 263311 SCMC Detour Gold Corporation 100% West of Sunday Lake 4/26/2027 400 N 263312 SCMC Detour Gold Corporation 100% Lower Detour Lake 6/3/2026 400 N 263313 SCMC Detour Gold Corporation 100% Hopper Lake 9/8/2026 400 N 263472 SCMC Detour Gold Corporation 100% Hopper Lake 3/15/2027 200 Y 263811 SCMC Detour Gold Corporation 100% Lower Detour Lake 3/11/2027 400 N 263819 SCMC Detour Gold Corporation 100% Lower Detour Lake 3/11/2027 200 N 263841 SCMC Detour Gold Corporation 100% West of Sunday Lake 4/23/2026 400 Y 263971 SCMC Detour Gold Corporation 100% Sunday Lake 7/12/2027 200 Y 263992 SCMC Detour Gold Corporation 100% Sunday Lake 4/26/2027 400 N 263993 BCMC Detour Gold Corporation 100% Sunday Lake 4/26/2027 200 N 264013 SCMC Detour Gold Corporation 100% West of Sunday Lake 4/26/2027 400 N 264014 SCMC Detour Gold Corporation 100% West of Sunday Lake 4/26/2027 400 N 264019 SCMC Detour Gold Corporation 100% Lower Detour Lake 8/8/2026 400 N 264020 BCMC Detour Gold Corporation 100% Lower Detour Lake 8/8/2026 200 N 264075 BCMC Detour Gold Corporation 100% Hopper Lake 3/3/2027 200 N 264076 BCMC Detour Gold Corporation 100% Hopper Lake 3/3/2027 200 N 264077 SCMC Detour Gold Corporation 100% Lower Detour Lake 3/11/2027 200 N 264089 SCMC Detour Gold Corporation 100% Hopper Lake 5/8/2026 400 N 264103 BCMC Detour Gold Corporation 100% Lower Detour Lake 10/14/2026 200 Y 264121 SCMC Detour Gold Corporation 100% West of Sunday Lake 4/26/2027 400 N 264122 SCMC Detour Gold Corporation 100% West of Sunday Lake 4/26/2027 200 N 264123 SCMC Detour Gold Corporation 100% Lower Detour Lake 8/8/2026 200 N 264447 SCMC Detour Gold Corporation 100% Lower Detour Lake 4/19/2027 400 N 264454 SCMC Detour Gold Corporation 100% West of Sunday Lake 4/23/2027 400 Y 264470 BCMC Detour Gold Corporation 100% West of Sunday Lake 4/23/2027 200 Y

Detour Lake Operations Ontario, Canada NI 43-101 Technical Report March 2021 Appendix A Claim Number Claim Type Ownership Township Anniversary Date Work Required Royalty Y/N 264718 SCMC Detour Gold Corporation 100% West of Sunday Lake 8/20/2027 400 N 264795 BCMC Detour Gold Corporation 100% Sunday Lake 7/12/2027 200 Y 264995 SCMC Detour Gold Corporation 100% Lower Detour Lake 2/24/2027 400 N 265236 SCMC Detour Gold Corporation 100% Sunday Lake 4/26/2027 400 N 265278 BCMC Detour Gold Corporation 100% Sunday Lake 7/12/2027 200 Y 265761 BCMC Detour Gold Corporation 100% Atkinson Lake 4/19/2025 200 N 265921 SCMC Detour Gold Corporation 100% Sunday Lake 4/26/2027 400 N 267673 BCMC Detour Gold Corporation 100% Atkinson Lake 4/19/2027 200 N 267703 SCMC Detour Gold Corporation 100% Sunday Lake 4/26/2027 400 N 267704 SCMC Detour Gold Corporation 100% Sunday Lake 4/26/2027 400 N 268397 SCMC Detour Gold Corporation 100% Lower Detour Lake 4/19/2027 400 N 268539 SCMC Detour Gold Corporation 100% Lower Detour Lake 10/14/2026 400 Y 268552 SCMC Detour Gold Corporation 100% Lower Detour Lake 10/14/2026 400 Y 268686 SCMC Detour Gold Corporation 100% West of Sunday Lake 4/26/2027 400 N 268840 BCMC Detour Gold Corporation 100% West of Sunday Lake 9/18/2027 200 Y 269450 SCMC Detour Gold Corporation 100% Lower Detour Lake 6/3/2026 400 N 269936 SCMC Detour Gold Corporation 100% Atkinson Lake 10/9/2026 400 N 270012 SCMC Detour Gold Corporation 100% Hopper Lake 8/20/2027 400 N 270049 BCMC Detour Gold Corporation 100% West of Sunday Lake 9/18/2027 200 Y 270136 BCMC Detour Gold Corporation 100% Lower Detour Lake 10/14/2026 200 Y 270137 BCMC Detour Gold Corporation 100% Lower Detour Lake 10/14/2026 200 Y 270138 SCMC Detour Gold Corporation 100% West of Sunday Lake 4/26/2027 400 N 270404 SCMC Detour Gold Corporation 100% Sunday Lake 4/26/2027 400 N 270405 SCMC Detour Gold Corporation 100% Sunday Lake 4/26/2027 400 N 270406 SCMC Detour Gold Corporation 100% Sunday Lake 4/26/2027 400 N 270490 SCMC Detour Gold Corporation 100% Atkinson Lake 4/19/2027 400 N 270491 BCMC Detour Gold Corporation 100% Atkinson Lake 4/19/2025 200 N 270515 SCMC Detour Gold Corporation 100% Sunday Lake 4/26/2027 400 N 270549 SCMC Detour Gold Corporation 100% Lower Detour Lake 3/11/2027 400 N 270550 SCMC Detour Gold Corporation 100% Lower Detour Lake 3/11/2027 200 N 270697 SCMC Detour Gold Corporation 100% West of Sunday Lake 4/26/2027 400 N 270743 SCMC Detour Gold Corporation 100% Hopper Lake 3/15/2027 400 Y 270776 SCMC Detour Gold Corporation 100% Lower Detour Lake 3/11/2027 400 N 270787 BCMC Detour Gold Corporation 100% Hopper Lake 3/15/2027 200 Y 270788 SCMC Detour Gold Corporation 100% West of Sunday Lake 4/13/2027 400 Y 270793 SCMC Detour Gold Corporation 100% Hopper Lake 9/8/2026 400 N 271115 SCMC Detour Gold Corporation 100% West of Sunday Lake 8/20/2027 400 N 271908 SCMC Detour Gold Corporation 100% West of Sunday Lake 4/23/2027 400 Y 271971 SCMC Detour Gold Corporation 100% Sunday Lake 4/26/2027 400 N 271972 SCMC Detour Gold Corporation 100% Sunday Lake 4/26/2027 400 N 271973 SCMC Detour Gold Corporation 100% Sunday Lake 4/26/2027 400 N
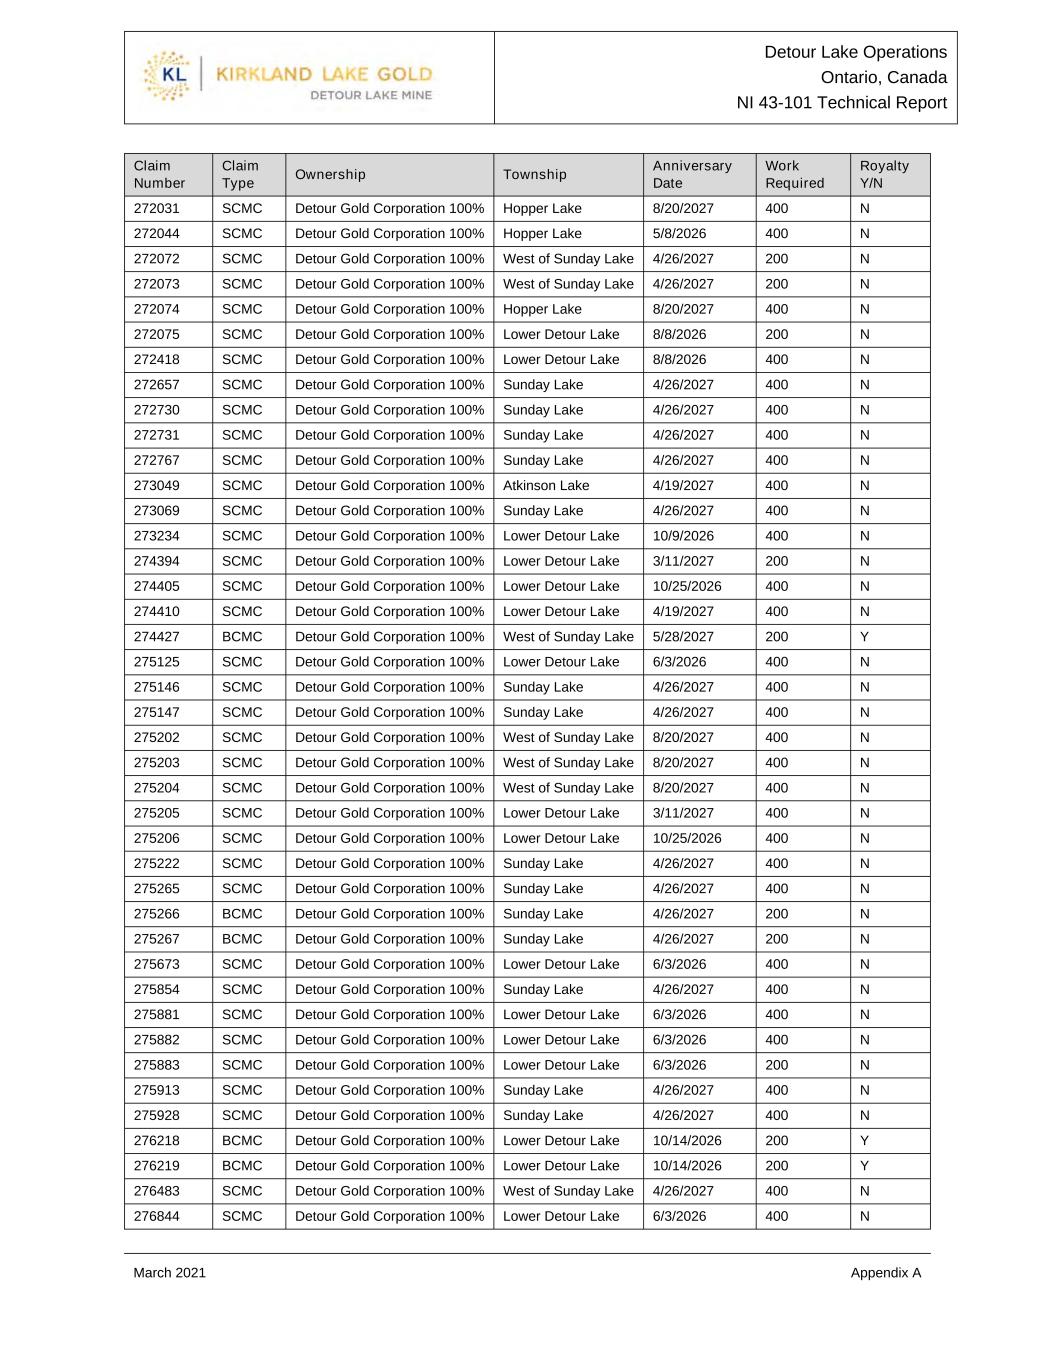
Detour Lake Operations Ontario, Canada NI 43-101 Technical Report March 2021 Appendix A Claim Number Claim Type Ownership Township Anniversary Date Work Required Royalty Y/N 272031 SCMC Detour Gold Corporation 100% Hopper Lake 8/20/2027 400 N 272044 SCMC Detour Gold Corporation 100% Hopper Lake 5/8/2026 400 N 272072 SCMC Detour Gold Corporation 100% West of Sunday Lake 4/26/2027 200 N 272073 SCMC Detour Gold Corporation 100% West of Sunday Lake 4/26/2027 200 N 272074 SCMC Detour Gold Corporation 100% Hopper Lake 8/20/2027 400 N 272075 SCMC Detour Gold Corporation 100% Lower Detour Lake 8/8/2026 200 N 272418 SCMC Detour Gold Corporation 100% Lower Detour Lake 8/8/2026 400 N 272657 SCMC Detour Gold Corporation 100% Sunday Lake 4/26/2027 400 N 272730 SCMC Detour Gold Corporation 100% Sunday Lake 4/26/2027 400 N 272731 SCMC Detour Gold Corporation 100% Sunday Lake 4/26/2027 400 N 272767 SCMC Detour Gold Corporation 100% Sunday Lake 4/26/2027 400 N 273049 SCMC Detour Gold Corporation 100% Atkinson Lake 4/19/2027 400 N 273069 SCMC Detour Gold Corporation 100% Sunday Lake 4/26/2027 400 N 273234 SCMC Detour Gold Corporation 100% Lower Detour Lake 10/9/2026 400 N 274394 SCMC Detour Gold Corporation 100% Lower Detour Lake 3/11/2027 200 N 274405 SCMC Detour Gold Corporation 100% Lower Detour Lake 10/25/2026 400 N 274410 SCMC Detour Gold Corporation 100% Lower Detour Lake 4/19/2027 400 N 274427 BCMC Detour Gold Corporation 100% West of Sunday Lake 5/28/2027 200 Y 275125 SCMC Detour Gold Corporation 100% Lower Detour Lake 6/3/2026 400 N 275146 SCMC Detour Gold Corporation 100% Sunday Lake 4/26/2027 400 N 275147 SCMC Detour Gold Corporation 100% Sunday Lake 4/26/2027 400 N 275202 SCMC Detour Gold Corporation 100% West of Sunday Lake 8/20/2027 400 N 275203 SCMC Detour Gold Corporation 100% West of Sunday Lake 8/20/2027 400 N 275204 SCMC Detour Gold Corporation 100% West of Sunday Lake 8/20/2027 400 N 275205 SCMC Detour Gold Corporation 100% Lower Detour Lake 3/11/2027 400 N 275206 SCMC Detour Gold Corporation 100% Lower Detour Lake 10/25/2026 400 N 275222 SCMC Detour Gold Corporation 100% Sunday Lake 4/26/2027 400 N 275265 SCMC Detour Gold Corporation 100% Sunday Lake 4/26/2027 400 N 275266 BCMC Detour Gold Corporation 100% Sunday Lake 4/26/2027 200 N 275267 BCMC Detour Gold Corporation 100% Sunday Lake 4/26/2027 200 N 275673 SCMC Detour Gold Corporation 100% Lower Detour Lake 6/3/2026 400 N 275854 SCMC Detour Gold Corporation 100% Sunday Lake 4/26/2027 400 N 275881 SCMC Detour Gold Corporation 100% Lower Detour Lake 6/3/2026 400 N 275882 SCMC Detour Gold Corporation 100% Lower Detour Lake 6/3/2026 400 N 275883 SCMC Detour Gold Corporation 100% Lower Detour Lake 6/3/2026 200 N 275913 SCMC Detour Gold Corporation 100% Sunday Lake 4/26/2027 400 N 275928 SCMC Detour Gold Corporation 100% Sunday Lake 4/26/2027 400 N 276218 BCMC Detour Gold Corporation 100% Lower Detour Lake 10/14/2026 200 Y 276219 BCMC Detour Gold Corporation 100% Lower Detour Lake 10/14/2026 200 Y 276483 SCMC Detour Gold Corporation 100% West of Sunday Lake 4/26/2027 400 N 276844 SCMC Detour Gold Corporation 100% Lower Detour Lake 6/3/2026 400 N
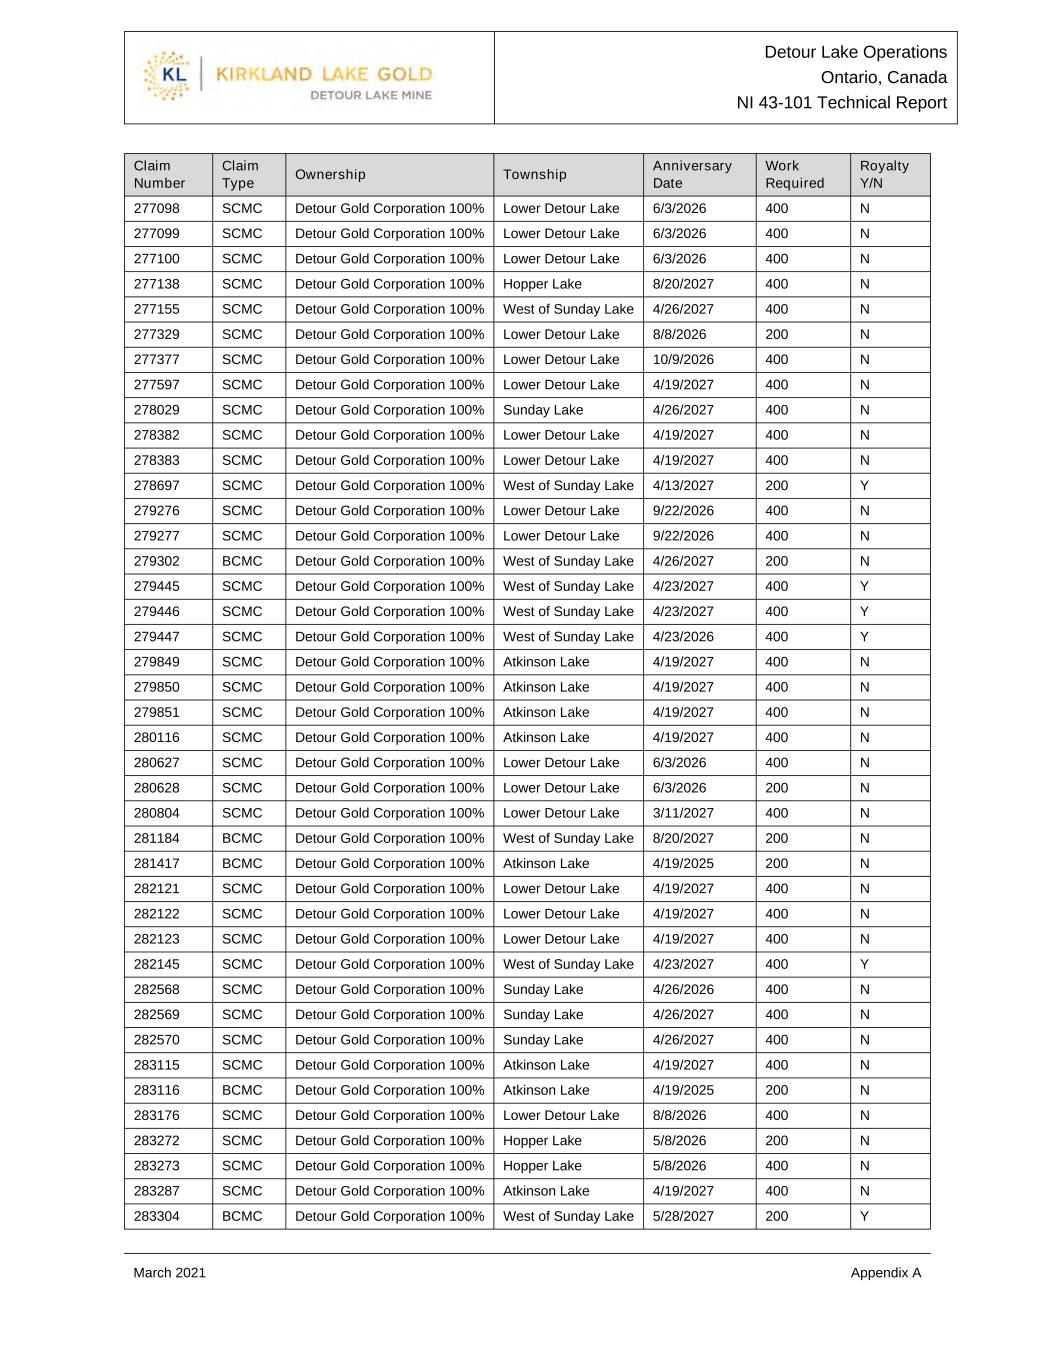
Detour Lake Operations Ontario, Canada NI 43-101 Technical Report March 2021 Appendix A Claim Number Claim Type Ownership Township Anniversary Date Work Required Royalty Y/N 277098 SCMC Detour Gold Corporation 100% Lower Detour Lake 6/3/2026 400 N 277099 SCMC Detour Gold Corporation 100% Lower Detour Lake 6/3/2026 400 N 277100 SCMC Detour Gold Corporation 100% Lower Detour Lake 6/3/2026 400 N 277138 SCMC Detour Gold Corporation 100% Hopper Lake 8/20/2027 400 N 277155 SCMC Detour Gold Corporation 100% West of Sunday Lake 4/26/2027 400 N 277329 SCMC Detour Gold Corporation 100% Lower Detour Lake 8/8/2026 200 N 277377 SCMC Detour Gold Corporation 100% Lower Detour Lake 10/9/2026 400 N 277597 SCMC Detour Gold Corporation 100% Lower Detour Lake 4/19/2027 400 N 278029 SCMC Detour Gold Corporation 100% Sunday Lake 4/26/2027 400 N 278382 SCMC Detour Gold Corporation 100% Lower Detour Lake 4/19/2027 400 N 278383 SCMC Detour Gold Corporation 100% Lower Detour Lake 4/19/2027 400 N 278697 SCMC Detour Gold Corporation 100% West of Sunday Lake 4/13/2027 200 Y 279276 SCMC Detour Gold Corporation 100% Lower Detour Lake 9/22/2026 400 N 279277 SCMC Detour Gold Corporation 100% Lower Detour Lake 9/22/2026 400 N 279302 BCMC Detour Gold Corporation 100% West of Sunday Lake 4/26/2027 200 N 279445 SCMC Detour Gold Corporation 100% West of Sunday Lake 4/23/2027 400 Y 279446 SCMC Detour Gold Corporation 100% West of Sunday Lake 4/23/2027 400 Y 279447 SCMC Detour Gold Corporation 100% West of Sunday Lake 4/23/2026 400 Y 279849 SCMC Detour Gold Corporation 100% Atkinson Lake 4/19/2027 400 N 279850 SCMC Detour Gold Corporation 100% Atkinson Lake 4/19/2027 400 N 279851 SCMC Detour Gold Corporation 100% Atkinson Lake 4/19/2027 400 N 280116 SCMC Detour Gold Corporation 100% Atkinson Lake 4/19/2027 400 N 280627 SCMC Detour Gold Corporation 100% Lower Detour Lake 6/3/2026 400 N 280628 SCMC Detour Gold Corporation 100% Lower Detour Lake 6/3/2026 200 N 280804 SCMC Detour Gold Corporation 100% Lower Detour Lake 3/11/2027 400 N 281184 BCMC Detour Gold Corporation 100% West of Sunday Lake 8/20/2027 200 N 281417 BCMC Detour Gold Corporation 100% Atkinson Lake 4/19/2025 200 N 282121 SCMC Detour Gold Corporation 100% Lower Detour Lake 4/19/2027 400 N 282122 SCMC Detour Gold Corporation 100% Lower Detour Lake 4/19/2027 400 N 282123 SCMC Detour Gold Corporation 100% Lower Detour Lake 4/19/2027 400 N 282145 SCMC Detour Gold Corporation 100% West of Sunday Lake 4/23/2027 400 Y 282568 SCMC Detour Gold Corporation 100% Sunday Lake 4/26/2026 400 N 282569 SCMC Detour Gold Corporation 100% Sunday Lake 4/26/2027 400 N 282570 SCMC Detour Gold Corporation 100% Sunday Lake 4/26/2027 400 N 283115 SCMC Detour Gold Corporation 100% Atkinson Lake 4/19/2027 400 N 283116 BCMC Detour Gold Corporation 100% Atkinson Lake 4/19/2025 200 N 283176 SCMC Detour Gold Corporation 100% Lower Detour Lake 8/8/2026 400 N 283272 SCMC Detour Gold Corporation 100% Hopper Lake 5/8/2026 200 N 283273 SCMC Detour Gold Corporation 100% Hopper Lake 5/8/2026 400 N 283287 SCMC Detour Gold Corporation 100% Atkinson Lake 4/19/2027 400 N 283304 BCMC Detour Gold Corporation 100% West of Sunday Lake 5/28/2027 200 Y

Detour Lake Operations Ontario, Canada NI 43-101 Technical Report March 2021 Appendix A Claim Number Claim Type Ownership Township Anniversary Date Work Required Royalty Y/N 283336 SCMC Detour Gold Corporation 100% Atkinson Lake 4/19/2027 400 N 283337 SCMC Detour Gold Corporation 100% Atkinson Lake 4/19/2027 400 N 283338 SCMC Detour Gold Corporation 100% Atkinson Lake 4/19/2027 400 N 283408 SCMC Detour Gold Corporation 100% Atkinson Lake 4/19/2027 400 N 283409 SCMC Detour Gold Corporation 100% Atkinson Lake 4/19/2027 400 N 283574 SCMC Detour Gold Corporation 100% Sunday Lake 4/26/2027 400 N 283764 SCMC Detour Gold Corporation 100% Lower Detour Lake 6/3/2026 400 N 283926 SCMC Detour Gold Corporation 100% Sunday Lake 4/26/2027 400 N 283927 SCMC Detour Gold Corporation 100% Sunday Lake 4/26/2027 400 N 283928 SCMC Detour Gold Corporation 100% Sunday Lake 4/26/2027 400 N 284059 SCMC Detour Gold Corporation 100% West of Sunday Lake 3/3/2027 200 N 284152 SCMC Detour Gold Corporation 100% Hopper Lake 5/8/2026 400 N 284153 SCMC Detour Gold Corporation 100% Hopper Lake 5/8/2026 400 N 284154 SCMC Detour Gold Corporation 100% Hopper Lake 5/8/2026 400 N 284190 SCMC Detour Gold Corporation 100% West of Sunday Lake 4/26/2027 200 N 284191 SCMC Detour Gold Corporation 100% Hopper Lake 8/20/2027 400 N 284192 SCMC Detour Gold Corporation 100% Hopper Lake 8/20/2027 400 N 284588 SCMC Detour Gold Corporation 100% Sunday Lake 4/26/2026 400 N 284589 SCMC Detour Gold Corporation 100% Sunday Lake 4/26/2027 400 N 284655 SCMC Detour Gold Corporation 100% Sunday Lake 4/26/2027 400 N 284796 SCMC Detour Gold Corporation 100% West of Sunday Lake 8/20/2027 400 N 284876 SCMC Detour Gold Corporation 100% Sunday Lake 4/26/2027 400 N 284877 SCMC Detour Gold Corporation 100% Sunday Lake 4/26/2027 400 N 284910 SCMC Detour Gold Corporation 100% Sunday Lake 4/26/2027 400 N 285229 SCMC Detour Gold Corporation 100% West of Sunday Lake 4/23/2027 400 Y 285230 SCMC Detour Gold Corporation 100% West of Sunday Lake 4/23/2027 400 Y 285728 BCMC Detour Gold Corporation 100% Lower Detour Lake 6/3/2026 200 N 285729 SCMC Detour Gold Corporation 100% Lower Detour Lake 6/3/2026 400 N 286455 SCMC Detour Gold Corporation 100% Lower Detour Lake 2/24/2027 400 N 286589 SCMC Detour Gold Corporation 100% Sunday Lake 4/26/2027 400 N 286590 SCMC Detour Gold Corporation 100% Sunday Lake 4/26/2027 400 N 286591 SCMC Detour Gold Corporation 100% Sunday Lake 4/26/2027 400 N 286676 SCMC Detour Gold Corporation 100% Lower Detour Lake 8/8/2026 400 N 286677 SCMC Detour Gold Corporation 100% Hopper Lake 8/20/2027 400 N 286678 SCMC Detour Gold Corporation 100% Hopper Lake 8/20/2027 400 N 286731 SCMC Detour Gold Corporation 100% Sunday Lake 4/26/2027 400 N 286796 SCMC Detour Gold Corporation 100% Sunday Lake 4/26/2027 400 N 287179 BCMC Detour Gold Corporation 100% Sunday Lake 4/26/2027 200 N 287416 BCMC Detour Gold Corporation 100% West of Sunday Lake 4/23/2027 200 Y 288022 SCMC Detour Gold Corporation 100% Hopper Lake 8/20/2027 400 N 288505 SCMC Detour Gold Corporation 100% Atkinson Lake 10/9/2026 400 N

Detour Lake Operations Ontario, Canada NI 43-101 Technical Report March 2021 Appendix A Claim Number Claim Type Ownership Township Anniversary Date Work Required Royalty Y/N 288568 SCMC Detour Gold Corporation 100% Lower Detour Lake 6/3/2026 400 N 288569 SCMC Detour Gold Corporation 100% Lower Detour Lake 10/9/2026 400 N 288570 SCMC Detour Gold Corporation 100% Lower Detour Lake 10/9/2026 400 N 288815 SCMC Detour Gold Corporation 100% Atkinson Lake 4/19/2027 400 N 288943 SCMC Detour Gold Corporation 100% Atkinson Lake 4/19/2027 400 N 289069 SCMC Detour Gold Corporation 100% Lower Detour Lake 6/3/2026 400 N 289340 SCMC Detour Gold Corporation 100% Sunday Lake 4/26/2027 400 N 289341 SCMC Detour Gold Corporation 100% Sunday Lake 4/26/2027 400 N 289342 SCMC Detour Gold Corporation 100% Sunday Lake 4/26/2027 400 N 289467 SCMC Detour Gold Corporation 100% West of Sunday Lake 4/23/2027 400 Y 289468 SCMC Detour Gold Corporation 100% West of Sunday Lake 4/23/2027 400 Y 289940 SCMC Detour Gold Corporation 100% Lower Detour Lake 10/9/2026 400 N 290182 SCMC Detour Gold Corporation 100% Lower Detour Lake 4/19/2027 400 N 290557 SCMC Detour Gold Corporation 100% Sunday Lake 4/26/2027 400 N 290581 SCMC Detour Gold Corporation 100% Sunday Lake 4/26/2027 400 N 290582 SCMC Detour Gold Corporation 100% Sunday Lake 4/26/2027 400 N 290583 SCMC Detour Gold Corporation 100% Sunday Lake 4/26/2027 400 N 290584 SCMC Detour Gold Corporation 100% Sunday Lake 4/26/2027 200 N 290757 SCMC Detour Gold Corporation 100% Hopper Lake 9/8/2026 200 N 290928 SCMC Detour Gold Corporation 100% Atkinson Lake 4/19/2027 400 N 290929 BCMC Detour Gold Corporation 100% Atkinson Lake 4/19/2027 200 N 290930 BCMC Detour Gold Corporation 100% Atkinson Lake 4/19/2025 200 N 291334 SCMC Detour Gold Corporation 100% Atkinson Lake 4/19/2027 400 N 291352 SCMC Detour Gold Corporation 100% West of Sunday Lake 5/28/2027 400 Y 291392 SCMC Detour Gold Corporation 100% West of Sunday Lake 9/18/2027 200 Y 291398 BCMC Detour Gold Corporation 100% Atkinson Lake 4/19/2027 200 N 291431 SCMC Detour Gold Corporation 100% Sunday Lake 4/26/2027 200 N 291479 BCMC Detour Gold Corporation 100% Lower Detour Lake 10/25/2026 200 N 291490 SCMC Detour Gold Corporation 100% Lower Detour Lake 3/11/2027 400 N 291494 SCMC Detour Gold Corporation 100% Lower Detour Lake 10/25/2026 400 N 291495 SCMC Detour Gold Corporation 100% West of Sunday Lake 9/18/2026 200 Y 292116 SCMC Detour Gold Corporation 100% West of Sunday Lake 3/3/2027 200 N 292117 SCMC Detour Gold Corporation 100% West of Sunday Lake 3/3/2027 400 N 292369 SCMC Detour Gold Corporation 100% Lower Detour Lake 2/24/2027 400 N 292925 SCMC Detour Gold Corporation 100% Sunday Lake 4/26/2027 400 N 292926 SCMC Detour Gold Corporation 100% Sunday Lake 4/26/2027 400 N 292990 SCMC Detour Gold Corporation 100% Lower Detour Lake 3/11/2027 400 N 293194 SCMC Detour Gold Corporation 100% Lower Detour Lake 3/11/2027 400 N 293195 SCMC Detour Gold Corporation 100% Lower Detour Lake 3/11/2027 400 N 293196 SCMC Detour Gold Corporation 100% Lower Detour Lake 3/11/2027 400 N 293218 SCMC Detour Gold Corporation 100% Sunday Lake 4/26/2027 400 N

Detour Lake Operations Ontario, Canada NI 43-101 Technical Report March 2021 Appendix A Claim Number Claim Type Ownership Township Anniversary Date Work Required Royalty Y/N 293388 SCMC Detour Gold Corporation 100% West of Sunday Lake 5/28/2027 400 Y 293483 SCMC Detour Gold Corporation 100% Hopper Lake 3/15/2027 200 Y 293594 SCMC Detour Gold Corporation 100% Lower Detour Lake 6/3/2026 200 N 293595 SCMC Detour Gold Corporation 100% Lower Detour Lake 6/3/2026 400 N 293622 SCMC Detour Gold Corporation 100% Sunday Lake 4/26/2027 400 N 293623 SCMC Detour Gold Corporation 100% Sunday Lake 4/26/2027 400 N 293668 SCMC Detour Gold Corporation 100% Lower Detour Lake 10/25/2026 400 N 294043 SCMC Detour Gold Corporation 100% West of Sunday Lake 4/23/2027 200 Y 294691 SCMC Detour Gold Corporation 100% Hopper Lake 8/20/2027 400 N 294727 SCMC Detour Gold Corporation 100% Atkinson Lake 4/19/2027 400 N 294742 SCMC Detour Gold Corporation 100% Sunday Lake 4/26/2027 200 N 294790 BCMC Detour Gold Corporation 100% Hopper Lake 5/28/2027 200 Y 294812 SCMC Detour Gold Corporation 100% Sunday Lake 4/26/2027 400 N 295057 SCMC Detour Gold Corporation 100% Lower Detour Lake 4/19/2027 400 N 295058 SCMC Detour Gold Corporation 100% Lower Detour Lake 4/19/2027 400 N 295218 SCMC Detour Gold Corporation 100% Sunday Lake 4/26/2027 400 N 295219 SCMC Detour Gold Corporation 100% Sunday Lake 4/26/2026 400 N 295309 SCMC Detour Gold Corporation 100% Sunday Lake 4/26/2027 400 N 295319 SCMC Detour Gold Corporation 100% Lower Detour Lake 8/8/2026 200 N 295320 SCMC Detour Gold Corporation 100% Lower Detour Lake 9/22/2026 400 N 295450 SCMC Detour Gold Corporation 100% Sunday Lake 4/26/2027 400 N 295566 SCMC Detour Gold Corporation 100% Atkinson Lake 4/19/2027 400 N 295567 SCMC Detour Gold Corporation 100% Atkinson Lake 4/19/2027 400 N 296035 SCMC Detour Gold Corporation 100% Hopper Lake 8/20/2027 400 N 296036 SCMC Detour Gold Corporation 100% Hopper Lake 8/20/2027 400 N 296037 SCMC Detour Gold Corporation 100% Hopper Lake 8/20/2027 400 N 296604 SCMC Detour Gold Corporation 100% Atkinson Lake 10/9/2026 400 N 296663 SCMC Detour Gold Corporation 100% Lower Detour Lake 10/9/2026 400 N 297203 SCMC Detour Gold Corporation 100% Lower Detour Lake 10/25/2027 400 N 297211 SCMC Detour Gold Corporation 100% Lower Detour Lake 6/3/2026 400 N 297844 SCMC Detour Gold Corporation 100% Lower Detour Lake 4/19/2027 400 N 297894 BCMC Detour Gold Corporation 100% West of Sunday Lake 5/28/2027 200 Y 297896 SCMC Detour Gold Corporation 100% West of Sunday Lake 9/18/2027 400 Y 297969 SCMC Detour Gold Corporation 100% Atkinson Lake 4/19/2027 400 N 297970 SCMC Detour Gold Corporation 100% Atkinson Lake 4/19/2027 400 N 297971 SCMC Detour Gold Corporation 100% Lower Detour Lake 4/19/2027 400 N 297972 SCMC Detour Gold Corporation 100% Lower Detour Lake 4/19/2027 400 N 298050 SCMC Detour Gold Corporation 100% West of Sunday Lake 4/23/2027 400 Y 298556 SCMC Detour Gold Corporation 100% Lower Detour Lake 6/3/2026 400 N 298557 SCMC Detour Gold Corporation 100% Lower Detour Lake 6/3/2026 400 N 298700 SCMC Detour Gold Corporation 100% Atkinson Lake 4/19/2027 400 N

Detour Lake Operations Ontario, Canada NI 43-101 Technical Report March 2021 Appendix A Claim Number Claim Type Ownership Township Anniversary Date Work Required Royalty Y/N 299321 BCMC Detour Gold Corporation 100% Lower Detour Lake 6/3/2026 200 N 299322 SCMC Detour Gold Corporation 100% Lower Detour Lake 6/3/2026 400 N 299323 SCMC Detour Gold Corporation 100% West of Sunday Lake 6/3/2027 400 N 299504 SCMC Detour Gold Corporation 100% Sunday Lake 4/26/2027 400 N 299530 SCMC Detour Gold Corporation 100% Lower Detour Lake 4/19/2027 400 N 299531 SCMC Detour Gold Corporation 100% Atkinson Lake 4/19/2027 400 N 299819 SCMC Detour Gold Corporation 100% Hopper Lake 8/20/2027 400 N 299950 SCMC Detour Gold Corporation 100% Lower Detour Lake 3/11/2027 400 N 300016 SCMC Detour Gold Corporation 100% West of Sunday Lake 4/26/2025 400 N 300040 BCMC Detour Gold Corporation 100% West of Sunday Lake 10/25/2027 200 N 300120 SCMC Detour Gold Corporation 100% Lower Detour Lake 6/3/2026 400 N 300351 SCMC Detour Gold Corporation 100% Lower Detour Lake 3/11/2027 400 N 300477 SCMC Detour Gold Corporation 100% Lower Detour Lake 10/25/2027 400 N 300492 SCMC Detour Gold Corporation 100% Lower Detour Lake 3/11/2027 200 N 300575 SCMC Detour Gold Corporation 100% Hopper Lake 3/15/2027 400 Y 300614 SCMC Detour Gold Corporation 100% West of Sunday Lake 4/13/2027 200 Y 300618 SCMC Detour Gold Corporation 100% Hopper Lake 9/8/2026 400 N 300619 SCMC Detour Gold Corporation 100% Hopper Lake 9/8/2026 400 N 300634 SCMC Detour Gold Corporation 100% Lower Detour Lake 8/8/2026 400 N 300635 SCMC Detour Gold Corporation 100% Lower Detour Lake 8/8/2026 400 N 300831 SCMC Detour Gold Corporation 100% Atkinson Lake 4/19/2027 400 N 300832 SCMC Detour Gold Corporation 100% Atkinson Lake 4/19/2027 400 N 300851 SCMC Detour Gold Corporation 100% Hopper Lake 8/20/2027 400 N 300867 SCMC Detour Gold Corporation 100% Lower Detour Lake 6/3/2026 200 N 300868 SCMC Detour Gold Corporation 100% Lower Detour Lake 6/3/2026 400 N 300869 SCMC Detour Gold Corporation 100% Lower Detour Lake 6/3/2026 400 N 300870 SCMC Detour Gold Corporation 100% West of Sunday Lake 6/3/2027 400 N 300987 BCMC Detour Gold Corporation 100% West of Sunday Lake 4/23/2027 200 Y 301006 BCMC Detour Gold Corporation 100% West of Sunday Lake 4/23/2027 200 Y 301007 BCMC Detour Gold Corporation 100% West of Sunday Lake 4/23/2027 200 Y 301310 SCMC Detour Gold Corporation 100% Lower Detour Lake 8/8/2026 400 N 301311 BCMC Detour Gold Corporation 100% Lower Detour Lake 8/8/2026 200 N 301455 SCMC Detour Gold Corporation 100% Lower Detour Lake 6/3/2026 400 N 301500 SCMC Detour Gold Corporation 100% West of Sunday Lake 6/3/2027 200 N 301837 SCMC Detour Gold Corporation 100% Sunday Lake 4/26/2026 400 N 301897 BCMC Detour Gold Corporation 100% Lower Detour Lake 10/14/2026 200 N 301920 BCMC Detour Gold Corporation 100% Lower Detour Lake 10/14/2026 200 Y 301922 SCMC Detour Gold Corporation 100% Hopper Lake 8/31/2026 400 N 301923 SCMC Detour Gold Corporation 100% West of Sunday Lake 4/26/2027 200 N 302115 BCMC Detour Gold Corporation 100% West of Sunday Lake 3/3/2027 200 N 302325 SCMC Detour Gold Corporation 100% Atkinson Lake 4/19/2027 400 N

Detour Lake Operations Ontario, Canada NI 43-101 Technical Report March 2021 Appendix A Claim Number Claim Type Ownership Township Anniversary Date Work Required Royalty Y/N 302739 SCMC Detour Gold Corporation 100% Hopper Lake 9/8/2026 400 N 303008 SCMC Detour Gold Corporation 100% Sunday Lake 4/26/2027 400 N 303100 SCMC Detour Gold Corporation 100% Lower Detour Lake 10/9/2026 400 N 303245 SCMC Detour Gold Corporation 100% Sunday Lake 4/26/2027 400 N 303279 SCMC Detour Gold Corporation 100% Sunday Lake 4/26/2027 400 N 303451 SCMC Detour Gold Corporation 100% Hopper Lake 5/8/2026 200 N 303452 SCMC Detour Gold Corporation 100% Hopper Lake 5/8/2026 400 N 303544 SCMC Detour Gold Corporation 100% Sunday Lake 4/26/2027 400 N 304098 BCMC Detour Gold Corporation 100% Atkinson Lake 4/19/2027 200 N 304104 SCMC Detour Gold Corporation 100% Sunday Lake 4/26/2027 400 N 304105 SCMC Detour Gold Corporation 100% Sunday Lake 4/26/2027 400 N 304290 SCMC Detour Gold Corporation 100% Atkinson Lake 4/19/2027 400 N 304291 SCMC Detour Gold Corporation 100% Atkinson Lake 4/19/2027 400 N 304315 SCMC Detour Gold Corporation 100% Sunday Lake 4/26/2027 400 N 304744 SCMC Detour Gold Corporation 100% West of Sunday Lake 3/3/2027 400 N 304847 SCMC Detour Gold Corporation 100% Sunday Lake 4/26/2027 400 N 305059 SCMC Detour Gold Corporation 100% Hopper Lake 8/20/2027 400 N 305060 SCMC Detour Gold Corporation 100% Hopper Lake 8/20/2027 400 N 305087 SCMC Detour Gold Corporation 100% Sunday Lake 4/26/2027 400 N 305088 SCMC Detour Gold Corporation 100% Sunday Lake 4/26/2027 200 N 305109 SCMC Detour Gold Corporation 100% Sunday Lake 4/26/2027 400 N 305110 SCMC Detour Gold Corporation 100% Sunday Lake 4/26/2027 400 N 305111 SCMC Detour Gold Corporation 100% Sunday Lake 4/26/2027 400 N 305228 SCMC Detour Gold Corporation 100% Sunday Lake 4/26/2027 400 N 305336 SCMC Detour Gold Corporation 100% Lower Detour Lake 3/11/2027 400 N 305337 SCMC Detour Gold Corporation 100% Lower Detour Lake 3/11/2027 400 N 305338 SCMC Detour Gold Corporation 100% Lower Detour Lake 3/11/2027 400 N 305665 SCMC Detour Gold Corporation 100% Lower Detour Lake 8/8/2026 400 N 305680 SCMC Detour Gold Corporation 100% Sunday Lake 4/26/2027 400 N 305681 SCMC Detour Gold Corporation 100% Sunday Lake 4/26/2027 400 N 305717 BCMC Detour Gold Corporation 100% West of Sunday Lake 8/20/2027 200 N 305718 SCMC Detour Gold Corporation 100% Lower Detour Lake 3/11/2027 400 N 305719 SCMC Detour Gold Corporation 100% Lower Detour Lake 3/11/2027 400 N 305968 BCMC Detour Gold Corporation 100% West of Sunday Lake 4/23/2027 200 Y 306083 BCMC Detour Gold Corporation 100% West of Sunday Lake 5/28/2027 200 Y 306472 BCMC Detour Gold Corporation 100% Sunday Lake 7/12/2027 200 Y 306494 SCMC Detour Gold Corporation 100% Lower Detour Lake 10/9/2026 400 N 306878 SCMC Detour Gold Corporation 100% Hopper Lake 8/20/2027 400 N 306914 SCMC Detour Gold Corporation 100% Atkinson Lake 4/19/2027 400 N 306927 SCMC Detour Gold Corporation 100% Sunday Lake 4/26/2027 400 N 307162 SCMC Detour Gold Corporation 100% West of Sunday Lake 6/3/2027 400 N

Detour Lake Operations Ontario, Canada NI 43-101 Technical Report March 2021 Appendix A Claim Number Claim Type Ownership Township Anniversary Date Work Required Royalty Y/N 307317 SCMC Detour Gold Corporation 100% Sunday Lake 4/26/2027 400 N 307318 SCMC Detour Gold Corporation 100% Sunday Lake 4/26/2027 400 N 307411 SCMC Detour Gold Corporation 100% Sunday Lake 4/26/2027 400 N 307419 SCMC Detour Gold Corporation 100% Lower Detour Lake 8/8/2026 400 N 307695 SCMC Detour Gold Corporation 100% Lower Detour Lake 6/3/2026 400 N 307696 SCMC Detour Gold Corporation 100% Lower Detour Lake 6/3/2026 400 N 307753 BCMC Detour Gold Corporation 100% Hopper Lake 8/20/2027 200 N 307754 BCMC Detour Gold Corporation 100% Hopper Lake 8/20/2027 200 N 307755 SCMC Detour Gold Corporation 100% Hopper Lake 8/20/2027 400 N 307756 SCMC Detour Gold Corporation 100% Hopper Lake 9/8/2026 400 N 307771 SCMC Detour Gold Corporation 100% West of Sunday Lake 4/26/2027 400 N 307807 SCMC Detour Gold Corporation 100% Hopper Lake 9/8/2026 400 N 307808 SCMC Detour Gold Corporation 100% Hopper Lake 9/8/2026 400 N 308204 SCMC Detour Gold Corporation 100% Lower Detour Lake 8/8/2026 400 N 308205 SCMC Detour Gold Corporation 100% Lower Detour Lake 8/8/2026 400 N 308238 SCMC Detour Gold Corporation 100% Hopper Lake 8/20/2027 400 N 308524 SCMC Detour Gold Corporation 100% Hopper Lake 9/8/2026 400 N 308646 SCMC Detour Gold Corporation 100% Atkinson Lake 4/19/2027 400 N 308647 BCMC Detour Gold Corporation 100% Atkinson Lake 4/19/2027 200 N 308775 SCMC Detour Gold Corporation 100% Atkinson Lake 10/9/2026 400 N 309056 SCMC Detour Gold Corporation 100% Lower Detour Lake 10/14/2026 400 Y 309057 SCMC Detour Gold Corporation 100% Lower Detour Lake 10/14/2026 400 Y 309064 SCMC Detour Gold Corporation 100% Hopper Lake 9/8/2026 400 N 309065 SCMC Detour Gold Corporation 100% Hopper Lake 9/8/2026 400 N 309066 SCMC Detour Gold Corporation 100% Hopper Lake 9/8/2026 400 N 309126 BCMC Detour Gold Corporation 100% Hopper Lake 5/28/2027 200 Y 309306 SCMC Detour Gold Corporation 100% Atkinson Lake 10/9/2026 400 N 309307 SCMC Detour Gold Corporation 100% Atkinson Lake 10/9/2026 400 N 309308 SCMC Detour Gold Corporation 100% Atkinson Lake 10/9/2026 400 N 309357 SCMC Detour Gold Corporation 100% Lower Detour Lake 10/9/2026 400 N 309421 SCMC Detour Gold Corporation 100% Lower Detour Lake 10/9/2026 400 N 309422 SCMC Detour Gold Corporation 100% Lower Detour Lake 4/19/2027 400 N 309436 SCMC Detour Gold Corporation 100% Lower Detour Lake 10/9/2026 400 N 309941 SCMC Detour Gold Corporation 100% Hopper Lake 8/20/2027 400 N 309965 BCMC Detour Gold Corporation 100% West of Sunday Lake 9/18/2027 200 Y 310121 SCMC Detour Gold Corporation 100% West of Sunday Lake 4/23/2027 400 Y 310123 SCMC Detour Gold Corporation 100% Lower Detour Lake 9/22/2026 200 N 310124 SCMC Detour Gold Corporation 100% Atkinson Lake 4/19/2027 400 N 310125 SCMC Detour Gold Corporation 100% Lower Detour Lake 4/19/2027 400 N 310126 SCMC Detour Gold Corporation 100% Lower Detour Lake 4/19/2027 400 N 310273 SCMC Detour Gold Corporation 100% West of Sunday Lake 4/23/2027 400 Y

Detour Lake Operations Ontario, Canada NI 43-101 Technical Report March 2021 Appendix A Claim Number Claim Type Ownership Township Anniversary Date Work Required Royalty Y/N 310274 SCMC Detour Gold Corporation 100% West of Sunday Lake 4/23/2027 400 Y 310341 SCMC Detour Gold Corporation 100% Atkinson Lake 4/19/2027 400 N 310350 SCMC Detour Gold Corporation 100% Sunday Lake 4/26/2027 400 N 310890 SCMC Detour Gold Corporation 100% Sunday Lake 4/26/2027 400 N 310984 BCMC Detour Gold Corporation 100% Atkinson Lake 4/19/2025 200 N 311524 SCMC Detour Gold Corporation 100% West of Sunday Lake 3/3/2027 400 N 311525 SCMC Detour Gold Corporation 100% West of Sunday Lake 3/3/2027 200 N 311601 SCMC Detour Gold Corporation 100% Sunday Lake 4/26/2027 400 N 311718 SCMC Detour Gold Corporation 100% Lower Detour Lake 4/19/2027 400 N 311719 SCMC Detour Gold Corporation 100% Lower Detour Lake 4/19/2027 400 N 311841 SCMC Detour Gold Corporation 100% Sunday Lake 4/26/2027 400 N 311909 SCMC Detour Gold Corporation 100% Sunday Lake 4/26/2027 400 N 312373 SCMC Detour Gold Corporation 100% Hopper Lake 8/20/2027 400 N 312412 SCMC Detour Gold Corporation 100% Sunday Lake 7/12/2027 400 Y 312413 SCMC Detour Gold Corporation 100% Sunday Lake 7/12/2027 200 Y 312414 SCMC Detour Gold Corporation 100% Sunday Lake 7/12/2027 200 Y 312476 SCMC Detour Gold Corporation 100% Sunday Lake 4/26/2027 200 N 312504 SCMC Detour Gold Corporation 100% Lower Detour Lake 6/3/2026 400 N 312941 BCMC Detour Gold Corporation 100% West of Sunday Lake 4/23/2027 200 Y 312960 SCMC Detour Gold Corporation 100% Atkinson Lake 4/19/2027 400 N 313012 SCMC Detour Gold Corporation 100% West of Sunday Lake 8/20/2027 400 N 313013 SCMC Detour Gold Corporation 100% West of Sunday Lake 8/20/2027 400 N 313014 SCMC Detour Gold Corporation 100% West of Sunday Lake 8/20/2027 400 N 313275 SCMC Detour Gold Corporation 100% Lower Detour Lake 10/9/2026 400 N 313318 SCMC Detour Gold Corporation 100% Atkinson Lake 4/19/2027 400 N 313319 SCMC Detour Gold Corporation 100% Atkinson Lake 4/19/2027 400 N 313441 SCMC Detour Gold Corporation 100% Lower Detour Lake 6/3/2026 400 N 313578 SCMC Detour Gold Corporation 100% Lower Detour Lake 8/8/2026 400 N 313635 SCMC Detour Gold Corporation 100% Sunday Lake 4/26/2027 400 N 313919 BCMC Detour Gold Corporation 100% Lower Detour Lake 8/8/2026 200 N 313920 SCMC Detour Gold Corporation 100% West of Sunday Lake 6/3/2027 400 N 313972 SCMC Detour Gold Corporation 100% Lower Detour Lake 10/9/2026 400 N 314216 SCMC Detour Gold Corporation 100% Sunday Lake 4/26/2027 400 N 314217 SCMC Detour Gold Corporation 100% Sunday Lake 4/26/2027 400 N 314218 SCMC Detour Gold Corporation 100% Sunday Lake 4/26/2027 400 N 314219 SCMC Detour Gold Corporation 100% Sunday Lake 4/26/2027 400 N 314453 SCMC Detour Gold Corporation 100% Hopper Lake 9/8/2026 400 N 314484 SCMC Detour Gold Corporation 100% Hopper Lake 8/20/2027 400 N 314485 SCMC Detour Gold Corporation 100% Hopper Lake 8/20/2027 400 N 314486 SCMC Detour Gold Corporation 100% Hopper Lake 8/20/2027 400 N 314552 SCMC Detour Gold Corporation 100% Hopper Lake 9/8/2026 400 N
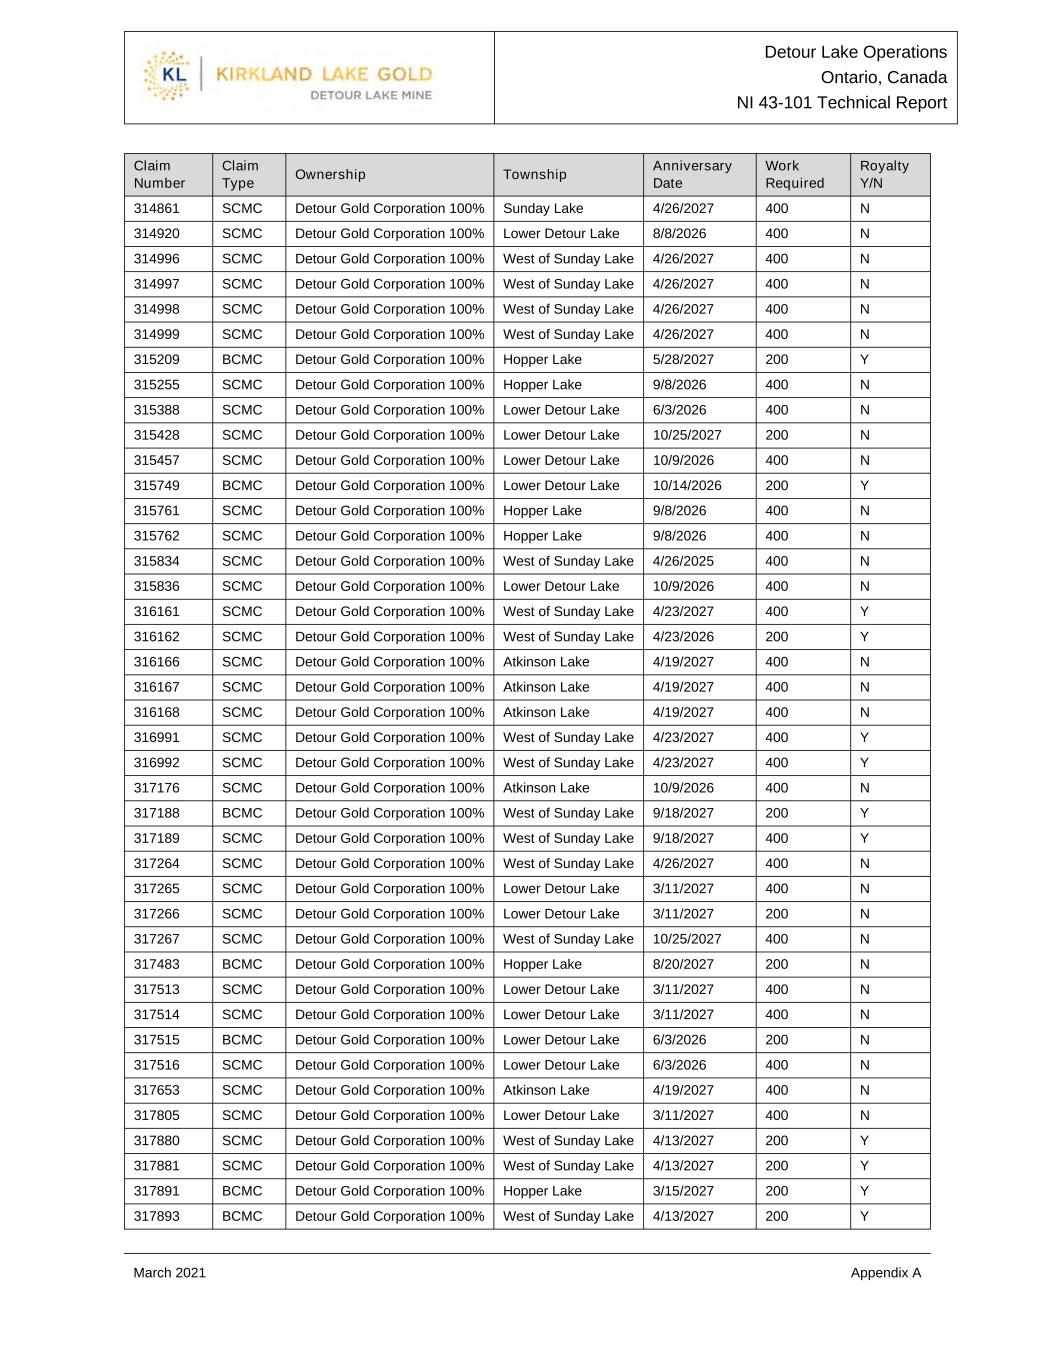
Detour Lake Operations Ontario, Canada NI 43-101 Technical Report March 2021 Appendix A Claim Number Claim Type Ownership Township Anniversary Date Work Required Royalty Y/N 314861 SCMC Detour Gold Corporation 100% Sunday Lake 4/26/2027 400 N 314920 SCMC Detour Gold Corporation 100% Lower Detour Lake 8/8/2026 400 N 314996 SCMC Detour Gold Corporation 100% West of Sunday Lake 4/26/2027 400 N 314997 SCMC Detour Gold Corporation 100% West of Sunday Lake 4/26/2027 400 N 314998 SCMC Detour Gold Corporation 100% West of Sunday Lake 4/26/2027 400 N 314999 SCMC Detour Gold Corporation 100% West of Sunday Lake 4/26/2027 400 N 315209 BCMC Detour Gold Corporation 100% Hopper Lake 5/28/2027 200 Y 315255 SCMC Detour Gold Corporation 100% Hopper Lake 9/8/2026 400 N 315388 SCMC Detour Gold Corporation 100% Lower Detour Lake 6/3/2026 400 N 315428 SCMC Detour Gold Corporation 100% Lower Detour Lake 10/25/2027 200 N 315457 SCMC Detour Gold Corporation 100% Lower Detour Lake 10/9/2026 400 N 315749 BCMC Detour Gold Corporation 100% Lower Detour Lake 10/14/2026 200 Y 315761 SCMC Detour Gold Corporation 100% Hopper Lake 9/8/2026 400 N 315762 SCMC Detour Gold Corporation 100% Hopper Lake 9/8/2026 400 N 315834 SCMC Detour Gold Corporation 100% West of Sunday Lake 4/26/2025 400 N 315836 SCMC Detour Gold Corporation 100% Lower Detour Lake 10/9/2026 400 N 316161 SCMC Detour Gold Corporation 100% West of Sunday Lake 4/23/2027 400 Y 316162 SCMC Detour Gold Corporation 100% West of Sunday Lake 4/23/2026 200 Y 316166 SCMC Detour Gold Corporation 100% Atkinson Lake 4/19/2027 400 N 316167 SCMC Detour Gold Corporation 100% Atkinson Lake 4/19/2027 400 N 316168 SCMC Detour Gold Corporation 100% Atkinson Lake 4/19/2027 400 N 316991 SCMC Detour Gold Corporation 100% West of Sunday Lake 4/23/2027 400 Y 316992 SCMC Detour Gold Corporation 100% West of Sunday Lake 4/23/2027 400 Y 317176 SCMC Detour Gold Corporation 100% Atkinson Lake 10/9/2026 400 N 317188 BCMC Detour Gold Corporation 100% West of Sunday Lake 9/18/2027 200 Y 317189 SCMC Detour Gold Corporation 100% West of Sunday Lake 9/18/2027 400 Y 317264 SCMC Detour Gold Corporation 100% West of Sunday Lake 4/26/2027 400 N 317265 SCMC Detour Gold Corporation 100% Lower Detour Lake 3/11/2027 400 N 317266 SCMC Detour Gold Corporation 100% Lower Detour Lake 3/11/2027 200 N 317267 SCMC Detour Gold Corporation 100% West of Sunday Lake 10/25/2027 400 N 317483 BCMC Detour Gold Corporation 100% Hopper Lake 8/20/2027 200 N 317513 SCMC Detour Gold Corporation 100% Lower Detour Lake 3/11/2027 400 N 317514 SCMC Detour Gold Corporation 100% Lower Detour Lake 3/11/2027 400 N 317515 BCMC Detour Gold Corporation 100% Lower Detour Lake 6/3/2026 200 N 317516 SCMC Detour Gold Corporation 100% Lower Detour Lake 6/3/2026 400 N 317653 SCMC Detour Gold Corporation 100% Atkinson Lake 4/19/2027 400 N 317805 SCMC Detour Gold Corporation 100% Lower Detour Lake 3/11/2027 400 N 317880 SCMC Detour Gold Corporation 100% West of Sunday Lake 4/13/2027 200 Y 317881 SCMC Detour Gold Corporation 100% West of Sunday Lake 4/13/2027 200 Y 317891 BCMC Detour Gold Corporation 100% Hopper Lake 3/15/2027 200 Y 317893 BCMC Detour Gold Corporation 100% West of Sunday Lake 4/13/2027 200 Y

Detour Lake Operations Ontario, Canada NI 43-101 Technical Report March 2021 Appendix A Claim Number Claim Type Ownership Township Anniversary Date Work Required Royalty Y/N 318100 SCMC Detour Gold Corporation 100% Lower Detour Lake 6/3/2026 400 N 318144 SCMC Detour Gold Corporation 100% Sunday Lake 4/26/2027 400 N 318145 SCMC Detour Gold Corporation 100% Sunday Lake 4/26/2027 400 N 318634 BCMC Detour Gold Corporation 100% Lower Detour Lake 10/14/2026 200 Y 318635 SCMC Detour Gold Corporation 100% Lower Detour Lake 10/14/2026 400 Y 318652 BCMC Detour Gold Corporation 100% Lower Detour Lake 10/14/2026 200 Y 318653 SCMC Detour Gold Corporation 100% West of Sunday Lake 4/26/2026 200 N 318654 SCMC Detour Gold Corporation 100% Hopper Lake 8/20/2027 400 N 318655 SCMC Detour Gold Corporation 100% Lower Detour Lake 8/8/2026 200 N 318942 SCMC Detour Gold Corporation 100% Lower Detour Lake 4/19/2027 400 N 318943 BCMC Detour Gold Corporation 100% Lower Detour Lake 4/19/2025 200 N 319170 SCMC Detour Gold Corporation 100% Sunday Lake 4/26/2027 400 N 319300 BCMC Detour Gold Corporation 100% Sunday Lake 7/12/2027 200 Y 319301 SCMC Detour Gold Corporation 100% Sunday Lake 7/12/2027 200 Y 319440 SCMC Detour Gold Corporation 100% Sunday Lake 4/26/2027 400 N 319669 SCMC Detour Gold Corporation 100% Lower Detour Lake 4/19/2027 400 N 319702 SCMC Detour Gold Corporation 100% Hopper Lake 3/15/2027 400 Y 319703 SCMC Detour Gold Corporation 100% Hopper Lake 3/15/2027 400 Y 319715 SCMC Detour Gold Corporation 100% Sunday Lake 7/12/2027 400 Y 320098 SCMC Detour Gold Corporation 100% Hopper Lake 9/8/2026 400 N 320099 SCMC Detour Gold Corporation 100% Hopper Lake 9/8/2026 400 N 320100 SCMC Detour Gold Corporation 100% Hopper Lake 9/8/2026 400 N 320158 SCMC Detour Gold Corporation 100% Atkinson Lake 4/19/2027 400 N 320209 BCMC Detour Gold Corporation 100% Atkinson Lake 4/19/2025 200 N 320259 SCMC Detour Gold Corporation 100% Atkinson Lake 4/19/2027 400 N 320439 SCMC Detour Gold Corporation 100% Lower Detour Lake 10/9/2026 400 N 320440 SCMC Detour Gold Corporation 100% Lower Detour Lake 10/9/2026 400 N 320502 SCMC Detour Gold Corporation 100% Lower Detour Lake 8/8/2026 200 N 320757 SCMC Detour Gold Corporation 100% Hopper Lake 3/3/2027 400 N 320758 SCMC Detour Gold Corporation 100% Lower Detour Lake 3/11/2027 200 N 320805 SCMC Detour Gold Corporation 100% Hopper Lake 8/20/2027 400 N 320882 SCMC Detour Gold Corporation 100% West of Sunday Lake 8/20/2027 400 N 321364 BCMC Detour Gold Corporation 100% Sunday Lake 7/12/2027 200 Y 321365 SCMC Detour Gold Corporation 100% Sunday Lake 7/12/2027 400 Y 321460 SCMC Detour Gold Corporation 100% Sunday Lake 4/26/2027 400 N 321497 SCMC Detour Gold Corporation 100% Sunday Lake 4/26/2027 400 N 321836 SCMC Detour Gold Corporation 100% Lower Detour Lake 3/11/2027 400 N 321837 SCMC Detour Gold Corporation 100% Lower Detour Lake 3/11/2027 400 N 321845 SCMC Detour Gold Corporation 100% Sunday Lake 4/26/2026 400 N 321846 SCMC Detour Gold Corporation 100% Sunday Lake 4/26/2026 400 N 321847 SCMC Detour Gold Corporation 100% Sunday Lake 4/26/2027 400 N

Detour Lake Operations Ontario, Canada NI 43-101 Technical Report March 2021 Appendix A Claim Number Claim Type Ownership Township Anniversary Date Work Required Royalty Y/N 322027 SCMC Detour Gold Corporation 100% Sunday Lake 4/26/2027 400 N 322028 SCMC Detour Gold Corporation 100% Sunday Lake 4/26/2027 400 N 322029 SCMC Detour Gold Corporation 100% Sunday Lake 4/26/2027 400 N 322273 SCMC Detour Gold Corporation 100% Lower Detour Lake 6/3/2026 400 N 322296 SCMC Detour Gold Corporation 100% Lower Detour Lake 6/3/2026 400 N 322466 BCMC Detour Gold Corporation 100% West of Sunday Lake 4/23/2027 200 Y 322467 BCMC Detour Gold Corporation 100% West of Sunday Lake 4/23/2027 200 Y 322468 SCMC Detour Gold Corporation 100% West of Sunday Lake 4/23/2027 400 Y 322469 SCMC Detour Gold Corporation 100% West of Sunday Lake 4/23/2027 400 Y 322470 SCMC Detour Gold Corporation 100% West of Sunday Lake 4/23/2027 400 Y 322473 SCMC Detour Gold Corporation 100% Hopper Lake 3/15/2027 200 Y 322495 SCMC Detour Gold Corporation 100% Hopper Lake 3/15/2027 200 Y 322616 SCMC Detour Gold Corporation 100% Lower Detour Lake 10/9/2026 400 N 323786 SCMC Detour Gold Corporation 100% Atkinson Lake 4/19/2027 400 N 323894 SCMC Detour Gold Corporation 100% Lower Detour Lake 10/9/2026 400 N 323895 SCMC Detour Gold Corporation 100% Atkinson Lake 10/9/2026 400 N 323896 SCMC Detour Gold Corporation 100% Atkinson Lake 10/9/2026 400 N 324253 SCMC Detour Gold Corporation 100% Lower Detour Lake 4/19/2027 400 N 324297 BCMC Detour Gold Corporation 100% Lower Detour Lake 10/14/2026 200 Y 324505 SCMC Detour Gold Corporation 100% Sunday Lake 4/26/2027 400 N 324617 BCMC Detour Gold Corporation 100% Sunday Lake 4/26/2027 200 N 324618 SCMC Detour Gold Corporation 100% Sunday Lake 4/26/2027 400 N 324619 SCMC Detour Gold Corporation 100% Sunday Lake 4/26/2027 200 N 324732 BCMC Detour Gold Corporation 100% Lower Detour Lake 6/3/2026 200 N 324863 SCMC Detour Gold Corporation 100% Atkinson Lake 4/19/2027 400 N 324988 SCMC Detour Gold Corporation 100% Atkinson Lake 4/19/2027 400 N 325084 SCMC Detour Gold Corporation 100% Lower Detour Lake 8/8/2026 400 N 325272 SCMC Detour Gold Corporation 100% Sunday Lake 4/26/2027 200 N 325495 SCMC Detour Gold Corporation 100% Lower Detour Lake 6/3/2026 400 N 325496 SCMC Detour Gold Corporation 100% Lower Detour Lake 6/3/2026 400 N 325635 SCMC Detour Gold Corporation 100% Lower Detour Lake 4/19/2027 400 N 326010 BCMC Detour Gold Corporation 100% Sunday Lake 7/12/2027 200 Y 326011 SCMC Detour Gold Corporation 100% Sunday Lake 7/12/2027 400 Y 326029 SCMC Detour Gold Corporation 100% Lower Detour Lake 10/9/2026 400 N 326678 BCMC Detour Gold Corporation 100% Lower Detour Lake 8/8/2026 200 N 326679 SCMC Detour Gold Corporation 100% Lower Detour Lake 8/8/2026 200 N 326736 SCMC Detour Gold Corporation 100% Lower Detour Lake 10/9/2026 400 N 327106 SCMC Detour Gold Corporation 100% Lower Detour Lake 6/3/2026 400 N 327151 SCMC Detour Gold Corporation 100% Hopper Lake 5/8/2026 400 N 327163 SCMC Detour Gold Corporation 100% Hopper Lake 8/20/2027 400 N 327180 SCMC Detour Gold Corporation 100% West of Sunday Lake 4/26/2027 400 N
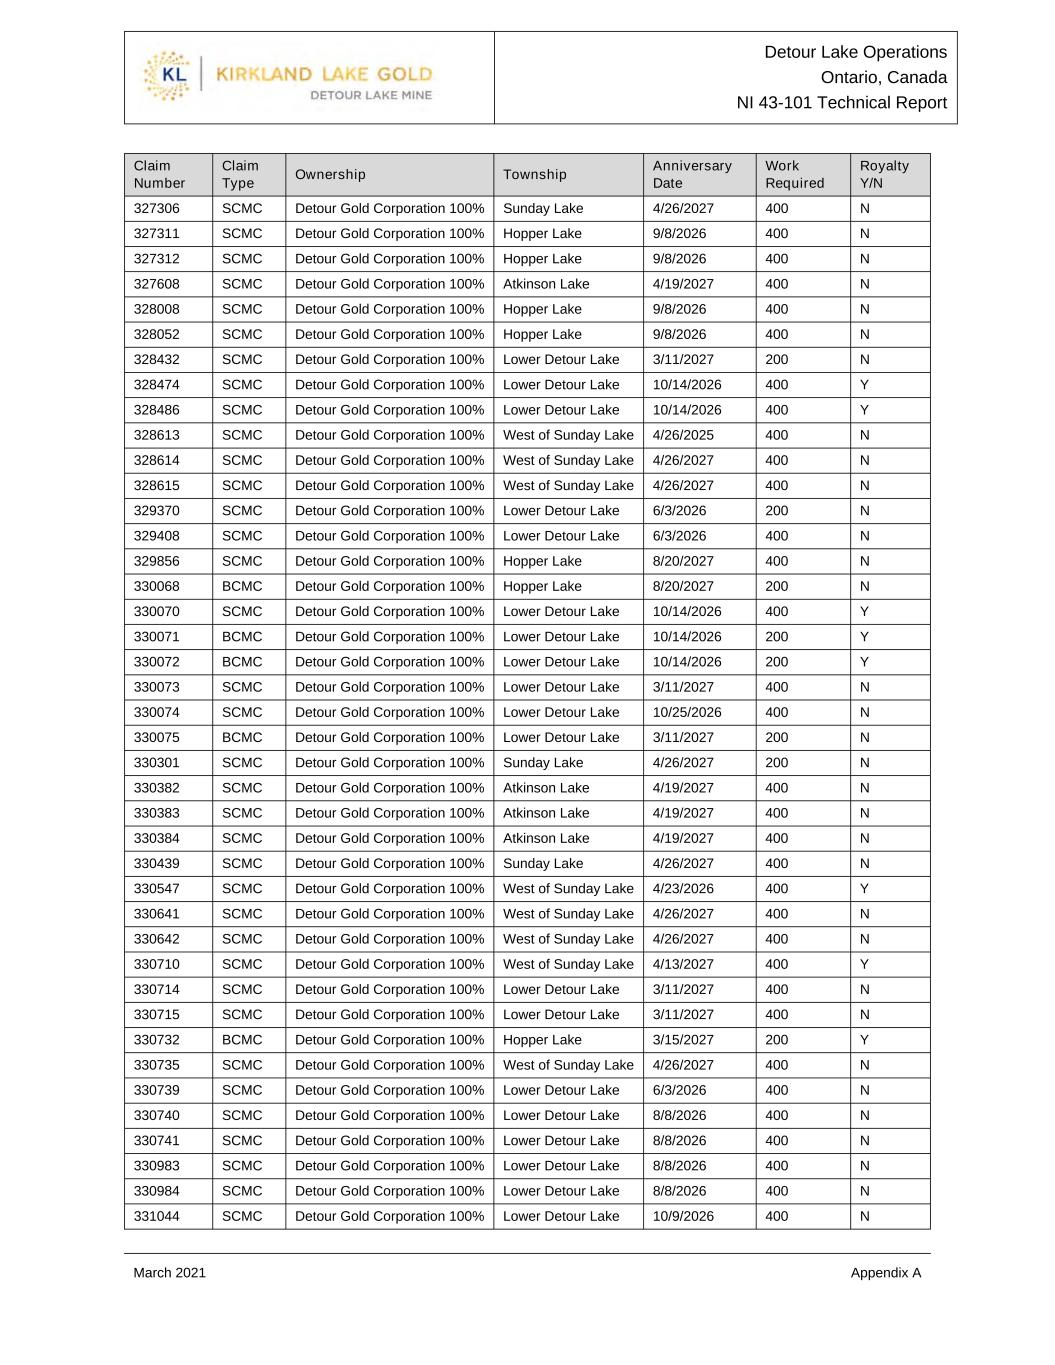
Detour Lake Operations Ontario, Canada NI 43-101 Technical Report March 2021 Appendix A Claim Number Claim Type Ownership Township Anniversary Date Work Required Royalty Y/N 327306 SCMC Detour Gold Corporation 100% Sunday Lake 4/26/2027 400 N 327311 SCMC Detour Gold Corporation 100% Hopper Lake 9/8/2026 400 N 327312 SCMC Detour Gold Corporation 100% Hopper Lake 9/8/2026 400 N 327608 SCMC Detour Gold Corporation 100% Atkinson Lake 4/19/2027 400 N 328008 SCMC Detour Gold Corporation 100% Hopper Lake 9/8/2026 400 N 328052 SCMC Detour Gold Corporation 100% Hopper Lake 9/8/2026 400 N 328432 SCMC Detour Gold Corporation 100% Lower Detour Lake 3/11/2027 200 N 328474 SCMC Detour Gold Corporation 100% Lower Detour Lake 10/14/2026 400 Y 328486 SCMC Detour Gold Corporation 100% Lower Detour Lake 10/14/2026 400 Y 328613 SCMC Detour Gold Corporation 100% West of Sunday Lake 4/26/2025 400 N 328614 SCMC Detour Gold Corporation 100% West of Sunday Lake 4/26/2027 400 N 328615 SCMC Detour Gold Corporation 100% West of Sunday Lake 4/26/2027 400 N 329370 SCMC Detour Gold Corporation 100% Lower Detour Lake 6/3/2026 200 N 329408 SCMC Detour Gold Corporation 100% Lower Detour Lake 6/3/2026 400 N 329856 SCMC Detour Gold Corporation 100% Hopper Lake 8/20/2027 400 N 330068 BCMC Detour Gold Corporation 100% Hopper Lake 8/20/2027 200 N 330070 SCMC Detour Gold Corporation 100% Lower Detour Lake 10/14/2026 400 Y 330071 BCMC Detour Gold Corporation 100% Lower Detour Lake 10/14/2026 200 Y 330072 BCMC Detour Gold Corporation 100% Lower Detour Lake 10/14/2026 200 Y 330073 SCMC Detour Gold Corporation 100% Lower Detour Lake 3/11/2027 400 N 330074 SCMC Detour Gold Corporation 100% Lower Detour Lake 10/25/2026 400 N 330075 BCMC Detour Gold Corporation 100% Lower Detour Lake 3/11/2027 200 N 330301 SCMC Detour Gold Corporation 100% Sunday Lake 4/26/2027 200 N 330382 SCMC Detour Gold Corporation 100% Atkinson Lake 4/19/2027 400 N 330383 SCMC Detour Gold Corporation 100% Atkinson Lake 4/19/2027 400 N 330384 SCMC Detour Gold Corporation 100% Atkinson Lake 4/19/2027 400 N 330439 SCMC Detour Gold Corporation 100% Sunday Lake 4/26/2027 400 N 330547 SCMC Detour Gold Corporation 100% West of Sunday Lake 4/23/2026 400 Y 330641 SCMC Detour Gold Corporation 100% West of Sunday Lake 4/26/2027 400 N 330642 SCMC Detour Gold Corporation 100% West of Sunday Lake 4/26/2027 400 N 330710 SCMC Detour Gold Corporation 100% West of Sunday Lake 4/13/2027 400 Y 330714 SCMC Detour Gold Corporation 100% Lower Detour Lake 3/11/2027 400 N 330715 SCMC Detour Gold Corporation 100% Lower Detour Lake 3/11/2027 400 N 330732 BCMC Detour Gold Corporation 100% Hopper Lake 3/15/2027 200 Y 330735 SCMC Detour Gold Corporation 100% West of Sunday Lake 4/26/2027 400 N 330739 SCMC Detour Gold Corporation 100% Lower Detour Lake 6/3/2026 400 N 330740 SCMC Detour Gold Corporation 100% Lower Detour Lake 8/8/2026 400 N 330741 SCMC Detour Gold Corporation 100% Lower Detour Lake 8/8/2026 400 N 330983 SCMC Detour Gold Corporation 100% Lower Detour Lake 8/8/2026 400 N 330984 SCMC Detour Gold Corporation 100% Lower Detour Lake 8/8/2026 400 N 331044 SCMC Detour Gold Corporation 100% Lower Detour Lake 10/9/2026 400 N

Detour Lake Operations Ontario, Canada NI 43-101 Technical Report March 2021 Appendix A Claim Number Claim Type Ownership Township Anniversary Date Work Required Royalty Y/N 331447 SCMC Detour Gold Corporation 100% West of Sunday Lake 4/26/2027 400 N 331448 SCMC Detour Gold Corporation 100% West of Sunday Lake 4/26/2027 400 N 331451 SCMC Detour Gold Corporation 100% Lower Detour Lake 8/8/2026 400 N 331452 SCMC Detour Gold Corporation 100% West of Sunday Lake 4/26/2027 400 N 331537 SCMC Detour Gold Corporation 100% Sunday Lake 7/12/2027 200 Y 331556 SCMC Detour Gold Corporation 100% Lower Detour Lake 10/9/2026 400 N 331698 BCMC Detour Gold Corporation 100% Lower Detour Lake 8/8/2026 200 N 331699 SCMC Detour Gold Corporation 100% Lower Detour Lake 8/8/2026 200 N 331703 SCMC Detour Gold Corporation 100% West of Sunday Lake 6/3/2027 400 N 331885 SCMC Detour Gold Corporation 100% Atkinson Lake 4/19/2027 400 N 331892 SCMC Detour Gold Corporation 100% Sunday Lake 4/26/2027 400 N 331999 SCMC Detour Gold Corporation 100% Hopper Lake 9/8/2026 400 N 332350 SCMC Detour Gold Corporation 100% Lower Detour Lake 10/9/2026 400 N 332351 SCMC Detour Gold Corporation 100% Lower Detour Lake 10/9/2026 400 N 332463 SCMC Detour Gold Corporation 100% Hopper Lake 8/20/2027 400 N 332464 SCMC Detour Gold Corporation 100% Hopper Lake 8/20/2027 400 N 332480 BCMC Detour Gold Corporation 100% Lower Detour Lake 8/8/2026 200 N 332481 SCMC Detour Gold Corporation 100% Lower Detour Lake 8/8/2026 200 N 332488 BCMC Detour Gold Corporation 100% West of Sunday Lake 9/18/2027 200 Y 332567 BCMC Detour Gold Corporation 100% Hopper Lake 8/20/2027 200 N 332568 SCMC Detour Gold Corporation 100% Hopper Lake 8/20/2027 400 N 332621 SCMC Detour Gold Corporation 100% West of Sunday Lake 4/26/2025 400 N 332667 SCMC Detour Gold Corporation 100% Sunday Lake 7/12/2027 400 Y 332848 SCMC Detour Gold Corporation 100% West of Sunday Lake 4/13/2027 400 Y 332868 SCMC Detour Gold Corporation 100% West of Sunday Lake 4/26/2025 400 N 332885 SCMC Detour Gold Corporation 100% Lower Detour Lake 8/8/2026 400 N 333006 BCMC Detour Gold Corporation 100% West of Sunday Lake 4/23/2027 200 Y 333007 BCMC Detour Gold Corporation 100% West of Sunday Lake 4/23/2027 200 Y 333067 SCMC Detour Gold Corporation 100% Sunday Lake 4/26/2027 400 N 333207 BCMC Detour Gold Corporation 100% West of Sunday Lake 4/26/2027 200 N 333258 SCMC Detour Gold Corporation 100% Hopper Lake 8/20/2027 400 N 333418 SCMC Detour Gold Corporation 100% Sunday Lake 4/26/2027 400 N 333419 SCMC Detour Gold Corporation 100% Sunday Lake 4/26/2027 400 N 333622 SCMC Detour Gold Corporation 100% Sunday Lake 4/26/2027 400 N 334475 SCMC Detour Gold Corporation 100% Sunday Lake 4/26/2027 400 N 334476 SCMC Detour Gold Corporation 100% Sunday Lake 4/26/2027 400 N 334477 SCMC Detour Gold Corporation 100% Sunday Lake 4/26/2027 400 N 334518 SCMC Detour Gold Corporation 100% Sunday Lake 4/26/2027 200 N 334644 BCMC Detour Gold Corporation 100% Lower Detour Lake 6/3/2026 200 N 335025 SCMC Detour Gold Corporation 100% Atkinson Lake 4/19/2027 400 N 335026 SCMC Detour Gold Corporation 100% Atkinson Lake 4/19/2027 400 N

Detour Lake Operations Ontario, Canada NI 43-101 Technical Report March 2021 Appendix A Claim Number Claim Type Ownership Township Anniversary Date Work Required Royalty Y/N 335105 SCMC Detour Gold Corporation 100% Sunday Lake 4/26/2027 400 N 335185 SCMC Detour Gold Corporation 100% West of Sunday Lake 4/26/2027 400 N 335186 SCMC Detour Gold Corporation 100% West of Sunday Lake 4/26/2027 400 N 335536 SCMC Detour Gold Corporation 100% Sunday Lake 4/26/2027 400 N 335537 BCMC Detour Gold Corporation 100% Sunday Lake 4/26/2027 200 N 335546 SCMC Detour Gold Corporation 100% Lower Detour Lake 9/22/2026 400 N 335547 SCMC Detour Gold Corporation 100% Lower Detour Lake 8/8/2026 400 N 335703 BCMC Detour Gold Corporation 100% West of Sunday Lake 4/23/2027 200 Y 335704 BCMC Detour Gold Corporation 100% West of Sunday Lake 4/23/2027 200 Y 335705 SCMC Detour Gold Corporation 100% Sunday Lake 4/26/2027 400 N 335886 SCMC Detour Gold Corporation 100% Hopper Lake 5/8/2026 200 N 335887 SCMC Detour Gold Corporation 100% Hopper Lake 5/8/2026 200 N 335888 SCMC Detour Gold Corporation 100% Hopper Lake 5/8/2026 200 N 335896 SCMC Detour Gold Corporation 100% Atkinson Lake 4/19/2027 400 N 335898 SCMC Detour Gold Corporation 100% Hopper Lake 8/20/2027 400 N 335899 SCMC Detour Gold Corporation 100% Hopper Lake 8/20/2027 400 N 336098 SCMC Detour Gold Corporation 100% Lower Detour Lake 4/19/2027 400 N 336265 BCMC Detour Gold Corporation 100% West of Sunday Lake 5/28/2027 200 Y 336639 SCMC Detour Gold Corporation 100% Lower Detour Lake 3/11/2027 200 N 336942 SCMC Detour Gold Corporation 100% Lower Detour Lake 10/9/2026 400 N 336988 SCMC Detour Gold Corporation 100% Lower Detour Lake 10/25/2027 200 N 336989 SCMC Detour Gold Corporation 100% Lower Detour Lake 10/25/2027 200 N 337180 SCMC Detour Gold Corporation 100% Lower Detour Lake 10/14/2026 400 Y 337192 SCMC Detour Gold Corporation 100% Hopper Lake 9/8/2026 400 N 337493 SCMC Detour Gold Corporation 100% Lower Detour Lake 4/19/2027 400 N 337894 SCMC Detour Gold Corporation 100% West of Sunday Lake 4/23/2027 400 Y 337895 SCMC Detour Gold Corporation 100% West of Sunday Lake 4/23/2027 400 Y 337896 SCMC Detour Gold Corporation 100% West of Sunday Lake 4/23/2027 400 Y 338235 SCMC Detour Gold Corporation 100% West of Sunday Lake 4/23/2026 400 Y 338236 SCMC Detour Gold Corporation 100% West of Sunday Lake 4/23/2027 200 Y 338238 SCMC Detour Gold Corporation 100% Lower Detour Lake 9/22/2026 200 N 338240 SCMC Detour Gold Corporation 100% Atkinson Lake 4/19/2027 400 N 338241 SCMC Detour Gold Corporation 100% Atkinson Lake 4/19/2027 400 N 338242 SCMC Detour Gold Corporation 100% Atkinson Lake 4/19/2027 400 N 338258 SCMC Detour Gold Corporation 100% West of Sunday Lake 10/25/2027 400 N 338259 BCMC Detour Gold Corporation 100% West of Sunday Lake 10/25/2027 200 N 338318 SCMC Detour Gold Corporation 100% Lower Detour Lake 6/3/2026 400 N 338319 SCMC Detour Gold Corporation 100% Lower Detour Lake 6/3/2026 400 N 338320 SCMC Detour Gold Corporation 100% Lower Detour Lake 6/3/2026 400 N 338369 SCMC Detour Gold Corporation 100% West of Sunday Lake 4/23/2027 400 Y 338370 SCMC Detour Gold Corporation 100% West of Sunday Lake 4/23/2027 400 Y

Detour Lake Operations Ontario, Canada NI 43-101 Technical Report March 2021 Appendix A Claim Number Claim Type Ownership Township Anniversary Date Work Required Royalty Y/N 338371 SCMC Detour Gold Corporation 100% West of Sunday Lake 4/23/2026 400 Y 338372 SCMC Detour Gold Corporation 100% West of Sunday Lake 4/23/2026 400 Y 339028 SCMC Detour Gold Corporation 100% Atkinson Lake 4/19/2027 400 N 339248 SCMC Detour Gold Corporation 100% Lower Detour Lake 4/19/2027 400 N 339252 SCMC Detour Gold Corporation 100% Hopper Lake 8/20/2027 400 N 339253 SCMC Detour Gold Corporation 100% Hopper Lake 8/20/2027 400 N 339506 SCMC Detour Gold Corporation 100% Atkinson Lake 4/19/2027 400 N 339585 SCMC Detour Gold Corporation 100% Hopper Lake 8/20/2027 400 N 339586 SCMC Detour Gold Corporation 100% Hopper Lake 8/20/2027 400 N 339606 SCMC Detour Gold Corporation 100% Lower Detour Lake 6/3/2026 200 N 339607 BCMC Detour Gold Corporation 100% Lower Detour Lake 6/3/2026 200 N 339724 SCMC Detour Gold Corporation 100% Lower Detour Lake 3/11/2027 400 N 339725 SCMC Detour Gold Corporation 100% Lower Detour Lake 3/11/2027 400 N 339736 SCMC Detour Gold Corporation 100% Lower Detour Lake 3/11/2027 400 N 339832 SCMC Detour Gold Corporation 100% Lower Detour Lake 4/19/2027 400 N 339833 SCMC Detour Gold Corporation 100% Atkinson Lake 4/19/2027 400 N 339839 SCMC Detour Gold Corporation 100% West of Sunday Lake 4/23/2027 400 Y 339840 BCMC Detour Gold Corporation 100% West of Sunday Lake 4/23/2027 200 Y 340975 SCMC Detour Gold Corporation 100% Hopper Lake 9/8/2026 200 N 341037 SCMC Detour Gold Corporation 100% Lower Detour Lake 4/19/2027 400 N 341632 SCMC Detour Gold Corporation 100% Lower Detour Lake 6/3/2026 400 N 341706 SCMC Detour Gold Corporation 100% Hopper Lake 5/8/2026 200 N 341784 BCMC Detour Gold Corporation 100% Atkinson Lake 4/19/2025 200 N 342163 SCMC Detour Gold Corporation 100% Sunday Lake 4/26/2027 400 N 342226 SCMC Detour Gold Corporation 100% Atkinson Lake 4/19/2027 400 N 342275 BCMC Detour Gold Corporation 100% Atkinson Lake 4/19/2025 200 N 342352 BCMC Detour Gold Corporation 100% Atkinson Lake 4/19/2027 200 N 342360 SCMC Detour Gold Corporation 100% Sunday Lake 4/26/2027 400 N 342361 SCMC Detour Gold Corporation 100% Sunday Lake 4/26/2027 400 N 342833 SCMC Detour Gold Corporation 100% Lower Detour Lake 8/8/2026 400 N 342998 BCMC Detour Gold Corporation 100% West of Sunday Lake 3/3/2027 200 N 343072 BCMC Detour Gold Corporation 100% Atkinson Lake 4/19/2027 200 N 343184 SCMC Detour Gold Corporation 100% Lower Detour Lake 3/11/2027 200 N 343468 BCMC Detour Gold Corporation 100% Hopper Lake 5/28/2027 200 Y 343593 SCMC Detour Gold Corporation 100% Sunday Lake 4/26/2027 400 N 344412 SCMC Detour Gold Corporation 100% West of Sunday Lake 4/23/2027 400 Y 344518 SCMC Detour Gold Corporation 100% West of Sunday Lake 8/20/2027 400 N 344892 SCMC Detour Gold Corporation 100% Hopper Lake 3/15/2027 400 Y 345379 SCMC Detour Gold Corporation 100% Lower Detour Lake 2/24/2027 400 N 345533 BCMC Detour Gold Corporation 100% Hopper Lake 5/28/2027 200 Y Note: SCMC: single cell mining claim. BCMC: boundary cell mining claim.

Detour Lake Operations Ontario, Canada NI 43-101 Technical Report March 2021 Appendix A
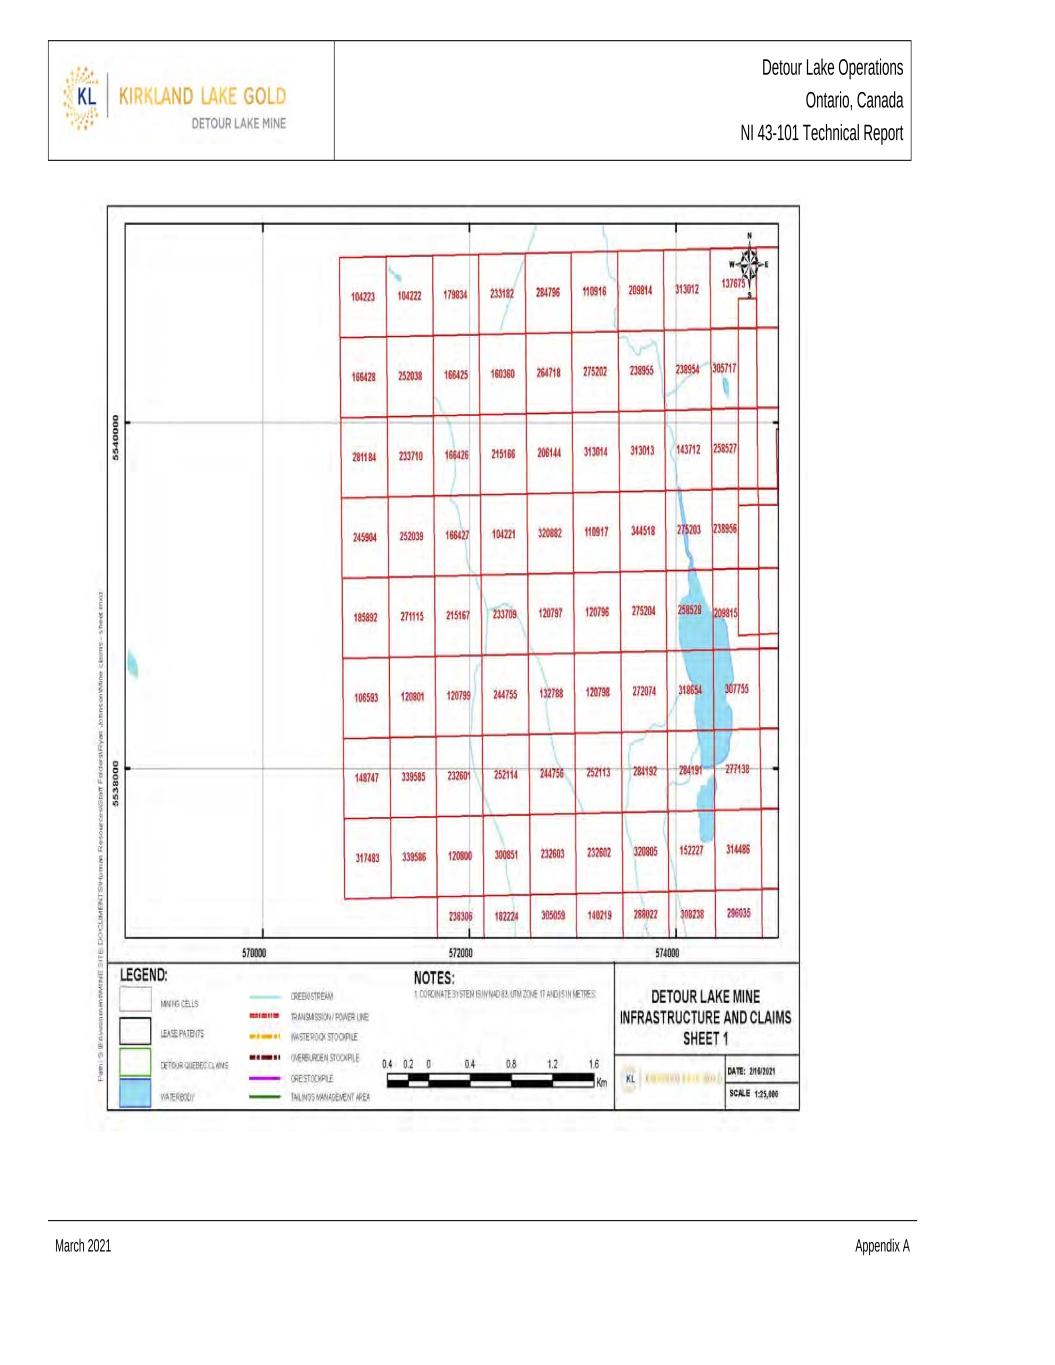
Detour Lake Operations Ontario, Canada NI 43-101 Technical Report March 2021 Appendix A

Detour Lake Operations Ontario, Canada NI 43-101 Technical Report March 2021 Appendix A

Detour Lake Operations Ontario, Canada NI 43-101 Technical Report March 2021 Appendix A

Detour Lake Operations Ontario, Canada NI 43-101 Technical Report March 2021 Appendix A

Detour Lake Operations Ontario, Canada NI 43-101 Technical Report March 2021 Appendix A
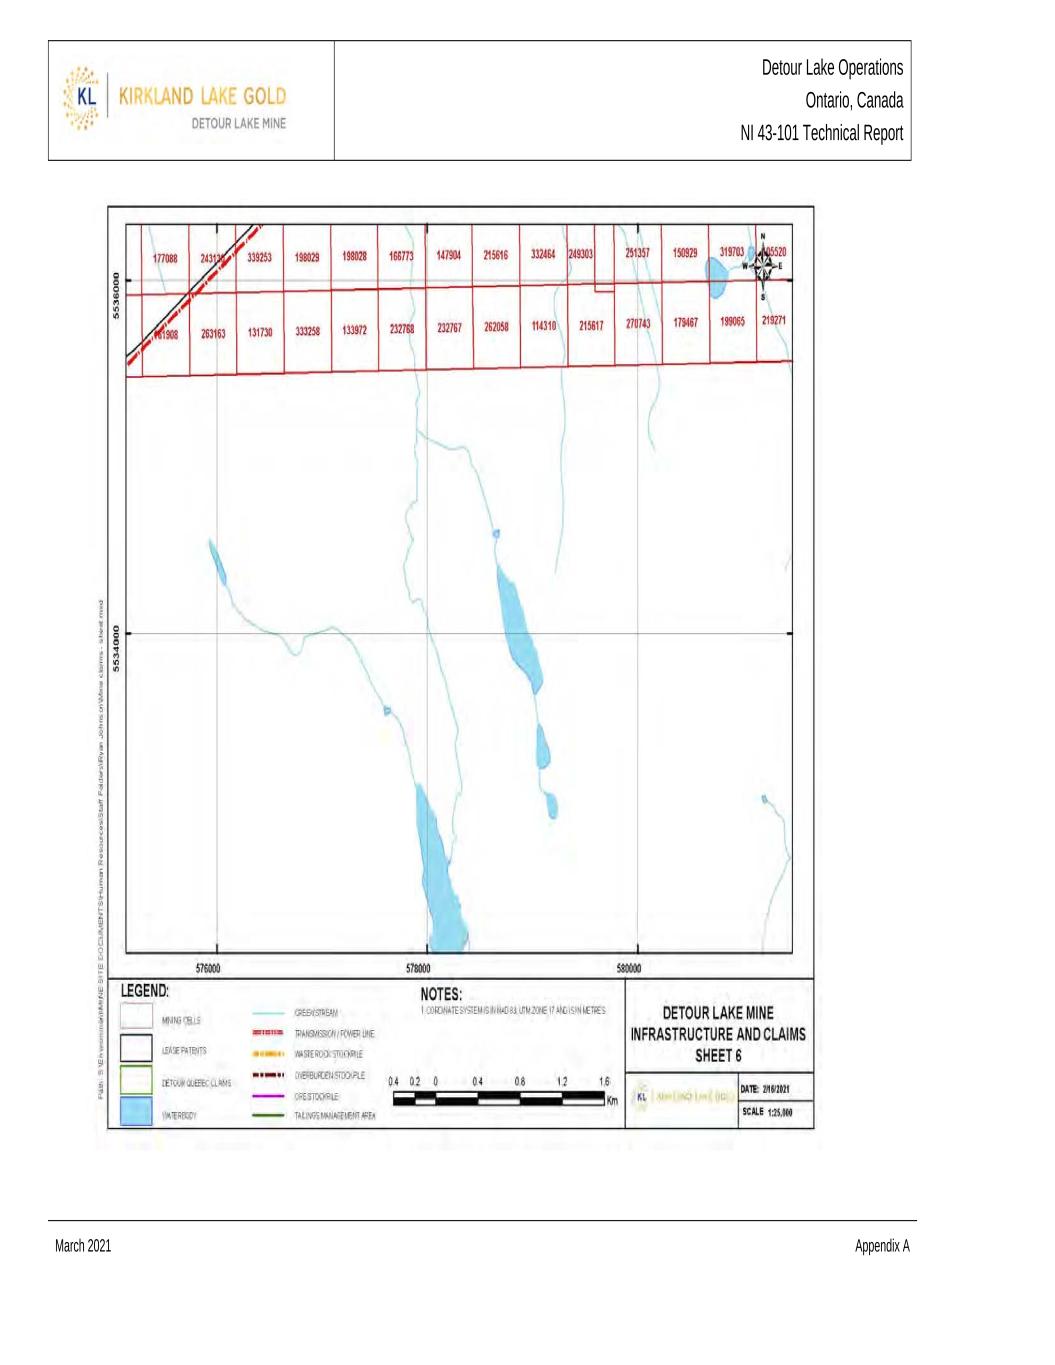
Detour Lake Operations Ontario, Canada NI 43-101 Technical Report March 2021 Appendix A

Detour Lake Operations Ontario, Canada NI 43-101 Technical Report March 2021 Appendix A

Detour Lake Operations Ontario, Canada NI 43-101 Technical Report March 2021 Appendix A

Detour Lake Operations Ontario, Canada NI 43-101 Technical Report March 2021 Appendix A

Detour Lake Operations Ontario, Canada NI 43-101 Technical Report March 2021 Appendix A
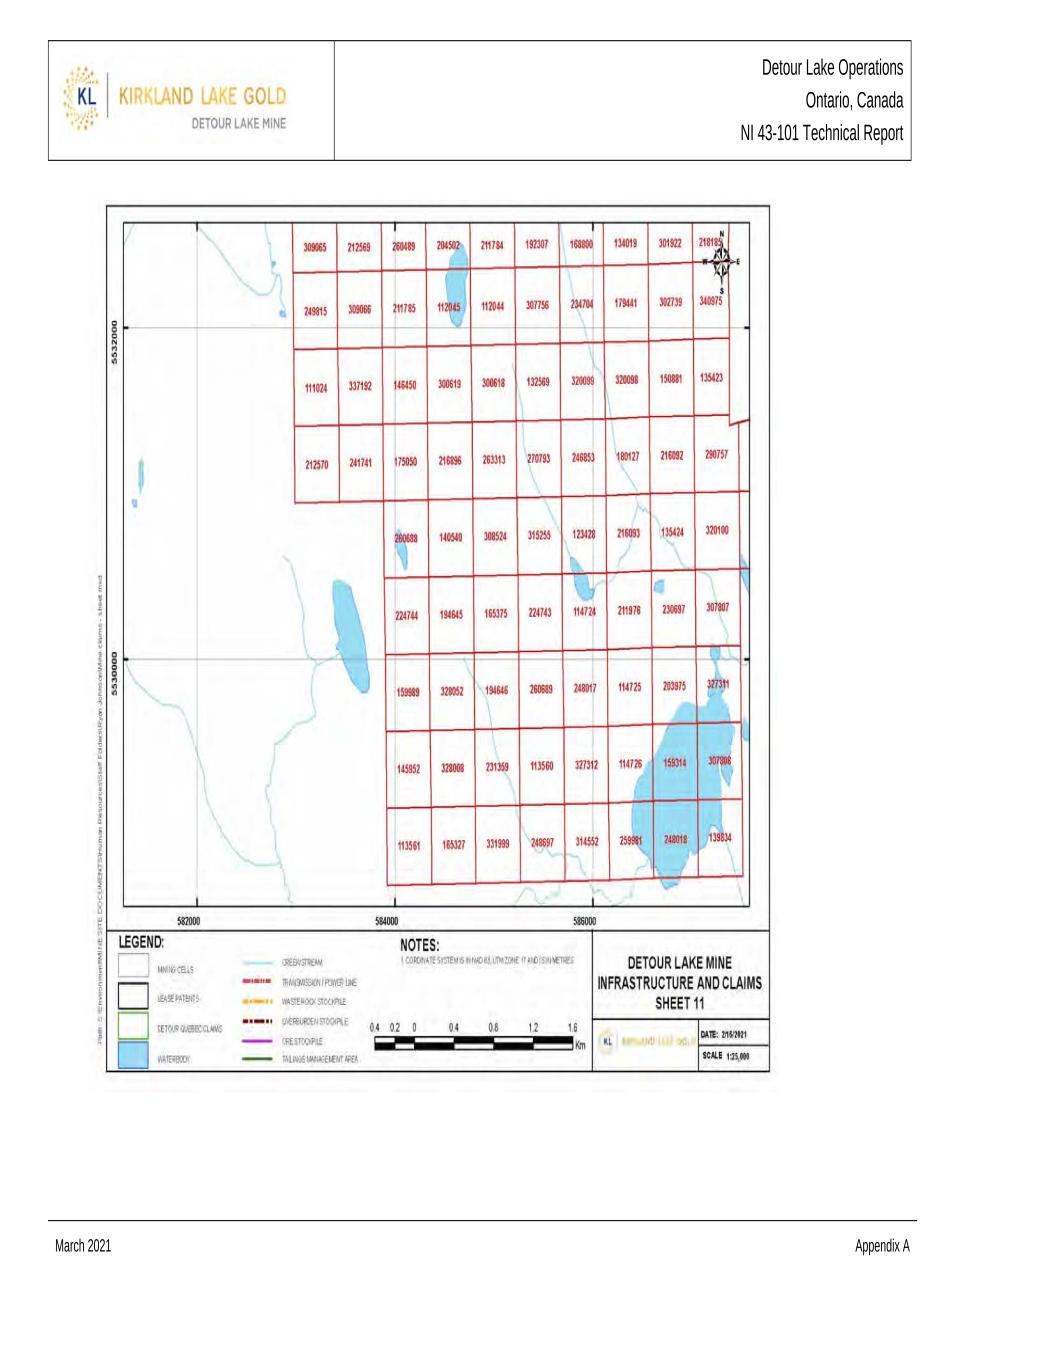
Detour Lake Operations Ontario, Canada NI 43-101 Technical Report March 2021 Appendix A

Detour Lake Operations Ontario, Canada NI 43-101 Technical Report March 2021 Appendix A

Detour Lake Operations Ontario, Canada NI 43-101 Technical Report March 2021 Appendix A
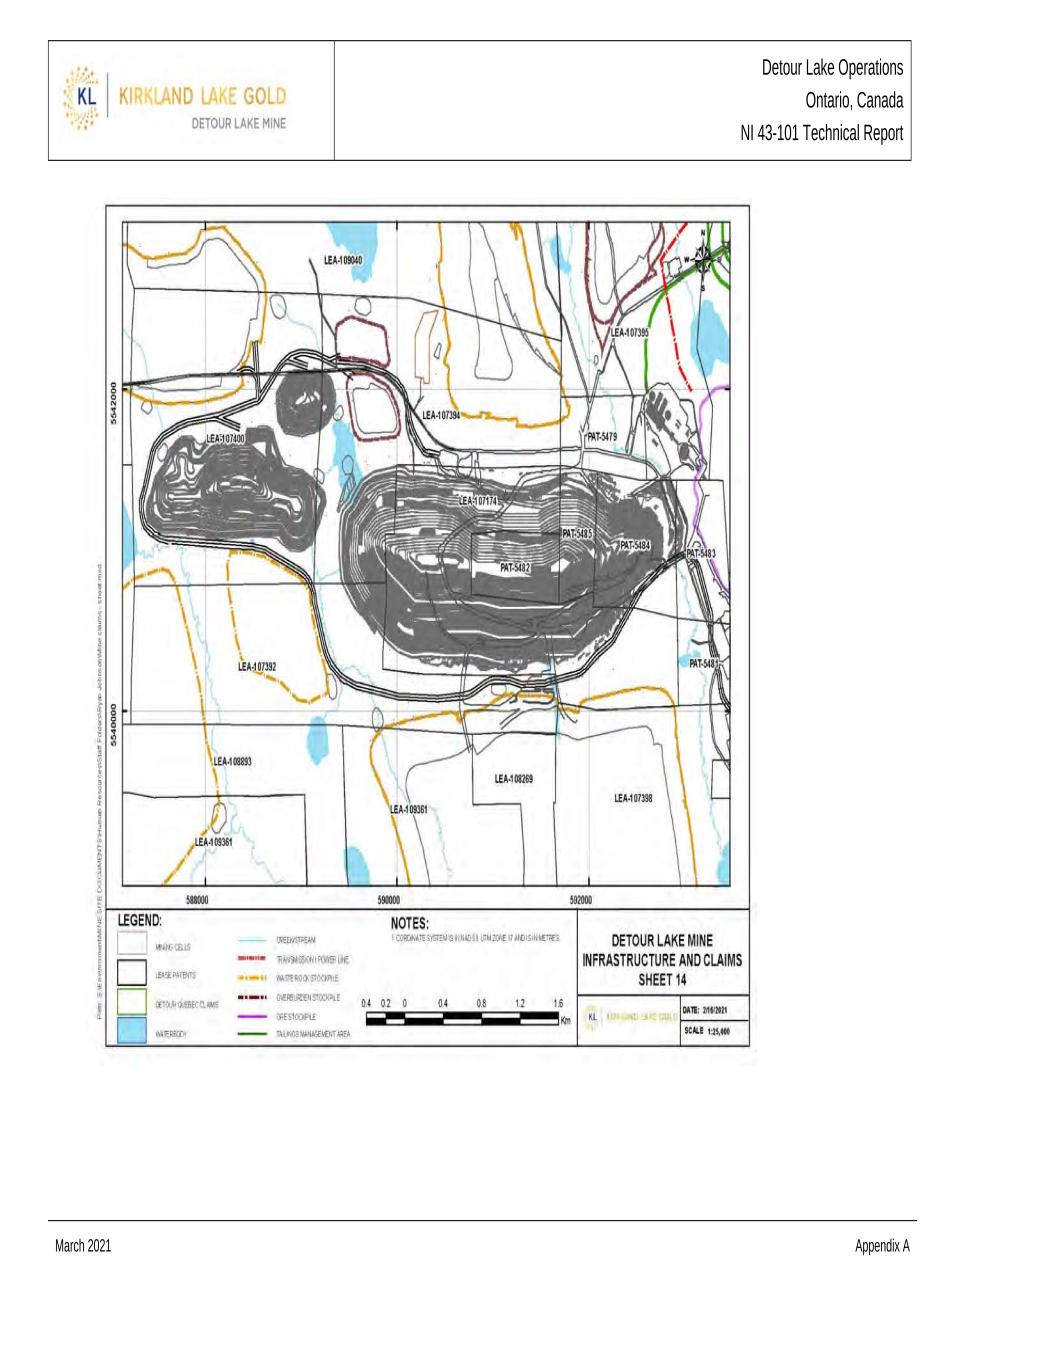
Detour Lake Operations Ontario, Canada NI 43-101 Technical Report March 2021 Appendix A
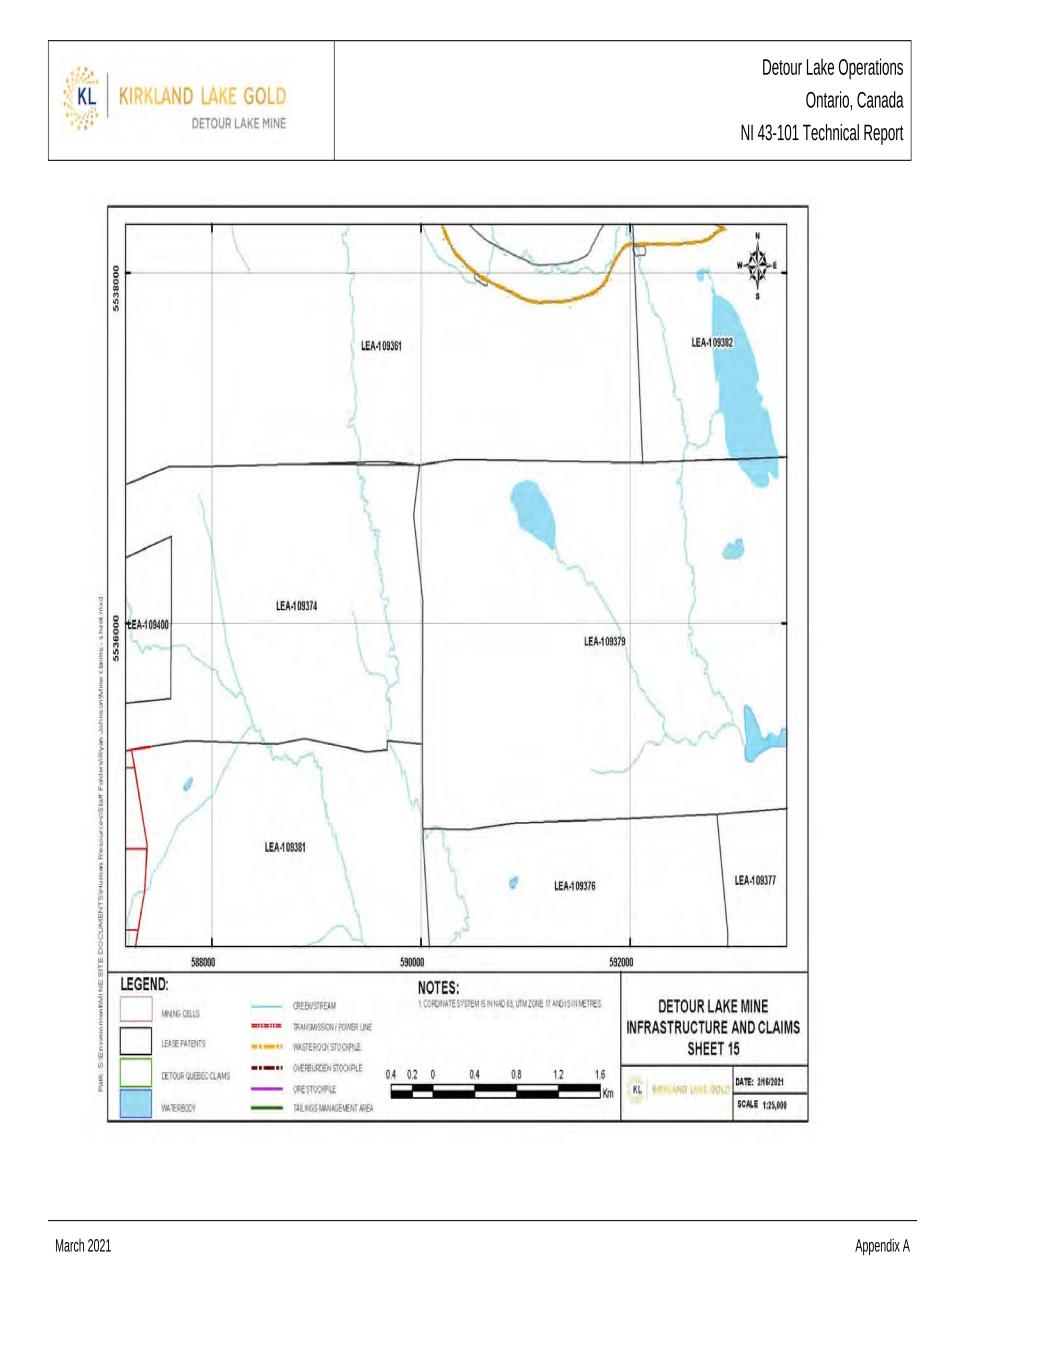
Detour Lake Operations Ontario, Canada NI 43-101 Technical Report March 2021 Appendix A

Detour Lake Operations Ontario, Canada NI 43-101 Technical Report March 2021 Appendix A

Detour Lake Operations Ontario, Canada NI 43-101 Technical Report March 2021 Appendix A
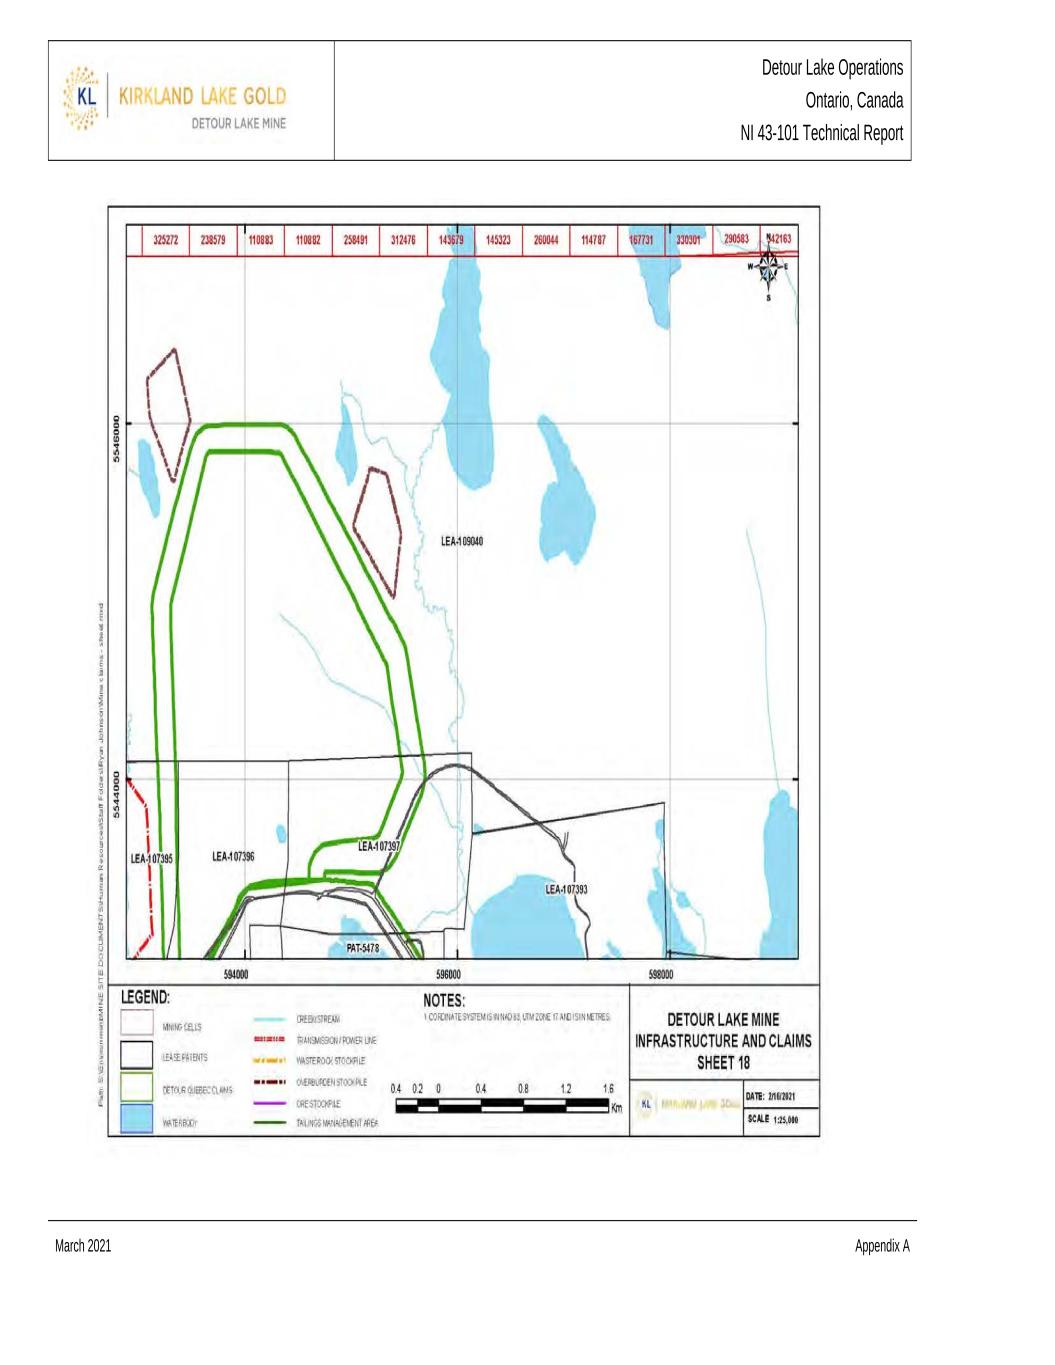
Detour Lake Operations Ontario, Canada NI 43-101 Technical Report March 2021 Appendix A
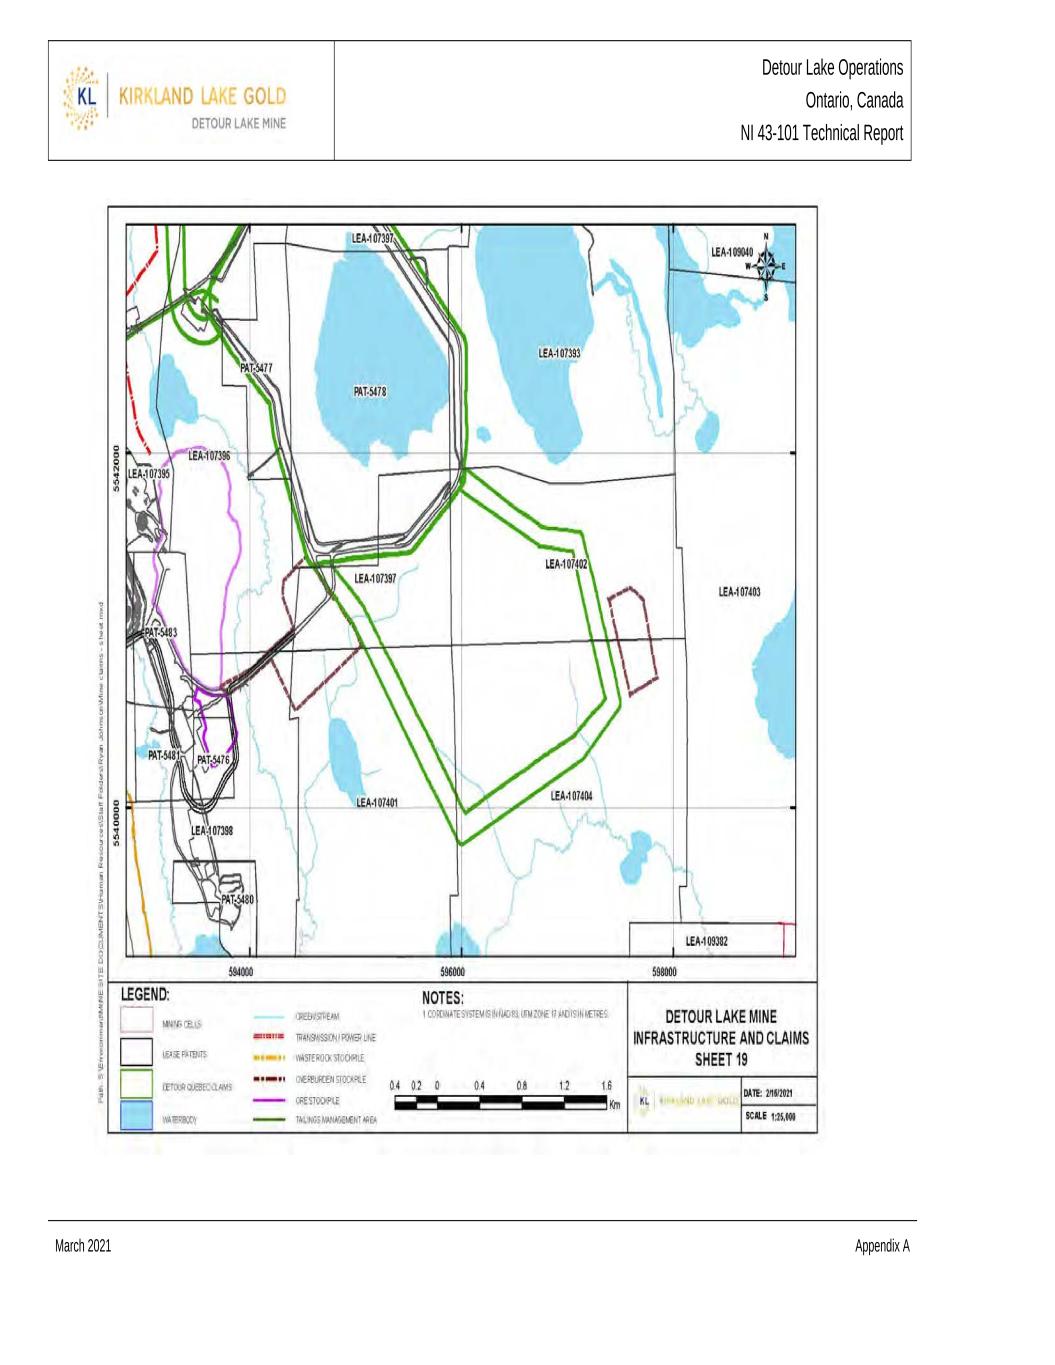
Detour Lake Operations Ontario, Canada NI 43-101 Technical Report March 2021 Appendix A
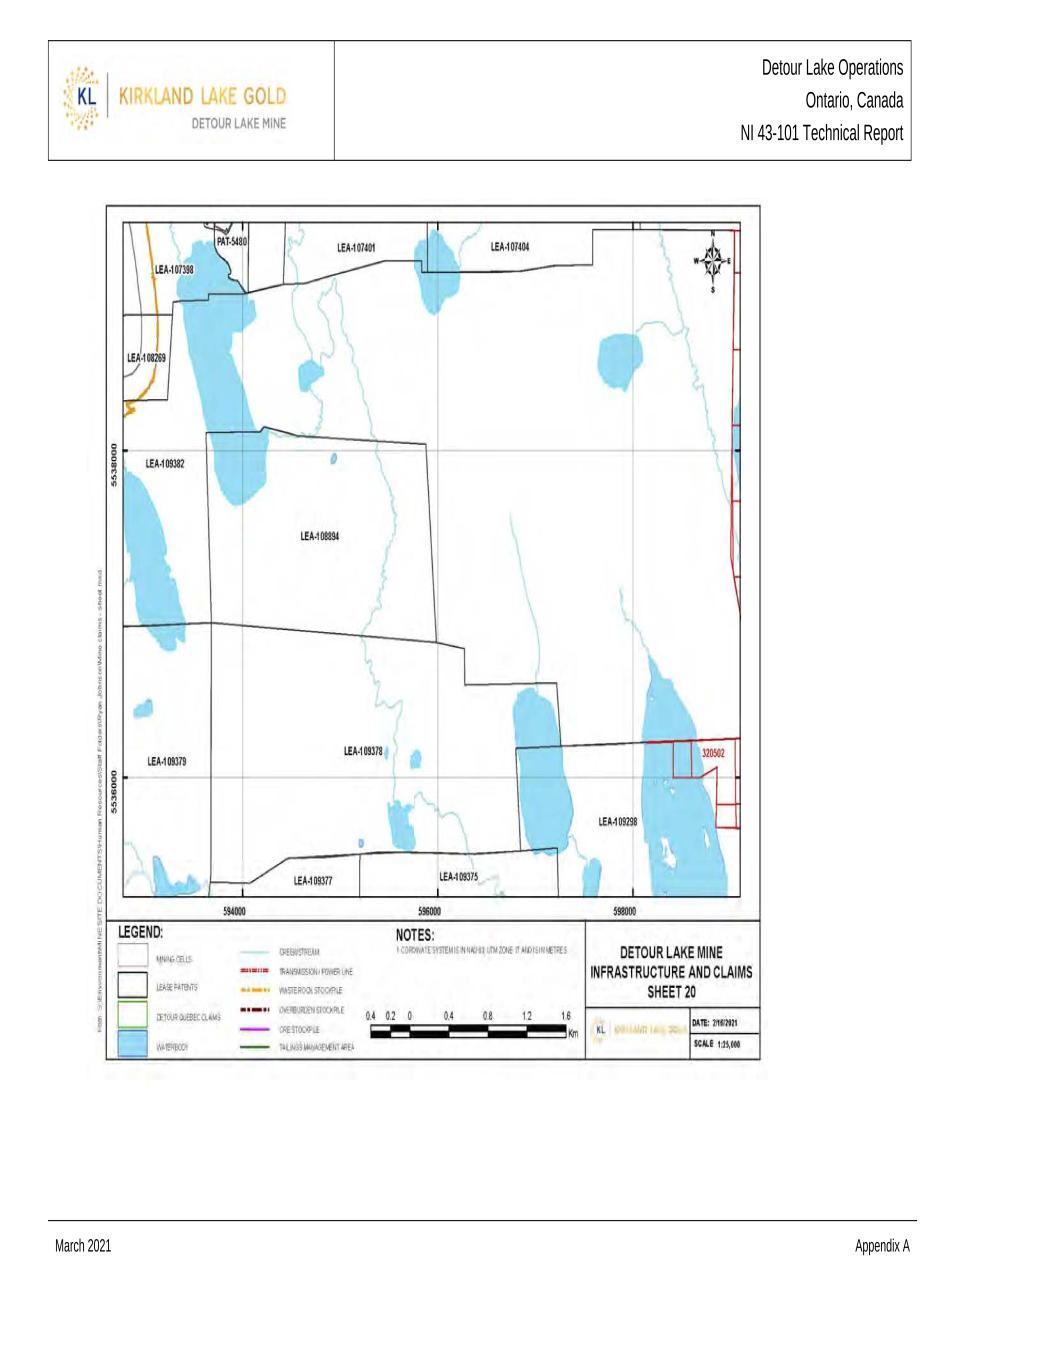
Detour Lake Operations Ontario, Canada NI 43-101 Technical Report March 2021 Appendix A
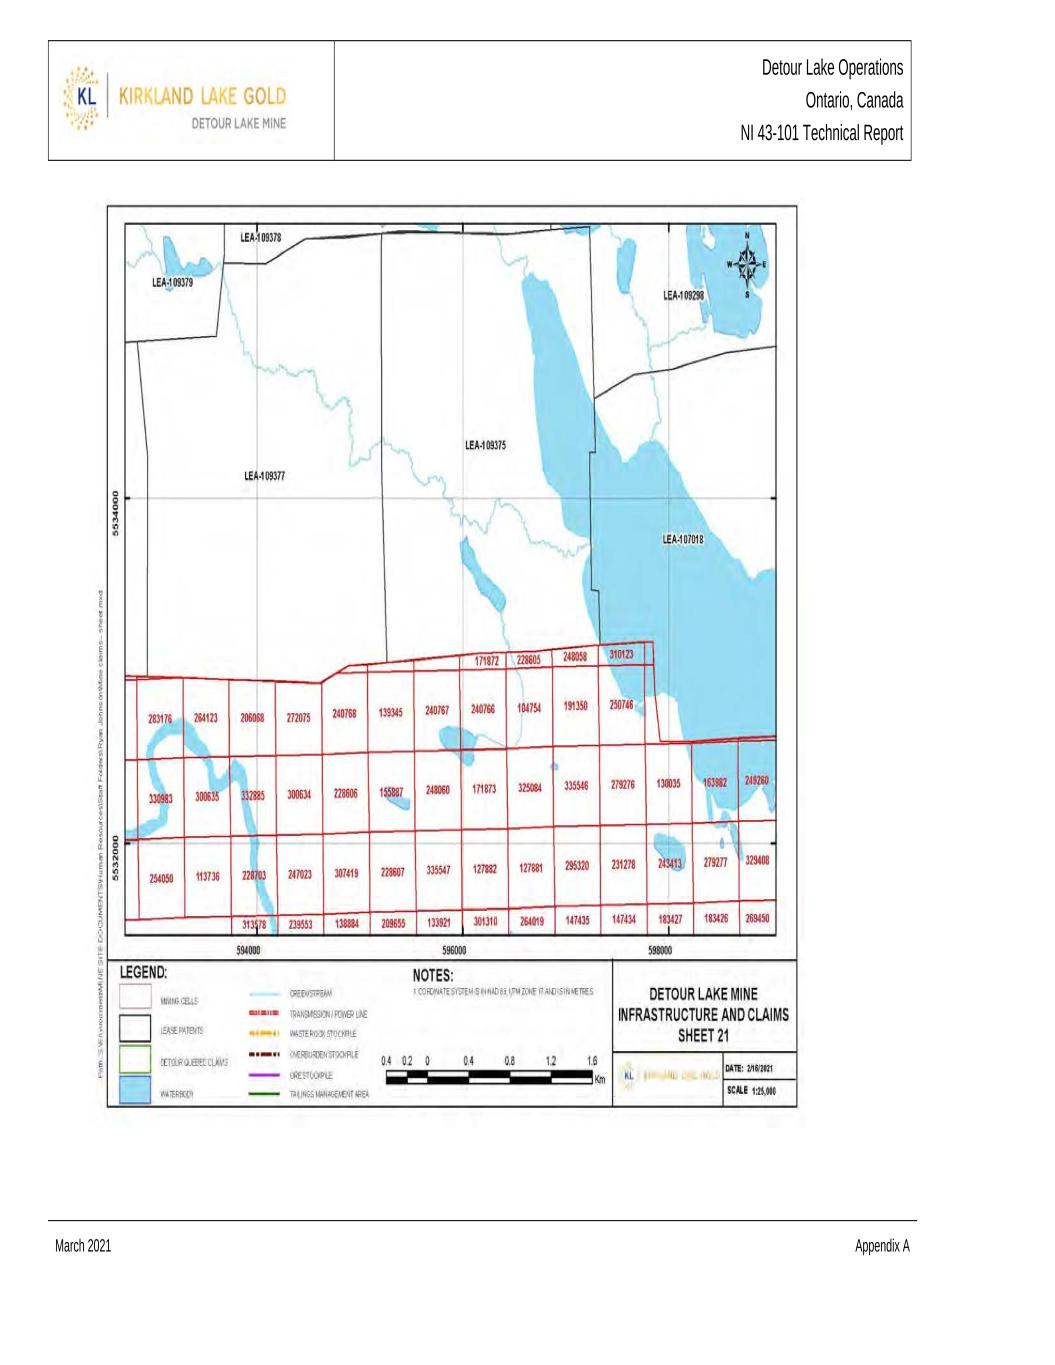
Detour Lake Operations Ontario, Canada NI 43-101 Technical Report March 2021 Appendix A

Detour Lake Operations Ontario, Canada NI 43-101 Technical Report March 2021 Appendix A
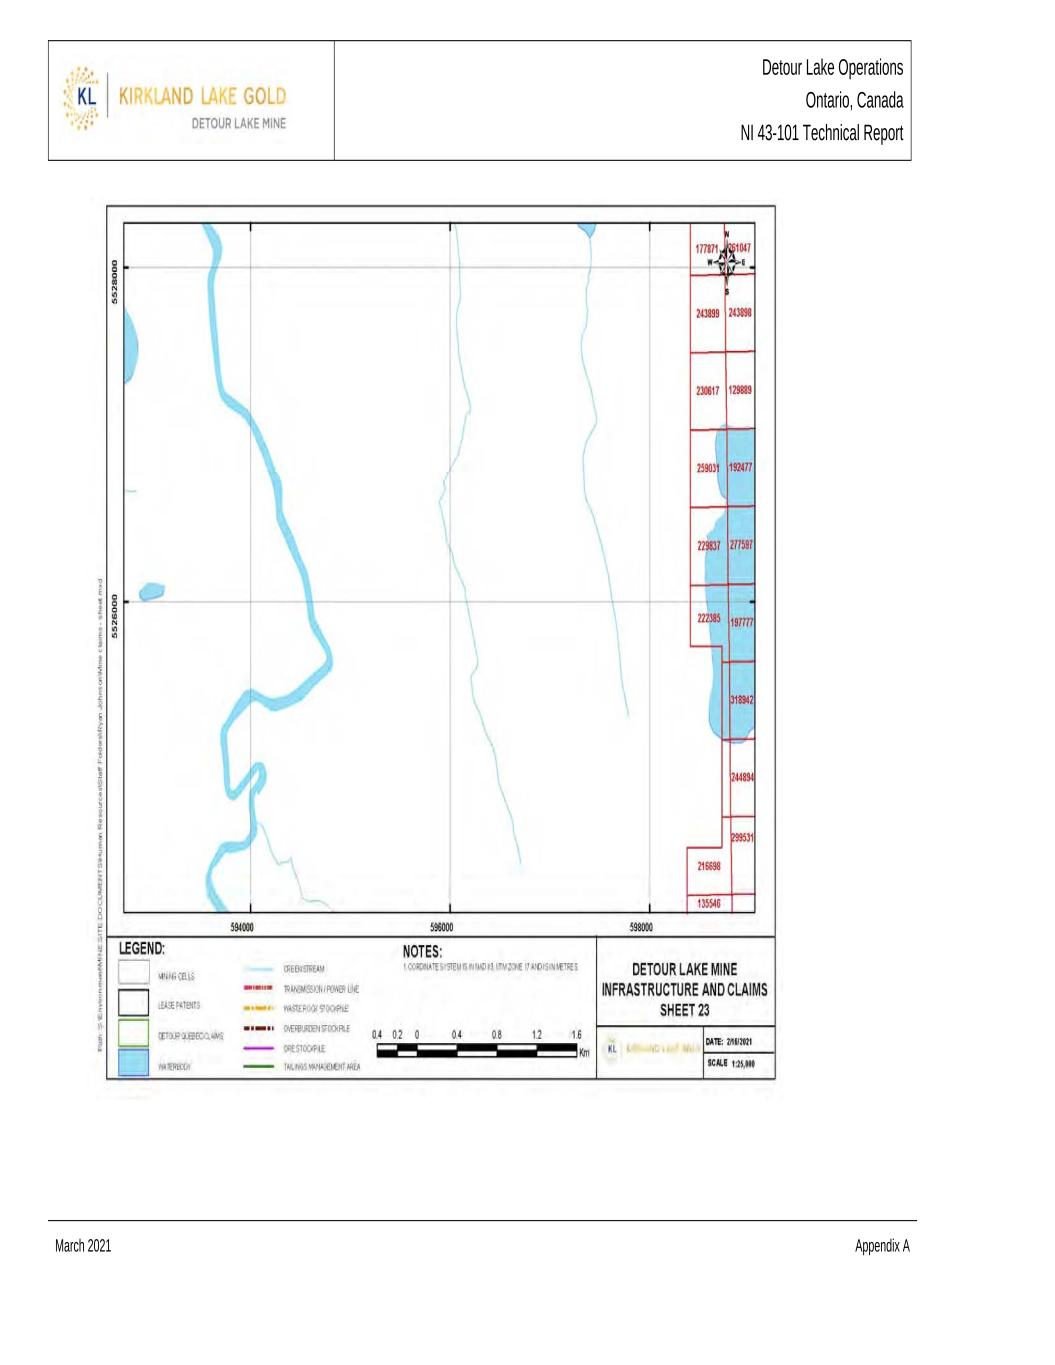
Detour Lake Operations Ontario, Canada NI 43-101 Technical Report March 2021 Appendix A
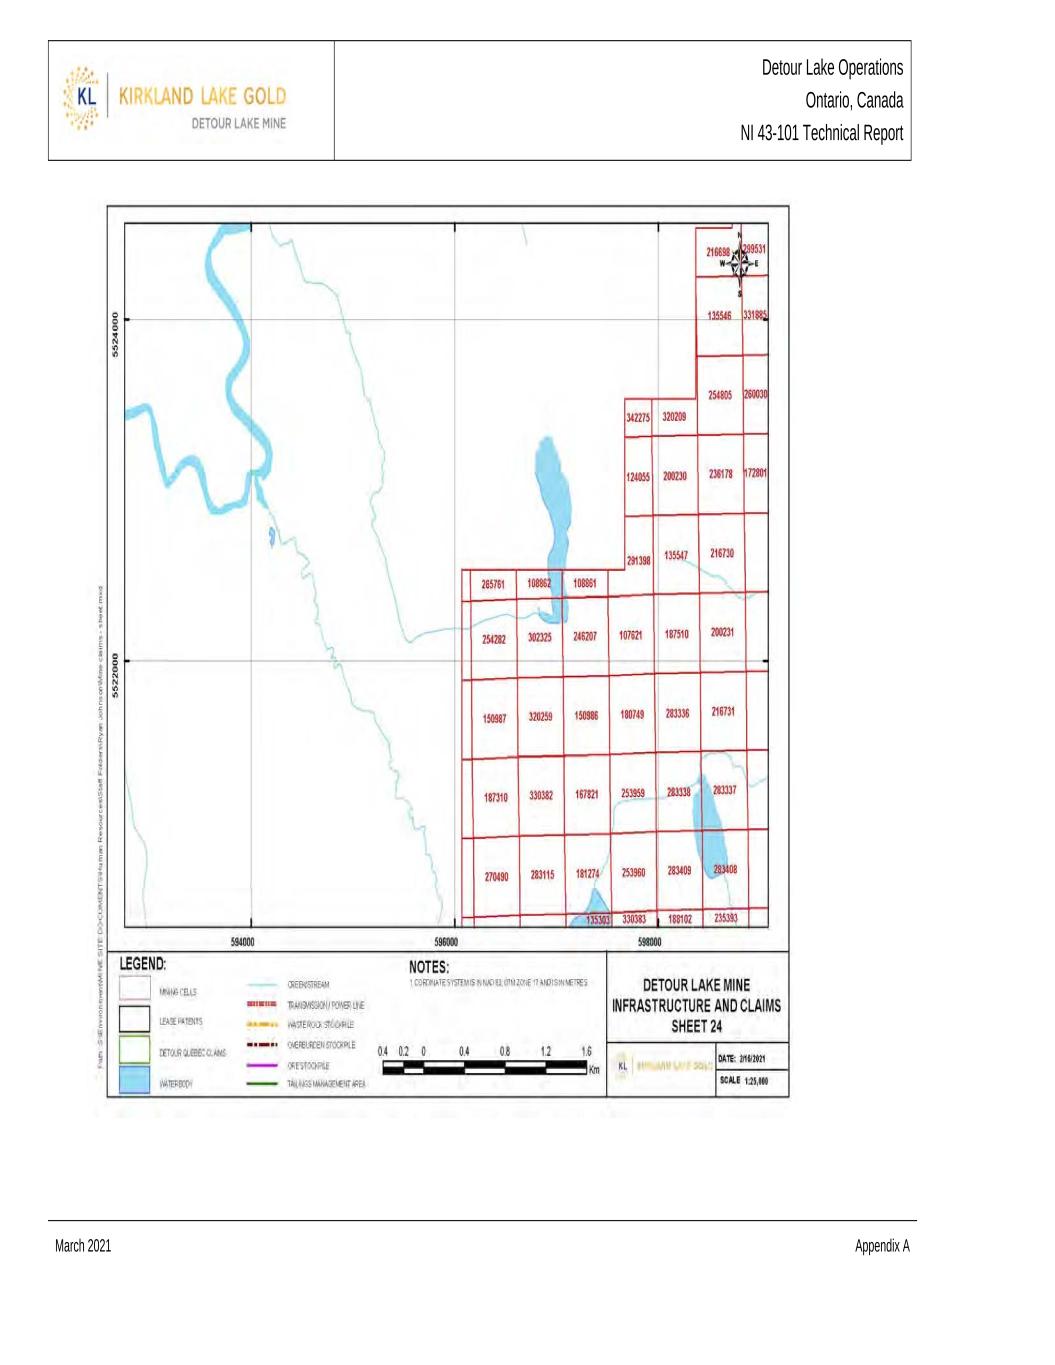
Detour Lake Operations Ontario, Canada NI 43-101 Technical Report March 2021 Appendix A

Detour Lake Operations Ontario, Canada NI 43-101 Technical Report March 2021 Appendix A
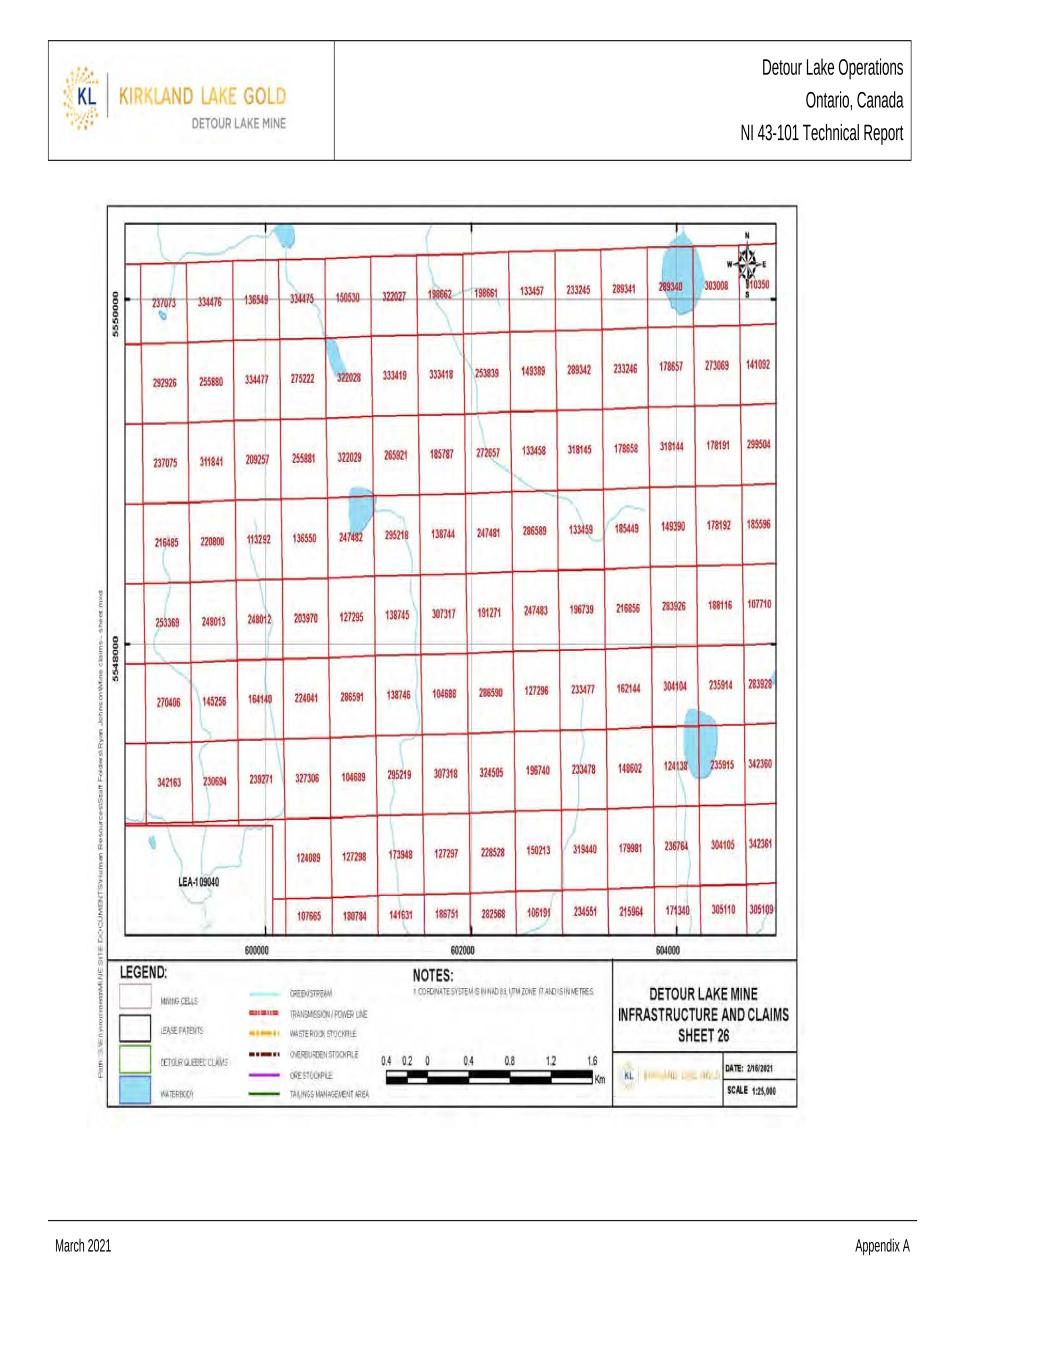
Detour Lake Operations Ontario, Canada NI 43-101 Technical Report March 2021 Appendix A

Detour Lake Operations Ontario, Canada NI 43-101 Technical Report March 2021 Appendix A
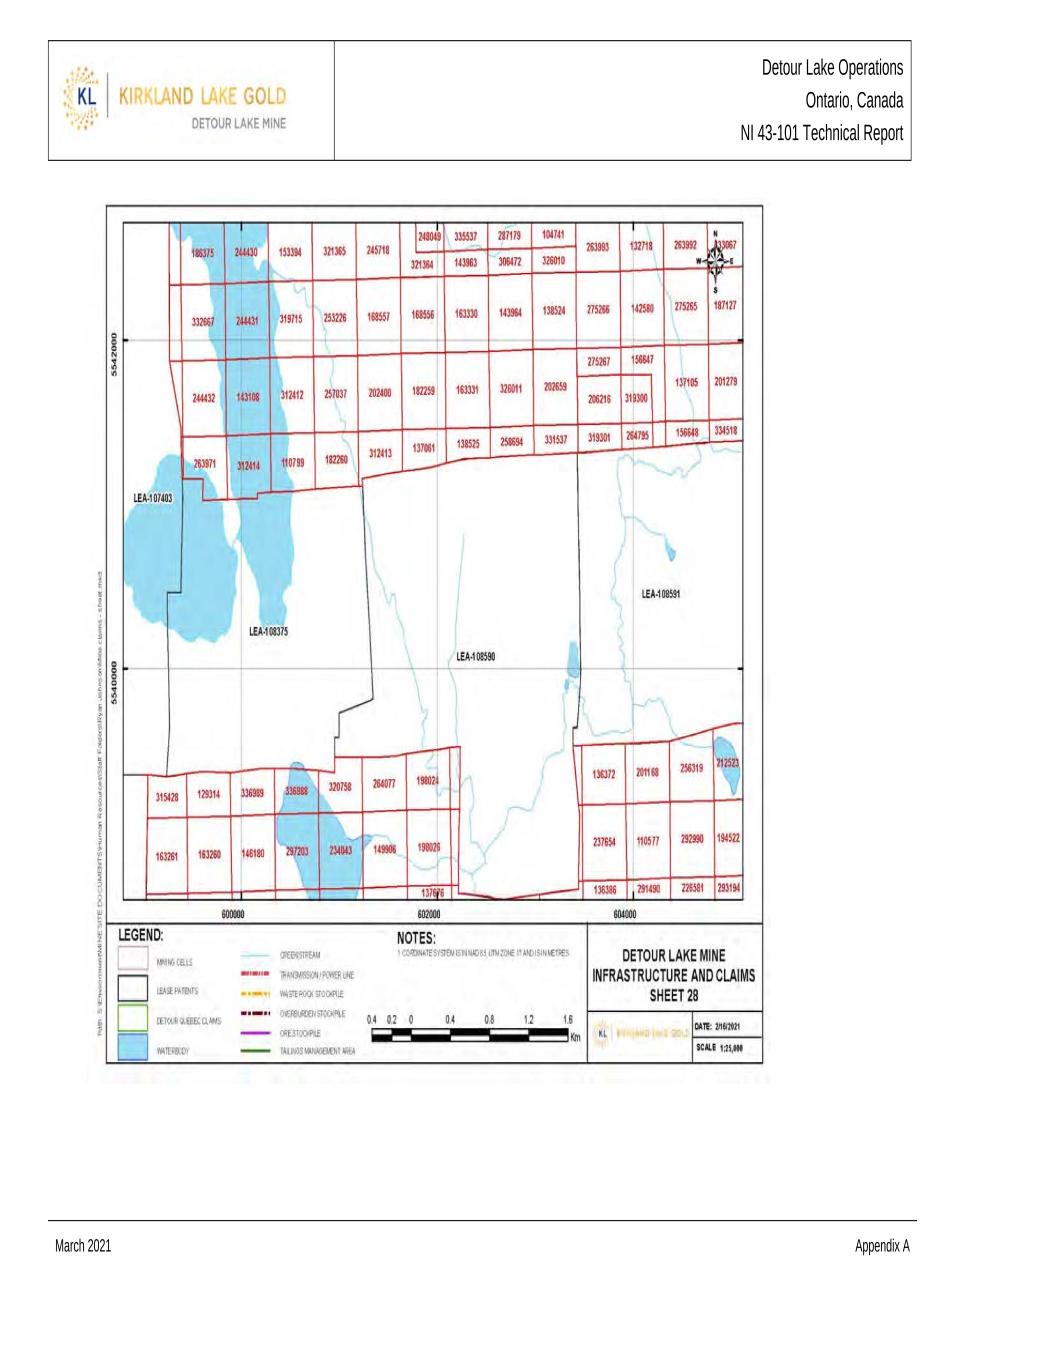
Detour Lake Operations Ontario, Canada NI 43-101 Technical Report March 2021 Appendix A
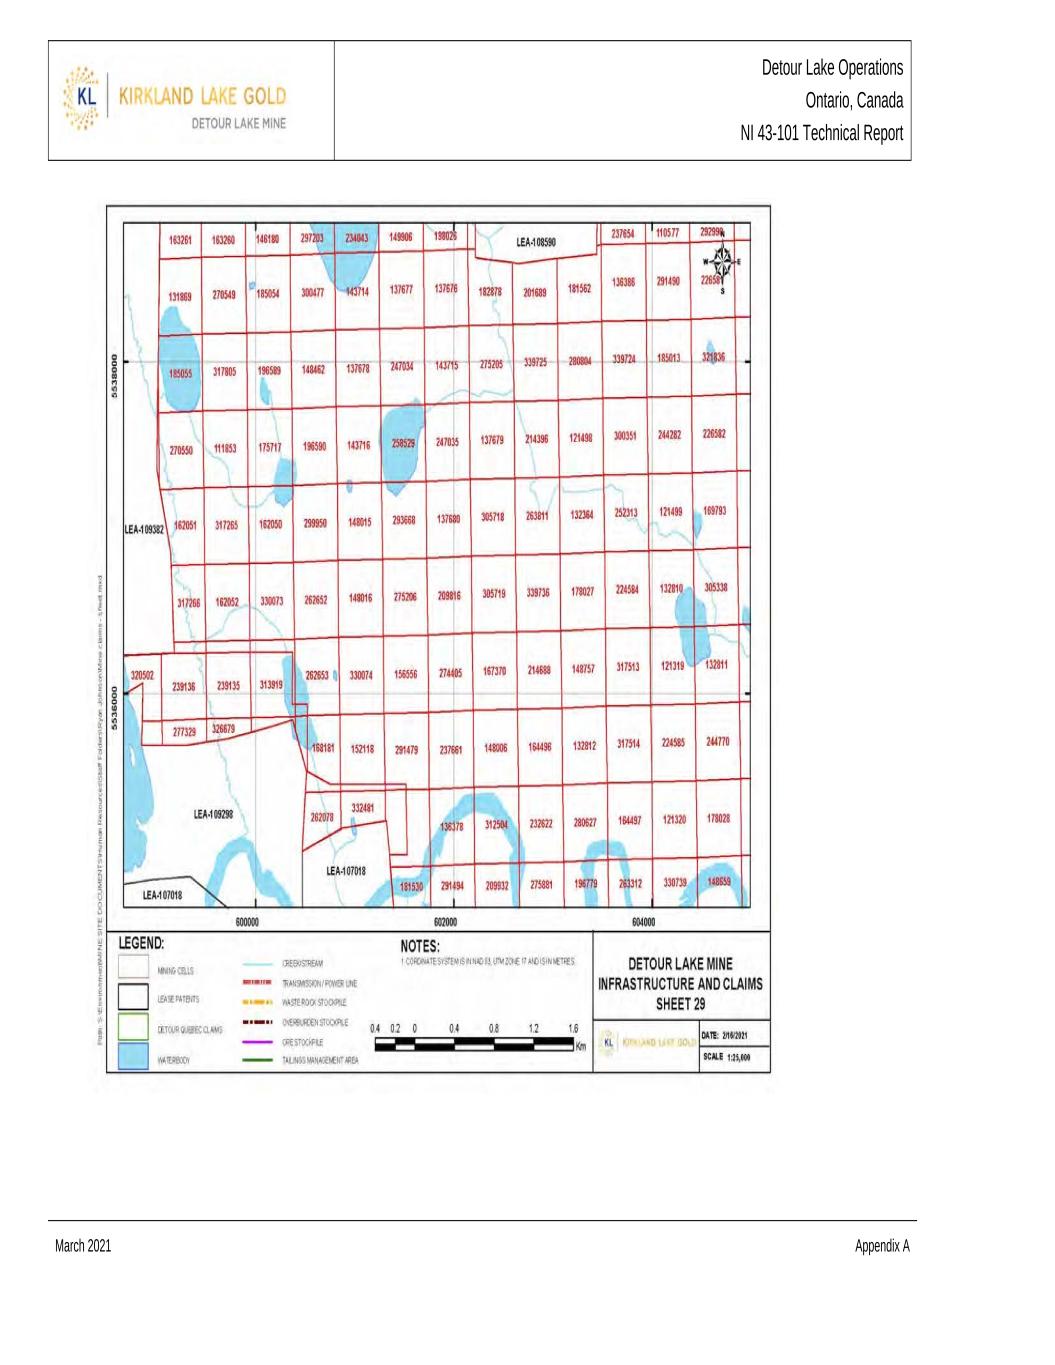
Detour Lake Operations Ontario, Canada NI 43-101 Technical Report March 2021 Appendix A

Detour Lake Operations Ontario, Canada NI 43-101 Technical Report March 2021 Appendix A

Detour Lake Operations Ontario, Canada NI 43-101 Technical Report March 2021 Appendix A

Detour Lake Operations Ontario, Canada NI 43-101 Technical Report March 2021 Appendix A

Detour Lake Operations Ontario, Canada NI 43-101 Technical Report March 2021 Appendix A

Detour Lake Operations Ontario, Canada NI 43-101 Technical Report March 2021 Appendix A
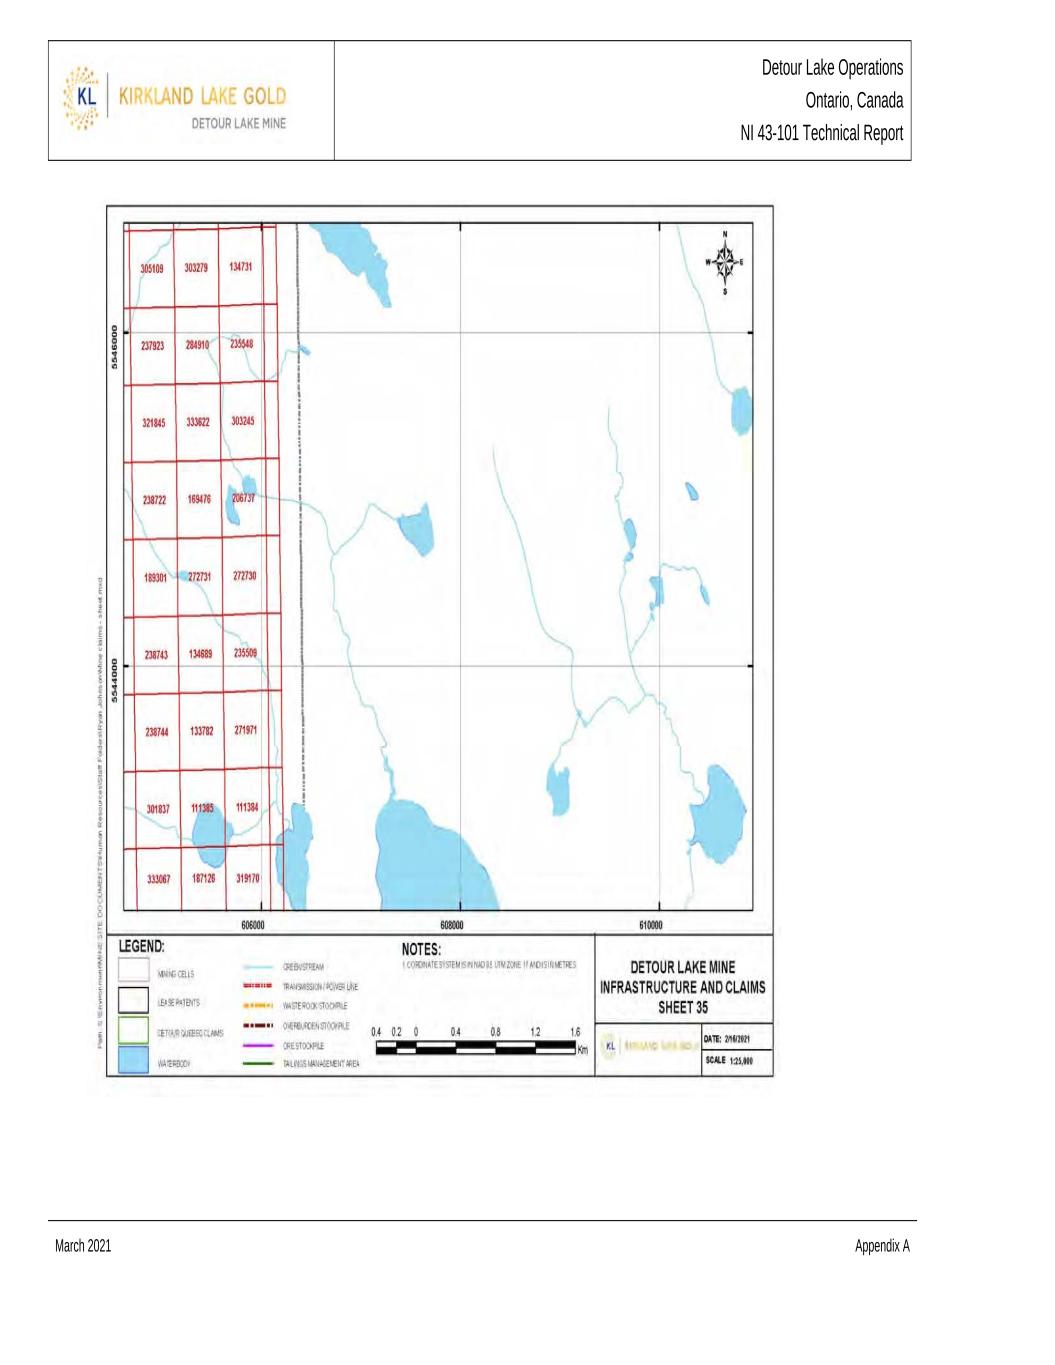
Detour Lake Operations Ontario, Canada NI 43-101 Technical Report March 2021 Appendix A
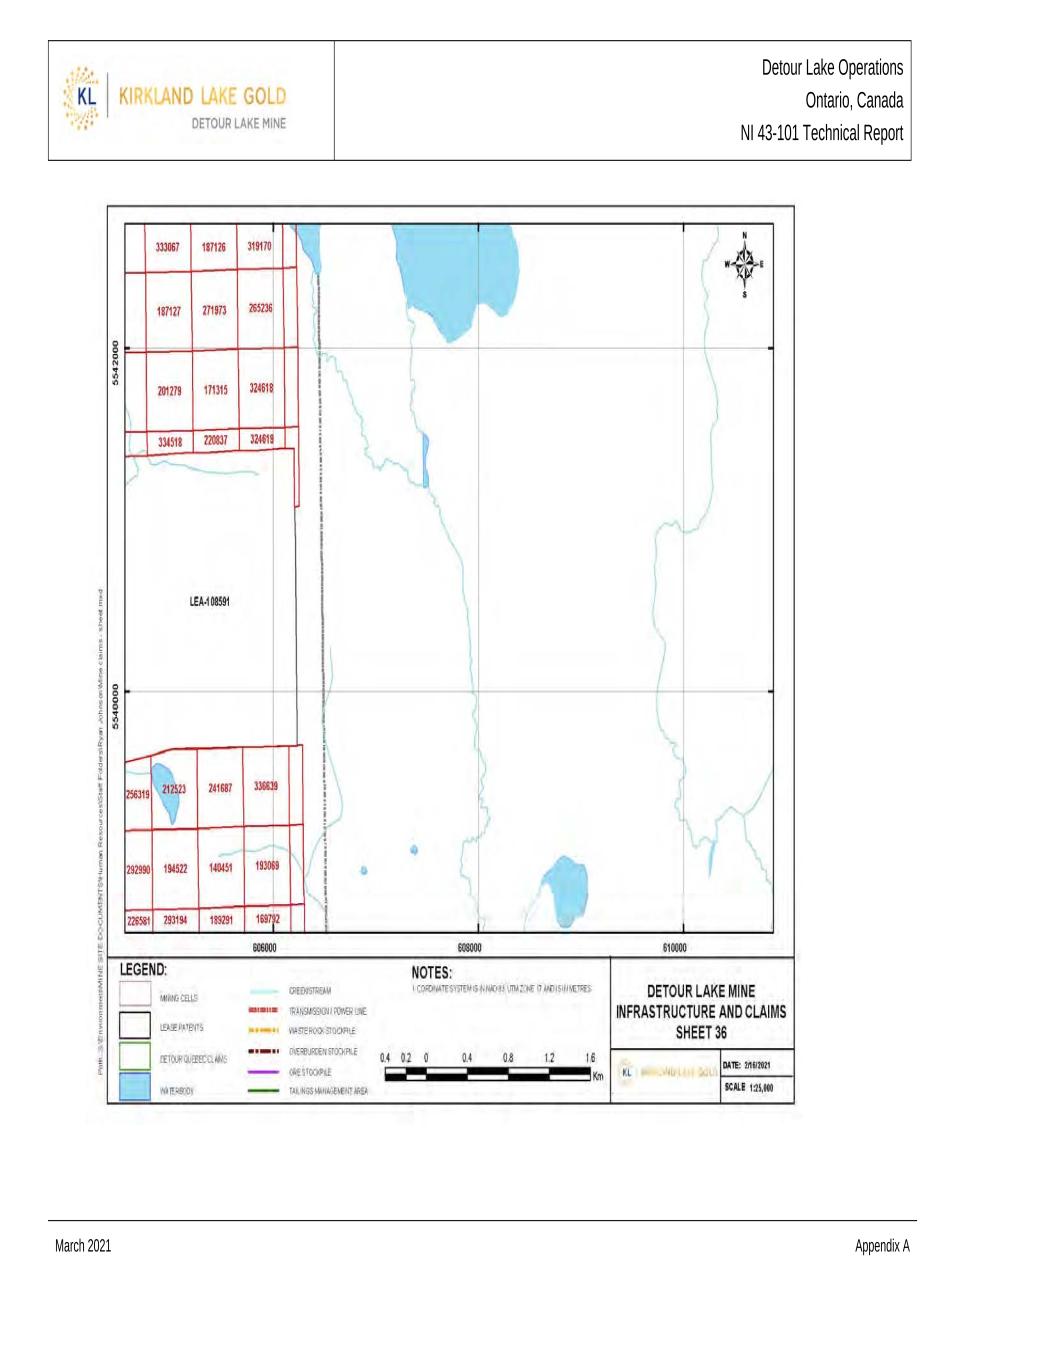
Detour Lake Operations Ontario, Canada NI 43-101 Technical Report March 2021 Appendix A

Detour Lake Operations Ontario, Canada NI 43-101 Technical Report March 2021 Appendix A

Detour Lake Operations Ontario, Canada NI 43-101 Technical Report March 2021 Appendix A
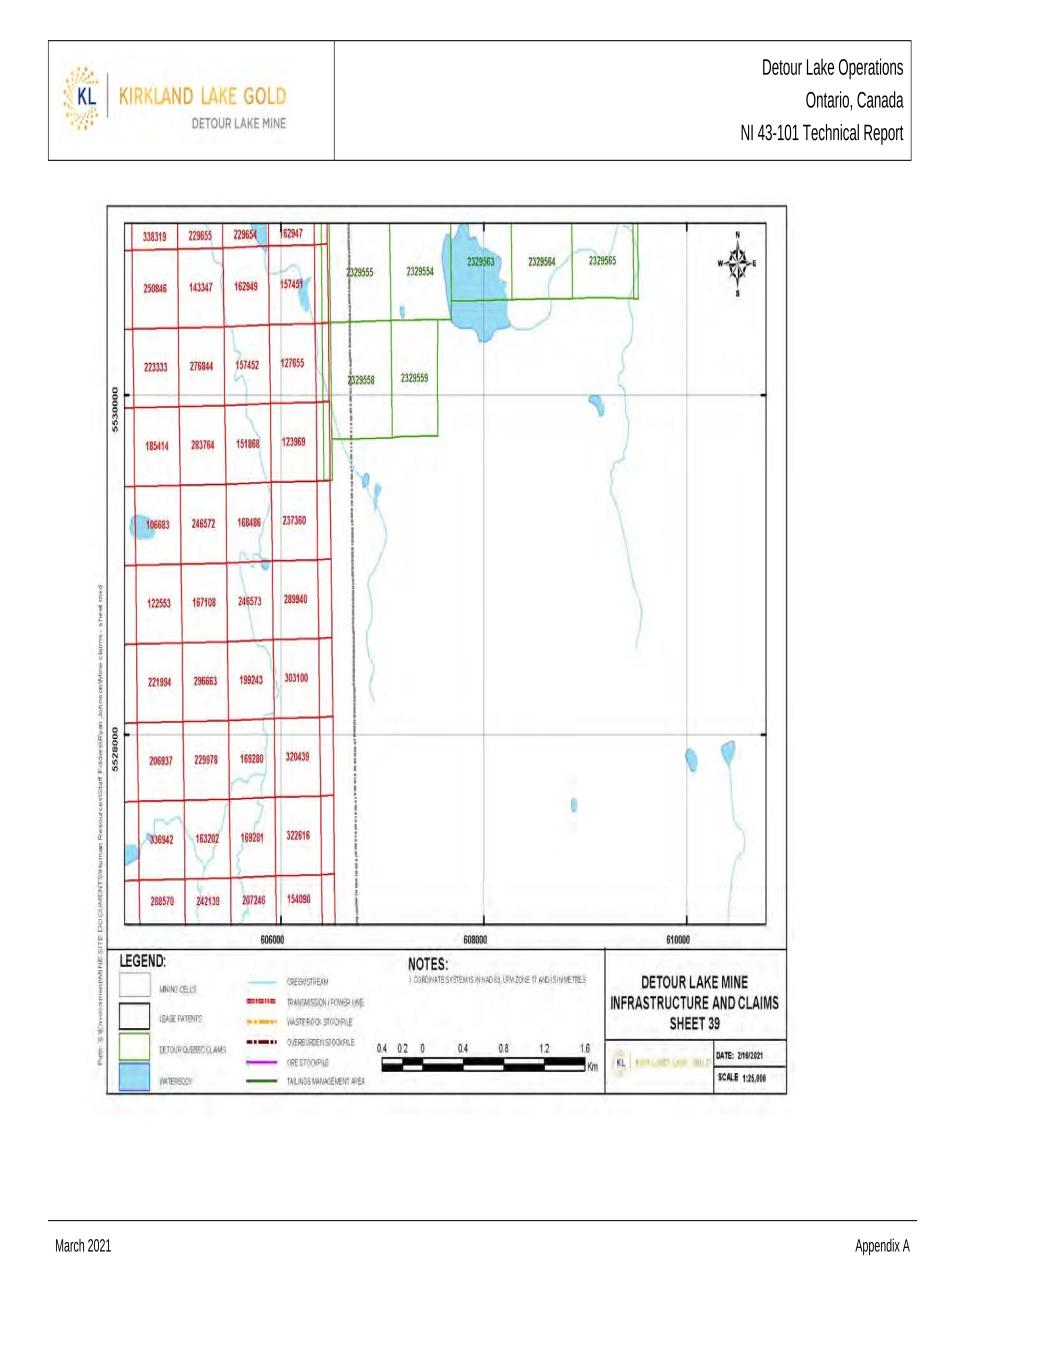
Detour Lake Operations Ontario, Canada NI 43-101 Technical Report March 2021 Appendix A

Detour Lake Operations Ontario, Canada NI 43-101 Technical Report March 2021 Appendix A
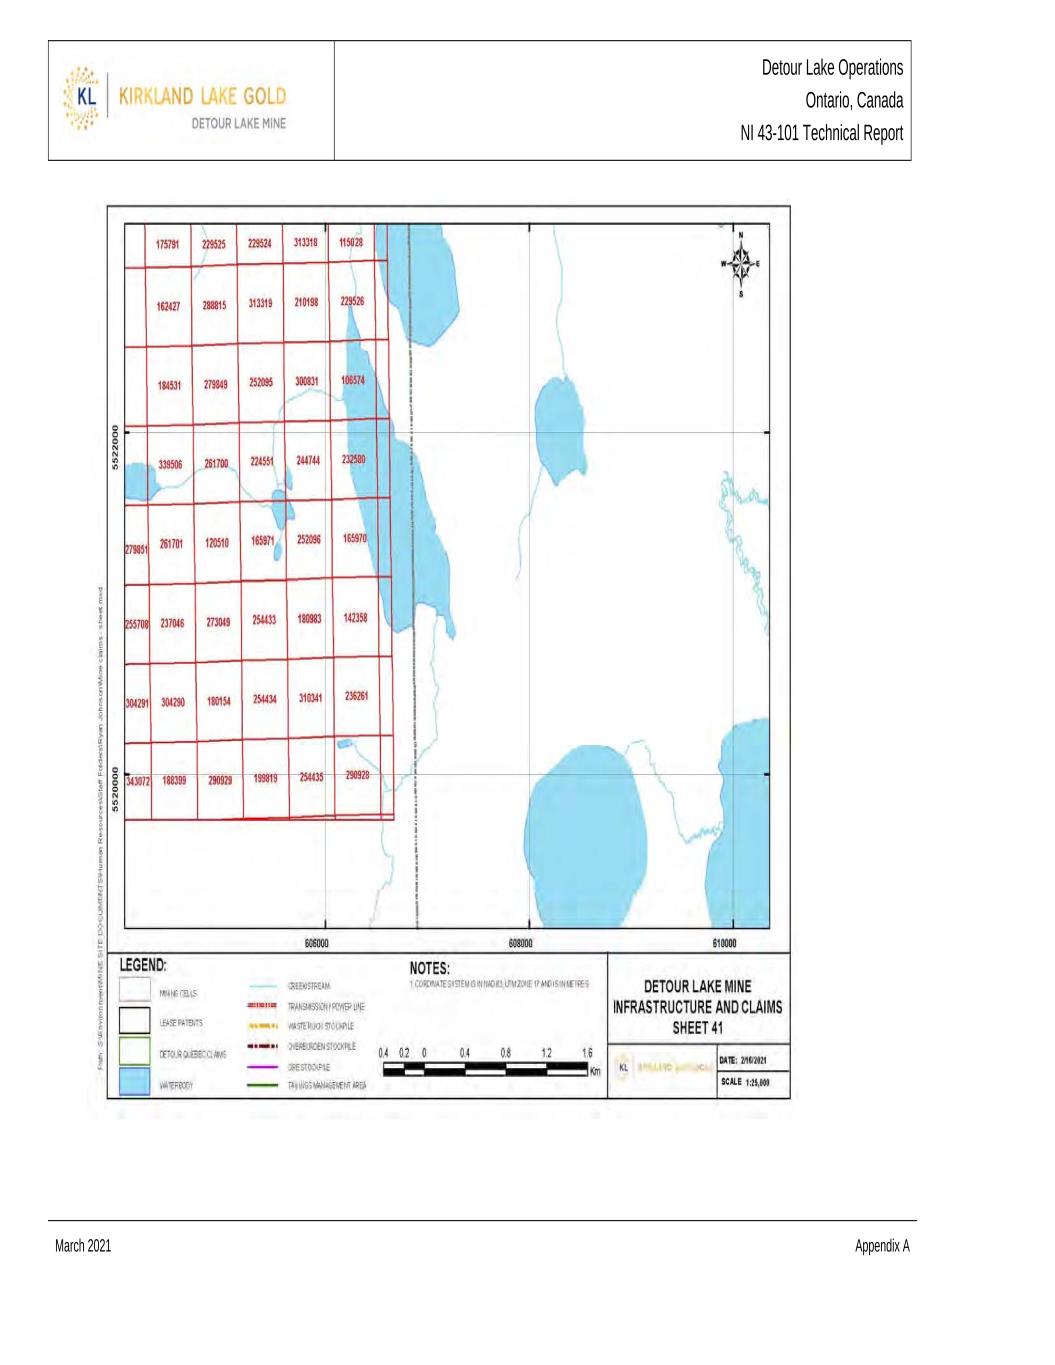
Detour Lake Operations Ontario, Canada NI 43-101 Technical Report March 2021 Appendix A