0001714562 GAME:CADExercisePriceMember GAME:LiabilityWarrantsMember ifrs-full:TopOfRangeMember 2019-09-01 2020-08-31
UNITED STATES
SECURITIES AND EXCHANGE COMMISSION
WASHINGTON, D.C. 20549
FORM 20-F
| ☐ | REGISTRATION STATEMENT PURSUANT TO SECTION 12(b) OR 12(g) OF THE SECURITIES EXCHANGE ACT OF 1934 |
OR
| ☒ | ANNUAL REPORT PURSUANT TO SECTION 13 OR 15(d) OF THE SECURITIES EXCHANGE ACT OF 1934 |
| | For the fiscal year ended August 31, 2022 |
OR
| ☐ | TRANSITION REPORT PURSUANT TO SECTION 13 OR 15(d) OF THE SECURITIES EXCHANGE ACT OF 1934 |
| | For the transition period from ____________________ to ____________________ |
OR
| ☐ | SHELL COMPANY REPORT PURSUANT TO SECTION 13 OR 15(d) OF THE SECURITIES EXCHANGE ACT OF 1934 |
Commission file number: 001-39389
Engine Gaming and Media, Inc.
(Exact name of Registrant as specified in its charter)
British Columbia, Canada
(Jurisdiction of incorporation or organization)
2110 Powers Ferry Road SE, Suite 450, Atlanta, GA 30339
(Address of principal executive offices)
Michael Munoz, (212) 931-1200, mmunoz@franklymedia.com
2110 Powers Ferry Road SE, Suite 450, Atlanta, GA 30339
(Name, Telephone, E-Mail and/or Facsimile number and Address of Company Contact Person)
Securities registered or to be registered pursuant to Section 12(b) of the Act:
| Title of each class | | Trading Symbol | | Name of each exchange on which registered |
| Common Shares | | GAME | | Nasdaq Capital Market |
Securities registered or to be registered pursuant to Section 12(g) of the Act: N/A
Securities for which there is a reporting obligation pursuant to Section 15(d) of the Act: None
Indicate the number of outstanding shares of each of the issuer’s classes of capital or common stock as of the close of the period covered by the annual report: 15,803,875 Common Shares.
Indicate by check mark if the Company is a well-known seasoned issuer, as defined in Rule 405 of the Securities Act. Yes ☐ No ☒
If this report is an annual or transition report, indicate by check mark if the Company is not required to file reports pursuant to Section 13 or 15(d) of the Securities Exchange Act of 1934. Yes ☒ No ☐
Indicate by check mark whether the Company (1) has filed all reports required to be filed by Section 13 or 15(d) of the Securities Exchange Act of 1934 during the preceding 12 months (or such shorter period that the Company was required to file such reports), and (2) has been subject to such filing requirements for the past 90 days. Yes ☒ No ☐
Indicate by check mark whether the Company has submitted electronically every Interactive Data File required to be submitted pursuant to Rule 405 of Regulation S-T (§232.405 of this chapter) during the preceding 12 months (or for such shorter period that the Company was required to submit and post such files). Yes ☒ No ☐
Indicate by check mark whether the Company is a large accelerated filer, an accelerated filer, a non-accelerated filer or an emerging growth company. See the definitions of “large accelerated filer,” “accelerated filer,” and “emerging growth company” in Rule 12b-2 of the Exchange Act.
| Large accelerated filer ☐ | | Accelerated filer ☐ |
| Non-accelerated filer ☒ | | Emerging growth company ☒ |
If an emerging growth company that prepares its financial statements in accordance with U.S. GAAP, indicate by check mark if the registrant has elected not to use the extended transition period for complying with any new or revised financial accounting standards provided pursuant to Section 13(a) of the Exchange Act.
Indicate by check mark whether the registrant has filed a report on and attestation to its management’s assessment of the effectiveness of its internal control over financial reporting under Section 404(b) of the Sarbanes-Oxley Act (15 U.S.C. 7262(b)) by the registered public accounting firm that prepared or issued its audit report. ☐
Indicate by check mark which basis of accounting the Company has used to prepare the financial statements included in this filing:
| U.S. GAAP ☐ | International Financial Reporting Standards as issued By the International Accounting Standards Board ☒ | Other ☐ |
If “Other” has been checked in response to previous question, indicate by check mark which financial statement item the Company has elected to follow. Item 17 ☐ Item 18 ☐
If this is an annual report, indicate by check mark whether the Company is a shell company (as defined in Rule 12b-2 of the Exchange Act). Yes ☐ No ☒
TABLE OF CONTENTS
INTRODUCTION
In this Annual Report on Form 20-F (the “Annual Report”), the term “Company”, or “Engine” refers to Engine Gaming and Media, Inc. and its subsidiaries as a whole, unless otherwise specified or the context otherwise requires.
Information contained in this Annual Report is given as of August 31, 2022, the fiscal year end of Company, unless otherwise specifically stated.
Market and industry data used throughout this Annual Report was obtained from various publicly available sources. Although the Company believes that these independent sources are generally reliable, the accuracy and completeness of such information are not guaranteed and have not been verified due to limits on the availability and reliability of raw data, the voluntary nature of the data gathering process and the limitations and uncertainty inherent in any statistical survey of market size, conditions and prospects.
Statements made in this Registration Statement concerning the contents of any contract, agreement or other document are summaries of such contracts, agreements or documents and are not complete descriptions of all of their terms. If we file any of these documents as an exhibit to this Registration Statement, you may read the document itself for a complete description of its terms.
Unless otherwise indicated in this Annual Report, references to “$”, “US$” or “U.S. dollars” are to United States dollars, references to “Canadian dollars” or “CDN$” are to the currency of Canada, and references to “EUR”, “€” or “Euros” are to European Euros.
The following table sets forth the rate of exchange for the Canadian dollar, expressed in United States dollars in effect at various times.
| Canadian Dollars to U.S. Dollars | | Year Ended August 31, 2022 | | | Year Ended August 31, 2021 | |
| High for period | | | 0.8111 | | | | 0.8306 | |
| Low for period | | | 0.7612 | | | | 0.7465 | |
| Average rate for period | | | 0.7863 | | | | 0.7887 | |
| Rate at end of period | | | 0.7627 | | | | 0.7926 | |
As of December 28, 2022, the closing exchange rate for Canadian dollars in terms of the United States dollar, as quoted by the Bank of Canada, was CDN$1.00 = US$0.7372.
The following table sets forth the rate of exchange for the Canadian dollar, expressed in Euros in effect at various times.
| Canadian Dollars to Euros | | Year Ended August 31, 2022 | | | Year Ended August 31, 2021 | |
| High for period | | | 0.7754 | | | | 0.6840 | |
| Low for period | | | 0.6649 | | | | 0.6357 | |
| Average rate for period | | | 0.7167 | | | | 0.6598 | |
| Rate at end of period | | | 0.7598 | | | | 0.6709 | |
As of December 28, 2022, the closing exchange rate for Canadian dollars in terms of Euros, as quoted by the Bank of Canada, was CDN$1.00 = EUR€0.6934.
SPECIAL NOTE REGARDING FORWARD-LOOKING STATEMENTS
This Annual Report contains “forward-looking statements” and “forward-looking information” within the meaning of United States and Canadian securities laws (collectively, “forward-looking statements”). These statements relate to future events or future performance and reflect the Company’s expectations and assumptions regarding such future events and performance. In particular, all statements, other than historical facts, included in this Annual Report that address activities, events or developments that management of the Company expect or anticipate will or may occur in the future are forward-looking statements, including but not limited to, statements with respect to:
| ● | financial, operational and other projections and outlooks as well as statements or information concerning future operation plans, objectives, performance, revenues, growth, acquisition strategy, profits or operating expenses; |
| ● | the Company’s ability to successfully execute its business plan; |
| ● | any expectation of regulatory approval and receipt of certifications with respect to the Company’s current and proposed business transactions; |
| ● | expectations regarding existing products and plans to develop, implement or adopt new technology or products; |
| ● | the expectation of obtaining new customers for the Company’s products and services, as well as expectations regarding expansion and acceptance of the Company’s brand and products to new markets; |
| ● | estimates and projections regarding the industry in which the Company operates and adoption of technologies, including expectations regarding the growth and impact of esports; |
| ● | requirements for additional capital and future financing options; |
| ● | the risks inherent in international operations; |
| ● | marketing plans; |
| ● | the Company’s ability to compete with its competitors and their technologies; |
| ● | the Company’s reliance on key executives and the ability to attract and retain qualified personnel; |
| ● | the availability of intellectual property protection for the Company’s products, and the Company’s ability to expand and exploit its intellectual property; |
| ● | statements related to the expected or potential impact of the novel coronavirus (“COVID-19”) pandemic; |
| ● | the completion of and the Company’s use of the proceeds of any offering; and |
| ● | other expectations of the Company. |
Often, but not always, forward-looking statements can be identified by the use of words such as “plans”, “expects”, “is expected”, “budget”, “scheduled”, “estimates”, “forecasts”, “intends”, “anticipates”, or “believes” or variations (including negative variations) of such words and phrases, or statements that certain actions, events or results “may”, “could”, “would”, “might” or “will” be taken, occur or be achieved.
Such statements, made as of the date hereof, reflect the Company’s current views with respect to future events and are based on information currently available to the Company and are subject to and involve certain known and unknown risks, uncertainties, assumptions and other factors which may cause the actual results, performance or achievements of the Company to be materially different from any future results, performance or achievements expressed in or implied by such forward-looking statements. Should one or more of these risks or uncertainties materialize, or should assumptions underlying the forward-looking statements prove incorrect, actual results may vary materially from those described herein as intended, planned, anticipated, believed, estimated or expected.
When relying on forward-looking statements to make decisions, readers should ensure that the preceding information, the risk factors described herein under in Item 3.D – Risk Factors, and the contents of this Annual Report are all carefully considered. These forward-looking statements are made as of the date of this Annual Report, and, except as may be required by law, the Company disclaims any obligation or undertaking to publicly release any updates or revisions to any forward-looking statements contained herein to reflect any change in expectations, estimates and projections with regard thereto or any changes in events, conditions or circumstances on which any statement is based. Readers should not place undue importance on forward-looking statements and should not rely upon this information as of any other date. In addition to the disclosure contained herein, for more information concerning the Company’s various risks and uncertainties, please refer to the Company’s periodic public filings available under its profile on the SEC’s (as defined below) Electronic Data Gathering, Analysis and Retrieval system (“EDGAR”) at www.sec.gov and the Canadian System for Electronic Document Analysis and Retrieval (“SEDAR”) at www.sedar.com.
STATUS AS AN EMERGING GROWTH COMPANY
We are an “emerging growth company” as defined in Section 3(a) of the United States Securities Exchange Act of 1934, as amended (the “Exchange Act”) by the Jumpstart Our Business Startups Act of 2012 (the “JOBS Act”), and we may take advantage of certain exemptions from various reporting requirements that are applicable to other public companies that are not emerging growth companies. We will continue to qualify as an “emerging growth company” until the earliest to occur of: (a) the last day of the fiscal year during which we had total annual gross revenues of US$1,235,000,000 (as such amount is indexed for inflation every 5 years by the United States Securities and Exchange Commission (“SEC”)) or more; (b) the last day of our fiscal year following the fifth anniversary of the date of the first sale of equity securities pursuant to an effective registration statement under the United States Securities Act of 1933, as amended (the “Securities Act”); (c) the date on which we have, during the previous 3-year period, issued more than US$1,000,000,000 in non-convertible debt; or (d) the date on which we are deemed to be a “large accelerated filer”, as defined in Exchange Act Rule 12b-2. We expect to continue to be an emerging growth company for the immediate future.
Generally, a registrant that registers any class of its securities under Section 12 of the Exchange Act is required to include in the second and all subsequent annual reports filed by it under the Exchange Act a management report on internal control over financial reporting and, subject to an exemption available to registrants that are neither an “accelerated filer” or a “large accelerated filer” (as those terms are defined in Exchange Act Rule 12b-2), an auditor attestation report on management’s assessment of internal control over financial reporting. However, for so long as we continue to qualify as an emerging growth company, we will be exempt from the requirement to include an auditor attestation report on management’s assessment of internal controls over financial reporting in its annual reports filed under the Exchange Act, even if we were to qualify as an “accelerated filer” or a “large accelerated filer”. In addition, Section 103(a)(3) of the Sarbanes-Oxley Act of 2002 (the “SOX”) has been amended by the JOBS Act to provide that, among other things, auditors of an emerging growth company are exempt from any rules of the Public Company Accounting Oversight Board requiring a supplement to the auditor’s report in which the auditor would be required to provide additional information about the audit and the financial statements of the company.
Foreign Private Issuer Filings
We are considered a “foreign private issuer” pursuant to Rule 405 promulgated under the Securities Act. In our capacity as a foreign private issuer, we are exempt from certain rules under the Exchange Act that impose certain disclosure obligations and procedural requirements for proxy solicitations under Section 14 of the Exchange Act. In addition, our officers, directors and principal shareholders are exempt from the reporting and “short-swing” profit recovery provisions of Section 16 of the Exchange Act and the rules under the Exchange Act with respect to their purchases and sales of our shares. Moreover, we are not required to file periodic reports and financial statements with the SEC as frequently or as promptly as United States companies whose securities are registered under the Exchange Act. In addition, we are not required to comply with Regulation FD, which restricts the selective disclosure of material information. For as long as we are a “foreign private issuer” we intend to file our annual financial statements on Form 20-F and furnish our quarterly financial statements on Form 6-K to the SEC for so long as we are subject to the reporting requirements of Section 13(g) or 15(d) of the Exchange Act. However, the information we file or furnish may not be the same as the information that is required in annual and quarterly reports on Form 10-K or Form 10-Q for United States domestic issuers. Accordingly, there may be less information publicly available concerning us than there is for a company that files as a domestic issuer.
We may take advantage of these exemptions until such time as we are no longer a foreign private issuer. We are required to determine our status as a foreign private issuer on an annual basis at the end of our second fiscal quarter. We would cease to be a foreign private issuer at such time as more than 50% of our outstanding voting securities are held by United States residents and any of the following three circumstances applies: (1) the majority of our executive officers or directors are United States citizens or residents; (2) more than 50% of our assets are located in the United States; or (3) our business is administered principally in the United States. If we lose our “foreign private issuer status” we would be required to comply with Exchange Act reporting and other requirements applicable to United States domestic issuers, which are more detailed and extensive than the requirement for foreign private issuers.
PART I
| ITEM 1. | IDENTITY OF DIRECTORS, SENIOR MANAGEMENT AND ADVISERS |
Not applicable.
| ITEM 2. | OFFER STATISTICS AND EXPECTED TIMETABLE |
Not applicable.
| B. | Capitalization and Indebtedness |
Not applicable.
| C. | Reasons for the Offer and Use of Proceeds |
Not applicable.
The Company’s operations and financial performance are subject to the normal risks of its industry and are subject to various factors which are beyond the control of the Company. Certain of these risk factors are described below. The risks described below are not the only ones facing the Company. Additional risks not currently known to the Company, or that it currently considers immaterial, may also adversely impact the Company’s business, operations, financial results or prospects, should any such other events occur.
Risks Associated with the Business and Industry of the Company
Liquidity concerns and future financings
Although the Company has been successful in the past in financing its activities, there can be no assurance that it will be able to obtain additional financing as and when needed in the future to execute its business plan and future operations. The ability of the Company to arrange such financing in the future will depend in part upon the prevailing capital market conditions as well as the business performance of the Company. It may be difficult or impossible for the Company to obtain financing on commercially acceptable terms. This may be further complicated by the limited market liquidity for shares of smaller companies such as the Company, restricting access to some institutional investors. There is a risk that interest rates will increase given the current historical low level of interest rates. An increase in interest rates could result in a significant increase in the amount that the Company pays to service future debt incurred by the Company and affect the Company’s ability to fund ongoing operations.
Failure to obtain additional financing on a timely basis could also result in delay or indefinite postponement of further development of its products. Such delay would have a material and adverse effect on the Company’s business, financial condition and results of operations.
The Company may not be able to successfully execute its business plan
The execution of the Company’s business plan poses many challenges and is based on a number of assumptions. The Company may not be able to successfully execute its business plan. If the Company’s business plan is more costly than anticipated or there are significant cost overruns, certain products and development activities may be delayed or eliminated or the Company may be compelled to secure additional funding (which may or may not be available) to execute its business plan. The Company cannot predict with certainty its future revenues or results from its operations. If the assumptions on which revenue or expenditure forecasts are based change, the benefits of the Company’s business plan may change as well. In addition, the Company may consider expanding its business beyond what is currently contemplated in its business plan. Depending on the financing requirements of a potential acquisition or new product opportunity, the Company may be required to raise additional capital through the issuance of equity or debt. If the Company is unable to raise additional capital on acceptable terms, the Company may be unable to pursue a potential acquisition or new product opportunity.
Difficulties integrating acquisitions and strategic investments
The Company has acquired businesses, personnel and technologies in the past and expects to continue to pursue acquisitions, such as the completed acquisitions of Frankly Inc. (“Frankly”), WinView, Inc,. (“WinView”), Stream Hatchet S.L (“Stream Hatchet”), SideQik, Inc. (“SideQik”), and other investments that are complementary to the existing business, and expanding the employee base and the breadth of the Company’s offerings. The Company’s ability to grow through future acquisitions will depend on the availability of suitable acquisition and investment candidates at an acceptable cost, the ability to compete effectively to attract these candidates and the availability of financing to complete larger acquisitions. Since the Company expects the esports industry to consolidate in the future, the Company may face significant competition in executing its growth strategy. Future acquisitions or investments could result in potential dilutive issuances of equity securities, use of significant cash balances or incurrence of debt, and contingent liabilities or amortization expenses related to goodwill and other intangible assets, any of which could adversely affect the financial condition and results of operations of the Company. The benefits of an acquisition or investment may also take considerable time to develop, and the Company cannot be certain that any particular acquisition or investment will produce the intended benefits.
The above risks and difficulties, if they materialize, could disrupt the Company’s ongoing business, distract management, result in the loss of key personnel, increase expenses and otherwise have a material adverse effect on the Company’s business, results of operations and financial performance.
Management of growth
The Company has grown rapidly since its inception and it plans to continue to grow at a rapid pace. This growth has put significant demands on the Company’s processes, systems and personnel.
The Company may be subject to growth-related risks including capacity constraints and pressure on its internal systems and controls. The ability of the Company to manage growth effectively will require it to continue to implement and improve its operational and financial systems and to expand, train and manage its employee base. Managing the Company’s growth will require significant expenditures and allocation of valuable management resources. The inability of the Company to deal with this growth may have a material adverse effect on the Company’s business, financial condition, results of operations and prospects.
The Company may continue to have reduced cash reserves
The Company expects its cash reserves will be reduced due to future operating losses, working capital requirements, capital expenditures, and potential acquisitions and other investments by its business, and the Company cannot provide certainty as to how long its cash reserves will last or that it will be able to access additional capital when necessary.
The Company expects to incur continued losses and generate negative cash flow until it can produce sufficient revenues to cover its costs. The Company may never become profitable. Even if the Company does achieve profitability, it may be unable to sustain or increase profitability in the future. For the reasons discussed in more detail below, there are substantial uncertainties associated with the Company achieving and sustaining profitability. The Company expects its cash reserves will be reduced due to future operating losses, and working capital requirements, and the Company cannot provide certainty as to how long its cash reserves will last or that it will be able to access additional capital if and when necessary.
Competition
The Company’s failure to compete successfully in its various markets could have a material adverse effect on the Company’s business, financial condition and results of operations. The market for the various types of product and service offerings of the Company is very competitive and rapidly changing. The Company faces competition from other esports businesses, many of which are larger and better funded than the Company. There can be no guarantee that the Company’s current and future competitors will not develop similar or superior services to the Company’s products and services which may render the Company uncompetitive. Increasing competition could result in fewer future customers, reduced revenue, reduced sales margins and loss of market share, any one of which could harm the business of the Company.
Players in the current market face a vast array of entertainment choices. Other forms of entertainment, such as offline, traditional online, personal computer and console games, television, movies, sports and the Internet are much larger and more well-established markets and may be perceived by the Company’s customers to offer greater variety, affordability, interactivity and enjoyment. These other forms of entertainment compete for the discretionary time and income of the Company’s customers. If the Company is unable to sustain sufficient interest in its products and services in comparison to other forms of entertainment, including new forms, the business model may no longer be viable.
For a detailed description of the competitive environment faced by the Company, see Item 4.B. – Business Overview – Competitive Conditions.
Security and privacy breaches
Security or privacy breaches may result in an interruption of service or a reduced quality of service, which could increase the Company’s costs or result in a reduction in the use of the Company’s services by its customers. The Company’s systems may be vulnerable to physical break-ins, computer viruses, attacks by computer hackers or similar disruptive problems. If unauthorized users gain access to the Company’s databases, they may be able to steal, publish, delete or modify sensitive information that is stored or transmitted on the Company’s networks and which the Company is required by its contracts to keep confidential. A security or privacy breach could result in an interruption of service or a reduced quality of service. Confidential information internal to the Company may also be disclosed to unauthorized personnel who may use such information in a manner adverse to the Company’s interests. Hackers may attempt to “flood” the network, thereby preventing legitimate network traffic or to disrupt the network, thereby preventing access to a service or preventing a particular individual from accessing a service. The Company may therefore be required to make significant expenditures in connection with corresponding corrective or preventive measures. In addition, a security or privacy breach may harm the Company’s reputation and cause its customers to reduce their use of the Company’s services, which could harm the Company’s revenue and business prospects. In addition, the Company’s revenue may be adversely affected by un-captured usage, in the event that the Company’s system is “hacked”, resulting in transmissions that may not be detected by its billing system. Further, the increase in traffic as a result of such unauthorized “hacking” may slow or overload the Company’s transmission network, thereby adversely affecting the overall quality of services which the Company provides to its paying customers. If the Company incurs any such losses or liabilities, the Company’s operating results, financial condition, business and prospects may be adversely affected.
The development of high-quality products requires substantial up-front expenditures
Consumer preferences for games are usually cyclical and difficult to predict, and even the most successful titles remain popular for only limited periods of time, unless refreshed with new content or otherwise enhanced. In order to remain competitive, the Company must continuously develop new products or enhancements to existing products. The amount of lead time and cost involved in the development of high-quality products is increasing, and the longer the lead time involved in developing a product and the greater the allocation of financial resources to such product, the more critical it is that the Company accurately predicts consumer demand for such product. If its future products do not achieve expected consumer acceptance or generate sufficient revenues upon introduction, the Company may not be able to recover the substantial development and marketing costs associated with those products.
Rapid technological changes
Rapid technological changes may increase competition and render the Company’s technologies, products or services obsolete or cause the Company to lose market share. The online gaming, influencer and media software industries is subject to rapid and significant changes in technology, frequent new service introductions and evolving industry standards. Such changes may adversely affect the Company’s revenue. There can be no assurance that the Company can improve the features, functionality, reliability and responsiveness of infrastructure. Similarly, the technologies that the Company employs may become obsolete or subject to intense competition from new technologies in the future. If the Company fails to develop, or obtain timely access to, new technologies, or if it fails to obtain the necessary licenses for the provision of services using these new technologies, the Company may lose market share, and its results of operations would be adversely affected.
Failure to license necessary third party software for use in the Company’s products and services, or failure to successfully integrate third party software, could cause delays or reductions in the Company’s sales, or errors or failures of the Company’s service
The Company licenses third party software that it incorporates into its products and services. In the future, the Company might need to license other software to enhance its products and meet evolving customer requirements. These licenses may not continue to be available on commercially reasonable terms or at all. Some of this technology could be difficult to replace once integrated. The loss of, or inability to obtain, these licenses could result in delays or reductions of the Company’s applications until it identifies, licenses and integrates or develops equivalent software, and new licenses could require the Company to pay higher royalties. If the Company is unable to successfully license and integrate third party technology, it could experience a reduction in functionality and/or errors or failures of the Company’s products, which may reduce demand for its products and services.
Third-party licenses may expose the Company to increased risks, including risks associated with the integration of new technology, the impact of new technology integration on existing technology, open source software disclosure risks, the diversion of resources from the development of the Company’s own proprietary technology, and inability to generate revenue from new technology sufficient to offset associated acquisition and maintenance costs.
Proprietary protection and intellectual property disputes
Protection of the trade secrets, copyrights, trademarks, domain names and other product rights of the Company are important to its success. The Company protects its intellectual property rights by relying on trademark protection, common law rights as well as contractual restrictions. However, many of the Company’s proprietary technologies are currently unpatented nor has the Company made any applications for such intellectual property registrations and has no present intention to do so in the near future. As such, the current steps that it takes to protect its intellectual property, including contractual arrangements, may not be sufficient to prevent the misappropriation of its proprietary information or deter independent development of similar technologies by others.
Should the Company decide to register its intellectual property in one or more jurisdictions, it will be an expensive and time consuming process and there is no assurance that the Company will be successful in any or all of such jurisdictions. The absence of registered intellectual property rights, or the failure to obtain such registrations in the future, may result in the Company being unable to successfully prevent its competitors from imitating its solutions or using some or all of its processes. Even if patents and other registered intellectual property rights were to be issued to the Company, its intellectual property rights may not be sufficiently comprehensive to prevent its competitors from developing similar competitive products and technologies.
Litigation may be necessary to enforce the intellectual property rights of the Company. Any litigation of this nature, regardless of outcome or merit, could result in substantial costs, adverse publicity or diversion of management and technical resources, any of which could adversely affect the business and operating results of the Company. Moreover, due to the differences in foreign patent, trademark, copyright and other laws concerning proprietary rights, the Company’s intellectual property may not receive the same degree of protection in foreign countries as it would in Canada or the United States. The Company’s failure to possess, obtain or maintain adequate protection of its intellectual property rights for any reason could have a material adverse effect on its business, results of operations and financial condition.
The Company may also face allegations that it has infringed the trademarks, copyrights, patents and other intellectual property rights of third parties, including from its competitors and former employers of the Company’s personnel. Whether a product infringes a patent or other intellectual property right involves complex legal and factual issues, the determination of which is often uncertain.
System failures, delays and other technical problems
System failures, delays and other technical problems could harm the Company’s reputation and business, causing the Company to lose customers and expose it to customer liability. The Company may experience failures or interruptions of its systems and services, or other problems in connection with its operations as a result of, amongst other things:
| | ● | damage to, or failure of, its computer software or hardware or its infrastructure and connections; |
| | ● | data processing errors by its systems; |
| | ● | computer viruses or software defects; and |
| | ● | physical or electronic break-ins, sabotage, intentional acts of vandalism and similar events. |
If the Company cannot adequately ensure that its network services perform consistently at a high level or otherwise fail to meet its customers’ expectations:
| | ● | it may experience damage to its reputation, which may adversely affect its ability to attract or retain customers who participate in online esports tournaments; |
| | ● | its operating expenses or capital expenditures may increase as a result of corrective actions that the Company must perform; or |
| | ● | one or more of its significant contracts may be terminated early, or may not be renewed. |
Transmission of User Data
The Company transmits and stores a large volume of data. The Company is subject to legislation and regulations on the collection, storage, retention, transmission, and use of user-data that it collects. The Company’s efforts to protect the personal information of its users, partners and clients may be unsuccessful due to the actions of third parties, software bugs or technical malfunctions, employee error or malfeasance, or other factors. In addition, third parties may attempt to fraudulently induce employees or users to disclose information in order to gain access to the Company’s data, users’ data, partners’ data or clients’ data. If any of these events occur, users’, partners’ or clients’ information could be accessed or disclosed improperly. Any incidents involving the unauthorized access to or improper use of the information of users or incidents involving violation of the Company’s terms of service or policies could damage the Company’s reputation and brands and diminish its competitive position. Moreover, affected users, clients or governmental authorities could initiate legal or regulatory action against the Company in connection with such incidents, which could cause the Company to incur significant expense and liability or result in orders or consent decrees forcing the Company to modify its business practices and remediate the effects of any such incidents of unauthorized access or use. Any of these events could have a material adverse effect on the Company’s prospects, businesses, financial condition or results of operations.
Data collection risks
The Company partially relies on data captured by Stream Hatchet for its revenues and for assessing the performance of some of its brands. Capturing accurate data is subject to various limitations. For example, Stream Hatchet may need to collect certain data from mobile carriers or other third parties such as various viewing platforms, which limits the Company’s ability to verify the reliability of such data. Further, Stream Hatchet may not be able to collect any data from third parties at all. Failure to capture accurate data or an incorrect assessment of this data may materially harm business and operating results.
Global economy
The business of the Company is subject to general economic conditions. Adverse changes in general economic and market conditions could adversely impact demand for the Company’s products, prices, revenue, operating costs, results of financing efforts, and the timing and extent of capital expenditures.
Foreign operational risks
A significant portion of the business and operations of the Company is conducted in foreign jurisdictions, including the United States, and Spain. As such, the Company’s business and operations may be adversely affected by changes in foreign government policies and legislation or social instability and other factors which are not within the control of the Company, including, but not limited to, renegotiation or nullification of existing contracts or licenses, changes in policies, regulatory requirements or the personnel administering them, economic sanctions, risk of terrorist activities, revolution, border disputes, implementation of tariffs and other trade barriers and protectionist practices, volatility of financial markets, labour disputes and other risks arising out of foreign governmental sovereignty over the areas in which the Company’s business is conducted. The Company’s operations may also be adversely affected by laws and policies of such foreign jurisdictions affecting foreign trade, taxation and investment.
If the Company’s operations are disrupted and/or the economic integrity of its contracts is threatened for unexpected reasons, its business may be harmed. In the event of a dispute arising in connection with the Company’s operations in a foreign jurisdiction where the Company conducts or will conduct its business, the Company may be subject to the exclusive jurisdiction of foreign courts or may not be successful in subjecting foreign persons to the jurisdictions of the courts of Canada or enforcing Canadian judgments in such other jurisdictions. The Company may also be hindered or prevented from enforcing its rights with respect to a governmental instrumentality because of the doctrine of sovereign immunity. Accordingly, the Company’s activities in foreign jurisdictions could be substantially affected by factors beyond their control, any of which could have a material adverse effect on the Company. The Company believes that its management is sufficiently experienced to manage these risks.
Regulation
The Company is subject to general business regulations and laws as well as regulations and laws specifically governing the internet, gaming, e-commerce and electronic devices. Existing and future laws and regulations may impede the Company’s growth or strategy. These regulations and laws cover taxation, privacy, data protection, pricing, content, copyrights, distribution, mobile communications, consumer protection, web services, wagering, the provision of online payment services, websites and the characteristics and quality or products and services. Unfavourable changes in regulations and laws could decrease demand for the Company’s events, online offering and merchandise, increase its cost of doing business or otherwise have a material adverse effect on the Company’s reputation, popularity, results of operations and financial condition.
The Company has never paid dividends and may not do so in the foreseeable future
The Company has never paid cash dividends on the common shares in its capital (the “Common Shares”). Currently, the Company intends to retain its future earnings, if any, to fund the development and growth of its business, and does not anticipate paying any cash dividends on its Common Shares in the near future. As a result, shareholders will have to rely on capital appreciation, if any, to earn a return on investment in any Common Shares in the foreseeable future.
The market price for Common Shares has been volatile in the past, and may be subject to fluctuations in the future
The market price of the Common Shares may be volatile and subject to wide fluctuations in response to numerous factors, many of which are beyond the Company’s control. This volatility may affect the ability of holders of Common Shares to sell their securities at an advantageous price. Market price fluctuations in the Common Shares may be due to the Company’s operating results failing to meet expectations of securities analysts or investors in any period, downward revision in securities analysts’ estimates, adverse changes in general market conditions or economic trends, acquisitions, dispositions or other material public announcements by the Company or its competitors, along with a variety of additional factors. These broad market fluctuations may adversely affect the market price of the Common Shares.
Financial markets historically at times experienced significant price and volume fluctuations that have particularly affected the market prices of equity securities of companies and that have often been unrelated to the operating performance, underlying asset values or prospects of such companies. Accordingly, the market price of the Common Shares may decline even if the Company’s operating results, underlying asset values or prospects have not changed. Additionally, these factors, as well as other related factors, may cause decreases in asset values that are deemed to be other than temporary, which may result in impairment losses. There can be no assurance that continuing fluctuations in price and volume will not occur. If such increased levels of volatility and market turmoil continue, the Company’s operations could be adversely impacted and the trading price of the Common Shares may be materially adversely affected.
Emerging diseases, like COVID-19, may adversely affect the Company’s operations, suppliers, or customers
Emerging diseases, like COVID-19, and government actions to address them, may adversely affect the Company’s operations, suppliers, or customers. The COVID-19 pandemic continues to evolve rapidly and, as a result, it is difficult to accurately assess its continued magnitude, outcome and duration, but it could:
| | ● | worsen economic conditions, which could negatively impact access to capital; |
| | | |
| | ● | reduce consumer spending; |
| | | |
| | ● | limit the Company’s employees from travelling which could affect the execution of the Company’s business plan given the Company is multi-jurisdictional; or |
| | | |
| | ● | result in governmental regulation adversely impacting the Company’s business |
all of which could have a material adverse effect on the Company’s business, financial condition and results of operations, which could be rapid and unexpected.
Retention and acquisition of new CMS platform customers
Our financial performance and operations are dependent in part on retaining our current CMS platform customers and acquiring new CMS platform customers. We currently serve a large number of customers with our CMS platform and a typical customer contract runs for multiple years. However, we compete with the other technology providers in the market and increasing competition may affect our ability to retain current and acquire new customers. Any number of factors could potentially negatively affect our customer retention or acquisition. For example, a current customer may request products or services that we currently do not provide and may be unwilling to wait until we can develop or source such additional features. Other factors that affect our ability to retain or acquire new CMS platform customers include:
| | ● | customers increasingly use competing products or services; |
| | ● | we fail to introduce new and improved products or if we introduce new products or services that are not favorably received; |
| | ● | we are unable to continue to develop new products and services that work with a variety of mobile operating systems and networks and/or that have a high level of market acceptance; |
| | ● | there are changes in customer preference; |
| | ● | there is consolidation or vertical integration of our customers; |
| | ● | there are changes in customer sentiment about the quality or usefulness of our products and services; |
| | ● | there are adverse changes in our products that are mandated by legislation, regulatory authorities, or litigation, including settlements or consent decrees; |
| | ● | technical or other problems prevent us from delivering our products in a rapid and reliable manner; |
| | ● | we fail to provide adequate customer service to our customers; or |
| | ● | we, our software developers, or other companies in our industry are the subject of adverse media reports or other negative publicity. |
Exposure to advertising marketplace
A significant portion of our projected revenue is generated from the sale of national and local online advertising inventory, which is dependent on available advertising inventory and market demand and prices for such inventory. A decline in available supply of advertising inventory, general demand for advertising inventory and general economic conditions may materially and adversely affect our advertising revenue. Changes in advertising technologies, rules and regulations may also have a material adverse effect on our advertising revenue.
A significant portion of our projected revenue is generated from the sale of national and local online advertising inventory, the majority of which we sell on an automated basis through real-time bidding. We also sell a small portion of our inventory to premium direct advertising customers to whom we provide guaranteed advertisement inventory. Our advertising revenue is dependent on the amount of advertising inventory that is available to us to sell and market demand and prices for such inventory.
The amount of advertising inventory available for us to sell is affected by many variables including but not limited to:
| | ● | the negotiated amount of inventory we receive from our current CMS customers; |
| | ● | the amount of additional inventory our current CMS customers permit us to sell on their behalf; |
| | ● | our ability to acquire inventory to sell on behalf of parties that are not customers of our CMS; |
| | ● | the amount of inventory available on our owned and operated properties; |
| | ● | the amount of end-user traffic to our customers’ and our online properties; and |
| | ● | the specific type of advertising to be sold, such as display, video or mobile advertising. |
While we endeavor to maximize the amount of inventory, we are able to sell, some of the foregoing variables, and by extension the amount of inventory we may sell, are affected by market forces and other contingencies that we do not control.
The other principal component of gross advertising revenue is the price at which advertising inventory may be sold. To a large extent, the prices we are able to achieve for our advertising inventory are a product of the market supply and demand, which may vary based on several factors including ad size, ad type, geographic region and time of year. At a macro level, advertising spending is also sensitive to overall economic conditions, and our advertising revenues will be adversely affected if advertisers respond to weak and uncertain economic conditions, for example as a result of disruptions from COVID-19, by reducing their budgets or changing their spending patterns. There are limitations on the amount that we can compensate for fluctuations in the prevailing market prices for advertising inventory. Any reduction in spending by existing or potential advertisers and a decline in available advertising inventory or demand for such inventory would negatively affect our advertising revenue and could affect our ability to grow our advertising customer base.
Volatility of Revenues and Expenses
We may experience wide fluctuations in reported revenue and earnings from one period to another due to seasonality in revenue streams, short-term nature of some customer agreements and engagements, gain or loss of customer agreements, one-time other non-recurring revenues and expenses. Additionally, we may experience wide-fluctuations in revenues and expenses due to required accounting treatment of certain non-cash items, including the accounting treatment of the liability for our outstanding warrants and convertible debt. Because of the nascent nature and stage of some of our assets, investments, and intangibles, and difficulty in assessing their valuation, we may be required from time to time to impair, write down or otherwise adjust the carrying value of these assets, investments and intangibles, and such impairments and write-downs may have a material impact on our reported earnings.
Cybersecurity threats
A cyber incident is an intentional or unintentional event that could threaten the integrity, confidentiality or availability of the Company’s information resources. These events include, but are not limited to, unauthorized access to information systems, a disruption to our information systems, or loss of confidential information. Engine’s primary risks that could result directly from the occurrence of a cyber incident include operational interruption, damage to our public image and reputation, and/or potentially impact the relationships with our customers.
We have implemented processes, procedures and controls to mitigate these risks, including, but not limited to, firewalls and antivirus programs and training and awareness programs on the risks of cyber incidents. These procedures and controls do not guarantee that the financial results may not be negatively impacted by such an incident.
Proposed legislation in the U.S. Congress, including changes in U.S. tax law, and the recently enacted Inflation Reduction Act of 2022 may adversely impact the Company and the value of the Common Shares.
Changes to U.S. tax laws (which changes may have retroactive application) could adversely affect the Company or holders of the Common Shares. In recent years, many changes to U.S. federal income tax laws have been proposed and made, and additional changes to U.S. federal income tax laws are likely to continue to occur in the future.
The U.S. Congress is currently considering numerous items of legislation which may be enacted prospectively or with retroactive effect, which legislation could adversely impact the Company’s financial performance and the value of the Common Shares. Additionally, states in which the Company operates or owns assets may impose new or increased taxes. If enacted, most of the proposals would be effective for 2022 or later years. The proposed legislation remains subject to change, and its impact on the Company and purchasers of the Common Shares is uncertain.
In addition, the Inflation Reduction Act of 2022 was recently signed into law and includes provisions that will impact the U.S. federal income taxation of corporations. Among other items, this legislation includes provisions that will impose a minimum tax on the book income of certain large corporations and an excise tax on certain corporate stock repurchases that would be imposed on the corporation repurchasing such stock. It is unclear how this legislation will be implemented by the U.S. Department of the Treasury and the Company cannot predict how this legislation or any future changes in tax laws might affect the Company or purchasers of the Common Shares.
Risks Related to Our Securities
The Company’s Foreign Private Issuer status under United States Securities Laws.
The Company is a “foreign private issuer”, under applicable United States federal securities laws, and is, therefore, not subject to the same requirements that are imposed upon United States domestic issuers by the SEC. Under the Exchange Act, the Company is subject to reporting obligations that, in certain respects, are less detailed and less frequent than those of United States domestic reporting companies. As a result, the Company does not file the same reports that a United States domestic issuer would file with the SEC, although the Company is required to file with or furnish to the SEC the continuous disclosure documents that it is required to file in Canada under Canadian securities laws. In addition, the Company’s officers, directors, and principal shareholders are exempt from the reporting and short-swing profit recovery provisions of Section 16 of the Exchange Act. Therefore, the Company’s shareholders may not know on as timely a basis when the Company’s officers, directors and principal shareholders purchase or sell Common Shares, as the reporting periods under the corresponding Canadian insider reporting requirements are longer.
As a foreign private issuer, the Company is exempt from the rules and regulations under the Exchange Act related to the furnishing and content of proxy statements. The Company is also exempt from Regulation FD, which prohibits issuers from making selective disclosures of material non-public information. While the Company complies with the corresponding requirements relating to proxy statements and disclosure of material non-public information under Canadian securities laws, these requirements differ from those under the Exchange Act and Regulation FD and shareholders should not expect to receive the same information at the same time as such information is provided by United States domestic companies. In addition, the Company may not be required under the Exchange Act to file annual and quarterly reports with the SEC as promptly as U.S. domestic companies whose securities are registered under the Exchange Act.
In order to maintain its status as a foreign private issuer, a majority of the Common Shares must be either directly or indirectly owned by non-residents of the United States unless the Company also satisfies one of the additional requirements necessary to preserve this status. The Company may in the future lose its foreign private issuer status if a majority of its Common Shares are held in the United States and if the Company fails to meet the additional requirements necessary to avoid loss of its foreign private issuer status. The regulatory and compliance costs under United States federal securities laws as a United States domestic issuer may be significantly more than the costs incurred as a Canadian foreign private issuer using the standard foreign form or as Canadian foreign private issuer eligible to use the multi-jurisdictional disclosure system adopted by the securities regulatory authorities in United States and Canada (“MJDS”). If the Company is not a foreign private issuer, it would not be eligible to use the MJDS or other foreign issuer forms and would be required to file periodic and current reports and registration statements on United States domestic issuer forms with the SEC, which are more detailed and extensive than the forms available to a foreign private issuer.
The Company is an emerging growth company and relies on exemptions from certain disclosure requirements which may make its Common Shares less attractive to investors.
The Company is an “emerging growth company” as defined in section 3(a) of the Exchange Act (as amended by the JOBS Act, enacted on April 5, 2012), and the Company will continue to qualify as an emerging growth company until the earliest to occur of: (a) the last day of the fiscal year during which the Company has total annual gross revenues of US$1,235,000,000 (as such amount is indexed for inflation every five years by the SEC) or more; (b) the last day of the fiscal year of the Company following the fifth anniversary of the date of the first sale of common equity securities of the Company pursuant to an effective registration statement under the Securities Act, as amended; (c) the date on which the Company has, during the previous three year period, issued more than US$1,000,000,000 in non-convertible debt; and (d) the date on which the Company is deemed to be a “large accelerated filer”, as defined in Rule 12b-2 under the Exchange Act. The Company will qualify as a large accelerated filer (and would cease to be an emerging growth company) at such time when on the last business day of its second fiscal quarter of such year the aggregate worldwide market value of its common equity held by non-affiliates will be US$700,000,000 or more.
For so long as the Company remains an emerging growth company, it is permitted to and intends to rely upon exemptions from certain disclosure requirements that are applicable to other public companies that are not emerging growth companies. These exemptions include not being required to comply with the auditor attestation requirements of Section 404 of SOX. The Company cannot predict whether investors will find its Common Shares less attractive because the Company relies upon certain of these exemptions. If some investors find the Common Shares less attractive as a result, there may be a less active trading market for the Common Shares and the Common Share price may be more volatile. On the other hand, if the Company no longer qualifies as an emerging growth company, the Company would be required to divert additional management time and attention from the Company’s development and other business activities and incur increased legal and financial costs to comply with the additional associated reporting requirements, which could negatively impact the Company’s business, financial condition and results of operations.
Our failure to meet the continued listing requirements Nasdaq could result in a delisting of our securities.
On June 23, 2022, we received a letter from the Listing Qualifications Department of The Nasdaq Stock Market LLC indicating that, based upon the closing bid price of our Common Shares for the 30 consecutive business day period prior to June 23, 2022, we did not meet the minimum bid price of $1.00 per share required for continued listing on the Nasdaq Capital Market (“Nasdaq”) pursuant to Nasdaq Listing Rule 5550(a)(2). The letter also indicated that we will be provided with a compliance period of 180 calendar days, or until December 20, 2022 (the “Compliance Period”), in which to regain compliance pursuant to Nasdaq Listing Rule 5810(c)(3)(A). On December 21, 2022 we received a 180 calendar day extension to the initial Compliance Period.
In order to regain compliance with Nasdaq’s minimum bid price requirement, our Common Shares must maintain a minimum closing bid price of $1.00 for at least ten consecutive business days during the Compliance Period. In the event we do not regain compliance by the end of the Compliance Period, we may be eligible for additional time to regain compliance. To qualify, we will be required to meet the continued listing requirement for the market value of its publicly held shares and all other initial listing standards for Nasdaq, with the exception of the bid price requirement, and will need to provide written notice of our intention to cure the deficiency during the second compliance period, including by effecting a reverse stock split if necessary. If we meet these requirements, we may be granted an additional 180 calendar days to regain compliance. However, if it appears to Nasdaq that we will be unable to cure the deficiency, or if we are not otherwise eligible for the additional cure period, Nasdaq will provide notice that our Common Shares will be subject to delisting.
If we fail to satisfy the continued listing requirements of Nasdaq, such as minimum bid price requirements, Nasdaq may take steps to delist our Common Shares. Such a delisting would have a materially adverse effect on the price of our Common Shares, impair the ability to sell or purchase our Common Shares when persons wish to do so, and materially adversely affect our ability to raise capital or pursue strategic restructuring, refinancing or other transactions on acceptable terms, or at all. Delisting from Nasdaq could also have other negative results, including the potential loss of institutional investor interest and fewer business development opportunities, as well as a limited amount of news and analyst coverage. In the event of a delisting, we would attempt to take actions to restore our compliance with Nasdaq’s listing requirements, but we can provide no assurance that any such action taken by us would allow our securities to become listed again, stabilize the market price or improve the liquidity of our securities, prevent our Common Shares from dropping below the Nasdaq minimum bid price requirement or prevent future non-compliance with Nasdaq’s listing requirements.
| ITEM 4. | INFORMATION ON THE COMPANY |
| A. | History and Development of the Company |
Name, Address and Incorporation
The Company was incorporated as “Stratton Capital Corp.” under the Business Corporations Act (Ontario) pursuant to articles of incorporation on April 8, 2011. On October 19, 2016, the Company filed Articles of Amendment changing its name from “Stratton Capital Corp.” to “Millennial Esports Corp.”
On June 7, 2019, the Company filed Articles of Amendment to effect a consolidation of the Common Shares on the basis of one post-consolidation Common Share for every fifteen pre-consolidation Common Shares. On October 17, 2019, the Company filed Articles of Amendment to (i) change its name from “Millennial Esports Corp.” to “Torque Esports Corp.”, and (ii) to effect a consolidation of the Common Shares on the basis of one post-consolidation Common Share for every five pre-consolidation Common Shares.
On August 13, 2020, the Company filed Articles of Amendment to (i) change its name from “Torque Esports Corp.” to “Engine Gaming and Media, Inc.”, and (ii) to effect a consolidation of the Common Shares on the basis of one post-consolidation Common Share for every fifteen pre-consolidation Common Shares.
On December 18, 2020, the Company filed a Continuance Application with the British Columbia Registrar of Companies to continue into British Columbia under the Business Corporation Act (British Columbia) (the “BCBCA”).
On October 19, 2021, the Company changed its name from “Engine Media Holdings, Inc.” to “Engine Gaming and Media, Inc.”
The head office of the Company is located at 2110 Powers Ferry Road SE, Suite 450, Atlanta, GA 30339 and the registered office of the Company is located at 77 King Street West, Suite 3000, PO Box 95, Toronto, Ontario M5K 1G8, telephone number +1(647)725-7765.
The Company is a reporting issuer in the provinces of Alberta, British Columbia, Ontario, Saskatchewan, Manitoba, New Brunswick, Nova Scotia, Prince Edward Island, and Newfoundland. The Common Shares are listed and posted for trading on the TSX Venture Exchange (the “TSXV”) under the trading symbol “GAME” and on Nasdaq under the symbol “GAME”.
The SEC maintains an internet site (http://www.sec.gov) that contains report, proxy and information statements and other information regarding issuers that file electronically with the SEC. Such information can also be found on the Company’s website (http://www.enginegaming.com).
Three Year History
The following is a description of how the business of the Company developed over the three most recently completed financial years and the current financial year.
Fiscal Year Ended August 31, 2020
Frankly Arrangement and WinView Merger
On March 10, 2020, the Company, Frankly and WinView announced that they had entered into a business combination agreement dated March 9, 2020 (the “Business Combination Agreement”) where the three companies agreed to form an integrated news, gaming, sports and esports platform (the “FW Transaction”).
On May 8, 2020, the Company acquired all of the issued and outstanding common shares of Frankly in exchange for consideration of one Engine Common Share for each Frankly common share acquired, pursuant to a court approved plan of arrangement under the BCBCA, resulting in the issuance of 2,216,607 Common Shares upon closing the business combination. All outstanding convertible securities of Frankly were exchanged for equivalent securities of the Company (other than outstanding warrants to purchase common shares of Frankly, which remain outstanding and have the terms of such securities adjusted to reflect the exchange ratio). The Company also concurrently indirectly acquired WinView, pursuant to a statutory merger under the laws of the State of Delaware, with WinView securityholders receiving an aggregate of 1,759,997 Common Shares of the Company as well as certain contingent consideration. The contingent consideration entitles WinView holders to proceeds from the enforcement of WinView’s patent portfolio, equal to 50% of the net license fees, damages awards or settlement amounts collected from third parties, with such payments to be calculated after deduction of certain amounts. In connection with the transaction, it was announced that the combined company would be co-led by Darren Cox and Frankly Chief Executive Officer Lou Schwartz, and WinView Executive Chairman Tom Rogers, who also served as Chairman of Frankly, would serve as Executive Chairman of the combined company.
For more information on the FW Transaction, see the Company’s business acquisition report dated November 13, 2020 on www.sedar.com.
Convertible Debentures
On August 19, 2020, the Company closed a first tranche of a non-brokered private placement of convertible debentures in the amount of US$5,750,000 (“2020 Convertible Debentures”). The 2020 Convertible Debentures will mature 24 months from the date of issuance and bear interest at a rate of 5% per annum (subject to the following adjustments), payable on maturity. At the Company’s option, interest under the 2020 Convertible Debentures is payable in kind in Common Shares at an issue price which would be based on the trading price of the Common Shares at the time of such interest payment. The interest rate under the 2020 Convertible Debentures will increase from 5% to 10% per annum on a prospective basis on December 19, 2020, if a public offering has not occurred by that date. The 2020 Convertible Debentures holders may convert all or a portion of the principal amount of the 2020 Convertible Debentures into units of the Company at a price equal to the lesser of (a) US$11.25 per unit, and (b) if such conversion occurs after a public offering of securities by the Company, a 15% discount to the public offering price, provided that such conversion price shall not be less than US$7.50 per unit. Notwithstanding the foregoing, if by December 19, 2020, the Company has not obtained registration rights in the United States to allow sale in the United States of the Common Shares of the Company and the exercise of Warrants of the Company to be issued pursuant to the conversion of the 2020 Convertible Debentures, holders of 2020 Convertible Debentures may convert such convertible debentures into units at US$7.50 per unit. As of December 19, 2020, the Company had not obtained registration rights in the United States. As such, the conversion price is US$7.50 per unit and the interest rate increased to 10% on December 19, 2020.
Each unit is comprised of one Common Share and one-half of one warrant, with each Warrant exercisable into one Common Share of the Company at an exercise price of US$15.00 per share for a period of three years from the issuance of the 2020 Convertible Debentures. Under certain circumstances, the Company shall be entitled to call for the exercise of any outstanding Warrants in the event.
Acquisition of Interest in One Up Group
On August 25, 2020, Engine announced it completed the acquisition of a 20.48% interest in mobile gaming company One Up Group, LLC (“One Up”). One Up operates the OneUp mobile app, which allows gamers to organize and play one-on-one matches with other gamers and compete for money. The purchase price was satisfied with the issuance of principal amount US$3 million convertible debentures, having the same terms as the 2020 Convertible Debentures, except that references therein to US$7.50 have been changed to US$9.50.
Fiscal Year Ended August 31, 2021
Financings
On September 15, 2020, the Company closed the final tranche of 2020 Convertible Debentures in the amount of US$1,901,393.
On October 16, 2020, the Company announced that it closed a first tranche of principal amount US$1,050,000 of the first US$2,000,000 draw of a US$8,000,000 stand-by convertible debenture facility (“Standby Debentures”). The Standby Debentures have substantially similar terms as the 2020 Convertible Debentures, described above, except the following: (i) the references therein to a minimum US$7.50 conversion price have been changed to US$8.90; and (ii) the Standby Debentures are only convertible into Common Shares of the Company, not units.
On October 16, 2020, the Company announced that it closed a principal US$1 million convertible debenture financing which has similar terms to the 2020 Convertible Debentures, described above, except the references therein to US$7.50 have been changed to US$7.80.
On November 20, 2020, the Company announced that it closed the final tranche of the previously announced US$2,000,000 draw of the Standby Debentures, for total proceeds of US$950,000. In connection with the Standby Debentures, the Company issued 224,719 Warrants, with each Warrant exercisable into a Common Share at an exercise price of US$15.00 until November 20, 2024.
On December 2, 2020, the Company announced that its wholly-owned subsidiaries Frankly Media LLC and Frankly have amended the existing secured credit facility (as amended, the “EB Loan”) with arm’s length lender EB Acquisition Company, LLC (the “EB Lender”), in connection with the advance of an additional US$1,000,000 under the EB Loan, which is convertible at the option of the EB Lender, at a conversion price per share of US$11.25. The credit limit under the EB Loan of US$5 million is now fully drawn. In connection with the amendment, the maturity date of the EB Loan has been extended from January 5, 2021 until January 5, 2022. Additionally, the Company has guaranteed the obligations under the EB Loan and has granted a security interest in favour of the EB Lender over the assets of the Company. In consideration of the extension of the maturity date, the Company has agreed to issue to the EB Lender an aggregate of 6,666 Common Shares and an amendment fee of US$100,000 which forms part of the outstanding principal under the EB Loan. The Common Shares issuable will be subject to a hold period expiring four months and a day following the date of issuance, as well as restrictions on transfer under applicable securities laws.
On January 8, 2021 the Company settled convertible debentures (the “Debt Settlements”) of an aggregate principal amount of US$10,726,393 in outstanding convertible debentures through the issuance of 1,430,186 units at a deemed price of US$7.50 per unit, with each unit consisting of a Common Share and three-quarters of a warrant, with each whole Warrant exercisable into a Common Share at an exercise price of US$15.00 per share for a period of three years. Included in the Debt Settlements was the US$3,000,000 convertible debenture that was issued in connection with the Company’s acquisition of an interest in One Up.
On December 23, 2020, the Company announced its intention to complete a non-brokered private placement of up to approximately 3,300,000 units at a price of US$7.50 per unit for gross proceeds of up to US$25,000,000 (“December 2020 Private Placement”). Each Unit consists of one Common Share and one-half of one common share purchase warrant. Each whole Warrant entitles the holder to acquire one additional Common Share of the Company at a price of US$15.00 per share for a period of 3 years provided that: (i) if the Common Shares are listed for trading on Nasdaq, (ii) the Company completes an offering of securities under a short form prospectus for an aggregate amount of at least US$30,000,000, and (iii) the closing price of the Common Shares on Nasdaq is US$30.00 or greater for a period of 15 consecutive trading days, then the Company may accelerate the expiry date of the warrants to the 30th day after the date written notice is provided to the holders.
On January 8, 2021, the Company closed the first tranche of the December 2020 Private Placement for aggregate gross proceeds of US$10,540,883 and 1,405,451 units were issued. The Company paid cash commissions to eligible finders totaling US$284,989 and also issued the following securities as partial payment of commissions to finders: 36,948 units; and, 74,947 finders warrants, with each finder warrant exercisable into a common share at an exercise price of US$15.00 per share for 3 years subject to the same acceleration terms described above.
In January and February 2021, the Company completed multiple tranches of equity financings totaling 4,371,767 units at an issue price of US$7.50 per unit, for gross proceeds of US$32,788,253. Each unit consisted of one Common Share and one-half of one Common Share purchase warrant. Each whole Warrant entitles the holder to acquire one additional share of the Company at a price of US$15.00 per share for a period of 3 years provided that: (i) if the Common Shares are listed for trading on Nasdaq, (ii) the Company completes an offering of securities under a short form prospectus for an aggregate amount of at least $30,000,000, and (iii) the closing price of the Common Shares on Nasdaq is $30.00 or greater for a period of 15 consecutive trading days, then the Company may accelerate the expiry date of the warrants to the 30th day after the date written notice is provided to the holders.
On February 26, 2021 the EB Lender converted the EB Loan into a US$5,000,000 secured convertible debenture, which is convertible into units of the Company at a conversion price of US$10.25 per unit. Each such unit is comprised of one Common Share and one-half of one common share purchase warrant, with each whole Warrant exercisable into a Common Share at an exercise price of US$15.00 per share for a period of three years from the issuance of the convertible debenture.
On March 25, 2021, the Company filed a final short form base shelf prospectus (with the securities regulators in each province of Canada, except for the Province of Québec) (the “Base Shelf Prospectus”) and a corresponding shelf registration statement on Form F-10 with the SEC. The prospectus and registration statement allow the Company to offer up to US$150 million of common shares, preference shares, warrants, subscription receipts, debt securities, units, or any combination thereof during the 25-month period that the shelf prospectus is effective.
On June 7, 2021, the Company received approval to list its shares on Nasdaq. The Company’s Common Shares commenced trading on Nasdaq on June 17, 2021.
On August 10, 2021, the Company entered into an at-the-market Equity Distribution Agreement (the “Equity Distribution Agreement”) with Canaccord Genuity LLC (“Canaccord”), on behalf of itself and co-sales agents Oppenheimer & Co. Inc. and B. Riley Securities, Inc., to establish an at-the-market equity program (the “ATM Program”). Under the ATM Program, the Company will have the flexibility through the expiration date of its Base Shelf Prospectus to issue up to US$50 million of Common Shares as needed to support the Company’s ongoing business activities. Any Common Shares sold under the ATM Program will be sold at the prevailing market price at the time of sale, when sold through Nasdaq. No Common Shares will be offered or sold in Canada. As of the date hereof, the Company has not yet issued any shares under the ATM Program.
Patent Lawsuits against DraftKings and FanDuel
On July 7, 2021, Engine announced that its Winview subsidiary commenced an action in the United States District Court for the District of New Jersey against DraftKings Inc. (“DraftKings Inc.”) (Nasdaq: DKNG), alleging infringement of patents owned by Winview. The lawsuit alleges that various gaming services provided by DraftKings infringe Winview’s United States Patent No. 9,878,243 (the “‘243 Patent”) entitled “Methodology for Equalizing Systemic Latencies in Television Reception in Connection with Games of Skill Played in Connection with Live Television Programming” and United States Patent No. 10,721,543 (the “543 Patent”) entitled “Method Of and System For Managing Client Resources and Assets for Activities On Computing Devices.” The action seeks the recovery of damages and other appropriate relief.
On July 20, 2021, Engine announced that its Winview subsidiary commenced an action in the United States District Court for the District of New Jersey against FanDuel, Inc. (“FanDuel”), alleging infringement of patents owned by Winview. The lawsuit alleges that various gaming services provided by FanDuel infringe Winview’s 243 Patent and 543 Patent. The action seeks the recovery of damages and other appropriate relief.
On July 29, 2021, Engine announced that its Winview subsidiary filed amended complaints in its patent infringement lawsuits against DraftKings, and FanDuel, which are pending in the United States District Court for the District of New Jersey, to include allegations that the gaming services provided by DraftKings and FanDuel infringe two additional patents owned by Winview: United States Patent No. 9,993,730 entitled “Methodology for Equalizing Systemic Latencies in Television Reception in Connection with Games of Skill Played in Connection with Live Television Programming,” and United States Patent No. 10,806,988 entitled “Method Of and System For Conducting Multiple Contests of Skill with a Single Performance.” These actions seek the recovery of damages and other appropriate relief.
Acquisition of SideQik
On July 6, 2021, the Company announced the completion of the acquisition of SideQik. Engine will integrate SideQik with its subsidiary Stream Hatchet, a global leader in live gaming video distribution analytics and audience engagement. SideQik’s and Stream Hatchet’s combined assets will allow brands and agencies to have a one-stop-shop solution with proven expertise in evaluating and generating efficiencies across all live and non-live influencer marketing expenditures. With this focus on influencer marketing, Engine will empower brands to discover and connect with content creating influencers across any content vertical. It will provide tools to best shape the creation of authentic content that resonates with consumers, as well as best in class measurement to determine earned media value, sales effectiveness, and campaign return on investment.
Fiscal Year Ended August 31, 2022
Allinsports Arbitration
On October 1, 2021, the arbitration in Ontario commenced by the shareholders of Allinsports was completed. The arbitration sought, among other things, a ruling that the Company’s pending acquisition of Allinsports, a manufacturer of motorsports racing simulators, had been completed and that the selling shareholders were entitled to receive the outstanding payment of 966,667 Common Shares due under the acquisition agreement. The arbitrator determined that the transaction was completed and that the Allinsports shareholders are entitled to receive the outstanding share consideration under the acquisition agreement. The Company is reviewing the decision to determine its options, including other relief and remedies it may pursue.
SideQik Services Extension with HyperX
On February 10, 2022, SideQik finalized a multi-year services extension with HyperX, the gaming peripherals team at HP Inc. and brand leader in gaming and esports. HyperX will continue to leverage SideQik’s premium influencer marketing technology, enabling discovery, verification and management of creators across numerous live-streaming and social platforms. In addition, HyperX will leverage SideQik’s recently launched social commerce technology integrations, enabling tracking of individual creator and affiliate sales performance across all platforms. The end-to-end suite of services, from discovery to commerce, enables brands to effectively and efficiently grow sales through creator marketing across all major social media channels.
Sale of Eden Games
On April 7, 2022, Engine sold its 96% interest in Eden Games for approximately USD$15.3 million (approximately CAD$19.2 million) in cash consideration. To facilitate the sale of Eden Games, under a separate agreement, the Company agreed to purchase Euro-denominated 6% promissory notes amounting to EUR$1,453,154 ($1,558,319) that were due to the former co-founders of Eden Games from third parties. EUR$1,081,081 ($1,181,005) of the consideration was paid on the closing of the sale with the remainder due in two equal payments on April 4, 2023, and October 6, 2023.
Sale of UMG Media Ltd. Assets
On June 13, 2022, Engine Gaming and Media, Inc. entered into an Agreement to sell certain assets of UMG for $100 to Harena Data, Inc. (“Harena”). On June 30, 2022, the Company completed the sale. Concurrently with the sale agreement the Company entered into a transition services agreement with the purchaser for a total value of $300,000 with payments beginning July 31, 2022, and the remainder to be paid in full, 12 months following the first payment. Harena will take ownership of the UMG online business, which hosts daily tournaments and matches for competitive e-sports players, as well as the ownership of the studio and media properties under UMG including its social channels.
Discontinued Operations of Winview
During the fourth quarter of fiscal 2022, The Company executed a plan to discontinue operating the Winview business, following a strategic decision to focus the Company’s resources on the key revenue streams of software-as-a-service and advertising. Winview was previously part of the Company’s Gaming segment.
Recent Developments
Frankly Media Partnership with Aggregated Media
On October 3, 2022, Frankly Media, announced a partnership with Aggregated Media (“A8”), an esports and video game culture media company. The partnership enables Frankly Media to monetize A8’s content via their premium yield advertising services and maximize their audience reach through Frankly Media’s video streaming platform, mobile apps and OTT/CTV.
Frankly Media Partnership with Filmfeed, Inc.
On October 10, 2022, Frankly Media announced a partnership with Filmfeed, Inc. The partnership enables Frankly to monetize their recently launched Stash TV video streaming content via their premium yield advertising services. Frankly Media’s Programmatic Advertising monetization services are being leveraged for their revenue growing AI technology, audience insight solutions and performance tracking tools to better track and importantly, monetize newly launched Stash TV CTV streaming content.
Amended and Settled 2020 Series Convertible Debt
Subsequent to August 31, 2022, the remaining $750,000 principal value of the Company’s 2020 Series convertible debt that was due to mature in November 2022 was either settled by offset against the Company’s promissory notes receivable or amended. Two of the three parties holding the convertible debt agreed to allow the Company to offset principal of $500,000 and interest of $91,781 due at maturity against the Company’s promissory notes receivable. The remaining $250,000 principal value convertible debt was amended to extend the maturity date to February 28, 2023, with all other terms remaining unchanged.
Definitive Arrangement Agreement with GameSquare Esports Inc.
On December 7, 2022 Engine entered into a definitive arrangement agreement (the “Arrangement Agreement”) with GameSquare Esports Inc. (“GameSquare”) to combine businesses in an all share transaction, whereby each common share of GameSquare will be exchanged for 0.08262 Common Shares (the “Arrangement”). Following the all-share transaction, former GameSquare shareholders are expected to own approximately 60% of the combined entity, and current Engine shareholders are expected to own approximately 40% of the combined entity on a fully diluted basis, and it is intended that the Common Shares will continue to trade on Nasdaq and TSXV, in each case, under the symbol “GAME.” The combined entity will retain the “GameSquare” brand globally.
The Arrangement is anticipated to close in the first quarter of 2023. The completion of the Arrangement is subject to customary terms and conditions, including the following: approval of the Arrangement by Engine and GameSquare shareholders; court approval of the Arrangement; and, receipt of all required regulatory approvals, including acceptance by the TSXV.
Business of Engine
Engine is a building a leading media and gaming platform for sports and esports for fans, publishers, influencers, and brands. The Company offers a unique combination of esports content, streaming technology, gaming platforms, data analytics and intellectual property.
Engine is focused on accelerating new, live, immersive esports and interactive gaming experiences for consumers through its partnerships with traditional and emerging media companies. Engine clients include more than 1,200 television, print and radio brands including CNN, ESPN, Discovery / Eurosport, Fox, Vice, Newsweek, and Cumulus; dozens of gaming and technology companies including EA, Activision, Blizzard, Take2Interactive, Microsoft, Google, Twitch, and Ubisoft; and has connectivity into hundreds of millions of homes around the world through content, distribution, and technology.
Engine Media operates a portfolio of businesses that bring together key capabilities and technology for the benefit of its customers. Engine’s media focused businesses include Frankly, Stream Hatchet, and SideQik.
Engine generates revenue through a combination of subscription fees; streaming technology and data software-as-a-service (“SaaS”) based offerings; and, programmatic advertising and sponsorships.
Media
Frankly Inc.
Frankly, through its wholly-owned subsidiary Frankly Media, LLC, provides a complete suite of solutions that give publishers a unified workflow for the creation, management, publishing and monetization of digital content to any device, while maximizing audience value and revenue.
Frankly’s products include an online video platform for Live, Video-on-Demand (“VOD”) and Live-to-VOD workflows, a full-featured content management system with rich storytelling capabilities, as well as native apps for iOS, Android, Apple TV, Fire TV and Roku.
Frankly also provides comprehensive advertising products and services, including direct sales and programmatic ad support. With the release of its server-side ad insertion (SSAI) platform, Frankly has been positioned to help video producers take full advantage of the growing market in addressable advertising.
SideQik, Inc.
SideQik is an influencer marketing platform that offers brands, direct marketers, and agencies tools to discover, connect and execute marketing campaigns with content creators. SideQik’s end-to-end solutions offer marketers advanced capabilities to discover influencers with demographic and content filtering; connect and message influencers; share marketing collateral such as campaign briefs, photos, logos, videos; measure reach, sentiment, and engagement across all major social media platforms; and evaluate earned media value and return on investment across the entire campaign.
Gaming
Stream Hatchet
Stream Hatchet is a data analytics company based in Terrassa, Spain, providing intelligence for persons and entities involved in video game streaming. Stream Hatchet provides real-time data analytics and viewership information that assists in the development and marketing decisions of the Company’s initiatives These unique data analytic capabilities provide the Company an edge in accessing sponsorships and promotions from major brands focused on esports, as the Company has proprietary data on esports viewership, brand exposure and sponsorship valuation to quantify the value of our brand exposure on multiple streaming platforms around the globe.
WinView
The Company discontinued operations of WinView on July 31, 2022.
Industry Overview and Principal Markets
Video gaming is one of the largest and fastest growing markets in the entertainment sector, with an estimated 2.6 billion gamers globally, with esports being the major source of growth. Esports is a term that comprises a diverse offering of competitive electronic games that gamers play against each other. One of the biggest differences between esports and video games of old is the community and spectator nature of esports - the competitive play against another person, either one-on-one or in teams, is a central feature of esports. Since players play against each other online, a global network of players and viewers has developed as these players compete against each other worldwide. Additionally, game developers have greatly increased the entertainment value of games, which has made the spectator aspect of gaming much more prevalent and further drives expansion of the gaming market.
The expanded reach of broadband service and the computer technology advances in the last decade have also greatly accelerated the growth of esports. Esports has become so popular that many high schools and colleges now offer programs to support students’ interest in esports, as well as tournaments and scholarships. The best-known esports teams are receiving marquee sponsorships and are being purchased or invested in by a range of financial and strategic partners. The highest profile esports gamers have significant online audiences as they stream themselves playing against other players online and potentially can generate millions of dollars in sponsorship money and affiliate fees from their online streaming channels. It is projected that by 2023, approximately 650 million people will be watching esports globally. Most major professional esports events and a wide range of amateur esports events are broadcast live via streaming services, including Twitch.tv, Youtube.com and Facebook Gaming.
Seasonality
There is seasonality in both the Advertising and SaaS business. Advertising cost-per-impressions (CPMs), the standard metric for evaluating the price an advertiser is willing to pay for digital inventory, historically peaks in calendar fourth quarter given the increased consumer expenditure that occurs during that time. SaaS tends to follow a slightly alternative seasonal trend, with higher demand in first three calendar quarters with fourth quarter being lighter, as organizations need to be onboarded onto technologies to maximize their fourth quarter revenue opportunities.
Market Channels
The Company predominantly leverages two marketing channels: (1) content and (2) paid search. The Company will produce regular white papers, social, and blog posts that portray thought leadership within its industry. In addition, the Company will purchase advertisements on search engines, such as Google, for keywords often used by purchasers when seeking a product or service the Company offers.
Revenue Model
Overview
The Company generates revenue through a combination of (i) business-to-business SaaS subscription and professional service fees; and (ii) programmatic advertising sales and brand sponsorships. The Company is uniquely positioned with a base of predictable business-to-business revenues and an extensive network of media and gaming publisher relationships. These media and gaming publishers engage over one hundred (100) million monthly active users. Leveraging these relationships to efficiently create awareness for our gaming competition platform, where players and fans can play, watch and engage with other members of the esports community, is key to the Company’s long-term growth strategy.
Brands
 | Stream Hatchet Stream Hatchet is a data analytics company based in Terrassa, Spain, providing intelligence for persons and entities involved in video game streaming. Stream Hatchet provides real-time data analytics and viewership information that assists in the development and marketing decisions of the Company’s initiatives. These unique data analytic capabilities provide the Company an edge in accessing sponsorships and promotions from major brands focused on esports, as the Company has proprietary data on esports viewership, brand exposure and sponsorship valuation to quantify the value of our brand exposure on multiple streaming platforms around the globe.
|
 | SideQik SideQik is an influencer marketing platform that offers brands, direct marketers, and agencies tools to discover, connect and execute marketing campaigns with content creators. SideQik’s end-to-end solutions offer marketers advanced capabilities to discover influencers with demographic and content filtering; connect and message influencers; share marketing collateral such as campaign briefs, photos, logos, videos; measure reach, sentiment, and engagement across all major social media platforms; and evaluate earned media value and return on investment across the entire campaign. |
| | |
 | Frankly Media Frankly Media provides a complete suite of content management, video streaming and engagement solutions that give broadcasters and publishers a unified workflow for the creation, management, publishing and monetization of digital content to any device, while maximizing audience value and revenue. Frankly delivers publishers and their audiences the solutions and services to meet the dynamic challenges of a multi-screen content distribution world. Frankly Media’s products include an online video platform for Live, VOD and Live-to-VOD workflows, a full-featured CMS with rich storytelling capabilities, as well as native apps for iOS, Android, Apple TV, Fire TV and Roku. Additionally, Frankly’s in-house team of digital advertising sales and operations experts monetize billions of monthly display and video advertising impressions through programmatic and direct brand sales across client and owned and operated media properties. Frankly has over 1,200 radio, TV and print media brands, including CNN, Newsweek and Vice Media; TV affiliates of NBC, CBS, FOX and ABC, and radio station groups such as Cumulus. |
Breakdown of Revenue Streams
The following table provides the breakdown for the main streams of revenue from continuing operations for the three most recently completed financial years:
| Source of Revenue | | Year ended August 31, 2022 ($) | | | Year ended August 31, 2021 ($) | | | Year ended August 31, 2020 ($) | |
| Software-as-a-service | | | 9,220,069 | | | | 7,952,426 | | | | 3,361,181 | |
| | | | | | | | | | | | | |
| Advertising | | | 32,662,544 | | | | 25,392,842 | | | | 4,085,446 | |
| | | | | | | | | | | | | |
| Total | | | 41,882,613 | | | | 33,345,268 | | | | 7,446,627 | (1) (2) (3) |
Notes:
| (1) | The sale of Eden Games was completed on April 6, 2022. Revenue of Eden Games of $2,732,846 is not included in the table above as it is part of discontinued operations. |
| (2) | A disposition of UMG Events LLC assets took place on June 13, 2022. Revenue of UMG of $314,948 is not included in the table above as it is part of discontinued operations. |
| (3) | The Company discontinued operations of WinView on July 31, 2022. Revenue of WinView of $51,422 is not included in the table above as it is part of discontinued operations. |
| Geography | | Year ended August 31, 2022 ($) | | | Year ended August 31, 2021 ($) | | | Year ended August 31, 2020 ($) | |
| United States | | | 39,976,476 | | | | 31,943,288 | | | | 6,405,111 | |
| | | | | | | | | | | | | |
| Spain | | | 1,906,137 | | | | 1,401,980 | | | | 1,041,516 | |
| | | | | | | | | | | | | |
| Total | | | 41,882,613 | | | | 33,345,268 | | | | 7,446,627 | (1) (2) (3) |
Notes:
| (1) | The sale of Eden Games was completed on April 6, 2022. Revenue of Eden Games of $2,732,846 is not included in the table above as it is part of discontinued operations. |
| (2) | A disposition of UMG Events LLC assets took place on June 13, 2022. Revenue of UMG of $314,948 is not included in the table above as it is part of discontinued operations. |
| (3) | The Company discontinued operations of WinView on July 31, 2022. Revenue of WinView of $51,422 is not included in the table above as it is part of discontinued operations. |
Customers
The Company has different business segments which target different customers.
Frankly’s services are currently being used by approximately 1,200+ U.S. local news and radio stations, mostly affiliated with large broadcasting networks such as Cumulus, NBC, CBS, FOX and ABC.
Stream Hatchet’s customers include industry leaders such as Microsoft, Allied Esports, Activision and Twitch.
Foreign Operations
Although the Company is headquartered in Canada, the majority of its business is conducted outside of Canada:
| | ● | Stream Hatchet has an office in Terrassa, Spain; |
| | ● | Frankly has an office in Atlanta, Georgia; |
| | ● | SideQik has an office in Atlanta, Georgia. |
See Item 3.D – Risk Factors.
Competitive Conditions
The Company competes in highly competitive and fragmented sectors, which include esports content, streaming technology, gaming platforms, data analytics and intellectual property. Some of the Company’s most direct competitors in North America and Europe include well capitalized and multinational companies.
The major competitors in the Company’s markets include:
| | ● | Nielsen Holdings Plc |
| | ● | CreatorIQ |
| | ● | TownNews.com |
Despite intense competition, the Company believes it is well positioned to compete with its competitors by means of having an experienced management team and directors, integrated business model, in-house data analytics and in being a market leader in expanding key verticals. The Company’s management and directors have broad and extensive experience, an optimal blend of abilities across channels and assets, and a global footprint. The Company currently holds a number of growth assets that offer its customers the ability to deliver marketing and analytics to an expanding global customer base.
Proprietary Protection
The Company considers the creation, use, and protection of intellectual property to be crucial to its business. The Company’s general practice is to require all key employees and consultants to sign confidentiality agreements and assign all rights of inventions to the Company. In addition to the above contractual arrangements, the Company also relies on a combination of trade secret, copyright, domain name and other legal rights to protect its intellectual property. The Company typically owns the copyright to the software code to its content. The Company believes that it has provided sufficient security for its intellectual property.
Non-patent intellectual properties owned by the Company include:
| | ● | Trade secrets and know-how that it uses to develop processes; |
| | ● | Common law trademarks, including product names and graphics, music and other audio-visual elements of games; |
| | ● | Software code relating to its products; |
| | ● | Certain program assets; and |
Employees
As at August 31, 2022, the Company had approximately 113 employees globally. Of these employees, approximately 3 are located in Canada, 24 in Spain, 9 in India, and 77 in the United States. None of the Company’s employees are represented by a collective bargaining agreement. The Company considers its relations with its employees to be strong and views its employees as an important competitive advantage.
Specialized Skill and Knowledge
Specialized skill and knowledge is necessary to capitalize on significant trends, esports, news streaming and gaming. The Company has assembled experienced management and technical teams within its portfolio companies.
As part of the Company’s acquisition of Frankly and WinView, media/technology industry veteran, founder of CNBC and long-time CEO of TiVo, Tom Rogers, joined the Company as executive chairman and board member. Additionally, seasoned executive Lou Schwartz joined the Company and is now its CEO.
Stream Hatchet are the leaders in the provision of data for esports companies from leading streaming platforms. Stream Hatchet has developed unique back-end IP and technology for its data collection services.
The SideQik software platform enables discovery, collaboration, and technology integration with social media influencers, as well as engagement with a target audience, across all major social media platforms. The discovery feature in the software enables searching of relevant influencers by keywords, interest, location, brand affinity, and other such parameters. The audience engagement tool utilizes artificial intelligence to provide insight into how influencers perform before launching a relationship. Audience analytics breakdown demographics of users and audiences by age, gender, race, income, and other such parameters to ensure audiences align with target demographics. The influencer relationship manager streamlines communication with influencers with messages, emails, and attachments centralized inside of the platform. Customizable groups allow users to organize and identify influencers and group them by different pre-sets.
| C. | Organizational Structure |
The following is a summary of the inter-corporate relationships between the Company and its wholly-owned subsidiaries, which together comprise the consolidated Company as at the date of this Annual Report:
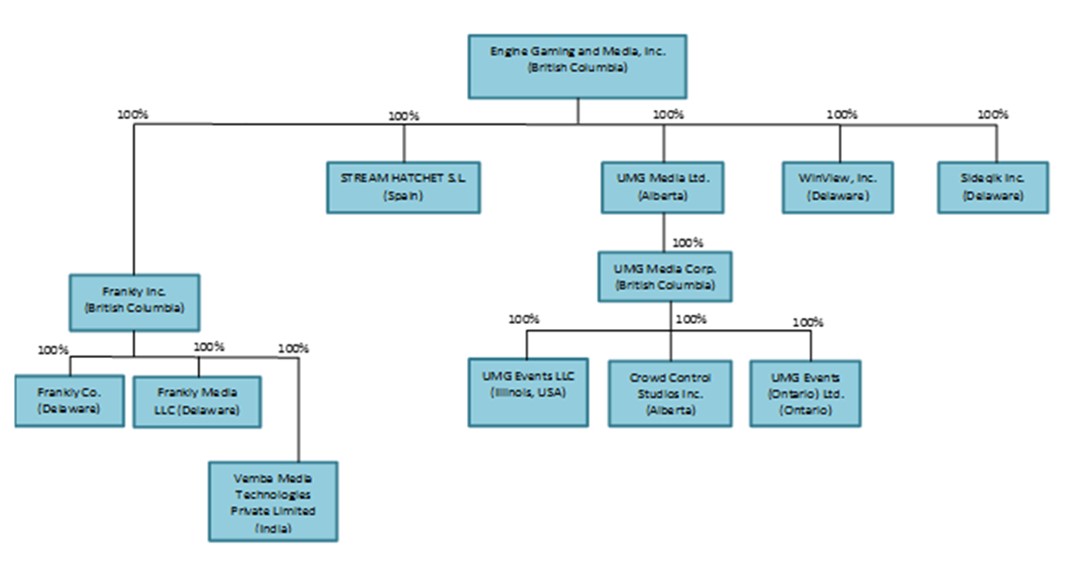
| D. | Property, Plants and Equipment |
Not applicable.
| ITEM 4A. | UNRESOLVED STAFF COMMENTS |
Not applicable.
| ITEM 5. | OPERATING AND FINANCIAL REVIEW AND PROSPECTS |
The following Operating and Financial Review and Prospects section is intended to help the reader understand the factors that have affected the Company’s financial condition and results of operations for the historical period covered by the financial statements and management’s assessment of factors and trends which are anticipated to have a material effect on the Company’s financial condition and results in future periods. This section is provided as a supplement to, and should be read in conjunction with, our Consolidated Financial Statements and the other financial information contained elsewhere in this document. Our Consolidated Financial Statements have been prepared in accordance with International Reporting Standards as issued by the International Accounting Standards Board (“IFRS”). Our discussion contains forward-looking statements based on current expectations that involve risks and uncertainties, such as our plans, objectives and intentions. Our actual results may differ from those indicated in such forward-looking statements.
Selected Annual Information
| | | For the years ended | |
| | | August 31, 2022 | | | August 31, 2021 | |
| | | | | | | |
| Operating results | | | | | | | | |
| Total revenues | | $ | 41,882,613 | | | $ | 33,345,268 | |
| Total expenses | | | 58,284,217 | | | | 57,793,056 | |
| Total net income (loss) from continuing operations | | | (16,466,823 | ) | | | (24,477,712 | ) |
| Total net gain (loss) from discontinued operations | | | 1,988,225 | | | | (16,243,099 | ) |
| Comprehensive income (loss) | | | (14,084,670 | ) | | | (40,710,561 | ) |
| | | | | | | | | |
| Loss per share – Continuing operations | | | | | | | | |
| Basic income (loss) per share | | $ | (1.05 | ) | | $ | (2.06 | ) |
| Diluted income (loss) per share | | $ | (1.05 | ) | | $ | (2.06 | ) |
The total expenses above for the year ended August 31, 2022, include a non-cash decrease in the fair value of warrant liability of $4.7 million, discussed in more detail below.
Revenue
| | | | | | | | | Increase | |
| For the year ended August 31, | | 2022 | | | 2021 | | | (decrease) | |
| | | | $ | | | | $ | | | | $ | |
| | | | | | | | | | | | | |
| Software-as-a-service | | | 9,220,069 | | | | 7,952,426 | | | | 1,267,643 | |
| Advertising | | | 32,662,544 | | | | 25,392,842 | | | | 7,269,702 | |
| | | | 41,882,613 | | | | 33,345,268 | | | | 8,537,345 | |
| ● | Software-as-a-service revenue for the year ended August 31, 2022, was $9,220,069 in comparison to $7,952,426 for the year ended August 31, 2021. The increase of $1,267,643 was primarily due to the full year impact of revenue recognized from the SideQik acquisition and increased SaaS revenue from the Steam Hatchet business, offset to some degree by lower SaaS revenue at Frankly. |
| | |
| ● | Advertising revenue for the year ended August 31, 2022, was $32,662,544 in comparison to $25,392,842 for the year ended August 31, 2021. The increase of $7,269,702 was primarily due to growth from Frankly’s largest client, which saw significant growth in traffic to its various digital properties. |
Expenses
| | | | | | | | | Increase | |
| For the year ended August 31, | | 2022 | | | 2021 | | | (decrease) | |
| | | | $ | | | | $ | | | | $ | |
| | | | | | | | | | | | | |
| Salaries and wages | | | 14,086,955 | | | | 12,161,000 | | | | 1,925,955 | |
| Consulting | | | 2,253,836 | | | | 2,223,147 | | | | 30,689 | |
| Professional fees | | | 1,920,663 | | | | 1,771,190 | | | | 149,473 | |
| Revenue sharing expense | | | 30,090,316 | | | | 22,853,680 | | | | 7,236,636 | |
| Advertising and promotion | | | 1,187,161 | | | | 1,299,909 | | | | (112,748 | ) |
| Office and general | | | 5,282,145 | | | | 2,406,678 | | | | 2,875,467 | |
| Technology expenses | | | 3,062,181 | | | | 2,309,248 | | | | 752,933 | |
| Amortization and depreciation | | | 1,242,383 | | | | 1,112,863 | | | | 129,520 | |
| Share-based payments | | | 4,688,218 | | | | 3,702,754 | | | | 985,464 | |
| Interest expense | | | 729,848 | | | | 1,274,998 | | | | (545,150 | ) |
| (Gain) loss on foreign exchange | | | 400,521 | | | | 1,090,944 | | | | (690,423 | ) |
| Loss on extinguishment of debt | | | - | | | | 2,428,900 | | | | (2,428,900 | ) |
| Gain on retained interest in former associate | | | - | | | | (99,961 | ) | | | 99,961 | |
| Transaction costs | | | 1,327,990 | | | | 341,702 | | | | 986,288 | |
| Arbitration settlement reserve | | | (5,775,717 | ) | | | 6,468,330 | | | | (12,244,047 | ) |
| Impairment expense | | | 3,873,000 | | | | - | | | | 3,873,000 | |
| Restructuring costs | | | 177,952 | | | | - | | | | 177,952 | |
| Change in fair value of promissory notes receivable and investment at FVTPL | | | 873,778 | | | | (581,812 | ) | | | 1,455,590 | |
| Change in fair value of warrant liability | | | (4,748,893 | ) | | | (9,037,108 | ) | | | 4,288,215 | |
| Change in fair value of convertible debt | | | (2,388,120 | ) | | | 6,066,594 | | | | (8,454,714 | ) |
| | | | 58,284,217 | | | | 57,793,056 | | | | 491,161 | |
| ● | Salaries and wages for the year ended August 31, 2022, was $14,086,956 in comparison to $12,161,000 for the year ended August 31, 2021. The increase of $1,925,956 was primarily due to the full-year impact of the acquisition of SideQik which increased salaries and wages by $3.7 million from the prior year, the increase was offset somewhat by restructuring actions completed during 2022. |
| | |
| ● | Revenue sharing for the year ended August 31, 2022, was $30,090,316 in comparison to $22,853,680 for the year ended August 31, 2021. These costs are the full year share of our gross advertising revenue paid to Frankly’s customers. |
| | |
| ● | Office and general for the year ended August 31, 2022, was $5,282,145 in comparison to $2,406,678 for the year ended August 31, 2021. The increase of $2,875,467 was related to the directors’ and officers’ insurance acquired during the Nasdaq up-listing process as well as to a smaller extent, office, and general expenses from the SideQik acquisition, which did not impact the comparable period. |
| | |
| ● | Technology for the year ended August 31, 2022, was $3,062,181 in comparison to $2,309,248 for the year ended August 31, 2021. The increase of $752,933 was due to the acquisition of SideQik full-year impact, somewhat offset by technology savings at Frankly. |
| | |
| ● | Share-based payments expense for the year ended August 31, 2022, was $4,688,218 in comparison to $3,702,754 for the year ended August 31, 2021. The increase of $985,464 was due to a full year of share-based payment expense related to employees from the acquisition of SideQik as well as stock options and restricted stock units granted to officers and directors, during the year. |
| ● | Interest expense for the year ended August 31, 2022, was $729,848 in comparison to $1,274,998 for the year ended August 31, 2021. The decrease of $545,150 was primarily due to significantly lower average principal balance during fiscal 2022 than 2021. |
| | |
| ● | Loss on foreign exchange for the year ended August 31, 2022, was $400,521 in comparison to of $1,090,944 for the year ended August 31, 2021. The decrease of $690,423 was due primarily to the weakening of the US dollar versus the Canadian dollar in the comparable period. |
| | |
| ● | Loss on extinguishment of debt was $0 for the year ended August 31, 2022, compared to $2,428,900 for the year ended August 31, 2021, as no debt extinguishments occurred in fiscal 2022. |
| | |
| ● | Transaction costs for the year ended August 31, 2021, was $1,327,990, in comparison to $341,702 for the year ended August 31, 2021. The increase of $986,288 was related to financing work that didn’t impact the comparable period as well as costs related to the disposal of Eden Games. |
| | |
| ● | Arbitration settlement reserve for the year ended August 31, 2022, was a benefit of $5,775,717, in comparison to expense of $6,468,330 for the year ended August 31, 2021. We recognized a liability for an arbitration ruling, relating to AIS, which represents the fair value of the Common Shares directed to be delivered as of August 31, 2022. This liability was adjusted to fair value at the end of each reporting period. |
| | |
| ● | Impairment expense for the year ended August 31, 2022, was $3,873,000 in comparison to $0 for the year ended August 31, 2021. The increase was due to full impairment of SideQik goodwill, and $972,807 impairment allocated across the related software, brand and customer lists intangibles. The fiscal 2022 impairment was primarily driven by a delay in future forecasted revenue growth. |
| | |
| ● | Change in fair value of promissory notes receivable and investment at FVTPL for the year ended August 31, 2022, increased expense by $873,778 in comparison to decreasing expense $581,812 for the year ended August 31, 2021. The change of $1,455,590 was primarily due to a fair value adjustment of promissory notes receivable in 2022, these notes were acquired in 2022. |
| | |
| ● | Change in fair value of warrant liability for the year ended August 31, 2022, decreased expense by $4,748,893 in comparison to decreasing expense $9,037,108 for the year ended August 31, 2021. The change of $4,288,215 in the warrant liability is a result of the revaluation of the Company’s warrant obligation at each period end, driven by lower share price. |
| | |
| ● | Change in fair value of convertible debt for the year ended August 31, 2022, decreased expense by $2,388,120 in comparison to an increase in expense of $6,066,594 for the year ended August 31, 2021. The change of $8,454,714 is a result of the revaluation of the Company’s convertible debt at each period end, with a lower share price on August 31, 2022, than the comparable year. In addition, the change was impacted by a substantial decrease in outstanding convertible debt as of August 31, 2022. |
Other items
| | | | | | | | Increase | |
| For the year ended August 31, | | 2022 | | | 2021 | | | (decrease) | |
| | | | $ | | | | $ | | | | $ | |
| | | | | | | | | | | | | |
| Share of net loss of associate | | | - | | | | 103,930 | | | | (103,930 | ) |
| Gain (loss) on disposal of subsidiary | | | 14,934,149 | | | | (678,931 | ) | | | 15,613,080 | |
| Gain (loss) on disposal of assets | | | 257,550 | | | | - | | | | 257,550 | |
| Gain (loss) from discontinued operations | | | (13,203,474 | ) | | | (15,564,168 | ) | | | 2,360,694 | |
| Net loss attributable to non-controlling interest | �� | | (65,219 | ) | | | 74,006 | | | | (139,225 | ) |
| Foreign currency translation differences | | | 393,928 | | | | 10,250 | | | | 383,678 | |
| ● | The Gain (loss) on disposal of subsidiary for the year ended August 31, 2022, was a gain of $14,934,149 in comparison to a loss of $678,931 for the year ended August 31, 2021. The increase of $15,613,080 was primarily due to the gain on the sale of Eden that closed in 2022. The $678,931 loss on the disposal of Motorsports was a fiscal 2021 event. |
| | |
| ● | The Loss from discontinued operations for the year ended August 31, 2022, was $13,203,474 in comparison to $15,564,168. 2022 period primarily includes losses from Winview of $13.3 million and UMG of $2.3 million, offset by a gain of $1.3 million from Eden Games discontinued operations and a $1.1 million gain on disposal of a liability from the Motorsports discontinued operation. 2021 period primarily includes the losses from UMG of $5.9 million, Winview losses of $5.8 million, Eden losses of $2.7 million and losses of $.9 million from the Motorsports discontinued operation. |
| | |
| ● | Foreign currency translation differences for the year ended August 31, 2022, was a gain of $ $393,928 in comparison to $10,250 for the year ended August 31, 2021. The increase of $383,678 was due to fluctuations in trading foreign currencies against the US dollar. Primarily the Euro at our Stream Hatchet business have Euro functional currencies. As such, when translating into US dollars, any changes resulting from change in foreign currency exchange rates are recorded within the foreign currency translation reserve. |
Segmented analysis
For the year ended August 31, 2022
| | | Gaming | | | Media | | | Corporate and Other | | | Total | |
| | | $ | | | $ | | | $ | | | $ | |
| Revenue | | | | | | | | | | | | | | | | |
| External sales | | | 1,906,137 | | | | 39,976,476 | | | | - | | | | 41,882,613 | |
| | | | | | | | | | | | | | | | | |
| Results | | | | | | | | | | | | | | | | |
| Segment loss | | | (706,528 | ) | | | (11,436,185 | ) | | | - | | | | (12,142,713 | ) |
| | | | | | | | | | | | | | | | | |
| Central administration costs | | | - | | | | - | | | | 9,788,532 | | | | 9,788,532 | |
| Other gains and losses | | | (6,490 | ) | | | 4,059,247 | | | | (10,312,246 | ) | | | (6,259,489 | ) |
| Finance costs | | | 57 | | | | 1,193 | | | | 728,598 | | | | 729,848 | |
| Income (loss) before tax | | | (700,095 | ) | | | (15,496,625 | ) | | | (204,884 | ) | | | (16,401,604 | ) |
| Income tax | | | - | | | | - | | | | - | | | | - | |
| Gain (Loss) for the period from: | | | | | | | | | | | | | | | | |
| Discontinued operations | | | (12,547,685 | ) | | | - | | | | 14,535,910 | | | | 1,988,225 | |
| Non-controlling interest in net loss | | | - | | | | - | | | | (65,219 | ) | | | (65,219 | ) |
| Net income (loss) | | | (13,247,780 | ) | | | (15,496,625 | ) | | | 14,265,807 | | | | (14,478,598 | ) |
For the year ended August 31, 2021
| | | Gaming | | | Media | | | Corporate and Other | | | Total | |
| | | $ | | | $ | | | $ | | | $ | |
| Revenue | | | | | | | | | | | | | | | | |
| External sales | | | 1,401,981 | | | | 31,943,287 | | | | - | | | | 33,345,268 | |
| | | | | | | | | | | | | | | | | |
| Results | | | | | | | | | | | | | | | | |
| Segment loss | | | (354,356 | ) | | | (7,611,679 | ) | | | - | | | | (7,966,035 | ) |
| | | | | | | | | | | | | | | | | |
| Central administration costs | | | - | | | | - | | | | 8,529,166 | | | | 8,529,166 | |
| Other gains and losses | | | 4,569 | | | | (39,258 | ) | | | 6,712,278 | | | | 6,677,589 | |
| Finance costs | | | (60 | ) | | | 512,937 | | | | 762,121 | | | | 1,274,998 | |
| Loss before tax | | | (358,865 | ) | | | (8,085,358 | ) | | | (16,003,565 | ) | | | (24,447,788 | ) |
| Income tax | | | - | | | | - | | | | - | | | | - | |
| Gain (Loss) for the period from: | | | | | | | | | | | | | | | | |
| Share of net loss of associate | | | - | | | | - | | | | (103,930 | ) | | | (103,930 | ) |
| Discontinued operations | | | (14,496,066 | ) | | | - | | | | (1,747,033 | ) | | | (16,243,099 | ) |
| Non-controlling interest in net loss | | | - | | | | - | | | | 74,006 | | | | 74,006 | |
| Net loss | | | (14,854,931 | ) | | | (8,085,358 | ) | | | (17,780,522 | ) | | | (40,720,811 | ) |
Segment loss - Segment loss includes total revenue less operating expenses including the following: salaries and wages, consulting, professional fees, revenue sharing expense, advertising and promotion, office and general, technology expenses, amortization and depreciation and share based payments.
Central administration costs - Central administration costs include corporate operating expenses including the following: salaries and wages, consulting, professional fees, advertising and promotion, office and general, technology expenses, amortization and depreciation and share based payments.
Other gains and losses - Other gains and losses includes gain / loss on foreign exchange, loss on extinguishment of debt, gain on retained interest in former associate, transaction costs, arbitration settlement reserve, impairment expense, restructuring costs, change in fair value of investment at FVTPL, change in fair value of warrant liability and change in fair value of convertible debt.
Finance costs - Finance costs includes interest expense.
| ● | Gaming net loss for the year ended August 31, 2022, was $13,247,781 in comparison to $14,854,931 for the year ended August 31, 2021. The decrease of $1,607,151 was primarily due to the year over year decrease in loss from discontinued operations. |
| ● | Media net loss for the year ended August 31, 2022, was $15,496,625 in comparison to $8,085,358 for the year ended August 31, 2021. The increase was primarily due to the inclusion full-year results of operations from the SideQik acquisition, somewhat offset by operating efficiencies in the Frankly business. |
| | |
| ● | Corporate and Other income for the year ended August 31, 2022, was $14,265,807 in comparison to net loss of $17,780,522 for the year ended August 31, 2021. The increase of $32,046,329 was primarily due the $15.1 million gain on the disposal of Eden Games, the change in fair value of convertible debt of $8.5 million, a decrease in the arbitration reserve of $12.2 million, a $2.5 million decrease in loss on extinguishment of debt, a decrease in amortization and depreciation expense of $1.1 million, a $.6 million decrease in professional fees, a $.4 million decrease in share-based payments, a $.4 million decrease in advertising and promotion expense, and a decrease in (gain) loss on foreign exchange of $.5 million. This was somewhat offset by the change in fair value of warrants of $4.3 million, a $1.7 million increase in office and general expenses, a $1.5 million increase in change in fair value of investment at FVTPL, and a increase in transaction costs of $1.0 million. |
| | | | | | From continuing operations | | | | |
| Three-month period ended | | Total revenue | | | Total income (loss) | | | Basic income (loss) per share | | | Total assets | |
| | | $ | | | $ | | | $ | | | $ | |
| August 31, 2022 | | | 11,459,973 | | | | (10,306,365 | ) | | | (0.66 | ) | | | 42,694,808 | |
| May 31, 2022 | | | 9,210,112 | | | | (4,066,518 | ) | | | (0.26 | ) | | | 58,530,202 | |
| February 28, 2022 | | | 8,998,026 | | | | (4,204,897 | ) | | | (0.27 | ) | | | 54,403,352 | |
| November 30, 2021 | | | 12,214,502 | | | | 2,110,957 | | | | 0.14 | | | | 61,138,576 | |
| August 31, 2021 | | | 10,863,340 | | | | (7,620,364 | ) | | | (0.50 | ) | | | 67,462,847 | |
| May 31, 2021 | | | 8,000,790 | | | | 3,174,086 | | | | 0.22 | | | | 71,339,843 | |
| February 28, 2021 | | | 7,564,534 | | | | (18,687,327 | ) | | | (1.85 | ) | | | 70,344,899 | |
| November 30, 2020 | | | 6,916,604 | | | | (1,344,107 | ) | | | (0.17 | ) | | | 47,362,028 | |
For the quarter ended February 28, 2021, the loss was much larger due to the change in fair value of the warrant liability and convertible debt as compared to the quarter ended November 30, 2020. For the quarter ended May 31, 2021, the profit was much larger due to the change in fair value of the warrant liability as compared to the quarter ended February 28, 2021. For the quarter ended August 31, 2021, the loss was significantly higher due to changes in the fair value of warrant liability and an accrual for the AIS related arbitration liability. For the quarter ended November 30, 2021, the profit was significantly higher due to fair value adjustment to the accrual for the AIS related arbitration liability. For the quarter ended February 28, 2022, the loss was significantly higher due the fair value adjustment to the accrual for the AIS related arbitration liability and change in fair value of warrant liability and convertible debt. The loss for the quarter ended May 31, 2022 was comparable to the loss for the quarter ended February 28, 20022. For the quarter ended August 31, 2022, the loss was significantly higher due impairment of goodwill and intangibles at our SideQik subsidiary, fair value adjustment to the accrual for the AIS related arbitration liability, change in fair value of our promissory notes receivable and change in fair value of warrant liability.
| B. | Liquidity and Capital Resources |
Liquidity and Cash Management
The Company’s approach to managing liquidity risk is to ensure that it will have sufficient liquidity to meet liabilities when due. The Company’s liquidity and operating results may be adversely affected if the Company’s access to the capital market is hindered, whether as a result of a downturn in stock market conditions generally or as a result of conditions specific to the Company.
The Company regularly evaluates its cash position to ensure preservation and security of capital as well as maintenance of liquidity. As the Company does not presently generate sufficient revenue to cover its costs, managing liquidity risk is dependent upon the ability to reduce its monthly operating cash outflow and secure additional financing. The recoverability of the carrying value of the assets and the Company’s continued existence is dependent upon the ability of the Company to raise financing in the near term, and ultimately the achievement of profitable operations.
As of August 31, 2022, the Company had current assets of $22,058,901 (August 31, 2021: $31,557,682) and current liabilities of $21,824,981 (August 31, 2021: $32,495,266). This represents a working capital surplus of $233,920 (August 31, 2021: deficiency of $937,584) which is comprised of current assets less current liabilities. The Company has not yet realized profitable operations and has incurred significant losses to date resulting in a cumulative deficit of $127,293,571 as of August 31, 2022 (August 31, 2021: $112,814,973).
The Company has plans to raise additional funds. While management has been historically successful in raising the necessary capital, it cannot provide assurance that it will be able to execute on its business strategy or be successful in future financing activities.
The Company announced on October 6, 2022, that it has commenced a process to explore and evaluate strategic options to enhance and preserve shareholder value. Potential strategic options to be explored or evaluated as part of this process may include, but are not limited to, merger, reverse merger, acquisition, other business combination, sale of assets, partnerships, joint ventures, licensing, or other strategic transactions involving Engine. The Company has not set a timetable for completion of this process and does not expect to disclose developments with respect to this process unless and until the evaluation of strategic alternatives has been completed or the Company’s Board of Directors (the “Board”) has concluded disclosure is appropriate or legally required.
Our ability to maintain sufficient liquidity could be affected by various risks and uncertainties including, but not limited to, our ability to raise additional funds through financing, those related to consumer demand and acceptance of our products and services, our ability to collect payments as they become due, achieving our internal forecasts and objectives, the economic conditions of the United States and abroad. These risk factors are described in Item 3.D – Risk Factors.
Share Consolidations
Share consolidations occurred during the period from September 1, 2020, to the date of this Annual Report:
On August 13, 2020, the Company consolidated its Common Shares on a 15 to 1 basis.
Capital management framework
The Company considers its capital to be its shareholders’ equity. As of August 31, 2022, the Company had shareholders’ equity of $15,886,591 (August 31, 2021: shareholders’ equity of $25,422,165).
The Company’s objective when managing its capital is to seek continuous improvement in the return to its shareholders while maintaining a moderate to high tolerance for risk. The objective is achieved by prudently managing the capital generated through internal growth and profitability, using lower cost capital, including raising share capital or debt when required to fund opportunities as they arise.
The Company may also return capital to shareholders through the repurchase of shares, pay dividends or reduce debt where it determines any of these to be an effective method of achieving the above objective. The Company does not use ratios in the management of its capital.
There have been no changes to management’s approach to managing its capital for the year ended August 31, 2021.
Financing
The proceeds of the financings disclosed below were intended to be used primarily for working capital and future operating needs. The proceeds received have been used primarily for those purposes.
Equity
Activity for the year ended August 31, 2022
During the year ended August 31, 2022, the Company issued 203,537 common shares upon vesting of an equal number of RSUs, and 57,029 shares for services provided by certain officers of SideQik.
Activity for the year ended August 31, 2021
In January and February 2021, the Company closed on the issuance of 4,371,767 units (the “Units”) for gross proceeds of $32,788,253 of non-brokered private placements. Each Unit consists of one common share of the Company and one-half of one common share purchase warrant (a “Warrant”). Each whole Warrant entitles the holder to acquire one additional share of the Company at a price of $15.00 per share for a period of 3 years provided that: (i) if the Common Shares are listed for trading on Nasdaq, (ii) the Company completes an offering of securities under a short form prospectus for an aggregate amount of at least $30,000,000, and (iii) the closing price of the Common Shares on Nasdaq is $30.00 or greater for a period of 15 consecutive trading days, then the Company may accelerate the expiry date of the Warrants to the 30th day after the date written notice is provided to the holders.
The Company paid cash commissions to eligible finders under the offering of $1,681,477 and regulatory and legal fees of $89,402. Net cash proceeds from the offering amounted to $31,017,374.
In addition to the cash finder’s fees discussed above, the Company issued the following securities as partial payment of commissions to finders: 63,666 Units; and 159,554 finders warrants, with each finder warrant exercisable into a common share at an exercise price of US$15.00 per share for 3 years subject to the same acceleration terms described above.
The total number of Common Shares issued as a result of the private placements totaled 4,435,433, which was comprised of 4,371,767 Units issued for proceeds and 63,666 Units issued as partial payment to finders. The total number of warrants issued totaled 2,377,272, which was comprised of warrants issued as part of the Units issued of 2,217,718 (50% of Units issued) and 159,554 finders warrants issued.
The fair value allocated between the Common Shares and warrants on the issuance of the Units is based on a relative fair value allocation between the Common Shares issued and warrants issued. Refer to equity measured warrants note for discussion of the key assumptions used in valuation of the warrants as part of the relative fair value allocation.
During the year ended August 31, 2021, the Company had the following additional activity to share capital: (i) issued 277,749 Common Shares upon vesting of an equal number of RSUs; (ii) issued 20,833 Common Shares upon the exercise of vested stock options, (iii) issued 1,728,848 Common Shares in connection with conversion of convertible debt, (iv) issued 901,060 Common Shares in connection with the exercise of warrants ; (v) issued 40,000 Common Shares for cancelation of $226,556 of debt (shares for debt); and (vi) issued 6,666 Common Shares valued at $54,061 as an amendment fee to the lender in connection with the Amended EB Loan (the “EB Bonus Shares”). In addition to the EB Bonus Shares, the Company paid the lender a cash fee of $100,000. The amendment fees were recorded within interest expense as the Amended EB Loan and the subsequently the EB CD is being accounted for at FVTPL.
Debt
Promissory Notes
The Company has promissory notes with a balance of $200,000 (August 31, 2021 – $200,000) that are unsecured, due on demand, and bear interest at 18%. As of August 31, 2022, interest of $141,940 has been accrued (August 31, 2021 – $139,644).
The Company, through its WinView subsidiary, has a secured promissory note outstanding for amounts due for the provision of services by the noteholder. As of August 31, 2022, $429,822 was due under the note (August 31, 2021 – $482,304). The note is secured by the assets of WinView, bears interest at 8%, and is currently due. As of August 31, 2022, and 2021, no interest is accrued on this note.
Paycheck Protection Program (“PPP”) loans
In April and May 2020, the Company entered into promissory notes (the “Notes”) with three banks. The Notes evidence loans to the Company of $1,589,559 pursuant to the PPP of the CARES Act administered by the U.S. Small Business Administration (the “SBA”). In accordance with the requirements of the CARES Act, the Company used the proceeds from the loans exclusively for qualified expenses under the PPP, including payroll costs, rent and utility costs, as further detailed in the CARES Act and applicable guidance issued by the SBA.
Interest will accrue on the outstanding balance of the Notes at a rate of 1.00% per annum. However, the Company expects to apply for and receive forgiveness of up to all amounts due under the Notes, in an amount equal to the sum of qualified expenses under the PPP during the twenty-four weeks following disbursement.
Subject to any forgiveness granted under the PPP, the Notes are scheduled to mature in April 2022 and require 18 equal monthly payments of principal and interest beginning November 2020. The Notes may be prepaid at any time prior to maturity with no prepayment penalties. The Notes provide for customary events of default, including, among others, those relating to failure to make payments, bankruptcy, breaches of representations, significant changes in ownership, and material adverse effects. The Company’s obligations under the Notes are not secured by any collateral.
Upon the receipt of the proceeds of $1,589,559 from the Notes, the Company accounted for the Notes as a grant in the form of forgivable loan and recorded the amount as a deferred income liability. The liability was reduced as the Company recognized expenses which qualified for forgiveness of the loan. As of August 31, 2022, the Company had incurred greater than $1,589,559 of qualifying expenses and therefore had a remaining deferred income liability of $nil. The Company recognized the impact of the loan forgiveness as an offset against related salaries and wages expense, in the consolidated statement of loss and comprehensive loss for the year ended August 31, 2020. As of August 31, 2022, $209,875 has not been formally forgiven.
Convertible Debt
| (a) | Conversions during the years ended August 31, 2021 |
2019 Series
During the year ended August 31, 2021, 2019 Series convertible debentures with a principal amount of CAD$1,315,000 (2020 – CAD$13,047,122) were converted into 175,331 units (2020 – 1,739,615), and as a result, the Company issued 175,331 Common Shares and 175,331 warrants (2020 – 1,739,615 Common Shares and 1,739,615 warrants). The fair value of the convertible debentures at the time of conversion was estimated using the binomial lattice model with the below assumptions:
Share price of CAD$11.65 – $14.15 (2020 – CAD$7.05 – $18,00); term of 1.36 – 1.90 years (2020 – 1.85 and 2.52); conversion price and warrant exercise price of CAD$7.50 (2020 – CAD$7.50); interest rate of 6% (2020 – 6%); expected volatility of 98.5% – 179% (2020 – 168.65% – 181.93%); risk-free interest rate of 0.21% - 0.27% (2020 – 0.26% – 0.96%); exchange rate of 0.7651 – 0.8286 (2020 – 0.6899 – 0.7651); and an expected dividend yield of 0% for both years.. The fair value assigned to these convertible debentures was $2,603,875 (2020 – $10,189,558).
This value was split between Common Shares and warrants as $1,500,214 (2020 – $5,152,023) and $1,103,661 (2020 – $5,037,535), respectively.
2020 Series
During the year ended August 31, 2021, 2020 Series convertible debentures with a principal amount of $11,651,393 (2020 – nil) were converted or settled into 1,553,518 units, and as a result, the Company issued 1,553,518 Common Shares and 1,134,305 warrants. The fair value of the convertible debentures at the time of conversion or settlement was estimated using the binomial lattice model with the below assumptions:
Share price of $7.79 – $9.92; term of 1.44 – 1.77 years; conversion price of $7.50; warrant exercise price of $15.00, interest rate of 10%; expected volatility of 95% – 98.5%; risk-free interest rate of 0.09% - 0.13%; and an expected dividend yield of 0%. The fair value assigned to these convertible debentures was $16,460,505.
This value was split between Common Shares and warrants as $12,204,391 and $4,256,114, respectively.
| (b) | Issuances during the year ended August 31, 2021 |
During the year ended August 31, 2021, 2020 Series convertible debentures with a principal amount of $2,901,393 were issued for gross proceeds of $2,901,393. In addition, in November 2020, $2,000,000 of convertible debentures from the Company’s standby convertible debenture facility were issued along with 224,719 warrants for gross proceeds of $2,000,000. Of the gross proceeds of $2,000,000, $1,381,084 was allocated to the convertible debt and $618,916 was allocated to the 224,719 warrants issued. The total fair value recorded to convertible debt for issuances above amounted to $4,282,477.
On December 1, 2020, the EB Loan was amended. The amendment extended the maturity date by one year and added a conversion feature to $1,000,000 of the $5,000,000million principal outstanding. The conversion feature allowed the holder to convert $1,000,000 into Common Shares of the Company at a conversion price of $11.25 per common share. On February 24, 2021, the Company extinguished the Amended EB Loan and issued the Lender a convertible debenture in the principal amount of $5,000,000. The EB CD is convertible into units of the Company at a conversion price of $10.25 per unit, with each unit comprised of one common share and one-half of a warrant, with each whole warrant exercisable into a common share at an exercise price of $15.00 per share for a period of three years from the issuance of the EB CD. The EB CD has a term of three years.
The fair value of the Amended EB Loan on December 1, 2020, was $5,043,103. The carrying value of the former EB Loan on December 1, 2020, consisted of $5,000,000 in principal and $76,412 in accrued interest, for total carrying value on the amendment date of $5,076,412. As a result, a gain on extinguishment of debt of $33,309 was recognized. The fair value of the EB CD on the date of issuance of February 24, 2021, was $7,394,022. The fair value of the Amended EB Loan on February 24, 2021, was $4,931,813. As a result, a loss on extinguishment of debt of $2,462,209 was recognized. The above two transactions resulted in a loss on extinguishment of debt of $2,428,900.
The 2020 Series debentures will mature twenty-four (24) months from the date of issuance and bear interest at a rate of 5% per annum (subject to adjustment as described below), payable on maturity. At the Company’s option, interest under the 2020 Series debentures is payable in kind in Common Shares at an issue price which would be based on the trading price of the Common Shares at the time of such interest payment. The interest rate under the 2020 Series debentures will increase from 5% to 10% per annum on a prospective basis on December 19, 2020, if a public offering has not occurred by that date.
The 2020 Series debenture holders may convert all or a portion of the principal amount of the debentures into units (“2020 Units”) of the Company at a conversion price equal to the lesser of (a) $11.25 per 2020 Unit, and (b) if such conversion occurs after a public offering of securities by the Company, a fifteen percent (15%) discount to the public offering price, provided that such conversion price shall not be less than $7.50 per 2020 Unit.
Notwithstanding the foregoing, if by December 19, 2020, the Company has not obtained registration rights in the United States to allow sale in the United States of the Common Shares and the exercise of warrants (the “2020 Warrants”) of the Company to be issued pursuant to the conversion of the 2020 Series debentures, holders of 2020 Series debentures may convert such debentures into 2020 Units at $7.50 per 2020 Unit. As of December 19, 2020, the Company had not obtained registration rights in the United States. As such, the conversion price is $7.50 per 2020 Unit and the interest rate increased to 10% on December 19, 2020.
Each 2020 Unit is comprised of one common share and one-half of one 2020 Warrant, with each 2020 Warrant exercisable into one Common Share of the Company at an exercise price of $15.00 per share for a period of three years from the issuance of the 2020 Series debentures. Under certain circumstances, the Company shall be entitled to call for the exercise of any outstanding 2020 Warrants in the event that the closing trading price of the Company Common Shares on the Nasdaq is above $30.00 per share for fifteen (15) consecutive trading days.
In the event that the Company’s Common Shares are listed for trading on the Nasdaq and the Company completes a public offering for an aggregate amount of at least US$30,000,000, the Company may cause the 2020 Series debentures to be converted at the conversion price by the Company delivering a notice to the holder not less than a minimum of 30 days and a maximum 60 days prior to the forced conversion date.
These convertible debentures (the “2020 Series One Up” debentures) have identical terms as the 2020 Series debentures except that the minimum conversion price of $7.50 per Unit (as described above) will be US$9.50 per Unit. The 2020 Series One Up convertible debentures had a fair value at issuance of $3,078,550.
In September 2020, the Company entered into an $8,000,000 stand-by convertible debenture facility (the “2020 Series Standby” debentures). The 2020 Series Standby Debenture has substantially similar terms as the 2020 Series debentures, except (i) the references to a minimum $7.50 conversion price (as described above) have been changed to $8.90; and (ii) the 2020 Series Standby debentures are only convertible into Common Shares of the Company, not units.
In November 2020, the Company issued 224,719 warrants in connection with this first draw of $2,000,000 of the Standby Debentures, with each warrant exercisable into one common share the Company at an exercise price of $15.00 per share for a period of two years, subject to the same acceleration clause as the warrants underlying the 2020 Series debentures.
The remaining $6,000,000 of convertible debentures that are issuable under this facility have substantially similar terms as the 2020 Series debentures, including conversion into units consisting of one share and one-half warrant, provided that the conversion price of any additional convertible debentures will be based on the market price of the Common Shares at the time of such subscriptions and are subject to TSX-V approval.
$6,000,000 of convertible debentures that are issuable under this facility have substantially similar terms as the 2020 Series debentures, including conversion into units consisting of one share and one-half warrant, provided that the conversion price of any additional convertible debentures will be based on the market price of the Common Shares at the time of such subscriptions and are subject to TSX-V approval.
On February 24, 2021, the Company extinguished the Amended EB Loan and issued the Lender a convertible debenture in the principal amount of $5 million (the “EB CD”). The EB CD is convertible into units of the Company at a conversion price of $10.25 per unit, with each unit comprised of one common share and one-half of a warrant, with each whole warrant exercisable into a common share at an exercise price of $15.00 per share for a period of three years from the issuance of the EB CD. The EB CD has a term of three years.
| C. | Research and Development, Patents and Licences, etc. |
The Company is heavily focused on innovation and continuously improving our platforms and processes. This is key for maintaining and acquiring customers. The Company generally relies on patent, trademark, and copyright laws as well as confidentiality agreements, and other employee agreement to protect the Company’s intellectual property rights. As a result of these innovations the Company’s continuing and discontinued operation hold several patents. Research and development costs are expensed as incurred through the Consolidated Statements of Loss and Comprehensive Loss.
Securities of gaming and technology companies have experienced substantial volatility in the past, often based on factors unrelated to the financial performance or prospects of the companies involved. These factors include macroeconomic developments globally and market perceptions of the attractiveness of particular industries.
The price of the securities of companies is also significantly affected by short-term currency exchange fluctuation and the political environment in the countries in which the Company does business. As of August 31, 2022, the global economy continues to be in a period of significant economic volatility, in large part due to the COVID-19 pandemic discussed previously, as well US and European economic and political concerns which have impacted global economic growth.
Our customer’s advertising and SaaS spend allocations and preferences change from time to time and can be affected by a number of different and unexpected trends. The Company’s failure to anticipate, identify or react quickly to these changes and trends, and to introduce new and improved products on a timely basis, could result in reduced demand for the Company’s products and services, which in turn could result in a material adverse effect on the Company.
| E. | Critical Accounting Estimates. |
Not applicable.
| ITEM 6. | DIRECTORS, SENIOR MANAGEMENT AND EMPLOYEES |
| A. | Directors and Senior Management |
The following table and the notes thereto state the names of all directors and executive officers, all other positions or offices with the Company and its subsidiaries now held by them, their principal occupations or employment, the year in which they became directors and/or executive officers of the Company.
Name Province/State Country of Residence and Position(s) with the Company(1) | | Principal Occupation Business or Employment for Last Five Years(1) | | Periods Served as a Director or Officer (1) |
Tom Rogers New York, USA Chairman and Director | | Executive Chairman and Director of the Company since May 2020. Chairman and CEO of TRget Media, LLC, a media investment and operations advisory firm since June 2003. | | May 2020 |
Louis Schwartz(5) Georgia, USA Chief Executive Officer and Director | | Co-CEO of the Company from May 2020 to November 2020, CEO of the Company since November 2020. Director of the Company since July 2020. | | July 2020 |
Gregory Raifman(2)(3)(4), Kamas, UT, USA Director | | Director of the Company. The former President of Nexstar Digital, LLC, a wholly owned subsidiary of Nexstar Media Group, Inc. (NASDAQ: NXST). | | July 2022 |
Lawrence Rutkowski(2)(3)(4)(5) California, USA Director | | Director of the Company. President & owner of L&S Investments, L.L.C. Director of Stanley M. Proctor Co. | | January 2021 |
Rudolph Cline-Thomas(2) New York, New York, USA Director | | Director of the Company. Founder and Managing Partner of venture fund MASTRY. Founder of commercial real estate investment firm Mastry Properties. Serves on Salesforce Global Advisory Board (NYSE: CRM). Strategic advisor to Gucci. Board advisor for Jumia Technologies (NYSE: JMIA) and Zuora (NYSE: ZUO). | | July 2021 |
Stuart Porter Boston, MA, USA Director | | Director of the Company. Founder of Denham Capital and is its Chief Executive Officer and Chief Investment Officer. | | January 2022 |
Notes:
| | (1) | Information has been furnished by the directors and executive officers individually or from www.sedi.ca. No family relationships exist between any of the Directors or senior management. |
| | | |
| | (2) | Member of the Audit Committee. |
| | | |
| | (3) | Member of the Nominating and Governance Committee. |
| | | |
| | (4) | Member of the Compensation Committee. |
| | | |
| | (5) | Member of the Patent Committee. |
Objectives of the Compensation Program
Executive compensation has been designed to encourage Management to make decisions and take actions that will result in the improvement of long-term shareholder value as reflected in the growth in assets and value of the Common Shares. The focus of the Company’s current compensation policy is to:
| ● | strengthen the relationship between compensation and enhancement of shareholder value by focusing on variable compensation, such as annual performance incentives and ownership of Common Shares, primarily by using options for acquiring Common Shares; |
| ● | enhance the Company’s ability to attract, encourage and retain knowledgeable and experienced executives; and |
| ● | balance the short-term and long-term business goals of the Company. |
The key components of executive compensation include: (1) base salary; (2) a short-term incentive comprised of cash bonus awards and; (3) long-term incentives comprised primarily of stock option incentives, which are reviewed annually based on job performance as well as corporate performance and external competitive practices.
The Compensation Committee does not set specific performance objectives in assessing the performance of its Management. Instead, the Compensation Committee looks at the performance of the Company and its Management and relies on its experience and judgment in determining the overall compensation package for Management. Compensation of Management (also referred to as “Named Executive Officers,” as defined below) as detailed in this Annual Report is not linked to the achievement of target results or improvement in the Common Share price on the markets on which they trade.
Summary Compensation Table for Named Executive Officers
The following table provides a summary of total compensation earned during the fiscal years ended August 31, 2022, 2021, and 2020 by the Company’s Chief Executive Officer and Chief Financial Officer, each of the three other most highly compensated executive officers of the Company who were serving as such as at the end of the applicable fiscal year and whose total compensation was, individually, more than C$150,000 (the “Other Executive Officers”), if any, and each other individual who would have been an Other Executive Officer but for the fact that such individual was neither serving as an executive officer, nor acting in a similar capacity, as at the end of the applicable fiscal year, if any, for services rendered in all capacities during such period (hereinafter, collectively, referred to as the “Named Executive Officers” or “NEO”). The Named Executive Officers of the Company for the purposes of this Annual Report are Louis Schwartz (CEO), Michael Munoz (CFO), and Tom Rogers (Executive Chairman).
| | | | | | | | | | | | Non-Equity Incentive Plan Compensation ($) | | | | | | |
| Name and Principal Position | | Year | | | Salary ($) | | | Option-Based Awards ($)(1) | | | Annual Incentive Plans ($) | | | Long-Term Incentive Plans ($) | | All Other Compensation ($) | | | Total Compensation ($) | |
| Louis Schwartz(2) | | | 2022 | | | | 500,000 | | | | 320,999 | | | | 210,000 | | | Nil | | | 31,453 | | | | 1,062,452 | |
| CEO | | | 2021 | | | | 430,000 | | | | 463,714 | | | | 250,000 | | | Nil | | | 30,846 | | | | 1,174,560 | |
| | | | 2020 | | | | 120,000 | | | | 37,841 | | | | Nil | | | Nil | | | 10,856 | | | | 168,697 | |
| Michael Munoz(3) | | | 2022 | | | | 250,000 | | | | 97,561 | | | | 83,500 | | | Nil | | | 26,040 | | | | 457,101 | |
| CFO | | | 2021 | | | | 227,084 | | | | 149,103 | | | | 142,500 | | | Nil | | | 25,034 | | | | 543,721 | |
| | | | 2020 | | | | 65,000 | | | | 21,840 | | | | Nil | | | Nil | | | 8,873 | | | | 95,713 | |
| Tom Rogers | | | 2022 | | | | 448,875 | | | | 320,953 | | | | 199,500 | | | Nil | | | 18,387 | | | | 987,715 | |
| Executive Chairman | | | 2021 | | | | 414,775 | | | | 440,526 | | | | 232,500 | | | Nil | | | 8,959 | | | | 1,096,760 | |
| | | | 2020 | | | | 60,000 | | | | 35,949 | | | | Nil | | | Nil | | | Nil | | | | 95,949 | |
Notes:
| (1) | When the Company issues stock options, it accounts for them using the fair value method for stock-based compensation as recommended under International Financial Reporting Standards (“IFRS”). The fair value of options is determined by using the Black-Scholes Option Pricing Model (which model is commonly used by junior public companies) with assumptions for risk-free interest rates, dividend yields, volatility factors of the expected market price of the Common Shares and expected life of the options. |
| | |
| (2) | Mr. Schwartz was appointed Co-CEO of the Company on May 8, 2020, together with Mr. Cox as the other Co-CEO. Previously, Mr. Schwartz served as the CEO of Frankly Inc. On November 3, 2020, Mr. Cox stepped down from his role as Co-CEO and Mr. Schwartz took on the role of CEO of the Company. |
| | |
| (3) | Mr. Munoz was appointed CFO of the Company on May 8, 2020. Previously, he served as CFO of Frankly Inc. from April 2018 to May 8, 2020. |
Named Executive Officer Outstanding Option-Based and Share-Based Awards
The weight allocated to long-term incentives is based on a consideration of each NEO’s anticipated ability to influence the long-term growth and performance of the business, with the objective to strengthen the relationship between compensation and enhancement of Shareholder value. The CEO is considered to have the greatest influence on the long-term performance of the business. Accordingly, in addition to short-term cash compensation, the CEO receives the largest allocation of stock options and/or restricted share units. There is no relationship between the Company’s historical performance and the number of equity incentive awards granted. No stock appreciation rights, or shares or units subject to restrictions on resale or other incentives have been granted.
The table below reflects all option-based awards and share-based awards for each Named Executive Officer outstanding as at August 31, 2022 (including option-based awards and share-based awards granted to a Named Executive Officer before such fiscal year). The Company does not currently have any equity incentive plans other than its Omnibus Equity Incentive Plan (the “Omnibus Plan”) as described below.
NAMED EXECUTIVE OFFICER OPTION–BASED AWARDS AND SHARE-BASED AWARDS OUTSTANDING AS AT AUGUST 31, 2022
| Option-Based Awards(1) | | Share-Based Awards |
| Name of Named Executive Officer | | As at Fiscal Year Ended | | | Number of Securities Underlying Unexercised Options | | | Option Exercise Price
($/ Security) | | | Option Expiration Date | | Value of Unexercised In-the-Money Options ($)(2) | | Number of Shares or Units of Shares That Have Not Vested (#) | | | Market or Payout Value of Share-Based Awards That Have Not Vested ($) | | | Market or Payout Value of Share-Based Awards not paid out or distributed |
Louis Schwartz
CEO | | | 2022 | | | | 807 | | | | C106.50 | | | Feb. 10, 2026 | | Nil. | | | 307,047 | | | | 219,538 | | | Nil |
| | | | | | | | 730 | | | | C106.50 | | | Mar. 3, 2027 | | Nil. | | | | | | | | | | |
| | | | | | | | 340 | | | | C106.50 | | | Aug. 25, 2025 | | Nil. | | | | | | | | | | |
| | | | | | | | 165,589 | | | | 0.91 | | | May 26, 2029 | | Nil. | | | | | | | | | | |
Michael Munoz
CFO | | | 2022 | | | | 46 | | | | C106.50 | | | Feb. 10, 2026 | | Nil. | | | 97,619 | | | | 69,797 | | | Nil |
| | | | | | | | 44,157 | | | | 0.91 | | | May 26, 2029 | | Nil. | | | | | | | | | | |
Tom Rogers
Executive Chairman | | | 2022 | | | | 157,310 | | | | 0.91 | | | May 26, 2029
| | Nil.
| | | 291,695 | | | | 208,561 | | | Nil |
| | | | | | | | 100,000 | | | | 0.90 | | | Aug. 10, 2027 | | Nil. | | | | | | | | | | |
Notes:
| (1) | Each option entitles the holder to purchase one Common Share. |
| | |
| (2) | Value of unexercised options is equal to the difference between the closing price of the Common Shares on the TSXV on August 31, 2022 (being the last day of the Company’s most recently completed financial year that the Common Shares traded on the TSXV) of C$0.94 (USD$0.715) and the exercise prices of options outstanding, multiplied by the number of Common Shares available for purchase under such options. |
Incentive Award Plans
The following table provides information concerning the incentive award plans of the Company with respect to each Named Executive Officer during the fiscal year ended August 31, 2022. The only incentive award plan of the Company during the fiscal year 2022 is the Omnibus Plan.
INCENTIVE AWARD PLANS – VALUE VESTED OR EARNED DURING THE FISCAL YEAR ENDED AUGUST 31, 2022
| Name of Executive Officer | | Option-Based Awards Value Vested During Fiscal 2022 ($) | | | Non-Equity Incentive Plan Compensation Value Earned During Fiscal 2022 ($) |
Louis Schwartz
CEO | | | 254,077 | | | Nil |
Michael Munoz
CFO | | | 83,889 | | | Nil |
Tom Rogers
Executive Chairman | | | 241,372 | | | Nil |
Employment, Consulting and Management Contracts
Management functions of the Company and its subsidiaries are substantially performed by the Company’s directors and executive officers. During the year ended August 31, 2022, the Company did not enter into any contracts, agreements or arrangements with parties other than its directors and executive officers (or their personal holding company) for the provision of such management functions.
Louis Schwartz
The Company has an employment agreement with Louis Schwartz for his services as CEO which is effective as of May 1, 2021 (“Schwartz Agreement”). The annual base salary under the Schwartz Agreement is USD$500,000. The Schwartz Agreement has a term of two years from its effective date, which will automatically renew for subsequent periods of one year unless either party provides written notice at least 120 days prior to the expiration of the applicable period at such time. The Schwartz Agreement also provides for certain benefits, including health and medical insurance, and reimbursement for reasonable business expenses.
Under the Schwartz Agreement, Mr. Schwartz is entitled to receive a severance payment if terminated without cause, or in the event of resignation with good reason (as defined therein), equal to 18 months of his annual compensation, paid in monthly installments, and continued premium payments for health insurance to allow Mr. Schwartz to continue such insurance coverage for an 18-month period. In the event the Schwartz Agreement is terminated without cause or for good reason (both as defined therein), outstanding equity incentive awards held by Mr. Schwartz will vest through the end of the 18-month period. In the event there is a change of control (as defined therein) and within 12 months thereafter the Schwartz Agreement is terminated without cause or for good reason, accelerated vesting will apply to all outstanding equity incentive awards, including that performance-based awards will fully vest.
Tom Rogers
The Company has an employment agreement with Tom Rogers for his services as Executive Chairman which is effective as of May 1, 2021 (“Rogers Agreement”). The annual base salary under the Rogers Agreement is USD$475,000. The Rogers Agreement has a term of two years from its effective date, which will automatically renew for subsequent periods of one year unless either party provides written notice at least 120 days prior to the expiration of the applicable period at such time. The Rogers Agreement also provides for certain benefits, including health and medical insurance, and reimbursement for reasonable business expenses.
Under the Rogers Agreement, Mr. Rogers is entitled to receive a severance payment if terminated without cause, or in the event of resignation with good reason (as defined therein), equal to 18 months of his annual compensation, paid in monthly installments, and continued premium payments for health insurance to allow Mr. Rogers to continue such insurance coverage for an 18-month period. In the event the Mr. Rogers is terminated without cause or for good reason (both as defined therein), outstanding equity incentive awards held by Mr. Rogers will vest through the end of the 18-month period. In the event there is a change of control (as defined therein) and within 12 months thereafter the Rogers Agreement is terminated without cause or for good reason, accelerated vesting will apply to all outstanding equity incentive awards, including that performance-based awards will fully vest.
Compensation of Directors
Individual Director Compensation
The following table provides a summary of the compensation provided to the directors of the Company during the fiscal year ended August 31, 2022. Except as otherwise disclosed below, the Company did not pay any fees or compensation to directors for serving on the Board (or any committee) beyond reimbursing such directors for travel and related expenses and the granting of Awards (as defined below) under the Omnibus Plan.
DIRECTOR COMPENSATION TABLE
| Name | | Fiscal Year Ended | | | Fees Earned ($) | | | Share-Based Awards ($) | | | Option-Based Awards ($)(1) | | | Non-Equity Incentive Plan Compensation ($) | | | All Other Compensation ($) | | | Total ($) | |
| Louis Schwartz(2) | | | 2022 | | | | | (2) | | | | (2) | | | | (2) | | | | (2) | | | | (2) | | | | (2) |
| Tom Rogers(3) | | | 2022 | | | | | (3) | | | | (3) | | | | (3) | | | | (3) | | | | (3) | | | | (3) |
| Larry Rutkowski | | | 2022 | | | | 52,164 | | | | 77,118 | | | | Nil | | | | Nil | | | | Nil | | | | 129,282 | |
| Rudolph Cline-Thomas | | | 2022 | | | | 44,712 | | | | 66,100 | | | | Nil | | | | Nil | | | | Nil | | | | 110,812 | |
| Stuart Porter | | | 2022 | | | | 36,329 | | | | 1,005 | | | | Nil | | | | Nil | | | | Nil | | | | 37,334 | |
| Greg Raifman | | | 2022 | | | | 7,933 | | | | Nil | | | | Nil | | | | Nil | | | | Nil | | | | 7,933 | |
| Hank Ratner(4) | | | 2022 | | | | 32,526 | | | | 43,927 | | | | Nil | | | | Nil | | | | Nil | | | | 76,453 | |
| Lori Conkling(5) | | | 2022 | | | | 14,575 | | | | 24,796 | | | | Nil | | | | Nil | | | | Nil | | | | 39,371 | |
| Bryan Reyhani(6) | | | 2022 | | | | 3,483 | | | | 10,836 | | | | Nil | | | | Nil | | | | Nil | | | | 14,319 | |
Notes:
| (1) | When the Company issues stock options, it accounts for them using the fair value method for stock-based compensation as recommended under the IFRS. The fair value of options is determined by using the Black-Scholes Option Pricing Model (which model is commonly used by junior public companies) with assumptions for risk-free interest rates, dividend yields, volatility factors of the expected market price of the Common Shares and expected life of the options. |
| | |
| (2) | For disclosure regarding Mr. Schwartz’s compensation, see “Summary Compensation Table for Named Executive Officers” and “Named Executive Officer Outstanding Option-Based and Share-Based Awards”. |
| | |
| (3) | For disclosure regarding Mr. Rogers’ compensation, see “Summary Compensation Table for Named Executive Officers” and “Named Executive Officer Outstanding Option-Based and Share-Based Awards”. |
| | |
| (4) | Mr. Ratner resigned as a director of the Company on April 27, 2022. |
| | |
| (5) | Ms. Conkling resigned as a director of the Company on January 17, 2022. |
| | |
| (6) | Mr. Reyhani resigned as a director of the Company on October 6, 2021. |
Director Outstanding Option-Based Awards and Share-Based Awards
The table below reflects all option-based awards and share-based awards for each director of the Company outstanding as at August 31, 2022. The Company does not have any equity incentive plan other than the Omnibus Plan.
DIRECTOR OPTION–BASED AWARDS AND SHARE-BASED AWARDS OUTSTANDING
| Option-Based Awards | | Share-Based Awards |
| Name of Director | | Fiscal Year Ended | | | Number of Securities Underlying Unexercised Options | | Option Exercise Price ($/ Security) | | | Option Expiration Date | | Value of Unexercised In-the-Money Options(1) ($) | | Number of Shares or Units of Shares that have not vested (#) | | | Market or Payout Value of Share-Based Awards That Have Not Vested ($) | | | Market or Payout Value of Share-Based Awards Not Paid Out or Distributed |
| Larry Rutkowski | | | 2022 | | | Nil | | | N/A | | | N/A | | N/A | | | 19,878 | | | | 14,213 | | | Nil |
| Rudy Cline-Thomas | | | 2022 | | | Nil | | | N/A | | | N/A | | N/A | | | 17,038 | | | | 12,182 | | | Nil |
| Stuart Porter | | | 2022 | | | Nil | | | N/A | | | N/A | | N/A | | | 11,719 | | | | 8,379 | | | Nil |
| Greg Raifman | | | 2022 | | | Nil | | | N/A | | | N/A | | N/A | | | 7,346 | | | | 5,252 | | | Nil |
| Hank Ratner(2) | | | 2022 | | | Nil | | | N/A | | | N/A | | N/A | | | Nil | | | | N/A | | | Nil |
| Lori Conkling(3) | | | 2022 | | | Nil | | | N/A | | | N/A | | N/A | | | Nil | | | | N/A | | | Nil |
| Bryan Reyhani(4) | | | 2022 | | | Nil | | | N/A | | | N/A | | N/A | | | 29,133 | | | | 20,830 | | | Nil |
Notes:
| (1) | This column contains the aggregate value of in-the-money unexercised options as at the applicable year end, calculated based on the difference between the market price of the Common Shares underlying the options as at the close of day on the applicable year end, being C$0.94 (USD$0.715) at August 31, 2022, and the exercise price of the options. |
| | |
| (2) | Mr. Ratner resigned as a director of the Company on April 27, 2022. |
| | |
| (3) | Ms. Conkling resigned as a director of the Company on January 17, 2022. |
| | |
| (4) | Mr. Reyhani resigned as a director of the Company on October 6, 2021. |
Director Incentive Award Plans
Under the Omnibus Plan, all directors, officers, employees and consultants of the Company and/or its affiliates are eligible to receive awards of Common Share purchase options, restricted share units, and deferred share units. The purpose of the Omnibus Plan is to provide the Company with a share ownership incentive to attract and motivate qualified directors, officers and employees of and consultants to the Company and its subsidiaries and thereby advance the Company’s interests and contribute toward its long term goals by affording such persons with an opportunity to acquire an equity interest in the Company through the Awards. Awards are made by and are within the discretion of the Company’s Board and are non-transferable (subject to certain exceptions).
Securities Authorized For Issuance Under Equity Compensation Plans
The following table provides information regarding the number of Common Shares to be issued upon the exercise of outstanding options granted under the Omnibus Plan, and the weighted-average exercise price of said outstanding options, outstanding on August 31, 2022.
| Plan Category | | Fiscal Year Ended | | Number of securities to be issued upon exercise of outstanding Options, RSUs, and DSUs (a) | | Weighted-average exercise price of outstanding Options, RSUs, and DSUs ($) (b) | | Number of securities remaining available for future issuance under equity compensation plans (excluding securities reflected in column (a)) (c) |
Equity compensation plans approved by Shareholders (the Omnibus Plan) | | August 31, 2022 | | 1,143,182 (Options) 1,196,211 (RSUs) Nil (DSUs) | | 3.93 (Options) N/A (RSUs) N/A (DSUs) | | 437,206 (Options)(1) 148,426 (RSUs & DSUs)(1) |
| Equity compensation plans not approved by Shareholders | | August 31, 2022 | | Nil | | Nil | | Nil |
| Total | | | | 2,339,393 | | 3.93 | | 585,632(1) |
Notes:
| (1) | Pursuant to the Omnibus Plan, the total number of Common Shares reserved and available for grant and issuance pursuant to Options granted under the Omnibus Plan is 10% of the issued and outstanding Common Shares, from time to time. The maximum number of Common Shares available for issuance pursuant to the settlement of RSUs and DSUs (both as defined herein) is fixed at 1,548,174 Common Shares. |
Omnibus Equity Incentive Plan
The Company has adopted an omnibus equity incentive plan (the “Omnibus Plan”) in accordance with the policies of the TSXV which provides that the Board may from time to time, in its discretion and in accordance with TSXV requirements, grant to directors, officers, employees and consultants of the Company and/or its affiliates (“Eligible Participants”), Common Share purchase options (“Options”), restricted share units (“RSUs”), and deferred share units (“DSUs”, and collectively with the Options and RSUs, the “Awards”).
Under the policies of the TSXV, RSUs and DSUs are subject to a 1-year vesting period except in certain circumstances. Further, directors may grant Awards with vesting periods as the circumstances require. The Omnibus Plan authorizes the Board to grant Awards to Eligible Participants on the following terms:
| 1. | Under the Omnibus Plan, subject to Article 7, the total number of Common Shares reserved and available for grant and issuance pursuant to Options shall not exceed 10% of the issued and outstanding Common Shares. |
| 2. | For so long as the Company is listed on the TSXV or on another exchange that requires the Company to fix the number of Common Shares to be issued in settlement of Awards that are not Options, the maximum number of Common Shares available for issuance pursuant to the settlement of RSUs and DSUs together shall be an aggregate of 1,548,174 Common Shares. |
| | |
| 3. | The aggregate number of Common Shares issuable to Insiders at any time, under all of the Corporation’s Share Compensation Arrangements, shall not exceed 10% of the Corporation’s issued and outstanding Common Shares at any point in time, unless the Corporation has obtained disinterested shareholder approval as required by the policies of the TSXV. |
| 4. | The aggregate number of Common Shares for which Awards may be issued to any one participant in any 12-month period shall not exceed 5% of the outstanding Common Shares, unless the Company obtains disinterested shareholder approval as required by the policies of the TSXV. The aggregate number of Common Shares for which Awards may be issued to any one consultant within any 12-month period shall not exceed 2% of the outstanding Common Shares, calculated on the date an Award is granted to the consultant. The aggregate number of Common Shares for which Options may be issued to any Investor Relations Service Provider (as defined by the TSXV) within any 12-month period shall not exceed 2% of the outstanding Shares, calculated on the date an Option is granted to such persons. Investor Relations Service Providers are not eligible to receive any Award of RSUs or DSUs. |
| | |
| 5. | Unless disinterested shareholder approval as required by the policies of the TSXV is obtained, and subject to the adjustment pursuant to provisions of Article 7 of the Omnibus Plan, the aggregate number of Shares (i) issued to Insiders under the Plan or any other proposed or established Share Compensation Arrangement within any 12-month period and (ii) issuable to Insiders at any time under the Plan or any other proposed or established Share Compensation Arrangement, shall in each case not exceed ten percent (10%) of the total issued and outstanding Shares of the Corporation (on a non-diluted basis) from time to time. |
| | |
| 6. | The Board shall not make grants of Awards to Directors if, after giving effect to such grants of Awards, the aggregate number of Shares issuable to Directors, at the time of such grant, under all of the Corporation’s Share Compensation Arrangements would exceed 2% of the issued and outstanding Common Shares on a non-diluted basis, provided that such limit shall not apply to (i) Awards taken in lieu of any cash retainer or meeting director fees, and (ii) a one-time initial grant to a Director upon such Director joining the Board. |
| | |
| 7. | All Awards granted under the Omnibus Plan are non-transferable and non-assignable in any manner, including assignment, except as may be permitted by TSXV policies. |
As of December 28, 2022, there were an aggregate of 1,489,974 Options, nil DSUs, and 1,215,242 RSUs outstanding under the existing Omnibus Plan.
At present, the directors of the Company are elected at each annual general meeting and hold office until the next annual general meeting or until his or her successor is appointed, unless his or her office is earlier vacated in accordance with the BCBCA and the articles and by-laws of the Company. The directors of the Company do not have service contracts with the Company or any of its subsidiaries providing for benefits upon termination of employment. The following persons comprise the following committees:
Audit Committee | | Nominating and Governance Committee | | Compensation Committee | | Patent Committee |
| Gregory Raifman | | Gregory Raifman | | Gregory Raifman | | Louis Schwartz |
| Lawrence Rutkowski | | Lawrence Rutkowski | | Lawrence Rutkowski | | Lawrence Rutkowski |
| Rudolph Cline-Thomas | | | | | | |
Audit Committee Disclosure
The Audit Committee Charter
The Board is responsible for reviewing and approving the unaudited interim financial statements together with other financial information of the Company and for ensuring that management fulfills its financial reporting responsibilities. The Audit Committee assists the Board in fulfilling this responsibility. The Audit Committee meets with management to review the financial reporting process and the unaudited interim financial statements together with other financial information of the Company. The Audit Committee reports its findings to the Board for its consideration in approving the unaudited interim financial statements together with other financial information of the Company for issuance to the shareholders.
The Audit Committee has the general responsibility to review and make recommendations to the Board on the approval of the Company’s annual and interim financial statements, the Management Discussion and Analysis and the other financial information or disclosure of the Company. More particularly, it has the mandate to:
| (i) | oversee all the aspects pertaining to the process of reporting and divulging financial information, the internal controls and the insurance coverage of the Company; |
| (ii) | oversee the implementation of the Company’s rules and policies pertaining to financial information and internal controls and management of financial risks and to ensure that the certifications process of annual and interim financial statements is conformed with the applicable regulations; and |
| | |
| (iii) | evaluate and supervise the risk control program and review all related party transactions. |
The Audit Committee ensures that the external auditors are independent from management. The Audit Committee reviews the work of outside auditors, evaluates their performance, evaluates their remuneration and makes recommendations to the Board. The Audit Committee also authorizes non-related audit work.
Terms of reference of the Audit Committee are given in the Audit Committee charter. All charters of the committees of the Board are available on the Company’s website (www.enginegaming.com) or, on request, from the Company’s offices listed in this Annual Report.
Composition of the Audit Committee
The Audit Committee is currently comprised of the following members of the Board:
| Name | | Position | | Independent(1) | | Financial Literacy(1) |
| Lawrence Rutkowski(2) | | Director | | Yes | | Financially literate |
| Gregory Raifman(3) | | Director | | Yes | | Financially literate |
| Rudolph Cline-Thomas | | Director | | Yes | | Financially literate |
Notes:
| (1) | Terms have their respective meanings ascribed in National Instrument 52-110 of the Canadian Securities Administrators (“NI 52-110”). All members of the Audit Committee are independent based on the criteria for independence prescribed by Rule 10A-3 of the Exchange Act and Rule 5605(a)(2) of the NASDAQ Stock Market Rules. |
| (2) | Chairman of the Audit Committee. |
| (3) | Effective April 27, 2022, Hank Ratner resigned as a director of the Company. On July 20, 2022, he was replaced by Gregory Raifman, who joined the Company’s Audit Committee. |
The Audit Committee meets the composition requirements set forth by Section 5605(c)(2) of the NASDAQ Stock Market Rules.
Compensation Committee Disclosure
The Compensation Committee Charter
The Compensation Committee is responsible for assisting the Board with, among other things: evaluation and compensation of the Company’s senior management; compensation of the Board; and additional matters delegated to the Compensation Committee by the Board.
Terms of reference of the Compensation Committee are given in the Compensation Committee charter. All charters of the committees of the Board are available on the Company’s website (www.enginegaming.com) or, on request, from the Company’s offices listed in this Annual Report.
Composition of the Compensation Committee
The Compensation Committee is currently comprised of the following members of the Board:
| Name | | Position | | Independent(1) |
| Lawrence Rutkowski | | Director | | Yes |
| Gregory Raifman | | Director | | Yes |
Notes:
| (1) | As defined in NI 52-110. All members of the Compensation Committee are independent based on the criteria for independence prescribed by Rule 5605(a)(2) of the NASDAQ Stock Market Rules. |
Nominating and Governance Committee
The Nominating and Governance Committee Charter
The Nominating and Governance Committee is responsible for, among other things: maintaining oversight of the governance functions and effectiveness of the Board and the Company’s governance functions; identifying, screening and recommending qualified candidates to serve as directors; reviewing and evaluating the Board; and addressing any related matters required by applicable law.
Terms of reference of the Nominating and Governance Committee are given in the Compensation Committee charter. All charters of the committees of the Board are available on the Company’s website (www.enginegaming.com) or, on request, from the Company’s offices listed in this Annual Report.
Composition of the Nominating and Governance Committee
The Nominating and Governance Committee is currently comprised of the following members of the Board:
| Name | | Position | | Independent(1) |
| Lawrence Rutkowski | | Director | | Yes |
| Gregory Raifman | | Director | | Yes |
Notes:
| (1) | As defined in NI 52-110. All members of the Nominating and Governance Committee are independent based on the criteria for independence prescribed by Rule 5605(a)(2) of the NASDAQ Stock Market Rules. |
As at August 31, 2022, the Company had approximately 113 employees globally. Of these employees, approximately 3 are located in Canada, 24 in Spain, 9 in India, and 77 in the United States.
As at August 31, 2021, the Company had approximately 195 employees globally. Of these employees, approximately 2 are located in Canada, 57 in France, 21 in Spain, 7 in India, and 108 in the United Sates.
As at August 31, 2020, the Company had approximately 163 employees globally. Of these employees, approximately 4 are located in Canada, 51 in France, 11 in Spain, 16 in the United Kingdom, 5 in India, and 76 in the United Sates.
None of the Company’s employees are represented by a collective bargaining agreement. The Company considers its relations with its employees to be strong and views its employees as an important competitive advantage
At present, the directors of the Company are elected at each annual general meeting and hold office until the next annual general meeting or until his or her successor is appointed, unless his or her office is earlier vacated in accordance with the BCBCA and the articles and by-laws of the Company.
The following table and the notes thereto state the names of all directors and executive officers, all other positions or offices with the Company and its subsidiaries now held by them, their principal occupations or employment, the year in which they became directors and/or executive officers of the Company, the approximate number of Common Shares beneficially owned, directly or indirectly, by each of them, or over which they exert control or direction, and the number of options to acquire Common Shares held as of December 28, 2022.
Name
Province/State
Country of Residence and Position(s)
with the Company(1) | | Principal Occupation
Business or Employment
for Last Five Years(1) | | Periods Served
as a Director or Officer (1) | | Number of
Common Shares
owned, directly or indirectly or controlled or directed(1)(2) | |
Tom Rogers
New York, USA
Chairman and Director | | Executive Chairman and Director of the Company since May 2020. Chairman and CEO of TRget Media, LLC, a media investment and operations advisory firm since June 2003. | | May 2020 | | | 259,535 | |
Louis Schwartz(6)
Georgia, USA
Chief Executive Officer and Director | | Co-CEO of the Company from May 2020 to November 2020, CEO of the Company since November 2020. Director of the Company since July 2020. | | July 2020 | | | 263,126 | |
Gregory Raifman(3)(4)(5),
Kamas, UT, USA
Director | | Director of the Company. The former President of Nexstar Digital, LLC, a wholly owned subsidiary of Nexstar Media Group, Inc. (NASDAQ: NXST). | | July 2022 | | | 0 | |
Lawrence Rutkowski(3)(4)(5)(6)
California, USA
Director | | Director of the Company. President & owner of L&S Investments, L.L.C. Director of Stanley M. Proctor Co. | | January 2021 | | | 29,926 | |
Rudolph Cline-Thomas(3)
New York, New York, USA
Director | | Director of the Company. Founder and Managing Partner of venture fund MASTRY. Founder of commercial real estate investment firm Mastry Properties. Serves on Salesforce Global Advisory Board (NYSE: CRM). Strategic advisor to Gucci. Board advisor for Jumia Technologies (NYSE: JMIA) and Zuora (NYSE: ZUO). | | July 2021 | | | 17,600 | |
Stuart Porter
Boston, MA, USA
Director | | Director of the Company. Founder of Denham Capital and is its Chief Executive Officer and Chief Investment Officer. | | January 2022 | | | 1,546,400 | |
Notes:
| | (1) | Information has been furnished by the directors and executive officers individually or from www.sedi.ca. |
| | | |
| | (2) | The information as to shares beneficially owned, directly or indirectly, or over which control or direction is exercised, is based upon information furnished to the Company by the respective directors and executive officers as at the date hereof and does not include any convertible securities held by such person. |
| | | |
| | (3) | Member of the Audit Committee. |
| | | |
| | (4) | Member of the Nominating and Governance Committee. |
| | | |
| | (5) | Member of the Compensation Committee. |
| | | |
| | (6) | Member of the Patent Committee. |
The directors and executive officers of the Company listed above, as a group, beneficially owned, control or direct, directly or indirectly, 2,151,282 Common Shares as of the date hereof.
| ITEM 7. | MAJOR SHAREHOLDERS AND RELATED PARTY TRANSACTIONS |
As of December 28, 2022, according to www.sedi.ca, Stuart Porter beneficially owned 1,546,400 Common Shares, representing approximately 9.6% of the 16,027,267 Common Shares issued and outstanding on such date, 33,256 RSUs, 63,750 Options, 633,333 Warrants and $1,250,000 in convertible debentures convertible into 1,136,364 Common Shares.
From July 27, 2021 through October 6, 2021, Mr. Porter acquired 679,734 Common Shares in open market transactions for aggregate consideration of $3,846,691. In December 2020, Three Curve LP, an entity controlled by Mr. Porter (“Three Curve”), acquired 66,666 Common Shares and warrants to purchase 33,333 Common Shares in a private placement from the Company for aggregate consideration of $499,995. In December 2020 Three Curve also acquired 800,000 Common Shares and warrants to purchase 600,000 Common Shares from the Company in connection with the conversion of certain convertible debentures.
| B. | Related Party Transactions |
Key Management Compensation
Key management includes the Company’s directors, officers and any consultants with the authority and responsibility for planning, directing and controlling the activities of an entity, directly or indirectly. Compensation awarded to key management includes the following:
| | | For the year ended | |
| | | August 31, 2022 | | | August 31, 2021 | |
| | | | $ | | | | $ | |
| | | | | | | | | |
| Total compensation paid to key management | | | 1,390,598 | | | | 2,231,871 | |
| Share based payments | | | 963,295 | | | | 1,897,855 | |
Total compensation paid to key management is recorded in consulting fees and salaries and wages in the consolidated statement of loss and comprehensive loss for the years ended August 31, 2022, and 2021.
Amounts due to related parties as of August 31, 2022, with respect to the above fees were $5,588 (2021 – $33,349). The amounts due to related parties are recorded within accounts payable and accrued liabilities on the consolidated statements of loss and comprehensive loss. These amounts are unsecured, non-interest bearing and due on demand.
Commitment to Former Holders of WinView
Pursuant to the Business Combination agreement dated March 9, 2020, among the Company, Frankly Inc. and Winview Inc., the Company is required to pay to certain former Winview securities holders (“Stubholders”) fifty percent (50%) of the net license fees, damages awards or settlement amounts collected from third parties in connection with the Winview Patent Portfolio, after deduction of certain expenses. Company director, Tom Rogers is among the pool of Stubholders.
While the Company does not believe that the interests of Mr. Rogers, as Stubholder, are sufficiently material or adverse to the Company’s interests to create an actual or potential conflict of interest with respect to the management of the Winview Patent Portfolio, the Company nevertheless has formed a Patent Committee, that excludes Mr. Rogers, to make recommendations to the Company’s Board regarding matters involving the Winview Patent Portfolio.
| C. | Interests of Experts and Counsel |
Not applicable.
| ITEM 8. | FINANCIAL INFORMATION |
| A. | Consolidated Statements and Other Financial Information |
Financial Statements
This Annual Report contains the Company’s audited consolidated financial statements which comprise the consolidated statements of financial position as at August 31, 2022, 2021 and 2020, and the consolidated statements of loss and comprehensive loss, consolidated statements of changes in shareholders’ equity (deficiency) and consolidated statements of cash flows for the years ended August 31, 2022, 2021 and 2020, and notes to the consolidated financial statements, including a summary of significant accounting policies.
Legal Proceedings
In April 2020, the Company announced its renegotiation of the acquisition of Allinsports. The revised purchase agreement provided for the acquisition of 100% of Allinsports in exchange for the issuance of 966,667 Common Shares of the Company and other consideration, including payments of $1,200,000 as a portion of the purchase consideration. In September 2020, the Company advised the shareholders of Allinsports that closing conditions of the transaction, including the requirement to provide audited financial statements, had not been satisfied.
In response, in November 2020, the shareholders of Allinsports commenced arbitration in Alberta, Canada seeking, among other things, to compel the Company to complete the acquisition of Allinsports without the audited financial statements, and to issue 966,667 Common Shares of the Company to those shareholders. As alternative relief, the shareholders of Allinsports sought up to US$20,000,000 in damages. As of August 31, 2020, the Company had recorded an impairment against the entire balance of advances to Allinsports, amounting to $2,625,657. A hearing in this matter was held in May of 2021, and by a decision dated September 30, 2021, the Arbitrator determined that the closing of the transaction had previously occurred and directed the Company to issue the 966,667 Common Shares. The Company is pursuing regulatory approval to issue the shares and is also pursuing relief against the Allinsports shareholders for various alleged breaches of the share purchase agreement. The Company recognized a liability for the arbitration ruling of $899,569, which represents the fair value of the Common Shares directed to be delivered as of August 31, 2022. The liability is recorded as Arbitration reserve on the Company’s Consolidated Statements of Financial Position. This liability will be adjusted to fair value at the end of each reporting period.
On July 15, 2021, a complaint was filed against Winview by Bleacher League Entertainment, Inc. in the United States District Court for the District of Delaware, alleging that Winview had violated two of Bleacher’s patents covering an interactive themed baseball game and seeking damages and other relief. The parties have entered into an agreement resolving this matter and in connection therewith, on November 8, 2021, the plaintiff terminated the pending action by filing a notice of voluntary dismissal with prejudice. There was no related expense.
In April of 2021, the Company received a copy of a complaint filed by 3CI Holdings, LLLP in the Circuit Court for the 11th Judicial Circuit for Miami-Dade naming Allinsports, A1 Simulation LLC (an entity purported to be a subsidiary of Allinsports), and the Company, seeking to hold the parties, including Company, responsible for unpaid rent under a lease agreement between 3CI’s predecessors in interest and A1 Simulation, and seeking damages of at least $2,890,000. On July 6, 2021, the Company filed motion to dismiss the complaint. On February 17, 2022, 3CI Holdings filed an Amended Complaint, to which the Company filed a motion to dismiss, which was granted pursuant to an order signed by the court on July 5, 2022.
On January 21, 2021, eight former shareholders of Winview filed a Complaint in Delaware Chancery Court against four Winview directors (David Lockton, et al. v. Thomas S. Rogers, et al.) alleging that the defendants breached their fiduciary duties in connection with the sale of Winview to Engine. The relief sought includes rescission of the sale of Winview to Engine and compensatory damages. The defendants have filed a motion to dismiss the claims. By Decision dated March 1, 2022, the Court granted in part and denied in part, the defendants’ Motion to Dismiss the Complaint. Neither the Company nor Winview have been named as parties to this action. Under the March 9, 2020, Business Combination Agreement pursuant to which the Company acquired Winview, the Company agreed to indemnify Winview’s directors for any claims arising out of their service as directors for Winview. By Complaint filed on October 28, 2022, against the defendant directors, the insurance carrier providing directors and officers coverage for the shareholder action is seeking a declaration that the action is not covered under the directors and officers policy issued by it. As of August 31, 2022 it is impossible to estimate a liability or if one is likely.
In July of 2021, Winview filed separate patent infringement lawsuits against DraftKings and FanDuel in the United States District Court for the District of New Jersey, alleging that Sportsbook and Daily Fantasy Sports offerings of DraftKings and FanDuel infringe four of Winview’s patents. These actions seek the recovery of damages and other appropriate relief. Draft Kings and FanDuel have filed motions to dismiss, which are pending. The defendants have also filed petitions for inter partes review with the United States Patent Office, which are expected to commence in the first quarter of 2023. During the quarter ended August 31, 2022, the company recognized patent impairment expense amounting to $5,029,475. The impairment expense reflects the impact of reductions in estimated future net cash flows for certain portfolios that management determined it would no longer allocate resources to in future periods.
By Order to Continue dated May 5, 2022, the Company was substituted in as the plaintiff in a matter pending in the Ontario Superior Court of Justice, seeking recovery of €1,903,153 of principal and additional amounts of accrued interest under promissory notes acquired by the Company. The matter is in the discovery stage.
The outcomes of pending litigations in which the Company is involved are necessarily uncertain as are the Company’s expenses in prosecuting and defending these actions. From time to time the Company may modify litigation strategy and/or the terms on which it retains counsel and other professionals in connection with such actions, which may affect the outcomes of and/or the expenses incurred in connection with such actions.
The Company is subject to various other claims, lawsuits and other complaints arising in the ordinary course of business. The Company records provisions for losses when claims become probable, and the amounts are estimable. Although the outcome of such matters cannot be determined, it is the opinion of management that the final resolution of these matters will not have a material adverse effect on the Company’s financial condition, operations, or liquidity.
Dividend Policy
The Company has not paid any dividends since its incorporation. Any determination to pay any future dividends will remain at the discretion of the Board and will be made based on the Company’s financial condition and other factors deemed relevant by the Board. There are currently no restrictions on the ability of the Company to pay dividends except as set out under the Company’s governing statute.
We have not experienced any significant changes since the date of the Consolidated Financial Statements included with this Annual Report except as disclosed in this Annual Report.
| ITEM 9. | THE OFFER AND LISTING |
| A. | Offer and Listing Details |
The Common Shares are listed and posted for trading on the TSXV under the trading symbol “GAME” and on Nasdaq under the symbol “GAME”.
June 2020 Cease Trade Order
On June 22, 2020, the Ontario Securities Commission (the “OSC”) issued a temporary cease trade order against the Company for failure to file its second quarter interim financial statements for the six-month period ended February 29, 2020, the related management’s discussion and analysis and certificates of its CEO and CFO (the “Q2 Filings”). On July 8, 2020, the Company filed the Q2 Filings. The OSC lifted the cease trade order on July 10, 2020. The Company was reinstated for trading on the TSXV and the Common Shares resumed trading on July 27, 2020. At the time, Bryan Reyhani, Steven Zenz, Louis Schwartz, Tom Rogers and Michael Munoz were directors or officers of the Company.
Not applicable.
See Item 9.A. - Offer and Listing Details.
Not applicable.
Not applicable.
Not applicable.
| ITEM 10. | ADDITIONAL INFORMATION |
Not applicable.
| B. | Memorandum and Articles of Association |
Incorporation
See Item 4.A. – Name, Address and Incorporation.
Objects and Purposes
The Articles of the Company (the “Articles”) do not contain a limitation on objects and purposes.
Directors
Section 148 of the BCBCA deals with a directors’ disclosable interest (as defined in the BCBCA) in contracts or transactions into which the Company has entered or proposes to enter. Section 149 of the BCBCA provides that a director who holds such a disclosable interest is not entitled to vote on any directors’ resolution to approve such contract or transaction, unless all the directors have a disclosable interest in that contract or transaction, in which case any or all of those directors may vote on such resolution.
Pursuant to the BCBCA, a director holds a disclosable interest in a contract or transaction if (a) the contract or transaction is material to the Company, (b) the Company has entered, or proposes to enter, into the contract or transaction, and (c) the director has a material interest in the contract or transaction or the director is a director or senior officer of, or has a material interest in, a person who has a material interest in the contract or transaction. Pursuant to the BCBCA, a director does not have a disclosable interest in a number of prescribed situations, including without limitation in respect of a contract or transaction merely because the contract or transaction relates to the remuneration of the director in that person’s capacity as a director of the Company.
The directors may act notwithstanding any vacancy on the Board, but if the Company has fewer directors in office than the number set pursuant to the Articles as the quorum of directors, the directors may only act for the purpose of appointing directors up to that number or of summoning a meeting of shareholders for the purpose of filling any vacancies on the Board or, subject to the BCBCA, for any other purpose. The quorum necessary for the transaction of the business of the directors may be set by the directors and, if not so set, is deemed to be set at two directors or, if the number of directors is set at one, is deemed to be set at one director, and that director may constitute a meeting.
Article 6 of the Articles deals with borrowing powers. The Company, if authorized by the directors, may: (i) borrow money in the manner and amount, on the security, from the sources and on the terms and conditions that they consider appropriate; (ii) issue bonds, debentures and other debt obligations either outright or as security for any liability or obligation of the Company or any other person and at such discounts or premiums and on such other terms as they consider appropriate; (iii) guarantee the repayment of money by any other person or the performance of any obligation of any other person; and (iv) mortgage, charge, whether by way of specific or floating charge, grant a security interest in, or give other security on, the whole or any part of the present and future assets and undertaking of the Company.
Qualifications of Directors
The Articles do not specify a retirement age for directors.
Directors are not required to own any Common Shares of the Company.
Section 124 of the BCBCA provides that an individual is not qualified to become or act as a director of a company if that individual is:
| 1. | under the age of 18 years; |
| 2. | found by a court, in Canada or elsewhere, to be incapable of managing the individual’s own affairs; |
| 3. | an undischarged bankrupt; or |
| 4. | convicted in or out of the Province of British Columbia of an offence in connection with the promotion, formation or management of a corporation or unincorporated business, or of an offence involving fraud, unless: |
| a. | the court orders otherwise; |
| b. | 5 years have elapsed since the last to occur of: |
| i. | the expiration of the period set for suspension of the passing of sentence without a sentence having been passed; |
| ii. | the imposition of a fine; |
| iii. | the conclusion of the term of any imprisonment; and |
| iv. | the conclusion of the term of any probation imposed; or |
| c. | a pardon was granted or issued, or a record suspension ordered, under the Criminal Records Act (Canada) and the pardon or record suspension, as the case may be, has not been revoked or ceased to have effect. |
A director who ceases to be qualified to act as a director of the Company must promptly resign.
Section 120 of the BCBCA provides that every company must have at least one director, and a public company must have at least three directors.
Rights, Preference and Restrictions
Holders of Common Shares are entitled to receive notice of any meeting of shareholders of the Company, to attend and to cast one vote per share at such meetings. Holders of Common Shares are also entitled to receive on a pro rata basis such dividends, if any, as and when declared by the Board at its discretion from funds legally available therefor and upon the liquidation, dissolution, or winding up of the Company are entitled to receive on a pro rata basis, the net assets of the Company after payment of debts and other liabilities, in each case subject to the rights, privileges, restrictions, and conditions attaching to any other series or class of shares ranking senior in priority. Common Shares do not carry any pre-emptive, subscription, redemption, conversion rights, sinking fund provisions, liability to further capital calls by the Company, or provisions discriminating against any existing or prospective holder of Common Shares as a result of such shareholder owning a substantial number of Common Shares.
The rights of shareholders of the Company may be altered only with the approval of the holders of two thirds or more of the Common Shares voted at a meeting of the Company’s shareholders called and held in accordance with the Articles and applicable law.
Shareholder Meetings
The BCBCA provides that: (i) a general meeting of shareholders must be held in the Province of British Columbia, unless otherwise provided in the Company’s Articles or if the articles do not restrict the Company from approving a location outside of British Columbia, the location for the meeting is approved in writing by the registrar before the meeting is held; (ii) the Company must hold an annual general meeting of shareholders not later than 15 months after the last preceding annual general meeting and once in every calendar year; (iii) for the purpose of determining shareholders entitled to receive notice of or vote at a meeting of shareholders, the directors may set a date as the record date for that determination, provided that such date shall not precede by more than 2 months (or, in the case of a general meeting requisitioned by shareholders under the BCBCA, by more than 4 months) or be less than 21 days before the date on which the meeting is to be held; (iv) a quorum for the transaction of business at a meeting of shareholders of the Company is the quorum established by the Articles (Article 8.3 of the Articles provide that the quorum for the transaction of business at a meeting of shareholders is one or more persons, present in person or by proxy); (v) the holders of not less than 5% of the issued shares entitled to vote at a meeting may requisition the directors to call a meeting of shareholders for the purpose of transacting any business that may be transacted at a general meeting; and (vi) the Court may, on its own motion or on the application of the Company, upon the application of a director or the application of a shareholder entitled to vote at the meeting: (a) order that a meeting of shareholders be called, held and conducted in a manner that the Court considers appropriate; and (b) give directions it considers necessary as to the call, holding and conduct of the meeting.
Limitations on Ownership of Securities
Except as provided in the Investment Canada Act, there are no limitations specific to the rights of non-Canadians to hold or vote the Common Shares under the laws of Canada or the Province of British Columbia or in the Company’s constating documents.
Change in Control
There are no provisions in the Company’s constating documents or under applicable corporate law that would have the effect of delaying, deferring or preventing a change in the control of the Company, or that would operate with respect to any proposed merger, acquisition or corporate restructuring involving the Company or any of its subsidiaries.
Ownership Threshold
There are no provisions in the Company’s constating documents or under applicable corporate law requiring share ownership to be disclosed. Securities legislation in Canada requires that shareholder ownership (as well as ownership of an interest in, or right or obligation associated with, a related financial instrument of a security of the Company) must be disclosed once a person beneficially owns or has control or direction over, directly or indirectly, securities of a reporting issuer carrying more than 10% of the voting rights attached to all the reporting issuer’s outstanding voting securities. This threshold is higher than the 5% threshold under U.S. securities legislation at which stockholders must report their share ownership.
Changes to Capital
There are no conditions imposed by the Articles governing changes in the capital where such conditions are more significant than is required by the corporate laws of the Province of British Columbia for as long as the Company is a public company. If the Company is not a public company, Section 23.2 of the Articles provides that no share or designated security may be sold, transferred or otherwise disposed of without the consent of the directors and the directors are not required to give any reason for refusing to consent to any such sale, transfer or other disposition.
Description of Capital Structure
Our authorized share structure consists of an unlimited number of Common Shares without par value, of which 15,803,875 Common Shares were issued and outstanding as of August 31, 2022. All of the issued Common Shares are fully paid and non-assessable common shares in the capital of the Company. The Company does not own any of its Common Shares.
We are a party to the following contracts entered into in the two years immediately preceding the publication of this Annual Report which management currently considers to be material to the Company and our assets and operations and were not entered into in the ordinary course of business:
| ● | the Arrangement Agreement; and |
| ● | the Equity Distribution Agreement. |
The terms and conditions of these material contracts are summarized below.
Arrangement Agreement
On December 7, 2022 Engine entered into the Arrangement with GameSquare to combine businesses in an all share transaction, whereby each common share of GameSquare will be exchange for 0.08262 Common Shares. Following the all-share transaction, former GameSquare shareholders are expected to own approximately 60% of the combined entity, and current Engine shareholders are expected to own approximately 40% of the combined entity on a fully diluted basis, and it is intended that the Common Shares will continue to trade on Nasdaq and TSXV, in each case, under the symbol “GAME.” The combined entity will retain the “GameSquare” brand globally.
The Arrangement is anticipated to close in the first quarter of 2023. The completion of the Arrangement is subject to customary terms and conditions, including the following: approval of the Arrangement by Engine and GameSquare shareholders; court approval of the Arrangement; and, receipt of all required regulatory approvals, including acceptance by the TSXV.
Equity Distribution Agreement
On August 10, 2021, the Company entered into the Equity Distribution Agreement with Canaccord, on behalf of itself and co-sales agents Oppenheimer & Co. Inc. and B. Riley Securities, Inc., to establish the ATM Program. Under the ATM Program, the Company has the flexibility through the expiration date of its Base Shelf Prospectus to issue up to US$50 million of Common Shares as needed to support the Company’s ongoing business activities. Any Common Shares sold under the ATM Program will be sold at the prevailing market price at the time of sale, when sold through Nasdaq. No Common Shares will be offered or sold in Canada. As of the date hereof, the Company has not yet issued any shares under the ATM Program.
Canada has no system of exchange controls. There are no Canadian governmental laws, decrees, or regulations relating to restrictions on the repatriation of capital or earnings of the Company to non-resident investors. There are no laws in Canada or exchange control restrictions affecting the remittance of dividends or other payments made by the Company in the ordinary course to non-resident holders of the Common Shares by virtue of their ownership of such Common Shares, except as discussed below under Item 10.E. - Taxation.
There are no limitations under the laws of Canada or in the organizing documents of the Company on the right of foreigners to hold or vote securities of the Company, except that the Investment Canada Act may require that a “non-Canadian” not acquire “control” of the Company without prior review and approval by the Minister of Innovation, Science and Economic Development , where applicable thresholds are exceeded. The acquisition of one-third or more of the voting shares of the Company would give rise a rebuttable presumption of an acquisition of control, and the acquisition of more than fifty percent of the voting shares of the Company would be deemed to be an acquisition of control. In addition, the Investment Canada Act provides the Canadian government with broad discretionary powers in relation to national security to review and potentially prohibit, condition or require the divestiture of, any investment in the Company by a non-Canadian, including non-control level investments. “Non-Canadian” generally means an individual who is neither a Canadian citizen nor a permanent resident of Canada within the meaning of the Immigration and Refugee Protection Act (Canada) who has been ordinarily resident in Canada for not more than one year after the time at which he or she first became eligible to apply for Canadian citizenship, or a corporation, partnership, trust or joint venture that is ultimately controlled by non-Canadians.
Certain United States Federal Income Tax Considerations
The following is a general summary of certain material U.S. federal income tax considerations applicable to a U.S. Holder (as defined below) arising from and relating to the acquisition, ownership, and disposition of Common Shares. This summary is for general information purposes only and does not purport to be a complete analysis or listing of all potential U.S. federal income tax considerations that may apply to a U.S. Holder arising from and relating to the acquisition, ownership, and disposition of Common Shares. In addition, this summary does not take into account the individual facts and circumstances of any particular U.S. Holder that may affect the U.S. federal income tax consequences to such U.S. Holder, including without limitation specific tax consequences to a U.S. Holder under an applicable income tax treaty. Accordingly, this summary is not intended to be, and should not be construed as, legal or U.S. federal income tax advice with respect to any U.S. Holder. This summary does not address the U.S. federal net investment income, U.S. federal alternative minimum, U.S. federal estate and gift, U.S. state and local, and non-U.S. tax consequences to U.S. Holders of the acquisition, ownership, and disposition of Common Shares. In addition, except as specifically set forth below, this summary does not discuss applicable tax reporting requirements. Each prospective U.S. Holder should consult its own tax advisor regarding the U.S. federal, U.S. federal net investment income, U.S. federal alternative minimum, U.S. federal estate and gift, U.S. state and local, and non-U.S. tax consequences relating to the acquisition, ownership, and disposition of Common Shares. No legal opinion from U.S. legal counsel or ruling from the Internal Revenue Service (the “IRS”) has been requested, or will be obtained, regarding the U.S. federal income tax consequences of the acquisition, ownership, and disposition of Common Shares. This summary is not binding on the IRS, and the IRS is not precluded from taking a position that is different from, and contrary to, the positions taken in this summary. In addition, because the authorities on which this summary is based are subject to various interpretations, the IRS and the U.S. courts could disagree with one or more of the conclusions described in this summary.
Scope of this Summary
Authorities
This summary is based on the United States Internal Revenue Code of 1986, as amended (the “Code”), Treasury Regulations (whether final, temporary, or proposed), published rulings of the IRS, published administrative positions of the IRS, the Convention between the United States and Canada with respect to taxes on income and on capital of 1980, as amended (the “Canada-U.S. Tax Convention”), and U.S. court decisions that are applicable and, in each case, as in effect and available, as of the date of this document. Any of the authorities on which this summary is based could be changed in a material and adverse manner at any time, and any such change could be applied on a retroactive or prospective basis which could affect the U.S. federal income tax considerations described in this summary. This summary does not discuss the potential effects, whether adverse or beneficial, of any proposed legislation that, if enacted, could be applied on a retroactive, current or prospective basis.
U.S. Holders
For purposes of this summary, the term “U.S. Holder” means a beneficial owner of Common Shares that is for U.S. federal income tax purposes:
| ● | an individual who is a citizen or resident of the U.S.; |
| ● | a corporation (or other entity taxable as a corporation for U.S. federal income tax purposes) organized under the laws of the U.S., any state thereof or the District of Columbia; |
| ● | an estate whose income is subject to U.S. federal income taxation regardless of its source; or |
| ● | a trust that (1) is subject to the primary supervision of a court within the U.S. and the control of one or more U.S. persons for all substantial decisions or (2) has a valid election in effect under applicable Treasury Regulations to be treated as a U.S. person. |
Non-U.S. Holders
For purposes of this summary, a “non-U.S. Holder” is a beneficial owner of Common Shares that is not a U.S. Holder or is a partnership. This summary does not address the U.S. federal income tax considerations to non-U.S. Holders arising from and relating to the acquisition, ownership and disposition of Common Shares. Accordingly, a non-U.S. Holder should consult its own tax advisors regarding the U.S. federal, U.S. federal alternative minimum, U.S. federal estate and gift, U.S. state and local and non-U.S. tax consequences (including the potential application of, and operation of, any income tax treaties) relating to the acquisition, ownership and disposition of Common Shares.
U.S. Holders Subject to Special U.S. Federal Income Tax Rules Not Addressed
This summary does not address the U.S. federal income tax considerations applicable to U.S. Holders that are subject to special provisions under the Code, including, but not limited to, U.S. Holders that: (a) are tax-exempt organizations, qualified retirement plans, individual retirement accounts, or other tax-deferred accounts; (b) are financial institutions, underwriters, insurance companies, real estate investment trusts, or regulated investment companies; (c) are broker-dealers, dealers, or traders in securities or currencies that elect to apply a mark-to-market accounting method; (d) have a “functional currency” other than the U.S. dollar; (e) own Common Shares as part of a straddle, hedging transaction, conversion transaction, constructive sale, or other integrated transaction; (f) acquired Common Shares in connection with the exercise of employee stock options or otherwise as compensation for services; (g) hold Common Shares other than as a capital asset within the meaning of Section 1221 of the Code (generally, property held for investment purposes); (h) are subject to taxing jurisdictions other than, or in addition to, the United States; (i) are partnerships and other pass-through entities (and investors in such partnerships and entities); (j) are S corporations (and shareholders or investors in such S corporations); (k) own, have owned or will own (directly, indirectly, or by attribution) 10% or more of the total combined voting power or value of the outstanding shares of the Company; (l) U.S. expatriates or former long-term residents of the U.S., (m) hold Common Shares in connection with a trade or business, permanent establishment, or fixed base outside the United States, or (n) are subject to special tax accounting rules with respect to Common Shares. U.S. Holders that are subject to special provisions under the Code, including, but not limited to, U.S. Holders described immediately above, should consult their own tax advisor regarding the U.S. federal, U.S. federal net investment income, U.S. federal alternative minimum, U.S. federal estate and gift, U.S. state and local, and non-U.S. tax consequences relating to the acquisition, ownership and disposition of Common Shares.
If an entity or arrangement that is classified as a partnership (or other “pass-through” entity) for U.S. federal income tax purposes holds Common Shares, the U.S. federal income tax consequences to such entity and the partners (or other owners) of such entity generally will depend on the activities of the entity and the status of such partners (or owners). This summary does not address the tax consequences to any such owner. Partners (or other owners) of entities or arrangements that are classified as partnerships or as “pass-through” entities for U.S. federal income tax purposes should consult their own tax advisors regarding the U.S. federal, U.S. federal net investment income, U.S. federal alternative minimum, U.S. federal estate and gift, U.S. state and local, and non-U.S. tax consequences arising from and relating to the acquisition, ownership, and disposition of Common Shares.
Ownership and Disposition of Common Shares
The following discussion is subject to the rules described below under the heading “Passive Foreign Investment Company Rules”.
Taxation of Distributions
A U.S. Holder that receives a distribution, including a constructive distribution, with respect to a share will be required to include the amount of such distribution in gross income as a dividend (without reduction for any foreign income tax withheld from such distribution) to the extent of the current or accumulated “earnings and profits” of the Company, as computed for U.S. federal income tax purposes. A dividend generally will be taxed to a U.S. Holder at ordinary income tax rates if the Company is a PFIC for the tax year of such distribution or the preceding tax year. To the extent that a distribution exceeds the current and accumulated “earnings and profits” of the Company, such distribution will be treated first as a tax-free return of capital to the extent of a U.S. Holder’s tax basis in the Common Shares and thereafter as gain from the sale or exchange of such Common Shares (see “Sale or Other Taxable Disposition of Common Shares” below). However, the Company may not maintain the calculations of its earnings and profits in accordance with U.S. federal income tax principles, and each U.S. Holder should therefore assume that any distribution by the Company with respect to the Common Shares will constitute ordinary dividend income. Dividends received on Common Shares by corporate U.S. Holders generally will not be eligible for the “dividends received deduction”. Subject to applicable limitations and provided the Company is eligible for the benefits of the Canada-U.S. Tax Convention or the Common Shares are readily tradable on a United States securities market, dividends paid by the Company to non-corporate U.S. Holders, including individuals, generally will be eligible for the preferential tax rates applicable to long-term capital gains for dividends, provided certain holding period and other conditions are satisfied, including that the Company not be classified as a PFIC (as defined below) in the tax year of distribution or in the preceding tax year. The dividend rules are complex, and each U.S. Holder should consult its own tax advisor regarding the application of such rules.
Sale or Other Taxable Disposition of Common Shares
A U.S. Holder will generally recognize gain or loss on the sale or other taxable disposition of Common Shares in an amount equal to the difference, if any, between (a) the amount of cash plus the fair market value of any property received and (b) such U.S. Holder’s tax basis in such Common Shares sold or otherwise disposed of. Any such gain or loss recognized on such sale or other disposition generally will be capital gain or loss, which will be long-term capital gain or loss if, at the time of the sale or other disposition, such Common Shares are held for more than one year.
Preferential tax rates apply to long-term capital gains of a U.S. Holder that is an individual, estate, or trust. There are currently no preferential tax rates for long-term capital gains of a U.S. Holder that is a corporation. Deductions for capital losses are subject to significant limitations under the Code.
Passive Foreign Investment Company (“PFIC”) Rules
If the Company were to constitute a PFIC for any year during a U.S. Holder’s holding period, then certain potentially adverse rules would affect the U.S. federal income tax consequences to a U.S. Holder resulting from the acquisition, ownership and disposition of Common Shares. The Company believes that it was not a PFIC for its most recently completed tax year and based on current business plans and financial expectations, the Company does not anticipate that it will be a PFIC for its current tax year. No opinion of legal counsel or ruling from the IRS concerning the status of the Company as a PFIC has been obtained or is currently planned to be requested. However, PFIC classification is fundamentally factual in nature, generally cannot be determined until the close of the tax year in question and is determined annually. Additionally, the analysis depends, in part, on the application of complex U.S. federal income tax rules, which are subject to differing interpretations. Consequently, there can be no assurance that the Company has never been and will not become a PFIC for any tax year during which U.S. Holders hold Common Shares.
In addition, in any year in which the Company is classified as a PFIC, a U.S. Holder will be required to file an annual report with the IRS containing such information as Treasury Regulations and/or other IRS guidance may require. A failure to satisfy such reporting requirements may result in an extension of the time period during which the IRS can assess a tax. U.S. Holders should consult their own tax advisors regarding the requirements of filing such information returns under these rules, including the requirement to file an IRS Form 8621 annually.
The Company generally will be a PFIC under Section 1297 of the Code if, after the application of certain “look-through” rules with respect to subsidiaries in which the Company holds at least 25% of the value of such subsidiary, for a tax year, (a) 75% or more of the gross income of the Company for such tax year is passive income (the “income test”) or (b) 50% or more of the value of the Company’s assets either produce passive income or are held for the production of passive income (the “asset test”), based on the quarterly average of the fair market value of such assets. “Gross income” generally includes all sales revenues less the cost of goods sold, plus income from investments and incidental or outside operations or sources, and “passive income” generally includes, for example, dividends, interest, certain rents and royalties, certain gains from the sale of stock and securities, and certain gains from commodities transactions. Active business gains arising from the sale of commodities generally are excluded from passive income if substantially all of a foreign corporation’s commodities are stock in trade or inventory, depreciable property used in a trade or business or supplies regularly used or consumed in the ordinary course of its trade or business, and certain other requirements are satisfied.
If the Company were a PFIC in any tax year during which a U.S. Holder held Common Shares, such holder generally would be subject to special rules with respect to “excess distributions” made by the Company on the Common Shares and with respect to gain from the disposition of Common Shares. An “excess distribution” generally is defined as the excess of distributions with respect to the Common Shares received by a U.S Holder in any tax year over 125% of the average annual distributions such U.S. Holder has received from the Company during the shorter of the three preceding tax years, or such U.S. Holder’s holding period for the Common Shares. Generally, a U.S. Holder would be required to allocate any excess distribution or gain from the disposition of the Common Shares ratably over its holding period for the Common Shares. Such amounts allocated to the year of the disposition or excess distribution would be taxed as ordinary income, and amounts allocated to prior tax years would be taxed as ordinary income at the highest tax rate in effect for each such year and an interest charge at a rate applicable to underpayments of tax would apply.
While there are U.S. federal income tax elections that sometimes can be made to mitigate these adverse tax consequences (including the “QEF Election” under Section 1295 of the Code and the “Mark-to-Market Election” under Section 1296 of the Code), such elections are available in limited circumstances and must be made in a timely manner.
U.S. Holders should be aware that, for each tax year, if any, that the Company is a PFIC, the Company can provide no assurances that it will satisfy the record-keeping requirements of a PFIC, or that it will make available to U.S. Holders the information such U.S. Holders require to make a QEF Election with respect to the Company or any subsidiary that also is classified as a PFIC.
Certain additional adverse rules may apply with respect to a U.S. Holder if the Company is a PFIC, regardless of whether the U.S. Holder makes a QEF Election. These rules include special rules that apply to the amount of foreign tax credit that a U.S. Holder may claim on a distribution from a PFIC. Subject to these special rules, foreign taxes paid with respect to any distribution in respect of stock in a PFIC are generally eligible for the foreign tax credit. U.S. Holders should consult their own tax advisors regarding the potential application of the PFIC rules to the ownership and disposition of Common Shares, and the availability of certain U.S. tax elections under the PFIC rules.
Additional Considerations
Receipt of Foreign Currency
The amount of any distribution paid to a U.S. Holder in foreign currency, or payment received on the sale, exchange or other taxable disposition of Common Shares, generally will be equal to the USD value of such foreign currency based on the exchange rate applicable on the date of receipt (regardless of whether such foreign currency is converted into USD at that time). A U.S. Holder will have a basis in the foreign currency equal to its USD value on the date of receipt. Any U.S. Holder who converts or otherwise disposes of the foreign currency after the date of receipt may have a foreign currency exchange gain or loss that would be treated as ordinary income or loss, and generally will be U.S. source income or loss for foreign tax credit purposes. Different rules apply to U.S. Holders who use the accrual method with respect to foreign currency received upon the sale, exchange or other taxable disposition of the Common Shares. Each U.S. Holder should consult its own U.S. tax advisor regarding the U.S. federal income tax consequences of receiving, owning, and disposing of foreign currency.
Foreign Tax Credit
Dividends paid on the Common Shares will be treated as foreign-source income, and generally will be treated as “passive category income” or “general category income” for U.S. foreign tax credit purposes. The Code applies various complex limitations on the amount of foreign taxes that may be claimed as a credit by U.S. taxpayers. In addition, Treasury Regulations that apply to taxes paid or accrued in taxable years beginning on or after December 28, 2021 (the “Foreign Tax Credit Regulations”) impose additional requirements for Canadian withholding taxes to be eligible for a foreign tax credit, and there can be no assurance that those requirements will be satisfied.
Subject to the PFIC rules and the Foreign Tax Credit Regulations, each as discussed above, a U.S. Holder that pays (whether directly or through withholding) Canadian income tax with respect to dividends paid on the Common Shares generally will be entitled, at the election of such U.S. Holder, to receive either a deduction or a credit for such Canadian income tax. Generally, a credit will reduce a U.S. Holder’s U.S. federal income tax liability on a dollar-for-dollar basis, whereas a deduction will reduce a U.S. Holder’s income that is subject to U.S. federal income tax. This election is made on a year-by-year basis and applies to all foreign taxes paid (whether directly or through withholding) by a U.S. Holder during a year. The foreign tax credit rules are complex and involve the application of rules that depend on a U.S. Holder’s particular circumstances. Accordingly, each U.S. Holder should consult its own U.S. tax advisor regarding the foreign tax credit rules.
Backup Withholding and Information Reporting
Under U.S. federal income tax law and Treasury Regulations, certain categories of U.S. Holders must file information returns with respect to their investment in, or involvement in, a foreign corporation. For example, U.S. return disclosure obligations (and related penalties) are imposed on individuals who are U.S. Holders that hold certain specified foreign financial assets in excess of certain threshold amounts. The definition of specified foreign financial assets includes not only financial accounts maintained in foreign financial institutions, but also, unless held in accounts maintained by a financial institution, any stock or security issued by a non-U.S. person, any financial instrument or contract held for investment that has an issuer or counterparty other than a U.S. person and any interest in a foreign entity. U.S. Holders may be subject to these reporting requirements unless their Common Shares are held in an account at certain financial institutions. Penalties for failure to file certain of these information returns are substantial. U.S. Holders should consult their own tax advisors regarding the requirements of filing information returns, including the requirement to file an IRS Form 8938.
Payments made within the U.S. or by a U.S. payor or U.S. middleman, of dividends on, and proceeds arising from the sale or other taxable disposition of, Common Shares will generally be subject to information reporting and backup withholding tax, currently at the rate of 24%, if a U.S. Holder (a) fails to furnish such U.S. Holder’s correct U.S. taxpayer identification number (generally on IRS Form W-9), (b) furnishes an incorrect U.S. taxpayer identification number, (c) is notified by the IRS that such U.S. Holder has previously failed to properly report items subject to backup withholding tax, or (d) fails to certify, under penalty of perjury, that such U.S. Holder has furnished its correct U.S. taxpayer identification number and that the IRS has not notified such U.S. Holder that it is subject to backup withholding tax. However, certain exempt persons generally are excluded from these information reporting and backup withholding rules. Backup withholding is not an additional tax. Any amounts withheld under the U.S. backup withholding tax rules will be allowed as a credit against a U.S. Holder’s U.S. federal income tax liability, if any, or will be refunded, if such U.S. Holder furnishes required information to the IRS in a timely manner.
The discussion of reporting requirements set forth above is not intended to constitute a complete description of all reporting requirements that may apply to a U.S. Holder. A failure to satisfy certain reporting requirements may result in an extension of the time period during which the IRS can assess a tax, and under certain circumstances, such an extension may apply to assessments of amounts unrelated to any unsatisfied reporting requirement. Each U.S. Holder should consult its own tax advisor regarding the information reporting and backup withholding rules.
THE ABOVE SUMMARY IS NOT INTENDED TO CONSTITUTE A COMPLETE ANALYSIS OF ALL TAX CONSIDERATIONS APPLICABLE TO U.S. HOLDERS WITH RESPECT TO THE ACQUISITION, OWNERSHIP, AND DISPOSITION OF COMMON SHARES. U.S. HOLDERS SHOULD CONSULT THEIR OWN TAX ADVISORS AS TO THE TAX CONSIDERATIONS APPLICABLE TO THEM IN LIGHT OF THEIR OWN PARTICULAR CIRCUMSTANCES.
Canadian Federal Income Tax Consequences
The following summarizes certain Canadian federal income tax consequences generally applicable under the Tax Act and the Canada-U.S. Tax Convention to the holding and disposition of Common Shares.
This summary is restricted to holders of Common Shares each of whom, at all material times for the purposes of the Tax Act and the Canada-U.S. Tax Convention:
| (i) | are resident solely in the United States for the purposes of the Canada-U.S. Tax Convention; |
| (ii) | are entitled to the benefits of the Canada-U.S. Tax Convention; |
| (iii) | hold all Common Shares as capital property and as beneficial owner; |
| (iv) | hold no Common Shares that are “taxable Canadian property” (as defined in the Tax Act) of the holder; |
| (v) | deal at arm’s length with and are not affiliated with the Company; |
| (vi) | do not and are not deemed to use or hold any Common Shares in a business carried on in Canada; |
| (vii) | did not, do not and will not have a permanent establishment in Canada within the meaning of the Canada-U.S. Tax Convention; |
| (viii) | did not acquire Common Shares by virtue of employment; |
| (ix) | are not financial institutions, authorized foreign banks, partnerships or trusts for the purposes of the Tax Act; and |
| (x) | are not insurers that carry on business in Canada and elsewhere; |
(each such holder, a “U.S. Resident Holder”).
Certain U.S.-resident entities that are fiscally transparent for United States federal income tax purposes (including limited liability companies) may not in all circumstances be entitled to the benefits of the Canada-U.S. Tax Convention. However, members of or holders of an interest in such entities that hold Common Shares may be entitled to the benefits of the Canada-U.S. Tax Convention for income derived through such entities. Such members or holders should consult their own tax advisors in this regard.
Generally, a holder’s Common Shares will be considered to be capital property of the holder provided that the holder is not a trader or dealer in securities, did not acquire, hold or dispose of the Common Shares in one or more transactions considered to be an adventure or concern in the nature of trade and does not hold the Common Shares as inventory in the course of carrying on a business.
Generally, a holder’s Common Shares will not be “taxable Canadian property” of the holder at a particular time at which the Common Shares are listed on a “designated stock exchange” (which currently includes the TSXV) unless both of the following conditions are met at any time during the 60-month period ending at the particular time:
| (i) | the holder, persons with whom the holder does not deal at arm’s length, or any partnership in which the holder or persons with whom the holder did not deal at arm’s length holds a membership interest directly or indirectly through one or more partnerships, alone or in any combination, owned 25% or more of the issued shares of any class of the capital stock of the Company; and |
| (ii) | more than 50% of the fair market value of the Common Shares was derived directly or indirectly from, or from any combination of, real or immovable property situated in Canada, “Canadian resource properties” (as defined in the Tax Act), “timber resource properties” (as defined in the Tax Act), or options in respect of or interests in such properties. |
In certain other circumstances, a Common Share may be deemed to be “taxable Canadian property” for purposes of the Tax Act.
This summary is based on the current provisions of the Tax Act and the Canada-U.S. Tax Convention in effect on the date hereof, all specific proposals to amend the Tax Act and Canada-U.S. Tax Convention publicly announced by or on behalf of the Minister of Finance (Canada) on or before the date hereof, and the current published administrative and assessing policies of the Canada Revenue Agency (“CRA”). It is assumed that all such amendments will be enacted as currently proposed, and that there will be no other material change to any applicable law or administrative or assessing practice, although no assurance can be given in these respects. Except as otherwise expressly provided, this summary does not take into account any provincial, territorial or foreign tax considerations, which may differ materially from those set out herein.
This summary is of a general nature only, is not exhaustive of all possible Canadian federal income tax considerations, and is not intended to be and should not be construed as legal or tax advice to any particular U.S. Resident Holder. U.S. Resident Holders are urged to consult their own tax advisers for advice with respect to their particular circumstances. The discussion below is qualified accordingly.
A U.S. Resident Holder who disposes or is deemed to dispose of one or more Common Shares generally should not thereby incur any liability for Canadian federal income tax in respect of any capital gain arising as a consequence of the disposition.
A U.S. Resident Holder to whom the Company pays or is deemed to pay a dividend on the holder’s Common Shares will be subject to Canadian withholding tax, and the Company will be required to withhold the tax from the dividend and remit it to the CRA for the holder’s account. The rate of withholding tax under the Tax Act is 25% of the gross amount of the dividend (subject to reduction under the provisions of an applicable tax treaty). Under the Canada-U.S. Tax Convention, a U.S. Resident Holder who beneficially owns the dividend will generally be subject to Canadian withholding tax at the rate of 15% (or 5%, if the U.S. Resident Holder who beneficially owns the dividend is a company that is not fiscally transparent and which owns at least 10% of the voting stock of the Company) of the gross amount of the dividend.
| F. | Dividends and Paying Agents |
Not applicable
Not applicable.
Any statement in this Annual Report about any of our contracts or other documents is not necessarily complete. If the contract or document is filed as an exhibit to this Annual Report, the contract or document is deemed to modify the description contained in this Annual Report. Readers must review the exhibits themselves for a complete description of the contract or document.
We are subject to the informational requirements of the Exchange Act and file reports and other information with the SEC. The SEC maintains a website that contains reports, proxy and information statements and other information regarding registrants that file electronically with the SEC at http://www.sec.gov.
We are required to file reports and other information with the securities commissions in Canada. You are invited to read and copy any reports, statements or other information, other than confidential filings, that we file with the provincial securities commissions. These filings are also electronically available from SEDAR, the Canadian equivalent of EDGAR.
Copies of our material contracts are kept at our registered office.
Not applicable.
| J. | Annual Report to Security Holders |
Not applicable.
| ITEM 11. | QUANTITATIVE AND QUALITATIVE DISCLOSURES ABOUT MARKET RISK |
Financial Risk Management Objectives and Policies
The Company’s activities expose it to a variety of financial risks including foreign currency risk, interest rate risk, credit risk, and liquidity risk. These financial instrument risks are actively managed by the Company under the policies approved by the Board. On an ongoing basis, the finance department actively manages market conditions with a view to minimizing the exposure of the Company to changing market factors, while at the same time limiting the funding costs to the Company. There have been no changes in objectives, policies or how the Company manages these risks.
Credit Risk
Credit risk refers to the risk that a counterparty will default on its contractual obligations resulting in financial loss to the Company. The Company has adopted a policy of only dealing with creditworthy counterparties and obtaining sufficient collateral where appropriate, as a means of mitigating the risk of financial loss from defaults. The Company uses information supplied by independent rating agencies where available, and if not available, the Company uses other publicly available financial information and its own records to rate its customers.
Credit risk arises from cash with banks as well as credit exposure to outstanding receivables. The carrying amounts represent the Company’s maximum exposure to credit risk.
The Company’s exposure to credit risk is influenced mainly by the individual characteristics of each customer. The Company establishes an allowance for doubtful accounts that represents its estimate of expected losses in respect to accounts receivable. The main components of this allowance are a specific loss component that relates to individually significant exposures, and a collective loss component established for groups of similar assets in respect of losses that have been incurred but not yet identified. The collective loss allowance is determined based on historical data of payment statistics for similar financial assets. The allowance for doubtful accounts was $1,155,638 and $1,084,305 as of August 31, 2022, and 2021, respectively.
The Company’s accounts receivable are concentrated among customers in the media and broadcasting industry, which may be affected by adverse economic factors impacting that industry. The Company performs ongoing credit evaluations of its major customers, maintains reserves for expected credit losses, and does not require any collateral deposits.
As of August 31, 2022, one customer (2021 - one) accounted for greater than 10% of the Company’s accounts receivable balance. In total, this one customer (2021 - one) accounted for 16% and 13% of the Company’s accounts and other receivables balance as of August 31, 2022, and 2021, respectively. During the year ended August 31, 2022, one (2021 - one) customer represented 72% (2021 - 60%) of total revenue.
The below table reflects the aging of the Company’s aging by invoice date of gross trade accounts receivable and allowance for doubtful accounts as of August 31, 2022:
| | | Current | | | 0 - 30 | | | 31 - 60 | | | 61 - 90 | | | 91+ | | | Total | |
| | | | | | | | | | | | | | | | | | | |
| Trade accounts receivable | | | 6,805,057 | | | | 202,359 | | | | 428,098 | | | | 305,056 | | | | 2,010,049 | | | | 9,750,619 | |
| Allowance for doubtful accounts | | | 12,753 | | | | 3,577 | | | | 17,423 | | | | 9,790 | | | | 1,312,095 | | | | 1,355,638 | |
| % Allowance | | | | | | | 2 | % | | | 4 | % | | | 3 | % | | | 65 | % | | | 14 | % |
Liquidity Risk
Liquidity risk is the risk that the Company will encounter difficulty in meeting obligations associated with financial liabilities. The Company is exposed to liquidity risk with respect to its contractual obligations and financial liabilities. The Company manages liquidity risk by continuously monitoring forecasted and actual cash flows and matching maturity profiles of financial assets and liabilities. The Company seeks to ensure that it has sufficient capital to meet short term financial obligations after taking into account its operating obligations and cash on hand.
The Company’s policy is to seek to ensure adequate funding is available from operations and other sources, including debt and equity capital markets, as required.
| | | < 1 year | | | 1-2 years | |
| | | $ | | | $ | |
| | | | | | | |
| Accounts payable | | | 12,772,375 | | | | - | |
| Accrued liabilities | | | 3,756,758 | | | | - | |
| Players liability account | | | 47,455 | | | | - | |
| Promissory notes payable | | | 771,762 | | | | - | |
| Convertible debt | | | 2,267,367 | | | | 4,983,236 | |
Market Risk
Market risk represents the risk of loss that may impact the Company’s financial position, results of operations, or cash flows due to adverse changes in financial market prices, including interest rate risk, foreign currency exchange rate risk, and other relevant market or price risks. The Company does not use derivative instruments to mitigate this risk.
Interest Rate Risk
Interest rate risk is the risk that the fair value or future cash flows of a financial instrument will fluctuate because of changes in market interest rates. The Company is exposed to fair value risk with respect to debt which bears interest at fixed rates.
Currency Risk
The Company’s exposure to the risk of changes in foreign exchange rates relates primarily to fluctuations of financial instruments related to cash, accounts and other receivables, and accounts payable denominated in Euros, as well as debt denominated in Canadian dollars.
Fair Value Hierarchy
The following tables combine information about:
| | ● | classes of financial instruments based on their nature and characteristics; |
| | ● | the carrying amounts of financial instruments; |
| | ● | fair values of financial instruments (except financial instruments when carrying amount approximates their fair value); and |
| | ● | fair value hierarchy levels of financial assets and financial liabilities for which fair value was disclosed. |
Fair value hierarchy levels 1 to 3 are based on the degree to which the fair value is observable.
For the year ended August 31, 2022:
| Carrying value at August 31, 2022 | | FVTPL -
mandatorily
measured | | | Amortized
cost | |
| | | $ | | | $ | |
| | | | | | | |
| Financial assets: | | | | | | | | |
| Cash | | | - | | | | 8,601,706 | |
| Restricted cash | | | - | | | | 47,455 | |
| Accounts and other receivables | | | - | | | | 8,404,009 | |
| Government remittances | | | - | | | | 874,334 | |
| Publisher advance | | | 1,490,648 | | | | - | |
| Promissory notes receivable | | | 576,528 | | | | - | |
| Investment at FVTPL | | | 2,629,851 | | | | - | |
| | | | 4,697,027 | | | | 17,927,504 | |
| Carrying value at August 31, 2022 | | FVTPL -
mandatorily
measured | | | FVTPL -
designated | | | Amortized
cost | |
| | | $ | | | $ | | | $ | |
| | | | | | | | | | |
| Financial liabilities: | | | | | | | | | | | | |
| Accounts payable | | | - | | | | - | | | | 12,772,375 | |
| Accrued liabilities | | | - | | | | - | | | | 3,756,758 | |
| Players liability account | | | - | | | | - | | | | 47,455 | |
| Long-term debt | | | - | | | | - | | | | - | |
| Promissory notes payable | | | - | | | | - | | | | 771,762 | |
| Warrant liability | | | 49,894 | | | | - | | | | - | |
| Convertible debt | | | - | | | | 7,250,603 | | | | - | |
| | | | 49,894 | | | | 7,250,603 | | | | 17,348,350 | |
For the year ended August 31, 2021:
| Carrying value at August 31, 2021 | | FVTPL -
mandatorily
measured | | | Amortized
cost | |
| | | $ | | | $ | |
| | | | | | | |
| Financial assets: | | | | | | | | |
| Cash | | | - | | | | 15,305,996 | |
| Restricted cash | | | - | | | | 331,528 | |
| Accounts and other receivables | | | - | | | | 8,646,807 | |
| Government remittances | | | - | | | | 1,070,216 | |
| Publisher advance | | | 4,534,218 | | | | - | |
| Promissory notes receivable | | | - | | | | - | |
| Investment at FVTPL | | | 2,629,851 | | | | - | |
| | | | 7,164,069 | | | | 25,354,547 | |
| Carrying value at August 31, 2021 | | FVTPL -
mandatorily
measured | | | FVTPL -
designated | | | Amortized
cost | |
| | | $ | | | $ | | | $ | |
| | | | | | | | | | |
| Financial liabilities: | | | | | | | | | | | | |
| Accounts payable | | | - | | | | - | | | | 10,403,665 | |
| Accrued liabilities | | | - | | | | - | | | | 5,722,470 | |
| Players liability account | | | - | | | | - | | | | 331,528 | |
| Long-term debt | | | - | | | | - | | | | 96,664 | |
| Promissory notes payable | | | - | | | | - | | | | 821,948 | |
| Warrant liability | | | 4,868,703 | | | | - | | | | - | |
| Convertible debt | | | - | | | | 9,951,496 | | | | - | |
| | | | 4,868,703 | | | | 9,951,496 | | | | 17,376,275 | |
A summary of instruments, with their classification in the fair value hierarchy is as follows:
| | | Level 1 | | | Level 2 | | | Level 3 | | | Fair value as
of August 31, 2022 | |
| | | $ | | | $ | | | $ | | | $ | |
| | | | | | | | | | | | | |
| Warrant liability | | | - | | | | 49,894 | | | | - | | | | 49,894 | |
| Convertible debt | | | - | | | | - | | | | 7,250,603 | | | | 7,250,603 | |
| Publisher advance | | | - | | | | - | | | | 1,490,648 | | | | 1,490,648 | |
| Promissory notes receivable | | | - | | | | - | | | | 576,528 | | | | 576,528 | |
| Investment at FVTPL | | | - | | | | - | | | | 2,629,851 | | | | 2,629,851 | |
| | | Level 1 | | | Level 2 | | | Level 3 | | | Fair value as
of August 31, 2021 | |
| | | $ | | | $ | | | $ | | | $ | |
| | | | | | | | | | | | | |
| Warrant liability | | | - | | | | 4,868,703 | | | | - | | | | 4,868,703 | |
| Convertible debt | | | - | | | | - | | | | 9,951,496 | | | | 9,951,496 | |
| Publisher advance | | | - | | | | - | | | | 4,534,218 | | | | 4,534,218 | |
| Promissory notes receivable | | | - | | | | - | | | | - | | | | - | |
| Investment at FVTPL | | | - | | | | - | | | | 2,629,851 | | | | 2,629,851 | |
| Financial assets / financial liabilities | | Valuation technique | | Key Inputs | | Relationship and sensitivity of unobservable inputs to fair value to fair value |
| Convertible debt | | The fair value of the convertible debentures as of August 31, 2022 has been calculated using a binomial lattice methodology. | | Key observable inputs | | The estimated fair value would increase (decrease) if: |
| | | | | Share price CAD $.94 (USD $.72) | | The share price was higher (lower) |
| | | | | | | |
| | | | | Risk-free interest rate (2.85% to 3.45%) | | The risk-free interest rate was higher (lower) |
| | | | | | | |
| | | | | Dividend yield (0%) | | The dividend yield was lower (higher) |
| | | | | | | |
| | | | | Key unobservable inputs | | |
| | | | | | | |
| | | | | Credit spread (10.13% to 13.56%) | | The credit spread was lower (higher) |
| | | | | | | |
| | | | | Discount for lack of marketability (0%) | | The discount for lack of marketability was lower (higher) |
| Convertible debt | | The fair value of the convertible debentures as of August 31, 2021 has been calculated using a binomial lattice methodology. | | Key observable inputs | | The estimated fair value would increase (decrease) if: |
| | | | | | | |
| | | | | Share price CAD$8.42 (USD $6.66) | | The share price was higher (lower) |
| | | | | | | |
| | | | | Risk-free interest rate (0.10% to 0.30%) | | The risk-free interest rate was higher (lower) |
| | | | | | | |
| | | | | Dividend yield (0%) | | The dividend yield was lower (higher) |
| | | | | | | |
| | | | | Key unobservable inputs | | |
| | | | | | | |
| | | | | Credit spread (1.14% to 8.45%) | | The credit spread was lower (higher) |
| | | | | | | |
| | | | | Discount for lack of marketability (0%) | | The discount for lack of marketability was lower (higher) |
| ITEM 12. | DESCRIPTION OF SECURITIES OTHER THAN EQUITY SECURITIES |
Not applicable.
PART II
| ITEM 13. | DEFAULTS, DIVIDEND ARREARAGES AND DELINQUENCIES |
There has not been a material default in the payment of principal, interest, a sinking or purchase fund installment, or any other material default not cured within thirty days, relating to indebtedness of the Company or any of its significant subsidiaries. There are no payments of dividends by the Company in arrears, nor has there been any other material delinquency relating to any class of preference shares of the Company.
| ITEM 14. | MATERIAL MODIFICATIONS TO THE RIGHTS OF SECURITY HOLDERS AND USE OF PROCEEDS |
A. to D.
None.
Not applicable.
| ITEM 15. | CONTROLS AND PROCEDURES |
| A. | Disclosure Controls and Procedures |
As of the end of the period covered by this Annual Report, the Company carried out an evaluation, under the supervision of the Company’s Chief Executive Officer (“CEO”) and Chief Financial Officer (“CFO”), of the effectiveness of the Company’s disclosure controls and procedures (as defined in Rules 13a-15(e) and 15d-15(e) of the Exchange Act). Based upon that evaluation, the Company’s CEO and CFO have concluded that, as of the end of the period covered by this Annual Report, the Company’s disclosure controls and procedures are effective to ensure that information required to be disclosed by the Company in reports that it files or submits under the Exchange Act is (i) recorded, processed, summarized and reported within the time periods specified in SEC rules and forms, and (ii) accumulated and communicated to the Company’s management, including its principal executive officer and principal financial officer, to allow timely decisions regarding required disclosure.
While the Company’s principal executive officer and principal financial officer believe that the Company’s disclosure controls and procedures provide a reasonable level of assurance that they are effective, they do not expect that the Company’s disclosure controls and procedures or internal control over financial reporting will prevent all errors or fraud. A control system, no matter how well conceived or operated, can provide only reasonable, not absolute, assurance that the objectives of the control system are met.
| B. | Management’s Annual Report on Internal Control Over Financial Reporting |
Management is responsible for establishing and maintaining adequate internal control over financial reporting, as defined in Rule 13a-15(f) under the Exchange Act. The Company’s management has employed a framework consistent with Exchange Act Rule 13a-15(c), to evaluate the Company’s internal control over financial reporting described below. A company’s internal control over financial reporting is a process designed to provide reasonable assurance regarding the reliability of financial reporting and the preparation of financial statements for external purposes in accordance with generally accepted accounting principles.
A company’s internal control over financial reporting includes those policies and procedures that (i) pertain to the maintenance of records that, in reasonable detail, accurately and fairly reflect the transactions and dispositions of the assets of the company; (ii) provide reasonable assurance that transactions are recorded as necessary to permit preparation of financial statements in accordance with generally accepted accounting principles, and that receipts and expenditures of the company are being made only in accordance with authorizations of management and directors of the company; and (iii) provide reasonable assurance regarding prevention or timely detection of unauthorized acquisition, use, or disposition of the company’s assets that could have a material effect on the financial statements. It should be noted that a control system, no matter how well conceived or operated, can only provide reasonable assurance, not absolute assurance, that the objectives of the control system are met. Also, projections of any evaluation of effectiveness to future periods are subject to the risk that controls may become inadequate because of changes in conditions, or that the degree of compliance with policies and procedures may deteriorate.
Management, including the CEO and CFO, is responsible for establishing and maintaining adequate internal control over financial reporting, and has used the 2013 framework issued by the Committee of Sponsoring Organizations of the Treadway Commission (the “2013 COSO Framework”) to evaluate the effectiveness of the Company’s controls in 2019. Based on this evaluation, management concluded that the Company’s internal control over financial reporting was effective as at August 31, 2022, and provided a reasonable assurance of the reliability of the Company’s financial reporting and preparation of financial statements.
| C. | Attestation Report of Registered Public Accounting Firm |
This Annual Report does not include an attestation report of our registered public accounting firm regarding internal control over financial reporting. Management’s report was not subject to attestation by our registered public accounting firm as we qualify as an “emerging growth company” under section 3(a) of the Exchange Act (as amended by the JOBS Act, enacted on April 5, 2012), and are therefore exempt from the attestation requirement.
| D. | Changes in Internal Controls Over Financial Reporting |
There were no changes in the Company’s internal controls over financial reporting identified in connection with the evaluation required by paragraph (d) of 17 CFR 240.13a-15 or 240.15d-15 that occurred during the period covered by this Annual Report that has materially affected, or is reasonably likely to materially affect, the issuer’s internal control over financial reporting.
| ITEM 16A. | AUDIT COMMITTEE FINANCIAL EXPERT |
The Board has determined that Lawrence Rutkowski qualifies as a financial expert (as defined in Item 407(d)(5)(ii) of Regulation S-K under the Exchange Act) and Rule 5605(c)(2)(A) of The Nasdaq Stock Market Rules; and (ii) is independent (as determined under Exchange Act Rule 10A-3 and Rule 5605(a)(2) of The Nasdaq Stock Market Rules).
The SEC has indicated that the designation or identification of a person as an audit committee financial expert does not make such person an “expert” for any purpose, impose any duties, obligations or liability on such person that are greater than those imposed on members of the audit committee and the board of directors who do not carry this designation or identification, or affect the duties, obligations or liability of any other member of the audit committee or board of directors.
The Company has adopted a Code of Ethical Conduct that applies to directors, officers and employees of, and consultants to, the Company (the “Code”). The Code is posted on the Company’s website at www.enginegaming.com.
All waivers of the Code with respect to any of the employees, officers or directors covered by it will be promptly disclosed as required by applicable securities rules and regulations. During the fiscal year ended August 31, 2022, the Company did not waive or implicitly waive any provision of the Code with respect to any of the Company’s principal executive officer, principal financial officer, principal accounting officer or controller, or persons performing similar functions.
| ITEM 16C. | PRINCIPAL ACCOUNTANT FEES AND SERVICES |
Aggregate fees paid to our external auditor, Baker Tilly WM LLP (PCAOB ID 6135) during the financial years ended August 31, 2022 and 2021 were as follows:
| | | 2022 Fee Amount ($) | | | 2021 Fee Amount ($) | |
| Audit Fees(1) | | $ | 533,665 | | | $ | 552,091 | |
| Audit-Related Fees(2) | | | Nil | | | | Nil | |
| Tax Fees(3) | | | Nil | | | | Nil | |
| All Other Fees(4) | | | Nil | | | | Nil | |
| Total: | | $ | 533,665 | | | $ | 552,091 | |
Notes:
| (1) | “Audit fees” include fees rendered by the Company’s external auditor for professional services necessary to perform the annual audit and any quarterly reviews of the Company’s financial statements. This includes fees for the review of tax provisions and for accounting consultations on matters reflected in the financial statements. |
| | |
| (2) | “Audit-related fees” include fees for assurance and related services that are reasonably related to the performance of the audit or review of the Company’s financial statements and that are not included in the “Audit Fees” category. |
| | |
| (3) | “Tax fees” include fees for professional services rendered by the Company’s external auditor for tax compliance, tax advice and tax planning. |
| | |
| (4) | “All other fees” include fees for products and services provided by the Company’s external auditor, other than services reported under the table headings “Audit Fees”, “Audit-Related Fees” or “Tax Fees”. |
Pre-Approval Policies and Procedures
The Audit Committee has not adopted specific policies and procedures for the engagement of non-audit services.
| ITEM 16D. | EXEMPTIONS FROM THE LISTING STANDARDS FOR AUDIT COMMITTEES |
Not applicable.
| ITEM 16E. | PURCHASES OF EQUITY SECURITIES BY THE ISSUER AND AFFILIATED PURCHASERS |
Not applicable.
| ITEM 16F. | CHANGE IN COMPANY’S CERTIFYING ACCOUNTANT |
None.
| ITEM 16G. | CORPORATE GOVERNANCE |
The Company is a “foreign private issuer” as defined in Rule 3b-4 under the Exchange Act and the Common Shares are listed on Nasdaq. Rule 5615(a)(3) of The Nasdaq Stock Market Rules permits foreign private issuers to follow home country practices in lieu of certain provisions of The Nasdaq Stock Market Rules. A foreign private issuer that follows home country practices in lieu of certain provisions of Nasdaq Stock Market Rules must disclose ways in which its corporate governance practices differ from those followed by domestic companies either on its website or in the annual report that it distributes to shareholders in the United States. A description of the ways in which the Company’s governance practices differ from those followed by domestic companies pursuant to Nasdaq standards are as follows:
| ● | Shareholder Meeting Quorum Requirement: Nasdaq Stock Market Rule 5620(c) (“Rule 5620(c)”) requires that the minimum quorum requirement for a meeting of shareholders be 33 1/3 % of the outstanding Common Shares. In addition, Rule 5620(c) requires that an issuer listed on Nasdaq state its quorum requirement in its by-laws. In lieu of following Rule 5620(c), the Company has elected to follow Canadian practices consistent with the requirements of the TSXV and the BCBCA. |
| ITEM 16H. | MINE SAFETY DISCLOSURE |
Not applicable.
| ITEM 16I. | DISCLOSURE REGARDING FOREIGN JURISDICTIONS THAT PREVENT INSPECTIONS |
Not applicable.
PART III
| ITEM 17. | FINANCIAL STATEMENTS |
See Item 18.
| ITEM 18. | FINANCIAL STATEMENTS |
The Consolidated Financial Statements and schedules appear on pages F-1 through F-135 of this Annual Report and are incorporated herein by reference. Our audited financial statements as prepared by our management and approved by the Board include:
Consolidated Statements of Financial Position
Consolidated Statements of Loss and Comprehensive Loss
Consolidated Statements of Shareholders’ Equity (Deficiency)
Consolidated Statements of Cash Flows
Notes to the Consolidated Financial Statements
All the above statements are available on the Company’s website at www.enginegaming.com or under the Company’s profile on SEDAR at www.sedar.com.
Financial Statements
Table of Contents
Table of Contents

ENGINE GAMING AND MEDIA, INC.
(formerly, Engine Media Holdings, Inc.)
Consolidated Financial Statements
For the years ended
August 31, 2022 and 2021
(Expressed in United States Dollars)
Engine Gaming and Media, Inc. (formerly, Engine Media Holdings, Inc.) |  |
| | |
Table of Contents
 | Baker Tilly WM LLP 1500 - 401 Bay Street Toronto, Ontario Canada M5H 2Y4 T: +1 416.368.7990 F: +1 416.368.0886 toronto@bakertilly.ca www.bakertilly.ca |
INDEPENDENT AUDITOR’S REPORT
To the Shareholders of Engine Gaming and Media, Inc. (formerly, Engine Media Holdings, Inc.):
Opinion
We have audited the consolidated financial statements of Engine Gaming and Media, Inc. (formerly, Engine Media Holdings, Inc.) and its subsidiaries (together the “Company”), which comprise the consolidated statements of financial position as at August 31, 2022 and 2021, and the consolidated statements of loss and comprehensive loss, consolidated statements of changes in shareholders’ equity (deficiency) and consolidated statements of cash flows for the years then ended, and notes to the consolidated financial statements, including a summary of significant accounting policies.
In our opinion, the accompanying consolidated financial statements present fairly, in all material respects, the consolidated financial position of the Company as at August 31, 2022 and 2021, and its consolidated financial performance and its consolidated cash flows for the years then ended in accordance with International Financial Reporting Standards as issued by the International Accounting Standards Board.
Basis for Opinion
We conducted our audits in accordance with Canadian generally accepted auditing standards. Our responsibilities under those standards are further described in the Auditor’s Responsibilities for the Audit of the Consolidated Financial Statements section of our report. We are independent of the Company in accordance with the ethical requirements that are relevant to our audits of the consolidated financial statements in Canada, and we have fulfilled our other ethical responsibilities in accordance with these requirements. We believe that the audit evidence we have obtained in our audits is sufficient and appropriate to provide a basis for our opinion.
Material Uncertainty Related to Going Concern
We draw attention to Note 1(b) in the consolidated financial statements, which describes the events and conditions indicating that a material uncertainty exists that may cast significant doubt on the Company’s ability to continue as a going concern. Our opinion is not modified in respect of this matter.
Other Information
Management is responsible for the other information. The other information comprises:
| | ● | The information included in the Management’s Discussion & Analysis. |
| | ● | The information, other than the consolidated financial statements and our auditor’s report thereon, in the Form 20-F. |
Our opinion on the consolidated financial statements does not cover the other information and we do not and will not express any form of assurance conclusion thereon. In connection with our audit of the consolidated financial statements, our responsibility is to read the other information identified above and, in doing so, consider whether the other information is materially inconsistent with the consolidated financial statements or our knowledge obtained in the audit, or otherwise appears to be materially misstated.
We obtained the Management’s Discussion & Analysis prior to the date of this auditor’s report. If, based on the work we have performed on this other information, we conclude that there is a material misstatement of this other information, we are required to report that fact in this auditor’s report. We have nothing to report in this regard.
The Form 20-F is expected to be made available to us after the date of this auditor’s report. If, based on the work we will perform on this other information, we conclude that there is a material misstatement of this other information, we are required to report that fact to those charged with governance.
Responsibilities of Management and Those Charged with Governance for the Consolidated Financial Statements
Management is responsible for the preparation and fair presentation of the consolidated financial statements in accordance with International Financial Reporting Standards, and for such internal control as management determines is necessary to enable the preparation of consolidated financial statements that are free from material misstatement, whether due to fraud or error.
In preparing the consolidated financial statements, management is responsible for assessing the Company’s ability to continue as a going concern, disclosing, as applicable, matters related to going concern and using the going concern basis of accounting unless management either intends to liquidate the Company or to cease operations, or has no realistic alternative but to do so.
Those charged with governance are responsible for overseeing the Company’s financial reporting process.
Auditor’s Responsibilities for the Audit of the Consolidated Financial Statements
Our objectives are to obtain reasonable assurance about whether the consolidated financial statements as a whole are free from material misstatement, whether due to fraud or error, and to issue an auditor’s report that includes our opinion. Reasonable assurance is a high level of assurance, but is not a guarantee that an audit conducted in accordance with Canadian generally accepted auditing standards will always detect a material misstatement when it exists. Misstatements can arise from fraud or error and are considered material if, individually or in the aggregate, they could reasonably be expected to influence the economic decisions of users taken on the basis of these consolidated financial statements.
As part of an audit in accordance with Canadian generally accepted auditing standards, we exercise professional judgement and maintain professional skepticism throughout the audit. We also:
| | ● | Identify and assess the risks of material misstatement of the consolidated financial statements, whether due to fraud or error, design and perform audit procedures responsive to those risks, and obtain audit evidence that is sufficient and appropriate to provide a basis for our opinion. The risk of not detecting a material misstatement resulting from fraud is higher than for one resulting from error, as fraud may involve collusion, forgery, intentional omissions, misrepresentations, or the override of internal control. |
| | | |
| | ● | Obtain an understanding of internal control relevant to the audit in order to design audit procedures that are appropriate in the circumstances, but not for the purpose of expressing an opinion on the effectiveness of the Company’s internal control. |
| | | |
| | ● | Evaluate the appropriateness of accounting policies used and the reasonableness of accounting estimates and related disclosures made by management. |
| | | |
| | ● | Conclude on the appropriateness of management’s use of the going concern basis of accounting and, based on the audit evidence obtained, whether a material uncertainty exists related to events or conditions that may cast significant doubt on the Company’s ability to continue as a going concern. If we conclude that a material uncertainty exists, we are required to draw attention in our auditor’s report to the related disclosures in the consolidated financial statements or, if such disclosures are inadequate, to modify our opinion. Our conclusions are based on the audit evidence obtained up to the date of our auditor’s report. However, future events or conditions may cause the Company to cease to continue as a going concern. |
| | | |
| | ● | Evaluate the overall presentation, structure and content of the consolidated financial statements, including the disclosures, and whether the consolidated financial statements represent the underlying transactions and events in a manner that achieves fair presentation. |
| | | |
| | ● | Obtain sufficient appropriate audit evidence regarding the financial information of the entities or business activities within the Company to express an opinion on the consolidated financial statements. We are responsible for the direction, supervision and performance of the group audit. We remain solely responsible for our audit opinion. |
We communicate with those charged with governance regarding, among other matters, the planned scope and timing of the audit and significant audit findings, including any significant deficiencies in internal control that we identify during our audit.
We also provide those charged with governance with a statement that we have complied with relevant ethical requirements regarding independence, and to communicate with them all relationships and other matters that may reasonably be thought to bear on our independence, and where applicable, related safeguards.
The engagement partner on the audit resulting in this independent auditor’s report is Mary Louise Hall.
/s/ Baker Tilly WM LLP
Chartered Professional Accountants, Licensed Public Accountants
Toronto, Ontario
November 29, 2022
ASSURANCE ● TAX ● ADVISORY
Baker Tilly WM LLP is a member of Baker Tilly Canada Cooperative, which is a member of the global network of Baker Tilly International Limited. All members of Baker Tilly Canada Cooperative and Baker Tilly International Limited are separate and independent legal entities.
Engine Gaming and Media, Inc.
(formerly, Engine Media Holdings, Inc.)
Consolidated Statements of Financial Position
August 31, 2022 and 2021
(Expressed in United States Dollars) | |
| | |
| | | | | | | | | | | | |
| | | Note | | | August 31, 2022 | | | August 31, 2021 | |
| | | | | | | $ | | | | $ | |
| ASSETS | | | | | | | | | | | |
| Current | | | | | | | | | | | |
| Cash | | | | | | 8,601,706 | | | | 15,305,996 | |
| Restricted cash | | 18 | | | | 47,455 | | | | 331,528 | |
| Accounts and other receivables | | 9 | | | | 8,404,009 | | | | 8,646,807 | |
| Government remittances | | | | | | 874,334 | | | | 1,070,216 | |
| Publisher advance, current | | 9 | | | | 1,490,648 | | | | 3,197,102 | |
| Prepaid expenses and other | | | | | | 2,064,221 | | | | 3,006,033 | |
| Promissory notes receivable | | 10 | | | | 576,528 | | | | - | |
| Total current assets | | | | | | 22,058,901 | | | | 31,557,682 | |
| Non-Current | | | | | | | | | | | |
| Publisher advance, non-current | | 9 | | | | - | | | | 1,337,116 | |
| Investment in associate | | | | | | | | | | | |
| Investment at FVTPL | | 11 | | | | 2,629,851 | | | | 2,629,851 | |
| Property and equipment | | 12 | | | | 127,390 | | | | 403,811 | |
| Goodwill | | 13 | | | | 15,200,188 | | | | 18,495,121 | |
| Intangible assets | | 14 | | | | 2,667,363 | | | | 12,482,244 | |
| Right-of-use assets | | 15 | | | | 11,115 | | | | 557,022 | |
| Total non-current assets | | | | | | 20,635,907 | | | | 35,905,165 | |
| Total assets | | | | | | 42,694,808 | | | | 67,462,847 | |
The accompanying notes are an integral part of these consolidated financial statements.
Engine Gaming and Media, Inc.
(formerly, Engine Media Holdings, Inc.)
Consolidated Statements of Financial Position
August 31, 2022 and 2021
(Expressed in United States Dollars) | |
| | |
| | | Note | | | August 31, 2022 | | | August 31, 2021 | |
| | | | | | | $ | | | | $ | |
| LIABILITIES | | | | | | | | | | | |
| Current | | | | | | | | | | | |
| Accounts payable | | 29 | | | | 12,772,375 | | | | 10,403,665 | |
| Accrued liabilities | | 31 | | | | 3,756,758 | | | | 5,722,470 | |
| Players liability account | | 18 | | | | 47,455 | | | | 331,528 | |
| Deferred revenue | | | | | | 1,077,923 | | | | 2,644,948 | |
| Line of credit | | | | | | | | | | | |
| Lease liabilities, current | | 17 | | | | 388,834 | | | | 222,583 | |
| Long-term debt, current | | | | | | - | | | | 96,664 | |
| Promissory notes payable | | 19 | | | | 771,762 | | | | 821,948 | |
| Deferred purchase consideration | | | | | | | | | | | |
| Warrant liability | | 21 | | | | 49,894 | | | | 4,868,703 | |
| Convertible debt, current | | 20 | | | | 2,267,367 | | | | 914,427 | |
| Arbitration reserve | | 26 | | | | 692,613 | | | | 6,468,330 | |
| Contingent performance share obligation, current | | | | | | | | | | | |
| Total current liabilities | | | | | | 21,824,981 | | | | 32,495,266 | |
| | | | | | | | | | | | |
| Convertible debt, non-current | | 20 | | | | 4,983,236 | | | | 9,037,069 | |
| Lease liabilities, non-current | | 17 | | | | - | | | | 364,968 | |
| Long-term debt, non-current | | | | | | | | | | | |
| Non-current liabilities | | | | | | 4,983,236 | | | | 9,402,037 | |
| Total liabilities | | | | | | 26,808,217 | | | | 41,897,303 | |
| | | | | | | | | | | | |
| SHAREHOLDERS’ EQUITY (DEFICIENCY) | | | | | | | | | | | |
| Share capital | | 22 | | | | 124,897,859 | | | | 122,741,230 | |
| Shares to be issued | | | | | | | | | | | |
| Contributed surplus | | | | | | 20,351,522 | | | | 17,819,933 | |
| Foreign currency translation reserve | | | | | | (2,069,219 | ) | | | (2,324,025 | ) |
| Deficit | | | | | | (127,293,571 | ) | | | (112,814,973 | ) |
| Attributable to shareholders | | | | | | 15,886,591 | | | | 25,422,165 | |
| Non-controlling interest | | | | | | - | | | | 143,379 | |
| Total equity | | | | | | 15,886,591 | | | | 25,565,544 | |
| Total liabilities and equity | | | | | | 42,694,808 | | | | 67,462,847 | |
| Going concern | | 1 | | | | | | | | | |
| Commitments and contingencies | | 26 | | | | | | | | | |
| Subsequent events | | 32 | | | | | | | | | |
| Approved on Behalf of Board: | “Larry Rutkowski” | | “Lou Schwartz” |
| | Director | | Director |
The accompanying notes are an integral part of these consolidated financial statements.
Engine Gaming and Media, Inc.
(formerly, Engine Media Holdings, Inc.)
Consolidated Statements of Loss and Comprehensive Loss
August 31, 2022 and 2021
(Expressed in United States Dollars) | |
| | |
| | | | | | | | | | | | |
| | | | | | For the year ended | |
| | | Note | | | August 31, 2022 | | | August 31, 2021 | |
| | | | | | $ | | | | $ | |
| CONTINUING OPERATIONS | | | | | | | | | | | |
| REVENUE | | | | | | | | | | | |
| Software-as-a-service | | 7 | | | | 9,220,069 | | | | 7,952,426 | |
| Advertising | | 7 | | | | 32,662,544 | | | | 25,392,842 | |
| Net revenue | | | | | | 41,882,613 | | | | 33,345,268 | |
| EXPENSES | | | | | | | | | | | |
| Salaries and wages | | 29 | | | | 14,086,955 | | | | 12,161,000 | |
| Consulting | | 29 | | | | 2,253,836 | | | | 2,223,147 | |
| Professional fees | | | | | | 1,920,663 | | | | 1,771,190 | |
| Revenue sharing expense | | | | | | 30,090,316 | | | | 22,853,680 | |
| Sponsorships and tournaments | | | | | | | | | | | |
| Advertising and promotion | | | | | | 1,187,161 | | | | 1,299,909 | |
| Office and general | | | | | | 5,282,145 | | | | 2,406,678 | |
| Technology expenses | | | | | | 3,062,181 | | | | 2,309,248 | |
| Amortization and depreciation | | 12,14,15 | | | | 1,242,383 | | | | 1,112,863 | |
| Share-based payments | | 23, 24 | | | | 4,688,218 | | | | 3,702,754 | |
| Interest expense | | 19, 20 | | | | 729,848 | | | | 1,274,998 | |
| (Gain) loss on foreign exchange | | | | | | 400,521 | | | | 1,090,944 | |
| Change in fair value of contingent consideration | | | | | | | | | | | |
| Loss on extinguishment of debt | | | | | | - | | | | 2,428,900 | |
| Gain on retained interest in former associate | | | | | | - | | | | (99,961 | ) |
| Transaction costs | | | | | | 1,327,990 | | | | 341,702 | |
| Non-operational professional fees | | | | | | | | | | | |
| Arbitration settlement reserve | | 26 | | | | (5,775,717 | ) | | | 6,468,330 | |
| Impairment expense | | 13, 14 | | | | 3,873,000 | | | | - | |
| Restructuring costs | | | | | | 177,952 | | | | - | |
| Change in fair value of promissory notes receivable and investment at FVTPL | | 10, 11 | | | | 873,778 | | | | (581,812 | ) |
| Change in fair value of warrant liability | | 21 | | | | (4,748,893 | ) | | | (9,037,108 | ) |
| Impairment of goodwill and intangibles | | | | | | | | | | | |
| Change in fair value of convertible debt | | 20 | | | | (2,388,120 | ) | | | 6,066,594 | |
| Total | | | | | | 58,284,217 | | | | 57,793,056 | |
| ASSOCIATES | | | | | | | | | | | |
| Share of net loss of associate | | | | | | - | | | | 103,930 | |
| Net income (loss) for the year before discontinued operations | | | | | | (16,401,604 | ) | | | (24,551,718 | ) |
| Income tax expense | | 16 | | | | - | | | | - | |
| Net loss after taxes | | | | | | (16,401,604 | ) | | | (24,551,718 | ) |
| DISCONTINUED OPERATIONS | | | | | | | | | | | |
| Gain (loss) on disposal of subsidiary | | 27 | | | | 14,934,149 | | | | (678,931 | ) |
| Gain on disposal of asssets | | 27 | | | | 257,550 | | | | - | |
| Loss from discontinued operations | | 27 | | | | (13,203,474 | ) | | | (15,564,168 | ) |
| Net income (loss) for the year from discontinued operations | | | | | | 1,988,225 | | | | (16,243,099 | ) |
| Net loss for the year | | | | | | (14,413,379 | ) | | | (40,794,817 | ) |
| | | | | | | | | | | | |
| Net income (loss) attributable to non-controlling interest | | | | | | (65,219 | ) | | | 74,006 | |
| Net loss attributable to owners of the Company | | | | | | (14,478,598 | ) | | | (40,720,811 | ) |
| | | | | | | | | | | | |
| OTHER COMPREHENSIVE INCOME (LOSS) | | | | | | | | | | | |
| Items that may be reclassified subsequently to profit or loss | | | | | | | | | | | |
| Foreign currency translation differences | | | | | | 393,928 | | | | 10,250 | |
| Comprehensive loss for the year | | | | | | (14,084,670 | ) | | | (40,710,561 | ) |
| INCOME (LOSS) PER SHARE | | | | | | | | | | | |
| Basic loss per share - continuing operations | | 8 | | | | (1.05 | ) | | | (2.06 | ) |
| Basic income (loss) per share - discontinued operations | | | | | | 0.13 | | | | (1.37 | ) |
| Basic and diluted loss per share | | 8 | | | | (0.93 | ) | | | (3.43 | ) |
| Weighted average number of shares outstanding - Basic | | 8 | | | | 15,637,418 | | | | 11,874,775 | |
The accompanying notes are an integral part of these consolidated financial statements.
Engine Gaming and Media, Inc.
(formerly, Engine Media Holdings, Inc.)
Consolidated Statements of Shareholders’ Equity (Deficiency)
Years ended August 31, 2022 and 2021
(Expressed in United States Dollars) | |
| | |
| | | | | | | | | | | | | | | | | | | | | | | | | | | | | | | | | | | | | |
| | | Share capital:
Number | | | Share capital:
Amount | | | Shares to be issued | | | Contributed surplus | | | Foreign currency translation reserve | | | Deficit | | | Total
equity before
non-controlling interest | | | Non-controlling interest | | | Total
equity | |
| | | | # | | | | $ | | | | $ | | | | $ | | | | $ | | | | $ | | | | $ | | | | $ | | | | $ | |
| Balance, as at August 31, 2020 | | | 7,746,136 | | | | 69,380,807 | | | | 1,059,214 | | | | 4,034,323 | | | | (2,334,275 | ) | | | (72,094,162 | ) | | | 45,907 | | | | 217,385 | | | | 263,292 | |
| Share-based payments | | | - | | | | - | | | | - | | | | 3,702,705 | | | | - | | | | - | | | | 3,702,705 | | | | - | | | | 3,702,705 | |
| Shares issued on vesting of RSUs | | | 277,749 | | | | 1,895,891 | | | | - | | | | (1,715,891 | ) | | | - | | | | - | | | | 180,000 | | | | - | | | | 180,000 | |
| Common shares issued on exercise of options | | | 20,833 | | | | 290,558 | | | | | | | | (104,303 | ) | | | | | | | | | | | 186,255 | | | | - | | | | 186,255 | |
| Convertible debt conversion | | | 1,728,848 | | | | 13,704,605 | | | | - | | | | 4,256,114 | | | | - | | | | - | | | | 17,960,719 | | | | - | | | | 17,960,719 | |
| Common shares issued on private placement, net of costs | | | 4,435,433 | | | | 24,225,901 | | | | - | | | | 6,791,473 | | | | - | | | | - | | | | 31,017,374 | | | | - | | | | 31,017,374 | |
| Warrants issued in private placement of convertible debt | | | - | | | | - | | | | - | | | | 618,916 | | | | - | | | | - | | | | 618,916 | | | | - | | | | 618,916 | |
| EB bonus shares | | | 6,666 | | | | 54,061 | | | | - | | | | - | | | | - | | | | - | | | | 54,061 | | | | - | | | | 54,061 | |
| Shares for debt | | | 40,000 | | | | 226,556 | | | | - | | | | - | | | | - | | | | - | | | | 226,556 | | | | - | | | | 226,556 | |
| Common shares issued on exercise of warrants | | | 901,060 | | | | 9,000,851 | | | | - | | | | - | | | | - | | | | - | | | | 9,000,851 | | | | - | | | | 9,000,851 | |
| Disposal of Motorsports | | | - | | | | - | | | | (1,059,214 | ) | | | - | | | | - | | | | - | | | | (1,059,214 | ) | | | - | | | | (1,059,214 | ) |
| Shares issued on acquisition of SideQik | | | 386,584 | | | | 3,962,000 | | | | - | | | | 245,000 | | | | - | | | | - | | | | 4,207,000 | | | | - | | | | 4,207,000 | |
| Non-controlling interest in subsidiary | | | - | | | | - | | | | - | | | | (8,404 | ) | | | - | | | | - | | | | (8,404 | ) | | | - | | | | (8,404 | ) |
| Net loss for the year | | | - | | | | - | | | | - | | | | - | | | | - | | | | (40,720,811 | ) | | | (40,720,811 | ) | | | (74,006 | ) | | | (40,794,817 | ) |
| Foreign currency translation differences | | | - | | | | - | | | | - | | | | - | | | | 10,250 | | | | - | | | | 10,250 | | | | - | | | | 10,250 | |
| Balance, as at August 31, 2021 | | | 15,543,309 | | | | 122,741,230 | | | | - | | | | 17,819,933 | | | | (2,324,025 | ) | | | (112,814,973 | ) | | | 25,422,165 | | | | 143,379 | | | | 25,565,544 | |
| | | | | | | | | | | | | | | | | | | | | | | | | | | | | | | | | | | | | |
| Balance, as at August 31, 2021 | | | 15,543,309 | | | | 122,741,230 | | | | - | | | | 17,819,933 | | | | (2,324,025 | ) | | | (112,814,973 | ) | | | 25,422,165 | | | | 143,379 | | | | 25,565,544 | |
| Beginning Balance, value | | | 15,543,309 | | | | 122,741,230 | | | | - | | | | 17,819,933 | | | | (2,324,025 | ) | | | (112,814,973 | ) | | | 25,422,165 | | | | 143,379 | | | | 25,565,544 | |
| Share-based payments | | | - | | | | - | | | | - | | | | 4,688,218 | | | | - | | | | - | | | | 4,688,218 | | | | - | | | | 4,688,218 | |
| Shares issued on vesting of RSUs | | | 203,537 | | | | 1,489,962 | | | | - | | | | (1,489,962 | ) | | | - | | | | - | | | | - | | | | - | | | | - | |
| Shares issued under shares for services | | | 57,029 | | | | 666,667 | | | | - | | | | (666,667 | ) | | | - | | | | - | | | | - | | | | - | | | | - | |
| Disposal of Eden Games | | | - | | | | - | | | | - | | | | - | | | | (139,122 | ) | | | - | | | | (139,122 | ) | | | (208,598 | ) | | | (347,720 | ) |
| Net income for the year | | | - | | | | - | | | | - | | | | - | | | | - | | | | (14,478,598 | ) | | | (14,478,598 | ) | | | 65,219 | | | | (14,413,379 | ) |
| Foreign currency translation differences | | | - | | | | - | | | | - | | | | - | | | | 393,928 | | | | - | | | | 393,928 | | | | - | | | | 393,928 | |
| Balance, as at August 31, 2022 | | | 15,803,875 | | | | 124,897,859 | | | | - | | | | 20,351,522 | | | | (2,069,219 | ) | | | (127,293,571 | ) | | | 15,886,591 | | | | - | | | | 15,886,591 | |
| Ending balance, value | | | 15,803,875 | | | | 124,897,859 | | | | - | | | | 20,351,522 | | | | (2,069,219 | ) | | | (127,293,571 | ) | | | 15,886,591 | | | | - | | | | 15,886,591 | |
The accompanying notes are an integral part of these consolidated financial statements.
Engine Gaming and Media, Inc.
(formerly, Engine Media Holdings, Inc.)
Consolidated Statements of Cash Flows
August 31, 2022 and 2021
(Expressed in United States Dollars) | |
| | |
| | | | | | | | | | | | |
| | | | | | For the year ended | |
| | | Note | | | August 31, 2022 | | | August 31, 2021 | |
| | | | | | | $ | | | | $ | |
| OPERATING ACTIVITIES | | | | | | | | | | | |
| Net loss for the year | | | | | | (14,413,379 | ) | | | (40,794,817 | ) |
| Items not affecting cash: | | | | | | | | | | | |
| Amortization and depreciation | | 12,14,15 | | | | 3,690,939 | | | | 5,092,432 | |
| Forgiveness of government grants | | | | | | | | | | | |
| Legal proceedings provision | | | | | | | | | | | |
| Impairment expense | | 13,14,15 | | | | 9,515,210 | | | | 3,885,001 | |
| Arbitration settlement reserve | | 26 | | | | (5,775,717 | ) | | | 6,468,330 | |
| Gain on disposal of Eden Games, net of cash | | 27 | | | | (15,128,417 | ) | | | - | |
| Gain on disposal of UMG assets, net of cash | | 27 | | | | (257,550 | ) | | | - | |
| Loss on disposal of Motorsports, net of cash | | 27 | | | | 194,268 | | | | 678,931 | |
| Loss on disposal of P&E | | 27 | | | | - | | | | 9,767 | |
| Gain on bankruptcy of subsidiary | | | | | | (1,105,023 | ) | | | - | |
| Loss on extinguishment of debt | | 20 | | | | - | | | | 2,428,900 | |
| Gain on retained interest in former associate | | | | | | - | | | | (99,961 | ) |
| Share of net loss of associate | | | | | | - | | | | 103,930 | |
| Change in fair value of investment at FVTPL | | 10 | | | | 873,778 | | | | (581,812 | ) |
| Change in fair value of warrant liability | | 21 | | | | (4,748,893 | ) | | | (9,037,108 | ) |
| Change in fair value of convertible debt | | 20 | | | | (2,388,120 | ) | | | 6,066,594 | |
| Change in fair value of contingent consideration | | | | | | | | | | | |
| Impairment of investment in associate and advances | | | | | | | | | | | |
| Impairment of goodwill and intangibles | | | | | | | | | | | |
| Accretion of debt | | | | | | 4,610 | | | | 108,616 | |
| Share-based payments | | 23, 24 | | | | 4,688,218 | | | | 3,702,705 | |
| Total Adjustments | | | | | | (24,850,076 | ) | | | (21,968,492 | ) |
| Changes in non-cash working capital: | | | | | | | | | | | |
| Restricted cash | | | | | | 284,073 | | | | 57,059 | |
| Accounts and other receivables | | | | | | (275,778 | ) | | | (4,008,628 | ) |
| Government remittances | | | | | | (370,449 | ) | | | 30,601 | |
| Publisher advance | | 9 | | | | 3,043,570 | | | | (4,534,218 | ) |
| Prepaid expenses and other | | | | | | 905,688 | | | | (1,388,709 | ) |
| Accounts payable | | | | | | 2,871,087 | | | | (1,030,542 | ) |
| Accrued liabilities | | | | | | (110,301 | ) | | | 953,086 | |
| Players liability account | | | | | | (260,692 | ) | | | (57,059 | ) |
| Deferred revenue | | | | | | (1,567,025 | ) | | | 1,607,553 | |
| Changes in non-cash working capital | | | | | | 4,520,173 | | | | (8,370,857 | ) |
| Net cash used in operating activities | | | | | | (20,329,903 | ) | | | (30,339,349 | ) |
| INVESTING ACTIVITIES | | | | | | | | | | | |
| Purchase of property and equipment | | | | | | (78,698 | ) | | | (188,170 | ) |
| Purchase of promissory notes | | | | | | (1,181,005 | ) | | | - | |
| Cash acquired, net of cash paid in business combinations | | | | | | - | | | | 255,852 | |
| Advances | | | | | | | | | | | |
| Acquisition of intangible assets | | | | | | | | | | | |
| Proceeds on disposal of Eden Games, net of cash | | | | | | 14,710,616 | | | | - | |
| Proceeds on disposal of UMG assets, net of cash | | | | | | 100 | | | | - | |
| Proceeds on disposal of Motorsports, net of cash | | | | | | - | | | | 24,348 | |
| Net cash used in investing activities | | | | | | 13,451,013 | | | | 92,030 | |
| FINANCING ACTIVITIES | | | | | | | | | | | |
| Proceeds from issuance of Units, net of costs | | 22 | | | | - | | | | 31,017,374 | |
| Proceeds from government grants | | | | | | | | | | | |
| Proceeds from line of credit | | | | | | | | | | | |
| Proceeds from private placement unit offerings | | | | | | | | | | | |
| Proceeds from convertible debentures | | | | | | - | | | | 4,901,393 | |
| Proceeds from promissory notes payable | | 19 | | | | 330,814 | | | | 263,384 | |
| Payments on promissory notes payable | | 19 | | | | (381,000 | ) | | | (3,260,356 | ) |
| Proceeds from exercise of options | | | | | | - | | | | - | |
| Proceeds from exercise of warrants | | 21 | | | | - | | | | 6,866,735 | |
| Proceeds from exercise of options | | | | | | - | | | | 186,255 | |
| Payments on lease financing | | 17 | | | | (201,156 | ) | | | (228,328 | ) |
| Payments on long-term debt | | | | | | (75,262 | ) | | | (162,040 | ) |
| Net cash provided by financing activities | | | | | | (326,604 | ) | | | 39,584,417 | |
| Impact of foreign exchange on cash | | | | | | 501,204 | | | | 725,620 | |
| Change in cash | | | | | | (6,704,290 | ) | | | 10,062,718 | |
| | | | | | | | | | | | |
| Cash, beginning of year | | | | | | 15,305,996 | | | | 5,243,278 | |
| Cash, end of year | | | | | | 8,601,706 | | | | 15,305,996 | |
The accompanying notes are an integral part of these consolidated financial statements.
Engine Gaming and Media, Inc.
(formerly, Engine Media Holdings, Inc.)
Notes to the Consolidated Financial Statements
August 31, 2022 and 2021
(Expressed in United States Dollars) | |
| | |
1. Corporate information and going concern
Engine Gaming and Media, Inc. (formerly Engine Media Holdings, Inc.) (“Engine”, “Engine Media” or the “Company”) was incorporated under the Business Corporations Act (Ontario) on April 8, 2011. The registered head office of the Company is 77 King St. West, Suite 3000, PO Box 95, TD Centre – North Tower, Toronto, Ontario, M5K 1G8, Canada.
With the acquisition of Sideqik, Inc. on July 2, 2021 (Note 6), the Company focuses on accelerating new, live, immersive esports and interactive gaming experiences for consumers through its partnerships with traditional and emerging media companies and providing online interactive technology and monetization services.
Pursuant to shareholder approval at the October 6, 2021, shareholders’ meeting, effective October 19, 2021, the Company changed its name to Engine Gaming and Media, Inc. The Company’s common shares trade on the TSX Venture Exchange under the trading symbol GAME.V and NASDAQ under the trading symbol GAME.
These consolidated financial statements have been prepared on a going concern basis, which contemplates that the Company will be able to realize its assets and discharge its liabilities in the normal course of business. Accordingly, they do not give effect to adjustments that would be necessary should the Company be unable to continue as a going concern, and therefore be required to realize its assets and liquidate its liabilities and commitments in other than the normal course of business and at amounts different from those in the accompanying consolidated financial statements. Such adjustments could be material. It is not possible to predict whether the Company will be able to raise adequate financing or to ultimately attain profitable levels of operations.
The Company has not yet realized profitable operations and has incurred significant losses to date resulting in a cumulative deficit of $127,293,571 as of August 31, 2022 (August 31, 2021 – $112,814,973). The recoverability of the carrying value of the assets and the Company’s continued existence is dependent upon the achievement of profitable operations, or the ability of the Company to raise alternative financing, if necessary. While management has been historically successful in raising the necessary capital, it cannot provide assurance that it will be able to execute on its business strategy or be successful in future financing activities. As of August 31, 2022, the Company had a working capital surplus of $233,920 (August 31, 2021 – working capital deficiency of $937,584) which is comprised of current assets less current liabilities. The Company also faced uncertain future impacts from COVID-19 (Note 3(b)).
These conditions indicate the existence of a material uncertainty that may cast significant doubt about the Company’s ability to continue as a going concern. Changes in future conditions could require material write downs of the carrying values of goodwill and other long-lived intangibles.
Engine Gaming and Media, Inc.
(formerly, Engine Media Holdings, Inc.)
Notes to the Consolidated Financial Statements
August 31, 2022 and 2021
(Expressed in United States Dollars) | |
| | |
2. Basis of preparation
| (a) | Statement of compliance |
The consolidated financial statements of the Company have been prepared in accordance with International Financial Reporting Standards (“IFRS”) as issued by the International Accounting Standards Board (“IASB”).
The consolidated financial statements for the year ended August 31, 2022 (including comparatives) were approved and authorized for issue by the board of directors on November 29, 2022.
| (b) | Basis of consolidation |
The consolidated financial statements comprise the accounts of the Company and its controlled subsidiaries. The financial statements of subsidiaries are included in the consolidated financial statements from the date that control commences until the date that control ceases. Consolidated financial statements are prepared using uniform accounting policies for like transactions and other events in similar circumstances.
Control is achieved when the Company is exposed, or has rights, to variable returns from its involvement with the investee and has the ability to affect those returns through its power over the investee. Specifically, the Company controls an investee if and only if the Company has all the following:
(a) power over the investee.
(b) exposure, or rights, to variable returns from its involvement with the investee; and
(c) the ability to use its power over the investee to affect the amount of the investor’s returns.
All transactions and balances between the Company and its subsidiaries are eliminated on consolidation, including unrealized gains and losses on transactions between companies. Unrealized gains arising from transactions with equity accounted investees are eliminated against the investment to the extent of the Company’s interest in the investee. Unrealized losses are eliminated in the same way as unrealized gains, but only to the extent that there is no evidence of impairment.
The Company’s material subsidiaries as of August 31, 2022, are as follows:
Schedule of material subsidiaries
| Name of Subsidiary | | Country of Incorporation | | Ownership Percentage | | Functional Currency |
| Frankly Inc. | | Canada | | 100% | | Canadian Dollar |
| Stream Hatchet S.L. | | Spain | | 100% | | Euro |
| SideQik, Inc. | | USA | | 100% | | US Dollar |
Non-controlling interests are measured initially at their proportionate share of the acquiree’s identifiable net assets at the date of acquisition. Changes in the Company’s interest in a subsidiary that do not result in a loss of control are accounted for as equity transactions.
Business combinations are accounted for using the acquisition method under IFRS 3 Business Combinations.
Identifiable assets acquired and liabilities and contingent liabilities assumed in a business combination are measured initially at their fair values at the acquisition date, irrespective of the extent of any non-controlling interest. The excess of the fair value of the consideration transferred including the recognized amount of any non-controlling interest in the acquiree, over the fair value of the Company’s share of the identifiable net assets acquired is recorded as goodwill. When the excess is negative, a bargain purchase gain is recognized immediately in profit or loss.
Engine Gaming and Media, Inc.
(formerly, Engine Media Holdings, Inc.)
Notes to the Consolidated Financial Statements
August 31, 2022 and 2021
(Expressed in United States Dollars) | |
| | |
The measurement period is the period from the date of acquisition to the date the Company obtains complete information about facts and circumstances that existed as of the acquisition date – and is subject to a maximum of one year. The Company elects on a transaction-by-transaction basis whether to measure non-controlling interest at its fair value, or at its proportionate share of the recognized amount of the identifiable net assets, at the acquisition date.
Acquisition costs are expensed as incurred, unless they qualify to be treated as debt issue costs, or as cost of issuing equity securities.
These consolidated financial statements have been prepared on a historical cost basis, except for financial instruments which are measured at fair value. In addition, these consolidated financial statements have been prepared using the accrual basis of accounting except for cash flow information.
| (d) | Functional and presentation currency |
The functional currency of the Company is the US Dollar (“USD). The functional currencies of the Company’s subsidiaries are disclosed in Note 2(b). The presentation currency of the consolidated financial statements is the US Dollar (“USD”).
For comparability, certain prior year amounts have been reclassified to conform with fiscal 2022 presentation.
These reclassifications had no effect on Net loss or shareholders’ deficiency.
3. Significant judgments, estimates and assumptions
The preparation of these consolidated financial statements requires management to make judgments and estimates and form assumptions that affect the reported amounts of assets and liabilities at the date of the consolidated financial statements and reported amounts of revenues and expenses during the reporting period. Such estimates primarily relate to unsettled transactions and events as at the date of the consolidated financial statements. On an ongoing basis, management evaluates its judgments and estimates in relation to assets, liabilities, revenues, and expenses. Management uses historical experience and various other factors it believes to be reasonable under the given circumstances as the basis for its judgments and estimates. Actual outcomes may differ from these estimates under different assumptions and conditions. Significant estimates and judgments made by management in the preparation of these consolidated financial statements are outlined below.
The assessment of the Company’s ability to execute its strategy by funding future working capital requirements involves judgment. Estimates and assumptions are continually evaluated and are based on historical experience and other factors, including expectations of future events that are believed to be reasonable under the circumstances.
Engine Gaming and Media, Inc.
(formerly, Engine Media Holdings, Inc.)
Notes to the Consolidated Financial Statements
August 31, 2022 and 2021
(Expressed in United States Dollars) | |
| | |
| (a) | Significant estimates and critical judgments | |
Information about significant estimates and critical judgements in applying accounting policies that have the most significant effect on the amounts recognized in the consolidated financial statements is included in the following notes:
| | Note 1 | Going concern |
| | Note 30 | Expected credit losses |
| | Note 21 | Valuation of warrant liability |
| | Note 6 | Business acquisitions |
| | Note 13 and 14 | Goodwill and intangible assets |
| | Note 23 and 24 | Valuation of share-based payments |
| | Note 20 | Convertible debt |
| | Note 26 | Contingencies |
| (b) | Update on the effects of COVID-19 |
In December 2019, a novel strain of coronavirus (“COVID-19”) emerged and has since extensively impacted global health and the economic environment. To contain the spread of COVID-19, domestic and international governments around the world enacted various measures, including orders to close all businesses not deemed “essential,” quarantine orders for individuals to stay in their homes or places of residence, and to practice social distancing when engaging in essential activities. The Company anticipates that these actions and the global health crisis caused by COVID-19 will continue to negatively impact many business activities and financial markets across the globe.
In an effort to protect the health and safety of our employees, much of the Company’s workforce is currently working from home. The Company has implemented business continuity plans and has increased support and resources to enable employees to work remotely and thus far has been able to operate with minimal disruption.
The global COVID-19 pandemic remains an evolving situation. The Company will continue to actively monitor the developments of the pandemic and may take further actions that could alter business operations as may be required by federal, state, local, or foreign authorities, or that management determines are in the best interests of our employees, customers, partners and shareholders. It is not clear what effects any such potential actions may have on the Company’s business, including the effects on our employees, players and consumers, customers, partners, development and content pipelines, the Company’s reputation, financial condition, results of operations, revenue, cash flows, liquidity or stock price.
4. Changes in significant accounting policies
Future accounting pronouncements
The following standards have not yet been adopted and are being evaluated to determine their impact on the Company:
Amendments to IAS 1 - Classification of liabilities as current or non-current
Amendments to IAS 1 - Non-current Liabilities with Covenants
Amendments to IAS 1 and IFRS Practice Statement 2 – Disclosure of Accounting Policies
Amendments to IAS 8 - Definition of Accounting Estimates
Amendments to IAS 12 Income Taxes - Deferred Tax Related to Assets and liabilities Arising from a Single Transaction
Other accounting standards or amendments to existing accounting standards that have been issued but have future effective dates are either not applicable or the Company is still assessing what the impact will be to the Company’s financial statements.
Engine Gaming and Media, Inc.
(formerly, Engine Media Holdings, Inc.)
Notes to the Consolidated Financial Statements
August 31, 2022 and 2021
(Expressed in United States Dollars) | |
| | |
5. Significant accounting policies
(a) Foreign currency translation
The functional currency of the Company and its subsidiaries is disclosed in Note 2(b). The presentation currency of the consolidated financial statements is the US Dollar (“USD”).
The financial statements of entities that have a functional currency different from the presentation currency are translated into US dollars as follows: assets and liabilities at the closing rate at the date of the Company’s consolidated statement of financial position and income and expenses at the average rate of the year (as this is considered a reasonable approximation of the actual rates prevailing at the transaction dates). All resulting changes are recognized in other comprehensive income (loss) as foreign currency translation adjustments, except to the extent that the translation difference is allocated to non-controlling interest.
Foreign currency transactions are translated into the functional currency of each entity using the exchange rates prevailing at the dates of the transactions. Foreign exchange gains and losses resulting from the settlement of foreign currency transactions and from the translation at year-end exchange rates of monetary assets and liabilities denominated in currencies other than an entity’s functional currency are recognized in the consolidated statements of loss.
(b) Revenue recognition
Revenue is measured based on the consideration specified in a contract with a customer. The Company recognizes revenue when it transfers control of its services to a customer.
The following provides information about the nature and timing of the satisfaction of performance obligations in contracts with customers, including significant payment terms and related revenue recognition policies:
The Company enters into license agreements with customers for its content management system, video software, and mobile applications (Frankly), e-sports data platform (Stream Hatchet) and an influencer marketing platform (SideQik). These license agreements, generally non-cancellable, without paying a termination penalty, and multiyear, provide the customer with the right to use the Company’s application solely on a Company-hosted platform or, in certain instances, on purchased encoders. The license agreements also entitle the customer to technical support.
Revenue from these license agreements is recognized ratably over the license term. Early termination fees are recognized when customer ceases use of agreed upon services prior to the expiration of their contract. These fees are recognized in full on the date the customer has completed their migration of the Company’s solutions and there is no continuing service obligation to the customer.
The Company charges its customers for the optional use of its content delivery network to stream and store videos. The revenue is recognized as earned based on the actual usage because it has stand-alone value and delivery is in control of the customer. The Company also charges its customers for the use of its ad serving platform to serve ads under local advertising campaigns. The Company reports revenue as earned based on the actual usage.
Under national advertising agreements with advertisers, the Company sources, creates, and places advertising campaigns that run across the Company’s network of publisher sites. National advertising revenue, net of third-party costs, is shared with publishers based on their respective contractual agreements. The Company invoices national advertising amounts due from advertisers and remits payments to publishers for their share. Depending on the agreement with the publisher, the obligation to remit payment to the publisher is based on either billing to the advertiser or the collection of cash from the advertiser.
Engine Gaming and Media, Inc.
(formerly, Engine Media Holdings, Inc.)
Notes to the Consolidated Financial Statements
August 31, 2022 and 2021
(Expressed in United States Dollars) | |
| | |
National advertising revenue is recognized in the period during which the ad impressions are delivered. The Company reports revenue earned through national advertising agreements either on a net or gross basis. The Company applies judgement in recognizing revenue earned through national advertising agreements on a net or gross basis based on the criteria as disclosed below.
Under national advertising agreements wherein the Company does not bear inventory risk and only has credit risk on its portion of the revenue, national advertising revenues are accounted for on a net basis and the publisher is identified as the customer.
In select national advertising agreements with its publishers, the Company takes on inventory risk and additional credit risk. Under these agreements, the Company either a) provides the publisher with a guaranteed minimum gross selling price per advertising unit delivered, wherein the greater of the actual selling price or guaranteed minimum selling price is used in determining the publisher’s share or b) provides the publisher with a fixed rate per advertising unit delivered, wherein the publisher is paid the fixed rate per advertising unit delivered irrespective of the actual selling price. Under these national advertising agreements, national advertising revenues are accounted for on a gross basis with the advertiser identified as the customer and the publisher identified as a supplier, with amounts billed to the advertiser reported as revenue and amounts due to the publisher reported as a revenue sharing expense, within expenses.
Also included in advertising revenue is advertising revenue generated by the Company’s various owned and operated properties.
The Company assesses its revenue arrangements against specific criteria in order to determine if it is acting as principal or agent. When the Company acts in the capacity of an agent rather than as the principal in a transaction, the revenue recognized is the net amount of commission made by the Company.
Deferred revenue consists of customer advances for Company services to be rendered that will be recognized as income in future periods.
(c) Cash and equivalents, and restricted cash
The “cash and cash equivalents” category consists of cash in banks, call deposits and other highly liquid investments with initial maturities of three months or less. Any investments in securities, investments with initial maturities greater than three months without early redemption feature and bank accounts subject to restrictions, other than restrictions due to regulations specific to a country or activity sector (exchange controls, etc.) are not presented as cash equivalents but as financial assets. Bank overdrafts that are repayable on demand and form an integral part of the Company’s cash management are included as a component of cash and cash equivalents for the purpose of the statement of cash flows. Restricted cash is presented as a separate category on the statement of financial position and consists of cash in a bank account restricted for use in the WinView Inc. businesses (Note 18).
(d) Accounts and other receivables
Trade receivables are recognized initially at fair value and subsequently measured at amortized cost less provision for impairment of trade accounts receivable. A provision for impairment of trade accounts receivable is established based on a forward-looking “expected loss” impairment model. The carrying amount of the trade receivables is reduced using the provision for impairment account, and the amount of any increase in the provision for impairment is recognized in the consolidated statement of loss and comprehensive loss. When a trade receivable is uncollectible, it is written off against the provision for impairment account for trade accounts receivable. Subsequent recoveries of amounts previously written off are credited to the consolidated statement of loss and comprehensive loss.
Engine Gaming and Media, Inc.
(formerly, Engine Media Holdings, Inc.)
Notes to the Consolidated Financial Statements
August 31, 2022 and 2021
(Expressed in United States Dollars) | |
| | |
(e) Property and equipment
Property and equipment are carried at historical cost less any accumulated depreciation and impairment losses. Historical cost includes the acquisition cost or production cost as well as the costs directly attributable to bringing the asset to the location and condition necessary for its use in operations. When property and equipment include significant components with different useful lives, they are recorded and depreciated separately. Depreciation is computed using the straight-line and declining balance methods based on the estimated useful life of the assets. Useful life is reviewed at the end of each reporting period.
After initial recognition, the cost model is applied to property and equipment. Where parts of an item of property and equipment have different useful lives, they are accounted for as separate items of property and equipment.
The Company recognizes in the carrying amount of an item of property, plant and equipment the cost of replacing part of such an item when that cost is incurred if it is probable that the future economic benefits embodied with the item will flow to the Company and the cost of the item can be measured reliably. All other costs are recognized in the consolidated statement of loss and comprehensive loss as an expense as incurred. Depreciation is provided at rates calculated to write off the cost of property, plant and equipment less their estimated residual value on the straight-line and declining balance methods, over the estimated useful lives, as follows.
Schedule of estimated useful lives of property, plant and equipment
| Computer equipment | | 3 years, straight-line |
| Furniture and fixtures | | 5 years, straight-line |
| Leasehold improvements | | Term of the lease, plus one renewal |
(f) Goodwill
Goodwill arising on an acquisition of a business is carried at cost as established at the date of acquisition of the business less accumulated impairment losses, if any.
(g) Intangible assets
Intangible assets include acquired software used in production or administration and brand names and customer relationships that qualify for recognition as an intangible asset in a business combination. They are accounted for using the cost model whereby capitalized costs are amortized on a straight-line basis over their estimated useful lives, as these assets are considered finite. Residual values and useful lives are reviewed at each reporting date.
The useful lives of the intangibles are as follows:
Schedule of useful lives of intangibles
| Software | | 3-5 years |
| Brands | | 1-20 years |
| Customer relationships | | 1-10 years |
| Patents | | 5 years |
| Application platforms | | 3 years |
Acquired computer software licenses are capitalized on the basis of the costs incurred to acquire and install the specific software. Subsequent expenditure on brands is expensed as incurred. Costs associated with maintaining computer software (expenditure relating to patches and other minor updates as well as their installation), are expensed as incurred.
Engine Gaming and Media, Inc.
(formerly, Engine Media Holdings, Inc.)
Notes to the Consolidated Financial Statements
August 31, 2022 and 2021
(Expressed in United States Dollars) | |
| | |
Patents and Application platforms with a finite useful life that are acquired in an asset acquisition are initially recognized on the basis of their relative fair value at the acquisition date. These assets are amortized on a straight-line basis over their useful life, which is generally up to 5 years. Amortization is calculated over the cost of the asset less its residual value. Amortization expense is recognized on a straight-line basis over the estimated useful lives of intangible assets, other than goodwill, from the date that they are available for use.
Other intangible assets, such as brands, that are acquired by the Company are stated at cost less accumulated amortization and impairment losses. Expenditures on internally generated brands, mastheads or editorial pages, publishing titles, customer lists and items similar in substance is recognized in the consolidated statement of loss and comprehensive loss as an expense as incurred.
Research costs are expensed when incurred. Development costs are capitalized when the feasibility and profitability of the project can be reasonably considered certain. Expenditure on development activities, whereby research findings are applied to a plan or design to produce new or substantially improved products and processes, is capitalized if the product or process is technically and commercially feasible and the Company has sufficient resources to complete development. The expenditure capitalized includes the cost of materials, direct labor and an appropriate proportion of overheads. Other development expenditure is recognized in the consolidated statement of loss and comprehensive loss as an expense as incurred. Capitalized development expenditure is stated at cost less accumulated amortization and impairment losses.
(h) Impairment of property and equipment, intangible assets and goodwill
| | i) | Timing of impairment testing |
The carrying values of property and equipment and finite life intangible assets are assessed at the reporting date as to whether there is any indication that the assets may be impaired. Goodwill and indefinite life intangible assets are tested for impairment annually or when there is an indication that the asset may be impaired.
If any indication of impairment exists or when the annual impairment testing for an asset is required, the Company estimates the recoverable amount of the asset or cash generating unit (“CGU”) to which the asset relates to determine the extent of any impairment loss. The recoverable amount is the higher of an asset’s or CGU’s fair value less costs of disposal and its value in use (“VIU”) to the Company. In assessing VIU, estimated future cash flows are discounted to their present value using a discount rate that reflects current market assessments of the time value of money and the risks specific to the asset or CGU. In determining fair value less costs of disposal, recent market transactions are considered, if available. If the recoverable amount of an asset or a CGU is estimated to be less than its carrying amount, the carrying amount is reduced to its recoverable amount. An impairment loss is recognized immediately in the consolidated statement of loss and comprehensive loss.
For impaired assets, excluding goodwill, an assessment is made at each reporting date as to whether there is any indication that previously recognized impairment losses may no longer exist or may have decreased. If such indication exists, the Company estimates the asset’s recoverable amount. A previously recognized impairment loss is reversed only if there has been a change in the assumptions used to determine the asset’s recoverable amount since the last impairment loss was recognized. The reversal is limited so that the carrying amount of the asset does not exceed its recoverable amount, nor exceed the carrying amount that would have been determined, net of amortization, had no impairment loss been recognized for the asset in prior years. Such reversal is recognized in the consolidated statement of loss and comprehensive loss. Impairment losses relating to goodwill cannot be reversed.
Engine Gaming and Media, Inc.
(formerly, Engine Media Holdings, Inc.)
Notes to the Consolidated Financial Statements
August 31, 2022 and 2021
(Expressed in United States Dollars) | |
| | |
(i) Leases
The Company assesses whether a contract is or contains a lease, at inception of the contract. The Company recognises a right-of-use asset and a corresponding lease liability with respect to all lease arrangements in which it is the lessee, except for short-term leases (defined as leases with a lease term of 12 months or less) and leases of low value assets (such as tablets and personal computers, small items of office furniture and telephones). For these leases, the Company recognises the lease payments as an operating expense on a straight-line basis over the term of the lease unless another systematic basis is more representative of the time pattern in which economic benefits from the leased assets are consumed.
The lease liability is initially measured at the present value of the lease payments that are not paid at the commencement date, discounted by using the rate implicit in the lease. If this rate cannot be readily determined, the Company uses its incremental borrowing rate.
Lease payments included in the measurement of the lease liability comprise:
| ● | Fixed lease payments (including in-substance fixed payments), less any lease incentives receivable; |
| ● | Variable lease payments that depend on an index or rate, initially measured using the index or rate at the commencement date; |
| ● | The amount expected to be payable by the lessee under any residual value guarantees; |
| ● | The exercise price of purchase options, if the lessee is reasonably certain to exercise the options; and |
| ● | Payments of penalties for terminating the lease, if the lease term reflects the exercise of an option to terminate the lease. |
The lease liability is presented as a separate line in the consolidated statement of financial position.
The lease liability is subsequently measured by increasing the carrying amount to reflect interest on the lease liability (using the effective interest method) and by reducing the carrying amount to reflect the lease payments made. The Company remeasures the lease liability (and makes a corresponding adjustment to the related right-of-use asset)
whenever:
| ● | The lease term has changed or there is a significant event or change in circumstances resulting in a change the assessment of exercise of a purchase option, in which case the lease liability is remeasured by discounting the revised lease payments using a revised discount rate. |
| ● | The lease payments change due to changes in an index or rate or a change in expected payment under a guaranteed residual value, in which cases the lease liability is remeasured by discounting the revised lease payments using an unchanged discount rate (unless the lease payments change is due to a change in a floating interest rate, in which case a revised discount rate is used). |
| ● | A lease contract is modified, and the lease modification is not accounted for as a separate lease, in which case the lease liability is remeasured based on the lease term of the modified lease by discounting the revised lease payments using a revised discount rate at the effective date of the modification. |
The Company did not make any such adjustments during the periods presented.
The right-of-use assets comprise the initial measurement of the corresponding lease liability, lease payments made at or before the commencement day, less any lease incentives received and any initial direct costs. They are subsequently measured at cost less accumulated depreciation and impairment losses.
Engine Gaming and Media, Inc.
(formerly, Engine Media Holdings, Inc.)
Notes to the Consolidated Financial Statements
August 31, 2022 and 2021
(Expressed in United States Dollars) | |
| | |
Right-of-use assets are depreciated over the shorter period of lease term and useful life of the underlying asset. If a lease transfers ownership of the underlying asset or the cost of the right-of-use asset reflects that the Company expects to exercise a purchase option, the related right-of-use asset is depreciated over the useful life of the underlying asset. The depreciation starts at the commencement date of the lease.
The right-of-use assets are presented as a separate line in the consolidated statement of financial position.
The Company applies IAS 36 Impairment of Assets to determine whether a right-of-use asset is impaired and accounts for any identified impairment loss as described in the ‘property and equipment’ policy.
Variable rents that do not depend on an index or rate are not included in the measurement the lease liability and the right-of-use asset. The related payments are recognised as an expense in the period in which the event or condition that triggers those payments occurs and are included in the line “other expenses” in profit or loss.
As a practical expedient, IFRS 16 Leases permits a lessee not to separate non-lease components, and instead account for any lease and associated non-lease components as a single arrangement. The Company has not used this practical expedient. For contracts that contain a lease component and one or more additional lease or non-lease components, the Company allocates the consideration in the contract to each lease component on the basis of the relative stand-alone price of the lease component and the aggregate stand-alone price of the non-lease components.
(j) Issuance of Units
The Company issues units that consist of shares and warrants. The fair value is allocated to the shares and warrants utilizing the relative fair value method.
(k) Financial instruments
Financial assets
Recognition and Initial Measurement
The Company recognizes financial assets when it becomes party to the contractual provisions of the instrument. Financial assets are measured initially at their fair value plus, in the case of financial assets not subsequently measured at fair value through profit or loss, transaction costs that are directly attributable to their acquisition. Transaction costs attributable to the acquisition of financial assets subsequently measured at fair value through profit or loss are expensed in profit or loss when incurred.
Classification and Subsequent Measurement
On initial recognition, financial assets and liabilities are classified as subsequently measured at amortized cost, fair value through other comprehensive income (“FVOCI”) or fair value through profit or loss (“FVTPL”). The Company determines the classification of its financial assets, together with any embedded derivatives, based on the business model for managing the financial assets and their contractual cash flow characteristics.
Financial assets are classified as follows:
| ● | Amortized cost - Assets that are held for collection of contractual cash flows where those cash flows are solely payments of principal and interest are measured at amortized cost. Interest revenue is calculated using the effective interest method and gains or losses arising from impairment, foreign exchange and derecognition are recognized in profit or loss. Financial assets measured at amortized cost are comprised of cash, restricted cash, accounts and other receivables and advances. |
| | | |
| ● | Fair value through other comprehensive income - Assets that are held for collection of contractual cash flows and for selling the financial assets, and for which the contractual cash flows are solely payments of principal and interest, are measured at fair value through other comprehensive income. Interest income calculated using the effective interest method and gains or losses arising from impairment and foreign exchange are recognized in profit or loss. All other changes in the carrying amount of the financial assets are recognized in other comprehensive income. Upon derecognition, the cumulative gain or loss previously recognized in other comprehensive income is reclassified to profit or loss. The Company does not hold any financial assets measured at fair value through other comprehensive income. |
Engine Gaming and Media, Inc.
(formerly, Engine Media Holdings, Inc.)
Notes to the Consolidated Financial Statements
August 31, 2022 and 2021
(Expressed in United States Dollars) | |
| | |
| ● | Mandatorily at fair value through profit or loss - Assets that do not meet the criteria to be measured at amortized cost, or fair value through other comprehensive income, are measured at fair value through profit or loss. All interest income and changes in the financial assets’ carrying amount are recognized in profit or loss. Financial assets measured mandatorily at fair value through profit and loss include publisher advance, promissory notes receivable and investment at FVTPL. |
| ● | Designated at fair value through profit or loss – On initial recognition, the Company may irrevocably designate a financial asset to be measured at fair value through profit or loss in order to eliminate or significantly reduce an accounting mismatch that would otherwise arise from measuring assets or liabilities, or recognizing the gains and losses on them, on different bases. All interest income and changes in the financial assets’ carrying amount are recognized in profit or loss. |
Business Model Assessment
The Company assesses the objective of its business model for holding a financial asset at a level of aggregation which best reflects the way the business is managed, and the way information is provided to management. Information considered in this assessment includes stated policies and objectives.
Contractual Cash Flow Assessment
The cash flows of financial assets are assessed as to whether they are solely payments of principal and interest on the basis of their contractual terms. For this purpose, ‘principal’ is defined as the fair value of the financial asset on initial recognition. ‘Interest’ is defined as consideration for the time value of money, the credit risk associated with the principal amount outstanding, and other basic lending risks and costs. In performing this assessment, the Company considers factors that would alter the timing and amount of cash flows such as prepayment and extension features, terms that might limit the Company’s claim to cash flows, and any features that modify consideration for the time value of money.
Impairment
The Company recognizes a loss allowance for the expected credit losses associated with its financial assets, other than financial assets measured at fair value through profit or loss. Expected credit losses are measured to reflect a probability-weighted amount, the time value of money, and reasonable and supportable information regarding past events, current conditions, and forecasts of future economic conditions.
The Company applies the simplified approach for accounts receivable. Using the simplified approach, the Company records a loss allowance equal to the expected credit losses resulting from all possible default events over the assets’ contractual lifetime.
The Company assesses whether a financial asset is credit-impaired at the reporting date. Regular indicators that a financial instrument is credit-impaired include significant financial difficulties as evidenced through borrowing patterns or observed balances in other accounts and breaches of borrowing contracts such as default events or breaches of borrowing covenants. For financial assets assessed as credit-impaired at the reporting date, the Company continues to recognize a loss allowance equal to lifetime expected credit losses.
For financial assets measured at amortized cost, loss allowances for expected credit losses are presented in the statement of financial position as a deduction from the gross carrying amount of the financial asset.
Financial assets are written off when the Company has no reasonable expectations of recovering all or any portion thereof.
Engine Gaming and Media, Inc.
(formerly, Engine Media Holdings, Inc.)
Notes to the Consolidated Financial Statements
August 31, 2022 and 2021
(Expressed in United States Dollars) | |
| | |
Derecognition of Financial Assets
The Company derecognizes a financial asset when its contractual rights to the cash flows from the financial asset expire.
Financial Liabilities
Recognition and Initial Measurement
The Company recognizes a financial liability when it becomes party to the contractual provisions of the instrument. At initial recognition, the Company measures financial liabilities at their fair value plus transaction costs that are directly attributable to their issuance, except for financial liabilities subsequently measured at fair value through profit or loss for which transaction costs are immediately recorded in profit or loss.
Financial liabilities are classified as either financial liabilities at FVTPL or at amortized cost. The Company determines the classification of its financial liabilities at initial recognition.
| ● | Amortized cost - Financial liabilities are classified as measured at amortized cost unless they fall into one of the following categories: financial liabilities at FVTPL, financial liabilities that arise when a transfer of a financial asset does not qualify for derecognition, financial guarantee contracts, or commitments to provide a loan at a below-market interest rate, or contingent consideration recognized by an acquirer in a business combination. |
The Company’s accounts payable, accrued liabilities, players liability account, line of credit, long-term debt and promissory notes payable do not fall into any of the exemptions and are therefore classified as measured at amortized cost.
| ● | Financial liabilities recorded at FVTPL - Financial liabilities are classified as FVTPL if they fall into one of the five exemptions detailed above, or they are derivatives or they are designated as such on initial recognition. The Company’s warrants that are not issued in exchange for goods or services and have characteristics of derivative financial liabilities as a result of the warrants having an exercise price in a currency different from the functional currency of the Company, are measured as financial liabilities at FVTPL. The Company’s convertible debt is designated as financial liabilities at FVTPL. |
Transaction costs
Transaction costs associated with financial instruments, carried at FVTPL, are expensed as incurred, while transaction costs associated with all other financial instruments are included or deducted from the initial carrying amount of the asset or the liability.
Engine Gaming and Media, Inc.
(formerly, Engine Media Holdings, Inc.)
Notes to the Consolidated Financial Statements
August 31, 2022 and 2021
(Expressed in United States Dollars) | |
| | |
Subsequent measurement
Instruments classified as FVTPL are measured at fair value with unrealized gains and losses recognized in profit or loss. Instruments classified as amortized cost are measured at amortized cost using the effective interest rate method. Instruments classified as FVTOCI are measured at fair value with unrealized gains and losses recognized in other comprehensive income.
Derecognition of financial liabilities
The Company derecognizes financial liabilities only when its obligations under the financial liabilities are discharged, cancelled, or expired. The difference between the carrying amount of the financial liability derecognized and the consideration paid and payable, including any noncash assets transferred or liabilities assumed, is recognized in profit or loss.
Fair value measurement
The Company categorizes its financial assets and liabilities measured at fair value into one of three different levels depending on the observability of the inputs used in the measurement.
| | Level 1: | This level includes assets and liabilities measured at fair value based on unadjusted quoted prices for identical assets and liabilities in active markets that are accessible at the measurement date. |
| | Level 2: | This level includes valuations determined using directly or indirectly observable inputs other than quoted prices included within Level 1. |
| | Level 3: | This level includes valuations based on inputs which are unobservable. |
Offsetting
Financial assets and liabilities are offset, and the net amount presented in the statement of financial position when, and only when, the Company has a legal right to offset the amounts and intends either to settle on a net basis or to realize the asset and settle the liability simultaneously.
(l) Short-term employee benefits
Short-term employee benefits include wages, salaries, compensated absences, profit-sharing and bonuses. Short-term employee benefit obligations are measured on an undiscounted basis and are recognized in salaries and wages expense as the related service is provided or capitalized if the service rendered is in connection with the creation of an asset. A liability is recognized for the amount expected to be paid under short-term cash bonus or profit-sharing plans if the Company has a present legal or constructive obligation to pay this amount as a result of past service provided by the employee and the obligation can be estimated reliably.
Engine Gaming and Media, Inc.
(formerly, Engine Media Holdings, Inc.)
Notes to the Consolidated Financial Statements
August 31, 2022 and 2021
(Expressed in United States Dollars) | |
| | |
(m) Income taxes
Income tax on the profit or loss for the periods presented comprises current and deferred tax. Income tax is recognized in profit or loss except to the extent that it relates to items recognized directly in equity, in which case it is recognized in equity.
Current tax expense is the expected tax payable on the taxable income for the year, using tax rates enacted or substantively enacted at year end, adjusted for amendments to tax payable with regards to previous years.
Deferred tax is provided using the liability method, providing for temporary differences between the carrying amounts of assets and liabilities for financial reporting purposes and the amounts used for taxation purposes. Deferred tax is not recognized for the following temporary differences: the initial recognition of goodwill; the initial recognition of assets or liabilities in a transaction that is not a business combination and that affects neither accounting nor taxable profit; and differences relating to investments in subsidiaries, associates, and jointly controlled entities to the extent that they will probably not reverse in the foreseeable future. The amount of deferred tax provided is based on the expected manner of realization or settlement of the carrying amount of assets and liabilities, using tax rates enacted or substantively enacted at the financial position reporting date applicable to the period of expected realization or settlement.
A deferred tax asset is recognized only to the extent that it is probable that future taxable profits will be available against which the asset can be utilized.
Deferred tax assets and liabilities are offset when there is a legally enforceable right to set off current tax assets against current tax liabilities and when they relate to income taxes levied by the same taxation authority and the Company intends to settle its current tax assets and liabilities on a net basis.
(n) Share capital
Common shares are classified as equity. Transaction costs directly attributable to the issue of common shares, share purchase options, and equity classified warrants are recognized as a deduction from equity, net of any tax effects. When share capital recognized as equity is repurchased, the amount of the consideration paid, including directly attributable costs, is recognized as a deduction from total equity.
(o) Share-based payment
The share-based payment plan allows Company employees and consultants to acquire shares of the Company. The fair value of share-based payment awards granted is recognized within share-based payments expense with a corresponding increase in equity.
Each tranche in an award is considered a separate award with its own vesting period and grant date fair value. The fair value is measured at grant date and each tranche is recognized on a straight-line basis over the period during which the share purchase options vest. The fair value of the share-based payment awards granted is measured using the Black-Scholes option pricing model taking into account the terms and conditions upon which the awards
were granted such as stock price, term, and stock volatility. At each financial position reporting date, the amount recognized as an expense is adjusted to reflect the actual number of awards, for which the related service and non-market vesting conditions are expected to be met.
For each Restricted Share Units (“RSU”) granted, the Company recognizes an expense equal to the market value of a common share at the date of grant and for each common share option granted, the Company recognizes an expense equal to the fair value of the option estimated using a Black Scholes model at grant date, based on the number of RSUs/options expected to vest, recognized over the term of the vesting period, with a corresponding increase to contributed surplus. Share based payments expense is adjusted for subsequent changes in management’s estimate of the number of RSUs/options that are expected to vest. The effect of these changes is recognized in the period of the change.
Engine Gaming and Media, Inc.
(formerly, Engine Media Holdings, Inc.)
Notes to the Consolidated Financial Statements
August 31, 2022 and 2021
(Expressed in United States Dollars) | |
| | |
The Company’s warrants having an exercise price in the functional currency of the Company that are not issued in exchange for good and services are equity measured and the fair value at grant date for these warrants is classified within contributed surplus.
For equity-settled share-based payment transactions, including share options and RSUs granted to officers and directors of the Company and warrants granted to advisors in a financing transaction, the Company measures the goods or services received, and the corresponding increase in contributed surplus, directly, at the fair value of the goods or services received, unless that fair value cannot be estimated reliably, in which cases, the Company measures their value, and the corresponding increase in equity, indirectly, by reference to the fair value of the equity instruments granted.
(p) Discontinued operations and assets held for sale
A non-current asset or a group of assets and liabilities is a disposal group when the carrying amount will be recovered principally through its divestiture and not by continuing utilization. To meet this definition, the asset must be available for immediate sale, and divestiture must be highly probable. Non-current assets or disposal groups classified as held for sale are measured at the lower of carrying amounts and fair value less costs to sell.
Classification as a discontinued operation occurs at the earlier of disposal or when the operation meets the criteria to be classified as held-for-sale.
Discontinued operations are presented on a single line of the consolidated statements of loss and comprehensive loss for the periods reported, comprising the earnings after tax of discontinued operations until divestiture and the gain or loss after tax on sale or fair value measurement, less costs to sell the assets and liabilities making up the discontinued operations. In addition, the cash flows generated by the discontinued operations are presented on one separate line of the statement of consolidated cash flows for the periods presented.
(q) Segment reporting
A segment is a distinguishable component of the Company that is engaged either in providing products or services (business segment), or in providing products or services within a particular economic environment (geographical segment), which is subject to risks and rewards that are different from those of other segments.
(r) Government grants
Government grants are recognized when it is probable that the grant will be received, and all conditions of the grant are complied with. When the grant is in the form of a forgivable loan, the loan is initially recognized as a deferred income liability. The Company then relieves the deferred income liability on a systematic and rational basis in those periods over which the entity recognizes the expenses that the grant is intended to offset. The Company recognizes the impact of the loan forgiveness as an offset against related expense.
Assistance for operating expenses is recorded as a reduction of expenses when the assistance is receivable.
A forgivable loan from government is treated as government assistance when there is reasonable assurance that the Company will meet the terms for forgiveness of the loan. If there is no reasonable assurance that the entity will meet the terms for forgiveness of the loan, the loan is recognized as a liability in accordance with IFRS 9 Financial Instruments. The liability would become a government grant (forgivable loan) when there is reasonable assurance that the entity will meet the terms for forgiveness.
Engine Gaming and Media, Inc.
(formerly, Engine Media Holdings, Inc.)
Notes to the Consolidated Financial Statements
August 31, 2022 and 2021
(Expressed in United States Dollars) | |
| | |
6. Acquisitions
Acquisition of SideQik, Inc
On July 2, 2021, the Company acquired all issued and outstanding shares of SideQik, Inc. (“SideQik”) which was carried out pursuant to a statutory reverse-triangular merger. The Company issued 386,584 shares and 23,939 RSUs in exchange for the SideQik securities exchanged pursuant to the transaction.
SideQik empowers brands to discover and connect with content creating influencers across any content vertical. The acquisition of Sideqik (combined with a prior acquisition of Stream Hatchet) brings technology and customers that are expected to expand Engine’s advertising and media offerings.
All transaction costs associated with this acquisition were expensed. If the acquisition of SideQik had occurred at the beginning of the Company’s fiscal year (September 1, 2020), the loss attributed to SideQik’s operations for the year ended August 31, 2021, would have been $1,130,080, with revenue of $2,148,987. The loss attributed to SideQik’s operations from the acquisition date to August 31, 2021, was $383,167, with revenue of $412,981.
The acquisition was accounted for using the acquisition method of accounting under IFRS 3, Business Combinations, which requires that the Company recognize the identifiable assets acquired and the liabilities assumed at their fair values on the date of acquisition. The estimated fair values are preliminary and based on the information that was available as of that date.
The purchase price allocation is as follows:
Schedule of assets and liabilities assumed in acquisition
| Consideration paid | | # Issued | | | Amount | |
| Common shares | | | 386,584 | | | $ | 3,962,000 | |
| RSUs | | | 23,939 | | | $ | 245,000 | |
| | | | | | | $ | 4,207,000 | |
| | | | | | | | | |
| Fair value of identifiable assets acquired | | | | | | | | |
| Cash | | | | | | $ | 255,852 | |
| Accounts and other receivables | | | | | | | 817,557 | |
| Prepaid and other current assets | | | | | | | 69,631 | |
| Property and equipment | | | | | | | 12,730 | |
| Intangible assets - Software (Useful life - 5 years) | | | | | | | 910,000 | |
| Intangible assets - Brand (Useful life - 10 years) | | | | | | | 210,000 | |
| Intangible assets - Customer relationships (Useful life - 10 years) | | | | | | | 310,000 | |
| Goodwill | | | | | | | 2,900,193 | |
| Accounts payable | | | | | | | (292,571 | ) |
| Accrued liabilities | | | | | | | (502,392 | ) |
| Deferred revenue | | | | | | | (484,000 | ) |
| | | | | | | $ | 4,207,000 | |
The Company common shares issued for the acquisition of SideQik were subject to lock-up restrictions to be discharged 16 2/3% at 180 days from the closing date, and thereafter another 16 2/3% on the 15th of each subsequent month with the restriction being fully liquidated at the end of the 12th month. The Company’s common shares issued were valued based on the closing price on TSX Venture exchange on July 2, 2021, reduced by a discount for lack of marketability of fifteen percent.
Engine Gaming and Media, Inc.
(formerly, Engine Media Holdings, Inc.)
Notes to the Consolidated Financial Statements
August 31, 2022 and 2021
(Expressed in United States Dollars) | |
| | |
Significant judgments and assumptions related to the valuation and useful lives of certain classes of assets acquired are as follows:
| | i) | Intangible assets, software |
The fair value of the software intangible asset was determined based on the relief from royalty method under the income approach. The software intangible asset was valued using Level 3 inputs which consisted of the following key inputs: (i) revenue projections; (ii) royalty rate of 7.5%; (iii) tax rate of 25.5% (iv) discount rate of 20%. This asset is amortized on a straight-line basis over the estimated useful life of five years.
| | ii) | Intangible assets, brand |
The fair value of the brand intangible asset was determined based on the relief from royalty method under the income approach. The brand intangible asset was valued using Level 3 inputs which consisted of the following key inputs: (i) cash flow projections with long term growth rate of 3%; (ii) royalty rate of 0.5%; (iii) tax rate of 25.5%; and (iv) discount rate of 20.0%. This asset is amortized on a straight-line basis over the estimated useful life of ten years.
| | iii) | Intangible assets, customer relationships |
SideQik has created custom partnerships with clients to build out integrations with proprietary brand tools which are expected to result in future sales. The fair value of the customer relationships intangible asset was determined based on the excess earnings method under the income approach. The customer relationships intangible asset was valued using Level 3 inputs which consisted of the following key inputs: (i) cash flow projections with long term growth rate of 3%; (ii) customer attrition rate of 15%; and (iii) discount rate of 22.0%; (iv) tax rate of 25.5%. This asset is amortized on a straight-line basis over the estimated useful life of ten years.
The difference between the acquisition date fair value of the consideration transferred and the values assigned to the assets acquired and liabilities assumed represents goodwill of $2,900,193. The goodwill is not expected to be deductible for tax purposes.
The goodwill recorded represents the following:
| ● | Cost savings and operating synergies expected to result from combining the operations of SideQik with those of the Company. |
| ● | Intangible assets that do not qualify for separate recognition such as the assembled workforce. |
7. Revenue
Revenue streams and disaggregation of revenue from contracts with customers
In the following table, revenue from contracts with customers is disaggregated by service lines.
Schedule of revenue from contracts with customers disaggregated
| | | | | | | | | | | | | | |
| | | | | | | | | | Increase | |
| For the year ended August 31, | | | 2022 | | | 2021 | | | (decrease) | |
| | | | $ | | | $ | | | $ | |
| Software-as-a-service | | | | 9,220,069 | | | | 7,952,426 | | | | 1,267,643 | |
| Advertising | | | | 32,662,544 | | | | 25,392,842 | | | | 7,269,702 | |
| Revenue | | | | 41,882,613 | | | | 33,345,268 | | | | 8,537,345 | |
$328,461 of the 2021 Software-as-a-service revenue was previously reported as Professional services, it has been reclassified to conform with current year presentation.
Engine Gaming and Media, Inc.
(formerly, Engine Media Holdings, Inc.)
Notes to the Consolidated Financial Statements
August 31, 2022 and 2021
(Expressed in United States Dollars) | |
| | |
8. Net income (loss) per share
Basic net income (loss) per share is calculated using the weighted-average number of common shares outstanding during each period. Diluted net income (loss) per share assumes the conversion, exercise or issuance of all potential common share equivalents unless the effect is to reduce the loss or increase the income per share. For purposes of this calculation, stock options, warrants and RSU’s are considered to be potential common shares and are only included in the calculation of diluted net income (loss) per share when their effect is dilutive.
Due to the net loss incurred during the years ended August 31, 2022, and 2021, all outstanding options, RSU’s and warrants were excluded from diluted weighted-average common shares outstanding as their effect was anti-dilutive. Weighted average common shares outstanding for the years ended August 31, 2022, and 2021 were 15,637,418 and 11,874,775, respectively.
9. Accounts and other receivables and publisher advances
| (a) | Accounts and other receivables |
The Company’s accounts and other receivables are comprised of the following:
Schedule of accounts and other receivables
| | | August 31,
2022 | | | August 31,
2021 | |
| | | $ | | | $ | |
| Trade accounts receivable | | | 9,750,619 | | | | 9,677,725 | |
| Other receivables | | | 9,028 | | | | 53,387 | |
| Allowance for doubtful accounts | | | (1,355,638 | ) | | | (1,084,305 | ) |
| Total accounts and other receivables | | | 8,404,009 | | | | 8,646,807 | |
A continuity of the Company’s allowance for doubtful accounts is as follows:
Schedule of allowance for doubtful accounts
| | | 2022 | | | 2021 | |
| | | $ | | | $ | |
| Balance, August 31, | | | (1,084,305 | ) | | | (874,438 | ) |
| Acquisition of SideQik | | | - | | | | (140,896 | ) |
| Provision, bad debt expense | | | (473,898 | ) | | | (72,636 | ) |
| Write-offs | | | 202,565 | | | | 3,665 | |
| Balance, August 31, | | | (1,355,638 | ) | | | (1,084,305 | ) |
Engine Gaming and Media, Inc.
(formerly, Engine Media Holdings, Inc.)
Notes to the Consolidated Financial Statements
August 31, 2022 and 2021
(Expressed in United States Dollars) | |
| | |
| (b) | Publisher advance at FVTPL |
On February 7, 2021, the Company’s subsidiary Frankly Media LLC, amended its commercial agreement with its largest publisher, which secured a long-term extension. One of the key terms of the amended agreement required the Company to advance $6 million of revenue sharing payments to the publisher under the following schedule:
(i) $4 million within one day of execution of the amendment.
(ii) $1 million on or before February 28, 2021; and
(iii) $1 million on or before March 31, 2021.
The advance is to be recouped through additional withholding on future advertising revenue share payments made to the publisher, beyond Frankly’s share, and is effective for amounts billed for periods February 1, 2021, forward.
As of August 31, 2022, $6 million had been advanced to the publisher and $4,509,352 had been recouped through the process explained above. As of August 31, 2022, a net amount of $1,490,648 was outstanding on the advance all of which is current and reflects fair value.
The breakout of the publisher advance into current and non-current portions is based on an estimate of advertising billings over the next twelve months and the resulting additional withholding on the related advertising revenue share payments.
10. Promissory notes receivable at FVTPL
Schedule of promissory notes receivable
| | | Promissory notes receivable | |
| | | $ | |
| Balance, August 31, 2021 | | - | |
| Acquisition | | | 1,585,783 | |
| Change in fair value | | | (873,778 | ) |
| Effect of foreign exchange | | | (135,477 | ) |
| Balance, August 31, 2022 | | | 576,528 | |
To facilitate the sale of Eden Games, under a separate agreement, the Company agreed to purchase Euro- denominated 6% promissory notes amounting to Euro 1,453,154 ($1,585,783) that were due to the former co-founders of Eden Games from third parties. Euro 1,081,081 ($1,181,005) of the consideration was paid on the closing of the sale with the remainder due in two equal payments on April 4, 2023, and October 6, 2023.
The Company assessed the fair value of the promissory notes receivable based on the present value of expected future cash flows of $591,781 and has recognized a fair value write-down of $873,778. The Company is not accruing interest.
The fair value of the Company’s promissory note receivable is estimated at each reporting period, with reference to expected cash flows discounted to present value. Promissory notes receivable is classified with a level 3 in the fair value hierarchy (Note 30).
Engine Gaming and Media, Inc.
(formerly, Engine Media Holdings, Inc.)
Notes to the Consolidated Financial Statements
August 31, 2022 and 2021
(Expressed in United States Dollars) | |
| | |
11. Investment at FVTPL
Schedule of investment in associate and investment
| | | Investment at FVTPL | |
| | | | $ | |
| Balance, August 31, 2021 | | | 2,629,851 | |
| Balance, August 31, 2022 | | | 2,629,851 | |
On August 25, 2020, the Company acquired a 20.48% interest in One Up Group, LLC (“One Up”). One Up operates a mobile app which allows gamers to organize and play one-on-one matches with other gamers and compete for money.
0
The Company accounted for this investment as an investment in associate under the equity method from acquisition through January 5, 2021. The Company’s share in the loss of One Up for the period from September 1, 2020, to January 5, 2021, amounted to $103,930.
On January 5, 2021, the Company’s interest in One Up was reduced to 18.62% as a result of One Up closing a financing round. In accordance with IAS 28, the Company discontinued the use of the equity method on January 5, 2021, the date at which its investment ceased being an associate. The difference between the fair value of the Company’s retained interest in One Up and its carrying value on January 5, 2021, amounted to $99,961, which is recognized as a gain on retained interest in former associate on the Company’s statement of loss and comprehensive loss.
The fair value of the Company’s investment in One Up is estimated at each reporting period, with reference to valuations underlying privately placed financing transactions closed by One Up. Key inputs being the number of shares owned by the Company and the underlying share value of the privately placed financing transaction. This investment is classified within level 3 in the fair value hierarchy (Note 30).
Engine Gaming and Media, Inc.
(formerly, Engine Media Holdings, Inc.)
Notes to the Consolidated Financial Statements
August 31, 2022 and 2021
(Expressed in United States Dollars) | |
| | |
12. Property and equipment
Disclosure of detailed information about property plant and equipment
| Cost | | Leasehold
improvements | | | Computer equipment | | | Furniture
and fixtures | | | Total | |
| | | $ | | | $ | | | $ | | | $ | |
| August 31, 2020 | | | 221,653 | | | | 486,340 | | | | 173,091 | | | | 881,084 | |
| Acquisition of SideQik | | | - | | | | 11,399 | | | | 1,331 | | | | 12,730 | |
| Additions | | | - | | | | 170,305 | | | | 17,865 | | | | 188,170 | |
| Disposals | | | - | | | | (14,244 | ) | | | - | | | | (14,244 | ) |
| Disposal of Motorsports | | | (2,631 | ) | | | (47,645 | ) | | | (18,118 | ) | | | (68,394 | ) |
| Foreign exchange | | | (171 | ) | | | (2,548 | ) | | | (1,125 | ) | | | (3,844 | ) |
| UMG Asset Sale | | | - | | | | (59,550 | ) | | | (35,178 | ) | | | (94,728 | ) |
| Impairment | | | (153,192 | ) | | | - | | | | - | | | | (153,192 | ) |
| August 31, 2021 | | | 218,851 | | | | 603,607 | | | | 173,044 | | | | 995,502 | |
| | | | | | | | | | | | | | | | | |
| August 31, 2021 | | | 218,851 | | | | 603,607 | | | | 173,044 | | | | 995,502 | |
| Additions | | | - | | | | 77,147 | | | | 1,551 | | | | 78,698 | |
| Impairment | | | (153,192 | ) | | | - | | | | - | | | | (153,192 | ) |
| Disposal of Eden Games | | | (7,407 | ) | | | (314,440 | ) | | | (52,460 | ) | | | (374,307 | ) |
| UMG Asset Sale | | | - | | | | (59,550 | ) | | | (35,178 | ) | | | (94,728 | ) |
| Foreign exchange | | | 850 | | | | (35,128 | ) | | | (4,963 | ) | | | (39,241 | ) |
| August 31, 2022 | | | 59,102 | | | | 271,636 | | | | 81,994 | | | | 412,732 | |
| Accumulated depreciation | | Leasehold
improvements | | | Computer equipment | | | Furniture
and fixtures | | | Total | |
| | | $ | | | $ | | | $ | | | $ | |
| August 31, 2020 | | | 57,517 | | | | 307,508 | | | | 106,670 | | | | 471,695 | |
| Depreciation | | | 5,949 | | | | 117,092 | | | | 26,150 | | | | 149,191 | |
| Disposals | | | - | | | | (4,477 | ) | | | - | | | | (4,477 | ) |
| Disposal of Motorsports | | | - | | | | (11,068 | ) | | | (9,910 | ) | | | (20,978 | ) |
| Foreign exchange | | | (99 | ) | | | (2,824 | ) | | | (817 | ) | | | (3,740 | ) |
| UMG Asset Sale | | | - | | | | (31,619 | ) | | | (35,178 | ) | | | (66,797 | ) |
| August 31, 2021 | | | 63,367 | | | | 406,231 | | | | 122,093 | | | | 591,691 | |
| | | | | | | | | | | | | | | | | |
| August 31, 2021 | | | 63,367 | | | | 406,231 | | | | 122,093 | | | | 591,691 | |
| Depreciation | | | 3,765 | | | | 114,530 | | | | 10,598 | | | | 128,893 | |
| Disposal of Eden Games | | | (7,202 | ) | | | (278,569 | ) | | | (47,404 | ) | | | (333,175 | ) |
| UMG Asset Sale | | | - | | | | (31,619 | ) | | | (35,178 | ) | | | (66,797 | ) |
| Foreign exchange | | | (828 | ) | | | (29,994 | ) | | | (4,448 | ) | | | (35,270 | ) |
| August 31, 2022 | | | 59,102 | | | | 180,579 | | | | 45,661 | | | | 285,342 | |
| Net book value | | Leasehold
improvements | | | Computer equipment | | | Furniture
and fixtures | | | Total | |
| | | $ | | | $ | | | $ | | | $ | |
| August 31, 2021 | | | 155,484 | | | | 197,376 | | | | 50,951 | | | | 403,811 | |
| August 31, 2022 | | | - | | | | 91,057 | | | | 36,333 | | | | 127,390 | |
Engine Gaming and Media, Inc.
(formerly, Engine Media Holdings, Inc.)
Notes to the Consolidated Financial Statements
August 31, 2022 and 2021
(Expressed in United States Dollars) | |
| | |
13. Goodwill
Disclosure of detailed information about goodwill
| | | 2022 | | | 2021 | |
| | | $ | | | $ | |
| Balance, beginning of year | | | 18,495,121 | | | | 18,785,807 | |
| Disposal of Eden Games | | | (345,150 | ) | | | - | |
| Acquisition of SideQik | | | - | | | | 2,900,193 | |
| Impairment of goodwill associated with Sideqik | | | (2,900,193 | ) | | | - | |
| Impairment of goodwill associated with UMG | | | - | | | | (3,209,045 | ) |
| Effect of foreign exchange | | | (49,590 | ) | | | 18,166 | |
| Balance, end of year | | | 15,200,188 | | | | 18,495,121 | |
| | a) | Frankly |
| | | |
| | | The Company tested the Frankly CGU goodwill balance of $14,895,595 (2021 - $14,895,595) as of August 31, 2022, for impairment. When assessing whether or not there is an impairment, the recoverable amount of the CGU was determined based on a value in use calculation. The calculation used a five-year projected and terminal period debt-free cash flow model discounted to present value using a discount rate of 21.0% (pre-tax 28.3%), tax rate of 26% and a long-term growth rate of 3%. The recoverable value of $24,500,000 was concluded after making adjustments to the discounted cash flow model for cash or any other non-operating assets or liabilities as of the measurement date. The concluded recoverable value was then compared to carrying value of the CGU. The results of the assessment indicated that the fair value of the Frankly CGU exceeded its carrying value by 43.6% and no impairment charge was determined to be necessary. |
| | | |
| | b) | Sideqik |
| | | |
| | | The Company tested the Sideqik CGU goodwill balance of $2,900,193 (2021 - $2,900,193) as of August 31, 2022, for impairment. When assessing whether there is an impairment, the recoverable amount of the CGU was determined based on a value in use calculation. The calculation used a five-year projected and terminal period debt-free cash flow model discounted to present value using a discount rate of 23.5% (pre-tax 31.5%), tax rate of 25.5% and a long-term growth rate of 3%. The recoverable value is concluded after making adjustments to the discounted cash flow model for cash or any other non-operating assets or liabilities as of the measurement date. The concluded recoverable value is then compared to carrying value of the CGU. Based on this impairment assessment, the Company determined that an impairment charge was necessary and recorded a full goodwill impairment charge of $2,900,193 to impairment expense on the Company’s consolidated statement of loss and comprehensive loss. Additionally, resulting from this impairment assessment the Company recorded $972,807 impairment charge to impairment expense in connection with the intangibles within the Sideqik CGU (Note 14). The results for Sideqik were reflected in the Company’s Media segment. |
| | | |
| | c) | Stream Hatchet |
| | | |
| | | The Company tested the Stream Hatchett goodwill balance of $304,593 (2021 - $335,650) as of August 31, 2022. The recoverable amounts for the Stream Hatchet CGU below were based on fair value less costs of disposal, estimated using a guideline public company method which is a market-based approach. The fair value measurement was categorized as a Level 3 fair value based on inputs in the valuation technique used. |
| | | |
| | | Revenue multiples from publicly traded companies operating within the same industry and location and having similar business activities to the Company were utilized, after adjusting for differences in size, margins and growth rates when compared to the Company and Stream Hatchet. These adjusted multiples of 2.5x for Stream Hatchet were applied to the financial metrics of the CGU to determine indicative enterprise values. Recoverable amounts were determined after an adjustment for costs of disposal, estimated at 5% of indicative enterprise values. No impairment charge was determined to be necessary for the Stream Hatchet CGU. |
Engine Gaming and Media, Inc.
(formerly, Engine Media Holdings, Inc.)
Notes to the Consolidated Financial Statements
August 31, 2022 and 2021
(Expressed in United States Dollars) | |
| | |
14. Intangible assets
Schedule of detailed information about intangible assets
| | | | | | | | | | | | | | | | | | | | | | | | | |
| Cost | | Patents | | | Application Platforms | | | Software | | | Brand | | | Customer
Lists and
Contracts | | | Total | |
| | | $ | | | $ | | | $ | | | $ | | | $ | | | $ | |
| August 31, 2020 | | | 9,430,265 | | | | 1,322,802 | | | | 10,763,975 | | | | 2,310,475 | | | | 3,671,954 | | | | 27,499,471 | |
| Disposal of Motorsports | | | - | | | | - | | | | (3,598,869 | ) | | | (201,627 | ) | | | (222,650 | ) | | | (4,023,146 | ) |
| Acquisition of SideQik | | | - | | | | - | | | | 910,000 | | | | 210,000 | | | | 310,000 | | | | 1,430,000 | |
| Impairment of UMG | | | - | | | | (266,731 | ) | | | - | | | | (263,158 | ) | | | (146,067 | ) | | | (675,956 | ) |
| Foreign exchange | | | - | | | | 16,974 | | | | 255,577 | | | | 81,759 | | | | 11,063 | | | | 365,373 | |
| August 31, 2021 | | | 9,430,265 | | | | 1,073,045 | | | | 8,330,683 | | | | 2,137,449 | | | | 3,624,300 | | | | 24,595,742 | |
| | | | | | | | | | | | | | | | | | | | | | | | | |
| August 31, 2021 | | | 9,430,265 | | | | 1,073,045 | | | | 8,330,683 | | | | 2,137,449 | | | | 3,624,300 | | | | 24,595,742 | |
| Intangible assets, Cost, Beginning balance | | | 9,430,265 | | | | 1,073,045 | | | | 8,330,683 | | | | 2,137,449 | | | | 3,624,300 | | | | 24,595,742 | |
| Impairment | | | (5,029,475 | ) | | | (50,602 | ) | | | (586,599 | ) | | | (218,644 | ) | | | (230,239 | ) | | | (6,115,559 | ) |
| Disposal of Eden Games | | | - | | | | (269,098 | ) | | | (4,709,219 | ) | | | (1,390,134 | ) | | | (269,010 | ) | | | (6,637,461 | ) |
| Disposal of UMG | | | - | | | | (242,667 | ) | | | - | | | | (184,167 | ) | | | (313,933 | ) | | | (740,767 | ) |
| Cost, Disposal | | | - | | | | (242,667 | ) | | | - | | | | (184,167 | ) | | | (313,933 | ) | | | (740,767 | ) |
| Foreign exchange | | | - | | | | (14,450 | ) | | | (285,842 | ) | | | (82,763 | ) | | | (19,230 | ) | | | (402,285 | ) |
| August 31, 2022 | | | 4,400,790 | | | | 496,228 | | | | 2,749,023 | | | | 261,741 | | | | 2,791,888 | | | | 10,699,670 | |
| Intangible assets, Cost, Ending balance | | | 4,400,790 | | | | 496,228 | | | | 2,749,023 | | | | 261,741 | | | | 2,791,888 | | | | 10,699,670 | |
| Accumulated amortization | | Patents | | | Application Platforms | | | Software | | | Brand | | | Customer
Lists and
Contracts | | | Total | |
| | | $ | | | $ | | | $ | | | $ | | | $ | | | $ | |
| August 31, 2020 | | | 628,684 | | | | 793,041 | | | | 4,909,000 | | | | 1,077,491 | | | | 648,933 | | | | 8,057,149 | |
| Amortization | | | 1,886,053 | | | | 159,843 | | | | 1,734,064 | | | | 465,398 | | | | 494,825 | | | | 4,740,183 | |
| Disposal of Motorsports | | | - | | | | - | | | | (532,412 | ) | | | (201,627 | ) | | | (222,650 | ) | | | (956,689 | ) |
| Foreign exchange | | | - | | | | 13,560 | | | | 229,650 | | | | 34,385 | | | | (4,740 | ) | | | 272,855 | |
| August 31, 2021 | | | 2,514,737 | | | | 966,444 | | | | 6,340,302 | | | | 1,375,647 | | | | 916,368 | | | | 12,113,498 | |
| | | | | | | | | | | | | | | | | | | | | | | | | |
| August 31, 2021 | | | 2,514,737 | | | | 966,444 | | | | 6,340,302 | | | | 1,375,647 | | | | 916,368 | | | | 12,113,498 | |
| Intangible assets, Accumulated amortization, Beginning balance | | | 2,514,737 | | | | 966,444 | | | | 6,340,302 | | | | 1,375,647 | | | | 916,368 | | | | 12,113,498 | |
| Amortization | | | 1,886,053 | | | | 56,000 | | | | 848,672 | | | | 215,676 | | | | 375,250 | | | | 3,381,651 | |
| Disposal of Eden Games | | | - | | | | (269,098 | ) | | | (4,709,219 | ) | | | (1,112,108 | ) | | | (250,801 | ) | | | (6,341,226 | ) |
| Disposal of UMG | | | - | | | | (242,667 | ) | | | - | | | | (184,167 | ) | | | (313,933 | ) | | | (740,767 | ) |
| Accumulated amortization, Disposal | | | - | | | | (242,667 | ) | | | - | | | | (184,167 | ) | | | (313,933 | ) | | | (740,767 | ) |
| Foreign exchange | | | - | | | | (14,451 | ) | | | (285,842 | ) | | | (62,839 | ) | | | (17,717 | ) | | | (380,849 | ) |
| August 31, 2022 | | | 4,400,790 | | | | 496,228 | | | | 2,193,913 | | | | 232,209 | | | | 709,167 | | | | 8,032,307 | |
| Intangible assets, Accumulated amortization, Ending balance | | | 4,400,790 | | | | 496,228 | | | | 2,193,913 | | | | 232,209 | | | | 709,167 | | | | 8,032,307 | |
| Net book value | | Patents | | | Application Platforms | | | Software | | | Brand | | | Customer
Lists and
Contracts | | | Total | |
| | | $ | | | $ | | | $ | | | $ | | | $ | | | $ | |
| August 31, 2021 | | | 6,915,528 | | | | 106,601 | | | | 1,990,381 | | | | 761,802 | | | | 2,707,932 | | | | 12,482,244 | |
| August 31, 2022 | | | - | | | | - | | | | 555,110 | | | | 29,532 | | | | 2,082,721 | | | | 2,667,363 | |
For further intangible asset impairment information as it relates to discontinued operations see Note 27.
Engine Gaming and Media, Inc.
(formerly, Engine Media Holdings, Inc.)
Notes to the Consolidated Financial Statements
August 31, 2022 and 2021
(Expressed in United States Dollars) | |
| | |
15. Right-of-use assets
Schedule of detailed information about right-of-use assets
| | | | | | | | | |
| | | 2022 | | | 2021 | |
| | | $ | | | $ | |
| Balance, beginnng of year | | | 557,022 | | | | 550,478 | |
| Acquired | | | - | | | | 210,178 | |
| Depreciation | | | (180,395 | ) | | | (203,058 | ) |
| Impairment | | | (346,266 | ) | | | - | |
| Disposal of Eden Games | | | (16,036 | ) | | | - | |
| Effect of foreign exchange | | | (3,210 | ) | | | (576 | ) |
| Balance, end of year | | | 11,115 | | | | 557,022 | |
Right of use assets consist primarily of leases for corporate office facilities and are amortized on a monthly basis over the term of the lease, or useful life, if shorter.
16. Income taxes
The Company had no income tax expense or benefit for the year ended August 31, 2022, or 2021.
| (a) | Reconciliation of the effective tax rate |
The reconciliation of the statutory income tax rate of 26.5% (2021 - 26.5%) to the effective tax rate is as follows:
Disclosure of detailed information about components of income tax expense
| | | | | | | | | |
| | | 2022 | | | 2021 | |
| | | $ | | | $ | |
| Income (loss) before discontinued operations and income taxes | | | (16,401,604 | ) | | | (24,551,718 | ) |
| Statutory income tax rate | | | 26.5 | % | | | 26.5 | % |
| Expected income tax (benefit) | | | (4,346,425 | ) | | | (6,506,205 | ) |
| | | | | | | | | |
| Reconciling items: | | | | | | | | |
| Foreign rate differential | | | 986 | | | | (477,761 | ) |
| Stock-based compensation and other non-deductible expenses | | | (786,187 | ) | | | 1,299,240 | |
| Other | | | 796,659 | | | | (4,136,359 | ) |
| Deferred tax assets not recognized | | | 4,334,967 | | | | 9,821,085 | |
| Income tax expense | | | - | | | | - | |
Engine Gaming and Media, Inc.
(formerly, Engine Media Holdings, Inc.)
Notes to the Consolidated Financial Statements
August 31, 2022 and 2021
(Expressed in United States Dollars) | |
| | |
The Company had the following temporary differences that would ordinarily give rise to deferred taxes:
Disclosure of detailed information about recognized deferred tax assets and liabilities
| | | 2022 | | | 2021 | |
| | | | $ | | | | $ | |
| Deferred tax assets | | | | | | | | |
| Net operating losses | | | 1,577,831 | | | | 1,664,801 | |
| | | | | | | | | |
| Deferred tax liabilities | | | | | | | | |
| Intangible assets | | | (1,520,569 | ) | | | (1,391,070 | ) |
| Other - United States | | | (57,262 | ) | | | (273,731 | ) |
| Net deferred tax asset | | | - | | | | - | |
Deferred tax assets and liabilities have been offset where they relate to income taxes levied by the same taxation authority and where the Company has the legal right and intent to offset.
Unrecognized Deductible Temporary Differences
Deferred taxes are provided as a result of temporary differences that arise due to the difference between the income tax values and the carrying amount of assets and liabilities. Deferred tax assets have not been recognized in respect of the following deductible temporary differences:
Disclosure of detailed information about unrecognized deductible temporary differences and unused tax losses
| | | | | | | | | |
| | | 2022 | | | 2021 | |
| | | $ | | | $ | |
| Intangible assets | | | 23,737,179 | | | | 28,362,021 | |
| Net operating losses | | | 172,145,340 | | | | 153,954,414 | |
| Net capital losses | | | - | | | | 2,156,922 | |
| Property and equipment | | | - | | | | 483,175 | |
| Share issuance costs | | | 2,347,823 | | | | 206,655 | |
| Convertible debt | | | 250,603 | | | | 2,385,606 | |
| Investments | | | 3,074,356 | | | | - | |
| Other | | | 2,219,206 | | | | 8,802,009 | |
| Deferred tax assets, unrecognized | | | 203,774,507 | | | | 196,350,802 | |
The Company’s net operating losses expire in the manner discussed below. The remaining deductible temporary differences may be carried forward indefinitely. Deferred tax assets have not been recognized in respect of these items because it cannot be determined as probable that future taxable profits will be available against which the Company can utilize the benefits therefrom.
As of August 31, 2022, the Company has net operating loss carryforwards related to its domestic and international operations of approximately $173.2 million; $122.4 million of which have expiration periods ranging between 10 to 20 years, and $50.8 million have an indefinite carryforward period. Of these, CAD$44.3 million belong to Canadian entities which expire between 2034 and 2042. Net-capital losses were Nil in the year. Certain of these foreign, federal and state net operating loss carryforwards may be subject to Internal Revenue Code Section 382 or similar provisions, which impose limitations on their utilization.
Engine Gaming and Media, Inc.
(formerly, Engine Media Holdings, Inc.)
Notes to the Consolidated Financial Statements
August 31, 2022 and 2021
(Expressed in United States Dollars) | |
| | |
17. Lease liabilities
Lease liabilities are measured at the present value of the lease payments that were not paid at that financial statement date. The lease payments are discounted by using the rate implicit in the lease. If this rate cannot be readily determined, the Company uses its incremental borrowing rate. The continuity of the lease liabilities is presented in the table below:
Disclosure of detailed information about continuity of the lease liabilities
| | | | | | | | | | | | | |
| | | Equipment | | | Office lease | | | Total | |
| | | $ | | | $ | | | $ | |
| Balance, August 31, 2020 | | | 35,457 | | | | 536,691 | | | | 572,148 | |
| Acquired | | | - | | | | 210,178 | | | | 210,178 | |
| Disposal of Eden Games | | | - | | | | (17,959 | ) | | | (17,959 | ) |
| Interest expense | | | 1,971 | | | | 32,226 | | | | 34,197 | |
| Payments | | | (13,380 | ) | | | (214,948 | ) | | | (228,328 | ) |
| Effect of foreign exchange | | | - | | | | (644 | ) | | | (644 | ) |
| Balance, August 31, 2021 | | | 24,048 | | | | 563,503 | | | | 587,551 | |
| | | | | | | | | | | | | |
| Balance, August 31, 2021 | | | 24,048 | | | | 563,503 | | | | 587,551 | |
| Beginning balance | | | 24,048 | | | | 563,503 | | | | 587,551 | |
| Acquired | | | - | | | | - | | | | - | |
| Disposal of Eden Games | | | - | | | | (17,959 | ) | | | (17,959 | ) |
| Interest expense | | | 1,206 | | | | 22,716 | | | | 23,922 | |
| Payments | | | (13,380 | ) | | | (187,776 | ) | | | (201,156 | ) |
| Effect of foreign exchange | | | - | | | | (3,524 | ) | | | (3,524 | ) |
| Balance, August 31, 2022 | | | 11,874 | | | | 376,960 | | | | 388,834 | |
| Ending balance | | | 11,874 | | | | 376,960 | | | | 388,834 | |
| | | Equipment | | | Office lease | | | Total | |
| | | $ | | | $ | | | $ | |
| As of August 31, 2022: | | | | | | | | | | | | |
| Less than one year | | | 11,874 | | | | 376,960 | | | | 388,834 | |
| Total lease obligation | | | 11,874 | | | | 376,960 | | | | 388,834 | |
The future minimum undiscounted lease payments as of August 31, 2022, are presented below:
Disclosure of detailed information about future minimum undiscounted lease payments
| | | | | | | | | | | | | |
| | | Equipment | | | Office lease | | | Total | |
| Less than one year | | | 12,265 | | | | 404,271 | | | | 416,536 | |
| Total undiscounted lease obligation | | | 12,265 | | | | 404,271 | | | | 416,536 | |
18. Players liability account
| | The Players liability account consists of UMG and Winview cash deposited by players, plus any prize winnings, less any fees for match game play and withdrawal requests processed to date. As of August 31, 2022, and 2021, the players liability account balance is the total amount payable if all players were to request closure of their accounts. |
Engine Gaming and Media, Inc.
(formerly, Engine Media Holdings, Inc.)
Notes to the Consolidated Financial Statements
August 31, 2022 and 2021
(Expressed in United States Dollars) | |
| | |
19. Promissory notes payable and other borrowings
| (a) | Promissory notes |
| | |
| | The Company has promissory notes with a balance of $200,000 (August 31, 2021 – $200,000) that are unsecured, due on demand, and bear interest at 18%. As of August 31, 2022, interest of $141,940 has been accrued (August 31, 2021 – $139,644). |
| | |
| | The Company, through its WinView subsidiary, has a secured promissory note outstanding for amounts due for the provision of services by the noteholder. As of August 31, 2022, $429,822 was due under the note (August 31, 2021 – $482,304). The note is secured by the assets of WinView, bears interest at 8%, and is currently due. As of August 31, 2022, and 2021, no interest is accrued on this note. |
| | |
| (b) | Paycheck Protection Program (the “PPP”) loans |
| | |
| | In April and May 2020, the Company entered into promissory notes (the “Notes”) with three banks. The Notes evidence loans to the Company of $1,589,559 pursuant to the PPP of the CARES Act administered by the U.S. Small Business Administration (the “SBA”). In accordance with the requirements of the CARES Act, the Company used the proceeds from the loans exclusively for qualified expenses under the PPP, including payroll costs, rent and utility costs, as further detailed in the CARES Act and applicable guidance issued by the SBA. |
| | |
| | Interest will accrue on the outstanding balance of the Notes at a rate of 1.00% per annum. However, the Company expects to apply for and receive forgiveness of up to all amounts due under the Notes, in an amount equal to the sum of qualified expenses under the PPP during the twenty-four weeks following disbursement. |
| | |
| | Subject to any forgiveness granted under the PPP, the Notes were scheduled to mature in April 2022 and require 18 equal monthly payments of principal and interest beginning November 2020. The Notes may be prepaid at any time prior to maturity with no prepayment penalties. The Notes provide for customary events of default, including, among others, those relating to failure to make payments, bankruptcy, breaches of representations, significant changes in ownership, and material adverse effects. The Company’s obligations under the Notes are not secured by any collateral. |
| | |
| | Upon the receipt of the proceeds of $1,589,559 from the Notes, the Company accounted for the Notes as a grant in the form of forgivable loan and recorded the amount as a deferred income liability. The liability was reduced as the Company recognized expenses which qualified for forgiveness of the loan. As of August 31, 2022, the Company had incurred greater than $1,589,559 of qualifying expenses and therefore had a remaining deferred income liability of $nil. The Company recognized the impact of the loan forgiveness as an offset against related salaries and wages expense, in the consolidated statement of loss and comprehensive loss for the year ended August 31, 2020. As of August 31, 2022, $209,875 has not been formally forgiven. |
Engine Gaming and Media, Inc.
(formerly, Engine Media Holdings, Inc.)
Notes to the Consolidated Financial Statements
August 31, 2022 and 2021
(Expressed in United States Dollars) | |
| | |
20. Convertible debt
The continuity of convertible debt for the year ended August 31, 2022, is as follows:
Schedule of detailed information about continuity of convertible debt
| | | | | | | | | | | | | | | | | | | | | |
| | | 2019
Series | | | 2020
Series | | | Amended EB Loan | | | EB CD | | | Total | |
| | | $ | | | $ | | | | | | | | | $ | |
| Balance, August 31, 2020 | | | 2,121,869 | | | | 8,671,590 | | | | - | | | | - | | | | 10,793,459 | |
| Issuances | | | - | | | | 4,282,477 | | | | - | | | | - | | | | 4,282,477 | |
| Exchange of EB Loan for Amended EB Loan | | | - | | | | - | | | | 5,043,103 | | | | - | | | | 5,043,103 | |
| Exchange of Amended EB Loan for EB CD | | | - | | | | - | | | | (4,931,813 | ) | | | 7,394,022 | | | | 2,462,209 | |
| Principal and interest at maturity | | | | | | | | | | | | | | | | | | | | |
| Conversion - common shares issued | | | (1,500,214 | ) | | | (12,204,391 | ) | | | - | | | | - | | | | (13,704,605 | ) |
| Conversion - warrants issued | | | (1,103,661 | ) | | | (4,256,114 | ) | | | - | | | | - | | | | (5,359,775 | ) |
| Interest expense | | | 54,126 | | | | 398,183 | | | | 138,710 | | | | 250,000 | | | | 841,019 | |
| Accrued interest on conversion / interest payments | | | (101,247 | ) | | | (256,300 | ) | | | (250,000 | ) | | | - | | | | (607,547 | ) |
| Effect of foreign exchange | | | 134,562 | | | | - | | | | - | | | | - | | | | 134,562 | |
| Change in fair value | | | 1,308,993 | | | | 5,461,682 | | | | - | | | | (704,081 | ) | | | 6,066,594 | |
| Balance, August 31, 2021 | | | 914,428 | | | | 2,097,127 | | | | - | | | | 6,939,941 | | | | 9,951,496 | |
| | | 2019
Series | | | 2020
Series | | | Amended EB Loan | | | EB CD | | | Total | |
| | | $ | | | $ | | | | | | | | | $ | |
| Balance, August 31, 2021 | | | 914,428 | | | | 2,097,127 | | | | - | | | | 6,939,941 | | | | 9,951,496 | |
| Total convertible debt obligation beginning balance | | | 914,428 | | | | 2,097,127 | | | | - | | | | 6,939,941 | | | | 9,951,496 | |
| Interest expense | | | 23,983 | | | | 200,000 | | | | - | | | | 500,000 | | | | 723,983 | |
| Accrued interest on conversion / interest payments | | | - | | | | - | | | | - | | | | (500,000 | ) | | | (500,000 | ) |
| Principal and interest at maturity | | | (509,716 | ) | | | - | | | | - | | | | - | | | | (509,716 | ) |
| Effect of foreign exchange | | | (27,040 | ) | | | - | | | | - | | | | - | | | | (27,040 | ) |
| Change in fair value | | | (401,655 | ) | | | (29,760 | ) | | | - | | | | (1,956,705 | ) | | | (2,388,120 | ) |
| Balance, August 31, 2022 | | | - | | | | 2,267,367 | | | | - | | | | 4,983,236 | | | | 7,250,603 | |
| Total convertible debt obligation ending balance | | | - | | | | 2,267,367 | | | | - | | | | 4,983,236 | | | | 7,250,603 | |
| | | 2020
Series | | | Total | |
| | | $ | | | $ | |
| As of August 31, 2022: | | | | | | | | |
| Less than one year | | | 2,267,367 | | | | 2,267,367 | |
| Greater than one year | | | - | | | | 4,983,236 | |
| Total convertible debt obligation | | | 2,267,367 | | | | 7,250,603 | |
Engine Gaming and Media, Inc.
(formerly, Engine Media Holdings, Inc.)
Notes to the Consolidated Financial Statements
August 31, 2022 and 2021
(Expressed in United States Dollars) | |
| | |
As of August 31,2022, the 2019 series notes have matured.
| (a) | Conversions during the years ended August 31, 2021 |
2019 Series
During the year ended August 31, 2021, 2019 Series convertible debentures with a principal amount of CAD$1,315,000 were converted into 175,331 units, and as a result, the Company issued 175,331 common shares and 175,331 warrants. The fair value of the convertible debentures at the time of conversion was estimated using the binomial lattice model with the below assumptions:
Share price of CAD$11.65 – $14.15; term of 1.36 – 1.90 years; conversion price and warrant exercise price of CAD$7.50; interest rate of 6%; expected volatility of 98.5% – 179%; risk-free interest rate of 0.21% - 0.27%; exchange rate of 0.7651 – 0.8286; and an expected dividend yield of 0%. The fair value assigned to these convertible debentures was $2,603,875.
This value was split between common shares and liability measured warrants as $1,500,214 and $1,103,661, respectively.
2020 Series
During the year ended August 31, 2021, 2020 Series convertible debentures with a principal amount of $11,651,393 were converted or settled into 1,553,518 units, and as a result, the Company issued 1,553,518 common shares and 1,134,305 warrants. The fair value of the convertible debentures at the time of conversion or settlement was estimated using the binomial lattice model with the below assumptions:
Share price of $7.79 – $9.92; term of 1.44 – 1.77 years; conversion price of $7.50; warrant exercise price of $15.00, interest rate of 10%; expected volatility of 95% – 98.5%; risk-free interest rate of 0.09% - 0.13%; and an expected dividend yield of 0%. The fair value assigned to these convertible debentures was $16,460,505.
This value was split between common shares and equity measured warrants as $12,204,391 and $4,256,114, respectively.
| (b) | Issuances during the year ended August 31, 2021 |
| | |
| | During the year ended August 31, 2021, 2020 Series convertible debentures with a principal amount of $2,901,393 were issued for gross proceeds of $2,901,393. In addition, in November 2020, $2,000,000 of convertible debentures from the Company’s standby convertible debenture facility were issued along with 224,719 warrants for gross proceeds of $2,000,000 (Note 20(e)). Of the gross proceeds of $2,000,000, $1,381,084 was allocated to the convertible debt and $618,916 was allocated to the 224,719 warrants issued (Note 20(e)). The total fair value recorded to convertible debt for issuances above amounted to $4,282,477. |
| | |
| | On December 1, 2020, the EB Loan was amended. The amendment extended the maturity date by one year and added a conversion feature to $1,000,000 of the $5,000,000 principal outstanding. The conversion feature allowed the holder to convert $1,000,000 into common shares of the Company at a conversion price of $11.25 per common share. On February 24, 2021, the Company extinguished the Amended EB Loan and issued the Lender a convertible debenture in the principal amount of $5,000,000. The EB CD is convertible into units of the Company at a conversion price of $10.25 per unit, with each unit comprised of one common share and one-half of a warrant, with each whole warrant exercisable into a common share at an exercise price of $15.00 per share for a period of three years from the issuance of the EB CD. The EB CD has a term of three years. |
| | |
| | The fair value of the Amended EB Loan on December 1, 2020, was $5,043,103. The carrying value of the former EB Loan on December 1, 2020, consisted of $5,000,000 in principal and $76,412 in accrued interest, for total carrying value on the amendment date of $5,076,412. As a result, a gain on extinguishment of debt of $33,309 was recognized. The fair value of the EB CD on the date of issuance of February 24, 2021, was $7,394,022. The fair value of the Amended EB Loan on February 24, 2021, was $4,931,813. As a result, a loss on extinguishment of debt of $2,462,209 was recognized. The above two transactions resulted in a loss on extinguishment of debt of $2,428,900. |
Engine Gaming and Media, Inc.
(formerly, Engine Media Holdings, Inc.)
Notes to the Consolidated Financial Statements
August 31, 2022 and 2021
(Expressed in United States Dollars) | |
| | |
| (c) | 2020 Series |
| | |
| | The 2020 Series debentures will mature twenty-four (24) months from the date of issuance and bear interest at a rate of 5% per annum (subject to adjustment as described below), payable on maturity. At the Company’s option, interest under the 2020 Series debentures is payable in kind in common shares at an issue price which would be based on the trading price of the common shares at the time of such interest payment. The interest rate under the 2020 Series debentures will increase from 5% to 10% per annum on a prospective basis on December 19, 2020, if a public offering has not occurred by that date. |
| | |
| | The 2020 Series debenture holders may convert all or a portion of the principal amount of the debentures into units (“Units”) of the Company at a price (the “Conversion Price”) equal to the lesser of (a) $11.25 per Unit, and (b) if such conversion occurs after a public offering of securities by the Company (the “Public Offering”), a fifteen percent (15%) discount to the public offering price, provided that such conversion price shall not be less than $7.50 per Unit. |
| | |
| | Notwithstanding the foregoing, if by December 19, 2020, the Company has not obtained registration rights in the United States to allow sale in the United States of the common shares (“Common Shares”) of the Company and the exercise of warrants (the “Warrants”) of the Company to be issued pursuant to the conversion of the 2020 Series debentures, holders of 2020 Series debentures may convert such debentures into Units at $7.50 per Unit. As of December 19, 2020, the Company had not obtained registration rights in the United States. As such, the conversion price is $7.50 per Unit and the interest rate increased to 10% on December 19, 2020. |
| | |
| | Each Unit is comprised of one common share and one-half of one Warrant, with each Warrant exercisable into one common share of the Company at an exercise price of $15.00 per share for a period of three years from the issuance of the 2020 Series debentures. Under certain circumstances, the Company shall be entitled to call for the exercise of any outstanding Warrants in the event that the closing trading price of the Company common shares on the NASDAQ is above $30.00 per share for fifteen (15) consecutive trading days. |
| | |
| | In the event that the Company’s common shares are listed for trading on the NASDAQ Capital Market and the Company completes a Public Offering for an aggregate amount of at least US$30,000,000, the Company may cause the 2020 Series debentures to be converted at the Conversion Price by the Company delivering a notice to the holder not less than a minimum of 30 days and a maximum 60 days prior to the forced conversion date. |
| | |
| (d) | 2020 Series - One Up |
| | |
| | These convertible debentures (the “2020 Series One Up” debentures) have identical terms as the 2020 Series debentures except that the minimum conversion price of $7.50 per Unit (as described above) will be US$9.50 per Unit. The 2020 Series One Up convertible debentures had a fair value at issuance of $3,078,550. |
| | |
| (e) | 2020 Series – Standby |
| | |
| | In September 2020, the Company entered into an $8,000,000 stand-by convertible debenture facility (the “2020 Series Standby” debentures). The 2020 Series Standby Debenture has substantially similar terms as the 2020 Series debentures, except (i) the references to a minimum $7.50 conversion price (as described above) have been changed to $8.90; and (ii) the 2020 Series Standby debentures are only convertible into common shares of the Company, not units. |
| | |
| | In November 2020, the Company issued 224,719 warrants in connection with this first draw of $2,000,000 of the Standby Debentures, with each warrant exercisable into one common share the Company at an exercise price of $15.00 per share for a period of two years, subject to the same acceleration clause as the warrants underlying the 2020 Series debentures. |
| | |
| | The remaining $6,000,000 of convertible debentures that are issuable under this facility have substantially similar terms as the 2020 Series debentures, including conversion into units consisting of one share and one-half warrant, provided that the conversion price of any additional convertible debentures will be based on the market price of the common shares at the time of such subscriptions and are subject to TSX-V approval. |
Engine Gaming and Media, Inc.
(formerly, Engine Media Holdings, Inc.)
Notes to the Consolidated Financial Statements
August 31, 2022 and 2021
(Expressed in United States Dollars) | |
| | |
As of August 31, 2022, the fair value of the 2020 Series convertible debentures was estimated using the binomial lattice model with the below assumptions:
Disclosure of detailed information about fair value of convertible debentures
| | | | | | | | | |
| 2020 Series | | August 31 2022
(US$) | | | August 31, 2021
(US$) | |
| Share price | | | 0.72 | | | | 6.66 | |
| Conversion price | | | 8.90 | | | | 8.90 | |
| | | | | | | | | |
| Term, in years | | | 0.22 | | | | 1.26 | |
| Interest rate | | | 10 | % | | | 10 | % |
| Expected volatility | | | 90.00 | % | | | 90.00 | % |
| Risk-free interest rate | | | 2.85 | % | | | 0.10 | % |
| Expected dividend yield | | | 0 | % | | | 0 | % |
On February 24, 2021, the Company extinguished the Amended EB Loan and issued the Lender a convertible debenture in the principal amount of $5 million (the “EB CD”). The EB CD is convertible into units of the Company at a conversion price of $10.25 per unit, with each unit comprised of one common share and one-half of a warrant, with each whole warrant exercisable into a common share at an exercise price of $15.00 per share for a period of three years from the issuance of the EB CD. The EB CD has a term of three years.
As of August 31, 2022, the fair value of the EB CD convertible debenture was estimated using the binomial lattice model with the below assumptions:
Disclosure of detailed information about fair value of convertible debentures
| | | | | | | | | |
| EB CD | | August 31 2022
(US$) | | | August 31, 2021
(US$) | |
| Share price | | | 0.72 | | | | 6.66 | |
| Conversion price | | | 10.25 | | | | 10.25 | |
| Warrant exercise price | | | 15.00 | | | | 15.00 | |
| | | | | | | | | |
| Term, in years | | | 1.48 | | | | 1.26 | |
| Interest rate | | | 10 | % | | | 10 | % |
| Expected volatility | | | 90.00 | % | | | 90.00 | % |
| Risk-free interest rate | | | 3.45 | % | | | 0.30 | % |
| Expected dividend yield | | | 0 | % | | | 0 | % |
Engine Gaming and Media, Inc.
(formerly, Engine Media Holdings, Inc.)
Notes to the Consolidated Financial Statements
August 31, 2022 and 2021
(Expressed in United States Dollars) | |
| | |
The following table gives information about how the fair values of these financial liabilities are determined (in particular, the valuation technique and key inputs used) and sensitivity of unobservable inputs.
Disclosure of key inputs of convertible debt
| Financial assets / financial liabilities | | Valuation technique | | Key Inputs | | Relationship and sensitivity of unobservable inputs to fair value to fair value |
| Convertible debt | | The fair value of the convertible debentures as of August 31, 2022 has been calculated using a binomial lattice methodology. | | Key observable inputs | | The estimated fair value would increase (decrease) if: |
| | | | | Share price CAD $.94 (USD $.72) | | The share price was higher (lower) |
| | | | | Risk-free interest rate (2.85% to 3.45%) | | The risk-free interest rate was higher (lower) |
| | | | | Dividend yield (0%) | | The dividend yield was lower (higher) |
| | | | | Key unobservable inputs | | |
| | | | | Credit spread (10.13% to 13.56%) | | The credit spread was lower (higher) |
| | | | | Discount for lack of marketability (0%) | | The discount for lack of marketability was lower (higher) |
| | | | | | | |
| Convertible debt | | The fair value of the convertible debentures as of August 31, 2021 has been calculated using a binomial lattice methodology. | | Key observable inputs | | The estimated fair value would increase (decrease) if: |
| | | | | Share price CAD$8.42 (USD $6.66) | | The share price was higher (lower) |
| | | | | Risk-free interest rate (0.10% to 0.30%) | | The risk-free interest rate was higher (lower) |
| | | | | Dividend yield (0%) | | The dividend yield was lower (higher) |
| | | | | Key unobservable inputs | | |
| | | | | Credit spread (1.14% to 8.45%) | | The credit spread was lower (higher) |
| | | | Discount for lack of marketability (0%) | | The discount for lack of marketability was lower (higher) |
Engine Gaming and Media, Inc.
(formerly, Engine Media Holdings, Inc.)
Notes to the Consolidated Financial Statements
August 31, 2022 and 2021
(Expressed in United States Dollars) | |
| | |
21. Warrants
Liability measured warrants having CAD exercise price
The following table reflects the continuity of the Company’s liability measured warrants for the years ended August 31, 2022, and 2021:
Schedule of measured warrants
| | | Amount | |
| | | $ | |
| Balance at August 31, 2020 | | 14,135,321 | |
| Issued on conversion of convertible debt | | | 1,103,661 | |
| Exercised | | | (2,134,116 | ) |
| Issued in private placement of units - transaction costs | | | | |
| Issued in private placement of units | | | | |
| Issued in private placement of convertible debt | | | | |
| Change in fair value | | | (9,037,108 | ) |
| Foreign exchange | | | 800,945 | |
| Balance, August 31, 2021 | | | 4,868,703 | |
| | | | |
| | | Amount | |
| | | $ | |
| Balance at August 31, 2021 | | | 4,868,703 | |
| Change in fair value | | | (4,748,893 | ) |
| Foreign exchange | | | (69,916 | ) |
| Balance, August 31, 2022 | | | 49,894 | |
The following table reflects the continuity of the Company’s outstanding liability measured warrants for the years ended August 31, 2022, and 2021:
Schedule of outstanding warrants
| | | | | | | |
| | | | | | Weighted-average | |
| | | Number of | | | exercise price | |
| | | warrants | | | CAD | |
| | | # | | | $ | |
| Outstanding, August 31, 2020 | | | 2,405,369 | | | | 9.60 | |
| Issued on conversion of convertible debt | | | 175,331 | | | | 7.50 | |
| Number of warrants, Issued in private placement of convertible debt | | | | | | | | |
| Weighted average exercise price, Issued in private placement of convertible debt | | | | | | | | |
| Number of warrants, Issued in private placement of units | | | | | | | | |
| Weighted average exercise price, Issued in private placement of units | | | | | | | | |
| Exercised | | | (901,060 | ) | | | 9.27 | |
| Expired | | | (226,797 | ) | | | 13.43 | |
| Outstanding as of August 31, 2021 | | | 1,452,843 | | | | 8.96 | |
| | | | | | Weighted-average | |
| | | Number of | | | exercise price | |
| | | warrants | | | CAD | |
| | | # | | | $ | |
| Outstanding, August 31, 2021 | | | 1,452,843 | | | | 8.96 | |
| Expired | | | (123,159 | ) | | | 9.24 | |
| Outstanding as of August 31, 2022 | | | 1,329,684 | | | | 8.93 | |
Engine Gaming and Media, Inc.
(formerly, Engine Media Holdings, Inc.)
Notes to the Consolidated Financial Statements
August 31, 2022 and 2021
(Expressed in United States Dollars) | |
| | |
The following table reflects the liability measured warrants issued and outstanding as of August 31, 2022:
Schedule of warrants issued and outstanding
| | | | | | Warrants outstanding | |
| Expiry date | | Number outstanding | | | Average
exercise price CAD | | | Average remaining
contractual life
(years) | |
| December 20, 2022 | | | 29,066 | | | | 27.00 | | | | 0.30 | |
| March 20, 2023 | | | 27,777 | | | | 13.50 | | | | 0.55 | |
| March 30, 2023 | | | 46,909 | | | | 13.50 | | | | 0.58 | |
| March 31, 2023 | | | 17,222 | | | | 13.50 | | | | 0.58 | |
| May 27, 2023 | | | 130,304 | | | | 13.50 | | | | 0.74 | |
| July 8, 2024 | | | 445,982 | | | | 7.50 | | | | 1.85 | |
| July 25, 2024 | | | 401,624 | | | | 7.50 | | | | 1.90 | |
| August 8, 2024 | | | 230,800 | | | | 7.50 | | | | 1.94 | |
| | | | 1,329,684 | | | $ | 8.93 | | | | 1.65 | |
As of August 31, 2022, the fair value of the 1,329,684 liability measured warrants outstanding (August 31, 2021 – 1,452,843) was determined to be $49,894 (August 31, 2021 – $4,868,703) as calculated using the Black Scholes option pricing model with the following range of assumptions: 0.30 – 1.65 years (August 31, 2021 – 0.53 – 2.94) as expected average life; share price of CAD$8.93 (August 31, 2021 – CAD$8.42); exercise price of CAD$7.50 – CAD$27.00 (August 31, 2021 – CAD$7.50 – CAD$27.00); 90% expected volatility (August 31, 2021 – 70% - 90%); risk free interest rate of 3.61% - 3.87% (August 31, 2021 – 0.28% - 0.63%); and an expected dividend yield of 0%.
If all liability measured warrants outstanding and exercisable as of August 31, 2022, were exercised, the Company would receive cash from exercise of approximately CAD$11.9 million.
| (a) | Liability measured warrants exercised during the year ended August 31, 2021 |
During the year ended August 31, 2021, the holders of 901,060 warrants exercised their right to convert the warrants into the Company’s common shares at an exercise price of CAD$7.50 - $9.75. As a result of the underlying exercise of warrants, the Company received $6,866,735 in cash proceeds and the intrinsic value of the underlying warrants at the date of exercise of $2,134,116 was transferred to share capital, for a total addition to share capital of $9,000,851.
| (b) | Liability measured warrants issued during the year ended August 31, 2021 |
During the year ended August 31, 2021, the Company issued 175,331 warrants in connection with conversion of convertible debt (Note 20(a) – 2019 Series).
2019 Series
During the year ended August 31, 2021, the Company issued 175,331 warrants in conjunction with the conversion of convertible debt. The fair value of the 175,331 warrants issued was determined to be $1,103,661 as calculated using the Black Scholes option pricing model with the following assumptions:
A 3.36 – 3.90 years as expected average life; share price of CAD$9.50 – $12.33; exercise price of CAD$7.50; 98.5% - 136% expected volatility; risk free interest rate of 0.25% - 0.54%; and an expected dividend yield of 0%.
Volatility is calculated using a weighted approach based on the changes in the Company’s historical stock price. The final fair value allocated to the warrants on conversion of convertible debt is based on a relative fair value allocation between the common shares issued and warrants issued on conversion.
Engine Gaming and Media, Inc.
(formerly, Engine Media Holdings, Inc.)
Notes to the Consolidated Financial Statements
August 31, 2022 and 2021
(Expressed in United States Dollars) | |
| | |
Equity measured warrants having USD exercise price
The following table reflects the continuity of the Company’s equity measured warrants for the years ended August 31, 2022, and 2021.
Schedule of measured warrants
| | | Amount | |
| | | $ | |
| Balance at August 31, 2020 | | - | |
| Issued on conversion of convertible debt | | | 4,256,114 | |
| Issued in private placement of convertible debt | | | 618,916 | |
| Issued in private placement of units | | | 7,373,806 | |
| Issued in private placement of units - transaction costs | | | (582,333 | ) |
| Balance, August 31, 2021 | | | 11,666,503 | |
| | | Amount | |
| | | $ | |
| Balance at August 31, 2021 | | | 11,666,503 | |
| Beginning Balance | | | 11,666,503 | |
| Balance, August 31, 2022 | | | 11,666,503 | |
| Ending Balance | | | 11,666,503 | |
The following table reflects the continuity of the Company’s outstanding equity measured warrants for the years ended August 31, 2022, and 2021:
Schedule of outstanding warrants
| | | | | | Weighted-average | |
| | | Number of | | | exercise price | |
| | | warrants | | | USD | |
| | | # | | | $ | |
| Outstanding, August 31, 2020 | | - | | | - | |
| Issued on conversion of convertible debt | | | 1,134,305 | | | | 15.00 | |
| Issued in private placement of convertible debt | | | 224,719 | | | | 15.00 | |
| Issued in private placement of units | | | 2,377,272 | | | | 15.00 | |
| Outstanding as of August 31, 2021 | | | 3,736,296 | | | | 15.00 | |
| | | | | | Weighted-average | |
| | | Number of | | | exercise price | |
| | | warrants | | | USD | |
| | | # | | | $ | |
| Outstanding, August 31, 2021 | | | 3,736,296 | | | | 15.00 | |
| Outstanding as of August 31, 2022 | | | 3,736,296 | | | | 15.00 | |
Engine Gaming and Media, Inc.
(formerly, Engine Media Holdings, Inc.)
Notes to the Consolidated Financial Statements
August 31, 2022 and 2021
(Expressed in United States Dollars) | |
| | |
The following table reflects the equity measured warrants issued and outstanding as of August 31, 2022:
Schedule of warrants issued and outstanding
| | | | | | Warrants outstanding | |
| Expiry date | | Number outstanding | | | Average exercise price USD | | | Average remaining contractual life (years) | |
| November 20, 2022 | | | 224,719 | | | | 15.00 | | | | 0.22 | |
| January 8, 2024 | | | 1,868,787 | | | | 15.00 | | | | 1.36 | |
| January 22, 2024 | | | 522,898 | | | | 15.00 | | | | 1.39 | |
| February 24, 2024 | | | 1,058,227 | | | | 15.00 | | | | 1.48 | |
| August 19, 2024 | | | 49,999 | | | | 15.00 | | | | 1.97 | |
| September 15, 2024 | | | 11,666 | | | | 15.00 | | | | 2.04 | |
| | | | 3,736,296 | | | $ | 15.00 | | | | 1.34 | |
If all equity measured warrants outstanding and exercisable as of August 31, 2022, were exercised, the Company would receive cash from exercise of approximately $56.0 million.
The November 20,2022 warrants expired unexercised subsequent to year end.
| (c) | Equity measured warrants issued during the year ended August 31, 2021 |
During the year ended August 31, 2021, the Company issued 1,134,305 warrants in connection with conversion of convertible debt (Note 20(a) – 2020 Series), 224,719 warrants in connection with the private placement of convertible debentures (Note 20(e)) and 2,377,272 warrants in connection with the private placement of units (Note 21(f)), for a total number of 3,736,296 warrants issued.
| (d) | Equity measured warrants issued on conversion of convertible debt |
2020 Series
During the year ended August 31, 2021, the Company issued 1,134,305 warrants in conjunction with the conversion of convertible debt. The fair value of the 1,134,305 warrants issued was determined to be $4,256,114 as calculated using the Black Scholes option pricing model with the following assumptions:
A 3.00 – 3.50 years expected average life; share price of $7.79 – $11.17; exercise price of $15.00; 98.5% expected volatility; risk free interest rate of 0.29% - 0.57%; and an expected dividend yield of 0%.
Volatility is calculated using a weighted approach based on the changes in the Company’s historical stock price. The final fair value allocated to the warrants on conversion of convertible debt is based on a relative fair value allocation between the common shares and equity measured warrants.
| (e) | Equity measured warrants issued on private placement of standby convertible debentures during the year ended August 31, 2021 |
During the year ended August 31, 2021, the Company issued 224,719 warrants in connection with the private placement of convertible debentures under its standby convertible debenture facility (Note 20(e)). The fair value of the 224,719 warrants issued was determined to be $618,916 as calculated using the Black Scholes option pricing model with the following assumptions:
2 years expected average life; share price of $5.63; exercise price of $15.00; 200% expected volatility; risk free interest rate of 0.16%; and an expected dividend yield of 0%.
Volatility is calculated using a weighted approach based on the changes in the Company’s historical stock price. The final fair value allocated to the warrants on conversion of convertible debt is based on a relative fair value allocation between the common shares issued and warrants issued on conversion.
Engine Gaming and Media, Inc.
(formerly, Engine Media Holdings, Inc.)
Notes to the Consolidated Financial Statements
August 31, 2022 and 2021
(Expressed in United States Dollars) | |
| | |
| (f) | Equity measured warrants issued on private placement of units during the year ended August 31, 2021 |
During the year ended August 31, 2021, the Company issued 2,377,272 warrants in conjunction with the private placement of units. Of the 2,377,272 warrants issued, 191,387 were issued to finders as fees for services. The fair value of the 2,377,272 warrants issued was determined to be $7,373,806 as calculated using the Black Scholes option pricing model with the following assumptions:
A 3.00 year expected average life; share price of $7.79 – $10.00; exercise price of $15.00; 98.5% expected volatility; risk free interest rate of 0.29% - 0.43%; and an expected dividend yield of 0%.
Of the $7,373,806 total fair value, $6,603,243 was the fair value of the 2,185,885 warrants issued for proceeds, with $770,563 being the fair value of the 191,387 warrants issued to finders. The amount recorded in contributed surplus of $6,791,473 represents the fair value of warrants issued of $7,373,806 less $582,333 for transaction costs allocated to the warrants issued.
Volatility is calculated using a weighted approach based on the changes in the Company’s historical stock price. The final fair value allocated to the warrants on the issuance of the units is based on a relative fair value allocation between the common shares issued and warrants issued.
22. Share capital
The Company is authorized to issue an unlimited number of no par value common shares and an unlimited number of preference shares.
Engine Gaming and Media, Inc.
(formerly, Engine Media Holdings, Inc.)
Notes to the Consolidated Financial Statements
August 31, 2022 and 2021
(Expressed in United States Dollars) | |
| | |
| (b) | Issued and outstanding, common shares |
Schedule of shares issued and outstanding
| | | Shares | | | Consideration | |
| | | # | | | $ | |
| Balance, August 31, 2020 | | 7,746,136 | | | 69,380,807 | |
| Shares issued on vesting of RSUs | | | 277,749 | | | | 1,895,891 | |
| Shares issued under shares for services | | | | | | | | |
| Shares issued under shares for services, shares | | | | | | | | |
| Common shares issued on exercise of options | | | 20,833 | | | | 290,558 | |
| Convertible debt conversion | | | 1,728,848 | | | | 13,704,605 | |
| Common shares issued on private placement, net of costs | | | 4,435,433 | | | | 24,225,901 | |
| EB bonus shares | | | 6,666 | | | | 54,061 | |
| Shares for debt | | | 40,000 | | | | 226,556 | |
| Common shares issued on exercise of warrants | | | 901,060 | | | | 9,000,851 | |
| Shares issued on acquisiton of SideQik | | | 386,584 | | | | 3,962,000 | |
| Balance, August 31, 2021 | | | 15,543,309 | | | | 122,741,230 | |
| | | Shares | | | Consideration | |
| | | # | | | $ | |
| Balance, August 31, 2021 | | | 15,543,309 | | | | 122,741,230 | |
| Shares issued on vesting of RSUs | | | 203,537 | | | | 1,489,962 | |
| Shares issued under shares for services | | | 57,029 | | | | 666,667 | |
| Balance, August 31, 2022 | | | 15,803,875 | | | | 124,897,859 | |
| (c) | Activity for the year ended August 31, 2022 |
During the year ended August 31, 2022, the Company issued 203,537 common shares upon vesting of an equal number of RSUs, see (Note 24) and 57,029 shares for services provided by certain officers of Sideqik.
| (d) | Activity for the year ended August 31, 2021 |
Private Placement of units
In January and February 2021, the Company closed on the issuance of 4,371,767 units (the “Units”) for gross proceeds of $32,788,253 of non-brokered private placements. Each Unit consists of one common share of the Company and one-half of one common share purchase warrant (a “Warrant”). Each whole Warrant entitles the holder to acquire one additional share of the Company at a price of $15.00 per share for a period of 3 years provided that: (i) if the common shares are listed for trading on NASDAQ, (ii) the Company completes an offering of securities under a short form prospectus for an aggregate amount of at least $30,000,000, and (iii) the closing price of the common shares on NASDAQ is $30.00 or greater for a period of 15 consecutive trading days, then the Company may accelerate the expiry date of the Warrants to the 30th day after the date written notice is provided to the holders.
The Company paid cash commissions to eligible finders under the offering of $1,681,477 and regulatory and legal fees of $89,402. Net cash proceeds from the offering amounted to $31,017,374.
In addition to the cash finder’s fees discussed above, the Company issued the following securities as partial payment of commissions to finders: 63,666 Units; and 159,554 finders warrants, with each finder warrant exercisable into a common share at an exercise price of US$15.00 per share for 3 years subject to the same acceleration terms described above.
Engine Gaming and Media, Inc.
(formerly, Engine Media Holdings, Inc.)
Notes to the Consolidated Financial Statements
August 31, 2022 and 2021
(Expressed in United States Dollars) | |
| | |
The total number of common shares issued as a result of the private placements totaled 4,435,433, which was comprised of 4,371,767 Units issued for proceeds and 63,666 Units issued as partial payment to finders. The total number of warrants issued totaled 2,377,272, which was comprised of warrants issued as part of the Units issued of 2,217,718 (50% of Units issued) and 159,554 finders warrants issued.
A summary of amounts recorded in connection with private placement and their effect on financial statement line items is noted below:
Schedule of private placement
| | | Proceeds | | | Shares | | | Impact on share capital | | | Warrants | | | Impact on contributed surplus | |
| | | $ | | | # | | | $ | | | # | | | $ | |
| Units issued in private placement | | | 32,788,253 | | | | 4,371,767 | | | | 26,185,009 | | | | 2,185,885 | | | | 6,603,244 | |
| Cash commissions | | | (1,681,477 | ) | | | - | | | | (1,345,736 | ) | | | - | | | | (335,741 | ) |
| Regulatory and legal fees | | | (89,402 | ) | | | - | | | | (71,522 | ) | | | - | | | | (17,880 | ) |
| Finders’ units issued | | | - | | | | 63,666 | | | | 383,720 | | | | 31,833 | | | | 93,775 | |
| Finders’ units considered as transaction costs | | | - | | | | - | | | | (383,720 | ) | | | - | | | | (93,775 | ) |
| Finders’ warrants issued | | | - | | | | - | | | | - | | | | 159,554 | | | | 676,787 | |
| Finders’ warrants considered as transaction costs | | | - | | | | - | | | | (541,850 | ) | | | - | | | | (134,937 | ) |
| | | | 31,017,374 | | | | 4,435,433 | | | | 24,225,901 | | | | 2,377,272 | | | | 6,791,473 | |
The fair value allocated between the common shares and warrants on the issuance of the Units is based on a relative fair value allocation between the common shares issued and warrants issued. Refer to equity measured warrants note for discussion of the key assumptions used in valuation of the warrants as part of the relative fair value allocation.
Other activity
During the year ended August 31, 2021, the Company had the following additional activity to share capital: (i) issued 277,749 common shares upon vesting of an equal number of RSUs (Note 24); (ii) issued 20,833 common shares upon the exercise of vested stock options, (iii) issued 1,728,848 common shares in connection with conversion of convertible debt (Note 20(a)), (iv) issued 901,060 common shares in connection with the exercise of warrants (Note 21(a)); (v) issued 40,000 common shares for cancelation of $226,556 of debt (shares for debt); and (vi) issued 6,666 common shares valued at $54,061 as an amendment fee to the lender in connection with the Amended EB Loan (the “EB Bonus Shares”). In addition to the EB Bonus Shares, the Company paid the lender a cash fee of $100,000. The amendment fees were recorded within interest expense as the Amended EB Loan and the subsequently the EB CD is being accounted for at FVTPL.
23. Stock options
On October 6, 2021, the Company adopted an amended and restated equity incentive plan (“Omnibus Plan”), which amends and restates the equity incentive plan which was previously established as of July 15, 2020. Under the amendments, there were no changes in the terms of previously issued awards. Under the Omnibus Plan, the total number of common shares reserved and available for grant and issuance pursuant to stock options shall not exceed 10% of the then issued and outstanding shares.
Options may be exercisable over periods of up to 10 years as determined by the Board of Directors of the Company and the exercise price shall not be less than the closing price of the shares on the day preceding the award date, subject to regulatory approval. Unvested share-based payments expense is reversed in the period of forfeiture.
Engine Gaming and Media, Inc.
(formerly, Engine Media Holdings, Inc.)
Notes to the Consolidated Financial Statements
August 31, 2022 and 2021
(Expressed in United States Dollars) | |
| | |
The following table reflects the continuity of stock options for the years ended August 31, 2022, and 2021: Disclosure of detailed information about number and weighted average exercise prices of share options
| | | | | | Weighted-average | | | | |
| | | Number of
stock options | | | Exercise
price | | | Grant-date
fair value | | | Remaining
contractual
term | |
| | | # | | | $ | | | $ | | | (yrs.) | |
| Balance, August 31, 2020 | | | 253,121 | | | | 12.73 | | | | 4.39 | | | | 4.31 | |
| Granted | | | 487,466 | | | | 11.77 | | | | 8.16 | | | | | |
| Issued on exercise of options | | | (20,833 | ) | | | 7.91 | | | | 4.38 | | | | | |
| Forefitures | | | (26,816 | ) | | | 27.20 | | | | 6.51 | | | | | |
| Balance, August 31, 2021 | | | 692,938 | | | | 11.64 | | | | 7.06 | | | | 4.46 | |
| | | | | | | | | | | | | | | | |
| Balance, August 31, 2021 | | | 692,938 | | | | 11.64 | | | | 7.06 | | | | 4.46 | |
| Granted | | | 953,957 | | | | 1.41 | | | | 0.75 | | | | | |
| Forefitures | | | (503,713 | ) | | | 9.76 | | | | 5.61 | | | | | |
| Balance, August 31, 2022 | | | 1,143,182 | | | | 3.93 | | | | 2.43 | | | | 5.64 | |
| | | | | | | | | | | | | | | | | |
| Exercisable as of August 31, 2022 | | | 555,934 | | | | 3.89 | | | | 2.29 | | | | 5.65 | |
During the year ended August 31, 2022, the Company granted options to purchase 953,957 common shares of the Company. Each option allows the holder to purchase one common share of the Company. The options had exercise prices of CAD$1.15 to CAD $3.90. The fair value of the options granted was estimated at the grant dates based on the Black-Sholes pricing model. Key assumptions include 0% expected dividend yield, Risk-free interest rate of 1.24% to 2.75%, expected life of 5 years and expected volatility of 90%.
During the year ended August 31, 2021, the Company granted options to purchase 487,466 common shares of the Company. Each option allows the holder to purchase one common share of the Company. The options had exercise prices of CAD$7.78 to CAD $15.08. The fair value of the options granted was estimated at the grant dates based on the Black-Sholes pricing model. Key assumptions include 0% expected dividend yield, Risk-free interest rate of .83% to 1.48%, expected life of 5 or 10 years and expected volatility of 90%.
Engine Gaming and Media, Inc.
(formerly, Engine Media Holdings, Inc.)
Notes to the Consolidated Financial Statements
August 31, 2022 and 2021
(Expressed in United States Dollars) | |
| | |
The following tables reflect the stock options issued and outstanding as of August 31, 2022:
Disclosure of detailed information about options issued and outstanding
| | | Outstanding | | | | | | Weighted
average
exercise
price | | | Weighted
average
remaining
contractual
term | |
| Expiry date | | options | | | CAD | | | USD | | | (Years) | |
| April 1, 2023 | | | 47,499 | | | | 11.25 | | | | 7.91 | | | | 0.58 | |
| August 25, 2025 | | | 340 | | | | 106.50 | | | | 76.43 | | | | 2.99 | |
| February 10, 2026 | | | 1,338 | | | | 106.50 | | | | 76.43 | | | | 3.45 | |
| May 23, 2026 | | | 9 | | | | 106.50 | | | | 76.43 | | | | 3.73 | |
| June 24, 2026 | | | 146,433 | | | | 15.04 | | | | 12.21 | | | | 3.82 | |
| July 2, 2026 | | | 45,010 | | | | 15.08 | | | | 12.21 | | | | 3.84 | |
| August 20, 2026 | | | 10,000 | | | | 7.78 | | | | 6.05 | | | | 3.97 | |
| March 3, 2027 | | | 1,003 | | | | 106.50 | | | | 76.43 | | | | 4.51 | |
| November 3, 2027 | | | 133 | | | | 106.50 | | | | 76.43 | | | | 5.18 | |
| November 7, 2029 | | | 30,755 | | | | 7.50 | | | | 5.38 | | | | 7.19 | |
| June 14, 2031 | | | 10,683 | | | | 14.20 | | | | 11.69 | | | | 8.79 | |
| November 23, 2031 | | | 10,000 | | | | 12.45 | | | | 9.82 | | | | 9.24 | |
| January 31, 2027 | | | 15,000 | | | | 3.90 | | | | 3.07 | | | | 4.42 | |
| April 12, 2027 | | | 100,000 | | | | 2.87 | | | | 2.27 | | | | 4.62 | |
| August 10, 2027 | | | 100,000 | | | | 1.47 | | | | 1.15 | | | | 4.95 | |
| May 26, 2029 | | | 624,979 | | | | 1.49 | | | | 1.16 | | | | 6.74 | |
| | | | | | | | | | | | | | | | | |
| | | | 1,143,182 | | | | 5.01 | | | | 3.93 | | | | 5.64 | |
Of the 1,143,182 options outstanding as of August 31, 2022 (2021 – 692,938), 555,934 are exercisable as of August 31, 2022 (2021 – 209,950). During the year ended August 31, 2022, share-based payments expense for the Company’s stock options was $3,034,073 (August 31, 2021 – $665,339).
24. Restricted share units
The Omnibus Plan allows the Company to award restricted share units to officers, employees, directors and consultants of the Company and its subsidiaries upon such conditions as the Board may establish, including the attainment of performance goals recommended by the Company’s compensation committee. The purchase price for common shares of the Company issuable under each Restricted Share Unit (“RSU”) award, if any, shall be established by the Board at its discretion. Common shares issued pursuant to any RSU award may be made subject to vesting conditions based upon the satisfaction of service requirements, conditions, restrictions, time periods or performance goals established by the board.
The TSXV requires the Company to fix the number of common shares to be issued in settlement of awards that are not options. The maximum number of common shares available for issuance pursuant to the settlement of RSUs shall be an aggregate of 1,548,174 common shares.
Engine Gaming and Media, Inc.
(formerly, Engine Media Holdings, Inc.)
Notes to the Consolidated Financial Statements
August 31, 2022 and 2021
(Expressed in United States Dollars) | |
| | |
The Company’s outstanding RSUs are as follows:
Disclosure of detailed information about restricted stock units outstanding
| | | Number | |
| | | # | |
| Balance, August 31, 2020 | | | 402,372 | |
| Issued on acquisition of SideQik | | | 23,939 | |
| Granted | | | 353,467 | |
| Vested | | | (277,749 | ) |
| Cancelled | | | (11,855 | ) |
| Balance, August 31, 2021 | | | 490,174 | |
| | | | | |
| Balance, August 31, 2021 | | | 490,174 | |
| Granted | | | 1,086,382 | |
| Vested | | | (203,537 | ) |
| Cancelled | | | (176,808 | ) |
| Balance, August 31, 2022 | | | 1,196,211 | |
Activity for the year ended August 31, 2022
During the year ended August 31, 2022, the Company granted 966,691 RSUs to key management employees, pursuant to the Company’s incentive plan. The fair value of these RSUs was estimated based on the closing price CAD$1.15 for a total fair value of CAD$1,111,695. 159,568 of these RSUs have a performance condition that the Company estimates will not be achieved, no related share-based compensation was recorded for the performance based RSUs during the year ended August 31, 2022. The fair value of the 807,123-service period based RSUs will be recognized as share-based compensation over the vesting period of three years. Also, during the year, the company granted 119,691 RSUs to members of the board of directors. The grant date fair value was estimated based on the closing prices of CAD$1.10 – CAD$4.98 for a total fair value of CAD$538,452. The fair value of these RSUs will be recognized as share-based compensation expense over the vesting period, which is approximately ten - twelve months.
Activity for the year ended August 31, 2021
During the year ended August 31, 2021, the Company granted 353,467 RSUs pursuant to the Company’s incentive plan to a former officer and key management employees. The fair value of these RSUs was estimated based on the closing price of CAD$7.94 – CAD$14.61 for a total fair value on date of grant of CAD$3,547,104. Of the 377,406 RSUs granted, 75,944 were severance compensation to a former officer. As these RSUs were issued as severance compensation, the grant date fair value of CAD$713,874 ($550,896) was recognized on the grant date. The Company issued 23,939 RSUs as purchase consideration related to the SideQik, Inc. acquisition with a fair value of $245,000 The remaining RSUs will be recognized as share-based payments expense over the vesting period, which is generally three years.
During the years ended August 31, 2022, and 2021, share-based compensation expense for the Company’s RSUs was $1,654,145 (2021 – $3,037,366).
25. Capital management
The Company considers its capital to be its shareholders’ equity.
As of August 31, 2022, the Company had shareholders’ equity before non-controlling interests of $15,886,591 (2021 – $25,422,165). The Company’s objective when managing its capital is to seek continuous improvement in the return to its shareholders while maintaining a moderate to high tolerance for risk. The objective is achieved by prudently managing the capital generated through internal growth and profitability, through the use of lower cost capital, including raising share capital or debt when required to fund opportunities as they arise.
Engine Gaming and Media, Inc.
(formerly, Engine Media Holdings, Inc.)
Notes to the Consolidated Financial Statements
August 31, 2022 and 2021
(Expressed in United States Dollars) | |
| | |
The Company may also return capital to shareholders through the repurchase of shares, pay dividends or reduce debt where it determines any of these to be an effective method of achieving the above objective. The Company does not use ratios in the management of its capital. There have been no changes to management’s approach to managing its capital during the years ended August 31, 2022, and 2021.
26. Commitments and contingencies
Litigation and arbitration
In April 2020, the Company announced its renegotiation of the acquisition of Allinsports. The revised purchase agreement provided for the acquisition of 100% of Allinsports in exchange for the issuance of 966,667 common shares of the Company and other consideration, including payments of $1,200,000 as a portion of the purchase consideration. In September 2020, the Company advised the shareholders of Allinsports that closing conditions of the transaction, including the requirement to provide audited financial statements, had not been satisfied.
In response, in November 2020, the shareholders of Allinsports commenced arbitration in Alberta, Canada seeking, among other things, to compel the Company to complete the acquisition of Allinsports without the audited financial statements, and to issue 966,667 common shares of the Company to those shareholders. As alternative relief, the shareholders of Allinsports sought up to US$20,000,000 in damages. As of August 31, 2020, the Company had recorded an impairment against the entire balance of advances to Allinsports, amounting to $2,625,657. A hearing in this matter was held in May of 2021, and by a decision dated September 30, 2021, the Arbitrator determined that the closing of the transaction had previously occurred and directed the Company to issue the 966,667 common shares. The Company is pursuing regulatory approval to issue the shares and is also pursuing relief against the Allinsports shareholders for various alleged breaches of the share purchase agreement. The Company recognized a liability for the arbitration ruling of $692,613, which represents the fair value of the common shares directed to be delivered as of August 31, 2022. The liability is recorded as Arbitration reserve on the Company’s Consolidated Statements of Financial Position. This liability will be adjusted to fair value at the end of each reporting period.
On July 15, 2021, a complaint was filed against Winview Inc. by Bleacher League Entertainment, Inc. in the United States District Court for the District of Delaware, alleging that Winview had violated two of Bleacher’s patents covering an interactive themed baseball game and seeking damages and other relief. The parties have entered into an agreement resolving this matter and in connection therewith, on November 8, 2021, the plaintiff terminated the pending action by filing a notice of voluntary dismissal with prejudice. There was no related expense.
In April of 2021, the Company received a copy of a complaint filed by 3CI Holdings, LLLP in the Circuit Court for the 11th Judicial Circuit for Miami-Dade naming Allinsports, A1 Simulation LLC (an entity purported to be a subsidiary of Allinsports), and the Company, seeking to hold the parties, including Company, responsible for unpaid rent under a lease agreement between 3CI’s predecessors in interest and A1 Simulation, and seeking damages of at least $2,890,000. On July 6, 2021, the Company filed motion to dismiss the complaint. On February 17, 2022, 3CI Holdings filed an Amended Complaint, to which the Company filed a motion to dismiss, which was granted pursuant to an order signed by the court on July 5, 2022.
On January 21, 2021, eight former shareholders of Winview filed a Complaint in Delaware Chancery Court against four Winview directors (David Lockton, et al. v. Thomas S. Rogers, et al.) alleging that the defendants breached their fiduciary duties in connection with the sale of Winview to Engine. The relief sought includes rescission of the sale of Winview to Engine and compensatory damages. The defendants have filed a motion to dismiss the claims. By Decision dated March 1, 2022, the Court granted in part and denied in part, the defendants’ Motion to Dismiss the Complaint. Neither the Company nor Winview have been named as parties to this action. Under the March 9, 2020, Business Combination Agreement pursuant to which the Company acquired Winview, the Company agreed to indemnify Winview’s directors for any claims arising out of their service as directors for Winview. By Complaint filed on October 28, 2022, against the defendant directors, the insurance carrier providing directors and officers coverage for the shareholder action is seeking a declaration that the action is not covered under the directors and officers policy issued by it. As of August 31, 2022 it is impossible to estimate a liability or if one is likely.
In July of 2021, Winview Inc. filed separate patent infringement lawsuits against DraftKings Inc. and FanDuel, Inc in the United States District Court for the District of New Jersey, alleging that Sportsbook and Daily Fantasy Sports offerings of DraftKings and FanDuel infringe four of Winview’s patents. These actions seek the recovery of damages and other appropriate relief. Draft Kings and FanDuel have filed motions to dismiss, which are pending. The defendants have also filed petitions for inter partes review with the United States Patent Office, which are expected to commence in the first quarter of 2023. During the quarter ended August 31, 2022, the Company recognized patent impairment expense amounting to $5,029,475. The impairment expense reflects the impact of reductions in estimated future net cash flows for certain portfolios that management determined it would no longer allocate resources to in future periods.
By Order to Continue dated May 5, 2022, the Company was substituted in as the plaintiff in a matter pending in the Ontario Superior Court of Justice, seeking recovery of €1,903,153 of principal and additional amounts of accrued interest under promissory notes acquired by the Company. The matter is in the discovery stage.
The outcomes of pending litigations in which the Company is involved are necessarily uncertain as are the Company’s expenses in prosecuting and defending these actions. From time to time the Company may modify litigation strategy and/or the terms on which it retains counsel and other professionals in connection with such actions, which may affect the outcomes of and/or the expenses incurred in connection with such actions.
Engine Gaming and Media, Inc.
(formerly, Engine Media Holdings, Inc.)
Notes to the Consolidated Financial Statements
August 31, 2022 and 2021
(Expressed in United States Dollars) | |
| | |
The Company is subject to various other claims, lawsuits and other complaints arising in the ordinary course of business. The Company records provisions for losses when claims become probable, and the amounts are estimable. Although the outcome of such matters cannot be determined, it is the opinion of management that the final resolution of these matters will not have a material adverse effect on the Company’s financial condition, operations, or liquidity.
27. Discontinued operations
Winview
During the fourth quarter of fiscal 2022, The Company executed a plan to discontinue operating the Winview business, following a strategic decision to focus the Company’s resources on the key revenue streams of software-as-a-service and advertising. Winview was previously part of the Company’s Gaming segment.
Accordingly, WinView results for the current and comparative periods have been presented as discontinued operations within the Consolidated Statements of Loss and Comprehensive Loss. Winview revenue was previously categorized as Direct to consumer.
During the quarter ended August 31, 2022, the Company recognized patent impairment expense amounting to $5,029,475. The impairment expense reflects the impact of reductions in estimated future net cash flows for certain portfolios that management determined it would no longer allocate resources to in future periods. The impairment expense consisted of the excess of the asset’s recoverable value over its fair value less costs of disposal. The key assumption in calculating the asset’s recoverable value is cash flow projections of $0. The Company recorded impairment losses of $136,331 to write down the right of use asset to fair value less costs of disposal, the remaining book value of these assets is $0 (Notes 14 and 15). These impairments are recorded in the Gain (loss) from discontinued operations within the Consolidated Statements of Loss and Comprehensive Loss.
Engine Gaming and Media, Inc.
(formerly, Engine Media Holdings, Inc.)
Notes to the Consolidated Financial Statements
August 31, 2022 and 2021
(Expressed in United States Dollars) | |
| | |
Results from the discontinued operations for Winview and the related cash flows are as follows:
Schedule of discontinued operations
| Revenues | | | | | | | | |
| | | For the year ended | |
| | | August 31, 2022 | | | August 31, 2021 | |
| | | $ | | | $ | |
| Revenues | | | | | | | | |
| Revenue | | | 135,160 | | | | 3,543 | |
| | | | | | | | | |
| Operating expenses | | | | | | | | |
| Salaries and wages | | | 1,882,859 | | | | 1,449,744 | |
| Consulting | | | 945,397 | | | | 524,971 | |
| Professional fees | | | 468,408 | | | | 584,149 | |
| Sponsorships and tournaments | | | 150,512 | | | | 15,133 | |
| Advertising and promotion | | | 416,968 | | | | 69,592 | |
| Office and general | | | 518,540 | | | | 411,636 | |
| Technology expenses | | | 47,809 | | | | 25,009 | |
| Amortization and depreciation | | | 1,948,538 | | | | 1,897,414 | |
| Impairment expense | | | 5,165,806 | | | | | |
| Restructuring Costs | | | 226,152 | | | | | |
| Interest expense | | | 66,164 | | | | 46,977 | |
| (Gain) loss on foreign exchange | | | (601 | ) | | | | |
| Non-operational professional fees | | | 1,613,831 | | | | 846,475 | |
| Net income (loss) from discontinued operations | | | (13,315,223 | ) | | | (5,867,557 | ) |
Schedule of cash flow in discontinued operation
| Net cash provided by (used in) operating activities | | | 78,772 | | | | 1,097,635 | |
| | | For the year ended | |
| | | August 31, 2022 | | | August 31, 2021 | |
| | | | | | | |
| Net cash provided by (used in) operating activities | | | 78,772 | | | | 1,097,635 | |
| Disposal of Motorsports | | | | | | | | |
| Net cash used in financing activities | | | (110,906 | ) | | | (1,054,503 | ) |
| Change in cash | | | (32,134 | ) | | | 43,132 | |
| Cash, beginning of period | | | 52,746 | | | | 9,614 | |
| Cash, end of period | | | 20,612 | | | | 52,746 | |
UMG
The Company entered into an agreement on June 13, 2022, to sell certain assets of UMG for $100. On June 30, 2022, the Company completed the sale. Concurrently with the sale agreement the Company entered into a transition services agreement with the purchaser for a total value of $300,000 of which $262,000 has been recognized as additional purchase consideration in other receivables, with payments beginning July 31, 2022, and the remainder to be paid in full, 12 months following the first payment.
Accordingly, UMG results for the current and comparative periods have been presented as discontinued operations within the Consolidated Statements of Loss and Comprehensive Loss. UMG revenue was previously categorized as Direct to consumer.
During the quarter ended May 2022, the Company recognized impairment expense relating to assets not disposed of in connection with the UMG asset sale amounting to $476,404. The impairment expense reflects the reductions to $0 of the right of use asset, application platform and brand intangible assets, and a group of fixed assets. The impairment expense consisted of the excess of the asset’s carrying values over their fair values less costs of disposal. (Notes 10, 14 and 15). These impairments are recorded in the Gain (loss) from discontinued operations within the Consolidated Statements of Loss and Comprehensive Loss.
Engine Gaming and Media, Inc.
(formerly, Engine Media Holdings, Inc.)
Notes to the Consolidated Financial Statements
August 31, 2022 and 2021
(Expressed in United States Dollars) | |
| | |
Consideration transferred for the sale of UMG Games sales and the resulting gain on disposal was as follows:
Schedule of loss on disposal
| | | Amount | |
| | | $ | |
| Consideration received or receivable: | | | | |
| Cash consideration | | | 100 | |
| Deferred cash consideration | | | 262,000 | |
| Total disposal consideration | | | 262,100 | |
| Carrying amount of net assets sold | | | (4,550 | ) |
| Gain on disposal of UMG Assets | | | 257,550 | |
The net assets of UMG (the disposal group) as of the date of sale were as follows:
Schedule of net asset
| | | Amount | |
| | | | $ | |
| Carrying amounts of assets as at the date of sale: | | | | |
| Cash and cash equivalents | | | | |
| Restricted cash | | | | |
| Accounts and other receivables | | | | |
| Government remittances | | | | |
| Prepaid expenses and other | | | | |
| Right-of-use assets | | | | |
| Intangible assets | | | | |
| Goodwill | | | | |
| Property and equipment | | | 27,931 | |
| Total assets of disposal group | | | 27,931 | |
| | | | | |
| Carrying amount of liabilities directly associated with assets as at the date of sale: | | | | |
| Long-term debt, current | | | | |
| Lease obligation, current | | | | |
| Accrued liabilities | | | | |
| Accounts payable | | | | |
| Players liability account | | | 23,381 | |
| Total liabilities of disposal group | | | 23,381 | |
| | | | | |
| Net assets of disposal group | | | 4,550 | |
Results from the discontinued operations for UMG and the related cash flows are as follows:
Schedule of discontinued operations
| Revenues | | | | | | | | |
| | | For the year ended | |
| | | August 31, 2022 | | | August 31, 2021 | |
| | | $ | | | $ | |
| Revenues | | | | | | | | |
| Revenue | | | 596,126 | | | | 449,857 | |
| | | | | | | | | |
| Operating expenses | | | | | | | | |
| Salaries and wages | | | 1,119,786 | | | | 1,024,732 | |
| Consulting | | | - | | | | - | |
| Professional fees | | | (6,227 | ) | | | 253,147 | |
| Sponsorships and tournaments | | | 713,031 | | | | 420,537 | |
| Advertising and promotion | | | 23,790 | | | | 17,869 | |
| Office and general | | | 97,666 | | | | 145,866 | |
| Technology expenses | | | 82,189 | | | | 153,312 | |
| Amortization and depreciation | | | 275,669 | | | | 503,270 | |
| Impairment expense | | | 476,404 | | | | 3,885,001 | |
| Restructuring Costs | | | 81,394 | | | | - | |
| Interest expense | | | 14,553 | | | | 36,107 | |
| (Gain) loss on foreign exchange | | | 19,974 | | | | (15,733 | ) |
| Net income (loss) from discontinued operations | | | (2,302,103 | ) | | | (5,974,251 | ) |
Engine Gaming and Media, Inc.
(formerly, Engine Media Holdings, Inc.)
Notes to the Consolidated Financial Statements
August 31, 2022 and 2021
(Expressed in United States Dollars) | |
| | |
Schedule of cash flow in discontinued operation
| Net cash provided by (used in) operating activities | | | 6,491 | | | | 438,394 | |
| | | For the year ended | |
| | | August 31, 2022 | | | August 31, 2021 | |
| | | | | | | |
| Net cash provided by (used in) operating activities | | | 6,491 | | | | 438,394 | |
| Net cash used in financing activities | | | (72,409 | ) | | | (86,117 | ) |
| Change in cash | | | (65,918 | ) | | | 352,277 | |
| Cash, beginning of period | | | 175,296 | | | | (176,981 | ) |
| Cash, end of period | | | 109,378 | | | | 175,296 | |
The Company tested the UMG CGU goodwill balance of $3,209,045 as of August 31, 2021, for impairment. When assessing whether there is an impairment, the recoverable amount of the CGU was determined based on a value in use calculation. The value in use calculation used a ten-year projected and terminal period debt-free cash flow model discounted to present value using a discount rate of 21.0% and a long-term growth rate of 3%. The recoverable value is concluded after making adjustments to the discounted cash flow model for cash or any other non-operating assets or liabilities as of the measurement date. The concluded recoverable value is then compared to carrying value of the CGU. Based on this impairment assessment, the Company determined that an impairment charge was necessary and recorded a full goodwill impairment charge of $3,209,045 (Note 13) on the Company’s consolidated statement of loss and comprehensive loss. Additionally, resulting from this impairment assessment the Company recorded $675,956 impairment charge in connection with the intangibles within the UMG CGU (Note 14). These impairments are recorded in the Gain (loss) from discontinued operations within the Consolidated Statements of Loss and Comprehensive Loss. The results for UMG were reflected in the Company’s Gaming segment prior to becoming a discontinued operation.
Eden Games
The Company committed to a plan to sell Eden Games, S.A. (“Eden Games”) during the second quarter of fiscal 2022, following a strategic decision to focus the Company’s resources on the key revenue streams of software-as-a-service, and advertising. Eden Games was previously part of the Company’s Gaming segment. On April 6, 2022, the Company completed the sale of Eden Games.
Accordingly, Eden Games’ results for the current and comparative periods have been presented as discontinued operations within the Consolidated Statements of Loss and Comprehensive Loss. Eden Games revenue was previously categorized as Games development.
Consideration transferred for the sale of Eden Games sales and the resulting gain on disposal was as follows:
Schedule of loss on disposal
| | | Amount | |
| | | $ | |
| Consideration received or receivable: | | | | |
| Cash consideration | | | 15,357,803 | |
| Total disposal consideration | | | 15,357,803 | |
| Carrying amount of net assets sold | | | (595,065 | ) |
| Carrying amount attributable to non-controlling interests | | | 208,598 | |
| Gain on disposal before income tax and reclassification of foreign currency translation reserve | | | 14,971,336 | |
| | | | | |
| Reclassification of foreign currency translation reserve | | | 139,122 | |
| | | | | |
| Gain on disposal of Eden Games | | | 15,110,458 | |
Engine Gaming and Media, Inc.
(formerly, Engine Media Holdings, Inc.)
Notes to the Consolidated Financial Statements
August 31, 2022 and 2021
(Expressed in United States Dollars) | |
| | |
The net assets of Eden Games (the disposal group) as of the date of sale were as follows:
Schedule of net asset
| | | Amount | |
| | | $ | |
| Carrying amounts of assets as at the date of sale: | | | | |
| Cash | | | 647,187 | |
| Accounts and other receivables | | | 586,309 | |
| Government remittances | | | 566,331 | |
| Prepaid expenses and other | | | 36,124 | |
| Right-of-use assets | | | 16,036 | |
| Property and equipment | | | 41,132 | |
| Intangible assets | | | 296,235 | |
| Goodwill | | | 345,150 | |
| Total assets of disposal group | | | 2,534,504 | |
| | | | | |
| Carrying amount of liabilities directly associated with assets as at the date of sale: | | | | |
| Accounts payable | | | 1,168,966 | |
| Accrued liabilities | | | 750,388 | |
| Lease obligation, current | | | - | |
| Long-term debt, current | | | 20,085 | |
| Total liabilities of disposal group | | | 1,939,439 | |
| | | | | |
| Net assets of disposal group | | | 595,065 | |
Results of discontinued operations for Eden and the related cash flows are as follows:
Schedule of discontinued operations
| Revenues | | | | | | | | |
| | | For the year ended | |
| | | August 31, 2022 | | | August 31, 2021 | |
| | | $ | | | $ | |
| Revenues | | | | | | | | |
| Revenue | | | 4,759,711 | | | | 3,422,202 | |
| | | | | | | | | |
| Operating expenses | | | | | | | | |
| Salaries and wages | | | 2,113,180 | | | | 3,384,577 | |
| Consulting | | | 796,570 | | | | 966,372 | |
| Office and general | | | 265,125 | | | | 565,340 | |
| Amortization and depreciation | | | 224,349 | | | | 1,377,550 | |
| Share-based payments | | | (93 | ) | | | (49 | ) |
| Interest expense | | | 7,145 | | | | 41,639 | |
| (Gain) loss on foreign exchange | | | 39,350 | | | | (135,976 | ) |
| Net income (loss) from discontinued operations | | | 1,314,085 | | | | (2,777,251 | ) |
Engine Gaming and Media, Inc.
(formerly, Engine Media Holdings, Inc.)
Notes to the Consolidated Financial Statements
August 31, 2022 and 2021
(Expressed in United States Dollars) | |
| | |
Schedule of cash flow in discontinued operation
| Net cash provided by (used in) operating activities | | | 509,166 | | | | 444,640 | |
| | | For the year ended | |
| | | August 31, 2022 | | | August 31, 2021 | |
| | | $ | | | $ | |
| | | | | | | |
| Net cash provided by (used in) operating activities | | | 509,166 | | | | 444,640 | |
| Disposal of Eden | | | (647,187 | ) | | | - | |
| Net cash used in financing activities | | | (132,550 | ) | | | (281,647 | ) |
| Change in cash | | | (270,571 | ) | | | 162,993 | |
| Cash, beginning of period | | | 270,571 | | | | 107,578 | |
| Cash, end of period | | | - | | | | 270,571 | |
Motorsport Group
On November 3, 2020, the Company, following a detailed strategic review in connection with the merger of Torque Esports, Frankly and WinView, announced that it has completed the sale of IDEAS+CARS, The Race Media, WTF1, Driver DataDB and Lets Go Racing (collectively the “Motorsport Group”) to Ideas + Cars Holdings Limited, a third party investment group based in the UK. As a result, the Company is eliminating its funding obligations related to the cost of maintaining and growing these auto media businesses and certain accrued liabilities. Accordingly, the operational results for this group have been presented as a discontinued operation.
Consideration transferred for the Motorsport Group was as follows:
Schedule of loss on disposal
| | | Amount | |
| | | $ | |
| Consideration received or receivable: | | | | |
| Accounts payable assumed | | | 101,322 | |
| Deferred purchase consideration of LGR | | | 333,503 | |
| Fair value of contingent consideration | | | 1,321,281 | |
| Total disposal consideration | | | 1,756,106 | |
| Carrying amount of net assets sold | | | (2,334,303 | ) |
| Loss on disposal before income tax and reclassification of foreign currency translation reserve | | | (578,197 | ) |
| | | | | |
| Reclassification of foreign currency translation reserve | | | (100,734 | ) |
| Loss on disposal of Motorsports | | | (678,931 | ) |
Engine Gaming and Media, Inc.
(formerly, Engine Media Holdings, Inc.)
Notes to the Consolidated Financial Statements
August 31, 2022 and 2021
(Expressed in United States Dollars) | |
| | |
During the year ended August 31, 2022 the Company determined that $194,268 in receivables retained from the disposal of Motorsports was no longer collectible and those receivables have been expensed in gain (loss) on disposal of subsidiary.
The net assets of the Motorsport Group as of the date of sale were as follows:
Schedule of net asset
| | | Amount | |
| | | $ | |
| Carrying amounts of assets as at the date of sale: | | | | |
| Cash and cash equivalents | | | (24,348 | ) |
| Restricted cash | | | - | |
| Accounts and other receivables | | | 126,590 | |
| Government remittances | | | 25,095 | |
| Prepaid expenses and other | | | 24,113 | |
| Property and equipment | | | 47,416 | |
| Intangible assets | | | 3,066,457 | |
| Total assets of disposal group | | | 3,265,323 | |
| | | | | |
| Carrying amount of liabilities directly associated with assets as at the date of sale: | | | | |
| Accounts payable | | | 508,881 | |
| Accrued liabilities | | | 422,139 | |
| Total liabilities of disposal group | | | 931,020 | |
| | | | | |
| Net assets of disposal group | | | 2,334,303 | |
Results of discontinued operations for the Motorsports Group and PGL Nevada, (together, the “discontinued operations”) and the related cash flows are as follows:
Schedule of discontinued operations
| Revenues | | | | | | | | |
| | | For the year ended | |
| | | August 31, 2022 | | | August 31, 2021 | |
| | | $ | | | $ | |
| Revenues | | | | | | | | |
| Revenue | | | - | | | | 90,934 | |
| | | | | | | | | |
| Operating expenses | | | | | | | | |
| Salaries and wages | | | - | | | | 212,546 | |
| Consulting | | | - | | | | 267,933 | |
| Professional fees | | | - | | | | 24,781 | |
| Sponsorships and tournaments | | | - | | | | 203,637 | |
| Advertising and promotion | | | - | | | | 1,740 | |
| Office and general | | | - | | | | 7,374 | |
| Technology expenses | | | - | | | | 86,590 | |
| Amortization and depreciation | | | - | | | | 201,335 | |
| Interest expense | | | - | | | | 572 | |
| (Gain) loss on foreign exchange | | | 5,256 | | | | 29,535 | |
| Gain on extinguishment of liabilities | | | (1,105,023 | ) | | | - | |
| Net income (loss) from discontinued operations | | | 1,099,767 | | | | (945,109 | ) |
Schedule of cash flow in discontinued operation
| Net cash provided by (used in) operating activities | | | - | | | | (92,652 | ) |
| | | For the year ended | |
| | | August 31, 2022 | | | August 31, 2021 | |
| | | $ | | | $ | |
| | | | | | | |
| Net cash provided by (used in) operating activities | | | - | | | | (92,652 | ) |
| Disposal of Motorsports | | | - | | | | 24,348 | |
| Change in cash | | | - | | | | (68,304 | ) |
| Cash, beginning of period | | | - | | | | 68,304 | |
| Cash, end of period | | | - | | | | - | |
Engine Gaming and Media, Inc.
(formerly, Engine Media Holdings, Inc.)
Notes to the Consolidated Financial Statements
August 31, 2022 and 2021
(Expressed in United States Dollars) | |
| | |
28. Segmented information
Information reported to the Company’s Co-Chief Executives, the Chief Operating Decision Makers (“CODM”), for the purposes of resource allocation and assessment of segment performance is focused on the category of services for each type of activity. The principal categories of services are Gaming, Media, and Corporate and Other. Discontinued operations have been removed from the segment information and prior periods have been rested to conform with current year presentation. The Group’s reportable segments under IFRS 8 Operating Segments are therefore as follows:
| | Gaming | - | Services related to competitive organized video gaming or sporting events |
| | Media | - | Platform and advertising services provided to other broadcasters, primarily local tv and radio broadcasters |
| | | | |
| | Corporate and Other | - | Services provided to other businesses and other revenues |
The Corporate and Other segment primarily consists of support costs not allocated to the two other segments.
The following is an analysis of the Company’s revenue and results by reportable segment in fiscal 2022:
Schedule of segment reporting
| | | Gaming | | | Media | | | Corporate
and Other | | | Total | |
| | | $ | | | $ | | | $ | | | $ | |
| Revenue | | | | | | | | | | | | | | | | |
| External sales | | | 1,906,137 | | | | 39,976,476 | | | | - | | | | 41,882,613 | |
| | | | | | | | | | | | | | | | | |
| Results | | | | | | | | | | | | | | | | |
| Segment loss | | | (706,528 | ) | | | (11,436,185 | ) | | | - | | | | (12,142,713 | ) |
| | | | | | | | | | | | | | | | | |
| Central administration costs | | | - | | | | - | | | | 9,788,532 | | | | 9,788,532 | |
| Other gains and losses | | | (6,490 | ) | | | 4,059,247 | | | | (10,312,246 | ) | | | (6,259,489 | ) |
| Finance costs | | | 57 | | | | 1,193 | | | | 728,598 | | | | 729,848 | |
| Income (loss) before tax | | | (700,095 | ) | | | (15,496,625 | ) | | | (204,884 | ) | | | (16,401,604 | ) |
| Income tax | | | - | | | | - | | | | - | | | | - | |
| Gain (Loss) for the period from: | | | | | | | | | | | | | | | | |
| Share of net loss of associate | | | |
| Discontinued operations | | | (12,547,685 | ) | | | - | | | | 14,535,910 | | | | 1,988,225 | |
| Non-controlling interest in net loss | | | - | | | | - | | | | (65,219 | ) | | | (65,219 | ) |
| Net income (loss) | | | (13,247,780 | ) | | | (15,496,625 | ) | | | 14,265,807 | | | | (14,478,598 | ) |
Engine Gaming and Media, Inc.
(formerly, Engine Media Holdings, Inc.)
Notes to the Consolidated Financial Statements
August 31, 2022 and 2021
(Expressed in United States Dollars) | |
| | |
The following is an analysis of the Company’s revenue and results by reportable segment in fiscal 2021:
| | | Gaming | | | Media | | | Corporate
and Other | | | Total | |
| | | $ | | | $ | | | $ | | | $ | |
| Revenue | | | | | | | | | | | | | | | | |
| External sales | | | 1,401,981 | | | | 31,943,287 | | | | - | | | | 33,345,268 | |
| | | | | | | | | | | | | | | | | |
| Results | | | | | | | | | | | | | | | | |
| Segment loss | | | (354,356 | ) | | | (7,611,679 | ) | | | - | | | | (7,966,035 | ) |
| | | | | | | | | | | | | | | | | |
| Central administration costs | | | - | | | | - | | | | 8,529,166 | | | | 8,529,166 | |
| Other gains and losses | | | 4,569 | | | | (39,258 | ) | | | 6,712,278 | | | | 6,677,589 | |
| Finance costs | | | (60 | ) | | | 512,937 | | | | 762,121 | | | | 1,274,998 | |
| Loss before tax | | | (358,865 | ) | | | (8,085,358 | ) | | | (16,003,565 | ) | | | (24,447,788 | ) |
| Income tax | | | - | | | | - | | | | - | | | | - | |
| Gain (Loss) for the period from: | | | | | | | | | | | | | | | | |
| Share of net loss of associate | | | - | | | | - | | | | (103,930 | ) | | | (103,930 | ) |
| Discontinued operations | | | (14,496,066 | ) | | | - | | | | (1,747,033 | ) | | | (16,243,099 | ) |
| Non-controlling interest in net loss | | | - | | | | - | | | | 74,006 | | | | 74,006 | |
| Net loss | | | (14,854,931 | ) | | | (8,085,358 | ) | | | (17,780,522 | ) | | | (40,720,811 | ) |
Segment loss - Segment loss includes total revenue less operating expenses including the following: salaries and wages, consulting, professional fees, revenue sharing expense, advertising and promotion, office and general, technology expenses, amortization and depreciation and share based payments.
Central administration costs - Central administration costs include corporate operating expenses including the following: salaries and wages, consulting, professional fees, advertising and promotion, office and general, technology expenses, amortization and depreciation and share based payments.
Other gains and losses - Other gains and losses includes gain / loss on foreign exchange, loss on extinguishment of debt, gain on retained interest in former associate, transaction costs, arbitration settlement reserve, impairment expense, restructuring costs, change in fair value of investment at FVTPL, change in fair value of warrant liability and change in fair value of convertible debt.
Finance costs - Finance costs include interest expense.
Geographical breakdown
| | | North
America | | | European
Union | | | Total | |
| | | $ | | | $ | | | $ | |
| August 31, 2021 | | | | | | | | | | | | |
| Assets | | | 64,943,049 | | | | 2,519,798 | | | | 67,462,847 | |
| Long-term assets | | | 35,796,241 | | | | 108,924 | | | | 35,905,165 | |
| | | | | | | | | | | | | |
| August 31, 2022 | | | | | | | | | | | | |
| Assets | | | 41,548,305 | | | | 1,146,504 | | | | 42,694,809 | |
| Long-term assets | | | 20,635,907 | | | | - | | | | 20,635,907 | |
29. Related party transactions and balances
| (a) | Key management compensation |
Key management includes the Company’s directors, officers and any consultants with the authority and responsibility for planning, directing and controlling the activities of an entity, directly or indirectly. Compensation awarded to key management includes the following:
Schedule of compensation award to key management
| | | $ | | | $ | |
| | | For the year ended | |
| | | August 31, 2022 | | | August 31, 2021 | |
| | | $ | | | $ | |
| | | | | | | |
| Total compensation paid to key management | | | 1,390,598 | | | | 2,231,871 | |
| Share based payments | | | 963,295 | | | | 1,897,855 | |
Engine Gaming and Media, Inc.
(formerly, Engine Media Holdings, Inc.)
Notes to the Consolidated Financial Statements
August 31, 2022 and 2021
(Expressed in United States Dollars) | |
| | |
Total compensation paid to key management is recorded in consulting fees and salaries and wages in the consolidated statement of loss and comprehensive loss for the years ended August 31, 2022, and 2021.
Amounts due to related parties as of August 31, 2022, with respect to the above fees were $5,588 (2021 – $33,349). The amounts due to related parties are recorded within accounts payable and accrued liabilities on the consolidated statements of loss and comprehensive loss. These amounts are unsecured, non-interest bearing and due on demand.
Commitment to former holders of WinView to proceeds from the patent portfolio enforcement action
Pursuant to the Business Combination agreement dated March 9, 2020, among the Company, Frankly Inc. and Winview Inc., the Company is required to pay to certain former Winview securities holders (“Stubholders”) fifty percent (50%) of the net license fees, damages awards or settlement amounts collected from third parties in connection with the Winview Patent Portfolio, after deduction of certain expenses. Company director, Tom Rogers is among the pool of Stubholders.
While the Company does not believe that the interests of Mr. Rogers, as Stubholder, are sufficiently material or adverse to the Company’s interests to create an actual or potential conflict of interest with respect to the management of the Winview Patent Portfolio, the Company nevertheless has formed a Patent Committee, that excludes Mr. Rogers, to make recommendations to the Company’s Board regarding matters involving the Winview Patent Portfolio.
30. Financial instruments and risk management
| (a) | Financial risk management objectives and policies |
The Company’s activities expose it to a variety of financial risks including foreign currency risk, interest rate risk, credit risk, liquidity risk and market risk and other price risk. These financial instrument risks are actively managed by the Company under the policies approved by the Board of Directors. On an ongoing basis, the finance department actively manages market conditions with a view to minimizing the exposure of the Company to changing market factors, while at the same time limiting the funding costs to the Company. There have been no changes in objectives, policies or how the Company manages these risks.
The Board approves and monitors the risk management processes. The Board’s main objectives for managing risks are to ensure liquidity, the fulfillment of obligations and limited exposure to credit and market risks while ensuring greater returns on any surplus funds.
Credit risk is the risk that one party to a financial instrument will cause a loss for the other party by failing to pay for its obligation resulting in financial loss to the Company. The Company has adopted a policy of only dealing with creditworthy counterparties and obtaining sufficient collateral where appropriate, as a means of mitigating the risk of financial loss from defaults. The Company uses information supplied by independent rating agencies where available, and if not available, the Company uses other publicly available financial information and its own records to rate its customers.
Engine Gaming and Media, Inc.
(formerly, Engine Media Holdings, Inc.)
Notes to the Consolidated Financial Statements
August 31, 2022 and 2021
(Expressed in United States Dollars) | |
| | |
Credit risk arises from cash with banks as well as credit exposure to outstanding receivables. The carrying amounts represent the Company’s maximum exposure to credit risk.
The Company’s exposure to credit risk is influenced mainly by the individual characteristics of each customer. The Company establishes an allowance for doubtful accounts that represents its estimate of expected losses in respect to accounts receivable. The main components of this allowance are a specific loss component that relates to individually significant exposures, and a collective loss component established for groups of similar assets in respect of losses that have been incurred but not yet identified. The collective loss allowance is determined based on historical data of payment statistics for similar financial assets. The allowance for doubtful accounts was $1,155,638 and $1,084,305 as of August 31, 2022, and 2021, respectively.
The Company’s accounts receivable are concentrated among customers in the media and broadcasting industry, which may be affected by adverse economic factors impacting that industry. The Company performs ongoing credit
evaluations of its major customers, maintains reserves for expected credit losses, and does not require any collateral deposits.
As of August 31, 2022, one customer (2021 - one) accounted for greater than 10% of the Company’s accounts receivable balance. In total, this one customer (2021 - one) accounted for 16% and 13% of the Company’s accounts and other receivables balance as of August 31, 2022, and 2021, respectively. During the year ended August 31, 2022, one (2021 - one) customer represented 72% (2021 - 60%) of total revenue.
The below table reflects the aging of the Company’s aging by invoice date of gross trade accounts receivable and allowance for doubtful accounts as of August 31, 2022:
Schedule of trade accounts receivable and allowance for doubtful accounts
| | | Current | | | 0 - 30 | | | 31 - 60 | | | 61 - 90 | | | 91+ | | | Total | |
| | | | | | | | | | | | | | | | | | | |
| Trade accounts receivable | | | 6,805,057 | | | | 202,359 | | | | 428,098 | | | | 305,056 | | | | 2,010,049 | | | | 9,750,619 | |
| Allowance for doubtful accounts | | | 12,753 | | | | 3,577 | | | | 17,423 | | | | 9,790 | | | | 1,312,095 | | | | 1,355,638 | |
| % Allowance | | | | | | | 2 | % | | | 4 | % | | | 3 | % | | | 65 | % | | | 14 | % |
Liquidity risk is the risk that the Company will encounter difficulty in meeting obligations associated with financial liabilities that are settled by delivering cash or another financial asset. The Company is exposed to liquidity risk with respect to its contractual obligations and financial liabilities. The Company manages liquidity risk by continuously monitoring forecasted and actual cash flows and matching maturity profiles of financial assets and liabilities. The Company seeks to ensure that it has sufficient capital to meet short term financial obligations after taking into account its operating obligations and cash on hand.
The Company’s policy is to seek to ensure adequate funding is available from operations and other sources, including debt and equity capital markets, as required.
Schedule of funding available from operations and other sources
| | | < 1 year | | | 1-2 years | |
| | | $ | | | $ | |
| Accounts payable | | | 12,772,375 | | | | - | |
| Accrued liabilities | | | 3,756,758 | | | | - | |
| Players liability account | | | 47,455 | | | | - | |
| Promissory notes payable | | | 771,762 | | | | - | |
| Convertible debt | | | 2,267,367 | | | | 4,983,236 | |
Engine Gaming and Media, Inc.
(formerly, Engine Media Holdings, Inc.)
Notes to the Consolidated Financial Statements
August 31, 2022 and 2021
(Expressed in United States Dollars) | |
| | |
Market risk represents the risk of loss that may impact the Company’s financial position, results of operations, or cash flows due to adverse changes in financial market prices, including interest rate risk, foreign currency exchange rate risk, and other relevant market or price risks. The Company does not use derivative instruments to mitigate this risk.
Interest rate risk
Interest rate risk is the risk that the fair value or future cash flows of a financial instrument will fluctuate because of changes in market interest rates. The Company is exposed to fair value risk with respect to debt which bears interest at fixed rates.
Currency Risk
The Company’s exposure to the risk of changes in foreign exchange rates relates primarily to fluctuations of financial instruments related to cash, accounts and other receivables, and accounts payable denominated in Euros, as well as debt denominated in Canadian dollars.
The following tables combine information about:
| | ● | classes of financial instruments based on their nature and characteristics; |
| | ● | the carrying amounts of financial instruments; |
| | ● | fair values of financial instruments (except financial instruments when carrying amount approximates their fair value); and |
| | ● | fair value hierarchy levels of financial assets and financial liabilities for which fair value was disclosed. |
Fair values are categorized into different levels in a fair value hierarchy based on the inputs used in the valuation techniques as follows:
| | ■ | Level 1: unadjusted quoted prices in active markets for identical assets or liabilities; |
| | ■ | Level 2: inputs other than quoted prices included in Level 1 that are observable for the asset or liability, either directly or indirectly; or |
| | ■ | Level 3: inputs for the asset or liability that are not based on observable market data (unobservable inputs). |
Schedule of fair value measurement
For the year ended August 31, 2022:
| Carrying value at August 31, 2022 | | FVTPL -
mandatorily
measured | | | Amortized
cost | |
| | | $ | | | $ | |
| Financial assets: | | | | | | | | |
| Cash | | | - | | | | 8,601,706 | |
| Restricted cash | | | - | | | | 47,455 | |
| Accounts and other receivables | | | - | | | | 8,404,009 | |
| Government remittances | | | - | | | | 874,334 | |
| Publisher advance | | | 1,490,648 | | | | - | |
| Promissory notes receivable | | | 576,528 | | | | - | |
| Investment at FVTPL | | | 2,629,851 | | | | - | |
| Financial assets | | | 4,697,027 | | | | 17,927,504 | |
Engine Gaming and Media, Inc.
(formerly, Engine Media Holdings, Inc.)
Notes to the Consolidated Financial Statements
August 31, 2022 and 2021
(Expressed in United States Dollars) | |
| | |
| Carrying value at August 31, 2022 | | FVTPL -
mandatorily
measured | | | FVTPL -
designated | | | Amortized
cost | |
| | | $ | | | $ | | | $ | |
| Financial liabilities: | | | | | | | | | | | | |
| Accounts payable | | | - | | | | - | | | | 12,772,375 | |
| Accrued liabilities | | | - | | | | - | | | | 3,756,758 | |
| Players liability account | | | - | | | | - | | | | 47,455 | |
| Long-term debt | | | - | | | | - | | | | - | |
| Promissory notes payable | | | - | | | | - | | | | 771,762 | |
| Warrant liability | | | 49,894 | | | | - | | | | - | |
| Convertible debt | | | - | | | | 7,250,603 | | | | - | |
| | | 49,894 | | | | 7,250,603 | | | | 17,348,350 | |
For the year ended August 31, 2021:
| Carrying value at August 31, 2021 | | FVTPL -
mandatorily
measured | | | Amortized
cost | |
| | | $ | | | $ | |
| Financial assets: | | | | | | | | |
| Cash | | | - | | | | 15,305,996 | |
| Restricted cash | | | - | | | | 331,528 | |
| Accounts and other receivables | | | - | | | | 8,646,807 | |
| Government remittances | | | - | | | | 1,070,216 | |
| Publisher advance | | | 4,534,218 | | | | - | |
| Promissory notes receivable | | | - | | | | - | |
| Investment at FVTPL | | | 2,629,851 | | | | - | |
| Financial assets | | | 7,164,069 | | | | 25,354,547 | |
| Carrying value at August 31, 2021 | | FVTPL -
mandatorily
measured | | | FVTPL -
designated | | | Amortized
cost | |
| | | $ | | | $ | | | $ | |
| Financial liabilities: | | | | | | | | | | | | |
| Accounts payable | | | - | | | | - | | | | 10,403,665 | |
| Accrued liabilities | | | - | | | | - | | | | 5,722,470 | |
| Players liability account | | | - | | | | - | | | | 331,528 | |
| Long-term debt | | | - | | | | - | | | | 96,664 | |
| Promissory notes payable | | | - | | | | - | | | | 821,948 | |
| Warrant liability | | | 4,868,703 | | | | - | | | | - | |
| Convertible debt | | | - | | | | 9,951,496 | | | | - | |
| Financial liabilities | | | 4,868,703 | | | | 9,951,496 | | | | 17,376,275 | |
Engine Gaming and Media, Inc.
(formerly, Engine Media Holdings, Inc.)
Notes to the Consolidated Financial Statements
August 31, 2022 and 2021
(Expressed in United States Dollars) | |
| | |
A summary of instruments, with their classification in the fair value hierarchy is as follows:
Schedule of hierarchy levels of fair value
| | | Level 1 | | | Level 2 | | | Level 3 | | | Fair value as of
August 31, 2022 | |
| | | $ | | | $ | | | $ | | | $ | |
| Warrant liability | | | - | | | | 49,894 | | | | - | | | | 49,894 | |
| Convertible debt | | | - | | | | - | | | | 7,250,603 | | | | 7,250,603 | |
| Publisher advance | | | - | | | | - | | | | 1,490,648 | | | | 1,490,648 | |
| Promissory notes receivable | | | - | | | | - | | | | 576,528 | | | | 576,528 | |
| Investment at FVTPL | | | - | | | | - | | | | 2,629,851 | | | | 2,629,851 | |
| | | Level 1 | | | Level 2 | | | Level 3 | | | Fair value as of
August 31, 2021 | |
| | | $ | | | $ | | | $ | | | $ | |
| Warrant liability | | | - | | | | 4,868,703 | | | | - | | | | 4,868,703 | |
| Convertible debt | | | - | | | | - | | | | 9,951,496 | | | | 9,951,496 | |
| Publisher advance | | | - | | | | - | | | | 4,534,218 | | | | 4,534,218 | |
| Promissory notes receivable | | | - | | | | - | | | | - | | | | - | |
| Investment at FVTPL | | | - | | | | - | | | | 2,629,851 | | | | 2,629,851 | |
During the years ended August 31, 2022, and 2021 there were no transfers of amounts between levels.
31. Restructuring charges
During 2022, a restructuring provision of $485,498 was made primarily to cover employee related costs for headcount reductions at Corporate and at what are now discontinued operations. The remaining restructuring provision on August 31, 2022, is $215,076 and is recorded in accrued liabilities.
32. Subsequent events
The Company has evaluated subsequent events from the balance sheet date through November 29, 2022, the date at which the consolidated financial statements were available to be issued and determined there were no additional items to be disclosed except for the transaction described below.
On September 1, 2022, the Company extended convertible debentures that were due to expire in October and November 2022 with an aggregate principal amount of US$1,250,000. The original convertible debentures had an annual interest rate of 10% per annum and a conversion price of US$8.90 per share.
In place of the expiring convertible debentures, the Company has issued a new convertible debenture with an aggregate principal amount of US$1,250,000 which expires on August 31, 2025, carries an annual interest rate of 7% per annum and is convertible into common shares of the Company at a conversion price of US$1.10 per share.
Each of the expiring convertible debentures and the replacement convertible debenture is beneficially held by a director of the Company. The participation of a director in the amendment of the convertible debentures constitutes a “related party transaction” as such term is defined by Multilateral Instrument 61-101 - Protection of Minority Security Holders in Special Transactions (“MI 61-101”). The Company is relying on an exemption from the formal valuation requirements and the minority shareholder approval requirements under MI 61-101 as the fair market value of the amendment of the convertible debentures does not exceed 25% of the market capitalization of the Company.
Subsequent to year end, the remaining $750,000 principal value of the Company’s 2020 Series convertible debt that was due to mature in November 2022 was either settled by offset against the Company’s promissory notes receivable or amended. Two of the three parties holding the convertible debt agreed to allow the Company to offset principal of $500,000 and interest of $91,781 due at maturity against the Company’s promissory notes receivable. The remaining $250,000 principal value convertible debt was amended to extend the maturity date to February 28, 2023, with all other terms remaining unchanged.
ENGINE GAMING AND MEDIA, INC.
(formerly Engine Media Holdings, Inc.)
Consolidated Financial Statements
For the years ended
August 31, 2021 and 2020
(Expressed in United States Dollars)
Engine Gaming and Media, Inc. (formerly Engine Media Holdings, Inc.) | |
Table of Contents
The accompanying notes are an integral part of these consolidated financial statements.
| Baker Tilly WM LLP
1500 - 401 Bay Street
Toronto, Ontario
Canada M5H 2Y4
T: +1 416.368.7990
F: +1 416.368.0886
toronto@bakertilly.ca
www.bakertilly.ca |
INDEPENDENT AUDITOR’S REPORT
To the Shareholders of Engine Gaming and Media, Inc. (formerly, Engine Media Holdings, Inc.):
Opinion
We have audited the consolidated financial statements of Engine Gaming and Media, Inc. (formerly, Engine Media Holdings, Inc.) and its subsidiaries (together the “Company”), which comprise the consolidated statements of financial position as at August 31, 2021 and 2020 and the consolidated statements of loss and comprehensive loss, consolidated statements of changes in shareholders’ equity (deficiency) and consolidated statements of cash flows for the years then ended, and notes to the consolidated financial statements, including a summary of significant accounting policies.
In our opinion, the accompanying consolidated financial statements present fairly, in all material respects, the consolidated financial position of the Company as at August 31, 2021 and 2020, and its consolidated financial performance and its consolidated cash flows for the years then ended in accordance with International Financial Reporting Standards as issued by the International Accounting Standards Board.
Basis for Opinion
We conducted our audits in accordance with Canadian generally accepted auditing standards. Our responsibilities under those standards are further described in the Auditor’s Responsibilities for the Audit of the Consolidated Financial Statements section of our report. We are independent of the Company in accordance with the ethical requirements that are relevant to our audits of the consolidated financial statements in Canada, and we have fulfilled our other ethical responsibilities in accordance with these requirements. We believe that the audit evidence we have obtained in our audits is sufficient and appropriate to provide a basis for our opinion.
Material Uncertainty Related to Going Concern
We draw attention to Note 1(b) in the consolidated financial statements, which describes the conditions indicating that a material uncertainty exists that may cast significant doubt on the Company’s ability to continue as a going concern. Our opinion is not modified in respect of this matter.
Other Information
Management is responsible for the other information. The other information comprises the information included in:
| | ● | Management’s Discussion and Analysis filed with the relevant Canadian securities commissions; and |
| | ● | Form 40-F filed with the United States Securities and Exchange Commission |
Our opinion on the consolidated financial statements does not cover the other information and we do not express any form of assurance conclusion thereon.
In connection with our audits of the consolidated financial statements, our responsibility is to read the other information and, in doing so, consider whether the other information is materially inconsistent with the consolidated financial statements or our knowledge obtained in the audits and remain alert for indications that the other information appears to be materially misstated. If, based on the work we have performed, we conclude that there is a material misstatement of this other information, we are required to report that fact in this auditor’s report. We have nothing to report in this regard.
Responsibilities of Management and Those Charged with Governance for the Consolidated Financial Statements
Management is responsible for the preparation and fair presentation of the consolidated financial statements in accordance with International Financial Reporting Standards, and for such internal control as management determines is necessary to enable the preparation of consolidated financial statements that are free from material misstatement, whether due to fraud or error.
In preparing the consolidated financial statements, management is responsible for assessing the Company’s ability to continue as a going concern, disclosing, as applicable, matters related to going concern and using the going concern basis of accounting unless management either intends to liquidate the Company or to cease operations, or has no realistic alternative but to do so.
Those charged with governance are responsible for overseeing the Company’s financial reporting process.
Auditor’s Responsibilities for the Audit of the Consolidated Financial Statements
Our objectives are to obtain reasonable assurance about whether the consolidated financial statements as a whole are free from material misstatement, whether due to fraud or error, and to issue an auditor’s report that includes our opinion. Reasonable assurance is a high level of assurance, but is not a guarantee that an audit conducted in accordance with Canadian generally accepted auditing standards will always detect a material misstatement when it exists. Misstatements can arise from fraud or error and are considered material if, individually or in the aggregate, they could reasonably be expected to influence the economic decisions of users taken on the basis of these consolidated financial statements.
As part of an audit in accordance with Canadian generally accepted auditing standards, we exercise professional judgement and maintain professional skepticism throughout the audit. We also:
| ● | Identify and assess the risks of material misstatement of the consolidated financial statements, whether due to fraud or error, design and perform audit procedures responsive to those risks, and obtain audit evidence that is sufficient and appropriate to provide a basis for our opinion. The risk of not detecting a material misstatement resulting from fraud is higher than for one resulting from error, as fraud may involve collusion, forgery, intentional omissions, misrepresentations, or the override of internal control. |
| ● | Obtain an understanding of internal control relevant to the audit in order to design audit procedures that are appropriate in the circumstances, but not for the purpose of expressing an opinion on the effectiveness of the Company’s internal control. |
| ● | Evaluate the appropriateness of accounting policies used and the reasonableness of accounting estimates and related disclosures made by management. |
| ● | Conclude on the appropriateness of management’s use of the going concern basis of accounting and, based on the audit evidence obtained, whether a material uncertainty exists related to events or conditions that may cast significant doubt on the Company’s ability to continue as a going concern. If we conclude that a material uncertainty exists, we are required to draw attention in our auditor’s report to the related disclosures in the consolidated financial statements or, if such disclosures are inadequate, to modify our opinion. Our conclusions are based on the audit evidence obtained up to the date of our auditor’s report. However, future events or conditions may cause the Company to cease to continue as a going concern. |
| ● | Evaluate the overall presentation, structure and content of the consolidated financial statements, including the disclosures, and whether the consolidated financial statements represent the underlying transactions and events in a manner that achieves fair presentation. |
| ● | Obtain sufficient appropriate audit evidence regarding the financial information of the entities or business activities within the Company to express an opinion on the consolidated financial statements. We are responsible for the direction, supervision and performance of the group audit. We remain solely responsible for our audit opinion. |
We communicate with those charged with governance regarding, among other matters, the planned scope and timing of the audit and significant audit findings, including any significant deficiencies in internal control that we identify during our audit.
We also provide those charged with governance with a statement that we have complied with relevant ethical requirements regarding independence, and to communicate with them all relationships and other matters that may reasonably be thought to bear on our independence, and where applicable, related safeguards.
The engagement partner on the audit resulting in this independent auditor’s report is John C. Sinclair.
| /s/ Baker Tilly WM LLP | |
| Chartered Professional Accountants | |
| Licensed Public Accountants | |
Toronto, Ontario
November 26, 2021
Engine Gaming and Media, Inc. (formerly Engine Media Holdings, Inc.) Consolidated Statements of Financial Position August 31, 2021 and 2020 (Expressed in United States Dollars) | |
| | | Note | | | Aug 31, 2021 | | | Aug 31, 2020 | |
| | | | | | $ | | | $ | |
| ASSETS | | | | | | | | | | | | |
| Current | | | | | | | | | | | | |
| Cash | | | | | | | 15,305,996 | | | | 5,243,278 | |
| Restricted cash | | | 17 | | | | 331,528 | | | | 388,587 | |
| Accounts and other receivables | | | 9 | | | | 8,646,807 | | | | 3,845,890 | |
| Government remittances | | | | | | | 1,070,216 | | | | 1,125,912 | |
| Publisher advance, current | | | 9 | | | | 3,197,102 | | | | - | |
| Prepaid expenses and other | | | | | | | 3,006,033 | | | | 1,571,806 | |
| Promissory notes receivable | | | | | | | - | | | | - | |
| Total current assets | | | | | | | 31,557,682 | | | | 12,175,473 | |
| Non-Current | | | | | | | | | | | | |
| Publisher advance, non-current | | | 9 | | | | 1,337,116 | | | | - | |
| Investment in associate | | | 10 | | | | - | | | | 2,052,008 | |
| Investment at FVTPL | | | 10 | | | | 2,629,851 | | | | - | |
| Property and equipment | | | 11 | | | | 403,811 | | | | 409,389 | |
| Goodwill | | | 12 | | | | 18,495,121 | | | | 18,785,807 | |
| Intangible assets | | | 13 | | | | 12,482,244 | | | | 19,442,322 | |
| Right-of-use assets | | | 14 | | | | 557,022 | | | | 550,478 | |
| Total Non-Current | | | | | | | 35,905,165 | | | | 41,240,004 | |
| Total assets | | | | | | | 67,462,847 | | | | 53,415,477 | |
The accompanying notes are an integral part of these consolidated financial statements.
Engine Gaming and Media, Inc. (formerly Engine Media Holdings, Inc.) Consolidated Statements of Financial Position August 31, 2021 and 2020 (Expressed in United States Dollars) | |
| | | Note | | | Aug 31, 2021 | | | Aug 31, 2020 | |
| | | | | | $ | | | $ | |
| LIABILITIES | | | | | | | | | | | | |
| Current | | | | | | | | | | | | |
| Accounts payable | | | | | | | 10,403,665 | | | | 12,455,215 | |
| Accrued liabilities | | | | | | | 5,722,470 | | | | 4,689,131 | |
| Players liability account | | | 17 | | | | 331,528 | | | | 388,587 | |
| Deferred revenue | | | | | | | 2,644,948 | | | | 553,395 | |
| Lease obligation, current | | | 16 | | | | 222,583 | | | | 185,671 | |
| Line of credit | | | 18 | | | | - | | | | 4,919,507 | |
| Long-term debt, current | | | 20 | | | | 96,664 | | | | 97,702 | |
| Promissory notes payable | | | 18 | | | | 821,948 | | | | 3,818,920 | |
| Deferred purchase consideration | | | | | | | - | | | | 333,503 | |
| Warrant liability | | | 21 | | | | 4,868,703 | | | | 14,135,321 | |
| Convertible debt, current | | | 19 | | | | 914,427 | | | | - | |
| Arbitration reserve | | | 26 | | | | 6,468,330 | | | | - | |
| Contingent performance share obligation, current | | | 27 | | | | - | | | | 262,067 | |
| Total current liabilities | | | | | | | 32,495,266 | | | | 41,839,019 | |
| | | | | | | | | | | | | |
| Convertible debt, non-current | | | 19 | | | | 9,037,069 | | | | 10,793,459 | |
| Lease obligation, non-current | | | 16 | | | | 364,968 | | | | 386,477 | |
| Long-term debt, non-current | | | 20 | | | | - | | | | 133,230 | |
| Non-current liabilities | | | | | | | 9,402,037 | | | | 11,313,166 | |
| Total liabilities | | | | | | | 41,897,303 | | | | 53,152,185 | |
| | | | | | | | | | | | | |
| SHAREHOLDERS’ EQUITY (DEFICIENCY) | | | | | | | | | | | | |
| Share capital | | | 22 | | | | 122,741,230 | | | | 69,380,807 | |
| Shares to be issued | | | 27 | | | | - | | | | 1,059,214 | |
| Contributed surplus | | | | | | | 17,819,933 | | | | 4,034,323 | |
| Foreign currency translation reserve | | | | | | | (2,324,025 | ) | | | (2,334,275 | ) |
| Deficit | | | | | | | (112,814,973 | ) | | | (72,094,162 | ) |
| Attributable to shareholders | | | | | | | 25,422,165 | | | | 45,907 | |
| Non-controlling interest | | | | | | | 143,379 | | | | 217,385 | |
| Total equity | | | | | | | 25,565,544 | | | | 263,292 | |
| Total liabilities and equity | | | | | | | 67,462,847 | | | | 53,415,477 | |
| Going concern | | | 1 | | | | | | | | | |
| Commitments and contingencies | | | 26 | | | | | | | | | |
| Subsequent events | | | 31 | | | | | | | | | |
| Approved on Behalf of Board: | “Larry Rutkowski” | | “Lou Schwartz” |
| | | Director | | Director |
The accompanying notes are an integral part of these consolidated financial statements.
Engine Gaming and Media, Inc. (formerly Engine Media Holdings, Inc.) Consolidated Statements of Loss and Comprehensive Loss August 31, 2021 and 2020 (Expressed in United States Dollars) | |
| | | Note | | | August 31, 2021 | | | August 31, 2020 | |
| CONTINUING OPERATIONS | | | | | | | $ | | | | $ | |
| REVENUE | | | | | | | | | | | | |
| Games development | | | 7 | | | | 3,422,202 | | | | 2,732,846 | |
| Direct to consumer | | | 7 | | | | 453,400 | | | | 363,554 | |
| Software-as-a-service | | | 7 | | | | 6,360,361 | | | | 2,571,672 | |
| Advertising | | | 7 | | | | 26,656,446 | | | | 4,491,356 | |
| Professional services | | | 7 | | | | 328,461 | | | | 386,415 | |
| Net revenue | | | | | | | 37,220,870 | | | | 10,545,843 | |
| EXPENSES | | | | | | | | | | | | |
| Salaries and wages | | | | | | | 18,020,053 | | | | 6,254,017 | |
| Consulting | | | | | | | 3,714,490 | | | | 2,753,235 | |
| Professional fees | | | | | | | 2,608,486 | | | | 2,634,599 | |
| Revenue sharing expense | | | | | | | 22,853,680 | | | | 3,380,017 | |
| Sponsorships and tournaments | | | | | | | 435,670 | | | | 585,186 | |
| Advertising and promotion | | | | | | | 1,387,370 | | | | 2,513,687 | |
| Office and general | | | | | | | 3,529,520 | | | | 1,771,888 | |
| Technology expenses | | | | | | | 2,487,569 | | | | 1,062,807 | |
| Amortization and depreciation | | | 11,13,14, 27 | | | | 4,891,097 | | | | 3,549,374 | |
| Share-based payments | | | 23, 24 | | | | 3,702,705 | | | | 1,409,569 | |
| Interest expense | | | | | | | 1,399,721 | | | | 908,766 | |
| Loss on foreign exchange | | | | | | | 939,235 | | | | 578,900 | |
| Change in fair value of contingent consideration | | | | | | | - | | | | 87,702 | |
| Loss on extinguishment of debt | | | 19 | | | | 2,428,900 | | | | - | |
| Gain on retained interest in former associate | | | 10 | | | | (99,961 | ) | | | - | |
| Transaction costs | | | 22 | | | | 341,702 | | | | - | |
| Non-operational professional fees | | | | | | | 846,475 | | | | - | |
| Arbitration settlement reserve | | | 26 | | | | 6,468,330 | | | | - | |
| Impairment of investment in associate and advances | | | | | | | - | | | | 3,652,199 | |
| Impairment of goodwill and intangibles | | | 12 | | | | 3,885,001 | | | | - | |
| Change in fair value of investment at FVTPL | | | 10 | | | | (581,812 | ) | | | - | |
| Change in fair value of warrant liability | | | 21 | | | | (9,037,108 | ) | | | 6,189,921 | |
| Change in fair value of convertible debt | | | 19 | | | | 6,066,594 | | | | (230,127 | ) |
| Total | | | | | | | 76,287,717 | | | | 37,101,740 | |
| ASSOCIATES | | | | | | | | | | | | |
| Share of net loss of associate | | | 10 | | | | 103,930 | | | | - | |
| Net loss for the year before taxes | | | | | | | (39,170,777 | ) | | | (26,555,897 | ) |
| Income tax expense | | | 15 | | | | - | | | | - | |
| Net loss after taxes | | | | | | | (39,170,777 | ) | | | (26,555,897 | ) |
| DISCONTINUED OPERATIONS | | | | | | | | | | | | |
| Loss on disposal of Motorsports | | | 27 | | | | (678,931 | ) | | | - | |
| Loss from discontinued operations | | | 27 | | | | (945,109 | ) | | | (5,860,211 | ) |
| Net loss for the year | | | | | | | (40,794,817 | ) | | | (32,416,108 | ) |
| | | | | | | | | | | | | |
| Net loss attributable to non-controlling interest | | | | | | | 74,006 | | | | 76,066 | |
| Net loss attributable to owners of the Company | | | | | | | (40,720,811 | ) | | | (32,340,042 | ) |
| | | | | | | | | | | | | |
| OTHER COMPREHENSIVE INCOME (LOSS) | | | | | | | | | | | | |
| Items that may be reclassified subsequently to profit or loss | | | | | | | | | | | | |
| Foreign currency translation differences | | | | | | | 10,250 | | | | (1,001,103 | ) |
| Comprehensive loss for the year | | | | | | | (40,710,561 | ) | | | (33,341,145 | ) |
| LOSS PER SHARE | | | | | | | | | | | | |
| Basic loss per share - continuing operations | | | 8 | | | | (3.29 | ) | | | (8.98 | ) |
| Basic loss per share - discontinued operations | | | 8 | | | | (0.14 | ) | | | (1.99 | ) |
| Basic and diluted loss per share | | | 8 | | | | (3.43 | ) | | | (10.96 | ) |
| Weighted average number of shares outstanding - Basic | | | 8 | | | | 11,874,775 | | | | 2,949,511 | |
The accompanying notes are an integral part of these consolidated financial statements.
Engine Gaming and Media, Inc. (formerly Engine Media Holdings, Inc.) Consolidated Statements of Shareholders’ Equity (Deficiency) Years ended August 31, 2021 and 2020 (Expressed in United States Dollars) | |
| | | Share capital:
Number | | | Share capital:
Amount | | | Shares to be issued | | | Contributed surplus | | | Foreign currency translation reserve | | | Deficit | | | Total
equity before
non-controlling interest | | | Non-controlling interest | | | Total
equity | |
| | | # | | | $ | | | $ | | | $ | | | $ | | | $ | | | $ | | | $ | | | $ | |
| | | | | | | | | | | | | | | | | | | | | | | | | | | | |
| Balance, as at August 31, 2019 | | | 156,438 | | | | 29,613,406 | | | | 760,216 | | | | 2,753,037 | | | | (1,333,172 | ) | | | (39,754,120 | ) | | | (7,960,633 | ) | | | 293,451 | | | | (7,667,182 | ) |
| Impact of share consolidation | | | (114 | ) | | | - | | | | - | | | | - | | | | - | | | | - | | | | - | | | | - | | | | - | |
| Share-based payments | | | - | | | | - | | | | - | | | | 1,409,569 | | | | - | | | | - | | | | 1,409,569 | | | | - | | | | 1,409,569 | |
| Shares issued on vesting of RSUs | | | 26,666 | | | | 159,895 | | | | - | | | | (159,895 | ) | | | - | | | | - | | | | - | | | | - | | | | - | |
| Convertible debt conversion | | | 1,739,615 | | | | 5,152,023 | | | | - | | | | - | | | | - | | | | - | | | | 5,152,023 | | | | - | | | | 5,152,023 | |
| Private placements, net of costs | | | 502,562 | | | | 2,694,076 | | | | - | | | | - | | | | - | | | | - | | | | 2,694,076 | | | | - | | | | 2,694,076 | |
| Shares issued for debt conversion | | | 59,654 | | | | 724,231 | | | | - | | | | - | | | | - | | | | - | | | | 724,231 | | | | - | | | | 724,231 | |
| Shares issued on acquisition of UMG | | | 288,560 | | | | 3,804,344 | | | | - | | | | 41,879 | | | | - | | | | - | | | | 3,846,223 | | | | - | | | | 3,846,223 | |
| Shares issued on acquisition of Frankly | | | 2,258,215 | | | | 12,155,000 | | | | - | | | | - | | | | - | | | | - | | | | 12,155,000 | | | | - | | | | 12,155,000 | |
| Shares issued on acquisition of Winview | | | 1,759,997 | | | | 7,579,000 | | | | - | | | | - | | | | - | | | | - | | | | 7,579,000 | | | | - | | | | 7,579,000 | |
| Shares issued on acquisition of Driver Database | | | 100,000 | | | | 859,745 | | | | - | | | | - | | | | - | | | | - | | | | 859,745 | | | | - | | | | 859,745 | |
| Shares issued on acquisition of Lets Go Racing | | | 200,000 | | | | 1,719,491 | | | | - | | | | - | | | | - | | | | - | | | | 1,719,491 | | | | - | | | | 1,719,491 | |
| Common shares issued on exercise of warrants | | | 654,543 | | | | 4,919,596 | | | | - | | | | - | | | | - | | | | - | | | | 4,919,596 | | | | - | | | | 4,919,596 | |
| Shares to be issued | | | - | | | | - | | | | 298,998 | | | | | | | | | | | | | | | | 298,998 | | | | | | | | 298,998 | |
| Non-controlling interest in subsidiary | | | - | | | | - | | | | - | | | | (10,267 | ) | | | - | | | | - | | | | (10,267 | ) | | | - | | | | (10,267 | ) |
| Net loss for the period | | | - | | | | - | | | | - | | | | - | | | | - | | | | (32,340,042 | ) | | | (32,340,042 | ) | | | (76,066 | ) | | | (32,416,108 | ) |
| Foreign currency translation differences | | | - | | | | - | | | | - | | | | - | | | | (1,001,103 | ) | | | - | | | | (1,001,103 | ) | | | - | | | | (1,001,103 | ) |
| Balance, as at August 31, 2020 | | | 7,746,136 | | | | 69,380,807 | | | | 1,059,214 | | | | 4,034,323 | | | | (2,334,275 | ) | | | (72,094,162 | ) | | | 45,907 | | | | 217,385 | | | | 263,292 | |
| Balance | | | 7,746,136 | | | | 69,380,807 | | | | 1,059,214 | | | | 4,034,323 | | | | (2,334,275 | ) | | | (72,094,162 | ) | | | 45,907 | | | | 217,385 | | | | 263,292 | |
| Share-based payments | | | - | | | | - | | | | - | | | | 3,702,705 | | | | - | | | | - | | | | 3,702,705 | | | | - | | | | 3,702,705 | |
| Shares issued on vesting of RSUs | | | 277,749 | | | | 1,895,891 | | | | - | | | | (1,715,891 | ) | | | - | | | | - | | | | 180,000 | | | | - | | | | 180,000 | |
| Common shares issued on exercise of options | | | 20,833 | | | | 290,558 | | | | - | | | | (104,303 | ) | | | - | | | | - | | | | 186,255 | | | | | | | | 186,255 | |
| Convertible debt conversion | | | 1,728,848 | | | | 13,704,605 | | | | - | | | | 4,256,114 | | | | - | | | | - | | | | 17,960,719 | | | | - | | | | 17,960,719 | |
| Common shares issued on private placement, net of costs | | | 4,435,433 | | | | 24,225,901 | | | | - | | | | 6,791,473 | | | | - | | | | - | | | | 31,017,374 | | | | - | | | | 31,017,374 | |
| Warrants issued in private placement of convertible debt | | | - | | | | - | | | | - | | | | 618,916 | | | | - | | | | - | | | | 618,916 | | | | - | | | | 618,916 | |
| EB bonus shares | | | 6,666 | | | | 54,061 | | | | - | | | | - | | | | - | | | | - | | | | 54,061 | | | | - | | | | 54,061 | |
| Shares for debt | | | 40,000 | | | | 226,556 | | | | - | | | | - | | | | - | | | | - | | | | 226,556 | | | | - | | | | 226,556 | |
| Common shares issued on exercise of warrants | | | 901,060 | | | | 9,000,851 | | | | - | | | | - | | | | - | | | | - | | | | 9,000,851 | | | | - | | | | 9,000,851 | |
| Disposal of Motorsports | | | - | | | | - | | | | (1,059,214 | ) | | | - | | | | - | | | | - | | | | (1,059,214 | ) | | | - | | | | (1,059,214 | ) |
| Shares issued on acquisition of SideQik | | | 386,584 | | | | 3,962,000 | | | | - | | | | 245,000 | | | | - | | | | - | | | | 4,207,000 | | | | - | | | | 4,207,000 | |
| Non-controlling interest in subsidiary | | | - | | | | - | | | | - | | | | (8,404 | ) | | | - | | | | - | | | | (8,404 | ) | | | - | | | | (8,404 | ) |
| Net loss for the period | | | - | | | | - | | | | - | | | | - | | | | - | | | | (40,720,811 | ) | | | (40,720,811 | ) | | | (74,006 | ) | | | (40,794,817 | ) |
| Foreign currency translation differences | | | - | | | | - | | | | - | | | | - | | | | 10,250 | | | | - | | | | 10,250 | | | | - | | | | 10,250 | |
| Balance, as at August 31, 2021 | | | 15,543,309 | | | | 122,741,230 | | | | - | | | | 17,819,933 | | | | (2,324,025 | ) | | | (112,814,973 | ) | | | 25,422,165 | | | | 143,379 | | | | 25,565,544 | |
| Balance | | | 15,543,309 | | | | 122,741,230 | | | | - | | | | 17,819,933 | | | | (2,324,025 | ) | | | (112,814,973 | ) | | | 25,422,165 | | | | 143,379 | | | | 25,565,544 | |
The accompanying notes are an integral part of these consolidated financial statements.
Engine Gaming and Media, Inc. (formerly Engine Media Holdings, Inc.) Consolidated Statements of Cash Flows August 31, 2021 and 2020 (Expressed in United States Dollars) | |
| | | Note | | August 31, 2021 | | | August 31, 2020 | |
| | | | | For the year ended | |
| | | Note | | August 31, 2021 | | | August 31, 2020 | |
| | | | | | $ | | | | $ | |
| OPERATING ACTIVITIES | | | | | | | | | | |
| Net loss for the period before non-controlling interest | | | | | (40,794,817 | ) | | | (32,416,108 | ) |
| Items not affecting cash: | | | | | | | | | | |
| Amortization and depreciation | | 11, 13, 14 | | | 5,092,432 | | | | 3,891,042 | |
| Forgiveness of government grants | | | | | - | | | | (1,589,559 | ) |
| Legal proceedings provision | | | | | 6,468,330 | | | | - | |
| Loss on disposal of Motorsports | | 27 | | | 678,931 | | | | - | |
| Loss on disposal of P&E | | | | | 9,767 | | | | - | |
| Loss on extinguishment of debt | | 19 | | | 2,428,900 | | | | - | |
| Gain on retained interest in former associate | | | | | (99,961 | ) | | | - | |
| Share of net loss of associate | | | | | 103,930 | | | | - | |
| Change in fair value of investment at FVTPL | | | | | (581,812 | ) | | | - | |
| Change in fair value of warrant liability | | 21 | | | (9,037,108 | ) | | | 6,189,921 | |
| Change in fair value of convertible debt | | 19 | | | 6,066,594 | | | | (230,127 | ) |
| Change in fair value of contingent consideration | | | | | - | | | | 87,702 | |
| Impairment of investment in associate and advances | | | | | - | | | | 3,652,199 | |
| Impairment of goodwill and intangibles | | 12 | | | 3,885,001 | | | | - | |
| Accretion of debt | | | | | 108,616 | | | | 96,733 | |
| Share-based payments | | 23, 24 | | | 3,702,705 | | | | 1,409,569 | |
| Total Adjustments | | | | | (21,968,492 | ) | | | (18,908,628 | ) |
| Changes in non-cash working capital: | | | | | | | | | | |
| Restricted cash | | | | | 57,059 | | | | (65,876 | ) |
| Accounts and other receivables | | | | | (4,008,628 | ) | | | 2,115,952 | |
| Government remittances | | | | | 30,601 | | | | (414,634 | ) |
| Publisher advance | | 9 | | | (4,534,218 | ) | | | - | |
| Prepaid expenses and other | | | | | (1,388,709 | ) | | | (163,517 | ) |
| Accounts payable | | | | | (1,030,542 | ) | | | 3,451,614 | |
| Accrued liabilities | | | | | 953,086 | | | | 607,229 | |
| Players liability account | | | | | (57,059 | ) | | | 65,875 | |
| Deferred revenue | | | | | 1,607,553 | | | | 221,142 | |
| Changes in non-cash working capital | | | | | (8,370,857 | ) | | | 5,817,785 | |
| Net cash used in operating activities | | | | | (30,339,349 | ) | | | (13,090,843 | ) |
| INVESTING ACTIVITIES | | | | | | | | | | |
| Purchase of property and equipment | | | | | (188,170 | ) | | | (110,380 | ) |
| Cash acquired, net of cash paid in business combinations | | | | | 255,852 | | | | 1,458,920 | |
| Advances | | | | | - | | | | (1,155,657 | ) |
| Acquisition of intangible assets | | | | | - | | | | (557,709 | ) |
| Cash from disposal of Motorsports | | | | | 24,348 | | | | - | |
| Net cash used in investing activities | | | | | 92,030 | | | | (364,826 | ) |
| FINANCING ACTIVITIES | | | | | | | | | | |
| Proceeds from government grants | | | | | - | | | | 1,414,764 | |
| Proceeds from line of credit | | | | | - | | | | 1,000,000 | |
| Proceeds from private placement unit offerings | | 22 | | | 31,017,374 | | | | 3,685,785 | |
| Proceeds from convertible debentures | | 19 | | | 4,901,393 | | | | 5,750,000 | |
| Net (payments) proceeds from promissory notes payable | | 18 | | | (2,996,972 | ) | | | 1,111,553 | |
| Proceeds from exercise of warrants | | 21 | | | 6,866,735 | | | | 3,574,023 | |
| Proceeds from exercise of options | | 23 | | | 186,255 | | | | - | |
| Payments on lease financing | | 16 | | | (228,328 | ) | | | (139,937 | ) |
| Payments on long-term debt | | 20 | | | (162,040 | ) | | | (53,736 | ) |
| Net cash provided by financing activities | | | | | 39,584,417 | | | | 16,342,452 | |
| Impact of foreign exchange on cash | | | | | 725,620 | | | | (462,249 | ) |
| Change in cash | | | | | 10,062,718 | | | | 2,424,534 | |
| | | | | | | | | | | |
| Cash, beginning of year | | | | | 5,243,278 | | | | 2,818,744 | |
| Cash, end of year | | | | | 15,305,996 | | | | 5,243,278 | |
The accompanying notes are an integral part of these consolidated financial statements.
Engine Gaming and Media, Inc. (formerly Engine Media Holdings, Inc.) Notes to the Consolidated Financial Statements August 31, 2021 and 2020 (Expressed in United States Dollars) | |
1. Corporate information and going concern
Engine Gaming and Media, Inc. (formerly Engine Media Holdings, Inc.) (“Engine”, “Engine Media” or the “Company”) was incorporated under the Business Corporations Act (Ontario) on April 8, 2011. The registered head office of the Company is 77 King St. West, Suite 3000, PO Box 95, TD Centre – North Tower, Toronto, Ontario, M5K 1G8, Canada.
With the acquisitions of Frankly Inc. (“Frankly”) and WinView, Inc. (“WinView”), on May 8, 2020, and Sideqik, Inc. on July 2, 2021 (Note 6), the Company focuses on accelerating new, live, immersive esports and interactive gaming experiences for consumers through its partnerships with traditional and emerging media companies and providing online interactive technology and monetization services.
On August 13, 2020, the Company consolidated its shares on the basis of 15 pre-consolidation shares for every 1 post-consolidation share.
Pursuant to shareholder approval at the October 6, 2021, shareholders’ meeting, effective October 19, 2021, the Company changed its name to Engine Gaming and Media, Inc. The Company’s common shares trade on the TSX Venture Exchange under the trading symbol GAME.V and NASDAQ under the trading symbol GAME.
Pursuant to shareholder approval at the July 15, 2020, shareholders’ meeting, effective August 13, 2020, the Company changed its name to Engine Media Holdings, Inc.
These consolidated financial statements have been prepared on a going concern basis, which contemplates that the Company will be able to realize its assets and discharge its liabilities in the normal course of business. Accordingly, they do not give effect to adjustments that would be necessary should the Company be unable to continue as a going concern, and therefore be required to realize its assets and liquidate its liabilities and commitments in other than the normal course of business and at amounts different from those in the accompanying consolidated financial statements. Such adjustments could be material. It is not possible to predict whether the Company will be able to raise adequate financing or to ultimately attain profitable levels of operations.
The Company has not yet realized profitable operations and has incurred significant losses to date resulting in a cumulative deficit of $112,814,973 as of August 31, 2021 (August 31, 2020 – $72,094,162). The recoverability of the carrying value of the assets and the Company’s continued existence is dependent upon the achievement of profitable operations, or the ability of the Company to raise alternative financing, if necessary. While management has been historically successful in raising the necessary capital, it cannot provide assurance that it will be able to execute on its business strategy or be successful in future financing activities. As of August 31, 2021, the Company had a working capital deficiency of $937,584 (August 31, 2020 – working capital deficiency of $$29,663,546) which is comprised of current assets less current liabilities. The Company also faced uncertain future impacts from COVID-19 (Note 3(b)).
These conditions indicate the existence of a material uncertainty that may cast significant doubt about the Company’s ability to continue as a going concern and, therefore, the Company may be unable to realize its assets and discharge its liabilities in the normal course of business.
Engine Gaming and Media, Inc. (formerly Engine Media Holdings, Inc.) Notes to the Consolidated Financial Statements August 31, 2021 and 2020 (Expressed in United States Dollars) | |
2. Basis of preparation
| (a) | Statement of compliance |
The consolidated financial statements of the Company have been prepared in accordance with International Financial Reporting Standards (“IFRS”) as issued by the International Accounting Standards Board (“IASB”).
The consolidated financial statements for the year ended August 31, 2021 (including comparatives) were approved and authorized for issue by the board of directors on November 26, 2021.
| (b) | Basis of consolidation |
The consolidated financial statements comprise the accounts of the Company and its controlled subsidiaries. The financial statements of subsidiaries are included in the consolidated financial statements from the date that control commences until the date that control ceases. Consolidated financial statements are prepared using uniform accounting policies for like transactions and other events in similar circumstances.
Control is achieved when the Company is exposed, or has rights, to variable returns from its involvement with the investee and has the ability to affect those returns through its power over the investee. Specifically, the Company controls an investee if and only if the Company has all the following:
(a) power over the investee.
(b) exposure, or rights, to variable returns from its involvement with the investee; and
(c) the ability to use its power over the investee to affect the amount of the investor’s returns.
All transactions and balances between the Company and its subsidiaries are eliminated on consolidation, including unrealized gains and losses on transactions between companies. Unrealized gains arising from transactions with equity accounted investees are eliminated against the investment to the extent of the Company’s interest in the investee. Unrealized losses are eliminated in the same way as unrealized gains, but only to the extent that there is no evidence of impairment.
The Company’s material subsidiaries as at August 31, 2021 are as follows:
Schedule of material subsidiaries
| Name of Subsidiary | | Country of
Incorporation | | Ownership Percentage | | Functional Currency |
| Frankly Inc. | | Canada | | 100% | | Canadian Dollar |
| UMG Media Ltd. | | Canada | | 100% | | Canadian Dollar |
| Eden Games S.A. | | France | | 96% | | Euro |
| Stream Hatchet S.L. | | Spain | | 100% | | Euro |
| SideQik, Inc. | | USA | | 100% | | US Dollar |
| WinView, Inc. | | USA | | 100% | | US Dollar |
Non-controlling interests are measured initially at their proportionate share of the acquiree’s identifiable net assets at the date of acquisition. Changes in the Group’s interest in a subsidiary that do not result in a loss of control are accounted for as equity transactions.
Entities over which the Company exercises significant influence are associates and are accounted for by the equity method. Significant influence is the power to participate in the financial and operating policy decisions of the investee. Significant influence is assumed to exist where the Company holds, directly or indirectly, at least a 20% voting interest in an entity, unless it can be clearly demonstrated that this is not the case.
Engine Gaming and Media, Inc. (formerly Engine Media Holdings, Inc.) Notes to the Consolidated Financial Statements August 31, 2021 and 2020 (Expressed in United States Dollars) | |
Investments in associates are accounted for using the equity method, where the investment is initially recognized at cost and the carrying amount is increased or decreased to recognize the investor’s share of the profit or loss, other comprehensive income and equity movements of the investee after the date of acquisition. Any goodwill or fair value adjustment attributable to the Company’s share in the equity accounted investee is included in the amount recognized as investment. When the Company’s share of losses exceeds its interest in an equity accounted investee, the carrying amount of that interest, including any long-term investments, is reduced to nil, and the recognition of further losses is discontinued except to the extent that the Company has an obligation or has made payments on behalf of the investee.
Business combinations are accounted for using the acquisition method under IFRS 3 Business Combinations.
Identifiable assets acquired and liabilities and contingent liabilities assumed in a business combination are measured initially at their fair values at the acquisition date, irrespective of the extent of any non-controlling interest. The excess of the fair value of the consideration transferred including the recognized amount of any non-controlling interest in the acquiree, over the fair value of the Company’s share of the identifiable net assets acquired is recorded as goodwill. When the excess is negative, a bargain purchase gain is recognized immediately in profit or loss.
The measurement period is the period from the date of acquisition to the date the Company obtains complete information about facts and circumstances that existed as of the acquisition date – and is subject to a maximum of one year. The Company elects on a transaction-by-transaction basis whether to measure non-controlling interest at its fair value, or at its proportionate share of the recognized amount of the identifiable net assets, at the acquisition date.
Acquisition costs are expensed as incurred, unless they qualify to be treated as debt issue costs, or as cost of issuing equity securities.
These consolidated financial statements have been prepared on a historical cost basis, except for financial instruments which are measured at fair value. In addition, these consolidated financial statements have been prepared using the accrual basis of accounting except for cash flow information.
| (d) | Functional and presentation currency |
The functional currency of the Company is the US Dollar (“USD). The functional currencies of the Company’s subsidiaries are disclosed in Note 2(b). The presentation currency of the consolidated financial statements is the US Dollar (“USD”).
3. Significant judgments, estimates and assumptions
The preparation of these consolidated financial statements requires management to make judgments and estimates and form assumptions that affect the reported amounts of assets and liabilities at the date of the consolidated financial statements and reported amounts of revenues and expenses during the reporting period. Such estimates primarily relate to unsettled transactions and events as at the date of the consolidated financial statements. On an ongoing basis, management evaluates its judgments and estimates in relation to assets, liabilities, revenues, and expenses. Management uses historical experience and various other factors it believes to be reasonable under the given circumstances as the basis for its judgments and estimates. Actual outcomes may differ from these estimates under different assumptions and conditions. Significant estimates and judgments made by management in the preparation of these consolidated financial statements are outlined below.
Engine Gaming and Media, Inc. (formerly Engine Media Holdings, Inc.) Notes to the Consolidated Financial Statements August 31, 2021 and 2020 (Expressed in United States Dollars) | |
The assessment of the Company’s ability to execute its strategy by funding future working capital requirements involves judgment. Estimates and assumptions are continually evaluated and are based on historical experience and other factors, including expectations of future events that are believed to be reasonable under the circumstances. There is a material uncertainty regarding the Company’s ability to continue as a going concern.
| (a) | Significant estimates and critical judgments |
Information about significant estimates and critical judgements in applying accounting policies that have the most significant effect on the amounts recognized in the consolidated financial statements is included in the following notes:
| Note 1 | Going concern |
| Note 30 | Expected credit losses |
| Note 21 | Valuation of warrant liability |
| Note 6 | Business acquisitions |
| Note 12 and 13 | Goodwill and intangible assets |
| Note 23 and 24 | Valuation of share-based payments |
| Note 19 | Convertible debt |
| Note 26 | Contingencies |
| (b) | Uncertainty about the effects of COVID-19 |
In December 2019, a novel strain of coronavirus (“COVID-19”) emerged and has since extensively impacted global health and the economic environment. To contain the spread of COVID-19, domestic and international governments around the world enacted various measures, including orders to close all businesses not deemed “essential,” quarantine orders for individuals to stay in their homes or places of residence, and to practice social distancing when engaging in essential activities. The Company anticipates that these actions and the global health crisis caused by COVID-19 will continue to negatively impact many business activities and financial markets across the globe.
In an effort to protect the health and safety of our employees, much of the Company’s workforce is currently working from home. The Company has implemented business continuity plans and has increased support and resources to enable employees to work remotely and thus far has been able to operate with minimal disruption.
The global COVID-19 pandemic remains an evolving situation. The Company will continue to actively monitor the developments of the pandemic and may take further actions that could alter business operations as may be required by federal, state, local, or foreign authorities, or that management determines are in the best interests of our employees, customers, partners and shareholders. It is not clear what effects any such potential actions may have on the Company’s business, including the effects on our employees, players and consumers, customers, partners, development and content pipelines, the Company’s reputation, financial condition, results of operations, revenue, cash flows, liquidity or stock price.
4. Changes in significant accounting policies
Future accounting pronouncements
The following standards have not yet been adopted and are being evaluated to determine their impact on the Company:
Amendments to IAS 37 – Onerous Contracts – Cost of Fulfilling a Contract;
Amendments to IAS 16 – Property, Plant and Equipment: Proceeds before Intended Use
Amendments to IFRS 3 – Reference to the Conceptual Framework
Other accounting standards or amendments to existing accounting standards that have been issued but have future effective dates are either not applicable or the Company is still assessing what the impact will be to the Company’s financial statements.
Engine Gaming and Media, Inc. (formerly Engine Media Holdings, Inc.) Notes to the Consolidated Financial Statements August 31, 2021 and 2020 (Expressed in United States Dollars) | |
5. Significant accounting policies
| (a) | Foreign currency translation |
The functional currency of the Company and its subsidiaries is disclosed in Note 2. The presentation currency of the consolidated financial statements is the US Dollar (“USD”).
The financial statements of entities that have a functional currency different from the presentation currency are translated into US dollars as follows: assets and liabilities at the closing rate at the date of the Company’s consolidated statement of financial position and income and expenses at the average rate of the year (as this is considered a reasonable approximation of the actual rates prevailing at the transaction dates). All resulting changes are recognized in other comprehensive income (loss) as foreign currency translation adjustments, except to the extent that the translation difference is allocated to non-controlling interest.
Foreign currency transactions are translated into the functional currency of each entity using the exchange rates prevailing at the dates of the transactions. Foreign exchange gains and losses resulting from the settlement of foreign currency transactions and from the translation at year-end exchange rates of monetary assets and liabilities denominated in currencies other than an entity’s functional currency are recognized in the consolidated statements of loss.
Revenue is measured based on the consideration specified in a contract with a customer. The Company recognizes revenue when it transfers control of its services to a customer.
The following provides information about the nature and timing of the satisfaction of performance obligations in contracts with customers, including significant payment terms and related revenue recognition policies:
Game development income is derived from the development and sale of gaming applications. Revenue from game development is recognized by reference to the stage of completion. Stage of completion is measured by reference to actual costs incurred to date as a percentage of total estimated costs for each contract.
Sponsorship, tournament and event income is income directly associated with an e-sport or sporting event or tournament. Sponsorship, tournament and event income is recognized upon completion of the underlying event.
Engine Gaming and Media, Inc. (formerly Engine Media Holdings, Inc.) Notes to the Consolidated Financial Statements August 31, 2021 and 2020 (Expressed in United States Dollars) | |
| | iii) | Software-as-a-service |
The Company enters into license agreements with customers for its content management system, video software, and mobile applications (Frankly), e-sports data platform (Stream Hatchet) and an influencer marketing platform (SideQik). These license agreements, generally non-cancellable, without paying a termination penalty, and multiyear, provide the customer with the right to use the Company’s application solely on a Company-hosted platform or, in certain instances, on purchased encoders. The license agreements also entitle the customer to technical support.
Revenue from these license agreements is recognized ratably over the license term. Early termination fees are recognized when customer ceases use of agreed upon services prior to the expiration of their contract. These fees are recognized in full on the date the customer has completed their migration of the Company’s solutions and there is no continuing service obligation to the customer.
The Company charges its customers for the optional use of its content delivery network to stream and store videos. The revenue is recognized as earned based on the actual usage because it has stand-alone value and delivery is in control of the customer. The Company also charges its customers for the use of its ad serving platform to serve ads under local advertising campaigns. The Company reports revenue as earned based on the actual usage.
Under national advertising agreements with advertisers, the Company sources, creates, and places advertising campaigns that run across the Company’s network of publisher sites. National advertising revenue, net of third-party costs, is shared with publishers based on their respective contractual agreements. The Company invoices national advertising amounts due from advertisers and remits payments to publishers for their share. Depending on the agreement with the publisher, the obligation to remit payment to the publisher is based on either billing to the advertiser or the collection of cash from the advertiser.
National advertising revenue is recognized in the period during which the ad impressions are delivered. The Company reports revenue earned through national advertising agreements either on a net or gross basis.
Under national advertising agreements wherein the Company does not bear inventory risk and only has credit risk on its portion of the revenue, national advertising revenues are accounted for on a net basis and the publisher is identified as the customer.
In select national advertising agreements with its publishers, the Company takes on inventory risk and additional credit risk. Under these agreements, the Company either a) provides the publisher with a guaranteed minimum gross selling price per advertising unit delivered, wherein the greater of the actual selling price or guaranteed minimum selling price is used in determining the publisher’s share or b) provides the publisher with a fixed rate per advertising unit delivered, wherein the publisher is paid the fixed rate per advertising unit delivered irrespective of the actual selling price. Under these national advertising agreements, national advertising revenues are accounted for on a gross basis with the advertiser identified as the customer and the publisher identified as a supplier, with amounts billed to the advertiser reported as revenue and amounts due to the publisher reported as a revenue sharing expense, within expenses.
Also included in advertising revenue is advertising revenue generated by the Company’s various owned and operated properties.
Engine Gaming and Media, Inc. (formerly Engine Media Holdings, Inc.) Notes to the Consolidated Financial Statements August 31, 2021 and 2020 (Expressed in United States Dollars) | |
Professional services consist primarily of installation and website design services (Frankly) and data analysis report delivery (Steam Hatchet). Installation fees are contracted on a fixed-fee basis. The Company recognizes revenue as services are performed. Such services are readily available from other vendors and are not considered essential to the functionality of the service. Website design services are also not considered essential to the functionality of the product and have historically been insignificant; the fee allocable to website design is recognized as revenue as the Company performs the services.
The Company assesses its revenue arrangements against specific criteria in order to determine if it is acting as principal or agent. When the Company acts in the capacity of an agent rather than as the principal in a transaction, the revenue recognized is the net amount of commission made by the Company.
Deferred revenue consists of customer advances for Company services to be rendered that will be recognized as income in future periods.
| (c) | Cash and equivalents, and restricted cash |
The “cash and cash equivalents” category consists of cash in banks, call deposits and other highly liquid investments with initial maturities of three months or less. Any investments in securities, investments with initial maturities greater than three months without early redemption feature and bank accounts subject to restrictions, other than restrictions due to regulations specific to a country or activity sector (exchange controls, etc.) are not presented as cash equivalents but as financial assets. Bank overdrafts that are repayable on demand and form an integral part of the Company’s cash management are included as a component of cash and cash equivalents for the purpose of the statement of cash flows. Restricted cash is presented as a separate category on the statement of financial position and consists of cash in a bank account restricted for use in the UMG Media Ltd. and WinView Inc. businesses (Note 17).
| (d) | Accounts and other receivables |
Trade receivables are recognized initially at fair value and subsequently measured at amortized cost less provision for impairment of trade accounts receivable. A provision for impairment of trade accounts receivable is established based on a forward-looking “expected loss” impairment model. The carrying amount of the trade receivables is reduced using the provision for impairment account, and the amount of any increase in the provision for impairment is recognized in the consolidated statement of loss and comprehensive loss. When a trade receivable is uncollectible, it is written off against the provision for impairment account for trade accounts receivable. Subsequent recoveries of amounts previously written off are credited to the consolidated statement of loss and comprehensive loss.
| (e) | Property and equipment |
Property and equipment are carried at historical cost less any accumulated depreciation and impairment losses. Historical cost includes the acquisition cost or production cost as well as the costs directly attributable to bringing the asset to the location and condition necessary for its use in operations. When property and equipment include significant components with different useful lives, they are recorded and depreciated separately. Depreciation is computed using the straight-line and declining balance methods based on the estimated useful life of the assets. Useful life is reviewed at the end of each reporting period.
After initial recognition, the cost model is applied to property and equipment. Where parts of an item of property and equipment have different useful lives, they are accounted for as separate items of property and equipment.
Engine Gaming and Media, Inc. (formerly Engine Media Holdings, Inc.) Notes to the Consolidated Financial Statements August 31, 2021 and 2020 (Expressed in United States Dollars) | |
The Company recognizes in the carrying amount of an item of property, plant and equipment the cost of replacing part of such an item when that cost is incurred if it is probable that the future economic benefits embodied with the item will flow to the Company and the cost of the item can be measured reliably. All other costs are recognized in the consolidated statement of loss and comprehensive loss as an expense as incurred. Depreciation is provided at rates calculated to write off the cost of property, plant and equipment less their estimated residual value on the straight-line and declining balance methods, over the estimated useful lives, as follows.
Schedule of estimated useful lives of property, plant and equipment
| Computer equipment | 3 years, straight-line |
| Furniture and fixtures | 5 years, straight-line |
| Leasehold improvements | Term of the lease, plus one renewal |
Goodwill arising on an acquisition of a business is carried at cost as established at the date of acquisition of the business less accumulated impairment losses, if any.
Intangible assets include acquired software used in production or administration and brand names and customer relationships that qualify for recognition as an intangible asset in a business combination. They are accounted for using the cost model whereby capitalized costs are amortized on a straight-line basis over their estimated useful lives, as these assets are considered finite. Residual values and useful lives are reviewed at each reporting date.
The useful lives of the intangibles are as follows:
Schedule of useful lives of intangibles
| Software | 3-5 years |
| Brands | 1-20 years |
| Customer relationships | 1-10 years |
| Patents | 5 years |
| Application platforms | 3 years |
Acquired computer software licenses are capitalized on the basis of the costs incurred to acquire and install the specific software. Subsequent expenditure on brands is expensed as incurred. Costs associated with maintaining computer software (expenditure relating to patches and other minor updates as well as their installation), are expensed as incurred.
Patents and Application platforms with a finite useful life that are acquired in an asset acquisition are initially recognized on the basis of their relative fair value at the acquisition date. These assets are amortized on a straight-line basis over their useful life, which is generally up to 5 years. Amortization is calculated over the cost of the asset less its residual value. Amortization expense is recognized on a straight-line basis over the estimated useful lives of intangible assets, other than goodwill, from the date that they are available for use.
Other intangible assets, such as brands, that are acquired by the Company are stated at cost less accumulated amortization and impairment losses. Expenditures on internally generated brands, mastheads or editorial pages, publishing titles, customer lists and items similar in substance is recognized in the consolidated statement of loss and comprehensive loss as an expense as incurred.
Research costs are expensed when incurred. Development costs are capitalized when the feasibility and profitability of the project can be reasonably considered certain. Expenditure on development activities, whereby research findings are applied to a plan or design to produce new or substantially improved products and processes, is capitalized if the product or process is technically and commercially feasible and the Company has sufficient resources to complete development. The expenditure capitalized includes the cost of materials, direct labor and an appropriate proportion of overheads. Other development expenditure is recognized in the consolidated statement of loss and comprehensive loss as an expense as incurred. Capitalized development expenditure is stated at cost less accumulated amortization and impairment losses.
Engine Gaming and Media, Inc. (formerly Engine Media Holdings, Inc.) Notes to the Consolidated Financial Statements August 31, 2021 and 2020 (Expressed in United States Dollars) | |
| (h) | Impairment of property and equipment, intangible assets and goodwill |
| | i) | Timing of impairment testing |
The carrying values of property and equipment and finite life intangible assets are assessed at the reporting date as to whether there is any indication that the assets may be impaired. Goodwill and indefinite life intangible assets are tested for impairment annually or when there is an indication that the asset may be impaired.
If any indication of impairment exists or when the annual impairment testing for an asset is required, the Company estimates the recoverable amount of the asset or cash generating unit (“CGU”) to which the asset relates to determine the extent of any impairment loss. The recoverable amount is the higher of an asset’s or CGU’s fair value less costs of disposal and its value in use (“VIU”) to the Company. In assessing VIU, estimated future cash flows are discounted to their present value using a discount rate that reflects current market assessments of the time value of money and the risks specific to the asset or CGU. In determining fair value less costs of disposal, recent market transactions are considered, if available. If the recoverable amount of an asset or a CGU is estimated to be less than its carrying amount, the carrying amount is reduced to its recoverable amount. An impairment loss is recognized immediately in the consolidated statement of loss and comprehensive loss.
For impaired assets, excluding goodwill, an assessment is made at each reporting date as to whether there is any indication that previously recognized impairment losses may no longer exist or may have decreased. If such indication exists, the Company estimates the asset’s recoverable amount. A previously recognized impairment loss is reversed only if there has been a change in the assumptions used to determine the asset’s recoverable amount since the last impairment loss was recognized. The reversal is limited so that the carrying amount of the asset does not exceed its recoverable amount, nor exceed the carrying amount that would have been determined, net of amortization, had no impairment loss been recognized for the asset in prior years. Such reversal is recognized in the consolidated statement of loss and comprehensive loss. Impairment losses relating to goodwill cannot be reversed.
The Company assesses whether a contract is or contains a lease, at inception of the contract. The Company recognises a right-of-use asset and a corresponding lease liability with respect to all lease arrangements in which it is the lessee, except for short-term leases (defined as leases with a lease term of 12 months or less) and leases of low value assets (such as tablets and personal computers, small items of office furniture and telephones). For these leases, the Company recognises the lease payments as an operating expense on a straight-line basis over the term of the lease unless another systematic basis is more representative of the time pattern in which economic benefits from the leased assets are consumed.
Engine Gaming and Media, Inc. (formerly Engine Media Holdings, Inc.) Notes to the Consolidated Financial Statements August 31, 2021 and 2020 (Expressed in United States Dollars) | |
The lease liability is initially measured at the present value of the lease payments that are not paid at the commencement date, discounted by using the rate implicit in the lease. If this rate cannot be readily determined, the Company uses its incremental borrowing rate.
Lease payments included in the measurement of the lease liability comprise:
| | ● | Fixed lease payments (including in-substance fixed payments), less any lease incentives receivable; |
| | ● | Variable lease payments that depend on an index or rate, initially measured using the index or rate at the commencement date; |
| | ● | The amount expected to be payable by the lessee under any residual value guarantees; |
| | ● | The exercise price of purchase options, if the lessee is reasonably certain to exercise the options; and |
| | ● | Payments of penalties for terminating the lease, if the lease term reflects the exercise of an option to terminate the lease. |
The lease liability is presented as a separate line in the consolidated statement of financial position.
The lease liability is subsequently measured by increasing the carrying amount to reflect interest on the lease liability (using the effective interest method) and by reducing the carrying amount to reflect the lease payments made. The Company remeasures the lease liability (and makes a corresponding adjustment to the related right-of-use asset)
whenever:
| | ● | The lease term has changed or there is a significant event or change in circumstances resulting in a change the assessment of exercise of a purchase option, in which case the lease liability is remeasured by discounting the revised lease payments using a revised discount rate. |
| | ● | The lease payments change due to changes in an index or rate or a change in expected payment under a guaranteed residual value, in which cases the lease liability is remeasured by discounting the revised lease payments using an unchanged discount rate (unless the lease payments change is due to a change in a floating interest rate, in which case a revised discount rate is used). |
| | ● | A lease contract is modified, and the lease modification is not accounted for as a separate lease, in which case the lease liability is remeasured based on the lease term of the modified lease by discounting the revised lease payments using a revised discount rate at the effective date of the modification. |
The Company did not make any such adjustments during the periods presented.
The right-of-use assets comprise the initial measurement of the corresponding lease liability, lease payments made at or before the commencement day, less any lease incentives received and any initial direct costs. They are subsequently measured at cost less accumulated depreciation and impairment losses.
Right-of-use assets are depreciated over the shorter period of lease term and useful life of the underlying asset. If a lease transfers ownership of the underlying asset or the cost of the right-of-use asset reflects that the Company expects to exercise a purchase option, the related right-of-use asset is depreciated over the useful life of the
underlying asset. The depreciation starts at the commencement date of the lease.
The right-of-use assets are presented as a separate line in the consolidated statement of financial position.
The Company applies IAS 36 Impairment to determine whether a right-of-use asset is impaired and accounts for any identified
impairment loss as described in the ‘property and equipment’ policy.
Engine Gaming and Media, Inc. (formerly Engine Media Holdings, Inc.) Notes to the Consolidated Financial Statements August 31, 2021 and 2020 (Expressed in United States Dollars) | |
Variable rents that do not depend on an index or rate are not included in the measurement the lease liability and the right-of-use asset. The related payments are recognised as an expense in the period in which the event or condition that triggers those payments occurs and are included in the line “other expenses” in profit or loss.
As a practical expedient, IFRS 16 Leases permits a lessee not to separate non-lease components, and instead account for any lease and associated non-lease components as a single arrangement. The Company has not used this practical expedient. For contracts that contain a lease component and one or more additional lease or non-lease components, the Company allocates the consideration in the contract to each lease component on the basis of the relative stand-alone price of the lease component and the aggregate stand-alone price of the non-lease components.
Financial assets
Recognition and Initial Measurement
The Company recognizes financial assets when it becomes party to the contractual provisions of the instrument. Financial assets are measured initially at their fair value plus, in the case of financial assets not subsequently measured at fair value through profit or loss, transaction costs that are directly attributable to their acquisition. Transaction costs attributable to the acquisition of financial assets subsequently measured at fair value through profit or loss are expensed in profit or loss when incurred.
Classification and Subsequent Measurement
On initial recognition, financial assets and liabilities are classified as subsequently measured at amortized cost, fair value through other comprehensive income (“FVOCI”) or fair value through profit or loss (“FVTPL”). The Company determines the classification of its financial assets, together with any embedded derivatives, based on the business model for managing the financial assets and their contractual cash flow characteristics.
Financial assets are classified as follows:
| | ● | Amortized cost - Assets that are held for collection of contractual cash flows where those cash flows are solely payments of principal and interest are measured at amortized cost. Interest revenue is calculated using the effective interest method and gains or losses arising from impairment, foreign exchange and derecognition are recognized in profit or loss. Financial assets measured at amortized cost are comprised of cash, restricted cash, accounts and other receivables and advances. |
| | | |
| | ● | Fair value through other comprehensive income - Assets that are held for collection of contractual cash flows and for selling the financial assets, and for which the contractual cash flows are solely payments of principal and interest, are measured at fair value through other comprehensive income. Interest income calculated using the effective interest method and gains or losses arising from impairment and foreign exchange are recognized in profit or loss. All other changes in the carrying amount of the financial assets are recognized in other comprehensive income. Upon derecognition, the cumulative gain or loss previously recognized in other comprehensive income is reclassified to profit or loss. The Company does not hold any financial assets measured at fair value through other comprehensive income. |
Engine Gaming and Media, Inc. (formerly Engine Media Holdings, Inc.) Notes to the Consolidated Financial Statements August 31, 2021 and 2020 (Expressed in United States Dollars) | |
| | ● | Mandatorily at fair value through profit or loss - Assets that do not meet the criteria to be measured at amortized cost, or fair value through other comprehensive income, are measured at fair value through profit or loss. All interest income and changes in the financial assets’ carrying amount are recognized in profit or loss. None of the Company’s assets fall under this category. |
| | | |
| | ● | Designated at fair value through profit or loss – On initial recognition, the Company may irrevocably designate a financial asset to be measured at fair value through profit or loss in order to eliminate or significantly reduce an accounting mismatch that would otherwise arise from measuring assets or liabilities, or recognizing the gains and losses on them, on different bases. All interest income and changes in the financial assets’ carrying amount are recognized in profit or loss. |
Business Model Assessment
The Company assesses the objective of its business model for holding a financial asset at a level of aggregation which best reflects the way the business is managed, and the way information is provided to management. Information considered in this assessment includes stated policies and objectives.
Contractual Cash Flow Assessment
The cash flows of financial assets are assessed as to whether they are solely payments of principal and interest on the basis of their contractual terms. For this purpose, ‘principal’ is defined as the fair value of the financial asset on initial recognition. ‘Interest’ is defined as consideration for the time value of money, the credit risk associated with the principal amount outstanding, and other basic lending risks and costs. In performing this assessment, the Company considers factors that would alter the timing and amount of cash flows such as prepayment and extension features, terms that might limit the Company’s claim to cash flows, and any features that modify consideration for the time value of money.
Impairment
The Company recognizes a loss allowance for the expected credit losses associated with its financial assets, other than financial assets measured at fair value through profit or loss. Expected credit losses are measured to reflect a probability-weighted amount, the time value of money, and reasonable and supportable information regarding past events, current conditions, and forecasts of future economic conditions.
The Company applies the simplified approach for accounts receivable. Using the simplified approach, the Company records a loss allowance equal to the expected credit losses resulting from all possible default events over the assets’ contractual lifetime.
The Company assesses whether a financial asset is credit-impaired at the reporting date. Regular indicators that a financial instrument is credit-impaired include significant financial difficulties as evidenced through borrowing patterns or observed balances in other accounts and breaches of borrowing contracts such as default events or breaches of borrowing covenants. For financial assets assessed as credit-impaired at the reporting date, the Company continues to recognize a loss allowance equal to lifetime expected credit losses.
For financial assets measured at amortized cost, loss allowances for expected credit losses are presented in the statement of financial position as a deduction from the gross carrying amount of the financial asset.
Financial assets are written off when the Company has no reasonable expectations of recovering all or any portion thereof.
Engine Gaming and Media, Inc. (formerly Engine Media Holdings, Inc.) Notes to the Consolidated Financial Statements August 31, 2021 and 2020 (Expressed in United States Dollars) | |
Derecognition of Financial Assets
The Company derecognizes a financial asset when its contractual rights to the cash flows from the financial asset expire.
Financial Liabilities
Recognition and Initial Measurement
The Company recognizes a financial liability when it becomes party to the contractual provisions of the instrument. At initial recognition, the Company measures financial liabilities at their fair value plus transaction costs that are directly attributable to their issuance, except for financial liabilities subsequently measured at fair value through profit or loss for which transaction costs are immediately recorded in profit or loss.
Financial liabilities are classified as either financial liabilities at FVTPL or at amortized cost. The Company determines the classification of its financial liabilities at initial recognition.
| | ● | Amortized cost - Financial liabilities are classified as measured at amortized cost unless they fall into one of the following categories: financial liabilities at FVTPL, financial liabilities that arise when a transfer of a financial asset does not qualify for derecognition, financial guarantee contracts, or commitments to provide a loan at a below-market interest rate, or contingent consideration recognized by an acquirer in a business combination. |
| | | |
| | | The Company’s accounts payable, accrued liabilities, players liability account, lease obligation, line of credit, long-term debt, promissory notes payable and deferred purchase consideration do not fall into any of the exemptions and are therefore classified as measured at amortized cost. |
| | | |
| | ● | Financial liabilities recorded at FVTPL - Financial liabilities are classified as FVTPL if they fall into one of the five exemptions detailed above, or they are derivatives or they are designated as such on initial recognition. The Company’s warrants that are not issued in exchange for goods or services and have characteristics of derivative financial liabilities as a result of the warrants having an exercise price in a currency different from the functional currency of the Company, are measured as financial liabilities at FVTPL. The Company’s convertible debt is designated as financial liabilities at FVTPL. |
Transaction costs
Transaction costs associated with financial instruments, carried at FVTPL, are expensed as incurred, while transaction costs associated with all other financial instruments are included or deducted from the initial carrying amount of the asset or the liability.
Engine Gaming and Media, Inc. (formerly Engine Media Holdings, Inc.) Notes to the Consolidated Financial Statements August 31, 2021 and 2020 (Expressed in United States Dollars) | |
Subsequent measurement
Instruments classified as FVTPL are measured at fair value with unrealized gains and losses recognized in profit or loss. Instruments classified as amortized cost are measured at amortized cost using the effective interest rate method. Instruments classified as FVTOCI are measured at fair value with unrealized gains and losses recognized in other comprehensive income.
Derecognition of financial liabilities
The Company derecognizes financial liabilities only when its obligations under the financial liabilities are discharged, cancelled, or expired. The difference between the carrying amount of the financial liability derecognized and the consideration paid and payable, including any noncash assets transferred or liabilities assumed, is recognized in profit or loss.
Fair value measurement
The Company categorizes its financial assets and liabilities measured at fair value into one of three different levels depending on the observability of the inputs used in the measurement.
| | Level 1: | This level includes assets and liabilities measured at fair value based on unadjusted quoted prices for identical assets and liabilities in active markets that are accessible at the measurement date. |
| | Level 2: | This level includes valuations determined using directly or indirectly observable inputs other than quoted prices included within Level 1. |
| | Level 3: | This level includes valuations based on inputs which are unobservable. |
Offsetting
Financial assets and liabilities are offset, and the net amount presented in the statement of financial position when, and only when, the Company has a legal right to offset the amounts and intends either to settle on a net basis or to realize the asset and settle the liability simultaneously.
| (k) | Short-term employee benefits |
Short-term employee benefits include wages, salaries, compensated absences, profit-sharing and bonuses. Short-term employee benefit obligations are measured on an undiscounted basis and are recognized in salaries and wages expense as the related service is provided or capitalized if the service rendered is in connection with the creation of an asset. A liability is recognized for the amount expected to be paid under short-term cash bonus or profit-sharing plans if the Company has a present legal or constructive obligation to pay this amount as a result of past service provided by the employee and the obligation can be estimated reliably.
Engine Gaming and Media, Inc. (formerly Engine Media Holdings, Inc.) Notes to the Consolidated Financial Statements August 31, 2021 and 2020 (Expressed in United States Dollars) | |
Income tax on the profit or loss for the periods presented comprises current and deferred tax. Income tax is recognized in profit or loss except to the extent that it relates to items recognized directly in equity, in which case it is recognized in equity.
Current tax expense is the expected tax payable on the taxable income for the year, using tax rates enacted or substantively enacted at year end, adjusted for amendments to tax payable with regards to previous years.
Deferred tax is provided using the liability method, providing for temporary differences between the carrying amounts of assets and liabilities for financial reporting purposes and the amounts used for taxation purposes. Deferred tax is not recognized for the following temporary differences: the initial recognition of goodwill; the initial recognition of assets or liabilities in a transaction that is not a business combination and that affects neither accounting nor taxable profit; and differences relating to investments in subsidiaries, associates, and jointly controlled entities to the extent that they will probably not reverse in the foreseeable future. The amount of deferred tax provided is based on the expected manner of realization or settlement of the carrying amount of assets and liabilities, using tax rates enacted or substantively enacted at the financial position reporting date applicable to the period of expected realization or settlement.
A deferred tax asset is recognized only to the extent that it is probable that future taxable profits will be available against which the asset can be utilized.
Deferred tax assets and liabilities are offset when there is a legally enforceable right to set off current tax assets against current tax liabilities and when they relate to income taxes levied by the same taxation authority and the Company intends to settle its current tax assets and liabilities on a net basis.
Common shares are classified as equity. Transaction costs directly attributable to the issue of common shares, share purchase options, and equity classified warrants are recognized as a deduction from equity, net of any tax effects. When share capital recognized as equity is repurchased, the amount of the consideration paid, including directly attributable costs, is recognized as a deduction from total equity.
Preference share capital is classified as equity if it is non-redeemable, or redeemable only at the Company’s option, and any dividends are discretionary. Dividends thereon are recognized as distributions within equity upon approval by the Company’s shareholders. Preference share capital is classified as a liability if it is redeemable on a specific date or at the option of the shareholders, or if dividend payments are not discretionary. Dividends thereon are recognized as interest expense in profit or loss as accrued.
The Company’s warrants having an exercise price in the functional currency of the Company that are not issued in exchange for good and services are equity measured and the fair value at grant date for these warrants is classified within contributed surplus.
The share-based payment plan allows Company employees and consultants to acquire shares of the Company. The fair value of share-based payment awards granted is recognized within share-based payments expense with a corresponding increase in equity.
Each tranche in an award is considered a separate award with its own vesting period and grant date fair value. The fair value is measured at grant date and each tranche is recognized on a straight-line basis over the period during which the share purchase options vest. The fair value of the share-based payment awards granted is measured using the Black-Scholes option pricing model taking into account the terms and conditions upon which the awards were granted such as stock price, term, and stock volatility. At each financial position reporting date, the amount recognized as an expense is adjusted to reflect the actual number of awards, for which the related service and non-market vesting conditions are expected to be met.
Engine Gaming and Media, Inc. (formerly Engine Media Holdings, Inc.) Notes to the Consolidated Financial Statements August 31, 2021 and 2020 (Expressed in United States Dollars) | |
For each Restricted Share Units (“RSU”) granted, the Company recognizes an expense equal to the market value of a common share at the date of grant and for each common share option granted, the Company recognizes an expense equal to the fair value of the option estimated using a Black Scholes model at grant date, based on the number of RSUs/options expected to vest, recognized over the term of the vesting period, with a corresponding increase to contributed surplus. Share based payments expense is adjusted for subsequent changes in management’s estimate of the number of RSUs/options that are expected to vest. The effect of these changes is recognized in the period of the change.
For equity-settled share-based payment transactions, including share options and RSUs granted to officers and directors of the Company and warrants granted to advisors in a financing transaction, the Company measures the goods or services received, and the corresponding increase in contributed surplus, directly, at the fair value of the goods or services received, unless that fair value cannot be estimated reliably, in which cases, the Company measures their value, and the corresponding increase in equity, indirectly, by reference to the fair value of the equity instruments granted.
| (o) | Discontinued operations and assets held for sale |
A non-current asset or a group of assets and liabilities is a disposal group when the carrying amount will be recovered principally through its divestiture and not by continuing utilization. To meet this definition, the asset must be available for immediate sale, and divestiture must be highly probable. Non-current assets or disposal groups classified as held for sale are measured at the lower of carrying amounts and fair value less costs to sell.
Classification as a discontinued operation occurs at the earlier of disposal or when the operation meets the criteria to be classified as held-for-sale.
Discontinued operations are presented on a single line of the consolidated statements of loss and comprehensive loss for the periods reported, comprising the earnings after tax of discontinued operations until divestiture and the gain or loss after tax on sale or fair value measurement, less costs to sell the assets and liabilities making up the discontinued operations. In addition, the cash flows generated by the discontinued operations are presented on one separate line of the statement of consolidated cash flows for the periods presented.
A segment is a distinguishable component of the Company that is engaged either in providing products or services (business segment), or in providing products or services within a particular economic environment (geographical segment), which is subject to risks and rewards that are different from those of other segments.
Government grants are recognized when it is probable that the grant will be received, and all conditions of the grant are complied with. When the grant is in the form of a forgivable loan, the loan is initially recognized as a deferred income liability. The Company then relieves the deferred income liability on a systematic and rational basis in those periods over which the entity recognizes the expenses that the grant is intended to offset. The Company recognizes the impact of the loan forgiveness as an offset against related expense.
Assistance for operating expenses is recorded as a reduction of expenses when the assistance is receivable.
Engine Gaming and Media, Inc. (formerly Engine Media Holdings, Inc.) Notes to the Consolidated Financial Statements August 31, 2021 and 2020 (Expressed in United States Dollars) | |
A forgivable loan from government is treated as government assistance when there is reasonable assurance that the Company will meet the terms for forgiveness of the loan. If there is no reasonable assurance that the entity will meet the terms for forgiveness of the loan, the loan is recognized as a liability in accordance with IFRS 9 Financial Instruments. The liability would become a government grant (forgivable loan) when there is reasonable assurance that the entity will meet the terms for forgiveness.
6. Acquisitions
On December 31, 2019, the Company acquired all issued and outstanding shares of UMG Media Ltd. (“UMG”) which was carried out by way of a plan of arrangement under the Business Corporations Act (Alberta). UMG shareholders received, on an exchange ratio of 0.0643205, common shares of the Company. In total, the Company issued 288,560 shares (the “Consideration Shares”) in exchange for the UMG securities exchanged pursuant to the transaction, including the securities issued pursuant to the UMG Private Placement (defined below) (a total of 54,157 of these Engine Media Shares were issued to the UMG Private Placement shareholders and the remainder were issued to the former UMG Shareholders). In addition, each outstanding option and warrant to purchase a UMG Share was exchanged for an option or warrant, as applicable, to purchase an Engine Media share, based upon the exchange ratio.
All transaction costs associated with this acquisition have been expensed. If the acquisition of UMG had occurred at the beginning of the Company’s fiscal year (September 1, 2019), the loss attributed to UMG’s operations for the year ended August 31, 2020, would have been $3,519,046, with revenue of $491,323. The loss attributed to UMG’s operations from the acquisition date of December 31, 2019, to August 31, 2020, was $1,875,539, with revenue of $314,948.
The acquisition was accounted for using the acquisition method of accounting under IFRS 3, Business Combinations, which requires that the Company recognize the identifiable assets acquired and the liabilities assumed at their fair values on the date of acquisition.
The purchase price allocation is as follows:
Schedule of assets and liabilities assumed in acquisition
| Consideration paid | | # Issued | | | Amount | |
| Common shares | | | 288,560 | | | $ | 3,804,344 | |
| Options and warrants exchanged | | | 26,553 | | | | 41,879 | |
| | | | | | | | | |
| | | | | | | $ | 3,846,223 | |
| | | | | | | | | |
| Fair value of identifiable assets acquired | | | | | | | | |
| Cash | | | | | | $ | (82,528 | ) |
| Restricted cash | | | | | | | 112,901 | |
| Accounts and other receivables | | | | | | | 76,052 | |
| Prepaid and other current assets | | | | | | | 88,877 | |
| Property and equipment | | | | | | | 313,622 | |
| Right-of-use asset | | | | | | | 388,996 | |
| Intangible assets - Application platforms (Useful life - 5 years) | | | | | | | 560,000 | |
| Intangible assets - Brand (Useful life - 6 years) | | | | | | | 510,000 | |
| Intangible assets - Customer lists (Useful life - 3 years) | | | | | | | 460,000 | |
| Goodwill | | | | | | | 3,209,045 | |
| Accounts payable and accrued liabilities | | | | | | | (761,766 | ) |
| Lease liabilities | | | | | | | (420,863 | ) |
| Players liability account | | | | | | | (112,902 | ) |
| Promissory notes | | | | | | | (430,745 | ) |
| Deferred revenue | | | | | | | (64,466 | ) |
| | | | | | | $ | 3,846,223 | |
Engine Gaming and Media, Inc. (formerly Engine Media Holdings, Inc.) Notes to the Consolidated Financial Statements August 31, 2021 and 2020 (Expressed in United States Dollars) | |
The Engine Media common shares issued were valued based on the closing price on the TSX Venture exchange on December 31, 2019.
Significant judgments and assumptions related to the valuation and useful lives of certain classes of assets acquired are as follows:
| | i) | Intangible assets, application platforms |
UMG had certain proprietary technology used in its platform, which the Company expects will contribute to future cash flow. The fair value of the software intangible asset was determined based on the relief from royalty method under the income approach. The software intangible asset was valued using Level 3 inputs which consisted of the following key inputs: (i) revenue projections; (ii) royalty rate of 7%; (iii) technology replacement rate of 5 years; and (iv) discount rate of 17.5%. This asset is amortized on a straight-line basis over the estimated useful life of five years.
| | ii) | Intangible assets, brand |
UMG had established itself as a recognized brand in its industry and is well known amongst gaming enthusiasts and the esports community. The Company expects the brand will contribute to future cash flow. The fair value of the brand intangible asset was determined based on the relief from royalty method under the income approach. The brand intangible asset was valued using Level 3 inputs which consisted of the following key inputs: (i) revenue projections with long term growth rate of 3%; (ii) royalty rate of 2%; and (iv) discount rate of 18.5%. This asset is amortized on a straight-line basis over the estimated useful life of six years.
| | iii) | Intangible assets, customer lists |
UMG had an established customer list which is expected to result in future sales. The fair value of the customer list intangible asset was determined based on the cost approach. The customer list intangible asset was valued using Level 3 inputs which consisted of the following key inputs: (i) number of active users; (ii) user acquisition cost; (iii) time to recreate of 1.5 years; (iv) obsolescence rate of 10% and (v) discount rate of 16.5%. This asset is amortized on a straight-line basis over the estimated useful life of three years.
The difference between the acquisition date fair value of the consideration transferred and the values assigned to the assets acquired and liabilities assumed represents goodwill of $3,209,045. The goodwill is not expected to be deductible for tax purposes.
The goodwill recorded represents the following:
| | ● | Cost savings and operating synergies expected to result from combining the operations of UMG with those of the Company |
| | ● | Intangible assets that do not qualify for separate recognition such as the assembled workforce |
Engine Gaming and Media, Inc. (formerly Engine Media Holdings, Inc.) Notes to the Consolidated Financial Statements August 31, 2021 and 2020 (Expressed in United States Dollars) | |
On May 8, 2020, the Company acquired all issued and outstanding shares of Frankly Inc. (“Frankly”) which was carried out by way of a court-approved plan of arrangement under the Business Corporations Act (British Columbia). Frankly shareholders received one share of the Company’s common shares for each share of Frankly. In total, the Company issued 2,258,215 shares in exchange for the Frankly securities exchanged pursuant to the transaction. In addition, each outstanding option, RSU and warrant to purchase a Frankly share was exchanged for an option, RSU or warrant, as applicable, to purchase a Company share, based upon the exchange ratio.
All transaction costs associated with this acquisition were expensed. If the acquisition of Frankly had occurred at the beginning of the Company’s fiscal year (September 1, 2019), the loss attributed to Frankly’s operations for the year ended August 31, 2020, would have been $8,350,289, with revenue of $23,165,702. The loss attributed to Frankly’s operations from the acquisition date of May 8, 2020, to August 31, 2020, was $2,266,289, with revenue of $6,404,736.
The acquisition was accounted for using the acquisition method of accounting under IFRS 3, Business Combinations, which requires that the Company recognize the identifiable assets acquired and the liabilities assumed at their fair values on the date of acquisition. The estimated fair values were preliminary and based on the information that was available as of that date. The Company has since finalized the purchase price allocation with no change to the preliminary amounts.
The purchase price allocation is as follows:
Schedule of assets and liabilities assumed in acquisition
| Consideration paid | | # Issued | | | Amount | |
| Common shares | | | 2,258,215 | | | $ | 12,155,000 | |
| Warrants exchanged | | | 1,055,036 | | | | 2,157,000 | |
| Settlement of a pre-existing relationship | | | | | | | (1,099,999 | ) |
| | | | | | | $ | 13,212,001 | |
| | | | | | | | | |
| Fair value of identifiable assets acquired | | | | | | | | |
| Cash | | | | | | | 1,241,511 | |
| Accounts and other receivables | | | | | | | 5,368,562 | |
| Prepaid and other current assets | | | | | | | 444,690 | |
| Property and equipment | | | | | | | 40,152 | |
| Intangible assets - Software (Useful life - 3 years) | | | | | | | 2,000,000 | |
| Intangible assets - Brand (Useful life - 1 year) | | | | | | | 100,000 | |
| Intangible assets - Customer contracts (Useful life - 10 years) | | | | | | | 2,700,000 | |
| Goodwill | | | | | | | 14,895,595 | |
| Accounts payable and accrued liabilities | | | | | | | (9,590,547 | ) |
| Deferred revenue | | | | | | | (148,949 | ) |
| Line of credit | | | | | | | (3,839,013 | ) |
| | | | | | | $ | 13,212,001 | |
Engine Gaming and Media, Inc. (formerly Engine Media Holdings, Inc.) Notes to the Consolidated Financial Statements August 31, 2021 and 2020 (Expressed in United States Dollars) | |
The Engine Media common shares issued were valued based on the closing price on the TSX Venture exchange on May 8, 2020. The warrants were valued using the Black Scholes method.
Significant judgments and assumptions related to the valuation and useful lives of certain classes of assets acquired are as follows:
| | i) | Intangible assets, software |
Frankly had certain proprietary technology used in its products, which the Company expects will contribute to future cash flow. The fair value of the software intangible asset was determined based on the relief from royalty method under the income approach. The software intangible asset was valued using Level 3 inputs which consisted of the following key inputs: (i) revenue projections; (ii) royalty rate of 3%; (iii) technology replacement rate of 5 years; and (iv) discount rate of 18%. This asset is amortized on a straight-line basis over the estimated useful life of three years.
| | ii) | Intangible assets, customer contracts |
Frankly had established relationships with media companies which are expected to result in future sales. The fair value of the customer relationships intangible asset was determined based on the excess earnings method under the income approach. The customer relationships intangible asset was valued using Level 3 inputs which consisted of the following key inputs: (i) cash flow projections with long term growth rate of 3%; (ii) customer attrition rate of 10%; (iii) charges for use of assets; and (iv) discount rate of 21.5%. This asset is amortized on a straight-line basis over the estimated useful life of ten years.
iii) Goodwill
The difference between the acquisition date fair value of the consideration transferred and the values assigned to the assets acquired and liabilities assumed represents goodwill of $14,895,595. The goodwill is not expected to be deductible for tax purposes.
The goodwill recorded represents the following:
| | ● | Cost savings and operating synergies expected to result from combining the operations of Frankly with those of the Company |
| | ● | Intangible assets that do not qualify for separate recognition such as the assembled workforce |
On May 8, 2020, the Company acquired all issued and outstanding shares of WinView, Inc. (“WinView”) which was carried out pursuant to a statutory merger. The Company issued 1,759,997 shares in exchange for the WinView securities exchanged pursuant to the transaction. In addition, WinView shareholders are entitled to contingent consideration based on a portion of any future licensing revenue from its patent portfolio.
If the acquisition of WinView had occurred at the beginning of the Company’s fiscal year (September 1, 2019), the loss attributed to WinView’s operations for the year ended August 31, 2020, would have been $6,034,836, with revenue of $68,813. The loss attributed to WinView’s operations from the acquisition date of May 8, 2020, to August 31, 2020, was $1,557,248, with revenue of $51,422.
IFRS 3 – Business Combinations (“IFRS 3”) was amended in October 2018 to clarify the definition of a business and added an optional concentration test to assess when a company has acquired a group of assets, rather than a business, if the value of the assets acquired is substantially all concentrated in a single asset or group of similar assets. The Company concluded that the value of the WinView assets acquired is substantially concentrated in the patent portfolio, and therefore the acquisition of WinView was accounted for as an asset acquisition.
Engine Gaming and Media, Inc. (formerly Engine Media Holdings, Inc.) Notes to the Consolidated Financial Statements August 31, 2021 and 2020 (Expressed in United States Dollars) | |
For an asset acquisition, the Company’s accounting policy is to recognize a liability for contingent consideration when the related activity occurs. Accordingly, a liability was not recorded for the contingent consideration as at August 30, 2020.
The purchase price allocation is as follows:
Schedule of assets and liabilities assumed in acquisition
| Consideration paid | | # Issued | | | Amount | |
| Common shares | | | 1,759,997 | | | $ | 7,579,000 | |
| | | | | | | $ | 7,579,000 | |
| | | | | | | | | |
| Fair value of identifiable assets acquired | | | | | | | | |
| Cash | | | | | | $ | 359,190 | |
| Restricted cash | | | | | | | 201,540 | |
| Prepaid and other current assets | | | | | | | 174,313 | |
| Intangible assets - Patents (Useful life - 5 years) | | | | | | | 9,430,265 | |
| Accounts payable and accrued liabilities | | | | | | | (699,053 | ) |
| Players liability account | | | | | | | (201,540 | ) |
| Government grants - PPP Loan | | | | | | | (174,795 | ) |
| Promissory notes | | | | | | | (1,423,738 | ) |
| Deferred revenue | | | | | | | (87,182 | ) |
| | | | | | | $ | 7,579,000 | |
The Company common shares issued for the acquisition of Winview were subject to lock-up restrictions to be discharged 10% at 120 days, another 15% at 180 days, another 15% at 270 days, another 20% at 360 days and the remaining 40% at 390 days, in each case following the closing date. The Company common shares issued were valued based on the closing price on TSX Venture exchange on May 8, 2020, reduced by a discount for lack of marketability of twenty percent.
| (d) | Acquisitions of WTF1, Lets Go Racing and DriverDB |
During the year ended August 31, 2020, the Company completed three acquisitions in its motorsports division that were disposed on November 3, 2020, as a result of a strategic business review that began in October 2020 .
The Company acquired certain assets of WTF1 on April 2, 2020, for a purchase price of $557,709. The acquisition was accounted for as an asset acquisition. The purchase price was allocated to the assets acquired on a relative fair value basis. The amount allocated to software is being amortized over three years.
On June 3, 2020, the Company completed the acquisition of Lets Go Racing pursuant to a share purchase agreement dated June 2, 2020. Purchase consideration comprised of £50,000 ($63,274) in cash, 200,000 common shares of the Company and deferred cash consideration of £265,000 ($333,503). Of the deferred cash consideration, £100,000 ($125,850) is due 120 days following closing and £165,000 ($207,653) is due 240 days following closing. Total purchase consideration discussed above amounted to $2,116,267. The acquisition was accounted for as an asset acquisition. The purchase price was allocated to software and is being amortized over three years.
On June 3, 2020, the Company completed the acquisition of DriverDB in exchange for the issuance of 100,000 common shares of the Company pursuant to a share purchase agreement dated June 1, 2020. The common shares were valued at $859,745. The acquisition was accounted for as an asset acquisition. The purchase price was allocated to the assets acquired on a relative fair value basis. The amount allocated to software is being amortized over three years.
Engine Gaming and Media, Inc. (formerly Engine Media Holdings, Inc.) Notes to the Consolidated Financial Statements August 31, 2021 and 2020 (Expressed in United States Dollars) | |
| (e) | Acquisition of SideQik, Inc |
On July 2, 2021, the Company acquired all issued and outstanding shares of SideQik, Inc. (“SideQik”) which was carried out pursuant to a statutory reverse-triangular merger. The Company issued 386,584 shares and 23,939 RSUs in exchange for the SideQik securities exchanged pursuant to the transaction.
The acquisition of Sideqik (combined with a prior acquisition of Stream Hatchet) brings technology and customers that are expected to expand Engine’s advertising and media offerings.
All transaction costs associated with this acquisition were expensed. If the acquisition of SideQik had occurred at the beginning of the Company’s fiscal year (September 1, 2020), the loss attributed to SideQik’s operations for the year ended August 31, 2021, would have been $1,130,080, with revenue of $2,148,987. The loss attributed to SideQik’s operations from the acquisition date to August 31, 2021, was $383,167, with revenue of $412,981.
The acquisition was accounted for using the acquisition method of accounting under IFRS 3, Business Combinations, which requires that the Company recognize the identifiable assets acquired and the liabilities assumed at their fair values on the date of acquisition. The estimated fair values are preliminary and based on the information that was available as of that date.
The purchase price allocation is as follows:
Schedule of assets and liabilities assumed in acquisition
| Consideration paid | | # Issued | | | Amount | |
| Common shares | | | 386,584 | | | $ | 3,962,000 | |
| RSUs | | | 23,939 | | | $ | 245,000 | |
| | | | | | | $ | 4,207,000 | |
| | | | | | | | | |
| Fair value of identifiable assets acquired | | | | | | | | |
| Cash | | | | | | $ | 255,852 | |
| Accounts and other receivables | | | | | | | 817,557 | |
| Prepaid and other current assets | | | | | | | 69,631 | |
| Property and equipment | | | | | | | 12,730 | |
| Intangible assets - Software (Useful life - 5 years) | | | | | | | 910,000 | |
| Intangible assets - Brand (Useful life - 10 years) | | | | | | | 210,000 | |
| Intangible assets - Customer relationships (Useful life - 10 years) | | | | | | | 310,000 | |
| Goodwill | | | | | | | 2,900,193 | |
| Accounts payable | | | | | | | (292,571 | ) |
| Accrued liabilities | | | | | | | (502,392 | ) |
| Deferred revenue | | | | | | | (484,000 | ) |
| | | | | | | $ | 4,207,000 | |
The Company common shares issued for the acquisition of SideQik were subject to lock-up restrictions to be discharged 16 2/3% at 180 days from the closing date, and thereafter another 16 2/3% on the 15th of each subsequent month with the restriction being fully liquidated at the end of the 12th month. The Company’s common shares issued were valued based on the closing price on TSX Venture exchange on July 2, 2021, reduced by a discount for lack of marketability of fifteen percent.
Engine Gaming and Media, Inc. (formerly Engine Media Holdings, Inc.) Notes to the Consolidated Financial Statements August 31, 2021 and 2020 (Expressed in United States Dollars) | |
Significant judgments and assumptions related to the valuation and useful lives of certain classes of assets acquired are as follows:
| | i) | Intangible assets, software |
The fair value of the software intangible asset was determined based on the relief from royalty method under the income approach. The software intangible asset was valued using Level 3 inputs which consisted of the following key inputs: (i) revenue projections; (ii) royalty rate of 7.5%; (iii) tax rate of 25.5% (iv) discount rate of 20%. This asset is amortized on a straight-line basis over the estimated useful life of five years.
| | ii) | Intangible assets, brand |
The fair value of the brand intangible asset was determined based on the relief from royalty method under the income approach. The brand intangible asset was valued using Level 3 inputs which consisted of the following key inputs: (i) cash flow projections with long term growth rate of 3%; (ii) royalty rate of 0.5%; (iii) tax rate of 25.5%; and (iv) discount rate of 20.0%. This asset is amortized on a straight-line basis over the estimated useful life of ten years.
| | iii) | Intangible assets, customer relationships |
SideQik has created custom partnerships with clients to build out integrations with proprietary brand tools which are expected to result in future sales. The fair value of the customer relationships intangible asset was determined based on the excess earnings method under the income approach. The customer relationships intangible asset was valued using Level 3 inputs which consisted of the following key inputs: (i) cash flow projections with long term growth rate of 3%; (ii) customer attrition rate of 15%; and (iii) discount rate of 22.0%; (iv) tax rate of 25.5%. This asset is amortized on a straight-line basis over the estimated useful life of ten years.
The difference between the acquisition date fair value of the consideration transferred and the values assigned to the assets acquired and liabilities assumed represents goodwill of $2,900,193. The goodwill is not expected to be deductible for tax purposes.
The goodwill recorded represents the following:
| | ● | Cost savings and operating synergies expected to result from combining the operations of SideQik with those of the Company. |
| | ● | Intangible assets that do not qualify for separate recognition such as the assembled workforce. |
Engine Gaming and Media, Inc. (formerly Engine Media Holdings, Inc.) Notes to the Consolidated Financial Statements August 31, 2021 and 2020 (Expressed in United States Dollars) | |
7. Revenue
Revenue streams and disaggregation of revenue from contracts with customers
In the following table, revenue from contracts with customers is disaggregated by service lines.
Schedule of revenue from contracts with customers disaggregated
| For the year ended August 31, | | | | | | |
| | | 2021 | | | 2020 | |
| | | $ | | | $ | |
| | | | | | | |
| Games development | | | 3,422,202 | | | | 2,732,846 | |
| Direct to consumer | | | 453,400 | | | | 363,554 | |
| Software-as-a-service | | | 6,360,361 | | | | 2,571,672 | |
| Advertising | | | 26,656,446 | | | | 4,491,356 | |
| Professional services | | | 328,461 | | | | 386,415 | |
| Revenue | | | 37,220,870 | | | | 10,545,843 | |
8. Net income (loss) per share
Basic net income (loss) per share is calculated using the weighted-average number of common shares outstanding during each period. Diluted net income (loss) per share assumes the conversion, exercise or issuance of all potential common share equivalents unless the effect is to reduce the loss or increase the income per share. For purposes of this calculation, stock options, warrants and RSU’s are considered to be potential common shares and are only included in the calculation of diluted net income (loss) per share when their effect is dilutive.
Due to the net loss incurred during the years ended August 31, 2021, and 2020, all outstanding options, RSU’s and warrants were excluded from diluted weighted-average common shares outstanding as their effect was anti-dilutive. Weighted average common shares outstanding for the years ended August 31, 2021, and 2020 were 11,874,775 and 2,949,511, respectively.
9. Accounts and other receivables and publisher advances
| (a) | Accounts and other receivables |
The Company’s accounts and other receivables are comprised of the following:
Schedule of accounts and other receivables
| | | August 31,
2021 | | | August 31,
2020 | |
| | | $ | | | $ | |
| | | | | | | |
| Trade accounts receivable | | | 9,677,725 | | | | 4,690,922 | |
| Other receivables | | | 53,387 | | | | 29,406 | |
| Allowance for doubtful accounts | | | (1,084,305 | ) | | | (874,438 | ) |
| Total accounts and other receivables | | | 8,646,807 | | | | 3,845,890 | |
Engine Gaming and Media, Inc. (formerly Engine Media Holdings, Inc.) Notes to the Consolidated Financial Statements August 31, 2021 and 2020 (Expressed in United States Dollars) | |
A continuity of the Company’s allowance for doubtful accounts is as follows:
Schedule of allowance for doubtful accounts
| | | August 31,
2021 | | | August 31,
2020 | |
| | | $ | | | $ | |
| | | | | | | |
| Allowance for doubtful accounts, beginning of year | | | (874,438 | ) | | | - | |
| Acquisition of Frankly | | | - | | | | (887,763 | ) |
| Acquisition of SideQik | | | (140,896 | ) | | | - | |
| Provision, bad debt expense | | | (72,636 | ) | | | - | |
| Writeoffs | | | 3,665 | | | | 13,325 | |
| Allowance for doubtful accounts, end of year | | | (1,084,305 | ) | | | (874,438 | ) |
On February 7, 2021, the Company’s subsidiary Frankly Media LLC, amended its commercial agreement with its largest publisher, which secured a long-term extension. One of the key terms of the amended agreement required the Company to advance $6 million of revenue sharing payments to the publisher under the following schedule:
| | (i) | $4 million within one day of execution of the amendment. |
| | (ii) | $1 million on or before February 28, 2021; and |
| | (iii) | $1 million on or before March 31, 2021. |
The advance is to be recouped through additional withholding on future advertising revenue share payments made to the publisher, beyond Frankly’s share, and is effective for amounts billed for periods February 1, 2021, forward.
As of August 31, 2021, $6 million had been advanced to the publisher and $1,465,782 had been recouped through the process explained above. As of August 31, 2021, a net amount of $4,534,218 was outstanding on the advance and the current portion of the advance was $3,197,102.
The breakout of the publisher advance into current and non-current portions is based on an estimate of advertising billings over the next twelve months and the resulting additional withholding on the related advertising revenue share payments.
10. Investment in associate and investment at FVTPL
Investment at FVTPL
Schedule of investment in associate and investment
| | | Investment in associate | | | Investment at FVTPL | |
| | | | $ | | | | $ | |
| | | | | | | | | |
| Balance, August 31, 2020 | | | 2,052,008 | | | | - | |
| Share of loss in One Up | | | (103,930 | ) | | | - | |
| Discontinue use of equity method on retained interest in former associate | | | (1,948,078 | ) | | | 2,048,039 | |
| Change in fair value of investment at FVTPL | | | - | | | | 581,812 | |
| Balance, August 31, 2021 | | | - | | | | 2,629,851 | |
On August 25, 2020, the Company acquired a 20.48% interest in One Up Group, LLC (“One Up”). One Up operates a mobile app which allows gamers to organize and play one-on-one matches with other gamers and compete for money.
Engine Gaming and Media, Inc. (formerly Engine Media Holdings, Inc.) Notes to the Consolidated Financial Statements August 31, 2021 and 2020 (Expressed in United States Dollars) | |
The Company accounted for this investment as an investment in associate under the equity method from acquisition through January 5, 2021. The Company’s share in the loss of One Up for the period from September 1, 2020, to January 5, 2021, amounted to $103,930.
On January 5, 2021, the Company’s interest in One Up was reduced to 18.62% as a result of One Up closing a financing round. In accordance with IAS 28, the Company discontinued the use of the equity method on January 5, 2021, the date at which its investment ceased being an associate. The difference between the fair value of the Company’s retained interest in One Up and it’s carrying value on January 5, 2021, amounted to $99,961, which is recognized as a gain on retained interest in former associate on the Company’s statement of loss and comprehensive loss.
The fair value of the Company’s investment in One Up is estimated at each reporting period, with reference to valuations underlying privately placed financing transactions closed by One Up and is classified with a level 3 in the fair value hierarchy (Note 30).
Engine Gaming and Media, Inc. (formerly Engine Media Holdings, Inc.) Notes to the Consolidated Financial Statements August 31, 2021 and 2020 (Expressed in United States Dollars) | |
11. Property and equipment
Disclosure of detailed information about property plant and equipment
| Cost | | Leasehold
improvements | | | Computer equipment | | | Furniture
and fixtures | | | Total | |
| | | $ | | | $ | | | $ | | | $ | |
| | | | | | | | | | | | | |
| August 31, 2019 | | | 54,465 | | | | 209,126 | | | | 123,298 | | | | 386,889 | |
| Acquisition of UMG | | | 166,193 | | | | 116,668 | | | | 30,761 | | | | 313,622 | |
| Acquisition of Frankly | | | - | | | | 34,461 | | | | 5,691 | | | | 40,152 | |
| Additions | | | - | | | | 116,028 | | | | 8,762 | | | | 124,790 | |
| Disposals | | | - | | | | (14,410 | ) | | | - | | | | (14,410 | ) |
| Effect of foreign exchange | | | 995 | | | | 24,467 | | | | 4,579 | | | | 30,041 | |
| August 31, 2020 | | | 221,653 | | | | 486,340 | | | | 173,091 | | | | 881,084 | |
| | | | | | | | | | | | | | | | | |
| | | | | | | | | | | | | | | | | |
| August 31, 2020 | | | 221,653 | | | | 486,340 | | | | 173,091 | | | | 881,084 | |
| Acquisition of SideQik | | | - | | | | 11,399 | | | | 1,331 | | | | 12,730 | |
| Additions | | | - | | | | 170,305 | | | | 17,865 | | | | 188,170 | |
| Disposals | | | - | | | | (14,244 | ) | | | - | | | | (14,244 | ) |
| Disposal of Motorsports | | | (2,631 | ) | | | (47,645 | ) | | | (18,118 | ) | | | (68,394 | ) |
| Foreign exchange | | | (171 | ) | | | (2,548 | ) | | | (1,125 | ) | | | (3,844 | ) |
| August 31, 2021 | | | 218,851 | | | | 603,607 | | | | 173,044 | | | | 995,502 | |
| Accumulated depreciation | | Leasehold
improvements | | | Computer equipment | | | Furniture
and fixtures | | | Total | |
| | | $ | | | $ | | | $ | | | $ | |
| | | | | | | | | | | | | |
| August 31, 2019 | | | 51,847 | | | | 181,089 | | | | 68,700 | | | | 301,636 | |
| Depreciation | | | 4,998 | | | | 102,241 | | | | 34,066 | | | | 141,305 | |
| Foreign exchange | | | 672 | | | | 24,178 | | | | 3,904 | | | | 28,754 | |
| August 31, 2020 | | | 57,517 | | | | 307,508 | | | | 106,670 | | | | 471,695 | |
| | | | | | | | | | | | | | | | | |
| | | | | | | | | | | | | | | | | |
| August 31, 2020 | | | 57,517 | | | | 307,508 | | | | 106,670 | | | | 471,695 | |
| Depreciation | | | 5,949 | | | | 117,092 | | | | 26,150 | | | | 149,191 | |
| Disposals | | | - | | | | (4,477 | ) | | | - | | | | (4,477 | ) |
| Disposal of Motorsports | | | - | | | | (11,068 | ) | | | (9,910 | ) | | | (20,978 | ) |
| Foreign exchange | | | (99 | ) | | | (2,824 | ) | | | (817 | ) | | | (3,740 | ) |
| August 31, 2021 | | | 63,367 | | | | 406,231 | | | | 122,093 | | | | 591,691 | |
| Net book value | | Leasehold
improvements | | | Computer equipment | | | Furniture
and fixtures | | | Total | |
| | | $ | | | $ | | | $ | | | $ | |
| | | | | | | | | | | | | |
| August 31, 2020 | | | 164,136 | | | | 178,832 | | | | 66,421 | | | | 409,389 | |
| August 31, 2021 | | | 155,484 | | | | 197,376 | | | | 50,951 | | | | 403,811 | |
Engine Gaming and Media, Inc. (formerly Engine Media Holdings, Inc.) Notes to the Consolidated Financial Statements August 31, 2021 and 2020 (Expressed in United States Dollars) | |
12. Goodwill
Disclosure of detailed information about goodwill
| | | Aug 31,
2021 | | | Aug 31,
2020 | |
| | | $ | | | $ | |
| | | | | | | |
| Balance, beginning of year | | | 18,785,807 | | | | 651,354 | |
| Acquisition of UMG | | | - | | | | 3,209,045 | |
| Acquisition of Frankly | | | - | | | | 14,895,595 | |
| Acquisition of SideQik | | | 2,900,193 | | | | - | |
| Impairment of goodwill associated with UMG | | | (3,209,045 | ) | | | - | |
| Effect of foreign exchange | | | 18,166 | | | | 29,813 | |
| Balance, end of year | | | 18,495,121 | | | | 18,785,807 | |
The Company tested the Frankly CGU goodwill balance of $14,895,595 (2020 - $14,895,595) as of August 31, 2021, for impairment. When assessing whether or not there is an impairment, the recoverable amount of the CGU was determined based on a value in use calculation. The calculation used a ten-year projected and discounted cash flow model using a discount rate of 20.5% and a long-term growth rate of 3%. The recoverable value was concluded after making adjustments to the discounted cash flow model for cash or any other non-operating assets or liabilities as of the measurement date. The concluded recoverable value was then compared to carrying value of the CGU. No impairment charge was determined to be necessary.
The recoverable amounts for the Stream Hatchet, and Eden Games CGUs below were based on fair value less costs of disposal, estimated using a guideline public company method which is a market-based approach. The fair value measurement was categorized as a Level 3 fair value based on inputs in the valuation technique used.
Revenue multiples from publicly traded companies operating within the same industry and location and having similar business activities to the Company were utilized, after adjusting for differences in size, margins and growth rates when compared to the Company and its CGUs. These adjusted multiples of 3x for Stream Hatchet and 3.5x for Eden Games were applied to the financial metrics of the CGU to determine indicative enterprise values. Recoverable amounts were determined after an adjustment for costs of disposal, estimated at 5% of indicative enterprise values. No impairment charge was determined to be necessary for the Stream Hatchet and Eden Games CGUs.
The Company tested the UMG CGU goodwill balance of $3,209,045 (2020 - $3,209,045) as of August 31, 2021, for impairment. When assessing whether there is an impairment, the recoverable amount of the CGU was determined based on a value in use calculation. The value in use calculation used a ten-year projected and terminal period debt-free cash flow model discounted to present value using a discount rate of 21.0% and a long-term growth rate of 3%. The recoverable value is concluded after making adjustments to the discounted cash flow model for cash or any other non-operating assets or liabilities as of the measurement date. The concluded recoverable value is then compared to carrying value of the CGU. Based on this impairment assessment, the Company determined that an impairment charge was necessary and recorded a full goodwill impairment charge of $3,209,045 to impairment expense on the Company’s consolidated statement of loss and comprehensive loss. Additionally, resulting from this impairment assessment the Company recorded $675,956 impairment charge to impairment expense in connection with the intangibles within the UMG CGU (Note 13). The results for UMG are reflected in the Company’s Gaming segment.
Engine Gaming and Media, Inc. (formerly Engine Media Holdings, Inc.) Notes to the Consolidated Financial Statements August 31, 2021 and 2020 (Expressed in United States Dollars) | |
13. Intangible assets
Disclosure of detailed information about intangible assets
| Cost | | Patents | | | Application Platforms | | | Software | | | Brand | | | Customer
Lists and
Contracts | | | Total | |
| | | | $ | | | | $ | | | | $ | | | | $ | | | | $ | | | | $ | |
| | | | | | | | | | | | | | | | | | | | | | | | | |
| August 31, 2019 | | | - | | | | 760,323 | | | | 5,055,798 | | | | 1,662,993 | | | | 477,592 | | | | 7,956,706 | |
| Acquisition of UMG | | | - | | | | 560,000 | | | | - | | | | 510,000 | | | | 460,000 | | | | 1,530,000 | |
| Acquisition of Frankly | | | - | | | | - | | | | 2,000,000 | | | | 100,000 | | | | 2,700,000 | | | | 4,800,000 | |
| Acquisition of WinView | | | 9,430,265 | | | | - | | | | - | | | | - | | | | - | | | | 9,430,265 | |
| Acquisition of WTF1 | | | - | | | | - | | | | 557,709 | | | | - | | | | - | | | | 557,709 | |
| Acquisition of Driver DB | | | - | | | | - | | | | 854,158 | | | | - | | | | - | | | | 854,158 | |
| Acquisition of Lets Go Racing | | | - | | | | - | | | | 2,116,267 | | | | - | | | | - | | | | 2,116,267 | |
| Foreign exchange | | | - | | | | 2,479 | | | | 180,043 | | | | 37,482 | | | | 34,362 | | | | 254,366 | |
| August 31, 2020 | | | 9,430,265 | | | | 1,322,802 | | | | 10,763,975 | | | | 2,310,475 | | | | 3,671,954 | | | | 27,499,471 | |
| Disposal of Motorsports | | | - | | | | - | | | | (3,598,869 | ) | | | (201,627 | ) | | | (222,650 | ) | | | (4,023,146 | ) |
| Acquisition of SideQik | | | - | | | | - | | | | 910,000 | | | | 210,000 | | | | 310,000 | | | | 1,430,000 | |
| Impairment of UMG | | | - | | | | (266,731 | ) | | | - | | | | (263,158 | ) | | | (146,067 | ) | | | (675,956 | ) |
| Foreign exchange | | | - | | | | 16,974 | | | | 255,577 | | | | 81,759 | | | | 11,063 | | | | 365,373 | |
| August 31, 2021 | | | 9,430,265 | | | | 1,073,045 | | | | 8,330,683 | | | | 2,137,449 | | | | 3,624,300 | | | | 24,595,742 | |
| Accumulated amortization | | Patents | | | Application Platforms | | | Software | | | Brand | | | Customer
Lists and
Contracts | | | Total | |
| | | | $ | | | | $ | | | | $ | | | | $ | | | | $ | | | | $ | |
| | | | | | | | | | | | | | | | | | | | | | | | | |
| August 31, 2019 | | | - | | | | 628,277 | | | | 2,634,338 | | | | 673,302 | | | | 296,061 | | | | 4,231,978 | |
| Amortization | | | 628,684 | | | | 162,804 | | | | 2,205,781 | | | | 375,514 | | | | 228,267 | | | | 3,601,050 | |
| Foreign exchange | | | - | | | | 1,960 | | | | 68,881 | | | | 28,675 | | | | 124,605 | | | | 224,121 | |
| August 31, 2020 | | | 628,684 | | | | 793,041 | | | | 4,909,000 | | | | 1,077,491 | | | | 648,933 | | | | 8,057,149 | |
| Amortization | | | 1,886,053 | | | | 159,843 | | | | 1,734,064 | | | | 465,398 | | | | 494,825 | | | | 4,740,183 | |
| Disposal of Motorsports | | | - | | | | - | | | | (532,412 | ) | | | (201,627 | ) | | | (222,650 | ) | | | (956,689 | ) |
| Foreign exchange | | | - | | | | 13,560 | | | | 229,650 | | | | 34,385 | | | | (4,740 | ) | | | 272,855 | |
| August 31, 2021 | | | 2,514,737 | | | | 966,444 | | | | 6,340,302 | | | | 1,375,647 | | | | 916,368 | | | | 12,113,498 | |
| Net book value | | | Patents | | | | Application Platforms | | | | Software | | | | Brand | | | | Customer
Lists and
Contracts | | | | Total | |
| | | | $ | | | | $ | | | | $ | | | | $ | | | | $ | | | | $ | |
| | | | | | | | | | | | | | | | | | | | | | | | | |
| August 31, 2020 | | | 8,801,581 | | | | 529,761 | | | | 5,854,975 | | | | 1,232,984 | | | | 3,023,021 | | | | 19,442,322 | |
| August 31, 2021 | | | 6,915,528 | | | | 106,601 | | | | 1,990,381 | | | | 761,802 | | | | 2,707,932 | | | | 12,482,244 | |
Engine Gaming and Media, Inc. (formerly Engine Media Holdings, Inc.) Notes to the Consolidated Financial Statements August 31, 2021 and 2020 (Expressed in United States Dollars) | |
14. Right-of-use assets
Disclosure of detailed information about right-of-use assets
| | | August 31,
2021 | | | August 31,
2020 | |
| | | $ | | | $ | |
| | | | | | | |
| Balance, beginning of year | | | 550,478 | | | | - | |
| Additions to right-of-use assets on adoption of IFRS 16, September 1, 2019 | | | - | | | | 258,756 | |
| Acquisition of UMG | | | - | | | | 388,996 | |
| Acquired | | | 210,178 | | | | 36,375 | |
| Depreciation | | | (203,058 | ) | | | (148,687 | ) |
| Effect of foreign exchange | | | (576 | ) | | | 15,038 | |
| Balance, end of year | | | 557,022 | | | | 550,478 | |
Right of use assets consist primarily of leases for corporate office facilities and are amortized on a monthly basis over the term of the lease, or useful life, if shorter.
15. Income taxes
The Company had no income tax expense or benefit for the year ended August 31, 2021.
| (a) | Reconciliation of the effective tax rate |
The reconciliation of the combined federal and provincial statutory income tax rate of 26.5% (2020 - 26.5%) to the effective tax rate is as follows:
Disclosure of detailed information about components of income tax expense
| | | 2021 | | | 2020 | |
| | | | $ | | | | $ | |
| | | | | | | | | |
| Income (loss) before income taxes | | | (40,794,817 | ) | | | (32,416,108 | ) |
| Statutory income tax rate | | | 26.5 | % | | | 26.5 | % |
| Expected income tax (benefit) | | | (10,810,627 | ) | | | (8,590,269 | ) |
| | | | | | | | | |
| Reconciling items: | | | | | | | | |
| Foreign rate differential | | | (243,335 | ) | | | 443,749 | |
| Stock-based compensation and other non-deductible expenses | | | 1,318,852 | | | | 484,247 | |
| True up of prior period balances | | | 1,323,876 | | | | - | |
| Deferred tax assets not recognized | | | 8,411,234 | | | | 7,662,273 | |
| Income tax expense | | | - | | | | - | |
Engine Gaming and Media, Inc. (formerly Engine Media Holdings, Inc.) Notes to the Consolidated Financial Statements August 31, 2021 and 2020 (Expressed in United States Dollars) | |
The Company had the following temporary differences that would ordinarily give rise to deferred taxes:
Disclosure of detailed information about recognized deferred tax assets and liabilities
| | | 2021 | | | 2020 | |
| | | | $ | | | | $ | |
| Deferred tax assets | | | | | | | | |
| Net operating losses | | | 1,664,801 | | | | 1,340,296 | |
| | | | | | | | | |
| Deferred tax liabilities | | | | | | | | |
| Intangible assets | | | (1,391,070 | ) | | | (919,340 | ) |
| Other - Canada | | | - | | | | (14,052 | ) |
| Other - United States | | | (273,731 | ) | | | (318,712 | ) |
| Convertible Debt | | | - | | | | (88,192 | ) |
| Net deferred tax asset | | | - | | | | - | |
Deferred tax assets and liabilities have been offset where they relate to income taxes levied by the same taxation authority and the Company has the legal right and intent to offset.
Unrecognized Deductible Temporary Differences
Deferred taxes are provided as a result of temporary differences that arise due to the difference between the income tax values and the carrying amount of assets and liabilities. Deferred tax assets have not been recognized in respect of the following deductible temporary differences:
Disclosure of detailed information about unrecognized deductible temporary differences and unused tax losses
| | | 2021 | | | 2020 | |
| | | $ | | | $ | |
| | | | | | | |
| Intangible assets | | | 28,362,021 | | | | 25,826,171 | |
| Net operating losses | | | 153,954,414 | | | | 133,010,627 | |
| Net capital losses | | | 2,156,922 | | | | - | |
| Property and equipment | | | 483,175 | | | | 552,680 | |
| Share issuance costs | | | 206,655 | | | | 67,250 | |
| Convertible debt | | | 2,385,606 | | | | - | |
| Other | | | 8,802,009 | | | | 8,998,673 | |
| | | | 196,350,802 | | | | 168,455,401 | |
The Company’s net operating losses expire in the manner discussed below. The remaining deductible temporary differences may be carried forward indefinitely. Deferred tax assets have not been recognized in respect to these items because it cannot be determined as probable that future taxable profit will be available against which the Company can utilize the benefits therefrom.
As of August 31, 2021, the Company has net operating loss carryforwards related to its domestic and international operations of approximately $159.8 million; $114.2 million of which have expiration periods ranging between 10 to 20 years, and $45.6 million have an indefinite carryforward period. Certain of these foreign, federal and state net operating loss carryforwards may be subject to Internal Revenue Code Section 382 or similar provisions, which impose limitations on their utilization. Net-capital losses were incurred in the year on the disposal of Motorsports group in the amount of $2,156,922. These losses can be carried forward indefinitely.
Engine Gaming and Media, Inc. (formerly Engine Media Holdings, Inc.) Notes to the Consolidated Financial Statements August 31, 2021 and 2020 (Expressed in United States Dollars) | |
16. Lease liabilities
Lease liabilities are measured at the present value of the lease payments that were not paid at that date. The lease payments are discounted by using the rate implicit in the lease. If this rate cannot be readily determined, the Company uses its incremental borrowing rate. The continuity of the lease liabilities is presented in the table below:
Disclosure of detailed information about continuity of the lease liabilities
| | | Equipment | | | Office lease | | | Total | |
| | | $ | | | $ | | | $ | |
| Balance, August 31, 2019 | | - | | | - | | | - | |
| Additions to right-of-use assets on adoption of IFRS 16, September 1, 2019 | | - | | | 258,756 | | | 258,756 | |
| Acquisition of UMG | | - | | | 401,441 | | | 401,441 | |
| Acquired | | 36,375 | | | - | | | 36,375 | |
| Interest expense | | (918 | ) | | (139,019 | ) | | (139,937 | ) |
| Payments | | - | | | 15,513 | | | 15,513 | |
| Balance, August 31, 2020 | | | 35,457 | | | | 536,691 | | | | 572,148 | |
| Acquired | | | - | | | | 210,178 | | | | 210,178 | |
| Interest expense | | | 1,971 | | | | 32,226 | | | | 34,197 | |
| Payments | | | (13,380 | ) | | | (214,948 | ) | | | (228,328 | ) |
| Effect of foreign exchange | | | - | | | | (644 | ) | | | (644 | ) |
| Balance, August 31, 2021 | | | 24,048 | | | | 563,503 | | | | 587,551 | |
| | | Equipment | | | Office lease | | | Total | |
| | | $ | | | $ | | | $ | |
| As of August 31, 2020: | | | | | | | | | | | | |
| Less than one year | | | 11,409 | | | | 174,262 | | | | 185,671 | |
| Greater than one year | | | 24,048 | | | | 362,429 | | | | 386,477 | |
| Total lease obligation | | | 35,457 | | | | 536,691 | | | | 572,148 | |
| | | Equipment | | | Office lease | | | Total | |
| | | $ | | | $ | | | $ | |
| As of August 31, 2021: | | | | | | | | | | | | |
| Less than one year | | | 12,174 | | | | 210,409 | | | | 222,583 | |
| Greater than one year | | | 11,874 | | | | 353,094 | | | | 364,968 | |
| Total lease obligation | | | 24,048 | | | | 563,503 | | | | 587,551 | |
The future minimum undiscounted lease payments as of August 31, 2021, are presented below:
Disclosure of detailed information about future minimum undiscounted lease payments
| | | Total | |
| | | $ | |
| Current | | | 250,216 | |
| 2 years | | | 176,513 | |
| 3 years | | | 160,696 | |
| 4 years | | | 52,089 | |
| Total undiscounted lease obligation | | | 639,514 | |
17. Players liability account
The Players liability account consists of UMG and Winview cash deposited by players, plus any prize winnings, less any fees for match game play and withdrawal requests processed to date. As of August 31, 2021, and 2020, the players liability account balance is the total amount payable if all players were to request closure of their accounts.
18. Promissory notes payable and other borrowings
The Company has promissory notes with a balance of $200,000 (August 31, 2020 – $200,000) that are unsecured, due on demand, and bear interest at 18%. As of August 31, 2021, interest of $139,644 has been accrued (August 31, 2020 – $83,435).
Engine Gaming and Media, Inc. (formerly Engine Media Holdings, Inc.) Notes to the Consolidated Financial Statements August 31, 2021 and 2020 (Expressed in United States Dollars) | |
The Company, through its WinView subsidiary, has a secured promissory note outstanding for amounts due for the provision of services by the noteholder. As of August 31, 2021, $482,304 was due under the note (August 31, 2020 – $1,527,582). The note is secured by the assets of WinView, bears interest at 8%, and is currently due. As of August 31, 2021, no interest is accrued on this note (August 31, 2020 – $63,612).
| (b) | Paycheck Protection Program (the “PPP”) loans |
In April and May 2020, the Company entered into promissory notes (the “Notes”) with three banks. The Notes evidence loans to the Company of $1,589,559 pursuant to the PPP of the CARES Act administered by the U.S. Small Business Administration (the “SBA”). In accordance with the requirements of the CARES Act, the Company used the proceeds from the loans exclusively for qualified expenses under the PPP, including payroll costs, rent and utility costs, as further detailed in the CARES Act and applicable guidance issued by the SBA.
Interest will accrue on the outstanding balance of the Notes at a rate of 1.00% per annum. However, the Company expects to apply for and receive forgiveness of up to all amounts due under the Notes, in an amount equal to the sum of qualified expenses under the PPP during the twenty-four weeks following disbursement.
Subject to any forgiveness granted under the PPP, the Notes are scheduled to mature in April 2022 and require 18 equal monthly payments of principal and interest beginning November 2020. The Notes may be prepaid at any time prior to maturity with no prepayment penalties. The Notes provide for customary events of default, including, among others, those relating to failure to make payments, bankruptcy, breaches of representations, significant changes in ownership, and material adverse effects. The Company’s obligations under the Notes are not secured by any collateral.
Upon the receipt of the proceeds of $1,589,559 from the Notes, the Company accounted for the Notes as a grant in the form of forgivable loan and recorded the amount as a deferred income liability. The liability was reduced as the Company recognized expenses which qualified for forgiveness of the loan. As of August 31, 2020, the Company had incurred greater than $1,589,559 of qualifying expenses and therefore had a remaining deferred income liability of $nil. The Company recognized the impact of the loan forgiveness as an offset against related salaries and wages expense, in the consolidated statement of loss and comprehensive loss for the year ended August 31, 2020.
| (c) | Frankly line of credit |
On January 7, 2020, the Company’s Frankly Media LLC subsidiary (“Frankly Media”) entered an agreement with an arm’s length lender, EB Acquisition Company, LLC (the “Lender”), whereby the Lender agreed, subject to the terms and conditions thereof, to provide Frankly Media with a revolving term line of credit in the principal amount of up to $5 million (the “EB Loan”).
The EB Loan had a one-year term, extendable for a second year upon the mutual agreement of Lender and Frankly Media; and was secured by a security interest in Frankly Media’s assets, as well as a guarantee by the Company, secured against the Company’s assets.
On December 1, 2020, the EB Loan was amended (the “Amended EB Loan”). The amendment extended the maturity date by one year and added a conversion feature to $1 million of the $5 million principal outstanding. The conversion feature allowed the holder to convert $1 million into common shares of the Company at a conversion price of $11.25 per common share. On February 24, 2021, the Company extinguished the Amended EB Loan and issued the Lender a convertible debenture in the principal amount of $5 million (the “EB CD”). The EB CD is convertible into units of the Company at a conversion price of $10.25 per unit, with each unit comprised of one common share and one-half of a warrant, with each whole warrant exercisable into a common share at an exercise price of $15.00 per share for a period of three years from the issuance of the EB CD. The EB CD has a term of three years.
Engine Gaming and Media, Inc. (formerly Engine Media Holdings, Inc.) Notes to the Consolidated Financial Statements August 31, 2021 and 2020 (Expressed in United States Dollars) | |
The Company determined the EB Loan was substantially modified on December 1, 2020 and the Amended EB Loan was substantially modified on February 24, 2021 (Note 19).
The carrying value of the line of credit as of August 31, 2021, was $0 (August 31, 2020 – $4,919,507).
19. Convertible debt
The continuity of convertible debt for the year ended August 31, 2021, is as follows:
Disclosure of detailed information about continuity of convertible debt
| | | 2019
Series | | | 2020
Series | | | Amended EB Loan | | | EB CD | | | Total | |
| | | $ | | | $ | | | | | | | | | $ | |
| | | | | | | | | | | | | | | | |
| Balance, August 31, 2019 | | | 12,532,723 | | | | - | | | | - | | | | - | | | | 12,532,723 | |
| Issuances | | | - | | | | 8,828,550 | | | | | | | | | | | | 8,828,550 | |
| Exchange of EB Loan for Amended EB Loan | | | | | | | | | | | | | | | | | | | | |
| Exchange of Amended EB Loan for EB CD | | | | | | | | | | | | | | | | | | | | |
| Conversion - common shares issued | | | (5,152,023 | ) | | | - | | | | - | | | | - | | | | (5,152,023 | ) |
| Conversion - warrants issued | | | (5,037,535 | ) | | | - | | | | - | | | | - | | | | (5,037,535 | ) |
| Interest expense | | | 358,123 | | | | - | | | | - | | | | - | | | | 358,123 | |
| Accrued interest on conversion | | | (317,508 | ) | | | 11,917 | | | | - | | | | - | | | | (305,591 | ) |
| Effect of foreign exchange | | | (200,661 | ) | | | - | | | | - | | | | - | | | | (200,661 | ) |
| Change in fair value | | | (61,250 | ) | | | (168,877 | ) | | | - | | | | - | | | | (230,127 | ) |
| Balance, August 31, 2020 | | | 2,121,869 | | | | 8,671,590 | | | | - | | | | - | | | | 10,793,459 | |
| | | 2019
Series | | | 2020
Series | | | Amended EB Loan | | | EB CD | | | Total | |
| | | $ | | | $ | | | | | | | | | $ | |
| | | | | | | | | | | | | | | | |
| Balance, August 31, 2020 | | | 2,121,869 | | | | 8,671,590 | | | | - | | | | - | | | | 10,793,459 | |
| Total convertible debt obligation beginning balance | | | 2,121,869 | | | | 8,671,590 | | | | - | | | | - | | | | 10,793,459 | |
| Issuances | | | - | | | | 4,282,477 | | | | - | | | | - | | | | 4,282,477 | |
| Exchange of EB Loan for Amended EB Loan | | | - | | | | - | | | | 5,043,103 | | | | - | | | | 5,043,103 | |
| Exchange of Amended EB Loan for EB CD | | | - | | | | - | | | | (4,931,813 | ) | | | 7,394,022 | | | | 2,462,209 | |
| Conversion - common shares issued | | | (1,500,214 | ) | | | (12,204,391 | ) | | | - | | | | - | | | | (13,704,605 | ) |
| Conversion - warrants issued | | | (1,103,661 | ) | | | (4,256,114 | ) | | | - | | | | - | | | | (5,359,775 | ) |
| Interest expense | | | 54,126 | | | | 398,183 | | | | 138,710 | | | | 250,000 | | | | 841,019 | |
| Accrued interest on conversion / interest payments | | | (101,247 | ) | | | (256,300 | ) | | | (250,000 | ) | | | - | | | | (607,547 | ) |
| Effect of foreign exchange | | | 134,562 | | | | - | | | | - | | | | - | | | | 134,562 | |
| Change in fair value | | | 1,308,993 | | | | 5,461,682 | | | | - | | | | (704,081 | ) | | | 6,066,594 | |
| Balance, August 31, 2021 | | | 914,428 | | | | 2,097,127 | | | | - | | | | 6,939,941 | | | | 9,951,496 | |
| Total convertible debt obligation ending balance | | | 914,428 | | | | 2,097,127 | | | | - | | | | 6,939,941 | | | | 9,951,496 | |
Engine Gaming and Media, Inc. (formerly Engine Media Holdings, Inc.) Notes to the Consolidated Financial Statements August 31, 2021 and 2020 (Expressed in United States Dollars) | |
| | | 2019
Series | | | 2020
Series | | | Amended EB Loan | | | EB CD | | | Total | |
| | | $ | | | $ | | | $ | | | $ | | | $ | |
| As of August 31, 2021: | | | | | | | | | | | | | | | | | | | | |
| Less than one year | | | 914,428 | | | | - | | | | - | | | | - | | | | 914,428 | |
| Greater than one year | | | - | | | | 2,097,127 | | | | - | | | | 6,939,941 | | | | 9,037,068 | |
| Total convertible debt obligation | | | 914,428 | | | | 2,097,127 | | | | - | | | | 6,939,941 | | | | 9,951,496 | |
| Total convertible debt obligation ending balance | | | 914,428 | | | | 2,097,127 | | | | - | | | | 6,939,941 | | | | 9,951,496 | |
| (a) | Conversions during the years ended August 31, 2021, and 2020 |
2019 Series
During the year ended August 31, 2021, 2019 Series convertible debentures with a principal amount of CAD$1,315,000 (2020 – CAD$13,047,122) were converted into 175,331 units (2020 – 1,739,615), and as a result, the Company issued 175,331 common shares and 175,331 warrants (2020 – 1,739,615 common shares and 1,739,615 warrants). The fair value of the convertible debentures at the time of conversion was estimated using the binomial lattice model with the below assumptions:
Share price of CAD$11.65 – $14.15 (2020 – CAD$7.05 – $18,00); term of 1.36 – 1.90 years (2020 – 1.85 and 2.52); conversion price and warrant exercise price of CAD$7.50 (2020 – CAD$7.50); interest rate of 6% (2020 – 6%); expected volatility of 98.5% – 179% (2020 – 168.65% – 181.93%); risk-free interest rate of 0.21% - 0.27% (2020 – 0.26% – 0.96%); exchange rate of 0.7651 – 0.8286 (2020 – 0.6899 – 0.7651); and an expected dividend yield of 0% for both years. The fair value assigned to these convertible debentures was $2,603,875 (2020 – $10,189,558).
This value was split between common shares and liability measured warrants as $1,500,214 (2020 – $5,152,023) and $1,103,661 (2020 – $5,037,535), respectively.
2020 Series
During the year ended August 31, 2021, 2020 Series convertible debentures with a principal amount of $11,651,393 (2020 – nil) were converted or settled into 1,553,518 units, and as a result, the Company issued 1,553,518 common shares and 1,134,305 warrants. The fair value of the convertible debentures at the time of conversion or settlement was estimated using the binomial lattice model with the below assumptions:
Share price of $7.79 – $9.92; term of 1.44 – 1.77 years; conversion price of $7.50; warrant exercise price of $15.00, interest rate of 10%; expected volatility of 95% – 98.5%; risk-free interest rate of 0.09% - 0.13%; and an expected dividend yield of 0%. The fair value assigned to these convertible debentures was $16,460,505.
This value was split between common shares and equity measured warrants as $12,204,391 and $4,256,114, respectively.
| (b) | Issuances during the year ended August 31, 2021 |
During the year ended August 31, 2021, 2020 Series convertible debentures with a principal amount of $2,901,393 were issued for gross proceeds of $2,901,393. In addition, in November 2020, $2,000,000 of convertible debentures from the Company’s standby convertible debenture facility were issued along with 224,719 warrants for gross proceeds of $2,000,000 (Note 19(f)). Of the gross proceeds of $2,000,000, $1,381,084 was allocated to the convertible debt and $618,916 was allocated to the 224,719 warrants issued (Note 19(f)). The total fair value recorded to convertible debt for issuances above amounted to $4,282,477.
Engine Gaming and Media, Inc. (formerly Engine Media Holdings, Inc.) Notes to the Consolidated Financial Statements August 31, 2021 and 2020 (Expressed in United States Dollars) | |
On December 1, 2020, the EB Loan was amended (Note 18(c)). The amendment extended the maturity date by one year and added a conversion feature to $1,000,000 of the $5,000,000 principal outstanding. The conversion feature allowed the holder to convert $1,000,000 into common shares of the Company at a conversion price of $11.25 per common share. On February 24, 2021, the Company extinguished the Amended EB Loan and issued the Lender a convertible debenture in the principal amount of $5,000,000. The EB CD is convertible into units of the Company at a conversion price of $10.25 per unit, with each unit comprised of one common share and one-half of a warrant, with each whole warrant exercisable into a common share at an exercise price of $15.00 per share for a period of three years from the issuance of the EB CD. The EB CD has a term of three years.
The fair value of the Amended EB Loan on December 1, 2020, was $5,043,103. The carrying value of the former EB Loan on December 1, 2020, consisted of $5,000,000 in principal and $76,412 in accrued interest, for total carrying value on the amendment date of $5,076,412. As a result, a gain on extinguishment of debt of $33,309 was recognized. The fair value of the EB CD on the date of issuance of February 24, 2021, was $7,394,022. The fair value of the Amended EB Loan on February 24, 2021, was $4,931,813. As a result, a loss on extinguishment of debt of $2,462,209 was recognized. The above two transactions resulted in a loss on extinguishment of debt of $2,428,900.
As of August 31, 2021, the fair value of the 2019 Series convertible debentures was estimated using the binomial lattice model with the below assumptions:
Disclosure of detailed information about fair value of convertible debentures
| 2019 Series | | August 31, 2021
(CA$) | | | August 31,
2020
(CA$) | |
| | | | | | | |
| Share price | | | 8.42 | | | | 11.65 | |
| Conversion price | | | 7.50 | | | | 7.50 | |
| Warrant exercise price | | | 7.50 | | | | 7.50 | |
| | | | | | | | | |
| Term, in years | | | .85 - .94 | | | | 1.85 - 1.94 | |
| Interest rate | | | 6 | % | | | 6 | % |
| Expected volatility | | | 90.00 | % | | | 179.00 | % |
| Risk-free interest rate | | | 0.25% - 0.26 | % | | | 0.25 | % |
| Exchange rate | | | 0.7947 | | | | 0.7651 | |
| Expected dividend yield | | | 0 | % | | | 0 | % |
The 2020 Series debentures will mature twenty-four (24) months from the date of issuance and bear interest at a rate of 5% per annum (subject to adjustment as described below), payable on maturity. At the Company’s option, interest under the 2020 Series debentures is payable in kind in common shares at an issue price which would be based on the trading price of the common shares at the time of such interest payment. The interest rate under the 2020 Series debentures will increase from 5% to 10% per annum on a prospective basis on December 19, 2020, if a public offering has not occurred by that date.
Engine Gaming and Media, Inc. (formerly Engine Media Holdings, Inc.) Notes to the Consolidated Financial Statements August 31, 2021 and 2020 (Expressed in United States Dollars) | |
The 2020 Series debenture holders may convert all or a portion of the principal amount of the debentures into units (“Units”) of the Company at a price (the “Conversion Price”) equal to the lesser of (a) $11.25 per Unit, and (b) if such conversion occurs after a public offering of securities by the Company (the “Public Offering”), a fifteen percent (15%) discount to the public offering price, provided that such conversion price shall not be less than $7.50 per Unit.
Notwithstanding the foregoing, if by December 19, 2020, the Company has not obtained registration rights in the United States to allow sale in the United States of the common shares (“Common Shares”) of the Company and the exercise of warrants (the “Warrants”) of the Company to be issued pursuant to the conversion of the 2020 Series debentures, holders of 2020 Series debentures may convert such debentures into Units at $7.50 per Unit. As of December 19, 2020, the Company had not obtained registration rights in the United States. As such, the conversion price is $7.50 per Unit and the interest rate increased to 10% on December 19, 2020.
Each Unit is comprised of one common share and one-half of one Warrant, with each Warrant exercisable into one common share of the Company at an exercise price of $15.00 per share for a period of three years from the issuance of the 2020 Series debentures. Under certain circumstances, the Company shall be entitled to call for the exercise of any outstanding Warrants in the event that the closing trading price of the Company common shares on the NASDAQ is above $30.00 per share for fifteen (15) consecutive trading days.
In the event that the Company’s common shares are listed for trading on the NASDAQ Capital Market and the Company completes a Public Offering for an aggregate amount of at least US$30,000,000, the Company may cause the 2020 Series debentures to be converted at the Conversion Price by the Company delivering a notice to the holder not less than a minimum of 30 days and a maximum 60 days prior to the forced conversion date.
These convertible debentures (the “2020 Series One Up” debentures) have identical terms as the 2020 Series debentures except that the minimum conversion price of $7.50 per Unit (as described above) will be US$9.50 per Unit. The 2020 Series One Up convertible debentures had a fair value at issuance of $3,078,550.
In September 2020, the Company entered into an $8,000,000 stand-by convertible debenture facility (the “2020 Series Standby” debentures). The 2020 Series Standby Debenture has substantially similar terms as the 2020 Series debentures, except (i) the references to a minimum $7.50 conversion price (as described above) have been changed to $8.90; and (ii) the 2020 Series Standby debentures are only convertible into common shares of the Company, not units.
In November 2020, the Company issued 224,719 warrants in connection with this first draw of $2,000,000 of the Standby Debentures, with each warrant exercisable into one common share the Company at an exercise price of $15.00 per share for a period of two years, subject to the same acceleration clause as the warrants underlying the 2020 Series debentures.
The remaining $6,000,000 of convertible debentures that are issuable under this facility have substantially similar terms as the 2020 Series debentures, including conversion into units consisting of one share and one-half warrant, provided that the conversion price of any additional convertible debentures will be based on the market price of the common shares at the time of such subscriptions and are subject to TSX-V approval.
Engine Gaming and Media, Inc. (formerly Engine Media Holdings, Inc.) Notes to the Consolidated Financial Statements August 31, 2021 and 2020 (Expressed in United States Dollars) | |
As of August 31, 2021, the fair value of the 2020 Series convertible debentures was estimated using the binomial lattice model with the below assumptions:
Disclosure of detailed information about fair value of convertible debentures
| 2020 Series | | August 31, 2021
(US$) | | | August 31,
2020
(US$) | |
| | | | | | | |
| Share price | | | 6.66 | | | | 8.92 | |
| Conversion price | | | 8.90 | | | | 7.50 - 9.50 | |
| Warrant exercise price | | | - | | | | 15.00 | |
| | | | | | | | | |
| Term, in years | | | 1.26 | | | | 1.97 - 1.98 | |
| Interest rate | | | 10 | % | | | 5% and 10 | % |
| Expected volatility | | | 90.00 | % | | | 200.00 | % |
| Risk-free interest rate | | | 0.10 | % | | | 0.14 | % |
| Expected dividend yield | | | 0 | % | | | 0 | % |
On February 24, 2021, the Company extinguished the Amended EB Loan and issued the Lender a convertible debenture in the principal amount of $5 million (the “EB CD”). The EB CD is convertible into units of the Company at a conversion price of $10.25 per unit, with each unit comprised of one common share and one-half of a warrant, with each whole warrant exercisable into a common share at an exercise price of $15.00 per share for a period of three years from the issuance of the EB CD. The EB CD has a term of three years.
As of August 31, 2021, the fair value of the EB CD convertible debenture was estimated using the binomial lattice model with the below assumptions:
Disclosure of detailed information about fair value of convertible debentures
| EB CD | | August 31, 2021
(US$) | | | August 31,
2020
(US$) | |
| | | | | | | |
| Share price | | | 6.66 | | | | - | |
| Conversion price | | | 10.25 | | | | - | |
| Warrant exercise price | | | 15.00 | | | | - | |
| | | | | | | | | |
| Term, in years | | | 1.26 | | | | - | |
| Interest rate | | | 10 | % | | | - | |
| Expected volatility | | | 90.00 | % | | | - | |
| Risk-free interest rate | | | 0.30 | % | | | - | |
| Expected dividend yield | | | 0 | % | | | - | |
Disclosure of key inputs of convertible debt
| Financial assets / financial liabilities | | Valuation technique | | Key Inputs | | Relationship and sensitivity of unobservable inputs to fair value to fair value |
| | | | | | | |
| Convertible debt | | The fair value of the convertible debentures as of August 31, 2021 has been calculated using a binomial lattice methodology. | | Key observable inputs | | The estimated fair value would increase (decrease) if: |
| | | | | Share price CAD$8.42 (USD $6.66) | | The share price was higher (lower) |
| | | | | Risk-free interest rate (0.10% to 0.30%) | | The risk-free interest rate was higher (lower) |
| | | | | Dividend yield (0%) | | The dividend yield was lower (higher) |
| | | | | Key unobservable inputs | | |
| | | | | Credit spread (1.14% to 8.45%) | | The credit spread was lower (higher) |
| | | | | Discount for lack of marketability (0%) | | The discount for lack of marketability was lower (higher) |
| | | | | | | |
| | | | | | | |
| Convertible debt | | The fair value of the convertible debentures as of August 31, 2020 has been calculated using a binomial lattice methodology. | | Key observable inputs | | The estimated fair value would increase (decrease) if: |
| | | | | Share price (USD $8.92) | | The share price was higher (lower) |
| | | | | Risk-free interest rate (0.14%) | | The risk-free interest rate was higher (lower) |
| | | | | Dividend yield (0%) | | The dividend yield was lower (higher) |
| | | | | Key unobservable inputs | | |
| | | | | Credit spread (18.35%) | | The credit spread was lower (higher) |
| | | | | Discount for lack of marketability (47%) | | The discount for lack of marketability was lower (higher) |
20. Long-term debt
The Company has an unsecured, non-interest bearing loan that matures on June 30, 2022. The loan bears interest at 0% per annum. As of August 31, 2021, the present value of the loan was $96,664 (2020 – $230,932), with accretion of $28,123 (2020 – $16,239) having been charged to interest expense on the Company’s consolidated statements of loss and comprehensive loss for the years then ended. A discount rate of 10% was used for both years.
Scheduled repayments are: €90,000 ($106,330) as of August 31, 2021, all of which is current.
Engine Gaming and Media, Inc. (formerly Engine Media Holdings, Inc.) Notes to the Consolidated Financial Statements August 31, 2021 and 2020 (Expressed in United States Dollars) | |
21. Warrants
Liability measured warrants having CAD exercise price
The following table reflects the continuity of the Company’s liability measured warrants for the years ended August 31, 2021, and 2020:
Schedule of measured warrants
| | | Amount | |
| | | $ | |
| | | | |
| Balance at August 31, 2020 | | | 14,135,321 | |
| Issued in acquisition of Frankly | | | | |
| Issued on conversion of convertible debt | | | 1,103,661 | |
| Issued in private placement of convertible debt | | | | |
| Issued in private placement of units | | | | |
| Issued in private placement of units - transaction costs | | | | |
| Exercised | | | (2,134,116 | ) |
| Change in fair value | | | (9,037,108 | ) |
| Foreign exchange | | | 800,945 | |
| Balance, August 31, 2021 | | | 4,868,703 | |
| | | Amount | |
| | | $ | |
| | | | |
| Balance at August 31, 2019 | | | 296,795 | |
| Issued in acquisition of Frankly | | | 2,157,000 | |
| Issued on conversion of convertible debt | | | 5,037,535 | |
| Issued in private placement of units | | | 991,709 | |
| Exercised | | | (1,345,573 | ) |
| Change in fair value | | | 6,189,921 | |
| Foreign exchange | | | 807,934 | |
| Balance, August 31, 2020 | | | 14,135,321 | |
Engine Gaming and Media, Inc. (formerly Engine Media Holdings, Inc.) Notes to the Consolidated Financial Statements August 31, 2021 and 2020 (Expressed in United States Dollars) | |
The following table reflects the continuity of the Company’s outstanding liability measured warrants for the years ended August 31, 2021, and 2020:
Schedule of outstanding warrants
| | | | | | Weighted-average | |
| | | Number of | | | exercise price | |
| | | warrants | | | CAD | |
| | | # | | | $ | |
| | | | | | | |
| Outstanding, August 31, 2020 | | | 2,405,369 | | | | 9.60 | |
| Issued on conversion of convertible debt | | | 175,331 | | | | 7.50 | |
| Number of warrants, Issued | | | | | | | | |
| Weighted average exercise price, Issued | | | | | | | | |
| Number of warrants, Issued on acquisition of UMG | | | | | | | | |
| Weighted average exercise price, Issued on acquisition of UMG | | | | | | | | |
| Number of warrants, Issued in acquisition of Frankly | | | | | | | | |
| Weighted average exercise price, Issued in acquisition of Frankly | | | | | | | | |
| Number of warrants, Issued in private placement of convertible debt | | | | | | | | |
| Weighted average exercise price, Issued in private placement of convertible debt | | | | | | | | |
| Number of warrants, Issued in private placement of units | | | | | | | | |
| Weighted average exercise price, Issued in private placement of units | | | | | | | | |
| Exercised | | | (901,060 | ) | | | 9.27 | |
| Expired | | | (226,797 | ) | | | 13.43 | |
| Oustanding as at August 31, 2021 | | | 1,452,843 | | | | 8.96 | |
| | | Number of | | | Weighted-average | |
| | | | | | exercise price | |
| | | warrants | | | CAD | |
| | | # | | | $ | |
| | | | | | | |
| Outstanding, August 31, 2019 | | | 29,318 | | | | 448.50 | |
| Issued | | | 1,990,890 | | | | 8.45 | |
| Issued on acquisition of UMG | | | 9,943 | | | | 174.18 | |
| Issued in acquisition of Frankly | | | 1,055,036 | | | | 9.69 | |
| Exercised | | | (654,543 | ) | | | 7.50 | |
| Expired | | | (25,275 | ) | | | 551.26 | |
| Oustanding as at August 31, 2020 | | | 2,405,369 | | | | 9.60 | |
The following table reflects the liability measured warrants issued and outstanding as of August 31, 2021:
Schedule of warrants issued and outstanding
| | | | | | Warrants outstanding | |
| Expiry date | | Number outstanding | | | Average exercise price CAD | | | Average remaining contractual life (years) | |
| March 13, 2022 | | | 123,159 | | | | 10.50 | | | | 0.53 | |
| December 20, 2022 | | | 29,066 | | | | 27.00 | | | | 1.30 | |
| March 20, 2023 | | | 27,777 | | | | 13.50 | | | | 1.55 | |
| March 30, 2023 | | | 46,909 | | | | 13.50 | | | | 1.58 | |
| March 31, 2023 | | | 17,222 | | | | 13.50 | | | | 1.58 | |
| May 27, 2023 | | | 130,304 | | | | 13.50 | | | | 1.74 | |
| July 8, 2024 | | | 445,982 | | | | 7.50 | | | | 2.85 | |
| July 25, 2024 | | | 401,624 | | | | 7.50 | | | | 2.90 | |
| August 8, 2024 | | | 230,800 | | | | 7.50 | | | | 2.94 | |
| | | | 1,452,843 | | | $ | 8.96 | | | | 2.47 | |
Engine Gaming and Media, Inc. (formerly Engine Media Holdings, Inc.) Notes to the Consolidated Financial Statements August 31, 2021 and 2020 (Expressed in United States Dollars) | |
As of August 31, 2021, the fair value of the 1,452,843 liability measured warrants outstanding (August 31, 2020 – 2,405,369) was determined to be $4,868,703 (August 31, 2020 – $14,135,321) as calculated using the Black Scholes option pricing model with the following range of assumptions: 0.53 – 2.94 years (August 31, 2020 – 0.23 – 3.94) as expected average life; share price of CAD$8.42 (August 31, 2020 – CAD$11.65); exercise price of CAD$7.50 – CAD$27.00 (August 31, 2020 – CAD$7.50 – CAD$205.20); 70% - 90% expected volatility (August 31, 2020 – 115% - 136%); risk free interest rate of 0.28% - 0.63% (August 31, 2020 – 0.23% - 0.32%); and an expected dividend yield of 0%.
If all liability measured warrants outstanding and exercisable as of August 31, 2021, were exercised, the Company would receive cash from exercise of approximately CAD$13.0 million.
| (a) | Liability measured warrants exercised during the year ended August 31, 2021 |
During the year ended August 31, 2021, the holders of 901,060 warrants exercised their right to convert the warrants into the Company’s common shares at an exercise price of CAD$7.50 - $9.75. As a result of the underlying exercise of warrants, the Company received $6,866,735 in cash proceeds and the intrinsic value of the underlying warrants at the date of exercise of $2,134,116 was transferred to share capital, for a total addition to share capital of $9,000,851.
| (b) | Liability measured warrants issued during the year ended August 31, 2021 |
During the year ended August 31, 2021, the Company issued 175,331 warrants (August 31, 2020 – 1,739,613) in connection with conversion of convertible debt (Note 19(a) – 2019 Series), and nil warrants (August 31, 2020 – 251,277) in connection with the private placement of units (Note 22(c)), for a total number of 175,331 warrants issued (August 31, 2020 – 1,990,890 warrants issued, excluding warrants issued in connection with acquisitions as highlighted in the continuity above).
| (c) | Liability measured warrants issued on conversion of convertible debt |
2019 Series
During the year ended August 31, 2021, the Company issued 175,331 warrants (August 31, 2020 – 1,739,613) in conjunction with the conversion of convertible debt. The fair value of the 175,331 warrants (August 31, 2020 – 1,739,613) issued was determined to be $1,103,661 (August 31, 2020 – $5,037,535) as calculated using the Black Scholes option pricing model with the following assumptions:
A 3.36 – 3.90 years as expected average life (August 31, 2020 – 3.92 to 4.91); share price of CAD$9.50 – $12.33 (August 31, 2020 – CAD$7.05 – $25.65); exercise price of CAD$7.50 (August 31, 2020 – CAD$7.50); 98.5% - 136% expected volatility (August 31, 2020 – 136%); risk free interest rate of 0.25% - 0.54% (August 31, 2020 – 0.28% and 1.71%); and an expected dividend yield of 0% for both years.
Volatility is calculated using a weighted approach based on the changes in the Company’s historical stock price. The final fair value allocated to the warrants on conversion of convertible debt is based on a relative fair value allocation between the common shares issued and warrants issued on conversion.
Engine Gaming and Media, Inc. (formerly Engine Media Holdings, Inc.) Notes to the Consolidated Financial Statements August 31, 2021 and 2020 (Expressed in United States Dollars) | |
Equity measured warrants having USD exercise price
The following table reflects the continuity of the Company’s equity measured warrants for the year ended August 31, 2021. There were no equity measured warrants outstanding as of August 31, 2020:
Schedule of measured warrants
| | | Amount | |
| | | $ | |
| | | | |
| Balance at August 31, 2020 | | | - | |
| Beginning Balance | | | - | |
| Issued on conversion of convertible debt | | | 4,256,114 | |
| Issued in private placement of convertible debt | | | 618,916 | |
| Issued in private placement of units | | | 7,373,806 | |
| Issued in private placement of units - transaction costs | | | (582,333 | ) |
| Balance, August 31, 2021 | | | 11,666,503 | |
| Ending Balance | | | 11,666,503 | |
The following table reflects the continuity of the Company’s outstanding equity measured warrants for the year ended August 31, 2021:
Schedule of outstanding warrants
| | | | | | Weighted-average | |
| | | Number of | | | exercise price | |
| | | warrants | | | USD | |
| | | # | | | $ | |
| | | | | | | |
| Outstanding, August 31, 2020 | | | - | | | | - | |
| Issued on conversion of convertible debt | | | 1,134,305 | | | | 15.0 | |
| Issued in private placement of convertible debt | | | 224,719 | | | | 15.00 | |
| Issued in private placement of units | | | 2,377,272 | | | | 15.00 | |
| Oustanding as at August 31, 2021 | | | 3,736,296 | | | | 15.00 | |
Engine Gaming and Media, Inc. (formerly Engine Media Holdings, Inc.) Notes to the Consolidated Financial Statements August 31, 2021 and 2020 (Expressed in United States Dollars) | |
The following table reflects the equity measured warrants issued and outstanding as of August 31, 2021:
Schedule of warrants issued and outstanding
| | | | | | Warrants outstanding | |
| Expiry date | | Number outstanding | | | Average exercise price USD | | | Average remaining contractual life (years) | |
| November 20, 2022 | | | 224,719 | | | | 15.00 | | | | 1.22 | |
| January 8, 2024 | | | 1,868,787 | | | | 15.00 | | | | 2.36 | |
| January 22, 2024 | | | 522,898 | | | | 15.00 | | | | 2.39 | |
| February 24, 2024 | | | 1,058,227 | | | | 15.00 | | | | 2.48 | |
| August 19, 2024 | | | 49,999 | | | | 15.00 | | | | 2.97 | |
| September 15, 2024 | | | 11,666 | | | | 15.00 | | | | 3.04 | |
| | | | 3,736,296 | | | $ | 15.00 | | | | 2.34 | |
If all equity measured warrants outstanding and exercisable as of August 31, 2021, were exercised, the Company would receive cash from exercise of approximately $56.0 million.
| (a) | Equity measured warrants issued during the year ended August 31, 2021 |
During the year ended August 31, 2021, the Company issued 1,134,305 warrants (August 31, 2020 – nil) in connection with conversion of convertible debt (Note 19(a) – 2020 Series), 224,719 warrants (August 31, 2020 – nil) in connection with the private placement of convertible debentures (Note 19(f)) and 2,377,272 warrants (August 31, 2020 – nil) in connection with the private placement of units (Note 22(c)), for a total number of 3,736,296 warrants issued (August 31, 2020 – nil).
| (b) | Equity measured warrants issued on conversion of convertible debt |
2020 Series
During the year ended August 31, 2021, the Company issued 1,134,305 warrants (August 31, 2020 – nil) in conjunction with the conversion of convertible debt. The fair value of the 1,134,305 warrants issued was determined to be $4,256,114 as calculated using the Black Scholes option pricing model with the following assumptions:
A 3.00 – 3.50 years expected average life; share price of $7.79 – $11.17; exercise price of $15.00; 98.5% expected volatility; risk free interest rate of 0.29% - 0.57%; and an expected dividend yield of 0%.
Volatility is calculated using a weighted approach based on the changes in the Company’s historical stock price. The final fair value allocated to the warrants on conversion of convertible debt is based on a relative fair value allocation between the common shares and equity measured warrants.
| (c) | Equity measured warrants issued on private placement of standby convertible debentures |
During the year ended August 31, 2021, the Company issued 224,719 warrants in connection with the private placement of convertible debentures under its standby convertible debenture facility (Note 19(f)). The fair value of the 224,719 warrants issued was determined to be $618,916 as calculated using the Black Scholes option pricing model with the following assumptions:
A 2 years expected average life; share price of $5.63; exercise price of $15.00; 200% expected volatility; risk free interest rate of 0.16%; and an expected dividend yield of 0%.
Volatility is calculated using a weighted approach based on the changes in the Company’s historical stock price. The final fair value allocated to the warrants on conversion of convertible debt is based on a relative fair value allocation between the common shares issued and warrants issued on conversion.
Engine Gaming and Media, Inc. (formerly Engine Media Holdings, Inc.) Notes to the Consolidated Financial Statements August 31, 2021 and 2020 (Expressed in United States Dollars) | |
| (d) | Equity measured warrants issued on private placement of units |
During the year ended August 31, 2021, the Company issued 2,377,272 warrants (August 31, 2020 – nil) in conjunction with the private placement of units. Of the 2,377,272 warrants issued, 191,387 were issued to finders as fees for services. The fair value of the 2,377,272 warrants issued (August 31, 2020 – nil) was determined to be $7,373,806 (August 31, 2020 – $nil) as calculated using the Black Scholes option pricing model with the following assumptions:
A 3.00 year expected average life (August 31, 2020 – nil); share price of $7.79 – $10.00 (August 31, 2020 – nil); exercise price of $15.00 (August 31, 2020 – nil); 98.5% expected volatility (August 31, 2021 – nil); risk free interest rate of 0.29% - 0.43% (August 31, 2020 – nil); and an expected dividend yield of 0%.
Of the $7,373,806 total fair value, $6,603,243 was the fair value of the 2,185,885 warrants issued for proceeds, with $770,563 being the fair value of the 191,387 warrants issued to finders. The amount recorded in contributed surplus of $6,791,473 represents the fair value of warrants issued of $7,373,806 less $582,333 for transaction costs allocated to the warrants issued.
Volatility is calculated using a weighted approach based on the changes in the Company’s historical stock price. The final fair value allocated to the warrants on the issuance of the units is based on a relative fair value allocation between the common shares issued and warrants issued.
22. Share capital
The Company is authorized to issue an unlimited number of common shares and an unlimited number of preference shares.
| (b) | Issued and outstanding, common shares |
Schedule of shares issued and outstanding
| | | Shares | | | Consideration | |
| | | # | | | $ | |
| | | | | | | |
| Balance, August 31, 2019 | | | 156,438 | | | | 29,613,406 | |
| Impact of share consolidation | | | (114 | ) | | | - | |
| Shares issued on vesting of RSUs | | | 26,666 | | | | 159,895 | |
| Convertible debt conversion | | | 1,739,615 | | | | 5,152,023 | |
| Private placements, net of costs | | | 502,562 | | | | 2,694,076 | |
| Shares issued for debt conversion | | | 59,654 | | | | 724,231 | |
| Shares issued on acquisition of UMG | | | 288,560 | | | | 3,804,344 | |
| Shares issued on acquisition of Frankly | | | 2,258,215 | | | | 12,155,000 | |
| Shares issued on acquisition of Winview | | | 1,759,997 | | | | 7,579,000 | |
| Shares issued on acquisition of Driver Database (Note 6) | | | 100,000 | | | | 859,745 | |
| Shares issued on acquisition of Lets Go Racing (Note 6) | | | 200,000 | | | | 1,719,491 | |
| Common shares issued on exercise of options | | | | | | | | |
| Common shares issued on exercise of options (in shares) | | | | | | | | |
| Common shares issued on private placement, net of costs | | | | | | | | |
| Common shares issued on private placement, net of costs (in shares) | | | | | | | | |
| EB bonus shares | | | | | | | | |
| EB bonus shares (in shares) | | | | | | | | |
| Shares for debt | | | | | | | | |
| Shares for debt (in shares) | | | | | | | | |
| Shares issued on acquisiton of SideQik | | | | | | | | |
| Shares issued on acquisiton of SideQik (in shares) | | | | | | | | |
| Common shares issued on exercise of warrants | | | 654,543 | | | | 4,919,596 | |
| Balance, August 31, 2020 | | | 7,746,136 | | | | 69,380,807 | |
| | | Shares | | | Consideration | |
| | | # | | | $ | |
| | | | | | | |
| Balance, August 31, 2020 | | | 7,746,136 | | | | 69,380,807 | |
| Shares issued on vesting of RSUs | | | 277,749 | | | | 1,895,891 | |
| Common shares issued on exercise of options | | | 20,833 | | | | 290,558 | |
| Convertible debt conversion | | | 1,728,848 | | | | 13,704,605 | |
| Common shares issued on private placement, net of costs | | | 4,435,433 | | | | 24,225,901 | |
| EB bonus shares | | | 6,666 | | | | 54,061 | |
| Shares for debt | | | 40,000 | | | | 226,556 | |
| Common shares issued on exercise of warrants | | | 901,060 | | | | 9,000,851 | |
| Shares issued on acquisiton of SideQik | | | 386,584 | | | | 3,962,000 | |
| Balance, August 31, 2021 | | | 15,543,309 | | | | 122,741,230 | |
Engine Gaming and Media, Inc. (formerly Engine Media Holdings, Inc.) Notes to the Consolidated Financial Statements August 31, 2021 and 2020 (Expressed in United States Dollars) | |
| (c) | Activity for the year ended August 31, 2021 |
Private Placement of units
In January and February 2021, the Company closed on the issuance of 4,371,767 units (the “Units”) for gross proceeds of $32,788,253 of non-brokered private placements. Each Unit consists of one common share of the Company and one-half of one common share purchase warrant (a “Warrant”). Each whole Warrant entitles the holder to acquire one additional share of the Company at a price of $15.00 per share for a period of 3 years provided that: (i) if the common shares are listed for trading on NASDAQ, (ii) the Company completes an offering of securities under a short form prospectus for an aggregate amount of at least $30,000,000, and (iii) the closing price of the common shares on NASDAQ is $30.00 or greater for a period of 15 consecutive trading days, then the Company may accelerate the expiry date of the Warrants to the 30th day after the date written notice is provided to the holders.
The Company paid cash commissions to eligible finders under the offering of $1,681,477 and regulatory and legal fees of $89,402. Net cash proceeds from the offering amounted to $31,017,374.
In addition to the cash finder’s fees discussed above, the Company issued the following securities as partial payment of commissions to finders: 63,666 Units; and 159,554 finders warrants, with each finder warrant exercisable into a common share at an exercise price of US$15.00 per share for 3 years subject to the same acceleration terms described above.
The total number of common shares issued as a result of the private placements totaled 4,435,433, which was comprised of 4,371,767 Units issued for proceeds and 63,666 Units issued as partial payment to finders. The total number of warrants issued totaled 2,377,272, which was comprised of warrants issued as part of the Units issued of 2,217,718 (50% of Units issued) and 159,554 finders warrants issued.
A summary of amounts recorded in connection with private placement and their effect on financial statement line items is noted below:
Schedule of private placement
| | | Proceeds | | | Shares | | | Impact on share capital | | | Warrants | | | Impact on contributed surplus | |
| | | $ | | | # | | | $ | | | # | | | $ | |
| Units issued in private placement | | | 32,788,253 | | | | 4,371,767 | | | | 26,185,009 | | | | 2,185,885 | | | | 6,603,244 | |
| Cash commissions | | | (1,681,477 | ) | | | - | | | | (1,345,736 | ) | | | - | | | | (335,741 | ) |
| Regulatory and legal fees | | | (89,402 | ) | | | - | | | | (71,522 | ) | | | - | | | | (17,880 | ) |
| Finders’ units issued | | | - | | | | 63,666 | | | | 383,720 | | | | 31,833 | | | | 93,775 | |
| Finders’ units considered as transaction costs | | | - | | | | - | | | | (383,720 | ) | | | - | | | | (93,775 | ) |
| Finders’ warrants issued | | | - | | | | - | | | | - | | | | 159,554 | | | | 676,787 | |
| Finders’ warrants considered as transaction costs | | | - | | | | - | | | | (541,850 | ) | | | - | | | | (134,937 | ) |
| | | | 31,017,374 | | | | 4,435,433 | | | | 24,225,901 | | | | 2,377,272 | | | | 6,791,473 | |
The fair value allocated between the common shares and warrants on the issuance of the Units is based on a relative fair value allocation between the common shares issued and warrants issued. Refer to equity measured warrants note for discussion of the key assumptions used in valuation of the warrants as part of the relative fair value allocation.
Engine Gaming and Media, Inc. (formerly Engine Media Holdings, Inc.) Notes to the Consolidated Financial Statements August 31, 2021 and 2020 (Expressed in United States Dollars) | |
Other activity
During the year ended August 31, 2021, the Company had the following additional activity to share capital: (i) issued 277,749 common shares upon vesting of an equal number of RSUs (Note 24); (ii) issued 20,833 common shares upon the exercise of vested stock options, (iii) issued 1,728,848 common shares in connection with conversion of convertible debt (Note 19(a)), (iv) issued 901,060 common shares in connection with the exercise of warrants (Note 21(a)); (v) issued 40,000 common shares for cancelation of $226,556 of debt (shares for debt); and (vi) issued 6,666 common shares valued at $54,061 as an amendment fee to the lender in connection with the Amended EB Loan (the “EB Bonus Shares”). In addition to the EB Bonus Shares, the Company paid the lender a cash fee of $100,000. The amendment fees were recorded within interest expense as the Amended EB Loan and the subsequently the EB CD is being accounted for at FVTPL; (vii) issued 386,584 common shares with a fair value of $3,962,000 in connection with the acquisition of SideQik, Inc (Note 6).
Activity for the year ended August 31, 2020
During the year ended August 31, 2020, the Company issued 26,666 common shares upon vesting of an equal number of RSUs (Note 24), issued 1,739,615 common shares in connection with conversion of convertible debt (Note 19), and issued 502,562 common shares in connection with a series of non-brokered private placements as follows:
On December 18, 2019, the Company closed a non-brokered private placement at a price of CAD$18.75 ($14.25) per unit. The Company issued 58,133 units for gross proceeds of CAD$1,090,000 ($830,907). Each unit is comprised of one common share of the Company and one-half of one common share purchase warrant. Each whole warrant entitles the holder to acquire one common share of the Company for a period of 36 months from the date of issuance of the warrant, at an exercise price of CAD$27.00 per share. The proceeds were allocated to the common shares and warrants using the relative fair value method, with $612,745 being allocated to the 58,133 common shares issued and the remaining $218,162 allocated to the 29,067 warrants issued (Note 21).
During the third quarter of 2020 the Company closed a non-brokered private placement at a price of CAD$9.00 per unit in four tranches. The Company issued a total of 444,429 units for gross proceeds of CAD$3,999,860 ($2,875,593). Each unit is comprised of one common share of the Company and one-half of one common share purchase warrant. Each whole warrant entitles the holder to acquire one common share of the Company for a period of 36 months from the date of issuance of the warrant, at an exercise price of CAD$13.50 per share. The proceeds were allocated to the common shares and warrants using the relative fair value method, with $2,102,047 being allocated to the 444,429 common shares issued and the remaining $773,546 allocated to the 222,214 warrants issued (Note 21).
On March 20, 2020, the Company issued 46,300 common shares in settlement of select trade payables through a shares for debt placement amounting to CAD$900,003 ($632,522). The fair value of the shares issued were based on market price on the date of settlement. In addition, on June 13, 2020, the Company issued 13,354 common shares in settlement of select trade payables through a shares for debt placement amounting to CAD$125,000 ($91,709).
Engine Gaming and Media, Inc. (formerly Engine Media Holdings, Inc.) Notes to the Consolidated Financial Statements August 31, 2021 and 2020 (Expressed in United States Dollars) | |
On December 31, 2019, the Company issued 288,560 common shares with a fair value of $3,804,344 in connection with the acquisition of UMG (Note 6). On May 8, 2020, the Company issued 2,258,215 common shares with a fair value of $12,155,000 in connection with the acquisition of Frankly (Note 6). On May 8, 2020, the Company issued 1,759,997 common shares with a fair value of $7,579,000 in connection with the acquisition of Winview (Note 6).
On June 3, 2020, the Company issued 100,000 common shares with a fair value of $859,745 in connection with the acquisition of DriverDB (Note 6). On June 3, 2020, the Company issued 200,000 common shares with a fair value of $1,719,491 in connection with the acquisition of Lets Go Racing (Note 6).
During the year ended August 31, 2020, the Company issued 654,543 common shares in connection with the exercise of warrants. In connection with these exercises, amounts recorded to share capital of $4,919,596 are comprised of exercise proceeds of $3,574,023 and intrinsic value of warrants on exercise of $1,345,573 (Note 21).
23. Stock options
On October 6, 2021, the Company adopted an amended and restated equity incentive plan (“Omnibus Plan”), which amends and restates the equity incentive plan which was previously established as of July 15, 2020. Under the amendments, there were no changes in the terms of previously issued awards. Under the Omnibus Plan, the total number of common shares reserved and available for grant and issuance pursuant to stock options shall not exceed 10% of the then issued and outstanding shares.
Options may be exercisable over periods of up to 10 years as determined by the Board of Directors of the Company and the exercise price shall not be less than the closing price of the shares on the day preceding the award date, subject to regulatory approval. The following table reflects the continuity of stock options for the years ended August 31, 2021, and 2020:
Disclosure of detailed information about number and weighted average exercise prices of share options
| | | | | | Weighted-average | | | | |
| | | Number of
stock options | | | Exercise
price | | | Grant-date
fair value | | | Remaining
contractual
term | |
| | | # | | | $ | | | $ | | | (yrs.) | |
| | | | | | | | | | | | | |
| Balance, Aug. 31, 2019 | | | 6,971 | | | | 166.20 | | | | 49.86 | | | | 5.84 | |
| Issued on acquisition of UMG | | | 16,606 | | | | 63.30 | | | | 2.32 | | | | | |
| Issued on acquisition of Frankly | | | 64,659 | | | | 9.22 | | | | 5.07 | | | | | |
| Number of stock options Issued on exercise of options | | | | | | | | | | | | | | | | |
| Exercise price Issued on exercise of options | | | | | | | | | | | | | | | | |
| Grant-date fair value Issued on exercise of options | | | | | | | | | | | | | | | | |
| Granted | | | 169,995 | | | | 7.91 | | | | 4.38 | | | | | |
| Expired/Cancelled | | | (5,110 | ) | | | 185.97 | | | | 55.79 | | | | | |
| Balance, Aug 31, 2020 | | | 253,121 | | | | 12.73 | | | | 4.39 | | | | 4.31 | |
| | | | | | | | | | | | | | | | | |
| | | | | | | | | | | | | | | | | |
| Balance, August 31, 2020 | | | 253,121 | | | | 12.73 | | | | 4.39 | | | | 4.31 | |
| Granted | | | 487,466 | | | | 11.77 | | | | 8.16 | | | | | |
| Issued on exercise of options | | | (20,833 | ) | | | 7.91 | | | | 4.38 | | | | | |
| Expired/Cancelled | | | (26,816 | ) | | | 27.20 | | | | 6.51 | | | | | |
| Balance, Aug 31, 2021 | | | 692,938 | | | | 11.64 | | | | 7.06 | | | | 4.46 | |
| | | | | | | | | | | | | | | | | |
| Exerciseable as at Aug 31, 2021 | | | 209,950 | | | | 13.01 | | | | 4.30 | | | | 2.35 | |
Engine Gaming and Media, Inc. (formerly Engine Media Holdings, Inc.) Notes to the Consolidated Financial Statements August 31, 2021 and 2020 (Expressed in United States Dollars) | |
The following tables reflect the stock options issued and outstanding as of August 31, 2021:
Disclosure of detailed information about options issued and outstanding
| Expiry date | | Outstanding options | | | CAD | | | Weighted average exercise price
USD | | | Weighted average remaining contractual term
(Years) | |
| December 10, 2021 | | | 1,564 | | | | 93.30 | | | | 71.84 | | | | 0.28 | |
| June 30, 2022 | | | 4,428 | | | | 153.45 | | | | 118.15 | | | | 0.83 | |
| April 1, 2023 | | | 84,165 | | | | 11.25 | | | | 7.91 | | | | 1.58 | |
| October 31, 2023 | | | 64,997 | | | | 11.25 | | | | 7.91 | | | | 2.17 | |
| January 29, 2025 | | | 46 | | | | 106.50 | | | | 76.43 | | | | 3.42 | |
| August 25, 2025 | | | 340 | | | | 106.50 | | | | 76.43 | | | | 3.99 | |
| September 23, 2025 | | | 11 | | | | 106.50 | | | | 76.43 | | | | 4.07 | |
| February 10, 2026 | | | 1,443 | | | | 106.50 | | | | 76.43 | | | | 4.45 | |
| May 19, 2026 | | | 4 | | | | 106.50 | | | | 76.43 | | | | 4.72 | |
| May 23, 2026 | | | 9 | | | | 106.50 | | | | 76.43 | | | | 4.73 | |
| June 24, 2026 | | | 375,188 | | | | 15.04 | | | | 12.21 | | | | 4.82 | |
| July 1, 2026 | | | 10,000 | | | | 14.87 | | | | 12.00 | | | | 4.84 | |
| July 2, 2026 | | | 57,762 | | | | 15.08 | | | | 12.21 | | | | 4.84 | |
| August 20, 2026 | | | 32,500 | | | | 7.78 | | | | 6.05 | | | | 4.97 | |
| March 3, 2027 | | | 1,256 | | | | 106.50 | | | | 76.43 | | | | 5.51 | |
| July 31, 2027 | | | 159 | | | | 106.50 | | | | 76.43 | | | | 5.92 | |
| November 3, 2027 | | | 133 | | | | 106.50 | | | | 76.43 | | | | 6.18 | |
| November 7, 2029 | | | 46,251 | | | | 7.50 | | | | 5.38 | | | | 8.19 | |
| April 20, 2030 | | | 666 | | | | 7.05 | | | | 5.06 | | | | 8.64 | |
| December 2, 2030 | | | 1,333 | | | | 9.50 | | | | 7.38 | | | | 9.26 | |
| June 14, 2031 | | | 10,683 | | | | 14.20 | | | | 11.69 | | | | 9.79 | |
| | | | 692,938 | | | | 14.86 | | | | 11.64 | | | | 4.46 | |
Of the 692,938 options outstanding as of August 31, 2021 (2020 – 253,121), 209,950 are exercisable as of August 31, 2021 (2020 – 191,730).
24. Restricted share units
The Omnibus Plan allows the Company to award restricted share units to officers, employees, directors and consultants of the Company and its subsidiaries upon such conditions as the Board may establish, including the attainment of performance goals recommended by the Company’s compensation committee. The purchase price for common shares of the Company issuable under each Restricted Share Unit (“RSU”) award, if any, shall be established by the Board at its discretion. Common shares issued pursuant to any RSU award may be made subject to vesting conditions based upon the satisfaction of service requirements, conditions, restrictions, time periods or performance goals established by the board.
The TSXV requires the Company to fix the number of common shares to be issued in settlement of awards that are not options. The maximum number of common shares available for issuance pursuant to the settlement of RSUs shall be an aggregate of 1,548,174 common shares.
Engine Gaming and Media, Inc. (formerly Engine Media Holdings, Inc.) Notes to the Consolidated Financial Statements August 31, 2021 and 2020 (Expressed in United States Dollars) | |
The Company’s outstanding RSUs are as follows:
Disclosure of detailed information about restricted stock units outstanding
| | | Number | |
| | | # | |
| | | | |
| Balance, August 31, 2019 | | | - | |
| Issued on acquisition of Frankly | | | 50,037 | |
| Granted | | | 379,001 | |
| Vested | | | (26,666 | ) |
| Cancelled | | | - | |
| | | | - | |
| Balance, August 31, 2020 | | | 402,372 | |
| | | | | |
| Balance, August 31, 2020 | | | 402,372 | |
| Issued on acquisition of SideQik | | | 23,939 | |
| Granted | | | 353,467 | |
| Vested | | | (277,749 | ) |
| Cancelled | | | (11,855 | ) |
| Balance, August 31, 2021 | | | 490,174 | |
Activity for the year ended August 31, 2021
During the year ended August 31, 2021, the Company granted 353,467 RSUs pursuant to the Company’s incentive plan to a former officer and key management employees. The fair value of these RSUs was estimated based on the closing price of CAD$7.94 – CAD$14.61 for a total fair value on date of grant of CAD$3,547,104. Of the 377,406 RSUs granted, 75,944 were severance compensation to a former officer. As these RSUs were issued as severance compensation, the grant date fair value of CAD$713,874 ($550,896) was recognized on the grant date. The Company issued 23,939 RSUs as purchase consideration related to the SideQik, Inc. acquisition with a fair value of $245,000 The remaining RSUs will be recognized as share-based compensation expense over the vesting period, which is generally three years.
Activity for the year ended August 31, 2020
On April 1, 2020, the Company granted 26,666 RSUs to compensate directors, officers and key employees, which vested immediately. On August 13, 2020, the Company granted 352,335 RSUs to compensate directors and officers. The director RSUs vest at the end of one year, and the officer RSUs vest over three years. The remaining 50,037 RSUs were granted on May 8, 2020, in connection with the acquisition of Frankly. These RSUs have a vesting period of three years from the original date of the grant.
The fair value of RSUs granted on April 1, 2020, was estimated based on a closing price of CAD$8.55 (US$6.01) for a total fair value on date of grant of CAD$228,000 ($159,895). As these RSUs had immediate vesting, the fair value was recognized in full on the date of grant as stock-based compensation expense and 26,666 common shares were issued. The fair value of RSUs granted on August 13, 2020, was estimated based on a closing price of CAD$8.40 (US$6.34) for a total fair value on date of grant of CAD$2,959,614 ($2,232,997). The fair value of these RSUs will be recognized as stock-based compensation expense over the vesting period. The fair value of the RSUs granted on May 8, 2020, in connection with the acquisition of Frankly will be recognized as stock-based compensation expense over the vesting period.
During the year ended August 31, 2021, share-based compensation expense for the Company’s RSUs was $3,037,366 (2020 – $479,663).
Engine Gaming and Media, Inc. (formerly Engine Media Holdings, Inc.) Notes to the Consolidated Financial Statements August 31, 2021 and 2020 (Expressed in United States Dollars) | |
25. Capital management
The Company considers its capital to be its shareholders’ equity.
As of August 31, 2021, the Company had shareholders’ equity before non-controlling interests of $25,422,165 (2020 – $45,907). The Company’s objective when managing its capital is to seek continuous improvement in the return to its shareholders while maintaining a moderate to high tolerance for risk. The objective is achieved by prudently managing the capital generated through internal growth and profitability, through the use of lower cost capital, including raising share capital or debt when required to fund opportunities as they arise.
The Company may also return capital to shareholders through the repurchase of shares, pay dividends or reduce debt where it determines any of these to be an effective method of achieving the above objective. The Company does not use ratios in the management of its capital. There have been no changes to management’s approach to managing its capital during the years ended August 31, 2021, and 2020.
26. Commitments and contingencies
Litigation and Arbitration
In April 2020, the Company announced its renegotiation of the acquisition of Allinsports. The revised purchase agreement provided for the acquisition of 100% of Allinsports in exchange for the issuance of 966,667 common shares of the Company and other consideration, including payments of $1,200,000 as a portion of the purchase consideration. In September 2020, the Company advised the shareholders of Allinsports that closing conditions of the transaction, including the requirement to provide audited financial statements, had not been satisfied.
In response, in November 2020, the shareholders of Allinsports commenced arbitration in Alberta, Canada seeking, among other things, to compel the Company to complete the acquisition of Allinsports without the audited financial statements, and to issue 966,667 common shares of the Company to those shareholders. As alternative relief, the shareholders of Allinsports sought up to US$20,000,000 in damages. As of August 31, 2020 the Company had recorded an impairment against the entire balance of advances to Allinsports, amounting to $2,625,657. A hearing in this matter was held in May of 2021, and by a decision dated September 30, 2021, the Arbitrator determined that the closing of the transaction had previously occurred and directed the Company to issue the 966,667 common shares. The Company is pursuing regulatory approval to issue the shares and is also pursuing relief against the Allinsports shareholders for various alleged breaches of the share purchase agreement. The Company recognized a liability for the arbitration ruling of $6,468,330, which represents the fair value of the common shares directed to be delivered as of August 31, 2021. The liability is recorded as Arbitration reserve on the Company’s Consolidated Statements of Financial Position. This liability will be adjusted to fair value at the end of each reporting period.
Separately, in April of 2021, the Company received a copy of a complaint filed by 3CI Holdings, LLP in the Circuit Court for the 11th Judicial Circuit for Miami-Dade naming Allinsports, A1 Simulation LLC (an entity purported to be a subsidiary of Allinsports), and the Company, seeking to hold the parties, including Company, responsible for unpaid rent under a lease agreement between 3CI’s predecessors in interest and A1 Simulation, and seeking damages of at least $2,890,000. On July 6, 2021, the Company filed motion to dismiss the complaint in this matter.
On January 21, 2021, eight former shareholders of Winview filed a Complaint in Delaware Chancery Court against four Winview directors (David Lockton, et al. v. Thomas S. Rogers, et al.) alleging that the defendants breached their fiduciary duties in connection with the sale of Winview to Engine. The relief sought includes rescission of the sale of Winview to Engine and compensatory damages. The defendants have filed a motion to dismiss the claims in this matter. Neither the Company nor Winview have been named as parties to this action. Under the March 9, 2020, Business Combination Agreement pursuant to which the Company acquired Winview, the Company agreed to indemnify Winview’s directors for any claims arising out of their service as directors for Winview.
On July 15, 2021, a complaint was filed against Winview Inc. by Bleacher League Entertainment, Inc. in the United States District Court for the District of Delaware, alleging that Winview had violated two of Bleacher’s patents covering an interactive themed baseball game and seeking damages and other relief. The parties have entered into an agreement resolving this matter and in connection therewith, on November 8, 2021, the plaintiff terminated the pending action by filing a notice of voluntary dismissal with prejudice.
Engine Gaming and Media, Inc. (formerly Engine Media Holdings, Inc.) Notes to the Consolidated Financial Statements August 31, 2021 and 2020 (Expressed in United States Dollars) | |
In July of 2021, Winview Inc. filed separate patent infringement lawsuits against DraftKings Inc. and FanDuel, Inc in the United States District Court for the District of New Jersey, alleging that Sportsbook and Daily Fantasy Sports offerings of DraftKings and FanDuel infringe four of Winview’s patents. These actions seek the recovery of damages and other appropriate relief. FanDuel filed a partial motion to dismiss two of the claims alleged in Winview’s complaint. Winview has responded and the motion is pending. DraftKings filed a motion to dismiss Winview’s complaint, which was withdrawn without prejudice after Winview filed an amended complaint. While potential damages may be significant if these lawsuits are wholly or partially successful, at this time the Company cannot predict the outcome of the suits or determine the extent of potential damages if they are successful in whole or in part.
The outcomes of pending litigations in which the Company is involved are necessarily uncertain as are the Company’s expenses in prosecuting and defending these actions. From time to time the Company may modify litigation strategy and/or the terms on which it retains counsel and other professionals in connection with such actions, which may affect the outcomes of and/or the expenses incurred in connection with such actions.
The Company is subject to various other claims, lawsuits and other complaints arising in the ordinary course of business. The Company records provisions for losses when claims become probable and the amounts are estimable. Although the outcome of such matters cannot be determined, it is the opinion of management that the final resolution of these matters will not have a material adverse effect on the Company’s financial condition, operations, or liquidity.
27. Discontinued operations
On November 3, 2020, the Company, following a detailed strategic review in connection with the merger of Torque Esports, Frankly and WinView, announced that it has completed the sale of IDEAS+CARS, The Race Media, WTF1, Driver DataDB and Lets Go Racing (collectively the “Motorsport Group”) to Ideas + Cars Holdings Limited, a third party investment group based in the UK. As a result, the Company is eliminating its funding obligations related to the cost of maintaining and growing these auto media businesses and certain accrued liabilities. Accordingly, the operational results for this group have been presented as a discontinued operation.
Consideration transferred for the Motorsport Group was as follows:
Schedule of loss on disposal
| | | Amount | |
| | | $ | |
| Consideration received or receivable: | | | |
| Accounts payable assumed | | | 101,322 | |
| Deferred purchase consideration of LGR | | | 333,503 | |
| Fair value of contingent consideration | | | 1,321,281 | |
| Total disposal consideration | | | 1,756,106 | |
| Carrying amount of net assets sold | | | (2,334,303 | ) |
| Loss on disposal before income tax and reclassification of foreign currency translation reserve | | | (578,197 | ) |
| | | | | |
| Reclassification of foreign currency translation reserve | | | (100,734 | ) |
| Loss on disposal of Motorsports | | | (678,931 | ) |
Engine Gaming and Media, Inc. (formerly Engine Media Holdings, Inc.) Notes to the Consolidated Financial Statements August 31, 2021 and 2020 (Expressed in United States Dollars) | |
The net assets of the Motorsport Group as of the date of sale were as follows:
Disclosure of net asset
| | | Amount | |
| | | $ | |
| Carrying amounts of assets as at the date of sale: | | | |
| Cash and cash equivalents | | | (24,348 | ) |
| Restricted cash | | | - | |
| Accounts and other receivables | | | 126,590 | |
| Government remittances | | | 25,095 | |
| Prepaid expenses and other | | | 24,113 | |
| Property and equipment | | | 47,416 | |
| Intangible assets | | | 3,066,457 | |
| Total assets of disposal group | | | 3,265,323 | |
| | | | | |
| Carrying amount of liabilities directly associated with assets as at the date of sale: | | | | |
| Accounts payable | | | 508,881 | |
| Accrued liabilities | | | 422,139 | |
| Total liabilities of disposal group | | | 931,020 | |
| | | | | |
| Net assets of disposal group | | | 2,334,303 | |
The operating results of the Motorsports Group and PGL Nevada, (together, the “discontinued operations”) for the years ended August 31, 2021, and 2020 are presented as follows:
Schedule of discontinued operations
| | | For the year ended | |
| | | Aug 31, 2021 | | | Aug 31, 2020 | |
| | | $ | | | $ | |
| Revenues | | | | | | | | |
| Advertising revenue | | | 90,934 | | | | 562,534 | |
| | | | | | | | | |
| Operating expenses | | | | | | | | |
| Salaries and wages | | | 212,546 | | | | 815,304 | |
| Consulting | | | 267,933 | | | | 1,014,940 | |
| Professional fees | | | 24,781 | | | | 219,369 | |
| Sponsorships and tournaments | | | 203,637 | | | | 3,697,046 | |
| Advertising and promotion | | | 1,740 | | | | 30,808 | |
| Office and general | | | 7,374 | | | | 155,464 | |
| Technology expenses | | | 86,590 | | | | 163,534 | |
| Amortization and depreciation | | | 201,335 | | | | 341,668 | |
| Share-based payments | | | - | | | | - | |
| Interest expense | | | 572 | | | | 1,162 | |
| (Gain) loss on foreign exchange | | | 29,535 | | | | (16,550 | ) |
| Net loss from discontinued operations | | | (945,109 | ) | | | (5,860,211 | ) |
Engine Gaming and Media, Inc. (formerly Engine Media Holdings, Inc.) Notes to the Consolidated Financial Statements August 31, 2021 and 2020 (Expressed in United States Dollars) | |
The net cash flows from discontinued operations for the years ended August 31, 2021, and 2020 are as follows:
Schedule of cash flow in discontinued operation
| | | For the year months ended | |
| | | Aug 31, 2021 | | | Aug 31, 2020 | |
| | | $ | | | $ | |
| | | | | | | |
| Net cash provided by (used in) operating activities | | | (92,652 | ) | | | 85,693 | |
| Disposal of Motorsports | | | 24,348 | | | | - | |
| Change in cash | | | (68,304 | ) | | | 85,693 | |
| Cash, beginning of period | | | 68,304 | | | | (17,389 | ) |
| Cash, end of period | | | - | | | | 68,304 | |
28. Segmented information
Information reported to the Company’s Co-Chief Executives, the Chief Operating Decision Makers (“CODM”), for the purposes of resource allocation and assessment of segment performance is focused on the category of services for each type of activity. The principal categories of services are Gaming, Media, and Corporate and Other. The Group’s reportable segments under IFRS 8 Operating Segments are therefore as follows:
| | Gaming | - | Services related to competitive organized video gaming or sporting events |
| | Media | - | Platform and advertising services provided to other broadcasters, primarily local tv and radio broadcasters |
| | Corporate and Other | - | Services provided to other businesses and other revenues |
The Corporate and Other segment primarily consists of support costs not allocated to the two other segments.
The following is an analysis of the Company’s revenue and results by reportable segment in fiscal 2021:
Schedule of segment reporting
| | | Gaming | | | Media | | | Corporate
and Other | | | Total | |
| | | $ | | | $ | | | $ | | | $ | |
| Revenue | | | | | | | | | | | | |
| External sales | | | 5,277,583 | | | | 31,943,287 | | | | - | | | | 37,220,870 | |
| | | | | | | | | | | | | | | | | |
| Results | | | | | | | | | | | | | | | | |
| Segment loss | | | (9,064,847 | ) | | | (7,611,679 | ) | | | - | | | | (16,676,526 | ) |
| | | | | | | | | | | | | | | | | |
| Central administration costs | | | - | | | | - | | | | 9,733,244 | | | | 9,733,244 | |
| Other gains and losses | | | 4,720,312 | | | | (39,258 | ) | | | 6,576,302 | | | | 11,257,356 | |
| Finance costs | | | 124,663 | | | | 512,937 | | | | 762,121 | | | | 1,399,721 | |
| Loss before tax | | | (13,909,822 | ) | | | (8,085,358 | ) | | | (17,071,667 | ) | | | (39,066,847 | ) |
| Income tax | | | - | | | | - | | | | - | | | | - | |
| Gain (Loss) for the year from: | | | | | | | | | | | | | | | | |
| Share of net loss of associate | | | - | | | | - | | | | (103,930 | ) | | | (103,930 | ) |
| Discontinued operations | | | (945,109 | ) | | | - | | | | (678,931 | ) | | | (1,624,040 | ) |
| Non-controlling interest in net loss | | | - | | | | - | | | | 74,006 | | | | 74,006 | |
| Net loss | | | (14,854,931 | ) | | | (8,085,358 | ) | | | (17,780,522 | ) | | | (40,720,811 | ) |
Engine Gaming and Media, Inc. (formerly Engine Media Holdings, Inc.) Notes to the Consolidated Financial Statements August 31, 2021 and 2020 (Expressed in United States Dollars) | |
The following is an analysis of the Company’s revenue and results by reportable segment in fiscal 2020:
| | | Gaming | | | Media | | | Corporate
and Other | | | Total | |
| | | $ | | | $ | | | $ | | | $ | |
| Revenue | | | | | | | | | | | | |
| External sales | | | 4,140,731 | | | | 6,404,736 | | | | 376 | | | | 10,545,843 | |
| | | | | | | | | | | | | | | | | |
| Results | | | | | | | | | | | | | | | | |
| Segment loss | | | (4,842,557 | ) | | | (833,891 | ) | | | 376 | | | | (5,676,072 | ) |
| | | | | | | | | | | | | | | | | |
| Central administration costs | | | | | | | | | | | 9,692,464 | | | | 9,692,464 | |
| Other gains and losses | | | 16,565 | | | | (14,011 | ) | | | 10,276,041 | | | | 10,278,595 | |
| Finance costs | | | 102,596 | | | | 241,520 | | | | 564,650 | | | | 908,766 | |
| Loss before tax | | | (4,961,718 | ) | | | (1,061,400 | ) | | | (20,532,779 | ) | | | (26,555,897 | ) |
| Income tax | | | - | | | | - | | | | - | | | | - | |
| Gain (Loss) for the year from: | | | | | | | | | | | | | | | | |
| Discontinued operations | | | (5,860,211 | ) | | | - | | | | - | | | | (5,860,211 | ) |
| Non-controlling interest in net loss | | | - | | | | - | | | | 76,066 | | | | 76,066 | |
| Net loss | | | (10,821,929 | ) | | | (1,061,400 | ) | | | (20,456,713 | ) | | | (32,340,042 | ) |
Geographical breakdown
| | | North
America | | | United
Kingdom | | | European
Union | | | Total | |
| | | $ | | | $ | | | $ | | | $ | |
| August 31, 2020 | | | | | | | | | | | | | | | | |
| Assets | | | 48,230,804 | | | | 2,896,582 | | | | 2,288,091 | | | | 53,415,477 | |
| Long-term assets | | | 37,664,748 | | | | 2,507,761 | | | | 1,067,495 | | | | 41,240,004 | |
| | | | | | | | | | | | | | | | | |
| | | | | | | | | | | | | | | | | |
| August 31, 2021 | | | | | | | | | | | | | | | | |
| Assets | | | 64,943,049 | | | | - | | | | 2,519,798 | | | | 67,462,847 | |
| Long-term assets | | | 35,796,241 | | | | - | | | | 108,924 | | | | 35,905,165 | |
29. Related party transactions and balances
| (a) | Key management compensation |
Key management includes the Company’s directors, officers and any consultants with the authority and responsibility for planning, directing and controlling the activities of an entity, directly or indirectly. Compensation awarded to key management includes the following:
Schedule of compensation award to key management
| | | Aug 31, 2021 | | | Aug 31, 2020 | |
| | | For the year ended | |
| | | Aug 31, 2021 | | | Aug 31, 2020 | |
| | | $ | | | $ | |
| | | | | | | |
| Total compensation paid to key management | | | 2,231,871 | | | | 929,958 | |
| Share based payments | | | 1,897,855 | | | | 1,409,569 | |
Engine Gaming and Media, Inc. (formerly Engine Media Holdings, Inc.) Notes to the Consolidated Financial Statements August 31, 2021 and 2020 (Expressed in United States Dollars) | |
Total compensation paid to key management is recorded in consulting fees and salaries and wages in the consolidated statement of loss and comprehensive loss for the years ended August 31, 2021, and 2020.
Amounts due to related parties as at August 31, 2021 with respect to the above fees were $33,349 (2020 – $275,502). The amounts due to related parties are recorded within accounts payable and accrued liabilities on the consolidated statements of loss and comprehensive loss. These amounts are unsecured, non-interest bearing and due on demand.
Commitment to former holders of WinView to proceeds from the patent portfolio enforcement action
Pursuant to the Business Combination agreement dated March 9, 2020, among the Company, Frankly Inc. and Winview Inc., the Company is required to pay to certain former Winview securities holders (“Stubholders”) fifty percent (50%) of the net license fees, damages awards or settlement amounts collected from third parties in connection with the Winview Patent Portfolio, after deduction of certain expenses. Certain directors of the Company are among the pool of Stubholders.
30. Financial instruments and risk management
| (a) | Financial risk management objectives and policies |
The Company’s activities expose it to a variety of financial risks including foreign currency risk, interest rate risk, credit risk, and liquidity risk. These financial instrument risks are actively managed by the Company under the policies approved by the Board of Directors. On an ongoing basis, the finance department actively manages market conditions with a view to minimizing the exposure of the Company to changing market factors, while at the same time limiting the funding costs to the Company.
Credit risk refers to the risk that a counterparty will default on its contractual obligations resulting in financial loss to the Company. The Company has adopted a policy of only dealing with creditworthy counterparties and obtaining sufficient collateral where appropriate, as a means of mitigating the risk of financial loss from defaults. The Company uses information supplied by independent rating agencies where available, and if not available, the Company uses other publicly available financial information and its own records to rate its customers.
Credit risk arises from cash with banks as well as credit exposure to outstanding receivables. The carrying amounts represent the Company’s maximum exposure to credit risk.
The Company’s exposure to credit risk is influenced mainly by the individual characteristics of each customer. The Company establishes an allowance for doubtful accounts that represents its estimate of expected losses in respect to accounts receivable. The main components of this allowance are a specific loss component that relates to individually significant exposures, and a collective loss component established for groups of similar assets in respect of losses that have been incurred but not yet identified. The collective loss allowance is determined based on historical data of payment statistics for similar financial assets. The allowance for doubtful accounts was $1,084,305 and $874,438 as of August 31, 2021, and 2020, respectively.
Engine Gaming and Media, Inc. (formerly Engine Media Holdings, Inc.) Notes to the Consolidated Financial Statements August 31, 2021 and 2020 (Expressed in United States Dollars) | |
The Company’s accounts receivable are concentrated among customers in the media and broadcasting industry, which may be affected by adverse economic factors impacting that industry. The Company performs ongoing credit
evaluations of its major customers, maintains reserves for expected credit losses, and does not require any collateral deposits.
As of August 31, 2021, one customer (2020 - one) accounted for greater than 10% of the Company’s accounts receivable balance. In total, this one customer (2020 - one) accounted for 13% of the Company’s accounts and other receivables balance as of August 31, 2021, and 2020. During the year ended August 31, 2021, one (2020 - three) customer represented 60% (2020 - 50%) of total revenue.
The below table reflects the aging of the Company’s aging by invoice date of gross trade accounts receivable and allowance for doubtful accounts as of August 31, 2021:
Schedule of gross trade accounts receivable and allowance for doubtful accounts
| | | 0 - 30 | | | 31 - 60 | | | 61 - 90 | | | 91+ | | | Total | |
| | | | | | | | | | | | | | | | |
| Trade accounts receivable | | | 7,376,270 | | | | 210,815 | | | | 265,377 | | | | 1,825,263 | | | | 9,677,725 | |
| Allowance for doubtful accounts | | | 3,000 | | | | 1,500 | | | | 1,500 | | | | 1,078,305 | | | | 1,084,305 | |
| % Allowance | | | 0 | % | | | 1 | % | | | 1 | % | | | 59 | % | | | 11 | % |
Liquidity risk is the risk that the Company will encounter difficulty in meeting obligations associated with financial liabilities. The Company is exposed to liquidity risk with respect to its contractual obligations and financial liabilities. The Company manages liquidity risk by continuously monitoring forecasted and actual cash flows and matching maturity profiles of financial assets and liabilities. The Company seeks to ensure that it has sufficient capital to meet short term financial obligations after taking into account its operating obligations and cash on hand.
The Company’s policy is to seek to ensure adequate funding is available from operations and other sources, including debt and equity capital markets, as required.
Schedule of funding available from operations and other sources
| | | < 1 year | | | 1-2 years | | | 2-5 years | |
| | | $ | | | $ | | | $ | |
| | | | | | | | | | |
| Accounts payable | | | 10,403,665 | | | | - | | | | - | |
| Accrued liabilities | | | 5,722,470 | | | | - | | | | - | |
| Players liability account | | | 331,528 | | | | - | | | | - | |
| Lease obligation | | | 222,583 | | | | 364,968 | | | | - | |
| Long-term debt | | | 96,664 | | | | - | | | | - | |
| Promissory notes payable | | | 821,948 | | | | - | | | | - | |
| Convertible debt | | | 914,428 | | | | 2,097,127 | | | | 6,939,941 | |
Interest rate risk is the risk that the fair value of future cash flows of a financial instrument will fluctuate because of changes in market interest rates. The Company is exposed to fair value risk with respect to debt which bears interest at fixed rates.
Engine Gaming and Media, Inc. (formerly Engine Media Holdings, Inc.) Notes to the Consolidated Financial Statements August 31, 2021 and 2020 (Expressed in United States Dollars) | |
| (e) | Foreign exchange rates |
The Company’s exposure to the risk of changes in foreign exchange rates relates primarily to fluctuations of financial instruments related to cash, accounts and other receivables, and accounts payable denominated in Euros and GBP, as well as debt denominated in Canadian dollars.
The following tables combine information about:
| | ● | classes of financial instruments based on their nature and characteristics; |
| | ● | the carrying amounts of financial instruments; |
| | ● | fair values of financial instruments (except financial instruments when carrying amount approximates their fair value); and |
| | ● | fair value hierarchy levels of financial assets and financial liabilities for which fair value was disclosed. |
Fair value hierarchy levels 1 to 3 are based on the degree to which the fair value is observable.
For the year ended August 31, 2021:
Schedule of fair value measurement
| Carrying value at August 31, 2021 | | FVTPL -
mandatorily
measured | | | FVOCI -
mandatorily
measured | | | FVOCI -
designated | | | Amortized
cost | |
| | | $ | | | $ | | | $ | | | $ | |
| | | | | | | | | | | | | |
| Financial assets: | | | | | | | | | | | | | | | | |
| Cash and cash equivalents | | | - | | | | - | | | | - | | | | 15,305,996 | |
| Restricted cash | | | - | | | | - | | | | - | | | | 331,528 | |
| Accounts and other receivables | | | - | | | | - | | | | - | | | | 8,646,807 | |
| Government remittances | | | - | | | | - | | | | - | | | | 1,070,216 | |
| Publisher advance | | | - | | | | - | | | | - | | | | 4,534,218 | |
| Investment at FVTPL | | | 2,629,851 | | | | - | | | | - | | | | - | |
| Assets | | | 2,629,851 | | | | - | | | | - | | | | 29,888,765 | |
| Carrying value at August 31, 2021 | | FVTPL -
mandatorily
measured | | | FVTPL -
designated | | | Amortized
cost | |
| | | | $ | | | | $ | | | | $ | |
| | | | | | | | | | | | | |
| Financial liabilities: | | | | | | | | | | | | |
| Accounts payable | | | - | | | | - | | | | 10,403,665 | |
| Accrued liabilities | | | - | | | | - | | | | 5,722,470 | |
| Players liability account | | | - | | | | - | | | | 331,528 | |
| Line of credit | | | - | | | | - | | | | - | |
| Long-term debt | | | - | | | | - | | | | 96,664 | |
| Promissory notes payable | | | - | | | | - | | | | 821,948 | |
| Deferred purchase consideration | | | - | | | | - | | | | - | |
| Warrant liability | | | 4,868,703 | | | | - | | | | - | |
| Convertible debt | | | - | | | | 9,951,496 | | | | - | |
| Liabilities | | | 4,868,703 | | | | 9,951,496 | | | | 17,376,275 | |
Engine Gaming and Media, Inc. (formerly Engine Media Holdings, Inc.) Notes to the Consolidated Financial Statements August 31, 2021 and 2020 (Expressed in United States Dollars) | |
For the year ended August 31, 2020:
| Carrying value at August 31, 2020 | | FVTPL -
mandatorily
measured | | | FVOCI -
mandatorily
measured | | | FVOCI -
designated | | | Amortized
cost | |
| | | $ | | | $ | | | $ | | | $ | |
| | | | | | | | | | | | | |
| Financial assets: | | | | | | | | | | | | | | | | |
| Cash and cash equivalents | | | - | | | | - | | | | - | | | | 5,243,278 | |
| Restricted cash | | | - | | | | - | | | | - | | | | 388,587 | |
| Accounts and other receivables | | | - | | | | - | | | | - | | | | 3,845,890 | |
| Government remittances | | | - | | | | - | | | | - | | | | 1,125,912 | |
| Publisher advance | | | - | | | | - | | | | - | | | | - | |
| Investment at FVTPL | | | - | | | | - | | | | - | | | | - | |
| Financial assets | | | - | | | | - | | | | - | | | | 10,603,667 | |
| Carrying value at August 31, 2020 | | FVTPL -
mandatorily
measured | | | FVTPL -
designated | | | Amortized
cost | |
| | | | $ | | | | $ | | | | $ | |
| | | | | | | | | | | | | |
| Financial liabilities: | | | | | | | | | | | | |
| Accounts payable | | | - | | | | - | | | | 12,455,215 | |
| Accrued liabilities | | | - | | | | - | | | | 4,689,131 | |
| Players liability account | | | - | | | | - | | | | 388,587 | |
| Line of credit | | | - | | | | - | | | | 4,919,507 | |
| Long-term debt | | | - | | | | - | | | | 230,932 | |
| Promissory notes payable | | | - | | | | - | | | | 3,818,920 | |
| Deferred purchase consideration | | | - | | | | - | | | | 333,503 | |
| Warrant liability | | | 14,135,321 | | | | - | | | | - | |
| Convertible debt | | | - | | | | 10,793,459 | | | | - | |
| Financial liabilities | | | 14,135,321 | | | | 10,793,459 | | | | 26,835,795 | |
A summary of instruments, with their classification in the fair value hierarchy is as follows:
Schedule of hierarchy levels of fair value
| | | Level 1 | | | Level 2 | | | Level 3 | | | Fair value as
of August 31, 2021 | |
| | | | $ | | | | $ | | | | $ | | | | $ | |
| | | | | | | | | | | | | | | | | |
| Warrant liability | | | - | | | | 4,868,703 | | | | - | | | | 4,868,703 | |
| Convertible debt | | | - | | | | - | | | | 9,951,496 | | | | 9,951,496 | |
| Investment at FVTPL | | | - | | | | | | | | 2,629,851 | | | | 2,629,851 | |
| | | Level 1 | | | Level 2 | | | Level 3 | | | Fair value
as of August
31, 2020 | |
| | | | $ | | | | $ | | | | $ | | | | $ | |
| | | | | | | | | | | | | | | | | |
| Warrant liability | | | - | | | | 14,135,321 | | | | - | | | | 14,135,321 | |
| Convertible debt | | | - | | | | - | | | | 10,793,459 | | | | 10,793,459 | |
Engine Gaming and Media, Inc. (formerly Engine Media Holdings, Inc.) Notes to the Consolidated Financial Statements August 31, 2021 and 2020 (Expressed in United States Dollars) | |
31. Subsequent events
The Company has evaluated subsequent events from the balance sheet date through November 26, 2021, the date at which the consolidated financial statements were available to be issued and determined there were no additional items to be disclosed.
| Exhibit | | |
| No. Item | | Description of Exhibit |
| 1.1 | | Notice of Articles dated October 19, 2021 |
| | | |
| 1.2 | | Certificate of Change of Name, dated October 19, 2021 |
| | | |
| 2.1 | | Description of Common Shares |
| | | |
| 4.1 | | Arrangement Agreement between the Company and GameSquare Esports Inc., dated December 7, 2022 (incorporated by reference to Exhibit 99.1 to the Company’s Form 6-K furnished to the SEC on December 27, 2022) |
| | | |
| 4.2 | | Equity Distribution Agreement among the Company, Canaccord Genuity LLC, Oppenheimer & Co. Inc., and B. Riley Securities, Inc., dated August 10, 2021 (incorporated by reference to Exhibit 99.1 to the Company’s Form 6-K furnished to the SEC on August 11, 2021) |
| | | |
| 4.3 | | Engine Media Holdings, Inc. Omnibus Equity Incentive Plan |
| | | |
| 8.1 | | List of Subsidiaries of the Company |
| | | |
| 12.1 | | Certification of the Chief Executive Officer pursuant to rule 13a-14(a) of the Securities Exchange Act of 1934 |
| | | |
| 12.2 | | Certification of the Chief Financial Officer pursuant to rule 13a-14(a) of the Securities Exchange Act of 1934 |
| | | |
| 13.1 | | Certification of Chief Executive Officer Pursuant to 18 U.S.C. Section 1350, as adopted pursuant to Section 906 of the Sarbanes-Oxley Act of 2002 |
| | | |
| 13.2 | | Certification of Chief Financial Officer Pursuant to 18 U.S.C. Section 1350, as adopted pursuant to Section 906 of the Sarbanes-Oxley Act of 2002 |
| | | |
| 15.1 | | Consent of Baker Tilly WM LLP |
| | | |
| 101.INS | | Inline XBRL Instant Document |
| | | |
| 101.SCH | | Inline XBRL Taxonomy Extension Schema Document |
| | | |
| 101.CAL | | Inline XBLR Taxonomy Extension Calculation Linkbase Document |
| | | |
| 101.DEF | | Inline XBRL Taxonomy Extension Definition Linkbase |
| | | |
| 101.LAB | | Inline XBRL Taxonomy Extension Label Linkbase |
| | | |
| 101.PRE | | Inline XBRL Taxonomy Extension Presentation Linkbase |
| | | |
| 104 | | Cover Page Interactive Data File – (formatted as Inline XBRL and contained in Exhibit 101) |
SIGNATURES
The Registrant hereby certifies that it meets all of the requirements for filing on Form 20-F and that it has duly caused and authorized the undersigned to sign this Registration Statement on its behalf.
| | ENGINE GAMING AND MEDIA, INC. |
| | |
| Date: December 29, 2022 | By: | /s/ Michael Munoz |
| | Name: | Michael Munoz |
| | Title: | Chief Financial Officer |