As filed with the Securities and Exchange Commission on December 29, 2017
File No.: 0-55864
UNITED STATES
SECURITIES AND EXCHANGE COMMISSION
Washington, D.C. 20549
Amendment No. 1 to
Form 10
General Form for Registration of Securities
Pursuant to Section 12(b) or (g) of the Securities Exchange Act of 1934
KINDER MORGAN CANADA LIMITED
(Exact name of registrant as specified in its charter)
Alberta, Canada |
| N/A |
Suite 2700, 300 — 5th Avenue S.W.
Calgary, Alberta T2P 5J2
(Address of principal executive offices, including zip code)
(403) 514-6780
(Registrant’s telephone number, including area code)
Copies to:
Troy L. Harder
Bracewell LLP
711 Louisiana Street, Suite 2300
Houston, Texas 77002
Securities to be registered pursuant to Section 12(b) of the Act: None.
Securities to be registered pursuant to Section 12(g) of the Exchange Act:
Restricted Voting Shares
(Title of class)
Indicate by check mark whether the registrant is a large accelerated filer, an accelerated filer, a non-accelerated filer, a smaller reporting company or emerging growth company. See definitions of “large accelerated filer,” “accelerated filer,” “smaller reporting company” and “emerging growth company” in Rule 12b-2 of the Exchange Act.
Large accelerated filer | o | Accelerated filer o |
Non-Accelerated filer | o | Smaller reporting company o |
Emerging Growth Company | x |
|
If an emerging growth company, indicate by check mark if the registrant has elected not to use the extended transition period for complying with any new or revised financial accounting standards provided pursuant to Section 7(a)(2)(B) of the Securities Act. x
We are an Alberta, Canada corporation that completed the initial public offering in Canada of our Restricted Voting Shares in May 2017. Such shares are traded on the Toronto Stock Exchange under the symbol “KML.” We are filing this registration statement on Form 10 pursuant to Section 12(g) of the Exchange Act to submit to Exchange Act reporting in the United States.
Once the registration of the Restricted Voting Shares becomes effective, we will be subject to the requirements of Section 13(a) of the Exchange Act, including the rules and regulations promulgated thereunder, which will require us to file, among other things, annual reports on Form 10-K, quarterly reports on Form 10-Q, current reports on Form 8-K and proxy or information statements with the SEC. Although we may be entitled to use certain abridged forms available to “foreign private issuers,” we have chosen to use the forms applicable to U.S. domestic issuers to satisfy our reporting obligations.
Capitalized terms used throughout this document are defined in “Defined Terms” below. References to “we,” “us,” “our” and the “Company” are to Kinder Morgan Canada Limited and, unless the context otherwise indicates, the Operating Entities. We state our financial statements in Canadian dollars. References in this document to “dollars,” “$” or “CAD$” are to the currency of Canada, and references to “US$” are to the currency of the United States. See “Abbreviations, Conversions, Exchange Rates and Market Data.”
Our principal office is located at Suite 2700, 300 — 5th Avenue S.W., Calgary, Alberta T2P 5J2, and our telephone number at such office is (403) 514-6780.
SPECIAL NOTE REGARDING FORWARD-LOOKING STATEMENTS
This document includes forward-looking statements and forward-looking information, including forward-looking information and projections provided by third party sources (collectively “forward-looking statements”). These forward-looking statements are identified as any statement that does not relate strictly to historical or current facts. Forward-looking statements may be identified by words such as “anticipate,” “believe,” “intend,” “plan,” “projection,” “forecast,” “strategy,” “position,” “continue,” “estimate,” “expect,” “may,” or the negative of those terms or other variations of them or comparable terminology. In particular, but without limitation, this document contains forward-looking statements pertaining to the following:
· the TMEP and Base Line Terminal project, including the possibility of mitigation to address project delays, the impact of cost increases (and the extent to which Trans Mountain is able to pass such costs through to shippers) and delays on project returns, and the cost structure, anticipated funding, construction plans, completion scheduling, in-service dates, future utilization, future revenue and costs and future impacts on our Adjusted EBITDA and Distributable Cash Flow;
· the future commercial viability of our business;
· the realization of benefits deriving from future growth projects, including the TMEP and Base Line Terminal;
· the potential growth opportunities and anticipated competitive position of our business segments;
· the anticipated results of our pipeline tolls and toll structure and our ability to recover certain cost overruns and earn returns as a result of such tolls;
· expectations respecting our ability to generate predictable and growing cash available for distribution and to support growing dividends;
· expectations and intentions respecting distributions from the Limited Partnership, the payout of distributable cash flow and our payment of quarterly dividends to our shareholders, as well as the amounts of those dividends;
· the extent of Kinder Morgan’s indirect participation in the Limited Partnership’s distribution reinvestment plan;
· the impact of commodity pricing;
· anticipated future capital and operating expenditures;
· expectations respecting the ongoing financing of our business and operations;
· anticipated decommissioning and abandonment costs;
· operational (including marine) safety levels and standards;
· future pipeline capacity and tolls; and
· future crude oil supply and demand and demand for the services we provide.
Forward-looking statements are not guarantees of performance. They involve risks, uncertainties and assumptions. Future actions, conditions or events and future results of operations may differ materially from those expressed in forward-looking statements. Many of the factors that will determine these results are beyond our ability to control or predict. Any “financial outlook” set out in this document has been included for the purpose of providing information relating to management’s current expectations and plans for the future, is based on a number of significant assumptions and may not be appropriate, and should not be used, for purposes other than those for which such forward-looking statements are disclosed herein. Our business, financial condition and results of operations, including our ability to pay cash dividends, are substantially dependent on the successful development of the TMEP. As a result, factors or events that impact our business as well as the costs associated with and the time required to complete (if completed) the TMEP are likely to have a commensurate impact on us, the market price and value of the Restricted Voting Shares and our ability to pay dividends. Similarly, given the nature of our relationship with Kinder Morgan, factors or events that impact Kinder Morgan may have consequences for us. Specific factors that could cause actual results to differ from those in the forward-looking statements provided in this document include, but are not limited to:
· issues, delays or stoppages associated with major expansion projects, including the TMEP;
· our receipt, and the timing of receipt, of regulatory approvals and permits;
· changes in the level or nature of support from the federal government and various provincial governments (including the Alberta and British Columbia provincial governments), municipal governments and/or applicable regulators (including the NEB);
· public opposition and concerns of individuals, special interest or Aboriginal groups, governmental organizations, non-governmental organizations and other third parties that may expose us to higher project or operating costs, project delays or even project cancellations;
· an increase in our indebtedness and/or significant unanticipated cost overruns or required capital expenditures;
· changes in public opinion or damage to our reputation;
· the resolution of issues relating to interested third party and/or Aboriginal rights, title and consultation;
· the level of shipper demand for spot utilization on the Trans Mountain pipeline;
· the breakdown or failure of equipment, pipelines and facilities; releases or spills; operational disruptions or service interruptions; and catastrophic events;
· volatility in prices for and resulting changes in demand for refined petroleum products, oil, steel and other bulk materials and chemicals and certain agricultural products;
· industry, market and economic conditions and demand for the services we provide;
· the availability of alternative energy sources and conservation and technological advances;
· changes in overall global demand for hydrocarbons;
· natural disasters, extreme weather events or power shortages;
· difficulties or delays experienced by railroads, barges, trucks, ships or pipelines in delivering products to or from our terminals, storage facilities or pipelines;
· conditions in the capital and credit markets, inflation and fluctuations in interest rates;
· our ability to access external sources of financing in sufficient amounts and on acceptable terms to the extent needed to fund expansions of our pipelines, terminals, storage and related facilities and the acquisition of operating businesses and assets;
· compliance with legislative or regulatory requirements or changes in laws, regulations, third-party relations, approvals and decisions of courts, regulators (including the NEB) and other applicable governmental bodies;
· changes to regulatory, environmental, political, legal, operational and geological considerations;
· changes in tariff rates set by the NEB or another regulatory agency;
· changes in our capital structure and credit ratings;
· changes in tax law and/or tax reassessments;
· national, international, regional and local economic, competitive and regulatory conditions and developments;
· abandonment costs that may be substantial and exceed the amounts held in abandonment trusts;
· risks related to Kinder Morgan holding the controlling voting interests in us and any changes in our relationship with Kinder Morgan;
· the ability of our customers and other counterparties to perform under their contracts with us, financial distress experienced by our customers and other counterparties and our ability to secure development efforts, including renewing long-term customer contracts and the terms of such renewal;
· our ability to recover indemnification from contractual counterparties;
· our ability to adequately maintain a skilled workforce;
· strikes, blockades, riots, terrorism (including cyber-attacks), war or other acts or accidents or catastrophic events;
· increased industry competition;
· volatility and wide fluctuations in the market price for the Restricted Voting Shares;
· foreign exchange fluctuations;
· changes in accounting pronouncements and the timing of when such measurements are to be made and recorded; and
· our ability to obtain and maintain sufficient insurance coverage.
The foregoing list should not be construed to be exhaustive. We believe the forward-looking statements in this document are reasonable. However, there is no assurance that any of the actions, events or results of the forward-looking statements will occur, or if any of them do, of their timing or what impact they will have on our results of operations or financial condition. Because of these uncertainties, investors should not put undue reliance on any forward-looking statements.
See “Item 1A. Risk Factors” for a more detailed description of these and other factors that may affect the forward-looking statements in this document. When considering forward-looking statements, you should keep in mind the risk factors described in “Item 1A. Risk Factors.” Such risk factors could cause actual results to differ materially from those contained in any forward-looking statement. We disclaim any obligation, other than as required by applicable law, to update the above list or to announce publicly the result of any revisions to any of the forward-looking statements to reflect future events or developments.
The prospective financial information included in this document has been prepared by, and is the responsibility of, our management. PricewaterhouseCoopers LLP (Canada) has neither examined, compiled nor performed any procedures with respect to the accompanying prospective financial information and, accordingly, PricewaterhouseCoopers LLP (Canada) does not express an opinion or any other form of assurance with respect thereto. The PricewaterhouseCoopers LLP (Canada) report included in this document relates to our historical financial information. It does not extend to the prospective financial information and should not be read to do so. This prospective financial information was not prepared with a view toward compliance with published guidelines of the
Securities and Exchange Commission or the guidelines established by the American Institute of Certified Public Accountants for preparation, presentation of prospective financial information.
The forward-looking statements contained in this registration statement are expressly qualified by the foregoing cautionary statements.
In this document, unless otherwise indicated, the following terms shall have the indicated meanings. Singular words include the plural and vice versa and words importing any gender include all genders. A reference to an agreement means the agreement as it may be amended, supplemented or restated from time to time.
“ABCA” means the Business Corporations Act (Alberta) and the regulations thereunder, as amended from time to time;
“AER” means the Alberta Energy Regulator;
“ASU” means Accounting Standards Update;
“BC OGC” means the British Columbia Oil and Gas Commission;
“BCUC” means the British Columbia Utilities Commission;
“Board of Directors” means the board of directors of the Company;
“Canadian Securities Laws” means the securities legislation and regulations thereunder of each province and territory of Canada and the rules, instruments, policies and orders of each Canadian securities regulator made thereunder;
“CAPP” means the Canadian Association of Petroleum Producers;
“Class A Units” means the Class A limited partnership units of the Limited Partnership, as further described under “Item 11. Description of Registrant’s Securities to be Registered”;
“Class B Units” means the Class B limited partnership units of the Limited Partnership, as further described under “Item 11. Description of Registrant’s Securities to be Registered”;
“CO2” means carbon dioxide;
“CO2e” means carbon dioxide equivalent;
“Company Voting Shares” means, collectively, the Restricted Voting Shares and the Special Voting Shares;
“Cooperation Agreement” means the cooperation agreement, between the Company, the General Partner, the Limited Partnership, KMCC, KM Canada Terminals and Kinder Morgan (in respect to certain provisions only) entered into in connection with the IPO, as described under “Item 7. Certain Relationships and Related Transactions and Director Independence—Agreements Between the Company and Kinder Morgan—Cooperation Agreement”;
“Exchange Act” means the United States Securities Exchange Act of 1934, as amended from time to time;
“FASB” means the U.S. Financial Accounting Standards Board;
“FERC” means the U.S. Federal Energy Regulatory Commission;
“GAAP” means generally accepted accounting principles in the United States that the SEC has identified as having substantial authoritative support, as supplemented by Regulation S-X under Exchange Act, as amended from time to time;
“General Partner” means Kinder Morgan Canada GP Inc., a corporation organized under the laws of the Province of Alberta and a wholly-owned subsidiary of the Company;
“GP Units” means the general partnership units of the Limited Partnership held by the General Partner, as further described under “Item 11. Description of the Registrant’s Securities to be Registered”;
“investment grade” means an issuer credit rating of BBB- or higher by S&P, BBB (low) or higher by Dominion Bond Rating Service or Baa3 or higher by Moody’s Investors Service;
“Kinder Morgan” means Kinder Morgan, Inc., and where the context requires, includes its majority-owned and/or controlled subsidiaries;
“Kinder Morgan Canada Group” means, collectively, the Company, the General Partner, the Limited Partnership, and each person that any of the Company, the General Partner or the Limited Partnership controls from time to time;
“Kinder Morgan Group” means Kinder Morgan and each person that Kinder Morgan directly or indirectly controls from time to time, other than any member of the Kinder Morgan Canada Group;
“KM Canada Marine Terminal” means KM Canada Marine Terminal Limited Partnership, an indirect, wholly-owned partnership of the Limited Partnership;
“KM Canada North 40” means KM Canada North 40 Limited Partnership, an indirect, wholly-owned partnership of the Limited Partnership;
“KM Canada Rail” means Kinder Morgan Canada Rail Holdings GP Limited, an indirect, wholly-owned subsidiary of the Limited Partnership;
“KM Canada Terminals” means KM Canada Terminals ULC, an indirect wholly-owned subsidiary of Kinder Morgan;
“KMI Loans” means certain indebtedness of the Operating Entities owed to Kinder Morgan and incurred prior to the IPO as more fully described in Note 5 “Transactions with Related Parties” to the September 30, 2017 unaudited interim financial statements attached hereto;
“KMCC” means Kinder Morgan Canada Company, an indirect, wholly-owned subsidiary of Kinder Morgan;
“KMCI” means Kinder Morgan Canada Inc., an indirect, wholly-owned subsidiary of the Limited Partnership;
“KMCU” means Kinder Morgan Cochin ULC, a direct, wholly-owned subsidiary of the Limited Partnership;
“Land Agreements” means rights-of-way, right of entry orders, Crown pipeline agreements, pipe rack agreements, temporary working space agreements, crossing agreements, road use agreements, and other similar land-related agreements which are required for construction, operation and maintenance of TMPL, the TMEP, the Puget Sound pipeline system, the Jet Fuel pipeline system, the Canadian Cochin pipeline system or our other pipeline assets;
“Limited Partnership” means Kinder Morgan Canada Limited Partnership, a limited partnership formed under the laws of the Province of Alberta;
“Limited Partnership Agreement” means the limited partnership agreement of the Limited Partnership, as amended from time to time, the terms of which are further described under “Item 11. Description of Registrant’s Securities to be Registered— Limited Partnership Units”;
“LP Units” means, collectively, the Class A Units and the Class B Units;
“NEB” means the National Energy Board;
“NEB Act” means the National Energy Board Act (Canada) and the regulations thereunder, as amended from time to time;
“Operating Entities” means the corporation, companies, partnerships and joint ventures that own and operate the assets comprising our business, which are direct or indirect wholly-owned subsidiaries or jointly-controlled investments of the Limited Partnership, with the principal operating entities being KMCU, KM Canada Marine Terminal, KM Canada North 40, KM Canada Rail, KMCI, TM Pipeline L.P., TM Jet Fuel, TM Puget Sound and Trans Mountain;
“PADD” means Petroleum Administration for Defense District;
“PHMSA” means the U.S. Department of Transportation Pipeline Hazardous Materials Safety Administration;
“Pipeline Safety Act” means the Pipeline Safety Act (Canada) and the regulations thereunder, as amended from time to time;
“Preferred Shares” means the Series 1, Series 2, Series 3 and Series 4 Preferred Shares, as further described under “Item 11. Description of Registrant’s Securities to be Registered—Preferred Shares”;
“Restricted Voting Shares” means the restricted voting shares in the capital of the Company, as further described under “Item 11. Description of Registrant’s Securities to be Registered”;
“S&P” means Standard and Poor’s Rating Service;
“SCADA” or “SCADA computer system” means the Supervisory Control and Data Acquisition computer system;
“SEC” means the U.S. Securities and Exchange Commission;
“Securities Act” means the United States Securities Act of 1933, as amended from time to time;
“SEDAR” means the System for Electronic Document Analysis and Retrieval;
“Series 1 Preferred Shares” means the 12,000,000 cumulative redeemable minimum rate reset Preferred Shares, Series 1, as further described under “Item 11. Description of Registrant’s Securities to be Registered—Preferred Shares”;
“Series 2 Preferred Shares” means the cumulative redeemable floating rate Preferred Shares, Series 2, as further described under “Item 11. Description of Registrant’s Securities to be Registered—Preferred Shares”;
“Series 3 Preferred Shares” means the 10,000,000 cumulative redeemable minimum rate reset Preferred Shares, Series 3, as further described under “Item 11. Description of Registrant’s Securities to be Registered—Preferred Shares”;
“Series 4 Preferred Shares” means the cumulative redeemable floating rate Preferred Shares, Series 4, as further described under “Item 11. Description of Registrant’s Securities to be Registered—Preferred Shares”;
“Preferred LP Units” means the preferred limited partnership units in the Limited Partnership, as further described under “Item 11. Description of Registrant’s Securities to be Registered—Limited Partnership Units—Preferred Units”;
“Services Agreement” means the services agreement between the Company, the General Partner, the Limited Partnership and KMCI entered into in connection with the IPO, as described under “Item 7. Certain Relationships and Related Transactions, and Director Independence—Agreements Between the Company and Kinder Morgan—Services Agreement”;
“Special Voting Shares” means the special voting shares in the capital of the Company, as further described under “Item 11. Description of Registrant’s Securities to be Registered”;
“Tax Act” means the Income Tax Act (Canada) and the regulations thereunder, as amended from time to time;
“Terminals” means, collectively, the Company’s merchant (non-regulated) terminal assets comprised of the Vancouver Wharves Terminal, the Edmonton South Terminal, the North 40 Terminal, the Edmonton Rail Terminal, the Alberta Crude Terminal and the Base Line Terminal, as further described under “Item 1. Business—Terminals Segment”;
“TM Jet Fuel” means Trans Mountain (Jet Fuel) Inc., an indirect, wholly-owned subsidiary of the Limited Partnership;
“TM Pipeline L.P.” means Trans Mountain Pipeline L.P., a wholly-owned partnership of the Limited Partnership;
“TMEP” means the proposed project to expand the TMPL as described under the heading “Item 1. Business—Pipeline Segment—The TMEP”;
“TMPL”, “TMPL system” or “Trans Mountain pipeline” means the Trans Mountain pipeline system (including the related terminals assets) that transports crude oil and refined petroleum products from Edmonton, Alberta, Canada to marketing terminals and refineries on the West Coast, as further described under “Item 1. Business—Pipeline Segment”;
“TM Puget Sound” means Trans Mountain Pipeline (Puget Sound) LLC, which is an indirect, wholly-owned subsidiary of the Limited Partnership;
“Trans Mountain” means Trans Mountain Pipeline ULC and its predecessors, the general partner of TM Pipeline L.P. and the holder of the NEB certificates for the TMPL system, which is a direct, wholly-owned subsidiary of the Limited Partnership;
“TSX” means the Toronto Stock Exchange;
“WCSB” means the Western Canadian Sedimentary Basin.
ABBREVIATIONS, CONVERSIONS, EXCHANGE RATES AND MARKET DATA
In this document, the following abbreviations have the meanings set forth below:
/d | = | per day |
LLC | = | limited liability company |
MBbl | = | thousand barrels |
MMBbl | = | million barrels |
MMtonne | = | million metric tons |
WTI | = | West Texas Intermediate |
WCS | = | Western Canada Select |
All references to cubic feet measurements are at a pressure of 14.73 pounds per square inch.
The following table sets forth certain standard conversions between Standard Imperial Units and the International System of Units (or metric units), both of which are used in this document.
To Convert From |
| To |
| Multiply By |
|
cubic feet |
| cubic meters |
| 0.0283 |
|
cubic meters |
| cubic feet |
| 35.301 |
|
barrels |
| cubic meters |
| 0.159 |
|
cubic meters |
| barrels |
| 6.290 |
|
feet |
| meters |
| 0.305 |
|
meters |
| feet |
| 3.281 |
|
kilometers |
| miles |
| 0.621 |
|
miles |
| kilometers |
| 1.609 |
|
millimeters |
| inches |
| 0.039 |
|
The following tables set forth for the period indicated the rate used to convert one Canadian dollar to U.S. dollars, expressed in U.S. dollars.
|
| December 31, |
| December 31, |
| December 31, |
| December 31, |
| December 31, |
| September 30, |
| September 30, |
|
Daily Closing Rate |
| 1.0051 |
| 0.9402 |
| 0.8620 |
| 0.7225 |
| 0.7448 |
| 0.7624 |
| 0.8013 |
|
|
| 2012 |
| 2013 |
| 2014 |
| 2015 |
| 2016 |
|
|
|
|
|
Annual Average Rate |
| 1.0006 |
| 0.9711 |
| 0.9064 |
| 0.7828 |
| 0.7556 |
|
|
|
|
|
Yearly High Closing Rate |
| 1.0326 |
| 1.0171 |
| 0.9406 |
| 0.8502 |
| 0.7981 |
|
|
|
|
|
Yearly Low Closing Rate |
| 0.9606 |
| 0.9340 |
| 0.8570 |
| 0.7163 |
| 0.6859 |
|
|
|
|
|
Certain market, independent third party and industry data contained in this document is based upon information from government or other independent industry publications and reports or based on estimates derived from such publications and reports. Government and industry publications and reports generally indicate that they have obtained their information from sources believed to be reliable, but we have not conducted our own independent verification of such information. This document also includes certain data respecting, among other things, WCSB crude supply, pipeline capacity, tolls and toll ranges, rail costs and industry activity levels, expected commodity prices and foreign exchange rates and commodity supply and demand projections generated by independent third parties.
In particular, certain information included in this document has been extracted directly from the following publicly available sources: (i) the 2016 CAPP Crude Oil Forecasts, Markets & Transportation, 2016-0007 report, which has been referenced with respect to WCSB pipeline takeaway capacity and crude supply, anticipated bitumen production growth, crude products consumption, demand and markets and crude products pricing information; (ii) the Environment and Climate Change Canada report respecting the TMEP dated November, 2016, which has been referenced with respect to crude by rail transportation cost estimates; and (iii) the statistics and analysis of the U.S. Energy Information Administration, which has been referenced with respect to Alaskan North Slope crude supply data. In addition, the third party reportable right of way releases data provided in this document was compiled, and industry average pipeline release values calculated, from raw 2013 — 2015 PHMSA incident and annual report data.
While we believe this data to be reliable, market and industry data is subject to variations and cannot be verified with complete certainty due to limits on the availability and reliability of raw data, the voluntary nature of the data gathering process, and
other limitations and uncertainties inherent in any statistical survey. In addition, this market, independent third party and industry data has been prepared as of a specific date and therefore does not contemplate changes in facts and circumstances following such date. We have not independently verified any of the data from independent third party sources referred to in this document or ascertained the underlying assumptions relied upon by such sources.
|
| Page | ||
|
|
| ||
i | ||||
|
| |||
i | ||||
|
| |||
iv | ||||
|
| |||
vii | ||||
|
| |||
1 | ||||
|
|
| ||
| 1 | |||
|
| 1 | ||
|
| 3 | ||
|
| 5 | ||
|
| 23 | ||
|
| 24 | ||
|
| 29 | ||
|
| 32 | ||
|
|
|
| |
| 35 | |||
|
| 35 | ||
|
| 42 | ||
|
| 45 | ||
|
| 45 | ||
|
|
|
| |
| 48 | |||
|
| 48 | ||
|
| 49 | ||
|
|
|
| |
| 68 | |||
|
|
|
| |
| SECURITY OWNERSHIP OF CERTAIN BENEFICIAL OWNERS AND MANAGEMENT | 68 | ||
|
|
|
| |
| 69 | |||
|
| 71 | ||
|
| 73 | ||
|
| 73 | ||
|
| 73 | ||
|
|
|
| |
| 75 | |||
|
| 75 | ||
|
| 77 | ||
|
| 79 | ||
|
|
|
| |
| CERTAIN RELATIONSHIPS AND RELATED TRANSACTIONS, AND DIRECTOR INDEPENDENCE | 79 | ||
|
| 79 | ||
|
| 81 | ||
|
|
|
| |
| 81 | |||
|
|
| Page |
|
|
|
|
| MARKET PRICE OF AND DIVIDENDS ON THE REGISTRANT’S COMMON EQUITY AND RELATED STOCKHOLDER MATTERS | 81 | |
|
| 81 | |
|
| 81 | |
|
| 82 | |
|
|
|
|
| 83 | ||
|
|
|
|
| 83 | ||
|
| 84 | |
|
| 84 | |
|
| 84 | |
|
| 84 | |
|
| 85 | |
|
| 86 | |
|
| 88 | |
|
| 88 | |
|
|
|
|
| 89 | ||
|
|
|
|
| 90 | ||
|
|
|
|
| CHANGES IN AND DISAGREEMENTS WITH ACCOUNTANTS ON ACCOUNTING AND FINANCIAL DISCLOSURE | 90 | |
|
|
|
|
| 91 |
INFORMATION REQUIRED IN REGISTRATION STATEMENT
Our Corporate History and Background
We were incorporated under the ABCA on April 7, 2017. The Limited Partnership was formed under the laws of the Province of Alberta and the General Partner was incorporated under the ABCA prior to the closing of our initial public offering (“IPO”) in Canada on May 25, 2017. The Limited Partnership owns, directly and indirectly, the Operating Entities. See “Item 11. Description of Registrant’s Securities to be Registered—Limited Partnership Units.” Unless otherwise noted or the context otherwise requires, the disclosure in this document is presented on the basis that the entirety of our Operating Entities is and has been, for all relevant periods, under common control, management and ownership. In reviewing the information set forth herein, you should note that we indirectly hold an approximate 30% interest in the Operating Entities through our minority interest in the Limited Partnership. Accordingly, while our consolidated financial information presents 100% of the Limited Partnership, our interest in the Limited Partnership is only 30%.
Prior to the closing of the IPO, the Limited Partnership acquired the Operating Entities from Kinder Morgan, through its subsidiaries KMCC and KM Canada Terminals, in exchange for the issuance to KMCC and KM Canada Terminals of Class B Units of the Limited Partnership and Special Voting Shares of the Company. Immediately following closing of our IPO, we used the proceeds from our IPO to indirectly subscribe for Class A Units representing an approximate 30% interest in the Limited Partnership, following which the Class B Units held indirectly by Kinder Morgan represented, in the aggregate, an approximate 70% interest in the Limited Partnership. KMCI, the Company, the General Partner and the Limited Partnership then entered into the Services Agreement pursuant to which KMCI provides certain operational and administrative services in connection with the management of the business and affairs of the Kinder Morgan Canada Group, and the Company, the Limited Partnership, KMCC, KM Canada Terminals and Kinder Morgan entered into the Cooperation Agreement. See “Item 7. Certain Relationships and Related Transactions, and Director Independence—Agreements between the Company and Kinder Morgan.”
Immediately following our IPO, purchasers under our IPO held 100% of the issued and outstanding Restricted Voting Shares, then comprising approximately 30% of the votes attached to all outstanding Company Voting Shares, and Kinder Morgan indirectly owned 100% of the Special Voting Shares, then comprising approximately 70% of the votes attached to all outstanding Company Voting Shares. Each Restricted Voting Share and each Special Voting Share generally entitles the holder to one vote at all meetings of our shareholders. Except as otherwise provided by our Articles or required by law, the holders of Restricted Voting Shares and the holders of Special Voting Shares will vote together as a single class. Each Class A Unit of the Limited Partnership, which represents the Company’s common equity economic interest in the Limited Partnership, corresponds to a Restricted Voting Share of the Company and represents the Restricted Voting Shareholder’s indirect economic interest in the Limited Partnership. Similarly, each Class B Unit of the Limited Partnership, which represents Kinder Morgan’s common equity economic interest in the Limited Partnership, corresponds to one Special Voting Share of the Company, which represents Kinder Morgan’s voting interest in the Company. We may not issue additional Restricted Voting Shares or Special Voting Shares unless the Limited Partnership contemporaneously issues an equal number of additional Class A Units or Class B Units, respectively. Kinder Morgan owns (indirectly through KMCC and KM Canada Terminals) 100% of the outstanding Special Voting Shares and is our largest voting shareholder, with approximately 70% of the total outstanding Company Voting Shares. See “Item 11. Description of Registrant’s Securities to be Registered.”
On August 15, 2017, we issued 12,000,000 cumulative redeemable minimum rate reset Preferred Shares, Series 1 to the public at a price of $25.00 per share, and the Limited Partnership issued 12,000,000 corresponding preferred limited partnership units to the General Partner. On December 8, 2017, we issued 10,000,000 cumulative redeemable minimum rate reset Preferred Shares, Series 3 to the public at a price of $25.00 per share, and the Limited Partnership issued 10,000,000 corresponding preferred limited partnership units to the General Partner. See “Item 11. Description of Registrant’s Securities to be Registered—Preferred Shares.”
The intercorporate relationships of the Company, the Limited Partnership and their material subsidiaries, partnerships and joint ventures are as follows:
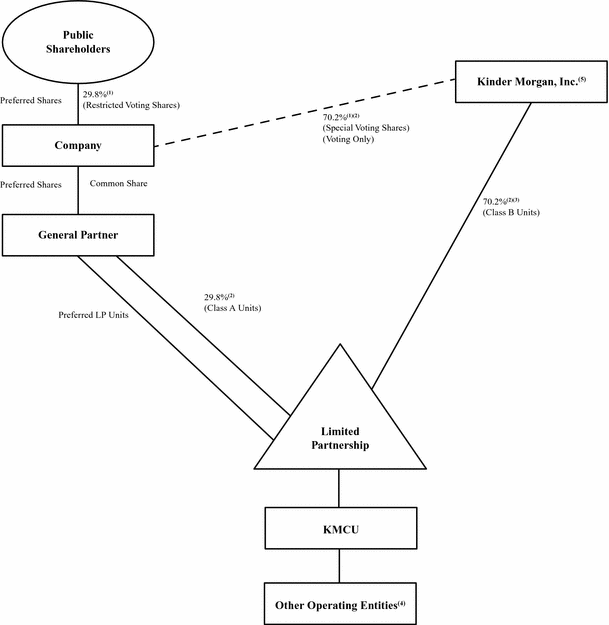
Notes:
(1) Approximate percentages based on ownership of total outstanding Company Voting Shares.
(2) Approximate percentages based on ownership of total outstanding Class A Units and Class B Units. Distributions on the Preferred LP Units will be made prior to any distributions on the Class A Units and Class B Units.
(3) Held indirectly through KMCC and KM Canada Terminals.
(4) Other operating entities include KMCU, KM Canada Marine Terminal Limited Partnership, KM Canada North 40, KM Canada Rail Holdings GP Limited, Kinder Morgan Canada Inc., Trans Mountain Pipeline L.P., Trans Mountain (Jet Fuel) Inc., Trans Mountain Pipeline (Puget Sound) LLC and Trans Mountain.
(5) Kinder Morgan owns (indirectly through KMCC and KM Canada Terminals) 100% of our outstanding Special Voting Shares and 100% of the Class B Units.
We focus on providing fee-based services to customers from an asset portfolio consisting of energy-related pipelines and liquid and bulk terminaling facilities. Our two business segments are: (a) Pipelines, which is comprised of the TMPL system including the Westridge Marine Terminal and other related terminaling assets, the Puget Sound pipeline system (“Puget Sound”) and the Jet Fuel pipeline system (“Jet Fuel”), as described below under “—Pipeline Segment” and the Canadian Cochin pipeline system (“Cochin”), as described below under “—Cochin Pipeline System”; and (b) Terminals, which is comprised of the Vancouver Wharves Terminal and the terminals located in the Edmonton, Alberta area, as described below under “—Terminals Segment.”
Our key strategies are to:
· focus on stable, fee-based energy transportation and storage assets that are central to the energy infrastructure of Western Canada;
· increase utilization of its existing assets while controlling costs, operating safely, and employing environmentally sound operating practices;
· leverage economies of scale from incremental acquisitions and expansions of assets that fit within its strategy and are accretive to cash flow; and
· maintain a strong balance sheet and maximize value for its investors.
Overview of Assets
Asset |
| Design [Storage] |
| Description |
Pipelines | ||||
TMPL |
| ~300 MBbl/d |
| Only pipeline in Canada transporting crude oil and refined products to the West Coast. |
TMEP |
| ~890 MBbl/d |
| Total capital cost currently estimated to be ~$7.4 billion, further described below under “-Pipelines -TMEP Construction Progress.” (1) |
Puget Sound |
| ~240 MBbl/d |
| Ships from Sumas Terminal to Washington State refineries via TMPL. |
Edmonton Terminal |
| [~8,000 MBbl] |
| 35 tanks in total, majority serving TMPL regulated service |
Westridge Marine Terminal |
| [395 MBbl] |
| Liquid export / import terminals in Burnaby, which can accommodate Aframax sized tankers. |
Kamloops/Sumas/Burnaby Terminals |
| [2,560 MBbl] |
| Kamloops: 2 tanks serving TMPL (160 MBbl), |
Jet Fuel(3) |
| [45 MBbl] |
| Transport jet fuel from refinery in Burnaby and the Westridge Marine Terminal to Vancouver International Airport. |
Canadian Cochin(4) |
| ~110 MBbl/d |
| Transport condensate from the Canada/U.S. border near Maxbass, North Dakota to Fort Saskatchewan, Alberta. |
Terminals | ||||
Vancouver Wharves Terminal |
| 4.0 MMtonnes bulk + |
| Bulk commodity marine terminal provides handling, storage, loading and unloading services. |
Edmonton South Terminal |
| [5,100 MBbl] |
| 15 tanks currently leased from Trans Mountain(2); tanks sub-leased to third parties in unregulated service (merchant tanks). |
North 40 Terminal |
| [2,150 MBbl] |
| Merchant crude oil storage and blending services. |
Edmonton Rail Terminal |
| 210 MBbl/d |
| Operated 50/50 joint venture with Imperial Oil (largest origination crude-by-rail terminal in North America). |
Alberta Crude Terminal |
| 40 MBbl/d |
| Non-operated 50/50 joint venture with Keyera (fully contracted). |
Baseline Terminal |
| [4,800 MBbl] |
| Operated 50/50 joint venture with Keyera (12 tanks planned to be placed in service throughout 2018), further described below. |
![]()
(1) Includes capitalized financing costs.
(2) We currently expect that TMPL will recall two of the 15 merchant tanks comprising the Edmonton South Terminal upon the completion of the TMEP for use in its regulated service.
(3) Jet Fuel has a B.C. Utilities Commission-approved negotiated settlement that ends in 2018.
(4) Canadian Cochin is part of the Cochin, which transports condensate from Kankakee County, Illinois to Fort Saskatchewan, Alberta. Capacity on the U.S. portion of Cochin (“U.S. Cochin”), which is not owned by us, is approximately 95 MBbl/d.
Overview Map of Our Business
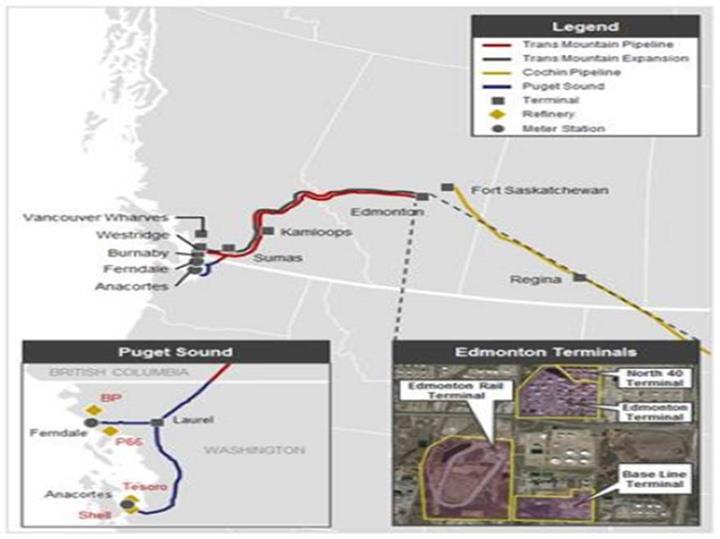
Our business is comprised of a portfolio of strategic energy infrastructure assets across Western Canada. For over 60 years, the Trans Mountain pipeline system has been the only Canadian crude oil and refined products export pipeline with North American West Coast tidewater access. Current transportation capacity on the TMPL is approximately 300,000 barrels per day (based on throughput of 80% light oil and refined products and 20% heavy oil), and it is connected to 20 incoming pipelines near Edmonton, Alberta, one of North America’s most significant energy hubs. In Alberta, we have one of the largest integrated networks of crude tank storage and rail terminals in Western Canada and the largest merchant terminal storage facility in the Edmonton market. We also operate the largest origination crude by rail loading facility in North America. In British Columbia, we control the largest mineral concentrate export/import facility on the west coast of North America through our Vancouver Wharves Terminal, transferring over four million tons of bulk cargo and 1.5 million barrels of liquids annually. In Washington State, we ship crude oil from the Sumas Terminal for delivery to the BP plc, Phillips 66, Shell Oil Products U.S. and Tesoro Corporation refineries in Anacortes and Ferndale. We also own the Canadian Cochin pipeline system, which forms part of the Cochin pipeline system transporting light condensate to Fort Saskatchewan, Alberta, traversing two provinces in Canada and four states in the United States. Given the challenges faced by the energy sector looking to construct major infrastructure projects, particularly in environmentally sensitive regions, our asset base has many unique attributes that offer significant, sustainable competitive advantages that we believe would be challenging for competitors to replicate over the near to mid-term.
Trans Mountain
Trans Mountain Oil Pipe Line Company was established on March 21, 1951. Construction of the TMPL commenced in 1952 and the first shipment of oil reached Trans Mountain’s Burnaby Terminal on October 17, 1953. The initial capacity of the pipeline system was 150,000 barrels per day. Since 1953, the capacity of the TMPL has been increased a number of times by twinning parts of the line and adding associated facilities.
In 2008, the Anchor Loop project was completed, which project involved the installation of a second pipeline adjacent to the existing TMPL on a 158 kilometer section of the system between Hinton, Alberta and Hargreaves, British Columbia, just west of Mount Robson Provincial Park. The Anchor Loop project increased the capacity of the pipeline system from 260,000 barrels per day to 300,000 barrels per day and involved the installation of two new pump stations.
The TMPL is approximately 1,150 kilometers long, beginning in Edmonton, Alberta and terminating on the west coast of British Columbia in Burnaby. Twenty-three active pump stations located along the TMPL route maintain the 300,000 barrels per day capacity of the line, flowing at a speed of approximately eight kilometers per hour. In addition to the pump stations, four terminals located in Edmonton, Kamloops, Sumas and Burnaby and the Westridge Marine Terminal, house storage tanks and serve as locations for incoming pipelines. The 300,000 barrels per day nominal capacity of the pipeline has been determined based on a throughput mix of 20% heavy oil and 80% light oil. As shown in the table below respecting TMPL’s historical throughput apportionment, the actual delivery capacity on the TMPL mainline is based on the type of oil or refined product being transported. For example, when the pipeline is delivering only light oil, it can deliver an amount closer to approximately 350,000 barrels per day and if it is delivering only heavy oil, the system’s delivery capacity is closer to approximately 280,000 barrels per day.

Notes:
(1) Apportionment = 1 - (accepted nominations / total nominations).
(2) On May 1, 2015 the NEB changed the nomination methodology by limiting the amount of accepted nominations to the best 18 of the last 24 months of historical nominations. This resulted in a decrease in nominations because there was less opportunity to achieve more accepted nominations.
The Trans Mountain pipeline regularly ships multiple products, including refined petroleum, synthetic crude oil, light crude oil and heavy crude oil, and it is the only pipeline in North America that carries both refined products and crude oil together in the same line. This process, known as “batching,” means that a series of products can follow one another through the pipeline in a “batch train.” A typical batch train in the TMPL mainline is made up of a variety of materials being transported for different shippers; however, any product moved in the pipeline must meet Trans Mountain’s tariff requirements, which include technical specifications for any products accepted for transportation in the TMPL system. While products move next to each other in the pipeline mix, product interface is kept to a minimum by moving the products in a specific sequence, as illustrated below. Products that do mix are re-refined for use.

In order to optimize batches to achieve maximum throughput, Trans Mountain has built tanks, pumps and other ancillary equipment which enable connection and staging of batches to be delivered to the TMPL mainline pipe. Tanks are used to accumulate enough of a particular type of product to make up an efficient batch. While shippers are permitted to deliver oil to the mainline at a rated throughput to avoid the use of tanks, the TMPL tanks can be used by shippers delivering at less than the 300,000 barrels per day capacity to accumulate their product and have it pumped at the throughput capacity 300,000 barrels per day so as not to slow the line
down. In addition to maximizing throughput, the tanks are also used to minimize the mixing or product interfaces. See “—Trans Mountain Terminals” and “—Terminals Segment” below.
As at the date hereof, the Trans Mountain pipeline remains the only pipeline that transports liquid petroleum from the WCSB to the West Coast. It is also the only pipeline providing Canadian producers with direct access to world market pricing through a Canadian port.
Trans Mountain Terminals
Edmonton Terminal
The TMPL system begins in Sherwood Park, Alberta at the Edmonton Terminal. This facility is made up of 35 tanks with total storage capacity of approximately 8.0 million barrels. All tanks at the Edmonton Terminal are in crude oil, condensate or refined product service and each tank has the flexibility to handle most products that are connected to the terminal, including in-tank mixing of multiple products. The Edmonton Terminal is connected to 20 incoming pipelines from oil and refinery production in Alberta and is adjacent, or in close proximity, to the starting point of the Enbridge Inc. cross-continent crude oil pipeline system, the North 40 Terminal, the Suncor Energy Inc. Edmonton refinery, the Keyera Edmonton terminal, the Keyera Alberta Envirofuels plant, the Gibson Energy Inc. Edmonton terminal, the Plains Midstream Canada Edmonton Strathcona terminal and the Imperial Oil Strathcona refinery.
Twenty of the tanks at the Edmonton Terminal, ranging in size from 80,000 barrels to 220,000 barrels and comprising 2.9 million barrels of total storage capacity, are currently used by Trans Mountain to serve the TMPL system’s regulated service. As noted above, these tanks are used by Trans Mountain to facilitate batching and maximize throughput on the TMPL mainline. See “—Trans Mountain” above. The remaining 15 tanks at the Edmonton Terminal (referred to as the “Edmonton South Terminal” and as illustrated in the image below), ranging in size from 250,000 barrels to 400,000 barrels and constituting approximately 5.1 million barrels of the total storage capacity, are leased to KM Canada North 40’s Edmonton South Terminal and are marketed on a merchant basis, subject to a 24 month right of recall, exercisable by Trans Mountain, in the event that the Edmonton Terminal is built out and Trans Mountain requires the tanks for its regulated service. This leasing arrangement is based on a Memorandum of Understanding with the Canadian Association of Petroleum Producers and has been sanctioned by the NEB. In connection with the completion of the TMEP, Trans Mountain expects that it will exercise recall rights under the leasing arrangement with KM Canada North 40 in respect of two of the tanks at the Edmonton South Terminal. As a result, following this recall, the Edmonton South Terminal will be comprised of 13 merchant tanks and 22 of the existing tanks will be used by Trans Mountain to service the regulated TMPL system. As the use of the recalled tanks will be included in the overall tolls charged on the expanded TMPL, such tanks will no longer generate the incremental revenue realized through leases to external customers. As such, the recall is expected to result in a decrease in the net cash earnings attributable to the Edmonton South Terminal. See “—Terminals—Edmonton South Terminal” below.

In addition to its service as a storage and terminaling facility, the Edmonton Terminal houses the primary control center for the Trans Mountain pipeline, the Puget Sound pipeline, the Jet Fuel pipeline, the North 40 Terminal, the Westridge Marine Terminal and the line to the Edmonton Rail Terminal. It will also control the supply lines to the Base Line Terminal, once the terminal is in service. The control center located at the Edmonton Terminal does not operate the Cochin pipeline system, which is controlled from the United States. See “—Terminals Segment” below.
Kamloops Terminal
In Kamloops, British Columbia, refined products from Edmonton, Alberta are delivered to a distribution terminal operated by a third party. The TMPL terminal in Kamloops contains two storage tanks with a total storage capacity of approximately 160,000 barrels and also serves as a primary pump station for the TMPL system.
Sumas Pump Station and Sumas Terminal
The Sumas pump station and the Sumas Terminal are approximately three kilometers apart and are both located in Abbotsford, British Columbia. The terminal is used to stage oil for delivery and contains six storage tanks with total storage capacity of approximately 715,000 barrels. The pump station includes four pumps, two of which are used to route product from the TMPL mainline into Washington State via the Puget Sound pipeline system and two of which are used to route the product on the TMPL mainline to Burnaby, British Columbia.
Burnaby Terminal
The Burnaby Terminal, located in Burnaby, British Columbia, is the terminus of the TMPL mainline. It receives both crude oil and refined products for temporary storage and distribution through separate pipelines to a local distribution terminal, a local refinery and the Westridge Marine Terminal. The Burnaby Terminal has 13 storage tanks with total storage capacity of approximately 1.685 million barrels.
The pump station used to operate the Jet Fuel pipeline system is also located within the Burnaby Terminal although the Jet Fuel pipeline system and the Trans Mountain pipeline system are not connected and are operated as separate systems.
Westridge Marine Terminal
The Westridge Marine Terminal is located within the Burrard Inlet in Burnaby, British Columbia. Regulated by Transport Canada and the NEB, the dock at the terminal can accommodate up to Aframax class vessels (approximately 120,000 dead weight tons) and barges.
The Westridge Marine Terminal is used to deliver crude oil from the Trans Mountain pipeline system onto barges and tankers and to receive jet fuel to the three tanks at the terminal used for delivery into the Jet Fuel pipeline system.
The Westridge Marine Terminal houses three storage tanks, that are currently being leased to a third party, with total storage capacity of approximately 395,000 barrels. Significant modifications are planned for the Westridge Marine Terminal as part of the TMEP. Limited construction activity on such modifications began in September 2017. See “—The TMEP—Project Description” below.
Puget Sound Pipeline System
In operation since 1954, the Puget Sound pipeline system ships crude oil products from the Sumas Terminal to Washington State refineries in Anacortes and Ferndale.

The Puget Sound pipeline system is approximately 111 kilometers long, with one pump station and a diameter of 16 to 20 inches (406 to 508 mm) and two storage tanks with total storage capacity of approximately 200,000 barrels. The system has total throughput capacity of approximately 240,000 barrels per day (when transporting primarily light oil), with approximately 191,000 barrels per day transported in 2016. The transit time of products on the Puget Sound pipeline system is approximately one day. The pipeline is regulated by the FERC for tariffs and the U.S. Department of Transportation for safety and integrity. Approximately 80% of the 2016 revenue from Puget Sound originated from counterparties that have, or are subsidiaries of a parent entity that has, an investment grade credit rating (however such parent entity may not be a guarantor).
In addition to their access to the Westridge Marine Terminal, shippers on the TMPL system have, and following completion of the TMEP will continue to have, the option to deliver their product to the Puget Sound pipeline system.
Jet Fuel Pipeline System
The Jet Fuel pipeline system transports jet fuel from a Burnaby refinery and the Westridge Marine Terminal to the Vancouver International Airport. The 41 kilometer pipeline system has been in operation since 1969. It includes five storage tanks at the Vancouver International Airport with aggregate storage capacity of 45,000 barrels. The BC OGC regulates the integrity and safety of the pipeline and the BCUC regulates the Jet Fuel pipeline’s tolls.

The TMEP
Background
At an estimated total capital cost of approximately $7.4 billion (including capitalized financing costs), upon completion, the TMEP will provide western Canadian crude oil producers with an additional 590,000 barrels per day of shipping capacity and tidewater access to the western United States (most notably Washington State, California and Hawaii) and global markets (most notably Asia). Over 70% of Canadian crude products are currently exported to U.S. markets, with the majority of the remaining products being consumed domestically (Source: CAPP 2016 Forecast, Markets and Transportation 2016-0007). This dependence on a single market, combined with the cost and limited availability of transportation options, has resulted in Canadian crude products producers receiving a material discount to global benchmark prices on the sale of similar quality products (Source: CAPP 2016 Crude Oil Forecast, Markets and Transportation 2016-0007).
Beginning in early 2011, through discussions with Trans Mountain and existing shippers and other interested parties, it became clear that there was significant interest in an expansion of the TMPL for the purpose of improving access to the North American west coast and offshore markets. Between October 2011 and November 2012, Trans Mountain conducted an open season process to obtain commitments for the TMEP. Trans Mountain advanced a firm service offering designed to provide shippers with long-term contractual certainty of shipping crude oil product volumes on the expanded system, while providing Trans Mountain with the financial certainty necessary to support the contemplated investment in the expansion. In total, at the conclusion of the open season process, Trans Mountain entered into firm transportation services agreements with 13 companies for a total of 707,500 barrels per day based on a capacity of 890,000 barrels per day (the maximum amount that Trans Mountain anticipated the NEB would authorize) following completion of the TMEP.
In January 2013, Trans Mountain made an application to the NEB for approval of the proposed transportation service to be provided; and the proposed toll methodology to be used in the event the TMEP was approved by the NEB (key matters included approval of negotiated rates for contracted shippers, a 10% premium embedded in the toll methodology for spot shippers over 15-year contract shippers, the limitation of contract capacity to 80% of total capacity and the apportionment methodology for spot capacity). In May 2013, the NEB approved the commercial terms of the expansion proposal. See “—Customers and Contractual Relationships—Expansion Shipping Agreements” below.
In December 2013, Trans Mountain submitted its formal facilities application to the NEB. The NEB review process included approximately 1,650 participants, including commenters and approximately 400 intervenors. Key steps in the process included several rounds of information requests by the NEB and intervenors, information request responses from Trans Mountain and opportunities for intervenors to file written evidence. The process also included an oral hearing of Aboriginal groups’ traditional evidence in 2014 and oral argument respecting the TMEP as a whole in 2015 and 2016.
On May 19, 2016, following a 29-month review, the NEB recommended that the Government of Canada approve the TMEP, subject to the satisfaction of 157 required conditions. These conditions apply during various stages of the proposed project’s lifecycle, including before construction, during construction and during the operation of the expanded TMPL system. The conditions are designed to reduce possible risks that were identified by the NEB during the application process. The
conditions cover a wide range of areas including safety and integrity, emergency preparedness and response, environmental protection, ongoing consultation with stakeholders, socio-economic matters, financial responsibility and affirmation of commercial support. The conditions, which are acceptable to us on both a cost and schedule basis, are comprised of five general conditions, 98 conditions that must be satisfied prior to commencing construction, 35 conditions that must be satisfied prior to commencing operations and 19 conditions that will require activities after operations have commenced.
On November 29, 2016, the Government of Canada approved the TMEP, and on December 1, 2016, the NEB issued its Certificate of Public Convenience and Necessity. The approval of the TMEP by the Government of Canada was provided in the context of a broader pipeline plan developed by the federal government designed to grow the Canadian economy while protecting environmentally sensitive areas. As a result, along with the announcement of the TMEP approval, the Government of Canada also noted that, among other things: (i) a moratorium on persistent oil tankers along British Columbia’s north coast has been implemented; (ii) more than $300 million had been committed to Indigenous groups by Kinder Morgan under mutual benefit agreements and the Government of Canada had agreed to provide funding for an Indigenous advisory and monitoring committee to work with federal regulators and Kinder Morgan to oversee environmental aspects of the TMEP and other projects throughout their applicable life cycles; (iii) before any shipping from the TMEP begins, a recovery plan for the southern resident killer whale population and a $1.5 billion national ocean protection plan will be implemented to improve marine safety and responsible shipping; (iv) Trans Mountain is required to develop a construction-related emissions offset plan to achieve zero net emissions; and (v) through the climate leadership plan, the Government of Alberta had committed to cap oil sands emissions at 100 megatonnes of CO2 per year to limit future potential upstream greenhouse gas emissions.
On January 11, 2017, the Government of British Columbia announced the issuance of an environmental assessment certificate from British Columbia’s Environmental Assessment Office to Trans Mountain for the British Columbia portion of the TMEP. The environmental assessment certificate includes 37 conditions that are in addition to and designed to supplement the 157 conditions required by the NEB.
In addition, on January 11, 2017, the Government of British Columbia announced that the TMEP had met the British Columbia Government’s five conditions relating to world-leading marine and land oil spill response, protection and recovery measures for British Columbia’s coast and land areas, environmental reviews, First Nations consultations and participation and economic agreements that reflect the level and nature of the risk the province bears with a heavy oil project. The meeting of such conditions is an important precursor to receiving approval of additional provincial permits. In connection with the British Columbia conditions, Trans Mountain has entered into an agreement to contribute a guaranteed amount of $25 million annually for 20 years to the British Columbia Government, and up to a maximum of $50 million annually, depending on spot volume shipments. The British Columbia Government has stated that all of the proceeds received from Trans Mountain pursuant to this agreement will be used and applied to a new British Columbia Clean Communities Program, or similar program, which has a mandate to provide funding for projects and initiatives that protect the environment and benefit communities, including local projects that protect, sustain and restore British Columbia’s natural and coastal environments.
Trans Mountain incorporated the NEB’s 157 conditions and the 37 conditions of the Government of British Columbia into its cost estimates and project schedule and, in response to public feedback, has implemented certain additional changes to the TMEP including, among other things, increasing pipe wall thickness and adding additional drilled crossings in environmentally sensitive areas and the Burnaby Mountain tunnel. These and other factors resulted in Trans Mountain increasing the final cost estimate and tolls to reflect an updated estimated TMEP cost of approximately $7.4 billion (including capitalized financing costs). On March 9, 2017, the final cost estimate review with shippers was completed wherein shippers had the option to keep their volume commitments or turn back their commitments (or a portion thereof) and pay their pro rata share of development costs to date.
The NEB-approved commercial terms for the TMEP contemplate a capital cost risk sharing investment structure whereby the capital costs associated with the TMEP will be classified into two segments: capped costs and uncapped costs. Uncapped costs, which account for approximately 24% of the capital cost of the TMEP, will include some of the higher risk capital cost components of the TMEP whereby any cost overruns will be reflected in increased tolls. These components include: (i) the price of steel for pipe; (ii) difficult pipeline construction spreads totaling approximately 10% of the TMEP specifically, one mountain spread through the Coquihalla Summit near Hope, British Columbia and one urban spread between Langley and Burnaby, British Columbia (including the Burnaby tunnel); (iii) land acquisition costs between Langley and Burnaby, British Columbia; and (iv) all consultation and accommodation costs, including with respect to Aboriginal and non-Aboriginal communities. Costs above or below the uncapped cost amount will be reflected in higher or lower tolls for shippers by approximately $0.07 per barrel per $100 million of capital cost change. This structure is anticipated to not only allow Trans Mountain to recover its costs with respect to overruns on uncapped costs but also to earn returns following such cost recovery.
Capped costs, which are expected to account for approximately 76% of the capital cost of the TMEP, include all other costs associated with the construction of the TMEP not classified as uncapped costs. Any capped costs above the pre-determined amount are the responsibility of Trans Mountain; however, capped costs below the pre-determined amount are reflected in lower tolls for shippers by approximately $0.07 per barrel per $100 million of capital cost change. Kinder Morgan has spent years advancing engineering designs for the TMEP and has developed a comprehensive construction plan in conjunction with several of the world’s leading engineering, procurement and construction and general contractor construction companies. As of September 30, 2017, remaining cash construction costs on the TMEP were estimated to be approximately $6.0 billion, excluding capitalized interest. The economics of the TMEP are expected to remain attractive even in cases of significant cost increases and schedule delays; however, such increases or delays will affect the amount of capital raised and the timing of the realization of earnings and cash flows from the TMEP.
Trans Mountain delivered the final cost estimate and tolls to shippers in February 2017. At that time some existing shippers gave up capacity, some increased capacity and some new shippers acquired capacity, the net result of which was the turn back of 22,000 barrels per day (or 3% of the previously committed barrels). These 22,000 barrels per day were subsequently recommitted during an additional supplemental open season process in March 2017. As a result of the TMEP’s open season processes, 13 companies have entered into one 15-year and twelve 20-year transportation service agreements with Trans Mountain for a total of 707,500 barrels per day, representing approximately 80% of the expanded system’s capacity (the maximum amount under the regulated limit imposed by the NEB). This maximum level of recommitment highlights the strong market demand for the expanded system’s takeaway capacity and has better aligned the TMEP shipper composition with the changing Canadian crude producer landscape.
See “—TMEP Construction Progress” below for more recent developments.
Project Description
Upon the completion of the proposed TMEP, the TMPL system is anticipated to have capacity of 890,000 barrels per day. The proposed expansion of the TMPL system is intended to comprise, among other things, the following:
· approximately 980 kilometers of new, buried pipeline segments that twin (or “loop”) the existing pipeline in Alberta and British Columbia, including two 3.6 kilometer segments (7.2 kilometers in total) of new buried delivery lines from the Burnaby Terminal to the Westridge Marine Terminal;
· new and modified facilities, including pump stations and tanks; and
· a new dock complex with three new berths at the Westridge Marine Terminal, each capable of handling Aframax class vessels.
The following diagram illustrates the overall TMEP configuration:

The major components of the pipeline portion of the TMEP will include:
· using existing active 24 inch (610 mm) and 30 inch (762 mm) outside diameter buried pipeline segments;
· reactivating two 24 inch (610 mm) outside diameter buried pipeline segments that have been maintained in a deactivated state;
· constructing three new 36 inch (914 mm) and one new 42 inch (1,220 mm) outside diameter buried pipeline segments totaling approximately 860 kilometers and 120 kilometers, respectively; and
· constructing two parallel 3.6 kilometers long, 30 inch (762 mm) outside diameter buried delivery lines from the Burnaby Terminal to the Westridge Marine Terminal.
The TMEP will result in two continuous pipelines between Edmonton and Burnaby:
· Line 1 is expected to have a capacity of 350,000 barrels per day of light crude oil; and
· Line 2 is expected to have a capacity of 540,000 barrels per day of heavy crude oil.
The existing TMPL has been operating safely for more than 60 years and its location is known to local TMPL operations crews, landowners, surface management agencies, and local emergency responders. To minimize environmental and socio-economic effects and facilitate efficient pipeline operations, use of the existing TMPL right of way has been maximized in the TMEP design. Where it was not possible to align along the existing TMPL right of way, construction along other linear facilities was evaluated including other pipelines, power lines, highways and roads, railways, communication lines and other utilities. The result is that approximately 73% of the new pipeline corridor follows the existing TMPL right of way, approximately 17% follows other existing rights of way, and approximately 10% will be within a new corridor. The completion of the Anchor Loop project in 2008 also avoids the need for additional construction in the highly sensitive Jasper National Park region.
Electrically powered pump stations located at regular intervals along the pipeline will be required for the expansion. The major components of the pump stations portion of the TMEP which will support mainline operation include:
· adding 12 new pump stations;
· reactivating the existing Niton pump station and adding one pumping unit at the Sumas pump station; and
· deactivating some elements of the existing Wolf, Alberta and Blue River, British Columbia pump stations.
The major components of the associated facilities of the TMEP include:
· the addition of 20 new above-ground storage tanks, including the construction of four new tanks and inclusion of two existing tanks at the Edmonton Terminal, constructing one new tank at the Sumas Terminal and the construction of 14 new tanks and the demolition of one existing tank at the Burnaby Terminal; and
· constructing a new dock complex, with a total of three Aframax-capable berths, as well as a utility dock (for tugs, boom deployment vessels, and emergency response vessels and equipment), at the Westridge Marine Terminal, followed by the deactivation and demolition of the existing berth.
Seventy-two new buried remote mainline block valves will be installed and complement existing mainline block valves, which will be located at the pump stations. These remote mainline block valves and mainline block valves work to limit the volume and consequences associated with a pipeline leak or ruptures. A total of 25 new sending or receiving scraper traps for in-line inspection tools will also be installed at facility locations along the pipeline.
In addition, the TMEP requires two power line connections to the BC Hydro system, an approximately 24 kilometer line to connect to a power station in Kingsvale, British Columbia and an approximately 1.5 kilometer connection to a power station in Black Pines, British Columbia. BC Hydro requires Trans Mountain to either build such lines and turn them over to BC Hydro for a minimal amount or continue to own, maintain and operate them. We are currently considering selling these power line assets to a third party and entering into a services contract in relation thereto.
Currently, up to approximately five vessels per month are loaded with heavy crude oil at the Westridge Marine Terminal. Upon completion of the TMEP, it is anticipated that the Westridge Marine Terminal will be capable of serving up to 34 Aframax class vessels per month with actual demand to be influenced by market conditions. The maximum vessel size (Aframax class) served at the terminal will not change as a result of the TMEP. Similarly, product moving over the dock at the Westridge Marine Terminal is expected to continue to be primarily heavy crude oil. Of the 890,000 barrels per day capacity of the expanded system, up to 630,000 barrels per day may be handled through the Westridge Marine Terminal for shipment. Currently, monthly barge traffic typically consists of loading two crude oil barges and receiving one jet fuel barge. This level of activity is not expected to be affected by the TMEP.
We have signed a number of agreements with prime construction contractors and are currently in negotiations with other construction contractors to construct the various pipeline spreads on the TMEP, with the intention that general construction contracts will be entered into with respect to spreads one through six and engineering, procurement and construction contracts will be entered into with respect to spread seven, terminals and pump stations (including the Edmonton Terminal) and with respect to any work required in the Lower Mainland. An illustration of the TMEP pipeline spreads is set out below.

Upon completion, the newly constructed pipeline is expected to carry predominantly heavy crude volumes and the existing pipeline will carry predominantly light crude and refined products.
TMEP Construction Progress
Following provincial elections in British Columbia on May 9, 2017, the New Democratic Party and the Green Party agreed to form a government resulting in a 44 seat majority in the British Columbia legislature, consisting of 41 New Democratic Party seats and three Green Party seats. One component of the agreement between the New Democratic Party and the Green Party was the statement of intent to utilize all means available to the British Columbia government to oppose the TMEP. To that end, the British Columbia government intervened in the judicial review proceedings heard by the Federal Court of Appeal in October 2017, arguing that the NEB approval for the TMEP failed to adequately consider the risks associated with marine shipping. Acting in its official capacity as custodian of British Columbia lands, the British Columbia government recently granted us access to approximately 140 kilometers of British Columbia Crown land and is advancing the additional provincial permits that are expected to enable us to start pre-construction work in British Columbia. In addition, we have received conditional permits from the NEB, the British Columbia Environmental Assessment Office, Vancouver Fraser Port Authority, and the federal Department of Fisheries and Oceans to proceed with water work at the Westridge Marine Terminal. Provincial and federal judicial reviews relating to project approvals are underway, with decisions from the British Columbia Supreme Court and the Federal Court of Appeal expected in the coming months.
The TMEP has experienced opposition from the City of Burnaby, British Columbia. After many months of working to obtain municipal permits from the City of Burnaby without success, in October 2017 we petitioned the NEB to permit us to proceed with work at the Westridge and Burnaby terminals under the terms and conditions of the Certificate of Public Necessity and Convenience issued by the federal government and applicable NEB orders. On December 7, 2017 the NEB issued an order granting all relief requested. Representatives of the City of Burnaby have stated that they intend to appeal the NEB order to the Federal Court of Appeal. We have also requested that the NEB establish an efficient, fair and timely process for us to bring similar future matters to the NEB for its determination in cases where municipal or provincial permitting agencies unreasonably delay or fail to issue permits or authorizations in relation to the TMEP (the “Process Motion”). NEB consideration of this request is pending.
On November 28, 2017, the federal government filed a letter with the NEB supporting our Process Motion. We remain willing to continue to work with the British Columbia provincial and local officials, including from the City of Burnaby; however, we cannot predict the impact that the change in provincial government in British Columbia, active opposition from the City of Burnaby or any future disputes with municipalities, regulators or permitting authorities may have on our ability to complete the TMEP on current expected timelines or budget or at all. In October 2017, we announced a potential unmitigated delay in our project completion date of nine months (to September 2020 as compared to our originally targeted completion date of December 2019) and, as discussed below, if uncertainty around permitting and judicial processes extends further into 2018, the previously announced unmitigated delay could extend beyond September 2020. Our requests to the NEB are intended to help mitigate the possible delay in the construction schedule.
Financial Highlights and Growth Estimates
On December 4, 2017, we issued a news release announcing our preliminary financial guidance for 2018 and certain expectations relating to the TMEP. We announced that despite making progress during 2017 on permitting, regulatory condition satisfaction and land access, the scope and pace of the permits and approvals received did not allow for significant additional construction to begin at that time and that we must have a clear line of sight on the timely conclusion of the permitting and approvals processes before we will commit to full construction spending. In light of these circumstances and having regard to the NEB petitions intended to address certain of the delays, we also announced certain expectations and preliminary financial projections for 2018, in which we expect our business to:
· generate $474 million of Adjusted EBITDA and $349 million of DCF, respectively, with growth due primarily to the phased in-service of tanks at the new Base Line Terminal during the year and higher capitalized equity financing costs associated with spending on the TMEP (recognized in other income). Excluding capitalized equity financing costs, Adjusted EBITDA and DCF are budgeted to be $403 million and $278 million, respectively. Actual capitalized equity financing costs will vary depending on the amount and timing of TMEP expenditures;
· generate DCF to holders of Restricted Voting Shares of $0.96 per Restricted Voting Share, with an expected declared dividend of $0.65 per Restricted Voting Share;
· invest $1.9 billion on expansion projects and other discretionary spending, of which $1.8 billion is associated with the TMEP and the balance is associated with the Base Line Terminal; and
· end 2018 with a net debt-to-Adjusted EBITDA ratio of approximately 2.7 times.
In order to prudently manage shareholder capital, our preliminary 2018 budget assumes TMEP spending in the first part of 2018 is primarily focused on advancing the permitting process, rather than spending at full construction levels, until we have greater clarity on key permits, approvals and judicial reviews. As noted above, we previously announced a potential unmitigated delay to project completion of nine months (to September 2020) due primarily to the time required to file for, process and obtain necessary permits and regulatory approvals. Potential mitigation measures require obtaining greater clarity early in 2018 with respect to key permits, approvals and judicial reviews and continued planning with TMEP contractors to assess options to start or accelerate work in certain areas. Construction delays entail increased costs due to a variety of factors, including extended personnel, equipment and facilities charges, storage charges for unused material and equipment, extended debt service, and inflation, among others. Because those costs are highly uncertain at this stage of the TMEP and the extent of a delay, if any, is currently unknown, we have not updated our cost estimate associated with the TMEP at this time. In order to help achieve the necessary clarity with respect to permits and approvals, as described above, we have filed motions with the NEB to resolve existing delays and to establish an NEB process that will backstop provincial and municipal processes in a fair, transparent and expedited fashion. As stated in the Process Motion presented to the NEB, “it is critical for Trans Mountain to have certainty that once started, the [TMEP] can confidently be completed on schedule.” If uncertainty around permitting and judicial processes extends further into 2018, we would expect to reduce the 2018 budgeted spending on the TMEP. As a result, the previously announced unmitigated delay to a September 2020 in-service date due to a potential nine month delay could extend beyond September 2020. Further, as stated in the Process Motion, if the TMEP continues to be “faced with unreasonable regulatory risks due to a lack of clear processes to secure necessary permits . . . it may become untenable for Trans Mountain’s shareholders . . . to proceed.”
As of September 30, 2017, remaining cash construction costs on the TMEP were estimated to be approximately $6.0 billion, excluding capitalized interest. We currently expect that a significant majority of the capital expenditure requirements related to the TMEP will be funded through a combination of the Credit Facility, dividend and distribution reinvestments, term debt and the issuance of preferred equity and common equity. Our targeted funding mix during construction and following completion of the TMEP is intended to be consistent with an investment grade credit rating.
For additional information about the risks and uncertainties regarding the TMEP and Base Line Terminal projects, see “Item 1A. Risk Factors—Risks Relating to Our Business,” including the risk factors captioned “Major projects, including the TMEP, may be inhibited, delayed or stopped.” and “Judicial reviews of the processes pursuant to which we have been granted certain governmental, administrative and contractual rights to construct and operate our pipelines for the TMEP, including on other owners’ land, are ongoing. If we were to lose these rights or the TMEP were to be subject to additional significant regulatory reviews, changes, further obligations or restrictions, the TMEP may be significantly delayed or stopped altogether, and we may incur additional costs.” As a result of the significance of the assumptions and the substantial risks to which the TMEP and the Base Line Terminal are subject, the actual impact of each of the TMEP and Base Line Terminal on incremental projected Adjusted EBITDA, and our business generally, will vary and may vary materially. Therefore, investors are cautioned not to attribute undue certainty to this projected financial information. We plan to provide updates to this projected financial information when we believe such projections no longer have a reasonable basis.
Our projected Adjusted EBITDA and DCF assumptions include:
· Our base business, while expected to be relatively stable, is subject to re-contracting and other risks;
· Our 2018 projected Adjusted EBITDA includes $71 million of TMEP capitalized equity financing costs based on capital spent to date and our 2018 projected $1.8 billion capital expenditures. Our 2018 projected Adjusted EBITDA includes the capitalized equity financing costs derived under our current methodology, which is approved by the NEB and is agreed upon with representatives of current TMPL shippers and applies a 45% equity capital structure and a 9.5% return on equity to the monthly average cumulative spend on the TMEP. After the TMEP is complete, capitalized equity financing costs associated with the project will no longer be recognized in Adjusted EBITDA. See Note 2 “Summary of Significant Accounting Policies—Property, Plant and Equipment” in our Annual Consolidated Financial Statements for further information regarding capitalized equity financing costs which is one of two components of our allowance for funds used during construction;
· Our 2018 projected Adjusted EBITDA also includes $22 million of Adjusted EBITDA contribution related to our 50% share of a partial year of in-service of the Base Line Terminal project based on contracted volumes, rates and expected operating costs (with the full $44 million of Adjusted EBTIDA expected on an annualized basis after the project is fully placed into service). See “—Terminals Segment—Base Line Terminal;” and
· A Canadian/United States dollar exchange rate of $0.79.
We currently expect the TMEP to generate $900 million of incremental Adjusted EBITDA in its first 12 months of service (or approximately $75 million of Adjusted EBITDA per month). This is based on our average current expected toll rate of $5.17 per barrel for our contracted minimum volume commitments of 707.5 Mbbl/d less projected operating costs and less the existing Trans Mountain System’s Adjusted EBITDA contribution. For simplicity, this $900 million of Adjusted EBITDA is incremental to Adjusted EBITDA in previous periods after removing the contribution of capitalized equity financing costs to Adjusted EBITDA during periods prior to the TMEP completion. Once the TMEP is in service, Adjusted EBITDA will not include capitalized equity financing costs for TMEP, which are included in Adjusted EBITDA for pre-completion periods.
If TMEP construction costs increase by 10%, the impact on Adjusted EBITDA from the TMEP would be an increase of approximately 3%, assuming those costs were allocated approximately 24% to uncapped and approximately 76% to capped TMEP costs. The forecasted operating costs are comprised of fixed costs, variable costs, and a fixed payment to the province of British Columbia. The variable costs, which include power and certain Aboriginal accommodation and consultation costs, flow through to the shippers via a tariff adjustment. Fixed costs, which include operating and maintenance, labor, property tax, insurance and other expenses, are not protected by a tariff rate adjustment. These costs are forecasted based on our experience operating similar assets, and if these costs were to increase or decrease by 10%, the resulting impact on Adjusted EBITDA from the TMEP would be an increase or decrease of less than 1.5% on a full year basis.
Estimated incremental Adjusted EBITDA attributable to the TMEP as described above excludes any utilization of spot volumes, which, as discussed below, could add more than $200 million of Adjusted EBITDA annually.
We do not provide forecasted net income (the GAAP financial measure most directly comparable to the non-GAAP financial measures distributable cash flow and Adjusted EBITDA) due to the impracticality of quantifying certain amounts required by GAAP, such as realized and unrealized foreign currency gains and losses and potential changes in estimates for certain contingent liabilities. See “Item 2. Financial Information—Management’s Discussion and Analysis—Results of Operations—Non-GAAP Financial Measures” as well as the other information set forth herein.
Upon completion of the TMEP, 100% spot utilization on the expanded TMPL could add more than $200 million to our Adjusted EBITDA annually on such terms. Notably, the three pipeline connected refineries with historic and
expected continued demand in excess of 100,000 barrels per day on the TMPL are not contracted shippers on the expanded TMPL and, accordingly, could become spot shippers or receive allocated capacity for any additional volumes following completion of the project. We believe that there will be significant demand for spot volume capacity upon start-up of the new system due to increasing demand in the United States and abroad. PADD V, and Washington State in particular (as demand is expected to stay flat), is expected to require increasing access to Canadian crude oil if Alaskan production continues to decline. In addition, transit time to California from Burnaby is shorter than from Alaska by approximately three days (thereby reducing tanker costs) and the reversal of the U.S. oil export ban in late 2015 has put further supply pressure on the PADD V market. While markets in Asia are collectively larger than the U.S. Gulf Coast market and are forecasted to grow significantly, representing the majority of global crude demand growth (estimated to be approximately 70% from 2014 to 2040), Canadian crude exported from the West Coast can, where pricing is favorable, also access the U.S. Gulf Coast market through the Panama Canal (Source: CAPP 2016 Crude Oil Forecast, Markets and Transportation, 2016-0007).
Alaskan North Slope Supply and Asian Crude Demand
|
|
|

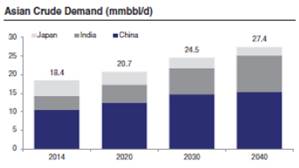
Note:
(1) Alaskan North Slope crude supply data sourced from U.S. Energy Information Administration and Asian crude demand sourced from CAPP 2016 Crude Oil Forecast, Markets and Transportation 2016-0007.
Customers and Contractual Relationships
Existing Shipping Agreements
The TMPL mainline is a common carrier pipeline, providing transportation services under a cost of service model that is negotiated with shippers and regulated by the NEB. Although Trans Mountain takes custody of its shippers’ products, it does not own any of the product it ships. The TMPL system has posted tariff rates that are available to all shippers based on a monthly contract which varies according to the type of product being shipped as well as receipt and delivery points. As such, it provides service to producers, marketers, refineries and terminals who sell or resell products to domestic markets, oil marketers and international shippers moving oil to such places as California, Washington State and Asia.
Since late 2010, the TMPL system has been meaningfully over-subscribed, resulting in pipeline apportionment (nominating less volumes for shipment than shippers request). Shippers on the TMPL system are generally large and well-capitalized. In 2016, the top ten shippers on the Trans Mountain pipeline accounted for approximately 70% of the revenue generated from the system. Of these shippers, as a percentage of such revenue generated, 85% have, or are subsidiaries of a parent entity that has, an investment grade credit rating (however, such parent entity may not be a guarantor), with approximately 66% being rated A- to AA+ by S&P and approximately 19% being rated BBB to BBB+ by S&P. Of the remaining 15%, 11% are non-investment grade and 4% of the shippers
do not have a credit rating. In alphabetical order, current shippers on the Trans Mountain pipeline system include the following entities or affiliates thereof: BP Canada Energy Trading Company, Cenovus Energy Inc., Chevron Canada Limited, Imperial Oil Limited, Nexen Energy ULC, Phillips 66 Canada Ltd, Shell Canada Products, Suncor Energy Inc., and Tesoro Canada Supply and Distribution Ltd.
Throughout the past 20 years, Trans Mountain has entered into negotiated toll settlements with its shippers to establish final tolls on the TMPL system. We believe that negotiated settlements are advantageous from a cost perspective and may provide opportunities for additional returns.
In February 2016, the NEB approved Trans Mountain’s 2016 to 2018 (inclusive) negotiated toll settlement. The toll settlement provides for a three-year term and includes a rollover provision and a TMEP transition provision. TMPL’s net regulated rate base is approximately $1 billion as of December 31, 2016 with sustaining capital automatically added in subsequent years. Under the NEB-approved negotiated toll settlement, the tolls on the TMPL system are based on a 9.5% return on equity, a 5% cost of debt and a deemed 45% equity and 55% debt structure. The toll settlement provides for the flow-through to shippers of certain operating costs, including power costs, property tax, income tax, integrity costs, environmental compliance and remediation costs and the cost of insurance and security. Labor and service-related costs are fixed costs determined by the shared service model using a methodology approved by the NEB. These costs are allocated to the system based on usage and are escalated at a set index during the toll settlement period. In addition, the toll settlement agreement provides power and capacity incentives. Specifically, 50% of the British Columbia power costs savings are allocated to the shipper and 50% are allocated to the pipeline system, and 75% of the transmission power costs savings are allocated to the shipper and 25% are allocated to pipeline sharing. The settlement agreement also provides for a capacity incentive which is allocated 50% to the shipper and 50% to the pipeline system above a formulaic 96% capacity target. Revenue variances resulting from volume are recovered from shippers in the following year. Trans Mountain’s current negotiated toll settlement includes a provision for extension, if the extension is mutually acceptable to Trans Mountain and the shipper, up until the TMEP in-service date.
In 2011, Trans Mountain received approval from the NEB to implement firm service for 54,000 barrels per day of service to the Westridge Marine Terminal, and charge a premium on such barrels to fund expansion projects on the TMPL system. This service and the premiums associated with it will be in effect until the earlier of the in-service date of the TMPL expansion and ten years from the date of implementation. The premiums are approved to be used by Trans Mountain to offset the cost of projects designed to enhance existing and future operations including development costs relating to the TMEP and equate to a total of approximately $28.6 million per year. As of December 31, 2016, $34 million had been used to construct a 250,000 barrel tank and associated infrastructure at the Edmonton Terminal and $104 million had been used to offset the development costs of the TMEP. As part of its firm service implementation, 27,000 barrels per day of existing TMPL capacity was reallocated to the Westridge Marine Terminal, increasing the terminal’s allocation to a total of 79,000 barrels per day.
Rates charged on the Puget Sound pipeline system are regulated by the FERC and are based on a cost of service model that has been in place since prior to 1992 and, as such, have been grandfathered and escalated from time to time as permitted by the FERC. As a result of this grandfathering, the Puget Sound cost of service rates that were in place for the 365-day period prior to September 1992, plus escalation, may continue to be charged to its shippers unless and until the rates are successfully challenged on the basis that a substantial change has occurred in the economic circumstances or nature of the services provided which were a basis for such rates. To date, no such complaints have been made. In 2016 approximately 80% of the revenue on the Puget Sound pipeline originated from customers that have, or are subsidiaries of a parent entity that has, an investment grade credit rating (however such parent entity may not be a guarantor).
The Jet Fuel pipeline system delivers jet fuel from the Westridge Marine Terminal and from a refinery in Burnaby to the Vancouver International Airport. With respect to the volume from the Westridge Marine Terminal, Trans Mountain has a contract with one of Canada’s largest airlines to unload jet fuel from barges at the Westridge Marine Terminal and store such volumes at the Westridge Marine Terminal. The Jet Fuel pipeline system then transports such jet fuel to the Vancouver International Airport. Through this arrangement and the jet fuel shipped from the Burnaby refinery, the Jet Fuel pipeline system has a BCUC-approved negotiated settlement that ends in 2018.
Expansion Shipping Agreements
The NEB approval for the TMEP requires that no less than 60% of the expanded system’s capacity remain contracted and that no shipper termination rights remain outstanding prior to the commencement of construction. As noted above, as a result of the TMEP’s open season processes, 13 companies have entered into transportation service agreements with Trans Mountain, one having a 15-year term and 12 having a 20-year term, for a total of 707,500 barrels per day, representing approximately 80% of the expanded system’s capacity (the maximum amount under the regulated limit imposed by the NEB). As illustrated below, these shippers represent or are affiliates of some of the largest producing companies in the WCSB and a significant majority of these committed shippers have, or are subsidiaries of a parent entity that has, an
investment grade credit rating (however such parent entity may not be a guarantor). These companies have direct access to large volumes of supply, either through their own production, or through their position in the market as a large marketer and/or refiner of crude oil.

Note:
(1) On a barrels per day basis, approximately 93% of the post-expansion shippers have, or have a parent entity with, an investment grade credit rating (although such parent may not be a guarantor). Credit rating information sourced from Bloomberg.
Where a particular shipper is not investment grade or no support provider is available, Trans Mountain may obtain, in respect of such shipper, letters of credit from acceptable banks for an amount having the same value as up to 12 months of the shipper’s contract exposure, or such other amount as may be determined reasonable and appropriate.
The TMEP-related transportation service agreements provide for a sharing of risks between Trans Mountain and its shippers during the development stage, including the construction of the TMEP and the long-term operation of the pipeline system. Each shipper is entitled to a certain amount of capacity each month, and the shippers are required to pay for the fixed cost of such capacity whether they use it or not.
The transportation service agreements also provide flexibility to the shippers that are parties to them, as such agreements enable the shippers to manage their capacity entitlements and associated financial obligations. Shippers can assign their shipping rights to third parties on a short-term or long-term basis, thereby reducing risk and ensuring that the firm capacity is fully utilized. There are also make-up provisions in the event that shippers cannot use their full capacity entitlements in any given month. Shippers also have the right to renew their contracts at the end of the initial term for an additional five-year period on rates to be determined at the time of renewal (if any).
The fixed toll to be paid by shippers under the TMEP-related transportation service agreements has been established according to a risk sharing formula that will be escalated during the lifetime of the contracts at a fixed rate. Under the agreements there is a variable toll component based on actual costs incurred for power, unanticipated costs related to changes in legislation or regulation and other costs as may be agreed to by Trans Mountain and shippers. As the vast majority of the toll will not be adjusted according to actual costs incurred, as would normally occur under a cost-of-service approach, this arrangement will provide greater toll certainty to shippers and reduce the risk of unanticipated increases in transportation costs over time.
Approximately 20% of the expanded TMPL system’s nominal capacity (182,500 barrels per day), will be reserved for spot month-to-month shipments. The toll for spot shipments will be tied to the toll for long-term service and, as such, spot shippers will benefit from all of the contractual provisions that protect long-term shippers from cost escalation.
Competition
Trans Mountain is subject to competition resulting from the shipment of oil from the WCSB to markets other than the Canadian and U.S. West Coast, including shipments to refineries in Ontario, the U.S. Midwest and the U.S. Gulf Coast. In addition, refineries in Washington State and California, which comprise an important point of sale on the U.S. West Coast, have, in the past, been supplied primarily by crude oil from the Alaska North Slope. As such, there has historically been some competitive pressure on supply originating from the WCSB for sale in the Washington State and California refinery markets. A further source of competition exists from the transportation of oil to the Canadian West Coast by rail. We expect that such supply and demand conditions in the oil markets served from the west coast of British Columbia will continue to impact the long-term value and economics of the TMPL system.
Despite this potential competitive pressure, we believe that the TMPL system, both pre- and post-expansion, will maintain its strong competitive position as a result of a number of factors. For example, contracted tariff rates on Trans Mountain after the expansion will range from approximately $5.00 per barrel to approximately $7.00 per barrel from Edmonton to Burnaby area. Uncontracted spot tariff rates will be 10% higher than the equivalent contracted tariff rates. Converted to U.S. dollars, these tariff rates would range from approximately U.S.$4.00 per barrel to approximately U.S.$6.00 per barrel. Environment and Climate Change Canada has estimated comparable rail transportation costs to California and the U.S. Gulf Coast to be approximately U.S.$16.00 per barrel and approximately U.S.$18.00 per barrel, respectively. Keystone posted tariff rates for U.S. Gulf Coast delivery are approximately U.S.$7.80 per barrel to U.S.$12.60 per barrel for heavy oil. The Government of Alberta, as of January 2017, reported the differential between WTI (light oil at Cushing Oklahoma) and WCS (heavy crude at Hardisty, Alberta) was approximately U.S.$15.00 per barrel.
In addition, the TMPL offers significant optionality and flexibility to its customers. Its tolling methodology and transportation contracts have been designed to promote high operating standards while remaining cost-competitive for the foreseeable future. Trans Mountain remains the only pipeline that transports oil and other liquid petroleum products from the WCSB to the West Coast of Canada and the United States and this important outlet provides producers in the WCSB with improved market access and market diversification. Further, due to recent changes in U.S. legislation, oil from the Alaska North Slope may now be sold to markets outside of the United States. To the extent this additional access to alternative markets for Alaskan producers increases overall demand from Washington State and California refineries, the TMPL system, including through its Puget Sound pipeline connection to four refineries in Washington State, will be in a position to facilitate supply to such markets for WCSB producers. As evidence of these competitive advantages, capacity on the TMPL has been over-subscribed since 2010 and approximately 80% of the capacity of the TMPL upon completion of the TMEP is subject to long-term firm commitments. Similarly, throughput on the Puget Sound pipeline system has remained strong in recent years, with 2015 and 2016 experiencing increases from previous years of over 15% and 30%, respectively, though throughput in the first half of 2017 returned to a similar level seen in the first half of 2015. In 2016, the Puget Sound pipeline transported average volumes of approximately 191,000 barrels per day, comprising approximately one-third of the collective capacity of all refineries in the Anacortes and Ferndale area.
Historically, the Jet Fuel pipeline has transported a significant proportion of the jet fuel used at the Vancouver International Airport. However, the airport also receives jet fuel through other means including trucks and, recently, an affiliate of each of the airlines using the airport received approval to construct a jet fuel barge-receiving terminal near the airport. In 2016, the entity owning the Burnaby refinery supplying products to Jet Fuel for shipment announced its intention to sell the refinery and in April 2017 announced that it had reached an agreement with a third party for such sale. As a result of this pending sale, we are unable to predict whether, and to what extent, that refinery will continue to supply jet fuel to the Jet Fuel pipeline. These developments have made it unclear how much jet fuel will continue to be available for shipment to the Vancouver International Airport by way of the Jet Fuel pipeline in the future. To the extent it becomes uneconomic to continue shipping jet fuel to the Vancouver International Airport, we estimate that the decommissioning and abandonment costs of the Jet Fuel pipeline would be in the range of $2.0 million to $3.0 million, subject to regulatory approval of the BCUC and the BC OGC. We continue to assess our options relating to the Jet Fuel assets.
Potential Growth Opportunities
While we do not presently have any plans to expand the TMPL system outside of the current scope of the TMEP, the combined capacity of the expanded pipeline could potentially be further increased by over 300,000 barrels per day to approximately 1.2 million barrels per day, with additional power and further capital enhancements.
The Puget Sound pipeline is capable of being expanded to increase its capacity to approximately 500,000 barrels per day from its current capacity of 240,000 barrels per day. See “Item 1. Business—Our Business Segments.”
We will continue to monitor market and industry developments to determine which, if any, further expansion projects on the TMPL system may be appropriate.
See “Item 1A. Risk Factors—Risks Relating to Our Business—Major projects, including the TMEP, may be inhibited, delayed or stopped.”
Overview
The Cochin pipeline system consists of a 12 inch (305 mm) diameter pipeline which spans from Kankakee County, Illinois to Fort Saskatchewan, Alberta, totaling approximately 2,452 kilometers. The Cochin pipeline system, which transports light hydrocarbon liquids (primarily to be used as diluent to facilitate bitumen transportation), traverses two provinces in Canada and four states in the United States. The Canadian Cochin pipeline system is comprised of approximately 1000 kilometers of pipeline and includes 38 block valves and ten pump stations. While we do not own or operate the U.S. portion of Cochin, the U.S. portion of Cochin and the Canadian Cochin pipeline system are interdependent (including with respect to volumes shipped and financial and contractual obligations) and, as the bulk of the tariffs on the Cochin pipeline system are governed by a joint international tariff, revenue is shared between the U.S. portion of Cochin and the Canadian Cochin pipeline system.

In 2014, Kinder Morgan reversed the western leg of the Cochin pipeline system (which was previously used primarily to ship propane into the United States) to begin moving light condensate westbound from the Kinder Morgan Cochin terminal in Kankakee County, Illinois, to terminal facilities near Fort Saskatchewan, Alberta (the “Cochin Reversal Project”). The Cochin pipeline system is currently capable of transporting approximately 95,000 barrels per day of light condensate (constrained by the U.S. portion of the Cochin pipeline). If additional receipt points in Canada are established, and future demand supports it, throughput on the Canadian Cochin pipeline system has the potential to reach approximately 110,000 barrels per day. This additional volume would most likely come from the Bakken oil play in North Dakota.
KMCU is the operator of the Canadian Cochin pipeline system, which is operated and maintained by Canadian staff located at the KMCU regional and local offices in Wainwright, Alberta and Regina, Saskatchewan. KMCU is also the holder of the NEB certificates for the Canadian Cochin pipeline system.
Customers and Contractual Relationships
The Cochin pipeline system has three primary customers who, among them, have total contractual take-or-pay commitments of 85,000 barrels per day. These customers have investment grade credit ratings and financial capacity that support their long-term contractual commitments, which expire in 2024. The take-or-pay commitments obligate the committed shippers to make payments based on their contractual volume commitments, regardless of actual throughput. The joint international tariff rate is adjusted annually in accordance with the standard FERC methodology for escalating indexed rates for petroleum products pipelines. The Cochin pipeline also offers transportation under: (i) a volumes incentive rate (available to certain committed shippers who ship above their contractual commitments in a calendar year), (ii) an uncommitted joint rate, as well as (iii) local uncommitted U.S. and Canadian rates.
Competition
Diluent used in Canada is primarily supplied by local production in Canada (both conventional and unconventional condensates, as well as refinery light naphtha) and imports from the United States. Historically, as production of bitumen in Canada increased, local Canadian diluent sources were insufficient to meet demand. First imports to Canada were by rail; however, rail transport of diluent has a higher cost basis than transport via pipeline and is thus limited to areas that do not have access to pipeline transportation. In 2014, the Cochin Reversal Project came online, bringing in an additional 95,000 barrels per day of pipeline import capacity and offering a low all-in cost for transportation of diluent to the Ft. Saskatchewan, Alberta region. While Cochin is exposed to competition from other pipeline systems that are capable of transporting significant volumes of diluent, Cochin’s delivery point in Fort Saskatchewan has a low gravity diluent pool and a high level of connectivity, thereby making Cochin an attractive mode of shipping diluent. As evidence of this, through July of 2017, Cochin has had an approximate 92% utilization rate.
Potential Growth Opportunities
With the projected continuing growth of Canadian bitumen production, U.S. diluent imports are expected to remain an integral part of bringing Canadian bitumen to market (Source: CAPP 2017 Crude Oil Forecast, Markets and Transportation 2017-0009). The Cochin pipeline system has an additional 15,000 barrels per day of capacity on the Canadian section of the pipeline due to a higher pressure rating in Canada. While Cochin would need to loop its line to be in position to expand its capacity to greater than 110,000 barrels per day, we are currently evaluating a number of other opportunities to utilize the existing 15,000 barrel per day capacity through the addition of new connections to Cochin. In 2017, Cochin completed a new delivery point to the Plains Midstream Canada storage facility in Fort Saskatchewan, Alberta, as well as a new receipt point near Kankakee County, Illinois from Marathon Pipe Line LLC’s Wabash pipeline. Kinder Morgan is also currently constructing a new truck facility in Maxbass, ND to allow for delivery of additional volumes onto the Cochin pipeline from the Bakken region. Future projects that we may undertake, should conditions warrant, include, among others, the addition of a new delivery point to the Pembina Condensate Diluent Hub facility, as well as a connection to the Conway NGL market via Oneok’s North system. Other than as disclosed in this document, no definitive decisions have been made with respect to any material growth projects within the Pipelines segment. See “Item 1A. Risk Factors—Risks Relating to Our Business—Major projects, including the TMEP, may be inhibited, delayed or stopped.”
In addition to our pipeline assets, we are supported by a network of strategically located terminal facilities in Western Canada, including the largest merchant terminal position in the Edmonton, Alberta market. This merchant terminal position is underpinned predominantly by fee-based services without direct commodity price exposure, and is secured by superior market positions and contracts. See “—Customers and Contractual Relationships” and “—Competition” below.
Edmonton Area Terminals
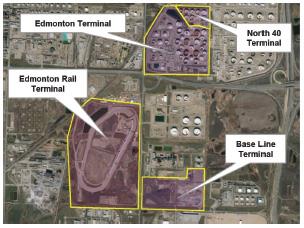
Vancouver Wharves Terminal
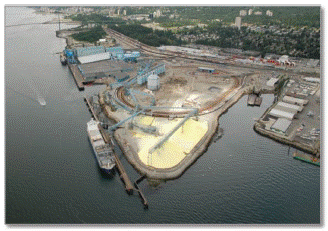
Edmonton Rail Terminal

Vancouver Wharves Terminal
Located in North Vancouver, British Columbia, the Vancouver Wharves Terminal is a 125-acre bulk marine terminal facility that annually transfers over 4.0 million tons of bulk cargo and 1.5 million barrels of liquids predominantly to offshore export markets. The Vancouver Wharves Terminal, which has been in operation since 1959, was acquired by Kinder Morgan in 2007. This acquisition included securing a 40-year operating lease and asset ownership agreement with the British Columbia Railway Company for the terminal uplands. Vancouver Wharves also holds a corresponding water lot lease agreement with Port Metro Vancouver to support the terminal vessel loading and unloading operations with the same 40–year term.
Since the acquisition of Vancouver Wharves, Kinder Morgan has undertaken a number of projects designed to improve and expand the terminal: in June 2013, it sanctioned the construction of a zinc concentrate truck load out facility; in April 2014, approval was received to expand the terminal’s lead concentrate interior shed walls; in March 2015, upgrading work commenced on the sulphur load out facility; and in June 2015, project approval was received to upgrade the terminal’s grain handling facility. The Vancouver Wharves Terminal currently has 1.0 million tons of bulk storage capacity, 250,000 barrels of petroleum storage and facilities that can house up to 325 rail cars. The terminal assets include four berths capable of handling Panamax-size vessels. The main export products at Vancouver Wharves are sulphur, copper concentrates, diesel, jet fuel, bio-diesel, wheat and canola seed, while the most significant import products at Vancouver Wharves are zinc and lead concentrate. With good connectivity through the recently expanded Vancouver North Shore rail gateway corridor and connections with three Class 1 rail companies serving the area (the Canadian National Railway (“CN”), the Canadian Pacific Railway (“CP”) and the BNSF Railway) as well as all major highway routes in western Canada, Vancouver Wharves continues to provide a safe and efficient link for customers’ supply chain connectivity for water borne trade to global markets.
Edmonton South Terminal
The Edmonton South Terminal is a merchant tank terminal located in Sherwood Park, Alberta. As noted above, the assets currently making up the Edmonton South Terminal are embedded within the Edmonton Terminal, are owned by Trans Mountain and are operated by KMCI, for and on behalf of KM Canada North 40. A long-term leasing arrangement with Trans Mountain governs the merchant use of the tanks by KM Canada North 40. The first phase of the Edmonton South Terminal, comprised of nine merchant tanks, was put into service throughout 2013 and 2014. As part of a phase two expansion, an additional four tanks and associated infrastructure were constructed and placed in service in 2014. In connection with the Edmonton Rail Terminal project, a final two tanks were brought into service at the Edmonton South Terminal at the end of 2014. In total, the assets comprising this facility consist of 15 tanks with a total storage capacity of approximately 5.1 million barrels along with associated outbound pumps, meters and pipe connections to other facilities. As a result of the completion of the TMPL expansion, Trans Mountain currently expects to recall two of the tanks in merchant service at the Edmonton South Terminal upon the completion of the TMEP for use in TMPL regulated service, comprising between approximately 700,000 and 800,000 barrels of total storage capacity. The NEB approved agreement specifies that if additional tanks are identified as needed for TMPL for regulated purposes, more tanks can be recalled upon 24-months’ notice. As the use of the recalled tanks will be included in the overall tolls charged on the expanded TMPL, such tanks will no longer generate the incremental revenue realized through leases to external customers. As such, the recall is expected to result in a decrease in the net cash earnings attributable to the Edmonton South Terminal. See “—Pipeline Segment—Trans Mountain Terminals —Edmonton Terminal” above.
The Edmonton South Terminal provides significant optionality for customers through its diverse suite of inbound and outbound pipeline connections, including access to the vast majority of crude types in Alberta. All tanks at the terminal are in crude oil service and each tank has the flexibility to handle all products that are connected to the terminal, including in-tank mixing and outbound blending of multiple products. In addition to its connection to the Edmonton Rail Terminal and the North 40 Terminal, the Edmonton South Terminal has significant pipeline connectivity. The Edmonton South Terminal has 14 major inbound pipeline connections from throughout Alberta and two major outbound pipeline connections, which allow customers to ship their products west, east or south. In addition to its position within the larger Trans Mountain Edmonton Terminal, the Edmonton South Terminal is, similarly, adjacent, or in close proximity, to the starting point of the Enbridge Inc. cross-continent crude oil pipeline system, the North 40 Terminal, the Suncor Energy Inc. Edmonton refinery, the Keyera Edmonton terminal, the Keyera Alberta Envirofuels plant, the Gibson Energy Inc. Edmonton terminal, the Plains Midstream Canada Edmonton Strathcona terminal and the Imperial Oil Strathcona refinery. Customers utilizing the Edmonton South Terminal tanks have the option of direct injection into the TMPL mainline or utilizing any of the other outbound connections available at the terminal.
North 40 Terminal
Located in Sherwood Park, Alberta, immediately adjacent to the Edmonton South Terminal, the nine tank North 40 Terminal facility, in service since March 2008, provides merchant storage for crude oil products. This approximately 2.15 million barrel facility is comprised of eight 250,000 barrel tanks and one 150,000 barrel tank. The North 40 Terminal has a highly diverse suite of eight inbound pipeline connections (which is anticipated to increase to ten inbound pipeline connections by 2018), including access to the vast majority of crude types in Alberta, and five outbound connections. In addition to its pipeline connections which allow customers to ship their products west, east or south, the North 40 Terminal is connected to the Alberta Crude Terminal (as described below), the Base Line Terminal (as described below), the TMPL system, a local refinery and a third-party midstream facility. All tanks at the terminal are in crude oil service and have the flexibility to handle all products that are connected to the terminal, including in-tank mixing of multiple products. The North 40 Terminal is operated by KMCI, for and on behalf of KM Canada North 40.
Edmonton Rail Terminal
In December 2013, Kinder Morgan and Imperial Oil announced the formation of a 50-50 unincorporated joint venture to build the Edmonton Rail Terminal with an initial capacity of 100,000 barrels per day. By August 2014, the joint venture had entered into firm, take-or-pay agreements with strong, creditworthy major oil companies. These contracted commitments allowed for an expansion of the Edmonton Rail Terminal to add incremental capacity of 110,000 barrels per day, for a total of 210,000 barrels per day. The terminal was constructed by Kinder Morgan, placed in service in April 2015 and is currently operated by an affiliate of KM Canada North 40.
The Edmonton Rail Terminal capacity at start-up in 2015 was approximately 210,000 barrels per day, making the terminal the largest origination crude by rail loading facility in North America. The terminal is connected via pipeline to the Edmonton South Terminal and is capable of sourcing all crude streams that are handled there for delivery by rail to North American markets and refineries. The terminal connects to both the CN and CP railway networks and can hold up to four unit trains on-site (two loading and two staged), load unit trains of up to 150 rail cars per train and load two trains with the same or differing products simultaneously. Trains are loaded at the Edmonton Rail Terminal through a 38 spot dual sided rack (76 loading spots in total). Upon the completion of the construction of the Base Line Terminal, the Edmonton Rail Terminal, through its connections with the Edmonton South Terminal and the Base Line Terminal, will have access to the approximately 9.9 million barrels of crude oil capable of being stored at such terminals.
Alberta Crude Terminal
An unincorporated joint venture between an affiliate of KM Canada North 40 and Keyera, the Alberta Crude Terminal is a crude oil rail loading facility located in Sherwood Park, Alberta and operated by Keyera Corp. The Alberta Crude Terminal construction project was sanctioned in July 2013 and placed in service in November 2014. The terminal is fully contracted and is served by the CN and CP railway networks. This terminal has approximately 40,000 barrels per day of manifest crude oil rail loading capacity as well as capacity for 250 rail car storage spots, which assist in the efficient manifest movement of the railcars loaded at the facility. Upon the completion of the construction of the Base Line Terminal, the Alberta Crude Terminal, through its connections with the North 40 Terminal and the Base Line Terminal, will have access to the approximately 7.0 million barrels of crude oil capable of being stored at such terminals.
Base Line Terminal
Announced in March 2015, the Base Line Terminal is a second 50-50 unincorporated joint venture between an affiliate of KM Canada North 40 and Keyera. The Base Line Terminal will be a merchant crude oil storage terminal located on land at Keyera’s Alberta Enviro Fuels facility in Sherwood Park, Alberta. Construction commenced on this project in the second half of 2015. The initial build is expected to have 12 tanks with a total capacity of 4.8 million barrels. As of December 30, 2017, construction of all major facilities is materially complete, including off-site pipe rack and bridges required to connect the terminal with the North 40 Terminal, Edmonton South Terminal, and Edmonton Rail Terminal. Commissioning of the facility is underway, and the first four tanks are expected to be placed into service in January, 2018 with the balance phased into service throughout that year. Our total investment for the Base Line Terminal project is expected to be approximately $398 million, including costs associated with the construction of a new pipeline segment that will be funded solely by us. The project is forecast to be on schedule and on budget. This project is supported by multiple long-term customer contracts that will draw revenue streams and associated risks that are similar in nature to those for the existing terminals near Edmonton. See “—Customers and Contractual Relationships” and “—Competition” below. The project is forecast to be on schedule and on budget.
Upon completion, the Base Line Terminal is expected to have some of the best tank terminal connectivity in Canada, with a diverse suite of ten inbound pipeline connections, including access to the vast majority of crude types in Alberta and six outbound connections, including both pipeline and rail. This terminal will leverage off of the existing North 40 Terminal by using transfer lines to facilitate product transfer between terminals via a pipeline bridge over a highway in Strathcona County. In addition to its pipeline access, the Base Line Terminal will also be connected to the Alberta Crude and Edmonton Rail Terminals. All tanks at the terminal will be in crude oil service and have the flexibility to handle all products that are connected to the terminal, including in-tank mixing and outbound blending of multiple products. We expect to have more than 14.9 million barrels of total storage (including regulated tankage) capacity in the Edmonton area upon completion of the Base Line Terminal.
The Base Line Terminal is expected to increase our annual Adjusted EBITDA by approximately $22 million during 2018 and approximately $44 million on an annualized basis thereafter based on contracted volumes, rates and expected operating costs. Projected Adjusted EBITDA contribution from the Base Line Terminal includes firm, take-or-pay revenue plus a relatively small amount of variable, volume-sensitive revenue less operating expenses. The forecasted annual take-or-pay revenue is equal to contracted storage capacity on an annual basis multiplied by the corresponding contracted tariff rates. The forecasted annual variable revenue is based on forecasted utilization of the terminal after it is placed in service. If these uncontracted revenues were higher than forecasted by 10%, the resulting impact on Adjusted EBITDA from the Base Line Terminal would be an increase of less than 1% on a full year basis. The estimates of operating expenses are based on our historical experience with other operating assets. The forecasted operating costs are comprised of labor, power, property taxes and other operating costs. The forecast for operating costs is based on our relevant experience operating similar assets, and if these operating costs were to increase or decrease by 10%, the resulting impact on Adjusted EBITDA from the Base Line Terminal would be an increase or decrease of less than 1.5% on a full year basis. See “— Pipeline Segment—Financial Highlights and Growth Estimates” above. See also “Item 1A. Risk Factors—Risks Relating to Our Business—Major projects, including the TMEP, may be inhibited, delayed or stopped” and “Item 2. Financial Information—Management’s Discussion and Analysis—Results of Operations—Non-GAAP Financial Measures.”
Customers and Contractual Relationships
The Terminals business services over 20 liquids customers, made up of a diverse mix of production, refining, marketing and integrated companies, and over 12 bulk customers at any given point in time. Approximately 75% (by revenue dollar amount) of these customers have, or their parent entity has, an investment grade credit rating (however parent entities may not be guarantors). Our top three Terminals customers account for approximately 45% of total Terminals revenue and the top ten Terminals customers account for approximately 75% of total Terminals revenue.
The majority of the Vancouver Wharves Terminal capacity is contracted under long-term, take-or-pay terminal service agreements. For the most part, the terminal service agreements contain annual minimum volume guarantees and/or service exclusivity arrangements under which customers are required to utilize the terminal for all or a specified percentage of their production for exports. While our contractual arrangements at Vancouver Wharves are typically shorter in duration than those for our Alberta Terminals assets (with Vancouver Wharves’ average term being approximately four years), customers have, historically, opted to renew their contractual arrangements with Vancouver Wharves. The majority of the Vancouver Wharves revenue originates from customers that have been using our terminal services for over five years, and including term extension options, a number of major long-term contracts at the Vancouver Wharves Terminal could be extended out through 2039 and 2045.
Each of the Edmonton South, North 40, Edmonton Rail, Alberta Crude and Base Line Terminals are contracted under long-term, take-or-pay agreements with terms between two and 20 years and an average term of ten years. As at December 31, 2016, the remaining life of the contracts at our terminals in Edmonton, Alberta ranged between approximately one and 18 years, with an average contract life of six years. The rates charged for the Terminals segment terminals’ services are market-based and the majority of the fees charged at the Alberta-based terminals are fixed, regardless of the volumes actually handled. Over 90% of the total revenue of the Edmonton South, North 40, Edmonton Rail, Alberta Crude and Base Line Terminals is, or will be, derived from guaranteed take-or-pay contracts while the remaining is, or will be, derived from throughput in excess of contracted minimums as well as ancillary terminaling and connection services delivered, which are driven by the demand for the crude oil that is being handled and stored. One of the current contractual arrangements, which accounts for a significant source of revenue at the Edmonton Rail Terminal, will expire in 2020. This contract is subject to a right of renewal on very favorable terms for the customer and, as a result, revenue from the Edmonton Rail Terminal is expected to decline following such renewal.
Competition
Vancouver Wharves is currently the largest mineral concentrate export and import facility on the west coast of North America. With respect to its liquids operations, Vancouver Wharves is the only merchant terminal for import and export distillates in Port Metro Vancouver. Competing liquids facilities are significantly smaller than Vancouver Wharves and Vancouver Wharves enjoys a superior and highly flexible dock, better storage, berth depth and ship loading capacity and unsurpassed rail access, when compared to the assets of the liquids terminal competitors. In terms of bulk products handling competition, significant capital investment and regulatory approval requirements are barriers to entry for new bulk or liquid handling terminals on the West Coast. While there are currently a number of potential competitive grain terminal projects contemplated or underway which may increase the competitive pressures on the Vancouver Wharves grain business, as a result of the Vancouver Wharves berth depth, rail access and location, we believe that the grain business will be able to maintain its strong competitive position. In addition, Vancouver Wharves enjoys a distinct advantage in the mineral concentrates business as it is one of only three facilities on the west coast of North America that is currently permitted to handle these commodities. Given this fact, along with its strategic location, Vancouver Wharves is well positioned to retain its current business and attract new concentrate business dependent on mine location. Sulphur competition is limited as Vancouver Wharves currently contracts with the owner of the only other sulphur terminal in Port Metro Vancouver.
Edmonton and Hardisty, Alberta are the two primary crude oil hubs in Canada, with a majority of crude gathering pipelines feeding into the Edmonton area. The TMPL system and the Enbridge Mainline System also originate in the Edmonton Area from Sherwood Park. While limited land availability and the significant capital investment required to enter this business are significant barriers to entry, the Alberta-based Terminals are subject to competition from other truck and rail terminals and storage facilities which are either in the general vicinity of the facilities or have gathering systems that are, or could potentially extend into, areas served by the Alberta-based terminals. The Alberta-based Terminals currently enjoy a leading market position in the Edmonton hydrocarbon storage and rail transporting business. The Terminals’ assets located in Alberta have excellent inbound and outbound connectivity, both in terms of the facilities to which these terminals are connected and the diversity of product that may be stored and transported by them. In addition to the considerable market access offered to customers via pipeline, through its Alberta Crude Terminal and Edmonton Rail Terminal origination crude-by-rail loading facilities, the Alberta-based Terminals are able to offer customers the flexibility to move crude oil to markets without pipeline access, supplement deliveries to markets with constrained pipeline capacity and supply different or unique crude types to refineries looking to maintain quality. In addition, revenues from the Terminals business are largely fixed and generally not subject to short term fluctuations in oil and gas market prices; however, as with the rest of our business, as the long-term terminals contracts expire, while fees for tankage are generally expected to increase on
renewal, the storage and handling services of the Terminals segment’s terminals will have additional exposure to the longer-term trends in supply and demand for oil and gas products.
Potential Growth Opportunities
The Terminals segment routinely explores opportunities for growth in its Terminals business. In addition to its growth projects currently underway, there is potential for the Base Line Terminal to expand its operations in the future to include up to six additional tanks and add additional inbound and outbound connections. Vancouver Wharves has one of the last remaining parcels of land available for development in Port Metro Vancouver and the Terminals segment is currently exploring potential opportunities for this available land. To date, we have identified approximately $250 million worth of potential capital projects (excluding projects that have been discussed elsewhere in this document), and those projects are in various stages of evaluation and/or development. Other than as disclosed in this document, no definitive decisions have been made with respect to any material growth projects within the Terminals segment. See “Item 1A. Risk Factors—Risks Relating to Our Business—Major projects, including the TMEP, may be inhibited, delayed or stopped.”
Safety, compliance and protection are the key components of our Operations Management System (“OMS”), a management system capturing important operational expectations in areas such as physical operations, engineering, environmental compliance, asset integrity, efficiency, quality, and project management.
Across our operations, we strive to provide for the safety of the public, our employees and contractors; protect the environment; comply with applicable laws, rules, regulations, and permit requirements; and operate and expand efficiently and effectively to serve our stakeholders and customers. The OMS plays a critical role in setting the objectives and expectations for all these activities and individual business unit operations, maintenance procedures, and site-specific procedures are designed to meet these objectives and expectations.
We are committed to our operational goals, which include risk reduction, efficiency and productivity, effective expansion and integration, quality assurance, and a culture of excellence. These goals are embedded into our operations. The operations of each business unit are as unique as the regulatory and commercial environments in which they operate.
As federally regulated businesses, the Canadian Cochin pipeline system, the TMPL system and the Edmonton South Terminal are regularly audited by the NEB. Concerns identified in NEB audits are addressed through a comprehensive Corrective Action Plan approved by the NEB that remains in place until all items are completed. We are committed to continually improving pipeline and facility integrity to protect the safety of the public, the environment, and company employees. We are dedicated to being a good corporate citizen by incorporating responsible business practices and conducting our business in an ethical manner.
Additionally, we have implemented an Integrated Safety and Loss Management System (“ISLMS”) which is designed for establishing, implementing and continually improving our processes and controls to conduct business in a safe, secure, environmentally responsible and sustainable manner. The ISLMS applies to activities involving the design, construction, operations and abandonment of certain pipelines and terminals systems, including the Trans Mountain, Jet Fuel, and Puget Sound pipeline systems and certain Terminals assets in Alberta. Through our procedures, this system helps provide for appropriate satisfaction of NEB regulations and efficient, safe operations in an integrated, systematic and comprehensive manner.
Employees
At the head office located in Calgary, Alberta, a total of 168 staff service our business. Non-union Canadian employees are employed by KMCI and provide services to each of the Canadian operating assets. On the current TMPL system, 100 staff are employed in Alberta in Edmonton, Stony Plain, Edson, and Jasper. Through central British Columbia in the towns of Blue River, Clearwater, and Kamloops, an additional 33 operations personnel maintain the pipeline, while in southern British Columbia, 60 staff are located in Hope, Sumas and Burnaby. Seventeen staff are dedicated exclusively to work on the Canadian Cochin pipeline system and are primarily located in the two most critical strategic locations along the pipeline. With respect to the Terminals business, we currently employ 21 staff at the Edmonton Rail Terminal, 11 staff at the Base Line Terminal and 62 staff at Vancouver Wharves.
With respect to the operation of Vancouver Wharves, KM Canada Marine Terminals is a member of the British Columbia Maritime Employers Association which is party to collective agreements with the International Longshore and Warehouse Union — Canada (the “Longshore CBA”) and the International Longshore and Warehouse Union Ship and Dock Foreman Local 514 (the “Foremen CBA”). Each of these collective bargaining agreements expire in March 2018. Under the Longshore CBA, up to 250 longshoremen supplement the non-unionized workforce employed by KMCI at the Vancouver Wharves Terminal. Under the Foremen CBA, up to 30 foremen are similarly provided at that location.
In addition to its permanent staff, KMCI is party to a general service contract with Roevin Technical People, a division of Adecco Employment Services Limited (“Roevin”), whereby Roevin provides services relating to the administration of term employees and independent contractors for KMCI. Currently, Roevin manages 304 personnel for KMCI, 102 of which are temporary employees. These contracted employees augment the KMCI workforce and are utilized throughout our business, but they are primarily utilized on the TMEP.
Safety and Emergency Management
Our operators maintain programs designed to safeguard the health and safety of employees, contractors and the general public, including through comprehensive health and safety programs that address risk assessment and monitoring, capability, development, emergency response plans, systems for incident investigation and tracking, and employee evaluation. We believe these safety programs meet or exceed the standards set by the Canadian energy infrastructure industry and applicable government regulations. We have a strong operating and safety track record, with no reportable right of way releases since 2013. See “—Our Business Segments” above.
The integrity of each of the TMPL system and the Canadian Cochin pipeline system are regularly monitored using in-line inspection tools. These devices inspect the pipeline from the inside and can identify potential anomalies or changes to the condition of the pipe. The collected data is analyzed to find locations where further investigation is required. If necessary, a section of the pipe is exposed and assessed by qualified technicians so that it can be repaired or replaced.
Each of the TMPL system (including the Puget Sound and Jet Fuel pipeline systems) and the Cochin pipeline system has its own control center wherein CCOs monitor pipeline operations and operating conditions 24 hours a day, seven days a week using the sophisticated SCADA computer system. This electronic surveillance system gathers and displays such data as pipeline pressures, volume and flow rates and the status of pumping equipment and valves. Alarms notify CCOs if parameters deviate from prescribed operating limits. Both automated and manual valves are strategically located along the pipeline system to enable the pipeline to be shut down immediately and sections to be isolated quickly, if necessary. In the event of a precautionary shutdown of the pipeline there is a formal protocol related to restarting the pipeline. This protocol includes analysis of SCADA and leak detection system data, aerial or foot patrols of the pipeline as appropriate, completion of any inspections or repairs, notifications to regulators, and development of a restart plan.
Similarly, our terminals have been built with sophisticated technology and incorporate safety and environmental protection features. In Alberta, the Strathcona District Mutual Assistance Program, assists with emergency planning and tests of the emergency preparedness of our terminals in the Edmonton area. Each of the terminals facilities, as described under “—Terminals Segment” above, are staffed with trained personnel 24 hours a day, seven days a week.
Pipeline rights-of-way are regularly patrolled by both land and air. Any observed unauthorized activity or encroachment is reported and investigated. We have a public awareness program for each of our pipelines that is designed to create awareness about pipelines, provide important safety information, increase knowledge of the regulations for working around pipelines, and educate first responders and the public on emergency preparedness response activities.
Operations staff are trained to maintain our pipelines and to respond in the event of a spill or other safety related incident along each pipeline route.
We maintain comprehensive emergency management plans and actively maintain emergency response capabilities across our operations. We take an all-hazards approach to preparedness and use the Incident Command System (“ICS”) to manage incident response. ICS is widely used by the public safety agencies with whom we may need to coordinate a response. It provides a standardized management structure that allows ready integration of public safety agencies and regulators into a unified response organization.
As part of its integrated safety and loss management program, Trans Mountain maintains an emergency management program (“EMP”). The EMP is a comprehensive set of policies, procedures and processes designed to support its commitment to the safety and security of the public, employees, workers, company property and the environment. The EMP is an all-hazards emergency management program of mitigation, preparedness and response designed to provide a continuous cycle of improvement as mandated by the NEB Onshore Pipeline Regulations. Emergency response plans are constantly being updated to keep them current. The plans are location specific, identify locations of emergency response materials and equipment and are regularly practiced through field deployment exercises.
Caches of mobile equipment are located along the Trans Mountain pipeline system to minimize response time. These caches typically include river boats and response trailers equipped with booms, pumps and liquid storage. Trans Mountain also provides
training sessions to first responders along the TMPL system. These sessions, along with regular exercises, provide Trans Mountain with the opportunity to maintain working relationships with first responders and to facilitate mutual awareness of response programs.
Trans Mountain is a member and shareholder of both Western Canadian Spill Services (“WCSS”) and the Western Canada Marine Response Corporation (“WCMRC”). WCSS maintains caches of oil spill response equipment in western Canada to augment the resources of member companies. WCMRC is the Transport Canada-certified spill response organization for the West Coast of Canada. Vancouver Wharves, KM Canada Marine Terminal is also a member of WCMRC for the liquid bulk distillates exports and imports. While WCMRC’s primary role is to respond to ship and terminal based oil spills, Trans Mountain maintains its position as a shareholder with respect to both the Westridge Marine Terminal and the pipeline. Trans Mountain also participates in mutual assistance agreements with Canadian Energy Pipeline Association member companies, the Strathcona District Mutual Assistance Program, the Kamloops Fire Department and the Burnaby Industrial Mutual Aid Group, which consists of the petroleum terminals operating in Burnaby, British Columbia.
While we do not own, operate or control the vessels that call at the Vancouver Wharves Terminal or the Westridge Marine Terminal, we are an active member of the maritime community and work with maritime agencies to promote business practices and facilitate improvements to provide for the safety and efficiency of tanker traffic in the Salish Sea.
In addition to our own rigorous screening process and terminal procedures, vessels calling at Westridge and Vancouver Wharves must operate according to rules established by the International Maritime Organization, the Government of Canada through Transport Canada, the Pacific Pilotage Authority, and Port Metro Vancouver. Under this regime there is a well-established system to provide for maritime safety in the Salish Sea, including established shipping lanes and aids to navigation, various inspection methodologies, coordinated vessel traffic monitoring, mandatory tug escort for laden tankers and mandatory pilotage with two pilots on the bridge of laden tankers. In addition, such vessels must maintain their membership in a mandatory spill response regime.
Trans Mountain, along with Suncor Energy Inc., Imperial Oil, Parkland Fuel Corp. and Shell Canada Products, are shareholders of the WCMRC, Canada’s West Coast-certified response organization responsible for emergency response preparedness which is on call 24 hours a day, seven days per week, to manage oil spill response on the British Columbia coast. To address changes in maritime shipping that will result from the TMEP, the WCMRC has agreed to implement an enhancement program to increase its response capacity in the Salish Sea. These enhancements, including the five new bases along the transit route illustrated below, will satisfy certain of the NEB conditions for the TMEP and double capacity and half response times relating to the existing planning standards under which the WCMRC operates. In addition, the vessel acceptance process will require tankers to engage in an extended tug escort with new larger tugs being required for the Juan de Fuca Strait. The improvements to be implemented in connection with the commitments made by Trans Mountain, including spill response capacity enhancements, are expected to build upon the existing systems to result in an overall level of marine safety that exceeds globally accepted standards. See “—Pipeline Segment—Trans Mountain Terminals—Westridge Marine Terminal” and “—Terminals Segment—Vancouver Wharves Terminal” above.

Engaging Communities
We believe that our neighbors as well as governments and Aboriginal communities play an important role in how we conduct our business and that our success depends on earning the trust, respect and cooperation of such groups.
In addition to cooperating with various government initiatives including abandonment trusts and the federal government’s $1.5 billion ocean protection plan, Trans Mountain participates in Canadian Energy Pipeline Association work groups, Integrity First
and is a party to the Canadian Energy Pipeline Association mutual aid agreement. In addition, the Pipelines segment has established relationships with landowners, neighbors, and communities along its pipeline corridors. Our pipelines cross private properties as well as public lands. Agreements are in place with landowners that have allowed us to build and operate our existing pipelines. We value our ongoing and positive relationships with landowners and neighbors in communities along pipeline routes and are committed to respectful, transparent and collaborative interactions with them to develop long-term effective relationships.
The Terminals segment has developed working relationships with key governmental authorities, regulatory bodies and local stakeholders, including the AER, Alberta Transport, Strathcona County, the City of Edmonton, the District of North Vancouver, Transport Canada, Port Metro Vancouver and the Longshore CBA. We have had the opportunity to engage with the public on new terminals and terminal expansion projects and have welcomed the opportunity to discuss our growing terminals business with the communities in which we have facilities. The Terminals segment’s open engagement with the communities in which it operates, along with its productive relationships with applicable regulators, has historically helped to facilitate receipt of the permits required to successfully grow and operate the Terminals segment, including, most recently, its successful agreement with both Alberta Transport and Strathcona County to build Strathcona County’s first highway overhead pipeline bridge.
In connection with our commitment to developing strong relationships with the communities in which we operate, we routinely host facility open houses, provide newsletters and project updates, make safety and public awareness presentations and participate in community events.
As the TMPL system operates in certain Aboriginal territories and reserve lands, we recognize and appreciate the many unique and diverse interests of Aboriginal groups. As such, we are committed to open, transparent dialogue and to creating mutually beneficial working relationships with these groups. With respect to the TMEP process, we view the Crown’s obligation for Aboriginal consultation as an opportunity to demonstrate recognition and respect for the constitutionally protected rights held by Aboriginal groups. Accordingly, numerous Aboriginal communities have entered into mutual benefit agreements agreeing to support the TMEP, and over the last five years, Trans Mountain has had more than 40,000 engagements with 133 separate Aboriginal communities with respect to the TMEP and remains committed to continuing this engagement through the entire life of the project. See “Item 1A. Risk Factors—Risks Relating to Our Business” and “Item 1A. Risk Factors—Risks Relating to Regulation.”
Environmental Stewardship
As a long-time industry and community member, we are committed to working with residents, regulatory authorities, and other stakeholders on environmental initiatives. Recent examples of our commitment to preserving and protecting the environment include Trans Mountain’s Raft River erosion protection and stabilization project; the Stoney Creek salmon habitat restoration; and a commitment by Trans Mountain to contribute to the planting of 13,000 trees for the purpose of offsetting CO2 emissions. In addition, KMCI was awarded an Emerald Award in 2010 for the excellent environmental initiatives associated with the Anchor Loop expansion project.
Canadian Regulation
National Energy Board
Both the TMPL system and the Canadian Cochin pipeline system are primarily regulated by the NEB. The NEB, pursuant to the terms of the NEB Act, regulates the tolls and tariffs governing these pipeline systems, as well as the physical construction, operation and abandonment of the associated pipelines and facilities.
Tolls are either determined on a contested application to the NEB or through a negotiated toll settlement between the operator and interested parties, which settlement must subsequently be approved by the NEB. With respect to its approvals of these tolls, the NEB generally allows companies to recover costs of transporting shipper’s products and earn a reasonable return of capital and return on equity. However, all tolls must comply with the governing regime under the NEB Act which requires that tolls: (i) be just and reasonable; (ii) always, under substantially similar circumstances and conditions with respect to all traffic of the same description carried over the same route, be charged equally to all persons at the same rate; and (iii) not result in unjust discrimination. Generally, the NEB approves each pipeline’s cost of service and tolls on a yearly basis, and will allow for the recovery or refund of the variance between actual and expected revenues and costs in future years. As described above, the TMPL system currently operates under a fixed toll arrangement for its transportation services.
In addition to rate regulation, the NEB regulates all phases of a pipeline’s operational life-cycle, from the planning and application phase of a project through to the deactivation, decommissioning or abandonment of a project. Where necessary, the NEB can issue mandatory compliance or remediation orders or use other appropriate tools to enforce its requirements, including, among other things, issuing fines and monetary penalties. The NEB is also responsible for conducting environmental assessments for certain projects that it regulates in accordance with the requirements of the Canadian Environmental Assessment Act, 2012.
In the planning and application assessment phase of a project, the NEB is responsible for assessing whether the project is in the national public interest and can be built and operated safely and in a manner that protects the public and the environment. The NEB assessment includes a review of the design, construction and proposed operations of the pipeline as well as an evaluation of the potential risks posed to people or effects on the environment by the project plans and whether these risks will be prevented, managed and mitigated through appropriate planning. Where a Certificate of Public Convenience and Necessity is required, the NEB will undertake its assessment and, if it finds that the project is in the public interest, make a recommendation to the Governor in Council that the project be approved subject to any conditions that might be appropriate to mitigate any potential project-related risks and effects. If the Governor in Council accepts the NEB’s recommendation and approves the project, the NEB is then required to issue a Certificate of Public Convenience and Necessity to authorize construction and operation. After the NEB issues its approval, it will review compliance with all conditions that must be satisfied prior to construction. In addition, for projects that require a Certificate of Public Convenience and Necessity, the NEB must review and approve the detailed route for the pipeline (called the Plan, Profile and Book of Reference). Parties affected by the detailed route are entitled to a detailed route hearing if they object to the detailed location, methods or timing of construction activities. The pipeline company may also apply to the NEB for a right-of-entry approval to acquire land rights if it is unable to acquire the rights through direct negotiation with the landowner.
During the construction phase of a project, the NEB monitors and verifies compliance with its construction-related requirements and the terms and conditions of its project approval. Once construction is completed, the pipeline company must apply for leave to open the pipeline, which the NEB must approve before the pipeline can be placed in service.
With respect to assets that are in operation, the NEB monitors and verifies compliance with its operation-related requirements. The NEB will hold compliance meetings with regulated companies, conduct audits of management and protection programs and systems, inspect facilities to assess compliance with requirements, review and approve key documents and evaluate regulated company emergency response exercises for the ability to respond to an emergency. The NEB requires pipeline companies to have integrity management programs in place to ensure the physical condition of the asset is monitored and maintained so that releases do not occur. In addition, pipeline companies must have an EMP that anticipates, prevents, manages and mitigates conditions during an emergency that could adversely affect property, the environment, or the safety of workers or the public, as well as incident first-responders. In the case of a pipeline emergency, the NEB will monitor and assess a company’s emergency response, investigate the incident, initiate enforcement actions as necessary and oversee remediation actions.
In the deactivation, decommissioning or abandonment of a project, the NEB will assess whether the applied-for plan can be conducted safely and whether risks to people or the environment can be reduced or avoided. The NEB currently requires holders of an authorization to operate a pipeline under the NEB Act to file a proposed process and mechanism to set aside funds to pay for future abandonment costs in respect of the sites in Canada used for the operation of a pipeline and associated facilities. While a pipeline company bears the ultimate responsibility for the full cost of the abandonment attributable to its assets, upon receipt of approval from the NEB, companies are able to recover certain of these abandonment costs from users of the applicable pipelines. As at the date hereof, Kinder Morgan has received approval to recover its estimated future abandonment costs from shippers on all of its NEB-regulated pipeline assets.
In June 2016, the Pipeline Safety Act, which enshrines in law the “polluter pays” principle, came into force in Canada. Under the Pipeline Safety Act, in the event that an environmental incident occurs with respect to one of our pipeline assets, we will have unlimited liability if we are determined to be at fault or negligent. Further, in the event of any environmental incident, regardless of whether there is proof of fault or negligence by us, we will be liable for up to $1 billion in costs and damages. In connection with this “absolute liability” of up to $1 billion, we are required to demonstrate that we have the financial resources to meet these responsibilities (and a portion of our resources need to be readily accessible to help ensure rapid incident response). In this respect, the NEB has determined that Trans Mountain must have $500 million of short term cash available for this purpose and the remainder may be met with insurance and/or other instruments and has indicated that they intend to require similar financial capacity for the Canadian Cochin pipeline system. Further, in connection with the Pipeline Safety Act requirements, among other things: (i) the government has the ability to pursue pipeline operators for the costs of environmental damages; (ii) the NEB is authorized to order reimbursement of costs and expenses incurred by others in taking actions related to an incident; and (iii) the NEB is permitted to take control of incident response in exceptional circumstances, if a company operating a pipeline is unwilling or unable to shoulder its responsibilities. The Pipeline Safety Act also provides that a pipeline company remains liable indefinitely for any pipelines that are abandoned in place.
British Columbia Regulations
While the NEB is the primary regulator for pipelines and associated infrastructure that are interprovincial or international, such projects are also subject to elements of provincial jurisdiction. For example, in addition to the federal legislative regime that is administered by the NEB, aspects of the TMPL system are regulated by the BC OGC, which maintains certain incremental requirements with respect to, among other things, environmental management, pipeline crossings, integrity management and damage prevention.
As the Jet Fuel pipeline is located wholly within British Columbia, its operations are regulated by the BC OGC and its tolls are regulated by the BCUC. The financial regulation of Jet Fuel pipeline tolls is undertaken by the BCUC on a complaints basis, meaning that pipeline-related matters are generally dealt with between the Jet Fuel pipeline operator and the party using its services, subject to the ability to make complaint to the BCUC where a dispute cannot be resolved. The Jet Fuel pipeline is currently being operated pursuant to a contract that has been approved by the BCUC through 2018.
Climate Change and GHG Regulations
We generate greenhouse gas (“GHG”) emissions through our operations, which GHG emissions are below regulatory reporting thresholds. These GHG emissions are subject to various climate change policies and regulations across North America.
Canada has committed to reduce its GHG emissions by 30% below 2005 levels by 2030. In December of 2015, Canada, along with 194 other countries reached an historic agreement to maintain global temperature increases to below two degrees Celsius (the “Paris Agreement”). In late 2016, Canada, along with all of its provincial and territorial governments, with the exception of Saskatchewan and Manitoba, entered into the Pan-Canadian Framework on Clean Growth and Climate Change (the “Framework”). Under the Framework, the federal government will require all provinces and territories to implement a carbon price, starting at $10 per metric ton in 2018 and rising by $10 per year to $50 per metric ton in 2022. The provinces and territories will have the flexibility to implement either price-based systems such as a carbon tax or cap-and-trade systems. Within these programs the provinces and territories will also have the discretion to manage the competitiveness of their trade-exposed industries.
In Alberta, facilities that emit less than 100,000 metric tons of CO2e per annum as well as all residents are subject to a carbon tax of $20 per metric ton of carbon used. This tax will increase to $30/metric ton on January 1, 2018. Facilities that emit greater than 100,000 metric tons of CO2e per annum are subject to the Specified Gas Emitters Regulation (the “SGER”). As of January 1, 2017, existing facilities that exceed this threshold must decrease their emissions intensity by 20% relative to their baseline emissions. If a facility is unable to decrease its emissions intensity through increases in operational efficiency, it is still able to comply with the Alberta requirements by purchasing qualifying emission offsets from other sources in Alberta or by contributing to the Climate Change and Emissions Management Fund (the “Fund”). The contribution cost to the Fund is currently $30 per metric ton of CO2e. To address the competiveness of trade-exposed sectors, the SGER will be replaced with a Carbon Competiveness Regulation in 2018.
Alberta has also enacted the Oil Sands Emissions Limit Act (the “OSEL Act”) which limits GHG emissions in the oil sands sector to a maximum of 100 metric megatons per annum. The OSEL Act includes provisions for cogeneration and new upgrading facilities allowing for continued growth and optimization while accelerating emissions reduction technology.
In British Columbia the government introduced a broad-based, revenue-neutral carbon tax in 2008 on the purchase and use of fuels. Since 2012 the carbon tax has been set at $30 per metric ton of CO2e. In 2016 it introduced the Greenhouse Gas Industrial Reporting and Control Act which creates intensity-based emissions performance standards for prescribed industrial facilities and sectors.
British Columbia recently adopted a Climate Leadership Plan, which outlines more than 20 climate change action areas that will be developed by the Province. Highlights include action items to reduce GHG emissions under the following six categories: natural gas; transportation; forestry and agriculture; industry and utilities; communities and the built environment; and the public sector. On September 11, 2017, the British Columbia government announced proposed changes to the provincial tax laws, which are still subject to the approval of the legislature, including an increase to carbon tax rates which will be increased by $5 per metric ton of CO2e annually beginning April 1, 2018 until rates are equal to $50 per metric ton of CO2e on April 1, 2021.
The imposition of carbon pricing is not expected to have a material direct effect on the TMPL system or the TMEP. Existing and pending carbon taxes were considered in Trans Mountain’s $7.4 billion cost estimate for the TMEP and future power costs and cost impacts relating to changes in legislation included as flow-through items to shippers under the existing shipper contracts for the expanded TMPL system. In addition and as noted above, Trans Mountain has take-or-pay contracts for approximately 80% of the expanded throughput following the completion of the TMEP. See “Item 1A. Risk Factors—Risks Relating to Our Business.”
United States Regulation
Puget Sound is a common carrier interstate pipeline subject to the regulatory authority of the FERC under the provisions of the ICA; it has tariffs on file at the FERC and files quarterly and annual reports at FERC, among other regulatory requirements. Transportation by Puget Sound is of petroleum that crosses the international boundary and is delivered to refineries and/or terminals near the Washington State coast — i.e., the shipments are exclusively interstate in nature. Puget Sound is also subject to pipeline safety oversight and authority of the PHMSA. Under PHMSA procedures, the Washington Utilities and Transportation Commission has been acting as an Interstate Agent in oversight of Puget Sound under PHMSA standards. In addition, because of its status as a liquids pipeline that crosses (or, perhaps, abuts and transports across) an international border, Puget Sound may be subject to the Executive Orders requiring a Presidential Permit for certain physical changes, which are issued by the U.S. Department of State. Certain changes in facilities may require submission of an application for a Presidential Permit as to the new facilities, particularly if the facilities affect the border crossing or increase capacity.
Our business, financial condition and results of operations, including our ability to pay cash dividends, are substantially dependent on our financial condition and results of operations and our successful development of the TMEP. As a result, factors or events that impact the successful operation or our business as well as the costs associated with and the time required to complete (if completed) the TMEP, are likely to have a commensurate impact on us, the market price and value of the Restricted Voting Shares and our ability to pay dividends. Similarly, given the nature of our relationship with Kinder Morgan, factors or events that impact Kinder Morgan may have consequences for us.
Risks Relating to Our Business
Major projects, including the TMEP, may be inhibited, delayed or stopped.
Our ability to commence and complete construction on the TMEP, as well as other expansion and new build projects, may be inhibited, delayed or stopped by a variety of factors (some of which may be outside of our control), including without limitation, inabilities to overcome challenges posed by or related to regulatory approvals by federal, provincial or municipal governments, difficulty in obtaining, or inability to obtain, permits (including those that are required prior to construction such as the permits required under the Species at Risk Act), Land Agreements, public opposition, blockades, legal and regulatory proceedings (including judicial reviews, injunctions, detailed route hearings and land acquisition processes), delays to ancillary projects that are required for the TMEP (including, with respect to power lines and power supply), increased costs and/or cost overruns, inclement weather or significant weather-related events (including storms and rising sea levels (potentially resulting from climate change) impacting our marine terminals) and other issues. Detailed route hearings will be required where valid route objections arise. The NEB must approve the detailed route for the TMEP before full construction can commence. Such approval will be by segment. Detailed route hearings could result in delays and increased cost to the project and could require modifications to the detailed location, construction methods and construction schedule. To the extent we are not able to acquire land rights through negotiated agreements for the sections of the TMEP that require new land rights, we will need to seek right of entry orders from the NEB, which could result in delays and increased cost to the TMEP. In addition, we have applied for certain variances to the Certificate of Public Convenience and Necessity from the NEB and may apply for additional variances in the future. These variances may require, among other things, additional consultation and further regulatory processes and approvals before construction of the affected portions of the TMEP can commence. These additional processes and approvals could result in delays, increased costs and/or cost overruns or other issues with respect to the project.
Although we have signed a number of agreements with prime construction contractors for the TMEP, we are currently in negotiations with other construction contractors to construct the various pipeline spreads on the TMEP. As some of the contractors themselves and the terms of such applicable contracts have not been finalized, there can be no assurance that the construction contracts entered into in respect of the TMEP will be finalized on terms that are advantageous to us or consistent with our cost estimates. Further, there is no guarantee that, once such contracts are entered into, such contracts will be performed in a manner satisfactory to us. In the event that we must enter into construction contracts on terms that are less favorable to us or contractual counterparties fail to perform their duties in accordance with the terms of the applicable contract, the TMEP may be delayed or we may incur significant additional costs.
In addition to the TMEP, we are currently undertaking certain other growth projects and may, in the future, further expand existing assets and construct new assets. Such projects, and any potential growth opportunities that are undertaken, will be subject to the same or similar risks as those identified above and elsewhere in these Risk Factors, for the TMEP.
Any new growth projects will be subject to, among other things, the receipt of regulatory approvals, feasibility and cost analyses, funding availability and industry, market and demand conditions. There can be no guarantee that any potential opportunities identified will be undertaken or completed or, if any such growth projects are undertaken there can be no certainty as to the timing, nature, extent or completion of such projects. Additionally, events such as inclement weather or significant weather-related events (including storms and rising sea levels (potentially resulting from climate change) impacting our marine terminals), natural disasters, unforeseen geological conditions and delays in performance by third-party contractors may result in increased costs and/or cost overruns or delays in construction. Significant cost increases and/or cost overruns or delays could have a material adverse effect on our return on investment, results of operations and cash flows and could result in reduced or eliminated dividends, project cancellations or constraints on our ability to pursue other growth opportunities.
Judicial reviews of the processes pursuant to which we have been granted certain governmental, administrative and contractual rights to construct and operate our pipelines for the TMEP, including on other owners’ land, are ongoing. If we were to lose these rights or the TMEP were to be subject to additional significant regulatory reviews, changes, further obligations or restrictions, the TMEP may be significantly delayed or stopped altogether, and we may incur additional costs.
While a number of key governmental approvals have been received with respect to the TMEP, the completion, timing and costs of the TMEP are still subject to significant risks. Numerous legal challenges have been filed with the Federal Court of Appeal by various governmental and non-governmental organizations, Aboriginal groups or other parties that seek judicial review of the recommendation of the NEB and subsequent decision by the Federal Governor in Council to conditionally approve the Trans Mountain Pipeline Expansion Project. Such requests for judicial review claim, among other things, that additional Aboriginal consultation, engagement or accommodation is required and that various non-economic impacts of the TMEP were not adequately considered. The remedies sought include requests that the NEB recommendation report be quashed, that additional consultations be undertaken and that the order of the Governor in Council approving the TMEP be quashed. As leave has been granted in a number of circumstances, the Federal Court of Appeal will review, in the case of the NEB, its recommendation that the TMEP proceed and, in the case of the Government of Canada, the Governor in Council’s approval of the TMEP. In the event that an applicant is successful at the Federal Court of Appeal, among other things, the NEB recommendation or Governor in Council’s approval may be quashed, permits may be revoked, the TMEP may be subject to additional significant regulatory reviews, there may be significant changes to the TMEP plans, further obligations or restrictions may be imposed or the TMEP may be stopped altogether.
If an applicant is unsuccessful at the Federal Court of Appeal, the applicant may further appeal such decision to the Supreme Court of Canada. If the applicant is successful at the Supreme Court of Canada, among other things, the NEB recommendation or Governor in Council’s approval may be quashed, permits may be revoked, the TMEP may be subject to additional significant regulatory reviews, there may be significant changes to the TMEP plans, further obligations or restrictions may be imposed or the TMEP may be stopped altogether.
In addition to the judicial reviews of the NEB recommendation report and Governor in Council’s order, two judicial review proceedings have been commenced at the Supreme Court of British Columbia (Squamish Nation and the City of Vancouver) and seek to quash the Environmental Assessment Certificate, or EAC, that was issued by the British Columbia Environmental Assessment Office. The petitions allege a duty and failure to consult or accommodate First Nations, and generally, among other claims, that the Province ought not to have approved the Project. If one of these applicants for judicial review is successful, among other things, the EAC may be quashed, provincial permits may be revoked, the TMEP may be subject to additional significant regulatory reviews, there may be significant changes to the TMEP plans, further obligations or restrictions may be imposed or the TMEP may be stopped altogether. In the event that an applicant is unsuccessful at the Supreme Court of British Columbia, they may further seek to appeal the decision to the British Columbia Court of Appeal. Any decision of the British Columbia Court of Appeal may be appealed to the Supreme Court of Canada. A successful appeal at either of these levels could result in the same types of consequences described above.
To the extent we seek to continue construction of the TMEP prior to the determination of judicial review applications by the applicable court, the applicants may seek an injunction from the court to prevent us from proceeding with construction until the litigation has been resolved. If such injunctive relief is granted, the TMEP may be significantly delayed or stopped altogether, and we may incur additional costs.
Additional efforts to block or revise the TMEP (including through new litigation, changes in government, protests, blockades or otherwise) may arise in the future and the success of any such future efforts may have the same or similar results. Events such as a change in government, legislative or regulatory changes, loss of government or community support or ongoing governmental or community opposition to projects, including the TMEP (for example, the strong and likely unyielding opposition of the City of Burnaby), may cause such projects, including the TMEP, to be significantly disrupted, delayed or stopped, or cause significant increased costs to be incurred. (see also “—We are subject to reputational risks and risks relating to public opinion,” “—Aboriginal relations have the potential to delay or halt regulatory approval processes and construction and increase project costs, which may negatively affect the economics of projects,” “—Non-governmental organizations could impact projects and operations” and “—Risks Relating to Regulation” below). The total stoppage of the TMEP would have a material adverse effect on us. Further, in addition to potentially resulting in significant increased costs and/or cost overruns and delays, the quashing of the NEB recommendation or the Governor in Council’s approval, the revocation of permits, additional significant regulatory reviews, significant changes to the TMEP plans or the imposition of further obligations or restrictions, could materially impact the overall feasibility or economic benefits of the TMEP, which, in turn, would have a material adverse effect on the TMEP (including the anticipated increases to Adjusted EBITDA referenced in this document) and, consequently, our business.
We could be adversely affected by our substantial level of debt.
We must incur substantial indebtedness to fund capital expenditure requirements related to the TMEP. See Note 3 “Debt” to the Interim Consolidated Financial Statements attached hereto for a description of our indebtedness. As of September 30, 2017, we had approximately $165.0 million of debt outstanding. A significant increase in our debt levels could have significant negative consequences, including in connection with the TMEP, such as (i) limiting our ability to obtain additional financing to fund our working capital, capital expenditures, debt service requirements or potential growth, including with respect to the TMEP, or for other purposes; (ii) increasing the cost of our future borrowings; (iii) limiting our ability to use operating cash flow in other areas of our business or to pay dividends or distributions because we must dedicate a substantial portion of these funds to make payments on our debt; (iv) placing us at a competitive disadvantage compared to competitors with less debt; and (v) increasing our vulnerability to adverse economic and industry conditions.
Our ability to service debt will depend upon, among other things, our future financial and operating performance, which will be affected by the relative success (or lack thereof) of the TMEP, prevailing economic conditions and financial, business, regulatory and other factors, many of which are beyond our control. If cash flow is not sufficient to service our debt, we will be forced to take actions such as reducing or eliminating dividends or distributions, reducing or delaying business activities (including our expansion projects), acquisitions, investments and/or capital expenditures, selling assets or seeking additional equity capital. We may not be able to effect any of these actions on satisfactory terms or at all. See also “—We will require access to external capital” and “—Risks Relating to Ownership of Restricted Voting Shares—Additional sales of Restricted Voting Shares will dilute a holder’s ownership in us, and issuances of our senior securities or senior securities of the Limited Partnership may impact the rights of the Restricted Voting Shares and their trading price” below.
The terms of the Credit Facility, and any debt we may incur in the future, may prevent us or the Limited Partnership from engaging in certain transactions, including paying dividends or distributions, as applicable, that might have otherwise been beneficial to us and the holders of Restricted Voting Shares.
We will require access to external capital.
Our growth plans, including the TMEP, require access to significant amounts of external capital. Limitations on our ability to access external financing sources could impair our ability to complete these significant projects, including the TMEP. We will have limited amounts of internally generated cash flows to fund growth capital expenditures and acquisitions. Kinder Morgan has stated that the TMEP will be funded by us without further capital infusion from Kinder Morgan. In order to execute on our business plans, including with respect to the completion of the TMEP, we expect that we will have to rely on external financing sources, including additional commercial borrowings and issuances of debt and equity securities (including preferred securities) and potential joint venture arrangements, to fund such growth capital expenditures. Adverse changes to the availability, terms and cost of capital or interest rates affecting our ability to meet the requirements to borrow under the Credit Facility could cause the cost of doing business to increase by limiting our access to capital, limiting our ability to pursue expansion opportunities or additional acquisitions and reducing our cash flows. Also, disruptions and volatility in the global financial markets may lead to an increase in interest rates or a contraction in credit availability impacting our ability to finance our operations on satisfactory terms.
Limitations on access to external financing sources, whether due to tightened capital markets, more expensive capital or otherwise, or any significant reduction in the availability of credit would significantly impair our ability to execute our growth strategy, including without limitation the completion of the TMEP, which would have a significant material and adverse effect on our business, financial condition and results of operations. To the extent that we are required to issue additional equity, including preferred shares, or the Limited Partnership issues additional securities, including preferred units, to raise
funds that are required to continue operating our business or complete the TMEP or other expansion projects, the dilutive impact on existing shareholders would be increased and the price of the Restricted Voting Shares could decline. Further delays or cost overruns of key projects could result in depressed market prices or values of the Restricted Voting Shares and the issuance of additional equity or voting shares, including preferred shares, at such depressed prices may be required.
We are subject to reputational risks and risks relating to public opinion.
The TMEP, our other expansion and new build projects and our business, operations or financial condition generally may be negatively impacted as a result of any negative public opinion toward the TMEP or our other expansion and new build projects or as a result of any negative sentiment toward or in respect of Kinder Morgan’s or our enterprise-wide reputation with stakeholders, special interest groups, political leadership, the media or other entities. Public opinion may be influenced by certain media and special interest groups’ negative portrayal of the industry in which we operate as well as their opposition to development projects, including the TMEP. In addition, market events specific to us or Kinder Morgan could result in the deterioration of our reputation with key stakeholders. Potential impacts of negative public opinion or reputational issues may include delays or stoppages in project execution, legal or regulatory actions or challenges, blockades, increased regulatory oversight, reduced support of the federal, provincial or municipal governments for, delays in, challenges to, or the revocation of regulatory approvals, permits and/or Land Agreements and increased costs and/or cost overruns in respect of the TMEP and/or the loss or degradation of our business generally.
Reputational risk cannot be managed in isolation from other forms of risk. Credit, market, operational, insurance, regulatory and legal risks, among others, must all be managed effectively to safeguard our reputation. Our reputation and public opinion could also be impacted by the actions and activities of other companies operating in the energy industry, particularly other energy infrastructure providers, over which we have no control. In particular, our reputation could be impacted by negative publicity related to pipeline incidents, unpopular expansion plans or new projects and due to opposition from organizations opposed to energy, oil sands and pipeline development and particularly with shipment of production from oil sands regions that are considered to increase GHG emissions and contribute to climate change. Negative impacts from a compromised reputation or changes in public opinion (including with respect to the production, transportation and use of hydrocarbons generally) could include revenue loss, reduction in customer base, delays in obtaining, or challenges to, regulatory approvals with respect to growth projects and decreased value of our securities, including the Restricted Voting Shares, and our business.
Aboriginal relations have the potential to delay or halt regulatory approval processes and construction and increase project costs, which may negatively affect the economics of projects.
The Canadian courts have confirmed that the Crown has a duty to consult with Aboriginal people, and to accommodate if necessary, when its decisions or actions may adversely affect Aboriginal rights and interests or treaty rights. Crown consultation has the potential to delay regulatory approval processes and construction, which may affect the economics of projects, including the TMEP. In some cases, respecting Aboriginal rights may mean regulatory approval is denied or the conditions in the approval make a project economically challenging or not feasible. Certain of the TMEP-related claims for which leave to seek judicial review at the Federal Court of Appeal has been granted, involve, among other things, Aboriginal rights and title and the Crown’s duty to consult. The petitions seeking judicial review of the recommendation of the NEB, the subsequent decision by the Governor in Council to approve the TMEP and the issuance of the British Columbia Environmental Assessment Certificate allege, among other things, that additional consultation, engagement or accommodation is required and that various non-economic impacts of the TMEP were not adequately considered. In addition to the potential impacts of such claims noted above under “—Major projects, including the TMEP, may be inhibited, delayed or stopped,” a successful claim respecting Aboriginal title along any portion of the TMEP route could result in, among other things, a significant increase in costs and/or cost overruns, TMEP delays, reduced support of the federal, provincial or municipal governments for the TMEP, delays in, further challenges to, or the revocation of regulatory approvals, permits and/or Land Agreements, the need for additional regulatory processes, significant changes to the TMEP plans or additional obligations and/or restrictions placed on Trans Mountain in respect of the TMEP, any of which could materially impact the overall feasibility or economic benefits of the TMEP which, in turn, could have a material adverse effect on the TMEP and, consequently, our business. In certain circumstances, these claims, if successful, could result in the total stoppage of the TMEP, which stoppage would have a material adverse effect on our business.
We have instituted policies to promote the achievement of participative and mutually beneficial relationships with the Aboriginal groups affected by our projects and operations, including the TMEP, and are committed to working with such groups so they may realize benefits from our projects and operations. Notwithstanding the efforts to this end, the
issues are complex and the impact of Aboriginal relations on operations and development initiatives is uncertain. There is no guarantee that we will be able to satisfy the concerns of the Aboriginal groups and attempting to address such concerns may require us to incur significant and unanticipated capital and operating expenditures. In addition, to the extent that we have entered into agreements with Aboriginal groups respecting our operations, including the TMEP, future disagreements with Aboriginal groups could result in legal challenges by Aboriginal groups alleging breach of contract. If successful, such claims could require us to pay significant and/or unanticipated compensation or damages to one or more Aboriginal groups.
Non-governmental organizations could impact projects and operations.
The development of the TMEP, as well as other expansion projects, and our operations generally will at times be subject to public opposition which could expose us to the risk of higher costs, delays or even project cancellations (including the TMEP) due to increasing pressure on governments and regulators by special interest groups including Aboriginal groups, landowners, environmental interest groups (including those opposed to oil sands and other oil and gas production operations) and other non-governmental organizations, blockades, legal or regulatory actions or challenges, increased regulatory oversight, reduced support of the federal, provincial or municipal governments, and delays in, challenges to, or the revocation of regulatory approvals, permits and/or Land Agreements. There is no guarantee that we will be able to satisfy the concerns of the special interest groups and non-governmental organizations and attempting to address such concerns may require us to incur significant and unanticipated capital and operating expenditures.
Commodity transportation and storage activities involve numerous operational risks that may result in accidents or otherwise adversely affect our operations.
Commodity transportation and storage activities involve numerous risks that may result in accidents or otherwise adversely affect our operations. There are a variety of hazards and operating risks inherent in the transportation and storage of crude oil, refined petroleum products and other products, such as: leaks; releases; the breakdown or failure of equipment, pipelines and facilities (including as a result of internal or external corrosion, cracking, third party damage, material defects, operator error or outside forces), information systems or processes; the compromise of information and control systems; the performance of equipment at levels below those originally intended (whether due to misuse, ordinary course “wear and tear,” unexpected degradation or design, construction or manufacturing defects); spills at terminals and hubs; spills associated with the loading and unloading of harmful substances onto rail cars; adverse sea conditions (including storms and rising sea levels) and releases or spills from vessels loaded at our marine terminals; failure to maintain adequate supplies of spare parts; operator error; labor disputes/work stoppages; disputes with interconnected facilities and carriers; operational disruptions or apportionment on third-party systems or refineries which may prevent the full utilization of assets; and catastrophic events including but not limited to natural disasters, fires, floods, explosions, earthquakes, acts of terrorists and saboteurs, cyber security breaches, and other similar events, many of which are beyond our control. Some climatic models indicate that global warming may result in rising sea levels, increased intensity of weather, and increased frequency of extreme precipitation and flooding. To the extent these phenomena occur, they could damage physical assets, especially operations located near rivers, and facilities situated in rain susceptible regions. In addition, we may experience increased insurance premiums and deductibles, or a decrease in available coverage, for our assets in areas subject to severe weather. Further, given the natural hazards inherent in our operations, workers and contractors are subject to personal safety risks. We will also be exposed, from time to time, to other operational risks in addition to those set out above.
The occurrence or continuance of any of the risks set out above could result in serious injury and loss of human life, significant damage to property and natural resources, environmental pollution, significant reputational damage, impairment or suspension of operations, fines or other regulatory penalties, and revocation of regulatory approvals or imposition of new requirements, any of which also could result in substantial financial losses. For pipeline and storage assets located near populated areas, including residential areas, commercial business centers, industrial sites and other public gathering areas, the level of damage resulting from these risks may be greater. In addition, the consequences of any operational incident (including as a result of adverse sea conditions) at our marine terminals or involving a vessel receiving products from one of our marine terminals, may be even more significant as a result of the complexities involved in addressing leaks and releases occurring in the ocean or along coastlines and/or the repair of our marine terminals. We do not own or operate vessels calling at the Westridge Marine Terminal or the Vancouver Wharves Terminal. Any leaks, releases or other incidents involving such vessels, or other similar operators along the West Coast, could result in significant curtailment of, or disruptions and/or delays in, offshore shipping activity in the affected areas, including our ability to effectively carry on operations at our marine terminals. Our inability to facilitate the movement of our shippers’ products to offshore markets, or a significant delay in such services, could have a material adverse effect on our business.
Incidents that cause an interruption of service, such as when unrelated third party construction damages a pipeline or a newly completed expansion experiences a weld failure, may negatively impact our revenues and cash flows while the affected asset is temporarily out of service.
A service interruption due to a major power disruption or curtailment of commodity supply could have a significant impact on our ability to operate, and could negatively impact future earnings, relationships with stakeholders and our enterprise-wide reputation. Service interruptions that impact our transportation services can negatively impact shippers’ operations and earnings as they are dependent on our services to move their product to market or fulfill their own contractual arrangements.
We are covered by an insurance program that is renewed annually and has $1 billion worth of financial capacity for spill events in accordance with the Pipeline Safety Act (see “Item 1. Business—Regulatory Matters—Canadian Regulation”). The insurance program includes coverage for commercial liability that is considered customary for the industry in which we operate and includes coverage for operational and environmental incidents. However, our insurance program may not cover all operational risks and costs and/or may not provide sufficient coverage in the event a claim is made against us. Losses in excess of our insurance coverage could have a material adverse effect on our business, financial condition and results of operations. The total insurance coverage will be allocated among the Kinder Morgan Canada Group on an equitable basis in the event multiple insurable incidents exceeding our coverage limits within the same insurance period are experienced.
We are dependent on the supply of and demand for the commodities we handle.
Our pipelines, terminals and other assets and facilities depend in large part on continued production of crude oil and other products in the geographic areas to which our pipelines, terminals and other facilities provide service, and the ability and willingness of shippers and other customers to supply such demand. Without additions to oil and gas reserves, production will decline over time as reserves are depleted, and production costs may rise. Producers may shut down production at lower product prices or higher production costs, especially where the existing cost of production exceeds other extraction methodologies. Producers in the areas we serve may not be successful in exploring for and developing additional reserves, and our pipelines and related facilities may not be able to maintain existing volumes of throughput. Commodity prices and tax allowance may not remain at levels that encourage producers to explore for and develop additional reserves, produce existing marginal reserves or renew transportation contracts as they expire. Changes in the business environment, an increase in production costs, supply disruptions, or higher development costs, could result in a slowing of supply to our pipelines, terminals and other assets. In addition, changes in the overall demand for hydrocarbons, the regulatory environment or applicable governmental policies (including in relation to climate change or other environmental concerns) may have a negative impact on the supply of crude oil and other products. In recent years, a number of initiatives and regulatory changes relating to reducing GHG emissions have been undertaken by federal, provincial, state and municipal governments and oil and gas industry participants (including, for example, the decarbonization targets set forth in the Paris Agreement). In addition, emerging technologies and public opinion has resulted in an increased demand for energy provided from renewable energy sources rather than fossil fuels. These factors could not only result in increased costs for producers of hydrocarbons but also an overall decrease in the global demand for hydrocarbons. Each of the foregoing could negatively impact our business directly as well as the customers that are shipping through our pipelines or using our terminals, which in turn could negatively impact the prospects of new contracts for transportation or terminaling, renewals of existing contracts or the ability of our customers and shippers to honor their contractual commitments. See “—Financial distress experienced by our customers or other counterparties could have an adverse impact on us in the event they are unable to pay us for the products or services we provide or otherwise fulfill their obligations to us” below.
Our pipelines and transmission infrastructure assets are largely dependent on supply and demand for the crude oil and other products originating in the WCSB. We will continue to monitor any changes in our customers’ crude oil production plans and how these changes may impact our existing assets and project schedules. There is significant competition for WCSB supply from several pipelines and rail terminals within the WCSB and significant competition from other pipelines and modes of transportation for the delivery of the diluent required by producers in the WCSB. An overall decrease in production and/or competing demand for supply could impact throughput on WCSB connected pipelines that, in turn, could negatively impact overall revenues generated. The WCSB has considerable reserves, but the amount actually produced depends on many variables, including commodity prices, basin-on-basin competition, pipeline tolls, demand for these products and the overall value of the reserves.
We cannot predict the impact of any of the risks set out above, all of which could reduce the production of and/or demand for crude oil, refined petroleum products and other hydrocarbons which in turn would reduce the demand for the pipeline and terminaling services we provide.
Our operating results may be adversely affected by unfavorable economic and market conditions including, in particular, the volatility of commodity prices and overall demand for fossil fuels.
Economic conditions worldwide have from time to time contributed to slowdowns in several industries, including the energy infrastructure industry, and in the specific segments and markets in which we operate, resulting in reduced demand and increased price competition for our products and services. Our operating results in one or more geographic regions also may be affected by uncertain or changing economic conditions within that region. Volatility in commodity prices or changes in markets for a given commodity
might also have a negative impact on many of our customers, which in turn could have a negative impact on their ability to meet their obligations to us. Prices for crude oil are subject to large fluctuations in response to relatively minor changes in the supply and demand for crude oil, uncertainties within the market and a variety of other factors beyond our control. These factors include, among other things (i) weather conditions or significant weather-related events (including storms and rising sea levels on the West Coast of British Columbia or other environmental events potentially related to climate change); (ii) North American economic conditions; (iii) the activities of the Organization of Petroleum Exporting Countries; (iv) governmental regulation; (v) political changes in North American or political instability in the Middle East and elsewhere; (vi) the foreign supply of and demand for crude oil; (vii) the price of foreign imports; and (viii) the availability of alternative fuel sources. If global economic and market conditions (including volatility in commodity markets), or economic conditions in the WCSB or other key markets, remain uncertain or persist, spread or deteriorate further, we may experience material impacts on our business, financial condition and results of operations.
The industry in which we operate is highly competitive.
We face significant competition from other pipelines and other forms of transportation in the areas we serve and with respect to the supply for our pipeline systems. Any current or future pipeline system or other form of transportation that delivers crude oil, refined petroleum products or other hydrocarbons into the areas that our pipelines serve could offer transportation services that are more desirable to shippers than those currently provided by us because of price, location, facilities or other factors. To the extent that an excess of supply into these areas is created and persists, our ability to re-contract for expiring transportation capacity at favorable rates or otherwise to retain existing customers could be impaired. We also could experience competition for the supply of crude oil, refined petroleum products or other hydrocarbons from both existing and proposed pipeline systems. Several other pipelines access the same areas of supply as our pipeline systems and transport to destinations not served by us. See “Item 1. Business.”
Financial distress experienced by our customers or other counterparties could have an adverse impact on us in the event they are unable to pay us for the products or services we provide or otherwise fulfill their obligations to us.
We are party to numerous contracts of varying durations. Certain of the contracts associated with our services are comprised of a mixture of firm and non-firm commitments, varying tenures and varying renewal terms, among other differences. There can be no guarantee that, upon the expiry of our contracts, we will be able to renew such contracts on terms as favorable to us, or at all. In particular, one of the current contractual arrangements, which accounts for a significant source of revenue at the Edmonton Rail Terminal, will expire in 2020. This contract is subject to a right of renewal on very favorable terms for the customer and, as a result, revenue from the Edmonton Rail Terminal is expected to decline following such renewal. Such a revenue decline could have a significant negative impact on our financial position.
Financial distress experienced by our customers or other counterparties could have an adverse impact in the event they are unable to pay us for the services we provide or otherwise fulfill their contractual obligations. We are exposed to the risk of loss in the event of non-performance by such customers or other counterparties. Some of these counterparties may be highly leveraged and subject to their own operating, market and regulatory risks, and some are experiencing, or may experience in the future, severe financial problems that have had or may have a significant impact on their creditworthiness. Further, while certain of our customers are subsidiaries of an entity that has an investment grade credit rating, in many cases the parent entity has not guaranteed the obligations of the subsidiary and, therefore, there can be no assurance as to the impact of the parent credit ratings on such customers’ ability to pay us for the services we provide or otherwise fulfill their obligations to us.
We cannot provide any assurance that such customers and key counterparties will not become financially distressed or that such financially distressed customers or counterparties will not default on their obligations to us or file for bankruptcy or creditor protection. If one of such customers or counterparties files for bankruptcy or creditor protection, we likely would be unable to collect all, or even a significant portion, of amounts owed to us. Significant customer and other counterparty defaults and bankruptcy filings could have a material adverse effect on our business, financial position, results of operations or cash flows. Furthermore, in the case of financially distressed customers, such events might force such customers to reduce or curtail their future use of our services, which could have a material adverse effect on our results of operations, financial condition, and cash flows.
We require a skilled workforce, and difficulties recruiting and retaining our workforce could result in a failure to implement our business plan.
The operation and management of our business requires the recruitment and retention of a skilled workforce, including engineers, technical personnel and other professionals, and the loss of key members of such workforce, or a substantial portion of the workforce as a whole, could result in the failure to implement our business plans. We compete with other companies in the energy infrastructure industry for this skilled workforce. In addition, many of our current employees are retirement eligible and have significant institutional knowledge that must be transferred to other employees. If we are unable to (i) retain current employees; (ii)
successfully complete effective knowledge transfers; and/or (iii) recruit new employees with comparable knowledge and experience, we could be negatively impacted. In addition, we could experience increased allocated costs to retain and recruit these professionals.
Terrorist attacks and “cyber security” events may adversely affect our business or reputation.
Terrorist attacks or “cyber security” events, or the threat of them, may adversely affect our business. Our pipeline systems, terminals or operating systems may be targets for terrorist organizations or experience “cyber security” events. Our infrastructure, applications and data are becoming more integrated, creating an increased risk that failure in one system could lead to a failure of another system. There is also increasing industry-wide cyber-attacking activity targeting industrial control systems and intellectual property. A successful cyber-attack could lead to unavailability, disruption or loss of key functionalities within our control systems which could impact pipeline operations and potentially result in an environmental or public safety incident. A successful cyber-attack could also lead to a large scale data breach resulting in unauthorized disclosure, corruption or loss of sensitive information which could have lasting reputational impacts on us, and could negatively impact our ability to work with various stakeholders.
The occurrence of one of these events could cause a substantial decrease in revenues and cash flows, increased costs to respond or other financial loss, damage to our reputation, increased regulation or litigation or inaccurate information reported from their operations. There is no assurance that adequate cyber sabotage and terrorism insurance will be available at rates that we believe are reasonable in the near future. These developments may subject our operations to increased risks, as well as increased costs, and, depending on their ultimate magnitude, could have a material adverse effect on our business, results of operations and financial condition.
We may be subject to abandonment costs.
We are responsible for compliance with all applicable laws and regulations regarding the abandonment of our pipeline systems and other assets at the end of their economic life, and these abandonment costs may be substantial. The proceeds of the disposition of certain assets, including in respect of certain pipeline systems and line fill, may be available to offset abandonment costs. While we estimate future abandonment costs and receive (through tolls) future abandonment costs based on such estimates, actual abandonment costs may be higher than the amounts received through tolls. We may, in the future, determine it to be prudent or required by applicable laws or regulations to establish and fund additional reclamation trusts to provide for payment of our future abandonment costs. Such reserves could decrease cash flow available for dividends to shareholders and to service our obligations under any applicable debt obligations.
To date, we have complied with the NEB requirements on our NEB-regulated pipelines (the Trans Mountain pipeline system and the Canadian Cochin pipeline system) for the creation of abandonment trusts and has completed the compliance-based filings that are required under the applicable NEB rules and regulations regarding the abandonment of our NEB-regulated pipeline systems and assets. While we collect abandonment surcharges from our shippers and deposit such amounts in our abandonment trust for our NEB-regulated pipelines, there is a risk that abandonment costs and post-abandonment liabilities could exceed the amounts held in trust. Further, and unlike the Trans Mountain pipeline system and Canadian Cochin pipeline system, we do not maintain dedicated abandonment trusts for our Puget Sound pipeline system, Jet Fuel pipeline system or Terminals. Additional or unexpected expenditures incurred in respect of abandonment costs could decrease distributable cash flow available for dividends to shareholders and to service obligations under any applicable debt obligations.
New laws, policies, regulations, rulemaking and oversight, as well as changes to those currently in effect, could adversely impact our earnings, cash flows and operations.
New regulations, rulemaking and oversight, as well as changes in regulations, by regulatory agencies having jurisdiction over our operations could adversely impact our earnings, cash flows and operations. Our assets and operations are subject to regulation and oversight by federal, state, provincial and municipal regulatory authorities. Regulatory actions taken by these agencies have the potential to adversely affect our profitability and/or the profitability of our business. Regulation affects almost every part of our business and extends to such matters as (i) the certification and construction of expansion projects and new facilities; (ii) tariff rates, operating terms and conditions of service; (iii) the types of services we may offer to our customers; (iv) the contracts for service entered into with customers; (v) the integrity, safety and security of facilities and operations; (vi) the acquisition of other businesses; (vii) the acquisition, extension, disposition or abandonment of services or facilities; (viii) reporting and information posting requirements; (ix) the maintenance of accounts and records; and (x) relationships with affiliated companies involved in various aspects of the oil and gas industry.
Should we fail to comply with any applicable statutes, rules, regulations, and orders of such regulatory authorities, we could be subject to substantial penalties and fines and potential revocation of permits, including with respect of the TMEP.
Furthermore, new laws or regulations sometimes arise from unexpected sources. New laws or regulations, or different interpretations of existing laws or regulations, including unexpected policy changes, applicable to us or the TMEP could have a material adverse impact on our business, financial condition and results of operations.
Environmental, health and safety laws and regulations could expose us to significant costs and liabilities.
Our operations are subject to federal, provincial and local laws, regulations and potential liabilities arising under or relating to the protection or preservation of the environment (including with respect to climate change), natural resources and human health and safety. Such laws, regulations and obligations affect many aspects of our present and future operations, and generally require us to obtain and comply with various environmental registrations, licenses, permits, inspections and other approvals, including with respect to our expansion and new build projects. Liability under such laws and regulations may be incurred without regard to fault for the remediation of contaminated areas. Private parties, including the owners of properties through which our pipelines pass, also may have the right to pursue legal actions to enforce compliance as well as to seek damages for non-compliance with such laws and regulations or for personal injury or property damage.
Failure to comply with these laws and regulations also may expose us to civil, criminal and administrative fines, penalties and/or interruptions in operations that could influence our business, financial position, results of operations or prospects. For example, if an accidental leak, release or spill of liquid petroleum products, chemicals or other hazardous substances occurs at or from our pipelines or storage or other facilities, we may experience significant operational disruptions and we may have to pay a significant amount to clean up or otherwise respond to the leak, release or spill, pay government penalties, address natural resource damage, compensate for human exposure, property damage or economic loss, install costly pollution control equipment or undertake a combination of these and other measures. The resulting costs and liabilities could materially and negatively affect our earnings and cash flows. In addition, emission controls required under provincial laws could require significant capital expenditures at our facilities.
We own and/or operate numerous properties and assets that have been used for many years in connection with our business activities. While we believe we have utilized operating, handling, and disposal practices that were consistent with industry practices at the time, hydrocarbons or other hazardous substances may have been released at or from properties owned, operated or used by us or our predecessors, or at or from properties where we or our predecessors’ wastes have been taken for disposal. In addition, many of these properties and assets have been owned and/or operated by third parties whose management, operation, handling and disposal of hydrocarbons or other hazardous substances were not under our or our predecessors’ control. These properties and the hazardous substances released and wastes disposed on them may be subject to laws which impose joint and several liability, without regard to fault or the legality of the original conduct. In addition, we could be required to remove or remediate previously disposed wastes or property contamination, including contamination caused by prior owners or operators. Imposition of such liability schemes could have a material adverse impact on our operations and financial position.
We cannot ensure that existing laws and regulations will not be revised or that new laws or regulations will not be adopted or become applicable to our business. There can be no assurance as to the amount or timing of future expenditures for environmental compliance or remediation, and actual future expenditures may be different from the amounts currently anticipated. Revised or additional regulations that result in increased compliance costs or additional operating restrictions, particularly if those costs are not fully recoverable from customers, could have a material adverse effect on our business, financial position, results of operations and prospects. In addition to revised or additional regulations affecting our customers and/or shippers, including those related to the protection or preservation of the environment (including with respect to climate change), natural resources and human health or safety may have significant negative impacts on the business and operations of such customers and/or shippers that result in such customers and/or shippers defaulting on their contractual obligations (including with respect to take-or-pay obligations). We are exposed to the risk of loss in the event of non-performance by such customers and/or shippers, which could have a material adverse effect on us. See “—Financial distress experienced by our customers or other counterparties could have an adverse impact on us in the event they are unable to pay us for the products or services we provide or otherwise fulfill their obligations to us” above.
An environmental incident could have lasting reputational impacts on us and could impact our ability to work with various stakeholders. In addition to the cost of remediation activities (to the extent not covered by insurance), environmental incidents may lead to an increased cost of operating and insuring our assets, thereby negatively impacting earnings and distributable cash flow. See “Item 1. Business—Regulatory Matters—Canadian Regulation—Climate Change and GHG Regulations.”
Although we have OMS and EMP programs in place, there remains a chance that an environmental incident could occur. We have also invested significant resources to enhance our emergency response plans, operator training and landowner education programs to address potential environmental incidents. However, our mitigation efforts are incapable of guarding against all environmental risks, including in the event that there is significant damage to our assets as a result of catastrophic events (including natural disasters, other significant weather-related events or adverse sea conditions) or the actions of third parties acting outside of our control.
We maintain an insurance program which is renewed annually and has $1 billion worth of financial capacity for spill events in accordance with the Pipeline Safety Act (see “Item 1. Business—Regulatory Matters—Canadian Regulation”). The insurance program includes coverage for commercial liability that is considered customary for the industry in which we operate and includes coverage for operational and environmental incidents. However, our insurance program may not cover all environmental risks and costs and/or may not provide sufficient coverage in the event an environmental claim is made against us. The total insurance coverage will be allocated on an equitable basis among the members of the Kinder Morgan Canada Group in the event multiple insurable incidents exceeding our coverage limits within the same insurance period are experienced.
Pipeline integrity laws and regulations may have a negative impact on us.
Increased regulatory requirements relating to the integrity of our pipelines may require it to incur significant capital and operating expenditures to comply. We are subject to extensive laws and regulations related to pipeline integrity. The ultimate costs of compliance with the integrity management rules are difficult to predict. The majority of compliance costs relate to pipeline integrity testing and repairs. Technological advances in in-line inspection tools and identification of additional threats to a pipeline’s integrity can have a significant impact on integrity testing and repair costs. We plan to continue our integrity testing programs in respect of our assets to assess and maintain the integrity of our existing and future pipelines as required by applicable laws, rules and regulations. The results of these tests could cause us to incur significant and unanticipated capital and operating expenditures for repairs or upgrades deemed necessary to provide for the continued safe and reliable operation of these pipelines.
Further, additional laws and regulations that may be enacted in the future or a new interpretation of existing laws and regulations could significantly increase the amount of these expenditures. There can be no assurance as to the amount or timing of future expenditures for pipeline integrity regulation, and actual future expenditures may be different from the amounts currently anticipated. Revised or additional regulations that result in increased compliance costs or additional operating restrictions, particularly if those costs are not deemed by regulators or negotiated customer agreements to be fully recoverable from customers, could have a material adverse effect on our business, financial position, results of operations and prospects.
Changes in tax laws and reassessments could adversely impact future distributable cash flow.
Income tax returns filed by entities forming part of our business remain subject to reassessment by applicable taxation authorities and it is possible that the taxation authorities could successfully challenge prior transactions and tax filings of such entities. In the event of a successful reassessment, we could be subject to higher than expected past or future income tax liability as well as, potentially, interest and/or penalties, which could result in a material reduction in distributable cash flow or cash available for dividends.
Income tax laws, including income tax laws applicable to the energy infrastructure industry, may in the future be changed or interpreted in a manner that adversely affects us. Furthermore, tax authorities having jurisdiction over us may disagree with how those entities calculate income for tax purposes or could change administrative practices to the detriment of those entities. A change in applicable tax laws, or the administrative interpretation thereof, in a manner adverse to us could result in a material reduction in distributable cash flow or cash available for dividends.
Changes in pipeline tariff rates may have a negative impact on our operating results.
Regulatory bodies having jurisdiction over us may establish pipeline tariff rates or requirements that could have a negative impact on our business. In addition, such regulatory bodies, or our customers could file complaints challenging the tariff rates charged by us, and a successful complaint could have an adverse impact on us. The profitability of our regulated pipelines is influenced by fluctuations in costs and our ability to recover any increases in our costs in the rates charged to our shippers. To the extent that those costs increase in an amount greater than what we are permitted by the regulators to recover in our rates, or to the extent that there is a lag before we can file for and obtain rate increases, such events can have a negative impact upon our operating results.
Certain existing rates may also be challenged by complaint. Regulators and shippers on our pipelines have rights to challenge the rates that are charged under certain circumstances prescribed by applicable regulations. We may face challenges to the rates charged on our pipelines. Any successful challenge to our rates could materially adversely affect our future earnings, distributable cash flow and financial condition.
Risks Relating to Our Relationship with Kinder Morgan
Kinder Morgan’s shareholdings in the Company may give rise to conflicts of interest.
Kinder Morgan, indirectly through its wholly-owned subsidiaries KMCC and KM Canada Terminals, holds the controlling voting interest in us, including with respect to the right to vote for the election of directors to the Board of Directors. In addition, we are the sole shareholder of the General Partner and, as such, Kinder Morgan indirectly, through controlling the Company Voting Shares, has the ability to influence elections of the directors to the board of directors of the General Partner. In its capacity as general partner of the Limited Partnership, the General Partner is authorized to manage, administer and operate the business and affairs of the Limited Partnership, to make all decisions regarding the business of the Limited Partnership and to bind the Limited Partnership in respect of any such decisions, subject to certain limitations contained in the Limited Partnership Agreement. As a result of the foregoing, Kinder Morgan, indirectly through its controlling voting interest in us and corresponding ability to influence the elections of directors, has the ability to influence the management of our business. See “Item 7. Certain Relationships and Related Transactions, and Director Independence” and “—Risks Relating to Ownership of Restricted Voting Shares—There are limitations on voting power of the holders of Restricted Voting Shares” below.
Our relationship with Kinder Morgan, as our majority shareholder, does not impose any duty on Kinder Morgan or its affiliates to act in our best interest and, other than is set out in the Cooperation Agreement, Kinder Morgan is not prohibited from engaging in other business activities that may compete with us. Our ownership structure involves a number of relationships that may give rise to conflicts of interest between us and the holders of Restricted Voting Shares, on the one hand, and Kinder Morgan, on the other hand. In certain instances, the interests of Kinder Morgan may differ from our interests and the interests of our shareholders, including with respect to future acquisitions or strategic decisions. It is possible that conflicts of interest may arise between us and Kinder Morgan, and that such conflicts may not be resolved in a manner that is in our best interests or in the best interests of our shareholders. Additionally, Kinder Morgan and its affiliates has access to material confidential information about us. Although some of these entities are subject to confidentiality obligations pursuant to confidentiality agreements or pursuant to duties of confidence or applicable codes of conduct, neither the Services Agreement nor the Cooperation Agreement contain general confidentiality provisions. See “Item 7. Certain Relationships and Related Transactions and Director Independence—Agreements Between the Company and Kinder Morgan.”
Future changes in our relationship with Kinder Morgan may negatively impact our business.
Our arrangements with Kinder Morgan do not require Kinder Morgan, either directly or indirectly, to maintain any ownership level in us or the Limited Partnership. Accordingly, Kinder Morgan may transfer all or a substantial portion of its interest in the Limited Partnership (together with the Special Voting Shares) to a third party, including in a merger or consolidation or sale of its Class B Units and Special Voting Shares, without our consent or the consent of our shareholders, but subject to compliance with applicable “coattail” provisions of the Limited Partnership Agreement and our Articles, market conditions, Kinder Morgan’s requirements for capital or other circumstances that may arise in the future. The interests of a transferee of the Class B Units and Special Voting Shares may be different from Kinder Morgan’s and may not align with those of other shareholders. We cannot predict with any certainty the effect that any such transfer would have on the trading price of the Restricted Voting Shares or our ability to raise capital in the future. As a result, our future would be uncertain and our business and financial condition may suffer.
Risks Relating to Ownership of Restricted Voting Shares
There are limitations on voting power of the holders of Restricted Voting Shares.
Each Restricted Voting Share and each Special Voting Share entitles the holder thereof to one vote per share held at all meetings of our shareholders, except meetings at which or in respect of matters on which only the holders of another class of shares are entitled to vote separately as a class pursuant to applicable laws. Unless otherwise required by law, the holders of Restricted Voting Shares and Special Voting Shares vote together as a single class. Holders of Restricted Voting Shares are entitled to approximately 30% of the votes held by all our shareholders and Kinder Morgan, the holder of the Special Voting Shares, is entitled to approximately 70% of the votes held by all our shareholders.
As a result, Kinder Morgan has a controlling interest in the combined voting power of the Company Voting Shares, including with respect to the election of the Board of Directors. This level of ownership of Special Voting Shares indirectly by Kinder Morgan will limit the ability of holders of the Restricted Voting Shares to influence corporate and partnership matters for the foreseeable future, including the election of directors (both with respect to the Company and the General Partner) as well as with respect to decisions regarding the amendment of our share capital or the Limited Partnership Agreement, creating and issuing additional Company Voting Shares or classes of shares or limited partnership units, making significant acquisitions, selling significant assets or parts of our business, merging with other companies, significant joint ventures, the payment or non-payment of dividends or limited partnership distributions and undertaking other significant transactions. The market price of the Restricted Voting Shares could be adversely affected due to the significant voting power of Kinder Morgan. Additionally, the significant voting interest of Kinder Morgan may discourage transactions involving a change of control, including transactions in which a holder of the Restricted Voting
Shares might otherwise receive a premium for their Restricted Voting Shares over the then-current market price, or discourage competing proposals if a going private transaction is proposed or undertaken by Kinder Morgan. See “Item 7. Certain Relationships and Related Transactions and Director Independence—Agreements Between the Company and Kinder Morgan” and “Item 11. Description of Registrant’s Securities to be Registered.”
Additional sales of Restricted Voting Shares will dilute a holder’s ownership in us, and issuances of our senior securities or senior securities of the Limited Partnership may impact the rights of the Restricted Voting Shares and their trading price.
Subject to the provisions of the Limited Partnership Agreement, Kinder Morgan may sell its Special Voting Shares (together with the accompanying Class B Units in the Limited Partnership) from time to time and is not required to consider the potential negative impact of such sales on the trading price of the Restricted Voting Shares or on us in general.
The Board of Directors may issue an unlimited number of Restricted Voting Shares (or Special Voting Shares to the extent the General Partner issues additional Class B Units of the Limited Partnership) without any vote or action by the shareholders, subject to the rules of any stock exchange on which our securities may be listed from time to time. We may make future acquisitions or enter into financings or other transactions involving the issuance of our securities.
Our Preferred Shares are senior to the Restricted Voting Shares with respect to priority in payment of dividends and the distribution of assets in the event of liquidation, but such shares are not entitled to vote absent a default in payment of dividends. Additionally, we are authorized to issue an unlimited number of preferred shares and may issue additional preferred shares in the future. Any such additional preferred shares will be entitled to preference over the Restricted Voting Shares with respect to priority in payment of dividends and the distribution of assets in the event of the liquidation, dissolution or winding up of the Company. The rights of the holders of Restricted Voting Shares will be subject to, and may be adversely affected by, the rights of the holders of any preferred shares that may be issued in the future. The issuance of preferred shares could delay, deter or prevent certain transactions and could adversely affect the voting power or economic value of the Restricted Voting Shares. Further, if we issue any additional equity or voting shares, the percentage ownership or voting power, as applicable, of existing shareholders will be reduced and diluted, which reduction and dilution may be significant, and the price of the Restricted Voting Shares could decline.
Similarly, the Limited Partnership Agreement authorizes the General Partner to cause the Limited Partnership to issue additional LP Units as well as any other type of security, including preferred units, that it determines to be necessary or advisable. Like us, the Limited Partnership may make future acquisitions or enter into financings or other transactions involving the issuance of its securities, including LP Units or preferred units. In the event that the Limited Partnership were to issue preferred units, the rights associated with the Class A Units held indirectly by us will be subject to, and may be adversely affected by, the rights associated with such preferred units. Additionally, an issuance of additional securities by the Limited Partnership, including preferred units, may dilute our interest in the Limited Partnership and/or reduce the amounts available for distribution by the Limited Partnership to us as an indirect holder of Class A Units. See “—Cash dividend payments are not guaranteed” below.
We are currently undertaking significant projects, including the TMEP, which will require considerable amounts of capital. The Credit Facility requires that we maintain an overall balance of debt and equity capital of 70% and 30%, and with respect to capital expenditures on the TMEP, a balance of debt and equity capital of 60% and 40%. See Note 3 “Debt” to the Interim Consolidated Financial Statements attached hereto. We expect to issue additional equity over the course of the TMEP in order to comply with these requirements under the Credit Facility.
In the event that we are unable to access debt or other external financing sources to fund the completion of such projects or such projects experience significant cost increases and/or cost overruns or delays, we may be required to issue additional equity or voting shares, or the Limited Partnership may be required to issue additional units, to raise funds that are required for us to continue operating or complete our projects. Additionally, if the TMEP is over budget and/or delayed and the value of our business becomes depressed, issuances of our securities, including preferred shares, or issuances of securities of the Limited Partnership, including preferred units, to fund the TMEP, could be pursued at prices reflecting such depressed value, increasing the dilutive impact on the existing Restricted Voting Shares and/or our indirect interest in the Limited Partnership. See also “—Risks Relating to Our Business—We will require access to external capital” above.
Cash dividend payments are not guaranteed.
The payment of dividends under our dividend policy is not guaranteed and amounts of such dividends could fluctuate with the performance of our business. Additionally, the Preferred Shares are, and any series of preferred shares issued by us in the future may be, senior to the Restricted Voting Shares with respect to priority in payment of dividends and the distribution of assets in the event of liquidation. The terms of the Preferred Shares prohibit us from declaring or paying dividends on the Restricted Voting Shares unless all dividends on the Preferred Shares have been paid.
The Board of Directors has the discretion to determine the amount of dividends, if any, to be declared and paid to shareholders. The Board of Directors may alter our dividend policy at any time, and the payment of dividends will depend on distributions from the Limited Partnership, as determined in the discretion of the General Partner, which distributions may be affected by, among other things, changes in: commodity prices; the financial condition of our business; current and expected future levels of earnings; capital and liquidity requirements; market opportunities; income taxes; debt repayments; legal and regulatory requirements, including the solvency requirements of the ABCA; contractual constraints; tax laws; and other relevant factors (including the TMEP being over budget, delayed or stopped). There can be no guarantee as to the amount of distributions from the General Partner and any number of factors could cause the General Partner to revise its policies and/or strategies respecting distributions. Certain terms of the Credit Facility may prevent or restrict our ability to pay dividends or the ability of the Limited Partnership to pay distributions.
Over time, our capital and other cash needs may change significantly from our current needs, which could affect whether we pay dividends and the amount of dividends, if any, we may pay in the future. If we experience a significant downturn, the currently anticipated level of distributions by the Limited Partnership (and funding for Company dividends) could leave us with insufficient cash to finance growth opportunities, meet any large unanticipated liquidity requirements or fund our activities. The Board of Directors may amend, revoke or suspend our dividend policy at any time in response to such circumstances or for other reasons. A decline in the market price or liquidity, or both, of the Restricted Voting Shares could result if we reduce or eliminate the payment of dividends, which could result in losses to shareholders.
There can be volatility in the market price of Restricted Voting Shares.
The market price for Restricted Voting Shares may be volatile and subject to wide fluctuations in response to numerous factors, many of which are beyond our control, including the following: (i) delays or difficulties experienced during construction or the completion of the TMEP or the total stoppage of the TMEP; (ii) anticipated fluctuations in our financial results; (iii) recommendations by securities research analysts; (iv) changes in the economic performance or market valuations of other companies that investors deem comparable to us or Kinder Morgan; (v) the loss or resignation of directors, officers and other key personnel of the Company; (vi) sales or anticipated sales of additional Restricted Voting Shares; (vii) significant acquisitions or business combinations, strategic partnerships, joint ventures or capital commitments by or involving us or our competitors where we do not realize the anticipated benefits from such transaction; (viii) trends, concerns, technological or competitive developments, regulatory changes and other related issues in the energy infrastructure industry; and (ix) actual or anticipated fluctuations in interest rates.
Financial markets have experienced significant price and volume fluctuations in recent years that have particularly affected the market prices of equity securities of companies and that have, in many cases, been unrelated to the operating performance, underlying asset values or prospects of such companies. Accordingly, the market price of the Restricted Voting Shares may decline even if our operating results, underlying asset values or prospects have not changed. Additionally, these factors, as well as other related factors, may cause decreases in asset values which may result in impairment losses. Certain institutional investors may base their investment decisions on consideration of our environmental, governance and social practices and performance against such institutions’ respective investment guidelines and criteria, and failure to meet such criteria may result in a limited or no investment in the Restricted Voting Shares by those institutions, which could adversely affect the trading price of the Restricted Voting Shares.
Non-Canadian holders of Restricted Voting Shares face foreign exchange risk on dividends.
Our cash dividends will be declared in Canadian dollars. As a consequence, non-resident shareholders, and shareholders who calculate their return in currencies other than the Canadian dollar, will be subject to foreign exchange risk. To the extent that the Canadian dollar strengthens with respect to their currency, the amount of the dividend will be reduced when converted to their home currency.
ITEM 2. FINANCIAL INFORMATION.
Selected Historical Financial Information
The following table sets forth, for the periods and at the dates indicated, our summarized historical GAAP income statement and balance sheet information as well as certain non-GAAP financial measures and financial information. The table is derived from and should be read in conjunction with unaudited and audited financial statements and accompanying notes attached hereto (in millions of Canadian dollars).
|
| As at and for the |
| As at and for the Years Ended December 31, |
| ||||||
|
| 2017 |
| 2016 |
| 2016 |
| 2015 |
| 2014 |
|
GAAP Income Statement Information:(1) |
|
|
|
|
|
|
|
|
|
|
|
Revenues |
| 500.2 |
| 501.9 |
| 676.1 |
| 645.9 |
| 505.2 |
|
Operating income |
| 152.4 |
| 181.0 |
| 237.4 |
| 242.3 |
| 162.9 |
|
Foreign exchange (loss) gain |
| (5.3 | ) | 59.3 |
| 32.6 |
| (185.4 | ) | (78.3 | ) |
Net income (loss) |
| 114.3 |
| 184.0 |
| 201.8 |
| (22.9 | ) | 19.5 |
|
Non-GAAP Financial Measures:(1)(2) |
|
|
|
|
|
|
|
|
|
|
|
DCF |
| 240.0 |
| 251.0 |
| 318.2 |
| 272.7 |
| 147.3 |
|
Adjusted EBITDA |
| 280.2 |
| 301.5 |
| 395.4 |
| 368.7 |
| 256.9 |
|
Financial Information:(2) |
|
|
|
|
|
|
|
|
|
|
|
Preferred share dividends |
| 2.0 |
|
|
|
|
|
|
|
|
|
Net income (loss) attributable to Kinder Morgan interest |
| 96.4 |
| 184.0 |
| 201.8 |
| (22.9 | ) | 19.5 |
|
Net income available to Restricted Voting Stockholders |
| 11.7 |
|
|
|
|
|
|
|
|
|
DCF available to Kinder Morgan interest |
| 208.5 |
| 251.0 |
| 318.2 |
| 272.7 |
| 147.3 |
|
DCF available to Restricted Voting Stockholders(3) |
| 30.7 |
|
|
|
|
|
|
|
|
|
GAAP Balance Sheet Information (at end of period): |
|
|
|
|
|
|
|
|
|
|
|
Property, plant and equipment, net |
| 3,540.0 |
| 3,103.7 |
| 3,181.1 |
| 3,008.3 |
| 2,827.0 |
|
Total assets |
| 4,356.8 |
| 3,657.2 |
| 3,739.4 |
| 3,485.2 |
| 3,410.6 |
|
Long-term debt-affiliates |
| — |
| 1,281.4 |
| 1,362.1 |
| 1,320.4 |
| 1,050.1 |
|
Total equity |
| 3,392.8 |
| 1,434.3 |
| 1,436.0 |
| 1,251.0 |
| 1,296.8 |
|
Notes:
(1) Prior to our May 2017 IPO, net income and DCF were attributable only to Kinder Morgan.
(2) See “—Financial Information—Management’s Discussion and Analysis—Results of Operations—Non-GAAP Financial Measures.”
(3) For further information respecting DCF on a per Restricted Voting Share basis, see “—Financial Information—Management’s Discussion and Analysis—Results of Operations—Non-GAAP Financial Measures—Distributable Cash Flow.” 2017 amount excludes approximately $0.8 million of U.S. cash taxes attributable to Restricted Voting Stockholders.
In reviewing the above information, reference should be made to: (i) our unaudited interim consolidated financial statements for the three and nine months ended and as of September 30, 2017 (the “Interim Consolidated Financial Statements”); (ii) our audited consolidated financial statements as at December 31, 2016 and December 31, 2015 and for the years ended December 31, 2016, 2015 and 2014 (the “Annual Consolidated Financial Statements”), in each case together with the related notes; and (iii) the sections entitled “—Management’s Discussion and Analysis” and “Item 1A. Risk Factors” in this document.
Management’s Discussion and Analysis
Presentation of Information
The following MD&A is as of October 24, 2017, except for the TMEP Construction Progress and December 8, 2017 preferred share offering described below and/or referenced elsewhere in this Form 10, and should be read in conjunction with the Company’s Interim Consolidated Financial Statements and the Company’s Annual Consolidated Financial Statements included elsewhere in this Form 10.
Management is responsible for preparing the MD&A. This MD&A has been reviewed and approved by our board of directors.
The Interim Consolidated Financial Statements and Annual Consolidated Financial Statements have been prepared in accordance with GAAP. All financial information in this MD&A is presented in Canadian dollars, unless otherwise indicated.
In respect of forward-looking statements contained in this document, see “Special Note Regarding Forward-Looking Statements.” Also, the non-GAAP financial measures “Adjusted EBITDA” and “DCF” contained in this document are not prescribed by GAAP, see “—Non-GAAP Financial Measures” below.
Recent Developments
The Reorganization and the Initial Public Offering (“IPO”)
The Company was incorporated on April 7, 2017. On May 30, 2017, we completed our IPO of 102,942,000 Restricted Voting Shares on the TSX at a price to the public of $17.00 per Restricted Voting Share for total gross proceeds of approximately $1.75 billion. We used our IPO proceeds to indirectly acquire from Kinder Morgan an approximate 30% economic interest in the Limited Partnership, with Kinder Morgan retaining the remaining approximate 70% economic interest.
Concurrent with closing of our IPO, the Limited Partnership acquired an interest in the Operating Entities from KMCC and KM Canada Terminals in exchange for the issuance to KMCC and KM Canada Terminals of Class B Units. In addition, KMCC and KM Canada Terminals were issued Special Voting Shares in the Company for nominal consideration.
Immediately following closing of our IPO, the Company used the proceeds from our IPO to indirectly subscribe for Class A Units representing an approximate 30% interest in the Limited Partnership while the Class B Units held by KMCC and KM Canada Terminals represent, in the aggregate, an approximate 70% economic interest in the Limited Partnership’s total LP Units. Following the issuance of the Series 1 Preferred Shares, the Company’s and Kinder Morgan’s respective interests in the Limited Partnership are subject to the preferred shareholders’ priority on distributions and upon liquidation.
The issued and outstanding Restricted Voting Shares comprise approximately 30% of the votes attached to all outstanding Company voting shares, and the Kinder Morgan interest, which represents its indirectly ownership of 100% of the Special Voting Shares, comprises approximately 70% of the votes attached to all outstanding Company voting shares.
Pursuant to current accounting principles in conformity with GAAP, we accounted for our acquisition of an approximate 30% economic interest in the Limited Partnership as a transfer of net assets among entities under common control. Therefore, the assets and liabilities in our Interim Consolidated Financial Statements have been reflected at historical carrying value of the immediate parent(s) within the Kinder Morgan organization structure including goodwill and purchase price assigned amounts, as applicable. Additionally, we prepared our Interim Consolidated Financial Statements to reflect the transfer of net assets of the Operating Entities from Kinder Morgan to us as if such transfer had taken place on January 1, 2016.
In addition, as of and for the reporting periods after May 30, 2017, Kinder Morgan’s interest in the Limited Partnership is reflected within “Kinder Morgan interest” in our consolidated statements of equity and consolidated balance sheets. The earnings attributable to Kinder Morgan’s ownership interest in the Limited Partnership are presented in “Net Income attributable to Kinder Morgan Interest” in our consolidated statements of income.
Series 1 Preferred Share Offering
On August 15, 2017, we completed an offering of 12,000,000 Series 1 Preferred Shares on the TSX at a price to the public of $25.00 per Series 1 Preferred Share for total gross proceeds of $300 million. The net proceeds of $293.0 million from the offering were used to indirectly subscribe for preferred units in the Limited Partnership, which in turn were used by the Limited Partnership to repay Credit Facility indebtedness recently incurred to, directly or indirectly, finance the development, construction and completion of the TMEP and Base Line Terminal project, and for general corporate purposes. We have the option to redeem the Series 1 Preferred Shares on November��15, 2022 and on November 15 in every fifth year thereafter by payment of $25.00 per Series 1 Preferred Share plus all accrued and unpaid dividends. The holders of the Series 1 Preferred Shares will have the right to convert all or any of their Series 1 Preferred Shares into Series 2 Preferred Shares, subject to certain conditions, on November 15, 2022 and on November 15 in every fifth year thereafter. The Series 1 Preferred Shares and the Series 2 Preferred Shares are series of shares in the same class. The conversion right entitles holders to elect periodically which of the two series they wish to hold and does not entitle holders to receive a different class or type of security.
Series 3 Preferred Share Offering
On December 8, 2017, we completed an offering of 10,000,000 Series 3 Preferred Shares on the TSX at a price to the public of $25.00 per Series 3 Preferred Share for total gross proceeds of $250 million. The net proceeds of $243.2 million from the offering were used to indirectly subscribe for preferred units in the Limited Partnership, which in turn were used by the Limited Partnership to repay Credit Facility indebtedness recently incurred to, directly or indirectly, finance the development, construction and completion of the Base Line Terminal project as well as potential future growth opportunities, to repay indebtedness and for general corporate purposes. We have the option to redeem the Series 3 Preferred Shares on February 15, 2023 and on February 15 in every fifth year thereafter by payment of $25.00 per Series 3 Preferred Share plus all accrued and unpaid dividends. The holders of the Series 3 Preferred Shares will have the right to convert all or any of their Series 3 Preferred Shares into Series 4 Preferred Shares, subject to certain conditions, on February 15, 2023 and on February 15 in every fifth year thereafter. The Series 3 Preferred Shares and the Series 4 Preferred Shares are series of shares in the same class. The conversion right entitles holders to elect periodically which of the two series they wish to hold and does not entitle holders to receive a different class or type of security.
Results of Operations
Overview
The reportable business segments of KML are based on the way management organizes the enterprise. Each of our reportable business segments represents a component of the enterprise that engages in a separate business activity and for which discrete financial information is available.
Our reportable business segments are:
· Pipelines - the ownership and operation of (i) the TMPL; (ii) the Canadian Cochin pipeline system; (iii) the Puget Sound pipeline system; (iv) the Jet Fuel pipeline system; and (v) KMCI.
· Terminals - the ownership and operation of liquid product merchant storage and rail terminals in the Edmonton, AB market as well as a predominantly dry cargo import/export facility in North Vancouver, B.C.
We evaluate the performance of our reportable business segments by evaluating the earnings before depreciation and amortization of each segment (“Segment EBDA”). We believe that Segment EBDA is a useful measure of the operating performance of KML because it measures segment operating results before depreciation, depletion and amortization (“DD&A”) and certain
expenses that are generally not controllable by the operating managers of the respective business segments of KML, such as certain general and administrative expense, foreign exchange losses (or gains) on the KMI Loans, interest expense, and income tax expense. Our general and administrative expenses include such items as employee benefits, insurance, rentals, certain litigation and shared corporate services including accounting, information technology, human resources and legal services. Certain general and administrative expenses attributable to Trans Mountain are billable as flow through items to shippers and result in incremental revenues. See Notes 11 and 17 to the Interim Consolidated Financial Statements and Annual Consolidated Financial Statements, respectively, for further discussion of our reportable business segments.
Current Business Developments
Pipelines
We have spent a cumulative total, net of contributions in aid of construction, of $778.8 million on the TMEP, which includes capitalized equity financing costs, on development of the TMEP as of September 30, 2017 (December 31, 2016—$480.0 million). All available long-term firm service capacity remains contracted on the pipeline expansion with a diverse group of 13 customers. This demonstrates strong market support for the TMEP and the much-needed access to new markets it will bring to Canadian producers, as well as providing a secure supply of Canadian crude to refineries throughout the Pacific basin, including Washington State. Collectively, the firm shippers have made 15- and 20-year commitments of 707,500 barrels per day, or approximately 80 percent of the capacity on the expanded pipeline, with the remaining 20 percent reserved for spot volumes consistent with NEB requirements. Aboriginal support for the TMEP continues to grow, with 42 Aboriginal communities in support of the TMEP.
TMEP Construction Progress
See “Item 1. Business—Pipeline Segment—The TMEP—TMEP Constuction Progress.”
Terminals
Construction continues at the Company’s and Keyera Corp.’s Base Line Terminal, a 50-50 joint venture crude oil merchant storage terminal being developed in Sherwood Park, Alberta, Canada. In the third quarter, on-site facility mechanical work was materially completed and significant progress was made on the off-site pipe rack and bridges required to connect the terminal with our other Edmonton-area facilities, including the North 40 Terminal, Edmonton South Terminal, and Edmonton Rail Terminal joint venture. The 12-tank, 4.8 million barrel new-build facility is fully contracted with long-term, firm take-or-pay agreements with strong, credit worthy customers. Our investment in the joint venture will be approximately $396.0 million, including costs associated with the construction of a new pipeline segment that will be funded solely by us, with total spend to date of $250.0 million and remaining spend in 2017 of $33.0 million. Commissioning is expected to begin in the first quarter of 2018 with tanks phased into service throughout that year. The facility is forecast to be on schedule and on budget.
Consolidated Earnings Results
|
| Three Months Ended |
| Nine Months Ended |
| ||||
(In millions of Canadian dollars) |
| 2017 |
| 2016 |
| 2017 |
| 2016 |
|
Segment EBDA (1) |
|
|
|
|
|
|
|
|
|
Pipelines |
| 58.5 |
| 58.2 |
| 169.0 |
| 184.3 |
|
Terminals |
| 52.7 |
| 52.0 |
| 159.1 |
| 162.6 |
|
Total segment EBDA (1) |
| 111.2 |
| 110.2 |
| 328.1 |
| 346.9 |
|
DD&A |
| (37.2 | ) | (34.3 | ) | (107.6 | ) | (102.5 | ) |
Foreign exchange gain (loss) on the KMI Loans (2) |
| 0.6 |
| (15.7 | ) | (2.4 | ) | 54.2 |
|
General and administrative expenses |
| (16.2 | ) | (15.2 | ) | (50.5 | ) | (45.4 | ) |
Interest, net |
| (1.3 | ) | (7.0 | ) | (10.9 | ) | (22.9 | ) |
Income before income taxes |
| 57.1 |
| 38.0 |
| 156.7 |
| 230.3 |
|
Income tax expense |
| (14.7 | ) | (17.7 | ) | (42.4 | ) | (46.3 | ) |
Net income |
| 42.4 |
| 20.3 |
| 114.3 |
| 184.0 |
|
Preferred share dividend |
| (2.0 | ) | — |
| (2.0 | ) | — |
|
Net income attributable to Kinder Morgan interest |
| (28.7 | ) | (20.3 | ) | (96.4 | ) | (184.0 | ) |
Net income available to restricted voting stockholders |
| 11.7 |
| — |
| 15.9 |
| — |
|
Years Ended December 31, |
| 2016 |
| 2015 |
| 2014 |
|
Segment EBDA(1) |
|
|
|
|
|
|
|
Pipelines |
| 241.9 |
| 249.5 |
| 220.9 |
|
Terminals |
| 211.2 |
| 180.5 |
| 98.5 |
|
Total Segment EBDA(1) |
| 453.1 |
| 430.0 |
| 319.4 |
|
DD&A |
| (137.2 | ) | (123.5 | ) | (88.7 | ) |
Unrealized foreign exchange gain (loss) on the KMI Loans(2) |
| 29.7 |
| (175.9 | ) | (76.0 | ) |
General and administrative expense |
| (57.6 | ) | (61.3 | ) | (59.2 | ) |
Interest, net |
| (29.9 | ) | (30.1 | ) | (49.4 | ) |
Income before income taxes |
| 258.1 |
| 39.2 |
| 46.1 |
|
Income tax expense |
| (56.3 | ) | (62.1 | ) | (26.6 | ) |
Net income (loss) |
| 201.8 |
| (22.9 | ) | 19.5 |
|
Notes:
(1) Includes revenues and other (income) expense less operating expenses and other, net. Operating expenses primarily include operations and maintenance expenses, and taxes, other than income taxes.
Segment EBDA for the three months ended September 30, 2017 and 2016 includes (i) $(1.5) million and $(1.4) million, respectively, of unrealized foreign exchange losses due to changes in exchange rates between the Canadian dollar and the U.S. dollar on U.S. dollar denominated balances and (ii) $7.8 million and $4.6 million, respectively, of capitalized equity financing costs. Segment EBDA for the nine months ended September 30, 2017 and 2016 includes (i) $(3.3) million and $5.1 million, respectively, of unrealized foreign exchange (losses) gains due to changes in exchange rates between the Canadian dollar and the U.S. dollar on U.S. dollar denominated balances and (ii) $19.6 million and $12.8 million, respectively, of capitalized equity financing costs.
Segment EBDA for the year ended December 31, 2016, 2015 and 2014 includes (i) $17.9 million, $12.9 million and $11.2 million, respectively, of capitalized equity financing costs and (ii) $2.9 million, $(9.5) million and $(2.3) million of unrealized foreign exchange gains (losses) due to changes in exchange rates between the Canadian dollar and the U.S. dollar on U.S. dollar denominated balances.
(2) The KMI Loans, which represented U.S. dollar denominated long-term notes payable with Kinder Morgan, were settled with proceeds from our IPO.
Three Months Ended September 30, 2017 vs. Three Months Ended September 30, 2016
The increase of $22.1 million (109%) from the prior year third quarter in net income is primarily attributable to the $16.3 million change in foreign exchange gains (losses) on the KMI Loans. The remainder of the $3.8 million increase is largely attributable to lower interest expense primarily due to the settlement of the KMI Loans.
Nine Months Ended September 30, 2017 vs. Nine Months Ended September 30, 2016
The decrease of $69.7 million (38%) from the prior year in net income is primarily attributable to the $56.6 million change in foreign exchange gains (losses) on the KMI Loans. The remainder of the $13.1 million decrease is largely attributable to decreased results on our Cochin and Puget Sound pipelines in our Pipelines segment, increased general and administrative expense and DD&A expense, partially offset by lower interest expense primarily due to the settlement of the KMI Loans.
Year Ended December 31, 2016 vs. 2015 and 2015 vs. 2014
The increase in net income of $224.7 million (981%) from the prior year in net income is primarily attributable to a $205.6 million change in the unrealized foreign exchange gains (losses) on the KMI Loans denominated in U.S. dollars. Due to changes in the exchange rates between Canadian and U.S. dollars, we recorded unrealized foreign exchange gains of $29.7 million in 2016, and unrealized foreign exchange losses of $175.8 million in 2015 associated with the KMI Loans. The remainder of the $19.1 million increase is largely attributable to increased Terminals segment EBDA driven by increased contributions from the Edmonton Rail Terminal joint venture and other terminal projects being placed in service, and reduced general and administrative expense from 2015 environmental costs that did not recur in 2016.
The decrease in net income of $42.4 million (217%) from the prior year in net income is primarily attributable to a $99.9 million increase in the unrealized foreign exchange losses on the KMI Loans denominated in U.S. dollars. Due to changes in the exchange rates between Canadian and U.S. dollars, we recorded unrealized foreign exchange losses of $175.9 million and $76.0 million in 2015 and 2014, respectively. The remainder of the $57.5 million increase is largely attributable to an increase of $110.6 million in segment EBDA that is partially offset by a $34.8 million increase in DD&A, which were driven by the commissioning of new terminals facilities, including two new joint ventures in 2014 and 2015, incremental earnings from completion of the Cochin Reversal Project in 2014 and higher volumes on the Puget Sound pipeline system.
Non-GAAP Financial Measures
In addition to using financial measures prescribed by GAAP, references are made in this document to DCF and Adjusted EBITDA which are measures that do not have any standardized meaning as prescribed by GAAP. Neither Adjusted EBITDA nor DCF should be considered an alternative to GAAP net income or any other GAAP measures and such non-GAAP measures have important limitations as an analytical tool. The computation of Adjusted EBITDA and DCF may differ from similarly titled measures used by others. Accordingly, use of such terms may not be comparable to similarly defined measures presented by other entities. Investors should not consider these non-GAAP financial measures in isolation or as a substitute for an analysis of results as reported under GAAP. The limitations of these non-GAAP financial measures are compensated for by reviewing the comparable GAAP measures, understanding the differences between the measures and taking this information into account in our analysis and our decision making processes. Any use of Adjusted EBITDA or DCF in this document is expressly qualified by this cautionary statement.
DCF is net income before DD&A adjusted for (i) income tax expense and cash income taxes (paid) refunded; (ii) sustaining capital expenditures; and (iii) certain items that are items required by GAAP to be reflected in net income, but typically either (a) do not have a cash impact, or (b) by their nature are separately identifiable from the normal business operations and in our view are likely to occur only sporadically.
DCF is an important performance measure used by us and by external users of our financial statements to evaluate our performance and to measure and estimate our ability to generate cash earnings after servicing our debt and preferred share dividends, paying cash taxes and expending sustaining capital, that could be used for discretionary purposes such as distributions or expansion capital expenditures. We use this performance measure and believe it provides users of our financial statements a useful performance measure reflective of our ability to generate cash earnings to supplement the comparable GAAP measure. DCF should not be used as an alternative to net cash provided by operating activities computed under GAAP. We believe the GAAP measure most directly comparable to DCF is net income available to Kinder Morgan Interest and Restricted Voting Shareholders. A reconciliation of net income to DCF is provided in the table below. DCF per Restricted Voting Share is DCF divided by average outstanding Restricted Voting Shares, including restricted stock awards that participate in dividends.
Reconciliation of Net Income to DCF
|
| Three Months Ended |
| Nine Months Ended |
| ||||
(In millions of Canadian dollars) |
| 2017 |
| 2016 |
| 2017 |
| 2016 |
|
|
|
|
|
|
|
|
|
|
|
Net Income (1) |
| 42.4 |
| 20.3 |
| 114.3 |
| 184.0 |
|
Add/(Subtract): |
|
|
|
|
|
|
|
|
|
DD&A |
| 37.2 |
| 34.3 |
| 107.6 |
| 102.5 |
|
Certain items(2) |
| (0.4 | ) | 15.7 |
| 3.6 |
| (54.2 | ) |
Total book taxes(3) |
| 14.6 |
| 17.7 |
| 43.8 |
| 46.3 |
|
Cash income taxes refunded (paid) |
| 0.3 |
| 0.2 |
| — |
| (1.0 | ) |
Preferred share dividends |
| (2.0 | ) | — |
| (2.0 | ) | — |
|
Sustaining capital expenditures |
| (14.9 | ) | (11.0 | ) | (27.3 | ) | (26.6 | ) |
DCF |
| 77.2 |
| 77.2 |
| 240.0 |
| 251.0 |
|
Weighted average Restricted Voting Shares outstanding for dividends(4) |
| 103.6 |
| n/a |
| 103.4 |
| n/a |
|
DCF per Restricted Voting Share |
| 0.214 |
| n/a |
| 0.297 |
| n/a |
|
Declared dividend per Restricted Voting Share |
| 0.1625 |
| n/a |
| 0.2196 |
| n/a |
|
|
| Years Ended December 31, |
| ||||
(In millions of Canadian dollars) |
| 2016 |
| 2015 |
| 2014 |
|
Net Income (Loss)(1) |
| 201.8 |
| (22.9 | ) | 19.5 |
|
Add/(Subtract): |
|
|
|
|
|
|
|
DD&A |
| 137.2 |
| 123.5 |
| 88.7 |
|
Certain items(2) |
| (29.7 | ) | 175.9 |
| (72.7 | ) |
Total book taxes |
| 56.3 |
| 62.1 |
| 26.6 |
|
Cash income taxes (paid) refunded |
| (1.2 | ) | 0.4 |
| (1.5 | ) |
Sustaining capital expenditures |
| (46.2 | ) | (66.3 | ) | (58.7 | ) |
DCF |
| 318.2 |
| 272.7 |
| 147.3 |
|
Adjusted EBITDA is used by the Company and external users of our financial statements, in conjunction with net debt, to evaluate certain leverage metrics. Adjusted EBITDA is calculated by adjusting net income before interest expense, taxes and DD&A (EBITDA) adjusted for certain items, as applicable. Because Adjusted EBITDA is derived from net income, we believe the GAAP measure that is most directly comparable to Adjusted EBITDA is net income. A reconciliation of net income to Adjusted EBITDA is provided in the table below. We do not allocate Adjusted EBITDA amongst equity interest holders as we view total Adjusted EBITDA as a measure against our overall leverage.
Reconciliation of Net Income to Adjusted EBITDA
|
| Three Months Ended |
| Nine Months Ended |
| ||||
(In millions of Canadian dollars) |
| 2017 |
| 2016 |
| 2017 |
| 2016 |
|
|
|
|
|
|
|
|
|
|
|
Net Income(1) |
| 42.4 |
| 20.3 |
| 114.3 |
| 184.0 |
|
Add/(Subtract): |
|
|
|
|
|
|
|
|
|
DD&A |
| 37.2 |
| 34.3 |
| 107.6 |
| 102.5 |
|
Certain items(2) |
| (0.4 | ) | 15.7 |
| 3.6 |
| (54.2 | ) |
Total book taxes(3) |
| 14.6 |
| 17.7 |
| 43.8 |
| 46.3 |
|
Interest, net |
| 1.3 |
| 7.0 |
| 10.9 |
| 22.9 |
|
Adjusted EBITDA |
| 95.1 |
| 95.0 |
| 280.2 |
| 301.5 |
|
|
| Years Ended December 31, |
| ||||
(In millions of Canadian dollars) |
| 2016 |
| 2015 |
| 2014 |
|
Net Income (Loss)(1) |
| 201.8 |
| (22.9 | ) | 19.5 |
|
Add/(Subtract): |
|
|
|
|
|
|
|
DD&A |
| 137.2 |
| 123.5 |
| 88.7 |
|
Certain items(2) |
| (29.7 | ) | 175.9 |
| 72.7 |
|
Income tax expense |
| 56.3 |
| 62.1 |
| 26.6 |
|
Interest, net |
| 29.9 |
| 30.1 |
| 49.4 |
|
Adjusted EBITDA |
| 395.5 |
| 368.7 |
| 256.9 |
|
n/a — not applicable
Notes:
(1) During the three and nine months ended September 30, 2017 and 2016, net income includes (a) capitalized equity financing costs of $7.8 million, $4.6 million, $19.6 million, and $12.8 million, respectively, and (b) interest expense on KMI Loans of none, $10.9 million, $19.6 million, and $32.9 million, respectively. During the years ended December 31, 2016, 2015 and 2014, net income (loss) includes (a) capitalized equity financing costs of $17.9 million, $12.9 million and $11.2 million, respectively, and (b) interest expense on long-term debt-affiliates of $44.5 million, $42.5 million and $63.0 million, respectively.
(2) Prior to our IPO, amounts primarily represented foreign currency losses and (gains) on the KMI Loans. The principal portion of the KMI Loans were repaid using proceeds from our IPO and the 2014 amount also includes a gain on the sale of propane pipeline line-fill related to the Cochin Reversal Project.
(3) Excludes book tax certain items.
(4) Includes restricted stock awards that participate in dividends.
Segment Earnings Results
Pipelines Segment
(In millions of Canadian |
| Three Months Ended |
| Nine Months Ended |
| ||||||||||
dollars, except operating statistics) |
| 2017 |
| 2016 |
| 2017 |
| 2016 |
| ||||||
|
|
|
|
|
|
|
|
|
| ||||||
Revenues |
| 95.9 |
| 98.6 |
| 281.8 |
| 287.0 |
| ||||||
Operating expenses, except DD&A |
| (42.4 | ) | (45.1 | ) | (124.9 | ) | (115.5 | ) | ||||||
Other income and unrealized foreign exchange loss, net |
| 5.0 |
| 4.7 |
| 12.1 |
| 12.8 |
| ||||||
Segment EBDA |
| 58.5 |
| 58.2 |
| 169.0 |
| 184.3 |
| ||||||
|
|
|
|
|
|
|
|
|
| ||||||
Change from prior period |
| Increase/(Decrease) |
| ||||||||||||
Revenues |
| (2.7 | ) | (3 | )% | (5.2 | ) | (2 | )% | ||||||
Segment EBDA |
| 0.3 |
| 1 | % | (15.3 | ) | (8 | )% | ||||||
|
| 2017 |
| 2016 |
| 2017 |
| 2016 |
|
Trans Mountain transport volumes (MMBbl) |
| 29.3 |
| 30.7 |
| 84.4 |
| 88.1 |
|
Puget Sound transport volumes (MMBbl) |
| 16.1 |
| 18.7 |
| 45.5 |
| 55.3 |
|
Cochin transport volumes (MMBbl) |
| 7.7 |
| 7.7 |
| 23.4 |
| 22.6 |
|
Year Ended December 31, |
| 2016 |
| 2015 |
| 2014 |
|
Revenues |
| 388.6 |
| 383.7 |
| 351.0 |
|
Operating expenses, except DD&A |
| (164.5 | ) | (152.7 | ) | (145.0 | ) |
Other income, net |
| — |
| 1.7 |
| 1.2 |
|
Other income and unrealized foreign exchange gain (loss), net (1) |
| 17.8 |
| 16.8 |
| 13.7 |
|
Segment EBDA |
| 241.9 |
| 249.5 |
| 220.9 |
|
Change from prior period |
| Increase/(Decrease) |
|
|
| ||
Revenues |
| 4.9 |
| 32.7 |
|
|
|
Segment EBDA |
| (7.6 | ) | 28.6 |
|
|
|
Trans Mountain pipeline system transport volumes (MMBbl) |
| 115.2 |
| 115.4 |
| 106.8 |
|
Puget Sound pipeline system transport volumes (MMBbl) |
| 69.8 |
| 64.6 |
| 52.4 |
|
Canadian Cochin pipeline system transport volumes (MMBbl) |
| 30.8 |
| 29.2 |
| 14.4 |
|
Note:
(1) 2014 includes a certain item for a $3.3 million gain on sale of propane pipeline line-fill.
Below are the changes in both Segment EBDA and revenues, in the comparable three and nine month periods ended September 30, 2017 and 2016:
Three Months Ended September 30, 2017 vs. Three Months Ended September 30, 2016
(In millions of Canadian |
| Segment EBDA |
| Revenues increase/(decrease) |
| ||||
Trans Mountain |
| 4.6 |
| 10 | % | (1.0 | ) | (1 | )% |
Cochin |
| (2.8 | ) | (64 | )% | (0.1 | ) | (1 | )% |
Puget Sound |
| (1.6 | ) | (22 | )% | (1.7 | ) | (18 | )% |
All others (including eliminations) |
| 0.1 |
| 13 | % | 0.1 |
| 6 | % |
Total Pipelines |
| 0.3 |
| 1 | % | (2.7 | ) | (3 | )% |
Nine Months Ended September 30, 2017 vs. Nine Months Ended September 30, 2016
(In millions of Canadian |
| Segment EBDA |
| Revenues increase/(decrease) |
| ||||
Trans Mountain |
| 2.7 |
| 2 | % | (1.4 | ) | (1 | )% |
Cochin |
| (11.6 | ) | (64 | )% | 1.4 |
| 4 | % |
Puget Sound |
| (6.7 | ) | (29 | )% | (5.4 | ) | (19 | )% |
All others (including eliminations) |
| 0.3 |
| 12 | % | 0.2 |
| 4 | % |
Total Pipelines |
| (15.3 | ) | (8 | )% | (5.2 | ) | (2 | )% |
The changes in Segment EBDA for our Pipelines segment are further explained by the following discussion of the significant factors driving Segment EBDA in the comparable three and nine month periods ended September 30, 2017 and 2016:
· increases of $4.6 million (10%) and $2.7 million (2%), respectively, from Trans Mountain primarily due to an increase in capitalized equity financing costs related to the TMEP and an increase in unrealized foreign exchange gains between the comparable periods primarily related to U.S. dollar denominated affiliate balances partially offset by an increase in operating expense largely due to timing changes and lower Washington State revenues;
· decreases of $2.8 million (64%) and $11.6 million (64%), respectively, from Cochin primarily due to a decrease in earnings resulting from unrealized foreign exchange losses between the comparable periods primarily related to U.S. dollar denominated receivables with affiliates and cash balances. In addition, the quarter-to-date and year-to-date decreases were partially impacted by lower and higher pipeline integrity expenses, respectively; and
· decreases of $1.6 million (22%) and $6.7 million (29%), respectively, from Puget Sound primarily due to lower revenues driven by lower pipeline throughput volumes.
Year Ended December 31, 2016 vs. 2015 and 2015 vs. 2014
For the comparable years of 2016 and 2015, the Pipelines segment had a decrease in Segment EBDA of $7.6 million (3%) which was driven primarily by (i) an $8.6 million decrease in Segment EBDA from the Cochin pipeline system, consisting of a $2.6 million increase in revenues offset by an $11.2 million increase in operating expenses, which included a $9.0 million increase in pipeline integrity costs in 2016 and (ii) $4.2 million of lower unrealized foreign exchange gains related to U.S. dollar denominated cash, accounts payable and accounts receivable. The decreases in Segment EBDA were partially offset by (i) a $2.0 million increase in Segment EBDA from the Puget Sound pipeline system, consisting of a $4.6 million increase in revenues and a $2.6 million increase in operating expenses from increased pipeline volumes, net of foreign exchange effects and (ii) a $5.0 million increase in capitalized equity financing costs related to the TMEP.
For the comparable years of 2015 and 2014, the Pipelines segment had an increase in Segment EBDA of $28.7 million (13%) which was driven primarily by (i) an increase in revenues and earnings of $29.5 million and $14.6 million, respectively, due to the full year of contributions from the Cochin Reversal Project that was completed in July 2014; (ii) a $9.4 million increase in earnings from the Puget Sound pipeline system in Washington State from higher volumes which contributed approximately $10.5 million in additional revenues offset by $1.1 million of additional operating expense, net of foreign currency effects; (iii) $5.2 million of higher revenues and earnings on Trans Mountain pipeline system due to changes in rate base; and (iv) a $1.7 million increase in capitalized equity financing costs related to the TMEP.
Terminals Segment
(In millions of Canadian |
| Three Months Ended |
| Nine Months Ended |
| ||||
dollars, except operating statistics) |
| 2017 |
| 2016 |
| 2017 |
| 2016 |
|
|
|
|
|
|
|
|
|
|
|
Revenues |
| 71.1 |
| 70.9 |
| 218.4 |
| 214.9 |
|
Operating expenses, except DD&A |
| (20.1 | ) | (17.4 | ) | (62.1 | ) | (57.3 | ) |
Other expense, net |
| (0.5 | ) | (0.2 | ) | (2.7 | ) | (0.2 | ) |
Other income and unrealized foreign exchange loss, net |
| 2.2 |
| (1.3 | ) | 5.5 |
| 5.2 |
|
Segment EBDA |
| 52.7 |
| 52.0 |
| 159.1 |
| 162.6 |
|
Change from prior period |
| Increase/(Decrease) |
| ||||||
Revenues |
| 0.2 |
| — | % | 3.5 |
| 2 | % |
Segment EBDA |
| 0.7 |
| 1 | % | (3.5 | ) | (2 | )% |
|
|
|
|
|
|
|
|
|
|
Bulk transload tonnage (MMtonnes) |
| 1.2 |
| 1.2 |
| 3.2 |
| 3.1 |
|
Liquids leaseable capacity (MMBbl) |
| 7.3 |
| 7.3 |
| 7.3 |
| 7.3 |
|
Liquids utilization %(1) |
| 100 | % | 100 | % | 100 | % | 100 | % |
Year Ended December 31, |
| 2016 |
| 2015 |
| 2014 |
|
Revenues |
| 287.5 |
| 262.2 |
| 154.2 |
|
Operating expenses, except DD&A |
| (79.1 | ) | (67.4 | ) | (50.4 | ) |
Other expense, net |
| (0.3 | ) | (0.4 | ) | (0.2 | ) |
Other income and unrealized foreign exchange gain (loss), net |
| 3.1 |
| (13.9 | ) | (5.1 | ) |
Segment EBDA |
| 211.2 |
| 180.5 |
| 98.5 |
|
Change from prior period |
| Increase/(Decrease) |
|
|
| ||
Revenues |
| 25.3 |
| 108.0 |
|
|
|
EBDA |
| 30.7 |
| 82.0 |
|
|
|
Bulk transload tonnage (MMtonnes) |
| 3.7 |
| 4.5 |
| 4.3 |
|
Liquids leaseable capacity (MMBbl) |
| 7.5 |
| 7.5 |
| 5.8 |
|
Liquids utilization %(1) |
| 100 | % | 100 | % | 100 | % |
Note:
(1) The ratio of our storage capacity under contract to estimated storage capacity.
Below are the changes in both Segment EBDA and revenues, in the comparable three and nine month periods ended September 30, 2017 and 2016:
Three Months Ended September 30, 2017 vs. Three Months Ended September 30, 2016
(In millions of Canadian |
| Segment EBDA |
| Revenues increase/(decrease) |
| ||||
North 40 Terminal |
| 1.8 |
| 26 | % | 0.8 |
| 10 | % |
Edmonton Rail Terminal joint venture |
| 1.2 |
| 9 | % | — |
| — | % |
Alberta Crude Terminal joint venture |
| (1.7 | ) | (68 | )% | (1.9 | ) | (49 | )% |
Vancouver Wharves Terminal |
| (0.8 | ) | (9 | )% | 0.1 |
| — | % |
Edmonton South Terminal |
| — |
| — | % | 1.2 |
| 6 | % |
All others (including eliminations) |
| 0.2 |
| (200 | )% | — |
| — | % |
Total Terminals |
| 0.7 |
| 1 | % | 0.2 |
| — | % |
Nine Months Ended September 30, 2017 vs. Nine Months Ended September 30, 2016
(In millions of Canadian |
| Segment EBDA |
| Revenues increase/(decrease) |
| ||||
North 40 Terminal |
| (0.1 | ) | — | % | 1.7 |
| 7 | % |
Edmonton Rail Terminal joint venture |
| 2.1 |
| 5 | % | 0.1 |
| — | % |
Alberta Crude Terminal joint venture |
| (5.2 | ) | (69 | )% | (5.6 | ) | (48 | )% |
Vancouver Wharves Terminal |
| (2.6 | ) | (10 | )% | 4.7 |
| 7 | % |
Edmonton South Terminal |
| 2.4 |
| 4 | % | 2.6 |
| 4 | % |
All others (including eliminations) |
| (0.1 | ) | (100 | )% | — |
| — | % |
Total Terminals |
| (3.5 | ) | (2 | )% | 3.5 |
| 2 | % |
The changes in Segment EBDA for our Terminals business segment are further explained by the following discussion of the significant factors driving Segment EBDA in the comparable three and nine month periods ended September 30, 2017 and 2016:
· increase of $1.8 million (26%) and decrease of $0.1 million (0%), respectively, from North 40 Terminal. The quarter-to-date increase was primarily due to higher throughput volumes and ancillary service fees and an increase in unrealized foreign exchange gains between the comparable periods primarily related to U.S. dollar denominated accounts payable to Kinder Morgan. The year-to-date decrease was impacted by a decrease in unrealized foreign exchange gains between the comparable periods primarily related to U.S. dollar denominated accounts payable to Kinder Morgan which was partially offset by an increase in revenues due to higher throughput volumes and ancillary service fees;
· increases of $1.2 million (9%) and $2.1 million (5%), respectively, from Edmonton Rail Terminal joint venture primarily due to an increase in unrealized foreign exchange gains between the comparable periods primarily related to U.S. dollar denominated accounts payable to Kinder Morgan;
· decreases of $1.7 million (68%) and $5.2 million (69%), respectively, from Alberta Crude Terminal joint venture which was primarily driven by a contracted throughput fee reduction;
· decreases of $0.8 million (9%) and $2.6 million (10%), respectively, from Vancouver Wharves Terminal primarily due to lower margins associated with bulk handling operations. The year-to-date decrease was partially offset by an increase in earnings related to a customer contract buy-out, net of associated project write-off costs; and
· flat and increase of $2.4 million (4%), respectively, from Edmonton South Terminal primarily due to higher throughput volumes and ancillary service fees. The quarter-to-date flat performance was also impacted by higher operating costs resulting from a timing adjustment in the prior year quarter.
Year Ended December 31, 2016 vs. 2015
For the comparable years of 2016 and 2015, the Terminals business segment had an increase in Segment EBDA of $30.7 million (17%) driven primarily by Edmonton-area expansion projects including (i) the commissioning of the Edmonton Rail Terminal joint venture which contributed $23.1 million and $18.6 million of additional revenue and Segment EBDA, respectively; (ii) rail terminal connectivity additions at the Edmonton South Terminal that contributed $6.5 million and $4.8 million of additional revenues and Segment EBDA, respectively; and (iii) $16.6 million favorable change in foreign exchange effects. The Vancouver Wharves Terminal’s 2015 revenues included a contract buyout and additional “take-or-pay” revenue totaling $5.5 million.
Year Ended December 31, 2015 vs. 2014
For the comparable years of 2015 and 2014, the Terminals business segment had an increase in Segment EBDA of $82.0 million (83%). This increase was driven by (i) the Edmonton Rail Terminal joint venture which was commissioned in April 2015 and contributed $37.6 million Segment EBDA in 2015; (ii) expansion capital projects at the Edmonton South Terminal, including the full-year impact of eight additional storage tanks placed in service throughout 2014 and an outbound pipeline connection to the Edmonton Rail Terminal joint venture placed in service in 2015, which combined contributed $34.1 million of additional revenues and $32.0 million of additional Segment EBDA in 2015; and (iii) the Alberta Crude Terminal joint venture which was commissioned in November 2014 and contributed $11.6 million and $ 8.8 million in additional revenue and earnings, respectively. In addition, during 2015 the Vancouver Wharves Terminal’s revenue benefited from a contract buyout and additional “take-or-pay” revenue totaling $5.5 million. These increases in Segment EBDA were partially offset by $8.7 million unfavorable change in foreign exchange effects.
Unrealized foreign exchange gain (loss) on the long-term debt affiliates
Three and Nine Months Ended September 30, 2017 vs. Three and Nine Months Ended September 30, 2016
During June 2017 we repaid the principal on the long-term debt-affiliate (KMI Loans) utilizing proceeds from our IPO, and the associated notes payable were terminated. The exchange rate at the time of repayment of the notes was 1.3470. Prior to then we were exposed to foreign currency risk related to the U.S. dollar denominated KMI Loans.
As of September 30, 2016, we had amounts outstanding under the KMI Loans of $1,281.4 million. The Bank of Canada quoted U.S. dollar to Canadian dollar closing exchange rates on September 30, 2016 was 1.3116. As of December 31, 2016, we had amounts outstanding under the KMI Loans of $1,362.1 million. The Bank of Canada quoted U.S. dollar to Canadian dollar closing exchange rates on December 31, 2016 was 1.3427.
The $16.3 million favorable change between the three months ended September 30, 2017 and 2016 was due to the payoff of the notes in June 2017. The $56.6 million unfavorable change between the nine months ended September 30, 2017 and 2016 on foreign exchange rate gains associated with the KMI Loans was primarily due to less strengthening of the Canadian dollar against the U.S. dollar during the period prior to the KMI Loans payoff in June 2017.
Year Ended December 31, 2016 vs. 2015 and 2015 vs. 2014
As of December 31, 2016, 2015, 2014 and 2013, we had amounts outstanding under the KMI Loans of $1,362.1 million, $1,320.4 million, $1,050.1 million and $942.2 million, respectively. The Bank of Canada quoted U.S. dollar to Canadian dollar closing exchange rates on each of December 31, 2016, 2015, 2014 and 2013 were 1.3427; 1.3841; 1.1601 and 1.0636, respectively.
The $205.6 million favorable change between 2016 and 2015 on unrealized foreign exchange rate gains (losses) associated with the KMI Loans was due to a slight strengthening of the Canadian dollar against the U.S. dollar in 2016, as compared to a significant weakening in 2015. In addition, the KMI Loans balance increased by $270.3 million from December 31, 2014 to December 31, 2015.
General and Administrative Expense
Three and Nine Months Ended September 30, 2017 vs. Three and Nine Months Ended September 30, 2016
The $0.9 million increase in general and administrative expense before certain items of $0.1 million in 2017 for the comparable third quarters of 2017 and 2016 was primarily driven by increased benefits costs and audit fees. The $2.5 million increase
in general and administrative expense before certain items of $2.6 million in 2017 for the comparable nine months of 2017 and 2016 was primarily driven by increased benefits costs and audit fees.
Year Ended December 31, 2016 vs. 2015 and 2015 vs. 2014
General and administrative costs were higher in 2015 than in 2016 and 2014 because we allocated fewer labor costs to new construction projects in 2015 as compared to 2014 and 2016 after the completion of several projects in 2014 and early 2015, and before the 2016 ramp-up of work on the TMEP.
Interest, net
Three and Nine Months Ended September 30, 2017 vs. Three and Nine Months Ended September 30, 2016
Interest expense is presented as net of interest income and capitalized interest. Interest, net decreased $5.7 million for the comparable quarters of 2017 and 2016, driven primarily by a $10.9 million decrease due to the repayment of our long-term debt-affiliates (KMI Loans) in June 2017 as part of our IPO and a $4.2 million increase in capitalized debt financing costs partially offset by an increase of $9.2 million in interest expense, including interest on revolver, commitment fees and amortization of debt issue costs, associated with our Credit Facility. See “—Liquidity and Capital Resources” below. Interest, net decreased $12.0 million for the comparable nine months of 2017 and 2016, driven primarily by a $14.4 million decrease due to the repayment of our long-term debt-affiliates (KMI Loans) in June 2017 as part of our IPO and a $9.5 million increase in capitalized debt financing costs partially offset by an increase of $10.5 million in interest expense, including interest on revolver, commitment fees and amortization of debt issue costs, associated with our new Credit Facility.
Year Ended December 31, 2016 vs. 2015 and 2015 vs. 2014
Interest expense decreased $0.2 million and $19.4 million in 2016 and 2015, respectively, when compared with the respective prior year. The 2016 interest expense was relatively flat compared to 2015 because the KMI Loans balances were relatively consistent during those two years. The decrease in interest expense in 2015, as compared to 2014, was primarily due to the renewal of notes payable to Kinder Morgan subsidiaries at lower interest rates, partially offset by an increase in the KMI Loans during 2014. The weighted average interest rate on the KMI Loans was 3.3%, 3.6% and 6.0% for the years ended December 31, 2016, 2015 and 2014, respectively.
Net Income Attributable to Kinder Morgan Interest
Net income attributable to Kinder Morgan interest represents the allocation of our consolidated net income attributable to all outstanding ownership interests in our consolidated subsidiaries that is owned by Kinder Morgan. The increase in net income attributable to Kinder Morgan interest for the three months ended September 30, 2017 when compared with the respective prior period was $8.4 million, which was due to inclusion of earnings attributable to Kinder Morgan. The decrease in net income attributable to Kinder Morgan interest for the nine months ended September 30, 2017 when compared with the respective prior period was $87.6 million, which was primarily attributable to the May 2017 IPO and associated reduction in Kinder Morgan’s interest in us.
Income Taxes
Three and Nine Months Ended September 30, 2017 vs. Three and Nine Months Ended September 30, 2016
Income tax expense for the three months ended September 30, 2017 was $14.7 million, as comparable with 2016 income tax expense of $17.7 million. The $3.0 million decrease in income tax expense is primarily due to a reduction in pretax income and the impact of pension adjustments. Income tax expense for the nine months ended September 30, 2017 was $42.4 million, as compared with 2016 income tax expense of $46.3 million. The $3.9 million decrease in income tax expense is due primarily to a reduction in pretax income and the impact of pension adjustments.
Year Ended December 31, 2016 vs. 2015 and 2015 vs. 2014
Income tax expense for the year ended December 31, 2016 was $56.4 million, as compared with 2015 income tax expense of $62.1 million. The $5.7 million decrease in income tax expense was due primarily to the capital gain from the impact of exchange rate fluctuations in respect of the KMI Loans which resulted in the release of the valuation allowance. These decreases were partially offset by the tax impact on higher pre-tax earnings. Income tax expense for the year ended December 31, 2015 was $62.1 million, as compared with 2014 income tax expense of $26.5 million. The $35.6 million increase in income tax expense was due primarily to the
change in the statutory corporate tax rate and the impact of exchange rate fluctuations in respect of the KMI Loans, the capital losses from which are fully valued.
Liquidity and Capital Resources
On June 16, 2017, we closed on the Credit Facility, which includes a $4.0 billion revolving construction facility, a $1.0 billion revolving contingent facility and a $500.0 million revolving working capital facility.
Any drawn funds on the Credit Facility bear interest (i) in the case of drawdowns by way of bankers’ acceptances or London Interbank Offered Rate Loans, at an annual rate of approximately the Canadian Dollar Offered Rate (“CDOR”) or the London Interbank Offered Rate, as the case may be, plus a fixed spread ranging from 1.50% to 2.50%, and (ii) in the case of loans in Canadian dollars or U.S. dollars, at an annual rate of approximately the Canadian prime rate or the U.S. dollar base rate, as the case may be, plus a fixed spread ranging from 0.50% to 1.50%, in each case, with the range dependent on the credit ratings of the Company. In addition, drawdowns on the Credit Facility by way of issuance of letters of credit will have issuance fees based on an annual rate of approximately CDOR plus a fixed spread ranging from 1.50% to 2.50%, with the range dependent on the credit ratings of the Company. The foregoing rates and fees will increase by 0.25% on the fourth anniversary of the Credit Facility. Any undrawn commitments incur a standby fee of 0.30% to 0.625%, with the range dependent on the credit ratings of the Company. The Credit Facility is guaranteed by the Company and all of the non-borrower subsidiaries of the Company and are secured by a first lien security interest on all of the assets of the Company and the equity and assets of the other guarantors. The Credit Facility has a five year term. The Credit Facility provides for customary positive and negative covenants, including limitations on liens, dispositions, amalgamations, liquidations and dissolutions.
As of September 30, 2017, we were in compliance with all required covenants. As of September 30, 2017, we had $165.0 million outstanding on our construction facility and no outstanding borrowings under our working capital facility. For the three and nine months ended September 30, 2017, we incurred $3.9 million and $4.6 million in standby fees. Our Credit Facility includes various financial and other covenants including:
· a maximum ratio of consolidated total funded debt to consolidated capitalization of 70%;
· restrictions on ability to incur debt;
· restrictions on ability to make dispositions, restricted payments and investments;
· restrictions on granting liens and on sale-leaseback transactions;
· restrictions on ability to engage in transactions with affiliates; and
· restrictions on ability to amend organizational documents and engage in corporate reorganization transactions.
Drawdowns on each of the Credit Facilities are subject to satisfaction of certain conditions precedent set out in the credit agreement relating thereto, a copy of which is available under our profile on SEDAR at www.sedar.com.
General
As of September 30, 2017, we had $330.3 million of cash and cash equivalents, an increase of $171.3 million (108%) from December 31, 2016. We believe that, our cash position, our cash flows from operating activities and our access to cash through the Credit Facility are considered adequate to manage our day-to-day cash requirements.
We generated cash flows from operating activities of $158.8 million and $261.6 million in the first nine months of 2017 and 2016, respectively, (the decrease of 39% for the first nine months of 2017 versus 2016 are discussed below in ‘‘—Cash Flows—Operating Activities’’). Prior to our May 2017 IPO, we also received $70.2 million of borrowings and $10.8 million of contributions from Kinder Morgan subsidiaries that were used to partially fund our expansion capital expenditures.
Short-term Liquidity
As of September 30, 2017 and December 31, 2016 our principal source of short-term liquidity was cash from operating activities. We had working capital (defined as current assets less current liabilities) deficits of $44.2 million and $200.6 million as of September 30, 2017 and December 31, 2016, respectively. Generally, our working capital balance varies due to factors such as timing differences in the collection and payment of receivables and payables, and changes in our cash and cash equivalent balances after payments for investing activities net of cash received from operating and financing activities. We expect to continue to operate with a working capital deficit during the construction of the TMEP. Such a deficit will be funded primarily
through the use of the revolving construction facility, which has been put in place to fund the cost of the TMEP, as well as dividend and distribution reinvestments, term debt and the issuance of preferred equity. In addition, we will be in a position to utilize the $500.0 million revolving working capital facility for general corporate purposes, including the funding of growth capital expenditures for expansion projects other than the TMEP. In addition, we received $293.0 million of net proceeds from the issuance of the Series 1 Preferred Shares in August, 2017 and $243.2 million of net proceeds from the issuance of the Series 3 Preferred Shares in December, 2017.
Long-term Financing
We expect to fund the TMEP capital expenditures through (i) additional borrowings on our Credit Facility; (ii) the issuance of additional preferred shares; (iii) the issuance of long-term notes payable; (iv) retained cash flow from operations; and (v) the issuance of additional restricted voting stock or a combination of the above.
Credit Ratings
The following credit ratings information is provided as it relates to our financing costs and liquidity. Specifically, credit ratings affect our ability to obtain short-term and long-term financing and the cost of such financing. A reduction in the current ratings on our debt by its rating agencies, particularly a downgrade below investment-grade ratings, could adversely affect our cost of financing and its access to sources of liquidity and capital. In addition, changes in credit ratings may affect our ability, and the associated costs, to enter into normal course derivative or hedging transactions. Credit ratings are intended to provide investors with an independent measure of credit quality of any issues of securities.
These ratings are not recommendations to purchase, hold or sell the securities inasmuch as such ratings do not comment as to market price or suitability for a particular investor. There is no assurance that any rating will remain in effect for any given period of time or that any rating will not be revised or withdrawn entirely by a rating agency in the future if, in its judgment, circumstances so warrant.
DBRS Limited (“DBRS”) has assigned a debt rating of ‘BBB (high)’ to KMCU with a stable trend. KMCU is a wholly-owned subsidiary of the Limited Partnership and is the primary borrower under the Credit Facilities. DBRS also assigned a Pfd-3 (high), Stable rating to the Company’s preferred shares. S&P has assigned a rating of ‘BBB’ corporate credit rating to the Company and KMCU, an issue-level rating of ‘BBB’ to the borrower’s Credit Facilities and a stable outlook. S&P also assigned a P-3 (High) rating to the Company’s preferred shares.
On October 17, 2017, Moody’s Investors Service (“Moody’s”) assigned a Baa3 senior secured rating to KMCU’s credit facility. The rating outlook is stable. Moody’s credit ratings are on a long-term debt rating scale that ranges from Aaa to C; a rating of Baa by Moody’s is within the fourth highest of nine categories and is assigned to obligations that are judged to be medium-grade and are subject to moderate credit risk. Moody’s appends numerical modifiers 1, 2 and 3 to each generic rating classification; the modifier 3 indicates a ranking in the lower end of that generic rating category. A Moody’s rating outlook is an opinion regarding the likely rating direction over the medium term. A stable outlook indicates a low likelihood of a rating change over the medium term.
Capital Expenditures
We account for our capital expenditures in accordance with GAAP. We also distinguish between capital expenditures that are sustaining capital expenditures (also referred to as “maintenance” capital expenditures) and those that are expansion capital expenditures (also referred to as “discretionary” capital expenditures). Expansion capital expenditures are those expenditures which increase throughput or capacity from that which existed immediately prior to the addition or improvement, and are not deducted in calculating DCF. Sustaining capital expenditures are those which maintain throughput or capacity. The distinction between maintenance and expansion capital expenditures is a physical determination rather than an economic one, irrespective of the amount by which the throughput or capacity is increased.
Budgeting of sustaining capital expenditures is done annually on a bottom-up basis. For each of our assets, we budget for and make those sustaining capital expenditures that are necessary to maintain safe and efficient operations, meet customer needs and comply with our operating policies and applicable law. We may budget for and make additional sustaining capital expenditures that we expect will produce economic benefits such as increasing efficiency and/or lowering future expenses. Budgeting and approval of expansion capital expenditures are generally made periodically throughout the year on a project-by-project basis in response to specific investment opportunities identified by our segments from which it generally expects to receive sufficient returns to justify the expenditures. Generally, the determination of whether a capital expenditure is classified as sustaining or as expansion capital expenditures is made on a project level. The classification of capital expenditures as expansion capital expenditures or as sustaining capital expenditures is made consistent with our accounting policies and is generally a straightforward process, but in certain
circumstances can be a matter of management judgment and discretion. The classification of capital expenditures has an impact on DCF because capital expenditures that are classified as discretionary capital expenditures are not deducted from DCF, while those classified as sustaining capital expenditures are.
|
| 2016 |
| Q3 2017 |
| Expected 2017 |
| Total 2017 |
|
|
| (In millions of Canadian dollars) |
| ||||||
Sustaining capital expenditures |
| 46.2 |
| 27.3 |
| 20.1 |
| 47.4 |
|
Expansion capital expenditures |
| 231.2 | (1) | 449.2 | (2) | 266.7 |
| 715.9 |
|
Notes:
(1) The 2016 amount includes an increase of a combined $8.4 million of net changes from accrued capital expenditures and contractor retainage that primarily relates to the TMEP and Base Line Terminal project.
(2) Nine-months 2017 excludes $68.7 million of net changes from accrued capital expenditures, contractor retainage, capitalized equity financing costs and other.
Off Balance Sheet Arrangements
As at September 30, 2017, we had no material off balance sheet arrangements other than those included below.
Contractual Obligations and Commercial Commitments
|
| Payments due by period |
| ||||||||
|
| Total |
| Remaining |
| 2 - 3 years |
| 4 - 5 years |
| More than 5 |
|
|
| (In millions of Canadian dollars) |
| ||||||||
Contractual obligations: |
|
|
|
|
|
|
|
|
|
|
|
Debt Borrowings — principal payments(1) |
| 165.0 |
| 165.0 |
| — |
| — |
| — |
|
Leases and rights-of-way obligations(2) |
| 52.6 |
| 5.1 |
| 31.9 |
| 13.0 |
| 2.6 |
|
Pension and post-retirement welfare plans (3) |
| 66.1 |
| 2.0 |
| 1.8 |
| 1.9 |
| 60.4 |
|
Other obligations(4) |
| 5.0 |
| 1.6 |
| 3.1 |
| 0.3 |
| — |
|
Total |
| 288.8 |
| 173.8 |
| 36.8 |
| 15.2 |
| 63.0 |
|
Other commercial commitments: |
|
|
|
|
|
|
|
|
|
|
|
Standby letters of credit(5) |
| 46.7 |
| 446.7 |
| — |
| — |
| — |
|
Capital expenditures(6) |
| 373.3 |
| 373.3 |
| — |
| — |
| — |
|
Notes:
(1) Represents principal amount outstanding under the Credit Facility as of September 30, 2017. Excludes interest payments associated with the debt balance.
(2) Represents commimitments pursuant to the terms of operating lease agreements and liabilities for rights-of-way.
(3) Represents the amount by which the benefit obligations exceeded the fair value of fund assets for pension and other post-retirement benefit plans at December 31, 2016 net of contributions made during the nine months ended September 30, 2017. The payments by period include contributions to funded plans in 2017 and estimated benefit payments for unfunded plans in all years.
(4) Primarily includes environmental liabilities related to sites that we own or have a contractual or legal obligation with a regulatory agency or property owner upon which it will perform remediation activities. These liabilities are included within “Retirement and post-retirement benefits” in our consolidated balance sheets.
(5) The amount outstanding as of September 30, 2017 represents the letters of credit supporting the Pipelines and Terminals segments.
(6) Represents commitments for the purchase of plant, property and equipment as of September 30, 2017 including $69.6 million of our proportional share of commitments through joint ownership of a joint venture.
Cash Flows
The following table summarizes our net cash flows from operating, investing and financing activities for each period presented:
Nine Months Ended September 30, |
| 2017 |
| 2016 |
|
Net cash provided by (used in): |
|
|
|
|
|
Operating activities |
| 158.8 |
| 261.6 |
|
Investing activities |
| (420.0 | ) | (190.1 | ) |
Financing activities |
| 433.8 |
| 12.4 |
|
Effect of Exchange Rate Changes on Cash and Cash Equivalents |
| (1.3 | ) | (1.6 | ) |
Net increase in cash and cash equivalents |
| 171.3 |
| 82.3 |
|
Years Ended December 31, |
| 2016 |
| 2015 |
| 2014 |
|
Net cash provided by (used in): |
|
|
|
|
|
|
|
Operating activities |
| 309.7 |
| 223.9 |
| 357.2 |
|
Investing activities |
| (283.5 | ) | (353.4 | ) | (485.9 | ) |
Financing activities |
| 59.9 |
| 11.9 |
| 90.0 |
|
Effect of Exchange Rate Changes on Cash and Cash Equivalents |
| 0.2 |
| 10.6 |
| 8.0 |
|
Net increase (decrease) in cash and cash equivalents |
| 86.3 |
| (107.0 | ) | (30.7 | ) |
Operating Activities
The net decrease of $102.8 million in cash provided by operating activities in the nine months ended September 30, 2017 compared to the same period in 2016 was primarily attributable to:
· a $97.1 million net decrease in cash associated with net changes in operating assets and liabilities, primarily due to interest payments made to Kinder Morgan subsidiaries when we paid off the KMI Loans in 2017, and due to the timing of the collection of trade and affiliate receivables and payables. These decreases were partially offset by an increase in cash due to favorable changes from the dock premiums and toll collections received from Westridge Marine Terminal dock customers; and
· a $5.7 million decrease in operating cash flow resulting from after the combined effects of adjusting the $69.7 million decrease in net income for the period-to-period increase in non-cash items primarily consisting of the following: (i) change in foreign exchange due to foreign exchange rate on the KMI Loans; (ii) DD&A expenses; (iii) deferred income taxes; (iv) capitalized equity financing costs; and (v) other non-cash items.
The net increase of $85.8 million in cash provided by operating activities in 2016 compared to 2015 was primarily attributable to:
· a $93.7 million net increase in cash associated with net changes in operating assets and liabilities, primarily due to the following: (i) $75.1 million increase in accrued interests due to the timing of payments, and (ii) $18.5 million higher cash flows from favorable changes in the collection and payment of trade and affiliates receivables and payables; and
· a $7.9 million decrease in cash from overall net income after adjusting for a period-to-period $224.7 million increase in net income for non-cash items primarily consisting of the following: (i) change in foreign exchange due to foreign exchange rate on the KMI Loans; (ii) DD&A expenses; (iii) deferred income taxes; (iv) capitalized equity financing costs; and (v) other non-cash items.
The net decrease of $133.3 million in cash provided by operating activities in 2015 compared to 2014 was primarily attributable to:
· a $292.3 million net decrease in cash associated with net changes in operating assets and liabilities, primarily due to the following: (i) $141.5 million decrease in accrued interests due to the timing of payments; (ii) $80.9 million lower cash flows from unfavorable changes in the collection and payment of trade and affiliates receivables and payables; and (iii) $37.7 million decrease in cash due to lower net dock premiums and toll collections received from the Westridge Marine Terminal dock customers; and
· a $159.0 million increase in cash from overall net income after adjusting for a period-to-period $42.4 million decrease in net income for non-cash items primarily consisting of the following: (i) loss due to foreign exchange rate on the KMI Loans; (ii) DD&A expenses; (iii) deferred income taxes; (iv) capitalized equity financing costs; and (v) gain on sale of property, plant and equipment and other miscellaneous non-cash items.
Investing Activities
The $229.9 million net increase in cash used in investing activities in nine months ended September 30, 2017 compared to the same period in 2016 was primarily attributable to a $230.4 million increase in capital expenditures for expansion projects.
The $69.9 million net decrease in cash used in investing activities in 2016 compared to 2015 was primarily attributable to a $71.0 million decrease in cash used due to lower capital expenditures.
The $132.5 million net decrease in cash used in investing activities in 2015 compared to 2014 was primarily attributable to a $145.8 million decrease in cash used due to lower capital expenditures, partially offset by a $14.0 million increase in cash used due to contributions made in 2015 to Trans Mountain and Cochin reclamation trusts as restricted funds required by the NEB for estimated future pipeline abandonment costs.
Financing Activities
The net increase of $421.4 million in cash provided by financing activities in the nine months ended September 30, 2017, compared to the same period in 2016 was primarily attributable to:
· $1,671.0 million of proceeds from our IPO, net of fees paid;
· $293.5 million of proceeds from the preferred shares issuance in 2017, net of fees paid; and
· $90.3 million of net proceeds from the net draw from our construction and working capital facilities, net of debt issue costs; partially offset by,
· a $1,618.8 million decrease in cash related to the long-term affiliate debt activity primarily due to a $1,606.3 million decrease in cash in 2017 as we paid off the KMI Loans using proceeds from our IPO;
· a $10.2 million decrease in cash due to the contribution received from Kinder Morgan in 2016 and none in 2017; and
· a $4.3 million decrease in cash due to the dividend we paid to our share owners.
The net increase of $48.0 million in cash provided by financing activities in 2016 compared to 2015 was primarily attributable to a $18.7 million increase in cash due to lower distributions paid to Kinder Morgan, a $17.7 million decrease in cash due to lower proceeds from KMI Loans and a $10.7 million increase in cash due to higher contributions received from Kinder Morgan.
The net decrease of $78.1 million in cash provided by financing activities in 2015 compared to 2014 was primarily attributable to a $39.8 million decrease in cash due to distributions paid to Kinder Morgan in 2015 and a $37.4 million decrease in cash due to lower proceeds from KMI Loans.
Risks and Risk Management
For a detailed discussion of the risks and trends that could affect our financial performance and the steps that we take to mitigate these risks, see Notes 9 and 10 of the Interim Consolidated Financial Statements and Notes 15 and 16 of the Annual Consolidated Financial Statements attached hereto.
Transactions with Affiliates
We have transactions with Kinder Morgan and its subsidiaries. Refer to Notes 5 and 9 of the Interim Consolidated Financial Statements and Annual Consolidated Financial Statements, respectively, attached hereto for the amounts due to or from affiliates on the consolidated balance sheets and the classification of revenue and expenses in the consolidated statements of income.
Accounting Policies, Judgments and Estimates
Our significant accounting policies and critical judgments and estimates used in the preparation of our consolidated financial statements are summarized in the Annual Consolidated Financial Statements included elsewhere in this report. There have been no material changes to our significant accounting policies and critical accounting estimates and judgments during the periods presented herein.
Accounting Policy Changes
Adoption of New Accounting Pronouncements
Amendments to the Consolidation Analysis
On February 18, 2015, the FASB issued ASU No. 2015-02, “Consolidation (Topic 810) — Amendments to the Consolidated Analysis.” This ASU focuses on the consolidation evaluation for reporting organizations that are required to evaluate whether they
should consolidate certain legal entities. We adopted ASU No. 2015-02 effective January 1, 2016 with no material impact to our consolidated financial statements.
Balance Sheet Classification of Deferred Taxes
In November 2015, the FASB issued ASU No. 2015-17 “Income Taxes (Topic 740): Balance Sheet Classification of Deferred Taxes,” which requires that deferred tax assets and liabilities be classified as non-current on the balance sheet. The new guidance is effective January 1, 2017, however, since early application is permitted, we elected to retrospectively apply this guidance on January 1, 2014. Application of this new guidance simplified our process in determining deferred tax amounts and our financial statement presentation.
Changes to Statement of Cash Flows Presentation
On August 26, 2016, the FASB issued ASU 2016-15, “Statement of Cash Flows — Classification of Certain Cash Receipts and Cash Payments (Topic 230).” This ASU is intended to reduce the diversity in practice around how certain transactions are classified within the statement of cash flows. We adopted ASU No. 2016-15 in 2016 with no material impact to our consolidated financial statements.
Going Concern Considerations
On August 27, 2014, the FASB issued ASU No. 2014-15, “Disclosure of Uncertainties about an Entity’s Ability to Continue as a Going Concern.” This ASU provides guidance about management’s responsibility to evaluate whether there is substantial doubt about an entity’s ability to continue as a going concern and to provide related footnote disclosures if management concludes that substantial doubt exists or that our plans alleviate substantial doubt that was raised. ASU 2014-15 was adopted by us for the year ended December 31, 2016 with no impact to our consolidated financial statements.
Accounting for Inventory
On July 22, 2015, the FASB issued ASU No. 2015-11, “Inventory (Topic 330): Simplifying the Measurement of Inventory.” This ASU requires entities to subsequently measure inventory at the lower of cost and net realizable value, and defines net realizable value as the estimated selling price in the ordinary course of business, less reasonably predictable costs of completion, disposal, and transportation. We adopted ASU No. 2015-1 as of January 1, 2017, with no material impact to our consolidated financial statements.
Future Accounting Changes
Revenue from Contracts with Customers (Topic 606)
On May 28, 2014, the FASB issued ASU No. 2014-09, “Revenue from Contracts with Customers” followed by a series of related accounting standard updates (collectively referred to as “Topic 606”). Topic 606 is designed to create greater revenue recognition and disclosure comparability in financial statements. The provisions of Topic 606 include a five-step process by which an entity will determine revenue recognition, depicting the transfer of goods or services to customers in amounts reflecting the payment to which an entity expects to be entitled in exchange for those goods or services. Topic 606 requires certain disclosures about contracts with customers and provides more comprehensive guidance for transactions such as service revenue, contract modifications, and multiple-element arrangements.
We are in the process of comparing our current revenue recognition policies to the requirements of Topic 606 for each of our revenue categories. While we have not identified any material differences in the amount and timing of revenue recognition for the categories we have reviewed to date, our evaluation is not complete, and we have not concluded on the overall impacts of adopting Topic 606. Topic 606 will require that our revenue recognition policy disclosure include further detail regarding our performance obligations as to the nature, amount, timing, and estimates of revenue and cash flows generated from our contracts with customers. Topic 606 will also require disclosure of significant changes in contract asset and contract liability balances period to period and the amount of the transaction price allocated to performance obligations that are unsatisfied (or partially unsatisfied) as of the end of the reporting period, as applicable. We anticipate utilizing the modified retrospective method to adopt the provisions of this standard effective January 1, 2018, which requires us to apply the new revenue standard to (i) all new revenue contracts entered into after January 1, 2018 and (ii) all existing revenue contracts as of January 1, 2018 through a cumulative adjustment to equity. In accordance with this approach, our consolidated revenues for periods prior to January 1, 2018 will not be revised.
Accounting for Leases
On February 25, 2016, the FASB issued ASU No. 2016-02, “Leases (Topic 842).” This ASU requires that lessees will be required to recognize assets and liabilities on the balance sheet for the present value of the rights and obligations created by all leases with terms of more than 12 months. The ASU will also require disclosures designed to give financial statement users information on the amount, timing, and uncertainty of cash flows arising from leases. ASU 2016-02 will be effective for us as of January 1, 2019. We are currently reviewing the effect of ASU No. 2016-02.
Changes in Restricted Cash as presented in the Statement of Cash Flows
On November 17, 2016, the FASB issued ASU No. 2016-18, “Statement of Cash Flows (Topic 230): Restricted Cash (a consensus of the FASB Emerging Issues Task Force).” This ASU requires the statement of cash flows to explain the change during the period in the total of cash, cash equivalents, and amounts generally described as restricted cash or restricted cash equivalents. Therefore, amounts generally described as restricted cash and restricted cash equivalents are to be included with cash and cash equivalents when reconciling the beginning of period and end of period amounts shown on the statement of cash flows. ASU No. 2016-18 will be effective for us as of January 1, 2018. We are currently reviewing the effect of this ASU to our financial statements.
Goodwill Impairment Testing
On January 26, 2017, the FASB issued ASU No. 2017-04, “Simplifying the Test for Goodwill Impairment (Topic 350)” to simplify the accounting for goodwill impairment. The guidance removes Step 2 of the goodwill impairment test, which requires a hypothetical purchase price allocation. A goodwill impairment will now be the amount by which a reporting unit’s carrying value exceeds its fair value, not to exceed the carrying amount of goodwill. ASU No. 2017-04 will be effective for us as of January 1, 2020. We are currently reviewing the effect of this ASU to our financial statements.
Presentation of Retirement Benefit Costs
On March 10, 2017, the FASB issued ASU No. 2017-07, “Compensation - Retirement Benefits (Topic 715).” This ASU requires an employer to disaggregate the service cost component from the other components of net benefit cost, allow only the service cost component of net benefit cost to be eligible for capitalization, and how to present the service cost component and the other components of net benefit cost in the income statement. ASU No. 2017-07 will be effective for us as of January 1, 2018. We are currently reviewing the effect of this ASU to our financial statements.
The information required by Item 3 is contained in “Item 1. Business.”
ITEM 4. SECURITY OWNERSHIP OF CERTAIN BENEFICIAL OWNERS AND MANAGEMENT.
The following tables set forth, as of the date of this document, information known to us regarding the beneficial ownership of :
· Company Voting Shares by each person known by us to own beneficially more than 5% of our Company Voting Shares,
· Company Voting Shares by each of our directors, executive officers and all of our directors and executive officers as a group and
· Shares of common stock of Kinder Morgan, Inc. by each of our directors and executive officers and all of our directors and executive officers as a group.
Beneficial ownership is determined in accordance with the rules of the SEC. Based on information provided to us, except as indicated in the footnotes or as provided by applicable community property laws, the persons named in the table below have sole voting and investment power with respect to the shares indicated.
As at the date hereof, the following persons beneficially own more than 5% of our Company Voting Shares.
Shareholder Name and address |
| Class of |
| Amount and |
| Percentage |
| Percentage of |
|
Kinder Morgan Canada Company |
| Special Voting Shares |
| 227,167,977 | (1) | 65.79 | % | 93.77 | % |
|
|
|
|
|
|
|
|
|
|
KM Canada Terminals ULC |
| Special Voting Shares |
| 15,092,849 | (1) | 4.37 | % | 6.23 | % |
(1) Kinder Morgan, Inc. is the ultimate parent of both KMCC and KM Canada Terminals and has voting and investment power over the Special Voting Shares held by KMCC and KM Canada Terminals.
As at the date hereof, the following directors or executive officers of the Company beneficially own, directly or indirectly, Company Voting Shares.
Shareholder Name and address |
| Class of |
| Amount and |
| Percentage of |
| Percentage |
|
Daniel P.E. Fournier |
| Restricted Voting Shares |
| 16,500 |
| * |
| * |
|
|
|
|
|
|
|
|
|
|
|
Gordon M. Ritchie |
| Restricted Voting Shares |
| 17,790 |
| * |
| * |
|
|
|
|
|
|
|
|
|
|
|
Brooke N. Wade |
| Restricted Voting Shares |
| 5,790 |
| * |
| * |
|
|
|
|
|
|
|
|
|
|
|
Directors and executive officers as a group |
| Restricted Voting Shares |
| 40,080 |
| * |
| * |
|
* represents ownership of less than 1%.
As at the date hereof, the following directors and executive officers beneficially own, directly or indirectly, shares of common stock of Kinder Morgan, Inc, or KMI.
Shareholder Name and address |
| Title of Class |
| Amount and |
| Percentage of |
|
Steven J. Kean (1) |
| Class P Common Stock of Kinder Morgan, Inc. |
| 7,777,651 |
| * |
|
|
|
|
|
|
|
|
|
Kimberly A. Dang (2) |
| Class P Common Stock of Kinder Morgan, Inc. |
| 2,340,985 |
| * |
|
|
|
|
|
|
|
|
|
Daniel P.E. Fournier |
| Class P Common Stock of Kinder Morgan, Inc. |
| — |
| — |
|
|
|
|
|
|
|
|
|
Gordon M. Ritchie |
| Class P Common Stock of Kinder Morgan, Inc. |
| — |
| — |
|
Dax A. Sanders (3) |
| Class P Common Stock of Kinder Morgan, Inc. |
| 278,471 |
| * |
|
|
|
|
|
|
|
|
|
Brooke N. Wade |
| Class P Common Stock of Kinder Morgan, Inc. |
| — |
| — |
|
|
|
|
|
|
|
|
|
Ian D. Anderson |
| Class P Common Stock of Kinder Morgan, Inc. |
| 17,803 |
| * |
|
|
|
|
|
|
|
|
|
Hugh Harden |
| Class P Common Stock of Kinder Morgan, Inc. |
| — |
| — |
|
|
|
|
|
|
|
|
|
Norm Rinne |
| Class P Common Stock of Kinder Morgan, Inc. |
| — |
| — |
|
|
|
|
|
|
|
|
|
David Safari |
| Class P Common Stock of Kinder Morgan, Inc. |
| — |
| — |
|
|
|
|
|
|
|
|
|
John W. Schlosser (4) |
| Class P Common Stock of Kinder Morgan, Inc. |
| 255,094 |
| * |
|
|
|
|
|
|
|
|
|
Scott Stoness |
| Class P Common Stock of Kinder Morgan, Inc. |
| — |
| — |
|
|
|
|
|
|
|
|
|
Directors and executive officers as a group |
|
|
| 10,670,004 |
| * |
|
* represents ownership of less than 1%.
(1) Includes 754,717 restricted shares subject to forfeiture until July 16, 2019. Includes 230,000 shares held by a limited partnership of which Mr. Kean is the sole general partner and two trusts (for which Mr. Kean serves as the sole trustee and of which family members of Mr. Kean are sole beneficiaries) each own a 49.5% limited partner interest. Mr. Kean disclaims beneficial ownership of the shares held by the limited partnership except to the extent of his pecuniary interest therein. Also includes 225,000 shares owned by a charitable foundation of which Mr. Kean is a member of the board of directors and shares voting and investment power. Mr. Kean disclaims any beneficial ownership in these 225,000 shares. Also includes 7,877 shares into which 5,102 depositary shares, each representing 1/20th of a share of KMI’s 9.75% Series A Mandatory Convertible Preferred Stock, are convertible.
(2) Includes 226,416 restricted shares subject to forfeiture until July 16, 2019. Includes 2,026,048 shares held by a limited partnership of which Ms. Dang controls the voting and disposition power. Ms. Dang disclaims 10% of any beneficial and pecuniary interest in these shares.
(3) Includes 62,894 restricted shares subject to forfeiture until July 16, 2018. Also includes 944 shares into which 612 depositary shares, each representing 1/20th of a share of KMI’s 9.75% Series A Mandatory Convertible Preferred Stock, are convertible. Includes 800 shares held in IRA accounts of the reporting person’s mother over which the reporting person has been granted a limited power of attorney on behalf of and for the benefit of his mother and with respect to which he is a contingent beneficiary and 800 shares held in a brokerage account from which all dividends and other payments are made to the reporting person’s mother and with respect to which the reporting person is a joint tenant with right of survivorship. The reporting person disclaims beneficial ownership of the securities held in such IRA accounts and brokerage account. 131,903 shares, together with the 612 depositary shares described in this paragraph, are pledged by Mr. Sanders as collateral for a line of credit, which line of credit is undrawn as of the date hereof.
(4) Includes 150,944 shares subject to forfeiture restrictions that lapse on March 1, 2019.
ITEM 5. DIRECTORS AND EXECUTIVE OFFICERS.
The following table provides the names, ages as of December 15, 2017 and business addresses of the directors and executive officers of the Company and their principal occupation. Mr. Kean, Ms. Dang, Mr. Sanders and Mr. Fournier were appointed as directors on April 21, 2017 and Mr. Ritchie and Mr. Wade were appointed as directors on May 5, 2017. The term of office of all directors of the Company will expire at the first annual meeting of our shareholders and, thereafter, at each annual meeting of our shareholders or at the time at which his or her successor is elected or appointed, or earlier if any director otherwise resigns, is removed or is disqualified. The board of directors and executive officers of the General Partner, which is responsible for managing the business and affairs of the Limited Partnership, are the same as that of the Company. None of the executive officers of the Company is employed by the Company, with five of the executive officers being primarily located in Canada and employed by KMCI (including Mr. Anderson) and the remaining three executive officers being primarily located in the United States and employed by Kinder Morgan. As a result of their existing roles with Kinder Morgan, the three executive officers of the Company located in the United States and employed by Kinder Morgan will not devote all or a majority of their time to the business and affairs of the Company. See “Item 11. Description of Registrant’s Securities to be Registered—Limited Partnership Units” and “Item 1A. Risk Factors—Risks Relating to Our Relationship with Kinder Morgan.”
Name and |
| Position with the Company |
| Age |
| Principal Occupation |
|
Steven J. Kean |
| Chair of the Board and Chief Executive Officer |
| 56 |
| President and Chief Executive Officer and a member of the Office of the Chairman and Director of Kinder Morgan |
|
Name and |
| Position with the Company |
| Age |
| Principal Occupation |
|
Kimberly A. Dang |
| Director |
| 47 |
| Vice President and Chief Financial Officer and a member of the Office of the Chairman and Director of Kinder Morgan |
|
|
|
|
|
|
|
|
|
Daniel P. E. Fournier |
| Director (Independent)(1)(2)(3)(4) |
| 64 |
| Retired, former barrister and solicitor with Blake, Cassels & Graydon LLP |
|
|
|
|
|
|
|
|
|
Gordon M. Ritchie |
| Lead Director (Independent)(1)(2)(3)(4) |
| 64 |
| Retired, former Vice Chairman of RBC Capital Markets |
|
|
|
|
|
|
|
|
|
Dax A. Sanders |
| Director and Chief Financial Officer |
| 42 |
| Vice President of Corporate Development of Kinder Morgan |
|
|
|
|
|
|
|
|
|
Brooke N. Wade |
| Director (Independent)(1)(2)(3)(4) |
| 64 |
| President of Wade Capital Corporation |
|
|
|
|
|
|
|
|
|
Ian D. Anderson |
| President |
| 59 |
| President of the Company and an officer of Kinder Morgan (President of Kinder Morgan Canada) |
|
|
|
|
|
|
|
|
|
Hugh Harden |
| Vice President, Operations |
| 64 |
| Vice President, Operations of the Company |
|
|
|
|
|
|
|
|
|
Norm Rinne |
| Vice President, Business Development |
| 56 |
| Vice President, Business Development of the Company |
|
|
|
|
|
|
|
|
|
David Safari |
| Vice President, TMEP |
| 63 |
| Vice President, TMEP of the Company |
|
|
|
|
|
|
|
|
|
John W. Schlosser |
| President, Terminals |
| 54 |
| President, Terminals of Kinder Morgan |
|
|
|
|
|
|
|
|
|
Scott Stoness |
| Vice President, Finance and Corporate Secretary |
| 57 |
| Vice President, Finance and Corporate Secretary of the Company |
|
Notes:
(1) Member of the Audit Committee. Mr. Ritchie serves as Chair of the Audit Committee.
(2) Member of the Nominating and Governance Committee. Mr. Fournier serves as Chair of the Nominating and Governance Committee.
(3) Member of the Compensation Committee. Mr. Wade serves as Chair of the Compensation Committee.
(4) Member of the Environmental, Health and Safety Committee. Mr. Fournier serves as Chair of the Environmental, Health and Safety Committee.
Directors and Executive Officers Biographical Information
The following are brief profiles of each of the executive officers and directors of the Company, which include a description of their qualifications, present occupation and principal occupations for the past five years and beyond.
Steven J. Kean, Chair of the Board and Chief Executive Officer
Steven J. Kean has served as the non-independent Chair of the Board of Directors and Chief Executive Officer of the Company since April 2017 and is the President and Chief Executive Officer and a member of the board of directors of Kinder Morgan. Mr. Kean joined Kinder Morgan in 2002 and has held numerous senior management positions within Kinder Morgan, including Executive Vice President of Operations and President of Natural Gas Pipelines. He was Executive Vice President and Chief Operating Officer for Kinder Morgan and its predecessors from 2006 until March 2013, when he was named President and Chief Operating Officer, in which capacity he served until he assumed the Chief Executive Officer role in June 2015. Mr. Kean has worked in the energy industry since 1985 in various commercial, operational and legal positions, primarily in the wholesale energy and pipeline sectors. He holds a bachelor’s degree from Iowa State University and a law degree from the University of Iowa.
Kimberly A. Dang, Director
Kimberly A. Dang has served as a non-independent director of the Company since April 2017, and is Vice President and Chief Financial Officer of Kinder Morgan. Ms. Dang has also been a member of the board of directors of Kinder Morgan since January 2017. Ms. Dang has served as Vice President and Chief Financial Officer for Kinder Morgan and its predecessors and affiliates since 2005, and in various management and senior executive roles since joining Kinder Morgan in 2001. Prior to Kinder Morgan, Ms. Dang spent six years at Goldman Sachs working in the company’s real estate investment area. She also worked in Washington, D.C., as a legislative assistant for Congressman Jack Fields and in Austin, Texas, for a venture capital firm. Ms. Dang holds an MBA from the J.L. Kellogg Graduate School of Management at Northwestern University and a bachelor’s degree in accounting from Texas A&M University.
Daniel P. E. Fournier, Director
Daniel P. E. Fournier has served as an independent director of the Company since April 2017. For over 25 years, Mr. Fournier was a partner at the law firm of Blake, Cassels & Graydon LLP. Prior to his retirement in January 2017, Mr. Fournier led the Finance and Banking group in the firm’s Calgary office and obtained significant legal experience in the Middle East and North Africa region, having opened the firm’s offices in Bahrain and Saudi Arabia and acted as Chair of Blake, Cassels & Graydon LLP’s practice in the region for a number of years. Mr. Fournier has advised on the structuring of numerous private and public financings including with respect to the development of Canada’s oil sands industry and advising Canadian companies doing business abroad. His expertise also extends to structuring joint ventures between major energy participants and advising on shareholder agreements, joint venture agreements and corporate governance matters. Mr. Fournier recently served as General Counsel and Corporate Secretary of a public energy company prior to its sale to an international enterprise. He currently sits on the board of the Canada Arab Business Council and the board of DrillBook.com Inc. Mr. Fournier also served as a long-time director of Sports Calgary and was a founder of the Edge School for Athletes in Calgary. Mr. Fournier holds a Bachelor of Commerce from Concordia University (Montreal) and both a B.C.L. and an LL.B. from McGill University. Mr. Fournier was honored with a Queen’s Counsel designation in 2008.
Gordon M. Ritchie, Director
Gordon M. Ritchie has served as an independent director of the Company since May 2017. Mr. Ritchie retired in 2016, following a career spanning over 30 years with RBC Capital Markets LLC. From 2005 through 2016 Mr. Ritchie served as Vice Chairman, with primary responsibility for many of RBC’s top energy clients. During this period Mr. Ritchie led teams completing most of the largest energy M&A and financing transactions in Canada, aggregating in excess of $200 billion. From 2001 through 2005, Mr. Ritchie served as Managing Director and Head of the Global E&P Energy Group. Before that, Mr. Ritchie spent six years in New York where he served as President and Chief Executive Officer of RBC’s U.S. Broker/Dealer Operations (1993 to 1999); was co-Head of RBC’s International Corporate Finance Group based in London, England (1989 to 1993); was Vice President, Corporate Finance in Calgary (1984 to 1988); and Energy Research Analyst (1979 to 1983). He served as Vice-Chairman of RBC Capital Markets from 2005 until his retirement. Mr. Ritchie has extensive experience in investment banking with RBC Capital Markets in Europe, the United States and Canada. He served on the board of directors of Gemini Corporation from 2012 to 2016 and then rejoined its board in May 2017; in addition, he joined the board of directors of Obsidian Energy, Ltd. on December 1, 2017. Mr. Ritchie has been a member of the board of governors of the University of Calgary since 2013 and was appointed as Chair to the board of governors in 2016. Mr. Ritchie holds an MBA from the University of Western Ontario and a Bachelor of Arts (Economics) from the University of Alberta.
Dax A. Sanders, Chief Financial Officer and Director
Dax A. Sanders has served as a non-independent director and Chief Financial Officer of the Company since April 2017 and is Vice President, Corporate Development of Kinder Morgan, a role he has served in for Kinder Morgan and its predecessors and affiliates since March 2013. From 2009 until March 2013, he was a Vice President within Kinder Morgan’s Corporate Development group. From 2006 until 2009, Mr. Sanders was Vice President of Finance for Kinder Morgan’s Canada business segment. Mr. Sanders joined Kinder Morgan in 2000, and from 2000 to 2006 served in various finance and business development roles within its Corporate Development, Investor Relations, Natural Gas Pipelines and Products Pipelines groups, with the exception of a two year period while he attended business school. Mr. Sanders holds a master’s degree in business administration from the Harvard Business School and a master’s and a bachelor’s degree in accounting from Texas A&M University. He is also a Certified Public Accountant in the State of Texas.
Brooke N. Wade, Director
Brooke N. Wade has served as an independent director of the Company since May 2017. Mr. Wade is the President of Wade Capital Corporation, a private investment company active in private equity, oil and gas, real estate and industrial businesses. From 1994 to 2005, Mr. Wade was the co-founder and Chairman and Chief Executive Officer of Acetex Corporation, a publicly traded chemical company specializing in acetyls, specialty polymers, and films. In July 2005, Acetex Corporation was acquired by Blackstone. Prior to founding Acetex, Mr. Wade was founding President and Chief Executive Officer of Methanex Corporation. In 1991, Ocelot Industries spun out its oil and gas assets and began a plan of growth through acquisition into what is today Methanex Corporation — the world’s largest methanol producer. Prior to joining Ocelot, he was involved in a number of independent business ventures. Mr. Wade also serves on the boards of several private and public companies including, Novinium Inc., Gran Tierra Energy Inc., Belkin Enterprises Ltd., and is a member of the Advisory Board of Northbridge Capital Partners and a participant of the AEA Investors group of funds. In addition, Mr. Wade is a member of the Dean’s Advisory Council of the John F. Kennedy School of Government at Harvard University and the Buck Advisory Council of The Buck Institute for Research on Aging.
Ian D. Anderson, President
Ian D. Anderson has served as President of the Company since April 2017 and is also the President of Kinder Morgan Canada (a business segment of Kinder Morgan). Mr. Anderson has been with Kinder Morgan and its Canadian predecessor companies for more than 38 years. He was named President of Kinder Morgan Canada in 2005. Mr. Anderson is a Certified Management Accountant and a graduate of the University of Michigan Executive Program. He serves on several boards, including the Canadian Energy Pipeline Association, Association of Oil Pipe Lines and the Business Council of British Columbia.
Hugh Harden, Chief Operating Officer
Hugh Harden has served as Vice President, Operations of the Company since April 2017 and currently holds the position of Chief Operating Officer for Kinder Morgan Canada (a business segment of Kinder Morgan). Mr. Harden joined Kinder Morgan Canada in 2004 after working for Terasen, Inc. as Vice President, Operations. Mr. Harden holds a Bachelor of Science in Mechanical Engineering from the University of British Columbia and a Master’s of Business Administration from Simon Fraser University. Mr. Harden maintains his designation as a professional engineer in British Columbia. Mr. Harden is a member of the Canadian Energy Pipeline Association Standing Committee on Operations and a member of the Operating and Technical Committee of the American Petroleum Institute.
Norm Rinne, Vice President, Business Development
Norm Rinne has served as Vice President, Business Development of the Company since April 2017 and currently holds the position of Director, Business Development for Kinder Morgan Canada (a business segment of Kinder Morgan). Mr. Rinne has been with Kinder Morgan and its predecessor companies since 1990. Prior to that, he worked with Gulf Canada Resources in Calgary in the 1980s and was a geotechnical engineering consultant in Vancouver. Mr. Rinne holds a Bachelor of Science in Civil Engineering from the University of Waterloo (Ontario) and a Master’s of Science in Geotechnical Engineering from the University of British Columbia. Mr. Rinne maintains his designation as a professional engineer in both Alberta and British Columbia.
David Safari, Vice President, TMEP
David Safari has served as Vice President, TMEP of the Company since April 2017 and currently holds the position of Vice President, TMEP for Kinder Morgan Canada (a business segment of Kinder Morgan). He joined Kinder Morgan Canada in 2015, prior thereto he worked for Laricina Energy Ltd. as Vice President, Facilities from 2012 to 2015 and Statoil Canada as Senior Director, Projects from 2011 to 2012 Mr. Safari has over 30 years of industry experience in the energy sector. He holds a Bachelor of Science in Chemical Engineering (Oil & Gas) from the Sharif University of Technology in Tehran. Mr. Safari has worked on several major projects in multiple regions and countries around the world.
John W. Schlosser, President, Terminals
John W. Schlosser has served as President, Terminals of the Company since April 2017 and holds the position of President, Terminals for Kinder Morgan. Mr. Schlosser has served in his current role for Kinder Morgan and its predecessors and affiliates since March 2013. From 2010 until March 2013, he was Senior Vice President and Chief Commercial Officer of Kinder Morgan’s Terminals group. Mr. Schlosser joined Kinder Morgan in 2001 as Vice President of Sales and Business Development for Kinder Morgan’s Terminals group in connection with Kinder Morgan’s purchase of the U.S. pipeline and terminal assets of the GATX Corporation, where he served as Vice President of Sales. Mr. Schlosser has more than 32 years of experience in commodity transportation and logistics, business development and sales, sales management and operations. He previously worked for GATX, CSX Transportation, Sealand and Consolidated Freightways. Mr. Schlosser holds a Bachelor of Science degree in science from Miami University, Oxford, Ohio. He is a member of the Houston Chapter’s American Diabetes Association board and is chairman elect.
Scott Stoness, Vice President, Finance and Corporate Secretary
Scott Stoness has served as Vice President, Finance and Corporate Secretary of the Company since April 2017 and currently holds the position of Vice President, Regulatory and Finance for Kinder Morgan Canada (a business segment of Kinder Morgan). Mr. Stoness joined Kinder Morgan Canada in 2006 as Vice President, Regulatory. In 2009, Mr. Stoness’ role was expanded to include finance accountability. Prior to joining Kinder Morgan Canada, Mr. Stoness was the Vice-President of Regulatory for ENMAX Corporation and has worked in the energy sector of Canada and the U.S. for over 34 years. Mr. Stoness has extensive experience in managing projects and people in the area of cost of service, tariff design, cost of capital, facilities applications, risk management, structuring and finance. Mr. Stoness holds a Bachelor of Science in Electrical Engineering from the University of Manitoba and a Master’s of Business Administration from the University of Calgary. Mr. Stoness is a member of the Canadian Energy Pipeline Association Executive Business Standing Committee.
The Board of Directors has adopted a written Code of Business Conduct and Ethics (the “Code of Ethics”) that encourages and promotes a culture of ethical business conduct that is applicable to all directors, management, employees and consultants of the Company. The Audit Committee is responsible for the implementation and administration of the Code of Ethics. A copy of the Code of Ethics is available on our corporate website at Kindermorgancanadalimited.com under the Corporate Governance tab. Our corporate website is not incorporated into this registration statement.
Compliance with Section 16(a) of the Exchange Act
Section 16(a) of the Exchange Act will require our executive officers and directors and persons who own more than 10% of a registered class of our equity securities to file with the SEC initial statements of beneficial ownership, reports of changes in ownership and annual reports concerning their ownership of the our Restricted Voting Shares and Special Voting Shares, on Form 3, 4 and 5 respectively. Executive officers, directors and greater than 10% shareholders are required by SEC regulations to furnish our company with copies of all Section 16(a) reports they file.
The Board of Directors has appointed four standing committees: the Audit Committee, the Nominating and Governance Committee, the Compensation Committee and the Environmental, Health and Safety Committee. The Board of Directors has determined that all members of the Audit Committee are “independent” within the meaning of such term under the New York Stock Exchange (“NYSE”) listing standards applicable to audit committees, and Mr. Wade qualifies as an “audit committee financial expert” as defined in Item 407(d)(5) of SEC Regulation S-K. The Board of Directors has also determined that all members of the other committees of the Board of Directors are “independent” within the meaning of such term under the applicable NYSE listing standard for such committee.
Audit Committee
The Audit Committee is comprised of Gordon M. Ritchie, as Audit Committee Chair, Daniel P. E. Fournier and Brooke N. Wade. The committee’s primary role is to: (i) monitor the integrity of our financial statements, financial reporting processes, systems of internal controls regarding finance, accounting and legal compliance and disclosure controls and procedures; (ii) monitor our compliance with legal and regulatory requirements; (iii) subject to the rights of shareholders and applicable law, recommend for appointment, engage, oversee, retain, compensate and evaluate our external auditors, pre approve all audit and non-audit services to be provided, consistent with all applicable laws, to the Company by our external auditors, and establish the fees and other compensation
to be paid to the external auditors; (iv) monitor and evaluate the qualifications, independence and performance of our external auditors and internal auditing function; and (v) establish procedures for the receipt, retention, response to and treatment of complaints, including confidential, anonymous submissions by our employees, regarding accounting, internal controls, disclosure or auditing matters, and provide an avenue of communication among the external auditors, management, the internal auditing function and the Board of Directors.
The specific responsibilities of the Audit Committee are set out in the Audit Committee Charter, a copy of which is available on our corporate website at KinderMorganCanadaLimited.com under the Corporate Governance tab. For a summary of the education and experience of each member of the Audit Committee that is relevant to the performance of his responsibilities as a member of the Audit Committee, see “Item 5. Directors and Executive Officers—Directors and Executive Officers Biographical Information.”
PricewaterhouseCoopers LLP (Canada) is our auditor and was appointed in connection with our incorporation. PricewaterhouseCoopers LLP in the United States has served as Kinder Morgan’s auditor continuously since the inception of Kinder Morgan and its predecessor entity.
The Audit Committee, or the Audit Committee Chair or other members of the Audit Committee delegated such authority by the Audit Committee, has the sole authority to and must approve in advance any non-audit services performed by our external auditors, including tax services. Notwithstanding the foregoing, to the extent prohibited by law, our external auditors may not provide the following services to the Company: (i) bookkeeping or other services related to the accounting records or financial statements of the Company; (ii) financial information systems design and implementation; (iii) appraisal or valuation services, fairness opinions or contribution in kind reports; (iv) actuarial services; (v) internal audit outsourcing services; (vi) management functions; (vii) human resources; (viii) broker or dealer, investment adviser, or investment banking services; (ix) legal services; (x) expert services unrelated to the audit; and (xi) any other service that the applicable securities regulatory authorities determine, by regulation, is impermissible.
Nominating and Governance Committee
The Nominating and Governance Committee is comprised of Daniel P. E. Fournier, as Nominating and Governance Committee Chair, Gordon M. Ritchie and Brooke N. Wade.
The primary role of the Nominating and Governance Committee is to: (i) make recommendations regarding the size of the Board of Directors; (ii) identify individuals qualified to become Board of Directors members, and recommend director nominees to the Board of Directors for election at each annual meeting of the shareholders of the Company; (iii) identify from among the members of the Board of Directors and report to the Board of Directors on individuals recommended to serve as members of the various committees of the Board of Directors; (iv) annually reevaluate the Board Mandate and recommend to the Board of Directors any changes that the Nominating and Governance Committee deems necessary or appropriate; and (v) periodically evaluate Board of Directors and committee performance.
Compensation Committee
The Compensation Committee is comprised of Brooke N. Wade, as Compensation Committee Chair, Daniel P. E. Fournier and Gordon M. Ritchie.
The primary role of the Compensation Committee is to: (i) develop and recommend to the Board of Directors, the annual compensation, direct and indirect, to be received by the members of our senior management (other than those who are also employees of Kinder Morgan) and paid by KMCI; (ii) review new executive compensation programs; (iii) assess and monitor our director compensation programs; (iv) review on a periodic basis the effectiveness of our director and executive compensation to determine whether they are properly coordinated and achieving their intended purpose; (v) take steps to monitor any executive compensation program that yields payments and benefits that are not reasonably related to executive and institutional performance or are not competitive in the aggregate to programs of peer businesses; (vi) produce disclosure relating to director and executive compensation for inclusion in our periodic disclosure as required by applicable securities laws; and (vii) periodically review and assess our compensation and benefits plans of broad application.
Environmental, Health and Safety Committee
The Environmental, Health and Safety Committee is comprised of Daniel P. E. Fournier, as Environmental, Health and Safety Committee Chair, Gordon M. Ritchie and Brooke N. Wade.
The primary role of the Environmental Health and Safety Committee is to assist the Board of Directors in fulfilling certain of its oversight responsibilities by, among other things, overseeing the establishment and administration of the environmental, health and
safety policies, programs, procedures and initiatives for the Company, including those as will promote the safety and health of its employees, contractors, customers, the public and the environment, and reviewing periodically the reputation of the Kinder Morgan Canada Group as a responsible corporate citizens and efforts to employ sustainable business practices consistent with the purpose and values of the Company.
Assessment of Directors, the Board of Directors and Board Committees
The members of the Board of Directors, under the leadership of the Chair of the Board, will collectively assess the performance of the Board of Directors as a whole, each standing committee of the Board of Directors and all directors. Such assessment will occur annually and seek to determine whether the Board of Directors and its committees are functioning effectively and identify specific areas, if any, in need of improvement or strengthening.
ITEM 6. EXECUTIVE COMPENSATION.
Compensation of Executive Officers
The executive officers of the Company are Steven J. Kean, Dax A. Sanders, Ian D. Anderson, Hugh Harden, Norm Rinne, David Safari, John W. Schlosser and Scott Stoness. Each of Mr. Kean, Mr. Sanders, Mr. Anderson and Mr. Schlosser also currently serves as an executive officer of Kinder Morgan.
The compensation of Company executive officers who are employees of KMCI (including Mr. Anderson) will be determined by our Board of Directors, based on recommendations developed by the Compensation Committee in consultation with our senior management. The compensation of executive officers who are employees of Kinder Morgan is, and will continue to be, determined exclusively by the board of directors and compensation committee of Kinder Morgan and allocated among Kinder Morgan and its subsidiaries, including KMCI, in accordance with the existing policies of Kinder Morgan, with each subsidiary being responsible for paying its allocated portion. No profit or margin is charged in such allocation, unless otherwise required by applicable laws.
At this time, we have not developed a methodology for, and have not settled the significant elements of, our executive compensation for the executive officers that will be employed by KMCI. In addition, the allocated portion of the compensation of the Company’s executive officers that will continue to be employed by Kinder Morgan for the remainder of 2017 or for future periods will be made based on records kept by the applicable executive officers based on the time that is spent on the business of the Company relative to other components of Kinder Morgan’s overall business. The Board of Directors, however, awarded RSUs to certain executive officers in July 2017. See “—RSU Plan” below.
We estimate that, for 2017, the amount that will be paid by KMCI or allocated to the Kinder Morgan Canada Group in respect of the executive officers’ compensation will be approximately $9.4 million. See “Item 7. Certain Relationships and Related Transactions, and Director Independence—Agreements Between the Company and Kinder Morgan—Services Agreement.”
RSU Plan
Overview
We have adopted the 2017 Restricted Share Unit Plan for Employees (the “RSU Plan”) for employees of the Company and its affiliates (including employees of KMCI, as the service provider under the Services Agreement) (“Grantees”). The purpose of the RSU Plan is to provide incentive to employees of the Company and its affiliates for future endeavors and to advance the interests of the Company and its shareholders to enable the Company to compete effectively for the services of employees. The RSU Plan is administered by the Board of Directors, which will have authority to construe and interpret the RSU Plan, including any questions in respect of any restricted share units (“RSUs”) granted thereunder.
In July 2017, the Board of Directors granted RSUs to the Company’s executive officers in the amounts set forth below. All RSUs awarded vest on the earlier of July 25, 2020 or the three month anniversary of the in-service date of the TMEP, with the exception of Mr. Harden’s RSUs, which vest on December 31, 2018.
Name |
| Grant Date |
| Number of RSUs |
| Grant Date Fair Value |
| |
Ian Anderson |
| July 25, 2017 |
| 93,809 |
| $ | 1,500,000 |
|
Hugh Harden |
| July 25, 2017 |
| 45,341 |
| 725,000 |
| |
Norm Rinne |
| July 25, 2017 |
| 32,677 |
| 522,500 |
| |
David Safari |
| July 25, 2017 |
| 79,737 |
| 1,275,000 |
| |
Scott Stoness |
| July 25, 2017 |
| 75,047 |
| 1,200,000 |
| |
Grants of RSUs in the future will be determined by the Compensation Committee and Board of Directors as part of our ongoing executive and employee compensation program.
Grants and Vesting of RSU Awards
Under the RSU Plan, the Company may, in its discretion, award RSUs, which are effectively “phantom” Restricted Voting Shares, to Grantees, each of which will initially have a notional value equivalent to the value of a Restricted Voting Share. RSUs will vest and be settled at the end of a “restricted period” determined by the Board of Directors. Upon the expiration of the restricted period, and subject to the satisfaction of any performance goals (as described below) required to be achieved for all or a portion of such RSUs to vest and become payable, the Company will pay to the Grantee either (i) a number of Restricted Voting Shares equal to the number of vested RSUs, or (ii) an amount in cash equal to the fair market value of the Restricted Voting Shares otherwise issuable (generally being the closing price of the Restricted Voting Shares on the TSX on the day of vesting).
At the discretion of the Board of Directors, each RSU may be credited with cash and stock dividends equivalent to those paid on a Restricted Voting Share while the RSU is outstanding, and such cash dividend equivalents will be paid to the Grantee in cash either at approximately the time such dividends are paid on the Restricted Voting Shares or at the time of settlement of the RSU. KMCI’s historic practice has been to make dividend equivalent payments to employees quarterly at approximately the time dividends are paid on Kinder Morgan’s outstanding common stock, and the RSU Plan provides discretion to the Board of Directors to continue this practice. To the extent such cash dividend payments are deferred until settlement and an RSU is forfeited prior to settlement, the Grantee will have no right to such dividend equivalent payments.
In connection with the grant of RSUs, the Board of Directors may set certain performance goals that must be achieved in order for all or a portion of such RSUs to vest and become payable at the end of the applicable restricted period. Such performance goals will generally consist of one or more financial or operational metrics or share performance metrics. Any payments made under the RSU Plan are subject to applicable withholding tax requirements.
Restricted Voting Shares Reserved for Issuance
The RSU Plan provides that the number of Restricted Voting Shares that may be issued or issuable from the treasury of the Company pursuant to RSU awards shall not exceed 5,000,000 Restricted Voting Shares at any time. Additionally, the RSU Plan provides that the number of Restricted Voting Shares reserved for issuance from the treasury of the Company under all “security based compensation arrangements” (as defined by the TSX) shall not exceed 5,000,000 Restricted Voting Shares at any time. A “security based compensation arrangement” generally means any other plan under which equity securities can be issued from the Company’s treasury.
If any RSU is terminated, cancelled or has expired without being fully exercised, or is settled for cash, any unissued Restricted Voting Shares which have been reserved for issuance upon the vesting and settlement of the RSU shall become available to be issued upon the settlement of RSUs subsequently granted under the RSU Plan.
In addition, no RSUs shall be granted under the RSU Plan if, together with any other security based compensation arrangement established or maintained by the Company, such grant of RSUs could result, at any time, in the aggregate number of Restricted Voting Shares (i) issued to insiders of the Company, within any one-year period and (ii) issuable to insiders of the Company, at any time, exceeding the lesser of 5,000,000 Restricted Voting Shares and 10% of the issued and outstanding Restricted Voting Shares.
Forfeiture in Certain Circumstances
RSUs shall be subject to forfeiture until the expiration of the restricted period and satisfaction of any applicable performance goals during such period (as determined by the Board of Directors and set forth in the applicable RSU award agreement). To the extent such RSUs are forfeited, all rights of the Grantee to such RSUs shall terminate. Upon the termination of employment with or service to the Company or any of its affiliates during the applicable restricted period, RSUs held by a Grantee shall be forfeited, unless the Board of Directors determines that such forfeiture will be waived in whole or in part in the applicable award agreement or otherwise. In the event of a change in control (as such term is defined in the RSU Plan) of the Board of Directors, in its discretion, may take any action with respect to outstanding RSUs that it deems appropriate, which action may vary among RSUs granted to individual Grantees.
Effect of Certain Transactions
If the outstanding Restricted Voting Shares shall be changed in number or class by reason of split-ups, spin-offs, combinations, mergers, consolidations or recapitalizations, or by reason of stock dividends, the number of RSUs which may be issued pursuant to RSU awards shall be adjusted so as to reflect such change, all as determined by the Board of Directors. If there shall be any other change in the number or kind of the outstanding Restricted Voting Shares, or of any stock or other securities or property into which such Restricted Voting Shares shall have been changed or exchanged, then if the Board of Directors determines that such change equitably requires an adjustment in any RSU award, such adjustment shall be made in accordance with such determination. All such adjustments shall be subject to the approval of the TSX.
Notwithstanding the above, but subject to any particular award agreement, in the event of any of the following: (i) the Company is merged or consolidated with another corporation or entity and, in connection therewith, consideration is received by shareholders of the Company in a form other than stock or other equity interests of the surviving entity or outstanding RSU awards are not to be assumed upon consummation of the proposed transaction; (ii) all or substantially all of the assets of the Company are acquired by another person; (iii) the reorganization or liquidation of the Company; or (iv) the Company shall enter into a written agreement to undergo an event described in clause (i), (ii) or (iii) above, then the Board of Directors may, in its discretion and upon at least 10 days’ advance notice to the affected persons, cancel any outstanding RSU awards and cause the holders thereof to be paid in cash the value of such RSU awards based upon the price per Restricted Voting Share received or to be received by holders of Restricted Voting Shares in the applicable event. Furthermore, in the event of a change in control of the Company, the Board of Directors, in its discretion, may take any action with respect to outstanding RSU awards that it deems appropriate, which action may vary among RSU awards granted to individual Grantees; provided, however, that such action shall not reduce the value of an RSU award.
Amendments to the RSU Plan
The Board of Directors may, at any time, without the approval of Company Voting Shareholders, suspend, discontinue or amend the RSU Plan or an RSU awarded thereunder. However, the Board of Directors may not amend the RSU Plan or an RSU without the approval of the holders of a majority of Company Voting Shares who vote at a shareholder meeting to: (i) increase the number of Restricted Voting Shares, or the percentage of the issued and outstanding Company Voting Shares, reserved for issuance pursuant to the RSU Plan; (ii) expand the categories of individuals who are eligible to participate in the RSU Plan; (iii) remove or increase the limits on the number of Restricted Voting Shares issuable to any individual holder or to insiders as described under “—Restricted Voting Shares Reserved for Issuance” above; (iv) permit the transfer or assignment of RSUs, except to permit a transfer to a family member, an entity controlled by the holder of the RSUs or a family member, a charity or for estate planning or estate settlement purposes; or (v) amend the amendment provisions of the RSU Plan; unless the change to the RSU Plan or an RSU results from the application of the customary anti-dilution provisions of the RSU Plan. Additionally, no suspension, discontinuance or amendment may be made by the Board of Directors in respect of previously issued RSUs that would adversely alter or impair those awards without the consent of the affected holder. For greater certainty, the exercise by the Board of Directors of any discretion provided for in the RSU Plan, including to set or amend applicable performance goals, will not be considered to be an amendment to the RSU Plan or an RSU. Any amendments to the RSU Plan are also subject to the requirements of the TSX or other applicable regulatory bodies.
The Board’s director compensation policies provide that directors who are not also executive officers of the Company or employees of Kinder Morgan will be paid an annual retainer of $175,000. The Company will reimburse directors for all reasonable expenses incurred in connection with board or committee meetings.
Director RSU Plan
Overview
We have adopted the Restricted Share Unit Plan for Non-Employee Directors (the “Director RSU Plan”) for directors who are not salaried employees of the Company or Kinder Morgan (“Non-Employee Directors”). The purpose of the Director RSU Plan is to align the compensation of Non-Employee Directors with our interests and the interests of our shareholders.
The Director RSU Plan is administered by the Board of Directors, which has authority to construe and interpret the Director RSU Plan, including any questions in respect of any RSUs granted thereunder.
In August, 2017, Mr. Wade and Mr. Ritchie were each awarded 5,790 RSUs that vested on December 28, 2017.
Grants of RSUs in the future will be determined by the Board of Directors as part of our ongoing director compensation program.
Grants and Vesting of RSUs
Under the Director RSU Plan, a Non-Employee Director may elect to receive, in satisfaction of all or a portion of cash compensation otherwise payable to the Non-Employee Director in accordance with our director compensation program, a number of RSUs with a notional value, based on the fair market value of Restricted Voting Shares (generally being the closing price of the Restricted Voting Shares on the TSX on the day the cash compensation is awarded), equal to the value of the cash compensation elected to be satisfied in the form of RSUs. Any RSUs granted under the Director RSU Plan will be subject to forfeiture restrictions, which shall lapse no later than the end of the calendar year to which the cash compensation underlying the RSUs relates.
The Restricted Voting Shares issued to Non-Employee Directors in settlement of RSUs granted under the Director RSU Plan shall either be newly issued Restricted Voting Shares, or Restricted Voting Shares purchased on the open market on behalf of the Non-Employee Director.
At the discretion of the Board of Directors, each RSU may be credited with cash and stock dividends equivalent to those paid on a Restricted Voting Share while the RSU is outstanding, and such cash dividend equivalents will be paid to the Non-Employee Director in cash either at approximately the time such dividends are paid on the Restricted Voting Shares or at the time of settlement of the RSU. KMCI’s historic practice has been to make dividend equivalent payments quarterly at approximately the time dividends are paid on Kinder Morgan’s outstanding common stock, and the Director RSU Plan provides discretion to the Board of Directors to continue this practice. To the extent such cash dividend payments are deferred until settlement and an RSU is forfeited prior to settlement, the Non-Employee Director will have no right to such dividend equivalent payments.
Any payments made under the Director RSU Plan are subject to applicable withholding tax requirements.
Restricted Voting Shares Reserved for Issuance
The Director RSU Plan provides that the number of Restricted Voting Shares that may be issued or issuable from the treasury of the Company pursuant to Director RSU Plan awards shall not exceed 500,000 Restricted Voting Shares at any time. Additionally, the Director RSU Plan provides that the number of Restricted Voting Shares reserved for issuance from the treasury of the Company under all “security based compensation arrangements” (as defined by the TSX) shall not exceed 5,000,000 Restricted Voting Shares at any time. A “security based compensation arrangement” generally means any other plan under which equity securities can be issued from the Company’s treasury, and includes the Company’s RSU Plan.
In addition, no Restricted Voting Shares shall be issued under the Director RSU Plan if, together with any other security based compensation arrangement established or maintained by the Company, such grant of Restricted Voting Shares could result, at any time, in the aggregate number of Restricted Voting Shares (i) issued to insiders of the Company, within any one-year period and (ii) issuable to insiders of the Company, at any time, exceeding the lesser of 5,000,000 Restricted Voting Shares and 10% of the issued and outstanding Restricted Voting Shares.
Forfeiture in Certain Circumstances
RSUs issued under the Director RSU Plan shall be subject to forfeiture until the expiration of the forfeiture restrictions. To the extent such Restricted Voting Shares are forfeited, all rights of the Non-Employee Director to such RSUs shall terminate. Upon the termination of service as a director prior to the lapsing of the applicable forfeiture restrictions, such RSUs shall be forfeited.
In the event of a change in control (as such term is defined in the Director RSU Plan), the Board of Directors, in its discretion, may take any action that it deems appropriate with respect to outstanding RSUs in respect of which the forfeiture restrictions have not lapsed.
Effect of Certain Transactions
If the outstanding Restricted Voting Shares shall be changed in number or class by reason of split-ups, spin-offs, combinations, mergers, consolidations or recapitalizations, or by reason of stock dividends, the number of Restricted Voting Shares which may be issued pursuant to the Director RSU Plan shall be adjusted so as to reflect such change, all as determined by the Board of Directors. If there shall be any other change in the number or kind of the outstanding Restricted Voting Shares, or of any stock or other securities or property into which such Restricted Voting Shares shall have been changed or exchanged, then if the Board of Directors determines that such change equitably requires an adjustment in any award under the Director RSU Plan, such adjustment shall be made in accordance with such determination. All such adjustments shall be subject to the approval of the TSX.
Amendments to the Director RSU Plan
The Board of Directors may, at any time, without the approval of Company Voting Shareholders, suspend, discontinue or amend the Director RSU Plan or an RSU awarded thereunder. However, the Board of Directors may not amend the Director RSU Plan or an RSU without the approval of the holders of a majority of Company Voting Shares who vote at a shareholder meeting to: (i) increase the number of Restricted Voting Shares, or the percentage of the issued and outstanding Company Voting Shares, reserved for issuance pursuant to the Director RSU Plan; (ii) expand the categories of individuals who are eligible to participate in the Director RSU Plan; (iii) remove or increase the limits on the number of Restricted Voting Shares issuable to any individual holder or to insiders as described under “—Restricted Voting Shares Reserved for Issuance” above; or (v) amend the amendment provisions of the Director RSU Plan; unless the change to the Director RSU Plan or an RSU results from the application of the customary anti-dilution provisions of the Director RSU Plan. Additionally, no suspension, discontinuance or amendment may be made by the Board of Directors in respect of previously issued RSUs that would adversely alter or impair those awards without the consent of the affected Non-Employee Director. For greater certainty, the exercise by the Board of Directors of any discretion provided for in the Director RSU Plan will not be considered to be an amendment to the Director RSU Plan or an RSU. Any amendments to the Director RSU Plan are also subject to the requirements of the TSX or other applicable regulatory bodies.
Compensation Committee Interlocks and Insider Participation
Our Compensation Committee is composed of Brooke N. Wade, Daniel P. E. Fournier and Gordon M. Ritchie, with Mr. Wade serving as chair of the committee.
None of our executive officers currently serves, or in the past year has served, as a member of the board of directors or compensation committee of any entity that has one or more executive officers serving on our board of directors or compensation committee, except that Mr. Kean and Ms. Dang are executive officers and serve on the board of directors of Kinder Morgan and Mr. Sanders is an executive officer of Kinder Morgan. There are no family relationships among any of our directors or executive officers.
ITEM 7. CERTAIN RELATIONSHIPS AND RELATED TRANSACTIONS, AND DIRECTOR INDEPENDENCE.
Certain Relationships and Related Transactions
Agreements Between the Company and Kinder Morgan
This section provides a description of the material terms of the principal agreements among the Company, Kinder Morgan, the General Partner and/or the Limited Partnership. The description of each agreement is subject to, and qualified in its entirety by, the terms of such agreement, which is filed as an exhibit to this registration statement. See Note 9 “Transactions with Affiliates and Related Parties” to the Annual Consolidated Financial Statements attached hereto and “Item 1A. Risk Factors—Risks Relating to the Company’s Relationship with Kinder Morgan.” For description of the material provisions of the Limited Partnership Agreement, see “Item 11. Description of Registrant’s Securities to be Registered—Limited Partnership Units.”
Cooperation Agreement
The Cooperation Agreement provides for certain matters among the Company, the Limited Partnership, the General Partner, Kinder Morgan (in respect of certain matters only), KMCC and KM Canada Terminals. The Cooperation Agreement does not in any way limit the ability of either KMCC or KM Canada Terminals to exercise its rights attached to the Special Voting Shares.
The Cooperation Agreement includes an acknowledgement by the parties that the Class A Units and the Restricted Voting Shares on the one hand and the Class B Units and the Special Voting Shares on the other hand (collectively, the “Related Securities”) are intended to convey, on a per security basis, equivalent rights to participate, directly or indirectly, in distributions of the Limited Partnership (subject to applicable taxes), the exercise of rights of limited partners and voting rights at the Company level. To the
extent that any Related Securities, or any securities convertible into, or exchangeable or exercisable for, Related Securities, are issued, sold or distributed, the parties will determine whether any adjustments are required to ensure that the equivalency noted above is maintained, and in the event that an adjustment is required and subject to applicable laws, additional Related Securities, or securities convertible into or exchangeable or exercisable for Related Securities, may be issued or distributed on substantially equivalent terms, having regard to the particular attributes of the different classes of the Related Securities. In the event that any class of Related Security is subdivided, consolidated, reclassified or otherwise changed, an equivalent change will be made to the other classes of Related Securities if such a change is required to maintain the equivalency noted above. Subject to applicable laws, if there is a dispute among the parties as to whether an adjustment or change is required in order to maintain equivalency, any adjustment must be approved on behalf of the General Partner or the Company, as applicable, by both the board of directors of the General Partner or the Company, as applicable, as a whole, and the independent directors not affiliated with the Kinder Morgan Group.
Pursuant to the Cooperation Agreement, the parties thereto agreed that any acquisition or investing activity that would be material to the Company, on a consolidated basis, will only be undertaken through the Limited Partnership. In addition, Kinder Morgan has agreed that it will first offer to the Company, on behalf of the Kinder Morgan Canada Group, any crude oil, natural gas liquids or refined product infrastructure development opportunities and/or acquisition opportunities (individually an “Opportunity” and collectively the “Opportunities”) which currently have or are expected to have a majority of their physical assets and/or infrastructure within the provinces of British Columbia and Alberta, except in the event of an Opportunity involving an acquisition of all or any portion of the equity of a publicly traded company or entity or an acquisition of all or substantially all of the assets of a publicly traded company or entity, in which cases Kinder Morgan, in its sole discretion, may determine to pursue the Opportunity on its own behalf. In the event there is a conflict of interest (or potential conflict of interest) between one or more members of the Kinder Morgan Group and the Kinder Morgan Canada Group with respect to any matter or transaction (including a transaction involving the transfer of assets and/or liabilities from a member of the Kinder Morgan Group to a member of the Kinder Morgan Canada Group), the independent directors of the Board of Directors shall be responsible to take all such actions and make all such decisions (such decision to be approved, subject to applicable laws, by the majority of the independent directors of the Board of Directors) relating to such conflict as it pertains to the applicable member of the Kinder Morgan Canada Group.
Subject to the applicable provisions in the Cooperation Agreement described above, the Company, the General Partner and the Limited Partnership expressly consent in the Cooperation Agreement to Kinder Morgan and its affiliates that are members of the Kinder Morgan Group and their respective officers, directors and employees engaging in any business or activities whatsoever, including those that may be in competition or conflict with the business and/or the interests of, the Company.
Unless terminated earlier by written agreement of the parties, the Cooperation Agreement will terminate when no Special Voting Shares or Class B Units remain outstanding. No party to the Cooperation Agreement may assign its rights or interest thereunder without the express prior written consent of the other parties, which, in the case of the consent of KMCC or KM Canada Terminals, may be granted or withheld in their sole discretion, and, in the case of the consent of any other party, will not be unreasonably withheld or delayed. Notwithstanding the foregoing, KMCC or KM Canada Terminals may assign any or all of its rights or interest under the Cooperation Agreement to any affiliate of Kinder Morgan without the consent of the Company. The Cooperation Agreement may be amended from time to time by the parties, provided that if any amendment constitutes, or could reasonably be expected to constitute, a conflict of interest or potential conflict of interest between the Kinder Morgan Canada Group and the Kinder Morgan Group, subject to applicable law, such amendment must be approved on behalf of the Company or the General Partner, as applicable, by both the Board of Directors and the board of directors of the General Partner, as applicable, as a whole and the independent directors of each entity, as applicable, not affiliated with the Kinder Morgan Group.
Services Agreement
KMCI, the Company, the General Partner and the Limited Partnership are party to the Services Agreement pursuant to which KMCI, an Alberta corporation which is an indirect subsidiary of the Company, provides certain operational and administrative services in connection with the management of the business and affairs of the Kinder Morgan Canada Group, or where requested, will coordinate on behalf of entities in the Kinder Morgan Canada Group to procure assistance and/or support in providing such services from its affiliates. KMCI’s activities under the Services Agreement are subject to the supervision of the executive officers of the Company and the Board of Directors.
The operational and administrative services provided by KMCI to the Company, the General Partner and the Limited Partnership under the Services Agreement include certain services to: (i) enable the Company to comply with its continuous disclosure and other obligations under applicable laws; (ii) coordinate financing and investing activities of the Company, including through the Company, the General Partner, the Limited Partnership or other entities in the Kinder Morgan Canada Group; (iii) assist with development, implementation and monitoring of operational plans for the Company; (iv) assist in implementing any dividend or distribution reinvestment plans, and any incentive plans of the Company and the Limited Partnership, as applicable; (v) facilitate performance of required acts and responsibilities in connection with the acquisition and disposition of assets and property by entities
in the Kinder Morgan Canada Group; (vi) provide accounting and bookkeeping services, including for the preparation of the annual and interim financial statements of the Company and the preparation and filing of all tax returns; and (vii) arrange for audit, legal and other third party professional and non-professional services. Any support and/or assistance with any services provided by an affiliate of KMCI outside of the Kinder Morgan Canada Group will be reimbursed at cost, unless otherwise required by applicable laws.
The Services Agreement shall continue in effect until terminated by mutual agreement of the parties. The Services Agreement may be amended from time to time by the parties, provided that if any amendment constitutes, or could reasonably be expected to constitute, a conflict of interest or potential conflict of interest between the Kinder Morgan Canada Group and the Kinder Morgan Group, subject to applicable law, such amendment must be approved on behalf of the Company or the General Partner by both the Board of Directors and the board of directors of the General Partner, as applicable, as a whole, and the independent directors not affiliated with the Kinder Morgan Group.
Independence of the Board of Directors
The Board of Directors is comprised of six directors, of whom Daniel P.E. Fournier, Gordon M. Ritchie and Brooke N. Wade are “independent” when applying the definition of independence under the rules of both the TSX and the NYSE. See “Item 5. Directors and Executive Officers.”
The Board of Directors does not have an independent director as Chair of the Board. Rather, it has a Lead Director and has developed a procedure for the independent directors to function independently of management and, where necessary, Kinder Morgan. The Board of Directors has adopted a fixed in camera agenda item for each board and committee meeting, during which independent directors, under the direction of the Lead Director or committee chair, may meet without any members of management or non-independent directors present. Gordon M. Ritchie, one of our independent directors, has been appointed as Lead Director. In his role as Lead Director, Mr. Ritchie will be responsible for moderating the in camera Board of Directors meetings held by the independent directors and acting as principal liaison between the independent directors and the Chair of the Board on matters dealt with in such in camera sessions. In the absence of the Chair of the Board, the Lead Director shall preside at meetings of the Board of the Directors. See “Item 5. Directors and Executive Officers—Board Committees” for information regarding the standing committees of the Board of Directors.
See “Item 1A. Risk Factors—Risks Relating to Our Business” and Note 9 “Contingencies and Litigation” to the Interim Consolidated Financial Statements attached hereto.
ITEM 9. MARKET PRICE OF AND DIVIDENDS ON THE REGISTRANT’S COMMON EQUITY AND RELATED STOCKHOLDER MATTERS.
Our Restricted Voting Shares are listed on the TSX under the symbol “KML.” The following table sets forth, for the periods indicated, the high and low closing prices of our Restricted Voting Shares on the TSX:
Period |
| High ($) |
| Low ($) |
|
|
|
|
|
|
|
May 25, 2017 (initial listing) — June 30, 2017 |
| 16.72 |
| 15.41 |
|
June 30, 2017 — September 30, 2017 |
| 18.35 |
| 15.44 |
|
September 30, 2017 — December 15, 2017 |
| 17.34 |
| 15.74 |
|
The last reported sales price of the Restricted Voting Shares on the TSX on December 15, 2017 was $16.80 per share.
The Restricted Voting Shares are not currently listed on a national securities exchange in the U.S., and there can be no assurance that an active U.S. trading market for the Restricted Voting Shares will develop.
Our first dividend was paid on August 15, 2017 to shareholders of record on July 31, 2017 in the amount of $0.0571 per Restricted Voting Share (representing the dividend payable for the period between closing of the IPO and June 30, 2017). On October 18, 2017, we declared a dividend for the quarterly period ended September 30, 2017 of $0.1625 per Restricted Voting Share, paid on November 15, 2017, to restricted voting shareholders of record as of October 31, 2017.
We have established a dividend policy pursuant to which we will pay quarterly dividends to holders of Restricted Voting Shares of record as of the close of business on or about the last business day of the month following the end of each calendar quarter, which dividends are expected to be paid to shareholders on or about the 45th day (or next business day) following the end of each calendar quarter in an amount based on our portion of our distributable cash flow. The terms of the Preferred Shares prohibit us from declaring or paying dividends on the Restricted Voting Shares unless all dividends on the Preferred Shares have been paid. See “Item 1. Business—Pipeline Segment—Financial Highlights and Growth Estimates” regarding our announced 2018 projected DCF and Restricted Voting Share dividend and “Item 11. Description of Registrant’s Securities to be Registered—Preferred Shares.”
The Credit Facility restricts us from paying dividends until the completion of the TMEP unless the following three conditions have been satisfied: (i) the dividend payment would not result in aggregate distributions in any period of four consecutive fiscal quarters exceeding Distributable Cash (as defined in the Credit Facility) for such period; (ii) the delivery of a certification by an authorized officer that the Company is in compliance with certain enumerated financial metrics, including maximum debt and minimum equity requirements, equity financing to sufficiently cover project costs for a six month period and the forecasted distributions included in the calculation of net forecasted retained cash flow; and (iii) no default has occurred under the Credit Facility. Following the completion of the TMEP, we may pay quarterly dividends provided that no default has occurred under the Credit Facility. See Note 3 “Debt” to the Interim Consolidated Financial Statements attached hereto and “Item 2. Financial Information—Management’s Discussion and Analysis—Recent Developments—Financing.”
The payment of dividends is not guaranteed and the amount and timing of any dividends payable will be at the discretion of the Board of Directors.
As of December 15, 2017, there were 103,036,003 Restricted Voting Shares, 242,260,826 Special Voting Shares, 12,000,000 Series 1 Preferred Shares and 10,000,000 Series 3 Preferred Shares outstanding, and there was one holder of record of our Restricted Voting Shares, two holders of record of our Special Voting Shares, one holder of record of our Series 1 Preferred Shares and one holder of record of our Series 3 Preferred Shares.
Our RSU Plan and Director RSU Plan were approved by our shareholder prior to the IPO. As of December 15, 2017, 796,221 Restricted Voting Shares were reserved for issuance pursuant to outstanding RSU Awards and 4,203,799 shares were available for issuance under our RSU Plan and Director RSU Plan. There are no options, warrants or other rights outstanding.
The number of Restricted Voting Shares reserved for issuance under all “security based compensation arrangements” (as defined by the TSX) shall not exceed 5,000,000 Restricted Voting Shares at any time. A “security based compensation arrangement” generally means any plan under which equity securities can be issued from the Company’s treasury, and includes the Company’s RSU Plan and Director RSU Plan.
Plan Category |
| Number of shares remaining available for |
|
Equity compensation plans approved by security holders |
| 4,203,799 |
|
Equity compensation plans not approved by security holders |
| — |
|
Total |
| 4,203,799 |
|
Tax Matters Applicable to Ownership of Restricted Voting Shares
Holders Resident in the United States
The following portion of this summary is applicable to a Holder who, for the purposes of the Canadian Income Tax Act (the “Tax Act”) and the Canada-United States Tax Convention (1980), as amended (the “Treaty”), at all relevant times, is not resident or deemed to be resident in Canada, is a resident of the United States for the purposes of the Treaty and qualifies for the full benefits thereunder, and who does not use or hold (and is not deemed to use or hold) the Restricted Voting Shares in connection with a business carried on in Canada (a “U.S. Resident Holder”). This part of the summary is not applicable to a U.S. Resident Holder that is an insurer that carries on an insurance business in Canada.
This part of the summary is not applicable to a U.S. Resident Holder whose Restricted Voting Shares are or are deemed to be “taxable Canadian property” for purposes of the Tax Act. Provided that the Restricted Voting Shares are listed on a designated stock exchange (which includes the TSX) at a particular time, the Restricted Voting Shares generally will not constitute taxable Canadian property to a U.S. Resident Holder at that time unless, at any time during the five year period immediately preceding that time: (i) 25% or more of the issued shares of any class or series of the Company’s capital stock were owned by any combination of (a) the U.S.
Resident Holder, (b) persons with whom the U.S. Resident Holder did not deal at arm’s length, and (c) partnerships in which the U.S. Resident Holder or a person described in (b) holds a membership interest directly or indirectly through one or more partnerships; and (ii) more than 50% of the value of the Restricted Voting Shares was derived, directly or indirectly, from one or any combination of (a) real or immoveable property situated in Canada, (b) Canadian resource properties, (c) timber resource properties, and (d) options in respect of, or an interest in, any such property (whether or not the property exists), all for purposes of the Tax Act. A U.S. Resident Holder’s Restricted Voting Shares can also be deemed to be taxable Canadian property in certain circumstances set out in the Tax Act.
Taxation of Dividends
Dividends paid or credited or deemed to be paid or credited by the Company to a non-resident of Canada will generally be subject to Canadian withholding tax at the rate of 25%, subject to any applicable reduction in the rate of such withholding under an income tax treaty between Canada and the country where the holder is resident. Under the Treaty, the withholding tax rate in respect of a dividend paid to a U.S. Resident Holder that beneficially owns such dividends is generally reduced to 15%, unless the U.S. Resident Holder is a company which owns at least 10% of the voting shares of the Company at that time, in which case the withholding tax rate is reduced to 5%.
Disposition of Restricted Voting Shares
A U.S. Resident Holder will not be subject to tax under the Tax Act in respect of any capital gain realized on the disposition of Restricted Voting Shares.
ITEM 10. RECENT SALES OF UNREGISTERED SECURITIES.
Since our incorporation on April 7, 2017, we have issued the following securities in offerings not registered under the Securities Act:
On May 25, 2017, we consummated our IPO and sold 102,942,000 Restricted Voting Shares to the public in Canada for gross proceeds of $1,750,014,000 through TD Securities Inc. and RBC Dominion Securities Inc., as principal underwriters. The Restricted Voting Shares were sold in Canada in accordance with applicable Canadian securities laws and in the United States to qualified institutional buyers in reliance on Rule 144A under the Securities Act. The proceeds of our IPO were used to purchase our indirect ownership interest in the Operating Entities. See “Item 1. Business—Our Corporate History and Background.”
In connection with our IPO, 226,616,700 Special Voting Shares were issued to KMCC and KM Canada Terminals. See “Item 1. Business—Our Corporate History and Background.”
On August 15, 2017, we completed an offering of 12,000,000 Series 1 Preferred Shares to the public in Canada at a price to the public of $25.00 per Series 1 Preferred Share for total gross proceeds of $300 million. The Series 1 Preferred Shares are listed on the TSX. The net proceeds of $293 million from the offering were used to indirectly subscribe for preferred units in the Limited Partnership, which in turn were used by the Limited Partnership to repay Credit Facility indebtedness recently incurred to, directly or indirectly, finance the development, construction and completion of the TMEP and Base Line Terminal project, and for general corporate purposes. We have the option to redeem the Series 1 Preferred Shares on November 15, 2022 and on November 15 in every fifth year thereafter by payment of $25.00 per Series 1 Preferred Share plus all accrued and unpaid dividends. The holders of the Series 1 Preferred Shares will have the right to convert all or any of their Series 1 Preferred Shares into Series 2 Preferred Shares, subject to certain conditions, on November 15, 2022 and on November 15 in every fifth year thereafter. The Series 1 Preferred Shares and the Series 2 Preferred Shares are series of shares in the same class. The conversion right entitles holders to elect periodically which of the two series they wish to hold and does not entitle holders to receive a different class or type of security. See “Item 11. Description of Registrant’s Securities to Be Registered—Preferred Shares” and “Item 11. Description of Registrant’s Securities to Be Registered—Limited Partnership Units.”
On December 8, 2017, we completed an offering of 10,000,000 Series 3 Preferred Shares on the TSX at a price to the public of $25.00 per Series 3 Preferred Share for total gross proceeds of $250 million. The net proceeds of $243.2 million from the offering were used to indirectly subscribe for preferred units in the Limited Partnership, which in turn were used by the Limited Partnership to repay Credit Facility indebtedness recently incurred to, directly or indirectly, finance the development, construction and completion of the Base Line Terminal project as well as potential future growth opportunities, to repay indebtedness and for general corporate purposes. We have the option to redeem the Series 3 Preferred Shares on February 15, 2023 and on February 15 in every fifth year thereafter by payment of $25.00 per Series 3 Preferred Share plus all accrued and unpaid dividends. The holders of the Series 3 Preferred Shares will have the right to convert all or any of their Series 3 Preferred Shares into Series 4 Preferred Shares, subject to certain conditions, on February 15, 2023 and on February 15 in every fifth year thereafter. The Series 3 Preferred Shares and the Series 4 Preferred Shares are series of shares in the same class. The conversion right entitles holders to elect periodically which of the two series they wish to hold and does not entitle holders to receive a different class or type of security. See “Item 11. Description of Registrant’s Securities to Be Registered—Preferred Shares” and “Item 11. Description of Registrant’s Securities to Be Registered—Limited Partnership Units.”
ITEM 11. DESCRIPTION OF REGISTRANT’S SECURITIES TO BE REGISTERED.
The following description of our capital stock is a summary only and is qualified in its entirety by reference to our Articles and By-laws, each as amended, which are included as Exhibits 3.1, 3.2, 3.3 and 3.4 of this registration statement.
We are authorized to issue an unlimited number of Restricted Voting Shares, an unlimited number of Special Voting Shares and an unlimited number of preferred shares issuable in series. As of December 15, 2017, we have outstanding 103,036,003 Restricted Voting Shares, 242,260,826 Special Voting Shares, 12,000,000 Series 1 Preferred Shares and 10,000,000 Series 3 Preferred Shares. This registration statement relates to the registration of the Restricted Voting Shares under Section 12(g) of the Exchange Act, and a summary of the material terms of the Restricted Voting Shares appears below. Additionally, descriptions of the Special Voting Shares, preferred shares and certain other
arrangements are included below to the extent such securities and arrangements may affect the value and terms of the Restricted Voting Shares.
Holders of Restricted Voting Shares will be entitled to one vote for each Restricted Voting Share held at all meetings of our shareholders, except meetings at which or in respect of matters on which only holders of another class of shares are entitled to vote separately as a class. Except as otherwise provided by our Articles or required by law, the holders of Restricted Voting Shares will vote together with the holders of Special Voting Shares as a single class.
Restrictions on Further Issuances
Notwithstanding the foregoing, we may not issue or distribute to all or to substantially all of the holders of the Restricted Voting Shares either (i) Restricted Voting Shares, or (ii) rights or securities of the Company exchangeable for or convertible into or exercisable to acquire Restricted Voting Shares, unless contemporaneously therewith, we issue or distribute Special Voting Shares or rights or securities of the Company exchangeable for or convertible into or exercisable to acquire Special Voting Shares on substantially similar terms (having regard to the specific attributes of the Special Voting Shares) and in the same proportion.
None of the Restricted Voting Shares will be subdivided, consolidated, reclassified or otherwise changed unless contemporaneously therewith the Special Voting Shares are subdivided, consolidated, reclassified or otherwise changed in the same proportion or same manner (having regard to the specific attributes of the classes of securities comprising the Company Voting Shares). In addition, under the Cooperation Agreement, we will make equivalent changes to the Restricted Voting Shares in the event any adjustments are made to the LP Units, in order to preserve the general alignment of the LP Units and the Company Voting Shares. See “—Special Voting Shares” below and “Item 7. Certain Relationships and Related Transactions and Director Independence—Agreements Between the Company and Kinder Morgan—Cooperation Agreement.”
We may not modify or remove any of the rights, privileges, conditions or restrictions of the Restricted Voting Shares without the approval by special resolution of the holders of Restricted Voting Shares.
The holders of Restricted Voting Shares are entitled to receive, subject to the rights of the holders of another class of shares, any dividend we declare, and the remaining property of the Company upon the liquidation, dissolution or winding-up of the Company, whether voluntary or involuntary. For a description of our dividend policy, see “Item 9. Market Price of and Dividends on the Registrant’s Common Equity and Related Stockholder Matters—Dividends.”
All of the outstanding Special Voting Shares are held by Kinder Morgan, indirectly through KMCC and KM Canada Terminals. Under our Articles, we are prohibited from issuing any Special Voting Shares unless a corresponding number of associated Class B Units are concurrently issued by the Limited Partnership. In addition, holders of Special Voting Shares are prohibited from transferring their Special Voting Shares separately from the related Class B Units except for certain permitted transfers among affiliates.
Holders of Special Voting Shares will be entitled to one vote for each Special Voting Share held at all meetings of shareholders of the Company, except meetings at which or in respect of matters on which only holders of another class of shares are entitled to vote separately as a class. Except as otherwise provided by our Articles or required by law, the holders of Special Voting Shares will vote together with the holders of Restricted Voting Shares as a single class.
The holders of Special Voting Shares will be entitled to receive, subject to the rights of the holders of preferred shares and in priority to the holders of Restricted Voting Shares, an amount per Special Voting Share equal to $0.000001 on the liquidation, dissolution or winding up of the Company, whether voluntary or involuntary.
The holders of Special Voting Shares, as such, will not be entitled to receive any dividends or other distributions except for such dividends payable in Special Voting Shares, as may be declared by the Board of Directors from time to time. Notwithstanding the foregoing, we may not issue or distribute to all or to substantially all of the holders of the Special Voting Shares either (i) Special Voting Shares, or (ii) rights or securities of the Company exchangeable for or convertible into or exercisable to acquire Special Voting Shares, unless contemporaneously therewith, we issue or distribute Restricted Voting Shares, or rights or securities of the Company
exchangeable for or convertible into or exercisable to acquire Restricted Voting Shares on substantially similar terms (having regard to the specific attributes of the Restricted Voting Shares) and in the same proportion.
The Special Voting Shares are subject to anti-dilution provisions, which provide that adjustments will be made to the Special Voting Shares in the event of a change to the Restricted Voting Shares in order to preserve the voting equivalency of such shares. In addition, pursuant to the Cooperation Agreement, we will make equivalent changes to the Special Voting Shares in the event of any adjustments made to the LP Units, in order to preserve the general alignment of the LP Units and the Company Voting Shares. See “Item 7. Certain Relationships and Related Transactions and Director Independence—Agreements Between the Company and Kinder Morgan—Cooperation Agreement.” The Special Voting Shares are also subject to “coattail” provisions which restrict the transfer of Special Voting Shares in certain circumstances. See “—Takeover Bid Protection—Coattail Arrangements” below.
We may not modify or remove any of the rights, privileges, conditions or restrictions of the Special Voting Shares without the approval by special resolution of the holders of Special Voting Shares.
Series 1 Preferred Shares
On August 15, 2017, we issued 12,000,000 Series 1 Preferred Shares at a price of $25.00 per share. The holders of Series 1 Preferred Shares are entitled to receive dividends at an annual rate of $1.3125 per share, payable quarterly, up to but excluding November 15, 2022. For each five-year period following November 15, 2022, the holders of Series 1 Preferred Shares shall be entitled to receive dividends in the amount per share determined by multiplying one-quarter of the “Annual Fixed Dividend Rate” by $25.00. The Annual Fixed Dividend Rate for the applicable period will be equal to the sum of the Government of Canada Yield (as defined herein) on such date plus 3.65%, provided that, in any event, such rate shall not be less than 5.25%. This spread will remain unchanged over the life of the Series 1 Preferred Shares.
On October 18, 2017, we declared a cash dividend of $0.3308 per Series 1 Preferred Share for the period from and including August 15, 2017 through and excluding November 15, 2017, which was paid on November 15, 2017 to the holders of Series 1 Preferred Shares of record as of October 31, 2017.
The Series 1 Preferred Shares are not entitled to vote or attend meetings of the holders of Voting Shares (except as otherwise provided by law and except for meetings of the holders of Preferred Shares as a class and meetings of the holders of Series 2 Preferred Shares as a series) unless dividends on the Series 1 Preferred Shares have not been paid for eight quarters, whether or not consecutive, whether or not such dividends have been declared and whether or not we have sufficient cash properly applicable to the payment of such dividends. Until all such arrears of dividends have been paid, holders of Series 1 Preferred Shares will be entitled to one vote per Series 1 Preferred Share with respect to resolutions to elect directors.
The Series 1 Preferred Shares are not redeemable prior to November 15, 2022. Subject to certain conditions, on November 15, 2022, and on November 15 in every fifth year thereafter, we may, at our option, upon not less than 30 days and not more than 60 days prior written notice, redeem for cash all or any part of the outstanding Series 1 Preferred Shares by the payment of $25.00 per Series 1 Preferred Share plus all accrued and unpaid dividends.
Prior to November 15, 2022, the Series 1 Preferred Shares are not convertible. The holders of the Series 1 Preferred Shares will have the right to convert all or any of their Series 1 Preferred Shares into Series 2 Preferred Shares, subject to certain conditions, on November 15, 2022 and on November 15 in every fifth year thereafter. Other than redemption rights and dividends, the Series 2 Preferred Shares are identical to the Series 1 Preferred Shares.
The holders of the Series 2 Preferred Shares will be entitled to receive, as and when declared by the Board of Directors of the Company, quarterly cash dividends calculated using a floating rate of interest. Holders of Series 2 Preferred Shares have the right to convert their Series 2 Preferred Shares back into Series 1 Preferred Shares under certain circumstances.
In the event of the liquidation, dissolution or winding-up of the Company, the holders of the Series 1 Preferred Shares and Series 2 Preferred Shares are entitled to receive $25.00 per share plus all accrued and unpaid dividends thereon before any amount is paid or any property or assets of the Company are distributed to the holders of the Restricted Voting Shares, Special Voting Shares or to the holders of any other shares ranking junior to the Series 1 Preferred Shares or Series 2 Preferred Shares in any respect.
The terms of the Series 1 Preferred Shares and the Series 2 Preferred Shares prohibit the Company from declaring or paying dividends on the Restricted Voting Shares unless all dividends on the Series 1 Preferred Shares and the Series 2 Preferred Shares have been paid.
Series 3 Preferred Shares
On December 8, 2017, we issued 10,000,000 Series 3 Preferred Shares at a price of $25.00 per share. The holders of Series 3 Preferred Shares are entitled to receive dividends at an annual rate of $1.30 per share, payable quarterly, up to but excluding February 15, 2023. For each five-year period following February 15, 2023, the holders of Series 3 Preferred Shares shall be entitled to receive dividends in the amount per share determined by multiplying one-quarter of the “Annual Fixed Dividend Rate” by $25.00. The Annual Fixed Dividend Rate for the applicable period will be equal to the sum of the Government of Canada Yield (as defined herein) on such date plus 3.51%, provided that, in any event, such rate shall not be less than 5.20%. This spread will remain unchanged over the life of the Series 3 Preferred Shares.
The Series 3 Preferred Shares are not entitled to vote or attend meetings of the holders of Voting Shares (except as otherwise provided by law and except for meetings of the holders of Preferred Shares as a class and meetings of the holders of Series 4 Preferred Shares as a series) unless dividends on the Series 3 Preferred Shares have not been paid for eight quarters, whether or not consecutive, whether or not such dividends have been declared and whether or not we have sufficient cash properly applicable to the payment of such dividends. Until all such arrears of dividends have been paid, holders of Series 3 Preferred Shares will be entitled to one vote per Series 3 Preferred Share with respect to resolutions to elect directors.
The Series 3 Preferred Shares are not redeemable prior to February 15, 2023. Subject to certain conditions, on February 15, 2023, and on February 15 in every fifth year thereafter, we may, at our option, upon not less than 30 days and not more than 60 days prior written notice, redeem for cash all or any part of the outstanding Series 3 Preferred Shares by the payment of $25.00 per Series 3 Preferred Share plus all accrued and unpaid dividends.
Prior to February 15, 2023, the Series 3 Preferred Shares are not convertible. The holders of the Series 3 Preferred Shares will have the right to convert all or any of their Series 3 Preferred Shares into Series 4 Preferred Shares, subject to certain conditions, on February 15, 2023 and on February 15 in every fifth year thereafter. Other than redemption rights and dividends, the Series 4 Preferred Shares are identical to the Series 3 Preferred Shares.
The holders of the Series 4 Preferred Shares will be entitled to receive, as and when declared by the Board of Directors of the Company, quarterly cash dividends calculated using a floating rate of interest. Holders of Series 4 Preferred Shares have the right to convert their Series 4 Preferred Shares back into Series 3 Preferred Shares under certain circumstances.
In the event of the liquidation, dissolution or winding-up of the Company, the holders of the Series 3 Preferred Shares and Series 4 Preferred Shares are entitled to receive $25.00 per share plus all accrued and unpaid dividends thereon before any amount is paid or any property or assets of the Company are distributed to the holders of the Restricted Voting Shares, Special Voting Shares or to the holders of any other shares ranking junior to the Series 3 Preferred Shares or Series 4 Preferred Shares in any respect.
The terms of the Series 3 Preferred Shares and the Series 4 Preferred Shares prohibit the Company from declaring or paying dividends on the Restricted Voting Shares unless all dividends on the Series 3 Preferred Shares and the Series 4 Preferred Shares have been paid.
We are authorized to issue an unlimited number of preferred shares and may issue additional preferred shares in one or more series with such terms as the Board of Directors may fix, subject to the ABCA. Any such additional preferred shares may be entitled to preference over the Restricted Voting Shares and the Special Voting Shares with respect to priority in payment of dividends and the distribution of assets in the event of the liquidation, dissolution or winding up of the Company.
As of December 15, 2017, the Limited Partnership has issued and outstanding two GP Units held by the General Partner, 103,036,003 Class A Units held by the Company (indirectly through the General Partner) representing an approximate 30% interest in the Limited Partnership, 242,260,826 Class B Units held by Kinder Morgan, indirectly through KMCC and KM Canada Terminals, representing an approximate 70% interest in the Limited Partnership and 22,000,000 Preferred LP Units held by the General Partner.
In certain circumstances, the General Partner may be required to make changes to the attributes of the LP Units to maintain the equivalency among the Related Securities in the manner contemplated by the Limited Partnership Agreement and the Cooperation Agreement. See “Item 7. Certain Relationships and Related Transactions and Director Independence—Agreements Between the Company and Kinder Morgan—Cooperation Agreement.”
Each of the Class B Units will be accompanied by a Special Voting Share, which will entitle the holder of such Special Voting Share to receive notice of, to attend and to vote at meetings of our shareholders. See “—Restrictions on Further Issuances” above. Under our Articles and the Limited Partnership Agreement, as applicable, the transfer of the Special Voting Shares separately from the Class B Units to which they relate, as well as the transfer of Class B Units separately from the related Special Voting Shares, is prohibited except for certain permitted transfers among affiliates. See “—Special Voting Shares” above.
Distributions
It is anticipated that the Limited Partnership will make distributions to (i) the Company, indirectly through the General Partner, and (ii) Kinder Morgan, indirectly through KMCC and KM Canada Terminals, on a quarterly basis, and on or before any scheduled date for payment by the Company of any declared dividends. The Company will be entirely dependent on indirectly receiving distributions from the Limited Partnership in order to pay any dividends on the Restricted Voting Shares, which dividends shall in any event be declared only at the discretion of the Board of Directors.
Distributions by the Limited Partnership are not guaranteed and will be at the discretion of the General Partner. The General Partner will, in its sole discretion, determine the amount of the distribution from the Limited Partnership. See “Item 1A. Risk Factors—Risks Relating to Ownership of Restricted Voting Shares—Cash dividend payments are not guaranteed.”
The Limited Partnership will make its distributions in the following order and priority: (i) the reimbursement of costs and expenses to the General Partner pursuant to the Limited Partnership Agreement; (ii) an amount to the holders of GP Units (being the General Partner) sufficient to allow the Company to pay its expenses (including, without limitation, any fees or commissions payable to agents or underwriters in connection with the sale of securities by the Company, listing fees of applicable stock exchanges and fees of the Company’s counsel and auditors) on a timely basis (the “Priority Distribution”); (iii) an amount to the holders of Preferred LP Units in accordance with the terms of the Preferred LP Units; (iv) an amount to the General Partner equal to 0.001% of the balance of the distributable cash of the Limited Partnership; and (v) an amount equal to the remaining distribution to the holders of Class A Units and the holders of Class B Units in accordance with their respective holdings of Class A Units and Class B Units. The General Partner may, in addition to the distributions described above, make a distribution in cash or other property to holders of GP Units or LP Units, provided that such distribution is paid or distributed to the holders of LP Units in accordance with their pro rata entitlements as holders of LP Units.
A holder of Class B Units has the right to elect to reinvest all distributions payable on its Class B Units in Class B Units on the same economic terms as a holder of Restricted Voting Shares that participates in the DRIP. See “—Dividend Reinvestment Plan” below. If a holder of Class B Units elects to reinvest its distributions, such distributions will be used to purchase additional Class B Units at the same price per unit as Restricted Voting Shares are issued by the Company under the DRIP (generally being the weighted average trading price of the Restricted Voting Shares on the TSX for the five trading days preceding the dividend payment date) at a discount of between 0% and 5%, as determined from time to time by the board of directors of the General Partner, in its sole discretion. The market discount has initially been set at 3%. Pursuant to the terms of the DRIP and pursuant to the Limited Partnership Agreement, the Company and the Limited Partnership may concurrently suspend the DRIP and the distribution reinvestment plan, respectively, at their discretion. During construction of the TMEP, Kinder Morgan currently expects to participate in the distribution reinvestment plan at a level of less than half of its cash distributions received.
Allocation of Net Income and Losses
The net income of the Limited Partnership, determined in accordance with the provisions of the Tax Act, will generally be allocated in respect of each fiscal year in the following manner: (i) first, to the General Partner in an amount equal to (a) the Priority Distribution, and (b) the aggregate of reimbursement of costs and expenses to the General Partner pursuant to the Limited Partnership Agreement and the distributions paid on the GP Units; (ii) second, to holders of Preferred LP Units based on their proportionate share of distributions on the Preferred LP Units received or receivable for such fiscal year; and (iii) the balance, among the holders of Class A Units and Class B Units based on their proportionate share of distributions received or receivable for such fiscal year. The amount of income for tax purposes allocated to a partner may be more or less than the amount of cash distributed by the Limited Partnership to that partner.
Income and loss of the Limited Partnership for accounting purposes is allocated to each partner in the same proportion as income or loss is allocated for tax purposes.
If, with respect to a given fiscal year, no distribution is paid or payable or allocated to the partners, or the Limited Partnership has a loss for tax purposes, the taxable income or loss, as the case may be, for tax purposes of the Limited Partnership for that fiscal year will be allocated to the holders of LP Units in that fiscal year in the proportion to the percentage of LP Units held by each holder of LP Units at each of those dates. The fiscal year end of the Limited Partnership will initially be December 31.
Functions and Powers of the General Partner
In its capacity as general partner of the Limited Partnership, the General Partner is authorized to manage, administer and operate the business and affairs of the Limited Partnership, to make all decisions regarding the business and affairs of the Limited Partnership and to bind the Limited Partnership in respect of any such decisions, subject to certain limitations contained in the Limited Partnership Agreement. The General Partner is required to exercise its powers and discharge its duties honestly, in good faith with a view to the best interests of the Limited Partnership and to exercise the care, diligence and skill that a reasonably prudent person would exercise in comparable circumstances. The board of directors of the General Partner is the same as the Board of Directors of the Company. Similarly, the executive officers of the General Partner are the same as the executive officers of the Company. See “Item 5. Directors and Executive Officers.”
The authority and power vested in the General Partner to manage the business and affairs of the Limited Partnership includes all authority to do any act, take any proceeding, make any decision and execute and deliver any instrument, deed, agreement or document necessary or incidental to carrying out the objects, purposes and business of the Limited Partnership, including, without limitation, the ability to engage other persons to assist the General Partner to carry out its management obligations and administrative functions in respect of the Limited Partnership and its business. Pursuant to the terms of the Services Agreement, the General Partner will contract with KMCI for certain services relating to the operation of the Operating Entities. See “Item 7. Certain Relationships and Related Transactions, and Director Independence—Agreements between the Company and Kinder Morgan—Services Agreement.”
Restrictions on the Authority of the General Partner
The authority of the General Partner, as general partner, is limited in certain respects under the Limited Partnership Agreement. Certain matters must be approved by special resolution of the holders of Class A Units (all of which is held indirectly by the Company and voted in accordance with the instructions of the Company), including (i) the removal of the general partner, (ii) the dissolution, termination, wind up or other discontinuance of the Limited Partnership, (iii) the sale, exchange or other disposition of all or substantially all of the business or assets of the Limited Partnership, (iv) amendments to the Limited Partnership Agreement, and (v) a merger or consolidation involving the Limited Partnership. Certain other matters must be approved by special resolution of the holders of the Class A Units and Class B Units voting together as a class, including (i) a consolidation, subdivision or reclassification of LP Units (except for the purposes of preserving the alignment of the LP Units and the Company Voting Shares pursuant to the Limited Partnership Agreement and the Cooperation Agreement), and (ii) a waiver of a default by the general partner or release of the general partner from any claims in respect thereof.
Transfer of Partnership Units
No limited partner may transfer any of the LP Units owned by it except to persons and in the manner expressly permitted in the Limited Partnership Agreement. LP Units may not be transferred to a person who is not an Eligible Person (as defined in the Limited Partnership Agreement). In addition, the Class B Units are subject to “coattail” provisions which restrict the transfer of Class B Units in certain circumstances. See “—Takeover Bid Protection—Coattail Arrangements” below.
The General Partner
The authorized capital of the General Partner consists of an unlimited number of common shares and an unlimited number of preferred shares issuable in series. The Company holds all of the issued and outstanding common shares of the General Partner. Pursuant to the Cooperation Agreement, the board of directors of the General Partner is the same as the Board of Directors. Similarly, the executive officers of the General Partner is the same as the executive officers of the Company. See “Item 5. Directors and Executive Officers.”
Preferred Units
Concurrently with the offerings of the Series 1 Preferred Shares and the Series 3 Preferred Shares, 12,000,000 and 10,000,000 Preferred LP Units, respectively, were offered and sold to the General Partner. The terms of the Preferred LP Units are substantially similar to the terms of the Preferred Shares. Pursuant to the terms of the Amended and Restated Limited Partnership Agreement of the Limited Partnership, the General Partner, as the holder of the Preferred LP Units, will have priority over the holders of LP Units (being, indirectly, the Company and Kinder Morgan) on any distributions, and in the event of dissolution, of the Limited Partnership. In addition, no amendments to the provisions of the Preferred LP Units or the priority of distributions or in the event of dissolution may be made unless such amendments receive approval of two-thirds of then outstanding Preferred Shares and, if required, the approval of the TSX.
Takeover Bid Protection — Coattail Arrangements
Under applicable securities laws in Canada, an offer to purchase Special Voting Shares or Class B Units would not necessarily require that an offer be made to purchase Restricted Voting Shares. In accordance with the rules of the TSX designed to ensure that, in the event of a takeover, the holders of Restricted Voting Shares will be entitled to participate on an equal footing with holders of Special Voting Shares or Class B Units, each of the Company’s Articles and the Limited Partnership Agreement contain customary coattail provisions.
Pursuant to the Articles of the Company, no holder of Special Voting Shares is permitted to transfer such Special Voting Shares unless either: (i) such transfer would not require that the transferee make an offer to holders of Restricted Voting Shares to acquire Restricted Voting Shares on the same terms and conditions under applicable securities laws, if such Special Voting Shares were outstanding as Restricted Voting Shares; or (ii) if such transfer would require that the transferee make such an offer to holders of Restricted Voting Shares to acquire Restricted Voting Shares on the same terms and conditions under applicable securities laws, the transferee acquiring such Special Voting Shares makes a contemporaneous identical offer for Restricted Voting Shares (in terms of price, timing, proportion of securities sought to be acquired and conditions) and does not acquire such Special Voting Shares unless the transferee also acquires a proportionate number of Restricted Voting Shares actually tendered to such identical offer.
In addition, pursuant to the terms of the Limited Partnership Agreement, no holder of Class B Units is permitted to transfer such Class B Units, unless: (i) such transfer would not require the transferee to make an offer to holders of Restricted Voting Shares to acquire Restricted Voting Shares on the same terms and conditions under applicable securities laws if such Class B Units, and all other outstanding Class B Units, were instead outstanding as Restricted Voting Shares; or (ii) the offeror acquiring such Class B Units makes a contemporaneous identical offer for the Restricted Voting Shares (in terms of price, timing, proportion of securities sought to be acquired and conditions) and acquires such Class B Units along with a proportionate number of Restricted Voting Shares actually tendered to such identical offer.
The Company has implemented a DRIP pursuant to which holders (excluding holders not resident in Canada) of Restricted Voting Shares may elect to have all cash dividends of the Company payable to any such shareholder automatically reinvested in additional Restricted Voting Shares at a price per share calculated by reference to the volume weighted average of the closing price of the Restricted Voting Shares on the stock exchange on which the Restricted Voting Shares are then listed for the five trading days immediately preceding the relevant dividend payment date, less a discount of between 0% and 5% (as determined from time to time by the Board of Directors, in its sole discretion). The market discount has initially been set at 3%.
No brokerage commission will be payable in connection with the purchase of Restricted Voting Shares under the DRIP and all administrative costs will be borne by the Company. Cash undistributed by the Company upon the issuance of additional Restricted Voting Shares under the DRIP will be invested in the Company and/or the Limited Partnership to be used for general corporate purposes and working capital.
Holders of Restricted Voting Shares who are non-residents of Canada are not entitled to participate in the DRIP as a result of foreign securities law restrictions.
The Limited Partnership Agreement provides for a similar distribution reinvestment plan for the holders of Class B Units such that they may elect to have all of the cash distributions on the Class B Units payable to any such person automatically reinvested in additional Class B Units on the same basis and at the same price per Class B Unit as a holder of Restricted Voting Shares purchases Restricted Voting Shares pursuant to the DRIP. Kinder Morgan may participate in the Limited Partnership’s distribution reinvestment plan at levels that vary from the levels of participation by shareholders in the DRIP. The proceeds received by the Company pursuant to the DRIP will be used to indirectly acquire additional Class A Units of the Limited Partnership. Similarly, the reinvestment of distributions received by Kinder Morgan from the Limited Partnership pursuant to the corresponding distribution reinvestment mechanism applicable to the Class B Units will result in the issuance of additional Class B Units to Kinder Morgan, at the same price per unit at which additional Restricted Voting Shares are issued by the Company pursuant to the DRIP. See “—Limited Partnership Units—Distributions” above.
As a result of differing participation levels, the overall ownership interests in the Company, as between Kinder Morgan (through its ownership interest in Special Voting Shares) and the holders of Restricted Voting Shares, may vary and such variances may be significant. Pursuant to the terms of the DRIP and the Limited Partnership Agreement, the Company and the Limited Partnership may concurrently suspend the DRIP and the distribution reinvestment plan, respectively, at their discretion.
ITEM 12. INDEMNIFICATION OF DIRECTORS AND OFFICERS.
We have entered into indemnification agreements with our directors and officers which generally require that we indemnify and hold the indemnitees harmless to the greatest extent permitted by law for liabilities arising out of the indemnitees’ service to us and our subsidiaries (including the General Partner) as directors and officers, if the indemnitees acted honestly and in good faith with a view to our best interests and, with respect to criminal or administrative actions or proceedings that are enforced by monetary penalty, if the indemnitee had no reasonable grounds to believe that his or her conduct was unlawful. The indemnification agreements will also provide for the advancement of defense expenses to the indemnitees by us. We have acquired and maintain liability insurance for our directors and officers with coverage and terms that are customary for a company of our size in our industry of operations.
Under Section 124 of the ABCA, except in respect of an action by or on behalf of the Company or body corporate to procure a judgment in our favor, we may indemnify a current or former director or officer or a person who acts or acted at our request as a director or officer of a body corporate of which we are or were a shareholder or creditor and the heirs and legal representatives of any such persons (collectively, “Indemnified Persons”) against all costs, charges and expenses, including an amount paid to settle an action or satisfy a judgment, reasonably incurred by any such Indemnified Person in respect of any civil, criminal or administrative actions or proceedings to which the director or officer is made a party by reason of being or having been a director or officer of the Company or other body corporate, if (i) the director or officer acted honestly and in good faith with a view to our best interests, and (ii) in the case of a criminal or administrative action or proceeding that is enforced by a monetary penalty, the director or officer had reasonable grounds for believing that such director’s or officer’s conduct was lawful (collectively, the “Indemnification Conditions”).
Notwithstanding the foregoing, the ABCA provides that an Indemnified Person is entitled to indemnity from us in respect of all costs, charges and expenses reasonably incurred by the person in connection with the defense of any civil, criminal or administrative action or proceeding to which the person is made a party by reason of being or having been a director or officer of the Company or body corporate, if the person seeking indemnity (i) was substantially successful on the merits in the person’s defense of the action or proceeding, (ii) fulfills the Indemnification Conditions, and (iii) is fairly and reasonably entitled to indemnity. We may advance funds to an Indemnified Person for the costs, charges and expenses of a proceeding; however, the Indemnified Person shall repay the moneys if such individual does not fulfill the Indemnification Conditions. The indemnification may be made in connection with a derivative action only with court approval and only if the Indemnification Conditions are met.
As contemplated by Section 124(4) of the ABCA and our by-laws, we have acquired and maintain liability insurance for our directors and officers with coverage and terms that are customary for a company of our size in our industry of operations. The ABCA provides that we may not purchase insurance for the benefit of an Indemnified Person against a liability that relates to the person’s failure to act honestly and in good faith with a view to our best interests.
Our by-laws provide that, subject to the ABCA, the Indemnified Persons shall be indemnified against all costs, charges and expenses, including an amount paid to settle an action or satisfy a judgment, reasonably incurred by such person in respect of any civil, criminal or administrative action or proceeding to which such person is made a party by reason of being or having been a director or officer of the Company or such body corporate, if the Indemnification Conditions are satisfied. In addition, pursuant to our by-laws, we may indemnify such person in such other circumstances as the ABCA or law permits.
Our by-laws also provide that no director or officer of the Company shall be liable for the acts, receipts, neglects or defaults of any other director, officer or employee, or for joining in any receipt or other act for conformity, or for any loss, damage or expense happening to the Company through the insufficiency or deficiency of title to any property acquired for or on behalf of the Company, or for the insufficiency or deficiency of any security in or upon which any of the moneys of the Company shall be invested, or for any loss or damage arising from the bankruptcy, insolvency or tortious acts of any person with whom any of the moneys, securities or effects of the Company shall be deposited, or for any loss occasioned by any error of judgment or oversight on his part, or for any other loss, damage or misfortune which shall happen in the execution of the duties of his or her office or in relation thereto; provided that nothing in our by-laws shall relieve any director or officer from the duty to act in accordance with the ABCA and the regulations thereunder. The foregoing is premised on the requirement under our by-laws that every director and officer of the Company in exercising his or her powers and discharging duties shall act honestly and in good faith with a view to our best interests and exercise the care, diligence and skill that a reasonably prudent person would exercise in comparable circumstances.
We have entered into indemnification agreements with our directors and officers which generally require that we indemnify and hold the indemnitees harmless to the greatest extent permitted by law for liabilities arising out of the indemnitees’ service to us and our subsidiaries (including the General Partner) as directors and officers, if the indemnitees acted honestly and in good faith with a view to our best interests and, with respect to criminal or administrative actions or proceedings that are enforced by monetary penalty, if the indemnitee had no reasonable grounds to believe that his or her conduct was unlawful. The indemnification agreements will also provide for the advancement of defense expenses to the indemnitees by us.
ITEM 13. FINANCIAL STATEMENTS AND SUPPLEMENTARY DATA.
Our financial statements appear on pages F-1 through F-47 of this registration statement.
ITEM 14. CHANGES IN AND DISAGREEMENTS WITH ACCOUNTANTS ON ACCOUNTING AND FINANCIAL DISCLOSURE.
None.
ITEM 15. FINANCIAL STATEMENTS AND EXHIBITS.
(a) Financial Statements
Our financial statements appear on pages F-1 through F-47 of this registration statement.
(b) Exhibits
Exhibit |
| Description |
|
|
|
3.1* |
| Certificate of Incorporation of Kinder Morgan Canada Limited |
3.2* |
| Certificate of Amendment and Registration of Restated Articles of Kinder Morgan Canada Limited |
3.3** |
| |
3.4* |
| Amended and Restated By-law No. 1 of Kinder Morgan Canada Limited |
3.5* |
| |
3.6** |
| |
3.7* |
| |
3.8* |
| |
3.9** |
| |
10.1* |
| |
10.2* |
| |
10.3 |
| |
10.4* |
| |
10.5* |
| |
21.1* |
|
* Previously filed as part of the registration statement on Form 10 (File No. 0-55864) filed on November 3, 2017 and incorporated herein by reference
** Filed herewith
SIGNATURES
Pursuant to the requirements of Section 12 of the Securities Exchange Act of 1934, the registrant has duly caused this registration statement to be signed on its behalf by the undersigned, thereunto duly authorized.
| KINDER MORGAN CANADA LIMITED | |
|
|
|
|
|
|
Dated: December 29, 2017 | By: | /s/ Dax A. Sanders |
|
| Dax A. Sanders |
|
| Chief Financial Officer |
[Signature Page to Form 10]
INDEX TO FINANCIAL STATEMENTS
CONSOLIDATED STATEMENTS OF INCOME
(In millions of Canadian dollars, except per share amounts)
(Unaudited)
|
| Three Months Ended September 30, |
| Nine Months Ended September 30, |
| ||||
|
| 2017 |
| 2016 |
| 2017 |
| 2016 |
|
Revenues |
|
|
|
|
|
|
|
|
|
Services |
| 166.3 |
| 169.3 |
| 498.8 |
| 500.9 |
|
Product Sales and Other |
| 0.7 |
| 0.2 |
| 1.4 |
| 1.0 |
|
Total Revenues |
| 167.0 |
| 169.5 |
| 500.2 |
| 501.9 |
|
|
|
|
|
|
|
|
|
|
|
Operating Costs, Expenses and Other |
|
|
|
|
|
|
|
|
|
Operations and maintenance |
| 52.9 |
| 53.4 |
| 157.8 |
| 143.7 |
|
Depreciation, depletion and amortization |
| 37.2 |
| 34.3 |
| 107.6 |
| 102.5 |
|
General and administrative |
| 16.2 |
| 15.2 |
| 50.5 |
| 45.4 |
|
Taxes, other than income taxes |
| 9.3 |
| 9.0 |
| 28.9 |
| 29.1 |
|
Other expense, net |
| 0.8 |
| 0.2 |
| 3.0 |
| 0.2 |
|
Total Operating Costs, Expenses and Other |
| 116.4 |
| 112.1 |
| 347.8 |
| 320.9 |
|
|
|
|
|
|
|
|
|
|
|
Operating Income |
| 50.6 |
| 57.4 |
| 152.4 |
| 181.0 |
|
|
|
|
|
|
|
|
|
|
|
Other Income (Expense) |
|
|
|
|
|
|
|
|
|
Interest, net |
| (1.3 | ) | (7.0 | ) | (10.9 | ) | (22.9 | ) |
Foreign exchange (loss) gain |
| (0.2 | ) | (17.0 | ) | (5.3 | ) | 59.3 |
|
Other, net |
| 8.0 |
| 4.6 |
| 20.5 |
| 12.9 |
|
Total Other Income (Expense) |
| 6.5 |
| (19.4 | ) | 4.3 |
| 49.3 |
|
|
|
|
|
|
|
|
|
|
|
Income Before Income Taxes |
| 57.1 |
| 38.0 |
| 156.7 |
| 230.3 |
|
|
|
|
|
|
|
|
|
|
|
Income Tax Expense |
| (14.7 | ) | (17.7 | ) | (42.4 | ) | (46.3 | ) |
|
|
|
|
|
|
|
|
|
|
Net Income |
| 42.4 |
| 20.3 |
| 114.3 |
| 184.0 |
|
|
|
|
|
|
|
|
|
|
|
Preferred share dividend |
| (2.0 | ) | — |
| (2.0 | ) | — |
|
|
|
|
|
|
|
|
|
|
|
Net Income Attributable to Kinder Morgan Interest |
| (28.7 | ) | (20.3 | ) | (96.4 | ) | (184.0 | ) |
|
|
|
|
|
|
|
|
|
|
Net Income Available to Restricted Voting Stockholders |
| 11.7 |
| — |
| 15.9 |
| — |
|
|
|
|
|
|
|
|
|
|
|
Restricted Voting Shares |
|
|
|
|
|
|
|
|
|
Basic and Diluted Earnings Per Restricted Voting Share |
| 0.11 |
|
|
| 0.22 |
|
|
|
|
|
|
|
|
|
|
|
|
|
Basic and Diluted Weighted Average Restricted Voting Shares Outstanding |
| 103.0 |
|
|
| 72.1 |
|
|
|
|
|
|
|
|
|
|
|
|
|
Dividends Per Restricted Voting Share Declared for the Period |
| 0.1625 |
|
|
| 0.2196 |
|
|
|
The accompanying notes are an integral part of these consolidated financial statements.
KINDER MORGAN CANADA LIMITED
CONSOLIDATED STATEMENTS OF COMPREHENSIVE INCOME
(In millions of Canadian dollars)
(Unaudited)
|
| Three Months Ended September 30, |
| Nine Months Ended September 30, |
| ||||
|
| 2017 |
| 2016 |
| 2017 |
| 2016 |
|
Net income |
| 42.4 |
| 20.3 |
| 114.3 |
| 184.0 |
|
|
|
|
|
|
|
|
|
|
|
Other comprehensive income (loss) |
|
|
|
|
|
|
|
|
|
Benefit plans |
| (0.1 | ) | 0.5 |
| (0.7 | ) | 2.5 |
|
Foreign currency translation adjustments |
| (1.3 | ) | 0.9 |
| (1.8 | ) | (3.1 | ) |
|
|
|
|
|
|
|
|
|
|
Total other comprehensive (loss) income |
| (1.4 | ) | 1.4 |
| (2.5 | ) | (0.6 | ) |
|
|
|
|
|
|
|
|
|
|
Comprehensive income |
| 41.0 |
| 21.7 |
| 111.8 |
| 183.4 |
|
Comprehensive income attributable to Kinder Morgan interest |
| (27.8 | ) | (21.7 | ) | (94.9 | ) | (183.4 | ) |
Comprehensive income attributable to Kinder Morgan Canada Limited |
| 13.2 |
| — |
| 16.9 |
| — |
|
The accompanying notes are an integral part of these consolidated financial statements.
KINDER MORGAN CANADA LIMITED
(In millions of Canadian dollars)
(Unaudited)
|
| September 30, 2017 |
| December 31, 2016 |
|
ASSETS |
|
|
|
|
|
Current assets |
|
|
|
|
|
Cash and cash equivalents |
| 330.3 |
| 159.0 |
|
Accounts receivable |
| 49.2 |
| 34.5 |
|
Accounts receivable-affiliates |
| 3.9 |
| 39.1 |
|
Prepayments |
| 21.2 |
| 3.7 |
|
Inventories |
| 12.6 |
| 12.4 |
|
Other current assets |
| 7.2 |
| 13.1 |
|
Total current assets |
| 424.4 |
| 261.8 |
|
|
|
|
|
|
|
Property, plant and equipment, net |
| 3,540.0 |
| 3,181.1 |
|
Investments |
| 40.5 |
| 30.2 |
|
Goodwill |
| 248.0 |
| 248.0 |
|
Deferred charges and other assets |
| 103.9 |
| 18.3 |
|
Total Assets |
| 4,356.8 |
| 3,739.4 |
|
|
|
|
|
|
|
LIABILITIES AND EQUITY |
|
|
|
|
|
Current liabilities |
|
|
|
|
|
Current portion of debt |
| 165.0 |
| — |
|
Accounts payable |
| 158.3 |
| 109.2 |
|
Accounts payable-affiliates |
| 1.5 |
| 144.3 |
|
Accrued interest-affiliates |
| — |
| 61.8 |
|
Regulatory liabilities |
| 107.9 |
| 122.9 |
|
Other current liabilities |
| 35.9 |
| 24.2 |
|
Total current liabilities |
| 468.6 |
| 462.4 |
|
|
|
|
|
|
|
Long-term liabilities and deferred credits |
|
|
|
|
|
Long-term debt-affiliates (KMI Loans) |
| — |
| 1,362.1 |
|
Deferred income taxes |
| 323.4 |
| 304.8 |
|
Retirement and postretirement benefits |
| 73.9 |
| 74.9 |
|
Regulatory liabilities |
| 41.2 |
| 37.6 |
|
Deferred revenues |
| 51.9 |
| 51.6 |
|
Other deferred credits |
| 5.0 |
| 10.0 |
|
Total long-term liabilities and deferred credits |
| 495.4 |
| 1,841.0 |
|
Total Liabilities |
| 964.0 |
| 2,303.4 |
|
|
|
|
|
|
|
Commitments and contingencies (Note 9) |
|
|
|
|
|
|
|
|
|
|
|
Equity |
|
|
|
|
|
Preferred share capital (Note 4) |
| 293.5 |
| — |
|
Restricted and special voting share capital (Note 4) |
| 1,701.4 |
| — |
|
Equity attributable to Kinder Morgan - pre-IPO |
| — |
| 1,475.0 |
|
Retained deficit |
| (765.7 | ) | (13.1 | ) |
Accumulated other comprehensive loss |
| (8.5 | ) | (25.9 | ) |
Total Kinder Morgan Canada Limited equity |
| 1,220.7 |
| 1,436.0 |
|
Kinder Morgan interest |
| 2,172.1 |
| — |
|
Total Equity |
| 3,392.8 |
| 1,436.0 |
|
Total Liabilities and Equity |
| 4,356.8 |
| 3,739.4 |
|
The accompanying notes are an integral part of these consolidated financial statements.
KINDER MORGAN CANADA LIMITED
CONSOLIDATED STATEMENTS OF CASH FLOWS
(In millions of Canadian dollars)
(Unaudited)
|
| Nine Months Ended September 30, |
| ||
|
| 2017 |
| 2016 |
|
Operating Activities |
|
|
|
|
|
Net income |
| 114.3 |
| 184.0 |
|
Non-cash items: |
|
|
|
|
|
Depreciation, depletion and amortization |
| 107.6 |
| 102.5 |
|
Deferred income tax |
| 38.5 |
| 45.0 |
|
Allowance for equity funds used during construction |
| (19.6 | ) | (12.8 | ) |
Unrealized foreign exchange loss (gain) |
| 5.7 |
| (59.3 | ) |
Other non-cash items |
| 9.4 |
| 2.2 |
|
Change in operating assets and liabilities (Note 8) |
| (97.1 | ) | — |
|
Cash provided by operating activities |
| 158.8 |
| 261.6 |
|
|
|
|
|
|
|
Investing Activities |
|
|
|
|
|
Capital expenditures |
| (407.8 | ) | (177.4 | ) |
Construction in advance |
| (1.3 | ) | — |
|
Contributions to trusts |
| (10.3 | ) | (12.1 | ) |
Sale of property, plant and equipment, net of removal costs |
| (0.2 | ) | (0.4 | ) |
Change in restricted cash |
| (0.4 | ) | (0.2 | ) |
Cash used in investing activities |
| (420.0 | ) | (190.1 | ) |
|
|
|
|
|
|
Financing Activities |
|
|
|
|
|
Proceeds received from IPO |
| 1,671.0 |
| — |
|
Issuance of preferred shares |
| 293.5 |
| — |
|
Issuances of debt |
| 287.3 |
| — |
|
Payments of debt |
| (122.3 | ) | — |
|
Debt issue costs |
| (74.7 | ) | — |
|
(Repayments of) advances from debt with affiliate |
| (1,606.3 | ) | 12.5 |
|
Dividend |
| (4.3 | ) | — |
|
Distributions to noncontrolling interests |
| (10.4 | ) | — |
|
Contributions from Parent |
| — |
| 10.2 |
|
Distributions to parent |
| — |
| (10.3 | ) |
Cash provided by financing activities |
| 433.8 |
| 12.4 |
|
|
|
|
|
|
|
Effect of Exchange Rate Changes on Cash and Cash Equivalents |
| (1.3 | ) | (1.6 | ) |
|
|
|
|
|
|
Net increase in Cash and Cash Equivalents |
| 171.3 |
| 82.3 |
|
Cash and Cash Equivalents, beginning of period |
| 159.0 |
| 72.7 |
|
Cash and Cash Equivalents, end of period |
| 330.3 |
| 155.0 |
|
|
|
|
|
|
|
Supplemental Disclosures of Cash Flow Information |
|
|
|
|
|
Cash paid including affiliates during the period for interest (net of capitalized interest) |
| 60.6 |
| — |
|
Cash paid during the period for income taxes |
| 1.4 |
| 1.0 |
|
Noncash Investing and Financing Activities |
|
|
|
|
|
Increase in property, plant and equipment from both accruals and contractor retainage |
| 42.0 |
| 14.4 |
|
Decrease in property, plant and equipment due to foreign currency translation adjustments |
| (2.2 | ) | (7.4 | ) |
The accompanying notes are an integral part of these consolidated financial statements.
KINDER MORGAN CANADA LIMITED
CONSOLIDATED STATEMENTS OF EQUITY
(In millions of Canadian dollars)
(Unaudited)
|
| Special |
| Restricted |
| Preferred |
| Equity |
| Restricted |
| Preferred |
| Retained |
| Accumulated other |
| Kinder |
|
|
|
|
| Issued |
| Issued |
| Issued |
| Morgan |
| Share |
| share |
| earning |
| comprehensive |
| Morgan |
| Total |
|
Balance at December 31, 2016 |
| — |
| — |
| — |
| 1,475.0 |
| — |
| — |
| (13.1 | ) | (25.9 | ) | — |
| 1,436.0 |
|
Activity attributable to Kinder Morgan prior to IPO: |
|
|
|
|
|
|
|
|
|
|
|
|
|
|
|
|
|
|
|
|
|
Equity interests issued |
|
|
|
|
|
|
| 126.9 |
|
|
|
|
|
|
|
|
|
|
| 126.9 |
|
Distribution |
|
|
|
|
|
|
| (261.7 | ) |
|
|
|
|
|
|
|
|
|
| (261.7 | ) |
Issuance of restricted voting shares |
|
|
| 102.9 |
|
|
|
|
| 1,750.0 |
|
|
|
|
|
|
|
|
| 1,750.0 |
|
Issuance of special voting shares and reallocation of Kinder Morgan pre-IPO carrying basis |
| 242.1 |
|
|
|
|
| (1,340.2 | ) |
|
|
|
| 13.1 |
| 25.9 |
| 1,301.2 |
| — |
|
Reallocation of equity on common control transaction |
|
|
|
|
|
|
|
|
|
|
|
|
| (777.7 | ) | (7.5 | ) | 785.2 |
| — |
|
Equity issuance fees |
|
|
|
|
|
|
|
|
| (69.9 | ) | (7.0 | ) |
|
|
|
|
|
| (76.9 | ) |
Issuance of preferred shares |
|
|
|
|
| 12.0 |
|
|
|
|
| 300.0 |
|
|
|
|
|
|
| 300.0 |
|
Net income |
|
|
|
|
|
|
|
|
|
|
|
|
| 17.9 |
|
|
| 96.4 |
| 114.3 |
|
Dividends |
|
|
|
|
|
|
|
|
|
|
|
|
| (5.9 | ) |
|
| (13.8 | ) | (19.7 | ) |
Dividend reinvestment plan |
| 0.2 |
| 0.1 |
|
|
|
|
| 1.6 |
|
|
|
|
|
|
| 3.5 |
| 5.1 |
|
Stock-based compensation |
|
|
|
|
|
|
|
|
| 0.9 |
|
|
|
|
|
|
|
|
| 0.9 |
|
Deferred tax liability adjustment on IPO and preferred shares |
|
|
|
|
|
|
|
|
| 18.8 |
| 0.5 |
|
|
|
|
| 1.1 |
| 20.4 |
|
Other comprehensive loss |
|
|
|
|
|
|
|
|
|
|
|
|
|
|
| (1.0 | ) | (1.5 | ) | (2.5 | ) |
Balance at September 30, 2017 |
| 242.3 |
| 103.0 |
| 12.0 |
| — |
| 1,701.4 |
| 293.5 |
| (765.7 | ) | (8.5 | ) | 2,172.1 |
| 3,392.8 |
|
|
| Equity attributable |
| Retained |
| Accumulated |
| Total |
|
Balance at December 31, 2015 |
| 1,464.3 |
| (193.8 | ) | (19.5 | ) | 1,251.0 |
|
Net income |
|
|
| 184.0 |
|
|
| 184.0 |
|
Contributions |
|
|
| 10.2 |
|
|
| 10.2 |
|
Distributions |
|
|
| (10.3 | ) |
|
| (10.3 | ) |
Other comprehensive loss |
|
|
|
|
| (0.6 | ) | (0.6 | ) |
Balance at September 30, 2016 |
| 1,464.3 |
| (9.9 | ) | (20.1 | ) | 1,434.3 |
|
The accompanying notes are an integral part of these consolidated financial statements.
KINDER MORGAN CANADA LIMITED
NOTES TO CONSOLIDATED FINANCIAL STATEMENTS
(Unaudited)
1. General
The Company was incorporated under the Business Corporations Act (Alberta) on April 7, 2017. On May 30, 2017, we completed an initial public offering (“IPO”) of our Restricted Voting Shares and used the net proceeds of $1,671.0 million to acquire an approximate 30% indirect interest in Kinder Morgan Canada Limited Partnership (“Limited Partnership”) from certain affiliates of Kinder Morgan, Inc. (“Kinder Morgan”), who retained an approximate 70% ownership of the limited partnership units in the Limited Partnership. When we refer to “us,” “we,” “our,” “ours,” “the Company”, or “KML,” we are describing Kinder Morgan Canada Limited.
The Limited Partnership and Kinder Morgan Canada GP Inc. (the “General Partner”) were formed under the laws of the Province of Alberta in conjunction with the IPO. The Limited Partnership, through its ownership of Kinder Morgan Cochin ULC, indirectly consolidates Kinder Morgan Canada, Inc. (“KMCI”) and all or its proportion of the following operating entities (collectively the “Operating Entities”):
· Kinder Morgan Cochin ULC(1)
· KM Canada Marine Terminal Limited Partnership
· KM Canada North 40 Limited Partnership
· KM Canada Rail Holdings GP Limited
· Trans Mountain (Jet Fuel) Inc.
· Trans Mountain Pipeline (Puget Sound) LLC
· Trans Mountain Pipeline ULC
· Trans Mountain Pipeline L.P.
(1) Kinder Morgan Cochin ULC indirectly owns a 50% undivided interest in the Edmonton Rail Terminal, the Alberta Crude Terminal and the Base Line Terminal joint venture operations which are proportionally consolidated by subsidiaries of the Limited Partnership.
The Limited Partnership is a variable interest entity because a simple majority or lower threshold of the limited partnership interests do not possess substantive “kick-out” rights (i.e., the right to remove the general partner or to dissolve (liquidate) the entity without cause) or substantive participation rights. The General Partner is the primary beneficiary because it has the power to direct the activities that most significantly impact the Limited Partnership’s performance and the right to receive benefits, and obligation to absorb losses, that could be significant to the Limited Partnership. As a result, the General Partner consolidates the Limited Partnership. The General Partner is a wholly-owned subsidiary of the Company. Consequently, the Company indirectly consolidates the Limited Partnership and the Operating Entities in its consolidated financial statements.
Business Description
We have two business segments: (i) the Pipelines segment which includes the Trans Mountain Pipeline system (“Trans Mountain”) that currently transports approximately 300,000 barrels per day (“bpd”) of crude oil and refined petroleum from Edmonton, Alberta to Vancouver, British Columbia (“B.C.”); the Trans Mountain (Puget Sound) pipeline serving Washington State; the Trans Mountain Jet Fuel pipeline serving Vancouver International Airport; KMCI, the employer of Canadian staff; and the Canadian segment of the Cochin pipeline, a 12-inch diameter multi-product pipeline which spans approximately 1,000 km in Saskatchewan and Alberta; and (ii) the Terminals segment which includes the ownership and operation of liquid product merchant storage and rail terminals in the Edmonton, AB market as well as a predominantly dry cargo import/export facility in Vancouver, B.C.
2. Basis of Presentation
We have prepared the accompanying unaudited interim consolidated financial statements (the “Interim Consolidated Financial Statements”) in accordance with the accounting principles contained in the Financial Accounting Standards Board’s (“FASB”) Accounting Standards Codification, the single source of United States Generally Accepted Accounting Principles (“U.S. GAAP”) and referred to in this report as the Codification. U.S. GAAP means generally accepted accounting principles that the Securities Exchange Commission has identified as having substantial authoritative support, as supplemented by Regulation S-X under the 1934 Act, as amended from time to time.
In our opinion, all adjustments, which are of a normal and recurring nature, considered necessary for a fair statement of our financial position and operating results for the interim periods have been included in the accompanying consolidated financial statements. Interim results are not necessarily indicative of results for a full year; accordingly, you should read these consolidated financial statements in conjunction with the Company’s audited consolidated financial statements for the years ended December 31, 2016, 2015 and 2014 available on SEDAR.
In March 2017, the Alberta Securities Commission and Ontario Securities Commission issued a relief order which permits us to continue to prepare our financial statements in accordance with U.S. GAAP until the earliest of: (i) January 1, 2019; (ii) the first day of the financial year that commences after the Company ceases to have activities subject to rate regulation; or (iii) the effective date prescribed by the International Accounting Standards Board for the mandatory application of a standard within International Financial Reporting Standards specific to entities with activities subject to rate regulation.
All significant intercompany balances between the companies included in the accompanying consolidated financial statements have been eliminated. Management has evaluated subsequent events through October 24, 2017, the date the financial statements were available to be issued. We evaluate goodwill for impairment on May 31 of each year. There were no impairment charges resulting from our May 31, 2017 impairment testing, and no event indicating an impairment has occurred subsequent to that date.
The Reorganization and our Initial Public Offering
On May 30, 2017, we completed an IPO of 102,942,000 restricted voting shares (“Restricted Voting Shares”) on the Toronto Stock Exchange at a price of $17.00 per Restricted Voting Share for total gross proceeds of approximately $1.75 billion. We used our IPO proceeds to indirectly acquire from Kinder Morgan an approximate 30% economic interest in the Limited Partnership, with Kinder Morgan retaining the remaining approximate 70% economic interest.
Concurrent with closing of our IPO, the Limited Partnership acquired an interest in the Operating Entities from Kinder Morgan Canada Company (“KMCC”) and KM Canada Terminals ULC (“KM Canada Terminals”) in exchange for the issuance to KMCC and KM Canada Terminals of Class B limited partnership units of the Limited Partnership. In addition, KMCC and KM Canada Terminals were issued Special Voting Shares in the Company for nominal consideration.
Immediately following closing of our IPO, the Company used the proceeds from our IPO to indirectly subscribe for Class A limited partnership units representing an approximate 30% economic interest in the Limited Partnership while the Class B limited partnership units held by KMCC and KM Canada Terminals represent, in the aggregate, an approximate 70% economic interest in the Limited Partnership’s total Class A units and Class B units. Following the issuance of the Series 1 Preferred Shares, the Company’s and Kinder Morgan’s respective interests in the Limited Partnership is subject to the preferred shareholders’ priority on distributions and upon liquidation, see Note 4.
Upon completion of our IPO and the reorganization transaction described above, the issued and outstanding Restricted Voting Shares comprise approximately 30% of the votes attached to all outstanding Company voting shares, and the Kinder Morgan interest, which represents its indirect ownership of 100% of the Special Voting Shares, comprises approximately 70% of the votes attached to all outstanding Company voting shares.
Subsequent to our IPO, Kinder Morgan retained control of KML and the Limited Partnership, as a result we accounted for our acquisition of an approximate 30% economic interest in the Limited Partnership as a transfer of net assets among entities under common control. Therefore, the assets and liabilities in the Interim Consolidated Financial Statements have been reflected at historical carrying value of the immediate parent(s) within the Kinder Morgan organization structure including goodwill and purchase price assigned amounts, as applicable.
In addition, as of and for the reporting periods after May 30, 2017, Kinder Morgan’s economic interest in the Limited Partnership is reflected within “Kinder Morgan interest” in our consolidated statements of stockholders’ equity and consolidated balance sheets and earnings attributable to Kinder Morgan’s economic ownership interest in the Limited Partnership are presented in “Net Income Attributable to Kinder Morgan Interest” in our consolidated statements of income.
Kinder Morgan retained control of us, therefore, the amounts recorded to “Share capital,” “Retained deficit,” “Accumulated other comprehensive loss” and “Kinder Morgan interest” presented in the Statement of Equity for the nine months ended September 30, 2017 include (i) the “Reallocation of Kinder Morgan pre-IPO carrying basis” which represents Kinder Morgan’s pre-IPO 100% ownership interest in us prior to the IPO including net income for the period January 1 through May 29, 2017 and (ii) the “Reallocation of equity on common control transaction” which represents the difference between our book value prior to our IPO and the proportionate ownership percentages in the book value in our net assets after our IPO.
Prior to May 30, 2017, our historical financial statements were presented as combined consolidated financial statements derived from the consolidated financial statements and accounting records of Kinder Morgan. The reorganization described above was treated as a common control transaction, therefore, the assets and liabilities for all periods presented herein reflect the historical carrying value of the immediate parent(s) within the Kinder Morgan organization structure.
Foreign Currency
Amounts are stated in Canadian dollars unless otherwise noted which is the functional currency of most of our operations. Transactions in foreign currencies are initially recorded at the exchange rate in effect at the time of the transactions. Monetary assets and liabilities denominated in foreign currencies are translated to Canadian dollars using the closing exchange rate at the balance sheet date. The resulting exchange rate differences are included in the consolidated statement of operations.
We translate the assets and liabilities of our indirectly owned subsidiary, Trans Mountain Pipeline (Puget Sound) LLC, which uses U.S. dollars as its functional currency, to Canadian dollars using period-end exchange rates. Income and expense items are translated at weighted-average rates of exchange prevailing during the year and our equity accounts are translated by using historical exchange rates. The cumulative translation adjustments balance is included in the “Accumulated other comprehensive loss” balance on our consolidated balance sheets and would be recognized in earnings upon the sale of those U.S. operations.
Recent Accounting Pronouncements
Topic 606
On May 28, 2014, the FASB issued ASU No. 2014-09, “Revenue from Contracts with Customers” followed by a series of related accounting standard updates (collectively referred to as “Topic 606”). Topic 606 is designed to create greater revenue recognition and disclosure comparability in financial statements. The provisions of Topic 606 include a five-step process by which an entity will determine revenue recognition, depicting the transfer of goods or services to customers in amounts reflecting the payment to which an entity expects to be entitled in exchange for those goods or services. Topic 606 requires certain disclosures about contracts with customers and provides more comprehensive guidance for transactions such as service revenue, contract modifications, and multiple-element arrangements.
We are in the process of comparing our current revenue recognition policies to the requirements of Topic 606 for each of our revenue categories. While we have not identified any material differences in the amount and timing of revenue recognition for the
categories we have reviewed to date, our evaluation is not complete, and we have not concluded on the overall impacts of adopting Topic 606. Topic 606 will require that our revenue recognition policy disclosure include further detail regarding our performance obligations as to the nature, amount, timing, and estimates of revenue and cash flows generated from our contracts with customers. Topic 606 will also require disclosure of significant changes in contract asset and contract liability balances period to period and the amount of the transaction price allocated to performance obligations that are unsatisfied (or partially unsatisfied) as of the end of the reporting period, as applicable. We anticipate utilizing the modified retrospective method to adopt the provisions of this standard effective January 1, 2018, which requires us to apply the new revenue standard to (i) all new revenue contracts entered into after January 1, 2018 and (ii) all existing revenue contracts as of January 1, 2018 through a cumulative adjustment to equity. In accordance with this approach, our consolidated revenues for periods prior to January 1, 2018 will not be revised.
ASU No. 2015-11
On July 22, 2015, the FASB issued ASU No. 2015-11, “Inventory (Topic 330): Simplifying the Measurement of Inventory.” This ASU requires entities to subsequently measure inventory at the lower of cost and net realizable value, and defines net realizable value as the estimated selling price in the ordinary course of business, less reasonably predictable costs of completion, disposal, and transportation. ASU No. 2015-11 was effective January 1, 2017. We adopted ASU No. 2015-11 with no material impact to our financial statements.
ASU No. 2016-02
On February 25, 2016, the FASB issued ASU No. 2016-02, “Leases (Topic 842).” This ASU requires that lessees will be required to recognize assets and liabilities on the balance sheet for the present value of the rights and obligations created by all leases with terms of more than 12 months. The ASU also will require disclosures designed to give financial statement users information on the amount, timing, and uncertainty of cash flows arising from leases. ASU 2016-02 will be effective for us as of January 1, 2019. We are currently reviewing the effect of ASU No. 2016-02.
ASU No. 2016-18
On November 17, 2016, the FASB issued ASU No. 2016-18, “Statement of Cash Flows (Topic 230): Restricted Cash (a consensus of the FASB Emerging Issues Task Force).” This ASU requires the statement of cash flows to explain the change during the period in the total of cash, cash equivalents, and amounts generally described as restricted cash or restricted cash equivalents. Therefore, amounts generally described as restricted cash and restricted cash equivalents are to be included with cash and cash equivalents when reconciling the beginning of period and end of period amounts shown on the statement of cash flows. ASU No. 2016-18 will be effective for us as of January 1, 2018. We are currently reviewing the effect of this ASU to our financial statements.
ASU No. 2017-04
On January 26, 2017, the FASB issued ASU No. 2017-04, “Simplifying the Test for Goodwill Impairment (Topic 350)” to simplify the accounting for goodwill impairment. The guidance removes Step 2 of the goodwill impairment test, which requires a hypothetical purchase price allocation. A goodwill impairment will now be the amount by which a reporting unit’s carrying value exceeds its fair value, not to exceed the carrying amount of goodwill. ASU No. 2017-04 will be effective for us as of January 1, 2020. We are currently reviewing the effect of this ASU to our financial statements.
ASU No. 2017-07
On March 10, 2017, the FASB issued ASU No. 2017-07, “Compensation - Retirement Benefits (Topic 715).” This ASU requires an employer to disaggregate the service cost component from the other components of net benefit cost, allow only the service cost component of net benefit cost to be eligible for capitalization, and how to present the service cost component and the other components of net benefit cost in the income statement. ASU No. 2017-07 will be effective for us as of January 1, 2018. We are currently reviewing the effect of this ASU to our financial statements.
3. Debt
Credit Facility
On June 16, 2017, Kinder Morgan Cochin ULC and Trans Mountain Pipeline ULC, our indirect subsidiaries, entered into a definitive credit agreement establishing (i) a $4.0 billion revolving construction facility for the purposes of funding the development, construction and completion of the Trans Mountain Expansion Project, (ii) a $1.0 billion revolving contingent credit facility for the purpose of funding, if necessary, additional Trans Mountain Expansion Project costs (and, subject to the need to fund such additional costs, meeting the National Energy Board-mandated liquidity requirements) and (iii) a $500 million revolving working capital facility, to be used for working capital and other general corporate purposes (collectively, the “Credit Facility”). The Credit Facility has a five year term and is with a syndicate of financial institutions with Royal Bank of Canada as the administrative agent. Any undrawn commitments under the Credit Facility incur a standby fee of 0.30% to 0.625%, with the range dependent on our credit ratings. The Credit Facility is guaranteed by the Company and all of the non-borrower subsidiaries of the Company and is secured by a first lien security interest on all of the assets of the Company and the equity and assets of the other guarantors.
Draw down of funds on the Credit Facility bear interest dependent on type of loans requested and are as follows:
· bankers’ acceptances or London Interbank Offered Rate loans are at an annual rate of approximately the Canadian Dollar Offered Rate (“CDOR”) or the London Interbank Offered Rate, as the case may be, plus a fixed spread ranging from 1.50% to 2.50%;
· loans in Canadian dollars or U.S. dollars are at an annual rate of approximately the Canadian prime rate or the U.S. dollar base rate, as the case may be, plus a fixed spread ranging from 0.50% to 1.50%, in each case, with the range dependent on the credit ratings of the Company; and
· letters of credit (under working capital facility only) will have issuance fees based on an annual rate of approximately CDOR plus a fixed spread ranging from 1.50% to 2.50%, with the range dependent on the credit ratings of the Company.
The foregoing rates and fees will increase by 0.25% upon the fourth anniversary of the Credit Facility.
Our Credit Facility includes various financial and other covenants including:
· a maximum ratio of consolidated total funded debt to consolidated capitalization of 70%;
· restrictions on ability to incur debt;
· restrictions on ability to make dispositions, restricted payments and investments;
· restrictions on granting liens and on sale-leaseback transactions;
· restrictions on ability to engage in transactions with affiliates; and
· restrictions on ability to amend organizational documents and engage in corporate reorganization transactions.
As of September 30, 2017, we were in compliance with all required covenants. As of September 30, 2017, we had $165.0 million outstanding on our construction facility and no outstanding borrowings under our working capital facility. For the three and nine months ended September 30, 2017, we incurred $3.9 million and $4.6 million, respectively, in standby fees.
Fair Value of Financial Instruments
The carrying value and estimated fair value of debt-balances are disclosed below:
|
| September 30, 2017 |
| December 31, 2016 |
| ||||
(In millions of Canadian dollars) |
| Carrying |
| Estimated |
| Carrying |
| Estimated |
|
|
|
|
|
|
|
|
|
|
|
Total debt(a) |
| 165.0 |
| 165.0 |
| 1,126.2 |
| 1,183.3 |
|
(a) September 30, 2017 debt balance is third party and December 31, 2016 debt balance is affiliate, and the December 31, 2016 amounts exclude $235.9 million non-interest bearing notes payable.
Level 2 input values were used to measure the estimated fair value of the long-term debt-balances as of both September 30, 2017 and December 31, 2016.
4. Equity
As of September 30, 2017, we had 103.0 million and 242.3 million of Restricted Voting Shares and Special Voting Shares outstanding, respectively, with no par value for an aggregate of 345.3 million voting shares outstanding, and 12.0 million cumulative redeemable minimum rate reset preferred shares, Series 1 (Series 1 Preferred Shares).
Restricted Voting Shares
Restricted Voting Shares were issued to the public pursuant to the May 30, 2017 IPO. Holders of Restricted Voting Shares are entitled to one vote for each Restricted Voting Share held at all meetings of shareholders of the Company, except meetings at which or in respect of matters on which only holders of another class of shares are entitled to vote separately as a class. Except as otherwise provided by the articles of the Company or required by law, the holders of Restricted Voting Shares will vote together with the holders of Special Voting Shares as a single class.
The holders of Restricted Voting Shares are entitled to receive, subject to the rights of the holders of another class of shares, any dividend declared by the Company and the remaining property of the Company on the liquidation, dissolution or winding up of the Company, whether voluntary or involuntary. Notwithstanding the foregoing, the Company may not issue or distribute to all or to substantially all of the holders of the Restricted Voting Shares either (i) Restricted Voting Shares, or (ii) rights or securities of the Company exchangeable for or convertible into or exercisable to acquire Restricted Voting Shares, unless contemporaneously therewith, the Company issues or distributes Special Voting Shares or rights or securities of the Company exchangeable for or convertible into or exercisable to acquire Special Voting Shares on substantially similar terms (having regard to the specific attributes of the Special Voting Shares) and in the same proportion.
On August 15, 2017, we paid a dividend of $0.0571 per Restricted Voting Share to restricted voting shareholders of record as of July 31, 2017 for the quarterly period ended June 30, 2017. This initial dividend was prorated from May 30, 2017, the day we closed on its IPO, to June 30, 2017 and amounted to approximately $5.9 million in total. We paid approximately $4.3 million of this dividend to restricted voting shareholders in cash and $1.6 million of the remaining dividend in the form of 94,003 Restricted Voting Shares issued in lieu of cash dividends under the restricted voting shareholders’ Dividend Reinvestment Plan (DRIP). The DRIP allows holders (excluding holders not resident in Canada) of Restricted Voting Shares to elect to have any or all cash dividends payable to such shareholder automatically reinvested in additional Restricted Voting Shares at a price per share calculated by reference to the volume-weighted average of the closing price of the Restricted Voting Shares on the stock exchange on which the Restricted Voting Shares are then listed for the five trading days immediately preceding the relevant dividend payment date, less a
discount of between 0% and 5% (as determined from time to time by our board of directors, in its sole discretion). The market discount for the dividend paid on August 15, 2017 was 3%.
On October 17, 2017, our board of directors declared a dividend of $0.1625 per Restricted Voting Share ($0.65 annualized), payable on November 15, 2017, to restricted voting shareholders of record as of close of business on October 31, 2017.
Series 1 Preferred Share Offering
On August 15, 2017, we completed an offering of 12,000,000 cumulative redeemable minimum rate reset preferred shares, Series 1 (Series 1 Preferred Shares) to the public at a price to the public of $25.00 per Series 1 Preferred Share for total gross proceeds of $300.0 million. The Series 1 Preferred Shares are listed on the Toronto Stock Exchange. The net proceeds of $293.0 million from the offering were used to indirectly subscribe for preferred units in the Limited Partnership, which in turn were used by the Limited Partnership to repay Credit Facility indebtedness and for general corporate purposes. We have the option to redeem the Series 1 Preferred Shares on November 15, 2022 and on November 15 in every fifth year thereafter by payment of $25.00 per Series 1 Preferred Share plus all accrued and unpaid dividends. The holders of the Series 1 Preferred Shares will have the right to convert all or any of their Series 1 Preferred Shares into cumulative redeemable floating rate Preferred Shares, Series 2 (Series 2 Preferred Shares), subject to certain conditions, on November 15, 2022 and on November 15 in every fifth year thereafter. The Series 1 Preferred Shares and the Series 2 Preferred Shares are series of shares in the same class. The conversion right entitles holders to elect periodically which of the two series they wish to hold and does not entitle holders to receive a different class or type of securities.
In the event of liquidation of the Company, the holders of Series 1 Preferred Shares shall be entitled to receive $25.00 per Series 1 Preferred Share plus all accrued and unpaid dividends thereon before any amount shall be paid or an property or assets of the Company shall be distributed to the holders of the Restricted Voting Shares, Special Voting Shares and holders of any other shares ranking junior to the Series 1 Preferred Shares.
Dividends on the Series 1 Preferred Shares are fixed, cumulative, preferential and $1.3125 per share annually, payable quarterly on the 15th day of February, May, August and November, as and when declared by our board of directors, for the initial fixed rate period to but excluding November 15, 2022.
On October 17, 2017, our board of directors declared a cash dividend of $0.3308 per share of our Series 1 Preferred Shares for the period from and including August 15, 2017 through and including November 14, 2017, which is payable on November 15, 2017 to series 1 preferred shareholders of record as of close of business on October 31, 2017.
Special Voting Shares (Kinder Morgan Interest)
The Special Voting Shares are held by indirect wholly owned subsidiaries of Kinder Morgan. Holders of Special Voting Shares are entitled to one vote for each Special Voting Share held at all meetings of shareholders of the Company, except meetings at which or in respect of matters on which only holders of another class of shares are entitled to vote separately as a class. The holders of Special Voting Shares are entitled to receive, subject to the rights of the holders of preferred shares and in priority to the holders of Restricted Voting Shares, an amount per Special Voting Share equal to $0.000001 on the liquidation, dissolution or winding-up of the Company, whether voluntary or involuntary. The Special Voting Shares are subject to anti-dilution provisions, which provide that adjustments will be made to the Special Voting Shares in the event of a change to the Restricted Voting Shares in order to preserve the voting equivalency of such shares.
Kinder Morgan owns approximately 70% of the total Limited Partnership Class A units and Class B units through certain affiliates. These interests are presented as “Kinder Morgan interest” in our consolidated financial statements. See Note 2.
On August 15, 2017, the Limited Partnership paid a pro rated distribution of $0.0571 per Class B limited partnership unit to Kinder Morgan for the quarterly period ended June 30, 2017 that amounted to approximately $13.8 million in total. Approximately $10.4 million of this distribution was paid to Kinder Morgan in cash, and $3.4 million of the remaining distribution in the form of
202,826 Class B limited partnership units issued under its distribution reinvestment plan. Kinder Morgan (as the sole holder of the Class B limited partnership units) subject to certain limitations, is entitled to reinvest its distributions into additional Class B limited partnership units on the same general terms as described above for the restricted voting shareholders’ distribution reinvestment plan.
Earnings per Share
We calculate earnings per share using the two-class method. Earnings were allocated to Restricted Voting Shares and participating securities based on the amount of dividends paid in the current period plus an allocation of the undistributed earnings or excess distributions over earnings to the extent that each security participates in earnings or excess distributions over earnings. Our unvested restricted stock awards, which may be settled in stock issued to management employees from treasury or in cash and include dividend equivalent payments, do not participate in excess distributions over earnings.
The following table sets forth the allocation of net income available to shareholders of Restricted Voting Shares and participating securities:
|
| Three Months Ended September 30, |
| Nine Months Ended September 30, |
| ||||||||
(In millions of Canadian dollars) |
| 2017 |
| 2016 |
| 2017 |
| 2016 |
| ||||
|
|
|
|
|
|
|
|
|
| ||||
Restricted Voting Shares |
| $ | 11.6 |
| $ | — |
| $ | 15.8 |
| $ | — |
|
Participating securities: |
|
|
|
|
|
|
|
|
| ||||
Restricted stock awards(a) |
| 0.1 |
| — |
| 0.1 |
| — |
| ||||
Net Income Available to Restricted Voting Stockholders |
| $ | 11.7 |
| $ | — |
| $ | 15.9 |
| $ | — |
|
(a) As of September 30, 2017 there were approximately 0.8 million restricted stock awards.
For the three months ended September 30, 2017 and for the period April 7, 2017 (from the date of our inception) to September 30, 2017, the weighted average maximum number of potential Restricted Voting Share equivalents, consisting of restricted stock awards, was 0.6 million and 0.3 million, respectively.
5. Transactions with Related Parties
Affiliate Activities
The following table summarizes related party income statement activity. Revenues, operating costs and capitalized costs are under normal trade terms.
|
| Three Months Ended September 30, |
| Nine Months Ended September 30, |
| ||||
(In millions of Canadian dollars) |
| 2017 |
| 2016 |
| 2017 |
| 2016 |
|
|
|
|
|
|
|
|
|
|
|
Income Statement location |
|
|
|
|
|
|
|
|
|
Revenues-Services (a) |
| 14.6 |
| 14.6 |
| 44.2 |
| 44.2 |
|
Operations and maintenance and general and administrative expense |
| 1.2 |
| 0.5 |
| 2.4 |
| 1.2 |
|
Interest expense |
| — |
| 10.9 |
| 19.6 |
| 32.9 |
|
Other |
|
|
|
|
|
|
|
|
|
Capitalized costs in property, plant and equipment |
| 1.2 |
| 7.5 |
| 5.2 |
| 11.4 |
|
(a) Amounts represent sales to a customer who is a related party through joint ownership of a joint venture.
Accounts receivable and payable
Accounts receivable-affiliate and accounts payable-affiliate are non-interest bearing and are settled on demand.
Long-term debt-affiliates (KMI Loans)
During June 2017 we repaid the principal on the Long-term debt-affiliates (KMI Loans) utilizing proceeds from our IPO and the associated notes payable were terminated. As of December 31, 2016, the KMI Loans on the consolidated balance sheet was $1,362.1 million, of primarily U.S. dollar denominated five-year notes payable with Kinder Morgan subsidiaries.
6. Income Taxes
Income tax expense included in our accompanying consolidated statements of income is as follows:
|
| Three Months Ended September 30, |
| Nine Months Ended September 30, |
| ||||
(In millions of Canadian dollars, except percentages) |
| 2017 |
| 2016 |
| 2017 |
| 2016 |
|
|
|
|
|
|
|
|
|
|
|
Income tax expense |
| 14.7 |
| 17.7 |
| 42.4 |
| 46.3 |
|
Effective tax rate |
| 25.7 | % | 46.6 | % | 27.1 | % | 20.1 | % |
The effective tax rate for the nine months ended September 30, 2017 is slightly higher than the statutory federal and provincial rate of 27% primarily due to (i) the tax impact of pension adjustments and the impact of foreign exchange rate gain and loss in respect to the KMI Loans (which represented U.S. dollar denominated long-term notes payable to Kinder Morgan) and (ii) the capital loss carryforwards for which we recorded a full valuation allowance. These increases to the effective tax rate were offset by (i) the U.S. tax on earnings from Trans Mountain Pipeline (Puget Sound) LLC which we are limited to the Company’s ownership interests therein and (ii) the impact of provincial allocation changes from the 2016 return to provision true-up.
The effective tax rate for the three months ended September 30, 2017 was lower than the statutory federal and provincial rate of 27% primarily due to (i) the U.S. tax on earnings from Trans Mountain Pipeline (Puget Sound) LLC is limited to the Company’s ownership interest therein and (ii) the impact of provincial allocation changes from the 2016 return to provision true-up.
The effective tax rate for the nine months ended September 30, 2016 was lower than the statutory federal and provincial rate of 27% primarily due to (i) KMI Loans, which gave rise to foreign exchange gains (which are considered capital gains that are only 50% tax-effected), and (ii) the release of valuation allowances on capital loss carryforwards utilized as a result of the above-mentioned capital gains.
The effective tax rate for the three months ended September 30, 2016 was higher than the statutory federal and provincial rate of 27% primarily as a consequence of the impact of (i) KMI Loans, which gave rise to foreign exchange losses (which are considered capital losses that are only 50% tax-effected) (ii) the valuation allowances on capital loss carryforwards as a result of the above-mentioned capital losses, (iii) pension adjustments.
As a result of our IPO and subsequent revaluation (or rebalancing) of our investment in the Limited Partnership, our tax basis exceeds our accounting basis in our investment in the Limited Partnership by approximately $830 million. This excess tax basis results in a deferred tax asset of approximately $112 million. A full valuation allowance was taken against this deferred tax asset as we determined it was more likely than not to not be realized.
7. Benefit Plans
Components of net benefit cost related to our pension plans and other postretirement benefit (OPEB) plans are as follows:
|
| Three Months Ended |
| Nine Months Ended |
| ||||||||||||
|
| Pension |
| OPEB |
| Pension |
| OPEB |
| ||||||||
(In millions of Canadian dollars) |
| 2017 |
| 2016 |
| 2017 |
| 2016 |
| 2017 |
| 2016 |
| 2017 |
| 2016 |
|
|
|
|
|
|
|
|
|
|
|
|
|
|
|
|
|
|
|
Service cost |
| 2.2 |
| 1.9 |
| 0.2 |
| 0.2 |
| 6.4 |
| 5.6 |
| 0.5 |
| 0.5 |
|
Interest cost |
| 1.9 |
| 1.8 |
| 0.2 |
| 0.2 |
| 5.8 |
| 5.4 |
| 0.5 |
| 0.5 |
|
Expected return on assets |
| (1.9 | ) | (1.7 | ) | — |
| — |
| (5.8 | ) | (5.1 | ) | — |
| — |
|
Amortization of prior service costs |
| — |
| — |
| — |
| — |
| 0.1 |
| 0.1 |
| — |
| — |
|
Amortization of net actuarial (gains) losses |
| 1.0 |
| 0.7 |
| — |
| — |
| 3.1 |
| 2.2 |
| 0.1 |
| — |
|
Total net benefit cost |
| 3.2 |
| 2.7 |
| 0.4 |
| 0.4 |
| 9.6 |
| 8.2 |
| 1.1 |
| 1.0 |
|
8. Change in Operating Assets and Liabilities
|
| Nine Months Ended September 30, |
| ||
|
| Cash inflow (outflow) |
| ||
(In millions of Canadian dollars) |
| 2017 |
| 2016 |
|
|
|
|
|
|
|
Accounts receivable-trade |
| (15.1 | ) | (3.9 | ) |
Accounts receivables-affiliates |
| 27.2 |
| 29.9 |
|
Prepaid expenses and deposits |
| (10.4 | ) | (9.4 | ) |
Inventory |
| (0.2 | ) | (0.4 | ) |
Other current assets |
| 11.5 |
| 3.4 |
|
Deferred amounts and other assets |
| (15.8 | ) | (2.3 | ) |
Accounts payable-trade |
| 9.0 |
| (1.7 | ) |
Accounts payable-affiliates |
| (26.5 | ) | 14.1 |
|
Accrued interest |
| (61.5 | ) | 33.5 |
|
Other current liabilities |
| 0.4 |
| (23.0 | ) |
Retirement and postretirement benefits obligation |
| (2.4 | ) | (2.3 | ) |
Regulatory liabilities and deferred credits |
| (13.3 | ) | (37.9 | ) |
|
| (97.1 | ) | — |
|
9. Contingencies and Litigation
Contingencies
We and our subsidiaries are subject to various legal and regulatory actions and proceedings which arise in the normal course of business. While the final outcome of such actions and proceedings cannot be predicted with certainty, management believes that the resolution of such actions and proceedings will not have material impact on our financial position or results of operations.
We and our subsidiaries are also subject to environmental cleanup and enforcement actions from time to time. Although we believe our operations are in substantial compliance with applicable environmental law and regulations, risks of additional costs and liabilities are inherent in pipeline and terminal operations, and there can be no assurance that it will not incur significant costs and
liabilities. Moreover, it is possible that other developments, such as increasingly stringent environmental laws, regulations and enforcement policies under the terms of authority of those laws, and claims for damages to property or persons resulting from our operations, could result in substantial costs and liabilities to us.
Although it is not possible to predict the ultimate outcomes, we believe that the resolution of the environmental matters to which we and our subsidiaries are a party, will not have a material adverse effect on our business, financial position, results of operations or cash flows. As of September 30, 2017 and December 31, 2016, we have accrued a total reserve for environmental liabilities in the amount of $8.1 million and $9.3 million, respectively.
Trans Mountain Expansion Project
Currently, the $7.4 billion Trans Mountain Expansion Project expansion will increase throughput capacity of Trans Mountain from approximately 300,000 to 890,000 barrels per day (‘‘bpd’’). The Trans Mountain Expansion Project has transportation service agreements for a total of 707,500 bpd representing approximately 80% of the expanded system’s capacity (with the remaining capacity available for spot shippers consistent with the requirements of the National Energy Board (“NEB”)).
On May 19, 2016, the NEB recommended that the Governor in Council approve the Trans Mountain Expansion Project, subject to 157 conditions. On November 29, 2016, the Governor in Council approved the Trans Mountain Expansion Project, and directed the NEB to issue, Amending Orders AO-003-OC-2 and AO-002-OC-49, and Certificate of Public Convenience and Necessity OC-064, authorizing the construction of the Trans Mountain Expansion Project. On January 11, 2017, the Government of British Columbia announced the issuance of an Environmental Assessment Certificate (“EAC”) from British Columbia’s Environmental Assessment Office to the Trans Mountain Pipeline ULC for the British Columbia portion of the Trans Mountain Expansion Project. The EAC includes 37 conditions that are in addition to and designed to supplement the 157 conditions required by the NEB. We have spent a cumulative total, net of contributions in aid of construction, of $778.8 million, which includes capitalized equity financing costs, on development of the Trans Mountain Expansion Project as of September 30, 2017 (December 31, 2016— $480 million).
Trans Mountain Expansion Project Litigation
There are numerous legal challenges pending before the Federal Court of Appeal which have been filed by various governmental and non-governmental organizations, Aboriginal groups or other parties that seek judicial review of the recommendation of the NEB and subsequent decision by the Federal Governor in Council to conditionally approve the Trans Mountain Pipeline Expansion Project (the “Project”). The petitions allege, among other things, that additional consultation, engagement or accommodation is required and that various non-economic impacts of the Project were not adequately considered. The remedies sought include requests that the NEB recommendation be quashed, that additional consultations be undertaken, and that the order of the Governor in Council approving the Project be quashed. After provincial elections in British Columbia on May 9, 2017, the New Democratic Party and Green Party formed a majority government. The new British Columbia government sought and was granted limited intervenor status in the Federal Court of Appeal proceedings to argue against the government’s approval of the Project. A hearing was conducted by the Federal Court of Appeal from October 2 through October 13, 2017. A decision is expected in the coming months, and is subject to potential further appeal to the Supreme Court of Canada. Although we believe that each of the foregoing appeals lacks merit, in the event an applicant is successful at the Supreme Court of Canada, among other potential impacts, the NEB recommendation or Governor in Council’s approval may be quashed, permits may be revoked, the Project may be subject to additional significant regulatory reviews, there may be significant changes to the Project plans, further obligations or restrictions may be implemented, or the Project may be stopped altogether, which could materially impact the overall feasibility or economic benefits of the Project, which in turn would have a material adverse effect on the Project and, consequently, KML.
In addition to the judicial reviews of the NEB recommendation report and Governor in Council’s order, two judicial review proceedings have been commenced at the Supreme Court of British Columbia (Squamish Nation and the City of Vancouver). The petitions allege a duty and failure to consult or accommodate First Nations, and generally, among other claims, that the Province ought not to have approved the Project. Each Applicant seeks to quash the EAC that was issued by the British Columbia Environmental Assessment Office. On September 29,2017, the British Columbia government filed evidence in support of the EAC approval in the
judicial review proceeding involving the Squamish Nation. Hearings are scheduled for October and November 2017, respectively, for the City of Vancouver and the Squamish Nation judicial review proceedings. Although we believe that each of the foregoing appeals lacks merit, in the event that an applicant for judicial review is successful, among other potential impacts, the EAC may be quashed, provincial permits may be revoked, the Project may be subject to additional significant regulatory reviews, there may be significant changes to the Project plans, further obligations or restrictions may be imposed or the Project may be stopped altogether. In the event that an applicant is unsuccessful at the Supreme Court of British Columbia, they may further seek to appeal the decision to the British Columbia Court of Appeal. Any decision of the British Columbia Court of Appeal may be appealed to the Supreme Court of Canada. A successful appeal at either of these levels could result in the same types of consequences described above.
10. Risk Management and Financial Instruments
Credit risk
We are exposed to credit risk, which is the risk that a customer or other counterparty will fail to perform an obligation or settle a liability, resulting in a financial loss to our business is primarily concentrated in the crude oil and refined products transportation industry and is dependent upon the ability of our customers to pay for these services. A majority of our customers operate in the oil and gas exploration and development, or energy marketing or transportation industries. We may be exposed to long-term downturns in energy commodity prices, including the price for crude oil, or other credit events impacting these industries.
We limit our exposure to credit risk by requiring shippers who fail to maintain specified credit ratings or a suitable financial position to provide acceptable security, generally in the form of guarantees from credit worthy parties or letters of credit from well rated financial institutions.
Our cash and cash equivalents are held with major financial institutions, minimizing the risk of non-performance by counter parties.
Interest Rate Risk
We are exposed to interest rate risk attributed to floating rate debt, which is used to finance capital expansion projects, including the Trans Mountain Expansion Project, and general corporate operations. The changes in interest rates may impact future cash flows and the fair value of our financial instruments.
Foreign Currency Transactions and Translation
Foreign currency transaction gains or losses result from a change in exchange rates between the functional currency of an entity, and the currency in which a transaction is denominated. Unrealized and realized gains and losses are recorded in Foreign exchange (loss) gain in the accompanying consolidated statements of income and include:
· As of September 30, 2017, we had no notes payable outstanding with Kinder Morgan or any of its subsidiaries, and as of December 31, 2016, we had $1,362.1 million of notes payable outstanding that are presented as Long-term debt-affiliates (KMI Loans) in the accompanying balances sheets. These balances were U.S. dollar denominated loans from Kinder Morgan subsidiaries to us. Foreign exchange rate changes on the long-term debt with affiliates, and associated interest expense payable balances, resulted in foreign exchange losses of ($0.6) million and $2.4 million for the three and nine months ended September 30, 2017, respectively, and a foreign exchange loss of $15.7 million and a gain of $54.2 million for the three and nine months ended September 30, 2016, respectively. Although the U.S. dollar denominated long-term loans from Kinder Morgan subsidiaries exposed KML to significant foreign exchange risk, there has historically been no foreign currency exchange risk on the KMI Loans on a Kinder Morgan consolidated basis. As a result, KML had not historically entered into any foreign currency derivatives and had not historically been engaged in hedging activities related to foreign currency exchange risk. Interest expense on the long-term debt with affiliates is translated at weighted-average rates of exchange prevailing during the year; and
· Additionally, foreign exchange losses and gains for the three and nine months ended September 30, 2017 include losses of $0.8 million and $2.9 million, respectively, and for the three and nine months ended September 30, 2016 include a loss of $1.3 million, and a gain of $5.1 million, respectively, recognized due to changes in exchange rates between the Canadian dollar and the U.S. dollar on U.S. dollar denominated balances. These currency exchange rate fluctuations affect the expected Canadian dollar cash flows on unsettled U.S. dollar denominated transactions, primarily related to cash bank accounts that are denominated in U.S. dollars and affiliate receivables or payables that are denominated in U.S. dollars. We translate the assets and liabilities of Trans Mountain Pipeline (Puget Sound) LLC that has the U.S. dollar as its functional currency to Canadian dollars at period-end exchange rates.
Liquidity risk
Liquidity risk is the risk that we will not be able to meet our financial obligations, including commitments, as they become due. We manage our liquidity risk by ensuring access to sufficient funds to meet our obligations. We forecast cash requirements to ensure funding is available to settle financial liabilities when they become due. Our primary sources of liquidity and capital resources are funds generated from operations and our Credit Facility, see Note 3.
Fair value measurements
We do not carry any financial assets or liabilities measured at fair value on a recurring basis, other than the Trans Mountain Pipeline Reclamation Trust and Cochin Pipeline Reclamation Trust (“Trusts”) that were established in 2015 in the Province of Alberta to set aside funds collected through pipeline abandonment surcharges over a collection period established by the NEB. The use of amounts in the Trusts is restricted to pay future abandonment costs. We disclose the fair value of other financial instruments not measured at fair value. The fair value of financial instruments reflects our best estimate of market value based on generally accepted valuation techniques or models and are supported by observable market prices and rates. When such values are not available, we use discounted cash flow analysis from applicable yield curves based on observable market inputs to estimate fair value.
Fair value of financial instruments
Fair value represents the price at which a financial instrument could be exchanged in an orderly market, in an arm’s length transaction between knowledgeable and willing parties who are under no compulsion to act. We classify the fair value of the financial instruments according to the following hierarchy based on the observable inputs used to value the instrument:
· Level 1 - inputs to the valuation methodology are quoted prices unadjusted for identical assets or liabilities in active markets.
· Level 2 - inputs other than quoted prices included in Level 1 that are observable for the asset or liability either directly (as prices) or indirectly (i.e. derived from prices).
· Level 3 - inputs to the valuation model are not based on observable market data.
Fair value measurements are classified in the fair value hierarchy based on the lowest level input that is significant to that fair value measurement. This assessment requires judgment considering factors specific to an asset or liability and may affect placement within the fair value hierarchy. Level 1 and Level 2 are used for the fair value of cash and cash equivalents and restricted investments, respectively.
Due to the short-term or on demand nature of cash and cash equivalents, restricted cash, accounts receivable, accounts receivable from affiliates, accounts payable, accounts payable to affiliates and accrued interest, it has been determined that the carrying amounts for these balances approximate fair value.
11. Reportable Segments
The reportable business segments of KML are based on the way management organizes the enterprise. Each of our reportable business segments represents a component of the enterprise that engages in a separate business activity and for which discrete financial information is available.
Our reportable business segments are:
· Pipelines - the ownership and operation of (i) Trans Mountain that currently transports approximately 300,000 bpd of crude oil and refined petroleum from Edmonton, Alberta to Vancouver, B.C.; (ii) the Trans Mountain (Puget Sound) pipeline serving Washington State; (iii) the Trans Mountain Jet Fuel pipeline serving Vancouver International Airport; (iv) KMCI, the employer of Canadian staff; and (v) the Canadian segment of the Cochin pipeline, a 12-inch diameter multi-product pipeline which spans approximately 1,000 km in Saskatchewan and Alberta; and
· Terminals - which includes the ownership and operation of liquid product merchant storage and rail terminals in the Edmonton, AB market as well as a predominantly dry cargo import/export facility in Vancouver, B.C.
We evaluate the performance of our reportable business segments by evaluating the earnings before depreciation and amortization of each segment (“Segment EBDA”). We believe that Segment EBDA is a useful measure of the operating performance of KML because it measures segment operating results before DD&A and certain expenses that are generally not controllable by the operating managers of our respective business segments, such as general and administrative expense, foreign exchange losses (or gains) on the KMI Loans, interest expense, and income tax expense. Our general and administrative expenses include such items as employee benefits, insurance, rentals, and shared corporate services including accounting, information technology, human resources and legal services. Certain general and administrative costs attributable to Trans Mountain are billable as flow through items to shippers and result in incremental revenues.
We consider each period’s earnings before all non-cash DD&A expenses to be an important measure of business segment performance for our reporting segments. We account for intersegment sales at market prices, while it accounts for asset transfers at either market value or, in some instances, book value. Intercompany transactions are eliminated in consolidation.
Financial information by segment follows:
|
| Three Months Ended September 30, |
| Nine Months Ended September 30, |
| ||||
(In millions of Canadian dollars) |
| 2017 |
| 2016 |
| 2017 |
| 2016 |
|
|
|
|
|
|
|
|
|
|
|
Revenues |
|
|
|
|
|
|
|
|
|
Pipelines |
| 95.9 |
| 98.6 |
| 281.8 |
| 287.0 |
|
Terminals |
| 71.1 |
| 70.9 |
| 218.4 |
| 214.9 |
|
Total consolidated revenues |
| 167.0 |
| 169.5 |
| 500.2 |
| 501.9 |
|
|
| Three Months Ended September 30, |
| Nine Months Ended September 30, |
| ||||
(In millions of Canadian dollars) |
| 2017 |
| 2016 |
| 2017 |
| 2016 |
|
|
|
|
|
|
|
|
|
|
|
Segment EBDA(a)(b) |
|
|
|
|
|
|
|
|
|
Pipelines |
| 58.5 |
| 58.2 |
| 169.0 |
| 184.3 |
|
Terminals |
| 52.7 |
| 52.0 |
| 159.1 |
| 162.6 |
|
Total segment EBDA |
| 111.2 |
| 110.2 |
| 328.1 |
| 346.9 |
|
DD&A |
| (37.2 | ) | (34.3 | ) | (107.6 | ) | (102.5 | ) |
Foreign exchange gain (loss) on long-term debt-affiliates (KMI Loans) |
| 0.6 |
| (15.7 | ) | (2.4 | ) | 54.2 |
|
General and administrative expenses |
| (16.2 | ) | (15.2 | ) | (50.5 | ) | (45.4 | ) |
Interest, net |
| (1.3 | ) | (7.0 | ) | (10.9 | ) | (22.9 | ) |
Income tax expense |
| (14.7 | ) | (17.7 | ) | (42.4 | ) | (46.3 | ) |
Total consolidated net income |
| 42.4 |
| 20.3 |
| 114.3 |
| 184.0 |
|
(In millions of Canadian dollars) |
| September 30, 2017 |
| December 31, 2016 |
|
|
|
|
|
|
|
Assets |
|
|
|
|
|
Pipelines |
| 2,984.7 |
| 2,375.1 |
|
Terminals |
| 1,372.1 |
| 1,364.3 |
|
Total consolidated assets |
| 4,356.8 |
| 3,739.4 |
|
(a) Includes revenues and other (income) expense less operating expenses and other, net. Operating expenses primarily include operations and maintenance expenses, and taxes, other than income taxes. Segment EBDA for the three months ended September 30, 2017 and 2016 includes (i) $(1.5) million and $(1.4) million, respectively, of unrealized foreign exchange losses due to changes in exchange rates between the Canadian dollar and the U.S. dollar on U.S. dollar denominated balances and (ii) $7.8 million and $4.6 million, respectively, of capitalized equity financing costs. Segment EBDA for the nine months ended September 30, 2017 and 2016 includes (i) $(3.3) million and $5.1 million, respectively, of unrealized foreign exchange (losses) gains due to changes in exchange rates between the Canadian dollar and the U.S. dollar on U.S. dollar denominated balances and (ii) $19.6 million and $12.8 million, respectively, of capitalized equity financing costs.
(b) The KMI Loans, which represented U.S. dollar denominated long-term notes payable to Kinder Morgan, were settled with proceeds from our IPO.
Report of Independent Registered Public Accounting Firm
To the Shareholders of Kinder Morgan Canada Limited
We have audited the accompanying consolidated balance sheets of Kinder Morgan Canada Limited and its subsidiaries (together the “Company”) as of December 31, 2016 and December 31, 2015, and the related consolidated statements of operations, comprehensive income (loss), cash flows and equity for each of the three years in the period ended December 31, 2016. These consolidated financial statements are the responsibility of the Company’s management. Our responsibility is to express an opinion on these consolidated financial statements based on our audits.
We conducted our audits in accordance with the standards of the Public Company Accounting Oversight Board (United States). Those standards require that we plan and perform the audit to obtain reasonable assurance about whether the consolidated financial statements are free of material misstatement. An audit includes examining, on a test basis, evidence supporting the amounts and disclosures in the consolidated financial statements. An audit also includes assessing the accounting principles used and significant estimates made by management, as well as evaluating the overall consolidated financial statement presentation. We believe that our audits provide a reasonable basis for our opinion.
In our opinion, the consolidated financial statements referred to above present fairly, in all material respects, the financial position of Kinder Morgan Canada Limited and its subsidiaries as of December 31, 2016 and December 31, 2015, and the results of their operations and their cash flows for each of the three years in the period ended December 31, 2016 in conformity with accounting principles generally accepted in the United States of America.
/s/ PricewaterhouseCoopers LLP
PricewaterhouseCoopers LLP
Calgary, Alberta
October 19, 2017
KINDER MORGAN CANADA LIMITED
CONSOLIDATED STATEMENTS OF OPERATIONS
(In millions of Canadian dollars)
Year Ended December 31, |
| 2016 |
| 2015 |
| 2014 |
|
Revenues |
|
|
|
|
|
|
|
Services |
| 674.7 |
| 644.2 |
| 501.0 |
|
Product Sales and Other |
| 1.4 |
| 1.7 |
| 4.2 |
|
Total Revenues |
| 676.1 |
| 645.9 |
| 505.2 |
|
|
|
|
|
|
|
|
|
Operating Costs, Expenses and Other |
|
|
|
|
|
|
|
Costs of sales |
| — |
| 0.1 |
| 1.2 |
|
Operations and maintenance |
| 205.4 |
| 182.7 |
| 158.9 |
|
Depreciation, depletion and amortization (Note 5) |
| 137.2 |
| 123.5 |
| 88.7 |
|
General and administrative |
| 57.6 |
| 61.3 |
| 59.2 |
|
Taxes, other than income taxes |
| 38.2 |
| 37.3 |
| 35.3 |
|
Other expense (income), net |
| 0.3 |
| (1.3 | ) | (1.0 | ) |
Total Operating Costs, Expenses and Other |
| 438.7 |
| 403.6 |
| 342.3 |
|
|
|
|
|
|
|
|
|
Operating Income |
| 237.4 |
| 242.3 |
| 162.9 |
|
|
|
|
|
|
|
|
|
Other Income (Expense) |
|
|
|
|
|
|
|
Interest, net (Note 13) |
| (29.9 | ) | (30.1 | ) | (49.4 | ) |
Unrealized foreign exchange gain (loss) (Note 16) |
| 32.6 |
| (185.4 | ) | (78.3 | ) |
Other, net |
| 18.0 |
| 12.4 |
| 10.9 |
|
Total Other Income (Expense) |
| 20.7 |
| (203.1 | ) | (116.8 | ) |
|
|
|
|
|
|
|
|
Income Before Income Taxes |
| 258.1 |
| 39.2 |
| 46.1 |
|
|
|
|
|
|
|
|
|
Income Tax Expense (Note 10) |
| (56.3 | ) | (62.1 | ) | (26.6 | ) |
|
|
|
|
|
|
|
|
Net Income (Loss) |
| 201.8 |
| (22.9 | ) | 19.5 |
|
|
|
|
|
|
|
|
|
Net (Income) Loss Attributable to Kinder Morgan Interest |
| (201.8 | ) | 22.9 |
| (19.5 | ) |
|
|
|
|
|
|
|
|
Net Income Available to Restricted Voting Stockholders |
| — |
| — |
| — |
|
The accompanying notes are an integral part of these consolidated financial statements.
KINDER MORGAN CANADA LIMITED
CONSOLIDATED STATEMENTS OF COMPREHENSIVE INCOME (LOSS)
(In millions of Canadian dollars)
Year Ended December 31, |
| 2016 |
| 2015 |
| 2014 |
|
Net income (loss) |
| 201.8 |
| (22.9 | ) | 19.5 |
|
|
|
|
|
|
|
|
|
Other comprehensive income (loss) |
|
|
|
|
|
|
|
Benefit plans |
|
|
|
|
|
|
|
Unrealized actuarial (losses) gains arising during period (net of tax benefit (expense) of $3.4, $(1.1), and $2.9, respectively) |
| (6.0 | ) | 3.1 |
| (8.3 | ) |
Amortization of prior service costs (net of tax expense of $(-), $(-), and $(-), respectively |
| 0.1 |
| 0.1 |
| 0.1 |
|
Amortization of actuarial losses (net of tax expense of $(0.7), $(0.6), and $(0.5), respectively |
| 1.2 |
| 1.6 |
| 1.2 |
|
Foreign currency translation adjustments |
| (1.7 | ) | 12.0 |
| 4.9 |
|
|
|
|
|
|
|
|
|
Total other comprehensive (loss) income |
| (6.4 | ) | 16.8 |
| (2.1 | ) |
Comprehensive income (loss) |
| 195.4 |
| (6.1 | ) | 17.4 |
|
|
|
|
|
|
|
|
|
Comprehensive (income) loss attributable to Kinder Morgan interest |
| (195.4 | ) | 6.1 |
| (17.4 | ) |
|
|
|
|
|
|
|
|
Comprehensive income attributable to Kinder Morgan Canada Limited |
| — |
| — |
| — |
|
The accompanying notes are an integral part of these consolidated financial statements.
KINDER MORGAN CANADA LIMITED
(In millions of Canadian dollars)
December 31, |
| 2016 |
| 2015 |
|
ASSETS |
|
|
|
|
|
Current assets |
|
|
|
|
|
Cash and cash equivalents (Note 2) |
| 159.0 |
| 72.7 |
|
Accounts receivable (Note 2) |
| 34.5 |
| 30.8 |
|
Accounts receivable-affiliates (Note 9) |
| 39.1 |
| 68.5 |
|
Inventories (Note 2) |
| 12.4 |
| 10.9 |
|
Other current assets (Note 4) |
| 16.8 |
| 14.4 |
|
Total current assets |
| 261.8 |
| 197.3 |
|
|
|
|
|
|
|
Property, plant and equipment, net (Note 5) |
| 3,181.1 |
| 3,008.3 |
|
Goodwill (Note 2) |
| 248.0 |
| 248.0 |
|
Deferred charges and other assets (Note 6) |
| 48.5 |
| 31.6 |
|
Total Assets |
| 3,739.4 |
| 3,485.2 |
|
|
|
|
|
|
|
LIABILITIES AND EQUITY |
|
|
|
|
|
Current liabilities |
|
|
|
|
|
Accounts payable (Note 7) |
| 109.2 |
| 82.5 |
|
Accounts payable-affiliates (Note 9) |
| 144.3 |
| 115.1 |
|
Accrued interest-affiliates (Note 9) |
| 61.8 |
| 65.7 |
|
Regulatory liabilities (Note 2) |
| 122.9 |
| 170.5 |
|
Other current liabilities (Note 8) |
| 24.2 |
| 18.4 |
|
Total current liabilities |
| 462.4 |
| 452.2 |
|
|
|
|
|
|
|
Long-term liabilities and deferred credits |
|
|
|
|
|
Long-term debt-affiliates (Note 9) |
| 1,362.1 |
| 1,320.4 |
|
Deferred income taxes (Note 10) |
| 304.8 |
| 253.4 |
|
Retirement and postretirement benefits (Note 11) |
| 74.9 |
| 62.3 |
|
Regulatory liabilities (Note 2) |
| 37.6 |
| 87.9 |
|
Deferred revenues |
| 51.6 |
| 50.5 |
|
Other deferred credits (Note 12) |
| 10.0 |
| 7.5 |
|
Total long-term liabilities and deferred credits |
| 1,841.0 |
| 1,782.0 |
|
Total Liabilities |
| 2,303.4 |
| 2,234.2 |
|
|
|
|
|
|
|
Commitments and contingencies (Notes 9 and 15) |
|
|
|
|
|
|
|
|
|
|
|
Equity |
|
|
|
|
|
Kinder Morgan interest — pre-IPO (Note 1) |
| 1,475.0 |
| 1,464.3 |
|
Retained deficit |
| (13.1 | ) | (193.8 | ) |
Accumulated other comprehensive loss |
| (25.9 | ) | (19.5 | ) |
Total Equity |
| 1,436.0 |
| 1,251.0 |
|
Total Liabilities and Equity |
| 3,739.4 |
| 3,485.2 |
|
The accompanying notes are an integral part of these consolidated financial statements.
KINDER MORGAN CANADA LIMITED
CONSOLIDATED STATEMENTS OF CASH FLOWS
(In millions of Canadian dollars)
Year Ended December 31, |
| 2016 |
| 2015 |
| 2014 |
|
Operating Activities |
|
|
|
|
|
|
|
Net income (loss) |
| 201.8 |
| (22.9 | ) | 19.5 |
|
Non-cash items: |
|
|
|
|
|
|
|
Depreciation, depletion and amortization |
| 137.2 |
| 123.5 |
| 88.7 |
|
Deferred income tax |
| 55.1 |
| 62.6 |
| 22.9 |
|
Allowance for equity funds used during construction |
| (17.9 | ) | (12.9 | ) | (11.2 | ) |
Unrealized foreign exchange (gain) loss |
| (32.6 | ) | 185.4 |
| 78.3 |
|
Other non-cash items |
| (6.2 | ) | 9.6 |
| (12.0 | ) |
Change in operating assets and liabilities (Note 14) |
| (27.5 | ) | (121.6 | ) | 170.9 |
|
Cash provided by operating activities |
| 309.9 |
| 223.7 |
| 357.1 |
|
|
|
|
|
|
|
|
|
Investing Activities |
|
|
|
|
|
|
|
Capital expenditures |
| (269.1 | ) | (340.0 | ) | (485.8 | ) |
Contributions to trusts |
| (13.7 | ) | (14.0 | ) | — |
|
Sale of property, plant and equipment, net of removal costs |
| (0.4 | ) | 1.7 |
| — |
|
Change in restricted cash |
| (0.3 | ) | (1.0 | ) | — |
|
Cash used in investing activities |
| (283.5 | ) | (353.3 | ) | (485.8 | ) |
|
|
|
|
|
|
|
|
Financing Activities |
|
|
|
|
|
|
|
Proceeds from debt with affiliates |
| 70.2 |
| 52.6 |
| 90.0 |
|
Repayment of debt with affiliates |
| — |
| (0.9 | ) | — |
|
Contributions from Parent |
| 10.7 |
| — |
| — |
|
Distributions to Parent |
| (21.1 | ) | (39.7 | ) | — |
|
Cash provided by financing activities |
| 59.8 |
| 12.0 |
| 90.0 |
|
|
|
|
|
|
|
|
|
Effect of Exchange Rate Changes on Cash and Cash Equivalents |
| 0.1 |
| 10.6 |
| 8.0 |
|
|
|
|
|
|
|
|
|
Net increase (decrease) in Cash and Cash Equivalents |
| 86.3 |
| (107.0 | ) | (30.7 | ) |
Cash and Cash Equivalents, beginning of period |
| 72.7 |
| 179.7 |
| 210.4 |
|
Cash and Cash Equivalents, end of period |
| 159.0 |
| 72.7 |
| 179.7 |
|
|
|
|
|
|
|
|
|
Supplemental Disclosures of Cash Flow Information |
|
|
|
|
|
|
|
Cash paid to affiliates during the period for interest |
| 45.7 |
| 119.8 |
| — |
|
Cash paid (refund) during the period for income taxes |
| 1.1 |
| (0.4 | ) | 1.5 |
|
Non-cash Investing and Financing Activities |
|
|
|
|
|
|
|
Increase (decrease) in property, plant and equipment from both accruals and contractor retainage |
| 26.0 |
|
|
| 36.4 |
|
(Decrease) increase in property, plant and equipment due to foreign currency translation adjustments |
| (4.0 | ) | 23.2 |
| 9.1 |
|
The accompanying notes are an integral part of these consolidated financial statements.
KINDER MORGAN CANADA LIMITED
CONSOLIDATED STATEMENTS OF EQUITY
(In millions of Canadian dollars)
Year ended December 31, |
| 2016 |
| 2015 |
| 2014 |
|
Kinder Morgan interest — pre-IPO (Note 1) |
|
|
|
|
|
|
|
Beginning balance |
| 1,464.3 |
| 1,464.3 |
| 1,310.9 |
|
Contributions |
| 10.7 |
| — |
| 153.4 |
|
Ending balance |
| 1,475.0 |
| 1,464.3 |
| 1,464.3 |
|
Retained earnings (deficit) |
|
|
|
|
|
|
|
Beginning balance |
| (193.8 | ) | (131.2 | ) | (150.7 | ) |
Net income (loss) |
| 201.8 |
| (22.9 | ) | 19.5 |
|
Distributions |
| (21.1 | ) | (39.7 | ) | — |
|
Ending balance |
| (13.1 | ) | (193.8 | ) | (131.2 | ) |
Accumulated other comprehensive income |
|
|
|
|
|
|
|
Beginning balance |
| (19.5 | ) | (36.3 | ) | (34.2 | ) |
Benefit plan adjustments |
| (4.7 | ) | 4.8 |
| (7.0 | ) |
Foreign currency adjustments |
| (1.7 | ) | 12.0 |
| 4.9 |
|
Ending balance |
| (25.9 | ) | (19.5 | ) | (36.3 | ) |
|
|
|
|
|
|
|
|
Total Canadian Business equity |
| 1,436.0 |
| 1,251.0 |
| 1,296.8 |
|
The accompanying notes are an integral part of these consolidated financial statements.
KINDER MORGAN CANADA LIMITED
NOTES TO CONSOLIDATED FINANCIAL STATEMENTS
1. General
Kinder Morgan Canada Limited was incorporated under the Business Corporations Act (Alberta) on April 7, 2017. On May 30, 2017, we completed an initial public offering (“IPO”) of our Restricted Voting Shares and used the net proceeds of $1,670.6 million to acquire an approximate 30% indirect interest in Kinder Morgan Canada Limited Partnership (“Limited Partnership”) from certain affiliates of Kinder Morgan, Inc. (“Kinder Morgan”), who retained an approximate 70% ownership of the limited partnership units in the Limited Partnership. When we refer to “us,” “we,” “our,” “ours,” “the Company,” or “KML,” we are describing Kinder Morgan Canada Limited. Also, see subsequent events below.
The Limited Partnership and its general partner, Kinder Morgan Canada GP Inc (the “General Partner”), were formed under the laws of the Province of Alberta in conjunction with the IPO. The Limited Partnership, through its ownership of Kinder Morgan Cochin ULC, indirectly consolidates Kinder Morgan Canada, Inc. (“KMCI”) and all or its proportion of the following operating entities (collectively the “Operating Entities”):
· Kinder Morgan Cochin ULC(1)
· KM Canada Marine Terminal Limited Partnership
· KM Canada North 40 Limited Partnership
· KM Canada Rail Holdings GP Limited
· Trans Mountain (Jet Fuel) Inc.
· Trans Mountain Pipeline (Puget Sound) LLC
· Trans Mountain Pipeline ULC
· Trans Mountain Pipeline L.P.
· KM Canada Terminals GP ULC
· KM Canada Edmonton South Rail Terminal Limited Partnership
· KM Canada Edmonton North Rail Terminal Limited Partnership
· Base Line Terminal East Limited Partnership
(1) Kinder Morgan Cochin ULC indirectly owns a 50% undivided interest in the Edmonton Rail Terminal, the Alberta Crude Terminal and the Base Line Terminal joint venture operations which are proportionally consolidated by subsidiaries of the Limited Partnership.
The Limited Partnership is a variable interest entity because a simple majority or lower threshold of the limited partnership interests do not possess substantive “kick-out” rights (i.e., the right to remove the general partner or to dissolve (liquidate) the entity without cause) or substantive participation rights. The General Partner is the primary beneficiary because it has the power to direct the activities that most significantly impact the Limited Partnership’s performance and the right to receive benefits, and obligation to absorb losses, that could be significant to the Limited Partnership. As a result, the General Partner consolidates the Limited Partnership. The General Partner is a wholly-owned subsidiary of the Company. Consequently, we indirectly consolidate the Limited Partnership and the Operating Entities in our consolidated financial statements.
The Reorganization and our Initial Public Offering
On May 30, 2017, we completed an IPO of 102,942,000 restricted voting shares (“Restricted Voting Shares”) on the Toronto Stock Exchange at a price of $17.00 per Restricted Voting Share for total gross proceeds of approximately $1.75 billion. We used our IPO proceeds to indirectly acquire from Kinder Morgan an approximate 30% economic interest in the Limited Partnership, with Kinder Morgan retaining the remaining approximate 70% economic interest.
Concurrent with closing of our IPO, the Limited Partnership acquired an interest in the Operating Entities from Kinder Morgan Canada Company (“KMCC”) and KM Canada Terminals ULC (“KM Canada Terminals”) in exchange for the issuance to KMCC and KM Canada Terminals of Class B limited partnership units of the Limited Partnership. In addition, KMCC and KM Canada Terminals were issued Special Voting Shares in the Company for nominal consideration.
Immediately following the closing of our IPO, we used the proceeds from our IPO to indirectly subscribe for Class A limited partnership units representing an approximate 30% economic interest in the Limited Partnership while the Class B limited partnership units held by KMCC and KM Canada Terminals represent, in the aggregate, an approximate 70% economic interest in the Limited Partnership.
Upon completion of our IPO and the reorganization transaction described above, the issued and outstanding Restricted Voting Shares comprises approximately 30% of the votes attached to all outstanding Company voting shares, and the Kinder Morgan interest, which represents its indirect ownership of 100% of the Special Voting Shares, comprises approximately 70% of the votes attached to all outstanding Company voting shares.
Subsequent to our IPO, Kinder Morgan retained control of KML and the Limited Partnership, as a result we accounted for our acquisition of an approximate 30% economic interest in the Limited Partnership as a transfer of net assets among entities under common control. Therefore, our consolidated financial statements presented herein were derived from the consolidated financial statements and accounting records of Kinder Morgan. The assets and liabilities in these consolidated financial statements have been reflected at historical carrying value of the immediate parent(s) within the Kinder Morgan organization structure including goodwill and purchase price assigned amounts, as applicable. All significant intercompany balances between the companies included in our accompanying consolidated financial statements have been eliminated.
These consolidated financial statements were previously issued as consolidated combined financial statements to reflect that KML did not own or control the Operating Entities prior to May 25, 2017.
Credit Facility
On June 16, 2017, Kinder Morgan Cochin ULC and Trans Mountain Pipeline ULC, our indirect subsidiaries, entered into a definitive credit agreement establishing (i) a C$4.0 billion revolving construction facility for the purposes of funding the development, construction and completion of the Trans Mountain expansion project, (ii) a C$1.0 billion revolving contingent credit facility for the purpose of funding, if necessary, additional Trans Mountain expansion project costs (and, subject to the need to fund such additional costs, meeting the Canadian National Energy Board-mandated liquidity requirements) and (iii) a C$500 million revolving working capital facility, to be used for working capital and other general corporate purposes (collectively, the “Credit Facility”). The Credit Facility has a five year term and is with a syndicate of financial institutions with Royal Bank of Canada as the administrative agent. Any undrawn commitments under the Credit Facility will incur a standby fee of 0.30% to 0.625%, with the range dependent on the credit ratings of Kinder Morgan Cochin ULC or KML. The Credit Facility is guaranteed by KML and all of the non-borrower subsidiaries of KML and are secured by a first lien security interest on all of the assets of KML and the equity and assets of the other guarantors.
Preferred Share Offering
On August 15, 2017, we completed an offering of cumulative redeemable minimum rate reset preferred shares, Series 1 (the “Series 1 Shares”). We issued 12,000,000 Series 1 Shares for aggregate gross proceeds of $300 million. The proceeds from the offering were used by us to indirectly subscribe for preferred units in the Limited Partnership, which in turn were used by the Limited Partnership to repay Credit Facility indebtedness recently incurred to, directly or indirectly, finance the development, construction and completion of the Trans Mountain Expansion project and Base Line Terminal project, and for general corporate purposes.
2. Summary of Significant Accounting Policies
Basis of Presentation
We have prepared the accompanying financial statements in accordance with the accounting principles contained in the Financial Accounting Standards Board’s (“FASB”) Accounting Standards Codification, the single source of United States Generally Accepted Accounting Principles (“U.S. GAAP”) and referred to in this report as the Codification. U.S. GAAP means generally accepted accounting principles that the Securities Exchange Commission has identified as having substantial authoritative support, as supplemented by Regulation S-X under the U.S. Securities Exchange Commission Act of 1934, as amended from time to time. Amounts are stated in Canadian dollars unless otherwise noted which is the functional currency of most of our operations.
In March 2017, the Alberta Securities Commission (“ASC”) and Ontario Securities Commission (“OSC”) issued a relief order which permits us to continue to prepare our financial statements in accordance with U.S. GAAP until the earliest of: (i) January 1, 2019; (ii) the first day of the financial year that commences after we cease to have activities subject to rate regulation; or (iii) the effective date prescribed by the International Accounting Standards Board for the mandatory application of a standard within International Financial Reporting Standards specific to entities with activities subject to rate regulation.
Management has evaluated subsequent events through October 19, 2017, the date the financial statements were available to be issued.
Use of Estimates
Certain amounts included in or affecting our financial statements and related disclosures must be estimated, requiring certain assumptions with respect to values or conditions which cannot be known with certainty at the time our financial statements are prepared. These estimates and assumptions affect the amounts we report for assets and liabilities, our revenues and expenses during the reporting period, and our disclosures, including as it relates to contingent assets and liabilities at the date of our financial statements. We evaluate these estimates on an ongoing basis, utilizing historical experience, consultation with experts and other methods considered reasonable in the particular circumstances. Nevertheless, actual results may differ significantly from our estimates. Any effects on our business, financial position or results of operations resulting from revisions to these estimates are recorded in the period in which the facts that give rise to the revision become known.
In addition, we believe that certain accounting policies are of more significance in our financial statement preparation process than others, and set out below are the principal accounting policies we apply in the preparation of our accompanying consolidated financial statements.
Revenue Recognition
We recognize revenue as services are rendered or goods are delivered and, if applicable, risk of loss has passed.
The Trans Mountain and Cochin pipeline regulated tariffs are designed to provide revenues sufficient to recover the costs of providing transportation services to shippers, including a return of capital and an allowed return on equity. We recognize transportation revenues when our customers’ products are delivered and services have been provided and adjusted according to terms prescribed by the relevant toll settlements with shippers as approved by the regulator. Certain customer contracts may contain minimum volume commitments by our customers. To the extent a customer does not meet its minimum volume commitment, we generally recognize revenue when we have no further performance obligation at the contractual rate applicable to such committed volumes. If such minimum volume commitments contain make up rights, we defer revenue until the expiration of the make-up right or when our obligation to the customer has otherwise ceased. We recognize differences between transportation revenue and actual toll receipts as regulatory assets or liabilities and settled through future tolls.
We generally recognize bulk terminal transfer service revenues based on volumes handled. Liquids terminal warehousing revenue is generally recognized ratably over the contract period. We generally recognize liquids terminal throughput revenue based on volumes received and volumes delivered. We generally defer revenue within the Terminals segment related to capital improvements paid for in advance by certain customers, which we then amortize over the initial term of the related customer contracts.
For the year ended December 31, 2016, we had two customers that represented 14% and 10% of total revenue, respectively. For the year ended December 31, 2015, we had two customers that each represented 12% of total revenue. For the year ended December 31, 2014, we had one customer that represented 13% of total revenues.
Cash, Cash Equivalents and Restricted Cash
We define cash equivalents as all highly liquid short-term investments with original maturities of three months or less. Restricted cash of approximately $1.3 million and $1.0 million as of December 31, 2016 and 2015, respectively, is included in “Other current assets” on our accompanying consolidated balance sheets.
Accounts Receivable
We establish provisions for losses on accounts receivable due from customers if it is determined that all or part of the outstanding balance is probable of not being collected. We review collectability regularly and establish an allowance or record adjustments as necessary using the specific identification method. We had no allowance for doubtful accounts as of December 31, 2016 and December 31, 2015.
Inventories
Our inventories, which consist of materials and supplies, are valued at weighted-average cost, and we periodically review for physical deterioration and obsolescence and adjust inventories to lower cost or market, as necessary.
Property, Plant and Equipment
We record property, plant and equipment at historical cost. We capitalize expenditures for construction, expansion, major renewals and betterments. We expense maintenance and repair costs as incurred. We capitalize expenditures for project development if they are expected to have future benefit. We capitalize Interest incurred During Construction (“IDC”) for non rate-regulated assets. For rate-regulated assets, Allowance for Funds Used During Construction (“AFUDC”) is included in the cost of property, plant and equipment and is depreciated over future periods as part of the total cost of the related asset. AFUDC includes both an interest component and, if approved by the regulator, a cost of equity component.
These capitalized financing costs are referred to herein as “Capitalized Debt Financing Costs” for capitalized interest costs and “Capitalized Equity Financing Costs” for capitalized equity costs. During the years ended December 31, 2016, 2015 and 2014, $17.9 million, $12.9 million and $11.2 million, respectively, of Capitalized Equity Financing Costs is included in Other, net on our accompanying consolidated statements of operations.
For regulated assets, except Cochin, we record depreciation on a straight-line basis over their estimated useful lives. Depreciation rates for regulated assets are approved by the regulator. Non-regulated assets require the use of management estimates of the useful lives of assets. For the Cochin pipeline system assets, we apply a composite depreciation rate to the total cost of the composite group until the net book value equals the salvage value. In applying the composite method, we generally charge the original cost of property sold or retired to accumulated depreciation and amortization, net of salvage and cost of removal.
Asset Retirement Obligations (“ARO”)
We record liabilities for obligations related to the retirement and removal of long-lived assets used in our businesses. We record the fair values of asset retirement obligations, as liabilities, on a discounted basis when they are incurred and can be reasonably estimated, which is typically at the time the assets are installed or acquired. Amounts recorded for the related assets are increased by the amount of these obligations. Over time, the liabilities increase due to the change in their present value, and the initial capitalized costs are depreciated over the useful lives of the related assets. The liabilities are eventually extinguished when the asset is taken out of service.
Due to the lack of information that can be derived from past experience or industry practice, the timing and fair value of future removal and site restoration costs for our assets is not currently determinable. We have not recognized an ARO in these consolidated financial statements. Also, see Note 6 regarding Trans Mountain and Cochin Pipeline Reclamation Trust Securities.
Long-lived Asset Impairments
We evaluate long-lived assets and investments for impairment whenever events or changes in circumstances indicate that the carrying amount of an asset or investment may not be recoverable. We recognize impairment losses when estimated future cash flows expected to result from the use of the asset and its eventual disposition is less than its carrying amount.
Prior to us conducting the goodwill impairment test, to the extent triggering events exist, we complete a review of the carrying value of our long-lived assets, including property, plant and equipment as well as other intangibles, and record, as applicable, the appropriate impairments. Because step one of the impairment test for long-lived assets held in use is based on undiscounted cash flows, there may be instances where an asset or asset group is not considered impaired, even when its fair value may be less than its carrying value, because the asset or asset group is recoverable based on the cash flows to be generated over the estimated life of the asset or asset group. We did not record any impairments to long-lived assets in the years ended December 31, 2016, 2015 or 2014.
Jointly controlled operations
Jointly controlled operations are assets over which we have joint ownership with unaffiliated entities which are not held in a partnership, corporation or other legal entity. We have three joint ventures that undertake terminaling activities through jointly controlled operations. We account for jointly controlled operations using the proportionate consolidation method for which (i) our consolidated balance sheets include our share of the assets that we control jointly with third parties and the liabilities for which we are jointly responsible and (ii) our consolidated statements of operations include our share of the income and expenses generated by the jointly controlled operations.
Goodwill
Our Goodwill represents the cost in excess of the fair value of the Trans Mountain Pipeline assets and liabilities in excess of fair value when acquired by Kinder Morgan in 2006 and is recorded as an asset assigned to the Pipelines segment. Goodwill is not subject to amortization but must be tested for impairment at least annually. This test requires us to assign goodwill to an appropriate reporting unit and to determine if the implied fair value of the reporting unit’s goodwill is less than its carrying amount. We evaluate goodwill for impairment on May 31 of each year.
We also evaluate goodwill for impairment to the extent events or conditions indicate a risk of possible impairment during the interim periods subsequent to the annual impairment test. Generally, the evaluation of goodwill for impairment involves a two-step test, although under certain circumstance an initial qualitative evaluation may be sufficient to conclude that goodwill is not impaired without conducting the quantitative test. We did not record any impairments to goodwill in the years ended December 31, 2016, 2015 or 2014.
Regulatory Assets and Liabilities
Our Trans Mountain and Cochin operations are regulated by the National Energy Board of Canada (“NEB”). Our Trans Mountain (Puget Sound) operations are regulated by the U.S. Federal Energy Regulatory Commission (“FERC”) and the U.S. Department of Transportation Office of Pipeline Safety. The FERC exercises statutory authority over rates and ratemaking, for U.S. interstate and international pipelines and accounting practices, while facilities are regulated by the U.S. Department of Transportation Office of Pipeline Safety. To recognize the economic effects of the actions of the regulator, the timing of recognition of certain revenues and expenses in these operations may differ from that otherwise expected under U.S. GAAP for non-regulated businesses
Regulatory assets represent amounts that are expected to be recovered from customers in future periods through rates. Regulatory liabilities represent amounts that are expected to be refunded to customers in future periods through rates, or as discussed below, paid out of the Trusts to cover future abandonment costs in relation to the NEB’s Land Matters Consultation Initiative. We recognize regulatory assets and liabilities based on the actions, or expected future actions, of the regulator.
The Trans Mountain Pipeline Reclamation Trust and Cochin Pipeline Reclamation Trust (the “Trusts”) were established in 2015 in the Province of Alberta to set aside funds collected through pipeline abandonment surcharges over a collection period established by the NEB. The use of amounts in the Trusts is restricted to pay future abandonment costs. See Notes 6 and 8.
The following table summarizes our regulatory asset and liability balances:
December 31, |
| 2016 |
| 2015 |
|
Current regulatory assets(a) |
| 10.0 |
| 2.6 |
|
Non-current regulatory assets |
| 7.4 |
| 8.6 |
|
Total regulatory assets(b) |
| 17.4 |
| 11.2 |
|
|
|
|
|
|
|
Current regulatory liabilities |
| 122.9 |
| 170.5 |
|
Non-current regulatory liabilities |
| 37.6 |
| 87.9 |
|
Total regulatory liabilities(c) |
| 160.5 |
| 258.4 |
|
(a) Amounts are included within Other current assets on our accompanying consolidated balance sheets.
(b) Regulatory assets as of December 31, 2016 include (i) $7.4 million of deferred pension and other post-retirement benefit costs and (ii) under-collections of transportation revenues and incentives based on estimated operating costs (see below). As of December 31, 2016, none of the regulatory assets earn a rate of return, and have a weighted average remaining recovery period of approximately 7 years.
(c) Regulatory liabilities as of December 31, 2016 include (i) Westridge dock premium surcharges (see below); and (ii) pipeline abandonment surcharges, that are expected to be returned to shippers or netted against under-collections over time. Approximately, $1.6 million of the $37.6 million classified as non-current is expected to be credited to shippers over a remaining weighted average period of 22 years, while the remaining $36.0 million is not subject to a defined period.
For 2016 and 2015, tolls were governed by the terms of the 2016 - 2018 and 2013 - 2015 Incentive Toll Settlements (“ITS”), respectively. The ITS is a negotiated settlement between TMPL, its shippers, and the Canadian Association of Petroleum Producers (“CAPP”), as approved by the NEB. Under the terms of the ITS, tolls are designed to recover an NEB-approved rate of return on capital, an allowance for income taxes, and estimated operating expenses and depreciation for the upcoming year. Differences between
expected and actual results cause a transportation revenue variance (an under or over collection of revenue) in a given year. We record these under or over collections as regulatory assets or liabilities, respectively, and are collected from or refunded to shippers via toll adjustments in subsequent years. As of December 31, 2016 and 2015, there was approximately $10 million and $3 million, respectively, of transportation revenue variance and incentives recorded in Other current assets and Deferred charges and other assets in our accompanying consolidated balance sheets.
On April 12, 2006, the NEB approved the inclusion of a Westridge dock premium in the Trans Mountain pipeline tariff structure as a means of allocating capacity to shippers at the Westridge dock. We account for such premiums as regulatory liabilities because they are refundable to shippers in future periods through tariff reductions incorporated into the following year’s rate filings. The timing of such tariff reductions vary depending on the rate filing which is agreed with the shippers and approved annually by the NEB, but is generally one year or more. Customer demand for capacity at the Westridge dock determines the amount of premiums collected and therefore, the amount added to the regulatory liability can vary year to year. As of December 31, 2016 and 2015, there was approximately $121 million and $222 million, respectively, of Westridge dock refundable premiums recorded in current and non-current Regulatory liabilities. The decrease was driven by reduced customer demand at the Westridge docks resulting in lower premiums collected in the current year while premiums previously collected are being amortized according to the agreed tariff reductions. The premiums collected do not result in revenue, but rather comprise a component of the subsequent year’s tariff filing.
Income Taxes
We record income tax expense based on an estimate of the effective tax rate in effect or to be in effect during the relevant periods. We include changes in tax legislation in the relevant computations in the period in which such changes are enacted. We do business in a number of provinces with differing laws concerning how income subject to each province’s tax regime is measured and at what effective rate such income is taxed, requiring us to estimate how our income will be apportioned among the various provinces in order to arrive at an overall effective tax rate. Changes in our effective rate, including any effect on previously recorded deferred taxes, are recorded in the period in which the need for such change is identified.
Deferred income tax assets and liabilities are recognized for temporary differences between the basis of assets and liabilities for financial reporting and tax purposes. Deferred tax assets are reduced by a valuation allowance for the amount that is more likely than not to be realized. While we have considered estimated future taxable income and prudent and feasible tax planning strategies in determining the amount of our valuation allowance, any change in the amount that we expect to ultimately realize will be included in income in the period in which such a determination is reached. For the years ended and as of December 31, 2016 and 2015, there is no U.S. income tax recognized on Trans Mountain Pipeline (Puget Sound) LLC as it is a subsidiary of a limited partnership.
Effective January 1, 2016, we elected to early adopt Accounting Standards Update (ASU) 2015-17 and applied the standard on a prospective basis. The amendments require that deferred tax liabilities and assets be classified as noncurrent in our consolidated balance sheets. The adoption of the pronouncement did not have a material impact on our consolidated financial statements.
Foreign Currency
Transactions in foreign currencies are initially recorded at the exchange rate in effect at the time of the transactions. Monetary assets and liabilities denominated in foreign currencies are translated to Canadian dollars using the closing exchange rate at the balance sheet date. The resulting exchange rate differences are included in the consolidated statements of operations.
We translate the assets and liabilities of Trans Mountain Pipeline (Puget Sound) LLC, which uses U.S. dollars as its functional currency, to Canadian dollars at year-end exchange rates. Income and expense items are translated at weighted-average rates of exchange prevailing during the year and its equity accounts are translated by using historical exchange rates. The cumulative translation adjustments balance is included in the “Accumulated other comprehensive loss” balance on our consolidated balance sheets and would be recognized in earnings upon the sale of those U.S. operations.
Environmental Matters
We capitalize or expense, as appropriate, environmental expenditures. We capitalize certain environmental expenditures required in obtaining rights-of-way, regulatory approvals or permitting as part of construction. We accrue and expense environmental costs that relate to an existing condition caused by past operations, which do not contribute to current or future revenue generation. We generally do not discounted environmental liabilities to a net present value, and we record environmental liabilities when environmental assessments and/or remedial efforts are probable and we can reasonably estimate the costs. Generally, our recording of these accruals coincides with completion of a feasibility study or commitment to a formal plan of action. We recognize receivables for anticipated associated insurance recoveries when such recoveries are deemed to be probable. We record at estimated fair value, where appropriate, environmental liabilities assumed in a business combination.
We routinely conduct reviews of potential environmental issues and claims that could impact our assets or operations. These reviews assist us in identifying environmental issues and estimating the costs and timing of remediation efforts. We also routinely adjust our environmental liabilities to reflect changes in previous estimates. In making environmental liability estimations, we consider the material effect of environmental compliance, pending legal actions against us, and potential third-party liability claims. Often, as the remediation evaluation and effort progresses, additional information is obtained, requiring revisions to estimated costs. These revisions are reflected in income in the period in which they are reasonably determinable. As of December 31, 2016 and 2015, we had $9.3 million and $7.5 million, respectively, accrued for our outstanding environmental matters.
Legal Proceedings
We are party to various legal, regulatory and other matters arising from the day-to-day operations of our business that may result in claims against the Company. Although no assurance can be given, we believe, based on our experiences to date and taking into account established reserves, that the ultimate resolution of such items will not have a material adverse impact on our business, financial position, results of operations or cash flows. We believe we have meritorious defenses to the matters to which we are a party and intend to vigorously defend the Company. When we determine a loss is probable of occurring and is reasonably estimable, we accrue an undiscounted liability for such contingencies based on our best estimate using information available at that time. If the estimated loss is a range of potential outcomes and there is no better estimate within the range, we accrue the amount at the low end of the range. We disclose contingencies where an adverse outcome may be material, or in the judgment of management, we conclude the matter should otherwise be disclosed. We had no accruals for any outstanding legal proceedings as of December 31, 2016 and 2015.
Trans Mountain Expansion Project Litigation
There are numerous legal challenges pending before the Federal Court of Appeal which have been filed by various governmental and non-governmental organizations, Aboriginal groups or other parties that seek judicial review of the recommendation of the National Energy Board (NEB) and subsequent decision by the Federal Governor in Council to conditionally approve the Trans Mountain Pipeline Expansion Project (the ‘‘Project’’). The petitions allege, among other things, that additional consultation, engagement or accommodation is required and that various non-economic impacts of the Project were not adequately considered. The remedies sought include requests that the NEB recommendation be quashed, that additional consultations be undertaken, and that the order of the Governor in Council approving the Project be quashed. After provincial elections in British Columbia on May 9, 2017, the New Democratic Party and Green Party formed a majority government. The new British Columbia government sought and was granted limited intervenor status in the Federal Court of Appeal proceedings to argue against the government’s approval of the Project. A hearing was conducted by the Federal Court of Appeal from October 2 through October 13, 2017. A decision is expected in the coming months, and is subject to potential further appeal to the Supreme Court of Canada. Although we believe that each of the foregoing appeals lacks merit, in the event an applicant is successful at the Supreme Court of Canada, among other potential impacts, the NEB recommendation or Governor in Council’s approval may be quashed, permits may be revoked, the Project may be subject to additional significant regulatory reviews, there may be significant changes to the Project plans, further obligations or restrictions may be implemented, or the Project may be stopped altogether, which could materially impact the overall feasibility or economic benefits of the Project, which in turn would have a material adverse effect on the Project and, consequently, our investment in KML.
In addition to the judicial reviews of the NEB recommendation report and Governor in Council’s order, two judicial review proceedings have been commenced at the Supreme Court of British Columbia (Squamish Nation; and the City of Vancouver). The petitions allege a duty and failure to consult or accommodate First Nations, and generally, among other claims, that the Province ought not to have approved the Project. Each Applicant seeks to quash the Environmental Assessment Certificate (EAC) that was issued by the British Columbia Environmental Assessment Office. On September 29, 2017, the British Columbia government filed evidence in support of the EAC approval in the judicial review proceeding involving the Squamish Nation. Hearings are scheduled for October and November 2017, respectively, for the City of Vancouver and the Squamish Nation judicial review proceedings. Although we believe that each of the foregoing appeals lacks merit, in the event that an applicant for judicial review is successful, among other potential impacts, the EAC may be quashed, provincial permits may be revoked, the Project may be subject to additional significant regulatory reviews, there may be significant changes to the Project plans, further obligations or restrictions may be imposed or the Project may be stopped altogether. In the event that an applicant is unsuccessful at the Supreme Court of British Columbia, they may further seek to appeal the decision to the British Columbia Court of Appeal. Any decision of the British Columbia Court of Appeal may be appealed to the Supreme Court of Canada. A successful appeal at either of these levels could result in the same types of consequences described above.
Pensions and Other Postretirement Benefits
We recognize the differences between the fair value of each of our pension and other postretirement benefit plans’ assets and the benefit obligations as either assets or liabilities on our accompanying consolidated balance sheets. We record deferred plan costs and income—unrecognized losses and gains, unrecognized prior service costs and credits, and any remaining unamortized transition obligations—in Accumulated other comprehensive loss until they are amortized as a component of benefit expense. See Note 11 for additional information regarding our pension and other postretirement benefit plans.
3. Recent Accounting Pronouncements
Accounting Standards Updates
Topic 606
On May 28, 2014, the FASB issued ASU No. 2014-09, “Revenue from Contracts with Customers” followed by a series of related accounting standard updates (collectively referred to as “Topic 606”). Topic 606 is designed to create greater revenue recognition and disclosure comparability in financial statements. The provisions of Topic 606 include a five-step process by which an entity will determine revenue recognition, depicting the transfer of goods or services to customers in amounts reflecting the payment to which an entity expects to be entitled in exchange for those goods or services. Topic 606 requires certain disclosures about contracts with customers and provides more comprehensive guidance for transactions such as service revenue, contract modifications, and multiple-element arrangements.
We are in the process of comparing our current revenue recognition policies to the requirements of Topic 606 for each of our revenue categories. While material differences have not been identified in the amount and timing of revenue recognition for the categories reviewed to date, the evaluation is not complete and we have not concluded on the overall impacts of adopting Topic 606. Topic 606 will require that our revenue recognition policy disclosure include further detail regarding our performance obligations as to the nature, amount, timing, and estimates of revenue and cash flows generated from our contracts with customers. Topic 606 will also require disclosure of significant changes in contract asset and contract liability balances period to period and the amount of the transaction price allocated to performance obligations that are unsatisfied (or partially unsatisfied) as of the end of the reporting period, as applicable. We will adopt Topic 606 effective January 1, 2018. Topic 606 provides for adoption either retrospectively to each prior reporting period presented or as a cumulative-effect adjustment as of the date of adoption. We plan to make a determination as to our method of adoption once we more fully complete our evaluation of the impacts of the standard on our revenue recognition and we are better able to evaluate the cost-benefit of each method.
ASU No. 2015-02
On February 18, 2015, the FASB issued ASU No. 2015-02, “Consolidation (Topic 810) - Amendments to the Consolidated Analysis.” This ASU focuses on the consolidation evaluation for reporting organizations that are required to evaluate whether they should consolidate certain legal entities. We adopted ASU No. 2015-02 effective January 1, 2016 with no material impact to our accompanying consolidated financial statements.
ASU No. 2015-11
On July 22, 2015, the FASB issued ASU No. 2015-11, “Inventory (Topic 330): Simplifying the Measurement of Inventory.” This ASU requires entities to subsequently measure inventory at the lower of cost and net realizable value, and defines net realizable value as the estimated selling price in the ordinary course of business, less reasonably predictable costs of completion, disposal, and transportation. ASU No. 2015-11 was effective January 1, 2017. We adopted ASU No. 2015-11 with no material impact on our financial statements.
ASU No. 2016-02
On February 25, 2016, the FASB issued ASU No. 2016-02, “Leases (Topic 842).” This ASU requires that lessees will be required to recognize assets and liabilities on the balance sheet for the present value of the rights and obligations created by all leases with terms of more than 12 months. The ASU also will require disclosures designed to give financial statement users information on the amount, timing, and uncertainty of cash flows arising from leases. ASU No. 2016-02 will be effective for us as of January 1, 2019. We are currently reviewing the effect of ASU No. 2016-02.
ASU No. 2016-15
On August 26, 2016, the FASB issued ASU No. 2016-15, “Statement of Cash Flows - Classification of Certain Cash Receipts and Cash Payments (Topic 230).” This ASU is intended to reduce the diversity in practice around how certain transactions are classified within the statement of cash flows. We adopted ASU No. 2016-15 in 2016 with no material impact to our accompanying consolidated financial statements.
ASU No. 2016-18
On November 17, 2016, the FASB issued ASU No. 2016-18, “Statement of Cash Flows (Topic 230): Restricted Cash (a consensus of the FASB Emerging Issues Task Force).” This ASU requires the statement of cash flows to explain the change during the period in the total of cash, cash equivalents, and amounts generally described as restricted cash or restricted cash equivalents. Therefore, amounts generally described as restricted cash and restricted cash equivalents are to be included with cash and cash equivalents when reconciling the beginning of period and end of period amounts shown on the statement of cash flows. ASU No. 2016-18 will be effective for us as of January 1, 2018. We are currently reviewing the effect of this ASU to our financial statements.
ASU No. 2017-04
On January 26, 2017, the FASB issued ASU No. 2017-04, “Simplifying the Test for Goodwill Impairment (Topic 350)” to simplify the accounting for goodwill impairment. The guidance removes Step 2 of the goodwill impairment test, which requires a hypothetical purchase price allocation. A goodwill impairment will now be the amount by which a reporting unit’s carrying value exceeds its fair value, not to exceed the carrying amount of goodwill. ASU No. 2017-04 will be effective for us as of January 1, 2020. We are currently reviewing the effect of this ASU to our financial statements.
4. Other Current Assets
December 31, |
| 2016 |
| 2015 |
|
Regulatory assets |
| 10.0 |
| 2.6 |
|
Prepaid expenses and deposits |
| 3.7 |
| 8.1 |
|
Restricted cash(a) |
| 1.3 |
| 1.0 |
|
Other current deferred assets |
| 1.8 |
| 2.7 |
|
|
| 16.8 |
| 14.4 |
|
(a) Represents restricted cash by the Trusts that is to be used solely for the purposes of satisfying NEB’s Land Matters Consultation Initiative (“LMCI”) liabilities. Also see Note 6.
5. Property, Plant and Equipment, Net
Classes and Depreciation
As of December 31, 2016 and 2015, our property, plant and equipment, net consisted of the following:
December 31, |
| Useful Life |
| 2016 |
| 2015 |
|
Pipelines (primarily transportation of crude oil and other refined products) |
| 30-64 |
| 1,031.2 |
| 1,014.1 |
|
Station equipment (primarily storage of crude oil and other refined products) |
| 5-40 |
| 2,019.3 |
| 1,965.2 |
|
Other |
| 5-35 |
| 233.1 |
| 244.8 |
|
Accumulated depreciation, depletion and amortization |
|
|
| (779.6 | ) | (646.3 | ) |
|
|
|
| 2,504.0 |
| 2,577.8 |
|
Land |
|
|
| 60.2 |
| 60.3 |
|
Construction work in process |
|
|
| 616.9 |
| 370.2 |
|
Property, plant and equipment, net |
|
|
| 3,181.1 |
| 3,008.3 |
|
(a) For the Cochin pipeline system, the composite depreciation rate is reflected as the equivalent number of years.
As of December 31, 2016 and 2015, property, plant and equipment, net included $2.2 billion and $2.1 billion, respectively, of assets which were regulated by the FERC or the NEB. Depreciation, depletion, and amortization expense charged against property, plant and equipment was $137.2 million, $124.7 million, and $87.8 million for the years ended December 31, 2016, 2015, and 2014, respectively.
For the years ended December 31, 2016, and 2015, Trans Mountain Expansion Project costs, net of contributions in aid of construction, of $480.0 million, and $335.0 million, respectively, were capitalized and are included in Property, plant and equipment, net on our accompanying consolidated balance sheets as construction work in process.
For the years ended December 31, 2016, 2015, our property, plant and equipment, net balances increased (decreased) by $16.8 million, and $(7.5) million, respectively, due to overhead accruals. In addition, these balances (decreased) increased by $(4.0) million, and $23.2 million, respectively, due to foreign currency translation adjustments.
6. Deferred Charges and Other Assets
December 31, |
| 2016 |
| 2015 |
|
Trans Mountain Reclamation Trust Securities |
| 25.9 |
| 13.0 |
|
Cochin Pipeline Reclamation Trust Securities |
| 3.0 |
| 1.2 |
|
Restricted long-term investments in Canadian government and corporate bonds (a) |
| 28.9 |
| 14.2 |
|
Contributions in aid of construction |
| 1.6 |
| 2.1 |
|
Regulatory assets |
| 7.4 |
| 8.6 |
|
Prepaid expenses |
| 6.1 |
| 3.8 |
|
Other |
| 4.5 |
| 2.9 |
|
|
| 48.5 |
| 31.6 |
|
(a) Represents restricted investments in Canadian government and Federal agency bonds. Restricted long-term investments by the Trusts are to be used solely for the purposes of satisfying LMCI liabilities. We have related LMCI long term obligations of an amount equal to our restricted cash and restricted investments recorded in “Long-term liabilities and deferred credits-Regulatory liabilities” on our accompanying consolidated balance sheets. The restricted assets are measured at fair value with offsetting adjustments recorded to the LMCI liabilities. Fair values for the restricted asset investments were determined based on observable prices and inputs for similar instruments available in the market, utilizing widely accepted cash flow models to value such instruments. Such techniques represent a Level 2 fair value measurement, see Note 16.
7. Accounts Payable
December 31, |
| 2016 |
| 2015 |
|
Accounts payables-trade |
| 55.3 |
| 37.8 |
|
Property, plant and equipment accrued liabilities |
| 53.9 |
| 44.7 |
|
|
| 109.2 |
| 82.5 |
|
8. Other Current Liabilities
December 31, |
| 2016 |
| 2015 |
|
Deferred revenue |
| 14.3 |
| 10.1 |
|
Environmental capital recovery surcharge |
| 5.1 |
| 3.6 |
|
Retirement and postretirement liabilities |
| 1.0 |
| 1.0 |
|
Accrued income taxes |
| 0.7 |
| 1.2 |
|
Other |
| 3.1 |
| 2.5 |
|
|
| 24.2 |
| 18.4 |
|
9. Transactions with Affiliates and Related Parties
Affiliate and Related Party Balances
The following tables summarize our affiliate and related party balance sheet balances and income statement activity:
December 31, |
| 2016 |
| 2015 |
|
Balance sheet location |
|
|
|
|
|
Accounts receivable-affiliates |
| 39.1 |
| 68.5 |
|
|
| 39.1 |
| 68.5 |
|
Accounts payable-affiliates |
| 144.3 |
| 115.1 |
|
Accrued interest-affiliates |
| 61.8 |
| 65.7 |
|
Long-term debt-affiliates |
| 1,362.1 |
| 1,320.4 |
|
|
| 1,568.2 |
| 1,501.2 |
|
Revenues, operating costs and capitalized costs are under normal trade terms. See Long-term Debt—Affiliates below for interest expense terms.
Years Ended December 31, |
| 2016 |
| 2015 |
| 2014 |
|
Income Statement location |
|
|
|
|
|
|
|
Revenues-Services(a) |
| 59.1 |
| 39.0 |
| — |
|
Operations and maintenance and general and administrative expense |
| 2.3 |
| 3.5 |
| 0.4 |
|
Interest expense |
| 44.5 |
| 42.5 |
| 63.0 |
|
Other |
|
|
|
|
|
|
|
Capitalized costs in property, plant and equipment |
| 19.1 |
| 21.8 |
| 34.9 |
|
(a) Amounts represent sales to a customer who is a related party through joint ownership of a joint venture.
Accounts receivable and payable
Accounts receivable-affiliate and accounts payable-affiliate are non-interest bearing and are settled on demand.
Long-term Debt—Affiliates
As of December 31, 2016 and December 31, 2015, the Long-term debt-affiliates (“KMI Loans”) on our accompanying consolidated balance sheets includes $1,362.1 million and $1,320.4 million, respectively, of U.S. dollar denominated five-year notes payable to Kinder Morgan subsidiaries. As of December 31, 2016, $1,126.2 million of notes are due from January 31, 2019 to December 31, 2020 and have interest rates ranging from 3.50% to 4.82%, see Note 13, and we had a $235.9 million non-interest bearing note payable to a Kinder Morgan subsidiary that is due on December 30, 2018. During June 2017, the Limited Partnership repaid the principal on the KMI Loans utilizing proceeds from our IPO and the associated notes payable were terminated, see Note 1.
KMI and substantially all of its U.S. subsidiaries, including Trans Mountain Pipeline (Puget Sound) LLC prior to the IPO and Reorganization (see Note 1), are a party to a cross guarantee agreement whereby each party to the agreement unconditionally guarantees, jointly and severally, the payment of specified indebtedness of each other party to the agreement.
Fair Value of Financial Instruments
The carrying value and estimated fair value of our debt-affiliates balances are disclosed below:
|
| 2016 |
| 2015 |
| ||||
December 31, |
| Carrying |
| Estimated |
| Carrying |
| Estimated |
|
(In millions of Canadian dollars) |
| value |
| fair value |
| value |
| fair value |
|
Total debt(a) |
| 1,126.2 |
| 1,183.3 |
| 1,085.7 |
| 1,092.7 |
|
(a) Total debt excludes $235.9 million and $234.7 million of non-interest bearing notes payable from the carrying value and estimated fair value balances as of December 31, 2016 and 2015, respectively. Level 2 input values were used to measure the estimated fair value of our long-term debt-affiliates balance as of both December 31, 2016 and 2015.
10. Income Taxes
The components of “Income Before Income Taxes” are generated as follows:
Years Ended December 31, |
| 2016 |
| 2015 |
| 2014 |
|
Canada |
| 235.4 |
| 21.1 |
| 34.7 |
|
U.S. |
| 22.7 |
| 18.1 |
| 11.4 |
|
Total Income Before Income Taxes |
| 258.1 |
| 39.2 |
| 46.1 |
|
Components of our income tax provision are as follows:
Years Ended December 31, |
| 2016 |
| 2015 |
| 2014 |
|
Current tax expense (benefit) |
|
|
|
|
|
|
|
Canada |
| 1.2 |
| (0.5 | ) | 3.6 |
|
U.S. |
| — |
| — |
| — |
|
Total |
| 1.2 |
| (0.5 | ) | 3.6 |
|
Deferred tax expense |
|
|
|
|
|
|
|
Canada |
| 55.1 |
| 62.6 |
| 23.0 |
|
U.S. |
| — |
| — |
| — |
|
Total |
| 55.1 |
| 62.6 |
| 23.0 |
|
Total tax provision |
| 56.3 |
| 62.1 |
| 26.6 |
|
The difference between the statutory income tax rate and our effective income tax rate is summarized as follows:
Years Ended December 31, |
| 2016 |
| 2015 |
| 2014 |
| ||||||
Statutory income tax |
| 69.7 |
| 27.0 | % | 10.2 |
| 26.0 | % | 11.5 |
| 25.0 | % |
Increase (decrease) as a result of: |
|
|
|
|
|
|
|
|
|
|
|
|
|
Foreign earnings not taxable |
| (6.1 | ) | (2.4 | )% | (4.7 | ) | (12.0 | )% | (2.8 | ) | (6.2 | )% |
Capital gains deduction |
| (4.1 | ) | (1.6 | )% | 22.3 |
| 57.0 | % | 7.6 |
| 16.5 | % |
Valuation allowance |
| (4.1 | ) | (1.6 | )% | 22.3 |
| 56.9 | % | 8.2 |
| 17.8 | % |
Tax impact on the future tax rate change |
| 1.3 |
| 0.5 | % | 7.9 |
| 20.0 | % | — |
| — | % |
Inter-corporate charges not tax deducted |
| (0.3 | ) | (0.1 | )% | 4.6 |
| 11.8 | % | 1.6 |
| 3.5 | % |
Other |
| (0.1 | ) | — | % | (0.5 | ) | (1.3 | )% | 0.5 |
| 1.0 | % |
Total |
| 56.3 |
| 21.8 | % | 62.1 |
| 158.4 | % | 26.6 |
| 57.6 | % |
Deferred tax assets and liabilities result from the following:
As at December 31, |
| 2016 |
| 2015 |
|
Deferred tax assets |
|
|
|
|
|
Non capital losses |
| 11.8 |
| 12.5 |
|
Reserves |
| 35.8 |
| 34.2 |
|
Other |
| 0.1 |
| — |
|
Capital losses |
| 28.3 |
| 30.6 |
|
Valuation allowances |
| (28.3 | ) | (30.6 | ) |
Total deferred tax assets |
| 47.7 |
| 46.7 |
|
Deferred tax liabilities |
|
|
|
|
|
Property, plant and equipment |
| (352.5 | ) | (300.1 | ) |
Total deferred tax liabilities |
| (352.5 | ) | (300.1 | ) |
Net non-current deferred tax liability |
| (304.8 | ) | (253.4 | ) |
Deferred Tax Assets and Valuation Allowances: We have deferred tax assets of $11.8 million related to non-capital loss carryovers, $28.3 million capital loss carryovers and $28.3 million of valuation allowances related to these deferred tax assets at December 31, 2016. As of December 31, 2015, we had deferred tax assets of $12.5 million related to non-capital loss carryovers, $30.6 million capital loss carryovers and $30.6 million of valuation allowances related to these deferred tax assets. We expect to generate taxable income beginning in 2018 and utilize all non-capital loss carryforwards by the end of 2018.
Expiration Periods for Deferred Tax Assets: As of December 31, 2016, we have non-capital loss carryforwards of $44.0 million, which will expire from 2029 - 2036 and capital loss carryforwards of $213.0 million which can be carried forward indefinitely.
Unrecognized Tax Benefits: We had no unrecognized tax benefits as of December 31, 2016 and 2015.
11. Benefit Plans
We sponsor pension plans covering eligible Canadian employees and include plans which are closed to new participants. The plans include registered defined benefit pension plans (the closed plan includes a defined contribution component that was converted to a defined benefit pension and is included in the following disclosures), supplemental unfunded arrangements (which provide pension benefits in excess of statutory limits) and defined contribution plans. We also provide postretirement benefits other than pensions for retired employees.
Defined pension plans
Retirement benefits under our defined benefit plans are based on employees’ years of credited service and remuneration. Contributions for the defined benefit component of the plans are based upon independent actuarial valuations. The most recent actuarial valuation of the defined benefit pension plans for funding purposes was completed as of December 31, 2016. Contributions for the defined contribution component of the closed plan are based upon pensionable earnings.
Certain employees are eligible to receive supplemental benefits under the defined benefit plans. The supplemental plans provide pension benefits in excess of statutory limits. The supplemental plans are unfunded and are secured by letters of credit.
Other post-employment benefits
Other post-employment benefits (“OPEB”) are provided to current and future retirees and their dependents, including, depending on circumstance, supplemental health, dental and life insurance coverage. Medical benefits under these OPEB plans may be subject to deductibles, co-payment provisions, dollar caps and other limitations on the amount of employer costs, and we reserve the right to change these benefits. Post-employment benefits are unfunded and annual expense is recorded on an accrual basis based on independent actuarial determination, considering, among other factors, health care cost escalation. The most recent actuarial valuation was completed as at December 31, 2016.
Benefit Obligation, Plan Assets and Funded Status
The following tables detail the changes in the benefit obligation, the fair value of plan assets and the recorded asset or liability for the defined benefit pension plans and OPEB plans using the accrual method.
December 31, |
| Pension |
| OPEB |
| ||||
(In millions of Canadian dollars) |
| 2016 |
| 2015 |
| 2016 |
| 2015 |
|
Change in accrued benefit obligation |
|
|
|
|
|
|
|
|
|
Benefit obligation at beginning of period |
| 209.3 |
| 205.6 |
| 18.4 |
| 18.0 |
|
Service cost |
| 7.4 |
| 7.8 |
| 0.6 |
| 0.7 |
|
Interest cost |
| 7.3 |
| 7.9 |
| 0.6 |
| 0.7 |
|
Actuarial (gain) loss |
| 15.4 |
| (7.6 | ) | 0.6 |
| (0.3 | ) |
Benefits paid |
| (8.5 | ) | (7.7 | ) | (0.8 | ) | (0.7 | ) |
Participant contributions |
| 3.4 |
| 3.3 |
| — |
| — |
|
Benefit obligation at end of period |
| 234.3 |
| 209.3 |
| 19.4 |
| 18.4 |
|
Change in plan assets |
|
|
|
|
|
|
|
|
|
Fair value of plan assets at beginning of period |
| 164.4 |
| 150.0 |
| — |
| — |
|
Actual (loss) return on plan assets |
| 7.5 |
| 7.1 |
| — |
| — |
|
Employer contributions |
| 10.9 |
| 11.7 |
| 0.8 |
| 0.7 |
|
December 31, |
| Pension |
| OPEB |
| ||||
(In millions of Canadian dollars) |
| 2016 |
| 2015 |
| 2016 |
| 2015 |
|
Participant contributions |
| 3.4 |
| 3.3 |
| — |
| — |
|
Benefits paid |
| (8.5 | ) | (7.7 | ) | (0.8 | ) | (0.7 | ) |
Fair value of plan assets at end of period |
| 177.7 |
| 164.4 |
| — |
| — |
|
Underfunded status at end of year |
| (56.6 | ) | (44.9 | ) | (19.4 | ) | (18.4 | ) |
Presented as follows: |
|
|
|
|
|
|
|
|
|
Current benefit liability(a) |
| (0.3 | ) | (0.2 | ) | (0.8 | ) | (0.8 | ) |
Non-current benefit liability(b) |
| (56.3 | ) | (44.7 | ) | (18.6 | ) | (17.6 | ) |
|
| (56.6 | ) | (44.9 | ) | (19.4 | ) | (18.4 | ) |
(a) Amounts included in Other current liabilities on our consolidated balance sheets.
(b) Amounts included in Retirement and postretirement benefits on our consolidated balance sheets.
Components of Accumulated Other Comprehensive Loss
The following table details the amounts of pre-tax accumulated other comprehensive loss related to the pension and OPEB plans which are included on our accompanying consolidated balance sheets, and excludes amounts recoverable through tolls which are accounted for as regulatory assets or liabilities.
December 31, |
| Pension |
| OPEB |
| ||||
(In millions of Canadian Dollars) |
| 2016 |
| 2015 |
| 2016 |
| 2015 |
|
Unrecognized net actuarial loss |
| (48.1 | ) | (40.8 | ) | (3.2 | ) | (2.9 | ) |
Unrecognized prior service cost |
| (1.2 | ) | (1.3 | ) | — |
| — |
|
Accumulated other comprehensive loss |
| (49.3 | ) | (42.1 | ) | (3.2 | ) | (2.9 | ) |
Actuarial gains and losses and prior service costs deferred in accumulated other comprehensive income are amortized into income over either the period of expected future service of active participants, or over the expected future lives of inactive plan participants. It is anticipated that approximately $4.1 million of pre-tax accumulated other comprehensive loss will be recognized as part of the net periodic benefit cost in 2017, including $3.9 million of unrecognized net actuarial loss and approximately $0.2 million of unrecognized prior service cost. Pension and other postretirement benefits expense associated with direct labour attributable to Trans Mountain’s regulated operations is considered a flow through cost under the terms of TMPL’s ITS.
Plan Assets. The investment policies and strategies for the assets of the pension plans are established by the Pension Committee (the “Committee”), which is responsible for investment decisions and management oversight of the plans. The stated philosophy of the Committee is to manage these assets in a manner consistent with the purpose for which the plans were established and the time frame over which the plans’ obligations need to be met. The objectives of the investment management program are to (1) meet or exceed plan actuarial earnings assumptions over the long term and (2) provide a reasonable return on assets within established risk tolerance guidelines and to maintain the liquidity needs of the plans with the goal of paying benefit and expense obligations when due. In seeking to meet these objectives, the Committee recognizes that prudent investing requires taking reasonable risks in order to raise the likelihood of achieving the targeted investment returns. In order to reduce portfolio risk and volatility, the Committee has adopted a strategy of using multiple asset classes.
As of December 31, 2016, the allowable range for asset allocations in effect for our pension plans were 0% to 55% equity and 45% to 100% fixed income.
Below are the details of our pension plan assets by class and a description of the valuation methodologies used for assets measured at fair value.
· Level 1 assets’ fair values are based on quoted market prices for the instruments in actively traded markets. Included in this level are cash and exchange traded mutual funds. These investments are valued at the closing price reported on the active market on which the individual securities are traded.
· Plan assets with fair values that are based on the net asset value per share, or its equivalent (“NAV”), as reported by the issuers are determined based on the fair value of the underlying securities as of the valuation date and include private investment funds.
These amounts are not categorized within the fair value hierarchy described above, but are separately identified in the following tables.
Listed below are the fair values of our pension plans’ assets that are recorded at fair value by class and categorized by fair value measurement:
December 31, |
| Pension Assets |
| ||
(In millions of Canadian dollars) |
| 2016 |
| 2015 |
|
Measured within Level 1 of fair value hierarchy |
|
|
|
|
|
Cash |
| 4.4 |
| 4.2 |
|
Mutual funds(a) |
| 171.7 |
| 158.8 |
|
Subtotal |
| 176.1 |
| 163.0 |
|
Measured at NAV(b) |
|
|
|
|
|
Private investment funds(c) |
| 1.6 |
| 1.4 |
|
Subtotal |
| 1.6 |
| 1.4 |
|
Total plan assets fair value |
| 177.7 |
| 164.4 |
|
(a) Mutual funds were invested in 68% fixed income and 32% equity in 2016 and 70% fixed income and 30% equity in 2015.
(b) Plan assets for which fair value was measured using NAV as a practical expedient.
(c) Private investment funds were invested in approximately 7% fixed income, 33% equity and 60% balanced funds in 2016 and 8% fixed income, 31% equity and 61% balanced funds in 2015.
Expected Payment of Future Benefits and Employer Contributions. Following are the expected future benefit payments as of December 31, 2016:
Fiscal year |
| Pension |
| OPEB |
|
2017 |
| 8.6 |
| 0.8 |
|
2018 |
| 9.2 |
| 0.9 |
|
2019 |
| 9.9 |
| 0.9 |
|
2020 |
| 10.4 |
| 0.9 |
|
2021 |
| 10.8 |
| 1.0 |
|
2022-2026 |
| 58.2 |
| 5.3 |
|
In 2017, we expect to contribute approximately $11.0 million and $0.8 million to our pension and OPEB plans, respectively.
Actuarial Assumptions and Sensitivity Analysis. Benefit obligations and net benefit cost are based on actuarial estimates and assumptions. The following table details the weighted-average actuarial assumptions used in determining the benefit obligation and net benefit costs of our pension and OPEB plans:
|
| Pension |
| OPEB |
| ||||||||
December 31, |
| 2016 |
| 2015 |
| 2014 |
| 2016 |
| 2015 |
| 2014 |
|
Assumptions related to benefit obligations: |
|
|
|
|
|
|
|
|
|
|
|
|
|
Discount rate |
| 3.91 | % | 4.08 | % | 3.90 | % | 3.90 | % | 4.10 | % | 3.90 | % |
Rate of compensation increase |
| 3.75 | % | 3.75 | % | 4.00 | % | n/a |
| n/a |
| n/a |
|
Assumptions related to benefit costs: |
|
|
|
|
|
|
|
|
|
|
|
|
|
Discount rate for benefit obligations |
| 4.08 | % | 3.90 | % | 4.80 | % | 4.10 | % | 3.90 | % | 4.80 | % |
Discount rate for interest on benefit obligations |
| 3.54 | % | 3.90 | % | 4.80 | % | 3.46 | % | 3.90 | % | 4.80 | % |
Discount rate for service cost |
| 4.25 | % | 3.90 | % | 4.80 | % | 4.30 | % | 3.90 | % | 4.80 | % |
Discount rate for interest on service cost |
| 4.06 | % | 3.90 | % | 4.80 | % | 4.09 | % | 3.90 | % | 4.80 | % |
Expected return on plan assets |
| 4.10 | % | 4.27 | % | 5.19 | % | n/a |
| n/a |
| n/a |
|
Rate of compensation increase |
| 3.75 | % | 4.00 | % | 4.00 | % | n/a |
| n/a |
| n/a |
|
For 2016, we selected our discount rates by matching the timing and amount of expected future benefit payments for pension and other postretirement benefit obligations to the average yields of various high-quality bonds with corresponding maturities. Effective January 1, 2016, we changed our estimate of the service and interest cost components of net periodic benefit cost (credit) for our pension and other postretirement benefit plans. The new estimate utilizes a full yield curve approach in the estimation of these components by applying the specific spot rates along the yield curve used in the determination of the benefit obligation to their underlying projected cash flows. The new estimate provides a more precise measurement of service and interest costs by improving the correlation between projected benefit cash flows and their corresponding spot rates. The change does not affect the measurement of our pension and postretirement benefit obligations and it is accounted for as a change in accounting estimate, which is applied prospectively. The change in the service and interest costs going forward will not be significant. The expected long-term rates of return on plan assets were determined by combining a review of the historical returns realized within the portfolio, the investment strategy included in the plans’ investment policy, and capital market projections for the asset classes in which the portfolio is invested and the target weightings of each asset class.
Actuarial estimates for our OPEB plan assumed a weighted-average annual rate of increase in the per capita cost of covered health care benefits of 5.52%, gradually decreasing to 4.50% by the year 2035. Assumed health care cost trends have a significant effect on the amounts reported for OPEB plans. A one-percentage point change in assumed health care cost trends would have the following effects:
December 31, |
| 2016 |
| 2015 |
|
One-percentage point increase: |
|
|
|
|
|
Aggregate of service cost and interest cost |
| 0.1 |
| 0.1 |
|
Accumulated postretirement benefit obligation |
| 1.4 |
| 1.3 |
|
One-percentage point decrease: |
|
|
|
|
|
Aggregate of service cost and interest cost |
| (0.1 | ) | (0.1 | ) |
Accumulated postretirement benefit obligation |
| (1.1 | ) | (1.1 | ) |
Components of Net Benefit Cost and Other Amounts Recognized in Other Comprehensive Income. The components of net benefit cost and other amounts, excluding amounts recoverable through tolls, recognized in pre-tax other comprehensive income related to our pension and OPEB plans are as follows (in millions):
Years Ended December 31, |
| Pension |
| OPEB |
| ||||||||
(In millions of Canadian dollars) |
| 2016 |
| 2015 |
| 2014 |
| 2016 |
| 2015 |
| 2014 |
|
Components of net benefit cost: |
|
|
|
|
|
|
|
|
|
|
|
|
|
Service cost |
| 7.4 |
| 7.8 |
| 5.4 |
| 0.6 |
| 0.7 |
| 0.4 |
|
Interest cost |
| 7.3 |
| 7.9 |
| 8.3 |
| 0.6 |
| 0.7 |
| 0.8 |
|
Expected return on assets |
| (6.8 | ) | (6.6 | ) | (6.8 | ) | — |
| — |
| — |
|
Amortization of prior service credit |
| 0.1 |
| 0.2 |
| 0.2 |
| — |
| — |
| — |
|
Amortization of net actuarial loss (gain) |
| 2.9 |
| 4.3 |
| 2.7 |
| 0.1 |
| 0.1 |
| — |
|
Curtailment and settlement gain |
| — |
| — |
| — |
| — |
| — |
| — |
|
Net benefit (credit) cost |
| 10.9 |
| 13.6 |
| 9.8 |
| 1.3 |
| 1.5 |
| 1.2 |
|
|
|
|
|
|
|
|
|
|
|
|
|
|
|
Other changes in plan assets and benefit obligations recognized in other comprehensive (income) loss: |
|
|
|
|
|
|
|
|
|
|
|
|
|
Net loss (gain) arising during period |
| 9.1 |
| (4.2 | ) | 9.9 |
| 0.4 |
| (0.1 | ) | 1.3 |
|
Prior service cost (credit) arising during period |
| — |
| — |
| — |
| — |
| — |
| — |
|
Amortization or settlement recognition of net actuarial (loss) gain |
| (1.8 | ) | (2.1 | ) | (1.6 | ) | (0.1 | ) | (0.1 | ) | — |
|
Amortization of prior service credit |
| (0.1 | ) | (0.1 | ) | (0.1 | ) | — |
| — |
| — |
|
Total recognized in total other comprehensive (income) loss |
| 7.2 |
| (6.4 | ) | 8.2 |
| 0.3 |
| (0.2 | ) | 1.3 |
|
Total recognized in net benefit cost (credit) and other comprehensive (income) loss |
| 18.1 |
| 7.2 |
| 18.0 |
| 1.6 |
| 1.3 |
| 2.5 |
|
12. Other Deferred Credits
December 31, |
| 2016 |
| 2015 |
|
Environmental liabilities |
| 9.3 |
| 7.5 |
|
Other |
| 0.7 |
| — |
|
|
| 10.0 |
| 7.5 |
|
13. Interest Expense, Net
Year ended December, 31 |
| 2016 |
| 2015 |
| 2014 |
|
Interest expense on long-term debt-affiliates |
| 44.5 |
| 42.5 |
| 63.0 |
|
Interest income |
| (0.1 | ) | (0.1 | ) | (0.1 | ) |
Capitalized debt financing costs |
| (14.5 | ) | (12.3 | ) | (13.5 | ) |
|
| 29.9 |
| 30.1 |
| 49.4 |
|
14. Changes in Operating Assets and Liabilities
December 31, |
| 2016 |
| 2015 |
| 2014 |
|
Accounts receivable-trade |
| (3.7 | ) | 34.1 |
| (5.5 | ) |
Accounts receivables-affiliates |
| 29.6 |
| (26.8 | ) | 21.4 |
|
Prepaid expenses and deposits |
| 4.4 |
| (1.9 | ) | 1.0 |
|
Inventory |
| (1.5 | ) | (2.4 | ) | (1.2 | ) |
Other current assets |
| (7.6 | ) | 17.9 |
| 10.7 |
|
Deferred amounts and other assets |
| (4.2 | ) | (1.6 | ) | 7.9 |
|
Accounts payable-trade |
| 17.5 |
| (16.9 | ) | 9.5 |
|
Accounts payable-affiliates |
| 17.8 |
| 52.2 |
| 98.0 |
|
Accrued interest |
| (3.4 | ) | (78.5 | ) | 63.0 |
|
Other current liabilities |
| (6.3 | ) | 16.3 |
| 40.1 |
|
Retirement and postretirement benefits obligation |
| 12.7 |
| (6.9 | ) | 14.1 |
|
Regulatory liabilities and deferred credits |
| (82.8 | ) | (107.1 | ) | (88.1 | ) |
|
| (27.5 | ) | (121.6 | ) | 170.9 |
|
15. Commitments and Contingencies
Leases and Rights-of-Way Obligations
The table below depicts future gross minimum rental commitments under our operating leases and rights-of-way obligations as of December 31, 2016:
Fiscal Year |
| Commitment |
|
2017 |
| 21.6 |
|
2018 |
| 18.0 |
|
2019 |
| 16.1 |
|
2020 |
| 7.4 |
|
2021 |
| 5.0 |
|
Thereafter |
| 2.4 |
|
Total minimum payments |
| 70.5 |
|
The remaining terms on our operating leases range from one to thirteen years. Total lease and rental expenses were $14.1 million, $13.2 million and $7.4 million for the years ended December 31, 2016, 2015 and 2014, respectively.
Contingencies
We are subject to various legal and regulatory actions and proceedings which arise in the normal course of business. While the final outcome of such actions and proceedings cannot be predicted with certainty, we believe that the resolution of such actions and proceedings will not have a material impact on our financial position or results of operations.
We and our subsidiaries are also subject to environmental cleanup and enforcement actions from time to time. Although we believe our operations are in substantial compliance with applicable environmental law and regulations, risks of additional costs and liabilities are inherent in pipeline and terminal operations, and there can be no assurance that we will not incur significant costs and liabilities. Moreover, it is possible that other developments, such as increasingly stringent environmental laws, regulations and enforcement policies under the terms of authority of those laws, and claims for damages to property or persons resulting from our operations, could result in substantial costs and liabilities to us.
Although it is not possible to predict the ultimate outcomes, we believe that the resolution of the environmental matters to which we and our subsidiaries are a party, will not have a material adverse effect on our business, financial position, results of operations or cash flows.
Trans Mountain Expansion Project
Trans Mountain Pipeline received final approval from the Board of Directors of Kinder Morgan for the Trans Mountain Expansion Project (the “Project”) in May, 2017. The proposed estimated $7.4 billion expansion will increase throughput capacity of Trans Mountain Pipeline from approximately 300,000 to 890,000 bpd. The Project has transportation service agreements for a total of 707,500 bpd, representing approximately 80% of the expanded system’s capacity (the maximum amount under the regulated limit imposed by the NEB).
On May 19, 2016, the NEB recommended that the Governor in Council approve the Project, subject to 157 conditions. On November 29, 2016, the Governor in Council approved the Project, and directed the NEB to issue, Amending Orders AO-003-OC-2 and AO-002-OC-49, and Certificate of Public Convenience and Necessity OC-064, authorizing the construction of the Project. On January 11, 2017, the Government of British Columbia announced the issuance of an environmental assessment certificate from B.C.’s Environmental Assessment Office to Trans Mountain Pipeline for the B.C. portion of the Project. The environmental assessment certificate includes 37 conditions that are in addition to and designed to supplement the 157 conditions required by the NEB. We have spent a cumulative total, net of contributions in aid of construction, of $480 million on development of the Project as at December 31, 2016 (December 31, 2015 - $335 million). These amounts are included in Property, Plant, and Equipment under construction as detailed in Note 5.
We are currently investigating financing options in connection with the Project, which may include additional borrowings, issuance of additional preferred shares, sale of additional interests in the Trans Mountain Pipeline Project, or other alternatives as determined by Kinder Morgan, also see Note 1 for 2017 financing transactions.
16. Risk Management and Financial Instruments
Credit risk
We are exposed to credit risk, which is the risk that a customer or other counterparty will fail to perform an obligation or settle a liability, resulting in a financial loss to our business, which is primarily concentrated in the crude oil and refined products transportation industry and is dependent upon the ability of our customers to pay for these services. A majority of our customers operate in the oil and gas exploration and development, or energy marketing or transportation industries. We may be exposed to long-term downturns in energy commodity prices, including the price for crude oil, or other credit events impacting these industries.
We limit our exposure to credit risk by requiring shippers who fail to maintain specified credit ratings or a suitable financial position to provide acceptable security, generally in the form of guarantees from credit worthy parties or letters of credit from well rated financial institutions.
Our cash and cash equivalents are held with major financial institutions, minimizing the risk of non-performance by counter parties.
Foreign Currency Transactions and Translation
Foreign currency transaction gains or losses result from a change in exchange rates between the functional currency of an entity, and the currency in which a transaction is denominated. Unrealized gains and losses are recorded in Unrealized foreign exchange gains (losses) and Other, net and realized gains (losses) are recognized in Other, net in our accompanying consolidated statements of operations and include:
· As of December 31, 2016 and 2015, we had notes payable to Kinder Morgan subsidiaries of $1,362.1 million, and $1.3 million, respectively, presented as Long-term debt-affiliates in our accompanying balances sheets (“KMI Loans”). During June 2017, the Limited Partnership repaid the principal on the KMI Loans utilizing proceeds from our IPO and the associated notes payable were terminated. These balances were U.S. dollar denominated loans from Kinder Morgan subsidiaries to us. Foreign exchange rate changes on the KMI Loans, and associated interest expense, resulted in unrealized gain (losses) of $29.7 million, $(175.9) million and $(76.0) million for the years ended December 31, 2016, 2015 and 2014, respectively. Although the U.S. dollar denominated KMI Loans exposed us to significant foreign exchange risk, there was no foreign currency exchange risk on these loans on a Kinder Morgan consolidated basis. As a result, we did not historically enter into any foreign currency derivatives and have not historically been engaged in hedging activities related to foreign currency exchange risk. Interest expense on the KMI Loans was translated at weighted-average rates of exchange prevailing during the year and equity accounts were translated using historical exchange rates; and
· Additionally, unrealized foreign exchange gains (losses) for the year ended December 31, 2016, 2015 and 2014 also includes $2.9 million, $(9.5) million and $(2.3) million, respectively, of foreign exchange gains (losses) recognized for the changes in exchange rates between our Canadian dollar functional currency and the U.S. dollar on U.S. dollar denominated transactions. These gains and losses affect the expected Canadian dollar cash flows on unsettled U.S. denominated transactions, primarily related to cash bank accounts that are denominated in U.S. dollars and affiliate receivables or payables that are denominated in U.S. dollars. We translate the assets and liabilities of Trans Mountain Pipeline (Puget Sound) LLC) that has the U.S. dollars as its functional currency to Canadian dollars at year-end exchange rates.
Liquidity risk
Liquidity risk is the risk that we will not be able to meet our financial obligations, including commitments, as they become due. We manage our liquidity risk by ensuring access to sufficient funds to meet our obligations. We forecast cash requirements to ensure funding is available to settle financial liabilities when they become due. Historically, our primary sources of liquidity and capital resources are funds generated from operations and loans from affiliates, including the KMI Loans. The Trans Mountain Expansion Project will likely require additional third party financing to complete this estimated $7.4 billion (including AFUDC-equity) project, see Note 15— Trans Mountain Expansion Project.
Fair value measurements
We do not carry any financial assets or liabilities measured at fair value on a recurring basis, other than the Trusts described in Notes 2 and 6. We disclose the fair value of other financial instruments not measured at fair value. The fair value of financial instruments reflects our best estimate of market value based on generally accepted valuation techniques or models and are supported by observable market prices and rates. When such values are not available, we use discounted cash flow analysis from applicable yield curves based on observable market inputs to estimate fair value.
Fair value of financial instruments
Fair value represents the price at which a financial instrument could be exchanged in an orderly market, in an arm’s length transaction between knowledgeable and willing parties who are under no compulsion to act. We classify the fair value of the financial instruments according to the following hierarchy based on the observable inputs used to value the instrument:
· Level 1— inputs to the valuation methodology are quoted prices unadjusted for identical assets or liabilities in active markets.
· Level 2— inputs other than quoted prices included in Level 1 that are observable for the asset or liability either directly (as prices) or indirectly (i.e. derived from prices).
· Level 3 — inputs to the valuation model are not based on observable market data.
Fair value measurements are classified in the fair value hierarchy based on the lowest level input that is significant to that fair value measurement. This assessment requires judgment considering factors specific to an asset or liability and may affect placement within the fair value hierarchy. Level 1 and Level 2 are used for the fair value of cash and cash equivalents and restricted investments, respectively.
Due to the short-term or on demand nature of cash and cash equivalents, restricted cash, accounts receivable, accounts receivable from affiliates, accounts payable, accounts payable to affiliates and accrued interest, we have determined that the carrying amounts for these balances approximate fair value. See Note 9 — Fair Value of Financial Instruments.
17. Reportable Segments
Our reportable business segments are based on the way management organizes the enterprise. Each of our reportable business segments represent a component of the enterprise that engages in a separate business activity and for which discrete financial information is available.
Our reportable business segments are:
· Pipelines — the ownership and operation of (i) the Trans Mountain pipeline that currently transports approximately 300,000 bpd of crude oil and refined petroleum from the oil sands in Alberta to Vancouver, British Columbia and associated terminal and dock operations; (ii) the Canadian portion of the Cochin pipeline system, a 12-inch diameter multi-product pipeline which spans between Kankakee, Illinois and Fort Saskatchewan, Alberta; (iii) the TM (Puget Sound) pipeline serving Washington State; (iv) the Jet Fuel pipeline serving Vancouver International Airport; and (v) Kinder Morgan Canada Inc.
· Terminals — the ownership and operation of terminal facilities located in western Canada that provide merchant storage as well as rail terminals offering loading and delivery services for liquids product as well as certain bulk commodity handling.
We evaluate the performance of the our reportable business segments by evaluating the earnings before depreciation and amortization of each segment (“Segment EBDA”). We believe that Segment EBDA is a useful measure of our operating performance because it measures segment operating results before DD&A and certain expenses that are generally not controllable by the operating managers of our respective business segments, such as general and administrative expense, unrealized foreign exchange losses (or gains) on long-term debt-affiliates, interest expense, and income tax expense. Our general and administrative expenses include such items as employee benefits, insurance, rentals, certain litigation and environmental expenses, and shared corporate services including accounting, information technology, human resources and legal services. Certain general and administrative costs attributable to Trans Mountain are billable as flow through items to shippers and result in incremental revenues.
We consider each period’s earnings before all non-cash DD&A expenses to be an important measure of business segment performance for our reporting segments. We account for intersegment sales at market prices, while we account for asset transfers at either market value or, in some instances, book value. Intercompany transactions are eliminated in consolidation.
Financial information by segment follows:
Years Ended December 31, |
| 2016 |
| 2015 |
| 2014 |
|
Revenues |
|
|
|
|
|
|
|
Pipelines |
| 388.6 |
| 383.7 |
| 351.0 |
|
Terminals |
| 287.5 |
| 262.2 |
| 154.2 |
|
Total consolidated revenues |
| 676.1 |
| 645.9 |
| 505.2 |
|
Years Ended December 31, |
| 2016 |
| 2015 |
| 2014 |
|
Operating expenses(a) |
|
|
|
|
|
|
|
Pipelines |
| 164.5 |
| 152.7 |
| 145.0 |
|
Terminals |
| 79.1 |
| 67.4 |
| 50.4 |
|
Total consolidated operating expenses |
| 243.6 |
| 220.1 |
| 195.4 |
|
Years Ended December 31, |
| 2016 |
| 2015 |
| 2014 |
|
Other segment operating expense (income) |
|
|
|
|
|
|
|
Pipelines |
| — |
| (1.8 | ) | (1.2 | ) |
Terminals |
| 0.3 |
| 0.5 |
| 0.2 |
|
Total consolidated other expense (income) |
| 0.3 |
| (1.3 | ) | (1.0 | ) |
Years Ended December 31, |
| 2016 |
| 2015 |
| 2014 |
|
DD&A |
|
|
|
|
|
|
|
Pipelines |
| 62.3 |
| 61.3 |
| 59.9 |
|
Terminals |
| 74.9 |
| 62.2 |
| 28.8 |
|
Total consolidated DD&A |
| 137.2 |
| 123.5 |
| 88.7 |
|
Years Ended December 31, |
| 2016 |
| 2015 |
| 2014 |
|
Other segment income and unrealized foreign exchange loss, net(b) |
|
|
|
|
|
|
|
Pipelines |
| 17.8 |
| 16.7 |
| 13.7 |
|
Terminals |
| 3.1 |
| (13.8 | ) | (5.1 | ) |
Total consolidated other income and unrealized foreign exchange loss, net |
| 20.9 |
| 2.9 |
| 8.6 |
|
Years Ended December 31, |
| 2016 |
| 2015 |
| 2014 |
|
Segment EBDA(a)(b) |
|
|
|
|
|
|
|
Pipelines |
| 241.9 |
| 249.5 |
| 220.9 |
|
Terminals |
| 211.2 |
| 180.5 |
| 98.5 |
|
Total segment EBDA |
| 453.1 |
| 430.0 |
| 319.4 |
|
DD&A |
| (137.2 | ) | (123.5 | ) | (88.7 | ) |
Unrealized foreign exchange gain (loss) on long-term debt-affiliates |
| 29.7 |
| (175.9 | ) | (76.0 | ) |
General and administrative expenses |
| (57.6 | ) | (61.3 | ) | (59.2 | ) |
Interest expense, net |
| (29.9 | ) | (30.1 | ) | (49.4 | ) |
Income tax expense |
| (56.3 | ) | (62.1 | ) | (26.6 | ) |
Total consolidated net income |
| 201.8 |
| (22.9 | ) | 19.5 |
|
Years Ended December 31, |
| 2016 |
| 2015 |
| 2014 |
|
Capital expenditures |
|
|
|
|
|
|
|
Pipelines |
| 171.7 |
| 200.0 |
| 220.1 |
|
Terminals |
| 97.4 |
| 140.0 |
| 265.7 |
|
Total consolidated capital expenditures |
| 269.1 |
| 340.0 |
| 485.8 |
|
December 31, |
| 2016 |
| 2015 |
|
Assets |
|
|
|
|
|
Pipelines |
| 2,375.1 |
| 2,232.8 |
|
Terminals |
| 1,364.3 |
| 1,252.4 |
|
Total consolidated assets |
| 3,739.4 |
| 3,485.2 |
|
(a) Includes natural gas purchases and other costs of sales, operations and maintenance expenses, and taxes, other than income taxes.
(b) For the year ended December 31, 2016, 2015 and 2014 includes (i) $2.9 million, $(9.5) million and $(2.3) million, respectively, of unrealized foreign exchange gains (losses) for the changes in exchange rates between our Canadian dollar functional currency and the U.S. dollar on U.S. dollar denominated transactions and (ii) $17.9 million, $12.9 million and $11.2 million, respectively, of Capitalized Equity Financing Costs.
We do not allocate interest, net, general administration, income taxes and unrealized foreign currency exchange losses and gains associated with short and long term debt - affiliates to any of our reportable business segments.
Following is geographic information regarding the revenues and long-lived assets of our segments:
Years Ended December 31, |
| 2016 |
| 2015 |
| 2014 |
|
Revenues from customers |
|
|
|
|
|
|
|
Canada |
| 639.5 |
| 613.9 |
| 483.7 |
|
U.S. |
| 36.6 |
| 32.0 |
| 21.5 |
|
Total consolidated revenues from external customers |
| 676.1 |
| 645.9 |
| 505.2 |
|
December 31, |
| 2016 |
| 2015 |
|
Long-term assets, excluding goodwill |
|
|
|
|
|
Canada |
| 3,185.9 |
| 2,993.1 |
|
U.S. |
| 43.7 |
| 46.8 |
|
Total consolidated long-lived assets |
| 3,229.6 |
| 3,039.9 |
|