
GOLUB CAPITAL BDC 3, INC. INVESTOR PRESENTATION QUARTER ENDED DECEMBER 31, 2019
Disclaimer Some of the statements in this presentation constitute forward-looking statements, Such forward-looking statements may include statements preceded by, followed by which relate to future events or our future performance or financial condition. The or that otherwise include the words “may,” “might,” “will,” “intend,” “should,” “could,” forward-looking statements contained in this presentation involve risks and “can,” “would,” “expect,” “believe,” “estimate,” “anticipate,” “predict,” “potential,” “plan” uncertainties, including statements as to: our future operating results; our business or similar words. prospects and the prospects of our portfolio companies; the effect of investments We have based the forward-looking statements included in this presentation on that we expect to make and the competition for those investments; our contractual information available to us on the date of this presentation. Actual results could differ arrangements and relationships with third parties; completion of a public offering of materially from those anticipated in our forward-looking statements and future our securities or other liquidity event; actual and potential conflicts of interest with results could differ materially from historical performance. We undertake no GC Advisors LLC ("GC Advisors"), our investment adviser, and other affiliates of Golub obligation to revise or update any forward-looking statements, whether as a result of Capital LLC (collectively, "Golub Capital"); the dependence of our future success on the new information, future events or otherwise. You are advised to consult any general economy and its effect on the industries in which we invest; the ability of additional disclosures that we may make directly to you or through reports that we our portfolio companies to achieve their objectives; the use of borrowed money to have filed or in the future may file with the Securities and Exchange Commission finance a portion of our investments; the adequacy of our financing sources and (“SEC”), including annual reports on Form 10-K, quarterly reports on Form 10-Q and working capital; the timing of cash flows, if any, from the operations of our portfolio current reports on Form 8-K. companies; general economic and political trends and other external factors; the ability of GC Advisors to locate suitable investments for us and to monitor and This presentation contains statistics and other data that have been obtained from or administer our investments; the ability of GC Advisors or its affiliates to attract and compiled from information made available by third-party service providers. We have retain highly talented professionals; our ability to qualify and maintain our not independently verified such statistics or data. qualification as a regulated investment company and as a business development In evaluating prior performance information in this presentation, you should company; general price and volume fluctuations in the stock markets; the impact on remember that past performance is not a guarantee, prediction or projection of our business of the Dodd-Frank Wall Street Reform and Consumer Protection Act future results, and there can be no assurance that we will achieve similar results in and the rules and regulations issued thereunder and any actions toward repeal the future. thereof; and the effect of changes to tax legislation and our tax position. 2
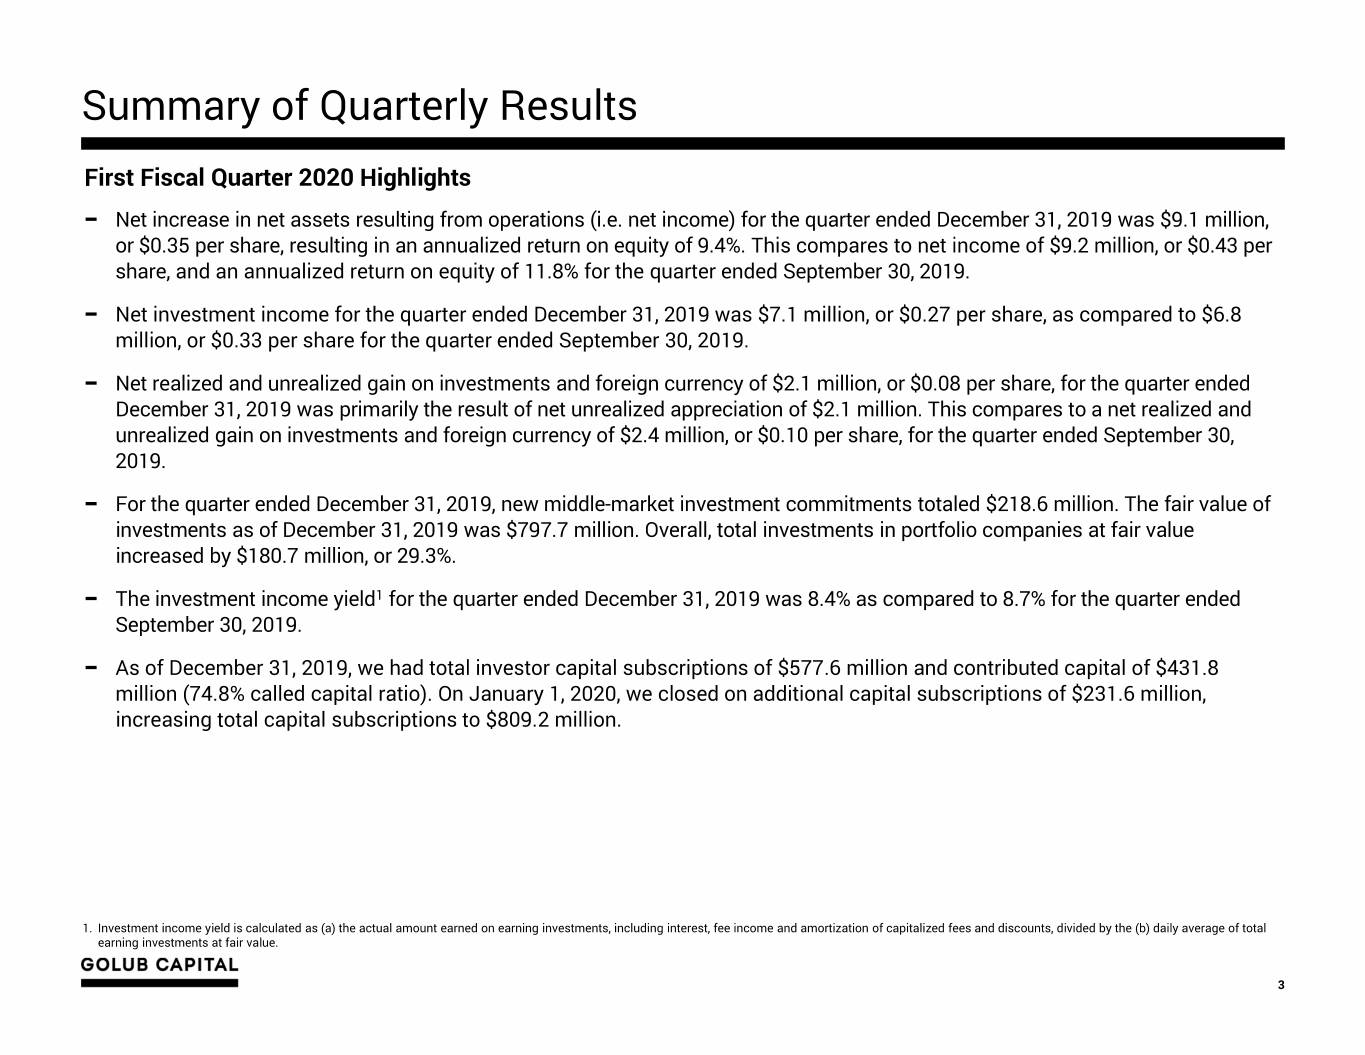
Summary of Quarterly Results First Fiscal Quarter 2020 Highlights − Net increase in net assets resulting from operations (i.e. net income) for the quarter ended December 31, 2019 was $9.1 million, or $0.35 per share, resulting in an annualized return on equity of 9.4%. This compares to net income of $9.2 million, or $0.43 per share, and an annualized return on equity of 11.8% for the quarter ended September 30, 2019. − Net investment income for the quarter ended December 31, 2019 was $7.1 million, or $0.27 per share, as compared to $6.8 million, or $0.33 per share for the quarter ended September 30, 2019. − Net realized and unrealized gain on investments and foreign currency of $2.1 million, or $0.08 per share, for the quarter ended December 31, 2019 was primarily the result of net unrealized appreciation of $2.1 million. This compares to a net realized and unrealized gain on investments and foreign currency of $2.4 million, or $0.10 per share, for the quarter ended September 30, 2019. − For the quarter ended December 31, 2019, new middle-market investment commitments totaled $218.6 million. The fair value of investments as of December 31, 2019 was $797.7 million. Overall, total investments in portfolio companies at fair value increased by $180.7 million, or 29.3%. − The investment income yield1 for the quarter ended December 31, 2019 was 8.4% as compared to 8.7% for the quarter ended September 30, 2019. − As of December 31, 2019, we had total investor capital subscriptions of $577.6 million and contributed capital of $431.8 million (74.8% called capital ratio). On January 1, 2020, we closed on additional capital subscriptions of $231.6 million, increasing total capital subscriptions to $809.2 million. 1. Investment income yield is calculated as (a) the actual amount earned on earning investments, including interest, fee income and amortization of capitalized fees and discounts, divided by the (b) daily average of total earning investments at fair value. 3
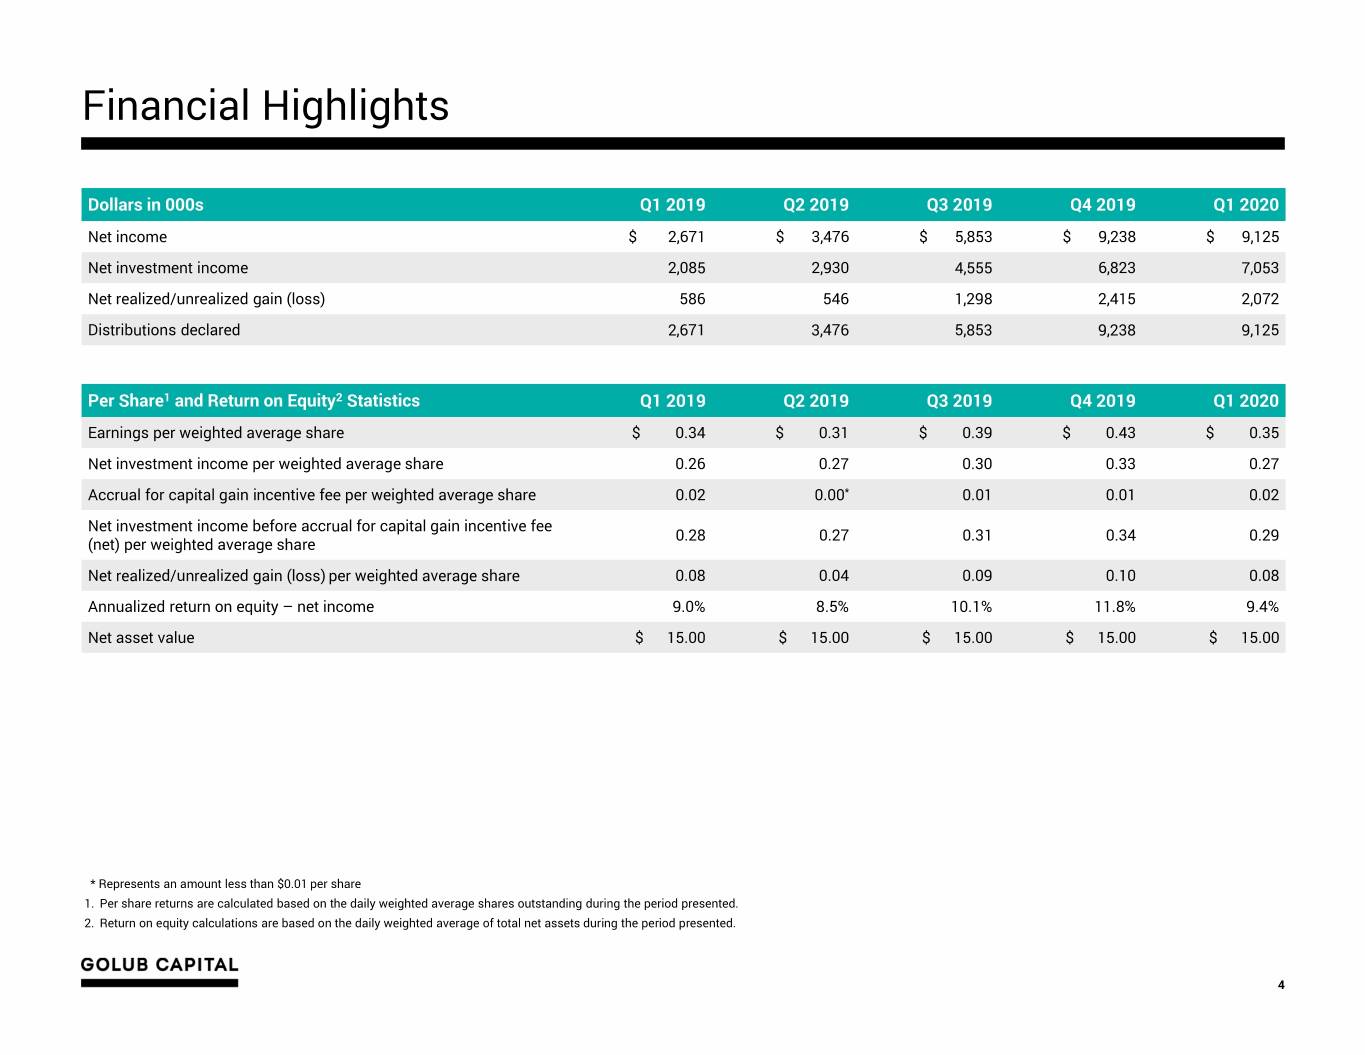
Financial Highlights Dollars in 000s Q1 2019 Q2 2019 Q3 2019 Q4 2019 Q1 2020 Net income $ 2,671 $ 3,476 $ 5,853 $ 9,238 $ 9,125 Net investment income 2,085 2,930 4,555 6,823 7,053 Net realized/unrealized gain (loss) 586 546 1,298 2,415 2,072 Distributions declared 2,671 3,476 5,853 9,238 9,125 Per Share1 and Return on Equity2 Statistics Q1 2019 Q2 2019 Q3 2019 Q4 2019 Q1 2020 Earnings per weighted average share $ 0.34 $ 0.31 $ 0.39 $ 0.43 $ 0.35 Net investment income per weighted average share 0.26 0.27 0.30 0.33 0.27 Accrual for capital gain incentive fee per weighted average share 0.02 0.00* 0.01 0.01 0.02 Net investment income before accrual for capital gain incentive fee 0.28 0.27 0.31 0.34 0.29 (net) per weighted average share Net realized/unrealized gain (loss) per weighted average share 0.08 0.04 0.09 0.10 0.08 Annualized return on equity – net income 9.0% 8.5% 10.1% 11.8% 9.4% Net asset value $ 15.00 $ 15.00 $ 15.00 $ 15.00 $ 15.00 * Represents an amount less than $0.01 per share 1. Per share returns are calculated based on the daily weighted average shares outstanding during the period presented. 2. Return on equity calculations are based on the daily weighted average of total net assets during the period presented. 4
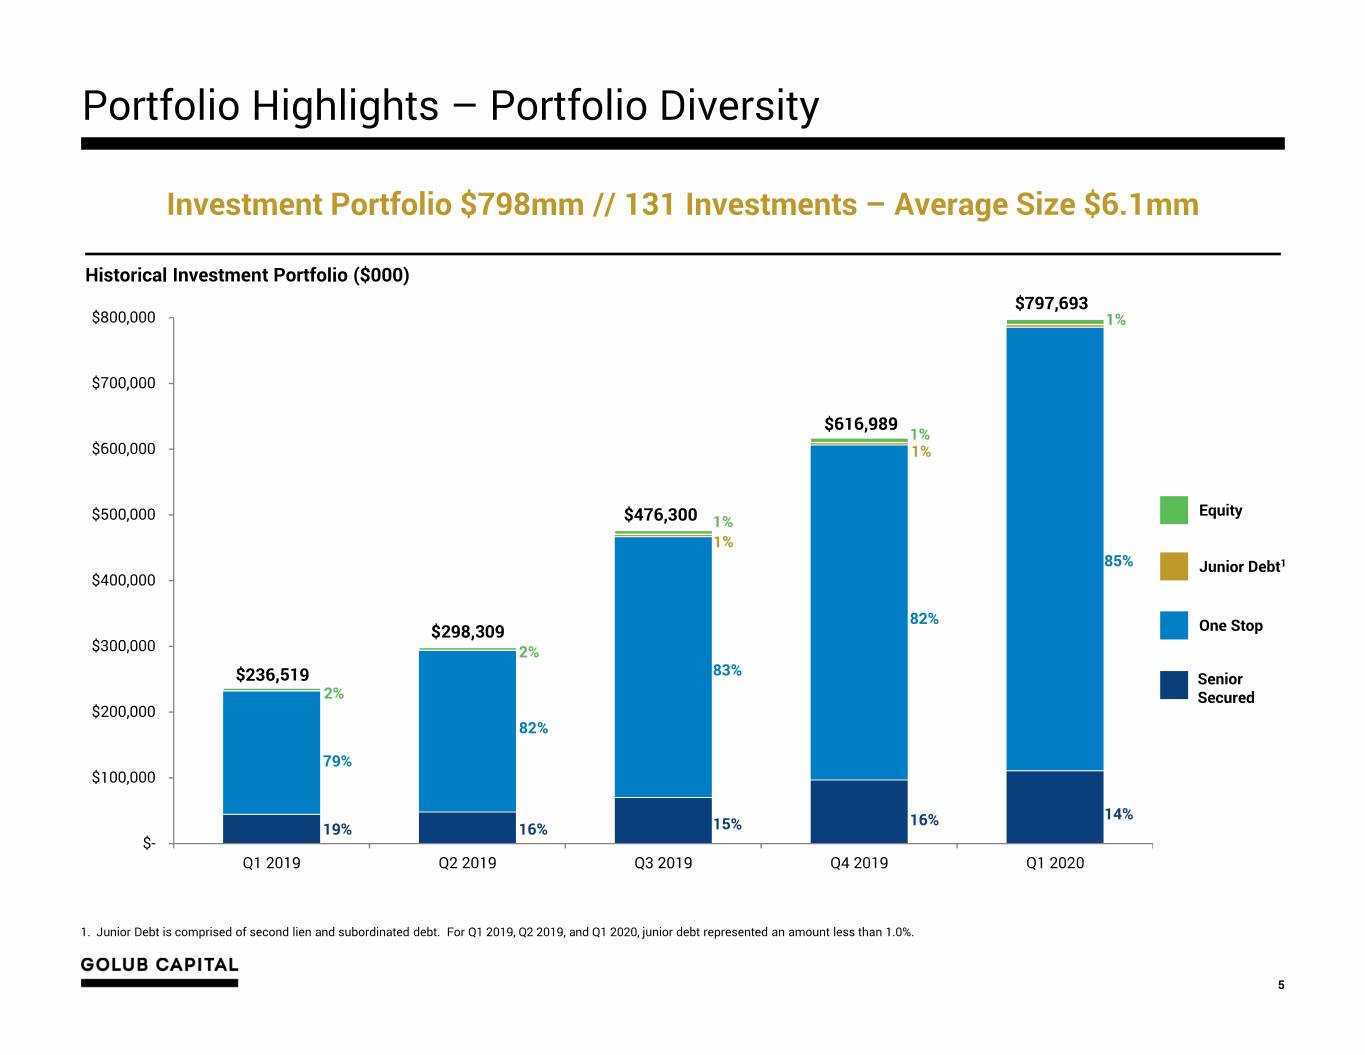
Portfolio Highlights – Portfolio Diversity Investment Portfolio $798mm // 131 Investments – Average Size $6.1mm Historical Investment Portfolio ($000) $797,693 $800,000 1% $700,000 $616,989 1% $600,000 1% Equity $500,000 $476,300 1% 1% 85% Junior Debt1 $400,000 82% $298,309 One Stop $300,000 2% 83% $236,519 Senior 2% Secured $200,000 82% 79% $100,000 16% 14% 19% 16% 15% $- Q1 2019 Q2 2019 Q3 2019 Q4 2019 Q1 2020 1. Junior Debt is comprised of second lien and subordinated debt. For Q1 2019, Q2 2019, and Q1 2020, junior debt represented an amount less than 1.0%. 5
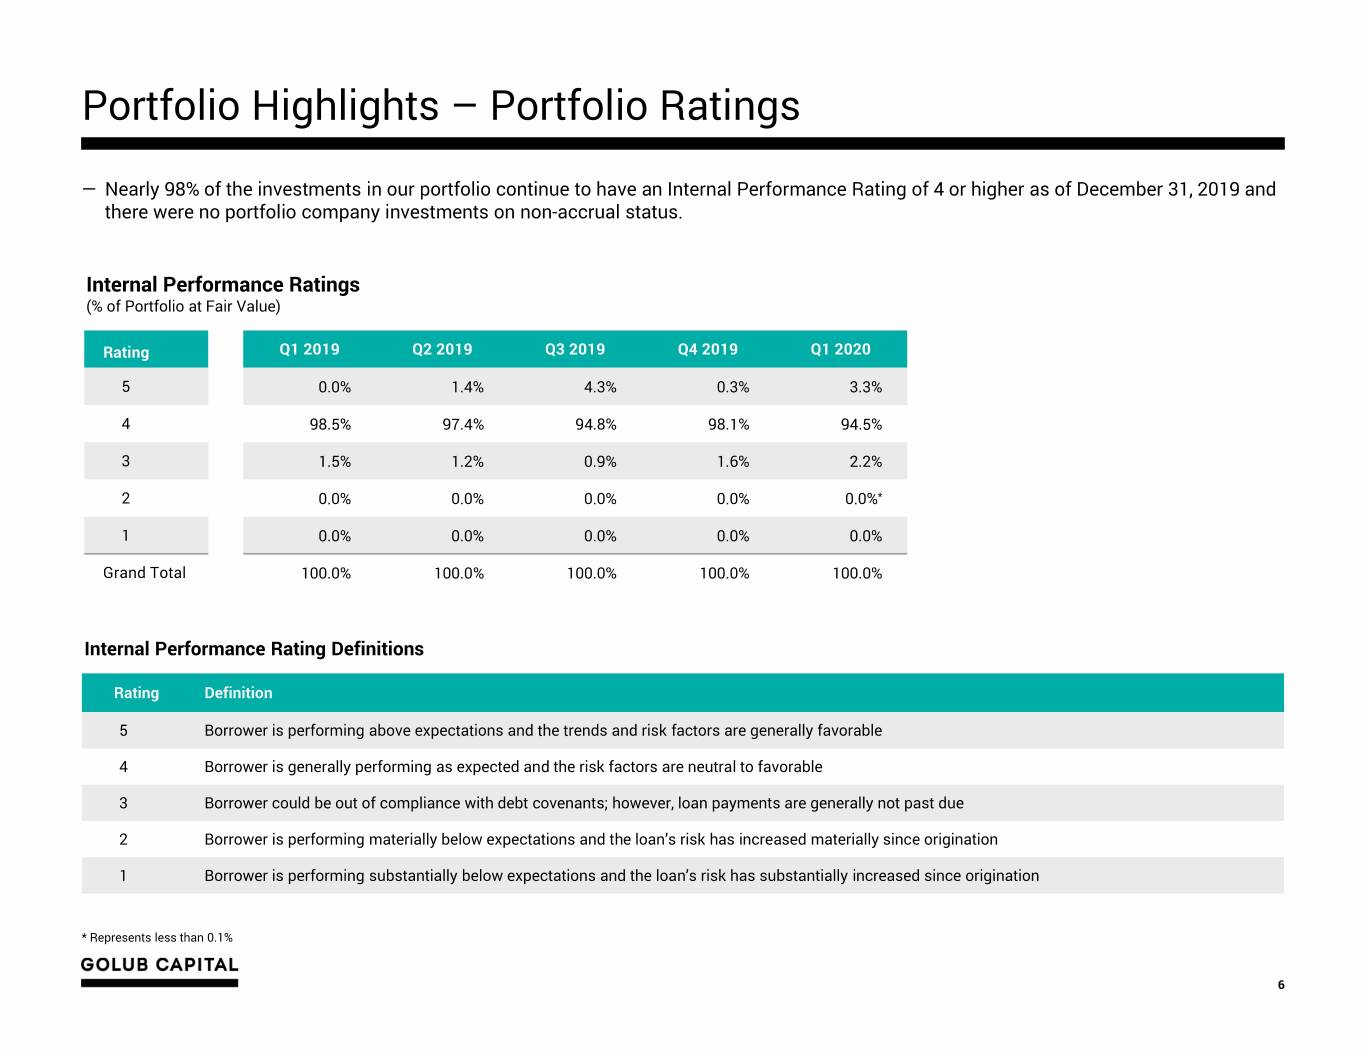
Portfolio Highlights – Portfolio Ratings ― Nearly 98% of the investments in our portfolio continue to have an Internal Performance Rating of 4 or higher as of December 31, 2019 and there were no portfolio company investments on non-accrual status. Internal Performance Ratings (% of Portfolio at Fair Value) Rating Q1 2019 Q2 2019 Q3 2019 Q4 2019 Q1 2020 5 0.0% 1.4% 4.3% 0.3% 3.3% 4 98.5% 97.4% 94.8% 98.1% 94.5% 3 1.5% 1.2% 0.9% 1.6% 2.2% 2 0.0% 0.0% 0.0% 0.0% 0.0%* 1 0.0% 0.0% 0.0% 0.0% 0.0% Grand Total 100.0% 100.0% 100.0% 100.0% 100.0% Internal Performance Rating Definitions Rating Definition 5 Borrower is performing above expectations and the trends and risk factors are generally favorable 4 Borrower is generally performing as expected and the risk factors are neutral to favorable 3 Borrower could be out of compliance with debt covenants; however, loan payments are generally not past due 2 Borrower is performing materially below expectations and the loan’s risk has increased materially since origination 1 Borrower is performing substantially below expectations and the loan’s risk has substantially increased since origination * Represents less than 0.1% 6
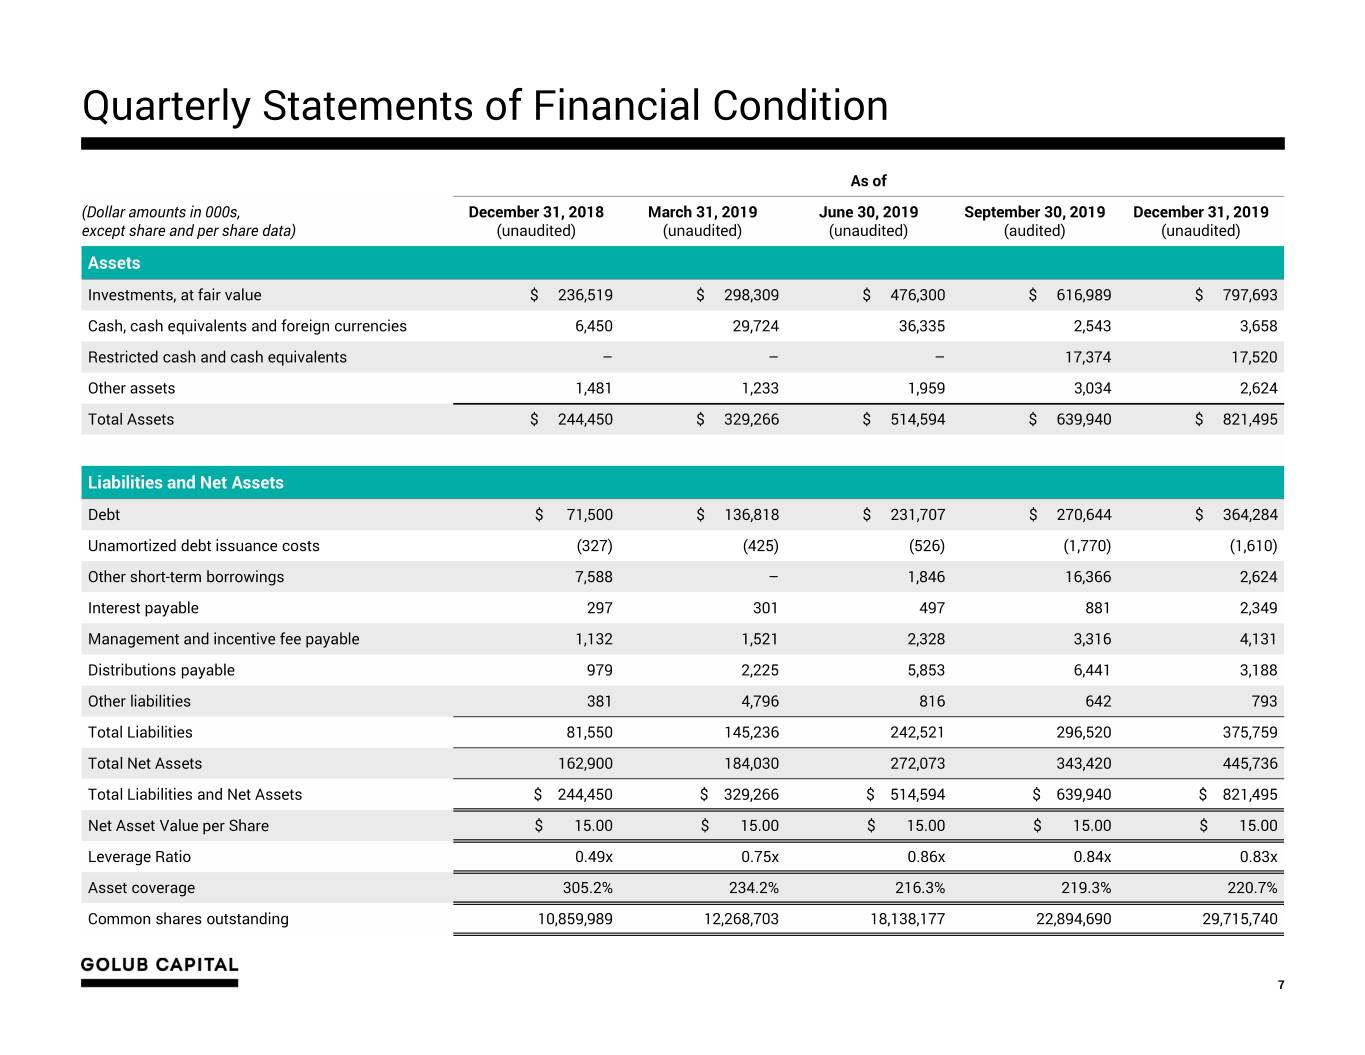
Quarterly Statements of Financial Condition As of (Dollar amounts in 000s, December 31, 2018 March 31, 2019 June 30, 2019 September 30, 2019 December 31, 2019 except share and per share data) (unaudited) (unaudited) (unaudited) (audited) (unaudited) Assets Investments, at fair value $ 236,519 $ 298,309 $ 476,300 $ 616,989 $ 797,693 Cash, cash equivalents and foreign currencies 6,450 29,724 36,335 2,543 3,658 Restricted cash and cash equivalents – – – 17,374 17,520 Other assets 1,481 1,233 1,959 3,034 2,624 Total Assets $ 244,450 $ 329,266 $ 514,594 $ 639,940 $ 821,495 Liabilities and Net Assets Debt $ 71,500 $ 136,818 $ 231,707 $ 270,644 $ 364,284 Unamortized debt issuance costs (327) (425) (526) (1,770) (1,610) Other short-term borrowings 7,588 – 1,846 16,366 2,624 Interest payable 297 301 497 881 2,349 Management and incentive fee payable 1,132 1,521 2,328 3,316 4,131 Distributions payable 979 2,225 5,853 6,441 3,188 Other liabilities 381 4,796 816 642 793 Total Liabilities 81,550 145,236 242,521 296,520 375,759 Total Net Assets 162,900 184,030 272,073 343,420 445,736 Total Liabilities and Net Assets $ 244,450 $ 329,266 $ 514,594 $ 639,940 $ 821,495 Net Asset Value per Share $ 15.00 $ 15.00 $ 15.00 $ 15.00 $ 15.00 Leverage Ratio 0.49x 0.75x 0.86x 0.84x 0.83x Asset coverage 305.2% 234.2% 216.3% 219.3% 220.7% Common shares outstanding 10,859,989 12,268,703 18,138,177 22,894,690 29,715,740 7
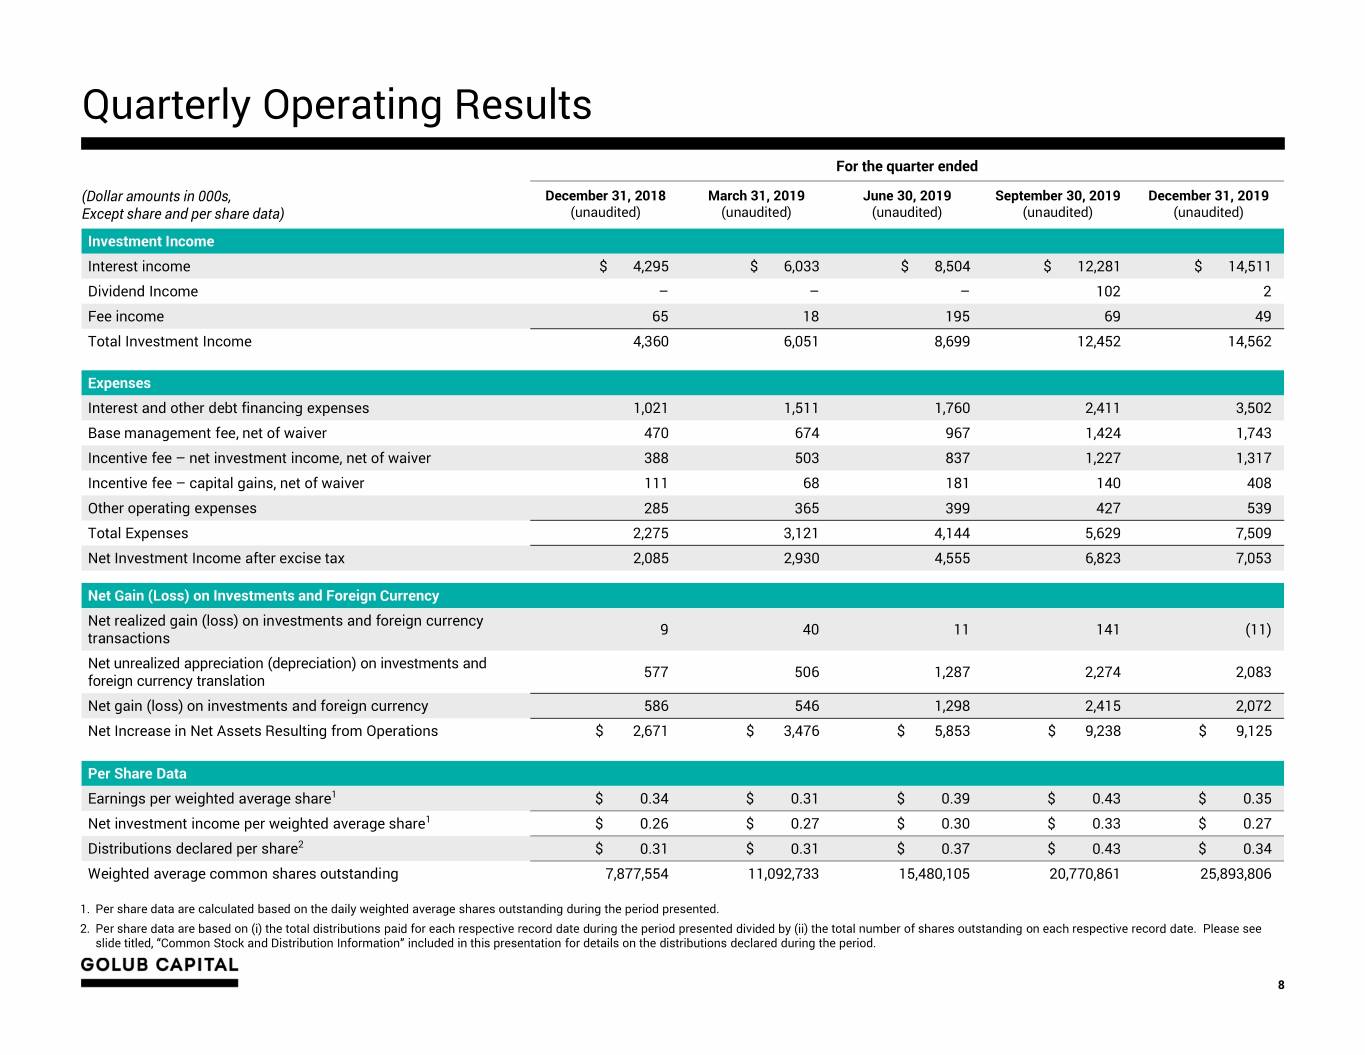
Quarterly Operating Results For the quarter ended (Dollar amounts in 000s, December 31, 2018 March 31, 2019 June 30, 2019 September 30, 2019 December 31, 2019 Except share and per share data) (unaudited) (unaudited) (unaudited) (unaudited) (unaudited) Investment Income Interest income $ 4,295 $ 6,033 $ 8,504 $ 12,281 $ 14,511 Dividend Income – – – 102 2 Fee income 65 18 195 69 49 Total Investment Income 4,360 6,051 8,699 12,452 14,562 Expenses Interest and other debt financing expenses 1,021 1,511 1,760 2,411 3,502 Base management fee, net of waiver 470 674 967 1,424 1,743 Incentive fee – net investment income, net of waiver 388 503 837 1,227 1,317 Incentive fee – capital gains, net of waiver 111 68 181 140 408 Other operating expenses 285 365 399 427 539 Total Expenses 2,275 3,121 4,144 5,629 7,509 Net Investment Income after excise tax 2,085 2,930 4,555 6,823 7,053 Net Gain (Loss) on Investments and Foreign Currency Net realized gain (loss) on investments and foreign currency 9 40 11 141 (11) transactions Net unrealized appreciation (depreciation) on investments and 577 506 1,287 2,274 2,083 foreign currency translation Net gain (loss) on investments and foreign currency 586 546 1,298 2,415 2,072 Net Increase in Net Assets Resulting from Operations $ 2,671 $ 3,476 $ 5,853 $ 9,238 $ 9,125 Per Share Data Earnings per weighted average share1 $ 0.34 $ 0.31 $ 0.39 $ 0.43 $ 0.35 Net investment income per weighted average share1 $ 0.26 $ 0.27 $ 0.30 $ 0.33 $ 0.27 Distributions declared per share2 $ 0.31 $ 0.31 $ 0.37 $ 0.43 $ 0.34 Weighted average common shares outstanding 7,877,554 11,092,733 15,480,105 20,770,861 25,893,806 1. Per share data are calculated based on the daily weighted average shares outstanding during the period presented. 2. Per share data are based on (i) the total distributions paid for each respective record date during the period presented divided by (ii) the total number of shares outstanding on each respective record date. Please see slide titled, “Common Stock and Distribution Information” included in this presentation for details on the distributions declared during the period. 8
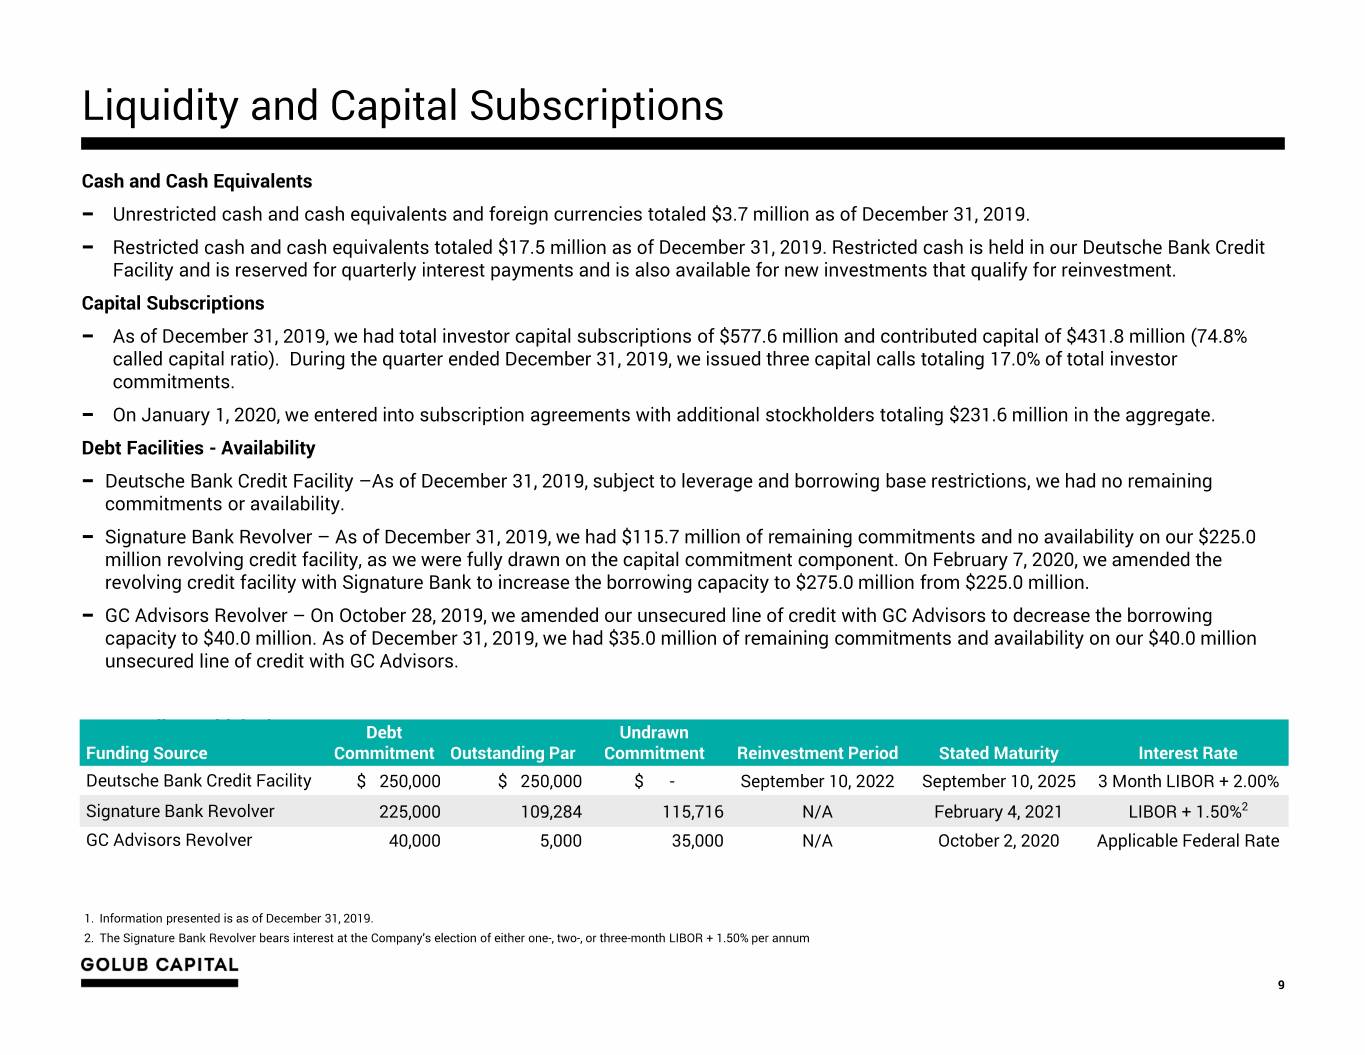
Liquidity and Capital Subscriptions Cash and Cash Equivalents − Unrestricted cash and cash equivalents and foreign currencies totaled $3.7 million as of December 31, 2019. − Restricted cash and cash equivalents totaled $17.5 million as of December 31, 2019. Restricted cash is held in our Deutsche BankCredit Facility and is reserved for quarterly interest payments and is also available for new investments that qualify for reinvestment. Capital Subscriptions − As of December 31, 2019, we had total investor capital subscriptions of $577.6 million and contributed capital of $431.8 million (74.8% called capital ratio). During the quarter ended December 31, 2019, we issued three capital calls totaling 17.0% of total investor commitments. − On January 1, 2020, we entered into subscription agreements with additional stockholders totaling $231.6 million in the aggregate. Debt Facilities - Availability − Deutsche Bank Credit Facility –As of December 31, 2019, subject to leverage and borrowing base restrictions, we had no remaining commitments or availability. − Signature Bank Revolver – As of December 31, 2019, we had $115.7 million of remaining commitments and no availability on our $225.0 million revolving credit facility, as we were fully drawn on the capital commitment component. On February 7, 2020, we amended the revolving credit facility with Signature Bank to increase the borrowing capacity to $275.0 million from $225.0 million. − GC Advisors Revolver – On October 28, 2019, we amended our unsecured line of credit with GC Advisors to decrease the borrowing capacity to $40.0 million. As of December 31, 2019, we had $35.0 million of remaining commitments and availability on our $40.0 million unsecured line of credit with GC Advisors. 1 Key Funding Vehicles Debt Undrawn Funding Source Commitment Outstanding Par Commitment Reinvestment Period Stated Maturity Interest Rate Deutsche Bank Credit Facility $ 250,000 $ 250,000 $ - September 10, 2022 September 10, 2025 3 Month LIBOR + 2.00% Signature Bank Revolver 225,000 109,284 115,716 N/A February 4, 2021 LIBOR + 1.50%2 GC Advisors Revolver 40,000 5,000 35,000 N/A October 2, 2020 Applicable Federal Rate 1. Information presented is as of December 31, 2019. 2. The Signature Bank Revolver bears interest at the Company’s election of either one-, two-, or three-month LIBOR + 1.50% per annum 9
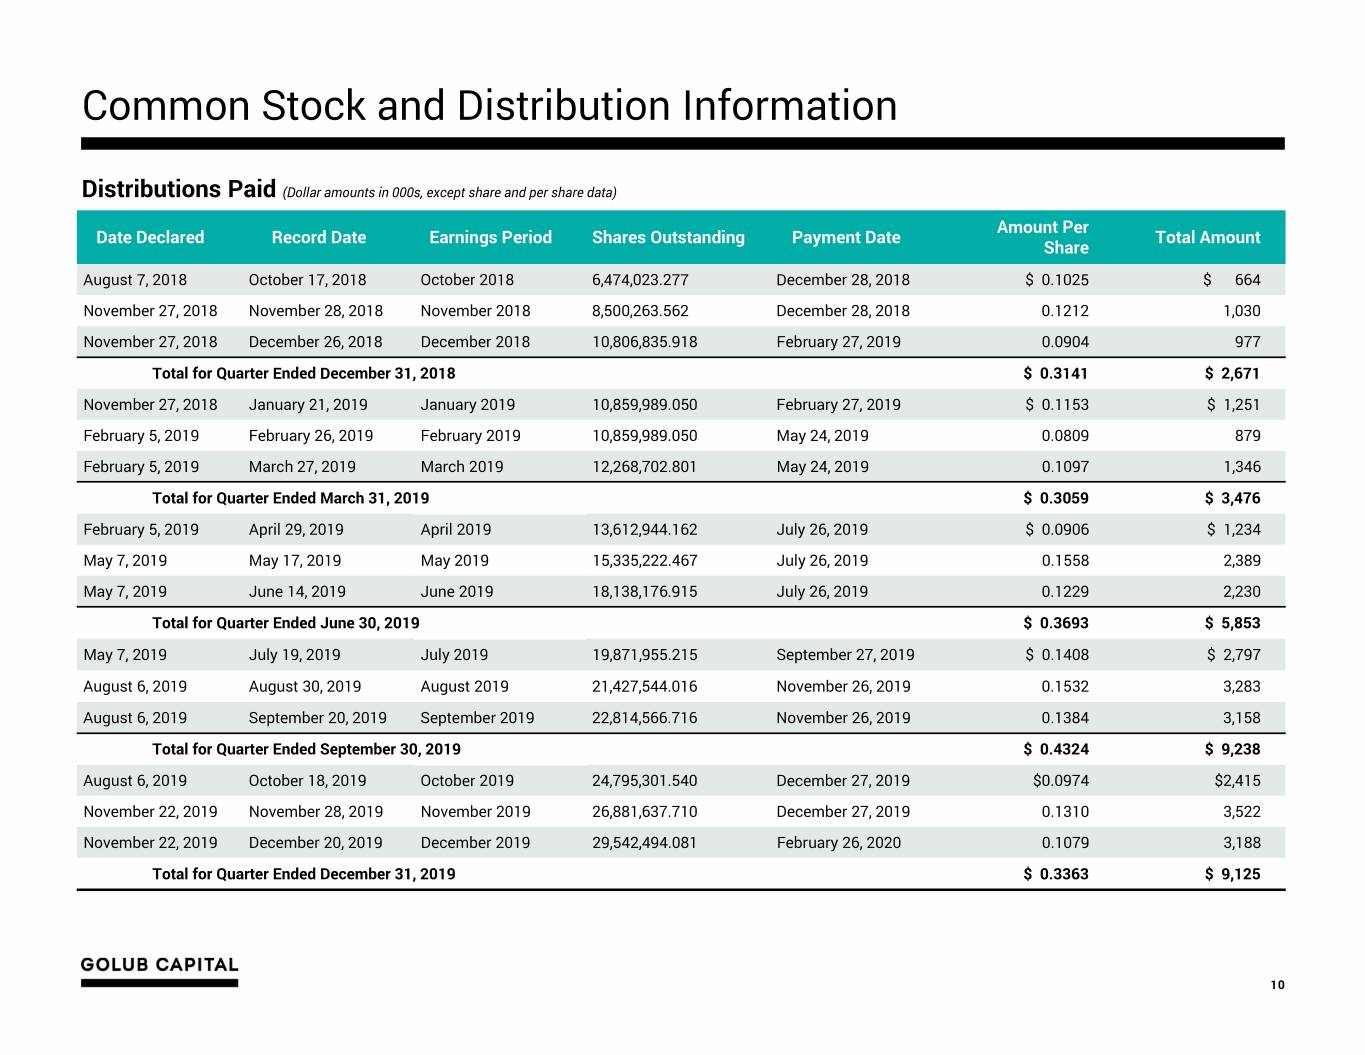
Common Stock and Distribution Information Distributions Paid (Dollar amounts in 000s, except share and per share data) Amount Per Date Declared Record Date Earnings Period Shares Outstanding Payment Date Total Amount Share August 7, 2018 October 17, 2018 October 2018 6,474,023.277 December 28, 2018 $ 0.1025 $ 664 November 27, 2018 November 28, 2018 November 2018 8,500,263.562 December 28, 2018 0.1212 1,030 November 27, 2018 December 26, 2018 December 2018 10,806,835.918 February 27, 2019 0.0904 977 Total for Quarter Ended December 31, 2018 $ 0.3141 $ 2,671 November 27, 2018 January 21, 2019 January 2019 10,859,989.050 February 27, 2019 $ 0.1153 $ 1,251 February 5, 2019 February 26, 2019 February 2019 10,859,989.050 May 24, 2019 0.0809 879 February 5, 2019 March 27, 2019 March 2019 12,268,702.801 May 24, 2019 0.1097 1,346 Total for Quarter Ended March 31, 2019 $ 0.3059 $ 3,476 February 5, 2019 April 29, 2019 April 2019 13,612,944.162 July 26, 2019 $ 0.0906 $ 1,234 May 7, 2019 May 17, 2019 May 2019 15,335,222.467 July 26, 2019 0.1558 2,389 May 7, 2019 June 14, 2019 June 2019 18,138,176.915 July 26, 2019 0.1229 2,230 DistributionsTotal for Quarter Declared Ended June 30, 2019 $ 0.3693 $ 5,853 May 7, 2019 July 19, 2019 July 2019 19,871,955.215 September 27, 2019 $ 0.1408 $ 2,797 August 6, 2019 August 30, 2019 August 2019 21,427,544.016 November 26, 2019 0.1532 3,283 August 6, 2019 September 20, 2019 September 2019 22,814,566.716 November 26, 2019 0.1384 3,158 Total for Quarter Ended September 30, 2019 $ 0.4324 $ 9,238 August 6, 2019 October 18, 2019 October 2019 24,795,301.540 December 27, 2019 $0.0974 $2,415 November 22, 2019 November 28, 2019 November 2019 26,881,637.710 December 27, 2019 0.1310 3,522 November 22, 2019 December 20, 2019 December 2019 29,542,494.081 February 26, 2020 0.1079 3,188 Total for Quarter Ended December 31, 2019 $ 0.3363 $ 9,125 10
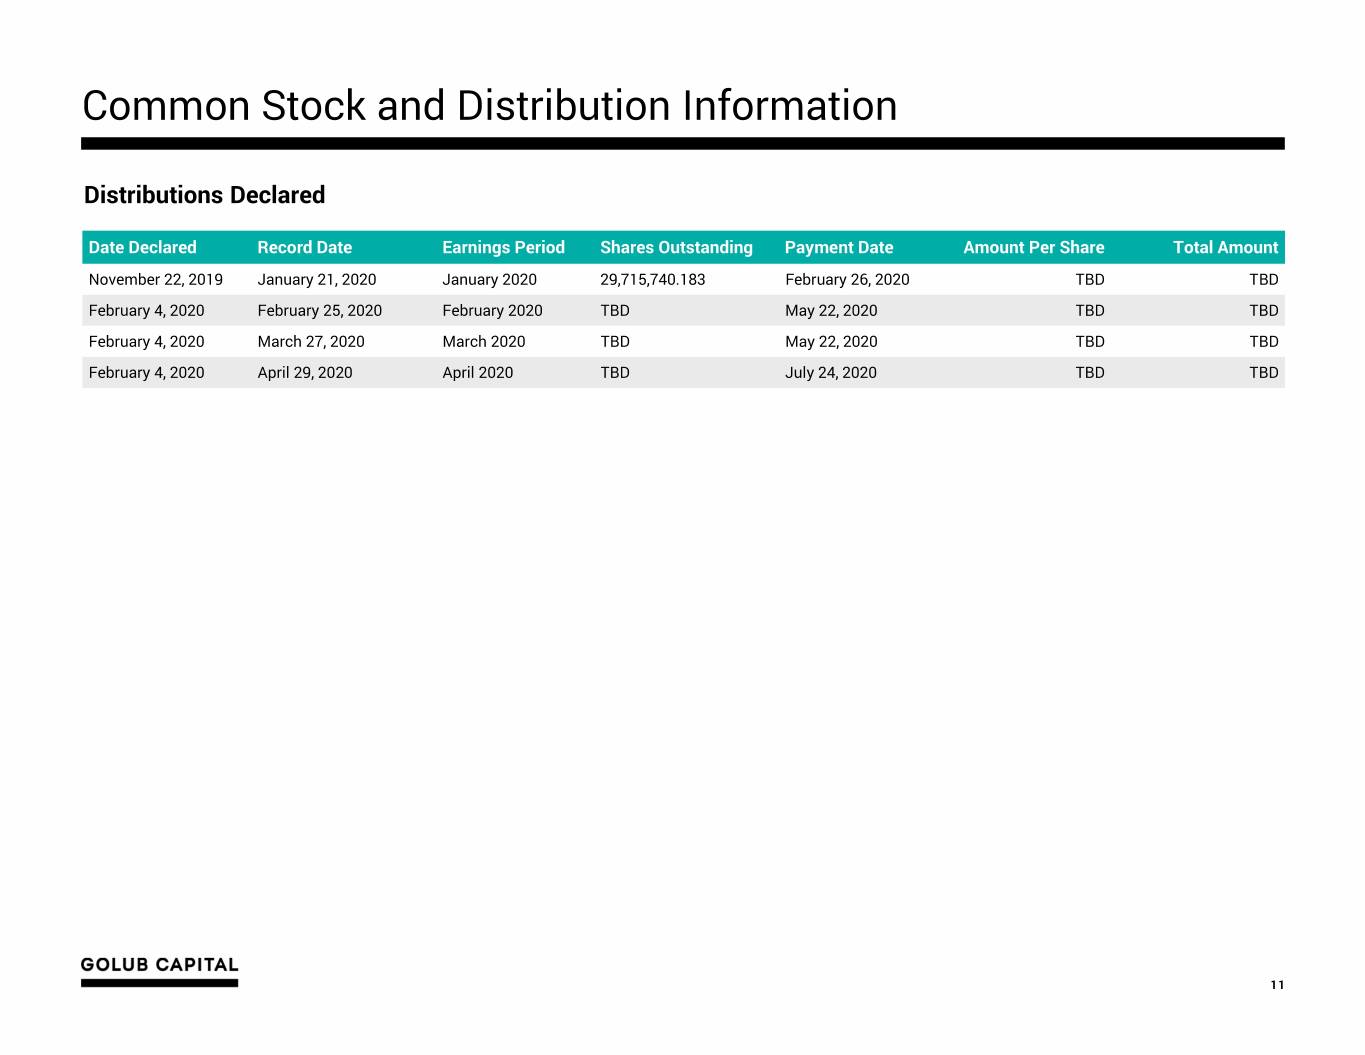
Common Stock and Distribution Information Distributions Declared Date Declared Record Date Earnings Period Shares Outstanding Payment Date Amount Per Share Total Amount November 22, 2019 January 21, 2020 January 2020 29,715,740.183 February 26, 2020 TBD TBD February 4, 2020 February 25, 2020 February 2020 TBD May 22, 2020 TBD TBD February 4, 2020 March 27, 2020 March 2020 TBD May 22, 2020 TBD TBD February 4, 2020 April 29, 2020 April 2020 TBD July 24, 2020 TBD TBD 11


