GOLUB CAPITAL BDC 3, INC. INVESTOR PRESENTATION QUARTER ENDED JUNE 30, 2021
Disclaimer 2 Some of the statements in this presentation constitute forward-looking statements, which relate to future events or our future performance or financial condition. The forward-looking statements contained in this presentation involve risks and uncertainties, including statements as to: our future operating results; our business prospects and the prospects of our portfolio companies including our and their ability to achieve our and their respective objectives as a result of the coronavirus ("COVID-19") pandemic; the effect of investments that we expect to make and the competition for those investments; our contractual arrangements and relationships with third parties; actual and potential conflicts of interest with GC Advisors LLC ("GC Advisors"), our investment adviser, and other affiliates of Golub Capital LLC (collectively, "Golub Capital"); the dependence of our future success on the general economy and its effect on the industries in which we invest; the ability of our portfolio companies to achieve their objectives; the use of borrowed money to finance a portion of our investments and the effect of the COVID-19 pandemic on the availability of equity and debt capital and our use of borrowed funds to finance a portion of our investments; the adequacy of our financing sources and working capital; the timing of cash flows, if any, from the operations of our portfolio companies; general economic and political trends and other external factors, including the COVID-19 pandemic; changes in political, economic or industry conditions, the interest rate environment or conditions affecting the financial and capital markets that could result in changes to the value of our assets, including changes from the impact of the COVID-19 pandemic; the ability of GC Advisors to locate suitable investments for us and to monitor and administer our investments; the ability of GC Advisors or its affiliates to attract and retain highly talented professionals; the ability of GC Advisors to continue to effectively manage our business due to the disruptions caused by the COVID-19 pandemic; our ability to qualify and maintain our qualification as a regulated investment company and as a business development company; general price and volume fluctuations in the stock market; the impact on our business of the Dodd-Frank Wall Street Reform and Consumer Protection Act and the rules and regulations issued thereunder and any actions toward repeal thereof; and the effect of changes to tax legislation and our tax position. Such forward-looking statements may include statements preceded by, followed by or that otherwise include the words “may,” “might,” “will,” “intend,” “should,” “could,” “can,” “would,” “expect,” “believe,” “estimate,” “anticipate,” “predict,” “potential,” “plan” or similar words. We have based the forward-looking statements included in this presentation on information available to us on the date of this presentation. Actual results could differ materially from those anticipated in our forward-looking statements and future results could differ materially from historical performance. We undertake no obligation to revise or update any forward-looking statements, whether as a result of new information, future events or otherwise. You are advised to consult any additional disclosures that we may make directly to you or through reports that we have filed or in the future may file with the Securities and Exchange Commission (“SEC”), including annual reports on Form 10-K, quarterly reports on Form 10-Q and current reports on Form 8-K. This presentation contains statistics and other data that have been obtained from or compiled from information made available by third-party service providers. We have not independently verified such statistics or data. In evaluating prior performance information in this presentation, you should remember that past performance is not a guarantee, prediction, or projection of future results, and there can be no assurance that we will achieve similar results in the future.
Summary of Financial Results 01

4 Summary of Financial Results vs. Prior Quarter Quarter Ended March 31, 2021 June 30, 2021 Selected Financial Highlights Net investment income per share $0.26 $0.26 Accrual (reversal) for capital gain incentive fee per weighted average share 0.03 0.02 Net investment income before accrual for capital gain incentive fee (net) per weighted average share $0.29 $0.28 Net realized/unrealized gain (loss) per share $0.25 $0.11 Earnings (loss) per share $0.51 $0.37 Net Asset Value Per Share $15.00 $15.00
GBDC 3 Performance Drivers 02

GBDC 3’s Strong Earnings in Quarter Ended June 30, 2021 Were Driven by a Continuation of Themes from the Prior Quarter 6 Key Themes from Quarter Ended June 30, 2021 Impact on GBDC 3 Earnings growth across middle market private companies in Golub Capital portfolios was remarkably strong at 31.5%1 as compared to calendar Q2 2019, reflecting an economy that is booming, even compared to strong, pre-COVID Q2 2019 results Middle market deal activity was strong and Golub Capital’s calendar Q2 originations surpassed the previous record set in calendar Q4 2020 GBDC 3 portfolio companies generally continued to perform well ‒ Improved internal performance ratings2 ‒ No non-accruals3 ‒ No net realized losses ‒ Solid net unrealized gains, resulting in a near-full recapture of the unrealized losses incurred in the March 31, 2020 quarter4 Robust funds growth during the quarter 1. Please see June 30, 2021 Golub Capital Middle Market Report (which is available on Golub Capital’s website at www.golubcapital.com) for additional details. The Golub Capital Middle Market Report for Q2 2021 compared the April and May 2021 revenue and earnings of middle market private companies in the Golub Capital Altman Index to revenue and earnings in April and May 2019. 2. Please see page titled, “Strong Borrower Performance – GBDC 3’s Performance Ratings Highlight the Quality of the Portfolio”. 3. Please see page titled, “Portfolio Highlights – Credit Quality”. 4. Please see page titled, “GBDC 3’s NAV Per Share Remains Stable”.

Strong Borrower Performance – GBDC 3’s Performance Ratings Highlight the Quality of the Portfolio 7 Internal Performance Rating Migration % of Portfolio at Fair Value 15.0% 12.2% 9.6% 5.8% 3.2% 84.7% 87.8% 90.4% 94.2% 96.8% June 30, 2020 September 30, 2020 December 31, 2020 March 31, 2021 June 30, 2021 0.3% Internal Performance Ratings 4-5 (Performing At or Above Expectations) Internal Performance Rating 3 (Performing Below Expectations) Internal Performance Ratings 1 and 2* (Performing Materially Below Expectations) -3.8% 1. Based on internal performance ratings of Golub Capital BDC, Inc. (“GBDC”)’s portfolio in the last five fiscal years (FY 2015 – FY 2019) pre-COVID. * Represents an amount less than 0.1% as of September 30, 2020, December 31, 2020, March 31, 2021 and June 30, 2021. -2.8% -2.6% − The percentage of portfolio investments at fair value with internal performance rating 3 continues to decline and as of June 30, 2021 is below levels typically seen in a seasoned Golub Capital-managed loan portfolio.1 − No or minimal investments with internal performance ratings 1-2 through the COVID-impacted period. -2.6%

GBDC 3’s NAV Per Share Remains Stable NAV Per Share Bridge $15.00 $0.26 $0.00* $0.11 ($0.37) March 31, 2021 NAV Net Investment Income Dividends Recorded in June 30, 2021 Quarter Net Realized Gain on Investments Net Change in Unrealized Appreciation (Depreciation) on Investments June 30, 2021 NAV $0.29 $15.01 * Rounds to less than $0.01. Net Realized & Unrealized Gain: $0.11 8 $15.00

Summary of Financial Results for the Quarter Ended June 30, 2021 03

(Dollar amounts in 000s, except per share data) Quarter Ended Selected Financial Highlights 6/30/20 9/30/20 12/31/20 3/31/21 6/30/21 Net income/(loss) $37,616 $17,353 $16,411 $19,376 $15,344 Net investment income 11,078 9,473 10,169 9,972 10,596 Net realized/unrealized gain (loss) 26,538 7,880 6,242 9,404 4,749 Distributions declared $3,043 $7,327 $14,864 $19,693 $15,344 Quarter Ended Per Share1 and Return on Equity2 Statistics 6/30/20 9/30/20 12/31/20 3/31/21 6/30/21 Earnings/(loss) per weighted average share $1.13 $0.51 $0.46 $0.51 $0.37 Net investment income per weighted average share 0.34 0.28 0.29 0.26 0.26 Accrual (reversal) for capital gain incentive fee per weighted average share - - - 0.03 0.02 Net investment income before accrual for capital gain incentive fee (net) per weighted average share 0.34 0.28 0.29 0.29 0.28 Net realized/unrealized gain (loss) per weighted average share 0.79 0.23 0.17 0.25 0.11 Quarterly return on equity – net income/(loss) 8.3% 3.5% 3.1% 3.4% 2.5% Net asset value $14.68 $14.97 $15.01 $15.00 $15.00 Financial Highlights 10 1. Per share returns are calculated based on the daily weighted average shares outstanding during the period presented. 2. The quarterly return on equity is calculated as the annualized return on average equity divided by four. Return on equity calculations are based on the daily weighted average of total net assets during the period presented.
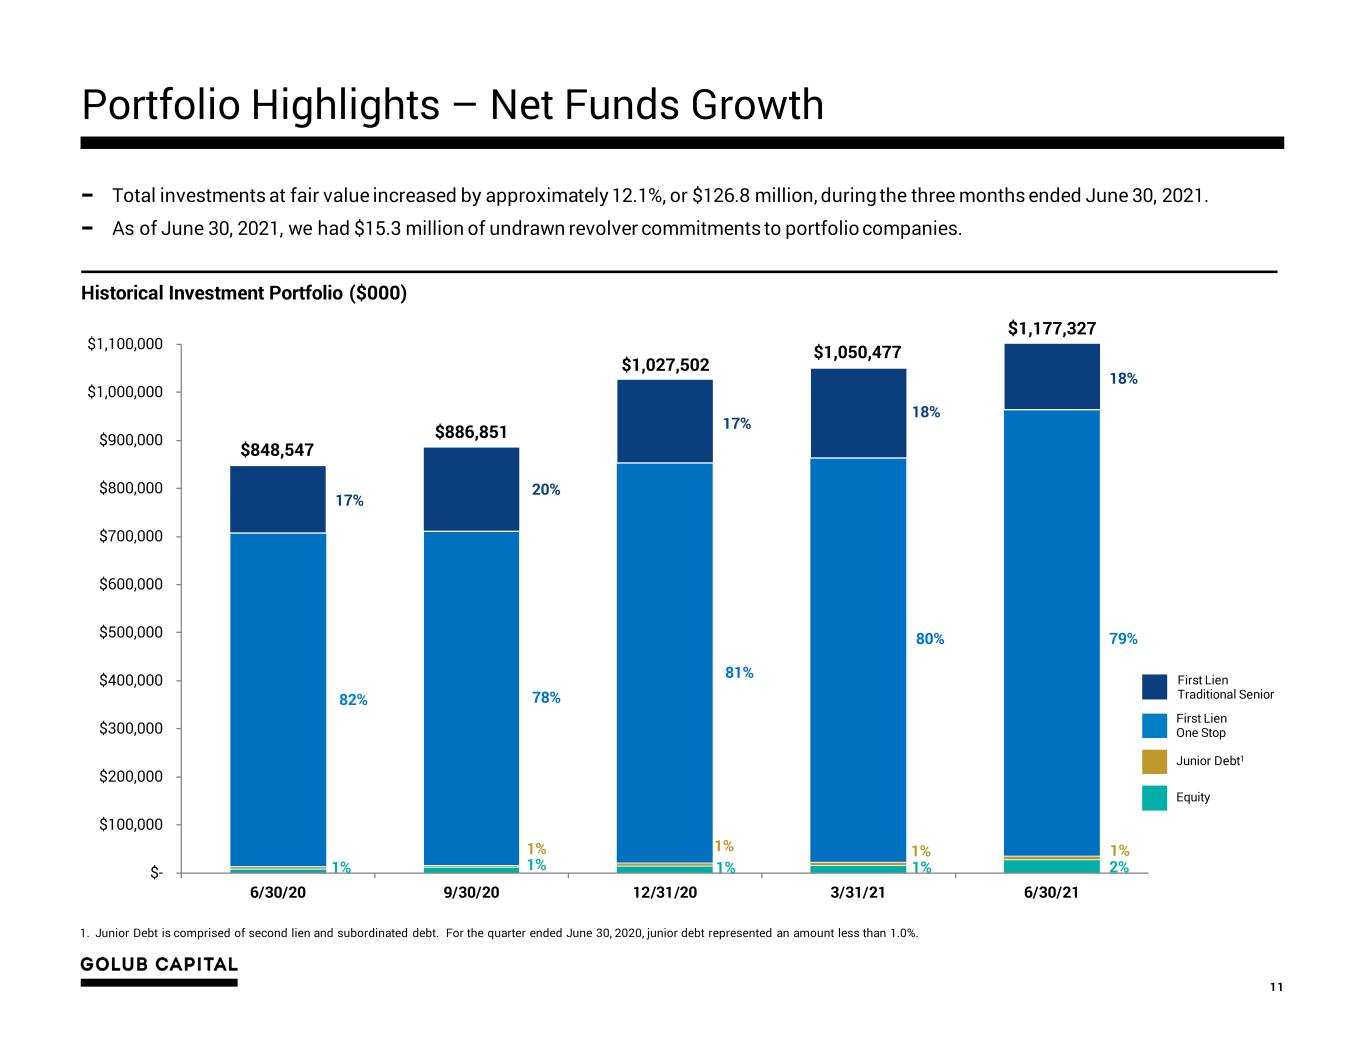
Portfolio Highlights – Net Funds Growth 11 $- $100,000 $200,000 $300,000 $400,000 $500,000 $600,000 $700,000 $800,000 $900,000 $1,000,000 $1,100,000 6/30/20 9/30/20 12/31/20 3/31/21 6/30/21 1% Historical Investment Portfolio ($000) 79% 18% 1. Junior Debt is comprised of second lien and subordinated debt. For the quarter ended June 30, 2020, junior debt represented an amount less than 1.0%. 1% 1% 82% 17% − Total investments at fair value increased by approximately 12.1%, or $126.8 million, during the three months ended June 30, 2021. − As of June 30, 2021, we had $15.3 million of undrawn revolver commitments to portfolio companies. 80% 18% 2% $848,547 Equity Junior Debt1 First Lien One Stop First Lien Traditional Senior $886,851 78% 20% 1% $1,050,477 1%1% $1,027,502 81% 17% 1% 1% $1,177,327
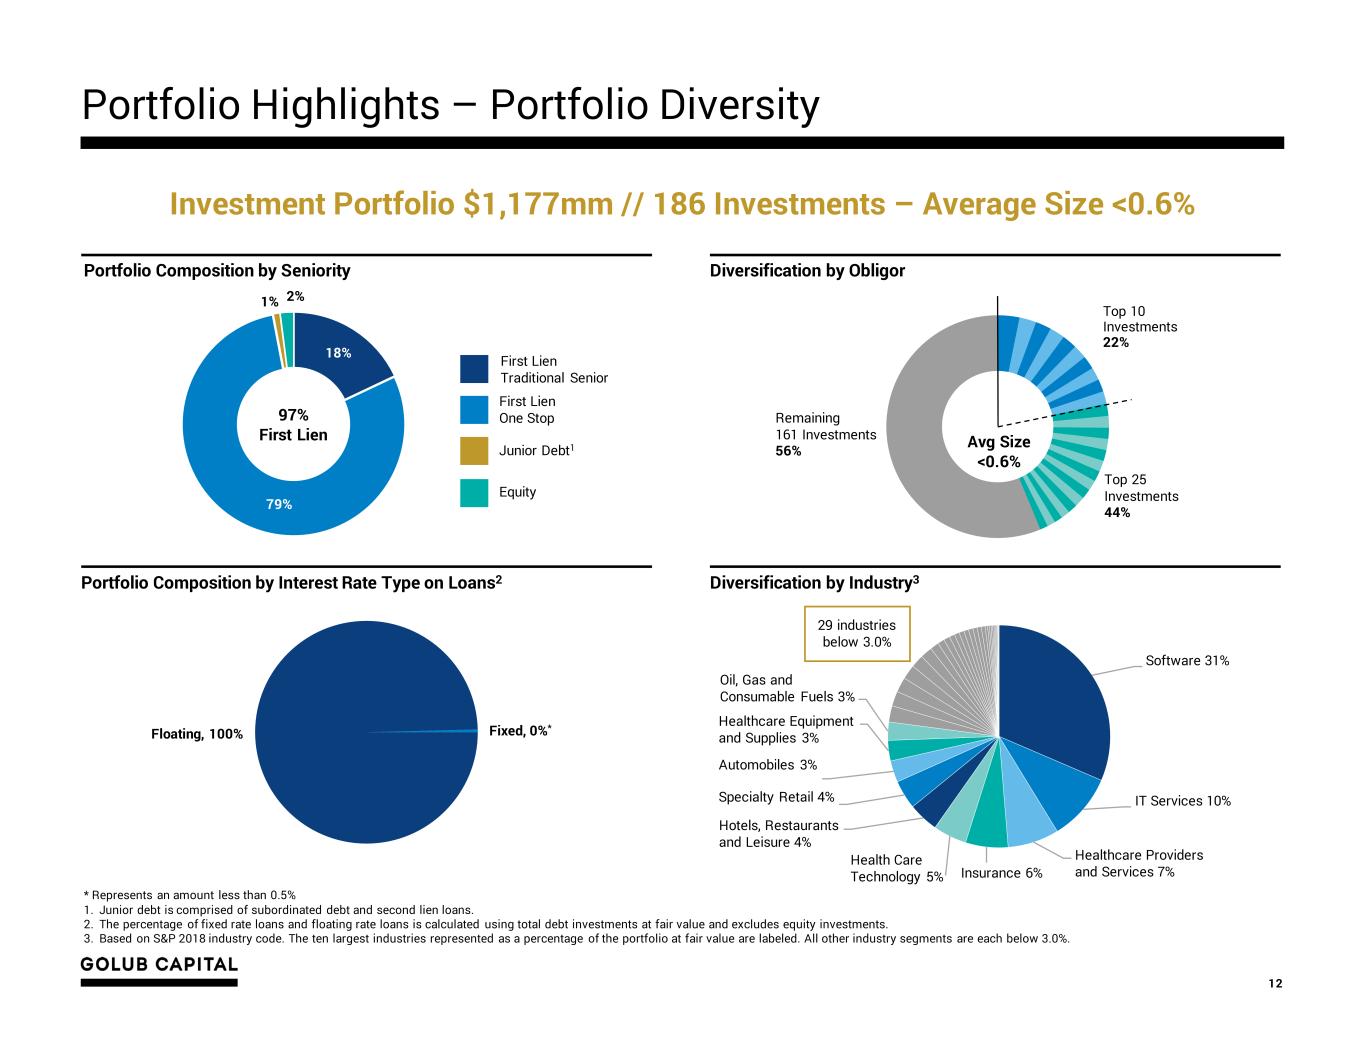
Floating, 100% Fixed, 0%* Software 31% IT Services 10% Healthcare Providers and Services 7%Insurance 6% Health Care Technology 5% Hotels, Restaurants and Leisure 4% Specialty Retail 4% Automobiles 3% Healthcare Equipment and Supplies 3% Oil, Gas and Consumable Fuels 3% Portfolio Highlights – Portfolio Diversity 12 * Represents an amount less than 0.5% 1. Junior debt is comprised of subordinated debt and second lien loans. 2. The percentage of fixed rate loans and floating rate loans is calculated using total debt investments at fair value and excludes equity investments. 3. Based on S&P 2018 industry code. The ten largest industries represented as a percentage of the portfolio at fair value are labeled. All other industry segments are each below 3.0%. Portfolio Composition by Seniority Diversification by Obligor 18% 79% 1% Equity Junior Debt1 First Lien One Stop First Lien Traditional Senior 97% First Lien Top 25 Investments 44% Remaining 161 Investments 56% Top 10 Investments 22% Avg Size <0.6% Portfolio Composition by Interest Rate Type on Loans2 Diversification by Industry3 Investment Portfolio $1,177mm // 186 Investments – Average Size <0.6% 2% 29 industries below 3.0%

1. Investment income yield is calculated as (a) the actual amount earned on earning investments, including interest and fee income and amortization of capitalized fees and discounts, divided by (b) the daily average of total earning investments at fair value. 2. Income yield is calculated as (a) the actual amount earned on earning investments, including interest and fee income but excluding amortization of capitalized fees and discounts, divided by (b) the daily average of total earning investments at fair value. 3. The weighted average net investment spread is calculated as (a) the investment income yield less (b) the weighted average cost of debt. 4. The weighted average cost of debt is calculated as (a) the actual amount of expenses incurred on debt obligations divided by (b) the daily average of total debt obligations. 13 Portfolio Highlights – Economic Analysis 9.0% 8.4% 8.3% 8.1% 7.7% 7.7% 7.7% 7.6% 8.7% 8.0% 7.8% 7.7% 7.3% 7.2% 7.2% 7.1% 5.3% 4.1% 4.4% 5.2% 5.2% 5.1% 5.1% 4.9% 3.8% 4.3% 3.9% 2.9% 2.5% 2.6% 2.6% 2.7% 2.1% 1.9% 1.5% 0.3% 0.2% 0.2% 0.2% 0.1% 0.0% 1.0% 2.0% 3.0% 4.0% 5.0% 6.0% 7.0% 8.0% 9.0% 10.0% September 30, 2019 December 31, 2019 March 31, 2020 June 30, 2020 September 30, 2020 December 31, 2020 March 31, 2021 June 30, 2021 Investment income yield¹ Income yield² Weighted average net investment spread³ Weighted average cost of debt⁴ 3-Month London Interbank Offered Rate ("LIBOR")

Portfolio Highlights – Credit Quality 14 − As of June 30, 2021, March 31, 2021 and December 31, 2020, we had no investments on non-accrual status. − Due to continued improvement in borrower performance, the percentage of internal performance rated “3” investments decreased to 3.2% of the portfolio at fair value as of June 30, 2021 from 5.8% as of March 31, 2021. * Represents an amount less than 0.1%. Internal Performance Ratings (% of Portfolio at Fair Value) Rating Definition 5 Borrower is performing above expectations and the trends and risk factors are generally favorable 4 Borrower is generally performing as expected and the risk factors are neutral to favorable 3 Borrower may be out of compliance with debt covenants; however, loan payments are generally not past due 2 Borrower is performing materially below expectations and the loan’s risk has increased materially since origination 1 Borrower is performing substantially below expectations and the loan’s risk has substantially increased since origination Internal Performance Rating Definitions At Fiscal Year End At Quarter End Rating 2018 2019 2020 12/31/20 3/31/21 6/30/21 5 1.1% 0.3% 2.2% 3.7% 11.6% 7.0% 4 98.9% 98.1% 85.6% 86.7% 82.6% 89.8% 3 0.0% 1.6% 12.2% 9.6% 5.8% 3.2% 2 0.0% 0.0% 0.0%* 0.0%* 0.0%* 0.0%* 1 0.0% 0.0% 0.0% 0.0% 0.0% 0.0% Total 100.0% 100.0% 100.0% 100.0% 100.0% 100.0%
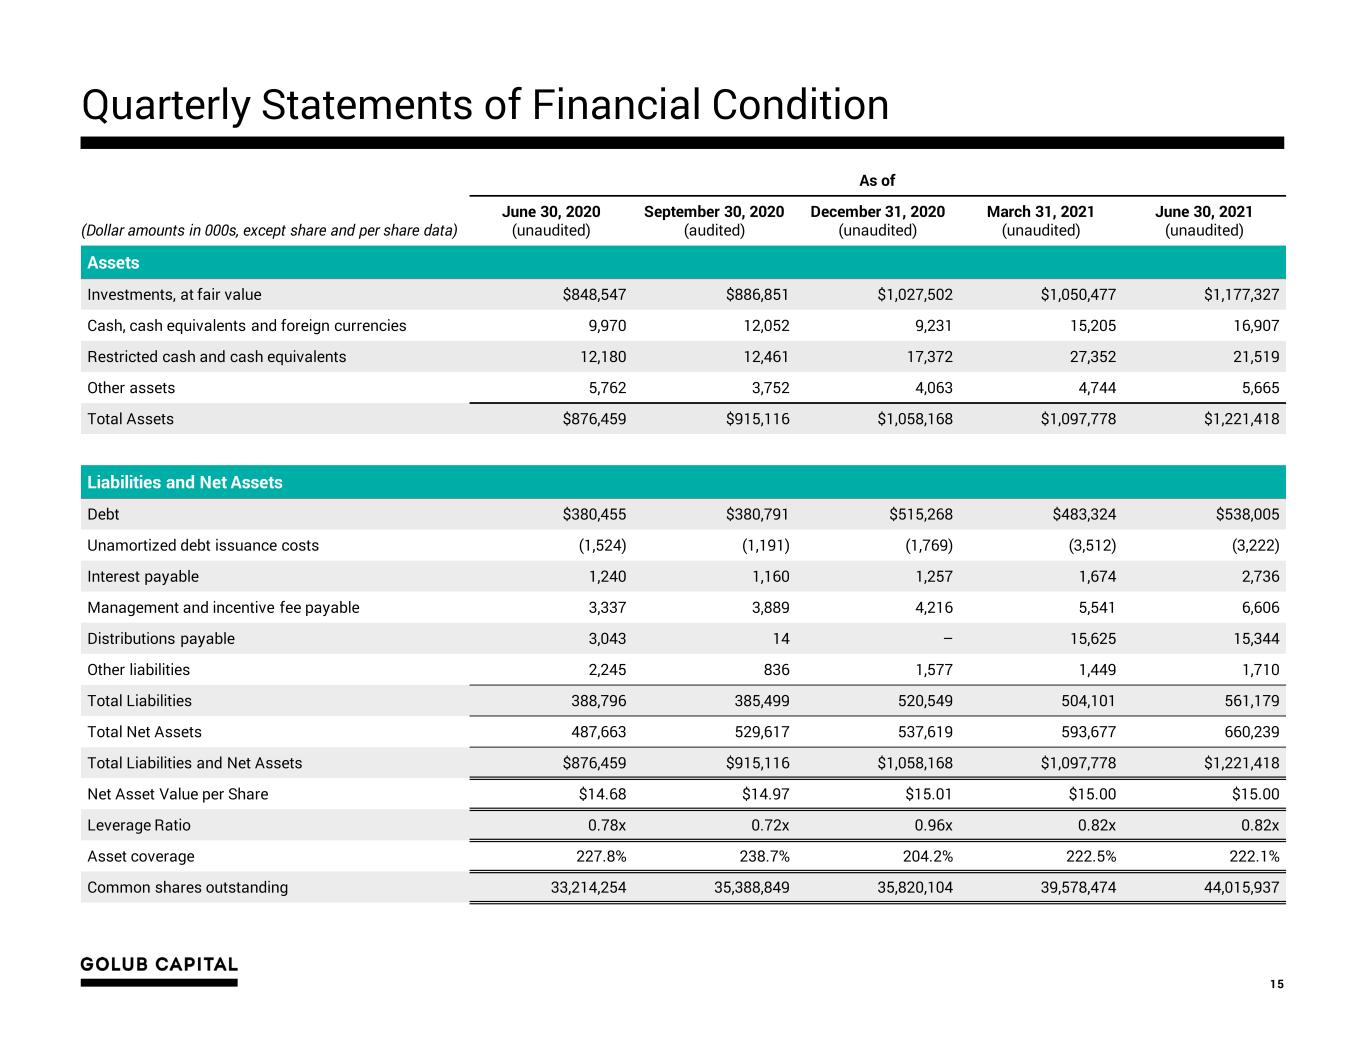
Quarterly Statements of Financial Condition 15 As of (Dollar amounts in 000s, except share and per share data) June 30, 2020 (unaudited) September 30, 2020 (audited) December 31, 2020 (unaudited) March 31, 2021 (unaudited) June 30, 2021 (unaudited) Assets Investments, at fair value $848,547 $886,851 $1,027,502 $1,050,477 $1,177,327 Cash, cash equivalents and foreign currencies 9,970 12,052 9,231 15,205 16,907 Restricted cash and cash equivalents 12,180 12,461 17,372 27,352 21,519 Other assets 5,762 3,752 4,063 4,744 5,665 Total Assets $876,459 $915,116 $1,058,168 $1,097,778 $1,221,418 Liabilities and Net Assets Debt $380,455 $380,791 $515,268 $483,324 $538,005 Unamortized debt issuance costs (1,524) (1,191) (1,769) (3,512) (3,222) Interest payable 1,240 1,160 1,257 1,674 2,736 Management and incentive fee payable 3,337 3,889 4,216 5,541 6,606 Distributions payable 3,043 14 – 15,625 15,344 Other liabilities 2,245 836 1,577 1,449 1,710 Total Liabilities 388,796 385,499 520,549 504,101 561,179 Total Net Assets 487,663 529,617 537,619 593,677 660,239 Total Liabilities and Net Assets $876,459 $915,116 $1,058,168 $1,097,778 $1,221,418 Net Asset Value per Share $14.68 $14.97 $15.01 $15.00 $15.00 Leverage Ratio 0.78x 0.72x 0.96x 0.82x 0.82x Asset coverage 227.8% 238.7% 204.2% 222.5% 222.1% Common shares outstanding 33,214,254 35,388,849 35,820,104 39,578,474 44,015,937

Quarterly Operating Results 16 1. Per share data are calculated based on the daily weighted average shares outstanding during the period presented. 2. Per share data are based on (i) the total distributions paid for each respective record date during the period presented divided by (ii) the total number of shares outstanding on each respective record date. Please see slide titled, “Common Stock and Distribution Information” included in this presentation for details on the distributions declared during the period. Quarter Ended (Dollar amounts in 000s, except share and per share data) June 30, 2020 (unaudited) September 30, 2020 (unaudited) December 31, 2020 (unaudited) March 31, 2021 (unaudited) June 30, 2021 (unaudited) Investment Income Interest income $15,953 $16,368 $17,370 $19,078 $20,046 Dividend Income – – 39 10 16 Fee income 150 180 361 238 337 Total investment Income $16,103 $16,548 $17,770 $19,326 $20,399 Expenses Interest and other debt financing expenses $2,679 $2,491 $2,674 $3,109 $3,463 Base management fee, net of waiver 2,062 2,217 2,422 2,571 2,759 Incentive fee – net investment income, net of waiver (260) 1,672 1,794 1,942 2,000 Incentive fee – capital gains, net of waiver – – – 1,028 738 Other operating expenses 544 695 711 704 844 Total expenses 5,025 7,075 7,601 9,354 9,804 Net investment income after excise tax $11,078 $9,473 $10,169 $9,972 $10,595 Net Gain (Loss) on Investments and Foreign Currency Net realized gain (loss) on investments and foreign currency transactions $25 ($978) $299 $177 $273 Net unrealized appreciation (depreciation) on investments and foreign currency transactions 26,513 8,858 5,943 9,227 4,476 Net gain (loss) on investments and foreign currency transactions 26,538 7,880 6,242 9,404 4,749 Net increase/(decrease) in net assets resulting from operations $37,616 $17,353 $16,411 $19,376 $15,344 Per Share Data Earnings/(loss) per weighted average share1 $1.13 $0.51 $0.46 $0.51 $0.37 Net investment income per weighted average share1 $0.34 $0.28 $0.29 $0.26 $0.26 Distributions declared per share2 $0.09 $0.22 $0.42 $0.52 $0.37 Weighted average common shares outstanding 33,145,177 33,784,160 35,454,475 37,728,245 40,825,943

1.8% 3.1% 3.1% 2.7% 2.3% 2.1% 2.5% 3.0% 2.4% (8.7%) 8.3% 3.5% 3.1% 3.5% 2.5% Dec-17 Mar-18 Jun-18 Sep-18 Dec-18 Mar-19 Jun-19 Sep-19 Dec-19 Mar-20 Jun-20 Sep-20 Dec-20 Mar-21 Jun-21 Investors in GBDC 3 have achieved a 9.3% IRR on NAV1 Quarterly Return on Equity Since Inception* * Quarterly return on equity is calculated as the annualized return on average equity divided by four. Return on equity calculations are based on the daily weighted average of total net assets during the period presented. 1. Internal rate of return (“IRR”) on NAV is calculated at the fund level using beginning of period NAV, capital share issuances during the period, distributions paid during the period, and ending period NAV. Period beginning August 1, 2017 and ending June 30, 2021. The first investment in GBDC 3 took place on August 1, 2017. 17 Avg. 2.3%
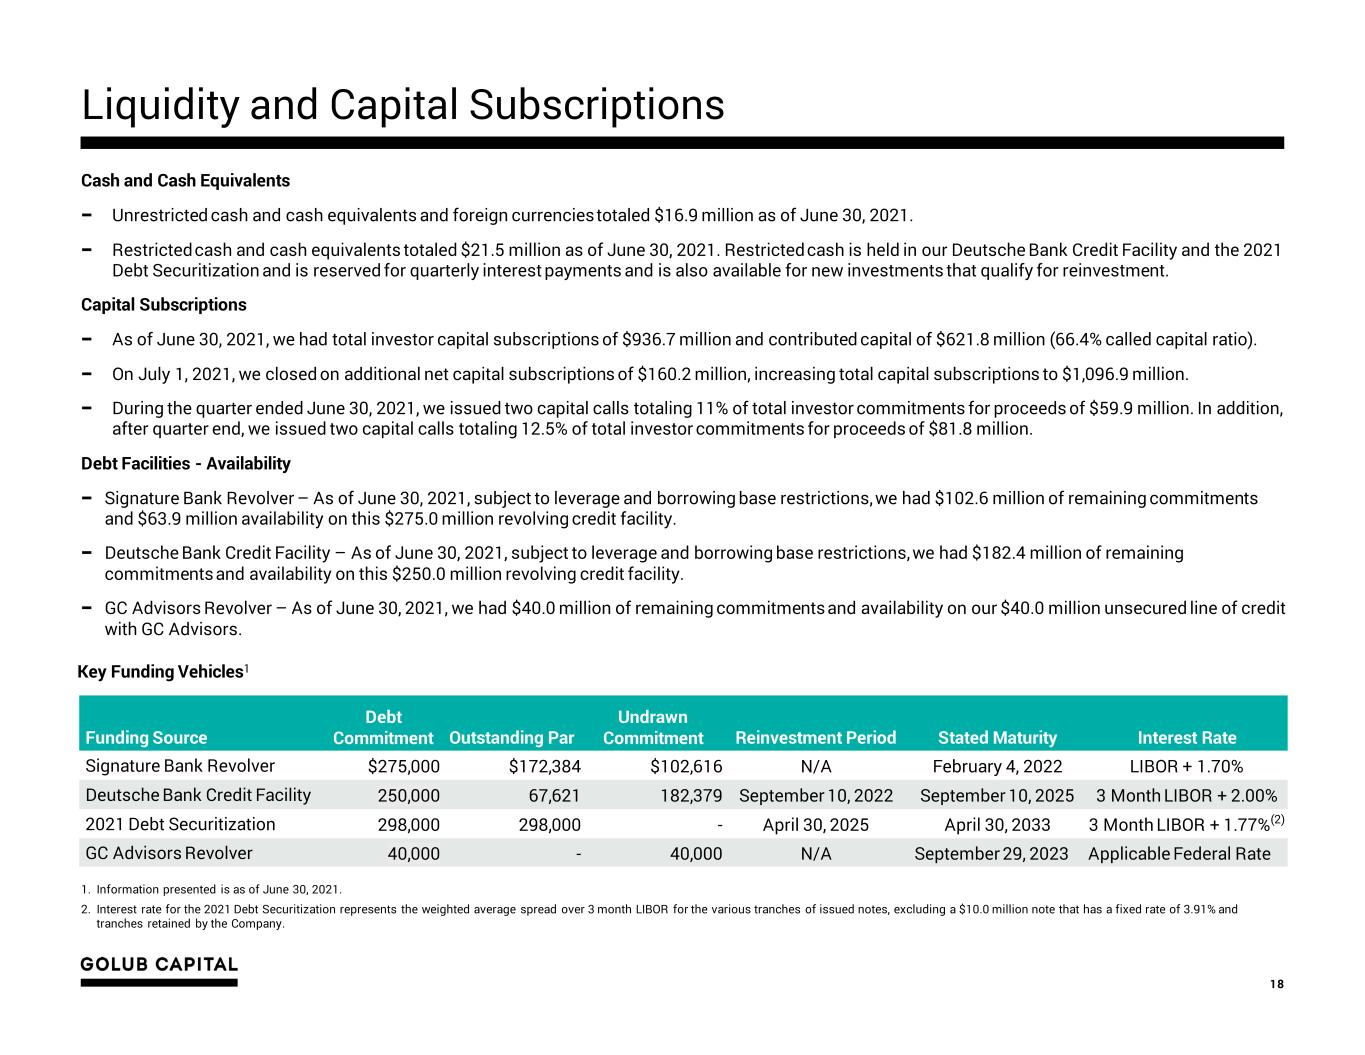
Liquidity and Capital Subscriptions 18 Cash and Cash Equivalents − Unrestricted cash and cash equivalents and foreign currencies totaled $16.9 million as of June 30, 2021. − Restricted cash and cash equivalents totaled $21.5 million as of June 30, 2021. Restricted cash is held in our Deutsche Bank Credit Facility and the 2021 Debt Securitization and is reserved for quarterly interest payments and is also available for new investments that qualify for reinvestment. Capital Subscriptions − As of June 30, 2021, we had total investor capital subscriptions of $936.7 million and contributed capital of $621.8 million (66.4% called capital ratio). − On July 1, 2021, we closed on additional net capital subscriptions of $160.2 million, increasing total capital subscriptions to $1,096.9 million. − During the quarter ended June 30, 2021, we issued two capital calls totaling 11% of total investor commitments for proceeds of $59.9 million. In addition, after quarter end, we issued two capital calls totaling 12.5% of total investor commitments for proceeds of $81.8 million. Debt Facilities - Availability − Signature Bank Revolver – As of June 30, 2021, subject to leverage and borrowing base restrictions, we had $102.6 million of remaining commitments and $63.9 million availability on this $275.0 million revolving credit facility. − Deutsche Bank Credit Facility – As of June 30, 2021, subject to leverage and borrowing base restrictions, we had $182.4 million of remaining commitments and availability on this $250.0 million revolving credit facility. − GC Advisors Revolver – As of June 30, 2021, we had $40.0 million of remaining commitments and availability on our $40.0 million unsecured line of credit with GC Advisors. 1. Information presented is as of June 30, 2021. 2. Interest rate for the 2021 Debt Securitization represents the weighted average spread over 3 month LIBOR for the various tranches of issued notes, excluding a $10.0 million note that has a fixed rate of 3.91% and tranches retained by the Company. Funding Source Debt Commitment Outstanding Par Undrawn Commitment Reinvestment Period Stated Maturity Interest Rate Signature Bank Revolver $275,000 $172,384 $102,616 N/A February 4, 2022 LIBOR + 1.70% Deutsche Bank Credit Facility 250,000 67,621 182,379 September 10, 2022 September 10, 2025 3 Month LIBOR + 2.00% 2021 Debt Securitization 298,000 298,000 - April 30, 2025 April 30, 2033 3 Month LIBOR + 1.77%(2) GC Advisors Revolver 40,000 - 40,000 N/A September 29, 2023 Applicable Federal Rate Key Funding Vehicles1

Common Stock and Distribution Information 19 Distributions Paid (Dollar amounts in 000s, except share and per share data) 1. On February 4, 2020, our board of directors declared distributions in an amount equal to the net increase in net assets resulting from operations earned by us (if positive) as determined in accordance with U.S. generally accepted accounting principles (“GAAP”) for the period March 1, 2020 through March 31, 2020 per share payable on May 22, 2020 to shareholders of record on March 27, 2020. Due to a net decrease in net assets resulting from operations for the period March 1, 2020 through March 31, 2020, the distributions declared for the March 2020 earnings period was zero. Date Declared Record Date Earnings Period Shares Outstanding Payment Date Amount Per Share Total Amount November 22, 2019 January 21, 2020 January 2020 29,715,740.183 February 26, 2020 $0.0876 $2,604 February 4, 2020 February 25, 2020 February 2020 29,715,740.183 May 22, 2020 0.1280 3,805 February 4, 2020 March 27, 2020 March 20201 29,885,803.162 May 22, 2020 – – Total for Quarter Ended March 31, 2020 $0.2156 $6,409 February 4, 2020 April 29, 2020 April 2020 33,090,999.162 July 24, 2020 $0.0919 $3,043 Total for Quarter Ended June 30, 2020 $0.0919 $3,043 August 20, 2020 August 20, 2020 N/A 33,303,658.071 August 21, 2020 $0.2200 $7,327 Total for Quarter Ended September 30, 2020 $0.2200 $7,327 November 20, 2020 December 15, 2020 N/A 35,388,849.466 December 18, 2020 $0.4200 $14,864 Total for Quarter Ended December 31, 2020 $0.4200 $14,864 November 20, 2020 January 28, 2021 N/A 37,640,060.105 March 11, 2021 $0.1081 $4,068 February 5, 2021 February 25, 2021 February 2021 37,640,060.105 May 25, 2021 0.1493 5,622 February 5, 2021 March 26, 2021 March 2021 39,578,474.129 May 25, 2021 0.2527 10,003 Total for Quarter Ended March 31, 2021 $0.5101 $19,693 February 5, 2021 April 29, 2021 April 2021 39,578,474.129 July 26, 2021 $0.1001 $3,961 May 7, 2021 May 28, 2021 May 2021 41,898,514.167 July 26, 2021 0.1491 6,247 May 7, 2021 June 25, 2021 June 2021 44,018,143.919 July 26, 2021 0.1167 5,136 Total for Quarter Ended June 30, 2021 $0.3659 $15,344

Common Stock and Distribution Information 20 Distributions Declared (Dollar amounts in 000s, except share and per share data) Date Declared Record Date Earnings Period Shares Outstanding Payment Date Amount Per Share Total Amount May 7, 2021 July 19, 2021 July 2021 44,015,937.428 September 27, 2021 TBD TBD August 6, 2021 August 30, 2021 August 2021 TBD November 22, 2021 TBD TBD August 6, 2021 September 20, 2021 September 2021 TBD November 22, 2021 TBD TBD August 6, 2021 October 18, 2021 October 2021 TBD December 27, 2021 TBD TBD


