Free signup for more
- Track your favorite companies
- Receive email alerts for new filings
- Personalized dashboard of news and more
- Access all data and search results
Filing tables
Filing exhibits
BORR similar filings
- 26 Jan 23 Current report (foreign)
- 25 Jan 23 Borr Drilling Limited – Updated 2022 and 2023 guidance
- 25 Jan 23 6-K (Mandate Announcement)
- 17 Nov 22 Borr Drilling Limited – Q3 2022 Presentation
- 17 Nov 22 Current report (foreign)
- 15 Nov 22 Borr Drilling Limited – Invitation to webcast and conference call Q3 2022 results
- 20 Oct 22 Borr Drilling Limited – New 3-year contracts for 5 jack-up drilling rigs in Mexico
Filing view
External links
Exhibit 99.2
Q3 2022 presentation November 17, 2022 cover
FORWARD LOOKING STATEMENTS This presentation and related discussions includes forward looking statements, which may be identified by words such as "anticipate," "expect", "illustrative," "may", "potential," "will" and similar expressions and include statements with respect to sales of rigs, statements with respect to our financial progression, expected financial results, including expected revenue and Adjusted EBITDA, statements about the drilling market, including this market being tight, the global and modern feet utilization being at heathy levels and impacting day rates, the day rate curve sharply inflecting, the shallow water production being a key to growth, including information relating to expected industry drivers of growth, strong utilization and strong demand driving the recovery, including forward utilization and rig demand pipeline remaining strong, limited availability of rigs in key markets, lead times for completion of rigs, newbuild prices; expectations on utilization and day rates, our focus on operational execution, safety, uptime and value creation for our customers; our plans to refinance our convertible bond in the first quarter of 2023, and other non-historical statements. These forward-looking statements are subject to risks, uncertainties, contingencies and other factors could cause actual events to differ materially from the expectations expressed or implied by the forward-looking statements included herein, including our industry and business and liquidity, the risk that our actual results of operations in future periods may differ materially from the expected results / guidance discussed herein, the risk of delays in payments to our Mexico JVs and payments from our JVs to us, the risk that our customers do not comply with their contractual obligations, risks relating to industry conditions, risks relating to geopolitical events and inflation and energy commodity prices and tendering activity, risks relating to contracting, including our ability to convert LOIs and LOAs into contracts, the risk that options will not be exercised, risks relating to our ability to secure contracts for our rigs and the rates that we will be able to achieve, risks relating to market trends, tender activity and rates, risks relating to the agreements we have reached with our lenders to refinance our debt, including risks relating to our undertaking in certain of our loan agreements to refinance the convertible bond by the first quarter of 2023, risks relating to the maturity of our secured debt in 2025, risks relating to our liquidity, the risk that our available liquidity is not sufficient to meet or refinance our liquidity requirements and other risks relating to our available liquidity and requirements, risks relating to cash flows from operations, risks relating to our loan agreements and other debt instruments including risks relating to our ability to comply with covenants and obtain any necessary waivers and the risk of cross defaults, risks relating to our ability to meet our significant debt obligations and our other obligations as they fall due, and other risks described in our working capital statement included in our most recent audited and unaudited financial statements, risks relating to future financings including the risk that future financings may not be completed when required and future equity financings will dilute shareholders and the risk that the foregoing would result in insufficient liquidity to continue our operations or to operate as a going concern, risk relating to our newbuild purchase and financing agreements, risks relating to our plans and agreements to sell three newbuild rigs including the risk that we may be unable to complete the sales on the intended terms at all, risk relating to the military action in Ukraine and its impact on our business, and other risks included in our filings with the Securities and Exchange Commission including those set forth under “Risk Factors” in our annual report on Form 20-F for the year ended December 31, 2021. 2
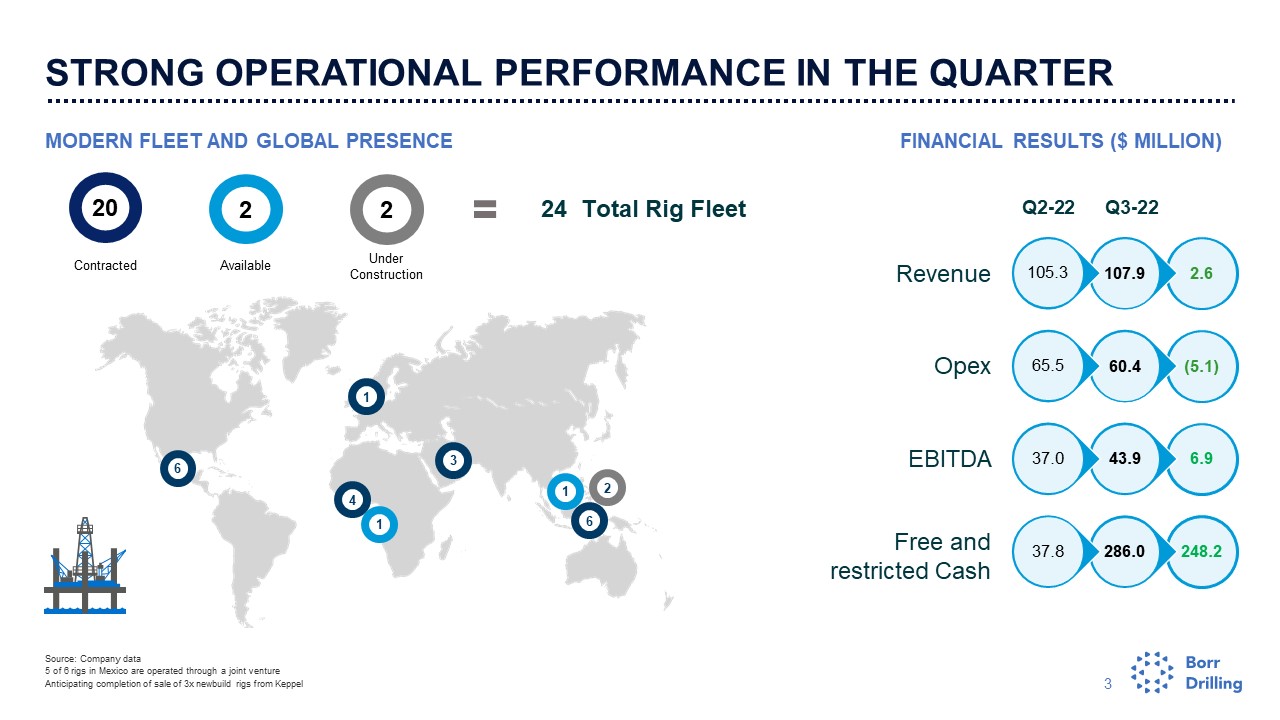
MODERN FLEET AND GLOBAL PRESENCE FINANCIAL RESULTS ($ MILLION) 3 STRONG OPERATIONAL PERFORMANCE IN THE QUARTER Source: Company data 5 of 6 rigs in Mexico are operated through a joint venture Anticipating completion of sale of 3x newbuild rigs from Keppel Contracted Available Under Construction 24 Total Rig Fleet 2 20 2 6 6 4 3 1 1 1 2 248.2 286.0 6.9 43.9 (5.1) 60.4 2.6 107.9 Revenue Opex EBITDA Free and restricted Cash 37.8 37.0 65.5 105.3 Q2-22 Q3-22

KEY FINANCIALS Q3 2022 Revenues increased by $2.6 million primarily as a result of an increase in the number of operational days. Related party revenue (bareboat) from Mexico decreased by $0.2 million quarter on quarter. Rig operating and maintenance expenses decreased by $5.1 million quarter on quarter primarily due to decrease in amortization of deferred costs. Impairment in Q3 relates to the rig “Gyme”, which was classified as held for sale. The sale price was $120 million. G&A decreased by $2.6 million in comparison to the prior quarter, primarily due to a decrease in legal and professional fees in addition to salary expenses. Total financial expenses net increased by $17.2 million, driven by: (i) a $7.5 million financing fee, (ii) $4.3 million higher interest costs due to higher market interest rates, (iii) $3.1 million decrease in interest income and (iv) $2.3 million increase in FX losses. Adjusted EBITDA increased by $6.9 million quarter on quarter Cash increased by $249.3 million in comparison to the prior quarter and is primarily driven by: Cash proceeds generated from operating activities of $9.3 million, which includes $9.9 million cash interest paid, and the payment of a $7.5 million financing fee; Cash used on fixed asset additions of $20.4 million, mainly driven by activations of the “Arabia I”, “Arabia II” and “Thor”; $260.4 million of net proceeds from the August 2022 equity offering. INCOME STATEMENT COMMENTS Q3 2022 USD million Q3 2022 Q2 2022 Operating revenues 107.9 105.3 Rig operating and maintenance expenses (60.4) (65.5) Impairment of non-current assets (7.3) (124.4) General and administrative expenses (7.0) (9.6) Depreciation of non-current assets (29.2) (29.5) Total operating expenses (103.9) (229.0) Operating profit/loss 3.9 (123.0) Income/(loss) from equity method investments (0.2) (1.1) Total financial expenses net (54.1) (36.9) Net loss (54.9) (165.3) Adjusted EBITDA 43.9 37.0 USD million Q3 2022 Q2 2022 Total assets 3,279 2,991 Total liabilities 2,362 2,279 Total equity 917 712 Cash and cash equivalents 279.0 29.7 Restricted cash (short-term and long-term) 7.0 8.1 SUMMARY BALANCE SHEET

FINANCIAL PROGRESSION REVENUE - QUARTERLY REVENUE YTD - 2022 VS 2021 ADJUSTED EBITDA - QUARTERLY ADJUSTED EBITDA - YTD 2022 VS 2021 + 68% + 581%

FLEET OVERVIEW – BORR DRILLING Option Under Construction Available Firm
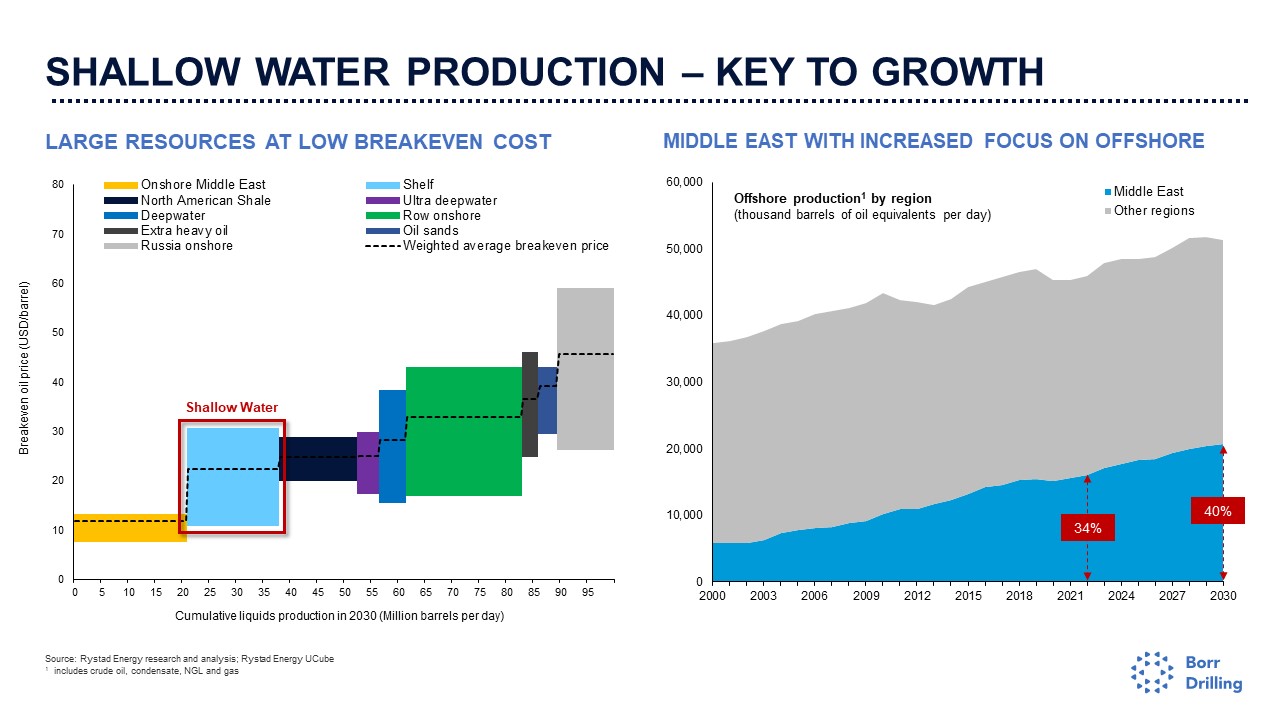
SHALLOW WATER PRODUCTION – KEY TO GROWTH LARGE RESOURCES AT LOW BREAKEVEN COST MIDDLE EAST WITH INCREASED FOCUS ON OFFSHORE Source: Rystad Energy research and analysis; Rystad Energy UCube 1 includes crude oil, condensate, NGL and gas Breakeven oil price (USD/barrel) Shallow Water 34% 40%
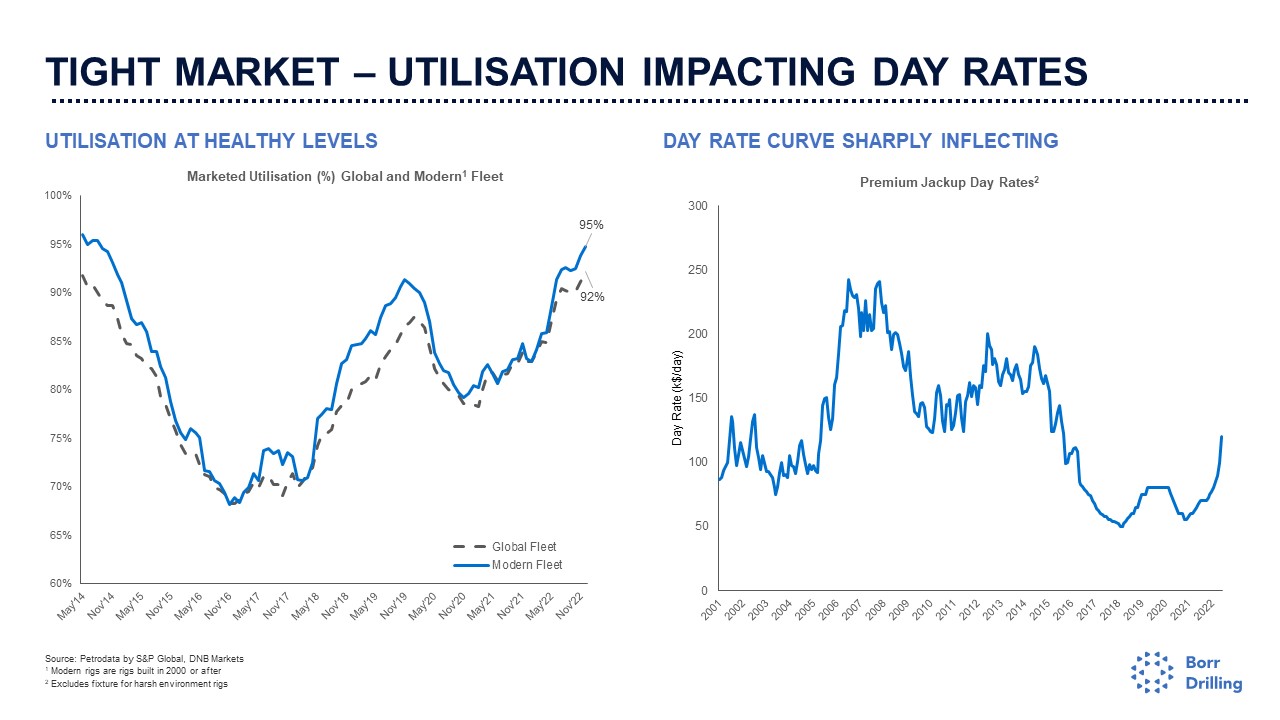
TIGHT MARKET – UTILISATION IMPACTING DAY RATES UTILISATION AT HEALTHY LEVELS DAY RATE CURVE SHARPLY INFLECTING Source: Petrodata by S&P Global, DNB Markets 1 Modern rigs are rigs built in 2000 or after 2 Excludes fixture for harsh environment rigs
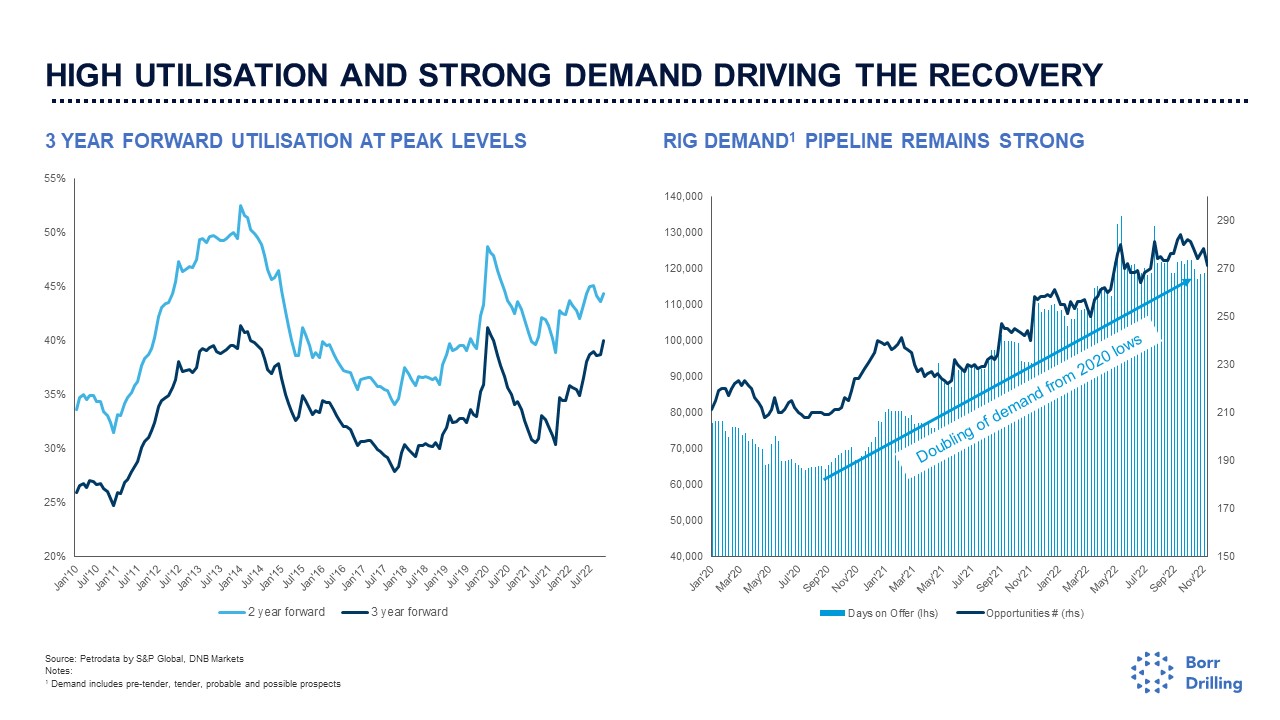
HIGH UTILISATION AND STRONG DEMAND DRIVING THE RECOVERY 3 YEAR FORWARD UTILISATION AT PEAK LEVELS RIG DEMAND1 PIPELINE REMAINS STRONG Source: Petrodata by S&P Global, DNB Markets Notes: 1 Demand includes pre-tender, tender, probable and possible prospects Doubling of demand from 2020 lows
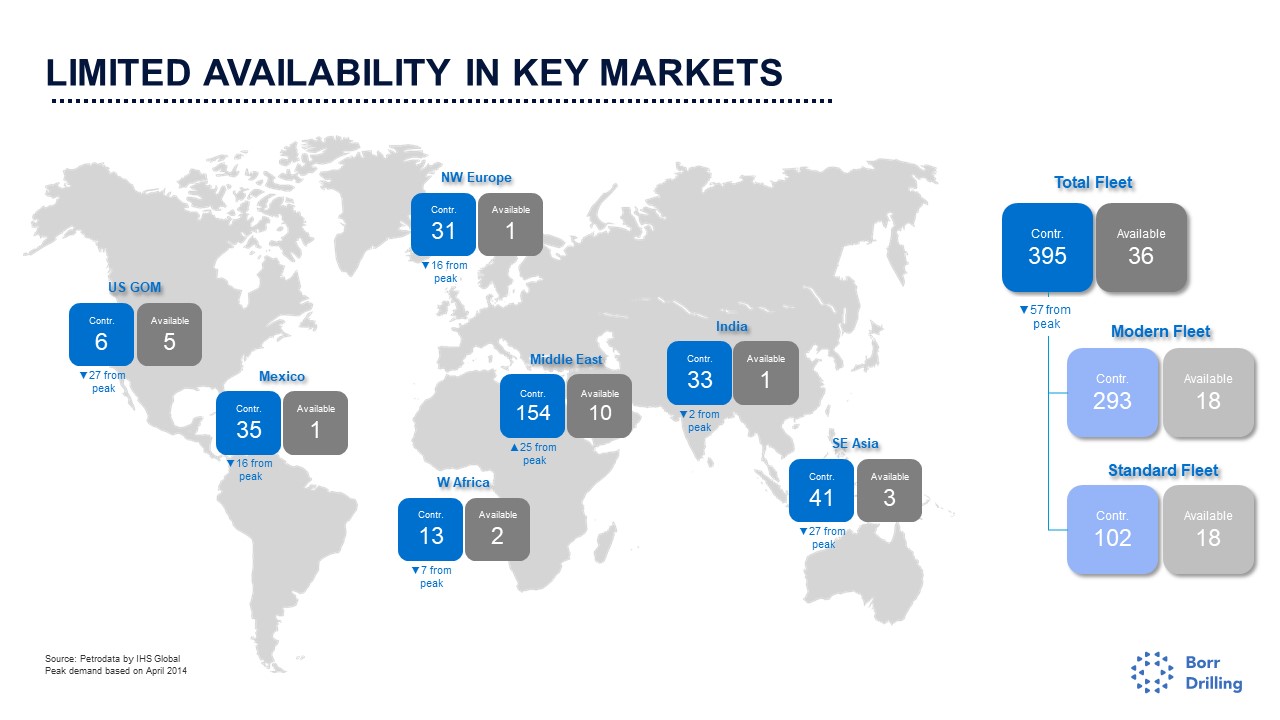
LIMITED AVAILABILITY IN KEY MARKETS Source: Petrodata by IHS Global Peak demand based on April 2014 NW Europe Available 1 Contr. 31 ▼16 from peak US GOM Available 5 Contr. 6 ▼27 from peak Mexico Available 1 Contr. 35 ▼16 from peak W Africa Available 2 Contr. 13 ▼7 from peak Middle East Available 10 Contr. 154 ▲25 from peak India Available 1 Contr. 33 ▼2 from peak SE Asia Available 3 Contr. 41 ▼27 from peak Total Fleet Contr. 395 Contr. 293 Contr. 102 ▼57 from peak Modern Fleet Standard Fleet Available 36 Available 18 Available 18
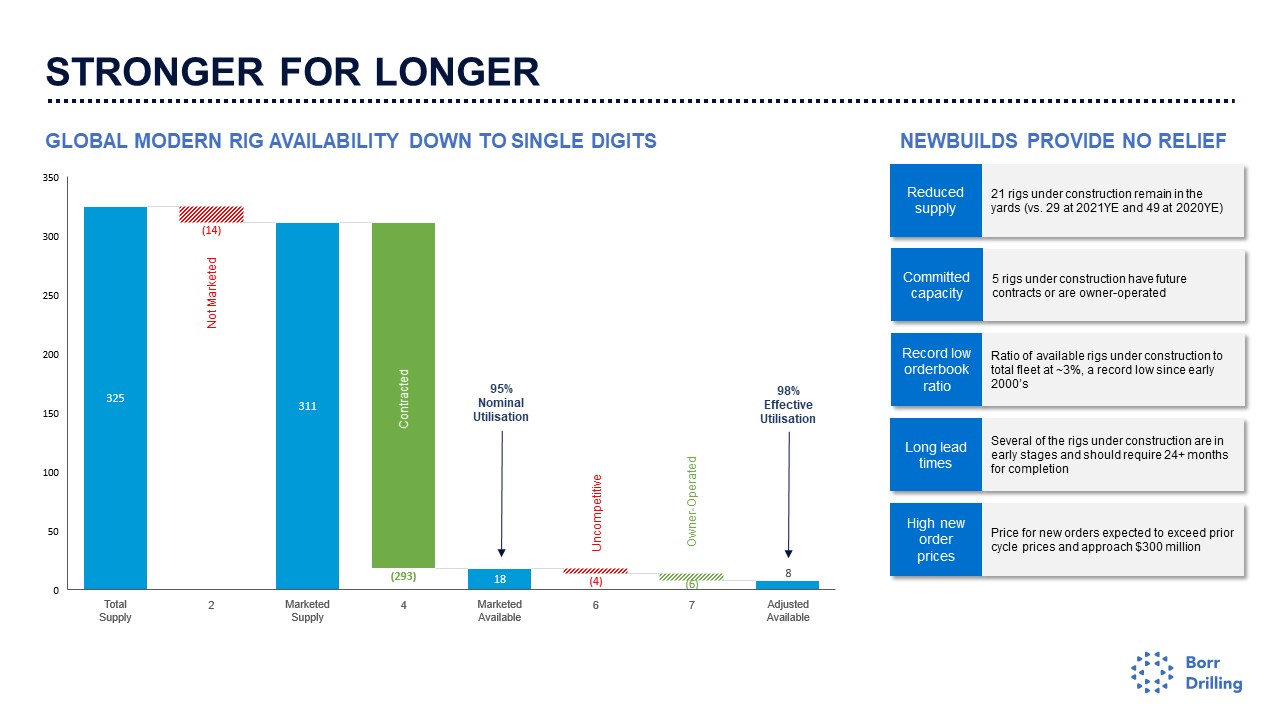
GLOBAL MODERN RIG AVAILABILITY DOWN TO SINGLE DIGITS NEWBUILDS PROVIDE NO RELIEF STRONGER FOR LONGER Not Marketed Uncompetitive Owner-Operated 95% Nominal Utilisation 98% Effective Utilisation Contracted Reduced supply 21 rigs under construction remain in the yards (vs. 29 at 2021YE and 49 at 2020YE) Committed capacity 5 rigs under construction have future contracts or are owner-operated Record low orderbook ratio Ratio of available rigs under construction to total fleet at ~3%, a record low since early 2000’s High new order prices Price for new orders expected to exceed prior cycle prices and approach $300 million Long lead times Several of the rigs under construction are in early stages and should require 24+ months for completion

IN CONCLUSION 12 ✓ Refinance of secured creditors successfully completed – Convertible bond due for refinance in Q1 2023 ✓ High asset utilization – currently at 95% – with day rates increasing accordingly ✓ Revenue and EBITDA 2022 expected to be above previously guided range ✓ Shipyard new build inventory largely exhausted – and newbuild pricing rumoured to approach $300 million ✓ Laser focused on operational execution, safety and uptime – value creation for our customers is paramount
