| FREE WRITING PROSPECTUS | ||
| FILED PURSUANT TO RULE 433 | ||
| REGISTRATION FILE NO.: 333-207132-14 | ||
September 8, 2017
Free Writing Prospectus
Structural and Collateral Term Sheet
$1,087,114,895
(Approximate Initial Mortgage Pool Balance)
$917,864,000
(Offered Certificates)
Citigroup Commercial Mortgage Trust 2017-P8
As Issuing Entity
Citigroup Commercial Mortgage Securities Inc.
As Depositor
Commercial Mortgage Pass-Through Certificates, Series 2017-P8
Citi Real Estate Funding Inc.
Barclays Bank PLC
Principal Commercial Capital
Starwood Mortgage Funding V LLC
Citigroup Global Markets Realty Corp.
As Sponsors and Mortgage Loan Sellers
STATEMENT REGARDING THIS FREE WRITING PROSPECTUS
The depositor has filed a registration statement (including a prospectus) with the Securities and Exchange Commission (“SEC”) (SEC File No. 333-207132) for the offering to which this communication relates. Before you invest, you should read the prospectus in the registration statement and other documents the depositor has filed with the SEC for more complete information about the depositor, the issuing entity and this offering. You may get these documents for free by visiting EDGAR on the SEC website at www.sec.gov. Alternatively, the depositor or Citigroup Global Markets Inc., Barclays Capital Inc., Drexel Hamilton, LLC or any other underwriter or dealer participating in this offering will arrange to send you the prospectus if you request it by calling toll-free 1-800-831-9146.
IMPORTANT NOTICE RELATING TO AUTOMATICALLY GENERATED EMAIL DISCLAIMERS
Any legends, disclaimers or other notices that may appear at the bottom of the email communication to which this free writing prospectus is attached relating to (1) these materials not constituting an offer (or a solicitation of an offer), (2) no representation being made that these materials are accurate or complete and that these materials may not be updated or (3) these materials possibly being confidential, are, in each case, not applicable to these materials and should be disregarded. Such legends, disclaimers or other notices have been automatically generated as a result of these materials having been sent via Bloomberg or another system.
| Citigroup | Barclays |
| Co-Lead Managers and Joint Bookrunners | |
| Drexel Hamilton | |
| Co-Manager | |
| CERTIFICATE SUMMARY |
The securities offered by this structural and collateral term sheet (this “Term Sheet”) are described in greater detail in the preliminary prospectus, dated on or about September 11, 2017, included as part of our registration statement (SEC File No. 333-207132) (the “Preliminary Prospectus”). The Preliminary Prospectus contains material information that is not contained in this Term Sheet (including, without limitation, a detailed discussion of risks associated with an investment in the offered securities under the heading“Risk Factors” in the Preliminary Prospectus). The Preliminary Prospectus is available upon request from Citigroup Global Markets Inc., Barclays Capital Inc. or Drexel Hamilton, LLC. This Term Sheet is subject to change.
For information regarding certain risks associated with an investment in this transaction, refer to “Risk Factors” in the Preliminary Prospectus. Capitalized terms used but not otherwise defined in this Term Sheet have the respective meanings assigned to those terms in the Preliminary Prospectus.
The Securities May Not Be a Suitable Investment for You
The securities offered by this Term Sheet are not suitable investments for all investors. In particular, you should not purchase any class of securities unless you understand and are able to bear the prepayment, credit, liquidity and market risks associated with that class of securities. For those reasons and for the reasons set forth under the heading “Risk Factors” in the Preliminary Prospectus, the yield to maturity of, the aggregate amount and timing of distributions on and the market value of the offered securities are subject to material variability from period to period and give rise to the potential for significant loss over the life of those securities. The interaction of these factors and their effects are impossible to predict and are likely to change from time to time. As a result, an investment in the offered securities involves substantial risks and uncertainties and should be considered only by sophisticated institutional investors with substantial investment experience with similar types of securities and who have conducted appropriate due diligence on the mortgage loans and the securities. Potential investors are advised and encouraged to review the Preliminary Prospectus in full and to consult with their legal, tax, accounting and other advisors prior to making any investment in the offered securities described in this Term Sheet.
The securities offered by these materials are being offered when, as and if issued. This Term Sheet is not to be construed as an offer to sell or the solicitation of any offer to buy any security in any jurisdiction where such an offer or solicitation would be illegal. The information contained in this Term Sheet may not pertain to any securities that will actually be sold. The information contained in this Term Sheet may be based on assumptions regarding market conditions and other matters as reflected in this Term Sheet. We make no representations regarding the reasonableness of such assumptions or the likelihood that any of such assumptions will coincide with actual market conditions or events, and this Term Sheet should not be relied upon for such purposes. We and our affiliates, officers, directors, partners and employees, including persons involved in the preparation or issuance of this Term Sheet may, from time to time, have long or short positions in, and buy or sell, the securities mentioned in this Term Sheet or derivatives thereof (including options). Information contained in this Term Sheet is current as of the date appearing on this Term Sheet only. Information in this Term Sheet regarding the securities and the mortgage loans backing any securities discussed in this Term Sheet supersedes all prior information regarding such securities and mortgage loans. None ofCitigroup Global Markets Inc., Barclays Capital Inc. or Drexel Hamilton, LLCprovides accounting, tax or legal advice.
The depositor has filed a registration statement (including a prospectus) with the Securities and Exchange Commission (“SEC”) (SEC File No. 333-207132) for the offering to which this communication relates. Before you invest, you should read the prospectus in the registration statement and other documents the depositor has filed with the SEC for more complete information about the depositor, the issuing entity and this offering. You may get these documents for free by visiting EDGAR on the SEC website at www.sec.gov. Alternatively, the depositor or Citigroup Global Markets Inc., Barclays Capital Inc., Drexel Hamilton, LLC or any other underwriter or dealer participating in this offering will arrange to send you the prospectus if you request it by calling toll-free 1-800-831-9146.
| 2 |
The issuing entity will be relying on an exclusion or exemption from the definition of “investment company” under the Investment Company Act of 1940, as amended (the “Investment Company Act”), contained in Section 3(c)(5) of the Investment Company Act or Rule 3a-7 under the Investment Company Act, although there may be additional exclusions or exemptions available to the issuing entity. The issuing entity is being structured so as not to constitute a “covered fund” for purposes of the Volcker Rule under the Dodd-Frank Act (both as defined in “Risk Factors—Legal and Regulatory Provisions Affecting Investors Could Adversely Affect the Liquidity and Other Aspects of the Offered Certificates” in the Preliminary Prospectus). See also “Legal Investment” in the Preliminary Prospectus.
The depositor has filed a registration statement (including a prospectus) with the Securities and Exchange Commission (“SEC”) (SEC File No. 333-207132) for the offering to which this communication relates. Before you invest, you should read the prospectus in the registration statement and other documents the depositor has filed with the SEC for more complete information about the depositor, the issuing entity and this offering. You may get these documents for free by visiting EDGAR on the SEC website at www.sec.gov. Alternatively, the depositor or Citigroup Global Markets Inc., Barclays Capital Inc., Drexel Hamilton, LLC or any other underwriter or dealer participating in this offering will arrange to send you the prospectus if you request it by calling toll-free 1-800-831-9146.
| 3 |
| CERTIFICATE SUMMARY |
| OFFERED CERTIFICATES | |||||||||||||||
Offered Classes | Expected Ratings | Approximate Initial | Approximate | Initial Pass- | Pass- | Expected | Expected | ||||||||
| Class A-1 | Aaa(sf) / AAA(sf) / AAAsf / AAA(sf) | $31,000,000 | 30.000% | % | (6) | 2.95 | 10/17 - 9/22 | ||||||||
| Class A-2 | Aaa(sf) / AAA(sf) / AAAsf / AAA(sf) | $40,600,000 | 30.000% | % | (6) | 6.96 | 9/24 - 9/24 | ||||||||
| Class A-3 | Aaa(sf) / AAA(sf) / AAAsf / AAA(sf) | $285,000,000 | 30.000% | % | (6) | 9.67 | 2/27 - 7/27 | ||||||||
| Class A-4 | Aaa(sf) / AAA(sf) / AAAsf / AAA(sf) | $317,631,000 | 30.000% | % | (6) | 9.86 | 7/27 - 8/27 | ||||||||
| Class A-AB | Aaa(sf) / AAA(sf) / AAAsf / AAA(sf) | $48,700,000 | 30.000% | % | (6) | 7.16 | 9/22 - 2/27 | ||||||||
| Class X-A | Aa1(sf) / AAA(sf) / AAAsf / AAA(sf) | $833,953,000 | (7) | N/A | % | Variable IO(8) | N/A | N/A | |||||||
| Class X-B | NR / AA(sf) / AA-sf / AAA(sf) | $41,310,000 | (7) | N/A | % | Variable IO(8) | N/A | N/A | |||||||
| Class X-C | NR / A(sf) / A-sf / AA(low)(sf) | $42,601,000 | (7) | N/A | % | Variable IO(8) | N/A | N/A | |||||||
| Class A-S | Aa2(sf) / AAA(sf) / AAAsf / AAA(sf) | $111,022,000 | 19.250% | % | (6) | 9.95 | 8/27 - 9/27 | ||||||||
| Class B | NR / AA(sf)/ AA-sf / AAA(sf) | $41,310,000 | 15.250% | % | (6) | 9.96 | 9/27 - 9/27 | ||||||||
| Class C | NR / A(sf) / A-sf / A(high)(sf) | $42,601,000 | 11.125% | % | (6) | 9.96 | 9/27 - 9/27 | ||||||||
| NON-OFFERED CERTIFICATES | |||||||||||||||
Non-Offered Classes | Expected Ratings | Approximate Initial Certificate Balance | Approximate Initial Credit Support(3) | Initial Pass- | Pass- | Expected | Expected Principal Window(5) | ||||||||
| Class X-D | NR / BBB-(sf) / BBB-sf / BBB(high)(sf) | $47,765,000 | (7) | N/A | % | Variable IO(8) | N/A | N/A | |||||||
| Class X-E | NR / BB(sf) / BB-sf / BBB(low)(sf) | $20,655,000 | (7) | N/A | % | Variable IO(8) | N/A | N/A | |||||||
| Class X-F | NR / BB-(sf) / B-sf / BB(sf) | $10,328,000 | (7) | N/A | % | Variable IO(8) | N/A | N/A | |||||||
| Class X-G | NR / NR / NR / NR | $36,147,149 | (7) | N/A | % | Variable IO(8) | N/A | N/A | |||||||
| Class D | NR / BBB-(sf) / BBB-sf / BBB(sf) | $47,765,000 | 6.500% | % | (6) | 9.96 | 9/27 - 9/27 | ||||||||
| Class E | NR / BB(sf) / BB-sf / BB(high)(sf) | $20,655,000 | 4.500% | % | (6) | 9.96 | 9/27 - 9/27 | ||||||||
| Class F | NR / BB-(sf) / B-sf / BB(low)(sf) | $10,328,000 | 3.500% | % | (6) | 9.96 | 9/27 - 9/27 | ||||||||
| Class G | NR / NR / NR / NR | $36,147,149 | 0.000% | % | (6) | 9.96 | 9/27 - 9/27 | ||||||||
| Class S(9) | N/A | N/A | N/A | N/A | N/A | N/A | N/A | ||||||||
| Class R(9) | N/A | N/A | N/A | N/A | N/A | N/A | N/A | ||||||||
NON-OFFERED VERTICAL RISK RETENTION INTEREST | |||||||||||||||
Non-Offered Eligible Vertical Interest | Expected Ratings | Approximate Initial | Approximate | Initial Pass- | Pass- | Expected | Expected | ||||||||
| VRR Interest(10) | NR / NR / NR / NR | $54,355,745 | N/A | % | WAC(11) | 9.39 | 10/17 - 9/27 | ||||||||
| (1) | It is a condition of issuance that the offered certificates and certain classes of non-offered certificates receive the ratings set forth above. The anticipated ratings shown are those of Moody’s Investors Service, Inc. (“Moody’s”), S&P Global Ratings (“S&P”), Fitch Ratings, Inc. (“Fitch”) and DBRS, Inc. (“DBRS”). Subject to the discussion under “Ratings” in the Preliminary Prospectus, the ratings on the certificates address the likelihood of the timely receipt by holders of all payments of interest to which they are entitled on each distribution date and, except in the case of the interest only certificates, the ultimate receipt by holders of all payments of principal to which they are entitled on or before the applicable rated final distribution date. Certain nationally recognized statistical rating organizations, as defined in Section 3(a)(62) of the Securities Exchange Act of 1934, as amended, that were not hired by the depositor may use information they receive pursuant to Rule 17g-5 under the Securities Exchange Act of 1934, as amended, or otherwise to rate the offered certificates. We cannot assure you as to what ratings a non-hired nationally recognized statistical rating organization would assign. See “Risk Factors—Nationally Recognized Statistical Rating Organizations May Assign Different Ratings to the Certificates; Ratings of the Certificates Reflect Only the Views of the Applicable Rating Agencies as of the Dates Such Ratings Were Issued; Ratings May Affect ERISA Eligibility; Ratings May Be Downgraded” in the Preliminary Prospectus. Moody’s, S&P, Fitch and DBRS have informed us that the “sf” designation in the ratings represents an identifier of structured finance product ratings. For additional information about this identifier, prospective investors can go to the related rating agency’s website. The depositor and the underwriters have not verified, do not adopt and do not accept responsibility for any statements made by the rating agencies on those websites. Credit ratings referenced throughout this Term Sheet are forward-looking opinions about credit risk and express a rating agency’s opinion about the willingness and ability of an issuer of securities to meet its financial obligations in full and on time. Ratings are not indications of investment merit and are not buy, sell or hold recommendations, a measure of asset value or an indication of the suitability of an investment. |
| (2) | Approximate, subject to a variance of plus or minus 5%. The certificate balance of the VRR Interest (as defined in footnote (10) below) is not included in the certificate balance or notional amount of any other class of certificates listed in the table above, and the VRR Interest is not offered hereby. In addition, the notional amounts of the Class X-A, Class X-B, Class X-C, Class X-D, Class X-E, Class X-F and Class X-G certificates may vary depending upon the final pricing of the classes of Principal Balance Certificates (as defined in footnote (3) below) whose certificate balances comprise such notional amounts, and, if as a result of such pricing the pass-through rate of any class of the Class X-A, Class X-B, Class X-C, Class X-D, Class X-E, Class X-F or Class X-G certificates, as applicable, would be equal to zero at all times, such class of certificates will not be issued on the closing date of this securitization. |
| (3) | The approximate initial credit support percentages set forth for the Class A-1, Class A-2, Class A-3, Class A-4 and Class A-AB certificates are represented in the aggregate. The approximate initial credit support percentages shown in the table above do not take into account the VRR Interest. However, losses incurred on the mortgage loans will be allocated between the VRR Interest, on the one hand, and the Class A-1, Class A-2, Class A-3, Class A-4, Class A-AB, Class A-S, Class B, Class C, Class D, Class E, Class F and Class G certificates (collectively, the “Non-Vertically Retained Principal Balance Certificates”), on the other hand,pro rata in accordance with their respective outstanding certificate balances. See “Credit Risk Retention” and “Description of the Certificates” in the Preliminary Prospectus. The VRR Interest and the Non-Vertically Retained Principal Balance Certificates are collectively referred to in this Term Sheet as the “Principal Balance Certificates”. |
| (4) | Approximateper annum rate as of the Closing Date. |
The depositor has filed a registration statement (including a prospectus) with the Securities and Exchange Commission (“SEC”) (SEC File No. 333-207132) for the offering to which this communication relates. Before you invest, you should read the prospectus in the registration statement and other documents the depositor has filed with the SEC for more complete information about the depositor, the issuing entity and this offering. You may get these documents for free by visiting EDGAR on the SEC website at www.sec.gov. Alternatively, the depositor or Citigroup Global Markets Inc., Barclays Capital Inc., Drexel Hamilton, LLC or any other underwriter or dealer participating in this offering will arrange to send you the prospectus if you request it by calling toll-free 1-800-831-9146.
| 4 |
| (5) | Determined assuming no prepayments prior to the maturity date or any anticipated repayment date, as applicable, for anymortgage loan and based on the modeling assumptions described under“Yield, Prepayment and Maturity Considerations” in the Preliminary Prospectus. |
| (6) | For any distribution date, the pass-through rate for each class of the Non-Vertically Retained Principal Balance Certificates will generally be equal to one of (i) a fixedper annumrate, (ii) the weighted average of the net interest rates on the mortgage loans (in each case, adjusted, if necessary, to accrue on the basis of a 360-day year consisting of twelve 30-day months) as in effect from time to time, (iii) a rate equal to the lesser of a specifiedper annum rate and the weighted average rate described in clause (ii), or (iv) the weighted average rate described in clause (ii) less a specified percentage, but no less than 0.000%, as describedunder“Description of the Certificates—Distributions—Pass Through Rates” in the Preliminary Prospectus. |
| (7) | The Class X-A, Class X-B, Class X-C, Class X-D, Class X-E, Class X-F and Class X-G certificates (collectively, the “Class X Certificates”) will not have certificate balances and will not be entitled to receive distributions of principal. Interest will accrue on each class of Class X Certificates at the related pass-through rate based upon the related notional amount. The notional amount of each class of the Class X Certificates will be equal to the certificate balance or the aggregate of the certificate balances, as applicable, from time to time of the class or classes of the Non-Vertically Retained Principal Balance Certificates identified in the same row as such class of Class X Certificates in the chart below (as to such class of Class X Certificates, the “Corresponding Principal Balance Certificates”): |
| Class of Class X Certificates | Class(es) of Corresponding Principal Balance Certificates |
| Class X-A | Class A-1, Class A-2, Class A-3, Class A-4, Class A-AB and Class A-S |
| Class X-B | Class B |
| Class X-C | Class C |
| Class X-D | Class D |
| Class X-E | Class E |
| Class X-F | Class F |
| Class X-G | Class G |
| (8) | The pass-through rate for each class of Class X Certificates will generally be aper annumrate equal to the excess, if any, of (i) the weighted average of the net interest rates on the mortgage loans (in each case, adjusted, if necessary, to accrue on the basis of a 360-day year consisting of twelve 30-day months) as in effect from time to time, over (ii) the pass-through rate (or, if applicable, the weighted average of the pass-through rates) of the class or classes of Corresponding Principal Balance Certificates as in effect from time to time, as described in the Preliminary Prospectus. |
| (9) | Neither the Class S certificates nor the Class R certificates will have a certificate balance, notional amount, pass-through rate, rating or rated final distribution date. The Class R certificates will represent the residual interests in each of two separate REMICs, as further described in the Preliminary Prospectus. The Class R certificates will not be entitled to distributions of principal or interest.Excess interest accruing after the related anticipated repayment date on any mortgage loan with an anticipated repayment date will, to the extent collected, be allocated to the Class S certificates and the VRR Interest as set forth in “Description of the Certificates—Distributions—Excess Interest” in the Preliminary Prospectus. |
| (10) | Citi Real Estate Funding Inc. (as retaining sponsor) is expected toacquire (or cause one or more other retaining parties to acquire)from the depositor, on the Closing Date (as defined below), portions of an “eligible vertical interest” (as defined in Regulation RR) in the form of a “single vertical security” (as defined in Regulation RR) with an initial certificate balance of approximately $54,355,745 (the “VRR Interest”), which is expected to represent approximately 5.0% of the aggregate initial certificate balance of all of the “ABS interests” (as defined in Regulation RR) issued by the issuing entity on the Closing Date. The VRR Interest will be retained by certain retaining parties in accordance with the creditriskretention rules applicable to this securitization transaction. See “Credit Risk Retention” in the Preliminary Prospectus. The VRR Interest is a class of certificates. |
| (11) | Although it does not have a specified pass-through rate (other than for tax reporting purposes), the effective interest rate for the VRR Interest will be the weighted average of the net mortgage interest rates on the mortgage loans (in each case, adjusted, if necessary, to accrue on the basis of a 360-day year consisting of twelve 30-day months) as in effect from time to time. |
The depositor has filed a registration statement (including a prospectus) with the Securities and Exchange Commission (“SEC”) (SEC File No. 333-207132) for the offering to which this communication relates. Before you invest, you should read the prospectus in the registration statement and other documents the depositor has filed with the SEC for more complete information about the depositor, the issuing entity and this offering. You may get these documents for free by visiting EDGAR on the SEC website at www.sec.gov. Alternatively, the depositor or Citigroup Global Markets Inc., Barclays Capital Inc., Drexel Hamilton, LLC or any other underwriter or dealer participating in this offering will arrange to send you the prospectus if you request it by calling toll-free 1-800-831-9146.
| 5 |
| MORTGAGE POOL CHARACTERISTICS |
| Mortgage Pool Characteristics(1) | |
| Initial Pool Balance(2) | $1,087,114,895 |
| Number of Mortgage Loans | 53 |
| Number of Mortgaged Properties | 167 |
| Average Cut-off Date Balance | $20,511,602 |
| Weighted Average Mortgage Rate | 4.29159% |
| Weighted Average Remaining Term to Maturity/ARD (months)(3) | 117 |
| Weighted Average Remaining Amortization Term (months)(4) | 357 |
| Weighted Average Cut-off Date LTV Ratio(5) | 57.4% |
| Weighted Average Maturity Date/ARD LTV Ratio(3)(5) | 51.9% |
| Weighted Average UW NCF DSCR(6) | 2.21x |
| Weighted Average Debt Yield on Underwritten NOI(7) | 11.5% |
| % of Initial Pool Balance of Mortgage Loans that are Amortizing Balloon | 21.2% |
| % of Initial Pool Balance of Mortgage Loans that are Interest Only then Amortizing Balloon | 35.7% |
| % of Initial Pool Balance of Mortgage Loans that are Interest Only | 43.1% |
| % of Initial Pool Balance of Mortgaged Properties with Single Tenants | 13.2% |
| % of Initial Pool Balance of Mortgage Loans with only Subordinate Debt | 5.1% |
| % of Initial Pool Balance of Mortgage Loans with only Mezzanine Debt | 22.0% |
| % of Initial Pool Balance of Mortgage Loans with Mezzanine Debt and Subordinate Debt | 1.4% |
| (1) | The Cut-off Date LTV Ratio, Maturity Date/ARD LTV Ratio, UW NCF DSCR, Debt Yield on Underwritten NOI and Cut-off Date Balance Per SF / Rooms information for each mortgage loan is presented in this Term Sheet (i) if such mortgage loan is part of a loan combination (as defined under “Collateral Overview—Loan Combination Summary” below), based on both that mortgage loan and any related pari passu companion loan(s) but, unless otherwise specifically indicated, without regard to any related subordinate companion loan(s), and (ii) unless otherwise specifically indicated, without regard to any other indebtedness (whether or not secured by the related mortgaged property, ownership interests in the related borrower or otherwise) that currently exists or that may be incurred by the related borrower or its owners in the future. |
| (2) | Subject to a permitted variance of plus or minus 5%. |
| (3) | Unless otherwise indicated, mortgage loans with anticipated repayment dates are presented as if they were to mature on the anticipated repayment date. |
| (4) | Excludes mortgage loans that are interest-only for the entire term. |
| (5) | The Cut-off Date LTV Ratios and Maturity Date/ARD LTV Ratios presented in this Term Sheet are generally based on the “as-is” appraised values of the related mortgaged properties (as set forth on Annex A to the Preliminary Prospectus), provided that such LTV ratios may be calculated (i) based on “as-stabilized” or similar values in certain cases where the completion of certain hypothetical conditions or other events at the property are assumed and/or where reserves have been established at origination to satisfy the applicable condition or event that is expected to occur or (ii) based on an “as-is portfolio value”, which represents the appraised value for a portfolio of mortgaged properties as a whole and not the sum of the appraised values for each of the individual mortgaged properties, in each case as further described in the definitions of “Appraised Value”, “Cut-off Date LTV Ratio” and “Maturity Date/ARD LTV Ratio” under “Certain Definitions” in this Term Sheet and under “Description of the Mortgage Pool—Certain Calculations and Definitions” in the Preliminary Prospectus. |
| (6) | The UW NCF DSCR for each mortgage loan is generally calculated by dividing the UW NCF for the related mortgaged property or mortgaged properties by the annual debt service for such mortgage loan, as adjusted in the case of mortgage loans with a partial interest only period by using the first 12 amortizing payments due instead of the actual interest only payment due. |
| (7) | The Debt Yield on Underwritten NOI for each mortgage loan is generally calculated as the related mortgaged property’s Underwritten NOI divided by the Cut-off Date Balance of such mortgage loan, and the Debt Yield on Underwritten NCF for each mortgage loan is generally calculated as the related mortgaged property’s Underwritten NCF divided by the Cut-off Date Balance of such mortgage loan. |
The depositor has filed a registration statement (including a prospectus) with the Securities and Exchange Commission (“SEC”) (SEC File No. 333-207132) for the offering to which this communication relates. Before you invest, you should read the prospectus in the registration statement and other documents the depositor has filed with the SEC for more complete information about the depositor, the issuing entity and this offering. You may get these documents for free by visiting EDGAR on the SEC website at www.sec.gov. Alternatively, the depositor or Citigroup Global Markets Inc., Barclays Capital Inc., Drexel Hamilton, LLC or any other underwriter or dealer participating in this offering will arrange to send you the prospectus if you request it by calling toll-free 1-800-831-9146.
| 6 |
| KEY FEATURES OF THE CERTIFICATES |
| Co-Lead Managers and Joint Bookrunners: | Citigroup Global Markets Inc. Barclays Capital Inc. |
| Co-Manager: | Drexel Hamilton, LLC |
| Depositor: | Citigroup Commercial Mortgage Securities Inc. |
| Initial Pool Balance: | $1,087,114,895 |
| Master Servicer: | Wells Fargo Bank, National Association |
| Special Servicer: | KeyBank National Association |
| Certificate Administrator: | Citibank, N.A. |
| Trustee: | Wilmington Trust, National Association |
| Operating Advisor: | Pentalpha Surveillance LLC |
| Asset Representations Reviewer: | Pentalpha Surveillance LLC |
| Risk Retention Consultation Party: | Citi Real Estate Funding Inc. |
| Credit Risk Retention: | For a discussion on the manner in which the U.S. credit risk retention requirements are being satisfied by Citi Real Estate Funding Inc., as retaining sponsor, see “Credit Risk Retention” in the Preliminary Prospectus. Note that this securitization transaction is not structured to satisfy the EU risk retention and due diligence requirements. |
| Closing Date: | On or about September 29, 2017 |
| Cut-off Date: | With respect to each mortgage loan, the due date in September 2017 for that mortgage loan (or, in the case of any mortgage loan that has its first due date subsequent to September 2017, the date that would have been its due date in September 2017 under the terms of that mortgage loan if a monthly payment were scheduled to be due in that month) |
| Determination Date: | The 11th day of each month or next business day, commencing in October 2017 |
| Distribution Date: | The 4th business day after the Determination Date, commencing in October 2017 |
| Interest Accrual: | Preceding calendar month |
| ERISA Eligible: | The offered certificates are expected to be ERISA eligible, subject to the exemption conditions described in the Preliminary Prospectus |
| SMMEA Eligible: | No |
| Payment Structure: | Sequential Pay |
| Day Count: | 30/360 |
| Tax Structure: | REMIC |
| Rated Final Distribution Date: | September 2050 |
| Cleanup Call: | 1.0% |
| Minimum Denominations: | $10,000 minimum for the offered certificates (other than the Class X-A, Class X-B and Class X-C certificates); $1,000,000 minimum for the Class X-A, Class X-B and Class X-C certificates; and integral multiples of $1 thereafter for all the offered certificates
|
| Delivery: | Book-entry through DTC |
| Bond Information: | Cash flows are expected to be modeled by TREPP, INTEX and BLOOMBERG |
The depositor has filed a registration statement (including a prospectus) with the Securities and Exchange Commission (“SEC”) (SEC File No. 333-207132) for the offering to which this communication relates. Before you invest, you should read the prospectus in the registration statement and other documents the depositor has filed with the SEC for more complete information about the depositor, the issuing entity and this offering. You may get these documents for free by visiting EDGAR on the SEC website at www.sec.gov. Alternatively, the depositor or Citigroup Global Markets Inc., Barclays Capital Inc., Drexel Hamilton, LLC or any other underwriter or dealer participating in this offering will arrange to send you the prospectus if you request it by calling toll-free 1-800-831-9146.
| 7 |
| TRANSACTION HIGHLIGHTS |
| ■ | $1,087,114,895 (Approximate) New-Issue Multi-Borrower CMBS: |
| — | Overview:The mortgage pool consists of 53 fixed-rate commercial mortgage loans that have an aggregate Cut-off Date Balance of $1,087,114,895 (the “Initial Pool Balance”), have an average mortgage loan Cut-off Date Balance of $20,511,602 and are secured by 167 mortgaged properties located throughout 32 states. |
| — | LTV:57.4% weighted average Cut-off Date LTV Ratio |
| — | DSCR:2.21x weighted average Underwritten Debt Service Coverage Ratio |
| — | Debt Yield: 11.5% weighted average Debt Yield on Underwritten NOI |
| — | Credit Support: 30.000% credit support to Class A-1 / A-2 / A-3 / A-4 / A-AB |
| ■ | Loan Structural Features: |
| — | Amortization:56.9% of the mortgage loans by Initial Pool Balance have scheduled amortization: |
| – | 21.2% of the mortgage loans by Initial Pool Balance have amortization for the entire term with a balloon payment due at maturity |
| – | 35.7% of the mortgage loans by Initial Pool Balance have scheduled amortization following a partial interest only period with a balloon payment due at maturity |
| — | Hard Lockboxes: 66.6% of the mortgage loans by Initial Pool Balance have a Hard Lockbox in place |
| — | Cash Traps: 93.0% of the mortgage loans by Initial Pool Balance have cash traps triggered by certain declines in cash flow, all at levels equal to or greater than a 1.08x coverage, that fund an excess cash flow reserve |
| — | Reserves:The mortgage loans require amounts to be escrowed for reserves as follows: |
| – | Real Estate Taxes: 42 mortgage loans representing 67.7% of the Initial Pool Balance |
| – | Insurance: 31 mortgage loans representing 50.4% of the Initial Pool Balance |
| – | Replacement Reserves (Including FF&E Reserves): 43 mortgage loans representing 68.8% of the Initial Pool Balance |
| – | Tenant Improvements / Leasing Commissions: 26 mortgage loans representing 61.7% of the portion of the Initial Pool Balance that is secured by office, retail, mixed use and industrial properties |
| — | Predominantly Defeasance Mortgage Loans: 87.6% of the mortgage loans by Initial Pool Balance permit defeasance only after an initial lockout period |
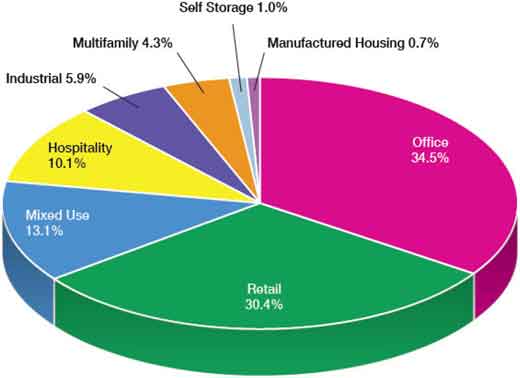
| ■ | Multiple-Asset Types > 5.0% of the Initial Pool Balance: |
| — | Office:34.5% of the mortgaged properties by allocated Initial Pool Balance are office properties |
| — | Retail:30.4% of the mortgaged properties by allocated Initial Pool Balance are retail properties (24.8% are anchored retail properties) |
| — | Mixed Use: 13.1% of the mortgaged properties by allocated Initial Pool Balance are mixed use properties |
| — | Hospitality:10.1% of the mortgaged properties by allocated Initial Pool Balance are hospitality properties |
| — | Industrial:5.9% of the mortgaged properties by allocated Initial Pool Balance are industrial properties |
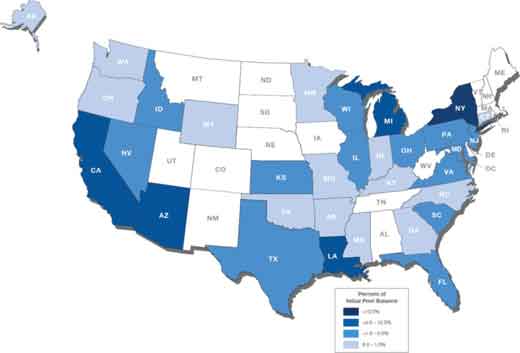
| ■ | Geographic Diversity: The 167 mortgaged properties are located throughout 32 states, with only one state having greater than 10.0% of the allocated Initial Pool Balance: New York (25.9%) |
The depositor has filed a registration statement (including a prospectus) with the Securities and Exchange Commission (“SEC”) (SEC File No. 333-207132) for the offering to which this communication relates. Before you invest, you should read the prospectus in the registration statement and other documents the depositor has filed with the SEC for more complete information about the depositor, the issuing entity and this offering. You may get these documents for free by visiting EDGAR on the SEC website at www.sec.gov. Alternatively, the depositor or Citigroup Global Markets Inc., Barclays Capital Inc., Drexel Hamilton, LLC or any other underwriter or dealer participating in this offering will arrange to send you the prospectus if you request it by calling toll-free 1-800-831-9146.
| 8 |
| COLLATERAL OVERVIEW |
Mortgage Loans by Loan Seller
Mortgage Loan Seller | Mortgage Loans | Mortgaged Properties | Aggregate Cut-off | % of Initial | ||||
| Citi Real Estate Funding Inc. | 14 | 31 | $256,708,000 | 23.6% | ||||
| Principal Commercial Capital(1) | 13 | 13 | 243,155,580 | 22.4 | ||||
| Starwood Mortgage Funding V LLC | 13 | 43 | 228,538,597 | 21.0 | ||||
| Barclays Bank PLC | 10 | 13 | 214,695,217 | 19.7 | ||||
| Citigroup Global Markets Realty Corp. | 1 | 1 | 55,200,000 | 5.1 | ||||
| Citi Real Estate Funding Inc. / Barclays Bank PLC(2) | 1 | 1 | 47,000,000 | 4.3 | ||||
| Barclays Bank PLC / Starwood Mortgage Funding V LLC(3) | 1 | 65 | 41,817,500 | 3.8 | ||||
| Total | 53 | 167 | $1,087,114,895 | 100.0% |
| (1) | As used herein, “Principal Commercial Capital” refers to Macquarie US Trading LLC d/b/a Principal Commercial Capital. Macquarie US Trading LLC and Principal Real Estate Investors, LLC jointly formed a lending platform to originate and securitize commercial mortgage loans. |
| (2) | The Mall of Louisiana mortgage loan is part of a loan combination that was co-originated by Citi Real Estate Funding Inc., Barclays Bank PLC and Bank of America, National Association. Such mortgage loan is evidenced by two promissory notes: (i) note A-3-1, with an outstanding principal balance of $30,000,000 as of the Cut-off Date, as to which Citi Real Estate Funding Inc. is acting as mortgage loan seller; and (ii) note A-5-2, with an outstanding principal balance of $17,000,000 as of the Cut-off Date, as to which Barclays Bank PLC is acting as mortgage loan seller. |
| (3) | The Starwood Capital Group Hotel Portfolio mortgage loan is part of a loan combination that was co-originated by Barclays Bank PLC, Deutsche Bank AG, acting through its New York Branch, JPMorgan Chase Bank, National Association and Bank of America, National Association. Such mortgage loan is evidenced by two promissory notes: (i) note A-17, with an outstanding principal balance of $31,817,500 as of the Cut-off Date, as to which Barclays Bank PLC is acting as mortgage loan seller; and (ii) note A-16-2, with an outstanding principal balance of $10,000,000 as of the Cut-off Date, as to which Starwood Mortgage Funding V LLC is acting as mortgage loan seller. |
Ten Largest Mortgage Loans(1)(2)
# | Mortgage Loan Name | Cut-off Date Balance | % of Initial Pool | Property | Property | Cut-off Date Balance Per SF/Rooms | UW | UW | Cut-off | |||||||||
| 1 | 225 & 233 Park Avenue South | $60,000,000 | 5.5% | Office | 675,756 | $348 | 3.27x | 12.6% | 31.3% | |||||||||
| 2 | General Motors Building | 55,200,000 | 5.1 | Mixed Use | 1,989,983 | $739 | 4.33x | 15.5% | 30.6% | |||||||||
| 3 | 9-19 9th Avenue | 55,000,000 | 5.1 | Retail | 61,038 | $1,720 | 1.91x | 8.0% | 52.0% | |||||||||
| 4 | Corporate Woods Portfolio | 50,000,000 | 4.6 | Various | 2,033,179 | $109 | 1.48x | 10.2% | 74.0% | |||||||||
| 5 | Bank of America Plaza | 47,600,000 | 4.4 | Office | 438,996 | $108 | 2.15x | 13.3% | 60.1% | |||||||||
| 6 | Mall of Louisiana | 47,000,000 | 4.3 | Retail | 776,789 | $418 | 1.85x | 11.1% | 57.0% | |||||||||
| 7 | The Grove at Shrewsbury | 43,600,000 | 4.0 | Retail | 147,878 | $295 | 3.86x | 15.2% | 36.1% | |||||||||
| 8 | Starwood Capital Group Hotel Portfolio | 41,817,500 | 3.8 | Hospitality | 6,366 | $90,680 | 2.72x | 13.9% | 60.4% | |||||||||
| 9 | Grant Building | 38,000,000 | 3.5 | Office | 461,006 | $82 | 1.56x | 11.2% | 65.4% | |||||||||
| 10 | Ann Arbor Mixed Use Portfolio | 34,750,000 | 3.2 | Mixed Use | 190,205 | $183 | 1.53x | 10.2% | 69.5% | |||||||||
| Top 10 Total / Wtd. Avg. | $472,967,500 | 43.5% | 2.53x | 12.1% | 52.2% | |||||||||||||
| Remaining Total / Wtd. Avg. | 614,147,395 | 56.5 | 1.95x | 11.1% | 61.4% | |||||||||||||
| Total / Wtd. Avg. | $1,087,114,895 | 100.0% | 2.21x | 11.5% | 57.4% |
| (1) | See footnotes to table entitled“Mortgage Pool Characteristics” above. |
| (2) | With respect to each mortgage loan that is part of a loan combination (as identified under “Collateral Overview—Loan Combination Summary” below), the UW NCF DSCR, UW NOI Debt Yield and Cut-off Date LTV Ratio are calculated based on both that mortgage loan and any related pari passu companion loan(s), but without regard to any related subordinate companion loan(s) or other indebtedness. With respect to the General Motors Building mortgage loan, the mortgaged property is also encumbered by subordinate companion loans with an aggregate outstanding principal balance as of the Cut-off Date of $830,000,000. The UW NCF DSCR, UW NOI Debt Yield and Cut-off Date LTV Ratio for the General Motors Building mortgage loan inclusive of the subordinate companion loans are 2.77x, 9.9% and 47.9%, respectively. |
| (3) | With respect to certain of the mortgage loans identified above, the Cut-off Date LTV Ratios have been calculated using “as-stabilized”, “portfolio premium” or similar hypothetical values. Such mortgage loans are identified under the definition of “Appraised Value” set forth under “Description of the Mortgage Pool—Certain Calculations and Definitions” in the Preliminary Prospectus. |
The depositor has filed a registration statement (including a prospectus) with the Securities and Exchange Commission (“SEC”) (SEC File No. 333-207132) for the offering to which this communication relates. Before you invest, you should read the prospectus in the registration statement and other documents the depositor has filed with the SEC for more complete information about the depositor, the issuing entity and this offering. You may get these documents for free by visiting EDGAR on the SEC website at www.sec.gov. Alternatively, the depositor or Citigroup Global Markets Inc., Barclays Capital Inc., Drexel Hamilton, LLC or any other underwriter or dealer participating in this offering will arrange to send you the prospectus if you request it by calling toll-free 1-800-831-9146.
| 9 |
| COLLATERAL OVERVIEW (continued) |
Loan Combination Summary
Mortgaged Property Name(1) | Mortgage Loan Cut-off Date Balance | Mortgage | Aggregate Pari Passu Companion Loan Cut-off Date Balance | Aggregate Subordinate Companion Loan Cut-off Date Balance | Loan Combination Cut-off Date Balance | Controlling Pooling/Trust and Servicing Agreement (“Controlling PSA”)(2) | Master | Special | ||||||||
| 225 & 233 Park Avenue South | $60,000,000 | 5.5% | $175,000,000 | — | $235,000,000 | WFCM 2017-C39 | Wells Fargo | LNR Partners | ||||||||
| General Motors Building | $55,200,000 | 5.1% | $1,414,800,000 | $830,000,000 | $2,300,000,000 | BXP 2017-GM | Wells Fargo | AEGON | ||||||||
| 9-19 9th Avenue | $55,000,000 | 5.1% | $50,000,000 | — | $105,000,000 | CGCMT 2017-P8 | Wells Fargo | KeyBank | ||||||||
| Corporate Woods Portfolio | $50,000,000 | 4.6% | $171,250,000 | — | $221,250,000 | CGCMT 2017-P8 | Wells Fargo | KeyBank | ||||||||
| Mall of Louisiana | $47,000,000 | 4.3% | $278,000,000 | — | $325,000,000 | (3) | (3) | (3) | ||||||||
| Starwood Capital Group Hotel Portfolio | $41,817,500 | 3.8% | $535,452,500 | — | $577,270,000 | DBJPM 2017-C6 | Midland | Midland | ||||||||
| Visions Hotel Portfolio | $34,400,000 | 3.2% | $19,950,000 | — | $54,350,000 | CGCMT 2017-P8 | Wells Fargo | KeyBank | ||||||||
| Pleasant Prairie Premium Outlets | $34,000,000 | 3.1% | $111,000,000 | — | $145,000,000 | CGCMT 2017-P8 | Wells Fargo | KeyBank | ||||||||
| Lakeside Shopping Center | $33,000,000 | 3.0% | $142,000,000 | — | $175,000,000 | CGCMT 2017-B1 | Wells Fargo | LNR Partners | ||||||||
| Long Island Prime Portfolio – Uniondale | $29,180,000 | 2.7% | $168,770,000 | — | $197,950,000 | GSMS 2017-GS7 | Wells Fargo | Rialto | ||||||||
| Scripps Center | $22,000,000 | 2.0% | $50,000,000 | — | $72,000,000 | CGCMT 2017-P7 | Wells Fargo | Rialto | ||||||||
| Atlanta and Anchorage Hotel Portfolio | $16,855,648 | 1.6% | $97,167,856 | — | $114,023,504 | CFCRE 2017-C8 | Wells Fargo | Rialto | ||||||||
| 245 Park Avenue | $15,000,000 | 1.4% | $1,065,000,000 | $120,000,000 | $1,200,000,000 | 245 Park Avenue Trust 2017-245P | Wells Fargo | AEGON |
| (1) | Each of the mortgage loans included in the issuing entity that is secured by a mortgaged property or portfolio of mortgaged properties identified in the table above, together with the related companion loan(s) (each of which is not included in the issuing entity), is referred to in this Term Sheet as a “loan combination”. See “Description of the Mortgage Pool—The Loan Combinations” in the Preliminary Prospectus. |
| (2) | Each loan combination will be serviced under the related Controlling PSA, and the controlling class representative (or an equivalent entity), if any, under the related Controlling PSA (or such other party as is designated under the related Controlling PSA) will be entitled to exercise the rights of controlling note holder for the subject loan combination, except as otherwise discussed in footnote (3) below. |
| (3) | The Mall of Louisiana mortgage loan is expected to be an outside serviced mortgage loan that will be serviced and administered by an outside servicer and an outside special servicer pursuant to an outside servicing agreement governing the commercial mortgage securitization transaction to which the related controlling pari passu companion loan is contributed. Such other commercial mortgage securitization transaction is expected to close on or before the closing date for this securitization transaction, however, the parties to the outside servicing agreement governing that other commercial mortgage securitization transaction have not been definitively identified. Further, if the related controlling pari passu companion loan is not securitized on or prior to the closing date as expected, then the Mall of Louisiana loan combination will be initially serviced and administered under the pooling and servicing agreement governing the securitization of the first note in the related loan combination to be securitized (which may in such event be the pooling and servicing agreement for this securitization transaction) by the parties thereto until the occurrence of the securitization of the Mall of Louisiana controlling pari passu companion loan. |
Mortgage Loans with Existing Mezzanine Debt or Subordinate Debt(1)
Mortgaged Property Name | Mortgage | Aggregate Pari Passu Companion | Aggregate Subordinate Companion | Mezzanine | Cut-off Date | Wtd. Avg Cut-off Interest | Cut-off | Cut-off Debt LTV(2) | Cut-off | Cut-off | ||||||||||
| 225 & 233 Park Avenue South | $60,000,000 | $175,000,000 | — | $195,000,000 | $430,000,000 | 4.11332% | 31.3% | 57.3% | 3.27x | 1.59x | ||||||||||
| General Motors Building | $55,200,000 | $1,414,000,000 | $830,000,000 | — | $2,300,000,000 | 3.43000% | 30.6% | 47.9% | 4.33x | 2.77x | ||||||||||
| Bank of America Plaza | $47,600,000 | — | — | $7,500,000 | $55,100,000 | 4.99998% | 60.1% | 69.6% | 2.15x | 1.64x | ||||||||||
| Grant Building | $38,000,000 | — | — | $4,000,000 | $42,000,000 | 5.32381% | 65.4% | 72.3% | 1.56x | 1.31x | ||||||||||
| Ann Arbor Mixed Use Portfolio | $34,750,000 | — | — | $6,750,000 | $41,500,000 | 5.50990% | 69.5% | 83.0% | 1.53x | 1.13x | ||||||||||
| Mesa Grand Shopping Center | $30,000,000 | — | — | $3,500,000 | $33,500,000 | 5.37045% | 67.6% | 75.5% | 1.56x | 1.29x | ||||||||||
| Long Island Prime Portfolio - Uniondale | $29,180,000 | $168,770,000 | — | $45,970,000 | $243,920,000 | 5.41588% | 61.9% | 76.2% | 2.49x | 1.66x | ||||||||||
| 245 Park Avenue | $15,000,000 | $1,065,000,000 | $120,000,000 | $568,000,000 | $1,768,000,000 | 4.30000% | 48.9% | 80.0% | 2.73x | 1.42x |
| (1) | See footnotes to table entitled “Mortgage Pool Characteristics” above. |
| (2) | All “Total Debt” calculations set forth in the table above include any related pari passu companion loan(s), any related subordinate companion loan(s) and any related mezzanine debt. |
| (3) | “Cut-off Date Mortgage Loan LTV” and “Cut-off Date Mortgage Loan UW NCF DSCR” calculations include any related pari passu companion loan(s). |
The depositor has filed a registration statement (including a prospectus) with the Securities and Exchange Commission (“SEC”) (SEC File No. 333-207132) for the offering to which this communication relates. Before you invest, you should read the prospectus in the registration statement and other documents the depositor has filed with the SEC for more complete information about the depositor, the issuing entity and this offering. You may get these documents for free by visiting EDGAR on the SEC website at www.sec.gov. Alternatively, the depositor or Citigroup Global Markets Inc., Barclays Capital Inc., Drexel Hamilton, LLC or any other underwriter or dealer participating in this offering will arrange to send you the prospectus if you request it by calling toll-free 1-800-831-9146.
| 10 |
| COLLATERAL OVERVIEW (continued) |
Loan Combination Controlling Notes and Non-Controlling Notes
Mortgaged Property Name / | Controlling Note(1)(2) | Current Holder of | Current or | Aggregate |
| 225 & 233 Park Avenue South | ||||
| Note A-1 | Yes | — | WFCM 2017-C39 | $70,000,000 |
| Note A-2 | No | Barclays Bank PLC | CGCMT 2017-P8 | $60,000,000 |
| Note A-3 | No | Barclays Bank PLC | Not Identified | $60,000,000 |
| Note A-4 | No | — | WFCM 2017-C38 | $45,000,000 |
| General Motors Building | ||||
| Notes A-1-S, A-2-S, A-3-S, A-4-S, A-1-C1, A-2-C1, A-3-C1 and A-4-C1 | Yes (Note A-1-S) | — | BXP 2017-GM | $725,000,000 |
| Notes A-1-C2, A-1-C3-1 and A-4-A3 | No | — | BANK 2017-BNK6 | $90,000,000 |
| Notes A-1-A2, A-1-C3-2, A-3-A2-2 and A-3-C3-1 | No | — | CGCMT 2017-B1 | $92,700,000 |
| Notes A-1-C4 and A-1-A3 | No | Morgan Stanley Bank, N.A. | Not Identified | $111,900,000 |
| Notes A-1-A1, A-2-A1, A-3-A1 and A-4-A1 | No | Cantor Commercial Real Estate Lending, L.P. | Not Identified | $85,000,000 |
| Note A-2-C2-1, A-3-C2 and A-3-C3-2 | No | — | CD 2017-CD5 | $100,000,000 |
| Notes A-2-C2-2, A-2-C3, A-2-A2 and A-2-A3 | No | Deutsche Bank AG, acting through its New York Branch | Not Identified | $95,200,000 |
| Notes A-3-A2-1 and A-3-A3 | No | Citigroup Global Markets Realty Corp. | CGCMT 2017-P8 | $55,200,000 |
| Notes A-4-C2, A-4-C3 and A-4-A2 | No | — | WFCM 2017-C38 | $115,000,000 |
| Notes B-1-S, B-2-S, B-3-S and B-4-S | No | — | BXP 2017-GM | $830,000,000 |
| 9-19 9th Avenue | ||||
| Note A-1 | Yes | Starwood Mortgage Funding III LLC | CGCMT 2017-P8 | $55,000,000 |
| Note A-2 | No | Starwood Mortgage Funding III LLC | Not Identified | $50,000,000 |
| Corporate Woods Portfolio | ||||
| Notes A-1-A and A-3 | Yes (Note A-1-A) | Citi Real Estate Funding Inc. | CGCMT 2017-P8 | $50,000,000 |
| Notes A-1-B and A-2 | No | Citi Real Estate Funding Inc. | Not Identified | $60,625,000 |
| Notes A-4 and A-5 | No | Morgan Stanley Bank, N.A. | Not Identified | $110,625,000 |
| Mall of Louisiana | ||||
| Notes A-1 and A-2 | Yes (Note A-1) | Bank of America, National Association | Not Identified(5) | $109,000,000 |
| Note A-3-1 | No | Citi Real Estate Funding Inc. | CGCMT 2017-P8 | $30,000,000 |
| Notes A-3-2 and A-4 | No | Citi Real Estate Funding Inc. | Not Identified | $78,000,000 |
| Notes A-5-1, A-6 and A-7 | No | Barclays Bank PLC | Not Identified | $91,000,000 |
| Note A-5-2 | No | Barclays Bank PLC | CGCMT 2017-P8 | $17,000,000 |
| Starwood Capital Group Hotel Portfolio | ||||
| Notes A-1 and A-7 | Yes (Note A-1) | — | DBJPM 2017-C6 | $80,000,000 |
| Notes A-2-1 and A-16-1 | No | — | JPMCC 2017-JP7 | $60,000,000 |
| Notes A-2-2, A-9 and A-14 | No | JPMorgan Chase Bank, National Association | Not Identified | $46,817,500 |
| Note A-3 | No | — | BANK 2017-BNK5 | $72,500,000 |
| Note A-4 | No | — | BANK 2017-BNK6 | $59,317,500 |
| Note A-5 | No | — | WFCM 2017-C38 | $50,000,000 |
| Note A-6-1 | No | — | WFCM 2017-C39 | $40,000,000 |
| Note A-6-2 | No | Barclays Bank PLC | Not Identified | $10,000,000 |
| Notes A-8 and A-10 | No | — | CD 2017-CD5 | $40,000,000 |
| Notes A-11, A-12 and A-13-2 | No | — | UBS 2017-C2 | $37,500,000 |
| Note A-13-1 | No | Deutsche Bank AG, acting through its New York Branch | Not Identified | $14,317,500 |
| Note A-15 | No | Starwood Mortgage Funding II LLC | Not Identified | $25,000,000 |
| Note A-16-2 | No | Starwood Mortgage Funding II LLC | CGCMT 2017-P8 | $10,000,000 |
| Note A-17 | No | Barclays Bank PLC | CGCMT 2017-P8 | $31,817,500 |
| Visions Hotel Portfolio | ||||
| Note A-1 | Yes | Starwood Mortgage Funding II LLC | CGCMT 2017-P8 | $34,400,000 |
| Note A-2 | No | Starwood Mortgage Funding II LLC | Not Identified | $19,950,000 |
| Pleasant Prairie Premium Outlets | ||||
| Note A-1 | Yes | Citi Real Estate Funding Inc. | CGCMT 2017-P8 | $34,000,000 |
| Note A-2 | No | Citi Real Estate Funding Inc. | Not Identified | $41,000,000 |
| Notes A-3 and A-4 | No | Wells Fargo Bank, National Association | Not Identified | $70,000,000 |
| Lakeside Shopping Center | ||||
| Note A-1 | Yes | — | CGCMT 2017-B1 | $59,000,000 |
| Note A-2 | No | — | WFCM 2017-C39 | $58,000,000 |
| Note A-3-1 | No | Barclays Bank PLC | CGCMT 2017-P8 | $33,000,000 |
| Note A-3-2 | No | Barclays Bank PLC | Not Identified | $25,000,000 |
| Long Island Prime Portfolio - Uniondale | ||||
| Note A-1-1 | Yes | — | GSMS 2017-GS7 | $85,000,000 |
| Note A-1-2 | No | Goldman Sachs Mortgage Company | Not Identified | $33,770,000 |
| Note A-2-1 | No | — | WFCM 2017-C39 | $50,000,000 |
| Note A-2-2 | No | Barclays Bank PLC | CGCMT 2017-P8 | $29,180,000 |
| Scripps Center | ||||
| Note A-1 | Yes | — | CGCMT 2017-P7 | $50,000,000 |
| Note A-2 | No | Principal Commercial Capital | CGCMT 2017-P8 | $22,000,000 |
| Atlanta and Anchorage Hotel Portfolio | ||||
| Note A-1-A-1 | Yes | — | CFCRE 2017-C8 | $32,224,034 |
| Notes A-1-A-2 and A-1-B | No | — | UBSCM 2017-C1 | $19,830,175 |
| Note A-2 | No | — | CGCMT 2017-P7 | $27,762,244 |
| Note A-3-A | No | — | MSC 2017-H1 | $17,351,403 |
| Note A-3-B | No | Barclays Bank PLC | CGCMT 2017-P8 | $16,855,648 |
| 245 Park Avenue | ||||
| Notes A-1-A, A-1-B, A-1-C, A-1-D and A-1-E | Yes (Note A-1-A) | — | 245 Park Avenue Trust 2017-245P | $380,000,000 |
| Note A-2-A-1 | No | — | JPMCC 2017-JP6 | $98,000,000 |
| Notes A-2-A-2 and A-2-C-1-A | No | — | DBJPM 2017-C6 | $93,750,000 |
| Note A-2-A-3 | No | — | JPMCC 2017-JP7 | $75,000,000 |
| Note A-2-A-4 | No | JPMorgan Chase Bank, National Association | Not Identified | $32,000,000 |
| Note A-2-B-1 | No | — | CSAIL 2017-C8 | $80,000,000 |
| Notes A-2-B-2-A, A-2-B-2-B and A-2-B-3-B | No | Natixis Real Estate Capital LLC | Not Identified | $85,000,000 |
| Note A-2-B-3-A | No | — | WFCM 2017-C39 | $45,000,000 |
| Notes A-2-C-1-B and A-2-C-2 | No | — | CD 2017-CD5 | $51,250,000 |
| Notes A-2-D-2 and A-2-D-3 | No | — | UBS 2017-C3 | $38,000,000 |
| Note A-2-D-1 | No | — | UBS 2017-C2 | $32,000,000 |
| Note A-2-E-1 | No | — | WFCM 2017-C38 | $55,000,000 |
| Note A-2-E-2 | No | Barclays Bank PLC | CGCMT 2017-P8 | $15,000,000 |
| Notes B-1, B-2, B-3, B-4 and B-5 | No | — | 245 Park Avenue Trust 2017-245P | $120,000,000 |
The depositor has filed a registration statement (including a prospectus) with the Securities and Exchange Commission (“SEC”) (SEC File No. 333-207132) for the offering to which this communication relates. Before you invest, you should read the prospectus in the registration statement and other documents the depositor has filed with the SEC for more complete information about the depositor, the issuing entity and this offering. You may get these documents for free by visiting EDGAR on the SEC website at www.sec.gov. Alternatively, the depositor or Citigroup Global Markets Inc., Barclays Capital Inc., Drexel Hamilton, LLC or any other underwriter or dealer participating in this offering will arrange to send you the prospectus if you request it by calling toll-free 1-800-831-9146.
| 11 |
| COLLATERAL OVERVIEW (continued) |
| (1) | The holder(s) of one or more specified controlling notes (collectively, the “Controlling Note”) will be the “controlling note holder(s)” entitled (directly or through a representative) to (a) approve or, in some cases, direct material servicing decisions involving the related loan combination (while the remaining such holder(s) generally are only entitled to non-binding consultation rights in such regard), and (b) in some cases, replace the applicable special servicer with respect to such loan combination with or without cause. See “Description of the Mortgage Pool—The Loan Combinations” and “The Pooling and Servicing Agreement—Directing Holder” in the Preliminary Prospectus. |
| (2) | The holder(s) of the note(s) other than the Controlling Note (each, a “Non-Controlling Note”) will be the “non-controlling note holder(s)” generally entitled (directly or through a representative) to certain non-binding consultation rights with respect to any decisions as to which the holder of the Controlling Note has consent rights involving the related loan combination, subject to certain exceptions, including that in certain cases where the related Controlling Note is a B-note such consultation rights will not be afforded to the holder(s) of the Non-Controlling Notes until after a control trigger event has occurred with respect to either such Controlling Note or certain certificates backed thereby, in each case as set forth in the related co-lender agreement. See “Description of the Mortgage Pool—The Loan Combinations” in the Preliminary Prospectus. |
| (3) | Unless otherwise specified, with respect to each loan combination, any related unsecuritized Controlling Note and/or Non-Controlling Note may be further split, modified, combined and/or reissued (prior to its inclusion in a securitization transaction) as one or multiple Controlling Notes or Non-Controlling Notes, as the case may be, subject to the terms of the related co-lender agreement (including that the aggregate principal balance, weighted average interest rate and certain other material terms cannot be changed). In connection with the foregoing, any such split, modified or combined Controlling Note or Non-Controlling Note, as the case may be, may be transferred to one or multiple parties (not identified in the table above) prior to its inclusion in a future commercial mortgage securitization transaction. |
| (4) | Unless otherwise specified, with respect to each loan combination, each related unsecuritized pari passu companion loan (both controlling and non-controlling) is expected to be contributed to one or more future commercial mortgage securitization transactions. Under the column “Current or Anticipated Holder of Securitized Note”, (i) the identification of a securitization trust means we have identified an outside securitization that has closed or as to which a preliminary prospectus or final prospectus has printed that has or is expected to include the subject Controlling Note or Non-Controlling Note, as the case may be, (ii) “Not Identified” means no preliminary prospectus or final prospectus has printed that identifies the future outside securitization that is expected to include the subject Controlling Note or Non-Controlling Note, and (iii) “Not Applicable” means the subject Controlling Note or Non-Controlling Note is not intended to be contributed to a future commercial mortgage securitization transaction. Under the column “Current Holder of Unsecuritized Note”, “—” means the subjectControlling Note or Non-Controlling Note is not an unsecuritized note and is currently held by the securitization trust referenced under the “Current or Anticipated Holder of Securitized Note” column. |
| (5) | Note A-1 is expected to be securitized no later than the closing date for this securitization transaction. |
The depositor has filed a registration statement (including a prospectus) with the Securities and Exchange Commission (“SEC”) (SEC File No. 333-207132) for the offering to which this communication relates. Before you invest, you should read the prospectus in the registration statement and other documents the depositor has filed with the SEC for more complete information about the depositor, the issuing entity and this offering. You may get these documents for free by visiting EDGAR on the SEC website at www.sec.gov. Alternatively, the depositor or Citigroup Global Markets Inc., Barclays Capital Inc., Drexel Hamilton, LLC or any other underwriter or dealer participating in this offering will arrange to send you the prospectus if you request it by calling toll-free 1-800-831-9146.
| 12 |
| COLLATERAL OVERVIEW (continued) |
Previously Securitized Mortgaged Properties(1)
Mortgaged Property Name | Mortgage Loan | City | State | Property Type | Cut-off Date | % of | Previous Securitization |
| Corporate Woods Portfolio(2) | CREFI | Overland Park | Kansas | Various | $50,000,000 | 4.6% | CGCC 2014-FL1 |
| Mall of Louisiana | CREFI, Barclays | Baton Rouge | Louisiana | Retail | $47,000,000 | 4.3% | MLMT 2006-C1 |
| Starwood Capital Group Hotel Portfolio | Barclays, SMF V | Various | Various | Hospitality | $41,817,500 | 3.8% | Various(3) |
| Pleasant Prairie Premium Outlets | CREFI | Pleasant Prairie | Wisconsin | Retail | $34,000,000 | 3.1% | Various(4) |
| Lakeside Shopping Center | Barclays | Metairie | Louisiana | Retail | $33,000,000 | 3.0% | BACM 2007-4 |
| RXR Plaza | Barclays | Uniondale | New York | Office | $17,372,382 | 1.6% | GSMS 2007-GG10 |
| Omni | Barclays | Uniondale | New York | Office | $11,807,618 | 1.1% | GCCFC 2007-GG9 |
| Canyon Portal | CREFI | Sedona | Arizona | Mixed Use | $22,500,000 | 2.1% | JPMCC 2006-CB14 |
| Scripps Center | PCC | Cincinnati | Ohio | Office | $22,000,000 | 2.0% | BSCMS 2007-T26 |
| Victoria Park Shoppes | PCC | Fort Lauderdale | Florida | Retail | $19,955,580 | 1.8% | JPMCC 2007-LD11 |
| Hilton Anchorage | Barclays | Anchorage | Alaska | Hospitality | $9,594,754 | 0.9% | JPMCC 2007-CB18 |
| Renaissance Concourse Atlanta Airport Hotel | Barclays | Atlanta | Georgia | Hospitality | $7,260,895 | 0.7% | COMM 2013-LC6 |
| Ocean City Shopping Center | PCC | Ocean City | Maryland | Retail | $13,500,000 | 1.2% | RAITF 2016-FL6 |
| Bay Tec Center | SMF V | St. Petersburg | Florida | Industrial | $6,545,102 | 0.6% | RAITF 2014-FL3 |
| Airport Corporate Center | SMF V | Tampa | Florida | Industrial | $5,039,898 | 0.5% | RAITF 2014-FL3 |
| Royal Oaks Shopping Center | CREFI | Valrico | Florida | Retail | $10,000,000 | 0.9% | MSC 2007-HQ13 |
| Lindbergh Plaza | Barclays | St. Louis | Missouri | Retail | $8,989,569 | 0.8% | MLMT 2007-C1 |
| Fox Run Apartments | PCC | Ledyard | Connecticut | Multifamily | $7,100,000 | 0.7% | BSCMS 2007-PW16 |
| American Mini Storage - Converse | SMF V | Converse | Texas | Self Storage | $5,700,000 | 0.5% | LBUBS 2007-C7 |
| Parma Heights Plaza | Barclays | Parma Heights | Ohio | Retail | $2,737,500 | 0.3% | CSMC 2007-C4 |
| Upper Sandusky Plaza | Barclays | Upper Sandusky | Ohio | Retail | $2,732,500 | 0.3% | CSMC 2007-C4 |
| Kohls White Lake | SMF V | White Lake | Michigan | Retail | $5,188,820 | 0.5% | CD 2007-CD5 |
| 1000 South Sherman Street | Barclays | Clinton | Illinois | Industrial | $4,000,000 | 0.4% | JPMCC 2008-C2 |
| CSS Rohnert Park | CREFI | Rohnert Park | California | Self Storage | $2,100,000 | 0.2% | BSCMS 2007-T28 |
| (1) | The table above includes mortgaged properties securing mortgage loans for which the most recent prior financing of all or a significant portion of such mortgaged property was included in a securitization. Information under “Previous Securitization” represents the most recent such securitization with respect to each of those mortgaged properties. The information in the above table is based solely on information provided by the related borrower or obtained through searches of a third-party database, and has not otherwise been confirmed by the mortgage loan sellers. |
| (2) | All 16 of the Corporate Woods Portfolio mortgage properties were previously securitized in CGCC 2014-FL1. |
| (3) | The Starwood Capital Group Hotel Portfolio mortgage properties were previously securitized in the WFRBS 2012-C10, WFCM 2012-LC5, GSMS 2012-GCJ9, WFRBS 2013-C11, COMM 2013-CR6, COMM 2013-CR7, CSMC 2008-C1 and COMM 2013-CRE6 transactions. |
| (4) | The Pleasant Prairie Premium Outlets Property was previously securitized in the JPMCC 2007-CB18, WBCMT 2006-C25 and WBCMT 2006-C23 transactions. |
The depositor has filed a registration statement (including a prospectus) with the Securities and Exchange Commission (“SEC”) (SEC File No. 333-207132) for the offering to which this communication relates. Before you invest, you should read the prospectus in the registration statement and other documents the depositor has filed with the SEC for more complete information about the depositor, the issuing entity and this offering. You may get these documents for free by visiting EDGAR on the SEC website at www.sec.gov. Alternatively, the depositor or Citigroup Global Markets Inc., Barclays Capital Inc., Drexel Hamilton, LLC or any other underwriter or dealer participating in this offering will arrange to send you the prospectus if you request it by calling toll-free 1-800-831-9146.
| 13 |
| COLLATERAL OVERVIEW (continued) |
Property Types
Property Type / Detail | Number of Mortgaged | Aggregate | % of Initial | Wtd. Avg. | Wtd. Avg. | Wtd. Avg. Debt Yield on | |||||||||
| Office | 28 | $374,563,249 | 34.5 | % | 2.02x | 59.9% | 11.1% | ||||||||
| Suburban | 23 | 230,363,249 | 21.2 | 1.81x | 65.3% | 11.0% | |||||||||
| CBD | 4 | 135,000,000 | 12.4 | 2.43x | 49.7% | 11.5% | |||||||||
| Medical | 1 | 9,200,000 | 0.8 | 1.35x | 72.0% | 9.3% | |||||||||
| Retail | 17 | $330,432,721 | 30.4 | % | 2.20x | 55.6% | 10.7% | ||||||||
| Anchored | 9 | 145,215,149 | 13.4 | 2.25x | 58.9% | 11.5% | |||||||||
| Super Regional Mall | 2 | 80,000,000 | 7.4 | 2.22x | 53.3% | 11.2% | |||||||||
| Single Tenant Retail | 3 | 64,588,820 | 5.9 | 1.88x | 53.9% | 8.2% | |||||||||
| Outlet Center | 1 | 34,000,000 | 3.1 | 2.66x | 50.0% | 11.2% | |||||||||
| Shadow Anchored | 1 | 5,512,000 | 0.5 | 1.92x | 51.5% | 12.0% | |||||||||
| Unanchored | 1 | 1,116,751 | 0.1 | 1.48x | 74.0% | 10.2% | |||||||||
| Mixed Use | 6 | $142,450,000 | 13.1 | % | 2.59x | 54.6% | 12.1% | ||||||||
| Office/Retail | 4 | 96,550,000 | 8.9 | 3.13x | 46.9% | 13.3% | |||||||||
| Office/Warehouse | 1 | 23,400,000 | 2.2 | 1.54x | 68.2% | 10.6% | |||||||||
| Retail/Hospitality | 1 | 22,500,000 | 2.1 | 1.35x | 73.8% | 8.9% | |||||||||
| Hospitality | 79 | $109,654,848 | 10.1 | % | 2.30x | 58.6% | 14.5% | ||||||||
| Limited Service | 51 | 58,821,703 | 5.4 | 2.36x | 56.2% | 14.7% | |||||||||
| Extended Stay | 22 | 20,783,813 | 1.9 | 2.72x | 60.4% | 13.9% | |||||||||
| Full Service | 5 | 18,949,332 | 1.7 | 1.93x | 62.4% | 15.7% | |||||||||
| Select Service | 1 | 11,100,000 | 1.0 | 1.83x | 61.7% | 12.3% | |||||||||
| Industrial | 6 | $64,275,000 | 5.9 | % | 2.04x | 57.4% | 11.2% | ||||||||
| Distribution | 1 | 23,670,000 | 2.2 | 1.74x | 59.9% | 10.6% | |||||||||
| Flex | 3 | 21,605,000 | 2.0 | 2.18x | 62.4% | 12.2% | |||||||||
| Warehouse | 1 | 15,000,000 | 1.4 | 2.36x | 48.4% | 9.7% | |||||||||
| Warehouse/Distribution | 1 | 4,000,000 | 0.4 | 1.92x | 50.0% | 15.6% | |||||||||
| Multifamily | 25 | $47,283,078 | 4.3 | % | 2.34x | 56.0% | 11.3% | ||||||||
| Self Storage | 3 | $11,300,000 | 1.0 | % | 3.73x | 54.8% | 16.6% | ||||||||
| Manufactured Housing | 3 | $7,156,000 | 0.7 | % | 1.36x | 60.7% | 8.8% | ||||||||
| Total | 167 | $1,087,114,895 | 100.0 | % | 2.21x | 57.4% | 11.5% | ||||||||
| (1) | Calculated based on the mortgaged property’s allocated loan amount for mortgage loans secured by more than one mortgaged property. |
| (2) | Weighted average based on the mortgaged property’s allocated loan amount for mortgage loans secured by more than one mortgaged property. |
| (3) | See footnotes to the table entitled “Mortgage Pool Characteristics” above. |
The depositor has filed a registration statement (including a prospectus) with the Securities and Exchange Commission (“SEC”) (SEC File No. 333-207132) for the offering to which this communication relates. Before you invest, you should read the prospectus in the registration statement and other documents the depositor has filed with the SEC for more complete information about the depositor, the issuing entity and this offering. You may get these documents for free by visiting EDGAR on the SEC website at www.sec.gov. Alternatively, the depositor or Citigroup Global Markets Inc., Barclays Capital Inc., Drexel Hamilton, LLC or any other underwriter or dealer participating in this offering will arrange to send you the prospectus if you request it by calling toll-free 1-800-831-9146.
| 14 |
| COLLATERAL OVERVIEW (continued) |
Geographic Distribution
Property Location | Number of | Aggregate | % of Initial | Aggregate Appraised Value(2) | % of Total | Underwritten | % of Total | ||||||||||||
| New York | 17 | $281,780,000 | 25.9 | % | $8,432,500,000 | 69.9 | % | $417,036,370 | 61.5 | % | |||||||||
| Michigan | 7 | 89,722,504 | 8.3 | 182,800,000 | 1.5 | 14,503,165 | 2.1 | ||||||||||||
| California | 16 | 83,898,418 | 7.7 | 404,410,000 | 3.4 | 31,761,757 | 4.7 | ||||||||||||
| Louisiana | 2 | 80,000,000 | 7.4 | 935,000,000 | 7.7 | 55,843,298 | 8.2 | ||||||||||||
| Arizona | 5 | 67,443,684 | 6.2 | 112,070,000 | 0.9 | 7,715,642 | 1.1 | ||||||||||||
| Ohio | 7 | 52,968,421 | 4.9 | 183,400,000 | 1.5 | 13,563,846 | 2.0 | ||||||||||||
| Kansas | 16 | 50,000,000 | 4.6 | 295,500,000 | 2.4 | 22,612,063 | 3.3 | ||||||||||||
| Pennsylvania | 5 | 44,890,421 | 4.1 | 97,900,000 | 0.8 | 7,789,620 | 1.1 | ||||||||||||
| New Jersey | 2 | 44,367,368 | 4.1 | 137,000,000 | 1.1 | 8,182,880 | 1.2 | ||||||||||||
| Florida | 6 | 43,696,580 | 4.0 | 63,085,000 | 0.5 | 4,286,452 | 0.6 | ||||||||||||
| Illinois | 26 | 41,834,210 | 3.8 | 99,375,000 | 0.8 | 6,104,063 | 0.9 | ||||||||||||
| Wisconsin | 2 | 34,383,684 | 3.2 | 298,100,000 | 2.5 | 16,949,624 | 2.5 | ||||||||||||
| Texas | 23 | 30,227,927 | 2.8 | 213,610,000 | 1.8 | 17,901,961 | 2.6 | ||||||||||||
| Virginia | 3 | 18,858,947 | 1.7 | 54,100,000 | 0.4 | 4,447,113 | 0.7 | ||||||||||||
| South Carolina | 2 | 18,100,000 | 1.7 | 29,400,000 | 0.2 | 2,011,139 | 0.3 | ||||||||||||
| Idaho | 1 | 15,750,000 | 1.4 | 32,500,000 | 0.3 | 1,836,141 | 0.3 | ||||||||||||
| Maryland | 2 | 13,945,263 | 1.3 | 29,100,000 | 0.2 | 2,082,985 | 0.3 | ||||||||||||
| Nevada | 1 | 13,650,000 | 1.3 | 21,125,000 | 0.2 | 1,378,017 | 0.2 | ||||||||||||
| Alaska | 1 | 9,594,754 | 0.9 | 103,600,000 | 0.9 | 8,540,120 | 1.3 | ||||||||||||
| Indiana | 6 | 9,546,315 | 0.9 | 72,500,000 | 0.6 | 6,983,598 | 1.0 | ||||||||||||
| Missouri | 1 | 8,989,569 | 0.8 | 12,000,000 | 0.1 | 834,823 | 0.1 | ||||||||||||
| Connecticut | 2 | 7,502,631 | 0.7 | 19,000,000 | 0.2 | 1,585,772 | 0.2 | ||||||||||||
| Georgia | 1 | 7,260,895 | 0.7 | 78,400,000 | 0.6 | 9,585,865 | 1.4 | ||||||||||||
| North Carolina | 2 | 7,148,947 | 0.7 | 25,775,000 | 0.2 | 1,958,026 | 0.3 | ||||||||||||
| Mississippi | 1 | 5,481,699 | 0.5 | 8,700,000 | 0.1 | 709,631 | 0.1 | ||||||||||||
| Washington | 2 | 2,259,473 | 0.2 | 47,700,000 | 0.4 | 4,232,275 | 0.6 | ||||||||||||
| Oregon | 1 | 956,842 | 0.1 | 20,200,000 | 0.2 | 1,866,414 | 0.3 | ||||||||||||
| Minnesota | 2 | 893,311 | 0.1 | 19,600,000 | 0.2 | 2,084,498 | 0.3 | ||||||||||||
| Kentucky | 1 | 781,579 | 0.1 | 16,500,000 | 0.1 | 1,556,179 | 0.2 | ||||||||||||
| Oklahoma | 2 | 585,077 | 0.1 | 12,900,000 | 0.1 | 963,108 | 0.1 | ||||||||||||
| Wyoming | 1 | 445,263 | 0.0 | 9,400,000 | 0.1 | 832,069 | 0.1 | ||||||||||||
| Arkansas | 1 | 151,113 | 0.0 | 4,100,000 | 0.0 | 232,441 | 0.0 | ||||||||||||
| Total | 167 | $1,087,114,895 | 100.0 | % | $12,071,350,000 | 100.0 | % | $677,970,954 | 100.0 | % | |||||||||
| (1) | Calculated based on the mortgaged property’s allocated loan amount for mortgage loans secured by more than one mortgaged property. |
| (2) | Aggregate Appraised Values and Underwritten NOI reflect the aggregate values without any reduction for the pari passu companion loan(s). |
The depositor has filed a registration statement (including a prospectus) with the Securities and Exchange Commission (“SEC”) (SEC File No. 333-207132) for the offering to which this communication relates. Before you invest, you should read the prospectus in the registration statement and other documents the depositor has filed with the SEC for more complete information about the depositor, the issuing entity and this offering. You may get these documents for free by visiting EDGAR on the SEC website at www.sec.gov. Alternatively, the depositor or Citigroup Global Markets Inc., Barclays Capital Inc., Drexel Hamilton, LLC or any other underwriter or dealer participating in this offering will arrange to send you the prospectus if you request it by calling toll-free 1-800-831-9146.
| 15 |
| COLLATERAL OVERVIEW (continued) |
| Distribution of Cut-off Date Balances | ||||||||||
| Number | % of | |||||||||
| of | Initial | |||||||||
| Range of Cut-off Date | Mortgage | Cut-off Date | Pool | |||||||
| Balances ($) | Loans | Balance | Balance | |||||||
| 2,100,000- 4,999,999 | 5 | $16,156,000 | 1.5 | % | ||||||
| 5,000,000 - 9,999,999 | 12 | 75,875,166 | 7.0 | |||||||
| 10,000,000 - 19,999,999 | 15 | 214,166,229 | 19.7 | |||||||
| 20,000,000 - 29,999,999 | 6 | 143,550,000 | 13.2 | |||||||
| 30,000,000 - 39,999,999 | 7 | 237,150,000 | 21.8 | |||||||
| 40,000,000 - 49,999,999 | 4 | 180,017,500 | 16.6 | |||||||
| 50,000,000 - 60,000,000 | 4 | 220,200,000 | 20.3 | |||||||
| Total | 53 | $1,087,114,895 | 100.0 | % | ||||||
| Distribution of UW NCF DSCRs(1) | ||||||||||
| % of | ||||||||||
| Number of | Initial | |||||||||
| Mortgage | Cut-off Date | Pool | ||||||||
| Range of UW DSCR (x) | Loans | Balance | Balance | |||||||
| 1.25 - 1.35 | 8 | $125,025,580 | 11.5 | % | ||||||
| 1.36 - 1.50 | 8 | 117,534,389 | 10.8 | |||||||
| 1.51 - 1.65 | 8 | 168,933,078 | 15.5 | |||||||
| 1.66 - 1.80 | 2 | 29,151,699 | 2.7 | |||||||
| 1.81 - 2.00 | 7 | 151,052,648 | 13.9 | |||||||
| 2.01 - 3.00 | 16 | 334,517,500 | 30.8 | |||||||
| 3.01 - 12.24 | 4 | 160,900,000 | 14.8 | |||||||
| Total | 53 | $1,087,114,895 | 100.0 | % | ||||||
| (1) See footnotes (1) and (6) to the table entitled “Mortgage Pool Characteristics” above. | ||||||||||
| Distribution of Amortization Types(1) | ||||||||||
| Number | % of | |||||||||
| of | Initial | |||||||||
| Mortgage | Cut-off Date | Pool | ||||||||
| Amortization Type | Loans | Balance | Balance | |||||||
| Interest Only | 19 | $468,417,500 | 43.1 | % | ||||||
| Interest Only, Then Amortizing(2) | 16 | 364,967,000 | 33.6 | |||||||
| Amortizing (30 Years) | 14 | 203,471,669 | 18.7 | |||||||
| Amortizing (25 Years) | 3 | 27,458,726 | 2.5 | |||||||
| Interest Only, Then Amortizing | ||||||||||
| – ARD(2) | 1 | 22,800,000 | 2.1 | |||||||
| Total | 53 | $1,087,114,895 | 100.0 | % | ||||||
| (1) All of the mortgage loans will have balloon payments at maturity date or have an anticipated repayment date, as applicable. | ||||||||||
| (2) Original partial interest only periods range from 12 to 60 months. | ||||||||||
| Distribution of Lockboxes | ||||||||||
| Number | % of | |||||||||
| of | Initial | |||||||||
| Mortgage | Cut-off Date | Pool | ||||||||
| Lockbox Type | Loans | Balance | Balance | |||||||
| Hard | 27 | $723,484,469 | 66.6 | % | ||||||
| Springing | 21 | 250,812,926 | 23.1 | |||||||
| Soft Springing | 2 | 64,317,500 | 5.9 | |||||||
| Soft | 1 | 30,000,000 | 2.8 | |||||||
| None | 2 | 18,500,000 | 1.7 | |||||||
| Total | 53 | $1,087,114,895 | 100.0 | % | ||||||
| Distribution of Cut-off Date LTV Ratios(1) | ||||||||||
| % of | ||||||||||
| Number of | Initial | |||||||||
| Range of Cut-off | Mortgage | Cut-off Date | Pool | |||||||
| Date LTV (%) | Loans | Balance | Balance | |||||||
| 13.7 - 50.0 | 10 | $277,650,000 | 25.5 | % | ||||||
| 50.1 - 55.0 | 5 | 119,262,000 | 11.0 | |||||||
| 55.1 - 60.0 | 7 | 106,390,000 | 9.8 | |||||||
| 60.1 - 65.0 | 11 | 224,117,926 | 20.6 | |||||||
| 65.1 - 70.0 | 12 | 214,135,401 | 19.7 | |||||||
| 70.1 - 74.9 | 8 | 145,559,569 | 13.4 | |||||||
| Total | 53 | $1,087,114,895 | 100.0 | % | ||||||
| (1) See footnotes (1) and (5) to the table entitled “Mortgage Pool Characteristics” above. | ||||||||||
| Distribution of Maturity Date/ARD LTV Ratios(1) | ||||||||||
| % of | ||||||||||
| Number of | Initial | |||||||||
| Range of Maturity | Mortgage | Cut-off Date | Pool | |||||||
| Date/ARD LTV (%) | Loans | Balance | Balance | |||||||
| 13.7 - 39.9 | 4 | $160,900,000 | 14.8 | % | ||||||
| 40.0 - 44.9 | 3 | 43,912,000 | 4.0 | |||||||
| 45.0 - 49.9 | 8 | 158,838,726 | 14.6 | |||||||
| 50.0 - 54.9 | 10 | 234,701,699 | 21.6 | |||||||
| 55.0 - 59.9 | 15 | 211,340,401 | 19.4 | |||||||
| 60.0 - 63.5 | 13 | 277,422,069 | 25.5 | |||||||
| Total | 53 | $1,087,114,895 | 100.0 | % | ||||||
| (1) See footnotes (1), (3) and (5) to the table entitled “Mortgage Pool Characteristics” above. | ||||||||||
| Distribution of Loan Purpose | ||||||||||
| % of | ||||||||||
| Number of | Initial | |||||||||
| Mortgage | Cut-off Date | Pool | ||||||||
| Loan Purpose | Loans | Balance | Balance | |||||||
| Refinance | 37 | $724,739,895 | 66.7 | % | ||||||
| Acquisition | 13 | 268,575,000 | 24.7 | |||||||
| Recapitalization | 3 | 93,800,000 | 8.6 | |||||||
| Total | 53 | $1,087,114,895 | 100.0 | % | ||||||
| Distribution of Mortgage Rates | ||||||||||
| % of | ||||||||||
| Number of | Initial | |||||||||
| Range of Mortgage | Mortgage | Cut-off Date | Pool | |||||||
| Rates (%) | Loans | Balance | Balance | |||||||
| 3.430 - 4.000 | 10 | $320,650,000 | 29.5 | % | ||||||
| 4.001 - 4.500 | 21 | 449,734,500 | 41.4 | |||||||
| 4.501 - 5.000 | 20 | 294,393,047 | 27.1 | |||||||
| 5.001 - 5.730 | 2 | 22,337,348 | 2.1 | |||||||
| Total | 53 | $1,087,114,895 | 100.0 | % | ||||||
The depositor has filed a registration statement (including a prospectus) with the Securities and Exchange Commission (“SEC”) (SEC File No. 333-207132) for the offering to which this communication relates. Before you invest, you should read the prospectus in the registration statement and other documents the depositor has filed with the SEC for more complete information about the depositor, the issuing entity and this offering. You may get these documents for free by visiting EDGAR on the SEC website at www.sec.gov. Alternatively, the depositor or Citigroup Global Markets Inc., Barclays Capital Inc., Drexel Hamilton, LLC or any other underwriter or dealer participating in this offering will arrange to send you the prospectus if you request it by calling toll-free 1-800-831-9146.
| 16 |
| COLLATERAL OVERVIEW (continued) |
| Distribution of Debt Yield on Underwritten NOI(1) | ||||||||||
| Range of | Number of | % of Initial | ||||||||
| Debt Yields on | Mortgage | Cut-off Date | Pool | |||||||
| Underwritten NOI (%) | Loans | Balance | Balance | |||||||
| 8.0 - 8.9 | 5 | $125,255,580 | 11.5 | % | ||||||
| 9.0 - 9.9 | 13 | 141,704,389 | 13.0 | |||||||
| 10.0 - 10.9 | 8 | 193,970,000 | 17.8 | |||||||
| 11.0 - 11.9 | 12 | 244,953,078 | 22.5 | |||||||
| 12.0 - 12.9 | 7 | 135,658,699 | 12.5 | |||||||
| 13.0 - 47.9 | 8 | 245,573,148 | 22.6 | |||||||
| Total | 53 | $1,087,114,895 | 100.0 | % | ||||||
| (1) See footnotes (1) and (7) to the table entitled “Mortgage Pool Characteristics” above. | ||||||||||
| Distribution of Debt Yield on Underwritten NCF(1) | ||||||||||
| Range of | Number of | % of Initial | ||||||||
| Debt Yields on | Mortgage | Cut-off Date | Pool | |||||||
| Underwritten NCF (%) | Loans | Balance | Balance | |||||||
| 7.8 - 7.9 | 2 | $42,755,580 | 3.9 | % | ||||||
| 8.0 - 8.9 | 12 | 197,178,389 | 18.1 | |||||||
| 9.0 - 9.9 | 12 | 240,826,000 | 22.2 | |||||||
| 10.0 - 10.9 | 12 | 220,958,078 | 20.3 | |||||||
| 11.0 - 11.9 | 7 | 83,823,699 | 7.7 | |||||||
| 12.0 - 12.9 | 3 | 149,417,500 | 13.7 | |||||||
| 13.0 - 47.3 | 5 | 152,155,648 | 14.0 | |||||||
| Total | 53 | $1,087,114,895 | 100.0 | % | ||||||
| (1) See footnotes (1) and (7) to the table entitled “Mortgage Pool Characteristics” above. | ||||||||||
| Mortgage Loans with Original Partial Interest Only Periods | ||||||||||
| Original Partial | Number of | % of Initial | ||||||||
| Interest Only Period | Mortgage | Cut-off Date | Pool | |||||||
| (months) | Loans | Balance | Balance | |||||||
| 12 | 1 | $33,000,000 | 3.0 | % | ||||||
| 18 | 1 | $47,600,000 | 4.4 | % | ||||||
| 24 | 4 | $60,112,000 | 5.5 | % | ||||||
| 36 | 4 | $91,270,000 | 8.4 | % | ||||||
| 48 | 5 | $116,035,000 | 10.7 | % | ||||||
| 60 | 2 | $39,750,000 | 3.7 | % | ||||||
| Distribution of Original Terms to Maturity/ARD(1) | ||||||||||
| Number of | % of Initial | |||||||||
| Original Term to | Mortgage | Cut-off Date | Pool | |||||||
| Maturity/ARD (months) | Loans | Balance | Balance | |||||||
| 84 | 1 | $47,600,000 | 4.4 | % | ||||||
| 120 | 52 | 1,039,514,895 | 95.6 | |||||||
| Total | 53 | $1,087,114,895 | 100.0 | % | ||||||
| (1) See footnote (3) to the table entitled “Mortgage Pool Characteristics” above. | ||||||||||
| Distribution of Remaining Terms to Maturity/ARD(1) | ||||||||||
| Range of Remaining | Number of | % of Initial | ||||||||
| Terms to Maturity/ARD | Mortgage | Cut-off Date | Pool | |||||||
| (months) | Loans | Balance | Balance | |||||||
| 84 | 1 | $47,600,000 | 4.4 | % | ||||||
| 113 - 120 | 52 | 1,039,514,895 | 95.6 | |||||||
| Total | 53 | $1,087,114,895 | 100.0 | % | ||||||
| (1) See footnote (3) to the table entitled “Mortgage Pool Characteristics” above. | ||||||||||
| Distribution of Original Amortization Terms(1) | ||||||||||
| % of | ||||||||||
| Number of | Initial | |||||||||
| Original Amortization | Mortgage | Cut-off Date | Pool | |||||||
| Term (months) | Loans | Balance | Balance | |||||||
| Interest Only | 19 | $468,417,500 | 43.1 | % | ||||||
| 300 | 3 | 27,458,726 | 2.5 | |||||||
| 360 | 31 | 591,238,669 | 54.4 | |||||||
| Total | 53 | $1,087,114,895 | 100.0 | % | ||||||
| (1) All of the mortgage loans will have balloon payments at maturity or have an anticipated repayment date, as applicable. | ||||||||||
| Distribution of Remaining Amortization Terms(1) | ||||||||||
| % of | ||||||||||
| Range of Remaining | Number of | Initial | ||||||||
| Amortization Terms | Mortgage | Cut-off Date | Pool | |||||||
| (months) | Loans | Balance | Balance | |||||||
| Interest Only | 19 | $468,417,500 | 43.1 | % | ||||||
| 294 - 300 | 3 | 27,458,726 | 2.5 | |||||||
| 357 - 360 | 31 | 591,238,669 | 54.4 | |||||||
| Total | 53 | $1,087,114,895 | 100.0 | % | ||||||
| (1) All of the mortgage loans will have balloon payments at maturity or have an anticipated repayment date, as applicable. | ||||||||||
| Distribution of Prepayment Provisions | ||||||||||
| Number | % of | |||||||||
| of | Initial | |||||||||
| Mortgage | Cut-off Date | Pool | ||||||||
| Prepayment Provision | Loans | Balance | Balance | |||||||
| Defeasance | 44 | $952,197,395 | 87.6 | % | ||||||
| Yield Maintenance | 7 | 99,267,500 | 9.1 | |||||||
| Defeasance or Yield | ||||||||||
| Maintenance | 2 | 35,650,000 | 3.3 | |||||||
| Total | 53 | $1,087,114,895 | 100.0 | % | ||||||
| Distribution of Escrow Types | ||||||||||
| % of | ||||||||||
| Number of | Initial | |||||||||
| Mortgage | Cut-off Date | Pool | ||||||||
| Escrow Type | Loans | Balance | Balance | |||||||
| Replacement Reserves(1) | 43 | $747,626,075 | 68.8 | % | ||||||
| Real Estate Tax | 42 | $736,069,006 | 67.7 | % | ||||||
| TI/LC(2) | 26 | $562,812,149 | 61.7 | % | ||||||
| Insurance | 31 | $547,440,246 | 50.4 | % | ||||||
| (1) Includes mortgage loans with FF&E reserves. | ||||||||||
| (2) Percentage of the portion of the Initial Pool Balance secured by office, retail, mixed use and industrial properties. | ||||||||||
The depositor has filed a registration statement (including a prospectus) with the Securities and Exchange Commission (“SEC”) (SEC File No. 333-207132) for the offering to which this communication relates. Before you invest, you should read the prospectus in the registration statement and other documents the depositor has filed with the SEC for more complete information about the depositor, the issuing entity and this offering. You may get these documents for free by visiting EDGAR on the SEC website at www.sec.gov. Alternatively, the depositor or Citigroup Global Markets Inc., Barclays Capital Inc., Drexel Hamilton, LLC or any other underwriter or dealer participating in this offering will arrange to send you the prospectus if you request it by calling toll-free 1-800-831-9146.
| 17 |
| SHORT TERM CERTIFICATE PRINCIPAL PAY DOWN SCHEDULE |
Class A-2 Principal Pay Down(1)(2)
Mortgage Loan Name | Property Type | Cut-off Date Balance | % of Initial Pool Balance | Remaining Loan Term | Underwritten NCF DSCR | Debt Yield on Underwritten NOI | Cut-off Date LTV Ratio | |||||||
| Bank of America Plaza | Office | $47,600,000 | 4.4% | 84 | 2.15x | 13.3% | 60.1% |
| (1) | The table above presents the mortgage loans whose balloon payments would be applied to pay down the certificate balance of the Class A-2 certificates assuming no prepayments prior to the maturity date or any anticipated repayment date, as applicable, for any mortgage loan and applying the modeling assumptions described under “Yield, Prepayment and Maturity Considerations” in the Preliminary Prospectus, including the assumptions that (i) no mortgage loan in the pool experiences prepayments prior to its stated maturity date or anticipated repayment date, as applicable, or defaults or losses; (ii) there are no extensions of the maturity date of any mortgage loan in the pool; and (iii) each mortgage loan in the pool is paid in full on its stated maturity date or, if applicable, anticipated repayment date. Each class of certificates, including the Class A-2 certificates, evidences undivided ownership interests in the entire pool of mortgage loans. Debt service coverage ratio, debt yield and loan-to-value ratio information does not take into account any subordinate debt (whether or not secured by the mortgaged property) that currently exists or is allowed under the terms of any mortgage loan. See Annex A to the Preliminary Prospectus. See the footnotes to the table entitled “Mortgage Pool Characteristics” above. |
| (2) | See footnotes to the table entitled “Mortgage Pool Characteristics” above. |
The depositor has filed a registration statement (including a prospectus) with the Securities and Exchange Commission (“SEC”) (SEC File No. 333-207132) for the offering to which this communication relates. Before you invest, you should read the prospectus in the registration statement and other documents the depositor has filed with the SEC for more complete information about the depositor, the issuing entity and this offering. You may get these documents for free by visiting EDGAR on the SEC website at www.sec.gov. Alternatively, the depositor or Citigroup Global Markets Inc., Barclays Capital Inc., Drexel Hamilton, LLC or any other underwriter or dealer participating in this offering will arrange to send you the prospectus if you request it by calling toll-free 1-800-831-9146.
| 18 |
| STRUCTURAL OVERVIEW (continued) |
| Allocation Between | |
| VRR Interest and | |
| Non-Vertically | |
| Retained Certificates | The aggregate amount available for distribution to holders of the certificates (including the VRR Interest) on each distribution date will be: (i) the gross amount of interest, principal, yield maintenance charges and prepayment premiums collected with respect to the mortgage loans in the applicable one-month collection period, net of specified expenses of the issuing entity, including fees payable therefrom to, and losses, liabilities, advances, costs and expenses reimbursable or indemnifiable therefrom to, the master servicer, the special servicer, the certificate administrator, the trustee, the operating advisor, the asset representations reviewer and CREFC®; and (ii) allocated to amounts available for distribution to the holders of the VRR Interest, on the one hand, and amounts available for distribution to the holders of the remaining certificates (the “Non-Vertically Retained Certificates”), on the other hand. On each distribution date, the portion of such aggregate available funds allocable to: (a) the VRR Interest will be the product of such aggregate available funds multiplied by a fraction, expressed as a percentage, the numerator of which is the initial certificate balance of the VRR Interest, and the denominator of which is the aggregate initial certificate balance of all the classes of Principal Balance Certificates (the “Vertically Retained Percentage”); and (b) the Non-Vertically Retained Certificates will at all times be the product of such aggregate available funds multiplied by the difference between 100% and the Vertically Retained Percentage (such difference, the “Non-Vertically Retained Percentage”). See “Credit Risk Retention” and “Description of the Certificates” in the Preliminary Prospectus. |
| Distributions | On each Distribution Date, funds available for distribution to holders of the Non-Vertically Retained Certificates (exclusive of any portion thereof that represents the Non-Vertically Retained Percentage of (i) any yield maintenance charges and prepayment premiums and/or (ii) any excess interest accrued after the related anticipated repayment date on any mortgage loan with an anticipated repayment date) (“Non-Vertically Retained Available Funds”) will be distributed in the following amounts and order of priority (in each case to the extent of remaining available funds): |
| 1. | Class A-1, A-2, A-3, A-4, A-AB, X-A, X-B, X-C, X-D, X-E, X-F and X-G certificates: to interest on the Class A-1, Class A-2, Class A-3, Class A-4, Class A-AB, Class X-A, Class X-B, Class X-C, Class X-D, Class X-E, Class X-F and Class X-G certificates, up to, andpro rata in accordance with, their respective interest entitlements. |
| 2. | Class A-1, A-2, A-3, A-4 and A-AB certificates: to the extent of Non-Vertically Retained Available Funds allocable to principal received or advanced on the mortgage loans, (i) to principal on the Class A-AB certificates until their certificate balance is reduced to the Class A-AB scheduled principal balance set forth in Annex F to the Preliminary Prospectus for the relevant Distribution Date, then (ii) to principal on the Class A-1 certificates until their certificate balance is reduced to zero, all funds available for distribution of principal remaining after the distributions to the Class A-AB certificates in clause (i) above, then (iii) to principal on the Class A-2 certificates until their certificate balance is reduced to zero, all funds available for distribution of principal remaining after the distributions to the Class A-1 certificates in clause (ii) above, then (iv) to principal on the Class A-3 certificates until their certificate balance is reduced to zero, all funds available for distribution of principal remaining after the distributions to the Class A-2 certificates in clause (iii) above, then (v) to principal on the Class A-4 certificates until their certificate balance is reduced to zero, all funds available for distribution of principal remaining after the distributions to the Class A-3 certificates in clause (iv) above and then (vi) to principal on the Class A-AB certificates until their certificate balance is reduced to zero, all funds available for distribution of principal remaining after the distributions to the Class A-4 certificates in clause (v) above. However, if the certificate balances of each and every class of the Class A-S, Class B, Class C, Class D, Class E, Class F and Class G certificates have been reduced to zero as a result of the allocation of mortgage loan losses and other unanticipated expenses to those certificates, then Non-Vertically Retained Available Funds allocable to principal will be distributed to the Class A-1, Class A-2, Class A-3, Class A-4 and Class A-AB certificates,pro rata, based on their respective certificate balances (and the schedule for the Class A-AB principal distributions will be disregarded). |
| 3. | Class A-1, A-2, A-3, A-4 and A-AB certificates: to reimburse the Class A-1, Class A-2, Class A-3, Class A-4 and Class A-AB certificates,pro rata, for any unreimbursed losses on the mortgage loans that were previously allocated to reduce the certificate balances of those classes, together with interest at their respective pass-through rates. |
| 4. | Class A-S certificates: (i) first, to interest on the Class A-S certificates in the amount of their interest entitlement; (ii) next, to the extent of Non-Vertically Retained Available Funds allocable to principal remaining after distributions in respect of principal to each class of Non-Vertically Retained Principal Balance Certificates with a higher principal payment priority (in this case, the Class A-1, Class A-2, Class A-3, Class A-4 and Class A-AB certificates), to principal on the Class A-S certificates until their certificate balance is reduced to zero; and (iii) next, to reimburse the Class A-S certificates for any unreimbursed losses on the mortgage loans that were previously allocated to reduce the certificate balance of that class, together with interest at its pass-through rate. |
The depositor has filed a registration statement (including a prospectus) with the Securities and Exchange Commission (“SEC”) (SEC File No. 333-207132) for the offering to which this communication relates. Before you invest, you should read the prospectus in the registration statement and other documents the depositor has filed with the SEC for more complete information about the depositor, the issuing entity and this offering. You may get these documents for free by visiting EDGAR on the SEC website at www.sec.gov. Alternatively, the depositor or Citigroup Global Markets Inc., Barclays Capital Inc., Drexel Hamilton, LLC or any other underwriter or dealer participating in this offering will arrange to send you the prospectus if you request it by calling toll-free 1-800-831-9146.
| 19 |
| STRUCTURAL OVERVIEW (continued) |
| Distributions | ||
| (continued) | 5. | Class B certificates: (i) first, to interest on the Class B certificates in the amount of their interest entitlement; (ii) next, to the extent of Non-Vertically Retained Available Funds allocable to principal remaining after distributions in respect of principal to each class of Non-Vertically Retained Principal Balance Certificates with a higher principal payment priority (in this case, the Class A-1, Class A-2, Class A-3, Class A-4, Class A-AB and Class A-S certificates), to principal on the Class B certificates until their certificate balance is reduced to zero; and (iii) next, to reimburse Class B certificates for any unreimbursed losses on the mortgage loans that were previously allocated to reduce the certificate balance of that class, together with interest at its pass-through rate. |
| 6. | Class C certificates: (i) first, to interest on the Class C certificates in the amount of their interest entitlement; (ii) next, to the extent of Non-Vertically Retained Available Funds allocable to principal remaining after distributions in respect of principal to each class of Non-Vertically Retained Principal Balance Certificates with a higher principal payment priority (in this case, the Class A-1, Class A-2, Class A-3, Class A-4, Class A-AB, Class A-S and Class B certificates), to principal on the Class C certificates until their certificate balance is reduced to zero; and (iii) next, to reimburse the Class C certificates for any unreimbursed losses on the mortgage loans that were previously allocated to reduce the certificate balance of that class, together with interest at its pass-through rate. |
| 7. | After the Class A-1, Class A-2, Class A-3, Class A-4, Class A-AB, Class X-A, Class X-B, Class X-C, Class X-D, Class X-E, Class X-F, Class X-G, Class A-S, Class B and Class C certificates are paid all amounts to which they are entitled on such Distribution Date, the remaining Non-Vertically Retained Available Funds will be used to pay interest and principal and to reimburse (with interest) any unreimbursed losses to the Class D, Class E, Class F and Class G certificates, sequentially in that order and in a manner analogous to the Class C certificates pursuant to clause 6 above. |
| Realized Losses | The certificate balances of the Principal Balance Certificates will each be reduced without distribution on any Distribution Date as a write-off to the extent of any loss realized on the mortgage loans allocated to such class on such Distribution Date. On each Distribution Date, the Vertically Retained Percentage of any such losses will be applied to the VRR Interest until the related certificate balance is reduced to zero, and the Non-Vertically Retained Percentage of any such losses will be applied to the respective classes of Non-Vertically Retained Principal Balance Certificates in the following order, in each case until the related certificate balance is reduced to zero: first, to the Class G certificates; second, to the Class F certificates; third, to the Class E certificates; fourth, to the Class D certificates; fifth, to the Class C certificates; sixth, to the Class B certificates; seventh, to the Class A-S certificates; and, finallypro rata, to the Class A-1, Class A-2, Class A-3, Class A-4 and Class A-AB certificates, based on their then current respective certificate balances. The notional amount of each class of Class X Certificates will be reduced to reflect reductions in the certificate balance(s) of the class (or classes, as applicable) of Corresponding Principal Balance Certificates as a result of allocations of losses realized on the mortgage loans to such class(es) of Principal Balance Certificates. |
The depositor has filed a registration statement (including a prospectus) with the Securities and Exchange Commission (“SEC”) (SEC File No. 333-207132) for the offering to which this communication relates. Before you invest, you should read the prospectus in the registration statement and other documents the depositor has filed with the SEC for more complete information about the depositor, the issuing entity and this offering. You may get these documents for free by visiting EDGAR on the SEC website at www.sec.gov. Alternatively, the depositor or Citigroup Global Markets Inc., Barclays Capital Inc., Drexel Hamilton, LLC or any other underwriter or dealer participating in this offering will arrange to send you the prospectus if you request it by calling toll-free 1-800-831-9146.
| 20 |
| STRUCTURAL OVERVIEW (continued) |
| Prepayment Premiums | |
| and Yield Maintenance | |
| Charges | On each Distribution Date, until the notional amounts of the Class X-A, Class X-B, Class X-C and Class X-D certificates and the certificate balances of the Class A-1, Class A-2, Class A-3, Class A-4, Class A-AB, Class A-S, Class B, Class C and Class D certificates have been reduced to zero, each yield maintenance charge collected on the mortgage loans during the related one-month collection period (or, in the case of an outside serviced mortgage loan, that accompanied a principal prepayment included in the aggregate available funds for such Distribution Date) is required to be distributed to certificateholders (excluding holders of the Class X-E, Class X-F, Class X-G, Class E, Class F, Class G, Class S and Class R certificates) as follows: (1)(a) first the Non-Vertically Retained Percentage of such yield maintenance charge will be allocated between (i) the group (the “YM Group A”) of the Class A-1, Class A-2, Class A-3, Class A-4, Class A-AB, Class X-A and Class A-S certificates, (ii) the group (the “YM Group B”) of the Class X-B and Class B certificates, (iii) the group (the “YM Group C”) of the Class X-C and Class C certificates, and (iv) the group (the “YM Group D” and, together with the YM Group A, the YM Group B and the YM Group C, the “YM Groups”) of the Class X-D and Class D certificates,pro rata, based upon the aggregate amount of principal distributed to the classes of Non-Vertically Retained Principal Balance Certificates in each YM Group on such Distribution Date, and (b) then the portion of such yield maintenance charge allocated to each YM Group will be further allocated as among the classes of certificates in such YM Group, in the following manner: (i) each class of Non-Vertically Retained Principal Balance Certificates in such YM Group will entitle the applicable certificateholders to receive on the applicable Distribution Date that portion of such yield maintenance charge equal to the product of (X) solely in the case of YM Group A, a fraction whose numerator is the amount of principal distributed to such class of certificates on such Distribution Date and whose denominator is the total amount of principal distributed to all of the Non-Vertically Retained Principal Balance Certificates in that YM Group on such Distribution Date, (Y) the Base Interest Fraction for the related principal prepayment and such class of certificates, and (Z) the portion of such yield maintenance charge allocated to such YM Group, and (ii) the portion of such yield maintenance charge allocated to such YM Group and remaining after such distributions with respect to the Non-Vertically Retained Principal Balance Certificates in such YM Group will be distributed to the class of Class X Certificates in such YM Group; and (2) the Vertically Retained Percentage of such yield maintenance charge will be distributed to holders of the VRR Interest. If there is more than one class of Non-Vertically Retained Principal Balance Certificates in any YM Group entitled to distributions of principal on any particular Distribution Date on which yield maintenance charges are distributable to such classes, the aggregate portion of such yield maintenance charges allocated to such YM Group will be allocated among all such classes of Non-Vertically Retained Principal Balance Certificates up to, and on apro rata basis in accordance with, their respective entitlements in those yield maintenance charges in accordance with the prior sentence of this paragraph. |
| The “Base Interest Fraction” with respect to any principal prepayment on any mortgage loan and with respect to any class of Class A-1, Class A-2, Class A-3, Class A-4, Class A-AB, Class A-S, Class B, Class C and Class D certificates is a fraction (a) whose numerator is the amount, if any, by which (i) the pass-through rate on such class of certificates exceeds (ii) the discount rate used in accordance with the related loan documents in calculating the yield maintenance charge with respect to such principal prepayment and (b) whose denominator is the amount, if any, by which (i) the mortgage loan rate on such mortgage loan exceeds (ii) the discount rate used in accordance with the related loan documents in calculating the yield maintenance charge with respect to such principal prepayment; provided, however, that under no circumstances will the Base Interest Fraction be greater than one. However, if such discount rate is greater than or equal to both of (x) the mortgage loan rate on the prepaid mortgage loan and (y) the pass-through rate described in the preceding sentence, then the Base Interest Fraction will equal zero, and if such discount rate is greater than or equal to the mortgage loan rate described in the preceding sentence, but less than the pass-through rate, the Base Interest Fraction will be one. | |
| If a prepayment premium (calculated as a percentage of the amount prepaid) is imposed in connection with a prepayment rather than a yield maintenance charge, then the prepayment premium so collected will be allocated as described above. For this purpose, the discount rate used to calculate the Base Interest Fraction will be the discount rate used to determine the yield maintenance charge for mortgage loans that require payment at the greater of a yield maintenance charge or a minimum amount equal to a fixed percentage of the principal balance of the mortgage loan or, for mortgage loans that only have a prepayment premium based on a fixed percentage of the principal balance of the mortgage loan, such other discount rate as may be specified in the related loan documents. | |
| After the notional amounts of the Class X-A, Class X-B, Class X-C and Class X-D certificates and the certificate balances of the Class A-1, Class A-2, Class A-3, Class A-4, Class A-AB, Class A-S, Class B, Class C and Class D certificates have been reduced to zero, all prepayment premiums and yield maintenance charges with respect to the mortgage loans will be allocated: (1) to the extent of the Non-Vertically Retained Percentage thereof, to the holders of the Class E, Class F and Class G certificates (collectively), allocable between such classes as provided in the CGCMT 2017-P8 pooling and servicing agreement; and (2) to the extent of the Vertically Retained Percentage thereof, to the holders of the VRR Interest. No yield maintenance charges or prepayment premiums will be distributed to the holders of the Class X-E, Class X-F, Class X-G, Class S or Class R certificates. For a description of prepayment premiums and yield maintenance charges required on the mortgage loans, see Annex A to the Preliminary Prospectus. See also “Certain Legal Aspects of the Mortgage Loans—Default Interest and Limitations on Prepayments” in the Preliminary Prospectus. |
The depositor has filed a registration statement (including a prospectus) with the Securities and Exchange Commission (“SEC”) (SEC File No. 333-207132) for the offering to which this communication relates. Before you invest, you should read the prospectus in the registration statement and other documents the depositor has filed with the SEC for more complete information about the depositor, the issuing entity and this offering. You may get these documents for free by visiting EDGAR on the SEC website at www.sec.gov. Alternatively, the depositor or Citigroup Global Markets Inc., Barclays Capital Inc., Drexel Hamilton, LLC or any other underwriter or dealer participating in this offering will arrange to send you the prospectus if you request it by calling toll-free 1-800-831-9146.
| 21 |
| STRUCTURAL OVERVIEW (continued) |
| Advances | The master servicer and, if it fails to do so, the trustee, will be obligated to make P&I advances with respect to each mortgage loan in the issuing entity and, with respect to all of the mortgage loans serviced under the pooling and servicing agreement for this transaction, servicing advances, including paying delinquent property taxes, condominium assessments, insurance premiums and ground lease rents, but only to the extent that those advances are not deemed non-recoverable from collections on the related mortgage loan and, in the case of servicing advances, any related companion loans as described below. P&I advances are subject to reduction in connection with any appraisal reductions that may occur. The special servicer will have no obligation to make any advances, provided that, in an urgent or emergency situation requiring the making of a property protection advance, the special servicer may, in its sole discretion, make a property protection advance and will be entitled to reimbursement from the master servicer for such advance. | |
| Serviced Mortgage | ||
| Loans/Outside Serviced | ||
| Mortgage Loans | Each of (i) the 225 & 233 Park Avenue South loan combination, (ii) the General Motors Building loan combination, (iii) the Mall of Louisiana loan combination, (iv) the Starwood Capital Group Hotel Portfolio loan combination, (v) the Lakeside Shopping Center loan combination, (vi) the Long Island Prime Portfolio - Uniondale loan combination, (vii) the Scripps Center loan combination, (viii) the Atlanta and Anchorage Hotel Portfolio loan combination and (ix) the 245 Park Avenue loan combination constitutes an “outside serviced loan combination,” each related mortgage loan constitutes an “outside serviced mortgage loan” and each related companion loan constitutes an “outside serviced companion loan.” Each outside serviced mortgage loan and each related outside serviced companion loan will be serviced under a servicing agreement other than the CGCMT 2017-P8 pooling and servicing agreement (such other servicing agreement, an “outside servicing agreement”) as reflected in the “Loan Combination Summary” table above. | |
| All of the mortgage loans transferred to the issuing entity (other than any outside serviced mortgage loan) are sometimes referred to in this Term Sheet as the “serviced mortgage loans” and, together with any related companion loans, as the “serviced loans” (which signifies that they are being serviced by the master servicer and the special servicer under the CGCMT 2017-P8 pooling and servicing agreement). Any loan combination serviced under the CGCMT 2017-P8 pooling and servicing agreement is sometimes referred to in this Term Sheet as a “serviced loan combination” and any companion loan serviced under the CGCMT 2017-P8 pooling and servicing agreement is sometimes referred to in this Term Sheet as a “serviced companion loan.” See“—Loan Combinations” below. | ||
| Appraisal Reduction | ||
| Amounts | An Appraisal Reduction Amount generally will be created with respect to a required appraisal loan (which is a serviced loan as to which certain defaults, modifications or insolvency events have occurred (as further described in the Preliminary Prospectus)) in the amount, if any, by which the principal balance of such required appraisal loan, plus other amounts overdue or advanced in connection with such required appraisal loan, exceeds 90% of the appraised value of the related mortgaged property plus certain escrows and reserves (including letters of credit) held with respect to such required appraisal loan. In the case of an outside serviced mortgage loan, any Appraisal Reduction Amounts will be calculated pursuant to, and by a party to, the related outside servicing agreement. In general, any Appraisal Reduction Amount calculated with respect to a loan combination will be allocatedfirst, to any related subordinate companion loan(s) (up to the outstanding principal balance(s) thereof), andthen, to the related mortgage loan and any related pari passu companion loan(s) on apro rata basis in accordance with their respective outstanding principal balances. As a result of an Appraisal Reduction Amount being calculated for and/or allocated to a given mortgage loan, the interest portion of any P&I advance for such mortgage loan will be reduced, which will have the effect of reducing the amount of interest available for distribution to the VRR Interest (to the extent of the Vertically Retained Percentage of the reduction in such P&I advance) and to the most subordinate class(es) of Non-Vertically Retained Certificates (exclusive of the Class S and Class R certificates) then outstanding (i.e., first, to the Class G certificates, then, to the Class F certificates, then, to the Class E certificates, then, to the Class D certificates, then, to the Class C certificates, then, to the Class B certificates, then, to the Class A-S certificates, and then,pro rata based on interest entitlements, to the Class A-1, Class A-2, Class A-3, Class A-4, Class A-AB, Class X-A, Class X-B, Class X-C, Class X-D, Class X-E, Class X-F and Class X-G certificates) (to the extent of the Non-Vertically Retained Percentage of the reduction in such P&I advance). In general, a serviced loan will cease to be a required appraisal loan, and no longer be subject to an Appraisal Reduction Amount, when the same has ceased to be a specially serviced loan (if applicable), has been brought current for at least three consecutive months and no other circumstances exist that would cause such serviced loan to be a required appraisal loan. |
The depositor has filed a registration statement (including a prospectus) with the Securities and Exchange Commission (“SEC”) (SEC File No. 333-207132) for the offering to which this communication relates. Before you invest, you should read the prospectus in the registration statement and other documents the depositor has filed with the SEC for more complete information about the depositor, the issuing entity and this offering. You may get these documents for free by visiting EDGAR on the SEC website at www.sec.gov. Alternatively, the depositor or Citigroup Global Markets Inc., Barclays Capital Inc., Drexel Hamilton, LLC or any other underwriter or dealer participating in this offering will arrange to send you the prospectus if you request it by calling toll-free 1-800-831-9146.
| 22 |
| STRUCTURAL OVERVIEW (continued) |
| Appraisal Reduction | |
| Amounts (continued) | For purposes of determining the identity of the Controlling Class and the existence of a Control Termination Event, as well as the allocation and/or exercise of voting rights for certain purposes, the Vertically Retained Percentage of Appraisal Reduction Amounts will be allocated to notionally reduce the certificate balance of the VRR Interest, and the Non-Vertically Retained Percentage of Appraisal Reduction Amounts will be allocated to notionally reduce the certificate balances of the Non-Vertically Retained Principal Balance Certificates as follows: first, to the Class G, Class F, Class E, Class D, Class C, Class B and Class A-S certificates, in that order, in each case until the related certificate balance is notionally reduced to zero; and then to the Class A-1, Class A-2, Class A-3, Class A-4 and Class A-AB certificates,pro rata based on certificate balance. |
| Cumulative Appraisal | |
| Reduction Amounts | A “Cumulative Appraisal Reduction Amount”, as of any date of determination, is equal to the sum of (i) all Appraisal Reduction Amounts then in effect, and (ii) with respect to any AB Modified Loans, any Collateral Deficiency Amounts then in effect. |
| “Collateral Deficiency Amount” means, with respect to any AB Modified Loan as of any date of determination, the excess of (i) the stated principal balance of such AB Modified Loan (taking into account the related junior note(s) included therein), over (ii) the sum of (in the case of a loan combination, solely to the extent allocable to the subject mortgage loan) (x) the most recent appraised value for the related mortgaged property or mortgaged properties, plus (y) solely to the extent not reflected or taken into account in such appraised value and to the extent on deposit with, or otherwise under the control of, the lender as of the date of such determination, any capital or additional collateral contributed by the related borrower at the time the mortgage loan became (and as part of the modification related to) such AB Modified Loan for the benefit of the related mortgaged property or mortgaged properties (provided, that in the case of an outside serviced mortgage loan, the amounts set forth in this clause (y) will be taken into account solely to the extent relevant information is received), plus (z) any other escrows or reserves (in addition to any amounts set forth in the immediately preceding clause (y)) held by the lender in respect of such AB Modified Loan as of the date of such determination. For purposes of determining the identity of the Controlling Class and the existence of a Control Termination Event, the Non-Vertically Retained Percentage of Collateral Deficiency Amounts will be allocable to the respective Classes of Control Eligible Certificates (as defined below), in reverse alphabetical order of class designation, in a manner similar to the allocation of Appraisal Reduction Amounts to such classes. | |
| “AB Modified Loan” means any corrected mortgage loan that became a corrected mortgage loan (which includes for purposes of this definition any outside serviced mortgage loan that became a “corrected” mortgage loan (or any term substantially similar thereto) pursuant to the related outside servicing agreement) due to a modification thereto that resulted in the creation of an A/B note structure (or similar structure) and as to which the new junior note(s) did not previously exist or the principal amount of the new junior note(s) was previously part of either an A note held by the trust or the original unmodified mortgage loan. | |
| Age of Appraisals | Appraisals (which can be an update of a prior appraisal) with respect to a serviced loan are required to be no older than 9 months for purposes of determining appraisal reductions (other than the annual re-appraisal), market value, and other calculations as described in the Preliminary Prospectus. |
| Sale of Defaulted Loans | There will be no “Fair Market Value Purchase Option”. Instead defaulted mortgage loans will be sold in a process similar to the sale process for REO property. With respect to an outside serviced loan combination, the party acting as special servicer with respect to such outside serviced loan combination (as discussed under “—Loan Combinations” below) pursuant to the related outside servicing agreement (the “outside special servicer”) may offer to sell to any person (or may offer to purchase) for cash such outside serviced loan combination in accordance with the terms of the related outside servicing agreement during such time as such outside serviced loan combination constitutes a sufficiently defaulted mortgage loan thereunder and, in connection with any such sale, the related outside special servicer is required to sell both the applicable outside serviced mortgage loan and the related outside serviced companion loan(s) as one loan combination. |
| Directing Holder | The “Directing Holder” with respect to any mortgage loan or loan combination serviced under the CGCMT 2017-P8 pooling and servicing agreement will be the Controlling Class Representative. |
| The applicable directing holder (or equivalent party) with respect to any outside serviced mortgage loan will be (or, if the applicable outside servicing agreement has not yet been executed, is anticipated to be) the controlling class representative (or equivalent entity), if any, under, or such other party as may be designated in, the related outside servicing agreement and/or the related co-lender agreement. |
The depositor has filed a registration statement (including a prospectus) with the Securities and Exchange Commission (“SEC”) (SEC File No. 333-207132) for the offering to which this communication relates. Before you invest, you should read the prospectus in the registration statement and other documents the depositor has filed with the SEC for more complete information about the depositor, the issuing entity and this offering. You may get these documents for free by visiting EDGAR on the SEC website at www.sec.gov. Alternatively, the depositor or Citigroup Global Markets Inc., Barclays Capital Inc., Drexel Hamilton, LLC or any other underwriter or dealer participating in this offering will arrange to send you the prospectus if you request it by calling toll-free 1-800-831-9146.
| 23 |
| STRUCTURAL OVERVIEW (continued) |
| Controlling Class | |
| Representative | The “Controlling Class Representative” will be the controlling class certificateholder or other representative designated by at least a majority of the controlling class certificateholders, by certificate balance. The “Controlling Class” is, as of any time of determination, the most subordinate class of the Control Eligible Certificates that has an aggregate outstanding certificate balance as notionally reduced by any Cumulative Appraisal Reduction Amount allocable to such class, at least equal to 25% of the initial certificate balance of that class of certificates, or if no such class meets the preceding requirement, then the Class E certificates will be the controlling class;provided,however, that (at any time that the aggregate certificate balance of the Class A-1, Class A-2, Class A-3, Class A-4, Class A-AB, Class A-S, Class B, Class C and Class D certificates has been reduced to zero without regard to the allocation of Appraisal Reduction Amounts) (A) in the case of any class of Control Eligible Certificates to which the designation of “controlling class” would otherwise shift by operation of this definition, where the certificate balance of such class of Control Eligible Certificates has been reduced to zero (without regard to the allocation of Cumulative Appraisal Reduction Amounts) prior to such shift, then designation of “controlling class” will not shift and will remain with the class of Control Eligible Certificates currently designated as the controlling class, and (B) in the case of any class of Control Eligible Certificates which is then designated the “controlling class”, if the certificate balance of such class of Control Eligible Certificates is reduced to zero (without regard to the allocation of any Cumulative Appraisal Reduction Amount), then the designation of “controlling class” will shift to the class of Control Eligible Certificates that is the most subordinate and that also has a remaining certificate balance. The “Control Eligible Certificates” consist of the Class E, Class F and Class G certificates. See “The Pooling and Servicing Agreement—Directing Holder” in the Preliminary Prospectus. No other class of certificates will be eligible to act as the controlling class or appoint a Controlling Class Representative. No person may exercise any of the rights and powers of the Controlling Class Representative with respect to an excluded mortgage loan. |
| On the Closing Date, Prime Finance CMBS B-Piece Holdco X, L.P. (or an affiliate) (i) is expected to purchase the Class X-E, Class X-F, Class X-G, Class E, Class F and Class G certificates and will also receive the Class S certificates, and (ii) is expected to be appointed the initial Controlling Class Representative. | |
| Control Termination | |
| Event | A “Control Termination Event” will either (a) occur when no class of the Control Eligible Certificates has an outstanding certificate balance (as notionally reduced by any Cumulative Appraisal Reduction Amount then allocable to such class) that is equal to or greater than 25% of the initial certificate balance of that class of certificates or (b) be deemed to occur as described below under “Control/Consultation Rights” and in the Preliminary Prospectus;provided,however, that a Control Termination Event will in no event exist at any time that the certificate balance of each class of the Class A-1, Class A-2, Class A-3, Class A-4, Class A-AB, Class A-S, Class B, Class C and Class D certificates (without regard to the allocation of Appraisal Reduction Amounts) has been reduced to zero. With respect to excluded mortgage loans, a Control Termination Event will be deemed to exist. |
| The holders of Certificates representing the majority of the certificate balance of the most senior class of Control Eligible Certificates whose certificate balance is notionally reduced to less than 25% of the initial certificate balance of that class as a result of an allocation of an Appraisal Reduction Amount or a Collateral Deficiency Amount, as applicable, to such class will have the right to challenge the Special Servicer’s Appraisal Reduction Amount determination or a Collateral Deficiency Amount determination, as applicable, and, at their sole expense, obtain a second appraisal of any serviced loan for which an Appraisal Reduction Event has occurred or as to which there exists a Collateral Deficiency Amount, under the circumstances described in the Preliminary Prospectus. | |
| Consultation Termination | |
| Event | A “Consultation Termination Event” will either (a) occur when no class of Control Eligible Certificates has an outstanding certificate balance, without regard to the allocation of any Cumulative Appraisal Reduction Amount, that is equal to or greater than 25% of the initial certificate balance of that class of certificates or (b) be deemed to occur as described below under “Control/Consultation Rights” and in the Preliminary Prospectus;provided,however, that a Consultation Termination Event will in no event exist at any time that the certificate balance of each class of the Class A-1, Class A-2, Class A-3, Class A-4, Class A-AB, Class A-S, Class B, Class C and Class D certificates (without regard to the allocation of Appraisal Reduction Amounts) has been reduced to zero. With respect to excluded mortgage loans, a Consultation Termination Event will be deemed to exist. |
The depositor has filed a registration statement (including a prospectus) with the Securities and Exchange Commission (“SEC”) (SEC File No. 333-207132) for the offering to which this communication relates. Before you invest, you should read the prospectus in the registration statement and other documents the depositor has filed with the SEC for more complete information about the depositor, the issuing entity and this offering. You may get these documents for free by visiting EDGAR on the SEC website at www.sec.gov. Alternatively, the depositor or Citigroup Global Markets Inc., Barclays Capital Inc., Drexel Hamilton, LLC or any other underwriter or dealer participating in this offering will arrange to send you the prospectus if you request it by calling toll-free 1-800-831-9146.
| 24 |
| STRUCTURAL OVERVIEW (continued) |
| Control/Consultation | |
| Rights | So long as a Control Termination Event does not exist, the Controlling Class Representative will be entitled to have consent and/or consultation rights under the CGCMT 2017-P8 pooling and servicing agreement with respect to certain major decisions (including with respect to assumptions, waivers, loan modifications and workouts) and other matters with respect to each serviced mortgage loan, except with respect to any serviced mortgage loan as to which the Controlling Class Representative or a holder of more than 50% of the Controlling Class (by certificate balance) is a Borrower Party (any such mortgage loan, an “excluded mortgage loan”). |
A “Borrower Party” means either (i) a borrower or mortgagor under a mortgage loan or loan combination or a manager of a related mortgaged property or any affiliate of any of the foregoing, or (ii) a holder or beneficial owner (or an affiliate of any holder or beneficial owner) of any accelerated mezzanine loan. Solely for the purposes of the definition of “Borrower Party”, the term “affiliate” means, with respect to any specified person, (i) any other person controlling or controlled by or under common control with such specified person or (ii) any other person that owns, directly or indirectly, 25% or more of the beneficial interests in such specified person.
After the occurrence and during the continuance of a Control Termination Event, the consent rights of the Controlling Class Representative will terminate, and the Controlling Class Representative will retain consultation rights under the CGCMT 2017-P8 pooling and servicing agreement with respect to certain major decisions and other matters with respect to the serviced mortgage loans, other than any excluded mortgage loan.
After the occurrence and during the continuance of a Consultation Termination Event, all of these rights of the Controlling Class Representative with respect to the serviced mortgage loans will terminate.
In the event of a change in the Controlling Class, the certificate administrator will be required to promptly contact the current holder(s) of the Controlling Class (or any designee(s) thereof) or (if known to the certificate administrator) one of its affiliates, or, if applicable, any successor Controlling Class Representative or controlling class certificateholder(s), and determine whether any such entity is the holder (or beneficial owner) of at least a majority of the Controlling Class (in effect after such change in Controlling Class) by certificate balance. If at any time the current holder of the Controlling Class (or its designee) or (if known to the certificate administrator) one of its affiliates, or any successor Controlling Class Representative or controlling class certificateholder(s) is no longer the holder (or beneficial owner) of at least a majority of the Controlling Class by certificate balance and the certificate administrator has neither (i) received notice of the then-current holders (or, in the case of book-entry certificates, beneficial owners) of at least a majority of the Controlling Class by certificate balance nor (ii) received notice of a replacement Controlling Class Representative pursuant to the CGCMT 2017-P8 pooling and servicing agreement, then a Control Termination Event and a Consultation Termination Event will be deemed to have occurred and will be deemed to continue until such time as the certificate administrator receives either such notice.
For so long as the Class E certificates are the Controlling Class, a holder of a majority of the Class E certificates (by principal balance) may waive its right to act as or appoint, and to exercise any of the rights of, a Controlling Class Representative, in which case a Control Termination Event and a Consultation Termination Event will be deemed to exist until the Class E certificates cease to be the Controlling Class or another party becomes the holder of a majority of the Class E certificates (by principal balance).
With respect to each outside serviced loan combination, the applicable outside controlling class representative or other related controlling noteholder pursuant to, and subject to the limitations set forth in, the related outside servicing agreement and the related co-lender agreement will have consent, consultation, approval and direction rights with respect to certain major decisions (including with respect to assumptions, waivers, loan modifications and workouts) regarding such outside serviced loan combination, as provided for in the related co-lender agreement and in the related outside servicing agreement, and as described under “Description of the Mortgage Pool—The Loan Combinations” in the Preliminary Prospectus. To the extent permitted under the related co-lender agreement, the Controlling Class Representative (so long as a Consultation Termination Event does not exist) may have certain consultation rights with respect to each outside serviced loan combination. |
The depositor has filed a registration statement (including a prospectus) with the Securities and Exchange Commission (“SEC”) (SEC File No. 333-207132) for the offering to which this communication relates. Before you invest, you should read the prospectus in the registration statement and other documents the depositor has filed with the SEC for more complete information about the depositor, the issuing entity and this offering. You may get these documents for free by visiting EDGAR on the SEC website at www.sec.gov. Alternatively, the depositor or Citigroup Global Markets Inc., Barclays Capital Inc., Drexel Hamilton, LLC or any other underwriter or dealer participating in this offering will arrange to send you the prospectus if you request it by calling toll-free 1-800-831-9146.
| 25 |
| STRUCTURAL OVERVIEW (continued) |
| Risk Retention | |
| Consultation Party | The risk retention consultation party will have certain non-binding consultation rights with respect to certain major decisions: (i) for so long as no Consultation Termination Event is continuing, with respect to any specially serviced loan (other than any outside serviced mortgage loan); and (ii) during the continuance of a Consultation Termination Event, with respect to any mortgage loan (other than any outside serviced mortgage loan), as further described in the Preliminary Prospectus. Notwithstanding the foregoing, the risk retention consultation party will not have any consultation rights with respect to any excluded RRCP mortgage loan. Citi Real Estate Funding Inc. is expected to appoint itself as the initial risk retention consultation party. |
| With respect to the risk retention consultation party, an “excluded RRCP mortgage loan” is a mortgage loan or loan combination with respect to which the risk retention consultation party or the person(s) entitled to appoint the risk retention consultation party is a Borrower Party. | |
| Termination of | |
| Special Servicer | At any time, prior to the occurrence and continuance of a Control Termination Event, the special servicer (but not any outside special servicer for any outside serviced loan combination) may be removed and replaced by the Controlling Class Representative (except with respect to any excluded mortgage loan) with or without cause upon satisfaction of certain conditions specified in the CGCMT 2017-P8 pooling and servicing agreement. |
After the occurrence and during the continuance of a Control Termination Event, the holders of at least 25% of the voting rights of the certificates (other than the Class S and Class R certificates) may request a vote to replace the special servicer (but not any outside special servicer for any outside serviced loan combination). The subsequent vote may result in the termination and replacement of the special servicer if, within 180 days of the initial request for that vote, the holders of (a) at least 66-2/3% of the voting rights allocable to the certificates of those holders that voted on the matter (provided that holders representing the applicable Certificateholder Quorum voted on the matter), or (b) more than 50% of the voting rights of each class of Non-Reduced Certificates (as defined under “Certain Definitions” below) vote affirmatively to so replace.
At any time after the occurrence and during the continuance of a Consultation Termination Event, if the operating advisor determines, in its sole discretion exercised in good faith, that (1) the special servicer has failed to comply with the servicing standard and (2) a replacement of the special servicer would be in the best interest of the certificateholders (as a collective whole), the operating advisor will have the right to recommend the replacement of the special servicer with respect to the serviced mortgage loans (but not any outside special servicer for any outside serviced loan combination), resulting in a solicitation of a certificateholder vote. The subsequent vote may result in the termination and replacement of the special servicer if, within 180 days of the initial request for that vote, the holders of at least a majority of the aggregate outstanding principal balance of the certificates of those holders that voted on the matter (provided that holders representing the applicable Certificateholder Quorum vote on the matter) vote affirmatively to so replace.
“Certificateholder Quorum” means a quorum that, (a) for purposes of a vote to terminate and replace the special servicer or the asset representations reviewer at the request of the holders of certificates evidencing not less than 25% of the voting rights (without regard to the application of any Appraisal Reduction Amounts), consists of the holders of certificates evidencing at least 50% of the aggregate voting rights (taking into account the allocation of any Appraisal Reduction Amounts to notionally reduce the certificate balances of the respective classes of Principal Balance Certificates) of all certificates (other than the Class S and Class R certificates), on an aggregate basis, and (b) for purposes of a vote to terminate and replace the special servicer based on a recommendation of the operating advisor, consists of the holders of certificates evidencing at least 20% of the aggregate of the outstanding principal balances of all certificates, with such quorum including at least three (3) holders that are not affiliated with each other.
The related outside special servicer under each outside servicing agreement generally may be (or, if the applicable outside servicing agreement has not yet been executed, it is anticipated that such outside special servicer may be) replaced by the related outside controlling class representative (or an equivalent party), or the vote of the requisite holders of certificates issued, under the applicable outside servicing agreement (depending on whether or not the equivalent of a control termination event or a consultation termination event exists under that outside servicing agreement) or by any applicable other controlling noteholder in a manner generally similar to the manner in which the special servicer may be replaced under the CGCMT 2017-P8 pooling and servicing agreement as described in the four preceding paragraphs (although there will be differences, in particular as regards certificateholder votes and the timing of when an outside special servicer may be terminated based on the recommendation of an operating advisor, and in some cases, the related outside servicing agreement may not include an operating advisor as a party). |
The depositor has filed a registration statement (including a prospectus) with the Securities and Exchange Commission (“SEC”) (SEC File No. 333-207132) for the offering to which this communication relates. Before you invest, you should read the prospectus in the registration statement and other documents the depositor has filed with the SEC for more complete information about the depositor, the issuing entity and this offering. You may get these documents for free by visiting EDGAR on the SEC website at www.sec.gov. Alternatively, the depositor or Citigroup Global Markets Inc., Barclays Capital Inc., Drexel Hamilton, LLC or any other underwriter or dealer participating in this offering will arrange to send you the prospectus if you request it by calling toll-free 1-800-831-9146.
| 26 |
| STRUCTURAL OVERVIEW (continued) |
| Termination of | |
| Special Servicer | |
| (continued) | If the special servicer, to its knowledge, becomes a Borrower Party with respect to a mortgage loan, the special servicer will not be permitted to act as special servicer with respect to that mortgage loan. Subject to certain limitations described in the Preliminary Prospectus, the Controlling Class Representative (so long as it is not itself a Borrower Party with respect to the applicable mortgage loan and so long as no Control Termination Event shall have occurred and be continuing) will be entitled to appoint a replacement special servicer for that mortgage loan. If the Controlling Class Representative is precluded from appointing a replacement special servicer or, if not so precluded, does not take action to appoint a replacement special servicer, a replacement special servicer will be appointed in the manner specified in the CGCMT 2017-P8 pooling and servicing agreement. |
| Servicing Standard | Each of the serviced loans will be serviced and administered by the master servicer and the special servicer pursuant to the terms of the CGCMT 2017-P8 pooling and servicing agreement. In all circumstances, each of the master servicer and the special servicer is obligated to act in the best interests of the certificateholders and the holders of the serviced companion loans as a collective whole as if such certificateholders and holders of the serviced companion loans constituted a single lender. The special servicer is required to determine the effect on net present value of various courses of action (including workout or foreclosure), using the Calculation Rate as the discount rate, and pursue the course of action that it determines would maximize recovery on a net present value basis. |
| “Calculation Rate” means, for principal and interest payments on a mortgage loan or proceeds from the sale of a defaulted loan, the highest of (i) the rate determined by the master servicer or the special servicer, as applicable, that approximates the market rate that would be obtainable by borrowers on similar debt of the borrowers as of such date of determination, (ii) the mortgage loan rate and (iii) the yield on 10-year US treasuries; and for all other cash flows, including property cash flow, the “discount rate” set forth in the most recent appraisal (or update of such appraisal). | |
| Voting Rights | At all times during the term of the CGCMT 2017-P8 pooling and servicing agreement, the voting rights for the certificates will be allocated among the respective classes of certificateholders as follows: |
| (1) | 1% in the aggregate in the case of the respective classes of the Class X Certificates, allocatedpro rata based upon their respective notional amounts as of the date of determination (for so long as the notional amount of at least one class of the Class X Certificates is greater than zero), and |
| (2) | in the case of any class of Principal Balance Certificates, a percentage equal to the product of 99% (or, if the notional amounts of all classes of the Class X Certificates have been reduced to zero, 100%) and a fraction, the numerator of which is equal to the certificate balance of such class of Principal Balance Certificates as of the date of determination, and the denominator of which is equal to the aggregate of the certificate balances of all classes of the Principal Balance Certificates, in each case, as of the date of determination, |
| provided, that in certain circumstances described under “The Pooling and ServicingAgreement” in the Preliminary Prospectus, voting rights will only be exercisable by holders of the Non-Reduced Certificates and/or may otherwise be exercisable or allocated in a manner that takes into account the allocation of Appraisal Reduction Amounts. | |
| The voting rights of any class of certificates are required to be allocated among certificateholders of such class in proportion to their respective percentage interests. | |
| The Class S and Class R certificates will not be entitled to any voting rights. |
| Servicing | |
| Compensation | Modification Fees: Certain fees resulting from modifications, amendments, waivers or other changes to the terms of the loan documents, as more fully described in the Preliminary Prospectus, will be used to offset expenses on the related serviced mortgage loan (i.e. reimburse the trust for certain expenses including unreimbursed advances and interest on unreimbursed advances previously incurred (other than special servicing fees, workout fees and liquidation fees) on the related serviced mortgage loan but not yet reimbursed to the trust or servicers or to pay expenses (other than special servicing fees, workout fees and liquidation fees) that are still outstanding in each case unless as part of the written modification the related borrower is required to pay these amounts on a going forward basis or in the future). Any excess modification fees not so applied to offset expenses will be available as compensation to the master servicer and/or special servicer. Within any prior 12 month period, all such excess modification fees earned by the master servicer or by the special servicer (after taking into account the offset described below applied during such 12-month period) with respect to any serviced mortgage loan will be subject to a cap equal to the greater of (i) 1% of the outstanding principal balance of such mortgage loan after giving effect to such transaction and (ii) $25,000.
All excess modification fees earned by the special servicer will be required to offset any future workout fees or liquidation fees payable with respect to the related serviced mortgage loan or related REO property; provided, that if the serviced mortgage loan ceases being a corrected loan, and is subject to a subsequent modification, any excess modification fees earned by the special servicer prior to such serviced mortgage loan ceasing to be a corrected loan will no longer be offset against future liquidation fees and workout fees unless such serviced mortgage loan ceased to be a corrected loan within 18 months of it becoming a modified mortgage loan. |
The depositor has filed a registration statement (including a prospectus) with the Securities and Exchange Commission (“SEC”) (SEC File No. 333-207132) for the offering to which this communication relates. Before you invest, you should read the prospectus in the registration statement and other documents the depositor has filed with the SEC for more complete information about the depositor, the issuing entity and this offering. You may get these documents for free by visiting EDGAR on the SEC website at www.sec.gov. Alternatively, the depositor or Citigroup Global Markets Inc., Barclays Capital Inc., Drexel Hamilton, LLC or any other underwriter or dealer participating in this offering will arrange to send you the prospectus if you request it by calling toll-free 1-800-831-9146.
| 27 |
| STRUCTURAL OVERVIEW (continued) |
| Servicing | |
| Compensation | Penalty Fees: All late fees and default interest will first be used to reimburse certain expenses previously incurred with respect to the related mortgage loan (other than special servicing fees, workout fees and liquidation fees) but not yet reimbursed to the trust, the master servicer or the special servicer or to pay certain expenses (other than special servicing fees, workout fees and liquidation fees) that are still outstanding on the related mortgage loan, and any excess received with respect to a serviced loan will be paid to the master servicer (for penalty fees accrued while a non-specially serviced loan) and the special servicer (for penalty fees accrued while a specially serviced loan). To the extent any amounts reimbursed out of penalty charges are subsequently recovered on a related serviced loan, they will be paid to the master servicer or special servicer who would have been entitled to the related penalty charges that were previously used to reimburse such expense.
Liquidation / Workout Fees: Liquidation fees will be calculated at the lesser of (a) 1.0% and (b) such rate as would result in a liquidation fee of $1,000,000, for each serviced loan that is a specially serviced loan and any REO property, subject in any case to a minimum liquidation fee of $25,000. For any serviced loan that is a corrected loan, workout fees will be calculated at the lesser of (a) 1.0% and (b) such rate as would result in a workout fee of $1,000,000 when applied to each expected payment of principal and interest (other than default interest and excess interest) on the related serviced loan from the date such serviced loan becomes a corrected mortgage loan through and including the then related maturity date, subject in any case to a minimum workout fee of $25,000.
Notwithstanding the foregoing, in connection with a maturity default, no liquidation or workout fee will be payable in connection with a payoff or refinancing of the related serviced loan within 90 days of the maturity default, but the special servicer may collect and retain appropriate fees from the related borrower in connection with the subject liquidation or workout.
In the case of an outside serviced loan combination, calculation of the foregoing amounts payable to the related outside servicer or outside special servicer may be different than as described above. For example, the extent to which modification fees and penalty fees are applied to offset expenses may be different and liquidation fees and workout fees may be subject to different caps or no caps. |
| Operating Advisor | The operating advisor will, in general and under certain circumstances described in the Preliminary Prospectus, have the following rights and responsibilities with respect to the serviced mortgage loans: |
| ● | after the occurrence and during the continuance of a Control Termination Event, reviewing the actions of the special servicer with respect to specially serviced loans; |
| ● | reviewingreports provided by the special servicer to the extent set forth in the CGCMT 2017-P8 pooling and servicing agreement; |
| ● | reviewing foraccuracy certain calculations made by the special servicer; |
| ● | after the occurrence and during the continuance of a Control Termination Event, under certain conditions described in the CGCMT 2017-P8 pooling and servicing agreement, issuing anannual report generally setting forth, among other things, its assessment of whether the special servicer is performing its duties in compliance with the servicing standard and the CGCMT 2017-P8 pooling and servicing agreement and identifying any material deviations therefrom; |
| ● | after the occurrence and during the continuance of a Consultation Termination Event, recommending the replacement of the special servicer if the operating advisor determines, in its sole discretion exercised in good faith, that (1) the special servicer has failed to comply with the servicing standard and (2) a replacement of the special servicer would be in the best interest of the certificateholders (as a collective whole); and |
| ● | after theoccurrence and during the continuance of a Control Termination Event, consulting on a non-binding basis with the special servicer with respect to certain major decisions (and such other matters as are set forth in the CGCMT 2017-P8 pooling and servicing agreement) in respect of the applicable serviced mortgage loan(s) and/or related companion loan(s). |
Notwithstanding the foregoing, the operating advisor will generally have no obligations or consultation rights as operating advisor under the CGCMT 2017-P8 pooling and servicing agreement with respect to any outside serviced mortgage loan or any related REO property.
The operating advisor will be subject to termination and replacement if the holders of at least 15% of the voting rights of Non-Reduced Certificates vote to terminate and replace the operating advisor and such termination and replacement is affirmatively voted for by the holders of more than 50% of the voting rights allocable to the Non-Reduced Certificates of those holders that exercise their right to vote (provided that holders entitled to exercise at least 50% of the voting rights allocable to the Non-Reduced Certificates exercise their right to vote within 180 days of the initial request for a vote). The holders initiating such vote will be responsible for the fees and expenses in connection with the vote and replacement.
See “The Pooling and Servicing Agreement—Operating Advisor”in the Preliminary Prospectus. |
The depositor has filed a registration statement (including a prospectus) with the Securities and Exchange Commission (“SEC”) (SEC File No. 333-207132) for the offering to which this communication relates. Before you invest, you should read the prospectus in the registration statement and other documents the depositor has filed with the SEC for more complete information about the depositor, the issuing entity and this offering. You may get these documents for free by visiting EDGAR on the SEC website at www.sec.gov. Alternatively, the depositor or Citigroup Global Markets Inc., Barclays Capital Inc., Drexel Hamilton, LLC or any other underwriter or dealer participating in this offering will arrange to send you the prospectus if you request it by calling toll-free 1-800-831-9146.
| 28 |
| STRUCTURAL OVERVIEW (continued) |
| Asset Representations | |
| Reviewer | The asset representations reviewer will be required to review certain delinquent mortgage loans after a specified delinquency threshold has been exceeded and the required percentage of certificateholders vote to direct a review of such delinquent mortgage loans. An asset review will occur when either (1) mortgage loans with an aggregate outstanding principal balance of 25% or more of the aggregate outstanding principal balance of all of the mortgage loans (including any REO loans) held by the issuing entity as of the end of the applicable collection period are at least 60 days delinquent in respect of their related monthly payments or balloon payment, if any (for purposes of this paragraph, “delinquent loans”) or (2) at least 15 mortgage loans are delinquent loans as of the end of the applicable collection period and the aggregate outstanding principal balance of such delinquent loans constitutes at least 20% of the aggregate outstanding principal balance of all of the mortgage loans (including any REO loans) held by the issuing entity as of the end of the applicable collection period. |
| The asset representations reviewer may be terminated and replaced without cause. Upon (i) the written direction of certificateholders evidencing not less than 25% of the voting rights requesting a vote to terminate and replace the asset representations reviewer with a proposed successor asset representations reviewer that is an eligible asset representations reviewer, and (ii) payment by such holders to the certificate administrator of the reasonable fees and expenses to be incurred by the certificate administrator in connection with administering such vote, the certificate administrator will promptly provide notice of such request to all certificateholders and the asset representations reviewer by posting such notice on its internet website, and by mailing such notice to all certificateholders and the asset representations reviewer. Upon the affirmative vote of certificateholders evidencing at least 75% of the voting rights allocable to those holders that exercise their right to vote (provided that holders representing the applicable Certificateholder Quorum exercise their right to vote within 180 days of the initial request for a vote), the trustee will be required to terminate all of the rights and obligations of the asset representations reviewer under the CGCMT 2017-P8 pooling and servicing agreement by written notice to the asset representations reviewer, and the proposed successor asset representations reviewer will be appointed. See “The Pooling and Servicing Agreement—The Asset Representations Reviewer” in the Preliminary Prospectus. | |
| Dispute Resolution | |
| Provisions | The mortgage loan sellers will be subject to the dispute resolution provisions set forth in the CGCMT 2017-P8 pooling and servicing agreement to the extent those provisions are triggered with respect to any mortgage loan sold to the depositor by a mortgage loan seller and such mortgage loan seller will be obligated under the related mortgage loan purchase agreement to comply with all applicable provisions and to take part in any mediation or arbitration proceedings that may result. |
Generally, in the event that a Repurchase Request (as defined in the Preliminary Prospectus) is not “Resolved” (as defined below) within 180 days after the related mortgage loan seller receives such Repurchase Request, then the enforcing servicer will be required to send a notice to the “Initial Requesting Certificateholder” (if any) indicating the enforcing servicer’s intended course of action with respect to the Repurchase Request. If (a) the enforcing servicer’s intended course of action with respect to the Repurchase Request does not involve pursuing further action to exercise rights against the applicable mortgage loan seller with respect to the Repurchase Request and the Initial Requesting Certificateholder, if any, or any other certificateholder or certificate owner wishes to exercise its right to refer the matter to mediation (including nonbinding arbitration) or arbitration, or (b) the enforcing servicer’s intended course of action is to pursue further action to exercise rights against the related mortgage loan seller with respect to the Repurchase Request but the Initial Requesting Certificateholder, if any, or any other certificateholder or certificate owner does not agree with the dispute resolution method selected by the enforcing servicer, then the Initial Requesting Certificateholder, if any, or such other certificateholder or certificate owner may deliver a written notice to the enforcing servicer indicating its intent to exercise its right to refer the matter to either mediation or arbitration. In addition, any other certificateholder or certificate owner may deliver, within the time frame provided in the CGCMT 2017-P8 pooling and servicing agreement, a written notice requesting the right to participate in any dispute resolution consultation that is conducted by the enforcing servicer following the enforcing servicer’s receipt of the notice described in the preceding sentence.
“Resolved” means, with respect to a Repurchase Request, (i) that any material breach of representations and warranties or a material document defect has been cured, (ii) the related mortgage loan has been repurchased in accordance with the related mortgage loan purchase agreement, (iii) a mortgage loan has been substituted for the related mortgage loan in accordance with the related mortgage loan purchase agreement, (iv) the applicable mortgage loan seller has made a “loss of value payment”, (v) a contractually binding agreement has been entered into between the enforcing servicer, on behalf of the issuing entity, and the related mortgage loan seller that settles the related mortgage loan seller’s obligations under the related mortgage loan purchase agreement, or (vi) the related mortgage loan is no longer property of the issuing entity as a result of a sale or other disposition in accordance with the CGCMT 2017-P8 pooling and servicing agreement. See “The Pooling and Servicing Agreement—Dispute Resolution Provisions” in the Preliminary Prospectus. |
The depositor has filed a registration statement (including a prospectus) with the Securities and Exchange Commission (“SEC”) (SEC File No. 333-207132) for the offering to which this communication relates. Before you invest, you should read the prospectus in the registration statement and other documents the depositor has filed with the SEC for more complete information about the depositor, the issuing entity and this offering. You may get these documents for free by visiting EDGAR on the SEC website at www.sec.gov. Alternatively, the depositor or Citigroup Global Markets Inc., Barclays Capital Inc., Drexel Hamilton, LLC or any other underwriter or dealer participating in this offering will arrange to send you the prospectus if you request it by calling toll-free 1-800-831-9146.
| 29 |
| STRUCTURAL OVERVIEW (continued) |
| Credit Risk Retention | This securitization transaction will be subject to the credit risk retention rules of Section 15G of the Securities Exchange Act of 1934, as amended. An economic interest in the credit risk of the mortgage loans in this transaction is expected to be retained pursuant to Regulation RR (17 CFR § 246.1et seq) promulgated under Section 15G (“Regulation RR”), as an “eligible vertical interest” in the form of the VRR Interest. Citi Real Estate Funding Inc. will act as retaining sponsor under Regulation RR and is expected, on the Closing Date, to (i) offset portions of its risk retention obligation by the acquisition by each of Macquarie US Trading LLC d/b/a Principal Commercial Capital, Starwood Mortgage Capital LLC, or a “majority-owned affiliate” (as defined in Regulation RR), and Barclays Bank PLC of a pro rata portion (based on the respective percentages of the mortgage loans originated by Macquarie US Trading LLC d/b/a Principal Commercial Capital, Starwood Mortgage Capital LLC and Barclays Bank PLC) of the VRR Interest and (ii) satisfy a portion of its risk retention requirements through the acquisition by Citigroup Global Markets Realty Corp., a “majority-owned affiliate” of the retaining sponsor, of the remaining portion of the VRR Interest. For a further discussion of the manner in which the credit risk retention requirements are expected to be satisfied by Citi Real Estate Funding Inc. as retaining sponsor, see “Credit Risk Retention” in the Preliminary Prospectus. |
| Investor Communications | The certificate administrator is required to include on any Form 10–D any request received from a certificateholder to communicate with other certificateholders related to certificateholders exercising their rights under the terms of the CGCMT 2017-P8 pooling and servicing agreement. Any certificateholder wishing to communicate with other certificateholders regarding the exercise of its rights under the terms of the CGCMT 2017-P8 pooling and servicing agreement will be able to deliver a written request signed by an authorized representative of the requesting investor to the certificate administrator. |
| Deal Website | The certificate administrator will maintain a deal website including, but not limited to: |
—all special notices delivered.
—summaries of final asset status reports.
—all appraisals in connection with an appraisal reduction plus any subsequent appraisal updates.
—an “Investor Q&A Forum” and a voluntary investor registry. | |
| Cleanup Call | On any Distribution Date on which the aggregate unpaid principal balance of the mortgage loans remaining in the issuing entity is less than 1% of the aggregate principal balance of the pool of mortgage loans as of the Cut-off Date, certain specified persons will have the option to purchase all of the remaining mortgage loans (and all property acquired through exercise of remedies in respect of any mortgage loan) at the price specified in the Preliminary Prospectus. Exercise of the option will terminate the issuing entity and retire the then outstanding certificates. |
| If the aggregate certificate balances of the Class A-1, Class A-2, Class A-3, Class A-4, Class A-AB, Class A-S, Class B, Class C and Class D certificates and the notional amounts of the Class X-A, Class X-B, Class X-C and Class X-D certificates have been reduced to zero and if the master servicer has received from the remaining certificateholders the payment specified in the CGCMT 2017-P8 pooling and servicing agreement, the issuing entity could also be terminated in connection with an exchange of all the then-outstanding certificates (excluding the Class S and Class R certificates) for the mortgage loans remaining in the issuing entity, as further described under “The Pooling and Servicing Agreement—Optional Termination; Optional Mortgage Loan Purchase” in the Preliminary Prospectus. |
The Certificates involve certain risks and may not be suitable for all investors. For information regarding certain risks associated with an investment in the Certificates, see “Risk Factors” in the Preliminary Prospectus. Capitalized terms used but not otherwise defined in this Term Sheet have the respective meanings assigned to those terms in the Preliminary Prospectus.
The depositor has filed a registration statement (including a prospectus) with the Securities and Exchange Commission (“SEC”) (SEC File No. 333-207132) for the offering to which this communication relates. Before you invest, you should read the prospectus in the registration statement and other documents the depositor has filed with the SEC for more complete information about the depositor, the issuing entity and this offering. You may get these documents for free by visiting EDGAR on the SEC website at www.sec.gov. Alternatively, the depositor or Citigroup Global Markets Inc., Barclays Capital Inc., Drexel Hamilton, LLC or any other underwriter or dealer participating in this offering will arrange to send you the prospectus if you request it by calling toll-free 1-800-831-9146.
| 30 |
| CERTAIN DEFINITIONS (continued) |
| ■ | “ADR”: For any hospitality property, average daily rate. |
| ■ | “Appraised Value”: With respect to each mortgaged property and any date of determination, the most current appraised value of such mortgaged property as determined by an appraisal of the mortgaged property and in accordance with MAI standards made not more than 4 months prior to the origination date of the related mortgage loan. The Appraised Value for each mortgaged property is an “as-is” appraised value, except as set forth under the definition of “Appraised Value” in, and/or in the footnotes to Annex A to, the Preliminary Prospectus. |
| ■ | “Borrower Sponsor”: The indirect owner, or one of the indirect owners, of the related borrower (in whole or in part) that may or may not have control of the related borrower. The Borrower Sponsor may be, but is not necessarily, the entity that acts as the guarantor of the non-recourse carveouts. |
| ■ | “Cut-off Date LTV Ratio”: With respect to each mortgage loan, the ratio, expressed as a percentage of (1) the Cut-off Date Balance of that mortgage loan (together with the Cut-off Date Balance of any related pari passu companion loan(s) in the case of a loan combination, but without regard to any subordinate companion loan(s)) divided by (2) the Appraised Value of the related mortgaged property or portfolio of mortgaged properties, except as set forth under the definition of “Cut-off Date LTV Ratio” in, and in the footnotes to Annex A to, the Preliminary Prospectus, including, without limitation, that for certain mortgage loans, the Cut-off Date LTV Ratio may have been calculated using (i) an “as-stabilized” or similar value for the related mortgaged property or mortgaged properties or (ii) an “as-is portfolio value”, which represents the appraised value for a portfolio of mortgaged properties as a whole and not the sum of the appraised values for each of the individual mortgaged properties. |
| ■ | “FF&E”: Furniture, fixtures and equipment. |
| ■ | “GLA”: Gross leasable area. |
| ■ | “Hard Lockbox”: The borrower is required to direct the tenants to pay rents directly to a lockbox account controlled by the lender. Hospitality, mixed use, multifamily and manufactured housing community properties are considered to have a hard lockbox if credit card receivables are required to be deposited directly into the lockbox account even though cash, checks or “over the counter” receipts are deposited by the manager of the related mortgaged property into the lockbox account controlled by the lender. |
| ■ | “Maturity Date/ARD LTV Ratio”: With respect to each mortgage loan, the ratio, expressed as a percentage of (1) the Balloon Balance of that mortgage loan (together with the Balloon Balance of any related pari passu companion loan(s) in the case of a loan combination, but without regard to any subordinate companion loan(s)), divided by (2) the Appraised Value of the related mortgaged property or portfolio of mortgaged properties, except as set forth under the definition of “Maturity Date/ARD LTV Ratio” in, and in the footnotes to Annex A to, the Preliminary Prospectus, including, without limitation, that for certain mortgage loans, the Maturity Date/ARD LTV Ratio may have been calculated using (i) an “as-stabilized” or similar value for the related mortgaged property or mortgaged properties or (ii) an “as-is portfolio value”, which represents the appraised value for a portfolio of mortgaged properties as a whole and not the sum of the appraised values for each of the individual mortgaged properties. |
| ■ | “MSA”: Metropolitan statistical area. |
| ■ | “Non-owned Anchor(s)”: Tenants that occupy space equal to or greater than 30,000 SF at the related mortgaged property, which occupied space is not owned by the related borrower and is not part of the collateral for the related mortgage loan. |
| ■ | “Non-owned Junior Anchor(s)”: Tenants that occupy space equal to or greater than 10,000 SF at the related mortgaged property and less than 30,000 SF at the related mortgaged property, which occupied space is not owned by the related borrower and is not part of the collateral for the related mortgage loan. |
| ■ | “Non-owned Outparcel(s)”: Freestanding tenants that occupy space at the property that is separated from the rest of the tenants at the applicable mortgaged property which space occupied by those freestanding tenants is not owned by the related borrower and is not part of the collateral for the related mortgage loan. |
| ■ | “Non-Reduced Certificates”: Each class of Principal Balance Certificates that has an outstanding certificate balance as may be notionally reduced by any appraisal reduction amounts allocated to that class, equal to or greater than 25% of an amount equal to the initial certificate balance of that class of certificates minus all principal payments made on such class of certificates. |
| ■ | “Occupancy Cost”:With respect to any mortgaged property, total rental revenues divided by total sales. |
| ■ | “Owned Anchor(s)”: Tenants that lease space equal to or greater than 30,000 SF at the related mortgaged property, which leased space is owned by the related borrower and is part of the collateral for the related mortgage loan. |
| ■ | “Owned GLA”: With respect to any particular mortgaged property, the GLA of the space that is owned by the related borrower and is part of the collateral for the related mortgage loan. |
| ■ | “Owned Junior Anchor(s)”: Tenants that lease space equal to or greater than 10,000 SF and less than 30,000 SF at the related mortgaged property, which leased space is owned by the related borrower and is part of the collateral for the related mortgage loan. |
| ■ | “Owned Occupancy”: With respect to any particular mortgaged property, as of a certain date (or, in the case of a hospitality property, for a trailing 12-month period ending on a certain date), the percentage of net rentable square footage, available rooms, units or beds that are leased or rented (as applicable), solely with respect to the aggregate leased space, available rooms, units or beds in the property that is owned by the related borrower. In some cases Owned Occupancy was based on assumptions regarding occupancy, such as assumptions that a certain tenant at the mortgaged property that has executed a lease, but has not yet taken occupancy and/or has not yet commenced paying rent, will take occupancy on a future date generally expected to occur within twelve months after the Cut-off Date; assumptions regarding the renewal of particular leases and/or the re-leasing of certain space at the related mortgaged property; in some cases, assumptions regarding leases under negotiation being executed; in some cases, assumptions regarding tenants taking additional space in the future if currently committed to do so or, in some cases, the exclusion of dark tenants, tenants with material aged receivables, tenants that may have already given notice to vacate their space, bankrupt tenants that have not yet affirmed their lease and certain additional leasing assumptions. |
| ■ | “Owned Outparcel(s)”: Freestanding tenants that occupy space at the mortgaged property that is separated from the rest of the tenants at the applicable mortgaged property which space occupied by those freestanding tenants is owned by the related borrower and is part of the collateral for the related mortgage loan. |
The depositor has filed a registration statement (including a prospectus) with the Securities and Exchange Commission (“SEC”) (SEC File No. 333-207132) for the offering to which this communication relates. Before you invest, you should read the prospectus in the registration statement and other documents the depositor has filed with the SEC for more complete information about the depositor, the issuing entity and this offering. You may get these documents for free by visiting EDGAR on the SEC website at www.sec.gov. Alternatively, the depositor or Citigroup Global Markets Inc., Barclays Capital Inc., Drexel Hamilton, LLC or any other underwriter or dealer participating in this offering will arrange to send you the prospectus if you request it by calling toll-free 1-800-831-9146.
| 31 |
| CERTAIN DEFINITIONS (continued) |
| ■ | “Owned Tenant(s)”: Tenants whose leased space at the related mortgaged property is owned by the related borrower and is part of the collateral for the related mortgage loan. |
| ■ | “Rating Agency Confirmation”: With respect to any matter, confirmation in writing (which may be in electronic form) by each applicable rating agency engaged by the depositor that a proposed action, failure to act or other event so specified will not, in and of itself, result in the downgrade, withdrawal or qualification of the then current rating assigned by that rating agency to any class of certificates. However, such confirmation will be deemed received or not required in certain circumstances as further described in the Preliminary Prospectus. See “The Pooling and Servicing Agreement—Rating Agency Confirmations”in the Preliminary Prospectus. |
| ■ | “RevPAR”: With respect to any hospitality property, revenues per available room. |
| ■ | “SF”: Square feet. |
| ■ | “Soft Lockbox”: An account into which either (i) the related borrower is required to deposit, or cause the property manager to deposit, all rents collected into a lockbox account (rather than tenants directly depositing such amounts), or (ii) in the case of hospitality, mixed use, multifamily and manufactured housing community properties, all credit card receivables, cash, checks and “over the counter” receipts are deposited into a lockbox account by the borrower or property manager (rather than credit card companies directly depositing credit card receivables);provided, that in the case of certain flagged hospitality properties, the property manager may instead be required to deposit only the portion of rents that is payable to the borrower, which may be net of hotel reserves, management fees and operating expenses that are payable to the property manager. |
| ■ | “Soft Springing Lockbox”: An account initially established as a Soft Lockbox; provided, that upon the occurrence of an event of default or one or more specified trigger events under the related loan documents, the lockbox account converts to a Hard Lockbox. |
| ■ | “Springing Lockbox”: An account that is not currently in place, but the related loan documents require the imposition of a lockbox account upon the occurrence of an event of default or one or more specified trigger events under the related loan documents. |
| ■ | “Total Occupancy”: With respect to any particular mortgaged property, as of a certain date (or, in the case of a hospitality property, for a trailing 12-month period ending on a certain date), the percentage of net rentable square footage, available rooms, units or beds that are leased or rented (as applicable), for the aggregate leased space, available rooms, units or beds at the mortgaged property, including any space that is owned by the related borrower and is part of the collateral in addition to any space that is owned by the applicable tenant and not part of the collateral for the related mortgage loan. In some cases Total Occupancy was calculated based on assumptions regarding occupancy, such as the assumption that a certain tenant at the mortgaged property that has executed a lease, but has not yet taken occupancy and/or has not yet commenced paying rent, will take occupancy on a future date generally expected to occur within twelve months after the Cut-off Date; assumptions regarding the renewal of particular leases and/or the re-leasing of certain space at the related mortgaged property; in some cases, assumptions regarding leases under negotiation being executed; in some cases, assumptions regarding tenants taking additional space in the future if currently committed to do so or, in some cases, the exclusion of dark tenants, tenants with material aged receivables, tenants that may have already given notice to vacate their space, bankrupt tenants that have not yet affirmed their lease and certain additional leasing assumptions. |
| ■ | “TRIPRA”: Terrorism Risk Insurance Program Reauthorization Act of 2015. |
| ■ | “TTM”: Trailing twelve months. |
| ■ | “Underwritten Expenses”: With respect to any mortgage loan or mortgaged property, an estimate of operating expenses, as determined by the related sponsor and generally derived from historical expenses at the mortgaged property(-ies), the borrower’s budget or appraiser’s estimate, in some cases adjusted for significant occupancy increases and a market-rate management fee. We cannot assure you that the assumptions made with respect to any mortgaged property will, in fact, be consistent with that mortgaged property’s actual performance. |
| ■ | “Underwritten NCF”: With respect to any mortgage loan or mortgaged property, cash flow available for debt service, generally equal to the Underwritten NOI decreased by an amount that the related sponsor has determined for tenant improvements and leasing commissions and / or replacement reserves for capital items. Underwritten NCF does not reflect debt service or non-cash items such as depreciation or amortization. With respect to each of the General Motors Building, Long Island Prime Portfolio - Uniondale, 3901 North First Street, 245 Park Avenue and Lindbergh Plaza mortgage loans, in the case of certain investment grade-rated or institutional entities (or their subsidiaries) that are tenants at the related mortgaged property, Underwritten NCF is based on the “straight line” rent of those tenants generally over the lesser of the term of the related lease and the term of the related mortgage loan (or, in the case of the General Motors Building mortgage loan, the term of the related lease which extends beyond the term of such mortgage loan). Underwritten NCF for other mortgage loans may also include straight line rent for certain tenants. The Underwritten NCF for each mortgaged property is calculated based on the basis of numerous assumptions and subjective judgments (including, but not limited to, with respect to future occupancy and rental rates), which, if ultimately proved erroneous, could cause the actual net cash flow for the mortgaged property to differ materially from the Underwritten NCF set forth in this Term Sheet. In some cases, historical net cash flow for a particular mortgaged property, and/or the net cash flow assumed by the applicable appraiser in determining the Appraised Value of the mortgaged property, may be less (and, perhaps, materially less) than the Underwritten NCF shown in this Term Sheet for such mortgaged property. No representation is made as to the future cash flows of the mortgaged properties, nor are the Underwritten NCFs set forth in the Preliminary Prospectus intended to represent such future cash flows. See “Risk Factors—Underwritten Net Cash Flow Could Be Based on Incorrect or Failed Assumptions” in the Preliminary Prospectus. |
| ■ | “Underwritten NOI”: With respect to any mortgage loan or mortgaged property, Underwritten Revenues less Underwritten Expenses, as both are determined by the related sponsor, based in part upon borrower supplied information (including but not limited to a rent roll, leases, operating statements and budget) for a recent period which is generally the 12 months prior to the origination date or acquisition date of the mortgage loan (or loan combination, if applicable), adjusted for specific property, tenant and market considerations. Historical operating statements may not be available for newly constructed mortgaged properties, mortgaged properties with triple net leases, mortgaged properties that have recently undergone substantial renovations and/or newly acquired mortgaged properties. The Underwritten NOI for each mortgaged property is calculated based on the basis of numerous assumptions and subjective judgments (including, but not limited to, with respect to future occupancy and rental rates), which, if ultimately proved erroneous, could cause the actual net operating income for the mortgaged property to differ materially from the Underwritten NOI set forth in this Term Sheet. In some cases, historical net operating income for a particular mortgaged property, and/or the net operating income assumed by the applicable appraiser in determining the Appraised Value of the mortgaged property, may be less (and, perhaps, materially less) than the Underwritten NOI shown in this Term Sheet for such mortgaged property. With respect to each of the General Motors Building, Long Island Prime Portfolio - Uniondale, 3901 North First Street, 245 Park Avenue and Lindbergh Plaza mortgage loans, in the case of certain investment grade-rated or institutional entities (or their |
The depositor has filed a registration statement (including a prospectus) with the Securities and Exchange Commission (“SEC”) (SEC File No. 333-207132) for the offering to which this communication relates. Before you invest, you should read the prospectus in the registration statement and other documents the depositor has filed with the SEC for more complete information about the depositor, the issuing entity and this offering. You may get these documents for free by visiting EDGAR on the SEC website at www.sec.gov. Alternatively, the depositor or Citigroup Global Markets Inc., Barclays Capital Inc., Drexel Hamilton, LLC or any other underwriter or dealer participating in this offering will arrange to send you the prospectus if you request it by calling toll-free 1-800-831-9146.
| 32 |
| CERTAIN DEFINITIONS (continued) |
subsidiaries) that are tenants at the related mortgaged property, Underwritten NOI is based on the “straight line” rent of those tenants over the lesser of the term of the related lease and the term of the related mortgage loan (or, in the case of the General Motors Building mortgage loan, the term of the related lease which extends beyond the term of such mortgage loan). Underwritten NOI for other mortgage loans may also include straight line rent for certain tenants. No representation is made as to the future cash flows of the mortgaged properties, nor are the Underwritten NOIs set forth in this Term Sheet intended to represent such future cash flows. | |
| ■ | “Underwritten Revenues”: With respect to any mortgage loan or mortgaged property, an estimate of operating revenues, as determined by the related sponsor and generally derived from the rental revenue (which may include rental revenue related to reimbursement of tenant improvements and leasing commissions) based on leases in place, leases that have been executed but the tenant is not yet paying rent, month-to-month leases (based on current rent roll and annualized), leases that are being negotiated and expected to be signed, additional space that a tenant has committed to take as described under “Description of the Mortgage Pool—Tenant Issues” in the Preliminary Prospectus to the extent material, and in certain cases contractual rent steps generally within 12 months following the Cut-off Date, in certain cases certain appraiser estimates of rental income, and in some cases adjusted downward to market rates, with vacancy rates equal to the mortgaged property’s historical rate, current rate, market rate or an assumed vacancy as determined by the related sponsor; plus any additional recurring revenue fees. Additionally, in determining rental revenue for multifamily rental, manufactured housing community and self storage properties, the related sponsor either reviewed rental revenue shown on the certified rolling 12-month operating statements or annualized the rental revenue and reimbursement of expenses shown on rent rolls or recent partial year operating statements with respect to the prior one- to 12-month period or in some cases may have relied on information provided in the appraisal for market rental rates and vacancy. In certain cases, with respect to mortgaged properties with leases with rent increases or rent decreases during the term of the related mortgage loan, Underwritten Revenues were based on the average rent over the term of the mortgage loan. In some cases, the related sponsor included revenue otherwise payable by a tenant but for the existence of an initial “free rent” period or a permitted rent abatement while the leased space is built out. We cannot assure you that the assumptions made with respect to any mortgaged property will, in fact, be consistent with that mortgaged property’s actual performance. See “Description of the Mortgage Pool—Tenant Issues” in the Preliminary Prospectus. |
The depositor has filed a registration statement (including a prospectus) with the Securities and Exchange Commission (“SEC”) (SEC File No. 333-207132) for the offering to which this communication relates. Before you invest, you should read the prospectus in the registration statement and other documents the depositor has filed with the SEC for more complete information about the depositor, the issuing entity and this offering. You may get these documents for free by visiting EDGAR on the SEC website at www.sec.gov. Alternatively, the depositor or Citigroup Global Markets Inc., Barclays Capital Inc., Drexel Hamilton, LLC or any other underwriter or dealer participating in this offering will arrange to send you the prospectus if you request it by calling toll-free 1-800-831-9146.
| 33 |
LOAN #1: 225 & 233 Park Avenue south

The depositor has filed a registration statement (including a prospectus) with the Securities and Exchange Commission (“SEC”) (SEC File No. 333-207132) for the offering to which this communication relates. Before you invest, you should read the prospectus in the registration statement and other documents the depositor has filed with the SEC for more complete information about the depositor, the issuing entity and this offering. You may get these documents for free by visiting EDGAR on the SEC website at www.sec.gov. Alternatively, the depositor or Citigroup Global Markets Inc., Barclays Capital Inc., Drexel Hamilton, LLC or any other underwriter or dealer participating in this offering will arrange to send you the prospectus if you request it by calling toll-free 1-800-831-9146.
| 34 |
LOAN #1: 225 & 233 Park Avenue south
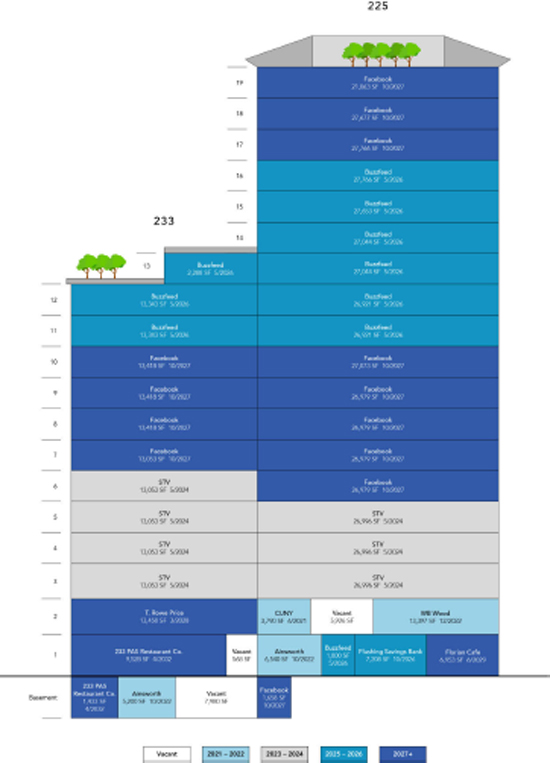
The depositor has filed a registration statement (including a prospectus) with the Securities and Exchange Commission (“SEC”) (SEC File No. 333-207132) for the offering to which this communication relates. Before you invest, you should read the prospectus in the registration statement and other documents the depositor has filed with the SEC for more complete information about the depositor, the issuing entity and this offering. You may get these documents for free by visiting EDGAR on the SEC website at www.sec.gov. Alternatively, the depositor or Citigroup Global Markets Inc., Barclays Capital Inc., Drexel Hamilton, LLC or any other underwriter or dealer participating in this offering will arrange to send you the prospectus if you request it by calling toll-free 1-800-831-9146.
| 35 |
LOAN #1: 225 & 233 Park Avenue south
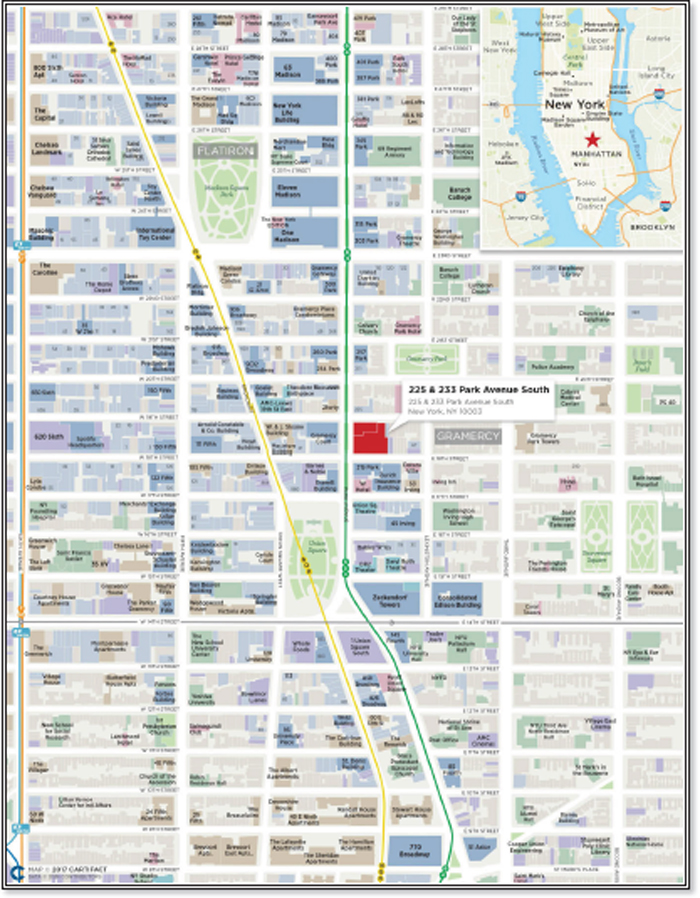
The depositor has filed a registration statement (including a prospectus) with the Securities and Exchange Commission (“SEC”) (SEC File No. 333-207132) for the offering to which this communication relates. Before you invest, you should read the prospectus in the registration statement and other documents the depositor has filed with the SEC for more complete information about the depositor, the issuing entity and this offering. You may get these documents for free by visiting EDGAR on the SEC website at www.sec.gov. Alternatively, the depositor or Citigroup Global Markets Inc., Barclays Capital Inc., Drexel Hamilton, LLC or any other underwriter or dealer participating in this offering will arrange to send you the prospectus if you request it by calling toll-free 1-800-831-9146.
| 36 |
LOAN #1: 225 & 233 Park Avenue south
| Mortgaged Property Information | Mortgage Loan Information | |||||||||||||||||
| Number of Mortgaged Properties | 1 | Loan Seller | Barclays | |||||||||||||||
| Location (City/State) | New York, New York | Cut-off Date Balance(3) | $60,000,000 | |||||||||||||||
| Property Type | Office | Cut-off Date Balance per SF(2) | $347.76 | |||||||||||||||
| Size (SF) | 675,756 | Percentage of Initial Pool Balance | 5.5% | |||||||||||||||
| Total Occupancy as of 5/24/2017 | 97.9% | Number of Related Mortgage Loans | None | |||||||||||||||
| Owned Occupancy as of 5/24/2017 | 97.9% | Type of Security | Fee Simple | |||||||||||||||
| Year Built / Latest Renovation | 1909-1910 / 1982, 2016-2017 | Mortgage Rate | 3.65140% | |||||||||||||||
| Appraised Value(1) | $750,000,000 | Original Term to Maturity (Months) | 120 | |||||||||||||||
| Appraisal Date(1) | 4/1/2017 | Original Amortization Term (Months) | NAP | |||||||||||||||
| Borrower Sponsor | Orda Management Corporation; Morton F. Silver | Original Interest Only Period (Months) | 120 | |||||||||||||||
| Property Management | Self-Managed | First Payment Date | 7/6/2017 | |||||||||||||||
| Maturity Date | 6/6/2027 | |||||||||||||||||
| Underwritten Revenues | $48,106,942 | |||||||||||||||||
| Underwritten Expenses | $18,601,103 | Escrows(4) | ||||||||||||||||
| Underwritten Net Operating Income (NOI) | $29,505,839 | Upfront | Monthly | |||||||||||||||
| Underwritten Net Cash Flow (NCF) | $28,439,583 | Taxes | $0 | $0 | ||||||||||||||
| Cut-off Date LTV Ratio(1)(2) | 31.3% | Insurance | $0 | $0 | ||||||||||||||
| Maturity Date LTV Ratio(1)(2) | 31.3% | Replacement Reserve | $0 | $0 | ||||||||||||||
| DSCR Based on Underwritten NOI / NCF(2) | 3.39x / 3.27x | TI/LC | $8,106,455 | $0 | ||||||||||||||
| Debt Yield Based on Underwritten NOI / NCF(2) | 12.6% / 12.1% | Other(5) | $26,393,540 | $0 | ||||||||||||||
| Sources and Uses | ||||||||||||||||||
| Sources | $ | % | Uses | $ | % | |||||||||||||
| Loan Combination Amount | $235,000,000 | 54.7% | Loan Payoff | $226,370,056 | 52.6% | |||||||||||||
| Mezzanine Debt | 195,000,000 | 45.3 | Principal Equity Distribution | 159,383,488 | 37.1 | |||||||||||||
| Reserves | 34,499,995 | 8.0 | ||||||||||||||||
| Closing Costs | 9,746,461 | 2.3 | ||||||||||||||||
| Total Sources | $430,000,000 | 100.0% | Total Uses | $430,000,000 | 100.0% | |||||||||||||
| (1) | The Appraised Value represents the “as-is assuming holdbacks” appraised value for the 225 & 233 Park Avenue South Property (as defined below), which assumes that all outstanding amounts for TI/LCs, free rent and capital expenditures are deposited into escrow on the origination date. The borrower deposited all such amounts into escrow on the origination date. The Cut-off Date LTV Ratio and Maturity Date LTV Ratio are calculated based on the “as-is assuming holdbacks” appraised value. The Cut-off Date LTV Ratio and Maturity Date LTV Ratio calculated based on the “as-is” appraised value of $720,000,000 are each 32.6%. |
| (2) | Calculated based on the aggregate outstanding principal balance of the 225 & 233 Park Avenue South Loan Combination (as defined below). |
| (3) | The Cut-off Date Balance of $60,000,000 represents the non-controlling note A-2, which is part of a loan combination evidenced by fourpari passu notes having an aggregate outstanding principal balance as of the Cut-off Date of $235,000,000. The related companion loans are evidenced by: (i) the controlling note A-1, which has an outstanding principal balance as of the Cut-off Date of $70,000,000 and was securitized in the WFCM 2017-C39 securitization transaction, (ii) the non-controlling note A-3, which has an outstanding principal balance as of the Cut-off Date of $60,000,000, is currently held by Barclays Bank PLC (“Barclays”) and is expected to be contributed to one or more future securitization transactions and (iii) the non-controlling note A-4, which has an outstanding principal balance as of the Cut-off Date of $45,000,000 and was securitized in the WFCM 2017-C38 securitization transaction. See “—The Mortgage Loan” below. |
| (4) | See “—Escrows” below. |
| (5) | Other upfront escrows include $11,529,288 for remaining capital expenditures and $14,864,252 for free rent. |
| ■ | The Mortgage Loan.The mortgage loan (the “225 & 233 Park Avenue South Loan”) is part of a loan combination (the “225 & 233 Park Avenue South Loan Combination”) evidenced by fourpari passu notes that are together secured by the borrower’s fee interest in two, contiguous office buildings located on Park Avenue South in New York, New York (the “225 & 233 Park Avenue South Property”). The 225 & 233 Park Avenue South Loan is evidenced by the non-controlling note A-2, which has an outstanding principal balance as of the Cut-off Date of $60,000,000 and represents approximately 5.5% of the Initial Pool Balance. The related companion loans (collectively, the “225 & 233 Park Avenue South Companion Loans”) are evidenced by: (i) the controlling note A-1, which had an original principal balance of $70,000,000, has an outstanding principal balance as of the Cut-off Date of $70,000,000 and was securitized in the WFCM 2017-C39 securitization transaction; (ii) the non-controlling note A-3, which had an original principal balance of $60,000,000, has an outstanding principal balance as of the Cut-off Date of $60,000,000, is currently held by Barclays and is expected to be contributed to one or more future securitization transactions; and (iii) the non-controlling note A-4, which had an original principal balance of $45,000,000, has an outstanding principal balance as of the Cut-off Date of $45,000,000 and was securitized in the WFCM 2017-C38 securitization transaction. The 225 & 233 Park Avenue South Loan Combination was originated by Barclays on May 31, 2017. Each note evidencing the 225 & 233 Park Avenue South Loan Combination has an interest rate of 3.65140%per annum. The borrower utilized the proceeds of the 225 & 233 Park Avenue South Loan Combination to refinance the existing debt on the 225 & 233 Park Avenue South Property, return equity to the borrower sponsors, fund reserves and pay origination costs. |
The 225 & 233 Park Avenue South Loan Combination had an initial term of 120 months and has a remaining term of 117 months as of the Cut-off Date. The 225 & 233 Park Avenue South Loan Combination requires interest only payments throughout the entire term. The scheduled maturity date of the 225 & 233 Park Avenue South Loan Combination is the due date in June 2027. Voluntary prepayment of the 225 & 233 Park Avenue South Loan Combination is permitted on or after the due date in February 2027. Defeasance of the 225 & 233 Park Avenue South Loan Combination with direct, non-callable obligations of the United States of America or other obligations
The depositor has filed a registration statement (including a prospectus) with the Securities and Exchange Commission (“SEC”) (SEC File No. 333-207132) for the offering to which this communication relates. Before you invest, you should read the prospectus in the registration statement and other documents the depositor has filed with the SEC for more complete information about the depositor, the issuing entity and this offering. You may get these documents for free by visiting EDGAR on the SEC website at www.sec.gov. Alternatively, the depositor or Citigroup Global Markets Inc., Barclays Capital Inc., Drexel Hamilton, LLC or any other underwriter or dealer participating in this offering will arrange to send you the prospectus if you request it by calling toll-free 1-800-831-9146.
| 37 |
LOAN #1: 225 & 233 Park Avenue south
which are “government securities” is permitted at any time after the earlier of May 31, 2020 or the second anniversary of the securitization of the last portion of the 225 & 233 Park Avenue South Loan Combination.
The 225 & 233 Park Avenue South Loan, which is evidenced by note A-2, received a credit assessment of A- by S&P, BBB+ by Fitch and A(low) by DBRS.
| ■ | The Mortgaged Property. The 225 & 233 Park Avenue South Property comprises two contiguous Class A office buildings, totaling 675,756 SF, located on Park Avenue South, between East 18th and East 19th Streets in Manhattan, New York. 225 Park Avenue South is a 19-story Class A office building with 503,104 SF built in 1910. 233 Park Avenue South is a 13-story Class A office building with 172,652 SF built in 1909. The two buildings operate as a single property, as they are interconnected on each floor. The 225 & 233 Park Avenue South Property provides various amenities, including, but not limited to, exclusive outdoor spaces on the roof of each building, bike storage and separate entrances (one on Park Avenue South and one on East 18th Street). The 225 & 233 Park Avenue South Property is located one block north of Union Square and one block south of Gramercy Park. According to the appraisal, the 225 & 233 Park Avenue South Property is considered to be located in a trendy, upscale neighborhood with access to restaurants, nightclubs, galleries, theaters and universities. |
Prior to 2014, the 225 & 233 Park Avenue South Property was 100.0% occupied by the Port Authority of New York and New Jersey (the “Port Authority”), STV and a few other tenants. Once the Port Authority elected to leave the building in 2015, the borrower sponsor commenced an approximately $133 million capital improvement plan for the 225 & 233 Park Avenue South Property. Of the $133 million, approximately $113.6 million had been spent as of the origination date on various hard and soft improvements and tenant improvements and leasing costs for Facebook, Buzzfeed, T. Rowe Price and the new ground floor restaurant. The remaining $19.6 million was deposited into escrow by the borrower on the origination date. The outstanding hard and soft improvements include upgrading the elevators, building out the 19th floor garden courtyard/rooftop and finishing the build-out of the ground floor retail.
The 225 & 233 Park Avenue South Property’s largest tenant is Facebook, a technology company whose platforms allow users to communicate with family, friends and coworkers. As of December 31, 2016, Facebook had approximately 1.23 billion daily active users. Facebook utilizes the 225 & 233 Park Avenue South Property as its marketing headquarters and leases 39.4% of the net rentable area through October 2027. Facebook has been a tenant at the 225 & 233 Park Avenue South Property since October 2016 and has invested approximately $60 million in excess of its initial tenant improvement allowance in its space. The build-out of the Facebook space includes a sit-down restaurant and garden courtyard/rooftop on the 19th floor, a contiguous staircase between the 8th, 9th and 10th floors and interior design by Frank Gehry. On May 26, 2017, Facebook exercised an expansion option to lease a portion of the 6th floor and the entire 7th floor (the “Facebook Expansion Space”), an increase of 67,011 SF. The tenant is currently engaged in the build-out of the Facebook Expansion Space and is expected to take occupancy in July 2018.
The second largest tenant, Buzzfeed, leases 28.7% of the net rentable area through May 2026. Buzzfeed is an independent digital media company delivering news and entertainment to millions of users globally. Buzzfeed, which utilizes the 225 & 233 Park Avenue South Property as its headquarters, has been a tenant at the 225 & 233 Park Avenue South Property since June 2015 and has spent approximately $23.9 million in excess of its initial tenant improvement allowance in its space. Buzzfeed has its own separate building entrance on East 18th Street and has a garden courtyard/rooftop on the 13th floor (the top floor of the 233 Park Avenue South building). As of November 2016, Buzzfeed raised approximately $200 million from NBCUniversal, increasing the company’s investment in Buzzfeed to approximately $400 million. Based on the terms of the NBCUniversal investment, Buzzfeed would be valued at approximately $1.7 billion.
The depositor has filed a registration statement (including a prospectus) with the Securities and Exchange Commission (“SEC”) (SEC File No. 333-207132) for the offering to which this communication relates. Before you invest, you should read the prospectus in the registration statement and other documents the depositor has filed with the SEC for more complete information about the depositor, the issuing entity and this offering. You may get these documents for free by visiting EDGAR on the SEC website at www.sec.gov. Alternatively, the depositor or Citigroup Global Markets Inc., Barclays Capital Inc., Drexel Hamilton, LLC or any other underwriter or dealer participating in this offering will arrange to send you the prospectus if you request it by calling toll-free 1-800-831-9146.
| 38 |
LOAN #1: 225 & 233 Park Avenue south
The following table presents certain information relating to historical leasing at the 225 & 233 Park Avenue South Property:
Historical Leased %(1)(2)
Property Name | 2013 | 2014(3) | 2015(3) | 2016 | UW (May 2017)(4)(5) |
| 225 & 233 Park Avenue South | 100.0% | 95.8% | 49.2% | 96.6% | 97.9% |
| (1) | Source: borrower sponsor |
| (2) | Represents occupancy as of December 31 for the indicated year unless otherwise specified. |
| (3) | The decrease in occupancy from year-end 2014 to year-end 2015 is a result of the Port Authority vacating its premises at the 225 & 233 Park Avenue South Property, except for Floors 4 and 8 in the 233 Park Avenue South building. The borrower sponsor commenced gut renovating the space made available after the Port Authority vacated. |
| (4) | Based on the underwritten rent roll dated May 24, 2017. |
| (5) | The underwritten occupancy as of May 2017 includes the Facebook Expansion Space and Facebook’s 8th floor space (40,397 SF), which have a lease commencement date of July 1, 2018 and June 1, 2017, respectively. The tenant is currently building out both spaces. The tenant expects to take occupancy of the 8th floor space in November 2017. All free rent amounts attributable to both spaces were deposited into escrow by the borrower sponsor on the origination date. |
The following table presents certain information relating to the major tenants at the 225 & 233 Park Avenue South Property:
Ten Largest Owned Tenants Based on Underwritten Base Rent(1)
Tenant Name | Credit Rating | Tenant | % of GLA | UW Base Rent | % of | UW Base | Lease Expiration | Renewal / Extension Options | ||||||||
| Facebook(2)(3)(4) | NR / NR / NR | 266,460 | 39.4% | $21,146,899 | 45.1% | $79.36 | 10/31/2027 | 1, 5-year option(5) | ||||||||
| Buzzfeed(6)(7) | NR / NR / NR | 194,123 | 28.7 | 14,808,325 | 31.6 | $76.28 | 5/31/2026 | NA | ||||||||
| STV | NR / NR / NR | 133,200 | 19.7 | 6,037,948 | 12.9 | $45.33 | 5/31/2024 | 1, 10-year option(8) | ||||||||
| 233 PAS Restaurant Co.(9) | NR / NR / NR | 10,961 | 1.6 | 1,100,000 | 2.3 | $100.36 | 4/30/2032 | 1, 5-year option | ||||||||
| T. Rowe Price(10) | NR / NR / NR | 13,450 | 2.0 | 1,049,100 | 2.2 | $78.00 | 3/31/2028 | 1, 5-year option | ||||||||
| WB Wood | NR / NR / NR | 13,397 | 2.0 | 739,380 | 1.6 | $55.19 | 12/31/2022 | 1, 5-year option | ||||||||
| Ainsworth | NR / NR / NR | 11,740 | 1.7 | 613,759 | 1.3 | $52.28 | 10/31/2022 | NA | ||||||||
| Florian Café | NR / NR / NR | 6,953 | 1.0 | 600,000 | 1.3 | $86.29 | 6/30/2029 | 1, 5-year option | ||||||||
| Flushing Savings Bank | NR / NR / NR | 7,208 | 1.1 | 501,628 | 1.1 | $69.59 | 10/31/2026 | 1, 5-year option | ||||||||
| CUNY | NR / NR / NR | 3,790 | 0.6 | 287,547 | 0.6 | $75.87 | 6/30/2021 | NA | ||||||||
| Ten Largest Owned Tenants | 661,282 | 97.9% | $46,884,586 | 100.0% | $70.90 | |||||||||||
| Remaining Tenants | 0 | 0 | 0 | 0.0 | $0.00 | |||||||||||
| Vacant | 14,474 | 2.1 | 0 | 0.0 | $0.00 | |||||||||||
| Total / Wtd. Avg. All Tenants | 675,756 | 100.0% | $46,884,586 | 100.0% | $70.90 |
| (1) | Based on the underwritten rent roll dated May 24, 2017. |
| (2) | Facebook recently exercised its expansion option at the 225 & 233 Park Avenue South Property for a portion of the 6th floor and the entire 7th floor totaling 67,011 SF. |
| (3) | Facebook is entitled to 19 months of free rent through December 2018 for the Facebook Expansion Space (9.9% of GLA), 12 months of free rent through May 2018 for the 8th floor (40,397 SF, 6.0% of GLA), and five months of free rent through October 2017 for the 18thand 19th floors (48,740 SF, 7.2% of GLA). Such free rent amount was reserved upfront at loan origination. |
| (4) | Facebook has a one-time right to terminate its lease effective March 31, 2024 by providing 18 months’ written notice and delivering a termination payment of $32,991,937. However, the termination payment will be increased by seven months of fixed rent with respect to the Facebook Expansion Space and the unamortized value of the transaction costs with respect to the Facebook Expansion Space amortized at a 6% interest rate over the term of the Facebook Expansion Space (commencing on July 1, 2018 and expiring on October 31, 2027). |
| (5) | Facebook has one five-year lease renewal option on the (i) 8th, 9th, 10th, 17th, 18th and 19th floors, (ii) 9th and 10th floors, (iii) 17th, 18th and 19th floors or (iv) 9th, 10th, 17th, 18th and 19thfloors. |
| (6) | Buzzfeed currently subleases the entire 11th floor of the 225 Park Avenue South building (26,921 SF, 4.0% of GLA) to Teacher Synergy, LLC, through June 30, 2019. The sublease will automatically renew on a month-to-month basis after the expiration date until either Buzzfeed or Teacher Synergy, LLC gives six months’ termination notice to the other party. |
| (7) | Buzzfeed is entitled to 16 months of free rent through September 2018 on 2,288 SF (0.3% of GLA). Such free rent amount was reserved upfront at loan origination. |
| (8) | STV’s renewal option may apply to all or a part of the STV premises, provided that the renewal may not consist of less than two full contiguous floors within the 225 & 233 Park Avenue South Property. |
| (9) | 233 PAS Restaurant Co. is entitled to 10 months of free rent through March 2018 on 9,488 SF (1.4% of GLA). Such free rent amount was reserved upfront at loan origination. |
| (10) | T. Rowe Price is entitled to nine months of free rent through February 2018 on 13,450 SF (2.0% of GLA). Such free rent amount was reserved upfront at loan origination. |
The depositor has filed a registration statement (including a prospectus) with the Securities and Exchange Commission (“SEC”) (SEC File No. 333-207132) for the offering to which this communication relates. Before you invest, you should read the prospectus in the registration statement and other documents the depositor has filed with the SEC for more complete information about the depositor, the issuing entity and this offering. You may get these documents for free by visiting EDGAR on the SEC website at www.sec.gov. Alternatively, the depositor or Citigroup Global Markets Inc., Barclays Capital Inc., Drexel Hamilton, LLC or any other underwriter or dealer participating in this offering will arrange to send you the prospectus if you request it by calling toll-free 1-800-831-9146.
| 39 |
LOAN #1: 225 & 233 Park Avenue south
The following table presents the lease rollover schedule at the 225 & 233 Park Avenue South Property, based on initial lease expiration dates:
Lease Expiration Schedule(1)(2)
Year Ending | Expiring Owned | % of Owned | Cumulative % of Owned GLA | UW | % of Total UW | UW Base Rent | # of Expiring | |||||||
| MTM | 0 | 0.0% | 0.0% | $0 | 0.0% | $0.00 | 0 | |||||||
| 2017 | 0 | 0.0 | 0.0% | 0 | 0.0 | $0.00 | 0 | |||||||
| 2018 | 0 | 0.0 | 0.0% | 0 | 0.0 | $0.00 | 0 | |||||||
| 2019 | 0 | 0.0 | 0.0% | 0 | 0.0 | $0.00 | 0 | |||||||
| 2020 | 0 | 0.0 | 0.0% | 0 | 0.0 | $0.00 | 0 | |||||||
| 2021 | 3,790 | 0.6 | 0.6% | 287,547 | 0.6 | $75.87 | 1 | |||||||
| 2022 | 25,137 | 3.7 | 4.3% | 1,353,139 | 2.9 | $53.83 | 2 | |||||||
| 2023 | 0 | 0.0 | 4.3% | 0 | 0.0 | $0.00 | 0 | |||||||
| 2024 | 133,200 | 19.7 | 24.0% | 6,037,948 | 12.9 | $45.33 | 1 | |||||||
| 2025 | 0 | 0.0 | 24.0% | 0 | 0.0 | $0.00 | 0 | |||||||
| 2026 | 201,331 | 29.8 | 53.8% | 15,309,953 | 32.7 | $76.04 | 2 | |||||||
| 2027 | 266,460 | 39.4 | 93.2% | 21,146,899 | 45.1 | $79.36 | 1 | |||||||
| 2028 & Thereafter | 31,364 | 4.6 | 97.9% | 2,749,100 | 5.9 | $87.65 | 3 | |||||||
| Vacant | 14,474 | 2.1 | 100.0% | 0 | 0.0 | $0.00 | 0 | |||||||
| Total / Wtd. Avg. | 675,756 | 100.0% | $46,884,586 | 100.0% | $70.90 | 10 |
| (1) | Calculated based on approximate square footage occupied by each Owned Tenant unless otherwise specified. |
| (2) | Certain tenants may have lease termination options that are exercisable prior to the originally stated expiration date of the subject lease and that are not considered in the Lease Expiration Schedule. |
| ■ | Operating History and Underwritten Net Cash Flow. The following table presents certain information relating to the historical operating performance and the Underwritten Net Cash Flow at the 225 & 233 Park Avenue South Property: |
Cash Flow Analysis
2014 | 2015(1) | 2016(1)(2) | TTM | Underwritten(3) | Underwritten $ per SF | |||||||
| Base Rent(4) | $34,757,905 | $36,390,135 | $30,962,652 | $31,901,632 | $45,723,854 | $67.66 | ||||||
| Rent Steps | 0 | 0 | 0 | 0 | 445,767 | 0.66 | ||||||
| Gross Up Vacancy | 0 | 0 | 0 | 0 | 977,863 | 1.45 | ||||||
| Reimbursements | 5,329,836 | 5,220,534 | 4,283,556 | 2,896,654 | 2,082,476 | 3.08 | ||||||
| Other Income(5) | 311,227 | 271,394 | 248,411 | 245,387 | 245,387 | 0.36 | ||||||
| Gross Revenue | $40,398,967 | $41,882,063 | $35,494,619 | $35,043,673 | $49,475,347 | $73.21 | ||||||
| Vacancy & Credit Loss | 0 | 0 | 0 | 0 | (1,368,405) | (2.02) | ||||||
| Effective Gross Income | $40,398,967 | $41,882,063 | $35,494,619 | $35,043,673 | $48,106,942 | $71.19 | ||||||
| Total Operating Expenses | $19,345,506 | $19,132,092 | $19,250,259 | $19,795,518 | $18,601,103 | $27.53 | ||||||
| Net Operating Income | $21,053,461 | $22,749,971 | $16,244,360 | $15,248,156 | $29,505,839 | $43.66 | ||||||
| TI/LCs | 0 | 0 | 0 | 0 | 991,923 | 1.47 | ||||||
| Capital Expenditures | 0 | 0 | 0 | 0 | 74,333 | 0.11 | ||||||
| Net Cash Flow | $21,053,461 | $22,749,971 | $16,244,360 | $15,248,156 | $28,439,583 | $42.09 | ||||||
| Occupancy | 95.8% | 49.2% | 96.6% | 97.9% | 97.9% | |||||||
| NOI Debt Yield(6) | 9.0% | 9.7% | 6.9% | 6.5% | 12.6% | |||||||
| NCF DSCR(6) | 2.42x | 2.61x | 1.87x | 1.75x | 3.27x |
| (1) | The decrease in Net Operating Income from 2015 to 2016 is primarily due to the Port Authority vacating its premises in March 2015, with the exception of Floors 4 and 8. The Port Authority previously occupied 305,426 SF at rental rates between $56 and $62 per SF on a modified gross basis. |
| (2) | The decrease in Net Operating Income from 2016 to TTM 3/31/2017 is a result of the borrower sponsor’s gut renovation of the space previously occupied by the Port Authority. Additionally, two tenants, Buzzfeed and Facebook (186,368 SF, 29.4% of GLA) were in free rent periods. |
| (3) | The increase in Effective Gross Income from TTM 3/31/2017 to Underwritten is primarily due to (i) Facebook’s signed-not-occupied rent of $8,163,008 for the Facebook Expansion Space and its space on the 8th floor, (ii) three tenants (Buzzfeed, Facebook and STV) (198,791 SF, 29.4% of GLA) concluding their rent abatement periods and (iii) rent steps taken through April 2018. |
| (4) | Underwritten Base Rent is inclusive of a rent credit of $714,965 for Facebook which is reimbursed $2.70 per SF for cleaning costs. |
| (5) | Other Income consists of cleaning income and other miscellaneous income. |
| (6) | NOI Debt Yield and NCF DSCR calculations are based on the aggregate outstanding principal balance of the 225 & 233 Park Avenue South Loan Combination. |
The depositor has filed a registration statement (including a prospectus) with the Securities and Exchange Commission (“SEC”) (SEC File No. 333-207132) for the offering to which this communication relates. Before you invest, you should read the prospectus in the registration statement and other documents the depositor has filed with the SEC for more complete information about the depositor, the issuing entity and this offering. You may get these documents for free by visiting EDGAR on the SEC website at www.sec.gov. Alternatively, the depositor or Citigroup Global Markets Inc., Barclays Capital Inc., Drexel Hamilton, LLC or any other underwriter or dealer participating in this offering will arrange to send you the prospectus if you request it by calling toll-free 1-800-831-9146.
| 40 |
LOAN #1: 225 & 233 Park Avenue south
| ■ | Appraisal. According to the appraisal, the 225 & 233 Park Avenue South Property had an “as-is” appraised value of $720,000,000 as of April 1, 2017. The appraiser also concluded to an “as-is assuming holdbacks” appraised value of $750,000,000 as of April 1, 2017. The “as-is assuming holdbacks” appraised value assumes that all outstanding amounts related to the TI/LCs, free rent and capital expenditures are reserved upfront at loan origination. The borrower sponsor reserved all such amounts upfront at loan origination. |
| Appraisal Approach | Value | Discount Rate | Terminal Capitalization Rate | |||
| Direct Capitalization Approach(1) | $770,000,000 | N/A | 4.00% | |||
| Discounted Cash Flow Approach(2) | $720,000,000 | 6.50% | 5.00% |
| (1) | Based on the “as-stabilized” appraised value. |
| (2) | Based on the “as-is” appraised value. |
| ■ | Environmental Matters. Based on a Phase I environmental report dated April 13, 2017, the environmental consultant did not identify evidence of any recognized environmental conditions and no recommendations for further action (other than the continued implementation of the existing asbestos operations and maintenance program currently in place at the 225 & 233 Park Avenue South Property). |
| ■ | Market Overview and Competition. The 225 & 233 Park Avenue South Property is located in the Madison/Union Square office submarket of the Midtown South Manhattan market, a block north of Union Square and a few blocks south of Madison Square Park. The 225 & 233 Park Avenue South Property is located within “Silicon Alley”, the stretch of Broadway from the Flatiron District to SoHo, and is considered a hub for startups and tech companies. A few of the corporate neighbors to the 225 & 233 Park Avenue South Property are Tumblr, Sony, MasterCard and Digitas. The 225 & 233 Park Avenue South Property also benefits from its vicinity to numerous retailers and various fine and casual dining options. Proximity to Union Square also provides access to multiple subway lines, including the 4, 5, 6, N, Q, R, W and L, all of which connect the 225 & 233 Park Avenue South Property to various parts of New York City. |
As of the first quarter of 2017, the Madison/Union Square office submarket had approximately 32.0 million SF of office inventory, direct weighted average Class A asking rents of $84.23 per SF and a vacancy rate of 3.9%. According to the appraisal, average Class A office rents in the Madison/Union Square submarket are $81.83 per SF, with multiple spaces in the market exceeding $90.00 per SF.
The depositor has filed a registration statement (including a prospectus) with the Securities and Exchange Commission (“SEC”) (SEC File No. 333-207132) for the offering to which this communication relates. Before you invest, you should read the prospectus in the registration statement and other documents the depositor has filed with the SEC for more complete information about the depositor, the issuing entity and this offering. You may get these documents for free by visiting EDGAR on the SEC website at www.sec.gov. Alternatively, the depositor or Citigroup Global Markets Inc., Barclays Capital Inc., Drexel Hamilton, LLC or any other underwriter or dealer participating in this offering will arrange to send you the prospectus if you request it by calling toll-free 1-800-831-9146.
| 41 |
LOAN #1: 225 & 233 Park Avenue south
The following table presents certain information relating to recent office leasing activity for the 225 & 233 Park Avenue South Property’s office market:
| Recent Office Leasing Activity(1) | ||||||||||
| Address | 412 West 13th Street | 853 Broadway | 413 West 14th Street | 430 West 15th Street | 315 Park Avenue South | 330 Hudson Street | 250 Hudson Street | 315 Park Avenue South | 200 Park Avenue South | 770 Broadway |
| Year Built/Year Renovated | 1900/2001 | 1929 | 2017 | 1950/2016 | 1928/2007 | 2013 | 1928 | 1928/2007 | 1908 | 1905 |
| Office GLA (SF) | 80,330 | 126,000 | 110,358 | 98,087 | 276,000 | 394,315 | 30,000 | 276,000 | 225,000 | 911,213 |
| No. Stories | 8 | 21 | 5 | 7 | 20 | 13 | 14 | 20 | 17 | 15 |
| Lease Information | ||||||||||
| Tenant Name | Bumble & Bumble | 21stCentury Fox/ TrueX Media | Argo Group | Live Nation Entertainment, Inc. | BDG Media | Deloitte Digital | Lieff Cabraser Heimann & Bernstein | Winton Capital | Elizabeth Arden | |
| Floor(s) Leased | 3 – 6 | 21 | 3 - 4, PH | 2 – 7 | 11 - 12 | Pt. 9 - 10 | 8 | 19 – 20 | 6 – 7 | 14 |
| Lease Date | Feb-2017 | Jan-2017 | Feb-2017 | Jan-2017 | Nov-2016 | Nov-2016 | Sept-2016 | Jul-2016 | Mar-2016 | Feb-2016 |
| Term (Years) | 15 | 10 | 15 | 15 | 10 | 12 | 10 | 10 | 10 | 12 |
| Lease Type | Gross | Gross | Gross | Gross | Gross | Gross | Gross | Gross | Gross | Gross |
| Tenant Size | 41,210 | 5,864 | 45,495 | 76,915 | 34,100 | 37,356 | 27,778 | 34,844 | 35,698 | 79,998 |
| Rent per SF | $93.00 | $110.00 | $92.00 | $98.66 | $85.00 | $80.00 | $78.00 | $100.00 | $64.00 | $105.00 |
| (1) | Source: Appraisal. |
| ■ | The Borrower. The borrower, 225 Fourth LLC, is a single purpose entity and Delaware limited liability company structured to be bankruptcy-remote with two independent directors in its organizational structure. Legal counsel for the borrower delivered a non-consolidation opinion in connection with the origination of the 225 & 233 Park Avenue South Loan Combination. The sponsors of the borrower are Orda Management Corporation (“ORDA”) and Morton F. Silver. ORDA is a New York-based family-owned business that predominantly develops, manages and owns residential and commercial real estate in the New York metropolitan area. The non-recourse carveout guarantors are Morton F. Silver and ORDA. Morton F. Silver’s carveouts under the 225 & 233 Park Avenue South Loan Combination are limited to (i) transfers by the borrower of ownership of all or any material portion of the real property comprising part of the 225 & 233 Park Avenue South Property, (ii) a sale, assignment, pledge or other encumbrance by the borrower of the rents and (iii) bankruptcy related carveouts. |
| ■ | Escrows.In connection with the origination of the 225 & 233 Park Avenue South Loan Combination, the borrower deposited (i) $14,864,252 into a free rent reserve account for four tenants, (ii) $11,529,288 into a remaining base costs & fees reserve account for remaining base building costs and fees and (iii) $8,106,455 into a TI/LC reserve account for existing tenant improvement and leasing commission costs. |
Upon the occurrence and during the continuance of a Trigger Period (as defined below), on a monthly basis, the borrower is required to deposit reserves of (i) 1/12th of the estimated annual taxes, (ii) provided an acceptable blanket insurance policy is no longer in place, 1/12th of the annual insurance premiums, (iii) $11,176 into a replacement reserve account and (iv) $55,878 into a TI/LC reserve account.
The borrower is required, no later than one business day after receipt of the Facebook lease termination payment, to deposit such lease termination payment into the TI/LC reserve (“Facebook Rollover Reserve Fund”). The Facebook Rollover Reserve Fund will be used for tenant improvements and leasing commissions incurred in connection with the re-leasing of the Facebook space.
On the payment date occurring in June 2018 and each payment date thereafter prior to the occurrence of a Buzzfeed Trigger Period (as defined below), the borrower will be required to deposit $112,623 into a reserve (the “Buzzfeed Rollover Reserve”) and on each payment date during the continuation of a Buzzfeed Trigger Period, the borrower will
The depositor has filed a registration statement (including a prospectus) with the Securities and Exchange Commission (“SEC”) (SEC File No. 333-207132) for the offering to which this communication relates. Before you invest, you should read the prospectus in the registration statement and other documents the depositor has filed with the SEC for more complete information about the depositor, the issuing entity and this offering. You may get these documents for free by visiting EDGAR on the SEC website at www.sec.gov. Alternatively, the depositor or Citigroup Global Markets Inc., Barclays Capital Inc., Drexel Hamilton, LLC or any other underwriter or dealer participating in this offering will arrange to send you the prospectus if you request it by calling toll-free 1-800-831-9146.
| 42 |
LOAN #1: 225 & 233 Park Avenue south
be required to sweep all excess cash flow from the 225 & 233 Park Avenue South Property into the Buzzfeed Rollover Reserve until the amounts on deposit equal or exceed $13,000,000 (the “Buzzfeed Rollover Cap”).
| ■ | Lockbox and Cash Management. The 225 & 233 Park Avenue South Loan is structured with a hard lockbox and springing cash management. The borrower was required to send tenant direction letters to all tenants instructing them to deposit all rents and other payments into the clearing account controlled by the lender. All funds in the clearing account are required to be transferred within two business days of receipt, and applied to all required payments and reserves as set forth in the 225 & 233 Park Avenue South Loan documents. Provided no Trigger Period is continuing, excess cash in the deposit account will be disbursed to the borrower in accordance with the 225 & 233 Park Avenue South Loan documents. During the continuance of a Trigger Period, all funds in the clearing account are required to be transferred to the cash management account on a daily basis and applied to all required payments and reserves as set forth in the 225 & 233 Park Avenue South Loan documents. |
A “Trigger Period” will commence upon the occurrence of a (i) Default Trigger Period, (ii) Buzzfeed Trigger Period, (iii) Mezzanine Trigger Period or (iv) DSCR Trigger Period.
A “Default Trigger Period” will commence upon the occurrence and continuance of an event of default under the 225 & 233 Park Avenue South Loan documents and expire upon the cure of such event of default.
A “Buzzfeed Trigger Period” will commence on April 1, 2025, the date that is 14 months prior to the scheduled expiration of the Buzzfeed tenant, and terminate upon the first to occur of (i) Buzzfeed renewing or extending its lease in accordance with the 225 & 233 Park Avenue South Loan documents and (a) Buzzfeed paying full, unabated rent under such renewed or extended lease or (b) Buzzfeed being obligated to begin paying full unabated rent under such renewed or extended lease if the borrower reserves with the lender the amount equal to the aggregate amount of the rent that would accrue during such free rent period, (ii) (a) the borrower leasing the entire Buzzfeed space to one or more tenants pursuant to replacement lease(s) acceptable to the lender, (b) such tenants being in physical occupancy of their space, (c) such tenants being open for business and the landlord’s leasing obligations for such replacement lease(s) having been paid and (d) the applicable replacement tenant(s) paying full, unabated rent equaling or exceeding the rent payable under the Buzzfeed lease or (iii) the amount reserved in the Buzzfeed Rollover Reserve equaling or exceeding the Buzzfeed Rollover Cap. However, if clauses (i) and (ii) above occur prior to April 1, 2025, a Buzzfeed Trigger Period will not commence.
A “Mezzanine Trigger Period” will commence upon the date that the lender has received written notice from the mezzanine lender that an event of default under the 225 & 233 Park Avenue South Mezzanine Loan (as defined below) exists and expires upon the date that the lender has received written notice from the mezzanine lender that such event of default no longer exists.
A “DSCR Trigger Period” will commence upon the debt service coverage ratio (on the 225 & 233 Park Avenue South Total Debt (as defined below)), as calculated in the 225 & 233 Park Avenue South Loan documents, being less than 1.20x and expire upon the date that the debt service coverage ratio (on the 225 & 233 Park Avenue South Total Debt) is equal to or greater than 1.25x for two consecutive quarters.
| ■ | Property Management. The 225 & 233 Park Avenue South Property is managed by ORDA, an affiliate of the borrower. The lender has the right to direct the borrower to terminate the property management agreement and replace the property manager if (i) the property manager becomes insolvent or a debtor in any bankruptcy or insolvency proceeding; (ii) an event of default under the 225 & 233 Park Avenue South Loan documents has occurred and is continuing; or (iii) a default by the property manager of a material obligation under the property management agreement has occurred and is continuing beyond any applicable notice and cure period. Upon such occurrence, a Qualified Manager (as defined below) will be required to assume management of the 225 & 233 Park Avenue South Property pursuant to a replacement property management agreement on terms substantially the same as the management agreement entered into at origination. |
A “Qualified Manager” means (i) an individual or company (or another type of party as further specified under the 225 & 233 Park Avenue South Loan documents) that (A) is either a nationally or regionally recognized property management company having at least 10 years’ experience in the management of office properties similar to the 225 & 233 Park Avenue South Property, (B) has under management no less than 3,000,000 leasable square footage of office space, and (C) is not the subject of a bankruptcy or similar insolvency proceeding; (ii) an individual or company (or another type of party as further specified under the 225 & 233 Park Avenue South Loan documents) that has been approved by the lender in writing and may be conditioned upon a rating agency confirmation; or (iii) an affiliate of the
The depositor has filed a registration statement (including a prospectus) with the Securities and Exchange Commission (“SEC”) (SEC File No. 333-207132) for the offering to which this communication relates. Before you invest, you should read the prospectus in the registration statement and other documents the depositor has filed with the SEC for more complete information about the depositor, the issuing entity and this offering. You may get these documents for free by visiting EDGAR on the SEC website at www.sec.gov. Alternatively, the depositor or Citigroup Global Markets Inc., Barclays Capital Inc., Drexel Hamilton, LLC or any other underwriter or dealer participating in this offering will arrange to send you the prospectus if you request it by calling toll-free 1-800-831-9146.
| 43 |
LOAN #1: 225 & 233 Park Avenue south
borrower, which affiliate is majority owned and controlled by Morton F. Silver or in the event of the death or incompetency of Morton F. Silver, 25% of such affiliate is owned and controlled by one or more specified lineal descendants as further specified under the 225 & 233 Park Avenue South Loan documents.
| ■ | Mezzanine or Secured Subordinate Indebtedness. Barclays concurrently funded a $195,000,000 mezzanine loan (the “225 & 233 Park Avenue South Mezzanine Loan” and, together with the 225 & 233 Park Avenue South Loan Combination, the “225 & 233 Park Avenue South Total Debt”) with the origination of the 225 & 233 Park Avenue South Loan Combination to 225 Fourth Mezz LLC, of which $153,000,000 was sold to Hangang US Real Estate Fund No.2. Barclays currently holds the remaining $42,000,000 and expects to sell the remaining portion to one or more third party investors. The 225 & 233 Park Avenue South Mezzanine Loan was further split into a mezzanine A loan equal to $80,000,000, a mezzanine B loan equal to $75,000,000 and a mezzanine C loan equal to $40,000,000. The mezzanine loans are co-terminous with the 225 & 233 Park Avenue South Loan Combination and accrue interest at a blended fixedper annum rate equal to 4.6700%. An intercreditor agreement is in place with respect to the 225 & 233 Park Avenue South Loan Combination and the related mezzanine loans. |
| ■ | Future Mezzanine or Subordinate Indebtedness. Provided no event of default has occurred and is continuing, the borrower is permitted to incur future mezzanine indebtedness provided (i) prior written notice of not less than 45 days, but not more than 90 days, is provided to the lender specifying the origination date of the permitted mezzanine loan, (ii) the mezzanine lender enters into an intercreditor agreement acceptable to the rating agencies and reasonably acceptable to the lender, (iii) the mezzanine loan will have a term that is at least co-terminous with the 225 & 233 Park Avenue South Loan Combination, (iv) the mezzanine loan will be current pay and will not be a payment in kind structure, (v) the combined loan-to-value ratio for the 225 & 233 Park Avenue South Total Debt and permitted mezzanine loan will not be greater than 54.46%, (vi) the debt service coverage ratio of the 225 & 233 Park Avenue South Total Debt and the permitted mezzanine loan is equal to or greater than 1.67x, (vii) if the mezzanine loan is floating rate, the borrower acquires and maintains an interest rate cap or swap agreement from a counterparty reasonably acceptable to the lender, (viii) a rating agency confirmation that the future mezzanine indebtedness will not result in a downgrade, withdrawal or qualification of the respective ratings is obtained and (ix) any other requirements as stated under the 225 & 233 Park Avenue South Loan documents are met. |
| ■ | Release of Collateral. Not permitted. |
| ■ | Terrorism Insurance. So long as TRIPRA is in effect, the borrower is required to maintain terrorism insurance in an amount equal to the full replacement cost of the 225 & 233 Park Avenue South Property (plus 18 months of business interruption coverage), provided that so long as TRIPRA is in effect and continues to cover both foreign and domestic acts, the lender is required to accept terrorism insurance with coverage against acts which are “certified” within the meaning of TRIPRA. If TRIPRA is not in effect, then provided that terrorism insurance is commercially available, the borrower is required to carry terrorism insurance throughout the term of the 225 & 233 Park Avenue South Loan as described in the preceding sentence. See “Risk Factors—Terrorism Insurance May Not Be Available for All Mortgaged Properties”in the Preliminary Prospectus. |
The depositor has filed a registration statement (including a prospectus) with the Securities and Exchange Commission (“SEC”) (SEC File No. 333-207132) for the offering to which this communication relates. Before you invest, you should read the prospectus in the registration statement and other documents the depositor has filed with the SEC for more complete information about the depositor, the issuing entity and this offering. You may get these documents for free by visiting EDGAR on the SEC website at www.sec.gov. Alternatively, the depositor or Citigroup Global Markets Inc., Barclays Capital Inc., Drexel Hamilton, LLC or any other underwriter or dealer participating in this offering will arrange to send you the prospectus if you request it by calling toll-free 1-800-831-9146.
| 44 |
(THIS PAGE INTENTIONALLY LEFT BLANK)
The depositor has filed a registration statement (including a prospectus) with the Securities and Exchange Commission (“SEC”) (SEC File No. 333-207132) for the offering to which this communication relates. Before you invest, you should read the prospectus in the registration statement and other documents the depositor has filed with the SEC for more complete information about the depositor, the issuing entity and this offering. You may get these documents for free by visiting EDGAR on the SEC website at www.sec.gov. Alternatively, the depositor or Citigroup Global Markets Inc., Barclays Capital Inc., Drexel Hamilton, LLC or any other underwriter or dealer participating in this offering will arrange to send you the prospectus if you request it by calling toll-free 1-800-831-9146.
| 45 |
| LOAN #2: general motors building |
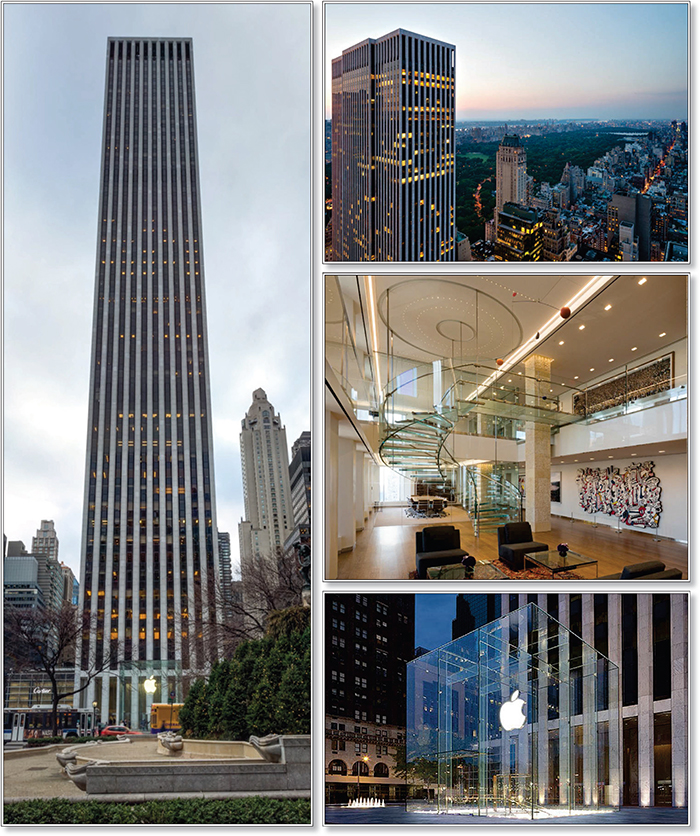
The depositor has filed a registration statement (including a prospectus) with the Securities and Exchange Commission (“SEC”) (SEC File No. 333-207132) for the offering to which this communication relates. Before you invest, you should read the prospectus in the registration statement and other documents the depositor has filed with the SEC for more complete information about the depositor, the issuing entity and this offering. You may get these documents for free by visiting EDGAR on the SEC website at www.sec.gov. Alternatively, the depositor or Citigroup Global Markets Inc., Barclays Capital Inc., Drexel Hamilton, LLC or any other underwriter or dealer participating in this offering will arrange to send you the prospectus if you request it by calling toll-free 1-800-831-9146.
| 46 |
| LOAN #2: general motors building |
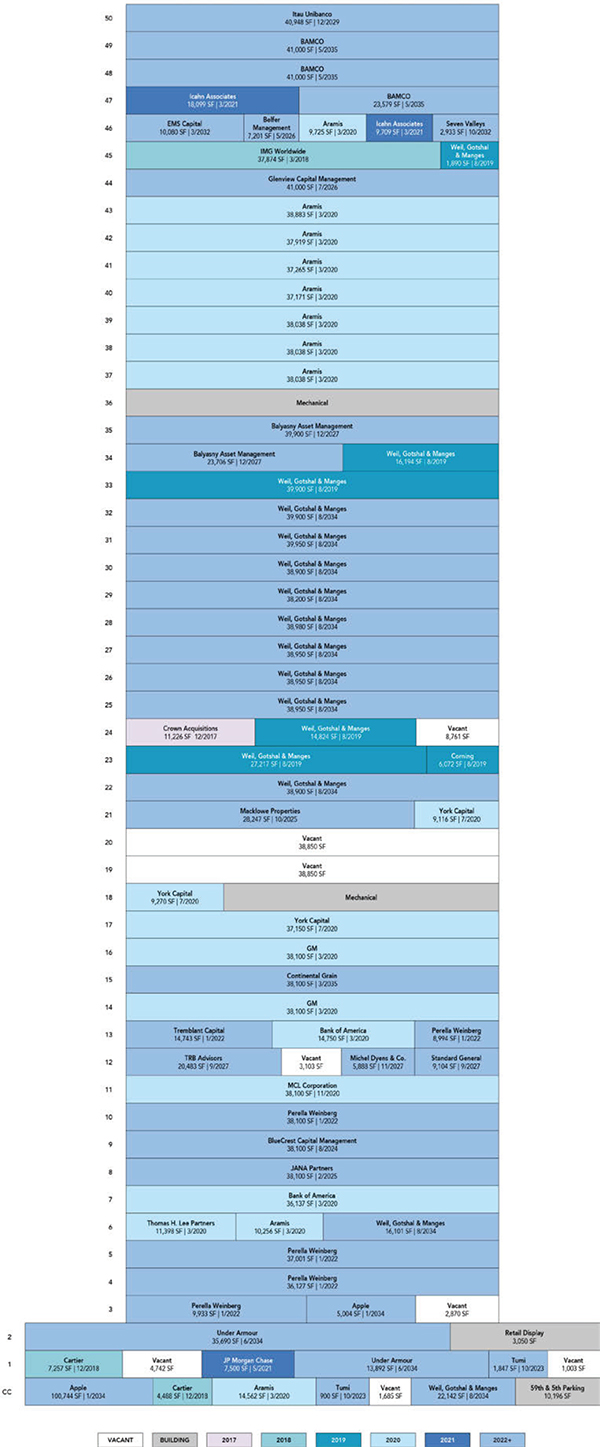
The depositor has filed a registration statement (including a prospectus) with the Securities and Exchange Commission (“SEC”) (SEC File No. 333-207132) for the offering to which this communication relates. Before you invest, you should read the prospectus in the registration statement and other documents the depositor has filed with the SEC for more complete information about the depositor, the issuing entity and this offering. You may get these documents for free by visiting EDGAR on the SEC website at www.sec.gov. Alternatively, the depositor or Citigroup Global Markets Inc., Barclays Capital Inc., Drexel Hamilton, LLC or any other underwriter or dealer participating in this offering will arrange to send you the prospectus if you request it by calling toll-free 1-800-831-9146.
| 47 |
| LOAN #2: general motors building |
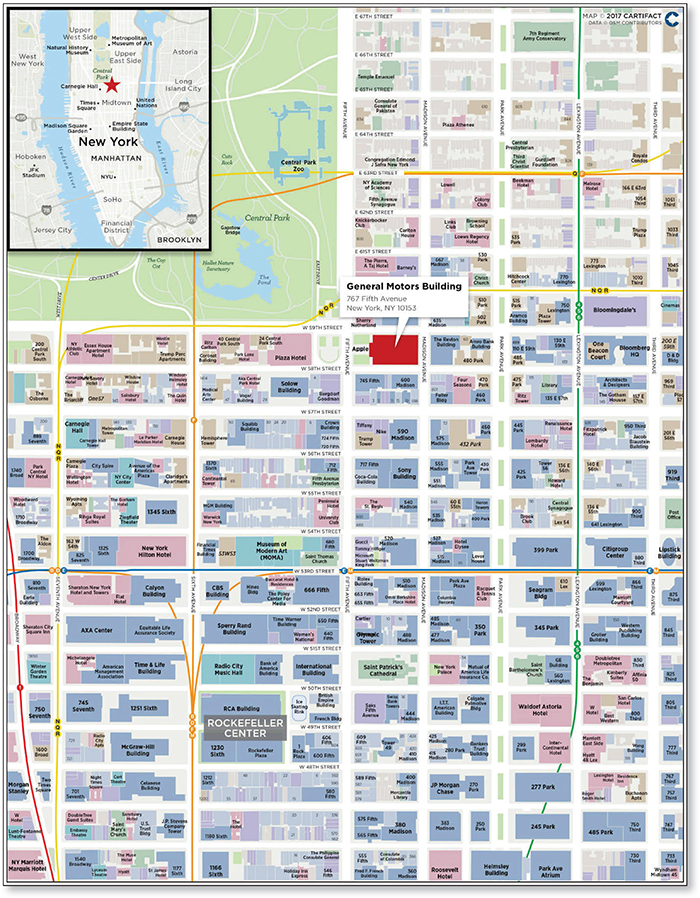
The depositor has filed a registration statement (including a prospectus) with the Securities and Exchange Commission (“SEC”) (SEC File No. 333-207132) for the offering to which this communication relates. Before you invest, you should read the prospectus in the registration statement and other documents the depositor has filed with the SEC for more complete information about the depositor, the issuing entity and this offering. You may get these documents for free by visiting EDGAR on the SEC website at www.sec.gov. Alternatively, the depositor or Citigroup Global Markets Inc., Barclays Capital Inc., Drexel Hamilton, LLC or any other underwriter or dealer participating in this offering will arrange to send you the prospectus if you request it by calling toll-free 1-800-831-9146.
| 48 |
| LOAN #2: general motors building |
| Mortgaged Property Information | Mortgage Loan Information | ||||
| Number of Mortgaged Properties | 1 | Loan Seller(3) | CGMRC | ||
| Location (City/State) | New York, New York | Cut-off Date Balance(4) | $55,200,000 | ||
| Property Type | Mixed Use | Cut-off Date Balance per SF(2) | $738.70 | ||
| Size (SF) | 1,989,983 | Percentage of Initial Pool Balance | 5.1% | ||
| Total Occupancy as of 6/1/2017(1) | 95.0% | Number of Related Mortgage Loans | None | ||
| Owned Occupancy as of 6/1/2017(1) | 95.0% | Type of Security | Fee Simple | ||
| Year Built / Latest Renovation | 1968 / 2017 | Mortgage Rate | 3.43000% | ||
| Appraised Value | $4,800,000,000 | Original Term to Maturity (Months) | 120 | ||
| Appraisal Date | 5/8/2017 | Original Amortization Term (Months) | NAP | ||
| Borrower Sponsors | Boston Properties Limited Partnership; | Original Interest Only Period (Months) | 120 | ||
| 767 LLC; Sungate Fifth Avenue LLC | First Payment Date | 7/9/2017 | |||
| Property Management | Boston Properties Limited Partnership | Maturity Date | 6/9/2027 | ||
| Underwritten Revenues | $334,764,418 | ||||
| Underwritten Expenses | $107,458,009 | Escrows(5) | |||
| Underwritten Net Operating Income (NOI) | $227,306,409 | Upfront | Monthly | ||
| Underwritten Net Cash Flow (NCF) | $221,544,794 | Taxes | $0 | $0 | |
| Cut-off Date LTV Ratio(2) | 30.6% | Insurance | $0 | $0 | |
| Maturity Date LTV Ratio(2) | 30.6% | Replacement Reserve | $0 | $0 | |
| DSCR Based on Underwritten NOI / NCF(2) | 4.45x / 4.33x | TI/LC(6) | $0 | $0 | |
| Debt Yield Based on Underwritten NOI / NCF(2) | 15.5% / 15.1% | Other(6) | $0 | $0 | |
| Sources and Uses | ||||||||
| Sources | $ | % | Uses | $ | % | |||
| Senior Pari Passu Notes | $1,470,000,000 | 63.9% | Loan Payoff | $1,606,000,000 | 69.8% | |||
| Junior Non-Trust Notes | 830,000,000 | 36.1 | Principal Equity Distribution | 652,892,324 | 28.4 | |||
| Closing Costs | 41,107,676 | 1.8 | ||||||
| Total Sources | $2,300,000,000 | 100.0% | Total Uses | $2,300,000,000 | 100.0% | |||
| (1) | Occupancy includes Under Armour, which has an executed lease but is not expected to be in occupancy at the General Motors Building Property (as defined below) until January 1, 2019. |
| (2) | DSCR, LTV, Debt Yield and Balance per SF calculations are based on the aggregate outstanding principal balance of the General Motors Building Senior Pari Passu Notes (as defined below) and exclude the aggregate outstanding principal balance of the General Motors Building Junior Non-Trust Notes (as defined below). Cut-off Date LTV Ratio, Maturity Date LTV Ratio, DSCR Based on Underwritten NOI, DSCR Based on Underwritten NCF, Debt Yield Based on Underwritten NOI, Debt Yield Based on Underwritten NCF, and Cut-off Date Balance per SF based on the aggregate outstanding principal balance of the General Motors Building Loan Combination (as defined below) are 47.9%, 47.9%, 2.84x, 2.77x, 9.9%, 9.6%, and $1,156, respectively. |
| (3) | The General Motors Building Loan Combination (as defined below) was co-originated by Morgan Stanley Bank, N.A. (“MSBNA”), Citigroup Global Markets Realty Corp. (“CGMRC”), Deutsche Bank AG, acting through its New York Branch (“DBNY”), and Wells Fargo Bank, National Association (“Wells Fargo”). |
| (4) | The Cut-off Date Balance of $55,200,000 represents the non-controlling notes A-3-A2-1 and A-3-A3 which are part of a loan combination evidenced by 37 notes having an aggregate outstanding principal balance as of the Cut-off Date of $2,300,000,000. The related companion loans are evidenced by (i) 31 pari passu notes with an aggregate outstanding principal balance as of the Cut-off Date of $1,414,800,000 and (ii) four junior notes with an aggregate outstanding principal balance as of the Cut-off Date of $830,000,000. |
| (5) | See “Escrows” below. |
| (6) | At loan origination, Boston Properties Limited Partnership (“BPLP”) provided a guaranty in lieu of depositing (i) $107,946,183 for existing tenant improvement and leasing commission costs and (ii) $161,161,013 in existing gap rent and free rent obligations. |
| ■ | The Mortgage Loan.The mortgage loan (the “General Motors Building Loan”) is part of a loan combination (the “General Motors Building Loan Combination”) evidenced by 37 notes comprising (i) 33 senior pari passu notes (collectively, the “General Motors Building Senior Pari Passu Notes”) with a combined outstanding principal balance as of the Cut-off Date of $1,470,000,000, and (ii) four junior pari passu notes (collectively, the “General Motors Building Junior Non-Trust Notes”) with a combined outstanding principal balance as of the Cut-off Date of $830,000,000. The General Motors Building Junior Non-Trust Notes are subordinate to the General Motors Building Senior Pari Passu Notes as and to the extent described in “Description of the Mortgage Pool—The Loan Combinations—The General Motors Building Pari Passu-A/B Loan Combination” in the Preliminary Prospectus. The aggregate outstanding principal balance as of the Cut-off Date of all the notes evidencing the General Motors Building Loan Combination is $2,300,000,000. The General Motors Building Loan Combination is secured by the borrower’s fee simple interest in a Class A mixed use, office and retail building located in New York, New York (the “General Motors Building Property”). The General Motors Building Loan, which is evidenced by the non-controlling notesA-3-A2-1 and A-3-A3, has an outstanding principal balance as of the Cut-off Date of $55,200,000 and represents approximately 5.1% of the Initial Pool Balance. The related companion loans are evidenced by 31 senior pari passu notes (collectively, the “General Motors Building Senior Pari Passu Companion Loans”) which have an aggregate outstanding principal balance as of the Cut-off Date of $1,414,800,000, and the General Motors Building Junior Non-Trust Notes, as detailed in the note summary table below. The General Motors Building Loan Combination was originated by MSBNA, CGMRC, DBNY, and Wells Fargo on June 7, 2017. Each note evidencing the General Motors Building Loan Combination has an interest rate of 3.43000%per annum. The borrower utilized the proceeds of the General Motors Building Loan Combination to refinance the existing debt on the General Motors Building Property, return equity to the borrower sponsors and pay origination costs. |
The General Motors Building Loan, which is evidenced by notes A-3-A2-1 and A-3-A3, received a credit assessment of Aaa by Moody’s, A+ by S&P, AAAsf by Fitch and AAA by DBRS.
The depositor has filed a registration statement (including a prospectus) with the Securities and Exchange Commission (“SEC”) (SEC File No. 333-207132) for the offering to which this communication relates. Before you invest, you should read the prospectus in the registration statement and other documents the depositor has filed with the SEC for more complete information about the depositor, the issuing entity and this offering. You may get these documents for free by visiting EDGAR on the SEC website at www.sec.gov. Alternatively, the depositor or Citigroup Global Markets Inc., Barclays Capital Inc., Drexel Hamilton, LLC or any other underwriter or dealer participating in this offering will arrange to send you the prospectus if you request it by calling toll-free 1-800-831-9146.
| 49 |
| LOAN #2: general motors building |
Note Summary
| Note(s) | Current or Anticipated Holder of Securitized Note | Aggregate Cut-off Date Balance |
| General Motors Building Loan
| ||
| A-3-A2-1 and A-3-A3 | CGCMT 2017-P8 | $55,200,000 |
General Motors Building Senior Pari Passu Companion Loans | ||
A-1-S, A-1-C1, A-2-S, A-2-C1, A-3-S, A-3-C1, A-4-S and A-4-C1 | BXP 2017-GM | $725,000,000 |
| A-1-A2, A-1-C3-2, A-3-C3-1 and A-3-A2-2 | CGCMT 2017-B1 | $92,700,000 |
| A-1-C2, A-1-C3-1 and A-4-A3 | BANK 2017-BNK6 | $90,000,000 |
| A-1-C4 and A-1-A3 | MSBNA | $111,900,000 |
| A-1-A1, A-2-A1, A-3-A1, and A-4-A1 | CCRE(1) | $85,000,000 |
| A-2-C2-2, A-2-C3, A-2-A2, and A-2-A3 | DBNY | $95,200,000 |
| A-2-C2-1, A-3-C2 and A-3-C3-2 | CD 2017-CD5 | $100,000,000 |
| A-4-C2, A-4-C3 and A-4-A2 | WFCM 2017-C38 | $115,000,000 |
General Motors Building Junior Non-Trust Notes | ||
| B-1-S, B-2-S, B-3-S, and B-4-S | BXP 2017-GM | $830,000,000 |
| (1) | Cantor Commercial Real Estate Lending, L.P. |
The General Motors Building Loan Combination had an initial term of 120 months and has a remaining term of 117 months as of the Cut-off Date. The General Motors Building Loan Combination requires payment of interest only until the scheduled maturity date, which is the due date in June 2027. Voluntary prepayment of the General Motors Building Loan Combination without payment of a yield maintenance premium is permitted on or after the due date in December 2026. Defeasance of the General Motors Building Loan Combination with direct, non-callable obligations of the United States of America or other obligations which are “government securities” is permitted under the General Motors Building Loan Combination documents at any time after the earlier of June 7, 2020 or the second anniversary of the securitization of the last portion of the General Motors Building Loan Combination.
| ■ | The Mortgaged Property.The General Motors Building Property is a 50-story mixed use office building comprised of approximately 1,989,983 total SF, including approximately 188,000 SF of retail space in the two-story retail base that wraps around the building and the below grade concourse. Originally developed in 1968 for the General Motors Corporation to serve as its headquarters, the General Motors Building Property occupies the entire city block bound by 58th Street, 59th Street, Madison Avenue and Fifth Avenue on the southeast corner of Central Park. The Fifth Avenue frontage of the General Motors Building Property features an open plaza with seating and is topped by the glass Apple cube, which serves as the entrance to Apple’s store in the below grade concourse. Because of its location, the General Motors Building Property features excellent light and unobstructed, protected views of Central Park from every office floor. |
The General Motors Building Property is 95.0% leased as of June 1, 2017 by a diverse roster of office and retail tenants. Approximately 54.0% of the General Motors Building Property’s gross leasable area (“GLA”) is leased by investment grade or large law firm tenants, which contribute approximately 49.0% of the General Motors Building Property’s underwritten gross rent. The General Motors Building Property serves as the global headquarters for Weil, Gotshal & Manges (“Weil”) (24.6% of GLA, 19.4% of underwritten gross rent), headquarters for Aramis (15.1% of GLA, 12.4% of underwritten gross rent), is expected to serve as a flagship retail location for Under Armour (2.5% of GLA, 10.2% of underwritten gross rent), BAMCO (5.3% of GLA, 7.4% of underwritten gross rent) and Apple’s flagship retail store (5.3% of GLA, 6.6% of underwritten gross rent). The top five tenants by underwritten gross rent at the General Motors Building Property occupy 52.8% of GLA and comprise 56.1% of the underwritten gross rent. As of June 1, 2017, the weighted average remaining lease term for the top five tenants is approximately 11.7 years, and the weighted average remaining lease term for the entire General Motors Building Property is approximately 9.4 years.
The General Motors Building Property has retained two original office tenants since it was constructed in 1968 – Weil and Aramis, which represent a combined 39.7% of GLA and 31.8% of underwritten gross rent. Weil executed an early
The depositor has filed a registration statement (including a prospectus) with the Securities and Exchange Commission (“SEC”) (SEC File No. 333-207132) for the offering to which this communication relates. Before you invest, you should read the prospectus in the registration statement and other documents the depositor has filed with the SEC for more complete information about the depositor, the issuing entity and this offering. You may get these documents for free by visiting EDGAR on the SEC website at www.sec.gov. Alternatively, the depositor or Citigroup Global Markets Inc., Barclays Capital Inc., Drexel Hamilton, LLC or any other underwriter or dealer participating in this offering will arrange to send you the prospectus if you request it by calling toll-free 1-800-831-9146.
| 50 |
| LOAN #2: general motors building |
renewal of its lease in September 2014, extending it through August 2034 at an initial rent of $114.00 per SF, representing a premium to its existing weighted average in place gross rent of $92.37 per SF. The General Motors Building Property has retail frontage in the Upper Fifth Avenue retail submarket, which runs along Fifth Avenue between 49th Street and 60th Street, and is leased by Apple, Under Armour and Cartier, as well as frontage in the Madison Avenue retail submarket which is leased by Tumi and JP Morgan Chase.
The General Motors Building Property has a nine year average historical occupancy of 97.4% dating back to 2008. Since acquiring the General Motors Building Property in 2008 and through 2016, based on information provided by the borrower, the borrower has invested approximately $98.0 million in capital expenditures for tenant improvements and other capital projects at the General Motors Building Property.
As of June 1, 2017, the General Motors Building Property was approximately 95.0% leased to 38 tenants. The top five tenants by underwritten gross rent at the General Motors Building Property lease 52.8% of GLA and comprise 56.1% of the underwritten gross rent, and the top ten tenants by underwritten gross rent at the General Motors Building Property lease 67.3% of GLA and comprise 73.9% of the underwritten gross rent. The weighted average underwritten base rent for office tenants in the top 10 is $110.51 per SF and the weighted average underwritten base rent for retail tenants in the top 10 is $361.70 per SF.
The majority of the General Motors Building Property’s annual underwritten base rent comes from office tenants (73.2%), with the remaining underwritten base rent coming from retail tenants (26.3%) and storage space (0.4%).
The following table presents certain information relating to historical leasing at the General Motors Building Property:
Historical Leased %(1)
2008 | 2009 | 2010 | 2011 | 2012 | 2013 | 2014 | 2015 | 2016 | As of 6/1/2017(2) | |
| Owned Space | 98.5% | 97.5% | 98.5% | 98.2% | 95.5% | 96.9% | 98.5% | 96.7% | 96.3% | 95.0% |
| (1) | As provided by the borrower and which represents occupancy as of July 31 for the indicated year unless otherwise specified. |
| (2) | Based on the underwritten rent roll. |
The following table presents certain information relating to historical average annual rent per SF at the General Motors Building Property:
Historical Average Base Rent per SF(1)
| 2014 | 2015 | 2016 | As of 6/1/2017(2)(3) | |||||
| Base Rent per SF | $99.08 | $97.37 | $103.95 | $118.01 |
| (1) | As provided by the borrower. |
| (2) | Based on the underwritten rent roll. |
| (3) | Based on the entire General Motors Building Property of 1,989,983 SF, which includes vacant SF. |
The depositor has filed a registration statement (including a prospectus) with the Securities and Exchange Commission (“SEC”) (SEC File No. 333-207132) for the offering to which this communication relates. Before you invest, you should read the prospectus in the registration statement and other documents the depositor has filed with the SEC for more complete information about the depositor, the issuing entity and this offering. You may get these documents for free by visiting EDGAR on the SEC website at www.sec.gov. Alternatively, the depositor or Citigroup Global Markets Inc., Barclays Capital Inc., Drexel Hamilton, LLC or any other underwriter or dealer participating in this offering will arrange to send you the prospectus if you request it by calling toll-free 1-800-831-9146.
| 51 |
| LOAN #2: general motors building |
The following table presents certain information relating to the General Motors Building Property:
Ten Largest Owned Tenants Based on Underwritten Base Rent(1)
Tenant Name | Credit Rating (Fitch/MIS/S&P)(2) | Tenant GLA | % of GLA | UW Base | % of Total UW Base Rent | UW Base | Lease | Renewal / | |||||||||||||
| Weil, Gotshal & Manges(4) | NR / NR / NR | 489,867 | 24.6 | % | $51,278,352 | 19.3 | % | $104.68 | 8/31/2034 | 2, 5-year options | |||||||||||
| Under Armour(5) | NR / Baa2 / BB+ | 49,582 | 2.5 | 29,999,945 | 11.3 | $605.06 | 6/30/2034 | 2, 5-year options | |||||||||||||
| Aramis(6) | NR / A2 / A+ | 299,895 | 15.1 | 27,530,236 | 10.3 | $91.80 | 3/31/2020 | 2, 5-year options | |||||||||||||
| BAMCO(7) | NR / NR / NR | 105,579 | 5.3 | 21,290,010 | 8.0 | $201.65 | 5/31/2035 | 1, 5-year option | |||||||||||||
| Apple(8) | NR / Aa1 / AA+ | 105,748 | 5.3 | 18,057,615 | 6.8 | $170.76 | 1/31/2034 | 1, 10-year and 2, 5-year options | |||||||||||||
| Perella Weinberg | NR / NR / NR | 130,155 | 6.5 | 12,392,687 | 4.7 | $95.21 | 1/31/2022 | NA | |||||||||||||
| JP Morgan Chase | A+ / A3 / A- | 7,500 | 0.4 | 10,980,750 | 4.1 | $1,464.10 | 5/31/2021 | 1, 5-year option | |||||||||||||
| Cartier | NR / NR / NR | 11,745 | 0.6 | 8,891,545 | 3.3 | $757.05 | 12/31/2018 | 2, 10-year options | |||||||||||||
| Balyasny Asset Management(9) | NR / NR / NR | 63,606 | 3.2 | 8,150,250 | 3.1 | $128.14 | 12/31/2027 | 1, 5-year option | |||||||||||||
| GM(10) | BBB- / Baa3 / BBB | 76,200 | 3.8 | 7,010,400 | 2.6 | $92.00 | 3/31/2020 | NA | |||||||||||||
| Ten Largest Owned Tenants | 1,339,877 | 67.3 | % | $195,581,790 | 73.4 | % | $145.97 | ||||||||||||||
| Remaining Tenants | 550,242 | 27.7 | 70,735,275 | 26.6 | $128.55 | ||||||||||||||||
| Vacant | 99,864 | 5.0 | 0 | 0.0 | $0.00 | ||||||||||||||||
| Total / Wtd. Avg. All Tenants | 1,989,983 | 100.0 | % | $266,317,065 | 100.0 | % | $140.90 | ||||||||||||||
| (1) | Based on the underwritten rent roll dated June 1, 2017. |
| (2) | Certain ratings are those of the parent company whether or not the parent guarantees the lease. |
| (3) | UW Base Rent and UW Base Rent $ per SF exclude $11,269,632 ($5.66 per SF) of straight line rents through the tenants’ respective lease terms associated with Weil ($6,010,916) and Apple ($4,107,800), as well as four other tenants, which are included in the “Cash Flow Analysis” table below. |
| (4) | Weil leases 100,024 SF of space through August 31, 2019 and 389,843 SF through August 31, 2034. Weil has the right to terminate (a) its 20,791 SF of below grade storage space, at any time, and (b) either (i) its 38,900 SF of space on the 22nd floor or (ii) its 39,900 SF of space on the 32nd floor, on or after August 31, 2022. Weil most recently extended its lease for 389,843 SF of its space through August 2034 at an initial base rent of $114.00 per SF, above its current in place weighted average gross rent of $92.37 per SF. BPLP, one of the borrower sponsors, provided a payment guaranty for the gap rent between Weil’s current rent and Weil’s underwritten rent which commences in September 2019. |
| (5) | Under Armour’s lease commences on the substantial completion of landlord’s work, which is projected to be January 1, 2019. Under Armour has the right to terminate its lease if its space is not delivered by July 1, 2019 and the failure to deliver the space is not due to tenant-caused delays or force majeure. Under Armour’s space is currently occupied by Apple while the Apple Cube Space (as defined below) and expansion is under construction. Under Armour is not currently in occupancy or paying rent. BPLP provided a payment guaranty with respect to Under Armour’s gap rent (for the difference between the rent being paid by Apple for the space anticipated to be occupied by Under Armour and the rent that will be due upon commencement of Under Armour’s lease) as well as with respect to Under Armour’s free rent. Under Armour has 12 months of free rent, equal to $30,000,000, beginning after its lease commencement date. |
| (6) | Aramis subleases 9,725 SF of its space on the 46th floor to GF Capital Management at $107.00 per SF. |
| (7) | BAMCO has executed a renewal to extend its lease to May 2035, commencing in January 2024 for a weighted average base rent of approximately $201.65 per SF. BAMCO’s in place weighted average base rent is approximately $147.77 per SF. BPLP provided a payment guaranty with respect to BAMCO’s gap rent between closing and the renewal rent commencing in January 2024. After the expiration of the guaranty by BPLP, the lower of market or in place rent has been underwritten. |
| (8) | Apple is temporarily occupying the space expected to be occupied by Under Armour once Under Armour’s lease commences, while the Apple Cube Space and expansion is under construction. Apple is obligated to vacate its temporary space by December 31, 2018 and has the right to terminate its entire lease if its space is not delivered by February 3, 2020, subject to force majeure. Apple leases 2,754 SF of storage space through December 31, 2018 and 102,994 SF through January 1, 2034. Apple has 17 months of free rent, equal to $9,562,500, on its 21,907 SF of expansion space commencing in August 2017. Once Apple has moved back into its expanded and redeveloped space, it will be required to pay 2.25% in percentage rent above $200,000,000 a year in sales. BPLP provided a guaranty for the estimated gap percentage rent of $8,962,500, as well as with respect to Apple’s free rent in the amount of $9,562,000. |
| (9) | Balyasny Asset Management may terminate its lease effective December 31, 2022 with a minimum of one year’s notice and payment of a termination fee. Balyasny Asset Management has six months of free rent on its 34th floor space, totaling $1,481,625. |
| (10) | GM subleases 38,100 SF on the 14th floor to Grosvenor Capital at $80.00 per SF and 38,100 SF on the 16th floor to Reservoir Operations at $85.00 per SF. |
The depositor has filed a registration statement (including a prospectus) with the Securities and Exchange Commission (“SEC”) (SEC File No. 333-207132) for the offering to which this communication relates. Before you invest, you should read the prospectus in the registration statement and other documents the depositor has filed with the SEC for more complete information about the depositor, the issuing entity and this offering. You may get these documents for free by visiting EDGAR on the SEC website at www.sec.gov. Alternatively, the depositor or Citigroup Global Markets Inc., Barclays Capital Inc., Drexel Hamilton, LLC or any other underwriter or dealer participating in this offering will arrange to send you the prospectus if you request it by calling toll-free 1-800-831-9146.
| 52 |
| LOAN #2: general motors building |
The following table presents the lease rollover schedule at the General Motors Building Property, based on initial lease expiration dates:
Lease Expiration Schedule(1)(2)
Year Ending | Expiring Owned | % of Owned | Cumulative % of | UW | % of Total UW | UW Base Rent | # of Expiring | |||||||||||||||
| 2017 | 11,226 | 0.6 | % | 0.6 | % | $993,600 | 0.4 | % | $88.51 | 1 | ||||||||||||
| 2018 | 52,373 | 2.6 | 3.2 | % | 15,456,871 | 5.8 | $295.13 | 3 | ||||||||||||||
| 2019 | 106,096 | 5.3 | 8.5 | % | 9,123,113 | 3.4 | $85.99 | 2 | ||||||||||||||
| 2020 | 532,016 | 26.7 | 35.3 | % | 50,741,831 | 19.1 | $95.38 | 6 | ||||||||||||||
| 2021 | 35,486 | 1.8 | 37.0 | % | 16,570,250 | 6.2 | $466.95 | 3 | ||||||||||||||
| 2022 | 144,898 | 7.3 | 44.3 | % | 14,412,478 | 5.4 | $99.47 | 2 | ||||||||||||||
| 2023 | 2,747 | 0.1 | 44.5 | % | 1,870,937 | 0.7 | $681.08 | 1 | ||||||||||||||
| 2024 | 38,100 | 1.9 | 46.4 | % | 3,429,000 | 1.3 | $90.00 | 1 | ||||||||||||||
| 2025 | 66,347 | 3.3 | 49.7 | % | 6,783,128 | 2.5 | $102.24 | 2 | ||||||||||||||
| 2026 | 48,201 | 2.4 | 52.1 | % | 9,096,994 | 3.4 | $188.73 | 2 | ||||||||||||||
| 2027 | 99,324 | 5.0 | 57.1 | % | 12,273,236 | 4.6 | $123.57 | 5 | ||||||||||||||
| 2028 & Thereafter | 753,305 | 37.9 | 95.0 | % | 125,565,627 | 47.1 | $166.69 | 10 | ||||||||||||||
| Vacant | 99,864 | 5.0 | 100.0 | % | 0 | 0.0 | $0.00 | 0 | ||||||||||||||
| Total / Wtd. Avg. | 1,989,983 | 100.0 | % | $266,317,065 | 100.0 | % | $140.90 | 38 | ||||||||||||||
| (1) | Calculated based on approximate square footage occupied by each owned tenant unless otherwise specified. |
| (2) | Certain tenants may have lease termination options that are exercisable prior to the stated expiration date of the subject lease or leases which are not considered in the Lease Expiration Schedule. |
| (3) | UW Base Rent and UW Base Rent $ per SF exclude $11,269,632 of total underwritten straight line rents associated with Weil ($6,010,916), which leases 100,024 SF of space through August 31, 2019 and 389,843 SF through August 31, 2034, and Apple ($4,107,800) which leases 2,754 SF of storage space through December 31, 2018 and 102,994 SF through January 1, 2034, as well as four other tenants. |
Major Tenants
Weil, Gotshal & Manges (489,867 SF, 24.6% of GLA, 19.3% of underwritten base rent). Weil, an international corporate law firm, has its global headquarters at the General Motors Building Property. Founded in 1931, Weil currently has over 1,100 lawyers in 19 offices worldwide. Weil’s specialty practice areas include litigation, corporate, restructuring, tax and benefits. Weil was ranked #15 in a legal industry publication ranking for profits per partner for 2016. Weil is an original tenant at the General Motors Building Property, having been in continuous occupancy since 1968, and has expanded its space multiple times in its 49 years at the General Motors Building Property. Weil most recently extended its lease for 389,843 SF of its space through August 2034 at an initial base rent of $114.00 per SF, above its current in-place weighted average gross rent of $92.37 per SF. BPLP provided a payment guaranty for the gap rent between Weil’s current rent and Weil’s underwritten rent which commences in September 2019. Weil has the right to terminate (a) its 20,791 SF of below grade storage space, at any time, and (b) either (i) its 38,900 SF of space on the 22nd floor or (ii) its 39,900 SF space on the 32nd floor, on or after August 31, 2022.
Aramis (299,895 SF, 15.1% of GLA, 10.3% of underwritten base rent). The General Motors Building Property serves as headquarters for Aramis, a brand launched in 1964 by The Estée Lauder Companies. Aramis was the first prestige men’s fragrance to be sold in department stores and continues to be engaged in the men’s fragrance and grooming retail category. Aramis is an original tenant at the General Motors Building Property, having been in continuous occupancy since 1968. Aramis currently subleases 9,725 SF of its space that is noncontiguous on the 46th floor, and has two five-year extension options remaining, each with 18 months’ notice at 95% of fair market rents.
Under Armour (49,582 SF, 2.5% of GLA, 11.3% of underwritten base rent).Under Armour is a developer, manufacturer and retailer of performance apparel, footwear and accessories for men, women and youth. Under Armour’s space at the General Motors Building Property is expected to be used as its flagship “Under Armour Brand House” retail store. Under Armour’s lease commences on the substantial completion of landlord’s work, which is projected to be January 1, 2019. Under Armour has the right to terminate its lease if its space is not delivered by July 1, 2019 and the failure to deliver the space is not due to tenant-caused delays or force majeure. Under Armour’s space is currently occupied by Apple while the Apple Cube Space (as defined below) and expansion is under construction. Under Armour is not currently in occupancy or paying rent. BPLP provided a payment guaranty with respect to Under Armour’s gap rent (for the difference between the rent being paid by Apple for the space anticipated to be occupied by Under Armour and the rent that will be due upon commencement of Under Armour’s lease) and free rent due to Under Armour. Under Armour will have 12 months of free rent, equal to $30,000,000, beginning after its lease commencement date.
The depositor has filed a registration statement (including a prospectus) with the Securities and Exchange Commission (“SEC”) (SEC File No. 333-207132) for the offering to which this communication relates. Before you invest, you should read the prospectus in the registration statement and other documents the depositor has filed with the SEC for more complete information about the depositor, the issuing entity and this offering. You may get these documents for free by visiting EDGAR on the SEC website at www.sec.gov. Alternatively, the depositor or Citigroup Global Markets Inc., Barclays Capital Inc., Drexel Hamilton, LLC or any other underwriter or dealer participating in this offering will arrange to send you the prospectus if you request it by calling toll-free 1-800-831-9146.
| 53 |
| LOAN #2: general motors building |
BAMCO (105,579 SF, 5.3% of GLA, 8.0% of underwritten base rent).BAMCO is a privately owned investment manager that provides services to investment companies and manages separate client-focused equity portfolios. BAMCO is a subsidiary of Baron Capital Group Inc., both of which are headquartered at the General Motors Building Property. BAMCO has executed a renewal to extend its lease to May 2035, commencing in January 2024 for a weighted average base rent of approximately $201.65 per SF. BAMCO’s in place weighted average base rent is approximately $147.77 per SF. BPLP provided a payment guaranty with respect to BAMCO’s gap rent between closing and the renewal rent commencing in January 2024. After the expiration of the guaranty by BPLP, the lower of market or in place rent has been underwritten.
Apple (105,748 SF, 5.3% of GLA, 6.8% of underwritten base rent).Apple is a designer, developer and retailer of consumer electronics, computer software and online services headquartered in Cupertino, California. Apple has its flagship retail location at the General Motors Building Property underneath a 35-foot glass cube at the center of the pedestrian plaza on the Fifth Avenue side of the General Motors Building Property (the “Apple Cube Space”). Apple recently executed an extension for 102,994 SF through January 2034 and is currently occupying the former FAO Schwarz space on the 58th Street side of the General Motors Building Property, while its store undergoes a renovation to expand its space by approximately 34,000 SF, increasing ceiling heights by lowering the floor approximately five feet and adding storage space and back of house capacity by expanding into formerly dark space located below grade. Apple is obligated to vacate its temporary space by December 31, 2018 and has the right to terminate its entire lease if its expanded Apple Cube Space is not delivered by February 3, 2020, subject to force majeure. Apple leases 2,754 SF of storage space through December 31, 2018 and 102,994 SF through January 1, 2034. Apple has 17 months of free rent, equal to $9,562,500, on its 21,907 SF of expansion space commencing in August 2017. BPLP provided a payment guaranty with respect to Apple’s free rent.
The depositor has filed a registration statement (including a prospectus) with the Securities and Exchange Commission (“SEC”) (SEC File No. 333-207132) for the offering to which this communication relates. Before you invest, you should read the prospectus in the registration statement and other documents the depositor has filed with the SEC for more complete information about the depositor, the issuing entity and this offering. You may get these documents for free by visiting EDGAR on the SEC website at www.sec.gov. Alternatively, the depositor or Citigroup Global Markets Inc., Barclays Capital Inc., Drexel Hamilton, LLC or any other underwriter or dealer participating in this offering will arrange to send you the prospectus if you request it by calling toll-free 1-800-831-9146.
| 54 |
| LOAN #2: general motors building |
■ | Operating History and Underwritten Net Cash Flow. The following table presents certain information relating to the historical operating performance and the Underwritten Net Cash Flow at the General Motors Building Property: |
Cash Flow Analysis(1)
2013 | 2014 | 2015 | 2016 | Underwritten(2) | Underwritten $ per SF(2) | |||||||||||||
| Base Rent(2) | $188,477,818 | $197,172,437 | $193,759,747 | $206,851,492 | $266,317,065 | $133.83 | ||||||||||||
| Straight Line Rent(3) | 0 | 0 | 0 | 0 | 11,269,632 | 5.66 | ||||||||||||
| Rent Abatements(4) | 0 | 0 | 0 | 0 | 0 | 0.00 | ||||||||||||
| Gross Up Vacancy | 0 | 0 | 0 | 0 | 16,547,756 | 8.32 | ||||||||||||
| Reimbursements | 29,544,790 | 35,800,858 | 38,501,366 | 39,027,298 | 27,629,542 | 13.88 | ||||||||||||
| Mark to Market(5) | 0 | 0 | 0 | 0 | 17,100,676 | 8.59 | ||||||||||||
| Apple Percentage Rent | 13,435,678 | 11,075,213 | 9,266,920 | 5,301,583 | 4,921,916 | 2.47 | ||||||||||||
| Direct Utilities | 2,040,806 | 2,298,058 | 2,229,659 | 1,242,134 | 2,345,676 | 1.18 | ||||||||||||
| Service Income | 2,596,805 | 2,976,371 | 3,277,203 | 3,357,322 | 4,425,456 | 2.22 | ||||||||||||
| Other Income(6) | 16,176,651 | 7,995,847 | 2,733,268 | 569,626 | 754,455 | 0.38 | ||||||||||||
| Gross Revenue | $252,272,548 | $257,318,784 | $249,768,162 | $256,349,455 | $351,312,174 | $176.54 | ||||||||||||
| Vacancy & Credit Loss | 0 | 0 | 0 | 0 | (16,547,756 | ) | (8.32 | ) | ||||||||||
| Effective Gross Income | $252,272,548 | $257,318,784 | $249,768,162 | $256,349,455 | $334,764,418 | $168.22 | ||||||||||||
| Real Estate Taxes | $48,843,713 | $56,588,425 | $64,304,184 | $69,746,440 | $76,093,094 | $38.24 | ||||||||||||
| Insurance | 5,185,870 | 4,151,381 | 3,138,234 | 2,868,853 | 2,820,108 | 1.42 | ||||||||||||
| Management Fee(7) | 5,242,237 | 5,338,307 | 5,478,829 | 5,405,290 | 1,000,000 | 0.50 | ||||||||||||
| Other Operating Expenses | 24,989,132 | 25,925,053 | 26,335,252 | 26,903,525 | 27,544,807 | 13.84 | ||||||||||||
| Total Operating Expenses | $84,260,952 | $92,003,166 | $99,256,499 | $104,924,109 | $107,458,009 | $54.00 | ||||||||||||
| Net Operating Income(8) | $168,011,596 | $165,315,617 | $150,511,664 | $151,425,346 | $227,306,409 | $114.23 | ||||||||||||
| TI/LC | 0 | 0 | 0 | 0 | 5,363,618 | 2.70 | ||||||||||||
| Capital Expenditures | 0 | 0 | 0 | 0 | 397,997 | 0.20 | ||||||||||||
| Net Cash Flow | $168,011,596 | $165,315,617 | $150,511,664 | $151,425,346 | $221,544,794 | $111.33 | ||||||||||||
| Occupancy | 96.9 | % | 98.5 | % | 96.7 | % | 96.3 | % | 95.0 | %(9) | ||||||||
| NOI Debt Yield(10) | 11.4 | % | 11.2 | % | 10.2 | % | 10.3 | % | 15.5 | % | ||||||||
| NCF DSCR(10) | 3.29 | x | 3.23 | x | 2.94 | x | 2.96 | x | 4.33 | x | ||||||||
| (1) | Certain items such as interest expense, interest income, lease cancellation income, depreciation, amortization, debt service payments and any other non-recurring or non-operating items were excluded from the historical presentation and are not considered for the underwritten cash flow. |
| (2) | Underwritten Base Rent and Underwritten $ per SF reflects contractual rents as of June 1, 2017, and includes rent steps through June 2018. Various adjustments have been made to the in place rents which are detailed below: |
| (i) | Apple is currently undergoing a major renovation to their Apple Cube Space. During the renovations, Apple is occupying the former FAO Schwarz space as temporary space until the earlier of the completion of their renovations or the outside kick out date of December 31, 2018. Base rent for Apple as of January 2019 has been underwritten in conjunction with the Under Armour lease commencement date. Apple is currently paying annual contractual rent of $12,500,004 on the temporary space, which steps up to $24,000,000 annually in August 2018 in addition to their existing lease for the Apple Cube Space. Lenders are underwriting $18,057,615 in base rent and $19,429,881 in gross rent (base rent plus recoveries) for Apple. |
| (ii) | Under Armour has executed a lease commencing in January 2019 for the space that is currently occupied by Apple as temporary space. Contractual rent has been underwritten for Under Armour based on the rent due date as of January 2019 when the lease is expected to commence. BPLP provided a payment guaranty for the gap rent between the rent Apple is currently paying to occupy its temporary space and the rent that will be due under Under Armour’s lease once such lease commences. |
| (iii) | Weil has executed a renewal for 389,843 SF of its space through August 2034, commencing in September 2019. Underwritten Base Rent for Weil uses rents effective as of September 2019. With respect to the space not extended, contractual in-place rent inclusive of 12 months’ rent steps and existing recoveries has been underwritten. BPLP provided a payment guaranty for the gap rent between Weil’s current rent and their underwritten rent which commences in September 2019. |
| (iv) | BAMCO has executed a renewal to extend its lease to May 2035, commencing in January 2024 for a weighted average base rent of approximately $201.65 per SF. BAMCO’s in place weighted average base rent is approximately $147.77 per SF. The gap rent between closing and the renewal rent commencing in January 2024 is guaranteed by BPLP. After the expiration of the guaranty by BPLP, the lower of market or in place rent has been underwritten. |
| (v) | Continental Grain is currently subleasing from GM and has executed a direct lease commencing in April 2020 on the expiration of their existing sublease. GM is currently paying $92.00 per SF in base rent. Continental Grain’s direct rent in 2020 of $110.00 per SF has been underwritten. BPLP provided a guaranty for the gap rent until 2020. |
| (3) | Underwritten Straight Line Rent is based on net present value of future contractual rent steps after June 1, 2018 for investment grade tenants and law firm tenants included in a listing of the largest 100 United States law firms through the tenants’ lease expirations (which in the case of certain tenants, expire beyond the loan term). Tenants with underwritten straight line rents include Weil ($6,010,916), Apple ($4,107,800) and four other tenants. |
| (4) | Apple has an abatement period for its percentage rent component that commences in October 2017 until it has moved into its expanded and redeveloped space. Once Apple has moved back into its expanded and redeveloped space, it will be required to pay 2.25% in percentage rent above $200,000,000 a year in sales. BPLP provided a guaranty for the estimated gap percentage rent. Underwritten Apple Percentage Rent is equal to the average Apple sales from 2013 through 2016 over the new $200,000,000 breakpoint and the 2.25% percentage rent. |
| (5) | Rents have been marked up or down, as applicable, based on the appraiser’s conclusion of market rents. |
| (6) | Underwritten Other Income primarily consists of net antenna income. |
| (7) | Contractual management fee is equal to 2.0% of Effective Gross Income. Underwritten management fee is capped at $1,000,000. |
| (8) | The Net Operating Income for the period beginning on January 1, 2017 and ending on March 31, 2017 was $49,643,832. |
| (9) | Underwritten Occupancy includes Under Armour, which has an executed lease but is not expected to be in occupancy at the General Motors Building Property until January 1, 2019. |
| (10) | NOI Debt Yield and NCF DSCR calculations are based on the aggregate outstanding principal balance of the General Motors Building Senior Pari Passu Notes and exclude the aggregate outstanding principal balance of the General Motors Building Junior Non-Trust Notes. |
The depositor has filed a registration statement (including a prospectus) with the Securities and Exchange Commission (“SEC”) (SEC File No. 333-207132) for the offering to which this communication relates. Before you invest, you should read the prospectus in the registration statement and other documents the depositor has filed with the SEC for more complete information about the depositor, the issuing entity and this offering. You may get these documents for free by visiting EDGAR on the SEC website at www.sec.gov. Alternatively, the depositor or Citigroup Global Markets Inc., Barclays Capital Inc., Drexel Hamilton, LLC or any other underwriter or dealer participating in this offering will arrange to send you the prospectus if you request it by calling toll-free 1-800-831-9146.
| 55 |
| LOAN #2: general motors building |
■ | Appraisal.According to the appraisal, the General Motors Building Property has an “as-is” appraised value of $4,800,000,000 as of May 8, 2017. |
Appraisal Approach(1) | Value | Discount Rate | Capitalization Rate | |||
| Direct Capitalization Approach | $4,600,000,000 | N/A | 3.50% | |||
| Discounted Cash Flow Approach | $4,800,000,000 | 6.00% | 4.50%(2) |
| (1) | Based on the “as-is” appraised value. |
| (2) | Represents the terminal capitalization rate. |
| ■ | Environmental Matters. Based on a Phase I environmental report dated May 9, 2017, the environmental consultant did not identify evidence of any recognized environmental conditions or recommendations for further action at the General Motors Building Property. |
| ■ | Market Overview and Competition.The General Motors Building Property is located on the entire city block bound by Fifth Avenue and Madison Avenue between East 58th Street and East 59th Street. This area of Midtown Manhattan is known as the Madison/Fifth Avenue subdistrict and is considered one of Manhattan’s premier office locations according to the appraisal. The General Motors Building Property is surrounded by many of New York’s landmarks, restaurants, hotels, shops and tourist attractions, made accessible by the presence of several major transportation hubs. The General Motors Building Property is located within the boundaries of the Plaza District, which is generally bound by 47th Street to the south and 65th Street to the north, and from Avenue of the Americas to the East River. |
As of the first quarter of 2017, the three office statistical areas that comprise the Plaza District contain 81.1 million SF of Class A office space, 6.4 million SF of Class B office space and 481,485 SF of Class C office space. Historically, the Plaza District has evidenced the highest rents in Midtown Manhattan due to the demand generated by its location and quality space, according to the appraisal. As of the first quarter of 2017, the Class A office space in the Plaza District had a direct vacancy rate of 9.4% and average asking rents of $99.69 per SF, above the direct primary Midtown Manhattan average of $88.93 per SF.
According to the appraisal, as of the first quarter of 2017, the Madison/Fifth Avenue subdistrict consisted of approximately 19.8 million SF of Class A office space and had a direct vacancy rate of 11.0% and overall direct weighted average asking rents of $110.15 per SF. Overall vacancy of Class A office space in the Madison/Fifth Avenue subdistrict dropped by 2.0% from 13.3% in the first quarter 2016 to 11.3% in the first quarter 2017, the lowest quarterly total since the first quarter of 2008. Direct weighted average Class A office rental rates increased by $5.10 per SF over the same time period.
The following tablepresents certain information relating to the Class A Office Market for thePlaza District as of first quarter 2017:
| Plaza District - Class A Office Market Summary(1) | |||||
| Inventory (SF) | Overall Vacancy | Direct Vacancy | Direct Rental Rate | YTD Leasing Activity (SF) | |
| Madison/Fifth Avenue | 19,782,877 | 11.8% | 11.0% | $110.15 | 296,980 |
| Park Avenue | 21,842,808 | 12.4% | 9.2% | $101.41 | 249,730 |
| Sixth Avenue/Rockefeller Center | 39,485,121 | 10.9% | 8.8% | $92.13 | 890,591 |
| Total / Wtd. Avg. | 81,110,806 | 11.5% | 9.4% | $99.69 | 1,437,301 |
| (1) | Source: Appraisal. |
The appraiser identified 10 comparable recent office leases ranging in tenant size from 4,002 SF to 110,025 SF. The comparable leases are all located in buildings similar in class to theGeneral Motors Building Property, and in theGeneral Motors Building Property’s general competitive market according to the appraisal. The comparable leases have terms ranging from six to fifteen years and exhibit a range of rents from $108.50 per SF to $180.00 per SF, with an average of $148.95 per SF, prior to adjustments. After adjustments for rent concessions, the comparables’ rents range from $108.37 per SF to $189.50 per SF, with an average of $156.50 per SF. Free rent concessions ranged from zero to 13 months. Tenant improvement allowances ranged from $35.00 per SF to $100.00 per SF.
The depositor has filed a registration statement (including a prospectus) with the Securities and Exchange Commission (“SEC”) (SEC File No. 333-207132) for the offering to which this communication relates. Before you invest, you should read the prospectus in the registration statement and other documents the depositor has filed with the SEC for more complete information about the depositor, the issuing entity and this offering. You may get these documents for free by visiting EDGAR on the SEC website at www.sec.gov. Alternatively, the depositor or Citigroup Global Markets Inc., Barclays Capital Inc., Drexel Hamilton, LLC or any other underwriter or dealer participating in this offering will arrange to send you the prospectus if you request it by calling toll-free 1-800-831-9146.
| 56 |
| LOAN #2: general motors building |
The following table presents certain information relating to recent office leasing activity for the General Motors Building Property’s office market:
| Recent Office Leasing Activity(1) | ||||||||||
| Address | 590 Madison Avenue | 520 Madison Avenue | 375 Park Avenue | 9 West 57thStreet | 650 Madison Avenue | 450 Park Avenue | 399 Park Avenue | 9 West 57thStreet | 375 Park Avenue | 375 Park Avenue |
| Year Built | 1982 | 1982 | 1958 | 1971 | 1987 | 1972/2003 | 1961 | 1971 | 1958 | 1958 |
| Office GLA (SF) | 1,016,413 | 849,600 | 830,009 | 1,500,000 | 521,544 | 247,242 | 1,250,000 | 1,500,000 | 830,009 | 830,009 |
| No. Stories | 43 | 43 | 38 | 50 | 27 | 33 | 39 | 50 | 38 | 38 |
| Lease Information | ||||||||||
| Tenant Name | Cemex | CIC Union | Servcorp NYC | Qatar Investment Authority | Carson Family Trust | Banco Bradesco | Morgan Stanley | Zimmer Partners | Fried Frank | Strategic Asset Services |
| Floor(s) Leased | Pt. 27th | Ent. 36th-37th | Pt. 26th | Pt. 38th | Pt. 26th | Ent. 32nd-33rd | Ent. 12th, Ent. 23rd, Ent. 24th | Pt. 33rd | Pt. 36th-37th | Pt. 20th |
| Lease Date | Feb-2017 | Jan-2017 | Jan-2017 | Jan-2017 | Jan-2017 | Dec-2016 | Jul-2016 | Jul-2016 | Jun-2016 | May-2016 |
| Term (Years) | 15 | 10 | 10 | 10 | 10 | 13 | 15 | 10 | 6 | 7 |
| Lease Type | Gross | Gross | Gross | Gross | Gross | Gross | Gross | Gross | Gross | Gross |
| Tenant Size | 5,903 | 46,822 | 9,572 | 14,000 | 4,002 | 21,822 | 110,025 | 20,100 | 11,703 | 16,000 |
| Rent per SF | $145.00 | $127.00 | $173.00 | $180.00 | $120.00 | $149.00 | $108.50 | $155.00 | $167.00 | $165.00 |
| Rent Steps | $155.00 (Yr. 5) | $136.00 (Yr. 6) | $183.00 (Yr. 6) | $185.00 (Yr. 6) | $130.00 (Yr. 6) | $159.00 (Yr. 6) | $118.50 (Yr. 6) | $165.00 (Yr. 6) | $174.00 (Yr. 5) | $170.00 (Yr. 5) |
| $165.00 (Yr. 10) | $145.00 (Yr. 11) | $128.50 (Yr. 11) | ||||||||
| Free Rent (Months) | 8 | 13 | 4 | 6 | 6 | 11 | 10 | 0 | 6 | 3 |
| Workletter (per SF) | $75.00 | $77.50 | $40.00 | $65.00 | $65.00 | $70.00 | $90.00 | $110.00 | $100.00 | $35.00 |
| Adjustments | ||||||||||
| Rent Concessions | $2.89 | ($1.81) | $14.53 | $9.50 | $6.50 | $0.96 | ($0.13) | $11.50 | $8.92 | $22.68 |
| Effective Adjusted Rent per SF | $147.89 | $125.19 | $187.53 | $189.50 | $126.50 | $149.96 | $108.37 | $166.50 | $175.92 | $187.68 |
| (1) | Source: Appraisal. |
The depositor has filed a registration statement (including a prospectus) with the Securities and Exchange Commission (“SEC”) (SEC File No. 333-207132) for the offering to which this communication relates. Before you invest, you should read the prospectus in the registration statement and other documents the depositor has filed with the SEC for more complete information about the depositor, the issuing entity and this offering. You may get these documents for free by visiting EDGAR on the SEC website at www.sec.gov. Alternatively, the depositor or Citigroup Global Markets Inc., Barclays Capital Inc., Drexel Hamilton, LLC or any other underwriter or dealer participating in this offering will arrange to send you the prospectus if you request it by calling toll-free 1-800-831-9146.
| 57 |
| LOAN #2: general motors building |
The following tablepresents certain information relating to the appraiser’s concluded office rental rate for theGeneral Motors Building Property:
| Office Market Rent Conclusion(1) | ||
| Market Rent | Floors | Rent per SF |
| 3 to 6 | $110.00 | |
| 7 to 10 | $115.00 | |
| 11 to 16 | $120.00 | |
| 17 to 26 | $140.00 | |
| 27 to 37 | $155.00 | |
| 38 to 43 | $175.00 | |
| 44 to 50 | $210.00 | |
| Tenant Category | Minor | Major |
| Size | Partial Floor | Full Floor |
| Lease Term (years) | 10 | 15 |
| Free Rent (months) | 10 | 12 |
| Tenant Improvements (per SF) | $65.00 | $70.00 |
| Lease Type (reimbursements) | Mod. Gross | Mod. Gross |
| Contract Rent Increase Projection | 10.0% in Year 6 | 10.0% in every 5 years |
| (1) | Source: Appraisal. |
The appraisal identified 29 comparable office properties totaling approximately 20.0 million SF that exhibited a gross rental range of $75.00 per SF to $200.00 per SF and a weighted average occupancy rate of approximately 90.5% for direct space. Of the 29 buildings surveyed, seven are considered directly competitive with the General Motors Building Property in terms of building classification, asking rents, rentable office area and current occupancy. The directly competitive properties exhibited a gross rental range of $85.00 per SF to $200.00 per SF and a weighted average direct occupancy of approximately 86.0%, and excluding 9 West 57th Street, the average direct occupancy rate for these buildings is 94.0%, compared to 90.5% for all the competitive buildings compared with the General Motors Building Property, and 91.3% for Class A space within Midtown as a whole.
| Directly Competitive Buildings(1) | |||||||
| Property | Office Area (GLA SF) | Direct Available SF | Sublease Available SF | % Occupied (Direct) | % Occupied (Total) | Direct Asking Rent (per SF) | |
| Low | High | ||||||
| 650 Madison Avenue | 521,544 | 18,094 | 0 | 96.5% | 96.5% | $120.00 | $130.00 |
| 660 Madison Avenue | 239,113 | 0 | 6,676 | 100.0% | 97.2% | N/A | N/A |
| 667 Madison Avenue | 267,135 | 59,435 | 0 | 77.8% | 77.8% | $135.00 | $195.00 |
| 712 Fifth Avenue | 457,281 | 31,408 | 9,813 | 93.1% | 91.0% | $85.00 | $140.00 |
| 375 Park Avenue | 830,009 | 7,650 | 0 | 99.1% | 99.1% | $150.00 | $180.00 |
| 390 Park Avenue | 260,000 | 36,979 | 10,726 | 85.8% | 81.7% | $185.00 | $185.00 |
| 9 West 57thStreet | 1,500,000 | 416,505 | 0 | 72.2% | 72.2% | $110.00 | $200.00 |
| Total / Wtd. Avg. | 4,075,082 | 570,071 | 27,215 | 86.0% | 85.3% | $85.00 | $200.00 |
| (1) | Source: Appraisal. |
The General Motors Building Property is located in both the Upper Fifth Avenue retail submarket, which is defined as Fifth Avenue between the north side of 49th Street to the south side of 60th Street, and the Madison Avenue retail submarket, which is defined as Madison Avenue between the north side of 57th Street and the south side of 72nd Street. The appraiser noted that the leasing markets along Fifth Avenue and Madison Avenue are among those with the highest rental rates in Manhattan and the United States as a whole. As of the first quarter 2017, direct asking rents in the Upper Fifth Avenue retail submarket and Madison Avenue retail submarket were $3,123 per SF and $1,407 per SF, respectively. The availability, which is the number of available retail spaces available divided by the total number of retail spaces in a given market, was 17.4% for the Upper Fifth Avenue retail submarket and 22.9% for the Madison Avenue retail submarket, for the first quarter 2017. The appraisal identified eight recent comparable retail leases which are detailed in the following chart.
The depositor has filed a registration statement (including a prospectus) with the Securities and Exchange Commission (“SEC”) (SEC File No. 333-207132) for the offering to which this communication relates. Before you invest, you should read the prospectus in the registration statement and other documents the depositor has filed with the SEC for more complete information about the depositor, the issuing entity and this offering. You may get these documents for free by visiting EDGAR on the SEC website at www.sec.gov. Alternatively, the depositor or Citigroup Global Markets Inc., Barclays Capital Inc., Drexel Hamilton, LLC or any other underwriter or dealer participating in this offering will arrange to send you the prospectus if you request it by calling toll-free 1-800-831-9146.
| 58 |
| LOAN #2: general motors building |
The following tablepresents certain information relating to recent retail leasing activity in theGeneral Motors Building Property’s retail market:
| Comparable Retail Leases(1) | ||||||||
| Address | 723 Madison Avenue | 650 Fifth Avenue | 680 Madison Avenue | 683 Fifth Avenue | 685 Fifth Avenue | 683 Madison Avenue | 730 Fifth Avenue | 650 Madison Avenue |
| Tenant Name | Paule Ka | Nike | Tom Ford | Stuart Weitzman | Coach | Bally’s | Zegna | Moncler |
| Frontage | Madison Avenue | Fifth Avenue & 52nd Street | 61stStreet & Madison Avenue | Fifth Avenue | Fifth Avenue & 54th Street | Madison Avenue & 61st Street | West 57th Street | Madison Avenue & East 60th Street |
| Lease Date | Dec-16 | Dec-16 | Aug-16 | Jun-16 | Feb-16 | Jan-16 | Feb-16 | Sep-15 |
| Original Term | 10 | 15.5 | 10 | 10 | 10 | 10 | 15 | 10 |
| Lease Type | Gross | Gross | Gross | Gross | Gross | Gross | Gross | Gross |
| Tenant Size (SF) | 867 Grade | 7,008 Grade | 3,470 Grade | 1,281 Grade | 4,627 Grade | 3,013 Grade | 1,600 Grade | 3,000 Grade |
| 415 LL | 4,706 LL | 5,000 2nd | 5,247 LL | 850 LL | ||||
| 379 2nd | 9,500 2nd | 1,601 Mezz | 1,600 Mezz | |||||
| 12,000 3rd | 6,337 2nd | 7,530 2nd | ||||||
| 12,000 4th | 6,337 3rd | |||||||
| 12,000 5th | ||||||||
| 12,000 6th | ||||||||
| Base Rent | $1,452,225 | $33,190,000 | $6,300,000 | $5,000,000 | $21,000,000 | $5,001,580 | $7,200,000 | $4,500,000 |
| Base Rent (per SF) | $1,600 Grade | $3,500 Grade | $1,650 Grade | $3,903 Grade | $3,550 Grade | $1,660 Grade | $3,515 Grade | $1,500 Grade |
| $50 LL | $50 LL | $115 2nd | $150 LL | $150 LL | ||||
| $125 2nd | $350 2nd | $200 Mezz | $200 Mezz | |||||
| $200 3rd | $400 2nd | $150 2nd | ||||||
| $75 4th | $150 3rd | |||||||
| $75 5th | ||||||||
| $75 6th | ||||||||
| Escalations | N/A | % Incr. / Yr. | N/A | % Incr. / Yr. | 9% Incr. / 3 Yrs. | % Incr. / Yr. | % Incr. / Yr. | % Incr. / Yr. |
| Free Rent (Months) | 5 | 6 | 6 | 6 | 9 | 6 | 6 | 6 |
| Workletter (per SF) | $0.00 | $508.00 | $1,534.83 | $0.00 | $869.60 | $0.00 | $1,727.12 | $0.00 |
| (1) | Source: Appraisal. |
The depositor has filed a registration statement (including a prospectus) with the Securities and Exchange Commission (“SEC”) (SEC File No. 333-207132) for the offering to which this communication relates. Before you invest, you should read the prospectus in the registration statement and other documents the depositor has filed with the SEC for more complete information about the depositor, the issuing entity and this offering. You may get these documents for free by visiting EDGAR on the SEC website at www.sec.gov. Alternatively, the depositor or Citigroup Global Markets Inc., Barclays Capital Inc., Drexel Hamilton, LLC or any other underwriter or dealer participating in this offering will arrange to send you the prospectus if you request it by calling toll-free 1-800-831-9146.
| 59 |
| LOAN #2: general motors building |
The following tablepresents certain information relating to the appraiser’s concluded retail rental rate for theGeneral Motors Building Property:
| Retail Market Rent Conclusion(1) | |
| Tenant Category | Rent per SF |
| Retail (Lobby) | $140.00 |
| Retail (Basement) | $250.00 |
| Retail (Concourse) | $75.00 |
| Retail (Madison Corner) | $1,250.00 |
| Retail (Madison Midblock) | $1,200.00 |
| Retail (Fifth Avenue) | $1,500.00 |
| Retail (2nd Floor) | $250.00 |
| Lease Term (years) | 10 |
| Free Rent (months) | 6 |
| Tenant Improvements (Per SF) | $0.00 |
| Lease Type (reimbursements) | Mod. Gross |
| Contract Rent Increase Projection | 10.0% in year 6 |
| (1) | Source: Appraisal. |
| ■ | The Borrower. The borrower is 767 Fifth Partners LLC, a single-purpose, single-asset Delaware limited liability company. Legal counsel for the borrower delivered a non-consolidation opinion in connection with the origination of the General Motors Building Loan Combination. The sponsors for theGeneral Motors Building Loan are BPLP, a Delaware limited partnership, 767 LLC, a Delaware limited liability company, and Sungate Fifth Avenue LLC, a Delaware limited liability company. Other than the borrower, no person or entity guarantees the non-recourse carveouts or provides environmental indemnities with respect to the General Motors Building Loan Combination.Boston Properties, Inc. (“Boston Properties”) is a self-administered and self-managed publicly traded real estate investment trust that conducts its business through BPLP, which in turn holds all of Boston Properties’ interests. BPLP is one of the largest owners, managers and developers of Class A office properties in the United States, with significant presence in five markets: Boston, Los Angeles, New York, San Francisco and Washington, D.C. As of May 31, 2017, BPLP owned or had interests in 175 commercial real estate properties, aggregating approximately 48.2 million net rentable SF. New York is BPLP’s largest market by net operating income, generating annualized net operating income of approximately $452 million as of the first quarter of 2017. For the same time period, BPLP reported that its New York CBD portfolio was 94.3% leased at an average rental rate of $102.50 per SF with over 3.4 million SF of office space under development nationwide. BPLP’s office buildings under development are 65% pre-leased and include Salesforce Tower in San Francisco, California, which is expected to be the tallest building in San Francisco when complete. |
| ■ | Escrows.During the continuance of a Cash Management Sweep Period (as defined below), the borrower is required to deposit on each due date an amount equal to one-twelfth of (i) the taxes that the lender reasonably estimates will be payable during the next ensuing 12 months, and (ii) the insurance premiums that the lender reasonably estimates will be payable for renewal of the coverage afforded by the policies upon their expiration, provided that the borrower’s obligation to deposit such amount is provisionally suspended upon delivery to the lender of evidence satisfactory to the lender that some or all of the policies of insurance required to be maintained by the borrower pursuant to the General Motors Building Loan documents are maintained pursuant to blanket insurance policies which blanket insurance policies otherwise comply with the requirements of the General Motors Building Loan documents. Notwithstanding the foregoing, in connection with the origination of the General Motors Building Loan, the borrower has the right to deliver the lender a guaranty (a “BPLP Guaranty”) from BPLP (in the context of the BPLP Guaranty, the “BPLP Guarantor”), in lieu of making the payments to any of the reserve accounts, so long as BPLP’s senior unsecured credit rating is BBB or higher by S&P and Baa3 or higher by Moody’s (the “BPLP Guarantor Required Rating”). The aggregate amount guaranteed under any such BPLP Guaranty (together with any cash delivered by the borrower to the lender in lieu of making the deposits to any reserve accounts and/or any letter of credit delivered by |
The depositor has filed a registration statement (including a prospectus) with the Securities and Exchange Commission (“SEC”) (SEC File No. 333-207132) for the offering to which this communication relates. Before you invest, you should read the prospectus in the registration statement and other documents the depositor has filed with the SEC for more complete information about the depositor, the issuing entity and this offering. You may get these documents for free by visiting EDGAR on the SEC website at www.sec.gov. Alternatively, the depositor or Citigroup Global Markets Inc., Barclays Capital Inc., Drexel Hamilton, LLC or any other underwriter or dealer participating in this offering will arrange to send you the prospectus if you request it by calling toll-free 1-800-831-9146.
| 60 |
| LOAN #2: general motors building |
the borrower to the lender) related to any such purpose, must at all times be at least equal to the aggregate amount which the borrower is required to have on deposit for such purpose. The aggregate amount guaranteed under any such BPLP Guaranty will be reduced as the borrower expends funds for the purposes which such funds would have otherwise been deposited in the reserve account. The aggregate amount of any BPLP Guaranty may not at any time exceed 11.8% of the outstanding principal balance of the General Motors Building Loan Combination.
In the event of any downgrade, withdrawal or qualification of the rating of the BPLP Guarantor by any rating agency such that the BPLP Guarantor no longer satisfies the BPLP Guarantor Required Rating, within 10 business days of such downgrade, withdrawal or qualification, the borrower is required to (i) deposit with the lender cash in the amount of the guaranteed obligations under each BPLP Guaranty then outstanding, and/or (ii) provide the lender with a letter of credit with a face amount equal to the guaranteed obligations under each BPLP Guaranty then outstanding.
At loan origination, BPLP provided a BPLP Guaranty in lieu of depositing $107,946,183 for existing tenant improvement and leasing commission costs and $161,161,013 in existing gap rent and free rent obligations.
| ■ | Lockbox and Cash Management. The General Motors Building Loan documents require a hard lockbox with springing cash management.TheGeneral MotorsBuilding Loan documents required the borrower to deliver tenant direction letters at origination, directing tenants to pay rent directly to a lender-controlled lockbox account, and require rents received by the borrower or the property manager with respect to theGeneral MotorsBuilding Property to be deposited into such lockbox account within five business days after receipt thereof during the term of theGeneral MotorsBuilding Loan.During the continuance of a Cash Management Sweep Period, all amounts in the lockbox account are required to be swept to a lender-controlled cash management account on a daily basis and, provided no event of default under the General Motors Building Loan documents is continuing, applied to payment of debt service and funding of required reserves, with the remainder (i) to the extent a Cash Management Sweep Period is continuing, first applied to pay monthly operating expenses and then deposited into an excess cash flow reserve and held by the lender as additional collateral for the General Motors Building Loan; provided, however, if no event of default is continuing, such funds are required to be disbursed to the borrower within ten days after the lender’s receipt of a written request from the borrower (at its election) (a) to pay shortfalls on debt service on the General Motors Building Loan Combination, (b) to disburse monthly operating expenses (including payments to any affiliate of the borrower if set forth in the approved annual budget or otherwise approved by the lender) as set forth in the approved annual budget and extraordinary expenses reasonably approved by the lender, (c) to pay capital expenditures (other than payments to any affiliate of the borrower unless set forth in the approved annual budget or otherwise approved by the lender) subject to the satisfaction of certain capital expenditure release conditions and (d) to pay tenant improvement costs, tenant improvement allowances or leasing expenses as set forth in the approved annual budget or incurred on commercially reasonable terms in connection with leases which do not require the lender’s approval, subject to satisfaction of certain tenant improvement release conditions or leasing commission/allowance release conditions, and (ii) to the extent no Cash Management Sweep Period is continuing, to be swept into the borrower’s operating account. After the occurrence and during the continuance of an event of default under the General Motors Building Loan documents, the lender may apply any funds in the cash management account to amounts payable under the General Motors Building Loan (and/or toward the payment of expenses of the General Motors Building Property), in such order of priority as the lender may determine. |
A“Cash Management Sweep Period” will commence upon the occurrence of (a) an event of default under the General Motors Building Loan documents or (b) the debt service coverage ratio being less than 1.20x as of the last day of any calendar quarter and will terminate upon (x) in the case of clause (a), the cure of such event of default, and (y) in the case of clause (b) (A) the debt service coverage ratio of the General Motors Building Loan Combination being 1.20x or greater for one calendar quarter and no event of default is continuing or (B) the borrower’s delivery of (x) cash in an amount that would have to be prepaid to bring the debt service coverage ratio to 1.20x to be held as an additional reserve fund, (y) a letter of credit satisfying the requirements in the General Motors Building Loan documents or (z) so long as BPLP’s senior unsecured credit rating is BBB or higher by S&P and Baa3 or higher by Moody’s, a guaranty by BPLP, in each case in an amount that would be required to be prepaid in order for the debt service coverage ratio to equal at least 1.20x.
| ■ | Property Management. The General Motors Building Property is managed by BPLP, a borrower affiliate. The lender has the right to direct the borrower to terminate the property management agreement and replace the property manager if (i) the property manager becomes insolvent or a debtor in an involuntary bankruptcy or insolvency proceeding not dismissed within 90 days or any voluntary bankruptcy or insolvency proceeding; (ii) an event of default under the General Motors Building Loan Combination documents has occurred and is continuing; (iii) the property |
The depositor has filed a registration statement (including a prospectus) with the Securities and Exchange Commission (“SEC”) (SEC File No. 333-207132) for the offering to which this communication relates. Before you invest, you should read the prospectus in the registration statement and other documents the depositor has filed with the SEC for more complete information about the depositor, the issuing entity and this offering. You may get these documents for free by visiting EDGAR on the SEC website at www.sec.gov. Alternatively, the depositor or Citigroup Global Markets Inc., Barclays Capital Inc., Drexel Hamilton, LLC or any other underwriter or dealer participating in this offering will arrange to send you the prospectus if you request it by calling toll-free 1-800-831-9146.
| 61 |
| LOAN #2: general motors building |
manager has engaged in gross negligence, fraud, willful misconduct or misappropriation of funds; or (iv) a default by the property manager under the property management agreement has occurred and is continuing beyond all applicable notice and cure periods. The borrower has the right to replace the property manager without the lender’s consent, provided no event of default is continuing under the General Motors Building Loan documents with a Qualified Manager (as defined below) provided that the borrower enters into a replacement property management agreement on an arms-length basis and commercially reasonable market terms and a subordination of management agreement reasonably acceptable to the lender, and, if such Qualified Manager is an affiliate of the borrower, upon delivery of a new non-consolidation opinion.
A “Qualified Manager” means (a) any affiliate of BPLP, (b) a property manager which has at least 10 years’ experience in the management of Class A office buildings in Manhattan, New York which at the time of its engagement as property manager of the General Motors Building Property has under management at least five million leasable SF comprising at least ten Class A office buildings, provided that such property manager is not the subject of a bankruptcy or similar insolvency proceeding; or (c) any other management organization approved by the lender in its reasonable discretion, for which the lender shall have received a rating agency confirmation in connection therewith.
| ■ | Mezzanine or Secured Subordinate Indebtedness. Not permitted. |
| ■ | Release of Collateral. Not permitted. |
| ■ | Terrorism Insurance. The borrower is required to maintain an “all-risk” insurance policy that provides coverage for terrorism in an amount equal to 100% of the full replacement cost of the General Motors Building Property with no deductible in excess of $100,000 (except with respect to earthquake and windstorm coverage), plus a business interruption insurance policy that provides 18 months of business interruption coverage with an additional extended period of indemnity for up to six months after the physical loss has been repaired. Notwithstanding the foregoing, in the event TRIPRA is no longer in effect, in no event is the borrower required to pay insurance premiums for terrorism insurance exceeding two times the amount of the then-current annual premium for the required comprehensive all risk insurance (excluding any terrorism, earthquake or flood component thereof) and business income/rent loss insurance (“Terrorism Premium Cap”) and, if the cost of such terrorism insurance exceeds the Terrorism Premium Cap, the borrower is required to purchase the maximum amount of terrorism insurance available with funds equal to the Terrorism Premium Cap. Provided that TRIPRA remains in effect, the borrower is permitted to maintain terrorism coverage from a captive insurance company pursuant to the conditions of the General Motors Building Loan documents. See “Risk Factors—Terrorism Insurance May Not Be Available for All Mortgaged Properties”in the Preliminary Prospectus. |
The depositor has filed a registration statement (including a prospectus) with the Securities and Exchange Commission (“SEC”) (SEC File No. 333-207132) for the offering to which this communication relates. Before you invest, you should read the prospectus in the registration statement and other documents the depositor has filed with the SEC for more complete information about the depositor, the issuing entity and this offering. You may get these documents for free by visiting EDGAR on the SEC website at www.sec.gov. Alternatively, the depositor or Citigroup Global Markets Inc., Barclays Capital Inc., Drexel Hamilton, LLC or any other underwriter or dealer participating in this offering will arrange to send you the prospectus if you request it by calling toll-free 1-800-831-9146.
| 62 |
(THIS PAGE INTENTIONALLY LEFT BLANK)
The depositor has filed a registration statement (including a prospectus) with the Securities and Exchange Commission (“SEC”) (SEC File No. 333-207132) for the offering to which this communication relates. Before you invest, you should read the prospectus in the registration statement and other documents the depositor has filed with the SEC for more complete information about the depositor, the issuing entity and this offering. You may get these documents for free by visiting EDGAR on the SEC website at www.sec.gov. Alternatively, the depositor or Citigroup Global Markets Inc., Barclays Capital Inc., Drexel Hamilton, LLC or any other underwriter or dealer participating in this offering will arrange to send you the prospectus if you request it by calling toll-free 1-800-831-9146.
| 63 |
LOAN #3: 9-19 9th avenue
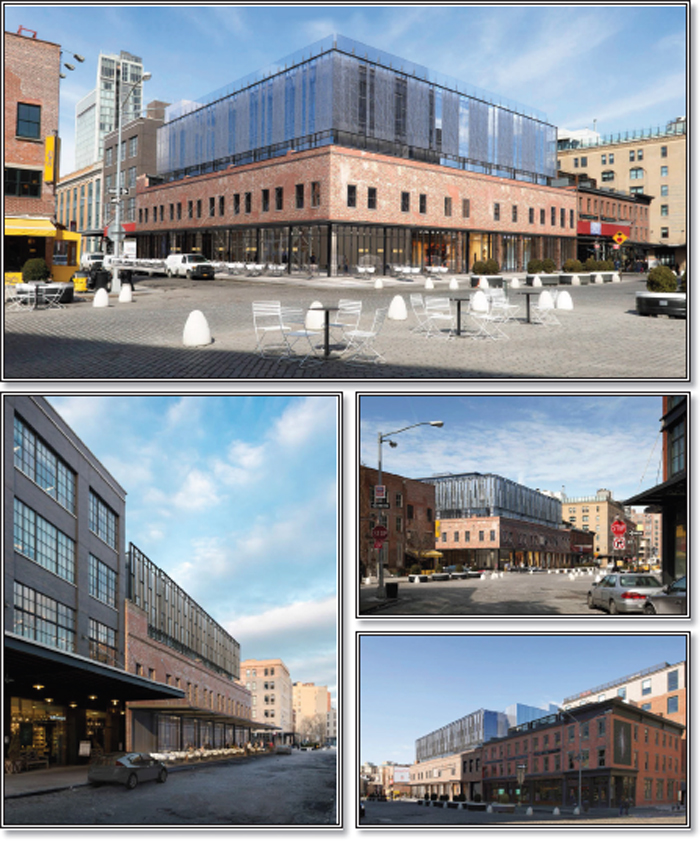
The depositor has filed a registration statement (including a prospectus) with the Securities and Exchange Commission (“SEC”) (SEC File No. 333-207132) for the offering to which this communication relates. Before you invest, you should read the prospectus in the registration statement and other documents the depositor has filed with the SEC for more complete information about the depositor, the issuing entity and this offering. You may get these documents for free by visiting EDGAR on the SEC website at www.sec.gov. Alternatively, the depositor or Citigroup Global Markets Inc., Barclays Capital Inc., Drexel Hamilton, LLC or any other underwriter or dealer participating in this offering will arrange to send you the prospectus if you request it by calling toll-free 1-800-831-9146.
| 64 |
LOAN #3: 9-19 9th avenue
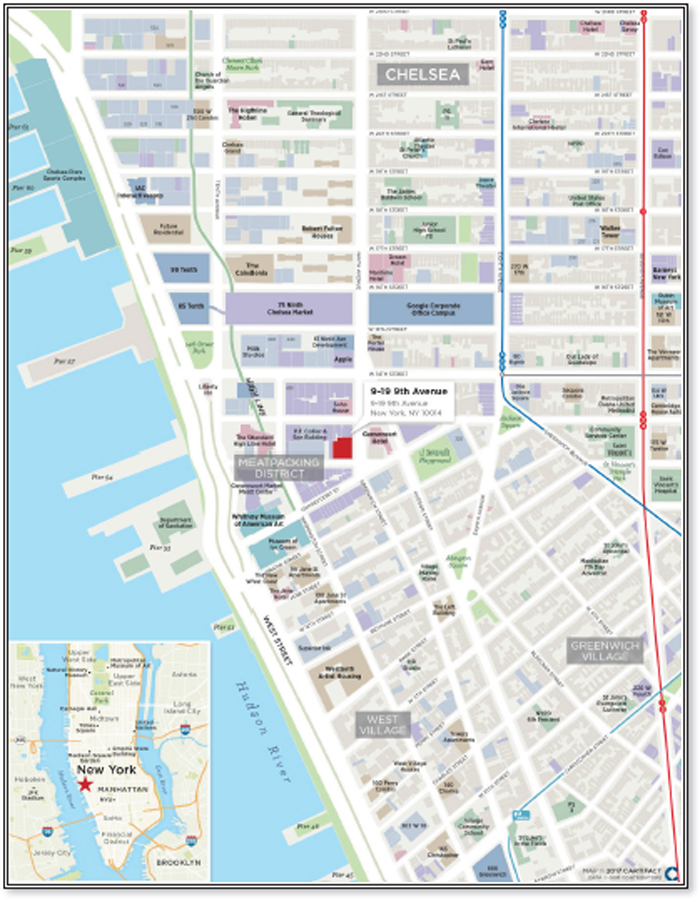
The depositor has filed a registration statement (including a prospectus) with the Securities and Exchange Commission (“SEC”) (SEC File No. 333-207132) for the offering to which this communication relates. Before you invest, you should read the prospectus in the registration statement and other documents the depositor has filed with the SEC for more complete information about the depositor, the issuing entity and this offering. You may get these documents for free by visiting EDGAR on the SEC website at www.sec.gov. Alternatively, the depositor or Citigroup Global Markets Inc., Barclays Capital Inc., Drexel Hamilton, LLC or any other underwriter or dealer participating in this offering will arrange to send you the prospectus if you request it by calling toll-free 1-800-831-9146.
| 65 |
LOAN #3: 9-19 9th avenue
| Mortgaged Property Information | Mortgage Loan Information | ||||||||||||||||||
| Number of Mortgaged Properties | 1 | Loan Seller | SMF V | ||||||||||||||||
| Location (City/State) | New York, New York | Cut-off Date Balance(3) | $55,000,000 | ||||||||||||||||
| Property Type | Retail | Cut-off Date Balance per SF(2) | $1,720.24 | ||||||||||||||||
| Size (SF) | 61,038 | Percentage of Initial Pool Balance | 5.1% | ||||||||||||||||
| Total Occupancy as of 9/6/2017(1) | 100.0% | Number of Related Mortgage Loans | None | ||||||||||||||||
| Owned Occupancy as of 9/6/2017(1) | 100.0% | Type of Security | Fee Simple | ||||||||||||||||
| Year Built / Latest Renovation | 1920 / 2017 | Mortgage Rate | 4.13100% | ||||||||||||||||
| Appraised Value | $202,000,000 | Original Term to Maturity (Months) | 120 | ||||||||||||||||
| Appraisal Date | 6/23/2017 | Original Amortization Term (Months) | NAP | ||||||||||||||||
| Borrower Sponsors | Robert Cayre; BRE Properties, LLC | Original Interest Only Period (Months) First Payment Date | 120 9/6/2017 | ||||||||||||||||
| Property Management | William Gottlieb Management Co., LLC | ||||||||||||||||||
| Maturity Date | 8/6/2027 | ||||||||||||||||||
| Underwritten Revenues | $9,411,761 | ||||||||||||||||||
| Underwritten Expenses | $991,395 | Escrows(4) | |||||||||||||||||
| Underwritten Net Operating Income (NOI) | $8,420,366 | Upfront | Monthly | ||||||||||||||||
| Underwritten Net Cash Flow (NCF) | $8,414,262 | Taxes | $128,689 | $64,345 | |||||||||||||||
| Cut-off Date LTV Ratio(2) | 52.0% | Insurance | $162,734 | $13,562 | |||||||||||||||
| Maturity Date LTV Ratio(2) | 52.0% | Replacement Reserve | $0 | $0 | |||||||||||||||
| DSCR Based on Underwritten NOI / NCF(2) | 1.91x / 1.91x | TI/LC | $0 | $0 | |||||||||||||||
| Debt Yield Based on Underwritten NOI / NCF(2) | 8.0% / 8.0% | Other | $0 | $0 | |||||||||||||||
| Sources and Uses | |||||||||||||||||||
| Sources | $ | % | Uses | $ | % | ||||||||||||||
| Loan Combination Amount | $105,000,000 | 100.0% | Loan Payoff | $60,399,767 | 57.5% | ||||||||||||||
| Principal Equity Distribution | 41,608,335 | 39.6 | |||||||||||||||||
| Closing Costs | 2,700,475 | 2.6 | |||||||||||||||||
| Reserves | 291,423 | 0.3 | |||||||||||||||||
| Total Sources | $105,000,000 | 100.0% | Total Uses | $105,000,000 | 100.0% | ||||||||||||||
| (1) | Occupancy includes Restoration Hardware, Inc. (“Restoration Hardware”). Restoration Hardware’s lease commenced in September 2016 and it began paying rent in May 2017. Restoration Hardware has not yet taken occupancy, but has accepted its leased premises and renovation work is expected to be completed in September 2017. Restoration Hardware anticipates opening for business in November 2017. |
| (2) | Calculated based on the aggregate outstanding principal balance of the 9-19 9th Avenue Loan Combination (as defined below). |
| (3) | The Cut-off Date Balance of $55,000,000 represents the controlling note A-1, which is part of a loan combination evidenced by twopari passunotes having an aggregate outstanding principal balance as of the Cut-off Date of $105,000,000. The related companion loan is evidenced by the non-controlling note A-2 with an outstanding principal balance as of the Cut-off Date of $50,000,000, which is currently held by Starwood Mortgage Funding III LLC and is expected to be contributed to a future securitization transaction. |
| (4) | See “––Escrows” below. |
| ■ | The Mortgage Loan.The mortgage loan (the “9-19 9th Avenue Loan”) is part of a loan combination (the “9-19 9th Avenue Loan Combination”) evidenced by twopari passunotes with a combined outstanding principal balance as of the Cut-off Date of $105,000,000. The 9-19 9th Avenue Loan Combination is secured by the borrower’s fee simple interest in a Class A retail flagship building located in New York, New York (the “9-19 9th Avenue Property”). The 9-19 9th Avenue Loan, which is evidenced by the controlling note A-1, has an outstanding principal balance as of the Cut-off Date of $55,000,000 and represents approximately 5.1% of the Initial Pool Balance. The related companion loan is evidenced by the non-controlling note A-2 (the “9-19 9th Avenue Companion Loan”) which has an outstanding principal balance as of the Cut-off Date of $50,000,000. The 9-19 9th Avenue Loan Combination was originated by Starwood Mortgage Capital LLC on July 20, 2017. The 9-19 9th Avenue Loan Combination has an interest rate of 4.13100%per annum. The borrower utilized the proceeds of the 9-19 9th Avenue Loan Combination to refinance the existing debt on the 9-19 9th Avenue Property, return equity to the borrower sponsors, fund reserves and pay origination costs. |
Note Summary
| Note | Current or Anticipated Holder of Securitized Note | Cut-off Date Balance |
| 9-19 9th Avenue Loan Combination | ||
| A-1 | CGCMT 2017-P8 | $55,000,000 |
| A-2(1) | Starwood Mortgage Funding III LLC | $50,000,000 |
| (1) | Expected to be contributed to a future securitization transaction. |
The depositor has filed a registration statement (including a prospectus) with the Securities and Exchange Commission (“SEC”) (SEC File No. 333-207132) for the offering to which this communication relates. Before you invest, you should read the prospectus in the registration statement and other documents the depositor has filed with the SEC for more complete information about the depositor, the issuing entity and this offering. You may get these documents for free by visiting EDGAR on the SEC website at www.sec.gov. Alternatively, the depositor or Citigroup Global Markets Inc., Barclays Capital Inc., Drexel Hamilton, LLC or any other underwriter or dealer participating in this offering will arrange to send you the prospectus if you request it by calling toll-free 1-800-831-9146.
| 66 |
LOAN #3: 9-19 9th avenue
The 9-19 9th Avenue Loan Combination had an initial term of 120 months and has a remaining term of 119 months as of the Cut-off Date. The 9-19 9th Avenue Loan Combination requires payment of interest only until the scheduled maturity date, which is the due date in August 2027. Voluntary prepayment of the 9-19 9th Avenue Loan Combination without payment of a yield maintenance premium is permitted on or after the due date in May 2027. Defeasance of the 9-19 9th Avenue Loan Combination with direct, non-callable obligations of the United States of America or other obligations which are “government securities” is permitted under the 9-19 9th Avenue Loan Combination documents at any time after the earlier of July 20, 2020 or the second anniversary of the securitization of the last portion of the 9-19 9th Avenue Loan Combination.
| ■ | The Mortgaged Property. The 9-19 9th Avenue Property is a recently redeveloped, five-story, 61,038 SF retail building located in Manhattan’s Meatpacking District. The 9-19 9th Avenue Property is 100.0% leased to a wholly-owned subsidiary of Restoration Hardware (NYSE: RH). The 9-19 9th Avenue Property will serve as Restoration Hardware’s New York City flagship location. Restoration Hardware is relocating its flagship store from 935 Broadway in New York’s Flatiron District. According to Restoration Hardware’s Chairman and CEO Gary Friedman, the New York flagship store is the company’s top-performing store. Originally developed in 1920, the 9-19 9th Avenue Property was previously occupied by Pastis, a restaurant. At the time, the 9-19 9th Avenue Property was two stories and contained approximately 31,000 SF. Now standing five stories tall with frontage along 9th Avenue and Little West 12th Street, the 9-19 9th Avenue Property features finishes that include a refinished brick façade and a glass paneled façade wrapping its upper three stories. The basement space is 10,773 SF, the ground floor is 13,140 SF, the second floor is 12,166 SF, the third floor is 11,094 SF, the fourth floor is 10,947 SF and the fifth floor is 2,918 SF. The basement through fourth floor will primarily consist of furniture display space. The fifth floor will be a rooftop restaurant with an open kitchen and a large covered patio (the patio space is not included in the GLA). |
The 9-19 9th Avenue Property is 100.0% leased as of September 6, 2017 by Restoration Hardware. After Restoration Hardware’s 15-year lease was executed in February 2014, redevelopment construction began at the 9-19 9th Avenue Property. To date, the borrower sponsors have spent in excess of $25.0 million on the redevelopment. Restoration Hardware’s lease commenced in September 2016 and, in May 2017, Restoration Hardware commenced paying rent of $8.5 million annually which will increase at a rate of 6.0% every two years. Restoration Hardware has two, 10-year extension options associated with the lease.
The following table presents certain information relating to historical leasing at the 9-19 9th Avenue Property:
Historical Leased %(1)(2)
| 2014 | 2015 | 2016 | As of 9/6/2017(3) | |||||
| Owned Space | N/A | N/A | N/A | 100.0% |
| (1) | As provided by the borrower and which represents occupancy for the indicated year unless otherwise specified. |
| (2) | Information regarding 2014, 2015 and 2016 occupancy is unavailable because the 9-19 9th Avenue Property underwent a substantial redevelopment commencing in 2014. |
| (3) | Restoration Hardware’s lease commenced in September 2016 and it began paying rent in May 2017. Restoration Hardware has not yet taken occupancy, but has accepted its leased premises and renovation work is expected to be completed in September 2017. Restoration Hardware anticipates opening for business in November 2017. |
The following table presents certain information relating to the 9-19 9th Avenue Property:
Owned Tenant Based on Underwritten Base Rent(1)
| Tenant Name | Credit Rating (Fitch/MIS/S&P) | Tenant GLA | % of GLA | UW Base Rent(2) | % of Total UW Base Rent | UW Base Rent | Lease Expiration | Renewal / Extension Options | ||||||||
| Restoration Hardware(3) | NR / NR / NR | 61,038 | 100.0% | $9,702,846 | 100.0% | $158.96 | 1/31/2032 | 2, 10-year options |
| (1) | Based on the underwritten rent roll dated September 6, 2017. |
| (2) | UW Base Rent and UW Base Rent $ per SF reflect average rent steps through the term of the 9-19 9th Avenue Loan Combination. Restoration Hardware is currently paying $8,500,000. |
| (3) | Restoration Hardware’s lease commenced in September 2016 and it began paying rent in May 2017. Restoration Hardware has not yet taken occupancy, but has accepted its leased premises and renovation work is expected to be completed in September 2017. Restoration Hardware anticipates opening for business in November 2017. |
The depositor has filed a registration statement (including a prospectus) with the Securities and Exchange Commission (“SEC”) (SEC File No. 333-207132) for the offering to which this communication relates. Before you invest, you should read the prospectus in the registration statement and other documents the depositor has filed with the SEC for more complete information about the depositor, the issuing entity and this offering. You may get these documents for free by visiting EDGAR on the SEC website at www.sec.gov. Alternatively, the depositor or Citigroup Global Markets Inc., Barclays Capital Inc., Drexel Hamilton, LLC or any other underwriter or dealer participating in this offering will arrange to send you the prospectus if you request it by calling toll-free 1-800-831-9146.
| 67 |
LOAN #3: 9-19 9th avenue
The following table presents the lease rollover schedule at the 9-19 9th Avenue Property, based on initial lease expiration dates:
Lease Expiration Schedule(1)
| Year Ending December 31, | Expiring Owned GLA | % of Owned GLA | Cumulative % of Owned GLA | UW | % of Total UW Base Rent | UW Base Rent | # of Expiring Tenants | |||||||
| 2017 | 0 | 0.0% | 0.0% | $0 | 0.0% | $0.00 | 0 | |||||||
| 2018 | 0 | 0.0 | 0.0% | 0 | 0.0 | $0.00 | 0 | |||||||
| 2019 | 0 | 0.0 | 0.0% | 0 | 0.0 | $0.00 | 0 | |||||||
| 2020 | 0 | 0.0 | 0.0% | 0 | 0.0 | $0.00 | 0 | |||||||
| 2021 | 0 | 0.0 | 0.0% | 0 | 0.0 | $0.00 | 0 | |||||||
| 2022 | 0 | 0.0 | 0.0% | 0 | 0.0 | $0.00 | 0 | |||||||
| 2023 | 0 | 0.0 | 0.0% | 0 | 0.0 | $0.00 | 0 | |||||||
| 2024 | 0 | 0.0 | 0.0% | 0 | 0.0 | $0.00 | 0 | |||||||
| 2025 | 0 | 0.0 | 0.0% | 0 | 0.0 | $0.00 | 0 | |||||||
| 2026 | 0 | 0.0 | 0.0% | 0 | 0.0 | $0.00 | 0 | |||||||
| 2027 | 0 | 0.0 | 0.0% | 0 | 0.0 | $0.00 | 0 | |||||||
| 2028 & Thereafter | 61,038 | 100.0 | 100.0% | 9,702,846 | 100.0 | $158.96 | 1 | |||||||
| Vacant | 0 | 0.0 | 100.0% | 0 | 0.0 | $0.00 | 0 | |||||||
| Total / Wtd. Avg. | 61,038 | 100.0% | $9,702,846 | 100.0% | $158.96 | 1 |
| (1) | Calculated based on approximate square footage occupied by each Owned Tenant unless otherwise specified. |
| (2) | UW Base Rent and UW Base Rent $ per SF reflect average rent steps through the term of the 9-19 9th Avenue Loan Combination. Restoration Hardware is currently paying $8,500,000. |
Major Tenant
Restoration Hardware (61,038 SF, 100.0% of GLA, 100.0% of underwritten base rent). Restoration Hardware, founded in 1979, is a retailer in the home furnishings marketplace. Restoration Hardware offers merchandise assortments across a range of categories, including furniture, lighting, textiles, bathware, decor, outdoor and garden furnishings. Restoration Hardware classifies its sales into furniture and non-furniture product lines. The furniture category includes both indoor and outdoor furniture while the non-furniture category includes lighting, textiles, fittings, fixtures, surfaces, accessories and home decor. Restoration Hardware operates a total of 85 retail galleries, consisting of 50 legacy galleries, six larger format design galleries, eight next generation “design” galleries, one RH Modern Gallery and five RH Baby & Child Galleries; the remaining galleries are waterworks showrooms, outlet stores and retail galleries throughout the United States and Canada and in the United Kingdom. Restoration Hardware has been publicly traded since August 2011 and has a market capitalization of approximately $2.3 billion (as of July 14, 2017). Per Restoration Hardware’s January 2017 10-K, the company has reported stockholders’ equity of approximately $919.9 million with liquidity of $87.0 million. Restoration Hardware’s lease commenced in September 2016 and it began paying rent in May 2017. Restoration Hardware has not yet taken occupancy, but has accepted its leased premises and renovation work is expected to be completed in September 2017. Restoration Hardware anticipates opening for business in November 2017. Restoration Hardware has two 10-year extension options.
The depositor has filed a registration statement (including a prospectus) with the Securities and Exchange Commission (“SEC”) (SEC File No. 333-207132) for the offering to which this communication relates. Before you invest, you should read the prospectus in the registration statement and other documents the depositor has filed with the SEC for more complete information about the depositor, the issuing entity and this offering. You may get these documents for free by visiting EDGAR on the SEC website at www.sec.gov. Alternatively, the depositor or Citigroup Global Markets Inc., Barclays Capital Inc., Drexel Hamilton, LLC or any other underwriter or dealer participating in this offering will arrange to send you the prospectus if you request it by calling toll-free 1-800-831-9146.
| 68 |
LOAN #3: 9-19 9th avenue
| ■ | Operating History and Underwritten Net Cash Flow. The following table presents certain information relating to the historical operating performance and the Underwritten Net Cash Flow at the 9-19 9th Avenue Property: |
Cash Flow Analysis
| Underwritten | Underwritten | |||
| Base Rent | $8,500,000 | $139.26 | ||
| Contractual Rent Steps(1) | 1,202,846 | 19.71 | ||
| Gross Up Vacancy | 0 | 0.00 | ||
| Reimbursements | 0 | 0.00 | ||
| Gross Revenue | $9,702,846 | $158.96 | ||
| Vacancy & Credit Loss | (291,085) | (4.77) | ||
| Effective Gross Income | $9,411,761 | $154.20 | ||
| Real Estate Taxes | $758,640 | $12.43 | ||
| Insurance | 38,416 | 0.63 | ||
| Management Fee | 188,235 | 3.08 | ||
| Administrative | 6,104 | 0.10 | ||
| Total Operating Expenses | $991,395 | $16.24 | ||
| Net Operating Income | $8,420,366 | $137.95 | ||
| TI/LC | 0 | 0.00 | ||
| Capital Expenditures | 6,104 | 0.10 | ||
| Net Cash Flow | $8,414,262 | $137.85 | ||
| Occupancy | 97.0% | |||
| NOI Debt Yield | 8.0% | |||
| NCF DSCR | 1.91x | |||
| (1) | Contractual Rent Steps reflects average rent steps through the term of the 9-19 9th Avenue Loan Combination. Restoration Hardware is currently paying $8,500,000. |
| ■ | Appraisal.According to the appraisal, the 9-19 9th Avenue Property has an “as-is” appraised value of $202,000,000 as of June 23, 2017 and a “go dark” value of $189,000,000. |
| Appraisal Approach | Value | Discount Rate | Capitalization Rate | |||
| Direct Capitalization Approach | $202,000,000 | N/A | 3.75% |
| ■ | Environmental Matters. Based on a Phase I environmental report dated June 27, 2017, the environmental consultant did not identify evidence of any recognized environmental conditions or recommendations for further action at the 9-19 9th Avenue Property. |
| ■ | Market Overview and Competition. The 9-19 9th Avenue Property is located in New York City’s Meatpacking District, on the far west side of Manhattan, bordered to the north by Chelsea and to the south by the West Village. The appraisal indicated that the 9-19 9th Avenue Property is located within the Greenwich Village submarket. The 9-19 9th Avenue Property is situated along the corner of 9th Avenue and Little West 12th Street, directly adjacent to Catch, a 400-seat, tri-level seafood restaurant, as well as being within walking distance from The High Line Park, the Whitney Museum of American Art and Chelsea Market. The Meatpacking District and Chelsea are home to high-end shopping including Christian Louboutin, Alexander McQueen, Stella McCartney, Hermes, Tory Burch, Patagonia, lululemon, Tesla and Theory. Additionally, both neighborhoods have emerged as destinations for technology, media and creative industry companies with Google, Twitter, Apple, Samsung and Uber all having a prominent presence. The 9-19 9th Avenue Property features access to public transportation options including the A / C / E subway lines two blocks to the north at 14th Street and 8th Avenue and the 1 / 2 / 3 subway lines one block to the east at 14th Street and 7th Avenue. |
The depositor has filed a registration statement (including a prospectus) with the Securities and Exchange Commission (“SEC”) (SEC File No. 333-207132) for the offering to which this communication relates. Before you invest, you should read the prospectus in the registration statement and other documents the depositor has filed with the SEC for more complete information about the depositor, the issuing entity and this offering. You may get these documents for free by visiting EDGAR on the SEC website at www.sec.gov. Alternatively, the depositor or Citigroup Global Markets Inc., Barclays Capital Inc., Drexel Hamilton, LLC or any other underwriter or dealer participating in this offering will arrange to send you the prospectus if you request it by calling toll-free 1-800-831-9146.
| 69 |
LOAN #3: 9-19 9th avenue
The 9-19 9th Avenue Property is located in the Greenwich Village retail submarket. According to the appraisal, as of the first quarter of 2017, the Greenwich Village retail submarket had a total inventory of 2,700,018 SF with a vacancy rate of 3.1% and average asking rent of $122.39 per SF. According to a market report, the 2017 population within a one-, three- and five-mile radius of the 9-19 9th Avenue Property was 138,112, 1,100,771 and 2,412,260, respectively. Additionally, the 2017 median household income within a one-, three- and five-mile radius of the 9-19 9th Avenue Property was $116,432, $95,725 and $82,394, respectively. The appraisal identified six recent comparable retail leases which are detailed in the following chart.
The following tablepresents certain information relating to retail lease comparables in the9-19 9th Avenue Property’s retail market:
Retail Lease Comparables(1)
9-19 9th Avenue Property (Subject) | 115-121 Wooster Street | 46 Gansevoort Street | 424 Broome Street | 810 Washington Street | ||||||
| Year Built / Renovated | 1920 / 2017 | 1900 / 2015 | 1941 / N/A | 1900 / 2016 | 1940 / N/A | |||||
| Building SF | 61,038 | 7,875 | 10,000 | 4,100 | 2,125 | |||||
| Total Occupancy | 100.0% | 100.0% | 100.0% | 100.0% | 100.0% | |||||
| Tenant | Restoration Hardware | Ted Baker | Hermes | Indochino | Intermix | |||||
| Lease SF | 61,038 | 7,875 | 10,000 | 4,100 | 2,125 | |||||
| Base Rent | $139.26 | $235.00 | $284.00 | $275.00 | $225.00 |
| 32 Gansevoort Street | 803 Broadway | |||
| Year Built / Renovated | 1910 / N/A | 1930 / N/A | ||
| Building SF | 10,100 | 115,000 | ||
| Total Occupancy | 100.0% | 100.0% | ||
| Tenant | Sweetgreen | Brooklyn Industries | ||
| Lease SF | 1,915 | 2,400 | ||
| Base Rent | $240.00 | $200.00 | ||
| (1) | Source: Appraisal. |
| ■ | The Borrower.The borrower is 9th Avenue Delaware Owner LLC, a single-purpose, single-asset Delaware limited liability company. Legal counsel for the borrower delivered a non-consolidation opinion in connection with the origination of the 9-19 9th Avenue Loan Combination. The sponsors and non-recourse carveout guarantors for the 9-19 9th Avenue Loan Combination are Robert Cayre and BRE Properties, LLC, a Delaware limited liability company. Robert Cayre is the founder of Aurora Capital Associates (“Aurora”). Aurora is a leading owner, developer and operator of premier properties in New York City and major markets throughout the United States. Aurora’s approximately 5.0 million SF portfolio features flagship retail properties, boutique offices and residential buildings. The firm focuses on adding value to assets located on high street retail corridors through repositioning, redevelopment and ground up construction. Aurora has grown to become one of the largest property owners in Manhattan’s Meatpacking District and SoHo neighborhoods. Currently, Aurora has over 2.0 million SF of construction projects in various stages of development throughout New York City. Recent development projects include the 215,000 SF Renaissance Marriott by Penn Plaza, a 150,000 SF mixed-use project on Harlem’s 125th Street anchored by Bed Bath & Beyond and a 150,000 SF mixed-use development featuring Whole Foods in Williamsburg, Brooklyn. Aurora has a significant presence in the Meatpacking District, owning and developing commercial assets such as 61 9th Avenue, 21-27 9th Avenue and Gansevoort Market. BRE Properties, LLC is an entity owned by the Gottlieb family of William Gottlieb Real Estate. William Gottlieb Real Estate is one the largest real estate companies in Manhattan. Since its founding in the 1950s, William Gottlieb Real Estate has focused on acquiring downtown buildings, warehouses and lots in Greenwich Village, the Meatpacking District and the Lower East Side. |
| ■ | Escrows.On the origination date of the 9-19 9th Avenue Loan Combination, the borrower funded a reserve of (i) $128,689 for real estate taxes and (ii) $162,734 for insurance. |
The depositor has filed a registration statement (including a prospectus) with the Securities and Exchange Commission (“SEC”) (SEC File No. 333-207132) for the offering to which this communication relates. Before you invest, you should read the prospectus in the registration statement and other documents the depositor has filed with the SEC for more complete information about the depositor, the issuing entity and this offering. You may get these documents for free by visiting EDGAR on the SEC website at www.sec.gov. Alternatively, the depositor or Citigroup Global Markets Inc., Barclays Capital Inc., Drexel Hamilton, LLC or any other underwriter or dealer participating in this offering will arrange to send you the prospectus if you request it by calling toll-free 1-800-831-9146.
| 70 |
LOAN #3: 9-19 9th avenue
Additionally, on each due date, the borrower is required to fund the following reserves with respect to the 9-19 9th Avenue Property: (i) a tax reserve in an amount equal to one-twelfth of the amount that the lender estimates will be necessary to pay taxes over the then succeeding 12-month period, which is initially estimated to be $64,345, (ii) an insurance reserve in an amount equal to one-twelfth of the amount that the lender estimates will be necessary to pay insurance premiums over the then succeeding 12-month period, which is initially estimated to be $13,562 and (iii) a replacement reserve in the amount of $509, provided that, so long as no event of default exists under the 9-19 9th Avenue Loan Combination, the borrower continues to maintain the 9-19 9th Avenue Property in accordance with the Restoration Hardware lease, the Restoration Hardware lease is in full force and effect and Restoration Hardware is maintaining the 9-19 9th Avenue Property in accordance with its lease, deposits into the replacement reserve will be suspended. The ongoing replacement reserve is currently suspended.
| ■ | Lockbox and Cash Management. The 9-19 9th Avenue Loan Combination is structured with a hard lockbox and in-place cash management. The 9-19 9th Avenue Loan Combination documents require the tenant, pursuant to a tenant direction letter, to pay rent directly to the lockbox account and require that all other money received by the borrower with respect to the 9-19 9th Avenue Property be deposited within two business days into such lockbox account. The lockbox account will be swept on each business day into a lender-controlled cash management account. All funds in the cash management account are required to be used to pay debt service, fund required reserves and pay operating expenses. During a Sweep Event Period (as defined below), following the payment of debt service, funding of required reserves and payment of operating expenses, all remaining amounts will be deposited in the excess cash flow reserve account and held as additional collateral for the 9-19 9th Avenue Loan Combination and used for extending the Major Tenant’s (as defined below) lease or re-tenanting the 9-19 9th Avenue Property, provided, however, that in the case of a Major Tenant Trigger Event Period (as defined below) in clause (ii) of that definition, other than during that last 36 months of the term of the 9-19 9th Avenue Loan Combination, so long as the Major Tenant is paying its rent as required under its lease, excess cash flow in the amount of $30 per SF will be transferred to the related major tenant reserve, capped at $19,200,000, or in the case of a Major Tenant Trigger Event Period in clause (iii) of that definition, so long as the Major Tenant is paying its rent as required under its lease, the amount of the excess cash flow that will be transferred to the related major tenant reserve will be capped at (x) $10,000,000 for an aggregate sublet of between 30.0% and 50.0% of the Major Tenant’s leased space or (y) $19,200,000 for an aggregate sublet of greater than 50.0% of the Major Tenant’s leased space. If no Sweep Event Period is continuing, following the payment of debt service, funding of required reserves and payment of operating expenses, all remaining amounts will be released to the borrower’s account. |
A“Sweep Event Period” occurs upon (i) an event of default under the 9-19 9th Avenue Loan Combination until cured (so long as no other Sweep Event Period is in effect), (ii) the debt service coverage ratio of the 9-19 9th Avenue Property (based on the trailing 12 calendar months and as determined by the lender) being less than 1.20x, until the debt service coverage ratio of the 9-19 9th Avenue Property (based on the trailing 12 calendar months and as determined by the lender) is equal to or greater than 1.30x for two consecutive calendar quarters (so long as no other Sweep Event Period is in effect) and (iii) the occurrence of a Major Tenant Trigger Event Period, until the same is cured.
A “Major Tenant Trigger Event Period” occurs upon Restoration Hardware, or any tenant occupying Restoration Hardware’s space at the 9-19 9th Avenue Property (each, a “Major Tenant”) (i) defaulting beyond any applicable cure or grace period under its lease, (ii) going dark or otherwise ceasing operations in its leased space at the 9-19 9th Avenue Property, (iii) subletting more than 30.0% of its leased space in the aggregate (other than a sublease to (a) an operator for a café at the 9-19 9th Avenue Property or (b) a sublessee that has (x) a credit rating of “BB” (or its equivalent) or better by a nationally recognized rating agency or (y) a net worth greater than the greater of the Major Tenant’s net worth as of the date of the 9-19 9th Avenue Loan Combination’s origination or the date of the sublease), (iv) becoming a debtor in any bankruptcy or other insolvency proceeding or (v) terminating or canceling its lease (or the lease failing or ceasing to be in full force and effect), or giving notice of, or commencing a legal proceeding asserting, any of the foregoing (each, a “Major Tenant Trigger Event”).
The depositor has filed a registration statement (including a prospectus) with the Securities and Exchange Commission (“SEC”) (SEC File No. 333-207132) for the offering to which this communication relates. Before you invest, you should read the prospectus in the registration statement and other documents the depositor has filed with the SEC for more complete information about the depositor, the issuing entity and this offering. You may get these documents for free by visiting EDGAR on the SEC website at www.sec.gov. Alternatively, the depositor or Citigroup Global Markets Inc., Barclays Capital Inc., Drexel Hamilton, LLC or any other underwriter or dealer participating in this offering will arrange to send you the prospectus if you request it by calling toll-free 1-800-831-9146.
| 71 |
LOAN #3: 9-19 9th avenue
��
| ■ | Property Management. The 9-19 9th Avenue Property is managed by William Gottlieb Management Co., LLC, a borrower affiliate. Under the 9-19 9th Avenue Loan Combination documents, the 9-19 9th Avenue Property may be managed by William Gottlieb Management Co., LLC or any other management company reasonably approved by the lender and with respect to which a rating agency confirmation has been received. Upon any of (i) the occurrence of an event of default under the 9-19 9th Avenue Loan Combination documents, (ii) the continuance of a default by the property manager under the management agreement beyond any applicable notice and cure period, (iii) the filing of a bankruptcy petition or the occurrence of a similar event with respect to the property manager or (iv) the engagement by the property manager in gross negligence, fraud, willful misconduct or misappropriation of funds, the lender may require the borrower to terminate the management agreement and replace the property manager with a new property manager selected by the borrower, subject to the lender’s approval and, if required by the lender, with respect to which a rating agency confirmation has been received. |
| ■ | Mezzanine or Secured Subordinate Indebtedness. Not permitted. |
| ■ | Release of Collateral. Not permitted. |
| ■ | Terrorism Insurance. The borrower is required to maintain an “all-risk” insurance policy that provides coverage for terrorism in an amount equal to 100.0% of the full replacement cost of the 9-19 9th Avenue Property, plus a business interruption insurance policy that provides 18 months of business interruption coverage. The required terrorism insurance may be included in a blanket policy, provided that, among other things, any such blanket policy specifically allocates to the 9-19 9th Avenue Property the amount of coverage from time to time required under the 9-19 9th Avenue Loan Combination documents. See “Risk Factors—Terrorism Insurance May Not Be Available for All Mortgaged Properties”in the Preliminary Prospectus. |
The depositor has filed a registration statement (including a prospectus) with the Securities and Exchange Commission (“SEC”) (SEC File No. 333-207132) for the offering to which this communication relates. Before you invest, you should read the prospectus in the registration statement and other documents the depositor has filed with the SEC for more complete information about the depositor, the issuing entity and this offering. You may get these documents for free by visiting EDGAR on the SEC website at www.sec.gov. Alternatively, the depositor or Citigroup Global Markets Inc., Barclays Capital Inc., Drexel Hamilton, LLC or any other underwriter or dealer participating in this offering will arrange to send you the prospectus if you request it by calling toll-free 1-800-831-9146.
| 72 |
(THIS PAGE INTENTIONALLY LEFT BLANK)
The depositor has filed a registration statement (including a prospectus) with the Securities and Exchange Commission (“SEC”) (SEC File No. 333-207132) for the offering to which this communication relates. Before you invest, you should read the prospectus in the registration statement and other documents the depositor has filed with the SEC for more complete information about the depositor, the issuing entity and this offering. You may get these documents for free by visiting EDGAR on the SEC website at www.sec.gov. Alternatively, the depositor or Citigroup Global Markets Inc., Barclays Capital Inc., Drexel Hamilton, LLC or any other underwriter or dealer participating in this offering will arrange to send you the prospectus if you request it by calling toll-free 1-800-831-9146.
| 73 |
| LOAN #4: corporate woods portfolio |
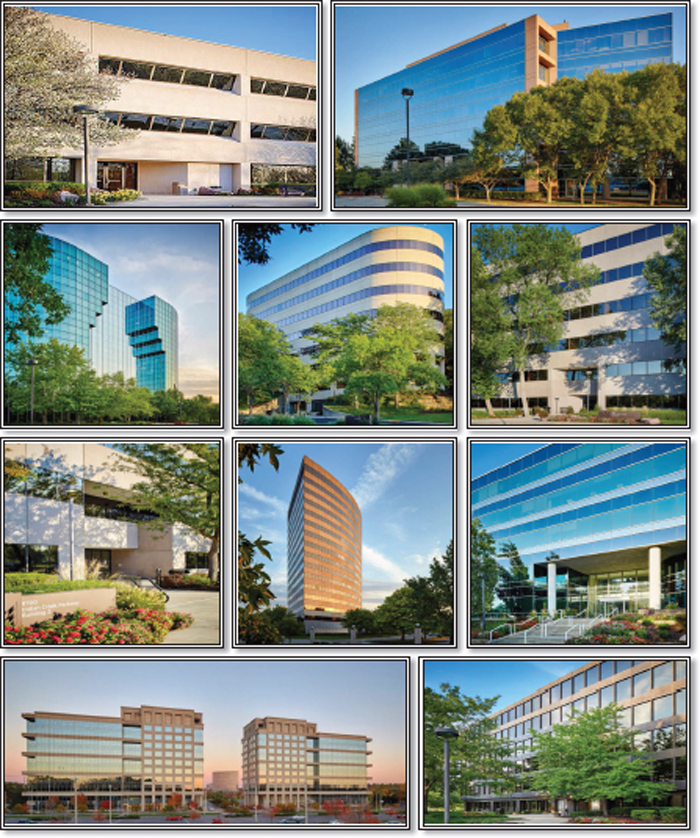
The depositor has filed a registration statement (including a prospectus) with the Securities and Exchange Commission (“SEC”) (SEC File No. 333-207132) for the offering to which this communication relates. Before you invest, you should read the prospectus in the registration statement and other documents the depositor has filed with the SEC for more complete information about the depositor, the issuing entity and this offering. You may get these documents for free by visiting EDGAR on the SEC website at www.sec.gov. Alternatively, the depositor or Citigroup Global Markets Inc., Barclays Capital Inc., Drexel Hamilton, LLC or any other underwriter or dealer participating in this offering will arrange to send you the prospectus if you request it by calling toll-free 1-800-831-9146.
| 74 |
| LOAN #4: corporate woods portfolio |
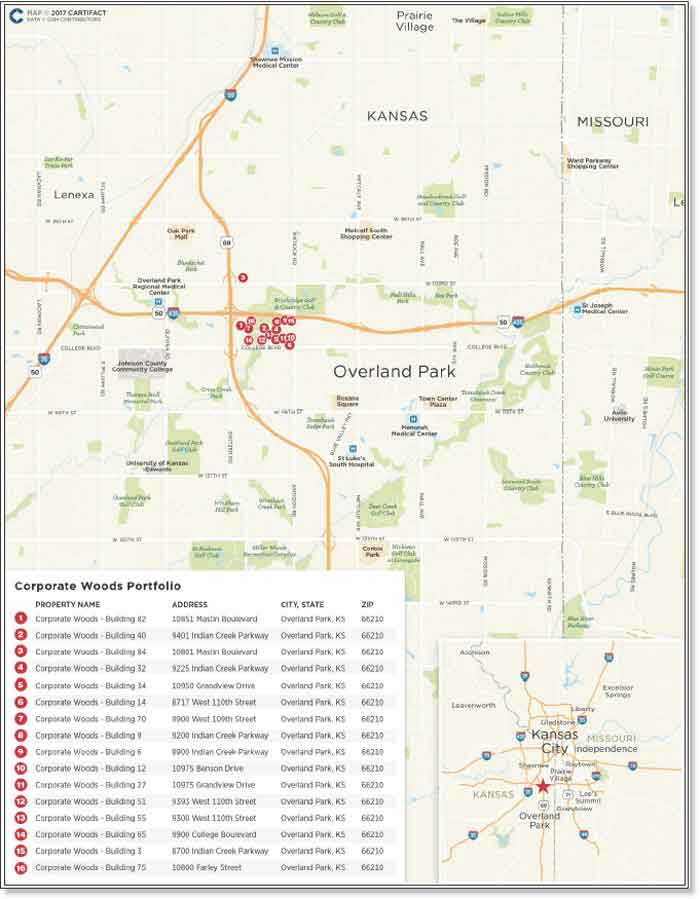
The depositor has filed a registration statement (including a prospectus) with the Securities and Exchange Commission (“SEC”) (SEC File No. 333-207132) for the offering to which this communication relates. Before you invest, you should read the prospectus in the registration statement and other documents the depositor has filed with the SEC for more complete information about the depositor, the issuing entity and this offering. You may get these documents for free by visiting EDGAR on the SEC website at www.sec.gov. Alternatively, the depositor or Citigroup Global Markets Inc., Barclays Capital Inc., Drexel Hamilton, LLC or any other underwriter or dealer participating in this offering will arrange to send you the prospectus if you request it by calling toll-free 1-800-831-9146.
| 75 |
| LOAN #4: corporate woods portfolio |
Mortgaged Property Information | Mortgage Loan Information | ||||
| Number of Mortgaged Properties | 16 | Loan Seller | CREFI | ||
| Location (City/State) | Overland Park, Kansas | Cut-off Date Balance(3) | $50,000,000 | ||
| Property Type | Various | Cut-off Date Balance per SF(2) | $108.82 | ||
| Size (SF) | 2,033,179 | Percentage of Initial Pool Balance | 4.6% | ||
| Total Occupancy as of 5/31/2017 | 92.7% | Number of Related Mortgage Loans | None | ||
| Owned Occupancy as of 5/31/2017 | 92.7% | Type of Security | Fee Simple | ||
| Year Built / Latest Renovation | Various | Mortgage Rate | 4.45000% | ||
| Appraised Value(1) | $299,100,000 | Original Term to Maturity (Months) | 120 | ||
| Appraisal Date(1) | 6/15/2017 | Original Amortization Term (Months) | 360 | ||
| Borrower Sponsor | Raymond Massa | Original Interest Only Period (Months) | NAP | ||
| Property Management | Block Real Estate Services, LLC | First Payment Date | 10/6/2017 | ||
| Maturity Date | 9/6/2027 | ||||
| Underwritten Revenues | $45,713,777 | ||||
| Underwritten Expenses | $23,101,714 | Escrows(4) | |||
| Underwritten Net Operating Income (NOI) | $22,612,063 | Upfront | Monthly | ||
| Underwritten Net Cash Flow (NCF) | $19,853,093 | Taxes | $6,258,114 | $625,811 | |
| Cut-off Date LTV Ratio(1)(2) | 74.0% | Insurance | $0 | $0 | |
| Maturity Date LTV Ratio(1)(2) | 59.7% | Replacement Reserve | $0 | $38,258 | |
| DSCR Based on Underwritten NOI / NCF(2) | 1.69x / 1.48x | TI/LC(5) | $7,500,000 | $0(5) | |
| Debt Yield Based on Underwritten NOI / NCF(2) | 10.2% / 9.0% | Other(6) | $2,101,654 | $0 | |
| Sources and Uses | |||||
| Sources | $ | % | Uses | $ | % |
| Loan Combination Amount | $221,250,000 | 73.8% | Purchase Price | $280,000,000 | 93.5% |
| Principal’s New Cash Contribution | 69,445,915 | 23.2 | Reserves | 15,859,767 | 5.3 |
| Other Sources(7) | 8,908,267 | 3.0 | Closing Costs | 3,193,771 | 1.1 |
| Other Uses | 550,644 | 0.2 | |||
| Total Sources | $299,604,182 | 100.0% | Total Uses | $299,604,182 | 100.0% |
| (1) | The Appraised Value represents the “As Portfolio” bulk appraised value as of June 15, 2017, which is inclusive of a $3,600,000 portfolio premium. The Cut-off Date LTV Ratio and Maturity Date LTV Ratio are calculated based upon the Appraised Value of $299,100,000. The Cut-off Date LTV Ratio and Maturity Date LTV Ratio based on the sum of the individual “as-is” appraised values of the Corporate Woods Portfolio Properties (as defined below) of $295,500,000, which excludes the portfolio premium, are 74.9% and 60.4%, respectively. |
| (2) | Calculated based on the aggregate outstanding principal balance of the Corporate Woods Portfolio Loan Combination (as defined below). |
| (3) | The Cut-off Date Balance of $50,000,000 represents the controlling note A-1-A and non-controlling note A-3 of the $221,250,000 Corporate Woods Portfolio Loan Combination, which is evidenced by sixpari passu notes and was co-originated by Citi Real Estate Funding Inc. (“CREFI”) and Morgan Stanley Bank, N.A. (“MSBNA”). The related companion loans are evidenced by (i) the non-controlling notes A-1-B and A-2, which have an aggregate outstanding principal balance as of the Cut-off Date of $60,625,000, are currently held by CREFI and are expected to be contributed to one or more future commercial mortgage securitization transactions, and (ii) the non-controlling notes A-4 and A-5, which have an aggregate outstanding principal balance as of the Cut-off Date of $110,625,000, are currently held by MSBNA and are expected to be contributed to one or more future commercial mortgage securitization transactions. See“—The Mortgage Loan” below. |
| (4) | See “—Escrows” below. |
| (5) | The TI/LC reserve is capped at $7,500,000. The borrower is not required to make an ongoing TI/LC Reserve deposit unless the TI/LC reserve account balance falls below the TI/LC minimum balance of $5,000,000, after which, on each monthly payment date, the borrower must make an ongoing TI/LC Reserve deposit equal to $169,428 until the TI/LC reserve balance equals or exceeds the TI/LC Cap of $7,500,000. |
| (6) | Upfront Other reserves include a reserve for unfunded tenant obligations ($1,481,165) and deferred maintenance ($620,488). |
| (7) | Other Sources are comprised of real estate tax prorations ($4,255,153), prepaid rent ($2,791,756), security deposits ($1,711,995) and various other credits ($149,363) that were transferred to the purchaser on the origination date of the Corporate Woods Portfolio Loan (as defined below). |
| ■ | The Mortgage Loan. The mortgage loan (the“Corporate Woods Portfolio Loan”) is part of a loan combination (the“Corporate Woods Portfolio Loan Combination”) evidenced by sixpari passu notes that are together secured by a first mortgage encumbering the borrower’s fee simple interest in 16 office buildings, located in an office complex, totaling 2,033,179 SF located in Overland Park, Kansas (the“Corporate Woods Portfolio Properties”). The Corporate Woods Portfolio Loan, which is evidenced by the controlling note A-1-A and non-controlling note A-3, had an original principal balance of $50,000,000, has a Cut-off Date Balance of $50,000,000 and represents approximately 4.6% of the Initial Pool Balance. The related companion loans are evidenced by (i) the non-controlling notes A-1-B and A-2, which have an aggregate outstanding principal balance as of the Cut-off Date of $60,625,000, are currently held by CREFI and are expected to be contributed to one or more future commercial mortgage securitization transactions and (ii) the non-controlling notes A-4 and A-5, which have an aggregate outstanding principal balance as of the Cut-off Date of $110,625,000, are currently held by MSBNA and are expected to be contributed to one or more future commercial mortgage securitization transactions. The Corporate Woods Portfolio Loan Combination, which accrues interest at an interest rate of 4.45000%per annum, was co-originated by CREFI and MSBNA on August 9, 2017, had an original principal balance of $221,250,000 and has an outstanding principal balance as of the Cut-off Date of $221,250,000. The proceeds of the Corporate Woods Portfolio Loan Combination were primarily used to acquire the Corporate Woods Portfolio Properties, fund reserves and pay origination costs. |
The Corporate Woods Portfolio Loan Combination had an initial term of 120 months and has a remaining term of 120 months as of the Cut-off Date. The Corporate Woods Portfolio Loan Combination requires monthly payments of principal and interest for the term of the Corporate Woods Portfolio Loan Combination. The scheduled maturity date of the Corporate Woods Portfolio Loan Combination is the due date in September 2027. At any time after the earlier of August 9, 2020 and the second anniversary of the securitization of the last portion of the Corporate Woods Portfolio Loan Combination, the Corporate Woods Portfolio Loan Combination may be defeased with certain direct full faith and credit obligations of the United States of America or other obligations which are “government securities” permitted
The depositor has filed a registration statement (including a prospectus) with the Securities and Exchange Commission (“SEC”) (SEC File No. 333-207132) for the offering to which this communication relates. Before you invest, you should read the prospectus in the registration statement and other documents the depositor has filed with the SEC for more complete information about the depositor, the issuing entity and this offering. You may get these documents for free by visiting EDGAR on the SEC website at www.sec.gov. Alternatively, the depositor or Citigroup Global Markets Inc., Barclays Capital Inc., Drexel Hamilton, LLC or any other underwriter or dealer participating in this offering will arrange to send you the prospectus if you request it by calling toll-free 1-800-831-9146.
| 76 |
| LOAN #4: corporate woods portfolio |
under the Corporate Woods Portfolio Loan documents. Voluntary prepayment of the Corporate Woods Portfolio Loan Combination is permitted on or after the due date occurring in April 2027 without payment of any prepayment premium. In the event the lender applies casualty or condemnation proceeds exceeding 30% of the allocated loan amount with respect to a Corporate Woods Portfolio Property, the borrower has the right to prepay a portion of the Corporate Woods Portfolio Loan and obtain the release of the applicable property in accordance with the provisions of the Corporate Woods Portfolio Loan documents.
| ■ | The Mortgaged Properties.The Corporate Woods Portfolio Properties are comprised of 16 buildings located within Corporate Woods, a 29-building master-planned, suburban office park and retail environment in Overland Park, Kansas, located approximately 15 miles southwest of the Kansas City central business district (“CBD”). Of the 16 buildings serving as collateral for the Corporate Woods Portfolio Loan, 15 are Class A or Class B office buildings totaling 2,004,567 SF and one is a 28,612 SF retail shopping center building. A Doubletree Hotel and six other office buildings are part of Corporate Woods, but are not collateral for the Corporate Woods Portfolio Loan. The Corporate Woods Portfolio Properties were constructed in stages between 1977 and 2001 and prior owners have invested capital into the Corporate Woods Portfolio Properties on an ongoing basis. The Corporate Woods Portfolio Properties are positioned at the southeast corner of Interstate 435 and U.S. Highway 69, are situated on a 160.8-acre site and provide for 7,704 parking spaces, which equates to a ratio of 3.8 spaces per 1,000 SF. As of May 31, 2017, the Corporate Woods Portfolio Properties were 92.7% leased to 283 tenants. |
Corporate Woods Building Summary
Building | Year Built | Building GLA | Building Occupancy as-of 5/31/2017 | Allocated Cut-off Date Loan Amount | % Allocated Cut-off Date Loan Amount | Appraised Value | % Appraised Value | Replacement Cost | Appraisal Market Rent $ per SF(1) | UW Base Rent $ per SF |
| 3 | 1979 | 60,950 | 81.2% | $4,941,624 | 2.2% | $6,600,000 | 2.2% | $9,336,100 | $21.00 | $20.51 |
| 6 | 1979 | 108,395 | 83.8% | 9,508,883 | 4.3 | 12,700,000 | 4.3 | 16,821,364 | $21.00 | $20.39 |
| 9 | 1984 | 99,400 | 92.7% | 9,583,756 | 4.3 | 12,800,000 | 4.3 | 15,722,193 | $22.00 | $21.56 |
| 12 | 1986 | 98,648 | 80.6% | 9,359,137 | 4.2 | 12,500,000 | 4.2 | 17,470,510 | $23.00 | $22.23 |
| 14 | 1981 | 120,385 | 96.7% | 10,781,726 | 4.9 | 14,400,000 | 4.9 | 18,974,570 | $21.50 | $19.79 |
| 27 | 1978 | 96,518 | 95.2% | 9,134,518 | 4.1 | 12,200,000 | 4.1 | 14,975,598 | $22.00 | $21.89 |
| 32 | 1985 | 208,244 | 98.5% | 23,809,645 | 10.8 | 31,800,000 | 10.8 | 32,034,249 | $24.00 | $21.92 |
| 34 | 1978 | 97,023 | 100.0% | 11,530,457 | 5.2 | 15,400,000 | 5.2 | 14,568,965 | $23.00 | $22.73 |
| 40 | 1981 | 300,043 | 96.8% | 32,420,051 | 14.7 | 43,300,000 | 14.7 | 47,059,741 | $24.00 | $22.82 |
| 51 | 1977 | 89,789 | 94.2% | 7,861,675 | 3.6 | 10,500,000 | 3.6 | 13,482,708 | $21.25 | $20.53 |
| 55 | 1977 | 89,221 | 88.4% | 7,711,929 | 3.5 | 10,300,000 | 3.5 | 13,397,418 | $22.25 | $21.03 |
| 65 | 1982 | 28,612 | 100.0% | 4,941,624 | 2.2 | 6,600,000 | 2.2 | 2,464,918 | $20.00 | $19.01 |
| 70 | 1987 | 100,809 | 94.6% | 10,257,614 | 4.6 | 13,700,000 | 4.6 | 15,137,471 | $23.00 | $24.92 |
| 75 | 1980 | 48,156 | 88.9% | 3,369,289 | 1.5 | 4,500,000 | 1.5 | 7,664,564 | $20.00 | $19.21 |
| 82 | 2001 | 245,413 | 98.2% | 34,441,624 | 15.6 | 46,000,000 | 15.6 | 53,145,129 | $27.00 | $27.02 |
84 | 1998 | 241,573 | 83.1% | 31,596,447 | 14.3 | 42,200,000 | 14.3 | 53,145,129 | $27.00 | $25.33 |
| Total / Wtd. Avg. | 2,033,179 | 92.7% | $221,250,000 | 100.0% | $295,500,000 | 100.0% | $345,400,627 | $23.63 | $22.80 |
| (1) | Appraisal Market Rent $ per SF is quoted on a modified gross basis for all buildings except Building 65, which is quoted on a triple net basis. |
The depositor has filed a registration statement (including a prospectus) with the Securities and Exchange Commission (“SEC”) (SEC File No. 333-207132) for the offering to which this communication relates. Before you invest, you should read the prospectus in the registration statement and other documents the depositor has filed with the SEC for more complete information about the depositor, the issuing entity and this offering. You may get these documents for free by visiting EDGAR on the SEC website at www.sec.gov. Alternatively, the depositor or Citigroup Global Markets Inc., Barclays Capital Inc., Drexel Hamilton, LLC or any other underwriter or dealer participating in this offering will arrange to send you the prospectus if you request it by calling toll-free 1-800-831-9146.
| 77 |
| LOAN #4: corporate woods portfolio |
Corporate Woods Largest Tenants by Building
Building | Building GLA | Building Occupancy as-of 5/31/2017 | Building Largest Tenant | Largest Tenant GLA | Largest Tenant % Building GLA | Largest Tenant Lease Expiration |
| 3 | 60,950 | 81.2% | DeMars Pension Consulting Services, Inc. | 10,247 | 16.8% | 9/30/2021 |
| 6 | 108,395 | 83.8% | National Crop Insurance Services, Inc. | 18,522 | 17.1% | 9/30/2019 |
| 9 | 99,400 | 92.7% | University of Kansas Hospital Authority | 16,785 | 16.9% | 8/31/2018 |
| 12 | 98,648 | 80.6% | Lansing Trade Group, LLC | 44,496 | 45.1% | 1/31/2018 |
| 14 | 120,385 | 96.7% | Propharma Group, Inc. | 16,218 | 13.5% | 2/28/2021 |
| 27 | 96,518 | 95.2% | CSC Covansys Corporation | 16,550 | 17.1% | 3/31/2022 |
| 32 | 208,244 | 98.5% | Amerigroup Corp. & Amerigroup Kansas, Inc. | 39,056 | 18.8% | 12/31/2020 |
| 34 | 97,023 | 100.0% | TMFS Holdings, LLC | 33,100 | 34.1% | 3/1/2027 |
| 40 | 300,043 | 96.8% | Coventry Health Care of Kansas, Inc. | 69,640 | 23.2% | 12/31/2023 |
| 51 | 89,789 | 94.2% | RGN-Overland Park I, LLC | 15,796 | 17.6% | 5/31/2020 |
| 55 | 89,221 | 88.4% | Emerson Electric Co. | 10,073 | 11.3% | 3/31/2020 |
| 65 | 28,612 | 100.0% | Garozzo’s III, Inc. | 5,575 | 19.5% | 9/30/2021 |
| 70 | 100,809 | 94.6% | Compass Minerals International, Inc. | 60,699 | 60.2% | 2/29/2020 |
| 75 | 48,156 | 88.9% | Multi Service Technology Solutions, Inc. | 12,182 | 25.3% | 11/30/2017 |
| 82 | 245,413 | 98.2% | PNC Bank National Association | 159,270 | 64.9% | 10/31/2019 |
| 84 | 241,573 | 83.1% | Scoular Company | 37,432 | 15.5% | 8/31/2020 |
| Total / Wtd. Avg. | 2,033,179 | 92.7% | 565,641 | 27.8% |
Ten Largest Owned Tenants Based on Underwritten Base Rent
Tenant Name | Credit Rating (Fitch/MIS/S&P)(1) | Tenant GLA | % of GLA | UW Base Rent(2) | % of Total UW Base | UW Base Rent | Lease Expiration | Renewal / Extension Options |
| PNC Bank National Association | A+/A3/A- | 159,270 | 7.8% | $4,665,105 | 10.6% | $29.29 | 10/31/2019(3) | 2, 5-year options |
| Coventry Health Care of Kansas, Inc. | A-/Baa2/NR | 69,640 | 3.4% | 1,532,080 | 3.5 | $22.00 | 12/31/2023 | 1, 5-year option |
| Compass Minerals International, Inc. | NR/B1/BB | 60,699 | 3.0% | 1,504,728 | 3.4 | $24.79 | 2/29/2020 | 2, 5-year options |
| Lathrop & Gage, LLP. | NR/NR/NR | 39,993 | 2.0% | 1,081,091 | 2.5 | $27.03 | 1/31/2018(4) | 1, 5-year option |
| Lansing Trade Group LLC | NR/NR/NR | 44,496 | 2.2% | 981,171 | 2.2 | $22.05 | 1/31/2018 | NAV |
| Scoular Company | NR/NR/NR | 37,432 | 1.8% | 950,773 | 2.2 | $25.40 | 8/31/2020 | NAV |
| QC Holdings, Inc. | NR/NR/NR | 39,022 | 1.9% | 838,973 | 1.9 | $21.50 | 10/31/2017 | 1, 5-year option |
| Amerigroup Corp. & Amerigroup Kansas, Inc. | NR/Baa2/NR | 39,056 | 1.9% | 829,940 | 1.9 | $21.25 | 12/31/2020 | 1, 1-year option |
| TMFS Holdings, LLC | NR/NR/NR | 33,100 | 1.6% | 719,925 | 1.6 | $21.75 | 3/1/2027 | 1, 5-year option |
| Vendor Credentialing Service LLC dba symplr | NR/NR/NR | 30,823 | 1.5% | 708,929 | 1.6 | $23.00 | 8/31/2024 | 1, 5-year option |
| Ten Largest Tenants | 553,531 | 27.2% | $13,812,714 | 31.4% | $24.95 | |||
| Remaining Owned Tenants | 1,331,180 | 65.5 | 30,142,376 | 68.6 | $22.64 | |||
| Vacant | 148,468 | 7.3 | 0 | 0.0 | $0.00 | |||
| Total / Wtd. Avg. All Owned Tenants | 2,033,179 | 100.0% | $43,955,091 | 100.0% | $23.32 | |||
| (1) | Certain ratings are those of the parent company whether or not the parent guarantees the lease. |
| (2) | UW Base Rent, % of Total UW Base Rent and UW Base Rent $ per SF include contractual rent steps ($577,894) through July 2018 and the present value of rent steps for credit tenants ($376,232). |
| (3) | PNC Bank National Association has executed a letter of intent to extend their lease to October 31, 2029 pursuant to the following terms: 146,450 SF leased at $15.00 per SF triple net with $0.50 per SF annual rent increases. We cannot assure you that PNC Bank National Association will execute a lease pursuant to the aforementioned terms. |
| (4) | Lathrop & Gage, LLP leases 13,497 SF that expires on January 31, 2018 and 26,496 SF that expires on January 31, 2023. |
The depositor has filed a registration statement (including a prospectus) with the Securities and Exchange Commission (“SEC”) (SEC File No. 333-207132) for the offering to which this communication relates. Before you invest, you should read the prospectus in the registration statement and other documents the depositor has filed with the SEC for more complete information about the depositor, the issuing entity and this offering. You may get these documents for free by visiting EDGAR on the SEC website at www.sec.gov. Alternatively, the depositor or Citigroup Global Markets Inc., Barclays Capital Inc., Drexel Hamilton, LLC or any other underwriter or dealer participating in this offering will arrange to send you the prospectus if you request it by calling toll-free 1-800-831-9146.
| 78 |
| LOAN #4: corporate woods portfolio |
The following table presents the lease rollover schedule at the Corporate Woods Portfolio Properties, based on initial lease expiration dates:
Lease Expiration Schedule(1)(2)
Year Ending December 31 | Expiring Owned GLA | % of Owned GLA | Cumulative % of Owned GLA | UW Base Rent(3) | % of Total UW Base Rent | UW Base Rent $ per SF(3)(4) | # of Expiring Tenants | |||||||
| MTM | 1,885 | 0.1% | 0.1% | $103,177 | 0.2% | $23.79(5) | 5 | |||||||
| 2017 | 67,965 | 3.3 | 3.4% | 1,430,918 | 3.3 | $21.05 | 11 | |||||||
| 2018 | 316,500 | 15.6 | 19.0% | 7,063,187 | 16.1 | $22.32 | 50 | |||||||
| 2019 | 465,746 | 22.9 | 41.9% | 11,634,141 | 26.5 | $24.98 | 69 | |||||||
| 2020 | 405,813 | 20.0 | 61.9% | 9,205,093 | 20.9 | $22.68 | 61 | |||||||
| 2021 | 171,096 | 8.4 | 70.3% | 3,926,071 | 8.9 | $22.95 | 35 | |||||||
| 2022 | 183,823 | 9.0 | 79.3% | 4,145,160 | 9.4 | $22.55 | 34 | |||||||
| 2023 | 144,131 | 7.1 | 86.4% | 3,386,284 | 7.7 | $23.49 | 7 | |||||||
| 2024 | 61,082 | 3.0 | 89.4% | 1,457,728 | 3.3 | $23.87 | 6 | |||||||
| 2025 | 27,547 | 1.4 | 90.8% | 750,901 | 1.7 | $27.26 | 3 | |||||||
| 2026 | 0 | 0.0 | 90.8% | 0 | 0.0 | $0.00 | 0 | |||||||
| 2027 | 39,123 | 1.9 | 92.7% | 852,431 | 1.9 | $21.79 | 2 | |||||||
| 2028 & Thereafter | 0 | 0.0 | 92.7% | 0 | 0.0 | $0.00 | 0 | |||||||
| Vacant | 148,468 | 7.3 | 100.0% | 0 | 0.0 | $0.00 | 0 | |||||||
| Total / Wtd. Avg. | 2,033,179 | 100.0% | $43,955,091 | 100.0% | $23.32 | 283 |
| (1) | Calculated based on the approximate square footage occupied by each Owned Tenant. |
| (2) | Certain tenants may have lease termination options that are exercisable prior to the originally stated expiration date of the subject lease and that are not considered in the Lease Expiration Schedule. |
| (3) | UW Base Rent $ per SF includes contractual rent steps ($577,894) through July 2018 and the present value of rent steps for credit tenants ($376,232). |
| (4) | Total / Wtd. Avg. annual UW Base Rent $ per SF excludes vacant space. |
| (5) | UW Base Rent $ per SF for MTM tenants is calculated based on the $44,843 of UW Base Rent associated with 1,885 SF of conference room space. The remaining UW Base Rent of $58,335 is associated with antenna space, mail boxes and other miscellaneous tenants which have 0 SF attributed to them. |
The following table presents certain information relating to historical leasing at the Corporate Woods Portfolio Properties:
Historical Leased %(1)
2013 | 2014 | 2015 | 2016 | As of 5/31/2017(2) | |
| Owned Space | 87.4% | 92.0% | 91.8% | 89.5% | 92.7% |
| (1) | As provided by the borrower and which represents occupancy as of December 31 for the indicated year unless otherwise specified. |
| (2) | Based on the underwritten rent roll dated May 31, 2017. |
The depositor has filed a registration statement (including a prospectus) with the Securities and Exchange Commission (“SEC”) (SEC File No. 333-207132) for the offering to which this communication relates. Before you invest, you should read the prospectus in the registration statement and other documents the depositor has filed with the SEC for more complete information about the depositor, the issuing entity and this offering. You may get these documents for free by visiting EDGAR on the SEC website at www.sec.gov. Alternatively, the depositor or Citigroup Global Markets Inc., Barclays Capital Inc., Drexel Hamilton, LLC or any other underwriter or dealer participating in this offering will arrange to send you the prospectus if you request it by calling toll-free 1-800-831-9146.
| 79 |
| LOAN #4: corporate woods portfolio |
| ■ | Operating History and Underwritten Net Cash Flow. The following table presents certain information relating to the historical operating performance and the Underwritten Net Cash Flow at the Corporate Woods Portfolio Properties: |
Cash Flow Analysis
2014 | 2015 | 2016 | TTM 6/30/2017 | Underwritten(1) | Underwritten $ per SF(2) | |||||||
| Base Rent | $40,743,337 | $40,641,844 | $40,285,194 | $41,587,085 | $43,000,965 | $21.15 | ||||||
| Contractual Rent Steps | 0 | 0 | 0 | 0 | 954,126 | 0.47 | ||||||
| Gross Up Vacancy | 0 | 0 | 0 | 0 | 3,494,670 | 1.72 | ||||||
| Reimbursements | 952,901 | 1,912,725 | 2,243,749 | 2,653,606 | 3,080,143 | 1.51 | ||||||
| Other Income | 184,342 | 317,945 | 206,088 | 236,942 | 236,942 | 0.12 | ||||||
| Gross Revenue | $41,880,581 | $42,872,514 | $42,735,030 | $44,477,632 | $50,766,845 | $24.97 | ||||||
| Vacancy & Credit Loss | (685,338) | (638,017) | (953,455) | (1,237,930) | (5,053,068) | (2.49) | ||||||
| Effective Gross Income | $41,195,243 | $42,234,497 | $41,781,575 | $43,239,702 | $45,713,777 | $22.48 | ||||||
| Real Estate Taxes | $6,306,567 | $6,895,024 | $7,152,862 | $7,328,805 | $7,389,621 | 3.63 | ||||||
| Insurance | 302,946 | 296,902 | 328,068 | 330,164 | 330,164 | 0.16 | ||||||
| Management Fee | 611,060 | 627,055 | 622,794 | 648,685 | 1,142,844 | 0.56 | ||||||
| Other Operating Expenses | 12,795,399 | 13,234,241 | 13,798,380 | 14,239,084 | 14,239,084 | 7.00 | ||||||
| Total Operating Expenses | $20,015,972 | $21,053,221 | $21,902,104 | $22,546,739 | $23,101,714 | $11.36 | ||||||
| Net Operating Income | $21,179,271 | $21,181,276 | $19,879,471 | $20,692,963 | $22,612,063 | $11.12 | ||||||
| TI/LC | 0 | 0 | 0 | 0 | 2,299,877 | 1.13 | ||||||
| Capital Expenditures | 0 | 0 | 0 | 0 | 459,093 | 0.23 | ||||||
| Net Cash Flow | $21,179,271 | $21,181,276 | $19,879,471 | $20,692,963 | $19,853,093 | $9.76 | ||||||
| Occupancy(3) | 92.0% | 91.8% | 89.5% | 92.7% | 90.0% | |||||||
| NOI Debt Yield(4) | 9.6% | 9.6% | 9.0% | 9.4% | 10.2% | |||||||
| NCF DSCR(4) | 1.58x | 1.58x | 1.49x | 1.55x | 1.48x |
| (1) | Underwritten Base Rent includes contractual rent steps through July 2018. |
| (2) | Underwritten $ per SF is based on the owned space at the Corporate Woods Portfolio Properties. |
| (3) | Occupancy of 92.7% is based on the rent roll dated May 31, 2017 and Underwritten Occupancy represents the underwritten economic vacancy of 10.0%. |
| (4) | Calculated based on the outstanding principal balance as of the Cut-off Date of the Corporate Woods Portfolio Loan Combination. |
| ■ | Appraisal.According to the appraisal, the Corporate Woods Portfolio Properties had an “As Portfolio” bulk appraised value of $299,100,000 as of an effective date of June 15, 2017, which includes a portfolio premium of $3,600,000. The sum of the individual “as-is” appraised values of the Corporate Woods Portfolio Properties is $295,500,000. |
Appraisal Approach | As-Is Value | Discount Rate | Capitalization Rate |
| Direct Capitalization Approach | $295,800,000 | N/A | 7.50% |
| Discounted Cash Flow Approach | $299,100,000 | 8.25%(1) | 7.75%(2) |
| (1) | Represents the internal rate of return (cash flow). |
| (2) | Represents the terminal capitalization rate. |
| ■ | Environmental Matters.According to the Phase I environmental reports, dated August 9, 2017, there are no recognized environmental conditions or recommendations for further action for the Corporate Woods Portfolio Properties. |
| ■ | Market Overview and Competition. The Corporate Woods Portfolio Properties are located in Overland Park, Kansas which is situated in southwest Johnson County, about 15 miles southwest of the Kansas City CBD. Major employers within the area include: HCA Midwest Health System, Sprint Corporation, Saint Luke’s Health System, Cerner Corporation, Children’s Mercy Hospitals & Clinics, DST Systems, Inc., Truman Medical Center, and Black & Veatch Corporation, among others. |
The Corporate Woods Portfolio Properties are located in the city of Overland Park which is the second-most populous city in Kansas and the largest suburb in the Kansas City metropolitan area. The Corporate Woods Portfolio Properties are located approximately 15 miles from Kansas City’s CBD and 34 miles from the Kansas City International Airport. Additionally, an extensive interstate network runs directly through Overland Park, servicing residents and employees that live in the area. The 2016 population within a one-, three- and five-mile radius of the Corporate Woods Portfolio Properties was 9,145, 97,171 and 248,477, respectively. The 2016 estimated average household income within a one-, three- and five-mile radius of the Corporate Woods Portfolio Properties was $87,815,
The depositor has filed a registration statement (including a prospectus) with the Securities and Exchange Commission (“SEC”) (SEC File No. 333-207132) for the offering to which this communication relates. Before you invest, you should read the prospectus in the registration statement and other documents the depositor has filed with the SEC for more complete information about the depositor, the issuing entity and this offering. You may get these documents for free by visiting EDGAR on the SEC website at www.sec.gov. Alternatively, the depositor or Citigroup Global Markets Inc., Barclays Capital Inc., Drexel Hamilton, LLC or any other underwriter or dealer participating in this offering will arrange to send you the prospectus if you request it by calling toll-free 1-800-831-9146.
| 80 |
| LOAN #4: corporate woods portfolio |
$93,240 and $104,793, respectively. Overland Park has certain attractions such as a 300-acre arboretum and botanical garden, a bi-weekly farmers’ market and a new 12-field soccer complex which hosts local, regional and national tournaments.
The Corporate Woods Portfolio Properties are part of the Kansas City Metropolitan Statistical Area (“MSA”) office market and the South Johnson County/College Boulevard office submarket. Based on the Appraisal, the submarket is characteristically a higher-performing submarket in terms of effective rental rates achieved by the landlords. According to a market report, as of March 2017, the Kansas City MSA office market consisted of 136.8 million SF with an average occupancy rate of 92.1% and an average rent of $18.26 per SF. As of March 2017, the College Boulevard office submarket consisted of 20.5 million SF with an average vacancy rate of 8.5% and an average rent of $21.65 per SF. The Appraisal identified a subset of six comparable properties, located within the College Boulevard office submarket and within three miles of the Corporate Woods Portfolio Properties. The table below is based on the information available to the appraiser in connection with such comparable properties, which had gross rents ranging from $20.75 per SF to $26.00 per SF (see chart below).
The following table presents certain information relating to the primary competition for the Corporate Woods Portfolio Properties:
Office Lease Comparables(1)
Corporate Woods Portfolio Properties | Lighton Plaza I & II / Tower | 7101 Tower | Commerce Plaza I & II | South Creek Office Park | Financial Plaza II & III | Renaissance / Del Sarto | |
| Year Built | 1977-2001 | 1989 | 1986 | 1986 | 1995 | 1985 | 1986 |
| Total GLA | 2,033,179 | 476,278 | 228,040 | 285,465 | 898,488 | 254,336 | 545,218 |
| Total Occupancy | 92.7%(2) | 92.8% | 93.9% | 97.4% | 89.5% | 87.7% | 90.3% |
| Quoted Rent Rate per SF | $22.00-24.25 | $22.00-26.00 | $23.50 | $23.50 | $20.75-22.25 | $21.50-23.00 | $21.50-23.00 |
| Expense Basis | FSG | FSG | FSG | FSG | FSG | FSG | FSG |
| (1) | Source: Appraisal. |
| (2) | Based on the borrower rent roll dated May 31, 2017. |
| ■ | The Borrower. The borrower is Corporate Woods Kansas Realty LP, a single-purpose, single-asset entity that is 0.50% owned by its general partner, Corporate Woods Kansas Realty Management LLC and 99.5% owned by Corporate Woods Kansas LP. Corporate Woods Kansas LP is 0.5% owned by its general partner, Corporate Woods Kansas Management LLC and 99.5% owned by various limited partners. A non-consolidation opinion has been delivered in connection with the origination of the Corporate Woods Portfolio Loan. Raymond Massa is the non-recourse carveout guarantor of the Corporate Woods Portfolio Loan. |
Corporate Woods Kansas Realty Management LLC and Corporate Woods Kansas Management LLC are controlled by Group RMC Management Inc. (“Group RMC”). Group RMC is a real estate management company headquartered in New York City targeting investments in office assets throughout the United States. Group RMC is currently invested in 19 office properties totaling approximately 6.5 million SF across more than 80 buildings throughout the United States and Canada valued at approximately $621.5 million.
| ■ | Escrows. On the origination date of the Corporate Woods Portfolio Loan, the borrower funded reserves of (i) $6,258,114 for real estate taxes, (ii) $7,500,000 for tenant improvements and leasing commissions, (iii) $620,488 for deferred maintenance and (iv) $1,481,165 for unfunded tenant obligations. |
On each due date, the borrower will be required to fund (i) one-twelfth of the taxes that the lender estimates will be payable over the then-succeeding 12-month period, initially estimated to be $6,258,114, (ii) at the option of the lender, one-twelfth of the amount that the lender estimates will be necessary to pay insurance premiums over the then-succeeding 12-month period, provided that insurance is not covered under an acceptable blanket policy, (iii) $38,258 for replacement reserves and (iv) if at any time the tenant improvements and leasing commissions reserve is less than $5,000,000, a monthly payment of $169,428 up to a cap of $7,500,000.
| ■ | Lockbox and Cash Management. The Corporate Woods Portfolio Loan Combination is structured with a hard lockbox and springing cash management. The borrower was required to send tenant direction letters to all tenants instructing them to deposit all rents and other payments into the clearing account controlled by the lender, and any funds received by the borrower or the property manager are required to be deposited in the lockbox within two business days of receipt. During a Corporate Woods Portfolio Trigger Period (as defined below), all funds in the clearing account are required to be transferred on a daily basis into a deposit account established and maintained by |
The depositor has filed a registration statement (including a prospectus) with the Securities and Exchange Commission (“SEC”) (SEC File No. 333-207132) for the offering to which this communication relates. Before you invest, you should read the prospectus in the registration statement and other documents the depositor has filed with the SEC for more complete information about the depositor, the issuing entity and this offering. You may get these documents for free by visiting EDGAR on the SEC website at www.sec.gov. Alternatively, the depositor or Citigroup Global Markets Inc., Barclays Capital Inc., Drexel Hamilton, LLC or any other underwriter or dealer participating in this offering will arrange to send you the prospectus if you request it by calling toll-free 1-800-831-9146.
| 81 |
| LOAN #4: corporate woods portfolio |
the lender, and applied to all required payments and reserves as set forth in the Corporate Woods Portfolio Loan documents. Provided no Corporate Woods Portfolio Trigger Period is continuing, excess cash in the deposit account is required to be disbursed to the borrower in accordance with the Corporate Woods Portfolio Loan documents. Upon the occurrence of an event of default under the Corporate Woods Portfolio Loan documents, funds may be applied in such order of priority as the lender may determine.
A “Corporate Woods Portfolio Trigger Period” will commence upon the occurrence of (i) an event of default, (ii) the debt service coverage ratio, as of any calculation date, falling below 1.20x for one calendar quarter or (iii) a Corporate Woods Portfolio Specified Tenant Trigger Period (as defined below) and will end upon (a) with respect to clause (i) above, the date on which such event of default is cured, (b) with respect to clause (ii) above, the debt service coverage ratio being at least 1.25x for two consecutive calendar quarters and (c) with respect to clause (iii) above, the Corporate Woods Portfolio Specified Tenant Trigger Period ceasing to exist.
A“Corporate Woods Portfolio Specified Tenant Trigger Period” means a period (A) commencing upon the first to occur of (i) the Specified Tenant (as defined below) being in default under the applicable lease beyond any applicable notice and/or cure periods, (ii) the Specified Tenant failing to be in actual, physical possession of at least 80% of its space, (iii) the Specified Tenant giving notice that it is terminating its lease with respect to 15% or more of its space, (iv) any termination or cancellation of any Specified Tenant lease (including, without limitation, rejection in any bankruptcy or similar insolvency proceeding) and/or any Specified Tenant lease failing to otherwise be in full force and effect, (v) any bankruptcy or similar insolvency of the Specified Tenant and (vi) the Specified Tenant failing to extend or renew the applicable Specified Tenant lease on or prior to the earlier of (y) 12 months prior to the expiration of the then applicable term of the applicable Specified Tenant lease and (z) the renewal period required under the applicable Specified Tenant lease; and (B) expiring upon the earlier of (x) the cure of any conditions above in accordance with the Corporate Woods Portfolio Loan documents or (y) the borrower leasing the applicable Specified Tenant space for a term of at least 5 years and the applicable tenant under such lease being in actual, physical occupancy of the space demised under its lease and paying full rent.
A“Specified Tenant” means any tenant that at such time, together with any affiliates, leases space at the Corporate Woods Portfolio Properties that comprises more than 20% or more of either (1) the Corporate Woods Portfolio Properties’ aggregate gross leasable area, or (2) the total rental income (in the aggregate) for the Corporate Woods Portfolio Properties.
| ■ | Property Management.The Corporate Woods Portfolio Properties are currently managed by Block Real Estate Services, LLC, an independent third-party manager. The lender has the right to, or to direct the borrower to, terminate the property management agreement and replace the property manager if: (i) the property manager becomes insolvent or a debtor in an involuntary bankruptcy action or proceeding that is not dismissed within 90 days or any voluntary bankruptcy proceeding; (ii) a Corporate Woods Portfolio Trigger Period has occurred and is continuing under the Corporate Woods Portfolio Loan documents; (iii) the property manager has engaged in gross negligence, fraud, willful misconduct or misappropriation of funds; or (iv) a default by the property manager has occurred and is continuing under the property management agreement after the expiration of all applicable notice and cure periods. The borrower has the right to replace the property manager, provided no event of default is continuing under the Corporate Woods Portfolio Loan documents, with (x) a reputable management company (i) having at least seven years’ experience in the management of office properties with similar scope and class as the Corporate Woods Portfolio Properties located in geographic areas with characteristics similar to the geographic area in which the Corporate Woods Portfolio Properties is located, (ii) which has, for at least seven years preceding the applicable date of determination, managed at least seven comparable properties (exclusive of the Corporate Woods Portfolio Properties) each being of approximately the same size as the Corporate Woods Portfolio Properties, (iii) managing comparable properties (exclusive of the Corporate Woods Portfolio Properties) with at least 1,000,000 leasable SF (in the aggregate) and (iv) which is not the subject of any proceeding under any applicable creditors rights laws, or (y) a property manager approved by the lender in writing (which may be conditioned upon receipt of a rating agency confirmation). |
| ■ | Mezzanine or Secured Subordinate Indebtedness.Not permitted. |
| ■ | Release of Collateral. Provided that no event of default is then continuing under the Corporate Woods Portfolio Loan, the Corporate Woods Portfolio Loan documents permit a partial release of one or more of the individual Corporate Woods Portfolio Properties at any time after the earlier of August 9, 2020 and the second anniversary of the securitization of the last piece of the Corporate Woods Portfolio Loan Combination, subject to certain conditions, |
The depositor has filed a registration statement (including a prospectus) with the Securities and Exchange Commission (“SEC”) (SEC File No. 333-207132) for the offering to which this communication relates. Before you invest, you should read the prospectus in the registration statement and other documents the depositor has filed with the SEC for more complete information about the depositor, the issuing entity and this offering. You may get these documents for free by visiting EDGAR on the SEC website at www.sec.gov. Alternatively, the depositor or Citigroup Global Markets Inc., Barclays Capital Inc., Drexel Hamilton, LLC or any other underwriter or dealer participating in this offering will arrange to send you the prospectus if you request it by calling toll-free 1-800-831-9146.
| 82 |
| LOAN #4: corporate woods portfolio |
including, without limitation, the following: (i) if the partial release occurs on or after the due date in April 2027, the borrower must prepay, or if the partial release occurs prior to the due date in April 2027, the borrower must deliver the partial defeasance collateral with respect to the Corporate Woods Portfolio Property in accordance with the Corporate Woods Portfolio Loan documents, in each case in an amount equal to the greater of (A) 120% of the allocated loan amount for the individual Corporate Woods Portfolio Property to be released and (B) 95% of the net sales proceeds applicable to such property, , (ii) as of the release date, after giving effect to the release, the debt service coverage ratio for the remaining individual Corporate Woods Portfolio Properties is equal to or greater than the greater of (a) the debt service coverage ratio for all individual Corporate Woods Portfolio Properties securing the Corporate Woods Portfolio Loan immediately prior to the release and (b) 1.40x, (iii) as of the release date, after giving effect to such release, the debt yield for the remaining individual Corporate Woods Portfolio Properties is equal to or greater than the greater of (a) the debt yield for all individual Corporate Woods Portfolio Properties securing the Corporate Woods Portfolio Loan immediately prior to the release date, as applicable and (b) 9.0%, (iv) as of the release date, after giving effect to the release, the loan-to-value ratio for the remaining individual Corporate Woods Portfolio Properties is no greater than the lesser of (a) 74.0% and (b) the loan-to-value ratio for all the individual Corporate Woods Portfolio Properties securing the Corporate Woods Portfolio Loan immediately prior to the release date, as applicable, and (v) delivery to lender of a REMIC opinion.
| ■ | Terrorism Insurance. The borrower is required to maintain an “all-risk” insurance policy that provides coverage for terrorism in an amount equal to 100% of the full replacement cost of the Corporate Woods Portfolio Properties, plus a business interruption insurance policy that provides 18 months of business interruption coverage with an additional 6-month extended period of indemnity, with no deductible in excess of $10,000 (provided, however, that higher deductibles for damage caused by flood, earth movement, wind or terrorism are permitted so long as such higher deductibles are commercially reasonable but not to exceed $100,000 with respect to terrorism and 5% of the total insurable value of the applicable individual property with respect to flood, earth movement or wind). See“Risk Factors—Terrorism Insurance May Not Be Available for All Mortgaged Properties” in the Preliminary Prospectus. |
The depositor has filed a registration statement (including a prospectus) with the Securities and Exchange Commission (“SEC”) (SEC File No. 333-207132) for the offering to which this communication relates. Before you invest, you should read the prospectus in the registration statement and other documents the depositor has filed with the SEC for more complete information about the depositor, the issuing entity and this offering. You may get these documents for free by visiting EDGAR on the SEC website at www.sec.gov. Alternatively, the depositor or Citigroup Global Markets Inc., Barclays Capital Inc., Drexel Hamilton, LLC or any other underwriter or dealer participating in this offering will arrange to send you the prospectus if you request it by calling toll-free 1-800-831-9146.
| 83 |
| LOAN #5: bank of america plaza |
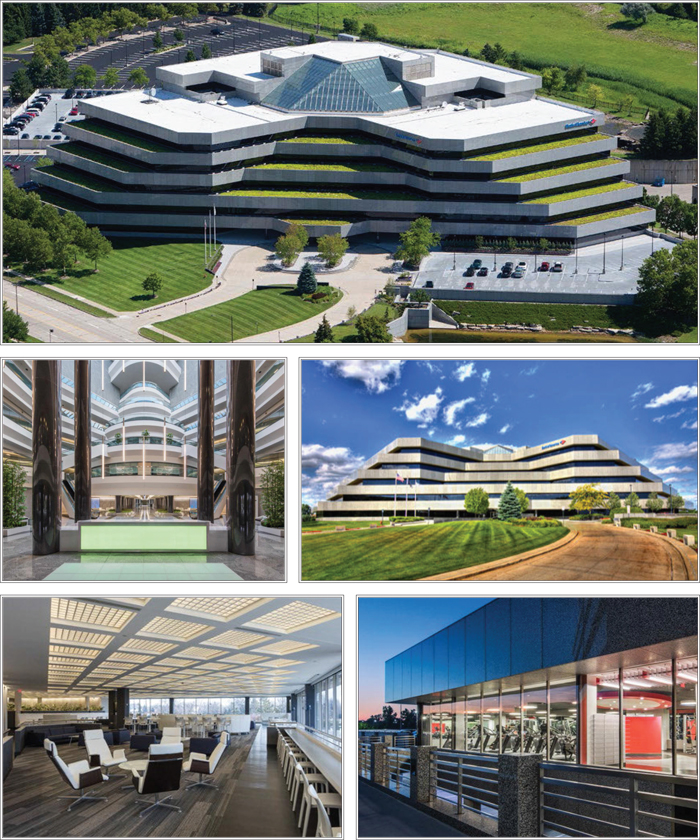
The depositor has filed a registration statement (including a prospectus) with the Securities and Exchange Commission (“SEC”) (SEC File No. 333-207132) for the offering to which this communication relates. Before you invest, you should read the prospectus in the registration statement and other documents the depositor has filed with the SEC for more complete information about the depositor, the issuing entity and this offering. You may get these documents for free by visiting EDGAR on the SEC website at www.sec.gov. Alternatively, the depositor or Citigroup Global Markets Inc., Barclays Capital Inc., Drexel Hamilton, LLC or any other underwriter or dealer participating in this offering will arrange to send you the prospectus if you request it by calling toll-free 1-800-831-9146.
| 84 |
| LOAN #5: bank of america plaza |
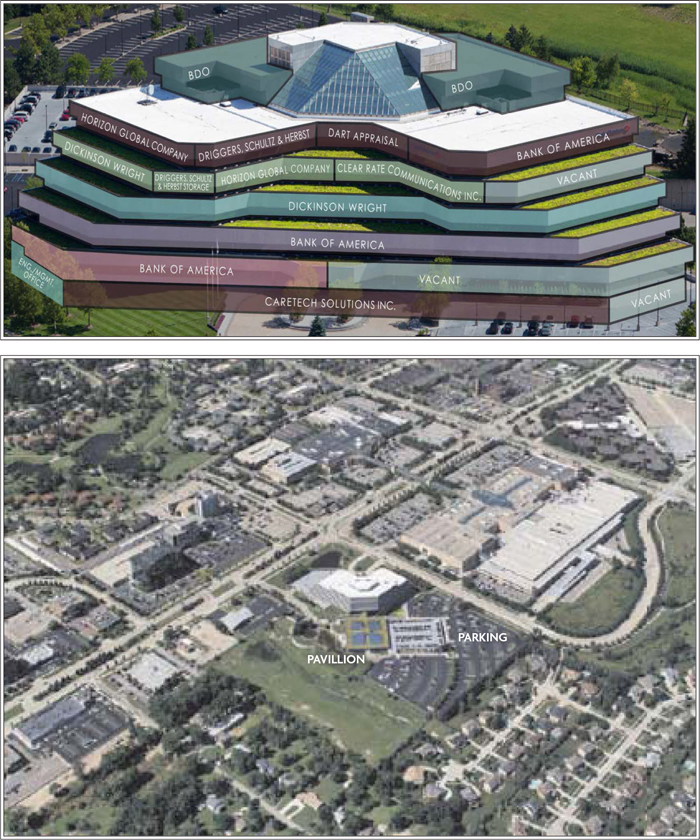
The depositor has filed a registration statement (including a prospectus) with the Securities and Exchange Commission (“SEC”) (SEC File No. 333-207132) for the offering to which this communication relates. Before you invest, you should read the prospectus in the registration statement and other documents the depositor has filed with the SEC for more complete information about the depositor, the issuing entity and this offering. You may get these documents for free by visiting EDGAR on the SEC website at www.sec.gov. Alternatively, the depositor or Citigroup Global Markets Inc., Barclays Capital Inc., Drexel Hamilton, LLC or any other underwriter or dealer participating in this offering will arrange to send you the prospectus if you request it by calling toll-free 1-800-831-9146.
| 85 |
| LOAN #5: bank of america plaza |
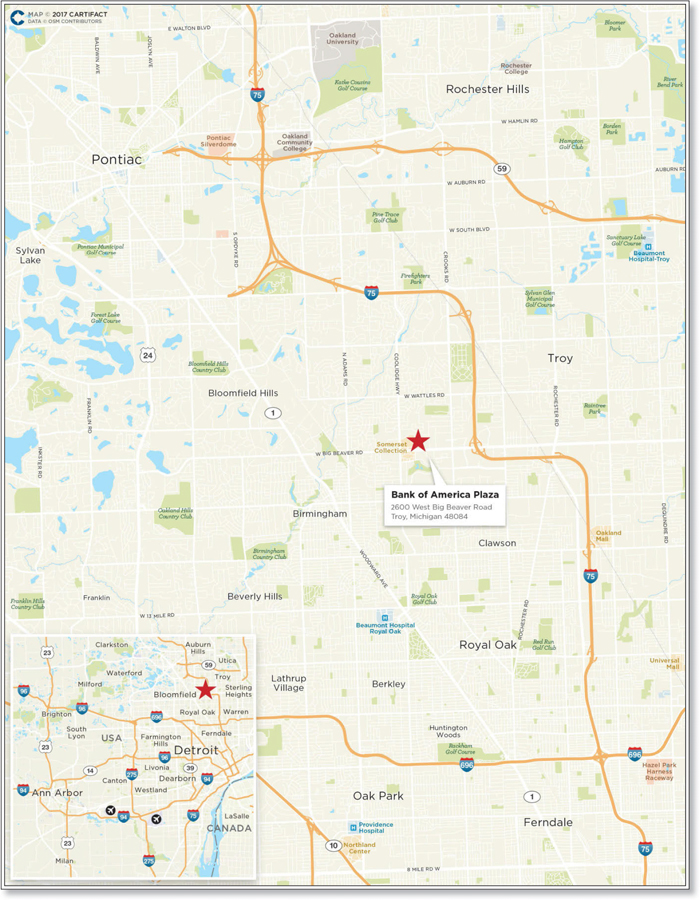
The depositor has filed a registration statement (including a prospectus) with the Securities and Exchange Commission (“SEC”) (SEC File No. 333-207132) for the offering to which this communication relates. Before you invest, you should read the prospectus in the registration statement and other documents the depositor has filed with the SEC for more complete information about the depositor, the issuing entity and this offering. You may get these documents for free by visiting EDGAR on the SEC website at www.sec.gov. Alternatively, the depositor or Citigroup Global Markets Inc., Barclays Capital Inc., Drexel Hamilton, LLC or any other underwriter or dealer participating in this offering will arrange to send you the prospectus if you request it by calling toll-free 1-800-831-9146.
| 86 |
| LOAN #5: bank of america plaza |
| Mortgaged Property Information | Mortgage Loan Information | ||||
| Number of Mortgaged Properties | 1 | Loan Seller | CREFI | ||
| Location (City/State) | Troy, Michigan | Cut-off Date Balance | $47,600,000 | ||
| Property Type | Office | Cut-off Date Balance per SF | $108.43 | ||
| Size (SF) | 438,996 | Percentage of Initial Pool Balance | 4.4% | ||
| Total Occupancy as of 7/1/2017 | 85.8% | Number of Related Mortgage Loans | None | ||
| Owned Occupancy as of 7/1/2017 | 85.8% | Type of Security | Fee Simple | ||
| Year Built / Latest Renovation | 1988 / 2016 | Mortgage Rate | 4.05460% | ||
| Appraised Value | $79,200,000 | Original Term to Maturity (Months) | 84 | ||
| Appraisal Date | 7/17/2017 | Original Amortization Term (Months) | 360 | ||
| Borrower Sponsor | Baruch D. Halberstam and Chaim Y. Halberstam | Original Interest Only Period (Months) | 18 | ||
| Property Management | Troy Beaver Management Corp. | First Payment Date | 10/6/2017 | ||
| Maturity Date | 9/6/2024 | ||||
| Underwritten Revenues | $9,961,339 | ||||
| Underwritten Expenses | $3,629,046 | Escrows(1) | |||
| Underwritten Net Operating Income (NOI) | $6,332,293 | Upfront | Monthly | ||
| Underwritten Net Cash Flow (NCF) | $5,888,123 | Taxes | $73,312 | $73,312 | |
| Cut-off Date LTV Ratio | 60.1% | Insurance | $27,704 | $9,235 | |
| Maturity Date LTV Ratio | 54.0% | Replacement Reserve | $0 | $7,317 | |
| DSCR Based on Underwritten NOI / NCF | 2.31x / 2.15x | TI/LC(2) | $800,000 | $29,266 | |
| Debt Yield Based on Underwritten NOI / NCF | 13.3% / 12.4% | Other(3) | $539,519 | $0 | |
Sources and Uses | |||||||
| Sources | $ | % | Uses | $ | % | ||
| Loan Amount | $47,600,000 | 58.7% | Purchase Price | $78,000,000 | 96.2% | ||
| Principal’s New Cash Contribution | 24,760,313 | 30.5 | Closing Costs | 1,615,957 | 2.0 | ||
| Subordinate Debt | 7,500,000 | 9.3 | Reserves | 1,440,535 | 1.8 | ||
| Other Sources(4) | 1,196,180 | 1.5 | |||||
| Total Sources | $81,056,492 | 100.0% | Total Uses | $81,056,492 | 100.0% | ||
| (1) | See “—Escrows” below. |
| (2) | The TI/LC reserve has a cap of $1,755,984. |
| (3) | The Upfront Other reserve is comprised of a $286,719 TI/LC reserve for Horizon Global Company and a $252,800 free rent reserve. See“—Escrows” below. |
| (4) | Other Sources are comprised of prepaid rent ($527,831), rent abatement credits ($252,800) and other various purchase price adjustments ($415,549) that were credited to the borrower sponsor on the origination date of the Bank of America Plaza Loan. |
| ■ | The Mortgage Loan. The mortgage loan (the“Bank of America Plaza Loan”) is evidenced by a note in the original principal amount of $47,600,000 and is secured by a first mortgage encumbering the borrowers’ fee simple interest in an office building located in Troy, Michigan (the“Bank of America Plaza Property”). The Bank of America Plaza Loan was originated by Citi Real Estate Funding Inc. on August 8, 2017 and amended and restated on August 31, 2017, and represents approximately4.4% of the Initial Pool Balance. The note evidencing the Bank of America Plaza Loan has an outstanding principal balance as of the Cut-off Date of $47,600,000 and an interest rate of 4.05460%per annum. The proceeds of the Bank of America Plaza Loan were primarily used to acquire the Bank of America Plaza Property, fund reserves and pay origination costs. |
The Bank of America Plaza Loan had an initial term of 84 months and has a remaining term of 84 months as of the Cut-off Date. The Bank of America Plaza Loan requires monthly payments of interest only through the due date in March 2019, after which it requires monthly payments of interest and principal sufficient to amortize the Bank of America Plaza Loan over a 30-year amortization schedule. The scheduled maturity date of the Bank of America Plaza Loan is the due date in September 2024. Provided that no event of default has occurred and is continuing under the Bank of America Plaza Loan documents, at any time after the earlier of (i) second anniversary of the securitization Closing Date or (ii) August 8, 2020, the Bank of America Plaza Loan may be defeased with certain direct full faith and credit obligations of the United States of America or other obligations which are “government securities” permitted under the Bank of America Plaza Loan documents. Provided that no event of default has occurred and is continuing under the Bank of America Plaza Loan documents, voluntary prepayment of the Bank of America Plaza Loan without a prepayment premium or yield maintenance charge is permitted on or after the due date in May 2024, provided that, following a casualty or condemnation, if proceeds are not required to be made available to the borrowers for restoration pursuant to the Bank of America Plaza Loan documents and the lender requires proceeds be applied towards the debt, the borrowers are permitted to prepay the whole Bank of America Plaza Loan within ninety days of such application.
| ■ | The Mortgaged Property. The Bank of America Plaza Property is a 438,996 SF, six-story, LEED Silver office building located in Troy, Michigan, approximately 20.0 miles northwest from the Detroit central business district. The Bank of America Plaza Property is located on an approximately 26.6 acre site and currently serves as Bank of America’s Michigan headquarters. The Bank of America Plaza Property underwent an over $6.0 million renovation in 2016, which included renovations to the lobby, fitness center, cafeteria, parking lot structures, HVAC and building |
The depositor has filed a registration statement (including a prospectus) with the Securities and Exchange Commission (“SEC”) (SEC File No. 333-207132) for the offering to which this communication relates. Before you invest, you should read the prospectus in the registration statement and other documents the depositor has filed with the SEC for more complete information about the depositor, the issuing entity and this offering. You may get these documents for free by visiting EDGAR on the SEC website at www.sec.gov. Alternatively, the depositor or Citigroup Global Markets Inc., Barclays Capital Inc., Drexel Hamilton, LLC or any other underwriter or dealer participating in this offering will arrange to send you the prospectus if you request it by calling toll-free 1-800-831-9146.
| 87 |
| LOAN #5: bank of america plaza |
management system. In addition to the $6.0 million renovation, Bank of America has invested over $7.0 million into its space since 2015 and BDO has invested approximately $850,000 into its space since moving its Michigan Headquarters to the Bank of America Plaza Property in 2016. The Bank of America Plaza Property is currently 85.8% occupied by nine tenants as of July 1, 2017. The largest tenant at the Bank of America Plaza Property is Bank of America, which occupies approximately 33.0% of the net rentable area through July 31, 2022. Bank of America has three, five-year renewal options remaining on its lease and primarily utilizes its space for its wealth management services due to its close proximity to high net worth clients in Oakland County (the average household income within a one-, three- and five-mile radius was $108,411, $124,172 and $116,130, respectively). The second largest tenant, Dickinson Wright, occupies approximately 19.9% of the net rentable area through May 31, 2028. Dickinson Wright employs more than 425 lawyers across more than 40 practice areas. Dickinson Wright has occupied space at the Bank of America Plaza Property since 2011 and recently expanded into additional space in 2016. Other than Bank of American and Dickinson Wright, the remaining tenancy is granular with no other tenant accounting for more than 6.8% of the net rentable area or 9.3% of underwritten base rent.
The following table presents certain information relating to the major tenants at the Bank of America Plaza Property:
Largest Owned Tenants Based on Underwritten Base Rent(1)
Tenant Name | Credit Rating | Tenant | % of | UW Base Rent(3) | % of Total UW Base Rent(3) | UW Base Rent | Lease Expiration | Renewal / | ||||||||
| Bank of America | A / Baa1 / BBB+ | 144,701 | 33.0% | $4,006,529 | 44.6% | $27.69 | 7/31/2022 | 3, 5-year options | ||||||||
| Dickinson Wright | NR / NR / NR | 87,473 | 19.9 | 2,153,997 | 24.0 | $24.62 | 5/31/2028 | 1, 5-year option | ||||||||
| CareTech Solutions, Inc. | NR / NR / NR | 29,803 | 6.8 | 831,642 | 9.3 | $27.90 | 4/30/2023 | 2, 5-year options | ||||||||
| Horizon Global Company | NR / NR / NR | 24,142 | 5.5 | 632,135 | 7.0 | $26.18 | 10/31/2027 | 1, 5-year option | ||||||||
| BDO(4) | NR / NR / NR | 21,418 | 4.9 | 599,704 | 6.7 | $28.00 | 4/30/2027 | 1, 5-year option | ||||||||
| Clear Rate Communications, Inc. | NR / NR / NR | 16,201 | 3.7 | 358,965 | 4.0 | $22.16 | 5/31/2026 | 1, 5-year option | ||||||||
| Driggers, Schultz & Herbst | NR / NR / NR | 10,395 | 2.4 | 248,171 | 2.8 | $23.87 | 7/31/2020 | 1, 5-year option | ||||||||
| Dart Appraisal | NR / NR / NR | 6,814 | 1.6 | 143,094 | 1.6 | $21.00 | 8/31/2018 | 1, 5-year option | ||||||||
| AT&T | A- / Baa1 / BBB+ | 295 | 0.1 | 8,555 | 0.1 | $29.00 | 8/31/2019 | NA | ||||||||
| Largest Owned Tenants | 341,242 | 77.7% | $8,982,792 | 100.0% | $26.32 | |||||||||||
| Remaining Tenants(5) | 35,577 | 8.1 | 0 | 0.0 | $0.00 | |||||||||||
| Vacant | 62,177 | 14.2 | 0 | 0.0 | $0.00 | |||||||||||
| Total / Wtd. Avg. All Tenants(6) | 438,996 | 100.0% | $8,982,792 | 100.0% | $23.84 |
|
| (1) | Based on the underwritten rent roll dated July 1, 2017. |
| (2) | Certain ratings are those of the parent company whether or not the parent guarantees the lease. |
| (3) | UW Base Rent, % of Total UW Base Rent and UW Base Rent $ per SF includes the present value of rent steps for Bank of America ($429,520) and contractual rent steps through December 2017 for the remaining tenants ($52,881). |
| (4) | BDO has a one-time option to terminate its lease on April 30, 2024, with 12 months prior notice and payment of a termination fee of $915,087. |
| (5) | The 35,577 SF represents building amenity space which is currently being used as a cafeteria, a conference center, a fitness center, as a dry cleaners and is also being used for various other building amenity functions. No rent is currently being collected for this space, however it is included in the table above, as this space can be used for tenants in the future. |
| (6) | The calculation for Wtd. Avg. UW Base Rent $ per SF excludes vacant space. |
The depositor has filed a registration statement (including a prospectus) with the Securities and Exchange Commission (“SEC”) (SEC File No. 333-207132) for the offering to which this communication relates. Before you invest, you should read the prospectus in the registration statement and other documents the depositor has filed with the SEC for more complete information about the depositor, the issuing entity and this offering. You may get these documents for free by visiting EDGAR on the SEC website at www.sec.gov. Alternatively, the depositor or Citigroup Global Markets Inc., Barclays Capital Inc., Drexel Hamilton, LLC or any other underwriter or dealer participating in this offering will arrange to send you the prospectus if you request it by calling toll-free 1-800-831-9146.
| 88 |
| LOAN #5: bank of america plaza |
The following table presents the lease rollover schedule at the Bank of America Plaza Property, based on initial lease expiration dates:
Lease Expiration Schedule(1)(2)
Year Ending | Expiring Owned GLA | % of Owned GLA | Cumulative % of Owned GLA | UW | % of Total UW | UW Base Rent | # of Expiring Tenants | |||||||
| MTM | 35,577 | 8.1% | 8.1% | $0 | 0.0% | $0.00 | 0 | |||||||
| 2017 | 0 | 0.0 | 8.1% | 0 | 0.0 | $0.00 | 0 | |||||||
| 2018 | 6,814 | 1.6 | 9.7% | 143,094 | 1.6 | $21.00 | 1 | |||||||
| 2019 | 295 | 0.1 | 9.7% | 8,555 | 0.1 | $29.00 | 1 | |||||||
| 2020 | 10,395 | 2.4 | 12.1% | 248,171 | 2.8 | $23.87 | 1 | |||||||
| 2021 | 0 | 0.0 | 12.1% | 0 | 0.0 | $0.00 | 0 | |||||||
| 2022 | 144,701 | 33.0 | 45.1% | 4,006,529 | 44.6 | $27.69 | 1 | |||||||
| 2023 | 29,803 | 6.8 | 51.8% | 831,642 | 9.3 | $27.90 | 1 | |||||||
| 2024 | 0 | 0.0 | 51.8% | 0 | 0.0 | $0.00 | 0 | |||||||
| 2025 | 0 | 0.0 | 51.8% | 0 | 0.0 | $0.00 | 0 | |||||||
| 2026 | 16,201 | 3.7 | 55.5% | 358,965 | 4.0 | $22.16 | 1 | |||||||
| 2027 | 45,560 | 10.4 | 65.9% | 1,231,839 | 13.7 | $27.04 | 2 | |||||||
| 2028 & Thereafter | 87,473 | 19.9 | 85.8% | 2,153,997 | 24.0 | $24.62 | 1 | |||||||
| Vacant | 62,177 | 14.2 | 100.0% | 0 | 0.0 | $0.00 | 0 | |||||||
| Total / Wtd. Avg. | 438,996 | 100.0% | $8,982,792 | 100.0% | $23.84 | 9 |
| (1) | Calculated based on approximate square footage occupied by each Owned Tenant unless otherwise specified. |
| (2) | Certain tenants may have lease termination options that are exercisable prior to the originally stated expiration date of the subject lease and that are not considered in the Lease Expiration Schedule. |
| (3) | UW Base Rent, % of Total UW Base Rent and UW Base Rent $ per SF includes the present value of rent steps for Bank of America ($429,520) and contractual rent steps through December 2017 for the remaining tenants ($52,881). |
The following table presents certain information relating to historical leasing at the Bank of America Plaza Property:
Historical Leased %(1)(2)
2014 | 2015 | 2016 | As of 7/1/2017 | |||||
| Owned Space | NAV | 68.6% | 80.1% | 85.8% |
| (1) | As provided by the borrowers and which represents occupancy as of December 31 for the indicated year unless otherwise specified. |
| (2) | As the borrowers acquired the Bank of America Plaza Property in connection with the origination of the Bank of America Plaza Loan, limited historical information is available. The borrowers were only provided year end 2015 and July 1, 2017 rent rolls. |
The depositor has filed a registration statement (including a prospectus) with the Securities and Exchange Commission (“SEC”) (SEC File No. 333-207132) for the offering to which this communication relates. Before you invest, you should read the prospectus in the registration statement and other documents the depositor has filed with the SEC for more complete information about the depositor, the issuing entity and this offering. You may get these documents for free by visiting EDGAR on the SEC website at www.sec.gov. Alternatively, the depositor or Citigroup Global Markets Inc., Barclays Capital Inc., Drexel Hamilton, LLC or any other underwriter or dealer participating in this offering will arrange to send you the prospectus if you request it by calling toll-free 1-800-831-9146.
| 89 |
| LOAN #5: bank of america plaza |
| ■ | Operating History and Underwritten Net Cash Flow. The following table presents certain information relating to the historical operating performance and the Underwritten Net Cash Flow at the Bank of America Plaza Property: |
Cash Flow Analysis(1)
2015 | 2016 | TTM 3/31/2017 | Underwritten | Underwritten $ per SF | ||||||
| Base Rent | $6,466,728 | $6,641,577 | $6,843,010 | $8,500,391 | $19.36 | |||||
| Contractual Rent Steps(2) | 0 | 0 | 0 | 482,401 | 1.10 | |||||
| Gross Up Vacancy | 0 | 0 | 0 | 1,513,983 | 3.45 | |||||
| Reimbursements | 0 | 737,046 | 682,739 | 1,009,011 | 2.30 | |||||
| Other Income(3) | 0 | 110,154 | 105,810 | 77,110 | 0.18 | |||||
| Gross Revenue | $6,466,728 | $7,488,777 | $7,631,559 | $11,582,896 | $26.38 | |||||
| Mark to Market | 0 | 0 | 0 | (12,497) | (0.03) | |||||
| Vacancy & Credit Loss | 0 | 0 | 0 | (1,609,061) | (3.67) | |||||
| Effective Gross Income | $6,466,728 | $7,488,777 | $7,631,559 | $9,961,339 | $22.69 | |||||
| Real Estate Taxes | $432,142 | $464,158 | $432,142 | $879,748 | $2.00 | |||||
| Insurance | 59,422 | 62,508 | 59,218 | 105,539 | 0.24 | |||||
| Management Fee | 193,501 | 299,491 | 306,078 | 298,840 | 0.68 | |||||
| Other Operating Expenses | 2,187,790 | 1,995,231 | 2,101,181 | 2,344,919 | 5.34 | |||||
| Total Operating Expenses | $2,872,855 | $2,821,388 | $2,898,619 | $3,629,046 | $8.27 | |||||
| Net Operating Income | $3,593,873 | $4,667,389 | $4,732,940 | $6,332,293 | $14.42 | |||||
| TI/LC | 0 | 0 | 0 | 356,370 | 0.81 | |||||
| Capital Expenditures | 0 | 0 | 0 | 87,799 | 0.20 | |||||
| Net Cash Flow | $3,593,873 | $4,667,389 | $4,732,940 | $5,888,123 | $13.41 | |||||
| Occupancy(4) | 68.6% | 80.1% | 85.8% | 86.0%(5) | ||||||
| NOI Debt Yield | 7.6% | 9.8% | 9.9% | 13.3% | ||||||
| NCF DSCR | 1.31x | 1.70x | 1.72x | 2.15x |
| (1) | Certain items such as straight line rent, interest expense, interest income, lease cancellation income, depreciation, amortization, debt service payments and any other non-recurring or non-operating items were excluded from the historical presentation and are not considered for the underwritten cash flow. |
| (2) | Contractual Rent Steps are underwritten based upon the actual scheduled rent increases through December 2017 and the present value of future rent increases for Bank of America. |
| (3) | Other Income includes parking income, and other miscellaneous income. |
| (4) | As the borrowers acquired the Bank of America Plaza Property in connection with the origination of the Bank of America Plaza Loan, limited historical information is available. The borrowers were only provided year end 2015 and July 1, 2017 rent rolls. |
| (5) | Represents the underwritten economic occupancy at the Bank of America Plaza Property. |
| ■ | Appraisal. According to the appraisal, the Bank of America Plaza Property had an “as-is” appraised value of $79,200,000 as of July 17, 2017. |
Appraisal Approach | Value | Discount Rate | Capitalization Rate |
| Direct Capitalization Approach | $79,300,000 | N/A | 8.00% |
| Discounted Cash Flow Approach | $79,200,000 | 9.75% | 8.50%(1) |
| (1) | Represents the terminal capitalization rate. |
| ■ | Environmental Matters. Based on a Phase I environmental report dated July 25, 2017, the environmental consultant did not identify evidence of any recognized environmental conditions or recommendations for further action at the Bank of America Plaza Property other than the implementation of the existing asbestos O&M plan. |
| ■ | Market Overview and Competition. The Bank of America Plaza Property is located in the city of Troy within Oakland County in southeast Michigan, approximately 20.0 miles northwest of the Detroit central business district. According to the appraisal, the 2017 estimated population within a one-, three- and five-mile radius of the Bank of America Plaza Property was 9,418, 83,132 and 230,561, respectively. For the same period, the average household income within a one-, three- and five-mile radius was $108,411, $124,172 and $116,130, respectively. The Bank of America Plaza Property is located within the Detroit office market which, according to a third party industry report, has an office inventory of 199.0 million SF, a 10.9% vacancy rate and asking rents of $19.00 per SF. According to a third party industry report, the Troy office submarket reported an office inventory of 18.1 million SF, a 14.6% vacancy rate and asking rents of $19.15 per SF. According to the appraisal, there is no known supply coming to market in the immediate area that would compete with the Bank of America Plaza Property. |
The depositor has filed a registration statement (including a prospectus) with the Securities and Exchange Commission (“SEC”) (SEC File No. 333-207132) for the offering to which this communication relates. Before you invest, you should read the prospectus in the registration statement and other documents the depositor has filed with the SEC for more complete information about the depositor, the issuing entity and this offering. You may get these documents for free by visiting EDGAR on the SEC website at www.sec.gov. Alternatively, the depositor or Citigroup Global Markets Inc., Barclays Capital Inc., Drexel Hamilton, LLC or any other underwriter or dealer participating in this offering will arrange to send you the prospectus if you request it by calling toll-free 1-800-831-9146.
| 90 |
| LOAN #5: bank of america plaza |
The following table presents certain information relating to lease comparables for the Bank of America Plaza Property:
Office Lease Comparables(1)
Bank of America Plaza | Columbia Center I | Columbia Center II | Somerset Place | |
| Year Built / Renovated | 1988 / 2016 | 1988 / 2015 | 2000 / NAP | 1986 / NAP |
| Building SF | 438,996 | 254,978 | 251,620 | 215,000 |
| Total Occupancy | 85.8% | 93.7% | 84.2% | 76.9% |
| Rent per SF Range | $13.00 – $36.50 | $18.47 – $30.75 | $22.69 – $29.30 | $20.00 – $26.00 |
| Lease Type | Base year stop | Base year stop | Base year stop | Gross plus electric |
Somerset Place Tower II | Liberty Center | 37000-371000 Woodward Avenue | |
| Year Built / Renovated | 1973 / NAP | 1986 / NAP | 2012 / NAP |
| Building SF | 165,000 | 292,146 | 74,332 |
| Total Occupancy | 83.5% | 71.7% | 100.0% |
| Rental Rate per SF Range | 20.00 – 26.00 | 12.50 – 21.50 | 17.75 – 35.00 |
| Lease Type | Gross plus electric | Gross plus electric | Gross plus electric |
| (1) | Source: Appraisal. |
| ■ | The Borrowers. The borrowers are tenants-in-common; a 45% interest in the Bank of America Plaza Property is owned by Troy Beaver Realty LLC and an 18.33% interest in the Bank of America Plaza Property is owned by each of Troy Beaver Holdings I LLC, Troy Beaver Holdings II LLC and Troy Beaver Holdings III LLC, each a Delaware limited liability company. Troy Beaver Realty LLC is wholly owned by Troy Beaver Realty Mezz LLC, which in turn is 50% owned by Baruch D. Halberstam, 30% owned by Chaim Y. Halberstam and 20% owned by Congregation S.Y.E. Inc., which is a not-for-profit entity. Each of Troy Beaver Holdings I LLC, Troy Beaver Holdings II LLC and Troy Beaver Holdings III LLC is wholly owned by Troy Beaver Holdings Mezz LLC, which is wholly owned by Marcy Square LLC. Chaim Y. Halberstam is the managing member for all of the borrowing entities. Legal counsel to the borrowers delivered a non-consolidation opinion in connection with the origination of the Bank of America Plaza Loan. |
The borrower sponsors and non-recourse carveout guarantors for the Bank of America Plaza Loan are Chaim Y. Halberstam and Baruch D. Halberstam. As of June 26, 2017, Baruch D. Halberstam had a net worth of approximately $55.1 million and a liquidity of approximately $29.6 million. As of July 14, 2017, Chaim Y. Halberstam had a net worth of approximately $7.3 million and a liquidity of approximately $215,000. Baruch D. Halberstam has been actively investing in real estate since 1971, primarily within the Manhattan, Brooklyn and Bronx boroughs of New York City. Baruch D. Halberstam has a current real estate portfolio of 859 residential units across the New York City metropolitan area. Chaim Y. Halberstam has a current portfolio of 4 multifamily properties containing 89 units and 2 commercial properties totaling 139,446 SF.
| ■ | Escrows. In connection with the origination of the Bank of America Plaza Loan, the borrowers funded reserves of (i) $73,312 for real estate taxes, (ii) $27,704 for insurance, (iii) $800,000 for general tenant improvements and leasing commissions, (iv) $286,719 for tenant improvements and leasing commissions for Horizon Global Company, and (v) $252,800 for free rent. |
Additionally, on each due date, the borrowers are required to fund the following reserves with respect to the Bank of America Plaza Property: (i) a tax reserve in an amount equal to one-twelfth of the amount that the lender estimates will be necessary to pay taxes over the then succeeding 12-month period (initially $73,312), (ii) an insurance reserve in an amount equal to one-twelfth of the amount that the lender estimates will be necessary to pay insurance premiums over the then succeeding 12-month period (initially $9,235), (iii) a replacement reserve in the amount of $7,317 and (iv) a tenant improvements and leasing commissions reserve in the amount of $29,266, subject to a cap of $1,755,984.
| ■ | Lockbox and Cash Management. The Bank of America Plaza Loan documents require a hard lockbox with springing cash management.The Bank of America Plaza Loan documents require the borrowers to deliver tenant direction letters within two days of origination of theBank of America Plaza Loan, which will direct tenants to pay rent directly to a lender-controlled lockbox account and require that all other money received by the borrowers with respect to the Bank of America Plaza Property be promptly deposited into such lockbox account during the term of the Bank of America Plaza Loan. After the occurrence of and during the continuance of a Bank of America Plaza Trigger Period (as defined below), all amounts in the lockbox account are required to be swept to a lender-controlled cash management account on a daily basis and, provided no event of default under the Bank of America Plaza Loan documents is continuing, applied to payment of debt service and operating expenses and funding of required |
The depositor has filed a registration statement (including a prospectus) with the Securities and Exchange Commission (“SEC”) (SEC File No. 333-207132) for the offering to which this communication relates. Before you invest, you should read the prospectus in the registration statement and other documents the depositor has filed with the SEC for more complete information about the depositor, the issuing entity and this offering. You may get these documents for free by visiting EDGAR on the SEC website at www.sec.gov. Alternatively, the depositor or Citigroup Global Markets Inc., Barclays Capital Inc., Drexel Hamilton, LLC or any other underwriter or dealer participating in this offering will arrange to send you the prospectus if you request it by calling toll-free 1-800-831-9146.
| 91 |
| LOAN #5: bank of america plaza |
reserves, with the remainder (i) to the extent a Bank of America Plaza Trigger Period is continuing, deposited into an excess cash flow reserve and held by the lender as additional collateral for the Bank of America Plaza Loan and (ii) to the extent no Bank of America Plaza Trigger Period is continuing, (a) first, if the mezzanine lender is entitled to receive any excess cash flow pursuant to the terms of the Bank of America Plaza Mezzanine Loan documents and the mezzanine intercreditor agreement, and the mezzanine lender has provided written notice to the lender certifying as such, to be disbursed to or as directed by the mezzanine lender, and (b) second, to be swept into the borrower’s operating account. After the occurrence and during the continuance of an event of default under the Bank of America Plaza Loan documents, the lender may apply any funds in the cash management account to amounts payable under the Bank of America Plaza Loan (and/or toward the payment of expenses of the Bank of America Plaza Property), in such order of priority as the lender may determine.
A“Bank of America Plaza Trigger Period” means a period commencing upon the earliest of (i) the occurrence and continuance of an event of default under the Bank of America Plaza Loan documents, (ii) the debt service coverage ratio being less than 1.30x, and (iii) the occurrence of a Bank of America Plaza Specified Tenant Trigger Period (as defined below), and expiring upon (x) with regard to any Bank of America Plaza Trigger Period commenced in connection with clause (i) above, the cure (if applicable) of such event of default, (y) with regard to any Bank of America Plaza Trigger Period commenced in connection with clause (ii) above, the date that the debt service coverage ratio is equal to or greater than 1.30x for two consecutive calendar quarters, and (z) with regard to any Bank of America Plaza Trigger Period commenced in connection with clause (iii) above, a Bank of America Plaza Specified Tenant Trigger Period ceasing to exist.
A “Bank of America Plaza Specified Tenant Trigger Period” means a period (A) commencing upon the first to occur of (i) a Bank of America Specified Tenant (as defined below) being in monetary or material non-monetary default under its lease beyond applicable notice and cure periods, (ii) aBank of America Specified Tenantfailing to be in actual, physical possession of its space and open to the public during customary hours, (iii) aBank of America Specified Tenantgiving notice that it is terminating its lease for all or any portion of its space, (iv) any termination, cancellation or failure to be in full force and effect of aBank of America Specified Tenantlease, (v) any bankruptcy or similar insolvency of aBank of America Specified Tenant, including any bankruptcy or insolvency proceeding pursuant to which aBank of America Specified Tenantlease is rejected, (vi) aBank of America Specified Tenantfailing to extend or renew its lease on or prior to the applicable extension deadline for a minimum renewal term of five (5) years, and (vii) the senior unsecured credit rating (or equivalent thereof) of aBank of America Specified Tenantfalling below investment grade; and (B) expiring upon (1) the satisfaction of cure conditions in accordance with the Bank of America Plaza Loan documents or (2) the borrowers re-leasing the entire space that was demised pursuant to aBank of America Specified Tenantlease (or applicable portion thereof) to one or more new tenants in accordance with the Bank of America Plaza Loan documents and the applicable new tenant under such lease being in actual, physical occupancy of the space demised under its lease, open for business and paying the full amount of the rent then due under its lease.
A “Bank of America Specified Tenant” means Bank of America or Dickinson Wright (or any subsequent lessee of the Bank of America or Dickinson Wright space (or at least 50% thereof)).
| ■ | Property Management. The Bank of America Plaza Property is managed by Troy Beaver Management Corp., a third-party manager. The lender has the right to, or to direct the borrowers to, terminate the property management agreement and replace the property manager if (i) the property manager becomes insolvent or a debtor in an involuntary bankruptcy or insolvency proceeding not dismissed within 90 days or any voluntary bankruptcy or insolvency proceeding; (ii) a Bank of America Plaza Trigger Period exists; (iii) the property manager has engaged in gross negligence, fraud, willful misconduct or misappropriation of funds; or (iv) a default by the property manager under the property management agreement has occurred and is continuing beyond all applicable notice and cure periods. The borrowers have the right to replace the property manager upon 60 days’ prior notice to the lender, with a property manager approved by the lender in writing (which may be conditioned upon receipt of a rating agency confirmation), provided no event of default is continuing under the Bank of America Plaza Loan documents. |
| ■ | Mezzanine or Secured Subordinate Indebtedness. Citigroup Global Markets Realty Corp. originated a mezzanine loan (the “Bank of America Plaza Mezzanine Loan”) in the original principal amount of $7,500,000 and subsequently assigned its interest in the Bank of America Plaza Mezzanine Loan to ACREFI Mortgage Lending, LLC. The Bank of America Plaza Mezzanine Loan is secured by the membership interests in each of the borrowers under the Bank of America Plaza Loan. The proceeds of the Bank of America Plaza Mezzanine Loan were used to pay down the principal balance of the Bank of America Plaza Loan. The Bank of America Plaza Mezzanine Loan is co-terminous |
The depositor has filed a registration statement (including a prospectus) with the Securities and Exchange Commission (“SEC”) (SEC File No. 333-207132) for the offering to which this communication relates. Before you invest, you should read the prospectus in the registration statement and other documents the depositor has filed with the SEC for more complete information about the depositor, the issuing entity and this offering. You may get these documents for free by visiting EDGAR on the SEC website at www.sec.gov. Alternatively, the depositor or Citigroup Global Markets Inc., Barclays Capital Inc., Drexel Hamilton, LLC or any other underwriter or dealer participating in this offering will arrange to send you the prospectus if you request it by calling toll-free 1-800-831-9146.
| 92 |
| LOAN #5: bank of america plaza |
with the Bank of America Plaza Loan with a term of 84 months and scheduled maturity date in September 2024. The Bank of America Plaza Mezzanine Loan requires monthly payments of interest only through the entire loan term.
| ■ | Release of Collateral. Not permitted. |
| ■ | Terrorism Insurance. The borrowers are required to maintain an “all-risk” insurance policy that provides coverage for terrorism in an amount equal to 100% of the full replacement cost of theBank of America PlazaProperty with no deductible in excess of $25,000 (except with respect to earthquake and windstorm coverage), plus a business interruption insurance policy that provides 18 months of business interruption coverage with an additional extended period of indemnity for up to six months after the physical loss has been repaired. See “Risk Factors—Terrorism Insurance May Not Be Available for All Mortgaged Properties”in the Preliminary Prospectus. |
The depositor has filed a registration statement (including a prospectus) with the Securities and Exchange Commission (“SEC”) (SEC File No. 333-207132) for the offering to which this communication relates. Before you invest, you should read the prospectus in the registration statement and other documents the depositor has filed with the SEC for more complete information about the depositor, the issuing entity and this offering. You may get these documents for free by visiting EDGAR on the SEC website at www.sec.gov. Alternatively, the depositor or Citigroup Global Markets Inc., Barclays Capital Inc., Drexel Hamilton, LLC or any other underwriter or dealer participating in this offering will arrange to send you the prospectus if you request it by calling toll-free 1-800-831-9146.
| 93 |
| LOAN #6: mall of louisiana |

The depositor has filed a registration statement (including a prospectus) with the Securities and Exchange Commission (“SEC”) (SEC File No. 333-207132) for the offering to which this communication relates. Before you invest, you should read the prospectus in the registration statement and other documents the depositor has filed with the SEC for more complete information about the depositor, the issuing entity and this offering. You may get these documents for free by visiting EDGAR on the SEC website at www.sec.gov. Alternatively, the depositor or Citigroup Global Markets Inc., Barclays Capital Inc., Drexel Hamilton, LLC or any other underwriter or dealer participating in this offering will arrange to send you the prospectus if you request it by calling toll-free 1-800-831-9146.
| 94 |
| LOAN #6: mall of louisiana |
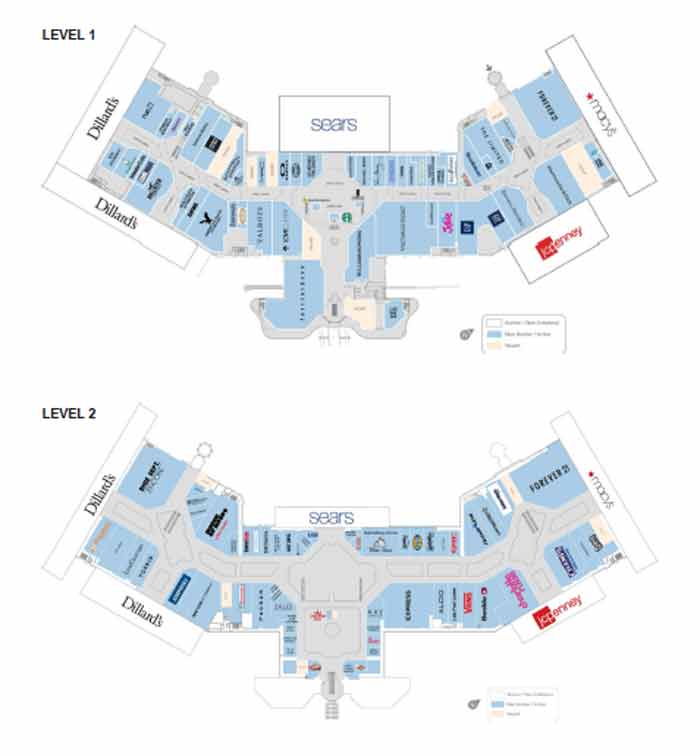
The depositor has filed a registration statement (including a prospectus) with the Securities and Exchange Commission (“SEC”) (SEC File No. 333-207132) for the offering to which this communication relates. Before you invest, you should read the prospectus in the registration statement and other documents the depositor has filed with the SEC for more complete information about the depositor, the issuing entity and this offering. You may get these documents for free by visiting EDGAR on the SEC website at www.sec.gov. Alternatively, the depositor or Citigroup Global Markets Inc., Barclays Capital Inc., Drexel Hamilton, LLC or any other underwriter or dealer participating in this offering will arrange to send you the prospectus if you request it by calling toll-free 1-800-831-9146.
| 95 |
| LOAN #6: mall of louisiana |
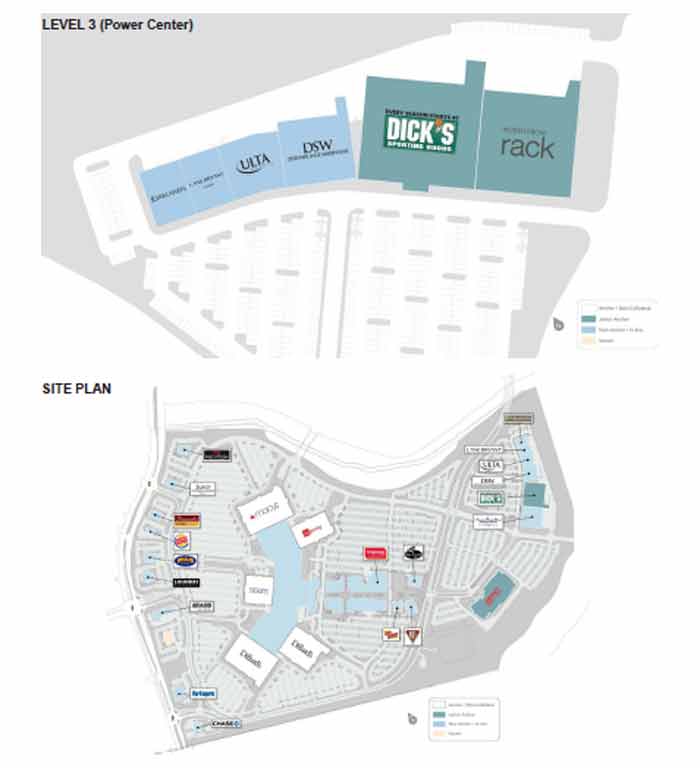
The depositor has filed a registration statement (including a prospectus) with the Securities and Exchange Commission (“SEC”) (SEC File No. 333-207132) for the offering to which this communication relates. Before you invest, you should read the prospectus in the registration statement and other documents the depositor has filed with the SEC for more complete information about the depositor, the issuing entity and this offering. You may get these documents for free by visiting EDGAR on the SEC website at www.sec.gov. Alternatively, the depositor or Citigroup Global Markets Inc., Barclays Capital Inc., Drexel Hamilton, LLC or any other underwriter or dealer participating in this offering will arrange to send you the prospectus if you request it by calling toll-free 1-800-831-9146.
| 96 |
| LOAN #6: mall of louisiana |
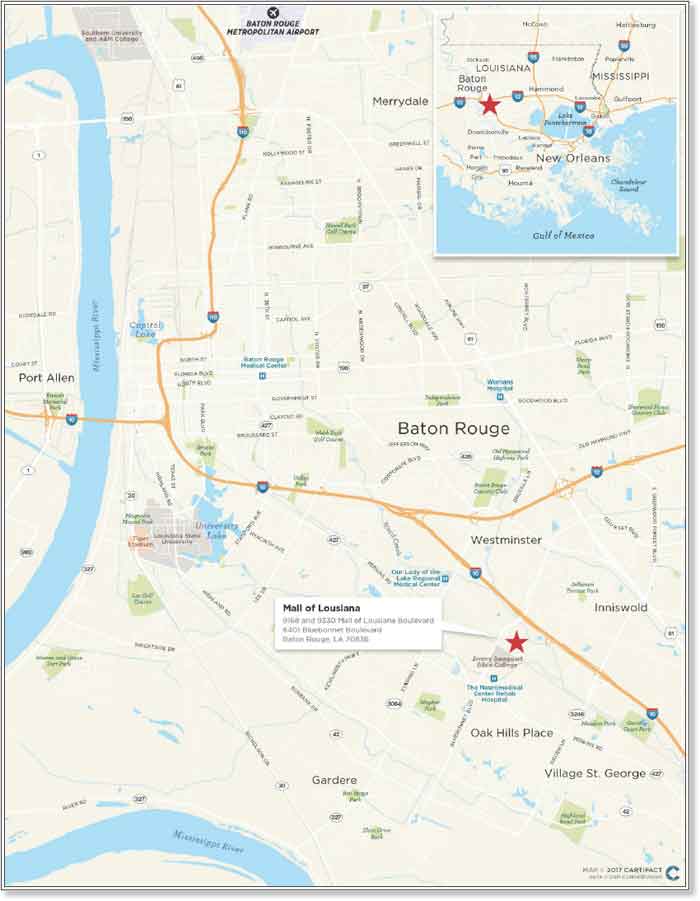
The depositor has filed a registration statement (including a prospectus) with the Securities and Exchange Commission (“SEC”) (SEC File No. 333-207132) for the offering to which this communication relates. Before you invest, you should read the prospectus in the registration statement and other documents the depositor has filed with the SEC for more complete information about the depositor, the issuing entity and this offering. You may get these documents for free by visiting EDGAR on the SEC website at www.sec.gov. Alternatively, the depositor or Citigroup Global Markets Inc., Barclays Capital Inc., Drexel Hamilton, LLC or any other underwriter or dealer participating in this offering will arrange to send you the prospectus if you request it by calling toll-free 1-800-831-9146.
| 97 |
| LOAN #6: mall of louisiana |
| Mortgaged Property Information | Mortgage Loan Information | ||||
| Number of Mortgaged Properties | 1 | Loan Seller(3) | CREFI / Barclays | ||
| Location (City/State) | Baton Rouge, Louisiana | Cut-off Date Balance(4) | $47,000,000 | ||
| Property Type | Retail | Cut-off Date Balance per SF(2) | $418.39 | ||
| Size (SF) | 776,789 | Percentage of Initial Pool Balance | 4.3% | ||
| Total Occupancy as of 6/30/2017(1) | 91.8% | Number of Related Mortgage Loans | None | ||
| Owned Occupancy as of 6/30/2017(1) | 91.8% | Type of Security | Fee Simple | ||
| Year Built / Latest Renovation | 1997 / 2008 | Mortgage Rate | 3.98400% | ||
| Appraised Value | $570,000,000 | Original Term to Maturity (Months) | 120 | ||
| Appraisal Date | 6/23/2017 | Original Amortization Term (Months) | 360 | ||
| Borrower Sponsor | GGP Real Estate Holding I, Inc. | Original Interest Only Period (Months) | 36 | ||
| Property Management | Self-Managed | First Payment Date | 9/1/2017 | ||
| Maturity Date | 8/1/2027 | ||||
| Underwritten Revenues | $43,215,234 | ||||
| Underwritten Expenses | $7,152,311 | Escrows(5) | |||
| Underwritten Net Operating Income (NOI) | $36,062,923 | Upfront | Monthly | ||
| Underwritten Net Cash Flow (NCF) | $34,433,637 | Taxes | $0 | $0 | |
| Cut-off Date LTV Ratio(2) | 57.0% | Insurance | $0 | $0 | |
| Maturity Date LTV Ratio(2) | 49.3% | Replacement Reserve | $0 | $0 | |
| DSCR Based on Underwritten NOI / NCF(2) | 1.94x / 1.85x | TI/LC | $0 | $0 | |
| Debt Yield Based on Underwritten NOI / NCF(2) | 11.1% / 10.6% | Other | $0 | $0 | |
| Sources and Uses | |||||
| Sources | $ | % | Uses | $ | % |
| Loan Combination Amount | $325,000,000 | 100.0% | Principal Equity Distribution(6) | $323,588,541 | 99.6% |
| Closing Costs | 1,411,459 | 0.4 | |||
| Total Sources | $325,000,000 | 100.0% | Total Uses | $325,000,000 | 100.0% |
| (1) | Total Occupancy and Owned Occupancy include the third largest tenant, Main Event, which has a signed lease but is not expected to take physical occupancy and commence paying rent until August 2018, and exclude temporary tenants. |
| (2) | Calculated based on the aggregate outstanding principal balance of the Mall of Louisiana Loan Combination (as defined below). |
| (3) | The Mall of Louisiana Loan Combination was co-originated by Bank of America, National Association (“BANA”), Citi Real Estate Funding Inc. (“CREFI”) and Barclays Bank PLC (“Barclays”). |
| (4) | The Cut-off Date Balance of $47,000,000 represents the non-controlling notes A-3-1 and A-5-2, which notes are part of a loan combination evidenced by ninepari passu notes having an aggregate outstanding principal balance as of the Cut-off Date of $325,000,000. CREFI is expected to contribute note A-3-1 to this securitization transaction, which note has an outstanding principal balance of $30,000,000 as of the Cut-off Date, and Barclays is expected to contribute note A-5-2 to this securitization transaction, which note has an outstanding principal balance of $17,000,000 as of the Cut-off Date. The related companion loans are evidenced by (i) the controlling note A-1 ($65,000,000) and non-controlling note A-2 ($44,000,000), which are currently held by BANA and are expected to be contributed to one or more future securitization transactions, (ii) the non-controlling notes A-3-2 ($28,000,000) and A-4 ($50,000,000), which are currently held by CREFI and are expected to be contributed to one or more future securitization transactions and (iii) the non-controlling notes A-5-1 ($41,000,000), A-6 ($25,000,000) and A-7 ($25,000,000), which are currently held by Barclays or an affiliate, and are expected to be contributed to one or more future securitization transactions. See “—The Mortgage Loan” below. |
| (5) | GGP Real Estate Holding I, Inc., as guarantor, has delivered a Main Event guaranty with respect to (i) completion of certain required work by the borrowers under the Main Event lease and (ii) rent obligations in lieu of posting an upfront cash reserve for the obligations. See “—Escrows” below. |
| (6) | The borrower sponsor acquired the Mall of Louisiana Property for approximately $265 million in 2004 and, inclusive of the $100 million spent on the 2008 property expansion, maintains a cost basis of approximately $413 million. The Mall of Louisiana Property was not encumbered by any prior existing debt. |
| ■ | The Mortgage Loan. The mortgage loan (the “Mall of Louisiana Loan”) is part of a loan combination (the “Mall of Louisiana Loan Combination”) evidenced by ninepari passu notes that are collectively secured by a first mortgage encumbering the borrowers’ fee interest in a super-regional mall located in Baton Rouge, Louisiana (the “Mall of Louisiana Property”). The Mall of Louisiana Loan, which is evidenced by the non-controlling notes A-3-1 and A-5-2, had an original principal balance of $47,000,000, has an outstanding principal balance as of the Cut-off Date of $47,000,000 and represents approximately 4.3% of the Initial Pool Balance. The related companion loans had an aggregate original principal balance of $278,000,000, have an aggregate outstanding principal balance as of the Cut-off Date of $278,000,000 and are evidenced by (i) the controlling note A-1 and non-controlling note A-2, which have an aggregate outstanding principal balance as of the Cut-off Date of $109,000,000, are currently being held by BANA and are expected to be contributed to one or more future securitization transactions, (ii) the non-controlling notes A-3-2 and A-4, which have an aggregate outstanding principal balance as of the Cut-off Date of $78,000,000, are currently held by CREFI and are expected to be contributed to one or more future securitization transactions and (iii) non-controlling notes A-5-1, A-6 and A-7, which have an aggregate outstanding principal balance as of the Cut-off Date of $91,000,000, are currently held by Barclays and are expected to be contributed to one or more future securitization transactions. The Mall of Louisiana Loan Combination was co-originated by BANA, CREFI and Barclays on July 26, 2017, had an original principal balance of $325,000,000 and has an outstanding principal balance as of the Cut-off Date of $325,000,000. CREFI is expected to contribute note A-3-1 to this securitization transaction, which note has an outstanding principal balance of $30,000,000 as of the Cut-off Date, and Barclays is expected to contribute note A-5-2 to this securitization transaction, which note has an outstanding principal balance of $17,000,000 as of the Cut-off Date. Each note evidencing the Mall of Louisiana Loan Combination accrues interest at an interest rate of 3.98400%per annum. The proceeds of the Mall of Louisiana Loan Combination were primarily used to encumber the Mall of Louisiana Property and pay origination costs. |
The depositor has filed a registration statement (including a prospectus) with the Securities and Exchange Commission (“SEC”) (SEC File No. 333-207132) for the offering to which this communication relates. Before you invest, you should read the prospectus in the registration statement and other documents the depositor has filed with the SEC for more complete information about the depositor, the issuing entity and this offering. You may get these documents for free by visiting EDGAR on the SEC website at www.sec.gov. Alternatively, the depositor or Citigroup Global Markets Inc., Barclays Capital Inc., Drexel Hamilton, LLC or any other underwriter or dealer participating in this offering will arrange to send you the prospectus if you request it by calling toll-free 1-800-831-9146.
| 98 |
| LOAN #6: mall of louisiana |
Note Summary
| Note(s) | Current or Anticipated Holder of Securitized Note | Aggregate Cut-off Date Balance |
Mall of Louisiana Loan | ||
| A-3-1 and A-5-2 | CGCMT 2017-P8 | $47,000,000(1) |
Mall of Louisiana Pari Passu Companion Loans(2) | ||
| A-1 and A-2 | BANA | $109,000,000 |
| A-3-2 and A-4 | CREFI | $78,000,000 |
| A-5-1, A-6 and A-7 | Barclays | $91,000,000 |
| (1) | The $30,000,000 non-controlling note A-3-1 is being contributed by CREFI and the $17,000,000 non-controlling note A-5-2 is being contributed by Barclays. |
| (2) | Expected to be contributed to future securitization transactions. |
The Mall of Louisiana Loan Combination has an initial term of 120 months and has a remaining term of 119 months as of the Cut-off Date. The Mall of Louisiana Loan Combination requires interest only payments for the initial 36 months, followed by payments of principal and interest sufficient to amortize the Mall of Louisiana Loan Combination over a 30-year amortization schedule. The scheduled maturity date of the Mall of Louisiana Loan Combination is the due date in August 2027. Provided that no event of default has occurred and is continuing under the Mall of Louisiana Loan Combination documents, at any time after the earlier of August 1, 2020 and the second anniversary of the securitization of the last portion of the Mall of Louisiana Loan Combination, the Mall of Louisiana Loan Combination may be defeased with certain direct full faith and credit obligations of the United States of America or other obligations which are “government securities” permitted under the Mall of Louisiana Loan Combination documents. Voluntary prepayment of the Mall of Louisiana Loan Combination is permitted (in whole, but not in part) without penalty on or after the due date in May 2027.
| ■ | The Mortgaged Property. The Mall of Louisiana Property is part of a two-story enclosed super-regional mall known as the Mall of Louisiana, which contains a total of 1,593,545 SF and is anchored by non-collateral anchors Dillard’s, Dillard’s Men’s & Home, JC Penney, Macy’s and Sears. The 776,789 SF portion of the Mall of Louisiana that serves as collateral for the Mall of Louisiana Loan Combination was 91.8% occupied as of June 30, 2017 by 135 retail and restaurant tenants. The largest tenants by size are AMC Theatres (9.6% of GLA, 5.9% of underwritten base rent, expiring July 2026), Dick’s Sporting Goods (9.5% of GLA, 3.3% of underwritten base rent, expiring January 2019), Nordstrom Rack (3.9% of GLA, 2.0% of underwritten base rent, expiring September 2025) and Forever 21 (3.5% of GLA, 5.1% of underwritten base rent, expiring January 2019). Main Event (6.0% of GLA, 4.0% of underwritten base rent, expiring June 2028) has a signed lease but is not expected to take occupancy and commence paying rent until August 2018. The Mall of Louisiana Loan Combination guarantor has provided a guaranty for all outstanding borrower obligations and fifteen months of gap rent with respect to the Main Event lease. |
No other tenant represents more than 1.9% of GLA or 2.6% of underwritten rent. Other notable tenants at the Mall of Louisiana Property include: Apple, DSW, Lush Fresh Handmade Cosmetics, Michael Kors, Pandora, Pottery Barn and Williams Sonoma. The Mall of Louisiana Property features an 11-bay food court and nine full service restaurants. Inline sales at the Mall of Louisiana Property as of the trailing 12-month period ending May 31, 2017 were approximately $183 million with an average of $585 per SF ($496 per SF excluding Apple), resulting in an occupancy cost of 13.6% (16.1% excluding Apple).
The Mall of Louisiana Property was built in 1997 and renovated in 2008 with a $100 million expansion project which added over 330,000 SF, comprised of a 125,000 SF lifestyle component, a 140,000 SF power center and 15-screen stadium seating cinema with IMAX – 3D. The Mall of Louisiana features the only Sears within 40 miles and the only Macy’s, Dick’s Sporting Goods and Nordstrom Rack within approximately 60 miles. The Mall of Louisiana Property includes 8,404 surface parking spaces (approximately 5.27 per 1,000 SF).
The depositor has filed a registration statement (including a prospectus) with the Securities and Exchange Commission (“SEC”) (SEC File No. 333-207132) for the offering to which this communication relates. Before you invest, you should read the prospectus in the registration statement and other documents the depositor has filed with the SEC for more complete information about the depositor, the issuing entity and this offering. You may get these documents for free by visiting EDGAR on the SEC website at www.sec.gov. Alternatively, the depositor or Citigroup Global Markets Inc., Barclays Capital Inc., Drexel Hamilton, LLC or any other underwriter or dealer participating in this offering will arrange to send you the prospectus if you request it by calling toll-free 1-800-831-9146.
| 99 |
| LOAN #6: mall of louisiana |
Non-Collateral Anchor Sales Summary
Tenant Name | Credit Rating (Fitch/MIS/S&P)(1) | Tenant GLA(2) | Sales per SF(3) | |||
| Dillard’s / Dillard’s Men’s & Home | BBB-/Baa3/BBB- | 370,655 | $148 | |||
| Macy’s | BBB/Baa3/BBB- | 204,890 | $166 | |||
| JC Penney | B+/B1/B+ | 116,568 | $309 | |||
| Sears | CC/Caa2/CCC+ | 113,517 | $123 |
| (1) | Certain ratings are those of the parent company whether or not the parent guarantees the lease. |
| (2) | Based on the underwritten rent roll dated June 30, 2017. |
| (3) | Sales per SF for the non-collateral anchor tenants are as of 2016 as reported in the appraisal. |
The following table presents certain information relating to the major tenants (of which certain tenants may have co-tenancy provisions) at the Mall of Louisiana Property:
Ten Largest Owned Tenants Based on Underwritten Base Rent(1)
Tenant Name | Credit Rating (Fitch/MIS/S&P)(2) | Tenant GLA | % of Owned GLA | UW Base Rent | % of Total UW Base Rent | UW Base Rent $ per SF(3) | Lease Expiration | Tenant Sales $ per SF/Screen(4) | Occupancy Cost(4) | Renewal / Extension Options | ||||||||||
| AMC Theatres | B/B1/B+ | 74,400 | 9.6% | $1,739,472 | 5.9% | $23.38 | 7/21/2026 | $560,583(5) | 22.6% | 4, 5-year options | ||||||||||
| Forever 21 | NR/NR/NR | 26,885 | 3.5 | 1,483,980 | 5.1 | $55.20 | 1/31/2019 | $183 | 28.6% | NA | ||||||||||
| Main Event(6) | NR/NR/NR | 46,900 | 6.0 | 1,172,500 | 4.0 | $25.00 | 6/30/2028 | NA | NA | 3, 5-year options | ||||||||||
| Dick’s Sporting Goods | NR/NR/NR | 74,061 | 9.5 | 962,793 | 3.3 | $13.00 | 1/31/2019 | $131 | 11.9% | 4, 5-year options | ||||||||||
| Gap/Gapkids | BB+/Baa2/BB+ | 9,761 | 1.3 | 758,019 | 2.6 | $77.66 | 12/31/2017 | $245 | 31.9% | NA | ||||||||||
| Victoria’s Secret | BB+/Ba1/BB+ | 13,472 | 1.7 | 648,138 | 2.2 | $48.11 | 1/31/2023 | $847 | 11.9% | NA | ||||||||||
| Express | NR/NR/NR | 9,769 | 1.3 | 601,673 | 2.1 | $61.59 | 1/31/2020 | $309 | 37.6% | NA | ||||||||||
| Nordstrom Rack(7) | BBB+/Baa1/BBB+ | 30,002 | 3.9 | 577,500 | 2.0 | $19.25 | 9/30/2025 | NA | NA | 4, 5-year options | ||||||||||
| Champs Sports(8) | NR/Ba2/BB+ | 6,293 | 0.8 | 500,734 | 1.7 | $79.57 | 7/31/2026 | $479 | 16.0% | NA | ||||||||||
| House of Hoops By Foot Locker(8) | NR/Ba2/BB+ | 6,459 | 0.8 | 500,443 | 1.7 | $77.48 | 1/31/2021 | $838 | 10.8% | NA | ||||||||||
| Ten Largest Owned Tenants | 298,002 | 38.4% | $8,945,251 | 30.5% | $30.02 | |||||||||||||||
| Other | 415,132 | 53.4 | 20,369,579 | 69.5 | $49.07 | |||||||||||||||
| Vacant | 63,655 | �� | 8.2 | 0 | 0.0 | $0.00 | ||||||||||||||
| Total / Wtd. Avg. All Owned Tenants | 776,789 | 100.0% | $29,314,830 | 100.0% | $41.11 | |||||||||||||||
| (1) | Based on the underwritten rent roll dated June 30, 2017. |
| (2) | Certain ratings are those of the parent company whether or not the parent guarantees the lease. |
| (3) | Total / Wtd. Avg. UW Base Rent $ per SF is calculated excluding vacant SF. |
| (4) | Sales information is for the trailing 12-month period ending May 31, 2017. |
| (5) | Tenant Sales $ per SF/Screen are shown per screen (15 screens). |
| (6) | Main Event has an executed lease but is not expected to take occupancy and commence paying rent until August 2018. The Mall of Louisiana Loan Combination guarantor has provided a guaranty for all outstanding borrower obligations and fifteen months of gap rent specific to Main Event. |
| (7) | Nordstrom Rack is not required to report sales at the Mall of Louisiana Property. |
| (8) | Both tenants are affiliated subsidiaries of Foot Locker, Inc. |
Tenant Sales (per SF) and Occupancy Costs(1)
TTM 5/31/2017 | ||||
Total In-Line | TTM 5/31/2017 | |||
| Comparable Sales per SF w/Apple | $585 | 13.6% | ||
| Comparable Sales per SF w/o Apple | $496 | 16.1% |
| (1) | Information as provided by the borrower sponsor. |
The depositor has filed a registration statement (including a prospectus) with the Securities and Exchange Commission (“SEC”) (SEC File No. 333-207132) for the offering to which this communication relates. Before you invest, you should read the prospectus in the registration statement and other documents the depositor has filed with the SEC for more complete information about the depositor, the issuing entity and this offering. You may get these documents for free by visiting EDGAR on the SEC website at www.sec.gov. Alternatively, the depositor or Citigroup Global Markets Inc., Barclays Capital Inc., Drexel Hamilton, LLC or any other underwriter or dealer participating in this offering will arrange to send you the prospectus if you request it by calling toll-free 1-800-831-9146.
| 100 |
| LOAN #6: mall of louisiana |
The following table presents certain information relating to the lease rollover schedule at the Mall of Louisiana Property, based on initial lease expiration dates:
Lease Expiration Schedule(1)(2)
Year Ending | Expiring | % of Owned GLA | Cumulative % of Owned GLA | UW Base Rent | % of Total UW | UW Base Rent $ | # of Expiring | |||||||
| MTM | 0 | 0.0% | 0.0% | $0 | 0.0% | $ 0.00 | 0 | |||||||
| 2017 | 27,967 | 3.6 | 3.6% | 2,330,756 | 8.0 | $83.34 | 11 | |||||||
| 2018 | 82,248 | 10.6 | 14.2% | 3,354,434 | 11.4 | $40.78 | 23 | |||||||
| 2019 | 165,390 | 21.3 | 35.5% | 4,979,391 | 17.0 | $30.11 | 17 | |||||||
| 2020 | 43,189 | 5.6 | 41.0% | 2,581,653 | 8.8 | $59.78 | 14 | |||||||
| 2021 | 60,190 | 7.7 | 48.8% | 2,840,401 | 9.7 | $47.19 | 16 | |||||||
| 2022 | 32,000 | 4.1 | 52.9% | 1,317,420 | 4.5 | $41.17 | 10 | |||||||
| 2023 | 39,863 | 5.1 | 58.0% | 2,544,415 | 8.7 | $63.83 | 11 | |||||||
| 2024 | 32,366 | 4.2 | 62.2% | 1,357,288 | 4.6 | $41.94 | 7 | |||||||
| 2025 | 58,878 | 7.6 | 69.8% | 1,792,374 | 6.1 | $30.44 | 9 | |||||||
| 2026 | 88,514 | 11.4 | 81.2% | 2,885,732 | 9.8 | $32.60 | 6 | |||||||
| 2027 | 11,360 | 1.5 | 82.6% | 1,081,295 | 3.7 | $95.18 | 6 | |||||||
| 2028 & Thereafter | 71,169 | 9.2 | 91.8% | 2,249,670 | 7.7 | $31.61 | 5 | |||||||
| Vacant | 63,655 | 8.2 | 100.0% | 0 | 0.0 | $0.00 | 0 | |||||||
| Total / Wtd. Avg. | 776,789 | 100.0% | $29,314,830 | 100.0% | $41.11 | 135 |
| (1) | Calculated based on the approximate square footage occupied by each Owned Tenant. |
| (2) | Certain tenants may have lease termination options that are exercisable prior to the originally stated expiration date of the subject lease and that are not considered in the Lease Expiration Schedule. |
| (3) | Wtd. Avg. UW Base Rent $ per SF excludes vacant space. |
The following table presents certain information relating to historical leasing at the Mall of Louisiana Property:
Historical Leased %(1)(2)
2014 | 2015 | 2016 | As of 6/30/2017(3) | |||
| 94.3% | 93.8% | 92.5% | 91.8% |
| (1) | As provided by the borrowers and which represents occupancy as of December 31 for the indicated year unless otherwise specified. |
| (2) | Excludes temporary tenants. |
| (3) | Based on the underwritten rent roll dated June 30, 2017. |
| ■ | Operating History and Underwritten Net Cash Flow. The following table presents certain information relating to the historical operating performance and the Underwritten Net Cash Flow at the Mall of Louisiana Property: |
Cash Flow Analysis(1)
2014 | 2015 | 2016 | TTM 4/30/2017 | Underwritten | Underwritten $ per SF | |||||||||||||
| Base Rent | $26,449,228 | $27,324,563 | $27,877,011 | $28,049,808 | $29,420,920 | $37.88 | ||||||||||||
| Potential Income from Vacant Space | 0 | 0 | 0 | 0 | 3,395,375 | 4.37 | ||||||||||||
| Percentage Rent | 559,072 | 516,649 | 571,657 | 591,865 | 581,929 | 0.75 | ||||||||||||
| Total Reimbursement Revenue | 10,554,704 | 10,707,373 | 10,410,615 | 10,242,969 | 10,408,010 | 13.40 | ||||||||||||
| Specialty Leasing Income | 3,089,790 | 3,046,453 | 3,044,110 | 2,921,431 | 2,956,431 | 3.81 | ||||||||||||
| Other Income(2) | 402,762 | 384,936 | 331,822 | 399,049 | 384,049 | 0.49 | ||||||||||||
| Vacancy and Credit Loss | (0) | (0) | (0) | (0) | (3,931,479) | (5.06) | ||||||||||||
| Effective Gross Income | $41,055,555 | $41,979,974 | $42,235,214 | $42,205,123 | $43,215,234 | $55.63 | ||||||||||||
| Total Operating Expenses | $7,514,389 | $7,399,438 | $7,196,737 | $7,209,498 | $7,152,311 | $9.21 | ||||||||||||
| Net Operating Income | $33,541,166 | $34,580,536 | $35,038,477 | $34,995,624 | $36,062,923 | $46.43 | ||||||||||||
| TI/LC | 0 | 0 | 0 | 0 | 1,473,928 | 1.90 | ||||||||||||
| Capital Expenditures | 0 | 0 | 0 | 0 | 155,358 | 0.20 | ||||||||||||
| Net Cash Flow | $33,541,166 | $34,580,536 | $35,038,477 | $34,995,624 | $34,433,637 | $44.33 | ||||||||||||
| Occupancy | 94.3% | (3) | 93.8% | (3) | 92.5% | (3) | 91.8% | (3)(4) | 91.0% | (5) | ||||||||
| NOI Debt Yield(6) | 10.3% | 10.6% | 10.8% | 10.8% | 11.1% | |||||||||||||
| NCF DSCR(6) | 1.80x | 1.86x | 1.89x | 1.88x | 1.85x | |||||||||||||
| (1) | Certain items such as straight line rent, interest expense, interest income, lease cancellation income, depreciation, amortization, debt service payments and any other non-recurring or non-operating items were excluded from the historical presentation and are not considered for the underwritten cash flow. |
| (2) | Other Income includes carousel revenue, rebates and miscellaneous non-rental income. |
| (3) | Occupancy excludes temporary tenants at the Mall of Louisiana Property. |
| (4) | Based on the June 30, 2017 rent roll. |
| (5) | Underwritten Occupancy represents the underwritten economic occupancy at the Mall of Louisiana Property. |
| (6) | NOI Debt Yield and NCF DSCR are based on the outstanding principal balance of the Mall of Louisiana Loan Combination. |
The depositor has filed a registration statement (including a prospectus) with the Securities and Exchange Commission (“SEC”) (SEC File No. 333-207132) for the offering to which this communication relates. Before you invest, you should read the prospectus in the registration statement and other documents the depositor has filed with the SEC for more complete information about the depositor, the issuing entity and this offering. You may get these documents for free by visiting EDGAR on the SEC website at www.sec.gov. Alternatively, the depositor or Citigroup Global Markets Inc., Barclays Capital Inc., Drexel Hamilton, LLC or any other underwriter or dealer participating in this offering will arrange to send you the prospectus if you request it by calling toll-free 1-800-831-9146.
| 101 |
| LOAN #6: mall of louisiana |
| ■ | Appraisal. According to the appraisal, the Mall of Louisiana Property had an “as-is” appraised value of $570,000,000 as of June 23, 2017. |
Appraisal Approach | Value | Discount | Capitalization Rate | |||
| Direct Capitalization Approach | $567,500,000 | N/A | 6.00% | |||
| Discounted Cash Flow Approach | $571,000,000 | 7.50% | 6.50%(1) |
| (1) | Represents the terminal capitalization rate. |
| ■ | Environmental Matters. According to the Phase I environmental report dated July 24, 2017, there was no evidence of any recognized environmental conditions or recommendations for further action at the Mall of Louisiana Property. |
| ■ | Market Overview and Competition. The Mall of Louisiana Property is located in East Baton Rouge Parish within the greater Baton Rouge metropolitan statistical area (“MSA”) of Louisiana. The Mall of Louisiana Property is located approximately 6.0 miles southeast of the Baton Rouge central business district, immediately south of Interstate 10, which connects to Interstate 12 approximately 2 miles north and connects to the New Orleans metropolitan area to the southeast. East Baton Rouge Parish includes the city of Baton Rouge and other established neighborhoods including Mid-City, the Garden District and Spanish Town and is the capital of Louisiana and the location of Louisiana State University, Southern University and Baton Rouge Community College. There are two hospitals located within two miles of the Mall of Louisiana Property: Baton Rouge General Medical Center and Our Lady of the Lake Regional Medical Center. East Baton Rouge Parish’s top employers include Turner Industries Group (9,875 employees), LSU System (6,250 employees), Performance Contractors (5,500 employees), Our Lady of the Lake Regional Medical Center (4,500 employees) and ExxonMobil Corporation (4,214 employees). IBM recently developed a $55 million office and residential building in downtown Baton Rouge and has committed to maintain 800 new jobs through 2023 in downtown Baton Rouge. The Baton Rouge MSA had a 2016 unemployment rate of 5.2%, which unemployment rate has seen a year over year decline since 2011. |
According to the appraisal, the primary trade area for the Mall of Louisiana Property encompasses an approximately fifteen-mile radius. The estimated 2016 population within a five-, ten- and fifteen-mile radius around the Mall of Louisiana Property was 169,831, 406,664 and 603,052, respectively. The estimated 2016 average household income within the same radii was $90,572, $76,294 and $74,587, respectively. The 2016 fifteen-mile radius population and average household income reflect a compound annual growth rate from 2000 to 2016 of 1.0% and 2.41%, respectively. The estimated 2016 average retail sales per household within a fifteen-mile radius of the Mall of Louisiana Property were $48,449.
The Mall of Louisiana Property is located in the Baton Rouge retail market which had 2017 first quarter-end average asking rents of $11.32 per SF and a vacancy rate of 4.5% (representing a 1.3% decrease from the first quarter end 2016), with only 11,581 SF of vacant retail space in the market. With respect to the malls within the Baton Rouge retail market, there are currently six lifestyle centers, power centers and regional malls with 2017 first quarter-end average asking rents of $19.61 per SF and a vacancy rate of 8.6% (representing a 1.7% decrease from the first quarter end 2016), with 74,739 SF of positive absorption.
The depositor has filed a registration statement (including a prospectus) with the Securities and Exchange Commission (“SEC”) (SEC File No. 333-207132) for the offering to which this communication relates. Before you invest, you should read the prospectus in the registration statement and other documents the depositor has filed with the SEC for more complete information about the depositor, the issuing entity and this offering. You may get these documents for free by visiting EDGAR on the SEC website at www.sec.gov. Alternatively, the depositor or Citigroup Global Markets Inc., Barclays Capital Inc., Drexel Hamilton, LLC or any other underwriter or dealer participating in this offering will arrange to send you the prospectus if you request it by calling toll-free 1-800-831-9146.
| 102 |
| LOAN #6: mall of louisiana |
The following table presents certain information relating to the primary competition for the Mall of Louisiana Property:
Competitive Set(1)
Mall of Louisiana (Subject) | Perkins Rowe | Town Center at Cedar Lodge | Siegen Lane Marketplace | Cortana Mall | ||||||
| Distance from Subject | - | 1.5 miles | 5.0 miles | 3.0 miles | 6.5 miles | |||||
| Property Type | Super Regional Mall | Lifestyle Center | Lifestyle Center | Power Center | Super Regional Mall | |||||
| Year Built / Renovated | 1997 / 2008 | 2006 / NAP | 2007 / NAP | 1994 / 2002 | 1976 / 2010 | |||||
| Total GLA | 776,789 | 749,300 | 410,000 | 462,150 | 1,360,000 | |||||
| Total Occupancy | 91.8%(2) | 85.0% | 98.0% | 100.0% | 30.0%(3) | |||||
| Estimated Sales per SF(4) | $585(5) | $420 | $400 | NAP | $250 | |||||
| Anchors | Dillard’s (non-collateral), Dillard’s Men’s (non-collateral), JC Penney (non-collateral), Macy’s (non-collateral), Sears (non-collateral), AMC Theatres | Cinemark, LA Fitness, Barnes & Noble, Fresh Market | Whole Foods, Books A Million, LOFT, Gap | Walmart, Lowes, Bed Bath Beyond, TJ Maxx | Dillard’s, JC Penney |
| (1) | Source: Appraisal unless otherwise indicated. |
| (2) | Per underwritten rent roll. Occupancy includes the third largest tenant, Main Event, which has a signed lease but is not expected to take physical occupancy and commence paying rent until August 2018. The Mall of Louisiana Loan Combination guarantor has provided a guaranty for all outstanding borrower obligations and fifteen months of gap rent specific to Main Event. |
| (3) | Cortana Mall is the only other enclosed shopping mall in Baton Rouge. Only two of the six anchor units at Cortana Mall are currently occupied and approximately 45 of 110 inline stores are occupied. |
| (4) | Not all Inline tenants may be required to report sales. |
| (5) | Comparable inline sales shown as of May 2017. Comparable inline sales excluding Apple for that period were $496 per SF. |
| ■ | The Borrowers. The borrowers are Mall of Louisiana, LLC and Mall of Louisiana Land, LLC (individually and collectively, the “Mall of Louisiana Borrower”), each a single-purpose Delaware limited liability company, with at least two independent directors. Legal counsel to the Mall of Louisiana Borrower delivered a non-consolidation opinion in connection with the origination of the Mall of Louisiana Loan Combination. The borrower sponsor and non-recourse carveout guarantor is GGP Real Estate Holding I, Inc., wholly owned by GGP Inc. (“General Growth”). |
General Growth is an S&P 500 company focused exclusively on owning, managing, leasing and redeveloping retail properties throughout the United States. General Growth’s portfolio as of June 2017 included 127 properties (121 million SF) in 40 states with an enterprise value of approximately $39 billion.
In addition to the recourse carveout guaranty and environmental indemnity, GGP Real Estate Holding I, Inc. has provided a guaranty for payment of unfunded tenant allowances equal to $3,986,500, landlord work equal to $3,067,797 and an additional $1,465,625, which is equal to fifteen months of gap rent, all related to the Main Event lease. GGP Real Estate Holding I, Inc. also provided a guaranty for unfunded obligations related to several other tenants at the Mall of Louisiana Property equal to $1,726,914.
| ■ | Escrows. During a Mall of Louisiana Trigger Period (as defined below), unless there are sufficient funds in the lockbox account to make the deposits, the Mall of Louisiana Borrower is required to deposit monthly (i) 1/12th of the estimated annual real estate taxes and 1/12th of the estimated annual insurance premiums (unless the Mall of Louisiana Property is covered by a blanket insurance policy and the premiums for the blanket insurance policy are prepaid for at least one year in advance), (ii) $12,931 to a replacement reserve subject to a cap of $155,169, and (iii) $129,308 to a tenant improvements and leasing commissions reserve subject to a cap of $1,551,690. |
| ■ | Lockbox and Cash Management. The Mall of Louisiana Loan documents require a hard lockbox with springing cash management. Funds deposited to the lockbox will be swept daily to the Mall of Louisiana Borrower’s operating account unless a Mall of Louisiana Trigger Period exists. During a Mall of Louisiana Trigger Period, funds in the lockbox are required to be transferred daily to a cash management account under the sole control of the lender for the payment of, among other things, debt service, monthly escrows and operating expenses with all excess cash being deposited to an excess cash reserve to be held as additional collateral for the Mall of Louisiana Loan Combination. |
A “Mall of Louisiana Trigger Period” will commence upon the earlier of (i) an event of default and (ii) the debt service coverage ratio being less than 1.15x. A Mall of Louisiana Trigger Period will cease upon (i) the cure or waiver of the event of default and (ii) the debt service coverage ratio being equal to or greater than 1.15x.
| ■ | Property Management. The Mall of Louisiana Property is currently self-managed and may be managed by (i) General Growth Management, Inc., (ii) General Growth Services, Inc., (iii) General Growth, (iv) any other affiliate of the Mall of Louisiana Loan Combination guarantor entirely owned (directly or indirectly) by the Mall of Louisiana Loan Combination guarantor, or (v) any Mall of Louisiana Qualifying Manager (as defined below) according to the Mall of Louisiana Loan documents. So long as no event of default is continuing under the Mall of Louisiana Loan documents, |
The depositor has filed a registration statement (including a prospectus) with the Securities and Exchange Commission (“SEC”) (SEC File No. 333-207132) for the offering to which this communication relates. Before you invest, you should read the prospectus in the registration statement and other documents the depositor has filed with the SEC for more complete information about the depositor, the issuing entity and this offering. You may get these documents for free by visiting EDGAR on the SEC website at www.sec.gov. Alternatively, the depositor or Citigroup Global Markets Inc., Barclays Capital Inc., Drexel Hamilton, LLC or any other underwriter or dealer participating in this offering will arrange to send you the prospectus if you request it by calling toll-free 1-800-831-9146.
| 103 |
| LOAN #6: mall of louisiana |
the Mall of Louisiana Borrower may, without the lender’s prior written consent, enter into a management agreement with a Mall of Louisiana Qualifying Manager, provided that: (i) such management agreement is on an arms’ length basis and under which the fees payable thereunder must not exceed 3% of income from gross operations, subject to commercially reasonable adjustments pursuant to then applicable market standards as reasonably approved by the lender, (ii) if such Mall of Louisiana Qualifying Manager is an affiliated property manager, the Mall of Louisiana Borrower delivers a non-consolidation opinion with respect to such manager, and (iii) such Mall of Louisiana Qualifying Manager and the Mall of Louisiana Borrower execute a subordination of management agreement. With respect to a new manager other than a Mall of Louisiana Qualifying Manager, the consent of the lender to the identity of the manager may be conditioned upon the Mall of Louisiana Borrower delivering a rating agency confirmation as to such new manager and management agreement. Upon and during the continuance of an event of default under the Mall of Louisiana Loan documents, the lender has the right to require the Mall of Louisiana Borrower to replace the property manager with a Mall of Louisiana Qualifying Manager, chosen by the Mall of Louisiana Borrower and approved by the lender.
A “Mall of Louisiana Qualifying Manager” means (i) the property manager or (ii) a reputable and experienced management organization possessing experience in managing properties similar in size, scope and value to the Mall of Louisiana Property, provided that with respect to clause (ii) above, the Mall of Louisiana Borrower has obtained the prior written consent of the lender for such entity (such consent not to be unreasonably withheld or delayed, but may be based on receipt of a rating agency confirmation).
| ■ | Mezzanine or Secured Subordinate Indebtedness.Not permitted. |
| ■ | Release, Substitution or Expansion of Collateral.The Mall of Louisiana Borrower may acquire one or more Expansion Parcels (whereupon any such Expansion Parcel will become an “Acquired Expansion Parcel”), provided, among other conditions, that the following are satisfied: (i) no event of default has occurred and is continuing under the Mall of Louisiana Loan documents; (ii) the related borrower acquires fee simple or leasehold interest in the Expansion Parcel and spreads the Mall of Louisiana Loan documents to include the Expansion Parcel as collateral; (iii) certain diligence is performed, including receipt of a title policy or endorsement, confirmation that the Expansion Parcel is its own tax lot and, except under the circumstances provided for in the Mall of Louisiana Loan documents, receipt of a Phase I environmental report or property condition report with respect to the Expansion Parcel; and (iv) at the request of the lender, the related borrower delivers a REMIC opinion. Acquired Expansion Parcels may be released as described below. |
An “Expansion Parcel” is any parcel of land, together with any improvements thereon located, (a) constituting an integral part of, or adjoining to, or proximately located near, the shopping center of which the Mall of Louisiana Property is a part, (b) is not owned by the related borrower at origination of the Mall of Louisiana Loan Combination and (c) is not a parcel acquired in connection with a substitution described in the next paragraph.
The Mall of Louisiana Borrower may obtain the release of (i) any vacant, unimproved, non-income producing parcel (including “air rights” parcels) or outlot, (ii) any Acquired Expansion Parcel or (iii) the portion of the Mall of Louisiana Property subject to the extension and/or widening of Picardy Street by the City of Baton Rouge (the “Picardy Street Extension Parcel”), in each case, in connection with a transfer to a person other than a person owned or controlled by the Mall of Louisiana Borrower, provided, among other conditions, that the following are satisfied: (1) no event of default has occurred and is continuing under the Mall of Louisiana Loan documents; (2) as it relates to any parcel release other than an Acquired Expansion Parcel release, the lender receives (a) evidence that the parcel is not necessary for the operation or use of the Mall of Louisiana Property and that such parcel may be readily separated from the Mall of Louisiana Property without material diminution of the value of the Mall of Louisiana Property and (b) a rating agency confirmation; (3) as it relates to the release of an Acquired Expansion Parcel, the lender receives from the Mall of Louisiana Borrower an officer’s certificate to the effect that (a) during the time that the Acquired Expansion Parcel was a part of the Mall of Louisiana Property, any tenants that were relocated to the Acquired Expansion Parcel from other areas of the Mall of Louisiana Property have been replaced with tenants of comparable credit quality and paying equal or better rent than the relocated tenants, and (b) to the extent existing tenants proposed to be relocated to the Acquired Expansion Parcel after its release, the Mall of Louisiana Borrower has entered into fully executed replacement leases with replacement tenants of comparable credit quality and on rental terms equal or better than the existing tenant, and (c) the release of the Acquired Expansion Parcel does not have a material adverse effect on the use or value of the Mall of Louisiana Property, the enforcement of the Mall of Louisiana Loan documents, or the Mall of Louisiana Borrower’s ability to repay the Mall of Louisiana Loan Combination; (4) the loan-to-value ratio for the remaining Mall of Louisiana Property is less than or equal to 125%, provided that the Mall of Louisiana Borrower may
The depositor has filed a registration statement (including a prospectus) with the Securities and Exchange Commission (“SEC”) (SEC File No. 333-207132) for the offering to which this communication relates. Before you invest, you should read the prospectus in the registration statement and other documents the depositor has filed with the SEC for more complete information about the depositor, the issuing entity and this offering. You may get these documents for free by visiting EDGAR on the SEC website at www.sec.gov. Alternatively, the depositor or Citigroup Global Markets Inc., Barclays Capital Inc., Drexel Hamilton, LLC or any other underwriter or dealer participating in this offering will arrange to send you the prospectus if you request it by calling toll-free 1-800-831-9146.
| 104 |
| LOAN #6: mall of louisiana |
prepay the Mall of Louisiana Loan Combination and pay the associated yield maintenance premium in order to meet the required loan-to-value ratio; and (5) at the request of the lender, a REMIC opinion is delivered.
In addition, with respect to the Mall of Louisiana Property, the Mall of Louisiana Borrower may obtain the release of a vacant, unimproved, non-income producing parcel in connection with a transfer to a person other than the Mall of Louisiana Borrower, provided, among other conditions, that the following are satisfied: (i) no event of default has occurred and is continuing under the Mall of Louisiana Loan documents; (ii) simultaneous with the release, the Mall of Louisiana Borrower acquires, and encumbers as collateral for the Mall of Louisiana Loan Combination, a substitute parcel at or adjacent to the Mall of Louisiana Property of reasonably equivalent value to the release parcel; (iii) a rating agency confirmation is obtained; (iv) certain diligence is performed, including receipt of a title policy or endorsement, confirmation that the release parcel and the substitute parcel are each its own tax lot and, except under the circumstances provided for in the Mall of Louisiana Loan documents, receipt of a Phase I environmental report or property condition report with respect to the substitute parcel; and (v) the loan-to-value ratio immediately after the substitution is less than or equal to 125%, provided that the Mall of Louisiana Borrower may prepay the Mall of Louisiana Loan Combination and pay the associated yield maintenance premium in order to meet the required loan-to-value ratio.
| ■ | Terrorism Insurance. The Mall of Louisiana Loan Combination documents require that the “all risk” insurance policy required to be maintained by the Mall of Louisiana Borrower provide coverage for terrorism in an amount equal to the full replacement cost of the Mall of Louisiana Property, as well as business interruption insurance covering no less than the 18-month period following the occurrence of a casualty event, together with a 12-month extended period of indemnity; provided that so long as TRIPRA is in effect, and covers both domestic and foreign acts of terrorism, the lender is required to accept terrorism insurance with coverage against acts which are “certified” within the meaning of TRIPRA in satisfaction of the foregoing requirements. If TRIPRA or a similar or subsequent statute is not in effect, provided that terrorism insurance coverage is commercially available, the Mall of Louisiana Borrower is required to carry terrorism insurance coverage as described above, or so much as may be purchased for no more than two times the insurance premium then payable for the Mall of Louisiana Property and business interruption coverage required under the Mall of Louisiana Loan Combination (without giving effect to the cost of terrorism components of such coverage). See“Risk Factors—Terrorism Insurance May Not Be Available for All Mortgaged Properties” in the Preliminary Prospectus. |
The depositor has filed a registration statement (including a prospectus) with the Securities and Exchange Commission (“SEC”) (SEC File No. 333-207132) for the offering to which this communication relates. Before you invest, you should read the prospectus in the registration statement and other documents the depositor has filed with the SEC for more complete information about the depositor, the issuing entity and this offering. You may get these documents for free by visiting EDGAR on the SEC website at www.sec.gov. Alternatively, the depositor or Citigroup Global Markets Inc., Barclays Capital Inc., Drexel Hamilton, LLC or any other underwriter or dealer participating in this offering will arrange to send you the prospectus if you request it by calling toll-free 1-800-831-9146.
| 105 |
LOAN #7: THE GROVE AT SHREWSBURY
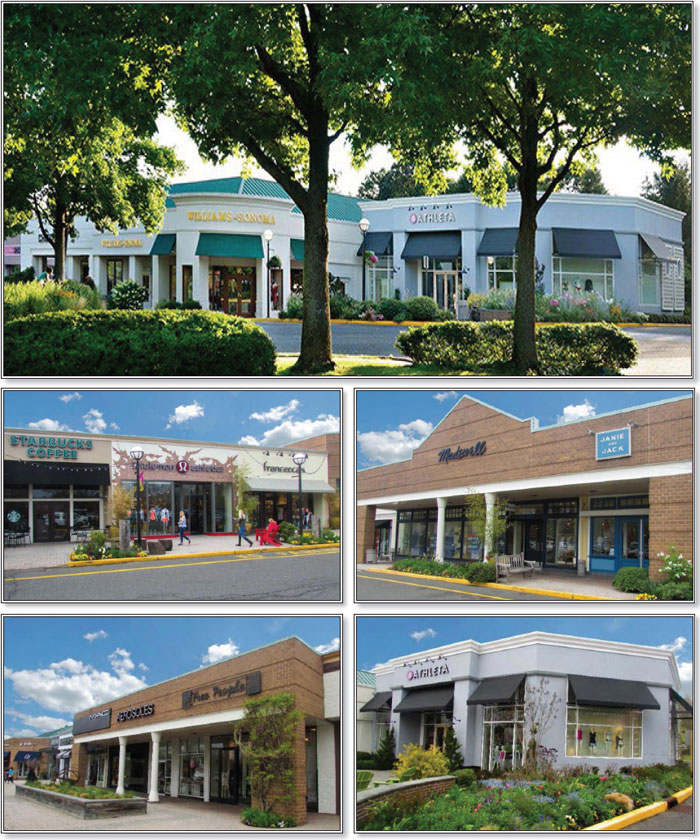
The depositor has filed a registration statement (including a prospectus) with the Securities and Exchange Commission (“SEC”) (SEC File No. 333-207132) for the offering to which this communication relates. Before you invest, you should read the prospectus in the registration statement and other documents the depositor has filed with the SEC for more complete information about the depositor, the issuing entity and this offering. You may get these documents for free by visiting EDGAR on the SEC website at www.sec.gov. Alternatively, the depositor or Citigroup Global Markets Inc., Barclays Capital Inc., Drexel Hamilton, LLC or any other underwriter or dealer participating in this offering will arrange to send you the prospectus if you request it by calling toll-free 1-800-831-9146.
| 106 |
LOAN #7: THE GROVE AT SHREWSBURY
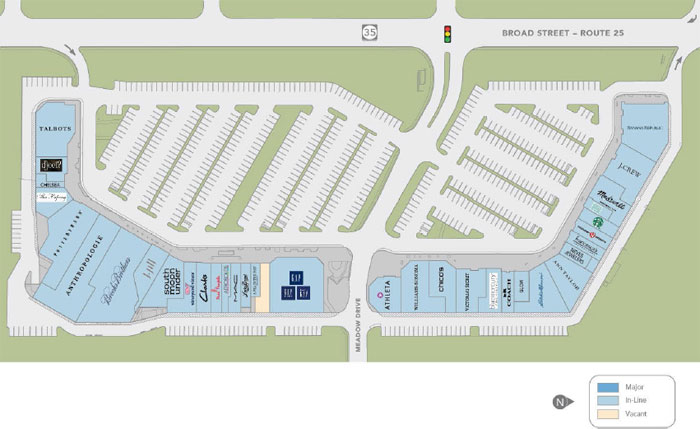
The depositor has filed a registration statement (including a prospectus) with the Securities and Exchange Commission (“SEC”) (SEC File No. 333-207132) for the offering to which this communication relates. Before you invest, you should read the prospectus in the registration statement and other documents the depositor has filed with the SEC for more complete information about the depositor, the issuing entity and this offering. You may get these documents for free by visiting EDGAR on the SEC website at www.sec.gov. Alternatively, the depositor or Citigroup Global Markets Inc., Barclays Capital Inc., Drexel Hamilton, LLC or any other underwriter or dealer participating in this offering will arrange to send you the prospectus if you request it by calling toll-free 1-800-831-9146.
| 107 |
LOAN #7: THE GROVE AT SHREWSBURY
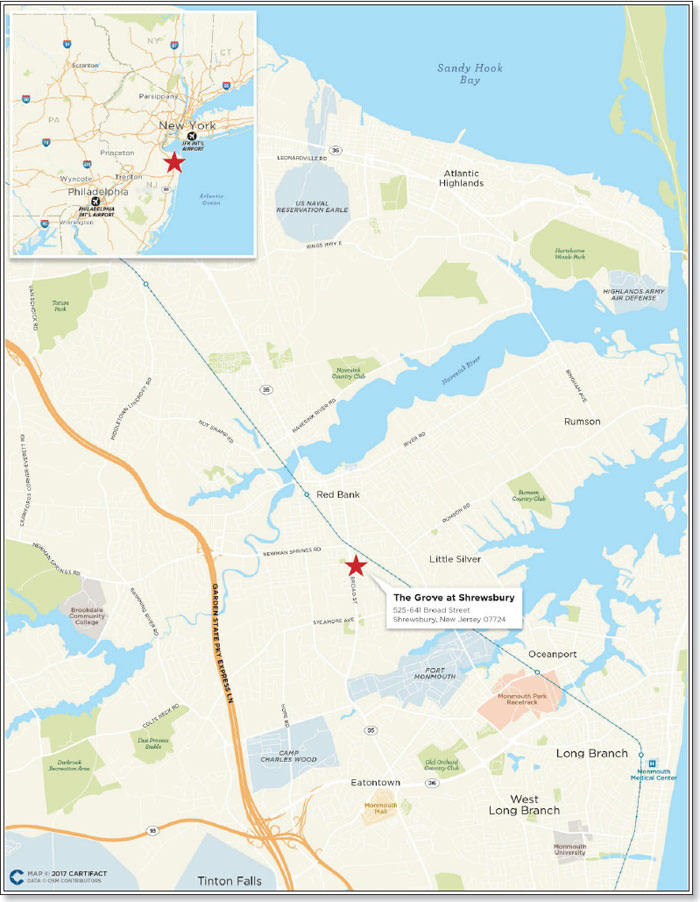
The depositor has filed a registration statement (including a prospectus) with the Securities and Exchange Commission (“SEC”) (SEC File No. 333-207132) for the offering to which this communication relates. Before you invest, you should read the prospectus in the registration statement and other documents the depositor has filed with the SEC for more complete information about the depositor, the issuing entity and this offering. You may get these documents for free by visiting EDGAR on the SEC website at www.sec.gov. Alternatively, the depositor or Citigroup Global Markets Inc., Barclays Capital Inc., Drexel Hamilton, LLC or any other underwriter or dealer participating in this offering will arrange to send you the prospectus if you request it by calling toll-free 1-800-831-9146.
| 108 |
LOAN #7: THE GROVE AT SHREWSBURY
| Mortgaged Property Information | Mortgage Loan Information | |||||||||||||||
| Number of Mortgaged Properties | 1 | Loan Seller | PCC | |||||||||||||
| Location (City/State) | Shrewsbury, New Jersey | Cut-off Date Balance | $43,600,000 | |||||||||||||
| Property Type | Retail | Cut-off Date Balance per SF | $294.84 | |||||||||||||
| Size (SF) | 147,878 | Percentage of Initial Pool Balance | 4.0% | |||||||||||||
| Total Occupancy as of 8/31/2017 | 98.6% | Number of Related Mortgage Loans | None | |||||||||||||
| Owned Occupancy as of 8/31/2017 | 98.6% | Type of Security | Fee Simple | |||||||||||||
| Year Built / Latest Renovation | 1988 / NAP | Mortgage Rate | 3.77000% | |||||||||||||
| Appraised Value | $120,800,000 | Original Term to Maturity (Months) | 120 | |||||||||||||
| Appraisal Date | 7/12/2017 | Original Amortization Term (Months) | NAP | |||||||||||||
| Borrower Sponsor(1) | None | Original Interest Only Term (Months) | 120 | |||||||||||||
| Property Management | Cole GP, Inc. | First Payment Date | 10/1/2017 | |||||||||||||
| Maturity Date | 9/1/2027 | |||||||||||||||
| Underwritten Revenues | $9,438,352 | |||||||||||||||
| Underwritten Expenses | $2,806,828 | |||||||||||||||
| Underwritten Net Operating Income (NOI) | $6,631,524 | Escrows(2) | ||||||||||||||
| Underwritten Net Cash Flow (NCF) | $6,436,325 | Upfront | Monthly | |||||||||||||
| Cut-off Date LTV Ratio | 36.1% | Taxes | $0 | $0 | ||||||||||||
| Maturity Date LTV Ratio | 36.1% | Insurance | $0 | $0 | ||||||||||||
| DSCR Based on Underwritten NOI / NCF | 3.98x /3.86x | Replacement Reserve | $0 | $0 | ||||||||||||
| Debt Yield Based on Underwritten NOI / NCF | 15.2%/14.8% | TI/LC | $0 | $0 | ||||||||||||
| Sources and Uses | ||||||||||||||||
| Sources | $ | % | Uses | $ | % | |||||||||||
| Mortgage Loan Amount | $43,600,000 | 100.0% | Loan Payoff | $42,026,129 | 96.4% | |||||||||||
| Principal Equity Distribution | 882,908 | 2.0 | ||||||||||||||
| Closing Costs | 690,963 | 1.6 | ||||||||||||||
| Total Sources | $43,600,000 | 100.0% | Total Uses | $43,600,000 | 100.0% | |||||||||||
| (1) | There is no non-recourse carveout guarantor and no environmental indemnitor other than the borrower. |
| (2) | See “—Escrows” below. |
| ■ | The Mortgage Loan. The mortgage loan (“The Grove at Shrewsbury Loan”) is evidenced by a note in the original principal amount of $43,600,000 and is secured by a first mortgage encumbering the borrower’s fee simple interest in a 147,878 SF lifestyle retail shopping center located in Shrewsbury, New Jersey (“The Grove at Shrewsbury Property”). The Grove at Shrewsbury Loan was originated by Principal Commercial Capital on August 31, 2017 and represents approximately 4.0% of the Initial Pool Balance. The Grove at Shrewsbury Loan has an outstanding principal balance as of the Cut-off Date of $43,600,000 and accrues interest at an interest rate of 3.77000%per annum. The proceeds of The Grove at Shrewsbury Loan were primarily used to refinance existing debt secured by The Grove at Shrewsbury Property and pay origination costs. |
The Grove at Shrewsbury Loan had an initial term of 120 months and has a remaining term as of the Cut-off Date of 120 months. The Grove at Shrewsbury Loan requires monthly payments of interest only during its term. The scheduled maturity date of The Grove at Shrewsbury Loan is September 1, 2027. Provided no event of default under The Grove at Shrewsbury Loan documents has occurred and is continuing, at any time after the earlier of October 1, 2020, and the second anniversary of the securitization Closing Date, The Grove at Shrewsbury Loan may be defeased in whole with certain direct full faith and credit obligations of the United States of America or other obligations which are “government securities” permitted under The Grove at Shrewsbury Loan documents. In addition, The Grove at Shrewsbury Loan is prepayable without penalty on or after the due date occurring in June 2027.
The Grove at Shrewsbury Loan received a credit assessment of Baa2 by Moody’s, A+ by S&P and BBB by DBRS.
| ■ | The Mortgaged Property. The Grove at Shrewsbury Property consists of a lifestyle retail shopping center constructed in 1988 and is situated on a 20.79-acre site. The Grove at Shrewsbury Property includes two buildings, with a total of 147,878 SF. The Grove at Shrewsbury Property contains 663 parking spaces, resulting in a ratio of approximately 4.48 spaces per 1,000 SF. The Grove at Shrewsbury Property is located in Shrewsbury, Monmouth County, New Jersey, approximately one mile south of Red Bank, New Jersey, 39 miles south of Newark, New Jersey, 51 miles south of Manhattan, New York and 80 miles east of Philadelphia, Pennsylvania. |
As of August 31, 2017, The Grove at Shrewsbury Property was 98.6% occupied by 34 tenants, none of which occupy more than 8.8% of the net rentable area. The largest tenants are Brooks Brothers, occupying 13,000 SF, Anthropologie, occupying 12,000 SF, Pottery Barn, occupying 11,235 SF, The Gap, Inc., occupying 10,859 SF, and Banana Republic, occupying 8,000 SF. Other noteworthy tenants include Bluemercury, Lululemon Athletica, Madewell, Victoria’s Secret, Athleta, Williams-Sonoma, Coach and J.Jill. Overall occupancy at The Grove at
The depositor has filed a registration statement (including a prospectus) with the Securities and Exchange Commission (“SEC”) (SEC File No. 333-207132) for the offering to which this communication relates. Before you invest, you should read the prospectus in the registration statement and other documents the depositor has filed with the SEC for more complete information about the depositor, the issuing entity and this offering. You may get these documents for free by visiting EDGAR on the SEC website at www.sec.gov. Alternatively, the depositor or Citigroup Global Markets Inc., Barclays Capital Inc., Drexel Hamilton, LLC or any other underwriter or dealer participating in this offering will arrange to send you the prospectus if you request it by calling toll-free 1-800-831-9146.
| 109 |
LOAN #7: THE GROVE AT SHREWSBURY
Shrewsbury Property has averaged 98% since 2000, ranging from 100% to a low of 86% in 2008 during the recession. Gross sales for all tenants that had reported as of December 31, 2016 were approximately $69 million ($469/SF) with an average occupancy cost of 15%.
The following table presents certain information relating to the major tenants at The Grove at Shrewsbury Property:
Ten Largest Owned Tenants Based on Underwritten Base Rent(1)
| Tenant Name | Credit Rating (Fitch/MIS/S&P)(2) | Tenant GLA | % of Owned GLA | UW Base Rent(3) | % of Total UW Base Rent | UW Base Rent $ per SF(3) | Lease Expiration | Tenant | Occupancy Cost(4) | Renewal / Extension Options | |||||||||||||||||
| The Gap, Inc.(5) | BB+ / Baa2 / BB+ | 10,859 | 7.3 | % | $537,521 | 7.4 | % | $49.50 | 12/31/2021 | $279 | 23.0 | % | 1, 4-year option | ||||||||||||||
| Brooks Brothers(6) | NR / NR / NR | 13,000 | 8.8 | 520,650 | 7.2 | $40.05 | 3/31/2018 | $259 | 21.7 | % | 1, 5-year option | ||||||||||||||||
| Anthropologie(7) | NR / NR / NR | 12,000 | 8.1 | 484,200 | 6.7 | $40.35 | 1/31/2023 | $402 | 12.1 | % | 1, 5-year option | ||||||||||||||||
| J. Crew | NR / NR / NR | 6,900 | 4.7 | 401,511 | 5.5 | $58.19 | 1/31/2023 | $676 | 9.4 | % | NA | ||||||||||||||||
| Banana Republic(5) | BB+ / Baa2 / BB+ | 8,000 | 5.4 | 396,000 | 5.4 | $49.50 | 1/31/2022 | $340 | 19.3 | % | NA | ||||||||||||||||
| Pottery Barn(8) | NR / NR / NR | 11,235 | 7.6 | 384,686 | 5.3 | $34.24 | 1/31/2025 | $503 | 10.0 | % | 2, 6-year options | ||||||||||||||||
| Talbots | NR / NR / NR | 7,230 | 4.9 | 368,730 | 5.1 | $51.00 | 1/31/2018 | $326 | 21.1 | % | NA | ||||||||||||||||
| Williams-Sonoma(9) | NR / NR / NR | 6,784 | 4.6 | 299,886 | 4.1 | $44.20 | 1/31/2023 | $398 | 15.2 | % | 1, 6-year option | ||||||||||||||||
| South Moon Under(10) | NR / NR / NR | 4,776 | 3.2 | 273,617 | 3.8 | $57.29 | 3/31/2025 | $345 | 22.7 | % | 1, 5-year option | ||||||||||||||||
| Ann Taylor(11) | NR / NR / NR | 5,009 | 3.4 | 255,459 | 3.5 | $51.00 | 11/30/2018 | $189 | 36.4 | % | 1, 5-year option | ||||||||||||||||
| Ten Largest Owned Tenants | 85,793 | 58.0 | % | $3,922,260 | 53.9 | % | $45.72 | ||||||||||||||||||||
| Remaining Owned Tenants(12) | 60,002 | 40.6 | 3,356,742 | 46.1 | $55.94 | ||||||||||||||||||||||
| Vacant Spaces (Owned Space)(13) | 2,083 | 1.4 | 0 | 0.0 | $0.00 | ||||||||||||||||||||||
| Total / Wtd. Avg. All Owned Tenants | 147,878 | 100.0 | % | $7,279,002 | 100.0 | % | $49.93 | ||||||||||||||||||||
| (1) | Based on the underwritten rent roll dated August 31, 2017. |
| (2) | Certain ratings are those of the parent company whether or not the parent guarantees the lease. |
| (3) | UW Base Rent and UW Base Rent $ per SF include contractual rent steps through March 31, 2018, totaling $231,556. |
| (4) | Tenant Sales $ per SF and Occupancy Cost were provided by the borrower for the trailing-12 months ending December 31, 2016. |
| (5) | Other tenants under the Gap umbrella include Banana Republic and Athleta for a total exposure to The Gap, Inc. of 15.3% of NRA or 16.0% of UW Base Rent. |
| (6) | Brooks Brothers has the right to reduce its rent or terminate its lease following the conclusion of a one-year period in which less than 65.0% of the gross leasable area of The Grove at Shrewsbury Property is open for business. |
| (7) | Anthropologie has the right to reduce its rent or terminate its lease following the conclusion of a one-year period in which less than 60.0% of the gross leasable area of The Grove at Shrewsbury Property is open for business. |
| (8) | Pottery Barn has the right to reduce its rent or terminate its lease following the conclusion of a one-year period in which less than 75.0% of the gross leasable area of The Grove at Shrewsbury Property is open for business. |
| (9) | Williams-Sonoma has the right to reduce its rent or terminate its lease following the conclusion of a one-year period in which less than 70.0% of the gross leasable area of The Grove at Shrewsbury Property is open for business. |
| (10) | South Moon Under has the right to terminate its lease if at no time during its third lease year (which commenced January 5, 2017) its gross sales equal or exceed $2,000,000 (or $419 per SF). Such right may be exercised upon 180 days’ notice which must be given within 60 days after the end of the third lease year. For the trailing twelve months ended December 31, 2016 the tenant’s sales were $345 per SF. |
| (11) | Ann Taylor has the right to reduce its rent or terminate its lease following the conclusion of a one-year period in which less than 70.0% of the gross leasable area of The Grove at Shrewsbury Property is open for business. |
| (12) | Other tenants outside the ten largest Owned Tenants have co-tenancy provisions, including but not limited to Victoria’s Secret, Athleta, J. Jill, Madewell, Lululemon Athletica, Lucky Brand Jeans, M.A.C. Cosmetics, Free People and Janie and Jack. |
| (13) | The vacant space is currently leased to and occupied by Nirvana, which is currently delinquent on its rent; accordingly, the tenant has been underwritten as vacant. The tenant continues to occupy the space and the borrower has allowed the tenant to defer a portion of its rent while the borrower seeks a new tenant for the space. |
The depositor has filed a registration statement (including a prospectus) with the Securities and Exchange Commission (“SEC”) (SEC File No. 333-207132) for the offering to which this communication relates. Before you invest, you should read the prospectus in the registration statement and other documents the depositor has filed with the SEC for more complete information about the depositor, the issuing entity and this offering. You may get these documents for free by visiting EDGAR on the SEC website at www.sec.gov. Alternatively, the depositor or Citigroup Global Markets Inc., Barclays Capital Inc., Drexel Hamilton, LLC or any other underwriter or dealer participating in this offering will arrange to send you the prospectus if you request it by calling toll-free 1-800-831-9146.
| 110 |
LOAN #7: THE GROVE AT SHREWSBURY
The following table presents certain information relating to the lease rollover schedule at The Grove at Shrewsbury Property, based on initial lease expiration dates:
Lease Expiration Schedule(1)(2)
Year Ending December 31, | Expiring Owned | % of Owned | Cumulative % of | UW | % of Total UW | UW Base Rent | # of Expiring | |||||||||||||||
| MTM | 0 | 0.0 | % | 0.0 | % | $0 | 0.0 | % | $0.00 | 0 | ||||||||||||
| 2017 | 1,988 | 1.3 | 1.3 | % | 123,256 | 1.7 | $62.00 | 1 | ||||||||||||||
| 2018 | 26,432 | 17.9 | 19.2 | % | 1,206,183 | 16.6 | $45.63 | 4 | ||||||||||||||
| 2019 | 8,439 | 5.7 | 24.9 | % | 464,855 | 6.4 | $55.08 | 4 | ||||||||||||||
| 2020 | 12,238 | 8.3 | 33.2 | % | 730,971 | 10.0 | $59.73 | 6 | ||||||||||||||
| 2021 | 18,887 | 12.8 | 46.0 | % | 939,697 | 12.9 | $49.75 | 4 | ||||||||||||||
| 2022 | 13,963 | 9.4 | 55.4 | % | 727,063 | 10.0 | $52.07 | 4 | ||||||||||||||
| 2023 | 31,345 | 21.2 | 76.6 | % | 1,420,529 | 19.5 | $45.32 | 4 | ||||||||||||||
| 2024 | 3,823 | 2.6 | 79.2 | % | 251,534 | 3.5 | $65.79 | 1 | ||||||||||||||
| 2025 | 19,720 | 13.3 | 92.5 | % | 845,237 | 11.6 | $42.86 | 3 | ||||||||||||||
| 2026 | 3,152 | 2.1 | 94.7 | % | 189,939 | 2.6 | $60.26 | 1 | ||||||||||||||
| 2027 | 3,578 | 2.4 | 97.1 | % | 210,064 | 2.9 | $58.71 | 1 | ||||||||||||||
| 2028 & Thereafter | 2,230 | 1.5 | 98.6 | % | 169,674 | 2.3 | $76.09 | 1 | ||||||||||||||
| Vacant | 2,083 | 1.4 | 100.0 | % | 0 | 0.0 | $0.00 | 0 | ||||||||||||||
| Total / Wtd. Avg. | 147,878 | 100.0 | % | $7,279,002 | 100.0 | % | $49.93 | 34 | ||||||||||||||
| (1) | Calculated based on the approximate square footage occupied by each Owned Tenant. |
| (2) | Certain tenants may have lease termination options that are exercisable prior to the originally stated expiration date of the subject lease and that are not considered in the Lease Expiration Schedule. |
The following table presents certain information relating to historical leasing at The Grove at Shrewsbury Property:
Historical Leased %(1)
2008 | 2009 | 2010 | 2011 | 2012 | 2013 | 2014 | 2015 | 2016 | As of 8/31/2017(2) | |||||||||||
| Owned Space | 86.0% | 92.0% | 100.0% | 97.0% | 100.0% | 100.0% | 100.0% | 100.0% | 100.0% | 98.6% |
| (1) | As provided by the borrower and which reflects average occupancy as of December 31 for the indicated year or period unless otherwise specified. |
| (2) | Based on the underwritten rent roll dated August 31, 2017. |
The depositor has filed a registration statement (including a prospectus) with the Securities and Exchange Commission (“SEC”) (SEC File No. 333-207132) for the offering to which this communication relates. Before you invest, you should read the prospectus in the registration statement and other documents the depositor has filed with the SEC for more complete information about the depositor, the issuing entity and this offering. You may get these documents for free by visiting EDGAR on the SEC website at www.sec.gov. Alternatively, the depositor or Citigroup Global Markets Inc., Barclays Capital Inc., Drexel Hamilton, LLC or any other underwriter or dealer participating in this offering will arrange to send you the prospectus if you request it by calling toll-free 1-800-831-9146.
| 111 |
LOAN #7: THE GROVE AT SHREWSBURY
| ■ | Operating History and Underwritten Net Cash Flow. The following table presents certain information relating to the historical operating performance and the Underwritten Net Cash Flow at The Grove at Shrewsbury Property: |
Cash Flow Analysis(1)
2014 | 2015 | 2016 | TTM | Underwritten | Underwritten | |||||||||||||
| Base Rent | $6,240,548 | $6,639,392 | $6,778,511 | $7,038,936 | $7,047,446 | $47.66 | ||||||||||||
| Contractual Rent Steps(2) | 0 | 0 | 0 | 0 | 231,556 | 1.57 | ||||||||||||
| Potential Income from Vacant Space | 0 | 0 | 0 | 0 | 135,395 | 0.92 | ||||||||||||
| Total Rent | $6,240,548 | $6,639,392 | $6,778,511 | $7,038,936 | $7,414,397 | $50.14 | ||||||||||||
| Reimbursements | 2,069,970 | 2,095,207 | 2,248,507 | 2,309,321 | 2,263,582 | 15.31 | ||||||||||||
| Other Income(3) | 334,425 | 322,221 | 289,088 | 248,906 | 244,272 | 1.65 | ||||||||||||
| Vacancy, Credit Loss & Concessions | 0 | 0 | 0 | 0 | (483,899) | (3.27) | ||||||||||||
| Effective Gross Income | $8,644,943 | $9,056,820 | $9,316,106 | $9,597,163 | $9,438,352 | $63.83 | ||||||||||||
| Real Estate Taxes | $1,179,037 | $1,186,212 | $1,200,617 | $1,205,167 | $1,288,675 | $8.71 | ||||||||||||
| Insurance | 23,882 | 34,188 | 31,920 | 31,831 | 31,909 | 0.22 | ||||||||||||
| Management Fee | 204,988 | 230,242 | 224,949 | 236,329 | 283,151 | 1.91 | ||||||||||||
| Other Expenses | 1,133,051 | 1,166,221 | 1,201,261 | 1,126,402 | 1,203,093 | 8.14 | ||||||||||||
| Total Operating Expenses | $2,540,958 | $2,616,863 | $2,658,747 | $2,599,729 | $2,806,828 | $18.98 | ||||||||||||
| Net Operating Income | $6,103,985 | $6,439,957 | $6,657,359 | $6,997,434 | $6,631,524 | $44.84 | ||||||||||||
| TI/LC | 0 | 0 | 0 | 0 | 147,878 | 1.00 | ||||||||||||
| Replacement Reserves | 0 | 0 | 0 | 0 | 47,321 | 0.32 | ||||||||||||
| Net Cash Flow | $6,103,985 | $6,439,957 | $6,657,359 | $6,997,434 | $6,436,325 | $43.52 | ||||||||||||
| Occupancy | 100.0% | 100.0% | 100.0% | 100.0% | 98.6% | |||||||||||||
| NOI Debt Yield | 14.0% | 14.8% | 15.3% | 16.0% | 15.2% | |||||||||||||
| NCF DSCR | 3.66x | 3.86x | 3.99x | 4.20x | 3.86x | |||||||||||||
| (1) | Certain items such as straight line rent, interest expense, interest income, lease cancellation income, depreciation, amortization, debt service payments and any other non-recurring or non-operating items were excluded from the historical presentation and are not considered for the underwritten cash flow. |
| (2) | Contractual Rent Steps are underwritten based upon the actual scheduled rent increases through March 31, 2018. |
| (3) | Other Income includes temporary tenant income as well as percentage rent. |
| ■ | Appraisal.According to the appraisal, The Grove at Shrewsbury Property had an “as-is” appraised value of $120,800,000 as of July 12, 2017. The appraiser valued The Grove at Shrewsbury Property based on the two approaches below and gave greater weight to the Discounted Cash Flow Approach to determine the “as-is” appraised value of The Grove at Shrewsbury Property. |
Appraisal Approach | Value | Discount Rate | Capitalization Rate | |||
| Direct Capitalization Approach | $111,800,000 | NA | 6.00% | |||
| Discounted Cash Flow Approach | $120,800,000 | 7.75% | 7.00%(1) |
| (1) | Represents the terminal capitalization rate. |
| ■ | Environmental Matters.Based on the Phase I environmental report dated July 20, 2017, there were no recognized environmental conditions related to The Grove at Shrewsbury Property. Based upon the identification of wetlands located on the northern portion of The Grove at Shrewsbury Property, the environmental consultant recommended consultation with local agencies prior to future construction activities at The Grove at Shrewsbury Property. Any construction activities to be performed proximate to confirmed wetlands must be completed in accordance with the Wetlands Protection Act and with the local wetland bylaws. |
| ■ | Market Overview and Competition. The Grove at Shrewsbury Property is located off Route 35, a primary retail corridor in Shrewsbury, New Jersey. According to a third party industry report, there are 135,662 people living within a five-mile radius of The Grove at Shrewsbury Property, an area with a median annual household income of $88,781 per household. The town of Shrewsbury is bordered by Red Bank and Navesink River to the north, Eatontown and Route 36 to the south, Oceanport, Sea Bright and the Atlantic Ocean to the east and the Garden State Parkway and Lincroft to the west. Primary access to the area is provided via Garden State Parkway, a major arterial that crosses The Grove at Shrewsbury Property in a north and south direction. Traffic reports from a state transportation agency indicate that an average of 22,120 vehicles travel past The Grove at Shrewsbury Property each day. |
According to a third party industry report, The Grove at Shrewsbury Property is located in the Monmouth County retail submarket of Northern New Jersey. According to an industry report, as of the second quarter of 2017, the Monmouth County retail submarket had a vacancy rate of 5.4%.
The depositor has filed a registration statement (including a prospectus) with the Securities and Exchange Commission (“SEC”) (SEC File No. 333-207132) for the offering to which this communication relates. Before you invest, you should read the prospectus in the registration statement and other documents the depositor has filed with the SEC for more complete information about the depositor, the issuing entity and this offering. You may get these documents for free by visiting EDGAR on the SEC website at www.sec.gov. Alternatively, the depositor or Citigroup Global Markets Inc., Barclays Capital Inc., Drexel Hamilton, LLC or any other underwriter or dealer participating in this offering will arrange to send you the prospectus if you request it by calling toll-free 1-800-831-9146.
| 112 |
LOAN #7: THE GROVE AT SHREWSBURY
The following table presents certain information relating to the primary competition for The Grove at Shrewsbury Property:
The Grove at Shrewsbury Property Competitive Set(1)
The Grove at | Grove West(2) | Clark Commons | Ridgewood 17 Plaza | Market Fair | ||||||
| Year Built | 1988 | 1993 & 2007 | 2015 | 2015 | 1987 | |||||
| SF | 147,878(3) | 39,825 | 245,000 | 15,388 | 240,000 | |||||
| Asking Rent | $33.00-$76.88(3) | $50.00 | $50.00 | $54.17 | $45.00-$55.00 |
| (1) | Source: Appraisal. |
| (2) | Grove West is located immediately northwest of The Grove at Shrewsbury Property, is owned by an affiliate of the borrower and is under the same property management. |
| (3) | Based on the underwritten rent roll dated August 31, 2017. |
| ■ | The Borrower. The borrower is The Grove Fee Owner, LLC, a newly formed special purpose entity and Delaware limited liability company. Legal counsel to the borrower delivered a non-consolidation opinion in connection with the origination of The Grove at Shrewsbury Loan. There is no non-recourse carveout guarantor for The Grove at Shrewsbury Loan and no environmental indemnitor other than the borrowing entity. The borrower is currently 51.3% indirectly owned by Federal Realty Investment Trust (“FRIT”), a publicly owned company rated A3 by Moody’s, A- by S&P and A- by Fitch. FRIT engages in the ownership, operation, and redevelopment of retail based properties located primarily in coastal markets from Washington, D.C. to Boston as well as San Francisco and Los Angeles. |
| ■ | Escrows.No upfront reserves were funded in connection with the origination of The Grove at Shrewsbury Loan. |
Upon the occurrence and during the continuance of a Cash Sweep Trigger Event (as defined below) and upon the occurrence of a second event of default, during the remaining term of The Grove at Shrewsbury Loan, the borrower is required to deposit with the lender (which requirement, during the continuance of a Cash Sweep Trigger Event, will be deemed to be satisfied to the extent such amounts have been deposited into the lockbox account), on each monthly payment date, one-twelfth of the sums calculated by the lender in its good faith reasonable discretion for payment of the estimated annual taxes and assessments assessed or levied against The Grove at Shrewsbury Property.
| ■ | Lockbox and Cash Management. The Grove at Shrewsbury Loan is structured with a hard lockbox with springing cash management. The Grove at Shrewsbury Loandocuments require the borrower to direct tenants to pay rent directly to a lender-controlled lockbox account and require that all other money received by the borrower with respect to TheGrove at Shrewsbury Propertybe deposited into such lockbox account within two business days following receipt. Prior to the occurrence of a Cash Sweep Trigger Event and after the occurrence of a Cash Sweep Cure (as defined below), all funds in the lockbox account are required to be swept into the borrower’s operating account. Following the occurrence of a Cash Sweep Trigger Event and until the occurrence of a Cash Sweep Cure, all cash flow is required to be swept from the lockbox account into a lender-controlled cash management account and applied in accordance with The Grove at Shrewsbury Loan documents, and excess cash is required to be swept and held as additional collateral for The Grove at Shrewsbury Loan. Provided no event of default is continuing, the borrower has the right to obtain disbursement of such excess cash for payment of expenses of tenant improvements and leasing commissions and/or capital expenditures, upon satisfaction of certain conditions set forth in The Grove at Shrewsbury Loan documents and for payment of budgeted operating expense and lender-approved extraordinary expenses, to the extent not otherwise paid from the cash management account. |
The depositor has filed a registration statement (including a prospectus) with the Securities and Exchange Commission (“SEC”) (SEC File No. 333-207132) for the offering to which this communication relates. Before you invest, you should read the prospectus in the registration statement and other documents the depositor has filed with the SEC for more complete information about the depositor, the issuing entity and this offering. You may get these documents for free by visiting EDGAR on the SEC website at www.sec.gov. Alternatively, the depositor or Citigroup Global Markets Inc., Barclays Capital Inc., Drexel Hamilton, LLC or any other underwriter or dealer participating in this offering will arrange to send you the prospectus if you request it by calling toll-free 1-800-831-9146.
| 113 |
LOAN #7: THE GROVE AT SHREWSBURY
A“Cash Sweep Trigger Event”means the occurrence of any one or more of the following: (a) an event of default under The Grove at Shrewsbury Loan documents; or(b) the debt service coverage ratio for any fiscal quarter of the borrower, based upon interest only debt service, being less than 1.25x. The debt service coverage ratio is required to be calculated by the borrower within 45 days after the end of each of the first three fiscal quarters, and 90 days after the fourth fiscal quarter, and is subject to approval of the lender, in its reasonable discretion.
A“Cash Sweep Cure” means the following: (i) with respect to a Cash Sweep Trigger Event described in clause (a) above, upon the waiver in writing by the lender of, or cure accepted by the lender of, such event of default, as determined by the lender in its sole discretion; or (ii) with respect to a Cash Sweep Trigger Event described in clause (b) of the definition thereof, either (x) The Grove at Shrewsbury Property maintaining a debt service coverage ratio of greater than 1.30x for two consecutive calendar quarters determined by the lender as of the last day of each calendar quarter for such quarter; or (y) the borrower deposits with the lender cash or a letter of credit (“DSC Avoidance Collateral”) in form and substance acceptable to the lender in an amount which, if added to the net cash flow, would result in a debt service coverage ratio greater than 1.30x. Provided no event of default is continuing under The Grove at Shrewsbury Loan, if the amount of DSC Avoidance Collateral held by the lender as of any determination date is equal to or greater than $500,000, the borrower will be deemed to have cured a Cash Sweep Trigger Event under clause (b) of the definition thereof, without being required to post any further DSC Avoidance Collateral.
| ■ | Property Management. The Grove at Shrewsbury Property is managed by Cole GP, Inc., an affiliate of the owner of an approximately 4.9% indirect interest in the borrower, pursuant to the terms of the management agreement. If (a) an event of default under The Grove at Shrewsbury Loan has occurred and is continuing, (b) the property manager becomes bankrupt or insolvent, or (c) a default beyond any applicable notice and cure period by the property manager occurs under the related management agreement, then the lender, at its option, may require the borrower to engage a replacement management agent and terminate the property manager without fee or obligation to the lender. Provided no event of default under The Grove at Shrewsbury Loan is continuing, the borrower has the right to replace the property manager with a Qualifying Manager without the lender’s consent, provided that (i) the new manager executes a management subordination agreement substantially similar to that executed at loan origination, and (ii) if the new manager is an affiliate of the borrower, a new non-consolidation is delivered with respect to such manager. |
A “Qualifying Manager” means (i) an affiliate of FRIT or of any FRIT Entity (as defined below) which is controlled by FRIT or any FRIT Entity, (ii) a qualified transferee (as defined in The Grove at Shrewsbury Loan documents), (iii) any affiliate of the current property manager which is controlled by such manager, (iv) a reputable property manager having at least seven years’ experience in the management of commercial properties with similar uses and quality as The Grove at Shrewsbury Property, or (v) a property manager selected by the borrower and acceptable to the lender in the lender’s reasonable discretion.
A “FRIT Entity” means a successor to FRIT by merger, consolidation, business combination or acquisition of assets; provided that such successor has a tangible net worth of not less than $500,000,000.
| ■ | Mezzanine or Secured Subordinate Indebtedness. Not permitted. |
| ■ | Release of Collateral. Not permitted. |
| ■ | Terrorism Insurance. The borrower is required to maintain an “all-risk” insurance policy (with a deductible that is no larger than $50,000) that provides coverage for terrorism in an amount equal to 100% of the full replacement cost of The Grove at Shrewsbury Property, plus a business interruption insurance policy that provides 12 months of business interruption coverage; provided that if the policies contain an exclusion for loss or damage incurred as a result of an act of terrorism or similar acts of sabotage, the borrower is required to maintain separate insurance against such loss or damage provided such insurance is commercially available. However, if TRIPRA, or a similar or subsequent statute is not in effect, then, the borrower is not required to spend on such separate terrorism insurance policy more than 200% of the insurance premium then payable for a stand-alone policy in respect of the “all-risk” and business interruption insurance required under The Grove at Shrewsbury Loan documents (without giving effect to the cost of supplemental coverages as may be required by special endorsement). See“Risk Factors—Terrorism Insurance May Not Be Available for All Mortgaged Properties” in the Preliminary Prospectus. |
The depositor has filed a registration statement (including a prospectus) with the Securities and Exchange Commission (“SEC”) (SEC File No. 333-207132) for the offering to which this communication relates. Before you invest, you should read the prospectus in the registration statement and other documents the depositor has filed with the SEC for more complete information about the depositor, the issuing entity and this offering. You may get these documents for free by visiting EDGAR on the SEC website at www.sec.gov. Alternatively, the depositor or Citigroup Global Markets Inc., Barclays Capital Inc., Drexel Hamilton, LLC or any other underwriter or dealer participating in this offering will arrange to send you the prospectus if you request it by calling toll-free 1-800-831-9146.
| 114 |
(THIS PAGE INTENTIONALLY LEFT BLANK)
The depositor has filed a registration statement (including a prospectus) with the Securities and Exchange Commission (“SEC”) (SEC File No. 333-207132) for the offering to which this communication relates. Before you invest, you should read the prospectus in the registration statement and other documents the depositor has filed with the SEC for more complete information about the depositor, the issuing entity and this offering. You may get these documents for free by visiting EDGAR on the SEC website at www.sec.gov. Alternatively, the depositor or Citigroup Global Markets Inc., Barclays Capital Inc., Drexel Hamilton, LLC or any other underwriter or dealer participating in this offering will arrange to send you the prospectus if you request it by calling toll-free 1-800-831-9146.
| 115 |
LOAN #8: starwood capital group hotel portfolio
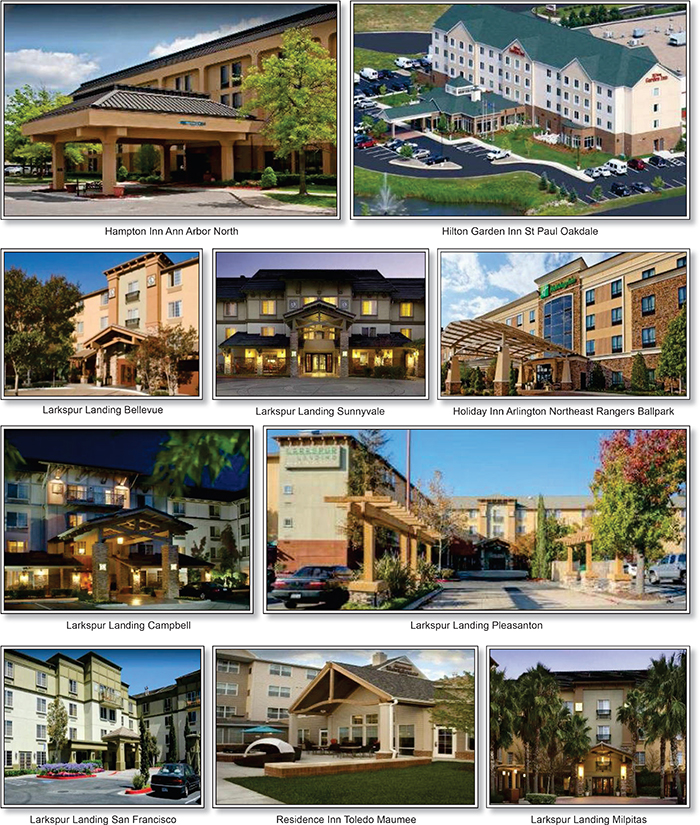
The depositor has filed a registration statement (including a prospectus) with the Securities and Exchange Commission (“SEC”) (SEC File No. 333-207132) for the offering to which this communication relates. Before you invest, you should read the prospectus in the registration statement and other documents the depositor has filed with the SEC for more complete information about the depositor, the issuing entity and this offering. You may get these documents for free by visiting EDGAR on the SEC website at www.sec.gov. Alternatively, the depositor or Citigroup Global Markets Inc., Barclays Capital Inc., Drexel Hamilton, LLC or any other underwriter or dealer participating in this offering will arrange to send you the prospectus if you request it by calling toll-free 1-800-831-9146.
| 116 |
LOAN #8: starwood capital group hotel portfolio
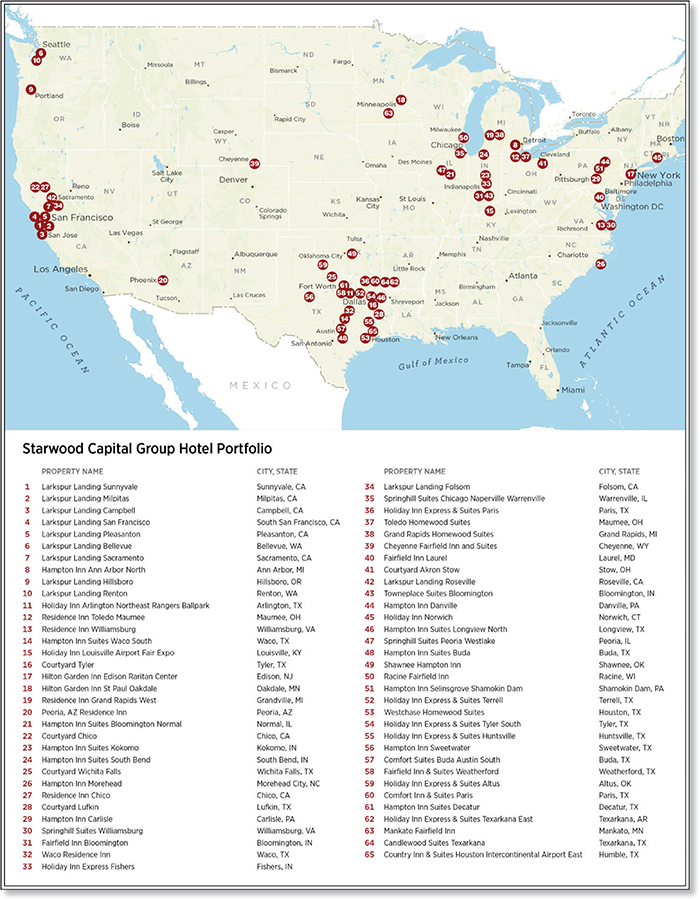
The depositor has filed a registration statement (including a prospectus) with the Securities and Exchange Commission (“SEC”) (SEC File No. 333-207132) for the offering to which this communication relates. Before you invest, you should read the prospectus in the registration statement and other documents the depositor has filed with the SEC for more complete information about the depositor, the issuing entity and this offering. You may get these documents for free by visiting EDGAR on the SEC website at www.sec.gov. Alternatively, the depositor or Citigroup Global Markets Inc., Barclays Capital Inc., Drexel Hamilton, LLC or any other underwriter or dealer participating in this offering will arrange to send you the prospectus if you request it by calling toll-free 1-800-831-9146.
| 117 |
LOAN #8: starwood capital group hotel portfolio
| Mortgaged Property Information(1) | Mortgage Loan Information | ||||
| Number of Mortgaged Properties | 65 | Loan Seller(5) | Barclays / SMF V | ||
| Location (City/State) | Various | Cut-off Date Balance(6) | $41,817,500 | ||
| Property Type | Hospitality | Cut-off Date Balance per Room(4) | $90,680.18 | ||
| Size (Rooms) | 6,366 | Percentage of Initial Pool Balance | 3.8% | ||
| Total Occupancy as of 3/31/2017 | 74.6% | Number of Related Mortgage Loans | None | ||
| Owned Occupancy as of 3/31/2017 | 74.6% | Type of Security(7) | Fee Simple / Leasehold | ||
| Year Built / Latest Renovation | Various / Various | Mortgage Rate | 4.48600% | ||
| Appraised Value(2) | $956,000,000 | Original Term to Maturity (Months) | 120 | ||
| Appraisal Date | 4/23/2017 | Original Amortization Term (Months) | NAP | ||
| Borrower Sponsor | SCG Hotel Investors Holdings, L.P. | Original Interest Only Period (Months) | 120 | ||
| Property Management(3) | Various | First Payment Date | 7/1/2017 | ||
| Maturity Date | 6/1/2027 | ||||
| Underwritten Revenues | $213,600,210 | ||||
| Underwritten Expenses | $133,537,987 | Escrows(8) | |||
| Underwritten Net Operating Income (NOI) | $80,062,224 | Upfront | Monthly | ||
| Underwritten Net Cash Flow (NCF) | $71,329,392 | Taxes | $0 | $0 | |
| Cut-off Date LTV Ratio(2)(4) | 60.4% | Insurance | $0 | $0 | |
| Maturity Date LTV Ratio(2)(4) | 60.4% | FF&E | $0 | $727,736 | |
| DSCR Based on Underwritten NOI / NCF(4) | 3.05x / 2.72x | Larkspur Landing Capital Work | $6,385,000 | $0 | |
| Debt Yield Based on Underwritten NOI / NCF(4) | 13.9% / 12.4% | Other(9) | $5,883,991 | $0 | |
| Sources and Uses | |||||
| Sources | $ | % | Uses | $ | % |
| Loan Combination Amount | $577,270,000 | 100.0% | Loan Payoff | $425,033,863 | 73.6% |
| Principal Equity Distribution | 130,991,748 | 22.7 | |||
| Reserves | 12,268,991 | 2.1 | |||
| Closing Costs | 8,975,399 | 1.6 | |||
| Total Sources | $577,270,000 | 100.0% | Total Uses | $577,270,000 | 100.0% |
| (1) | The Country Inn & Suites Houston Intercontinental Airport East property (0.2% of total ALA, 62 rooms) is currently out of service due to flood damage from Hurricane Harvey. The Starwood Capital Group Hotel Portfolio Loan Combination insurance policy provides wind coverage at the full limit of $500,000,000, subject to a named storm limit of $250,000,000. The flood limit is $100,000,000 per occurrence and in the annual aggregate. Additionally, the borrower has purchased policies through the National Flood Insurance Program in an amount equal to $500,000 for building and $500,000 for contents for each building in the SFHA (including the Country Inn & Suites Houston Intercontinental Airport East property). |
| (2) | The “As Portfolio” Appraised Value of $956.0 million for the Starwood Capital Group Hotel Portfolio Properties as a whole reflects an 8.1% premium to the aggregate “as-is” value of the individual properties. The sum of the “as-is” and “As Renovated” values, as applicable, for each of the properties on an individual basis is $889.2 million, which represents a Cut-off Date LTV Ratio and a Maturity Date LTV Ratio of 64.9%. Additionally, the aggregate “as-is” value for the individual properties as of April 23, 2017 is $884.7 million, which results in a Cut-off Date LTV Ratio and a Maturity Date LTV Ratio of 65.3%. |
| (3) | Property Management companies include Hersha Hospitality Management L.P., First Hospitality Group, Inc., TMI Property Management, L.L.C., Schulte Hospitality Group, Inc. and Pillar Hotels and Resorts, LLC. |
| (4) | DSCR, LTV, Debt Yield, and Balance / Room calculations are based on the approximately $577.3 million Starwood Capital Group Hotel Portfolio Loan Combination (as defined below). |
| (5) | The Starwood Capital Group Hotel Portfolio Loan Combination (as defined below) was co-originated by Barclays, Deutsche Bank AG, acting through its New York Branch (“DBNY”), JPMorgan Chase Bank, National Association (“JPMorgan Chase Bank”) and Bank of America, National Association (“BofA”). Starwood Mortgage Funding II LLC acquired notes A-15, A-16-1 and A-16-2 from JPMorgan Chase Bank and on or before the Closing Date will transfer note A-16-2 to SMF V. |
| (6) | The Cut-off Date Balance of $41,817,500 represents the non-controlling notes A-17 and A-16-2 which are part of a loan combination evidenced by 21 pari passu notes having an aggregate outstanding principal balance as of the Cut-off Date of $577,270,000. The related companion loans are evidenced by 19pari passu notes with an aggregate outstanding principal balance as of the Cut-off Date of $535,452,500. |
| (7) | One of the 65 properties, Hilton Garden Inn Edison Raritan Center, is secured by the applicable borrower’s leasehold interest. See“—Ground Leases” herein. |
| (8) | See “—Escrows” below. |
| (9) | Other reserves include $5,883,991 upfront for general capital work and springing for capital work and ground rent. See “—Escrows” below. |
| ■ | The Mortgage Loan.The mortgage loan (the “Starwood Capital Group Hotel Portfolio Loan”) is part of a loan combination (the “Starwood Capital Group Hotel Portfolio Loan Combination”) evidenced by 21pari passunotes that are collectively secured by the borrowers’ fee simple, leasehold and operating leasehold interests in a hospitality portfolio consisting of 65 properties and 6,366 rooms located across 21 states throughout the continental United States. The Starwood Capital Group Hotel Portfolio Loan, which is evidenced by notes A-17 and A-16-2, represents a non-controlling interest in the Starwood Capital Group Hotel Portfolio Loan Combination, had an original principal balance of $41,817,500, has an outstanding principal balance as of the Cut-off Date of $41,817,500 and represents approximately 3.8% of the Initial Pool Balance. The related companion loans (collectively, the “Starwood Capital Group Hotel Portfolio Companion Loans”) had an aggregate original principal balance of $535,452,500, and have an aggregate outstanding principal balance as of the Cut-off Date of $535,452,500. The Starwood Capital Group Hotel Portfolio Loan Combination was originated by Barclays, DBNY, JPMorgan Chase Bank and BofA on May 24, 2017. Starwood Mortgage Funding II LLC acquired notes A-15, A-16-1 and A-16-2 from JPMorgan Chase Bank and on or before the Closing Date will transfer note A-16-2 to SMF V. Barclays is expected to contribute note A-17 to this securitization transaction, which note has an outstanding principal balance of $31,817,500 as of the Cut-off Date, and SMF V is expected to contribute note A-16-2 to this securitization transaction, which note has an outstanding principal balance of $10,000,000 as of the Cut-off Date. The Starwood Capital Group Hotel Portfolio Loan Combination had an original principal balance of $577,270,000, has an outstanding principal balance as of the Cut-off Date of $577,270,000 and accrues interest at an interest rate of 4.48600%per annum. The borrowers utilized the proceeds of the Starwood Capital Group Hotel Portfolio Loan Combination to retire the existing debt of the Starwood Capital Group Hotel Portfolio Properties, return equity to the borrower sponsor, fund reserves and pay origination costs. |
The depositor has filed a registration statement (including a prospectus) with the Securities and Exchange Commission (“SEC”) (SEC File No. 333-207132) for the offering to which this communication relates. Before you invest, you should read the prospectus in the registration statement and other documents the depositor has filed with the SEC for more complete information about the depositor, the issuing entity and this offering. You may get these documents for free by visiting EDGAR on the SEC website at www.sec.gov. Alternatively, the depositor or Citigroup Global Markets Inc., Barclays Capital Inc., Drexel Hamilton, LLC or any other underwriter or dealer participating in this offering will arrange to send you the prospectus if you request it by calling toll-free 1-800-831-9146.
| 118 |
LOAN #8: starwood capital group hotel portfolio
Note Summary
| Note(s) | Current or Anticipated Holder of Securitized Note | Aggregate Cut-off Date Balance |
Starwood Capital Group Hotel Portfolio Loan | ||
| A-17, A-16-2(1) | CGCMT 2017-P8 | $41,817,500 |
Starwood Capital Group Hotel Portfolio Companion Loans | ||
| A-1, A-7 | DBJPM 2017-C6 | $80,000,000 |
| A-2-1, A-16-1 | JPMCC 2017-JP7 | $60,000,000 |
| A-2-2, A-9, A-14 | JPMorgan Chase Bank(2) | $46,817,500 |
| A-3 | BANK 2017-BNK5 | $72,500,000 |
| A-4 | BANK 2017-BNK6 | $59,317,500 |
| A-5 | WFCM 2017-C38 | $50,000,000 |
| A-6-1 | WFCM 2017-C39 | $40,000,000 |
| A-8, A-10 | CD 2017-CD5 | $40,000,000 |
| A-6-2 | Barclays(2) | $10,000,000 |
| A-11, A-12,A-13-2 | UBS 2017-C2 | $37,500,000 |
| A-13-1 | DBNY(2) | $14,317,500 |
| A-15 | Starwood Mortgage Funding II LLC(2)(3) | $25,000,000 |
| (1) | The $31,817,500 non-controlling note A-17 is being contributed by Barclays and the $10,000,000 non-controlling note A-16-2 is being contributed by SMF V. |
| (2) | Expected to be contributed to future securitization transactions. |
| (3) | Starwood Mortgage Funding II LLC is an affiliate of the Starwood Capital Group Hotel Portfolio borrowers. The related co-lender agreement provides that Starwood Mortgage Funding II LLC will have no non-controlling noteholder rights. |
The Starwood Capital Group Hotel Portfolio Loan Combination had an initial term of 120 months and has a remaining term of 117 months as of the Cut-off Date. The Starwood Capital Group Hotel Portfolio Loan Combination requires interest only payments on each due date. The scheduled maturity date of the Starwood Capital Group Hotel Portfolio Loan Combination is the due date in June 2027. On or after the first business day after the payment date in June 2018, provided that no event of default has occurred and is continuing under the Starwood Capital Group Hotel Portfolio Loan Combination documents, the borrowers have the right to prepay the Starwood Capital Group Hotel Portfolio Loan Combination in whole or in part on any business day before the payment date in April 2027, provided that the borrowers pay the greater of a yield maintenance premium or a prepayment premium equal to 1.0% of the principal amount being prepaid. In addition, the Starwood Capital Group Hotel Portfolio Loan Combination is pre-payable without penalty on or after the payment date in April 2027.
| ■ | The Mortgaged Properties.The Starwood Capital Group Hotel Portfolio Loan Combination is secured by the fee simple, leasehold and operating leasehold interests in 65 hospitality properties located across 21 states, totaling 6,366 rooms (each, a “Property” and together, the “Starwood Capital Group Hotel Portfolio Properties”or the“Starwood Capital Group Hotel Portfolio”). |
A summary detailing the composition of theStarwood Capital Group Hotel Portfolio by property sub-type is provided below:
| Property Sub-Type | |||||||||
| Property Sub-Type | # Hotels | Rooms | % Rooms | UW NCF | % of Total UW NCF | Appraised Value(1) | Per Room | TTM RevPAR Penetration(2) | |
| Extended Stay | 22 | 2,244 | 35.2% | $35,078,267 | 49.2% | $441,700,000 | $196,836 | 112.5% | |
| Limited Service | 40 | 3,734 | 58.7 | 32,572,979 | 45.7 | $403,300,000 | 108,007 | 131.5 | |
| Full Service | 3 | 388 | 6.1 | 3,678,146 | 5.2 | $44,200,000 | 113,918 | 106.4 | |
| Total / Wtd. Avg. | 65 | 6,366 | 100.0% | $71,329,392 | 100.0% | $956,000,000 | $150,173 | 123.3% | |
| (1) | The “As Portfolio” Appraised Value of $956.0 million for the Starwood Capital Group Hotel Portfolio Properties as a whole reflects an 8.1% premium to the aggregate “as-is” value of the individual properties. The sum of the “as-is” and “As Renovated” values, as applicable, for the individual properties is $889.2 million. Additionally, the aggregate “as-is” value for the individual properties as of April 23, 2017 is $884.7 million. |
| (2) | TTM RevPAR Penetration is calculated based on operating statements provided by the borrowers and competitive set data provided by a third party hospitality research report. The individual property sub-types and the Starwood Capital Group Hotel Portfolio weighted averages are weighted based on total room count. |
The depositor has filed a registration statement (including a prospectus) with the Securities and Exchange Commission (“SEC”) (SEC File No. 333-207132) for the offering to which this communication relates. Before you invest, you should read the prospectus in the registration statement and other documents the depositor has filed with the SEC for more complete information about the depositor, the issuing entity and this offering. You may get these documents for free by visiting EDGAR on the SEC website at www.sec.gov. Alternatively, the depositor or Citigroup Global Markets Inc., Barclays Capital Inc., Drexel Hamilton, LLC or any other underwriter or dealer participating in this offering will arrange to send you the prospectus if you request it by calling toll-free 1-800-831-9146.
| 119 |
LOAN #8: starwood capital group hotel portfolio
A summary of each individual Starwood Capital Group Hotel Portfolio Property is provided below:
| Starwood Capital Group Hotel Portfolio Property Summary | ||||||||||
| Property Name | City / State | Rooms | Year Built / Renovated | Allocated Loan Amount | % Allocated Loan Amount | Appraised Value(1) | UW NCF | %UW NCF | TTM Occupancy | TTM RevPAR Penetration(2) |
| Larkspur Landing Sunnyvale(3) | Sunnyvale, CA | 126 | 2000 / NAP | $34,068,063 | 5.9% | $52,100,000 | $4,171,961 | 5.8% | 83.8% | 105.3% |
| Larkspur Landing Milpitas(3) | Milpitas, CA | 124 | 1998 / NAP | 28,706,103 | 5.0 | 43,900,000 | 3,562,157 | 5.0 | 85.7% | 111.6% |
| Larkspur Landing Campbell(3) | Campbell, CA | 117 | 2000 / NAP | 25,240,446 | 4.4 | 38,600,000 | 3,199,426 | 4.5 | 84.3% | 93.3% |
| Larkspur Landing San Francisco(3) | South San Francisco, CA | 111 | 1999 / NAP | 20,793,943 | 3.6 | 31,800,000 | 2,426,585 | 3.4 | 84.9% | 83.6% |
| Larkspur Landing Pleasanton(3) | Pleasanton, CA | 124 | 1997 / NAP | 20,336,214 | 3.5 | 31,100,000 | 2,438,362 | 3.4 | 82.9% | 87.8% |
| Larkspur Landing Bellevue(3) | Bellevue, WA | 126 | 1998 / NAP | 18,112,963 | 3.1 | 27,700,000 | 2,173,526 | 3.0 | 78.8% | 108.6% |
| Larkspur Landing Sacramento(3) | Sacramento, CA | 124 | 1998 / NAP | 13,535,680 | 2.3 | 20,700,000 | 1,816,912 | 2.5 | 83.0% | 110.0% |
| Hampton Inn Ann Arbor North | Ann Arbor, MI | 129 | 1988 / 2015 | 13,208,731 | 2.3 | 20,200,000 | 1,836,126 | 2.6 | 73.9% | 123.7% |
| Larkspur Landing Hillsboro(3) | Hillsboro, OR | 124 | 1997 / NAP | 13,208,731 | 2.3 | 20,200,000 | 1,708,763 | 2.4 | 74.1% | 77.6% |
| Larkspur Landing Renton(3) | Renton, WA | 127 | 1998 / NAP | 13,077,951 | 2.3 | 20,000,000 | 1,694,132 | 2.4 | 80.3% | 103.3% |
| Holiday Inn Arlington Northeast Rangers Ballpark | Arlington, TX | 147 | 2008 / 2013 | 12,554,833 | 2.2 | 19,200,000 | 1,537,247 | 2.2 | 78.3% | 100.5% |
| Residence Inn Toledo Maumee | Maumee, OH | 108 | 2008 / 2016 | 12,424,054 | 2.2 | 19,000,000 | 1,468,871 | 2.1 | 81.7% | 142.7% |
| Residence Inn Williamsburg | Williamsburg, VA | 108 | 1999 / 2012 | 11,900,936 | 2.1 | 18,200,000 | 1,358,744 | 1.9 | 73.0% | 158.8% |
| Hampton Inn Suites Waco South | Waco, TX | 123 | 2008 / 2013 | 10,985,479 | 1.9 | 16,800,000 | 1,414,791 | 2.0 | 77.7% | 116.2% |
| Holiday Inn Louisville Airport Fair Expo | Louisville, KY | 106 | 2008 / NAP | 10,789,310 | 1.9 | 16,500,000 | 1,388,767 | 1.9 | 72.9% | 102.1% |
| Courtyard Tyler | Tyler, TX | 121 | 2010 / 2016 | 10,593,141 | 1.8 | 16,200,000 | 1,253,360 | 1.8 | 58.8% | 125.6% |
| Hilton Garden Inn Edison Raritan Center(4) | Edison, NJ | 132 | 2002 / 2014 | 10,593,141 | 1.8 | 16,200,000 | 1,317,397 | 1.8 | 78.1% | 135.7% |
| Hilton Garden Inn St Paul Oakdale | Oakdale, MN | 116 | 2005 / 2013 | 10,462,361 | 1.8 | 16,000,000 | 1,689,847 | 2.4 | 80.0% | 141.9% |
| Residence Inn Grand Rapids West(5) | Grandville, MI | 90 | 2000 / 2017 | 10,331,582 | 1.8 | 15,800,000 | 1,106,127 | 1.6 | 72.6% | 115.2% |
| Peoria, AZ Residence Inn | Peoria, AZ | 90 | 1998 / 2013 | 10,266,192 | 1.8 | 15,700,000 | 1,158,027 | 1.6 | 80.8% | 145.9% |
| Hampton Inn Suites Bloomington Normal | Normal, IL | 128 | 2007 / 2015 | 10,200,802 | 1.8 | 15,600,000 | 1,396,943 | 2.0 | 70.8% | 123.5% |
| Courtyard Chico | Chico, CA | 90 | 2005 / 2015 | 10,004,633 | 1.7 | 15,300,000 | 1,439,185 | 2.0 | 84.6% | 157.5% |
| Hampton Inn Suites Kokomo | Kokomo, IN | 105 | 1997 / 2013 | 9,677,684 | 1.7 | 14,800,000 | 1,255,566 | 1.8 | 77.9% | 158.5% |
| Hampton Inn Suites South Bend | South Bend, IN | 117 | 1997 / 2014 | 9,677,684 | 1.7 | 14,800,000 | 1,232,210 | 1.7 | 69.9% | 113.2% |
| Courtyard Wichita Falls | Wichita Falls, TX | 93 | 2009 / 2017 | 9,219,956 | 1.6 | 14,100,000 | 1,095,610 | 1.5 | 77.4% | 106.0% |
| Hampton Inn Morehead(5) | Morehead City, NC | 118 | 1991 / 2017 | 8,958,397 | 1.6 | 13,700,000 | 1,094,065 | 1.5 | 66.6% | 139.7% |
| Residence Inn Chico | Chico, CA | 78 | 2005 / 2014 | 8,696,838 | 1.5 | 13,300,000 | 1,208,180 | 1.7 | 88.0% | 166.0% |
| Courtyard Lufkin(5) | Lufkin, TX | 101 | 2009 / 2017 | 8,304,499 | 1.4 | 12,700,000 | 738,285 | 1.0 | 64.9% | 105.9% |
| Hampton Inn Carlisle | Carlisle, PA | 97 | 1997 / 2014 | 8,239,109 | 1.4 | 12,600,000 | 1,116,905 | 1.6 | 76.1% | 175.6% |
| Springhill Suites Williamsburg | Williamsburg, VA | 120 | 2002 / 2012 | 8,239,109 | 1.4 | 12,600,000 | 876,108 | 1.2 | 71.7% | 106.8% |
| Fairfield Inn Bloomington | Bloomington, IN | 105 | 1995 / 2015 | 8,173,720 | 1.4 | 12,500,000 | 1,271,230 | 1.8 | 87.1% | 106.3% |
| Waco Residence Inn(5) | Waco, TX | 78 | 1997 / 2012 | 7,977,550 | 1.4 | 12,200,000 | 912,234 | 1.3 | 82.0% | 112.5% |
| Holiday Inn Express Fishers | Fishers, IN | 115 | 2000 / 2012 | 7,454,432 | 1.3 | 11,400,000 | 951,428 | 1.3 | 67.1% | 90.5% |
| Larkspur Landing Folsom(3) | Folsom, CA | 84 | 2000 / NAP | 7,258,263 | 1.3 | 11,100,000 | 858,864 | 1.2 | 86.4% | 98.1% |
| Springhill Suites Chicago Naperville Warrenville | Warrenville, IL | 128 | 1997 / 2013 | 6,865,924 | 1.2 | 10,500,000 | 667,822 | 0.9 | 67.1% | 96.1% |
| Holiday Inn Express & Suites Paris | Paris, TX | 84 | 2009 / NAP | 6,800,535 | 1.2 | 10,400,000 | 798,480 | 1.1 | 72.6% | 126.5% |
| Toledo Homewood Suites(5) | Toledo, OH | 78 | 1997 / 2014 | 6,800,535 | 1.2 | 10,400,000 | 944,205 | 1.3 | 82.2% | 123.0% |
| Grand Rapids Homewood Suites(5) | Grand Rapids, MI | 78 | 1997 / 2013 | 6,604,365 | 1.1 | 10,100,000 | 739,572 | 1.0 | 84.1% | 113.7% |
| Cheyenne Fairfield Inn and Suites | Cheyenne, WY | 60 | 1994 / 2013 | 6,146,637 | 1.1 | 9,400,000 | 753,591 | 1.1 | 74.6% | 117.6% |
| Fairfield Inn Laurel | Laurel, MD | 109 | 1988 / 2013 | 6,146,637 | 1.1 | 9,400,000 | 657,471 | 0.9 | 79.9% | 139.2% |
| Courtyard Akron Stow | Stow, OH | 101 | 2005 / 2014 | 6,015,858 | 1.0 | 9,200,000 | 886,115 | 1.2 | 65.9% | 98.4% |
| Larkspur Landing Roseville(3) | Roseville, CA | 90 | 1999 / NAP | 5,688,909 | 1.0 | 8,700,000 | 786,149 | 1.1 | 79.5% | 96.9% |
| Towneplace Suites Bloomington | Bloomington, IN | 83 | 2000 / 2013 | 5,688,909 | 1.0 | 8,700,000 | 850,105 | 1.2 | 89.1% | 101.3% |
| Hampton Inn Danville | Danville, PA | 71 | 1998 / 2013 | 5,623,519 | 1.0 | 8,600,000 | 728,609 | 1.0 | 80.0% | 222.0% |
| Holiday Inn Norwich | Norwich, CT | 135 | 1975 / 2013 | 5,558,129 | 1.0 | 8,500,000 | 752,132 | 1.1 | 56.7% | 116.3% |
| Hampton Inn Suites Longview North | Longview, TX | 91 | 2008 / 2013 | 5,492,740 | 1.0 | 8,400,000 | 650,443 | 0.9 | 63.8% | 129.8% |
| Springhill Suites Peoria Westlake | Peoria, IL | 124 | 2000 / 2013 | 5,492,740 | 1.0 | 8,400,000 | 470,046 | 0.7 | 63.3% | 89.1% |
| Hampton Inn Suites Buda | Buda, TX | 74 | 2008 / NAP | 5,427,350 | 0.9 | 8,300,000 | 853,603 | 1.2 | 74.5% | 139.5% |
| Shawnee Hampton Inn(5) | Shawnee, OK | 63 | 1996 / 2013 | 5,427,350 | 0.9 | 8,300,000 | 618,775 | 0.9 | 77.6% | 146.0% |
| Racine Fairfield Inn(5) | Racine, WI | 62 | 1991 / 2016 | 5,296,570 | 0.9 | 8,100,000 | 603,823 | 0.8 | 68.6% | 154.1% |
| Hampton Inn Selinsgrove Shamokin Dam | Shamokin Dam, PA | 75 | 1996 / 2013 | 5,165,791 | 0.9 | 7,900,000 | 687,279 | 1.0 | 75.6% | 184.0% |
| Holiday Inn Express & Suites Terrell | Terrell, TX | 68 | 2007 / 2013 | 4,904,232 | 0.8 | 7,500,000 | 605,485 | 0.8 | 84.0% | 183.5% |
| Westchase Homewood Suites(5) | Houston, TX | 96 | 1998 / 2016 | 4,746,774 | 0.8 | 9,800,000 | 379,742 | 0.5 | 63.4% | 142.9% |
| Holiday Inn Express & Suites Tyler South | Tyler, TX | 88 | 2000 / 2015 | 4,708,062 | 0.8 | 7,200,000 | 599,880 | 0.8 | 65.9% | 132.5% |
| Holiday Inn Express & Suites Huntsville | Huntsville, TX | 87 | 2008 / 2013 | 4,511,893 | 0.8 | 6,900,000 | 689,387 | 1.0 | 65.5% | 243.3% |
| Hampton Inn Sweetwater | Sweetwater, TX | 72 | 2009 / NAP | 4,119,555 | 0.7 | 6,300,000 | 400,369 | 0.6 | 62.9% | 132.2% |
| Comfort Suites Buda Austin South | Buda, TX | 72 | 2009 / NAP | 3,465,657 | 0.6 | 5,300,000 | 541,569 | 0.8 | 76.8% | 109.7% |
| Fairfield Inn & Suites Weatherford | Weatherford, TX | 86 | 2009 / 2016 | 3,269,488 | 0.6 | 5,000,000 | 311,718 | 0.4 | 63.4% | 91.1% |
| Holiday Inn Express & Suites Altus | Altus, OK | 68 | 2008 / 2013 | 2,649,352 | 0.5 | 4,600,000 | 211,948 | 0.3 | 67.4% | 151.2% |
| Comfort Inn & Suites Paris | Paris, TX | 56 | 2009 / NAP | 2,354,031 | 0.4 | 3,600,000 | 251,060 | 0.4 | 67.4% | 146.2% |
| Hampton Inn Suites Decatur | Decatur, TX | 74 | 2008 / 2013 | 2,252,646 | 0.4 | 3,600,000 | 180,212 | 0.3 | 64.6% | 228.4% |
| Holiday Inn Express & Suites Texarkana E. | Texarkana, AR | 88 | 2009 / NAP | 2,086,036 | 0.4 | 4,100,000 | 166,883 | 0.2 | 66.5% | 100.5% |
| Mankato Fairfield Inn | Mankato, MN | 61 | 1997 / 2016 | 1,869,354 | 0.3 | 3,600,000 | 149,548 | 0.2 | 58.0% | 100.2% |
| Candlewood Suites Texarkana | Texarkana, TX | 80 | 2009 / 2014 | 1,445,301 | 0.3 | 2,600,000 | 115,624 | 0.2 | 75.0% | 110.1% |
| Country Inn & Suites Houston Intercontinental Airport East(6) | Humble, TX | 62 | 2001 / 2017 | 1,372,592 | 0.2 | 3,200,000 | 109,807 | 0.2 | 54.1% | 86.8% |
| Total / Weighted Average | 6,366 | $577,270,000 | 100.0% | $889,200,000 | $71,329,392 | 100.0% | 74.6% | 123.3% | ||
| Total w/ Portfolio Premium | $956,000,000 | |||||||||
| (1) | The “As Portfolio” Appraised Value of $956.0 million for the Starwood Capital Group Hotel Portfolio Properties as a whole reflects an 8.1% premium to the aggregate “as-is” value of the individual properties. The sum of the “as-is” and “As Renovated” values, as applicable, for the individual properties is $889.2 million. Additionally, the aggregate “as-is” value for the individual properties as of April 23, 2017 is $884.7 million. |
| (2) | TTM RevPAR Penetration is calculated based on operating statements provided by the borrowers and competitive set data provided by a third party hospitality research report. The Starwood Capital Group Hotel Portfolio weighted average is weighted based on total room count. |
| (3) | The Larkspur Landing properties operate pursuant to a licensing agreement with an affiliate of the borrower sponsor, which may be cancelled by either party on 60 days’ notice. |
| (4) | Hilton Garden Inn Edison Raritan Center is subject to a ground lease, which commenced in September 2001 for a term of 75 years with current annual ground rent of $275,517. |
The depositor has filed a registration statement (including a prospectus) with the Securities and Exchange Commission (“SEC”) (SEC File No. 333-207132) for the offering to which this communication relates. Before you invest, you should read the prospectus in the registration statement and other documents the depositor has filed with the SEC for more complete information about the depositor, the issuing entity and this offering. You may get these documents for free by visiting EDGAR on the SEC website at www.sec.gov. Alternatively, the depositor or Citigroup Global Markets Inc., Barclays Capital Inc., Drexel Hamilton, LLC or any other underwriter or dealer participating in this offering will arrange to send you the prospectus if you request it by calling toll-free 1-800-831-9146.
| 120 |
| LOAN #8: STARWOOD CAPITAL GROUP HOTEL PORTFOLIO |
| (5) | “As-Renovated” appraised values are shown for nine properties, the Residence Inn Grand Rapids West, Hampton Inn Morehead, Courtyard Lufkin, Waco Residence Inn, Toledo Homewood Suites, Grand Rapids Homewood Suites, Westchase Homewood Suites, Shawnee Hampton Inn, and Racine Fairfield Inn Properties, which values assume the completion of certain property improvements, for which the lender has fully reserved. |
| (6) | As of August 27, 2017, Country Inn & Suites Houston Intercontinental Airport East is out of service due to flood damage from Hurricane Harvey. |
The Starwood Capital Group Hotel Portfolio Properties are comprised of 65 hotels offering a range of amenities, spanning the limited service, full service and extended stay varieties. The hotels range in size from 56 to 147 rooms with an average count of 98 rooms. The Starwood Capital Group Hotel Portfolio benefits from geographic diversity, in addition to an overall granular property mix. No individual Starwood Capital Group Hotel Portfolio Property accounts for more than 2.3% of total rooms or 5.8% of underwritten net cash flow. Further, the top 10 properties based on allocated loan amount account for 19.4% of total rooms and 35.1% of underwritten net cash flow. All 65 hotels in the Starwood Capital Group Hotel Portfolio are operated pursuant to management agreements with: Hersha (39 hotels), First Hospitality (nine hotels), TMI (nine hotels), Schulte (six hotels) or Pillar (two hotels). The summary of Starwood Capital Group Hotel Portfolio Properties’ six brands and 14 flags is provided below:
| Starwood Capital Group Hotel Portfolio Brand Summary | |||||||||||||||||||||||||
| Brand | # Hotels | Rooms | % of Rooms | Allocated Loan Amount ($) | Allocated Loan Amount ($)/Room | Appraised Value(1) | LTV(1) | UW NCF | % UW NCF | ||||||||||||||||
| Larkspur Landing(2) | |||||||||||||||||||||||||
| Larkspur Landing | 11 | 1,277 | 20.1 | % | $200,027,266 | $156,638 | $305,900,000 | 65.4 | % | $24,836,836 | 34.8 | % | |||||||||||||
| Total Larkspur Landing | 11 | 1,277 | 20.1 | % | $200,027,266 | $156,638 | $305,900,000 | 65.4 | % | $24,836,836 | 34.8 | % | |||||||||||||
| Marriott(2) | |||||||||||||||||||||||||
| Residence Inn | 6 | 552 | 8.7 | % | $61,597,152 | $111,589 | $94,200,000 | 65.4 | % | $7,212,183 | 10.1 | ||||||||||||||
| Courtyard | 5 | 506 | 7.9 | % | 44,138,087 | $87,229 | 67,500,000 | 65.4 | % | 5,412,556 | 7.6 | ||||||||||||||
| Fairfield Inn & Suites | 6 | 483 | 7.6 | % | 30,902,406 | $63,980 | 48,000,000 | 64.4 | % | 3,747,382 | 5.3 | ||||||||||||||
| SpringHill Suites | 3 | 372 | 5.8 | % | 20,597,773 | $55,370 | 31,500,000 | 65.4 | % | 2,013,975 | 2.8 | ||||||||||||||
| TownePlace Suites | 1 | 83 | 1.3 | % | 5,688,909 | $68,541 | 8,700,000 | 65.4 | % | 850,105 | 1.2 | ||||||||||||||
| Total Marriott | 21 | 1,996 | 31.4 | % | $162,924,327 | $81,625 | $249,900,000 | 65.2 | % | $19,236,201 | 27.0 | % | |||||||||||||
| Hilton | |||||||||||||||||||||||||
| Hampton Inn & Suites | 14 | 1,337 | 21.0 | % | $104,456,837 | $78,128 | $159,900,000 | 65.3 | % | $13,465,895 | 18.9 | ||||||||||||||
| Hilton Garden Inn | 2 | 248 | 3.9 | % | 21,055,502 | $84,901 | 32,200,000 | 65.4 | % | 3,007,244 | 4.2 | ||||||||||||||
| Homewood Suites | 3 | 252 | 4.0 | % | 18,151,674 | $72,030 | 30,300,000 | 59.9 | % | 2,063,519 | 2.9 | ||||||||||||||
| Total Hilton | 19 | 1,837 | 28.9 | % | $143,664,013 | $78,206 | $222,400,000 | 64.6 | % | $18,536,658 | 26.0 | % | |||||||||||||
| IHG | |||||||||||||||||||||||||
| Holiday Inn Express | 7 | 598 | 9.4 | % | $33,114,542 | $55,375 | $52,100,000 | 63.6 | % | $4,023,491 | 5.6 | ||||||||||||||
| Holiday Inn | 3 | 388 | 6.1 | % | 28,902,272 | $74,490 | 44,200,000 | 65.4 | % | 3,678,146 | 5.2 | ||||||||||||||
| Candlewood | 1 | 80 | 1.3 | % | 1,445,301 | $18,066 | 2,600,000 | 55.6 | % | 115,624 | 0.2 | ||||||||||||||
| Total IHG | 11 | 1,066 | 16.7 | % | $63,462,115 | $59,533 | $98,900,000 | 64.2 | % | $7,817,261 | 11.0 | % | |||||||||||||
| Choice | |||||||||||||||||||||||||
| Comfort Inn | 2 | 128 | 2.0 | % | $5,819,688 | $45,466 | $8,900,000 | 65.4 | % | $792,628 | 1.1 | ||||||||||||||
| Total Choice | 2 | 128 | 2.0 | % | $5,819,688 | $45,466 | $8,900,000 | 65.4 | % | $792,628 | 1.1 | % | |||||||||||||
| Carlson | |||||||||||||||||||||||||
| Country Inn & Suites | 1 | 62 | 1.0 | % | $1,372,592 | $22,139 | $3,200,000 | 42.9 | % | $109,807 | 0.2 | ||||||||||||||
| Total Carlson | 1 | 62 | 1.0 | % | $1,372,592 | $22,139 | $3,200,000 | 42.9 | % | $109,807 | 0.2 | % | |||||||||||||
| Total | 65 | 6,366 | 100.0 | % | $577,270,000 | $90,680 | $956,000,000 | 60.4 | % | $71,329,392 | 100.0 | % | |||||||||||||
| (1) | The “As Portfolio” Appraised Value of $956.0 million of theStarwood Capital GroupHotel Portfolio Properties as a whole reflects an 8.1% premium to the aggregate “as-is” value of the individual properties. The sum of the “as-is” and “As Renovated” values, as applicable, for the individual properties is $889.2 million. Additionally, the aggregate “as-is” value for each individual property as of April 23, 2017 is $884.7 million. |
| (2) | The Larkspur Landing and Marriott brand/flag are affiliated with Starwood Capital Group, L.P. The Larkspur Landing properties operate pursuant to licensing agreements with an affiliate of the borrower sponsor, which may be terminated by either party upon 60 days’ notice, as further described below. |
The hotels range in age from seven to 42 years old with an average age of approximately 16 years and 59.0% of the portfolio based on underwritten net cash flow has been renovated since 2012. Approximately $84.8 million ($13,319 per room) of capital expenditures have been made since 2012 in order to update the Starwood Capital Group Hotel Portfolio Properties. Going forward, the borrowers have budgeted for approximately $28.8 million ($4,519 per room) in capital expenditures through 2019, of which approximately $5.9 million ($924 per room) is related to brand mandated property improvement plans. At origination, the borrowers reserved approximately $5.9 million in capital expenditures related to brand mandated property improvement plans. Additionally, at origination, the borrowers reserved approximately $6.4 million ($5,000 per Larkspur Landing branded room) for any future capital work or FF&E associated with the Larkspur Landing properties. The Larkspur Landing properties operate pursuant to licensing agreements with an affiliate of the borrower sponsor, which may be terminated upon 60 days’ notice, as further described below. The remaining budgeted capital expenditures have not been reserved for and the borrower is not
The depositor has filed a registration statement (including a prospectus) with the Securities and Exchange Commission (“SEC”) (SEC File No. 333-207132) for the offering to which this communication relates. Before you invest, you should read the prospectus in the registration statement and other documents the depositor has filed with the SEC for more complete information about the depositor, the issuing entity and this offering. You may get these documents for free by visiting EDGAR on the SEC website at www.sec.gov. Alternatively, the depositor or Citigroup Global Markets Inc., Barclays Capital Inc., Drexel Hamilton, LLC or any other underwriter or dealer participating in this offering will arrange to send you the prospectus if you request it by calling toll-free 1-800-831-9146.
| 121 |
| LOAN #8: STARWOOD CAPITAL GROUP HOTEL PORTFOLIO |
required under the Starwood Capital Group Hotel Portfolio Loan Combination to complete the related capital improvements.
A summary of both historical and budgeted capital expenditures at the Starwood Capital Group Hotel Portfolio Properties is provided below:
| Historical & Budgeted Capital Expenditures(1) | |||||||||
| 2012 | 2013 | 2014 | 2015 | 2016 | 2017B(2) | 2018B(2) | 2019B(2) | Total(2) | |
| Total | $15,974,481 | $28,295,183 | $14,870,099 | $10,258,955 | $15,388,521 | $11,852,877 | $5,093,750 | $11,818,750 | $113,552,617 |
| Per Room | $2,509 | $4,445 | $2,336 | $1,612 | $2,417 | $1,862 | $800 | $1,857 | $17,837 |
| (1) | Source: Borrowers. |
| (2) | The budgeted capital expenditures have not been reserved for and the borrower is not required under the Starwood Capital Group Hotel Portfolio Loan Combination to complete the related capital improvements. |
A summary of franchise agreement expirations during the term of theStarwood Capital Group Hotel Portfolio Loan is provided below:
Franchise Expiration Rollover
| Year Ending December 31 | Expiring # Hotels | Expiring Rooms | Expiring % Rooms | UW NCF | % of Total UW NCF | Cumulative Rooms Expiring | Cumulative % of Rooms Expiring | Cumulative UW NCF Expiring | Cumulative % of UW NCF Expiring | ||||||||||||||||||
| 2017 | 0 | 0 | 0.0 | % | $0 | 0.0 | % | 0 | 0.0 | % | $0 | 0.0 | % | ||||||||||||||
| 2018 | 1 | 90 | 1.8 | 1,158,027 | 2.5 | 90 | 1.8 | $1,158,027 | 2.5 | ||||||||||||||||||
| 2019 | 3 | 337 | 6.6 | 2,892,322 | 6.2 | 427 | 8.4 | $4,050,349 | 8.7 | ||||||||||||||||||
| 2020 | 0 | 0 | 0.0 | 0 | 0.0 | 427 | 8.4 | $4,050,349 | 8.7 | ||||||||||||||||||
| 2021 | 1 | 62 | 1.2 | 603,823 | 1.3 | 489 | 9.6 | $4,654,173 | 10.0 | ||||||||||||||||||
| 2022 | 21 | 2,025 | 39.8 | 18,055,211 | 38.8 | 2,514 | 49.4 | $22,709,384 | 48.8 | ||||||||||||||||||
| 2023 | 0 | 0 | 0.0 | 0 | 0.0 | 2,514 | 49.4 | $22,709,384 | 48.8 | ||||||||||||||||||
| 2024 | 0 | 0 | 0.0 | 0 | 0.0 | 2,514 | 49.4 | $22,709,384 | 48.8 | ||||||||||||||||||
| 2025 | 4 | 378 | 7.4 | 4,634,247 | 10.0 | 2,892 | 56.8 | $27,343,631 | 58.8 | ||||||||||||||||||
| 2026 | 1 | 128 | 2.5 | 1,396,943 | 3.0 | 3,020 | 59.3 | $28,740,574 | 61.8 | ||||||||||||||||||
| 2027 | 2 | 140 | 2.8 | 1,022,042 | 2.2 | 3,160 | 62.1 | $29,762,616 | 64.0 | ||||||||||||||||||
| 2028 & Beyond | 21 | 1,929 | 37.9 | 16,729,941 | 36.0 | 5,089 | 100.0 | $46,492,556 | 100.0 | ||||||||||||||||||
| Total(1) | 54 | 5,089 | 100.0 | % | $46,492,556 | 100.0 | % | ||||||||||||||||||||
| (1) | The above Franchise Expiration Rollover is exclusive of the Larkspur Landing properties, which operate pursuant to a licensing agreement with an affiliate of the borrower sponsor, which is subject to cancellation by either party upon 60 days’ notice. The Larkspur Landing brand/flag is owned by an affiliate of Starwood Capital Group. At origination, the borrowers reserved approximately $6.4 million for any future capital work or FF&E expenditures associated with the Larkspur Landing properties. |
The Starwood Capital Group Hotel Portfolio benefits from well-known brand and flag affiliations, as well as related customer loyalty programs. Approximately 60.2% based on room count and 53.0% based on underwritten net cash flow of the portfolio properties are associated with Marriott or Hilton affiliated flags, providing the portfolio with institutional brand affiliations across the majority of the portfolio properties. Approximately 20.1% based on room count and 34.8% by underwritten net cash flow of the portfolio properties are associated with the Larkspur Landing brand, all of which are located on the west coast. Larkspur Landing is an upscale select service and extended stay brand, which began operation in the 1990s. The Larkspur Landing properties operate pursuant to a licensing agreement between the related operating companies (as licensee) and an affiliate of Starwood Capital Group (as licensor), which effectively owns the licensing rights to the Larkspur Landing brand/flag. The Larkspur Landing licensing agreement for each individual property, as applicable, calls for an annual license fee in the amount of $10 and may be terminated upon 60 days’ notice of termination by either the licensor or the licensee. Per the terms of the loan documents, the Larkspur Landing licensing agreements may not be terminated by the borrowers during the term of the loan unless the borrowers replace the Larkspur Landing flag with a qualified franchisor (as defined in the loan documents).
In the event of any franchise or license agreement expiration, termination or cancellation in violation of the loan documents, a full excess cash flow sweep will be triggered, as further described in “Lockbox and Cash Management” below. Additionally, there is a recourse carve-out for any material amendment, modification, expiration, cancellation or termination of any franchise or Larkspur Landing license agreement in violation of the loan documents without the prior written consent of the lender.
The depositor has filed a registration statement (including a prospectus) with the Securities and Exchange Commission (“SEC”) (SEC File No. 333-207132) for the offering to which this communication relates. Before you invest, you should read the prospectus in the registration statement and other documents the depositor has filed with the SEC for more complete information about the depositor, the issuing entity and this offering. You may get these documents for free by visiting EDGAR on the SEC website at www.sec.gov. Alternatively, the depositor or Citigroup Global Markets Inc., Barclays Capital Inc., Drexel Hamilton, LLC or any other underwriter or dealer participating in this offering will arrange to send you the prospectus if you request it by calling toll-free 1-800-831-9146.
| 122 |
| LOAN #8: STARWOOD CAPITAL GROUP HOTEL PORTFOLIO |
| ■ | Operating History and Underwritten Net Cash Flow. The following table presents certain information relating to the historical operating performance and the Underwritten Net Cash Flow at the Starwood Capital Group Hotel Portfolio Properties: |
| Cash Flow Analysis | |||||||||||||
| 2014 | 2015 | 2016 | TTM 3/31/2017(1) | Underwritten | Underwritten per Room(2) | ||||||||
| Room Revenue | $192,509,535 | $202,927,905 | $206,707,091 | $205,120,564 | $206,046,538 | $32,367 | |||||||
| Food & Beverage Revenue | 4,481,265 | 5,413,425 | 5,367,185 | 5,436,865 | 5,449,118 | 856 | |||||||
| Other Revenue | 2,518,145 | 1,839,946 | 2,161,754 | 2,093,187 | 2,104,554 | 331 | |||||||
| Total Revenue | $199,508,945 | $210,181,276 | $214,236,030 | $212,650,616 | $213,600,210 | $33,553 | |||||||
| Room Expense | $43,419,428 | $44,601,150 | $46,539,452 | $46,836,463 | $47,702,619 | $7,493 | |||||||
| Food & Beverage Expense | 3,731,961 | 4,181,990 | 3,877,875 | 3,826,532 | 3,826,294 | 601 | |||||||
| Other Expense | 2,076,802 | 754,103 | 883,759 | 857,468 | 857,390 | 135 | |||||||
| Total Departmental Expense | $49,228,191 | $49,537,243 | $51,301,086 | $51,520,462 | $52,386,303 | $8,229 | |||||||
| Total Undistributed Expense | 56,768,412 | 60,404,169 | 61,876,151 | 62,127,172 | 62,263,971 | 9,781 | |||||||
| Total Management Fee | 6,387,948 | 6,809,293 | 6,853,190 | 6,818,728 | 7,967,134 | 1,252 | |||||||
| Total Fixed Charges | 10,592,272 | 10,840,419 | 10,979,711 | 10,915,631 | 10,920,578 | 1,715 | |||||||
| Total Operating Expense | $122,976,823 | $127,591,124 | $131,010,138 | $131,381,993 | $133,537,986 | $20,977 | |||||||
| Net Operating Income | $76,532,121 | $82,590,153 | $83,225,892 | $81,268,623 | $80,062,224 | $12,577 | |||||||
| FF&E | 7,980,358 | 8,583,513 | 8,756,495 | 8,693,699 | 8,732,831 | 1,372 | |||||||
| Net Cash Flow | $68,551,763 | $74,006,639 | $74,469,397 | $72,574,924 | $71,329,392 | $11,205 | |||||||
| Occupancy | 73.7% | 74.8% | 74.7% | 74.6% | 74.6% | ||||||||
| NOI Debt Yield(3) | 13.3% | 14.3% | 14.4% | 14.1% | 13.9% | ||||||||
| NCF DSCR(3) | 2.61x | 2.82x | 2.84x | 2.76x | 2.72x | ||||||||
| (1) | Country Inn & Suites Houston Intercontinental Airport East was out of service due to flood damage from May 2016 through January 2017. As of August 27, 2017, Country Inn & Suites Houston Intercontinental Airport East is out of service due to flood damage from Hurricane Harvey. |
| (2) | Underwritten per Room is based on a total of 6,366 rooms. |
| (3) | Based on the Starwood Capital Group Hotel Portfolio Loan Combination amount. |
| ■ | Appraisal.According to the appraisal, the Starwood Capital Group Hotel Portfolio Properties had an “As Portfolio” appraised value of $956,000,000 as of April 23, 2017. The “As Portfolio” value applies an 8.1% premium to the aggregate “as-is” value of the individual properties. The sum of the “as-is” and “As Renovated” values, as applicable, for each of the properties on an individual basis is $889.2 million. |
Appraisal Approach | Value | Discount | Terminal |
| Mortgage-Equity | $947,000,000 | NAP | 8.0% |
| EBITDA Multiple Based on First-Year EBITDA | $958,000,000 | 11.50% | NAP |
| EBITDA Multiple Based on Second-Year EBITDA | $959,000,000 | 11.25% | NAP |
| Direct Capitalization | $962,000,000 | 7.75% | NAP |
| Discounted Cash Flow Analysis | $943,000,000 | 10.25% | NAP |
| Reconciled “as-is” Market Value of Subject Portfolio | $956,000,000 | 7.72% | 8.0% |
The depositor has filed a registration statement (including a prospectus) with the Securities and Exchange Commission (“SEC”) (SEC File No. 333-207132) for the offering to which this communication relates. Before you invest, you should read the prospectus in the registration statement and other documents the depositor has filed with the SEC for more complete information about the depositor, the issuing entity and this offering. You may get these documents for free by visiting EDGAR on the SEC website at www.sec.gov. Alternatively, the depositor or Citigroup Global Markets Inc., Barclays Capital Inc., Drexel Hamilton, LLC or any other underwriter or dealer participating in this offering will arrange to send you the prospectus if you request it by calling toll-free 1-800-831-9146.
| 123 |
LOAN #8: starwood capital group hotel portfolio
| ■ | Environmental Matters. The Phase I environmental reports dated between March and April 2017 (each, an “ESA”) recommended no further action at the Starwood Capital Group Hotel Portfolio Properties, with the exception of the Hampton Inn Morehead and Hampton Inn Carlisle properties. With respect to the Hampton Inn Morehead property, the ESA recommended that certain surveys and limited subsurface investigations be conducted. With respect to the Hampton Inn Carlisle property, the ESA recommended that a regulatory file review be conducted. The borrowers obtained an environmental insurance policy in lieu of any post-origination remediation work for the Hampton Inn Morehead and Hampton Inn Carlisle properties. The policy was issued by Great American E&S Insurance Company with individual and aggregate claim limits of $1.0 million and a $25,000 deductible. The policy names the lender as a named insured, was paid in full on the origination date, and has an expiration date of May 24, 2030. The loan documents require that such environmental insurance include the same coverages, terms, conditions and endorsements (and may not be amended without the prior written consent of the lender) as the lender environmental policy approved at origination. |
| ■ | Market Overview and Competition. The Starwood Capital Group Hotel Portfolio Properties are located across 21 states and 56 cities, covering a broad geographical area with no individual state accounting for more than 16.8% of the portfolio’s total rooms or 30.7% of underwritten net cash flow. California represents the largest exposure to a single state, with 10 properties totaling 30.7% of underwritten net cash flow. Texas represents the second largest exposure to a single state, with 20 properties totaling 18.8% of total underwritten net cash flow. No other state accounts for more than 7.8% of total underwritten net cash flow. |
The following table presents certain information relating to occupancy, ADR and RevPAR at the Starwood Capital Group Hotel Portfolio Properties:
| Regional Summary | ||||||||||
Region | # Hotels | Rooms | % of Rooms | TTM Occupancy(1) | TTM ADR(1) | TTM RevPAR(1) | TTM RevPAR Penetration(1) | UW NCF | % of UW NCF | |
| California | 10 | 1,068 | 16.8% | 84.2% | $145.56 | $122.71 | 108.5% | $21,907,781 | 30.7% | |
| Texas | 20 | 1,753 | 27.5% | 69.9% | $104.82 | $73.59 | 131.2% | 13,438,906 | 18.8 | |
| Indiana | 5 | 525 | 8.2% | 77.4% | $109.06 | $83.34 | 114.0% | 5,560,538 | 7.8 | |
| Washington | 2 | 253 | 4.0% | 79.6% | $122.67 | $97.56 | 105.9% | 3,867,658 | 5.4 | |
| Michigan | 3 | 297 | 4.7% | 76.2% | $131.21 | $99.85 | 118.5% | 3,681,825 | 5.2 | |
| Ohio | 3 | 287 | 4.5% | 76.3% | $121.58 | $92.95 | 121.8% | 3,299,191 | 4.6 | |
| Illinois | 3 | 380 | 6.0% | 67.1% | $104.93 | $70.56 | 103.1% | 2,534,810 | 3.6 | |
| Pennsylvania | 3 | 243 | 3.8% | 77.1% | $123.01 | $94.83 | 191.7% | 2,532,793 | 3.6 | |
| Virginia | 2 | 228 | 3.6% | 72.3% | $118.96 | $86.15 | 131.4% | 2,234,852 | 3.1 | |
| Minnesota | 2 | 177 | 2.8% | 72.4% | $120.21 | $89.03 | 127.6% | 1,839,395 | 2.6 | |
| Oregon | 1 | 124 | 1.9% | 74.1% | $115.72 | $85.79 | 77.6% | 1,708,763 | 2.4 | |
| Kentucky | 1 | 106 | 1.7% | 72.9% | $135.94 | $99.11 | 102.1% | 1,388,767 | 1.9 | |
| New Jersey | 1 | 132 | 2.1% | 78.1% | $126.40 | $98.76 | 135.7% | 1,317,397 | 1.8 | |
| Arizona | 1 | 90 | 1.4% | 80.8% | $120.72 | $97.54 | 145.9% | 1,158,027 | 1.6 | |
| North Carolina | 1 | 118 | 1.9% | 66.6% | $108.23 | $72.10 | 139.7% | 1,094,065 | 1.5 | |
| Oklahoma | 2 | 131 | 2.1% | 72.3% | $94.31 | $68.74 | 148.7% | 830,723 | 1.2 | |
| Wyoming | 1 | 60 | 0.9% | 74.6% | $118.88 | $88.74 | 117.6% | 753,591 | 1.1 | |
| Connecticut | 1 | 135 | 2.1% | 56.7% | $131.41 | $74.49 | 116.3% | 752,132 | 1.1 | |
| Maryland | 1 | 109 | 1.7% | 79.9% | $97.48 | $77.87 | 139.2% | 657,471 | 0.9 | |
| Wisconsin | 1 | 62 | 1.0% | 68.6% | $115.68 | $79.34 | 154.1% | 603,823 | 0.8 | |
| Arkansas | 1 | 88 | 1.4% | 66.5% | $75.50 | $50.18 | 100.5% | 166,883 | 0.2 | |
| Total / Wtd. Avg. | 65 | 6,366 | 100.0% | 74.6% | $119.07 | $88.81 | 123.3% | $71,329,392 | 100.0% | |
| (1) | TTM Occupancy, TTM ADR and TTM RevPAR are based on borrower-provided operating statements dated as of March 31, 2017, and weighted based on available rooms and occupied rooms, as applicable. TTM RevPAR Penetration is calculated based on operating statements provided by the borrowers and competitive set data for each property provided by a third party hospitality research report, and weighted based on total rooms. The variances between the underwriting, the hospitality research report and the above table with respect to Occupancy, ADR and RevPAR at the Starwood Capital Group Hotel Portfolio Properties are attributable to variances in reporting methodologies and/or timing differences. |
Historically, the portfolio as a whole has outperformed its competitive set with occupancy, ADR and RevPAR penetration rates each in excess of 100.0% for 2014 through the trailing 12-month period ending March 31, 2017. Additionally, on a more granular level, the portfolio generally has outperformed on an individual basis, with 80.1% of the portfolio based on room count achieving a RevPAR penetration in excess of 100.0% for the trailing 12-month period ending March 31, 2017.
The depositor has filed a registration statement (including a prospectus) with the Securities and Exchange Commission (“SEC”) (SEC File No. 333-207132) for the offering to which this communication relates. Before you invest, you should read the prospectus in the registration statement and other documents the depositor has filed with the SEC for more complete information about the depositor, the issuing entity and this offering. You may get these documents for free by visiting EDGAR on the SEC website at www.sec.gov. Alternatively, the depositor or Citigroup Global Markets Inc., Barclays Capital Inc., Drexel Hamilton, LLC or any other underwriter or dealer participating in this offering will arrange to send you the prospectus if you request it by calling toll-free 1-800-831-9146.
| 124 |
LOAN #8: starwood capital group hotel portfolio
The following table presents certain information relating to historic occupancy, ADR and RevPAR at Starwood Capital Group Hotel Portfolio Properties:
Historical Statistics(1)
Starwood Capital Group Hotel Portfolio | Competitive Set(2) | Penetration(3) | ||||||||||||||||
Occupancy(4) | ADR(4) | RevPAR(4) | Occupancy(4) | ADR(4) | RevPAR(4) | Occupancy(4) | ADR(4) | RevPAR(4) | ||||||||||
| 2014 | 73.7% | $112.28 | $82.80 | 66.0% | $103.25 | $67.56 | 111.7% | 108.7% | 122.6% | |||||||||
| 2015 | 74.8% | $116.76 | $87.29 | 66.6% | $108.28 | $71.42 | 112.2% | 107.8% | 122.2% | |||||||||
| 2016 | 74.7% | $119.48 | $89.23 | 65.9% | $110.28 | $71.95 | 113.4% | 108.3% | 124.0% | |||||||||
| T-12 Mar 2017 | 74.6% | $119.07 | $88.81 | 65.9% | $110.31 | $72.05 | 113.1% | 107.9% | 123.3% | |||||||||
| (1) | The variances between the underwriting, the hospitality research report and the above table with respect to Occupancy, ADR and RevPAR at theStarwood Capital GroupHotel Portfolio are attributable to variances in reporting methodologies and/or timing differences. |
| (2) | Competitive Set data for each individual property provided from a third party hospitality research report. |
| (3) | Penetration Factor data for each individual property is calculated based on operating statements provided by the borrowers and competitive set data provided by a third party hospitality research report. Portfolio level statistics are weighted based on total room count. |
| (4) | Based on operating statements provided by the borrowers and weighted based on available rooms and occupied rooms, as applicable. |
| ■ | The Borrowers.The borrowers consist of 92 single purpose, Delaware limited liability companies and 36 single purpose, Delaware limited partnerships, each structured to be bankruptcy remote, with two independent directors in its organizational structure. Legal counsel to the borrowers delivered a non-consolidation opinion in connection with the origination of the Starwood Capital Group Hotel Portfolio Loan Combination. |
The sponsor of the borrowers and nonrecourse carve-out guarantor is SCG Hotel Investors Holdings, L.P., an affiliate of Starwood Capital Group (“SCG”). The aggregate recourse to the guarantor related to bankruptcy or insolvency actions may not exceed an amount equal to 20% of the principal balance of the Starwood Capital Group Hotel Portfolio Loan Combination outstanding at the time of the occurrence of such event, plus reasonable third-party costs incurred by the lender in connection with the enforcement of its rights. For additional information, see“Description of the Mortgage Pool–Non-Recourse Carveout Limitations”in the Preliminary Prospectus. SCG is a private alternative investment firm with a primary focus on global real estate. Since its inception in 1991, SCG has raised over $40 billion of equity capital and currently manages over $51 billion in assets. Over the past 26 years, SCG has acquired over $86.5 billion of assets across virtually every major real estate asset class. SCG directly employs over 2,200 professionals and approximately 16,000 additional employees through various portfolio operating companies through offices in Atlanta, Chicago, Greenwich, Hong Kong, London, Los Angeles, Luxembourg, Miami, San Francisco and Washington, D.C.
The borrowing entities, borrower sponsor and non-recourse carveout guarantor under the Starwood Capital Group Hotel Portfolio Loan Combination are affiliates of (i) SMF V, a sponsor and mortgage loan seller and (ii) Starwood Mortgage Funding II LLC, who currently holds note A-15 of the Starwood Capital Group Hotel Portfolio Loan Combination.
| ■ | Escrows. At origination, the borrowers deposited (i) $6,385,000 into a Larkspur Landing capital work and FF&E reserve account to be used towards capital work and FF&E expenditures only at the Larkspur Landing flagged properties and (ii) $5,883,991 into a general capital work reserve account to be used towards existing capital improvement and property improvement plan work as described in the loan documents. |
Upon the occurrence and during the continuance of a Trigger Period (as defined below), on a monthly basis, the borrowers are required to make deposits of (i) one-twelfth of the required annual taxes, (ii) one-twelfth of the annual insurance premiums if, among other things, (a) an acceptable blanket policy is no longer in place or (b) an event of default has occurred and is continuing, and (iii) one-twelfth of the ground rent that lender reasonably estimates will be payable under the ground lease encumbering the single leasehold property.
On a monthly basis, regardless of whether a Trigger Period has occurred and is continuing, the borrowers are required to make deposits equal to one-twelfth of the greater of (a) 4.0% of gross revenue for the calendar month that is two months prior to the applicable payment date and (b) the amount required under the franchise agreement for FF&E work (initially $727,736).
The depositor has filed a registration statement (including a prospectus) with the Securities and Exchange Commission (“SEC”) (SEC File No. 333-207132) for the offering to which this communication relates. Before you invest, you should read the prospectus in the registration statement and other documents the depositor has filed with the SEC for more complete information about the depositor, the issuing entity and this offering. You may get these documents for free by visiting EDGAR on the SEC website at www.sec.gov. Alternatively, the depositor or Citigroup Global Markets Inc., Barclays Capital Inc., Drexel Hamilton, LLC or any other underwriter or dealer participating in this offering will arrange to send you the prospectus if you request it by calling toll-free 1-800-831-9146.
| 125 |
LOAN #8: starwood capital group hotel portfolio
| ■ | Lockbox and Cash Management.The Starwood Capital Group Hotel Portfolio Loan Combination is structured with a soft springing lockbox and springing cash management. At origination, the borrowers established seven lender-controlled lockbox accounts. Prior to the occurrence of a Cash Management Trigger Period (as defined below), all sums payable to the borrowers under the related property management agreements, after the property managers have paid all amounts required to be paid under such agreements, are required to be deposited directly into the applicable lender-controlled lockbox account within two business days of receipt. Upon the occurrence and during the continuance of a Cash Management Trigger Period, the borrowers or managers are required to (i) deposit all revenues received by the borrowers and property managers directly into such lockbox accounts within two business days of receipt and (ii) cause all credit card companies or clearing banks to deliver all receipts directly into the applicable lender-controlled lockbox account. All funds in the clearing account are required to be transferred on a daily basis into the applicable lender-controlled cash management account and then to the applicable borrower’s operating account, unless a Trigger Period (as defined below) has occurred and is continuing, in which case such funds are required to be swept each business day into the applicable lender-controlled cash management account and disbursed on each payment date as set forth in the Starwood Capital Group Hotel Portfolio Loan documents. Upon the occurrence and during the continuance of a Trigger Period, all excess cash flow is required to be swept into the applicable cash management account and held by the lender as additional collateral for the Starwood Capital Group Hotel Portfolio Loan Combination. |
A“Cash Management Trigger Period” will commence upon the debt service coverage ratio (as calculated in the loan documents) for the Starwood Capital Group Hotel Portfolio Loan Combination falling below 2.00x. A Cash Management Trigger Period will cease to exist upon the debt service coverage ratio (as calculated in the loan documents) being at least 2.00x for two consecutive calendar quarters.
A “Trigger Period” will commence upon (i) an event of default under the loan documents, (ii) any bankruptcy or insolvency action of any property manager, (iii) any termination, expiration or cancellation of a franchise agreement or the Larkspur Landing license agreement in violation of the loan documents, (iv) the debt service coverage ratio (as calculated in the loan documents) for the Starwood Capital Group Hotel Portfolio Loan Combination falling below 1.75x, or (v) any borrower being subject to an involuntary bankruptcy or insolvency action.
A Trigger Period will cease to exist upon: (a) with respect to clause (i) above, a cure of the event of default being accepted by the lender in its sole and absolute discretion, (b) with respect to clause (ii) above, the borrowers entering into a replacement management agreement with a qualified manager within 60 days of the initial bankruptcy or insolvency action (provided that such 60-day period may be extended an additional 30 days upon borrowers’ written request at lender’s reasonable discretion), (c) with respect to clause (iii) above, the borrowers entering into a replacement franchise agreement with a qualified franchisor within 60 days of the existing franchise agreement expiration, cancellation or termination (provided that such 60-day period may be extended an additional 30 days upon borrowers’ written request at lender’s reasonable discretion), (d) with respect to clause (iv) above, the debt service coverage ratio (as defined in the loan documents) being at least 1.75x for two consecutive calendar quarters, which may be achieved by a prepayment of principal or deposit of cash in an amount such that the debt service coverage ratio is at least 1.75x for two consecutive calendar quarters (provided such prepayment is to be accompanied by the applicable yield maintenance premium). In addition, a Trigger Period related to one individual property can be cured by the release of that individual property in accordance with the conditions set forth below under “Partial Release of Collateral”.
The depositor has filed a registration statement (including a prospectus) with the Securities and Exchange Commission (“SEC”) (SEC File No. 333-207132) for the offering to which this communication relates. Before you invest, you should read the prospectus in the registration statement and other documents the depositor has filed with the SEC for more complete information about the depositor, the issuing entity and this offering. You may get these documents for free by visiting EDGAR on the SEC website at www.sec.gov. Alternatively, the depositor or Citigroup Global Markets Inc., Barclays Capital Inc., Drexel Hamilton, LLC or any other underwriter or dealer participating in this offering will arrange to send you the prospectus if you request it by calling toll-free 1-800-831-9146.
| 126 |
LOAN #8: starwood capital group hotel portfolio
| ■ | Property Management. The Starwood Capital Group Hotel Portfolio Properties are subject to operating agreements (“Operating Agreements”) with affiliates of Starwood Capital Group Hotel Investors Holdings, L.P. (the “Operators”) pursuant to which the Operators are responsible for the management of the Starwood Capital Group Hotel Portfolio Properties. The Operators subcontract such management responsibilities under management agreements with the following five managers: Hersha Hospitality Management L.P. (“Hersha”), First Hospitality Group, Inc. (“First Hospitality”), Schulte Hospitality Group, Inc. (“Schulte”), TMI Property Management, L.L.C. (“TMI”) and Pillar Hotels and Resorts, LLC (“Pillar”). The lender has the right to direct the borrowers to terminate the property management agreement and replace the property manager if (i) the property manager becomes the subject of a voluntary or involuntary bankruptcy action, (ii) there exists an event of default under the Starwood Capital Group Hotel Portfolio Loan Combination and the lender has accelerated all or a portion of the debt, or (iii) there exists a monetary or material non-monetary default by the property manager or any other condition under the management agreement, which if not remedied within any applicable notice, grace and/or cure period, would (A) give borrowers the right to terminate the management agreement and (B) reasonably be expected to cause a material adverse effect on the business of the borrowers, their ability to perform under the Starwood Capital Group Hotel Portfolio Loan documents or the SGC Hotel Portfolio Properties. The borrowers have the right to replace the property manager without the lender’s consent, provided no event of default is continuing under the Starwood Capital Group Hotel Portfolio Loan documents, with a Qualified Manager (as defined below) provided that the borrowers enter into a replacement property management agreement and an assignment of management agreement on term reasonably acceptable to the lender, and, if the new property manager is an affiliate of the borrowers, deliver an updated non-consolidation opinion. |
A “Qualified Manager” means (a) (i) Starwood Capital Group Global, L.P., (ii) Starwood Capital Group Global II, L.P., or (iii) Starwood Capital Group Global I, L.L.C., as long as such entities are under common control, or any affiliate controlled by the foregoing, (b) SCG Hotel Investors Holdings, L.P. (or any replacement guarantor) or any affiliate under common control with the foregoing, (c) any of First Hospitality, Schulte, Aimbridge, TMI or Hersha (or a controlled affiliate thereof), or (d) a reputable and experienced manager (which may be an affiliate of a borrower) which, in the reasonable judgment of the lender, possesses experience in managing properties similar in size, class, use and operation as the SGC Hotel Portfolio Properties; provided, that borrowers shall have obtained (i) a rating agency confirmation, with respect to clause (d) only, and (ii) if such person is an affiliate of a borrower, an additional non-consolidation opinion; provided, further, in order for any entity to qualify as a “Qualified Manager” under clauses (a), (b), (c), or (d) above, the lender receives satisfactory search results with respect to such entity.
| Management Company Distribution | |||||||
| Management Company | # Hotels | Rooms | % Rooms | UW NCF | % of Total UW NCF | Appraised Value(1) | Per Room |
| Hersha | 39 | 3,859 | 60.6% | $44,857,243 | 62.9% | $565,900,000 | $146,644 |
| First Hospitality | 9 | 981 | 15.4 | 12,107,023 | 17.0 | 137,400,000 | $140,061 |
| TMI | 9 | 666 | 10.5 | 6,259,518 | 8.8 | 87,600,000 | $131,532 |
| Schulte | 6 | 692 | 10.9 | 5,458,243 | 7.7 | 69,700,000 | $100,723 |
| Pillar | 2 | 168 | 2.6 | 2,647,365 | 3.7 | 28,600,000 | $170,238 |
| Total | 65 | 6,366 | 100.0% | $71,329,392 | 100.0% | $956,000,000 | $150,173 |
| (1) | The “As Portfolio” Appraised Value of $956.0 million for the Starwood Capital Group Hotel Portfolio Properties as a whole reflects an 8.1% premium to the aggregate “as-is” value of the individual properties. The sum of the “as-is” and “As Renovated” values, as applicable, for each of the properties on an individual basis is $889.2 million. Additionally, the aggregate “as-is” value for each individual property as of April 23, 2017 is $884.7 million. |
| ■ | Current Mezzanine or Secured Subordinate Indebtedness. None. |
The depositor has filed a registration statement (including a prospectus) with the Securities and Exchange Commission (“SEC”) (SEC File No. 333-207132) for the offering to which this communication relates. Before you invest, you should read the prospectus in the registration statement and other documents the depositor has filed with the SEC for more complete information about the depositor, the issuing entity and this offering. You may get these documents for free by visiting EDGAR on the SEC website at www.sec.gov. Alternatively, the depositor or Citigroup Global Markets Inc., Barclays Capital Inc., Drexel Hamilton, LLC or any other underwriter or dealer participating in this offering will arrange to send you the prospectus if you request it by calling toll-free 1-800-831-9146.
| 127 |
LOAN #8: starwood capital group hotel portfolio
| ■ | Future Mezzanine or Secured Subordinate Indebtedness. From and after the date that is the earlier of (i) May 24, 2018 and (ii) the date that all notes comprising the Starwood Capital Group Hotel Portfolio Loan Combination have been securitized, certain direct and indirect owners of the borrowers are permitted to obtain mezzanine financing secured by the direct or indirect ownership interests in the borrowers upon satisfaction of certain terms and conditions including, among others, (i) no event of default has occurred and is continuing, (ii) the combined loan-to-value ratio does not exceed 64.9%, (iii) the combined debt service coverage ratio (calculated as described in the Starwood Capital Group Hotel Portfolio Loan documents) is not less than 2.65x, (iv) in the event that the mezzanine loan bears a floating rate of interest, the mezzanine borrowers have obtained an interest rate cap agreement from a provider reasonably acceptable to the mortgage lender containing a strike rate that provides for a debt service coverage ratio of not greater than 1.75x, (v) the mezzanine lenders have entered into an intercreditor agreement reasonably acceptable to the mortgage lender, and (vi) the borrowers deliver a rating agency confirmation. |
| ■ | Ground Lease. The Hilton Garden Inn Edison Raritan Center property is subject to a ground lease, which has a current annual net rent of $275,517 (and is subject to increases every five years under the ground lease) and expires on September 30, 2076, with no extension options. Please see“Description of the Mortgage Pool—Statistical Characteristics of the Mortgage Loans—Leasehold Interests”, as well as representation and warranty number 34 under“Annex E-1 Sponsor Representations and Warranties” and the exceptions thereto in the Preliminary Prospectus for additional information regarding the risks associated with this ground lease. |
| ■ | Partial Release of Collateral. After June 1, 2018, the borrowers may obtain the release of an individual property or properties from the lien of the Starwood Capital Group Hotel Portfolio Loan Combination subject to, among other terms and conditions: (i) no monetary event of default has occurred and is continuing, (ii) the remaining collateral has a debt service coverage ratio (as calculated in the loan documents) of no less than the greater of (a) 2.65x and (b) the debt service coverage ratio in place immediately prior to the release and (iii) payment of a Release Price (as defined below), together with the related yield maintenance premium associated with the Release Price, provided the debt service coverage ratio test may be satisfied with an additional prepayment of principal (with the related yield maintenance premium, as applicable) or a cash deposit with the lender in an amount reasonably determined by the lender to meet such test. |
The “Release Price” is an amount equal to (a) if less than $57,727,000 has been prepaid to date, 105% of the allocated loan amount of each such individual property, (b) if less than $86,590,500 has been prepaid to date, 110% of the allocated loan amount of each such individual property, (c) if less than $115,454,000 has been prepaid to date, 115% of the allocated loan amount of each such individual property and (d) (x) for all amounts prepaid in excess of $115,454,000 or (y) if any release property is to be conveyed to an affiliate of the borrowers, principals, operating companies or guarantors, 120% of the allocated loan amount of each such individual property.
In addition, with respect to the Holiday Inn Express & Suites Terrell property, pursuant to a recorded declaration, Tanger Properties Limited Partnership, together with its successors and assignees, has the right to purchase the property in the event of a breach of the covenants, conditions and restrictions in such declaration. In the event that such purchase option is exercised, the applicable borrower entity is required to promptly cause the release of the property in compliance with the release provisions described above (except that the applicable borrower entity may release the property during the lockout period with payment of the applicable yield maintenance premium). The Starwood Capital Group Hotel Portfolio Loan Combination documents require that any release of such property in connection with the exercise of the purchase option be in compliance with the release provisions described above (except that the release may occur on or prior to June 1, 2018 with payment of the applicable yield maintenance premium). The Starwood Capital Group Hotel Portfolio Loan Combination is recourse to the guarantor for any losses suffered by the lender if and when the purchase option is exercised.
| ■ | Terrorism Insurance. The Starwood Capital Group Hotel Portfolio Loan documents require that the “all risks” insurance policy required to be maintained by the borrowers provide coverage for terrorism in an amount equal to the full replacement cost of the Starwood Capital Group Hotel Portfolio Properties. Terrorism coverage is provided under a stand-alone policy for both foreign and domestic acts with a sublimit of $500,000,000 per occurrence and in the annual aggregate, subject to a $25,000 deductible. See “Risk Factors—Terrorism Insurance May Not Be Available for All Mortgaged Properties” in the Preliminary Prospectus. |
The depositor has filed a registration statement (including a prospectus) with the Securities and Exchange Commission (“SEC”) (SEC File No. 333-207132) for the offering to which this communication relates. Before you invest, you should read the prospectus in the registration statement and other documents the depositor has filed with the SEC for more complete information about the depositor, the issuing entity and this offering. You may get these documents for free by visiting EDGAR on the SEC website at www.sec.gov. Alternatively, the depositor or Citigroup Global Markets Inc., Barclays Capital Inc., Drexel Hamilton, LLC or any other underwriter or dealer participating in this offering will arrange to send you the prospectus if you request it by calling toll-free 1-800-831-9146.
| 128 |
(THIS PAGE INTENTIONALLY LEFT BLANK)
The depositor has filed a registration statement (including a prospectus) with the Securities and Exchange Commission (“SEC”) (SEC File No. 333-207132) for the offering to which this communication relates. Before you invest, you should read the prospectus in the registration statement and other documents the depositor has filed with the SEC for more complete information about the depositor, the issuing entity and this offering. You may get these documents for free by visiting EDGAR on the SEC website at www.sec.gov. Alternatively, the depositor or Citigroup Global Markets Inc., Barclays Capital Inc., Drexel Hamilton, LLC or any other underwriter or dealer participating in this offering will arrange to send you the prospectus if you request it by calling toll-free 1-800-831-9146.
| 129 |
LOAN #9: grant building
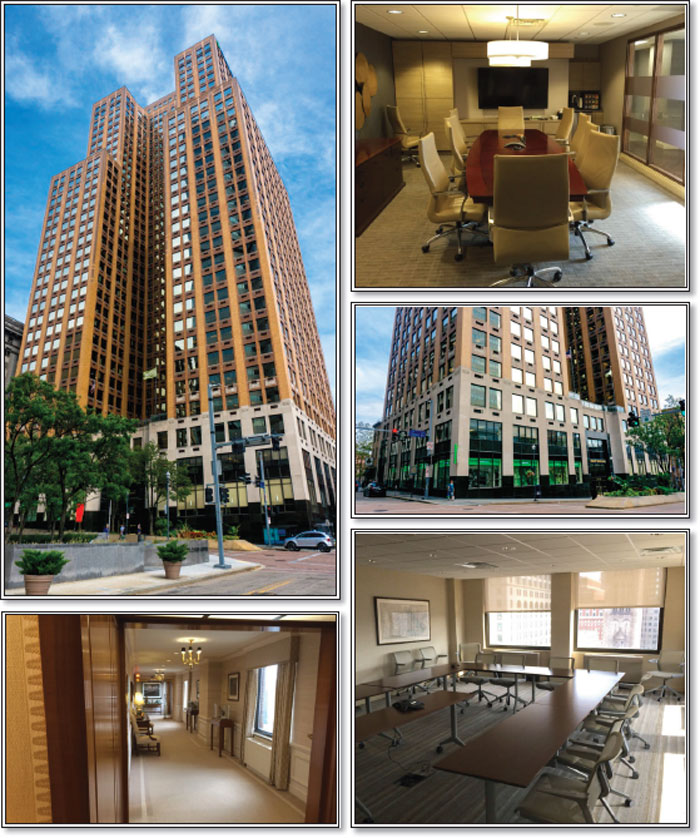
The depositor has filed a registration statement (including a prospectus) with the Securities and Exchange Commission (“SEC”) (SEC File No. 333-207132) for the offering to which this communication relates. Before you invest, you should read the prospectus in the registration statement and other documents the depositor has filed with the SEC for more complete information about the depositor, the issuing entity and this offering. You may get these documents for free by visiting EDGAR on the SEC website at www.sec.gov. Alternatively, the depositor or Citigroup Global Markets Inc., Barclays Capital Inc., Drexel Hamilton, LLC or any other underwriter or dealer participating in this offering will arrange to send you the prospectus if you request it by calling toll-free 1-800-831-9146.
| 130 |
LOAN #9: grant building
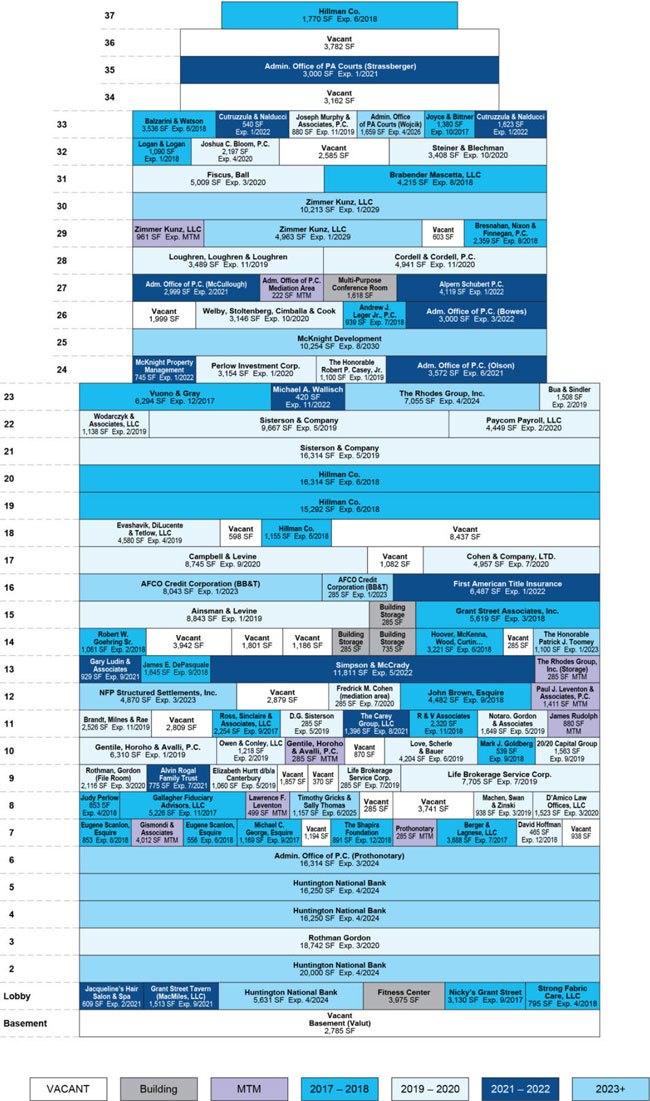
The depositor has filed a registration statement (including a prospectus) with the Securities and Exchange Commission (“SEC”) (SEC File No. 333-207132) for the offering to which this communication relates. Before you invest, you should read the prospectus in the registration statement and other documents the depositor has filed with the SEC for more complete information about the depositor, the issuing entity and this offering. You may get these documents for free by visiting EDGAR on the SEC website at www.sec.gov. Alternatively, the depositor or Citigroup Global Markets Inc., Barclays Capital Inc., Drexel Hamilton, LLC or any other underwriter or dealer participating in this offering will arrange to send you the prospectus if you request it by calling toll-free 1-800-831-9146.
| 131 |
LOAN #9: grant building
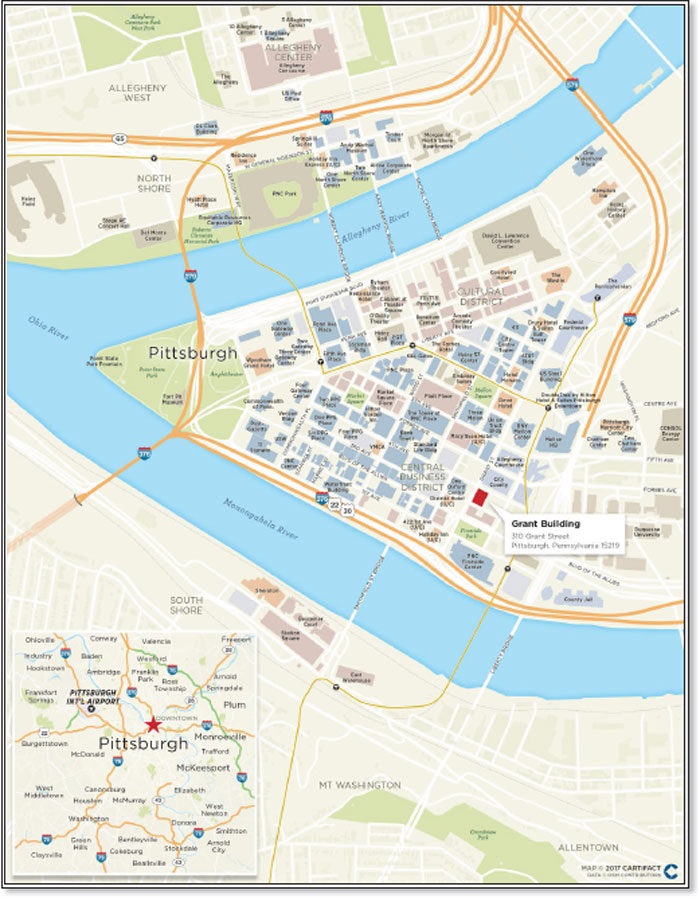
The depositor has filed a registration statement (including a prospectus) with the Securities and Exchange Commission (“SEC”) (SEC File No. 333-207132) for the offering to which this communication relates. Before you invest, you should read the prospectus in the registration statement and other documents the depositor has filed with the SEC for more complete information about the depositor, the issuing entity and this offering. You may get these documents for free by visiting EDGAR on the SEC website at www.sec.gov. Alternatively, the depositor or Citigroup Global Markets Inc., Barclays Capital Inc., Drexel Hamilton, LLC or any other underwriter or dealer participating in this offering will arrange to send you the prospectus if you request it by calling toll-free 1-800-831-9146.
| 132 |
LOAN #9: grant building
| Mortgaged Property Information | Mortgage Loan Information | ||||
| Number of Mortgaged Properties | 1 | Loan Seller | SMF V | ||
| Location (City/State) | Pittsburgh, Pennsylvania | Cut-off Date Balance | $38,000,000 | ||
| Property Type | Office | Cut-off Date Balance per SF | $82.43 | ||
| Size (SF) | 461,006 | Percentage of Initial Pool Balance | 3.5% | ||
| Total Occupancy as of 7/6/2017 | 89.5% | Number of Related Mortgage Loans | None | ||
| Owned Occupancy as of 7/6/2017 | 89.5% | Type of Security | Fee Simple | ||
| Year Built / Latest Renovation | 1929 / 2006 | Mortgage Rate | 4.70000% | ||
| Appraised Value | $58,100,000 | Original Term to Maturity (Months) | 120 | ||
| Appraisal Date | 6/15/2017 | Original Amortization Term (Months) | 360 | ||
| Borrower Sponsors | William C. Rudolph; Charles S. Perlow | Original Interest Only Period (Months) | 48 | ||
| Property Management | McKnight Property Management LLC | First Payment Date | 9/6/2017 | ||
| Maturity Date | 8/6/2027 | ||||
| Underwritten Revenues | $9,195,858 | ||||
| Underwritten Expenses | $4,937,318 | Escrows(1) | |||
| Underwritten Net Operating Income (NOI) | $4,258,540 | Upfront | Monthly | ||
| Underwritten Net Cash Flow (NCF) | $3,687,545 | Taxes | $93,536 | $67,895 | |
| Cut-off Date LTV Ratio | 65.4% | Insurance | $44,917 | $6,417 | |
| Maturity Date LTV Ratio | 58.8% | Replacement Reserve | $0 | $7,683 | |
| DSCR Based on Underwritten NOI / NCF | 1.80x / 1.56x | TI/LC | $1,000,000 | $38,417 | |
| Debt Yield Based on Underwritten NOI / NCF | 11.2% / 9.7% | Other(2) | $489,983 | $0 | |
| Sources and Uses | ||||||
| Sources | $ | % | Uses | $ | % | |
| Loan Amount | $38,000,000 | 90.5% | Loan Payoff | $35,489,178 | 84.5% | |
| Mezzanine Loan Amount | 4,000,000 | 9.5 | Return of Equity | 3,814,304 | 9.1 | |
| Reserves | 1,628,436 | 3.9 | ||||
| Closing Costs | 1,068,082 | 2.5 | ||||
| Total Sources | $42,000,000 | 100.0% | Total Uses | $42,000,000 | 100.0% | |
| (1) | See“—Escrows” below. |
| (2) | The upfront other reserve is comprised of an outstanding tenant improvements and leasing commissions related to Huntington National Bank ($262,500) and a prepaid rent reserve related to Balzarini & Watson ($227,483). See“—Escrows” below. |
| ■ | The Mortgage Loan. The mortgage loan (the“Grant Building Loan”) is evidenced by a note in the original principal amount of $38,000,000 and is secured by a first mortgage encumbering the borrower’s fee simple interest in a multi-tenant office building located in Pittsburgh, Pennsylvania (the“Grant Building Property”). The Grant Building Loan was originated by Starwood Mortgage Capital LLC on July 13, 2017 and represents approximately 3.5% of the Initial Pool Balance. The note evidencing the Grant Building Loan has an outstanding principal balance as of the Cut-off Date of $38,000,000 and an interest rate of 4.70000%per annum. The proceeds of the Grant Building Loan and $4,000,000 in the form of a mezzanine loan were primarily used to refinance prior debt secured by the Grant Building Property, return equity to the borrower sponsors, fund reserves and pay origination costs. |
The Grant Building Loan had an initial term of 120 months and has a remaining term of 119 months as of the Cut-off Date. The Grant Building Loan requires monthly payments of interest only for the initial 48 months, followed by monthly payments of principal and interest sufficient to amortize the Grant Building Loan over a 30-year amortization schedule. The scheduled maturity date of the Grant Building Loan is the due date in August 2027. At any time after the earlier of July 13, 2020 and the second anniversary of the securitization Closing Date, the Grant Building Loan may be defeased with certain direct full faith and credit obligations of the United States of America or other obligations which are “government securities” permitted under the Grant Building Loan documents. Voluntary prepayment of the Grant Building Loan is permitted on or after the due date occurring in May 2027 without payment of any prepayment premium.
| ■ | The Mortgaged Property. The Grant Building Property is comprised of a 461,006 SF, 37-story, high-rise office building that is located within Allegheny County, in Pittsburgh, Pennsylvania. The Grant Building Property is located in downtown Pittsburgh, adjacent to the County Courthouse, the City/County Building and the Allegheny County Family and Juvenile Courts. After acquiring the Grant Building Property in 2006, the borrower sponsors invested approximately $20.8 million in tenant improvements and leasing commissions and renovations. Renovation work at the 37-story Class A office building included adding a tenant-only fitness center, renovating the five-story, 215-car parking garage, modernizing the elevators and upgrading bathrooms and corridors. |
The depositor has filed a registration statement (including a prospectus) with the Securities and Exchange Commission (“SEC”) (SEC File No. 333-207132) for the offering to which this communication relates. Before you invest, you should read the prospectus in the registration statement and other documents the depositor has filed with the SEC for more complete information about the depositor, the issuing entity and this offering. You may get these documents for free by visiting EDGAR on the SEC website at www.sec.gov. Alternatively, the depositor or Citigroup Global Markets Inc., Barclays Capital Inc., Drexel Hamilton, LLC or any other underwriter or dealer participating in this offering will arrange to send you the prospectus if you request it by calling toll-free 1-800-831-9146.
| 133 |
LOAN #9: grant building
The Grant Building Property is located on an approximately 0.5-acre site. It is designed as a multi-tenant property and equipped with a full service bank and ATM, conference room, dry cleaner, on-site restaurant, tavern, newsstand, hair salon and 24-hour concierge and security desk. The Grant Building Property also includes an attached, below-ground five-story parking garage which contains 215 spaces for a parking capacity of 0.5 spaces per 1,000 SF. According to the appraisal, parking is at a premium in the downtown Pittsburgh CBD with many properties having no onsite parking, which provides a competitive advantage to the Grant Building Property.
The Grant Building Property is currently 89.5% occupied by 94 tenants. Over the last five years, the occupancy level at the Grant Building Property has averaged approximately 90.3%. The largest tenant at the Grant Building Property is Huntington National Bank (Fitch: A-; Moody’s: A3; S&P: BBB+). Huntington National Bank has been at the Grant Building Property since 2011 and has a lease through April 30, 2024. The Grant Building Property serves as Huntington National Bank’s regional headquarters. Under its lease, Huntington National Bank occupies a total of 58,131 SF, consisting of 52,500 SF of office space and 5,631 SF of retail/branch space, at an average underwritten base rent of $20.91 per SF.
The following table presents certain information relating to historical leasing at the Grant Building Property:
Historical Leased %(1)
2013 | 2014 | 2015 | 2016 | As of 7/6/2017(2) | |
| Owned Space | 92.6% | 90.6% | 88.5% | 88.6% | 89.5% |
| (1) | As provided by the borrower and which represents average occupancy for the indicated year unless otherwise specified. |
| (2) | Based on the underwritten rent roll dated July 6, 2017. |
The following table presents certain information relating to the major tenants at the Grant Building Property:
Ten Largest Owned Tenants Based on Underwritten Base Rent(1)
Tenant Name | Credit Rating (Fitch/MIS/S&P)(2) | Tenant GLA | % of | UW Base | % of Total | UW Base | Lease Expiration | Renewal / Extension | ||||||||
| Huntington National Bank(3) | A- / A3 / BBB+ | 58,131 | 12.6% | $1,215,383 | 14.3% | $20.91 | 4/30/2024 | 3, 5-year options | ||||||||
| Hillman Co. | NR / NR / NR | 34,531 | 7.5 | 759,682 | 9.0 | $22.00 | 6/30/2018 | N/A | ||||||||
| Sisterson & Company | NR / NR / NR | 25,981 | 5.6 | 558,591 | 6.6 | $21.50 | 5/31/2019 | N/A | ||||||||
| Rothman Gordon | NR / NR / NR | 18,742 | 4.1 | 375,444 | 4.4 | $20.03 | 3/31/2020 | N/A | ||||||||
| Zimmer Kunz, LLC | NR / NR / NR | 16,422 | 3.6 | 333,872 | 3.9 | $20.33 | 1/31/2029 | Various(4) | ||||||||
| Admin. Office of P.C. | NR / NR / NR | 16,314 | 3.5 | 301,809 | 3.6 | $18.50 | 3/31/2024 | N/A | ||||||||
| Simpson & McCrady | NR / NR / NR | 11,811 | 2.6 | 271,653 | 3.2 | $23.00 | 5/31/2022 | N/A | ||||||||
| McKnight Development(5) | NR / NR / NR | 10,254 | 2.2 | 205,080 | 2.4 | $20.00 | 8/31/2030 | N/A | ||||||||
| Campbell & Levine | NR / NR / NR | 8,745 | 1.9 | 196,762 | 2.3 | $22.50 | 9/30/2020 | N/A | ||||||||
| Ainsman & Levine | NR / NR / NR | 8,843 | 1.9 | 194,546 | 2.3 | $22.00 | 1/31/2019 | 2, 5-year options | ||||||||
| Ten Largest Owned Tenants | 209,774 | 45.5% | $4,412,823 | 52.1% | $21.04 | |||||||||||
| Remaining Tenants | 203,022 | 44.0 | 4,062,088 | 47.9 | $20.01 | |||||||||||
| Vacant | 48,210 | 10.5 | 0 | 0.0 | $0.00 | |||||||||||
| Total / Wtd. Avg. All Tenants | 461,006 | 100.0% | $8,474,911 | 100.0% | $20.53 | |||||||||||
| (1) | Based on the underwritten rent roll dated July 6, 2017. |
| (2) | Certain ratings are those of the parent company whether or not the parent guarantees the lease. |
| (3) | Huntington National Bank is rated investment grade and its UW Base Rent is underwritten based on the average rent of its remaining lease term. Huntington National Bank is currently paying $20.16 per SF. Huntington National Bank occupies a total of 58,131 SF, consisting of 52,500 SF of office space and 5,631 SF of retail/branch space, at an average UW Base Rent of $20.91 per SF. |
| (4) | Zimmer Kunz, LLC has one five-year renewal option and one two-year renewal option remaining. |
| (5) | Borrower sponsor affiliated. |
The depositor has filed a registration statement (including a prospectus) with the Securities and Exchange Commission (“SEC”) (SEC File No. 333-207132) for the offering to which this communication relates. Before you invest, you should read the prospectus in the registration statement and other documents the depositor has filed with the SEC for more complete information about the depositor, the issuing entity and this offering. You may get these documents for free by visiting EDGAR on the SEC website at www.sec.gov. Alternatively, the depositor or Citigroup Global Markets Inc., Barclays Capital Inc., Drexel Hamilton, LLC or any other underwriter or dealer participating in this offering will arrange to send you the prospectus if you request it by calling toll-free 1-800-831-9146.
| 134 |
LOAN #9: grant building
The following table presents the lease rollover schedule at the Grant Building Property, based on initial lease expiration dates:
Lease Expiration Schedule(1)(2)
Year Ending December 31, | Expiring Owned GLA | % of Owned | Cumulative % of Owned GLA | UW | % of Total UW | UW Base Rent | # of Expiring Tenants | |||||||||||||
| MTM(3) | 19,846 | 4.3 | % | 4.3% | $191,139 | 2.3 | % | $18.89 | 14 | |||||||||||
| 2017 | 19,453 | 4.2 | 8.5% | 360,887 | 4.3 | $18.55 | 6 | |||||||||||||
| 2018 | 71,193 | 15.4 | 24.0% | 1,493,038 | 17.6 | $20.97 | 20 | |||||||||||||
| 2019 | 73,754 | 16.0 | 40.0% | 1,584,998 | 18.7 | $21.49 | 16 | |||||||||||||
| 2020 | 60,556 | 13.1 | 53.1% | 1,290,738 | 15.2 | $21.31 | 12 | |||||||||||||
| 2021 | 14,793 | 3.2 | 56.3% | 309,217 | 3.6 | $20.90 | 8 | |||||||||||||
| 2022 | 28,205 | 6.1 | 62.4% | 643,246 | 7.6 | $22.81 | 8 | |||||||||||||
| 2023 | 14,013 | 3.0 | 65.5% | 324,273 | 3.8 | $23.14 | 3 | |||||||||||||
| 2024 | 81,500 | 17.7 | 83.1% | 1,675,930 | 19.8 | $20.56 | 3 | |||||||||||||
| 2025 | 1,157 | 0.3 | 83.4% | 23,718 | 0.3 | $20.50 | 1 | |||||||||||||
| 2026 | 1,650 | 0.4 | 83.8% | 38,775 | 0.5 | $23.50 | 1 | |||||||||||||
| 2027 | 0 | 0.0 | 83.8% | 0 | 0.0 | $0.00 | 0 | |||||||||||||
| 2028 & Thereafter | 26,676 | 5.8 | 89.5% | 538,952 | 6.4 | $20.20 | 2 | |||||||||||||
| Vacant | 48,210 | 10.5 | 100.0% | 0 | 0.0 | $0.00 | 0 | |||||||||||||
| Total / Wtd. Avg. | 461,006 | 100.0 | % | $8,474,911 | 100.0 | % | $20.53 | 94 | ||||||||||||
| (1) | Calculated based on approximate square footage occupied by each Owned Tenant unless otherwise specified. |
| (2) | Certain tenants may have lease termination options that are exercisable prior to the originally stated expiration date of the subject lease and that are not considered in the Lease Expiration Schedule. |
| (3) | Includes 9,729 SF (2.1% of GLA) of fitness center, conference room, storage and file room space that accounts for no base rent and is thus excluded from the UW Base Rent $ per SF calculation. |
| ■ | Operating History and Underwritten Net Cash Flow. The following table presents certain information relating to the historical operating performance and the Underwritten Net Cash Flow at the Grant Building Property: |
Cash Flow Analysis(1)(2)
2014 | 2015 |
2016 | TTM 4/30/2017 | Underwritten | Underwritten $ per SF | ||||||
| Base Rent | $7,742,443 | $8,045,565 | $8,146,954 | $8,165,668 | $8,387,444 | $18.19 | |||||
| Contractual Rent Steps(3) | 0 | 0 | 0 | 0 | 87,468 | 0.19 | |||||
| Gross Up Vacancy | 0 | 0 | 0 | 0 | 979,133 | 2.12 | |||||
| Reimbursements | 32,902 | 135,641 | 291,358 | 333,518 | 333,518 | 0.72 | |||||
| Other Income(4) | 379,675 | 387,953 | 392,024 | 387,429 | 387,429 | 0.84 | |||||
| Gross Revenue | $8,155,020 | $8,569,159 | $8,830,336 | $8,886,615 | $10,174,991 | $22.07 | |||||
| Vacancy & Credit Loss | 0 | 0 | 0 | 0 | (979,133) | (2.12) | |||||
| Effective Gross Income | $8,155,020 | $8,569,159 | $8,830,336 | $8,886,615 | $9,195,858 | $19.95 | |||||
| Real Estate Taxes | $749,269 | $776,323 | $785,908 | $787,186 | $764,894 | $1.66 | |||||
| Insurance | 75,991 | 73,729 | 70,847 | 71,367 | 77,000 | 0.17 | |||||
| Management Fee | 158,521 | 159,516 | 176,372 | 171,896 | 229,896 | 0.50 | |||||
| Other Operating Expenses | 3,652,424 | 3,774,468 | 3,896,478 | 3,865,528 | 3,865,528 | 8.38 | |||||
| Total Operating Expenses | $4,636,205 | $4,784,036 | $4,929,605 | $4,895,977 | $4,937,318 | $10.71 | |||||
| Net Operating Income | $3,518,815 | $3,785,123 | $3,900,731 | $3,990,638 | $4,258,540 | $9.24 | |||||
| TI/LC | 0 | 0 | 0 | 0 | 478,794 | 1.04 | |||||
| Capital Expenditures | 0 | 0 | 0 | 0 | 92,201 | 0.20 | |||||
| Net Cash Flow | $3,518,815 | $3,785,123 | $3,900,731 | $3,990,638 | $3,687,545 | $8.00 | |||||
| Occupancy(5) | 90.6% | 88.5% | 88.6% | 89.5% | 90.0% | ||||||
| NOI Debt Yield | 9.3% | 10.0% | 10.3% | 10.5% | 11.2% | ||||||
| NCF DSCR | 1.49x | 1.60x | 1.65x | 1.69x | 1.56x |
| (1) | Certain items such as straight line rent, interest expense, interest income, lease cancellation income, depreciation, amortization, debt service payments and any other non-recurring or non-operating items were excluded from the historical presentation and are not considered for the underwritten cash flow. |
| (2) | Represents a fiscal year-end of December 31 for the indicated year unless otherwise specified. |
| (3) | Contractual Rent Steps are underwritten based upon the actual scheduled rent increases through February 1, 2018 ($20,172) and the average rent for Huntington National Bank over the remainder of its lease ($67,296). |
| (4) | Other Income includes parking income, fitness center income, miscellaneous tenant charges and conference room rental fees. |
| (5) | TTM Occupancy is as of July 6, 2017. |
The depositor has filed a registration statement (including a prospectus) with the Securities and Exchange Commission (“SEC”) (SEC File No. 333-207132) for the offering to which this communication relates. Before you invest, you should read the prospectus in the registration statement and other documents the depositor has filed with the SEC for more complete information about the depositor, the issuing entity and this offering. You may get these documents for free by visiting EDGAR on the SEC website at www.sec.gov. Alternatively, the depositor or Citigroup Global Markets Inc., Barclays Capital Inc., Drexel Hamilton, LLC or any other underwriter or dealer participating in this offering will arrange to send you the prospectus if you request it by calling toll-free 1-800-831-9146.
| 135 |
LOAN #9: grant building
| ■ | Appraisal. According to the appraisal, the Grant Building Property had an “as-is” appraised value of $58,100,000 as of June 15, 2017. |
Appraisal Approach(1) | Value | Discount Rate | Capitalization Rate |
| Direct Capitalization Approach | $58,600,000 | N/A | 7.00% |
| Discounted Cash Flow Approach | $58,100,000 | 9.00% | 7.75%(2) |
| (1) | Based on the “as-is” appraised value. |
| (2) | Represents the terminal capitalization rate. |
| ■ | Environmental Matters. Based on a Phase I environmental report dated June 21, 2017, the environmental consultant did not identify evidence of any recognized environmental conditions or recommendations for further action at the Grant Building Property. |
| ■ | Market Overview and Competition. The Grant Building Property is located in Pittsburgh, Pennsylvania within the Pittsburgh office submarket. The Grant Building Property is located at 310 Grant Street with access to primary transportation routes including Interstates 376, 279 and 79. According to the appraisal, as of the first quarter of 2017, the Pittsburgh office market had a total office inventory of 52.7 million SF with a vacancy rate of 16.5% and average asking rent of $22.14 per SF. According to the appraisal, as of the first quarter of 2017, the CBD office submarket for Class A properties has a total office inventory of 14.3 million SF with a vacancy rate of 11.0% and average asking rent of $27.33 per SF. According to the appraisal, the 2016 population within a one-, three- and five-mile radius of the Grant Building Property was 20,113, 146,758 and 386,857, respectively. Additionally, the 2016 median household income within a one-, three- and five-mile radius of the Grant Building Property was $48,006, $36,468 and $46,224, respectively. |
The following table presents certain information relating to lease comparables for the Grant Building Property:
| Directly Competitive Buildings(1) | |||||
| Property | Office Area (GLA SF) | Built / Renovated | % Occupied (Total) | Asking Rent (per SF) | |
| Low | High | ||||
Koppers Building 436 7th Avenue Pittsburgh, PA | 356,439 | 1929 /1996 | 75.0% | $22.00 | $24.00 |
The Frick Building 437 Grant Street Pittsburgh, PA | 366,010 | 1902 / N/A | 88.0% | $25.00 | $25.00 |
Law & Finance Building 429 4th Avenue Pittsburgh, PA | 133,246 | 1930 / N/A | 87.0% | $18.50 | $19.50 |
K&L Gates Building 210 6th Avenue Pittsburgh, PA | 637,243 | 1968 / 2010 | 90.0% | $26.00 | $29.00 |
The Gulf Tower 707 Grant Street Pittsburgh, PA | 435,491 | 1932 / 2004 | 65.0% | $21.00 | $22.00 |
| Total / Wtd. Avg. | 1,928,429 | 81.0% | $23.42 | $25.08 | |
| (1) | Source: Appraisal. |
| ■ | The Borrower. The borrower is McKnight Grant Building Associates, L.P., a single-purpose Delaware limited partnership. Legal counsel for the borrower delivered a non-consolidation opinion in connection with the origination of the Grant Building Loan. The non-recourse carveout guarantors are William C. Rudolph and Charles S. Perlow, who are principals at McKnight Realty Partners. McKnight Realty Partners is a leading real estate investment and development company based in Pittsburgh, Pennsylvania. Since 1959, McKnight Realty Partners has specialized in purchasing retail, industrial and multifamily properties, and currently owns and operates more than 5.0 million SF of commercial space nationwide. |
| ■ | Escrows. On the origination date of the Grant Building Loan, the borrower funded a reserve of (i) $93,536 for real estate taxes, (ii) $44,917 for insurance, (iii) $1,000,000 for future tenant improvements and leasing commissions, (iv) |
The depositor has filed a registration statement (including a prospectus) with the Securities and Exchange Commission (“SEC”) (SEC File No. 333-207132) for the offering to which this communication relates. Before you invest, you should read the prospectus in the registration statement and other documents the depositor has filed with the SEC for more complete information about the depositor, the issuing entity and this offering. You may get these documents for free by visiting EDGAR on the SEC website at www.sec.gov. Alternatively, the depositor or Citigroup Global Markets Inc., Barclays Capital Inc., Drexel Hamilton, LLC or any other underwriter or dealer participating in this offering will arrange to send you the prospectus if you request it by calling toll-free 1-800-831-9146.
| 136 |
LOAN #9: grant building
$262,500 for outstanding tenant improvements and leasing commissions related to Huntington National Bank and (v) $227,483 for a prepaid rent reserve related to Balzarini & Watson.
Additionally, on each due date, the borrower is required to fund the following reserves with respect to the Grant Building Property: (i) a tax reserve in an amount equal to one-twelfth of the amount that the lender estimates will be necessary to pay taxes over the then succeeding 12-month period, which is initially estimated to be $67,895; (ii) an insurance reserve in an amount equal to one-twelfth of the amount that the lender estimates will be necessary to pay insurance premiums over the then succeeding 12-month period, which is initially estimated to be $6,417; (iii) a replacement reserve in the amount of $7,683 and (iv) a tenant improvements and leasing commissions reserve in the amount of $38,417. Beginning on the due date in August 2023 and occurring thereafter up to and including the payment date in August 2024, the borrower is required to fund a reserve equal to $7,588 for tenant improvements and leasing commissions related to Zimmer Kunz. During a Key Tenant Trigger Event Period (as defined below), the borrower is required to deposit excess cash flow into the excess cash flow account.
| ■ | Lockbox and Cash Management. The Grant Building Loan is structured with a hard lockbox and springing cash management. The Grant Building Loan documents require tenants, pursuant to tenant direction letters, to pay rent directly to the lockbox account and require that all other money received by the borrower with respect to the Grant Building Property to be deposited within two business days into such lockbox account. During a Grant Building Trigger Event Period (as defined below), funds on deposit in the lockbox account are required to be transferred on a daily basis to a lender-controlled cash management account. On each due date during a Grant Building Trigger Event Period, the Grant Building Loan documents require that all amounts on deposit in the cash management account be used to pay debt service, fund required reserves, pay debt service under the Grant Building Mezzanine Loan (as defined below) and pay operating expenses, and all remaining amounts will be deposited (i) in the excess cash flow reserve account and held as additional collateral for the Grant Building Loan, (ii) during a Key Tenant Trigger Event Period, into a reserve for tenant improvements and leasing commissions related to the leased space occupied by the Key Tenant (as defined below) or (iii) if the Grant Building Trigger Event Period is caused solely by an event of default under the Grant Building Mezzanine Loan, to the mezzanine lender under the Grant Building Mezzanine Loan. |
A“Grant Building Trigger Event Period” occurs upon (i) an event of default under the Grant Building Loan until cured (so long as no other Grant Building Trigger Event Period is in effect), (ii) the debt service coverage ratio of the Grant Building Property (based on the trailing 12 calendar months and as determined by the lender) being less than 1.10x, until the debt service coverage ratio of the Grant Building Property (based on the trailing 12 calendar months and as determined by the lender) is equal to or greater than 1.20x for two consecutive calendar quarters (so long as no other Grant Building Trigger Event Period is in effect), (iii) a Key Tenant Trigger Event Period (as defined below), until the same is cured, or (iv) an event of default under the Grant Building Mezzanine Loan (as defined below).
A “Key Tenant Trigger Event Period” occurs upon Huntington National Bank, or any tenant occupying Huntington National Bank’s space at the Grant Building Property (each, a “Key Tenant”) (i) failing to extend the terms of its lease for at least five years and otherwise on terms and conditions satisfactory to the lender, on or before April 30, 2023, (ii) defaulting beyond any applicable cure or grace period under its lease, (iii) going dark or otherwise ceasing operations in its leased space at the Grant Building Property, (iv) subletting its leased space, (v) becoming a debtor in any bankruptcy or other insolvency proceeding or (vi) terminating or canceling its lease (or the lease otherwise failing or ceasing to be in full force and effect) (each, a “Key Tenant Trigger Event”).
| ■ | Property Management. The Grant Building Property is managed by McKnight Property Management LLC, a borrower affiliate. Under the Grant Building Loan documents, the Grant Building Property may be managed by McKnight Property Management LLC or any other management company reasonably approved by the lender and with respect to which a rating agency confirmation has been received. Upon any of (i) the occurrence of an event of default under the Grant Building Loan documents, (ii) the debt service coverage ratio of the Grant Building Property (based on the trailing 12 calendar months and as determined by the lender) falling below 1.05x, (iii) the continuance of a default by the property manager under the management agreement beyond any applicable notice and cure period, (iv) the filing of a bankruptcy petition or the occurrence of a similar event with respect to the property manager or (v) the engagement by the property manager in gross negligence, fraud, willful misconduct or misappropriation of funds, the lender may require the borrower to terminate the management agreement and replace the property manager with a new property manager selected by the borrower, subject to the lender’s approval and, if required by the lender, with respect to which a rating agency confirmation has been received. |
The depositor has filed a registration statement (including a prospectus) with the Securities and Exchange Commission (“SEC”) (SEC File No. 333-207132) for the offering to which this communication relates. Before you invest, you should read the prospectus in the registration statement and other documents the depositor has filed with the SEC for more complete information about the depositor, the issuing entity and this offering. You may get these documents for free by visiting EDGAR on the SEC website at www.sec.gov. Alternatively, the depositor or Citigroup Global Markets Inc., Barclays Capital Inc., Drexel Hamilton, LLC or any other underwriter or dealer participating in this offering will arrange to send you the prospectus if you request it by calling toll-free 1-800-831-9146.
| 137 |
LOAN #9: grant building
| ■ | Mezzanine or Secured Subordinate Indebtedness. Concurrently with the origination of the Grant Building Loan, MSC – 310 Grant Holdco, LLC funded a $4,000,000 mezzanine loan (the “Grant Building Mezzanine Loan”) to McKnight Grant Building Associates I, L.P., as mezzanine borrower. The Grant Building Mezzanine Loan is secured by a pledge of (i) the mezzanine borrower’s 100.0% limited partnership interests in the borrower under the Grant Building Loan and (ii) the 100.0% direct equity interest held by the mezzanine borrower in McKnight Grant Building LLC, the general partner of the borrower under the Grant Building Loan. The Grant Building Mezzanine Loan requires monthly payment of interest only and accrues interest at an interest rate of 11.25000%per annum and is co-terminous with the Grant Building Loan. The rights and obligations of the respective holders of the Grant Building Loan and the related Grant Building Mezzanine Loan are subject to an intercreditor agreement. |
| ■ | Release of Collateral. Not permitted. |
| ■ | Terrorism Insurance. The borrower is required to maintain an “all-risk” insurance policy that provides coverage for terrorism in an amount equal to 100.0% of the full replacement cost of the Grant Building Property, plus a business interruption insurance policy that provides 18 months of business interruption coverage. The required terrorism insurance may be included in a blanket policy, provided that, among other things, any such blanket policy specifically allocates to the Grant Building Property the amount of coverage from time to time required under the Grant Building Loan documents. See “Risk Factors—Terrorism Insurance May Not Be Available for All Mortgaged Properties”in the Preliminary Prospectus. |
The depositor has filed a registration statement (including a prospectus) with the Securities and Exchange Commission (“SEC”) (SEC File No. 333-207132) for the offering to which this communication relates. Before you invest, you should read the prospectus in the registration statement and other documents the depositor has filed with the SEC for more complete information about the depositor, the issuing entity and this offering. You may get these documents for free by visiting EDGAR on the SEC website at www.sec.gov. Alternatively, the depositor or Citigroup Global Markets Inc., Barclays Capital Inc., Drexel Hamilton, LLC or any other underwriter or dealer participating in this offering will arrange to send you the prospectus if you request it by calling toll-free 1-800-831-9146.
| 138 |
(THIS PAGE INTENTIONALLY LEFT BLANK)
The depositor has filed a registration statement (including a prospectus) with the Securities and Exchange Commission (“SEC”) (SEC File No. 333-207132) for the offering to which this communication relates. Before you invest, you should read the prospectus in the registration statement and other documents the depositor has filed with the SEC for more complete information about the depositor, the issuing entity and this offering. You may get these documents for free by visiting EDGAR on the SEC website at www.sec.gov. Alternatively, the depositor or Citigroup Global Markets Inc., Barclays Capital Inc., Drexel Hamilton, LLC or any other underwriter or dealer participating in this offering will arrange to send you the prospectus if you request it by calling toll-free 1-800-831-9146.
| 139 |
| LOAN #10: ann arbor mixed use portfolio |
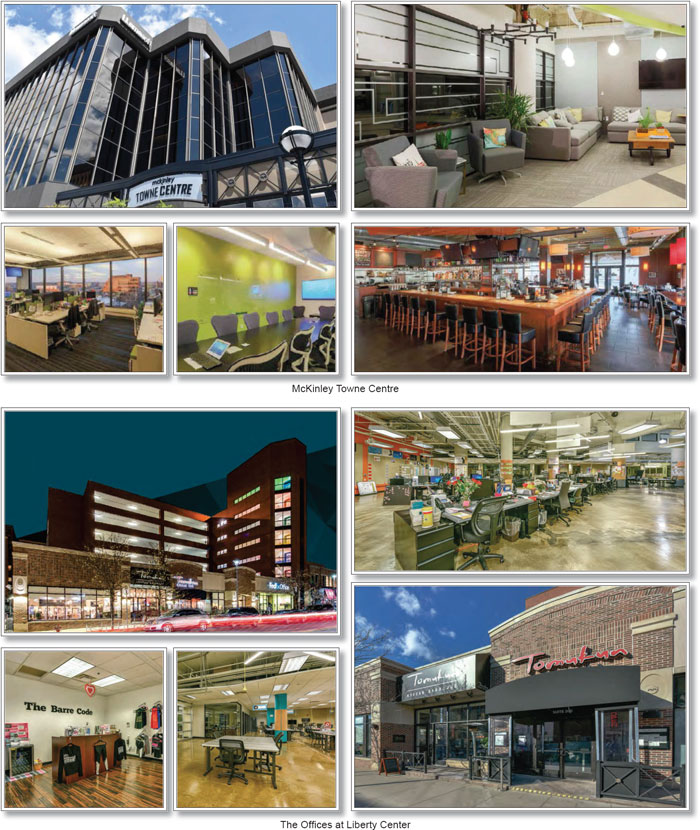
The depositor has filed a registration statement (including a prospectus) with the Securities and Exchange Commission (“SEC”) (SEC File No. 333-207132) for the offering to which this communication relates. Before you invest, you should read the prospectus in the registration statement and other documents the depositor has filed with the SEC for more complete information about the depositor, the issuing entity and this offering. You may get these documents for free by visiting EDGAR on the SEC website at www.sec.gov. Alternatively, the depositor or Citigroup Global Markets Inc., Barclays Capital Inc., Drexel Hamilton, LLC or any other underwriter or dealer participating in this offering will arrange to send you the prospectus if you request it by calling toll-free 1-800-831-9146.
| 140 |
| LOAN #10: ann arbor mixed use portfolio |
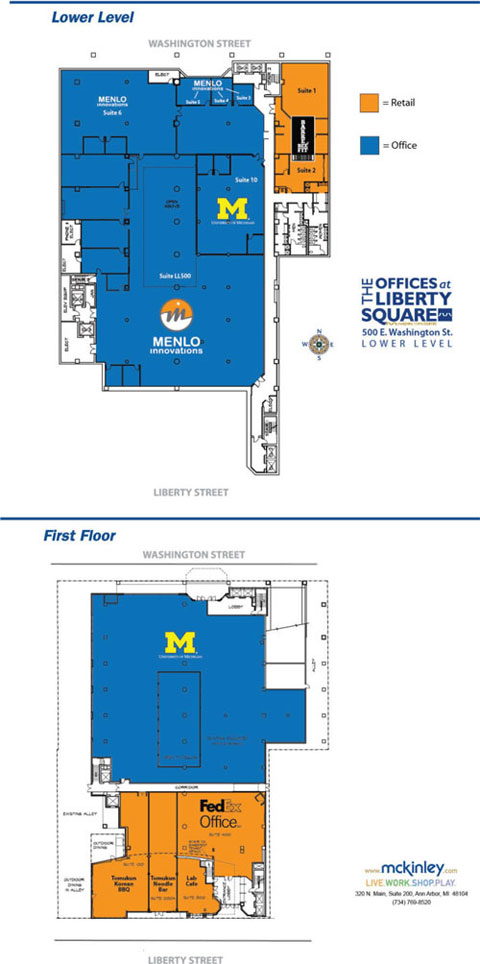
The depositor has filed a registration statement (including a prospectus) with the Securities and Exchange Commission (“SEC”) (SEC File No. 333-207132) for the offering to which this communication relates. Before you invest, you should read the prospectus in the registration statement and other documents the depositor has filed with the SEC for more complete information about the depositor, the issuing entity and this offering. You may get these documents for free by visiting EDGAR on the SEC website at www.sec.gov. Alternatively, the depositor or Citigroup Global Markets Inc., Barclays Capital Inc., Drexel Hamilton, LLC or any other underwriter or dealer participating in this offering will arrange to send you the prospectus if you request it by calling toll-free 1-800-831-9146.
| 141 |
| LOAN #10: ann arbor mixed use portfolio |
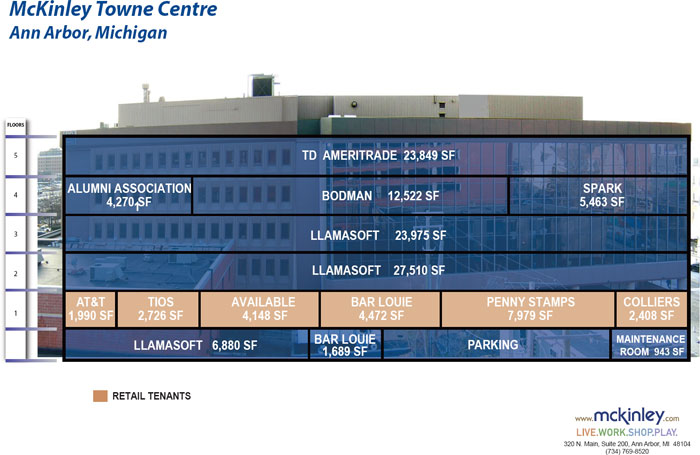
The depositor has filed a registration statement (including a prospectus) with the Securities and Exchange Commission (“SEC”) (SEC File No. 333-207132) for the offering to which this communication relates. Before you invest, you should read the prospectus in the registration statement and other documents the depositor has filed with the SEC for more complete information about the depositor, the issuing entity and this offering. You may get these documents for free by visiting EDGAR on the SEC website at www.sec.gov. Alternatively, the depositor or Citigroup Global Markets Inc., Barclays Capital Inc., Drexel Hamilton, LLC or any other underwriter or dealer participating in this offering will arrange to send you the prospectus if you request it by calling toll-free 1-800-831-9146.
| 142 |
| LOAN #10: ann arbor mixed use portfolio |
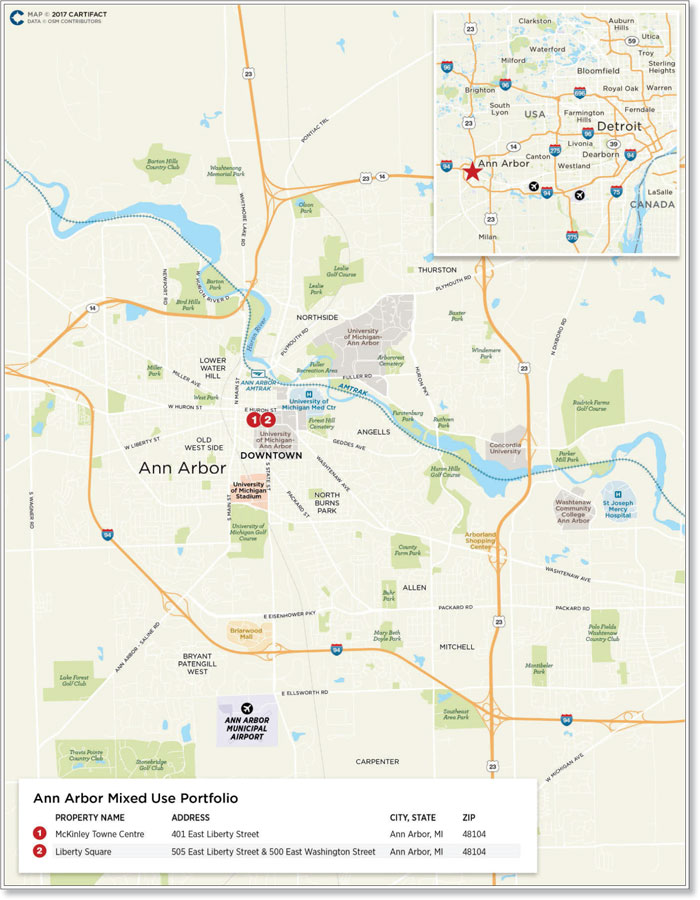
The depositor has filed a registration statement (including a prospectus) with the Securities and Exchange Commission (“SEC”) (SEC File No. 333-207132) for the offering to which this communication relates. Before you invest, you should read the prospectus in the registration statement and other documents the depositor has filed with the SEC for more complete information about the depositor, the issuing entity and this offering. You may get these documents for free by visiting EDGAR on the SEC website at www.sec.gov. Alternatively, the depositor or Citigroup Global Markets Inc., Barclays Capital Inc., Drexel Hamilton, LLC or any other underwriter or dealer participating in this offering will arrange to send you the prospectus if you request it by calling toll-free 1-800-831-9146.
| 143 |
| LOAN #10: ann arbor mixed use portfolio |
| Mortgaged Property Information | Mortgage Loan Information | |||||
| Number of Mortgaged Properties | 2 | Loan Seller | CREFI | |||
| Location (City/State) | Ann Arbor, Michigan | Cut-off Date Balance | $34,750,000 | |||
| Property Type | Mixed Use | Cut-off Date Balance per SF | $182.70 | |||
| Size (SF) | 190,205 | Percentage of Initial Pool Balance | 3.2% | |||
| Total Occupancy as of 6/1/2017 | 97.8% | Number of Related Mortgage Loans | None | |||
| Owned Occupancy as of 6/1/2017 | 97.8% | Type of Security | Fee Simple | |||
| Year Built / Latest Renovation | Various / Various | Mortgage Rate | 4.44350% | |||
| Appraised Value | $50,000,000 | Original Term to Maturity (Months) | 120 | |||
| Appraisal Date | 6/14/2017 | Original Amortization Term (Months) | 360 | |||
| Borrower Sponsors | Jaimey Roth; Marc Gardner; Jason Anstandig and Jason Biber | Original Interest Only Period (Months) | 60 | |||
| Property Management | Lakeshore Management, LLC | First Payment Date | 10/6/2017 | |||
| Maturity Date | 9/6/2027 | |||||
| Underwritten Revenues(1) | $6,533,958 | |||||
| Underwritten Expenses | $2,987,072 | Escrows(2) | ||||
| Underwritten Net Operating Income (NOI) | $3,546,886 | Upfront | Monthly | |||
| Underwritten Net Cash Flow (NCF) | $3,213,889 | Taxes | $166,194 | $110,796 | ||
| Cut-off Date LTV Ratio | 69.5% | Insurance | $9,678 | $4,839 | ||
| Maturity Date LTV Ratio | 63.5% | Replacement Reserve(3) | $0 | $3,170 | ||
| DSCR Based on Underwritten NOI / NCF | 1.69x / 1.53x | TI/LC(4) | $500,000 | $23,776 | ||
| Debt Yield Based on Underwritten NOI / NCF | 10.2% / 9.2% | Other(5) | $149,224 | $0 | ||
| Sources and Uses | ||||||||
| Sources | $ | % | Uses | $ | % | |||
| Mortgage Loan Amount | $34,750,000 | 67.1% | Purchase Price | $50,000,000 | 96.5% | |||
| Principal’s New Cash Contribution | 9,805,176 | 18.9 | Closing Costs | 980,081 | 1.9 | |||
| Mezzanine Loan | 6,750,000 | 13.0 | Reserves | 825,095 | 1.6 | |||
| Other Sources | 500,000 | 1.0 | ||||||
| Total Sources | $51,805,176 | 100.0% | Total Uses | $51,805,176 | 100.0% | |||
| (1) | Tenants Barre Bee Fit of Michigan, Menlo Associates, LLC and 3,233 SF of The Regents of the U of M space were underwritten as direct tenant leases, though they are subleases pursuant to a master lease with the borrower Hillside-Liberty MT LLC. Base rent under the master lease is 100% of all rents, revenues, amounts, and reimbursements actually collected from the subtenants thereunder. |
| (2) | See “—Escrows” below. |
| (3) | The Replacement Reserve has a cap of $114,123. See “—Escrows” below. |
| (4) | The TI/LC reserve has a cap of $900,000. See “—Escrows” below. |
| (5) | Upfront other reserve includes (i) $129,969 for unfunded tenant improvement obligations at the Ann Arbor Mixed Use Portfolio Properties and (ii) $19,255 for the payment of condominium assessments. See “—Escrows” below. |
| ■ | The Mortgage Loan. The mortgage loan (the“Ann Arbor Mixed Use Portfolio Loan”) is evidenced by a note in the original principal amount of $34,750,000 and is secured by a first mortgage encumbering the borrowers’ fee simple interest (and leasehold interest with respect to a portion of the Ann Arbor Mixed Use Portfolio Properties that is master leased between two of the borrowers) in two mixed-use buildings located in Ann Arbor, Michigan (the“Ann Arbor Mixed Use Portfolio Properties”). The Ann Arbor Mixed Use Portfolio Loan was originated by Citi Real Estate Funding Inc. on August 11, 2017 and represents approximately 3.2% of the Initial Pool Balance. The note evidencing the Ann Arbor Mixed Use Portfolio Loan has an outstanding principal balance as of the Cut-off Date of $34,750,000 and accrues interest at an interest rate of 4.44350%per annum. The proceeds of the Ann Arbor Mixed Use Portfolio Loan were primarily used to acquire the Ann Arbor Mixed Use Portfolio Properties, fund reserves and pay origination costs. The Ann Arbor Mixed Use Portfolio Loan had an initial term of 120 months and has a remaining term of 120 months as of the Cut-off Date. The Ann Arbor Mixed Use Portfolio Loan requires monthly payments of interest only through the due date in September 2022, after which it requires monthly payments of interest and principal sufficient to amortize the Ann Arbor Mixed Use Portfolio Loan over a 30-year amortization schedule. The scheduled maturity date of the Ann Arbor Mixed Use Portfolio Loan is the due date in September 2027. Provided that no event of default has occurred and is continuing under the Ann Arbor Mixed Use Portfolio Loan documents, at any time after the second anniversary of the securitization Closing Date, the Ann Arbor Mixed Use Portfolio Loan may be defeased with certain direct full faith and credit obligations of the United States of America or other obligations which are “government securities” permitted under the Ann Arbor Mixed Use Portfolio Loan documents. Provided that no event of default has occurred and is continuing under the Ann Arbor Mixed Use Portfolio Loan documents, voluntary prepayment of the Ann Arbor Mixed Use Portfolio Loan without a prepayment premium or yield maintenance charge is permitted on or after the due date in March 2027. |
| ■ | The Mortgaged Properties.The Ann Arbor Mixed Use Portfolio Properties are two neighboring office and retail properties located in downtown Ann Arbor next to the University of Michigan. McKinley Towne Centre (the“McKinley Towne Centre Property”) is a five-story 130,824 SF mixed-use building located at 401 East Liberty Street that was 96.8% occupied as of June 1, 2017 by 10 tenants. The McKinley Towne Centre Property contains 105,412 SF of office space and 25,412 SF of retail space. Liberty Square (the“Liberty Square Property”) is a two-story 59,381 SF mixed-use building located at 505 East Liberty Street & 500 East Washington Street that was 100% occupied as of |
The depositor has filed a registration statement (including a prospectus) with the Securities and Exchange Commission (“SEC”) (SEC File No. 333-207132) for the offering to which this communication relates. Before you invest, you should read the prospectus in the registration statement and other documents the depositor has filed with the SEC for more complete information about the depositor, the issuing entity and this offering. You may get these documents for free by visiting EDGAR on the SEC website at www.sec.gov. Alternatively, the depositor or Citigroup Global Markets Inc., Barclays Capital Inc., Drexel Hamilton, LLC or any other underwriter or dealer participating in this offering will arrange to send you the prospectus if you request it by calling toll-free 1-800-831-9146.
| 144 |
| LOAN #10: ann arbor mixed use portfolio |
June 1, 2017 by five tenants. The lower level of the Liberty Square Property is 29,959 SF and the upper, ground floor, level is 29,442 SF.
Llamasoft, Inc., the largest tenant across the Ann Arbor Mixed Use Portfolio Properties,provides supply chain design, analytics and planning solutions to companies.Llamasoft, Inc. has over 400 employees in 14 countries and utilizes its space at the McKinley Towne Centre Property as its global headquarters, occupying 30.7% of the aggregate NRA of the Ann Arbor Mixed Use Portfolio Properties on a lease which expires on October 31, 2026. Llamasoft, Inc. has two, 7-year renewal options available to exercise thereafter. Think Tech, Inc., the second largest tenant across the Ann Arbor Mixed Use Portfolio Properties, is a subsidiary of TD Ameritrade which provides online security brokerage services. Subsequent to signing its lease in May 2016, Think Tech, Inc. invested approximately $1.0 million of its own money into its space. Google previously occupied approximately 66.1% of the McKinley Towne Centre Property. However, in May 2015, Google announced it would be relocating to a larger campus northwest of downtown Ann Arbor. All of the former Google space at the McKinley Towne Centre Property had been pre-leased by replacement tenants prior to Google’s lease expiring in March 2016. The previous Google space was leased to current tenants Llamasoft, Inc., Alumni Association of the University of Michigan, and Think Tech, Inc. at a higher weighted average rental rate than what Google had been paying. Both the McKinley Towne Centre Property and Liberty Square Property are subject to a condominium regime with the related borrower sponsor owning and controlling all of the condominium units at the McKinley Towne Centre Property and the related borrower sponsor owning one of two condominium units at the Liberty Square Property, and actions by the board at the Liberty Square Property are decided by majority.
The following table presents certain information relating to the Ann Arbor Mixed Use Portfolio Properties:
Property Name | Year Built / Renovated | Building | Occupancy as of | Allocated Cut-off Date | % Allocated | Appraised | UW NCF |
| McKinley Towne Centre | 1973 / 2015-2016 | 130,824 | 96.8% | $27,800,000 | 80.0% | $39,500,000 | $2,635,883 |
| Liberty Square | 1960, 1999 / 2007-2009 | 59,381 | 100.0% | 6,950,000 | 20.0 | 10,500,000 | 578,006 |
| 190,205 | 97.8% | $34,750,000 | 100.0% | $50,000,000 | $3,213,889 |
The following table presents certain information relating to the major tenants (of which certain tenants may have co-tenancy provisions) at the Ann Arbor Mixed Use Portfolio Properties:
Ten Largest Owned Tenants Based on Underwritten Base Rent
Tenant Name | Credit Rating (Fitch/MIS/S&P)(1) | Tenant | % of | UW Base | % of Total | UW Base | Lease Expiration | Renewal / | |||||||||
| Llamasoft, Inc. | NR / NR / NR | 58,365 | 30.7% | $1,802,005 | 32.4% | $30.87 | 10/31/2026 | 2, 7-year options | |||||||||
| Think Tech, Inc. | NR / A3 / A | 23,849 | 12.5 | 889,700 | 16.0 | $37.31 | 7/31/2026 | 2, 5-year options | |||||||||
| The Regents of the U of M(3)(4) | NR / Aaa / AAA | 21,800 | 11.5 | 649,104 | 11.7 | $29.78 | 8/31/2018 | NA | |||||||||
| Bodman PLC | NR / NR / NR | 12,522 | 6.6 | 465,693 | 8.4 | $37.19 | 11/30/2018 | 2, 5-year options | |||||||||
| Bar Louie | NR / NR / NR | 6,161 | 3.2 | 283,283 | 5.1 | $45.98 | 5/31/2022 | 1, 5-year option | |||||||||
| Penny W. Stamps School of Art | NR / Aaa / AAA | 7,979 | 4.2 | 266,900 | 4.8 | $33.45 | 2/8/2027 | 2, 5-year options | |||||||||
| Menlo Associates, LLC(4) | NR / NR / NR | 23,721 | 12.5 | 260,931 | 4.7 | $11.00 | 8/31/2022 | 2, 5-year options | |||||||||
| Tomokun Noodle Bar | NR / NR / NR | 6,631 | 3.5 | 225,114 | 4.0 | $33.95 | 8/31/2028 | 4, 5-year options | |||||||||
| Alumni Association of the University of Michigan | NR / NR / NR | 4,270 | 2.2 | 158,552 | 2.8 | $37.13 | 5/31/2021 | 2, 5-year options | |||||||||
| FedEx Office | NR / NR / NR | 4,224 | 2.2 | 146,362 | 2.6 | $34.65 | 11/30/2022 | 1, 5-year option | |||||||||
| Ten Largest Owned Tenants | 169,522 | 89.1% | $5,147,644 | 92.5% | $30.37 | ||||||||||||
| Remaining Owned Tenants | 16,535 | 8.7 | 417,477 | 7.5 | $25.25 | ||||||||||||
| Vacant Spaces (Owned Space) | 4,148 | 2.2 | 0 | 0.0 | $0.00 | ||||||||||||
| Total / Wtd. Avg. All Owned Tenants | 190,205 | 100.0% | $5,565,121 | 100.0% | $29.91 | ||||||||||||
| (1) | Certain ratings are those of the parent company whether or not the parent guarantees the lease. |
| (2) | UW Base Rent per SF includes the present value of rent steps for credit tenants ($69,161) and contractual rent steps ($178,604) for other tenants through May 2018. |
| (3) | The Regents of the U of M has 18,567 SF which expires on December 31, 2022 and 3,233 SF which expires on August 31, 2018. |
| (4) | Menlo Associates, LLC subleases a total of 1,235 SF at the Liberty Square Property on a month-to-month basis to two separate sub-tenants. Menlo Associates, LLC and The Regents of the U of M are master lessees pursuant to a master lease with the borrower Hillside-Liberty MT LLC and are underwritten as a direct tenant leases. Base rent under the master lease is 100% of all rents, revenues, amounts, and reimbursements actually collected from the subtenants thereunder. |
The depositor has filed a registration statement (including a prospectus) with the Securities and Exchange Commission (“SEC”) (SEC File No. 333-207132) for the offering to which this communication relates. Before you invest, you should read the prospectus in the registration statement and other documents the depositor has filed with the SEC for more complete information about the depositor, the issuing entity and this offering. You may get these documents for free by visiting EDGAR on the SEC website at www.sec.gov. Alternatively, the depositor or Citigroup Global Markets Inc., Barclays Capital Inc., Drexel Hamilton, LLC or any other underwriter or dealer participating in this offering will arrange to send you the prospectus if you request it by calling toll-free 1-800-831-9146.
| 145 |
| LOAN #10: ann arbor mixed use portfolio |
The following table presents certain information relating to the lease rollover schedule at the Ann Arbor Mixed Use Portfolio Properties, based on initial lease expiration dates:
Lease Expiration Schedule(1)(2)
Year Ending | Expiring | % of Owned GLA | Cumulative % of | UW Base Rent | % of Total UW | UW Base Rent $ | # of Expiring | |||||||
| MTM | 943 | 0.5% | 0.5% | $0 | 0.0% | $0.00 | 0 | |||||||
| 2017 | 0 | 0.0 | 0.5% | 0 | 0.0 | $0.00 | 0 | |||||||
| 2018 | 18,163 | 9.5 | 10.0% | 583,463 | 10.5 | $32.12 | 3 | |||||||
| 2019 | 2,726 | 1.4 | 11.5% | 85,951 | 1.5 | $31.53 | 1 | |||||||
| 2020 | 0 | 0.0 | 11.5% | 0 | 0.0 | $0.00 | 0 | |||||||
| 2021 | 14,728 | 7.7 | 19.2% | 427,268 | 7.7 | $29.01 | 4 | |||||||
| 2022 | 52,673 | 27.7 | 46.9% | 1,284,719 | 23.1 | $24.39 | 4 | |||||||
| 2023 | 0 | 0.0 | 46.9% | 0 | 0.0 | $0.00 | 0 | |||||||
| 2024 | 0 | 0.0 | 46.9% | 0 | 0.0 | $0.00 | 0 | |||||||
| 2025 | 0 | 0.0 | 46.9% | 0 | 0.0 | $0.00 | 0 | |||||||
| 2026 | 82,214 | 43.2 | 90.1% | 2,691,705 | 48.4 | $32.74 | 2 | |||||||
| 2027 | 7,979 | 4.2 | 94.3% | 266,900 | 4.8 | $33.45 | 1 | |||||||
| 2028 & Thereafter | 6,631 | 3.5 | 97.8% | 225,114 | 4.0 | $33.95 | 1 | |||||||
| Vacant | 4,148 | 2.2 | 100.0% | 0 | 0.0 | $0.00 | 0 | |||||||
| Total / Wtd. Avg. | 190,205 | 100.0% | $5,565,121 | 100.0% | $29.91 | 16 |
| (1) | Calculated based on the approximate square footage occupied by each Owned Tenant. |
| (2) | Certain tenants may have lease termination options that are exercisable prior to the originally stated expiration date of the subject lease and that are not considered in the Lease Expiration Schedule. |
| (3) | The Regents of the U of M has 18,567 SF which expires on December 31, 2022 and 3,233 SF which expires on August 31, 2018. |
The following table presents certain information relating to historical leasing at the Ann Arbor Mixed Use Portfolio Properties:
Historical Leased %(1)
2014 | 2015 | 2016 | As of 6/1/2017 | |||||
| McKinley Towne Centre | 100.0% | 100.0% | 96.8% | 96.8% | ||||
Liberty Square | 100.0% | 100.0% | 100.0% | 100.0% | ||||
| Total | 100.0% | 100.0% | 97.8% | 97.8% |
| (1) | As provided by the borrowers and which represents occupancy as of December 31 for the indicated year unless otherwise specified. |
The depositor has filed a registration statement (including a prospectus) with the Securities and Exchange Commission (“SEC”) (SEC File No. 333-207132) for the offering to which this communication relates. Before you invest, you should read the prospectus in the registration statement and other documents the depositor has filed with the SEC for more complete information about the depositor, the issuing entity and this offering. You may get these documents for free by visiting EDGAR on the SEC website at www.sec.gov. Alternatively, the depositor or Citigroup Global Markets Inc., Barclays Capital Inc., Drexel Hamilton, LLC or any other underwriter or dealer participating in this offering will arrange to send you the prospectus if you request it by calling toll-free 1-800-831-9146.
| 146 |
| LOAN #10: ann arbor mixed use portfolio |
| ■ | Operating History and Underwritten Net Cash Flow. The following table presents certain information relating to the historical operating performance and the Underwritten Net Cash Flow at the Ann Arbor Mixed Use Portfolio Properties: |
Cash Flow Analysis(1)
2014 | 2015 | 2016 | TTM 5/31/2017 | Underwritten(1) | Underwritten | |||||||
| Base Rent(2) | $4,909,462 | $4,910,425 | $3,939,421 | $4,373,586 | $5,317,327 | $27.96 | ||||||
| Contractual Rent Steps(3) | 0 | 0 | 0 | 0 | 247,794 | 1.30 | ||||||
| Gross Up Vacancy | 0 | 0 | 0 | 0 | 186,660 | 0.98 | ||||||
| Reimbursements | 480,787 | 786,127 | 892,316 | 533,792 | 703,538 | 3.70 | ||||||
| Other Income(4) | 477,744 | 507,544 | 669,750 | 447,439 | 384,668 | 2.02 | ||||||
| Gross Revenue | $5,867,993 | $6,204,096 | $5,501,487 | $5,354,817 | $6,839,988 | $35.96 | ||||||
| Vacancy & Credit Loss | (30,833) | 0 | 0 | (24,041) | (306,030) | (1.61) | ||||||
| Effective Gross Income | $5,837,160 | $6,204,096 | $5,501,487 | $5,330,776 | $6,533,958 | $34.35 | ||||||
| Real Estate Taxes | $740,680 | $753,636 | $773,042 | $773,041 | $1,329,549 | $6.99 | ||||||
| Insurance | 62,873 | 63,176 | 56,247 | 58,942 | 55,300 | 0.29 | ||||||
| Management Fee | 175,115 | 186,123 | 165,045 | 159,923 | 196,019 | 1.03 | ||||||
| Other Operating Expenses | 1,654,187 | 1,583,034 | 1,398,224 | 1,354,430 | 1,406,205 | 7.39 | ||||||
| Total Operating Expenses | $2,632,855 | $2,585,969 | $2,392,557 | $2,346,336 | $2,987,072 | $15.70 | ||||||
| Net Operating Income | $3,204,305 | $3,618,127 | $3,108,930 | $2,984,440 | $3,546,886 | $18.65 | ||||||
| TI/LC | 0 | 0 | 0 | 0 | 296,919 | 1.56 | ||||||
| Capital Expenditures | 0 | 0 | 0 | 0 | 36,077 | 0.19 | ||||||
| Net Cash Flow | $3,204,305 | $3,618,127 | $3,108,930 | $2,984,440 | $3,213,889 | $16.90 | ||||||
| Occupancy(5) | 100.0% | 100.0% | 97.8% | 97.8% | 97.8% | |||||||
| NOI Debt Yield | 9.2% | 10.4% | 8.9% | 8.6% | 10.2% | |||||||
| NCF DSCR | 1.53x | 1.72x | 1.48x | 1.42x | 1.53x |
| (1) | Certain items such as straight line rent, interest expense, interest income, lease cancellation income, depreciation, amortization, debt service payments and any other non-recurring or non-operating items were excluded from the historical presentation and are not considered for the underwritten cash flow. |
| (2) | The Base Rent decrease from 2015 to 2016 and continuing in the TTM period ending May 31, 2017 was attributable to Google vacating its premises and the subsequent immediate lease-up of the vacated space by Llamasoft, Inc., Alumni Association of the University of Michigan, and Think Tech, Inc. Base Rent was Underwritten to contractual rents from tenants occupying the Ann Arbor Mixed Use Portfolio Properties. |
| (3) | Contractual Rent Steps are underwritten based upon actual scheduled rent increases through May 2018 and the present value of future rent increases for two investment grade tenants. |
| (4) | Other Income includes storage income, work order income, late & NSF income, and other miscellaneous income. |
| (5) | The occupancy presented in the TTM 5/31/2017 column is as of June 1, 2017. |
The depositor has filed a registration statement (including a prospectus) with the Securities and Exchange Commission (“SEC”) (SEC File No. 333-207132) for the offering to which this communication relates. Before you invest, you should read the prospectus in the registration statement and other documents the depositor has filed with the SEC for more complete information about the depositor, the issuing entity and this offering. You may get these documents for free by visiting EDGAR on the SEC website at www.sec.gov. Alternatively, the depositor or Citigroup Global Markets Inc., Barclays Capital Inc., Drexel Hamilton, LLC or any other underwriter or dealer participating in this offering will arrange to send you the prospectus if you request it by calling toll-free 1-800-831-9146.
| 147 |
| LOAN #10: ann arbor mixed use portfolio |
| ■ | Appraisal. According to the appraisals, the Ann Arbor Mixed Use Portfolio Properties had an aggregate “as-is” appraised value of $50,000,000 as of June 14, 2017. The McKinley Towne Centre Property and Liberty Square Property had individual “as-is” appraised values of $39,500,000 and $10,500,000, respectively, as of June 14, 2017. |
Appraisal Approach (McKinley Towne Centre Property) | As-Is Value | Discount Rate | Capitalization Rate | |||
| Direct Capitalization Approach | $39,800,000 | N/A | 7.00% | |||
| Discounted Cash Flow Approach | $38,400,000 - $39,800,000 | 7.25% - 7.75% | 7.25% | |||
Appraisal Approach (Liberty Square Property) | As-Is Value | Discount Rate | Capitalization Rate | |||
| Direct Capitalization Approach | $9,900,000 | N/A | 7.00% | |||
| Discounted Cash Flow Approach | $10,300,000 - $10,700,000 | 7.50% - 8.00% | 7.25% | |||
| ■ | Environmental Matters.According to the Phase I environmental reports, each dated June 20, 2017, there were no recognized environmental conditions or recommendations for further action at either of the Ann Arbor Mixed Use Portfolio Properties except for the continued implementation of the asbestos operations and maintenance plan at each of the Ann Arbor Mixed Use Portfolio Properties. |
| ■ | Market Overview and Competition. The Ann Arbor Mixed Use Portfolio Properties are located in downtown Ann Arbor, Michigan. Ann Arbor is home to the University of Michigan, which, as of the fall 2016, had an enrollment of 44,718 students. The University of Michigan is also the top employer in the greater Ann Arbor area, employing 30,835 people as of January 2017. The city of Ann Arbor’s economy is also centered on high technology, with companies drawn to the area by the university’s research and development infrastructure, and by its graduates. High tech, health services and biotechnology are other major components of the city’s economy with numerous medical offices, laboratories, and associated companies located within the city. According to the appraisals, the estimated 2017 population within a one-, three- and five-mile radius of the Ann Arbor Mixed Use Portfolio Properties was 34,064, 104,543 and 158,526, respectively. According to the appraisals, the estimated 2017 average annual household income within a one-, three- and five-mile radius of the Ann Arbor Mixed Use Portfolio Properties was $68,396, $95,082 and $96,660, respectively. According to a third party industry report, as of the first quarter of 2017, the Washtenaw County office submarket had a total office inventory of approximately 14.9 million SF, with an 8.1% vacancy rate and asking rents of $18.65 per SF. According to a third party industry report, as of the first quarter of 2017, the downtown Ann Arbor area consisting of properties within a 2-mile radius of the Ann Arbor Mixed Use Portfolio Properties, had a total office inventory of approximately 3.5 million SF, with a 3.6% vacancy rate and asking rents of $25.86. |
The following table presents certain information relating to the primary competition for the Ann Arbor Mixed Use Portfolio Properties:
Competitive Set(1)
Liberty Square (Subject) | McKinley Towne Centre (Subject) | 301 East Liberty Street | ||||
| Year Built / Renovated | 1960,1999 / 2007-2009 | 1973 / 2015-2016 | 1987 / NAP | |||
| NRA | 59,381 | 130,824 | 85,468 | |||
| Total Occupancy | 100.0% | 96.8% | 100.0% | |||
| Range of Rental Rates | $11.00 - $32.96 | $24.19 - $45.98 | $23.50 - $40.00 | |||
| Lease Type | Net, base year stop, and Gross | Net, base year stop, and Gross | Modified Gross | |||
600-612 East Liberty Street | Market Place, 303 Detroit Street | One North Main | ||||
| Year Built / Renovated | 1920 / 2012 | 1988 / NAP | 1987 | |||
| NRA | 64,000 | 28,000 | 114,914 | |||
| Total Occupancy | 100.0% | 100.0% | 93.3% | |||
| Range of Rental Rates | $24.00 - $49.00 | $14.00 - $31.00 | $24.62 – $38.00 | |||
| Lease Type | Net | Net and Modified Gross | Net and Modified Gross |
| (1) | Source: Appraisal. |
The depositor has filed a registration statement (including a prospectus) with the Securities and Exchange Commission (“SEC”) (SEC File No. 333-207132) for the offering to which this communication relates. Before you invest, you should read the prospectus in the registration statement and other documents the depositor has filed with the SEC for more complete information about the depositor, the issuing entity and this offering. You may get these documents for free by visiting EDGAR on the SEC website at www.sec.gov. Alternatively, the depositor or Citigroup Global Markets Inc., Barclays Capital Inc., Drexel Hamilton, LLC or any other underwriter or dealer participating in this offering will arrange to send you the prospectus if you request it by calling toll-free 1-800-831-9146.
| 148 |
| LOAN #10: ann arbor mixed use portfolio |
| ■ | The Borrowers. The borrowers, Hillside - Liberty Square LLC, Hillside - Liberty Town Center LLC and Hillside - Liberty MT LLC, are each single-purpose Delaware limited liability companies. Legal counsel to the borrowers delivered a non-consolidation opinion in connection with the origination of the Ann Arbor Mixed Use Portfolio Loan. The borrower sponsors and carveout guarantors are Jaimey Roth, Marc Gardner, Jason Anstandig, and Jason Biber. Jaimey Roth, Jason Anstandig, and Jason Biber lead Hillside Investments, a full-service real estate company specializing in acquiring and developing real estate investments. Throughout the history of Hillside Investments, it has acquired more than $1.0 billion worth of commercial real estate assets across sixteen states with a total footprint that exceeds 20.0 million SF. Hillside Investments’ current holdings in the state of Michigan include 12 properties totaling approximately 763,471 SF. Jaimey Roth, Jason Anstandig, and Jason Biber have a combined net worth of more than $28.1 million and a combined liquidity in excess of $2.6 million. The fourth borrower sponsor and carveout guarantor, Marc Gardner, is the founder of North American Bancard, a payment solutions provider headquartered in Troy, Michigan. As of June 30, 2017, Marc Gardner had a net worth of more than $606.1 million and liquidity in excess of $179.5 million. |
| ■ | Escrows. On the origination date of the Ann Arbor Mixed Use Portfolio Loan, the borrowers funded reserves of (i) $166,194 for real estate taxes, (ii) $9,678 for insurance, (iii) $500,000 for tenant improvements and leasing commissions, (iv) $129,969 for unfunded tenant obligations and (v) $19,255 for payment of condominium assessments. |
On each due date, the borrowers will be required to fund (i) one-twelfth of the taxes that the lender estimates will be payable over the then-succeeding 12-month period, initially estimated to be $110,796, (ii) one-twelfth of the amount that the lender estimates will be necessary to pay insurance premiums over the then-succeeding 12-month period, provided that insurance is not covered under an acceptable blanket insurance policy, initially estimated to be $4,839, (iii) $3,170 for replacement reserves, subject to a cap of $114,123, (iv) $23,776 for tenant improvements and leasing commissions, subject to a cap of $900,000, and (v) one-twelfth of the amount sufficient to pay condominium assessments for the next twelve months unless no Ann Arbor Mixed Use Portfolio Trigger Period (as defined below) has occurred and is continuing and the borrower has provided the lender with evidence of payment of the condominium assessments at least thirty days prior to the date on which such assessments become delinquent, in which case such monthly deposit is waived.
| ■ | Lockbox and Cash Management. The Ann Arbor Mixed Use Portfolio Loan documents require a springing lockbox with springing cash management. During the continuance of an Ann Arbor Mixed Use Portfolio Trigger Period, a lockbox springs into place and the borrowers are required to send tenant direction letters to all tenants within two days thereof directing rent be paid directly into the lockbox, and to (and to instruct the property manager to) deposit all other rents received into the lockbox within two business days. All amounts in the lockbox account are then required to be swept into a lender-controlled cash management account on a daily basis and, provided no event of default under the Ann Arbor Mixed Use Portfolio Loan documents is continuing, applied to payment of debt service, payment of operating expenses, and funding of required reserves, with the remainder being deposited into an excess cash flow reserve. Provided no event of default under the Ann Arbor Mixed Use Portfolio Loan documents is continuing, funds in the excess cash flow reserve are required (i) to the extent an Ann Arbor Mixed Use Portfolio Trigger Period is continuing, to be held by the lender as additional collateral for the Ann Arbor Mixed Use Portfolio Loan and (ii) to the extent no Ann Arbor Mixed Use Portfolio Trigger Period is continuing, to be swept to the borrowers. Upon the occurrence and during the continuance of an event of default under the Ann Arbor Mixed Use Portfolio Loan documents, the lender may apply any funds in the cash management account to amounts payable under the Ann Arbor Mixed Use Portfolio Loan (and/or toward the payment of expenses of the Ann Arbor Mixed Use Portfolio Properties), in such order of priority as the lender may determine. |
An“Ann Arbor Mixed Use Portfolio Trigger Period” will commence upon the earlier of (i) the occurrence of an event of default under the Ann Arbor Mixed Use Portfolio Loan documents and continuing until the cure of such event of default; (ii) the occurrence of the debt service coverage ratio including the Ann Arbor Mixed Use Portfolio Mezzanine Loan (as defined below) being less than 1.08x, and continuing until such debt service coverage ratio is equal to or greater than 1.10x for one calendar quarter; and (iii) the occurrence of an Ann Arbor Mixed Use Portfolio Specified Tenant Trigger Period (as defined below) and continuing until the Ann Arbor Mixed Use Portfolio Specified Tenant Trigger Period ceases to exist in accordance with the terms of the Ann Arbor Mixed Use Portfolio Loan documents.
An“Ann Arbor Mixed Use Portfolio Specified Tenant Trigger Period” means a period: (a) commencing upon the first to occur of (i) Llamasoft, Inc., any future tenants of Llamasoft, Inc.’s premises, and any parent, affiliate providing credit support or guarantor of the foregoing (collectively, “Llamasoft, Inc.”) being in monetary or material non-
The depositor has filed a registration statement (including a prospectus) with the Securities and Exchange Commission (“SEC”) (SEC File No. 333-207132) for the offering to which this communication relates. Before you invest, you should read the prospectus in the registration statement and other documents the depositor has filed with the SEC for more complete information about the depositor, the issuing entity and this offering. You may get these documents for free by visiting EDGAR on the SEC website at www.sec.gov. Alternatively, the depositor or Citigroup Global Markets Inc., Barclays Capital Inc., Drexel Hamilton, LLC or any other underwriter or dealer participating in this offering will arrange to send you the prospectus if you request it by calling toll-free 1-800-831-9146.
| 149 |
| LOAN #10: ann arbor mixed use portfolio |
monetary default under its lease beyond applicable notice and cure periods, (ii) Llamasoft, Inc. failing to be in actual, physical possession of the Llamasoft, Inc. space, failing to be open to the public for business during customary hours, and/or “going dark” in the Llamasoft, Inc. space (except for up to six months in connection with ordinary repairs or renovations), (iii) Llamasoft, Inc. providing notice that it is terminating its lease for all or any portion of its premises such that the remaining space following such termination will be less than 90% of the square footage demised to the applicable tenant as of the origination date of the Ann Arbor Mixed Use Portfolio Loan, (iv) any termination, cancellation or failure to be in full force and effect (including rejection in a bankruptcy or insolvency proceeding) of the Llamasoft, Inc. lease, (v) any bankruptcy or similar insolvency of Llamasoft, Inc. and (vi) Llamasoft, Inc. failing to extend or renew the applicable lease for the Llamasoft, Inc. space on or prior to the earlier of (x) twelve months before expiration of its lease and (y) the date under the lease on which notice must be given to the lessor to exercise the applicable extension option; and (b) expiring upon the first to occur of the lender’s receipt of reasonably acceptable evidence (including an estoppel certificate) of (1) the matter giving rise to the Ann Arbor Mixed Use Portfolio Specified Tenant Trigger Period has been cured or corrected in accordance with the terms of the Ann Arbor Mixed Use Portfolio Loan documents or (2) the borrowers re-leasing of the space that was demised pursuant to the Llamasoft Inc. lease to a new tenant pursuant to a lease entered into in accordance with the applicable terms and conditions under the Ann Arbor Mixed Use Portfolio Loan documents and such replacement tenant is in physical occupancy of the applicable premises, open for business, and paying full, unabated rent under its lease.
| ■ | Property Management. The Ann Arbor Mixed Use Portfolio Properties are managed by Lakeshore Management, LLC. The lender has the right to, or to direct the borrowers to, terminate the property management agreement and replace the property manager if: (i) the property manager becomes insolvent or a debtor in an involuntary bankruptcy action or proceeding that is not dismissed within 90 days or any voluntary bankruptcy proceeding; (ii) an Ann Arbor Mixed Use Portfolio Trigger Period has occurred and is continuing under the Ann Arbor Mixed Use Portfolio Loan documents; (iii) the property manager has engaged in gross negligence, fraud, willful misconduct or misappropriation of funds; or (iv) a default by the property manager has occurred and is continuing under the property management agreement after the expiration of all applicable notice and cure periods. The borrowers have the right to replace the property manager, provided no event of default is continuing under the Ann Arbor Mixed Use Portfolio Loan documents and such replacement would not cause a termination right, right of first refusal or offer or similar right to arise, any termination fees to be due, or a material adverse effect under the condominium documents, reciprocal easement agreements, or parking agreement, with a property manager approved by the lender in writing (which may be conditioned upon receipt of a rating agency confirmation). |
| ■ | Mezzanine or Secured Subordinate Indebtedness.Concurrently with the funding of the Ann Arbor Mixed Use Portfolio Loan, MSC - Ann Arbor OP Holdco, LLC (with its successors and/or assigns, the “Mezzanine Lender”) funded a mezzanine loan in the amount of $6,750,000 (the “Ann Arbor Mixed Use Portfolio Mezzanine Loan”) to Hillside – Liberty Mezzanine Holdings LLC, as mezzanine borrower, which is the direct owner of 100.0% of the limited liability company interests in each of the borrowers. The Ann Arbor Mixed Use Portfolio Mezzanine Loan is secured by a pledge of the mezzanine borrower’s 100% limited liability company interests in each of the borrowers. The Ann Arbor Mixed Use Portfolio Mezzanine Loan accrues interest at an interest rate of 11.00000%per annum and is co-terminous with the Ann Arbor Mixed Use Portfolio Loan. The Ann Arbor Mixed Use Portfolio Mezzanine Loan is subject to an intercreditor agreement. |
| ■ | Release of Collateral. Provided that no event of default has occurred and is continuing under the Ann Arbor Mixed Use Portfolio Loan documents, the borrowers may obtain the release of one or more of the Ann Arbor Mixed Use Portfolio Properties at any time after the second anniversary of the securitization Closing Date by partially defeasing the Ann Arbor Mixed Use Portfolio Loan with certain direct full faith and credit obligations of the United States of America or other obligations which are “government securities” permitted under the Ann Arbor Mixed Use Portfolio Loan documents (or, following the date that is six months prior to the maturity date of the Ann Arbor Mixed Use Portfolio Loan, prepaying the loan with respect to the applicable Ann Arbor Mixed Use Portfolio Property) in an amount equal to the greater of (y)115% of the allocated loan amount for such Ann Arbor Mixed Use Portfolio Property and (z) 80% of the net sales proceeds applicable to such Ann Arbor Mixed Use Portfolio Property, subject to the satisfaction of certain conditions, including, without limitation: (i) that the aforesaid defeasance collateral is sufficient to make all payments (including balloon payments) on a defeased portion of the Ann Arbor Mixed Use Portfolio Loan, (ii) when giving notice of the partial defeasance and after giving effect to the release, the debt service coverage ratio (including the Ann Arbor Mixed Use Portfolio Mezzanine Loan) based on the remaining Ann Arbor Mixed Use Portfolio Properties being greater than the greater of (a) such debt service coverage ratio immediately prior to the release (or notice date, as applicable) of all encumbered Ann Arbor Mixed Use Portfolio Properties, and (b) 1.25x, (iii) when giving notice of the partial defeasance and after giving effect to the release, the debt yield (including the Ann Arbor |
The depositor has filed a registration statement (including a prospectus) with the Securities and Exchange Commission (“SEC”) (SEC File No. 333-207132) for the offering to which this communication relates. Before you invest, you should read the prospectus in the registration statement and other documents the depositor has filed with the SEC for more complete information about the depositor, the issuing entity and this offering. You may get these documents for free by visiting EDGAR on the SEC website at www.sec.gov. Alternatively, the depositor or Citigroup Global Markets Inc., Barclays Capital Inc., Drexel Hamilton, LLC or any other underwriter or dealer participating in this offering will arrange to send you the prospectus if you request it by calling toll-free 1-800-831-9146.
| 150 |
| LOAN #10: ann arbor mixed use portfolio |
Mixed Use Portfolio Mezzanine Loan) based on the remaining Ann Arbor Mixed Use Portfolio Properties being no greater than the greater of (a) the debt yield immediately prior to the release (or notice date, as applicable) of all encumbered Ann Arbor Mixed Use Portfolio Properties and (b) 8.25%; (iv) when giving notice of the partial defeasance and after giving effect to the release, the loan-to-value ratio (including the Ann Arbor Mixed Use Portfolio Mezzanine Loan) based on the remaining Ann Arbor Mixed Use Portfolio Properties being no greater than the lesser of (a) the loan-to-value ratio immediately prior to the release (or notice date, as applicable) of all encumbered Ann Arbor Mixed Use Portfolio Properties and (b) 79.0%; (v) delivery of a rating agency confirmation and REMIC opinion with respect to the partial defeasance; and (vi) unless all parking associated with the released Ann Arbor Mixed Use Portfolio Property has been assigned to the remaining borrower and benefits the remaining Ann Arbor Mixed Use Portfolio Properties, the lender elects to consent to the borrower’s partial defeasance of the Ann Arbor Mixed Use Portfolio Loan.
| ■ | Terrorism Insurance. The borrowers are required to maintain an “all-risk” insurance policy that provides coverage for terrorism in an amount equal to 100% of the full replacement cost of the Ann Arbor Mixed Use Portfolio Properties, plus a business interruption insurance policy that provides 18 months of business interruption coverage with an additional 6-month extended period of indemnity, with no deductible in excess of $25,000 (provided, however, that higher deductibles for damage caused by windstorm/named storm are permitted so long as such higher deductibles are commercially reasonable but are not to exceed 5% of the total insurable value of the applicable individual property). See“Risk Factors—Terrorism Insurance May Not Be Available for All Mortgaged Properties” in the Preliminary Prospectus. |
The depositor has filed a registration statement (including a prospectus) with the Securities and Exchange Commission (“SEC”) (SEC File No. 333-207132) for the offering to which this communication relates. Before you invest, you should read the prospectus in the registration statement and other documents the depositor has filed with the SEC for more complete information about the depositor, the issuing entity and this offering. You may get these documents for free by visiting EDGAR on the SEC website at www.sec.gov. Alternatively, the depositor or Citigroup Global Markets Inc., Barclays Capital Inc., Drexel Hamilton, LLC or any other underwriter or dealer participating in this offering will arrange to send you the prospectus if you request it by calling toll-free 1-800-831-9146.
| 151 | �� |
LOAN #11: Visions hotel portfolio
| Mortgaged Property Information | Mortgage Loan Information | |||||||||
| Number of Mortgaged Properties | 10 | Loan Seller | SMF V | |||||||
| Location (City/State) | Various, New York | Cut-off Date Balance(4) | $34,400,000 | |||||||
| Property Type | Hospitality | Cut-off Date Balance per Room(3) | $64,779.50 | |||||||
| Size (Rooms) | 839 | Percentage of Initial Pool Balance | 3.2% | |||||||
| Total TTM Occupancy as of 6/30/2017 | 69.2% | Number of Related Mortgage Loans | None | |||||||
| Owned TTM Occupancy as of 6/30/2017 | 69.2% | Type of Security | Various | |||||||
| Year Built / Latest Renovation | Various / Various | Mortgage Rate | 4.48000% | |||||||
| Appraised Value(1) | $103,000,000 | Original Term to Maturity (Months) | 120 | |||||||
| Appraisal Date(1) | 7/1/2017 | Original Amortization Term (Months) | 360 | |||||||
| Borrower Sponsor(2) | Arun Patel; Hemant Patel | Original Interest Only Period (Months) | 0 | |||||||
| Property Management | Visions Hotels LLC | First Payment Date | 10/6/2017 | |||||||
| Maturity Date | 9/6/2027 | |||||||||
| Underwritten Revenues | $24,617,340 | |||||||||
| Underwritten Expenses | $16,202,402 | Escrows | ||||||||
| Underwritten Net Operating Income (NOI) | $8,414,938 | |||||||||
| Underwritten Net Cash Flow (NCF) | $7,430,244 | Upfront | Monthly | |||||||
| Cut-off Date LTV Ratio(1)(3) | 52.8% | Taxes | $1,280,823 | $137,128 | ||||||
| Maturity Date LTV Ratio(1)(3) | 42.6% | Insurance | $191,325 | $35,750 | ||||||
| DSCR Based on Underwritten NOI / NCF(3) | 2.55x / 2.25x | FF&E(5) | $0 | $41,029 | ||||||
| Debt Yield Based on Underwritten NOI / NCF(3) | 15.5% / 13.7% | Other(6) | $31,475 | $0 | ||||||
| Sources and Uses | ||||||||||
| Sources | $ | % | Uses | $ | % | |||||
| Loan Combination Amount | $54,350,000 | 100.0% | Loan Payoff | $43,730,209 | 80.5% | |||||
| Principal Equity Distribution | 8,095,257 | 14.9 | ||||||||
| Reserves | 1,503,623 | 2.8 | ||||||||
| Closing Costs | 1,020,911 | 1.9 | ||||||||
| Total Sources | $54,350,000 | 100.0% | Total Uses | $54,350,000 | 100.0% | |||||
| (1) | The “as is portfolio” Appraised Value of $103.0 million for the Visions Hotel Portfolio properties as a whole reflects a 4.6% premium to the aggregate “as is” appraised value of the individual properties. The aggregate “as is” appraised value for the individual properties as of July 1, 2017 is $98.5 million, which results in a Cut-off Date LTV Ratio of 55.2% and a Maturity Date LTV Ratio of 44.6%. |
| (2) | Arun Patel and Hemant Patel are the guarantors of the non-recourse carveouts under the Visions Hotel Portfolio Loan Combination (as defined below). |
| (3) | Calculated based on the aggregate outstanding principal balance of the Visions Hotel Portfolio Loan Combination. |
| (4) | The Cut-off Date Balance of $34,400,000 represents the controlling note A-1, which is part of a loan combination (the “Visions Hotel Portfolio Loan Combination”) evidenced by twopari passunotes having an aggregate outstanding principal balance as of the Cut-off Date of $54,350,000. The related companion loan is evidenced by the non-controlling note A-2 with an outstanding principal balance as of the Cut-off Date of $19,950,000, which is currently held by Starwood Mortgage Funding II LLC and is expected to be contributed to a future securitization transaction. |
| (5) | On each monthly payment date, the borrower is required to deposit into an FF&E reserve account an amount equal to (i) one-twelfth of 2.0% of total revenues up to and including the payment date in September 2019, (ii) one-twelfth of 3.0% of total revenues beginning on the payment date in October 2019 and up to and including the payment date in September 2022 and (iii) one-twelfth of 4.0% of total revenues on each payment date thereafter. |
| (6) | On the origination date of the Visions Hotel Portfolio Loan Combination, the borrower deposited $31,475 for ground rent related to the Fairfield Inn & Suites Olean and Fairfield Inn & Suites Rochester West/Greece properties. |
The following table presents certain information relating to the Visions Hotel Portfolio properties:
| Visions Hotel Portfolio Property Summary | ||||||||||||
| Property Name | City / State | Rooms | Year Built / Renovated | Allocated Loan Amount | % Allocated Loan Amount | Appraised Value(1) | UW NCF | %UW NCF | TTM(2)Occupancy | TTM(2) RevPAR Penetration | ||
| Holiday Inn Express & Suites Buffalo | Buffalo, NY | 146 | 1980 / 2016 | $5,063,478 | 14.7 | % | $15,500,000 | $979,128 | 13.2 | % | 83.0% | 74.5% |
| Hampton Inn Potsdam | Potsdam, NY | 94 | 2014 / NAP | 4,177,369 | 12.1 | 12,500,000 | 1,190,649 | 16.0 | 66.6% | 144.9% | ||
| Hampton Inn & Suites Utica | Utica, NY | 83 | 2007 / 2014 | 4,114,075 | 12.0 | 13,100,000 | 1,216,368 | 16.4 | 76.4% | 116.0% | ||
| Fairfield Inn & Suites Olean(3) | Olean, NY | 76 | 2001 / 2015 | 3,924,195 | 11.4 | 9,000,000 | 634,994 | 8.5 | 58.0% | 116.1% | ||
| Hampton Inn & Suites East Aurora | East Aurora, NY | 80 | 2003 / 2011 | 3,892,548 | 11.3 | 13,000,000 | 1,128,833 | 15.2 | 79.3% | 138.6% | ||
| Fairfield Inn & Suites Binghamton | Binghamton, NY | 82 | 2000 / 2013-2014 | 2,848,206 | 8.3 | 8,200,000 | 523,490 | 7.0 | 59.6% | 109.5% | ||
| Fairfield Inn & Suites Rochester South | Henrietta, NY | 62 | 1995 / 2016 | 2,848,206 | 8.3 | 7,000,000 | 521,357 | 7.0 | 66.3% | 96.2% | ||
| Fairfield Inn & Suites Albany | Albany, NY | 75 | 2006 / 2015 | 2,784,913 | 8.1 | 8,100,000 | 369,659 | 5.0 | 61.8% | 93.1% | ||
| Fairfield Inn & Suites Corning | Corning, NY | 63 | 1997 / 2017 | 2,373,505 | 6.9 | 6,500,000 | 432,924 | 5.8 | 55.7% | 87.8% | ||
| Fairfield Inn & Suites Rochester West/Greece(3) | Rochester, NY | 78 | 1998 / 2014 | 2,373,505 | 6.9 | 5,600,000 | 432,844 | 5.8 | 70.3% | 103.1% | ||
| Total / Weighted Average | 839 | $34,400,000 | 100.0 | % | $98,500,000 | $7,430,244 | 100.0 | % | 69.2% | 106.7% | ||
| Total w/ Portfolio Premium | $103,000,000 | |||||||||||
| (1) | The “as is portfolio” Appraised Value of $103.0 million for the Visions Hotel Portfolio properties as a whole reflects a 4.6% premium to the aggregate “as is” appraised value of the individual properties. The aggregate “as is” appraised value for the individual properties as of July 1, 2017 is $98.5 million, which results in a Cut-off Date LTV Ratio of 55.2% and a Maturity Date LTV Ratio of 44.6%. |
| (2) | Based on the trailing 12 months ending June 30, 2017. |
| (3) | Fairfield Inn & Suites Olean is subject to a ground lease, which commenced in May 2000 for a term of 40 years with a current annual ground rent of $36,545. Fairfield Inn & Suites Rochester West/Greece is subject to a ground lease, which commenced in June 1997 for a term of 60 years with current annual ground rent of $107,200. |
The depositor has filed a registration statement (including a prospectus) with the Securities and Exchange Commission (“SEC”) (SEC File No. 333-207132) for the offering to which this communication relates. Before you invest, you should read the prospectus in the registration statement and other documents the depositor has filed with the SEC for more complete information about the depositor, the issuing entity and this offering. You may get these documents for free by visiting EDGAR on the SEC website at www.sec.gov. Alternatively, the depositor or Citigroup Global Markets Inc., Barclays Capital Inc., Drexel Hamilton, LLC or any other underwriter or dealer participating in this offering will arrange to send you the prospectus if you request it by calling toll-free 1-800-831-9146.
| 152 |
LOAN #11: Visions hotel portfolio
The following table presents certain information relating to the estimated 2017 demand analysis with respect to each Visions Hotel Portfolio property based on market segmentation, as provided in the appraisals for the Visions Hotel Portfolio properties:
2017 Accommodated Room Night Demand(1)
Property | Meeting and Group | Leisure | Commercial | |||
| Holiday Inn Express & Suites Buffalo | 20% | 20% | 60% | |||
| Hampton Inn Potsdam | 10% | 70% | 20% | |||
| Hampton Inn & Suites Utica | 20% | 40% | 40% | |||
| Fairfield Inn & Suites Olean | 15% | 55% | 30% | |||
| Hampton Inn & Suites East Aurora | 20% | 20% | 60% | |||
| Fairfield Inn & Suites Binghamton | 10% | 50% | 40% | |||
| Fairfield Inn & Suites Rochester South | 10% | 30% | 60% | |||
| Fairfield Inn & Suites Albany | 15% | 25% | 60% | |||
| Fairfield Inn & Suites Corning | 10% | 40% | 50% | |||
| Fairfield Inn & Suites Rochester Greece/West | 15% | 45% | 40% | |||
| (1) | Source: Appraisals. |
The following table presents certain information relating to historic occupancy, ADR and RevPAR at the Visions Hotel Portfolio properties:
Historical Statistics
Visions Hotel Portfolio | Competitive Set(1) | Penetration(2) | ||||||||||||||||
Occupancy(3) | ADR(3) | RevPAR(3) | Occupancy | ADR | RevPAR | Occupancy | ADR | RevPAR | ||||||||||
| 2014(4) | 66.1% | $130.31 | $86.14 | 65.9% | $113.08 | $74.34 | 100.3% | 115.2% | 115.9% | |||||||||
| 2015 | 60.8% | $122.04 | $74.18 | 65.6% | $117.26 | $77.42 | 92.7% | 104.1% | 95.8% | |||||||||
| 2016 | 67.9% | $114.67 | $77.89 | 64.4% | $117.46 | $76.02 | 105.4% | 97.6% | 102.5% | |||||||||
| TTM June 2017 | 69.2% | $115.05 | $79.67 | 64.6% | $117.88 | $76.46 | 107.1% | 97.6% | 104.2% | |||||||||
| (1) | Competitive Set data for each individual property is based on a third party hospitality research report. |
| (2) | Penetration Factor data for each individual property is calculated based on operating statements provided by the borrowers and Competitive Set data provided by a third party hospitality research report. Portfolio level statistics are weighted based on total room count. |
| (3) | Based on operating statements provided by the borrowers and weighted based on available rooms or occupied rooms, as applicable. |
| (4) | 2014represents operations from three of the 10 Visions Hotel Portfolio properties. As such, Competitive Set and Penetration columns reflect only information pertaining to Hampton Inn & Suites Utica, Fairfield Inn & Suites Olean and Hampton Inn & Suites East Aurora, and their respective competitive sets. |
| ■ | Operating History and Underwritten Flow. The following table presents certain information relating to the historical operating performance and the Underwritten Net Cash Flow, on an aggregate basis and per room, at the Visions Hotel Portfolio properties: |
Cash Flow Analysis(1)
| 2014(2) | 2015 | 2016 | TTM 6/30/2017 | Underwritten | Underwritten | |||||
| Room Revenue | $7,514,420 | $22,690,822 | $23,889,434 | $24,397,250 | $24,258,317 | $28,913 | |||||
| Other Revenue(3) | 68,259 | 329,871 | 337,037 | 363,491 | 359,023 | 428 | |||||
| Total Revenue | $7,582,679 | $23,020,693 | $24,226,472 | $24,760,741 | $24,617,340 | $29,341 | |||||
| Room Expense | 1,574,931 | 5,785,154 | 5,815,280 | 6,015,004 | 5,967,662 | 7,113 | |||||
| Total Departmental Expense | $1,574,931 | $5,785,154 | $5,815,280 | $6,015,004 | $5,967,662 | $7,113 | |||||
| Total Undistributed Expense | 2,921,082 | 8,150,138 | 7,995,492 | 8,001,722 | 8,121,253 | 9,680 | |||||
| Total Fixed Charges | 555,805 | 1,923,397 | 2,019,759 | 2,020,050 | 2,113,487 | 2,519 | |||||
| Total Operating Expenses | $5,051,818 | $15,858,690 | $15,830,531 | $16,036,777 | $16,202,402 | $19,312 | |||||
| Net Operating Income | $2,530,861 | $7,162,004 | $8,395,941 | $8,723,964 | $8,414,938 | $10,030 | |||||
| FF&E | 0 | 0 | 0 | 0 | 984,694 | 1,174 | |||||
| Net Cash Flow | $2,530,861 | $7,162,004 | $8,395,941 | $8,723,964 | $7,430,244 | $8,856 | |||||
| Occupancy | 66.1% | 60.8% | 67.9% | 69.2% | 68.7% | ||||||
| NOI Debt Yield | 4.7% | 13.2% | 15.4% | 16.1% | 15.5% | ||||||
| NCF DSCR | 0.77x | 2.17x | 2.55x | 2.65x | 2.25x |
| (1) | Certain items such as interest expense, interest income, depreciation, amortization, debt service payments and any other non-recurring or non-operating items were excluded from the historical presentation and are not considered for the underwritten cash flow. |
| (2) | 2014 represents operations from three of the 10 Visions Hotel Portfolio properties (Hampton Inn & Suites Utica, Fairfield Inn & Suites Olean and Hampton Inn & Suites East Aurora). |
| (3) | Other Revenue consists of dry cleaning income, telecommunications revenue, meeting room rental income, cleaning fees, guest laundry income, meeting room food and beverage income, restaurant lease income, vending income and other miscellaneous income items. |
The depositor has filed a registration statement (including a prospectus) with the Securities and Exchange Commission (“SEC”) (SEC File No. 333-207132) for the offering to which this communication relates. Before you invest, you should read the prospectus in the registration statement and other documents the depositor has filed with the SEC for more complete information about the depositor, the issuing entity and this offering. You may get these documents for free by visiting EDGAR on the SEC website at www.sec.gov. Alternatively, the depositor or Citigroup Global Markets Inc., Barclays Capital Inc., Drexel Hamilton, LLC or any other underwriter or dealer participating in this offering will arrange to send you the prospectus if you request it by calling toll-free 1-800-831-9146.
| 153 |
| LOAN #12: PLEASANT PRAIRIE PREMIUM OUTLETS |
| Mortgaged Property Information | Mortgage Loan Information | ||||
| Number of Mortgaged Properties | 1 | Loan Seller(3) | CREFI | ||
| Location (City/State) | Pleasant Prairie, Wisconsin | Cut-off Date Balance(4) | $34,000,000 | ||
| Property Type | Retail | Cut-off Date Balance per SF(2) | $360.15 | ||
| Size (SF) | 402,615 | Percentage of Initial Pool Balance | 3.1% | ||
| Total Occupancy as of 7/26/2017 | 93.0% | Number of Related Mortgage Loans | None | ||
| Owned Occupancy as of 7/26/2017 | 93.0% | Type of Security | Fee Simple | ||
| Year Built / Latest Renovation(1) | 1987, 1989 and 2006 / NAP | Mortgage Rate | 3.99500% | ||
| Appraised Value | $290,000,000 | Original Term to Maturity (Months) | 120 | ||
| Appraisal Date | 7/20/2017 | Original Amortization Term (Months) | NAP | ||
| Borrower Sponsors | Simon Property Group, L.P. | Original Interest Only Period (Months) | 120 | ||
| Property Management | Simon Management Associates, LLC | First Payment Date | 10/1/2017 | ||
| Maturity Date | 9/1/2027 | ||||
| Underwritten Revenues | $22,589,594 | ||||
| Underwritten Expenses | $6,316,284 | Escrows | |||
| Underwritten Net Operating Income (NOI) | $16,273,310 | Upfront | Monthly | ||
| Underwritten Net Cash Flow (NCF) | $15,604,536 | Taxes | $0 | $0 | |
| Cut-off Date LTV Ratio(2) | 50.0% | Insurance | $0 | $0 | |
| Maturity Date LTV Ratio(2) | 50.0% | Replacement Reserve | $0 | $0 | |
| DSCR Based on Underwritten NOI / NCF(2) | 2.77x / 2.66x | TI/LC | $0 | $0 | |
| Debt Yield Based on Underwritten NOI / NCF(2) | 11.2% / 10.8% | Other(5) | $0 | $0 | |
| Sources and Uses | |||||
| Sources | $ | % | Uses | $ | % |
| Loan Combination Amount | $145,000,000 | 100.0% | Principal Equity Distribution | $144,317,359 | 99.5% |
| Closing Costs | 682,641 | 0.5 | |||
| Total Sources | $145,000,000 | 100.0% | Total Uses | $145,000,000 | 100.0% |
| (1) | The Pleasant Prairie Premium Outlets property was built in phases, beginning in 1987, with other portions being completed in 1989 and 2006. |
| (2) | Calculated based on the outstanding principal balance of the Pleasant Prairie Premium Outlets Loan Combination (as defined below). |
| (3) | The Pleasant Prairie Premium Outlets Loan Combination was co-originated by Citi Real Estate Funding Inc. (“CREFI”) and Wells Fargo Bank, National Association (“WFB”). |
| (4) | The Cut-off Date Balance of $34,000,000 represents the controlling note A-1, which is part of a loan combination (the “Pleasant Prairie Premium Outlets Loan Combination”) evidenced by fourpari passu notes having an aggregate outstanding principal balance as of the Cut-off Date of $145,000,000. The related companion loans are evidenced by the non-controlling note A-2, with an outstanding principal balance as of the Cut-off Date of $41,000,000, which is currently held by CREFI and is expected to be contributed to one or more future securitization transactions, and the non-controlling notes A-3 and A-4, which have an aggregate outstanding principal balance as of the Cut-off Date of $70,000,000, are currently held by WFB, and are expected to be contributed to one or more future securitization transactions. |
| (5) | The borrower sponsor delivered a guaranty in lieu of depositing a cash reserve for $416,575 of outstanding tenant allowances. |
The following table presents certain information relating to the major tenants (of which certain tenants may have co-tenancy provisions) at the Pleasant Prairie Premium Outlets property:
Ten Largest Owned Tenants Based on Underwritten Base Rent(1)
| Tenant Name | Credit Rating (Fitch/MIS/S&P)(2) | Tenant GLA | % of Owned GLA | UW Base Rent(3) | % of Total UW Base Rent(3) | UW Base Rent $ per SF(3) | Lease Expiration | Tenant Sales $ per SF(4) | Occupancy Cost(4) | |||||||||||
| The North Face | NR/A3/A | 6,500 | 1.6 | % | $675,481 | 4.6 | % | $103.92 | 9/30/2026 | $1,604.15 | 8.6% | |||||||||
| Nike Factory Store | NR/A1/AA- | 20,200 | 5.0 | 582,495 | 4.0 | $28.84 | 1/31/2028 | $892.73 | 5.5% | |||||||||||
| Gap Outlet | BB+/Baa2/BB+ | 11,000 | 2.7 | 575,460 | 3.9 | $52.31 | 1/31/2022 | $450.69 | 11.7% | |||||||||||
| Under Armour | NR/Baa2/BB+ | 11,250 | 2.8 | 565,051 | 3.9 | $50.23 | 9/30/2025 | $751.29 | 9.9% | |||||||||||
| Banana Republic Factory | BBB/Baa3/BBB- | 7,800 | 1.9 | 445,517 | 3.0 | $57.12 | 3/31/2021 | $466.14 | 16.5% | |||||||||||
| Old Navy | BB+/Baa2/BB+ | 16,115 | 4.0 | 425,436 | 2.9 | $26.40 | 1/31/2022 | $487.43 | 9.4% | |||||||||||
| Michael Kors | NR/NR/NR | 5,500 | 1.4 | 420,116 | 2.9 | $76.38 | 9/30/2025 | $1,298.96 | 8.0% | |||||||||||
| Adidas/Rockport | NR/NR/NR | 10,000 | 2.5 | 319,300 | 2.2 | $31.93 | 1/31/2027 | $654.45 | 8.5% | |||||||||||
| Columbia Sportswear Company | NR/NR/NR | 7,500 | 1.9 | 313,125 | 2.1 | $41.75 | 1/31/2019 | $706.29 | 8.8% | |||||||||||
| Dress Barn | NR/NR/NR | 8,000 | 2.0 | 303,280 | 2.1 | $37.91 | 6/30/2021 | $159.72 | 29.4% | |||||||||||
| Ten Largest Owned Tenants | 103,865 | 25.8 | % | $4,625,261 | 31.5 | % | $44.53 | |||||||||||||
| Other | 270,651 | 67.2 | 10,048,260 | 68.5 | $37.13 | |||||||||||||||
| Vacant | 28,099 | 7.0 | 0 | 0.0 | $0.00 | |||||||||||||||
| Total / Wtd. Avg. All Owned Tenants | 402,615 | 100.0 | % | $14,673,520 | 100.0 | % | $39.18 | |||||||||||||
| (1) | Based on the underwritten rent roll dated July 26, 2017. |
| (2) | Certain ratings are those of the parent company whether or not the parent guarantees the lease. |
| (3) | UW Base Rent includes $589,092, which represents the present value of rent steps for credit tenants and $217,393 for contractual rent steps through September 2018 for other tenants. |
| (4) | Based on sales for the trailing 12-month period ending June 30, 2017. Individual occupancy costs represent the underwritten in-place occupancy costs at the Pleasant Prairie Premium Outlets property based on each respective tenant’s SF as of the rent roll dated July 26, 2017. Some tenants may have expanded, contracted or relocated their space within the trailing-12 month period in which sales were reported. |
The depositor has filed a registration statement (including a prospectus) with the Securities and Exchange Commission (“SEC”) (SEC File No. 333-207132) for the offering to which this communication relates. Before you invest, you should read the prospectus in the registration statement and other documents the depositor has filed with the SEC for more complete information about the depositor, the issuing entity and this offering. You may get these documents for free by visiting EDGAR on the SEC website at www.sec.gov. Alternatively, the depositor or Citigroup Global Markets Inc., Barclays Capital Inc., Drexel Hamilton, LLC or any other underwriter or dealer participating in this offering will arrange to send you the prospectus if you request it by calling toll-free 1-800-831-9146.
| 154 |
| LOAN #12: PLEASANT PRAIRIE PREMIUM OUTLETS |
The following table presents certain information relating to the lease rollover schedule at the Pleasant Prairie Premium Outlets property, based on initial lease expiration dates:
Lease Expiration Schedule(1)(2)
Year Ending | Expiring | % of Owned GLA | Cumulative % of Owned GLA | UW Base Rent(3) | % of Total UW Base Rent(3) | UW Base Rent $ per SF(3)(4) | # of Expiring Tenants | |||||||||
| MTM | 0 | 0.0 | % | 0.0% | $0 | 0.0 | % | $0.00 | 0 | |||||||
| 2017 | 23,080 | 5.7 | 5.7% | 752,305 | 5.1 | $32.60 | 7 | |||||||||
| 2018 | 31,472 | 7.8 | 13.5% | 1,063,371 | 7.2 | $33.79 | 6 | |||||||||
| 2019 | 40,200 | 10.0 | 23.5% | 1,463,976 | 10.0 | $36.42 | 12 | |||||||||
| 2020 | 16,385 | 4.1 | 27.6% | 539,781 | 3.7 | $32.94 | 5 | |||||||||
| 2021 | 82,892 | 20.6 | 48.2% | 3,270,185 | 22.3 | $39.45 | 20 | |||||||||
| 2022 | 54,211 | 13.5 | 61.7% | 1,938,839 | 13.2 | $35.76 | 8 | |||||||||
| 2023 | 29,081 | 7.2 | 68.9% | 1,168,923 | 8.0 | $40.20 | 6 | |||||||||
| 2024 | 0 | 0.0 | 68.9% | 0 | 0.0 | $0.0 | 0 | |||||||||
| 2025 | 16,750 | 4.2 | 73.0% | 985,167 | 6.7 | $58.82 | 2 | |||||||||
| 2026 | 26,693 | 6.6 | 79.7% | 1,624,204 | 11.1 | $60.85 | 7 | |||||||||
| 2027 | 32,530 | 8.1 | 87.7% | 1,224,274 | 8.3 | $37.64 | 10 | |||||||||
| 2028 & Thereafter | 21,222 | 5.3 | 93.0% | 642,495 | 4.4 | $30.27 | 2 | |||||||||
| Vacant | 28,099 | 7.0 | 100.0% | 0 | 0.0 | $0.00 | 0 | |||||||||
| Total / Wtd. Avg.(4) | 402,615 | 100.0 | % | $14,673,520 | 100.0 | % | $39.18 | 85 | ||||||||
| (1) | Calculated based on the approximate square footage occupied by each Owned Tenant. |
| (2) | Certain tenants may have lease termination options that are exercisable prior to the originally stated expiration date of the subject lease and that are not considered in the Lease Expiration Schedule. |
| (3) | UW Base Rent includes $589,092, which represents the present value of rent steps for credit tenants and $217,393 for contractual rent steps through September 2018 for other tenants. |
| (4) | Wtd. Avg. UW Base Rent $ per SF excludes vacant space. |
The following table presents certain information relating to historical leasing at the Pleasant Prairie Premium Outlets property:
Historical Leased %(1)
2014 | 2015 | 2016 | As of 7/26/2017(2) | |||||
| Owned Space | 97.0% | 95.8% | 94.0% | 93.0% |
| (1) | As provided by the borrower and which represents occupancy as of December 31 for the indicated year unless otherwise specified. |
| (2) | Based on the underwritten rent roll dated July 26, 2017. |
The depositor has filed a registration statement (including a prospectus) with the Securities and Exchange Commission (“SEC”) (SEC File No. 333-207132) for the offering to which this communication relates. Before you invest, you should read the prospectus in the registration statement and other documents the depositor has filed with the SEC for more complete information about the depositor, the issuing entity and this offering. You may get these documents for free by visiting EDGAR on the SEC website at www.sec.gov. Alternatively, the depositor or Citigroup Global Markets Inc., Barclays Capital Inc., Drexel Hamilton, LLC or any other underwriter or dealer participating in this offering will arrange to send you the prospectus if you request it by calling toll-free 1-800-831-9146.
| 155 |
| LOAN #12: PLEASANT PRAIRIE PREMIUM OUTLETS |
| ■ | Operating History and Underwritten Net Cash Flow. The following table presents certain information relating to the historical operating performance and the Underwritten Net Cash Flow at the Pleasant Prairie Premium Outlets property: |
Cash Flow Analysis(1)
2014 | 2015 | 2016 | TTM 6/30/2017 | Underwritten | Underwritten | ||||||
| Base Rent | $12,212,614 | $12,488,959 | $13,535,045 | $13,825,230 | $13,867,036 | $34.44 | |||||
| Contractual Rent Steps(2) | 0 | 0 | 0 | 0 | 806,485 | 2.00 | |||||
| Gross Up Vacancy | 0 | 0 | 0 | 0 | 669,946 | 1.66 | |||||
| Reimbursements | 6,543,670 | 6,659,008 | 6,720,028 | 6,837,527 | 7,320,293 | 18.18 | |||||
| Percentage Rent | 1,222,636 | 1,378,887 | 645,234 | 685,673 | 533,877 | 1.33 | |||||
| Other Income(3) | 301,921 | 296,661 | 335,867 | 446,774 | 433,881 | 1.08 | |||||
| Vacancy & Credit Loss | (3,279) | 12,646 | (88,773) | (126,881) | (1,041,923) | (2.59) | |||||
| Effective Gross Income | $20,277,562 | $20,836,161 | $21,147,401 | $21,668,323 | $22,589,594 | $56.11 | |||||
| Real Estate Taxes | $2,795,521 | $2,893,594 | $2,656,064 | $2,585,913 | $2,792,689 | $6.94 | |||||
| Insurance | 120,102 | 124,521 | 126,761 | 126,083 | 125,987 | 0.31 | |||||
| Management Fee | 530,013 | 529,240 | 542,975 | 566,528 | 677,688 | 1.68 | |||||
| Other Operating Expenses | 2,911,308 | 2,699,704 | 2,664,213 | 2,563,232 | 2,719,920 | 6.76 | |||||
| Total Operating Expenses | $6,356,944 | $6,247,059 | $5,990,013 | $5,841,756 | $6,316,284 | $15.69 | |||||
| Net Operating Income | $13,920,618 | $14,589,102 | $15,157,388 | $15,826,567 | $16,273,310 | $40.42 | |||||
| TI/LC | 0 | 0 | 0 | 0 | 588,251 | 1.46 | |||||
| Capital Expenditures | 0 | 0 | 0 | 0 | 80,523 | 0.20 | |||||
| Net Cash Flow | $13,920,618 | $14,589,102 | $15,157,388 | $15,826,567 | $15,604,536 | $38.76 | |||||
| Occupancy | 97.0% | 95.8% | 94.0% | 93.0%(4) | 95.5%(5) | ||||||
| NOI Debt Yield(6) | 9.6% | 10.1% | 10.5% | 10.9% | 11.2% | ||||||
| NCF DSCR(6) | 2.37x | 2.48x | 2.58x | 2.69x | 2.66x |
| (1) | Certain items such as straight line rent, interest expense, interest income, lease cancellation income, depreciation, amortization, debt service payments and any other non-recurring or non-operating items were excluded from the historical presentation and are not considered for the underwritten cash flow. |
| (2) | Contractual Rent Steps of $806,485 includes $589,092, which represents the present value of rent steps for credit tenants and $217,393 for contractual rent steps through September 2018 for other tenants. |
| (3) | Other Income includes temporary tenant income, ATM minimum rents, beverage case rent, storage space income, beverage sponsorship, tower signage fees, local media and miscellaneous income. |
| (4) | Based on the underwritten rent roll dated July 26, 2017. |
| (5) | Represents an underwritten economic vacancy of 4.5%. |
| (6) | Calculated based on the outstanding principal balance of the Pleasant Prairie Premium Outlets Loan Combination. |
The depositor has filed a registration statement (including a prospectus) with the Securities and Exchange Commission (“SEC”) (SEC File No. 333-207132) for the offering to which this communication relates. Before you invest, you should read the prospectus in the registration statement and other documents the depositor has filed with the SEC for more complete information about the depositor, the issuing entity and this offering. You may get these documents for free by visiting EDGAR on the SEC website at www.sec.gov. Alternatively, the depositor or Citigroup Global Markets Inc., Barclays Capital Inc., Drexel Hamilton, LLC or any other underwriter or dealer participating in this offering will arrange to send you the prospectus if you request it by calling toll-free 1-800-831-9146.
| 156 |
(THIS PAGE INTENTIONALLY LEFT BLANK)
The depositor has filed a registration statement (including a prospectus) with the Securities and Exchange Commission (“SEC”) (SEC File No. 333-207132) for the offering to which this communication relates. Before you invest, you should read the prospectus in the registration statement and other documents the depositor has filed with the SEC for more complete information about the depositor, the issuing entity and this offering. You may get these documents for free by visiting EDGAR on the SEC website at www.sec.gov. Alternatively, the depositor or Citigroup Global Markets Inc., Barclays Capital Inc., Drexel Hamilton, LLC or any other underwriter or dealer participating in this offering will arrange to send you the prospectus if you request it by calling toll-free 1-800-831-9146.
| 157 |
LOAN #13: LAKESIDE SHOPPING CENTER
| Mortgaged Property Information | Mortgage Loan Information | |||||||||
| Number of Mortgaged Properties | 1 | Loan Seller | Barclays | |||||||
| Location (City/State) | Metairie, Louisiana | Cut-off Date Balance(3) | $33,000,000 | |||||||
| Property Type | Retail | Cut-off Date Balance per SF(2) | $144.47 | |||||||
| Size (SF) | 1,211,349 | Percentage of Initial Pool Balance | 3.0% | |||||||
| Total Occupancy as of 6/1/2017(1) | 97.5% | Number of Related Mortgage Loans | None | |||||||
| Owned Occupancy as of 6/1/2017(1) | 97.5% | Type of Security(4) | Fee Simple / Leasehold | |||||||
| Year Built / Latest Renovation | 1960 / 2002 | Mortgage Rate | 3.77000% | |||||||
| Appraised Value | $365,000,000 | Original Term to Maturity (Months) | 120 | |||||||
| Appraisal Date | 6/7/2017 | Original Amortization Term (Months) | NAP | |||||||
| Borrower Sponsor | Jeffrey J. Feil | Original Interest Only Period (Months) | 120 | |||||||
| Property Management | Broadwall Management Corp. | First Payment Date | 9/1/2017 | |||||||
| Maturity Date | 8/1/2027 | |||||||||
| Underwritten Revenues(1) | $32,713,717 | |||||||||
| Underwritten Expenses | $12,933,343 | Escrows | ||||||||
| Underwritten Net Operating Income (NOI) | $19,780,375 | Upfront | Monthly | |||||||
| Underwritten Net Cash Flow (NCF) | $18,307,305 | Taxes(5) | $0 | $0 | ||||||
| Cut-off Date LTV Ratio(2) | 47.9% | Insurance(5) | $0 | $0 | ||||||
| Maturity Date LTV Ratio(2) | 47.9% | Replacement Reserve(5) | $0 | $0 | ||||||
| DSCR Based on Underwritten NOI / NCF(2) | 2.96x / 2.74x | TI/LC(5) | $0 | $0 | ||||||
| Debt Yield Based on Underwritten NOI / NCF(2) | 11.3% / 10.5% | Other(5)(6) | $8,820,522 | $0 | ||||||
| Sources and Uses | ||||||||||
| Sources | $ | % | Uses | $ | % | |||||
| Loan Combination Amount | $175,000,000 | 100.0% | Loan Payoff | $95,495,796 | 54.6% | |||||
| Principal Equity Distribution | 69,947,856 | 40.0 | ||||||||
| Reserves | 8,820,522 | 5.0 | ||||||||
| Closing Costs | 735,826 | 0.4 | ||||||||
| Total Sources | $175,000,000 | 100.0% | Total Uses | $175,000,000 | 100.0% | |||||
| (1) | Total Occupancy, Owned Occupancy and Underwritten Revenues include five tenants including Zara, Charles Schwab, Flemings Prime Steakhouse, J. Jill and Free People, collectively representing 4.8% of the GLA and 8.0% of the underwritten base rent, which have executed leases but are not yet in occupancy or paying rent. Such tenants are anticipated to take occupancy between November 2017 and June 2018. Only the gap rents relating to Zara, Charles Schwab and Flemings Prime Steakhouse, collectively representing 6.8% of the underwritten base rent, have been reserved. |
| (2) | Calculated based on the aggregate outstanding principal balance of the Lakeside Shopping Center Loan Combination (as defined below). |
| (3) | The Cut-off Date Balance of $33,000,000 represents the non-controlling note A-3-1, which is part of a loan combination evidenced by fourpari passu notes having an aggregate outstanding principal balance as of the Cut-off Date of $175,000,000 (the “Lakeside Shopping Center Loan Combination”). The related companion loans are evidenced by (i) the controlling note A-1, which has an outstanding principal balance as of the Cut-off Date of $59,000,000 and was contributed to the CGCMT 2017-B1 securitization transaction, (ii) the non-controlling note A-2, which has an outstanding principal balance as of the Cut-off Date of $58,000,000 and was contributed to the WFCM 2017-C39 securitization transaction and (iii) the non-controlling note A-3-2, which has an outstanding principal balance as of the Cut-off Date of $25,000,000, is currently held by Barclays Bank PLC, and is expected to be contributed to one or more future securitization transactions. |
| (4) | The Lakeside Shopping Center property is subject to two separate long-term ground leases encompassing a total of 24,560 SF with a current aggregate annual ground rent payment of $67,710. Both ground leases expire in 2056. The 5,760 SF ground lease is subject to re-appraisal after August 31, 2017 and every ten years thereafter, which may result in rent escalation. The rent on the other ground lease is subject to re-appraisal every ten years, with the next reset after February 2027. |
| (5) | During a period when certain trigger events have occurred under the Lakeside Shopping Center Loan Combination documents, the borrower is required to deposit monthly escrows equal to (i) one-twelfth of the amount the lender estimates will be necessary to pay taxes over the then succeeding 12-month period, (ii) one-twelfth of the amount that the lender estimates will be necessary to pay insurance premiums for the renewal of the coverage (unless the Lakeside Shopping Center property is insured under an acceptable blanket insurance policy), (iii) the monthly amount due under the ground lease for the month in which such due date occurs, into a ground rent reserve, (iv) $20,193 into a replacement reserve (provided that the borrower is not required to make the monthly deposit to the replacement reserve if it would cause the amount then on deposit to exceed $1,000,000), and (v) an amount equal to $0.10 per SF for leases at the Lakeside Shopping Center property covering less than 20,000 SF into a tenant improvements and leasing commissions reserve. |
| (6) | Other upfront reserves are comprised of $7,606,095 for specified tenant improvement and leasing commissions and $1,214,427 for gap rent. |
The depositor has filed a registration statement (including a prospectus) with the Securities and Exchange Commission (“SEC”) (SEC File No. 333-207132) for the offering to which this communication relates. Before you invest, you should read the prospectus in the registration statement and other documents the depositor has filed with the SEC for more complete information about the depositor, the issuing entity and this offering. You may get these documents for free by visiting EDGAR on the SEC website at www.sec.gov. Alternatively, the depositor or Citigroup Global Markets Inc., Barclays Capital Inc., Drexel Hamilton, LLC or any other underwriter or dealer participating in this offering will arrange to send you the prospectus if you request it by calling toll-free 1-800-831-9146.
| 158 |
LOAN #13: LAKESIDE SHOPPING CENTER
The following table presents certain information relating to the major tenants (of which certain tenants may have co-tenancy provisions) at the Lakeside Shopping Center property:
Ten Largest Owned Tenants Based on Underwritten Base Rent(1)
| Tenant Name | Credit Rating (Fitch/MIS/S&P)(2) | Tenant GLA | % of Owned GLA | UW Base Rent(3) | % of Total UW Base Rent | UW Base Rent $ per SF(3) | Lease Expiration(4) | Tenant Sales $ per SF | Occupancy Cost | Renewal / Extension Options | ||||||||||
| JC Penney | B+/B1/B+ | 203,410 | 16.8% | $1,320,131 | 5.6% | $6.49 | 11/30/2022 | $116 | 8.5% | 4, 5-year options | ||||||||||
| Zara | NR/NR/NR | 34,722 | 2.9 | 1,009,716 | 4.3 | $29.08 | 4/30/2028(5) | NA | NA | 1, 5-year option | ||||||||||
| Victoria’s Secret | NR/NR/NR | 13,459 | 1.1 | 740,245 | 3.2 | $55.00 | 11/30/2025 | $742 | 10.3% | NA | ||||||||||
| Forever 21 | NR/NR/NR | 15,094 | 1.2 | 724,512 | 3.1 | $48.00 | 1/31/2018 | $417 | 16.6% | NA | ||||||||||
| Macy’s(6) | BBB/Baa3/BBB- | 229,520 | 18.9 | 649,542 | 2.8 | $2.83 | 1/31/2029 | $168 | 2.1% | 1, 10-year option, 4, 5-year options | ||||||||||
| Dick’s Sporting Goods | NR/NR/NR | 36,667 | 3.0 | 531,670 | 2.3 | $14.50 | 1/31/2021 | $252 | 8.6% | 4, 5-year options | ||||||||||
| Dillard’s | BBB-/Baa3/BBB- | 291,700 | 24.1 | 499,974 | 2.1 | $1.71 | 12/31/2019 | $199 | 0.9% | 1, 10-year option | ||||||||||
| Champs | NR/NR/NR | 4,500 | 0.4 | 495,000 | 2.1 | $110.00 | 1/31/2024 | $1,191 | 11.2% | NA | ||||||||||
| Apple | NR/Aa1/AA+ | 5,260 | 0.4 | 466,667 | 2.0 | $88.72 | 1/31/2019 | $7,096 | 1.3% | NA | ||||||||||
| Express | NR/NR/NR | 8,464 | 0.7 | 465,520 | 2.0 | $55.00 | 7/31/2027 | $596 | 9.2% | NA | ||||||||||
| Ten Largest Owned Tenants | 842,796 | 69.6% | $6,902,978 | 29.5% | $8.19 | |||||||||||||||
| Other | 338,554 | 27.9 | 16,521,985 | 70.5 | $48.80 | |||||||||||||||
| Vacant | 29,999 | 2.5 | 0 | 0.0 | $0.00 | |||||||||||||||
| Total / Wtd. Avg. All Owned Tenants | 1,211,349 | 100.0% | $23,424,962 | 100.0% | $19.83 |
| (1) | Based on the underwritten rent roll dated June 1, 2017. |
| (2) | Certain ratings are those of the parent company whether or not the parent guarantees the lease. |
| (3) | UW Base Rent and UW Base Rent $ per SF include contractual rent steps through July 31, 2018 totaling $420,066. |
| (4) | Most tenants have existing co-tenancy options to terminate their lease or cease operations at the Lakeside Shopping Center property generally related to one or more anchor tenants or tenants in excess of 100,000 SF not being open for business and/or certain occupancy thresholds for in-line gross leasable area not being maintained for a period of six to twelve months. |
| (5) | Zara has an early termination option if net sales for the third full lease year are less than $8.0 million. Zara’s lease is expected to commence June 2018. |
| (6) | Macy’s lease is a ground lease and it owns its own improvements. |
Tenant Sales (per SF) and Occupancy Costs(1)
| Total In-Line | TTM 4/31/2017 | TTM 4/31/2017 Occupancy Cost | ||
| Comparable Sales per SF w/Apple | $795 | 9.9% | ||
| Comparable Sales per SF w/o Apple | $651 | 12.0% |
| (1) | Information as provided by the borrower sponsor. |
The following table presents certain information relating to the lease rollover schedule at the Lakeside Shopping Center property, based on initial lease expiration dates:
Lease Expiration Schedule(1)(2)
Year Ending December 31 | Expiring Owned GLA | % of Owned GLA | Cumulative % of | UW Base Rent | % of Total UW Base Rent | UW Base Rent $ | # of Expiring | ||||||||||
| MTM | 3,020 | 0.2% | 0.2% | $24,002 | 0.1 | % | $7.95 | 4 | |||||||||
| 2017 | 2,322 | 0.2 | 0.4% | 549,668 | 2.3 | $236.72 | 2 | ||||||||||
| 2018 | 52,024 | 4.3 | 4.7% | 2,442,261 | 10.4 | $46.94 | 26 | ||||||||||
| 2019 | 358,007 | 29.6 | 34.3% | 3,195,857 | 13.6 | $8.93 | 15 | ||||||||||
| 2020 | 30,050 | 2.5 | 36.8% | 1,729,215 | 7.4 | $57.54 | 14 | ||||||||||
| 2021 | 63,990 | 5.3 | 42.1% | 2,088,586 | 8.9 | $32.64 | 11 | ||||||||||
| 2022 | 235,698 | 19.5 | 61.5% | 3,021,892 | 12.9 | $12.82 | 12 | ||||||||||
| 2023 | 24,888 | 2.1 | 63.6% | 1,747,188 | 7.5 | $70.20 | 11 | ||||||||||
| 2024 | 30,568 | 2.5 | 66.1% | 1,613,418 | 6.9 | $52.78 | 7 | ||||||||||
| 2025 | 53,657 | 4.4 | 70.5% | 2,613,729 | 11.2 | $48.71 | 13 | ||||||||||
| 2026 | 7,183 | 0.6 | 71.1% | 603,132 | 2.6 | $83.97 | 4 | ||||||||||
| 2027 | 19,274 | 1.6 | 72.7% | 877,383 | 3.7 | $45.52 | 4 | ||||||||||
| 2028 & Thereafter | 300,669 | 24.8 | 97.5% | 2,918,633 | 12.5 | $9.71 | 9 | ||||||||||
| Vacant | 29,999 | 2.5 | 100.0% | 0 | 0.0 | $0.00 | 0 | ||||||||||
| Total / Wtd. Avg.(3) | 1,211,349 | 100.0% | $23,424,962 | 100.0 | % | $19.83 | 132(4) | ||||||||||
| (1) | Calculated based on the approximate square footage occupied by each Owned Tenant. |
| (2) | Certain tenants may have lease termination options that are exercisable prior to the originally stated expiration date of the subject lease and that are not considered in the Lease Expiration Schedule. |
| (3) | Total / Wtd. Avg. annual UW Base Rent $ per SF excludes vacant space. |
| (4) | MiMi’s Kids Boutique, Starbucks and Maggie G each operate under two leases. |
The depositor has filed a registration statement (including a prospectus) with the Securities and Exchange Commission (“SEC”) (SEC File No. 333-207132) for the offering to which this communication relates. Before you invest, you should read the prospectus in the registration statement and other documents the depositor has filed with the SEC for more complete information about the depositor, the issuing entity and this offering. You may get these documents for free by visiting EDGAR on the SEC website at www.sec.gov. Alternatively, the depositor or Citigroup Global Markets Inc., Barclays Capital Inc., Drexel Hamilton, LLC or any other underwriter or dealer participating in this offering will arrange to send you the prospectus if you request it by calling toll-free 1-800-831-9146.
| 159 |
LOAN #13: LAKESIDE SHOPPING CENTER
The following table presents certain information relating to historical leasing at the Lakeside Shopping Center property:
Historical Leased %(1)
| 2012 | 2013 | 2014 | 2015 | 2016 | As of 6/1/2017(2) | |||||
| 99.7% | 98.3% | 97.1% | 98.2% | 98.9% | 97.5% |
| (1) | As provided by the borrower and which represents occupancy as of December 31 for the indicated year unless otherwise specified. |
| (2) | Based on the underwritten rent roll dated June 1, 2017. Occupancy as of June 1, 2017 includes five tenants, Zara, Charles Schwab, Flemings Prime Steakhouse, J. Jill and Free People, collectively representing 4.8% of the GLA, which have executed leases but are not expected to take occupancy until November 2017 to June 2018. |
| ■ | Operating History and Underwritten Net Cash Flow. The following table presents certain information relating to the historical operating performance and the Underwritten Net Cash Flow at the Lakeside Shopping Center property: |
Cash Flow Analysis(1)
2014 | 2015 | 2016 | TTM 3/31/2017 | Underwritten(2) | Underwritten $ per SF | |||||||||||||
| Base Rent | $22,511,952 | $22,224,455 | $22,643,543 | $22,644,279 | $23,424,962 | $19.34 | ||||||||||||
| Overage Rent | 1,904,324 | 1,892,475 | 1,601,600 | 1,558,077 | 1,462,657(3) | 1.21 | ||||||||||||
| Total Reimbursement Revenue | 7,819,042 | 7,732,795 | 7,909,595 | 7,853,546 | 7,415,542 | 6.12 | ||||||||||||
| Other Income | 413,733 | 556,196 | 460,051 | 447,054 | 410,556 | 0.34 | ||||||||||||
| Gross Revenue | $32,649,051 | $32,405,920 | $32,614,789 | $32,502,956 | $32,713,717 | $27.01 | ||||||||||||
| Effective Gross Income | $32,649,051 | $32,405,920 | $32,614,789 | $32,502,956 | $32,713,717 | $27.01 | ||||||||||||
| Total Operating Expenses | $12,900,841 | $13,228,233 | $13,589,313 | $13,680,575 | $12,933,343 | $10.68 | ||||||||||||
| Net Operating Income | $19,748,210 | $19,177,687 | $19,025,476 | $18,822,381 | $19,780,375 | $16.33 | ||||||||||||
| TI/LC | 0 | 0 | 0 | 0 | 1,230,800 | 1.02 | ||||||||||||
| Capital Expenditures | 0 | 0 | 0 | 0 | 242,270 | 0.20 | ||||||||||||
| Net Cash Flow | $19,748,210 | $19,177,687 | $19,025,476 | $18,822,381 | $18,307,305 | $15.11 | ||||||||||||
| Occupancy | 97.1% | 98.2% | 98.9% | 97.3%(4) | 97.5%(5) | |||||||||||||
| NOI Debt Yield(6) | 11.3% | 11.0% | 10.9% | 10.8% | 11.3% | |||||||||||||
| NCF DSCR(6) | 2.95x | 2.87x | 2.84x | 2.81x | 2.74x | |||||||||||||
| (1) | Certain items such as straight line rent, interest expense, interest income, lease cancellation income, depreciation, amortization, debt service payments and any other non-recurring or non-operating items were excluded from the historical presentation and are not considered for the underwritten cash flow. |
| (2) | Underwritten Base Rent is based on the rent roll as of June 1, 2017 and includes contractual rent increases through July 30, 2018 totaling $420,066 and income from Zara, Charles Schwab, Flemings Prime Steakhouse, J. Jill and Free People, collectively representing 8.0% of the underwritten base rent, which have executed leases but are not yet in occupancy or paying rent. Gap rent was reserved only for Zara, Charles Schwab and Flemings Prime Steakhouse, which collectively represent 6.8% of the underwritten base rent. |
| (3) | Overage Rent is based on TTM 4/30/2017 actual sales. |
| (4) | Occupancy for the TTM 3/31/2017 is based on the May 1, 2017 rent roll. |
| (5) | Underwritten Occupancy includes five tenants, Zara, Charles Schwab, Flemings Prime Steakhouse, J. Jill, and Free People, which have executed leases but are not expected to take occupancy until November 2017 to June 2018. Under the terms of their leases, such tenants may have the right to take occupancy and commence paying rent at a date later than the anticipated date. See “Description of the Mortgage Pool—Tenant Issues—Tenants Not Yet in Occupancy or in a Free Rent Period, Leases Under Negotiation and LOIs” in the Preliminary Prospectus. |
| (6) | NOI Debt Yield and NCF DSCR are based on the outstanding principal balance of the Lakeside Shopping Center Loan Combination. |
The depositor has filed a registration statement (including a prospectus) with the Securities and Exchange Commission (“SEC”) (SEC File No. 333-207132) for the offering to which this communication relates. Before you invest, you should read the prospectus in the registration statement and other documents the depositor has filed with the SEC for more complete information about the depositor, the issuing entity and this offering. You may get these documents for free by visiting EDGAR on the SEC website at www.sec.gov. Alternatively, the depositor or Citigroup Global Markets Inc., Barclays Capital Inc., Drexel Hamilton, LLC or any other underwriter or dealer participating in this offering will arrange to send you the prospectus if you request it by calling toll-free 1-800-831-9146.
| 160 |
(THIS PAGE INTENTIONALLY LEFT BLANK)
The depositor has filed a registration statement (including a prospectus) with the Securities and Exchange Commission (“SEC”) (SEC File No. 333-207132) for the offering to which this communication relates. Before you invest, you should read the prospectus in the registration statement and other documents the depositor has filed with the SEC for more complete information about the depositor, the issuing entity and this offering. You may get these documents for free by visiting EDGAR on the SEC website at www.sec.gov. Alternatively, the depositor or Citigroup Global Markets Inc., Barclays Capital Inc., Drexel Hamilton, LLC or any other underwriter or dealer participating in this offering will arrange to send you the prospectus if you request it by calling toll-free 1-800-831-9146.
| 161 |
LOAN #14: 440 MAMARONECK AVENUE
| Mortgaged Property Information | Mortgage Loan Information | ||||
| Number of Mortgaged Properties | 1 | Loan Seller | Barclays | ||
| Location (City/State) | Harrison, New York | Cut-off Date Balance | $33,000,000 | ||
| Property Type | Office | Cut-off Date Balance per SF | $137.99 | ||
| Size (SF) | 239,156 | Percentage of Initial Pool Balance | 3.0% | ||
| Total Occupancy as of 5/1/2017 | 83.7% | Number of Related Mortgage Loans | None | ||
| Owned Occupancy as of 5/1/2017 | 83.7% | Type of Security | Fee Simple | ||
| Year Built / Latest Renovation | 1979 / 2007 | Mortgage Rate | 4.97800% | ||
| Appraised Value | $52,000,000 | Original Term to Maturity (Months) | 120 | ||
| Appraisal Date | 6/1/2017 | Original Amortization Term (Months) | 360 | ||
| Borrower Sponsor(1) | Robert P. Weisz | Original Interest Only Period (Months) | 12 | ||
| Property Management | Self-Managed | First Payment Date | 9/6/2017 | ||
| Maturity Date | 8/6/2027 | ||||
| Underwritten Revenues | $5,815,869 | ||||
| Underwritten Expenses | $2,665,022 | Escrows | |||
| Underwritten Net Operating Income (NOI) | $3,150,847 | Upfront | Monthly | ||
| Underwritten Net Cash Flow (NCF) | $2,842,618 | Taxes | $266,729 | $60,219 | |
| Cut-off Date LTV Ratio | 63.5% | Insurance(2) | $0 | $0 | |
| Maturity Date LTV Ratio | 53.5% | Replacement Reserve | $0 | $3,986 | |
| DSCR Based on Underwritten NOI / NCF | 1.49x / 1.34x | TI/LC(3) | $1,000,000 | $24,912 | |
| Debt Yield Based on Underwritten NOI / NCF | 9.5% / 8.6% | Other(4) | $996,226 | $0 | |
| Sources and Uses | ||||||||
| Sources | $ | % | Uses | $ | % | |||
| Loan Amount | $33,000,000 | 89.1 | % | Loan Payoff | $34,308,942 | 92.6 | % | |
| Principal’s New Cash Contribution | 4,056,666 | 10.9 | Reserves | 2,262,955 | 6.1 | |||
| Closing Costs | 484,769 | 1.3 | ||||||
| Total Sources | $37,056,666 | 100.0 | % | Total Uses | $37,056,666 | 100.0 | % | |
| (1) | Robert P. Weisz is the non-recourse carveout guarantor for the 440 Mamaroneck Avenue loan. |
| (2) | The borrower is required to deposit monthly escrows equal to one-twelfth of the amount that the lender estimates will be necessary to pay insurance premiums for the renewal of the coverage (unless the 440 Mamaroneck Avenue property is insured under an acceptable blanket insurance policy). |
| (3) | The TI/LC reserve is capped at $2,750,000. |
| (4) | Other upfront reserves are comprised of $156,178 for deferred maintenance, $790,213 for TransAmerica free rent and $49,835 for Weissman free rent. |
The following table presents certain information relating to the major tenants at the 440 Mamaroneck Avenue property:
Ten Largest Owned Tenants Based on Underwritten Base Rent(1)
Tenant Name | Credit Rating (Fitch/MIS/S&P)(2) | Tenant | % of Owned GLA | UW Base Rent | % of Total UW Base Rent | UW Base Rent $ per SF | Lease Expiration | Renewal / Extensions Options | |||||||||||||
| TransAmerica Financial Life Insurance Company | NR / NR / AA- | 114,940 | 48.1 | % | $3,160,850 | 60.5 | % | $27.50 | 3/31/2021 | 2, 5-year options | |||||||||||
| Sprague/Castle Oil | NR / NR / NR | 17,018 | 7.1 | 462,549 | 8.9 | $27.18 | 5/31/2023 | NA | |||||||||||||
| The Plastic Surgery Center of Westchester | NR / NR / NR | 10,891 | 4.6 | 315,839 | 6.0 | $29.00 | 1/31/2023 | 2, 5-year options | |||||||||||||
| Cosmetic Surgery Associates of New York | NR / NR / NR | 6,210 | 2.6 | 180,090 | 3.4 | $29.00 | 1/31/2023 | 2, 5-year options | |||||||||||||
| Stillman Management, Inc. | NR / NR / NR | 7,993 | 3.3 | 179,843 | 3.4 | $22.50 | 11/30/2022 | 1, 5-year option | |||||||||||||
| Friedland Realty Inc. | NR / NR / NR | 7,386 | 3.1 | 177,264 | 3.4 | $24.00 | 4/30/2020 | 1, 5-year option | |||||||||||||
| Alfred Weissman Real Estate | NR / NR / NR | 5,563 | 2.3 | 122,386 | 2.3 | $22.00 | 10/31/2022 | 1, 5-year option | |||||||||||||
| Band Rosenbaum & Martin, P.C. | NR / NR / NR | 5,159 | 2.2 | 118,778 | 2.3 | $23.02 | 5/31/2024 | 1, 5-year option | |||||||||||||
| Dermatology Associates of New York | NR / NR / NR | 3,942 | 1.6 | 106,434 | 2.0 | $27.00 | 10/31/2027 | NA | |||||||||||||
| Athlete Evolution, LLC | NR / NR / NR | 4,049 | 1.7 | 89,078 | 1.7 | $22.00 | 4/30/2019 | 2, 5-year options | |||||||||||||
| Ten Largest Owned Tenants | 183,151 | 76.6 | % | $4,913,110 | 94.1 | % | $26.83 | ||||||||||||||
| Remaining Owned Tenants | 16,911 | 7.1 | 309,242 | 5.9 | $18.29 | ||||||||||||||||
| Vacant Spaces (Owned Space) | 39,094 | 16.3 | 0 | 0.0 | $0.00 | ||||||||||||||||
| Total / Wtd. Avg. All Owned Tenants | 239,156 | 100.0% | $5,222,352 | 100.0 | % | $26.10 | |||||||||||||||
| (1) | Based on the underwritten rent roll dated May 1, 2017. |
| (2) | Certain ratings are those of the parent company whether or not the parent guarantees the lease. |
The depositor has filed a registration statement (including a prospectus) with the Securities and Exchange Commission (“SEC”) (SEC File No. 333-207132) for the offering to which this communication relates. Before you invest, you should read the prospectus in the registration statement and other documents the depositor has filed with the SEC for more complete information about the depositor, the issuing entity and this offering. You may get these documents for free by visiting EDGAR on the SEC website at www.sec.gov. Alternatively, the depositor or Citigroup Global Markets Inc., Barclays Capital Inc., Drexel Hamilton, LLC or any other underwriter or dealer participating in this offering will arrange to send you the prospectus if you request it by calling toll-free 1-800-831-9146.
| 162 |
LOAN #14: 440 Mamaroneck Avenue
The following table presents certain information relating to the lease rollover schedule at the 440 Mamaroneck Avenue property, based on initial lease expiration dates:
Lease Expiration Schedule(1)(2)
Year Ending December 31 | Expiring Owned GLA | % of Owned GLA | Cumulative % of Owned GLA | UW Base Rent | % of Total UW Base Rent | UW Base Rent $ per SF(3) | # of Expiring Leases | |||||||||||||
| MTM(4) | 5,000 | 2.1 | % | 2.1% | $0 | 0.0 | % | $0.00 | 1 | |||||||||||
| 2017 | 0 | 0.0 | 2.1% | 0 | 0.0 | $0.00 | 0 | |||||||||||||
| 2018 | 0 | 0.0 | 2.1% | 0 | 0.0 | $0.00 | 0 | |||||||||||||
| 2019 | 4,049 | 1.7 | 3.8% | 89,078 | 1.7 | $22.00 | 1 | |||||||||||||
| 2020 | 10,769 | 4.5 | 8.3% | 265,060 | 5.1 | $24.61 | 4 | |||||||||||||
| 2021 | 122,018 | 51.0 | 59.3% | 3,345,321 | 64.1 | $27.42 | 4 | |||||||||||||
| 2022 | 15,006 | 6.3 | 65.6% | 339,204 | 6.5 | $22.60 | 3 | |||||||||||||
| 2023 | 34,119 | 14.3 | 79.8% | 958,478 | 18.4 | $28.09 | 3 | |||||||||||||
| 2024 | 5,159 | 2.2 | 82.0% | 118,778 | 2.3 | $23.02 | 1 | |||||||||||||
| 2025 | 0 | 0.0 | 82.0% | 0 | 0.0 | $0.00 | 0 | |||||||||||||
| 2026 | 0 | 0.0 | 82.0% | 0 | 0.0 | $0.00 | 0 | |||||||||||||
| 2027 | 3,942 | 1.6 | 83.7% | 106,434 | 2.0 | $27.00 | 1 | |||||||||||||
| 2028 & Thereafter | 0 | 0.0 | 83.7% | 0 | 0.0 | $0.00 | 0 | |||||||||||||
| Vacant | 39,094 | 16.3 | 100.0% | 0 | 0.0 | $0.00 | 0 | |||||||||||||
| Total / Wtd. Avg. | 239,156 | 100.0 | % | $5,222,352 | 100.0 | % | $26.10 | 18 | ||||||||||||
| (1) | Calculated based on the approximate square footage occupied by each Owned Tenant. |
| (2) | Certain tenants may have lease termination options that are exercisable prior to the originally stated expiration date of the subject lease and that are not considered in the Lease Expiration Schedule. |
| (3) | Total / Wtd. Avg. UW Base Rent $ per SF excludes vacant space. |
| (4) | MTM includes Cermele’s Catering, a café with no attributable rent. |
The following table presents certain information relating to historical leasing at the 440 Mamaroneck Avenue property:
Historical Leased %(1)
2014 | 2015 | 2016 | As of 5/1/2017(2) | |||||
| Owned Space | 73.4% | 81.2% | 83.9% | 83.7% |
| (1) | As provided by the borrower and which represents occupancy as of December 31 for the indicated year unless otherwise specified. |
| (2) | Based on the underwritten rent roll dated May 1, 2017. |
| ■ | Operating History and Underwritten Net Cash Flow. The following table presents certain information relating to the historical operating performance and the Underwritten Net Cash Flow at the 440 Mamaroneck Avenue property: |
Cash Flow Analysis
2014 | 2015 | 2016 | TTM 4/30/2017 | Underwritten(1) | Underwritten $ per SF(1) | |||||||||||||
| Base Rent | $4,372,114 | $4,310,659 | $4,991,393 | $5,018,827 | $5,222,352 | $21.84 | ||||||||||||
| Expense Reimbursement | 460,322 | 554,184 | 554,437 | 549,019 | 571,780 | 2.39 | ||||||||||||
| Gross Up Vacancy | 0 | 0 | 0 | 0 | 1,103,897 | 4.62 | ||||||||||||
| Gross Revenue | $4,832,436 | $4,864,843 | $5,545,830 | $5,567,846 | $6,898,028 | $28.84 | ||||||||||||
| Other Income(2) | 23,528 | 85,032 | 26,994 | 21,737 | 21,737 | 0.09 | ||||||||||||
| Vacancy & Credit Loss | 0 | 0 | 0 | 0 | (1,103,897 | ) | (4.62 | ) | ||||||||||
| Effective Gross Income | $4,855,964 | $4,949,875 | $5,572,824 | $5,589,583 | $5,815,869 | $24.32 | ||||||||||||
| Real Estate Taxes | $694,590 | $703,416 | $711,928 | $711,618 | $712,534 | $2.98 | ||||||||||||
| Insurance | 66,423 | 66,204 | 79,895 | 80,723 | 71,838 | 0.30 | ||||||||||||
| Management Fee | 43,721 | 43,107 | 49,914 | 50,188 | 174,476 | 0.73 | ||||||||||||
| Other Operating Expenses(3) | 1,391,361 | 1,401,213 | 1,696,185 | 1,706,174 | 1,706,174 | 7.13 | ||||||||||||
| Total Operating Expenses | $2,196,095 | $2,213,940 | $2,537,922 | $2,548,703 | $2,665,022 | $11.14 | ||||||||||||
| Net Operating Income | $2,659,869 | $2,735,935 | $3,034,902 | $3,040,880 | $3,150,847 | $13.17 | ||||||||||||
| TI/LC | 0 | 0 | 0 | 0 | 246,049 | (4) | 1.03 | |||||||||||
| Capital Expenditures | 0 | 0 | 0 | 0 | 62,181 | 0.26 | ||||||||||||
| Net Cash Flow | $2,659,869 | $2,735,935 | $3,034,902 | $3,040,880 | $2,842,618 | $11.89 | ||||||||||||
| Occupancy | 73.4% | 81.2% | 83.9% | 83.7% | (5) | 84.1% | ||||||||||||
| NOI Debt Yield | 8.1% | 8.3% | 9.2% | 9.2% | 9.5% | |||||||||||||
| NCF DSCR | 1.25x | 1.29x | 1.43x | 1.43x | 1.34x | |||||||||||||
| (1) | Underwritten Base Rent and Underwritten $ per SF reflect contractual rents as of May 1, 2017 and include rent steps through July 2018 totaling $39,585. |
| (2) | Includes work orders and HVAC. |
| (3) | Includes utilities, maintenance, janitorial, ground and pest control and general and administrative expenses. |
| (4) | Includes ($100,000) which represents the $1,000,000 upfront rollover reserve straight lined through maturity. |
| (5) | Most recent occupancy is as of May 1, 2017. |
The depositor has filed a registration statement (including a prospectus) with the Securities and Exchange Commission (“SEC”) (SEC File No. 333-207132) for the offering to which this communication relates. Before you invest, you should read the prospectus in the registration statement and other documents the depositor has filed with the SEC for more complete information about the depositor, the issuing entity and this offering. You may get these documents for free by visiting EDGAR on the SEC website at www.sec.gov. Alternatively, the depositor or Citigroup Global Markets Inc., Barclays Capital Inc., Drexel Hamilton, LLC or any other underwriter or dealer participating in this offering will arrange to send you the prospectus if you request it by calling toll-free 1-800-831-9146.
| 163 |
LOAN #15: Mesa Grand Shopping Center
| Mortgaged Property Information | Mortgage Loan Information | |||||||||
| Number of Mortgaged Properties | 1 | Loan Seller | SMF V | |||||||
| Location (City/State) | Mesa, Arizona | Cut-off Date Balance | $30,000,000 | |||||||
| Property Type | Retail | Cut-off Date Balance per SF | $130.57 | |||||||
| Size (SF) | 229,766 | Percentage of Initial Pool Balance | 2.8% | |||||||
| Total Occupancy as of 7/1/2017(1) | 94.6% | Number of Related Mortgage Loans | None | |||||||
| Owned Occupancy as of 7/1/2017 | 85.8% | Type of Security | Fee Simple | |||||||
| Year Built / Latest Renovation | 1999, 2001 / NAP | Mortgage Rate | 4.70200% | |||||||
| Appraised Value | $44,400,000 | Original Term to Maturity (Months) | 120 | |||||||
| Appraisal Date | 5/3/2017 | Original Amortization Term (Months) | 360 | |||||||
| Borrower Sponsor(2) | Gurpreet Singh Jaggi | Original Interest Only Period (Months) | 48 | |||||||
| Property Management | DSW Commercial Real Estate, L.L.C. | First Payment Date | 9/6/2017 | |||||||
| Maturity Date | 8/6/2027 | |||||||||
| Underwritten Revenues | $4,644,588 | |||||||||
| Underwritten Expenses | $1,501,004 | Escrows | ||||||||
| Underwritten Net Operating Income (NOI) | $3,143,583 | Upfront | Monthly | |||||||
| Underwritten Net Cash Flow (NCF) | $2,920,710 | Taxes | $196,723 | $32,787 | ||||||
| Cut-off Date LTV Ratio | 67.6% | Insurance | $5,100 | $2,550 | ||||||
| Maturity Date LTV Ratio | 60.8% | Replacement Reserve | $0 | $4,219 | ||||||
| DSCR Based on Underwritten NOI / NCF | 1.68x / 1.56x | TI/LC(3) | $0 | $14,383 | ||||||
| Debt Yield Based on Underwritten NOI / NCF | 10.5% / 9.7% | Other(4) | $0 | $36,445 | ||||||
| Sources and Uses | ||||||||||
| Sources | $ | % | Uses | $ | % | |||||
| Loan Amount | $30,000,000 | 71.5% | Purchase Price | $41,100,000 | 98.0% | |||||
| Principal’s New Cash Contribution | 8,459,802 | 20.2 | Closing Costs | 657,979 | 1.6 | |||||
| Mezzanine Loan | 3,500,000 | 8.3 | Reserves | 201,823 | 0.5 | |||||
| Total Sources | $41,959,802 | 100.0% | Total Uses | $41,959,802 | 100.0% | |||||
| (1) | Total Occupancy includes 338,707 SF of non-collateral space, including two anchor tenants: a 219,750 SF Wal-Mart and a 14-screen AMC Theatre. |
| (2) | Gurpreet Singh Jaggi is the guarantor of the non-recourse carveouts under the Mesa Grand Shopping Center loan documents. |
| (3) | The TI/LC Reserve is capped at $517,786. |
| (4) | During the first 48 months of the loan term, monthly deposits into an interest only reserve in an amount equal to the difference between the actual monthly interest only payment and $155,627.41 will be required. Funds in the interest only reserve may be used for general tenant improvements and leasing commissions. |
The following table presents certain information relating to the major tenants (of which certain tenants may have co-tenancy provisions) at the Mesa Grand Shopping Center property:
Ten Largest Owned Tenants Based on Underwritten Base Rent(1)
Tenant Name | Credit Rating | Tenant | % of | UW Base | % of Total | UW Base | Sales $ per | Occupancy | Lease | Renewal / | ||
| PetSmart | NR / B3 / B+ | 26,352 | 11.5% | $326,765 | 11.3% | $12.40 | $249.63 | 6.8% | 1/31/2020 | 3, 5-year options | ||
| Conn’s | NR / B3 / B | 33,948 | 14.8 | 305,532 | 10.5 | $9.00 | $302.85 | 5.3% | 1/31/2023 | 3, 5-year options | ||
| Office Max | NR / NR / NR | 23,530 | 10.2 | 276,478 | 9.5 | $11.75 | NA | NA | 1/31/2020 | 3, 5-year options | ||
| Michaels | NR / NR / BB- | 22,784 | 9.9 | 273,408 | 9.4 | $12.00 | NA | NA | 3/31/2025 | 3, 5-year options | ||
| Party City | NR / NR / NR | 12,000 | 5.2 | 144,000 | 5.0 | $12.00 | $144.21 | 11.3% | 7/31/2019 | NA | ||
| Mellow Mushroom(5) | NR / NR / NR | 7,200 | 3.1 | 131,688 | 4.5 | $18.29 | $269.54 | 8.2% | 5/31/2031 | 2, 5-year options | ||
| Village Inn | NR / NR / NR | 4,993 | 2.2 | 129,818 | 4.5 | $26.00 | $256.68 | 13.0% | 9/30/2024 | 2, 5-year options | ||
| Lifeway Christian Stores(6) | NR / NR / NR | 7,087 | 3.1 | 120,479 | 4.2 | $17.00 | $176.16 | 12.2% | 7/31/2024 | 2, 5-year options | ||
| Hi-Health | NR / NR / NR | 6,400 | 2.8 | 105,600 | 3.6 | $16.50 | $77.40 | 29.8% | 9/30/2019 | NA | ||
| Texas Roadhouse(5) | NR / NR / NR | 7,500 | 3.3 | 103,818 | 3.6 | $13.84 | $765.05 | 2.6% | 11/21/2025 | 3, 5-year options | ||
| Ten Largest Owned Tenants | 151,794 | 66.1% | $1,917,586 | 66.2 | % | $12.63 | ||||||
| Remaining Owned Tenants | 45,388 | 19.7 | 979,776 | 33.8 | $21.59 | |||||||
| Vacant Spaces (Owned Space) | 32,584 | 14.2 | 0 | 0.0 | $0.00 | |||||||
| Total / Wtd. Avg. All Owned Tenants | 229,766 | 100.0% | $2,897,362 | 100.0 | % | $14.69 | ||||||
| (1) | Based on the underwritten rent roll dated July 1, 2017. |
| (2) | Certain ratings are those of the parent company whether or not the parent guarantees the lease. |
| (3) | UW Base Rent and UW Base Rent $ per SF include contractual rent increases through February 1, 2018 ($46,752). |
| (4) | Sales $ per SF represent 2016 sales. |
| (5) | Mellow Mushroom and Texas Roadhouse each own their respective improvements and are subject to ground leases with an initial term expiring May 31, 2031 and November 21, 2025, respectively. |
| (6) | Lifeway Christian Stores has the one time right to terminate its lease in May 2019, with 60 days’ notice, if gross sales during the prior 12 month period are not equal to or greater than $1.3 million. |
The depositor has filed a registration statement (including a prospectus) with the Securities and Exchange Commission (“SEC”) (SEC File No. 333-207132) for the offering to which this communication relates. Before you invest, you should read the prospectus in the registration statement and other documents the depositor has filed with the SEC for more complete information about the depositor, the issuing entity and this offering. You may get these documents for free by visiting EDGAR on the SEC website at www.sec.gov. Alternatively, the depositor or Citigroup Global Markets Inc., Barclays Capital Inc., Drexel Hamilton, LLC or any other underwriter or dealer participating in this offering will arrange to send you the prospectus if you request it by calling toll-free 1-800-831-9146.
| 164 |
LOAN #15: Mesa Grand Shopping Center
The following table presents certain information relating to the lease rollover schedule at the Mesa Grand Shopping Center property, based on initial lease expiration dates:
Lease Expiration Schedule(1)(2)
Year Ending | Expiring | % of Owned GLA | Cumulative % of Owned GLA | UW Base Rent(3) | % of Total UW Base Rent | UW Base Rent $ per SF(3)(4) | # of Expiring Tenants | ||||||||||||||
| MTM | 0 | 0.0 | % | 0.0% | $0 | 0.0 | % | $0.00 | 0 | ||||||||||||
| 2017 | 0 | 0.0 | 0.0% | 0 | 0.0 | $0.00 | 0 | ||||||||||||||
| 2018 | 5,409 | 2.4 | 2.4% | 137,322 | 4.7 | $25.39 | 3 | ||||||||||||||
| 2019 | 34,847 | 15.2 | 17.5% | 575,395 | 19.9 | $16.51 | 7 | ||||||||||||||
| 2020 | 55,300 | 24.1 | 41.6% | 735,307 | 25.4 | $13.30 | 5 | ||||||||||||||
| 2021 | 3,810 | 1.7 | 43.2% | 100,487 | 3.5 | $26.37 | 2 | ||||||||||||||
| 2022 | 4,547 | 2.0 | 45.2% | 115,365 | 4.0 | $25.37 | 3 | ||||||||||||||
| 2023 | 33,948 | 14.8 | 60.0% | 305,532 | 10.5 | $9.00 | 1 | ||||||||||||||
| 2024 | 17,337 | 7.5 | 67.5% | 331,518 | 11.4 | $19.12 | 3 | ||||||||||||||
| 2025 | 30,284 | 13.2 | 80.7% | 377,226 | 13.0 | $12.46 | 2 | ||||||||||||||
| 2026 | 4,500 | 2.0 | 82.7% | 87,523 | 3.0 | $19.45 | 2 | ||||||||||||||
| 2027 | 0 | 0.0 | 82.7% | 0 | 0.0 | $0.00 | 0 | ||||||||||||||
| 2028 & Thereafter | 7,200 | 3.1 | 85.8% | 131,688 | 4.5 | $18.29 | 1 | ||||||||||||||
| Vacant | 32,584 | 14.2 | 100.0% | 0 | 0.0 | $0.00 | 0 | ||||||||||||||
| Total / Wtd. Avg. | 229,766 | 100.0 | % | $2,897,362 | 100.0 | % | $14.69 | 29 | |||||||||||||
| (1) | Calculated based on the approximate square footage occupied by each Owned Tenant. |
| (2) | Certain tenants may have lease termination options that are exercisable prior to the originally stated expiration date of the subject lease and that are not considered in the Lease Expiration Schedule. |
| (3) | UW Base Rent and UW Base Rent $ per SF include contractual rent increases through February 1, 2018 ($46,752). |
| (4) | Wtd. Avg. UW Base Rent $ per SF excludes vacant space. |
The following table presents certain information relating to historical leasing at the Mesa Grand Shopping Center property:
Historical Leased %(1)
2014 | 2015 | 2016 | As of 7/1/2017(2) | |
| Owned Space | 84.6% | 86.1% | 90.0% | 85.8% |
| (1) | As provided by the borrower and which represents occupancy as of December 31 for the indicated year unless otherwise specified. |
| (2) | Based on the underwritten rent roll dated July 1, 2017. |
The depositor has filed a registration statement (including a prospectus) with the Securities and Exchange Commission (“SEC”) (SEC File No. 333-207132) for the offering to which this communication relates. Before you invest, you should read the prospectus in the registration statement and other documents the depositor has filed with the SEC for more complete information about the depositor, the issuing entity and this offering. You may get these documents for free by visiting EDGAR on the SEC website at www.sec.gov. Alternatively, the depositor or Citigroup Global Markets Inc., Barclays Capital Inc., Drexel Hamilton, LLC or any other underwriter or dealer participating in this offering will arrange to send you the prospectus if you request it by calling toll-free 1-800-831-9146.
| 165 |
LOAN #15: Mesa Grand Shopping Center
| ■ | Operating History and Underwritten Net Cash Flow. The following table presents certain information relating to the historical operating performance and the Underwritten Net Cash Flow at the Mesa Grand Shopping Center property: |
Cash Flow Analysis(1)
2014 | 2015 | 2016 | TTM 4/30/2017 | Underwritten(2) | Underwritten | ||||||||||||
| Base Rent | $2,561,705 | $2,758,568 | $2,965,293 | $2,981,632 | $2,850,610 | $12.41 | |||||||||||
| Contractual Rent Steps | 0 | 0 | 0 | 0 | 46,752 | 0.20 | |||||||||||
| Gross Up Vacancy | 0 | 0 | 0 | 0 | 745,464 | 3.24 | |||||||||||
| Reimbursements | 1,303,832 | 1,397,415 | 1,494,527 | 1,613,702 | 1,697,157 | 7.39 | |||||||||||
| Percentage Rent | 34,035 | 39,536 | 28,231 | 22,432 | 22,432 | 0.10 | |||||||||||
| Other Income(3) | 40,809 | 23,843 | 34,082 | 27,637 | 27,637 | 0.12 | |||||||||||
| Vacancy & Credit Loss | 0 | 0 | 0 | 0 | (745,464) | (3.24) | |||||||||||
| Effective Gross Income | $3,940,380 | $4,219,362 | $4,522,132 | $4,645,403 | $4,644,588 | $20.21 | |||||||||||
| Real Estate Taxes | $390,831 | $399,992 | $387,568 | $387,568 | $432,456 | $1.88 | |||||||||||
| Insurance | 44,032 | 40,913 | 40,669 | 39,593 | 30,599 | 0.13 | |||||||||||
| Management Fee | 84,542 | 96,153 | 99,816 | 100,784 | 139,338 | 0.61 | |||||||||||
| Other Operating Expenses | 956,425 | 986,154 | 984,348 | 898,612 | 898,612 | 3.91 | |||||||||||
| Total Operating Expenses | $1,475,829 | $1,523,212 | $1,512,400 | $1,426,557 | $1,501,004 | $6.53 | |||||||||||
| Net Operating Income | $2,464,551 | $2,696,150 | $3,009,731 | $3,218,846 | $3,143,583 | $13.68 | |||||||||||
| TI/LC | 0 | 0 | 0 | 0 | 172,325 | 0.75 | |||||||||||
| Capital Expenditures | 0 | 0 | 0 | 0 | 50,549 | 0.22 | |||||||||||
| Net Cash Flow | $2,464,551 | $2,696,150 | $3,009,731 | $3,218,846 | $2,920,710 | $12.71 | |||||||||||
| Occupancy | 84.6% | 86.1% | 90.0% | 85.8%(4) | 86.2% | ||||||||||||
| NOI Debt Yield | 8.2% | 9.0% | 10.0% | 10.7% | 10.5% | ||||||||||||
| NCF DSCR | 1.32x | 1.44x | 1.61x | 1.72x | 1.56x | ||||||||||||
| (1) | Certain items such as interest expense, interest income, lease cancellation income, depreciation, amortization, debt service payments and any other non-recurring or non-operating items were are not considered for the underwritten cash flow. |
| (2) | Underwritten Base Rent includes contractual rent increases through February 1, 2018 ($46,752). |
| (3) | Other Income consists of advertising income, late fees and other miscellaneous income. |
| (4) | Represents occupancy as of July 1, 2017. |
The depositor has filed a registration statement (including a prospectus) with the Securities and Exchange Commission (“SEC”) (SEC File No. 333-207132) for the offering to which this communication relates. Before you invest, you should read the prospectus in the registration statement and other documents the depositor has filed with the SEC for more complete information about the depositor, the issuing entity and this offering. You may get these documents for free by visiting EDGAR on the SEC website at www.sec.gov. Alternatively, the depositor or Citigroup Global Markets Inc., Barclays Capital Inc., Drexel Hamilton, LLC or any other underwriter or dealer participating in this offering will arrange to send you the prospectus if you request it by calling toll-free 1-800-831-9146.
| 166 |