Morgan Stanley Bank of America Merrill Lynch Trust 2017-C34
Filed: 3 Oct 17, 12:00am
| FREE WRITING PROSPECTUS | ||
| FILED PURSUANT TO RULE 433 | ||
| REGISTRATION FILE NO.: 333-206847-07 | ||
 |  |
MSBAM 2017-C34
Free Writing Prospectus
Structural and Collateral Term Sheet
$1,048,622,110
(Approximate Total Mortgage Pool Balance)
$869,176,000
(Approximate Offered Certificates)
Banc of America Merrill Lynch Commercial Mortgage Inc.
as Depositor
Bank of America, National Association
Morgan Stanley Mortgage Capital Holdings LLC
KeyBank National Association
Starwood Mortgage Funding III LLC
as Sponsors and Mortgage Loan Sellers
Commercial Mortgage Pass-Through Certificates
Series 2017-C34
October 2, 2017
| BofA Merrill Lynch Co-Lead Bookrunning Manager | MORGAN STANLEY Co-Lead Bookrunning Manager | |
KeyBanc Capital Markets Co-Manager | Drexel Hamilton |
STATEMENT REGARDING THIS FREE WRITING PROSPECTUS
The depositor has filed a registration statement (including a prospectus) with the SEC (File No. 333-206847) for the offering to which this communication relates. Before you invest, you should read the prospectus in that registration statement and other documents the depositor has filed with the SEC for more complete information about the depositor, the issuing entity and this offering. You may get these documents for free by visiting EDGAR on the SEC web site atwww.sec.gov. Alternatively, the depositor or any underwriter or any dealer participating in the offering will arrange to send you the prospectus if you request it by calling toll free 1-800-294-1322 or by email todg.Prospectus_Requests@baml.com.
This is not a research report and was not prepared by any Underwriter’s research department. It was prepared by the Underwriters’ sales, trading, banking or other non-research personnel. Please see additional important information and qualifications at the end of this Term Sheet.
Neither this Term Sheet nor anything contained herein shall form the basis for any contract or commitment whatsoever.The information contained herein is preliminary as of the date hereof.This Term Sheet is subject to change, completion or amendment from time to time.The information contained herein will be superseded by similar information delivered to you as part of the Preliminary Prospectus.The information contained herein supersedes any such information previously delivered.The information contained herein should be reviewed only in conjunction with the entire Preliminary Prospectus.All of the information contained herein is subject to the same limitations and qualifications contained in the Preliminary Prospectus.The information contained herein does not contain all relevant information relating to the underlying mortgage loans or mortgaged properties.Such information is described in the Preliminary Prospectus.The information contained herein will be more fully described in the Preliminary Prospectus.The information contained herein should not be viewed as projections, forecasts, predictions or opinions with respect to value.Prior to making any investment decision, prospective investors are strongly urged to read the Preliminary Prospectus in its entirety.Neither the Securities and Exchange Commission nor any state securities commission has approved or disapproved of these securities or determined if this Term Sheet is truthful or complete.Any representation to the contrary is a criminal offense.
IMPORTANT NOTICE RELATING TO AUTOMATICALLY GENERATED EMAIL DISCLAIMERS
Any legends, disclaimers or other notices that may appear at the bottom of, or attached to, the email communication to which this Term Sheet may have been attached are not applicable to this Term Sheet and should be disregarded. Such legends, disclaimers or other notices have been automatically generated as a result of this Term Sheet having been sent via Bloomberg or another email system.
IMPORTANT NOTICE REGARDING THE CONDITIONS FOR THIS OFFERING OF ASSET-BACKED SECURITIES
THE ASSET-BACKED SECURITIES REFERRED TO IN THIS TERM SHEET ARE BEING OFFERED WHEN, AS AND IF ISSUED. IN PARTICULAR, YOU ARE ADVISED THAT THE ASSET-BACKED SECURITIES, AND THE ASSET POOL BACKING THEM, ARE SUBJECT TO MODIFICATION OR REVISION (INCLUDING, AMONG OTHER THINGS, THE POSSIBILITY THAT ONE OR MORE CLASSES OF SECURITIES MAY BE SPLIT, COMBINED OR ELIMINATED), AT ANY TIME PRIOR TO ISSUANCE OR AVAILABILITY OF A FINAL PROSPECTUS. AS A RESULT, YOU MAY COMMIT TO PURCHASE SECURITIES THAT HAVE CHARACTERISTICS THAT MAY CHANGE, AND YOU ARE ADVISED THAT ALL OR A PORTION OF THE SECURITIES MAY NOT BE ISSUED THAT HAVE THE CHARACTERISTICS DESCRIBED IN THIS TERM SHEET. OUR OBLIGATION TO SELL SECURITIES TO YOU IS CONDITIONED ON THE SECURITIES AND THE UNDERLYING TRANSACTION HAVING THE CHARACTERISTICS DESCRIBED IN THIS TERM SHEET. IF WE DETERMINE THAT THE FOREGOING CONDITION IS NOT SATISFIED IN ANY MATERIAL RESPECT, WE WILL NOTIFY YOU, AND NEITHER THE ISSUING ENTITY NOR ANY UNDERWRITER WILL HAVE ANY OBLIGATION TO YOU TO DELIVER ALL OR ANY PORTION OF THE SECURITIES WHICH YOU HAVE COMMITTED TO PURCHASE, AND THERE WILL BE NO LIABILITY BETWEEN US AS A CONSEQUENCE OF THE NON-DELIVERY.
This is not a research report and was not prepared by any Underwriter’s research department. Please see additional important information and qualifications at the end of this Term Sheet.
| T-1 |
| MSBAM 2017-C34 | Structural Overview |
Offered Certificates
| Class | Expected Ratings (Fitch/KBRA/Moody’s)(1) | Approximate Initial Certificate Balance or Notional Amount(2) | Approximate Initial Credit Support(3) | Pass-Through Rate Description | Expected Weighted Average Life (Years)(4) | Expected Principal Window (Months)(4) | Certificate Principal UW NOI Debt Yield(5) | Certificate Principal to Value Ratio(6) | ||||||||||
| Class A-1 | AAAsf/AAA(sf)/Aaa(sf) | $25,285,000 | 30.000 | % | (7) | 2.54 | 1 – 55 | 15.4 | % | 41.5 | % | |||||||
| Class A-2 | AAAsf/AAA(sf)/Aaa(sf) | $47,024,000 | 30.000 | % | (7) | 4.57 | 55 – 55 | 15.4 | % | 41.5 | % | |||||||
| Class A-SB | AAAsf/AAA(sf)/Aaa(sf) | $61,577,000 | 30.000 | % | (7) | 7.26 | 55 – 116 | 15.4 | % | 41.5 | % | |||||||
| Class A-3 | AAAsf/AAA(sf)/Aaa(sf) | [$200,000,000] | 30.000 | % | (7) | [9.77] | 116 – 118 | 15.4 | % | 41.5 | % | |||||||
| Class A-4 | AAAsf/AAA(sf)/Aaa(sf) | [$363,447,000] | 30.000 | % | (7) | [9.88] | 118 – 119 | 15.4 | % | 41.5 | % | |||||||
| Class X-A | AAAsf/AAA(sf)/Aaa(sf) | $697,333,000 | (8) | N/A | Variable(9) | N/A | N/A | N/A | N/A | |||||||||
| Class X-B | A-sf/AAA(sf)/NR | $171,843,000 | (8) | N/A | Variable(9) | N/A | N/A | N/A | N/A | |||||||||
| Class A-S | AAAsf/AAA(sf)/Aa3(sf) | $77,205,000 | 22.250 | % | (7) | 9.94 | 119 – 120 | 13.9 | % | 46.1 | % | |||||||
| Class B | AA-sf/AA(sf)/NR | $48,564,000 | 17.375 | % | (7) | 9.99 | 120 – 120 | 13.1 | % | 49.0 | % | |||||||
| Class C | A-sf/A(sf)/NR | $46,074,000 | 12.750 | % | (7) | 9.99 | 120 – 120 | 12.4 | % | 51.8 | % | |||||||
Privately Offered Certificates(10)
| Class | Expected Ratings (Fitch/KBRA/Moody’s)(1) | Approximate Initial Certificate Balance or Notional Amount(2) | Approximate Initial Credit Support(3) | Pass-Through Rate Description | Expected Weighted Average Life (Years)(4) | Expected Principal Window (Months)(4) | Certificate Principal UW NOI Debt Yield(5) | Certificate Principal to Value Ratio(6) | ||||||||
| Class X-D | BBB-sf/BBB-(sf)/NR | $56,036,000 | (8) | N/A | Variable(9) | N/A | N/A | N/A | N/A | |||||||
| Class X-E | BB-sf/BB-(sf)/NR | $24,905,000 | (8) | N/A | Variable(9) | N/A | N/A | N/A | N/A | |||||||
| Class X-F | B-sf/B-(sf)/NR | $11,207,000 | (8) | N/A | Variable(9) | N/A | N/A | N/A | N/A | |||||||
| Class X-G | NR/NR/NR | $34,867,004 | (8) | N/A | Variable(9) | N/A | N/A | N/A | N/A | |||||||
| Class D | BBB-sf/BBB-(sf)/NR | $56,036,000 | 7.125 | % | (7) | 9.99 | 120 – 120 | 11.6 | % | 55.1 | % | |||||
| Class E | BB-sf/BB-(sf)/NR | $24,905,000 | 4.625 | % | (7) | 9.99 | 120 – 120 | 11.3 | % | 56.6 | % | |||||
| Class F | B-sf/B-(sf)/NR | $11,207,000 | 3.500 | % | (7) | 9.99 | 120 – 120 | 11.2 | % | 57.3 | % | |||||
| Class G | NR/NR/NR | $34,867,004 | 0.000 | % | (7) | 9.99 | 120 – 120 | 10.8 | % | 59.3 | % | |||||
Non-Offered Eligible Vertical Interest(10)
| Non-Offered Eligible Vertical Interest | Expected Ratings (Fitch/KBRA/Moody’s) | Approximate Initial VRR Interest Balance | Approximate Initial Credit Support(3) | VRR Interest Rate Description | Expected Weighted Average Life (Years)(4) | Expected Principal Window (Months)(4) | Principal UW NOI Debt Yield | Principal to Value Ratio |
| VRR Interest | NR/NR/NR | $52,431,105.50 | 0.000% | WAC(11) | 9.29 | 1 - 120 | N/A | N/A |
| (1) | Ratings shown are those of Fitch Ratings, Inc. (“Fitch”), Kroll Bond Rating Agency, Inc. (“KBRA”) and Moody’s Investors Service, Inc. (“Moody’s”). Certain nationally recognized statistical rating organizations that were not hired by the depositor may use information they receive pursuant to Rule 17g-5 under the Securities Exchange Act of 1934, as amended, or otherwise to rate the certificates. There can be no assurance as to what ratings a non-hired nationally recognized statistical rating organization would assign. See “Risk Factors—Other Risks Relating to the Certificates—Nationally Recognized Statistical Rating Organizations May Assign Different Ratings to the Certificates; Ratings of the Certificates Reflect Only the Views of the Applicable Rating Agencies as of the Dates Such Ratings Were Issued; Ratings May Affect ERISA Eligibility; Ratings May Be Downgraded” and “Ratings” in the Preliminary Prospectus, expected to be dated October 3, 2017 (the “Preliminary Prospectus”). Capitalized terms used but not defined herein have the meanings assigned to such terms in the Preliminary Prospectus. |
| (2) | Approximate, subject to a permitted variance of plus or minus 5%. In addition, the notional amounts of the Class X-A, Class X-B, Class X-D, Class X-E, Class X-F and Class X-G certificates (collectively referred to as the “Class X Certificates”) may vary depending upon the final pricing of the classes of principal balance certificates whose certificate balances comprise such notional amounts, and, if as a result of such pricing the pass-through rate of any class of the Class X Certificates, would be equal to zero at all times, such class of certificates will not be issued on the closing date of this securitization. |
| (3) | The approximate initial credit support percentages set forth for the certificates are approximate and, for the Class A-1, Class A-2, Class A-SB, Class A-3, and Class A-4 certificates, are represented in the aggregate. The VRR Interest provides credit support only to the limited extent that it is allocated a portion of any losses incurred on the underlying mortgage loans, which such losses are allocated between it, on the one hand, and the certificates, on the other hand,pro rata in accordance with their respective Percentage Allocation Entitlements (as defined below). See “Credit Risk Retention” in the Preliminary Prospectus. |
| (4) | The Expected Weighted Average Life and Expected Principal Window during which distributions of principal would be received as set forth in the foregoing table with respect to each class of certificates having a certificate balance and the VRR Interest are based on the assumptions set forth under “Yield and Maturity Considerations—Weighted Average Life” in the Preliminary Prospectus and on the assumptions that there are no prepayments, modifications or losses in respect of the mortgage loans and that there are no extensions or forbearances of maturity dates or anticipated repayment dates of the mortgage loans. |
This is not a research report and was not prepared by any Underwriter’s research department. Please see additional important information and qualifications at the end of this Term Sheet.
| T-2 |
| MSBAM 2017-C34 | Structural Overview |
| (5) | Certificate Principal UW NOI Debt Yield for any class of principal balance certificates is calculated as the product of (a) the weighted average UW NOI Debt Yield for the mortgage pool, multiplied by (b) a fraction, the numerator of which is the total initial certificate balance of all the principal balance certificates, and the denominator of which is the total initial certificate balance of the subject class of principal balance certificates and all other classes of principal balance certificates, if any, that are senior to such class. The Certificate Principal UW NOI Debt Yields of the Class A-1, Class A-2, Class A-SB, Class A-3 and Class A-4 certificates are calculated in the aggregate for those classes as if they were a single class. |
| (6) | Certificate Principal to Value Ratio for any class of principal balance certificates is calculated as the product of (a) the weighted average Cut-off Date LTV Ratio of the mortgage pool, multiplied by (b) a fraction, the numerator of which is the total initial certificate balance of the subject class of principal balance certificates and all other classes of principal balance certificates, if any, that are senior to such class, and the denominator of which is the total initial certificate balance of all the principal balance certificates. The Certificate Principal to Value Ratios of the Class A-1, Class A-2, Class A-SB, Class A-3, and Class A-4 certificates are calculated in the aggregate for those classes as if they were a single class. |
| (7) | The pass-through rate for each class of the Class A-1, Class A-2, Class A-SB, Class A-3, Class A-4, Class A-S, Class B, Class C, Class D, Class E, Class F and Class G certificates (collectively referred to as the “principal balance certificates”) will be one of the following: (i) a fixed rateper annum, (ii) a variable rateper annum equal to the weighted average of the net mortgage interest rates on the mortgage loans for the related distribution date, (iii) a variable rateper annum equal to the lesser of (a) a fixed rate and (b) the weighted average of the net mortgage interest rates on the mortgage loans for the related distribution date or (iv) a variable rateper annum equal to the weighted average of the net mortgage interest rates on the mortgage loans for the related distribution date minus a specified percentage. For purposes of the calculation of the weighted average of the net mortgage interest rates on the mortgage loans for each distribution date, the net mortgage interest rates will be adjusted as necessary to a 30/360 basis. |
| (8) | The Class X Certificates are notional amount certificates and will not be entitled to distributions of principal. The notional amount of the Class X-A certificates will be equal to the aggregate certificate balance of the Class A-1, Class A-2, Class A-SB, Class A-3, and Class A-4 certificates. The notional amount of the Class X-B certificates will be equal to the aggregate certificate balance of the Class A-S, Class B and Class C certificates. The notional amount of the Class X-D certificates will be equal to the certificate balance of the Class D certificates. The notional amount of the Class X-E certificates will be equal to the certificate balance of the Class E certificates. The notional amount of the Class X-F certificates will be equal to the certificate balance of the Class F certificates. The notional amount of the Class X-G certificates will be equal to the certificate balance of the Class G certificates. If the certificate balance of a class of principal balance certificates constitutes all or part of the notional amount of a class of Class X certificates, then such class of principal balance certificates constitutes “an underlying class of principal balance certificates” for such class of Class X certificates. |
| (9) | The pass-through rate for the Class X-A certificates for any distribution date will be aper annum rate equal to the excess, if any, of (a) the weighted average of the net mortgage interest rates on the mortgage loans for the related distribution date, over (b) the weighted average of the pass-through rates on the Class A-1, Class A-2, Class A-SB, Class A-3 and Class A-4 certificates for the related distribution date, weighted on the basis of their respective certificate balances outstanding immediately prior to that distribution date. The pass-through rate for the Class X-B certificates for any distribution date will be aper annum rate equal to the excess, if any, of (a) the weighted average of the net mortgage interest rates on the mortgage loans for the related distribution date, over (b) the weighted average of the pass-through rates on the Class A-S, Class B and Class C certificates for the related distribution date, weighted on the basis of their respective certificate balances outstanding immediately prior to that distribution date. The pass-through rate for the Class X-D certificates for any distribution date will be aper annum rate equal to the excess, if any, of (a) the weighted average of the net mortgage interest rates on the mortgage loans for the related distribution date, over (b) the pass-through rate on the Class D certificates for the related distribution date. The pass-through rate for the Class X-E certificates for any distribution date will be aper annum rate equal to the excess, if any, of (a) the weighted average of the net mortgage interest rates on the mortgage loans for the related distribution date, over (b) the pass-through rate on the Class E certificates for the related distribution date. The pass-through rate for the Class X-F certificates for any distribution date will be aper annum rate equal to the excess, if any, of (a) the weighted average of the net mortgage interest rates on the mortgage loans for the related distribution date, over (b) the pass-through rate on the Class F certificates for the related distribution date. The pass-through rate for the Class X-G certificates for any distribution date will be aper annum rate equal to the excess, if any, of (a) the weighted average of the net mortgage interest rates on the mortgage loans for the related distribution date, over (b) the pass-through rate on the Class G certificates for the related distribution date. For purposes of the calculation of the weighted average of the net mortgage interest rates on the mortgage loans for each distribution date, the net mortgage interest rates will be adjusted as necessary to a 30/360 basis. |
| (10) | Not offered pursuant to the Preliminary Prospectus or this Term Sheet. Information provided in this Term Sheet regarding the characteristics of these certificates and the VRR Interest is provided only to enhance your understanding of the offered certificates. The privately offered certificates also include the Class V and Class R certificates, which do not have a certificate balance, notional amount, pass-through rate, rating or rated final distribution date, and which are not shown in the chart. The Class V certificates represent a beneficial ownership interest held through the grantor trust in a specified percentage of certain excess interest in respect of mortgage loans having anticipated repayment dates, if any. The Class R certificates represent the beneficial ownership of the residual interest in each of the real estate mortgage investment conduits, as further described in the Preliminary Prospectus. |
| (11) | Although it does not have a specified pass-through rate (other than for tax reporting purposes), the effective pass-through rate for the VRR Interest will be a variable rateper annumequal to the weighted average of the net mortgage interest rates on the mortgage loans for the related distribution date (in each case adjusted, if necessary, to accrue on the basis of a 360-day year consisting of twelve 30-day months). |
This is not a research report and was not prepared by any Underwriter’s research department. Please see additional important information and qualifications at the end of this Term Sheet.
| T-3 |
| MSBAM 2017-C34 | Structural Overview |
Issue Characteristics
| Offered Certificates: | $869,176,000 (approximate) monthly pay, multi-class, commercial mortgage pass-through certificates, consisting of eight principal balance classes (Class A-1, Class A-2, Class A-SB, Class A-3, Class A-4, Class A-S, Class B and Class C) and two interest-only classes (Class X-A and Class X-B) |
| Co-Lead Bookrunning Managers: | Merrill Lynch, Pierce, Fenner & Smith Incorporated and Morgan Stanley & Co. LLC |
| Co-Managers: | KeyBanc Capital Markets Inc. and Drexel Hamitlon, LLC |
| Mortgage Loan Sellers: | Bank of America, National Association, Morgan Stanley Mortgage Capital Holdings LLC, KeyBank National Association and Starwood Mortgage Funding III LLC |
| Rating Agencies: | Fitch, KBRA and Moody’s |
| Master Servicer: | Wells Fargo Bank, National Association |
| Special Servicer: | LNR Partners, LLC |
| Trustee: | Wilmington Trust, National Association |
| Certificate Administrator/ Certificate Registrar/Custodian: | Wells Fargo Bank, National Association |
| Operating Advisor: | Park Bridge Lender Services LLC |
| Asset Representations Reviewer: | Park Bridge Lender Services LLC |
| Initial Directing Certificateholder: | LNR Securities Holdings, LLC or an affiliate thereof |
| Risk Retention Consultation Party: | Bank of America, National Association |
| Credit Risk Retention: | Eligible vertical interest |
| Cut-off Date: | The mortgage loans will be considered part of the trust fund as of their respective cut-off dates. The cut-off date with respect to each mortgage loan is the respective due date for the monthly debt service payment that is due in October 2017 (or, in the case of any mortgage loan that has its first due date after October 2017, the date that would have been its due date in October 2017 under the terms of that mortgage loan if a monthly debt service payment were scheduled to be due in that month). |
| Expected Pricing Date: | Week of October 2, 2017 |
| Expected Closing Date: | October 19, 2017 |
| Determination Dates: | The 11th day of each month or, if the 11th day is not a business day, then the business day immediately following such 11th day. |
| Distribution Dates: | The 4th business day following each determination date. The first distribution date will be in November 2017. |
| Rated Final Distribution Date: | The distribution date in November 2052 |
| Interest Accrual Period: | Preceding calendar month |
| Payment Structure: | Sequential pay |
| Tax Treatment: | REMIC |
| Optional Termination: | 1.00% clean-up call (calculated without regard to the 222 Second Street mortgage loan and the U-Haul AREC 25 Portfolio mortgage loan, if the clean-up call occurs after November 2027 and such mortgage loan(s) remain assets of the trust fund)
|
| Minimum Denominations: | $10,000 for each class of Offered Certificates (other than Class X-A and Class X-B certificates); $1,000,000 for the Class X-A and Class X-B certificates |
| Settlement Terms: | DTC, Euroclear and Clearstream |
| Legal/Regulatory Status: | Each class of Offered Certificates is expected to be eligible for exemptive relief under ERISA. No class of Offered Certificates is SMMEA eligible. |
| Analytics: | The certificate administrator is expected to make available all distribution date statements, CREFC® reports and supplemental notices received by it to certain modeling financial services as described in the Preliminary Prospectus. |
| Bloomberg Ticker: | MSBAM 2017-C34<MTGE><GO> |
| Risk Factors: | THE OFFERED CERTIFICATES INVOLVE CERTAIN RISKS AND MAY NOT BE SUITABLE FOR ALL INVESTORS. SEE THE “RISK FACTORS” SECTION OF THE PRELIMINARY PROSPECTUS. |
This is not a research report and was not prepared by any Underwriter’s research department. Please see additional important information and qualifications at the end of this Term Sheet.
| T-4 |
| MSBAM 2017-C34 | Structural Overview |
Structural Overview
| Accrual: | Each class of Offered Certificates will accrue interest on a 30/360 basis. |
| Allocation Between the Certificates and the VRR Interest: | The aggregate amount available for distributions to the holders of the certificates and the VRR Interest will be (i) net of specified expenses of the issuing entity, including fees payable to, and costs and expenses reimbursable to, the master servicer, any primary servicer, the special servicer, the certificate administrator, the trustee, the operating advisor, the asset representations reviewer and CREFC®; and (ii) allocated between amounts available for distribution to the holders of the VRR Interest, on the one hand, and to the certificates, on the other hand. The portion of such aggregate amount (a) allocable to the VRR Interest will at all times be the product of such amounts multiplied by a fraction, expressed as a percentage, the numerator of which is the initial principal balance of the VRR Interest and the denominator of which is the sum of (x) the aggregate initial certificate balance of all the classes of certificates and (y) the initial principal balance of the VRR Interest (the “Vertically Retained Percentage”), and (b) allocable to the certificates will at all times be the product of such aggregate amount multiplied by the difference between 100% and the percentage set forth in clause (a) (the “Non-Vertically Retained Percentage,” and the Non-Vertically Retained Percentage and the Vertically Retained Percentage are each a “Percentage Allocation Entitlement”). |
| Amount and Order of Distributions: | On each distribution date, the Non-Vertically Retained Percentage of the aggregate funds available for distribution from the mortgage loans, net of (i) any yield maintenance charges and prepayment premiums and (ii) any excess interest, will be distributed in the following amounts and order of priority:
First, to the Class A-1, Class A-2, Class A-SB, Class A-3, Class A-4, Class X-A, Class X-B, Class X-D, Class X-E, Class X-F and Class X-G certificates, in respect of interest, up to an amount equal to, andpro rata in accordance with, the interest entitlements for those classes;
Second, to the Class A-1, Class A-2, Class A-SB, Class A-3, and Class A-4 certificates as follows, to the extent of applicable available funds allocated to principal: either (i)(a)first, to principal on the Class A-SB certificates, until the certificate balance of the Class A-SB certificates is reduced to the planned principal balance for the related distribution date set forth in Annex E to the Preliminary Prospectus, and (b)second, to principal on each class of the Class A-1, Class A-2, Class A-3, Class A-4 and Class A-SB certificates, in that order, in each case until the certificate balance of such class of certificates has been reduced to zero, or (ii) if the certificate balance of each class of the Class A-S, Class B, Class C, Class D, Class E, Class F and Class G certificates has been reduced to zero as a result of the allocation of losses on the mortgage loans to those certificates, to principal on the Class A-1, Class A-2, Class A-SB, Class A-3 and Class A-4 certificates,pro rata, without regard to the distribution priorities described above or the planned principal balance of the Class A-SB certificates;
Third, to the Class A-1, Class A-2, Class A-SB, Class A-3 and Class A-4 certificates: (a)first, up to an amount equal to, andpro rata based on, any previously unreimbursed losses on the mortgage loans allocable to principal that were previously borne by each such class, and (b)second, up to an amount equal to, andpro rata based on, interest on such unreimbursed losses previously allocated to each such class at the pass-through rate for such class from the date the related loss was allocated to such class;
Fourth, to each class of the Class A-S, Class B and Class C certificates, in that order, as follows: (a) to interest on such class of certificates in the amount of its interest entitlement; (b) to the extent of applicable available funds allocable to principal remaining after distributions in respect of principal to each class with a higher priority (as set forth in this clause or prior enumerated clauses set forth above), to principal on such class of certificates until its certificate balance has been reduced to zero; and (c) to reimburse such class of certificates,first, for any previously unreimbursed losses on the mortgage loans that were previously allocated to those certificates, andsecond, for interest on such unreimbursed losses at the pass-through rate for such class from the date the related loss was allocated to such class;
Fifth, to the Class D, Class E, Class F and Class G certificates in the amounts and order of priority described in “Description of the Certificates—Distributions” in the Preliminary Prospectus; and
Sixth, to the Class R certificates, any remaining amounts.
|
| Interest and Principal Entitlements: | The interest entitlement of each class of Offered Certificates on each distribution date generally will be the interest accrued during the related interest accrual period on the related certificate balance or notional amount at the related pass-through rate, net of any prepayment interest shortfalls allocated to that class for such distribution date as described below. If prepayment interest shortfalls arise from voluntary prepayments on serviced mortgage loans during any collection period, the master servicer is required to make a limited compensating interest payment to offset those shortfalls. See “Description of the Certificates—Prepayment Interest Shortfalls” in the Preliminary Prospectus. The remaining amount of prepayment interest shortfalls will be allocated between the VRR Interest, on one hand, and the certificates, on the other hand, in accordance with their respective Percentage Allocation Entitlements. The prepayment interest shortfalls allocated to the certificates will be allocated to all classes thereof (other than the Class V and Class R Certificates) to reduce the interest entitlement on each such class of certificates, on apro rata basis, based on their respective amounts of accrued interest for the related distribution date. If a class receives less than the entirety of its interest entitlement on any distribution date, then the shortfall (excluding any shortfall due to prepayment interest shortfalls), together with interest thereon, will be added to its interest entitlement for the next succeeding distribution date.
The aggregate principal distribution amount for each distribution date generally will be the aggregate amount of principal received or advanced in respect of the mortgage loans, net of any non-recoverable advances and interest thereon and any workout-delayed reimbursement amounts that are reimbursed to the master servicer or the |
This is not a research report and was not prepared by any Underwriter’s research department. Please see additional important information and qualifications at the end of this Term Sheet.
| T-5 |
| MSBAM 2017-C34 | Structural Overview |
trustee during the related collection period. Non-recoverable advances and interest thereon are reimbursable from principal collections before reimbursement from other amounts. Workout-delayed reimbursement amounts will be reimbursable from principal collections. The certificates and the VRR Interest will be entitled to their respective Percentage Allocation Entitlements of the aggregate principal distribution amount.
| |
| Special Servicer Compensation: | The principal compensation to be paid to the special servicer in respect of its special servicing activities will be the special servicing fee, the workout fee and the liquidation fee.
The special servicing fee for each distribution date is calculated at the special servicing fee rate based on the outstanding principal balance of each mortgage loan and any related companion loan that is serviced under the pooling and servicing agreement for this securitization (a “serviced mortgage loan” and “serviced companion loan”, respectively) that is being specially serviced or as to which the related mortgaged property has become an REO property. The special servicing fee rate will be a rate equal to the greater of 0.25%per annum and theper annum rate that would result in a special servicing fee for the related month of $3,500. The special servicing fee will be payable monthly,first, from liquidation proceeds, insurance and condemnation proceeds, and other collections in respect of the related specially serviced mortgage loan or REO property and,then, from general collections on all the mortgage loans and any REO properties.
The special servicer will also be entitled to (i) liquidation fees generally equal to 1.0% of liquidation proceeds and certain other collections in respect of a specially serviced mortgage loan (and any related serviced companion loan) or related REO property and of amounts received in respect of mortgage loan repurchases by the related mortgage loan sellers and (ii) workout fees generally equal to 1.0% of interest (other than post-ARD excess interest on mortgage loans with anticipated repayment dates and other than default interest) and principal payments made in respect of a rehabilitated mortgage loan (and any related serviced companion loan), in the case of each of clause (i) and (ii), subject to a cap of $1,000,000 and a floor of $25,000 with respect to any mortgage loan, whole loan or related REO property and subject to certain adjustments and exceptions as described in the Preliminary Prospectus under “Pooling and Servicing Agreement—Servicing and Other Compensation and Payment of Expenses—Special Servicer Compensation”.
With respect to any non-serviced mortgage loan, the related special servicer under the related other pooling and servicing agreement pursuant to which such mortgage loan is being serviced will be entitled to similar compensation as that described above with respect to such non-serviced mortgage loan under such other pooling and servicing agreement as further described in the Preliminary Prospectus, although any related fees may accrue at a different rate and there may be a higher (or no) cap on liquidation and workout fees.
|
| Prepayment Premiums/Yield Maintenance Charges: | If any yield maintenance charge or prepayment premium is collected during any collection period with respect to any mortgage loan, then on the distribution date immediately succeeding the end of such collection period, the certificate administrator will pay to the holders of each class of the Class A-1, Class A-2, Class A-SB, Class A-3, Class A-4, Class A-S, Class B, Class C and Class D certificates the product of (a) the Non-Vertically Retained Percentage of such yield maintenance charge or prepayment premium, (b) the related Base Interest Fraction for such class and the applicable principal prepayment, and (c) a fraction, the numerator of which is equal to the amount of principal distributed to such class for that distribution date, and the denominator of which is the total amount of principal distributed to all principal balance certificates (other than the Control Eligible Certificates) for that distribution date. Any portion of the Non-Vertically Retained Percentage of any yield maintenance charge or prepayment premium described in the prior sentence that is remaining after the distributions in the preceding sentence (as to the applicable distribution date, the “Class X YM Distribution Amount”) will be distributed to the holders of the Class X certificates as follows: (1) first, to the Class X-A and Class X-B certificates, in the case of each such class in an amount equal to the product of (i) a fraction, the numerator of which is equal to the amount of principal distributed on the applicable distribution date with respect to the underlying class(es) of principal balance certificates for such class of Class X certificates, and the denominator of which is the total amount of principal distributed on the applicable distribution date with respect to the principal balance certificates, multiplied by (ii) the Class X YM Distribution Amount for the applicable distribution date, and (2) second, to the Class X-D certificates, in an amount equal to the portion of the Class X YM Distribution Amount remaining after the distributions to the holders of the Class X-A and Class X-B certificates. The Vertically Retained Percentage of such yield maintenance charge or prepayment premium will be distributed to the holders of the VRR Interest. Notwithstanding any of the foregoing to the contrary, if at any time the certificate balances of the principal balance certificates (other than the Control Eligible Certificates) have been reduced to zero as a result of the allocation of principal payments on the mortgage loans, the certificate administrator will pay to the holders of each class of Control Eligible Certificates then entitled to distributions of principal on such distribution date the product of (a) the Non-Vertically Retained Percentage of such yield maintenance charge or prepayment premium, (b) the related Base Interest Fraction for such class and the applicable principal prepayment and (c) a fraction, the numerator of which is equal to the amount of principal distributed to such class for that distribution date, and the denominator of which is the total amount of principal distributed to all principal balance certificates for that distribution date. Any portion of the Non-Vertically Retained Percentage of any yield maintenance charge or prepayment premium described in the prior sentence that is remaining after the distributions in the preceding sentence (as to the applicable distribution date, the “Class X YM Subordinate Distribution Amount”) will be distributed to the holders of the Class X Certificates as follows: (1) first, to the Class X-E and Class X-F certificates, in the case of each such class in an amount equal to the product of (i) a fraction, the numerator of which is equal to the amount of principal distributed on the applicable distribution date with respect to the underlying classes of principal balance certificates for such class of Class X Certificates, and the denominator of which is the total amount of principal distributed on the applicable distribution date with respect to the principal balance certificates, multiplied by (ii) the Class X YM Subordinate Distribution Amount for the applicable distribution date, and (2) second, to the Class X-G certificates, in an amount equal to the portion of the Class X YM Subordinate Distribution Amount remaining after |
This is not a research report and was not prepared by any Underwriter’s research department. Please see additional important information and qualifications at the end of this Term Sheet.
| T-6 |
| MSBAM 2017-C34 | Structural Overview |
the distributions to the holders of the Class X-E and Class X-F certificates. The Vertically Retained Percentage of such yield maintenance charge or prepayment premium will be distributed to the holders of the VRR Interest.
“Base Interest Fraction” means, with respect to any principal prepayment of any mortgage loan that provides for the payment of a yield maintenance charge or prepayment premium, and with respect to any class of principal balance certificates, a fraction (A) the numerator of which is the greater of (x) zero and (y) the difference between (i) the pass-through rate on that class, and (ii) the applicable discount rate and (B) the denominator of which is the difference between (i) the mortgage interest rate on the related mortgage loan and (ii) the applicable discount rate; provided, that: under no circumstances will the Base Interest Fraction be greater than one; if the discount rate referred to above is greater than or equal to both the mortgage interest rate on the related mortgage loan and the pass-through rate on that class, then the Base Interest Fraction will equal zero; and if the discount rate referred to above is greater than or equal to the mortgage interest rate on the related mortgage loan and is less than the pass-through rate on that class, then the Base Interest Fraction will be equal to 1.0.
Consistent with the foregoing, the Base Interest Fraction is equal to: |
| (Pass-Through Rate – Discount Rate) | ||
| (Mortgage Rate – Discount Rate) |
| Realized Losses: | On each distribution date, immediately following the distributions to be made to the certificateholders on that date, the certificate administrator is required to calculate the amount, if any, by which (i) the aggregate stated principal balance of the mortgage loans, including any successor REO loans expected to be outstanding immediately following that distribution date is less than (ii) the then aggregate certificate balance of the principal balance certificates and the VRR Interest after giving effect to distributions of principal on that distribution date. The Non-Vertically Retained Percentage of the amount described in the first sentence will be applied to the Class G, Class F, Class E, Class D, Class C, Class B and Class A-S certificates, in that order, in each case until the related certificate balance has been reduced to zero, and then to the Class A-1, Class A-2, Class A-SB, Class A-3 and Class A-4 certificates,pro rata, based upon their respective certificate balances, until their respective certificate balances have been reduced to zero. The Vertically Retained Percentage of the amount described in the first sentence will be applied to the VRR Interest until its principal balance has been reduced to zero. |
| Serviced Whole Loans: | Each of the following mortgaged properties secures a mortgage loan and one or morepari passu promissory notes (each, a “servicedpari passu companion loan”) that will be serviced pursuant to the related intercreditor agreement and (subject to the discussion in the next paragraph) the pooling and servicing agreement for this transaction: American Cancer Society Center and OKC Outlets. With respect to each such mortgaged property, the related mortgage loan, together with the related servicedpari passu companion loan(s), is referred to herein (for so long as it is serviced under the pooling and servicing agreement for this transaction) as a “servicedpari passu whole loan.” Each servicedpari passu companion loan is not part of the mortgage pool and may be contributed to one or more future securitization transactions (if not already securitized) or may be otherwise transferred at any time, subject to compliance with the related intercreditor agreement. See the table below entitled “Mortgage Loans with Pari Passu Companion Loans” and “Description of the Mortgage Pool—The Whole Loans” in the Preliminary Prospectus, for additional information regarding each such whole loan. |
| Non-Serviced Whole Loans: | Each of the following mortgaged properties secures a mortgage loan (each, a “non-serviced mortgage loan”) and one or morepari passu promissory notes (each suchpari passu promissory note, a “non-serviced companion loan”) that will be serviced pursuant to the related intercreditor agreement and the pooling and servicing agreement or trust and servicing agreement (referred to herein as a related “pooling and servicing agreement”) for another securitization transaction: 222 Second Street, 237 Park Avenue, 9-19 9th Avenue, Mall of Louisiana, Corporate Woods Portfolio, Starwood Capital Hotel Portfolio, Great Valley Commerce Center and Visions Hotel Portfolio. With respect to each such mortgaged property, the related mortgage loan, together with the related non-serviced companion loan(s), is referred to herein (for so long as it is serviced under the pooling and servicing agreement for another securitization transaction) as a “non-serviced whole loan.” Each non-serviced companion loan is not part of the mortgage pool and may be contributed to one or more future securitization transactions (if not already securitized) or may be otherwise transferred at any time, subject to compliance with the related intercreditor agreement. Servicing of each non-serviced whole loan will generally be directed by the holder of the related control note (or, if such control note is included in a securitization, the directing certificateholder thereunder (or other party designated to exercise the rights of such control note)), and such holder will have the right to replace the special servicer with respect to the related whole loan with or without cause. See the table below entitled “Mortgage Loans with Pari Passu Companion Loans” and “Description of the Mortgage Pool—The Whole Loans” in the Preliminary Prospectus for additional information regarding each such whole loan. |
| Directing Certificateholder/ Controlling Class: | The initial Directing Certificateholder is expected to be LNR Securities Holdings, LLC (or an affiliate thereof)
The “Directing Certificateholder” will be the Controlling Class Certificateholder (or its representative) selected by more than 50% (by certificate balance) of the Controlling Class Certificateholders;provided, that (1) absent that selection, (2) until a Directing Certificateholder is so selected or (3) upon receipt of a notice from a majority of the Controlling Class Certificateholders (by certificate balance) that a Directing Certificateholder is no longer designated, the Controlling Class Certificateholder that owns the largest aggregate certificate balance of the Controlling Class (or its representative) will be the Directing Certificateholder;provided, that (i) if such holder elects or has elected to not be the Directing Certificateholder, the holder of the next largest aggregate certificate balance of the Controlling Class will be the Directing Certificateholder, (ii) in the event no one holder owns the largest aggregate certificate balance of the Controlling Class, then there will be no Directing Certificateholder until appointed in accordance with the terms of the pooling and servicing agreement, and (iii) the certificate |
This is not a research report and was not prepared by any Underwriter’s research department. Please see additional important information and qualifications at the end of this Term Sheet.
| T-7 |
| MSBAM 2017-C34 | Structural Overview |
administrator and the other parties to the pooling and servicing agreement will be entitled to assume that the identity of the Directing Certificateholder has not changed until such parties receive written notice of a replacement of the Directing Certificateholder from a party holding the requisite interest in the Controlling Class (as confirmed by the certificate registrar), or the resignation of the then-current Directing Certificateholder.
The “Controlling Class” will be, as of any time of determination, the most subordinate class of Control Eligible Certificates then-outstanding that has an aggregate certificate balance (as notionally reduced by any the Non-Vertically Retained Percentage of any Cumulative Appraisal Reduction Amounts (as defined below)) at least equal to 25% of the initial certificate balance thereof; provided, that if at any time the certificate balances of the certificates other than the Control Eligible Certificates have been reduced to zero as a result of principal payments on the mortgage loans, then the Controlling Class will be the most subordinate class of Control Eligible Certificates that has a certificate balance greater than zero without regard to the application of the Non-Vertically Retained Percentage of any Cumulative Appraisal Reduction Amounts. The Controlling Class as of the closing date will be the Class G certificates.
The “Control Eligible Certificates” will be any of the Class E, Class F and Class G certificates.
| |
| Control Rights: | Prior to a Control Termination Event, the Directing Certificateholder will have certain consent and consultation rights under the pooling and servicing agreement with respect to certain major decisions and other matters. A “Control Termination Event” will occur when the Class E certificates have a certificate balance (taking into account the application of the Non-Vertically Retained Percentage of any Cumulative Appraisal Reduction Amounts to notionally reduce the certificate balance thereof) of less than 25% of the initial certificate balance thereof; provided, that a Control Termination Event will be deemed not continuing in the event that the certificate balances of the principal balance certificates other than the Control Eligible Certificates have been reduced to zero as a result of principal payments on the mortgage loans.
After the occurrence of a Control Termination Event but prior to the occurrence of a Consultation Termination Event, the Directing Certificateholder will not have any consent rights, but the Directing Certificateholder will have certain non-binding consultation rights under the pooling and servicing agreement with respect to certain major decisions and other matters. A “Consultation Termination Event” will occur when (i) there is no class of Control Eligible Certificates that has a then-outstanding certificate balance at least equal to 25% of the initial certificate balance of that class, in each case, without regard to the application of the Non-Vertically Retained Percentage of any Cumulative Appraisal Reduction Amounts; provided, that a Consultation Termination Event will be deemed not continuing in the event that the certificate balances of the principal balance certificates other than the Control Eligible Certificates have been reduced to zero as a result of principal payments on the mortgage loans.
After the occurrence of a Consultation Termination Event, the Directing Certificateholder will not have any consent or consultation rights, except with respect to any rights expressly set forth in the pooling and servicing agreement, and the operating advisor will retain certain non-binding consultation rights under the pooling and servicing agreement with respect to certain major decisions and other matters.
Notwithstanding any proviso to the definitions of “Control Termination Event” and “Consultation Termination Event,” a Control Termination Event and a Consultation Termination Event will be deemed to have occurred with respect to any Excluded DCH Loan, and neither the Directing Certificateholder nor any Controlling Class Certificateholder will have any consent or consultation rights with respect to the servicing of such Excluded DCH Loan.
An “Excluded DCH Loan” is a mortgage loan or whole loan with respect to which the Directing Certificateholder or the holder of the majority of the Controlling Class is a Borrower Party. It is expected that there will be no Excluded DCH Loans as of the Closing Date with respect to this securitization.
“Borrower Party” means a borrower, a mortgagor, a manager of a mortgaged property, the holder of a mezzanine loan that has been accelerated or as to which foreclosure or enforcement proceedings have been commenced against the equity collateral pledged to secure the related mezzanine loan, or any Borrower Party Affiliate.
“Borrower Party Affiliate” means, with respect to a borrower, a mortgagor, a manager of a mortgaged property or the holder of a mezzanine loan that has been accelerated or as to which foreclosure or enforcement proceedings have been commenced against the equity collateral pledged to secure the related mezzanine loan, (a) any other person controlling or controlled by or under common control with such borrower, mortgagor, manager or mezzanine lender, as applicable, or (b) any other person owning, directly or indirectly, 25% or more of the beneficial interests in such borrower, mortgagor, manager or mezzanine lender, as applicable. For the purposes of this definition, “control” when used with respect to any specified person means the power to direct the management and policies of such person, directly or indirectly, whether through the ownership of voting securities, by contract or otherwise and the terms “controlling” and “controlled” have meanings correlative to the foregoing.
Notwithstanding any of the foregoing to the contrary, if any mortgage loan is part of a whole loan, the Directing Certificateholder’s consent and/or consultation rights with respect thereto may be limited as described in the Preliminary Prospectus. In particular, with respect to each non-serviced whole loan, the Directing Certificateholder will only have certain consultation rights with respect to certain major decisions and other matters related to such whole loan, in each case only prior to a Control Termination Event, and the holder of the related control note (or, if such control note has been securitized, the directing certificateholder with respect to such securitization or other designated party under the related pooling and servicing agreement) will be entitled to similar consent and/or consultation rights with respect to such whole loan. |
This is not a research report and was not prepared by any Underwriter’s research department. Please see additional important information and qualifications at the end of this Term Sheet.
| T-8 |
| MSBAM 2017-C34 | Structural Overview |
| Risk Retention Consultation Party: | The risk retention consultation party will be the party selected by the holder or holders of more than 50% of the VRR interest (by principal balance). The initial risk retention consultation party is expected to be Bank of America, National Association.
With respect to certain material servicing actions related to serviced mortgage loans that are not Excluded RRCP Loans, upon request of the risk retention consultation party, the party processing such servicing action will be required to consult on a non-binding basis with the risk retention consultation party, in each case within the same time period as such party would be required to consult with the Directing Certificateholder with respect to such servicing action (assuming the Directing Certificateholder had such right with respect to such mortgage loan); provided, that prior to the occurrence and continuance of a Consultation Termination Event, such mortgage loan must also be a specially serviced mortgage loan.
An “Excluded RRCP Loan” is a mortgage loan or whole loan with respect to which the Risk Retention Consultation Party or the holder of the majority of the VRR Interest is a Borrower Party. It is expected that there will be no Excluded RRCP Loans as of the Closing Date with respect to this securitization.
|
| Appraisal Reduction Amounts and Collateral Deficiency Amounts: | An “Appraisal Reduction Amount” generally will be created in the amount, if any, by which the principal balance of a required appraisal loan (which is a mortgage loan with respect to which certain defaults, modifications or insolvency events have occurred as further described in the Preliminary Prospectus) plus other amounts overdue or advanced in connection with such mortgage loan exceeds 90% of the appraised value of the related mortgaged property plus certain escrows and reserves (including letters of credit) held with respect to the mortgage loan.
A mortgage loan will cease to be subject to an Appraisal Reduction Amount when it has been brought current for at least three consecutive months, no additional event of default is foreseeable in the reasonable judgment of the special servicer and no other circumstances exist that would cause such mortgage loan or any related companion loan to be a specially serviced mortgage loan; however, a “Collateral Deficiency Amount” may exist with respect to any mortgage loan that is modified into an AB loan structure (an “AB Modified Loan”) and remains a rehabilitated mortgage loan and, if so, will generally equal the excess of (i) the stated principal balance of such AB Modified Loan (taking into account the related junior note(s) and anypari passu notes included therein, as well as any equity interests or other obligations senior to such junior notes), over (ii) the sum of (in the case of a whole loan, solely to the extent allocable to the subject mortgage loan) (x) the most recent appraised value for the related mortgaged property plus (y) solely to the extent not reflected or taken into account in such appraised value and to the extent on deposit with, or otherwise under the control of, the lender (or otherwise on deposit with a party acceptable to the lender or expended for the benefit of the mortgaged property or the mortgage loan at the time the mortgage loan became the subject of a workout and became (and as part of the modification related to) such AB Modified Loan) as of the date of such determination, any capital or additional collateral contributed by the related borrower at the time the mortgage loan became the subject of a workout and became (and as part of the modification related to) an AB Modified Loan for the benefit of the related mortgaged property plus (z) certain escrows or reserves (including letters of credit) in addition to any amounts set forth in the immediately preceding clause (y) held with respect to the mortgage loan.
As used herein, a “Cumulative Appraisal Reduction Amount” will be the sum of any Appraisal Reduction Amounts and any Collateral Deficiency Amounts.
Any Appraisal Reduction Amount in respect of any non-serviced mortgage loan generally will be calculated in accordance with the other servicing agreement pursuant to which such mortgage loan is being serviced, which calculations are expected to be generally similar to those provided for in the pooling and servicing agreement for this transaction.
If any mortgage loan is part of a whole loan, any Appraisal Reduction Amount or Collateral Deficiency Amount will (or effectively will) be calculated in respect of such whole loan taken as a whole and allocated, to the extent provided in the related intercreditor agreement and the related pooling and servicing agreement,first, to any related subordinate companion loan, andsecond, to the related mortgage loan and anypari passu companion loan on apro rata basis by unpaid principal balance.
Appraisal Reduction Amounts will proportionately reduce the interest portion of debt service advances required to be made in respect of the related mortgage loan. Appraisal Reduction Amounts and Collateral Deficiency Amounts will be taken into account in determining the identity of the controlling class entitled to appoint the Directing Certificateholder, the existence of a Control Termination Event and the allocation and/or exercise of voting rights for certain purposes (see“Directing Certificateholder/Controlling Class” above).
|
| Appraised-Out Class: | An “Appraised-Out Class” is any class of Control Eligible Certificates, the certificate balance of which (taking into account the application of the Non-Vertically Retained Percentage of any Appraisal Reduction Amounts or Collateral Deficiency Amounts to notionally reduce the certificate balance of such class) has been reduced to less than 25% of its initial certificate balance. Any Appraised-Out Class may not exercise any direction, control, consent and/or similar rights of the Controlling Class until such time, if any, as such class is reinstated as the Controlling Class, and the rights of the Controlling Class will be exercised by the most subordinate class of Control Eligible Certificates that is not an Appraised-Out Class, if any, during such period. |
| Appraisal Remedy: | The holders of the majority (by certificate balance) of an Appraised-Out Class (such holders, the “Requesting Holders”) will have the right, at their sole expense, to require the special servicer to order (or, with respect to a non-serviced mortgage loan, require the master servicer to request from the applicable outside special servicer) a second appraisal of any mortgage loan (or serviced whole loan) for which an appraisal reduction event has occurred or as to which there exists a Collateral Deficiency Amount. With respect to any serviced mortgage loan, the special servicer will be required to use its reasonable efforts to cause such appraisal to be (i) delivered within 30 days from receipt of the Requesting Holders’ written request and (ii) prepared on an “as-is” basis by an MAI |
This is not a research report and was not prepared by any Underwriter’s research department. Please see additional important information and qualifications at the end of this Term Sheet.
| T-9 |
| MSBAM 2017-C34 | Structural Overview |
| appraiser. With respect to any non-serviced mortgage loan, the master servicer will be required to use commercially reasonable efforts to obtain such second appraisal from the applicable outside special servicer and to forward such second appraisal to the special servicer. Upon receipt of such supplemental appraisal, the outside special servicer (for Appraisal Reduction Amounts on non-serviced mortgage loans, but only to the extent provided for in the applicable outside pooling and servicing agreement and applicable intercreditor agreement) and the special servicer (for Collateral Deficiency Amounts on non-serviced mortgage loan and for Cumulative Appraisal Reductions Amounts on serviced mortgage loans) will be required to determine, in accordance with the servicing standard, whether, based on its assessment of such supplemental appraisal, any recalculation of the applicable Appraisal Reduction Amount or Collateral Deficiency Amount is warranted and, if so warranted, will be required to recalculate such Appraisal Reduction Amount or Collateral Deficiency Amount, as applicable, based upon such supplemental appraisal and receipt of information requested by the special servicer from the master servicer. If required by any such recalculation, the applicable Appraised-Out Class will be reinstated as the Controlling Class and each Appraised-Out Class will, if applicable, have its related certificate balance notionally restored to the extent required by such recalculation of the Appraisal Reduction Amount or Collateral Deficiency Amount, if applicable. | |
| Sale of Defaulted Loans: | Under certain circumstances, the special servicer may be required to use reasonable efforts to solicit offers for a defaulted serviced mortgage loan (and any related companion loan (to the extent provided under the related intercreditor agreement) and/or related REO properties). If the special servicer does not receive an offer at least equal to the outstanding principal balance plus all accrued and unpaid interest and outstanding costs and expenses and certain other specified amounts (the “Par Purchase Price”), the special servicer may purchase the defaulted loan or REO property at the Par Purchase Price or may accept the highest offer received from any person that is determined to be a fair price for such defaulted loan or REO property. If multiple offers are received during the period designated by the special servicer for receipt of offers, the special servicer is generally required to select the highest offer. If the highest offer is made by an Interested Person (i.e., certain specified parties under the pooling and servicing agreement for this transaction, including the parties to such agreement, the Directing Certificateholder, any risk retention consultation party, any sponsor, any Borrower Party and known affiliates of the foregoing), the trustee, rather than the special servicer, will generally be required to determine whether the offer constitutes a fair price. Absent an offer at least equal to the Par Purchase Price, no offer from an Interested Person will constitute a fair price unless (x) it is the highest offer received and (y) at least one other offer is received from an independent third party. Neither the trustee nor any of its affiliates may make an offer for or purchase any specially serviced loan or REO property. See “Pooling and Servicing Agreement—Sale of Defaulted Loans and REO Properties” in the Prospectus.
Notwithstanding any of the foregoing to the contrary, the special servicer is not required to accept the highest offer and may accept a lower offer for a defaulted loan or REO property if it determines (in consultation with the Directing Certificateholder (unless a Consultation Termination Event exists or the mortgage loan is an Excluded DCH Loan), any related companion loan holders and, upon request, the risk retention consultation party), in accordance with the Servicing Standard (and subject to the requirements of any related intercreditor agreement), that a rejection of such offer would be in the best interests of the certificateholders, the VRR Interest owners and any related companion loan holders, as a collective whole as if they constituted a single lender, so long as such lower offer was not made by the special servicer or any of its affiliates.
If title to any mortgaged property is acquired by the trust fund, the special servicer will be required to sell such mortgaged property prior to the close of the third calendar year beginning after the year of acquisition, unless (a) the IRS grants or has not denied an extension of time to sell such mortgaged property or (b) the special servicer, trustee and the certificate administrator receive an opinion of independent counsel to the effect that the holding of the property by the trust longer than the above-referenced three-year period will not result in the imposition of a tax on any REMIC of the trust fund or cause any REMIC of the trust fund to fail to qualify as a REMIC.
The Directing Certificateholder will not have a right of first refusal to purchase a defaulted loan.
The foregoing applies to mortgage loans serviced under the pooling and servicing agreement. With respect to any non-serviced whole loan, if the special servicer under the applicable pooling and servicing agreement determines to sell the related controlling companion loan if it becomes a defaulted mortgage loan, then the applicable special servicer will be required to sell the related whole loan, including the related mortgage loan included in the MSBAM 2017-C34 securitization trust and the related pari passu companion loan(s) and, under certain circumstances, any subordinate companion loan(s), as a single loan. In connection with any such sale, the special servicer under the applicable pooling and servicing agreement will be required to follow procedures substantially similar to those set forth above.
|
| Appointment and Replacement of Special Servicer: | The Directing Certificateholder will appoint the initial special servicer as of the closing date. Prior to the occurrence and continuance of a Control Termination Event, the special servicer may generally be replaced by the Directing Certificateholder (i) for cause at any time or (ii) without cause if either (A) LNR Partners, LLC or its affiliate is no longer the special servicer or (B) LNR Securities Holdings, LLC or its affiliated owns less than 25% of the certificate balance of the Controlling Class.
After the occurrence and during the continuance of a Control Termination Event and upon (a) the written direction of holders of ABS Interests evidencing not less than 25% of the voting rights (taking into account the application of Cumulative Appraisal Reduction Amounts to notionally reduce the certificate balances of classes to which such Cumulative Appraisal Reduction Amounts are allocable and the principal balance of the VRR Interest) allocable to the principal balance certificates and the VRR Interest, as applicable, requesting a vote to replace the special servicer with a replacement special servicer, (b) payment by such requesting holders to the certificate administrator of all reasonable fees and expenses to be incurred by the certificate administrator in connection with administering such vote and (c) delivery by such holders to each applicable rating agency of a rating agency |
This is not a research report and was not prepared by any Underwriter’s research department. Please see additional important information and qualifications at the end of this Term Sheet.
| T-10 |
| MSBAM 2017-C34 | Structural Overview |
communication, the certificate administrator will be required to post such notice on its internet website and by mail and conduct the solicitation of votes of all applicable holders of ABS Interests in such regard, which such vote must occur within 180 days of the posting of such notice. Upon the written direction of holders of principal balance certificates and the VRR Interest representing at least 75% of the voting rights that constitute a minimum Quorum, the trustee will be required to immediately replace the special servicer with a qualified replacement special servicer designated by such ABS Interest holders.
After the occurrence of a Consultation Termination Event, if the operating advisor determines that the special servicer is not performing its duties as required under the pooling and servicing agreement or is otherwise not acting in accordance with the servicing standard, the operating advisor may also recommend the replacement of the special servicer. The operating advisor’s recommendation to replace the special servicer must be confirmed by an affirmative vote of holders of ABS Interests evidencing at least a majority of the aggregate voting rights allocable to all ABS Interests (taking into account the application of any Cumulative Appraisal Reduction Amounts to notionally reduce the respective balances of such ABS Interests).
A “Quorum” means, in connection with any solicitation of votes in connection with the replacement of the special servicer or the asset representations reviewer, the holders of ABS Interests representing at least 75% of the aggregate voting rights allocable to all classes of certificates entitled to principal and the VRR Interest on an aggregate basis (taking into account, other than with respect to the termination of the asset representations reviewer, the application of any Cumulative Appraisal Reduction Amounts to notionally reduce the certificate balances of the certificates and the principal balance of the VRR Interest).
“ABS Interest” means any class of certificates (other than the Class R certificates) or the VRR Interest, as applicable.
With respect to each serviced whole loan, any holder of a relatedpari passu companion loan, following a servicer termination event with respect to the special servicer that affects such holder, will be entitled to direct the trustee (and the trustee will be required) to terminate the special servicer solely with respect to such serviced whole loan. A replacement special servicer will be selected by the trustee or, prior to a Control Termination Event, by the Directing Certificateholder;provided, that any successor special servicer appointed to replace the special servicer with respect to such whole loan can generally not be the entity (or its affiliate) that was terminated at the direction of the holder of the relatedpari passu companion loan.
With respect to any non-serviced whole loan, the MSBAM 2017-C34 trust, as holder of the related mortgage loan, has the right to terminate the special servicer under the related pooling and servicing agreement if a servicer termination event occurs with respect to such special servicer that affects the trust in its capacity as such holder. Such rights may be exercised by the Directing Certificateholder prior to a Control Termination Event (or the master servicer or special servicer (as applicable), following the occurrence and during the continuance of a Control Termination Event). The successor special servicer will be selected pursuant to the applicable pooling and servicing agreement by the related directing holder prior to a control termination event under such pooling and servicing agreement.
| |
| Servicing Standard: | Each of the master servicer and the special servicer is obligated to service and administer the mortgage loans (and, if applicable, the serviced companion loans) in accordance with the definition of the “Servicing Standard” described in the Preliminary Prospectus and the terms of the pooling and servicing agreement, provided that each non-serviced mortgage loan, if any, will be serviced by another master servicer or special servicer under the pooling and servicing agreement with respect to the securitization of the related companion loan, which entities will be obligated to service and administer such non-serviced mortgage loan pursuant to a similar standard set forth in the related pooling and servicing agreement. |
| Voting Rights: | Voting rights for the ABS Interests will be allocated as follows: (1) 2% in the case of the Class X Certificates, allocated pro rata among the respective classes thereof based upon their respective notional amounts as of the date of determination; and (2) in the case of any class of principal balance certificates or the VRR Interest, a percentage equal to the product of 98% and a fraction, the numerator of which is equal to the related certificate balance or the VRR Interest principal balance of the class of certificates or VRR Interest, as applicable, each determined as of the prior distribution date, and the denominator of which is equal to the aggregate of the certificate balances of all classes of the principal balance certificates and the principal balance of the VRR Interest, each determined as of the prior Distribution Date, provided, that solely in connection with certain votes relating to the replacement of the special servicer and the operating advisor as described in the Preliminary Prospectus, the certificate balances of the respective classes of the principal balance certificates and the principal balance of the VRR interest referred to in this clause (2) will take into account any notional reduction in such certificate balances and/or VRR Interest principal balance for Cumulative Appraisal Reduction Amounts.
The voting rights of any class of certificates or the VRR Interest will be allocated among certificateholders of such class or the VRR Interest owners, as applicable, in proportion to their respective percentage interests. The Class V certificates and the Class R certificates will not be entitled to any voting rights.
|
| Excluded Special Servicer: | If the special servicer obtains knowledge that it has become a Borrower Party with respect to any serviced mortgage loan or serviced whole loan (an “Excluded Special Servicer Loan”), the special servicer will be required to resign as special servicer of that Excluded Special Servicer Loan. Prior to the occurrence and continuance of a Control Termination Event, the Directing Certificateholder will be entitled to select a separate special servicer that is not a Borrower Party (an “Excluded Special Servicer”) with respect to any Excluded Special Servicer Loan, unless such Excluded Special Servicer Loan is also an Excluded DCH Loan. After the occurrence and during the continuance of a Control Termination Event, if at any time the applicable Excluded Special Servicer Loan is also an Excluded DCH Loan or if the Directing Certificateholder is entitled to appoint the Excluded Special Servicer but does not so appoint within 30 days of notice of such resignation, the resigning special servicer will be required to |
This is not a research report and was not prepared by any Underwriter’s research department. Please see additional important information and qualifications at the end of this Term Sheet.
| T-11 |
| MSBAM 2017-C34 | Structural Overview |
| use reasonable efforts to select the related Excluded Special Servicer. Any Excluded Special Servicer will be required to perform all of the obligations of the special servicer and will be entitled to all special servicing compensation with respect to such Excluded Special Servicer Loan earned while the related mortgage loan is an Excluded Special Servicer Loan. | |
| Liquidated Loan Waterfall: | On liquidation of any mortgage loan, all net liquidation proceeds related to the mortgage loan (but not any related companion loan) will be applied under the pooling and servicing agreement for this transaction so that amounts allocated as a recovery of accrued and unpaid interest will not, in the first instance, include any delinquent interest that was not advanced as a result of Appraisal Reduction Amounts or accrued on the portion of the stated principal balance thereof equal to any related Collateral Deficiency Amount in effect from time to time and as to which no advance was made. After the adjusted interest amount is so allocated, any remaining liquidation proceeds will be allocated to offset certain advances and to pay principal on the mortgage loan until the unpaid principal amount of the mortgage loan has been reduced to zero. Any remaining liquidation proceeds will then be allocated to pay delinquent interest that was not advanced as a result of Appraisal Reduction Amounts or that accrued on the portion of the stated principal balance thereof equal to any related Collateral Deficiency Amount in effect from time to time and as to which no advance was made. |
| Operating Advisor: | The operating advisor will be required to perform certain review duties if a Control Termination Event has occurred and is continuing, which will generally include a limited annual review of, and the preparation of a report regarding, certain actions of the special servicer with respect to the resolution and/or liquidation of specially serviced loans. The review and report generally will be based on an annual meeting with the special servicer and any asset status reports and additional information delivered to the operating advisor by the special servicer. In addition, if a Control Termination Event has occurred and is continuing, the special servicer must consult with the operating advisor (in addition to the Directing Certificateholder if no Consultation Termination Event has occurred and is continuing) in connection with major decisions with respect to mortgage loans. Furthermore, under certain circumstances, but only if a Consultation Termination Event has occurred and is continuing, the operating advisor may recommend the replacement of the special servicer as described above under “—Appointment and Replacement of Special Servicer”; however, the operating advisor will not have any rights or obligations with respect to a non-serviced whole loan.
If a Consultation Termination Event has occurred and is continuing, the operating advisor may be removed and replaced without cause upon the affirmative direction of the owners of ABS Interests holding not less than 75% of the voting rights of all ABS Interests allocable to the Non-Reduced Interests (as defined below), following a proposal from certificate owners holding not less than 25% of the voting rights of all ABS Interests allocable to the Non-Reduced Interests. The certificateholders who initiate a vote on a termination and replacement of the operating advisor without cause must cause the payment of the fees and expenses incurred in the replacement. In addition, in the event there are no classes of certificates outstanding other than the Control Eligible Certificates and the Class X-E, Class X-F, Class X-G, Class V and Class R certificates and the VRR Interest, then all of the rights and obligations of the operating advisor under the PSA will terminate without payment of any penalty or termination fee (other than any rights or obligations that accrued prior to the date of such termination (including accrued and unpaid compensation) and other than indemnification rights arising out of events occurring prior to such termination). See “Pooling and Servicing Agreement—The Operating Advisor—Termination of the Operating Advisor Without Cause” in the Preliminary Prospectus.
“Non-Reduced Interest” means any ABS Interest then outstanding for which (a)(1) the initial certificate balance of such class of certificates or initial principal balance of the VRR Interest, as applicable, minus (2) the sum (without duplication) of (x) any payments of principal (whether as principal prepayments or otherwise) distributed to the certificateholders of such class of certificates or the VRR Interest owners, as applicable, (y) any Cumulative Appraisal Reduction Amounts allocated to such class of certificates or VRR Interest, as applicable and (z) any realized losses previously allocated to such class of certificates or VRR Interest, as applicable, is equal to or greater than (b) 25% of the difference between (1) the initial certificate balance of such class of certificates or initial principal balance of the VRR Interest, as applicable, and (2) any payments of principal (whether as principal prepayments or otherwise) distributed to the certificateholders of such class of certificates or the VRR Interest owners, as applicable.
|
| Operating Advisor Expenses: | In addition to the Operating Advisor Fee and the Operating Advisor Consulting Fee, the operating advisor will be entitled to reimbursement of Operating Advisor Expenses in accordance with the terms of the pooling and servicing agreement for this transaction. “Operating Advisor Expenses” for each distribution date will equal any unreimbursed indemnification amounts or additional trust fund expenses payable to the operating advisor pursuant to the pooling and servicing agreement for this transaction (other than the Operating Advisor Fee and the Operating Advisor Consulting Fee). |
| Asset Representations Reviewer: | The asset representations reviewer will be required to review certain delinquent mortgage loans after a specified delinquency threshold has been met and the required percentage of certificateholders vote to direct a review as described below. The asset representations reviewer will be entitled to the Asset Representations Reviewer Fee with respect to such review. See “Pooling and Servicing Agreement—The Asset Representations Reviewer” in the Preliminary Prospectus.
The certificate administrator will be required to notify certificateholders if the specified delinquency threshold has been met as described in the Preliminary Prospectus under “—The Asset Representations Reviewer”.
If holders of ABS Interests representing not less than 5.0% of the voting rights request a vote to commence an asset review, and if subsequently (i) a majority of the votes cast and (ii) a majority of a minimum Asset Review |
This is not a research report and was not prepared by any Underwriter’s research department. Please see additional important information and qualifications at the end of this Term Sheet.
| T-12 |
| MSBAM 2017-C34 | Structural Overview |
Quorum authorizes an asset review within 150 days of the request for a vote, the asset representations reviewer will be required to conduct an asset review of delinquent loans.
An “Asset Review Quorum” is, in connection with any solicitation of votes to authorize an asset review as described above, the holders of ABS Interests representing at least 5.0% of the aggregate voting rights.
The asset representations reviewer may be terminated and replaced without cause. Upon (i) the written direction of holders of ABS Interests representing not less than 25% of the voting rights (without regard to the application of any Cumulative Appraisal Reduction Amounts) requesting a vote to terminate and replace the asset representations reviewer with a proposed successor asset representations reviewer that is an eligible asset representations reviewer, and (ii) payment by such holders to the certificate administrator of the reasonable fees and expenses to be incurred by the certificate administrator in connection with administering such vote, the certificate administrator will be required to promptly provide notice to all certificateholders, VRR Interest owners and the asset representations reviewer of such request by posting such notice on its internet website, and by mailing such notice to all certificateholders, VRR Interest owners and the asset representations reviewer. Upon the written direction of holders of ABS Interests representing at least 75% of a minimum Quorum (without regard to the application of any Cumulative Appraisal Reduction Amounts), the trustee will be required to terminate all of the rights and obligations of the asset representations reviewer under the pooling and servicing agreement (other than any rights or obligations that accrued prior to the date of such termination and other than indemnification rights arising out of events occurring prior to such termination) by written notice to the asset representations reviewer, and the proposed successor asset representations reviewer will be appointed. See “Pooling and Servicing Agreement—The Asset Representations Reviewer” in the Preliminary Prospectus.
| |
| Dispute Resolution Provisions: | The mortgage loan sellers will be subject to the dispute resolution provisions set forth in the pooling and servicing agreement for this transaction to the extent those provisions are triggered with respect to any mortgage loan sold to the depositor by a mortgage loan seller, and such mortgage loan seller will be obligated under the related mortgage loan purchase agreement to comply with all applicable provisions and to take part in any mediation or arbitration proceedings that may result. Generally, in the event that a Repurchase Request is not “Resolved” within 180 days after the related mortgage loan seller receives such Repurchase Request, then the enforcing servicer will be required to send a notice to the first certificateholder (or beneficial owner) or VRR Interest owner to deliver a repurchase request with respect to the mortgage loan (the “Initial Requesting Holder”) (if any) and to the certificate administrator (which will be required to make such notice available to certificateholders and the VRR Interest owners via the certificate administrator’s website) indicating the enforcing servicer’s intended course of action with respect to the Repurchase Request. If (a) the enforcing servicer’s intended course of action with respect to the Repurchase Request does not involve pursuing further action to exercise rights against the related mortgage loan seller with respect to the Repurchase Request and the Initial Requesting Holder, if any, or any other certificateholder, certificate owner or VRR Interest owner wishes to exercise its right to refer the matter to mediation (including nonbinding arbitration) or arbitration, or (b) the enforcing servicer’s intended course of action is to pursue further action to exercise rights against the related mortgage loan seller with respect to the Repurchase Request but the Initial Requesting Holder, if any, or any other certificateholder, certificate owner or VRR Interest owner does not agree with the dispute resolution method selected by the enforcing servicer, then the Initial Requesting Holder, if any, or such other certificateholder, certificate owner or VRR Interest owner may deliver a written notice to the special servicer indicating its intent to exercise its right to refer the matter to either mediation or arbitration.
“Repurchase Request” means (i) a request by a certificateholder or VRR Interest owner alleging the existence of a material defect (as described in the Preliminary Prospectus) with respect to a mortgage loan and requesting that such mortgage loan be repurchased by the applicable mortgage loan seller or (ii) the depositor, the master servicer, the special servicer, the trustee, the certificate administrator, the operative advisor or the directing certificateholder providing notice of such material defect with respect to a mortgage loan.
“Resolved” means, with respect to a Repurchase Request, (i) that the related material defect or breach has been cured, (ii) the related mortgage loan has been repurchased in accordance with the related mortgage loan purchase agreement, (iii) a mortgage loan has been substituted for the related mortgage loan in accordance with the related mortgage loan purchase agreement, (iv) the applicable mortgage loan seller has made a loss of value payment, (v) a contractually binding agreement has been entered into between the enforcing servicer, on behalf of the issuing entity, and the related mortgage loan seller that settles the related mortgage loan seller’s obligations under the related mortgage loan purchase agreement, or (vi) the related mortgage loan is no longer property of the issuing entity as a result of a sale or other disposition in accordance with the pooling and servicing agreement. See “Pooling and Servicing Agreement—Dispute Resolution Provisions” in the Preliminary Prospectus.
|
| Investor Communications: | The certificate administrator is required to include on any Form 10-D any request received from a certificateholder to communicate with other certificateholders related to certificateholders exercising their rights under the terms of the pooling and servicing agreement for this transaction. Any certificateholder wishing to communicate with other certificateholders regarding the exercise of its rights under the terms of the pooling and servicing agreement for this transaction will be able to deliver a written request signed by an authorized representative of the requesting investor to the certificate administrator. |
| Deal Website: | The certificate administrator will be required to maintain a deal website which will include, among other items: (a) summaries of asset status reports prepared by the special servicer, (b) inspection reports, (c) appraisals, (d) various “special notices” described in the Preliminary Prospectus, (e) the “Investor Q&A Forum” and (f) a voluntary “Investor Registry”. Investors may access the deal website following execution of a certification and confidentiality agreement. |
This is not a research report and was not prepared by any Underwriter’s research department. Please see additional important information and qualifications at the end of this Term Sheet.
| T-13 |
| MSBAM 2017-C34 | Collateral Overview |
| Mortgage Loan Sellers | No. of Mortgage Loans | No. of Mortgaged Properties | Aggregate Cut-off Date Balance | % of Pool(1) |
| Bank of America, National Association | 13 | 33 | $324,656,637 | 31.0% |
| Morgan Stanley Mortgage Capital Holdings LLC | 12 | 28 | $268,629,068 | 25.6% |
| KeyBank National Association | 11 | 11 | $262,671,757 | 25.0% |
| Starwood Mortgage Funding III, LLC | 14 | 107 | $192,664,647 | 18.4% |
| Total: | 50 | 179 | $1,048,622,110 | 100.0% |
Pool Statistics(1)
| Aggregate Cut-off Date Balance: | $1,048,622,110 |
| Number of Mortgage Loans: | 50 |
| Average Cut-off Date Balance per Mortgage Loan: | $20,972,442 |
| Number of Mortgaged Properties: | 179 |
| Average Cut-off Date Balance per Mortgaged Property: | $5,858,224 |
| Weighted Average Mortgage Rate: | 4.2052% |
| % of Pool Secured by 5 Largest Mortgage Loans | 32.7% |
| % of Pool Secured by 10 Largest Mortgage Loans | 54.0% |
| % of Pool Secured by ARD Loans(2): | 14.0% |
| Weighted Average Original Term to Maturity (months)(2): | 117 |
| Weighted Average Remaining Term to Maturity (months)(2): | 116 |
| Weighted Average Seasoning (months): | 1 |
| % of Pool Secured by Single Tenant Mortgaged Properties: | 15.9% |
| % of Pool Secured by Refinance Loans: | 66.0% |
| % of Pool Secured by Acquisition Loans: | 29.8% |
| % of Pool Secured by Recapitalization Loans: | 4.2% |
Additional Debt
| % of Pool withPari Passu Mortgage Debt: | 47.0% |
| % of Pool with Mezzanine Debt: | 10.3% |
| % of Pool with Subordinate Mortgage Debt: | 6.7% |
Credit Statistics(3)
| Weighted Average UW NOI DSCR: | 2.16x |
| Weighted Average UW NOI Debt Yield: | 10.8% |
| Weighted Average UW NCF DSCR: | 1.99x |
| Weighted Average UW NCF Debt Yield: | 9.9% |
| Weighted Average Cut-off Date LTV Ratio(4): | 59.3% |
| Weighted Average Maturity Date LTV Ratio(2)(4): | 53.9% |
Footnotes are set forth on the following page.
This is not a research report and was not prepared by any Underwriter’s research department. Please see additional important information and qualifications at the end of this Term Sheet.
| T-14 |
| MSBAM 2017-C34 | Collateral Overview |
Amortization
| Weighted Average Original Amortization Term (months)(2): | 352 |
| Weighted Average Remaining Amortization Term (months)(2): | 352 |
| % of Pool Interest Only through Maturity(2): | 42.5% |
| % of Pool Interest Only followed by Amortizing Balloon: | 32.5% |
| % of Pool Amortizing Balloon(2): | 25.0% |
Lockboxes
| % of Pool with Hard Lockboxes: | 56.9% |
| % of Pool with Springing Lockboxes: | 33.1% |
| % of Pool with Soft Lockboxes: | 9.4% |
| % of Pool with no Lockboxes: | 0.6% |
Reserves
| % of Pool Requiring Tax Reserves: | 76.4% |
| % of Pool Requiring Insurance Reserves: | 39.1% |
| % of Pool Requiring Replacement Reserves: | 70.0% |
| % of Pool Requiring TI/LC Reserves(5): | 64.7% |
Call Protection
| % of Pool with lockout period, followed by defeasance until open period: | 91.9% |
| % of Pool with lockout period, followed by the greater of a prepayment premium and yield maintenance until open period: | 8.1% |
| (1) | Unless otherwise indicated, all references to “% of Pool” in this Term Sheet reflect a percentage of the aggregate principal balance of the mortgage pool as of the Cut-off Date, after application of all payments of principal due during or prior to October 2017. |
| (2) | With respect to any ARD Loan, unless otherwise indicated, references in this Term Sheet to the applicable “maturity date” or “maturity” refer to the applicable anticipated repayment date with respect to such ARD Loan, and such applicable anticipated repayment date is treated as its maturity date for all purposes hereof. |
| (3) | With respect to any mortgage loan that is part of a whole loan, unless otherwise indicated, all LTV, DSCR and Debt Yield calculations in this Term Sheet include any relatedpari passu companion loans and exclude any subordinate companion loans, as applicable. Additionally, LTV, DSCR and Debt Yield figures in this Term Sheet are calculated for mortgage loans without regard to any additional indebtedness that may be incurred at a future date. |
| (4) | The LTV ratios set forth in this Term Sheet are generally based on the “as-is” values of the related mortgaged properties; provided that the “as-is” value for a portfolio of mortgaged properties may include a premium relating to the valuation of the mortgaged properties as a whole rather than as the sum of individually valued mortgaged properties; provided, further, that such LTV ratios may be based on “as-stabilized”, “as complete” or other contingent values in certain cases in which reserves have been established at origination for the applicable condition or circumstance that is expected to result in stabilization. See the definition of “Appraised Value” under“Description of the Mortgage Pool—Certain Calculations and Definitions”in the Preliminary Prospectus. |
| (5) | Excludes hospitality, multifamily, manufactured housing, and self storage properties. |
This is not a research report and was not prepared by any Underwriter’s research department. Please see additional important information and qualifications at the end of this Term Sheet.
| T-15 |
| MSBAM 2017-C34 | Characteristics of the Mortgage Loans |
| Top 10 Mortgage Loans(1) | |||||||||||||
| Loan No. | Mortgage Loan Seller | Property Name | City | State | Property Type | Cut-off Date Balance | % of Pool | SF/Units | Cut-off Date Balance per SF/Unit | UW NCF DSCR | UW NOI Debt Yield | Cut-off Date LTV | Maturity Date LTV |
| 1 | BANA | 222 Second Street | San Francisco | CA | Office | $100,000,000 | 9.5% | 452,418 | $644.32 | 1.84x | 7.8% | 56.5% | 56.5% |
| 2 | KeyBank | American Cancer Society Center | Atlanta | GA | Office | $73,200,000 | 7.0% | 991,338 | $117.22 | 1.79x | 12.0% | 63.8% | 58.0% |
| 3 | MSMCH | 237 Park Avenue | New York | NY | Office | $70,005,000 | 6.7% | 1,251,717 | $278.02 | 4.10x | 16.4% | 26.6% | 26.6% |
| 4 | SMF III | 9-19 9th Avenue | New York | NY | Retail | $50,000,000 | 4.8% | 61,038 | $1,720.24 | 1.91x | 8.0% | 52.0% | 52.0% |
| 5 | KeyBank | OKC Outlets | Oklahoma City | OK | Retail | $49,500,000 | 4.7% | 393,793 | $219.66 | 2.41x | 11.2% | 59.9% | 59.9% |
| 6 | BANA | U-Haul AREC 25 Portfolio | Various | Various | Self Storage | $46,907,129 | 4.5% | 700,783 | $66.94 | 1.73x | 11.2% | 59.1% | 42.6% |
| 7 | BANA | Ocean Park Plaza | Santa Monica | CA | Office | $45,402,000 | 4.3% | 99,601 | $455.84 | 1.38x | 8.8% | 67.8% | 61.9% |
| 8 | KeyBank | Rodin Place | Philadelphia | PA | Mixed Use | $44,720,000 | 4.3% | 241,884 | $184.88 | 1.50x | 9.6% | 62.5% | 57.2% |
| 9 | BANA | Mall of Louisiana | Baton Rouge | LA | Retail | $44,000,000 | 4.2% | 776,789 | $418.39 | 1.85x | 11.1% | 57.0% | 49.4% |
| 10 | MSMCH | Remington Park | Houston | TX | Multifamily | $42,500,000 | 4.1% | 428 | $99,299.07 | 1.89x | 8.0% | 67.6% | 67.6% |
| Total/Wtd. Avg. | $566,234,129 | 54.0% | 2.10x | 10.5% | 56.1% | 52.5% | |||||||
| (1) | With respect to any mortgage loan that is part of a whole loan, unless otherwise indicated, all LTV, DSCR, Debt Yield and Balance per SF/Unit calculations in this Term Sheet include any relatedpari passu companion loans and exclude any subordinate companion loans or mezzanine loans, as applicable. Additionally, LTV, DSCR, Debt Yield and Balance per SF/Unit figures in this Term Sheet are calculated for mortgage loans without regard to any additional indebtedness that may be incurred at a future date. |
This is not a research report and was not prepared by any Underwriter’s research department. Please see additional important information and qualifications at the end of this Term Sheet.
| T-16 |
| MSBAM 2017-C34 | Characteristics of the Mortgage Loans |
| Mortgage Loans with Pari Passu Companion Loans | |||||||||||||
| Loan No. | Mortgage Seller | Property Name | Mortgage Loan Cut-off Date Balance | Aggregate Pari Passu Companion Loan Cut-off Date Balance | Combined Cut-off Date Balance | Lead Servicing Agreement | Master Servicer | Special Servicer | Control Rights | Combined UW NCF DSCR(1) | Combined UW NOI Debt Yield(1) | Combined Cut-off Date LTV(1) | |
| 1 | BANA | 222 Second Street | $100,000,000 | $191,500,000 | $291,500,000 | BANK 2017-BNK7 | Wells Fargo | Rialto | BANK 2017-BNK7 | 1.84x | 7.8% | 56.5% | |
| 2 | KeyBank | American Cancer Society Center | $73,200,000 | $43,000,000 | $116,200,000 | MSBAM 2017-C34 | Wells Fargo | LNR Partners | MSBAM 2017-C34 | 1.79x | 12.0% | 63.8% | |
| 3 | MSMCH | 237 Park Avenue | $70,005,000 | $277,995,000 | $348,000,000 | MSSG 2017-237P | Wells Fargo | Wells Fargo | MSSG 2017-237P | 4.10x | 16.4% | 26.6% | |
| 4 | SMF III | 9-19 9th Avenue | $50,000,000 | $55,000,000 | $105,000,000 | CGCMT 2017-P8 | Wells Fargo | KeyBank | CGCMT 2017-P8 | 1.91x | 8.0% | 52.0% | |
| 5 | KeyBank | OKC Outlets | $49,500,000 | $37,000,000 | $86,500,000 | MSBAM 2017-C34 | Wells Fargo | LNR Partners | MSBAM 2017-C34 | 2.41x | 11.2% | 59.9% | |
| 9 | BANA | Mall of Louisiana | $44,000,000 | $281,000,000 | $325,000,000 | BANK 2017-BNK7 | Wells Fargo | Rialto | BANK 2017-BNK7 | 1.85x | 11.1% | 57.0% | |
| 11 | MSMCH | Corporate Woods Portfolio | $39,946,846 | $181,009,145 | $220,955,991 | CGCMT 2017-P8 | Wells Fargo | KeyBank | CGCMT 2017-P8 | 1.48x | 10.2% | 73.9% | |
| 15 | SMF III | Starwood Capital Hotel Portfolio | $25,000,000 | $552,270,000 | $577,270,000 | DBJPM 2017-C6 | Midland | Midland | DBJPM 2017-C6 | 2.72x | 12.4% | 60.4% | |
| 19 | KeyBank | Great Valley Commerce Center | $21,470,686 | $27,679,978 | $49,150,664 | UBS 2017-C3 | Midland | Midland | UBS 2017-C3 | 1.66x | 11.5% | 66.9% | |
| 21 | SMF III | Visions Hotel Portfolio | $19,923,633 | $34,354,535 | $54,278,169 | CGCMT 2017-P8 | Wells Fargo | KeyBank | CGCMT 2017-P8 | 2.25x | 15.5% | 52.7% | |
| (1) | DSCR, Debt Yield and LTV calculations include any relatedpari passu companion loans and exclude any subordinate companion loans or mezzanine loans, as applicable. |
This is not a research report and was not prepared by any Underwriter’s research department. Please see additional important information and qualifications at the end of this Term Sheet.
| T-17 |
| MSBAM 2017-C34 | Characteristics of the Mortgage Loans |
| Mortgage Loans with Subordinate Debt | ||||||||||||
| Loan No. | Mortgage Loan Seller | Property Name | Mortgage Loan Cut-off Date Balance | Cut-off Date Balance per Unit/SF | Subordinate Debt Cut-off Date Balance | UW NCF DSCR | UW NOI Debt Yield | Cut-off Date LTV | Total Debt UW NCF DSCR(1) | Total Debt UW NOI Debt Yield(1) | Total Debt Cut-off Date LTV(1) | |
| 3 | MSMCH | 237 Park Avenue | $70,005,000 | $278.02 | $345,200,000 | 4.10x | 16.4% | 26.6% | 2.06x | 8.2% | 52.9% | |
| (1) | Total Debt UW NCF DSCR, Total Debt UW NOI Debt Yield and Total Debt Cut-off Date LTV figures shown above are calculated based on any relatedpari passu notes and the related subordinate note(s). |
| Mortgage Loans with Mezzanine Debt | |||||||||||
| Loan No. | Mortgage Loan Seller | Property Name | Mortgage Loan Cut-off Date Balance | Cut-off Date Balance per Unit/SF | Mezzanine Debt Cut-off Date Balance | UW NCF DSCR | UW NOI Debt Yield | Cut-off Date LTV | Total Debt UW NCF DSCR(1) | Total Debt UW NOI Debt Yield(1) | Total Debt Cut-off Date LTV(1) |
| 3 | MSMCH | 237 Park Avenue | $70,005,000 | $278.02 | $87,800,000 | 4.10x | 16.4% | 26.6% | 1.75x | 7.3% | 59.6% |
| 19 | KeyBank | Great Valley Commerce Center | $21,470,686 | $137.98 | $5,000,000 | 1.66x | 11.5% | 66.9% | 1.36x(2) | 10.4% | 73.7% |
| 22 | SMF III | San Mar Plaza | $16,750,000 | $90.05 | $3,107,710 | 1.93x | 10.3% | 60.2% | 1.31x | 8.7% | 71.3% |
| (1) | Total Debt UW NCF DSCR, Total Debt UW NOI Debt Yield and Total Debt Cut-off Date LTV figures shown above are calculated based on any relatedpari passu notes, any related subordinate note(s) and the mezzanine debt. |
| (2) | Based on a blended interest rate of 8.0000% for the payment dates in October and November 2017 and 14.0000% thereafter for the rate of the mezzanine debt related to the Great Valley Commerce Center Mortgage Loan. |
This is not a research report and was not prepared by any Underwriter’s research department. Please see additional important information and qualifications at the end of this Term Sheet.
| T-18 |
| MSBAM 2017-C34 | Characteristics of the Mortgage Loans |
| Prior Securitization History(1) | |||||||||||||||
| Loan No. | Mortgage Loan Seller | Property Name | City | State | Property Type | Cut-off Date Balance | % of Pool | SF/Rooms/ Units/Pads | Cut-off Date Balance per SF/Room/Unit/Pad | UW NCF DSCR(2) | UW NOI Debt Yield(2) | Cut-off Date LTV(2) | Maturity Date LTV(2) | Prior Securitization | |
| 2 | KeyBank | American Cancer Society Center | Atlanta | GA | Office | $73,200,000 | 7.0% | 991,338 | $117.22 | 1.79x | 12.0% | 63.8% | 58.0% | JPMCC 2007-C1 | |
| 3 | MSMCH | 237 Park Avenue | New York | NY | Office | $70,005,000 | 6.7% | 1,251,717 | $278.02 | 4.10x | 16.4% | 26.6% | 26.6% | LBCMT 2007-C3 | |
| 5 | KeyBank | OKC Outlets | Oklahoma City | OK | Retail | $49,500,000 | 4.7% | 393,793 | $219.66 | 2.41x | 11.2% | 59.9% | 59.9% | GSMS 2012-GCJ7 | |
| 6.02 | BANA | U-Haul Moving & Storage Of Lidgerwood | Spokane | WA | Self Storage | $5,968,722 | 0.6% | 92,775 | $66.94 | 1.73x | 11.2% | 59.1% | 42.6% | GECMC 2005-C3 | |
| 6.06 | BANA | U-Haul Moving & Storage Of East New Market | East New Market | MD | Self Storage | $3,345,037 | 0.3% | 62,315 | $66.94 | 1.73x | 11.2% | 59.1% | 42.6% | JPMCC 2006-LDP9 | |
| 6.11 | BANA | U-Haul Moving & Storage Of Trappe | Trappe | MD | Self Storage | $1,947,016 | 0.2% | 18,900 | $66.94 | 1.73x | 11.2% | 59.1% | 42.6% | JPMCC 2006-LDP9 | |
| 6.13 | BANA | U-Haul Storage Of Rochester South | Rochester | MN | Self Storage | $1,630,278 | 0.2% | 32,720 | $66.94 | 1.73x | 11.2% | 59.1% | 42.6% | WBCMT 2006-C29 | |
| 6.14 | BANA | U-Haul Storage Of Rochester North | Rochester | MN | Self Storage | $1,433,839 | 0.1% | 24,060 | $66.94 | 1.73x | 11.2% | 59.1% | 42.6% | WBCMT 2006-C29 | |
| 9 | BANA | Mall of Louisiana | Baton Rouge | LA | Retail | $44,000,000 | 4.2% | 776,789 | $418.39 | 1.85x | 11.1% | 57.0% | 49.4% | MLMT 2006-C1 | |
| 10 | MSMCH | Remington Park | Houston | TX | Multifamily | $42,500,000 | 4.1% | 428 | $99,299.07 | 1.89x | 8.0% | 67.6% | 67.6% | FREMF 2016-KF19 | |
| 11 | MSMCH | Corporate Woods Portfolio | Overland Park | KS | Various | $39,946,846 | 3.8% | 2,033,179 | $108.68 | 1.48x | 10.2% | 73.9% | 59.8% | (3) | |
| 12 | MSMCH | The Townsend Hotel | Birmingham | MI | Hospitality | $35,000,000 | 3.3% | 150 | $233,333.33 | 3.54x | 17.7% | 51.5% | 51.5% | DBUBS 2011-LC3A | |
| 13 | BANA | Enclave at Carpinteria | Carpinteria | CA | Office | $28,877,000 | 2.8% | 121,230 | $238.20 | 2.08x | 9.1% | 67.0% | 67.0% | WBCMT 2005-C20 | |
| 15 | SMF III | Starwood Capital Hotel Portfolio | Various | Various | Hospitality | $25,000,000 | 2.4% | 6,366 | $90,680.18 | 2.72x | 12.4% | 60.4% | 60.4% | (4) | |
| 17 | MSMCH | Hollister Business Park | Goleta | CA | Office | $23,000,000 | 2.2% | 142,206 | $161.74 | 1.41x | 9.9% | 61.7% | 56.8% | MLCFC 2007-8 | |
| 22 | SMF III | San Mar Plaza | San Marcos | TX | Retail | $16,750,000 | 1.6% | 186,016 | $90.05 | 1.93x | 10.3% | 60.2% | 60.2% | JPMCC 2007-CB19 | |
| 24 | BANA | 1102 Broadway | Tacoma | WA | Office | $12,425,000 | 1.2 | 84,035 | $147.86 | 1.56x | 10.2% | 70.6% | 60.1% | BACM 2006-3 | |
| 25 | MSMCH | Harbor Walk Office Building | Fort Lauderdale | FL | Office | $11,956,899 | 1.1% | 61,465 | $194.53 | 1.47x | 10.5% | 72.5% | 59.3% | MSC 2007-HQ13 | |
| 27 | KeyBank | Marina Beach Shopping Center | Marina Del Rey | CA | Retail | $9,800,000 | 0.9% | 23,883 | $410.33 | 1.72x | 11.2% | 54.4% | 47.5% | COMM 2007-C9 | |
| 29 | SMF III | Simsbury Plaza | West Bloomfield | MI | Retail | $9,400,000 | 0.9% | 80,278 | $117.09 | 1.62x | 10.4% | 67.1% | 57.2% | CGCMT 2008-C7 | |
| 34 | SMF III | The Marketplace Shopping Center | Odessa | TX | Retail | $6,271,744 | 0.6% | 66,540 | $94.26 | 1.44x | 11.9% | 64.5% | 49.3% | JPMCC 2007-CB20 | |
| 37 | MSMCH | MiniStor Self Storage | Citrus Heights | CA | Self Storage | $5,500,000 | 0.5% | 74,007 | $74.32 | 2.84x | 11.1% | 57.3% | 57.3% | JPMCC 2007-C1 | |
| 41 | KeyBank | Candlewood Suites Hopewell | Hopewell | VA | Hospitality | $3,594,071 | 0.3% | 59 | $60,916.46 | 1.61x | 12.9% | 60.9% | 46.0% | WBCMT 2007-C34 | |
| 49 | BANA | Luxor MHC | Bradenton | FL | Manufactured Housing | $2,089,956 | 0.2% | 67 | $31,193.37 | 1.35x | 8.8% | 74.9% | 61.7% | LNSTR 2014-2 | |
| Total | $523,141,408 | 49.9% | |||||||||||||
| (1) | Includes mortgage loans for which all or a portion of the previously existing debt was most recently securitized in conduit securitizations, based on information provided by the related borrower or obtained through searches of a third-party database. The information has not otherwise been confirmed by the mortgage loan sellers. With respect to any mortgage loan that is part of a whole loan, unless otherwise indicated, all LTV, DSCR, Debt Yield and Cut-off Date Balance per SF/Room/Unit/Pad calculations include any relatedpari passu companion loans and exclude any related subordinate companion loans or mezzanine loans, as applicable. |
| (2) | DSCR, Debt Yield and LTV calculations include any relatedpari passu companion loans and exclude any subordinate companion loans or mezzanine loans, as applicable. |
| (3) | The outstanding debt of the portfolio was primarily securitized in CGCC 2014-FL1. |
| (4) | The outstanding debt of the portfolio was primarily securitized in the following: WFRBS 2012-C10, WFCM 2012-LC5, GSMS 2012-GCJ9, WFRBS 2013-C11, COMM 2013-CRE6 and COMM 2013-CR7. |
This is not a research report and was not prepared by any Underwriter’s research department. Please see additional important information and qualifications at the end of this Term Sheet.
| T-19 |
| MSBAM 2017-C34 | Characteristics of the Mortgage Loans |
Mortgage Loans with Scheduled Balloon Payments and Related Classes(1)
| Class A-2 ($47,024,000) | |||||||||||||||||||||||
| Loan No. | Mortgage Loan Seller | Property Name | State | Property Type | Cut-off Date Balance | % of Pool | Maturity Date Balance | % of Class A-2 Certificate Principal Balance | SF | Cut-off Date Balance per SF(2) | UW NCF DSCR(2) | UW NOI Debt Yield(2) | Cut-off Date LTV(2) | Maturity Date LTV(2) | Rem. IO Period (mos.) | Rem. Term to Maturity (mos.) | |||||||
| 5 | KeyBank | OKC Outlets | OK | Retail | $49,500,000 | 4.7% | $49,500,000 | 105.3% | 393,793 | $219.66 | 2.41x | 11.2% | 59.9% | 59.9% | 55 | 55 | |||||||
| (1) | The table above reflects the mortgage loans whose balloon payments will be applied to pay down the Class A-2 certificates, assuming (i) that none of the mortgage loans experience prepayments, defaults or losses; (ii) there are no extensions of maturity dates; and (iii) each mortgage loan is paid in full on its stated maturity date or, in the case of any mortgage loan with an anticipated repayment date, on such anticipated repayment date. The table above is otherwise based on the Structuring Assumptions set forth under “Yield and Maturity Considerations—Weighted Average Life” in the Preliminary Prospectus. |
| (2) | Cut-off Date Balance per SF, UW NCF DSCR, UW NOI Debt Yield, Cut-off Date LTV and Maturity Date LTV calculations include the relatedpari passu companion loans. |
This is not a research report and was not prepared by any Underwriter’s research department. Please see additional important information and qualifications at the end of this Term Sheet.
| T-20 |
| MSBAM 2017-C34 | Characteristics of the Mortgage Loans |
Mortgage Loans with Scheduled Balloon Payments and Related Classes(1)
| Class A-SB ($61,577,000) | ||||||||||||||||||||
| Loan No. | Mortgage Loan Seller | Property Name | State | Property Type | Cut-off Date Balance | % of Pool | Maturity Date Balance | % of Class A-SB Certificate Principal Balance | SF | Cut-off Date Balance per SF | UW NCF DSCR | UW NOI Debt Yield | Cut-off Date LTV | Maturity Date LTV | Rem. IO Period (mos.) | Rem. Term to Maturity (mos.) | ||||
| 46 | SMF III | Las Vegas Dollar General Market | NV | Retail | $3,231,520 | 0.3% | $2,880,230 | 4.7% | 20,700 | $156.11 | 1.54x | 10.0% | 58.8% | 52.4% | 0 | 79 | ||||
| (1) | The table above reflects the mortgage loans whose balloon payments will be applied to pay down the Class A-SB certificates, assuming (i) that none of the mortgage loans experience prepayments, defaults or losses; (ii) there are no extensions of maturity dates; and (iii) each mortgage loan is paid in full on its stated maturity date or, in the case of any mortgage loan with an anticipated repayment date, on such anticipated repayment date. The table above is otherwise based on the Structuring Assumptions set forth under “Yield and Maturity Considerations—Weighted Average Life” in the Preliminary Prospectus. |
This is not a research report and was not prepared by any Underwriter’s research department. Please see additional important information and qualifications at the end of this Term Sheet.
| T-21 |
| MSBAM 2017-C34 | Characteristics of the Mortgage Loans |
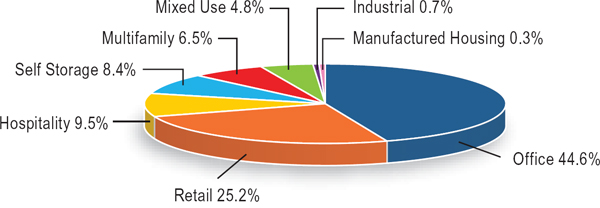
| Property Type Distribution(1) | ||||||||
| Property Type | Number of Mortgaged Properties | Aggregate Cut-off Date Balance | % of Pool | Wtd. Avg. Mortgage Rate | Wtd. Avg. UW NCF DSCR | Wtd. Avg. UW NOI Debt Yield | Wtd. Avg. Cut-off Date LTV | Wtd. Avg. Maturity Date LTV |
| Office | 28 | $467,228,966 | 44.6% | 4.1160% | 2.03x | 10.7% | 58.6% | 54.0% |
| CBD | 7 | $337,044,750 | 32.1% | 3.9919% | 2.19x | 10.9% | 54.7% | 51.9% |
| Suburban | 21 | $130,184,216 | 12.4% | 4.4372% | 1.62x | 10.1% | 68.6% | 59.7% |
| Retail | 18 | $263,995,478 | 25.2% | 4.2925% | 1.84x | 10.1% | 59.5% | 54.1% |
| Anchored | 4 | $72,250,000 | 6.9% | 4.4924% | 1.56x | 9.6% | 65.6% | 58.1% |
| Single Tenant | 6 | $66,431,520 | 6.3% | 4.2218% | 1.79x | 8.5% | 54.2% | 50.3% |
| Outlet Center | 1 | $49,500,000 | 4.7% | 4.1800% | 2.41x | 11.2% | 59.9% | 59.9% |
| Super Regional Mall | 1 | $44,000,000 | 4.2% | 3.9840% | 1.85x | 11.1% | 57.0% | 49.4% |
| Unanchored | 5 | $28,463,957 | 2.7% | 4.5897% | 1.70x | 11.1% | 59.9% | 50.5% |
| Shadow Anchored | 1 | $3,350,000 | 0.3% | 4.5700% | 1.70x | 11.3% | 54.9% | 50.4% |
| Hospitality | 79 | $99,517,704 | 9.5% | 4.3381% | 2.85x | 15.5% | 55.7% | 51.3% |
| Limited Service | 52 | $47,246,646 | 4.5% | 4.3595% | 2.46x | 15.1% | 57.2% | 48.8% |
| Full Service | 4 | $36,251,679 | 3.5% | 4.1809% | 3.51x | 17.5% | 51.8% | 51.8% |
| Extended Stay | 23 | $16,019,379 | 1.5% | 4.6305% | 2.47x | 12.5% | 60.5% | 57.2% |
| Self Storage | 25 | $87,956,771 | 8.4% | 4.1228% | 1.72x | 10.5% | 59.7% | 46.2% |
| Self Storage | 25 | $87,956,771 | 8.4% | 4.1228% | 1.72x | 10.5% | 59.7% | 46.2% |
| Multifamily | 23 | $68,532,324 | 6.5% | 4.1366% | 1.85x | 8.8% | 65.0% | 63.3% |
| Garden | 22 | $59,532,324 | 5.7% | 4.1505% | 1.84x | 8.9% | 67.2% | 65.2% |
| Mixed Use | 1 | $9,000,000 | 0.9% | 4.0450% | 1.91x | 8.1% | 50.6% | 50.6% |
| Mixed Use | 2 | $50,470,000 | 4.8% | 4.3789% | 1.48x | 9.6% | 63.0% | 56.9% |
| Office/Retail/Self Storage | 1 | $44,720,000 | 4.3% | 4.3500% | 1.50x | 9.6% | 62.5% | 57.2% |
| Retail/Office | 1 | $5,750,000 | 0.5% | 4.6040% | 1.34x | 9.5% | 66.9% | 54.4% |
| Industrial | 2 | $7,525,000 | 0.7% | 5.0103% | 1.36x | 10.3% | 62.9% | 50.3% |
| Flex | 2 | $7,525,000 | 0.7% | 5.0103% | 1.36x | 10.3% | 62.9% | 50.3% |
| Manufactured Housing | 2 | $3,395,866 | 0.3% | 4.9360% | 1.40x | 9.1% | 71.7% | 59.0% |
| Manufactured Housing | 2 | $3,395,866 | 0.3% | 4.9360% | 1.40x | 9.1% | 71.7% | 59.0% |
| Total/Wtd. Avg. | 179 | $1,048,622,110 | 100.0% | 4.2052% | 1.99x | 10.8% | 59.3% | 53.9% |
| (1) | All numerical information concerning the mortgage loans is approximate and, in the case of mortgage loans secured by multiple properties, is based on allocated loan amounts with respect to such properties. All weighted average information regarding the mortgage loans reflects the weighting of the mortgage loans based on their outstanding principal balances as of the Cut-off Date or, in the case of mortgage loans secured by multiple properties, allocated loan amounts. The sum of numbers and percentages in columns may not match the “Total” due to rounding. With respect to any mortgage loan that is part of a whole loan, unless otherwise indicated, all LTV, DSCR and Debt Yield calculations include any relatedpari passu companion loans and exclude any related subordinate companion loans, as applicable. |
This is not a research report and was not prepared by any Underwriter’s research department. Please see additional important information and qualifications at the end of this Term Sheet.
| T-22 |
| MSBAM 2017-C34 | Characteristics of the Mortgage Loans |
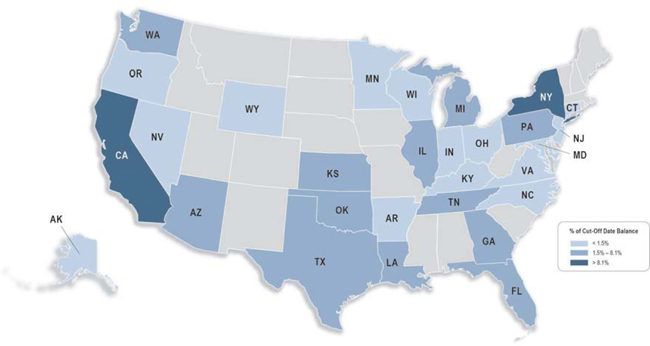
| Geographic Distribution(1) | ||||||||
| State or Other Jurisdiction | Number of Mortgaged Properties | Aggregate Cut-off Date Balance | % of Pool | Wtd. Avg. Mortgage Rate | Wtd. Avg. UW NCF DSCR | Wtd. Avg. UW NOI Debt Yield | Wtd. Avg. Cut-off Date LTV | Wtd. Avg. Maturity Date LTV |
| California | 19 | $277,741,471 | 26.5% | 4.1661% | 1.72x | 9.0% | 61.7% | 58.6% |
| California – Southern(2) | 6 | $155,179,000 | 14.8% | 4.3100% | 1.55x | 9.5% | 65.2% | 59.6% |
| California – Northern(2) | 13 | $122,562,471 | 11.7% | 3.9839% | 1.94x | 8.3% | 57.3% | 57.3% |
| New York | 13 | $148,928,633 | 14.2% | 3.9941% | 2.98x | 13.0% | 40.1% | 38.7% |
| Georgia | 4 | $84,589,884 | 8.1% | 4.0350% | 1.77x | 11.8% | 62.8% | 56.1% |
| Pennsylvania | 9 | $77,589,755 | 7.4% | 4.4623% | 1.55x | 10.3% | 64.3% | 56.0% |
| Texas | 24 | $71,604,226 | 6.8% | 4.3455% | 1.91x | 9.2% | 65.0% | 63.4% |
| Illinois | 27 | $59,126,632 | 5.6% | 4.3968% | 1.53x | 9.4% | 65.1% | 56.5% |
| Florida | 11 | $52,094,794 | 5.0% | 4.5144% | 1.43x | 10.1% | 66.2% | 51.8% |
| Oklahoma | 3 | $49,849,780 | 4.8% | 4.1821% | 2.41x | 11.2% | 59.9% | 59.9% |
| Michigan | 5 | $45,705,484 | 4.4% | 4.2160% | 3.12x | 16.0% | 55.0% | 52.9% |
| Louisiana | 1 | $44,000,000 | 4.2% | 3.9840% | 1.85x | 11.1% | 57.0% | 49.4% |
| Kansas | 16 | $39,946,846 | 3.8% | 4.4500% | 1.48x | 10.2% | 73.9% | 59.8% |
| Arizona | 7 | $24,259,355 | 2.3% | 4.1703% | 1.86x | 11.0% | 58.9% | 47.9% |
| Washington | 5 | $22,432,037 | 2.1% | 4.1377% | 1.70x | 10.7% | 65.5% | 53.4% |
| Tennessee | 2 | $16,000,000 | 1.5% | 4.1200% | 2.54x | 16.4% | 60.4% | 48.3% |
| Nevada | 2 | $6,581,520 | 0.6% | 4.7615% | 1.62x | 10.7% | 56.8% | 51.4% |
| Maryland | 3 | $5,558,247 | 0.5% | 3.9191% | 1.78x | 11.3% | 59.2% | 43.5% |
| Virginia | 3 | $4,466,282 | 0.4% | 5.0042% | 1.83x | 12.8% | 60.8% | 48.8% |
| Oregon | 2 | $4,000,059 | 0.4% | 3.9757% | 1.87x | 11.4% | 59.3% | 45.1% |
| Minnesota | 5 | $3,930,160 | 0.4% | 3.9715% | 1.86x | 11.4% | 59.3% | 45.0% |
| Kentucky | 2 | $2,663,235 | 0.3% | 3.9951% | 1.90x | 11.4% | 59.3% | 45.7% |
| Indiana | 5 | $1,761,413 | 0.2% | 4.4860% | 2.72x | 12.4% | 60.4% | 60.4% |
| Arkansas | 2 | $1,743,708 | 0.2% | 3.9214% | 1.78x | 11.3% | 59.2% | 43.5% |
| Alaska | 1 | $1,372,487 | 0.1% | 3.8906% | 1.73x | 11.2% | 59.1% | 42.6% |
| Ohio | 3 | $1,093,095 | 0.1% | 4.4860% | 2.72x | 12.4% | 60.4% | 60.4% |
| New Jersey | 1 | $458,760 | 0.0% | 4.4860% | 2.72x | 12.4% | 60.4% | 60.4% |
| North Carolina | 1 | $387,964 | 0.0% | 4.4860% | 2.72x | 12.4% | 60.4% | 60.4% |
| Wyoming | 1 | $266,194 | 0.0% | 4.4860% | 2.72x | 12.4% | 60.4% | 60.4% |
| Connecticut | 1 | $240,708 | 0.0% | 4.4860% | 2.72x | 12.4% | 60.4% | 60.4% |
| Wisconsin | 1 | $229,380 | 0.0% | 4.4860% | 2.72x | 12.4% | 60.4% | 60.4% |
| Total/Wtd. Avg. | 179 | $1,048,622,110 | 100.0% | 4.2052% | 1.99x | 10.8% | 59.3% | 53.9% |
| (1) | All numerical information concerning the mortgage loans is approximate and, in the case of mortgage loans secured by multiple properties, is based on allocated loan amounts with respect to such properties. All weighted average information regarding the mortgage loans reflects the weighting of the mortgage loans based on their outstanding principal balances as of the Cut-off Date or, in the case of mortgage loans secured by multiple properties, allocated loan amounts. The sum of numbers and percentages in columns may not match the “Total” due to rounding. With respect to any mortgage loan that is part of a whole loan, unless otherwise indicated, all LTV, DSCR and Debt Yield calculations include any relatedpari passu companion loans and exclude any related subordinate companion loans or mezzanine loans, as applicable. |
| (2) | “California – Southern” includes zip codes at or below 93600, and “California – Northern” includes zip codes above 93600. |
This is not a research report and was not prepared by any Underwriter’s research department. Please see additional important information and qualifications at the end of this Term Sheet.
| T-23 |
| MSBAM 2017-C34 | Collateral Statistics |
Collateral Statistics(1)
Cut-off Date Balance ($)
| No. of Mortgage Loans | Aggregate Cut-off Date Balance ($) | % of Pool | |||||
| 1,305,910 – 5,000,000 | 12 | 38,653,990 | 3.7 | ||||
| 5,000,001 - 10,000,000 | 12 | 88,783,928 | 8.5 | ||||
| 10,000,001 - 15,000,000 | 3 | 35,381,899 | 3.4 | ||||
| 15,000,001 - 25,000,000 | 9 | 189,244,319 | 18.0 | ||||
| 25,000,001 – 50,000,000 | 11 | 453,352,975 | 43.2 | ||||
| 50,000,001 - 100,000,000 | 3 | 243,205,000 | 23.2 | ||||
| Total: | 50 | $1,048,622,110 | 100.0 | % | |||
Min: $1,305,910 Max: $100,000,000 Avg: $20,972,442 | |||||||
State or Other Jurisdiction(2)
| No. of Mortgaged Properties | Aggregate Cut-off Date Balance ($) | % of Pool | |||||
| California | 19 | 277,741,471 | 26.5 | ||||
| California – Southern(3) | 6 | 155,179,000 | 14.8 | ||||
| California – Northern(3) | 13 | 122,562,471 | 11.7 | ||||
| New York | 13 | 148,928,633 | 14.2 | ||||
| Georgia | 4 | 84,589,884 | 8.1 | ||||
| Pennsylvania | 9 | 77,589,755 | 7.4 | ||||
| Texas | 24 | 71,604,226 | 6.8 | ||||
| Illinois | 27 | 59,126,632 | 5.6 | ||||
| Florida | 11 | 52,094,794 | 5.0 | ||||
| Oklahoma | 3 | 49,849,780 | 4.8 | ||||
| Michigan | 5 | 45,705,484 | 4.4 | ||||
| Louisiana | 1 | 44,000,000 | 4.2 | ||||
| Kansas | 16 | 39,946,846 | 3.8 | ||||
| Arizona | 7 | 24,259,355 | 2.3 | ||||
| Washington | 5 | 22,432,037 | 2.1 | ||||
| Tennessee | 2 | 16,000,000 | 1.5 | ||||
| Nevada | 2 | 6,581,520 | 0.6 | ||||
| Maryland | 3 | 5,558,247 | 0.5 | ||||
| Virginia | 3 | 4,466,282 | 0.4 | ||||
| Oregon | 2 | 4,000,059 | 0.4 | ||||
| Minnesota | 5 | 3,930,160 | 0.4 | ||||
| Kentucky | 2 | 2,663,235 | 0.3 | ||||
| Indiana | 5 | 1,761,413 | 0.2 | ||||
| Arkansas | 2 | 1,743,708 | 0.2 | ||||
| Alaska | 1 | 1,372,487 | 0.1 | ||||
| Ohio | 3 | 1,093,095 | 0.1 | ||||
| New Jersey | 1 | 458,760 | 0.0 | ||||
| North Carolina | 1 | 387,964 | 0.0 | ||||
| Wyoming | 1 | 266,194 | 0.0 | ||||
| Connecticut | 1 | 240,708 | 0.0 | ||||
| Wisconsin | 1 | 229,380 | 0.0 | ||||
| Total: | 179 | $1,048,622,110 | 100.0 | % |
Property Type(2)
| No. of Mortgaged Properties | Aggregate Cut-off Date Balance ($) | % of Pool | |||||
| Office | 28 | 467,228,966 | 44.6 | ||||
| CBD | 7 | 337,044,750 | 32.1 | ||||
| Suburban | 21 | 130,184,216 | 12.4 | ||||
| Retail | 18 | 263,995,478 | 25.2 | ||||
| Anchored | 4 | 72,250,000 | 6.9 | ||||
| Single Tenant | 6 | 66,431,520 | 6.3 | ||||
| Outlet Center | 1 | 49,500,000 | 4.7 | ||||
| Super Regional Mall | 1 | 44,000,000 | 4.2 | ||||
| Unanchored | 5 | 28,463,957 | 2.7 | ||||
| Shadow Anchored | 1 | 3,350,000 | 0.3 | ||||
| Hospitality | 79 | 99,517,704 | 9.5 | ||||
| Limited Service | 52 | 47,246,646 | 4.5 | ||||
| Full Service | 4 | 36,251,679 | 3.5 | ||||
| Extended Stay | 23 | 16,019,379 | 1.5 | ||||
| Self Storage | 25 | 87,956,771 | 8.4 | ||||
| Self Storage | 25 | 87,956,771 | 8.4 | ||||
| Multifamily | 23 | 68,532,324 | 6.5 | ||||
| Garden | 22 | 59,532,324 | 5.7 | ||||
| Mixed Use | 1 | 9,000,000 | 0.9 | ||||
| Mixed Use | 2 | 50,470,000 | 4.8 | ||||
| Office/Retail/Self Storage | 1 | 44,720,000 | 4.3 | ||||
| Retail/Office | 1 | 5,750,000 | 0.5 | ||||
| Industrial | 2 | 7,525,000 | 0.7 | ||||
| Flex | 2 | 7,525,000 | 0.7 | ||||
| Manufactured Housing | 2 | 3,395,866 | 0.3 | ||||
| Manufactured Housing | 2 | 3,395,866 | 0.3 | ||||
| Total/Wtd. Avg. | 179 | $1,048,622,110 | 100.0 | % |
Mortgage Rate (%)
| No. of Mortgage Loans | Aggregate Cut-off Date Balance ($) | % of Pool | |||||
| 3.7515 - 4.4990 | 34 | 910,997,010 | 86.9 | ||||
| 4.5000 - 4.9990 | 13 | 122,159,286 | 11.6 | ||||
| 5.0000 - 5.3720 | 3 | 15,465,815 | 1.5 | ||||
| Total: | 50 | $1,048,622,110 | 100.0 | % | |||
| Min: 3.7515% Max: 5.3720% Wtd Avg: 4.2052% | |||||||
Original Term to Maturity or ARD (mos.)
| No. of Mortgage Loans | Aggregate Cut-off Date Balance ($) | % of Pool | |||||
| 60 | 1 | 49,500,000 | 4.7 | ||||
| 84 | 1 | 3,231,520 | 0.3 | ||||
| 120 | 48 | 995,890,589 | 95.0 | ||||
| Total: | 50 | $1,048,622,110 | 100.0 | % | |||
| Min: 60 mos. Max: 120 mos. Wtd Avg: 117 mos. | |||||||
Remaining Term to Maturity or ARD (mos.)
| No. of Mortgage Loans | Aggregate Cut-off Date Balance ($) | % of Pool | |||||
| 55 - 60 | 1 | 49,500,000 | 4.7 | ||||
| 79 - 108 | 1 | 3,231,520 | 0.3 | ||||
| 112 - 120 | 48 | 995,890,589 | 95.0 | ||||
| Total: | 50 | $1,048,622,110 | 100.0 | % | |||
| Min: 55 mos. Max: 120 mos. Wtd Avg: 116 mos. | |||||||
Original Amortization Term (mos.)
| No. of Mortgage Loans | Aggregate Cut-off Date Balance ($) | % of Pool | |||||
| Interest Only | 13 | 445,644,750 | 42.5 | ||||
| 240 | 1 | 8,225,000 | 0.8 | ||||
| 300 | 3 | 56,772,944 | 5.4 | ||||
| 330 | 1 | 5,600,000 | 0.5 | ||||
| 360 | 32 | 532,379,416 | 50.8 | ||||
| Total: | 50 | $1,048,622,110 | 100.0 | % | |||
| Min: 240 mos. Max: 360 mos. Wtd Avg: 352 mos. | |||||||
Remaining Amortization Term (mos.)
| No. of Mortgage Loans | Aggregate Cut-off Date Balance ($) | % of Pool | |||||
| Interest Only | 13 | 445,644,750 | 42.5 | ||||
| 240 - 240 | 1 | 8,225,000 | 0.8 | ||||
| 241 - 300 | 3 | 56,772,944 | 5.4 | ||||
| 301 - 360 | 33 | 537,979,416 | 51.3 | ||||
| Total: | 50 | $1,048,622,110 | 100.0 | % | |||
| Min: 240 mos. Max: 360 mos. Wtd Avg: 352 mos. | |||||||
Mortgage Loan Sellers
| No. of Mortgage Loans | Aggregate Cut-off Date Balance ($) | % of Pool | |||||
| Bank of America, National Association | 13 | 324,656,637 | 31.0 | ||||
| Morgan Stanley Mortgage Capital Holdings LLC | 12 | 268,629,068 | 25.6 | ||||
| KeyBank National Association | 11 | 262,671,757 | 25.0 | ||||
| Starwood Mortgage Funding III LLC | 14 | 192,664,647 | 18.4 | ||||
| Total: | 50 | $1,048,622,110 | 100.0 | % |
Amortization Type
| No. of Mortgage Loans | Aggregate Cut-off Date Balance ($) | % of Pool | |||||
| Interest Only | 12 | 345,644,750 | 33.0 | ||||
| Partial Interest Only | 16 | 341,309,000 | 32.5 | ||||
| Amortizing Balloon | 20 | 214,761,231 | 20.5 | ||||
| Interest Only, ARD | 1 | 100,000,000 | 9.5 | ||||
| Amortizing Balloon, ARD | 1 | 46,907,129 | 4.5 | ||||
| Total: | 50 | $1,048,622,110 | 100.0 | % |
Cut-off Date LTV Ratio (%)
| No. of Mortgage Loans | Aggregate Cut-off Date Balance ($) | % of Pool | |||||
| 26.6 - 40.0 | 1 | 70,005,000 | 6.7 | ||||
| 40.1 - 60.0 | 18 | 406,480,389 | 38.8 | ||||
| 60.1 - 65.0 | 14 | 272,762,998 | 26.0 | ||||
| 65.1 - 70.0 | 12 | 227,980,022 | 21.7 | ||||
| 70.1 - 74.9 | 5 | 71,393,701 | 6.8 | ||||
| Total: | 50 | $1,048,622,110 | 100.0 | % | |||
| Min: 26.6% Max: 74.9% Wtd Avg: 59.3% | |||||||
Maturity Date or ARD LTV Ratio (%)
| No. of Mortgage Loans | Aggregate Cut-off Date Balance ($) | % of Pool | |||||
| 26.6 - 35.0 | 2 | 78,230,000 | 7.5 | ||||
| 35.1 - 45.0 | 4 | 75,173,869 | 7.2 | ||||
| 45.1 - 55.0 | 21 | 282,430,467 | 26.9 | ||||
| 55.1 - 60.0 | 13 | 403,194,068 | 38.4 | ||||
| 60.1 - 67.6 | 10 | 209,593,706 | 20.0 | ||||
| Total: | 50 | $1,048,622,110 | 100.0 | % | |||
| Min: 26.6% Max: 67.6% Wtd Avg: 53.9% | |||||||
UW DSCR (x)
| No. of Mortgage Loans | Aggregate Cut-off Date Balance ($) | % of Pool | |||||
| 1.32 - 1.40 | 7 | 133,316,956 | 12.7 | ||||
| 1.41 - 1.50 | 9 | 162,732,726 | 15.5 | ||||
| 1.51 - 1.60 | 6 | 33,806,729 | 3.2 | ||||
| 1.61 - 1.70 | 7 | 48,794,864 | 4.7 | ||||
| 1.71 - 1.80 | 5 | 144,402,452 | 13.8 | ||||
| 1.81 - 1.90 | 3 | 186,500,000 | 17.8 | ||||
| 1.91 - 2.50 | 7 | 183,563,383 | 17.5 | ||||
| 2.51 - 3.00 | 4 | 50,500,000 | 4.8 | ||||
| 3.01 - 4.10 | 2 | 105,005,000 | 10.0 | ||||
| Total: | 50 | $1,048,622,110 | 100.0 | % | |||
| Min: 1.32x Max: 4.10x Wtd Avg: 1.99x | |||||||
UW NOI Debt Yield (%)
| No. of Mortgage Loans | Aggregate Cut-off Date Balance ($) | % of Pool | |||||
| 7.8 - 8.5 | 4 | 201,500,000 | 19.2 | ||||
| 8.6 - 9.0 | 5 | 85,923,284 | 8.2 | ||||
| 9.1 - 9.5 | 5 | 69,364,958 | 6.6 | ||||
| 9.6 - 10.0 | 8 | 128,532,431 | 12.3 | ||||
| 10.1 - 11.0 | 10 | 115,283,851 | 11.0 | ||||
| 11.1 - 12.0 | 11 | 274,494,882 | 26.2 | ||||
| 12.1 - 15.0 | 3 | 32,594,071 | 3.1 | ||||
| 15.1 - 17.7 | 4 | 140,928,633 | 13.4 | ||||
| Total: | 50 | $1,048,622,110 | 100.0 | % | |||
| Min: 7.8% Max: 17.7% Wtd Avg: 10.8% | |||||||
| (1) | All numerical information concerning the mortgage loans is approximate. All weighted average information regarding the mortgage loans reflects the weighting of the mortgage loans based on their outstanding principal balances as of the Cut-off Date or, in the case of mortgage loans secured by multiple properties, allocated loan amounts. The sum of numbers and percentages in columns may not match the “Total” due to rounding. With respect to any mortgage loan that is part of a whole loan, unless otherwise indicated, all LTV, DSCR and Debt Yield calculations include any related pari passu companion loans and exclude any related subordinate companion loans or mezzanine loans, as applicable. |
| (2) | In the case of mortgage loans secured by multiple properties, Cut-off Date balance information is based on allocated loan amounts with respect to such properties. |
| (3) | “California – Southern” includes zip codes at or below 93600, and “California – Northern” includes zip codes above 93600. |
This is not a research report and was not prepared by any Underwriter’s research department. Please see additional important information and qualifications at the end of this Term Sheet.
| T-24 |
(THIS PAGE INTENTIONALLY LEFT BLANK)
| T-25 |
| MSBAM 2017-C34 | 222 Second Street |
Mortgage Loan No. 1 – 222 Second Street

This is not a research report and was not prepared by any Underwriter’s research department. Please see additional important information and qualifications at the end of this Term Sheet.
| T-26 |
| MSBAM 2017-C34 | 222 Second Street |
Mortgage Loan No. 1 – 222 Second Street

This is not a research report and was not prepared by any Underwriter’s research department. Please see additional important information and qualifications at the end of this Term Sheet.
| T-27 |
| MSBAM 2017-C34 | 222 Second Street |
| Mortgage Loan No. 1 – 222 Second Street |
| Mortgage Loan Information | Property Information | ||||||
| Mortgage Loan Seller: | BANA | Single Asset/Portfolio: | Single Asset | ||||
| Original Balance(1): | $100,000,000 | Location: | San Francisco, CA 94105 | ||||
| Cut-off Date Balance(1): | $100,000,000 | General Property Type: | Office | ||||
| % of Initial Pool Balance: | 9.5% | Detailed Property Type: | CBD | ||||
| Loan Purpose: | Refinance | Title Vesting: | Fee | ||||
| Sponsor: | TSCE Real Estate, L.P. | Year Built/Renovated: | 2015/N/A | ||||
| Mortgage Rate(2): | 3.9260% | Size: | 452,418 SF | ||||
| Note Date: | 8/30/2017 | Cut-off Date Balance per SF(1): | $644 | ||||
| First Payment Date: | 10/10/2017 | Maturity/ARD Date Balance per SF(1): | $644 | ||||
| Anticipated Repayment Date(2): | 9/10/2027 | Property Manager: | Tishman Speyer Properties, L.P. | ||||
| Maturity Date(2) | 9/10/2029 | ||||||
| Original Term to Maturity/ARD(2): | 120 months | ||||||
| Original Amortization Term: | 0 months | ||||||
| IO Period: | 120 months | Underwriting and Financial Information | |||||
| Seasoning: | 1 month | UW NOI: | $22,735,893 | ||||
| Prepayment Provisions(3): | LO (25); DEF (88); O (7) | UW NOI Debt Yield(1): | 7.8% | ||||
| Lockbox/Cash Mgmt Status: | Hard/Springing | UW NOI Debt Yield at Maturity/ARD(1): | 7.8% | ||||
| Additional Debt Type(1): | Pari Passu | UW NCF DSCR(1): | 1.84x | ||||
| Additional Debt Balance(1): | 191,500,000 | Most Recent NOI(5): | N/A | ||||
| Future Debt Permitted (Type): | No (N/A) | 2nd Most Recent NOI(5): | N/A | ||||
| Reserves(4) | 3rd Most Recent NOI(5): | N/A | |||||
| Type | Initial | Monthly | Cap | Most Recent Occupancy(5): | 100.0% (10/10/2017) | ||
| RE Tax: | $0 | Springing | N/A | 2nd Most Recent Occupancy(5): | 100.0% (12/31/2016) | ||
| Insurance: | $0 | Springing | N/A | 3rd Most Recent Occupancy(5): | N/A | ||
| Recurring Replacements: | $0 | Springing | $180,967 | Appraised Value (as of)(6): | $516,000,000 (7/26/2017) | ||
| TI/LC: | $0 | Springing | $22,620,900 | Cut-off Date LTV Ratio(1)(6): | 56.5% | ||
| Other: | $11,158,354 | $0 | N/A | Maturity/ARD Date LTV Ratio(1)(6): | 56.5% | ||
| Sources and Uses | ||||||
| Sources | Proceeds | % of Total | Uses | Proceeds | % of Total | |
| Loan Amount(1): | $291,500,000 | 100.0% | Loan Payoff: | $213,720,346 | 73.3% | |
| Return of Equity(7): | $64,540,437 | 22.1% | ||||
| Reserves: | $11,158,354 | 3.8% | ||||
| Closing Costs: | $2,080,863 | 0.7% | ||||
| Total Sources: | $291,500,000 | 100.0% | Total Uses: | $291,500,000 | 100.0% | |
| (1) | The 222 Second Street Mortgage Loan (as defined below) is part of the 222 Second Street Whole Loan (as defined below), which is comprised of threepari passu promissory notes with an aggregate original principal balance of $291,500,000. The Cut-off Date Balance per SF, Maturity/ARD Date Balance per SF, UW NOI Debt Yield, UW NOI Debt Yield at Maturity/ARD, UW NCF DSCR, Cut-off Date LTV Ratio and Maturity/ARD Date LTV Ratio numbers presented above are based on the aggregate principal balance of the promissory notes comprising the 222 Second Street Whole Loan. See “The Mortgage Loan” and “Additional Secured Indebtedness (not including trade debts)” below for further discussion of additional debt. |
| (2) | Interest on the 222 Second Street Whole Loan accrues at an interest rate of 3.9260%per annum(the “Initial Interest Rate”) through the anticipated repayment date of September 10, 2027. After the anticipated repayment date, if the 222 Second Street Whole Loan remains outstanding, (a) all excess cash flow with respect to the 222 Second Street Property (as defined below) is required to be applied to repay the 222 Second Street Whole Loan and (b) the 222 Second Street Whole loan will accrue interest at an interest rate equal to the sum of (x) the Initial Interest Rate plus (y) 3.0000% through the final maturity date of September 10, 2029, with all interest accrued over the Initial Interest Rate deferred and due and payable with the repayment of the 222 Second Street Whole Loan in full. |
| (3) | The defeasance lockout period will be at least 25 payments beginning with and including the first payment date of October 10, 2017. Defeasance of the 222 Second Street Whole Loan is permitted after the date that is earlier to occur of (i) two years after the closing date of the securitization that includes the last note to be securitized and (ii) October 10, 2020. The assumed lockout period of 25 payments is based on the expected MSBAM 2017-C34 securitization trust closing date in October 2017. |
| (4) | See “Escrows and Reserves” below for further discussion of reserve requirements. |
| (5) | The 222 Second Street Property is entirely leased to LinkedIn whose lease provides for four phases of occupancy: Phase I (34.6% of NRA) began on January 1, 2016, Phase II (32.9% of NRA) began on January 1, 2017, Phase III (15.7% of NRA) began on July 1, 2017 and Phase IV (16.8% of NRA) is expected to begin on January 1, 2018. Historical occupancy and NOI information are not available. |
| (6) | The appraiser provided a hypothetical dark value for the 222 Second Street Property of $445.0 million, which would result in a Cut-off Date LTV Ratio and a Maturity/ARD Date LTV Ratio of 65.5% and 65.5%, respectively. |
| (7) | The 222 Second Street Property was developed by the 222 Second Street Whole Loan sponsor in a joint venture partnership for a construction cost of approximately $304.5 million. The Return of Equity was used to pay off the previous joint venture partner. |
This is not a research report and was not prepared by any Underwriter’s research department. Please see additional important information and qualifications at the end of this Term Sheet.
| T-28 |
| MSBAM 2017-C34 | 222 Second Street |
The Mortgage Loan. The largest mortgage loan (the “222 Second Street Mortgage Loan”) is part of a whole loan (the “222 Second Street Whole Loan”) evidenced by threepari passu promissory notes in the aggregate original principal amount of $291,500,000, all of which are secured by a first priority mortgage encumbering the fee interest in a 452,418 SF Class A office tower located in San Francisco, California (the “222 Second Street Property”). The non-controlling Promissory Note A-2 in the original principal amount of $100,000,000 represents the 222 Second Street Mortgage Loan and will be included in the MSBAM 2017-C34 securitization trust. The controlling Promissory Note A-1 in the original principal amount of $110,000,000 is expected to be included in the BANK 2017-BNK7 securitization trust. The non-controlling Promissory Note A-3 in the original principal amount of $81,500,000 is currently being held by Bank of America, N.A. and is expected to be contributed to one or more future securitization transactions. The 222 Second Street Whole Loan will be serviced pursuant to the pooling and servicing agreement for the BANK 2017-BNK7 securitization trust. See “Description of the Mortgage Pool—The Whole Loans—The Non-Serviced Pari Passu Whole Loans” and “Pooling and Servicing Agreement—Servicing of the Non-Serviced Mortgage Loans”in the Preliminary Prospectus.
| 222 Second Street Whole Loan Summary | ||||
Notes | Original Balance | Note Holder | Controlling Interest | |
| A-1 | $110,000,000 | BANK 2017-BNK7 | Yes | |
| A-2 | $100,000,000 | MSBAM 2017-C34 | No | |
| A-3 | $81,500,000 | Bank of America, N.A. | No | |
| Total | $291,500,000 | |||
The Borrower and the Sponsor. The borrower is 222 Second Street Owner, L.P. (the “222 Second Street Borrower”), a single-purpose Delaware limited partnership, with two independent directors. Other than the 222 Second Street Borrower, no person or entity guarantees the nonrecourse carve-outs or provides environmental indemnities with respect to the 222 Second Street Whole Loan.
The loan sponsor is TSCE Real Estate, L.P. which is 93.8% owned by Tishman Speyer Crown Equities LLC, an affiliate of Tishman Speyer. Tishman Speyer is one of the leading owners, developers, operators and fund managers of real estate worldwide. Tishman Speyer operates in 30 markets in 7 countries and since inception in 1978 has acquired, developed and operated 402 assets totaling over 165 million SF, with a current portfolio value in excess of $85.8 billion.
The Property. The 222 Second Street Property is a 452,418 SF, 26-story high-rise, LEED-Gold certified, Class A office building that was constructed in 2015 and is entirely leased to LinkedIn. Approximately $103 million ($228 PSF) in tenant improvements was invested to build out LinkedIn’s space, inclusive of approximately $60 million reportedly invested by LinkedIn directly, as it consolidated its San Francisco-based workforce previously housed in various buildings in San Francisco’s Financial District and SOMA district to the 222 Second Street Property. On the ground floor of the building there is the LinkedIn lobby with a coffee kiosk, 2,209 SF of retail space and a landscaped public open space. The 222 Second Street Property also features a fitness center offering fitness classes and a massage room, a café with a full-service kitchen, outdoor terraces on floors 5 and 17 and a two-level sub-grade parking garage with 90 valet spots. The column-free floorplans provide for flexible layouts with floor-to-ceiling windows that allow for 360-degree bay and city views. LinkedIn has customized its space with art installations, creative interactive wall spaces, conference rooms, quiet areas, business centers and kitchenettes on every floor, a band room, pool hall, lending library, music library, and secure bicycle parking.
The Tenant. The 222 Second Street Property is entirely leased to LinkedIn Corporation (“LinkedIn”) under a lease dated April 21, 2014 with four phases of occupancy (Phase I (34.6% of NRA) began on January 1, 2016, Phase II (32.9% of NRA) began on January 1, 2017, Phase III (15.7% of NRA) began on July 1, 2017 and Phase IV (16.8% of NRA) is expected to begin on January 2018) and with staggered expirations in 2025, 2026 and 2027. The LinkedIn lease provides for an initial average rent of $69.70 PSF with annual rent increases of $1.50 PSF on the office space and 3.0% on the retail space. The LinkedIn lease does not have any contraction or termination options. The LinkedIn lease contains two, five-year renewal options for all or a portion of its space at 95% of fair market rent with 15 months’ notice, which if exercised consecutively and on the entire space, allows for a third five-year renewal option at 95% of fair market rent with 15 months’ notice. If the 222 Second Street Property is ever marketed for sale, LinkedIn has a one-time right of first offer to purchase the 222 Second Street Property provided that it continues to directly lease more than 400,000 SF and there is no default under the lease.
LinkedIn is the world’s largest professional social network company with over 400 million members globally and more than 10,000 full-time employees. LinkedIn has users in over 200 countries, provides services in 23 languages and earns revenue through three main sources: talent solutions, marketing solutions and premium subscriptions. LinkedIn launched in 2003, went public in 2011 and was acquired by Microsoft Corporation (Nasdaq: MSFT) in December 2016 for $26.2 billion, the largest acquisition in Microsoft history. Microsoft Corporation fully guarantees the lease.
This is not a research report and was not prepared by any Underwriter’s research department. Please see additional important information and qualifications at the end of this Term Sheet.
| T-29 |
| MSBAM 2017-C34 | 222 Second Street |
The following table presents certain information relating to the lease phases at the 222 Second Street Property:
| Lease Phase Summary | |||||||
| LinkedIn Lease Phase | Credit Rating (Fitch/Moody’s/S&P)(1) | SF | Approximate % of SF | Annual UW Rent(2) | % of Total Annual UW Rent(2) | Annual UW Rent PSF(2) | Lease Expiration |
| LinkedIn Phase I (Floors 2-8) | AA+/Aaa/AAA | 154,450 | 34.1% | $10,962,862 | 32.2% | $70.98 | 12/31/2025 |
| LinkedIn Phase II (Floors 9-15) | AA+/Aaa/AAA | 148,664 | 32.9% | $11,035,648 | 32.4% | $74.23 | 12/31/2026 |
| LinkedIn Phase III (Floors 16-20) | AA+/Aaa/AAA | 70,883 | 15.7% | $5,590,148 | 16.4% | $78.86 | 6/30/2027 |
| LinkedIn Phase IV (Floors 21-26) | AA+/Aaa/AAA | 76,212 | 16.8% | $6,288,804 | 18.5% | $82.52 | 12/31/2027 |
| LinkedIn Retail Space (Lobby) | AA+/Aaa/AAA | 2,209 | 0.5% | $168,463 | 0.5% | $76.26 | 12/31/2025 |
| Total | 452,418 | 100.0% | $34,045,925 | 100.0% | $75.25 | ||
| Vacant Space | 0 | 0.0% | $0 | 0.0% | $0.00 | ||
| Total/Wtd. Avg. | 452,418 | 100.0% | $34,045,925 | 100.0% | $75.25 | ||
| (1) | The LinkedIn lease is guaranteed by Microsoft Corporation, whose ratings are shown. |
| (2) | Annual UW Rent includes contractual rent increases through August 2018 and straightlined rent through the lease term. |
The following table presents certain information relating to the lease rollover schedule at the 222 Second Street Property:
| Lease Rollover Schedule(1) | ||||||||
| Year | # of Leases Rolling | SF Rolling | % of Total SF Rolling | Cumulative % of Total SF Rolling | Total UW Rent Rolling(2) | UW Rent PSF Rolling(2) | % of Total Rent Rolling(2) | Cumulative % of Total Rent Rolling(2) |
| 2017 | 0 | 0 | 0.0% | 0.0% | $0 | $0.00 | 0.0% | 0.0% |
| 2018 | 0 | 0 | 0.0% | 0.0% | $0 | $0.00 | 0.0% | 0.0% |
| 2019 | 0 | 0 | 0.0% | 0.0% | $0 | $0.00 | 0.0% | 0.0% |
| 2020 | 0 | 0 | 0.0% | 0.0% | $0 | $0.00 | 0.0% | 0.0% |
| 2021 | 0 | 0 | 0.0% | 0.0% | $0 | $0.00 | 0.0% | 0.0% |
| 2022 | 0 | 0 | 0.0% | 0.0% | $0 | $0.00 | 0.0% | 0.0% |
| 2023 | 0 | 0 | 0.0% | 0.0% | $0 | $0.00 | 0.0% | 0.0% |
| 2024 | 0 | 0 | 0.0% | 0.0% | $0 | $0.00 | 0.0% | 0.0% |
| 2025 | 2 | 156,659 | 34.6% | 34.6% | $11,131,325 | $71.05 | 32.7% | 32.7% |
| 2026 | 1 | 148,664 | 32.9% | 67.5% | $11,035,648 | $74.23 | 32.4% | 65.1% |
| 2027 | 2 | 147,095 | 32.5% | 100.0% | $11,878,952 | $80.76 | 34.9% | 100.0% |
| 2028 & Beyond | 0 | 0 | 0.0% | 100.0% | $0 | $0.00 | 0.0% | 100.0% |
| Vacant | 0 | 0 | 0.0% | 100.0% | $0 | $0.00 | 0.0% | 100.0% |
| Total/Wtd. Avg. | 5 | 452,418 | 100.0% | $34,045,925 | $75.25 | 100.0% | ||
| (1) | Information is based on the underwritten rent roll. |
| (2) | Total UW Rent Rolling includes contractual rent increases through August 2018 and straightlined rent through the lease term. |
The Market. The 222 Second Street Property is located in the South Financial District of downtown San Francisco, California, on the southwest corner of Howard and Second Streets with additional frontage on Tehama Street. To the north is the North Financial District, which contains older developments and prestigious buildings of San Francisco. To the south is the Rincon Hill/South Beach/SOMA District, which has seen a resurgence in leasing activity particularly with respect to the technology sector. To the west is the Yerba Buena District, which is home to several major redevelopment projects that have enhanced the economic utility of the area, including the Yerba Buena complex, the Moscone convention center, and Westfield Shopping Center.
Land area surrounding the 222 Second Street Property is approximately 95% developed, predominantly for commercial uses. Each October, the City of San Francisco releases office development allowances of 950,000 SF (875,000 SF available for office buildings of 50,000 SF or more). Notable recent developments in the South Financial District and SOMA, in addition to the 222 Second Street Property, include 350 Mission Street, a 30-story Class A office tower fully leased to Salesforce, 333 & 345 Brannan, a six-story creative office building fully leased to Dropbox, 270 Brannan, a five-story office building occupied by Splunk, and 85 Bluxome, a five-story creative office building fully leased to Collective Health. Large buildings under construction in the (North and South) Financial District include 101 1st Street (1,370,577 SF, 52% leased to Salesforce, expected to deliver in December 2017), 50 First Street (1,057,549 SF, mixed use development expected to deliver in late 2021), 181 Fremont Street (361,038 SF, mixed use tower expected to deliver in December 2017), and 250 Howard (766,745 SF expected to deliver in October 2018), with no other large buildings currently entitled.
The 222 Second Street Property is located two blocks from Interstate 80 leading across the Bay Bridge to the east and south to Highway 101, and within two blocks from the major mass transit arteries of Mission Street and Market Street. Public transportation access to the 222 Second Street Property is provided via a CalTrain station seven blocks south, a MUNI/BART station two blocks north, and a temporary Transbay Terminal (serving all bus routes in and out of San Francisco) located roughly three blocks northeast while the existing terminal immediately north of the 222 Second Street Property is undergoing an estimated $6.0 billion transformation into a modern transit hub connecting eight Bay Area counties through 11 transit systems and creating a new neighborhood of homes, offices, parks and shops.
This is not a research report and was not prepared by any Underwriter’s research department. Please see additional important information and qualifications at the end of this Term Sheet.
| T-30 |
| MSBAM 2017-C34 | 222 Second Street |
According to the appraisal, the 222 Second Street Property is located within the South Financial District office market. The South Financial District office market had second quarter 2017 inventory of approximately 25,627,040 SF with a 7.7% vacancy rate and average asking rents of $73.56 PSF, as compared to the broader San Francisco office market which had an 8.4% vacancy rate and average asking rents of $70.16 PSF for the same period.
The estimated 2017 population within a 0.5-, 1.0- and 3.0-mile radius around the 222 Second Street Property was 19,599, 99,419 and 400,571, respectively, reflective of a population compound growth rate from 2010 to 2017 of 4.2%, 2.3% and 1.6%, respectively. The estimated 2017 median household income within the same radii was $129,833, $51,078 and $86,193, respectively.
The following table presents information relating to competitive leases for the 222 Second Street Property:
| Competitive Leases | ||||||||
| Property Name | Year Built | Total GLA (SF / Stories) | Tenant | Lease Start | Term (mos) | Lease Type | Rent PSF | Free Rent/TI PSF |
| 222 Second Street | 2015 | 452,418 / 26 | Jan-16 | 120 | NNN | $75.25(1) | 4 mos / $75 | |
| 350 Bush Street | 2017 | 447,000 / 21 | Twitch | Apr-17 | 120 | NNN | $62 | 4 mos / $65 |
| China Basin Landing | 1920 | 918,179 / 6 | Lyft | Aug-16 | 108 | MG | $80 | 4-5 mos / $41 |
| 101 California Street | 1982 | 1,262,538 / 48 | Paul Hastings | Jan-17 | 127 | NNN | $71 | 5 mos / $75 |
| 211 Main | 1973 | 373,657 / 17 | Charles Schwab | May-18 | 120 | NNN | $40 | 0 mos / $34 |
Source:Appraisal.
| (1) | Rent PSF shown is the UW Base Rent which includes contractual rent increases through August 2018 and straightlined through the lease term. |
Underwritten Net Cash Flow.The following table presents certain information relating to the underwritten net cash flow at the 222 Second Street Property:
| Cash Flow Analysis(1) | |||
UW | UW PSF | ||
| Base Rent(2) | $34,045,925 | $75.25 | |
| Expense Reimbursements | $2,035,199 | $4.50 | |
| Other Income & Parking Income(3) | $1,039,764 | $2.30 | |
| Less Vacancy & Credit Loss | ($1,804,056) | ($3.99) | |
| Effective Gross Income | $35,316,832 | $78.06 | |
| Total Operating Expenses | $12,580,939 | $27.81 | |
| Net Operating Income | $22,735,893 | $50.25 | |
| TI/LC | $1,357,254 | $3.00 | |
| Capital Expenditures | $67,863 | $0.15 | |
| Net Cash Flow | $21,310,776 | $47.10 | |
| NOI DSCR(4) | 1.96x | ||
| NCF DSCR(4) | 1.84x | ||
| NOI DY(4) | 7.8% | ||
| NCF DY(4) | 7.3% | ||
| (1) | The 222 Second Street Property is entirely leased to LinkedIn. The lease provides for four phases of occupancy: Phase I (34.6% of NRA) began on January 1, 2016, Phase II (32.9% of NRA) began on January 1, 2017, Phase III (15.7% of NRA) began on July 1, 2017 and Phase IV (16.8% of NRA) is expected to begin on January 1, 2018. Historical information is not available. |
| (2) | UW Base Rent includes contractual rent increases through August 2018 and straightlined through the lease term. |
| (3) | Other Income includes work order income, overtime HVAC, sub-metered electric and cleaning income. Parking Income includes the contractual rent steps effective April 16, 2018. |
| (4) | Debt service coverage ratios and debt yields are based on the 222 Second Street Whole Loan. |
Escrows and Reserves. During a Cash Trap Event Period (as defined below), the 222 Second Street Borrower is required to deposit monthly or provide a letter of credit for (i) 1/12th of the estimated annual real estate taxes and 1/12th of the estimated annual insurance premiums (unless the 222 Second Street Property is covered by a blanket insurance policy), (ii) $7,540 to a replacement reserve subject to a cap of $180,967, and (iii) $113,105 to a leasing reserve subject to a cap of $22,620,900.
The 222 Second Street Borrower made an initial deposit (i) to the LinkedIn reserve in the amount of $7,709,282 for leasing expenses payable pursuant to the LinkedIn lease, (ii) to the gap rent reserve in the amount of $1,930,704 for September through December 2017 rents for LinkedIn, and (iii) to the Proposition 13 reserve in the amount of $1,518,368 for the difference in tax reimbursements between the stated reimbursements in LinkedIn’s lease and actual taxes due to Proposition 13 reassessment (collectively the “Tenant Reserves”).
A “Cash Trap Event Period” will commence upon the first to occur of (i) an event of default, (ii) the debt service coverage ratio being less than 1.30x for two consecutive quarters, (iii) the occurrence of a LinkedIn Non-Renewal Trigger (as defined below), (iv) the occurrence of a LinkedIn Dark Trigger (as defined below), or (v) borrower’s failure to repay or defease the 222 Second Street Whole Loan in full by September 10, 2027 (the anticipated repayment date).
This is not a research report and was not prepared by any Underwriter’s research department. Please see additional important information and qualifications at the end of this Term Sheet.
| T-31 |
| MSBAM 2017-C34 | 222 Second Street |
A Cash Trap Event Period will end upon (i) if triggered by clause (i) above, a cure of such event of default, (ii) if triggered by clause (ii) above, either (x) the debt service coverage ratio being equal to or greater than 1.30x for two consecutive quarters or (y) borrower’s deposit of Cash Trap Event Cure Collateral (as defined below), (iii) if triggered by clause (iii) above, the date either (1) LinkedIn renews its lease, or (2) (x) a replacement lease is entered into for the LinkedIn leased space and (y) the debt service coverage ratio for two consecutive calendar quarters is equal to or greater than 1.30x, or (iv) if triggered by clause (iv) above, a LinkedIn Dark Trigger Cure (as defined below). If triggered by clause (v) above, a Cash Trap Event Period will not end and will continue until the 222 Second Street Whole Loan is repaid in full. Additionally, a Cash Trap Event Period will not end if a separate trigger remains uncured.
A “LinkedIn Non-Renewal Trigger” means the date which is 17 months prior to the expiration of a phase of the LinkedIn lease if LinkedIn has not renewed its lease for that leased space.
A “LinkedIn Dark Trigger” means after September 10, 2021 LinkedIn fails to occupy at least 50% of its space for a period of more than six months (if and for so long as none of LinkedIn (or the current tenant under the LinkedIn lease if the lease has been assigned), the parent company of LinkedIn (or the parent of the current tenant under the LinkedIn Lease if the lease has been assigned) or the guarantor under the LinkedIn lease is rated at least “BBB-” (or the equivalent) by each of S&P and Moody’s.)
A “LinkedIn Dark Trigger Cure” means (1) (x) a replacement lease is entered into for at least 50% of the LinkedIn leased space, (y) 50% of the LinkedIn leased space which is not occupied by LinkedIn is subleased to one or more subtenants, or (z) LinkedIn reoccupies at least 50% of its leased space for a period of at least six months, and (2) the debt service coverage ratio is equal to or greater than 1.30x for two consecutive quarters.
“Cash Trap Event Cure Collateral” means cash or a letter of credit in an amount that if applied to the reduction of the outstanding principal of the 222 Second Street Whole Loan would result in a debt service coverage ratio of not less than 1.30x for the previous two quarters.
Lockbox and Cash Management. A hard lockbox is in place with respect to the 222 Second Street Whole Loan. Funds deposited to the lockbox will be swept daily to the borrower’s operating account unless a Cash Trap Event Period exists. During a Cash Trap Event Period, funds in the lockbox are required to be automatically transferred to a cash management account under the sole control of the lender for the payment of, among other things, operating expenses, debt service, and monthly escrows, with all excess cash being deposited to an excess cash reserve to be held as additional collateral for the 222 Second Street Whole Loan (or if the Cash Trap Event Period is triggered by a LinkedIn Dark Trigger solely, then 50% of the excess cash with respect to the 222 Second Street Property will be held as additional collateral for the 222 Second Street Whole Loan and the remaining 50% will be swept into the 222 Second Street Borrower’s operating account).
Additional Secured Indebtedness (not including trade debts). The 222 Second Street Property also secures the 222 Second Street Non-Serviced Pari Passu Companion Loans, which have an aggregate Cut-off Date principal balance of $191,500,000. The 222 Second Street Non-Serviced Pari Passu Companion Loans accrue interest at the same rate as the 222 Second Street Mortgage Loan. The 222 Second Street Mortgage Loan is entitled to payments of interest on a pro rata and pari passu basis with the 222 Second Street Non-Serviced Pari Passu Companion Loans. The holders of the 222 Second Street Mortgage Loan and the 222 Second Street Non-Serviced Pari Passu Companion Loans have entered into a co-lender agreement which sets forth the allocation of collections on the 222 Second Street Whole Loan. See “Description of the Mortgage Pool—The Whole Loans—The Non-Serviced Pari Passu Whole Loans” in the Preliminary Prospectus.
Mezzanine Loan and Preferred Equity. Not permitted.
Release of Property. Not permitted.
Terrorism Insurance. The 222 Second Street Borrower is required to obtain and maintain property insurance and rental loss and/or business interruption insurance that covers perils of terrorism and acts of terrorism, provided that if the Terrorism Risk Insurance Program Reauthorization Act of 2015 or any extension thereof or substantially similar program is in effect, the 222 Second Street Whole Loan documents provide for an annual terrorism premium cap of two times the cost of the annual premiums for property and business interruption insurance required under the related 222 Second Street Whole Loan documents (excluding the cost of the terrorism and earthquake components of such property insurance). See “Risk Factors— Risks Relating to the Mortgage Loans—Terrorism Insurance May Not Be Available for All Mortgaged Properties” in the Preliminary Prospectus.
This is not a research report and was not prepared by any Underwriter’s research department. Please see additional important information and qualifications at the end of this Term Sheet.
| T-32 |
(THIS PAGE INTENTIONALLY LEFT BLANK)
| T-33 |
| MSBAM 2017-C34 | American Cancer Society Center |
Mortgage Loan No. 2 – American Cancer Society Center
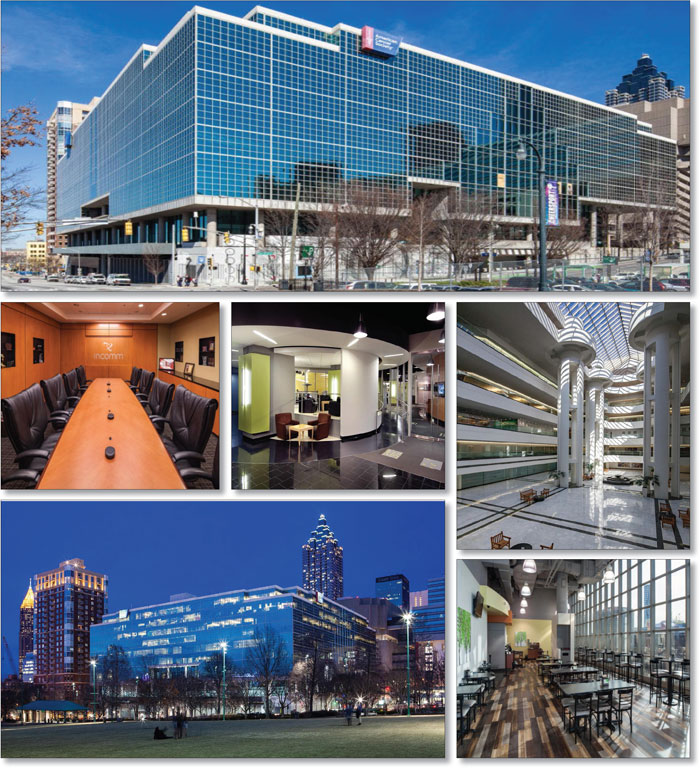
This is not a research report and was not prepared by any Underwriter’s research department. Please see additional important information and qualifications at the end of this Term Sheet.
| T-34 |
| MSBAM 2017-C34 | American Cancer Society Center |
Mortgage Loan No. 2 – American Cancer Society Center

This is not a research report and was not prepared by any Underwriter’s research department. Please see additional important information and qualifications at the end of this Term Sheet.
| T-35 |
| MSBAM 2017-C34 | American Cancer Society Center |
Mortgage Loan No. 2 – American Cancer Society Center
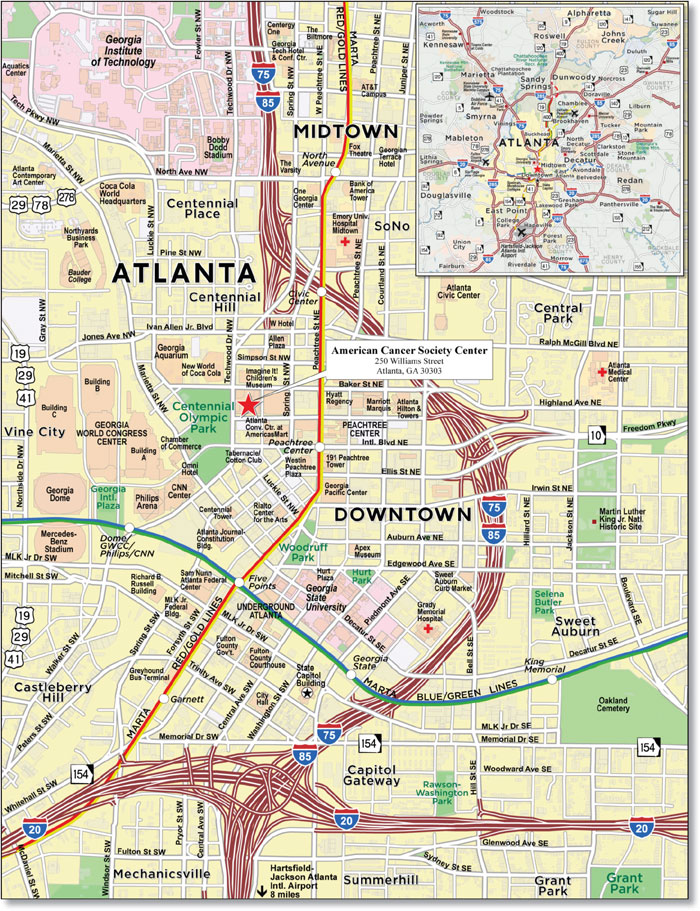
This is not a research report and was not prepared by any Underwriter’s research department. Please see additional important information and qualifications at the end of this Term Sheet.
| T-36 |
| MSBAM 2017-C34 | American Cancer Society Center |
| Mortgage Loan No. 2 – American Cancer Society Center |
| Mortgage Loan Information | Property Information | ||||||
| Mortgage Loan Seller: | KeyBank | Single Asset/Portfolio: | Single Asset | ||||
| Original Balance(1): | $73,200,000 | Location: | Atlanta, GA 30303 | ||||
| Cut-off Date Balance(1): | $73,200,000 | General Property Type: | Office | ||||
| % of Initial Pool Balance: | 7.0% | Detailed Property Type: | CBD | ||||
| Loan Purpose: | Acquisition | Title Vesting(4): | Fee | ||||
| Borrower Sponsor: | Carter Validus Operating Partnership II, LP | Year Built/Renovated: | 1989/2007 | ||||
| Mortgage Rate: | 3.9900% | Size: | 991,338 SF | ||||
| Note Date: | 6/15/2017 | Cut-off Date Balance per SF(1): | $117 | ||||
| First Payment Date: | 8/1/2017 | Maturity Date Balance per SF(1): | $107 | ||||
| Maturity Date: | 7/1/2027 | Property Manager: | Carter Validus Real Estate Management Services II, LLC (borrower-related) | ||||
| Original Term to Maturity: | 120 months | ||||||
| Original Amortization Term: | 360 months | ||||||
| IO Period: | 60 months | Underwriting and Financial Information | |||||
| Seasoning: | 3 months | UW NOI(5): | $13,997,375 | ||||
| Prepayment Provisions: | LO (27); DEF (87); O (6) | UW NOI Debt Yield(1): | 12.0% | ||||
| Lockbox/Cash Mgmt Status: | Hard/Springing | UW NOI Debt Yield at Maturity(1): | 13.2% | ||||
| Additional Debt Type(2): | Pari Passu | UW NCF DSCR(1): | 2.53x (IO) 1.79x (P&I) | ||||
| Additional Debt Balance(2): | $43,000,000 | Most Recent NOI(5): | $12,440,968 (4/30/2017 TTM) | ||||
| Future Debt Permitted (Type): | No (N/A) | 2nd Most Recent NOI: | $12,388,050 (12/31/2016) | ||||
| Reserves(3) | 3rd Most Recent NOI: | $11,782,820 (12/31/2015) | |||||
| Type | Initial | Monthly | Cap | Most Recent Occupancy: | 85.8% (5/23/2017) | ||
| RE Tax: | $1,779,586 | $177,959 | N/A | 2nd Most Recent Occupancy: | 83.1% (12/31/2016) | ||
| Insurance: | $40,976 | $10,244 | N/A | 3rd Most Recent Occupancy: | 86.8% (12/31/2015) | ||
| Recurring Replacements: | $2,000,000 | $20,511 | $738,396 | Appraised Value (as of): | $182,000,000 (5/12/2017) | ||
| TI/LC: | $2,000,000 | $61,534 | $3,692,040 | Cut-off Date LTV Ratio(1): | 63.8% | ||
| Other: | $935,390 | $0 | N/A | Maturity Date LTV Ratio(1): | 58.0% | ||
| Sources and Uses | ||||||
| Sources | Proceeds | % of Total | Uses | Proceeds | % of Total | |
| Loan Amount(1): | $116,200,000 | 65.9% | Purchase Price: | $166,000,000 | 94.1% | |
| Borrower Equity: | $60,177,129 | 34.1% | Reserves: | $6,755,953 | 3.8% | |
| Closing Costs: | $3,621,177 | 2.1% | ||||
| Total Sources: | $176,377,129 | 100.0% | Total Uses: | $176,377,129 | 100.0% | |
| (1) | The American Cancer Society Center Mortgage Loan (as defined below) is part of the American Cancer Society Center Whole Loan (as defined below), which is comprised of threepari passu promissory notes with an aggregate original principal balance of $116,200,000. The Cut-off Date Balance per SF, Maturity Date Balance per SF, UW NOI Debt Yield, UW NOI Debt Yield at Maturity, UW NCF DSCR, Cut-off Date LTV Ratio and Maturity Date LTV Ratio numbers presented above are based on the aggregate principal balance of the promissory notes comprising the American Cancer Society Center Whole Loan. |
| (2) | See“The Mortgage Loan” and“Additional Secured Indebtedness (not including trade debts)”below for further discussion of additional debt. |
| (3) | See “Escrows and Reserves”below for further discussion of reserve information. |
| (4) | Approximately 7,849 SF of the American Cancer Society Center Property’s 156,846 SF total site area is subject to a ground lease which expires January 31, 2068. The ground lessee has the right of first refusal to purchase the site at any time during the term of the ground lease. |
| (5) | UW NOI increased from the Most Recent NOI period due to an executed lease with Digital Realty for 37,805 SF and annual rent bumps for several other tenants. |
The Mortgage Loan. The second largest mortgage loan (the “American Cancer Society Center Mortgage Loan”) is part of a whole loan (the “American Cancer Society Center Whole Loan”) evidenced by threepari passu promissory notes in the aggregate original principal amount of $116,200,000, which are secured by a first priority fee mortgage encumbering a 991,338 SF office property known as American Cancer Society Center in Atlanta, Georgia (the “American Cancer Society Center Property”). Promissory Note A-1, with an original principal balance of $53,200,000, and Promissory Note A-3, with an original principal balance of $20,000,000, represent the American Cancer Society Center Mortgage Loan and will be included in the MSBAM 2017-C34 securitization trust. Promissory Note A-2, with an original principal balance of $43,000,000, represents the companion loan (the “American Cancer Society CenterPari Passu Companion Loan”). The American Cancer Society CenterPari Passu Companion Loan is included in the UBS 2017-C3 securitization trust. The American Cancer Society Center Whole Loan is currently being serviced pursuant to the pooling and servicing agreement for the UBS 2017-C3 securitization trust, and from and after the securitization of the American Cancer Society Center Mortgage Loan evidenced by Promissory Note A-1 and Promissory Note A-3, will be serviced pursuant to the respective pooling and servicing agreement of the MSBAM 2017-C34 securitization trust. See “Description of the Mortgage Pool—The Whole Loans—The Serviced Pari Passu Whole Loans” and “Pooling and Servicing Agreement” in the Prospectus.
This is not a research report and was not prepared by any Underwriter’s research department. Please see additional important information and qualifications at the end of this Term Sheet.
| T-37 |
| MSBAM 2017-C34 | American Cancer Society Center |
| American Cancer Society Center Whole Loan Summary | ||||
Notes | Original Balance | Note Holder | Controlling Interest | |
| A-1 | $53,200,000 | MSBAM 2017-C34 | Yes | |
| A-2 | $43,000,000 | UBS 2017-C3 | No | |
| A-3 | $20,000,000 | MSBAM 2017-C34 | No | |
| Total | $116,200,000 | |||
The proceeds of the American Cancer Society Center Whole Loan were used to acquire the American Cancer Society Center Property for $166,000,000, fund reserves and pay closing costs.
The Borrower and the Borrower Sponsor. The borrower is DCII-250 Williams Street NW, LLC (the “American Cancer Society Center Borrower”), a single-purpose Delaware limited liability company, with two independent directors. The borrower sponsor and nonrecourse carve-out guarantor is Carter Validus Operating Partnership II, LP.
Carter Validus Mission Critical REIT II, Inc. is the sole general partner and 99.99% owner of Carter Validus Operating Partnership II, LP. Carter Validus Mission Critical REIT II, Inc. was formed in 2013, and primarily invests in quality income-producing real estate with a focus on data centers and healthcare properties. As of March 31, 2017, Carter Validus Mission Critical REIT II, Inc. reported assets of $1.25 billion and a net worth of $727.2 million. As of December 31, 2016, Carter Validus Mission Critical REIT II, Inc.’s portfolio consisted of 51 properties comprising approximately 2.98 million SF which were 99.6% leased.
The Property. The American Cancer Society Center Property consists of a nine-story Class A office building containing 991,338 SF. Located in downtown Atlanta, Georgia and situated on a 3.6-acre site, the American Cancer Society Center Property was built in 1989 and renovated in 2007. The American Cancer Society Center Property features a nine-story large atrium-style lobby, large floor plates, and sits atop Georgia Power’s Fowler Underground Grid Systems, assuring an uninterrupted supply of power. Amenities at the American Cancer Society Center Property include a 450-seat theater, a 30-seat executive board room, a café, a newsstand, auto detailing, ATM, dry cleaning pickup and delivery, caterer and kitchen, state-of-the-art card access and video monitoring systems maintained 24/7 by security personnel, and a four-story subterranean garage containing 926 parking spaces. The Metropolitan Atlanta Rapid Transit Authority (“MARTA”) provides public bus and commuter rail transportation service to the area and the closest station is located within walking distance.
The American Cancer Society Center Property, located at 250 Williams Street, covers a city block, and is surrounded by roadways on all four sides and has multiple access points. The American Cancer Society Center Property is connected to the east via a covered pedestrian walkway to AmericasMart, a wholesale trade and exhibition center for gift, home furnishing and apparel for retail buyers. Centennial Olympic Park, Atlanta’s premier cultural and entertainment district, is located adjacent to the immediate west of the American Cancer Society Center Property. Centennial Olympic Park unites some of the city’s largest tourist attractions including the World of Coke, CNN Center and the Georgia Aquarium, and hosts many of the city’s top festivals, concert series, and special events. Additional tourist attractions near the American Cancer Society Center Property include The National Civil Rights Museum, Mercedes Benz Stadium and the College Football Hall of Fame.
The American Cancer Society Center Property includes 575,375 SF of occupied office space (58.0% of NRA; 64.4% of underwritten base rent) and 255,129 SF of occupied data center space (25.7% of NRA; 35.6% of underwritten base rent). As of May 23, 2017, the American Cancer Society Center Property was 85.8% occupied by 12 tenants. The 18-year average historical occupancy for the American Cancer Society Center Property is 88.0%. Currently, four tenants comprising 70.0% of the NRA utilize the American Cancer Society Center Property as their headquarters and 10 tenants comprising 81.1% of the NRA have been in occupancy for 10 years or more.
Major Tenants.
American Cancer Society, Inc. (275,160 SF, 27.8% of NRA, 29.6% of underwritten base rent). Founded in 1913, the American Cancer Society, Inc. (“American Cancer Society”) is a nationwide community-based voluntary health organization dedicated to eliminating cancer, saving lives and diminishing suffering from cancer through research, education, advocacy and service. The American Cancer Society, a 501(c)(3) non-profit corporation, is headquartered at the American Cancer Society Center Property, has been in occupancy since 2007 and has a lease expiration of June 30, 2022 (storage space of 1,453 SF expires November 30, 2018), with two five-year renewal options or one 10-year renewal option at market rent and no termination options.
InComm (196,223 SF, 19.8% of NRA, 21.8% of underwritten base rent). Founded in 1992, InComm is an international company that develops payment technologies and solutions such as gift cards, prepaid wireless products, reloadable debit cards, digital music downloads and various payment solutions. InComm is headquartered at the American Cancer Society Center Property, has been in occupancy since 1996, and has a lease expiration of December 31, 2021, with two five-year renewal options at market rent and no termination options.
Internap Corporation (“INAP”) (120,298 SF, 12.1% of NRA, 19.2% of underwritten base rent). Formed in 1996, INAP is a leading technology provider of Internet infrastructure through business and enterprise colocation and cloud services. INAP’s global high-capacity network connects 15 company-controlled Tier 3-type data centers in major markets throughout North America and points of presence in 26 central business districts around the world. INAP is traded on the NASDAQ under the ticker symbol INAP. INAP is headquartered at the American Cancer Society Center Property, has been in occupancy since 2000, and has a lease expiration of April 30, 2020, with one five-year renewal option at market rent and no termination options.
Georgia Lottery Corporation (101,805 SF, 10.3% of NRA, 11.3% of underwritten base rent).Georgia Lottery Corporation (“GLC”) was created in 1992 by the people of Georgia to enhance educational funding. Since inception, the GLC has transferred more than $18.7 billion to the State Treasury’s Lottery for Education Account which provides grants, scholarships or loans to undergraduate college students, funds the prekindergarten program, and funds capital outlay projects including computer and other technological upgrades. GLC is headquartered at the American Cancer Society Center Property, has been in occupancy since 1993 and has a lease expiration of June 30, 2023, with two 5-year renewal options at market rent and no termination options.
Level 3 Communications, LLC (49,313 SF, 5.0% of NRA, 6.2% of underwritten base rent). Level 3 Communications, LLC (“Level 3 Communications”) is a premier provider of global communication services, creating solutions that strengthen the growth, efficiency and security of business. Level 3 Communications serves customers in more than 500 markets within three continents and more than 60 countries. Level 3 Communications is traded on the NASDAQ and the NYSE under the ticker symbol LVLT. Level 3 Communications has been in occupancy since 1995, has a lease expiration of
This is not a research report and was not prepared by any Underwriter’s research department. Please see additional important information and qualifications at the end of this Term Sheet.
| T-38 |
| MSBAM 2017-C34 | American Cancer Society Center |
December 31, 2024 on 34,464 SF with two five-year renewal options at market rent and no termination options, and a lease expiration of March 31, 2020 on 14,849 SF, with no renewal options and no termination options.
The following table presents certain information relating to the leases at the American Cancer Society Center Property:
| Tenant Summary(1) | |||||||
| Tenant Name | Credit Rating (Fitch/Moody’s/S&P)(2) | Tenant SF | Approximate % of SF | Annual UW Base Rent | % of Total Annual UW Base Rent | Annual UW Base Rent PSF | Lease Expiration |
| Tenants | |||||||
| American Cancer Society, Inc. | NR/NR/NR | 275,160(3) | 27.8% | $5,404,963(4) | 29.6%(4) | $19.75(4) | 6/30/2022(5) |
| InComm | NR/NR/NR | 196,223(6) | 19.8% | $3,974,999(4) | 21.8%(4) | $20.73(4) | 12/31/2021 |
| INAP | NR/B3/B | 120,298 | 12.1% | $3,510,944 | 19.2% | $29.19 | 4/30/2020 |
| Georgia Lottery Corporation | NR/Aaa/AAA | 101,805(7) | 10.3% | $2,061,958(4) | 11.3%(4) | $21.62(4) | 6/30/2023 |
| Level 3 Communications, LLC | BB/Ba3/BB | 49,313 | 5.0% | $1,139,623 | 6.2% | $23.11 | 12/31/2024(8) |
| Subtotal/Wtd. Avg. | 742,799 | 74.9% | $16,092,486 | 88.2% | $22.03 | ||
| Other Tenants | 107,792 | 10.9% | $2,158,697 | 11.8% | $20.03 | ||
| Vacant Space | 140,747 | 14.2% | $0 | 0.0% | $0.00 | ||
| Total/Wtd. Avg.(9) | 991,338 | 100.0% | $18,251,183 | 100.0% | $21.77 | ||
| (1) | Information is based on the underwritten rent roll. |
| (2) | Certain ratings are those of the parent company whether or not the parent guarantees the lease. |
| (3) | Includes 1,453 SF of storage space. |
| (4) | Excludes rental amount for the tenant’s storage space. |
| (5) | American Cancer Society, Inc.’s Lease Expiration date is 6/30/2022 for the office space and is 11/30/2018 for the storage space. |
| (6) | Includes 4,514 SF of storage space. |
| (7) | Includes 6,438 SF of storage space. |
| (8) | Level 3 Communications, LLC’s Lease Expiration dates are 12/31/2024 for 34,464 SF and 3/31/2020 for 14,849 SF of space. |
| (9) | Wtd. Avg. Annual UW Base Rent, % of Total Annual UW Base Rent and Annual UW Base Rent PSF excludes vacant space and tenants’ storage space. |
The following table presents certain information relating to the lease rollover schedule at the American Cancer Society Center Property:
| Lease Rollover Schedule(1)(2) | ||||||||
| Year | # of Leases Rolling | SF Rolling | Approx. % of Total SF Rolling | Approx. Cumulative % of SF Rolling | UW Base Rent PSF Rolling | Total UW Base Rent Rolling | Approx. % of Total Base Rent Rolling | Approx. Cumulative % of Total Base Rent Rolling |
| 2017 | 1 | 2,026 | 0.2% | 0.2% | $5.33 | $10,800 | 0.1% | 0.1% |
| 2018(3) | 1 | 1,453 | 0.1% | 0.4% | $0.00 | $0 | 0.0% | 0.1% |
| 2019 | 0 | 0 | 0.0% | 0.4% | $0.00 | $0 | 0.0% | 0.1% |
| 2020 | 4 | 140,803 | 14.2% | 14.6% | $27.37 | $3,854,104 | 21.1% | 21.2% |
| 2021(4) | 3 | 196,223 | 19.8% | 34.3% | $20.26 | $3,974,999 | 21.8% | 43.0% |
| 2022 | 1 | 273,707 | 27.6% | 62.0% | $19.75 | $5,404,963 | 29.6% | 72.6% |
| 2023(5) | 2 | 101,805 | 10.3% | 72.2% | $20.25 | $2,061,958 | 11.3% | 83.9% |
| 2024 | 1 | 34,464 | 3.5% | 75.7% | $23.11 | $796,463 | 4.4% | 88.2% |
| 2025 | 2 | 37,841 | 3.8% | 79.5% | $22.93 | $867,698 | 4.8% | 93.0% |
| 2026 | 1 | 5,861 | 0.6% | 80.1% | $20.85 | $122,202 | 0.7% | 93.7% |
| 2027 | 0 | 0 | 0.0% | 80.1% | $0.00 | $0 | 0.0% | 93.7% |
| 2028 & Beyond | 2 | 56,408 | 5.7% | 85.8% | $20.53 | $1,157,997 | 6.3% | 100.0% |
| Vacant | 0 | 140,747 | 14.2% | 100.0% | $0.00 | $0 | 0.0% | 100.0% |
| Total/Wtd. Avg. | 18 | 991,338 | 100.0% | $21.77 | $18,251,183 | 100.0% | ||
| (1) | Information is based on the underwritten rent roll. |
| (2) | Certain tenants may have lease termination options that are exercisable prior to the originally stated expiration date of the subject lease and that are not considered in the lease rollover schedule. |
| (3) | SF Rolling includes 1,453 SF of storage space, however, no rental income for the storage space is included in the UW Base Rent PSF Rolling, Total UW Base Rent Rolling, Approx. % of Total Base Rent Rolling, and Approx. Cumulative % of Total Base Rent Rolling. |
| (4) | SF Rolling includes 4,514 SF of storage space, however, no rental income for the storage space is included in the UW Base Rent PSF Rolling, Total UW Base Rent Rolling, Approx. % of Total Base Rent Rolling, and Approx. Cumulative % of Total Base Rent Rolling. |
| (5) | SF Rolling includes 6,438 SF of storage space, however, no rental income for the storage space is included in the UW Base Rent PSF Rolling, Total UW Base Rent Rolling, Approx. % of Total Base Rent Rolling, and Approx. Cumulative % of Total Base Rent Rolling. |
This is not a research report and was not prepared by any Underwriter’s research department. Please see additional important information and qualifications at the end of this Term Sheet.
| T-39 |
| MSBAM 2017-C34 | American Cancer Society Center |
The Market. According to the appraisal, the American Cancer Society Center Property is located at 250 Williams Street within the Atlanta central business district and within the Atlanta-Sandy Springs-Roswell metropolitan statistical area (“Atlanta MSA”). The Atlanta MSA is the ninth largest by population within the United States, has a $300.0 billion economy and ranks third nationally for the largest number of Fortune 500 headquarters locations. The American Cancer Society Center Property is located approximately three blocks from access to Interstates 75/85, which provides north-south access through the Atlanta central business district and connects to Interstate 20 two miles south for east-west access through the Atlanta central business district. The Hartsfield-Jackson Atlanta International Airport is located approximately 12 miles south of the American Cancer Society Center Property. MARTA provides transportation via train and bus routes from the airport to several stops in downtown Atlanta.
According to the appraisal, downtown Atlanta, with its numerous tourist attractions, entertainment centers, restaurants, hotels, and business sectors, attracts millions of tourists every year while supporting hundreds of thousands of residents and business professionals on a daily basis.In 2016, over $449.0 million was invested in downtown Atlanta. Another $4.4 billion in projects are under construction or planned to be completed before 2020 including over 447,000 SF of retail space, 2,059 student beds, 372,790 SF of office space, over 3.1 million SF of institutional space, 5,662 housing units and 2,528 hotel rooms. One project, Centennial Park Apartments, a 407-unit apartment development spanning two blocks, is under construction immediately north of the American Cancer Society Center Property on Centennial Olympic Park Drive.
According to a third party market report, the American Cancer Society Property is located within the Atlanta office market and the Downtown Atlanta office submarket. The Atlanta office market consists of 15,979 properties providing approximately 305.0 million SF of office space. Vacancy as of the first quarter of 2017 was reported at 12.1% and asking rents were $22.30 PSF. The Atlanta office market has continued to improve over the last six years as vacancy moved from 17.1% in 2010 to 12.1% as of the first quarter of 2017, while asking rents moved from $19.65 PSF to $22.30 PSF during the same period.
The Downtown Atlanta submarket consists of 394 properties providing approximately 36.4 million SF of office space. In the Downtown Atlanta submarket as of the first quarter of 2017, vacancy was 12.6% and asking rents were $23.39 PSF with positive year to date absorption of 111,567 SF.
The following table presents recent leasing data at competitive office buildings with respect to the American Cancer Society Center Property:
| Comparable Office Leases | ||||||||
| Property Name/Address | Year Built | Size (SF) | Tenant Name | Lease Size (SF) | Lease Date | Lease Term (Yrs.) | Initial Rent/SF | Lease Type |
American Cancer Society Center Property 250 Williams Street Atlanta, GA 30303 | 1989 | 991,338(1) | InComm(1) | 152,991(1)(2) | Nov. 2015(1) | 6.2(1) | $20.27(1) | Mod Gross |
Peachtree Center – International Tower 229 Peachtree Street NE Atlanta, GA 30303 | 1976 | 393,442 | Atlanta Regional Commission | 49,812 | Jul. 2017 | 15.0 | $21.50 | Gross |
Marquis I 245 Peachtree Center Avenue NE Atlanta, GA 30303 | 1985 | 460,437 | State Road & Tollway Authority
| 38,794 | Jul. 2017 | 15.0 | $21.75 | Gross |
The Equitable Building 100 Peachtree Street Atlanta, GA 39393 | 1969 | 622,301 | Georgia’s Own Credit Union | 100,078 | Nov. 2016 | 15.0 | $22.00 | Gross |
SunTrust Plaza 303 Peachtree Street NE Atlanta, GA 30308 | 1992 | 1,249,022 | Drew Eckl Farnham | 50,000 | Nov. 2016 | 10.0 | $28.00 | Gross |
191 Peachtree Tower 191 Peachtree Street NE Atlanta, GA 30303 | 1991 | 1,219,000 | HNTB Corporation | 25,000 | Aug. 2016 | 8.0 | $28.75 | Gross |
Source:Appraisal.
| (1) | Based on the underwritten rent roll. |
| (2) | InComm leases additional office and storage space at the property totaling 43,232 SF under leases that also began in November 2015. |
This is not a research report and was not prepared by any Underwriter’s research department. Please see additional important information and qualifications at the end of this Term Sheet.
| T-40 |
| MSBAM 2017-C34 | American Cancer Society Center |
The following table presents recent leasing data at competitive data center buildings with respect to the American Cancer Society Center Property:
| Comparable Data Center Leases | |||||||
| Property Name | Year Built | Tenant Name | Lease Size (SF) | Lease Date | Lease Term (Yrs.) | Initial Rent/SF | Lease Type |
| American Cancer Society Center Property | 1989 | Digital Realty(1) | 37,805(1) | Jan. 2017(1) | 11.8(1) | $19.50(1) | Mod Gross |
| 1001 Windward Concourse | 1989 | GE Capital | 178,000 | NAV | 6.0 | $22.17 | NNN |
| E Trade Financial | NAV | E Trade | 165,000 | NAV | 10.0 | $26.23 | NNN |
| 345 Courtland | 1974 | Level 3 | 50,000 | NAV | 20.0 | $26.00 | NNN |
| 1155 Perimeter Center West | 2000 | Airwatch | 8,600 | NAV | 10.0 | $50.00 | NNN |
| 64 Perimeter Center | 1985 | Ventyx | 5,575 | NAV | 10.0 | $45.00 | NNN |
| 1052 West Peachtree | 1962 | SunGard | 35,191 | NAV | 10.0 | $34.00 | NNN |
Source:Appraisal and a third party market report.
| (1) | Based on the underwritten rent roll. |
Operating History and Underwritten Net Cash Flow.The following table presents certain information relating to the historical operating performance and the Underwritten Net Cash Flow at the American Cancer Society Center Property:
| Cash Flow Analysis | ||||||
| 2014 | 2015 | 2016 | 4/30/2017 TTM | UW | UW PSF | |
| Gross Potential Rent | $16,220,941 | $16,232,705 | $16,569,610 | $16,592,397 | $21,488,364(1) | $21.68 |
| Total Recoveries | $6,591,082 | $6,802,036 | $6,322,144 | $6,386,139 | $7,182,913 | $7.25 |
| Total Other Income | $1,402,252 | $1,259,613 | $1,277,209 | $1,292,850 | $1,292,850 | $1.30 |
| Less Vacancy & Credit Loss | $0 | $0 | $0 | $0 | ($3,329,640) | ($3.36) |
| Effective Gross Income | $24,214,275 | $24,294,355 | $24,168,963 | $24,271,386 | $26,634,488 | $26.87 |
| Total Operating Expenses | $12,161,173 | $12,511,534 | $11,780,913 | $11,830,418 | $12,637,113 | $12.75 |
| Net Operating Income(2) | $12,053,102 | $11,782,820 | $12,388,050 | $12,440,968 | $13,997,375 | $14.12 |
| Capital Expenditures | $0 | $0 | $0 | $0 | $246,132 | $0.25 |
| TI/LC | $36,939 | $46,984 | $46,722 | $56,639 | $1,866,055(3) | $1.88(3) |
| Net Cash Flow | $12,016,163 | $11,735,836 | $12,341,328 | $12,384,329 | $11,885,187 | $11.99 |
| Occupancy %(5) | 84.9%(4) | 86.8% | 83.1% | 85.8% | 88.9% | |
| NOI DSCR (IO)(6) | 2.56x | 2.51x | 2.64x | 2.65x | 2.98x | |
| NOI DSCR (P&I)(6) | 1.81x | 1.77x | 1.86x | 1.87x | 2.11x | |
| NCF DSCR (IO)(6) | 2.56x | 2.50x | 2.63x | 2.63x | 2.53x | |
| NCF DSCR (P&I)(6) | 1.81x | 1.77x | 1.86x | 1.86x | 1.79x | |
| NOI Debt Yield(6) | 10.4% | 10.1% | 10.7% | 10.7% | 12.0% | |
| NCF Debt Yield(6) | 10.3% | 10.1% | 10.6% | 10.7% | 10.2% | |
| (1) | UW Gross Potential Rent includes contractual rent steps through September 2018 totaling $154,491. |
| (2) | UW Net Operating Income increased from 4/30/2017 TTM due to an executed lease with Digital Realty for 37,805 SF and annual rent bumps for several other tenants. |
| (3) | UW TI/LC includes a $200,000 credit for upfront TI/LC deposit at closing. |
| (4) | Occupancy % is as of November 30, 2014. |
| (5) | 4/30/2017 TTM Occupancy % is as of the underwritten rent roll dated May 23, 2017. |
| (6) | The debt service coverage ratios and debt yields are based on the American Cancer Society Center Whole Loan. |
Escrows and Reserves.At origination, the American Cancer Society Center Borrower deposited (i) $1,779,586 into a real estate tax escrow, (ii) $40,976 into an insurance escrow, (iii) $2,000,000 into a replacement reserve, (iv) $2,000,000 into a TI/LC reserve and (v) $935,390 into a free rent reserve. On a monthly basis, the American Cancer Society Center Borrower is required to deposit (i) 1/12 of the annual estimated tax payments, which currently equates to $177,959, (ii) 1/12 of the annual estimated insurance premiums, which currently equates to $10,244, (iii) $20,511 for replacement reserves, capped at $738,396 (excluding the $2,000,000 initial deposit) and (iv) $61,534 for TI/LC reserves, capped at $3,962,040.
Lockbox and Cash Management. The American Cancer Society Center Whole Loan is structured with a hard lockbox and springing cash management. The American Cancer Society Center Borrower is required to direct all tenants to deposit all rents and other revenue directly into the lockbox account controlled by the lender. Notwithstanding the foregoing, the American Cancer Society Center Borrower and property manager are required to deposit all revenues received into the lockbox account within one business day of receipt. Until the occurrence of a Cash Sweep Period (as defined below), all funds in the lockbox account will be transferred to an account controlled by the American Cancer Society Center Borrower. Upon the occurrence and continuance of a Cash Sweep Period, all sums on deposit in the lockbox account are required to be swept on a daily basis into a cash management account under the control of the lender for the payment of, among other things, debt service, monthly escrows and property operating expenses pursuant to an annual approved budget.
This is not a research report and was not prepared by any Underwriter’s research department. Please see additional important information and qualifications at the end of this Term Sheet.
| T-41 |
| MSBAM 2017-C34 | American Cancer Society Center |
A “Cash Sweep Period” will commence upon:
| (i) | the occurrence of an event of default and continue until such event of default is cured; |
| (ii) | the occurrence of any bankruptcy action of the American Cancer Society Center Borrower or property manager and, in the case of any bankruptcy action of the property manager, continue until the manager is replaced with a qualified manager under a replacement agreement within 60 days (in no event will a Cash Sweep Period due to a bankruptcy action of the American Cancer Society Center Borrower be cured); |
| (iii) | the date the debt service coverage ratio for the immediately preceding three-month period is less than 1.25x (amortizing) and will continue until such time as the debt service coverage ratio for the immediately preceding three-month period is at least 1.30x (amortizing) for two consecutive calendar quarters; or |
| (iv) | with respect to American Cancer Society, any successor or assign or subsequent tenant (a “Major Tenant”) under a replacement lease (“Major Tenant Lease”): |
| (a) | the date that any Major Tenant files a bankruptcy action and will continue until (so long as there is no default or event of default that would trigger another Cash Sweep Period) (1) the date that is 30 days after the applicable Major Tenant has affirmed its Major Tenant Lease, is no longer the subject of a bankruptcy or similar proceeding, is in occupancy and paying full contractual unabated post-petition rent without right of offset or free rent credit, and has delivered a tenant estoppel acceptable to the lender or (2) the date the American Cancer Society Center Borrower has entered into replacement leases for the entire applicable Major Tenant premises in each case with tenants acceptable to the lender in its discretion and (w) the replacement tenants are in occupancy of the entire net leasable area of the applicable Major Tenant premises, are obligated to pay full contractual rent without right of offset or free rent credit, and have made their first monthly rental payment, (x) all tenant improvements have been completed, (y) all leasing commissions and any other tenant reimbursement obligations incurred by the American Cancer Society Center Borrower have been paid and (z) the replacement tenants have delivered a tenant estoppel acceptable to the lender; |
| (b) | the date any Major Tenant gives notice that it intends to go dark, vacate or abandon the premises or for five consecutive business days vacates, goes dark, abandons, or surrenders substantially all of the premises and will continue until the date that (1) is 30 days after the date that the applicable Major Tenant has resumed operations at its premises, is in occupancy and open for business paying full contractual unabated rent without right of offset or free rent credit, has made its next due monthly rental payment, and has delivered a tenant estoppel acceptable to the lender, (2) the American Cancer Society Center Borrower has entered into one or more replacement leases for the entire applicable premises with tenants acceptable to the lender in its discretion and (w) the replacement tenants are in occupancy of the entire net leasable area of the applicable premises, are obligated to pay full contractual rent without right of offset or free rent credit, and have made their first monthly rental payment, (x) all tenant improvements have been completed, (y) all leasing commissions and any other tenant reimbursement obligations incurred by the American Cancer Society Center Borrower have been paid, and (z) the replacement tenants have delivered a tenant estoppel acceptable to the lender or (3) the lender has approved of and received fully executed sublease(s) for the portion of the applicable premises not then occupied by the applicable Major Tenant pursuant to (1) above, and all such sublessees (a) are in occupancy of their entire net leasable area of the applicable premises, are obligated to pay full contractual rent without right of offset or free rent credit, and have made their first monthly rental payment, (b) all tenant improvements have been completed, (c) all leasing commissions and any other tenant reimbursement obligations incurred by the American Cancer Society Center Borrower and/or Major Tenant have been paid, (d) all such sublessees have delivered a tenant estoppel acceptable to the lender and (e) Major Tenant remains fully liable for all of the obligations under the Major Tenant Lease; or |
| (c) | the date upon the earlier to occur of: (1) any termination of a Major Tenant Lease or (2) the earlier to occur of the date (x) that is twelve (12) months prior to the then applicable expiration date of the applicable Major Tenant Lease (or any renewal or replacement thereof) or (y) on which notice for extension is due under the applicable Major Tenant Lease and will continue until the date that (1) the American Cancer Society Center Borrower has provided acceptable evidence that the Major Tenant has renewed the term of its Major Tenant Lease or (2) the American Cancer Society Center Borrower has entered into one or more replacement leases for the entire applicable premises with a tenant or tenants acceptable to the lender in its discretion, and (w) the replacement tenants are in occupancy of the entire net leasable area of the applicable premises, are obligated to pay full contractual rent without right of offset or free rent credit, and have made their first monthly rental payment, (x) all tenant improvements have been completed, (y) all leasing commissions and any other tenant reimbursement obligations incurred by the American Cancer Society Center Borrower have been paid and (z) the replacement tenant or tenants have delivered to the lender a tenant estoppel acceptable to the lender. |
Additional Secured Indebtedness (not including trade debts).The American Cancer Society Center Property also secures the American Cancer Society Center Non-Serviced Pari Passu Companion Loan, which has a Cut-off Date principal balance of $43,000,000. The American Cancer Society Center Non-Serviced Pari Passu Companion Loan accrues interest at the same rate as the American Cancer Society Center Mortgage Loan. The American Cancer Society Center Mortgage Loan is entitled to payments of interest on a pro rata and pari passu basis with the American Cancer Society Center Non-Serviced Pari Passu Companion Loan. The holders of the American Cancer Society Center Mortgage Loan and the American Cancer Society Center Non-Serviced Pari Passu Companion Loan have entered into a co-lender agreement which sets forth the allocation of collections on the American Cancer Society Center Whole Loan. See “Description of the Mortgage Pool—The Whole Loans—The Non-Serviced Pari Passu Whole Loans” in the Preliminary Prospectus.
Mezzanine Loan and Preferred Equity. Not permitted.
Release of Property. Not permitted.
Terrorism Insurance. The American Cancer Society Center Borrower is required to obtain and maintain property insurance, commercial general liability insurance, and business income or rental loss insurance that covers perils of terrorism and acts of terrorism, both foreign and domestic.
This is not a research report and was not prepared by any Underwriter’s research department. Please see additional important information and qualifications at the end of this Term Sheet.
| T-42 |
(THIS PAGE INTENTIONALLY LEFT BLANK)
| T-43 |
| MSBAM 2017-C34 | 237 Park Avenue |
Mortgage Loan No. 3 – 237 Park Avenue
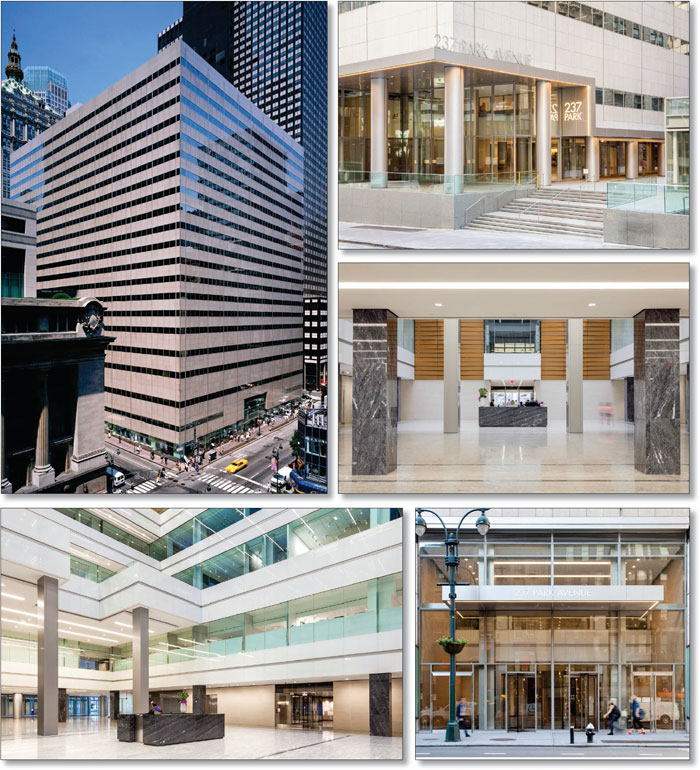
This is not a research report and was not prepared by any Underwriter’s research department. Please see additional important information and qualifications at the end of this Term Sheet.
| T-44 |
| MSBAM 2017-C34 | 237 Park Avenue |
Mortgage Loan No. 3 – 237 Park Avenue
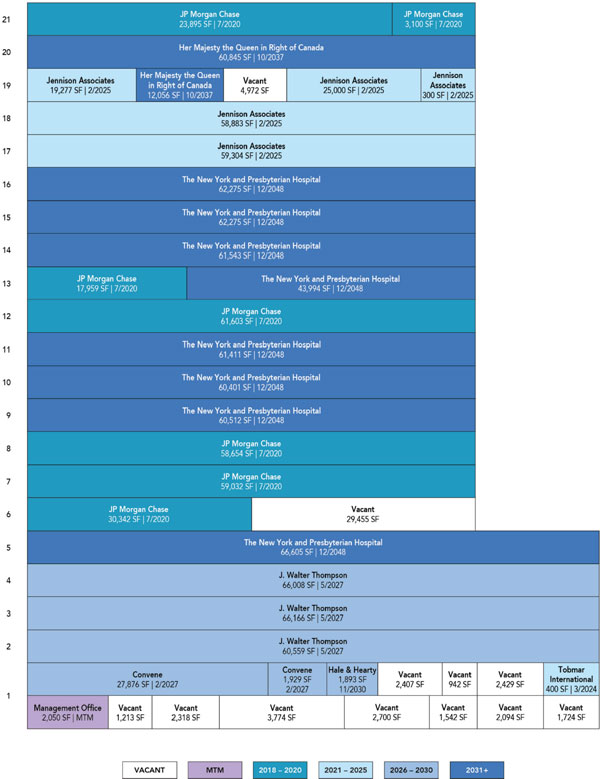
This is not a research report and was not prepared by any Underwriter’s research department. Please see additional important information and qualifications at the end of this Term Sheet.
| T-45 |
| MSBAM 2017-C34 | 237 Park Avenue |
Mortgage Loan No. 3 – 237 Park Avenue
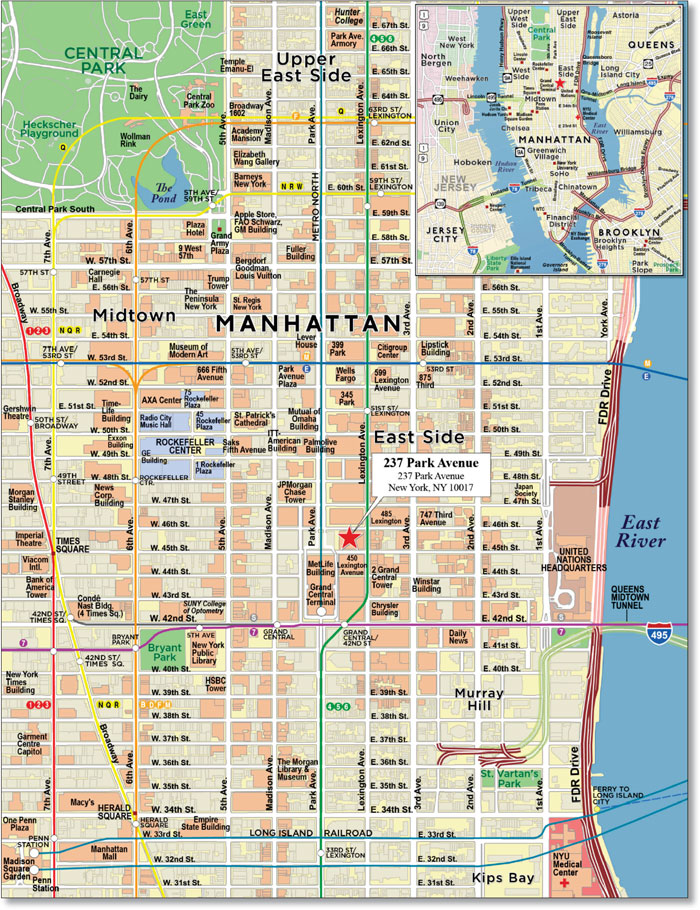
This is not a research report and was not prepared by any Underwriter’s research department. Please see additional important information and qualifications at the end of this Term Sheet.
| T-46 |
| MSBAM 2017-C34 | 237 Park Avenue |
| Mortgage Loan No. 3 – 237 Park Avenue |
| Mortgage Loan Information | Property Information | ||||||
| Mortgage Loan Seller: | MSMCH | Single Asset/Portfolio: | Single Asset | ||||
| Original Balance(1): | $70,005,000 | Location: | New York, NY 10017 | ||||
| Cut-off Date Balance(1): | $70,005,000 | General Property Type: | Office | ||||
| % of Initial Pool Balance: | 6.7% | Detailed Property Type: | CBD | ||||
| Loan Purpose: | Refinance | Title Vesting: | Fee / Leasehold | ||||
| Sponsors: | RXR Group; Walton Street | Year Built/Renovated: | 1914, 1935, 1981/2017 | ||||
| Mortgage Rate: | 3.7515436% | Size: | 1,251,717 SF | ||||
| Note Date: | 7/26/2017 | Cut-off Date Balance per SF(1): | $278 | ||||
| First Payment Date: | 9/9/2017 | Maturity Date Balance per SF(1): | $278 | ||||
| Maturity Date: | 8/9/2027 | Property Manager: | RXR Property Management LLC | ||||
| Original Term to Maturity: | 120 months | (borrower-related) | |||||
| Original Amortization Term: | 0 months | ||||||
| IO Period: | 120 months | ||||||
| Seasoning: | 2 months | Underwriting and Financial Information | |||||
| Prepayment Provisions(2): | LO (26); DEF (87); O (7) | UW NOI(6): | $57,166,479 | ||||
| Lockbox/Cash Mgmt Status: | Hard/Springing | UW NOI Debt Yield(1): | 16.4% | ||||
| Additional Debt Type(3): | Pari Passu/B-Note/Mezzanine | UW NOI Debt Yield at Maturity(1): | 16.4% | ||||
| Additional Debt Balance(3): | $277,995,000/$345,200,000/ | UW NCF DSCR(1): | 4.10x | ||||
| $87,800,000 | Most Recent NOI: | $19,845,834 (12/31/2016) | |||||
| Future Debt Permitted (Type)(3): | Yes (Mezzanine/Preferred Equity) | 2nd Most Recent NOI: | $19,489,476 (12/31/2015) | ||||
| Reserves(4) | 3rd Most Recent NOI: | $32,393,944 (12/31/2014) | |||||
| Type | Initial | Monthly | Cap | Most Recent Occupancy: | 95.6% (6/29/2017) | ||
| RE Tax: | $0 | Springing | N/A | 2nd Most Recent Occupancy: | 63.5% (12/31/2016) | ||
| Insurance: | $0 | Springing | N/A | 3rd Most Recent Occupancy: | 63.1% (12/31/2015) | ||
| Recurring Replacements: | $0 | Springing | N/A | Appraised Value (as of)(7): | $1,310,000,000 (5/22/2017) | ||
| TI/LC: | $0 | Springing | N/A | Cut-off Date LTV Ratio(1)(7): | 26.6% | ||
| Other(5): | $88,865,605 | Springing | N/A | Maturity Date LTV Ratio(1)(7): | 26.6% | ||
| Sources and Uses | ||||||
| Sources | Proceeds | % of Total | Uses | Proceeds | % of Total | |
| Loan Amount: | $693,200,000 | 88.8% | Loan Payoff: | $628,164,189 | 80.4% | |
| Mezzanine Loan: | $87,800,000 | 11.2% | Reserves: | $88,865,605 | 11.4% | |
| Closing Costs: | $41,379,906 | 5.3% | ||||
| Return of Equity: | $22,590,300 | 2.9% | ||||
| Total Sources: | $781,000,000 | 100.0% | Total Uses: | $781,000,000 | 100.0% | |
| (1) | The 237 Park Avenue Mortgage Loan (as defined below) is part of the 237 Park Avenue Whole Loan (as defined below), which is comprised of 14pari passusenior promissory notes with an aggregate principal balance of $348,000,000 and four junior promissory notes that arepari passu with each other with an aggregate principal balance of $345,200,000. The Cut-off Date Balance per SF, Maturity Date Balance per SF, UW NOI Debt Yield, UW NOI Debt Yield at Maturity, UW NCF DSCR, Cut-off Date LTV Ratio and Maturity Date LTV Ratio numbers presented above are based on the aggregate principal balance of the promissory notes comprising the 237 Park Avenue Senior Loans (as defined below), without regard to the 237 Park Avenue Subordinate Companion Loans (as defined below). The Cut-off Date Balance per SF, Maturity Date Balance per SF, UW NOI Debt Yield, UW NOI Debt Yield at Maturity, UW NCF DSCR, Cut-off Date LTV Ratio and Maturity Date LTV Ratio numbers based on the entire $693,200,000 237 Park Avenue Whole Loan are $554, $554, 8.2%, 8.2%, 2.06x, 52.9% and 52.9%, respectively. The Cut-off Date Balance per SF, Maturity Date Balance per SF, UW NOI Debt Yield, UW NOI Debt Yield at Maturity, UW NCF DSCR, Cut-off Date LTV Ratio and Maturity Date LTV Ratio numbers based on the combined balance of the 237 Park Avenue Whole Loan and mezzanine loan are $624, $624, 7.3%, 7.3%, 1.75x, 59.6% and 59.6%, respectively. |
| (2) | Defeasance of the 237 Park Avenue Whole Loan is permitted at any time after the earlier of (i) July 26, 2020, or (ii) two years from the closing date of the securitization that includes the lastpari passu note of the 237 Park Avenue Whole Loan to be securitized. The assumed lockout period of 26 payments is based on the closing date of this transaction in October 2017. |
| (3) | See “The Mortgage Loan,” “Additional Secured Indebtedness (not including trade debts)” and “Mezzanine Loan and Preferred Equity” below for further discussion of additional debt. |
| (4) | See “Escrows and Reserves” below for further discussion of reserve requirements. |
| (5) | The borrower also provided $8,500,000 of interest reserves held in the form of three letters of credit. |
| (6) | The increase in UW NOI from 2016 is due primarily to a new lease, in which New York and Presbyterian Hospital (“NYP”) leased 479,016 SF or 37.0% of underwritten gross rent for a period of 31.5-years bringing the overall occupancy to 95.6%, as well as a lease which commenced in October 2016 by Her Majesty the Queen in Right of Canada for 72,901 SF or 6.9% of underwritten gross rent. See “Major Tenants—New York and Presbyterian Hospital” and “Major Tenants—Her Majesty the Queen in Right of Canada” below. |
| (7) | Appraised Value (as of), Cut-off Date LTV Ratio and Maturity Date LTV Ratio, with respect to the 237 Park Avenue Mortgage Loan, is based on the “As-Is Assuming Reserves” value of $1,310,000,000 as of May 22, 2017, which assumes upfront reserves of $81,365,605 for capital expenditures and tenant improvements and leasing costs for recently signed leases in addition to a $7,500,000 escrow and letters of credit in an aggregate amount of $8,500,000 to cover interest payments. Such reserves and letters of credit were escrowed for at closing. The Cut-off Date LTV Ratio and Maturity Date LTV Ratio of the 237 Park Avenue Mortgage Loan (including the other 237 Park Avenue Senior Loans but excluding the 237 Park Avenue Subordinate Companion Loans) based on the $1.2 billion “As-Is” appraised value are 29.0% and 29.0%, respectively. |
This is not a research report and was not prepared by any Underwriter’s research department. Please see additional important information and qualifications at the end of this Term Sheet.
| T-47 |
| MSBAM 2017-C34 | 237 Park Avenue |
The Mortgage Loan. The third largest mortgage loan (the “237 Park Avenue Mortgage Loan”) is part of a whole loan (the “237 Park Avenue Whole Loan”) secured by the 237 Park Avenue Fee Borrower’s (as defined below) fee interest in the 237 Park Avenue Property (as defined below), the leasehold condominium units owned by the 237 Park Avenue Declarant Borrower (as defined below), the revenues from the 237 Park Avenue Property, and the collateral assignment of the purchase money note, the purchase money mortgage and the purchase and sale agreement each relating to NYP’s purchase of its leasehold condominium units at the 237 Park Avenue Property. The “237 Park Avenue Property” is a 21-story, 1,251,717 SF Class A office building that occupies the entire city block bound by Lexington Avenue and Park Avenue between 45th and 46th Streets in Midtown Manhattan, adjacent to Grand Central Terminal. The 237 Park Avenue Whole Loan was co-originated by Morgan Stanley Bank, N.A. and Société Générale on July 26, 2017.
The 237 Park Avenue Whole Loan consists of (i) a loan whose proceeds were used to refinance the prior mortgage loan, make deposits into the reserve funds, pay costs and expenses in connection with the origination of the loan, and fund any working capital requirements of the 237 Park Avenue Property (the “Senior Lien Loan”) and (ii) a loan whose proceeds are to be used for the cost of future improvements (the “Building Loan”). The Building Loan was created in order to comply with New York lien law and is subordinate to the Senior Lien Loan in terms of lien priority but not priority of payment. The Senior Lien Loan and the Building Loan are generally treated as one loan below. The 237 Park Avenue Whole Loan is comprised of (i) a senior loan, comprised of 14 notes which arepari passu in right of payment with each other (including seven Senior Lien Loan notes and seven Building Loan notes as indicated below), with an aggregate outstanding principal balance as of the Cut-off Date of $348.0 million (collectively, the “237 Park Avenue Senior Loans”) and (ii) a subordinate companion loan, comprised of four notes (two Senior Lien Loan notes and two Building Loan notes as indicated below) which four notes are subordinate in right of payment to the 237 Park Avenue Senior Loans andpari passu in right of payment with each other, with an aggregate outstanding principal balance as of the Cut-off Date of $345.2 million (collectively, the “237 Park Avenue Subordinate Companion Loans”). Senior Lien Loan note A-1-C1 and Building Loan note A-1-C1 with an aggregate principal amount as of the Cut-off Date of $70,005,000 represent the 237 Park Avenue Mortgage Loan and will be included in the MSBAM 2017-C34 securitization trust. The remaining 12 of the 237 Park Avenue Senior Loans (collectively, the “237 Park Avenue Non-ServicedPari Passu Companion Loans”) have an aggregate outstanding principal balance as of the Cut-off Date of $277,995,000. The controlling Senior Lien Loan Note A-1-S (along with three other 237 Park Avenue Non-ServicedPari Passu Companion Loans and the 237 Park Avenue Subordinate Companion Loans) were contributed to the MSSG Trust 2017-237P securitization trust, which governs the servicing and administration of the 237 Park Avenue Whole Loan. Senior Lien Loan Note A-1-S is the controlling note under the related intercreditor agreement, the rights of which will be exercised by the related trustee (or, prior to the occurrence and continuance of a control termination event under the related trust and servicing agreement (the “MSSG Trust 2017-237P Trust and Servicing Agreement”), the controlling class representative under the MSSG Trust 2017-237P Trust and Servicing Agreement). See “Description of the Mortgage Pool—The Whole Loans—The Non-Serviced Pari Passu-AB Whole Loan” and “Pooling and Servicing Agreement-Servicing of the Non-Serviced Mortgage Loans” in the Preliminary Prospectus. The remaining 237 Park Avenue Non-ServicedPari Passu Companion Loans are held by Morgan Stanley Bank, N.A and Société Générale, or affiliates thereof, and are expected to be contributed to one or more future securitization transactions or may be otherwise transferred at any time.
| 237 Park Avenue Whole Loan Summary | ||||
| Note(1) | Original Balance | Cut-off Date Balance | Note Holder | Controlling Piece |
| Senior Lien Loan Note A-1-S | $74,378,041 | $74,378,041 | MSSG Trust 2017-237P | Yes |
| Senior Lien Loan Note A-1-C1 | $60,411,124 | $60,411,124 | MSBAM 2017-C34 | No |
| Senior Lien Loan Note A-1-C2 | $60,411,124 | $60,411,124 | Morgan Stanley Bank, N.A. | No |
| Senior Lien Loan Note A-2-S | $40,049,714 | $40,049,714 | MSSG Trust 2017-237P | No |
| Senior Lien Loan Note A-2-C1 | $43,147,721 | $43,147,721 | Société Générale | No |
| Senior Lien Loan Note A-2-C2 | $10,955,206 | $10,955,206 | Société Générale | No |
| Senior Lien Loan Note A-2-C3 | $10,955,206 | $10,955,206 | Société Générale | No |
| Building Loan Note A-1-S | $11,811,959 | $11,811,959 | MSSG Trust 2017-237P | No |
| Building Loan Note A-1-C1 | $9,593,876 | $9,593,876 | MSBAM 2017-C34 | No |
| Building Loan Note A-1-C2 | $9,593,876 | $9,593,876 | Morgan Stanley Bank, N.A. | No |
| Building Loan Note A-2-S | $6,360,286 | $6,360,286 | MSSG Trust 2017-237P | No |
| Building Loan Note A-2-C1 | $6,852,279 | $6,852,279 | Société Générale | No |
| Building Loan Note A-2-C2 | $1,739,794 | $1,739,794 | Société Générale | No |
| Building Loan Note A-2-C3 | $1,739,794 | $1,739,794 | Société Générale | No |
| Senior Lien Loan Note B-1-S | $193,629,711 | $193,629,711 | MSSG Trust 2017-237P | No |
| Senior Lien Loan Note B-2-S | $104,262,152 | $104,262,152 | MSSG Trust 2017-237P | No |
| Building Loan Note B-1-S | $30,750,289 | $30,750,289 | MSSG Trust 2017-237P | No |
| Building Loan Note B-2-S | $16,557,848 | $16,557,848 | MSSG Trust 2017-237P | No |
| Total | $693,200,000 | $693,200,000 | ||
| (1) | The B-Notes are subordinate to the A-Notes. |
The Borrower and the Sponsor. The borrowers are 237 Park Owner LLC (the “237 Park Avenue Fee Borrower”) and 237 Park LH Owner LLC (the “237 Park Avenue Declarant Borrower”, and together with the 237 Park Avenue Fee Borrower, the “237 Park Avenue Borrower”), a wholly owned subsidiary of the 237 Park Avenue Fee Borrower, each a single-purpose Delaware limited liability company with two independent directors. The nonrecourse carve-out guarantors are RXR Real Estate Value Added Fund LP, RXR Real Estate Value Added Fund Parallel LP, RXR Real Estate Value Added Fund Parallel II LP, RXR Real Estate Value Added Fund Parallel II (REIT) LP and RXR Real Estate Value Added Fund Parallel III LP, each a Delaware limited partnership, Walton Street Real Estate Partners VII, L.P., Walton Street Real Estate Fund VII-Q, L.P., Walton Street Real Estate Fund VII-NUS-SRD, L.P., Walton Street Real Estate Fund VII, L.P., Walton Street Real Estate Fund VII-E, L.P., Walton Street Real Estate Investors VII, L.P., Walton Street Real Estate Partners VII-NGE, L.P. and WSC Capital Holdings VII, L.P., each a Delaware limited partnership. The guarantors are affiliates of the borrower sponsors, RXR Group (“RXR”) and Walton Street Group (“Walton Street”) (collectively, the “237 Park Avenue Borrower Sponsors”).
RXR is a real estate company with expertise in investment management, property management, development, design, construction, leasing and financing with a core focus on the New York Tri-State area with investments in properties encompassing 22.1 million SF
This is not a research report and was not prepared by any Underwriter’s research department. Please see additional important information and qualifications at the end of this Term Sheet.
| T-48 |
| MSBAM 2017-C34 | 237 Park Avenue |
Walton Street is a private equity real estate investment firm. Since its founding in 1994, affiliates of Walton Street have received total equity commitments of over $9.8 billion from public and corporate pension plans, foreign institutions, insurance companies and banks, endowments and foundations, trusts, and high net worth individuals. Affiliates of Walton Street have invested and/or committed to invest over $9.0 billion of equity in more than 350 separate transactions.
The Property. The 237 Park Avenue Property is a 21-story Class A office building comprised of approximately 1,251,717 SF, including approximately 19,618 SF of ground floor retail space. The 237 Park Avenue Property is located on the entire city block bound by Lexington Avenue and Park Avenue between 45th and 46th Streets in Midtown Manhattan, adjacent to Grand Central Terminal which provides access to transportation including subway service along the nearby 4, 5, 6, 7 and S lines and Metro-North Railroad. Penn Station and the Port Authority Terminal are also accessible via the subway, connecting the 237 Park Avenue Property to all major rail lines in the tristate area, namely Long Island Rail Road and New Jersey Transit. Originally built in 1914, the 237 Park Avenue Property was redeveloped into its current structure in 1981, and according to the 237 Park Avenue Borrower, underwent an approximately $65.8 million renovation and repositioning between October 2013 and March 2017. The renovation included office floor repositioning and a complete redevelopment of the 237 Park Avenue Property’s entrances, lobby, atrium and retail component, including the renovation of a retail space along an outdoor public plaza on the western side of the 237 Park Avenue Property (“Depew Place”), as well as landlord improvements to tenant-specific spaces.
As of June 29, 2017, the 237 Park Avenue Property is 95.6% leased, with the office portion being 97.2% leased, with concentration in the healthcare, financial services, advertising and government sectors. Approximately 92.8% of the 237 Park Avenue Property’s net rentable area (“NRA”) is leased by investment grade tenants, which contribute approximately 97.9% of the 237 Park Avenue Property’s underwritten gross rent. The 237 Park Avenue Property averaged occupancy of 92.6% from 2006 through 2012. After acquiring the 237 Park Avenue Property in October of 2013, the 237 Park Avenue Borrower Sponsors commenced an approximately $65.8 million renovation and reposition of the 237 Park Avenue Property, which was completed in March of 2017. As part of the repositioning plan, the 237 Park Avenue Borrower Sponsors vacated all of the retail space at Depew Place in order to renovate Depew Place and partially reconfigure the lobby.
Since November 1, 2015, the 237 Park Avenue Borrower Sponsors have been able to either renew existing tenants or sign new leases for 62.0% of the 237 Park Avenue Property. As of June 29, 2017, the weighted average remaining lease term at the 237 Park Avenue Property was 17.4 years. In June 2017, the New York and Presbyterian Hospital (“NYP”) (38.3% of GLA, 37.0% of underwritten base rent) executed an agreement whereby NYP would occupy space at the 237 Park Avenue Property for at least 31.5 years. Headquartered at the 237 Park Avenue Property since 1979, J. Walter Thompson (15.4% of GLA, 15.9% of underwritten base rent) signed a 10.4-year extension that commenced in January 2017. Her Majesty the Queen in Right of Canada (5.8% of GLA, 6.9% of underwritten base rent) signed a 21-year lease in August 2016.
The condominium units included in the collateral for the 237 Park Avenue Whole Loan are leasehold condominium units that represent interests in a ground lease between the 237 Park Avenue Fee Borrower, as ground lessor, and the 237 Park Avenue Declarant Borrower, as ground lessee. The ground lease expires on December 29, 2058. The 237 Park Avenue Declarant Borrower is obligated to pay a base rent of $10.00 per annum for the entire term of the ground lease. The 237 Park Avenue Declarant Borrower’s interest in the ground lease was assigned to the condominium board in order to create the leasehold condominiums.
| Historical and Current Occupancy(1) | |||||||||||
| 2006 | 2007 | 2008 | 2009 | 2010 | 2011 | 2012 | 2013 | 2014 | 2015 | 2016 | 6/29/2017(2) |
| 98.7% | 98.7% | 98.7% | 94.6% | 89.2% | 87.4% | 81.0% | 79.9% | 75.8% | 63.1% | 63.5% | 95.6% |
| (1) | Based on annual average occupancy except for 2013 occupancy which reflects occupancy at year end and unless otherwise specified. |
| (2) | The increase in occupancy is due to a new lease, in which NYP leases 479,016 SF or 38.3% of net rentable area for a period of 31.5 years. |
Major Tenants.
New York and Presbyterian Hospital (479,016 SF, 38.3% of NRA, 37.0% of underwritten base rent). The New York and Presbyterian Hospital is a comprehensive, integrated academic health care delivery system provider, which delivers care and service to patients in the New York metro area. Altogether the NYP campuses handle over 2.2 million outpatient and inpatient visits each year, including inpatient admissions and more than 286,000 emergency room visits and over 15,000 birth deliveries. The facilities employ a total of more than 23,700 people, including approximately 6,500 physicians.
On May 15, 2017, NYP executed an agreement to purchase and hold a leasehold condominium interest in a portion of the 237 Park Avenue Property for a term of 31.5 years, subject to a 10-year (or two five-year) extension term(s), which purchase was completed on June 29, 2017. The units encompass the entire 5th, 9th, 10th, 11th, 14th, 15th and 16th floors of the 237 Park Avenue Property and a portion of the 13th (collectively, the “NYP Unit”). The purchase price for the NYP Unit is required to be paid in monthly installments pursuant to a purchase money note, secured by a purchase money mortgage. In addition to the monthly payments under the purchase money note, NYP will also be responsible for NYP’s pro rata share of operating expenses of the 237 Park Avenue Property payable to the condominium association in accordance with the terms of the condominium documents. NYP will not be required to make payments under the purchase money note and purchase money mortgage until December 29, 2018. Gap installment payments were not escrowed; however the loan documents provide for an interest reserve as described below under “—Escrows and Reserves.” Assignments of the purchase money note, the purchase money mortgage and the purchase documents relating to NYP’s purchase of condominium units are included in the collateral for the 237 Park Avenue Whole Loan. The arrangements by which NYP occupies its space are sometimes referred to herein as a lease, and its purchase money installment payments are sometimes referred to herein as rents.
At origination, approximately $87.0 million of tenant improvement, leasing commission and landlord work obligations costs remained with respect to NYP, of which approximately $13.4 million was drawn at loan origination and the remaining approximately $73.6 million was escrowed. There is also $1.5 million of tenant allowances that were not escrowed.
JP Morgan Chase (254,585 SF, 20.3% of NRA, 23.8% of underwritten base rent). Founded in 1823 and headquartered in New York City, JPMorgan Chase (“JPM”) is a financial services firm. The company has more than 5,350 bank branches across the U.S. and is also among the nation’s largest mortgage lenders and credit card issuers. Active in approximately 60 countries, the company also includes investment banking and asset management operations.
J. Walter Thompson (192,733 SF, 15.4% of NRA, 15.9% of underwritten base rent). J. Walter Thompson (“JWT”) is a wholly owned subsidiary of WPP Group, a marketing communications provider. Established in 1864 and headquartered at the 237 Park Avenue Property since 1979, JWT has more than 200 offices in over 90 countries, employing nearly 10,000 marketing professionals. WPP Group has over 200,000 employees in 3,000 offices in 112 countries.
This is not a research report and was not prepared by any Underwriter’s research department. Please see additional important information and qualifications at the end of this Term Sheet.
| T-49 |
| MSBAM 2017-C34 | 237 Park Avenue |
Jennison Associates (162,764 SF, 13.0% of NRA, 14.4% of underwritten base rent). Jennison Associates (“Jennison”) is an indirect wholly owned subsidiary of Prudential. Founded in 1969, Jennison manages equity, fixed income and multi-asset portfolios across several styles, geographies and capitalizations. Jennison has roughly 339 employees in two offices. Jennison is responsible for $166.9 billion in assets under management as of June 30, 2017. Jennison, a tenant at the 237 Park Avenue Property since 1982, signed an extension term through February 28, 2025, which commences March 1, 2020 and includes a tenant improvement allowance of approximately $3.0 million, which Jennison may elect to receive as a credit against future rent payments. Such potential rent credit has not been reserved for.
Her Majesty the Queen in Right of Canada (72,901 SF, 5.8% of NRA, 6.9% of underwritten base rent). The 237 Park Avenue Property is home to the Permanent Mission of Canada to the United Nations and the Consulate General of Canada in New York, both of which recently consolidated into the 237 Park Avenue Property, on a lease through October 31, 2037, from their former locations. The consulate general is a satellite office of Canada’s embassy to the United States, located in Washington D.C. Her Majesty the Queen in Right of Canada signed a 21-year lease in August of 2016 that allows for free rent through October 31, 2017 and has approximately $6.9 million of tenant improvement allowance, leasing commission and landlord work remaining, which was escrowed at origination.
The following table presents certain information relating to the leases at the 237 Park Avenue Property:
| Tenant Summary(1) | |||||||
| Tenant Name | Credit Rating (Fitch/Moody’s/S&P)(2) | Tenant SF | Approximate % of SF | Annual UW Rent | Annual UW Rent PSF(3) | % of Total Annual UW Rent | Lease Expiration |
| Major Tenants | |||||||
| New York and Presbyterian Hospital(4) | AA/Aa3/NR | 479,016 | 38.3% | $31,136,040 | $65.00 | 37.0% | 12/29/2048 |
| JP Morgan Chase(5) | A+/A3/A- | 254,585 | 20.3% | $20,011,417 | $78.60 | 23.8% | 7/31/2020 |
| J. Walter Thompson | BBB+/NR/BBB | 192,733 | 15.4% | $13,346,760 | $69.25 | 15.9% | 5/31/2027 |
| Jennison Associates | A-/Baa1/A | 162,764 | 13.0% | $12,129,119 | $74.52 | 14.4% | 2/28/2025 |
| Her Majesty the Queen in Right of Canada(6) | AAA/Aaa/AAA | 72,901 | 5.8% | $5,777,263 | $79.25 | 6.9% | 10/31/2037 |
| Convene | NR/NR/NR | 29,805 | 2.4% | $1,533,464 | $51.45 | 1.8% | 2/28/2027 |
| Hale & Hearty | NR/NR/NR | 1,893 | 0.2% | $166,376 | $87.89 | 0.2% | 11/30/2030 |
| Tobmar International | NR/NR/NR | 400 | 0.0% | $33,116 | $82.79 | 0.0% | 3/31/2024 |
| Subtotal/Wtd. Avg. | 1,194,097 | 95.4% | $84,133,555 | $70.46 | 100.0% | ||
| Management Office Space | 2,050 | 0.2% | $0 | $0.00 | 0.0% | ||
| Vacant Space | 55,570 | 4.4% | $0 | $0.00 | 0.0% | ||
| Total/Wtd. Avg. | 1,251,717 | 100.0% | $84,133,555 | $70.46 | 100.0% | ||
| (1) | Information is based on the underwritten rent roll as of June 29, 2017. |
| (2) | Certain ratings are those of the parent company whether or not the parent guarantees the lease. |
| (3) | Wtd. Avg. Annual UW Rent PSF excludes vacant space and management office space. |
| (4) | NYP’s lease commenced June 29, 2017. NYP does not yet occupy its space and is expected to commence paying rent in January 2019. Annual UW Rent and Annual UW Rent PSF for NYP includes net present value step rent credit through its lease term (which is longer than the term of the 237 Park Avenue Whole Loan). The NYP Unit owner will have two cumulative contraction options to reconvey to the 237 Park Avenue Declarant Borrower portions of the NYP Unit. The NYP Unit owner will be permitted to give back the highest or lowest floor of its units (i) during a period from the 10th anniversary of the payment commencement date under the NYP purchase money note to the 11th anniversary of such payment commencement date, and (ii) during a period from the 20th anniversary of such payment commencement date to the 21th anniversary of such payment commencement date, provided that if such floor is only a partial floor and (1) such partial floor is contiguous to a full floor owned by NYP Unit owner, then NYP Unit owner will have the right to contract the NYP Unit by either such partial floor or such partial floor and such contiguous full floor or (2) if such floor is not contiguous to a full floor, then NYP Unit owner will have the right to contract the NYP Unit by either such partial floor or the highest or lowest full floor of the NYP Unit. |
| (5) | JPM currently occupies 79,562 SF of its premises and subleases 58,654 SF to Stifel, Nicolaus & Company, Incorporated. 116,369 SF is dark. |
| (6) | Her Majesty the Queen in Right of Canada is in a free rent period and is expected to commence paying rent November 1, 2017. Annual UW Rent and Annual UW Rent PSF for Her Majesty the Queen in Right of Canada includes net present value step rent credit through its lease term (which is longer than the term of the 237 Park Avenue Whole Loan). |
This is not a research report and was not prepared by any Underwriter’s research department. Please see additional important information and qualifications at the end of this Term Sheet.
| T-50 |
| MSBAM 2017-C34 | 237 Park Avenue |
The following table presents certain information relating to the lease rollover schedule at the 237 Park Avenue Property:
| Lease Rollover Schedule(1)(2) | ||||||||
| Year | # of Leases Rolling | SF Rolling | % of Total SF Rolling | Cumulative % of Total SF Rolling | Total UW Rent Rolling(3) | UW Rent PSF Rolling(4) | % of Total Rent Rolling | Cumulative % of Total Rent Rolling |
| MTM | 1 | 2,050 | 0.2% | 0.2% | $0 | $0.00 | 0.0% | 0.0% |
| 2017 | 0 | 0 | 0.0% | 0.2% | $0 | $0.00 | 0.0% | 0.0% |
| 2018 | 0 | 0 | 0.0% | 0.2% | $0 | $0.00 | 0.0% | 0.0% |
| 2019 | 0 | 0 | 0.0% | 0.2% | $0 | $0.00 | 0.0% | 0.0% |
| 2020 | 1 | 254,585 | 20.3% | 20.5% | $20,011,417 | $78.60 | 23.8% | 23.8% |
| 2021 | 0 | 0 | 0.0% | 20.5% | $0 | $0.00 | 0.0% | 23.8% |
| 2022 | 0 | 0 | 0.0% | 20.5% | $0 | $0.00 | 0.0% | 23.8% |
| 2023 | 0 | 0 | 0.0% | 20.5% | $0 | $0.00 | 0.0% | 23.8% |
| 2024 | 1 | 400 | 0.0% | 20.5% | $33,116 | $82.79 | 0.0% | 23.8% |
| 2025 | 1 | 162,764 | 13.0% | 33.5% | $12,129,119 | $74.52 | 14.4% | 38.2% |
| 2026 | 0 | 0 | 0.0% | 33.5% | $0 | $0.00 | 0.0% | 38.2% |
| 2027 | 2 | 222,538 | 17.8% | 51.3% | $14,880,224 | $66.87 | 17.7% | 55.9% |
| 2028 & Beyond | 3 | 553,810 | 44.2% | 95.6% | $37,079,679 | $66.95 | 44.1% | 100.0% |
| Vacant | 0 | 55,570 | 4.4% | 100.0% | $0 | $0.00 | 0.0% | 100.0% |
| Total/Wtd. Avg. | 9 | 1,251,717 | 100.0% | $84,133,555 | $70.46 | 100.0% | ||
| (1) | Information is based on the underwritten rent roll as of June 29, 2017. |
| (2) | Certain tenants may have lease termination options that are exercisable prior to the stated expiration date of the subject lease or leases which are not considered in the lease rollover schedule. |
| (3) | Total UW Rent Rolling includes net present value step rent credit for two investment-grade tenants (NYP and Her Majesty the Queen in Right of Canada) through the tenants’ lease terms (which are longer than the term of the 237 Park Avenue Whole Loan). |
| (4) | Wtd. Avg. UW Rent PSF Rolling excludes vacant space and management office space. |
The Market. The 237 Park Avenue Property is located on the entire city block bound by Lexington Avenue and Park Avenue between 45th and 46th Streets in Midtown Manhattan, adjacent to Grand Central Terminal. This area of Midtown Manhattan is known as the Park Avenue subdistrict within the Plaza Office District, and is considered one of Manhattan’s premier office locations according to the appraisal. The 237 Park Avenue Property is surrounded by many New York landmarks, restaurants, hotels, retail shops and tourist attractions, made accessible by the presence of several transportation options.
As of the first quarter 2017, the three office statistical areas that comprise the Plaza District contain 81.1 million SF of Class A office space, over 6.4 million SF of Class B office space and 481,485 SF of Class C office space. Historically, the Plaza District has evidenced the highest rents in Midtown Manhattan, according to the appraisal. As of the first quarter of 2017, the Class A office space in the Plaza District had a direct vacancy rate of 9.4% and average asking rents of $99.69 PSF, above the direct primary Midtown Manhattan average of $88.93 PSF.
According to the appraisal, as of first quarter 2017, the Park Avenue subdistrict consisted of approximately 21.8 million SF of Class A office space and had a direct vacancy rate of 9.2% and overall direct weighted average asking rents of $101.41 PSF.
The following table presents certain information relating to comparable leases for the 237 Park Avenue Property:
| Comparable Lease Summary | |||||||
| Property Address | Year Built | Total GLA (SF) | Tenant Name | Lease Date/Term | Lease Area (SF) | Annual Base Rent PSF | Reimbursements |
| 1177 Avenue of the Americas | 1992 | 960,050 | Kramer Levin Naftalis & Frankel LLP | Mar. 2017 / 15.0 Yrs. | 219,000 | $80.00 | Gross |
| 599 Lexington Avenue | 1986 | 955,274 | Welsh Carson | Feb. 2017 / 11.0 Yrs. | 31,337 | $85.00 | Gross |
| 437 Madison Avenue | 1968 | 712,117 | Lighthouse Investment Partners | Feb. 2017 / 10.0 Yrs. | 17,750 | $81.00 | Gross |
| 535 Madison Avenue | 1982 | 415,000 | Aquiline Capital | Jan. 2017 / 10.0 Yrs. | 13,389 | $90.50 | Gross |
| 485 Lexington Avenue | 1956 | 733,173 | Xerox | Jan. 2017 / 5.5 Yrs. | 14,206 | $73.00 | Gross |
| 900 Third Avenue | 1983 | 515,200 | Tannenbaum Helpern Syracuse & Hirschritt | Dec. 2016 / 10.0 Yrs. | 42,391 | $73.00 | Gross |
| 1221 Avenue of the Americas | 1971 | 2,200,000 | Dentons | Aug. 2016 / 7.0 Yrs. | 207,371 | $76.00 | Gross |
| 300 Park Avenue | 1955 | 690,800 | EnTrustPermal | Jul. 2016 / 8.0 Yrs. | 18,909 | $72.50 | Gross |
| 399 Park Avenue | 1961 | 1,250,000 | Morgan Stanley | Jul. 2016 / 15.0 Yrs. | 110,025 | $108.50 | Gross |
| 75 Rockefeller Plaza | 1947 | 582,428 | Merrill Lynch Wealth Management | Jun. 2016 / 15.0 Yrs. | 124,063 | $82.50 | Gross |
Source:Appraisal.
This is not a research report and was not prepared by any Underwriter’s research department. Please see additional important information and qualifications at the end of this Term Sheet.
| T-51 |
| MSBAM 2017-C34 | 237 Park Avenue |
The following table presents certain information relating to competitive office properties with respect to the 237 Park Avenue Property:
| Competitive Property Summary | |||||||
| Direct | Sublease | % | % | Direct | |||
| Office Area | Available | Available | Occupied | Occupied | Asking Rent (PSF)(1) | ||
| Property Address | (SF) | SF | SF | (Direct) | (Total) | Low | High |
| 90 Park Avenue | 785,000 | 31,072 | 7,090 | 96.0% | 95.1% | $89.00 | $95.00 |
| 100 Park Avenue | 825,815 | 86,149 | 0 | 89.6% | 89.6% | $70.00 | $85.00 |
| 200 Park Avenue | 2,254,274 | 88,047 | 0 | 96.1% | 96.1% | $86.00 | $96.00 |
| 230 Park Avenue | 1,335,947 | 114,540 | 13,194 | 91.4% | 90.4% | $78.00 | $105.00 |
| 330 Madison Avenue | 717,443 | 27,655 | 6,075 | 96.1% | 95.3% | $81.00 | $90.00 |
| 340 Madison Avenue | 714,869 | 41,150 | 10,872 | 94.2% | 92.7% | $65.00 | $75.00 |
| Total/Wtd. Avg. | 6,633,348 | 388,613 | 37,231 | 94.1% | 93.6% | $65.00 | $105.00 |
Source:Appraisal.
| (1) | Total/Wtd. Avg. Direct Asking Rent (PSF) Low and High for the competitive set represent the minimum and maximum asking rents among the directly competitive buildings to the 237 Park Avenue Property. |
Operating History and Underwritten Net Cash Flow.The following table presents certain information relating to the historical operating performance and the Underwritten Net Cash Flow at the 237 Park Avenue Property:
| Cash Flow Analysis | |||||
| 2014 | 2015 | 2016 | UW | UW PSF | |
| Base Rent(1) | $54,714,662 | $44,225,564 | $44,924,392 | $84,133,554 | $67.21 |
| IG Tenant Rent Steps(2) | $0 | $0 | $0 | $1,133,398 | $0.91 |
| Total Recoveries | $5,785,750 | $3,118,477 | $3,845,113 | $2,597,181 | 2.07 |
| Other Income(3) | $1,740,592 | $1,662,309 | $1,672,279 | $1,039,742 | 0.83 |
| Effective Gross Income | $62,241,004 | $49,006,350 | $50,441,783 | $88,903,875 | $71.03 |
| Total Operating Expenses | $29,847,060 | $29,516,874 | $30,595,950 | $31,737,396 | $25.36 |
| Net Operating Income | $32,393,944 | $19,489,476 | $19,845,834(4) | $57,166,479(4) | $45.67 |
| Capital Expenditures | $0 | $0 | $0 | $312,929 | 0.25 |
| TI/LC | $0 | $0 | $0 | $2,608,515 | 2.08 |
| Net Cash Flow | $32,393,944 | $19,489,476 | $19,845,834 | $54,245,035(4) | $43.34 |
| Occupancy % | 75.8% | 63.1% | 63.5% | 95.6%(5) | |
| NOI DSCR(6) | 2.45x | 1.47x | 1.50x | 4.32x | |
| NCF DSCR(6) | 2.45x | 1.47x | 1.50x | 4.10x | |
| NOI Debt Yield(6) | 9.3% | 5.6% | 5.7% | 16.4% | |
| NCF Debt Yield(6) | 9.3% | 5.6% | 5.7% | 15.6% | |
| (1) | UW Base Rent reflects contractual rents as of June 29, 2017 and includes rent steps of $143,596 through July 1, 2018. |
| (2) | Net present value step rent credit for two investment-grade tenants (NYP and Her Majesty the Queen in Right of Canada) through the tenants’ lease terms (which are longer than the term of the 237 Park Avenue Whole Loan). |
| (3) | Other Income is made up of submeter income, freight elevator income, overtime HVAC and other miscellaneous income. |
| (4) | The increase in UW NOI and UW Net Cash Flow from 2016 is due a new lease, in which NYP leased 479,016 SF or 37.0% of underwritten base rent bringing the overall occupancy to 95.6%. |
| (5) | Occupancy % is as of June 29, 2017. UW Occupancy % includes NYP, whose lease commenced June 29, 2017. NYP does not yet occupy its space and is expected to commence paying rent in January 2019. |
| (6) | The debt service coverage ratios and debt yields are based on the 237 Park Avenue Senior Loan, and exclude the 237 Park Avenue Subordinate Companion Loan. |
Escrows and Reserves. The 237 Park Avenue Whole Loan documents provide for upfront escrows in the amount of $81,365,605 for outstanding tenant improvements, leasing commissions and contractor work, and $7,500,000 for interest payments in addition to $8,500,000 in interest reserves delivered by the 237 Park Avenue Borrower via three letters of credit. So long as no event of default is continuing under the 237 Park Avenue Whole Loan, upon written request of the 237 Park Avenue Borrower, the lender is required to use funds in such interest reserves to pay the aggregate debt service monthly payment amount with respect to the 237 Park Avenue Whole Loan, the 237 Park Avenue Mezzanine Loan (as defined below) and scheduled monthly debt service on any other mezzanine loan or preferred equity entered into in accordance with the related loan documents and to pay operating expense deficits. Provided no Cash Sweep Period (as defined below) is then continuing under the 237 Park Avenue Whole Loan, on the payment commencement date under the NYP purchase money note, any remaining balance in the interest reserve must be disbursed to the 237 Park Avenue Borrower.
During the continuance of a Cash Sweep Period, the 237 Park Avenue Whole Loan documents provide for ongoing monthly reserve deposits of (i) 1/12 of the payments for the 237 Park Avenue Borrower’s allocable share of taxes under the condominium documents that the lender reasonably estimates will be payable during the next 12 months and 1/12 of the insurance premiums that the lender reasonably estimates will be payable for the renewal of insurance coverage (unless the 237 Park Avenue Property is insured as part of a “blanket” policy that complies with the requirements of the loan documents, in which case the insurance reserve is waived), (ii) to the extent the 237 Park Avenue Property generates sufficient cash flow, $20,862 for annual replacements and alterations to the 237 Park Avenue Property, and (iii) to the extent the 237 Park Avenue Property generates sufficient cash flow, monthly rollover reserve deposits of $156,465, provided that if a JPM Reserve Period (as defined below) is continuing such monthly amount will be reduced by $1.50 PSF of the JPM premises. During the continuance of a JPM Reserve Period, the 237 Park Avenue Whole Loan documents also provide for ongoing monthly
This is not a research report and was not prepared by any Underwriter’s research department. Please see additional important information and qualifications at the end of this Term Sheet.
| T-52 |
| MSBAM 2017-C34 | 237 Park Avenue |
reserve deposits in an amount equal to the monthly base rent then payable by JPM (“JPM Reserve Funds”) (up to a cap in an amount equal to $60.00 PSF of the JPM premises (“JPM Reserve Cap”) as adjusted pursuant to the 237 Park Avenue Whole Loan documents). In addition, in the event the 237 Park Avenue Borrower receives a lease termination fee (including a termination payment in respect of the NYP space) in excess of $1,000,000, the 237 Park Avenue Borrower is required to immediately deposit such lease termination fee with the lender to be utilized for tenant improvements, tenant improvement allowances, leasing commissions and legal costs reasonably approved by the lender associated with re-leasing the terminated space.
The 237 Park Avenue Whole Loan documents provide for springing Supplemental Interest Reserve Funds (as defined below) to be deposited in the form of cash if the 237 Park Avenue Borrower incurs additional mezzanine debt or preferred equity as described below under “Mezzanine Loan and Preferred Equity.” “Supplemental Interest Reserve Funds” means an amount determined by multiplying (i) the number of monthly payment dates occurring from the date of such deposit until such time that NYP begins making rent payments by (ii) the quotient of (A) $2,000,000 if the additional mezzanine debt or preferred equity equals $69,000,000 (or, in the event the additional mezzanine debt or preferred equity is less than $69,000,000, a prorated deposit amount based on multiplying (x) the actual balance of the mezzanine debt or preferred equity by (y) the quotient obtained by dividing $2,000,000 by $69,000,000) divided by (B) 18.
Lockbox and Cash Management. The 237 Park Avenue Whole Loan is structured with a hard lockbox and springing cash management. The related loan documents require the 237 Park Avenue Borrower to send tenant direction letters to all tenants instructing them to deposit all rents and other payments into the lockbox account controlled by the lender. So long as no Cash Sweep Period or JPM Reserve Period exists, funds deposited into the lockbox account are required to be disbursed to the 237 Park Avenue Borrower’s operating account. During the continuance of a Cash Sweep Period, funds in the lockbox account are required to be transferred on each business day to a lender-controlled cash management account and applied to fund the tax and insurance reserves deposits described above under “Escrows and Reserves,” to pay debt service on the 237 Park Avenue Whole Loan, to pay, if a JPM Reserve Period is continuing, the monthly deposit into the JPM Reserve Funds, to disburse monthly operating expenses as set forth in the annual budget (which is required to be reasonably approved by the lender, only during a Cash Sweep Period), to pay, if sufficient cash flow is available, the monthly deposits into the reserves for rollover expenses and replacements and alterations as described above under “Escrows and Reserves,” to pay extraordinary expenses reasonably approved by the lender, to pay, provided no event of default is continuing under the 237 Park Avenue Whole Loan, debt service on the 237 Park Avenue Mezzanine Loan, and to disburse the remainder into an account to be held as additional security for the 237 Park Avenue Whole Loan during such Cash Sweep Period. During a JPM Reserve Period (provided no Cash Sweep Period then exists), funds in the lockbox account are required to be transferred on each business day to a lender-controlled cash management account and applied to make the monthly deposit into the JPM Reserve Funds, and then disbursed to the 237 Park Avenue Borrower’s operating account.
A “Cash Sweep Period” means a period (A) commencing upon the earliest, whether or not any Cash Sweep Period has previously occurred and ended, of (i) the occurrence of an event of default or an event of default under the 237 Park Avenue Mezzanine Loan, or (ii) the occurrence of a Debt Yield Threshold Event (as defined below); and (B) expiring upon (x) with regard to any Cash Sweep Period commenced in connection with clause (A)(i) above, the cure (if applicable) of such event of default and/or mezzanine event of default, as the case may be, and (y) with regard to any Cash Sweep Period commenced in connection with clause (A)(ii) above, (1) the date on which the Debt Yield Cure Condition (as defined below) is satisfied, (2) the delivery to the lender and mezzanine lender of letters of credit in pro rata amounts which, if applied to reduce the outstanding principal balance of the 237 Park Avenue Whole Loan and the 237 Park Avenue Mezzanine Loan, respectively, would cause the Debt Yield Cure Condition to be satisfied or (3) with respect to a Debt Yield Threshold Event that resulted from a failure to satisfy the Debt Yield Threshold (as defined below) with respect to the combined outstanding principal balance of the 237 Park Avenue Whole Loan and the 237 Park Avenue Mezzanine Loan, the delivery to the mezzanine lender of cash prepayment in the amount which, if applied to the outstanding principal balance of the 237 Park Avenue Mezzanine Loan, would cause the Debt Yield Cure Condition to be satisfied.
A “JPM Reserve Period” will commence upon the date that is 15 months prior to the expiration of the JPM lease assuming no replacement leases have been executed and delivered by the 237 Park Avenue Borrower and will terminate upon the earlier to occur of (a) the amount of JPM Reserve Funds on deposit being equal to the JPM Reserve Cap, (b) the 237 Park Avenue Borrower entering into one or more replacement leases for the entire JPM premises or (c) JPM renewing its lease for its entire leased premises.
A “Debt Yield Threshold Event” will commence upon the debt yield falling below the Debt Yield Threshold as of the last day of the calendar quarter immediately preceding the applicable date of determination. Commencing with the third quarter of calendar year 2017, 45 days following the end of each calendar quarter, the 237 Park Avenue Borrower is required to calculate each debt yield specified by the Debt Yield Threshold for purposes of determining whether a Debt Yield Threshold Event has occurred and to submit such calculations to the lender, and such calculation will be subject to the lender’s reasonable approval.
The “Debt Yield Threshold” is equal to (a) 7.464% with respect to the debt yield calculated based solely on the 237 Park Avenue Whole Loan outstanding principal balance and (b) 6.625% with respect to the debt yield calculated based on the cumulative outstanding principal balance of the 237 Park Avenue Whole Loan and the 237 Park Avenue Mezzanine Loan.
The “Debt Yield Cure Condition” means the applicable debt yield being equal to or greater than the applicable Debt Yield Threshold as of the last day of the two consecutive calendar quarters immediately preceding the applicable date of determination.
Additional Secured Indebtedness (not including trade debts). In addition to the 237 Park Avenue Mortgage Loan, the 237 Park Avenue Property also secures the 237 Park AvenuePari Passu Companion Loans and 237 Park Avenue Subordinate Companion Loans. The 237 Park Avenue Whole Loan is comprised of 18 notes, with an aggregate outstanding principal balance of $693.2 million, which include (i) the 14 senior notes comprising the 237 Park Avenue Senior Loans, with an aggregate outstanding principal balance of $348 million and (ii) the four subordinate notes comprising the 237 Park Avenue Subordinate Companion Loans, with an aggregate outstanding principal balance as of the Cut-off Date of $345.2 million. Prior to a monetary event of default or an event of default that causes the 237 Park Avenue Whole Loan to be specially serviced (a “Triggering EoD”), payments on the 237 Park Avenue Whole Loan are required to be allocated first to pay interest on the 237 Park Avenue Senior Loanspro rata, then to pay interest on the 237 Park Avenue Subordinate Companion Loanspro rata, then to pay principal (if any) on the 237 Park Avenue Senior Loans in accordance with their principal entitlements under the loan documents, and then to pay principal (if any) on the 237 Park Avenue Subordinate Companion Loans in accordance with their principal entitlement under the loan documents. Following a Triggering EoD, payments on the 237 Park Avenue Whole Loan are required to be allocated first to pay interest on the 237 Park Avenue Senior Loanspro rata, then to pay interest on the 237 Park Avenue Subordinate Companion Loanspro rata, then to pay principal on the 237 Park Avenue Senior Loans until their principal balances have been reduced to zero, and then to pay principal on the 237 Park Avenue Subordinate Companion Loans until their principal balances have been reduced to zero. See “Description of the Mortgage Pool—The Whole Loans—The Non-Serviced Pari Passu-AB Whole Loan” in the Preliminary Prospectus.
This is not a research report and was not prepared by any Underwriter’s research department. Please see additional important information and qualifications at the end of this Term Sheet.
| T-53 |
| MSBAM 2017-C34 | 237 Park Avenue |
Mezzanine Loan and Preferred Equity. The “237 Park Avenue Mezzanine Loan” refers to a loan in the original principal amount of $87,800,000 made to 237 Park Mezz Borrower LLC, a Delaware limited liability company, by Morgan Stanley Bank, N.A. and Société Générale, secured by 100% of the direct equity interest in the 237 Park Avenue Fee Borrower (which in turn owns the 237 Park Avenue Declarant Borrower) and put in place simultaneously with the origination of the 237 Park Avenue Whole Loan. The 237 Park Avenue Mezzanine Loan and the 237 Park Avenue Whole Loan are subject to an intercreditor agreement between the 237 Park Avenue Whole Loan lender and the related mezzanine lender. The 237 Park Avenue Mezzanine Loan has the same maturity date as the 237 Park Avenue Whole Loan. The 237 Park Avenue Mezzanine Loan was sold to 237 Park Mezz Lender LLC on September 15, 2017.
The following table presents certain information relating to the 237 Park Avenue Mezzanine Loan:
| Mezzanine Debt Summary | |||||||
| Mezzanine Debt Original Principal Balance | Mezzanine Debt Interest Rate | Original Term to Maturity (mos.) | Original Amort. Term (mos.) | Original IO Term (mos.) | Total Debt UW NCF DSCR | Total Debt UW NOI Debt Yield | Total Debt Cut-off Date LTV |
| $87,800,000 | 5.25% | 120 | 0 | 120 | 1.75x | 7.3% | 59.6% |
In addition, the 237 Park Avenue Borrower is permitted to allow the incurrence of additional mezzanine debt secured by a pledge of the direct or indirect interests in the 237 Park Avenue Borrower and/or of preferred equity in the 237 Park Avenue Borrower in a maximum aggregate amount of $69,000,000, provided the following conditions are satisfied: (i) an aggregate loan-to-value ratio not more than 65.0%, taking into account the 237 Park Avenue Whole Loan, the 237 Park Mezzanine Loan and the additional mezzanine debt, (ii) an aggregate debt yield not less than 6.55%, taking into account the 237 Park Avenue Whole Loan, the 237 Park Avenue Mezzanine Loan and the additional mezzanine debt, (iii) if such mezzanine loan or preferred equity is floating rate, the related borrower is required to obtain an interest rate protection agreement which causes the aggregate debt service coverage ratio immediately following the closing of such mezzanine loan or preferred equity to be not less than 1.10x, (iv) the mezzanine loan or preferred equity is required to have a maturity or final redemption date not earlier than the maturity date of the 237 Park Avenue Whole Loan, (v) entry into a customary intercreditor or preferred equity recognition agreement, (vi) at the reasonable request of the mortgage lender, the 237 Park Avenue Borrower must execute amendments to the 237 Park Avenue Whole Loan documents to reflect the existence of such mezzanine loan(s) or preferred equity; (vii) the mezzanine loan or preferred equity is required to be structured so as not to adversely affect the compliance of the 237 Park Avenue Borrower with special purpose and bankruptcy remoteness criteria ; and (viii) delivery of the Supplemental Interest Reserve Funds.
Release of Property. NYP has a right of first offer to purchase any space that becomes available in the other condominium units at the 237 Park Avenue Property. If NYP exercises its right of first offer to purchase available space, the 237 Park Avenue Borrower is permitted to obtain a release of the lien of the mortgage on the applicable accepted offer space subject to the satisfaction of the conditions set forth in the loan agreement, including, without limitation, satisfaction of the closing conditions under the NYP purchase and sale agreement and the delivery of a collateral assignment of the purchase money note and purchase money mortgage relating to the accepted offer space in substantially the same form as the collateral assignment delivered to lender at loan origination. The 237 Park Avenue Borrower is not required to pay any release price in connection with any such release and is not required to deliver any REMIC opinion in connection therewith.
Terrorism Insurance. So long as the Terrorism Risk Insurance Program Reauthorization Act of 2015 or any replacement, reauthorization or extension thereof (“TRIPRA”) is in effect, the 237 Park Avenue Borrower is required to maintain property insurance that includes terrorism coverage in an amount equal to the full replacement cost of the 237 Park Avenue Property (plus 24 months of business interruption coverage), provided that so long as TRIPRA is in effect and continues to cover both foreign and domestic acts, the lender is required to accept terrorism insurance with coverage against acts which are “certified” within the meaning of TRIPRA. If TRIPRA is not in effect, then provided that terrorism insurance is commercially available, the 237 Park Avenue Borrower is required to carry terrorism insurance throughout the term of the 237 Park Avenue Whole Loan as described in the preceding sentence, but in that event the 237 Park Avenue Borrower is not required to spend more than two times the amount of the insurance premium that is payable at that time in respect of the property and business interruption insurance required under the related loan documents (without giving effect to the cost of the terrorism components of such insurance). See “Risk Factors—Risks Relating to the Mortgage Loans—Terrorism Insurance May Not Be Available for All Mortgaged Properties” in the Preliminary Prospectus.
This is not a research report and was not prepared by any Underwriter’s research department. Please see additional important information and qualifications at the end of this Term Sheet.
| T-54 |
(THIS PAGE INTENTIONALLY LEFT BLANK)
| T-55 |
| MSBAM 2017-C34 | 9-19 9th Avenue |
Mortgage Loan No. 4 – 9-19 9th Avenue
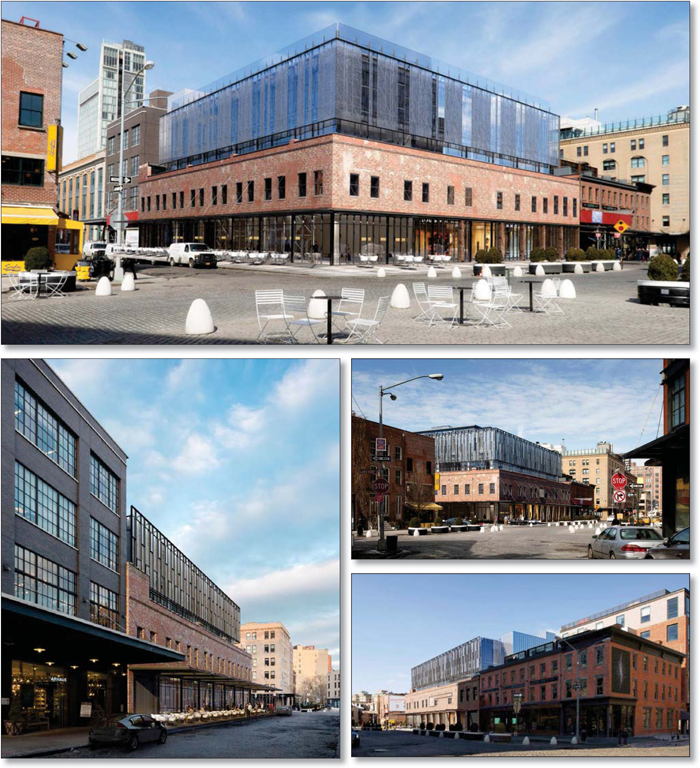
This is not a research report and was not prepared by any Underwriter’s research department. Please see additional important information and qualifications at the end of this Term Sheet.
| T-56 |
| MSBAM 2017-C34 | 9-19 9th Avenue |
Mortgage Loan No. 4 – 9-19 9th Avenue
![[MAP]](https://capedge.com/proxy/FWP/0001539497-17-001723/n1055tsimg014.jpg)
This is not a research report and was not prepared by any Underwriter’s research department. Please see additional important information and qualifications at the end of this Term Sheet.
| T-57 |
| MSBAM 2017-C34 | 9-19 9th Avenue |
| Mortgage Loan No. 4 – 9-19 9th Avenue |
| Mortgage Loan Information | Property Information | |||||||
| Mortgage Loan Seller: | SMF III | Single Asset/Portfolio: | Single Asset | |||||
| Original Balance(1): | $50,000,000 | Location: | New York, NY 10014 | |||||
| Cut-off Date Balance(1): | $50,000,000 | General Property Type: | Retail | |||||
| % of Initial Pool Balance: | 4.8% | Detailed Property Type: | Single Tenant | |||||
| Loan Purpose: | Refinance | Title Vesting: | Fee | |||||
| Sponsors: | Robert Cayre; BRE Properties, LLC | Year Built/Renovated: | 1920/2017 | |||||
| Mortgage Rate: | 4.1310% | Size: | 61,038 SF | |||||
| Note Date: | 7/20/2017 | Cut-off Date Balance per SF(1): | $1,720 | |||||
| First Payment Date: | 9/6/2017 | Maturity Date Balance per SF(1): | $1,720 | |||||
| Maturity Date: | 8/6/2027 | Property Manager: | William Gottlieb Management Co., LLC | |||||
| Original Term to Maturity: | 120 months | (borrower-related) | ||||||
| Original Amortization Term: | 0 months | |||||||
| IO Period: | 120 months | Underwriting and Financial Information | ||||||
| Seasoning: | 2 months | UW NOI: | $8,420,366 | |||||
| Prepayment Provisions: | LO (26); DEF (90); O (4) | UW NOI Debt Yield(1): | 8.0% | |||||
| Lockbox/Cash Mgmt Status: | Hard/In Place | UW NOI Debt Yield at Maturity(1): | 8.0% | |||||
| Additional Debt Type(2): | Pari Passu | UW NCF DSCR(1): | 1.91x | |||||
| Additional Debt Balance(2): | $55,000,000 | Most Recent NOI(4): | N/A | |||||
| Future Debt Permitted (Type): | No (N/A) | 2nd Most Recent NOI(4): | N/A | |||||
| Reserves(3) | 3rd Most Recent NOI(4): | N/A | ||||||
| Type | Initial | Monthly | Cap | Most Recent Occupancy(5): | 100.0% (10/6/2017) | |||
| RE Tax: | $128,689 | $64,345 | N/A | 2nd Most Recent Occupancy(5): | N/A | |||
| Insurance: | $162,734 | $13,562 | N/A | 3rd Most Recent Occupancy(5): | N/A | |||
| Recurring Replacements: | $0 | Springing | N/A | Appraised Value (as of): | $202,000,000 (6/23/2017) | |||
| TI/LC: | $0 | $0 | N/A | Cut-off Date LTV Ratio(1): | 52.0% | |||
| Other: | $0 | $0 | N/A | Maturity Date LTV Ratio(1): | 52.0% | |||
| Sources and Uses | ||||||
| Sources | Proceeds | % of Total | Uses | Proceeds | % of Total | |
| Loan Amount(1): | $105,000,000 | 100.0% | Loan Payoff: | $60,399,767 | 57.5% | |
| Return of Equity: | $41,608,335 | 39.6% | ||||
| Closing Costs: | $2,700,475 | 2.6% | ||||
| Reserves: | $291,423 | 0.3% | ||||
| Total Sources: | $105,000,000 | 100.0% | Total Uses: | $105,000,000 | 100.0% | |
| (1) | The 9-19 9th Avenue Mortgage Loan (as defined below) is part of the 9-19 9th Avenue Whole Loan (as defined below), which is comprised of twopari passu promissory notes with an aggregate principal balance of $105,000,000. The Cut-off Date Balance per SF, Maturity Date Balance per SF, UW NOI Debt Yield, UW NOI Debt Yield at Maturity, UW NCF DSCR, Cut-off Date LTV Ratio and Maturity Date LTV Ratio numbers presented above are based on the aggregate principal balance of the promissory notes comprising the 9-19 9th Avenue Whole Loan. |
| (2) | See “The Mortgage Loan”and“Additional Secured Indebtedness (not including trade debts)”,for further discussion of additional debt. |
| (3) | See “Escrows and Reserves” below for further discussion of reserve requirements. |
| (4) | Historical NOI is unavailable because the 9-19 9th Avenue Property (as defined below) underwent a substantial redevelopment commencing in 2014 which is expected to be completed in October 2017. |
| (5) | Most Recent Occupancy includes Restoration Hardware, Inc. (“Restoration Hardware”). Restoration Hardware’s lease commenced in September 2016 and it began paying rent in May 2017. Restoration Hardware has not yet taken occupancy, but has accepted its leased premises and renovation work is expected to be completed in October 2017. Restoration Hardware anticipates opening for business in November 2017. Historical Occupancy is unavailable because the 9-19 9th Avenue Property underwent a substantial redevelopment commencing in 2014. |
The Mortgage Loan. The fourth largest mortgage loan (the “9-19 9th Avenue Mortgage Loan”) is part of a whole loan (the “9-19 9th Avenue Whole Loan”) evidenced by twopari passu promissory notes in the aggregate original principal amount of $105,000,000, both of which are secured by a first priority fee mortgage encumbering a retail property located in New York, New York (the “9-19 9th Avenue Property”). Promissory Note A-2 in the original principal amount of $50,000,000 represents the 9-19 9th Avenue Mortgage Loan and will be included in the MSBAM 2017-C34 securitization trust. Promissory Note A-1 in the original principal amount of $55,000,000 (the “9-19 9th Avenue Non-ServicedPari Passu Companion Loan”) represents the controlling interest in the 9-19 9th Avenue Whole Loan and was contributed to the CGCMT 2017-P8 securitization trust. The 9-19 9th Avenue Whole Loan will be serviced pursuant to the pooling and servicing agreement for the CGCMT 2017-P8 trust. See “Description of the Mortgage Pool—The Whole Loans—The Non-Serviced Pari Passu Whole Loans” and “Pooling and Servicing Agreement—Servicing of the Non-Serviced Mortgage Loans” in the Preliminary Prospectus.
This is not a research report and was not prepared by any Underwriter’s research department. Please see additional important information and qualifications at the end of this Term Sheet.
| T-58 |
| MSBAM 2017-C34 | 9-19 9th Avenue |
The Borrower and the Sponsors.The borrower is 9th Avenue Delaware Owner LLC (“9-19 9th Avenue Borrower”), a single-purpose Delaware limited liability company with two independent directors. The loan sponsors and nonrecourse carve-out guarantors are Robert Cayre and BRE Properties, LLC, a Delaware limited liability company. Robert Cayre is the founder of Aurora Capital Associates (“Aurora”). Aurora is a leading owner, developer and operator of premier properties in New York City and major markets throughout the United States. Aurora’s approximately 5.0 million SF portfolio features flagship retail properties, boutique offices and residential buildings. The firm focuses on adding value to assets located on high street retail corridors through repositioning, redevelopment and ground-up construction. Aurora has grown to become one of the largest property owners in Manhattan’s Meatpacking District and SoHo neighborhoods. Currently, Aurora has over 2.0 million SF of construction projects in various stages of development throughout New York City.
Recent development projects include the 215,000 SF Renaissance Marriott New York Midtown, a 150,000 SF mixed-use project on Harlem’s 125th Street anchored by Bed Bath & Beyond and a 150,000 SF mixed-use development featuring Whole Foods in Williamsburg, Brooklyn. Aurora has a significant presence in the Meatpacking District, owning and developing commercial assets such as 61 9th Avenue, 21-27 9th Avenue and Gansevoort Market. BRE Properties, LLC is an entity owned by the Gottlieb family, which also owns William Gottlieb Real Estate. William Gottlieb Real Estate is one the largest real estate companies in Manhattan. Since its founding in the 1950s, William Gottlieb Real Estate has focused on acquiring downtown buildings, warehouses and lots in Greenwich Village, the Meatpacking District and the Lower East Side.
The Property.The 9-19 9th Avenue Property is a recently redeveloped, five-story, 61,038 SF retail building located in Manhattan’s Meatpacking District. The 9-19 9th Avenue Property is 100.0% leased to a wholly-owned subsidiary of Restoration Hardware (NYSE: RH). The 9-19 9th Avenue Property will serve as Restoration Hardware’s New York City flagship location. Restoration Hardware is relocating its flagship store from 935 Broadway in New York’s Flatiron District. According to Restoration Hardware’s Chairman and CEO, Gary Friedman, the New York flagship store is the company’s top-performing store. Originally developed in 1920, the 9-19 9th Avenue Property was previously occupied by Pastis, a restaurant. At the time, the 9-19 9th Avenue Property was two stories and contained approximately 31,000 SF. Now standing five stories tall with frontage along 9th Avenue and Little West 12th Street, the 9-19 9th Avenue Property features finishes that include a refinished brick façade and a glass paneled façade wrapping its upper three stories. The basement space is 10,773 SF, the ground floor is 13,140 SF, the second floor is 12,166 SF, the third floor is 11,094 SF, the fourth floor is 10,947 SF and the fifth floor is 2,918 SF. The basement through fourth floor will primarily consist of furniture display space. The fifth floor will be a rooftop restaurant with an open kitchen and a large covered patio (the patio space is not included in the GLA).
The 9-19 9th Avenue Property is 100.0% leased as of October 6, 2017 by Restoration Hardware. After Restoration Hardware’s 15-year lease was executed in February 2014, redevelopment began at the 9-19 9th Avenue Property. To date, the borrower sponsors have spent in excess of $25.0 million on the redevelopment. Restoration Hardware’s lease commenced in September 2016 and in May 2017, Restoration Hardware commenced paying rent of $8.5 million annually, which will increase at a rate of 6.0% every two years. Restoration Hardware has two 10-year extension options associated with the lease.
Major Tenant.
Restoration Hardware (61,038 SF, 100.0% of NRA, 100.0% of underwritten base rent). Restoration Hardware, founded in 1979, is a retailer in the home furnishings marketplace. Restoration Hardware offers merchandise assortments across a range of categories, including furniture, lighting, textiles, bathware, decor, outdoor and garden furnishings. Restoration Hardware classifies its sales into furniture and non-furniture product lines. The furniture category includes both indoor and outdoor furniture, while the non-furniture category includes lighting, textiles, fittings, fixtures, surfaces, accessories and home decor. Restoration Hardware operates a total of 85 retail galleries, consisting of 50 legacy galleries, six larger format design galleries, eight next generation “design” galleries, one RH Modern Gallery and five RH Baby & Child Galleries; the remaining galleries are waterworks showrooms, outlet stores and retail galleries throughout the United States, Canada and the United Kingdom. Restoration Hardware has been publicly traded since August 2011 and has a market capitalization of approximately $2.3 billion (as of July 26, 2017). Per Restoration Hardware’s January 2017 10-K, the company has reported stockholders’ equity of approximately $919.9 million with liquidity of approximately $87.0 million. Restoration Hardware’s lease commenced in September 2016 and it began paying rent in May 2017. Restoration Hardware has not yet taken occupancy, but has accepted its leased premises and renovation work is expected to be completed in October 2017. Restoration Hardware anticipates opening for business in November 2017. Restoration Hardware has two 10-year extension options
The following table presents a summary regarding the sole tenant at the 9-19 9th Avenue Property:
| Tenant Summary(1) | |||||||
| Tenant Name | Credit Rating (Fitch/Moody’s/S&P) | Tenant SF | Approximate % of SF | Annual UW Rent(2) | % of Total Annual UW Rent | Annual UW Rent PSF(2) | Lease Expiration |
| Restoration Hardware(3) | NR/NR/NR | 61,038 | 100.0% | $9,702,846 | 100.0% | $158.96 | 1/31/2032 |
| Subtotal/Wtd. Avg. | 61,038 | 100.0% | $9,702,846 | 100.0% | $158.96 | ||
| Vacant Space | 0 | 0.0% | $0 | 0.0% | $0.00 | ||
| Total/Wtd. Avg. | 61,038 | 100.0% | $9,702,846 | 100.0% | $158.96 | ||
| (1) | Information is based on the underwritten rent roll. |
| (2) | Annual UW Rent and Annual UW Rent PSF reflect average rent steps through the term of the 9-19 9th Avenue Whole Loan. Restoration Hardware is currently paying $8,500,000. |
| (3) | Restoration Hardware’s lease commenced in September 2016 and it began paying rent in May 2017. Restoration Hardware has not yet taken occupancy, but has accepted its leased premises and renovation work is expected to be completed in October 2017. Restoration Hardware anticipates opening for business in November 2017. |
This is not a research report and was not prepared by any Underwriter’s research department. Please see additional important information and qualifications at the end of this Term Sheet.
| T-59 |
| MSBAM 2017-C34 | 9-19 9th Avenue |
The following table presents certain information relating to the lease rollover schedule at the 9-19 9th Avenue Property:
| Lease Rollover Schedule(1) | ||||||||
| Year | # of Leases Rolling | SF Rolling | UW Rent PSF Rolling(2) | Approx. % of Total SF Rolling | Approx. Cumulative % of SF Rolling | Total UW Rent Rolling(2) | Approx. % of Total Rent Rolling | Approx. Cumulative % of Total Rent Rolling |
| 2017 | 0 | 0 | $0.00 | 0.0% | 0.0% | $0 | 0.0% | 0.0% |
| 2018 | 0 | 0 | $0.00 | 0.0% | 0.0% | $0 | 0.0% | 0.0% |
| 2019 | 0 | 0 | $0.00 | 0.0% | 0.0% | $0 | 0.0% | 0.0% |
| 2020 | 0 | 0 | $0.00 | 0.0% | 0.0% | $0 | 0.0% | 0.0% |
| 2021 | 0 | 0 | $0.00 | 0.0% | 0.0% | $0 | 0.0% | 0.0% |
| 2022 | 0 | 0 | $0.00 | 0.0% | 0.0% | $0 | 0.0% | 0.0% |
| 2023 | 0 | 0 | $0.00 | 0.0% | 0.0% | $0 | 0.0% | 0.0% |
| 2024 | 0 | 0 | $0.00 | 0.0% | 0.0% | $0 | 0.0% | 0.0% |
| 2025 | 0 | 0 | $0.00 | 0.0% | 0.0% | $0 | 0.0% | 0.0% |
| 2026 | 0 | 0 | $0.00 | 0.0% | 0.0% | $0 | 0.0% | 0.0% |
| 2027 | 0 | 0 | $0.00 | 0.0% | 0.0% | $0 | 0.0% | 0.0% |
| 2028 | 0 | 0 | $0.00 | 0.0% | 0.0% | $0 | 0.0% | 0.0% |
| 2029 | 0 | 0 | $0.00 | 0.0% | 0.0% | $0 | 0.0% | 0.0% |
| 2030 & Beyond | 1 | 61,038 | $158.96 | 100.0% | 100.0% | $9,702,846 | 100.0% | 100.0% |
| Vacant | 0 | 0 | $0.00 | 0.0% | 0.0% | $0 | 0.0% | 100.0% |
| Total/Wtd. Avg. | 1 | 61,038 | $158.96 | 100.0% | $9,702,846 | 100.0% | ||
| (1) | Information is based on the underwritten rent roll. |
| (2) | UW Rent PSF Rolling and Total UW Rent Rolling reflect average rent steps through the term of the 9-19 9th Avenue Whole Loan. Restoration Hardware is currently paying $8,500,000. |
The Market. The 9-19 9th Avenue Property is located in New York City’s Meatpacking District, on the far west side of Manhattan, bordered to the north by Chelsea and to the south by the West Village. The appraisal indicated that the 9-19 9th Avenue Property is located within the Greenwich Village submarket. The 9-19 9th Avenue Property is situated along the corner of 9th Avenue and Little West 12th Street, directly adjacent to Catch, a 400-seat, tri-level seafood restaurant, as well as being within walking distance from The High Line Park, the Whitney Museum of American Art and Chelsea Market. The Meatpacking District and Chelsea are home to high-end shopping including Christian Louboutin, Alexander McQueen, Stella McCartney, Hermes, Tory Burch, Patagonia, lululemon, Tesla and Theory. Additionally, both neighborhoods have emerged as destinations for technology, media and creative industry companies, with Google, Twitter, Apple, Samsung and Uber all having a prominent presence. The 9-19 9th Avenue Property features access to public transportation options including the A / C / E subway lines two blocks to the north and one block to the east at 14th Street and 8th Avenue and the 1 / 2 / 3 subway lines two blocks to the north and two blocks to the east at 14th Street and 7th Avenue.
The 9-19 9th Avenue Property is located in the Greenwich Village retail submarket. According to the appraisal, as of the first quarter of 2017, the Greenwich Village retail submarket had a total inventory of 2,700,018 SF, with a vacancy rate of 3.1% and average asking rent of $122.39 per SF. According to a market report, the 2017 population within a one-, three- and five-mile radius of the 9-19 9th Avenue Property was 138,112, 1,100,771 and 2,412,260, respectively. Additionally, the 2017 median household income within a one-, three- and five-mile radius of the 9-19 9th Avenue Property was $116,432, $95,725 and $82,394, respectively.
The following table presents rental comparables with respect to the 9-19 9th Avenue Property as identified in the appraisal:
| Comparable Rentals Summary | ||||||||
| Property Name/Location | Year Built | Size (SF) | Tenant Name | Lease Size (SF) | Lease Date | Lease Term (Yrs.) | Rent PSF | Lease Type |
115-121 Wooster Street New York, NY | 1900 | 7,875 | Ted Baker | 7,875 | Jan. 16 | 10.0 | $235.00 | Net |
46 Gansevoort Street New York, NY | 1941 | 10,000 | Hermes | 10,000 | Jan. 18 | 10.0 | $284.00 | Net |
424 Broome Street New York, NY | 1900 | 4,100 | Indochino | 4,100 | Jun. 16 | 5.0 | $275.00 | Net |
810 Washington Street New York, NY | 1940 | 2,125 | Intermix | 2,125 | Sep. 16 | 10.0 | $225.00 | Triple Net |
32 Gansevoort Street New York NY | 1910 | 10,100 | Sweetgreen | 1,915 | Aug. 16 | 10.0 | $240.00 | Triple Net |
803 Broadway New York, NY | 1930 | 115,000 | Brooklyn Industries
| 2,400 | May 17 | 9.0 | $200.00 | Triple Net |
Source:Appraisal.
This is not a research report and was not prepared by any Underwriter’s research department. Please see additional important information and qualifications at the end of this Term Sheet.
| T-60 |
| MSBAM 2017-C34 | 9-19 9th Avenue |
Underwritten Net Cash Flow. The following table presents certain information relating to the underwritten net cash flow at the 9-19 9th Avenue Property:
| Cash Flow Analysis(1) | ||
| UW | UW PSF | |
| Base Rent(2) | $9,702,846 | $158.96 |
| Total Recoveries | $0 | $0.00 |
| Other Income | $0 | $0.00 |
| Less Vacancy & Credit Loss | ($291,085) | ($4.77) |
| Effective Gross Income | $9,411,761 | $154.20 |
| Total Operating Expenses | $991,395 | $16.24 |
| Net Operating Income | $8,420,366 | $137.95 |
| Capital Expenditures | $6,104 | $0.10 |
| TI/LC | $0 | $0.00 |
| Net Cash Flow | $8,414,262 | $137.85 |
| Occupancy %(3) | 97.0% | |
| NOI DSCR(4) | 1.91x | |
| NCF DSCR(4) | 1.91x | |
| NOI Debt Yield(4) | 8.0% | |
| NCF Debt Yield(4) | 8.0% | |
| (1) | Historical information is unavailable because the 9-19 9th Avenue Property underwent a substantial redevelopment commencing in 2014. |
| (2) | Base Rent reflects average rent steps through the term of the 9-19 9th Avenue Whole Loan. Restoration Hardware is currently paying $8,500,000. |
| (3) | UW Occupancy % is based on underwritten economic occupancy which is based on the vacancy rate in place at 9-19 9th Avenue Property. |
| (4) | Debt service coverage ratios and debt yields are based on the 9-19 9th Avenue Whole Loan. |
Escrows and Reserves. At origination, the 9-19 9th Avenue Borrower deposited $162,734 for insurance premiums and $128,689 for taxes. 9-19 9th Avenue Borrower is required to escrow monthly an amount equal to: (i) 1/12th of the estimated annual tax payments (currently $64,345) and (ii) 1/12th of the estimated annual insurance premiums (currently $13,562) and (iii) $509 monthly into an escrow for replacement reserves, provided that, so long as no event of default exists under the 9-19 9th Avenue Whole Loan, the 9-19 9th Avenue Borrower continues to maintain the 9-19 9th Avenue Property in accordance with the Restoration Hardware lease, the Restoration Hardware lease is in full force and effect and Restoration Hardware is maintaining the 9-19 9th Avenue Property in accordance with its lease, deposits into the replacement reserve will be suspended. The ongoing replacement reserve is currently suspended.
Lockbox and Cash Management. The 9-19 9th Avenue Whole Loan is structured with a hard lockbox and in-place cash management. The 9-19 9th Avenue Mortgage Loan documents require the tenant, pursuant to a tenant direction letter, to pay rent directly to the lockbox account and require that all other money received by the 9-19 9th Avenue Borrower with respect to the 9-19 9th Avenue Property be deposited within two business days into such lockbox account. The lockbox account will be swept on each business day into a lender-controlled cash management account. All funds in the cash management account are required to be used to pay debt service, fund required reserves and pay operating expenses. During a Sweep Event Period (as defined below), following the payment of debt service, funding of required reserves and payment of operating expenses, all remaining amounts will be deposited in the excess cash flow reserve account and held as additional collateral for the 9-19 9th Avenue Mortgage Loan and used for extending the Major Tenant’s (as defined below) lease or re-tenanting the 9-19 9th Avenue Property, provided, however, that in the case of a Sweep Event Period attributable to clause (ii) of the definition of Major Tenant Trigger Event Period (as defined below), other than during that last 36 months of the term of the 9-19 9th Avenue Mortgage Loan, so long as the Major Tenant is paying its rent as required under its lease, the amount of excess cash flow to be transferred to the related major tenant reserve will be limited to $30.00 per SF, capped at $19,200,000 (the “Dark Sweep Cap Conditions”), or in the case of a Major Tenant Trigger Event Period in clause (iii) of that definition, so long as the Major Tenant is paying its rent as required under its lease, the amount of the excess cash flow that will be transferred to the related major tenant reserve will be capped at (x) $10,000,000 for an aggregate sublet of between 30.0% and 50.0% of the Major Tenant’s leased space or (y) $19,200,000 for an aggregate sublet of greater than 50.0% of the Major Tenant’s leased space (the “Sublease Cap Conditions”). If no Sweep Event Period is continuing, following the payment of debt service, funding of required reserves and payment of operating expenses, all remaining amounts will be released to the 9-19 9th Avenue Borrower’s account.
A “Sweep Event Period” will (i) commence upon the occurrence of an event of default under the 9-19 9th Avenue Mortgage Loan and continue until such event of default is cured (so long as no other Sweep Event Period is in effect), (ii) commence upon the date the debt service coverage ratio of the 9-19 9th Avenue Property (based on the trailing 12 calendar months and as determined by the lender) is less than 1.20x, and continue until the date the debt service coverage ratio of the 9-19 9th Avenue Property (based on the trailing 12 calendar months and as determined by the lender) is equal to or greater than 1.30x for two consecutive calendar quarters (so long as no other Sweep Event Period is in effect) and (iii) exist during any Major Tenant Trigger Event Period.
A “Major Tenant Trigger Event Period” occurs upon Restoration Hardware, or any tenant occupying Restoration Hardware’s space at the 9-19 9th Avenue Property (each, a “Major Tenant”), (i) defaulting beyond any applicable cure or grace period under its lease and continuing until (a) a Major Tenant Re-Tenanting Event (as defined below) has occurred or (b) the related default has been cured, (ii) going dark or otherwise ceasing operations in its leased space at the 9-19 9th Avenue Property and continuing until (a) a Major Tenant Re-Tenanting Event has occurred, (b) the applicable Major Tenant has resumed normal business operations in any of its space for a period of two consecutive calendar quarters or (c) the Dark Sweep Cap Conditions have been satisfied, (iii) subletting more than 30.0% of its leased space in the aggregate (other than a sublease to (a) an operator for a café at the 9-19 9th Avenue Property or (b) a sublessee that has (x) a credit rating of “BB” (or its equivalent) or better by a nationally recognized rating agency or (y) a net worth greater than the greater of $919,869,000 or the Major Tenant’s net worth the date of the sublease) and continuing until (a) such qualifying subleases
This is not a research report and was not prepared by any Underwriter’s research department. Please see additional important information and qualifications at the end of this Term Sheet.
| T-61 |
| MSBAM 2017-C34 | 9-19 9th Avenue |
have terminated and a Major Tenant is then open for business in the related subleased space for a period of two consecutive calendar quarters or (b) the Sublease Cap Conditions have been satisfied, (iv) becoming a debtor in any bankruptcy or other insolvency proceeding and continuing until (a) a Major Tenant Re-Tenanting Event has occurred or (b) the related bankruptcy or insolvency proceeding has terminated and the Major Tenant lease has been affirmed, in each case, in a manner satisfactory to the lender, or (v) terminating or canceling its lease (or the lease failing or ceasing to be in full force and effect), or giving notice of, or commencing a legal proceeding asserting and continuing until (a) a Major Tenant Re-Tenanting Event has occurred or (b) any applicable default has been cured and such Major Tenant lease has been in full force and effect for a period of two consecutive calendar quarters, any of the foregoing.
A “ Major Tenant Re-Tenanting Event” means that the lender has received satisfactory evidence that the applicable Major Tenant space has been leased to one or more reasonably satisfactory replacement Major Tenants, each pursuant to a reasonably satisfactory replacement lease for a term of no less than five years and otherwise on terms and conditions reasonably acceptable to the lender, that each such Major Tenant has accepted occupancy of its premises, open for business and is paying full, unabated rent (or sufficient additional funds are deposited with the lender to pay for such abatement periods) pursuant to the terms of the related lease or leases, and that all tenant improvement costs and leasing commissions provided in each such replacement lease have been paid (or sufficient additional funds as reasonably determined by the lender are deposited with the lender to pay for such costs), and a satisfactory estoppel certificate from each such replacement Major Tenant affirming the foregoing.
Additional Secured Indebtedness (not including trade debts).The 9-19 9th Avenue Property also secures the 9-19 9th Avenue Non-ServicedPari Passu Companion Loan, which has a Cut-off Date principal balance of $55,000,000. The 9-19 9th Avenue Non-ServicedPari Passu Companion Loan accrues interest at the same rate as the 9-19 9th Avenue Mortgage Loan. The 9-19 9th Avenue Mortgage Loan is entitled to payments of interest on apro rata andpari passu basis with the 9-19 9th Avenue Non-ServicedPari Passu Companion Loan. The holders of the 9-19 9th Avenue Mortgage Loan and the 9-19 9th Avenue ServicedPari Passu Companion Loan have entered into a co-lender agreement which sets forth the allocation of collections on the 9-19 9th Avenue Whole Loan. See “Description of the Mortgage Pool—The Whole Loans— The Non-Serviced Pari Passu Whole Loans” in the Preliminary Prospectus.
Mezzanine Loan and Preferred Equity. Not permitted.
Release of Property. Not permitted.
Terrorism Insurance.The 9-19 9th Avenue Borrower is required to obtain terrorism insurance for domestic and foreign acts of terrorism (as defined in the Terrorism Risk Insurance Program Reauthorization Act of 2007 as amended or replaced) in an amount equal to the full replacement cost of the 9-19 9th Avenue Property and business interruption insurance required under the 9-19 9th Avenue Whole Loan documents.
This is not a research report and was not prepared by any Underwriter’s research department. Please see additional important information and qualifications at the end of this Term Sheet.
| T-62 |
(THIS PAGE INTENTIONALLY LEFT BLANK)
| T-63 |
| MSBAM 2017-C34 | OKC Outlets |
Mortgage Loan No. 5 – OKC Outlets
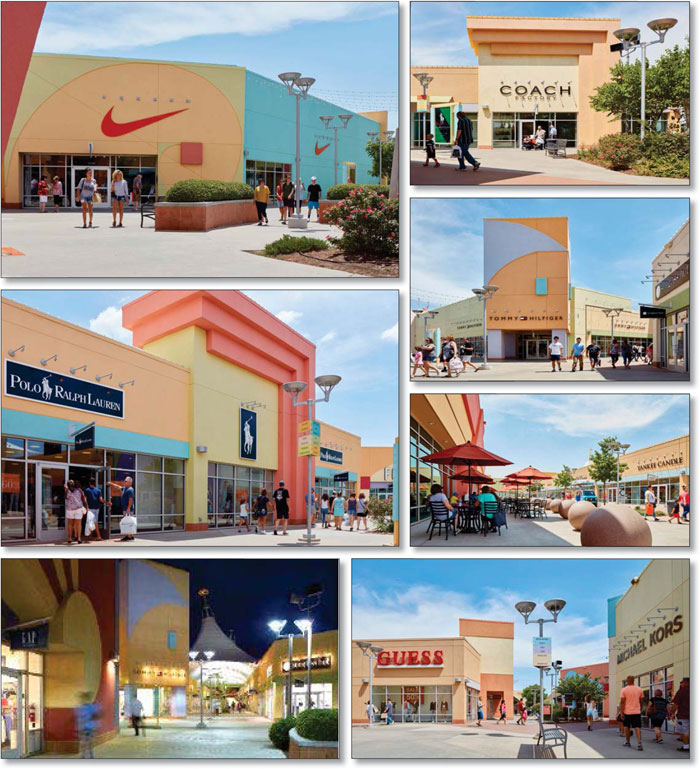
This is not a research report and was not prepared by any Underwriter’s research department. Please see additional important information and qualifications at the end of this Term Sheet.
| T-64 |
| MSBAM 2017-C34 | OKC Outlets |
Mortgage Loan No. 5 – OKC Outlets
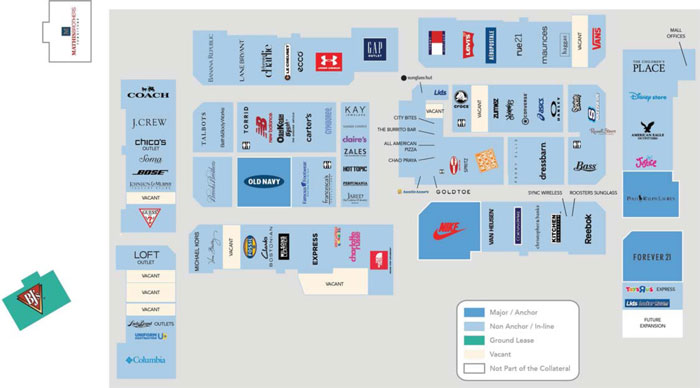
This is not a research report and was not prepared by any Underwriter’s research department. Please see additional important information and qualifications at the end of this Term Sheet.
| T-65 |
| MSBAM 2017-C34 | OKC Outlets |
Mortgage Loan No. 5 – OKC Outlets

This is not a research report and was not prepared by any Underwriter’s research department. Please see additional important information and qualifications at the end of this Term Sheet.
| T-66 |
| MSBAM 2017-C34 | OKC Outlets |
| Mortgage Loan No. 5 – OKC Outlets |
| Mortgage Loan Information | Property Information | ||||||
| Mortgage Loan Seller: | KeyBank | Single Asset/Portfolio: | Single Asset | ||||
| Original Balance(1): | $49,500,000 | Location: | Oklahoma City, OK 73127 | ||||
| Cut-off Date Balance(1): | $49,500,000 | General Property Type: | Retail | ||||
| % of Initial Pool Balance: | 4.7% | Detailed Property Type: | Outlet Center | ||||
| Loan Purpose: | Acquisition | Title Vesting: | Fee | ||||
| Sponsor: | Singerman Real Estate | Year Built/Renovated: | 2011/2012-2013 | ||||
| Mortgage Rate: | 4.1800% | Size: | 393,793 SF | ||||
| Note Date: | 4/28/2017 | Cut-off Date Balance per SF(1): | $220 | ||||
| First Payment Date: | 6/1/2017 | Maturity Date Balance per SF(1): | $220 | ||||
| Maturity Date: | 5/1/2022 | Property Manager: | AYA Management Services, LLC | ||||
| Original Term to Maturity: | 60 months | ||||||
| Original Amortization Term: | 0 months | ||||||
| IO Period: | 60 months | Underwriting and Financial Information | |||||
| Seasoning: | 5 months | UW NOI: | $9,649,018 | ||||
| Prepayment Provisions: | LO (29); DEF (25); O (6) | UW NOI Debt Yield(1): | 11.2% | ||||
| Lockbox/Cash Mgmt Status: | Hard/Springing | UW NOI Debt Yield at Maturity(1): | 11.2% | ||||
| Additional Debt Type(2): | Pari Passu | UW NCF DSCR(1): | 2.41x | ||||
| Additional Debt Balance(2): | $37,000,000 | Most Recent NOI: | $10,265,107 (3/31/2017 TTM) | ||||
| Future Debt Permitted (Type): | No (N/A) | 2nd Most Recent NOI: | $10,268,149 (12/31/2016) | ||||
| Reserves(3) | 3rd Most Recent NOI: | $9,390,490 (12/31/2015) | |||||
| Type | Initial | Monthly | Cap | Most Recent Occupancy: | 93.3% (6/1/2017) | ||
| RE Tax: | $511,766 | $102,353 | N/A | 2nd Most Recent Occupancy: | 97.1% (1/1/2016) | ||
| Insurance: | $14,559 | $14,559 | N/A | 3rd Most Recent Occupancy: | 100.0% (1/1/2015) | ||
| Recurring Replacements: | $0 | $8,213 | $295,685 | Appraised Value (as of): | $144,300,000 (3/24/2017) | ||
| TI/LC: | $0 | $41,067 | N/A | Cut-off Date LTV Ratio(1): | 59.9% | ||
| Other: | $2,926,196 | $0 | N/A | Maturity Date LTV Ratio(1): | 59.9% | ||
| Sources and Uses | ||||||
| Sources | Proceeds | % of Total | Uses | Proceeds | % of Total | |
| Loan Amount(1): | $86,500,000 | 64.9% | Purchase Price: | $128,625,000 | 96.5% | |
| Borrower Equity: | $46,785,586 | 35.1% | Reserves: | $3,452,521 | 2.6% | |
| Closing Costs: | $1,208,065 | 0.9% | ||||
| Total Sources: | $133,285,586 | 100.0% | Total Uses: | $133,285,586 | 100.0% | |
| (1) | The OKC Outlets Mortgage Loan (as defined below) is part of the OKC Outlets Whole Loan (as defined below), which is comprised of twopari passu promissory notes with an aggregate principal balance of $86,500,000. The Cut-off Date Balance per SF, Maturity Date Balance per SF, UW NOI Debt Yield, UW NOI Debt Yield at Maturity, UW NCF DSCR, Cut-off Date LTV Ratio and Maturity Date LTV Ratio numbers presented above are based on the aggregate principal balance of the promissory notes comprising the OKC Outlets Whole Loan. |
| (2) | See “The Mortgage Loan” and “Additional Secured Indebtedness (not including trade debts)” below for further discussion of additional debt. |
| (3) | See “Escrows and Reserves” below for further discussion of reserve requirements. |
The Mortgage Loan.The fifth largest mortgage loan (the “OKC Outlets Mortgage Loan”) is part of a whole loan (the “OKC Outlets Whole Loan”) evidenced by twopari passu promissory notes in the aggregate original principal amount of $86,500,000, which are secured by a first priority fee mortgage encumbering a 393,793 SF regional retail outlet center in Oklahoma City, Oklahoma (the “OKC Outlets Property”). Promissory Note A-1 in the original principal amount of $49,500,000 represents the OKC Outlets Mortgage Loan and will be included in the MSBAM 2017-C34 securitization trust. Promissory Note A-2 in the original principal amount of $37,000,000 represents the servicedpari passu companion loan (“OKC Outlets ServicedPari Passu Companion Loan”). The OKC Outlets ServicedPari Passu Companion Loan was included in the UBS 2017-C3 securitization trust. The OKC Outlets Whole Loan will be serviced pursuant to the pooling and servicing agreement for the MSBAM 2017-C34 securitization trust. See “Description of the Mortgage Pool—The Whole Loans—The Serviced Pari Passu Whole Loans” and “Pooling and Servicing Agreement” in the Preliminary Prospectus.
The proceeds of the OKC Outlets Whole Loan, together with $46,785,586 of borrower equity, were used to acquire the OKC Outlets Property, fund reserves and pay closing costs.
This is not a research report and was not prepared by any Underwriter’s research department. Please see additional important information and qualifications at the end of this Term Sheet.
| T-67 |
| MSBAM 2017-C34 | OKC Outlets |
The Borrower and the Sponsor. The borrower is OKC Outlets I, LLC (the “OKC Outlets Borrower”), a single-purpose Delaware limited liability company with two independent directors. The borrower sponsor is Singerman Real Estate, a Chicago-based real estate investment firm led by Seth Singerman. Seth Singerman was formerly a Managing Director at GEM Realty Capital before founding Singerman Real Estate in 2010. Since formation, Singerman Real Estate has led and sourced over $2.0 billion of direct investments. The OKC Outlets Borrower is 41.98% owned by the Ohio Public Employees Retirement System, the largest state pension fund in Ohio and the 12th largest public retirement system in the United States. The nonrecourse carve-out guarantors, SRE Opportunity Fund II, L.P. and SRE Opportunity Fund II-A, L.P., report on a combined basis liquidity of approximately $8.8 million, real estate assets of approximately $159.7 million and total assets of approximately $171.9 million as of December 31, 2016. The funds have a combined net worth of approximately $129.7 million. The fund is capitalized primarily by university endowment funds, foundations, state pension funds, family funds, and money management firms.
The Property.The OKC Outlets Property is a 393,793 SF regional retail outlet center located in Oklahoma City, Oklahoma County, Oklahoma, approximately 6.5 miles west of the Oklahoma City central business district. Situated on a 42.18-acre site, the OKC Outlets Property consists of 10 buildings developed in three phases, with the primary phase developed in 2011 and subsequent phases developed between 2012 and 2013. The OKC Outlets Property has 1,963 surface parking spaces (approximately 5.0 per 1,000 SF). As of June 1, 2017, the OKC Outlets Property is 93.3% occupied by 91 tenants and a BJ’s Restaurant outparcel, with no tenant representing more than 3.6% of the NRA. The OKC Outlets Property is leased to primarily national or regional tenants, the largest of which include Nike Factory Store (3.6% of NRA; 3.4% of underwritten rent), Forever 21 (3.1% of NRA; 4.0% of underwritten rent), Old Navy (2.8% of NRA; 2.3% of underwritten rent), Polo Ralph Lauren (2.6% of NRA; 0.0% of underwritten rent) and Columbia Sportswear (2.2% of NRA; 2.5% of underwritten rent). Since 2012, the OKC Outlets Property has had an average occupancy of 98.2%. As of the year-end 2016, the OKC Outlets Property reported total sales for tenants with at least 12 months of sales data of approximately $137.9 million, with average sales of $388 PSF and a weighted average occupancy cost of 12.2%.
Major Tenants.
Nike Factory Store (14,013 SF, 3.6% of NRA, 3.4% of underwritten rent). Founded in 1967, NIKE, Inc. (“NIKE”) is the largest seller of athletic footwear and apparel in the world, specializing in the design, development and worldwide marketing and selling of athletic footwear, apparel, equipment, accessories and services. With the world headquarters located in Beaverton, Oregon, the company has 70,700 employees as of May 31, 2016, and operates 1,045 stores throughout the world, of which 784 are factory outlet stores. NIKE generated approximately $32.4 billion in annual revenue for fiscal year 2016. NIKE is traded on the New York Stock Exchange under the ticker symbol NKE.Nike Factory Store has been at the OKC Outlets Property since the center opened in 2011, occupies 14,013 SF under a lease expiring in January 2022 and currently pays $22.50 PSF in base rent.Nike Factory Outlet has two, five-year renewal options remaining and no termination options.
Forever 21 (12,071 SF, 3.1% of NRA, 4.0% of underwritten rent). Headquartered in Los Angeles, California, Forever 21 is an American fashion retailer of women’s and men’s clothing and accessories. Forever 21 is the fifth largest specialty retailer in the United States, primarily marketing to teens and young shoppers. The average Forever 21 store is 38,000 SF. Forever 21 has been at the OKC Outlets Property since 2014 and currently occupies 12,071 SF under a lease expiring in January 2025. Under its current lease, Forever 21 pays $30.33 PSF in base rent with 3.0% annual rent increases and no renewal options. Forever 21 has a termination option if gross sales are less than $2.5 million during the fourth lease year (ending 7/31/2018).
Old Navy (10,869 SF, 2.8% of NRA, 2.3% of underwritten rent). Founded in 1994, Old Navy is an American fashion retailer of men’s, women’s and children’s apparel and accessories with over 1,000 stores around the world. Old Navy is a division of Gap Inc., which is a worldwide apparel retail company that offers its products under the Gap, Banana Republic, Old Navy, Athleta, and Intermix brands in approximately 3,700 stores. Gap Inc. is currently traded on the New York Stock Exchange under the ticker symbol GPS.Old Navy has been at the OKC Outlets Property since November 2016, currently occupies 10,869 SF under a lease expiring in January 2022 and pays $19.00 PSF in base rent. Old Navy has two five-year renewal options remaining and no termination options.
Polo Ralph Lauren (10,191 SF, 2.6% of NRA, 0.0% of underwritten rent). Ralph Lauren Corporation (“Ralph Lauren”) is a global designer, marketer and distributor of premium lifestyle products in apparel, home, accessories and fragrances. Ralph Lauren offers its products internationally through its brand that includes Ralph Lauren, Ralph Lauren Collection, Ralph Lauren Purple Label, Double RL, Polo Ralph Lauren, Lauren Ralph Lauren, Polo Ralph Lauren Children, Denim & Supply Ralph Lauren, Chaps and Club Monaco, among others. Ralph Lauren is currently traded on the New York Stock Exchange under the ticker symbol RL. Polo Ralph Lauren has been at the OKC Outlets Property since the center opened in 2011 and currently occupies 10,191 SF under a lease expiring in August 2021.Polo Ralph Lauren pays percentage rent equal to 3.0% of gross sales up to and including $500 PSF, plus 2.0% of gross sales in excess of $500 PSF up to and including $1,000 PSF, plus 1.0% of gross sales in excess of $1,000 PSF. Polo Ralph Lauren has four five-year renewal options remaining and an option to terminate its lease if gross sales are less than or equal to $500 PSF during the seventh year (ended 8/4/2018) and each year thereafter.
Columbia Sportswear (8,532 SF, 2.2% of NRA, 2.5% of underwritten rent). Headquartered in Portland, Oregon, Columbia Sportswear (“Columbia”) is a global apparel, footwear, accessories and equipment company that designs, develops, markets and distributes active outdoor and lifestyle products under the brands Columbia, SOREL, Mountain Hardwear, prAna and Pacific Trail. Columbia went public in 1998 and is traded on the NASDAQ under the ticker symbol COLM. Columbia has been a tenant at the OKC Outlets Property since November 2012 and currently occupies 8,532 SF under a lease expiring in January 2023.Under its current lease, Columbia pays $26.35 PSF in base rent with approximate annual rent increases of 3.0% and no renewal options.Columbia has a termination option if gross sales are less than $325 PSF during the fifth lease year (ending 11/6/2017).
This is not a research report and was not prepared by any Underwriter’s research department. Please see additional important information and qualifications at the end of this Term Sheet.
| T-68 |
| MSBAM 2017-C34 | OKC Outlets |
The following table presents certain information relating to the leases at the OKC Outlets Property:
| Tenant Summary(1) | |||||||||
| Tenant Name | Credit Rating (Fitch/Moody’s/S&P)(2) | Tenant SF | Approx. % of SF | Annual UW Rent | Annual UW Rent PSF(3) | App. % of Total Annual UW Rent | 2016 Sales PSF(4) | 2016 Occ. Cost %(5) | Lease Expiration |
| Major Tenants | |||||||||
| Nike Factory Store | NR/A1/AA- | 14,013 | 3.6% | $315,293 | $22.50 | 3.4% | $942 | 2.4% | 1/31/2022 |
| Forever 21(6) | NR/NR/NR | 12,071 | 3.1% | $366,064 | $30.33 | 4.0% | $190 | 17.1% | 1/31/2025 |
| Old Navy | BB+/Baa2/BB+ | 10,869 | 2.8% | $206,511 | $19.00 | 2.3% | NAV | NAV | 1/31/2022 |
| Polo Ralph Lauren(7)(8) | NR/A2/A | 10,191 | 2.6% | $0 | $0.00 | 0.0% | $517 | 3.0% | 8/31/2021 |
| Columbia Sportswear(9) | NR/NR/NR | 8,532 | 2.2% | $224,825 | $26.35 | 2.5% | $279 | 14.7% | 1/31/2023 |
| Under Armour | NR/Baa2/BB+ | 8,387 | 2.1% | $251,610 | $30.00 | 2.7% | $826(10) | 4.8%(10) | 6/30/2027 |
| Gap Outlet | BB+/Baa2/BB+ | 8,303 | 2.1% | $105,033 | $12.65 | 1.1% | $445 | 4.8% | 8/31/2021 |
| American Eagle Outfitters | NR/NR/NR | 8,294 | 2.1% | $197,480 | $23.81 | 2.2% | $435 | 7.6% | 1/31/2018 |
| Subtotal/Wtd. Avg.(8) | 80,660 | 20.5% | $1,666,815 | $23.65 | 18.2% | ||||
| In-Line Tenants (< 8,000 SF) | 286,566 | 72.8% | $7,498,082 | $27.35 | 81.8% | ||||
| Total Occupied(8) | 367,226 | 93.3% | $9,164,898 | $26.59 | 100.0% | ||||
| Vacant Space | 26,567 | 6.7% | |||||||
| Total/Wtd. Avg.(11) | 393,793 | 100.0% | |||||||
| (1) | Information is based on the underwritten rent roll. |
| (2) | Certain ratings are those of the parent company whether or not the parent guarantees the lease. |
| (3) | Wtd. Avg. Annual UW Rent PSF excludes vacant space. |
| (4) | Historical sales information is based on tenants that report sales. |
| (5) | 2016 Occupancy Cost % calculations are based on Annual UW Rent plus reimbursements, divided by sales from the respective year. |
| (6) | Forever 21 has the option to terminate its lease if gross sales are less than $2.5 million during the fourth lease year (ended 7/31/2018). |
| (7) | Polo Ralph Lauren has the option to terminate its lease if gross sales are less than or equal to $500 PSF during any lease year after the fifth year (ended 8/4/2016). |
| (8) | Polo Ralph Lauren and three other In-Line Tenants pay percentage rent in lieu of base rent. Wtd. Avg. Annual UW Rent PSF excludes the SF for these tenants. |
| (9) | Columbia Sportswear has the option to terminate its lease if gross sales are less than $325 PSF during the fifth lease year (ending 11/6/2017). |
| (10) | Under Armour’s 2016 Sales PSF and 2016 Occ. Cost reflect 2016 square footage amount of 6,385 prior to an expansion in 2017 for an additional 2,002 SF. |
| (11) | Total Tenant SF excludes BJ’s Restaurant, which is a ground lease tenant; however, its rent is included in the Annual UW Rent. |
The following table presents historical sales information at the OKC Outlets Property:
| Historical Sales Summary(1) | |||||||||
| 2014 | 2015 | 2016 | |||||||
| Tenant | Sales ($) | Sales PSF | Sales ($) | Sales PSF | Sales ($) | Sales PSF | Occ. Cost %(2) | ||
| Nike Factory Store | $11,098,558 | $792 | $11,683,986 | $834 | $13,206,036 | $942 | 2.4% | ||
| Forever 21 | NAV | NAV | $2,348,967 | $195 | $2,288,504 | $190 | 17.1% | ||
| Polo Ralph Lauren | $5,066,083 | $497 | $5,191,288 | $509 | $5,273,691 | $517 | 3.0% | ||
| Columbia Sportswear | $2,059,750 | $241 | $2,173,796 | $255 | $2,382,109 | $279 | 14.7% | ||
| Under Armour(3) | $5,556,380 | $870 | $5,275,837 | $826 | $5,270,824 | $826 | 4.8% | ||
| Gap Outlet | $4,403,444 | $530 | $3,925,104 | $473 | $3,690,970 | $445 | 4.8% | ||
| American Eagle Outfitters | $3,039,577 | $366 | $3,243,919 | $391 | $3,611,312 | $435 | 7.6% | ||
| Other In-Line Tenants | $92,029,318 | $343 | $93,515,147 | $333 | $102,163,579 | $355 | 13.2% | ||
| Total/Wtd. Avg.(4) | $123,253,110 | $380 | $127,358,044 | $365 | $137,887,025 | $388 | 12.2% | ||
| (1) | Comparable tenant sales are based on tenants with at least 12 months of sales data. Major Tenant Old Navy is not shown since the tenant took occupancy in November 2016. |
| (2) | Occ. Cost % calculations are based on Annual UW Rent plus reimbursements, divided by sales from the respective year. |
| (3) | Under Armour’s 2016 Sales PSF and 2016 Occ. Cost % reflect old square footage amount of 6,385 prior to an expansion in 2017 for an additional 2,002 SF. |
| (4) | Total Sales ($) and Sales PSF include BJ’s Restaurant sales and 8,500 SF of tenant-owned collateral. |
This is not a research report and was not prepared by any Underwriter’s research department. Please see additional important information and qualifications at the end of this Term Sheet.
| T-69 |
| MSBAM 2017-C34 | OKC Outlets |
The following table presents certain information relating to the lease rollover schedule at the OKC Outlets Property:
Lease Rollover Schedule(1)(2)
| ||||||||
| Year | # of Leases Rolling | SF Rolling | Approx. % of Total SF Rolling | Approx. Cumulative % of SF Rolling | Annual UW Rent PSF Rolling(3) | Total UW Rent Rolling | Approx. % of Total Rent Rolling | Approx. Cumulative % of Total Rent Rolling |
| 2017 | 1 | 5,985 | 1.5% | 1.5% | $22.50 | $134,663 | 1.5% | 1.5% |
| 2018 | 8 | 29,066 | 7.4% | 8.9% | $23.76 | $540,138 | 5.9% | 7.4% |
| 2019 | 3 | 6,720 | 1.7% | 10.6% | $22.00 | $147,836 | 1.6% | 9.0% |
| 2020 | 1 | 1,888 | 0.5% | 11.1% | $30.00 | $56,640 | 0.6% | 9.6% |
| 2021 | 36 | 139,832 | 35.5% | 46.6% | $25.05 | $3,247,843 | 35.4% | 45.0% |
| 2022 | 18 | 86,794 | 22.0% | 68.6% | $23.89 | $1,929,450 | 21.1% | 66.1% |
| 2023 | 3 | 17,196 | 4.4% | 73.0% | $25.34 | $435,758 | 4.8% | 70.8% |
| 2024 | 4 | 9,656 | 2.5% | 75.5% | $31.72 | $306,274 | 3.3% | 74.2% |
| 2025 | 6 | 28,907 | 7.3% | 82.8% | $34.21 | $988,822 | 10.8% | 85.0% |
| 2026 | 5 | 20,425 | 5.2% | 88.0% | $28.07 | $573,417 | 6.3% | 91.2% |
| 2027 | 4 | 17,140 | 4.4% | 92.3% | $27.56 | $472,300 | 5.2% | 96.4% |
| 2028 & Beyond(4) | 3 | 3,617 | 0.9% | 93.3% | $26.75 | $331,756 | 3.6% | 100.0% |
| Vacant | 0 | 26,567 | 6.7% | 100.0% | $0.00 | $0 | 0.0% | 100.0% |
| Total/Wtd. Avg. | 92 | 393,793 | 100.0% | $26.59 | $9,164,898 | 100.0% | ||
| (1) | Information is based on the underwritten rent roll. |
| (2) | Certain tenants may have lease termination options that are exercisable prior to the originally stated expiration date of the subject lease and that are not considered in the lease rollover schedule. |
| (3) | Wtd. Avg. Annual UW Rent PSF Rolling excludes vacant space as well as the spaces for the tenants paying percentage rent only: Polo Ralph Lauren, Coach, Toys “R” Us and ECCO Outlet. |
| (4) | SF Rolling and Annual UW Rent PSF Rolling exclude BJ’s Restaurant SF and rent, which is a ground lease tenant; however, its rent is included in the Total UW Rent Rolling. |
The Market. The OKC Outlets Property is located in Oklahoma City, Oklahoma, approximately 6.5 miles west of the Oklahoma City central business district. According to the appraisal, Oklahoma City has a diverse economy driven largely by major industries such as energy, government, aviation and aerospace, healthcare, and professional and business services.The subject neighborhood is primarily dominated by retail uses, including a Walmart Supercenter anchored power center, followed by industrial development. The OKC Outlets Property is located within the northeast quadrant of Interstate 40 and South Council Road, with visibility and access off Interstate 40, which has a traffic count of over 75,000 vehicles per day. Interstate 40 provides the OKC Outlets Property with nearby access to Interstate 44, which is a primary northeast-southwest regional thoroughfare for the state of Oklahoma, and Interstate 35, which is a primary north-south regional thoroughfare that travels north to Wichita, Kansas and south to Dallas, Texas. The OKC Outlets Property is the only regional outlet center in the state of Oklahoma, with the next closest regional outlet center located over 200 miles away in suburban Dallas, Texas.
According to a third party market research report, the estimated 2016 population within a 10-, 25- and 50-mile radius of the OKC Outlets Property was 543,497, 1,206,992 and 1,481,306, respectively. Population is projected to increase within the same radii over the next five years at above average annual rates of 1.7%, 1.7% and 1.6%, respectively. The estimated 2016 average household income within a 10-, 25- and 50-mile radius of the OKC Outlets Property was $64,651, $72,878 and $70,822, respectively.
According to a third party market research report, the OKC Outlets Property is part of the greater Oklahoma City retail market and within the Oklahoma County (retail) submarket. As of the second quarter of 2017, the Oklahoma City retail market contained 8,876 properties totaling approximately 89.7 million SF, with an overall vacancy rate of 5.6% and average rental rates of $12.42 PSF. The Oklahoma City retail power center market is comprised of 15 properties totaling approximately 6.3 million SF, with an overall vacancy rate of 2.8% and average rental rates of $14.01 PSF. The Oklahoma County submarket is comprised of 11 retail power center properties totaling 4.7 million SF, with a vacancy rate of 2.9% and average rental rates of $13.53 PSF.
The following table presents leasing data at certain competitive properties with respect to the OKC Outlets Property:
| Competitive Property Summary | |||||||
| Property Name/Address | Type | Year Built/Renovated | Size (SF) | Total Occupancy | Anchor Tenants | Distance to Subject | |
OKC Outlets 7624 West Reno Avenue Oklahoma City, OK | Outlet Center | 2011/2012-2013 | 393,793 | 93.3%(1) | Nike Factory Store, Forever 21, Old Navy, Polo Ralph Lauren | ─ | |
Penn Square Mall 1901 Northwest Expressway Oklahoma City, OK | Super Regional Mall | 1960/1982, 1988, 1995, 2000, 2007, 2013 | 1,062,590 | 97.0% | Dillard’s, JCPenney, Macy’s, Dillard’s Men’s | 10 miles | |
Quail Springs Mall 2501 West Memorial Road Oklahoma City, OK | Super Regional Mall | 1980/1998 | 1,114,927 | 88.0% | Dillard’s, JCPenney, Von Maur | 12 miles | |
Sooner Mall 3301 West Main Street Norman, OK | Super Regional Mall | 1975/2000 | 487,774 | 99.0% | Dillard’s, JCPenney, Sears | 20 miles | |
Spring Creek Village 1189-1489 East 15th Street Edmond, OK | Lifestyle Center | 1999/2018 (proposed) | 74,074 | 87.0% | Ann Taylor LOFT, Chico’s, JoS. A. Bank, Talbot’s | 18 miles | |
Classen Curve & Nichols Hills Plaza 5825 Northwest Grand Boulevard Oklahoma City, OK | Lifestyle Center | 2009/2017 | 282,000 | 98.0% | Whole Foods, Trader Joe’s, West Elm, Anthropologie | 11 miles | |
Source:Appraisal.
| (1) | Information is based on the underwritten rent roll as of June 1, 2017. |
This is not a research report and was not prepared by any Underwriter’s research department. Please see additional important information and qualifications at the end of this Term Sheet.
| T-70 |
| MSBAM 2017-C34 | OKC Outlets |
Operating History and Underwritten Net Cash Flow.The following table presents certain information relating to the historical operating performance and the Underwritten Net Cash Flow at the OKC Outlets Property:
| Cash Flow Analysis | ||||||||||||
| 2014 | 2015 | 2016 | 3/31/2017 TTM | UW | UW PSF | |||||||
| Base Rent(1) | $8,048,464 | $8,317,286 | $9,410,498 | $9,450,336 | $9,829,535 | $24.96 | ||||||
| Percentage Rent(2) | $812,305 | $766,944 | $821,910 | $704,851 | $805,512 | $2.05 | ||||||
| Total Recoveries | $3,068,658 | $3,189,933 | $3,328,189 | $3,270,259 | $3,708,371 | $9.42 | ||||||
| Other Income | $1,200,374 | $1,498,512 | $1,170,872 | $1,182,904 | $1,174,073 | $2.98 | ||||||
| Less Vacancy & Credit Loss | $0 | $0 | $0 | $0 | ($990,794) | ($2.52) | ||||||
| Effective Gross Income | $13,129,801 | $13,772,675 | $14,731,469 | $14,608,350 | $14,526,696 | $36.89 | ||||||
| Total Expenses | $3,988,820 | $4,382,185 | $4,463,320 | $4,343,243 | $4,877,678 | $12.39 | ||||||
| Net Operating Income | $9,140,981 | $9,390,490 | $10,268,149 | $10,265,107 | $9,649,018 | $24.50 | ||||||
| Capital Expenditures | $0 | $0 | $0 | $0 | $100,573 | $0.26 | ||||||
| TI/LC | $0 | $0 | $0 | $0 | $718,912 | $1.83 | ||||||
| Net Cash Flow | $9,140,981 | $9,390,490 | $10,268,149 | $10,265,107 | $8,829,533 | $22.42 | ||||||
| Occupancy %(3) | 98.7% | 100.0% | 97.1% | 93.3% | 93.6% | |||||||
| NOI DSCR(4) | 2.49x | 2.56x | 2.80x | 2.80x | 2.63x | |||||||
| NCF DSCR(4) | 2.49x | 2.56x | 2.80x | 2.80x | 2.41x | |||||||
| NOI Debt Yield(4) | 10.6% | 10.9% | 11.9% | 11.9% | 11.2% | |||||||
| NCF Debt Yield(4) | 10.6% | 10.9% | 11.9% | 11.9% | 10.2% | |||||||
| (1) | UW Base Rent includes $664,637 of grossed up vacant space, rent steps through December 2017 totaling $23,598 and a mark-to-market adjustment based on the appraiser’s concluded market rent totaling $12,780. |
| (2) | The following tenants pay percentage rent in lieu of base rent: Polo Ralph Lauren, Coach, Toys “R” Us and ECCO Outlet. |
| (3) | Occupancy % for 2014, 2015 and 2016 are as of January 1 of each respective year. 3/31/2017 TTM Occupancy % is as of the underwritten rent roll dated June 1, 2017. UW Occupancy % represents economic occupancy. |
| (4) | The debt service coverage ratios and debt yields are based on the OKC Outlets Whole Loan. |
Escrows and Reserves.At origination, the OKC Outlets Borrower deposited (i) $511,766 into a real estate tax escrow, (ii) $14,559 into an insurance escrow, (iii) $2,250,000 into a capital improvements reserve, (iv) $527,386 into a reserve for outstanding tenant improvements, and (v) $148,810 into a rent reserve for tenants who have executed leases but have not begun paying rent. On a monthly basis the OKC Outlets Borrower is required to deposit (i) 1/12 of the annual estimated tax payments into a real estate escrow, which currently equates to $102,353, (ii) 1/12 of the annual estimated insurance premiums into an insurance escrow, which currently equates to $14,559, (iii) $8,213 for replacement reserves, capped at $295,685, and (iv) $41,067 for TI/LC reserves.
Lockbox and Cash Management. The OKC Outlets Whole Loan is structured with a hard lockbox and springing cash management. The OKC Outlets Borrower is required to direct all tenants to deposit all rents and other revenue directly into the lockbox account controlled by the lender. Notwithstanding the foregoing, the OKC Outlets Borrower and property manager are required to deposit all revenues received into the lockbox account within two business day of receipt. For so long as a Cash Sweep Period (as defined below) does not exist, all funds in the lockbox account will be transferred to an account controlled by the OKC Outlets Borrower. Upon the occurrence and continuance of a Cash Sweep Period, all sums on deposit in the lockbox account are required to be swept on a daily basis into a cash management account for the payment of, among other things, debt service, monthly escrows and property operating expenses pursuant to an annual approved budget.
| A | “Cash Sweep Period” will: |
| (i) | commence upon the occurrence of an event of default and continue until such event of default is cured; |
| (ii) | commence upon the occurrence of (a) any bankruptcy action of the OKC Outlets Borrower and continue for the life of the OKC Outlet Whole Loan (in no event will a Cash Sweep Period due to a bankruptcy action of the OKC Outlet Borrower be cured) or (b) a property manager that is an affiliate of the OKC Outlets Borrower (unless such bankruptcy action is dismissed within 60 days or such property manager is replaced with a qualified manager under a replacement agreement within 60 days) and, continue until the manager is replaced with a qualified manager under a replacement agreement; or |
| (iii) | commence upon the date the debt service coverage ratio for the immediately preceding 12-month period is less than 1.20x (based on a 30-year amortization) and continue until such time as the debt service coverage ratio for the immediately preceding 12-month period is at least 1.20x (based on a 30-year amortization) for two consecutive calendar quarters. |
Additional Secured Indebtedness (not including trade debts).Not permitted.
Mezzanine Loan and Preferred Equity. Not permitted.
Release of Property.Not permitted.
Terrorism Insurance.The OKC Outlets Borrower is required to obtain and maintain property insurance, commercial general liability insurance and, as long as the Terrorism Risk Insurance Program Reauthorization Act of 2015 or its equivalent is still in effect or similar coverage is available at commercially reasonable rates, business income or rental loss insurance that, in each case, covers perils of terrorism and acts of terrorism, both foreign and domestic.
This is not a research report and was not prepared by any Underwriter’s research department. Please see additional important information and qualifications at the end of this Term Sheet.
| T-71 |
| MSBAM 2017-C34 | U-Haul AREC 25 Portfolio |
Mortgage Loan No. 6 – U-Haul AREC 25 Portfolio
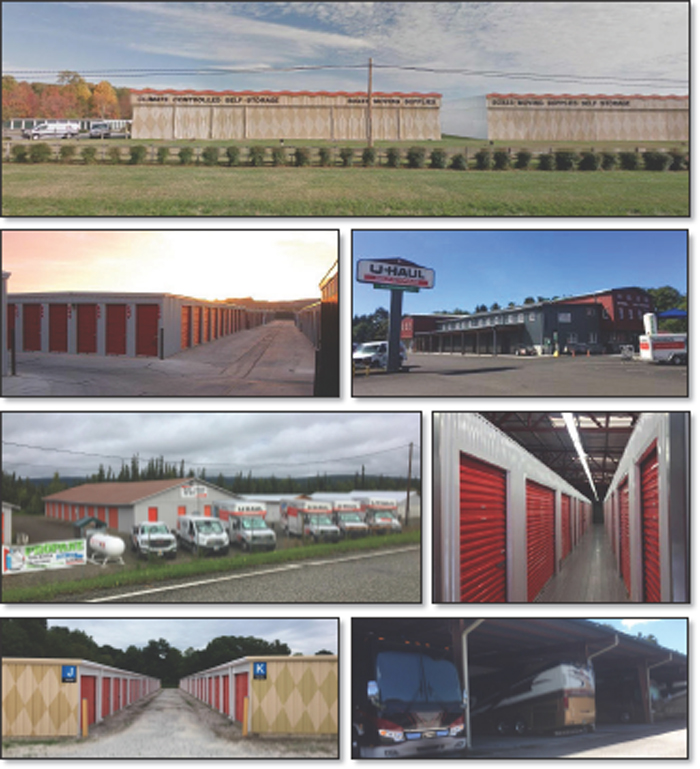
This is not a research report and was not prepared by any Underwriter’s research department. Please see additional important information and qualifications at the end of this Term Sheet.
| T-72 |
| MSBAM 2017-C34 | U-Haul AREC 25 Portfolio |
Mortgage Loan No. 6 – U-Haul AREC 25 Portfolio
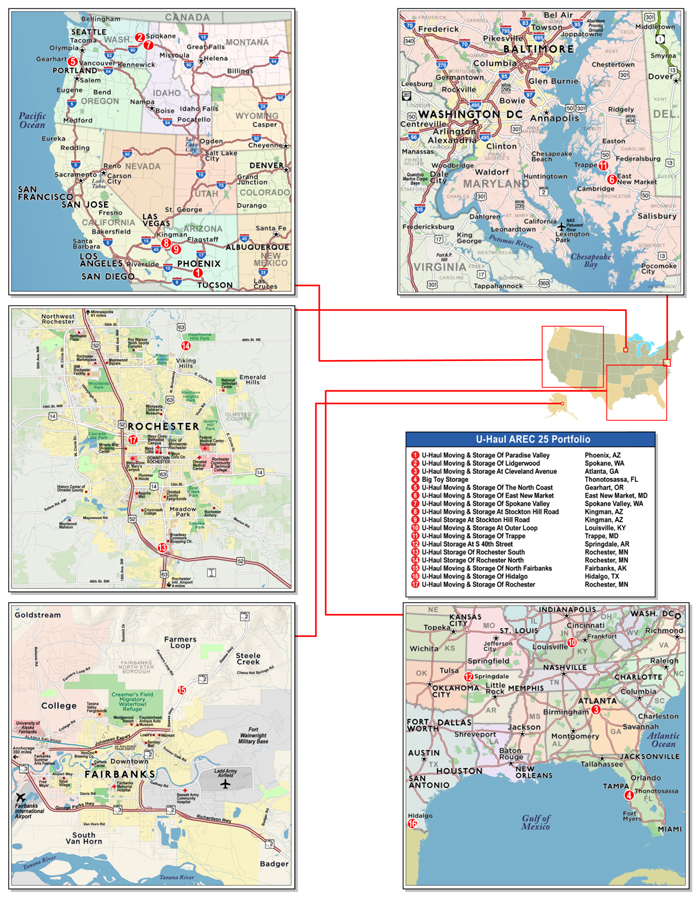
This is not a research report and was not prepared by any Underwriter’s research department. Please see additional important information and qualifications at the end of this Term Sheet.
| T-73 |
| MSBAM 2017-C34 | U-Haul AREC 25 Portfolio |
| Mortgage Loan No. 6 – U-Haul AREC 25 Portfolio |
| Mortgage Loan Information | Property Information | ||||||
| Mortgage Loan Seller: | BANA | Single Asset/Portfolio: | Portfolio | ||||
| Original Balance: | $47,000,000 | Location: | Various | ||||
| Cut-off Date Balance: | $46,907,129 | General Property Type: | Self Storage | ||||
| % of Initial Pool Balance: | 4.5% | Detailed Property Type: | Self Storage | ||||
| Loan Purpose: | Refinance | Title Vesting: | Fee | ||||
| Sponsor: | AMERCO | Year Built/Renovated: | Various/Various | ||||
| Mortgage Rate(1): | 3.8906% | Size: | 700,783 SF | ||||
| Note Date: | 9/1/2017 | Cut-off Date Balance per SF: | $67 | ||||
| First Payment Date: | 10/1/2017 | Maturity/ARD Date Balance per SF: | $48 | ||||
| Anticipated Repayment Date(1): | 9/1/2027 | Property Manager: | Self-managed | ||||
| Maturity Date(1): | 9/1/2042 | ||||||
| Original Term to Maturity/ARD(1): | 120 months | ||||||
| Original Amortization Term: | 300 months | Underwriting and Financial Information | |||||
| IO Period: | 0 months | UW NOI: | $5,236,209 | ||||
| Seasoning: | 1 month | UW NOI Debt Yield: | 11.2% | ||||
| Prepayment Provisions: | LO (25); DEF (91); O (4) | UW NOI Debt Yield at Maturity/ARD: | 15.5% | ||||
| Lockbox/Cash Mgmt Status: | Soft/Springing | UW NCF DSCR: | 1.73x | ||||
| Additional Debt Type: | N/A | Most Recent NOI: | $5,349,581 (7/31/2017 TTM) | ||||
| Additional Debt Balance: | N/A | 2nd Most Recent NOI(3): | $3,401,302 (12/31/2016) | ||||
| Future Debt Permitted (Type): | No (N/A) | 3rd Most Recent NO(3): | $1,731,206 (12/31/2015) | ||||
| Reserves(2) | Most Recent Occupancy: | 94.6% (7/31/2017) | |||||
| Type | Initial | Monthly | Cap | 2nd Most Recent Occupancy(3): | 79.7% (12/31/2016) | ||
| RE Tax: | $250,000 | Springing | N/A | 3rd Most Recent Occupancy(3): | 69.8% (12/31/2015) | ||
| Insurance: | $0 | Springing | N/A | Appraised Value (as of)(4): | $79,390,000 (Various) | ||
| Deferred Maintenance: | $131,356 | $0 | N/A | Cut-off Date LTV Ratio(4): | 59.1% | ||
| Recurring Replacements: | $75,656 | Springing | $75,656 | Maturity/ARD LTV Ratio(4): | 42.6% | ||
| Sources and Uses | ||||||
| Sources | Proceeds | % of Total | Uses | Proceeds | % of Total | |
| Loan Amount: | $47,000,000 | 100.0% | Loan Payoff: | $30,000,000 | 63.8% | |
| Return of Equity: | $15,627,131 | 33.2% | ||||
| Closing Costs: | $915,857 | 1.9% | ||||
| Reserves: | $457,012 | 1.0% | ||||
| Total Sources: | $47,000,000 | 100.0% | Total Uses: | $47,000,000 | 100.0% | |
| (1) | The U-Haul AREC 25 Portfolio Mortgage Loan (as defined below) has an initial term of 120 months to the anticipated maturity date (“ARD”) of September 1, 2027, with a final maturity date of September 1, 2042. From and after the ARD until the outstanding principal balance of the U-Haul AREC 25 Portfolio Mortgage Loan and all accrued interest has been paid in full, or until the final maturity date on September 1, 2042, the U-Haul AREC 25 Portfolio Mortgage Loan will accrue interest at a rate equal to 3.0000% plus the greater of (a) 3.8906% (the “Initial Interest Rate”) or (b) the 10-year swap yield as of the ARD plus 1.6600% (the “Extension Rate”), and all excess cash flow from the U-Haul AREC 25 Portfolio Properties (as defined below) will be collected by the lender (see “The Mortgage Loan” below.) |
| (2) | See “Escrows and Reserves” below for further discussion of reserve requirements. |
| (3) | The U-Haul AREC 25 Portfolio Properties were acquired by the U-Haul AREC 25 Portfolio Borrowers (as defined below) from 1978 through 2016. 2015 and 2016 figures do not represent full year performance of the complete portfolio. In 2014, 39.8% of the portfolio (by allocated loan amount) was acquired, in 2015, 10.6% of the portfolio (by allocated loan amount) was acquired, and in 2016, 13.1% of the portfolio (by allocated loan amount) was acquired. |
| (4) | Appraised Value represents the aggregate “as is” values for each of the individual properties ($73,430,000) plus a portfolio premium of $5,960,000. The Cut-off Date LTV Ratio and the Maturity/ARD LTV Ratio based on the aggregate values for each individual property without the portfolio premium are 63.9% and 46.1%, respectively. |
The Mortgage Loan. The sixth largest mortgage loan (the “U-Haul AREC 25 Portfolio Mortgage Loan”) is evidenced by a promissory note in the original principal amount of $47,000,000, secured by the fee interests in a portfolio of 17 self storage properties located across 11 states and totaling 700,783 SF (the “U-Haul AREC 25 Portfolio Properties”). Proceeds from the U-Haul AREC 25 Portfolio Mortgage Loan, were used to refinance the U-Haul AREC 25 Portfolio Properties, fund upfront reserves, pay closing costs and return equity to the U-Haul AREC 25 Mortgage Loan sponsor.
The U-Haul AREC 25 Portfolio Mortgage Loan has a term of 120 months with an anticipated repayment date (“ARD”) of September 1, 2027. From and after the ARD until the outstanding principal balance of the U-Haul AREC 25 Portfolio Mortgage Loan and all accrued interest has been paid in full, or until the final maturity date on September 1, 2042, the U-Haul AREC 25 Portfolio Mortgage Loan will accrue interest at a rate equal to 3.0000% plus the greater of (a) 3.8906% (the “Initial Interest Rate”) and (b) the 10-year swap yield as of the ARD plus 1.6600% (the “Extension Rate”), and all excess cash flow from the U-Haul AREC 25 Portfolio Properties will be collected by the lender and applied as follows: first, to pay interest at the initial interest rate, second, to reduce the principal balance of the U-Haul AREC 25 Portfolio Mortgage Loan until the entire outstanding principal balance of the U-Haul AREC 25 Portfolio Mortgage Loan is paid in full, and third, to pay accrued interest on the U-Haul AREC 25 Portfolio Mortgage Loan which has accrued at the Extension Rate and has been deferred until repayment of the U-Haul AREC 25 Mortgage Loan.
This is not a research report and was not prepared by any Underwriter’s research department. Please see additional important information and qualifications at the end of this Term Sheet.
| T-74 |
| MSBAM 2017-C34 | U-Haul AREC 25 Portfolio |
The Borrowers and the Sponsor. The borrowers are U-Haul Co. of Florida 25, LLC, UHIL 25, LLC and AREC 25, LLC, (individually and collectively, the “U-Haul AREC 25 Portfolio Borrowers”) each a Delaware limited liability company structured to be bankruptcy-remote with at least two independent directors.
The sponsor and nonrecourse carve out guarantor is AMERCO, a Nevada corporation. AMERCO (NASDAQ: UHAL) is a leading self-moving and self storage company and the parent company of U-Haul International, Inc. For its 2017 fiscal year, AMERCO had 1,750 owned or operated locations (51.4 million SF), 20,000 independent dealers, a fleet of 150,000 rental trucks, 112,000 rental trailers and 40,000 towing devices, and reported net earnings of approximately $398.4 million.
The Properties. The U-Haul AREC 25 Portfolio Properties are comprised of sixteen U-Haul branded properties and one non-branded self-storage property and moving facility containing a total of 5,634 traditional storage units, 512 RV storage units and 123 portable U-Box units. Additionally certain properties feature wine storage and office/warehouse space and two properties (U-Haul Moving & Storage at Stockton Hill Road and U-Haul Moving & Storage of Paradise Valley) receive additional income via ground leases to commercial tenants. The U-Haul AREC 25 Portfolio Properties range in size from approximately 2,725 SF to 92,775 SF and are self-managed by an affiliate of AMERCO.
The U-Haul AREC 25 Portfolio Properties are located across eleven states, with the largest presence in Arizona (three properties, 24.1% of SF), Washington (two properties, 20.3% of SF) and Maryland (two properties, 11.6% of SF) with the remaining ten properties (44.0% of SF) located across eight different states. The U-Haul AREC 25 Portfolio Properties were built between 1974 and 2008 with a weighted average year built of 1990 and were acquired by the U-Haul AREC 25 Portfolio sponsor between 1978 and 2016. The weighted average occupancy for the U-Haul AREC 25 Portfolio Properties was 94.6% by SF, as of July 31, 2017.
The following table presents detailed information with respect to each of the U-Haul AREC 25 Portfolio Properties.
| U-Haul AREC 25 Portfolio Properties Summary | ||||||||
| Property Name | City, State | SF | Total Units Storage / RV | Allocated Loan Amount (“ALA”) | % of ALA | Appraised Value | % of Appraised Value | |
| U-Haul Moving & Storage Of Paradise Valley | Phoenix, AZ | 68,412 | 740 / 16 | $6,153,237 | 13.1% | $9,620,000 | 13.1% | |
| U-Haul Moving & Storage Of Lidgerwood | Spokane, WA | 92,775 | 736 / 0 | $5,980,539 | 12.7% | $9,350,000 | 12.7% | |
| U-Haul Moving & Storage At Cleveland Avenue | Atlanta, GA | 53,310 | 422 / 9 | $4,899,565 | 10.4% | $7,660,000 | 10.4% | |
| Big Toy Storage | Thonotosassa, FL | 6,840 | 0 / 334 | $4,029,668 | 8.6% | $6,300,000 | 8.6% | |
| U-Haul Moving & Storage Of The North Coast | Gearhart, OR | 29,650 | 378 / 5 | $3,434,812 | 7.3% | $5,370,000 | 7.3% | |
| U-Haul Moving & Storage Of East New Market | East New Market, MD | 62,315 | 445 / 14 | $3,351,660 | 7.1% | $5,240,000 | 7.1% | |
| U-Haul Moving & Storage Of Spokane Valley | Spokane Valley, WA | 49,462 | 407 / 6 | $2,692,842 | 5.7% | $4,210,000 | 5.7% | |
| U-Haul Moving & Storage At Stockton Hill Road | Kingman, AZ | 44,000 | 340 / 0 | $2,511,176 | 5.3% | $3,925,983 | 5.3% | |
| U-Haul Storage At Stockton Hill Road | Kingman, AZ | 56,600 | 319 / 0 | $2,234,878 | 4.8% | $3,494,017 | 4.8% | |
| U-Haul Moving & Storage At Outer Loop | Louisville, KY | 46,215 | 354 / 52 | $2,200,327 | 4.7% | $3,440,000 | 4.7% | |
| U-Haul Moving & Storage Of Trappe | Trappe, MD | 18,900 | 177 / 5 | $1,950,871 | 4.2% | $3,050,000 | 4.2% | |
| U-Haul Storage At S 40th Street | Springdale, AR | 38,448 | 284 / 18 | $1,656,641 | 3.5% | $2,590,000 | 3.5% | |
| U-Haul Storage Of Rochester South | Rochester, MN | 32,720 | 235 / 1 | $1,633,506 | 3.5% | $2,553,830 | 3.5% | |
| U-Haul Storage Of Rochester North | Rochester, MN | 24,060 | 179 / 21 | $1,436,678 | 3.1% | $2,246,108 | 3.1% | |
| U-Haul Moving & Storage Of North Fairbanks | Fairbanks, AK | 29,147 | 310 / 23 | $1,375,204 | 2.9% | $2,150,000 | 2.9% | |
| U-Haul Moving & Storage Of Hidalgo | Hidalgo, TX | 45,204 | 268 / 8 | $1,125,749 | 2.4% | $1,710,000 | 2.3% | |
| U-Haul Moving & Storage Of Rochester | Rochester, MN | 2,725 | 40 / 0 | $332,647 | 0.7% | $520,062 | 0.7% | |
| Total | 700,783 | 5,634 / 512 | $47,000,000 | 100.0% | $73,430,000(1) | 100.0% | ||
| (1) | The individual “as is” appraised values are shown. The appraiser also provided a bulk portfolio value for the U-Haul AREC 25 Portfolio Properties of $79,390,000, which includes a portfolio premium of $5,960,000. |
This is not a research report and was not prepared by any Underwriter’s research department. Please see additional important information and qualifications at the end of this Term Sheet.
| T-75 |
| MSBAM 2017-C34 | U-Haul AREC 25 Portfolio |
The following table presents detailed information with respect to the individual performance of the U-Haul AREC 25 Portfolio Properties.
| U-Haul AREC 25 Portfolio Performance Summary | |||||||
| Property Name | Total Units Storage / RV | Year Built / Renovated | Date Acquired | 7/31/2017 TTM SF Occupancy | 7/31/2017 TTM NOI | % of Total TTM NOI | |
| U-Haul Moving & Storage Of Paradise Valley | 740 / 16 | 1999 / N/A | Feb. 2016 | 99.6% | $639,304 | 12.0% | |
| U-Haul Moving & Storage Of Lidgerwood | 736 / 0 | 1976, 1984-1985 / 2017 | Dec. 2014 | 98.9% | $666,749 | 12.5% | |
| U-Haul Moving & Storage At Cleveland Avenue | 422 / 9 | 2003 / N/A | Feb. 2013 | 87.4% | $469,029 | 8.8% | |
| Big Toy Storage | 0 / 334 | 2008 / N/A | Mar. 2013 | 96.9% | $540,525 | 10.1% | |
| U-Haul Moving & Storage Of The North Coast | 378 / 5 | 1990 / 2014 | Apr. 2013 | 99.6% | $312,571 | 5.8% | |
| U-Haul Moving & Storage Of East New Market | 445 / 14 | 1974, 1980, 2000, 2002 / N/A | Jul. 2014 | 90.2% | $632,233 | 11.8% | |
| U-Haul Moving & Storage Of Spokane Valley | 407 / 6 | 1977 / 2017 | Dec. 2014 | 99.0% | $301,549 | 5.6% | |
| U-Haul Moving & Storage At Stockton Hill Road(1) | 340 / 0 | 1995 / N/A | Feb. 2014 | 99.8% | $506,604 | 9.5% | |
| U-Haul Storage At Stockton Hill Road(1) | 319 / 0 | 1994 / N/A | Feb. 2014 | 92.5% | (2) | (2) | |
| U-Haul Moving & Storage At Outer Loop(2) | 354 / 52 | 1984 / 2016 | Apr. 2015 | 98.6% | $245,263 | 4.6% | |
| U-Haul Moving & Storage Of Trappe(2) | 177 / 5 | 1974, 1980, 2000, 2002 / N/A | Jul. 2014 | 81.1% | (3) | (3) | |
| U-Haul Storage At S 40th Street | 284 / 18 | 1990 / N/A | Jul. 2015 | 86.8% | $205,215 | 3.8% | |
| U-Haul Moving & Storage Of North Fairbanks | 310 / 23 | 1975 / N/A | May 2013 | 98.0% | $188,218 | 3.5% | |
| U-Haul Moving & Storage Of Hidalgo | 268 / 8 | 1998, 2000 / N/A | Nov. 2015 | 88.6% | $178,813 | 3.3% | |
| U-Haul Moving & Storage Of Rochester(3) | 40 / 0 | 1980 / 1993, 2015 | Oct. 1978 | 89.0% | $463,506 | 8.7% | |
| U-Haul Storage Of Rochester South(3) | 235 / 1 | 1997 / N/A | May 2013 | 95.1% | (4) | (4) | |
| U-Haul Storage Of Rochester North(3) | 179 / 21 | 1995 / N/A | May 2013 | 93.7% | (4) | (4) | |
| Total / Wtd. Avg. | 5,634 / 512 | 94.6% | $5,349,581 | 100.0% | |||
| (1) | U-Haul Moving & Storage At Stockton Hill Road and U-Haul Storage At Stockton Hill Road are operated together and report consolidated financial information. |
| (2) | U-Haul Moving & Storage At Outer Loop and U-Haul Moving & Storage Of Trappe are operated together and report consolidated financial information. |
| (3) | U-Haul Moving & Storage Of Rochester, U-Haul Storage Of Rochester South and U-Haul Storage Of Rochester North are operated together and report consolidated financial information. |
The Markets. The U-Haul AREC 25 Portfolio Properties are geographically diverse, located in 14 different cities across 11 states. The greatest concentration of U-Haul AREC 25 Portfolio Properties is located in Arizona (three properties, 24.1% of SF), Washington (two properties, 20.3% of SF) and Maryland (two properties, 11.6% of SF), with the remaining ten properties (44.0% of SF) located across eight different states.
The following table presents detailed information for the U-Haul AREC 25 Portfolio Properties by market.
| U-Haul AREC 25 Market Summary | |||||||||||
| Property State | Property Count | Total SF | Total Units Storage / RV | % Climate Control | Wtd. Avg. 7/31/2017 TTM Storage Occupancy | Wtd. Avg. 7/31/2017 TTM SF Occupancy | Wtd. Avg. Year Built | Wtd. Avg. Ann. Rent PSF | Total TTM GPR | % of TTM GPR | |
| Arizona | 3 | 169,012 | 1399 / 16 | 0.0% | 98.2% | 98.2% | 1997 | $9.15 | $1,546,791 | 19.8% | |
| Washington | 2 | 142,237 | 1143 / 6 | 14.3% | 98.9% | 98.6% | 1976 | $10.38 | $1,476,991 | 18.9% | |
| Maryland | 2 | 81,215 | 622 / 19 | 74.0% | 88.8% | 86.9% | 1974 | $11.27 | $915,575 | 11.7% | |
| Florida | 1 | 6,840 | 0 / 334 | 0.0% | 96.9% | 94.9% | 2008 | $121.50 | $831,040 | 10.6% | |
| Georgia | 1 | 53,310 | 422 / 9 | 14.0% | 87.4% | 91.6% | 2003 | $12.20 | $650,142 | 8.3% | |
| Minnesota | 3 | 59,505 | 454 / 22 | 20.0% | 94.1% | 93.9% | 1995 | $9.52 | $566,415 | 7.3% | |
| Oregon | 1 | 29,650 | 378 / 5 | 0.0% | 99.6% | 98.7% | 1990 | $14.65 | $434,350 | 5.6% | |
| Kentucky | 1 | 46,215 | 354 / 52 | 0.0% | 98.6% | 95.8% | 1984 | $8.61 | $398,035 | 5.1% | |
| Texas | 1 | 45,204 | 268 / 8 | 14.6% | 88.6% | 87.3% | 1998 | $8.52 | $384,974 | 4.9% | |
| Arkansas | 1 | 38,448 | 284 / 18 | 46.1% | 86.8% | 88.1% | 1990 | $8.93 | $343,319 | 4.4% | |
| Alaska | 1 | 29,147 | 310 / 23 | 0.0% | 98.0% | 95.5% | 1975 | $9.08 | $264,760 | 3.4% | |
| Total / Wtd. Avg.(1) | 17 | 700,783 | 5,634 / 512 | 15.9% | 95.2% | 95.0% | 1990 | $11.15 | $7,812,392 | 100.0% | |
| (1) | Wtd. Avg. figures are based on allocated loan amounts for the individual properties. Wtd. Avg. Year Built assumes the earliest year built if an individual property was built in multiple phases. |
This is not a research report and was not prepared by any Underwriter’s research department. Please see additional important information and qualifications at the end of this Term Sheet.
| T-76 |
| MSBAM 2017-C34 | U-Haul AREC 25 Portfolio |
U-Haul AREC 25 Demographic Summary | ||||||||
| Property Name | City, State | 1-mile Population | 3-mile Population | 5-mile Population | 1-mile Median Household Income | 3-mile Median Household Income | 5-mile Median Household Income | |
| U-Haul Moving & Storage Of Paradise Valley | Phoenix, AZ | 13,536 | 125,338 | 253,309 | $63,239 | $60,348 | $64,160 | |
| U-Haul Moving & Storage Of Lidgerwood | Spokane, WA | 18,047 | 104,355 | 181,236 | $39,116 | $44,906 | $43,634 | |
| U-Haul Moving & Storage At Cleveland Avenue | Atlanta, GA | 11,595 | 59,061 | 179,523 | $24,477 | $27,301 | $30,801 | |
| Big Toy Storage | Thonotosassa, FL | 4,053 | 13,542 | 65,234 | $36,793 | $41,916 | $47,546 | |
| U-Haul Moving & Storage Of The North Coast | Gearhart, OR | 968 | 5,376 | 10,686 | $56,085 | $51,421 | $48,259 | |
| U-Haul Moving & Storage Of East New Market | East New Market, MD | 516 | 2,932 | 15,747 | $60,003 | $53,699 | $39,986 | |
| U-Haul Moving & Storage Of Spokane Valley | Spokane Valley, WA | 12,123 | 64,655 | 112,120 | $35,012 | $47,510 | $53,755 | |
| U-Haul Moving & Storage At Stockton Hill Road | Kingman, AZ | 4,084 | 29,966 | 44,922 | $46,795 | $35,523 | $36,930 | |
| U-Haul Storage At Stockton Hill Road | Kingman, AZ | 7,767 | 31,116 | 44,593 | $41,336 | $40,457 | $37,078 | |
| U-Haul Moving & Storage At Outer Loop | Louisville, KY | 4,136 | 51,106 | 146,938 | $47,616 | $46,558 | $43,817 | |
| U-Haul Moving & Storage Of Trappe | Trappe, MD | 972 | 1,969 | 3,911 | $53,882 | $56,899 | $61,023 | |
| U-Haul Storage At S 40th Street | Springdale, AR | 7,894 | 50,587 | 99,692 | $56,388 | $48,605 | $48,733 | |
| U-Haul Storage Of Rochester South | Rochester, MN | 3,659 | 36,133 | 77,596 | $92,728 | $69,620 | $67,791 | |
| U-Haul Storage Of Rochester North | Rochester, MN | 1,647 | 41,771 | 95,362 | $111,094 | $66,232 | $65,544 | |
| U-Haul Moving & Storage Of North Fairbanks | Fairbanks, AK | 620 | 19,334 | 46,855 | $69,979 | $63,429 | $64,224 | |
| U-Haul Moving & Storage Of Hidalgo | Hidalgo, TX | 2,138 | 16,802 | 69,327 | $42,912 | $43,509 | $38,771 | |
| U-Haul Moving & Storage Of Rochester | Rochester, MN | 10,702 | 73,756 | 114,060 | $47,930 | $60,799 | $69,181 | |
| Total / Wtd. Avg. | 7,849 | 52,673 | 113,386 | $50,299 | $48,213 | $48,393 | ||
Source: Third Party Research Report.
Operating History and Underwritten Net Cash Flow.The following table presents certain information relating to the historical operating performance and Underwritten Net Cash Flow at the U-Haul AREC 25 Portfolio Properties:
| Cash Flow Analysis | ||||||||||||||||||||
| 2015(1) | 2016(1) | 7/31/2017 TTM | U/W | U/W PSF | ||||||||||||||||
| Base Rent | $2,519,809 | $4,481,897 | $6,403,396 | $7,828,173 | $11.17 | |||||||||||||||
| Other Income(2) | $335,565 | $425,404 | $627,032 | $627,032 | $0.89 | |||||||||||||||
| Less: Vacancy and Credit Loss | $0 | $0 | $0 | ($1,252,759 | ) | ($1.79 | ) | |||||||||||||
| Effective Gross Income | $2,855,374 | $4,907,301 | $7,030,428 | $7,202,446 | $10.28 | |||||||||||||||
| Total Operating Expenses | $1,124,168 | $1,505,999 | $1,680,847 | $1,966,237 | $2.81 | |||||||||||||||
| Net Operating Income | $1,731,206 | $3,401,302 | $5,349,581 | $5,236,209 | $7.47 | |||||||||||||||
| Capital Expenditures | $0 | $0 | $0 | $151,312 | $0.22 | |||||||||||||||
| Net Cash Flow | $1,731,206 | $3,401,301 | $5,349,581 | $5,084,897 | $7.26 | |||||||||||||||
| Occupancy % | 69.8% | 79.7% | 94.6% | 95.1% | ||||||||||||||||
| NOI DSCR | 0.59x | 1.16x | 1.82x | 1.78x | ||||||||||||||||
| NCF DSCR | 0.59x | 1.16x | 1.82x | 1.73x | ||||||||||||||||
| NOI Debt Yield | 3.7% | 7.3% | 11.4% | 11.2% | ||||||||||||||||
| NCF Debt Yield | 3.7% | 7.3% | 11.4% | 10.8% | ||||||||||||||||
| (1) | Historical information is unavailable or incomplete due to the U-Haul AREC 25 Portfolio Properties being acquired over a period from 1978-2016. In 2014, 39.8% of the portfolio (by allocated loan amount) was acquired, in 2015, 10.6% of the portfolio (by allocated loan amount) was acquired, and in 2016, 13.5% of the portfolio (by allocated loan amount) was acquired. |
| (2) | Other Income includes packing and moving supplies, U-Box portable storage income, U-Move truck and trailer rental income, third party lease income and other miscellaneous income. |
Escrows and Reserves. The U-Haul AREC 25 Portfolio Borrowers deposited at loan origination $75,656 to a replacement reserve, and if the replacement reserve balance is below $75,656 are required to deposit monthly $12,609 or such amount to meet the replacement reserve cap of $75,656. Additionally, the U-Haul AREC 25 Portfolio Borrowers deposited at loan origination $131,356 to an immediate repair reserve and $250,000 for real estate taxes. So long as no event of default exists and the U-Haul AREC 25 Portfolio Borrowers maintain in a reserve with the lender an amount sufficient to pay real estate taxes for six months and provide the lender with proof of current taxes paid, the U-Haul AREC 25 Portfolio Borrowers will not be required to deposit monthly reserves for real estate taxes. So long as no event of default exists and either (i) the U-Haul AREC 25 Portfolio Properties are covered by an acceptable blanket policy or (ii) the U-Haul AREC 25 Portfolio Borrowers maintain in a reserve with the lender in an amount sufficient to pay insurance premiums for six months and provide the lender with proof of current premiums paid, the U-Haul AREC 25 Portfolio Borrowers will not be required to deposit monthly reserves for insurance.
Lockbox and Cash Management. A soft lockbox is in place with respect to the U-Haul AREC 25 Portfolio Mortgage Loan, with springing cash management upon the occurrence of a Cash Sweep Period (as defined below). During the continuance of a Cash Sweep Period, all funds are required to be swept each business day to a lender-controlled cash management account and disbursed in accordance with the U-Haul AREC 25 Portfolio Mortgage Loan documents with all excess cash flow required to be held in the excess cash flow subaccount as additional security for the U-Haul AREC 25 Portfolio Mortgage Loan, unless collected after the ARD when all excess cash flow will be applied to (i) interest, (ii) principal and (iii) accrued interest.
This is not a research report and was not prepared by any Underwriter’s research department. Please see additional important information and qualifications at the end of this Term Sheet.
| T-77 |
| MSBAM 2017-C34 | U-Haul AREC 25 Portfolio |
A “Cash Sweep Period” will (a) commence upon an event of default and continue until the lender’s acceptance of the cure of the event of default; (b) exist during a DSCR Trigger Period (as defined below); (c) exist during a Tax/Insurance Trigger Period (as defined below); (d) commence upon the property manager becoming insolvent or a debtor in any bankruptcy action and continue until the property manager is replaced by a qualified manager; or (e) commence upon an Extension Term Trigger Event (as defined below) and will not be subject to cure. Cash Sweep Periods may not be cured more than five times during the term of the U-Haul AREC 25 Portfolio Mortgage Loan. Additionally, if a Cash Sweep Period is triggered by either an event of default caused by a bankruptcy action of the U-Haul AREC 25 Portfolio Borrowers, or by an Extension Term Trigger Event, the Cash Sweep Period may not be cured and will continue until the U-Haul AREC 25 Portfolio Mortgage Loan is repaid in full.
A “DSCR Trigger Period” will commence upon the trailing-twelve month debt service coverage ratio being less than 1.15x for two consecutive calendar quarters, and will end upon the trailing-twelve month debt service coverage ratio being greater than 1.15x for four consecutive calendar quarters.
A “Tax/Insurance Trigger Period” will exist during the U-Haul AREC 25 Portfolio Borrowers’ failure to provide timely evidence of payment of property taxes or proof of the required insurance coverage.
An “Extension Term Trigger Event” will commence 60 days prior to the ARD if the U-Haul AREC 25 Portfolio Mortgage Loan has not been repaid in full.
Additional Secured Indebtedness (not including trade debts). Not permitted.
Mezzanine Loan and Preferred Equity. Not permitted.
Release of Property.Not permitted.
Expansion of Property.The U-Haul AREC 25 Portfolio Borrowers are permitted to acquire a fee simple estate in vacant land that is adjacent and contiguous to an existing individual property, subject to certain conditions (including receipt of rating agency confirmation, a REMIC opinion and satisfactory environmental assessment), which land will thereafter be considered a part of the individual property, will be subject to the lien of the U-Haul AREC 25 Portfolio Mortgage Loan and governed by the U-Haul AREC 25 Portfolio Mortgage Loan Documents, provided no such land will be operated or integrated with the individual property.
The U-Haul AREC 25 Portfolio Borrowers are permitted to acquire a leasehold estate in property that is operated as a storage facility but that is not contiguous to an existing individual property, subject to certain conditions (including receipt of rating agency confirmation, a REMIC opinion and satisfactory environmental assessment), which acquired facility will thereafter only be operated as a remote storage facility, U-Box storage facility or vehicle or RV Storage facility. Following the acquisition of such property, all rents from the ownership of such property will be considered rents due under the U-Haul AREC 25 Portfolio Mortgage Loan Documents.
Terrorism Insurance.The U-Haul AREC 25 Portfolio Borrowers are required to obtain and maintain property insurance and business interruption insurance that covers perils of terrorism and acts of terrorism in an amount equal to the full replacement cost of the U-Haul AREC 25 Portfolio Properties and 24 months of business interruption insurance.
This is not a research report and was not prepared by any Underwriter’s research department. Please see additional important information and qualifications at the end of this Term Sheet.
| T-78 |
(THIS PAGE INTENTIONALLY LEFT BLANK)
| T-79 |
| MSBAM 2017-C34 | Ocean Park Plaza |
Mortgage Loan No. 7– Ocean Park Plaza
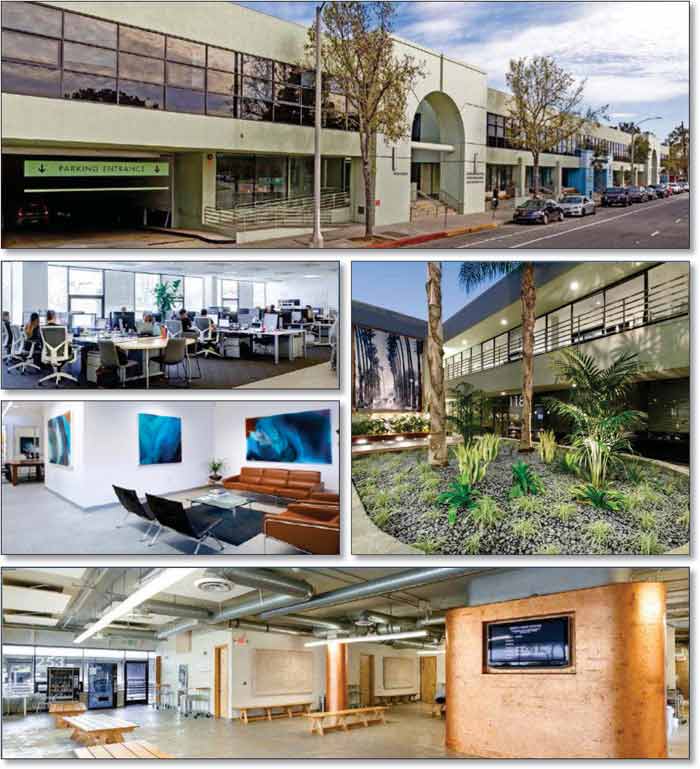
This is not a research report and was not prepared by any Underwriter’s research department. Please see additional important information and qualifications at the end of this Term Sheet.
| T-80 |
| MSBAM 2017-C34 | Ocean Park Plaza |
Mortgage Loan No. 7 – Ocean Park Plaza
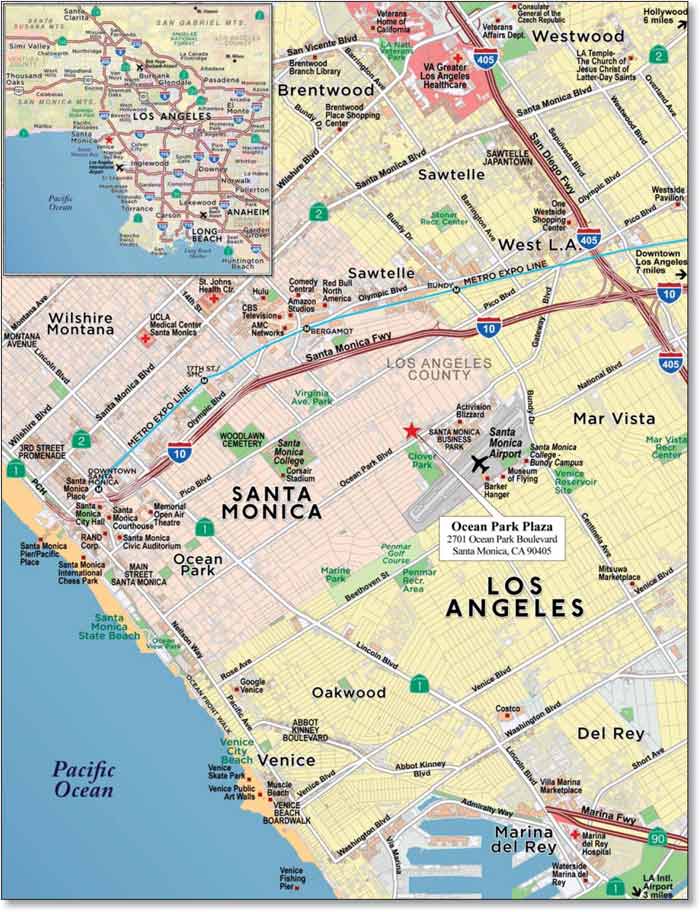
This is not a research report and was not prepared by any Underwriter’s research department. Please see additional important information and qualifications at the end of this Term Sheet.
| T-81 |
| MSBAM 2017-C34 | Ocean Park Plaza |
| Mortgage Loan No. 7 – Ocean Park Plaza |
| Mortgage Loan Information | Property Information | ||||||
| Mortgage Loan Seller: | BANA | Single Asset/Portfolio: | Single Asset | ||||
| Original Balance: | $45,402,000 | Location: | Santa Monica, CA 90405 | ||||
| Cut-off Date Balance: | $45,402,000 | General Property Type: | Office | ||||
| % of Initial Pool Balance: | 4.3% | Detailed Property Type: | CBD | ||||
| Loan Purpose: | Acquisition | Title Vesting: | Fee | ||||
| Sponsor: | David Taban | Year Built/Renovated: | 1986/2007 | ||||
| Mortgage Rate: | 4.2600% | Size: | 99,601 SF | ||||
| Note Date: | 9/20/2017 | Cut-off Date Balance per SF: | $456 | ||||
| First Payment Date: | 11/1/2017 | Maturity Date Balance per SF: | $416 | ||||
| Maturity Date: | 10/1/2027 | Property Manager: | Cushman & Wakefield U.S., Inc. | ||||
| Original Term to Maturity: | 120 months | ||||||
| Original Amortization Term: | 360 months | ||||||
| IO Period: | 60 months | Underwriting and Financial Information | |||||
| Seasoning: | 0 months | UW NOI(2): | $3,988,556 | ||||
| Prepayment Provisions: | LO (24); DEF (91); O (5) | UW NOI Debt Yield: | 8.8% | ||||
| Lockbox/Cash Mgmt Status: | Springing/Springing | UW NOI Debt Yield at Maturity: | 9.6% | ||||
| Additional Debt Type: | N/A | UW NCF DSCR: | 1.88x (IO) 1.38x (P&I) | ||||
| Additional Debt Balance: | N/A | Most Recent NOI(2): | $2,437,966 (7/31/2017 TTM) | ||||
| Future Debt Permitted (Type): | No (N/A) | 2nd Most Recent NOI: | $2,341,672 (12/31/2016) | ||||
| Reserves(1) | 3rd Most Recent NOI: | $1,891,743 (12/31/2015) | |||||
| Type | Initial | Monthly | Cap | Most Recent Occupancy: | 96.6% (9/1/2017) | ||
| RE Tax: | $285,971 | $47,662 | N/A | 2nd Most Recent Occupancy: | 87.3% (12/31/2016) | ||
| Insurance: | $0 | Springing | N/A | 3rd Most Recent Occupancy: | 90.3% (12/31/2015) | ||
| Recurring Replacements: | $0 | $2,069 | $74,466 | Appraised Value (as of): | $67,000,000 (7/12/2017) | ||
| TI/LC: | $250,000 | $8,250 | $500,000 | Cut-off Date LTV Ratio: | 67.8% | ||
| Other: | $626,190 | $0 | N/A | Maturity Date LTV Ratio: | 61.9% | ||
| Sources and Uses | ||||||
| Sources | Proceeds | % of Total | Uses | Proceeds | % of Total | |
| Loan Amount: | $45,402,000 | 71.4% | Purchase Price: | $62,270,819 | 97.9% | |
| Borrower Equity: | $18,222,602 | 28.6% | Reserves: | $1,162,161 | 1.8% | |
| Closing Costs: | $191,622 | 0.3% | ||||
| Total Sources: | $63,624,602 | 100.0% | Total Uses: | $63,624,602 | 100.0% | |
| (1) | See “Escrows and Reserves” below for further discussion of reserve requirements. |
| (2) | The increase in UW NOI is due primarily the exclusion of concessions previously given by the prior owner, and to an increase in average rent due to five tenant renewals or new leases signed. Current average underwritten base rent is $48.63 PSF as compared to the appraiser’s determined market rent of $58.19 PSF. |
The Mortgage Loan. The seventh largest mortgage loan (the “Ocean Park Plaza Mortgage Loan”) is evidenced by a promissory note in the original principal amount of $45,402,000, secured by a first priority fee mortgage encumbering a 99,601 SF office property known as Ocean Park Plaza located in Santa Monica, California (the “Ocean Park Plaza Property”). The proceeds of the Ocean Park Plaza Mortgage Loan, together with $18,222,602 of borrower equity, were used to acquire the Ocean Park Plaza Property, fund reserves and pay closing costs.
The Borrower and the Sponsors. The borrowers are Ocean Park One, LLC, Ocean Park Two, LLC and Ocean Park Three, LLC, (collectively as tenants-in-common, the “Ocean Park Plaza Borrower”), each a single-purpose Delaware limited liability company with one independent director. David Taban is the managing member of each of the borrower entities and the sponsor and nonrecourse carve-out guarantor for the Ocean Park Plaza Mortgage Loan. David Taban has ownership equity in 44 real estate investment properties. The Ocean Park Plaza Mortgage Loan documents require the nonrecourse carve-out guarantor to maintain a minimum net worth of $45.4 million and minimum liquidity of $2.5 million.
David Taban is also the nonrecourse carve-out guarantor for the mortgage loan known as Marina Beach Shopping Center as described in the Preliminary Prospectus.
The Property. The Ocean Park Plaza Property consists of a two-story, multi-tenant, creative-space office building totaling 99,601 SF and a 313-space, two-story subterranean parking garage located in Santa Monica, California. The Ocean Park Plaza Property was built in 1986, renovated in 2007, and according to the sponsor has had approximately $3.3 million of additional capital investment since 2007. The office spaces are built around a U-shaped landscaped courtyard and the second floor spaces have balconies overlooking the courtyard.
The Ocean Park Plaza Property is located two blocks from Santa Monica’s Main Street corridor of retail and entertainment venues, and adjacent to the Santa Monica Business Park, which consists of approximately 1 million SF of office and retail space, encompasses two full city blocks, and is home to tenants including Activision, Pandora and Snap, Inc. The Ocean Park Plaza Property fronts Ocean Park Boulevard and is located within one mile of the Santa Monica Freeway (Interstate 10) leading to downtown Los Angeles approximately fourteen miles east, within two miles of the Pacific Coast Highway
This is not a research report and was not prepared by any Underwriter’s research department. Please see additional important information and qualifications at the end of this Term Sheet.
| T-82 |
| MSBAM 2017-C34 | Ocean Park Plaza |
and within three miles of the San Diego Freeway (Interstate 405). The Ocean Park Plaza Property is served by several proximate public transportation options including Big Blue Bus (a municipal bus operated by the City of Santa Monica) with stops along Ocean Park Boulevard and the Los Angeles County Metropolitan Transportation Authority Expo Line’s new 26th Street station (running between downtown Los Angeles and Santa Monica) within approximately one mile.
As of September 1, 2017, the Ocean Park Plaza Property was 96.6% occupied by 14 tenants. The five largest tenants based on underwritten base rent represent 58.7% of the SF and 63.6% of underwritten base rent with no other tenant comprising more than 7.9% of SF or 7.5% of underwritten base rent.
Major Tenants.
Keller Williams Realty (17,854 SF, 17.9% of NRA, 19.7% of underwritten rent).Keller Williams Realty Santa Monica (“Keller Williams”) has a lease of three suites which expires in August 2019 and requires current average annual base rent of $51.53 PSF. Keller Williams is a real estate brokerage firm with over 95,000 real estate associates nationwide.
Matchcraft, LLC (16,263 SF, 16.3% of NRA, 15.1% of underwritten rent). Matchcraft, LLC (“Matchcraft”) has a lease of two suites which expires in May 2022 and requires current annual base rent of $42.00 PSF, increasing to $43.32 PSF as of June 2018. The Matchcraft lease contains one five-year renewal option. Matchcraft is a marketing platform for digital marketing campaigns operating in 44 countries, supported by over 6,000 sales representatives, and having managed over 1 million marketing campaigns. Matchcraft maintains its domestic headquarters at the Ocean Park Plaza Property.
Pacific Point Academy (8,399 SF, 8.4% of NRA, 10.2% of underwritten rent). Pacific Point Academy has a lease of three suites which expires in August 2020 and requires current annual base rent of $55.00 PSF, increasing to $56.65 PSF as of June 2018. The Pacific Point Academy lease contains one five-year renewal option. Pacific Point Academy is a non-profit full-day children’s academic provider and learning center.
Ocean Park Casting (8,410 SF, 8.4% of NRA, 9.6% of underwritten rent). Ocean Park Casting (“Ocean Park Casting”) has a lease of two suites which expires in November 2023 and requires current average annual base rent of $53.12 PSF. Ocean Park Casting is technologically advanced casting facility offering clients access to seven casting studios and three viewing rooms, real-time audition posting, multiple format castings and fast editing.
Transplant Connect (7,503 SF, 7.5% of NRA, 9.1% of underwritten rent). Transplant Connect has a lease of three suites which was recently renewed and expanded, expires in January 2021 and requires current annual base rent of $37.24 PSF, increasing to $57.00 PSF upon the new lease term in December 2017. The Transplant Connect lease contains one five-year renewal option. Transplant Connect is a medical software company specializing in human biologics donation and transplantation software that is used by over 12,500 medical professionals at over 100 donation and transplantation agencies worldwide.
The following table presents certain information relating to the leases at the Ocean Park Plaza Property:
| Tenant Summary(1) | |||||||
| Tenant Name | Credit Rating (Fitch/Moody’s/S&P)(2) | Tenant SF | Approximate % of SF | Annual UW Rent | % of Total Annual UW Rent | Annual UW Rent PSF(3) | Lease Expiration |
| Major Tenants | |||||||
| Keller Williams Realty | NR / NR / NR | 17,854 | 17.9% | $920,099 | 19.7% | $51.53 | 8/31/2019 |
| Matchcraft, LLC | NR / NR / NR | 16,263 | 16.3% | $704,513 | 15.1% | $43.32 | 5/31/2022 |
| Pacific Point Academy | NR / NR / NR | 8,399 | 8.4% | $475,803 | 10.2% | $56.65 | 8/31/2020 |
| Ocean Park Casting | NR / NR / NR | 8,410 | 8.4% | $446,777 | 9.6% | $53.12 | 11/30/2023 |
| Transplant Connect | NR / NR / NR | 7,503 | 7.5% | $427,671 | 9.1% | $57.00 | 11/30/2017 |
| Subtotal/Wtd. Avg. | 58,429 | 58.7% | $2,974,863 | 63.6% | $50.91 | ||
| Other Tenants | 37,769 | 37.9% | 1,703,076 | 36.4% | $45.09 | ||
| Vacant Space | 3,403 | 3.4% | $0 | 0.00% | $0.00 | ||
| Total/Wtd. Avg. | 99,601 | 100.0% | 4,677,939 | 100.0% | $48.63 | ||
| (1) | Information is based on the underwritten rent roll. Tenants are ordered by % of Total Annual UW Rent. |
| (2) | Certain ratings are those of the parent company whether or not the parent guarantees the lease. |
| (3) | Wtd. Avg. Annual UW Rent PSF excludes vacant space. |
This is not a research report and was not prepared by any Underwriter’s research department. Please see additional important information and qualifications at the end of this Term Sheet.
| T-83 |
| MSBAM 2017-C34 | Ocean Park Plaza |
The following table presents certain information relating to the lease rollover schedule at the Ocean Park Plaza Property:
| Lease Rollover Schedule(1)(2) | ||||||||
| Year | # of Leases Rolling | SF Rolling | Approx. % of Total SF Rolling | Approx. Cumulative % of SF Rolling | UW Base Rent PSF Rolling(3) | Total UW Base Rent Rolling | Approx. % of Total Rent Rolling | Approx. Cumulative % of Total Rent Rolling |
| 2017 | 1 | 7,503 | 7.5% | 7.5% | $57.00 | $427,671 | 9.1% | 9.1% |
| 2018 | 1 | 5,288 | 5.3% | 12.8% | $33.80 | $178,734 | 3.8% | 13.0% |
| 2019 | 3 | 28,058 | 28.2% | 41.0% | $43.41 | $1,217,946 | 26.0% | 39.0% |
| 2020 | 2 | 11,687 | 11.7% | 52.7% | $54.18 | $633,232 | 13.5% | 52.5% |
| 2021 | 1 | 2,537 | 2.5% | 55.3% | $56.65 | $143,721 | 3.1% | 55.6% |
| 2022 | 2 | 20,408 | 20.5% | 75.8% | $46.07 | $940,281 | 20.1% | 75.7% |
| 2023 | 2 | 11,581 | 11.6% | 87.4% | $54.14 | $627,048 | 13.4% | 89.1% |
| 2024 | 1 | 6,520 | 6.5% | 94.0% | $56.40 | $367,728 | 7.9% | 97.0% |
| 2025 | 0 | 0 | 0.0% | 94.0% | $0.00 | $0 | 0.0% | 97.0% |
| 2026 | 0 | 0 | 0.0% | 94.0% | $0.00 | $0 | 0.0% | 97.0% |
| 2027 | 1 | 2,616 | 2.6% | 96.6% | $54.12 | $141,578 | 3.0% | 100.0% |
| 2028 & Beyond | 0 | 0 | 0.0% | 96.6% | $0.00 | $0 | 0.0% | 100.0% |
| Vacant | 0 | 3,403 | 3.4% | 100.0% | $0.00 | $0 | 0.0% | 100.0% |
| Total/Wtd. Avg. | 14 | 99,601 | 100.0% | $48.63 | $4,677,939 | 100.0% | ||
| (1) | Information is based on the underwritten rent roll. Certain tenants may have co-terminus leases which are consolidated as presented. |
| (2) | Certain tenants may have lease termination options that are exercisable prior to the originally stated expiration date of the subject lease and that are not considered in the lease rollover schedule. |
| (3) | Total/Wtd. Avg. UW Base Rent PSF Rolling excludes vacant space. |
The Market. The Ocean Park Plaza Property is located at 2701 Ocean Park Boulevard, in Santa Monica, California. The City of Santa Monica’s local economy is supported by diversified industries including entertainment, retail, healthcare and education. According to the appraisal, the largest employers in Santa Monica include the UCLA Medical Center and Santa Monica College, a two-year, public community college, with an enrollment of approximately 33,000. According to the City of Santa Monica’s 2016 economic report, Santa Monica had over 9,000 businesses employing 88,383 employees. Of those businesses over 2,000 are in the creative office space and focused in the media and technology industries, representing approximately 41.0% of the city’s payrolls and over approximately 25.0% of the city’s employed population. Some of the largest tenants in Santa Monica’s creative office space are Activision Blizzard, Agensys, Cooley, Cornerstone on Demand, Edmunds.com, Hulu, Kite Pharma, Lionsgate Entertainment, Miramax Films, TrueCar, Twitter, Uber, Universal Music Group.
A driver of the growth in creative office use is the development of the tech-hub known as Silicon Beach, a three mile stretch along the Pacific Ocean between Santa Monica and Playa Vista, neighboring to the Ocean Park Plaza Property, and home to predominantly technology oriented firms with venture capital backing including Google, Yahoo!, YouTube, BuzzFeed, Facebook, Salesforce, AOL, Electronic Arts, EdgeCast Networks, and MySpace. Silicon Beach has emerged as the strongest submarket in Los Angeles.
According to the appraisal, the Santa Monica office submarket had a second quarter 2017 vacancy rate of 9.5% and asking rent of $60.09 PSF. From 2008 to 2016, vacancy has ranged from 8.1% to 12.2% with an average of 10.2% and asking rent has ranged from $39.91 PSF to $54.56 PSF. The Ocean Park Plaza Property is located within the Ocean Park office micro submarket, which had a second quarter 2017 inventory of 1,934,622 SF with a vacancy rate of 2.7% and asking rents of $53.40 PSF. From 2012 to 2016, there was no new supply in the Ocean Park micro submarket, but asking rent had grown by 7.8% for the period. The Class B office inventory in the Ocean Park office micro submarket consists of 1,681,756 SF with an average year built of 1977, an occupancy rate of 98.3% and average rents of $50.57 PSF.
The appraisal noted three office projects currently under construction or recently completed in the Santa Monica office market, totaling 252,800 SF and representing 1.6% of supply. The three buildings are (i) The Project located at 302 Colorado Avenue in downtown Santa Monica which is a mixed use creative office and retail redevelopment, (ii) ICE and Shift buildings within Santa Monica Gateway located at 2834 Colorado Avenue, which is a $90 million office development and (iii) Pen Factory located at 2701 Olympic Blvd. which is a 222,000 SF creative office conversion.
According to the appraisal, the estimated 2016 population within a one-, three- and five-mile radius of the Ocean Park Plaza Property was 24,678, 323,506 and 566,640, respectively, representing 6.35% growth since 2010 within a three-mile radius. The estimated 2016 average household income within the same radii was $113,229, $111,997 and $119,663, respectively, with 38.4% of the households earning over $100,000 annually within a three-mile radius.
This is not a research report and was not prepared by any Underwriter’s research department. Please see additional important information and qualifications at the end of this Term Sheet.
| T-84 |
| MSBAM 2017-C34 | Ocean Park Plaza |
The following table presents recent leasing data at comparable office buildings with respect to the Ocean Park Plaza Property:
| Comparable Lease Summary | |||||||||
| Property Name/Address | Year Built/ Renovated | Total NRA (SF) | Total Occ. | Tenant Name | Lease Area (SF) | Lease Date / Term | Initial Rent PSF/ Ann. Escalation | TI PSF/ Free Rent | Lease Type |
Arboretum Courtyard 2120 Colorado Avenue Santa Monica, CA | 1999 / N/A | 85,401 | 81.7% | Connexity | 21,973 | Aug. 2017 / 5 Yrs | $64.80 / 3.5% | $45 / 4 mo | FSG |
| Santa Monica Business Park 2850-3440 Ocean Park Blvd. Santa Monica, CA | 1980 / 1990 | 1,076,915 | 99.0% | Snap, Inc. | 217,000 | Dec. 2016 / 8 Yrs | $54.60 / 3.0% | $55 / 4 mo | FSG |
Tribeca West 12233 West Olympic Blvd. Los Angeles, CA | 1981 / 2011 | 151,029 | 99.0% | Riot Games | 8,490 | Apr. 2016 / 5 Yrs | $48.00 / 3.0% | $0 / 0 mo | FSG |
1447 Cloverfield Blvd. Santa Monica, CA | 1998 / N/A | 16,500 | 100.0% | High-end film company | 6,250 | Jan. 2016 / 10 Yrs | $55.20 / 3.0% | $64 / 0 mo | MG |
2716 Ocean Park Blvd. Santa Monica, CA | 1978 / N/A | 101,440 | 96.9% | California Receivership Group | 1,314 | Oct. 2015 / 3 Yrs | $41.40 / 3.0% | $5 / 0 mo | FSG |
Source:Appraisal.
Operating History and Underwritten Net Cash Flow.The following table presents certain information relating to the historical operating performance and the Underwritten Net Cash Flow at the Ocean Park Plaza Property:
| Cash Flow Analysis | ||||||
| 2014 | 2015 | 2016 | 7/31/2017 TTM | UW | UW PSF | |
| Gross Potential Rent(1) | $2,629,672 | $2,732,370 | $3,141,819 | $3,345,131 | $4,875,968 | $48.96 |
| Total Recoveries | $52,962 | $60,232 | $245,453 | $152,675 | $311,325 | $3.13 |
| Total Other Income(2) | $302,883 | $380,318 | $368,769 | $361,564 | $622,439 | $6.25 |
| Less Vacancy & Credit Loss(3) | $0 | $0 | $0 | $0 | ($259,365) | (5.0%) |
| Effective Gross Income | $2,985,517 | $3,172,920 | $3,756,041 | $3,859,370 | $5,550,367 | $55.73 |
| Total Operating Expenses | $1,129,664 | $1,281,177 | $1,414,369 | $1,421,404 | $1,561,811 | $15.68 |
| Net Operating Income | $1,855,853 | $1,891,743 | $2,341,672 | $2,437,966(1) | $3,988,556(1) | $40.05(4) |
| Capital Expenditures | $0 | $0 | $0 | $0 | $24,900 | $0.25 |
| TI/LC | $0 | $0 | $0 | $0 | $269,673 | $2.71 |
| Net Cash Flow | $1,855,853 | $1,891,743 | $2,341,672 | $2,437,966 | $3,693,983 | $37.09 |
| Occupancy % | NAV | 90.3% | 87.3% | 90.0%(3) | 95.0% | |
| NOI DSCR (IO) | 0.95x | 0.96x | 1.19x | 1.24x | 2.03x | |
| NOI DSCR (P&I) | 0.69x | 0.70x | 0.87x | 0.91x | 1.49x | |
| NCF DSCR (IO) | 0.95x | 0.96x | 1.19x | 1.24x | 1.88x | |
| NCF DSCR (P&I) | 0.69x | 0.70x | 0.87x | 0.91x | 1.38x | |
| NOI Debt Yield | 4.1% | 4.2% | 5.2% | 5.4% | 8.8% | |
| NCF Debt Yield | 4.1% | 4.2% | 5.2% | 5.4% | 8.1% | |
| (1) | Historical Gross Potential Rent includes concessions given by the prior owner. UW Gross Potential Rent includes contractual rent steps through September 2018 totaling $111,670, and vacant space grossed up at a market rent. The increase in UW NOI from the 7/31/2017 TTM NOI is also attributable to the increase in average rent due to five tenant renewals or new leases signed. Current average underwritten base rent is $48.63 PSF as compared to the appraiser’s determined market rent of $58.19 PSF. |
| (2) | UW Total Other Income includes primarily storage income and $600,000 of annual parking income pursuant to a contractual parking agreement. |
| (3) | Occupancy as of August 1, 2017. |
Escrows and Reserves. The Ocean Park Plaza Borrower deposited at loan origination $250,000 and is required to deposit monthly $8,250 to a general tenant improvement and leasing commission reserve, until a cap of $500,000 is reached. Additionally, the Ocean Park Plaza Borrower deposited at loan origination (i) $464,041 for tenant improvements and leasing commissions relating to the tenants Rand McClain, UCLA Regents and Providence Health, (ii) $162,149 for rent credits through March 2019 relating to the tenants Rand McClain, The Regents of the University of California, Providence Health Systems and TixTrack and (iii) $285,971 for real estate taxes.
The Ocean Park Plaza Borrower is required to deposit monthly (i) $2,069 to a replacement reserve, capped at $74,466, (ii) 1/12thof the annual estimated real estate taxes due (currently $47,662), and (iii) 1/12th of the annual estimated insurance premiums due (unless the Ocean Park Plaza Property is covered by an acceptable blanket insurance policy).
Lockbox and Cash Management.During a Cash Sweep Period, all tenants at the Ocean Park Plaza Property are required to deposit all rents directly to a lockbox account and all funds in the lockbox account will be swept each business day to a lender-controlled cash management account and disbursed in accordance with the Ocean Park Plaza Mortgage Loan documents, with all excess cash from the Ocean Park Plaza Property held by lender as additional security for the Ocean Park Plaza Mortgage Loan. Provided no event of default has occurred, upon the cure of the first Cash Sweep Period, the excess cash will be disbursed to the Ocean Park Plaza Borrower. Should a Cash Sweep Period occur again, all excess cash will be collected and held by lender for the term of the Ocean Park Plaza Mortgage Loan.
This is not a research report and was not prepared by any Underwriter’s research department. Please see additional important information and qualifications at the end of this Term Sheet.
| T-85 |
| MSBAM 2017-C34 | Ocean Park Plaza |
A “Cash Sweep Period” will commence upon the debt service coverage ratio being less than 1.10x for two consecutive calendar quarters, and will end upon the debt service coverage ratio being equal to or greater than 1.10x for two consecutive calendar quarters.
Additional Secured Indebtedness (not including trade debts).Not permitted.
Mezzanine Loan and Preferred Equity.Not permitted.
Release of Property.Not permitted.
Terrorism Insurance.The Ocean Park Plaza Mortgage Loan documents require that the “all risk” insurance policy required to be maintained by the Ocean Park Plaza Borrower provide coverage for perils of terrorism and acts of terrorism in an amount equal to the full replacement cost of the Ocean Park Plaza Property, and eighteen months of business interruption insurance with six months of extended indemnity, provided that if the Terrorism Risk Insurance Program Reauthorization Act of 2007 or extension thereof or substantially similar program (“TRIPRA”) is not in effect the Ocean Park Plaza Borrower will not be required to pay annual premiums in excess of two times the premium for a separate policy insuring the Ocean Park Plaza Property on a stand-alone basis.
This is not a research report and was not prepared by any Underwriter’s research department. Please see additional important information and qualifications at the end of this Term Sheet.
| T-86 |
(THIS PAGE INTENTIONALLY LEFT BLANK)
| T-87 |
| MSBAM 2017-C34 | Rodin Place |
Mortgage Loan No. 8 – Rodin Place
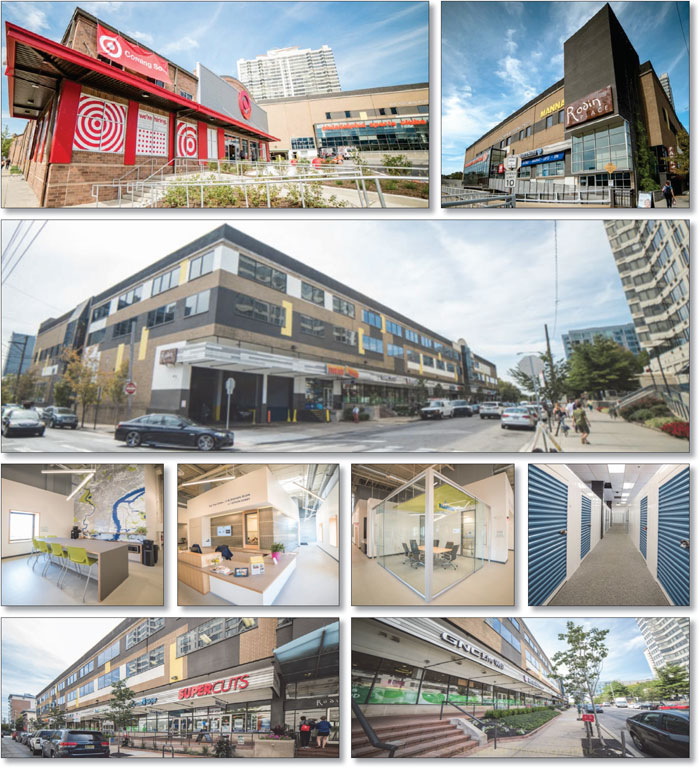
This is not a research report and was not prepared by any Underwriter’s research department. Please see additional important information and qualifications at the end of this Term Sheet.
| T-88 |
| MSBAM 2017-C34 | Rodin Place |
Mortgage Loan No. 8 – Rodin Place
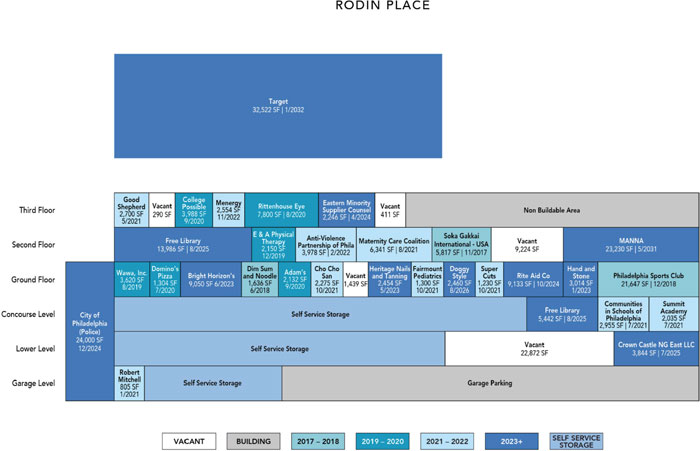
This is not a research report and was not prepared by any Underwriter’s research department. Please see additional important information and qualifications at the end of this Term Sheet.
| T-89 |
| MSBAM 2017-C34 | Rodin Place |
Mortgage Loan No. 8 – Rodin Place

This is not a research report and was not prepared by any Underwriter’s research department. Please see additional important information and qualifications at the end of this Term Sheet.
| T-90 |
| MSBAM 2017-C34 | Rodin Place |
| Mortgage Loan No. 8 – Rodin Place |
| Mortgage Loan Information | Property Information | ||||||
| Mortgage Loan Seller: | KeyBank | Single Asset/Portfolio: | Single Asset | ||||
| Original Balance: | $44,720,000 | Location: | Philadelphia, PA 19130 | ||||
| Cut-off Date Balance: | $44,720,000 | General Property Type: | Mixed Use | ||||
| % of Initial Pool Balance: | 4.3% | Detailed Property Type: | Office/Retail/Self Storage | ||||
| Loan Purpose: | Refinance | Title Vesting: | Fee | ||||
| Sponsor: | Valhal Holding Corp. | Year Built/Renovated: | 1989, 1997/2008, 2017 | ||||
| Mortgage Rate: | 4.3500% | Size(2): | 241,884 SF | ||||
| Note Date: | 7/31/2017 | Cut-off Date Balance per SF(2): | $185 | ||||
| First Payment Date: | 9/1/2017 | Maturity Date Balance per SF(2): | $169 | ||||
| Maturity Date: | 8/1/2027 | Property Manager: | Ranger Properties LLC (borrower-related) | ||||
| Original Term to Maturity: | 120 months | ||||||
| Original Amortization Term: | 360 months | ||||||
| IO Period: | 60 months | Underwriting and Financial Information | |||||
| Seasoning: | 2 months | UW NOI(3): | $4,277,380 | ||||
| Prepayment Provisions: | LO (26); DEF (91); O (3) | UW NOI Debt Yield: | 9.6% | ||||
| Lockbox/Cash Mgmt Status: | Hard/Springing | UW NOI Debt Yield at Maturity: | 10.5% | ||||
| Additional Debt Type: | N/A | UW NCF DSCR: | 2.04x (IO) 1.50x (P&I) | ||||
| Additional Debt Balance: | N/A | Most Recent NOI(3): | $3,480,536 (5/31/2017 TTM) | ||||
| Future Debt Permitted (Type): | No (N/A) | 2nd Most Recent NOI: | $3,452,757 (12/31/2016) | ||||
| Reserves(1) | 3rd Most Recent NOI: | $3,934,314 (12/31/2015) | |||||
| Type | Initial | Monthly | Cap | Most Recent Occupancy(4): | 85.8% (9/15/2017) | ||
| RE Tax: | $485,191 | $69,313 | N/A | 2nd Most Recent Occupancy(4): | 85.4% (12/31/2016) | ||
| Insurance: | $0 | Springing | N/A | 3rd Most Recent Occupancy(4): | 87.6% (12/31/2015) | ||
| Recurring Replacements: | $4,667 | $4,667 | N/A | Appraised Value (as of)(5): | $71,500,000 (5/1/2018) | ||
| TI/LC: | $319,500 | $19,500 | N/A | Cut-off Date LTV Ratio(5): | 62.5% | ||
| Other: | $487,830 | $0 | N/A | Maturity Date LTV Ratio(5): | 57.2% | ||
| Sources and Uses | ||||||
| Sources | Proceeds | % of Total | Uses | Proceeds | % of Total | |
| Loan Amount: | $44,720,000 | 100.0% | Loan Payoff: | $26,271,787 | 58.7% | |
| Return of Equity: | $16,873,165 | 37.7% | ||||
| Reserves: | $1,297,188 | 2.9% | ||||
| Closing Costs: | $277,860 | 0.6% | ||||
| Total Sources: | $44,720,000 | 100.0% | Total Uses: | $44,720,000 | 100.0% | |
| (1) | See “Escrows and Reserves”below for further discussion of reserve requirements. |
| (2) | Size, Cut-off Date Balance per SF and Maturity Date Balance per SF include the square footage for the office and retail space and exclude the 749 self storage units located at the Rodin Place Property (as defined below). |
| (3) | UW NOI increased from Most Recent NOI due to commencement of the Target lease (13.4% of NRA) in January 2017 with an annual underwritten base rent of $1,306,347. Prior to Target, Whole Foods occupied the space through lease expiration in January 2017 at a lower annual base rent of $779,098. UW NOI includes income net expenses from the 749 self storage units. |
| (4) | Occupancy excludes the 749 self storage units located at the Rodin Place Property. Occupancy of the self storage units is 86.9% as of July 1, 2017. |
| (5) | The appraised value represents the “prospective market value at stabilization”, which assumes the completion of tenant improvements to the Target space. At closing, the Rodin Place Borrower (as defined below) deposited $487,830 into a rollover reserve related to the tenant improvements to the Target space. The “as is” appraised value as of April 6, 2017, is $68,800,000, which results in a Cut-off Date LTV Ratio and Maturity Date LTV Ratio of 65.0% and 59.4%, respectively. |
The Mortgage Loan.The eighth largest mortgage loan (the “Rodin Place Mortgage Loan”) is evidenced by a promissory note in the original principal amount of $44,720,000 and secured by a first priority fee mortgage encumbering a mixed use property located in Philadelphia, Pennsylvania (the “Rodin Place Property”). Proceeds of the Rodin Place Mortgage Loan were used to refinance existing debt on the Rodin Place Property, fund reserves, pay closing costs and return equity to the Rodin Place Borrower.
The Borrower and the Sponsor. The borrower is RMPKey LLC (the “Rodin Place Borrower”), a newly-formed, single-purpose Delaware limited liability company with two independent directors. The sponsor of the Rodin Place Borrower and nonrecourse carve-out guarantor is Valhal Holding Corp. (“VHC”), which controls the Rodin Place Borrower through its subsidiary, Valhal Corp., the 99.5% majority owner of the Rodin Place Borrower. Valhal Corp. is a New York-based real estate development company with a portfolio of more than 670,000 SF of commercial and residential real estate and 300,000 SF of developable land. VHC purchased the Rodin Place Property in February 1990.
This is not a research report and was not prepared by any Underwriter’s research department. Please see additional important information and qualifications at the end of this Term Sheet.
| T-91 |
| MSBAM 2017-C34 | Rodin Place |
The Property.The Rodin Place Property is comprised of a six-story, 209,362 SF multi-tenant mixed use office and retail building located at 2000 Hamilton Street (“Rodin Place Building”) and a single-story, 32,522 SF single-tenant retail building located at 2001 Pennsylvania Avenue and leased to Target (“Target Building”). The buildings are situated adjacent to each other on a 3.94 acre site within Philadelphia, Pennsylvania, on the north side of the Philadelphia central business district (“Philadelphia CBD”). In addition to the office and retail space, the Rodin Place Building contains a subsurface parking garage and a self storage component with 749 traditional and climate controlled units on three below street level floors. As of July 1, 2017, the self storage units have an occupancy of 86.9%. The three above street level floors contain the office space and ground level retail space. The Rodin Place Building was constructed in 1989 and renovated in 2008, while the Target Building was constructed in 1997 as a Whole Foods store and renovated in 2017 when Whole Foods vacated and Target commenced its lease. The Rodin Place Property contains a total of 203 parking spaces, with 120 spaces in the Rodin Place Building parking garage and 83 surface spaces at the Target Building.
As of September 15, 2017, the Rodin Place Property was 85.8% leased to a mix of 15 retail and 15 office tenants. The Rodin Place Property is anchored by Target (13.4% of NRA), with other major tenants including the City of Philadelphia Police Department (9.9% of NRA), MANNA (9.6% of NRA), Philadelphia Sports Club (8.9% of NRA) and the Free Library of Philadelphia (8.0% of NRA). The remaining tenants consist of national, regional and local tenants, none of which occupy more than 3.8% of the total NRA or represent more than 4.8% of underwritten rent. In addition to Target, national and regional tenants at the Rodin Place Property include Rite Aid Co., Wawa, Inc., Domino’s Pizza and Super Cuts.
The Rodin Place Property is bordered by 20th Street and 21st Street, between Hamilton Street and Pennsylvania Avenue in the urban core of Philadelphia. Land uses within the immediate neighborhood consist of residential communities, modern office and retail buildings and historic architecture. Traffic counts next to the Rodin Place Property total more than 10,900 vehicles per day. The Rodin Place Property is located in the Art Museum neighborhood of Philadelphia, with the Rodin Museum and Barnes Foundation located across the street to the west and south, respectively, of the Rodin Pace Property and the Philadelphia Museum of Art is situated approximately one half mile to the northwest. Additionally, two condominium towers are located to the immediate north and east and a new Class A high-rise apartment tower with ground floor retail known as the Dalian on the Park is located to the immediate northwest of the Rodin Place Property. Access to the surrounding area is primarily provided by Interstate 676, which connects with Interstate 76 to the west and Interstate 95 to the east. Interstates 76 and 95 form the primary access points for the suburban communities of the city of Philadelphia in Pennsylvania, as well as the suburban areas to the east in New Jersey.
Major Tenants.
Target(32,522 SF, 13.4% of NRA, 30.8% ofunderwritten rent). Target leases the 32,522 SF Target Building at the Rodin Place Property pursuant to a 15-year lease that commenced January 26, 2017, expires January 31, 2032, has two, five-year extension options and has a third extension option that would extend the total term of the lease to 29.5 years. Rent during the first option is $48.46 PSF NNN and $55.72 PSF NNN in the second option. Target is expected to open for business at the Rodin Place Property in October 2017. Incorporated in 1902, Target (NYSE: TGT) (rated A-/A2/A by Fitch/Moody’s/S&P) is an upscale discount retailer that provides an assortment of general merchandise and food products through its standard-format general merchandise Target stores, larger format SuperTarget stores that offer a full line of food items comparable to traditional supermarkets, and smaller flexible-format TargetExpress stores that are generally less than 50,000 SF. The company has approximately 1,802 stores located throughout the United States with approximately 323,000 employees and reported revenue of over $69 billion in fiscal 2016. The Target location at the Rodin Place Property resembles the flexible-format TargetExpress stores, which cover approximately 15% of the size of a typical general merchandise Target store and offer a quick shopping experience.
City of Philadelphia Police Department (24,000 SF, 9.9% of NRA, 0.0% of underwritten rent). The City of Philadelphia Police Department (“Philadelphia Police Department”) has leased 24,000 SF at the Rodin Place Property since 1995. The 29-year lease commenced November 3, 1995, expires December 1, 2024 at zero base rent but paying a pro-rata share of reimbursements, and has five, four-year extension options at fair market rent. The Philadelphia Police Department (City of Philadelphia is rated A-/A2/A+ by Fitch/Moody’s/S&P) is the fourth largest police department in the United States, with over 6,300 sworn members and 800 civilian personnel. The Philadelphia Police Department utilizes its space at the Rodin Place Property as the headquarters for its 9th District.
MANNA (23,230 SF, 9.6% of NRA, 10.4% of underwritten rent).MANNA leases 23,230 SF at the Rodin Place Property on a 15-year lease that commenced January 4, 2016, expires May 4, 2031, and has two, five-year and one, 45-month extension options at fair market rent. Founded in 1990, MANNA is a non-profit organization that cooks and delivers nutritious, medically-appropriate meals and provides nutrition counseling to neighbors who are battling life-threatening illnesses. Each month, MANNA delivers over 95,000 meals to the Greater Philadelphia area and Southern New Jersey. MANNA is headquartered at the Rodin Place Property.
Philadelphia Sports Club (21,647 SF, 8.9% of NRA, 9.9% of underwritten rent).The Philadelphia Sports Club has leased 21,647 SF at the Rodin Place Property since 1998. The 20-year lease commenced December 29, 1998, expires December 31, 2018, and has two, five-year extension options at a fixed minimum rent per annum equal to 90% of the fair market value for a comparable lease. Philadelphia Sports Club is a fitness chain owned and operated by New York based Town Sports International (“TSI”) (NASDAQ: CLUB, rated Caa2/CCC+ by Moody’s/S&P), the largest owner and operator of fitness clubs in the Northeast and Mid-Atlantic regions and the third largest fitness club operator in the United States, as measured by number of clubs. TSI operates under the brand names New York Sports Clubs, Boston Sports Clubs, Washington Sports Clubs and Philadelphia Sports Clubs. The Philadelphia Sports Club located at the Rodin Place Property is one of five locations within the Philadelphia metropolitan area.
Free Library of Philadelphia (19,428 SF, 8.0% of NRA, 6.9% of underwritten rent).Free Library of Philadelphia (“Free Library”) leases 19,428 SF at the Rodin Place Property via two 10-year leases and has been a tenant since 1993. The current leases commenced August 15, 2015, expire August 14, 2025, and have one, five-year extension option at fair market rent. Chartered in 1891, the Free Library is the public library system that serves Philadelphia. With more than seven million items in circulation, the Free Library receives approximately six million visitors to its 54 neighborhood libraries each year.
This is not a research report and was not prepared by any Underwriter’s research department. Please see additional important information and qualifications at the end of this Term Sheet.
| T-92 |
| MSBAM 2017-C34 | Rodin Place |
The following table presents a summary regarding the largest tenants at the Rodin Place Property:
| Tenant Summary(1)(2) | |||||||
| Tenant Name | Credit Rating (Fitch/Moody’s/S&P)(3) | Tenant SF | Approx. % of SF | Annual UW Rent | % of Total Annual UW Rent | Annual UW Rent PSF | Lease Expiration |
| Target(4) | A-/A2/A | 32,522 | 13.4% | $1,306,347 | 30.8% | $40.17(4) | 1/31/2032 |
| Philadelphia Police Department(5) | A-/A2/A+ | 24,000 | 9.9% | $0 | 0.0% | $0.00 | 12/1/2024 |
| MANNA | NR/NR/NR | 23,230 | 9.6% | $440,499 | 10.4% | $18.96 | 5/4/2031 |
| Philadelphia Sports Club | NR/Caa2/CCC+ | 21,647 | 8.9% | $421,684 | 9.9% | $19.48 | 12/31/2018 |
| Free Library of Philadelphia | NR/NR/NR | 19,428 | 8.0% | $294,193 | 6.9% | $15.14 | 8/14/2025 |
| Subtotal/Wtd. Avg.(5) | 120,827 | 50.0% | $2,462,723 | 58.1% | $25.43 | ||
| Other Tenants | 86,821 | 35.9% | $1,776,990 | 41.9% | $20.47 | ||
| Vacant Space | 34,236 | 14.2% | $0 | 0.0% | $0.00 | ||
| Total/Wtd. Avg.(5) | 241,884 | 100.0% | $4,239,713 | 100.0% | $23.09 | ||
| (1) | Information is based on the underwritten rent roll. |
| (2) | Table excludes the 749 self storage units located at the Rodin Place Property. |
| (3) | Certain ratings are those of the parent company whether or not the parent guarantees the lease. |
| (4) | Target Annual UW Rent and Annual UW Rent PSF includes approximately $122,347 of straight line contractual rent increases through the loan term. |
| (5) | Philadelphia Police Department pays no base rent; therefore, Annual UW Rent and Annual UW Rent PSF calculations exclude the SF for this tenant. Philadelphia Police Department pays a pro-rata share of expenses. |
The following table presents certain information relating to the lease rollover at the Rodin Place Property:
| Lease Rollover Schedule(1)(2)(3) | ||||||||
| Year | # of Leases Rolling | SF Rolling | Approx. % of Total SF Rolling | Approx. Cumulative % of SF Rolling | UW Rent PSF Rolling(4) | Total UW Rent Rolling(4) | Approx. % of Total Rent Rolling | Approx. Cumulative % of Total Rent Rolling |
| 2017 | 1 | 5,817 | 2.4% | 2.4% | $19.50 | $113,432 | 2.7% | 2.7% |
| 2018 | 2 | 23,283 | 9.6% | 12.0% | $20.01 | $465,876 | 11.0% | 13.7% |
| 2019 | 2 | 5,770 | 2.4% | 14.4% | $23.30 | $134,418 | 3.2% | 16.8% |
| 2020 | 4 | 15,224 | 6.3% | 20.7% | $19.64 | $299,060 | 7.1% | 23.9% |
| 2021 | 8 | 19,641 | 8.1% | 28.8% | $19.86 | $390,010 | 9.2% | 33.1% |
| 2022 | 2 | 6,532 | 2.7% | 31.5% | $19.15 | $125,103 | 3.0% | 36.0% |
| 2023 | 3 | 14,518 | 6.0% | 37.5% | $20.38 | $295,946 | 7.0% | 43.0% |
| 2024(5) | 3 | 35,379 | 14.6% | 52.2% | $21.91 | $249,290 | 5.9% | 48.9% |
| 2025 | 4 | 23,272 | 9.6% | 61.8% | $15.31 | $356,387 | 8.4% | 57.3% |
| 2026 | 1 | 2,460 | 1.0% | 62.8% | $25.75 | $63,345 | 1.5% | 58.8% |
| 2027 | 0 | 0 | 0.0% | 62.8% | $0.00 | $0 | 0.0% | 58.8% |
| 2028 & Beyond | 2 | 55,752 | 23.0% | 85.8% | $31.33 | $1,746,846 | 41.2% | 100.0% |
| Vacant | 0 | 34,236 | 14.2% | 100.0% | $0.00 | $0 | 0.0% | 100.0% |
| Total/Wtd. Avg.(5) | 32 | 241,884 | 100.0% | $23.09 | $4,239,713 | 100.0% | ||
| (1) | Information is based on the underwritten rent roll. |
| (2) | Certain tenants may have lease termination options that are exercisable prior to the stated expiration date of the subject lease or leases which are not considered in the lease rollover schedule. |
| (3) | Table excludes the 749 self storage units located at the Rodin Place Property. |
| (4) | UW Rent PSF Rolling and Total UW Rent Rolling exclude vacant space. |
| (5) | UW Rent PSF Rolling calculation excludes the SF for the Philadelphia Police Department, which pays no base rent. Philadelphia Police Department pays a pro rata share of expenses. |
The Market. The Rodin Place Property is located in the Philadelphia-Camden-Wilmington, PA-NJ-DE-MD metropolitan statistical area (“Philadelphia MSA”), on the north side of the Philadelphia CBD. The Philadelphia MSA is the seventh most populous metropolitan area in the United States, with a 2017 estimated population of 6.1 million. Philadelphia is located in southeastern Pennsylvania approximately 90 miles southwest of New York City. The largest employment centers for the City of Philadelphia include education and health services and financial services.
According to the appraisal, the Rodin Place Property is located in the Center City area of Philadelphia (“Center City”), within the Art Museum/Fairmont neighborhood. Accounting for 46% of all jobs in Philadelphia, Center City is considered a major economic driver for the region and the focal point of the greater Philadelphia metropolitan area for business, government and cultural activities. Per the appraisal, over the last 25 years, Center City has been experiencing major commercial development activity. Center City serves as the headquarters for several companies including Comcast, Cigna, ACE, Blue Cross of Pennsylvania and Delaware Valley Investments. Center City also houses numerous city and federal government agencies such as the Environmental Protection Agency, Department of Housing and Urban Development, Department of Justice, U.S. Mint and the Federal Reserve. Several colleges and universities are located in Center City, including the Art Institute of Philadelphia, the Academy of the Arts, Thomas Jefferson University Medical School, the University of Pennsylvania, Drexel University and Temple University. Additionally, Wills Hospital, Thomas Jefferson Hospital, Hahnemann Hospital and Pennsylvania Hospital serve as demand generators for the Center City area.
This is not a research report and was not prepared by any Underwriter’s research department. Please see additional important information and qualifications at the end of this Term Sheet.
| T-93 |
| MSBAM 2017-C34 | Rodin Place |
According to a third party market research report, the estimated 2016 population within a five-, 10- and 15-minute walk of the Rodin Place Property was 4,607, 15,047 and 32,816, respectively. The 2016 median household income within a five-, 10- and 15-minute walk of the Rodin Place Property was $68,388, $65,893 and $65,197, respectively.
The Rodin Place Property is situated in the Philadelphia CBD retail submarket cluster and the Market Street West retail submarket. According to a second quarter 2017 third party market research report, the Philadelphia CBD retail submarket cluster is comprised of 1,573 retail buildings containing approximately 12.2 million SF of leasable area with an overall vacancy rate of 5.0% and an average rental rate of $33.19 PSF NNN. The Market Street West retail submarket is comprised of 582 buildings containing approximately 4.4 million SF of leasable area with an overall vacancy rate of 3.1% and an average rental rate of $42.11 PSF NNN. Year-to-date absorption in the Market Street West retail submarket was positive at 44,064 SF with 10,400 SF under construction.
The Rodin Place Property is situated in the Philadelphia CBD office submarket cluster and the Market Street West office submarket. According to a second quarter 2017 third party market research report, the Philadelphia CBD office submarket cluster is comprised of 756 office buildings containing approximately 61.6 million SF of space with a reported vacancy rate of 9.0% and asking rents of $30.02 PSF gross. The Market Street West submarket is comprised of 384 office buildings containing approximately 39.4 million SF of space with a reported vacancy rate of 8.6% and asking rents of $31.31 PSF. Year-to-date absorption in the Market Street West office submarket was positive at 357,948 SF with approximately 1.3 million SF under construction.
The following table presents retail rental comparables with respect to the Rodin Place Property:
| Competitive Property Summary | ||||||||
| Property Name/Location | Year Built | Size (SF) | Tenant Name | Lease Size (SF) | Lease Date | Lease Term (Months) | Rent PSF | Lease Type |
Rodin Place(1)(2) 2000 Hamilton Street and 2001 Pennsylvania Avenue Philadelphia, PA | 1989, 1997 | 241,884 | Target | 32,522 | Jan. 2017 | 180 | $36.41 | Triple Net |
Abbotts Square 200-210 Lombard Street Philadelphia, PA | 1985 | 38,164 | Fresh Formats | 16,821 | Oct. 2016 | 120 | $35.51 | Triple Net |
Dalian on the Park 501 North 22nd Street Philadelphia, PA | 2016 | 270,854 | Whole Foods Market | 55,000 | Aug. 2016 | 240 | $38.00 | Triple Net |
The Collins 1125 Sansom Street Philadelphia, PA | 2016 | 168,000 | Target Express | 19,054 | Jun. 2016 | 180 | $44.00 | Triple Net |
34 South 11th Street 34 South 11th Street Philadelphia, PA | 1925 | 207,031 | MOM’s Organic Market | 16,000 | Jan. 2017 | 120 | $37.00 | Triple Net |
1700 Chestnut 1700 Chestnut Street Philadelphia, PA | 1927 | 77,379 | Nordstrom Rack | 39,000 | Nov. 2014 | 120 | $51.28 | Triple Net |
Source: Appraisal.
| (1) | Based on the underwritten rent roll, except the Year Built. |
| (2) | Table excludes the 749 self storage units located at the Rodin Place Property. |
This is not a research report and was not prepared by any Underwriter’s research department. Please see additional important information and qualifications at the end of this Term Sheet.
| T-94 |
| MSBAM 2017-C34 | Rodin Place |
The following table presents office rental comparables with respect to the Rodin Place Property:
| Competitive Property Summary | ||||||||
| Property Name/Location | Year Built | Size (SF) | Tenant Name | Lease Size (SF) | Lease Date | Lease Term (Months) | Rent PSF | Lease Type |
Rodin Place(1)(2) 2000 Hamilton Street and 2001 Pennsylvania Avenue Philadelphia, PA | 1989, 1997 | 241,884 | Maternity Care Coalition | 6,341 | Sep. 2016 | 60 | $19.31 | Mod Gross |
Jefferson Building 1015 Chestnut Street Philadelphia, PA | 1920 | 156,000 | Biomeme | 4,524 | Oct. 2016 | 91 | $21.50 | Full Service |
Waterview Corporate Center 1020-84 North Delaware Avenue Philadelphia, PA | 1905 | 128,471 | Dharma Global Marketing, Inc. | 3,059 | Jun. 2015 | 37 | $19.50 | Gross + TE |
The Bourse Building 111 South Independence Mall East Philadelphia, PA | 1895 | 298,679 | Ride The Ducks International, LLC | 1,318 | Jan. 2015 | 60 | $22.00 | Full Service |
Stephen Girard Building 19-25 South 12th Street Philadelphia, PA | 1896 | 108,920 | Brian Sims | 1,552 | Jan. 2015 | 47 | $16.78 | Gross |
2100 Parkway 230 North 21st Street Philadelphia, PA | 1930 | 221,820 | Masqrray, Inc. | 5,000 | Dec. 2014 | 62 | $20.00 | Mod Gross |
Source: Appraisal.
| (1) | Based on the underwritten rent roll, except the Year Built. |
| (2) | Table excludes the 749 self storage units located at the Rodin Place Property. |
Operating History and Underwritten Net Cash Flow. The following table presents certain information relating to the historical operating performance and the Underwritten Net Cash Flow at the Rodin Place Property:
| Cash Flow Analysis | ||||||
| 2014 | 2015 | 2016 | 5/31/2017 TTM | UW | UW PSF | |
| Base Rent(1) | $3,685,988 | $3,618,386 | $3,297,712 | $3,490,064 | $4,784,471 | $19.78 |
| Total Recoveries | $1,769,243 | $1,744,519 | $1,536,757 | $1,248,216 | $1,540,222 | $6.37 |
| Parking Revenue | $100,030 | $120,450 | $131,154 | $141,782 | $141,782 | $0.59 |
| Other Income | $845,612 | $921,414 | $939,882 | $1,000,867 | $1,041,385 | $4.31 |
| Less Vacancy & Credit Loss | $0 | $0 | $0 | $0 | ($632,469) | ($2.61) |
| Effective Gross Income | $6,400,873 | $6,404,769 | $5,905,505 | $5,880,929 | $6,875,391 | $28.42 |
| Total Expenses | $2,542,958 | $2,470,455 | $2,452,747 | $2,400,393 | $2,598,011 | $10.74 |
| Net Operating Income | $3,857,915 | $3,934,314 | $3,452,757 | $3,480,536 | $4,277,380 | $17.68 |
| Capital Expenditures | $0 | $0 | $0 | $0 | $55,633 | $0.23 |
| TI/LC | $0 | $0 | $0 | $0 | $204,000 | $0.84 |
| Net Cash Flow | $3,857,915 | $3,934,314 | $3,452,757 | $3,480,536 | $4,017,747 | $16.61 |
| Occupancy %(2) | 87.9% | 87.6% | 85.4% | 85.8% | 91.6% | |
| NOI DSCR (P&I) | 1.44x | 1.47x | 1.29x | 1.30x | 1.60x | |
| NOI DSCR (IO) | 1.96x | 1.99x | 1.75x | 1.76x | 2.17x | |
| NCF DSCR (P&I) | 1.44x | 1.47x | 1.29x | 1.30x | 1.50x | |
| NCF DSCR (IO) | 1.96x | 1.99x | 1.75x | 1.76x | 2.04x | |
| NOI Debt Yield | 8.6% | 8.8% | 7.7% | 7.8% | 9.6% | |
| NCF Debt Yield | 8.6% | 8.8% | 7.7% | 7.8% | 9.0% | |
| (1) | UW Base Rent is based on the rent roll dated September 15, 2017, and includes approximately $5,259 of additional contractual rent steps through November 2017, approximately $122,347 of straight line contractual rent increases through the loan term for the Target space and approximately $55,348 of mark to market rent. UW Base Rent increased from 5/31/2017 TTM Base Rent due to the commencement of the Target lease in January 2017 at an annual underwritten base rent of $1,306,347. Prior to Target, Whole Foods occupied the space at a lower annual base rent of $779,098. |
| (2) | Occupancy % represents office and retail space only and excludes 749 self storage units at the Rodin Place Property. Occupancy of the self storage units is 86.9% as of July 1, 2017. 5/31/2017 TTM Occupancy % is as of the underwritten rent roll dated September 15, 2017. UW Occupancy % represents economic occupancy. |
This is not a research report and was not prepared by any Underwriter’s research department. Please see additional important information and qualifications at the end of this Term Sheet.
| T-95 |
| MSBAM 2017-C34 | Rodin Place |
Escrows and Reserves. The Rodin Place Borrower deposited $485,191 in escrow for annual real estate taxes at loan origination and is required to escrow monthly 1/12 of the annual estimated tax payments, which currently equates to $69,313. The Rodin Place Borrower is required to escrow monthly 1/12 of the annual estimated insurance premiums (unless the Rodin Place Borrower maintains insurance under an acceptable blanket insurance policy, among other conditions in the related loan documents). The Rodin Place Borrower currently maintains a blanket policy. The Rodin Place Borrower deposited $4,667 at loan origination and is required to make monthly deposits of $4,667 for replacement reserves. The Rodin Place Borrower deposited $319,500 at loan origination and is required to make monthly deposits of $19,500 for TI/LC reserves. The Rodin Place Borrower deposited $487,830 at loan origination for tenant improvements related to Target.
Lockbox and Cash Management. The Rodin Place Mortgage Loan is structured with a hard lockbox with springing cash management. The Rodin Place Borrower is required to direct all credit card companies and tenants to deposit all receipts and rents and other revenues directly into the lockbox account. Notwithstanding the foregoing, the Rodin Place Borrower and property manager are required to deposit all amounts received constituting rents into the lockbox account within five business days of receipt. For so long as a Cash Sweep Period (as defined below) does not exist, all funds in the lockbox account will be transferred to an account controlled by the Rodin Place Borrower. Upon the occurrence of a Cash Sweep Period, all sums on deposit in the lockbox account are required to be swept on a daily basis into the cash management account for the payment of, among other things, debt service, monthly escrows and, if caused only by a DSCR Trigger Event (as defined below), operating expenses pursuant to an annual approved budget, and all excess cash is required to be swept into an account to be held as additional security for the Rodin Place Mortgage Loan during the continuance of such Cash Sweep Period.
| A | “Cash Sweep Period” will |
| (i) | commence upon the occurrence of an event of default under the Rodin Place Mortgage Loan and continue until such event of default is cured; |
| (ii) | commence upon the occurrence of any bankruptcy action of the Rodin Place Borrower or property manager and, in the case of any bankruptcy action of the property manager, continue until the manager is replaced with a qualified manager under a replacement agreement within 60 days (in no event will a Cash Sweep Period due to a bankruptcy action of the Rodin Place Borrower be cured); |
| (iii) | commence upon the date that the debt service coverage ratio for the Rodin Place Mortgage Loan based on the trailing three-month period is less than 1.15x and continue until such time as the debt service coverage ratio based on the trailing three-month period is 1.20x or greater for two consecutive quarters (“DSCR Trigger Event”); or |
| (iv) | commence upon, with respect to Target Corporation or any successor, assign or subsequent tenant (“Major Tenant”) under a replacement lease (“Major Tenant Lease”): |
| (a) | the date that any Major Tenant files a bankruptcy action and will continue until (so long as there is no default or event of default that would trigger another Cash Sweep Period) (1) the date that is 30 days after the applicable Major Tenant has affirmed its Major Tenant Lease, is no longer the subject of a bankruptcy or similar proceeding, is in occupancy and paying full contractual unabated post-petition rent without right of offset or free rent credit, and has delivered a tenant estoppel acceptable to the lender or (2) the date the Rodin Place Borrower has entered into one or more replacement leases for the entire applicable Major Tenant premises in each case with tenants acceptable to the lender in its discretion and (w) the replacement tenants are in occupancy of the entire net leasable area of the applicable Major Tenant premises, are obligated to pay full contractual rent without right of offset or free rent credit, and have made their first monthly rental payment, (x) all tenant improvements have been completed, (y) all leasing commissions and any other tenant reimbursement obligations incurred by the Rodin Place Borrower have been paid and (z) the replacement tenants have delivered a tenant estoppel acceptable to the lender (clauses (w) through (z), collectively, the “Replacement Lease Conditions”); |
| (b) | the date any Major Tenant gives notice that it intends to go dark, vacate or abandon the premises or for 10 consecutive days vacates, goes dark, abandons, or surrenders substantially all of the premises and will continue until the date that (1) is 30 days after the date that the applicable Major Tenant has resumed operations at its premises, is in occupancy and open for business paying full contractual unabated rent without right of offset or free rent credit, has made its next due monthly rental payment, and has delivered a tenant estoppel acceptable to the lender or (2) the Rodin Place Borrower has entered into one or more replacement leases for the entire applicable premises with tenants acceptable to the lender in its discretion and the Replacement Lease Conditions have been satisfied; or |
| (c) | the date that any Major Tenant fails to maintain a rating of at least BBB- by S&P or Baa3 by Moody’s and will continue until the date that (1) the Major Tenant is rated BBB or higher by S&P or Baa2 or higher by Moody’s or (2) the Major Tenant is replaced with one or more tenants satisfactory to lender in its discretion with credit ratings satisfactory to lender in its discretion pursuant to replacement leases for the entire applicable Major Tenant premises and the Replacement Lease Conditions have been satisfied. |
Additional Secured Indebtedness (not including trade debts). Not permitted.
Mezzanine Loan and Preferred Equity.Not permitted.
Release of Property. Not permitted.
Terrorism Insurance. The Rodin Place Borrower is required to obtain and maintain property insurance, public liability insurance and rental loss and/or business interruption insurance that covers perils of terrorism and acts of terrorism.
This is not a research report and was not prepared by any Underwriter’s research department. Please see additional important information and qualifications at the end of this Term Sheet.
| T-96 |
(THIS PAGE INTENTIONALLY LEFT BLANK)
| T-97 |
| MSBAM 2017-C34 | Mall of Louisiana |
Mortgage Loan No. 9 – Mall of Louisiana

This is not a research report and was not prepared by any Underwriter’s research department. Please see additional important information and qualifications at the end of this Term Sheet.
| T-98 |
| MSBAM 2017-C34 | Mall of Louisiana |
Mortgage Loan No. 9 – Mall of Louisiana
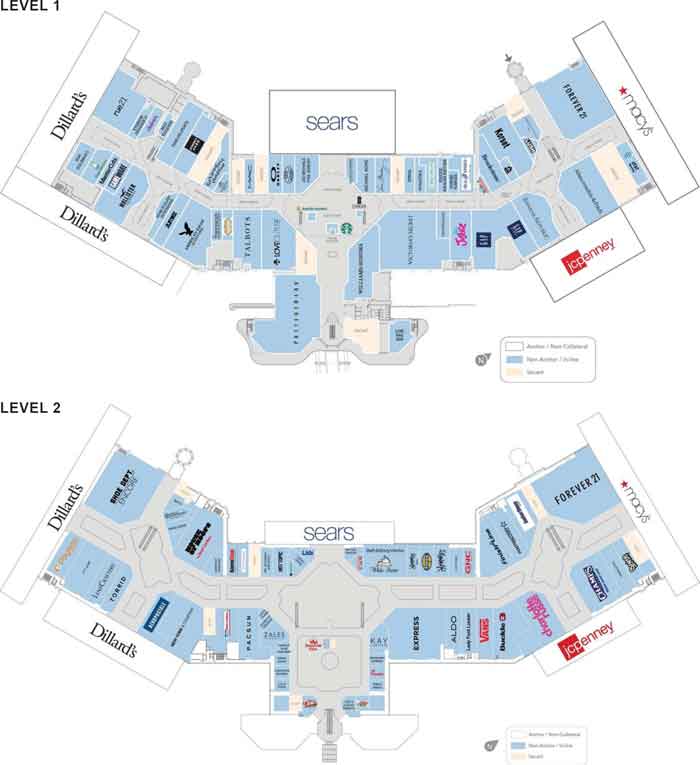
This is not a research report and was not prepared by any Underwriter’s research department. Please see additional important information and qualifications at the end of this Term Sheet.
| T-99 |
| MSBAM 2017-C34 | Mall of Louisiana |
Mortgage Loan No. 9 – Mall of Louisiana
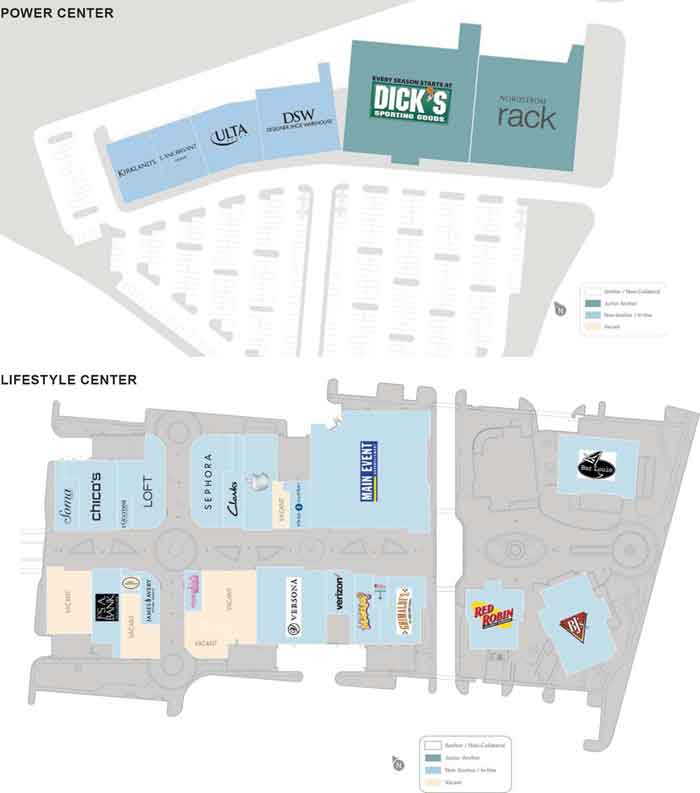
This is not a research report and was not prepared by any Underwriter’s research department. Please see additional important information and qualifications at the end of this Term Sheet.
| T-100 |
| MSBAM 2017-C34 | Mall of Louisiana |
Mortgage Loan No. 9 – Mall of Louisiana
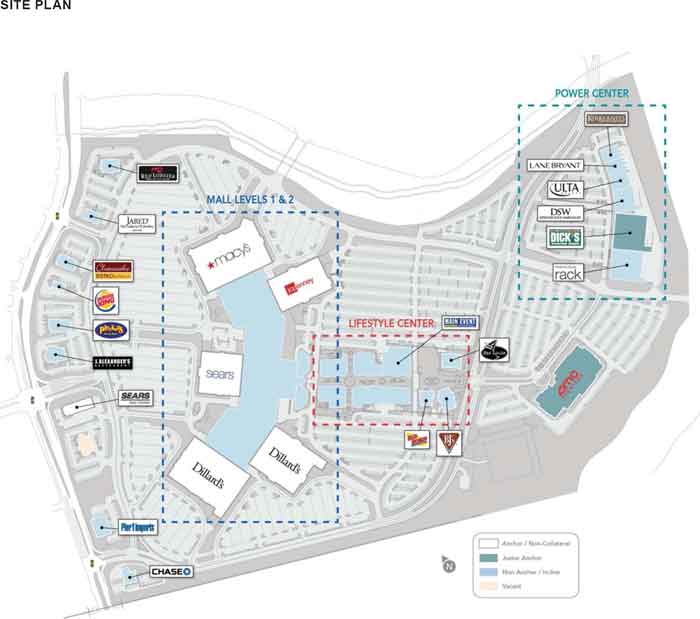
This is not a research report and was not prepared by any Underwriter’s research department. Please see additional important information and qualifications at the end of this Term Sheet.
| T-101 |
| MSBAM 2017-C34 | Mall of Louisiana |
Mortgage Loan No. 9 – Mall of Louisiana
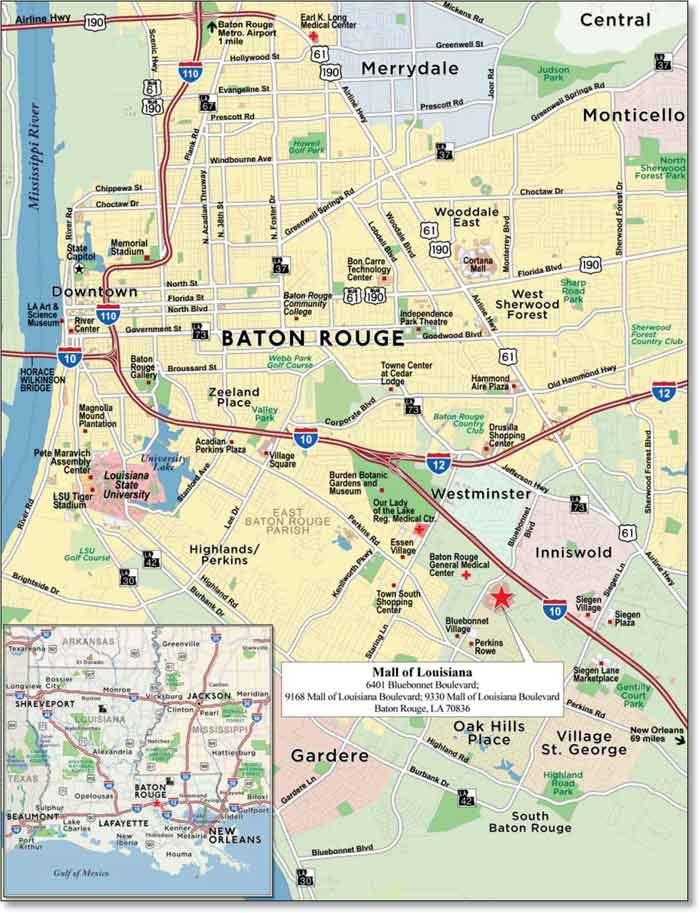
This is not a research report and was not prepared by any Underwriter’s research department. Please see additional important information and qualifications at the end of this Term Sheet.
| T-102 |
| MSBAM 2017-C34 | Mall of Louisiana |
| Mortgage Loan No. 9 – Mall of Louisiana |
| Mortgage Loan Information | Property Information | ||||||
| Mortgage Loan Seller: | BANA | Single Asset/Portfolio: | Single Asset | ||||
| Original Balance(1): | $44,000,000 | Location: | Baton Rouge, LA 70836 | ||||
| Cut-off Date Balance(1): | $44,000,000 | General Property Type: | Retail | ||||
| % of Initial Pool Balance: | 4.2% | Detailed Property Type: | Super Regional Mall | ||||
| Loan Purpose: | Recapitalization | Title Vesting: | Fee | ||||
| Sponsor: | GGP Real Estate Holding I, Inc. | Year Built/Renovated: | 1997/2008 | ||||
| Mortgage Rate: | 3.9840% | Size: | 776,789 SF | ||||
| Note Date: | 7/26/2017 | Cut-off Date Balance per SF(1): | $418 | ||||
| First Payment Date: | 9/1/2017 | Maturity Date Balance per SF(1): | $362 | ||||
| Maturity Date: | 8/1/2027 | Property Manager: | Self-managed | ||||
| Original Term to Maturity: | 120 months | ||||||
| Original Amortization Term: | 360 months | Underwriting and Financial Information | |||||
| IO Period: | 36 months | UW NOI: | $36,062,923 | ||||
| Seasoning: | 2 months | UW NOI Debt Yield(1): | 11.1% | ||||
| Prepayment Provisions(2): | LO (26); DEF (90); O (4) | UW NOI Debt Yield at Maturity(1): | 12.8% | ||||
| Lockbox/Cash Mgmt Status: | Hard/Springing | UW NCF DSCR(1): | 2.62x (IO) 1.85x (P&I) | ||||
| Additional Debt Type(1): | Pari Passu | Most Recent NOI: | $34,995,624 (4/30/2017 TTM) | ||||
| Additional Debt Balance(1): | $281,000,000 | 2nd Most Recent NOI: | $35,038,477 (12/31/2016) | ||||
| Future Debt Permitted (Type): | No (N/A) | 3rd Most Recent NOI: | $34,580,536 (12/31/2015) | ||||
| Reserves(3) | Most Recent Occupancy(4): | 91.8% (6/30/2017) | |||||
| Type | Initial | Monthly | Cap | 2nd Most Recent Occupancy(4): | 94.4% (12/31/2016) | ||
| RE Tax: | $0 | Springing | N/A | 3rd Most Recent Occupancy(4) : | 96.6% (12/31/2015) | ||
| Insurance: | $0 | Springing | N/A | Appraised Value (as of): | $570,000,000 (6/23/2017) | ||
| Recurring Replacements: | $0 | Springing | $155,169 | Cut-off Date LTV Ratio(1): | 57.0% | ||
| TI/LC: | $0 | Springing | $1,551,690 | Maturity Date LTV Ratio(1): | 49.4% | ||
| Sources and Uses | ||||||
| Sources | Proceeds | % of Total | Uses | Proceeds | % of Total | |
| Loan Amount(1): | $325,000,000 | 100.0% | Return of Equity(5): | $323,588,541 | 99.6% | |
| Closing Costs: | $1,411,459 | 0.4% | ||||
| Total Sources: | $325,000,000 | 100.0% | Total Uses: | $325,000,000 | 100.0% | |
| (1) | The Mall of Louisiana Mortgage Loan (as defined below) is part of the Mall of Louisiana Whole Loan (as described below), which is comprised of ninepari passupromissory notes with an aggregate original principal balance of $325,000,000. The Cut-off Date Balance per SF, Maturity Date Balance per SF, UW NOI Debt Yield, UW NOI Debt Yield at Maturity, UW NCF DSCR, Cut-off Date LTV Ratio and Maturity Date LTV Ratio numbers presented above are based on the aggregate principal balance of the promissory notes comprising the Mall of Louisiana Whole Loan. See “The Mortgage Loan” and “Additional Secured Indebtedness (not including trade debts)” below for further discussion of additional debt. |
| (2) | The defeasance lockout period will be at least 26 payment dates beginning with the first payment date on September 1, 2017. Defeasance of the Mall of Louisiana Whole Loan is permitted after the date that is the earlier to occur of (i) two years after the closing date of the securitization that includes the last note to be securitized and (ii) August 1, 2020. The assumed lockout period of 26 payments is based on the expected MSBAM 2017-C34 securitization trust closing date in October 2017. |
| (3) | See “Escrows and Reserves” below for further discussion of reserve requirements. |
| (4) | Historical occupancy information obtained from the Mall of Louisiana Borrower and includes temporary tenants. Most Recent Occupancy includes Main Event (6.0% of NRA) which has a signed lease but is not expected to take occupancy until August 2018 and excludes temporary tenants. The Mall of Louisiana Whole Loan guarantor has provided a guaranty for all outstanding landlord obligations and 15 months of gap rent specific to Main Event. |
| (5) | The Mall of Louisiana Property was previously unencumbered. The Mall of Louisiana Whole Loan sponsor acquired the Mall of Louisiana Property for approximately $265 million in 2004 and including the $100 million spent on the 2008 property expansion, maintains an undepreciated cost basis of approximately $413 million. |
The Mortgage Loan. The ninth largest mortgage loan (the “Mall of Louisiana Mortgage Loan”) is part of a whole loan (the “Mall of Louisiana Whole Loan”) evidenced by ninepari passu promissory notes, which are secured by the fee interest in a 776,789 SF portion of a super regional mall and adjacent power center in Baton Rouge, Louisiana (the “Mall of Louisiana Property”). The Mall of Louisiana Whole Loan was co-originated on July 26, 2017 by Bank of America, N.A., Citi Real Estate Funding Inc. and Barclays Bank PLC. The Mall of Louisiana Whole Loan had an original principal balance of $325,000,000, has an outstanding principal balance as of the Cut-off Date of $325,000,000 and accrues interest at an interest rate of 3.9840%per annum. Promissory Note A-2 in the original principal amount of $44,000,000 represents the Mall of Louisiana Mortgage Loan and will be included in the MSBAM 2017-C34 securitization trust. The controlling Promissory Note A-1 in the original principal amount of $65,000,000 is expected to be contributed to the BANK 2017-BNK7 securitization trust. The remaining non-controlling Promissory Notes are further described in the Mall of Louisiana Whole Loan Summary below. The Mall of Louisiana Whole Loan will be serviced pursuant to the pooling and servicing agreement for the BANK 2017-BNK7 securitization trust. See “Description of the Mortgage Pool—The Whole Loans—The Non-Serviced Pari Passu Whole Loans” and “Pooling and Servicing Agreement-Servicing of the Non-Serviced Mortgage Loans”in the Preliminary Prospectus.
This is not a research report and was not prepared by any Underwriter’s research department. Please see additional important information and qualifications at the end of this Term Sheet.
| T-103 |
| MSBAM 2017-C34 | Mall of Louisiana |
| Mall of Louisiana Whole Loan Summary | ||||
Notes | Original Balance | Note Holder | Controlling Interest | |
| A-1 | $65,000,000 | BANK 2017-BNK7 | Yes | |
| A-2 | $44,000,000 | MSBAM 2017-C34 | No | |
| A-3-1 | $30,000,000 | CGCMT 2017-P8 | No | |
| A-3-2 | $28,000,000 | Citi Real Estate Funding Inc. | No | |
| A-4 | $50,000,000 | COMM 2017-COR2 | No | |
| A-5-1 | $41,000,000 | Barclays Bank PLC | No | |
| A-5-2 | $17,000,000 | CGCMT 2017-P8 | No | |
| A-6 | $25,000,000 | Barclays Bank PLC | No | |
| A-7 | $25,000,000 | Barclays Bank PLC | No | |
| Total | $325,000,000 | |||
The Borrower and the Sponsor. The borrowers are Mall of Louisiana, LLC and Mall of Louisiana Land, LLC (individually and collectively, the “Mall of Louisiana Borrower”), each a single-purpose Delaware limited liability company, with at least two independent directors.
The loan sponsor and nonrecourse carve-out guarantor is GGP Real Estate Holding I, Inc., wholly owned by GGP Inc. GGP Inc. (NYSE: GGP) is an S&P 500 company focused exclusively on owning, managing, leasing and redeveloping retail properties throughout the United States. GGP Inc.’s portfolio as of March 2017 included 127 properties (121 million SF) in 40 states with an enterprise value of approximately $39 billion. See “Description of the Mortgage Pool— Loan Purpose; Default History, Bankruptcy Issues and Other Proceedings” in the Preliminary Prospectus.
GGP Real Estate Holding I, Inc. has provided a guaranty for payment of $1,726,914 in unfunded tenant allowances for ten various tenants and a guaranty related to the tenant Main Event for payment of $8,519,922 comprised of unfunded tenant allowances ($3,986,500), landlord work ($3,067,797) and gap rent ($1,465,625).
The Property. The Mall of Louisiana Property consists of a two-story enclosed super regional mall known as Mall of Louisiana, which contains a total of 1,593,545 SF and is anchored by non-collateral anchors Dillard’s, Dillard’s Men’s & Home, JCPenney, Macy’s and Sears. The 776,789 SF portion of the Mall of Louisiana that serves as collateral for the Mall of Louisiana Whole Loan was 91.8% leased as of June 30, 2017 by 135 retail and restaurant tenants. The largest tenants by size are AMC Theatres (9.6% of NRA, 5.9% of underwritten base rent, expiring July 2026), Dick’s Sporting Goods (9.5% of NRA, 3.3% of underwritten base rent, expiring January 2019), Nordstrom Rack (3.9% of NRA, 2.0% of underwritten base rent, expiring September 2025) and Forever 21 (3.5% of NRA, 5.1% of underwritten base rent, expiring January 2019). Main Event (6.0% of NRA, 4.0% of underwritten base rent, expiring June 2028) has a signed lease but is not expected to take occupancy until August 2018. The Mall of Louisiana Whole Loan guarantor has provided a guaranty for all outstanding landlord obligations and 15 months of gap rent specific to Main Event.
No other tenant represents more than 1.9% of NRA or 2.6% of underwritten base rent. Other notable tenants at the Mall of Louisiana Property include: Apple, DSW, Lush Fresh Handmade Cosmetics, Michael Kors, Pandora, Pottery Barn and Williams Sonoma. The Mall of Louisiana Property features an 11-bay food court and nine full service restaurants. Inline sales at the Mall of Louisiana Property as of May 31, 2017 were approximately $183 million with an average of $585 PSF ($496 PSF excluding Apple), resulting in an occupancy cost of 13.6% (16.1% excluding Apple).
The Mall of Louisiana Property was built in 1997 and renovated in 2008 with a $100 million expansion project which added over 330,000 SF, comprised of a 125,000 SF lifestyle component, a 140,000 SF power center and a 15-screen stadium seating cinema with IMAX – 3D. The Mall of Louisiana features the only Sears within 40 miles and the only Macy’s, Dick’s Sporting Goods and Nordstrom Rack within 60 miles. The Mall of Louisiana Property includes 8,404 surface parking spaces (approximately 5.3 per 1,000 SF).
This is not a research report and was not prepared by any Underwriter’s research department. Please see additional important information and qualifications at the end of this Term Sheet.
| T-104 |
| MSBAM 2017-C34 | Mall of Louisiana |
The following table presents certain information relating to the leases at the Mall of Louisiana Property:
| Tenant Summary | |||||||||
| Tenant Name | Credit Rating (Fitch/Moody’s/ S&P)(1) | Tenant SF(2) (3) | Approx. % of SF(2) | Annual UW Rent(4) | % of Total Annual UW Rent | Annual UW Rent PSF(4) | 5/30/2017 TTM Sales PSF(3) | 5/30/2017 TTM Occupancy Cost | Lease Expiration |
| Major Tenants | |||||||||
| AMC Theatres | B/B1/B+ | 74,400 | 9.6% | $1,739,472 | 5.9% | $23.38 | $560,583(5) | 22.6% | 7/21/2026 |
| Forever 21 | NR/NR/NR | 26,885 | 3.5% | $1,483,980 | 5.1% | $55.20 | $183 | 28.6% | 1/31/2019 |
| Main Event(6) | NR/NR/NR | 46,900 | 6.0% | $1,172,500 | 4.0% | $25.00 | N/A | N/A | 6/30/2028 |
| Dick’s Sporting Goods | NR/NR/NR | 74,061 | 9.5% | $962,793 | 3.3% | $13.00 | $131 | 11.9% | 1/31/2019 |
| Nordstrom Rack | BBB+/Baa1/BBB+ | 30,002 | 3.9% | $577,500 | 2.0% | $19.25 | N/A | N/A | 9/30/2025 |
| Subtotal/Wtd. Avg. | 252,248 | 32.5% | $5,936,245 | 20.2% | $23.53 | ||||
| Other Tenants | 460,886 | 59.3% | $23,378,585 | 79.8% | |||||
| Occupied Total | 713,134 | 91.8% | $29,314,830 | 100.0% | |||||
| Vacant Retail Space | 63,655 | 8.2% | |||||||
| Total/Wtd. Avg. | 776,789 | 100.0% | |||||||
| Non-Collateral Anchor Tenants | |||||||||
| Dillard’s / Dillard’s Men’s and Home(7) | BBB-/Baa3/BBB- | 370,655 | $148 | N/A | N/A | ||||
| Macy’s | BBB/Baa3/BBB- | 204,890 | $166 | N/A | N/A | ||||
| JC Penney | B+/B1/B+ | 116,568 | $309 | N/A | N/A | ||||
| Sears / Sears Auto Center | CC/Caa2/CCC+ | 113,517 | $123 | N/A | N/A | ||||
| (1) | Certain ratings are those of the parent company whether or not the parent guarantees the lease. |
| (2) | Tenant SF and Approximate % of SF are based on the underwritten rent roll. |
| (3) | Tenant SF and Sales PSF for the Non-Collateral Anchor Tenants are as of 2016 as reported in the appraisal. |
| (4) | Annual UW Rent includes contractual increases through August 2018. |
| (5) | Sales PSF is shown as Sales per screen (15 screens). |
| (6) | Main Event has an executed lease but is not expected to take occupancy until August 2018. The Mall of Louisiana Whole Loan guarantor has provided a guaranty for all outstanding landlord obligations and 15 months of gap rent specific to Main Event. |
| (7) | Dillard’s / Dillard’s Men’s and Home stores are separate stores but shown as combined on this table. |
The following table presents certain information relating to the lease rollover schedule at the Mall of Louisiana Property:
| Lease Rollover Schedule(1)(2) | ||||||||
| Year | # of Leases Rolling | SF Rolling | % of Total SF Rolling | Cumulative % of Total SF Rolling | Total UW Rent Rolling | UW Rent PSF Rolling(3) | % of Total Rent Rolling | Cumulative % of Total Rent Rolling |
| 2017 and MTM | 11 | 27,967 | 3.6% | 3.6% | $2,330,756 | $83.34 | 8.0% | 8.0% |
| 2018 | 23 | 82,248 | 10.6% | 14.2% | $3,354,434 | $40.78 | 11.4% | 19.4% |
| 2019 | 17 | 165,390 | 21.3% | 35.5% | $4,979,391 | $30.11 | 17.0% | 36.4% |
| 2020 | 14 | 43,189 | 5.6% | 41.0% | $2,581,653 | $59.78 | 8.8% | 45.2% |
| 2021 | 16 | 60,190 | 7.7% | 48.8% | $2,840,401 | $47.19 | 9.7% | 54.9% |
| 2022 | 10 | 32,000 | 4.1% | 52.9% | $1,317,420 | $41.17 | 4.5% | 59.4% |
| 2023 | 11 | 39,863 | 5.1% | 58.0% | $2,544,415 | $63.83 | 8.7% | 68.0% |
| 2024 | 7 | 32,366 | 4.2% | 62.2% | $1,357,288 | $41.94 | 4.6% | 72.7% |
| 2025 | 9 | 58,878 | 7.6% | 69.8% | $1,792,374 | $30.44 | 6.1% | 78.8% |
| 2026 | 6 | 88,514 | 11.4% | 81.2% | $2,885,732 | $32.60 | 9.8% | 88.6% |
| 2027 | 6 | 11,360 | 1.5% | 82.6% | $1,081,295 | $95.18 | 3.7% | 92.3% |
| Thereafter | 5 | 71,169 | 9.2% | 91.8% | $2,249,670 | $31.61 | 7.7% | 100.0% |
| Vacant | 0 | 63,655 | 8.2% | 100.0% | $0 | $0.00 | 0.0% | 100.0% |
| Total/Wtd. Avg. | 135 | 776,789 | 100.0% | $29,314,830 | $41.11 | 100.0% | ||
| (1) | Information is based on the underwritten rent roll. |
| (2) | Certain tenants may have lease termination options that are not considered in the Lease Rollover Schedule. |
| (3) | Wtd. Avg. UW Rent PSF Rolling excludes vacant space. |
This is not a research report and was not prepared by any Underwriter’s research department. Please see additional important information and qualifications at the end of this Term Sheet.
| T-105 |
| MSBAM 2017-C34 | Mall of Louisiana |
The following table presents certain information relating to the historical sales and occupancy costs at the Mall of Louisiana Property:
| Historical Tenant Sales (PSF) | |||||
| 2014 | 2015 | 2016 | 5/31/2017 TTM | 5/31/2017 TTM Occupancy Cost | |
| Comparable Sales PSF w/ Apple | $557 | $568 | $571 | $585 | 13.6% |
| Comparable Sales PSF w/o Apple | $481 | $493 | $488 | $496 | 16.1% |
The Market. The Mall of Louisiana Property is located in East Baton Rouge Parish within the greater Baton Rouge metropolitan statistical area (“MSA”) of Louisiana. The Mall of Louisiana Property is located approximately six miles southeast of the Baton Rouge central business district, immediately south of Interstate 10, which connects to Interstate 12 approximately three miles north and connects to the New Orleans metropolitan area to the southeast. East Baton Rouge Parish includes the City of Baton Rouge and other established neighborhoods including Mid-City, the Garden District and Spanish Town, and is home of the capital of Louisiana, Louisiana State University, Southern University and Baton Rouge Community College. There are two hospitals located within approximately two miles of the Mall of Louisiana Property: Baton Rouge General Medical Center and Our Lady of the Lake Regional Medical Center. East Baton Rouge Parish’s top employers include Turner Industries Group LLC (9,875 employees), LSU System (6,250 employees), Performance Contractors (5,500 employees), Our Lady of the Lake Regional Medical Center (4,500 employees) and ExxonMobil (4,214 employees). IBM recently developed a $55 million office and residential building in downtown Baton Rouge and has committed to maintain 800 new jobs through 2023 in downtown Baton Rouge. The Baton Rouge MSA had a 2016 unemployment rate of 5.2% continuing year over year declines since 2011.
According to the appraisal, the primary trade area for the Mall of Louisiana Property encompasses an approximately fifteen-mile radius. The estimated 2016 population within a five-, ten- and fifteen-mile radius around the Mall of Louisiana Property was 169,831, 406,664 and 603,052, respectively. The estimated 2016 average household income within the same radii was $90,572, $76,294 and $74,587, respectively. The 2016 fifteen-mile radius population and average household income reflects a compound annual growth rate from 2000-2016 of approximately 1.0% and 2.4%, respectively. Estimated 2016 average retail sales per household within a fifteen-mile radius of the Mall of Louisiana Property were $48,449.
The Mall of Louisiana Property is located in the Baton Rouge retail market which had 2017 first quarter-end average asking rents of $11.32 PSF and a vacancy rate of 4.5%, a 1.3% decrease from the first quarter-end 2016, with only 11,581 SF vacant in the market. There are currently six lifestyle centers and regional malls in the Baton Rouge retail market with 2017 first quarter-end average asking rents of $19.61 PSF and a vacancy rate of 8.6%, a 1.7% decrease from the first quarter-end 2016, with 74,739 SF of positive absorption. There is no proposed new competitive supply noted by the appraisal.
The following table presents the Competitive Set Summary with respect to the Mall of Louisiana Property:
| Competitive Set Summary(1) | |||||||
| Property Name/Address | Property Type | Year Built/ Renovated | Size (SF) | Est. Sales PSF | Occupancy | Distance | Lease Type |
Mall of Louisiana Baton Rouge, LA | Super Regional Mall | 1997/2008 | 776,789(1) | $585(1)(2) | 91.8%(1)(3) | -- | Dillard’s (non-collateral), Dillard’s Men’s (non-collateral), JC Penney (non-collateral), Macy’s (non-collateral), Sears (non-collateral), AMC Theatres |
Perkins Rowe Baton Rouge, LA | Lifestyle Center | 2006 | 749,300 | $420 | 85% | 1.5 miles | Cinemark, LA Fitness, Barnes & Noble, Fresh Market |
Town Center at Cedar Lodge Baton Rouge, LA | Lifestyle Center | 2007 | 410,000 | $400 | 98% | 5.0 miles | Whole Foods, Books A Million, LOFT, Gap |
Siegen Lane Marketplace Baton Rouge, LA | Power Center | 1994/2002 | 462,150 | N/A | 100% | 3.0 miles | Walmart, Lowes, Bed Bath & Beyond, TJ Maxx |
Cortana Mall Baton Rouge, LA(4) | Super Regional Mall | 1976/2010 | 1,360,000 | $250 | 30% | 6.5 miles | Dillard’s, JC Penney |
| (1) | Information obtained from the appraisal and underwritten rent roll for the subject collateral. Size (SF), Est. Sales PSF and Occupancy are shown for the collateral portion of the Mall of Louisiana Property. |
| (2) | Comparable inline sales shown as of May 2017. Comparable inline sales excluding Apple for that period were $496 PSF. |
| (3) | Occupancy as of June 30, 2017 excludes temporary tenants and includes Main Event (6.0% of NRA), which has a signed lease but is not expected to take occupancy until August 2018. The Mall of Louisiana Whole Loan guarantor has provided a guaranty for all outstanding landlord obligations and 15 months of gap rent specific to Main Event. |
| (4) | Cortana Mall is the only other enclosed shopping mall in Baton Rouge. Only two of the six anchor units at Cortana Mall and approximately 45 of 110 inline stores are currently occupied. |
This is not a research report and was not prepared by any Underwriter’s research department. Please see additional important information and qualifications at the end of this Term Sheet.
| T-106 |
| MSBAM 2017-C34 | Mall of Louisiana |
Operating History and Underwritten Net Cash Flow.The following table presents certain information relating to the historical operating performance and Underwritten Net Cash Flow at the Mall of Louisiana Property:
| Cash Flow Analysis | ||||||
| 2014 | 2015 | 2016 | 4/30/2107 TTM | UW | UW PSF | |
| Base Rent(1) | $27,008,300 | $27,841,212 | $28,448,668 | $28,641,673 | $30,002,849(2) | $38.62 |
| Grossed Up Vacant Space | $0 | $0 | $0 | $0 | $3,395,375 | $4.37 |
| Total Reimbursements | $10,554,704 | $10,707,373 | $10,410,615 | $10,242,969 | $10,408,010 | $13.40 |
| Specialty Leasing | $3,089,790 | $3,046,453 | $3,044,110 | $2,921,431 | $2,956,431 | $3.81 |
| Other Income(3) | $402,762 | $384,936 | $331,822 | $399,049 | $384,049 | $0.49 |
| Less Vacancy & Credit Loss | $0 | $0 | $0 | $0 | ($3,931,479) | ($5.06) |
| Effective Gross Income | $41,055,555 | $41,979,974 | $42,235,214 | $42,205,123 | $43,215,234 | $55.63 |
| Total Operating Expenses | ($7,514,389) | ($7,399,438) | ($7,196,737) | ($7,209,498) | ($7,152,311) | ($9.21) |
| Net Operating Income | $33,541,166 | $34,580,536 | $35,038,477 | $34,995,624 | $36,062,923 | $46.43 |
| Capital Expenditures | $0 | $0 | $0 | $0 | $155,358 | $0.20 |
| TI/LC | $0 | $0 | $0 | $0 | $1,473,928 | $1.90 |
| Net Cash Flow | $33,541,166 | $34,580,536 | $35,038,477 | $34,995,624 | $34,433,637 | $44.33 |
| Occupancy % | 96.5%(4) | 96.6%(4) | 94.4%(4) | 91.8%(5) | 91.0% | |
| NOI DSCR (IO)(6) | 2.55x | 2.63x | 2.67x | 2.67x | 2.75x | |
| NOI DSCR (P&I)(6) | 1.80x | 1.86x | 1.89x | 1.88x | 1.94x | |
| NCF DSCR (IO)(6) | 2.55x | 2.63x | 2.67x | 2.67x | 2.62x | |
| NCF DSCR (P&I)(6) | 1.80x | 1.86x | 1.89x | 1.88x | 1.85x | |
| NOI Debt Yield(6) | 10.3% | 10.6% | 10.8% | 10.8% | 11.1% | |
| NCF Debt Yield(6) | 10.3% | 10.6% | 10.8% | 10.8% | 10.6% | |
| (1) | Base Rent includes percentage rent. |
| (2) | UW Base Rent includes all tenants with signed leases and contractual rent steps through August 2018. |
| (3) | Other Income includes carousel revenue, rebates and miscellaneous non-rental income. |
| (4) | Occupancy information obtained from the Mall of Louisiana Borrower and includes temporary tenants. |
| (5) | Information obtained from the underwritten rent roll and excludes temporary tenants and includes Main Event (6.0% of NRA) which has a signed lease but is not expected to take occupancy until August 2018. |
| (6) | Debt service coverage ratios and debt yields are based on the Mall of Louisiana Whole Loan. |
Escrows and Reserves. During a Trigger Period (as defined below), unless there are sufficient funds in the lockbox account to make the deposits, the Mall of Louisiana Borrower is required to deposit monthly (i) 1/12th of the estimated annual real estate taxes and 1/12th of the estimated annual insurance premiums (unless the Mall of Louisiana Property is covered by a blanket insurance policy and the premiums for the blanket policy are prepaid for at least one year in advance), (ii) $12,931 to a replacement reserve subject to a cap of $155,169 and (iii) $129,308 to a tenant improvement and leasing commissions reserve subject to a cap of $1,551,690.
A “Trigger Period” will commence upon (i) an event of default or (ii) the debt service coverage ratio being less than 1.15x. A Trigger Period will end upon (i) the cure or waiver of the event of default and (ii) the debt service coverage ratio being equal to or greater than 1.15x.
Lockbox and Cash Management. A hard lockbox is in place with respect to the Mall of Louisiana Whole Loan. Funds deposited to the lockbox will be swept daily to the Mall of Louisiana Borrower’s operating account unless a Trigger Period exists. During a Trigger Period, funds in the lockbox are required to be transferred daily to a cash management account under the sole control of the lender for the payment of, among other things, debt service, monthly escrows and operating expenses with all excess cash being deposited to an excess cash reserve to be held as additional security for the Mall of Louisiana Whole Loan.
Additional Secured Indebtedness (not including trade debts). The Mall of Louisiana Property also secures the Mall of Louisiana Non-Serviced Pari Passu Companion Loans, which have an aggregate Cut-off Date principal balance of $281,000,000. The Mall of Louisiana Non-Serviced Pari Passu Companion Loans accrue interest at the same rate as the Mall of Louisiana Mortgage Loan. The Mall of Louisiana Mortgage Loan is entitled to payments of interest on a pro rata and pari passu basis with the Mall of Louisiana Non-Serviced Pari Passu Companion Loans. The holders of the Mall of Louisiana Mortgage Loan and the Mall of Louisiana Non-Serviced Pari Passu Companion Loans have entered into a co-lender agreement which sets forth the allocation of collections on the Mall of Louisiana Whole Loan. See “Description of the Mortgage Pool—The Whole Loans—The Non-Serviced Pari Passu Whole Loans” in the Preliminary Prospectus.
Mezzanine Loan and Preferred Equity. Not permitted.
Release of Property. The Mall of Louisiana Borrower may obtain the release of any vacant, non-income producing, unimproved parcel or outlot (including “air rights” parcels), any expansion parcel or the Picardy Street Extension Parcel (as defined below) in connection with a transfer to a person other than a person owned or controlled by the Mall of Louisiana Borrower, provided among other conditions that the following are satisfied: (i) no event of default has occurred and is continuing, and (ii)(A) as it relates to any parcel release other than an expansion parcel release (described in clause (B) below): (a) the lender receives evidence that the parcel is not necessary for the operation of the Mall of Louisiana Property and that it may be readily separated from the Mall of Louisiana Property without material diminution of the value of the Mall of Louisiana Property, (b) lender receives rating agency confirmation (except with respect to a release of the Picardy Street Extension Parcel so long as it remains vacant, non-income producing and unimproved), (c) the loan to value ratio for the remaining property is less than or equal to 125% provided that the Mall of Louisiana Borrower may prepay the Mall of Louisiana Whole Loan and pay the associated yield maintenance premium in order to meet the required loan to value ratio, or (B) as it relates to the release of an expansion
This is not a research report and was not prepared by any Underwriter’s research department. Please see additional important information and qualifications at the end of this Term Sheet.
| T-107 |
| MSBAM 2017-C34 | Mall of Louisiana |
parcel: (x) lender receives evidence that (I) during the time that the expansion parcel was a part of the Mall of Louisiana Property, any tenants that were relocated to the expansion parcel from other areas of the Mall of Louisiana Property have been replaced with tenants of comparable credit quality and paying equal or better rent than the relocated tenants or (II) to the extent existing tenants proposed to be relocated to the expansion parcel after its release, the Mall of Louisiana Borrower has entered into fully executed replacement leases with replacement tenants of comparable credit quality and on rental terms equal or better than the existing tenant and (y) the release of the expansion parcel does not have a material adverse effect on the use or value of the Mall of Louisiana Property, the priority of the lien of the mortgage, the enforcement of the Mall of Louisiana Whole Loan documents, or the Mall of Louisiana Borrower’s ability to repay the Mall of Louisiana Whole Loan.
The “Picardy Street Extension Parcel” is the portion of land subject to the extension and/or widening of Picardy Street by the City of Baton Rouge.
Real Estate Substitution. The Mall of Louisiana Borrower may obtain the release of a vacant, non-income producing, unimproved parcel, provided among other conditions that the following are satisfied: (i) no event of default has occurred or is continuing, (ii) simultaneous with the substitution, the Mall of Louisiana Borrower acquires an exchange parcel at or adjacent to the Mall of Louisiana Property of reasonably equivalent value to the release parcel, (iii) rating agency confirmation is obtained and (iv) the loan to value ratio immediately after the substitution is less than or equal to 125%, provided that the Mall of Louisiana Borrower may prepay the Mall of Louisiana Whole Loan and pay the associated yield maintenance premium in order to meet the required loan to value ratio.
Real Estate Expansion. The Mall of Louisiana Borrower may acquire one or more expansion parcels, provided among other conditions that the following are satisfied: (i) no event of default has occurred or is continuing, and (ii) the Mall of Louisiana Borrower acquires fee simple or leasehold interest in the expansion parcel. Any expansion parcel may be released (see “Release of Property” above.)
Terrorism Insurance. The Mall of Louisiana Borrower is required to obtain and maintain property insurance and business interruption insurance that covers acts of terrorism in an amount determined by the lender in its sole discretion (but not to exceed the full replacement cost of the Mall of Louisiana Property and 18-months of business interruption insurance), provided that if the Terrorism Risk Insurance Program Reauthorization Act of 2015 or any extension thereof or substantially similar program (“TRIPRA”) is in effect, the Mall of Louisiana Whole Loan documents provide for an annual terrorism premium cap of two times the cost of the annual premiums for property and business interruption insurance required under the related Mall of Louisiana Whole Loan documents.
This is not a research report and was not prepared by any Underwriter’s research department. Please see additional important information and qualifications at the end of this Term Sheet.
| T-108 |
(THIS PAGE INTENTIONALLY LEFT BLANK)
| T-109 |
| MSBAM 2017-C34 | Remington Park |
Mortgage Loan No. 10 – Remington Park
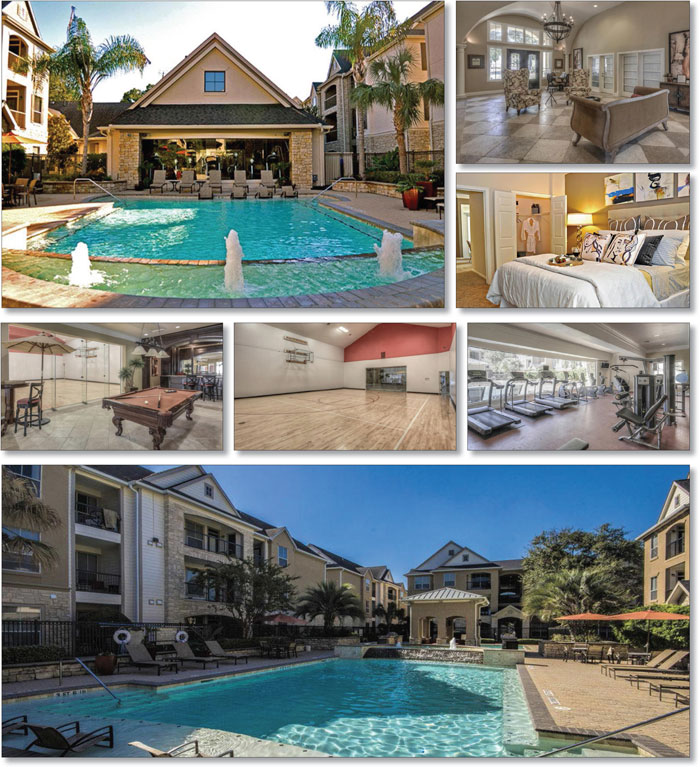
This is not a research report and was not prepared by any Underwriter’s research department. Please see additional important information and qualifications at the end of this Term Sheet.
| T-110 |
| MSBAM 2017-C34 | Remington Park |
Mortgage Loan No. 10 – Remington Park
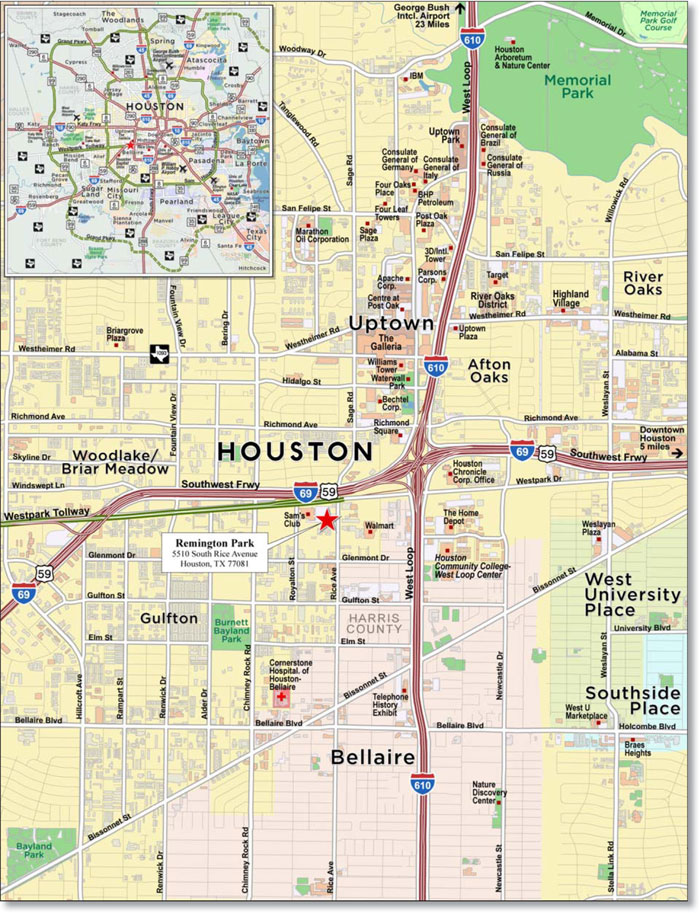
This is not a research report and was not prepared by any Underwriter’s research department. Please see additional important information and qualifications at the end of this Term Sheet.
| T-111 |
| MSBAM 2017-C34 | Remington Park |
| Mortgage Loan No. 10 – Remington Park |
| Mortgage Loan Information | Property Information | ||||||
| Mortgage Loan Seller: | MSMCH | Single Asset/Portfolio: | Single Asset | ||||
| Original Balance: | $42,500,000 | Location: | Houston, TX 77081 | ||||
| Cut-off Date Balance: | $42,500,000 | General Property Type: | Multifamily | ||||
| % of Initial Pool Balance: | 4.1% | Detailed Property Type: | Garden | ||||
| Loan Purpose: | Acquisition | Title Vesting: | Fee | ||||
| Sponsors: | American Realty Investors | Year Built/Renovated: | 2000/N/A | ||||
| Mortgage Rate: | 4.0400% | Size: | 428 Units | ||||
| Note Date: | 9/13/2017 | Cut-off Date Balance per Unit: | $99,299 | ||||
| First Payment Date: | 11/1/2017 | Maturity Date Balance per Unit: | $99,299 | ||||
| Maturity Date: | 10/1/2027 | Property Manager: | American Realty Investors I LP (borrower related) | ||||
| Original Term to Maturity: | 120 months | ||||||
| Original Amortization Term: | 0 months | ||||||
| IO Period: | 120 months | Underwriting and Financial Information | |||||
| Seasoning: | 0 months | UW NOI: | $3,405,680 | ||||
| Prepayment Provisions: | LO (24); DEF (92); O (4) | UW NOI Debt Yield: | 8.0% | ||||
| Lockbox/Cash Mgmt Status: | Springing/Springing | UW NOI Debt Yield at Maturity: | 8.0% | ||||
| Additional Debt Type: | N/A | UW NCF DSCR: | 1.89x | ||||
| Additional Debt Balance: | N/A | Most Recent NOI: | $3,497,999 (7/31/2017 TTM) | ||||
| Future Debt Permitted (Type): | No (N/A) | 2nd Most Recent NOI: | $3,606,186 (12/31/2016) | ||||
| Reserves(1) | 3rd Most Recent NOI: | $3,912,225 (12/31/2015) | |||||
| Type | Initial | Monthly | Cap | Most Recent Occupancy: | 97.0% (8/25/2017) | ||
| RE Tax: | $1,090,443 | $121,160 | N/A | 2nd Most Recent Occupancy: | 94.0% (12/31/2016) | ||
| Insurance: | $0 | Springing | N/A | 3rd Most Recent Occupancy: | 90.0% (12/31/2015) | ||
| Recurring Replacements: | $0 | $8,917 | N/A | Appraised Value (as of): | $62,900,000 (8/1/2017) | ||
| Deferred Maintenance: | $60,625 | $0 | N/A | Cut-off Date LTV Ratio: | 67.6% | ||
| Capital Improvement Reserve: | $1,500,000 | $0 | N/A | Maturity Date LTV Ratio: | 67.6% | ||
| Sources and Uses | ||||||
| Sources | Proceeds | % of Total | Uses | Proceeds | % of Total | |
| Loan Amount: | $42,500,000 | 64.4% | Purchase Price: | $62,702,000 | 95.0% | |
| Borrower Equity: | $23,472,175 | 35.6% | Reserves: | $2,651,068 | 4.0% | |
| Closing Costs: | $619,108 | 0.9% | ||||
| Total Sources: | $65,972,175 | 100.0% | Total Uses: | $65,972,175 | 100.0% | |
| (1) | See “Escrows and Reserves” below for further discussion of reserve requirements. |
The Mortgage Loan. The tenth largest mortgage loan (the “Remington Park Mortgage Loan”) is evidenced by a promissory note in the original principal amount of $42,500,000 secured by a first priority fee mortgage encumbering a 428-unit garden-style apartment community in Houston, Texas known as Remington Park (the “Remington Park Property”).
The proceeds of the Remington Park Mortgage Loan, together with $23,472,175 of borrower equity, were used to acquire the Remington Park Property, fund reserves and pay closing costs. The previous mortgage loan secured by the Remington Park Property was included in the FREMF 2016-KF19 securitization trust.
The Borrower and Sponsors. The borrower is BBE Remington Park Apartments LLC (the “Remington Park Borrower”), a single purpose Delaware limited liability company, with two independent directors. Kenneth L. Hatfield is the nonrecourse carve-out guarantor of the Remington Park Mortgage Loan. The sponsor of the Remington Park Mortgage Loan is American Realty Investors. The nonrecourse carve-out guarantor and his affiliates own the managing member of the Remington Park Borrower, and have an approximately 4.0% ownership interest in the Remington Park Borrower. The remaining approximately 96.0% ownership interest in the Remington Park Borrower is owned by Salus Trust, an irrevocable discretionary Cayman Islands trust.
Kenneth L. Hatfield, the Chief Operating Officer of American Realty Investors, has been involved in the acquisition and disposition of over 60 income producing properties, including office, multifamily, retail and industrial buildings, since 1982. American Realty Investors’ current portfolio consists of 14 multifamily apartment properties totaling 4,715 apartment units.
This is not a research report and was not prepared by any Underwriter’s research department. Please see additional important information and qualifications at the end of this Term Sheet.
| T-112 |
| MSBAM 2017-C34 | Remington Park |
The Property.The Remington Park Property is a 428-unit, Class A, garden-style apartment community built in 2000 and located in Houston, Texas. The units are contained within 23 three-story buildings on an approximate 15.7-acre site. Amenities at the Remington Park Property include a clubroom with an entertainment area, a 24-hour fitness center, an indoor basketball court, a game room with bar seating and billiards, a business center, a swimming pool with a spa, as well as a separate lap pool, and a picnic area with barbecue grills and a dog park. Each unit features a kitchen with a dishwasher, an ice dispensing refrigerator, a garbage disposal, a built in microwave, a washing machine and a dryer. The Remington Park Property also includes 610 total parking spaces (1.43 parking spaces per unit), of which 100 are located in a detached garage and 84 are carports.
The borrower sponsors’ business plan for the Remington Park Property includes a capital expenditure budget of over $3,000,000 for property improvements, including an office refresh ($100,000), pool upgrade ($60,000), carport construction ($72,000), new cabinets and granite countertops ($1,280,600), vinyl flooring ($170,000), new appliances ($758,250), and new fixtures ($294,875). The Remington Park Borrower reserved $1,500,000 in connection with the borrower sponsors’ business plan. The remaining budget was not reserved for. The renovations are permitted but not required under the loan documents. As of August 25, 2017, the Remington Park Property was 97.0% occupied.
In 2016, the previous owner completed storm water drainage improvements to the Remington Park Property, which included increasing the size of the on-site storm water detention pond capacity, increasing the size of the detention pond inlet piping and replacing sheetrock from the interior garage walls with waterproof cement board. According to the borrower sponsor and the property condition report, there was no damage observed or reported to any of the buildings interiors, roofs, or exteriors as a result of Hurricane Harvey. According to the property condition report, following the initial site visit, a flood occurred at the Remington Park Property from Hurricane Harvey, during which several of the garages were inundated with 10-16 inches of water, however, flood damage observed and reported was limited to 74 garage door panels on 52 garage doors, and the estimated cost to repair the garage doors is $15,000.
The table below shows the apartment unit mix at the Remington Park Property:
| Remington Park Unit Mix Summary | ||||||||
| Floor Plan | No. of Units | % of Total Units | Average Unit Size (SF)(1) | Total SF | Monthly Asking Rent Per Unit(1) | |||
| 1 Bedroom/1 Bath | 258 | 60.3% | 757 | 195,228 | $1,105 | |||
| 2 Bedroom/2 Bath | 170 | 39.7% | 1,198 | 203,640 | $1,454 | |||
| Total/Weighted Avg. | 428 | 100.0% | 932 | 398,868 | $1,244 | |||
Source: Appraisal.
| (1) | Represents the weighted average for each unit mix type. |
The Market.According to the appraisal, the Remington Park Property is located six miles southwest of the Houston, Texas central business district, and is considered to be in the Houston - The Woodlands - Sugar Land multifamily market and Westpark/Bissonnet multifamily submarket. According to the appraisal, the Houston - The Woodlands - Sugar Land multifamily market contains 637,595 units of multifamily space. For the second quarter of 2017, the Houston - The Woodlands - Sugar Land multifamily market had an average occupancy of 88.9% (slightly down from 89.5% for the second quarter of 2016) and asking rental rate of $1.11 PSF (compared to $1.12 PSF for the second quarter of 2016). According to the appraisal, the Westpark/Bissonnet multifamily market contains 16,900 units of multifamily space. For the second quarter of 2017, the Westpark/Bissonnet multifamily submarket had an average occupancy of 93.4% (slightly down from 94.8% for the second quarter of 2016) and asking rental rate of $0.89 PSF (compared to $0.90 PSF for the second quarter of 2016). According to the appraisal, there was no new inventory added to the Westpark/Bissonnet multifamily submarket in the past 12-months.
The estimated 2017 population within a one-, three- and five-mile radius of the Remington Park Property is 27,091, 229,796 and 524,057, respectively, according to the appraisal. The estimated 2017 average household income within a one-, three- and five-mile radius of the Remington Park Property is $100,018, $123,405 and $116,730, respectively.
Comparable rental properties to the Remington Park Property are shown in the table below:
| Remington Park Property Comparable Rentals Summary | ||||||
| Address City, State | Year Built | Occupancy | Beds/Bath | Units | Unit Size (SF)(1) | Rent per Month(1) |
Westmore at Bellaire 5454 Newcastle Houston, TX | 1990 | 95% | 1 BR/ 1 BA 2 BR/ 2 BA | 484 96 | 955 1,351 | $1,101 $1,492 |
Century Galleria Lofts 3363 McCue Road Houston, TX | 2003 | 90% | 1 BR/ 1 BA 2 BR/ 2 BA 3 BR/ 2 BA | 133 74 16 | 792 1,239 1,393 | $1,172 $1,748 $1,837 |
Estates at Bellaire 4807 Pin Oak Park Houston, TX | 1998 | 96% | 1 BR/ 1 BA 2 BR/ 2 BA | 249 136 | 774 1,229 | $1,158 $1,490 |
Gables Metropolitan Uptown 3300 Sage Houston, TX | 1996 | 94% | 1 BR/ 1 BA 2 BR/ 2 BA 3 BR/ 2 BA | 178 126 14 | 739 1,110 1,311 | $1,031 $1,297 $1,666 |
Marquis On Pin Oak Park 4848 Pin Oak Park Houston, TX | 1992 | 95% | 1 BR/ 1 BA 2 BR/ 2 BA | 402 72 | 955 1,401 | $1,264 $1,507 |
Providence Uptown 3323 McCue Road Houston, TX | 1999 | 96% | 1 BR/ 1 BA 2 BR/ 1 BA 2 BR/ 2 BA 3 BR/ 2 BA | 192 84 128 16 | 761 956 1,165 1,396 | $1,195 $1,356 $1,522 $1,842 |
Source: Appraisal.
| (1) | Represents the weighted average for each unit mix type. |
This is not a research report and was not prepared by any Underwriter’s research department. Please see additional important information and qualifications at the end of this Term Sheet.
| T-113 |
| MSBAM 2017-C34 | Remington Park |
The following table presents certain information relating to comparable multifamily sales for the Remington Park Property:
| Comparable Property Sales | |||||||
| Property Name/Location | Sale Date | Year Built | Total NRA (Units) | Total Occupancy | Sale Price | Sales Price per unit | Cap Rate |
Remington Park Property 5510 South Rice Avenue, Houston, TX | Jul. 2017 | 2000 | 428(1) | 97%(1) | $62,702,000 | $146,500 | 5.5% |
Vintage Park 15727 Cutten Road, Houston, TX | Dec. 2016 | 2006 | 324 | 92% | $46,000,000 | $141,975 | 5.4% |
Alexan Shadow Creek Ranch 11900 Shadow Creek Parkway, Pearland, TX | Feb. 2017 | 2008 | 392 | 93% | $52,400,000 | $133,673 | 5.8% |
Broadmead 2801 Broadmead, Houston, TX | Aug. 2016 | 1979 | 235 | 94% | $24,650,000 | $104,894 | 5.5% |
Reserves at Fall Creek 7800 N Sam Houston Parkway East, Humble, TX | Jul. 2016 | 2009 | 264 | 93% | $34,600,000 | $131,061 | 5.8% |
Voyage at the Space Center Apartments 18101 Point Lookout Drive, Nassau Bay, TX | Apr. 2017 | 2009 | 313 | 94% | $48,000,000 | $153,355 | 5.5% |
Source:Appraisal.
| (1) | Information is based on the underwritten rent roll. |
Operating History and Underwritten Net Cash Flow.The following table presents certain information relating to the historical operating performance and the Underwritten Net Cash Flow at the Remington Park Property:
| Cash Flow Analysis | |||||
| 2015 | 2016 | 7/31/2017 TTM | UW | UW per Unit | |
| Base Rent | $6,643,152 | $6,532,542 | $6,345,387 | $6,395,352 | $14,942 |
| Other Income(1) | $668,360 | $643,761 | $638,391 | $638,391 | $1,492 |
| Less Concessions, Vacancy & Credit Loss | ($523,132) | ($487,747) | ($378,197) | ($429,471) | ($1,003) |
| Effective Gross Income | $6,788,380 | $6,688,557 | $6,605,582 | $6,604,272 | $15,431 |
| Total Operating Expenses | $2,876,155 | $3,082,371 | $3,107,583 | $3,198,592 | $7,473 |
| Net Operating Income | $3,912,225 | $3,606,186 | $3,497,999 | $3,405,680 | $7,957 |
| Capital Expenditures | $0 | $0 | $0 | $107,000 | $250 |
| Net Cash Flow | $3,912,225 | $3,606,186 | $3,497,999 | $3,298,680 | $7,707 |
| Occupancy % | 90.0% | 94.0% | 97.0%(2) | 93.8% | |
| NOI DSCR | 2.25x | 2.07x | 2.01x | 1.96x | |
| NCF DSCR | 2.25x | 2.07x | 2.01x | 1.89x | |
| NOI Debt Yield | 9.2% | 8.5% | 8.2% | 8.0% | |
| NCF Debt Yield | 9.2% | 8.5% | 8.2% | 7.8% | |
| (1) | Other Income includes income from carports, utilities and other miscellaneous income. |
| (2) | Occupancy % as of August 25, 2017. |
Escrows and Reserves. The loan documents provide for upfront reserves at closing of $60,625 for required repairs, including repairs to garage door panels damaged during Hurricane Harvey and repairs to the drainage system, $1,090,443 for taxes and $1,500,000 for capital improvements in accordance with the Remington Park Borrower’s business plan. The loan documents also provide for ongoing monthly reserves of 1/12th of the annual estimated taxes due (currently $121,160), 1/12th of the estimated renewal cost of insurance premiums due (provided that if (i) no event of default has occurred and is continuing, (ii) an acceptable blanket policy is maintained in accordance with the loan documents and (iii) borrower provides evidence of renewal and payments of such blanket insurance premiums then reserves for insurance premiums will not be required) and $8,917 for capital expenditures.
Lockbox and Cash Management.Upon the occurrence of a Cash Sweep Event Period (as defined below), the Remington Park Borrower is required to open a lockbox account, to direct the tenants to directly deposit all rents into such lockbox account, and to deposit within two business days after receipt any rents received by the Remington Park Borrower or property manager notwithstanding such direction. During the continuance of a Cash Sweep Event Period, the lender has the right to establish a lender-controlled cash management account with a cash management bank, and the Remington Park Borrower is required to cooperate with the cash management bank to establish such account. During the continuance of a Cash Sweep Event Period, funds in the lockbox account are required to be transferred to such lender-controlled cash management account to be applied to make monthly reserve deposits as described above under “Escrows and Reserves” to pay debt service on the Remington Park Mortgage Loan, to pay (provided no event of default exists under the Remington Park Mortgage Loan) monthly operating expenses in accordance with the approved annual budget and extraordinary expenses approved by the lender, and to deposit the remainder into an excess cash reserve account to be held as additional security for the Remington Park Mortgage Loan during such Cash Sweep Event Period.
This is not a research report and was not prepared by any Underwriter’s research department. Please see additional important information and qualifications at the end of this Term Sheet.
| T-114 |
| MSBAM 2017-C34 | Remington Park |
A “Cash Sweep Event Period” will (i) commence upon the occurrence of an event of default and continue until such event of default is cured or (ii) commence when the amortizing debt service coverage ratio falls below 1.05x for six consecutive calendar months (based on the trailing six months operating statement and rent roll) and continue until the amortizing debt service coverage ratio is at least 1.05x for the immediately preceding six consecutive calendar months (based on the trailing twelve months’ operating statement and rent roll).
Additional Secured Indebtedness (not including trade debts). Not permitted.
Mezzanine Loan and Preferred Equity. Not permitted.
Release of Property.Not permitted.
Terrorism Insurance. The Remington Park Borrower is required to maintain comprehensive all risk insurance in an amount equal to the full replacement cost of the Remington Park Property and 18 months of business interruption coverage. If this insurance excludes “acts of terrorism,” the Remington Park Borrower is required to obtain coverage insuring against all such excluded acts or events and “fire following,” in an amount determined by the lender, but not more than the sum of 100% of the “Full Replacement Cost” and 12 months of business interruption insurance. For so long as the Terrorism Risk Insurance Program Reauthorization Act of 2015 or any replacement, reauthorization or extension thereof (“TRIPRA”) is in effect and covers both foreign and domestic acts of terrorism, the lender is required to accept terrorism insurance which covers against “covered acts” as defined in TRIPRA. The terrorism insurance requirement can be met by providing the so-called T3 policy form in lieu of TRIPRA coverage. See“Risk Factors--Risks Relating to the Mortgage Loans—Terrorism Insurance May Not Be Available for all Mortgaged Properties” in the Preliminary Prospectus.
This is not a research report and was not prepared by any Underwriter’s research department. Please see additional important information and qualifications at the end of this Term Sheet.
| T-115 |
| MSBAM 2017-C34 | Corporate Woods Portfolio |
| Mortgage Loan No. 11 – Corporate Woods Portfolio |
| Mortgage Loan Information | Property Information | ||||||
| Mortgage Loan Seller: | MSMCH | Single Asset/Portfolio: | Portfolio | ||||
| Original Balance(1): | $40,000,000 | Location: | Overland Park, KS 66210 | ||||
| Cut-off Date Balance(1): | $39,946,846 | General Property Type: | Various | ||||
| % of Initial Pool Balance: | 3.8% | Detailed Property Type: | Various | ||||
| Loan Purpose: | Acquisition | Title Vesting: | Fee | ||||
| Sponsor: | Raymond Massa | Year Built/Renovated: | Various | ||||
| Mortgage Rate: | 4.4500% | Size: | 2,033,179 SF | ||||
| Note Date: | 8/9/2017 | Cut-off Date Balance per SF(1): | $109 | ||||
| First Payment Date: | 10/6/2017 | Maturity Date Balance per SF(1): | $88 | ||||
| Maturity Date: | 9/6/2027 | Property Manager: | Block Real Estate Services, LLC | ||||
| Original Term: | 120 months | ||||||
| Original Amortization Term: | 360 months | ||||||
| IO Period: | 0 months | ||||||
| Seasoning: | 1 month | Underwriting and Financial Information | |||||
| Prepayment Provisions(2): | LO (25); DEF (89); O (6) | UW NOI(4): | $22,612,063 | ||||
| Lockbox/Cash Mgmt Status: | Hard/Springing | UW NOI Debt Yield(1): | 10.2% | ||||
| Additional Debt Type: | Pari Passu | UW NOI Debt Yield at Maturity(1): | 12.6% | ||||
| Additional Debt Balance: | $181,250,000 | UW NCF DSCR(1): | 1.48x | ||||
| Future Debt Permitted (Type): | No (N/A) | Most Recent NOI: | $20,692,963 (6/30/2017 TTM) | ||||
| Reserves | 2nd Most Recent NOI: | $19,879,471 (12/31/2016) | |||||
| Type | Initial | Monthly | Cap | 3rd Most Recent NOI: | $21,181,276 (12/31/2015) | ||
| RE Tax: | $6,258,114 | $625,811 | N/A | Most Recent Occupancy: | 92.7% (5/31/2017) | ||
| Insurance: | $0 | Springing | N/A | 2nd Most Recent Occupancy: | 91.9% (12/31/2016) | ||
| Recurring Replacements: | $0 | $38,258 | N/A | 3rd Most Recent Occupancy: | 88.9% (12/31/2015) | ||
| TI/LC(3): | $7,500,000 | Springing | $7,500,000 | Appraised Value (as of)(5): | $299,100,000 (6/15/2017) | ||
| Deferred Maintenance: | $620,488 | $0 | N/A | Cut-off Date LTV Ratio(1)(5): | 73.9% | ||
| Unfunded Tenant Obligations: | $1,481,165 | $0 | N/A | Maturity Date LTV Ratio(1)(5): | 59.8% | ||
| Sources and Uses | ||||||
| Sources | Proceeds | % of Total | Uses | Proceeds | % of Total | |
| Loan Amount(1): | $221,250,000 | 76.1% | Purchase Price(6): | $271,091,733 | 93.3% | |
| Borrower Sponsor Equity: | $69,445,915 | 23.9% | Reserves: | $15,859,767 | 5.5% | |
| Closing Costs: | $3,193,771 | 1.1% | ||||
| Other Uses(7): | $550,644 | 0.2% | ||||
| Total Sources: | $290,695,915 | 100.0% | Total Uses: | $290,695,915 | 100.0% | |
| (1) | The Corporate Woods Portfolio Mortgage Loan (as defined below) is part of the Corporate Woods Portfolio Whole Loan (as defined below), which is comprised of sixpari passu promissory notes with an aggregate original principal balance of $221,250,000. The Corporate Woods Portfolio Mortgage Loan is represented by Promissory Note A-5 in the original principal amount of $40,000,000. The Cut-off Date Balance PSF, Maturity Date Balance PSF, UW NOI Debt Yield, UW NOI Debt Yield at Maturity, UW NCF DSCR, Cut-off Date LTV Ratio and Maturity Date LTV Ratio numbers presented above are based on the aggregate principal balance of the promissory notes comprising the Corporate Woods Portfolio Whole Loan. |
| (2) | Defeasance is permitted at any time after the earlier to occur of (i) the end of the two-year period commencing on the closing date of the securitization of the last Corporate Woods Portfolio Whole Loan promissory note to be securitized and (ii) August 9, 2020. The assumed lockout period of 25 payments is based on the closing date of this transaction in October 2017. |
| (3) | If the TI/LC Reserve falls below $5,000,000, the borrower is required to make monthly deposits of $169,428 until the amount in the TI/LC Reserve reaches $7,500,000. |
| (4) | UW NOI includes UW Gross Potential Rent which has been underwritten based on the May 31, 2017 rent roll and includes rent escalations through August 1, 2018 for non-investment grade tenants ($577,892) and the present value of all rent steps through the earlier of their respective lease terms or earliest effective termination date for investment grade tenants ($376,234). |
| (5) | The Appraised Value represents the “As Portfolio” bulk appraised value of the Corporate Woods Portfolio Properties (as defined below) as of June 15, 2017, which is inclusive of a $3,600,000 portfolio premium. The Cut-off Date LTV Ratio and LTV Ratio at Maturity are calculated based upon the portfolio “As-Is” Appraised Value of $299,100,000. The Cut-off Date LTV Ratio and LTV Ratio at Maturity based on the sum of the individual “as-is” appraised values of $295,500,000, which excludes the portfolio premium, are 74.8% and 60.6%, respectively. |
| (6) | The borrower acquired 21 buildings and 8.3 acres of excess developable land, all within the Corporate Woods Office Park (as defined below), for a contract purchase price of $295,000,000. The collateral for the Corporate Woods Portfolio Whole Loan excludes 138,627 SF of class C office space and 8.3 acres of excess developable land, which was given a cumulative allocated purchase price of $15,000,000. The Corporate Woods Portfolio Properties had an allocated purchase price of $280,000,000. The $280,000,000 less a seller credit of $8,908,267, which represents real estate tax prorations ($4,255,153), prepaid rent ($2,791,756), security deposits ($1,711,995) and various other credits ($149,363) (which were paid at closing) results in a net purchase price of $271,091,733. |
| (7) | Other Uses represent $550,644 of tenant improvements and leasing commissions that were paid at origination. |
The Mortgage Loan. The eleventh largest mortgage loan (the “Corporate Woods Portfolio Mortgage Loan”) is part of a whole loan (the “Corporate Woods Portfolio Whole Loan”) evidenced by sixpari passu promissory notes in the aggregate original principal amount of $221,250,000, all of which are secured by a first priority fee mortgage encumbering a portfolio of 15 office buildings and one retail building located in Overland Park, Kansas (the “Corporate Woods Portfolio Properties”). The Corporate Woods Portfolio Whole Loan was co-originated by Morgan Stanley Bank, N.A. and Citi Real Estate Funding Inc. Promissory Note A-5, in the original principal amount of $40,000,000, represents the Corporate Woods Portfolio Mortgage Loan, and will be included in the MSBAM 2017-C34 securitization trust. Promissory Notes A-1-A, A-1-B, A-2, A-3 and A-4, in the aggregate original principal amount of $181,250,000, collectively represent thepari passu companion loans.
This is not a research report and was not prepared by any Underwriter’s research department. Please see additional important information and qualifications at the end of this Term Sheet.
| T-116 |
| MSBAM 2017-C34 | Corporate Woods Portfolio |
The following table presents a summary of the promissory notes comprising the Corporate Woods Portfolio Whole Loan. The Corporate Woods Portfolio Whole Loan will be serviced pursuant to the pooling and servicing agreement for the CGCMT 2017-P8 transaction. See “Description of the Mortgage Pool—The Whole Loans—The Non-Serviced Pari Passu Whole Loans” and “Pooling and Servicing Agreement-Servicing of the Non-Serviced Mortgage Loans” in the Preliminary Prospectus.
| Corporate Woods Portfolio Whole Loan Summary | |||
| Note | Original Balance | Note Holder | Controlling Piece |
| A-1-A | $30,000,000 | CGCMT 2017-P8 | Yes |
| A-1-B | $25,000,000 | Citi Real Estate Funding Inc. | No |
| A-2 | $35,625,000 | Citi Real Estate Funding Inc. | No |
| A-3 | $20,000,000 | CGCMT 2017-P8 | No |
| A-4 | $70,625,000 | BANK 2017-BNK7 | No |
| A-5 | $40,000,000 | MSBAM 2017-C34 | No |
| Total | $221,250,000 | ||
Proceeds from the Corporate Woods Portfolio Whole Loan, along with approximately $69.4 million of borrower equity, were used to acquire the Corporate Woods Portfolio Properties for a purchase price of approximately $271.1 million, fund upfront reserves of approximately $15.9 million, pay closing costs of approximately $3.2 million and pay approximately $0.6 million of tenant improvement and leasing commissions at closing.
The Borrower and the Sponsor. The borrower is Corporate Woods Kansas Realty LP (the “Corporate Woods Portfolio Borrower”), a single-purpose Delaware limited partnership, with two independent directors. The Corporate Woods Portfolio Borrower is 0.5% owned by its general partner, Corporate Woods Kansas Realty Management LLC and 99.5% owned by Corporate Woods Kansas LP. Corporate Woods Kansas Realty Management LLC and Corporate Woods Kansas LP are controlled by Group RMC Management Inc. (“Group RMC”).
Group RMC is a real estate management company headquartered in New York City targeting investments in office assets throughout the United States. Group RMC is currently invested in 18 office properties and one warehouse property totaling approximately 6,495,699 SF across more than 80 buildings throughout the United States and Canada.
The sponsor and nonrecourse carve-out guarantor is Raymond Massa. Raymond Massa controls Group RMC and has a 4.77% beneficial interest in the borrower.
The Properties. The Corporate Woods Portfolio Properties are comprised of 16 buildings located within a 29-building master-planned, suburban office park in Overland Park, Kansas (“Corporate Woods Office Park”), located approximately 13 miles southwest of the Kansas City central business district. Of the 16 buildings serving as collateral for the Corporate Woods Portfolio Loan (the “Buildings”), five are Class A office buildings (1,096,082 SF), 10 are Class B office buildings (908,485 SF) and one is a retail building (28,612 SF). The Corporate Woods Portfolio Properties were constructed in stages between 1977 and 2001 and the office buildings range from three to 16 stories. The Corporate Woods Portfolio Properties are positioned at the southeast corner of Interstate 435 and U.S. Highway 169, and provide for 7,704 parking spaces, which equates to a ratio of 3.8 spaces per 1,000 SF. The Corporate Woods Office Park features a Doubletree Hotel and a 50 acre wooded park, with biking and walking trails that run along Indian Creek, neither of which are collateral for the Corporate Woods Portfolio Loan. As of May 31, 2017, the Corporate Woods Portfolio Properties were 92.7% leased to approximately 280 tenants.
Of the buildings that are part of the 29 building Corporate Woods Office Park, but are not included in the Corporate Woods Portfolio Properties, an affiliate of the borrower acquired five Class C office buildings, as well as adjacent developable land (which may be developed as office properties). The five Class C office buildings are 86.5% occupied, with approximately 98% of leases expiring by 2020. The remaining non-collateral buildings at the Corporate Woods Office Park consist of the Doubletree hotel and office buildings, which are owned by third parties.
This is not a research report and was not prepared by any Underwriter’s research department. Please see additional important information and qualifications at the end of this Term Sheet.
| T-117 |
| MSBAM 2017-C34 | Corporate Woods Portfolio |
The following table presents detailed information with respect to each of the Corporate Woods Portfolio Properties.
| Corporate Woods Portfolio Properties Summary(1) | |||||||||||
| Building | Property Type | Allocated Cut-off Date | % of Portfolio Cut-off Date Balance | Occupancy(1) | Year Built | Net Rentable Area (SF) | Appraised Value(3) (3) | Replacement Cost | U/W NCF |
Appraisal | UW Base Rent PSF(5) |
| 82 | Office | $34,441,624 | 15.6% | 98.2% | 2001 | 245,413 | $46,000,000 | $53,145,129 | $3,618,028 | $27.00 | $28.38 |
| 40 | Office | $32,420,051 | 14.7% | 96.8% | 1981 | 300,043 | $43,300,000 | $47,059,741 | $3,015,444 | $24.00 | $23.11 |
| 84 | Office | $31,596,447 | 14.3% | 83.1% | 1998 | 241,573 | $42,200,000 | $53,145,129 | $2,332,658 | $27.00 | $25.80 |
| 32 | Office | $23,809,645 | 10.8% | 98.5% | 1985 | 208,244 | $31,800,000 | $32,034,249 | $1,992,435 | $24.00 | $22.28 |
| 34 | Office | $11,530,457 | 5.2% | 100.0% | 1978 | 97,023 | $15,400,000 | $14,568,965 | $973,541 | $23.00 | $23.24 |
| 14 | Office | $10,781,726 | 4.9% | 96.7% | 1981 | 120,385 | $14,400,000 | $18,974,570 | $987,468 | $21.50 | $20.21 |
| 70 | Office | $10,257,614 | 4.6% | 94.6% | 1987 | 100,809 | $13,700,000 | $15,137,471 | $1,163,715 | $23.00 | $25.10 |
| 9 | Office | $9,583,756 | 4.3% | 92.7% | 1984 | 99,400 | $12,800,000 | $15,722,193 | $963,037 | $22.00 | $21.95 |
| 6 | Office | $9,508,883 | 4.3% | 83.8% | 1979 | 108,395 | $12,700,000 | $16,821,364 | $752,156 | $21.00 | $20.67 |
| 12 | Office | $9,359,137 | 4.2% | 80.6% | 1986 | 98,648 | $12,500,000 | $17,470,510 | $642,797 | $23.00 | $22.77 |
| 27 | Office | $9,134,518 | 4.1% | 95.2% | 1978 | 96,518 | $12,200,000 | $14,975,598 | $882,814 | $22.00 | $22.26 |
| 51 | Office | $7,861,675 | 3.6% | 94.2% | 1977 | 89,789 | $10,500,000 | $13,482,708 | $769,152 | $21.25 | $20.94 |
| 55 | Office | $7,711,929 | 3.5% | 88.4% | 1977 | 89,221 | $10,300,000 | $13,397,418 | $674,971 | $22.25 | $21.50 |
| 65 | Retail | $4,941,624 | 2.2% | 100.0% | 1982 | 28,612 | $6,600,000 | $2,464,918 | $436,257 | $20.00 | $19.22 |
| 3 | Office | $4,941,624 | 2.2% | 81.2% | 1979 | 60,950 | $6,600,000 | $9,336,100 | $334,075 | $21.00 | $21.02 |
| 75 | Office | $3,369,289 | 1.5% | 88.9% | 1980 | 48,156 | $4,500,000 | $7,664,564 | $314,544 | $20.00 | $19.67 |
| Total | $221,250,000 | 100.0% | 92.7% | 2,033,179 | $295,500,000 | $345,400,627 | $19,853,093 | $23.63 | $23.32 | ||
| (1) | Information obtained from the underwritten rent roll dated May 31, 2017. |
| (2) | Allocated Cut-off Date Balance is based on the Corporate Woods Portfolio Whole Loan Cut-off Date balance. |
| (3) | As of the appraisal dated July 19, 2017. The total Appraised Value of $295,500,000 represents the sum of the individual appraised values of the Corporate Woods Portfolio Properties, as compared to the portfolio “As-Is” Appraised Value of $299,100,000, which includes a 1.2% portfolio premium. |
| (4) | Appraisal Market Rent PSF is quoted on a modified gross basis for all buildings except Building 65, which is quoted on a triple net basis. |
| (5) | UW Base Rent PSF includes rent escalations through August 1, 2018, for non-investment grade tenants ($577,892) and the present value of all rent steps through the earlier of their respective lease terms or earliest effective termination date for investment grade tenants ($376,234). |
This is not a research report and was not prepared by any Underwriter’s research department. Please see additional important information and qualifications at the end of this Term Sheet.
| T-118 |
| MSBAM 2017-C34 | Corporate Woods Portfolio |
The following table presents certain information relating to the leases at the Corporate Woods Portfolio Properties:
| Tenant Summary(1) | |||||||
| Tenant Name | Credit Rating (Fitch/Moody’s/S&P)(2) | Tenant SF | Approximate % of SF | Annual UW Rent(3) | % of Total Annual UW Rent | Annual UW Rent PSF(3)(4) | Lease Expiration |
| Tenants | |||||||
| PNC Bank National Association(5) | A+/A3/A- | 159,270 | 7.8% | $4,665,105 | 10.6% | $29.29 | 10/31/2019 |
| Coventry Health Care of Kansas, Inc.(6) | A-/Baa2/NR | 69,640 | 3.4% | $1,532,080 | 3.5% | $22.00 | 12/31/2023 |
| Compass Minerals International, Inc. | NR/B1/BB | 60,699 | 3.0% | $1,504,728 | 3.4% | $24.79 | 2/29/2020 |
| Lathrop & Gage, LLP.(7) | NR/NR/NR | 39,993 | 2.0% | $1,081,091 | 2.5% | $27.03 | Various |
| Lansing Trade Group, LLC | NR/NR/NR | 44,496 | 2.2% | $981,171 | 2.2% | $22.05 | 1/31/2018 |
| Scoular Company | NR/NR/NR | 37,432 | 1.8% | $950,773 | 2.2% | $25.40 | 8/31/2020 |
| QC Holdings, Inc. | NR/NR/NR | 39,022 | 1.9% | $838,973 | 1.9% | $21.50 | 10/31/2017 |
| Amerigroup Corp. & Amerigroup Kansas, Inc. | NR/Baa2/NR | 39,056 | 1.9% | $829,940 | 1.9% | $21.25 | 12/31/2020 |
| TMFS Holdings, LLC | NR/NR/NR | 33,100 | 1.6% | $719,925 | 1.6% | $21.75 | 3/1/2027 |
| Vendor Credentialing Service LLC dba symplr | NR/NR/NR | 30,823 | 1.5% | $708,929 | 1.6% | $23.00 | 8/31/2024 |
| Subtotal/Wtd. Avg. | 553,531 | 27.2% | 13,812,714 | 31.4% | $24.95 | ||
| Other Tenants | 1,331,180 | 65.5% | $30,142,376 | 68.6% | $22.64 | ||
| Vacant Space | 148,468 | 7.3% | $0 | 0.0% | $0.00 | ||
| Total/Wtd. Avg. | 2,033,179 | 100.0% | $43,955,091 | 100.0% | $23.32 | ||
| (1) | Information is based on the underwritten rent roll. |
| (2) | Certain ratings are those of the parent company whether or not the parent guarantees the lease. |
| (3) | Annual U/W Rent and Annual UW Rent PSF include rent escalations through August 1, 2018, for non-investment grade tenants ($577,892) and the present value of all rent steps through the earlier of their respective lease terms or earliest effective termination date for investment grade tenants ($376,234). |
| (4) | Wtd. Avg. Annual U/W Rent PSF excludes vacant space. |
| (5) | PNC Bank National Association has exercised an option to reduce its space by 12,820 SF on the 8th floor effective November 30, 2017. PNC Bank National Association has executed a letter of intent to extend its lease to October 31, 2029 pursuant to the following terms: 146,450 SF leased at $15.00/SF triple net with $0.50 per SF annual rent increases. The letter of intent provides PNC Bank National Association with an option to reduce its space by 13,672 SF effective October 31, 2019 and an option to terminate its lease effective October 31, 2026 with 12 months’ prior written notice. We cannot assure you that PNC Bank National Association will execute an extension of its lease pursuant to the aforementioned terms or at all. |
| (6) | Coventry Health Care of Kansas, Inc. has the right to terminate its lease as to either all of its leased premises or as to any full floor portion of its leased premises effective as of December 31, 2018 by written notice to the borrower by December 31, 2017. |
| (7) | Lathrop & Gage, LLP. leases 13,497 SF that expires on January 31, 2018 and 26,496 SF that expires on January 31, 2023. |
The following table presents information with respect to the largest tenant at each of the Corporate Woods Portfolio Properties.
| Corporate Woods Portfolio Largest Tenant by Building Summary | |||||||||
| Building | SF | Building Occupancy as-of 5/31/2017 | Building Largest Tenant | Largest Tenant SF | Largest Tenant % Building SF | Lease Expiration Date | |||
| 82 | 245,413 | 98.2% | PNC Bank National Association(1) | 159,270 | 64.9% | 10/31/2019 | |||
| 40 | 300,043 | 96.8% | Coventry Health Care of Kansas, Inc.(2) | 69,640 | 23.2% | 12/31/2023 | |||
| 84 | 241,573 | 83.1% | Scoular Company | 37,432 | 15.5% | 8/31/2020 | |||
| 32 | 208,244 | 98.5% | Amerigroup Corp. & Amerigroup Kansas, Inc. | 39,056 | 18.8% | 12/31/2020 | |||
| 34 | 97,023 | 100.0% | TMFS Holdings, LLC | 33,100 | 34.1% | 3/1/2027 | |||
| 14 | 120,385 | 96.7% | Propharma Group, Inc.(3) | 16,218 | 13.5% | 2/28/2021 | |||
| 70 | 100,809 | 94.6% | Compass Minerals International, Inc. | 60,699 | 60.2% | 2/29/2020 | |||
| 9 | 99,400 | 92.7% | University of Kansas Hospital Authority | 16,785 | 16.9% | 8/31/2018 | |||
| 6 | 108,395 | 83.8% | National Crop Insurance Services, Inc. | 18,522 | 17.1% | 9/30/2019 | |||
| 12 | 98,648 | 80.6% | Lansing Trade Group, LLC | 44,496 | 45.1% | 1/31/2018 | |||
| 27 | 96,518 | 95.2% | CSC Covansys Corporation(4) | 16,550 | 17.1% | 3/31/2022 | |||
| 51 | 89,789 | 94.2% | RGN-Overland Park I, LLC | 15,796 | 17.6% | 5/31/2020 | |||
| 55 | 89,221 | 88.4% | Emerson Electric Co. | 10,073 | 11.3% | 3/31/2020 | |||
| 65 | 28,612 | 100.0% | Garozzo’s III, Inc. | 5,575 | 19.5% | 9/30/2021 | |||
| 3 | 60,950 | 81.2% | DeMars Pension Consulting Services, Inc. | 10,247 | 16.8% | 9/30/2021 | |||
| 75 | 48,156 | 88.9% | Multi Service Technology Solutions, Inc. | 12,182 | 25.3% | 11/30/2017 | |||
| Total / Wtd. Avg. | 2,033,179 | 92.7% | 565,641 | 27.8% | |||||
| (1) | PNC Bank National Association has exercised an option to reduce its space by 12,820 SF on the 8th floor effective November 30, 2017. PNC Bank National Association has executed a letter of intent to extend its lease to October 31, 2029 pursuant to the following terms: 146,450 SF leased at $15.00 per SF triple net with $0.50 per SF annual rent increases. The letter of intent provides PNC Bank National Association with an option to reduce its space by 13,672 SF effective October 31, 2019 and an option to terminate its lease effective October 31, 2026 with 12 months’ prior written notice. We cannot assure you that PNC Bank National Association will execute a lease pursuant to the aforementioned terms or at all. |
| (2) | Coventry Health Care of Kansas, Inc. has the right to terminate its lease as to either all of its leased premises or as to any full floor portion of its leased premises effective as of December 31, 2018 by written notice to the borrower by December 31, 2017. |
| (3) | Propharma Group, Inc. has the right to terminate its lease effective as of February 28, 2019 by written notice to the borrower by July 31, 2018. |
| (4) | CSC Covansys Corporation has the right to terminate its lease effective as of March 31, 2019 by written notice to the borrower by June 30, 2018. |
This is not a research report and was not prepared by any Underwriter’s research department. Please see additional important information and qualifications at the end of this Term Sheet.
| T-119 |
| MSBAM 2017-C34 | Corporate Woods Portfolio |
The following table presents certain information with respect to the lease rollover at the Corporate Woods Portfolio Properties.
| Lease Rollover Schedule(1)(2) | ||||||||
| Year | # of Leases Rolling | Total Rolling SF | % of Total SF Rolling | Cumulative % of SF Rolling | Total UW Rent Rolling(4) | Annual U/W Rent PSF Rolling(3)(4) | % U/W Rent Rolling | Cumulative % of U/W Rent Rolling |
| MTM | 4 | 1,885 | 0.1% | 0.1% | $103,177 | $23.79(5) | 0.2% | 0.2% |
| 2017 | 11 | 67,965 | 3.3% | 3.4% | $1,430,918 | $21.05 | 3.3% | 3.5% |
| 2018 | 49 | 316,500 | 15.6% | 19.0% | $7,063,187 | $22.32 | 16.1% | 19.6% |
| 2019 | 69 | 465,746 | 22.9% | 41.9% | $11,634,141 | $24.98 | 26.5% | 46.0% |
| 2020 | 60 | 405,813 | 20.0% | 61.9% | $9,205,093 | $22.68 | 20.9% | 67.0% |
| 2021 | 35 | 171,096 | 8.4% | 70.3% | $3,926,071 | $22.95 | 8.9% | 75.9% |
| 2022 | 33 | 183,823 | 9.0% | 79.3% | $4,145,160 | $22.55 | 9.4% | 85.3% |
| 2023 | 7 | 144,131 | 7.1% | 86.4% | $3,386,284 | $23.49 | 7.7% | 93.0% |
| 2024 | 6 | 61,082 | 3.0% | 89.4% | $1,457,728 | $23.87 | 3.3% | 96.4% |
| 2025 | 3 | 27,547 | 1.4% | 90.8% | $750,901 | $27.26 | 1.7% | 98.1% |
| 2026 | 0 | 0 | 0.0% | 90.8% | $0 | $0.00 | 0.0% | 98.1% |
| 2027 | 2 | 39,123 | 1.9% | 92.7% | $852,431 | $21.79 | 1.9% | 100.0% |
| 2028 & Beyond | 0 | 0 | 0.0% | 92.7% | $0 | $0.00 | 0.0% | 100.0% |
| Vacant | 0 | 148,468 | 7.3% | 100.0% | $0 | $0.00 | 0.0% | 100.0% |
| Total / Wtd. Avg. | 279 | 2,033,179 | 100.0% | $43,955,091 | $23.32 | 100.0% | ||
| (1) | Information obtained from the underwritten rent roll dated May 31, 2017. |
| (2) | Certain tenants may have lease termination options that may become exercisable prior to the originally stated expiration date of the tenant lease that are not considered in the lease rollover schedule. |
| (3) | Annual UW Rent PSF includes rent escalations through August 1, 2018, for non-investment grade tenants ($577,892) and the present value of all rent steps through the earlier of their respective lease terms or earliest effective termination date for investment grade tenants ($376,234). |
| (4) | Wtd. Avg. Annual UW Rent PSF excludes vacant space. |
| (5) | Annual U/W Rent PSF for MTM tenants is calculated based on the $44,843 of U/W Rent associated with 1,885 SF of conference room space. The remaining U/W Rent of $58,334 is associated with antenna space, mail boxes and other miscellaneous tenants which have 0 SF attributed to them. |
The Market. The Corporate Woods Portfolio Properties are located in Overland Park, Kansas which is situated in Johnson County, about 15 miles southwest of the Kansas City central business district. Major employers within the area include: HCA Midwest Health System, Sprint Corporation, Saint Luke’s Health System, Cerner Corporation, Children’s Mercy Hospitals & Clinics, DST Systems, Inc., Truman Medical Center, and Black & Veatch Corporation, among others.
The Corporate Woods Portfolio Properties are in the City of Overland Park, which is the second-most populous city in Kansas and the largest suburb in the Kansas City metropolitan area. According to the appraisal, the 2016 population within a one-, three- and five-mile radius of the Corporate Woods Portfolio Properties was 9,145, 97,171 and 248,477, respectively. The 2016 estimated average household income within a one-, three- and five-mile radius of the Corporate Woods Portfolio Properties was $87,815, $93,240 and $104,793, respectively.
The Corporate Woods Portfolio Properties are part of the Kansas City metropolitan statistical area (“MSA”) office market and the South Johnson County/College Boulevard office submarket. According to a market report, as of March 2017, the Kansas City MSA office market consisted of 136.8 million SF with an average occupancy rate of 92.1% and an average rent of $18.26 per SF. As of March 2017, the College Boulevard office submarket consisted of 20.5 million SF with an average occupancy rate of 91.5% and an average rent of $21.65 per SF. The appraisal identified a subset of six comparable properties, located within the College Boulevard submarket and within three miles of the Corporate Woods Portfolio Properties. The Competitive Office Properties table below is based on the information available to the appraiser in connection with such comparable properties, which had gross rents ranging from $20.75 per SF to $26.00 per SF.
The following tables present certain information relating to competitive office properties to the Corporate Woods Portfolio Properties:
| Competitive Property Summary | ||||||
| Property Name/Location | Year Built | Total GLA (SF) | Occupancy | Distance from Subject | Annual Base Rent PSF | Lease Type |
Lighton Plaza I & II/Tower Overland Park, KS | 1989 | 476,278 | 92.8% | 1.5 miles | $22.00 to $26.00 | Full Service |
7107 Tower Overland Park, KS | 1986 | 228,040 | 93.9% | 1.5 miles | $23.50 | Full Service |
Commerce Plaza I & II Overland Park, KS | 1986 | 285,465 | 97.4% | 1.5 miles | $23.50 | Full Service |
South Creek Office Park Overland Park, KS | 1995 | 898,488 | 89.5% | 3.0 miles | $20.75 to $22.25 | Full Service |
Financial Plaza II & III Overland Park, KS | 1985 | 254,336 | 87.7% | 1.5 miles | $21.50 to $23.00 | Full Service |
Renaissance/Del Sarto Overland Park, KS | 1986 | 545,218 | 90.3% | 1.8 miles | $21.50 to $23.00 | Full Service |
Source: Appraisal.
This is not a research report and was not prepared by any Underwriter’s research department. Please see additional important information and qualifications at the end of this Term Sheet.
| T-120 |
| MSBAM 2017-C34 | Corporate Woods Portfolio |
Operating History and Underwritten Net Cash Flow.The following table presents certain information relating to the historical operating performance and Underwritten Net Cash Flow at the Corporate Woods Portfolio Properties:
| Cash Flow Analysis | ||||||
| 2014 | 2015 | 2016 | 6/30/2017 TTM | UW(1) | UW PSF | |
| Base Rent(1) | $40,743,337 | $40,641,844 | $40,285,194 | $41,587,085 | $43,000,965 | $21.15 |
| Contractual Rent Steps(2) | $0 | $0 | $0 | $0 | $954,126 | $0.47 |
| Grossed Up Vacant Space | $0 | $0 | $0 | $0 | $3,494,670 | $1.72 |
| Total Recoveries | $952,901 | $1,912,725 | $2,243,749 | $2,653,606 | $3,080,143 | $1.51 |
| Total Other Income | $184,342 | $317,945 | $206,088 | $236,942 | $236,942 | $0.12 |
| Less Vacancy & Credit Loss | ($685,338) | ($638,017) | ($953,455) | ($1,237,930) | ($5,053,068) | ($2.49) |
| Effective Gross Income | $41,195,243 | $42,234,497 | $41,781,575 | $43,239,702 | $45,713,777 | $22.48 |
| Total Operating Expenses | $20,015,972 | $21,053,221 | $21,902,104 | $22,546,739 | $23,101,714 | $11.36 |
| Net Operating Income | $21,179,271 | $21,181,276 | $19,879,471 | $20,692,963 | $22,612,063 | $11.12 |
| Capital Expenditures | $0 | $0 | $0 | $0 | $459,093 | $0.23 |
| TI/LC | $0 | $0 | $0 | $0 | $2,299,877 | $1.13 |
| Net Cash Flow | $21,179,271 | $21,181,276 | $19,879,471 | $20,692,963 | $19,853,093 | $9.76 |
| Occupancy % | 93.5% | 88.9% | 91.9% | 92.7%(3) | 90.0% | |
| NOI DSCR(4) | 1.58x | 1.58x | 1.49x | 1.55x | 1.69x | |
| NCF DSCR(4) | 1.58x | 1.58x | 1.49x | 1.55x | 1.48x | |
| NOI Debt Yield(4) | 9.6% | 9.6% | 9.0% | 9.4% | 10.2% | |
| NCF Debt Yield(4) | 9.6% | 9.6% | 9.0% | 9.4% | 9.0% | |
| (1) | U/W cash flow based on contractual rents as of May 31, 2017. |
| (2) | Contractual Rent Steps include rent escalations through August 1, 2018, for non-investment grade tenants ($577,892) and the present value of all rent steps through the earlier of their respective lease terms (none of which extend past the loan maturity date) or earliest effective termination date for investment grade tenants ($376,234). |
| (3) | Occupancy % is as of May 31, 2017. |
| (4) | Debt service coverage ratios and debt yields are based on the Corporate Woods Portfolio Whole Loan. |
Release of Property.Following the lockout date and prior to the open period, each of the Corporate Woods Portfolio Properties may be separately released upon defeasance of a release price equal to the greater of (x) 120% of the allocated loan amount of such individual property and (y) 95% of the net sale proceeds of such individual property, and satisfaction of the following conditions, among others: (i) the loan-to-value ratio of the remaining Corporate Woods Portfolio Properties following such release does not exceed the lesser of (x) 74.0% or (y) the loan-to-value ratio immediately prior to the release, (ii) the debt service coverage ratio of the remaining Corporate Woods Portfolio Properties following such release equals or exceeds the greater of (x) 1.40x and (y) the debt service coverage ratio immediately prior to the release, (iii) the debt yield of the remaining Corporate Woods Portfolio Properties following such release equals or exceeds the greater of (x) 9.0% and (y) the debt yield immediately prior to the release, (iv) delivery of a reciprocal easement agreement reasonably acceptable to the lender, providing access, parking, utility and other customary easements, (v) compliance with applicable legal and zoning requirements, leases and covenants, (vi) the released individual property must constitute a separate tax parcel and (vii) the release must be permitted under REMIC requirements and the lender must receive a legal opinion to such effect. During the open period, each of the Corporate Woods Portfolio Properties may be separately released upon satisfaction of the above conditions, except that prepayment, rather than defeasance, of the release price is required.
This is not a research report and was not prepared by any Underwriter’s research department. Please see additional important information and qualifications at the end of this Term Sheet.
| T-121 |
| MSBAM 2017-C34 | The Townsend Hotel |
| Mortgage Loan No. 12 – The Townsend Hotel |
| Mortgage Loan Information | Property Information | ||||||
| Mortgage Loan Seller: | MSMCH | Single Asset/Portfolio: | Single Asset | ||||
| Original Balance: | $35,000,000 | Location: | Birmingham, MI 48009 | ||||
| Cut-off Date Balance: | $35,000,000 | General Property Type: | Hospitality | ||||
| % of Initial Pool Balance: | 3.3% | Detailed Property Type: | Full Service | ||||
| Loan Purpose: | Refinance | Title Vesting: | Fee | ||||
| Sponsors: | David Sillman; The Keith J Pomeroy | Year Built/Renovated: | 1986, 2000/2014-2016 | ||||
| Trust Of December 13, 1976, as | Size: | 150 Rooms | |||||
| amended | Cut-off Date Balance per Room: | $233,333 | |||||
| Mortgage Rate: | 4.1700% | Maturity Date Balance per Room: | $233,333 | ||||
| Note Date: | 9/15/2017 | Property Manager: | Townsend Management Company | ||||
| First Payment Date: | 11/1/2017 | LLC (borrower-related) | |||||
| Maturity Date: | 10/1/2027 | ||||||
| Original Term to Maturity: | 120 months | ||||||
| Original Amortization Term: | 0 months | Underwriting and Financial Information | |||||
| IO Period: | 120 months | UW NOI: | $6,206,720 | ||||
| Seasoning: | 0 months | UW NOI Debt Yield: | 17.7% | ||||
| Prepayment Provisions: | LO (24); DEF (92); O (4) | UW NOI Debt Yield at Maturity: | 17.7% | ||||
| Lockbox/Cash Mgmt Status: | Springing/Springing | UW NCF DSCR: | 3.54x | ||||
| Additional Debt Type: | N/A | Most Recent NOI: | $6,209,737 (6/30/2017 TTM) | ||||
| Additional Debt Balance: | N/A | 2nd Most Recent NOI: | $6,336,430 (12/31/2016) | ||||
| Future Debt Permitted (Type): | No (N/A) | 3rd Most Recent NOI: | $6,355,870 (12/31/2015) | ||||
| Most Recent Occupancy: | 76.0% (6/30/2017) | ||||||
| Reserves | 2nd Most Recent Occupancy: | 76.0% (12/31/2016) | |||||
| Type | Initial | Monthly | Cap | 3rd Most Recent Occupancy: | 74.8% (12/31/2015) | ||
| RE Tax: | $96,850 | $48,425 | N/A | Appraised Value (as of): | $67,900,000 (8/1/2017) | ||
| Insurance: | $28,125 | $14,063 | N/A | Cut-off Date LTV Ratio: | 51.5% | ||
| Recurring Replacements(1): | $0 | Springing | N/A | Maturity Date LTV Ratio: | 51.5% | ||
| Sources and Uses | ||||||
| Sources | Proceeds | % of Total | Uses | Proceeds | % of Total | |
| Loan Amount: | $35,000,000 | 100.0% | Loan Payoff: | $24,329,286 | 69.5% | |
| Return of Equity: | $10,049,044 | 28.7% | ||||
| Closing Costs: | $496,694 | 1.4% | ||||
| Reserves: | $124,975 | 0.4% | ||||
| Total Sources: | $35,000,000 | 100.0% | Total Uses: | $35,000,000 | 100.0% | |
| (1) | Monthly deposits for Recurring Replacements in the amount of 1/12th of 3% of the operating income for The Townsend Hotel Property (as defined below) for the preceding calendar year are required upon the occurrence of a cash sweep event, which will occur upon an event of default or the debt service coverage ratio falling below 1.20x for six consecutive months based on the trailing twelve month period. The borrower is required to furnish the lender, within 90 days after the end of each fiscal year, reasonably satisfactory evidence that it has invested no less than 3% of gross operating income into furniture, fixtures and equipment at The Townsend Hotel Property. |
The Mortgage Loan. The twelfth largest mortgage loan (“The Townsend Hotel Mortgage Loan”) is evidenced by a promissory note in the original principal amount of $35,000,000 that is secured by a first priority fee mortgage encumbering a full service unflagged boutique hospitality property known as The Townsend Hotel in Birmingham, Michigan (“The Townsend Hotel Property”). The proceeds of The Townsend Hotel Mortgage Loan were primarily used to refinance a previous loan of approximately $24.3 million, fund reserves of approximately $125,000, pay closing costs of approximately $500,000 and return equity of approximately $10.0 million to The Townsend Hotel Borrower (as defined below). The Townsend Hotel Property was previously securitized in the DBUBS 2011-LC3A transaction.
The Borrower and the Sponsors. The borrower is THC Investors Limited Partnership (“The Townsend Hotel Borrower”), a Michigan limited partnership. The nonrecourse carve-out guarantors for The Townsend Hotel Mortgage Loan are David Sillman and The Keith J. Pomeroy Trust, a Revocable Trust U/T/A/D December 13, 1976, as amended (the “Pomeroy Trust”). The Townsend Hotel Borrower is 98.52% owned by several entities and 1.45% owned by GP Townsend, Inc., a Michigan corporation, which is the general partner. Of the 98.52%, over 54% is effectively owned or controlled by the two nonrecourse carve-out guarantors, who also own and control GP Townsend, Inc. The indirect limited partnership interest held by the Pomeroy Trust has been pledged to another indirect owner of The Townsend Hotel Borrower. No other entities or individuals hold or control more than 8% of total ownership.
David Sillman is president and CEO of Sillman Enterprises, which specializes in real estate acquisitions. Since its inception in 1991, Sillman Enterprises has acquired approximately 5,500 multifamily units and 547,000 SF of office/retail, along with The Townsend Hotel Property. Keith J. Pomeroy is the chair of Pomeroy Family Holdings, Inc., Pomeroy Financial Services and Pomeroy Living LLC. With over 40 years of real estate experience, which includes ownership and management, Pomeroy Family Holdings, Inc. and affiliates have developed, acquired and sold more than 20 multifamily projects encompassing 4,000 units nationwide, over 800 skilled nursing home beds, over 400 units in assisted living and independent living communities in Michigan and Colorado, and in excess of 2,300,000 SF of industrial, high-tech and office space across five states.
This is not a research report and was not prepared by any Underwriter’s research department. Please see additional important information and qualifications at the end of this Term Sheet.
| T-122 |
| MSBAM 2017-C34 | The Townsend Hotel |
The Property. The Townsend Hotel Property is a four and five-story, 150-room full service unflagged boutique hotel, located in Birmingham, Michigan. The Townsend Hotel Property contains 150 rooms, including four penthouse/presidential suites, three executive suites, 48 junior suites and 91 standard rooms. Each guestroom includes king or queen/queen beds complemented with 300 thread count cotton sheets and custom Italian covers. Junior suites feature separate living rooms from the bedrooms, with many offering balconies. Executive suites are 750 SF and feature eight-person dining tables in the living room area and a separate bedroom. Penthouse/presidential suites range from 1,200 SF and 2,600 SF. Each penthouse/presidential suite features a gas fireplace and kitchen. The Townsend Hotel Property includes The Rugby Grille, a 75-seat restaurant, and the Townsend Bakery. Additional amenities include a lounge, fitness center, business center, gift shop, and 15,395 SF of meeting and banquet space. The Townsend Hotel Property also features a 90-space, underground parking garage. The Townsend Hotel Property was ranked the best hotel in Michigan for 2017 by a major industry publication.
The Townsend Hotel Property was originally built in 1986 with 87 rooms, with another wing added in 2000 with 63 rooms. According to the borrower sponsors, between 2014 and 2016, approximately $8.24 million ($54,917/room) in capital improvements were completed at The Townsend Hotel Property. The scope of the improvements included complete guestroom renovations, common area renovations, restaurant renovations, ballroom renovations, kitchen equipment and HVAC upgrades. The borrower sponsors’ business plan includes approximately $2.1 million ($14,232/room) of renovations between 2018 and 2020. Such renovations have not been reserved for and are not required under The Townsend Hotel Mortgage Loan documents.
The Townsend Hotel Property is currently subject to a management agreement with Townsend Management Company LLC, an affiliate of The Townsend Hotel Borrower.
The Townsend Hotel Property generates approximately 50% of its room nights from commercial demand, 40% from meeting and group demand and 10% from leisure demand. RevPAR penetration for The Townsend Hotel Property has exceeded 190% each year from 2013 through 2016.
| Historical Occupancy, ADR, RevPAR(1)(2) | |||||||||
Competitive Set | The Townsend Hotel Property | Penetration Factor | |||||||
| Year | Occupancy | ADR | RevPAR | Occupancy | ADR | RevPAR | Occupancy | ADR | RevPAR |
| 2015 | 70.7% | $150.44 | $106.37 | 74.9% | $289.09 | $216.39 | 105.9% | 192.2% | 203.4% |
| 2016 | 70.8% | $157.96 | $111.83 | 74.8% | $287.95 | $215.45 | 105.7% | 182.3% | 192.7% |
| 7/31/2017 TTM | 71.8% | $162.82 | $116.84 | 75.1% | $289.83 | $217.71 | 104.7% | 178.0% | 186.3% |
Source:Industry Report and Underwritten Operating Statements.
| (1) | The competitive set includes The Atheneum Suite Hotel, Embassy Suites Detroit Southfield, Autograph Collection The Henry, Marriott Detroit Troy, Westin Book Cadillac Detroit, Royal Park Hotel and Foundation Hotel. |
| (2) | Variances between the underwriting, the appraisal and the above table with respect to Occupancy, ADR and RevPAR at The Townsend Hotel Property are attributable to variances in reporting methodologies and/or timing differences. |
The Market. The Townsend Hotel Property is located in Birmingham, Michigan, within Oakland County. As of the 2010 census, Oakland County was the second-most populous county in Michigan, with a population of 1,202,362. Downtown Birmingham, where The Townsend Hotel Property is located, features over 20 parks covering 230 acres, 1,500,000 SF of retail space and 935,645 SF of office space. Birmingham is a pedestrian friendly town with a diverse mix of restaurants, specialty stores, salons, spas and entertainment venues surrounding a central park.
The estimated 2016 population within a one-, three- and five-mile radius of The Townsend Hotel Property was 14,557, 86,119 and 227,076, respectively, according to the appraisal. The estimated 2016 average household income within a one-mile radius is $166,471, greater than the county and state levels of $100,279 and $69,563, respectively.
Competitive properties to The Townsend Hotel Property are shown in the table below:
| Competitive Property Summary | ||||||||
| Property Name | Year Opened | No. of Rooms | Commercial Demand | Meeting & Group Demand | Leisure Demand | 2016 Occ. | 2016 ADR | 2016 RevPAR |
| The Townsend Hotel Property(1) | 1986, 2000 | 150 | 50% | 40% | 10% | 76% | $292.45 | $222.12 |
| The Atheneum Suite Hotel | 1992 | 174 | 40% | 40% | 20% | 66% | $105.00 | $69.30 |
| Embassy Suites Detroit Southfield | 1987 | 239 | 60% | 20% | 20% | 71% | $116.00 | $82.36 |
| Autograph Collection The Henry | 1989 | 308 | 60% | 30% | 10% | 76% | $206.00 | $156.56 |
| Marriott Detroit Troy | 1990 | 350 | 60% | 35% | 5% | 73% | $148.00 | $108.04 |
| Westin Book Cadillac Detroit | 1924 | 453 | 40% | 45% | 15% | 66% | $160.00 | $105.60 |
| Royal Park Hotel | 2004 | 143 | 40% | 40% | 20% | 76% | $194.00 | $147.44 |
| Foundation Hotel(2) | 2017 | 90 | NAV | NAV | NAV | NAV | NAV | NAV |
Source:Appraisal.
| (1) | Variances between the underwriting, the appraisal and the Historical Occupancy, ADR and RevPAR table with respect to Occupancy, ADR and RevPAR at The Townsend Hotel Property are attributable to variances in reporting methodologies and/or timing differences. |
| (2) | The Foundation Hotel opened in May 2017 and data is not available. |
A mixed use development, to be located two blocks from The Townsend Hotel Property, including a projected 130-150-room boutique hotel which would compete directly with The Townsend Hotel Property, has been proposed for development.
This is not a research report and was not prepared by any Underwriter’s research department. Please see additional important information and qualifications at the end of this Term Sheet.
| T-123 |
| MSBAM 2017-C34 | The Townsend Hotel |
Operating History and Underwritten Net Cash Flow. The following table presents certain information relating to the historical operating performance and the Underwritten Net Cash Flow at The Townsend Hotel Property:
| Cash Flow Analysis(1) | ||||||
| 2014 | 2015 | 2016 | 6/30/2017 TTM | UW | UW per Room | |
| Occupancy | 74.9% | 74.8% | 76.0% | 76.0% | 76.0% | |
| ADR | $285.13 | $293.75 | $292.45 | $294.16 | $294.16 | |
| RevPAR | $213.55 | $219.87 | $222.12 | $223.42 | $223.42 | |
| Rooms Revenue | $11,659,635 | $12,037,741 | $12,013,077 | $12,232,260 | $12,232,260 | $81,548 |
| Food & Beverage | $10,805,375 | $11,178,528 | $10,757,822 | $11,050,540 | $11,050,540 | $73,670 |
| Other Income(2) | $970,789 | $951,825 | $822,500 | $772,953 | $772,953 | $5,153 |
| Total Revenue | $23,435,799 | $24,168,094 | $23,593,399 | $24,055,753 | $24,055,753 | $160,372 |
| Total Expenses | $17,462,137 | $17,812,224 | $17,256,969 | $17,846,016 | $17,849,033 | $118,994 |
| Net Operating Income | $5,973,662 | $6,355,870 | $6,336,430 | $6,209,737 | $6,206,720 | $41,378 |
| FF&E | $937,432 | $966,724 | $943,736 | $962,230 | $962,230 | $6,415 |
| Net Cash Flow | $5,036,230 | $5,389,146 | $5,392,694 | $5,247,507 | $5,244,490 | $34,963 |
| NOI DSCR | 4.04x | 4.30x | 4.28x | 4.20x | 4.19x | |
| NCF DSCR | 3.40x | 3.64x | 3.64x | 3.55x | 3.54x | |
| NOI Debt Yield | 17.1% | 18.2% | 18.1% | 17.7% | 17.7% | |
| NCF Debt Yield | 14.4% | 15.4% | 15.4% | 15.0% | 15.0% | |
| (1) | Occupancy, ADR and RevPAR figures are based on the underwriting, which have been taken from financial statements provided by The Townsend Hotel Borrower. Variances between the underwriting, the appraisal and the Historical Occupancy, ADR, RevPAR table with respect to Occupancy, ADR and RevPAR at The Townsend Hotel Property are attributable to variances in reporting methodologies and/or timing differences. |
| (2) | Other Income includes gift shop revenue, valet/guest laundry and vending. |
This is not a research report and was not prepared by any Underwriter’s research department. Please see additional important information and qualifications at the end of this Term Sheet.
| T-124 |
(THIS PAGE INTENTIONALLY LEFT BLANK)
| T-125 |
| MSBAM 2017-C34 | Enclave at Carpinteria |
| Mortgage Loan No. 13 – Enclave at Carpinteria |
| Mortgage Loan Information | Property Information | ||||||
| Mortgage Loan Seller: | BANA | Single Asset/Portfolio: | Single Asset | ||||
| Original Balance: | $28,877,000 | Location: | Carpinteria, CA 93013 | ||||
| Cut-off Date Balance: | $28,877,000 | General Property Type: | Office | ||||
| % of Initial Pool Balance: | 2.8% | Detailed Property Type: | Suburban | ||||
| Loan Purpose: | Refinance | Title Vesting: | Fee | ||||
| Sponsor: | Montana Avenue Capital Partners, LLC | Year Built/Renovated: | 1962, 1999 / 2016 | ||||
| Mortgage Rate: | 3.9940% | Size: | 121,230 SF | ||||
| Note Date: | 8/30/2017 | Cut-off Date Balance per SF: | $238 | ||||
| First Payment Date: | 10/1/2017 | Maturity Date Balance per SF: | $238 | ||||
| Maturity Date: | 9/1/2027 | Property Manager: | Bermant Development Company | ||||
| Original Term to Maturity: | 120 months | ||||||
| Original Amortization Term: | 0 months | Underwriting and Financial Information | |||||
| IO Period: | 120 months | UW NOI: | $2,638,962 | ||||
| Seasoning: | 1 month | UW NOI Debt Yield: | 9.1% | ||||
| Prepayment Provisions: | LO (25); DEF (91); O (4) | UW NOI Debt Yield at Maturity: | 9.1% | ||||
| Lockbox/Cash Mgmt Status: | Hard/Springing | UW NCF DSCR: | 2.08x | ||||
| Additional Debt Type: | N/A | Most Recent NOI: | $2,281,967 (6/30/2017 TTM) | ||||
| Additional Debt Balance: | N/A | 2nd Most Recent NOI: | $2,271,907 (12/31/2016) | ||||
| Future Debt Permitted (Type): | No (N/A) | 3rd Most Recent NOI: | $622,422 (12/31/2015) | ||||
| Reserves | Most Recent Occupancy: | 100.0% (7/31/2017) | |||||
| Type | Initial | Monthly | Cap | 2nd Most Recent Occupancy: | 100.0% (12/31/2016) | ||
| RE Tax: | $123,938 | $24,788 | N/A | 3rd Most Recent Occupancy: | 61.0% (12/31/2015) | ||
| Insurance: | $0 | Springing | N/A | Appraised Value (as of)(1): | $43,100,000 (7/26/2017) | ||
| Recurring Replacements: | $0 | $2,526 | N/A | Cut-off Date LTV Ratio(1): | 67.0% | ||
| TI/LC: | $1,741,950 | $8,333 | N/A | Maturity Date LTV Ratio(1): | 67.0% | ||
| Sources and Uses | ||||||
| Sources | Proceeds | % of Total | Uses | Proceeds | % of Total | |
| Loan Amount: | $28,877,000 | 100.0% | Loan Payoff: | $16,713,806 | 57.9% | |
| Return of Equity(2): | $9,870,154 | 34.2% | ||||
| Reserves: | $1,865,888 | 6.5% | ||||
| Closing Costs | $427,152 | 1.5% | ||||
| Total Sources: | $28,877,000 | 100.0% | Total Uses: | $28,877,000 | 100.0% | |
| (1) | The appraiser provided a dark value of $33,300,000 as of July 26, 2017 which results in a Cut-off Date loan to dark value of 86.7%. |
| (2) | The Enclave at Carpinteria sponsor purchased the Enclave at Carpinteria Property in June 2015 for $25,000,000 with the largest tenant (73% of NRA) known to be vacating in the first quarter of 2016. Since acquisition, the Enclave at Carpinteria sponsor has spent approximately $1.14 million in capital expenditures and $2.95 million in tenant improvements and leasing commissions for a total current cost basis of approximately $29.1 million. |
The Mortgage Loan. The thirteenth largest mortgage loan (the “Enclave at Carpinteria Mortgage Loan”) is evidenced by a promissory note in the original principal amount of $28,877,000 and secured by a first priority fee mortgage encumbering an office property located in Carpinteria, California (the “Enclave at Carpinteria Property”). The proceeds of the Enclave at Carpinteria Mortgage Loan were used to refinance the existing debt on the Enclave at Carpinteria Property, return equity to the Enclave at Carpinteria sponsor, fund reserves, and pay closing costs.
The Borrower and the Sponsor.The borrower is 6303 Carpinteria Avenue, LLC (the “Enclave at Carpinteria Borrower”), a single-purpose Delaware limited liability company with one independent director. The sponsor is Montana Avenue Capital Partners, LLC (“MAC”), a real estate investment, management and development company based in Los Angeles, California. MAC manages real property investments and loans on behalf of high net worth individuals, family offices and institutional investors. MAC is led by Jeremy K. Rogers, the nonrecourse carve-out guarantor for the Enclave at Carpinteria Mortgage Loan. Prior to founding MAC, Mr. Rogers co-headed Rockwood Capital’s Los Angeles office overseeing new debt and equity investments and various portfolio assets.
The Property.The Enclave at Carpinteria Property is located on an approximately 9.3-acre parcel on a bluff overlooking the Pacific Ocean in Carpinteria, California. The Enclave at Carpinteria Property consists of a four-building, Class A, creative office complex containing 121,230 SF. Two of the buildings are one-story and were originally built in 1962. The other two buildings are two-stories and were built in 1999. The property was converted to a creative office between 2014 and 2016. The Enclave at Carpinteria Property is currently 100.0% leased to two tenants, Procore Technologies, Inc. (“Procore”) (79.8% of NRA) and Continental Automotive (20.2% of NRA).
This is not a research report and was not prepared by any Underwriter’s research department. Please see additional important information and qualifications at the end of this Term Sheet.
| T-126 |
| MSBAM 2017-C34 | Enclave at Carpinteria |
Major Tenants.
Procore Technologies, Inc. (96,766 SF, 79.8% of NRA, 79.6% of underwritten rent). Procore leases 96,766 SF across four buildings under four co-terminus leases expiring in March 2027, each of which contains two, five-year renewal options. Procore is currently expanding its space into approximately 29.3% of NRA, has taken possession of and is paying rent on such space, and is expected to occupy such space beginning in spring 2018. Procore is a cloud-based computer software company known for its construction management software and has recently been named as one of Inc.’s Top 1,000 fastest growing companies in the United States and on Forbes “Unicorn List” of private companies that have exceeded a $1.0 billion business valuation. Procore’s corporate office is located at the Enclave at Carpinteria Property.
Continental Automotive (24,464 SF, 20.2% of NRA, 20.4% of underwritten rent). Continental Automotive occupies 24,464 SF under a lease expiring in March 2024 with two, five-year renewal options. Continental Automotive’s original lease commenced in April 2016 and in April 2017 it expanded its space and extended its lease term. Continental Automotive is a subsidiary of the Germany-based Continental Automotive Group, a leading supplier of automotive products and services. Continental Automotive operates its driverless car technology unit at the Enclave at Carpinteria Property.
The following table presents certain information relating to the leases at the Enclave at Carpinteria Property:
| Tenant Summary(1) | |||||||
| Tenant Name | Credit Rating (Fitch/Moody’s/S&P) | Tenant SF | Approximate % of SF | Annual UW Rent | % of Total Annual UW Rent | Annual UW Rent PSF | Lease Expiration |
| Tenant | |||||||
| Procore Technologies, Inc | NR/NR/NR | 96,766 | 79.8% | $2,191,288 | 79.6% | $22.65 | 3/31/2027 |
| Continental Automotive | BBB+/Baa1/BBB+ | 24,464 | 20.2% | $560,715 | 20.4% | $22.92 | 3/31/2024 |
| Subtotal/Wtd. Avg. | 121,230 | 100.0% | $2,752,003 | 100.0% | $22.70 | ||
| Vacant Space | 0 | 0.0% | $0 | 0.0% | $0.00 | ||
| Total/Wtd. Avg. | 121,230 | 100.0% | $2,752,003 | 100.0% | $22.70 | ||
| (1) | Information is based on the underwritten rent roll. |
The following table presents certain information relating to the lease rollover schedule at the Enclave at Carpinteria Property:
| Lease Rollover Schedule(1) | ||||||||
| Year | # of Leases Rolling | SF Rolling | Approx. % of Total SF Rolling | Approx. Cumulative % of SF Rolling | Total UW Rent Rolling | UW Rent PSF Rolling | Approx. % of Total Rent Rolling | Approx. Cumulative % of Total Rent Rolling |
| 2017 | 0 | 0 | 0.0% | 0.0% | $0 | $0.00 | 0.0% | 0.0% |
| 2018 | 0 | 0 | 0.0% | 0.0% | $0 | $0.00 | 0.0% | 0.0% |
| 2019 | 0 | 0 | 0.0% | 0.0% | $0 | $0.00 | 0.0% | 0.0% |
| 2020 | 0 | 0 | 0.0% | 0.0% | $0 | $0.00 | 0.0% | 0.0% |
| 2021 | 0 | 0 | 0.0% | 0.0% | $0 | $0.00 | 0.0% | 0.0% |
| 2022 | 0 | 0 | 0.0% | 0.0% | $0 | $0.00 | 0.0% | 0.0% |
| 2023 | 0 | 0 | 0.0% | 0.0% | $0 | $0.00 | 0.0% | 0.0% |
| 2024 | 1 | 24,464 | 20.2% | 20.2% | $560,715 | $22.92 | 20.4% | 20.4% |
| 2025 | 0 | 0 | 0.0% | 20.2% | $0 | $0.00 | 0.0% | 20.4% |
| 2026 | 0 | 0 | 0.0% | 20.2% | $0 | $0.00 | 0.0% | 20.4% |
| 2027 | 1 | 96,766 | 79.8% | 100.0% | $2,191,288 | $22.65 | 79.6% | 100.0% |
| 2028 & Beyond | 0 | 0 | 0.0% | 100.0% | $0 | $0.00 | 0.0% | 100.0% |
| Vacant | 0 | 0 | 0.0% | 100.0% | $0 | $0.00 | 0.0% | 100.0% |
| Total/Wtd. Avg. | 2 | 121,230 | 100.0% | $2,752,003 | $22.70 | 100.0% | ||
| (1) | Information is based on the underwritten rent roll. |
This is not a research report and was not prepared by any Underwriter’s research department. Please see additional important information and qualifications at the end of this Term Sheet.
| T-127 |
| MSBAM 2017-C34 | Enclave at Carpinteria |
The Market. The Enclave at Carpinteria Property is located at 6303-6309 Carpinteria Avenue between Rincon Road and Bailard Avenue in the City of Carpinteria, a coastal town in Southeastern Santa Barbara County approximately 80 miles northwest of Los Angeles and 12 miles southeast of downtown Santa Barbara. The Enclave at Carpinteria Property is located in the Bluffs subarea, an approximately 157-acres stretch of land between the coastline and U.S. Highway 101. Procore, the largest tenant at the Enclave at Carpinteria Property, is the largest employer in the City of Carpinteria with 455 employees, followed by Nusil Technology (403 employees), LinkedIn (400 employees), Carpinteria Unified School District (349 employees) and DAKO Corporation (250 employees). According to the appraisal, the 2016 estimated population within a one-, three- and five-mile radius of the Enclave at Carpinteria Property was 2,430, 14,294 and 17,087 respectively. The 2016 estimated average household income within the same radii was $83,392, $98,801 and $104,795, respectively.
The Enclave at Carpinteria Property is located in the Carpinteria office submarket within the Santa Barbara office market. The Santa Barbara office market has total inventory of 12.2 million SF, with a vacancy rate of 3.0% and average asking rates of $23.45 PSF. The Santa Barbara office market has experienced strong occupancy rates since 2009, with an average vacancy rate of less than 5.0% over the last eight years. According to a third party research report, the Carpinteria office submarket has inventory of 699,711 SF with vacancy of 1.8% and average asking rental rates of $19.11 PSF. The Carpinteria office submarket is supply constrained by the lack of available land. There has not been any new construction over the last 10 years and the appraiser did not note any new office properties currently under construction.
The following table reflects comparable office leases with respect to the Enclave at Carpinteria Property:
| Comparable Office Lease Summary | |||||||||
| Property/Location | Year Built | SF | Distance (miles) | Tenant Name | Lease Date | Lease Term (Yrs.) | Rent PSF(1) | Lease Type | |
| Size (SF) | |||||||||
| 6303-6309 Carpinteria Avenue Carpinteria, CA | 1962, 1999 | 121,230 | N/A | Procore Technologies, Inc. | 96,766 | 6/2014 - 4/2017 | 11.3(1) | $22.65 | NNN |
10 East Yanonali Street Santa Barbara, CA | 1925 | 20,088 | 12.8 | Impact Hub of Santa Barbara | 10,044 | 9/2016 | 7.0 | $26.40 | NNN |
27 East Cota Street Santa Barbara, CA | 1925 | 55,000 | 12.9 | Kaplan International North America | 23,000 | 2/2016 | 6.0 | $21.60 | NNN |
6410 Cindy Lane Carpinteria, CA | 1975 | 57,218 | 1.2 | 31,755 | 10/2015 | 5.0 | $22.20 | NNN | |
1155 Eugenia Place Carpinteria, CA | 1989 | 18,000 | 1.9 | AGIA | 18,000 | 1/2017 | 6.0 | $22.20 | NNN |
1145 Eugenia Place Carpinteria, CA | 1989 | 24,716 | 2.0 | Office Tenant | 8,648 | 7/2017 | 5.0 | $22.20 | NNN |
5425 Hollister Ave Goleta, CA | 1991 | 72,489 | 21.2 | Tobin Lucks | 9,553 | 4/2016 | 10.0 | $21.60 | NNN |
Source:Appraisal.
| (1) | Represents the weighted average of Procore’s four leases based on SF. |
Operating History and Underwritten Net Cash Flow. The following table presents certain information relating to the Underwritten Net Cash Flow at the Enclave at Carpinteria Property:
| Cash Flow Analysis(1) | |||||
| 2015 | 2016 | 6/30/2017 TTM | UW | UW PSF | |
| Base Rent | $817,126 | $2,243,160 | $2,323,104 | $2,752,003 | $22.70 |
| Total Recoveries | $301,740 | $753,087 | $757,953 | $908,549 | $7.49 |
| Less Vacancy & Credit Loss | $0 | $0 | $0 | ($183,028) | ($1.51) |
| Effective Gross Income | $1,118,866 | $2,996,247 | $3,081,157 | $3,477,524 | $28.69 |
| Total Operating Expenses | $496,444 | $724,340 | $799,190 | $838,563 | $6.92 |
| Net Operating Income | $622,422 | $2,271,907 | $2,281,967 | $2,638,962 | $21.77 |
| Capital Expenditures | $0 | $0 | $0 | $30,308 | $0.25 |
| TI/LC | $0 | $0 | $0 | $172,114 | $1.42 |
| Net Cash Flow | $622,422 | $2,271,907 | $2,281,967 | $2,436,540 | $20.10 |
| Occupancy % | 61.0% | 100.0% | 100.0% | 95.0% | |
| NOI DSCR | 0.53x | 1.94x | 1.95x | 2.26x | |
| NCF DSCR | 0.53x | 1.94x | 1.95x | 2.08x | |
| NOI Debt Yield | 2.2% | 7.9% | 7.9% | 9.1% | |
| NCF Debt Yield | 2.2% | 7.9% | 7.9% | 8.4% | |
| (1) | The Enclave at Carpinteria sponsor purchased the Enclave at Carpinteria Property in June 2015 for $25,000,000 with the largest tenant (73% of NRA) known to be vacating in the first quarter of 2016. Since acquisition, the Enclave at Carpinteria sponsor has spent approximately $1.14 million in capital expenditures and $2.95 million in tenant improvements and leasing commissions and has re-leased the Enclave at Carpinteria to its current occupancy of 100.0%. |
This is not a research report and was not prepared by any Underwriter’s research department. Please see additional important information and qualifications at the end of this Term Sheet.
| T-128 |
(THIS PAGE INTENTIONALLY LEFT BLANK)
| T-129 |
| MSBAM 2017-C34 | 444 West Ocean |
| Mortgage Loan No. 14 – 444 West Ocean |
| Mortgage Loan Information | Property Information | ||||||
| Mortgage Loan Seller: | KeyBank | Single Asset/Portfolio: | Single Asset | ||||
| Original Balance: | $26,500,000 | Location: | Long Beach, CA 90802 | ||||
| Cut-off Date Balance: | $26,500,000 | General Property Type: | Office | ||||
| % of Initial Pool Balance: | 2.5% | Detailed Property Type: | CBD | ||||
| Loan Purpose: | Refinance | Title Vesting(4): | Fee | ||||
| Sponsor: | Ensemble Real Estate Investment | Year Built/Renovated: | 1967-1968/2014 | ||||
| Mortgage Rate: | 4.1800% | Size: | 187,363 SF | ||||
| Note Date: | 8/18/2017 | Cut-off Date Balance per SF: | $141 | ||||
| First Payment Date: | 10/1/2017 | Maturity Date Balance per SF: | $129 | ||||
| Maturity Date: | 9/1/2027 | Property Manager: | Ensemble Realty Advisors, Inc. (borrower-related) | ||||
| Original Term to Maturity: | 120 months | ||||||
| Original Amortization Term: | 360 months | ||||||
| IO Period: | 60 months | Underwriting and Financial Information | |||||
| Seasoning: | 1 month | UW NOI: | $2,611,732 | ||||
| Prepayment Provisions: | LO (25); DEF (92); O (3) | UW NOI Debt Yield: | 9.9% | ||||
| Lockbox/Cash Mgmt Status: | Soft/Springing | UW NOI Debt Yield at Maturity: | 10.8% | ||||
| Additional Debt Type: | N/A | UW NCF DSCR: | 1.93x (IO) 1.39x (P&I) | ||||
| Additional Debt Balance: | N/A | Most Recent NOI: | $2,512,287 (6/30/2017 TTM) | ||||
| Future Debt Permitted (Type)(1): | Yes (Mezzanine) | 2nd Most Recent NOI: | $2,368,207 (12/31/2016) | ||||
| Reserves | 3rd Most Recent NOI: | $1,925,405 (12/31/2015) | |||||
| Type | Initial | Monthly | Cap | Most Recent Occupancy: | 83.9% (6/30/2017) | ||
| RE Tax: | $134,223 | $16,778 | N/A | 2nd Most Recent Occupancy: | 75.9% (12/31/2016) | ||
| Insurance: | $0 | Springing | N/A | 3rd Most Recent Occupancy: | 77.2% (12/31/2015) | ||
| Recurring Replacements: | $3,903 | $3,903 | $140,522 | Appraised Value (as of): | $41,000,000 (5/17/2017) | ||
| TI/LC(2): | $500,000 | Springing | $500,000 | Cut-off Date LTV Ratio: | 64.6% | ||
| Other(3): | $381,735 | $0 | N/A | Maturity Date LTV Ratio: | 58.9% | ||
| Sources and Uses | ||||||
| Sources | Proceeds | % of Total | Uses | Proceeds | % of Total | |
| Loan Amount: | $26,500,000 | 100.0% | Loan Payoff: | $23,003,561 | 86.8% | |
| Return of Equity: | $2,191,211 | 8.3% | ||||
| Reserves: | $1,019,861 | 3.8% | ||||
| Closing Costs: | $285,367 | 1.1% | ||||
| Total Sources: | $26,500,000 | 100.0% | Total Uses: | $26,500,000 | 100.0% | |
| (1) | Future mezzanine debt is permitted provided, among other things required by the 444 West Ocean Mortgage Loan documents, (i) no default or event of default exists, (ii) the combined loan to value ratio of the 444 West Ocean Mortgage Loan (as defined below) and the mezzanine loan does not exceed 64.6%, (iii) the debt service coverage ratio is not less than 1.39x (based on the trailing 12 months), taking into account the 444 West Ocean Mortgage Loan and the additional mezzanine debt and (iv) the mezzanine lender has signed an intercreditor agreement acceptable to the lender in its reasonable discretion. |
| (2) | Monthly deposits of $19,517 into the TI/LC reserve will commence upon the reserve balance falling below the $500,000 cap. |
| (3) | Other reserve consists of $209,020 for outstanding tenant improvement obligations and $172,715 for free rent or rent for tenants not yet in occupancy. |
| (4) | The 444 West Ocean Property (as defined below) contains 406 parking spaces, 43 of which are on a parcel that is ground leased from the City of Long Beach. The ground lease commenced August 17, 1999, and expires June 30, 2054. The ground lease was most recently extended in 2007 and had an initial monthly rent of $500 through March 31, 2012. The current rent is $2,500/month. |
The Mortgage Loan. The fourteenth largest mortgage loan (the “444 West Ocean Mortgage Loan”) is evidenced by a promissory note in the original principal amount of $26,500,000 and secured by a first priority fee mortgage encumbering an office property located in the Long Beach, California central business district (the “444 West Ocean Property”). Proceeds of the 444 West Ocean Mortgage Loan were used to refinance existing debt on the 444 West Ocean Property, fund reserves, pay closing costs and return equity to the 444 West Ocean Borrower.
The Borrower and the Sponsor.The borrower is 444 W. Ocean Holdco, LLC (the “444 West Ocean Borrower”), a newly-formed single-purpose Delaware limited liability company, with two independent directors. The nonrecourse carve-out guarantor is KSLB Holding Company, LLC (“KSLB”), which has ownership interests in 18 hospitality, office, single- and multi-family, parking and land properties with a total portfolio value of approximately $414.8 million.
The sponsor of the borrower, Ensemble Real Estate Investment (“Ensemble”), was formed in 1981 in part by Kambiz Babaoff, the manager of KSLB. Ensemble is a full service real estate solutions and investments provider headquartered in Phoenix, AZ with regional offices at the 444 West Ocean Property as well as Las Vegas and Reno, NV. Ensemble has over 30 years of real estate experience within the healthcare, hospitality, commercial and mixed use/residential sectors. Ensemble has a portfolio of 11 hospitality, commercial and healthcare properties located across five states.
This is not a research report and was not prepared by any Underwriter’s research department. Please see additional important information and qualifications at the end of this Term Sheet.
| T-130 |
| MSBAM 2017-C34 | 444 West Ocean |
The Property.The 444 West Ocean Property, located on an approximately 1.80-acre parcel along Ocean Boulevard in Long Beach, Los Angeles County, California, consists of a 176,443 SF, 15-story, Class B office building (“Building A”) and a 10,920 SF single-story office building (“Building B”). The buildings were constructed between 1967 and 1968 with Building A renovated in 2014 at an approximate cost to the sponsor of $4.9 million. The 444 West Ocean Property contains 406 parking spaces (approximately 2.2 spaces per 1,000 SF) within a 2.5-level subterranean parking garage beneath Building A and a surface parking lot on the south side of Building B. The 444 West Ocean Property amenities include a café, a club room with large screen TVs and arcade games and a partially enclosed patio with a fire pit, all in Building A.
The 444 West Ocean Property is located at the southeast corner of Ocean Boulevard and Queens Way (Magnolia Avenue) in the southern section of Downtown Long Beach. According to the appraisal, Ocean Boulevard is a major commercial thoroughfare that receives approximately 35,300 vehicles per day and contains a mix of office, retail, restaurants, apartments, civic institutions and hotels. Currently under construction across Ocean Boulevard to the north is the New Long Beach Civic Center Project, an approximately 15.8 acre, multi-phase, public-private development. Per the appraisal, the project intends to create a revitalized civic core to serve local residents and businesses, attract visitors and provide city services for the citizens of Long Beach. The $520 million civic center will replace the old city hall building and provide new offices for the Port of Long Beach, a new city library, a retail marketplace and a public park. Additionally, adjacent to the 444 West Ocean Property is 442 West Ocean Boulevard, a mixed-use development that is currently under construction and owned by Ensemble. Per the appraisal, the development will contain 95 residential units and 1,455 SF of retail space.
The 444 West Ocean Property was 83.9% leased to 53 tenants as of June 30, 2017, with three tenants located in Building B and the remaining tenants located in Building A. No tenant at the 444 West Ocean Property occupies more than 6.4% of the NRA or represents more than 7.1% of the underwritten base rent.
Major Tenants.
Premier Business Centers, LLC (12,019SF, 6.4% of NRA, 7.1% of underwritten rent). Founded in 2002, Premier Business Centers, LLC (“Premier”) is a national operator of executive suites and office centers in the United States. With over 80 locations, Premier provides businesses with professionally staffed office space on a full- or part-time basis and allows clients to rent by the hour, day, month or year. Premier has been in occupancy since 1997 and has extended its lease six times, with the current lease expiring on April 30, 2022. Premier has one, five-year lease renewal option remaining at market rent and no termination options.
Mercury Insurance Services, LLC (11,842 SF, 6.3% of NRA, 6.9% of underwritten rent).Mercury Insurance Services, LLC (“Mercury”) is an independent broker and agency writer of automobile insurance policies in California and several other states. Mercury is ranked as the fourth largest private passenger automobile insurer in California with total assets over $4 billion. In addition to car insurance, Mercury writes policies for home, condo, renters, business, and umbrella insurance. Mercury (rated A-/Baa2 by Fitch/Moody’s) is traded on the New York Stock Exchange under the ticker symbol MCY. Mercury has been in occupancy since 2015 and has a lease expiration of March 31, 2021. Mercury has one, five-year lease renewal option at market rent and no termination options.
Fresenius Kidney Care (8,220 SF, 4.4% of NRA, 5.5% of underwritten rent). Fresenius Kidney Care (“Fresenius”), a division of Fresenius Medical Care North America, provides services for people suffering from chronic kidney disease and end renal stage failure. Fresenius was founded in 1996 and over time has expanded to offer services and products in more than 120 countries. Fresenius’s parent company Fresenius Medical Care (rated BBB-/Baa3/BBB-by Fitch/Moody’s/S&P) is traded on the New York Stock Exchange under the ticker symbol FMS. Fresenius has been in occupancy since 1994 and has extended its lease twice, with the current lease expiring in August 31, 2019. Fresenius has no remaining lease renewal options and no termination options.
California Bank and Trust (8,167 SF, 4.4% of NRA, 4.0% of underwritten rent).Formed in 1998 as a merger of three banks, California Bank and Trust (“CB&T”) is a full service financial institution that provides personal and business services to customers. As a division of Zions Bancorporation, which operates nearly 500 local financial centers across 11 states, CB&T has over $10 billion in assets and nearly 100 branch offices in California. CB&T is a division of Zion Bancorporation (rated Baa3/BBB- by Moody’s/S&P) which is traded on the New York Stock Exchange under the ticker symbol ZBK. CB&T has been in occupancy since 1997, has extended its lease twice with a current expiration of July 31, 2021, has two, five-year lease renewal options remaining at market rent and has no termination options.
Ensemble Investments (6,445 SF, 3.4% of NRA, 4.2% of underwritten rent).Ensemble Investments is an affiliate of the sponsor, Ensemble, and utilizes the space at the 444 West Ocean Property as a regional office for its real estate investment and management services. Ensemble is in the process of relocating from a 3,468 SF space into a larger 6,445 SF space. The lease on the larger space commences January 1, 2018, expires on December 31, 2030, and has no lease renewal options or termination options.
The following table presents certain information relating to the leases at the 444 West Ocean Property:
| Tenant Summary(1) | |||||||
| Tenant Name | Credit Rating (Fitch/Moody’s/S&P)(2) | Tenant SF | Approximate % of SF | Annual UW Rent | % of Total Annual UW Rent | Annual UW Rent PSF | Lease Expiration |
| Premier Business Centers, LLC | NR/NR/NR | 12,019 | 6.4% | $266,822 | 7.1% | $22.20 | 04/30/2022 |
| Mercury Insurance Services, LLC | A-/Baa2/NR | 11,842 | 6.3% | $262,892 | 6.9% | $22.20 | 03/31/2021 |
| Fresenius Kidney Care | BBB-/Baa3/BBB- | 8,220 | 4.4% | $207,144 | 5.5% | $25.20 | 08/31/2019 |
| California Bank and Trust | NR/Baa3/BBB- | 8,167 | 4.4% | $151,486 | 4.0% | $18.55 | 07/31/2021 |
| Ensemble Investments(3) | NR/NR/NR | 6,445 | 3.4% | $158,547 | 4.2% | $24.60 | 12/31/2030 |
| Subtotal/Wtd. Avg. | 46,693 | 24.9% | $1,046,891 | 27.7% | $22.42 | ||
| Other Tenants(4) | 110,545 | 59.0% | $2,736,481 | 72.3% | $25.01 | ||
| Total Occupied | 157,238 | 83.9% | $3,783,373 | 100.0% | $24.06 | ||
| Vacant Space | 30,125 | 16.1% | $0 | 0.0% | $0.00 | ||
| Total/Wtd. Avg.(4) | 187,363 | 100.0% | $3,783,373 | 100.0% | $24.23 | ||
| (1) | Information is based on the underwritten rent roll. |
| (2) | Certain ratings are those of the parent company whether or not the parent guarantees the lease. |
| (3) | Ensemble Investments is an affiliate of the sponsor of the borrower. |
| (4) | Annual UW Rent PSF calculation excludes 1,113 SF for a tenant that pays no annual rent. |
This is not a research report and was not prepared by any Underwriter’s research department. Please see additional important information and qualifications at the end of this Term Sheet.
| T-131 |
| MSBAM 2017-C34 | 444 West Ocean |
The following table presents certain information relating to the lease rollover schedule at the 444 West Ocean Property:
| Lease Rollover Schedule(1)(2) | ||||||||
| Year | # of Leases Rolling | SF Rolling | Approx. % of Total SF Rolling | Approx. Cumulative % of SF Rolling | Total UW Rent Rolling | UW Rent PSF Rolling | Approx. % of Total Rent Rolling | Approx. Cumulative % of Total Rent Rolling |
| MTM | 2 | 2,008 | 1.1% | 1.1% | $22,017 | $24.60(3) | 0.6% | 0.6% |
| 2017 | 5 | 9,987 | 5.3% | 6.4% | $242,135 | $24.25 | 6.4% | 7.0% |
| 2018 | 8 | 17,562 | 9.4% | 15.8% | $442,248 | $25.18 | 11.7% | 18.7% |
| 2019 | 14 | 30,599 | 16.3% | 32.1% | $751,812 | $24.57 | 19.9% | 38.5% |
| 2020 | 4 | 6,055 | 3.2% | 35.3% | $136,153 | $22.49 | 3.6% | 42.1% |
| 2021 | 10 | 48,925 | 26.1% | 61.5% | $1,140,502 | $23.31 | 30.1% | 72.3% |
| 2022 | 7 | 31,707 | 16.9% | 78.4% | $788,048 | $24.85 | 20.8% | 93.1% |
| 2023 | 3 | 3,950 | 2.1% | 80.5% | $101,910 | $25.80 | 2.7% | 95.8% |
| 2024 | 0 | 0 | 0.0% | 80.5% | $0 | $0.00 | 0.0% | 95.8% |
| 2025 | 0 | 0 | 0.0% | 80.5% | $0 | $0.00 | 0.0% | 95.8% |
| 2026 | 0 | 0 | 0.0% | 80.5% | $0 | $0.00 | 0.0% | 95.8% |
| 2027 | 0 | 0 | 0.0% | 80.5% | $0 | $0.00 | 0.0% | 95.8% |
| 2028 & Beyond | 1 | 6,445 | 3.4% | 83.9% | $158,547 | $24.60 | 4.2% | 100.0% |
| Vacant | 0 | 30,125 | 16.1% | 100.0% | $0 | $0.00 | 0.0% | 100.0% |
| Total/Wtd. Avg.(3) | 54 | 187,363 | 100.0% | $3,783,373 | $24.23 | 100.0% | ||
| (1) | Information is based on the underwritten rent roll. |
| (2) | Certain tenants may have lease termination options that are exercisable prior to the stated expiration date of the related lease or leases which are not considered in the lease rollover schedule. |
| (3) | UW Rent PSF Rolling calculation excludes 1,113 SF for a tenant that pays no annual rent. |
The Market. According to the appraisal, Long Beach is approximately 24 miles south of downtown Los Angeles, within Los Angeles County and the Los Angeles-Long Beach-Santa Ana, CA metropolitan statistical area. Los Angeles County had an estimated 2016 population of approximately 10.2 million. Los Angeles County has one of the largest manufacturing centers in the nation and is a global gateway for trade and tourism. Long Beach is the second largest city in the Los Angeles County and offers a mix of residential, commercial, industrial, educational and cultural environments.
A driving force behind the Los Angeles County and Long Beach economies is trade through the Port of Long Beach, which acts as a major gateway for United States-Asian trade. Port of Long Beach is the second busiest container port in the United States, after the Port of Los Angeles, occupying 3,200 acres with 25 miles of waterfront. The port generates approximately $100 billion in trade and provides more than 316,000 jobs in Southern California.
The office market in Los Angeles County has performed well as job growth has exceeded the national average in recent years. The unemployment rate for the county is at an eight-year low, at nearly 5.0%, which is in line with the national unemployment rate. According to the appraisal, the 444 West Ocean Property’s immediate area is a primary white collar employment center in the city of Long Beach, with qualities that contribute to a positive demand for real estate and an overall stable long term outlook. In conjunction with an increasing population, Downtown Long Beach is also experiencing a boom in commercial development, with approximately 800 new businesses having opened in the Downtown Long Beach office submarket since 2012. At least 25 new developments have recently been completed or are planned for the downtown area, including the rebranding of Pike Outlets, downtown’s largest retail properties, and the three-phase renovation and rebranding of City Place, a six-block commercial development that includes retail, office and restaurants.
The 444 West Ocean Property is located in the Downtown Long Beach office submarket within the South Bay submarket cluster and the Los Angeles office market. According to a second quarter 2017 third party market report, the Los Angeles office market contains 18,203 office buildings providing approximately 434.5 million SF of space, with an average vacancy of 10.8% and average asking rents of $34.15 PSF gross. The South Bay submarket cluster is comprised of 2,550 office buildings containing approximately 65.1 million SF, with an average vacancy of 11.8% and average asking rents of $28.72 PSF gross. Downtown Long Beach, more specifically, has an existing inventory of 264 buildings containing 7.8 million SF, with an average vacancy of 9.7% and average asking rents of $28.02 PSF gross.
This is not a research report and was not prepared by any Underwriter’s research department. Please see additional important information and qualifications at the end of this Term Sheet.
| T-132 |
| MSBAM 2017-C34 | 444 West Ocean |
The following table reflects the competitive office properties with respect to 444 West Ocean Property as identified in the appraisal:
| Comparable Lease Summary | |||||||||||
| Property Name/Location | Distance (miles) | Year Built | Occ. | Size (SF) | Tenant Name | Lease Size (SF) | Lease Date | Lease Term (Yrs.) | Rent PSF | Lease Type | |
| 444 West Ocean Property | N/A | 1967-1968 | 83.9%(1) | 187,363(1) | Premier Business Centers, LLC(1) | 12,019(1) | May 2017(1) | 5.0(1) | $22.20(1) | Modified Gross | |
World Trade Center 1 World Trade Center Long Beach, CA | 0.1 | 1989 | 84.0% | 574,981 | Regional Centers Holding Group | 12,938 | Q1 2016 | 6.0 | $31.80 | Full Service Gross | |
The Hubb 100 W Broadway Long Beach, CA | 0.4 | 1986 | 81.0% | 209,882 | Northwestern Mutual | 4,053 | Q3 2016 | 5.4 | $28.20 | Full Service Gross | |
180 E Ocean Blvd Long Beach, CA | 0.4 | 1981 | 100.0% | 200,028 | Michel & Associates | 8,767 | Q1 2016 | 2.0 | $22.20 | Full Service Gross | |
100 Oceangate Long Beach, CA | 0.1 | 1971 | 93.0% | 214,873 | City National Bank | 14,806 | Q1 2016 | 10.5 | $27.00 | Full Service Gross | |
400 Oceangate Long Beach, CA | 0.3 | 1976 | 98.0% | 157,683 | ImageCat, Inc. | 3,832 | Q3 2016 | 2.0 | $22.20 | Full Service Gross | |
Source:Appraisal.
| (1) | Information is based on the underwritten rent roll. |
Operating History and Underwritten Net Cash Flow. The following table presents certain information relating to the historical operating performance and the Underwritten Net Cash Flow at the 444 West Ocean Property:
| Cash Flow Analysis | ||||||
| 2014 | 2015 | 2016 | 6/30/2017 TTM | UW | UW PSF | |
| Base Rent(1) | $2,996,949 | $2,997,280 | $3,446,134 | $3,630,957 | $4,516,285 | $24.10 |
| Total Recoveries | $133,315 | $179,083 | $162,597 | $133,642 | $195,000 | $1.04 |
| Parking Revenue | $481,669 | $445,438 | $512,991 | $521,435 | $521,435 | $2.78 |
| Other Income | $112,273 | $127,182 | $95,505 | $96,255 | $136,472 | $0.73 |
| Less Vacancy & Credit Loss | $0 | $0 | $0 | $0 | ($757,500) | ($4.04) |
| Effective Gross Income | $3,724,206 | $3,748,983 | $4,217,227 | $4,382,289 | $4,611,692 | $24.61 |
| Total Expenses | $1,704,670 | $1,823,578 | $1,849,020 | $1,870,002 | $1,999,960 | $10.67 |
| Net Operating Income | $2,019,536 | $1,925,405 | $2,368,207 | $2,512,287 | $2,611,732 | $13.94 |
| Capital Expenditures | $0 | $0 | $0 | $0 | $46,841 | $0.25 |
| TI/LC | $0 | $0 | $0 | $0 | $402,491 | $2.15 |
| Net Cash Flow | $2,019,536 | $1,925,405 | $2,368,207 | $2,512,287 | $2,162,400 | $11.54 |
| Occupancy % | 71.2% | 77.2% | 75.9% | 83.9% | 85.9% | |
| NOI DSCR (P&I) | 1.30x | 1.24x | 1.53x | 1.62x | 1.68x | |
| NOI DSCR (IO) | 1.80x | 1.71x | 2.11x | 2.24x | 2.33x | |
| NCF DSCR (P&I) | 1.30x | 1.24x | 1.53x | 1.62x | 1.39x | |
| NCF DSCR (IO) | 1.80x | 1.71x | 2.11x | 2.24x | 1.93x | |
| NOI Debt Yield | 7.6% | 7.3% | 8.9% | 9.5% | 9.9% | |
| NCF Debt Yield | 7.6% | 7.3% | 8.9% | 9.5% | 8.2% | |
| (1) | UW Base Rent is based on the rent roll dated June 30, 2017, includes rent steps through January 2018 totaling approximately $42,703, and includes approximately $203,460 of mark to market rent. |
This is not a research report and was not prepared by any Underwriter’s research department. Please see additional important information and qualifications at the end of this Term Sheet.
| T-133 |
| MSBAM 2017-C34 | Starwood Capital Hotel Portfolio |
| Mortgage Loan No. 15 – Starwood Capital Hotel Portfolio |
| Mortgage Loan Information | Property Information(7) | ||||||
| Mortgage Loan Seller(1): | SMF III | Single Asset/Portfolio: | Portfolio | ||||
| Original Balance(2): | $25,000,000 | Location: | Various | ||||
| Cut-off Date Balance(2): | $25,000,000 | General Property Type: | Hospitality | ||||
| % of Initial Pool Balance: | 2.4% | Detailed Property Type: | Various | ||||
| Loan Purpose: | Refinance | Title Vesting(8): | Fee / Leasehold | ||||
| Sponsors: | Starwood Capital Group Global, L.P.; | Year Built/Renovated: | Various / Various | ||||
| Starwood Capital Group Global II, L.P.; | Size: | 6,366 Rooms | |||||
| Starwood Capital Group Global I, L.L.C. | Cut-off Date Balance per Room(2): | $90,680 | |||||
| Mortgage Rate: | 4.4860% | Maturity Date Balance per Room(2): | $90,680 | ||||
| Note Date: | 5/24/2017 | Property Managers(9): | Various | ||||
| First Payment Date: | 7/1/2017 | ||||||
| Maturity Date: | 6/1/2027 | ||||||
| Original Term: | 120 months | ||||||
| Original Amortization Term: | 0 months | Underwriting and Financial Information | |||||
| IO Period: | 120 months | UW NOI: | $71,329,392 | ||||
| Seasoning: | 4 months | UW NOI Debt Yield(2): | 12.4% | ||||
| Prepayment Provisions: | LO (12); YM1 (105); O (3) | UW NOI Debt Yield at Maturity(2): | 12.4% | ||||
| Lockbox/Cash Mgmt Status: | Soft/Springing | UW NCF DSCR(2): | 2.72x | ||||
| Additional Debt Type(3): | Pari Passu | Most Recent NOI: | $72,574,927 (3/31/2017 TTM) | ||||
| Additional Debt Balance(3): | $552,270,000 | 2nd Most Recent NOI: | $74,469,395 (12/31/2016) | ||||
| Future Debt Permitted (Type): | Yes (Mezzanine) | 3rd Most Recent NOI: | $74,006,639 (12/31/2015) | ||||
| Reserves | Most Recent Occupancy: | 74.6% (3/31/2017) | |||||
| Type | Initial | Monthly | Cap | 2nd Most Recent Occupancy: | 74.7% (12/31/2016) | ||
| RE Tax(4): | $0 | Springing | N/A | 3rd Most Recent Occupancy: | 74.8% (12/31/2015) | ||
| Insurance(4): | $0 | Springing | N/A | Appraised Value (as of)(10): | $956,000,000 (4/23/2017) | ||
| Recurring Replacements(5): | $0 | $727,736 | N/A | Cut-off Date LTV Ratio(2)(10): | 60.4% | ||
| Other(4)(6): | $12,268,991 | Springing | N/A | Maturity Date LTV Ratio(2)(10)): | 60.4% | ||
| Sources and Uses | ||||||
| Sources | Proceeds | % of Total | Uses | Proceeds | % of Total | |
| Loan Amount(2): | $577,270,000 | 100.0% | Loan Payoff: | $425,033,863 | 73.6% | |
| Return of Equity: | $130,991,748 | 22.7% | ||||
| Reserves: | $12,268,991 | 2.1% | ||||
| Closing Costs: | $8,975,399 | 1.6% | ||||
| Total Sources: | $577,270,000 | 100.0% | Total Uses: | $577,270,000 | 100.0% | |
| (1) | The Starwood Capital Hotel Portfolio Mortgage Loan (as defined below) was co-originated by Barclays Bank PLC (“Barclays”), Deutsche Bank AG, acting through its New York Branch (“DBNY”), JPMorgan Chase Bank, National Association (“JPM”) and Bank of America, National Association (“BANA”). Starwood Mortgage Funding II LLC acquired notes A-15, A-16-1 and A-16-2 from JPM and on or before the securitization closing date will transfer note A-15 to SMF III. |
| (2) | The Starwood Capital Hotel Portfolio Mortgage Loan is part of the Starwood Capital Hotel Portfolio Whole Loan (as defined below), which is comprised of 21 pari passu promissory notes with an aggregate original principal balance of $577,270,000. The Cut-off Date Balance per Room, Maturity Date Balance per Room, UW NOI Debt Yield, UW NOI Debt Yield at Maturity, UW NCF DSCR, Cut-off Date LTV Ratio and Maturity Date LTV Ratio numbers presented above are based on the aggregate principal balance of the promissory notes comprising the Starwood Capital Hotel Portfolio Whole Loan. |
| (3) | See “The Mortgage Loan” for a discussion of the additional debt. |
| (4) | Upon the occurrence and during the continuance of a Trigger Period (as defined below), on a monthly basis, the Starwood Capital Hotel Portfolio Borrowers (as defined below) are required to make deposits of (i) 1/12 of the required annual taxes, (ii) 1/12 of the annual insurance premiums (unless an acceptable blanket policy is in place) and (iii) 1/12 of the ground rent due under the ground lease encumbering the single leasehold property. A “Trigger Period” will occur upon (i) an event of default under the Starwood Capital Hotel Portfolio Whole Loan, (ii) any bankruptcy or insolvency action of the Starwood Capital Hotel Portfolio Borrowers or property managers, (iii) any termination, expiration or cancellation of a franchise agreement or Larkspur Landing license agreement in violation of the Starwood Capital Hotel Portfolio Whole Loan documents or (iv) the debt service coverage ratio for the Starwood Capital Hotel Portfolio Whole Loan being below 1.75x. |
| (5) | The Starwood Capital Hotel Portfolio Borrowers are required to make monthly deposits equal to 1/12 of the greater of (a) 4.0% of the aggregate gross revenues for the 12 calendar month period ending in the month which is two months prior and (b) the annual amount required under the related franchise agreements for FF&E work. For any future capital work required under any franchise agreement, the Starwood Capital Hotel Portfolio Borrowers are required to deposit into a future capital work reserve account an amount equal to (x) 100.0% of any future capital work required pursuant to a replacement franchise agreement mandated property improvement plan less (y) any amounts then on deposit in the FF&E reserve account (provided that a capital work guaranty or a letter of credit may be provided by the Starwood Capital Hotel Portfolio guarantor in lieu of such deposit) (initially $727,736). |
| (6) | At loan origination, the Starwood Capital Hotel Portfolio Borrowers established a (i) $6,385,000 Larkspur Landing FF&E capital work reserve to be used towards capital work and FF&E expenditures only at the Larkspur Landing flagged properties and (ii) $5,883,991 existing capital work reserve to be used towards existing capital improvement and property improvement plan work as described in the Starwood Capital Hotel Portfolio Whole Loan documents. |
| (7) | The Country Inn & Suites Houston Intercontinental Airport East property (0.2% of the total allocated loan amount, 62 rooms) is currently out of service due to flood damage from Hurricane Harvey. The Starwood Capital Hotel Portfolio Mortgage Loan insurance policy provides wind coverage at the full limit of $500,000,000, subject to a named storm limit of $250,000,000. The flood limit is $100,000,000 per occurrence and in the annual aggregate. Additionally, the Starwood Capital Hotel Portfolio Borrowers have purchased policies through the National Flood Insurance Program in an amount equal to $500,000 for building and $500,000 for contents for each building in the special hazard flood zone (including the Country Inn & Suites Houston Intercontinental Airport East property). |
| (8) | Hilton Garden Inn Edison Raritan Center (1.8% of the total allocated loan amount) is subject to a ground lease. |
| (9) | The Property Managers include: Hersha Hospitality Management L.P. (“Hersha”), First Hospitality Group, Inc. (“First Hospitality”), TMI Property Management, L.L.C. (“TMI”), Schulte Hospitality Group, Inc. (“Schulte”) and Pillar Hotels and Resorts, LLC (“Pillar”). |
This is not a research report and was not prepared by any Underwriter’s research department. Please see additional important information and qualifications at the end of this Term Sheet.
| T-134 |
| MSBAM 2017-C34 | Starwood Capital Hotel Portfolio |
| (10) | The “As Portfolio” Appraised Value of $956.0 million reflects an 8.1% premium attributed to the aggregate “As-is” value of the Starwood Capital Hotel Portfolio Properties as a whole. The sum of the value of the “As-is” and “As-renovated” values, as applicable, for each of the Starwood Capital Hotel Portfolio Properties on an individual basis is $889.2 million, which represents a Cut-off Date LTV Ratio and Maturity Date LTV Ratio of 64.9%. Additionally, the aggregate “As-is” value for each individual property as of April 23, 2017 is $884.7 million, which results in a Cut-off Date LTV Ratio and Maturity Date LTV Ratio of 65.3%. |
The Mortgage Loan. The fifteenth largest mortgage loan (the “Starwood Capital Hotel Portfolio Mortgage Loan”) is part of a whole loan (the “Starwood Capital Hotel Portfolio Whole Loan”) evidenced by 21 pari passu promissory notes in the aggregate original principal amount of $577,270,000. The Starwood Capital Hotel Portfolio Whole Loan is secured by the fee, leasehold and operating leasehold interests in a hospitality portfolio consisting of 65 properties and 6,366 rooms located across 21 states throughout the continental United States (the “Starwood Capital Hotel Portfolio Properties”). The Starwood Capital Hotel Portfolio Whole Loan was co-originated by Bank of America, National Association (“BANA”), Barclays Bank PLC (“Barclays”), Deutsche Bank AG, acting through its New York Branch (“DBNY”) and JPMorgan Chase Bank, National Association (“JPM”). Starwood Mortgage Funding II LLC acquired notes A-15, A-16-1 and A-16-2 from JPM and on or before the securitization closing date will transfer note A-15 to SMF III. Promissory note A-15, in the original principal amount of $25,000,000, represents the Starwood Capital Hotel Portfolio Mortgage Loan, and will be included in the MSBAM 2017-C34 securitization trust.
The following table presents a summary of the notes comprising the Starwood Capital Hotel Portfolio Whole Loan. The promissory notes identified below, other than the Starwood Capital Hotel Portfolio Mortgage Loan (such promissory notes, the “Starwood Capital Hotel Portfolio Pari Passu Companion Loans”) are expected to be contributed to future securitization transactions or may be otherwise transferred at any time. The Starwood Capital Hotel Portfolio Mortgage Loan will be serviced pursuant to the pooling and servicing agreement for the DBJPM 2017-C6 securitization transaction. See “Description of the Mortgage Pool—The Whole Loans—the Non-Serviced Whole Loans” and “Pooling and Servicing Agreement-Servicing of the Non-Serviced Mortgage Loans” in the Preliminary Prospectus.
| Starwood Capital Hotel Portfolio Whole Loan Summary | ||||
| Note | Original Balance | Cut-off Date Balance | Note Holder(1) | Controlling Piece |
| Notes A-1 and A-7 | $80,000,000 | $80,000,000 | DBJPM 2017-C6 | Yes |
| Notes A-2-1 and A-16-1 | $60,000,000 | $60,000,000 | JPMCC 2017-JP7 | No |
| Notes A-2-2, A-9 and A-14 | $46,817,500 | $46,817,500 | JPM | No |
| Note A-3 | $72,500,000 | $72,500,000 | BANK 2017-BNK5 | No |
| Note A-4 | $59,317,500 | $59,317,500 | BANK 2017-BNK6 | No |
| Note A-5 | $50,000,000 | $50,000,000 | WFCM 2017-C38 | No |
| Note A-6-1 | $40,000,000 | $40,000,000 | WFCM 2017-C39 | No |
| Note A-6-2 | $10,000,000 | $10,000,000 | Barclays | No |
| Notes A-8 and A-10 | $40,000,000 | $40,000,000 | CD 2017-CD5 | No |
| Notes A-11, A-12 and A-13-2 | $37,500,000 | $37,500,000 | UBS 2017-C2 | No |
| Note A-13-1 | $14,317,500 | $14,317,500 | DBNY | No |
| Note A-15 | $25,000,000 | $25,000,000 | MSBAM 2017-C34 | No |
| Notes A-16-2 and A-17 | $41,817,500 | $41,817,500 | CGCMT 2017-P8 | No |
| Total Starwood Capital Hotel Portfolio Whole Loan | $577,270,000 | $577,270,000 | ||
| (1) | The promissory notes currently held by JPM, Barclays and DBNY are expected to be contributed to future securitization transactions or may be otherwise transferred at any time. |
The Borrowers and the Sponsors. The borrowers consist of 92 single-purpose Delaware limited liability companies and 36 single-purpose Delaware limited partnerships, each structured to be bankruptcy remote, with two independent directors in its organizational structure (the “Starwood Capital Hotel Portfolio Borrowers”). There are two borrowers with respect to each of the Starwood Capital Group Portfolio Properties, the property owner borrower and the operating lessee borrower.
The sponsors are any of Starwood Capital Group Global, L.P., Starwood Capital Group Global II, L.P. and Starwood Capital Group Global I, L.L.C (the “SCG Sponsors”). The nonrecourse carve-out guarantor is SCG Hotel Investors Holdings, L.P., an affiliate of Starwood Capital Group, L.P. (“SCG”). The aggregate recourse to the guarantor related to bankruptcy or insolvency actions may not exceed an amount equal to 20% of the principal balance of the Starwood Capital Hotel Portfolio Whole Loan outstanding at the time of the occurrence of such event, plus reasonable third-party costs incurred by the lender in connection with the enforcement of its rights. See “Description of the Mortgage Pool–Non-Recourse Carveout Limitations” in the Preliminary Prospectus.
SCG is a private alternative investment firm with a primary focus on global real estate. Since its inception in 1991, SCG has raised over $40 billion of equity capital and currently manages over $51 billion in assets. Over the past 26 years, SCG has acquired over $86.5 billion of assets across various real estate asset classes, geographies and positions in the capital stack. SCG directly employs over 2,200 professionals and approximately 16,000 additional employees through various portfolio operating companies with offices in Atlanta, Chicago, Greenwich, Hong Kong, London, Los Angeles, Luxembourg, Miami, San Francisco and Washington, D.C.
The Starwood Capital Hotel Portfolio Borrowers and the SCG Sponsors and non-recourse carve-out guarantor under the Starwood Capital Hotel Portfolio Mortgage Loan are affiliates of SMF III, a mortgage loan seller.
The Properties. The Starwood Capital Hotel Portfolio Properties are comprised of 65 hotels offering a range of amenities, spanning the limited service, full service and extended stay varieties. The hotels range in size from 56 to 147 rooms, with an average count of 98 rooms. The Starwood Capital Hotel Portfolio Properties benefit from geographic and brand diversity. No individual portfolio property accounts for greater than 2.3% of total rooms or 5.8% of underwritten net cash flow. The top 10 properties based on allocated loan amount account for only 19.4% of total rooms and 35.1% of underwritten net cash flow. The hotels range in age from seven to 42 years old, with an average age of approximately 16 years, and 59.0% of the Starwood Capital Hotel Portfolio Properties based on underwritten net cash flow have been renovated since 2012.
This is not a research report and was not prepared by any Underwriter’s research department. Please see additional important information and qualifications at the end of this Term Sheet.
| T-135 |
| MSBAM 2017-C34 | Starwood Capital Hotel Portfolio |
A summary detailing the composition of the Starwood Capital Hotel Portfolio by property sub-type is provided below:
| Starwood Capital Hotel Portfolio Property Sub-Type Summary | |||||||||
| Property Sub-Type | # Hotels | # Rooms | % of Total Rooms | UW NCF | % of Total UW NCF | Appraised Value(1) | Appraised Value Per Room | TTM RevPAR Penetration | |
| Extended Stay | 22 | 2,244 | 35.2% | $35,078,267 | 49.2% | $441,700,000 | $196,836 | 112.5% | |
| Limited Service | 40 | 3,734 | 58.7% | $32,572,979 | 45.7% | $403,300,000 | $108,007 | 131.5% | |
| Full Service | 3 | 388 | 6.1% | $3,678,146 | 5.2% | $44,200,000 | $113,918 | 106.4% | |
| Total / Weighted Average | 65 | 6,366 | 100.0% | $71,329,392 | 100.0% | $956,000,000 | $150,173 | 123.3% | |
| (1) | The “As Portfolio” Appraised Value of $956.0 million reflects an 8.1% premium attributed to the aggregate “As-is” value of the Starwood Capital Hotel Portfolio Properties as a whole. The sum of the value of the “As-is” and “As-renovated” values, as applicable, for each of the Starwood Capital Hotel Portfolio Properties on an individual basis is $889.2 million. Additionally, the aggregate “As-is” value for each individual property as of April 23, 2017 is $884.7 million. |
All 65 hotels in the Starwood Capital Hotel Portfolio are operated pursuant to management agreements with one of Hersha (39 hotels), First Hospitality (nine hotels), TMI (nine hotels), Schulte (six hotels) or Pillar (two hotels), as detailed in the below summary:
| Starwood Capital Group Hotel Management Company Summary | |||||||
| Management Company | # Hotels | # Rooms | % of Total Rooms | UW NCF | % of Total UW NCF | Appraised Value(1) | Appraised Value Per Room |
| Hersha | 39 | 3,859 | 60.6% | $44,857,243 | 62.9% | $565,900,000 | $146,644 |
| First Hospitality | 9 | 981 | 15.4% | $12,107,023 | 17.0% | $137,400,000 | $140,061 |
| TMI | 9 | 666 | 10.5% | $6,259,518 | 8.8% | $87,600,000 | $131,532 |
| Schulte | 6 | 692 | 10.9% | $5,458,243 | 7.7% | $69,700,000 | $100,723 |
| Pillar | 2 | 168 | 2.6% | $2,647,365 | 3.7% | $28,600,000 | $170,238 |
| Total | 65 | 6,366 | 100.0% | $71,329,392 | 100.0% | $956,000,000 | $150,173 |
| (1) | The “As Portfolio” Appraised Value of $956.0 million reflects an 8.1% premium attributed to the aggregate “As-is” value of the Starwood Capital Hotel Portfolio Properties as a whole. The sum of the value of the “As-is” and “As-renovated” values, as applicable, for each of the Starwood Capital Hotel Portfolio Properties on an individual basis is $889.2 million. Additionally, the aggregate “As-is” value for each individual property as of April 23, 2017 is $884.7 million. |
This is not a research report and was not prepared by any Underwriter’s research department. Please see additional important information and qualifications at the end of this Term Sheet.
| T-136 |
| MSBAM 2017-C34 | Starwood Capital Hotel Portfolio |
A summary of the individual Starwood Capital Hotel Portfolio Properties is provided below:
| Starwood Capital Hotel Portfolio Property Summary | ||||||||||
| Property Name | City / State | Rooms | Year Built / Renovated | Allocated Loan Amount | % of Allocated Loan Amount | Appraised Value(1) | UW NCF | % of UW NCF | TTM Occupancy | TTM RevPAR Penetration(2) |
| Larkspur Landing Sunnyvale | Sunnyvale, CA | 126 | 2000 / NAP | $34,068,063 | 5.9% | $52,100,000 | $4,171,961 | 5.8% | 83.8% | 105.3% |
| Larkspur Landing Milpitas | Milpitas, CA | 124 | 1998 / NAP | $28,706,103 | 5.0% | $43,900,000 | $3,562,157 | 5.0% | 85.7% | 111.6% |
| Larkspur Landing Campbell | Campbell, CA | 117 | 2000 / NAP | $25,240,446 | 4.4% | $38,600,000 | $3,199,426 | 4.5% | 84.3% | 93.3% |
| Larkspur Landing San Francisco | S. San Francisco, CA | 111 | 1999 / NAP | $20,793,943 | 3.6% | $31,800,000 | $2,426,585 | 3.4% | 84.9% | 83.6% |
| Larkspur Landing Pleasanton | Pleasanton, CA | 124 | 1997 / NAP | $20,336,214 | 3.5% | $31,100,000 | $2,438,362 | 3.4% | 82.9% | 87.8% |
| Larkspur Landing Bellevue | Bellevue, WA | 126 | 1998 / NAP | $18,112,963 | 3.1% | $27,700,000 | $2,173,526 | 3.0% | 78.8% | 108.6% |
| Larkspur Landing Sacramento | Sacramento, CA | 124 | 1998 / NAP | $13,535,680 | 2.3% | $20,700,000 | $1,816,912 | 2.5% | 83.0% | 110.0% |
| Hampton Inn Ann Arbor North | Ann Arbor, MI | 129 | 1988 / 2015 | $13,208,731 | 2.3% | $20,200,000 | $1,836,126 | 2.6% | 73.9% | 123.7% |
| Larkspur Landing Hillsboro | Hillsboro, OR | 124 | 1997 / NAP | $13,208,731 | 2.3% | $20,200,000 | $1,708,763 | 2.4% | 74.1% | 77.6% |
| Larkspur Landing Renton | Renton, WA | 127 | 1998 / NAP | $13,077,951 | 2.3% | $20,000,000 | $1,694,132 | 2.4% | 80.3% | 103.3% |
| Holiday Inn Arlington NE Rangers Ballpark | Arlington, TX | 147 | 2008 / 2013 | $12,554,833 | 2.2% | $19,200,000 | $1,537,247 | 2.2% | 78.3% | 100.5% |
| Residence Inn Toledo Maumee | Maumee, OH | 108 | 2008 / 2016 | $12,424,054 | 2.2% | $19,000,000 | $1,468,871 | 2.1% | 81.7% | 142.7% |
| Residence Inn Williamsburg | Williamsburg, VA | 108 | 1999 / 2012 | $11,900,936 | 2.1% | $18,200,000 | $1,358,744 | 1.9% | 73.0% | 158.8% |
| Hampton Inn Suites Waco South | Waco, TX | 123 | 2008 / 2013 | $10,985,479 | 1.9% | $16,800,000 | $1,414,791 | 2.0% | 77.7% | 116.2% |
| Holiday Inn Louisville Airport Fair Expo | Louisville, KY | 106 | 2008 / NAP | $10,789,310 | 1.9% | $16,500,000 | $1,388,767 | 1.9% | 72.9% | 102.1% |
| Courtyard Tyler | Tyler, TX | 121 | 2010 / 2016 | $10,593,141 | 1.8% | $16,200,000 | $1,253,360 | 1.8% | 58.8% | 125.6% |
| Hilton Garden Inn Edison Raritan Center(3) | Edison, NJ | 132 | 2002 / 2014 | $10,593,141 | 1.8% | $16,200,000 | $1,317,397 | 1.8% | 78.1% | 135.7% |
| Hilton Garden Inn St. Paul Oakdale | Oakdale, MN | 116 | 2005 / 2013 | $10,462,361 | 1.8% | $16,000,000 | $1,689,847 | 2.4% | 80.0% | 141.9% |
| Residence Inn Grand Rapids West | Grandville, MI | 90 | 2000 / 2017 | $10,331,582 | 1.8% | $15,800,000(4) | $1,106,127 | 1.6% | 72.6% | 115.2% |
| Peoria, AZ Residence Inn | Peoria, AZ | 90 | 1998 / 2013 | $10,266,192 | 1.8% | $15,700,000 | $1,158,027 | 1.6% | 80.8% | 145.9% |
| Hampton Inn Suites Bloomington Normal | Normal, IL | 128 | 2007 / 2015 | $10,200,802 | 1.8% | $15,600,000 | $1,396,943 | 2.0% | 70.8% | 123.5% |
| Courtyard Chico | Chico, CA | 90 | 2005 / 2015 | $10,004,633 | 1.7% | $15,300,000 | $1,439,185 | 2.0% | 84.6% | 157.5% |
| Hampton Inn Suites Kokomo | Kokomo, IN | 105 | 1997 / 2013 | $9,677,684 | 1.7% | $14,800,000 | $1,255,566 | 1.8% | 77.9% | 158.5% |
| Hampton Inn Suites South Bend | South Bend, IN | 117 | 1997 / 2014 | $9,677,684 | 1.7% | $14,800,000 | $1,232,210 | 1.7% | 69.9% | 113.2% |
| Courtyard Wichita Falls | Wichita Falls, TX | 93 | 2009 / 2017 | $9,219,956 | 1.6% | $14,100,000 | $1,095,610 | 1.5% | 77.4% | 106.0% |
| Hampton Inn Morehead | Morehead City, NC | 118 | 1991 / 2017 | $8,958,397 | 1.6% | $13,700,000(4) | $1,094,065 | 1.5% | 66.6% | 139.7% |
| Residence Inn Chico | Chico, CA | 78 | 2005 / 2014 | $8,696,838 | 1.5% | $13,300,000 | $1,208,180 | 1.7% | 88.0% | 166.0% |
| Courtyard Lufkin | Lufkin, TX | 101 | 2009 / 2017 | $8,304,499 | 1.4% | $12,700,000(4) | $738,285 | 1.0% | 64.9% | 105.9% |
| Hampton Inn Carlisle | Carlisle, PA | 97 | 1997 / 2014 | $8,239,109 | 1.4% | $12,600,000 | $1,116,905 | 1.6% | 76.1% | 175.6% |
| Springhill Suites Williamsburg | Williamsburg, VA | 120 | 2002 / 2012 | $8,239,109 | 1.4% | $12,600,000 | $876,108 | 1.2% | 71.7% | 106.8% |
| Fairfield Inn Bloomington | Bloomington, IN | 105 | 1995 / 2015 | $8,173,720 | 1.4% | $12,500,000 | $1,271,230 | 1.8% | 87.1% | 106.3% |
| Waco Residence Inn | Waco, TX | 78 | 1997 / 2012 | $7,977,550 | 1.4% | $12,200,000(4) | $912,234 | 1.3% | 82.0% | 112.5% |
| Holiday Inn Express Fishers | Fishers, IN | 115 | 2000 / 2012 | $7,454,432 | 1.3% | $11,400,000 | $951,428 | 1.3% | 67.1% | 90.5% |
| Larkspur Landing Folsom | Folsom, CA | 84 | 2000 / NAP | $7,258,263 | 1.3% | $11,100,000 | $858,864 | 1.2% | 86.4% | 98.1% |
| Springhill Suites Chi. Naperville Warrenville | Warrenville, IL | 128 | 1997 / 2013 | $6,865,924 | 1.2% | $10,500,000 | $667,822 | 0.9% | 67.1% | 96.1% |
| Holiday Inn Express & Suites Paris | Paris, TX | 84 | 2009 / NAP | $6,800,535 | 1.2% | $10,400,000 | $798,480 | 1.1% | 72.6% | 126.5% |
| Toledo Homewood Suites | Maumee, OH | 78 | 1997 / 2014 | $6,800,535 | 1.2% | $10,400,000(4) | $944,205 | 1.3% | 82.2% | 123.0% |
| Grand Rapids Homewood Suites | Grand Rapids, MI | 78 | 1997 / 2013 | $6,604,365 | 1.1% | $10,100,000(4) | $739,572 | 1.0% | 84.1% | 113.7% |
| Cheyenne Fairfield Inn & Suites | Cheyenne, WY | 60 | 1994 / 2013 | $6,146,637 | 1.1% | $9,400,000 | $753,591 | 1.1% | 74.6% | 117.6% |
| Fairfield Inn Laurel | Laurel, MD | 109 | 1988 / 2013 | $6,146,637 | 1.1% | $9,400,000 | $657,471 | 0.9% | 79.9% | 139.2% |
| Courtyard Akron Stow | Stow, OH | 101 | 2005 / 2014 | $6,015,858 | 1.0% | $9,200,000 | $886,115 | 1.2% | 65.9% | 98.4% |
| Larkspur Landing Roseville | Roseville, CA | 90 | 1999 / NAP | $5,688,909 | 1.0% | $8,700,000 | $786,149 | 1.1% | 79.5% | 96.9% |
| Towneplace Suites Bloomington | Bloomington, IN | 83 | 2000 / 2013 | $5,688,909 | 1.0% | $8,700,000 | $850,105 | 1.2% | 89.1% | 101.3% |
| Hampton Inn Danville | Danville, PA | 71 | 1998 / 2013 | $5,623,519 | 1.0% | $8,600,000 | $728,609 | 1.0% | 80.0% | 222.0% |
| Holiday Inn Norwich | Norwich, CT | 135 | 1975 / 2013 | $5,558,129 | 1.0% | $8,500,000 | $752,132 | 1.1% | 56.7% | 116.3% |
| Hampton Inn Suites Longview North | Longview, TX | 91 | 2008 / 2013 | $5,492,740 | 1.0% | $8,400,000 | $650,443 | 0.9% | 63.8% | 129.8% |
| Springhill Suites Peoria Westlake | Peoria, IL | 124 | 2000 / 2013 | $5,492,740 | 1.0% | $8,400,000 | $470,046 | 0.7% | 63.3% | 89.1% |
| Hampton Inn Suites Buda | Buda, TX | 74 | 2008 / NAP | $5,427,350 | 0.9% | $8,300,000 | $853,603 | 1.2% | 74.5% | 139.5% |
| Shawnee Hampton Inn | Shawnee, OK | 63 | 1996 / 2013 | $5,427,350 | 0.9% | $8,300,000(4) | $618,775 | 0.9% | 77.6% | 146.0% |
| Racine Fairfield Inn | Racine, WI | 62 | 1991 / 2016 | $5,296,570 | 0.9% | $8,100,000(4) | $603,823 | 0.8% | 68.6% | 154.1% |
| Hampton Inn Selinsgrove Shamokin Dam | Shamokin Dam, PA | 75 | 1996 / 2013 | $5,165,791 | 0.9% | $7,900,000 | $687,279 | 1.0% | 75.6% | 184.0% |
| Holiday Inn Express & Suites Terrell | Terrell, TX | 68 | 2007 / 2013 | $4,904,232 | 0.8% | $7,500,000 | $605,485 | 0.8% | 84.0% | 183.4% |
| Westchase Homewood Suites | Houston, TX | 96 | 1998 / 2016 | $4,746,774 | 0.8% | $9,800,000(4) | $379,742 | 0.5% | 63.4% | 142.9% |
| Holiday Inn Express & Suites Tyler South | Tyler, TX | 88 | 2000 / 2015 | $4,708,062 | 0.8% | $7,200,000 | $599,880 | 0.8% | 65.9% | 132.5% |
| Holiday Inn Express & Suites Huntsville | Huntsville, TX | 87 | 2008 / 2013 | $4,511,893 | 0.8% | $6,900,000 | $689,387 | 1.0% | 65.5% | 243.3% |
| Hampton Inn Sweetwater | Sweetwater, TX | 72 | 2009 / NAP | $4,119,555 | 0.7% | $6,300,000 | $400,369 | 0.6% | 62.9% | 132.2% |
| Comfort Suites Buda Austin South | Buda, TX | 72 | 2009 / NAP | $3,465,657 | 0.6% | $5,300,000 | $541,569 | 0.8% | 76.8% | 109.7% |
| Fairfield Inn & Suites Weatherford | Weatherford, TX | 86 | 2009 / 2016 | $3,269,488 | 0.6% | $5,000,000 | $311,718 | 0.4% | 63.4% | 91.1% |
| Holiday Inn Express & Suites Altus | Altus, OK | 68 | 2008 / 2013 | $2,649,352 | 0.5% | $4,600,000 | $211,948 | 0.3% | 67.4% | 151.2% |
| Comfort Inn & Suites Paris | Paris, TX | 56 | 2009 / NAP | $2,354,031 | 0.4% | $3,600,000 | $251,060 | 0.4% | 67.4% | 146.2% |
| Hampton Inn Suites Decatur | Decatur, TX | 74 | 2008 / 2013 | $2,252,646 | 0.4% | $3,600,000 | $180,212 | 0.3% | 64.6% | 228.4% |
| Holiday Inn Express & Suites Texarkana E. | Texarkana, AR | 88 | 2009 / NAP | $2,086,036 | 0.4% | $4,100,000 | $166,883 | 0.2% | 66.5% | 100.5% |
| Mankato Fairfield Inn | Mankato, MN | 61 | 1997 / 2016 | $1,869,354 | 0.3% | $3,600,000 | $149,548 | 0.2% | 58.0% | 100.2% |
| Candlewood Suites Texarkana | Texarkana, TX | 80 | 2009 / 2014 | $1,445,301 | 0.3% | $2,600,000 | $115,624 | 0.2% | 75.0% | 110.1% |
| Country Inn & Suites Houston IC Airport E.(5) | Humble, TX | 62 | 2001 / 2017 | $1,372,592 | 0.2% | $3,200,000 | $109,807 | 0.2% | 54.1% | 86.8% |
| Total / Weighted Average | 6,366 | $577,270,000 | 100.0% | $889,200,000 | $71,329,392 | 100.0% | 74.6% | 123.3% | ||
| Total with Portfolio Premium | $956,000,000 | |||||||||
| (1) | The “As Portfolio” Appraised Value of $956.0 million reflects an 8.1% premium attributed to the aggregate “As-is” value of the Starwood Capital Hotel Portfolio Properties as a whole. The sum of the value of the “As-is” and “As-renovated” values, as applicable, for each of the Starwood Capital Hotel Portfolio Properties on an individual basis is $889.2 million. Additionally, the aggregate “As-is” value for each individual property as of April 23, 2017 is $884.7 million. |
| (2) | TTM RevPAR Penetration is based on operating statements as of March 31, 2017 provided by the Starwood Capital Hotel Portfolio Borrowers and competitive set data provided from a third-party hospitality research report. The Starwood Capital Hotel Portfolio weighted average is weighted based on total room count. |
| (3) | Hilton Garden Inn Edison Raritan Center is subject to a ground lease, which commenced in September 2001 for a term of 75 years, with current annual ground rent of $275,517. |
| (4) | “As-renovated” appraised values are shown for nine properties, which values assume the completion of certain property improvements, for which the lender has fully reserved. |
| (5) | As of August 27, 2017, Country Inn & Suites Houston Intercontinental Airport East was out of service due to flood damage from Hurricane Harvey. |
This is not a research report and was not prepared by any Underwriter’s research department. Please see additional important information and qualifications at the end of this Term Sheet.
| T-137 |
| MSBAM 2017-C34 | Starwood Capital Hotel Portfolio |
The Starwood Capital Hotel Portfolio Properties benefit from well-known brand and flag affiliations, as well as related customer loyalty programs. Approximately 60.2% based on room count and 53.0% based on underwritten net cash flow of the portfolio is associated with Marriott or Hilton flags, providing the portfolio with institutional brand affiliations across the majority of the Starwood Capital Hotel Portfolio Properties. Approximately 20.1% based on room count and 34.8% by underwritten net cash flow of the portfolio is associated with the Larkspur Landing brand, all of which are located on the west coast. Larkspur Landing is an upscale select service and extended stay brand. The Larkspur Landing properties operate pursuant to a licensing agreement between the related operating companies (as licensee) and an affiliate of SCG (as licensor), which owns the licensing rights to the Larkspur Landing brand/flag. The Larkspur Landing licensing agreement for each applicable individual property calls for an annual license fee in the amount of $10 and may be terminated upon 60 days’ notice of termination by either the licensor or the licensee. Per the terms of the Starwood Capital Hotel Portfolio Whole Loan documents, the Larkspur Landing licensing agreements may not be terminated by the borrowers unless the borrowers replace the Larkspur Landing flag with a qualified franchisor.
In the event of any franchise or license agreement expiration, termination or cancellation in violation of the Starwood Capital Group Whole Loan documents, an excess cash flow sweep will be triggered (see “Lockbox and Cash Management”). Additionally, there is a recourse carve-out for any material amendment, modification, expiration, cancellation or termination of any franchise or Larkspur Landing license agreement without the prior written consent of the lender, in violation of the Starwood Capital Hotel Portfolio Whole Loan documents.
The Starwood Capital Hotel Portfolio Properties are operated under six brands and fourteen flags, a summary of which is provided below:
| Starwood Capital Hotel Portfolio Brand Summary | |||||||||
| Brand | # Hotels | # Rooms | % of Rooms | Allocated Loan Amount ($) | Allocated Loan Amount ($)/Room | Appraised Value(1) | LTV(1) | UW NCF | % UW NCF |
| Larkspur Landing(2)(3) | |||||||||
| Larkspur Landing | 11 | 1,277 | 20.1% | $200,027,266 | $156,638 | $305,900,000 | 65.4% | $24,836,836 | 34.8% |
| Total Larkspur Landing | 11 | 1,277 | 20.1% | $200,027,266 | $156,638 | $305,900,000 | 65.4% | $24,836,836 | 34.8% |
| Marriott(2) | |||||||||
| Residence Inn | 6 | 552 | 8.7% | $61,597,152 | $111,589 | $94,200,000 | 65.4% | $7,212,183 | 10.1% |
| Courtyard | 5 | 506 | 7.9% | $44,138,087 | $87,229 | $67,500,000 | 65.4% | $5,412,556 | 7.6% |
| Fairfield Inn & Suites | 6 | 483 | 7.6% | $30,902,406 | $63,980 | $48,000,000 | 64.4% | $3,747,382 | 5.3% |
| SpringHill Suites | 3 | 372 | 5.8% | $20,597,773 | $55,370 | $31,500,000 | 65.4% | $2,013,975 | 2.8% |
| TownePlace Suites | 1 | 83 | 1.3% | $5,688,909 | $68,541 | $8,700,000 | 65.4% | $850,105 | 1.2% |
| Total Marriot | 21 | 1,996 | 31.4% | $162,924,327 | $81,625 | $249,900,000 | 65.2% | $19,236,201 | 27.0% |
| Hilton | |||||||||
| Hampton Inn & Suites | 14 | 1,337 | 21.0% | $104,456,837 | $78,128 | $159,900,000 | 65.3% | $13,465,895 | 18.9% |
| Hilton Garden Inn | 2 | 248 | 3.9% | $21,055,502 | $84,901 | $32,200,000 | 65.4% | $3,007,244 | 4.2% |
| Homewood Suites | 3 | 252 | 4.0% | $18,151,674 | $72,030 | $30,300,000 | 59.9% | $2,063,519 | 2.9% |
| Total Hilton | 19 | 1,837 | 28.9% | $143,664,013 | $78,206 | $222,400,000 | 64.6% | $18,536,658 | 26.0% |
| IHG | |||||||||
| Holiday Inn Express | 7 | 598 | 9.4% | $33,114,542 | $55,375 | $52,100,000 | 63.6% | $4,023,491 | 5.6% |
| Holiday Inn | 3 | 388 | 6.1% | $28,902,272 | $74,490 | $44,200,000 | 65.4% | $3,678,146 | 5.2% |
| Candlewood | 1 | 80 | 1.3% | $1,445,301 | $18,066 | $2,600,000 | 55.6% | $115,624 | 0.2% |
| Total IHG | 11 | 1,066 | 16.7% | $63,462,115 | $59,533 | $98,900,000 | 64.2% | $7,817,261 | 11.0% |
| Choice | |||||||||
| Comfort Inn | 2 | 128 | 2.0% | $5,819,688 | $45,466 | $8,900,000 | 65.4% | $792,628 | 1.1% |
| Total Choice | 2 | 128 | 2.0% | $5,819,688 | $45,466 | $8,900,000 | 65.4% | $792,628 | 1.1% |
| Carlson | |||||||||
| Country Inn & Suites | 1 | 62 | 1.0% | $1,372,592 | $22,139 | $3,200,000 | 42.9% | $109,807 | 0.2% |
| Total Carlson | 1 | 62 | 1.0% | $1,372,592 | $22,139 | $3,200,000 | 42.9% | $109,807 | 0.2% |
| Total | 65 | 6,366 | 100.0% | $577,270,000 | $90,680 | $956,000,000 | 60.4% | $71,329,392 | 100.0% |
| (1) | The “As Portfolio” Appraised Value of $956.0 million reflects an 8.1% premium attributed to the aggregate “As-is” value of the Starwood Capital Hotel Portfolio Properties as a whole. The sum of the value of the “As-is” and “As-renovated” values, as applicable, for each of the properties on an individual basis is $889.2 million, which represents a Cut-off Date LTV Ratio and Maturity Date LTV Ratio of 64.9%. Additionally, the aggregate “As-is” value for each individual property as of April 23, 2017 is $884.7 million, which results in a Cut-off Date LTV Ratio and Maturity Date LTV Ratio of 65.3%. |
| (2) | The Marriott and Larkspur Landing brand/flag are affiliated with SCG. |
| (3) | The Larkspur Landing individual properties operate pursuant to licensing agreements with an affiliate of the SCG Sponsors, which may be terminated upon 60 days’ notice. There is a recourse carveout for any material amendment, modification, expiration, cancellation or termination of any franchise or Larkspur Landing license agreement without the prior written consent of the lender in violation of the Starwood Capital Hotel Portfolio Whole Loan documents. Per the terms of the Starwood Capital Hotel Portfolio Whole Loan documents, the Larkspur Landing licensing agreements may not be terminated by the borrower unless the borrowers replace the Larkspur Landing flag with a qualified franchisor. |
This is not a research report and was not prepared by any Underwriter’s research department. Please see additional important information and qualifications at the end of this Term Sheet.
| T-138 |
| MSBAM 2017-C34 | Starwood Capital Hotel Portfolio |
A summary of franchise agreement expirations within the Starwood Capital Hotel Portfolio is provided below:
| Starwood Capital Hotel Portfolio Franchise Expiration Schedule(1)(2) | ||||||||||
| Year | # Hotels | #Rooms | % of Total Rooms | UW NCF | % of Total UW NCF | Cumulative Rooms Expiring | Cumulative % of Rooms Expiring | Cumulative UW NCF Expiring | Cumulative % of UW NCF Expiring | |
| 2017 | 0 | 0 | 0.0% | $0 | 0.0% | 0 | 0.0% | $0 | 0.0% | |
| 2018 | 1 | 90 | 1.8% | $1,158,027 | 2.5% | 90 | 1.8% | $1,158,027 | 2.5% | |
| 2019 | 3 | 337 | 6.6% | $2,892,322 | 6.2% | 427 | 8.4% | $4,050,349 | 8.7% | |
| 2020 | 0 | 0 | 0.0% | $0 | 0.0% | 427 | 8.4% | $4,050,349 | 8.7% | |
| 2021 | 1 | 62 | 1.2% | $603,823 | 1.3% | 489 | 9.6% | $4,654,173 | 10.0% | |
| 2022 | 21 | 2,025 | 39.8% | $18,055,211 | 38.8% | 2,514 | 49.4% | $22,709,384 | 48.8% | |
| 2023 | 0 | 0 | 0.0% | $0 | 0.0% | 2,514 | 49.4% | $22,709,384 | 48.8% | |
| 2024 | 0 | 0 | 0.0% | $0 | 0.0% | 2,514 | 49.4% | $22,709,384 | 48.8% | |
| 2025 | 4 | 378 | 7.4% | $4,634,247 | 10.0% | 2,892 | 56.8% | $27,343,631 | 58.8% | |
| 2026 | 1 | 128 | 2.5% | $1,396,943 | 3.0% | 3,020 | 59.3% | $28,740,574 | 61.8% | |
| 2027 | 2 | 140 | 2.8% | $1,022,042 | 2.2% | 3,160 | 62.1% | $29,762,616 | 64.0% | |
| 2028 & Beyond | 21 | 1,929 | 37.9% | $16,729,941 | 36.0% | 5,089 | 100.0% | $46,492,556 | 100.0% | |
| Total(1) | 54 | 5,089 | 100.0% | $46,492,556 | 100.0% | |||||
| (1) | The information presented is exclusive of the Larkspur Landing properties, which operate pursuant to a licensing agreement with an affiliate of the SCG Sponsors. The Larkspur Landing brand/flag is owned by an affiliate of SCG. |
| (2) | For individual franchise agreement expirations, see “Description of the Mortgage Pool—Mortgage Pool Characteristics—Property Types—Hospitality Properties”in the Preliminary Prospectus. |
Approximately $84.8 million ($13,319 per room) in capital expenditures have been made since 2012 in order to update the Starwood Capital Hotel Portfolio Properties. Going forward, the Starwood Capital Hotel Portfolio Borrowers have budgeted for approximately $28.8 million ($4,519 per room) in capital expenditures through 2019, of which approximately $5.9 million ($924 per room) is related to brand-mandated property improvement plans. At origination, the Starwood Capital Hotel Portfolio Borrowers reserved approximately $5.9 million in capital expenditures related to a brand-mandated property improvement plan. Additionally, at loan origination, the Starwood Capital Hotel Portfolio Borrowers reserved approximately $6.4 million ($5,000 per Larkspur Landing-branded room) for any future capital work or FF&E associated with the Larkspur Landing properties. The remaining budgeted capital expenditures have not been reserved for and the Starwood Capital Hotel Portfolio Borrower is not required under the Starwood Capital Hotel Portfolio Whole Loan to complete the related capital improvements.
A summary of the historical capital expenditures at the Starwood Capital Hotel Portfolio Properties is provided below:
| Starwood Capital Hotel Portfolio Historical Capital Expenditures | |||||
| 2012 | 2013 | 2014 | 2015 | 2016 | |
| Total | $15,974,481 | $28,295,183 | $14,870,099 | $10,258,955 | $15,388,521 |
| Per Room | $2,509 | $4,445 | $2,336 | $1,612 | $2,417 |
Historically, the Starwood Capital Hotel Portfolio Properties as a whole have outperformed their competitive set with occupancy, ADR and RevPAR penetration rates all in excess of 100.0% for 2014 through the trailing 12-month period ended March 31, 2017. The Starwood Capital Hotel Portfolio Properties have generally also outperformed on an individual basis, with 80.1% of the portfolio based on room count having achieved a RevPAR penetration in excess of 100.0% for the trailing 12-month period ended March 31, 2017.
A summary of the Starwood Capital Hotel Portfolio’s historical performance is provided below:
| Starwood Capital Hotel Portfolio Historical Occupancy, ADR, RevPAR(1) | |||||||||
| Year | Starwood Capital Hotel Portfolio | Competitive Set | Penetration Factor | ||||||
| Occupancy(2) | ADR(2) | RevPAR(2) | Occupancy(3) | ADR(3) | RevPAR(3) | Occupancy(4) | ADR(4) | RevPAR(4) | |
| 2014 | 73.7% | $112.28 | $82.80 | 66.0% | $103.25 | $67.56 | 111.7% | 108.7% | 122.6% |
| 2015 | 74.8% | $116.76 | $87.29 | 66.6% | $108.28 | $71.42 | 112.2% | 107.8% | 122.2% |
| 2016 | 74.7% | $119.48 | $89.23 | 65.9% | $110.28 | $71.95 | 113.4% | 108.3% | 124.0% |
| 3/31/2017 TTM | 74.6% | $119.07 | $88.81 | 65.9% | $110.31 | $72.05 | 113.1% | 107.9% | 123.3% |
| (1) | The variances between the underwriting, the hospitality research report and the above table with respect to Occupancy, ADR and RevPAR at the Starwood Capital Hotel Portfolio are attributable to variances in reporting methodologies and/or timing differences. |
| (2) | Based on operating statements provided by the SCG Sponsors and weighted based on available rooms and occupied rooms, as applicable. |
| (3) | Competitive Set data for each individual property obtained from a third party hospitality research report. |
| (4) | Penetration Factor data for each individual property is based on operating statements provided by the SCG Sponsors and competitive set data obtained from a third party hospitality research report. Portfolio level statistics are weighted based on total room count. |
This is not a research report and was not prepared by any Underwriter’s research department. Please see additional important information and qualifications at the end of this Term Sheet.
| T-139 |
| MSBAM 2017-C34 | Starwood Capital Hotel Portfolio |
The Markets. The Starwood Capital Hotel Portfolio Properties have broad exposure across the United States with properties located across 21 states and 55 cities, with no individual state accounting for more than 16.8% of total rooms or 30.7% of underwritten net cash flow.
A summary of the regional representation of the Starwood Capital Hotel Portfolio Properties is provided below:
| Starwood Capital Hotel Portfolio Regional Summary | |||||||||
| State | # Hotels | # Rooms | % of Total Rooms | TTM Occupancy(1) | TTM ADR(1) | TTM RevPAR(1) | TTM RevPAR Penetration(1) | UW NCF | % of UW NCF |
| California | 10 | 1,068 | 16.8% | 84.2% | $145.73 | $122.71 | 108.5% | $21,907,781 | 30.7% |
| Texas | 20 | 1,753 | 27.5% | 70.2% | $105.64 | $74.18 | 131.2% | $13,438,906 | 18.8% |
| Indiana | 5 | 525 | 8.2% | 77.4% | $107.72 | $83.34 | 114.0% | $5,560,538 | 7.8% |
| Washington | 2 | 253 | 4.0% | 79.6% | $122.62 | $97.56 | 105.9% | $3,867,658 | 5.4% |
| Michigan | 3 | 297 | 4.7% | 76.2% | $130.98 | $99.85 | 118.5% | $3,681,825 | 5.2% |
| Ohio | 3 | 287 | 4.5% | 76.3% | $121.84 | $92.95 | 121.8% | $3,299,191 | 4.6% |
| Illinois | 3 | 380 | 6.0% | 67.1% | $105.14 | $70.56 | 103.1% | $2,534,810 | 3.6% |
| Pennsylvania | 3 | 243 | 3.8% | 77.1% | $123.04 | $94.83 | 191.7% | $2,532,793 | 3.6% |
| Virginia | 2 | 228 | 3.6% | 72.3% | $119.08 | $86.15 | 131.4% | $2,234,852 | 3.1% |
| Minnesota | 2 | 177 | 2.8% | 72.4% | $122.88 | $88.92 | 127.6% | $1,839,395 | 2.6% |
| Oregon | 1 | 124 | 1.9% | 74.1% | $115.72 | $85.79 | 77.6% | $1,708,763 | 2.4% |
| Kentucky | 1 | 106 | 1.7% | 72.9% | $135.94 | $99.11 | 102.1% | $1,388,767 | 1.9% |
| New Jersey | 1 | 132 | 2.1% | 78.1% | $126.40 | $98.76 | 135.7% | $1,317,397 | 1.8% |
| Arizona | 1 | 90 | 1.4% | 80.8% | $120.72 | $97.54 | 145.9% | $1,158,027 | 1.6% |
| North Carolina | 1 | 118 | 1.9% | 66.6% | $108.23 | $72.10 | 139.7% | $1,094,065 | 1.5% |
| Oklahoma | 2 | 131 | 2.1% | 72.3% | $95.08 | $68.74 | 148.7% | $830,723 | 1.2% |
| Wyoming | 1 | 60 | 0.9% | 74.6% | $118.88 | $88.74 | 117.6% | $753,591 | 1.1% |
| Connecticut | 1 | 135 | 2.1% | 56.7% | $131.41 | $74.49 | 116.3% | $752,132 | 1.1% |
| Maryland | 1 | 109 | 1.7% | 79.9% | $97.48 | $77.87 | 139.2% | $657,471 | 0.9% |
| Wisconsin | 1 | 62 | 1.0% | 68.6% | $115.68 | $79.34 | 154.1% | $603,823 | 0.8% |
| Arkansas | 1 | 88 | 1.4% | 66.5% | $75.50 | $50.18 | 100.5% | $166,883 | 0.2% |
| Total / Wtd. Avg. | 65 | 6,366 | 100.0% | 74.6% | $119.07 | $88.81 | 123.3% | $71,329,392 | 100.0% |
| (1) | TTM Occupancy, TTM ADR and TTM RevPAR are based on borrower sponsor provided operating statements dated as of March 31, 2017, and weighted based on available rooms and occupied rooms, as applicable. TTM RevPAR Penetration is calculated based on operating statements provided by the borrowers and competitive set data provided by a third-party hospitality research report, and weighted based on total rooms. The minor variances between the underwriting, the hospitality research report and the above table with respect to TTM Occupancy, TTM ADR and TTM RevPAR at the Starwood Capital Hotel Portfolio Properties are attributable to variances in reporting methodologies and/or timing differences. |
This is not a research report and was not prepared by any Underwriter’s research department. Please see additional important information and qualifications at the end of this Term Sheet.
| T-140 |
| MSBAM 2017-C34 | Starwood Capital Hotel Portfolio |
Operating History and Underwritten Net Cash Flow.The following table presents certain information relating to the historical operating performance and the Underwritten Net Cash Flow at the Starwood Capital Hotel Portfolio Properties:
| Cash Flow Analysis | |||||||||||||
| 2014 | 2015 | 2016 | 3/31/2017 TTM | U/W | U/W per Room(1) | ||||||||
| Occupancy | 73.7% | 74.8% | 74.7% | 74.6% | 74.6% | ||||||||
| ADR | $112.28 | $116.76 | $119.48 | $119.07 | $118.83 | ||||||||
| RevPAR | $82.80 | $87.29 | $89.23 | $88.81 | $88.67 | ||||||||
| Room Revenue | $192,509,535 | $202,927,905 | $206,707,091 | $205,120,564 | $206,046,538 | $32,367 | |||||||
| F&B Revenue | $4,481,265 | $5,413,425 | $5,367,185 | $5,436,865 | $5,449,118 | $856 | |||||||
| Other Revenue | $2,518,145 | $1,839,946 | $2,161,754 | $2,093,187 | $2,104,554 | $331 | |||||||
| Total Revenue | $199,508,945 | $210,181,276 | $214,236,030 | $212,650,616 | $213,600,210 | $33,553 | |||||||
| Room Expense | $43,419,428 | $44,601,150 | $46,539,452 | $46,836,463 | $47,702,619 | $7,493 | |||||||
| F&B Expense | $3,731,961 | $4,181,990 | $3,877,875 | $3,826,532 | $3,826,294 | $601 | |||||||
| Other Departmental Expenses | $2,076,802 | $754,103 | $883,759 | $857,468 | $857,390 | $135 | |||||||
| Departmental Expenses | $49,228,191 | $49,537,243 | $51,301,086 | $51,520,462 | $52,386,303 | $8,229 | |||||||
| Departmental Profit | $150,280,754 | $160,644,033 | $162,934,944 | $161,130,154 | $161,213,908 | $25,324 | |||||||
| Operating Expenses | $56,768,412 | $60,404,169 | $61,876,151 | $62,127,172 | $62,263,971 | $9,781 | |||||||
| Gross Operating Profit | $93,512,342 | $100,239,865 | $101,058,793 | $99,002,982 | $98,949,936 | $15,544 | |||||||
| Management Fee | $6,387,948 | $6,809,293 | $6,853,190 | $6,818,728 | $7,967,134 | $1,252 | |||||||
| Property Taxes | $8,481,331 | $8,752,425 | $8,874,165 | $8,811,094 | $8,818,912 | $1,385 | |||||||
| Property Insurance | $1,772,892 | $1,800,134 | $1,821,444 | $1,812,439 | $1,809,568 | $284 | |||||||
| Ground Lease Expense | $261,733 | $287,860 | $284,102 | $292,098 | $292,098 | $46 | |||||||
| Other Expenses | $76,316 | $0 | $0 | $0 | $0 | $0 | |||||||
| FF&E | $7,980,358 | $8,583,513 | $8,756,495 | $8,693,699 | $8,732,831 | $1,372 | |||||||
| Total Other Expenses | $24,960,579 | $26,233,225 | $26,589,396 | $26,428,058 | $27,620,544 | $4,339 | |||||||
| Net Operating Income | $68,551,763 | $74,006,639 | $74,469,395 | $72,574,927 | $71,329,392 | $11,205 | |||||||
| Net Cash Flow | $68,551,763 | $74,006,639 | $74,469,395 | $72,574,927 | $71,329,392 | $11,205 | |||||||
| NOI DSCR(2) | 2.61x | 2.82x | 2.84x | 2.76x | 2.72x | ||||||||
| NCF DSCR(2) | 2.61x | 2.82x | 2.84x | 2.76x | 2.72x | ||||||||
| NOI Debt Yield(2) | 11.9% | 12.8% | 12.9% | 12.6% | 12.4% | ||||||||
| NCF Debt Yield(2) | 11.9% | 12.8% | 12.9% | 12.6% | 12.4% | ||||||||
| (1) | U/W per Room is based on a total of 6,366 rooms. |
| (2) | Debt service coverage ratios and debt yields are based on the Starwood Capital Hotel Portfolio Whole Loan. |
Release of Property.After June 1, 2018, the Starwood Capital Hotel Portfolio Borrowers may obtain the release of an individual property or multiple properties subject to, among other conditions: (i) no monetary event of default has occurred and is continuing under the Starwood Capital Hotel Portfolio Whole Loan, (ii) the remaining Starwood Capital Hotel Portfolio Properties have a debt service coverage ratio no less than the greater of (a) 2.65x and (b) the debt service coverage ratio for the remaining properties immediately prior to the release (which may be satisfied with an additional prepayment of principal with the related yield maintenance premium, as applicable, or a cash deposit with lender to meet such test), (iii) prepayment of the Starwood Capital Hotel Portfolio Whole Loan in an amount equal to the Release Price (as defined below) together with the related yield maintenance premium associated with the Release Price and (iv) satisfaction of customary REMIC requirements.
In addition, with respect to the Holiday Inn Express & Suites Terrell property, pursuant to a recorded declaration, Tanger Properties Limited Partnership, the developer of the property, together with its successors and assigns, has the right to purchase the property in the event, among other things, either the improvements are abandoned or permanently closed or the borrower fails to use the property for its intended use for more than 60 days (other than due to a casualty or remodeling) or otherwise violates the declaration. In the event that such purchase option is exercised, the purchase price is equal to the sum of the price paid by the prior owner of the property (i.e. the initial transferee from the developer) and the costs of the improvements (as described in the declaration), and the applicable borrower is required to promptly cause the release of the property in compliance with the release provisions described above (except that the applicable borrower may release the property during the lockout period with payment of the applicable yield maintenance premium). The Starwood Capital Hotel Portfolio Whole Loan documents require that any release of such property in connection with the exercise of the purchase option be in compliance with the release provisions described above (except that the release may occur on or prior to June 1, 2018 with payment of the applicable yield maintenance premium). The Starwood Capital Hotel Portfolio Hotel Portfolio Whole Loan is recourse to the guarantor for any losses suffered by the lender if and when the purchase option is exercised.
The “Release Price” means an amount equal to (a) if less than $57,727,000 has been prepaid to date, 105% of the allocated loan amount of each such individual property, (b) if less than $86,590,500 has been prepaid to date, 110% of the allocated loan amount of each such individual property, (c) if less than $115,454,000 has been prepaid to date, 115% of the allocated loan amount of each such individual property and (d) (x) for all amounts prepaid in excess of $115,454,000 or (y) if any such released individual property is to be conveyed to an affiliate of the Starwood Capital Hotel Portfolio Borrowers, principals, operating companies or guarantors, 120% of the allocated loan amount of each such individual property.
This is not a research report and was not prepared by any Underwriter’s research department. Please see additional important information and qualifications at the end of this Term Sheet.
| T-141 |
| MSBAM 2017-C34 |
This material was prepared by sales, trading, banking or other non-research personnel of one of the following (or an affiliate thereof): Merrill Lynch, Pierce, Fenner & Smith Incorporated (together with its affiliates, “BofA Merrill Lynch”), Morgan Stanley & Co. LLC, Morgan Stanley & Co. International Limited, Morgan Stanley Japan Limited and/or Morgan Stanley Dean Witter Asia Limited (together with their affiliates, hereinafter “Morgan Stanley”), KeyBanc Capital Markets Inc. (together with its affiliates, “KeyBanc”, and Drexel Hamilton, LLC (together with its affiliates, “Drexel”, and collectively with BofA Merrill Lynch, Morgan Stanley and KeyBanc, the “Underwriters”). This material was not produced by an Underwriter’s research analyst, although it may refer to an Underwriter’s research analyst or research report. Unless otherwise indicated, these views (if any) are the author’s and may differ from those of the fixed income or equity research departments of the Underwriters or others in those firms.
This material may have been prepared by or in conjunction with the respective trading desks of the Underwriters that may deal as principal in or own or act as market maker or liquidity provider for the securities/instruments (or related derivatives) mentioned herein. The trading desk may have accumulated a position in the subject securities/instruments based on the information contained herein. Trading desk materials are not independent of the proprietary interests of the Underwriters, which may conflict with your interests. Each of the Underwriters may also perform or seek to perform investment banking services for the issuers of the securities and instruments mentioned herein.
The information contained in this material is subject to change, completion or amendment from time to time, and the information in this material supersedes information in any other communication relating to the securities referred to in this material. This material is not a solicitation to participate in any trading strategy, and is not an offer to sell any security or instrument or a solicitation of an offer to buy or sell any security or instrument in any jurisdiction where an offer, solicitation or sale is not permitted. Unless otherwise set forth in this material, any securities referred to in this material maynot have been registered under the U.S. Securities Act of 1933, as amended, and, if not, may not be offered or sold absent an exemption therefrom. Recipients are required to comply with any legal or contractual restrictions on their purchase, holding, sale, exercise of rights or performance of obligations under any securities/instruments transaction.
The securities/instruments discussed in this material may not be suitable for all investors. This material has been prepared and issued by the Underwriters for intended distribution to market professionals and institutional investor clients. Other recipients should seek independent investment advice prior to making any investment decision based on this material. This material does not provide individually tailored investment advice or offer tax, regulatory, accounting or legal advice. Prior to entering into any proposed transaction, recipients should determine, in consultation with their own investment, legal, tax, regulatory and accounting advisors, the economic risks and merits, as well as the legal, tax, regulatory and accounting characteristics and consequences, of the transaction. You should consider this material as only a single factor in making an investment decision.
The value of and income from investments may vary because of changes in interest rates, foreign exchange rates, default rates, prepayment rates, securities/instruments prices, market indexes, operational or financial conditions of companies or other factors. There may be time limitations on the exercise of options or other rights in securities/instruments transactions. Past performance is not necessarily a guide to future performance. Estimates of future performance are based on assumptions that may not be realized. Actual events may differ from those assumed and changes to any assumptions may have a material impact on any projections or estimates. Other events not taken into account may occur and may significantly affect the projections or estimates. Certain assumptions may have been made for modeling purposes only to simplify the presentation and/or calculation of any projections or estimates, and the Underwriters do not represent that any such assumptions will reflect actual future events. Accordingly, there can be no assurance that estimated returns or projections will be realized or that actual returns or performance results will not materially differ from those estimated herein. Some of the information contained in this document may be aggregated data of transactions in securities or other financial instruments executed by an Underwriter that has been compiled so as not to identify the underlying transactions of any particular customer.
Notwithstanding anything herein to the contrary, the Underwriters and each recipient hereof (and their employees, representatives, and other agents) may disclose to any and all persons, without limitation of any kind from the commencement of discussions, the U.S. federal and state income tax treatment and tax structure of the transaction and all materials of any kind (including opinions or other tax analyses) that are provided to it relating to the tax treatment and tax structure (as such terms are defined in Treasury Regulation 1.6011-4). For this purpose, “tax structure” is limited to facts relevant to the U.S. federal and state income tax treatment of the transaction and does not include information relating to the identity of the parties, their affiliates, agents or advisors. This authorization of tax disclosure is retroactively effective to the commencement of discussions with prospective investors regarding the transactions contemplated herein.
THE DISTRIBUTION OF THIS MATERIAL (A) IF MADE BY A PERSON WHO IS NOT AN AUTHORIZED PERSON UNDER THE FINANCIAL SERVICES AND MARKETS ACT 2000 (“FSMA”), IS BEING MADE ONLY TO, OR DIRECTED ONLY AT, PERSONS WHO (I) ARE OUTSIDE THE UNITED KINGDOM, OR (II) HAVE PROFESSIONAL EXPERIENCE IN MATTERS RELATING TO INVESTMENTS AND QUALIFY AS INVESTMENT PROFESSIONALS IN ACCORDANCE WITH ARTICLE 19(5) OF THE FINANCIAL SERVICES AND MARKETS ACT 2000 (FINANCIAL PROMOTION) ORDER 2005 (THE “FINANCIAL PROMOTION ORDER”), OR (III) ARE PERSONS FALLING WITHIN ARTICLE 49(2)(A) THROUGH (D) (HIGH NET WORTH COMPANIES, UNINCORPORATED ASSOCIATIONS, ETC.) OF THE FINANCIAL PROMOTION ORDER; AND (B) IF MADE BY A PERSON WHO IS AN AUTHORIZED PERSON UNDER THE FSMA, IS BEING MADE ONLY TO, OR DIRECTED ONLY AT, PERSONS WHO (I) ARE OUTSIDE THE UNITED KINGDOM, OR (II) HAVE PROFESSIONAL EXPERIENCE IN MATTERS RELATING TO INVESTMENTS AND QUALIFY AS INVESTMENT PROFESSIONALS IN ACCORDANCE WITH ARTICLE 14(5) OF THE FINANCIAL SERVICES AND MARKETS ACT 2000 (PROMOTION OF COLLECTIVE INVESTMENT SCHEMES) (EXEMPTIONS) ORDER 2001 (THE “PROMOTION OF COLLECTIVE INVESTMENT SCHEMES EXEMPTIONS ORDER”), OR (III) ARE PERSONS FALLING WITHIN ARTICLE 22(2)(A) THROUGH (D) (“HIGH NET WORTH COMPANIES, UNINCORPORATED ASSOCIATIONS, ETC.”) OF THE PROMOTION OF COLLECTIVE INVESTMENT SCHEMES EXEMPTIONS ORDER, OR (IV) ARE PERSONS TO WHOM THE ISSUING ENTITY MAY LAWFULLY BE PROMOTED IN ACCORDANCE WITH CHAPTER 4.12 OF THE UK FINANCIAL CONDUCT AUTHORITY’S CONDUCT OF BUSINESS SOURCEBOOK.
THE OFFERED CERTIFICATES HAVE NOT BEEN AND WILL NOT BE REGISTERED UNDER THE FINANCIAL INSTRUMENTS EXCHANGE ACT OF JAPAN (LAW NO. 25 OF 1948, AS AMENDED (THE “FIEL”)), AND EACH OF MERRILL LYNCH, PIERCE, FENNER & SMITH INCORPORATED, MORGAN STANLEY & CO. LLC, WELLS FARGO SECURITIES, LLC AND DREXEL HAMILTON, LLC HAS AGREED THAT IT WILL NOT OFFER OR SELL ANY OFFERED CERTIFICATES, DIRECTLY OR INDIRECTLY, IN JAPAN OR TO, OR FOR THE BENEFIT OF, ANY JAPANESE PERSON, OR TO OTHERS FOR REOFFERING OR RESALE, DIRECTLY OR INDIRECTLY, IN JAPAN OR TO ANY JAPANESE PERSON, EXCEPT PURSUANT TO AN EXEMPTION FROM THE REGISTRATION REQUIREMENTS OF, AND OTHERWISE IN COMPLIANCE WITH, THE FIEL AND ANY OTHER APPLICABLE LAWS AND REGULATIONS. FOR THE PURPOSES OF THIS PARAGRAPH, “JAPANESE PERSON” SHALL MEAN ANY PERSON RESIDENT IN JAPAN, INCLUDING ANY CORPORATION OR OTHER ENTITY ORGANIZED UNDER THE LAWS AND REGULATIONS OF JAPAN.
This is not a research report and was not prepared by any Underwriter’s research department. Please see additional important information and qualifications at the end of this Term Sheet.
| T-142 |